Investigating Cerebrovascular Health and Functional Plasticity ...
292
i Investigating Cerebrovascular Health and Functional Plasticity using Quantitative FMRI By Catherine Foster A Thesis Submitted to the School of Graduate Studies in Partial Fulfillment of the Requirements for the Degree Doctorate of Philosophy Cardiff University © Copyright by Catherine Foster, September 2017
-
Upload
khangminh22 -
Category
Documents
-
view
0 -
download
0
Transcript of Investigating Cerebrovascular Health and Functional Plasticity ...

i
Investigating Cerebrovascular Health
and Functional Plasticity using
Quantitative FMRI
By
Catherine Foster
A Thesis
Submitted to the School of Graduate Studies
in Partial Fulfillment of the Requirements
for the Degree
Doctorate of Philosophy
Cardiff University
© Copyright by Catherine Foster, September 2017

Doctor of Philosophy (2017)
(Psychology)
Cardiff University,
Cardiff, Wales
Title: Investigating cerebrovascular health and functional plasticity using quantitative
fMRI
Author: Catherine Foster
Supervisors: Prof. Richard G. Wise, Dr. Valentina Tomassini
Number of pages: 292

i
Declaration Form
The following declaration is required when submitting your PhD thesis
under the University's regulations.
Declaration
This work has not previously been accepted in substance for any degree
and is not concurrently submitted in candidature for any degree.
. . . . . . . . . . . . . . . . . . . . . . . . . . . . . . . . . . . . . . . . . . . . . . . . .
Candidate Date
Statement 1
This thesis is being submitted in partial fulfillment of the requirements
for the degree of PhD.
. . . . . . . . . . . . . . . . . . . . . . . . . . . . . . . . . . . . . . . . . . . . . . . . .
Candidate Date
Statement 2

ii
This thesis is the result of my own independent work/investigation, except
where otherwise stated. Other sources are acknowledged by explicit
references.
. . . . . . . . . . . . . . . . . . . . . . . . . . . . . . . . . . . . . . . . . . . . . . . . .
. . . . .
Candidate Date
Statement 3
I hereby give consent for my thesis, if accepted, to be available for
photocopying and for inter-library loan, and for the title and summary to
be made available to outside organisations.
. . . . . . . . . . . . . . . . . . . . . . . . . . . . . . . . . . . . . . . . . . . . . . . . .
Candidate Date
Statement 4: Previously approved bar on access
I hereby give consent for my thesis, if accepted, to be available for
photocopying and for inter-library loans after expiry of a bar on access
previously approved by the Graduate Development Committee.
. . . . . . . . . . . . . . . . . . . . . . . . . . . . . . . . . . . . . . . . . . . . . . . . .
Candidate Date

iii
Abbreviations for Frequently Used Terms
AF Aerobic fitness
ASL Arterial spin labelling
BOLD Blood oxygen-level dependent
BP Blood pressure
CASL Continuous arterial spin labelling
CBF Cerebral blood flow
CBV Cerebral blood volume
CSF Cerebrospinal fluid
CMRO2 Cerebral metabolic rate of oxygen consumption
CNS Central nervous system
CVR Cerebrovascular reactivity
EDSS Expanded Disease Status Scale
EPI Echo planar imaging
FSL FMRIB’s software library
FSPGR Fast spoiled gradient echo recalled
FMRI Functional magnetic resonance imaging
GM Grey matter
Hb Haemoglobin
HR Heart rate
MNI Montreal Neurological Institute
MS Multiple Sclerosis
MRI Magnetic resonance imaging
MTI Multiple inversion time
OEF Oxygen extraction fraction
PASL Pulsed arterial spin labelling
PCASL Pulsed continuous arterial spin labelling
PICORE Proximal control for off resonance effects

iv
Abbreviations for Frequently Used Terms
PO2 Oxygen pressure
PtO2 Tissue oxygen pressure
QUIPSS II Quantitative imaging of perfusion using a Single Subtraction II
SNR Signal to noise ratio
SRT Serial reaction time
TE Echo time
TI Inversion time
TR Repetition time
VBM Voxel based morphometry
�̇�O2max Maximal volume of oxygen uptake
�̇�O2peak Peak oxygen uptake volume
WM White matter

v
Acknowledgements
I would like to acknowledge several people who contributed to the work in this thesis. Firstly,
a huge thanks to my supervisor Richard Wise who guided the conception, design and analysis
of each chapter and for being extremely supportive throughout my PhD and post-PhD grant
applications and career planning. I would also like to thank Kevin Murphy for assisting with
the analysis using Afni in Chapter 3 but also for the valuable advice on many things throughout
my time in CUBRIC.
Thanks also to Jessica Steventon who made it possible to conduct the two exercise studies and
collect the data in Chapter 7. These studies involved many hours of set-up and data collection
which would not have been possible without Jessica’s presence and guidance. Thanks to
Hannah Chandler and Rachael Stickland who assisted data collection for Chapter 8 and,
collected almost all the data in Chapter 9 as well as processing the patient data due to
unforeseeable delays with study approval. Many thanks also to my second supervisor
Valentina Tomassini for informing the design of the MS study and assisting with patient
recruitment.
Data collected in the new centre (Chapters 5, 8 and 9) would not have been possible without
the MR sequences developed by Michael Germuska, who also developed the MR processing
and analysis pipeline for these chapters.
I would like to thank Esther Warnert for developing the analysis pipeline used in Chapter 4,
and Joe Whittaker for helping to improving my code over the years. Also thanks to Ian Driver
for his valuable input on data acquisition and analysis.
A huge thank you also to Ilona Lipp for her support with analysis of the SRT task data, and all
things Matlab related.

vi
Table of Contents
Abbreviations for Frequently Used Terms ................................................................................. iii
Acknowledgements ..................................................................................................................... v
Table of Contents ....................................................................................................................... vi
Thesis Summary ........................................................................................................................xii
Research Background and Rationale ..................................................................................... xiii
Quantitative FMRI as a Tool to Study Human Brain Function ................................................. xvii
Chapter 1 ................................................................................................................................... 19
The Energetic Brain: Functional Processes in Health and Disease ........................................... 19
1.1 Neuronal Activity ...................................................................................................... 19
1.2 Organisation of the Cerebrovasculature ................................................................... 21
1.3 Regulation and Modulation of Cerebral Blood Flow ................................................ 24
1.4 Cerebrovascular Reactivity ....................................................................................... 25
1.5 Oxygen and Carbon Dioxide Transport in the Brain ................................................. 26
1.6 Cerebral Blood Flow and Oxygen Metabolism ......................................................... 28
1.7 Impaired Oxygen Availability and Metabolism in Disease ........................................ 31
1.8 Multiple Sclerosis ...................................................................................................... 33
1.9 What is Functional Brain Plasticity? .......................................................................... 34
1.10 The Role of Aerobic Fitness in Cerebrovascular Function ........................................ 34
Chapter 2 ................................................................................................................................... 37
2. Functional Magnetic Resonance Imaging: Basis and Application in Cerebrovascular
Research .................................................................................................................................... 37
2.1 Nuclear Spin .............................................................................................................. 37
2.2 Relaxation and Decay ................................................................................................ 39
2.3 Slice Selection and Image Formation ........................................................................ 40
2.4 Signal Processing in K-space ..................................................................................... 40
2.5 MR Contrast Mechanisms ......................................................................................... 43
2.6 Spin Echo and Gradient Echo Imaging ...................................................................... 44
2.7 The Blood Oxygen Level Dependent (BOLD) Signal .................................................. 46
2.8 Arterial Spin Labelling ............................................................................................... 49
2.9 Types of ASL .............................................................................................................. 50
2.10 Dual echo and Dual Excitation .................................................................................. 55
2.11 Single and Multiple Inversion Time ASL .................................................................... 57
2.12 Quantification of Cerebral Haemodynamics ............................................................. 57
2.13 Calibrated FMRI......................................................................................................... 58
2.14 Measurement of Cerebrovascular Reactivity ........................................................... 60
2.15 Signal Contamination in BOLD and ASL .................................................................... 61
2.16 Summary Comparison of BOLD and ASL ................................................................... 62
2.17 Overview of Statistical Approaches .......................................................................... 63
2.1.1 Sample Sizes ...................................................................................................... 63
2.1.2 Multiple Comparison Corrections ..................................................................... 64
2.1.3 Outliers .............................................................................................................. 65
Chapter 3 ................................................................................................................................... 66

vii
Evaluation of the effects of partial volume correction and kinetic model parameters on PASL
estimates CBF and CVR ............................................................................................................. 66
Abstract ..................................................................................................................................... 66
3.1 Introduction .............................................................................................................. 67
3.1.1 Single vs. Multiple Postlabelling delay sequences ............................................ 67
3.1.2 ASL Partial Volume Correction .......................................................................... 68
3.1.3 Quantification of CBF ........................................................................................ 69
3.2 Methods .................................................................................................................... 71
3.2.1 Participants ....................................................................................................... 71
3.2.2 MRI Acquisition ................................................................................................. 71
3.2.3 MTI Image Acquisition ...................................................................................... 71
3.2.4 SiTI Acquisition .................................................................................................. 72
3.3 Data Analysis ............................................................................................................. 72
3.3.1 General Image Preprocessing ........................................................................... 72
3.3.2 MTI Analysis ...................................................................................................... 73
3.3.3 Kinetic model estimation using a non-linear framework.................................. 74
3.3.4 SiTI Analysis ....................................................................................................... 75
3.3.5 CVR .................................................................................................................... 75
3.3.6 Statistical Analysis ............................................................................................. 75
3.4 Results ....................................................................................................................... 76
3.4.1 Effects of PVC and acquisition sequence on CBF and CVR................................ 76
3.4.2 Downsampled CBF and CVR with and without PVC .......................................... 79
3.4.3 Buxton Model with IV component implemented using Oxford ASL and NLfit . 81
3.4.4 Individual model parameter differences .......................................................... 82
3.4.5 Summary of main findings ................................................................................ 82
3.5 Discussion .................................................................................................................. 83
3.5.1 PVC .................................................................................................................... 83
3.5.2 Choice of post-labelling delay scheme .............................................................. 85
3.5.3 Kinetic Model Differences ................................................................................. 86
3.5.4 Limitations ......................................................................................................... 87
3.6 Conclusions ............................................................................................................... 88
Chapter 3 Supplementary Information ..................................................................................... 89
Chapter 4 ................................................................................................................................... 94
Assessment of the Effects of Aerobic Fitness on Healthy Adults using Multiple Inversion Time
ASL fMRI .................................................................................................................................... 94
Abstract ..................................................................................................................................... 94
4.1 Introduction .............................................................................................................. 95
4.1.1 Experimental Models of Exercise and Aerobic Fitness ..................................... 96
4.1.2 Aerobic Fitness and Cerebrovascular Function: Evidence from Human Imaging
98
4.2 Methods .................................................................................................................. 102

viii
4.2.1 Participants ..................................................................................................... 102
4.2.2 Study Procedures ............................................................................................ 102
4.2.3 Fitness Test...................................................................................................... 104
4.2.4 MRI Acquisition ............................................................................................... 104
4.2.5 Data Analysis ................................................................................................... 106
4.3 Results ..................................................................................................................... 108
4.3.1 Demographics and Fitness Test Outcomes ..................................................... 108
4.3.2 Correlations between CBF, CVR and 𝑽O2peak ............................................... 109
4.4 Discussion ................................................................................................................ 113
4.4.1 Summary ......................................................................................................... 113
4.4.2 𝑽O2peak and CBF ............................................................................................ 113
4.4.3 𝑽O2peak and CVR ............................................................................................ 117
4.4.4 Cognitive Performance ................................................................................... 117
4.4.5 Limitations ....................................................................................................... 118
4.4.6 Future Directions ............................................................................................ 119
Chapter 4 Supplementary Information ................................................................................... 122
4.5 Cognitive Performance ........................................................................................... 122
4.6 Power Analysis ........................................................................................................ 125
Chapter 5 ................................................................................................................................. 127
A Cross-Sectional and Interventional Study to Characterise the Cerebral Vascular and
Metabolic Effects of Aerobic Fitness ...................................................................................... 127
Abstract ................................................................................................................................... 127
5.1 Introduction ............................................................................................................ 129
5.2 Methods .................................................................................................................. 133
5.2.1 Participants ..................................................................................................... 133
5.2.2 Screening Visit ................................................................................................. 133
5.2.3 Estimation of 𝑽O2max ..................................................................................... 134
5.2.4 Imaging Data Acquisition ................................................................................ 134
5.2.5 Respiratory Modulation Protocol ................................................................... 135
5.2.6 Exercise Training ............................................................................................. 137
5.3 Data Analysis ........................................................................................................... 138
5.3.1 𝑉O2max Estimation ......................................................................................... 138
5.3.2 Image Preprocessing ....................................................................................... 138
5.3.3 Physiological Traces ........................................................................................ 138
5.3.4 Physiological Forward Model .......................................................................... 138
5.3.5 Spatial Maps .................................................................................................... 140
5.3.6 Statistical Analysis ........................................................................................... 140
5.4 Results ..................................................................................................................... 141
5.4.1 Cross-Sectional Relationship between 𝑽O2max and Cerebrovascular Function
142
5.4.2 Effects of the Exercise Training Intervention on Cerebrovascular Function... 144
5.4.3 Results Summary ............................................................................................. 147

ix
5.5 Discussion ................................................................................................................ 148
5.5.1 Limitations ....................................................................................................... 153
5.5.2 Conclusions ..................................................................................................... 154
Chapter 5 Supplementary Information ................................................................................... 156
Chapter 6 ................................................................................................................................. 161
Overview of FMRI Studies on Motor Plasticity ....................................................................... 161
Abstract ................................................................................................................................... 161
6.1 Introduction ............................................................................................................ 162
6.2 Imaging Motor Plasticity in Healthy Cohorts .......................................................... 163
6.2.1 Functional Connectivity Changes following Motor Training ........................... 166
6.3 Quantitative FMRI and Plasticity............................................................................. 169
6.4 Imaging Plasticity in Patients .................................................................................. 175
6.5 Cellular and Molecular Mechanisms of Plasticity ................................................... 178
6.6 Conclusions and Future Directions ......................................................................... 179
Chapter 7 ................................................................................................................................. 181
Cerebral Metabolic Changes during Visuomotor Learning Assessed using Quantitative FMRI
................................................................................................................................................ 181
Abstract ................................................................................................................................... 181
7.1 Introduction ............................................................................................................ 183
7.2 Methods .................................................................................................................. 185
7.2.1 Participants ..................................................................................................... 185
7.2.2 Imaging ............................................................................................................ 185
7.2.3 Visuomotor Task ............................................................................................. 186
7.2.4 Hypercapnic Calibration .................................................................................. 187
7.2.5 Data Analysis ................................................................................................... 188
7.2.6 Statistical Analysis ........................................................................................... 191
7.3 Results ..................................................................................................................... 191
7.3.1 Behavioural Data ............................................................................................. 191
7.3.2 Imaging Data ................................................................................................... 192
7.3.3 Flow and Metabolism Changes during Task Performance .............................. 194
7.3.4 Flow and Metabolism Reductions over Time.................................................. 196
7.3.5 Flow-Metabolism Coupling ............................................................................. 197
7.3.6 Results Summary ............................................................................................. 197
7.4 Discussion ................................................................................................................ 198
7.4.1 Energetic Changes during Task Performance ................................................. 198
7.4.2 Flow-Metabolism Coupling ............................................................................. 202
7.4.3 Limitations ....................................................................................................... 203
7.4.4 Conclusions ..................................................................................................... 204
Chapter 7 Supplementary Information ................................................................................... 205
Chapter 8 ................................................................................................................................. 207
Resting CBF Changes Following a Single Session of Visuomotor Training .............................. 207
Abstract ................................................................................................................................... 207

x
8.1 Introduction ............................................................................................................ 208
8.2 Methods .................................................................................................................. 210
8.2.1 Participants ..................................................................................................... 210
8.2.2 Experimental Paradigm ................................................................................... 211
8.2.3 Image Acquisition ............................................................................................ 212
8.2.4 Data Analysis ................................................................................................... 213
8.2.5 ROI Definition from Task Responses ............................................................... 213
8.2.6 CBF Quantification .......................................................................................... 213
8.2.7 Resting State Functional Connectivity ............................................................ 213
8.2.8 Statistical Analysis ........................................................................................... 214
8.3 Results ..................................................................................................................... 215
8.3.1 Behavioural Results ......................................................................................... 215
8.3.2 Resting CBF in Task-Recruited Regions ........................................................... 216
8.3.3 Linear Signal Reductions across Task Blocks ................................................... 218
8.3.4 Resting Motor Network CBF Changes ............................................................. 220
8.3.5 Power Analysis for Future Studies .................................................................. 223
8.4 Discussion ................................................................................................................ 224
8.4.1 Summary of Main Results ............................................................................... 224
8.4.2 CBF in Task-Relevant Areas ............................................................................. 225
8.4.3 Resting State Functional Connectivity ............................................................ 227
8.4.4 Limitations ....................................................................................................... 229
8.4.5 Future Research .............................................................................................. 230
Chapter 8 Supplementary Data .............................................................................................. 231
8.5 Individual Subject CBF ............................................................................................. 231
8.6 G*Power Output ..................................................................................................... 233
8.7 M1 Resting State Functional Connectivity .............................................................. 238
Chapter 9 ................................................................................................................................. 242
Characterising Vascular and Metabolic Dysfunction in Multiple Sclerosis: Pilot Data ........... 242
Abstract ................................................................................................................................... 242
9.1 Introduction ............................................................................................................ 243
9.2 Methods .................................................................................................................. 246
9.2.1 Participants ..................................................................................................... 246
9.2.2 Imaging Protocol ............................................................................................. 246
9.3 Results ..................................................................................................................... 247
9.4 Discussion and Future Work ................................................................................... 250
Chapter 9 Supplementary Data .............................................................................................. 252
Chapter 10 ............................................................................................................................... 253
General Discussion .................................................................................................................. 253
10.1 Aerobic Fitness and Brain Health ............................................................................ 254
10.2 Functional Neuroplasticity of the Motor System .................................................... 256
10.3 Multiple Sclerosis .................................................................................................... 258
10.4 Methodological Considerations and Limitations .................................................... 259

xi
10.5 Translation of Findings: Improving Brain Plasticity in Disease ............................... 261
Bibliography ............................................................................................................................ 263

xii
Thesis Summary
A healthy cerebrovasculature is necessary to maintain optimal levels of blood flow and oxygen
metabolism required for overall brain health. Cerebrovascular health also promotes functional
plasticity which facilitates lifelong adaptation with experience and recovery following injury.
In diseases such as Multiple Sclerosis (MS), there is known vascular and metabolic dysfunction,
however, patients retain variable levels of functional plasticity which aids recovery following
acute bouts of inflammation. Physical exercise interventions, aimed at improving cerebral
blood flow and oxygen metabolism, present a potential avenue for improving patient
outcomes and slowing the progression of disability. However, there is a lack of mechanistic
understanding of i) brain energetic processes underlying plasticity and ii) how aerobic fitness
(AF), which is linked to increased brain plasticity, benefits brain vascular and metabolic
function. The work presented in this thesis uses arterial spin labelling (ASL) functional magnetic
resonance imaging (fMRI) to quantitatively characterise the vascular and metabolic processes
associated with functional brain plasticity, and the effects of AF on the brain’s functional
capacity in healthy adults.
This thesis begins with an overview of the neurobiological processes of interest and fMRI
techniques that can quantify these processes. Next, a comparison of common ASL acquisition
and analysis procedures is made to establish the most appropriate methods for subsequent
experimental work. Chapters 4 and 5 investigate the effects of AF on cerebrovascular function
in healthy adults. Chapter 6 then gives an overview of existing functional motor plasticity work,
before Chapters 7 and 8 which quantify vascular and metabolic adaptations following motor
training in the healthy brain. Chapter 9, presents preliminary work in an MS cohort, applying
methods from previous chapters to quantify vascular and metabolic differences between
patients and controls. The general discussion in Chapter 10 summarises the main findings and
contributions of this work and key areas for future research are outlined.

xiii
Research Background and Rationale
Figure 1 Overview of topics covered in each experimental chapter. For example, chapter 3 evaluates quantitative fMRI methods of measuring cerebrovascular function and chapters 4 & 5 investigate the effects of aerobic fitness on vascular and metabolic function. Additional future studies are needed to extend the current body of work, such as using aerobic fitness as a method to improve cerebrovascular health in Multiple Sclerosis.
The overall objectives of this thesis were to;
• Characterise the effect of aerobic fitness on cerebrovascular and metabolic function
in healthy young adults using quantitative fMRI
• Identify cerebrovascular and metabolic mechanisms of functional motor plasticity in
the healthy brain
• Map differences in blood flow and oxygen metabolism in people with MS and healthy
controls

xiv
The above objectives were chosen to address gaps in the literature regarding lifestyle and
behavioural interventions which may maintain or improve brain health in ageing and disease.
Figure 1 outlines areas of investigation of each chapter as well as areas not covered which
future studies informed by the outcomes of the current experimental work can address. This
body of research is motivated by the need to develop novel treatment interventions for
diseases such as MS, which work to improve the foundation of brain function; a plentiful supply
of oxygenated blood to tissue, and efficient extraction and metabolism of nutrients such as
oxygen.
The past few decades have seen an increasing body of evidence supporting the beneficial role
of aerobic fitness (AF) in cerebrovascular health, and this is discussed in detail in Chapter 4,
which along with Chapter 5, investigates the links between AF, vascular and metabolic function
using quantitative fMRI. AF is believed to increase the capacity for plasticity in the brain, in
both healthy ageing and disease (Colcombe et al., 2004; M. W. Voss, Vivar, Kramer, & van
Praag, 2013) as plasticity is dependent on an adequate energy supply. A separate body of work
shows that training on a motor sequence learning task for people with MS can improve
performance which is accompanied by altered patterns of activation (Tomassini, Johansen-
Berg, et al., 2012). This suggests retained capacity for plasticity in patients which could be
exploited by targeted training of affected functions. However, physical rehabilitation strategies
vary in efficacy between patients (Lipp & Tomassini, 2015) and this may be explained by
varying levels of plasticity, which in turn may be dependent on brain energetic function. Brain
energetics are affected in MS (Juurlink, 2013) and in future, combined interventions using
exercise training to improve AF, along with task-specific training, may improve cerebrovascular
function with subsequent increases in plasticity and recovery of function.
However, it is not known whether AF and task-specific training interventions also benefit
oxygen extraction and metabolism; therefore, the extent to which such rehabilitation
strategies may slow disease progression is also unknown. Further, the neural energetics
underlying plasticity are not yet well established even in the healthy brain. To address this,
Chapters 7 and 8, again employing quantitative imaging, investigate CMRO2 changes during
motor learning, and sustained cerebral blood flow (CBF) changes in task and resting state
networks following motor learning, respectively. The work in this thesis, therefore,
investigates both the effects of AF on cerebrovascular function and metabolism, and the
energetic processes underlying motor plasticity in the healthy brain.

xv
Chapter 9 moves towards clinical translation of this work, applying quantitative fMRI
techniques used in Chapter 5 to characterise vascular and metabolic dysfunction on a regional
basis. Further, this ongoing work will look at the effects of baseline blood flow and oxygen
metabolism on motor plasticity, using a motor training task employed in Chapters 7 and 8. This
work is ongoing, however, preliminary results demonstrate the feasibility of quantifying
regional oxygen extraction and metabolism in people with MS.
Below, specific objectives related to each chapter are listed.
Chapter 3
• Assess differences in cerebral blood flow (CBF) and cerebrovascular reactivity (CVR)
values obtained in the same imaging session using single and multiple inversion time
ASL
• Assess the effects of partial volume correction (PVC) on CBF and CVR values and data
variability
• Compare CBF and CVR results quantified using different implementations of the
general kinetic model (GKM) in FSL and AFNI, two commonly software packages widely
used for analysis of ASL data
• Determine the most appropriate methods for acquisition and analysis of ASL data and
the limitations where the gold-standard is not available
Chapter 4
• Investigate whether young, healthy adults with greater aerobic fitness (AF) have
higher CBF and CVR
• Test whether subjects with greater fitness achieve higher cognitive test performance
Chapter 5
• Building on chapter 4, investigate whether similar relationships between CBF and CVR
are observed
• Investigate the metabolic effects of AF in young adults, specifically differences in
capillary cerebral blood flow (CBVcap), baseline oxygen extraction fraction (OEF0) and
the cerebral metabolic rate of oxygen consumption (CMRO2) which correlate with
fitness level
Chapter 7

xvi
• Using calibrated fMRI, characterise neuroenergetic responses to a motor sequence
training task
• Measure energetic changes over time associated with task adaptation and functional
plasticity
Chapter 8
• Investigate whether sustained CBF changes, indicative of functional plasticity are
observed in task-relevant networks following motor sequence training
• Use ASL resting state functional connectivity (RSFC) analysis to examine whether M1
connectivity is altered following motor sequence training, and if so, measure changes
in CBF in these regions.
Chapter 9
• Examine differences in CBF and oxygen metabolism, as well as CBV between people
with MS and healthy controls

xvii
Quantitative FMRI as a Tool to Study Human Brain Function
The ultimate goal of quantitative brain imaging is to reach a detailed understanding of how
energy is supplied to and utilised by the brain at rest and during neural activation. To
understand brain dysfunction in disease, it is necessary to first quantify healthy brain activity
at rest, and in response to stimulation and interventions.
Rapid technological advancement in the last 50 years means that we can now study brain
function using a variety of minimally invasive and non-invasive methods. These include
positron emission tomography (PET) which can measure CBF, glucose and oxygen metabolism
by detecting the radiation given off by injected tracers. Although tracers contain a very low
level of radioactive material, PET is not ideally suited to repeated use in basic neuroscience.
Non-invasive techniques such as electroencephalography (EEG) which measures electrical
activity in the brain through electrodes placed on the scalp, and magnetoencephalography
(MEG) which records the magnetic fields produced by electrical signals from neuronal activity
provide non-invasive alternatives. EEG and MEG provide excellent temporal resolution but
relatively poor spatial resolution and detection of subcortical activity is often degraded. In
contrast, fMRI has lower temporal resolution (~1s) than EEG or MEG (<1 ms) as it measures
blood flow rather than electrical activity, but has excellent spatial resolution (typically 1-2mm,
although sub-millimetre resolution is now possible). At present, fMRI is one of the most widely
used imaging techniques due to it being widely available, non-invasive and suitable for
studying the whole brain under almost all conditions from anaesthesia to complex cognitive
processing. FMRI relies on changes in blood flow in response to neuronal activity and although
it is an indirect measure of neuronal activity, there is high correlation with local field potentials
(LFPs) (Nikos K Logothetis & Pfeuffer, 2004) and EEG signals (Mayhew, Macintosh, Dirckx,
Domenico, & Wise, 2010; Singh, Kim, & Kim, 2003). The introduction of ASL and development
of biophysical models of brain activity based largely on experimental animal models means
that it is now possible to obtain absolute values of CBF, cerebral blood volume and oxygen
metabolism through magnetic labelling of blood water, as opposed to intravenous tracers used
in PET.
The relationship between CBF and brain function was experimentally linked by Charles Roy and
Charles Sherrington in 1890, then Linus Pauling and Charles Coryell in 1936 discovered that
oxyhaemoglobin is diamagnetic and repelled by magnetic fields, and deoxyhaemoglobin is
paramagnetic, making it attracted to magnetic fields. MRI was being used to study brain
structure up until 1990 when Seiji Ogawa and Kenneth Kwong independently published the

xviii
first fMRI work using blood oxygen level dependent (BOLD) contrast. Kwong and Ogawa are
now jointly credited for discovering functional mapping of the brain using the
deoxyhaemoglobin contrast which gives rise to the BOLD signal. BOLD is still the most common
fMRI technique, however due to several limitations, discussed in later sections, most notably
the inability to obtain quantitative information about the BOLD signal, the use of ASL imaging
of brain perfusion (Williams, Detrett, Leight, & Koretsky, 1992) is growing and offers a
quantitative alternative to BOLD. Dual-echo and dual-excitation (see section 2.10) ASL is used
throughout this thesis to acquire CBF data, with BOLD-weighted data mainly used for
calibration purposes or to identify regions of interest (ROIs) for analysis of metabolic activity
changes. In Chapter 1 the biological processes which can be measured and modelled using
BOLD and ASL are outlined, followed by an overview of the basis of the MR signal and
techniques relevant to this thesis in Chapter 2.

19
Chapter 1
The Energetic Brain: Functional Processes in Health and
Disease
1.1 Neuronal Activity
Neuronal cells are structured to comprise a nucleus, located in the cell body (soma), dendrites
which extend from the soma and an axon coated in a myelin sheath. Dendrites conduct signals
towards the soma and the axon carries signals away from the soma. The myelin sheath
facilitates rapid signal transmission to other cells. Interconnected neurons possess synapses,
where the axon of one neuron almost connects to the dendrites of another. Neurotransmitters
are released from the synapse to the receiving neuron, therefore transferring the signal. This
ability of neurons to transmit signals is based on the excitability or electrical potential of the
neuron.
A neuron’s resting potential, or charge, is around -70mV with a threshold potential around -40
to -55mV. Neuronal excitability, which determines signal generation, is generated from this
negative electrical potential (-70mV) between intra and extra-cellular space. This is called the
membrane potential and is dependent on a balance between sodium ions (Na+), calcium
(Ca2+), potassium (K+) and chlorine (Cl-). Na+, Ca2+ and Cl- all have a greater concentration
outside the cell, and K+ is greater inside. A stimulus will activate voltage-gated sodium
channels causing them to open, flooding the cell with positive sodium ions and ramping up the
voltage. The now positive charge within the cell causes an outflow of potassium ions.
Potassium channels within the cell are now dampened so that further sodium entrance into
the cell activates more sodium channels. Sodium influx depolarises the cell to establish its own
equilibrium potential (+52mV) making the inside of the cell positive relative to the outside.
Signal, or an action potential, is generated because of transient depolarisation of the
membrane potential i.e. the loss of a difference in charge between the inside and outside of
the plasma membrane of a neuronal cell following a permeability change in the cell, and
movement of sodium ions into the cell. Then, neurotransmitter signalling to the receiving
neuron alters its resting potential. A positive excitatory potential exchange is created through

20
the neurotransmitter glutamate while γ-aminobutyric acid (GABA) generally causes negative
or inhibitory changes. The net change in polarisation achieved from the total of the excitatory
and inhibitory contributions determines the signal in the neuron receiving the signal, this is
called the post-synaptic neuron. Once the signal transmission has been completed, synaptic
recovery is necessary. Neurotransmitter molecules are taken back into the pre-synaptic and
the membrane potential is brought back to equilibrium in both the transmitting and receiving
neurons. This requires sodium ions to be transported against the gradient. This process is aided
by astrocytes, which along with blood vessels are required for neurovascular coupling (NVC),
the relationship between local neuronal activity and the subsequent vascular (blood flow)
response. With fMRI, it is possible to measure this blood flow response, hence fMRI provides
an indirect measure of neuronal activity.
The human brain has around a hundred billion neuronal cells which generate and transmit
electrical signals across the brain. Neuronal signalling requires significant energy availability,
and perhaps counter-intuitively, most resources are allocated to post-synaptic recovery
(Buxton, 2013). Brain energy metabolism is therefore very closely related to neuronal spiking,
as recovery has a high energetic cost. Inflowing blood to the brain carries the essential sources
of brain energy, oxygen and glucose to meet neuronal demands. As the brain cannot store
energy a constant adequate supply is required, and obstructing circulation to the brain for
even seconds can result in permanent brain damage.
Chemical processes within brain cells convert glucose to adenosine triphosphate (ATP) the
primary source of brain cellular energy. When energy is required, ATP is converted to
adenosine diphosphate (ADP) and back to ATP molecules for energy storage. ATP and ADP
constantly convert back and forth in response to energetic demand. Glucose is converted to
usable energy, first by glycolysis where glucose is converted to pyruvate and then from
pyruvate to water and carbon dioxide (CO2). ATP is produced at both stages, however the latter
cycle (also called the Krebs cycle) is slower and requires oxygen consumption but produces
more ATP (~18 times more) than the process of glycolysis. During glycolysis, some of the
pyruvate can be stored as lactate and shuttled back and forth between neurons and astrocytes
in response to energetic demand. The close coupling between local neuronal energy
metabolism and functional brain activity mean that neuroimaging techniques such as PET and
fMRI, capable of quantifying rates of energy metabolism, as well as the percentage of oxygen
extracted from blood, may provide a highly sensitive way to investigate neural processes in the
healthy and diseased brain. This thesis uses BOLD and ASL fMRI, techniques that are sensitive

21
to the concentration of oxyhaemoglobin, which indirectly reflects neuronal activity. The next
sections provide an overview of the brain’s vascular network through which energy is supplied
as well as the utilisation of oxygen in the brain.
1.2 Organisation of the Cerebrovasculature
The cerebral circulation is equipped with mechanisms to ensure an uninterrupted supply of
oxygenated blood (Iadecola & Nedergaard, 2007), ensuring sufficient quantities of energy
reach the site of functional activity, as well as maintaining adequate resting flow throughout
the brain. Constant supply of blood flow and nutrient delivery in the brain is regulated by a
complex network of large arteries (Figure 1.1) and smaller pial arteries, which are arterioles
covering the brain’s surface. Pial arteries then become penetrating arteries and arterioles
within brain tissue. These arteries and arterioles have 3 layers; the innermost endothelial layer
(tunica intima), a medial smooth muscle layer (tunica media) and the outer layer of
leptomeningeal cells (tunica adventitia). The cerebrospinal fluid (CSF) filled Virchow-Robin
space separates the penetrating vessels from the rest of the brain. Beyond the Virchow-Robin
space, deeper in the brain the vascular basement membrane comes directly into contact with
astrocytic end-feet (figure 1.2). Deeper again into brain tissue, arterioles become capillaries
(figure 1.3) which do not possess the smooth muscle cell layer of arteries. Regional blood flow
and metabolism varies throughout the brain, which is in part due to variation in the density of
capillaries within the neurovascular unit (NVU) (Girouard & Iadecola, 2006).

22
Figure 1.1 Organisation of the cerebral arteries. Anterior blood supply to the brain comes from the left and right internal carotid arteries (ICA) and posterior blood supply from the vertebral arteries (VA). The ICA arteries branch to form the middle cerebral artery (MCA) and the VA arteries converge to form the basilar artery. The VA and ICA arteries form the Circle of Willis (CoW). The ICA, anterior and posterior cerebral arteries along with the anterior and posterior communicating arteries are the main components of the CoW. The anterior, middle and posterior cerebral arteries branch from the CoW, each supplying blood to smaller connecting vessels distributed across the brain.

23
Figure 1.2 The neurovascular unit (NVU). Image taken from Muoio et al. (2014). Smc = Smooth muscle cells.
The NVU is comprised of vascular endothelial cells, myocytes (smooth muscle cells), glia
(astrocytes, microglia, and oligodendrocytes) and pericytes in addition to neurons and inter-
neurons (figure 1.2). Each of these cell types have specific functions and together make up the
blood-brain barrier (BBB) which maintains the neuronal environment required for normal
functioning, as well acting as the first line of defence against infection and injury (Paulson,
2002). Endothelial cells, for example, line the blood vessels forming the vessel wall which
makes up the BBB, as well as producing nitric oxide (NO) which maintains vascular
homeostasis, vasodilatory tone and stimulates cell growth. NO is also protective against injury.
Smooth muscle cells control the contractile properties of the vessels which is mediated by
Ca2+. Glial cells maintain the ionic environment for neurons, modulate signal propagation and
synaptic transmission, and importantly provide a protective barrier against injury and aiding
recovery. Lastly, pericytes support endothelial cell function as well as having the ability to
dilate and constrict to regulate vessel tone (Muoio, Persson, & Sendeski, 2014). Together, the
components of the NVU provide dynamic regulation of the cerebral environment to meet
energy needs during activation and protect the brain against injury.

24
Figure 1.3 Organisation of blood vessels. Oxygenated haemoglobin is transported from the heart through arteries and arterioles to reach capillaries. From capillaries oxygen diffuses through the tissue to reach cells and mitochondria. Deoxygenated blood is then transported away from the brain through venules and veins.
1.3 Regulation and Modulation of Cerebral Blood Flow
In the healthy brain, the average CBF to grey matter (GM) tissue is approximately 50-
60ml/100g/min, about 2.5 times that of white matter (WM) (Buxton, 2013). In GM, arterioles
and capillaries carrying oxygenated blood, and veins and venules draining deoxygenated blood
(figure 1.3), also occupy a proportion of the tissue. This is referred to as the cerebral blood
volume (CBV) and is estimated to be ~4 ml/100g of tissue (Traystman, 2017).
As discussed earlier in the chapter, CBF is primarily driven by neuronal energy demand. The
CBF response is extremely fast and initiated by NVC, a process that is not completely
understood. NVC involves interactions between neuronal firing, molecular signalling factors,
astrocytes, pericytes and endothelial cells, triggering a rapid increase in local CBF, CBV and
tissue oxygenation as well as CMRO2 (Girouard & Iadecola, 2006), all of which decline when
the stimulus is removed. Astrocytes surround arterioles and influence their diameter, pericytes
control vasodilation and constriction of arteries and arterioles and endothelial cells are
responsible for the release of factors that cause vasodilation (e.g. NO) and constriction (insulin,
endothelin). These components of the NVU work in collaboration to maintain homeostasis in
the brain, in terms of perfusion, oxygenation and clearance of waste products (e.g. CO2), and
disruption to the function of any of these cell types can impair blood flow, and therefore brain
oxygenation.

25
Cerebral vascular resistance is a key mediator of CBF, and is determined by the smooth muscle
cell layer (see figure 1.2) which regulates the internal diameter of arteries and arterioles.
Vasoactive substances such as CO2 and O2 decrease and increase vascular resistance
respectively, which in turn is regulated by Ca2+ concentration in cells. Membrane potential is
affected by vasoactive agents which act on ion channels to alter Ca2+ concentration and muscle
contraction and relaxation activity. Arterial concentrations of CO2 and O2 can be modulated to
increase CBF and tissue oxygenation in fMRI experiments through administration of
appropriate gas mixtures. This effect forms the basis of calibrated fMRI experiments where
vasodilatory capacity, also called cerebrovascular reactivity (CVR), oxygen extraction and
metabolism can be quantified to study functional processes in the healthy brain as well as
developing markers of disease-related dysfunction (Hoge, 2012; Marshall et al., 2014; Merola
et al., 2017).
1.4 Cerebrovascular Reactivity
The vasodilatory effect of CO2 can be observed as a global BOLD and/or CBF increase within
seconds. Brain perfusion is highly responsive to changes in the partial pressure of carbon
dioxide (PaCO2) and partial pressure of oxygen (PaO2) (Kety & Schmidt, 1947), although most
notably, changes in PaCO2. Hypercapnia, where PaCO2 is raised by administration of enhanced
inspired CO2 concentration, is an effective vasodilator which decreases vascular resistance as
well as the OEF. The brain’s response to changes in arterial blood gases serves to maintain
cardiovascular and respiratory autonomic control in the brainstem. Cerebral autoregulation
counteracts increased CO2 in tissue by increasing CBF, likewise during hypocapnia CBF is
decreased to offset the reduction in tissue CO2 and maintain optimal gas ratios. Many studies
have measured the blood velocity response and assumed a homogeneous reactivity level
throughout the brain (Bailey et al., 2013a; Barnes, Taylor, Kluck, Johnson, & Joyner, 2013). This
approach may over or underestimate regional differences in CVR to CO2 occurring in the
healthy brain or through vascular dysfunction not apparent at the global level. With fMRI, all
CVR measurements are based on either BOLD signal changes or direct CBF measurements
rather than blood velocity changes. CVR measures vascular regulation of CBF in response to
vasoactive stimuli through temporary adjustments in cerebral arterial resistance. CVR is an
autoregulatory process and therefore plays a role in NVC. In recent years, the measurement
of CVR using vasoactive stimuli during fMRI has been developed for use in basic and clinical
research to assess cerebrovascular health (Cantin et al., 2011; Marshall et al., 2014) as CVR
provides an index of the brain’s capacity to increase CBF in response to increased demand for

26
oxygenated blood. CVR is typically calculated as the ratio between BOLD or CBF changes and
the end-tidal CO2 (PETCO2) response and reported as percentage CVR (percentage change in
BOLD or CBF per mmHg change in PETCO2). Breath-holding, which causes a build-up of CO2 in
the vasculature can be used as an alternative approach to estimate CVR where gas
administration is not practical or tolerable. Measurement of CVR during fMRI, as well as its use
for BOLD signal calibration is discussed in sections 2.13 and 2.14.
1.5 Oxygen and Carbon Dioxide Transport in the Brain
Oxygen is transported via red blood cells (RBCs), which contain the protein haemoglobin (Hb),
and each molecule of Hb binds four oxygen molecules to form oxyhaemoglobin. Oxygen
molecules diffuse from capillaries to individual cells requiring oxygen for energy production.
Diffusion alone is not sufficient to meet energy requirements, therefore oxygen exerts a partial
pressure (pO2), also referred to as oxygen tension, as it travels from capillaries. The pO2
determines how much oxygen is bound to Hb, and the concentration of Hb determines the
oxygen carrying capacity of blood. When oxygen is bound to all Hb molecules, the blood
reaches 100% saturation. The transport of oxygen in blood can be described using the oxygen
dissociation curve (Brown, Wade, & Marshall, 1985), which relates oxygen saturation (SO2) to
pO2 (see figure 1.4). Oxygen travelling from the lungs to the tissue via capillaries diffuses down
a relatively large pressure gradient, from around 100mmHg in lungs to 35-50mmHg in
capillaries. This gradient causes highly oxygen saturated blood which has reached the
capillaries from the lungs, to be released to the tissue. Active tissue has a greater energy
(oxygen) demand, and this oxygen usage causes a drop in pO2, and thus a larger pO2 gradient
which allows more oxygen to be delivered to active tissue (Wittenberg & Wittenberg, 2007).
Figure 1.4 The oxygen dissociation curve relates oxygen saturation (SO2) to pO2 and is determined by haemoglobin’s (Hb) affinity for oxygen, how easily Hb acquires and releases oxygen from the surrounding tissue. Left shifts indicate increased affinity for oxygen and right shifts indicate reduced affinity for oxygen. Image taken from Rsc.org. (2017). Chemistry for Biologists: Transport of oxygen in

27
the blood. [Online] Available at: http://www.rsc.org/Education/Teachers/Resources/cfb/transport.htm [Accessed 13 Sep. 2017].
Hb concentrations are ~130-170 g/L in healthy males and ~120-150 g/L in healthy females (Bain
et al., 2006). However, variations due to age or disease will affect the CBF and BOLD signal due
to the dependence on blood oxygenation in the baseline state (Levin et al., 2001; Tuunanen &
Kauppinen, 2006). In order to account for Hb differences between individuals, peripheral Hb
samples can be obtained from the capillary and used to inform model estimations of
neurophysiological parameters. Peripheral and central Hb are not equivalent, however,
peripheral measures should help to control for relative differences between subjects or
groups.
Tissue oxygen pressure (ptO2) is heterogeneous due to the complex organisation of vessels,
therefore the longitudinal oxygen pressure gradient varies between capillaries and is referred
to as capillary transit time heterogeneity (CTTH). CTTH is dependent on multiple factors
including vascular geometry, CMRO2, capillary density and capillary oxygenation (Østergaard
et al., 2014). Leithner & Royl (2014) used the Krogh-Erlang model (1919) to show that where
inter-capillary distances are short, i.e. there is a high capillary density, a smaller tissue oxygen
gradient is sufficient for adequate oxygen delivery as the density tends to decrease CTTH.
Where capillary density is lower, CTTH becomes more variable which can lead to reductions in
maximum OEF (OEFmax) during CBF increases, leaving tissue vulnerable to hypoxia.
Jespersen & Østergaard (2012), incorporated CTTH into a simplified version of the Krogh-
Erlang model (Krogh, 1919) to show the potential impact of CTTH on CBF-CMRO2 coupling.
Model predictions show that CTTH reductions with constant CBF result in CMRO2 increases, as
do CBF increases with a constant CTTH. Importantly, CTTH reduction and ptO2 increases
improve oxygen availability to tissue by counteracting OEF reductions which inherently occur
with CBF increases. During hyperaemia (excess of blood in the vessels), low CTTH maintains
adequate oxygenation, thus protecting the brain from potential activation-induced hypoxia.
Lower CTTH is thought to protect tissue under conditions of hypoperfusion by increasing
OEFmax and therefore lower CTTH is considered to be a favourable physiological state
(Jespersen & Østergaard, 2012). At present, ptO2 and CTTH is not easily measured using non-
invasive ASL. However, deviations from normal values in these factors will affect the accuracy
of estimated OEF and CMRO2 in physiological models which rely on assumptions regarding
oxygen kinetics. Therefore, it is important to consider potential changes in ptO2 and CTTH
when interpreting the output of physiological models of oxygen metabolism. This point is
discussed further in Chapter 5.

28
Carbon dioxide (CO2) is produced in the mitochondria by cell metabolism, and is a waste
product of respiration. CO2 is not transported in the form it is created, but reacts with water
to form bicarbonate ions that dissolve easily in blood plasma for removal. This accounts for
~25% of CO2 removal. The formation of bicarbonate is slow in plasma, but enzymes (carbonic
anhydrase) in RBCs, speed up this process turning CO2 into hydrogen and hydrogencarbonate
ions. The process through which carbonic acid dissociates into hydrogen and
hydrogencarbonate decreases blood pH. Hydrogen ions then react with oxyhaemoglobin
which releases Hb bound to RBCs and reduces the acidity of the blood. This process could be
described as a buffering effect which allows large amounts of carbonic acid carrying CO2 to be
transported in the blood without dangerous alterations in pH. In active cells respiration is high,
so that Hb releases oxygen. Hb which has released oxygen increases its binding to CO2. CO2
concentration in the cell is then reduced and carried back to lungs as a continual process.
Impaired ventilation can affect the transport of O2 and CO2 to and from tissue, which must be
taken into consideration in fMRI studies. For example, a reduction in the CO2 gradient in the
lungs can cause an increase in vascular CO2 concentrations. As CO2 has a vasodilatory effect,
this could lead to an increased BOLD or CBF signal which is non-neural in origin. This is one of
several reasons, discussed in section 2.7, why BOLD must be used with caution in groups where
the vasculature may be abnormal.
As arterial gas concentrations are manipulated in fMRI experiments to modulate BOLD and
CBF signal, it is necessary to sample respiratory fluctuations. In order to sample arterial gas
concentrations an arterial puncture is required. This is invasive and not practical in imaging,
therefore the end-tidal concentrations of CO2 and O2 are sampled instead. Expired gas can be
recorded non-invasively using a nasal cannula or mask and represent the alveolar gas levels.
Due to rapid diffusion of O2 and CO2 across the tissue, the arterial and alveolar partial pressures
are almost equivalent (Young, Prohovnik, Ornstein, Ostapkovich, & Matteo, 1991), therefore
end-tidal measures are a valid proxy for arterial gas levels.
1.6 Cerebral Blood Flow and Oxygen Metabolism
ATP production declines almost instantly once the flow of oxygenated blood stops or is
interrupted, therefore the central role of CBF is to provide cells with the oxygen and other
nutrients required for survival and function. As mentioned in the previous section, oxygen
diffuses from the capillary to tissue down a concentration gradient. One of the most crucial

29
determinants of oxygen consumption is the OEF. The OEF refers to the fraction of oxygen
extracted from oxyhaemoglobin by tissue and is around 0.3-0.5 in the healthy brain under
resting conditions (Leithner & Royl, 2014). OEF can be calculated from arterial and venous
oxygen saturation:
𝑂𝐸𝐹 =𝐶𝑎𝑂2 − 𝐶𝑣𝑂2
CaO2
where CaO2 is the arterial oxygen content and CvO2 is the venous oxygen content. OEF is
generally homogenous across the brain, therefore areas of variation could indicate pathology.
CMRO2 can be calculated by combining OEF with measures of CBF and arterial oxygen
concentration (Zheng et al., 2002) using the formula given below:
CMRO2 = CaO2*OEF*CBF
where OEF relates to the concentration of deoxyhaemoglobin in blood. From previous
investigations, it is known that the average rate of CMRO2 in the healthy adult brain at rest is
160 μmol/100g/min, around 80% of CMRO2max, and therefore deviations from normal values
can, like OEF, indicate abnormal brain physiology. As neuronal energy consumption is closely
connected to oxygen metabolism, optimisation of imaging approaches to quantify absolute
CMRO2 has been of interest for the development of brain markers of pathophysiology and
physiological responses to treatment (Bulte et al., 2012; Gauthier & Hoge, 2013a; Wise, Harris,
Stone, & Murphy, 2013b). In Chapters 5 and 9, the application of a recently developed
optimised physiological model to quantify, OEF0 and absolute CMRO2 is demonstrated in a
healthy and clinical population respectively.
Upon neuronal activation, the CBF response is much greater than the increase in CMRO2 (Fox
& Raichle, 1986). A number of models have been proposed to explain this effect. Buxton &
Frank (1997) described a model which assumed constant oxygen diffusion in the absence of
capillary recruitment and 100% metabolism of oxygen in brain tissue. With mean transit time
(MTT) decreases accompanying CBF increases, OEF is therefore reduced, and CBF increases
must be large to provide adequate tissue oxygenation. Another model by Vafaee & Gjedde
(2000) predicted nonlinear CBF-CMRO2 responses based on an assumption of low oxygen
tension in mitochondria; if the oxygen gradient between the capillary and mitochondria can
only be increased by a rise in capillary pO2, which necessitates a reduction in OEF as OEF
becomes less efficient with greater oxygen tension gradients, then an increase in CBF must
occur, to ensure sufficient oxygen delivery. A recent model proposed by Jespersen &

30
Østergaard (2012) is an extension of the Krogh-Erlang model (Krogh, 1919) which describes
the oxygen diffusion process. The Krogh-Erlang equation relates the radius of a capillary and
radius of the tissue cylinder supplied by that capillary, tissue oxygen diffusion properties and
oxygen metabolism, to the oxygen gradient from the capillary to tissue. The Krogh-Erlang
model permits calculation of the minimum oxygen gradients required to support CMRO2, but
as this model was developed for muscle, where capillaries can be described as cylindrical
tubes, it is not directly accurate for calculating oxygen gradients in the brain where capillary
geometry is less ordered. Jespersen & Østergaard (2012) included CTTH changes into this
model to show the effects of CTTH on the relationship between CBF and CMRO2 changes.
Briefly, the model predicts that where CBF is constant, and where CTTH is decreasing, CMRO2
increases. Conversely, CBF increases with constant CTTH leads to CMRO2 decreases. The model
allows for a degree of variation in CTTH and CBF changes without a decrease in brain oxygen
metabolism. CTTH reduction allows for greater OEF, creating a more homogenous flow rate
and allowing oxygen to be extracted more easily. However a state of malignant CTTH can occur
where capillary flow is impaired; high CBF causes a reduction in MTT and OEF, when combined
with a high CTTH which reduces OEFmax, tissue oxygenation is reduced, despite high levels of
CBF (Angleys, Østergaard, & Jespersen, 2015). This model demonstrates that CBF alone does
not deliver a complete picture of tissue oxygenation and potential ischemia. Additional
measures of OEF and CMRO2 can provide more detail on the health of tissue, this is especially
important for disease studies where CBF may appear similar to controls.
Finally Leithner & Royl (2014) suggest that excess CBF evolved as a safety mechanism to ensure
adequate oxygen delivery, which in most cases is not needed. The authors present previous
experimental evidence where CMRO2 was constant in the presence of CBF decreases
(Mathiesen et al., 2011), or apparent increases with constant CBF (Offenhauser, Thomsen,
Caesar, & Lauritzen, 2005; Vanzetta, 1999) and argue that this effect shows that large CBF
increases evolved as a buffer against transient reductions in oxygen supply. In addition,
Leithner & Royl (2014) also suggest that factors other than oxygen supply may regulate CMRO2
such as rapid ATP production required for neural signalling. It is argued that the evolutionary
mechanism to increase ATP production to support neuronal activity is unlikely to have been
via a slow increase in CBF followed by a CMRO2 increase, instead CMRO2 dynamic adjustment
of CMRO2 is followed by an overcompensation in CBF to ensure sufficient oxygenation of tissue
when energy demands cannot be predicted. In summary, the exact mechanisms determining
the regulation of relative changes in CBF and CMRO2 during activation are still unknown as it
is difficult to study in-vivo. It is known that in the healthy brain CBF increases much more than

31
CMRO2, and the coupling varies between brain regions, and potentially depending on task
demands. In disease, the coupling between CBF and CMRO2 is likely to be altered (Blicher et
al., 2012; Iannetti & Wise, 2007b) due to a number of vascular and neuronal factors which
must be considered when interpreting relative changes in brain activity.
1.7 Impaired Oxygen Availability and Metabolism in Disease
As outlined in previous sections, inadequate oxygen availability to cells, will quickly lead to
irreversible brain damage (see figure 1.5, below). Dysregulation of the brain’s vascular and
metabolic network occurs gradually with normal ageing (Aanerud et al., 2012) and is
exacerbated in neurological diseases such as MS, where hypoperfusion (D’haeseleer,
Cambron, Vanopdenbosch, & De Keyser, 2011) as well as reductions in OEF and CMRO2 have
been reported (Fan et al., 2014; Ge et al., 2012).
Although chronic reductions in metabolic activity are prevalent in disease, changes in blood
flow and vascular reserve can lead to initial compensatory increases in OEF, which has been
reported in acute stroke (Park et al., 2014), and CMRO2, as observed in Parkinson’s disease
(Powers, 2009). Changes in OEF and CMRO2 may also occur before measurable CBF changes.
For example, OEF may increase where CBF cannot be adjusted to meet energy demands which
may be higher in early disease stages than in healthy tissue (Sperling et al., 2010). In the healthy
brain, OEF is highly homogenous, however, in order to maintain optimal oxygenation, OEF
increases to counteract perfusion reductions. Beyond a certain point, OEF cannot be further
increased (Jespersen & Østergaard, 2012 ) and eventually, with chronic or severe transient CBF
reductions, diminished energy supply will lead to cellular dysfunction and death.
Absolute CMRO2 and the coupling between CBF and CMRO2 during activation are also
informative indicators of cellular metabolic function. The fractional increase in CBF is generally
1.5-4 times higher than the change in CMRO2 as the coupling ratio varies from rest to
activation, as well as by brain region. Alterations in CBF-CMRO2 ratios can indicate flow
reductions where CMRO2 is increased to sustain metabolic demand, however this flow
reduction will reduce metabolic capacity and neuronal function in the long-term. Alternatively,
reduced CMRO2 may indicate metabolic dysfunction in the presence of adequate flow, where
oxygen extraction and/or metabolic efficiency is impaired. In such cases, CBF alone would not
be representative of metabolic health. OEF and CMRO2 may provide more sensitive indicators
of early disease-related brain dysfunction capable of identifying areas of at-risk tissue prior to
ischemia.

32
Whether vascular dysfunction is a primary cause of brain damage and disability in MS, or
secondary to neuronal loss caused by inflammatory activity, is not yet known. Regardless,
impaired oxygen availability is likely to limit brain plasticity and functional recovery following
relapses and may accelerate disease progression. Treatments which maintain, or restore
healthy CBF and oxygen metabolism are of interest and may complement anti-inflammatory
drugs such as interferon-beta (IFN-beta) which currently used to manage MS. FMRI techniques
capable of quantifying oxygen metabolism which are used in this thesis can identify the efficacy
of behavioural and pharmacological interventions in promoting healthy vascular function.
Figure 1.5 Healthy (a) and impaired (b) energy supply to neurons. Even brief interruptions to oxygen supply will result in cell death due to hypoxia. Image adapted from Greif and Eichmann (2014), Nature.
Table 1.1 Typical concentrations and rates of physiological parameters of interest in fMRI research.
Healthy Resting Brain Values
CBF 50-60 ml/100g/min
Inspired CO2 0.04 %
Inspired O2 20.9%
CMRO2 160 μmol/100g/min
OEF 30-50%
CBV 4 ml/100g

33
1.8 Multiple Sclerosis
MS is a chronic, progressive autoimmune disease, where inflammation leads to white matter
demyelination and axonal loss, as well as lesions in the grey and white matter. In later disease
stages, brain atrophy can occur because of cumulative inflammatory damage. Increasingly,
vascular and metabolic dysfunction such as hypoperfusion (De Keyser, Steen, Mostert, & Koch,
2008; Miguel et al., 2013; Ota et al., 2013), reductions in cerebrovascular reactivity (CVR) (
Marshall et al., 2014), and reduced CMRO2 (Ge et al., 2012) are also being identified.
Symptoms of MS include vision, balance, motor and cognitive impairment as well as
depression, bladder problems and extreme fatigue. The first stage of MS is relapsing-remitting
MS (RR-MS), where acute bouts of inflammation cause a flare-up of symptoms, followed by
periods of remission which can last weeks, months or years. Disease modifying therapies
(DMTs) can help to reduce the number and severity of relapses but are not a cure, and have
little effect on cognitive and behavioural symptoms. Physiotherapy is also often used for
specific motor problems and can help to restore function. The majority of patients are
diagnosed with RR-MS before disease progression leads to primary-progressive (PP-MS) and
secondary-progressive (SP-MS) disease stages. The Expanded Disability Severity Scale (EDSS) is
used to categorise the disease stage, and this can increase or decrease depending on
treatment response, which is highly variable. Other lifestyle factors can help to manage MS
such as physical exercise. For example, exercise can benefit people with MS by improving
certain disease symptoms such as fatigue (Andreasen, Stenager, & Dalgas, 2011) and higher
AF has been linked to increased cortical plasticity in MS (Prakash et al., 2007). Brain plasticity,
the ability to adapt or reorganise following injury is believed to influence treatment response
(Lipp & Tomassini, 2015).
Vascular dysfunction in MS has received considerably less research focus than structural
damage, however, without a healthy energetic system, the brain will not be capable of repair.
The work in this thesis is focused on understanding the normal vascular and metabolic
adaptations involved in plasticity, and investigating potentially beneficial effects of AF on
vascular and metabolic function. Ongoing work presented in the final chapter then maps
regional differences in vascular and metabolic function between patients and controls, and
this quantification of resting brain function will be used to investigate the effect of baseline
function on motor plasticity. In future, interventions which include physical exercise training
to increase AF may be an effective way to boost functional plasticity and improve disease
management.

34
1.9 What is Functional Brain Plasticity?
The brain retains a lifelong capacity to adapt and reorganise in response to new experiences
or following injury. However, this plasticity which can be both structural and functional, is
reduced by the ageing process and by disease, as neuroinflammation limits neuronal and non-
neuronal cell survival and adaptation (Yirmiya & Goshen, 2011). Impaired plasticity then leads
to behavioural and cognitive dysfunction, including learning and memory failures and motor
impairments; the specific functions affected may depend on the location and extent of
damage. Residual adaptive neuroplasticity in MS can work to promote recovery following
disease modifying treatments to reduce inflammation (Tomassini, d’Ambrosio, et al., 2016).
However, treatment response is variable and may be dependent on vascular reserve and
energy availability to tissue.
Imaging studies of plasticity frequently investigate motor plasticity (Zeller & Classen, 2014) as
motor impairment is a common disease feature. Functional adaptation to motor task training
occurs quickly, in the form of BOLD and CBF response increases, and motor paradigms can
easily be conducted during fMRI (see Chapter 6 for a review of imaging studies of motor
plasticity). In Chapters 7 and 8, the energetic changes during and following motor training are
investigated in the healthy brain both to assess the feasibility of quantifying the energetics of
plasticity using ASL, and to characterise blood flow and oxygen metabolism changes during
motor learning in the healthy brain.
1.10 The Role of Aerobic Fitness in Cerebrovascular Function
Aerobic fitness (AF), or cardiovascular fitness is measured as the amount of oxygen transported
in the blood to working muscles, and the ability of the muscle to use transported oxygen. High
AF means that the cardiovascular system has a greater capacity to supply oxygen and other
nutrients carried by blood around the body, and the brain. Higher levels of AF reduce the risk
of all-cause mortality (Kodama et al., 2009) and AF is associated with greater cerebrovascular
health in ageing (Brown et al., 2010; Gauthier et al., 2015).
Experimental animal models of exercise have shown that sustained periods of aerobic exercise
increases neurogenesis and survival of new neurons as well as increasing angiogenesis, the
formation of new blood vessels (Pereira et al., 2007; R. A. Swain et al., 2003; van Praag,
Kempermann, & Gage, 1999). Upregulation of neurotrophic factors including brain-derived
neurotrophic factor (BDNF), insulin-like growth factor (IGF-1) and vascular-endothelial growth
factor (VEGF) (Cotman & Berchtold, 2002; Cotman, Berchtold, & Christie, 2007) is believed to

35
play a role in the beneficial effect of exercise on the brain. IGF-1 blockage, for example,
mitigates the beneficial effect of exercise on brain health and behaviour following injury
(Carro, Trejo, Busiguina, & Torres-Aleman, 2001). In humans, neurogenesis and brain
concentrations of growth factors cannot be studied directly. However, cross-sectional
evidence suggests a neuroprotective effect of AF against ageing effects on brain volume
(Chaddock-Heyman et al., 2016), CBF (Thomas et al., 2013) and blood flow velocity (Ainslie et
al., 2008); see Chapter 4 for a more in-depth discussion.
More recent evidence suggests a similarly protective role of AF in MS; as mentioned above
greater AF is associated with cortical plasticity (Prakash et al., 2007) as well as greater regional
brain volume and white matter integrity (Prakash, Snook, Motl, & Kramer, 2010). However,
taking all available literature, the evidence for a modifying effect of physical activity in MS is
mixed, and future studies would benefit from an improved understanding of several areas; the
mechanisms through which exercise benefits cerebral health and plasticity, whether the level
of AF achieved through exercise mediates the extent of benefits, or whether regular physical
activity is enough, and the extent to which AF benefits the brain and behaviour. For example,
it is unclear whether lifelong benefits are observed, or whether the effect is merely
neuroprotective when the brain becomes vulnerable to damage. Further, whether AF can
restore cerebrovascular and metabolic health, or merely protect against further decline is of
clinical interest and the potential vascular and metabolic mechanisms underlying brain effects
of AF are investigated in healthy adults in Chapters 4 and 5.
Cerebrovascular function may be improved by AF, and is necessary for optimal brain plasticity.
Therefore, increasing AF may facilitate plasticity and offer a route to improving brain health
and functional ability in patient groups and older adults. However, before a full-scale
intervention to test whether increases in AF affect both cerebrovascular function and plasticity
in clinical or ageing groups, the neurophysiological processes which facilitate adaptive
plasticity must be better understood, as well as the effects of AF on cerebrovascular and
metabolic function.
FMRI is arguably the best available tool for studying brain haemodynamics in-vivo and
assessing the efficacy of interventions to improve brain health due to its superior ability spatial
resolution and ability to quantify a number of markers of function, including CBF and absolute
CMRO2 without the need for contrast, as in PET. The following chapter details the basis of BOLD
and ASL imaging, the range of image acquisition options available, and the strengths and

36
limitations of each technique. This is not intended to be an exhaustive review of all available
methods, focus is given to methods used in the experimental work presented in later chapters.

Chapter 2
37
Chapter 2
Functional Magnetic Resonance Imaging: Basis and
Application in Cerebrovascular Research
2.1 Nuclear Spin
Hydrogen is the most abundant atom in the human brain, found in water molecules which are
arranged as two atoms of hydrogen and one of oxygen (H2O). Each atom contains a nucleus
and orbiting electrons and fundamentally, MRI relies on the spinning motion of specific nuclei
in biological tissues. Although nuclei with an even mass number (equal neutrons and protons)
have no net spin, when nuclei have an odd mass number, spin directions are not in equal
opposition so the nucleus does have a net spin, otherwise known as angular momentum. When
these nuclei are placed in a static magnetic field (B0) their axis of rotation comes into alignment
with the magnetic field as the positively charged protons possess electrical charge. According
to the Faraday law of electromagnetic induction (Faraday, 1931), as hydrogen nuclei have
motion (spin) and electrical charge they acquire a magnetic moment and can therefore align
with a static magnetic field. In the absence of a magnetic field they are randomly oriented.
Some nuclei align in parallel with the field, a smaller proportion align anti-parallel.
B0 (always referred to as the z-direction in MR convention) produces additional motion (as
regarded in the classical model) of the hydrogen magnetic moments around B0 in a circular
path, this is called precession. So, there are many low energy parallel (spin up) nuclei and a
smaller number of high energy anti-parallel (spin down) nuclei. The precessional frequency, or
Larmor frequency, is given by the Larmor equation which states that the precessional
frequency is proportional to the magnetic field strength (see equation 1.1), which is 128MHz
at 3 Tesla. As B0 increases or decreases, so does the precessional frequency.
𝜔0 = 𝛾𝐵0
Equation 1.1 The Larmor Equation where ω0 is the precessional frequency, B0 is the magnetic field strength and γ is the gyromagnetic ratio.

Chapter 2
38
Resonance occurs when the hydrogen nuclei in tissue gain energy from a radiofrequency (RF)
pulse delivered at the same precessional frequency as the nuclei in question. In simple terms,
an RF pulse is a magnetic field, referred to as the field, which is temporarily applied in order to
cause excitation of hydrogen atoms. For resonance of hydrogen to occur, RF pulses at the same
Larmor frequency as hydrogen need to be applied. Non-hydrogen nuclei which may have
aligned to B0 will not resonate as they have a different gyromagnetic ratio and Larmor
frequency to hydrogen. The application of a RF (excitation) pulse causes energy absorption and
an increase in the number of high energy spins as some of the low energy spins become high
energy spins due to resonance. When resonance occurs, the net magnetisation vector (NMV)
moves out of alignment with B0 (see figure 2.1) into the transverse B1 field.
Figure 2.1 Schematic of the net magnetisation. Mz = longitudinal magnetisation, Mt = transverse magnetisation
Transverse magnetisation is produced by the net magnetic moment of hydrogen and
represents the balance between high and low energy nuclei. The NMV moving into B1 is caused
by low energy spins joining the high-energy population. The NMV then lies at an angle to B0
rather than parallel as it did before the RF pulse was applied to excite the tissue. This angle is
referred to as the flip angle and its magnitude is dependent on the RF pulse amplitude and
duration. Flip angles between 0-90 are used for gradient echo sequences, spin echo
sequences use a series of 180 pulses. Flip angle determines the signal intensity and image
contrast.
Following RF excitation, the magnetic moments of hydrogen move into phase, meaning that
they are in the same place on the precessional path. The MR signal results from in-phase
magnetisation which is detected by the receiver coil in the scanner. The transverse
magnetisation (flip angle) causes magnetic field fluctuations within the coil, and the phase and
magnetisation induce an electrical voltage (see Faraday’s law) which produces the measured

Chapter 2
39
MR signal, the magnitude of which depends on the amount of transverse magnetisation. When
the temporarily applied magnetic field (RF pulse) is switched off the NMV returns to its resting
state (B0) and this causes a signal, or radio wave, to be emitted and detected by the RF receiver
coil. This signal is used to create the resultant MR image, following digitisation and filtering of
the signal to obtain frequency and phase information contained within the signal (see 2.4
Signal Processing in K-space).
RF pulse timings and magnitudes can be used in various combinations to create pulse
sequences which generate the required contrast in MRI. For reference, the transverse
magnetisation is dictated by the x and y direction and rotates around the z axis (figure 2.1).
2.2 Relaxation and Decay
When the RF pulse is switched off, the NMV attempts to realign with B0 as the hydrogen nuclei
lose the energy transferred to them by the RF pulse, a process known as relaxation. As
relaxation occurs, magnetisation in the longitudinal plane (Mz) recovers, this is called T1
recovery. At the same time, there is a loss of magnetisation in the transverse plane, this is
called T2 decay.
T1 recovery is the process of hydrogen nuclei losing thermal energy to the surrounding
environment or lattice, hence the term spin-lattice relaxation. Energy released to the lattice
results in nuclei recovering their magnetisation in the longitudinal direction. This recovery time
is an exponential with a recovery time constant; the T1 relaxation time. This is the time it takes
63% of the longitudinal magnetisation to recover i.e. realign to B0 with most nuclei in a low
energy state. The spin-lattice relaxation time determines what delay between pulses should
be used. The nuclear spin system must be allowed to relax back to equilibrium before the next
pulse is applied and this time is determined by T1 relaxation.
T2 decay is caused by the magnetic fields of proximal nuclei interacting with each other and
deviating from the Larmor frequency, also called spin-spin relaxation. In addition, static
magnetic field inhomogeneities, such as those found near the boundaries of different tissue
types (e.g. water and bone) cause additional dephasing of hydrogen nuclei which mimics T2
decay. Like T1 recovery, T2 decay is exponential so the T2 recovery time constant is the time
it takes 63% of the transverse magnetisation to decay.
Decay caused by field inhomogeneities can be reversed with a 180 refocusing pulse. Following
a RF pulse, a free induction decay (FID) curve is present and the FID has an exponential T2*

Chapter 2
40
decay. The application of a 180 pulse can reverse the T2* effects, however, signal decay still
occurs due to irreversible T2 decay.
2.3 Slice Selection and Image Formation
The next step in acquiring an image of the object of interest, in this case the brain, is to spatially
select the relevant area within the magnetic field. For this purpose, MR scanners have
additional gradient coils which serve to manipulate the static magnetic field, creating a spatial
variation of the Larmor frequency. MR images of the brain are made up of a series of slices (or
a single slice), usually a few mm in thickness. A slice selection gradient is applied to isolate the
desired imaging plane. Each slice is selected through the presence of a linear gradient in the B0
field induced in the scanner’s gradient coil. Each slice has a different Larmor frequency based
on its location in the field. The B1 field must precess at the same frequency as the selected slice
for successful spatial selection.
The next step is to encode the transverse magnetisation in the x any y planes. Two additional
coils are used for this, one for frequency encoding in the x plane and a second for phase
encoding in the y plane. These gradient coils make the frequency and phase of the signal relate
to position within the image. Stronger gradients allow better spatial specificity and therefore
resolution.
The effect of the frequency encode gradient is that hydrogen spins take on frequency
variations depending on their position along the x-axis. The phase encode gradient causes
phase differences depending on the y position of the spin. Following signal encoding, each spin
has a frequency and phase specific to the location of the slice it lies within.
The signal which is then read out is the transverse magnetisation from the spins within each
slice which results in a map with spatially varying intensities depending on the amplitude, or
spin densities, within the brain slices. The frequency and phase encoding gradients determine
the signal frequencies just as the amplitude is determined by the spin densities.
To reconstruct the final MR image, the signal must be converted from the time domain in which
it is stored, called k-space, to the spatial frequency domain using the Fourier transform (FT).
2.4 Signal Processing in K-space
K-space is the FT of the MR image; in simple terms, k-space is a matrix of numbers relating to
the spatial frequencies contained within an MR image. Points in k-space are displayed on a

Chapter 2
41
grid with axes kx and ky which correspond to the horizontal (kx) and vertical (ky) axes of the
acquired image. The axes x and y axes in k-space represent spatial frequencies, not positions,
in the x and y axes of the image. Importantly, each point in k-space contains spatial frequency
and phase information relating to the full image.
Figure 2.2 Spatial information in k-space (a) is transformed into conventional MR image space (b) via the Fourier transform. Image adapted from Paschal & Moris (2004).
K-space can be sampled in multiple ways, however only two trajectories, Cartesian and spiral,
are relevant to this thesis. Echo planar imaging (EPI) refers to spin echo and gradient echo
sequences where k-space is filled in either one or a small number of excitations (single shot
and multi-shot EPI respectively) by rapidly switching gradients so that the k-space trajectory
scans back and forth across the entirety of the space (Buxton, 2009). Cartesian EPI (‘blipped
EPI’) (Mansfield, 1977) is currently the most widely used fMRI acquisition technique. It has
been a useful method in terms of acquisition speed and ease of reconstruction but there is a
trade-off as image resolution is low compared to slower techniques where k-space is acquired
line by line after one excitation pulse. Cartesian has the benefit of a fast readout which reduces
the blurring and distortion seen in spiral data. However, Cartesian trajectories have a longer
encode duration than spiral which can result in image warping and motion artifacts. Off-
resonance1 effects can create ghosting effects and pulsatile motion from flow can result in
1 Off-resonance effects are any signal which has a different than expected precessional
Larmor frequency in a nucleus. The pulse sequence relates spatial position to precession frequency so off-resonance effects result in problems such as signal loss, ghosting, image distortion/blurring and spatially specific areas of high or low signal which is not a true tissue signal.

Chapter 2
42
variable phase errors depending on the readout time with respect to the brain pulsatility
(Glover, 2013).
Spiral acquisitions in contrast, cover k-space in an Archimedean trajectory using either a spiral
in or spiral out pattern to or from the centre of k-space respectively. Spiral-out is an even
faster, efficient method of filling k-space compared to Cartesian read-outs as it can skip the
corners of images where there is very low unusable signal. However, spiral does require more
complex reconstruction and is harder on the gradient system. An advantage of spiral schemes
is that they do not require gradient loading at the start of the acquisition, therefore allowing
very short TEs (~2.7ms) to be used. The time efficiency allows the centre of k-space to be
oversampled in a short amount time. This translates to reduced pulsatile and motion artifacts
which affect signal at the centre of k-space more than the periphery as high spectral energy
(present near the k-space origin) is more susceptible to the effects of phase changes (Glover &
Lee, 1995).
Another factor to consider in terms of SNR is bandwidth. Bandwidth controls the frequency
range in RF excitation (transmit bandwidth) and the MR signal received (receiver bandwidth).
Larger receiver bandwidths decrease SNR but speed up imaging time. Slice thickness is
proportional to the transmit bandwidth, lowering the bandwidth allows reduced slice
thickness but can increase distortion.

Chapter 2
43
Figure 2.3 Example of a Cartesian readout (top) and spiral-out trajectory (bottom). Image adapted from Glover (2013), Neuroimage.
Partial k-space acquisition is also possible and is extremely useful in terms of significantly
reducing acquisition time. 50-70% of k-space can be filled, filling the remaining space with
zeroes and exploiting the symmetry of the FT to reconstruct the full image. Phase variations
due to off-resonance and motion effects across the image effect SNR, however, due to the
general smoothness of phase variations, this can be overcome by generating a low-resolution
map of the phase distribution which is then used to correct the full image (Buxton, 2009,
Chapter 10).
2.5 MR Contrast Mechanisms
Contrast between the process of interest and surrounding tissue is necessary in every MR scan.
Contrast arises from a number of sources; the hydrogen spin density p of tissue or fluid, T1,
T2, or T2* which is T2 decay plus the additional magnetic field inhomogeneities which are
always present.
In practice, MR contrast comes from a mixture of all of these mechanisms, but, one contrast
mechanism can be emphasised over the others by designing the pulse sequence with the
appropriate repetition time (TR), echo time (TE), inversion time (TI) and flip angle.
For example, a high-resolution structural brain image with good contrast between grey matter
(GM), white matter (WM) and cerebrospinal fluid (CSF) is achieved using T1 weighting. In such
images GM appears darker than white matter as GM has a longer T1 than WM. CSF appears

Chapter 2
44
black as it has the longest T1 of the three tissue types (see table 2.1 for relaxation times of
tissue at 3T) and image volumes are acquired before longitudinal magnetisation has recovered
in GM or WM. This is achieved using a short TR and short TE (~8 and 3ms respectively) so that
the signal does not have time to fully recover between excitations and steady state longitudinal
magnetisation can be achieved.
The most common contrast in functional imaging is T2*, where contrast arises from T2* decay
differences between tissue types. In T2* a long TR and long TE (~3s/30ms) is used so that
contrast is not affected by differences in longitudinal magnetisation between tissue types. T2*
is central to BOLD imaging which exploits the dephasing phenomenon caused by
inhomogeneities in the magnetic field. T1 provides the contrast mechanism for ASL, hence the
benefit of moving to higher field strengths for perfusion imaging. In addition to a signal to noise
(SNR) increase, due to the higher magnetic signal, the T1 of tissue is lengthened meaning the
labelling time of tissue is extended which increases the ASL signal (Ferré et al., 2013).
It is also possible to use exogenous paramagnetic chemical contrast agents in MR. However,
due to the risk of toxicity, MR contrast agents tend to be used mainly for clinical applications.
There are current efforts in MRI research to develop non-invasive alternatives to contrast MRI,
for example, PET is the gold-standard for measuring oxygen metabolism, however optimisation
of dual-calibrated ASL, as used in Chapters 5 and 9, may provide a clinical alternative to PET.
Relaxation Times at 3T
T1 (ms) T2 (ms) T2* (ms) PD
Grey Matter 1820 100 50 0.69
White Matter 1080 70 50 0.61
CSF 3817 1442 n/a 1.00
Arterial Blood 1932 275 46 0.72
Table 2.1 Relaxation times for tissue types at 3T (MacIntosh & Graham, 2013). PD = Proton Density.
2.6 Spin Echo and Gradient Echo Imaging
Spin echo can be used to obtain, T1, T2/T2* or PD weighted images with parameter
adjustments. In the spin echo sequence, a 90° RF pulse tips the NMV into the transverse plane.
A voltage is induced in the receiver coil caused by precession in the transverse plane. Once the
90° pulse is switched off a FID begins causing T2* decay. A 180° RF pulse is then applied to
reverse T2* dephasing, flipping the out of phase spins through 180°. This momentarily puts

Chapter 2
45
the slow (trailing) spins in phase with the fast (leading) spins putting all the spins on the same
precessional path. At this point the maximum signal is induced in the receiver coil as the
transverse magnetisation is in phase. This is how the spin echo is formed. As T2* dephasing
has been reduced, T1 and T2 information is prolonged due to the extended time for relaxation
to occur. In spin echo, the TR is the time between the 90° RF pulse for each slice and TE is the
time between the RF and the peak of the spin echo signal.
The basic spin echo sequences can be adapted further such as in fast turbo spin echo and
multiple echo acquisitions. In multi-echo acquisitions, multiple 180° refocusing pulses are
applied to create separate images for each echo. Turbo spin echo reduces the overall imaging
time by applying numerous 180° pulses which each fill separate lines in k-space. For example,
imaging time is reduced by a factor of 6 where 6 spin echoes are used (Buxton, 2009).
Figure 2.4 Spin echo pulse sequence. Image adapted from “Introduction to Functional Magnetic Resonance Imaging” Figure 10.1.
Although spin echo and gradient echo sequences use gradient echoes, spin echo includes a
second refocusing pulse whereas gradient echo sequences do not. This 180° refocusing pulse
is what separates the two classes of sequence. The gradient echo sequence uses a variable RF
pulse (0-90°) to tip the NMV into the transverse plane. When flip angles <90° are used,
longitudinal magnetisation is only partially converted to transverse magnetisation, this has the
advantage of allowing shorter TR. As in spin echo, as soon as the RF pulse is removed, the FID
induces T2* dephasing. A gradient is then applied in the opposite direction to the RF pulse
which rephrases the spins. The gradient induces a change in the magnetic field strength which

Chapter 2
46
causes an increase or decrease in the precessional frequency of spins (as stated by the Larmor
equation) at different locations along the linear gradient. Gradients cause hydrogen nuclei to
speed up or slow down depending making it possible to rephrase or dephase spins depending
on their position.
Figure 2.5 Gradient echo pulse sequence. Image adapted from “Introduction to Functional Magnetic Resonance Imaging” Figure 9.7.
Comparison of Spin and Gradient Echo Sequences
Echo Type Pros Cons
Spin Echo Better tissue contrast, reduced sensitivity to artifacts
Longer acquisition time
Gradient Echo Fast acquisition, shorter possible TR and TE
T2* cannot be eliminated, magnetic susceptibility and chemical shift artifacts
Table 2.2 Comparison of spin echo and gradient echo sequences
2.7 The Blood Oxygen Level Dependent (BOLD) Signal
To recap from section 2.2, the transverse relaxation rate T2, is the time constant for phase
coherence loss among spins oriented at a given angle to the static magnetic field due to spin-
spin interaction. This process causes a loss of transverse magnetisation and MRI signal decay.
T2* accounts for the additional signal loss due to magnetic field inhomogeneity and this
process is exploited in BOLD-weighted imaging. Note, T2 is always greater than T2*.

Chapter 2
47
Sensitivity to blood oxygenation arises in T2*-weighted MRI because the image intensity is
generally subject to attenuation caused by deoxyhaemoglobin (dHb), a paramagnetic
relaxation enhancer introduced into venous blood vessels as tissues extract oxygen during
aerobic metabolism. Increasing the concentration of oxygenated blood in tissue leads to
dilution of venous dHb, reducing the attenuation of the T2*-weighted signal. The subsequent
increase in signal intensity is referred to as the BOLD response. However, increases in CBF also
cause compliant venous vessels to dilate and increase the tissue volume fraction occupied by
dHb. This partially counteracts the diluting effect of the CBF increase. If the rise in CBF is due
to neuronal activity, as assumed in the explanation above, then the rise in the cerebral
metabolic rate of oxygen consumption CMRO2 and oxygen extraction fraction (OEF) of tissue
will accelerate the production of dHb and further counteract the dilution effect (Hoge et al.,
1999). The BOLD signal is reliant on the fact that the CBF increase following a neural stimulus
is typically over twice the increase in CMRO2 (Fox & Raichle, 1986). As neural activity and CBF
increase, the fraction of oxygen extracted by tissue decreases, and this phenomenon forms
the basis of BOLD. The dHb reduction with higher regional venous oxygenation due to OEF
reductions leads to an increase in the BOLD signal (Buxton, 2013). BOLD is an indirect measure
of neuronal activity, but has been a key tool in studying functional networks due to its superior
ability to localise resting state functional connectivity and evoked responses.
In comparison to ASL, BOLD has a much higher SNR, making it easier to detect very small
changes, especially in sub-cortical and frontal regions which can suffer from signal dropout and
blurring (Detre & Wang, 2002). A main limitation of BOLD is that it is not possible to quantify
activity changes due to its reliance on the relative mismatch between CBF and CMRO2 upon
neuronal activation. The BOLD signal is a complex interaction between changes in haematocrit,
cerebral blood volume (CBV), CBF, OEF and CMRO2, and contrast is dependent on signal decay
resulting from changes in the amount of deoxyhaemoglobin present in the vasculature
(Blockley, Griffeth, Simon, & Buxton, 2013). Signal dependence on the interplay between these
physiological variables means that it is challenging to interpret the exact meaning of the BOLD
signal in terms of brain function. If neuronal or vascular physiology is abnormal, then the BOLD
signal is not reliable in determining group differences and the signal can be misleading where
baseline physiology is altered (Iannetti & Wise, 2007). For example, a study is designed to
compare BOLD responses in young versus older adults to a visual stimulus. CBF is known to
decline with age so a significantly reduced BOLD signal may occur in the older group despite
potentially unchanged neural activity. Alternatively, declining neural function may require

Chapter 2
48
increased energy resources in this older group resulting in a similar or higher BOLD signal
compared with the younger group. Either way, it is unclear from the BOLD signal alone whether
electrical activity, vascular responses or both are causing the between group differences.
Therefore, when investigating brain function in any group with suspected or known abnormal
vascular physiology or neuronal function, it is helpful to acquire additional data to calibrate
the BOLD signal and make meaningful conclusions about data.
Another limitation of BOLD is the effect of the draining of dhb from capillaries to veins on
spatial specificity. This issue is most pronounced in studies which elicit a large BOLD response
as a portion of the blood draining into large vessels downstream of activation will have
originated in the activated area and combine with blood draining from other activated regions,
meaning that there will be a measured BOLD response from both the site of activation and
larger downstream vessels. When the true area of activation is small, dhb is diluted with blood
from non-activated areas quite quickly which reduces the non-specific signal (Kim & Ogawa,
2012). To overcome this problem, a high statistical threshold can be used in analysis to select
the most strongly activated areas, or predefine regions of interest (ROIs). Alternatively, where
simultaneous BOLD and ASL data have been acquired (see 2.10), the overlap of responses can
be selected as the ROI, as the ASL signal does not suffer from this draining vein contribution.
Lastly, the susceptibility to physiological noise (see 2.17) and thermal noise caused by the
motion of free electrons in the system, makes BOLD non-specific in terms of neuronal activity
(Ugurbil, 2016).
Despite these limitations, BOLD is a useful tool in quantitative fMRI, as demonstrated in this
thesis, where calibrated fMRI (see 2.13) can be used alongside ASL to determine relative
changes in CMRO2, as well as determining the baseline OEF (OEF0) and CBV. These applications
are discussed in the following sections.

Chapter 2
49
Figure 2.6 Diagram showing the components of the BOLD signal. Image taken from: Iannetti & Wise (2007).
2.8 Arterial Spin Labelling
CBF, which is quantified using ASL, is a direct measure of the amount of arterial blood delivered
to a tissue element (Buxton, 2013). ASL permits quantitative measurement of CBF, non-
invasively, using a diffusible endogenous tracer, arterial blood water. Water molecules in tissue
constantly exchange with molecules in inflowing blood to capillaries. Magnetic labelling
proximal to the tissue of interest is used to invert magnetisation of hydrogen protons in arterial
water. After the labelled protons flow into the tissue through the capillaries the net
magnetisation of the region is altered. Image intensity of the tissue is then altered as signal is
proportional to the magnetisation present. A modified Bloch equation (Williams, Detrett,
Leight, & Koretsky, 1992) can be used to explain the tissue magnetisation:
𝑑𝑀𝑏
𝑑𝑡=
𝑀𝑏 0
𝑇1𝑏+ p𝑏𝑓(𝑀𝑎 −𝑀𝑣)
where Mb, Ma, and Mv represent magnetisation of brain tissue, arterial blood and venous blood
respectively. Mb0 is the equilibrium magnetisation in the absence of a RF pulse, T1b is brain T1
(MR decay constant which is a function of magnetic field strength and tissue structure) and f
is the perfusion. Pb is the density of the brain tissue and is relevant because perfusion or CBF
is defined as the volume of blood being delivered to a tissue unit per minute, CBF is

Chapter 2
50
conventionally denoted in ml/100g/min. As T1b cannot be calculated precisely, absolute CBF is
not calculated from the temporal dynamics of the signal alone. Rather, average difference
images are calculated by subtracting images where magnetic inversion has been applied (tag
images) from images acquired directly before or after the tagged image without magnetic
inversion (control images). This subtraction improves the temporal stability of the images and
is necessary for quantification of CBF. Relative CBF changes can be calculated if the
magnetisation of tissue and arterial blood is different, for quantification, the magnetisation of
arterial blood must be different between the tag and control images.
In ASL, the measured perfusion signal in the region of interest is extremely small relative to
static background tissue, on the order of 1-4% (Shen & Duong, 2011). Although receiver coil
development and moving to higher field strengths has improved ASL sensitivity, ASL still has
lower SNR than BOLD, especially in populations where motion is difficult to minimise, i.e.
patient groups. Coupled with noise arising from physiological fluctuations over time,
background suppression of static tissue is an important consideration in ASL protocols and can
substantially increase the sensitivity to dynamic changes in CBF (Petcharunpaisan, Ramalho, &
Castillo, 2010).
Despite SNR limitations, ASL is more closely coupled to neuronal activity than BOLD as it
directly reflects capillary blood. ASL is also more resistant to scanner drift than BOLD making it
a superior technique for measuring changes in activity over long time scales (Olson et al., 2006)
or between different physiological states separated in time e.g. drug vs. placebo activity (Wise
& Tracey, 2006).
2.9 Types of ASL
There are two main ASL acquisition schemes, pulsed ASL (PASL) and continuous ASL (CASL), a
variation of the latter, pseudocontinuous ASL (PCASL) now being more widely used. In PASL,
labelling is achieved by applying a single pulse covering a slab of tissue (i.e. 10-20 cm) in the
neck region so that all spins are excited instantaneously (figure 2.9). Arterial blood water is
magnetically labelled below the lowest imaging slice using a 180° RF inversion pulse. This
causes inversion of the net magnetisation of the water molecules in the labelled arterial blood.
After a specified labelling duration and inversion time (TI), the magnetically labelled blood
water flows into the slice of interest where it exchanges with tissue water. The inflowing blood
water containing the inverted spins reduces overall tissue magnetisation and therefore signal
intensity is also reduced. An image is acquired at this point, referred to as the tag image. A

Chapter 2
51
control image without magnetic labelling is acquired before or after the tag image. The
resulting dataset contains pairs of tag and control images which are then subtracted from each
other to give the difference images which are perfusion weighted. Averaging the timeseries of
images is carried out to obtain a mean perfusion map. The perfusion weighted image or images
represents the amount of arterial blood delivered to voxels in the slice of interest within the
TI, also called the post-labelling delay (PLD) time. In other words, the magnetisation difference
between the tag and control images is proportional to the CBF in a voxel in the PLD period.
Label timing dynamics have a considerable effect on the ASL signal amplitude. In PASL,
techniques such as QUIPSS II (GE) and Q2TIPS (Siemens) are used to fix the bolus duration and
reduce inaccuracies associated with changes in the label duration. QUIPSS II renders the
labelled bolus time-dependent such that more spins are labelled when blood flow becomes
faster (Wong, Buxton, & Frank, 1998). This is done by applying two extra saturation pulses to
the labelled bolus to destroy any remaining inverted spins after the chosen TI. The TI effectively
determines the label duration, i.e. following the TI, no more inverted spins leave labelled bolus.
This scheme is effective so long as the trailing edge of the tagged bolus does not exit the
tagging region before saturation pulses are applied. However, the bolus may exit the tag region
earlier during flow increases, such as with hypercapnia, as increased flow increases flow
velocity in feeding arteries in the brain (Tancredi et al., 2012). This would result in QUIPSS
II/Q2TIPS pulses becoming ineffective; CBF being underestimated during hypercapnia, where
flow velocity increases occur, and is one potential limitation of QUIPSS II and Q2TIPS.
Figure 2.7 Schematic showing PASL acquisition scheme. With PASL a large slab of static and moving spins are tagged in one go before the image is acquired after the selected TI(s).

Chapter 2
52
Figure 2.8 Schematic of CASL/PCASL acquisition where a narrow plane of blood is continuously tagged for a chosen duration and images collected after the selected TI(s).
Figure 2.9 Pulse sequence designs for PCASL and PASL acquisitions. Figure adapted from Wong et al. (2016).
PASL is the most widely available ASL technique due to its relatively straightforward
implementation and compatibility with existing MRI hardware. PCASL however, can offer some
advantages over PASL. PCASL is an advancement of CASL where spins are continuously labelled
as they flow through a narrow tagging band. The labelling scheme can be problematic due to
the long RF duration (1-2s), putting high demand on the hardware and causing high specific
absorption rates (SAR). To overcome this, PCASL was implemented which involves multiple
short RF pulses in place of the single long pulse, making the label duration longer than in PASL.
PCASL may be beneficial for CBF quantification during hypercapnia as label duration is
inherently controlled. The temporal duration of bolus labelling is longer in PCASL than PASL,
meaning that a larger volume of labelled blood is delivered to tissue which increases SNR.
PCASL also has higher flow contrast compared to PASL, providing increased temporal SNR
(Tancredi et al., 2012) but as fewer images are acquired, power is reduced. A potential
drawback of PCASL is that labelling efficiency is affected by flow velocity making CBF
estimations under conditions with expected velocity changes less reliable. In PASL the

Chapter 2
53
instantaneous labelling pulse reduces the sensitivity to velocity changes in the labelled plane
(Aslan et al., 2010). However, a study by Tancredi et al., (2012) compared PASL and PCASL
during CO2 induced hypercapnia, visual stimulation and rest. Resting and visually-evoked CBF
responses were comparable, however PCASL led to significantly higher estimates of
cerebrovascular reactivity (CVR) to CO2. The authors concluded that PCASL may be more
sensitive to flow changes during hypercapnia, as label duration is controlled to a greater extent
than PASL, where arterial velocity changes may affect the efficacy of QUIPSS II/Q2TIPS
implementation. A greater number of voxels in GM were active for PCASL also; in sum, these
results suggest that experiments using PCASL may benefit from higher SNR and labelling timing
control. However, a degree of magnetisation transfer (MT) may have led to an overestimation
of CBF rather than higher CBF being due to increased sensitivity of PCASL to measure flow.
A second limitation of PCASL, which can be overcome, is the potential for MT effects which
arises from the repeated short RF pulses saturating protons in water macromolecules. These
pulses, off-resonance to the tissue volume, cause spins to transfer saturation to water protons
in the imaging slice which decreases the tissue signal in the labelled images. This would cause
an overestimation of perfusion as signal from labelled images would be contaminated by MT-
related signal reduction. To overcome this, gradients with higher amplitudes than used in CASL
are necessary during labelling (Saba, 2016) which make the resonance offset of the RF pulses
larger relative to the imaging region. This is an imperfect solution but MT effects are reduced
to the point that they are not a systematic source of error in PCASL (Wong, 2014). Lastly, arrival
times are longer in PCASL due to the greater distance from the labelling plane to the brain
tissue which must be taken into consideration when comparing results achieved using PASL
and PCASL. Table 2.3 summarises the strengths and limitations of each labelling scheme. In
this thesis, both PASL and PCASL are used. Halfway through the thesis data collection, a move
to a new imaging centre and vendor (GE to Siemens) means that PASL was used in 2
experiments, Chapters 3, 4 and 7, and PCASL in the remainder (Chapters 5, 8 and 9) as
sequences analogous to those used in were no longer available. See figure 2.10 for example
raw images and calibrated CBF maps from each scanner.

Chapter 2
54
Figure 2.10 Raw first echo images from the dual-echo sequence used on the GE scanner (top left) and dual excitation sequence used on the Siemens scanner (top right). The bottom left image shows a CBF map from the GE scanner following pre-processing and on the right, a processed CBF map from the Siemens scanner. Details of the acquisition and processing of images are detailed in Chapters 4 (GE) and 5 (Siemens).
Comparison of ASL Strategies Strengths Limitations
PASL Less sensitive to velocity changes
Lower labelling efficiency, missed perfusion
PCASL Higher SNR and labelling efficiency.
Sensitive to velocity changes, some MT effects
CASL Greater SNR vs. PASL, higher flow contrast and shorter TT delay
Higher SAR, lower inversion efficiency (80-95 %), MT effects
Table 2.3 MT = Magnetisation Transfer, RF = Radio Frequency, TT = transit time

Chapter 2
55
Within PASL sequences there are three main methods of creating the tag and control images;
Echo-Planar Imaging and Signal Targeting with Alternating Radio frequency (EPISTAR)
(Edelman & Chen, 1998), Flow-sensitive Alternating Inversion Recovery (FAIR) (Kim & Tsekos,
1997) and Proximal Inversion with a Control for Off-Resonance Effects (PICORE) (Wong, Buxton
& Frank, 1997). In EPISTAR, a wide inversion band is applied proximal to the lowest imaging
slice prior to label image acquisition and the control image is acquired after the same band is
inverted but this time distal to the imaging volume. In FAIR, there is a non-selective inversion
pulse is applied to all spins (global inversion) for the tag image and the control image is
acquired after a selective RF pulse is applied to the imaging slice. This means that during tag
image acquisition, all hydrogen spins are inverted and all spins are fully relaxed during control
image acquisition. In PICORE, the label image is acquired as in EPISTAR but the control is
subsequently acquired with the same inversion pulse but without the slice selective gradient
turned on. In PICORE, no spins are inverted above the imaging slice, making PICORE sensitive
only in ascending flow, therefore, it is ideal for axial imaging where all labelled blood comes
from the neck. For this reason, where PASL is used in this work, PICORE is the chosen labelling
method. PCASL also uses PICORE, where tagging is applied proximal to the imaging plane and
control images are acquired with the same pulse, but without the slice selective gradient.
Figure 2.11 Labelling schemes for PASL. Image adapted from Introduction to Functional Magnetic Resonance Imaging by R.B. Buxton, Figure. 13.3.
2.10 Dual echo and Dual Excitation
In experiments where both BOLD and CBF data is required, such as calibrated fMRI studies,
there are several acquisition options. BOLD and CBF data can be acquired separately using
optimal parameters for each contrast, however this is not ideal as the data is not acquired

Chapter 2
56
simultaneously which can introduce variability in data quality and physiological responses can
change over short periods of time. The second option is to acquire data using a single-echo or
single-excitation sequence where CBF and BOLD contrast is gained from one acquisition (Olson
et al., 2006). In this approach, it is not possible to achieve both optimal CBF and BOLD contrast,
so there will be a trade off in quality for either BOLD or CBF. Short TE will maximise CBF signal
at the cost of BOLD image weighting but the longer TE required for BOLD will attenuate the
perfusion signal. Dual-echo or dual-excitation approaches where the first short TE (9-13ms)
generates CBF images and a second longer TE (29-35ms) yields BOLD-weighted images, provide
better overall data quality where simultaneous BOLD and CBF signal is needed. As this results
in longer acquisition times per slice, later acquired slices have a lower signal due to T1
relaxation. Whole brain coverage with high SNR is therefore difficult with dual-echo sequences
but acquisition strategies such as spiral read-outs and partial-Fourier, where data is sampled
from only a portion of k-space and used to reconstruct the full image, speed up image
acquisition and can partially overcome this issue.
As an alternative to double-echo, double excitation methods have been developed where CBF
data is collected at short TE followed immediately by a second excitation where BOLD data is
collected at a longer TE. This means that CBF for all slices can be collected quickly following
the inversion time and helps to overcome signal loss due to relaxation. One issue with double
excitation ASL is the possibility of saturation from the CBF excitation affecting the BOLD
excitation. Many initial studies using dual-excitation also had limited coverage (Kastrup, Kru,
Neumann-haefelin, Glover, & Moseley, 2002) however, Schmithorst et al. (2014) introduced a
whole brain coverage method using PCASL with a RF body coil for transmission and a 32-
channel head coil for echo detection and sensitivity encoding (SENSE) reconstruction.
Schmithorst et al. (2014) reported that the double-excitation method provided better SNR in
the later acquired slices vs. the dual-echo method as well as BOLD signal sensitivity. Fernandez-
Seara et al. (2016), in agreement with these findings, reported that dual-excitation provided
superior temporal SNR (tSNR) for CBF data. BOLD tSNR was comparable to dual-echo but
resulted in 30% lower t-scores on activation maps. However, for calibrated fMRI where high
perfusion tSNR is necessary, the double-excitation method was preferable. A dual-excitation
PCASL sequence developed in-house was used to acquire the data in Chapters 5, 8 and 9, which
were acquired on the Siemens Prisma scanner.

Chapter 2
57
2.11 Single and Multiple Inversion Time ASL
Most frequently, ASL data is acquired at a single inversion time (TI), usually within 1500-
2000ms post labelling, when labelled blood will have reached tissue but significant signal decay
has not yet occurred. This approach permits quantification of CBF using a single compartment
kinetic model (Buxton et al., 1998) and generally yields reliable approximations of tissue CBF.
However, arrival time of labelled blood to tissue may vary, due to age, disease, experimental
conditions, or vascular geometry. In this case, imaging at a single delay time may over or
underestimate perfusion. By acquiring perfusion images at multiple inversion times (MTIs) the
kinetic curve of CBF can be fit to the data resulting in more accurate estimations of CBF as well
as permitting estimation of arterial and tissue arrival times and the arterial cerebral blood
volume (aCBV), providing short TIs are included in the protocol (Chappell et al., 2010). MTI
data however, requires longer acquisition times to achieve sufficient images at each TI for
acceptable SNR. For this reason, MTI imaging is best suited to resting state CBF estimates as
task timings, other than visual stimulation or motor tapping, are unlikely to be compatible with
MTI runs. In Chapter 3, CBF and CVR values achieved using single and MTI acquisitions are
compared to determine differences in values achieved using each approach.
2.12 Quantification of Cerebral Haemodynamics
Tag and control ASL images, following subtraction, must be appropriately scaled to convert the
perfusion signal to absolute CBF units (ml/100g/min). The general kinetic model (GKM)
developed by Buxton and colleagues (Buxton et al., 1998) models the kinetics of CBF through
vessels and tissue. Both PASL and PCASL can be quantified using this model with several
modifications to the mathematical implementation. The GKM describes the amount of
perfusion in a given voxel, based on 3 components; the delivery function, c(t) describes the
amount of tagged blood arriving in a voxel at a time t, the residue function r(t) which is the
amount of tagged blood remaining in a voxel at time t, and the relaxation function m(t) which
is the remaining longitudinal relaxation of tagged blood after time t. The original GKM assumes
that all signal arises from a single compartment, i.e. tissue, which is not always the case. Tagged
blood must flow through the intravascular compartment, arteries, before reaching the
extravascular compartment, tissue, which is where the signal of interest generally lies.
In using MTI imaging, a dual compartment model can be fit to the data which makes it possible
to model signal arising from both arterial and tissue sources. Chappell et al. (2010) extended
the GKM of Buxton et al. (1998) to allow fitting and removal of an arterial signal component

Chapter 2
58
from perfusion estimates. Two-compartment models can provide more accurate estimates of
perfusion, as single compartment models can either under or overestimate perfusion at high
and low flow rates, respectively (Parkes, 2005). However, MTI imaging is not always
appropriate, or available, as discussed above. Where calibrated fMRI is performed, separate
MTI acquisitions can be acquired to achieve the most accurate estimates of baseline perfusion.
2.13 Calibrated FMRI
The BOLD signal arises from the mismatch between CBF and CMRO2 increases as discussed in
2.7, therefore relative changes in CMRO2 in response to a task can be calculated from BOLD
and CBF CVR, measured during hypercapnia or hyperoxia, as well as during the task or stimulus
of interest (Davis, Kwong, Weisskoff, & Rosen, 1998a; Hoge et al., 1999). Hypercapnic
calibration, which is most widely used, provides an estimate of the theoretical maximum BOLD
signal M, assuming a full washout of dhb, for the measured baseline state. This calibration
factor can also help to account for between-subject differences in baseline physiology.
Hypercapnia is achieved by increasing the inspired level of CO2, as blood flow is sensitive to
changes in arterial CO2; CBF and CBV will increase to maintain optimal gas concentrations.
Calibrated fMRI is based on the premise that CVR to CO2 is isometabolic and elicits a purely
vascular response through a reduction in dhb, and although this assumption has been
challenged (Driver, Wise, Murphy, & Driver, 2017), Bulte et al. (2012) have previously shown
only small changes in CMRO2 at the mild levels of hypercapnia (typically raising the partial
pressure of end-tidal CO2 (PETCO2) by 5-7 mmHg) generally used in calibrated fMRI which had
no meaningful effect on end results.
Estimates of BOLD and CBF CVR and task responses as well as M can then be entered into a
BOLD signal calibration model originally developed by Davis, Kwong, Weisskoff, & Rosen
(1998a) to interpret the BOLD signal in terms of the oxygen metabolism changes in response
to a task or neuronal stimulus. This thesis uses the calibrated fMRI approach originally
proposed by Davis et al. (1998), with optimised parameters for grey matter at 3T in Chapter 7
to estimate relative CMRO2 (rCMRO2) changes during a motor sequence learning task. In this
method, CBV is not known, therefore CBV changes are estimated from CBF changes using the
Grubb equation (Grubb, 1974) with a constant exponent representing the CBF-CBV
relationship.

Chapter 2
59
The main limitations of standard calibrated fMRI approaches are the reliance on relative
changes and the sensitivity of the model to noise. Interpreting relative changes in CMRO2 can
be problematic, as with standard BOLD, where the baseline CMRO2 is affected by drugs or
disease, however calibrated fMRI still provides additional information to BOLD alone as the
vascular (CBF) and metabolic (rCMRO2) responses can be separated to infer physiological
meaning of the direction of BOLD signal change.
Propagation of noise is a more difficult problem to overcome; errors in CVR calculations feed
forward into inaccurate M values and affect end results. Despite these limitations, the original
calibration model has proved to be robust and accurate under most applications where good
quality CVR estimates can be obtained.
To overcome the limitations of standard calibrated fMRI, dual-calibrated fMRI which uses
hypercapnia and hyperoxia to modulate CBF and venous oxygenation was introduced (Bulte et
al., 2012;Gauthier & Hoge, 2013; Wise et al., 2013). With hypercapnia, the CBF and BOLD signal
is increased with an assumed constant CMRO2, whereas in hyperoxia the increase in venous
oxygenation increases BOLD signal, leaving CBF and CMRO2 relatively unchanged.
Biophysical modelling (Bulte et al., 2012; Gauthier & Hoge, 2013; Germuska et al., 2016) of
BOLD and CBF data acquired during blocks of interleaved hypercapnia and hyperoxia as well
as a normocapnic baseline, thus permits detailed quantification of cerebral haemodynamics
and oxygen utilisation. Using dual-calibrated (hyperoxia and hypercapnia), dual-excitation ASL,
as demonstrated in Chapters 5 and 9, baseline CBF, OEF, CVR, CBVcap and absolute CMRO2
can be estimated using the physiological forward model developed by Germuska et al. (2016).
The model also uses an optimised BOLD signal model which is sensitive to the capillary blood
flow compartment (Merola et al., 2016) so that capillary blood flow (CBVcap) can also be
estimated.

Chapter 2
60
These measures may be particularly useful for detecting subtle differences in cerebrovascular
function, for example where there is adequate blood supply to tissue but the ability to
efficiently extract and use oxygen from blood is affected. In this thesis, measures of OEF,
CBVcap and absolute CMRO2 are used as measure of brain function in addition to CBF and CVR,
first in healthy subjects and later to investigate functional changes in MS. Cerebral metabolic
dysfunction may contribute to disease progression and clinical disability as neurons require a
constant supply of energy to survive, therefore regional mapping of metabolic function may
identify specific regions of pathology, an advancement on previous methods estimating global
metabolism through venous oxygenation (Ge et al., 2012).
2.14 Measurement of Cerebrovascular Reactivity
In situations where only arterial CO2 is being manipulated, breath-hold tasks (Murphy, Harris,
& Wise, 2011) are commonly used as a convenient and fast way to measure CVR. Participants
are instructed to hold their breath for multiple 15-20 second periods followed by recovery
blocks where breathing is paced. This process is typically repeated for 5-10 breath-hold periods
to accurately model the peak PETCO2. It is vital that participants exhale at the end of the breath-
hold so that this can be measured. As a result, breath-hold tasks rely on the participant being
well trained and having the capacity to carry out the task as instructed. The breath-hold
method can lead to poor estimates of CVR or loss of data in non-compliant groups. It is also
impossible to control the increase in PETCO2 which may not be enough to cause a measurable
CBF increase, especially if the breath-hold is not properly performed. However, in healthy well
instructed cohorts breath-holding is feasible and repeatable (Lipp, Murphy, Caseras, & Wise,
2013).
CO2 administration, however, is the preferred method as direct manipulation of inspired gases
means that it is possible to achieve tighter control of PETCO2 modulation and there is less
reliance on the participant’s ability to comply with instructions. Throughout this thesis gas
challenges are used instead of breath-holding. Gas challenges can be carried out in several
ways (Tancredi & Hoge, 2013). The first method is to use manual flow-meters where a
researcher can dynamically adapt gas flow rates to achieve the required end-tidal values e.g.
a 7 mmHg increase in PETCO2. This works well as there is individual variation in the response to
CO2. However, inconsistencies in the timing of gas administration can occur making it difficult
to accurately model periods of hypercapnia and normocapnia. Second, this method is only
feasible where either hypercapnia or hyperoxia is induced as attempting to control the switch
between conditions would be lengthy and imprecise. Alternatively, gases can be delivered

Chapter 2
61
using the fixed-inspired (FI) method where pre-programmed gas mixtures are delivered at
specified timings and flow rates. While this method ensures correct block timings, it can result
in greater individual differences in PETCO2 and fMRI responses due to differences in sensitivity
to CO2 or O2. However, in experiments which use dual-calibration techniques automatic gas
delivery systems allow rapid switching between hypercapnia and hyperoxia using additional
gas mixtures which speed transitions e.g. during hyperoxia blocks, 50% O2 is administered to
participants, but short periods of 100% O2 following hypercapnia speed the transition to
hyperoxia.
Although gas challenges provide a more reliable vasoactive stimulus, they are not trivial to do.
Gas experiments involve a high cost, considerable set up time and many sites require a trained
physician present during experiments. In addition, a portion of individuals will not tolerate
hypercapnia as it can cause feelings of anxiety and breathlessness. However, as demonstrated
in Chapter 9, some patient groups will be able to tolerate hypercapnia. In situations where gas
challenges are not feasible, breath-holding or hyperventilation are useful alternatives.
In several experiments in healthy controls (Chapters 4 and 7) manual flowmeters were used to
control gas mixtures as achieving similar PETCO2 levels across subjects was prioritised. Other
experiments (Chapters 5 and 9) using dual-calibration with hypercapnia and hyperoxia
necessitated the use of the FI method to achieve quick and smooth transitions between
hypercapnia and hyperoxia.
2.15 Signal Contamination in BOLD and ASL
Although BOLD and ASL provide detailed insight into brain function, several sources of noise
can contaminate the fMRI signal and confound results, especially where noise has a similar
spatial or temporal pattern to the signal of interest. As well as artefacts caused by head motion,
BOLD baseline drift and magnetic susceptibility near bone and air cavities (Kim & Ogawa,
2012). It is known that fluctuations in respiratory and cardiac cycles and arterial CO2 can heavily
influence the fMRI signal; this is true for BOLD and CBF data (Bright & Murphy, 2015; Murphy,
Birn, & Bandettini, 2013; Wise, Ide, Poulin, & Tracey, 2004). Vasomotion due to low-frequency
oscillations (< 0.1Hz) (Murphy et al., 2013) exists throughout the body and can influence the
resting state signal and lead to spurious correlations with task paradigms. Blood pressure
fluctuations and cerebral autoregulation processes can introduce similar confounds (Murphy
& Fox, 2017). Methods to correct for physiological noise have been implemented including
retrospective image correction (RETROICOR) of physiological motion effects (Glover, Li, & Ress,

Chapter 2
62
2000). RETROICOR regresses out cardiac and respiratory phase information and is now a
standard step in BOLD pre-processing. RETROICOR has less effect on ASL signal quality, and if
used, is best applied to data before subtraction (Chen, Jann & Wang, 2015). Alternative noise
removal techniques are available, such as global signal regression (Desjardins, Kiehl, & Liddle,
2001) developed for resting state data, however, global signal will likely contain neuronal as
well as physiological signal and may bias BOLD and CBF measures (Murphy & Fox, 2017). Any
physiological noise correction method should be used with caution and with regard to the
signals of interest as it is likely that both neuronal and physiological information will be
removed due to common frequencies.
Simpler approaches which carry less risk of removing neural signal, include using the CO2 trace
only, which has the most significant effect on the fMRI signal, as a nuisance regressor in a GLM
analysis. Alternatively, data can be normalised using CO2 which may reveal effects masked by
CO2 differences, for example average CO2 may change following motor training and lead to
inaccurate interpretations of CBF differences. This latter approach was used in Chapter 8
where CBF changes following motor sequence learning were investigated, although
RETROICOR was used in earlier experiments (Chapters 3, 4 and 7).
2.16 Summary Comparison of BOLD and ASL
Table 2.4 summarises the relative advantages and limitations of BOLD and ASL which have
been outlined in this chapter. BOLD and ASL are complementary techniques and when used
together with physiological and mathematical models, provide quantitative estimates of
oxygen extraction and metabolism, not possible with BOLD or CBF-weighted imaging alone.
The focus of this thesis was to quantify cerebrovascular and metabolic processes, either in
relation to aerobic fitness levels or motor plasticity, although certain paradigms necessitate
the use of relative estimates of flow and metabolism, such as in Chapter 7. As the work in this
thesis was conducted with intentions for clinical applications, quantitative or semi-quantitative
(standard calibrated fMRI) measurements were used to overcome difficulties in interpreting
standalone measure of relative BOLD changes. While CBF is the main quantitative measure of
brain health, additional investigation of vascular reserve, blood volume and oxygen
metabolism may provide more sensitive measures of function which may help to determine
both the mechanisms underlying the proposed benefits of physical fitness on brain health, and
which facilitate plasticity. Establishing neurobiological effects of physical fitness, and motor
training in relation to plasticity in the healthy brain will help to identify informative markers of
dysfunction, capacity for plasticity and functional recovery in MS.

Chapter 2
63
Overview of BOLD and ASL
BOLD ASL
Signal Source CBF, CBV, CMRO2 CBF
Vascular Specificity Venules, draining veins Capillaries, arterioles
Contrast Parameter T2* T1
Intersubject Variability High Low
Advantages Good spatial resolution
Widely available
Whole brain coverage achieved more easily
Quantitative
More direct measure of neural activity
High repeatability, suited to longitudinal studies
Good spatial specificity and signal stability
Limitations Qualitative
Interpretation complicated by vascular dysfunction
Baseline drift over longer periods
Susceptibility artefacts, lower spatial specificity
Lower spatial resolution and SNR than BOLD
Vascular (arterial) artefacts due to TT differences
Whole brain coverage challenging
Table 2.4 Summary of the relative advantages and disadvantages of BOLD and ASL. Adapted from Detre & Wang (2002). TT = transit time.
2.17 Overview of Statistical Approaches
2.1.1 Sample Sizes
A-priori sample size calculations were not carried out but were instead based on previous
sample sizes used in studies of a similar nature, as well as necessary considerations of time and
cost involved. As the studies, were addressing novel questions, the expected effect size was
not known, thus a-priori calculations were not carried out. However, the observed effect sizes
can be used to inform future a-priori calculations for similar studies.

Chapter 2
64
2.1.2 Multiple Comparison Corrections
To correct for multiple comparisons, several approaches were used throughout the
experimental chapters based on the type of data in question and software being used for
statistical analysis.
For voxelwise data, multiple comparisons were corrected for using the false discovery rate
(FDR), which is automatically applied within FSL’s FEAT (https://www.fmrib.ox.ac.uk/fsl)
package. FDR limits the number of false positives found across the brain, and as it is sensitive
to the p-value distribution across all voxels, depends on the level of signal present making it a
widely used strategy in voxelwise imaging analysis.
For investigating correlations between fMRI ROI data and behavioural, demographic or other
physiological measures such as VO2peak in Chapters 4 and 5, permutation testing was used
when multiple correlations between potentially related variables were being compared. The
rationale for this approach was that Bonferroni is extremely conservative when variables are
likely to co-vary. FSL’s Randomise (https://www.fmrib.ox.ac.uk/fs) was used in Chapters 4 and
5 for voxelwise data, and as it uses a permutation approach, similar corrections were used
within these chapters for ROI and behavioural data.
Paired t-tests with bootstrapping (95% CIs, 1000 samples) were used when comparing data
from the same subjects at two timepoints. Bootstrapping, like permutation testing aids
appropriate data interpretation where sample sizes are small, and is robust where data does
not follow a normal distribution. Where more than two conditions or variables where being
tested for significant differences, ANOVAs were chosen as the most appropriate test.
Bonferroni corrections were used for ANOVAs carried out within SPSS as this is an accepted
correction approach for this test. Further, errors can occur using permutation testing with
factorial ANOVAs as it is not always clear what data should be permuted.
For parametric tests, normality was assessed using the Shapiro-Wilk test. Mauchley’s test for
sphericity was carried out to test for variance homogeneity and degrees of freedom were
corrected using the Greenhouse-Geisser method where the data did not meet the assumption
of homogeneity of variances.

Chapter 2
65
Although multiple comparison correction methods differed throughout this thesis, approaches
were not mixed within the same analysis and appropriate methods were chosen for each test,
with the intention of choosing the most sensible approach for each analysis.
2.1.3 Outliers
As the observed data variability was physiologically plausible in most cases (see Chapter 7,
discussion), it was decided that the typical approach of discarding data >3 standard deviations
from the mean was not appropriate here, and variability in parameters such as CBF and oxygen
metabolism with fitness and during learning is not well established in young adults. An
exception to this strategy was made for CVR data in Chapter 3, where 1 subject was removed
for this reason. As CVR is relatively homogenous at 5% hypercapnia in healthy subjects, the
data was considered a true outlier.
Elsewhere, data not considered physiologically plausible was removed, such as in Chapter 7
where a subject with a large BOLD calibration factor of 40%, this value is typically under 12%
in healthy controls.

Chapter 3
66
Chapter 3
Evaluation of the effects of partial volume correction and
kinetic model parameters on PASL estimates CBF and CVR
Abstract
There are several potential pitfalls in ASL experiments which if not addressed could lead to
incorrect quantification of CBF and CVR. These include; partial volume (PV) effects, selection
of post-labelling delays and kinetic model implementation. The aim of this investigation was
to establish the most appropriate ASL acquisition and analysis approaches for the studies in
this thesis.
To summarise, this investigation was motivated by three main questions;
• Does partial volume correction (PVC) improve CBF estimates in healthy cohorts and
what effect does PVC have on data variability? Do the data support the use of PVC
in healthy control studies?
• Is there a meaningful difference between multiple inversion time (MTI) and single
inversion time (SiTI) estimates of CBF and CVR? What are the implications of using
SiTI acquisitions where MTI is not available or practical?
• How different are results obtained from the same dual-compartment ASL kinetic
model with Bayesian probabilistic fitting vs. a frequentist non-linear least squares
(NLLS) fitting?
The outcomes suggest that MTI should be used where feasible to obtain the most accurate
perfusion estimates in healthy controls. PVC was not included in analysis of healthy subject
data due to increased variability and noise introduced by registration error. The comparison
between MTI and SiTI demonstrated that while SiTI yielded higher estimates of CBF,
estimates were moderately to strongly correlated between the acquisitions. Given that MTI
acquisitions are not feasible in dual-echo or task acquisitions in many cases, SiTI data must
be acquired. Finally, a Bayesian framework rather than strict lower and upper limits on data
is likely to result in more accurate estimations and reduce experimenter bias and uncertainty
which could be introduced by setting limits arbitrarily.

Chapter 3
67
3.1 Introduction
Arterial spin labelling (ASL) functional magnetic resonance imaging (fMRI) has a wide variety
of applications in healthy individuals and patients as it permits non-invasive quantitative
measures of cerebral blood flow (CBF). Cerebrovascular reactivity (CVR) is commonly
estimated with the administration of CO2 which has a vasodilatory effect on cerebral arteries,
resulting in a global increase in CBF without, or with little change in oxygen metabolism. The
cerebral rate of oxygen metabolism (CMRO2) will be addressed in later chapters, as this chapter
focuses on quantification of CBF and CVR.
CVR has been shown to be a reliable indicator of vascular reserve (Mark & Chen., 2015) and
can be used to identify areas of damaged or at-risk tissue (Bouvier et al., 2014; Cantin et al.,
2011; Richiardi et al., 2015) giving the technique direct clinical application. However, there are
several potential pitfalls in ASL experiments which if not addressed could lead to incorrect
quantification of CBF and CVR. These include; partial volume (PV) effects and the use of
appropriate post-labelling delays, so that CBF and tissue arrival times of the labelled bolus are
correctly estimated. As well as carefully choosing acquisition parameters, some thought should
also be given to the implementation of the ASL kinetic model to ensure a good fit to the data.
Each of these points are discussed below.
3.1.1 Single vs. Multiple Postlabelling delay sequences
ASL data can be acquired at a single delay time, also called single inversion time (herein
referred to as SiTI), or using multiple inversion time (MTI) sequences which collect image
volumes at a range of CBF inflow times. MTI sequences provide more detailed haemodynamic
information, such as estimations of arterial cerebral blood volume (aCBV) and tissue arrival
time (TAT) of the labelled blood bolus. In SiTI acquisitions, a single bolus arrival time must be
assumed across the brain, although TAT is known to vary across the brain (Gallichan & Jezzard,
2009; MacIntosh et al., 2010). MTI acquisitions are recommended where absolute perfusion is
of interest, as variations in TAT can lead to errors in CBF estimation. To establish the most
appropriate acquisitions and analysis for further work in this thesis, this chapter compares SiTI
and MTI ASL acquisitions. It was expected that MTI data would provide more accurate CBF and
CVR estimation for the reasons mentioned above. However, as MTI acquisitions are not suited
to certain study designs, and MTI imaging is not always available, CBF and CVR data were
acquired for the same participants in the same session using MTI and SiTI acquisitions and were
compared to investigate the relationship between values obtained using each method.

Chapter 3
68
3.1.2 ASL Partial Volume Correction
ASL acquisition must be fast to image signal from the labelled blood before it returns to
equilibrium. This speed comes at a cost to signal in later acquired slices and coupled with the
large voxels required in ASL, overall image quality is compromised. Large voxels introduce PV
effects which reduces the accuracy of CBF quantification. PV effects occur where multiple
tissue types are present in a single voxel. As CBF is ~2-4 times lower in white matter (WM) than
grey matter (GM) (Van Osch et al., 2009), CBF can be underestimated in voxels near boundaries
between GM and WM (or CSF which has no true ASL signal). For example, a binary mask used
to calculate CBF is typically thresholded to include all voxels with 50% GM probability and
above and typically no correction is applied to account for other tissue types in voxels which
will result in lower measured CBF. It should also be noted that as tissue flow is different
between GM and WM, apparent flow may actually be tissue variability and not true blood flow
(Borogovac & Asllani, 2012).
PV effects are more pronounced in subjects with brain atrophy. In older adults or patients with
atrophy, compensatory hyperperfusion to the remaining tissue often occurs. Due to PV effects,
this process may not be detected. CBF may then be inaccurately estimated as lower than
controls because there is less overall tissue, not because there is less perfusion to remaining
tissue. PV effects can also affect TAT estimations as the labelled blood takes ~2.5 times longer
to reach WM than GM (MacIntosh et al., 2010).
Several partial volume correction (PVC) methods have been proposed for single and multiple
inversion time ASL data. A local linear regression (LLR) method was proposed by Asllani et al.
(2008). In this method, probability maps for GM and WM are created from a T1-weighted
anatomical scan which is segmented and co-registered to the ASL image. Perfusion signal is
then modelled as the sum of GM, WM and CSF contributions using linear regression with
spatial regularisation. A criticism of this method is that it introduces spatial blurring due to the
assumption of constant CBF over a specified region (Petr, Schramm, Hofheinz, Langner, & Van
Den Hoff, 2013). This reduces spatial boundaries and is therefore not sensitive to regions of
abnormal perfusion. Liang et al. (2013) developed a modification of this method using a least
trimmed squares (LTS) regression to reduce spatial blurring. The authors used a sorting-based
algorithm based on a prior that assumes all neighbouring voxels should have similar perfusion.
Any sudden, large deviations in perfusion cause the voxel to be rejected from the regression
model. In this method, voxels are selected based on the squared residuals of the voxel as
opposed to a random with replacement approach making the LTS method more efficient and

Chapter 3
69
reducing spatial blurring. Both LLR and LTS were developed for single delay data, but can in
theory be applied to MTI data. An alternative correction method for MTI ASL was developed
by Chappell et al. (2011) which uses Bayesian non-linear regression in an effort to reduce the
blurring observed in LLR methods. PV estimates of GM, WM and CSF along with differences in
GM and WM kinetics are used to determine the contribution of each tissue type in a voxel,
with CSF signal always set to zero. Spatial smoothing is adaptive and defined from the data. In
simulated as well as real data the method of Chappell et al. (2011) preserved spatial
boundaries more effectively than LLR. The two methods were found to be comparable in terms
of CBF estimation with a tendency for the Bayesian method to overestimate CBF.
However, the Bayesian non-linear regression method proposed by Chappell et al. (2011) is
computationally intensive. In addition, the model uses several adaptive spatial priors which
could result in over-fitting of the model and produce artificially high estimates of CBF. In this
chapter, CBF and CVR estimates obtained using the CBF kinetic model proposed by Chappell
et al. (2010) were compared following analysis without PVC and with the Bayesian PVC method
(Chappell et al., 2011). To assess whether the Bayesian method may be prone to overfitting, a
simplified PVC approach was also applied to the uncorrected data. This method assumes signal
from CSF and WM to be 0 and a GM PV estimate map is used to scale CBF values. A second
objective of the PVC comparison was to determine whether PVC increases data variability as it
relies on accurate segmentation and registration of the T1 image used to create the tissue
probability maps. As ASL SNR is low, an analysis method which increases variability would be
counterproductive.
3.1.3 Quantification of CBF
CBF quantification can be carried out using single or dual-compartment models. Single
compartment models (Buxton et al., 1998; Davis, Kwong, Weisskoff, & Rosen, 1998), as
discussed in Chapter 2, model tissue and intravascular blood (IV) as one well mixed signal,
whereas dual-compartment models (Chappell et al., 2010; Parkes & Tofts, 2002) consider
tissue signal and the IV signal, comprising arterial blood, separately. One of the most
commonly used dual-compartment models is that of Chappell et al. (2010) which is
incorporated into Oxford ASL within the BASIL toolkit in FSL (www.fmrib.ox.ac.uk/fsl/basil). In
its typical usage, this Bayesian model sets a mean prior value for aCBV, TAT, and a fixed bolus
duration, typically 700ms. CBF is determined from the data with no prior assumptions, and the
IV parameter is only fit where it is justified by the data. IV signal is then discarded from the
estimated tissue perfusion value. This prior is set to have a mean of zero, as it assumes most
Chapter 3
70
voxels will not have an IV signal component. The data itself determines whether an IV
component is fit to each voxel; where variance is large or “non-informative”, an arterial
component can be included in the signal from that voxel. Where variance is small, or the data
is physiologically “informative”, only a tissue compartment is fit to the voxel. This data-driven
approach to fitting an IV component contrasts with other dual-compartment models which
automatically fit an IV component to each voxel.
The model described by Chappell et al. (2010) was used here to obtain quantitative CBF maps
from SiTI and MTI data; Oxford ASL was developed primarily for MTI data but can be adapted
for single delay data. The MTI data were then analysed using a dual-compartment model
within Afni. Afni is an open source package for analysis and visualisation of fMRI data using C
code and can be used instead of, or in combination with FSL tools for fMRI data analysis. Both
models use the general kinetic model (GKM) of (Buxton et al., 1998) extended to include an
arterial component, the main difference is that Afni fits an IV component to every voxel
whereas the FSL toolkit only does this for voxels which display a large variance from the
surrounding voxels. The output from each model was compared to determine the agreement
between CBF and CVR values when similar values were used with different model
implementations.
To summarise, this investigation was motivated by three main questions;
1. Does PVC improve CBF estimates in healthy cohorts and what effect does PVC have on data
variability? Do the data support the use of PVC in healthy control studies?
2. Is there a meaningful difference between MTI and SiTI estimates of CBF and CVR? What are
the implications of using SiTI acquisitions where MTI is not available or practical?
3. How different are results obtained from the same dual-compartment ASL kinetic model with
Bayesian probabilistic fitting vs. a frequentist2 non-linear least squares (NLLS) fitting?
2 The main difference between Bayesian and frequentist non-linear parameter estimation is that
frequentist methods produce best fit parameter estimates by sampling over the range of possible
datasets defined by the given range of parameter values. Bayesian approaches use prior probability
distributions to estimate the parameter (or posterior) probability distribution directly.

Chapter 3
71
3.2 Methods
3.2.1 Participants
20 (11 females, mean age 25±4.6) healthy adults were recruited from advertisements placed
around Cardiff University. The study was approved by the Cardiff University School of
Psychology Research Ethics Committee and performed in accordance with the guidelines
stated in the Cardiff University Research Framework (version 4.0, 2010). All participants were
non-smokers, with no cardiac, neurological or respiratory diagnoses.
3.2.2 MRI Acquisition
Images were acquired on a 3T whole body MRI system (GE Excite HDx, Milwaukee, WI, USA)
using an eight-channel receive-only head coil. Heart rate and cardiac traces were recorded
using a pulse oximeter and respiratory bellows. A sampling line connected to the face mask of
the breathing circuit was used to monitor end-tidal CO2 and O2 concentrations. The MEDRAD
system (MEDRAD, Pittsburgh, PA) was used to monitor O2 saturation throughout the
experiment.
A T1-weighted 3D fast spoiled gradient echo (FSPGR) was acquired for registration of
functional data and segmentation of tissue probability maps; TR/TE = 7.8/2.9ms, 1x1x1mm
isotropic resolution.
3.2.3 MTI Image Acquisition
A single subtraction pulsed arterial spin labelling (PASL) PICORE QUIPSS II sequence (Wong et
al., 1998) with a dual-echo gradient-echo readout (Liu et al., 2002) and spiral k-space
acquisition (Glover, 1999) (non-commercial) was used. MTI data were collected at 8 inversion
times; 400, 500, 600, 700, 1100, 1400, 1700 and 2000ms. QUIPSS-II cut-off at 700ms required
that short and long inversion times be acquired in separate runs. 16 and 8 tag-control pairs
were acquired for each short and long inversion time respectively. A variable TR was used for
efficiency, minimum of 1100ms for short TIs and minimum of 1600ms for long TIs. Other
acquisition parameters were; TE = 2.7ms, voxel size/gap = 7mm with 1.5mm gap, 3.1mm2 in-
plane resolution, matrix size 64x64mm, FOV = 198mm, flip angle = 90°, slice delay 55ms, 15
slices. Label thickness = 200mm with 10mm gap between the end of the label and the most
proximal imaging slice.
A calibration image without labelling was acquired before the MTI with matched acquisition
parameters, except TR = 4s; this was to obtain the equilibrium magnetisation of cerebrospinal

Chapter 3
72
fluid (M0, CSF), needed for the quantification of CBF. A minimal contrast image was acquired
to correct for coil inhomogeneities with TR/TE = 2s/11ms. This protocol was performed twice,
first during rest, then while volunteers were hypercapnic. The hypercapnia modulation was
carried out using the prospective control method described by Tancredi & Hoge (2013). A gas
mixing chamber had three feeding lines coming in for the delivery of medical air, 5% CO2, and
medical oxygen, the latter incorporated as a safety backup but not used during
experimentation, the circuit is described in detail by Tancredi, Lajoie, & Hoge (2014). A target
PETCO2 elevation of 7mmHg using 5% CO2 diluted in medical air was set and scanning began
once participants reached the target elevation.
3.2.4 SiTI Acquisition
The SiTI sequence was performed following the FSPGR to allow end-tidal traces to return to
baseline. This scan was a block design comprising 3x2 minutes of baseline, normal air
inspiration, and 2x2 minutes of hypercapnia (see figure 3.1). A 7mmHg end-tidal CO2 increase
was targeted as before. The same dual-echo sequence described above was used but with
imaging parameters adjusted to obtain acceptable BOLD weighted images from the second
echo. BOLD data was acquired for a separate research question and is not used here. Imaging
parameters were; TR = 2400ms, TE1/TE2 = 2.7/29ms, TI1/TI2 = 700/1500ms.
Figure 3.1 Hypercapnia protocol for the SiTI acquisition. Heart rate and oxygen saturation (O2 sat) were monitored and recorded throughout the session.
3.3 Data Analysis
3.3.1 General Image Preprocessing
Physiological noise correction was carried out using a modified RETROICOR technique (Glover
et al., 2000) to remove cardiac and respiratory noise components from the BOLD and CBF task

Chapter 3
73
data. First and second harmonics of the respiratory and cardiac cycle along with the interaction
term were regressed from the raw fMRI signal (before tag and control subtraction) in a GLM
framework. In addition, slower variability related to respiration and heart rate (e.g. breath to
breath variations in breathing depth and heart rate variability) were removed from the signal
(Birn, Murphy, Handwerker & Bandettini, 2009). MTI data were motion corrected using
MCFLIRT within FSL (FMRIB’s Software Library, www.fmrib.ox.ac.uk/fsl, (Jenkinson, Bannister,
Brady, & Smith, 2002). Interpolated surround subtraction of the first echo tag and control
image time-series was performed to remove BOLD signal contamination. The interpolation
method was chosen over pairwise subtraction as this method has been shown to perform
better in block designs (Liu & Wong, 2005). Average difference images were obtained for each
inversion time from tag-control subtraction of the CBF time series (Lu, Donahue, & Van Zijl,
2006). A total average image over all inversion times was created for MTI data at rest and
separately for the hypercapnic acquisition. Average difference images were created for the SiTI
data by averaging the 3 rest blocks and 2 hypercapnia blocks to create a resting CBF image and
hypercapnic CBF image per subject.
3.3.2 MTI Analysis
MTI data were analysed using the dual-compartment ASL kinetic model, Oxford ASL, within
FSL’s BASIL toolkit (www.fmrib.ox.ac.uk/fsl/basil) (Chappell et al., 2010; Chappell, Groves,
Whitcher, & Woolrich, 2009). As no coherent CSF signal should arise from the tag-control
difference images the signal from CBF is assumed to be 0 in this model. IV signal was accounted
for using an automatic relevancy determination (ARD) prior which removed the IV component
from the model where the data did not support it. The perfusion images were corrected for
coil sensitivity inhomogeneities using the minimal contrast images (Jinghua Wang, Qiu, &
Constable, 2005) and converted to ml/100g/min using the CSF signal as a reference to estimate
the fully relaxed magnetization of blood (Chalela et al., 2000).
Mean values for resting CBF and hypercapnic CBF were calculated for each subject by
averaging the CBF time series over all time points and over all voxels within GM. CBF was
calculated for whole brain GM using individual subject masks thresholded to include voxels
with >50% GM probability.
This analysis was repeated with Bayesian PVC incorporated into the Oxford ASL kinetic model
(Chappell, Groves, MacIntosh, et al., 2011). PVC is achieved through a multi-tissue component

Chapter 3
74
model weighted by PV estimates of each tissue type and informed by the different kinetics of
GM and WM. Spatial regularisation is applied based on the data to reduce spatial blurring.
A second simplified PVC method was applied to the SiTI and MTI perfusion maps from the first
Oxford ASL analysis where the quantified perfusion map was scaled by the GM probability
map. All voxels with GM probability of <50% were excluded from the GM map. This approach
served as a comparison for the Bayesian PVC which incorporates WM CBF in the PVC algorithm.
To assess the robustness of the two PVC options, data were downsampled, the rationale being
that lower resolution data would be more affected by PV effects, therefore the method which
produced the lowest variance in results is likely to be more robust.
3.3.3 Kinetic model estimation using a non-linear framework
The MTI data, following pre-processing, were also analysed using a non-linear regression
approach. This was carried out using the Afni NLfit programme (https://afni.nimh.nih.gov)
using the same underlying kinetic model as that of Chappell et al. (2010). The NLfit model
however, does not use a set of Bayesian priors, but instead fits the CBF model within a specified
range of values for each parameter and an IV component is fit for all voxels. Unlike Oxford ASL,
NLfit generates maps of the model fit (R2) which can be used to evaluate the parameters used
and discard data where the fit is poor, such as in areas of low signal. Two iterations of this
model were carried out; the first used parameters as near to the Oxford ASL implementation
as were achievable (referred to as NLfit A, see table 3.1), the second used a more liberal range
of values (NLfit B) to assess the robustness of the model when parameters were free to vary
to a greater degree.
Kinetic Model Parameters
Model CBF (ml/100g/min)
TAT (s)
aCBV (%)
AAT (s)
Bolus duration (s)
T1b
(s)
Inversion efficiency
λ
Oxford ASL
Non-informative
0.7 (0.3)
0 - ARD
0.5 (0.3)
0.7 1.66 0.98 0.9
NLfit A 0 – 1000 0.4 – 1
0 – 3 0.2 – 0.8
0.7 1.7 0.98 0.9

Chapter 3
75
NLfit B 0 – 1000 0 – 1.5
0 – 10 0 – 1.3
0.7 1.7 0.98 0.9
Table 3.1 Model parameters for each kinetic model implementation. Both models are two-compartment extensions of the original general kinetic model (Buxton et al., 1998). λ = Blood-brain partition coefficient. T1b = T1 of blood.
3.3.4 SiTI Analysis
SiTI data were analysed using Oxford ASL only which performs quantification on single delay
data by assuming an arrival time of 0.7 seconds across the brain. Note that aCBV and variations
in arrival time cannot be calculated for single delay data. PVC was applied in the same way as
described for the MTI data.
3.3.5 CVR
For MTI data, CVR to CO2 was calculated by dividing the percentage change increase in CBF
during hypercapnia by the unit (mmHg) increase in PETCO2 during hypercapnia. The CVR
response for the SiTI acquisition was calculated using the CVR analysis method described by
Bright & Murphy (2013) where the beta weight calculated for the CO2 regressor derived from
the end-tidal trace reflects the percentage CBF signal change caused by hypercapnia. This
change is quantified in % signal change per mmHg unit increase in end-tidal CO2. As the timing
of the haemodynamic response is not uniform across the brain and there are delays in the
physiological response to CO2, the end-tidal CO2 regressors were shifted per the best fit to the
data, this was calculated by fitting 97 time shifts to the data.
3.3.6 Statistical Analysis
6 acquisition and analysis options with PASL were compared; 2 acquisition types (SiTI and MTI)
and 3 PVC approaches; without PVC (woPVC), Bayesian PVC (bPVC) and simple PVC (sPVC)
(figure 3.2). MTI and SiTI results were collapsed across acquisitions in (i the effects of each PVC
on CBF ii) differences in MTI and SiTI CBF treated with the same PVC approach.
Coefficient of variance (CV) was calculated for group CBF and CVR values for each data type.
The CV provides a metric to compare normalised variability between data types with
significantly different means. To test whether the variance between any two methods was
significantly different, F-tests of variance were performed. As there were many comparisons,
the 2 groups with the largest CV difference per research question were compared first. If this
difference was not significant no further F-tests were performed. If the difference was
significant the groups with the next biggest CV difference were compared, and so on until the

Chapter 3
76
F-test was not significant. The CV and F-test are slightly different measures, but, as both
measure variance, the F-test was chosen to validate the CV values.
Statistical analysis was carried out using IBM SPSS Version 20.0, significant results are reported
following Bonferroni corrections for multiple comparisons.
Figure 3.2 Diagram of PVC carried out for single and multiple delay data. This analysis was repeated on downsampled data to investigate how each PVC method handled the lower resolution data. Next MTI data without PVC were analysed using the same model implanted using a frequentist non-linear least squares approach.
3.4 Results
3.4.1 Effects of PVC and acquisition sequence on CBF and CVR
Data Type rCBF ml/100g/min
rCBF CV %
hCBF ml/100g/min
hCBF CV %
CBF Change %
CVR %
CVR CV %
MTI woPVC 46.5 (8.6) 18.5 57.7 (10.2) 17.6 24.4 (8) 3.1 (0.9)
30.5
MTI bPVC 73 (15.6) 21.4 93.6 (22) 23.5 29 (18.1) 3.7 (2.3)
62.2
MTI sPVC 55.3 (10) 18 66.9 (15.69) 18.9 23.9 (10.24)
3.1 (1.2)
41.6
SiTI woPVC 60.9 (14.6) 23.40 72.1 (17.7) 23.92 18.5 (14) 3.3 (2)
58.2

Chapter 3
77
Data Type rCBF ml/100g/min
rCBF CV %
hCBF ml/100g/min
hCBF CV %
CBF Change %
CVR %
CVR CV %
SiTI bPVC 73.1 (19.3) 26.4 84.8 (22.4) 25.8 16.4 (9.3)
3 (1.4)
49.7
SiTI sPVC 87.3 (20.9) 24.0 103.5 (25.1) 23.6 15.1 (8.6)
3.3 (2)
58.8
Table 3.2 Group mean (sd) values for CBF and CVR derived from each acquisition and analysis method
(CVR reported as % CBF per unit end-tidal CO2). r = rest, h = hypercapnia. CV = Coefficient of Variation. woPVC = without partial volume correction. bPVC = Bayesian partial volume correction. sPVC = Simple partial volume correction.
3.4.1.1 CBF and CVR differ per acquisition type and PVC method
For the 6 data types presented in table 3.2, there was a significant CBF increase during
hypercapnia from rest; paired t-tests all significant at p < 0.001 (supplementary table 3.6). A
repeated measures ANOVA (RM-ANOVA) revealed a significant effect of data type on rCBF
Greenhouse-Geisser corrected F(1.403, 26.652 = 57.3, p < 0.001).3 Follow up comparisons
revealed significant differences between all data types except MTI and SiTI CBF with bPVC (p =
1.00). MTI woPVC produced the lowest CBF values and SiTI with sPVC the highest (see table
3.2).
For hCBF, there was also a significant effect of data type, Greenhouse-Geisser corrected
F(1.834, 34.853, = 66.916, p < 0.001). Pairwise comparisons showed that again MTI woPVC
produced significantly lower CBF values than any other method. SiTI with bPVC and sPVC were
significantly higher than SiTI woPVC, both p < 0.001.
One outlier was removed from the SiTI CVR analysis as CVR was >3 standard deviations from
the mean. A third RM-ANOVA revealed that CVR was not significantly different between any
methods, F(1.863, 35.404 = 0.731, p = 0.480).
3 Greenhouse-Geisser correction was applied where Mauchley’s test showed that the
assumption of sphericity was violated.

Chapter 3
78
3.4.1.2 Correlations
RCBF correlations were high within acquisition type (MTI or SiTI) but only moderate between
acquisition types. For hCBF data, there were high, significant positive correlations between all
data types (supplementary tables 3.7 and 3.8).
Moderate significant correlations were observed between MTI CVR estimates and strong
significant correlations were found between SITI estimates (supplementary table 3.9).
However, MTI and SiTI estimates were not correlated, despite no significant CVR differences
between methods. The similar group average CVR disguised the fact that many subjects had
very different CVR values when estimated using MTI vs. SiTI data (figure 3.3). This may have
been due to data quality differences between acquisitions, as the SiTI data was acquired last
in the protocol. Further, SiTI has been shown to overestimate CBF changes due to flow transit
time changes upon neuronal activation which cannot be measured at a single inversion time
(Van Osch, Hendrikse, Buchem, & Grond, 2007).
Although CO2, is a primarily vascular stimulus, transit time changes occur as CBF increases
regardless of neuronal activation. SiTI has less sensitivity to detect changes in activation as a
result, however individual differences in vasculature may result in sensitivity differences
between subjects. This would explain similar trends in some subjects across acquisitions but
not others.
3.4.1.3 Variability
SiTI data were more variable than MTI, and bPVC had the highest CV for both MTI and SiTI in
rCBF and hCBF. For rCBF, the largest CV difference between MTI bPVC and MTI sPVC was not
significant, F(19, 19 = 0.41, p = 0.06). Between SiTI methods, there was not a significant
difference between SiTI woPVC and SiTI with bPVC, F(19, 19 = 1.738, p = 0.237). The F statistics
for MTI and SiTI data treated with the same PVC approach were computed. Significant
differences in variance were observed for data woPVC, F(19, 19 = 2.88 , p = 0.025) and sPVC,
F(19, 19 = 4.41, p = 0.002) but not bPVC, F (19, 19 = 1.528, p = 0.362).
For hCBF, variability between MTI woPVC and bPVC differed significantly, F(19, 19 = 4.705, p =
0.001) and between bPVC and sPVC, F(19, 19 = 2.88, p = 0.02) but not between MTI woPVC
and sPVC, F(19, 19 = 1.634, p = 0.294). For SiTI, there was not a significant difference between
SiTI with bPVC and sPVC, F(19, 19 = 0.79,p = 0.620). MTI and SiTI with bPVC data did not have
significantly different variance F(19, 19 = 1.03, p = 0.943, but SiTI had significantly more
variance in bPVC data F(19, 19 = 0.266, p = 0.005 and data woPVC F(19, 19 = 0.03, p = 0.019).

Chapter 3
79
CV was much higher for CVR data than CBF, as expected due to the low SNR of ASL (table 3.2).
For MTI data, bPVC data had a relatively high CV (62.2% vs. 41.6% and 30.5% for sPVC and
woPVC) with significant variance between bPVC and sPVC F(19, 19 = 3.25, p = 0.013) and
woPVC F(19, 19 = 5.817, p < 0.001). In SiTI data there were no significant differences in
variability between PVC approaches, the largest difference between SiTI woPVC and sPVC was
not significant, F(19, 19 = 0.956, p = 0.923). Comparing MTI and SiTI data woPVC, MTI CVR had
greater variance F(19, 19 = 3.99, p = 0.004) as did MTI with bPVC F(19, 19 = 2.508, p = 0.051).
For sPVC, there was not a significant variance difference.
Based on these results, it was decided that MTI data woPVC should be used where possible
given its lower variability for calculated CVR. However, the moderate to high CBF correlations
between MTI and SiTI data and non-significant differences in % CVR suggest that SiTI
acquisitions can provide adequate CBF and CVR estimates where absolute perfusion at the
single subject level is not required.
3.4.2 Downsampled CBF and CVR with and without PVC
Downsampled Data
rCBF
ml/100g/min
rCBF CV %
hCBF ml/100g/min
hCBF CV %
CBF Change %
CVR % CVR CV %
MTI woPVC 32.8 (5.8) 17.9 40.5 (8.1) 19.7 23.5 (10.9)
3 (1.3) 42.5
MTI bPVC 52.9 (10.2) 19.3 65.4 (13.6) 20.8 23.7 (11.6)
3.1 (1.3) 43.7
MTI sPVC 47.9 (8.4) 17.6 59.1 (11.3) 19.2 23.6 (11.7)
3 (1.4) 44.6
SiTI woPVC 62.2 (15) 24.1 73.1 (14.3) 17.7 18 (11.4)
3.13(1.9) 49.1
SiTI bPVC 72.2 (17.9) 22.9 83.2 (20.7) 25 15.4 (8) 2.9 (1.4) 48.1
SiTI sPVC 103.3 (20.7) 20 123.4 (27) 22 19.1 (12)
3.3 (1.9) 54.2
Table 3.3 Mean (sd) shown. Data was downsampled by 1mm in each plane to compare the robustness of each PVC method. rCBF = Resting CBF. hCBF = Hypercapnic CBF

Chapter 3
80
3.4.2.1 Effect of PVC on low resolution data
All images were resampled to a lower resolution, 4.5x4.5x8mm/1.5mm gap, to increase PV
effects in GM. Paired t-tests were used to compare the original rCBF data with its
downsampled counterpart. For MTI data, resampling resulted in significantly lower CBF (all p
< 0.001). However, for SiTI data there was no significant difference between bPVC data before
and after resampling (p = 0.794), however woPVC downsampled data was significantly lower,
SiTI with sPVC was higher than data at the original resolution, both p < 0.001. For hCBF,
downsampled CBF data was significantly lower, p < 0.001, except woPVC and sPVC SiTI data
which was higher, P < 0.001. CVR did not differ between the original and downsampled data.
3.4.2.2 CV differences due to acquisition type and PVC
CV was generally lower for downsampled data. For MTI data CV was significantly higher for
bPVC than woPVC, F(19, 19 = 3.039, p = 0.019) but the difference was not significant between
bPVC and sPVC F(19, 19 = 2.072, p = 0.120). In SITI data the largest CV difference between SiTI
woPVC and sPVC was not significant F(19, 19 = 1.921, p = 0.163. Comparing CV for MTI and
SiTI, SiTI woPVC was significantly higher F(19, 19 = 6.528, p < 0.001) as was sPVC F(19, 19 =
6.052, p < 0.001 and bPVC, F(19, 19 = 3.08, p = 0.018).
MTI hCBF showed significantly greater variance in bPVC vs. uncorrected data F(19, 19 = 2.876,
p = 0.026) but not for bPVC vs. basic PVC F( 19, 19 = 2.017, p = 0.135). HCBF showed significantly
higher variance for bPVC vs. sPVC in the SiTI data F(19, 19 = 5.622, p < 0.001, but not between
bPVC and woPVC, F(19, 19 = 2.409, p = 0.062). Comparing MTI and STI data, SiTI variance was
significantly greater for data woPVC F(19, 19 = 4.895, p < 0.001) and sPVC, F(19, 19 = 5.667, p
< 0.001, but not bPVC data, F(19, 19 = 2.337, p = 0.071).
For CVR, the CV was lower in downsampled datasets, except for MTI data woPVC correction
(see tables 3.1 and 3.3). MTI CV was not significantly different between the data types with
the biggest CV difference, bPVC and sPVC F(19, 19 = 0.939, p = 0.892). SiTI CVs did not differ
significantly, F(19, 19 = 0.536, p = 0.184) between bPVC and sPVC. Comparing the CV between
MTI and SiTI CVR, the biggest difference between SiTI with sPVC and MTI woPVC, the variance
was not significantly different F(19, 19 = 1.915, p = 0.165).

Chapter 3
81
Downsampling the data showed that MTI data woPVC had less variance in most cases, but PVC
had little effect on variance for SiTI CBF and CVR, and contrary to our predictions,
downsampling the data did not identify the most robust PVC method of the two.
3.4.3 Buxton Model with IV component implemented using Oxford ASL and NLfit
Model CBFr ml/100g/min
CBFr CV %
CBFh ml/100g/min
CBFh CV %
Change r to h %
CVR %
CVR CV %
Oxford ASL 46.5 (8.6) 18.5 57.7 (10.2) 17.6 24.4 (8) 3.1 (0.9)
30.5
NLfit A 60.8 (9.9) 16.2 76.6 (13.3) 17.3 19.6 (12.6)
1.8 (1)
59
NLfit B 63.5 (9.2) 14.5 79.7 (13.5) 16.8 20.2 (14.2)
1.8 (1.2)
70.3
Table 3.4 Mean(sd) CBF and CVR values for each kinetic model implementation. NLfit A was generated using values as close as achievable to the default implementation in Oxford ASL. NLfit B was generated using a wider range of parameter values for aCBV, TAT and AAT.
3.4.3.1 ANOVAs
There was a significant difference in rCBF between the 3 models, with Oxford ASL producing
significantly lower values (all pairwise comparisons p < 0.001 following RM-ANOVA). For hCBF,
significant differences were also found between Oxford ASL and NLfit A, p = 0.026, Oxford ASL
and NLfit 3, p < 0.001, and NLfit A and NLfit B, p < 0.001. There were significant CVR differences;
Oxford ASL produced the highest CVR values, Oxford ASL vs. NLfit A (p = 0.003), and vs. NLfit B
(p = 0.010). NLfit A and B CVR did not differ significantly, p = 0.580.
3.4.3.2 Correlations
Moderate to high significant correlations were observed for all 3 models in rCBF and hCBF data
with Oxford ASL and NLfit B having the highest correlation for both conditions, r = .787, p <
0.001 for rCBF, r = .752, p < 0.001 for hCBF (supplementary tables 3.10 and 3.11). In the CVR
data, NLfit A and B were highly correlated, r = .973, p < 0.001, but Oxford ASL showed inverse
non-significant correlations with NLfit A and B (supplementary table 3.12).
3.4.3.3 Variability
There was not a significant difference in variance between Oxford ASL and NLfit B, F(19, 19 =
1.13, p = 0.78) for rCBF or hCBF, F(19, 19 = 2.4, 0.060). For CVR, NLfit A and B CV was 1.9 and
2.3 times higher than Oxford ASL CV respectively. However, the variance differences were not

Chapter 3
82
significant between Oxford ASL CVR and NLfit A CVR, F(19, 19 = 0.816, p = 0.66) or NLfit B CVR,
F(19,19 = 0.653, p = 0.361).
3.4.4 Individual model parameter differences
Finally, the model fit (R2) and AAT were compared between NLfit A and B, as Oxford ASL does
not produce this information, aCBV and TAT were compared between all three models to
investigate parameter differences affecting CBF values (table 3.5).
Model rCBF rTAT raCBV %
rAAT rR2 hCBF hTAT haCBV %
hAAT hR2
Oxford ASL
46.5
(8.6)
0.8 (.03)
0.2 (0.06)
n/a n/a 57.7 (10.2)
0.7 (.04)
0.2 (.09)
n/a n/a
NLfit A 60.8 (9.9)
0.7 (.03)
1.4 (0.1)
0.39 (.02)
0.7 (.06)
76.6 (13.3)
0.6 (.04)
1.4 (.13)
0.4 (.02)
0.7 (.09)
NLfit B 63.5 (9.2)
0.7
(.07)
4.9 (0.3)
0.47 (.05)
0.76 (.05)
79.7 (13.4)
0.7 (.07)
5.1
(.4)
0.42 (.05)
0.8 (.09)
Table 3.5 Mean (SD) for each model parameter. NLfit A was generated using values as close as achievable to the default implementation using BASIL oxford ASL. NLfit B was generated using a wider range of model parameters.
There was a significant difference between all 3 models for resting aCBV (raCBV) and
hypercapnic aCBV (haCBV), pairwise comparisons all p < 0.001 following RM-ANOVAs. Oxford
ASL produced the lowest aCBV and where aCBV parameters were set within a wide range,
values reached 5%, which is notably higher than literature values for GM.
RTAT and hTAT was also significantly different between the 3 models, all p < 0.05, Oxford ASL
TAT estimates were longer at rest and during hypercapnia.
R2 estimates of model fit were significantly lower for NLfit A where parameters were more
tightly constrained, p <0.001 for rest and hypercapnia. RAAT and hAAT were significantly
longer for NLfit B, rest, p < 0.001, hypercapnia, p< 0.004.
3.4.5 Summary of main findings
There were three main aims of the data exploration presented here. First, to evaluate the
effect of PVC on CBF and CVR estimates, second, to compare CBF and CVR estimates acquired
using single vs. multiple delay ASL acquisitions and third, to compare CBF and CVR values

Chapter 3
83
obtained using two software packages which use the same dual-compartment ASL kinetic
model, but which implement the model differently.
• PVC increased CBF estimates for both MTI and SiTI data, and all CBF estimates were
highly correlated for MTI and SiTI. Further, bPVC increased variability in MTI data in
line with the greater variability seen in the SiTI data. Mean CVR was not affected by
PVC, but PVC did increase variance in the MTI CVR data.
• Estimates of CBF produced by the SiTI data were significantly higher than MTI data
with greater variability. However, values were highly correlated, suggesting reliable
relative difference estimates between participants. SiTI and MTI CVR differences were
not statistically significant, but CVR estimates were not correlated between the two
acquisitions which may be due to differences in sensitivity to activation or data quality.
• Choice of model had a significant effect on CBF and CVR. Oxford ASL produced CBF
estimates around ~30% lower and CVR estimates ~70% higher than a similar set of
parameters in NLfit, and when NLfit was given a more liberal parameter range. CBF
values were highly correlated between each implementation, indicating that where
relative differences between subjects or groups are of interest, choice of model and
exact parameters are less important. Group-level CVR estimates calculated from
Oxford ASL were significantly higher than NLfit values and CVR did not correlate
between the two models. Higher CBF values obtained with NLfit may explain the lower
CVR overall, but not the lack of correlation. This may be due to much greater data
variability (see table 3.4) introduced by the NLfit model.
• TAT was longer and aCBV was lower with Oxford ASL than both NLfit models. AAT was
shorter with NLfit A and R2 was higher with NLfit B where there was greater flexibility
in the model fit.
3.5 Discussion
3.5.1 PVC
CBF is defined in terms of the volume of arterial blood delivered to a voxel of tissue in a unit
time divided by the volume of the voxel (Buxton, 2013). Typical GM CBF in the human brain is
approximately 40-60ml/100g/min at rest. Ml/100g/min is the standard unit used to report CBF
but can be misleading as it assumes a mean brain density across all voxels (Petersen et al.,
2006). This could introduce bias where brain volume and density differences are present,

Chapter 3
84
therefore PVC methods aim to correct for differences in tissue types per voxel. While PVC does
not correct directly for density differences, if a voxel contains only 50% GM due to atrophy for
example, PVC will reflect this in the CBF calculation. PVC increased GM CBF in the data
presented here, as expected (Asllani et al., 2008; Chappell et al., 2011; Liang et al., 2013), as
WM, when classified as GM, lowers perfusion estimates. Also, as WM CBF is lower than in GM,
if voxels with low CBF are falsely identified as grey matter it has the effect of inflating the CVR
value. This effect could have led to false high CVR values, however in this sample CVR was not
significantly different following PVC.
Here, mean rCBF without PVC and with sPVC fell within expected values for uncorrected data,
and bPVC CBF was significantly higher than both. The same trend was present for hCBF, and
the % CBF increase in the bPVC data was higher leading to slightly higher CVR. However, as CBF
had higher variance, this had a notable effect on CVR calculated with this method, doubling
the CV from the uncorrected data. PVC may reveal true variability in CBF not obvious in
uncorrected data. It is also possible however, that errors in co-registration of segmented tissue
maps to ASL data, coupled with the correction algorithm which also attempts to calculate WM
CBF present in predominantly GM voxels, leads to overestimation of CBF. The sPVC method,
which gives all WM CBF a value of 0, increased CBF to a lesser degree and may be more
appropriate where GM CBF is of interest or where there is a low or unreliable WM signal.
In SiTI data, PVC again increased CBF, but sPVC produced higher values than bPVC. CV was
higher for bPVC CBF but lowest for bPVC CVR. Interestingly, bPVC CBF was almost identical for
SiTI and MTI data, whether this is by chance or to do with the algorithm used for PVC should
be investigated further.
Downsampling the data was not as helpful as expected in terms of identifying which, if either,
PVC method introduced more variance into low resolution data. Downsampling led to overall
CBF reductions and reduced variability. The larger voxels may have blurred CBF differences
and led to the data appearing more homogeneous, an issue which should be considered where
spatial resolution is poor.
Until further PVC simulations and methodological comparisons are conducted, when
calculating perfusion in healthy brains where atrophy and perfusion abnormalities are not
expected, there is good reason to omit PVC from the analysis. PVC may add errors in the
analysis due to registration imperfections, as the PVC is only as good as the co-registration and
segmentation of T1 images. In several subjects in this analysis it was not possible to achieve

Chapter 3
85
excellent registration. Alternative PVC methods which use only low resolution ASL data such
as that proposed by Ahlgren, Wirestam, Petersen et al. (2014) could overcome reliance on
exact co-registration. PVC should be explored further in groups with atrophy, as the benefits
of PVC may outweigh the increased variability where perfusion is being compared to controls
without atrophy. However, in studies with young healthy groups only, results suggest that PVC
does not benefit the overall results.
3.5.2 Choice of post-labelling delay scheme
The difference between CBF and CVR values estimated using SiTI and MTI acquisitions was of
interest as MTI sequences are not always available and it takes longer to acquire multiple
averages, to achieve acceptable SNR. CBF values produced from SiTI ASL data were significantly
higher, as expected. This is because using a single delay time can lead to arterial blood being
modelled as tissue perfusion if the delay time is not long enough for all labelled blood to reach
the tissue. Alternatively, where longer delay times are used, there is a risk of underestimating
perfusion due to low SNR. The higher rCBF observed here for SiTI resulted in lower CVR
estimates, although this difference was not statistically significant. The smaller increase in CBF
during hypercapnia however, suggests that single delay methods have lower SNR and less
sensitivity to detect CBF changes.
The arrival time of tagged blood to tissue, varies across the brain, and with ageing and disease.
Imaging at a single time-point is not optimal for accurate perfusion quantification across the
whole brain and in groups with heterogeneous perfusion abnormalities (Buxton et al., 1998).
Imaging at multiple timepoints means that the kinetic curve can be sampled at a range of times
which ideally will capture early and delayed perfusion, as well as estimating TAT. Changes in
transit time of blood tissue can occur with activation, in this case during hypercapnia, meaning
that the relative change between baseline and hypercapnic perfusion is less reliable when
measured at only a single inversion time. In this study, the percentage increase in CBF during
activation was not significantly different between the SiTI estimation of 19.3% and non-PVC
MTI estimation of 24.4% p > 0.05. However, the degree of variability in the SiTI changes was
much higher than in the MTI data, in studies with only small activation changes this could have
a more serious impact on results.
To summarise, SiTI data produced higher CBF values with greater variability between subjects
and a smaller CBF increase was detected during hypercapnia. This suggests that MTI
acquisitions provide more accurate CBF estimates, however as SiTI and MTI data were highly
correlated, SiTI likely provides a useful indication of relative CBF differences between subjects

Chapter 3
86
or longitudinally. CVR did not correlate between the acquisitions however, which is
problematic and suggests the lower SNR and higher variance in SiTI data may mean that it is
not a reliable method to calculate CVR. An alternative explanation is that the different methods
used to calculate CVR led to the lack of correlation. The method used for SiTI CVR shifted the
CO2 and CBF data to find the best fit whereas a less sophisticated method of dividing the
percentage CBF change by the unit CO2 change was used for the MTI data.
Where MTI is not feasible, SiTI should still provide a good indicator of cerebrovascular activity.
Results from SiTI ASL should be interpreted with caution where arrival times may be altered as
this could lead to errors in quantification.
3.5.3 Kinetic Model Differences
The kinetic models used here were both dual-compartment extensions of the GKM proposed
by Buxton et al. (1998), with different implementations; Oxford ASL uses probabilistic Bayesian
inference (Chappell et al., 2010) to fit the model to the data whereas NLfit uses a typical non-
linear regression approach, fitting the model within a specified range of values. As NLfit
assumes IV signal in all voxels this model could be predicted to underestimate CBF if it falsely
identifies tissue perfusion as arterial signal. However, NLfit produced significantly higher rCBF
and hCBF values than Oxford ASL, but significantly lower and more variable estimates of CVR
much like the trend seen in SiTI data. Oxford ASL does not assume any IV signal in tissue voxels
but uses ARD to remove arterial signal where there is evidence to do so. A possible explanation
for the lower CBF with Oxford ASL is that it may overfit this component and discard tissue
signal. This possibility needs more in-depth investigation using simulated data as there is no
clear evidence for this argument from the current data.
In terms of other kinetic model components contributing to CBF estimation, GM aCBV values
were significantly lower in the Oxford ASL data, < 0.5% aCBV per voxel, where a mean aCBV of
0% was set as signal from arterial blood is expected to flow through tissue to its intended
destination elsewhere in the brain (Chappell et al., 2010) This is in keeping with other GM aCBV
values obtained using PASL and Oxford ASL (E. A. H. Warnert et al., 2014), but aCBV values
using this method are scarce. In NLfit, the importance of prior information about physiological
values was highlighted by the very different aCBV values produced by each model
implementation. A lower limit of 0 was set in NLfit A and B and while an upper limit of 3%
produced a 1.4% rCBF mean, the NLfit upper limit of 10% aCBV produced mean GM value of
4.9%. Literature aCBV values in GM tend be around 1-3% using multiple ASL techniques

Chapter 3
87
(Brookes, Morris, Gowland, & Francis, 2007; Bulte et al., 2012; Yan, Li, Kilroy, Wehrli, & Wang,
2012).
TAT and AAT were also significantly affected by choice of model but all were within expected
physiological ranges of ~0.6-0.8s for TAT and ~0.3-0.6s for AAT. Similarly, although R2 estimates
of fit were significantly different between the NLfit models, all were within 0.7-0.77 with
standard deviations of 0.05-0.09. NLfit B had a better fit for rCBF and hCBF, due to the more
liberal parameter limits giving the data a greater range to vary within. This may be because
whole GM was used as the ROI, and as physiological parameters vary throughout the brain, a
better fit was achieved overall by letting model parameters vary. Unfortunately, it was not
possible to produce the same R2 maps for Oxford ASL due to the hard-coded nature of the
software. As this analysis was carried out to determine the CBF analysis for research questions
about whole GM, regional ROIs were not investigated but would be useful to better
understand the optimal kinetic model design. In summary, the results from this model
comparison suggest that prior physiological information coupled with CBF and aCBV
determined from the data itself may improve the accuracy of the kinetic model and reduce the
variability seen in CVR estimates where limits are set based on researcher expectations of the
data alone. However, this may become problematic in patient studies where physiology is
unknown, for example delayed TAT, and priors or limits are not of a sufficient to capture
differences between or within groups.
3.5.4 Limitations
A limitation of this work is that CBF and CVR values were calculated as a mean over whole brain
GM as the following chapter looks at global CBF and CVR. While this approach is less sensitive
to PVC errors in small regions where registration may not have been excellent, CBF and CVR
are not uniform throughout the brain and this analysis may have failed to identify brain regions
where PVC made an important difference.
A second limitation is that as SiTI hypercapnic data was collected in a block design and MTI in
separate rest and hypercapnic scans, CVR was calculated in different ways (see methods).
Interestingly, CVR was not significantly different despite the difference in analysis but this may
have had on effect on variance.
A third limitation is that this was a post-hoc exploratory analysis, conducted to determine the
most fitting method to analyse data that was already collected to answer other research

Chapter 3
88
questions. In future, MTI and SiTI data should be collected using the same timings for
hypercapnia challenges or tasks and in-vivo data should be compared with simulations.
3.6 Conclusions
The current data provide a useful insight into the impact of PVC on data variability as well as
the potential CBF and CVR differences obtained with SiTI vs. MTI ASL. The kinetic model
comparison also highlights the differences in CBF and CVR achieved using Bayesian and
frequentist implementations of the kinetic model and demonstrates the importance of
accurate prior knowledge of physiology when defining the model.
Lastly, quantitative fMRI aims to overcome the limitations of relying on relative BOLD or CBF
changes. However, acquisitions must fully capture blood flow kinetics and analysis not be
biased by limits placed on models. Otherwise, although values are converted to physiological
units, they are essentially qualitative, only capturing relative differences between subjects.
In this thesis, MTI without PVC is used where feasible to obtain the most accurate perfusion
estimates. PVC was not included in analysis of healthy subject data as increased variability and
noise introduced by registration error, likely outweighs the benefits of PVC. The high
correlations between non-PVC and PVC data justify this choice when relative differences are
of interest. The comparison between MTI and SiTI demonstrated that while SiTI yielded higher
estimates of CBF, estimates were moderately to strongly correlated between the acquisitions.
Given that MTI acquisitions are not feasible in dual-echo or task acquisitions in many cases,
SiTI data must be acquired. Oxford ASL was chosen as the preferred tool to quantify CBF. A
Bayesian framework rather than strict lower and upper limits on data is likely to result in more
accurate estimations and reduce experimenter bias and uncertainty which could be introduced
by setting limits arbitrarily.
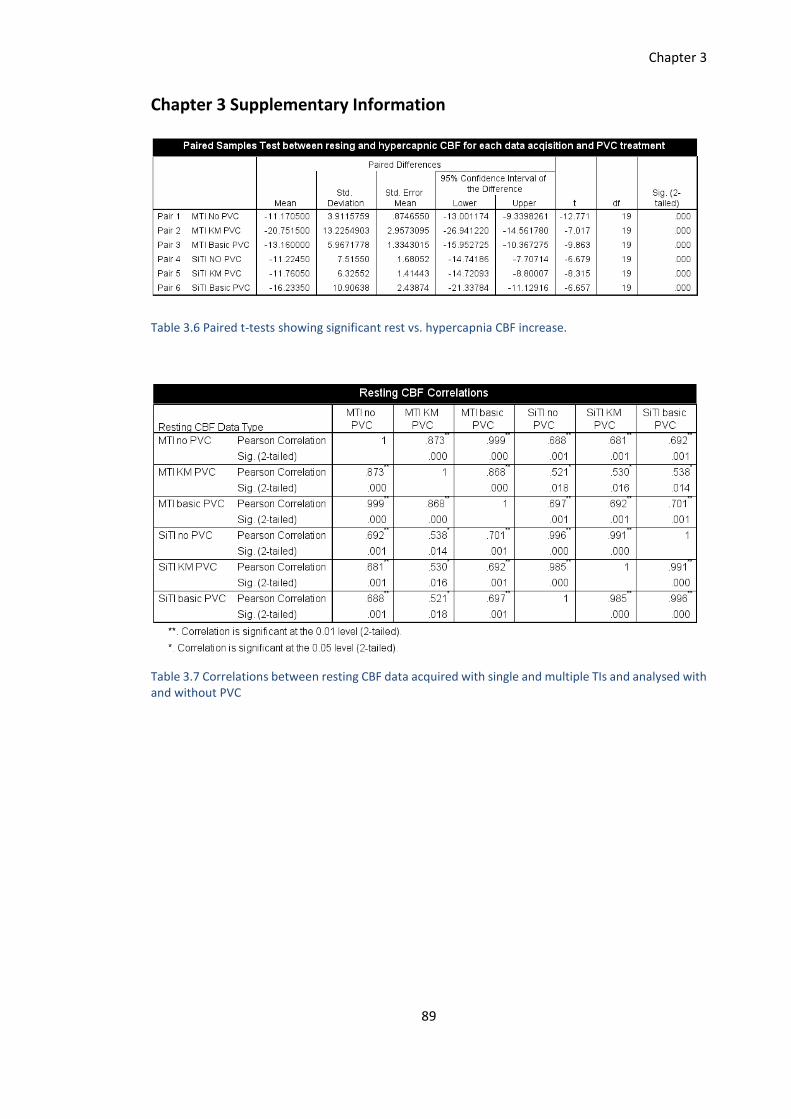
Chapter 3
89
Chapter 3 Supplementary Information
Table 3.6 Paired t-tests showing significant rest vs. hypercapnia CBF increase.
Table 3.7 Correlations between resting CBF data acquired with single and multiple TIs and analysed with and without PVC

Chapter 3
90
Table 3.8 Correlations for CBF data during hypercapnia for each data type
Table 3.9 Correlations between CV estimates from each data acquisition and analysis.

Chapter 3
91
A
B
R² = 0.0263
00.5
11.5
22.5
33.5
44.5
55.5
66.5
7
0 0.5 1 1.5 2 2.5 3 3.5 4 4.5 5
MTI
wo
PV
C
SiTI woPVC
CVR without PVC
R² = 0.00820
0.51
1.52
2.53
3.54
4.55
5.56
6.5
0 0.5 1 1.5 2 2.5 3 3.5 4 4.5 5 5.5 6 6.5 7 7.5
MTI
bP
VC
SiTI bPVC
CVR with Bayesian PVC

Chapter 3
92
C
Figure 3.3 Correlations plots for MTI and SiTI CVR estimates
Table 3.10 RCBF correlations for each model implementation
R² = 0.0234
00.5
11.5
22.5
33.5
44.5
55.5
66.5
77.5
0 0.5 1 1.5 2 2.5 3 3.5 4 4.5 5 5.5 6 6.5
MTI
sP
VC
SiTI sPVC
CVR with simple PVC

Chapter 3
93
Table 3.11 HCBF correlations for each model implementation
Table 3.12 CVR correlations for each model implementation

Chapter 4
94
Chapter 4
Assessment of the Effects of Aerobic Fitness on Healthy
Adults using Multiple Inversion Time ASL fMRI
Abstract
Neurodegenerative diseases are a global health burden and despite extensive research there
are no cures or effective long-term management solutions. Neuroimaging studies have
provided evidence of a neuroprotective effect of aerobic fitness (AF) in older adults, linking
higher AF with greater cognitive performance, brain volume (Erickson et al., 2011), cerebral
blood flow (CBF) (Thomas et al., 2013) and cerebrovascular reactivity (CVR) (Bailey et al.,
2013; Barnes et al., 2013). However, there is a lack of knowledge regarding the
cerebrovascular effects of AF in early adulthood which is necessary to establish the
mechanisms of effect across the lifespan.
This study used multiple inversion time (MTI) arterial spin labelling (ASL) fMRI to measure
cerebral perfusion at normocapnia and hypercapnia in 20 young, healthy adults (25±4.6) who
completed a �̇�O2peak test to determine AF and a battery of cognitive tests. In a voxelwise
analysis, subjects with a higher �̇�O2peak had significantly lower CBF in portions of the
thalamus, brainstem, visual cortex, precuneus and cerebellum. Region of interest analysis
revealed greater grey matter (GM) CVR to CO2. There was no significant relationship
between cognitive performance and AF, or GM volume and AF.
The results demonstrate an effect of AF on cerebrovascular function in early adulthood
indicative of increased metabolic efficiency. Additional work is needed to extend these
results to determine the effects of AF on cerebral blood volume and oxygen metabolism.

Chapter 4
95
4.1 Introduction
Neurodegenerative diseases are a global health burden and despite extensive research there
are no cures or effective long-term management solutions. The cost to the healthcare system
of dementia alone was estimated at $818 billion worldwide in a 2015 World Alzheimer’s Report
(https://www.alz.co.uk/research/world-report-2015), and this cost is predicted to rise due to
an ageing population. Aerobic fitness (AF) has emerged as a modifiable lifestyle factor which
reduces the risk of all-cause mortality (Kodama et al., 2009), cardiovascular events and obesity
(Haskell, Lee, Pate, Powell, & Blair, 2007; Lee et al., 2010; Roque, Hernanz, Salaices, & Briones,
2013) and protects the brain against age and disease-related decline (Hayes, Alosco, & Forman,
2014; Hillman, Erickson, & Kramer, 2008; Nishijima, Torres-Aleman, & Soya, 2016).
Neuroimaging studies have provided evidence of a neuroprotective effect of AF in older adults,
linking higher AF with greater brain volume (Erickson et al., 2011) and cerebral blood flow (CBF)
(Thomas et al., 2013), discussed in more detail in the following paragraphs. AF has also been
associated with greater cerebrovascular reactivity (CVR) assessed using transcranial Doppler
(TCD) ultrasound, an index of vascular reserve (Bailey et al., 2013a; Barnes, Taylor, Kluck,
Johnson, Joyner, et al., 2013). CVR reflects the ability of the cerebral vessels to dilate and
maintain adequate brain perfusion, and as a result CVR is a useful indicator of vascular reserve
independent of neuronal activity. CVR is typically calculated as the percentage CBF change in
response to an increase in partial pressure of end-tidal carbon dioxide (PETCO2) concentration.
However, the findings of Bailey et al. (2013) are in conflict with the MRI results of Thomas et
al. (2013) who reported lower CVR in Masters Athletes (MA) vs. sedentary young and age-
matched controls. These conflicting results regarding CVR and AF represent a bigger problem
of inconsistent findings regarding AF and its benefits for brain function.
If AF training is to be systematically delivered as a clinical intervention to reduce age and
disease-related brain decline, a full understanding of the mechanisms through which AF
delivers its apparent benefits is needed. To do this, the role of AF in protecting or potentially
restoring brain function must be investigated across the lifespan and health spectrum. At
present, it is unclear whether AF influences cerebrovascular function in the healthy brain, or
whether it serves to maintain function where the brain is vulnerable to damage.

Chapter 4
96
In addition, brain structure and function are closely linked; to maintain healthy brain tissue,
adequate energy must be supplied. Many studies have investigated the link between AF and
structure; cerebrovascular function has not been extensively studied in humans. The work
presented here focuses on how AF impacts the cerebrovascular processes which maintain
delivery and circulation of brain nutrients.
The current study was designed to investigate the effects of AF on the healthy brain. The
objective was to quantify variations in CBF and CVR, two widely used indices of cerebrovascular
function, in a sample of young, healthy adults within a normal range of fitness levels (i.e.
sedentary and active, but not athletes in structured training). Based on the extant TCD and
fMRI evidence, we predicted a positive relationship between fitness and resting grey matter
(GM) CBF. We also expected to see a positive correlation between CVR to CO2 and �̇�O2peak in
line with the findings of Bailey et al. (2013). Cognitive tests chosen to measure a number of
cognitive domains were included to test a secondary hypothesis that higher �̇�O2peak would
be associated with better cognitive performance. If CBF and CVR differences due to fitness
were evident, then demonstrating additional cognitive benefits would provide evidence for
functionally relevant effects of neurobiological differences.
This study used multiple inversion time (MTI) arterial spin labelling (ASL) fMRI to measure
cerebral perfusion at normocapnia and hypercapnia. A key benefit of ASL is that unlike BOLD
fMRI, it is possible to quantify baseline activity and changes in response to a stimulus, making
it an ideal technique to study groups with compromised cerebrovascular function as well as
healthy populations.
A brief review of the evidence for AF exerting beneficial effects on cerebrovascular function is
first presented along with potential mechanisms of effect.
4.1.1 Experimental Models of Exercise and Aerobic Fitness
Experimental models have provided much of our current knowledge about the potential
mechanisms underlying the neuroprotective and neuromodulatory effects of exercise and AF
on the brain. One of the first studies to demonstrate exercise-induced brain changes was
conducted by van Praag et al. (1999). This study showed that mice exposed to 43 days of either
voluntary wheel running or an enriched environment (EE) had double the number of surviving
newborn neurons compared with controls undergoing either water maze training or forced
swimming. Although enriched environments and aerobic exercise provided similar benefits,

Chapter 4
97
results show that physical activity resulted in enhanced neurogenesis. Stress, which has
negative effects on neurogenesis may have offset the benefits of swimming as animals were
forced to do this. A later study by (Kobilo et al., 2011), extended these findings showing that
neurogenesis and cell survival in rodents housed in an EE was only increased when access to
running was available suggesting that the running component of an EE underlies its neurogenic
effects. In terms of cerebrovascular function, Swain et al. (2003) reported reduced proton
signal intensity in the motor cortex of rats following 30 days of wheel running. The authors
attributed this change to greater capillary perfusion and/or cerebral blood volume (CBV)
following exercise. In a second experiment, also by Swain et al. (2003), measuring CBF during
normocapnia and hypercapnia, a greater CBF response to hypercapnia was observed in the
running group, although no baseline differences were evident. This result was explained as an
increase in the vascular reserve of capillaries due to exercise training (ET). In agreement with
these results, Pereira et al. (2007) demonstrated that mice subjected to wheel running had
increased cerebral blood volume (CBV) in the dentate gyrus (DG) of the hippocampus
compared to non-exercised controls, and the degree of CBV increase correlated with levels of
neurogenesis in the DG. Building on the evidence for cerebrovascular adaptations to exercise,
Cahill et al., (2017) reported increases in normocapnic and hypercapnic CBF in mice following
4 weeks of voluntary wheel running vs. non-exercised controls. In addition, greater CBF
changes correlated with volume changes in the hippocampus. CBF changes were not detected
in motor cortex, suggesting that flow changes may have been driven by vascular remodelling
in response to increased neuronal density or metabolic demand. However, this short
intervention study is unlikely to show the full extent of the effects of long-term physical activity
on the brain as imaging studies have demonstrated greater CBF in trained subjects in regions
other than the site of neurogenesis in the hippocampus (Macintosh, Swardfager, Crane,
Ranepura, & Saleem, 2014; Robertson et al., 2015; Thomas et al., 2013).
A constant adequate supply of blood delivering oxygen and other nutrients such as glucose is
required for optimal cerebral function. Results from experimental models suggest vascular
adaptations to exercise, such as increased angiogenesis and CBF, increases the availability of
nutrients necessary to support neurogenesis and cell survival. This in turn facilitates molecular
signalling for efficient brain communication and plasticity at the synaptic level. Exercise-driven
brain changes are thought to be underpinned by increased availability of a number of growth
factors including insulin-like-growth-factor (IGF-I), brain-derived-neurotrophic-factor (BDNF)
and vascular endothelial-derived growth factor (VEGF) (Cotman et al., 2007). Nitric oxide (NO),
a free radical, is a signalling molecule with both neuroprotective and neurotoxic effects (Kro,

Chapter 4
98
Fehsel, & Kolb-bachofen, 1997). NO has a vasodilatory effect in vessels and is necessary for
maintaining vascular endothelial function (Vallance & Hingorani, 1999). NO bioactivity is
increased with exercise training, and this increase has been demonstrated in humans with
cardiovascular disease (Walther, Gielen, & Hambrecht, 2004) and metabolic syndrome
(Gomes, Casella-Filho, Chagas, & Tanus-santos, 2008). Endothelial dysfunction which is
associated with vascular disease may be exacerbated by free radical production which
interferes with NO production. Increasing NO bioactivity through exercise may counteract the
effects of free radical damage and therefore improve vascular endothelial function (Green,
Maiorana, O’Driscoll, & Taylor, 2004).
These molecular factors are likely to play a key role in the cerebrovascular benefits linked to
AF, however these factors can only be measured peripherally in humans, and it is unknown
whether peripheral concentrations reflect levels in the brain, preventing researchers from
making causal associations. Human imaging studies focus on changes at the macroscopic level
such as changes in CBF and CVR as well as microstructural white matter (WM) and cortical
volume differences between trained and sedentary groups. The two bodies of work are
important in understanding fully how the molecular adaptations lead to large scale vascular
changes which maintain brain function.
4.1.2 Aerobic Fitness and Cerebrovascular Function: Evidence from Human Imaging
Acute exercise has been shown to increase CBF in tissue (MacIntosh et al., 2014), therefore
long-term aerobic ET, leading to higher AF, may support maintenance of optimal cerebral
energy supply and metabolism. This in turn may work to promote neuronal survival and
adaptive plasticity in response to new experiences or injury, protecting against age and disease
related functional decline.
Blood is supplied to the brain primarily through the internal carotid (IC) and vertebral arteries
which interconnect with the middle cerebral artery (MCA) to form the Circle of Willis which
connects with smaller branching arteries throughout the brain. The brain’s capillary bed, is
comprised of a single layer of endothelial cells which make up the entire blood vessel wall and
control the passage of molecules through this protective layer, the blood-brain-barrier (BBB).
The capillary bed is responsible for the transfer of nutrients such as oxygen (O2) to neurons
and removal of waste products including CO2. Capillaries do not possess elasticity, unlike
arteries. Arterial elasticity is therefore necessary for maintaining smooth blood flow into the
capillaries. Ageing processes contribute to the stiffening of arteries slowing or reducing

Chapter 4
99
nutrient delivery to neurons as arteries become less compliant to changes in CBF. There is
evidence to suggest that where compliance is reduced, perfusion pressure is increased to
maintain adequate energy supply to brain tissue, unlike in healthy arteries where vasodilation
occurs to support increased CBF to meet neuronal activity requirements (Warnert, 2016).
Sedentary lifestyles have been linked to arterial stiffening (Joyner, 2000; Tanaka et al., 2000),
meaning that sustained aerobic activity is important in delaying the effects of ageing on arterial
compliance (AC). Whether AF is limited to slowing AC reductions and CBF, or delivers
cerebrovascular benefits from development, has had limited investigation, and future studies
should address the effect of AF on cerebral arteries from early to late adulthood.
Only a small number of studies, most from the same lab, have looked at the relationship
between brain function and AF in children and young adults. One study has linked higher AF
with greater hippocampal perfusion (Chaddock-Heyman et al., 2016) and another with neural
network efficiency during cognitive control tasks (Voss et al., 2012) in preadolescent children.
Several other studies show small but positive effects of fitness on selective cognitive domains
such as relational memory and executive function in children, see Khan & Hillman (2014) for a
review.
In young adults (<30 years old), Bailey et al. (2013) showed that �̇�O2max, the gold standard
test of AF, displayed a positive linear relationship with MCA velocity and CVR to CO2 inhalation
measured using transcranial Doppler (TCD) imaging. This relationship was also observed in
older adults in the same study. These results suggest that fitness may increase vascular reserve
and AC which could help to maintain healthy blood pressure and efficient blood supply to
neural tissue. However, Barnes et al. (2013), using the same technique, did not find a
relationship between CVR and �̇�O2max in younger adults despite observing the same trend as
Bailey et al. (2013) in a cohort of older adults. This may be explained by differences in the study
design or a smaller spread of fitness levels in the Barnes et al. (2013) study. Also, Bailey et al.
(2013) compared CVR between two groups, sedentary vs. trained, whereas Barnes et al. (2013)
used a single group with a range of fitness levels who did not participate in a structured training
regime. Another TCD study in older women (A. D. Brown et al., 2010) reported positive
correlations between �̇�O2max and cerebrovascular conductance (CVC), an index of CBF, as well
as between �̇�O2max and mean arterial pressure (MAP). �̇�O2max was also weakly correlated
with global cognitive performance (r = .4), for cognitive domains including cognitive speed,
verbal ability and executive functions, a consistent correlation of ~0.3 was reported. An
interesting finding of the study was that CVC and MAP were stronger predictors of overall

Chapter 4
100
cognitive performance across domains, highlighting the potential role of cerebrovascular
health in cognition. A later study by Dupuy et al. (2015) using near infrared spectroscopy (NIRS)
in young (19-34 years old) and older women (55-72) reported higher levels of prefrontal
oxygenation and faster reaction times during the executive condition of the Stroop task in than
their less fit counterparts. The authors did not find an age effect in this study; however the
effects on cognition were extremely selective, only one of the ten domains revealed a
performance or oxygenation effect related to fitness. Cerebral oxygenation differences during
the Stroop were found only in the right inferior frontal gyrus (IFG). The prefrontal cortex is a
key area involved in executive function, and is an area most vulnerable to age related perfusion
reductions (Lu et al., 2011). The IFG may therefore be a region with visible perfusion
differences in individuals with higher AF when energy requirements are increased, however it
seems unlikely that effects would be so localised given that a network of brain regions are
involved in any task. If AF increases AC to maintain CBF and CVR, a whole brain increase in
oxygenated blood flow would be expected. Studies measuring CBF in the resting brain are
necessary to clarify whether resting global differences are apparent in young people, such as
in the current study, or whether effects only become measurable when local energy needs
increase. Much more work is needed to better characterise the link between fitness and whole
brain function in early adulthood. MRI is an ideal technique for this as TCD and NIRS offer
limited spatial coverage and resolution.
Using gadolinium contrast T1-weighted imaging, Pereira et al. (2007) reported increases in DG
cerebral blood volume (CBV) in untrained adults following a 3 month aerobic ET intervention,
and CBV changes correlated with �̇�O2max. Further, vascular adaptations have been shown
following a 12-week intervention in sedentary young and older people designed to increase
�̇�O2max. Murrell et al. (2013) found a small but statistically significant increase in MCA CVR in
both age groups, a promising result suggesting that cerebrovascular adaptations can be
achieved in a relatively short time frame across the lifespan.
In the fMRI study from Thomas et al. (2013) mentioned in the introductory paragraph, CBF and
CVR in a group of MA were compared to that of age-matched and young sedentary groups.
The MA group had greater absolute CBF vs. age-matched controls in the precuneus and
posterior cingulate cortex (PCC), part of the default mode network (DMN). The DMN is
believed to be involved in alertness and action monitoring and its action is known to be
downregulated in ageing and dementia. Further, relative perfusion was greater than that of
the young and age-matched control group. Despite lower total brain volume, aerobically fit
older adults had greater blood supply to these regions. In agreement with this finding,

Chapter 4
101
Boraxbekk et al. (2015) reported that higher levels of current physical activity, and activity over
a 10-year period, predicted PCC perfusion. Performance on a visuospatial task (block design)
was also predicted by physical activity, however performance on other task was not, in keeping
with the seemingly selective fitness-cognition relationship. Zimmerman et al. (2014), in
agreement with the Thomas et al. (2013) study, reported that cardiorespiratory fitness was
positively correlated with GM, but not WM, CBF in adults aged 55-85. A mediation analysis
showed that fitness was responsible for offsetting the age-related CBF reduction,
demonstrating a neuroprotective role for fitness in ageing.
In contrast to the TCD work, in the study by Thomas et al. (2013), a lower BOLD CVR response
to CO2 in MA vs. age-matched and young sedentary controls was also observed in temporal
regions and the insula at a statistically significant level, although this trend was present
throughout the brain. Thomas et al. (2013) attributed these results to a dampened CO2
response as a result of lifelong exposure to elevated arterial CO2. To add further complexity to
these results, Gauthier et al. (2015) found that in older adults, �̇�O2max was positively
correlated with BOLD CVR in periventricular watershed areas but inversely related to CVR in
regions of the frontal cortex. Taken together, these studies suggest regional variations in the
effects of AF on CVR, which may explain the mostly consistent positive correlation between
MCA CVR and AF in TCD studies which is spatially limited. An exception to the TCD findings
comes from a study by Zhu et al. (2013), also comparing MA, sedentary older adults and young
sedentary controls. Zhu et al. (2013) found a similar relationship to Thomas et al. (2013) in
that cerebral vasomotor reactivity (CVMR) to hypocapnia was lowest in the MA group.
However, CVMR to hypercapnia, was higher in both older groups with no difference between
the MA and sedentary groups. Zhu et al. (2013) did not find a resting MCA flow velocity
difference between the older groups at rest, hypocapnia or hypercapnia, however as expected,
values were higher for the younger group across conditions. At present, therefore, it is difficult
to come to a strong conclusion on how AF affects the brain at different stages of life, and what
this means in terms of cognition and behaviour.
There are also suggestions that physical activity benefits patients with chronic neurological
disorders such as Multiple Sclerosis (MS); improvements in fatigue, balance and ambulatory
capacity (Motl & Pilutti, 2012) as well as greater functional connectivity (FC) between the
hippocampus and frontal regions (Prakash, Patterson, Janssen, Abduljalil, & Boster, 2011) have
been reported. In addition, Prakash et al. (2011) showed that higher physical activity was
related to greater hippocampal-posteromedial cortex (PMC) coherence which in turn was

Chapter 4
102
related to relational memory performance. Linking function to structure, greater volume of
the hippocampus, thalamus and basal ganglia have been demonstrated in MS patients with
higher �̇�O2peak (Prakash et al., 2010), potentially due to maintained cerebrovascular function
and therefore energy delivery to tissue. However, this has not been directly examined.
The relationship between AF and brain function is even more difficult to determine in patients,
due to difficulties establishing whether patients are less impaired and/or have less
cerebrovascular damage because they have higher AF, or whether they have higher AF because
they are less impaired. Studies evaluating cerebrovascular function and AF pre and post ET
interventions are crucial for establishing the therapeutic role of aerobic exercise training in
patients. In support of the former, a TCD study in a cross-section of stroke patients
demonstrated improvements in CVR of ~28% following a six month ET intervention which
increased �̇�O2peak by 19% (Ivey, Ryan, Hafer-macko, & Macko, 2011), providing evidence of
functional recovery facilitated by increased AF. However it is still possible that participant
selection was dictated by level of impairment.
To summarise, imaging studies of the relationship between brain function and AF report mixed
evidence for AF protecting against cerebrovascular decline in ageing and disease or having
lifelong functional benefit. The main reason for this is a small number of overall studies with
varying methodologies and design. As TCD is limited to single arterial measurements and
measures flow rather than perfusion, there is a gap in the literature for studies investigating
global effects of AF, especially in younger adults free from age-related comorbidities. The
current study seeks to address this gap.
4.2 Methods
4.2.1 Participants
20 healthy adults (11 females, mean age 25±4.6) were recruited from advertisements placed
around Cardiff University. The study was approved by the Cardiff University School of
Psychology Research Ethics Committee and performed in accordance with the guidelines
stated in the Cardiff University Research Framework (version 4.0, 2010). All participants were
non-smokers and educated to university level.
4.2.2 Study Procedures
The study consisted of 3 lab visits. In Visit 1, eligibility screening for MRI, respiratory
modulations and intensive exercise was carried out. Contraindications to exercise were

Chapter 4
103
assessed using the Physical Activity Readiness Questionnaire (PARQ). Sociodemographic
information was recorded and estimations of weekly activity level were established using the
International Physical Activity Questionnaire (IPAQ) Short Form (Craig et al., 2003). Elevated
CO2 inhalation can cause sensations of breathlessness, light headedness and anxiety in some
individuals. For this reason, all volunteers took part in a gas modulation session in a simulation
MR scanner to ensure the gas modulations were tolerable. A stepwise protocol was employed
to allow participants time to become accustomed to CO2 inhalation (see figure 4.1). No adverse
effects were reported in this sample.
Figure 4.1 Protocol for the pre-MRI respiratory modulation test session. Heart rate and oxygen saturation were monitored and recorded throughout the session. Figure adapted from Merola, (2016).
In Visit 2, volunteers completed 7 cognitive tests, administered by the same researcher for all
participants, prior to the fitness test. The tests covering a range of cognitive domains were
chosen as they are validated for use in patient and control samples (see table 4.1).
Test Domain Measured
Speed and Capacity of Language Processing
(SCOLP) (Baddeley, Emslie, Nimmo-Smith,
1992)
Information processing, speed and language
comprehension
Forward Digit Span Working memory
Letter Fluency (Categories) Verbal fluency
Conners Continuous Performance Test
(Conners et al., 2000)
Sustained attention and response inhibition

Chapter 4
104
Trail Making Test (Part B) Processing speed and executive function
Symbol Digit Modalities Test Information processing speed
Table 4.1 List of cognitive tests used in this study.
4.2.3 Fitness Test
The fitness test was also performed in Visit 2. The PAR-Q was conducted a second time to
identify potential risk factors associated with exercise in the unlikely event of circumstance
changes from Visit 1. The �̇�O2peak test protocol used has previously been described by Collett
et al. (2011) and Cooney et al. (2013). The test began with a 2-minute unloaded warm up at 50
revolutions per minute (rpm) on a Lode cycle ergometer (Lode, Groningen, Netherlands).
During the test participants maintained a constant 50rpm and work rate was increased from
50 watts by 25 watts every 2 minutes. The protocol was designed so that exhaustion would be
reached in under 20 minutes. The test was terminated if any of the following criteria were
reached; work rate fell below 45rpm for > 10 seconds, RER was >1.15, or volitional exhaustion
occurred. At the end of each 2-minute step Borg ratings of perceived exertion (RPE), on the
CR10 scale (Borg & Kaijser, 2006) were used to record perceived heaviness of legs and
breathing.
Blood lactate concentration was sampled from the earlobe using Unistik 3 1.8mm Safety
Lancets (Williams Medical, Caerphilly, Wales) and tested using the Lactate Plus system (Nova
Biomedical, Waltam, MA USA) at baseline, 2 minute intervals and at exhaustion. Respiratory
gas exchanges were continuously monitored using breath by breath analysis with the Cortex
Metalyser 3b (Cortex Biophysik Metalyzer, Germany). �̇�O2peak was taken as the highest value
over a 30 second block average at the maximum recorded work rate. Heart rate (HR) and work
rate were also recorded at baseline and at 2 minute intervals and electrocardiography (ECG)
was monitored for the duration of the test. Blood pressure (BP) was recorded at baseline and
at the end of the test. Following termination of the �̇�O2peak test participants were monitored
for 10-minutes. In this 10-minute recovery period blood pressure, HR and blood lactate were
sampled every 2 minutes to ensure values were within baseline levels before leaving the lab.
4.2.4 MRI Acquisition
In Visit 3 volunteers were underwent a MR scan. Images were acquired on a 3T whole body
MRI system (GE Excite HDx, Milwaukee, WI, USA) using an eight-channel receive-only head
coil. Heart rate and cardiac traces were recorded using a pulse oximeter and respiratory

Chapter 4
105
bellows. A sampling line connected to the face mask of the breathing circuit was used to
monitor end-tidal CO2 and O2 concentrations. The MEDRAD system (MEDRAD, Pittsburgh, PA)
was used to monitor O2 saturation throughout the experiment.
Pulsed arterial spin labelling (PASL) data were acquired using a single subtraction PICORE
QUIPSS II (Wong et al., 1998) with a dual-echo gradient-echo readout (Liu et al., 2002) and
spiral k-space acquisition (Glover, 1999) the first echo being used for CBF quantification. Data
were acquired at 8 inversion times; 400, 500, 600, 700, 1100, 1400, 1700 and 2000ms. QUIPSS
II cut-off at 700ms meant that short and long inversion times were acquired in separate runs.
16 and 8 tag-control pairs were acquired for each short and long inversion time respectively.
A variable TR was used for efficiency, minimum of 1100ms for short TI data and minimum of
1600ms for long TIs. TR increased with TI e.g. TI of 800ms = TR 1600ms, TI of 1100ms = TR
1900ms. Other acquisition parameters were; TE = 2.7ms, voxel size = 3.5x3.5x7mm3, 3.2mm
in-plane resolution, matrix size 64x64mm, FOV = 19.8cm, flip angle = 90°, slice delay 55ms, 15
slices, slice gap 1.5mm for maximum brain coverage. Label thickness was 200mm with 10mm
gap between the end of the label and the most proximal imaging slice.
A calibration image without any labelling was acquired before the perfusion images using the
same acquisition parameters, except a long TR; this was used to obtain the equilibrium
magnetisation of cerebrospinal fluid (M0, CSF), needed for the quantification of CBF. A minimal
contrast image was also acquired to correct for coil inhomogeneities with TE = 11ms, TR = 2s.
This protocol was performed twice, first during rest, then while volunteers were hypercapnic.
The hypercapnia modulation was carried out using the prospective control method described
by Tancredi & Hoge (2013). A gas mixing chamber had three feeding lines coming in for the
delivery of medical air, 5% CO2, and medical oxygen, the latter incorporated as a safety backup
but not used during experimentation, the circuit is described in detail by Tancredi, Lajoie, &
Hoge (2014). PETCO2 elevation of 7mmHg was targeted using 5% CO2 (balance air) and the scan
commenced once participants reached the target CO2 level. MTI data acquisition time was ~15
minutes in total.
A T1-weighted 3D structural fast spoiled gradient echo (FSPGR) was also acquired for
registration of functional data and voxel-based morphometry (VBM) analysis; TR/TE =
7.8/2.9ms, resolution = 1mm isotropic.

Chapter 4
106
4.2.5 Data Analysis
4.2.5.1 �̇�O2peak Calculation
�̇�O2peak was calculated from the respiratory gas exchanges which were continuously
monitored using breath-by-breath analysis and averaged over 10 second blocks. �̇�O2peak was
defined as the averaged value at maximum recorded work rate. HR, RER and blood lactate
were recorded every 2 minutes and at termination of the fitness test to validate �̇�O2peak
criteria being reached. The test result was considered valid if heart rate exceeded 90% of age
predicted maximum, RER = >1 and blood lactate concentration was greater than 8 mM at the
end of the test (McArdle et al., 1996, Horton et al., 2011; Milani, Lavie, Mehra, & Ventura,
2006; Poole, Wilkerson, & Jones, 2008).
4.2.5.2 Cognitive Data Scoring
Cognitive data were scored by hand by the same researcher, the Conners Continuous
Performance test is computer based and scored automatically. Demeaned scores were
calculated for correlation analysis with �̇�O2peak and MR data.
4.2.5.3 Imaging Analysis
Physiological noise correction was carried out using a modified RETROICOR (Glover et al., 2000)
as described in Chapter 3. ASL data were motion corrected using MCFLIRT within FSL (FMRIB’s
Software Library, www.fmrib.ox.ac.uk/fsl, Jenkinson, Bannister, Brady, & Smith, 2002).
Average difference images were obtained for each inversion time from tag-control subtraction
of the CBF time series (Lu et al., 2006) and a perfusion map was created from the average over
all inversion times. A two-compartment CBF kinetic model (Chappell et al., 2010) was used to
obtain voxel-wise estimates of CBF, tissue arrival time (TAT) and arterial cerebral blood volume
(aCBV) (see Chapter 3 for a detailed model description). The CBF timeseries for the
normocapnia and hypercapnia scans were corrected for coil sensitivity inhomogeneities using
the minimal contrast images (Jinghua Wang et al., 2005) and converted to ml/100g/min using
the CSF signal as a reference to estimate the fully relaxed magnetisation of blood (Chalela et
al., 2000). The mean resting CBF for each subject was calculated by averaging the CBF time
series over all time points and over all voxels within the masked GM image.
CVR was calculated by dividing the percentage change in CBF from rest during hypercapnia by
the mmHG change in PETCO2 increase during hypercapnia.

Chapter 4
107
4.2.5.4 ROI Analysis of Grey Matter CBF and CVR
Individual subject GM masks were created using FMRIB's Automated Segmentation Tool (FAST)
and thresholded to include voxels with 50% and above probability of GM. ROI analysis of the
relationship between GM CBF at rest, during hypercapnia and CVR and �̇�O2peak was carried
out using correlation analysis and permutation testing (100,000 permutations per comparison)
in Matlab (Mathworks Inc., MA, USA). Permutation testing was used as an alternative to
Bonferroni correction for multiple comparisons which is too conservative when related
variables are tested. This approach was also applied to examine the associations between GM
CBF and CVR and cognitive test scores.
4.2.5.5 Voxelwise Analysis of Grey Matter CBF and CVR
Follow up voxelwise analysis was conducted using FSL’s Randomise tool
(http://www.fmrib.ox.ac.uk/fsl/randomise/index.html) (Winkler, Ridgway, Webster, Smith, &
Nichols, 2014) to examine the voxelwise correlation between i) CBF and �̇�O2peak and ii) CVR
and �̇�O2peak. The individual subject masks described in the ROI Analysis section were used to
confine this analysis to GM only. Randomise is a permutation testing method that uses
threshold free cluster enhancement (TFCE) (Smith & Nichols, 2009) to correct for multiple
comparisons across voxels. Significance was set at p < 0.05 (FDR corrected). TFCE identifies
cluster-like regions of activation while the image remains inherently voxelwise. TFCE is a
permutation method which produces images both corrected and uncorrected for multiple
comparisons. TFCE is thought to be more sensitive than traditional voxelwise thresholding
methods but potentially less spatially specific (Nichols, 2014).
4.2.5.6 Grey Matter Volume
T1-weighted structural data were analysed with FSL-VBM (Douaud et al., 2007; Good et al.,
2001, http://fsl.fmrib.ox.ac.uk/fsl/fslwiki/FSLVBM). Structural images were brain extracted
and segmented into grey and WM and CSF before being registered to the MNI 152 standard
space template using non-linear registration (Andersson et al., 2007). The resulting images
were averaged and flipped along the x-axis to create a left-right symmetric, group-specific GM
template. Second, all native GM images were non-linearly registered to this study-specific
template and modulated to correct for local expansion (or contraction) due to the non-linear
component of the spatial transformation. The modulated GM images were then smoothed
with an isotropic Gaussian kernel with a sigma of 3mm. Finally, voxelwise GLM was applied
using permutation-based non-parametric testing, correcting for multiple comparisons across
space to investigate whether GM volume and �̇�O2peak were correlated.

Chapter 4
108
4.3 Results
4.3.1 Demographics and Fitness Test Outcomes
Characteristics Mean (sd) or % (n)
Age 25 (4)
Sex 55% female (11)
Weight (kg) 69.1 (8.8)
Height (cm) 173 (7)
BMI 23 (2.1)
VO2peak (L/min) 2.9 (0.6)
VO2peak (L/kg/min) 41.2 (8)
Baseline Lactate 0.96 (0.3)
PE Lactate 9.5 (2)
Baseline HR 79.2 (18.8)
Peak HR 185.35 (9.8)
Peak RER 1.1 (0.04)
Maximum Work Rate
(watts)
205 (40)
Baseline Borg (legs) 0.075 (0.18)
Peak Borg (legs) 8.5 (1.7)
Baseline Borg (breathing) 0.075 (0.25)
Peak Borg (breathing) 7.55 (1.95)
Table 4.2 Group characteristics and fitness test outcomes including �̇�O2peak and secondary validation criteria.
All subjects completed the test until volitional exhaustion. Out of the 20 subjects 17 achieved
an RER > 1.1 and 3 achieved RER > 1. 17 subjects exceeded the 90% HR maximum threshold
and achieved a lactate peak >9, the remaining 3 exceeded 80% of HR maximum and achieved
a lactate peak >6. As this was a �̇�O2peak test all subjects satisfied test criteria by working to
volitional exhaustion. However, based on typical �̇�O2max criteria, 17 subjects fulfilled criteria
for a maximal exercise test (Dupuy et al., 2015; Wilkinson, Leedale-brown, & Winter, 2009).

Chapter 4
109
4.3.2 Correlations between CBF, CVR and �̇�O2peak
4.3.2.1 ROI Analysis
There was a non-significant inverse association between �̇�O2peak and resting CBF (rCBF) in
GM; r = -.4, p = .07, p’ =.17 (figure 4.2) and hypercapnic CBF (hCBF); r = -.23, p = .33, p’ =.58
(figure 4.3). There was a significant positive correlation between �̇�O2peak and CVR; r = .62, p
= .004, p’ =.009 (figure 4.4). G*Power (v3.1.9.2) was used to investigate the statistical power
of the significant correlation between �̇�O2peak and CVR. With a power of 0.8 and significance
threshold of 0.05, a power of 0.91 was achieved based on the effect size. This means we can
be confident that there was sufficient power to detect an effect in this analysis (see
supplementary table 4.5).
Neither baseline PETCO2 nor the PETCO2 response to hypercapnia was driven by �̇�O2peak; r = -
.26, p = .27 (Figs. 5 & 6). The PETCO2 response to hypercapnia was not driven by resting CBF; r
= -.14, p = .55 (supplementary figure 4.8). There was a positive trend between resting CBF and
baseline PETCO2 (supplementary figure 4.9), however baseline PETCO2 was not a predictor of
CVR response ((supplementary figure 4.10).
TAT and aCBV did not show any strong trends in relation to fitness (supplementary figures
4.11-14).
Figure 4.2 A non-significant inverse association between AF and CBF was observed

Chapter 4
110
Figure 4.3 There was a trend towards AF being inversely associated with CBF during hypercapnia
Figure 4.4 Across the group CVR and AF were positively correlated.

Chapter 4
111
Figure 4.5 AF was not a predictor of baseline PETCO2
Figure 4.6 AF was not a strong predictor of PETCO2 during hypercapnia
4.3.2.2 Voxelwise Analysis
Follow-up voxelwise analysis revealed a significant inverse association between �̇�O2peak and
resting CBF in the left and right thalamus, brainstem, left V1, left precuneus cortex and

Chapter 4
112
cerebellum; but only in the frontal pole for hypercapnic CBF (figure 4.7). Voxelwise CVR was
not related to �̇�O2peak in any region.
Figure 4.7 Regions of significantly lower CBF in subjects with higher aerobic fitness at rest (shown in blue) in the thalamus, brainstem, precuneus, visual cortex (V1) and lingual gyrus. During hypercapnia (shown in red), CBF in one cluster in the right frontal pole also displayed this inverse correlation. L = Left. P = Posterior.
4.3.2.3 �̇�O2peak, Grey Matter Volume and Cognitive Performance
The FSL-VBM output showed no significant, or sub-threshold association between �̇�O2peak
and GM brain volume.
Correlation analysis did not reveal any significant correlations between �̇�O2peak and cognitive
performance, or fMRI results following permutation testing to correct for multiple
comparisons (Table 4.3). Average scores are shown in supplementary table 4.4.
Correlation Analysis
Cognitive Test rCBF hCBF CVR �̇�O2peak
SCOLP r = 0.06
p = 0.80, p’ =
1.00
r = -0.01,
p =0.96, p’ =
1.00
r = 0.26,
p = 0.27, p’ =
0.832
r = -0.02,
p = 0.95, p’ =
1.00
Digit Span r = 0.04,
p = 0.88, p’ =
1.00
r = 0.01,
p = 0.97, p’ =
1.00
r = -0.07,
p = 0.76, p’ =
1.00
r = -0.46,
p = 0.04, p’ =
0.233
Letter Fluency r = -0.16, r = 0.01, r = 0.47, r = 0.27,
L
P

Chapter 4
113
Correlation Analysis
Cognitive Test rCBF hCBF CVR �̇�O2peak
p = 0.50, p’ =
0.982
p = 0.99, p’ =
1.00
p = 0.04, p’ =
0.205
p = 0.25, p’ =
0.808
Conners’
Continuous
Performance d’
r = -0.31,
p = 0.18, p’ =
0.675
r = 0.15,
p = 0.52, p’ =
0.985
r = 0.38,
p = 0.10, p’ =
0.46
r = 0.24,
p = 0.31, p’ =
0.878
Trail Making B r = -0.02,
p = 0.93, p’ =
1.00
r = -0.06,
p = 0.82, p’ =
1.00
r = 0.01,
p = 0.97, p’ =
1.00
r = 0.20,
p = 0.40, p’ =
0.947
SDMT r = 0.24,
p = 0.32, p’ =
0.889
r = 0.28,
p = 0.99, p’ =
1.00
r = 0.08,
p = 0.75, p’ =
0.999
r = -0.14,
p = 0.56, p’ =
0.991
Table 4.3 Correlations between cognitive task performance and fitness as well as CBF and CVR. RCBF = Resting CBF, hCBF = hypercapnic CBF. p' = corrected p value.
4.4 Discussion
4.4.1 Summary
In this study, we examined the effects of AF on two indices of cerebrovascular health, CBF and
CVR, using MTI PASL. This is the first study to investigate CBF CVR as opposed to BOLD CVR in
young adults, as well as being the first study to quantify whole GM CBF using ASL in young
adults. Across the group, subjects with a higher �̇�O2peak had lower GM CBF and greater CVR
to CO2. Second, the results did not support the hypothesis that �̇�O2peak would be associated
with better cognitive task performance.
4.4.2 �̇�O2peak and CBF
The most striking result in this study was the inverse correlation between CBF and �̇�O2peak,
as the opposite was predicted based on findings from studies in children (Chaddock-Heyman
et al., 2016), young adults (Bailey et al., 2013) and older adults (Ainslie et al., 2008; Brown et
al., 2010; Thomas et al., 2013). However, with the exception of Thomas et al. (2013) and
Chaddock-Heyman et al. (2016), previous studies have used TCD which measures blood flow
velocity only as TCD cannot measure vessel diameter which would be required to calculate
flow using this method. FMRI measures CBF directly through the labelling of inflowing blood

Chapter 4
114
to tissue. Therefore, results should not be directly compared as they are measuring different,
albeit related, vascular parameters. Second, MRI studies investigated groups undergoing
neurodevelopment and older adults where the mechanistic relationships with AF may be
different to adults not in stages of either development or decline.
In this study, CBF was not significantly lower across the brain, but was localised to regions of
the thalamus, brainstem, visual cortex, cerebellum and precuneus. Regional variation in SNR
may explain why these particular regions correlated with fitness. However, brainstem SNR is
low for PASL (Brooks, Faull, Pattinson, & Jenkinson, 2013; Warnert et al., 2014), therefore if
the results are SNR based, sensitivity to CBF differences in this region would not be expected.
A study by Robertson et al. (2015) in stroke survivors, using single inversion time PCASL,
similarly found an inverse correlation between precuneus CBF and AF, but also found a positive
correlation between thalamic and posterior cingulate CBF and AF. Gauthier et al. (2015) found
both positive and inverse correlations with AF in older adults, and the Robertson study adds
to the evidence that AF may have complex, regionally varying effects on the brain. Although
the direction of the correlation in stroke survivors contradicts the current results, the current
study and that of Robertson et al. (2015) further suggests that AF may exert localised effects
on CBF (Chaddock-Heyman et al., 2016; Thomas et al., 2013). Given that participants in each
of these cited studies have differed in age and health status, the fact that consistent regions
associated with AF have not been reported is unsurprising. The variance in the effects of AF on
brain function with age needs further investigation through interventions in young and older
groups.
There is a potential neurobiological explanation to explain the negative correlation between
CBF and �̇�O2peak in this study. Physical training which increases �̇�O2max, leads to an increased
ability of tissue to extract oxygen from blood (Kalliokoski et al., 2001; Ookawara et al., 2002).
A higher oxygen extraction fraction (OEF) in fitter subjects would explain the inverse
relationship between �̇�O2peak and CBF as cerebral autoregulation ensures balance between
CBF and OEF to maintain the optimum cerebral rate of oxygen metabolism. Usually, this means
that in diseases where hypoperfusion has occurred, the OEF increases to maintain adequate
oxygen supply to the brain (Derdeyn et al., 2002). However, in the healthy brain, fitness related
OEF increases may result in the brain being able to extract the required energy from less blood,
reducing CBF demand. Fitness may enhance oxygen extraction capacity in the healthy brain in
early adulthood leading to observed reductions in CBF at rest. In later adulthood, this efficiency
may serve to sustain optimal cerebrovascular function meaning that blood flow is higher in

Chapter 4
115
trained than sedentary subjects, as the age-related CBF decrease is offset. This could explain
the seemingly opposing effects of higher AF on CBF seen in this study in young adults and
existing work in older adults. Further evidence for differential effects of AF with age comes
from a recent study from Williams et al. (2017) which reported a positive correlation between
cortical thickness and �̇�O2peak in older adults but an inverse correlation between these
measures in young adults. Future studies directly examining the relationship between AF, CBF
and OEF would clarify whether the evidence supports this explanation.
Data from experimental models does however contradict the current results. Animals
subjected to wheel running for several weeks had increased angiogenesis and therefore
capillary density compared with sedentary animals (Pereira et al., 2007; R. . Swain et al., 2003).
From this, in humans with higher levels of fitness, greater CBV and CBF could be predicted.
However, the short duration of interventions and lifespan of rodents means that effects seen
in these studies may not be comparable to work investigating effects of long term AF, gained
through years of physical training.
Angiogenesis and capillary density cannot be studied in-vivo, instead CBV serves as an imaging
correlate in humans. Although the gold standard method for CBV measurement using MRI is
dynamic susceptibility contrast (DSC) MRI, CBV can be measured using VASO (Lu, Golay, Pekar,
& Zijl, 2003) or respiratory gas challenges (D. Bulte, Chiarelli, Wise, & Jezzard, 2007) as contrast
injection is not practical. Potential side-effects and adverse reactions to gadolinium contrast
range from nausea and skin complaints to injection site pain and nephrotoxicity in extreme
cases (Fraum, Ludwig, Bashir, & Fowler, 2017), therefore non-invasive alternatives are
necessary. Non-invasive measurement of CBV is not trivial due to the difficulty of isolating
blood volume from tissue (Lu, Hua, & van Zijl, 2013), however a number of methods do exist.
VASO indirectly measures CBV changes through nulling signal from blood and measuring
volume changes in the surrounding tissue, i.e., extravascular water signal. Using the latter
method of hyperoxia as an intravenous contrast agent, combining hyperoxic and normoxic
blocks, CBV can be estimated through the calculation of the signal difference during baseline
and steady state “infusion” of oxygen which is then normalised using the parameter M. Future
work should measure CBV to examine volume differences between trained and sedentary
groups, as well as changes brought about by physical activity interventions as CBV more closely
reflect angiogenesis than CBF. In this study, CBV values were much lower than literature
averages (Paula, Emma, & Ian, 2015; Yan, Li, Kilroy, Wehrli, & Wang, 2012) and CBV was not
strongly related to �̇�O2peak (supplementary figures 4.13 and 4.14). This contrasts with the

Chapter 4
116
work of Pereira et al. (2007) who used T1 signal differences before and after gadolinium
contrast to infer CBV increases in the DG in both rodents and young adults following ET.
However, as CBV was not a primary outcome measure, the ASL sequence used here was not
optimised for CBV, but was estimated as part of the kinetic model fitting (Michael A. Chappell
et al., 2010) as was tissue arrival time (TAT). TAT influences CBF estimation, as it is an index of
dispersion of tagged blood throughout the brain. As such, TAT is affected by arterial function
and is known to be affected in diseases such as MS (Paling et al., 2014). In this dataset, there
was not a strong association between TAT and �̇�O2peak (supplementary tables 4.11 and 4.12),
possibly due to the fact that all subjects regardless of fitness were assumed to have healthy
arterial function.
Upon neuronal activation, there is an increase in demand for energy; in the healthy brain this
is met with an increase in CBF through dilation of upstream arteries. These arteries deliver
blood to arterioles which in turn feed capillaries in the active tissue. The lower resting CBF
observed here, although initially counterintuitive, is not problematic if there is an adequate
vascular reserve to meet energy demands. The data support this argument as a greater CVR to
CO2 was observed in subjects with a higher �̇�O2peak. If AF maintains CBF and metabolic
efficiency, both of which naturally decline with age, then an increase in CBF would be expected
when comparing trained versus sedentary older adults. Such an explanation would fit with the
seemingly contradictory results found in the ageing literature and the current experimental
data. AF enhances metabolic efficiency in young people leading to a reduced CBF but also
maintains optimal energy supply and metabolism with advancing age, leading to higher CBF
measures in fit versus sedentary older groups.
Although evidence to date is not in agreement with the current results, either different aspects
of cerebrovascular function have been investigated, or the age ranges (children and older
adults) mean that we may be observing different age-dependent cerebrovascular effects of
AF. It should be noted that De Vis et al., (2015) showed that PETCO2 accounted for age-related
CBF differences almost entirely. In this study, there was a positive trend (r = .4, p = 0.06)
between baseline PETCO2 and CBF, but no strong association between �̇�O2peak and baseline
PETCO2 or the PETCO2 during hypercapnia. This suggests a cerebrovascular effect of fitness on
CVR rather than an effect on PETCO2 alone.

Chapter 4
117
4.4.3 �̇�O2peak and CVR
The ROI analysis showed a moderate statistically significant positive correlation between CVR
and �̇�O2peak in global GM which was not observed in a follow-up voxelwise analysis. CVR, as
it is dependent on CBF, declines with age. In the literature, there are contradictory reports on
the association between CVR and AF (Bailey et al., 2013; Barnes, Taylor, Kluck, Johnson, &
Joyner, 2013; Gauthier et al., 2015; Thomas et al., 2013), as discussed in the introduction, and
the positive association between �̇�O2peak and CVR reported here is in agreement with the
TCD findings by Bailey et al. (2013), whereby young trained adults had greater CVR than a
sedentary comparison group. However, few studies have investigated the relationship
between CVR and AF in healthy young adults, therefore much more work is needed to
adequately understand this relationship. The literature to date suggests that ET and AF has
complex and varying effects on brain regions with potential mechanistic differences across the
lifespan. This complexity presents an exciting area of future research in different age groups,
and a need to comprehensively map cerebrovascular function across the brain.
4.4.4 Cognitive Performance
In this study, cognitive performance scores were similar across the group (see Supplementary
Information) and there were no strong associations with �̇�O2peak nor with fMRI measures. It
is likely that more sensitive cognitive tests are required to detect differences among high
functioning groups. It is also possible that cognitive differences in young adults may only be
visible at more extreme ends of the fitness spectrum.
The cognitive reserve hypothesis (Chodzko-Zajko & Moore, 1994) states that higher fitness in
older age offsets age-related decline in cerebral circulation, enhancing oxygen delivery to
support neural demand. Etnier, Nowell, Landers, & Sibley (2006) conducted a meta-regression
on studies examining the effects of fitness on cognitive function. A discussion on the full
findings is beyond the scope of this chapter but in summary, the authors did not find strong
support for a beneficial effect of fitness in any age group once moderator variables were
considered, and in fact found a negative association between fitness and cognition in studies
using a pre-post design. Only a very small number of studies report a beneficial effect of fitness
or physical activity on select cognitive domains in young people (Baym et al., 2011; Themanon,
Pontifex & Hillman, 2009; Stroth, Hille, Spitzer, & Reinhardt, 2016) and other studies report
significant effects in older but not young adults (Hayes, Forman, & Verfaellie, 2014).

Chapter 4
118
Lastly, there was no variation in structural volume with fitness in this sample as evidenced by
VBM. Region-specific increases in volume following exercise interventions have been reported
(Erickson et al., 2011; Thomas et al., 2015) in older adults and cross-sectional studies have
reported an inverse relationship between cortical volume and �̇�O2peak (V. J. Williams et al.,
2017) in young adults. Greater hippocampal (Chaddock, Erickson, Prakash & Kim et al., 2010)
and basal ganglia volume in children with higher AF (Chaddock, Erickson, Prakash & VanPatter
et al., 2010). In sum, more work is needed in young adults to determine both structural and
functional effects of AF and their functional relevance in terms of health and cognition.
4.4.5 Limitations
This study had a number of limitations.
A 90° saturation pulse is applied to the imaged volume before labelling is applied. The purpose
of this saturation pulse is to zero the longitudinal magnetisation of the imaged volume and
eliminate the T1 effect introduced by a variable TR. However, as this saturation pulse is not
perfectly timed, the variable TR, and incomplete nulling of the longitudinal magnetisation can
have some residual influence on the signal from the static brain tissue, contaminating the
signal from the label. Unfortunately, it is not possible to quantify how accurate the saturation
pulse is at cancelling longitudinal magnetisation, also, its accuracy may vary across the brain
and between tissue types. In this study, there were originally 10 inversion times, however,
notable signal dips were observed at the first short TI (300ms) and first long TI (800ms). Images
at these TIs were removed due to the signal contamination. Hence, there is a large gap from
700-1100ms where CBF was not estimated.
A second limitation is that haemoglobin ([Hb]) levels were not measured. Blood [Hb] is a
protein molecule in red blood cells responsible for transport of O2 to tissue. [Hb] concentration
affects exercise performance; reduced [Hb] means that blood can carry less oxygen (Calbet,
2006). [Hb] concentration also affects perfusion estimates as there is an inverse relationship
between [Hb] and the T1 of blood. Brain [Hb] cannot be measured directly in-vivo, however
capillary samples may provide an indication of [Hb] differences between subjects or groups
which could help to explain biological mechanisms driving CBF differences.
Like many fMRI studies, costs and time constraints limited the sample size. In this sample of
20 subjects, results with borderline statistical significance or in some cases only directional
trends were observed. As more data becomes available, it will be more feasible to conduct
detailed power analyses and inform priors for Bayesian analysis. This more rigorous approach

Chapter 4
119
may help to clarify whether real differences exist between groups and how confident
researchers can be about the validity of results.
Here, the voxelwise and ROI analyses were not in total agreement. While the voxelwise
analysis of CBF revealed regions of significantly lower CBF with fitness, the ROI analysis showed
a non-significant trend in the same direction for global GM. The ROI analysis of CVR however,
showed a moderate significant association with fitness while the voxelwise analysis did not
reveal a strong trend in any direction related to fitness. This work needs replication to be able
to make any definitive conclusions about the results. ASL is an intrinsically low SNR technique
compared to standard BOLD EPI. Although ASL offers significant benefits in terms of
quantification of physiological parameters, the SNR may have prevented detection of greater
voxelwise associations with �̇�O2peak. An alternative possibility is that CBF is more
heterogeneous throughout the brain than CVR which is more affected by low SNR; therefore
greater averaging of data in the ROI analysis allowed CVR differences to be detected.
Lastly, there are known hormonal effects on exercise test performance (Jonge, 2003) and CBF
(Brackley, Ramsay, Pipkin, & Rubin, 1999; Duckles & Krause, 2007). In this case, the CBF
difference at baseline was not significantly different between groups; t(18)=-0.602, p = 0.094
but controlling for menstrual cycle phase or limiting individual studies to one sex only would
reduce variability within cohorts. It is important to ensure both sexes are studied however, as
hormonal differences are likely to play a role in mediating the effects of fitness on brain health.
Moreover, intervention studies are necessary to determine sex-specific responses to exercise.
4.4.6 Future Directions
Pathological mechanisms such as inflammation and loss of vascular elasticity associated with
ageing and disease are associated with alterations in CBF and energy metabolism. Numerous
studies have demonstrated cerebrovascular changes with so-called healthy ageing (Aanerud
et al., 2012; Lu et al., 2011; Martin, Friston, Colebatch, & Frackowiak, 1991) as well as dementia
(Cantin et al., 2011; Daulatzai, 2017) and non age-related progressive neurological diseases
such as MS (D’haeseleer, Cambron, Vanopdenbosch, & De Keyser, 2011a; Juurlink, 2013). The
most consistent finding with regards to AF and brain function is that fitness appears to offset
age-related CBF decreases. Studies measuring OEF and CMRO2 in trained vs. sedentary older
adults would be extremely informative to build on this work to characterise vascular and
metabolic health benefits of AF. Lu et al. (2011) reported CMRO2 increases with age, from

Chapter 4
120
these results a lower CMRO2 in trained older subjects vs. sedentary controls would be
predicted if AF offsets ageing effects.
In young people, we know very little about how AF affects cerebrovascular function. In-depth
mapping of multiple aspects of cerebrovascular function e.g. CBF, CBV, CVR, CMRO2 and OEF
in both young and older trained and sedentary adults will provide information necessary to
move forward in developing ET protocols to increase the adoption of fitness training as a
preventative health tool.
A clear narrative about the role AF plays in supporting brain function is lacking, despite
accumulating evidence of its efficacy in both preventing cerebrovascular decline (Thomas et
al. 2013; Zimmerman et al., 2014) and improving patient outcomes (Ivey et al., 2011).
Contradictory results may be a major factor limiting the use of exercise to increase aerobic
capacity as a clinical tool. With evidence-based examples of how AF benefits brain health,
schools would be encouraged to place more emphasis on physical education and the
importance of maintaining fitness from childhood to late adulthood. Research investigating
the neurological effects of fitness across the lifespan is therefore extremely important, but a
collaborative effort is required due to the conflicting results arising from small studies and
methodological differences. Recent efforts to clarify differences between MRI and TCD
measures of CVR (Burley et al., 2016) are valuable and will allow the methods to be
complementary rather than contradictory.
Research over the next decade should work to establish whether it is exercise itself that
delivers brain benefits or higher AF as a result of exercise. Answering this question will guide
optimal dose-response recommendations and guide interventional studies. At present, mixed
effects in the literature are likely due to interventions differing in intensity and duration and
levels of fitness in fit vs. sedentary comparison groups.
The results of the current study suggest that fitness influences cerebrovascular function in
young, healthy adults, however the modest effects observed need replication in larger
samples. As mentioned in previous paragraphs, follow-up studies could extend the current
investigations by directly examining whether higher �̇�O2peak is associated with greater OEF,
and whether the reduced CBF seen in this study can be replicated. Additionally, CBV
quantification would provide evidence for increased capillary density due to chronic physical
activity. This could be achieved using ASL with hyperoxia and hypercapnia challenges (D. Bulte

Chapter 4
121
et al., 2007). This method, with optimisation, could also be used to estimate WM vascular
parameters including CBV and CVR. Investigations in WM require careful MRI parameter
planning due to the lower signal in WM, hence why existing studies have mostly limited
investigations to GM.
Finally, this work has focused solely on AF. The importance of strength training should not be
ignored. Resistance training increases bone density, has hormonal influences during
development and adulthood as well as associations with psychological well-being (Westcott,
2011). However, it is sensible at present to separate resistance and AF training separately to
determine mechanistic links with health.

Chapter 4
122
Chapter 4 Supplementary Information
4.5 Cognitive Performance
Cognitive Test Mean (sd)
Conners Continuous
Performance (d’)
43.6 (7.6)
SDMT 62 (10)
Trail Making B 51.3 (28.5) (s)
SCOLP (max 100) 81 (17)
Digit Span (LDSF) 6.8 (1.4)
Letter Fluency 45.1 (8.6)
HADS A 3.75 (2.2)
HADS D 0.7 (0.9)
Table 4.4 Group average cognitive test perfomrmance.
Figure 4.8 Baseline CBF was not strongly related to the PETCO2 during hypercapnia

Chapter 4
123
Figure 4.9 There was a non-significant positive association between resting CBF and baseline PETCO2
Figure 4.10 Baseline PETCO2 was not a strong predictor of CVR

Chapter 4
124
Figure 4.11 AF and TAT at rest were not strongly associated
Figure 4.12 As above, AF and TAT during hypercapnia were not strongly associated

Chapter 4
125
Figure 4.13 A weak inverse assocaiton between aCBV at rest and AF.
Figure 4.14 As above, a weak inverse assocaiton between aCBV during hypercapnia and AF.
4.6 Power Analysis

Chapter 4
126
Power Analysis
Post-Intervention Correlations
with �̇�O2peak
Effect Size
(r)
Power Sample Size required for
power of 0.8
Resting CBF 0.405 0.45 44
Hypercapnic CBF 0.23 0.17 143
CVR 0.619 0.91 15
Table 4.5 Power analysis conducted post-hoc to determine power and sample sizes for future studies. All calculated using the correlation coefficient (r) in G*Power

Chapter 5
127
Chapter 5
A Cross-Sectional and Interventional Study to Characterise
the Cerebral Vascular and Metabolic Effects of Aerobic
Fitness
Abstract
Introduction: To elucidate the proposed neuroprotective effects of aerobic fitness (AF) on
cerebrovascular function, it is necessary to conduct cross-sectional and interventional studies.
This study investigated, cross-sectionally, associations between �̇�O2max and cerebral blood
flow (CBF), cerebrovascular reactivity (CVR), capillary blood volume (CBVcap), baseline oxygen
extraction fraction (OEF0), and the cerebral metabolic rate of oxygen consumption (CMRO2).
Second, a 1-week intensive exercise training (ET) intervention was conducted to assess
whether rapid brain vascular and metabolic adaptations occur with ET.
Methods: Dual-calibrated, dual-excitation PCASL fMRI was conducted at baseline and
following 1-week of ET in 15 healthy males aged 23-43 years old. An estimated �̇�O2max test to
estimate AF was conducted at baseline using cycle ergometry and the Storer method to
calculate �̇�O2max. Exercise training consisted of 5 supervised sessions of stationary cycling at
55-75% of the age-predicted maximum heart rate for 25 minutes, followed by a circuit of
resistance exercises on 3 of the 5 days.
Results: ROI analysis of the post-intervention data showed that CBVcap, CMRO2 and OEF0 were
negatively correlated with estimated �̇�O2max, before corrections for multiple comparisons.
Voxelwise analysis of the post-intervention data showed significant negative correlations with
estimated �̇�O2max for CBVcap and OEF. CBVcap was negatively correlated with estimated
�̇�O2max in left primary motor cortex (M1), left precuneus, bilateral anterior and posterior
cingulate gyrus, left intracalcarine cortex and left lateral occipital cortex. For OEF, the negative
correlation with �̇�O2max was confined to the left M1 and supplementary motor areas. No
other correlations between pre-training or post-intervention data and estimated �̇�O2max
were statistically significant. The intervention did not result in significant changes in any
parameter of interest. Discussion: The cross-sectional data suggest that AF leads to lower
CBVcap and OEF0 in numerous cortical regions including the precuneus and M1. However

Chapter 5
128
further investigations are needed to rule out confounding effects of capillary transit time
heterogeneity (CTTH), the oxygen tension of tissue (PtO2). The intervention suggests that
sustained cerebrovascular adaptations due to AF occur over longer periods of time, and are
independent of acute cerebral responses to exercise.

Chapter 5
129
5.1 Introduction
To elucidate the effects of aerobic fitness (AF) on cerebrovascular function, it is necessary to
conduct cross-sectional and intervention studies. The previous chapter investigated cross-
sectionally the relationship between �̇�O2peak, baseline CBF (CBF0) and CVR in young, healthy
adults. Secondly, the links between �̇�O2peak, brain function and cognition were explored. The
results showed that greater �̇�O2peak was associated with lower CBF and higher CVR in grey
matter (GM). However, there was no association with cognitive performance.
The study described in this chapter follows on from the work reported in Chapter 4, to test the
hypothesis that the lower CBF observed in more aerobically fit subjects was due to metabolic
adaptations, whereby greater ability to extract oxygen from blood results in lower CBF
requirements. Data from Chapter 4 was combined with measures of baseline oxygen
extraction fraction (OEF0), collected for a separate study by Merola et al. (2017), for common
subjects (n=7) by Furby (2016) to assess whether AF is associated with increased brain tissue
OEF. A trend towards a greater OEF with higher �̇�O2peak was observed but did not reach
statistical significance. A post-hoc power analysis conducted by Furby (2016) calculated a
required sample size of 15 to detect an adequately powered effect.
The current study recruited 15 healthy males <45 years old, to further investigate the
relationship between AF, CBF0 and OEF0. Previously, no correlation between the cerebral
metabolic rate of oxygen consumption (CMRO2) and OEF has been observed at rest (F. Xu, Ge,
& Lu, 2009) and under neural activation OEF is decreased vs. rest as the fractional change in
CBF is typically 2-4 times greater than the fractional CMRO2 increase (Fox & Raichle, 1986).
However, based on the hypothesis that higher baseline OEF (OEF0) in subjects with higher AF
is due to greater metabolic capacity, it is of interest to also investigate whether resting
absolute CMRO2 is also affected by AF. If oxygen supply, in the form of CBF, is altered with
fitness level (Bailey et al., 2013; Chaddock-Heyman et al., 2016; Thomas et al., 2013), then
oxygen demand would also be expected to differ. Age-related global increases in CMRO2 have
been reported (Lu et al., 2011), and as AF is thought to offset age-related vascular and
metabolic decline, CMRO2 could be predicted to be lower in individuals with greater AF.
However, animal studies report increased neurogenesis with exercise training (Cotman &
Berchtold, 2002; van Praag et al., 1999), which suggests that if similar processes occur in
humans, then a higher CMRO2 to sustain larger neuronal populations may be observed. As the

Chapter 5
130
relationship between AF, OEF and CMRO2 has not been reported in young adults, studies such
as the current one are much needed to understand the role of AF in cerebral energy demand
and supply, and the functional significance of this in terms of cognition and protection against
age and disease related damage.
In Part 1 of this study, we expected CBF and OEF to show inverse and positive correlations with
�̇�O2max, respectively, along with a positive CVR and �̇�O2max association, in line with the
previous results, and the suggestion that fitness increases vascular reserve (Bailey et al., 2013;
Bherer, Erickson, & Liu-Ambrose, 2013). The use of dual-calibrated4, dual-excitation pulsed
continuous arterial spin labelling (PCASL) also enabled estimation of capillary cerebral blood
volume (CBVcap) from BOLD signal changes and estimation of OEF0 (D. P. Bulte et al., 2012b;
Germuska et al., 2016).
Animal models have reported greater angiogenesis, as well as neurogenesis, in the dentate
gyrus (DG) of the hippocampus in exercised animals (Pereira et al., 2007; Swain et al., 2003a,
2003b), resulting in higher CBV. Pereira et al. (2007) found similar results in humans using T1-
weighted gadolinium contrast imaging to acquire global CBV maps. Results showed that DG
CBV increased following 3 months of exercise training, and CBV following the intervention was
correlated with individual changes in �̇�O2max, suggesting a direct link between fitness and
CBV. This CBV increase was limited to the DG and entorhinal cortex, although CBV increases in
the latter did not reach statistical significance. Pereira et al. (2007) investigated hippocampal
subregions, specifically, rather than whole brain effects. The hippocampus is particularly
affected by the ageing process along with default mode areas including the posterior cingulate
and precuneus (Boraxbekk et al., 2015), and plays an important role in cognitive functions such
as memory encoding, pattern separation (Deng, Aimone, & Gage, 2010) and spatial navigation
(Ekstrom et al., 2003). AF is known to offset cognitive effects of ageing (Bherer, Erickson, & Liu-
Ambrose, 2013; Voss et al., 2015), therefore, investigating and demonstrating increased CBV
with AF in this region provides evidence for a mechanism through which exercise benefits
hippocampal-mediated cognitive functions. Investigating whether increased �̇�O2max and CBV
4 Dual-calibrated fMRI uses hypercapnia and hyperoxia to modulate BOLD and CBF responses. Hyperoxia
enables estimation of venous oxygen saturation from which baseline OEF and absolute CMRO2 can be
estimated, unlike calibration with hypercapnia alone where only relative CMRO2 changes can be
estimated.

Chapter 5
131
were associated with cognitive performance, Pereira et al. (2007) found that �̇�O2max after
exercise training was related to better verbal learning performance and a trend was observed
for verbal learning and CBV. Delayed recognition and source memory testing showed similar
trends but did not each significance for �̇�O2max or CBV. These selective effects on cognition
are representative of effects seen elsewhere in healthy adults (Etnier, Nowell, Landers, &
Sibley, 2006; Thomas et al., 2015) and it is possible that cognitive effects of AF are not observed
in younger adults at the peak of lifetime cognitive ability. Cerebrovascular effects in young
adults, such as CBV changes observed by Pereira et al. (2007) may indicate long-term
neuroprotective processes, essentially laying down vascular reserve for later life. For this
reason, the current study focuses on cerebrovascular rather than cognitive effects of AF.
Further, it is important to elucidate the effects of AF across the brain, to determine whether
the hippocampus is selectively responsive to exercise training, or whether AF can benefit
global brain health. The DG may particularly benefit due to its capacity for neurogenesis, but
AF may have benefits for cerebral arterial health maintaining a healthy energy supply and
preserving function in the rest of the brain where neurogenesis does not occur across the
lifespan. In the current study, we investigated associations between �̇�O2max and
cerebrovascular parameters in whole brain GM.
There is a lack of exercise training (ET) intervention studies in young adults aimed at
establishing ET-related cerebrovascular changes, an exception being the Pereira et al. (2007)
study discussed above, and a transcranial Doppler (TCD) ultrasound study by Murrell et al.
(2013) which reported an increase in CVR at rest and during sub-maximal exercise following
12-weeks of ET in young and older adults. Thomas et al., (2015) conducted a 6-week
intervention study in young adults and used a multi-modal approach to investigate
hippocampal changes in volume, as well as myelination and total CBV, assessed using
susceptibility-weighted imaging (SWI), quantitative susceptibility mapping (QSM), T1, T2 and
direct CBV measurement using contrast agent. After 6 weeks, increased volume of the anterior
hippocampus along with apparent myelination increases were observed. However,
hippocampal volume returned to baseline 6 weeks post intervention where training was
discontinued. The SWI, QSM and T2 imaging was suggestive of myelin changes rather than
vascular adaptations, and the CBV imaging did not reveal any significant indications of blood
volume changes. This result is intriguing as it is difficult to explain the mechanistic drivers of
structural changes without accompanying metabolic adaptations. In the current study,
cerebrovascular rather than structural adaptations with ET were of interest, therefore,

Chapter 5
132
multiple indices of flow and metabolism, including OEF and CMRO2 as well as capillary CBV,
were calculated to differentiate between specific vascular and metabolic processes which may
be altered through ET.
Regarding the timescale of changes, an intervention was conducted which reduced exercise,
requiring Masters Athletes to cease training for 10 days (Alfini et al., 2016), which led to rapid
perfusion reductions across the brain. This study suggests that rapid cerebrovascular
adaptations occur in response to detraining, therefore equally rapid adaptations in response
to ET may also occur. Intervention studies are necessary to rule out potential differences
attributed to fitness, but which are actually driven by other behaviours that physically active
people engage in, e.g. a healthy diet, and to determine the timescale of brain adaptations to
physical training. For example, it is still not clear whether cerebral benefits of exercise are
specifically due to greater AF in individuals who exercise regularly, or whether regular exercise
participation is sufficient to gain benefits. Intervention studies will help to clarify this question
and determine how long it takes to achieve neurophysiological and cognitive benefits, as well
as the intensity of exercise required to have an effect on brain health.
Part 2 of the current study enrolled volunteers in a short ET intervention. To the best of our
knowledge, no published studies have used ASL fMRI to investigate the effects of a short ET
intervention in young adults. The timescale of exercise-related brain changes is unknown,
however, short-term changes in brain microstructure have been demonstrated in non-exercise
related training studies, for example after a 2-hour spatial learning task (Hofstetter, Tavor,
Moryosef, & Assaf, 2013) and the same duration of virtual car racing (Sagi et al., 2012). Motor
learning studies discussed in the following Chapter 6, show that resting brain activity is altered
following motor training (Albert, Robertson, & Miall, 2009; Ma, Narayana, Robin, Fox, & Xiong,
2011), and although these changes may not reflect sustained brain changes, they show that
even stationary training interventions can lead to short-term cerebrovascular alterations. In
studies more directly related to the current work, acute exercise interventions have shown
decreases in resting CBF following exercise (MacIntosh et al., 2014). The study by Macintosh
et al. (2014) used single inversion time PCASL fMRI to assess perfusion before and after 20
minutes of moderate intensity cycling in healthy young adults (mean age = 26). Results showed
global GM decreases at 10 minutes post-exercise and in an ROI analysis, decreases were
observed over the same timescale in the hippocampus and insula. These reductions returned

Chapter 5
133
to baseline by 40 minutes post-exercise where an increase in perfusion was observed in a
voxel-wise analysis in left somatosensory cortex. However, a separate small study using
multiple inversion time (MTI) PASL contradicts the results of Macintosh et al. (2014), reporting
increases in global resting CBF following 30 minutes of moderate cycling (Carson-Smith,
Paulson, Cook, Verber, & Tian, 2010).
Although contradictory, both studies show acute cerebrovascular changes following exercise,
therefore, it is likely that following 1-week of intensive training, changes could be observed
within 24 hours following a week of intensive training. The direction of effects, however, is less
predictable given the small existing literature on acute exercise in young adults. The duration
of training needed to see longer-term brain health and behaviourally relevant changes is
beyond the scope of this intervention; the main aim here was to investigate whether a 1-week
ET intervention leads to measurable changes in physiological parameters frequently used as
indices of overall brain health. We examined changes in the same parameters as Part 1; CBF0,
CVR, CBVcap, OEF0 and absolute CMRO2 before and after 1-week of mixed cardiovascular and
high intensity resistance training in addition to normal physical activities.
5.2 Methods
5.2.1 Participants
15 healthy males aged 23-43 (mean 29.8±6) were recruited from advertisements placed
around Cardiff University. The study was approved by the Cardiff University School of
Psychology Research Ethics Committee and performed in accordance with the guidelines
stated in the Cardiff University Research Framework (version 4.0, 2010).
5.2.2 Screening Visit
Eligibility was assessed for MRI, exercise participation and respiratory manipulations in the
initial screening visit. The Physical Activity Readiness Questionnaire (PAR-Q) and American
College of Sports Medicine (ACSM) checklist were used for exercise eligibility screening. The
International Physical Activity Questionnaire (IPAQ) Short Form was completed at screening
by all volunteers to estimate AF. Based on answers to this questionnaire, the researchers were
satisfied that there would be an adequate spread of fitness levels in the study.
Volunteers then completed a respiratory gas manipulation session which was identical to the
experimental procedure in a mock MR scanner in the presence of a qualified anaesthetist. This

Chapter 5
134
allowed volunteers to become accustomed to the procedure prior to the scan sessions and
reduce the likelihood of adverse events.
5.2.3 Estimation of �̇�O2max
�̇�O2max was estimated from a submaximal fitness test, therefore, when referring to the
�̇�O2max data from this study, it is estimated �̇�O2max. Prior to the test, participants were
required to fast for 12 hours overnight and tests were conducted between 7.30am and 11am.
Participants were also instructed to abstain from alcohol and exhaustive exercise for 24 hours
prior to the test. The fitness test began with a 1-minute warm up at 25 watts on a Lode cycle
ergometer (Lode, Groningen, Netherlands). The test began at 50 watts and was increased by
15 watts every 60 seconds while participants maintained a target constant RPM of 70. The test
was terminated if RPM dipped below 60 for >10 seconds. Borg ratings of perceived exertion
(RPE) for legs and breathing were recorded every minute using the CR10 scale (Borg & Kaijser,
2006). Capillary blood lactate and haemoglobin levels (Hb) were measured from the earlobe
at rest and at the point of test termination (100% exertion) as described in Chapter 4. Blood
pressure (BP) and heart rate (HR) were recorded at baseline, at the end of each test step and
at test termination using the MEDRAD system (MEDRAD, Pittsburgh, PA) and Polar FT1 heart
rate monitors (Polar, UK) respectively. Participants were encouraged to cycle until heart rate
exceeded 95% of the age predicted maximum, however, tests were terminated upon volitional
exhaustion. Fitness tests were only conducted at baseline as �̇�O2max was not expected to
change in one week based on previous work showing no change in �̇�O2max with moderate
intensity training for 8 weeks (Helgerud et al., 2007).
5.2.4 Imaging Data Acquisition
Participants were scanned at baseline (Scan 1) and the day following the fifth exercise training
session (Scan 2) at the same time each day. Scan sessions were scheduled for 2pm or 4pm and
participants were required to fast and abstain from caffeine for 6 hours prior to the scan.
All images were acquired on a Siemens 3T Prisma full-body scanner (Siemens, Erlangen,
Germany) using a 32 channel receive head coil. A phase contrast scan of the neck was acquired
to allow optimal placement of the PCASL labelling plane; TR/TE=40.65/5.60, FOV=240mm, 60
slices, slice thickness 1.3mm, flip angle=10, GRAPPA=2.

Chapter 5
135
Functional data were acquired on a 3T Siemens Prisma MRI system using a 32-channel head
coil (Siemens, Erlangen, Germany). A dual-calibrated dual-excitation PCASL sequence lasting
approximately 18 minutes (249 volumes) was used; TR1/TR2/TE1/TE2=3600/800/10/30ms,
TI/post-label delay= 1500/1500ms, 3.4x3.4x7mm voxels with 1mm gap, 16 slices,
FOV=220mm, GRAPPA=3, flip angle=90. Two nonselective adiabatic inversion pulses were
applied 950 ms and 300 ms prior to image acquisition for background suppression. This
sequence was developed in house by Dr. Michael Germuska. A PCASL calibration scan to
calculate M0 of CSF for absolute quantification of CBF was acquired with identical parameters
to the dual-excitation scan, except the TR which was 6000ms to allow full relaxation of the
signal. A high-resolution T1-weighted magnetization-prepared rapid gradient-echo (MPRAGE)
scan was also acquired for creation of individual GM masks; TR/TE/= 2100/3.19/ms, 1.2mm
resolution.
5.2.5 Respiratory Modulation Protocol
PETCO2 and PETO2 traces were recorded during scanning through a sampling line connected to
a facemask which attached to a gas analyser system running Labchart software (both
ADInstruments, Bella Vista, Australia). The breathing circuit used for delivery of gas mixtures
is shown in figure 5.1 and was adapted from the circuit described by Tancredi, Lajoie, & Hoge
(2014). The respiratory protocol has been described previously by Merola et al. (2017). Briefly,
to achieve mild hypercapnia, fixed inspired (FI) levels of gas mixtures containing 5% CO2
(balance air) were administered, and to achieve hyperoxia 50% O2 mixtures were delivered. To
accelerate the transition to and from hyperoxia, short periods of 100% O2 (14s) and 10% O2
(balance N2) (40s), respectively, were used (see figure 5.2). The duration of hypoxic mixture
inhalation was short enough not to induce arterial hypoxia. Mixtures were delivered at a
constant total flow rate of 25 L/min to a gas mixing chamber in the MR control room and
connected to the breathing circuit through a humidifier. A separate O2 backup cylinder was
connected directly to the breathing circuit in case of emergency. A laptop using MATLAB
software was used to control the voltage output from a NI-DAQ AD converter (National
Instruments, Austin, Texas) which were piped into 4 mass flow controllers at 25 L/min. Flow
rates and end-tidal traces were monitored by a researcher throughout the experiment to
ensure participant safety.

Chapter 5
136
Figure 5.1 Breathing circuit (left), bacterial filter and sample line for recording end-tidal traces (right)
Figure 5.2 Protocol for respiratory gas manipulation, adapted from (Merola, 2016). Red line shows oxygen manipulation and blue line shows carbon dioxide manipulation.

Chapter 5
137
5.2.6 Exercise Training
Volunteers completed 5 supervised exercise sessions over 7 days (table 5.1) in addition to
maintaining their regular activities. Training sessions were held at lunchtime and evenings to
accommodate those who participated in evening activities. The 1-week period was chosen to
ensure full compliance and as a starting point for determining the timescale of exercise-
induced brain changes. Each session consisted of 25 minutes of moderate intensity cycling on
a Keiser M3 spin ergometer (Keiser®, Keiser M3 Indoor Cycle, Fresno, California), and on 3 of
the 5 days a circuit of 5 bodyweight resistance exercises (table 5.2). Participants cycled at an
RPM and resistance level of their choice which maintained heart rate at 50-75% of their age
predicted maximum. In the resistance circuit, participants were asked to complete the sets as
quickly as possible while maintaining the correct form. If participants completed the prescribed
sets easily, they were encouraged to do additional sets within the 30-minute allocated period.
While this circuit was comprised of resistance exercises, they were compound movements
executed quickly, meaning that heart rate remained elevated for most of the session.
Therefore, the resistance circuit was also considered cardiovascular training.
Example Testing and Training Schedule for Study Participants Mon Tue Wed Thu Fri Sat
Sun Mon Tue
PPT 1
Fitness Test
MRI 1
MRI 2
C (1) C & R (2)
C (3) C & R (4)
- - C & R (5)
Table 5.1 Example schedule for a participant. C = cardiovascular exercise, R = resistance exercise, PPT = participant. Total time commitment for the study was ~11 hours for a given participant. Supervised exercise was not carried out on weekends.
Exercise Sets Repetitions per Set
Squat 3 10-12
Forward Lunge 2 20 (10 per leg)
Press Up 2 10-12
Glute Bridge 2 10-12
Tricep Dip 2 20
Table 5.2 Resistance exercise circuit. Sets and repetitions are the minimum prescribed, participants were encouraged to do as many sets as they could achieve in 30 minutes.

Chapter 5
138
5.3 Data Analysis
5.3.1 �̇�O2max Estimation
�̇�O2max was estimated using the Storer equation for males. The Storer equation estimates
�̇�O2max based on age, weight in kilograms and watts achieved (wattage for last full minute
completed) using the following formula for males;
Predicted �̇�O2max = (10.51*watts) + (6.35*KG) - (10.49*age) + 519.3
5.3.2 Image Preprocessing
Motion correction was carried out using FSL MCFLIRT
(https://fsl.fmrib.ox.ac.uk/fsl/fslwiki/MCFLIRT) (Mark Jenkinson et al., 2002) followed by brain
extraction using FSL BET (Smith, 2002). Slice timing correction was applied and data were
spatially smoothed with a 6mm Gaussian kernel using SUSAN (Smith & Brady, 1997). These
steps were applied to first and second excitation data.
5.3.3 Physiological Traces
Data analysis was carried out in MATLAB (Mathworks, Natick, MA, USA). PETCO2 and PETO2
traces were aligned to the fMRI data to remove effects of delay between the recorded traces
and the BOLD and CBF data. Misaligned traces would result in errors in the calculation of the
neurophysiological response to hyperoxia and hypercapnia. Physiological traces were used as
input into the physiological model (see below) to constrain the model fit within the gas delivery
paradigm. Second, PETO2 was used to estimate the arterial blood T1 change, as described by
Germuska et al. (2016).
5.3.4 Physiological Forward Model
The parameters of interest; CBF0, CVR, CBVcap, OEF0 and absolute CMRO2 were estimated
using a forward physiological model (Germuska et al., 2016). The ASL signal was converted to
absolute flow (ml/100g/min) using a PCASL kinetic model described previously (Heijtel et al.,
2014). Changes in CBF and BOLD signal, calculated using the optimised BOLD signal model
described by Wise et al. (2013a), along with changes in the fraction of deoxyhaemoglobin
([dHb]) were used as inputs to the forward physiological model. A value of 0.2 was assigned to
α, which describes the relationship between CBV and CBF, and 1.3 for to explain the effect
of [dhb] changes on the signal relaxation rate, R2* (Gauthier & Hoge, 2012). Additional fixed
input parameters were; the convolved PETCO2 and PETO2 traces, Hb, the post-label delay,
tagging duration of arterial blood and the BOLD echo time (TE2). Haemoglobin concentration,

Chapter 5
139
affects the measured BOLD signal as activation-related signal changes are dependent on
absolute deoxyhaemoglobin levels, and therefore baseline Hb concentration (Levin et al.,
2001). Individual subject Hb was incorporated into the model rather than assuming a default
value in order to improve the accuracy of OEF0 and CBV estimates.
The framework then finds the parameter values which minimise the error between the model
predictions (priors) and the data. To ensure the output values for each parameter are realistic
estimates, the model search space is restricted within an established physiological range.
The fixed model inputs were used to solve for 5 unknown parameters; CBVcap, CBF0, the
calibration parameter K (Germuska et al., 2016), OEF0 and CVR. Absolute baseline CMRO2 was
determined by multiplying OEF by O2 delivery, which was calculated as the product of;
CBF0*CaO2 (the arterial O2 content) (Lajoie, Tancredi, & Hoge, 2016). A constant CMRO2 was
assumed across periods of normocapnia/normoxia, hypercapnia and hyperoxia.
Voxelwise maps were calculated for each parameter using non-linear least squares fitting with
L2 parameter regularisation5 to determine the best fit to the data. Regularisation was applied
only to CBVcap and CVR as these parameters are the main sources of potential instability in
the model. The CBVcap prior was set at 1.3 ml/100g as values are approximately 2 ml/100g in
GM and 0.3 ml/10g in white matter (WM). Therefore 1.3 gives a good approximation where
GM maps are thresholded at 0.5 GM probability. CBVcap is then estimated from CBF, OEF0 and
mean transit time (MTT). CVR was given a prior of 2.5%, again an intermediate value based on
known GM and WM values. These priors were used to guide the model fit within known
physiological values. In this model, K is analogous to the BOLD calibration parameter M used
in calibrated fMRI experiments, but is renamed in this model as OEF0 can be factored out of
the calculation as all parameters are estimated in one step. K is not given a prior but estimated
directly from the data.
In a change from the original model (Germuska et al., 2016) where OEF0 was assigned a mean
prior of 0.35, here OEF was modelled using the an assumed value for the MTT of tagged blood,
incorporating known physiological constants describing the oxygen concentration in blood and
5 L2 regularisation is used to reduce model over-fitting and stabilise the model. Regularisation simplifies the model
to improve prediction accuracy. Least squares regression minimises the residual sum of squares increasing potential
instability of the model. Andale. (2017, July 29). Statistics How To. Retrieved August 8, 2017, from
http://www.statisticshowto.com/regularization/

Chapter 5
140
the ratio of tissue oxygen concentration to arterial plasma oxygen concentration (Zheng et al.,
2002). Finally, CBF0 was assigned a non-informative prior of 60 ml/100g/min to provide a
uniform probability distribution. Unlike previous models (Gauthier & Hoge, 2013; Wise, Harris,
Stone, & Murphy, 2013), BOLD and CBF data are analysed simultaneously with each time-series
informing the other to improve stability of parameter estimates.
Note, in this model, estimated CBVcap is only true CBVcap where the oxygen tension of tissue
(ptO2) remains constant, which in this model is an average of 15mmHg across tissue (Leithner
& Royl, 2013b). Therefore should this vary between subjects, or not represent true ptO2,
assumed CBVcap, is not a true reflection of blood volume but is a product of variation in ptO2.
This is addressed in the discussion in relation to the results.
5.3.5 Spatial Maps
Segmentation of the T1-weighted structural images into GM, WM and CSF was carried out
using FSL FAST (https://fsl.fmrib.ox.ac.uk/fsl/fslwiki/FAST). T1-weighted GM maps were
registered to subject space using FSL’s FLIRT (https://fsl.fmrib.ox.ac.uk/fsl/fslwiki/FLIRT). For
statistical analysis, values were extracted from masks thresholded at 50% GM probability to
avoid inclusion of regions of poor SNR such as near white matter or CSF borders.
5.3.6 Statistical Analysis
First, linear multiple regression analysis was carried out using SPSS Version 20 (IBM Corp.,
Armonk, N.Y., USA) to assess whether CBF0 was predicted by age or bodyweight. These
variables are known to influence CBF and it was necessary to determine whether these
parameters required consideration in further analysis.
Correlation analysis with permutation testing (1000 permutations per comparison, 95% CIs)
was conducted to examine relationships between �̇�O2max and cerebrovascular parameters at
baseline and post-intervention using GM ROI values. Permutation testing was used as an
alternative to Bonferroni to correct for multiple comparisons as described in Chapter 4. To test
whether there was an effect of the intervention on cerebrovascular function, paired t-tests
with bootstrapping (1000 samples, 95% CI) of the baseline and post-intervention data were
conducted.
Non-parametric, permutation-based voxelwise analysis of GM was conducted using FSL’s
Randomise as described in Chapter 4, including both positive and negative contrasts.
Significance threshold for clusters was set at z = 2.3, p < 0.05 and threshold-free cluster
enhancement (TFCE) was applied (Smith & Nichols, 2009).

Chapter 5
141
5.4 Results
Subject Characteristics Mean ± SD
Est. Vo2max l/min 3.28 ± 0.53
Est. VO2max ml/kg/min 40.01 ± 5.59
Age 29.86 ± 5.9
Weight (kg) 82.8 ± 10.7
IPAQ – Time Sitting (min) 540 ± 165
IPAQ – Time Active (min 4737 ± 8419
Baseline Lactate (mmol/L) 0.92 ± 0.37
Peak Lactate 10.44 ± 2.17
Baseline HR (BPM) 78.26 ± 18.31
Peak HR 186.4 ± 11.24
Baseline Hb (g/L) 155.35 ± 10.56
Baseline MAP 96.2 (9.2)
Peak MAP 111 (15.5)
Peak Hb 156.03 ± 45.03
Baseline Borg (Breathing) 0.13 ± 0.35
Baseline Borg (Legs) 0.1 ± 0.28
Peak Borg (Breathing) 8.4 ± 2.55
Peak Borg (Legs) 9.66 ± 0.61
Watts Achieved 243 ± 44
Table 5.3 Group characteristics and physiological measures from the fitness test. MAP = mean arterial pressure, Hb = haemoglobin, Borg ratings are out of a maximum score of 10.
Table 5.3 provides an overview of resting and post fitness test characteristics. 15 volunteers
completed the study, however baseline dual-calibrated PCASL data was not collected for 2
subjects due to timing (n=1) and equipment (n=1) issues leaving n=13 for the pre-post
intervention comparison. Baseline Hb was not obtained for 1 subject, therefore an estimated
value of 150 g/L (Bulte et al., 2012) was used in the forward model.
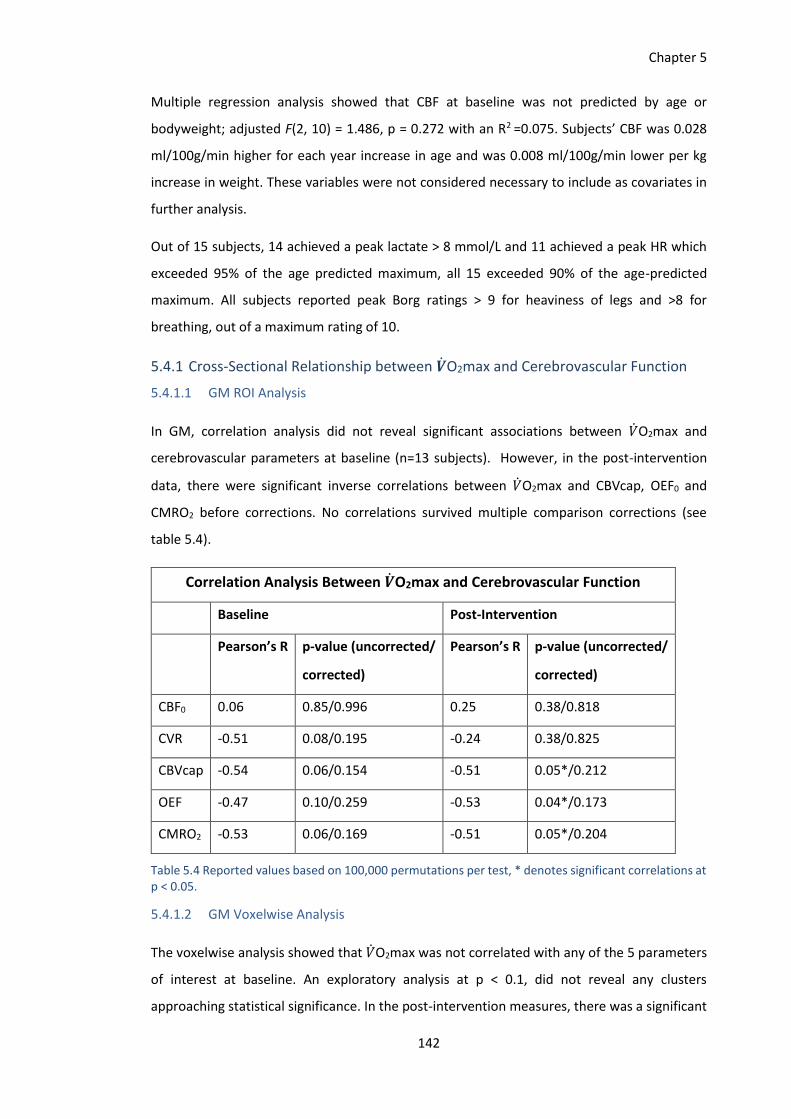
Chapter 5
142
Multiple regression analysis showed that CBF at baseline was not predicted by age or
bodyweight; adjusted F(2, 10) = 1.486, p = 0.272 with an R2 =0.075. Subjects’ CBF was 0.028
ml/100g/min higher for each year increase in age and was 0.008 ml/100g/min lower per kg
increase in weight. These variables were not considered necessary to include as covariates in
further analysis.
Out of 15 subjects, 14 achieved a peak lactate > 8 mmol/L and 11 achieved a peak HR which
exceeded 95% of the age predicted maximum, all 15 exceeded 90% of the age-predicted
maximum. All subjects reported peak Borg ratings > 9 for heaviness of legs and >8 for
breathing, out of a maximum rating of 10.
5.4.1 Cross-Sectional Relationship between �̇�O2max and Cerebrovascular Function
5.4.1.1 GM ROI Analysis
In GM, correlation analysis did not reveal significant associations between �̇�O2max and
cerebrovascular parameters at baseline (n=13 subjects). However, in the post-intervention
data, there were significant inverse correlations between �̇�O2max and CBVcap, OEF0 and
CMRO2 before corrections. No correlations survived multiple comparison corrections (see
table 5.4).
Correlation Analysis Between �̇�O2max and Cerebrovascular Function
Baseline Post-Intervention
Pearson’s R p-value (uncorrected/
corrected)
Pearson’s R p-value (uncorrected/
corrected)
CBF0 0.06 0.85/0.996 0.25 0.38/0.818
CVR -0.51 0.08/0.195 -0.24 0.38/0.825
CBVcap -0.54 0.06/0.154 -0.51 0.05*/0.212
OEF -0.47 0.10/0.259 -0.53 0.04*/0.173
CMRO2 -0.53 0.06/0.169 -0.51 0.05*/0.204
Table 5.4 Reported values based on 100,000 permutations per test, * denotes significant correlations at p < 0.05.
5.4.1.2 GM Voxelwise Analysis
The voxelwise analysis showed that �̇�O2max was not correlated with any of the 5 parameters
of interest at baseline. An exploratory analysis at p < 0.1, did not reveal any clusters
approaching statistical significance. In the post-intervention measures, there was a significant

Chapter 5
143
correlation between �̇�O2max and OEF in the left precentral gyrus (Figure 5.3) and between
�̇�O2max and CBVcap in the left precentral gyrus, left precuneus, bilateral anterior and
posterior cingulate gyrus, left intracalcarine cortex and left lateral occipital cortex (Figure 5.4).
For CBF, CVR and CMRO2, there were no strong associations with �̇�O2max.
Figure 5.3 OEF0 in the left precentral and postcentral gyri was significantly lower in subjects with greater
V̇O2max. Analysis was conducted using FSL Randomise, with a z-threshold of 2.3, p < 0.05, FDR corrected.

Chapter 5
144
Figure 5.4 CBVcap was significantly lower in subjects with greater V ̇O2max in regions of the left precentral gyrus (M1), bilateral precuneus, posterior and anterior cingulate, as well as left lateral occipital and intracalcarine cortices.
5.4.2 Effects of the Exercise Training Intervention on Cerebrovascular Function
5.4.2.1 GM ROI Analysis
Comparisons were based on 13 subjects for which full baseline and post-intervention data was
collected. Pre- and post-intervention data are shown in Figure 5.5 for each parameter. Paired
t-tests for GM CBF0, CVR, CBVcap, OEF0 and CMRO2 did not reveal any notable changes
following the intervention in an ROI analysis (Table 5.5). Further, there was no correlations
between �̇�O2max and percentage changes in any parameter following the intervention (Table
5.6).

Chapter 5
145
40
42
44
46
48
50
CBF pre CBF post
CB
F M
L/1
00
G/M
IN
Group CBF
2
2.1
2.2
2.3
2.4
2.5
2.6
2.7
CVR pre CVR post
%
Group CVR
1.2
1.3
1.4
1.5
1.6
CBV pre CBV post
% C
BV
Group CBV

Chapter 5
146
Figure 5.5 Changes (mean and SEM) in physiological parameters following the 1-week intervention.
Pre and Post Intervention Neurophysiological Measures
Baseline Post-Intervention
T-statistic p-value 95% CIs
CBF0
ml/100g/min 47.4 (1.7)
45.7 (2) -0.869 .402 -1.9-4.5
CVR % 2.4 (0.1) 2.5 (0.1) 1.488 .163 -0.4-0.08
CBVcap % 1.4 (0.05)
1.4 (0.02) 0.950 .361 -0.1-0.05
OEF0 0.4 (0.02)
0.38 (0.02) 1.689 .117 -0.04-0.005
0.34
0.36
0.38
0.4
0.42
0.44
0.46
OEF pre OEF post
OEF
(FR
AC
TIO
N)
Group OEF
144
147
150
153
156
159
162
165
CMRO2 pre CMRO2 post
ΜM
OL/
10
0G
/MIN
Group CMRO2

Chapter 5
147
Pre and Post Intervention Neurophysiological Measures
Baseline Post-Intervention
T-statistic p-value 95% CIs
CMRO2
µmol/100g/min 156.7 (5.1)
157.6 (3.7) 0.596 .562 -10.6-6
Table 5.5 Average (mean ± SEM) values for each parameter. Paired t-tests (uncorrected) showed no significant changes following the training intervention.
Correlation between �̇�O2max and % Change Following the Intervention
%Pre-Post Pearson’s R p-value
CBF0 ml/100g/min 0.09 (2.73) 0.197 0.519
CVR % 1.68 (4.1) -0.070 0.820
CBVcap % 0.4 (3) 0.157 0.608
OEF0 0.91 (3) 0.042 0.981
CMRO2 µmol/100g/min 1.08 (2.42) 0.236 0.438
Table 5.6 Group results (mean ± SEM) of correlation analysis between �̇�O2max and % change in parameters of interest following the intervention (uncorrected p values shown).
5.4.2.2 GM Voxelwise Analysis
Voxelwise paired t-tests for each parameter of interest were conducted using FSL Randomise.
No significant effects of the exercise intervention on cerebrovascular parameters were
observed, nor were any notable trends seen in the data at an uncorrected threshold.
5.4.3 Results Summary
This study examined the relationship between �̇�O2max and indices of cerebral vascular and
metabolic function, namely resting CBF, CBVcap, CVR, OEF0, and CMRO2. Secondly, we
investigated whether 1 week of intensive exercise lead to changes in the parameters of
interest. In this cohort, �̇�O2max was not significantly correlated with CBF0 or CVR in whole
brain GM in baseline or post-intervention data. In the post-intervention data only, inverse
correlations with �̇�O2max were observed for CBVcap, OEF0 and CMRO2, however, these
correlations did not survive corrections. In the voxelwise analysis of GM OEF0 and CBVcap, but
not CMRO2, were significantly negatively correlated with fitness.

Chapter 5
148
The extremely short duration is likely to be the main reason for the lack of observed changes.
Values changed only marginally in most cases, and not in a consistent direction for all subjects,
therefore, we conclude that 1 week of intensive exercise is not sufficient to induce
cerebrovascular adaptations.
5.5 Discussion
The results from part 1 of this study are not in agreement with the work reported in Chapter 4
where higher AF was associated with lower CBF and greater CVR in GM. There are several
possible reasons for the discrepancy between the two studies. First, there was a narrower
spread of estimated fitness levels despite a range of activity levels in the IPAQ scores (see table
5.3) which was suggestive of a larger than observed variation in �̇�O2max. It is possible that
fitness did not vary enough to see CBF and CVR differences. However, within this sample, OEF0,
CBVcap, and CMRO2 correlated with �̇�O2max in the post-intervention data, meaning that
either the fitness range was large enough to detect differences, or certain vascular and
metabolic processes show greater adaptation with ET. Second, this study was conducted on a
different scanner, using an EPI-based dual-excitation PCASL scheme rather than spiral dual-
echo PASL as in Chapter 4. In addition, multi-inversion time ASL was used previously, whereas
the dual-calibrated paradigm necessitated single inversion time imaging as simultaneous BOLD
data was needed to estimate OEF0 and CBVcap. In the previous study, normocapnic MTI data
was acquired over 7 minutes, from which an average perfusion map was created for CBF
quantification. In the current study, baseline flow is calculated within the forward model using
the full 18-minute timeseries, rather than creating an average perfusion map from a constant
resting normocapnic scan. Differences in the acquisition and analysis approach, most notably
the use of single rather than multiple inversion time ASL in the current study, may explain the
lack of a relationship between CBF and �̇�O2max. However, if a strong relationship between the
variables was present, it is unlikely that the use of single inversion time ASL would not have
revealed a significant relationship between the two variables. It is believed that MTI
acquisitions analysed using a 2-compartment model yield the most accurate estimates of CBF
(Michael A. Chappell et al., 2010; Wong, 2014), however, this was not possible in the dual-
calibrated experiment as explained above. Additional MTI acquisitions for baseline CBF
quantification would be useful in future studies to provide a gold-standard estimate of brain
perfusion.
We identified an interesting result in the cross-sectional data whereby �̇�O2max was inversely
correlated with CBVcap, OEF0 and CMRO2 in the GM ROI analysis before multiple comparison

Chapter 5
149
corrections, and with CBVcap and OEF0 in voxelwise analyses of GM. These results were only
observed in the post-intervention data and are probably due to either, small cerebrovascular
changes post-intervention which led to statistically significant correlations with �̇�O2max, or
the slightly larger sample size (n=15) in the post-intervention data compared to baseline
(n=13).
The following discussion focuses on potential explanations for the statistically significant
relationship between CBVcap, OEF0 and �̇�O2max in the voxelwise data. The direction of the
correlations between CBVcap and �̇�O2max, and OEF and �̇�O2max were the opposite of what
was expected. Studies in humans and animals such as that of Pereira et al. (2007) have
reported increased regional total CBV following exercise training, with CBV increases in
humans related to the degree of improvement in �̇�O2max following a 3-month ET intervention.
In rodents, increases in angiogenesis, which translates to increased CBV, has been reported
following exercise in a number of brain regions including motor cortex (R. . Swain et al., 2003),
hippocampus (Klauke & Borght, 2009) and cerebellum (Black, Isaacs, Anderson, Alcantara, &
Greenough, 1990). The consistent findings that ET is associated with higher CBV, and increased
angiogenesis in animals raises the question of whether the current data reflects a true CBVcap
reduction. While it is possible that there is regional heterogeneity in the effects of fitness on
the brain, as this has been described previously for CVR data by Gauthier et al. (2015), a
number of methodological factors must be considered when interpreting the results. Due to
model assumptions about flow and oxygen kinetics, it is possible that the CBVcap and OEF0
reductions in subjects with a greater �̇�O2max in reality reflect differences in tissue oxygen
tension (ptO2) and/or capillary transit time heterogeneity (CTTH).
PO2 is typically 35-50mmHg in capillaries, decreasing as it diffuses through the extravascular
compartment to meet local energy requirements. In the forward model, an average ptO2 of
15mmHg was assumed across the tissue, an accepted literature value for an assumed average
OEF0 of 0.3, flow rate of ~60ml/100g/min and mean transit time (MTT) of 1.4s (Angleys et al.,
2015; Jespersen & Østergaard, 2012; Leithner & Royl, 2013b). Model constants g and k which
represent the ratio of tissue O2 concentration to plasma O2 concentration, and the rate of O2
transfer across the capillary respectively, are assigned values based on the assumed average
ptO2 and MTT and used in the estimation of OEF0. If ptO2 and MTT are similar across all
participants, then the apparent CBVcap and OEF0 values likely reflect true reductions in
subjects with a greater �̇�O2max. The OEF0 reduction would occur as MTT would be shorter
where CBV is lower, making oxygen extraction more difficult. However, it is also possible that
the parameter representing CBVcap reflects some combination of CBVcap and ptO2

Chapter 5
150
differences, as an increase in ptO2 would lead to a reduced CBVcap estimate by the forward
model, as OEF0 is assumed to be constant across subjects.
Model parameters are estimated in one step and are therefore interdependent. For example,
CBVcap, which could be more appropriately termed apparent CBVcap, may reflect additional
physiological processes such as ptO2 and CTTH, and if this is the case, estimates of OEF0 and
CMRO2 will also be affected as OEF0 relies on accurate MTT estimation, which in turn is
estimated from CBV. CMRO2 is calculated outside of the forward model, but is calculated using
OEF0. Lower blood volume in capillaries leaves less oxygen available in tissue, hence the lower
measured OEF0, and does not facilitate any obvious cerebrovascular health benefits. At
present, it is not clear whether a true CBVcap was observed and if so, what this means in terms
of the effect of higher �̇�O2max on brain health. Greater Hb in subjects with a higher �̇�O2max
could have explained lower CBVcap, as the brain would have to compensate for a higher
haemoglobin mass, potentially by lowering CBVcap. This would also equate to less oxygen
availability for tissue, thereby reducing OEF0 and CMRO2. Trained athletes have a higher
circulating Hb mass, and therefore greater oxygen carrying capacity, in comparison to inactive
individuals (Mairbäurl, 2013), however, in this study �̇�O2max and Hb did not correlate, nor did
CBVcap and Hb (data not shown) as subjects were not trained to the level of typical athletes.
As ptO2 depends on several factors including vascular geometry, capillary density and capillary
oxygenation (Leithner & Royl, 2013), it is possible that �̇�O2max does influence oxygen tension
gradients, which lead to an apparent CBVcap reduction. As factors such as ptO2, MTT and CTTH
could not be measured in the current study, the model relies on assumed values in healthy
populations, and the accuracy of output parameters relies on these unknown variables.
Changes in ptO2 gradients in tissue may represent an additional means of regulating oxygen
supply, for example, in hypoxia (Jespersen & Østergaard, 2012) to maintain oxygen availability,
therefore increased ptO2 may represent greater oxygen availability in those with higher
�̇�O2max which is not reflected by the current forward model. Unfortunately, it is not possible
to conclusively attribute the apparent CBVcap reduction in those with a higher �̇�O2max to
differences in ptO2 or CBV, but it is a finding that warrants further investigation to determine
whether the observed effects can be replicated, and to identify whether there is an effect of
�̇�O2max on ptO2. It is not possible to directly measure brain ptO2 in humans non-invasively,
however, fMRI techniques exploiting the T1-signal relaxation rate (R1), could be used to
determine tissue oxygen tension in the brain (Muir et al., 2016).

Chapter 5
151
An alternative but related explanation for the inverse association between CBVcap and
�̇�O2max is the possibility of CTTH increases across participants related to fitness, leading to a
lower measured CBVcap. CTTH is a determinant of oxygen delivery to brain tissue and its
increase, seen in conditions such as Alzheimer’s disease, is associated with reduced OEF
efficacy for a given CBF rate (Gyldensted et al., 2017). Homogenous capillary transit time is
believed to indicate a healthy vascular system (Østergaard et al., 2016) and recent model
simulations have shown that CTTH reduction improves tissue oxygenation by counteracting
the inherent reduction in OEF as CBF increases (Angleys et al., 2015). Studies in humans have
reported increased OEF and longer MTT, along with reduced flow heterogeneity in the
quadriceps of trained subjects compared to untrained subjects during exercise, although no
significant differences at rest were observed (Kalliokoski et al., 2001). Although, higher OEF
and MTT are suggestive of greater CBV, no differences were observed between the groups,
either at rest or during exercise in the study by Kalliokoski et al. (2001).
Although comparatively greater CTTH is believed to limit oxygen delivery to tissue, Heinonen
et al. (2015) in a review paper on the effects of heterogeneity of ratios of oxygen delivery to
VO2 in muscle, suggested that rather than higher CTTH being a definitive indicator of poor
tissue oxygenation, factors such as local energy demands and haemodynamics along with
oxygen diffusion (DO2) capacity should be considered. It is possible that where capillary blood
flow and MTT are not compromised, CTTH may improve the flexibility of the system, allowing
for a greater capacity to maintain an efficient oxygen supply across a range of oxygen supply
and consumption ratios. Simulation studies show that CTTH varies in proportion to MTT in
healthy micro-vascular networks at rest (Rasmussen et al., 2015) and this covariance is crucial
for the maintenance of optimal oxygen extraction in tissue (Eskilden et al., 2017). MTT is longer
where capillary density is greater as there is a greater volume of blood to pass through and
diffusion of oxygen is hindered, therefore CTTH may also vary across the brain depending on
the regional capillary density. At present this theory is highly speculative and has not been
systematically investigated, but accounting for CTTH may be an important modification to the
forward model in future work investigating �̇�O2max and brain function, as well as disease
populations where greater CTTH is expected.
As CTTH is not factored into the forward model, homogenous capillary transit times are
intrinsically assumed. Elevated CTTH, associated with compromised oxygen delivery and
availability was not expected in this sample, and its omission from the model was not
considered to be a potential limitation at the outset. However, CTTH affects tissue perfusion
and blood volume, O2 availability, and the maximum OEF and CMRO2 (Jespersen & Østergaard,

Chapter 5
152
2012). If �̇�O2max does increase CTTH, as indicated by the lower apparent CBVcap, this will have
biased parameters estimated by the forward model. Future studies using methods capable of
measuring transit time distributions across the brain, such as velocity-selective ASL (van Osch
et al., 2017) will provide additional model input and reduce the reliance on average values
across a group.
In the previous study described in Chapter 4, lower CBF in subjects with higher AF was
identified in the thalamus, brainstem, precuneus visual cortex (V1) and lingual gyrus. Here,
lower CBV was observed in the precuneus, M1 and ACC and lower OEF0 also in M1 and
supplementary cortex. Both studies have found an effect of either training or detraining on the
precuneus, a component of the default mode network (DMN) and an area sensitive to the
effects of ageing on the brain (V. J. Williams et al., 2017). Further, Chapman et al. (2013)
reported CBF increases in the left precuneus with cognitive training in healthy older adults,
and this CBF increase correlated with cognitive gains. Thomas et al., (2013) have also reported
higher precuneus and posterior cingulate CBF in Masters Athletes vs. sedentary controls, and
Alfini et al. (2013) found detraining related CBF reductions in the precuneus in Masters
Athletes. The hippocampus is capable of lifelong neurogenesis and studies have shown CBF
(Chaddock-Heyman et al., 2016), microstructural (Kleemeyer et al., 2015) and volumetric
(Erickson et al., 2011) correlations with AF in this region in young and older adults. There is less
of a rationale for a localised effect of AF in other brain regions, yet studies consistently show
regional effects rather than whole brain effects, with the precuneus being a region identified
as showing AF-related CBF changes in response to both cognitive training and physical fitness.
This study and the work reported in Chapter 4, both report lower estimates of vascular
parameters (CBF, CBVcap and OEF0) with increased AF although CVR, an index of vascular
reserve was positively associated with fitness. As discussed in the previous chapter, there may
be age-dependent effects of AF on the brain, which are not yet understood.
Regarding the intervention, although no cerebrovascular or metabolic changes were observed
within the 1-week training period, there is evidence showing rapid CBF reductions when ET
ceases. Alfini et al., (2016) reported significant CBF reductions in Masters Athletes (over 50
years old) in areas including the hippocampus, cerebellum, inferior temporal gyrus (ITG),
lingual gyrus and precuneus following 10 days of restriction from all ET. While this suggests
that very rapid detraining effects occur, it appears that training effects may occur more
gradually, at least in younger adults and longer term interventions are needed to determine
the effects of ET in young adults.

Chapter 5
153
5.5.1 Limitations
A main limitation in this study was the low spread of fitness levels, despite differences in
physical activity levels evidenced by the IPAQ (table 5.3). The ratings of perceived exertion,
peak heart rates and lactate levels suggest that participants did exercise to exhaustion. It
appears that a number of subjects participating in regular organised exercise still had very poor
or poor fitness levels according to American College of Sports Medicine (ACSM) classifications
(see Supplementary table 5.10), and in future reported levels of physical activity should not be
used as an indicator of fitness level when the study aim is to recruit a range of fitness levels.
Related to the above point, the fitness test protocol used in this study provides an estimate of
�̇�O2max only. The equipment needed to record inspired and expired breathing gases and
calculate ventilation, which is necessary to calculate actual �̇�O2max was not available for this
study. However, the Storer method (Storer et al., 1990) has been widely used in exercise
testing (Malek, Berger, Housh, Coburn, & Beck, 2004; Jung, Nieman & Kernodle, 2001) and
shows high correlation with the gold-standard approach of calculating the maximal volume of
oxygen utilised per minute, during exhaustive exercise (ACSM’s Health-Related Physical Fitness
Assessment Manual, 2013). While the estimation of �̇�O2max could be considered a limitation,
it is believed to be a close approximation of true values as lactate and HR thresholds reached
by almost all participants satisfy secondary �̇�O2max criteria (Midgley & Carroll, 2009),
although it has also been shown that these thresholds can be reached at ~70% of �̇�O2max
(Poole et al., 2008). In sum, if ventilation measures are available they should be used, however
the Storer equation and secondary criteria should provide good estimates of fitness and
capture relative differences between subjects.
A third limitation, which may have had a meaningful impact on the results, is that CTTH was
not factored into the estimation physiological parameters in the forward model. As discussed
above, CTTH variation has implications for OEFmax and CMRO2max as does potential differences
in pto2 (Jespersen & Østergaard, 2012).
Another unavoidable limitation is that Hb was measured peripherally and is known to vary
within the capillary network and to be significantly lower in the brain than systemically (Levin
& Ausman, 1969; Pries, Fritzsche, Ley, & Gaehtgens, 1920). Although central and peripheral
values differ, peripheral variability between participants could be assumed to also reflect
central variability. Therefore, including individual Hb measures in the forward model is
preferable to assuming a value across all subjects, as the model output will more closely reflect
each subject’s physiology.

Chapter 5
154
5.5.2 Conclusions
Studies such as the work reported here are important as the timescale of ET related brain
changes must be established in order to prescribe effective guidelines for exercise aimed at
maintaining or improving brain health. The results of the intervention suggest that
cerebrovascular changes do not occur as rapidly as 1-week. While a lack of observable changes
after 1-week is not wholly unexpected, it is necessary to identify the point at which brain
benefits are achieved through ET, and determine the nature of initial neurophysiological
adaptations. The obvious samples to recruit in studies looking at associations between AF and
brain health are elite athletes and sedentary controls. However, athletes are a minority group;
most people will not train at the level of an athlete regardless of the potential lifelong benefits.
It is important to study normal population variance in fitness to determine whether moderate
levels of regular physical training is enough to obtain neuroprotective benefits of AF. In
addition, the intervention suggests that sustained cerebrovascular adaptations due to AF occur
over longer periods of time, and are independent of acute cerebral responses to exercise such
as those observed by Macintosh et al. (2014).
While there is a growing literature showing that AF preserves CBF in older adults (Ainslie et al.,
2008; Bailey et al., 2013; Gauthier et al., 2015; Thomas et al., 2013), we still do not know what
effect AF has on the brain’s vascular and metabolic function in early adulthood. From the two
studies presented in this thesis, the effects are not clear. While Chapter 4 suggests that higher
�̇�O2peak is associated with lower CBF in a number of regions including precuneus, thalamus
and brainstem, and higher CVR in whole brain GM, the current results are not in agreement,
as results do not show similar trends. Still, the novel finding that apparent CBVcap and OEF0 is
lower regionally, in subjects with higher �̇�O2max warrants further investigation in a larger
sample with a greater spread of �̇�O2max scores. Both studies suggest AF does impact
cerebrovascular function in young adults, however, additional studies are needed to clarify the
true direction of changes and the relevance to metabolic and cognitive health. The effect sizes
observed for each parameter suggest that �̇�O2max may have a greater effect on metabolic
processes such as OEF0 and CMRO2 as well as CBV. In young adults, CBF may not be the most
informative index of effects of AF on cerebrovascular function, as the healthy brain can
maintain optimal CBF, especially at rest. In early adulthood, underlying processes involving
oxygen availability and metabolism may be improved through chronic AF, leading to improved
haemodynamics in later life. In future studies, in addition to dual-calibrated PCASL, techniques
which are optimised for measurement of CBV such as VASO (Lu et al., 2013) could be used

Chapter 5
155
alongside T1 relaxation mapping to determine cerebral Hb and oxygen tension to provide
additional physiological information not available with the dual-calibrated data alone.
Finally, the power analysis calculated using mean effect sizes across all parameters, to calculate
sample sizes for future studies, suggest a sample of 33 for cross-sectional comparisons and 90
for the intervention to achieve a power of 0.8. Collaborative or multi-centre studies may
therefore be a more feasible way to achieve the required sample sizes, due to the high costs
and time resources required.

Chapter 5
156
Chapter 5 Supplementary Information
Baseline �̇�O2max and Dual-Calibrated FMRI Grey Matter Estimates
Participant Estimated VO2max
CBF ml/100g/min
% CVR
% CBVcap OEF CMRO2
μmol/100g/min
Participant 1 35.0 34.5 2.89 1.8 0.55 161.7
Participant 2 38.92 45.3 3.30 1.2 0.37 145
Participant 3 45.05 57.3 2.28 1.3 0.32 159.1
Participant 4 40.68 n/a n/a n/a n/a n/a
Participant 5 48.89 44.1 2.9 1 0.32 120.4
Participant 6 38.75 46.5 2.0 1.5 0.44 168.7
Participant 7 33.11 51.7 2.3 1.6 0.41 181
Participant 8 40.89 52. 2.2 1.4 0.38 166.2
Participant 9 44.85 46.2 1.6 0.9 0.28 116.4
Participant 10
39.66 47.4 1.9 1.6 0.44 171.7
Participant 11
40.5 47.9 2.6 1.66 0.45 180.3
Participant 12
50.9 n/a n/a n/a n/a n/a
Participant 13
31.8 50 2.6 1.25 0.35 149.8
Participant 14
36.7 36.7 2.4 1.55 0.50 153.8
Participant 15
34.5 56 1.8 1.28 0.34 158.3
Mean ± SD 40 ± 5 47.3 ± 6.5 2.4 ± 0.5
1.4 ± 0.25 0.4 ± 0.07
156.3 ± 19.9
Table 5.7 Average (median) parameter estimates for grey matter

Chapter 5
157
Post-Intervention Dual-Calibrated FMRI Grey Matter Estimates
Participant CBF
ml/100g/min
CVR
%
CBVcap
%
OEF
(fraction)
CMRO2
μmol/100g/min
Participant 1 34.6 2.9 1.7 0.55 159.6
Participant 2 45.7 3 1.4 0.41 159.5
Participant 3 59.3 2.2 1.4 0.35 173.7
Participant 4 32.4 2.8 1.6 0.55 148.6
Participant 5 47.3 3.3 1.1 0.32 128.9
Participant 6 41.9 2.4 1.3 0.41 147.4
Participant 7 49.9 2.5 1.5 0.42 173.7
Participant 8 42.2 2.4 1.4 0.44 155.9
Participant 9 47.3 1.6 1.1 0.34 138.5
Participant 10 40.5 2.8 1.5 0.48 156.9
Participant 11 54.3 2.5 1.6 0.40 182.2
Participant 12 53 1.8 1.2 0.33 149.5
Participant 13 55.4 2.4 1.4 0.36 169.5
Participant 14 35.2 2.2 1.5 0.50 147.2
Participant 15 45.42 2.9 1.6 0.45 169
Mean ± SD 45.6 ± 8 2.5 ± 0.4 1.4 ± 0.1 0.42 ± 0.07 157.4 ± 14.5
Table 5.8 Average (median) GM estimates post-intervention

Chapter 5
158
30
40
50
60
70
Pre Post
ml/
10
0g/
min
CBF0
1.51.75
22.25
2.52.75
33.25
3.5
Pre Post
% C
VR
CVR
0.25
0.3
0.35
0.4
0.45
0.5
0.55
0.6
Pre Post
OEF
115
135
155
175
195
Pre Post
μm
ol/
10
0g/
min
CMRO2

Chapter 5
159
Figure 5.6 Baseline and post-intervention GM values for each subject.
Power Analysis for Future Studies
Post-Intervention Correlations with
�̇�O2max
Effect Size (r)
Required Sample Size (based on observed power)
Required Sample Size (predicted)
OEF 0.53 23 33
CBV 0.67 12 33
CVR 0.24 131 33
CBF 0.25 120 33
CMRO2 0.56 26 33
Pre-Post Paired T-tests Effect Size (dz)
Required Sample Size (observed power)
Required Sample Size (predicted)
OEF 0.47 38 90
CBV 0.26 119 90
CVR 0.39 54 90
CBF 0.22 165 90
CMRO2 0.17 274 90
Table 5.9 Power analyses conducted for each parameter, for the cross-sectional correlation data and differences between pre- and post-intervention. All calculations are based on a required power of 0.8, p < 0.05, two-tailed tests. For the predicted sample size calculation, an effect size of 0.45 was chosen for the correlation analysis and 0.3 for the paired t-tests. These values were chosen as they represent the mean observed effect sizes.
0.8
1
1.2
1.4
1.6
1.8
2
Pre Post
% C
BV
CBVcap

Chapter 5
160
ACSM Categorisation of �̇�O2max Scores per Subject
Estimated VO2max ACSM Fitness Classification
Sub01 35.0 Very poor
Sub02 38.92 Poor
Sub03 45.05 Good
Sub04 40.68 Poor
Sub05 48.89 Very good
Sub06 38.75 Poor
Sub07 33.11 Very poor
Sub08 40.89 Poor
Sub09 44.85 Fair
Sub10 39.66 Poor
Sub11 40.50 Poor
Sub12 50.91 Excellent
Sub13 31.82 Very poor
Sub14 36.67 Very poor
Sub15 34.46 Very poor
Table 5.10 ACSM fitness classifications (Hwang, Castelli, & Gonzalez-lima, 2017) for each subject.

Chapter 6
161
Chapter 6
Overview of FMRI Studies on Motor Plasticity
Abstract
The next part of this thesis investigates the cerebrovascular and metabolic mechanisms
underlying motor plasticity. This chapter provides a brief overview of relevant imaging
studies which have demonstrated the functional networks involved in motor learning, along
with a small number of existing studies which have used quantitative fMRI (qfMRI), to
investigate the neural energetics of motor learning. The goal of the experiments in Chapters
7 and 8 was to test the feasibility of using quantitative techniques to characterise energetic
processes underlying motor learning in the healthy brain. The results will be used to inform
future studies in people with MS where the aim is to establish the contribution of
cerebrovascular changes to clinical features of the disease which often include motor, and
learning and memory impairments. An improved understanding of the neurobiological
mechanisms which influence functional plasticity will help to identify the potential for
adaptive plasticity which may be linked to cerebrovascular health. In addition, this
knowledge may be used to implement effective treatment strategies which could involve
interventions to improve cerebrovascular function.

Chapter 6
162
6.1 Introduction
The adult brain retains structural and functional plasticity to adapt to new experiences as well
as to repair and reorganise function following injury. Motor skill training leads to rapid neural
adaptations across the motor cortex and functionally connected regions including
sensorimotor cortex, cerebellum, prefrontal, superior temporal and visual cortices (Hardwick,
Rottschy, Miall, & Eickhoff, 2013; Ungerleider, Doyon, & Karni, 2002). Measurable behavioural
adaptations in the form of improved response accuracy and reaction times, mean that
learning-specific neural changes can be discriminated from activity related to simple motor
execution. As a result, motor and visuomotor learning paradigms are widely used models of
brain plasticity. However, the cerebrovascular and metabolic processes underlying plasticity
which facilitate reorganisation of structure and function in the healthy brain are not well
understood. In a clinical context, neurological patients retain variable degrees of plasticity, and
understanding key processes promoting and limiting this plasticity will inform appropriate
interventions and treatment. Following injury, the brain can reorganise functional networks so
that new regions can take over the function of a damaged area (Zeller & Classen, 2014) which
serves to reduce the level of disability, at least temporarily in the presence of disease.
Early positron emission tomography (PET) investigations measuring regional cerebral blood
flow (rCBF) changes during motor learning, to identify the anatomical networks involved in
motor execution and motor learning (Seitz & Roland, 1991) and network involvement
differences with implicit and explicit learning (Honda et al., 1998). To date, motor learning
investigations, more recently using mainly BOLD fMRI (Doyon & Benali, 2005), have placed
much focus on the correlation between behavioural markers of learning and anatomical
location of activation changes during the task. Much less consideration has been given to the
underlying neurobiological mechanisms facilitating motor plasticity, both in the activated state
and in the resting brain. An adequate supply of blood and capacity to utilise energy in the form
of oxygen and glucose is necessary for both motor execution and motor skill learning. FMRI
studies have shown that with training, functional brain adaptations occur as behavioural
performance improves, in the form of altered BOLD activation patterns. However, the
complexity of the BOLD signal, which arises from changes in CBF, cerebral blood volume (CBV)
and the cerebral metabolic rate of oxygen consumption (CMRO2) means that is not possible to
identify specific processes underlying plasticity using BOLD contrast alone. Understanding the
nature of vascular and metabolic changes which occur during learning-induced plasticity is
important if we are to make the best use of the capacity for plasticity in neurological
rehabilitation. Advanced fMRI techniques now allow us to non-invasively quantify normal and

Chapter 6
163
pathological brain responses to motor learning. Studies using quantitative imaging will help to
elucidate energetic deficits which affect behaviours such as motor learning in neurological
disorders including Multiple Sclerosis (MS) where plasticity can facilitate recovery following
bouts of acute inflammation (Tomassini, Matthews, et al., 2012).
The following experimental chapters use arterial spin labelling (ASL) calibrated fMRI to quantify
CBF and relative CMRO2 changes during motor learning (Chapter 7). As a follow-up study,
sustained changes in CBF and resting state functional connectivity (RSFC) are investigated
following motor sequence learning in Chapter 8. This chapter first provides a brief overview of
relevant imaging studies which have demonstrated the functional networks involved in motor
learning, along with a small number of existing studies which have used quantitative calibrated
fMRI, to quantify energetic changes during motor learning. The goal of the experiments in
Chapters 7 and 8 was to test the feasibility of using quantitative techniques to characterise
energetic processes underlying motor learning in the healthy brain. The results will be used to
inform future studies in people with MS where the aim is to establish the contribution of
cerebrovascular changes to clinical features of the disease which often include motor, and
learning and memory impairments. An improved understanding of the neurobiological
mechanisms which influence functional plasticity will help to identify the potential for adaptive
plasticity which may be linked to cerebrovascular health. In addition, this knowledge may be
used to implement effective treatment strategies which could involve interventions to improve
cerebrovascular function.
6.2 Imaging Motor Plasticity in Healthy Cohorts
Although neuroplasticity affects both structure and function, this brief overview will focus on
functional plasticity in response to motor and visuomotor skill learning. For a comprehensive
review on brain structural changes following motor learning see Draganski & May (2008). The
following experimental chapters use a visuomotor sequence learning task, the serial reaction
time (SRT) task (Nissen & Bullemer, 1987), to investigate brain vascular and energy metabolism
changes which accompany functional plasticity in the healthy brain. The SRT is a visuomotor
task which involves implicit or explicit learning, where participants repeat a sequence of finger
movements or button box responses following visual cues. These repeated movement
sequences are often interspersed with pseudorandom (control) task blocks or runs where
identical component movements are performed. Control tasks are used to separate activity
due to simple motor performance from sequence-specific learning and identify networks
involved in the acquisition and coordination of skilled movement with visual input, as well as
learning and memory. The SRT task can be modified in length and difficulty to suit the research

Chapter 6
164
question and the subject group of interest making it a widely used motor learning task. While
the SRT is relatively simple to perform, it requires rapid communication between multiple
brain regions making it an excellent task to probe cognitive function and communication
between brain regions. Due to fast neural and behavioural adaptations, the SRT task is
especially useful in fMRI paradigms to study the neural substrates of motor learning over time
and between groups.
Performance speed and accuracy on motor tasks can be improved over very short timescales,
from as little as 3 minutes (Fernandez-Seara et al., 2009). This speed of adaptation makes it
possible to study the healthy brain and assess motor learning in patients where scan duration
is often limited. Frequently used tasks other than the SRT include paradigms which require
guided coordination of movement (bimanual movement patterns) (Puttemans, Wenderoth, &
Swinnen, 2005) or response adaptation based on changes in task demands (Shannon, Neil,
Vlassenko, Shimony, & Rutlin, 2016).
Beyond initial performance improvements, longer neural adaptation occurs. Karni et al. (1995),
in an early fMRI study of motor plasticity, demonstrated BOLD signal changes during two
phases of motor sequence learning. Participants practised a finger tapping sequence (A or B)
for 20 minutes daily for 5 weeks without visual cues. Participants were scanned once a week
over 4-6 weeks where sets of the trained sequence were alternately performed along with the
control (non-trained) sequence. The study allowed the authors to identify two phases of
learning which has been replicated in subsequent studies (Bonzano et al., 2011; Kleim et al.,
2004; Korman, Raz, Flash, & Karni, 2003). In pre-training scans, primary motor cortex (M1)
activation was similar for the two sequences. In early sets (alternate presentation of sequences
A and B) of the first scan session, there was an effect of sequence order, whereby the first
executed sequence within a set (either A or B) elicited a greater M1 activation extent. This
effect reversed by the end of session 1 so that the second sequence executed within a set
elicited greater M1 activation. The authors attributed this switch in the order effect to an initial
fast learning phase, supported by behavioural data which showed gains in speed and accuracy
over the course of the first session. By the fourth session, where subjects had had three weeks
of daily practice, regardless of the order of presented sequences the trained sequence elicited
greater M1 activation extent. This was believed to represent slow learning where consolidation
of the increase in behavioural skill occurred. This pattern of activation overriding the order
effect, which evolved gradually with longer-term practice, persisted 21 weeks after maximum
performance was achieved (~5 weeks) without continued training. The authors concluded that
this persistent change in M1 activation during sequence performance indicated increased

Chapter 6
165
representation in M1 for the trained sequence which may support long term memory of the
specific motor skill.
The above study by Karni et al. (1995) and follow-up work (Korman, Raz, Flash, & Karni, 2003;
Karni et al., 1998) demonstrate that neural changes underlying functional motor plasticity
evolve through several stages involving initial fast learning followed by more gradual changes
reflecting consolidation and retention of skilled performance of the motor task. These studies
restricted the ROI to M1, however, it is now well established that there is a spatially diverse
network of regions involved in motor sequence learning, including primary somatosensory
cortex (S1) and pre-motor areas, basal ganglia (BG), fronto-parietal and fronto-cerebellum
circuits which are recruited under different conditions of awareness, timescale of learning and
task complexity (Doyon & Ungerleider, 2002). In addition to these areas, the visual cortex,
thalamus, putamen and superior parietal lobule (SPL) have also repeatedly shown recruitment
during visuomotor learning (Hardwick et al., 2013). The contribution of multiple brain
components reflects the multiple processes occurring to support motor learning and highlights
the usefulness of motor learning tasks in identifying subtle brain changes or deficits in patient
groups.
As well as neural adaptations over several weeks, visuomotor plasticity has been
demonstrated within a single scan session. Floyer-Lea & Matthews (2004) used a 12 minute
visuomotor tracking task to show two stages of functional changes associated with task
learning; initial fast learning was associated with greater task activity in prefrontal,
sensorimotor and parietal regions, bilaterally and ipsilateral cerebellum and caudate nucleus.
Second, with performance improvement, activity decreased in these regions. The timescale of
decreases was approximately halfway through the task, at the stage where performance was
no longer increasing. The authors identified the clinical potential of motor learning tasks to
investigate pathological processes associated with motor learning deficits. Importantly, for
clinical applications, functional changes could be observed in a matter of minutes, without the
need for weeks of daily training. Whether these changes represent true plasticity, or
alternatively a long term depression (LTD) like process associated with repeated stimulus
exposure is not clear. It is possible that these short-term changes represent the initial stages
leading to sustained functional and potentially structural adaptations to support behavioural
performance.
Structure and function are closely linked, adaptations in functional responses, e.g. changes in
neuronal excitability and inhibition, may drive structural plasticity, which in turn may lead to
sustained changes in metabolic demand. For example, one week of training on a visuomotor

Chapter 6
166
rotation task led to increased cortical volume in contralateral M1, and an increase in white
matter fractional anisotropy (FA) in a region immediately beneath M1 (Landi, Baguear, & Della-
Maggiore, 2011). The increase in grey matter concentration predicted task performance
(readaptation speed) at 1 year post training suggesting persistent functional adaptation as a
result of training. This study was a follow-up from earlier work (Della-Maggiore & Mcintosh,
2005) using the same task where increases in functional connectivity between the cerebellum,
superior temporal gyrus and motor areas were demonstrated at 1 month post training. Taken
together these studies suggest both structural and functional plasticity occur following motor
training. Given the likely importance of energy supply in plasticity, vascular and metabolic
health may predict the capacity for both, therefore it is important to extend this work to
investigate i) baseline CBF and ii) CBF and CMRO2 changes during and following motor training.
This will allow researchers to link structural and functional adaptations, and changes in the
magnitude of task responses to the underlying neurobiology and cerebrovascular health.
6.2.1 Functional Connectivity Changes following Motor Training
Resting state networks (RSNs) are thought to play an important role in supporting the active
brain during initiation and execution of behaviour (Miall & Robertson, 2006). This has led to a
body of research investigating the effect of motor learning on RSFC to understand how skill
training alters the resting brain. Many studies investigating functional plasticity focus on
changes in the activated state, but altered baseline or resting activity may actually drive
changes seen during task performance (Xiong et al., 2009).
Changes in BOLD RSFC have been reported following motor training. Albert et al. (2009)
demonstrated learning specific changes in RSFC following a single 11-minute motor training
session on a joystick adaptation task where one group performed a version requiring
adaptation to a moving target (motor learning), and a control group where adaptation was not
required. Using probabilistic ICA to investigate RSN changes over 10 minutes of resting BOLD
data collected before and after training, a fronto-parietal RSN (Damoiseaux et al., 2006) was
identified where functional connectivity strength was increased following the motor learning
task only. In addition, the cerebellum exhibited increased resting signal following training,
although this region was not identified as a resting network in baseline data across the training
and control groups. However, the cerebellum is known to be involved in motor learning and
coordination, it is possible that signal fluctuations are only evident following activities where
cerebellum engagement occurs.
Sami & Miall, (2013) reanalysed the data reported by Albert et al. (2009) adding data from two
groups training on either an implicit or explicit SRT task for ~15 minutes, again with 10 minutes

Chapter 6
167
of resting state BOLD recorded before and after training. Rather than using traditional seed-
based or ICA connectivity analysis, the authors employed graph theory analysis to map
connectivity network changes due to motor training across each group. In each group
functional connectivity (FC) strength was measured across 116 anatomical points. To
summarise, all 3 tasks with a learning component resulted in connectivity strength changes in
various brain regions depending on the task. Of greatest relevance to the current work are the
SRT tasks, which showed greater global and local FC strength, defined as the connection
density of each region, in frontal and visual regions and these changes were greatest in the
explicit learning condition. The degree of connectivity, defined as the number of nodes
connected to each point, was also measured and increases were noted again only in the 3 tasks
with a learning component. Increases were greatest in frontal and visual areas for the explicit
learning SRT task followed by visuomotor rotation where the amygdala and left hippocampus
showed increased FC strength. For the implicit SRT condition, increases in the degree of FC
were observed for the superior parietal gyrus, in addition to frontal and visual areas, but these
FC increases were lower than the other 2 learning tasks. The authors also investigated changes
in network efficiency across the tasks. Network efficiency increases for the implicit SRT
condition were found in the left precentral gyrus, SMA and thalamus, and in the frontal-orbital,
right angular gyrus and medial temporal cortex for the explicit condition. However for the
visuomotor rotation task, efficiency increases were observed in the right cerebellum, let
caudate nucleus and hippocampus. These selected results highlight the specificity of changes
which occur in the brain in response to very similar tasks.
The changes in RSFC described in this study, were measured over 10 minutes following motor
task performance, and do not necessarily reflect long term plasticity. To investigate whether
RSFC adaptations persist, Sami, Robertson, & Miall (2014) measured RSFC immediately, 30
minutes, and 6 hours after training on implicit and explicit versions of the SRT task. The authors
demonstrated different patterns of increased FC between implicit and explicit conditions, and
across RSNs, however, an overall picture of two learning phases emerged similar to other
studies. Immediately post-training, for the implicit learning condition, sensorimotor and
cerebellar networks exhibited peak increases in a sensorimotor network, whereas a cerebellar
network encompassing the thalamus and basal ganglia, showed peak activity at 30 minutes at
a later phase moving towards consolidation. Activity in both networks decreased by 6 hours
post training where a medial temporal (MTL) network showed greater connectivity strength
than at previous timepoints. Further, this MTL network exhibited increasing connectivity to the
right hippocampus at 30 minutes and 6 hours. The MTL and hippocampus are not typically

Chapter 6
168
recruited in short motor-learning tasks, but may reflect longer-term learning induced plasticity.
To verify this, later follow up sessions are needed, such as the 1-month follow up conducted
by Della-Maggiore et al. (2005).
Functional adaptations in resting brain connectivity have also been studied over longer
timescales. RSFC in the motor network was investigated over 4 weeks of daily sequential finger
opposition training (Ma, Narayana, et al., 2011). The authors used ICA to identify changes
related to early and late learning stages. From baseline to week 2 there was an increase in FC
strength between right postcentral gyrus and right supramarginal gyrus, and from week 2 to
week 4 a decrease in FC strength between these regions. Further, left supramarginal gyrus
showed a linear increase in FC across the 4 week period. The authors proposed that an initial
increase in connectivity is observed during skill acquisition, followed by reductions as
consolidation of the skill is complete and less neural resources are recruited to perform the
task. This is supported by behavioural data showing increases in performance from baseline to
week 2, where no further improvement with additional performance was noted. Interestingly,
connectivity of M1 and the supplementary motor area did not change over the 4 weeks,
despite the significance of these regions in motor learning and consolidation (Dayan & Cohen,
2011). The authors suggested differences in the neurobiology of task and resting activity may
explain this result, but given the nature of the BOLD data acquisition, differences in vascular
and metabolic activity driving the signal could not be identified.
The majority of fMRI studies to date, including those discussed above, investigating motor
learning related changes in RSFC and task responses have used changes in BOLD signal to infer
adaptive plasticity. These studies have shown adaptations in RSFC following training (Albert et
al., 2009) and changes from early to late phases of task performance (Doyon & Benali, 2005).
While these studies demonstrate an effect of training on the brain, the BOLD signal is an
indirect measure of the neuronal response to a stimulus which results from interactions
between cerebral blood flow (CBF), volume and the cerebral metabolic rate of oxygen
consumption (CMRO2). This complex signal makes it difficult to interpret the nature of the
physiological changes observed. As a result the vascular and metabolic adaptations facilitating
presumed changes at the cellular level during and following motor learning are less clear.
However, with alternatives to BOLD fMRI such as arterial spin labelling (ASL), quantification of
energy supply and metabolism, in the form of CBF and CMRO2, can be performed and is a
promising method to advance the field of plasticity research. Several groups have investigated
the cerebral metabolic processes which facilitate motor learning using ASL, in addition to
quantitative studies using PET.

Chapter 6
169
6.3 Quantitative FMRI and Plasticity
An early PET study (Grafton, Hazeltine & Ivry, 1995) demonstrated rCBF increases from
baseline in a network of frontal, motor, occipital regions and the putamen proportional to
sequence learning during a modified SRT task. The SRT was performed with and without
attentional interference from a concurrent task. Without interference from the second task,
most participants gained awareness of the sequence. Sequence awareness correlated with
greater rCBF in bilateral parietal, temporal and right premotor areas recruited by the task as
well as decreasing activity with sequence learning in areas including the right hippocampus,
left premotor and temporal cortex, operculum and caudate. In subjects without sequence
awareness, activity increases during the task were confined to the insula and superior
temporal cortex. Grafton et al. (1995) demonstrated patterns of increasing and decreasing
rCBF in during learning on an SRT task, with distinctly different patterns of activity between
subjects who were and were not aware of the presence of a sequence. Other studies such as
that of Seitz & Roland (1991) where both increases and decreases in rCBF were observed as
subjects learned a finger movement sequence, are in agreement with BOLD fMRI studies. BOLD
and rCBF increases in initial task stages, followed by reductions over time. Linear flow
metabolism coupling has been reported in response to visual stimulation (Hoge et al., 1999;
Uludag et al., 2004), however it is not known whether similar flow-metabolism coupling occurs
during learning. Vafaee & Gjedde (2004) used PET to measure CBF and CMRO2 during a finger
tapping task, where subjects tapped the thumb against each of the 4 fingers in turn. The results
showed generally linear flow-metabolism coupling in motor areas, however this was not the
case for the right putamen which showed an increase in CMRO2 without the expected increase
in CBF, and the cerebellum where the opposite trend was observed. Therefore, it is possible
that linear CBF-CMRO2 coupling does not always occur, but is dependent on the task
complexity and particular regions recruited. This task, essentially a motor learning task, may
reflect regional uncoupling during motor learning and requires further investigation to
determine whether this is a consistent pattern which occurs during motor learning.
A second study which measured both CBF and CMRO2 was that of Shannon et al. (2016) where
fMRI and PET scans were conducted before and after training on a visuomotor rotation task or
control tracking task without rotation. The aim of this study was to i) determine the
relationship between regional metabolic changes in oxygen and glucose consumption
following task training and ii) whether assumed task-induced synaptic plasticity would be

Chapter 6
170
reflected by changes in post-task aerobic glycolysis6. BOLD signal changes during task
performance in visual, motor and attention-related areas commonly recruited during
visuomotor tasks were reported. The most notable finding in this study, however, in terms of
metabolic changes, was the role of Brodmann area 44 (BA44) of the frontal cortex, an area
believed to play a role in execution of complex motor tasks (Shannon et al., 2016). This region
was one of many recruited during task performance, and BOLD signal was modulated by the
degree of learning. BA44 was the only region to show increased aerobic glycolysis, and reduced
CMRO2, assessed using PET, following task performance. This aerobic glycolysis increase was
attributed to a reduction in CMRO2 and an increase in glucose metabolism following motor
learning and the opposite trend was observed in the control group on a task without a learning
component. Task accuracy was highly correlated with the level of aerobic glycolysis and altered
BOLD functional connectivity between BA44 and primary visual cortex (V1) after the task in
different ways; subjects who made less errors had greater aerobic glycolysis and subjects who
made more errors showed greater reductions in connectivity. This study adds extremely
valuable information about the role of aerobic glycolysis and CMRO2 changes in BA44 in
relation to the level of task adaptation. This paper also demonstrates the strength of multi-
modal imaging in studying motor plasticity as converging PET and fMRI results give greater
confidence in results. Further, aerobic glycolysis is thought to support the expression of genes
which regulate synaptic development (Goyal, Hawrylycz, Miller, Snyder, & Raichle, 2015) and
the positive correlation between aerobic glycolysis increases and task performance in the
study by Shannon et al. (2016) supports this outlook. aerobic glycolysis is highest during
development, a time of high synaptic growth and pruning. The increased aerobic glycolysis in
BA44, may therefore reflect synaptic plasticity resulting from covert learning of a complex
motor task. The greater reduction in FC between BA44 and V1 in subjects with poorer task
performance is interesting; generally activity reductions are associated with learning. The
authors explain this result by suggesting that where visual input failed to result in motor
learning, resulting in repeated incorrect responses, communication between BA44 and V1 was
reduced. Behaviourally this may have been caused by disengagement with the task due to
6 Aerobic glycolysis is the non-oxidative process through which glucose is broken down into a series of
enzymes, despite the presence of sufficient oxygen. aerobic glycolysis is highest during development
when synaptic growth is at its peak. aerobic glycolysis is associated with expression of genes associated
with neural plasticity and synaptic remodelling and may therefore brain development and
reorganisation (Goyal et al., 2015). In Shannon et al. (2016) aerobic glycolysis is computed from the rate
of glucose and oxygen consumption.

Chapter 6
171
negative feedback visual feedback on responses, or lack of cognitive challenge if effort was
low. This could have leading to LTD like processes which were detected as reductions in
connectivity with BOLD fMRI.
Xiong et al. (2009) also used PET and fMRI to study neural adaptations during task performance
and in the resting state over 4 weeks of daily training on a motor sequence task previously
descried by Karni et al. (1995). In task vs. rest analysis, BOLD fMRI data showed increases from
baseline at week 2 in motor and somatosensory cortices, followed by reductions to within
baseline levels by week 4.
PET, conducted at baseline and week 4 showed activation in M1 and S1 which was not
significantly different from baseline at week 4 in a task vs. rest activation comparison. Both
PET and fMRI data showed that activity returned to baseline levels after 4 weeks, which is
initially suggestive of an absence of sustained functional plasticity and does not agree with
findings of Karni et al. (1995, 1998) where M1 activity continued to increase past 4 weeks of
training. Studies such as that of Hlustik et al. (2004) have shown decreasing trends after several
weeks of training but may not capture the results seen by Xiong et al. (2009) due to shorter
follow-up times. However, the resting and task performance rCBF data showed significantly
higher rCBF in right M1 in the task and resting state. Left M1 did not show this increase, as
expected given the left hand training task. The right supplementary motor area (SMA) also
showed increased rCBF in both states but this was not significant. FMRI power spectral analysis
for right and left M1 revealed an increase in spontaneous firing frequency in right M1 in the
low frequency bandwidth of 0.08 Hz at 2 weeks and 4 weeks. These low frequency fluctuations
are important markers of the strength of brain activity and may reflect increases in functional
connectivity at rest. Left M1 did not show this change. The study by Xiong et al. (2009) very
nicely illustrates the limitations of using BOLD fMRI alone to study motor plasticity, as well as
effects that are not detectable in traditional task vs. rest contrasts. Investigating absolute
changes in a quantitative manner, during task performance and at rest, could reveal much
more information about metabolic adaptations with motor learning.
Xiong et al. (2009) suggests three potential mechanisms for the increase in rCBF with 4 weeks
of motor training. The first is that synaptogenesis occurs as a result of repetitive localised
neuronal excitation, leading to greater energy consumption in the resting state. As CBF and
CMRO2 are coupled at rest, the increased CBF seen following motor training reflects greater
energetic demand due to the increased number of synapses. Second, angiogenesis is
potentially increased through motor training, leading to greater rCBF and cerebral blood
volume. This may be driven by neural adaptations leading to increased energy demand. Xiong

Chapter 6
172
et al. (2009) referred to studies which reported angiogenesis following aerobic exercise
training (Pereira et al., 2007; R. . Swain et al., 2003) and suggested motor training may have
similar results. Third, cytochrome oxidase activity has been shown to be upregulated in rodent
studies of learning (Sakata, Crews, & Gonzalez-Lima, 2005) and motor coordination is
negatively affected by its reduction (Lalonde et al., 1999). This enzyme is closely linked to
neuronal activity through its involvement in oxidative phosphorylation, the main energy
synthesising pathway in the brain. Cytochrome oxidase has been implicated in increased
metabolic capacity in the brain following skill training which, like synaptic formation, would
increase CMRO2 in regions critical for motor learning, and therefore rCBF would also be
increased to supply the additional energy required.
The use of PET to study plasticity is extremely informative regarding metabolic processes
involved in learning, however, it is costly, invasive and not widely available, especially for basic
research. Therefore, quantitative fMRI is a more practical alternative which can still provide
measures of CBF, blood volume and oxygen consumption during and following learning. Given
the evidence pointing to changing energy demands following motor training, quantitative fMRI
is a promising technique to further investigate learning-induced neural adaptations.
Moving away from PET, Olson et al. (2006) used single-echo ASL to measure learning related
continuous perfusion and BOLD signal changes over three 15-minute SRT training sessions,
each session proceeded by a 5-minute transfer task where a new sequence was presented.
Unlike previous work, no regions of BOLD or CBF changes reached significance at a map wise
level and it was only through reducing the statistical significance threshold and conducting ROI
analysis that correlations were found between CBF reductions and reaction time, the measure
of performance improvement over the session, in premotor cortex, inferior parietal lobule (IPL)
and superior temporal gyrus (STG). The authors attributed the results to low SNR and statistical
power and even at the uncorrected level, no BOLD signal changes related to learning were
detected. This may be explained by the long task duration, as BOLD signal suffers from drift
over longer timescales whereas perfusion is stable. The study by Olson et al. (2006), was
however, an important step in moving towards quantitative investigation of functional
plasticity. The benefits of ASL in this context are that changes can be detected over seconds or
minutes and unlike BOLD, quantification of CBF means that changes can be compared to other
subjects or groups without having to consider potential baseline differences. Third, greater
spatial specificity of the perfusion signal over traditional BOLD fMRI (Chiarelli et al., 2007;
Raoult, Petr, Bannier, Stamm, & Gauvrit, 2011) makes the technique more suited to identifying
the location of learning related functional brain adaptation. Olson et al. (2006) suggest low

Chapter 6
173
SNR and the continuous task design as explanations for the absence of significant signal
changes with learning in many regions typically reported in BOLD studies. In typical block
design experiments, spikes associated with block onsets may explain much of the task-related
activity. The continuous nature of this task may have led to a more gradual neural adaptation
not detected in the analysis due in part to low statistical power.
In a block design experiment by another group, Fernandez-Seara et al. (2009) used ASL to
investigate CBF changes during two 6-minute explicit learning tasks where a different pattern
of sequential finger movements was trained in each task. Even on this short timescale, a
pattern resembling early and intermediate phases of learning emerged. Performance
improved quickly within the first 2 minutes of task performance and perfusion increases were
observed in M1 and secondary motor cortex (M2), premotor cortex and pre-SMA. Widespread
activity was also detected in dorsolateral prefrontal cortex (DLPFC) and visual cortex as well as
the ACC, insula, IPL, SPL and temporal cortex. Sub-cortical perfusion increases were also
observed in the thalamus, putamen, caudate and globus pallidus. To investigate learning-
related changes, 3 learning phases were defined representing early to intermediate learning.
CBF decreases normalised to resting CBF were reported bilaterally for most regions recruited
during task performance, and perfusion reached levels comparable to baseline by the final task
block. Decreases were significantly correlated with reductions in RT, demonstrating learning
related perfusion changes. In addition to these results, CBF increased from the early to late
phase of learning. These increases were noted in S1, the posterior insula and putamen,
cingulate cortex and left hippocampus, and were inversely associated with RT. Although the
task duration was considered too short to achieve the late consolidation phase of learning, the
initial increases in perfusion followed by decreases over time with performance improvement
is similar to training studies which took place over weeks (Hlustik et al., 2004; Laguna &
Cognitive, 1995; Xiong et al., 2009). This study by Fernandez-Seara et al. (2009) provides
evidence firstly that ASL can in fact be used to detect group-level maps of activity associated
with motor learning. Second, it was shown that learning-related perfusion changes occur over
very short timescale so that plasticity can be studied without the cost to data quality that
occurs with long paradigms, for example, related to excessive head motion. Employing
calibrated fMRI to study plasticity over a short time scale, as described in Chapter 7, can extend
the neurobiological understanding of the changes reported by Fernandez-Seara et al. (2009)
by investigating the nature of metabolic changes accompanying CBF alterations during motor
learning.

Chapter 6
174
Krieger et al. (2014) conducted a methodological evaluation of calibrated fMRI (PCASL) at 7
Tesla to test the within and between session reproducibility of BOLD, CBF and CMRO2
measurements during a complex visuo-motor task. In the task, participants had to learn to
identify changes in movement patterns using a joystick to maintain the target position of a
vertical bar and were scanned 3 times over 7 days. The aim of this study was to measure the
reliability of BOLD and quantitative imaging parameters for studying plasticity, rather than
primarily considering the biological significance of changes in flow and metabolism during
learning. Results showed that intra and inter-subject variability was high across all 3
parameters and ROIs (grey matter, M1 and visual cortex), with CMRO2 being the most stable
and BOLD having the greatest variability. This variability was present despite accounting for
the expected decrease in signal due to performance improvements (Ungerleider et al., 2002).
Despite the variability, the authors concluded that calibrated fMRI is a promising solution for
increasing signal specificity and achieving quantitative neurophysiological measures in imaging
studies of cognition. The reason, despite low signal stability across sessions, is the promise of
CMRO2 as a marker of neural activity and learning-related neuronal changes. CMRO2 had lower
variability across sessions, subjects and regions, making it a preferable marker of plasticity due
to it being a closer correlate of neuronal activity than CBF or BOLD, and being more easily
interpreted from a neurobiological perspective due to greater signal stability. This study
measured relative CMRO2 (rCMRO2) changes, which are dependent on BOLD and CBF stimulus
responses and, for accuracy, noise-free estimations of the calibration parameter M. While the
use of rCMRO2 measures are reliable and informative, absolute CBF and CMRO2 are closer
correlates of the underlying stimulus-evoked neural signal. Whittaker et al. (2016) used a block
design visual stimulus and hypercapnia challenge to modulate baseline and task-evoked CBF.
The absolute CBF response to visual stimulation was preserved across different baseline states
which translated to a lower fractional change in CBF to visual stimulation when preceded by a
hyperperfused baseline. This would have a significant effect on BOLD and rCMRO2 responses
and potentially underestimate the true response, or change over time with training, in the case
of motor learning. Although absolute quantification of CMRO2 is not always feasible, this effect
should be taken into consideration in the interpretation of results.
An earlier study by Mohtasib et al. (2012) used calibrated fMRI during a Stroop task to
investigate age-effects on neuronal and vascular responses to the task. While this study was
not aiming to study motor learning plasticity, it demonstrates a rare application of calibrated
fMRI in studying neural correlates of cognitive performance, and the importance of going

Chapter 6
175
beyond reliance on BOLD signal alone in ageing studies. During Stroop performance the BOLD
response showed a linear relationship with age, and non-significant inverse associations with
accuracy and reaction time. However, the CBF response did not show an effect of age, meaning
that an overall reduction in CMRO2 with age was evident. This is suggestive of a reduction in
neural activity with age. Further analysis showed that the age-related BOLD and CMRO2
changes were due to a low-performing sub-group of the older adults. The authors examined
regional effects of age and found age-related BOLD increases to be greatest in bilateral M1 and
the medial frontal gyrus (MFG), and age effects on CMRO2 were also most pronounced in the
M1 and left MFG. Had BOLD alone been measured during the task, the increased BOLD in older
adults would likely have been attributed to an increase in neural activity, perhaps attributed
to greater neural resources required to perform the task. It should also be noted that changes
in end-tidal CO2 and O2 values with age are known to affect fMRI signal and CMRO2 estimation
(De Vis et al., 2015). However, when the data were analysed within a tight range of end-tidal
O2 values, the reduction in CMRO2 with age was still present.
6.4 Imaging Plasticity in Patients
As well as studies of ageing, calibrated fMRI should be employed where cerebrovascular
alterations are present, or suspected. In investigating neural markers of learning, or learning
impairment in patients, calibrated fMRI, unlike BOLD alone, can reveal the nature of vascular
and metabolic alterations which may underlie learning deficits. In MS, acute bouts of
inflammation, referred to as relapses, can impair motor, visual and cognitive function as well
as mood disturbances. Treatment of impairments generally involves psychological and physical
rehabilitation which in a proportion of patients has a high degree of efficacy, yet others do not
respond to these therapeutic interventions (Lipp & Tomassini, 2015). This suggests that non-
drug treatments can enhance plasticity, but, that patients greatly vary in their capacity for
adaptive plasticity. One possibility for heterogeneity in treatment responses where structural
imaging does not reflect the level of disability (Barkhof, 2002), is that regional cerebrovascular
and metabolic deficits are present in these patients (Ge et al., 2012; Marshall et al., 2014b)
and limit the brain’s ability to repair and/or reorganise function. Ge et al. (2012) used a global
measurement of OEF and CMRO2, and demonstrated CMRO2 reductions in RRMS patients.
CMRO2 was inversely correlated with expanded disability status scale (EDSS) scores and lesion
load. The results suggest that hypometabolism of oxygen occurs in MS and suggests a
mechanism of progressive dysfunction and tissue damage characteristic of the disease.
Calibrated fMRI could provide more sensitive regional identification of metabolic dysfunction
at rest and during task performance. In early MS, subtle vascular and metabolic alterations

Chapter 6
176
may be more apparent in the activated state, for example during motor learning.
Quantification of CMRO2 changes motor learning may indicate location and extent of disease-
related damage as well as the current capacity for plasticity. Whether altered metabolism
during learning reflects permanent damage, or reversible changes with appropriate treatment,
remains to be determined and quantitative fMRI will be a key technique in future studies
addressing this question.
Behavioural studies such as that of Tacchino et al. (2014) and (Deroost, Smetcoren,
Vandenbossche, & Hooghe, 2014) have used the SRT task to show motor learning capabilities
at different disease stages. Tacchino et al. (2014) recruited patients with minimal disability
(EDSS < 2) who performed the SRT under explicit and implicit conditions. In blocks of a random
sequence patients improved performance similar to controls. However, performance
impairment was observed for sequence learning on both explicit and implicit conditions, with
performance on the implicit learning condition lowest overall. This suggests that simple motor
performance is preserved in early MS, however implicit motor learning, and to a lesser extent
explicit learning, appears to be affected even at early stages.
Deroost et al. (2014) studied patients with more advanced MS (mean EDSS = 5.5), both
relapsing remitting MS (RRMS) and progressive MS. In this study, patients were also tested in
implicit and explicit learning conditions. In contrast to Tacchino et al. (2014), explicit learning
was more affected than implicit, and as expected, was more pronounced in patients with
progressive MS. Taken together, it could be concluded either that different learning systems
are affected to a degree dependent on disease duration, or that there is extreme
heterogeneity in MS symptoms and impairments. These studies relied on behavioural
measures alone; qfMRI studies using these tasks would determine the nature of underlying
neurophysiological impairments leading to these behavioural differences.
A sizeable number of studies have investigated motor activation in MS patients (see review by
Pantano, Mainero & Caramia (2006)) but few have investigated motor learning and plasticity
during fMRI. Morgen et al. (2004) looked at BOLD activation patterns over 8 minutes before
and after 30 minutes of training on direction-specific thumb movements in 9 MS patients
(mean EDSS = 2.2) and matched controls. Pre-training, patients exhibited greater pre-motor
activation, which suggests additional neural resource recruitment is needed for patients to
perform the task. With training, controls training led to BOLD signal reductions in M1, S1 and
bilateral parietal association cortex. Patients however did not demonstrate any significant
signal reductions despite comparable performance across the two groups. The results suggest
patients retain the ability to perform guided motor patterns, but either do not exhibit similar

Chapter 6
177
neural adaptation to the task as healthy controls, or require longer training periods to do so.
In this study, pre-training activation did not correlate with lesion load, EDSS or task
performance and post-training associations with these measures were not reported. It is
apparent from this study however, that even in patients with a low EDSS, CBF and/or oxygen
metabolism is altered during motor performance, potentially hindering neural adaptation with
learning.
In contrast to the results of Morgen et al. (2004), Mancini et al. (2009), in a multi-centre study
involving 56 patients (mean EDSS = 2.25) and 55 controls looked at activation patterns during
a cued finger tapping task, which was repeated in a subset at 1 year (26 patients and 33
controls). Over 4 runs of the task both patients and controls showed comparable linear
adaptation in the form of BOLD response reductions in M1, S1, SMA and the cerebellum. The
same trends were recorded at the 1 year follow up. This task was a motor execution task rather
than a motor learning task, and it is possible that simple motor execution is preserved in
patients and this task was not sufficiently demanding to detect subtle changes in MS patients.
A study by Tomassini et al., (2016) investigated the effect of inflammation on visuomotor
plasticity. Patients were scanned twice before and once after treatment with Interferon-Beta
(IFN-beta), during which two runs of a visually cued finger-thumb flexion task were performed,
separated by 25 minutes of practice. BOLD response changes within-session were used as the
main indicator of plasticity. Compared to controls, patients showed a greater BOLD reduction
in the cerebellum and visual cortex pre-treatment, suggesting a greater adaptation effect in
patients, potentially driven by altered plasticity due to inflammation. Post-treatment with IFN-
beta, which significantly reduced the presence of lesions in patients, within-session changes
were reduced, which was interpreted as restoration of functional plasticity with IFN-beta
treatment. While this reduction in response differences between runs could have been
attributed to practice effects in the post-treatment session, a second pre-treatment session
was included to control for this. If signal changes were primarily driven by practice effects, the
greatest between-run differences would be expected between session 1 and session 2. The
greater difference between sessions 3 and 2 are suggestive of a drug effect. This study
demonstrates a potentially therapeutic effect of IFN-beta on visuomotor plasticity. However,
without quantitative measures of brain function, such as CBF or CMRO2 during rest and task
performance before and after treatment, it is difficult to interpret the underlying
neurophysiological mechanisms underlying the BOLD signal changes between runs and
sessions. Future studies employing quantitative imaging, would provide additional information

Chapter 6
178
on both the effect of treatments on haemodynamics, and the nature of brain changes believed
to reflect plasticity.
In MS, additional studies are needed to characterise motor learning ability, and neural
correlates of task the presence or absence of task learning. Quantitative measures such as CBF
and CMRO2 would be more informative than BOLD alone, as these indices of vascular health
would elucidate potential mechanisms underlying motor plasticity in MS.
6.5 Cellular and Molecular Mechanisms of Plasticity
Neuroimaging offers an indirect way to study brain plasticity, as processes at the cellular level
which either drive or require metabolic adaptations cannot be directly examined. To study
microscopic-level mechanisms of plasticity we often rely on animal models, for example to
directly examine changes in neuronal structure and function, and from this assume similar
processes occur in humans. Studies in rodents show that acrobatic motor training leads to
synaptogenesis (Black et al., 1990; Jones, Chu, Grande, & Gregory, 1999) and water-maze
training has been associated with upregulation of BDNF and astrocytic processes (Sagi et al.,
2012).
Enriched environments have also been shown to increase neurogenesis in the dentate gyrus
(DG) of the hippocampus as well as enhancing the development of new blood vessels (Black,
Polinsky & Greenough, 1989). In addition to increased numbers of neurons and vessels, greater
dimensions of capillaries, glia, cell nucleus and somas of neurons have also been demonstrated
in animals housed in enriched environments (Vernadakis, 1996). Similar processes have been
demonstrated following aerobic exercise where angiogenesis and CBV have been upregulated
in the motor cortex of exercised animals (R. . Swain et al., 2003). A review by Voss et al. (2013)
discusses work showing upregulation of vascular endothelial growth factor (VEGF) and insulin-
like growth factor (IGF-1) and brain-derived neurotrophic factor (BDNF) in the brain of animals
who have been subjected to aerobic exercise over periods of typically 10-16 weeks. These
neurotrophic factors are thought to mediate exercise-related cell proliferation. BDNF
especially, has been widely associated with behavioural, structural and functional plasticity,
for example BDNF is also upregulated through water-maze training, a hippocampal-dependent
learning and memory task (Yamada, Mizuno, & Nabeshima, 2002).
It appears that skill learning, e.g. water maze training, and aerobic training, though very
different, both lead to strengthening of existing neuronal connections, and formation of new

Chapter 6
179
connections through neurogenesis and dendritic spine growth (M. W. Voss et al., 2013). Aside
from neuronal processes, astrocytic changes and vascular cell development support plasticity
which occurs through repeated behaviours. It should also be mentioned that immune
processes support learning and memory, and therefore brain plasticity. However, in the
presence of diseases, including MS, upregulation of immune processes can become toxic,
increasing neuronal excitability to a level that impairs neurogenesis, and reduces neurotrophic
factor production. Hyper excitability of neurons during inflammation has detrimental effects
on learning, memory and locomotor behaviour as plasticity is limited under these conditions
(Yirmiya & Goshen, 2011). Interventions which upregulate neurotrophic factors and stimulate
neurogenesis may therefore help to restore plasticity in combination with anti-inflammatory
treatments such as IFN-beta (Tomassini, d'Ambrosio, et al., 2016).
In humans, prolonged training of a particular skill or sustained increase in physical activity may
lead to similar brain changes, although this cannot be tested definitively. Imaging outcomes
such as changes in CBV, CBF and CMRO2, which is closely coupled to cellular energy
consumption, are the closest markers of cellular and molecular changes in the brain it is
possible to achieve in basic research. The difficulty lies in interpreting what changes in CMRO2
may reflect, as it could be any number of processes including increased firing rates,
neurogenesis or non-neuronal cell upregulation. Multiple measures, including CBF and CBV
may help to inform conclusions about underlying changes due to short and long term
functional plasticity.
6.6 Conclusions and Future Directions
While fMRI has enhanced the understanding of functional networks involved in motor learning
and the pattern of changes which occur with short and long term motor training, several
important questions still remain. These primarily concern the neurobiological processes which
facilitate the functional plasticity required for motor learning, and the metabolic adaptations
which facilitate long-term changes in neural responses both during task performance and in
the resting brain.
Both aerobic exercise and task-specific motor training can improve functional outcomes in
patients (Schmidt & Wonneberger, 2014; Zeller & Classen, 2014). Aerobic exercise has been
shown to increase CBF and vascular reserve in older adults (Bailey et al., 2013b; B. P. Thomas
et al., 2013) which may lead to the observed cognitive benefits of physical fitness in healthy
adults and patients (Beier, Bombardier, Hartoonian, Motl, & Kraft, 2014; M. W. Voss et al.,
2015). Much more work is needed to establish whether motor learning can bring about

Chapter 6
180
sustained changes in brain vascular function, and whether this has behavioural and cognitive
benefits. First though, it is necessary to develop a better understanding of neurometabolic
mechanisms of motor plasticity in the healthy brain and whether training induced changes
persist at rest following task performance.
The following chapters investigate the neural energetic responses to short-term motor
learning, which requires functional plasticity to improve performance. The results represent
the initial fast learning phase and while they do not reflect the full extent of metabolic changes
underlying functional plasticity, they provide evidence for the feasibility of calibrated fMRI and
CBF RSFC as techniques to study neuroplastic adaptations, as well as information on energetic
changes during the initial phase of learning.

Chapter 7
181
Chapter 7
Cerebral Metabolic Changes during Visuomotor Learning
Assessed using Quantitative FMRI
Abstract
Most fMRI studies investigating neural adaptation during visuomotor learning only measure
the blood oxygen level dependent (BOLD) response. This can be problematic in certain
groups as the BOLD signal is difficult to interpret due to its modulation by both neural and
vascular processes. Calibrated fMRI offers more physiologically meaningful measures of
brain activity changes compared to standard BOLD fMRI but is seldom used in cognitive
neuroimaging studies. In this study, we investigated the feasibility of quantifying changes in
cerebral blood flow (CBF) and the relative cerebral metabolic rate of oxygen consumption
(rCMRO2) during a visuomotor learning task.
The main aims were to measure CBF and rCMRO2 changes associated with motor learning
and to determine the flow-metabolism coupling ratio in regions recruited by the task as well
as changes in this ratio over time. Simultaneous BOLD and CBF data were acquired using
dual-echo arterial spin labelling (ASL) fMRI during a 12-minute serial reaction time (SRT) task,
followed by a reference hypercapnic calibration scan. BOLD and CBF task-related increases
were observed in the motor and sensorimotor cortex, thalamus, insula, lateral occipital
cortex (LOC) and cerebellum, along with increases in rCMRO2. BOLD and CBF decreases over
time attributed to sequence learning were identified in the left cerebellum, insula and LOC,
along with a trend towards increasing rCMRO2. The flow-metabolism coupling ratio increased
from 1.7 at the start of the task start to 2.8 by the end in the ROI showing a mean task
response. In the ROI representing the CBF and BOLD signal decrease over time, the coupling
ratio dropped from 2.2 to 1.7.
The study demonstrates the feasibility of measuring changes in neural energetics during a
complex cognitive task and provides novel evidence suggesting a change of coupling in CBF
and oxygen metabolism during visuomotor learning. This approach provides a more detailed
understanding of neural processes which occur during learning than BOLD fMRI alone, and

Chapter 7
182
may be a promising tool for studying alterations in cerebrovascular function and functional
plasticity in patient groups.

Chapter 7
183
7.1 Introduction
As detailed in the previous chapter, the brain has a lifelong ability to rapidly adapt through
learning, and in response to injury or disease related damage, a process known as functional
neuroplasticity. Residual neuroplasticity in chronic diseases such as Multiple Sclerosis (MS) can
be harnessed in rehabilitation strategies to promote recovery of cognitive functions. However,
the degree of plasticity varies between individuals and the mechanisms that promote and limit
plasticity are not fully understood. Adequate energy delivery, in the form of cerebral blood
flow (CBF) carrying oxygen, glucose and other nutrients to tissue is essential for healthy
neuronal function, as is the ability to metabolise this energy. In MS, there is evidence of flow
(D’haeseleer et al., 2011b; Ota et al., 2013) and metabolism dysfunction (Fan et al., 2015; Ge
et al., 2012; Kidd et al., 1999) which may play a central role in limiting plasticity.
The neural energetics underlying plasticity have not been fully characterised, even in the
healthy brain, and a better understanding of the flow and metabolism changes during learning
which facilitate plasticity is necessary. This will aid researchers and clinicians in predicting
patients’ capacity for plasticity and guide treatment interventions to maintain and recover
function. Secondly, the relative changes in CBF and the cerebral metabolic rate of oxygen
consumption (CMRO2) has not been well documented outside of the visual cortex, or during
complex cognitive task performance. Determining changes in the flow-metabolism coupling
ratio across task-relevant regions with learning will provide novel information on the balance
between CBF and oxygen metabolism in the healthy brain during visuomotor learning.
Blood oxygen level dependent (BOLD) functional magnetic resonance imaging (fMRI) is a
widely-used tool in plasticity research offering greater spatial and temporal resolution than
alternative imaging methods such as Transcranial Doppler (TCD) ultrasound and Near Infrared
Spectroscopy (NIRS). Another advantage of BOLD is that it is non-invasive, it does not require
exogenous tracers unlike Positron Emission Tomography (PET) which is still used in motor
learning studies (Shannon, Neil, Vlassenko, Shimony, & Rutlin, 2016; Ma et al., 2009). However,
BOLD has several limitations; it is not possible to quantify baseline activity, and the measured
signal is difficult to interpret due to its modulation by both neural and vascular processes
(Attwell & Iadecola, 2002, Logothetis, Pauls, Augath, Trinath, & Oeltermann, 2001). The BOLD
signal depends on complex interactions between CBF, cerebral blood volume (CBV) and
CMRO2, making errors in signal interpretation highly likely in the presence of compromised
vasculature (Iannetti & Wise, 2007b). Despite this, BOLD is often used qualitatively, to infer

Chapter 7
184
indirect changes in neural activity without much consideration given to the underlying
physiological processes contributing to BOLD signal changes. It should also be mentioned that
BOLD spatial specificity is limited as draining veins show large signal changes downstream of
the site of activation (Turner, 2002) which could be problematic when studies aim to identify
changes in specific anatomical regions during motor learning.
Calibrated fMRI, which provides estimates of CBF and relative CMRO2 (rCMRO2) through the
addition of hypercapnic calibration (Davis et al., 1998; Hoge et al., 1999), enables greater
understanding of cerebrovascular and metabolic responses contributing to the BOLD signal. In
addition, changes in CMRO2 should more closely reflect local neuronal activity than BOLD.
Calibrated fMRI can be used to obtain direct measures of CBF and estimates of relative changes
in brain energy metabolism (rCMRO2). The technique has potential future applications in
identifying clinically relevant abnormalities in vascular function which are not visible using
BOLD fMRI. These additional measures of CBF and rCMRO2 are helpful for accurate
interpretation of data from fMRI studies of ageing and disease where neurovascular coupling
(NVC) is likely to be altered (Restom, Bangen, Bondi, Perthen, & Liu, 2008). For example, Blicher
et al. (2012) demonstrated lower CBF and CBV responses to a motor task in chronic stroke
patients despite non-significant BOLD increases. Blicher et al. (2012) suggested that this effect
could be explained by a decrease in vascular reserve capacity and therefore oxygen supply,
meaning that an adequate CMRO2 increase during the task could not be achieved. In a second
study Mohtasib et al., (2012) found greater BOLD responses with increasing age during a
Stroop task, but a reduced rCMRO2 increase in response to the task. This suggests that as CBF
was unaffected by age in this cohort, the greater BOLD signal changes were due to a reduction
in the CMRO2 response. As CMRO2 and neuronal firing are closely coupled, a decreased neural
response with age is also likely. Such changes in vascular reserve and neurovascular coupling
would not have been evident had the authors of both studies used BOLD alone, and the results
demonstrate the value of calibrated fMRI in any study where cerebral energetics may be
altered.
A second, related application of CBF and rCMRO2 measurement is in the study of functional
brain plasticity. This application is in its early stages and has not been widely used yet. The
BOLD signal alone is not ideal for studying experience-induced plasticity as it cannot distinguish
changes in CBF and oxygen metabolism to a region, nor can it reliably reveal learning-related

Chapter 7
185
activity changes between groups as baseline activity is unknown. Another advantage of
obtaining perfusion measurements during learning tasks is that such tasks involve slow
changes in neural activity (Olson et al., 2006) and the BOLD signal drift over longer timescales
presents a challenge to separate task signal from noise due to this drift.
The aim of the current study was to quantify CBF and rCMRO2 changes, in addition to
measuring the BOLD response, during performance of a modified serial reaction time (SRT)
using dual-echo calibrated fMRI. Visuo-motor task performance can be improved over short
periods of time accompanied by changes in activity in task-recruited regions, demonstrating
plasticity in the adult brain (Fernández-Seara, Aznárez-Sanado, Mengual, Loayza, & Pastor,
2009; Olson et al., 2006; Shannon et al., 2016), therefore we measured the response
adaptation over time attributed to learning. Previous work has demonstrated increases in
BOLD and CBF in motor and visual cortex as well as prefrontal regions and the cerebellum from
rest during task performance. (Ungerleider et al., 2002). Signal reductions over time, with
sequence learning have also been observed within a single task training session (Fernandez-
Seara et al., 2016; Floyer-Lea & Matthews, 2004). However, rCMRO2 changes during
visuomotor learning have not been characterised using fMRI. Therefore, we explored rCMRO2
changes in brain regions recruited during task performance and where a modelled linear BOLD
and CBF signal reduction was observed across task blocks. Second, we characterised flow-
metabolism coupling in these regions at the beginning and end of the task.
7.2 Methods
7.2.1 Participants
20 right handed, healthy participants (10 female, mean age 25±4.6) took part in this study. All
participants were non-smokers and educated to university level. The study was approved by
the Cardiff University School of Psychology Research Ethics Committee and performed in
accordance with the guidelines stated in the Cardiff University Research Framework (version
4.0, 2010).
7.2.2 Imaging
Imaging was performed on a whole body 3T MRI (GE Excite HDx, Milwaukee WI, USA) system
using an 8-channel receive-only head coil. Simultaneous perfusion and BOLD data were
acquired with a single subtraction PICORE QUIPSS II (Wong et al., 1998) pulsed arterial spin

Chapter 7
186
labelling (PASL) sequence (non-commercial) with a dual-echo gradient-echo readout (Liu et al.,
2002) and spiral k-space acquisition (Glover, 1999).
Imaging parameters for functional scans were; TR = 2.4s, TE1 = 2.7ms, TE2 = 29ms, TI1 = 700ms,
TI2 = 1.5s (most proximal slice), FOV = 19.8cm, flip angle = 90 matrix size = 64x64, slice
thickness 7mm, 1.5 mm gap, 3.2mm in plane resolution, 15 slices. Label thickness was 200mm
with 10mm gap between the end of the label and the most proximal imaging slice. A separate
M0 scan was acquired using the same parameters, except TR= 4s, to measure the equilibrium
brain tissue magnetisation of cerebrospinal fluid (CSF) for absolute CBF estimation. A whole
brain T1-weighted fast spoiled gradient echo (FSPGR) structural scan was acquired to facilitate
registration of the functional data to the common standard space of the Montreal Neurological
Institute (MNI); 176 slices, 1mm3 isotropic resolution, TR=7.8s, TE=3s, TI = 450ms, flip angle
20°, acquisition matrix 256x256.
Physiological monitoring was performed, a respiratory belt placed just below the ribs
monitored ventilation and a pulse oximeter was used to obtain cardiac traces. A sampling line
connected to a tightly fitted face mask (Quadralite Intersurgical, Wokingham, Berkshire, UK)
was used to monitor and record PETCO2 and PETO2 concentrations. This face mask was part of
the breathing circuit used to deliver gas mixtures and followed the design used by Tancredi et
al. (2014). The MEDRAD system (MEDRAD, Pittsburgh, PA) was used to monitor O2 saturation
throughout the hypercapnia task.
7.2.3 Visuomotor Task
The SRT (Nissen & Bullemer, 1987) is a measure of implicit sequence learning used frequently
in fMRI studies to study the neural basis of visuomotor learning in healthy subjects as well as
learning deficits in patient groups such as MS, chronic stroke and Huntington’s Disease (HD)
(Bonzano et al., 2011; Boyd & Winstein, 2001; Knopman & Nissen, 1991). In the SRT task,
repeated presentation of visual stimuli at one of four positions on a computer monitor means
that subjects can learn the sequence without explicit knowledge of the sequence. The subject
is instructed to respond to each cue by pressing one of four buttons on a button box, where
each button corresponds to a cue position. Without explicit task knowledge the SRT is
presented as a low difficulty, continuous performance task with attentional, visuospatial, and
motor demands (Rauch et al., 1997). With continued performance over these repeating blocks,
subjects can improve their reaction time and accuracy due to a combination of motor
habituation and sequence learning.

Chapter 7
187
A modified version of the SRT developed by Nissen & Bullemer (1987) was used as the visuo-
motor learning task during imaging acquisition. The task was projected via a screen inside the
scanner at a frame rate of 60Hz and a resolution of 1024x768. A star appeared on the screen
in a sequence of 4 boxes (Figure 7.1), participants responded by pressing the corresponding
button on a button box in their right hand. The 12-minute task consisted of 6 blocks of a 12-
item sequence repeated 9 times with variable inter-stimulus interval (600-1000ms)
interspersed with 3 blocks of a pseudorandom sequence to control for response latency
decreases related to task familiarisation rather than sequence learning. Participants were not
informed that there was a repeating sequence during task instructions.
Figure 7.1 Schematic of the SRT presentation, example ISIs on the left indicate example times between trials.
7.2.4 Hypercapnic Calibration
The SRT task was followed by a hypercapnic calibration scan to obtain a measure of
cerebrovascular reactivity (CVR) to CO2 for estimation of rCMRO2. Participants breathed
through a tight-fitting face-mask as described above, gases were administered from gas
cylinders connected to an in-house built manually controlled flow meter system. Gases were
piped through a mixing chamber with three feeding lines coming in for the delivery of medical
air, 5% CO2, and medical oxygen. Medical oxygen was not administered but was connected in
case of emergency. Gases were humidified for participant comfort. The scan began with a 2-
minute normocapnia period during which participants breathed medical air (20.9% O2 balance
N2) with a flow rate of 30 L/min. This was followed by a rapid switch to 2 minutes of
hypercapnia where an increase in PETCO2 of +7 mmHg was targeted. In total, the scan consisted
of 3x2 minute blocks of normocapnia and 2x2 minute blocks of hypercapnia.

Chapter 7
188
7.2.5 Data Analysis
7.2.5.1 Image Preprocessing
Perfusion and BOLD weighted images were created from the first and second echo data
respectively. Physiological noise correction was carried out using a modified RETROICOR
technique (Glover et al., 2000) was carried out as described previously (Chapter 3). Afni
software https://afni.nimh.nih.gov/afni/ was used for motion correction and processing of the
image timeseries. Interpolated surround subtraction of the of the first echo tag and control
image time-series was performed and surround averaging was applied to the BOLD weighted
images to remove any contamination of BOLD and perfusion weighting respectively (Liu &
Wong, 2005).
7.2.5.2 Task Response Modelling
One subject was excluded from the analysis due to a low task response rate. The remaining 19
subjects’ BOLD and CBF task responses were modelled using a standard FEAT general linear
model (GLM) (FMRIB’s Software Library, www.fmrib.ox.ac.uk/fsl) with high pass filtering (cut
off 80s). Functional data were registered to the high resolution T1 weighted structural image
using FLIRT, FMRIB’s linear image registration tool (M Jenkinson & Smith, 2001), with 6 degrees
of freedom. The high-resolution images were then registered to the Montreal Neurological
Institute (MNI) standard space with 12 degrees of freedom. FEAT contrasts were set up to
investigate positive and negative task vs. rest activity. A second set of contrasts modelled linear
response changes over time, using the task timing regressor to model the average change
across the experiment as opposed to a block by block change (see supplementary figure 7.11).
Cluster based thresholding was applied to define significant BOLD and CBF task responses
(z>2.3, p < .05, FDR corrected). All subject’s data (n = 19) were then entered into a higher-level
FEAT analysis to help define functional ROIs for further analysis.
7.2.5.3 Definition of ROIs
2 ROIs were selected for investigation of BOLD, CBF and rCMRO2 responses during SRT
performance; i) the global mean task response (MR), and ii) global linear signal decrease over
time (LD). Both ROIs were defined from the intersection between statistically significant BOLD
and CBF responses. The ROIs were defined from positive responses only.

Chapter 7
189
7.2.5.4 Calculation of Percentage BOLD and CBF Signal Changes
Percentage relative signal changes from rest and over time were calculated by dividing the
appropriate FEAT contrast image by the baseline perfusion image for CBF data or mean the
mean functional image for BOLD data. These changes were calculated using the average signal
across the experiment from the task regressor rather than a block by block analysis. As
quantitative perfusion maps cannot be incorporated into the FEAT analysis framework, CBF is
reported in relative percentage changes rather than absolute ml/100g/min unit changes for
the main analysis as the main aim was to determine changes in perfusion during the task rather
than absolute CBF.
To estimate task BOLD and CBF signal at the start and end of the task, a linear signal change
across the task was assumed. Each subject’s mean linear response change across the task was
calculated for each ROI. Then, to achieve an estimate of the signal at the start of the task 50%
was added to the mean signal, and to estimate signal at the end of the task, 50% of the mean
value was subtracted. For example, if subject 1 had a 10% CBF increase from baseline when
averaging across all 6 task blocks, a 15% change from baseline would be assumed for the start
of the task (block 1) and a 5% change from baseline at the end of the task (block 6).
7.2.5.5 CBF Quantification
M0 of blood was calculated from the calibration image where equilibrium magnetisation of
cerebrospinal fluid (CSF) was determined from voxels in the ventricles. M0 of CSF was
converted to M0 blood using a blood water density scaling constant (0.87 ml/ml) (Donahue et
al., 2010). A single compartment model (Wong et al., 1998) was used to estimate CBF in
ml/100g/min.
7.2.5.6 BOLD and CBF CVR to CO2
The CO2 response was calculated using the CVR analysis method described by Bright & Murphy
(2013) where the beta weight calculated for the CO2 regressor reflects the percentage BOLD
or CBF signal change caused by hypercapnia. This change is quantified in % signal change per
mmHg unit increase in end-tidal CO2. CVR was calculated using the average timeseries in each
ROI used. As the timing of the haemodynamic response is not uniform across the brain and
there are delays in the physiological response to CO2, the end-tidal CO2 regressors were shifted
according to the best fit to the data, calculated from fitting 97 time shifts to the data. CVR was
calculated for each ROI (as described in Chapter 3 for single inversion time CVR data).

Chapter 7
190
7.2.5.7 RCMRO2 Calculation
Figure 7.2 Equations from (Davis et al., 1998) for the calculation of M (A) and rCMRO2 (B). BH and FH are BOLD and CBF CVR measures, α represents the change in CBV as a function of CBF, and β represents the relationship between blood oxygenation and the BOLD signal, F(t) = CBF at time (t), B(t) = BOLD at time (t).
The Davis model (Davis et al., 1998a) was used to calculate rCMRO2 from normalised BOLD and
CBF data in each ROI. The hypercapnia measurement was performed to estimate the scaling
parameter M (see Figure 7.2A) which represents the estimated maximum BOLD signal
response upon washout of all deoxyhaemoglobin per the calibrated fMRI equation from Davis
et al. (1998). This model assumes that the targeted level of hypercapnia does not change
CMRO2. The values for α and β must also be assumed. In the model, α represents the change
in CBV as a function of CBF, the original value of this exponential as proposed by Grubb (1974)
was 0.38 to describe arterio-venous blood volume. More recently it has been established that
the volume of the deoxyhaemoglobin compartment, venous CBV, is what is required to
calculate M. Chen & Pike (2010) used steady-state flow and volume changes to estimate the
power–law relationship between CBV and CBF and the model fit produced a coefficient of 0.18
which is comparable to simulation work from Griffeth & Buxton (2011) and values between
0.18-0.23 and are more commonly used at 3T. However, being a biological parameter, actual
α values are likely to vary with age, health status and under different experimental conditions.
The parameter β which equals 1.5 in the original equation is a constant representing the
relationship between blood oxygenation and the BOLD signal. As relaxivity is field dependent
an optimised value of 1.3 tends to be used at 3T (Bulte et al., 2012; Mark, Fisher, & Pike, 2011).
Values of α = 0.20 β =1.3 were used in this study in line with Bulte et al. (2012). These values
were input into the model for calculation of M and rCMRO2 changes.
A
B

Chapter 7
191
7.2.6 Statistical Analysis
All statistical comparisons were carried out using SPSS Version 20 (IBM Corp., Armonk, N.Y.,
USA). Paired t-tests were corrected using Bonferroni corrections for multiple comparisons
where relevant and significant at p < 0.05 using two-tailed tests. Normality was assessed using
the Shapiro-Wilk test, all variables were >.05 indicating normality.
7.3 Results
7.3.1 Behavioural Data
A
B
Figure 7.3 Average response accuracy per block (A), and average response time (B) across each task block. Error bars represent the standard error of the mean. Blocks 3, 6 and 9 (shown in red) represent pseudorandom sequence blocks.
A one-way repeated measures ANOVA was carried out to compare performance across
sequence blocks. Mauchley’s test for sphericity was significant with p < 0.001, therefore
70
75
80
85
90
95
100
1 2 3 4 5 6 7 8 9
% C
OR
REC
T R
ESP
ON
SES
SRT BLOCK NUMBER
SRT Response Accuracy
340
350
360
370
380
390
400
410
1 2 3 4 5 6 7 8 9
RT
(M
S)
SRT BLOCK NUMBER
SRT Reaction Time

Chapter 7
192
degrees of freedom were corrected using Greenhouse-Geisser estimates of sphericity, ε = .441.
The results showed that there was a significant effect of time on performance; response
accuracy improved over time; F(2.2, 38.3) = 12.47, p < 0.001. Follow up comparisons indicated
that all subsequent blocks had a significantly higher accuracy rate than block one. A direct
comparison showed a 16.9±9% accuracy improvement from block 1 to block 6, p = 0.007.
Accuracy was higher in sequence blocks than random blocks, except sequence block 1 which
had the lowest performance of all blocks (Figure 7.3A). Random blocks 1 and 2 had significantly
lower accuracy than sequence blocks 3-6, however random block 3 scores were only
significantly lower than sequence blocks 3, 4 and 6, all p < 0.05. This shows that performance
improvements over time can largely be attributed to sequence learning rather than motor
habituation to the task.
There was a significant effect of time on reaction speed; F(5, 85) = 27.98, p < 0.001, the
assumption of sphericity was met as Mauchley’s test was non-significant, p = 0.147. Follow up
comparisons showed that RT decreased by 5.1±11% from block 1 to block 6, p < 0.001. Random
blocks had a greater response latency, except for sequence block 1 as before (Figure 7.3B).
Reaction time (RT) was significantly longer in random block 1 than sequence blocks 2-6,
random block 2, RT in random blocks 2 and 3 was longer than sequence blocks 3-6, all p < 0.05.
7.3.2 Imaging Data
7.3.2.1 Group Average CVR and Task Responses
ROI BOLD CVR %/mmHg
CBF CVR %/mmHg
M % % Mean BOLD
% Mean CBF
% BOLD
Reduction
% CBF Reduction
Mean Response
0.18 (0.08) 2.3
(1)
7.8 (1.8) 0.26
(0.05)
6.9 (1.6) -0.12
(-0.02)
-8.1 (1.2)
Linear Reduction
0.17 (0.09) 2.4
(1)
7.1 (1.6)
0.25 (0.05)
6.2 (1.4) -0.21
(0.05)
-21.5 (5)
Table 7.1 Mean (SEM) CVR and M values used to calculate rCMRO2 along with the mean BOLD and CBF task responses and % BOLD and CBF signal reduction over time. % Mean = Average BOLD signal change from the mean during task blocks, or CBF change from baseline. % BOLD Reduction = Average signal relative to the mean in regions showing a linear signal decrease across task blocks. % CBF Reduction = CBF signal change from the mean perfusion across the task.

Chapter 7
193
7.3.2.2 Task Related BOLD and CBF Signal Changes
Figure 7.4 Z-score maps showing significant clusters (z= 2.3, p < 0.05, corrected) of average BOLD and CBF task-related signal increases from rest. Random blocks were not included in this analysis.
Figure 7.5 Z-score maps for Regions showing a significant (z= 2.3, p < 0.05, corrected) linear BOLD and CBF signal decrease during task blocks only over time.

Chapter 7
194
Figure 7.4 shows the mean CBF and BOLD responses to the task (task vs. rest contrast). There
were no areas showing signal reduction from baseline during the task. Figure 7.5 shows regions
where BOLD and CBF signal displayed a linear decreasing signal trend across task blocks.
7.3.3 Flow and Metabolism Changes during Task Performance
Figure 7.6 Mean Response (MR) ROI defined from the intersection of regions where both BOLD and CBF showed significant task responses (see figure 7.4 for BOLD and CBF mean task responses).

Chapter 7
195
A
B
Figure 7.7 Mean (SEM) signal changes from the mean at the start and end of the task in the mean task response MR ROI shown in Figure 7.6. 𝑥 Denotes significant difference from start values. Task mean shown for reference.
One subject was removed from analysis of the ROI shown in figure 7.7 due to a large M value
of 40% which is outside of assumed physiologically plausible limits.
For the ROI shown in figure 7.6, paired t-tests showed a significant BOLD reduction from the
start to end of the task; t(17)=-5.696, p< 0.001 [95% CIs, 0.05-0.12]. CBF was not significantly
lower from the start at the end of the task; t(17)=1.155, p = -0.264 [95% CIs, -.4-1.4]. RCMRO2
did not significantly increase from the start to end of the task; t(17)=2.068, p = 0.054 [95% CIs,
-1.5-0.2] (figure 7.7).
X
0
0.1
0.2
0.3
0.4
Mean Start End
% B
OLD
BOLD - MR ROI
0
1
2
3
4
5
6
7
8
9
MeanCBF
MeanCMRO2
Start CBF StartCMRO2
End CBF EndCMRO2
% C
han
ge
CBF and CMO2 - MR ROI

Chapter 7
196
7.3.4 Flow and Metabolism Reductions over Time
Figure 7.8 Linear decrease (LD) ROI defined from the overlap of regions where both BOLD and CBF showed a linear signal reduction over time during task performance shown in Figure 7.5.
A
B
Figure 7.9 Group average (mean ± SEM) BOLD, CBF and rCMRO2 in the ROI where a linear signal decrease was observed for BOLD and CBF across the task. ˣ Denotes significant difference from start values. Task mean shown for reference.
x
0
0.1
0.2
0.3
0.4
Mean Start End
% B
OLD
BOLD LD ROI
0
2
4
6
8
10
MeanCBF
MeanCMRO2
Start CBF StartCMRO2
End CBF EndCMRO2
% C
han
ge
CBF and CMRO2 Linear Decrease

Chapter 7
197
For the ROI shown in figure 7.8, paired t-tests showed a significant BOLD signal reduction at
the end of the task vs. the start; t(17)=-4.287, p > 0.001 [95% CIs, .10-.3]. CBF was not
significantly lower at the end of the task vs. the start; t(17)=-1.846, p = 0.082 [95% CIs, -2.3-
0.15]. RCMRO2 as in the previous ROI, did not show a significant increase from the start to end
of the task; t(17)=1.846, p = 0.082 [95% CIs, -2.3-0.15] (figure 7.9A-B).
7.3.5 Flow-Metabolism Coupling
ROI Start End t-stat p-value 95% CIs
Mean Task Response 1.7 (0.4) 2.8 (0.5) -.671 0.511 -2.6 - 1.3
Linear Signal Reduction 2.2 (0.5) 1.7 (0.4) 0.258 0.799 -1.6 - 2
Table 7.2 Ratio of CBF and rCMRO2 task-related changes for each ROI, mean (SEM)
2 additional subjects were removed from the flow-metabolism coupling results due to large
negative ratios; data from the remaining 15 subjects is reported in Table 7.2. Table 7.2 shows
the coupling ratio between CBF and rCMRO2 changes for each ROI. The coupling was within
ranges previously reported for visual (Ances et al., 2008; Uludag et al., 2004) and
motor/sensorimotor activation (Chiarelli et al., 2007; Kastrup, Kru, Neumann-Haefelin, Glover,
& Moseley, 2002). The coupling ratio decreased at the end of the task compared to the start
in the LD ROI, despite an overall rCMRO2 increase. This reduction in the coupling ratio (greater
CMRO2 changes relative to CBF changes) suggests that oxygen extraction efficiency increased
over the course of the task.
7.3.6 Results Summary
Using calibrated fMRI, we measured BOLD, CBF and rCMRO2 changes during a 12-minute
visuomotor learning paradigm; the SRT task. There were significant overlapping BOLD and CBF
task responses in bilateral motor and somatosensory cortices, cerebellum, thalamus, LOC, ACC
and left insular cortex. Statistically significant signal reductions over time were observed in the
left insula, LOC and the bilateral cerebellum in both CBF and BOLD data. Investigations of
energetic changes during task performance were confined to 2 ROIs defined from each of the
response conditions; the global mean task response (MR ROI) and the global linear signal
decrease (LD ROI) over time.

Chapter 7
198
Across both ROIs, similar trends were observed; BOLD and CBF showed increased responses
from the mean at the beginning of the task and signal reductions from the start of the task to
the end. In both ROIs, rCMRO2 was higher at the end of task vs. the mean and the starting
values. However, these differences did not quite reach statistical significance. Flow-
metabolism coupling ratios decreased over time in the LD ROI but increased in the MR ROI.
The coupling decrease was driven by the CBF response decreases relative to rCMRO2 response
increases over time, and the increase in the MR ROI by smaller overall CBF reductions relative
to rCMRO2 reductions. Taken together, the results suggest an altered coupling of CBF and
rCMRO2 during task learning; as the task progressed, CBF and BOLD were, on average, showing
signal reductions while rCMRO2 increased. Increasing rCMRO2 over the course of the task
suggests that tissue OEF was increasing. In other words, despite less CBF being required as the
task progressed, more oxygen was being extracted from blood flowing to regions involved in
task-performance.
The results demonstrate the feasibility of measuring CBF and rCMRO2 changes during learning
and offer new information on the relationship between CBF and oxygen metabolism changes
during sequence learning. This novel information about flow-metabolism coupling during
complex behavioural tasks is an important step in determining regional flow and metabolism
coupling in the healthy brain, which will inform the characterisation of alterations in neural
energetics with ageing and disease.
7.4 Discussion
7.4.1 Energetic Changes during Task Performance
Regarding the anatomical location of task responses, activity was identified in regions typical
of a visuomotor learning task, i.e. motor, visual, attention and information processing
networks. Decreases over time were noted in the contralateral cerebellum, insula and LOC
which can be attributed to task learning based on the improved accuracy and reaction times
over task blocks. The cerebellum is critically involved in motor learning and coordination of
voluntary movement, therefore decreases in this region coinciding with improved task
performance may represent a shift towards automated performance of the motor task. The
insula has been associated with hand to eye motor coordination, while the LOC is primarily
involved in shape discrimination; signal reductions in these regions may also be attributed to
increased skill and less effort required to perform the task. BOLD and CBF responses
overlapped to a degree although BOLD activity in all regions was less localised than CBF. BOLD

Chapter 7
199
signal has lower specificity than CBF despite higher SNR, and this study highlights the
importance of including CBF measures where spatial specificity of responses is required.
However, one drawback of the lower CBF SNR is that this may have reduced group level activity
due to higher between-subject variation. Therefore, in studies without a pre-defined ROI,
combining BOLD and CBF exploits the strengths of both techniques, allowing key ROIs to be
defined from the overlap between BOLD and CBF weighted images, but also enables regional
differences in BOLD and CBF responses to be identified so that potential metabolic alterations
due to task demands or pathology can be investigated.
The signal reductions over task blocks observed in this study are in line with previous work
showing within-session signal decreases as task-relevant skill acquisition occurs (Floyer-Lea &
Matthews, 2004; Karni et al., 1995). The novelty finding of this study is that despite BOLD and
CBF signal deceases from the start to end of the task, rCMRO2 increased. This is somewhat
counterintuitive, as CBF and CMRO2 are typically shown to be positively coupled (Hoge et al.,
1999; Uludag et al., 2004) during activation and deactivation. However, as rCMRO2 changes
over time during visuomotor learning have not been previously reported on this short
timescale, it is possible that skill training leads to alterations in energy demand and the way in
which the brain utilises oxygen. There is little information on changes in CMRO2 during any
form of learning in the calibrated fMRI and PET literature. Most quantitative fMRI studies use
visual stimulation or motor tapping to probe rCMRO2 changes from baseline rather than
studying more complex cognitive processes and changes with task training. It is possible that
typical coupling between CBF and CMRO2 is altered during motor tasks, as described by Vafaee,
& Gjedde (2004) or indeed during any task requiring more complex cognitive processing than
passive visual stimulation or simple finger tapping. Vafaee & Gjedde (2004) used PET to
compare regional CBF (rCBF) and CMRO2 responses in regions activated during a thumb flexion
task carried out at a range of frequencies, but did not look at changes over time. The results
showed that CBF and CMRO2 responses differed between regions as did the coupling between
them. For example, cerebellum CBF increases were not accompanied by significant CMRO2
changes, and at all frequencies (1-4 Hz) right putamen CMRO2 increases were greater than CBF
increases.
The current results may be true reflections of energetic changes during visuomotor learning,
but require validation in future studies. In this study, we have averaged over continuous
changes in neural activity due to the short task duration to calculate mean rCMRO2 responses

Chapter 7
200
and then calculated start and end values for BOLD, CBF and rCMRO2. Continuous, or block by
block rCMRO2 values across the 12 minutes would build a clearer picture of the timecourse of
CBF and rCMRO2 changes, and coupling alterations at specific stages of sequence learning.
However, with the method used here, the timeseries would simply be too noisy so that rCMRO2
changes would only reflect noise in the fMRI signal. Currently, averaging over a large number
of data points is needed to get reliable rCMRO2 estimates. For a continuous approach to be
viable, improvements in data acquisition to increase data quality are necessary, such as the
use of PCASL which offers greater labelling efficiency, and background suppression which
serves to reduce signal fluctuations due to physiological noise, motion and improve the
stability of the signal.
Additional studies are required to validate this result, however there are several potential
explanations for the observed change in coupling between CBF and rCMRO2. When a task
continues to be performed over a period of time, signal changes, usually reductions, in the
fMRI response, it is generally attributed to an increase in neural efficiency, however, this does
not explain the mechanisms driving response changes. Poldrack (2015) suggested a number of
neurobiological alternatives to the catch-all neuronal efficiency explanation which are relevant
to this study and may partially explain the observed changes.
The first potential mechanism for the CBF and BOLD reductions is a change in neuronal firing
intensity with learning. It is possible that the same populations of neurons continue to fire
during task performance, but the intensity (Hz) in certain regions critical for learning is less
frequent as the task becomes less demanding. This could lead to lower energy (CBF)
requirements to support cellular (neurons, glia and astrocytes) activity. However, following the
same logic, a concurrent reduction in task-induced CMRO2 increases would also be expected if
energy demands were lower by the end of the SRT task performance.
A second explanation is that the speed of processing may increase so that neurons fire for
shorter periods of time to perform the same task, resulting in lower measured fMRI responses.
This explanation is unlikely given our current understanding of brain energy metabolism as
rCMRO2 would typically decrease if CBF demand was reduced. The only way this explanation
would fit with the current results is if there was a switch in metabolic capacity with learning so
that despite a reduced haemodynamic response over time there is an increase in OEF and

Chapter 7
201
rCMRO2. The trend towards increasing rCMRO2 over time is intriguing given that Shannon et
al. (2016) reported a decrease in CMRO2 following visuomotor task performance. However, it
is possible that rCMRO2 changes observed during and following motor training depend on task
difficulty and/or length of training. Skill learning may increase the metabolic capacity of the
brain, perhaps even temporarily, leading to increased tissue OEF and CMRO2. Xiong et al.
(2009) reported rCBF increases following motor training and discussed the potential role of
cytochrome oxidase (CO) in training dependent energetic changes. CO is a rate-limiting enzyme
involved in oxidative phosphorylation, the major energy-synthesizing pathway used by the
brain, and is up-regulated in rodents during learning, both in Pavlovian conditioning type
training and spatial working memory training (Sakata et al., 2005). In these studies CO
histochemistry was used to assess the metabolic history of brain regions and CO upregulation
is interpreted as an increase in metabolic capacity. Xiong et al. (2009) suggested that CO
upregulation in humans during motor training may lead to rCMRO2 increases. If true, this could
explain the rCMRO2 increase despite an overall decreasing CBF. Again, more work using similar
paradigms is needed to determine the validity of this result and provide evidence for this
potential mechanism. Lastly, these results must be interpreted with caution as the rCMRO2
increases were not statistically significant and this trend may have emerged due to noise-
related variability across the group.
The high variability of responses between subjects requires further investigation. It is possible
that inter-subject variation in functional brain activity is high during learning, however, the
variability may also be due to data quality or low SNR as discussed above. There were a number
of negative BOLD signal average task responses, which are unlikely to occur in this type of task.
As rCMRO2 changes are calculated from BOLD and CBF this potential inaccuracy will propagate
through the model leading to inaccurate estimations. However, as BOLD signal is calculated as
a percentage change from the mean in this case, it is possible that there was a signal true
reduction and to class this data as outliers may be inappropriate.
Obtaining accurate estimates of rCMRO2 using the Davis model can be difficult due to its
simplicity. While the model has held up under many experimental conditions and is still widely
used 20 years almost following the publication of the method, any noise in the CVR or task
BOLD and CBF is problematic, as demonstrated.
In a task such as the SRT, with highly variable responses over time it is difficult to determine
the repeatability of results without comparable studies. However, studies such as that by

Chapter 7
202
Vafaee & Gjedde (2004) show that different regions recruited by the same task produce non-
uniform changes in BOLD, CBF and rCMRO2. Second, Krieger et al., (2014) showed that BOLD
and CBF responses during a motor learning task had high inter and intra-subject variability,
suggesting that individual response variability may be high during visuomotor learning, but
also that typical imaging sequences and paradigms may not be refined enough to reliably
measure continuous learning-related BOLD and perfusion responses. However, the authors
concluded that CMRO2 was more stable and repeatable than BOLD and CBF, suggesting that
the magnitude of relative BOLD and CBF changes may be preserved as rCMRO2 depends on
both parameters. So although absolute values differ across subjects and sessions, relative
changes may be reliable and rCMRO2 could be a robust marker of learning-related changes in
brain activity. In summary, we report promising results in using this technique to quantify brain
changes during a learning task, but it is also clear that attention must be paid to sources of
variability between subjects and over time in future work.
7.4.2 Flow-Metabolism Coupling
The central mechanism behind BOLD imaging is that CBF increases much more than CMRO2
upon neural activation so that blood oxygenation increases with brain activity (Ogawa et al.,
1993). For example, during visual stimulation CBF increases by approximately twice the CMRO2
increase with much smaller increases in BOLD, ~0.05% of CBF (Hoge et al., 1999). More
recently, Uludag et al. (2004) reported CBF changes 2.2 times greater than CMRO2 changes
during visual stimulation. Both Hoge et al. (1999) and Uludag et al. (2004) found strong linear
coupling between the CBF and CMRO2 increases under graded visual stimulation. In contrast,
somatosensory stimulation responses do not follow the same coupling ratio. Fox & Raichle
(1986), reported only a 5% CMRO2 increase for a 29% CBF increase in the somatosensory
cortex, meaning that CBF increased nearly 6 times that of CMRO2. Motor tasks such as finger
movement show coupling ratios ranging from 1.24 to 3 (Chiarelli et al., 2007; Kastrup et al.,
2002) and this variation may be due to differences in the type of stimulation or task used. The
degree of coupling between CBF and CMRO2 in other brain regions has not been clearly
established, nor is it clear how processes such as learning affect the flow-metabolism coupling.
Uludag et al. (2004) reported that activation and deactivation trends vary in a similar fashion
in visual cortex, but it is not clear if this trend is uniform across the brain and under different
levels of cognitive load. The current results show CBF-CMRO2 coupling within previously
reported ranges (see table 7.2) for both ROIs for task mean, start and end values. In the LD
ROI, the ratio of CBF to rCMRO2 changes decreased from the start to end of the task showing

Chapter 7
203
that as task adaptation or learning occurred, the slope between CBF and CMRO2 task responses
was reducing, in line with the BOLD reductions and rCMRO2 increases observed across task
blocks. As discussed above, this could indicate an increase in metabolic capacity, or efficiency,
i.e. increased oxygen extraction fraction (OEF) with task learning, so that more energy is being
extracted from less blood.
Future work using dual-calibrated FMRI, such as in Chapter 5, could provide additional insight
into the nature of metabolic changes during tasks such as the SRT, by measuring OEF and
absolute CMRO2 changes during learning. Additionally, a longer task duration, or multiple
imaging sessions would allow us to identify when CMRO2 increases and CBF deceases level off
and whether flow-metabolism coupling changes again during the late learning or consolidation
periods.
7.4.3 Limitations
The study had several limitations. Previous work studying cerebrovascular changes during
cognitive tasks have used much longer paradigms than the 12-minute task used here. Only 6
sequence blocks were included here due to time limitations within the scan session, meaning
that SNR was relatively low for the purposes of looking at individual 45 second block activity.
For this reason, we chose to assume BOLD and CBF responses at the beginning and end of the
task based on the mean response. While this is an imperfect approach, it allowed us to
estimate response adaptation over time. In future, calculating responses on a block-by-block
basis would yield more accurate estimations.
Also, using a block-by-bock approach and including additional task blocks, would allow
‘chunking’ of the data into early, intermediate and late blocks to examine differences between
the 3 stages of learning with increased SNR. For example, Olson et al. (2006) incorporated
three 20 minute SRT blocks in their protocol which served to dilute the effects of transient
anomalies in activity and build a more reliable picture of average group responses. While the
12-minute task is useful for measuring short term learning differences between patients and
controls and to limit head motion and fatigue effects, to quantitatively assess neural
adaptation to learning, longer paradigms should be used along with larger sample sizes to
establish whether the variability observed in this study is due to real individual differences or
simply noise in the data.

Chapter 7
204
Secondly, it is important to mention that there is evidence suggesting hypercapnia may not be
isometabolic and CMRO2 can decrease by up to 13% using a 5% CO2 mixture (F. Xu et al., 2011).
Bulte et al. (2012) tested the effect of metabolism reduction due to hypercapnia on oxygen
extraction fraction (OEF), which would directly affect CBF, and found that it had very little
effect overall ( < ±0.04 fractional OEF). We have not factored potential metabolism reductions
into the model in this instance, based on Bulte et al’s (2012) conclusions.
7.4.4 Conclusions
This study shows BOLD and CBF reductions over time during a visuomotor learning task,
alongside increases in rCMRO2. In keeping with this trend the flow-metabolism coupling ratio
decreased over time in regions where a mean task response was identified, and decreased
where there was a mean signal decrease over task blocks. The results demonstrate the
application of calibrated fMRI to study energetic changes in the brain during learning, and the
results suggest change in coupling between CBF and oxygen metabolism during task
performance that suggests a more efficient oxygen extraction with learning (higher OEF). High
inter-subject variability means that further research is warranted to validate the findings using
similar paradigms and understand the effects of learning on the brain’s metabolic capacity and
changes in energetic demands as skill acquisition occurs.

Chapter 7
205
Chapter 7 Supplementary Information
A
B
C
-8
-4
0
4
8
12
2 6 10 14
% r
CM
RO
2 C
han
ge
% CBF Task Response
MR ROI - CBF/CMRO2 at Task Start
-8
-4
0
4
8
12
-2 2 6 10 14
% r
CM
RO
2 C
han
ge
% CBF Response
MR ROI - CBF/rCMRO2 at Task End
-8
-4
0
4
8
12
-2 2 6 10 14
% r
CM
RO
2 C
han
ge
% CBF Task Response
LD ROI - CBF/rCMRO2 at Task Start

Chapter 7
206
D
Figure 7.10 Relationship between CBF task responses and rCMRO2 changes at the start and end of the task in both
ROIs for each subject.
Figure 7.11 FEAT model set up showing the regressors used to model the mean task response and linear signal change over time
-8
-4
0
4
8
12
-2 2 6 10 14
% r
CM
RO
2 C
han
ge
% CBF Response
LD ROI - CBF/rCMO2 at Task End

Chapter 8
207
Chapter 8
Resting CBF Changes Following a Single Session of
Visuomotor Training
Abstract
Introduction: When studying processes which involve functional neuroplasticity such as
visuomotor learning, what happens in the resting brain is potentially as important as activity
during tasks. Changes in the baseline state following task training may represent metabolic
adaptations involved in skill acquisition and learning which are not evident during task
performance. This study had several aims; to quantify resting state CBF before and after
performance of a single session of an SRT and pseudorandom (PR) sequence task and to
investigate RSFC of M1 before and after task training to identify potential task-related
metabolic alterations underlying changes in connectivity. Methods: 22 young adults were
scanned twice using a dual-excitation PCASL sequence for simultaneous BOLD and CBF
acquisition. In one session participants completed a 10-minute SRT where 10 minutes of
resting PCASL data was acquired before and after. In a separate session, participants
performed a control motor task consisting of a pseudorandom task matched in component
movements. We examined CBF differences following performance of both task conditions
focusing on i) regions showing a mean task response, and ii) regions displaying a linear signal
reduction over time during the task. CBF was also compared before and after task performance
in areas showing differential M1 BOLD and CBF RSFC pre- and post-task.
Results and Discussion: Resting CBF was not significantly different following SRT task
performance in regions showing a mean task response or in regions showing a mean signal
decrease across task performance. However, greater pre-SRT training relative to post-training
RSFC with M1 was identified in the right planum polare and temporal pole, and in the LOC and
lingual gyrus post-training M1 RSFC was greater than pre-training. Again, resting CBF did not
significantly change in these areas following SRT performance. Analysis of the PR task data
showed that resting CBF was significantly higher post training in the mean task response ROI.
In the ROI representing the linear signal reduction over task blocks, resting CBF was
significantly lower post PR task performance. The results suggest that task-specific metabolic

Chapter 8
208
adaptations occur following visuomotor task performance, however, further work is needed
to clarify the nature of quantitative CBF changes in task-relevant regions.
8.1 Introduction
When studying processes which involve functional neuroplasticity such as motor learning,
what happens in the resting brain is potentially as important as activity during task
performance (Albert et al., 2009). Changes in the baseline state following task training may
represent metabolic adaptations involved in skill acquisition and learning which are not
evident during task performance. Non-invasive imaging studies, i.e. without contrast agent,
measuring functional brain plasticity have, for the most part, relied on BOLD fMRI and studied
task response adaptations within-session (Floyer-Lea & Matthews, 2004) or over several weeks
(Hlustik, Solodkin, Noll, & Small, 2004) during task performance (see chapter 6 for additional
details on these studies), although within-session CBF changes during task performance have
been reported (Fernandez-Seara et al., 2009). These studies have revealed initial BOLD or CBF
response increases, followed by signal reductions with task practice, characteristic of
visuomotor learning (Doyon & Benali, 2005; Ungerleider et al., 2002). However it is necessary
to determine the specific energetic changes underlying plasticity, both to understand how
healthy brain physiology changes with learning, and to exploit the brain’s capacity for plasticity
in disease (Lipp & Tomassini, 2015; Tomassini, Matthews, et al., 2012; Zeller & Classen, 2014).
Xiong et al. (2009), using PET, showed that baseline CBF increases in the resting state likely
explained the reduced task activation after 4 weeks of motor training. This important study
provided a degree of mechanistic explanation for the functional changes observed during
motor learning, by showing altered baseline CBF after 4 weeks of training. In the study
reported in this chapter, we were interested in whether sustained cerebral blood flow (CBF)
changes could be observed after a single session of motor task training as BOLD resting state
functional connectivity (RSFC) changes have been reported on this timescale, but without any
investigation of sustained flow or metabolism alterations in task or resting state networks
(RSNs).
For example, Albert et al. (2009) reported fronto-parietal and cerebellar BOLD RSFC network
changes following a short, 11-minute sequence learning task (SRT) and these changes did not
occur with a motor performance control task without a learning component. Sami et al. (2014)
in a later study from this group, recorded BOLD RSFC for 10-minutes immediately, 30 minutes
and 6 hours following either implicit or explicit SRT performance. In the explicit condition,

Chapter 8
209
frontal and cerebellar networks showed enhanced connectivity along with visual areas
immediately following training. At 30 minutes, cerebellum connectivity to the thalamus and
basal ganglia (BG) was increased, and at 6 hours sensory-motor RSFC was greater. In the
implicit condition, there was increased connectivity in primary motor cortex (M1) and sensory-
motor areas following the task, at 30 minutes a similar cerebellar-thalamic-BG network
showed greater connectivity, and at 6 hours, there was increased connectivity in medial
temporal cortex, but lower RSFC in M1 and sensory-motor regions.
These studies show time-dependent RSFC changes related to motor learning, and may reflect
different stages of processing and consolidation related to skill learning. However, using BOLD
fMRI alone does not identify the nature of vascular and metabolic adaptations in the resting
state underlying motor learning. Using quantitative methods to measure cerebral blood flow
(CBF), and the cerebral metabolic rate of oxygen consumption (CMRO2) where possible, can
clarify whether sustained metabolic changes occur in areas recruited during task performance,
and in areas where rapid task response reductions occur. Further, determining whether CBF
changes occur in areas where connectivity differences are observed pre and post training,
would allow greater interpretation of the metabolic basis for RSFC changes following motor
learning.
Almost all RSFC studies use BOLD fMRI due to its high SNR and wide availability. Second, there
is a belief that task-independent BOLD may provide clearer information on mechanisms of
motor learning than task-based BOLD where changes from an unknown baseline are measured
(Ma, Narayana, et al., 2011). Inability to quantify the BOLD signal still limits the understanding
of the neurophysiological basis of changes where the resting vasculature is abnormal, as does
the fact that it is not possible to separate CBF, CBV and CMRO2 changes contributing to the
measured BOLD change. In addition, the BOLD signal suffers from signal drift over long scan
times (Olson et al., 2006), greater susceptibility artefacts and lower spatial specificity than
perfusion measures obtained with ASL (Chen, 2015). An alternative to BOLD RSFC is perfusion-
based RSFC using ASL. Viviani et al. (2011) demonstrated statistically significant correlations
between BOLD and CBF connectivity of the default mode network (DMN) in a large sample (n
= 265), but found that baseline CBF did not predict the strength of functional connectivity,
suggesting the two measures represent independent sources of biological differences. Jann et
al. (2015) comparing BOLD and ASL RSFC, showed moderate to high levels of overlap between
BOLD and CBF connectivity, but more reliable between session and between scanner
reproducibility with BOLD imaging. In the study by Jann et al. (2015), regional CBF was found

Chapter 8
210
to correlate positively with core hubs of ASL and BOLD RSFC networks, in line with similar
findings by Liang et al., (2013) in the default mode network. This finding suggests that ASL can
be used to assess baseline metabolism, not just in studies of connectivity networks, but also
to assess the effects of an intervention, such as motor training, on resting metabolism.
Perfusion imaging may therefore be well-suited to investigations of resting state vascular and
metabolic alterations underlying motor plasticity. Further, there is strong correlation between
ASL and PET resting state and task-based metrics (Cha et al., 2013; Kilroy et al., 2013) allowing
quantification of metabolic processes without the need for exogenous contrast agents.
Finally, lack of statistical power is a problem in many fMRI studies and increases the likelihood
of type I and type II errors (Button et al., 2013). Power analyses can be difficult to conduct a
priori where the expected effect size is not known, or where the aims are exploratory, such as
in validating new methods or investigating a relatively new area without pilot data or similar
published work. Also, sample sizes are often limited by practical considerations such as funding
allocation for scan costs reducing the motivation to conduct power analyses. Although, effect
sizes and observed power can be calculated from most published studies, reporting the results
of a post-hoc power analysis can aid interpretation of the results, as well as providing an
accessible guide for future studies using similar designs.
This study had several aims;
• To quantify resting state CBF before and after performance of a single session of an
SRT and pseudorandom (PR) sequence task. We were interested in sustained CBF
changes following task performance in regions showing a mean task response, and
regions where activity was decreasing throughout the task.
• Use ASL to investigate RSFC of M1 before and after task training to identify potential
task-related metabolic alterations underlying changes in connectivity
• Conduct a post-hoc power analysis of the main statistical comparisons to inform
related future studies and to provide a measure of confidence in the results.
8.2 Methods
8.2.1 Participants
22 healthy right-handed individuals (14 female, mean age = 22±3) were recruited from posters
placed around Cardiff University. The study was approved by the Cardiff University School of
Psychology Research Ethics Committee and performed in accordance with the guidelines

Chapter 8
211
stated in the Cardiff University Research Framework (version 4.0, 2010). All participants were
non-smokers.
8.2.2 Experimental Paradigm
The aim of the study was to measure CBF changes attributed to sequence learning and not
motor execution. For this reason, participants were scanned twice on separate days. In one
session participants performed a repeated 8-item sequence (SRT condition) and in the other
session, pseudorandom non-repeating number sequences (PR condition). The order of task
and random sessions was counterbalanced across subjects. Both block design tasks lasted 10
minutes and consisted of 13 blocks of 32 items. Each block was separated by rest periods of
varying durations from 13-30 seconds. Rest durations were identical in sequence and random
task sessions. 10 minutes of resting state data was acquired either side of the task presentation
within the same functional run to ensure all subjects data was acquired on exactly the same
timescale.
Before each session participants were informed that they would be asked to respond using a
button box to the location of circles on the screen and to respond as quickly and as accurately
as possible. This was considered an implicit learning task as participants were not told that a
repeating sequence was present in the SRT condition. A modified version of the task used in
Chapter 4 was used, the same visual stimuli and set up was used, the only changes being task
duration, inter-stimulus interval (ISI) (variable from 400-800ms) and the number sequence.
The sequence used was 1 2 1 4 2 3 4 3, corresponding to the first 8 cues of Curran's (1997)
second order predictive sequence where a cue can only be predicted using the previous two
cues. The sequence contains two reversals, 121 and 343. In a random sequence, the probability
of a reversal is 1/3*6 when repeating stimuli is not allowed. Vaquero et al. (2006)
demonstrated slowed response times for reversals, hence it is important to match the number
of reversals to expected occurrence frequency in a random sequence. This is needed when
performance on predefined sequences is being compared to that on random or pseudorandom
sequences where the number of reversals is of a statistically expected level.
In the random task session, subjects were presented with blocks of a 32 item ‘sequence’ to
match the duration of the sequence learning blocks. Stimuli were matched for reversals and
no repeating stimuli were allowed as before. Participants did not see or practice the task
before the scan sessions.

Chapter 8
212
Figure 8.1 Schematic of the SRT task presentation. The red circle appeared in each of the four boxes in the specified repeating or pseudorandom motor task (PR).
8.2.3 Image Acquisition
Acquisition of functional data was carried out using a 2D gradient echo dual-excitation
pseudocontinuous ASL (PCASL) sequence with EPI readout, PICORE Q2TIPS, GRAPPA 3, 16
slices, 3.4x3.4x7mm voxel size with 1mm gap, TR1/TR2=3600/800ms, TE1/TE2=3/30/ms,
TI=1500ms, tagging duration=1500ms, FOV=220mm, matrix size 64x64, in-plane resolution
~3.4mm2, flip angle 90, bandwidth=2298 Hz/pixel, EPI factor 64, echo spacing= 0.54ms, phase
encode direction A>>P. Two nonselective adiabatic inversion pulses were applied 950 ms and
300 ms prior to image acquisition for background suppression. A time-of-flight (TOF)
angiogram was performed to select the tagging region for the PCASL acquisition; TR/TE =
40.65/5.60ms, FOV =240, slice thickness 1.3mm, bandwidth 300 hz/pixel, transversal
orientation R>>L phase encode direction. A calibration image was acquired to determine M0 of
blood quantification of CBF data; TR1 = 6000ms, all other parameters identical to the
functional acquisition.
A T1-weighted 3D MPRAGE was acquired for registration of functional data; TR/TE/TI =
2300/2.96/900ms, slice thickness/gap 1.2/0.6mm, FOV 256mm, 176 slices, bandwidth 240
Hz/pixel.
Physiological monitoring and recording of CO2 and O2 end-tidal traces was carried out using a
nasal cannula connected through a sampling line to a gas analyser system (ADInstruments,
Bella Vista, Australia).
Figure 8.2 Schematic of the functional imaging run excluding preparation scans. SRT = Sequence Learning Task, PR = pseudorandom motor task.

Chapter 8
213
8.2.4 Data Analysis
Custom Matlab (Mathworks Inc., MA, USA) scripts were used to separate the data into CBF
and BOLD timeseries. Motion correction was performed using FSL MCFLIRT (Motion Correction
FMRIB’s Linear Image Registration Tool), slice timing correction and spatial smoothing (FWHM
= 5mm) was applied. The first four volumes of the BOLD and CBF timeseries were removed to
ensure the signal had reached a steady state. A GLM was then fit to the full BOLD and CBF-
weighted timeseries for each subject for the SRT and PR task runs using FILM (FMRIB's
Improved Linear Model) (https://fsl.fmrib.ox.ac.uk/fsl/) a nonparametric estimation
algorithm. Prewhitening was applied to correct for autocorrelation between timepoints. The
GLM was performed to determine regions of interest (ROIs) for SRT and PR task responses, and
signal decreases across task blocks. These ROIs were identified to quantify CBF in task-relevant
regions before and after task performance.
FLIRT (FMRIB’s Linear Image Registration Tool) was used to perform linear image registration
of functional data to standard space via individual subject T1-weighted images for subsequent
group-level analysis. T1-weighted images were first brain extracted using BET (Brain Extraction
Tool) to delete non-brain tissue.
8.2.5 ROI Definition from Task Responses
Group-level analysis of BOLD and CBF responses was conducted to identify regions recruited
by the SRT and PR tasks. ROIs were created from the overlap between BOLD and CBF positive
task responses, thresholded at z > 2.3, p < 0.05, FDR corrected. Separate ROIs were created for
the SRT and PR task runs. ROIs were defined from the intersection of BOLD and CBF task
responses. Group-level ROIs were transformed to individual subject space via the T1-weighted
image using FLIRT for creation of individual subject ROI masks.
8.2.6 CBF Quantification
M0 of blood was calculated from the calibration image where equilibrium magnetisation of
cerebrospinal fluid (CSF) was determined from voxels in the ventricles (Lu, Clingman, Golay, &
Van Zijl, 2004). A single compartment PCASL kinetic model described by (Jiongjiong Wang et
al., 2005) with labelling efficiency of 0.85 and T1blood = 1.65s, was then applied to the first-
excitation data to convert perfusion to units of ml/100g/min.
8.2.7 Resting State Functional Connectivity
A seed-based analysis was conducted. The intersection between M1, anatomically defined
using the Harvard-Oxford Cortical Atlas (within FSL), and areas of M1 where task responses

Chapter 8
214
were reducing over task blocks in both BOLD and CBF data, was selected as the connectivity
seed. The filtered CBF and surround averaged BOLD timeseries, were extracted for the M1
seed for each subject and used as regressors in a second GLM analysis. CBF was quantified in
areas showing both BOLD and CBF RSFC differences before and after task performance.
8.2.8 Statistical Analysis
All statistical comparisons were carried out using SPSS version 20 (IBM Corp., Armonk, N.Y.,
USA). Paired t-tests were conducted using bootstrapping (1000 samples, 95% CIs). All reported
ANOVA results are reported following Bonferroni corrections and all group data reported as
mean ± SEM unless stated otherwise.
2x2 repeated measures ANOVAs were conducted to investigate a) CBF before and after task
performance in regions showing an overall positive task response and b) CBF differences due
to task condition (SRT or PR). This CBF analysis was carried out twice; with and without
normalisation for resting PETCO2 as arterial CO2 fluctuations can have substantial effects on the
resting state signal (Murphy, Birn, & Bandettini, 2013b; Wise et al., 2004). CBF was normalised
by dividing CBF in each ROI by the mean PETCO2 value cross the rest period. This was considered
appropriate as the CBF- PETCO2 is linear within small PETCO2 changes (F. B. Tancredi & Hoge,
2013).
A power analysis was conducted using G*Power, version 3.1.9.2 (Faul, Erdfelder, Buchner, &
Lang, 2009; Faul, Erdfelder, Lang, & Buchner, 2007) to determine observed power in the
current study, and the required sample size in future studies to detect an effect of task training
on resting CBF. For ANOVAs, effect sizes are reported as partial eta squared (n2p). T-test effect
sizes were calculated using the Cohen’s dz formula which is the mean change score divided by
the standard deviation of change. Both Cohen’s dz and n2p values were calculated using Lakens
(2013) effect size calculator. These values were input into G*Power to determine the effect
size f, observed power and sample size required for a two-way test with power of 0.8 and 95%
confidence intervals (CIs).

Chapter 8
215
8.3 Results
8.3.1 Behavioural Results
Figure 8.3 Mean ± SEM accuracy across the group for the SRT and pseudorandom sequence tasks.
Figure 8.4 Reaction times (mean ± SEM) per block for the SRT and pseudorandom task conditions.
35
45
55
65
75
85
95
1 2 3 4 5 6 7 8 9 10 11 12 13
Acc
uar
cy %
Block Number
Accuracy per BLock on SRT and Random Conditions
SRT Random
250
270
290
310
330
350
370
390
1 2 3 4 5 6 7 8 9 10 11 12 13
Rea
ctio
n T
ime
(ms)
Block Number
Reaction Times per Block for SRT and Random Conditions
SRT Random

Chapter 8
216
One subject was excluded from the analysis as they did not complete the study. As expected,
reaction times were faster overall for the SRT learning task along with higher response
accuracy (Figures 8.3 & 8.4). Paired t-tests were used to identify accuracy and reaction time
(RT) differences between the first and last task blocks, and between the SRT and PR conditions.
There were significant improvements in accuracy from block 1 to block 13 for the SRT
condition; t(20)=4.787, p < 0.001, and the PR condition; t(20)=3.231, p = 0.004. Accuracy was
not significantly different between the SRT and PR conditions for block 1; t(20)=1.142, p =
0.268, or block 13; t(20)=.441, p = 0.664. For RT, there was a significant reduction from block
1 to block 13 for the SRT; t(20)=4.014, p = 0.001, but not the PR condition; t(20)=1.951, p =
0.067. RT was not significantly different between the SRT and PR conditions in block 1;
t(20)=0.188, p = 0.853, but RT was significantly shorter in the SRT condition by block 13;
t(20)=3.476, p = 0.003. The behavioural data demonstrates gains in reaction time in the SRT
condition, reflective of motor sequence learning.
8.3.2 Resting CBF in Task-Recruited Regions
Paired t-tests revealed a significant decrease in PETCO2 at rest following SRT training. PETCO2
decreased from a group mean of 34.64 (0.8) mmHg pre-training to 33.7 (0.9) mmHg post-
training; t(20)=2.745, p=0.012 [95% CIs, 0.2-1.5]. This was not observed for the random task
condition where PETCO2 was 33.8 (0.7) mmHg pre-task and 33.2 (0.6) mmHg post-task;
t(20)=0.824, p=0.420 [95% CIs,-0.4-1].
CBF data for each ROI was therefore analysed with and without PETCO2 normalisation to explore
effects of PETCO2 differences on CBF. The GLM analysis identified BOLD and CBF task responses
in bilateral primary motor (M1) and supplementary motor cortex (SMA), lateral occipital cortex
(LOC) and cerebellum (all z = 2.3, p < 0.05) for the SRT and PR task conditions (see figure 8.5).
In the analysis without PETCO2 normalisation, the repeated measures ANOVA showed that
there was not a significant interaction between time (pre and post training) and condition (SRT
or PR task), F(1, 20)=0.238, p=0.638. There was also not a significant main effect of time, F(1,
20)=2.435, p=0.134 [95% CIs, -.28-1.95], or condition, F(1, 20)=0.366, p=0.366 [95% CIs, -.2-
5.3].
When this data was reanalysed with PETCO2 normalisation, a significant interaction effect
emerged; F(1, 20)=5.080, p=0.036, but no main effect of time; F(1, 20)=2.806, p=0.109, or
condition; F(1, 20)=0.127, p=0.725. Follow-up paired tests of simple main effects revealed that

Chapter 8
217
CBF was significantly higher post-training in the PR condition only; t(20)=3.031, p = 0.007 [95%
CIs, 0.01-0.07] (figure 8.6). No other CBF changes were approaching significance.
Group-level voxelwise comparison of SRT and PR task runs was carried and no significant task
response differences between the SRT and PR runs were identified.
Figure 8.5 Group-level SRT and PR task responses, (z > 2.3, p < 0.05). SRT = Serial Reaction Time task, PR = pseudorandom sequence task. ROI was defined from regions showing both a BOLD and CBF significant task responses.
A
495051525354555657585960
SRT R1` SRT R2 PR R1 PR R2
CB
F m
l/1
00g
/min
CBF in Mean Task Response ROI

Chapter 8
218
B
Figure 8.6 Mean ± SEM CBF pre- and post-training in the ROI defined from the mean SRT and PR task responses (A) and the same data following PETCO2 normalisation (CBF/ PETCO2) (B). R1= Rest 1, R2 = Rest2. * denotes significant difference between R1 and R2 group CBF at p < 0.05.
8.3.3 Linear Signal Reductions across Task Blocks
Linear reductions in BOLD and CBF responses over the duration of the task runs were identified
in the right M1, superior parietal lobule (SPL), angular gyrus, supramarginal gyrus (SMG),
anterior cingulate cortex (ACC) and cuneal cortex for the SRT. For the PR task, reductions were
identified in the right M1, SMG, inferior frontal gyrus (IFG) and bilateral ACC. The overlap
between BOLD and CBF linear signal reductions over time for the SRT and PR tasks were
defined as ROIs for CBF quantification (see figure 8.7). A repeated measures ANOVA was
conducted as above. In the analysis without PETCO2 normalisation there was a significant
interaction effect between time and condition; F(1, 20)=10.457, p=0.004. There was not a
significant main effect of condition; F(1, 20)=0.058, p=0.816. However, there was a main effect
of time; F(1, 20)=7.609, p=0.014. Follow up comparisons of simple main effects revealed that
CBF was significantly lower post PR task performance; t(20)=3.592, p = 0.002 [95% CIs, -0.07-
1.6]. No other comparisons were approaching significance.
With PETCO2 normalisation there was also a significant interaction effect; F(1, 20)=16.474, p =
0.001. As before there was not a main effect of condition; F(1, 20)=0.273, p = 0.607, but there
was a main effect of time; F(1, 20)=8.060, p = 0.010. Follow-up tests to look at simple main
effects revealed the same effect as the previous analysis; CBF was significantly lower post PR
task performance; t(20)=4.066, p=0.001 [95% CIs, 0.08-0.25], with no other comparisons
nearing statistical significance (figure 8.8). Average CBF reductions of 6.3 ± 1.7 ml/100g/min
and 0.16 ± 0.04 (CBF/CO2) were observed for the original and normalised CBF for the PR task
*
*…
1
1.05
1.1
1.15
1.2
1.25
1.3
1.35
1.4
1.45
1.5
1.55
1.6
SRT R1 SRT R2 PR R1 PR R2
CB
F/P
ETC
O2
ml/
10
0g/
min
Normalised CBF - Mean Task Response

Chapter 8
219
condition respectively. For the SRT condition, average CBF was higher post-task; 1.2 ± 1.4 and
0.04 ± 0.01 for original and normalised data.
Group-level comparisons of the CBF and BOLD SRT and PR task decreases over time revealed
no significant differences between task responses reduction over time.
Figure 8.7 Group-level linear signal reduction across task blocks for SRT (left) and PR (right) task conditions.

Chapter 8
220
B
Figure 8.8 Mean ± SEM CBF pre- and post-training in the ROI defined from the linear signal decreases during SRT and PR task performance (A) and the same data following PETCO2 normalisation (B). R1= Rest 1, R2 = Rest2. * denotes significant difference between R1 and R2 group CBF at p < 0.05
8.3.4 Resting Motor Network CBF Changes
M1 seed (figure 8.9) RSFC differences before and after SRT and PR task performance were
investigated. In the PR task session, there were no statistically significant differences in BOLD
or CBF RSFC between baseline and post-task. For the SRT there were significant CBF RSFC
differences only, therefore CBF was quantified in these regions only as no overlap with BOLD
was observed.
In M1 regions showing a significant BOLD and CBF task response decrease over time, higher
CBF RSFC with the right planum polare and temporal pole was detected pre-training (figure
*
*
11.05
1.11.15
1.21.25
1.31.35
1.41.45
1.51.55
1.6
SRT R1 SRT R2 PR R1 PR R2
CB
F/P
ETC
O2
ml/
10
g/m
in
Normalised CBF - Linear Task Decrease
*
*
56
58
60
62
64
66
68
70
72
74
76
SRT R1` SRT R2 PR R1 PR R2
CB
F m
l/1
00
g/m
in
CBF - Linear Task Decrease
A

Chapter 8
221
8.10). Following SRT training, the same M1 seed showed greater connectivity with the right
LOC and lingual gyrus (figure 8.11).
Figure 8.9 Seed regions for the RSFC analysis. M1 as defined by the Harvard-Oxford Cortical Atlas shown in red. On the left the SRT task seed is shown in blue and on the right the PR task seed is shown in yellow.
Figure 8.10 Higher M1 connectivity pre-SRT training in the planum polare and temporal pole.

Chapter 8
222
Figure 8.11 Increased M1 connectivity post-SRT training in the lateral occipital cortex and lingual gyrus.
CBF was quantified for the ROIs showing increased connectivity before and after SRT training.
There was not a significant change in CBF for the ROI showing increased RSFC before training;
t(20)=1.833, p = 0.082 (figure 8.12A), nor was there a significant change in the ROI showing
increased RSFC following training; t(20)=1.901, p = 0.072 (figure 8.12B).

Chapter 8
223
A
B
Figure 8.12 CBF (without normalisation) pre- and post SRT task performance in the ROIs shown in figures 8.10 and 8.11 (mean ± SEM).
8.3.5 Power Analysis for Future Studies
A post-hoc power analysis was conducted based on the interaction effect size for the
normalised and non-normalised ANOVAs investigating CBF differences pre and post task. In
addition, power was assessed for the comparison of CBF in regions showing increased RSFC
pre and post training (table 8.1).
Power Analysis
F Tests Effect Size η2p Observed Power
Required n for power of 0.8
Mean Response ROI 0.11 0.3 69
Mean Response ROI (CO2 norm) 0.2 1 22
45
46
47
48
49
50
51
52
Pre Post
CB
F m
l/1
00
g/m
in
CBF in Regions Showing Greater Pre-SRT RSFC to M1
44
45
46
47
48
49
50
51
52
Pre Post
CB
F m
l/1
00
g/m
in
CBF in Regions Showing Greater Post-SRT RSFC to M1

Chapter 8
224
Power Analysis
Linear Decrease ROI .35 1 4
Linear Decrease ROI (CO2 norm) .45 1 5
T Tests Effect Size dz
SRT Pre-Training RSFC 0.4 0.41 52
SRT Post-Training RSFC 0.41 0.43 49
Table 8.1 A power analysis was conducted for the main statistical comparisons to inform sample size considerations in future studies.
8.4 Discussion
8.4.1 Summary of Main Results
The main aim of this study was to quantify CBF changes in the resting brain following
performance of a visuomotor learning task, the SRT, and a pseudorandom sequence response
task, to investigate metabolic adaptations underlying motor system plasticity. We examined
CBF differences following performance of both task conditions focusing on i) regions showing
a mean task response, and ii) regions displaying a linear signal reduction over time. CBF was
also compared before and after task performance in areas showing differential M1 CBF RSFC
pre- and post-task. Results showed that resting CBF was not significantly different following
SRT task performance in regions showing a mean task response, or in regions showing a mean
signal decrease across the 13 task blocks. However, greater pre-SRT training RSFC with M1 was
identified in the right planum polare and temporal pole, and greater post-training CBF was
identified in the LOC and lingual gyrus. Again, resting CBF did not significantly change in these
areas following SRT performance. Analysis of the PR task data showed that resting CBF was
significantly higher post training in the mean task response ROI. In the ROI representing the
linear signal reduction over task blocks, resting CBF was significantly lower post PR task
performance. There was not a statistically significant difference in RSFC of M1 with any region
before or after task performance.
A post-hoc power analysis revealed that follow-up studies would benefit from larger samples
as small to medium effect sizes were observed for each of the main CBF comparisons in this
study (table 8.1).

Chapter 8
225
8.4.2 CBF in Task-Relevant Areas
BOLD and CBF task responses were observed in the motor network including M1, premotor
cortex and primary somatosensory cortex (S1), cerebellum, and visual regions typical of
visuomotor tasks (Miall & Robertson, 2006; Ungerleider, Doyon, & Karni, 2002). Spatially, there
was little difference between the SRT and PR task responses. Of note, activity was not detected
in the cortico-striatal loop and frontal regions frequently associated with the early phase of
motor learning (Doyon & Benali, 2005). This may be due to susceptibility-induced signal
distortion in frontal and temporal regions, a common drawback of EPI (G. Xu et al., 2011). The
use of 3D or spiral acquisitions can partially overcome such artifacts, however neither options
were available at the time of data acquisition.
In line with previous work (Fernandez-Seara et al., 2009; Floyer-Lea & Matthews, 2004; Seitz
& Roland, 1991), signal reductions over task blocks were observed within the session and signal
decreases were more widespread for the SRT than the PR task condition (see figure 8.7) which
may reflect more similar neural energy demands across all blocks of the PR task than the SRT,
as evidenced by the lack of a significant RT decrease by the end of the PR task.
In this study, we were interested in identifying markers of metabolic adaptations following
performance of a motor learning task. Short-term motor learning is an indicator of motor
system plasticity (Doyon & Benali, 2005) which is reflected by neural response adaptations
with repeated performance of a motor sequence. To overcome the limitations of interpreting
BOLD changes during or following task performance, we quantified CBF in the resting brain,
before and after performance of the SRT task and control PR task to identify whether greater
CBF changes would occur following motor learning compared to motor performance (Albert
et al., 2009). Unexpectedly, significant resting CBF increases post-task were observed for the
PR condition only. At rest, in areas which had shown mean signal decrease across the PR task,
a significant CBF reduction was detected. In the mean response ROI, this effect was only
observed following CBF normalisation for PETCO2 changes, which demonstrates the importance
of correction for effects of physiological fluctuations.
Non-neuronal physiological processes such as arterial CO2 (PaCO2) fluctuations can affect the
resting BOLD and ASL signal, especially in occipital and temporal grey matter (Golestani, Chang,
& Chen, 2015; Grubb, Raichle & Eichling, 1974; Wise, Ide, Poulin, & Tracey, 2004), therefore it
is important to account for these effects to correctly interpret resting-state data. Task
performance can alter breathing patterns, and this may have continued at rest. In the current
study, PETCO2 which is believed to reflect PaCO2 was sampled throughout the study and

Chapter 8
226
included as a regressor in the GLM analyses to minimise the effect of fluctuations on measured
task responses and RSFC. Overall, the results with and without PETCO2 normalisation displayed
the same trends, however, in the mean response ROI the increase in CBF post PR task
performance was not evident before normalisation. While a statistically significant PETCO2
reduction was noted only in the SRT condition, the CBF-normalised data did not reveal any
task-effects masked by CO2 differences. However, in the PR condition the slight reduction in
PETCO2 appeared to hide the post-task CBF change in the mean task response ROI. It can be
concluded that PETCO2 alterations can mask task-related CBF changes, and motor learning
studies should include PETCO2 measures in analysis.
Previous work (Olson et al., 2006), did not find group level motor learning effects in BOLD or
CBF data, potentially due to low SNR and insufficient power. Another reason may be that the
data was acquired using a single echo, meaning that the necessary trade-off between BOLD
and CBF-weighted images may have resulted in low sensitivity to both perfusion and BOLD
changes. Alternative data acquisition methods, such as the dual-excitation PCASL sequence
used in the current study have improved simultaneous BOLD and CBF acquisitions to enable
identification of motor learning adaptations as observed in this study during task performance.
This study aimed to extend existing work, which has reported changes in resting state BOLD
connectivity following motor learning (Albert et al., 2009; Saber Sami et al., 2014), by
identifying sustained CBF changes following motor learning. However, evidence for metabolic
adaptations in areas involved in motor learning was not observed. Instead, CBF changes
following performance of a motor execution task, without a learning component were
identified. As the order of task conditions per subject was counterbalanced and the PR task
matched in duration, and component movements, this effect was unlikely to be due to order
effects or differences in motor execution difficulty.
The reduction in resting CBF in the PR condition where linear CBF and BOLD reductions were
observed over task blocks is suggestive of altered metabolic demand in portions of right M1,
SMG, IFG and the ACC following the task. In contrast, for the linear decrease ROI in the SRT
condition, mean CBF was non-significantly higher overall in right M1, SPL, angular gyrus, SMG,
ACC and cuneal cortex. It is possible that differences in task demand (motor learning vs. motor
execution) underlie the different effects seen in the two task conditions. However, the
reduction in CBF was expected in the SRT condition where the task becomes relatively easier
to perform as the sequence is learned. In the PR condition, task difficulty stays the same as a
new sequence is presented in each block. At present, the reason for this result is not easily

Chapter 8
227
explained and would benefit from further exploration in future studies investigating metabolic
changes following motor learning and motor execution tasks.
8.4.3 Resting State Functional Connectivity
A seed-based RSFC analysis was chosen as we were specifically interested in metabolic changes
in regions functionally connected to M1 due to its role in motor learning. RSFC analysis is based
on the assumption that functionally associated brain regions have measurable temporally
correlated fluctuations (Biswal, Yetkin, Haughton, & Hyde, 1995). As M1 is critical to motor
performance and motor learning, if sustained SRT task-related metabolic adaptations occur
over short timescales, these are likely to occur in areas showing altered RSFC to M1.
Unexpectedly, BOLD RSFC appeared not to change following SRT performance. Increases in
CBF RSFC of the right lingual gyrus and LOC were observed following the SRT task and M1 RSFC
was greater pre-task in the right temporal pole and planum polare. No changes were evident
for the PR task, which may reflect the absence of a task learning component and therefore a
lack of motor network adaptation. The spatially distinct areas of greater CBF RSFC before and
after the SRT task, may reflect a degree of motor learning. The LOC, which showed greater
post-task M1 connectivity is related to object perception and recognition (Grill-spector,
Kourtzi, & Kanwisher, 2001) and the lingual gyrus is linked to processing of complex visual
information and analysis of logical conditions and event order (Goel & Dolan, 2004;
Machielsen, Rombouts, Barkhof, Scheltens, & Witter, 2000). The temporal pole and planum
polare which were more highly connected to M1 pre-SRT task, have been linked to processing
of emotional information and language processing respectively (Binder et al., 1997; Olson &
Plotzker, 2007). The lingual gyrus has previously shown increased CBF during the early phase
of motor learning (Fernandez-Seara et al., 2009) and resting state activation of the LOC has
also been found following implicit motor learning (Saber Sami et al., 2014). These RSFC
increases post-SRT training may therefore reflect sustained metabolic alterations, however the
small CBF difference pre- and post-task does not clarify the nature of these changes. Further,
the power analysis suggests the study was not powered to detect a real effect with this
comparison, therefore further work in a much larger sample is needed to determine the
directional change in CBF in regions displaying altered RSFC with M1 following visuomotor
learning.
It could be argued that a single session may not be long enough to see connectivity changes in
motor-basal ganglia and motor-cerebellar networks as observed by Ma et al., (2010) following
4 weeks of training, for example. However, Albert et al. (2009) and Sami et al. (2014) reported

Chapter 8
228
altered BOLD RSFC in sample sizes of 9 and 29 respectively, following performance of a motor
learning task and these changes were attributed to increases in metabolic demand related to
memory consolidation of previously acquired skills occurring in the so-called resting state. In
this study, changes in BOLD M1 RSFC were not observed, the only M1 RSFC differences
exceeding the statistical threshold were noted in the CBF data before and after the SRT task,
but not the motor execution task in line with Albert et al., (2009) who reported motor-learning
specific effects. Data quality or choice of sequence may have influenced results. Data were
inspected for excessive head motion, which can decrease functional connectivity strength (Dijk
et al., 2010). The output of MCFLIRT motion correction revealed all subjects absolute head motion
was < 0.8mm. Further, CO2 fluctuations were accounted for by adding the PETCO2 traces as a
regressor in the analysis. Although some cardiac and respiratory noise may have been present due
to the absence of these recordings, it is unlikely to explain the absence of BOLD RSFC changes.
The use of the dual excitation sequence necessitated a long (4.4s) effective TR in order to
achieve full brain coverage, but also to facilitate an optimal labelling duration and post-label
delay time established during piloting. This meant that the TR used was not optimal for BOLD
which may have led to lower sensitivity to detect small fluctuations in the resting state, despite
being adequate to detect motor task responses. Typical TRs for BOLD are between 2-3s,
although longer TRs have been used successfully, although infrequently, in BOLD functional
connectivity studies (Horn, Jann & Federspiel et al., 2012). Dual-acquisition sequences with
long TRs have elsewhere been shown to affect BOLD temporal SNR, resulting in lower t-scores
on activation maps and lower number of activated voxels (Fernández-Seara, Rodgers, Englund,
& Wehrli, 2016). Although dual-excitation sequences can be optimised for both ASL and BOLD
in terms of TE, the inversion time and tagging duration must be long enough to label an
adequate amount of blood and ensure it reaches the tissue before images are acquired to
minimise arterial contributions in ASL data. Dual-excitation sequences may not be the most
optimal approach for BOLD RSFC studies; future studies aiming to quantify CBF changes
following motor learning should perhaps use CBF RSFC only to achieve the best data quality,
or combine multiband multi-echo acquisitions (Cohen, Nencka, Lebel, & Wang, 2017) to
improve resolution and image distortion in both BOLD and ASL data.
Seed based analysis is reliant on the seed being unaffected by noise and representative of the
process of interest. Motor and visual tasks tend to provide sufficiently robust responses from
which to define a seed area (Beckmann, Deluca, Devlin, & Smith, 2005) due to the typical
response magnitude. However, unlike ICA, where connectivity metrics are data-driven, seed-

Chapter 8
229
connectivity analysis is based on a-priori assumptions about regional connectivity, or in this
case, where task-related changes will occur. While it is sensible to predict motor network
connectivity changes following a visuomotor task, and use a seed defined from the task
activity, it is possible that with motor learning, plasticity occurs outside of the site of task
activation and may be dependent on pre-training motor experience or skill (Adkins, Boychuk,
Remple, & Kleim, 2006). Further analysis of known networks involved in motor learning, such
as cortico-striatal and cortico-cerebellar loops, could be investigated as sites of altered RSFC
and metabolism following visuomotor task performance.
ASL has long been suggested as a more powerful tool than BOLD for group analysis when using
low frequency tasks or long paradigms (Jiongjiong Wang et al., 2003), however low sensitivity
to small flow changes has hampered its widespread application in cognitive and clinical
research. Recent hardware and pulse sequence optimisation, such as the use of background
suppression, has improved SNR, spatial coverage and ASL can provide quantitative measures
of baseline perfusion, task activation and functional connectivity (Chuang et al., 2009).
Baseline or resting perfusion is associated with RSFC strength (Liang, Zou, He, & Yang, 2013;
Jann et al., 2015) providing a neurophysiological basis for resting network connectivity.
Repeated practice of a particular skill is thought to induce Hebbian like learning processes
where long term potentiation and depression (LTP and LTD) are altered due to synaptic
remodelling following skill acquisition (Shannon et al., 2016). Metabolic changes reflective of
synaptic plasticity can be quantified using ASL and used to characterise learning processes in
the healthy brain as well as identifying pathological changes affecting learning in disease.
8.4.4 Limitations
In this study cardiac and respiratory traces were not regressed from the fMRI data due to an
equipment failure and some degree of physiological noise may have been present in the data.
While we are aware of the importance of physiological noise regression (Bright & Murphy,
2013b) it was not possible in this case and is therefore a limitation of the study.
Global signal regression (GSR) of the resting state timeseries is a controversial technique and
there is no general consensus on whether it should be incorporated into the processing of
resting data (Murphy & Fox, 2017). The main reason for the conflicting opinions on the use of
GSR, is that the global signal includes some neuronal as well as physiological fluctuations (Chen
et al., 2012). GSR can potentially introduce spurious negative or anti-correlations with the
timeseries of the seed region. As we were interested in both positive and negative RSFC in this
study we did not carry out GSR. However, GSR can also improve specificity of positive

Chapter 8
230
correlations and remove cardiac and respiratory noise and may have improved the detection
of true RSFC changes following task performance.
Doyon & Benali (2005) stated that to understand the mechanisms of functional plasticity
occurring during learning and automatization of motor skills, methods including functional
connectivity analysis to detect changes in network communication were necessary. We believe
that in addition to traditional BOLD RSFC analysis, quantification of CBF and CMRO2 in regions
critical for motor skill learning, especially in areas showing dynamic changes at different
learning phases, can provide detailed information on the metabolic changes facilitating
plasticity.
8.4.5 Future Research
An alternative technique to ASL, with applications in plasticity research, is vascular space
occupancy (VASO) imaging of blood volume (Lu et al., 2013) which can be used to measure
task activity in specific cortical layers. This technique has been demonstrated using motor
paradigms (Huber, Goense, et al., 2015) and provides a high-resolution quantitative alternative
to BOLD and CBF imaging. More suitably powered studies, ideally with training and follow-up
imaging on the order of weeks or months are needed to determine whether sustained
metabolic changes occur following motor learning. However, in future methods such as VASO
could be used as a sensitive measure of changes in learning-related connectivity within and
between cortical layers. In addition, quantitative CBV measures obtained using VASO could be
used as a marker of angiogenesis. Angiogenesis is increased following physical exercise training
(Pereira et al., 2007) but it is not known if motor skill learning has similar effects in humans,
although vascular plasticity has been shown to be critical for learning and memory in rodents
(Kerr, Steuer, Pochtarev, & Swain, 2010).

Chapter 8
231
Chapter 8 Supplementary Data
8.5 Individual Subject CBF
SRT Task Condition
Mean Response ROI Linear Decrease ROI
Pre-Task
Post-Task CBF
ml/100g/min
Pre-Task Post-Task % CBF
ml/100g/min
sub01 58.6 56.9 -1.7 67.0 69.4 2.4
sub02 42.7 43.2 0.5 49.9 49.5 -0.3
sub03 74.2 72.9 -1.3 79.9 88.8 9
sub04 58.1 58.8 0.7 65.9 63.1 -2.8
sub06 75.3 71.7 -3.6 91 86.7 -4.3
sub07 57.2 58.7 1.5 77.8 70.5 -7.2
sub08 64.4 64 -0.4 73.9 68.9 -5
sub09 52 50.3 -1.7 56.4 53.8 -2.6
sub10 52.7 51.3 -1.4 60.5 53.7 -6.9
sub11 54.1 54.7 0.6 59.7 60.2 0.5
sub12 71.9 66.8 -5.1 83.1 79.9 -3.2
sub13 67.9 58.6 -9.3 75.7 69.7 -6
sub14 65.4 71.5 6.1 75.9 76.7 0.8
sub15 38.5 41.3 2.8 40.5 47.8 7.3
sub16 59.9 56.1 -3.8 69 67.7 -1.3
sub17 54.1 57.1 3 66 77.4 11.4
sub18 50.1 52.9 2.8 56.2 60 3.8
sub19 62 57.7 -4.3 65.1 63 -2.1
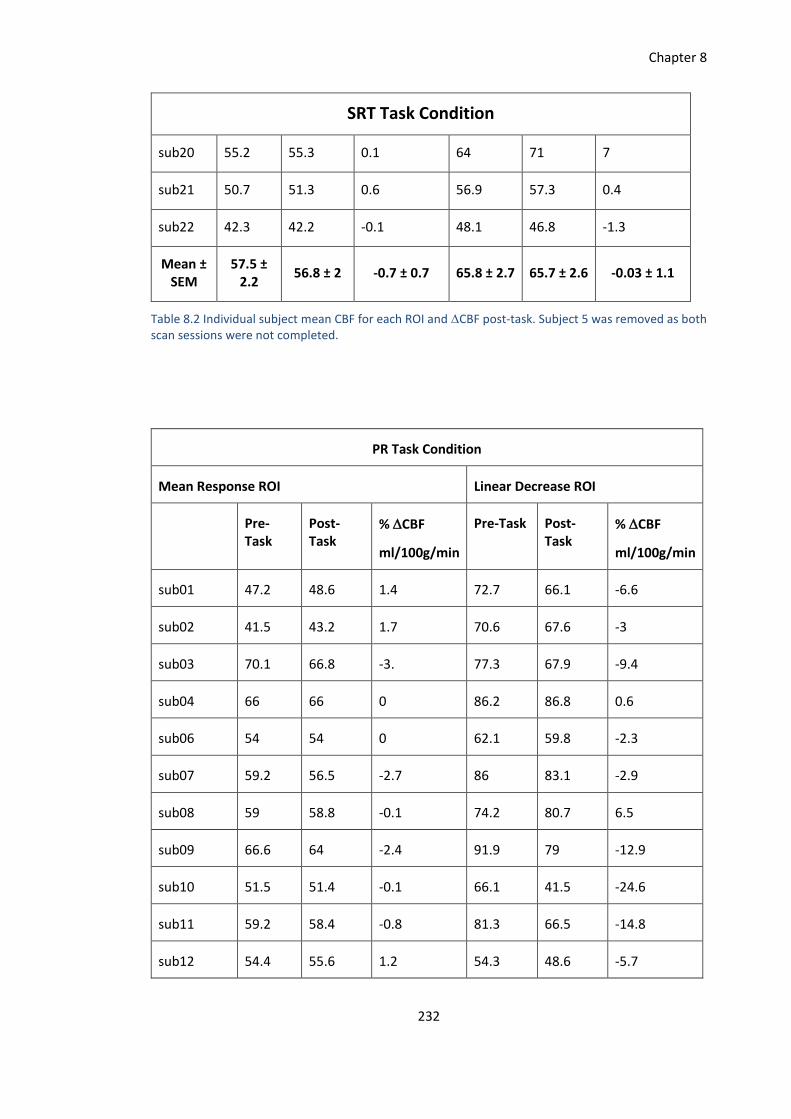
Chapter 8
232
SRT Task Condition
sub20 55.2 55.3 0.1 64 71 7
sub21 50.7 51.3 0.6 56.9 57.3 0.4
sub22 42.3 42.2 -0.1 48.1 46.8 -1.3
Mean ± SEM
57.5 ± 2.2
56.8 ± 2 -0.7 ± 0.7 65.8 ± 2.7 65.7 ± 2.6 -0.03 ± 1.1
Table 8.2 Individual subject mean CBF for each ROI and CBF post-task. Subject 5 was removed as both scan sessions were not completed.
PR Task Condition
Mean Response ROI Linear Decrease ROI
Pre-Task
Post-Task
% CBF
ml/100g/min
Pre-Task Post-Task
% CBF
ml/100g/min
sub01 47.2 48.6 1.4 72.7 66.1 -6.6
sub02 41.5 43.2 1.7 70.6 67.6 -3
sub03 70.1 66.8 -3. 77.3 67.9 -9.4
sub04 66 66 0 86.2 86.8 0.6
sub06 54 54 0 62.1 59.8 -2.3
sub07 59.2 56.5 -2.7 86 83.1 -2.9
sub08 59 58.8 -0.1 74.2 80.7 6.5
sub09 66.6 64 -2.4 91.9 79 -12.9
sub10 51.5 51.4 -0.1 66.1 41.5 -24.6
sub11 59.2 58.4 -0.8 81.3 66.5 -14.8
sub12 54.4 55.6 1.2 54.3 48.6 -5.7

Chapter 8
233
PR Task Condition
sub13 71.3 63.5 -7.8 103.9 86.3 -17.6
sub14 56.9 60 3.1 62.3 52.9 -9.4
sub15 44.9 41.1 -3.8 76.7 72 -4.7
sub16 52.5 50.4 -2.1 52.3 55.7 3.4
sub17 47.8 43.7 -4.1 58.5 50.3 -8.2
sub18 53 52 -1 55.8 60.1 4.3
sub19 68.3 66.8 -1.5 81.5 74.9 -6.6
sub20 55.6 58.1 2.5 41 44.9 3.9
sub21 51.7 50.6 -1.1 49.4 43 -6.4
sub22 46.4 46.2 -0.2 61.6 52.1 -9.5
Mean ± SEM
56 ± 1.9 55 ± 1.7 -1.1 ± 0.55 69.8 ±
3.4 63.7 ±
3.2 -6 ± 1.7
Table 8.3 Individual subject mean CBF for each ROI and CBF post-task.
8.6 G*Power Output
Mean Response ANOVA
F tests - ANOVA: Repeated measures, within factors
Analysis: Post hoc: Compute achieved power
Input: Effect size f = 0.1102078
α err prob = 0.05
Total sample size = 21
Number of groups = 1
Number of measurements = 4
Corr among rep measures = 0.7
Nonsphericity correction ε = 1
Output: Noncentrality parameter λ = 3.4008126
Critical F = 2.7580783
Numerator df = 3.0000000
Denominator df = 60.0000000
Power (1-β err prob) = 0.2904289

Chapter 8
234
Mean Response ANOVA
F tests - ANOVA: Repeated measures, within factors
Analysis: A priori: Compute required sample size
Input: Effect size f = 0.1102078
α err prob = 0.05
Power (1-β err prob) = 0.8
Number of groups = 1
Number of measurements = 4
Corr among rep measures = 0.7
Nonsphericity correction ε = 1
Output: Noncentrality parameter λ = 11.1740984
Critical F = 2.6488634
Numerator df = 3.0000000
Denominator df = 204
Total sample size = 69
Actual power = 0.8023706
Mean Response ANOVA (CO2 normalised)
F tests - ANOVA: Repeated measures, within factors
Analysis: Post hoc: Compute achieved power
Input: Effect size f = 0.5046832
α err prob = 0.05
Total sample size = 21
Number of groups = 1
Number of measurements = 4
Corr among rep measures = 0.7
Nonsphericity correction ε = 1
Output: Noncentrality parameter λ = 71.3174371
Critical F = 2.7580783
Numerator df = 3.0000000
Denominator df = 60.0000000
Power (1-β err prob) = 1.0000000
Mean Response ANOVA (CO2 normalised)
F tests - ANOVA: Repeated measures, within factors
Analysis: A priori: Compute required sample size
Input: Effect size f = 0.5046832
α err prob = 0.05
Power (1-β err prob) = 0.8
Number of groups = 1
Number of measurements = 4
Corr among rep measures = 0.7
Nonsphericity correction ε = 1
Output: Noncentrality parameter λ = 16.9803422
Critical F = 3.4902948

Chapter 8
235
Numerator df = 3.0000000
Denominator df = 12.0000000
Total sample size = 5
Actual power = 0.8461089
Linear Decrease ANOVA
F tests - ANOVA: Repeated measures, within factors
Analysis: Post hoc: Compute achieved power
Input: Effect size f = 0.7225441
α err prob = 0.05
Total sample size = 21
Number of groups = 1
Number of measurements = 4
Corr among rep measures = 0.7
Nonsphericity correction ε = 1
Output: Noncentrality parameter λ = 146.1796
Critical F = 2.7580783
Numerator df = 3.0000000
Denominator df = 60.0000000
Power (1-β err prob) = 1.0000000
Linear Decrease ANOVA
F tests - ANOVA: Repeated measures, within factors
Analysis: A priori: Compute required sample size
Input: Effect size f = 0.7225441
α err prob = 0.05
Power (1-β err prob) = 0.8
Number of groups = 1
Number of measurements = 4
Corr among rep measures = 0.7
Nonsphericity correction ε = 1
Output: Noncentrality parameter λ = 27.8437321
Critical F = 3.8625484
Numerator df = 3.0000000
Denominator df = 9.0000000
Total sample size = 4
Actual power = 0.9547112
Linear Decrease ANOVA (CO2 normalised)
F tests - ANOVA: Repeated measures, within factors
Analysis: Post hoc: Compute achieved power
Input: Effect size f = 0.9081946
α err prob = 0.05
Total sample size = 21

Chapter 8
236
Number of groups = 1
Number of measurements = 4
Corr among rep measures = 0.7
Nonsphericity correction ε = 1
Output: Noncentrality parameter λ = 230.9489
Critical F = 2.7580783
Numerator df = 3.0000000
Denominator df = 60.0000000
Power (1-β err prob) = 1.0000000
Linear Decrease ANOVA (CO2 normalised)
F tests - ANOVA: Repeated measures, within factors
Analysis: A priori: Compute required sample size
Input: Effect size f = 0.9081946
α err prob = 0.05
Power (1-β err prob) = 0.8
Number of groups = 1
Number of measurements = 4
Corr among rep measures = 0.7
Nonsphericity correction ε = 1
Output: Noncentrality parameter λ = 32.9926973
Critical F = 4.7570627
Numerator df = 3.0000000
Denominator df = 6.0000000
Total sample size = 3
Actual power = 0.9395918
RSFC CBF Change, Pre-training ROI
t tests - Means: Difference between two dependent means (matched pairs)
Analysis: Post hoc: Compute achieved power
Input: Tail(s) = Two
Effect size dz = 0.4
α err prob = 0.05
Total sample size = 21
Output: Noncentrality parameter δ = 1.8330303
Critical t = 2.0859634
Df = 20
Power (1-β err prob) = 0.4150032
RSFC CBF Change, Pre-training ROI
t tests - Means: Difference between two dependent means (matched pairs)
Analysis: A priori: Compute required sample size
Input: Tail(s) = Two
Effect size dz = 0.4
α err prob = 0.05

Chapter 8
237
Power (1-β err prob) = 0.8
Output: Noncentrality parameter δ = 2.8844410
Critical t = 2.0075838
Df = 51
Total sample size = 52
Actual power = 0.8077878
RSFC CBF Change, Post-training ROI
t tests - Means: Difference between two dependent means (matched pairs)
Analysis: Post hoc: Compute achieved power
Input: Tail(s) = Two
Effect size dz = 0.41
α err prob = 0.05
Total sample size = 21
Output: Noncentrality parameter δ = 1.8788560
Critical t = 2.0859634
Df = 20
Power (1-β err prob) = 0.4320424
RSFC CBF Change, Post-training ROI
t tests - Means: Difference between two dependent means (matched pairs)
Analysis: A priori: Compute required sample size
Input: Tail(s) = Two
Effect size dz = 0.41
α err prob = 0.05
Power (1-β err prob) = 0.8
Output: Noncentrality parameter δ = 2.8700000
Critical t = 2.0106348
Df = 48
Total sample size = 49
Actual power = 0.8029445
Table 8.4 Output from G*Power for each of the power calculations presented in table 8.1.

Chapter 8
238
8.7 M1 Resting State Functional Connectivity
Figure 8.13 M1 BOLD RSFC before (top) and after (bottom) SRT task performance, z-stat 4-6.9, p < 0.05.

Chapter 8
239
Figure 8.14 M1 CBF RSFC before (top) and after (bottom) SRT task performance, z-stat 4-7, p < 0.05.

Chapter 8
240
Figure 8.15 M1 BOLD RSFC before (top) and after (bottom) PR task performance, z-stat 4-5.9, p < 0.05.

Chapter 8
241
Figure 8.16 M1 CBF RSFC before (top) and after (bottom) PR task performance, z-stat 4-7.8, p < 0.05.

Chapter 9
242
Chapter 9
Characterising Vascular and Metabolic Dysfunction in
Multiple Sclerosis: Pilot Data
Abstract
It is now accepted that there is a vascular component to Multiple Sclerosis (MS) which
contributes to brain damage and cognitive dysfunction (D’haeseleer et al., 2011a). The
current project, which is ongoing, will build on existing work, quantifying regional CBF, CVR,
capillary cerebral blood volume (CBVcap), baseline OEF and absolute CMRO2 in 20 patients
with relapsing-remitting MS (RR-MS) and matched healthy controls using dual-excitation,
dual-calibrated PCASL fMRI.
The preliminary results demonstrate the application of the dual-calibrated PCASL acquisition
and forward physiological model used in healthy controls in Chapter 5, in a clinical
population. Here, the MS group showed significantly reduced grey matter CMRO2 (p=0.008),
baseline OEF (p=0.009), and CBVcap (p=0.013). Previous investigations have used either
quantitative but global estimates of metabolism (Ge et al., 2012) or regional but relative
estimates of CMRO2 (Hubbard et al., 2017). The current approach permits regional,
quantitative measures which in planned future analysis will be used to investigate the
relationship between baseline metabolic function and motor plasticity.

Chapter 9
243
9.1 Introduction
Multiple Sclerosis (MS) is the most common cause of neurological dysfunction in young adults
worldwide aside from traumatic brain injury (TBI) (Kingwell et al., 2013). The Multiple Sclerosis
Foundation estimates that the prevalence of MS is around 2.5million people worldwide, with
rates increasing further away from the equator. Symptoms of MS include, but are not limited
to; cognitive, motor and balance impairments, loss of vision due to optic neuritis, fatigue,
depression and bladder problems (Kister et al., 2013), all of which reduce independence and
quality of life.
Although the cause of MS is not known, the autoimmune model of MS, experimental
autoimmune encephalomyelitis (EAE) suggests that the disease is a consequence of T cell
attacks on myelin. This autoimmune response is thought to be triggered by viral infections such
as Epstein Barr, a herpes virus and one of the most common viruses in humans. The EAE model
has proved a very useful model to study the pathogenic processes of MS in non-human animals
and informed pharmaceutical treatment in humans targeting autoimmune responses. EAE
models have demonstrated how viruses trigger inflammation which over time leads to
demyelination, axonal injury and progressive neurodegeneration.
A diagnosis of MS requires objective evidence of two separate inflammatory lesions in the CNS
(brain, spinal cord, optic nerves) or objective evidence of one lesion with reasonable historical
evidence of a prior attack, according to the revised McDonald MS Diagnostic Criteria (Polman
et al., 2011). In addition to grey natter (GM) and white matter (WM) lesions caused by
inflammation, demyelination, axonal injury and gliosis are characteristic in MS along with brain
atrophy at later disease stages.
MS can develop at any stage of life but is most commonly diagnosed between 20-40 years of
age and is almost twice as common in women as men. Most patients are diagnosed with
relapsing-remitting MS (RR-MS), which is characterised by acute periods of increased
inflammation, or relapses, followed by periods of recovery. The frequency and severity of
relapses varies greatly between patients. Symptoms are also heterogeneous and the course of
disease progression is often unpredictable. Further, clinical disability is frequently not reflected
in traditional structural imaging protocols, which suggests that, additional factors such as
blood flow and oxygen availability may be compromised leading to metabolic dysfunction,
prior to significant lesion presence or atrophy. However, these processes are not detected by
traditional clinical imaging techniques which tend to focus on brain structure.

Chapter 9
244
It is now accepted that there is a vascular component to MS which contributes to brain damage
and cognitive dysfunction (D’haeseleer et al., 2011a). A growing number of studies show
cerebrovascular and metabolic alterations in RR-MS. Decreased global and regional CVR to CO2
has been demonstrated using PCASL in two studies, (Marshall, Chawla, Lu, Pape, & Ge, 2016;
Marshall et al., 2014) and correlations with lesion load and atrophy suggest that vascular
dysfunction may contribute to neurodegeneration in MS. As well as CVR decreases, in RR-MS
hypoperfusion has been reported in deep GM (Debernard et al., 2014), although increased
perfusion in white matter attributed to metabolic dysfunction has also been reported (Rashid,
Thompson & Miller et al., 2004). It is thought that hypoperfusion leads to an energy crisis in
MS which contributes to lesion development and atrophy (De Keyser, Steen, Mostert, & Koch,
2008; Juurlink, 2013). While perfusion reductions could be attributed to reduced energy
demand, diffusion tensor imaging (DTI) has demonstrated mean diffusivity (MD) reductions in
WM tracts during acute hypoperfusion (Saindane, Law, Ge, Johnson, Babb, & Grossman, 2007).
This suggests that perfusion reductions may occur prior to axonal loss. MD would be expected
to increase with axonal loss, leading to reduced energy demand and reduced perfusion (Paling,
Golay, & Miller, 2011). However, the inverse MD and perfusion correlation suggests initial
perfusion decreases lead to neuronal loss.
More focus must be given to understanding early dysfunction in energy supply and metabolism
to inform the development of new treatments which reverse or prevent further metabolic
dysfunction (D'haeseleer et al., 2013) before significant irreversible GM and WM damage
occurs. Such treatments may help to slow disease progression.
Several groups have studied metabolic function in RR-MS, and results have revealed absolute
CMRO2 and OEF reductions. In a study by Ge et al., (2012), higher global venous oxygenation
was reported along with reduced CMRO2, despite CBF being comparable to controls, which
suggests hypometabolism of oxygen in tissue. Venous oxygenation was positively correlated
with Expanded Disability Severity Scale (EDSS) scores and lesion load, whereas lesion load and
EDSS were inversely correlated with CMRO2. The downside of the method used by Ge et al.
(2012) is that only global measurements were permitted, meaning that focal areas of
dysfunction were not identified. More recently, Fan et al., (2015) assessed the repeatability of
OEF measurements using phase contrast MRI at 7T using pial veins in the sensorimotor,
parietal and prefrontal cortical regions. OEF was found to be highly reproducible, with OEF
significantly lower than controls across all region. Further, OEF correlated positively with
information processing speed in patients. Taken together, these studies show reductions in

Chapter 9
245
oxygen extraction and CMRO2, which relate to disease status, memory and lesion load.
A recent study by Hubbard et al. (2017) used calibrated BOLD during a visual stimulation task,
and DTI to investigate relationships between WM integrity and metabolic activity. Interesting
results were reported, whereby radial diffusivity (RD) of the occipital tract was inversely
correlated with BOLD signal but positively correlated with CBF and relative changes in CMRO2.
Further CMRO2 changes predicted fatigue scores on the Modified Fatigue Impact Scale (MFIS),
but were not related to lesion burden. The opposite direction of BOLD compared to CBF and
CMRO2 correlations with WM RD, may reflect failures in normal neurovascular coupling
(Iannetti & Wise, 2007a), potentially through altered baseline CMRO2, which as Hubbard et al.
(2017) suggested, may explain the increased CMRO2 during visual stimulation. The study
demonstrates that some perturbation of cerebral oxygen metabolism during stimulation is
present, however, conclusions are limited due to the measurement relative rather than
absolute changes and lack of control data.
The current project, which is ongoing, will build on this existing work, quantifying regional CBF,
CVR, capillary cerebral blood volume (CBVcap), OEF0 and absolute CMRO2 in patients with RR-
MS and matched healthy controls. The preliminary results demonstrate the application of the
dual-calibrated PCASL technique used in healthy controls in Chapter 5, in a clinical population,
an approach which combines the strengths of quantitative (Ge et al., 2012) and regional
(Hubbard et al., 2017) investigations of metabolism in MS.
The main aim of the study is to characterise cerebrovascular and metabolic dysfunction in MS,
and relate imaging outcomes to functional motor plasticity, using a modified version of the SRT
task from Chapter 8. As mentioned above, the results presented here should be considered
preliminary and demonstrate GM metabolic differences between 7 RR-MS patients and 12
(unmatched) controls.
The full study once completed, will include investigation of regional metabolism in areas
including the thalamus, putamen, frontal and motor cortices, areas where perfusion
abnormalities have been previously detected (Debernard et al., 2014; Rashid, Thompson &
Miller, 2004). Secondly, the relationship between baseline energetics and motor plasticity, will
be investigated, using lesion data, EDSS, and behavioural measures (walking ability, executive
function) to provide an improved understanding of the contribution of metabolic dysfunction

Chapter 9
246
to disease presentation.
9.2 Methods
9.2.1 Participants
Ethical approval was granted by the Cardiff University School of Psychology Research Ethics
Committee as well as a local NHS Research Ethics Committee and Research and Development
department of Cardiff and Vale University Health Board. The study is conducted in accordance
with Good Clinical Practice guidelines. 20 patients with RR-MS (EDSS < 6) will be recruited from
the Helen Durham Neuroinflammatory Centre, Department of Neurology at the University of
Wales. Age and gender matched controls will be recruited from the Cardiff University
Community Panel and poster advertisement within Cardiff University.
Note: the control data for the results reported here come from baseline data from subjects in
the Chapter 5 study and 2 matched controls for the current study.
9.2.2 Imaging Protocol
All imaging was performed on a 3T Siemens Prisma MRI system using a 32-channel head coil
(Siemens, Erlangen, Germany). Functional data were acquired using the dual-excitation, dual-
calibrated PCASL acquisition and respiratory modulation paradigm described in Chapter 5;
TR1/TR2/TE1/TE2=3600/800/10/30ms, TI/post-label delay= 1500/1500ms, 3.4x3.4x7mm
voxels with 1mm gap, 16 slices, FOV=220mm, GRAPPA=3, flip angle=90. Two nonselective
adiabatic inversion pulses were applied 950 ms and 300 ms prior to image acquisition
for background suppression. A T1-weighted MPRAGE was acquired for registration of
functional data; TR/TE/= 2100/3.19/ms, 1mm isotropic resolution.
A second dual-excitation scan, without gases, using identical parameters as the calibrated scan
was carried out during performance of an implicit learning serial reaction time (SRT) task, as
described in Chapter 8. A slight modification was made to include 3 blocks of a pseudorandom
sequence to control for response latency decreases related to task familiarisation rather than
sequence learning as in Chapter 7. Additional scans to characterise the presence of
inflammatory lesions were; a 3D FLAIR; TR/TE=5000/388ms, FOV=256mm, slice
thickness=1mm, partial Fourier 7/8, bandwidth 751 Hz/px and dual-echo T2/proton density
weighted scan; 41 slices, TR/TE1/TE2= 4050/11/90ms, slice thickness 3mm, FOV256mm, flip
angle= 160°.

Chapter 9
247
Data from the SRT and structural scans are not reported here, but will be used in planned
analysis of the full set of patients and controls were processed and analysed using the same
forward physiological model (Germuska et al., 2016) described in Chapter 5. Independent t-
tests to assess group differences were carried out using SPSS version 20 (IBM Corp., Armonk,
N.Y., USA). All t-tests were conducted with bootstrapping (1000 samples, 95% CIs) and
examined for normality using the Shapiro-Wilk test.
9.3 Results
Interim results from 7 patients (1 male) and 12 controls (11 male) are presented in table 9.1.
EDSS scores were not available for patient numbers 5 and 6, however they were known to be
<4 as assessed by a nurse. All patients were characterised as having RR-MS.
Table 9.1 Mean ± SEM group characteristics and grey matter values for all cerebrovascular parameters of interest.
Participant Characteristics and Neurophysiological Data
RR-MS Controls
Age 39 ± 1.1 29 ± 1.8
EDSS 3 ±1.1 n/a
Disease Duration (years) 11 ± 2.3 n/a
Baseline CBF 51.6 ± 2.2 50 ± 1.2
CBVcap 1.2 ± 0.09 1.4 ± 0.04
Baseline OEF 0.32 ± 0.02 0.38 ± 0.01
Absolute CMRO2 130 ± 8.8 160 ± 3.4
CVR 2.1 ± 0.2 2.3 ± 0.2
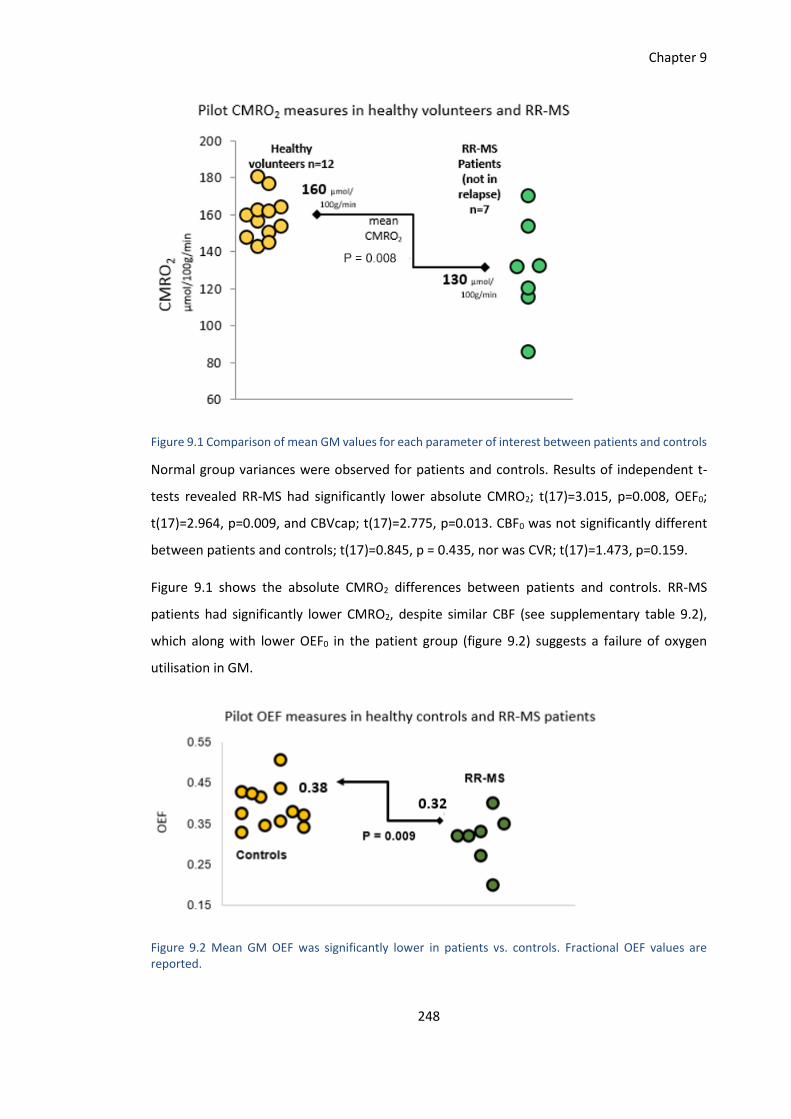
Chapter 9
248
Figure 9.1 Comparison of mean GM values for each parameter of interest between patients and controls
Normal group variances were observed for patients and controls. Results of independent t-
tests revealed RR-MS had significantly lower absolute CMRO2; t(17)=3.015, p=0.008, OEF0;
t(17)=2.964, p=0.009, and CBVcap; t(17)=2.775, p=0.013. CBF0 was not significantly different
between patients and controls; t(17)=0.845, p = 0.435, nor was CVR; t(17)=1.473, p=0.159.
Figure 9.1 shows the absolute CMRO2 differences between patients and controls. RR-MS
patients had significantly lower CMRO2, despite similar CBF (see supplementary table 9.2),
which along with lower OEF0 in the patient group (figure 9.2) suggests a failure of oxygen
utilisation in GM.
Figure 9.2 Mean GM OEF was significantly lower in patients vs. controls. Fractional OEF values are reported.

Chapter 9
249
Figure 9.3 Mean GM CBVcap (%) was also significantly lower in patients
Figure 9.4 Sample GM maps from a representative MS patient and control subject.

Chapter 9
250
9.4 Discussion and Future Work
This is an ongoing study and results must be interpreted with caution for several reasons. First,
the control group was not fully matched to patients as recruitment and testing is still in
progress. Second, patient group is small with only 7 patients, and at present, unmatched
controls. Still, this pilot data in in agreement with the work of Ge et al. (2012) who showed
that global CBF was unchanged between MS patients and controls, however CMRO2 and OEF
was significantly lower in patients. Additional work by Fan et al. (2015) also shows OEF
reductions in people with MS. The current data shows again absolute CMRO2 and OEF
reductions in an analysis of whole GM, demonstrating that this effect is not driven by WM
abnormalities alone. In other words, while WM lesions and demyelination may be present,
along with metabolic changes in WM, disease-related abnormalities are clearly present in GM
tissue. How CMRO2 and OEF0 relate to disability and structural integrity will be investigated in
the full study, however, based on previous work by Ge et al. (2012) and Fan et al (2015) it is
predicted that hypometabolism will be inversely related to EDSS and positively related to
behavioural function. It is also expected that regional metabolism will depend on the presence
and type of lesions observed, but inverse relationships between lesions and metabolism is
predicted based on the work of Fan et al. (2015).
In addition, the current data suggest that CBVcap are also significantly lower in patients. Unlike
Marshall et al. (2014) a significant reduction in CVR was not observed in patients although
there was a trend towards this effect. Reductions in CBVcap have not previously been
demonstrated using fMRI without contrast. Increases in CBV have been reported prior to
blood-brain-barrier (BBB) breakdown in MS in the rat brain, (Broom et al., 2005), and in
contrast enhancing lesions (Ge et al., 2005), however reductions in CBV have also been
observed in deep grey matter in progressive MS (thalamus, putamen, caudate) (Inglese, Park,
Johnson, Babb, & Miles, 2017). CBV reductions are thought to be the result of edema following
BBB breakdown. Blood volume measures, may therefore be sensitive markers to inflammatory
damage and the state of the BBB. However, as discussed in Chapter 5, our estimate of CBVcap
does not account for differences in tissue oxygen pressure (ptO2) and capillary transit time
heterogeneity (CTTH) which may be affected due to microvascular abnormalities in MS.
While CBF was not different between the groups, evidence of hypoperfusion, or regional
hyperperfusion (Juurlink, 2013) may emerge in the planned full group analysis of individual

Chapter 9
251
cortical regions known to be affected in MS including visual cortex, thalamus and other deep
GM structures. Similarly, CVR, which requires high SNR and will benefit from additional data,
may be altered in patients, but is not visible in this small sample. Additional processing steps,
namely correction or partial volume effects and the appearance of lesions, will be conducted
on the full sample as atrophy will affect all measures of flow and metabolism.
As discussed in the introduction, the effect of baseline flow and metabolism on short-term
motor plasticity will be investigated; it is predicted that patients with greater flow and
metabolism reductions at baseline will show less of a performance gain during motor training.
However, the effect of baseline function on task-responses, and adaptation over time is less
clear. It is expected that hypometabolism in task-relevant areas may lead to reduced overall
responses and less functional adaptation, however task CMRO2 will depend on baseline flow,
CBVcap and OEF0. The relationship between these parameters during behavioural tasks is not
clear at present, either in healthy controls or patients. This study will shed light on the effect
of vascular and metabolic dysfunction in MS on motor plasticity, and characterise
compensatory activity during task performance.
In future, interventions which help to promote vascular and metabolic health, such as AF
interventions, may be used in conjunction with anti-inflammatory pharmacological treatments
to maximise plasticity and functional recovery in MS.

Chapter 9
252
Chapter 9 Supplementary Data
Individual Participant Grey Matter Values
Sex Age EDSS CBF0 CBVcap OEF0 CMRO2 CVR
P01 F 43 4 46.2 1 0.3 125 2.1
P02 M 40 6 56.5 1 0.3 126.1 1.1
P03 F 45 3 51.5 1.2 0.3 134.4 2.6
P04 F 31 0 62.2 1.5 0.3 173.7 2.4
P05 F 39 n/a 41 1.2 0.4 133.3 1.6
P06 F 22 n/a 49.3 1.4 0.3 154.8 1.9
P07 F 35 1 57.1 0.8 0.2 100.8 2.7
C01 M 31 n/a 45.1 1.2 0.4 143.4 3.4
C02 M 23 n/a 57.2 1.2 0.3 156.7 2.4
C03 M 32 n/a 45.7 1.5 0.4 162.9 2.1
C04 M 31 n/a 52.1 1.6 0.4 180.8 2.5
C05 M 40 n/a 52.7 1.2 0.3 150.7 2.6
C06 M 25 n/a 46.7 1.5 0.4 164.5 1.9
C07 M 26 n/a 47.7 1.7 0.4 177.1 2.7
C08 M 28 n/a 49.3 1.2 0.4 145.2 2.6
C09 M 36 n/a 36.2 1.6 0.5 154.2 2.2
C10 M 26 n/a 51.9 1.4 0.4 162.3 2.2
C11 F 43 n/a 50.5 1.3 0.4 150.2 2.1
C12 F 28 n/a 59 1.4 0.3 164.5 2.0
Table 9.2 Individual subject data for each parameter of interest. P = patient, C = control.

Chapter 10
253
Chapter 10
General Discussion
Overall health and behavioural function is dependent on optimal CBF and O2 metabolism.
Although cerebrovascular dysfunction is not the only consequence of ageing and disease
processes, without adequate energy supply to the brain, rehabilitation and treatment will not
be effective. Therefore, efforts to maintain, or ideally improve, brain vascular and metabolic
health are extremely important and could reduce the burden of ill health in many populations.
This includes not only those with neurological disorders such as MS and mild cognitive
impairment (MCI) but also groups who develop cerebrovascular damage as secondary disease
complications such as in diabetes (Østergaard et al., 2015) and HIV (Ances, Vaida, Benson,
Smith, & Ellis, 2010).
Exercise training (ET), based on the literature in older adults, promotes healthy brain function
across the lifespan and may strengthen vascular reserve helping to protect the brain against
functional decline when it becomes vulnerable to the effects of ageing and disease
(Davenport, Hogan, Eskes, Longman, & Poulin, 2012). One of the most damaging effects of
functional decline is the loss of brain plasticity, which impairs the ability of the brain to adapt
and repair itself leading to a loss of behavioural and cognitive capabilities. ET may therefore
promote brain plasticity helping to reduce the functional decline in vulnerable groups.
To further the understanding of these two areas, this thesis used quantitative fMRI techniques
to investigate the effects of AF on brain function in the healthy brain (Chapters 4 and 5), and
the vascular and metabolic changes that occur during tasks requiring motor system plasticity
(Chapters 7 and 8). Then, the ASL techniques used to quantify CBF and O2 metabolism at rest
and during motor learning were applied to map the same parameters in a group of MS patients
(Chapter 9).
Below, the main findings from the work presented in this thesis are summarised followed by a
discussion of methodological considerations and areas for future research aimed at improving
brain energetics and plasticity in MS and other diseases.

Chapter 10
254
10.1 Aerobic Fitness and Brain Health
Chapters 4 and 5 suggest that AF does influence brain haemodynamics and O2 metabolism in
young adults. However, the results do not show a consistent and clear relationship between
AF and brain function. In Chapter 4, higher AF was inversely correlated with CBF and positively
with CVR. For CBF, this effect was statistically significant only in a voxelwise analysis, not in the
ROI analysis, and the opposite was true of CVR. The voxelwise analysis of CBF showed that
subjects with a higher VO2peak had lower CBF in portions of the thalamus, brainstem, visual
cortex, precuneus and cerebellum.
In Chapter 5, AF was negatively correlated with CBVcap, OEF0 and CMRO2 before multiple
comparison corrections in the ROI analysis. In a voxelwise analysis, CBVcap was negatively
correlated with estimated �̇�O2max in left primary motor cortex (M1), left precuneus, bilateral
anterior and posterior cingulate gyrus, left intracalcarine cortex and left lateral occipital cortex.
For OEF, the negative correlation with �̇�O2max was confined to the left M1 and supplementary
motor areas.
As these studies were conducted on different scanners the CBF and CVR results from the two
studies are not directly comparable. The results from Chapter 4 are likely more accurate
estimations of CBF as data were acquired using MTI ASL and analysed using a dual-
compartment model which fits a macro and microvascular compartment. This reduces the risk
of perfusion overestimation which can occur with single compartment models. Lower resting
GM CBF together with a greater CVR to CO2 was thought to indicate greater functional
efficiency in subjects with higher AF, whereby greater extraction of O2 reduced CBF demand,
yet the capacity to respond to a physiological stimulus was enhanced in some way as a result
of physical training.
The results from Chapter 5 did not support this hypothesis, as both baseline OEF and CMRO2
were negatively correlated with fitness as was CBVcap. Further, there was no strong directional
trend between CBF or CVR and fitness. As discussed in Chapter 5, due to the assumptions of
the forward physiological model, the apparent reduction in CBVcap and metabolic parameters
may be due to underlying differences in ptO2 and CTTH, rather than true blood volume and
metabolic reductions. This is highly speculative at present and new methods which are capable
of measuring CTTH and ptO2 noninvasively are needed to reduce the need for these model
assumptions.

Chapter 10
255
The ET intervention reported in Chapter 5 did not lead to measurable brain changes over 1-
week. Most studies assess the effects of ET on brain and/or behaviour following 12 weeks
(Chapman et al., 2013; Murrell et al., 2013) or longer 1-year periods (Erickson et al., 2011). The
very short-term effects of ET were not known, and a better understanding of the timescale of
vascular and metabolic adaptations to ET will help to elucidate the mechanisms driving ET
adaptations in humans.
Interesting work in cardiac muscle in pigs (White et al., 1998), has shown that the greatest
capillary density increases occurred only 3 weeks after training. Further training reduced
capillary density to control levels, however larger arterioles and then arteries increased at 8
and 16 weeks of training. At 8 weeks, not 16 weeks, the greatest coronary blood flow increase
was recorded. Therefore, should a study show no effect, or an unexpected effect, changes
which cannot be measured non-invasively but may affect results, such as capillary density and
the diameter of arterioles or arteries, should be considered. While White et al. (1998)
investigated cardiovascular changes, similar step-wise changes (Bloor, 2005) may occur in the
brain. This study provides useful information for future intervention studies of similar duration
in humans. Imaging of capillary and total blood volume at multiple time-points during an
intervention may show differential initial and long-term adaptations which could provide
useful mechanistic information on how exercise and AF increases affect brain physiology and
the changes necessary to induce cognitive or behavioural benefits.
Current understanding is that physical training upregulates neurotrophic factors which
stimulate cell and vessel development (M. W. Voss, Vivar, Kramer, & van Praag, 2013), and
training may also preserve aortic elasticity, which facilitates the transport of nutrients to the
brain (Claudine Joëlle Gauthier et al., 2015). In addition, as AF is associated with greater Hb
concentration (Mairbäurl, 2013), blood can transport more O2 to cells which may be of
particular benefit in groups with a lower absolute CBF.
In the healthy brain, not facing age-related decline, it is possible that AF does not lead to
measurable benefits in the presence of already healthy vessels and adequate energy supply,
as the system is already functioning optimally. It may be that only small or selective effects are
seen in younger adults for this reason, for example, greater CVR as reported in Chapter 4. A
greater extent of cerebrovascular benefits of AF may only become apparent when the system
becomes vulnerable to the loss of vessel elasticity, declines in stroke volume from the heart,
and therefore a decline in energy delivery to the brain. Fitness may preserve cerebral energy

Chapter 10
256
delivery and mitochondrial function, and the upregulation of factors such as BDNF, VEGF and
IGF-1 may facilitate this effect.
Research investigating neurological disorders and rehabilitation therapies rarely assesses the
contribution of cardiovascular problems to neurological disorders, despite known increased
cardiovascular risk in many brain conditions (Christiansen et al., 2010; Firoz et al., 2015;
Stampfer, 2006). Efforts to improve brain vascular function and metabolism will not be
successful if cardiovascular health is not also targeted in treatment strategies. Using MRI,
comprehensive investigations of the peripheral and central vasculature can be conducted
which would improve our understanding of the relationship between cardiovascular and brain
health. An integrated approach would allow for the development of therapeutic interventions
which act to maintain, or even improve, overall physiological function which would enhance
quality of life in many neurological disorders. AF is long known to reduce cardiovascular risk;
therefore, ET interventions are likely to have systemic benefit given the growing literature on
cerebral benefits. In addition, assessing the capacity of the cardiovascular system to adapt with
ET, may help to predict the potential for cerebrovascular benefits to be gained from such
interventions.
10.2 Functional Neuroplasticity of the Motor System
The aim of Chapters 7 and 8 was to identify i) metabolic changes during task performance
which are likely to facilitate functional motor plasticity in the healthy brain and ii) based on
previous work showing sustained BOLD RSFC changes following motor learning (Albert,
Robertson, & Miall, 2009; Saber Sami, Robertson, & Miall, 2014), investigate whether these
changes were due to sustained CBF alterations in these regions. Persistent CBF changes
following motor learning may also reflect energetic changes as a result of brain adaptation
following motor sequence learning.
The results of the first plasticity study (Chapter 7) revealed that performance of the SRT task
led to reductions in BOLD signal and CBF as the task progressed. Signal reductions were
observed in the left cerebellum, insula and LOC, however a concurrent increase in rCMRO2 that
did not reach statistical significance was observed in the same regions. This study
demonstrates the feasibility of using calibrated fMRI to study complex cognitive processes. The
limitations of using standard BOLD imaging in studies of plasticity are also shown, as reduced
BOLD signal could be interpreted as a reduction in neuronal activity in the absence of
accompanying information about rCMRO2. In addition, the flow-metabolism coupling ratio

Chapter 10
257
decreased from the beginning to end of the task, suggesting that a greater amount of O2 was
extracted from less CBF. Although this decrease did not reach statistical significance, future
studies designed specifically to investigate flow-metabolism coupling changes during learning
would be useful in determining regional coupling between CBF and O2 metabolism during
cognitive task performance.
The results of a second motor plasticity study (Chapter 8) did not support the predictions of
CBF alterations at rest following motor training in areas showing statistically significant BOLD
and CBF signal reductions across the SRT task. Reductions in right M1, superior parietal lobule
(SPL), angular gyrus, supramarginal gyrus (SMG), anterior cingulate cortex (ACC) and cuneal
cortex were observed over the duration of the task. However, CBF over 10 minutes
immediately post-task, was not different from the 10 minutes preceding the task. For the
control motor performance task, reductions were identified in the right M1, SMG, inferior
frontal gyrus (IFG) and bilateral ACC, demonstrating differences in task responses for the motor
learning vs. the motor performance task. Further, M1 RSFC was altered following the SRT, but
not the control task. Again, there was not a strong CBF change in these regions, or in M1,
following task performance. These results suggest that sustained brain changes, reflective of
functional and/or structural plasticity, likely occur over longer periods than a single session of
motor task training.
In future, using this data or new data, alternative approaches to modelling of task changes may
lend additional insight into task-related metabolic changes over time. The response change
over time may not be linear as assumed here, a steep initial change followed by less
pronounced block-by-block reductions in CBF or BOLD signal may better reflect the data. Also,
exploration of RSFC changes was limited to M1 connectivity changes due to time constraints.
Additional investigation of known resting state networks using ICA or seed-based analysis may
reveal additional changes as a result of motor learning, as reported previously in frontal-
cerebellar and cerebellar-basal ganglia networks (Albert et al., 2009; Saber Sami et al., 2014; S
Sami & Miall, 2013).
It should also be mentioned that aerobic glycolysis is increased during neuronal activation but
its contribution to plasticity cannot be investigated using ASL. Aerobic glycolysis is the
upregulation of glucose metabolism in the presence of sufficient O2, and although its cellular
function is not well known, it is a phenomenon that has been observed in many rodent studies

Chapter 10
258
of learning, memory acquisition and consolidation (Dienel & Cruz, 2016). Recently increases in
aerobic glycolysis with motor learning have been reported in healthy subjects (Shannon, Neil,
Vlassenko, Shimony, & Rutlin, 2016) and its role in plasticity both in health and disease may be
overlooked in an area of research primarily using fMRI. Imaging of glucose utilisation requires
PET imaging, therefore in ASL studies, only a portion of energy metabolism can be investigated.
To fully investigate plasticity, combined fMRI and PET imaging would be ideal, especially for
investigating mechanisms limiting plasticity in neurological patients.
Finally, with 7T now becoming more widely available it is possible to study intra-cortical layer-
specific plasticity, with sub-millimetre resolution (~0.8mm). While this is not possible with ASL,
BOLD imaging at extremely high resolution could be conducted during motor learning to
identify the specific regions and layers which show adaptation with learning. Additional scans
before and after task performance using VASO, could quantitatively assess changes in CBV
following task training. CBV changes peak in deeper cortical layers than the BOLD or CBF signal
and therefore measure activity closer to the site of neuronal and metabolic activity (Huber,
Goense, et al., 2015). Given the results in Chapter 8, longer motor-training paradigms, or inter-
session training may also be necessary in these studies to observe changes reflecting functional
plasticity. Yu & Koretsky (2014) used layer-specific fMRI to study brain reorganisation and
sensory input following denervation in rats. Given that factors limiting plasticity in humans are
still relatively unknown, ultra high-resolution investigations could provide information on
metabolic activity in different cortical layers e.g. afferent or efferent signal dysfunction in
disease.
10.3 Multiple Sclerosis
The MS patient study reported in Chapter 9 demonstrates the application of previous methods
used to quantify brain function in healthy controls (Chapter 5) in a clinical population.
This project is ongoing, however, metabolic changes in GM are evident in patients despite the
small sample (n=7), with lower CMRO2, OEF0 and CBVcap observed. These results are in
agreement with previous quantitative methods which have used sagittal sinus (Ge et al., 2012)
or pial artery measurements (Fan et al., 2014) to estimate global CBF and metabolism. The
current results add supporting evidence that global measures are reliable indicators of cortical
function, however the regional mapping method which will be used in the ongoing study may
identify areas specifically vulnerable to inflammatory damage. Secondly, dual-calibrated PCASL
acquisitions in conjunction with structural imaging of lesions and cortical integrity may help to

Chapter 10
259
determine whether vascular and metabolic changes are secondary to chronic inflammatory
damage, or occur prior to loss of cortical and subcortical tissue. OEF and CMRO2 may both be
more sensitive markers of brain health than CBF as metabolic changes could indicate at risk
tissue which could be preserved with effective treatments.
In optimising methods from Chapter 7, absolute CMRO2 and OEF0 changes during task
performance can be investigated as the dual-calibrated PCASL data is acquired in the same
session immediately before SRT task performance. This will enable more accurate
quantification of metabolism during cognitive task performance than standard calibrated fMRI
as baseline CMRO2 is known to be altered in this MS group. The use of dual-calibrated fMRI to
study plasticity in patient groups represents a step forward in this area of research as BOLD
fMRI is often used despite known vascular and metabolic changes in MS (Pantano, Mainero &
Caramia, 2006; Prosperini, Piattella, & Giannì, 2015). In fact, in the review by Prosperini et al.
(2015) the appropriateness of BOLD for investigating plasticity was questioned, due to the
heterogeneity of MS which makes group level responses to rehabilitation difficult to detect
(Rasova et al., 2006). Quantitative baseline measures of CMRO2 and OEF may provide an
indication of likely treatment response, as well as more meaningful measures of treatment
outcome which could explain the lack of measured BOLD changes in motor rehabilitation
interventions (Rasova et al., 2015)
10.4 Methodological Considerations and Limitations
Most limitations have been mentioned in the relevant chapters, however a few may be
highlighted here for consideration in future studies.
First, it is, unsurprisingly, difficult to recruit sedentary participants to exercise studies. Due to
time limitations for completing studies, it was not possible to recruit an even number of active
and sedentary subjects. Although both fit and sedentary subjects were recruited, samples had
a lower spread of fitness levels than planned which has obvious limitations for detecting
fitness-related brain differences. Given that participants were paid for their time, money does
not appear to be an incentive for inactive people to take part. In future, targeting people who
are currently inactive but intending to improve their fitness may be a more successful way of
recruiting sedentary individuals.

Chapter 10
260
Equipment for recording respiratory and cardiac traces was not available at the time of data
collection in the new imaging centre, meaning that physiological noise correction could not be
carried out on data reported in Chapters 5, 8 and 9. The effects of PETCO2 fluctuations were
controlled for where necessary (see normalisation of CBF in Chapter 8), cardiac and respiratory
variability are also known to confound fMRI signals (Golestani, Chang, & Chen, 2015; Murphy,
Birn, & Bandettini, 2013b). As a result, some non-neuronal signal may have been interpreted
as part of the task-response in Chapter 8. However, in Chapters 5 and 9, where the hypercapnia
and hyperoxia response is global, physiological fluctuations present less of a problem. As
discussed in the introduction, physiological noise correction also removes neuronal signal as
noise may be coupled to neuronal fluctuations. There is no perfect solution to data clean-up,
and the most appropriate method depends on the questions being addressed. However,
where correction is not carried out, either purposefully or due to lack of resources, it is
important to be aware of potential non-neuronal contributions.
The power analyses conducted to inform future studies suggest, in many cases, that larger
samples are necessary due to small effect sizes. FMRI is expensive and time-consuming, and
many studies including those presented in this thesis, are limited by time and funding
constraints. For example, the study presented in Chapter 5 required an 11-hour time
commitment for each participant, with each hour also requiring the time of at least 2
researchers. As a result, 15 participants was a feasible and affordable sample size. Ideally,
studies would not be designed around practical considerations, but that is often necessary at
a cost to statistical power. As previously suggested, the best way to overcome this problem is
coordinated research efforts across centres to increase total sample sizes.
In small samples, individual variability has a considerable effect on data, and this may explain
why the significant correlations between CBVcap and OEF and fitness were only observed in
the post-intervention data in Chapter 5 which had an additional 2 participants.
The eligibility criteria for respiratory challenges using gases is stringent, and this means that
the RR-MS patient cohort is disproportionately healthy in comparison to the general
population of people with MS. As the aim of the study is to look at MS-related vascular
dysfunction, those with other common comorbidities, e.g. bipolar disorder, asthma, were not
eligible. While this means that we can look at true dysfunction due to MS, the results may not
generalise to more severely impaired patients. Future studies which include those with
comorbidities which do not present a safety risk will provide a more representative picture of
vascular and metabolic dysfunction in MS.

Chapter 10
261
10.5 Translation of Findings: Improving Brain Plasticity in Disease
Exercise training in rodents has been shown to improve subsequent learning and memory
(Berchtold, Castello, & Cotman, 2010) and recently it has been suggested that aerobic exercise
in Parkinson’s disease may promote motor skill learning as a result of molecular, synaptic and
metabolic changes which occur with ET and help to improve motor control, learning and
memory (Petzinger et al., 2013). Figure 10.1 outlines this hypothesis, and provides a
framework for future research efforts to increase neuroplasticity and improve rehabilitation
outcomes.
Figure 10.1 Image taken from Petzinger et al. (2013). This diagram outlines the likely mechanisms through which aerobic exercise can increase brain plasticity and improve motor and cognitive function in disease.
A combination of aerobic ET and goal-directed training, e.g. motor sequence learning, may
strengthen synaptic connections (Adkins, Boychuk, Remple, & Kleim, 2006), vascular health
(Ainslie et al., 2008; Pereira et al., 2007; B. P. Thomas et al., 2013), and upregulate BDNF and
other neurotrophic factors involved in learning and memory formation (Cotman & Berchtold,

Chapter 10
262
2002). Multi-dimensional interventions encompassing both aerobic and motor skill training
may provide the greatest potential for clinically relevant improvements in plasticity and
functional ability, in MS and other diseases.
The results of Chapters 4 and 5 suggest that AF may have differential effects on the healthy
brain and those facing decline, which has been suggested elsewhere (V. J. Williams et al.,
2017). It may be that there are limited measurable differences in optimally functioning young
adults, however results are suggestive of greater vascular reserve, and potentially metabolic
efficiency, which warrants further exploration. This thesis clearly demonstrates the
application of quantitative fMRI and physiological modelling (Davis, Kwong, Weisskoff, &
Rosen, 1998b; Germuska et al., 2016) to investigate CBF and O2 metabolism at rest, during and
following motor learning. Importantly, Chapter 9 shows that the use of calibrated fMRI to study
metabolic dysfunction in MS is well-tolerated, and ongoing work will determine the role of
baseline metabolic dysfunction as a limiting factor in functional brain plasticity.
The feasibility of conducting exercise interventions in MS has been demonstrated (Platta,
Ensari, Motl, & Pilutti, 2016), and a recent motor training study in ~30 people with MS in our
lab shows that longitudinal home-based training also has a high retention rate (Lipp, Foster et
al., in prep). In the latter part of this thesis, it is shown that ideal imaging methods for
quantitative investigations of vascular and metabolic function are suitable for imaging studies
in people with MS. Going forward, studies combining both aerobic and motor training can
investigate the efficacy of this rehabilitation approach in terms of improving cerebral vascular
and metabolic function and behavioural outcomes in MS.

Chapter 10
263
Bibliography
American College of Sports Medicine (Ed.). (2013). ACSM's health-related physical fitness assessment manual. Lippincott Williams & Wilkins.
Aanerud, J., Borghammer, P., Chakravarty, M. M., Vang, K., Rodell, A. B., Møller, A., … Gjedde, A. (2012). Brain energy metabolism and blood flow differences in healthy aging, 2, 1177–1187. http://doi.org/10.1038/jcbfm.2012.18
Adkins, D. L., Boychuk, J., Remple, M. S., & Kleim, J. a. (2006). Motor training induces experience-specific patterns of plasticity across motor cortex and spinal cord. Journal of Applied Physiology (Bethesda, Md. : 1985), 101(6), 1776–1782. http://doi.org/10.1152/japplphysiol.00515.2006
Ahlgren, A., Wirestam, R., Petersen, E. T., Ståhlberg, F., & Knutsson, L. (2014). Partial volume correction of brain perfusion estimates using the inherent signal data of time-resolved arterial spin labeling. NMR in Biomedicine, 27(9), 1112–1122. http://doi.org/10.1002/nbm.3164
Ainslie, P. N., Cotter, J. D., George, K. P., Lucas, S., Murrell, C., Shave, R., … Atkinson, G. (2008). Elevation in cerebral blood flow velocity with aerobic fitness throughout healthy human ageing, 16, 4005–4010. http://doi.org/10.1113/jphysiol.2008.158279
Albert, N. B., Robertson, E. M., & Miall, R. C. (2009). The Resting Human Brain and Motor Learning. Current Biology, 19(12), 1023–1027. http://doi.org/10.1016/j.cub.2009.04.028
Alfini, A. J., Weiss, L. R., Leitner, B. P., Smith, T. J., Hagberg, J. M., Smith, J. C., … Smith, J. C. (2016). Hippocampal and Cerebral Blood Flow after Exercise Cessation in Master Athletes, 8(August), 1–9. http://doi.org/10.3389/fnagi.2016.00184
Ances, B. M., Leontiev, O., Perthen, J. E., Liang, C., Lansing, A. E., & Buxton, R. B. (2008). Regional differences in the coupling of cerebral blood flow and oxygen metabolism changes in response to activation: Implications for BOLD-fMRI. NeuroImage, 39(4), 1510–1521. http://doi.org/10.1016/j.neuroimage.2007.11.015
Ances, B. M., Vaida, F., Benson, D., Smith, D. M., & Ellis, R. J. (2010). Resting Cerebral Blood Flow as a Biomarker of HIV in the Brain, 73, 2009.
Andreasen, a K., Stenager, E., & Dalgas, U. (2011). The effect of exercise therapy on fatigue in multiple sclerosis. Multiple Sclerosis (Houndmills, Basingstoke, England), 17(9), 1041–54. http://doi.org/10.1177/1352458511401120
Angleys, H., Østergaard, L., & Jespersen, S. N. (2015). The effects of capillary transit time heterogeneity ( CTH ) on brain oxygenation, (December 2014), 806–817. http://doi.org/10.1038/jcbfm.2014.254
Antonio, S., Case, L., Harman, C., & Lacey, J. (1987). Attentional Requirements of Learning : Performance Measures Evidence from, 32.
Aslan, S., Xu, F., Wang, P. L., Uh, J., Yezhuvath, U. S., Osch, M. Van, & Lu, H. (2010). Estimation of Labeling Efficiency in Pseudocontinuous Arterial Spin Labeling, 771, 765–771. http://doi.org/10.1002/mrm.22245
Asllani, I., Borogovac, A., & Brown, T. R. (2008). Regression Algorithm Correcting for Partial Volume Effects in Arterial Spin Labeling MRI, 1371, 1362–1371.

Chapter 10
264
http://doi.org/10.1002/mrm.21670
Attwell, D., & Iadecola, C. (2002). The neural basis of functional brain imaging signals. Trends in Neurosciences, 25(12), 621–625. http://doi.org/10.1016/S0166-2236(02)02264-6
Bailey, D. M., Marley, C. J., Brugniaux, J. V, Hodson, D., New, K. J., Ogoh, S., & Ainslie, P. N. (2013a). Elevated aerobic fitness sustained throughout the adult lifespan is associated with improved cerebral hemodynamics. Stroke; a Journal of Cerebral Circulation, 44(11), 3235–8. http://doi.org/10.1161/STROKEAHA.113.002589
Bailey, D. M., Marley, C. J., Brugniaux, J. V, Hodson, D., New, K. J., Ogoh, S., & Ainslie, P. N. (2013b). Elevated aerobic fitness sustained throughout the adult lifespan is associated with improved cerebral hemodynamics. Stroke; a Journal of Cerebral Circulation, 44(11), 3235–8. http://doi.org/10.1161/STROKEAHA.113.002589
Barkhof, F. (2002). The clinico-radiological paradox in multiple sclerosis revisited, 239–245.
Barnes, J. N., Taylor, J. L., Kluck, B. N., Johnson, C. P., & Joyner, M. J. (2013). Cerebrovascular reactivity is associated with maximal aerobic capacity in healthy older adults. Journal of Applied Physiology (Bethesda, Md. : 1985), 114(10), 1383–7. http://doi.org/10.1152/japplphysiol.01258.2012
Barnes, J. N., Taylor, J. L., Kluck, B. N., Johnson, C. P., Joyner, M. J., Jn, B., … Mj, J. (2013). Cerebrovascular reactivity is associated with maximal aerobic capacity in healthy older adults, 1383–1387. http://doi.org/10.1152/japplphysiol.01258.2012
Baym, C. L., Khan, N. A., Pence, A., Raine, L. B., Hillman, C. H., & Cohen, N. J. (2011). Aerobic Fitness Predicts Relational Memory but Not Item Memory Performance in Healthy Young Adults, 2645–2652. http://doi.org/10.1162/jocn
Beckmann, C. F., DeLuca, M., Devlin, J. T., & Smith, S. M. (2005). Investigations into resting-state connectivity using independent component analysis. Philosophical Transactions of the Royal Society B: Biological Sciences, 360(1457), 1001-1013.
Beier, M., Bombardier, C. H., Hartoonian, N., Motl, R. W., & Kraft, G. H. (2014). Improved physical fitness correlates with improved cognition in multiple sclerosis. Archives of Physical Medicine and Rehabilitation, 95(7), 1328–34. http://doi.org/10.1016/j.apmr.2014.02.017
Berchtold, N. C., Castello, N., & Cotman, C. W. (2010). Exercise and time-dependent benefits to learning and memory. Neuroscience, 167(3), 588–97. http://doi.org/10.1016/j.neuroscience.2010.02.050
Bherer, L., Erickson, K. I., & Liu-ambrose, T. (2013). A Review of the Effects of Physical Activity and Exercise on Cognitive and Brain Functions in Older Adults, 2013.
Binder, J. R., Frost, J. A., Hammeke, T. A., Cox, R. W., Rao, S. M., & Prieto, T. (1997). Human Brain Language Areas Identified by Functional Magnetic Resonance Imaging, 17(1), 353–362.
Biswal, B., Zerrin Yetkin, F., Haughton, V. M., & Hyde, J. S. (1995). Functional connectivity in the motor cortex of resting human brain using echo‐planar mri. Magnetic resonance in medicine, 34(4), 537-541.
Black, J. E., Isaacs, K. R., Anderson, B. J., Alcantara, A. A., & Greenough, W. T. (1990). Learning causes synaptogenesis , whereas motor activity causes angiogenesis , in cerebellar cortex

Chapter 10
265
of adult rats 00OcOO ( OOOO, 87(July), 5568–5572.
Black, J. E., Polinsky, M., & Greenough, W. T. (1989). Progressive failure of cerebral angiogenesis supporting neural plasticity in aging rats. Neurobiology of aging, 10(4), 353-358.
Blicher, J. U., Stagg, C. J., O’Shea, J., Ostergaard, L., MacIntosh, B. J., Johansen-Berg, H., … Donahue, M. J. (2012). Visualization of altered neurovascular coupling in chronic stroke patients using multimodal functional MRI. Journal of Cerebral Blood Flow and Metabolism, 32(11), 2044–2054. http://doi.org/DOI 10.1038/jcbfm.2012.105
Blockley, N. P., Griffeth, V. E. M., Simon, A. B., & Buxton, R. B. (2013). A review of calibrated blood oxygenation level-dependent (BOLD) methods for the measurement of task-induced changes in brain oxygen metabolism. NMR in Biomedicine, 26(8). http://doi.org/10.1002/nbm.2847
Bloor, C. M. (2005). Angiogenesis during exercise and training. Angiogenesis, 8(3), 263–271. http://doi.org/10.1007/s10456-005-9013-x
Bonzano, L., Tacchino, A., Roccatagliata, L., Sormani, M. P., Mancardi, G. L., & Bove, M. (2011). NeuroImage Impairment in explicit visuomotor sequence learning is related to loss of microstructural integrity of the corpus callosum in multiple sclerosis patients with minimal disability, 57, 495–501. http://doi.org/10.1016/j.neuroimage.2011.04.037
Boraxbekk, C.-J., Salami, A., Wåhlin, A., & Nyberg, L. (2015). Physical activity over a decade modifies age-related decline in perfusion, gray matter volume, and functional connectivity of the posterior default-mode network—A multimodal approach. NeuroImage. http://doi.org/10.1016/j.neuroimage.2015.12.010
Borg, E. (2014). A Comparison Between Two Rating Scales For Perceived Exertion, (April).
Borogovac, A., & Asllani, I. (2012). Arterial Spin Labeling (ASL) fMRI: advantages, theoretical constrains, and experimental challenges in neurosciences. International Journal of Biomedical Imaging, 2012, 818456. http://doi.org/10.1155/2012/818456
Bouvier, J., Detante, O., Tahon, F., Attye, A., Perret, T., Chechin, D., … Krainik, A. (2014). Reduced CMRO2 and cerebrovascular reserve in patients with severe intracranial arterial stenosis: A combined multiparametric qBOLD oxygenation and BOLD fMRI study. Human Brain Mapping, 0(October), 1–12. http://doi.org/10.1002/hbm.22657
Boyd, L. A., & Winstein, C. J. (2001). Implicit motor-sequence learning in humans following unilateral stroke : the impact of practice and explicit knowledge, 298, 65–69.
Brackley, K. J., Ramsay, M. M., Pipkin, F. B., & Rubin, P. C. (1999). The effect of the menstrual cycle on human cerebral blood flow : studies using Doppler ultrasound, 52–57.
Bright, M. G., & Murphy, K. (2013a). Reliable quantification of BOLD fMRI cerebrovascular reactivity despite poor breath-hold performance. NeuroImage, 83, 559–568. http://doi.org/10.1016/j.neuroimage.2013.07.007
Bright, M. G., & Murphy, K. (2013b). Removing motion and physiological artifacts from intrinsic BOLD fluctuations using short echo data. NeuroImage, 64(1), 526–537. http://doi.org/10.1016/j.neuroimage.2012.09.043
Bright, M. G., & Murphy, K. (2015). NeuroImage Is fMRI “ noise ” really noise ? Resting state nuisance regressors remove variance with network structure. NeuroImage, 114, 158–

Chapter 10
266
169. http://doi.org/10.1016/j.neuroimage.2015.03.070
Brookes, M. J., Morris, P. G., Gowland, P. A., & Francis, S. T. (2007). Noninvasive Measurement of Arterial Cerebral Blood Volume Using Look-Locker EPI and Arterial Spin Labeling, 54, 41–54. http://doi.org/10.1002/mrm.21199
Brooks, J. C. W., Faull, O. K., Pattinson, K. T., & Jenkinson, M. (2013). Physiological noise in brainstem FMRI. Frontiers in human neuroscience, 7, 623.
Broom, K. A., Anthony, D. C., Blamire, A. M., Waters, S., Styles, P., Perry, V. H., & Sibson, N. R. (2005). MRI reveals that early changes in cerebral blood volume precede blood – brain barrier breakdown and overt pathology in MS-like lesions in rat brain, 204–216. http://doi.org/10.1038/sj.jcbfm.9600020
Brown, A. D., McMorris, C. a., Longman, R. S., Leigh, R., Hill, M. D., Friedenreich, C. M., & Poulin, M. J. (2010). Effects of cardiorespiratory fitness and cerebral blood flow on cognitive outcomes in older women. Neurobiology of Aging, 31(12), 2047–2057. http://doi.org/10.1016/j.neurobiolaging.2008.11.002
Brown, M. M., Wade, J. P. H., & Marshall, J. (1985). Fundamental importance of arterial oxygen content in the regulation of cerebral blood flow, (September 2017), 81–93.
Bulte, D., Chiarelli, P., Wise, R., & Jezzard, P. (2007). Measurement of Cerebral Blood Volume in Humans Using Hyperoxic MRI Contrast, i, 894–899. http://doi.org/10.1002/jmri.21096
Bulte, D. P., Kelly, M., Germuska, M., Xie, J., Chappell, M. a., Okell, T. W., … Jezzard, P. (2012a). Quantitative measurement of cerebral physiology using respiratory-calibrated MRI. NeuroImage, 60(1), 582–591. http://doi.org/10.1016/j.neuroimage.2011.12.017
Bulte, D. P., Kelly, M., Germuska, M., Xie, J., Chappell, M. a, Okell, T. W., … Jezzard, P. (2012b). Quantitative measurement of cerebral physiology using respiratory-calibrated MRI. NeuroImage, 60(1), 582–91. http://doi.org/10.1016/j.neuroimage.2011.12.017
Button, K. S., Ioannidis, J. P. A., Mokrysz, C., Nosek, B. A., Flint, J., Robinson, E. S. J., & Munafò, M. R. (2013). Power failure: why small sample size undermines the reliability of neuroscience, 14(May). http://doi.org/10.1038/nrn3475
Buxton, R. B., & Diego, S. (2015). HHS Public Access, 76(9). http://doi.org/10.1088/0034-4885/76/9/096601.
Buxton, R. B. (2009). Introduction to functional magnetic resonance imaging: principles and techniques. Cambridge university press.
Buxton, R. B., & Frank, L. R. (1997). A Model for the Coupling Between Cerebral Blood Flow and Oxygen Metabolism During Neural Stimulation, 64–72.
Buxton, R. B., Frank, L. R., Wong, E. C., Siewert, B., Warach, S., & Edelman, R. R. (1998). A General Kinetic Model for Quantitative Perhsion Imaging with Arterial Spin Labeling, (19), 383–396.
Cahill, L. S., Bishop, J., Gazdzinski, L. M., Dorr, A., Stefanovic, B., Sled, J. G., & Region-of-interest, R. O. I. (2017). Altered cerebral blood flow and cerebrovascular function after voluntary exercise in adult mice. Brain Structure and Function, 0(0), 0. http://doi.org/10.1007/s00429-017-1409-z
Cantin, S., Villien, M., Moreaud, O., Tropres, I., Keignart, S., Chipon, E., … Krainik, a. (2011). Impaired cerebral vasoreactivity to CO2 in Alzheimer’s disease using BOLD fMRI.

Chapter 10
267
NeuroImage, 58(2), 579–87. http://doi.org/10.1016/j.neuroimage.2011.06.070
Carro, E., Trejo, J. L., Busiguina, S., & Torres-Aleman, I. (2001). Circulating insulin-like growth factor I mediates the protective effects of physical exercise against brain insults of different etiology and anatomy. Journal of Neuroscience, 21(15), 5678–5684. http://doi.org/21/15/5678 [pii]
Cha, Y. K., Jog, M. A., Kim, Y., Chakrapani, S., Kraman, S. M., & Wang, D. J. J. (2013). Regional correlation between resting state FDG PET and pCASL perfusion MRI, 33(12), 1909–1914. http://doi.org/10.1038/jcbfm.2013.147
Chaddock-Heyman, L., Erickson, K. I., Chappell, M. A., Johnson, C. L., Kienzler, C., Knecht, A., … Kramer, A. F. (2016). Aerobic fitness is associated with greater hippocampal cerebral blood flow in children. Developmental Cognitive Neuroscience, 20, 52–58. http://doi.org/10.1016/j.dcn.2016.07.001
Chalela, J. A., Alsop, D. C., Gonzalez-Atavales, J. B., Maldjian, J. A., Kasner, S. E., & Detre, J. A. (2000). Magnetic resonance perfusion imaging in acute ischemic stroke using continuous arterial spin labeling. Stroke.31(3):680-7, (UNITED STATES PT-Journal Article PT-Research Support, Non-U.S. Gov’t PT-Research Support, U.S. Gov’t, P.H.S NO-NS02079 (United States NINDS NIH HHS) LG-English).
Chapman, S. B., Aslan, S., Spence, J. S., Defina, L. F., Keebler, M. W., Didehbani, N., & Lu, H. (2013). Shorter term aerobic exercise improves brain, cognition, and cardiovascular fitness in aging. Frontiers in Aging Neuroscience, 5(November), 75. http://doi.org/10.3389/fnagi.2013.00075
Chappell, M. A., Groves, A. R., Macintosh, B. J., Donahue, M. J., Jezzard, P., & Woolrich, M. W. (2011). Partial Volume Correction of Multiple Inversion Time Arterial Spin Labeling MRI Data, C, 1173–1183. http://doi.org/10.1002/mrm.22641
Chappell, M. A., Groves, A. R., Whitcher, B., & Woolrich, M. W. (2009). Variational Bayesian Inference for a Nonlinear Forward Model, 57(1), 223–236.
Chappell, M. A., MacIntosh, B. J., Donahue, M. J., G??nther, M., Jezzard, P., & Woolrich, M. W. (2010). Separation of macrovascular signal in multi-inversion time arterial spin labelling MRI. Magnetic Resonance in Medicine, 63(5), 1357–1365. http://doi.org/10.1002/mrm.22320
Chen, J. J. (2015). Characterizing Resting-State Brain Function Using Arterial Spin Labeling Characterizing Resting-State Brain Function, (July). http://doi.org/10.1089/brain.2015.0344
Chen, J. J., & Pike, G. B. (2009). BOLD-specific cerebral blood volume and blood flow changes during neuronal activation in humans, (May). http://doi.org/10.1002/nbm.1411
Chiarelli, P. A., Bulte, D. P., Gallichan, D., Piechnik, S. K., Wise, R., & Jezzard, P. (2007). Flow-Metabolism Coupling in Human Visual , Motor , and Resonance Imaging, 547, 538–547. http://doi.org/10.1002/mrm.21171
Christiansen, C. F., Christensen, S., Farkas, D. K., Miret, M., Sørensen, H. T., & Pedersen, L. (2010). Risk of arterial cardiovascular diseases in patients with multiple sclerosis: A population-based cohort study. Neuroepidemiology, 35(4), 267–274. http://doi.org/10.1159/000320245
Chuang, K., Gelderen, P. Van, Merkle, H., Bodurka, J., Vasiliki, N., Koretsky, A. P., … Talagala, S.

Chapter 10
268
L. (2009). NIH Public Access, 40(4), 1595–1605.
Chodzko-Zajko, W. J., & Moore, K. A. (1994). Physical fitness and cognitive functioning in aging. Exercise and sport sciences reviews, 22(1), 195-220.
Cohen, A. D., Nencka, A. S., Lebel, R. M., & Wang, Y. (2017). Multiband multi-echo imaging of simultaneous oxygenation and flow timeseries for resting state connectivity, 1–23. http://doi.org/10.1371/journal.pone.0169253
Colcombe, S. J., Kramer, A. F., Erickson, K. I., Scalf, P., McAuley, E., Cohen, N. J., … Elavsky, S. (2004). Cardiovascular fitness, cortical plasticity, and aging. Proceedings of the National Academy of Sciences of the United States of America, 101(9), 3316–21. http://doi.org/10.1073/pnas.0400266101
Collett, J., Dawes, H., Meaney, A., Sackley, C., Barker, K., Wade, D., … Buckingham, E. (2011). Exercise for multiple sclerosis: a single-blind randomized trial comparing three exercise intensities. Multiple Sclerosis Journal, 17(5), 594–603. http://doi.org/10.1177/1352458510391836
Cooney, J. K., Moore, J. P., Ahmad, Y. a, Jones, J. G., Lemmey, A. B., Casanova, F., … Thom, J. M. (2013). A simple step test to estimate cardio-respiratory fitness levels of rheumatoid arthritis patients in a clinical setting. International Journal of Rheumatology, 2013, 174541. http://doi.org/10.1155/2013/174541
Cotman, C. W., & Berchtold, N. C. (2002). Exercise: a behavioral intervention to enhance brain health and plasticity. Trends in Neurosciences, 25(6), 295–301. Retrieved from http://www.ncbi.nlm.nih.gov/pubmed/12086747
Cotman, C. W., Berchtold, N. C., & Christie, L.-A. (2007). Exercise builds brain health: key roles of growth factor cascades and inflammation. Trends in Neurosciences, 30(9), 464–72. http://doi.org/10.1016/j.tins.2007.06.011
Craig, C. L., Marshall, A. L., Sj??str??m, M., Bauman, A. E., Booth, M. L., Ainsworth, B. E., … Oja, P. (2003). International physical activity questionnaire: 12-Country reliability and validity. Medicine and Science in Sports and Exercise, 35(8), 1381–1395. http://doi.org/10.1249/01.MSS.0000078924.61453.FB
Curran, T. (1989). Higher-Order Associative Learning i n Amnesia Evidence from the Serial Reaction Time Task, 522–533.
D’haeseleer, M., Cambron, M., Vanopdenbosch, L., & De Keyser, J. (2011a). Vascular aspects of multiple sclerosis. The Lancet Neurology, 10(7), 657–666. http://doi.org/10.1016/S1474-4422(11)70105-3
Damoiseaux, J. S., Rombouts, S. A. R. B., Barkhof, F., Scheltens, P., Stam, C. J., Smith, S. M., & Beckmann, C. F. (2006). Consistent resting-state networks, (2).
Daulatzai, M. A. (2017). Review Cerebral Hypoperfusion and Glucose Hypometabolism : Key Pathophysiological Modulators Promote Neurodegeneration , Cognitive Impairment , and Alzheimer ’ s Disease, 972(February 2016), 943–972. http://doi.org/10.1002/jnr.23777
Davenport, M. H., Hogan, D. B., Eskes, G. a, Longman, R. S., & Poulin, M. J. (2012). Cerebrovascular reserve: the link between fitness and cognitive function? Exercise and Sport Sciences Reviews, 40(3), 153–8. http://doi.org/10.1097/JES.0b013e3182553430

Chapter 10
269
Davis, T. L., Kwong, K. K., Weisskoff, R. M., & Rosen, B. R. (1998a). Calibrated functional MRI: mapping the dynamics of oxidative metabolism. Proceedings of the National Academy of Sciences of the United States of America, 95(4), 1834–1839. http://doi.org/10.1073/pnas.95.4.1834
Davis, T. L., Kwong, K. K., Weisskoff, R. M., & Rosen, B. R. (1998b). Calibrated functional MRI: mapping the dynamics of oxidative metabolism. Proceedings of the National Academy of Sciences of the United States of America, 95(4), 1834–9. http://doi.org/10.1073/pnas.95.4.1834
Dayan, E., & Cohen, L. G. (2011). Review Neuroplasticity Subserving Motor Skill Learning. Neuron, 72(3), 443–454. http://doi.org/10.1016/j.neuron.2011.10.008
De Keyser, J., Steen, C., Mostert, J. P., & Koch, M. W. (2008). Hypoperfusion of the cerebral white matter in multiple sclerosis: possible mechanisms and pathophysiological significance. Journal of Cerebral Blood Flow & Metabolism, 28(10), 1645–1651. http://doi.org/10.1038/jcbfm.2008.72
De Vis, J. B., Hendrikse, J., Bhogal, a., Adams, a., Kappelle, L. J., & Petersen, E. T. (2015). Age-related changes in brain hemodynamics; A calibrated MRI study. Human Brain Mapping, (July), n/a-n/a. http://doi.org/10.1002/hbm.22891
Debernard, L., Melzer, T. R., Van Stockum, S., Graham, C., Wheeler-Kingshott, C. a., Dalrymple-Alford, J. C., … Mason, D. F. (2014). Reduced grey matter perfusion without volume loss in early relapsing-remitting multiple sclerosis. Journal of Neurology, Neurosurgery & Psychiatry, 85(5), 544–551. http://doi.org/10.1136/jnnp-2013-305612
Della-Maggiore, V., Mcintosh, A. R., & Mcintosh, A. R. (2005). Time Course of Changes in Brain Activity and Functional Connectivity Associated With Long-Term Adaptation to a Rotational Transformation, 2254–2262. http://doi.org/10.1152/jn.00984.2004.
Deng, W., Aimone, J. B., & Gage, F. H. (2010). NIH Public Access, 11(5), 339–350. http://doi.org/10.1038/nrn2822.New
Derdeyn, C. P., Videen, T. O., Yundt, K. D., Fritsch, S. M., Carpenter, D. A., Grubb, R. L., & Powers, W. J. (2002). Variability of cerebral blood volume and oxygen extraction : stages of cerebral haemodynamic impairment revisited.
Desjardins, A. E., Kiehl, K. A., & Liddle, P. F. (2001). Removal of Confounding Effects of Global Signal in Functional MRI Analyses 1, 758, 751–758. http://doi.org/10.1006/nimg.2000.0719
Detre, J. A., & Wang, J. (2002). Technical aspects and utility of fMRI using BOLD and ASL, 113, 621–634.
Dienel, G. A., & Cruz, N. F. (2016). Aerobic glycolysis during brain activation: adrenergic regulation and influence of norepinephrine on astrocytic metabolism. Journal of Neurochemistry, 14–52. http://doi.org/10.1111/jnc.13630
Dijk, K. R. A. Van, Hedden, T., Venkataraman, A., Evans, K. C., Lazar, S. W., & Buckner, R. L. (2010). Intrinsic Functional Connectivity As a Tool For Human Connectomics : Theory , Properties , and Optimization, 2138, 297–321. http://doi.org/10.1152/jn.00783.2009.
Donahue, M. J., Sideso, E., MacIntosh, B. J., Kennedy, J., Handa, A., & Jezzard, P. (2010). Absolute arterial cerebral blood volume quantification using inflow vascular-space-occupancy with dynamic subtraction magnetic resonance imaging. Journal of Cerebral

Chapter 10
270
Blood Flow and Metabolism, 30(7), 1329–1342. http://doi.org/10.1038/jcbfm.2010.16
Douaud, G., Smith, S., Jenkinson, M., Behrens, T., Johansen-Berg, H., Vickers, J., … James, A. (2007). Anatomically related grey and white matter abnormalities in adolescent-onset schizophrenia. Brain, 130(9), 2375–2386. http://doi.org/10.1093/brain/awm184
Doyon, J., & Benali, H. (2005). Reorganization and plasticity in the adult brain during learning of motor skills. Current Opinion in Neurobiology, 15(2), 161–167. http://doi.org/10.1016/j.conb.2005.03.004
Draganski, B., & May, A. (2008). Training-induced structural changes in the adult human brain, 192, 137–142. http://doi.org/10.1016/j.bbr.2008.02.015
Driver, I. D., Wise, R. G., Murphy, K., & Driver, I. D. (2017). Graded Hypercapnia-Calibrated BOLD : Beyond the Iso-metabolic Hypercapnic Assumption, 11(May), 1–9. http://doi.org/10.3389/fnins.2017.00276
Dubois, R. L. M., & Eyer, C. S. J. (1999). Motor coordination and spatial orientation are affected by neurofilament maldistribution : correlations with regional brain activity of cytochrome oxidase, 223–224.
Duckles, S. P., & Krause, D. N. (2007). Cerebrovascular effects of oestrogen: multiplicity of action. Clinical and experimental pharmacology and physiology, 34(8), 801-808.
Dupuy, O., Gauthier, C. J., Fraser, S. a, Desjardins-Crèpeau, L., Desjardins, M., Mekary, S., … Bherer, L. (2015). Higher levels of cardiovascular fitness are associated with better executive function and prefrontal oxygenation in younger and older women. Frontiers in Human Neuroscience, 9(February), 66. http://doi.org/10.3389/fnhum.2015.00066
Erickson, K. I., Voss, M. W., Prakash, R. S., Basak, C., Szabo, A., Chaddock, L., … Kramer, A. F. (2011). Exercise training increases size of hippocampus and improves memory. Proceedings of the National Academy of Sciences of the United States of America, 108(7), 3017–22. http://doi.org/10.1073/pnas.1015950108
Eskildsen, S. F., Gyldensted, L., Nagenthiraja, K., Nielsen, R. B., Hansen, M. B., Dalby, R. B., ... & Lund, T. E. (2017). Increased cortical capillary transit time heterogeneity in Alzheimer's disease: a DSC-MRI perfusion study. Neurobiology of aging, 50, 107-118.
Etnier, J. L., Nowell, P. M., Landers, D. M., & Sibley, B. A. (2006). A meta-regression to examine the relationship between aerobic fitness and cognitive performance. Brain Research Reviews, 52(1), 119–130. http://doi.org/10.1016/j.brainresrev.2006.01.002
Fan, A. P., Govindarajan, S. T., Kinkel, R. P., Madigan, N. K., Nielsen, a S., Benner, T., … Mainero, C. (2014). Quantitative oxygen extraction fraction from 7-Tesla MRI phase: reproducibility and application in multiple sclerosis. Journal of Cerebral Blood Flow and Metabolism : Official Journal of the International Society of Cerebral Blood Flow and Metabolism, 35(July), 1–9. http://doi.org/10.1038/jcbfm.2014.187
Faul, F., Erdfelder, E., Buchner, A., & Lang, A.-G. (2009). Statistical power analyses using G*Power 3.1: Tests for correlation and regression analyses. Behavior Research Methods, 41(4), 1149–1160. http://doi.org/10.3758/BRM.41.4.1149
Faul, F., Erdfelder, E., Lang, A.-G., & Buchner, A. (2007). G*Power: A flexible statistical power analysis program for the social, behavioral, and biomedical sciences. Behavior Research Methods, 39(2), 175–191. http://doi.org/10.3758/BF03193146

Chapter 10
271
Fernández-Seara, M. A., Aznárez-sanado, M., Mengual, E., Loayza, F. R., & Pastor, M. A. (2009). NeuroImage Continuous performance of a novel motor sequence leads to highly correlated striatal and hippocampal perfusion increases. NeuroImage, 47(4), 1797–1808. http://doi.org/10.1016/j.neuroimage.2009.05.061
Fernandez-Seara, M. A., Mengual, E., Loayza, F., Superior, E., Es, L., & Pastor, M. A. (2016). Continuous performance of a novel motor sequence leads to highly correlated striatal and hippocampal perfusion increases, (June 2009). http://doi.org/10.1016/j.neuroimage.2009.05.061
Fernández-seara, M. A., Rodgers, Z. B., Englund, E. K., & Wehrli, F. W. (2016). NeuroImage Calibrated bold fMRI with an optimized ASL-BOLD dual-acquisition sequence. NeuroImage, 142, 474–482. http://doi.org/10.1016/j.neuroimage.2016.08.007
Ferré, J.-C., Bannier, E., Raoult, H., Mineur, G., Carsin-Nicol, B., & Gauvrit, J.-Y. (2013). Arterial spin labeling (ASL) perfusion: techniques and clinical use. Diagnostic and Interventional Imaging, 94(12), 1211–23. http://doi.org/10.1016/j.diii.2013.06.010
Firoz, C. K., Jabir, N. R., Khan, M. S., Mahmoud, M., Shakil, S., Damanhouri, G. A., … Kamal, M. A. (2015). An overview on the correlation of neurological disorders with cardiovascular disease. Saudi Journal of Biological Sciences, 22(1), 19–23. http://doi.org/10.1016/j.sjbs.2014.09.003
Floyer-Lea, A., & Matthews, P. M. (2004). Changing brain networks for visuomotor control with increased movement automaticity. Journal of Neurophysiology, 92, 2405–2412. http://doi.org/10.1152/jn.01092.2003
Franke, B., Stein, J. L., Ripke, S., Anttila, V., Hibar, D. P., van Hulzen, K. J. E., … Medland, S. E. (2016). Genetic influences on schizophrenia and subcortical brain volumes: large-scale proof of concept. Nature Neuroscience. http://doi.org/10.1038/nn.4228
Fraum, T. J., Ludwig, D. R., Bashir, M. R., & Fowler, K. J. (2017). Gadolinium-Based Contrast Agents : A Comprehensive Risk Assessment. http://doi.org/10.1002/jmri.25625
Gallichan, D., & Jezzard, P. (2009). Variation in the Shape of Pulsed Arterial Spin Labeling Kinetic Curves across the Healthy Human Brain and Its Implications for CBF Quantification, 695(January), 686–695. http://doi.org/10.1002/mrm.21886
Gauthier, C. J., & Hoge, R. D. (2013). A generalized procedure for calibrated MRI incorporating hyperoxia and hypercapnia. Human Brain Mapping, 34(5). http://doi.org/10.1002/hbm.21495
Gauthier, C. J., & Hoge, R. D. (2013). A Generalized Procedure for Calibrated MRI Incorporating Hyperoxia and Hypercapnia, 1069(January 2012), 1053–1069. http://doi.org/10.1002/hbm.21495
Gauthier, C. J., Lefort, M., Mekary, S., Desjardins-Crépeau, L., Skimminge, A., Iversen, P., … Hoge, R. D. (2015). Hearts and minds: linking vascular rigidity and aerobic fitness with cognitive aging. Neurobiology of Aging, 36(1), 304–14. http://doi.org/10.1016/j.neurobiolaging.2014.08.018
Ge, Y., Law, M., Johnson, G., Herbert, J., Babb, J. S., Mannon, L. J., & Grossman, R. I. (2005). Dynamic Susceptibility Contrast Perfusion MR Imaging of Multiple Sclerosis Lesions : Characterizing Hemodynamic Impairment and Inflammatory Activity, (July), 1539–1547.
Ge, Y., Zhang, Z., Lu, H., Tang, L., Jaggi, H., Herbert, J., … Grossman, R. I. (2012). Characterizing

Chapter 10
272
brain oxygen metabolism in patients with multiple sclerosis with T2-relaxation-under-spin-tagging MRI. Journal of Cerebral Blood Flow & Metabolism, 32(3), 403–412. http://doi.org/10.1038/jcbfm.2011.191
Germuska, M., Merola, A., Murphy, K., Babic, A., Richmond, L., Khot, S., … Wise, R. G. (2016). NeuroImage A forward modelling approach for the estimation of oxygen extraction fraction by calibrated fMRI. NeuroImage, 139, 313–323. http://doi.org/10.1016/j.neuroimage.2016.06.004
Girouard, H., & Iadecola, C. (2006). Regulation of the Cerebral Circulation Neurovascular coupling in the normal brain and in hypertension , stroke , and Alzheimer disease, 10021, 328–335. http://doi.org/10.1152/japplphysiol.00966.2005.
Gjedde, A., Vafaee, M. S., & Gjedde, A. (2004). Vafaee MS & Gjedde A . Spatially dissociated flow-metabolism coupling in brain activation . Spatially dissociated flow-metabolism coupling in brain activation, (March). http://doi.org/10.1016/j.neuroimage.2003.10.003
Glover, G. H. (2013). Spiral Imaging in fMRI, 62(2), 706–712. http://doi.org/10.1016/j.neuroimage.2011.10.039.Spiral
Glover, G. H., & Lee, A. T. (1995). Motion artifacts in fMRI: comparison of 2DFT with PR and spiral scan methods. Magnetic Resonance in Medicine, 33(5), 624-635.
Glover, G. H., Li, T., & Ress, D. (2000). Image-Based Retrospective Correction of Noise. 167(March), 162–167.
Goel, V., & Dolan, R. J. (2004). Differential involvement of left prefrontal cortex in inductive and deductive reasoning, 93. http://doi.org/10.1016/j.cognition.2004.03.001
Golestani, A., Chang, C., & Chen, J. J. (2015). Mapping the end-tidal CO2 response function in the resting-state BOLD fMRI signal : Spatial specificity , test – retest reliability and ... NeuroImage, 104(January), 266–277. http://doi.org/10.1016/j.neuroimage.2014.10.031
Gomes, V. A., Casella-filho, A., Chagas, A. C. P., & Tanus-santos, J. E. (2008). Nitric Oxide Enhanced concentrations of relevant markers of nitric oxide formation after exercise training in patients with metabolic syndrome. Nitric Oxide, 19(4), 345–350. http://doi.org/10.1016/j.niox.2008.08.005
Good, C. D., Johnsrude, I., Ashburner, J., Henson, R. N., Friston, K. J., & Frackowiak, R. S. (2001). Cerebral asymmetry and the effects of sex and handedness on brain structure: a voxel-based morphometric analysis of 465 normal adult human brains. NeuroImage, 14(3), 685–700. http://doi.org/10.1006/nimg.2001.0857
Goyal, M. S., Hawrylycz, M., Miller, J. A., Snyder, A. Z., & Raichle, E. (2015). HHS Public Access, 19(1), 49–57. http://doi.org/10.1016/j.cmet.2013.11.020.Aerobic
Grafton, S. T., Hazeltine, E., & Ivry, R. (1995). Functional mapping of sequence learning in normal humans. Journal of Cognitive Neuroscience, 7(4), 497-510.
Green, D. J., Maiorana, A., O’driscoll, G., & Taylor, R. (2004). Effect of exercise training on endothelium-derived nitric oxide function in humans. Journal of Physiology, 561(Pt 1), 1–25. http://doi.org/10.1113/jphysiol.2004.068197
Greif, D. M., & Eichmann, A. (2014). Vascular biology: brain vessels squeezed to death. Nature, 508(7494), 50-51.
Griffeth, V. E. M., & Buxton, R. B. (2011). A theoretical framework for estimating cerebral

Chapter 10
273
oxygen metabolism changes using the calibrated-BOLD method: Modeling the effects of blood volume distribution, hematocrit, oxygen extraction fraction, and tissue signal properties on the BOLD signal. NeuroImage, 58(1), 198–212. http://doi.org/10.1016/j.neuroimage.2011.05.077
Grill-spector, K., Kourtzi, Z., & Kanwisher, N. (2001). The lateral occipital complex and its role in object recognition, 41, 1409–1422.
Grubb, B. Y. R. L., Raichle, M. E., Eichling, J. O., & Ph, D. (1974). The Effects of Changes in Paco 2 on Cerebral Blood Volume , Blood Flow , and Vascular Mean Transit Time, 11059(5).
Hardwick, R. M., Rottschy, C., Miall, R. C., & Eickhoff, S. B. (2013). A quantitative meta-analysis and review of motor learning in the human brain. NeuroImage, 67, 283–297. http://doi.org/10.1016/j.neuroimage.2012.11.020
Haskell, W. L., Lee, I., Pate, R. R., Powell, K. E., & Blair, S. N. (2007). Physical Activity and Public Health : Updated Recommendation for Adults From the American College of Sports Medicine and the American Heart Association, 39, 1423–1434. http://doi.org/10.1249/mss.0b013e3180616b27
Hayes, S. M., Alosco, M. L., & Forman, D. E. (2014). The Effects of Aerobic Exercise on Cognitive and Neural Decline in Aging and Cardiovascular Disease, 282–290. http://doi.org/10.1007/s13670-014-0101-x
Hayes, S. M., Forman, D. E., & Verfaellie, M. (2014). Cardiorespiratory Fitness Is Associated With Cognitive Performance in Older But Not Younger Adults, 1–8. http://doi.org/10.1093/geronb/gbu167
Heijtel, D. F. R., Mutsaerts, H. J. M. M., Bakker, E., Schober, P., Stevens, M. F., Petersen, E. T., … Nederveen, a J. (2014). Accuracy and precision of pseudo-continuous arterial spin labeling perfusion during baseline and hypercapnia: a head-to-head comparison with 15O H₂O positron emission tomography. NeuroImage, 92, 182–92. http://doi.org/10.1016/j.neuroimage.2014.02.011
Heinonen, I., Koga, S., Kalliokoski, K. K., Musch, T. I., & Poole, D. C. (2015). Heterogeneity of muscle blood flow and metabolism: influence of exercise, aging and disease states. Exercise and sport sciences reviews, 43(3), 117.
Helgerud, J. A. N., Ydal, K. H. K., Wang, E., Karlsen, T., Simonsen, T., Helgesen, C., … Hoff, J. A. N. (2007). Aerobic High-Intensity Intervals Improve ˙ O, (11), 665–671. http://doi.org/10.1249/mss.0b013e3180304570
Hillman, C. H., Erickson, K. I., & Kramer, A. F. (2008). Be smart, exercise your heart: exercise effects on brain and cognition. Nature reviews neuroscience, 9(1), 58.
Hlus, P., Solodkin, A., Noll, D. C., & Small, S. L. (2004). Cortical Plasticity During Three-Week Motor Skill Learning, 21(3), 1–12.
Hofstetter, S., Tavor, I., Moryosef, S. T., & Assaf, Y. (2013). Short-Term Learning Induces White Matter Plasticity in the Fornix, 33(31), 12844–12850. http://doi.org/10.1523/JNEUROSCI.4520-12.2013
Hoge, R. D. (2012). Calibrated fMRI. NeuroImage, 62(2), 930–937. http://doi.org/10.1016/j.neuroimage.2012.02.022
Hoge, R. D., Atkinson, J., Gill, B., Crelier, G. R., Marrett, S., & Pike, G. B. (1999). Linear coupling

Chapter 10
274
between cerebral blood flow and oxygen consumption in activated human cortex. Proceedings of the National Academy of Sciences USA, 96(August), 9403–9408.
Hoge, R. D., Atkinson, J., Gill, B., Crelier, R., Marrett, S., & Pike, G. B. (1999). Investigation of BOLD Signal Dependence on Cerebral Blood Flow and Oxygen Consumption : The Deoxyhemoglobin Dilution Model, 863, 849–863.
Honda, M., Deiber, M., Iba, V., Pascual-leone, A., Zhuang, P., & Hallett, M. (1998). Dynamic cortical involvement in implicit and explicit motor sequence learning A PET study, 2159–2173.
Horn, H., & Federspiel, A. (2012). Semantic Network Disconnection in, 14–23. http://doi.org/10.1159/000337133
Horton, T. J., Grunwald, G. K., Lavely, J., Donahoo, W. T., Horton, T. J., Dow, S., … Lavely, J. (2011). Glucose kinetics differ between women and men , during and after exercise Glucose kinetics differ between women and men , during and after exercise, 80262, 1883–1894. http://doi.org/10.1152/japplphysiol.01431.2005
Hubbard, N. A., Turner, M. P., Ouyang, M., Himes, L., Thomas, B. P., Hutchison, J. L., … Rypma, B. (2017). Calibrated Imaging Reveals Altered Grey Matter Metabolism Related to White Matter Microstructure and Symptom Severity in Multiple Sclerosis, 0(February). http://doi.org/10.1002/hbm.23727
Huber, L., Goense, J., Kennerley, A. J., Trampel, R., Guidi, M., Reimer, E., … Möller, H. E. (2015). Cortical lamina-dependent blood volume changes in human brain at 7 T. NeuroImage, 107(December 2014), 23–33. http://doi.org/10.1016/j.neuroimage.2014.11.046
Huber, L., Ivanov, D., Guidi, M., Turner, R., Uluda??, K., M??ller, H. E., & Poser, B. A. (2015). Functional cerebral blood volume mapping with simultaneous multi-slice acquisition. NeuroImage, 125, 1159–1168. http://doi.org/10.1016/j.neuroimage.2015.10.082
Hwang, J., Castelli, D. M., & Gonzalez-lima, F. (2017). Physiology & Behavior The positive cognitive impact of aerobic fi tness is associated with peripheral in fl ammatory and brain-derived neurotrophic biomarkers in young adults. Physiology & Behavior, 179(January), 75–89. http://doi.org/10.1016/j.physbeh.2017.05.011
Iadecola, C., & Nedergaard, M. (2007). Glial regulation of the cerebral microvasculature, 10(11), 1369–1376. http://doi.org/10.1038/nn2003
Iannetti, G. D., & Wise, R. G. (2007a). BOLD functional MRI in disease and pharmacological studies : room for improvement ?, 25, 978–988. http://doi.org/10.1016/j.mri.2007.03.018
Iannetti, G. D., & Wise, R. G. (2007b). BOLD functional MRI in disease and pharmacological studies: room for improvement? Magnetic Resonance Imaging, 25(6), 978–88. http://doi.org/10.1016/j.mri.2007.03.018
Inglese, M., Park, S., Johnson, G., Babb, J. S., & Miles, L. (2017). Deep Gray Matter Perfusion in Multiple Sclerosis, 64.
Ivey, F. M., Ryan, A. S., Hafer-macko, C. E., & Macko, R. F. (2011). Training in Hemiparetic Stroke Survivors, (18). http://doi.org/10.1161/STROKEAHA.110.607879
Jenkinson, M., Bannister, P., Brady, M., & Smith, S. (2002). Improved optimization for the robust and accurate linear registration and motion correction of brain images.

Chapter 10
275
NeuroImage, 17(2), 825–841. http://doi.org/10.1016/S1053-8119(02)91132-8
Jenkinson, M., & Smith, S. M. (2001). A global optimization method for robust affine registration of brain images. Medical Imaging Analysis, 5, 143–156.
Jespersen, S. N., & Østergaard, L. (2012). The roles of cerebral blood flow , capillary transit time heterogeneity , and oxygen tension in brain oxygenation and metabolism, 264–277. http://doi.org/10.1038/jcbfm.2011.153
Jones, T. A., Chu, C. J., Grande, L. A., & Gregory, A. D. (1999). Motor Skills Training Enhances Lesion-Induced Structural Plasticity in the Motor Cortex of Adult Rats, 19(22), 10153–10163.
Jonge, X. A. K. J. De. (2003). Effects of the Menstrual Cycle on Exercise Performance, 33(11), 833–851.
Joyner, M. J. (2000). Effect of exercise on arterial compliance. Circulation, 102, 1214–1215. http://doi.org/10.1161/01.CIR.102.11.1214
Juurlink, B. H. J. (2013). The evidence for hypoperfusion as a factor in multiple sclerosis lesion development. Multiple Sclerosis International, 2013, 598093. http://doi.org/10.1155/2013/598093
Kalliokoski, K. K., Oikonen, V., Takala, T. O., Kari, K., Oikonen, V., Teemu, O., … Nuu-, P. (2001). Enhanced oxygen extraction and reduced flow heterogeneity in exercising muscle in endurance-trained men, 1015–1021.
Kastrup, A., Kru, G., Neumann-haefelin, T., Glover, G. H., & Moseley, M. E. (2002). Changes of Cerebral Blood Flow , Oxygenation , and Oxidative Metabolism during Graded Motor Activation, 82, 74–82. http://doi.org/10.1006/nimg.2001.0916
Kerr, A. L., Steuer, E. L., Pochtarev, V., & Swain, R. A. (2010). ANGIOGENESIS BUT NOT NEUROGENESIS IS CRITICAL FOR NORMAL LEARNING AND MEMORY ACQUISITION. NSC, 171(1), 214–226. http://doi.org/10.1016/j.neuroscience.2010.08.008
Khan, N. A., & Hillman, C. H. (2014). The Relation of Childhood Physical Activity and Aerobic Fitness to Brain Function and Cognition : A Review, 138–146.
Kidd, D., Barkhof, F., Mcconnell, R., Algra, P. R., Allen, I. V, & Revesz, T. (1999). Cortical lesions in multiple sclerosis, 17–26.
Kim, S.-G., & Ogawa, S. (2012). Biophysical and Physiological Origins of Blood Oxygenation Level-Dependent fMRI Signals. Journal of Cerebral Blood Flow & Metabolism, 32(7), 1188–1206. http://doi.org/10.1038/jcbfm.2012.23
Kingwell, E., Marriott, J. J., Jetté, N., Pringsheim, T., Makhani, N., Morrow, S. A., … Marrie, R. A. (2013). Incidence and prevalence of multiple sclerosis in Europe : a systematic review.
Kister, I., Bacon, T. E., Chamot, E., Salter, A. R., Cutter, G. R., Kalina, J. T., & Herbert, J. (2013). Natural history of multiple sclerosis symptoms. International Journal of MS Care, 15(3), 146–158. http://doi.org/10.7224/1537-2073.2012-053
Klauke, K., & Borght, K. Van Der. (2009). Physical exercise leads to rapid adaptations in hippocampal vasculature : Temporal dynamics and relationship to cell ... Physical Exercise Leads to Rapid Adaptations in Hippocampal Vasculature : Temporal Dynamics and Relationship to Cell Proliferation and, (October). http://doi.org/10.1002/hipo.20545

Chapter 10
276
Kleemeyer, M. M., Kühn, S., Prindle, J., Bodammer, N. C., Brechtel, L., Garthe, A., … Lindenberger, U. (2015). Changes in fitness are associated with changes in hippocampal microstructure and hippocampal volume among older adults. NeuroImage. http://doi.org/10.1016/j.neuroimage.2015.11.026
Kleim, J. A., Hogg, T. M., Vandenberg, P. M., Cooper, N. R., Bruneau, R., & Remple, M. (2004). Cortical Synaptogenesis and Motor Map Reorganization Occur during Late , But Not Early , Phase of Motor Skill Learning, 24(3), 628–633. http://doi.org/10.1523/JNEUROSCI.3440-03.2004
Knaepen, K., Goekint, M., Heyman, E. M., & Meeusen, R. (2010). Neuroplasticity - exercise-induced response of peripheral brain-derived neurotrophic factor: a systematic review of experimental studies in human subjects. Sports Medicine (Auckland, N.Z.), 40(9), 765–801. http://doi.org/10.2165/11534530-000000000-00000
Knopman, D., & Nissen, M. J. (1991). PROCEDURAL LEARNING IS IMPAIRED IN HUNTINGTON ’ S DISEASE : EVIDENCE FROM THE SERIAL REACTION TIME TASK that the brain has separate learning systems has generated a great deal of controversy [ 12 , 22 , 29 ]. The neuropsychological evidence is perhaps the, 29(3), 245–254.
Kobilo, T., Liu, Q. R., Gandhi, K., Mughal, M., Shaham, Y., & van Praag, H. (2011). Running is the neurogenic and neurotrophic stimulus in environmental enrichment. Learning & memory, 18(9), 605-609.
Kodama, S., Saito, K., Tanaka, S., Maki, M., Yachi, Y., Asumi, M., … Sone, H. (2009). CLINICIAN ’ S CORNER Cardiorespiratory Fitness as a Quantitative Predictor of All-Cause Mortality and Cardiovascular Events. Journal of American Medical Association, 301(19), 2024–2035.
Korman, M., Raz, N., Flash, T., & Karni, A. (2003). Multiple shifts in the representation of a motor sequence during the acquisition of skilled performance.
Kramer, A. F. (2010). Basal Ganglia Volume Is Associated with Aerobic Fitness in Preadolescent Children, 249–256. http://doi.org/10.1159/000316648
Krieger, S. N., Gauthier, C. J., Ivanov, D., Huber, L., Roggenhofer, E., Sehm, B., … Egan, G. F. (2014). NeuroImage Regional reproducibility of calibrated BOLD functional MRI : Implications for the study of cognition and plasticity. NeuroImage, 101, 8–20. http://doi.org/10.1016/j.neuroimage.2014.06.072
Kro, K., Fehsel, K., & Kolb-bachofen, V. (1997). Nitric Oxide : Cytotoxicity versus Cytoprotection — How , Why , When , and Where ?, 1(2), 107–120.
Krogh, A. (1919). The number and distribution of capillaries in muscles with calculations of the oxygen pressure head necessary for supplying the tissue. The Journal of physiology, 52(6), 409-415.
Laguna, L., & Cognitive, H. (1995). Karni , A . et al . Functional MRI evidence for adult motor cortex plasticity during motor skill learning . Nature 377 , 155-158, (May 2016), 155–158. http://doi.org/10.1038/377155a0
Lajoie, I., Tancredi, F. B., & Hoge, R. D. (2016). Regional Reproducibility of BOLD Calibration Parameter M , OEF and Resting-State CMRO 2 Measurements with QUO2 MRI, 1–31. http://doi.org/10.1371/journal.pone.0163071
Lakens, D. (2013). Calculating and reporting effect sizes to facilitate cumulative science : a practical primer for t -tests and ANOVAs, 4(November), 1–12.

Chapter 10
277
http://doi.org/10.3389/fpsyg.2013.00863
Landi, S. M., Baguear, F., & Della-maggiore, V. (2011). One Week of Motor Adaptation Induces Structural Changes in Primary Motor Cortex That Predict Long-Term Memory One Year Later, 31(33), 11808–11813. http://doi.org/10.1523/JNEUROSCI.2253-11.2011
Law, M., Ge, Y., Johnson, G., Babb, J. S., & Grossman, R. I. (2007). Correlation of Diffusion Tensor and Dynamic Perfusion MR Imaging Metrics in Normal- Appearing Corpus Callosum : Support for Primary Hypoperfusion in Multiple Sclerosis.
Lee, D., Artero, E. G., Sui, X., & Blair, S. N. (2010). Mortality trends in the general population: the importance of cardiorespiratory fitness. Journal of Psychopharmacology (Oxford, England), 24(4 Suppl), 27–35. http://doi.org/10.1177/1359786810382057
Leithner, C., & Royl, G. (2013a). The oxygen paradox of neurovascular coupling, 34(1), 19–29. http://doi.org/10.1038/jcbfm.2013.181
Leithner, C., & Royl, G. (2013b). The oxygen paradox of neurovascular coupling, 34(1), 19–29. http://doi.org/10.1038/jcbfm.2013.181
Levin, J. M., Frederick, B. D., Ross, M. H., Fox, J. F., Von Rosenberg, H. L., Kaufman, M. J., … Renshaw, P. F. (2001). Influence of baseline hematocrit and hemodilution on BOLD fMRI activation. Magnetic Resonance Imaging, 19(8), 1055–1062. http://doi.org/10.1016/S0730-725X(01)00460-X
Levin, V. A., & Ausman, J. I. (1969). Relationship of peripheral venous hematocrit to brain hematocrit. Journal of applied physiology, 26(4), 433-437.
Liang, X., Connelly, A., & Calamante, F. (2013). Improved Partial Volume Correction for Single Inversion Time Arterial Spin Labeling Data, C, 531–537. http://doi.org/10.1002/mrm.24279
Liang, X., Zou, Q., He, Y., & Yang, Y. (2013). Coupling of functional connectivity and regional cerebral blood fl ow reveals a physiological basis for network hubs of the human brain, 110(5), 1929–1934. http://doi.org/10.1073/pnas.1214900110
Lipp, I., Murphy, K., Caseras, X., & Wise, R. (2013). Agreement and repeatability of vascular reactivity estimates based on a breath-hold task and a resting state scan, (2001).
Lipp, I., & Tomassini, V. (2015). Neuroplasticity and motor rehabilitation in multiple sclerosis, 6(March), 1–3. http://doi.org/10.1038/nn.3045
Liu, T. T., & Wong, E. C. (2005). A signal processing model for arterial spin labeling functional MRI. NeuroImage, 24(1), 207–215. http://doi.org/10.1016/j.neuroimage.2004.09.047
Logothetis, N. K., Pauls, J., Augath, M., Trinath, T., & Oeltermann, A. (2001). Neurophysiological investigation of the basis of the fMRI signal. Nature, 412(6843), 150–7. http://doi.org/10.1038/35084005
Logothetis, N. K., & Pfeuffer, J. (2004). On the nature of the BOLD f MRI contrast mechanism, 22, 1517–1531. http://doi.org/10.1016/j.mri.2004.10.018
Lu, H., Clingman, C., Golay, X., & Van Zijl, P. C. M. (2004). Determining the longitudinal relaxation time (T1) of blood at 3.0 tesla. Magnetic Resonance in Medicine, 52(3), 679–682. http://doi.org/10.1002/mrm.20178
Lu, H., Donahue, M. J., & Van Zijl, P. C. M. (2006). Detrimental effects of BOLD signal in arterial
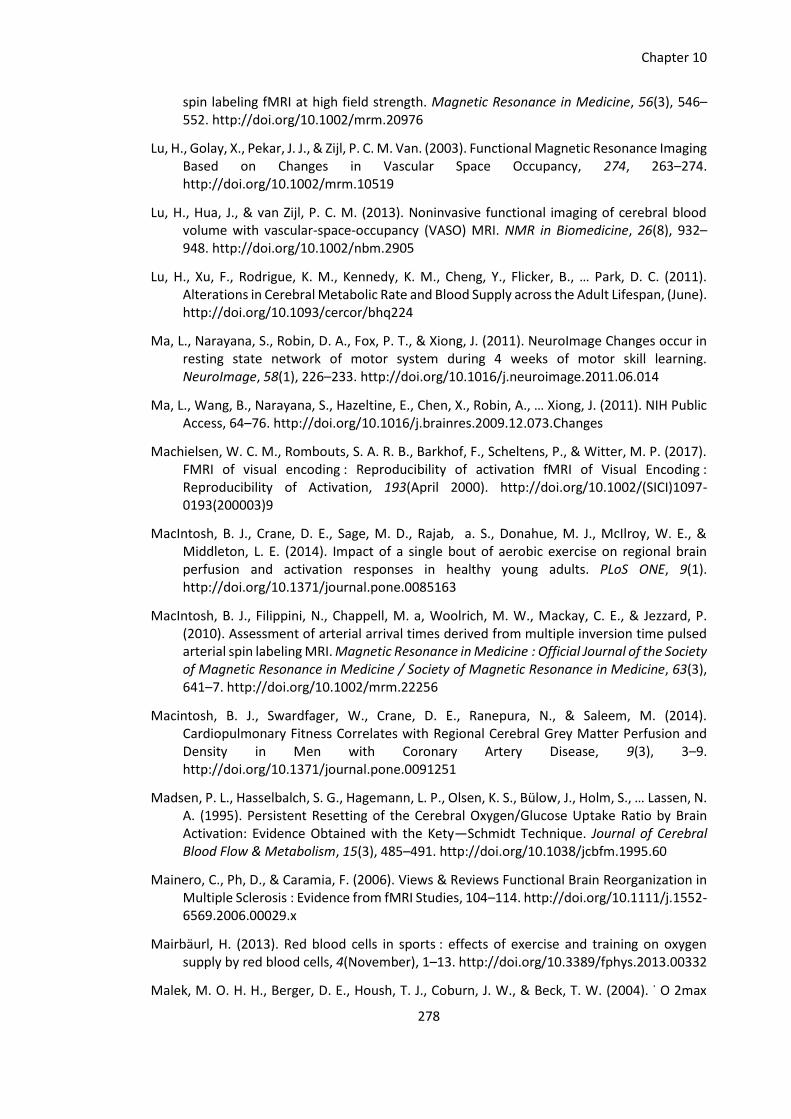
Chapter 10
278
spin labeling fMRI at high field strength. Magnetic Resonance in Medicine, 56(3), 546–552. http://doi.org/10.1002/mrm.20976
Lu, H., Golay, X., Pekar, J. J., & Zijl, P. C. M. Van. (2003). Functional Magnetic Resonance Imaging Based on Changes in Vascular Space Occupancy, 274, 263–274. http://doi.org/10.1002/mrm.10519
Lu, H., Hua, J., & van Zijl, P. C. M. (2013). Noninvasive functional imaging of cerebral blood volume with vascular-space-occupancy (VASO) MRI. NMR in Biomedicine, 26(8), 932–948. http://doi.org/10.1002/nbm.2905
Lu, H., Xu, F., Rodrigue, K. M., Kennedy, K. M., Cheng, Y., Flicker, B., … Park, D. C. (2011). Alterations in Cerebral Metabolic Rate and Blood Supply across the Adult Lifespan, (June). http://doi.org/10.1093/cercor/bhq224
Ma, L., Narayana, S., Robin, D. A., Fox, P. T., & Xiong, J. (2011). NeuroImage Changes occur in resting state network of motor system during 4 weeks of motor skill learning. NeuroImage, 58(1), 226–233. http://doi.org/10.1016/j.neuroimage.2011.06.014
Ma, L., Wang, B., Narayana, S., Hazeltine, E., Chen, X., Robin, A., … Xiong, J. (2011). NIH Public Access, 64–76. http://doi.org/10.1016/j.brainres.2009.12.073.Changes
Machielsen, W. C. M., Rombouts, S. A. R. B., Barkhof, F., Scheltens, P., & Witter, M. P. (2017). FMRI of visual encoding : Reproducibility of activation fMRI of Visual Encoding : Reproducibility of Activation, 193(April 2000). http://doi.org/10.1002/(SICI)1097-0193(200003)9
MacIntosh, B. J., Crane, D. E., Sage, M. D., Rajab, a. S., Donahue, M. J., McIlroy, W. E., & Middleton, L. E. (2014). Impact of a single bout of aerobic exercise on regional brain perfusion and activation responses in healthy young adults. PLoS ONE, 9(1). http://doi.org/10.1371/journal.pone.0085163
MacIntosh, B. J., Filippini, N., Chappell, M. a, Woolrich, M. W., Mackay, C. E., & Jezzard, P. (2010). Assessment of arterial arrival times derived from multiple inversion time pulsed arterial spin labeling MRI. Magnetic Resonance in Medicine : Official Journal of the Society of Magnetic Resonance in Medicine / Society of Magnetic Resonance in Medicine, 63(3), 641–7. http://doi.org/10.1002/mrm.22256
Macintosh, B. J., Swardfager, W., Crane, D. E., Ranepura, N., & Saleem, M. (2014). Cardiopulmonary Fitness Correlates with Regional Cerebral Grey Matter Perfusion and Density in Men with Coronary Artery Disease, 9(3), 3–9. http://doi.org/10.1371/journal.pone.0091251
Madsen, P. L., Hasselbalch, S. G., Hagemann, L. P., Olsen, K. S., Bülow, J., Holm, S., … Lassen, N. A. (1995). Persistent Resetting of the Cerebral Oxygen/Glucose Uptake Ratio by Brain Activation: Evidence Obtained with the Kety—Schmidt Technique. Journal of Cerebral Blood Flow & Metabolism, 15(3), 485–491. http://doi.org/10.1038/jcbfm.1995.60
Mainero, C., Ph, D., & Caramia, F. (2006). Views & Reviews Functional Brain Reorganization in Multiple Sclerosis : Evidence from fMRI Studies, 104–114. http://doi.org/10.1111/j.1552-6569.2006.00029.x
Mairbäurl, H. (2013). Red blood cells in sports : effects of exercise and training on oxygen supply by red blood cells, 4(November), 1–13. http://doi.org/10.3389/fphys.2013.00332
Malek, M. O. H. H., Berger, D. E., Housh, T. J., Coburn, J. W., & Beck, T. W. (2004). ˙ O 2max

Chapter 10
279
Equations for Aerobically Validity of V Trained Males and Females, (November 2003), 1427–1432. http://doi.org/10.1249/01.MSS.0000135795.60449.CE
Mancini, L., Ciccarelli, O., Manfredonia, F., Thornton, J. S., Agosta, F., Barkhof, F., … Yousry, T. (2009). NeuroImage Short-term adaptation to a simple motor task : A physiological process preserved in multiple sclerosis. NeuroImage, 45(2), 500–511. http://doi.org/10.1016/j.neuroimage.2008.12.006
Mansfield, P. (1977). Multi-planar image formation using NMR spin echoes. Journal of Physics C: Solid State Physics, 10(3), L55.
Mark, C. I., Fisher, J. A., & Pike, G. B. (2011). NeuroImage Improved fMRI calibration : Precisely controlled hyperoxic versus hypercapnic stimuli, 54, 1102–1111. http://doi.org/10.1016/j.neuroimage.2010.08.070
Mark, C. I., Mazerolle, E. L., & Chen, J. J. (2015). Metabolic and vascular origins of the BOLD effect: Implications for imaging pathology and resting‐state brain function. Journal of Magnetic Resonance Imaging, 42(2), 231-246.
Marshall, O., Chawla, S., Lu, H., Pape, L., & Ge, Y. (2016). Cerebral blood flow modulation insufficiency in brain networks in multiple sclerosis: A hypercapnia MRI study. Journal of Cerebral Blood Flow & Metabolism. http://doi.org/10.1177/0271678X16654922
Marshall, O., Lu, H., Brisset, J.-C., Xu, F., Liu, P., Herbert, J., … Ge, Y. (2014). Impaired cerebrovascular reactivity in multiple sclerosis. JAMA Neurology, 71(10), 1275–81. http://doi.org/10.1001/jamaneurol.2014.1668
Martin, a J., Friston, K. J., Colebatch, J. G., & Frackowiak, R. S. (1991). Decreases in regional cerebral blood flow with normal aging. Journal of Cerebral Blood Flow and Metabolism : Official Journal of the International Society of Cerebral Blood Flow and Metabolism, 11, 684–689. http://doi.org/10.1038/jcbfm.1991.121
Mathiesen, C., Caesar, K., Thomsen, K., Hoogland, T. M., Witgen, B. M., Brazhe, A., & Lauritzen, M. (2011). Activity-dependent Increases in Local Oxygen Consumption Correlate with Postsynaptic Currents in the Mouse Cerebellum In Vivo. Journal of Neuroscience, 31(50), 18327–18337. http://doi.org/10.1523/JNEUROSCI.4526-11.2011
Mayhew, S. D., Macintosh, B. J., Dirckx, S. G., Domenico, G., & Wise, R. G. (2010). Coupling of simultaneously acquired electrophysiological and haemodynamic responses during visual stimulation. Magnetic Resonance Imaging. http://doi.org/10.1016/j.mri.2010.03.027
Merola, A. (2016). Development of MRI methods to map cerebral metabolic oxygen consumption in humans. Cardiff University.
Merola, A., Germuska, M. A., Warnert, E. A., Richmond, L., Helme, D., Khot, S., … Wise, R. G. (2017). Mapping the pharmacological modulation of brain oxygen metabolism: the effects of caffeine on absolute CMRO 2 measured using dual calibrated fMRI. NeuroImage, 155(August 2016), 331–343. http://doi.org/10.1016/j.neuroimage.2017.03.028
Merola, A., Murphy, K., Stone, A. J., Germuska, M. A., Griffeth, V. E. M., Blockley, N. P., … Wise, R. G. (2013). Measurement of oxygen extraction fraction ( OEF ): an optimised BOLD signal model for use with hypercapnic and hyperoxic calibration. NeuroImage, (1998), 5–6. http://doi.org/10.1016/j.neuroimage.2016.01.021
Miall, R. C., & Robertson, E. M. (2006). Functional imaging: is the resting brain resting?. Current

Chapter 10
280
Biology, 16(23), R998-R1000.
Midgley, A. W., & Carroll, S. (2009). Emergence of the verification phase procedure for confirming ‘true’VO2max. Scandinavian journal of medicine & science in sports, 19(3), 313-322.
Miguel, D., Beelen, R., Fierens, Y., Cambron, M., Vanbinst, A., & Verborgh, C. (2013). Cerebral hypoperfusion in multiple sclerosis is reversible and mediated by endothelin-1. http://doi.org/10.1073/pnas.1222560110/-/DCSupplemental.www.pnas.org/cgi/doi/10.1073/pnas.1222560110
Milani, R. V, Lavie, C. J., Mehra, M. R., & Ventura, H. O. (2006). Understanding the basics of cardiopulmonary exercise testing. Mayo Clinic Proceedings. Mayo Clinic, 81(12), 1603–1611. http://doi.org/10.4065/81.12.1603
Mohtasib, R. S., Lumley, G., Goodwin, J. A., Emsley, H. C. A., Sluming, V., & Parkes, L. M. (2012). NeuroImage Calibrated fMRI during a cognitive Stroop task reveals reduced metabolic response with increasing age, 59, 1143–1151. http://doi.org/10.1016/j.neuroimage.2011.07.092
Morgen, K., Kadom, N., Sawaki, L., Tessitore, A., Ohayon, J., Mcfarland, H., … Cohen, L. G. (2004). Training-dependent plasticity in patients with multiple sclerosis, 2506–2517. http://doi.org/10.1093/brain/awh266
Motl, R. W., & Pilutti, L. a. (2012). The benefits of exercise training in multiple sclerosis. Nature Reviews. Neurology, 8(9), 487–97. http://doi.org/10.1038/nrneurol.2012.136
Muir, E. R., Cardenas, D. P., Duong, T. Q., Antonio, S., Antonio, S., Antonio, S., & Antonio, S. (2017). HHS Public Access, 498–503. http://doi.org/10.1016/j.neuroimage.2016.03.040.MRI
Muoio, V., Persson, P. B., & Sendeski, M. M. (2014). The neurovascular unit – concept review, 790–798. http://doi.org/10.1111/apha.12250
Murphy, K., Birn, R. M., & Bandettini, P. A. (2013a). NeuroImage Resting-state fMRI confounds and cleanup. NeuroImage, 80, 349–359. http://doi.org/10.1016/j.neuroimage.2013.04.001
Murphy, K., Birn, R. M., & Bandettini, P. A. (2013b). Resting-state fMRI confounds and cleanup. NeuroImage, 80, 349–359. http://doi.org/10.1016/j.neuroimage.2013.04.001
Murphy, K., & Fox, M. D. (2017). NeuroImage Towards a consensus regarding global signal regression for resting state functional connectivity MRI. NeuroImage, 154(November 2016), 169–173. http://doi.org/10.1016/j.neuroimage.2016.11.052
Murphy, K., Harris, A. D., & Wise, R. G. (2011). Robustly measuring vascular reactivity differences with breath-hold: normalising stimulus-evoked and resting state BOLD fMRI data. NeuroImage, 54(1), 369–79. http://doi.org/10.1016/j.neuroimage.2010.07.059
Murrell, C. J., Cotter, J. D., Thomas, K. N., Lucas, S. J. E., Williams, M. J. a, & Ainslie, P. N. (2013). Cerebral blood flow and cerebrovascular reactivity at rest and during sub-maximal exercise: effect of age and 12-week exercise training. Age (Dordrecht, Netherlands), 35(3), 905–20. http://doi.org/10.1007/s11357-012-9414-x
Nieman, D. C., & Kernodle, M. W. (2001). Prediction of Maximal Aerobic Power in Adolescents from Cycle Ergometry, 167–172.

Chapter 10
281
Nishijima, T., Torres-Aleman, I., & Soya, H. (2016). Exercise and cerebrovascular plasticity. Progress in Brain Research, 225(October), 243–268. http://doi.org/10.1016/bs.pbr.2016.03.010
Nissen, M. J., & Bullemer, P. (1987). Attentional requirements of learning: Evidence from performance measures. Cognitive Psychology, 19(1), 1–32. http://doi.org/10.1016/0010-0285(87)90002-8
Offenhauser, N., Thomsen, K., Caesar, K., & Lauritzen, M. (2005). Activity-induced tissue oxygenation changes in rat cerebellar cortex: interplay of postsynaptic activation and blood flow. The Journal of Physiology, 565(1), 279–294. http://doi.org/10.1113/jphysiol.2005.082776
Ogawa, S., Menon, R. S., Tank, D. W., Kim, S. G., Merkle, H., Ellermann, J. M., … Ugurbil, K. (1993). Functional brain mapping by blood oxygenation level-dependent contrast magnetic resonance imaging. A comparison of signal characteristics with a biophysical model. Biophysical Journal, 64(3), 803–812. http://doi.org/10.1016/S0006-3495(93)81441-3
Olson, I. R., & Plotzker, A. (2007). The Enigmatic temporal pole : a review of findings on social and emotional processing, 1718–1731. http://doi.org/10.1093/brain/awm052
Olson, I. R., Rao, H., Moore, K. S., Wang, J., Detre, J. A., & Aguirre, G. V. K. (2006). Using perfusion fMRI to measure continuous changes in neural activity with learning, 60, 262–271. http://doi.org/10.1016/j.bandc.2005.11.010
Ookawara, T., Suzuk, K., Haga, S., Ha, S., Chung, K. S., Toshinai, K., ... & Hitomi, Y. (2002). Transcription regulation of gene expression in human skeletal muscle in response to endurance training. Research communications in molecular pathology and pharmacology, 111(1-4), 41-54.Osch, M. J., Hendrikse, J., & van der Grond, J. (2007). Sensitivity comparison of multiple vs. single inversion time pulsed arterial spin labeling fMRI. Journal of magnetic resonance imaging, 25(1), 215-221.
Osch, M. J. P. Van, Teeuwisse, W. M., Chen, Z., Suzuki, Y., Helle, M., & Schmid, S. (2017). Advances in arterial spin labelling MRI methods for measuring perfusion and collateral flow. http://doi.org/10.1177/0271678X17713434
Osch, M. J. P. Van, Teeuwisse, W. M., Walderveen, M. A. A. Van, Hendrikse, J., Kies, D. A., & Buchem, M. A. Van. (2009). Can Arterial Spin Labeling Detect White Matter Perfusion Signal ?, 173(April), 165–173. http://doi.org/10.1002/mrm.22002
Østergaard, L., Engedal, T. S., Aamand, R., Mikkelsen, R., Iversen, N. K., Anzabi, M., … Rasmussen, M. (2014). Capillary transit time heterogeneity and flow-metabolism coupling after traumatic brain injury, (June), 1585–1598. http://doi.org/10.1038/jcbfm.2014.131
Østergaard, L., Engedal, T. S., Moreton, F., Hansen, M. B., Wardlaw, J. M., Dalkara, T., … Muir, K. W. (2016). Cerebral small vessel disease : Capillary pathways to stroke and cognitive decline. http://doi.org/10.1177/0271678X15606723
Østergaard, L., Finnerup, N. B., Terkelsen, A. J., Olesen, R. A., Drasbek, K. R., Knudsen, L., … Andersen, H. (2015). The effects of capillary dysfunction on oxygen and glucose extraction in diabetic neuropathy. Diabetologia, 58(4), 666–677. http://doi.org/10.1007/s00125-014-3461-z

Chapter 10
282
Ota, M., Sato, N., Nakata, Y., Ito, K., Kamiya, K., Maikusa, N., … Kunugi, H. (2013). Abnormalities of cerebral blood flow in multiple sclerosis: A pseudocontinuous arterial spin labeling MRI study. Magnetic Resonance Imaging, 31(6), 990–995. http://doi.org/10.1016/j.mri.2013.03.016
Oxide, T. H. E. N., & Of, D. (1947). THE NITROUS OXIDE METHOD FOR THE QUANTITATIVE, (1), 476–483.
Paling, D., Golay, X., & Miller, D. (2011). Energy failure in multiple sclerosis and its investigation using MR techniques, 2113–2127. http://doi.org/10.1007/s00415-011-6117-7
Paling, D., Thade Petersen, E., Tozer, D. J., Altmann, D. R., Wheeler-Kingshott, C. A. M., Kapoor, R., … Golay, X. (2014). Cerebral arterial bolus arrival time is prolonged in multiple sclerosis and associated with disability. Journal of Cerebral Blood Flow and Metabolism : Official Journal of the International Society of Cerebral Blood Flow and Metabolism, 34(1), 34–42. http://doi.org/10.1038/jcbfm.2013.161
Park, M. G., Yang, T. Il, Oh, S. J., Baik, S. K., Kang, Y. H., & Park, K. P. (2014). Multiple hypointense vessels on susceptibility-weighted imaging in acute ischemic stroke: Surrogate marker of oxygen extraction fraction in penumbra? Cerebrovascular Diseases, 38(4), 254–261. http://doi.org/10.1159/000367709
Parkes, L. M. (2005). Quantification of cerebral perfusion using arterial spin labeling: Two-compartment models. Journal of Magnetic Resonance Imaging, 22(6), 732–736. http://doi.org/10.1002/jmri.20456
Parkes, L. M., & Tofts, P. S. (2002). Improved Accuracy of Human Cerebral Blood Perfusion Measurements Using Arterial Spin Labeling : Accounting for Capillary Water Permeability, 41, 27–41. http://doi.org/10.1002/mrm.10180
Paula, L., Emma, L., & Ian, D. (2015). and Brookes , Matthew Jon and Gowland , Penny A . and Francis , Susan T . ( 2015 ) The effect of isocapnic hyperoxia on neurophysiology as measured with MRI and MEG . NeuroImage , 105 . pp . 323-331 . ISSN 1053-, 323–331.
Paulson, O. B. (2002). B lood – brain barrier , brain metabolism and cerebral blood flow, 12, 495–501.
Pereira, A. C., Huddleston, D. E., Brickman, A. M., Sosunov, A. a, Hen, R., McKhann, G. M., … Small, S. a. (2007). An in vivo correlate of exercise-induced neurogenesis in the adult dentate gyrus. Proceedings of the National Academy of Sciences of the United States of America, 104(13), 5638–43. http://doi.org/10.1073/pnas.0611721104
Petcharunpaisan, S., Ramalho, J., & Castillo, M. (2010). World Journal of Radiology, 2(10), 384–398. http://doi.org/10.4329/wjr.v2.i10.384
Petr, J., Schramm, G., Hofheinz, F., Langner, J., & Van Den Hoff, J. (2013). Partial volume correction in arterial spin labeling using a Look-Locker sequence. Magnetic Resonance in Medicine, 70(6), 1535–1543. http://doi.org/10.1002/mrm.24601
Petzinger, G. M., Fisher, B. E., McEwen, S., Beeler, J. a, Walsh, J. P., & Jakowec, M. W. (2013). Exercise-enhanced neuroplasticity targeting motor and cognitive circuitry in Parkinson’s disease. The Lancet. Neurology, 12(7), 716–26. http://doi.org/10.1016/S1474-4422(13)70123-6
Platta, M. E., Ensari, I., Motl, R. W., & Pilutti, L. A. (2016). Effect of Exercise Training on Fitness in Multiple Sclerosis: A Meta-Analysis. Archives of Physical Medicine and Rehabilitation

Chapter 10
283
(Vol. 97). Elsevier Ltd. http://doi.org/10.1016/j.apmr.2016.01.023
Poldrack, R. A. (2015). Developmental Cognitive Neuroscience Is “ efficiency ” a useful concept in cognitive neuroscience ? Accident Analysis and Prevention, 11, 12–17. http://doi.org/10.1016/j.dcn.2014.06.001
Polman, C. H., Reingold, S. C., Banwell, B., Clanet, M., Cohen, J. A., Filippi, M., … Connor, P. O. (2011). Diagnostic Criteria for Multiple Sclerosis : 2010 Revisions to the McDonald Criteria. http://doi.org/10.1002/ana.22366
Poole, D. C., Wilkerson, Æ. D. P., & Jones, A. M. (2008). Validity of criteria for establishing maximal O 2 uptake during ramp exercise tests, 403–410. http://doi.org/10.1007/s00421-007-0596-3
Powers, W. J. (2009). PET studies of cerebral metabolism in Parkinson Disease. Journal of Bioenergetics and Biomembranes, 41(6), 505–508. http://doi.org/10.1007/s10863-009-9251-5
Prakash, R. S., Patterson, B., Janssen, A., Abduljalil, A., & Boster, A. (2011). Physical activity associated with increased resting-state functional connectivity in multiple sclerosis. Journal of the International Neuropsychological Society : JINS, 17(6), 986–97. http://doi.org/10.1017/S1355617711001093
Prakash, R. S., Snook, E. M., Erickson, K. I., Colcombe, S. J., Voss, M. W., Motl, R. W., & Kramer, A. F. (2007). Cardiorespiratory fitness: A predictor of cortical plasticity in multiple sclerosis. NeuroImage, 34(3), 1238–1244. http://doi.org/10.1016/j.neuroimage.2006.10.003
Prakash, R. S., Snook, E. M., Motl, R. W., & Kramer, A. F. (2010). Aerobic fitness is associated with gray matter volume and white matter integrity in multiple sclerosis. Brain Research, 1341, 41–51. http://doi.org/10.1016/j.brainres.2009.06.063
Pries, A. R., Fritzsche, A., Ley, K., & Gaehtgens, P. (1920). Redistribution of Red Blood Cell Flow in Microcirculatory Networks by Hemodilution.
Prosperini, L., Piattella, M. C., & Giannì, C. (2015). Functional and Structural Brain Plasticity Enhanced by Motor and Cognitive Rehabilitation in Multiple Sclerosis. Neural Plasticity, 2015, 481574. http://doi.org/10.1155/2015/481574
Puttemans, V., Wenderoth, N., & Swinnen, S. P. (2005). Changes in Brain Activation during the Acquisition of a Multifrequency Bimanual Coordination Task : From the Cognitive Stage to Advanced Levels of Automaticity, 25(17), 4270–4278. http://doi.org/10.1523/JNEUROSCI.3866-04.2005
Raichle, M. E. (1986). Focal physiological uncoupling of cerebral blood flow and oxidative metabolism during somatosensory stimulation in human subjects, 83(February), 1140–1144.
Raichle, M. E. (1998). The acquisition of skilled motor performance : Fast and slow experience-driven changes in primary motor cortex, 95(February), 861–868.
Raoult, H., Petr, J., Bannier, E., Stamm, A., & Gauvrit, J. (2011). NeuroImage Arterial spin labeling for motor activation mapping at 3T with a 32-channel coil : Reproducibility and spatial accuracy in comparison with BOLD fMRI. NeuroImage, 58(1), 157–167. http://doi.org/10.1016/j.neuroimage.2011.06.011

Chapter 10
284
Rashid, W., Parkes, L. M., Ingle, G. T., Chard, D. T., Toosy, A. T., Altmann, D. R., ... & Miller, D. H. (2004). Abnormalities of cerebral perfusion in multiple sclerosis. Journal of Neurology, Neurosurgery & Psychiatry, 75(9), 1288-1293.
Rasova, K., Havrdova, E., Brandejsky, P., Zálisová, M., Foubikova, B., & Martinkova, P. (2006). Comparison of the influence of different rehabilitation programmes on clinical, spirometric and spiroergometric parameters in patients with multiple sclerosis. Multiple Sclerosis (Houndmills, Basingstoke, England), 12(January 2005), 227–234. http://doi.org/10.1191/135248506ms1248oa
Rasova, K., Prochazkova, M., Tintera, J., Ibrahim, I., Zimova, D., & Stetkarova, I. (2015). Motor programme activating therapy influences adaptive brain functions in multiple sclerosis. International Journal of Rehabilitation Research, 38(1), 49–54. http://doi.org/10.1097/MRR.0000000000000090
Rauch, S. L., Whalen, P. J., Savage, C. R., Curran, T., Kendrick, A., Brown, H. D., … Rosen, B. R. (1997). Striatal recruitment during an implicit sequence learning task as measured by functional magnetic resonance imaging. Human Brain Mapping, 5(2), 124–132. http://doi.org/10.1002/(SICI)1097-0193(1997)5:2<124::AID-HBM6>3.0.CO;2-5
Restom, K., Bangen, K. J., Bondi, M. W., Perthen, J. E., & Liu, T. (2008). NIH Public Access, 37(2), 430–439.
Richiardi, J., Monsch, A. U., Haas, T., Barkhof, F., Van de Ville, D., Radü, E. W., … Haller, S. (2015). Altered cerebrovascular reactivity velocity in mild cognitive impairment and Alzheimer’s disease. Neurobiology of Aging, 36(1), 33–41. http://doi.org/10.1016/j.neurobiolaging.2014.07.020
Robertson, A. D., Crane, D. E., Rajab, A. S., Swardfager, W., Marzolini, S., & Shirzadi, Z. (2015). Exercise intensity modulates the change in cerebral blood flow following aerobic exercise in chronic stroke. Experimental Brain Research, 233(8), 2467–2475. http://doi.org/10.1007/s00221-015-4317-6
Roque, F. R., Hernanz, R., Salaices, M., & Briones, A. M. (2013). Exercise training and cardiometabolic diseases: Focus on the vascular system. Current Hypertension Reports, 15(3), 204–214. http://doi.org/10.1007/s11906-013-0336-5
Saba, L. (Ed.). (2016). Image Principles, Neck, and the Brain. CRC Press.
Sagi, Y., Tavor, I., Hofstetter, S., Tzur-moryosef, S., Blumenfeld-katzir, T., & Assaf, Y. (2012). Article Learning in the Fast Lane : New Insights into Neuroplasticity, 1195–1203. http://doi.org/10.1016/j.neuron.2012.01.025
Sakata, J. T., Crews, D., & Gonzalez-lima, F. (2005). Behavioral correlates of differences in neural metabolic capacity, 48, 1–15. http://doi.org/10.1016/j.brainresrev.2004.07.017
Sami, S., & Miall, R. C. (2013). Graph network analysis of immediate motor-learning induced changes in resting state BOLD. Frontiers in Human Neuroscience, 7(May), 166. http://doi.org/10.3389/fnhum.2013.00166
Sami, S., Robertson, E. M., & Miall, R. C. (2014). The Time Course of Task-Specific Memory Consolidation Effects in Resting State Networks, 34(11), 3982–3992. http://doi.org/10.1523/JNEUROSCI.4341-13.2014
Schmidt, S., & Wonneberger, M. (2014). Long-term endurance exercise improves aerobic capacity in patients with relapsing-remitting multiple sclerosis: impact of baseline

Chapter 10
285
fatigue. Journal of the Neurological Sciences, 336(1–2), 29–35. http://doi.org/10.1016/j.jns.2013.09.035
Schmithorst, V. J., Hernandez‐Garcia, L., Vannest, J., Rajagopal, A., Lee, G., & Holland, S. K. (2014). Optimized simultaneous ASL and BOLD functional imaging of the whole brain. Journal of Magnetic Resonance Imaging, 39(5), 1104-1117.
Seitz, R. J., & Roland, P. E. (1991). Learning of Sequential Finger Movements in Man : A Combined Kinematic and Positron Emission Tomography ( PET ) Study, 4(May), 154–165.
Shannon, B. J., Neil, S., Vlassenko, A. G., Shimony, J. S., & Rutlin, J. (2016). Brain aerobic glycolysis and motor adaptation learning, (26), 1–10. http://doi.org/10.1073/pnas.1604977113
Singh, M., Kim, S., & Kim, T. (2003). Correlation Between BOLD-fMRI and EEG Signal Changes in Response to Visual Stimulus Frequency in Humans, 114, 108–114. http://doi.org/10.1002/mrm.10335
Smetcoren, S., Deroost, N., Smetcoren, S., Vandenbossche, J., & Hooghe, M. D. (2014). Implicit and Explicit Learning of Sequential Motor Skill in Multiple Sclerosis : Directions for Rehabilitation Implicit And Explicit Learning of Sequential Motor Skill in Multiple Sclerosis : Directions for Rehabilitation, (July). http://doi.org/10.17653/2374-9091.SS0001
Smith, J. C., Paulson, E. S., Cook, D. B., Verber, M. D., & Tian, Q. (2010). Detecting changes in human cerebral blood flow after acute exercise using arterial spin labeling : Implications for fMRI, 191, 258–262. http://doi.org/10.1016/j.jneumeth.2010.06.028
Smith, S., & Brady, J. (1997). SUSAN—a new approach to low level image processing. International Journal of Computer Vision, 23(1), 45–78. http://doi.org/10.1023/A:1007963824710
Smith, S. M. (2002). Fast Robust Automated Brain Extraction, 155, 143–155. http://doi.org/10.1002/hbm.10062
Smith, S. M., & Nichols, T. E. (2009a). Threshold-free cluster enhancement : Addressing problems of smoothing , threshold dependence and localisation in cluster inference. NeuroImage, 44(1), 83–98. http://doi.org/10.1016/j.neuroimage.2008.03.061
Smith, S. M., & Nichols, T. E. (2009b). Threshold-free cluster enhancement: Addressing problems of smoothing, threshold dependence and localisation in cluster inference. NeuroImage, 44(1), 83–98. http://doi.org/10.1016/j.neuroimage.2008.03.061
Sperling, R., Dickerson, B., Pihlajamaki, M., Vannini, P., LaViolette, P., Vitolo, O., … Johnson, K. (2010). Functional alterations in memory networks in early Alzheimer’s disease. Neuromolecular Med, 12(1), 27–43. http://doi.org/10.1007/s12017-009-8109-7.Functional
Stampfer, M. J. (2006). Cardiovascular disease and Alzheimer’s disease: Common links. Journal of Internal Medicine, 260(3), 211–223. http://doi.org/10.1111/j.1365-2796.2006.01687.x
Storer, T. W., Davis, J. A., & Caiozzo, V. J. (1990). Accurate prediction of VO2max in cycle ergometry. Medicine and Science in Sports and Exercise, 22(5), 704-712.Stroth, S., Hille, K., Spitzer, M., & Reinhardt, R. (2016). Aerobic endurance exercise benefits memory and affect in young adults, 2011(September). http://doi.org/10.1080/09602010802091183

Chapter 10
286
Swain, R. ., Harris, a. ., Wiener, E. ., Dutka, M. ., Morris, H. ., Theien, B. ., … Greenough, W. . (2003). Prolonged exercise induces angiogenesis and increases cerebral blood volume in primary motor cortex of the rat. Neuroscience, 117(4), 1037–1046. http://doi.org/10.1016/S0306-4522(02)00664-4
Swain, R. A., Harris, A. B., Wiener, E. C., Dutka, M. V., Morris, H. D., Theien, B. E., … Greenough, W. T. (2003). Prolonged exercise induces angiogenesis and increases cerebral blood volume in primary motor cortex of the rat. Neuroscience, 117(4), 1037–1046. http://doi.org/10.1016/S0306-4522(02)00664-4
Tacchino, A., Bove, M., Roccatagliata, L., Luigi, G., Uccelli, A., & Bonzano, L. (2014). Selective impairments of motor sequence learning in multiple sclerosis patients with minimal disability. Brain Research, 1585, 91–98. http://doi.org/10.1016/j.brainres.2014.08.031
Tanaka, H., Dinenno, F. A., Monahan, K. D., Clevenger, C. M., DeSouza, C. A., & Seals, D. R. (2000). Aging, habitual exercise, and dynamic arterial compliance. Circulation, 102(11), 1270–1275. http://doi.org/10.1161/01.CIR.102.11.1270
Tancredi, F. B., Gauthier, C. J., Bolar, D. S., Fisher, J. A., Wang, D. J. J., & Hoge, R. D. (2012). Comparison of Pulsed and Pseudocontinuous Arterial Spin-Labeling for Measuring CO 2 -Induced Cerebrovascular Reactivity, 0, 1–10. http://doi.org/10.1002/jmri.23658
Tancredi, F. B., & Hoge, R. D. (2013). Comparison of cerebral vascular reactivity measures obtained using breath-holding and CO2 inhalation. Journal of Cerebral Blood Flow and Metabolism : Official Journal of the International Society of Cerebral Blood Flow and Metabolism, 33(7), 1066–74. http://doi.org/10.1038/jcbfm.2013.48
Tancredi, F. B., Lajoie, I., & Hoge, R. D. (2014). A simple breathing circuit allowing precise control of inspiratory gases for experimental respiratory manipulations. BMC Research Notes, 7(1), 235. http://doi.org/10.1186/1756-0500-7-235
Themanson, J. R., Pontifex, M. B., & Hillman, C. H. (2008). Fitness and action monitoring: evidence for improved cognitive flexibility in young adults. Neuroscience, 157(2), 319-328.
Thomas, A. G., Dennis, A., Rawlings, N. B., Stagg, C. J., Matthews, L., Morris, M., … Johansen-Berg, H. (2015). Multi-modal characterization of rapid anterior hippocampal volume increase associated with aerobic exercise. NeuroImage, i. http://doi.org/10.1016/j.neuroimage.2015.10.090
Thomas, B. P., Yezhuvath, U. S., Tseng, B. Y., Liu, P., Levine, B. D., Zhang, R., & Lu, H. (2013). Life-long aerobic exercise preserved baseline cerebral blood flow but reduced vascular reactivity to CO2. Journal of Magnetic Resonance Imaging : JMRI, 38(5), 1177–83. http://doi.org/10.1002/jmri.24090
Thomas, D. L., Lythgoe, M. F., Calamante, F., Gadian, D. G., & Ordidge, R. J. (2001). Simultaneous noninvasive measurement of CBF and CBV using double-echo FAIR (DEFAIR). Magnetic Resonance in Medicine : Official Journal of the Society of Magnetic Resonance in Medicine / Society of Magnetic Resonance in Medicine, 45(5), 853–63. Retrieved from http://www.ncbi.nlm.nih.gov/pubmed/11323812
Thompson, A. J., & Miller, D. H. (2004). Abnormalities of cerebral perfusion in multiple sclerosis, 1288–1294. http://doi.org/10.1136/jnnp.2003.026021
Tomassini, V., Ambrosio, A., Petsas, N., Wise, R. G., Sbardella, E., Allen, M., … Pozzilli, C. (2016).

Chapter 10
287
The Effect of Inflammation and Its Reduction on Brain Plasticity in Multiple Sclerosis : MRI Evidence, 0(September 2015). http://doi.org/10.1002/hbm.23184
Tomassini, V., d’Ambrosio, A., Petsas, N., Wise, R. G., Sbardella, E., Allen, M., … Pozzilli, C. (2016). The effect of inflammation and its reduction on brain plasticity in multiple sclerosis: MRI evidence. Human Brain Mapping, 0(September 2015), n/a-n/a. http://doi.org/10.1002/hbm.23184
Tomassini, V., Johansen-Berg, H., Jbabdi, S., Wise, R. G., Pozzilli, C., Palace, J., & Matthews, P. M. (2012). Relating Brain Damage to Brain Plasticity in Patients With Multiple Sclerosis. Neurorehabilitation and Neural Repair, 26(6), 581–593. http://doi.org/10.1177/1545968311433208.Relating
Tomassini, V., Matthews, P. M., Thompson, A. J., Fuglø, D., Geurts, J. J., Johansen-Berg, H., … Palace, J. (2012). Neuroplasticity and functional recovery in multiple sclerosis. Nature Publishing Group, 8(11), 635–646. http://doi.org/10.1038/nrneurol.2012.179
Turner, R. (2002). How Much Cortex Can a Vein Drain ? Downstream Dilution of Activation-Related Cerebral Blood Oxygenation Changes, 1067, 1062–1067. http://doi.org/10.1006/nimg.2002.1082
Tuunanen, P. I., & Kauppinen, R. A. (2006). Effects of oxygen saturation on BOLD and arterial spin labelling perfusion fMRI signals studied in a motor activation task. NeuroImage, 30(1), 102–109. http://doi.org/10.1016/j.neuroimage.2005.09.021
Ugurbil, K. (2016). What is feasible with imaging human brain function and connectivity using functional magnetic resonance imaging.
Uludag, K., Dubowitz, D. J., Yoder, E. J., Restom, K., Liu, T. T., & Buxton, R. B. (2004). {C}oupling of cerebral blood flow and oxygen consumption during physiological activation and deactivation measured with f{MRI}. Neuroimage, 23(1), 148–155. http://doi.org/10.1016/j.neuroimage.2004.05.013
Ungerleider, L., Doyon, J., & Karni, A. (2002). Imaging brain plasticity during motor skill learning. Neurobiol Learn Mem, 78, 553–564. http://doi.org/10.1006/nlme.2002.4091
Vafaee, M. S., & Gjedde, A. (2000). Model of blood–brain transfer of oxygen explains nonlinear flow-metabolism coupling during stimulation of visual cortex. Journal of Cerebral Blood Flow & Metabolism, 20(4), 747-754.
Vallance, P., & Hingorani, A. (1999). Endothelial nitric oxide in humans in health and disease. International Journal of Experimental Pathology, 80(6), 291–303. Retrieved from http://www.ncbi.nlm.nih.gov/pubmed/10632779%5Cnhttp://www.pubmedcentral.nih.gov/articlerender.fcgi?artid=PMC2517837
van Praag, H., Kempermann, G., & Gage, F. H. (1999). Running increases cell proliferation and neurogenesis in the adult mouse dentate gyrus. Nature Neuroscience, 2(3), 266–270. http://doi.org/10.1038/6368
Vanzetta, I. (1999). Increased Cortical Oxidative Metabolism Due to Sensory Stimulation: Implications for Functional Brain Imaging. Science, 286(5444), 1555–1558. http://doi.org/10.1126/science.286.5444.1555
Vaquero, J. M. M., Jim??nez, L., & Lupi????ez, J. (2006). The problem of reversals in assessing implicit sequence learning with serial reaction time tasks. Experimental Brain Research, 175(1), 97–109. http://doi.org/10.1007/s00221-006-0523-6

Chapter 10
288
Vernadakis, A. (1996). Glia-neuron intercommunications and synaptic plasticity. Progress in neurobiology, 49(3), 185-214.
Viviani, R., Messina, I., & Walter, M. (2011). Resting state functional connectivity in perfusion imaging: correlation maps with BOLD connectivity and resting state perfusion. PloS One, 6(11), e27050. http://doi.org/10.1371/journal.pone.0027050
Voss, M. W., Chaddock, L., Kim, J. S., Vanpatter, M., Matthew, B., Raine, L. B., … Kramer, A. F. (2012). NIH Public Access, 166–176. http://doi.org/10.1016/j.neuroscience.2011.10.009.Aerobic
Voss, M. W., Nagamatsu, L. S., Liu-ambrose, T., Arthur, F., Fedewa, A. L., Ahn, S., … Kramer, A. F. (2015). Exercise , brain , and cognition across the life span adults, (April 2011), 1505–1513. http://doi.org/10.1152/japplphysiol.00210.2011
Voss, M. W., Vivar, C., Kramer, A. F., & van Praag, H. (2013). Bridging animal and human models of exercise-induced brain plasticity. Trends in Cognitive Sciences, 17(10), 525–44. http://doi.org/10.1016/j.tics.2013.08.001
Voss, W., Vanpatter, M., Pontifex, M. B., Raine, L. B., & Konkel, A. (2014). NIH Public Access, 172–183. http://doi.org/10.1016/j.brainres.2010.08.049.A
Walther, C., Gielen, S., & Hambrecht, R. (2004). The Effect of Exercise Training on Endothelial Function in Cardiovascular Disease in Humans, (2), 129–134.
Wang, J., Aguirre, G. K., Kimberg, D. Y., Roc, A. C., Li, L., & Detre, J. A. (2003). Arterial Spin Labeling Perfusion fMRI With Very Low Task Frequency, 802, 796–802. http://doi.org/10.1002/mrm.10437
Wang, J., Qiu, M., & Constable, R. T. (2005). In vivo method for correcting transmit/receive nonuniformities with phased array coils. Magnetic Resonance in Medicine, 53(3), 666–674. http://doi.org/10.1002/mrm.20377
Wang, J., Zhang, Y., Wolf, R. L., Roc, A. C., Alsop, D. C., & Detre, J. A. (2005). Radiology Perfusion MR Imaging with a Single Coil : Feasibility.
Warnert, E. A., Rodrigues, J. C., Burchell, A. E., Neumann, S., Ratcliffe, L. E., Manghat, N. E., ... & Paton, J. F. (2016). Is high blood pressure self-protection for the brain?. Circulation research, CIRCRESAHA-116.
Warnert, E. A. H., Harris, A. D., Murphy, K., Saxena, N., Tailor, N., Jenkins, N. S., … Wise, R. G. (2014). In vivo assessment of human brainstem cerebrovascular function : a multi-inversion time pulsed arterial spin labelling study, 34(6), 956–963. http://doi.org/10.1038/jcbfm.2014.39
Warnert, E. a H., Harris, A. D., Murphy, K., Saxena, N., Tailor, N., Jenkins, N. S., … Wise, R. G. (2014). In vivo assessment of human brainstem cerebrovascular function: A multi-inversion time pulsed arterial spin labelling study. Journal of Cerebral Blood Flow and Metabolism, 34(6), 956–963. http://doi.org/10.1038/jcbfm.2014.39
White, F. C., Bloor, C. M., Mckirnan, M. D., Carroll, S. M., Behnke, B. J., Ramsey, M. W., … Francis, C. (2014). Exercise training in swine promotes growth of arteriolar bed and capillary angiogenesis in heart morphology molecular mechanisms Exercise training in swine promotes growth of arteriolar bed and capillary angiogenesis in heart. Journal of Applied Physiology, 1, 1160–1168.

Chapter 10
289
Whittaker, J. R., Driver, I. D., Bright, M. G., & Murphy, K. (2015). The absolute CBF response to activation is preserved during elevated perfusion: Implications for neurovascular coupling measures. NeuroImage, 125, 198–207. http://doi.org/10.1016/j.neuroimage.2015.10.023
Wilkinson, M., Leedale-brown, D., & Winter, E. M. (2009). Validity of a Squash-Specific Fitness Test, 4, 29–40.
Williams, D. S., Detre, J. A., Leigh, J. S., & Koretsky, A. P. (1992). Magnetic resonance imaging of perfusion using spin inversion of arterial water. Proceedings of the National Academy of Sciences, 89(1), 212-216.Williams, V. J., Hayes, J. P., Forman, D. E., Salat, D. H., Sperling, R. A., Verfaellie, M., & Hayes, S. M. (2017). NeuroImage Cardiorespiratory fi tness is differentially associated with cortical thickness in young and older adults, 146(July 2016), 1084–1092. http://doi.org/10.1016/j.neuroimage.2016.10.033
Winkler, A. M., Ridgway, G. R., Webster, M. A., Smith, S. M., & Nichols, T. E. (2014). NeuroImage Permutation inference for the general linear model. NeuroImage, 92, 381–397. http://doi.org/10.1016/j.neuroimage.2014.01.060
Wise, R. G., Harris, A. D., Stone, A. J., & Murphy, K. (2013a). Measurement of OEF and absolute CMRO2: MRI-based methods using interleaved and combined hypercapnia and hyperoxia. NeuroImage, 83(0), 135–147. http://doi.org/10.1016/j.neuroimage.2013.06.008
Wise, R. G., Harris, A. D., Stone, A. J., & Murphy, K. (2013b). Measurement of OEF and absolute CMRO2: MRI-based methods using interleaved and combined hypercapnia and hyperoxia. NeuroImage, 83, 135–47. http://doi.org/10.1016/j.neuroimage.2013.06.008
Wise, R. G., Harris, A. D., Stone, A. J., & Murphy, K. (2013c). Measurement of OEF and absolute CMRO2: MRI-based methods using interleaved and combined hypercapnia and hyperoxia. NeuroImage, 83, 135–47. http://doi.org/10.1016/j.neuroimage.2013.06.008
Wise, R. G., Ide, K., Poulin, M. J., & Tracey, I. (2004). Resting fluctuations in arterial carbon dioxide induce significant low frequency variations in BOLD signal. NeuroImage, 21(4), 1652–1664. http://doi.org/10.1016/j.neuroimage.2003.11.025
Wise, R. G., & Tracey, I. (2006). The role of fMRI in drug discovery. Journal of Magnetic Resonance Imaging, 23(6), 862–876. http://doi.org/10.1002/jmri.20584
Wittenberg, J. B., & Wittenberg, B. A. (2007). Myoglobin-enhanced oxygen delivery to isolated cardiac mitochondria, 2082–2090. http://doi.org/10.1242/jeb.003947
Wong, E. C. (2014). An Introduction to ASL Labeling Techniques, 10, 1–10. http://doi.org/10.1002/jmri.24565
Wong, E. C., Buxton, R. B., & Frank, L. R. (1998). Quantitative imaging of perfusion using a single subtraction (QUIPSS and QUIPSS II). Magnetic Resonance in Medicine, 39(5), 702–708. http://doi.org/10.1002/mrm.1910390506
Xiong, J., Ma, L., Wang, B., Narayana, S., Duff, E. P., Egan, G. F., & Fox, P. T. (2009). NeuroImage Long-term motor training induced changes in regional cerebral blood flow in both task and resting states. NeuroImage, 45(1), 75–82. http://doi.org/10.1016/j.neuroimage.2008.11.016
Xu, F., Ge, Y., & Lu, H. (2009). Non-invasive quantification of whole-brain cerebral metabolic rate of oxygen by MRI. Magn Reson Med, 62(1), 141–148.

Chapter 10
290
http://doi.org/10.1002/mrm.21994.Non-invasive
Xu, F., Uh, J., Brier, M. R., Hart Jr., J., Yezhuvath, U. S., Gu, H., … Lu, H. (2011). The influence of carbon dioxide on brain activity and metabolism in conscious humans. J Cereb Blood Flow Metab, 31(1), 58–67. http://doi.org/jcbfm2010153 [pii]\r10.1038/jcbfm.2010.153
Xu, G., Rowley, H. A., Wu, G., Alsop, D. C., Dowling, M., Christian, B. T., … Hospital, M. V. A. (2011). NIH Public Access, 23(3), 286–293. http://doi.org/10.1002/nbm.1462.Reliability
Yamada, K., Mizuno, M., & Nabeshima, T. (2002). Role for brain-derived neurotrophic factor in learning and memory. Life Sciences, 70(7), 735–744. http://doi.org/10.1016/S0024-3205(01)01461-8
Yan, L., Li, C., Kilroy, E., Wehrli, F. W., & Wang, D. J. J. (2012). Quantification of arterial cerebral blood volume using multiphase-balanced SSFP-based ASL. Magnetic Resonance in Medicine, 68(1), 130–139. http://doi.org/10.1002/mrm.23218
Yirmiya, R., & Goshen, I. (2011). Immune modulation of learning, memory, neural plasticity and neurogenesis. Brain, Behavior, and Immunity, 25(2), 181–213. http://doi.org/10.1016/j.bbi.2010.10.015
Young, W. L., Prohovnik, I., Ornstein, E., Ostapkovich, N., & Matteo, R. S. (1991). Cerebral Blood Flow Reactivity to Changes in Carbon Dioxide Calculated Using End-Tidal versus Arterial Tensions. Journal of Cerebral Blood Flow & Metabolism, 11(6), 1031–1035. http://doi.org/10.1038/jcbfm.1991.171
Yu, X., & Koretsky, A. P. (2014). Interhemispheric plasticity protects the deafferented somatosensory cortex from functional takeover after nerve injury. Brain Connectivity, 4(9), 709–17. http://doi.org/10.1089/brain.2014.0259
Zeller, D., & Classen, J. (2014). Plasticity of the motor system in multiple sclerosis. Neuroscience, 283C, 222–230. http://doi.org/10.1016/j.neuroscience.2014.05.043
Zheng, Y., Martindale, J., Johnston, D., Jones, M., Berwick, J., & Mayhew, J. (2002). A Model of the Hemodynamic Response and Oxygen Delivery to Brain, 637, 617–637. http://doi.org/10.1006/nimg.2002.1078
Zhu, Y. S., Tarumi, T., Tseng, B. Y., Palmer, D. M., Levine, B. D., & Zhang, R. (2013). Cerebral vasomotor reactivity during hypo- and hypercapnia in sedentary elderly and Masters athletes. Journal of Cerebral Blood Flow and Metabolism, 33(8), 1190–1196. http://doi.org/DOI 10.1038/jcbfm.2013.66
Zimmerman, B., Bradley, P., Low, K. A., Fletcher, M. A., Tan, C. H., Schneider-garces, N., … Fabiani, M. (2014). Cardiorespiratory fitness mediates the effects of aging on cerebral blood flow, 6(April), 1–13. http://doi.org/10.3389/fnagi.2014.00059