
INVESTIGATING GREEN INHIBITORS FOR ACIDIC ...
152
United Arab Emirates University United Arab Emirates University Scholarworks@UAEU Scholarworks@UAEU Theses Electronic Theses and Dissertations 4-2019 INVESTIGATING GREEN INHIBITORS FOR ACIDIC CORROSION OF INVESTIGATING GREEN INHIBITORS FOR ACIDIC CORROSION OF CARBON STEEL CARBON STEEL Osama Abu-Alyosr Kamal Ibrahim Follow this and additional works at: https://scholarworks.uaeu.ac.ae/all_theses Part of the Chemical Engineering Commons Recommended Citation Recommended Citation Kamal Ibrahim, Osama Abu-Alyosr, "INVESTIGATING GREEN INHIBITORS FOR ACIDIC CORROSION OF CARBON STEEL" (2019). Theses. 780. https://scholarworks.uaeu.ac.ae/all_theses/780 This Thesis is brought to you for free and open access by the Electronic Theses and Dissertations at Scholarworks@UAEU. It has been accepted for inclusion in Theses by an authorized administrator of Scholarworks@UAEU. For more information, please contact [email protected].
-
Upload
khangminh22 -
Category
Documents
-
view
2 -
download
0
Transcript of INVESTIGATING GREEN INHIBITORS FOR ACIDIC ...

United Arab Emirates University United Arab Emirates University
Scholarworks@UAEU Scholarworks@UAEU
Theses Electronic Theses and Dissertations
4-2019
INVESTIGATING GREEN INHIBITORS FOR ACIDIC CORROSION OF INVESTIGATING GREEN INHIBITORS FOR ACIDIC CORROSION OF
CARBON STEEL CARBON STEEL
Osama Abu-Alyosr Kamal Ibrahim
Follow this and additional works at: https://scholarworks.uaeu.ac.ae/all_theses
Part of the Chemical Engineering Commons
Recommended Citation Recommended Citation Kamal Ibrahim, Osama Abu-Alyosr, "INVESTIGATING GREEN INHIBITORS FOR ACIDIC CORROSION OF CARBON STEEL" (2019). Theses. 780. https://scholarworks.uaeu.ac.ae/all_theses/780
This Thesis is brought to you for free and open access by the Electronic Theses and Dissertations at Scholarworks@UAEU. It has been accepted for inclusion in Theses by an authorized administrator of Scholarworks@UAEU. For more information, please contact [email protected].


iii
Copyright
Copyright © 2019 Osama Abu-Alyosr Kamal Ibrahim
All Rights Reserved

iv
Advisory Committee
1) Advisor: Basim Abu-Jdayil
Title: Professor
Department of Chemical and Petroleum Engineering
College of Engineering
2) Co-advisor: Abdel-Hamid Ismail Mourad
Title: Professor
Department of Mechanical Engineering
College of Engineering

vii
Abstract
This study is intended to investigate Khalas palm date pits extract as a green corrosion
inhibitor alternative to commercial inhibitors. Inhibition efficiency of obtained extract
was investigated on carbon steel grade S355JR immersed in different corrosive
mediums of 2 molarity hydrochloric acid (𝐻𝐶𝑙) solution and sea water solution. Along
with other ingredients in palm date pits, Polyphenolic compounds have a significant
anti-oxidation property and was found effective in reducing corrosion rate.
Due to its common industrial applications, Carbon steel was used in this investigation
as the corroding medium, while 2M 𝐻𝐶𝑙 and sea water solutions were used separately
as the corrosive mediums.
Soxhlet apparatus was utilized to continuously extract the palm date pits while
minimizing waste of extraction solvents. N-hexane, as a non-polar solvent, was used
for de-fatting the palm date pits. Separately, a mixture of polar solvents, includes
methanol, acetone, water and formic acid; was used in polar extraction process.
Corrosion rate in this work was measured and calculated based on weight loss method
as recommended by ASTM standards.
The results of this work illustrated that Khalas date pits extract is effective in reducing
corrosion rate of carbon steel in 2M 𝐻𝐶𝑙 acidic environment. Corrosion inhibition
efficiency of 52% has been achieved for carbon steel grade S355JR with 8000 ppm of
Khalas palm date pits solid extract, as an optimum concentration in 2M 𝐻𝐶𝑙 solution.
In identical corrosive medium, implementing Khalas palm date pits liquid extract has
achieved 72% at 16000 ppm optimum concentration without changing the acidity of
the corrosive medium.
When compared efficiency of Khalas palm date pits solid and liquid extracts, at
optimum concentrations, with a commercial liquid passivating inhibitor (Corrshield
NT4292) at the same concentrations, 79.9 - 80.7% higher inhibition efficiency was
obtained with the liquid form of green inhibitor in the same acidic environment.
As a part of further investigation on the liquid form of extract, effect of temperature
on inhibition efficiency was also examined. The efficiency of Khalas date pits liquid

viii
extract was found to decrease with increasing the temperature of corrosive medium
from 72.44% at 28.5 oC to 41.45% at 78 oC. The extract’s optimum concentration was
kept constant at 16000 ppm during this experiment.
On the other hand, Khalas palm date pits liquid extract was found to have higher
corrosion inhibition efficiency in sea water solution (up to 99.5% at 24000 ppm
concentration of extract) than in 2M 𝐻𝐶𝑙 solution.
Keywords: Green Inhibitor, Eco-Friendly Inhibitor, Khalas Palm Date Pits, Solvent
Extraction, Anti-Oxidant, Recycling.

ix
Title and Abstract (in Arabic)
إختبار فعالية مثبط صديق للبيئة على التآكل الحامضي لحديد الكربون
الملخص
كبديل تأكلالمستخلص نواة تمور الخالص في تثبيط ة لبحث فعاليةتهدف هذه الدراس
في المغمور حديد الكربون للمثبطات التجارية. و قد تم بحث فعالية المستخلص على تثبيط تأكل
باإلضافة .و كذلك في محلول مياه البحر ولية من محلول حمض الهيدروكلوريكم 2تركيز
و التي وجد في هذا لها خواص مضاضة لألكسدة، ولي فينولمركبات الب للمكونات األخرى، فإن
.حديد الكربون تأكل معدل على تثبيطلبحث أن لها القدرة ا
S355JRفي التطبيقات الصناعة، تم إستخدام معدن حديد الكربون و نظرا إلى إنتشاره
ط مسببة كأوسا البحر، كال على حده، كعنصر متأكل، و محلول حمض الهيدروليك و محلول ماء
لتأكل.ل
تم إستخدام أداة السوكسوليت للحصول على مستخلص نواة تمور الخالص بصورة
الهدر في كمية المذيب المستخدم. إستخدم مركب الهيكسان، كمذيب غير مستمرة مع تقليص كمية
قطبي، في التخلص من الدهون الموجودة في نواة تمور الخالص. و بشكل منفصل، تم إستخدام
ة، يتكون من الميثانول و األسيتون و الماء المقطر و حمض الفورميك، المذيبات القطبي خليط من
اإلستخالص القطبي. عملية في
و قد تم قياس معدل التأكل في هذا العمل على أساس طريقة الوزن المفقود أثناء التأكل
.ASTMكما هو مقترح في معايير
تأكل حديد الخالص فعال في تثبيط نتائج هذا العمل وضحت أن مستخلص نواة تمور
مولية من محلول حمض الهيدروكلوريك. 2المغمور في تركيز الكربون
في S355JR% لتثبيط التآكل الحادث لحديد الكربون 52و قد تحققت فعالية تصل إلى
المليون جزء في 8000باستخدام الهيدروكلوريكحمض مولية من 2يتكون من حمضيوسط
الصلب. و في نفس التركيز من الوسط الحمضي، فإن إستخدام مستخلصالمن كتركيز أمثل
16000% عند استخدام 72 التآكل بنسبة تثبيطالمستخلص السائل من نواة تمور الخالص قد حقق
بدون أن يطرأ تغيير على حامضية ، و ذلكجزء في المليون كتركيز أمثل من المستخلص السائل
.لوسطا

x
مع مادة مثبطة تجارية الصلب و السائل نواة تمور الخالصو بمقارنة مستخلص
%79.9عند نفس التركيز األمثل، تم الحصول على ما نسبته (Corrshield NT4292)أخرى
في نفس الوسط الحامضي. فعالية أعلى بمستخلص نواة تمور الخالص 80.7% -
ستخلص في الية المقد تمت دراسة تأثير إختالف درجة حرارة الوسط الحمضي على فعو
من وجد أن اإلرتفاع في درجة الحرارة يؤثر عكسيا على الفاعلية حيث تقليل معدل التأكل،
من المستخلص ثابت تركيزمع الحفاط على ،Co 78% عند 41.45إلى Co 28.5% عند 72.44
.جزء من المليون 16000و هو
حيث تم ،ساط مختلفةأو في السائل الخالص تمت مفارنة فعالية مستخلص نواة تمور
مولية من حمض الهيدروكلوريك و 2 محلول المستخلص في كل من نفس التراكيز من إختبار
% في 99.5نسبة وجد أن فعالية المستخلص تصل إلى د، وقة فعاليته في محلول ماء البحرمقارن
محلول % في72 -% 67مقارنة بنسبة جزء في المليون 24000 كيزد ترماء البحر عن محلول
.حمض الهيدروكلوريكمولية من 2
مثبط صديق للبيئة، التآكل الحمضي، تآكل حديد الكربون في ماء البحر، كلمات البحث الرئيسية:
نواة تمور الخالص، اإلستخالص بالمذيبات، مضاد األكسدة، إعادة التدوير.

xi
Acknowledgements
My thanks go to Dr. Basim Abu-Jdayil who introduced me to the exciting
field of corrosion studies and provided me with creative ideas to produce this
research. I am especially grateful to Prof. Abdel-Hamid I. Mourad whose enthusiasm
about this research topic got me started along with his encouragement led to this and
most other studies in which I have been involved.
My appreciation to Prof. Ali Al-Marzouqi and Prof. Sameer Abu-Aisha for
their encouragement and leading me to believe in goals and work hard to achieve my
objectives.
I would like to thank my committee for their guidance, support, and assistance
throughout my preparation of this thesis. I would like to thank the chair and all
members of the Departments of Chemical and Petroleum Engineering and Mechanical
Engineering at the United Arab Emirates University for assisting me all over my
studies and research. My special thanks are extended to laboratory supervisors and
students for providing me with the required assistance and research materials.
Special thanks go to my parents for being successful development patterns,
wife for her endless support, daughter, brothers, and sister who helped me along the
way. I am sure they suspected it was endless, but I believe that every success is a
beginning for a new challenge.

xii
Dedication
To my beloved parents and family

xiii
Table of Contents
Title ............................................................................................................................... i
Declaration of Original Work ...................................................................................... ii
Copyright .................................................................................................................... iii
Advisory Committee ................................................................................................... iv
Approval of the Master Thesis ..................................................................................... v
Abstract ...................................................................................................................... vii
Title and Abstract (in Arabic) ..................................................................................... ix
Acknowledgements ..................................................................................................... xi
Dedication .................................................................................................................. xii
Table of Contents ...................................................................................................... xiii
List of Tables............................................................................................................. xvi
List of Figures ......................................................................................................... xviii
List of Abbreviations.................................................................................................. xx
Chapter 1: Introduction ................................................................................................ 1
1.1 Motivation ................................................................................................. 1
1.2 Objectives and impact ............................................................................... 3
1.3 Economics of corrosion ............................................................................ 5
1.4 Contents .................................................................................................... 6
Chapter 2: Literature Review ....................................................................................... 7
2.1 Corrosion .................................................................................................. 9
2.2 Types of corrosion based on mechanism ................................................ 10
2.3 Corrosion in hydrochloric acid solution ................................................. 15
2.4 Corrosion in sea water solution .............................................................. 15
2.5 Corrosion inhibitor .................................................................................. 16
2.5.1 Inhibitor efficiency ......................................................................... 17
2.5.2 Types of inhibitors based on chemical composition ...................... 17
2.5.3 Corrosion inhibition mechanisms................................................... 18
2.5.4 Types of inhibitors based on inhibition mechanism....................... 19
2.6 Inhibition in acid solution ....................................................................... 24
2.7 Types of adsorption ................................................................................ 25
2.8 Green inhibitor ........................................................................................ 29

xiv
2.9 PDP composition .................................................................................... 39
2.10 Phenolic compounds ............................................................................. 42
2.11 Solvent for de-fatting (non-polar extraction) ........................................ 46
2.12 Solvents for polar extraction ................................................................. 48
2.13 Particle size effect on extraction process .............................................. 51
2.14 Extraction time effect on oil yield ........................................................ 52
Chapter 3: Materials and Research Methods ............................................................. 54
3.1 Materials ................................................................................................. 54
3.1.1 Khalas palm date pits ..................................................................... 54
3.1.2 Solvent for de-fatting (non-polar extraction) ................................. 54
3.1.3 Solvents for polar extraction .......................................................... 55
3.1.4 Hydrochloric acid ........................................................................... 58
3.1.5 Sea water ........................................................................................ 59
3.1.6 Commercial corrosion inhibitor ..................................................... 60
3.1.7 Test sheets ...................................................................................... 61
3.2 Equipment and apparatuses..................................................................... 62
3.2.1 Screening mesh .............................................................................. 62
3.2.2 Extraction ....................................................................................... 62
3.2.3 Rotary evaporator (RE) .................................................................. 63
3.2.4 Drying oven .................................................................................... 64
3.2.5 Fourier-transform infrared spectrophotometer (FTIR) .................. 65
3.2.6 Rotary grinding machine ................................................................ 66
3.2.7 Emery papers .................................................................................. 66
3.2.8 Analytical weighing balance .......................................................... 67
3.2.9 pH meter ......................................................................................... 67
3.2.10 Corrosion test apparatus ............................................................... 68
3.2.11 Magnetic stirrer ............................................................................ 68
3.2.12 Scanning electron microscopy (SEM).......................................... 69
3.3 Methodology ........................................................................................... 69
3.3.1 Screening and particle size ............................................................. 69
3.3.2 Defatting process (non-polar extraction)........................................ 70
3.3.3 Polar extraction .............................................................................. 71
3.3.4 Extract purification ......................................................................... 73
3.3.5 Extract drying ................................................................................. 75
3.3.6 Chemical analysis ........................................................................... 75
3.3.7 Interferences ................................................................................... 76
3.3.8 Pre-test specimen preparation ........................................................ 77
3.3.9 Test conditions ............................................................................... 80
3.3.10 Method of supporting specimens ................................................. 84
3.3.11 Post-test specimen cleaning method ............................................ 85
3.3.12 Corrosion rate calculation ............................................................ 86
Chapter 4: Results and Discussion ............................................................................. 91

xv
4.1 Chemical analysis results ........................................................................ 91
4.2 Scanning electron microscopy (SEM) .................................................... 96
4.2.1 Pre-test SEM .................................................................................. 97
4.2.2 Post-test SEM ................................................................................. 97
4.2.3 Final SEM after cleaning coupon ................................................. 100
4.3 Average corrosion rate and inhibition efficiency.................................. 102
Chapter 5: Conclusion and Recommendations ........................................................ 116
References ................................................................................................................ 120
Appendix .................................................................................................................. 129

xvi
List of Tables
Table 1.1: Corrosion cost estimation in 10 countries ................................................... 6
Table 2.1: Comparison between physisorption and chemisorption ........................... 28
Table 2.2: Green corrosion inhibitors ........................................................................ 37
Table 2.3: Approximate composition of date pits ...................................................... 39
Table 2.4: Physical characteristics of oil extracted from date pits ............................. 40
Table 2.5: Composition (%) of fatty acids in oil extracted from date pits ................. 40
Table 2.6: Date pit carbohydrates content (excluding sugars) - (% of dry
weight) ...................................................................................................... 41
Table 2.7: Nutritional characteristics of eighteen varieties of date seeds:
micronutrients content. ............................................................................. 45
Table 2.8: Antioxidant capacities of eighteen varieties of date seeds ........................ 46
Table 2.9: Physical properties of various solvents applicable for de-fatting
process ...................................................................................................... 47
Table 2.10: Physical properties of various solvents applicable for polar
extraction ................................................................................................. 49
Table 3.1: Specifications of n-hexane used for de-fatting process ............................ 54
Table 3.2: Specifications of methanol used for polar extraction ............................... 55
Table 3.3: Specifications of acetone used for polar extraction .................................. 56
Table 3.4: Specifications of distilled water used for polar extraction........................ 57
Table 3.5: Specifications of formic acid used for polar extraction ............................ 57
Table 3.6: Specifications of Hexamethylenetetramine used for coupon
cleaning ..................................................................................................... 58
Table 3.7: Specifications of hydrochloric acid .......................................................... 59
Table 3.8: Chemical measurements of Abu Dhabi marine water quality .................. 60
Table 3.9: Physical and chemical properties of commercial corrosion
inhibitor .................................................................................................... 61
Table 3.10: Chemical composition of carbon steel coupons...................................... 62
Table 3.11: Sequence of emery paper ratings ............................................................ 67
Table 3.12: Analytical balance specifications ............................................................ 67
Table 3.13: Comparison of distilled water properties with ASTM standard ............. 81
Table 3.14: 𝐻𝐶𝑙 corrosive medium composition ....................................................... 81
Table 3.15: 𝑁𝑎𝐶𝑙 corrosive medium composition ..................................................... 82
Table 3.16: Cleaning solution composition ............................................................... 85
Table 3.17: Measured parameters for corrosion rate calculation ............................... 88

xvii
Table 3.18: Surface coverage coefficient ................................................................... 90
Table 4.1: Corrosion rates at different inhibitors concentrations in 2M 𝐻𝐶𝑙 .......... 104
Table 4.2: Corrosion IE% of different inhibitors concentrations in 2M 𝐻𝐶𝑙 solution ................................................................................................... 105
Table 4.3: Corrosion IE% of BNV at different concentrations on 1018CS in
1M 𝐻𝐶𝑙 ................................................................................................... 106
Table 4.4: Temperature effect on average corrosion rates of carbon steel in
2M 𝐻𝐶𝑙 with 16000 ppm liquid PDPE ................................................... 110
Table 4.5: Corrosion rate comparison of PDP liquid extract in 2M 𝐻𝐶𝑙 and
sea water ................................................................................................. 112
Table 4.6: Average corrosion IE% of liquid PDPE in 2M 𝐻𝐶𝑙 and sea water
solutions .................................................................................................. 113

xviii
List of Figures
Figure 2.1: Corrosion inhibitors classification based on inhibition
mechanism ............................................................................................... 23
Figure 2.2: Different parts of palm date ..................................................................... 38
Figure 2.3: Antioxidant activity (CL method) of eighteen (18) commonly
vegetal polyphenols ................................................................................. 44
Figure 2.4: Effect of solvent type on oil yield ........................................................... 48
Figure 2.5: Antioxidant activity of Khalas variety of date pits using 4
different solvents ..................................................................................... 50
Figure 2.6: Total phenolic contents of Khalas variety of date pits using 4
different solvents ..................................................................................... 51
Figure 2.7: The effect of particle size on oil yield at 120 min ................................... 52
Figure 2.8: The oil yield vs. time for different particle size ...................................... 53
Figure 3.1: Carbon steel specimens grade S355JR .................................................... 61
Figure 3.2: Conventional Soxhlet extractor ............................................................... 63
Figure 3.3: Rotary evaporator arrangement ............................................................... 64
Figure 3.4: Vacuum drying oven ............................................................................... 65
Figure 3.5: Fourier-transform infrared spectroscopy (FTIR) ..................................... 65
Figure 3.6: Model 02145A grinding Machine. .......................................................... 66
Figure 3.7: Corrosion test apparatus .......................................................................... 68
Figure 3.8: Scanning electron microscopy (SEM) ..................................................... 69
Figure 3.9: PDP particles obtained in the range of 0.25 to 0.425 mm ....................... 70
Figure 3.10: Non-polar extraction process ................................................................. 71
Figure 3.11: Polar extraction process ......................................................................... 72
Figure 3.12: Palm date pit waste at the end of extraction process ............................. 73
Figure 3.13: Extract purification process by Rotary evaporator ................................ 74
Figure 3.14: Final extract after drying solvent (PDPE) ............................................. 75
Figure 3.15: Different stages of PDP extraction ........................................................ 76
Figure 3.16: Grinding stages of metallic coupons ..................................................... 78
Figure 3.17: Initial surface to mass ratio of different metallic coupons .................... 80
Figure 4.1: FT-IR characterization ............................................................................. 92
Figure 4.2: SEM analysis of prepared coupon’s surface morphology before
corrosion test ........................................................................................... 97
Figure 4.3: SEM analysis of PDPE deposits on metal surface after 1-week
immersion in 2M HCl solution with 2000 ppm concentration of
PDPE ....................................................................................................... 98

xix
Figure 4.4: SEM analysis of PDPE deposits on metal surface after 1-week
immersion in 2M HCl solution with 16000 ppm concentration
of PDPE ................................................................................................... 99
Figure 4.5: Comparison of PDPE deposits on metal surface at 200X SEM
after 1-week immersion in 2M HCl solution with different
concentrations of PDPE .......................................................................... 99
Figure 4.6: Comparison of PDPE deposits on metal surface at 2000X SEM
after 1-week immersion in 2M HCl solution with different
concentrations of PDPE ........................................................................ 100
Figure 4.7: Comparison of metallic surface morphology at 200X SEM after
cleaning coupon demonstrating the effect of 16000 ppm
concentration of PDPE .......................................................................... 101
Figure 4.8: Comparison of metallic surface morphology at 2000X SEM
after cleaning coupon demonstrating the effect of 16000 ppm
concentration of PDPE .......................................................................... 102
Figure 4.9: Average corrosion rates in 2M 𝐻𝐶𝑙 with different inhibitors
concentrations........................................................................................ 105
Figure 4.10: Corrosion IE% of different inhibitors concentrations in 2M
𝐻𝐶𝑙 ........................................................................................................ 107
Figure 4.11: Average corrosion rate of carbon steel with 16000 ppm in 2M
𝐻𝐶𝑙 solution at different temperatures .................................................. 110
Figure 4.12: Temperature effect on IE% of 16000 ppm liquid PDPE in 2M
𝐻𝐶𝑙 solution .......................................................................................... 111
Figure 4.13: Average corrosion rate of carbon steel with different
concentrations of liquid PDPE in 2M 𝐻𝐶𝑙 and sea water
solutions ................................................................................................ 112
Figure 4.14: Average IE% of liquid PDPE on carbon steel in 2M 𝐻𝐶𝑙 and
sea water solutions ................................................................................ 113
Figure 4.15: Comparison of corroded carbon steel coupons with liquid
PDPE in 2M 𝐻𝐶𝑙 and sea water solutions ............................................ 114
Figure 4.16: Comparison of cleaned carbon steel coupons with liquid PDPE
in 2M 𝐻𝐶𝑙 and sea water solutions at identical inhibitor
concentration of 12000 ppm .................................................................. 115

xx
List of Abbreviations
AFE Apple Fruit Extract
ASTM American Society of Testing and Material
CR Corrosion Rate
EFM Electrochemical Frequency Modulation
EIS Electrochemical Impedance Spectroscopy
FAO Food and Agriculture Organization
FTIR Fourier-transform infrared spectroscopy
GNP Gross National Product
ICPOES Inductively Coupled Plasma−Optical Emission Spectroscope
IE Corrosion Inhibition Efficiency
MPY Mils Per Year
PDP Palm Date Pits (Original)
PDPE Palm Date Pits Extract
PDPW Palm Date Pits Waste
RE Rotary Evaporator
SEM Scanning Electron Microscopy
WHO World Health Organization

1
1.Chapter 1: Introduction
1.1 Motivation
Just like diseases, which affect human body, economy is influenced by
industrial performance and possible interruption in the production capacity. Being a
dynamic process, all industries have a disease of varying degrees based on materials
and operating conditions, where investigation should differentiate accurately between
sickness symptoms and causes of disease. Corrosion is considered as a symptom that
might result from single or multiple causes. Corrosion is a natural reaction which
doesn’t need human interference to occur but requires human interference to eliminate
or at least reduce its rate.
The world economy depends on natural resources and other environmental
components which have been discovered and are utilized to satisfy the basic
requirements for human being life. In the modern era, energy is the most important
economic resource which is derived from oil and gas industry. Most designing
engineers of refineries and chemicals production plants are selecting the type of
constructing material based on nature of fluid stream. Low pH and chloride ions are
significant causes of different corrosion forms in carbon steel structures. However, if
any change occurred in the fluid properties that might influence the piping and
equipment. For example, Hydrochloric acid corrosion in the overhead section of crude
oil distillation towers is a common phenomenon because of dew point formation. On
the other hand, following to crude oil de-salting process, significant part of salts is
removed from the fluid while minor concentrations of chloride ions are left and might
result in overhead corrosion in the distillation column and piping. In this research,
corrosion in 2M HCl and sea water was examined as a source of low pH and high

2
chloride content, respectively. “Corrosion inhibitors” is a special type of chemicals
which are produced in downstream petrochemical industry by further processing of oil
and gas products and represents a basic requirement of modern industry. In
comparison, utilizing corrosion inhibitors is much cheaper than reconstructing
industrial facilities because of corrosion phenomena.
Utilizing such chemical substances is always accompanied by depletion in the
original resource, which is more valuable than producing non-recyclable compounds.
From another point of view, the problem of corrosion inhibition requires a permanent
resource, which should be available, recyclable, and independent of depleting
resources. In addition, fluctuation in the corrosion inhibitors prices, would highly rely
on the availability and market prices of crude oil products.
Another challenging fact of conventional corrosion inhibitors is harming
environmental components such as water, soil and atmosphere. In general,
implementing conventional corrosion inhibitors would cause a permanent damage to
the eco system on both short and long term. The scale of damage in this case is decided
by the chemical properties of inhibitor, capacity of surrounding environment, and
number of components in this environment.
In this regard, recent researches have been done to find other possible
resolutions to minimize corrosion rate without harming environment. One of these
methods researched is the “green inhibitors” which are produced from extracting bio
materials.
This research was driven by carbon steel being most common metal utilized in
industry, and Khalas date, which is uniquely produced in United Arab Emirates, and
used as the source of examined extract. Experimental results in this investigation can

3
be re-produced from other natural resources available and implemented on other types
of metals.
As corrosion of carbon steel is unavoidable problem, many books were aimed
to minimize the corrosion rates of carbon steel such as “Green Corrosion Inhibitors –
Theory and Practice” for Sastri et al. (2007), in addition to many published papers in
the same subject.
Negative environmental impacts of commercial corrosion inhibitors are not
limited to hazardous effect of the chemical on environment, but also surpass to the
production process where petrochemicals processing is involved. Similarly, the term
“Eco-friendly” suggested in this research should not be applicable only on the green
corrosion inhibitor, but also it should be dominant to the method of preparing that
green inhibitor. As this research is aimed to investigate inhibition efficiency and
doesn’t prioritize the method of obtaining the material, “Green” methods are
recommended in this research for future work such as using alternative energy source
for heating and extraction process other than electrical power, such as solar energy.
Other method of extraction can be proposed such as 𝐶𝑂2 extraction method. Recycling
of all chemicals was implemented in this work to minimize the consumption and
production process waste.
1.2 Objectives and impact
This research is aimed to investigate the possibility of using the extract of
Khalas date pits as a green corrosion inhibitor for carbon steel alloy in 2 M
concentration of Hydrochloric acid, as an example of severely corrosive medium as
well as sea water.

4
The experimental work here represents a basic milestone to achieve the
following objectives:
• Stating extraction method for a green inhibitor from palm date pits waste.
• Discovering a competitive green corrosion inhibitor comparable to commercial
inhibitors.
• Measuring corrosion inhibition efficiency of the obtained green inhibitor.
• Proofing antioxidation capacity is significantly related to corrosion inhibition.
• Recognizing active compounds which influence corrosion inhibition effect.
• Illustrating effect of aggressive mediums on carbon steel morphology in the
absence and presence of green inhibitor.
• Demonstrating the relation between green inhibitor concentration and corrosion
inhibition efficiency.
• Investigating the effect of temperature on corrosion inhibition efficiency of green
inhibitor.
• Confirming different corrosion responses of a specific metal in different corrosive
mediums.
• Confirming different corrosion inhibition efficiencies of green inhibitor in
different corrosive mediums for the identical metal.
There are many benefits of utilizing such natural product in this application, such as:
• Avoiding the permanent damage to surrounding environment.
• Sustainability of natural resources used for producing these inhibitors.
• Chemical compatibility with surrounding environment.
• Naturally decomposing materials.
• Available on large scale within the country and would enhance date industry.

5
• More stable market price based on availability of date pits as the raw material.
• Reusing palm date pits in another application that would promote the value of date
pits which is mostly used locally for animal feeding purposes.
1.3 Economics of corrosion
Apart from losing metallic structure in different applications because of
corrosion and cost of producing synthetic inhibitors, significant economic influences
can result from purchasing these chemicals to extend the life of these structures. With
synthetics, additional expenditures became mandatory to neutralize these chemicals
before disposing back to environment.
A review of earlier studies was done and included reported results by several
countries such as the United States by Uhlig (1950), and the United Kingdom by Hoar
(1971).
In addition to other countries such as Japan by Japan (2001), Australia by
Cherry (1983), Kuwait by Al-Kharafi et al. (1995), Germany by Behrens (1975),
Finland and Sweden by Linderborg (1967), India by Bhaskaran et al. (2014), and
China by Ke (2008). In these studies, Uhlig and Hoar methods were used to estimate
the total cost of corrosion by counting materials and inhibition method costs related to
corrosion control. As per this report results shown in Table 1.1, corrosion cost in
different countries ranged from 1 – 5 percent of the Gross National Product (GNP).
Out of this cost, it was found that 10 – 40 percent of this cost can be avoided by
conventional corrosion control methods, while the rest of 60 percent can’t be avoided
due to lack in corrosion advanced control technology. As a conclusion of these studies,
the indirect cost related to corrosion and inhibitors influence, which of course hard to
estimate, is much greater than the direct cost related to cost of material. One of the

6
most important indirect costs can be permanent environmental negative impact along
with depletion of raw material resources that will never be retrieved.
Table 1.1: Corrosion cost estimation in 10 countries
Country Total Annual Corrosion Cost Percent of GNP Year
USA $5.5 billion 2.1 1949
UK £1.365 billion* 3.5 1970
Japan $9.2 billion 1.8 1997
USA $70 billion 4.2 1975
Australia $2 billion 1.5 1982
Kuwait $1 billion 5.2 1987
W. Germany $6 billion 3 1967
China $28.098 billion 2 1997
China $32.032 billion 2 2001
Finland $54 million average - 1965
Sweden $66.5 million average - 1964
India $26.1 million 2.4 2011
1.4 Contents
The thesis consists of five chapters. The first chapter is dedicated to highlight
the motivation, objectives and impact of this investigation. In the second chapter,
literature review relevant to the area is presented. The materials and testing methods
are reported in chapter 3. The fourth chapter is dedicated to present and discuss the
results obtained and further discuss outcomes from this research. Recommendations
and possible improvements in the larger scale application of this research are
introduced in chapter five.

7
2.Chapter 2: Literature Review
Wherever metals are applicable, physical, mechanical and chemical properties
must be carefully considered with the application. Physical and mechanical properties
can be expressed in terms of constants that can be measured, while on the other hand,
chemical properties are more related to actual environmental conditions during the
service period which is dynamically alternate all the time because of more than one
effect from multiple sources.
Carbon steel is ranked first to be most common material used in construction
and more specifically in oil and gas industry. The metallurgical characteristics of
carbon steel such as hardness, strength and suitable melting point, in addition to lower
prices compared to other alloys, gives it an economical advantage over other alloys
that are used in all types of permanent structures, whether structures are made in dry
or wet environment.
In carbon steel, corrosion is the most common drawback if compared with
other more expensive types of steel and alloys under the same conditions, such as
stainless-steel alloys. Corrosion rate is highly influenced by the surrounding
environment. This phenomenon result from many external factors such as nature and
properties of surrounding environment.
Oil and gas industry utilizes carbon steel in most structures which extend from
upstream platforms through transportation pipelines, processing facilities and ending
with fuel storage in consumers facilities. As an example of fluctuation in
environment’s properties, the drop of pH value in wet environment is a major cause of
corrosion in carbon steel, while an increase in the pH value would result in a higher

8
precipitation rate and forming deposits which would lead finally to another type of
corrosion, such as under deposits corrosion.
Modern industry has developed a wide range of corrosion resisting materials,
but none of them is economical enough to be widely utilized in all applications, where
carbon steel is still occupying the first rank.
In application field, the modern industry has implemented chemical
compounds called “Corrosion Inhibitors”. Corrosion of metallic substances can be
controlled to some extent by adding these chemical compounds, and this control is
called “inhibition”. “Corrosion inhibitor” itself is a chemical substance or a
combination of substances that when exists in the corrosive environment prevent or
mitigate the rate of corrosion without a significant interaction with the environmental
components. Most inhibitors are applicable in closed environments, where adequate
control over the desired concentration is ensured. Such examples of closed
environment conditions are cooling water recirculating systems, oil production and
refining, and acid pickling of steel components.
Corrosion inhibitor application must be inspected carefully by the user
especially when multiple alloys are in use; because some inhibitors are effective to
prevent corrosion of specific metal in a certain environment, while triggering the
corrosion of another metal in the same environment.
United Arab Emirates is currently producing Khalas date palm as one of the
most valuable, common and unique crops being produced in the country. The Food
and Agriculture Organization (FAO) is to name UAE cultivation as a globally
important agricultural heritage system, said Jose Graziano da Silva, director general of
the UN organization (Lindsay, 2014).

9
On the local scale, the annual date’s production capacity of one company in
UAE has reached 113,000 metric tons. While on the wider scale, 90% of this
production is exported to 48 countries worldwide (Council, 2018). Hence,
investigating other applications of this product’s waste will have a significant impact,
economically by recycling waste and environmentally by reducing depletion of fossil
fuels and impact on eco system.
2.1 Corrosion
Corrosion is the reaction of an engineering constructional metal with its
environment with a consequent deterioration in properties of the metal (Shreir, 2010).
There are four basic requirements for corrosion to occur; these consist of
anode, where metal dissolution occurs because of metal atoms oxidation that is
associated with the release of electrons. The cathode, where metal ions are reduced by
transferred charge. There should be ionic path which is represented by the electrolyte
that is connecting the two parts of the electrochemical cell and another electronic path
which is completing the circuit by connecting the anode and cathode. Both anodic and
cathodic reactions occur at the same rate; in order to complete the corrosion reaction
(Davis, 2000). Corrosion rate is defined by ASTM G1-03(2017)e1 standard as the
metal loss per unit area per unit time.
Corrosion can be expressed as a non-homogenous reaction which occur in the
metal/environment interface where metal, such as carbon steel, would contribute as a
reactant that provide electrons and is named “Cathode” part of the reaction, while
surrounding environment gain these electrons and is named as the “anode”.
In general, corrosion can be divided based on surrounding environment into
dry corrosion, which doesn’t involve aqueous solution, and wet corrosion, where

10
solution will be one of the reactants. The products of any corrosion reaction, whether
it is dry or wet, should contain oxidized form of the metal. Equations 1 and 2 display
the simplest corrosion reaction in aqueous solution:
4𝐹𝑒 + 2𝐻2𝑂 + 3 𝑂2 → 2 𝐹𝑒2𝑂3 . 𝐻2𝑂 [1]
𝑀𝑒𝑡𝑎𝑙𝑙𝑖𝑐 + 𝑁𝑜𝑛. 𝑀𝑖𝑡𝑎𝑙𝑙𝑖𝑐 → 𝑂𝑥𝑖𝑑𝑖𝑧𝑒𝑑 𝑀𝑒𝑡𝑎𝑙 + 𝑅𝑒𝑑𝑢𝑐𝑒𝑑 𝑁𝑜𝑛. 𝑀𝑖𝑡𝑎𝑙𝑙𝑖𝑐 [2]
Other secondary factors affecting corrosion reaction rate are temperature, pH,
fluid dynamics and concentrations of dissolved oxygen and dissolved salts.
2.2 Types of corrosion based on mechanism
1. Uniform corrosion
This term is applicable when the reaction is evenly distributed over the entire
surface, and as a result relatively uniform thickness reduction occurs (Fontana &
Greene, 1967; Bardal, 2003). Metals such as carbon steel, which has low tendency for
passivation, are susceptible to this type of corrosion. Uniform corrosion is the most
common type (Fontana & Greene, 1967), which would effect metal’s service life. This
type of corrosion can be minimized by simple tests of corrosion rates and increase the
allowance thickness in accordance with strength requirements and service life (Bardal,
2003).
2. Pitting corrosion
It is one of the most common types in aluminum and steel, and it is the most
disconcerting one in the presence of corrosive anions such as 𝐶𝑙− and 𝑆𝑂4−2 near
neutral pH levels (Kruger et al., 1983; Pou et al., 1984; Bertocci, 1987; Strehblow,
2002). Usually it occurs in the shape of narrow pits with a diameter magnitude equal

11
or less than the depth. Pitting is initiated by the adsorption of halides and sulfates
anions on the metal surface after penetrating the passive film of metal oxide.
3. Crevice corrosion
This type occurs underneath deposits or any other narrow crevices where
oxygen supply is reduced (Leidheiser, 1987; Ijsseling et al., 2000; Combrade, 2002).
So that oxygen is reduced to 𝑂𝐻− in the crevice with a rate faster than the rate of
oxygen diffusion to the gap, until no more 𝑂𝐻− is produced. The metal dissolution in
the crevice continues in the absence of oxygen driven by oxygen reduction outside the
crevice. It is a type of localized corrosion that can occur in narrow crevices where the
liquid is able to penetrate to the exposed metal surface, but not able to flow through
the gap. As a result of lake in 𝑂𝐻− concentration in the crevice, and with continuous
metal dissolution, the electrical neutrality is maintained by migration of chloride ions
to the gap to form metal salts that will react with water to form metal hydroxides and
acids. There will be a variation in pH level between the crevice, with low pH as a result
of acids formation, and outside the crevice, where oxygen is still being reduced to form
a high pH area. This autocatalytic process leads to a complex situation where oxidation
of hydronium ions in highly acidic conditions occurs in the crevice while reduction of
the oxygen is the primary cathodic reaction outside the crevice (Ijsseling et al., 2000)
and reduction of the Hydrogen in the acidic medium crevice will be a secondary
cathodic reaction as shown in equations 3 and 4, respectively.
𝑂2 + 2𝐻2𝑂 + 4𝑒− → 4𝑂𝐻− [3]
2𝐻+ + 2𝑒− → 𝐻2 [4]

12
4. Galvanic corrosion
A type of corrosion that occurs when two metals with different electrochemical
potentials are in contact, where one of them is more or less noble than the other (Wallen
& Anderson, 1986; Dexter, 1999; Bardal et al., 1999). Electrolytic medium is
necessary for such reaction to occur; in order to establish a closed circuit. According
to the series of standard reduction potentials of various metals, when the ratio of
cathode surface area (more noble) to anode (less noble) surface area is high that means
there will be a high rate of anode oxidation reaction; in order to balance the rate of
reduction reaction on the cathode surface, which will result in a higher rate of anode
dissolution (Wallen & Anderson, 1986).
5. Intergranular corrosion
Intergranular corrosion is a type of localized reaction that occurs within the
structure of the material without infecting the surface (Leygraf, 1955; Fontana &
Greene, 1967; Uhlig, 1971; ASTM, 1972; Lees, 1982; Hatch et al., 1984; Hutchings,
1986; Roberge, 1999; Bardal, 2003). It would mostly occur in aluminum, copper alloys
and austenitic stainless steel (ASM, 2015). It results from different concentrations of
impurities or alloying elements within the metal structure. Mainly there are zones of
different nobility on or in the grain, where cathode and anode are formed and reaction
initiates. ASTM A26 stated 5 practices for testing this type of corrosion.
6. Selective corrosion
This type of corrosion occurs in alloys consisting of more than one element
that are having different nobility (Bardal, 2003), as a result dissolution of the less noble
element leaves a porous alloy with less strength and ductility. In most cases corroded

13
zones are covered with corrosion products or other deposits leaving a hardly
recognized corroded surface (Bardal, 2003).
7. Erosion or abrasion corrosion
A type of material dissolution results from mechanical wear where there is a
relative movement between a corrosive fluid and the material surface that would leave
a clean surface exposed to further corrosion effects especially when the metal is
covered with a protective metal oxide film (Fontana & Greene, 1967; Hutchings,
1986). When the fluid flow is parallel to the metallic surface it is named abrasion
corrosion, on the other hand, when the flow is moving with an angel to the material
surface it is named erosion corrosion (Hutchings, 1986).
8. Cavitation corrosion
In comparison to erosion corrosion, cavitation corrosion would be in the form
of deep, perpendicular pits that are close to each other. Usually it occurs due to high
velocities that are creating pressure variations on the metal surface. This form of rough
spongy surface can be observed on water turbines, propellers and pump rotors
(Fontana & Greene, 1967; Uhlig, 1971; ASTM, 1972).
9. Fretting corrosion
This type of corrosion would occur in the interface of two closely fitting
components that are under repeatedly relatively motion to each other and subject to
load (Uhlig, 1971; Bardal, 2003).
10. Stress corrosion cracking
Stress corrosion is defined as crack formation as a result of both static tensile
stress and corrosion reaction simultaneously (Uhlig, 1971; Lees, 1982). Tensile stress

14
might result from external load, centrifugal forces, temperature changes or internal
stress that is induced by cold working, welding or heat treatment. In general, the cracks
are formed on plane perpendicular to the tensile stress direction where it might transfer
and branched inter-granularly or trans-granularly (Lees, 1982). Unlike the stress
corrosion that is formed due to a combination of static tensile stress and corrosion,
corrosion fatigue is defined as crack formation due to varying stresses in combination
with corrosion effect (Uhlig, 1971; Bardal, 2003).
11. Microbial corrosion
Another distinguished type of corrosion is the one that results from existence
of organisms that will produce electron flow which may modify the environment to
corrosive one. As an example, the accumulation of microbial deposits on the metal
surface will form an inert film that would prevent the metal surface under deposit from
reacting with the corrosive electrolyte and become an anode, while oxygen reduction
will take place on the surface area just outside the colony deposit to form a cathode;
so that metal dissolution will start under the deposits causing pits on the metal surface.
Another case is those types of microbial deposits that can produce organic and
inorganic acids which will lead to form hydrogen irons that might cause hydrogen
embrittlement of the colonized metal.
In anaerobic conditions, there is a type of bacteria which is able reduce sulfate
ion to produce oxygen and sulfide ions, which in turn combines with ferrous ion to
form iron sulfide and lead to metal dissolution. Another type of bacteria is capable of
directly reducing metal atoms (Cicek, et al., 2011). In general, microbial corrosion can
be prevented by applying biocides to the electrolytic medium; to prevent any microbial
activity.

15
2.3 Corrosion in hydrochloric acid solution
Metal corrosion in acidic solution of 𝐻𝐶𝑙 can be illustrated by equation [5 and
6], where iron represents the anode to donate electrons. In the same reaction, as diluted
hydrochloric acid in water ionizes in a fast rate to release one proton in the form of
𝐶𝑙− and 𝐻3𝑂+ (Hydronium ion), it releases both hydrogen cation and chloride anion.
Hydrogen atoms in Hydronium are reduced by gaining donated electrons from iron
atom to form Hydrogen molecules, while chloride compensate that donation by
combining with iron to form ferrous chloride salt which has a dissolved form in the
solution.
2 𝐻𝐶𝑙(𝑎𝑞) + 2𝐻2𝑂(𝑎𝑞) → 𝐻3𝑂(𝑎𝑞)+ + 2𝐶𝑙− [5]
𝐹𝑒(𝑠) + 2 𝐻𝐶𝑙(𝑎𝑞) → 𝐹𝑒𝐶𝑙2 (𝑎𝑞) + 𝐻2 (𝑔) ↑ [6]
2.4 Corrosion in sea water solution
The two main types of corrosion which occur in sea water are the general and
localized corrosion. In terms of external corrosion of carbon steel pipelines under sea
water, it would cause leakage of toxic materials and result in significant influences on
environment and life species. As the corrosion in sea water is driven by dissolved
oxygen, which is called oxygen absorb corrosion, and is controlled by oxygen
concentration. There are many factors affecting the corrosion rate of metal in sea water
includes (Xiangyu et al., 2018):
• Salinity of the sea water is the main cause of increasing the water conductivity but
in the same time decrease the oxygen content. In addition to 𝑁𝑎𝐶𝑙, calcium and
magnesium salts precipitating on the metal surface would form a protective layer
which reduces corrosion rate.

16
• Chloride is a significant factor which destroys the protective oxide film of some
metals such as aluminum and stainless steel. The higher chloride content the more
will be corrosion rate in these types of metals.
• Conductivity in sea water results from ionized state of salts. Existence of ions
enhance the conductivity of the electrolyte in a corrosion cell.
• Higher concentration of dissolved oxygen increases the metal electrode potential.
Hence, as the concentration of dissolved oxygen increase the higher will be
corrosion rate.
• pH of the sea water contributes the corrosion of metals like carbon steel, but the
effect is much less than that of oxygen, especially with alkaline salts such as
calcium and magnesium salts which helps buffering the pH of the sea water and
keep it close to pH = 6.0 - 7.0.
• As the temperature the sea water increase the oxygen evolves and corrosion rate
reduces.
2.5 Corrosion inhibitor
The main purpose of inhibitors application is to control anodic oxidation; those
are known as anodic inhibitors, cathodic reduction; which are known as cathodic
inhibitors or both of them which in this case known as mixed inhibitors (Trabanelli,
1970; Foroulis, 1969; Riggs et al., 1973; Thomas, 1976; McCafferty, 1979; Ash &
Ash 2011). Generally, inhibitors tend to form protective films on the metal surface. It
is proved that inhibitors adsorption is either by physical (electrostatic) adsorption or
chemisorption.
Physical adsorption occurs as a result of electrostatic forces between the
organic ions and the electrically charged metal surface. Chemisorption results from

17
transferring or sharing inhibitor molecule’s charge to the metal surface, forming a
coordinate-type bond.
2.5.1 Inhibitor efficiency
In order to compare the effectiveness of various corrosion inhibitors, or same
inhibitor in different corrosive mediums, inhibition efficiency (EI) is calculated by
equation [7] (Karthik et al., 2014):
𝐼𝑒𝑓𝑓 = 𝐶𝑅0− 𝐶𝑅𝑖
𝐶𝑅0∗ 100 [7]
Where Ieff is the efficiency of the inhibitor (%), CR0 is the corrosion rate of the metal
without inhibitor present, and CRi is the corrosion rate of the metal with inhibitor
present.
Also, it is possible to define inhibitor efficiency ηI as the relative reduction of the
corrosion current density. Equation [8] is applicable when electrochemical evaluation
method is used and is mentioned here for reference only:
𝐼
= 𝐼𝐶,𝑂− 𝐼𝐶
𝐼𝐶,𝑂∗ 100 [8]
where IC,0 and IC are the corrosion current densities at open circuit, i.e., at the rest
potential ER without and with the addition of an inhibitor, respectively (Marcus, 2011).
2.5.2 Types of inhibitors based on chemical composition
Corrosion inhibitors can be divided into two types based on chemical nature,
organic inhibitors which are functioning by chemisorption on the metal surface, and
inorganic inhibitors that are physically depositing on the surface to form a barrier
between the metal and corrosive environment.

18
2.5.3 Corrosion inhibition mechanisms
Corrosion inhibition involves reducing corrosion rate through reducing metal
dissolution rate at the anode, controlling oxygen reduction rate, reducing hydrogen
evolution rate at the cathode, or both processes simultaneously. The following
mechanisms have been proved in corrosion control (Strehblow, 2012):
• Inhibition by adsorption
Inhibitors are often chemicals that contain alkyl chains and an active head
group like –CN, –SH, – NH2, –COOH, –O–PO3. The long organic chain is protecting
the surface through covering it, while active head group is binding to the metal surface
by electrons donation. Inhibiting efficiency increases as the electron density at this
group increase. In this type of inhibition mechanism many isotherms have been
suggested such as Langmuir, Frumkin and Freundlich isotherms which are correlating
the surface coverage, inhibitor concentration and the change in adsorption enthalpy.
Adsorption can reduce the metal dissolution at the anode, hydrogen evolution at the
cathode or both reactions in order to inhibit corrosion (Adejo et al., 2014; Ituen et al.,
2017).
• Inhibition by precipitation of compounds
Precipitates on the metal surface can be formed by the reaction of chemical
compounds and the metal surface or the electrolyte surrounding the metal; this physical
barrier will inhibit metal dissolution (or oxygen reduction) at the anodic electrode and
hydrogen evolution on the cathodic electrode simultaneously (Schweitzer, 1996). As
it is well known, diffusion of metal cations from metal pores to bulk electrolyte
medium or redox species from bulk electrolyte to metal surface are the rate

19
determining steps in the corrosion reaction, so the formation of a stable precipitate on
the metal surface can minimize corrosion rate. Some examples of this type of inhibitors
are Benzotriazole (BTA) with copper in 0.5 M H2SO4, polyphosphates in weakly
acidic up to weakly alkaline mediums and carbonates of calcium and magnesium on
carbon steel surface.
• Inhibition by passivation
This type of corrosion inhibition is suitable for neutral and weakly acidic
mediums, even when the metal has an active dissolution tendency passivation is
possible if the pH is high enough with a related small active dissolution. Most oxide
films are insoluble at high pH and as a result metal dissolution will be minimized. In
consequence, no high reaction rates are required at the cathode to compensate the
strong metal dissolution when compared to acidic electrolyte. Phosphates, borates,
carbonates, and silicates are some of the buffering chemicals that can act as passivating
compounds. Nitrites and chromates or di-chromates (alkaline and acidic electrolytes)
are good inhibitors for metals in a less aggressive environment with moderate active
dissolution rates.
An additional, modern classification of inhibitors considers them as hard, soft
and borderline (Salas, 2012).
2.5.4 Types of inhibitors based on inhibition mechanism
In general, inhibitors are mitigating corrosion reaction either by forming
adsorbed film, forming bulky precipitate, or promotion of passivity of the metal to be
protected. Corrosion inhibitors were classified based on the inhibition mechanism
(Riggs et al., 1973; Greene, 1982; Sastri et al., 2007; Revie, 2008; Schweitzer, 2009;

20
Papavinasam, 2013). Each inhibitor is described briefly in the next section and
different categories were concluded in Figure 2.1.
• Anodic (passivating) inhibitors
These chemical compounds perform through selectively forming a covering
film on the anodic sites of the metal surface. In terms of electrochemical
measurements, the effect of these inhibitors can be observed on the mixed potential
diagrams for both anodic and cathodic reaction kinetics. With regards to potential,
forming inhibitor’s film on metal surface reduces the potential difference between
anode and cathode. Consequently, reducing potential difference suppresses the
electrons transfer rate as the driving force and reduces the corrosion rate reaction (Zaki,
2006). Anodic inhibitors can be classified on the base of application into two types,
the first type is oxidizing chemicals, such as chromates, nitrites, and nitrates and
another type includes non-oxidizing chemicals which require the presence of other
oxidizing species (e.g. Oxygen) such as phosphates, tungstates, and molybdates.
• Cathodic inhibitors
This type of inhibitor performs through precipitation on cathodic sites and
blocking the diffusive oxidant species in the corroding environment or removing it; to
slow reduction reactions. Cathodic inhibitors also can be categorized according to the
type of corrosive species into precipitating hydroxides such as calcium, magnesium,
and zinc which will precipitate hydroxides at alkaline pH, and is induced through
cathodic reduction reactions. The second type includes arsenic, bismuth, and antimony
which are referred to as cathodic poisons, lowering hydrogen reduction rate and as a
result decreasing corrosion reaction rate. The third class of cathodic inhibitors

21
performs through removing reducible species (e.g. oxygen) from the electrolyte, such
as oxygen scavengers, include sodium sulfite or hydrazine (Zaki, 2006).
• Ohmic inhibitors
Referred to as general filming inhibitors, which reduce the mobility of ions
between anodic and cathodic sites on the metal surface through decreasing the
electrolyte ionic conductivity (Nuñez, 2007). This is performed through strong
adsorption to the metal surface. Ohmic inhibitors include amines which are cationic,
and sulfonates which are anionic.
• Precipitation inhibitors
Perform through precipitation in the form of protective film on the entire metal
surface that would function as a physical barrier between the metal surface and the
corrodant. Some examples of precipitation inhibitors include silicates and phosphates
(Nuñez, 2007) .
• Vapor phase inhibitors
These are chemical compounds characterized by its high vapor pressure and
ability to be adsorbed on metal surface. Once adsorbed it can mitigate corrosion
through neutralizing moisture, promote the formation of passive film, form a general
film on the surface, or a combination of these mechanisms. Application of these
inhibitors are metal specific, otherwise it can accelerate the corrosion rate (Mishra,
2018).

22
• Biocides
A special type of corrosion that might occur on the metal surface known as
microbiological induced corrosion (Ash et al. 2011) is the one that results from specific
types of bacteria and microbes in the surrounding environment. These microorganisms
may convert environment into a highly corrosive one through different mechanisms
that were explained in the previous section. Environments susceptible to this type of
corrosion are oil and gas industry, pipelines, sewage treatment systems, pulp paper
industry, and other cooling water applications. One of the most important types of
these organisms is sulfate reducing bacteria that convert sulfate into sulfide that will
combine later with iron to form iron sulfide scale.
Biocides can be divided into two main categories, surface active or non-surface
active. Chlorine, chlorine dioxide, and sodium hypochlorite are examples of biocides.
Another classification of chemicals that are controlling microbiological activity is
oxidizing and non-oxidizing (Javaherdashti, 2017). Application of different types of
biocides should be compatible with the metal type, other treatment chemicals, and
environmental conditions.
Based on different inhibition mechanisms, Figure 2.1 concludes the different
types of corrosion inhibitors. This summary can be helpful to select the proper inhibitor
for a specific application. In addition to this chart, type of metal and corrosion reaction
conditions including pH, temperature, dissolved oxygen, …etc. should be considered
in selecting the right inhibitor.

23
Figure 2.1: Corrosion inhibitors classification based on inhibition mechanism
Co
rro
sio
n I
nh
ibit
or
Anodic Inhibitor (Passivating)
Oxidizing
Non-Oxidizing
Cathodic Inhibitor
Precipitating Hydroxides
Cathodic Poisons
Scavengers
Ohmic Inhibitors
Catioinc
Anionic
Precipitation Inhibitors
Vapor Phase Inhibitors
Neutralizing
Passivating
General filming
Biocides
Surface Active
Non Surface Active

24
2.6 Inhibition in acid solution
Corrosion inhibition in acidic medium is achieved through applying various
organic compounds, such organics are triple-bonded hydrocarbons, acetylenic
alcohols, sulfoxides, sulfides, and mercaptans; aliphatic, aromatic, or heterocyclic
compounds containing nitrogen; and many other groups of simple organic compounds
and of condensation products formed by the reaction between two different species
such as amines and aldehydes (Schweitzer, 2009).
Proper choice and application of organic inhibitor is necessary to avoid corrosion
stimulation or hydrogen penetration to the metal surface. Corrosion stimulation
phenomena can be observed with mercaptans, sulfoxides, azoles, and tri-azole
derivatives, nitrites, and quinolone. Generally, stimulation of iron’s corrosion is not
affected by organic compounds type or structure, but more influenced by acidic
medium type. Some organic inhibitors could achieve effective reduction in corrosion
rates of steel in hydrochloric acid solution, such as (4-dimethylamino-
phenylantipyrilcarbinol) and its derivatives at a 10-4 concentration (Schweitzer, 2009),
while stimulating corrosion rate in sulfuric acid medium. Application of organic
inhibitors must be accompanied with regular monitoring; in order to keep inhibitor
concentration above the critical concentration, below which inhibitor is not effective.
Mechanism of corrosion inhibitor in acidic solution is initiated by adsorption of
the inhibitor on the metal surface. Numerous factors might affect adsorption process
nature and rate such as the nature and surface charge of the metal, chemical structure
of the inhibitor, and type of aggressive electrolyte (Schweitzer, 2009). Organic
inhibitors react with metal surface either physically (electrostatic adsorption) or
chemically (chemisorption).

25
2.7 Types of adsorption
In adsorption process, two substances are involved. One is the solid or the
liquid on which adsorption occurs on its surface and is called adsorbent, while the
second is the gas or liquid or the solute from a solution that gets adsorbed on that
surface and is called adsorbate.
Adsorption is different from absorption. In absorption, the molecules of a
substance are uniformly distributed in the bulk of the other, whereas in adsorption
molecules of one substance are present in higher concentration on the surface of the
other substance. Depending upon the nature of forces between adsorbate molecules
and adsorbent, the adsorption can be classified into two types (Mishra, 2018):
• Physical adsorption (physisorption)
If the force of attraction existing between adsorbate and adsorbent are Vander
Waal’s forces, the adsorption is called physical adsorption. It is also known as Vander
Waal’s adsorption. In physical adsorption the force of attraction between the adsorbate
and adsorbent are very weak, therefore this type of adsorption can be easily reversed
by heating or by decreasing the pressure.
When a metal is immersed in electrolyte, a double layer of electric charges is
established at the metal-solution interface. In association with this phenomenon,
surplus charges exist on the metal side and surplus concentration of one type of anions
in the solution side, each of them with opposite charge to the other (Riggs et al. 1981),
while absence of excess charges on the metal side is known as zero-charge potential,
which is not only depending on the metal type but the whole system structure (Gileadi,
1967). According to the used term, double layer, two sides had been defined, a diffuse
layer known as “outer Helmholtz plane” and an inner layer known as “inner Helmholtz

26
plane” (Riggs et al. 1981). The charge on the metal surface side can be defined by the
potential of the metal immersed in solution Ecorr versus metal’s zero charge potential
(ZCP) Eq=0. Cation adsorption is preferable when the difference between the two
potentials is negative, while anions adsorption occurs if the difference is positive. This
is also applicable to dipoles whose orientation depends on the potential value
(Schweitzer, 2009).
An electric field at the outer Helmholtz plane of the electrical double layer
existing at the metal/solution interface would create surface charges on the metal
surface. Physical adsorption results from electrostatic attraction forces arise between
these electric charges on the metal surface and organic ions or dipoles (Schweitzer,
2009).
According to Antropov (1961), metals with equal values of potential
difference, is showing same behavior of a given inhibiting species in the same
environment. This has been demonstrated when organic charged species were
adsorbed on mercury and iron electrodes at the same potential for both metals.
Based on the above concept, when adsorbable anions, such as halide, exist in
inhibited electrolyte, the anions will be adsorbed by forming oriented dipoles that will
enhance the adsorption of inhibitor cation, and as a result the degree of inhibition of
the two species together will be greater than the sum of each specie individually, this
phenomenon of positive synergistic effect would explain the greater inhibition degree
in hydrochloric acid solution compared to less inhibition in sulfuric acid solution.
• Chemical adsorption (chemisorption)
When the force of attraction existing between adsorbate and adsorbent are
almost same strength as chemical bonds, the adsorption is called chemical adsorption.

27
It is also known as Langmuir adsorption. In chemisorption the force of attraction is
very strong, therefore adsorption cannot be easily reversed.
This type of inhibitor’s adsorption on metal surface demands charge transfer
from inhibitor molecule to metal surface; in order to form a bond. The rate of this
process is slower than physical adsorption; because it requires higher activation
energy. This process is not completely reversible. Electron transfer depends on the
nature of both metal and organic inhibitor. In the metal side, electron transfer occurs
exemplary to those metals which have vacant, low energy electron orbitals. With
respect to inhibitor, transfer occurs from compounds which have loosely bound
electrons, more specifically electrons with characters that exist in adsorbed inhibitor
of multiple bonds or aromatic rings (Schweitzer, 2009). Electron transfer is even
preferable by heteroatoms with single pair of electrons in the adsorbed molecule. Most
structures of organic inhibitors include at least functional group that should perform
as the reaction center in chemisorption process. Adsorption bond’s strength in such
compounds depends to a high degree on electron density of the heteroatom and
polarizability of the function group. For a class of homologous compounds with
different heteroatoms, inhibition efficiency can be in the following order (Schweitzer,
2009):
Phosphorus (P) > Selenium (Se) > Sulfur (S) > Nitrohen (N) > Oxygen (O)
Higher inhibition efficiency in the above series of elements can be justified by
the higher polarizability and lower electron negativity of the heteroatom on the left
hand side (Schweitzer, 2009). In Table 2.1, a brief comparison between adsorption
mechanisms can be found.

28
Table 2.1: Comparison between physisorption and chemisorption
Physisorption Chemisorption
1. Low heat of adsorption usually in the range of
20-40 kJ mol-1
High heat of adsorption in the
range of 40-400 kJ mol-1
2. Force of attraction are Van der Waal's forces Forces of attraction are chemical
bond forces
3. It usually takes place at low temperature and
decreases with increasing temperature It takes place at high temperature
4. It is reversible It is irreversible
5. It is related to the ease of liquefaction of the
gas
The extent of adsorption is
generally not related to liquefaction
of the gas
6. It is not very specific It is highly specific
7. It forms multi-molecular layers It forms monomolecular layers
8. It does not require any activation energy It requires activation energy
• Factors affecting adsorption
The extent of adsorption depends upon the following factors: (McCafferty, 1979)
1. Nature of adsorbate and adsorbent.
2. The surface area of adsorbent.
3. Activation of adsorbent.
4. Experimental conditions. e.g., temperature, pressure, etc.
• Interactions between adsorbed inhibitors
Application of more than one inhibitor on the metal surface may prompt lateral
reactions between inhibitor species; this might result in an increase or a decrease in the
adsorption of inhibitor on metal’s surface and as a result positively or negatively
affecting inhibition efficiency. Usually, Van der Waal forces arise between long chains
hydrocarbon molecules. While on the other hand, existence of ions or dipoles might
enhance repulsive forces and as a result weakens the adsorption strength and so
inhibition efficiency.

29
• Relationships between inhibitor reactivity and efficiency
During application or experimental work, the nature of corrosion inhibitor
alternates with time or electrode potential due to reduction reaction occurs in the
electrochemical cell, polymerization reactions, or the formation of surface products.
As a result, other compounds with different structure may exist in the electrolyte as
by-products. These products can be either more or less efficient depending on the
electrochemical properties of the new compounds (Duwell et al., 1964). Inhibition
effect of the original compound added to the electrolyte is known as primary inhibition,
while inhibition by the products of electrochemical reaction is known as secondary
inhibition.
2.8 Green inhibitor
Recent experimental works were done to extract useful ingredients from plants.
These ingredients were utilized later in other purposes such as food industry, medicine,
corrosion, etc. Based on recent literatures, corrosion inhibition efficiency of different
fruits on different metallic alloys in different acidic mediums was investigated and
obtained results are summarized in Table 2.2. Also, this section includes details of
partially reviewed experiments, on which selection of the scope of this research was
based.
Inhibition efficiency of Podophyllum Hexandrum Fruit Extract (PHE) on mild
steel alloy in 1N 𝐻𝐶𝑙 solution was investigated by Kamaraj et al. (2014). Different
volume concentrations from 1% to 5% of PHE were tested during 1 to 4 hours period,
and the optimum efficiency was found to be 89% at 5% v/v of extract concentration.
Kumar et al. (2011) investigated inhibition efficiency of the extract obtained
from Psidium Guajava Seed (PGSE) in 5% of HCl as the corrosive environment.

30
Guajava seed mixed with 100 ml of 5% 𝐻𝐶𝑙 and refluxed for 1 h. The extract was
cooled, made up to 100 ml using double distilled water. Each corrosion test was run
for 1 hour. Inhibitor was found to be mixed inhibitor but acting more as a cathodic
inhibitor. Different methods were used to measure corrosion inhibition efficiency such
as gravimetric method, thermodynamic factors method, FT-IR, electrochemical
parameters (potentiodynamic Tafel polarization and impedance spectral studies), and
finally surface morphology method by Scanning Electron Microscopy (SEM), which
is a useful microscopic method for characterizing changes occurred to metal surface
by observing the surface before and after the corrosion reaction. Physical adsorption
was the inhibition mechanism with optimum concentration of 10% v/v. A decrease in
IE was observed at prolonged time exceeding 1 hour of exposure to acidic medium at
constant concentrations of green inhibitor 2%, 4%, 6%, 8%, 10% v/v.
In another study, Derfour et al. (2014) investigated corrosion inhibition effect
of Artemisia Herba Alba extract on carbon steel, containing (wt. %): 0.15% C; 0.50%
Mn, 0.03% P, 0.03% S, 99.29% Fe, in hydrochloric acid, where dried Artemisia herba
alba (10 g) plant leaves were soaked in 1M 𝐻𝐶𝑙 solution (500 ml) and refluxed for 5
hours. The aqueous solution was filtered and concentrated to 100 ml. This concentrated
solution was used to prepare solutions of different concentrations by dilution method,
and has achieved 89% inhibition efficiency as a cathodic inhibitor with optimum
concentration of 1000 ppm in 1 M 𝐻𝐶𝑙 at 300 K. Physisorption was the inhibition
mechanism, and IE was proofed by gravimetric, electrochemical measurement, while
inhibition on metal surface was verified by plotting Langmuir’s adsorption isotherm
and SEM. The oil extracted here was found to have both antibacterial and anti-fungal
properties.

31
Ethanolic extract of Ricinus communis leaves was investigated by
Sathiyanathan et al. (2005). Ricinus communis leaves collected and dried at room
temperature. Air dried leaves extracted with ethanol for 6 hrs. Extract filtered and
distilled at 70 - 80 C. The concentrate obtained was used as the inhibiting agent.
Different concentrations of 100, 300 and 500 ppm were implemented in this
experiment, and proved 85% corrosion inhibition on mild steel (consisting of C 1-2%,
Mn 0.1-0.2%, PO4 0.4-0.5%, S 0.02 - 0.03% and Fe reminder) in 100 ppm of NaCl
solution by gravimetric and electrochemical methods. This EI was achieved by
optimum inhibitor concentration of 500 ppm, but test was done for 4 days immersion
of the metallic coupon.
Mohammed (2015) studied the Pomegranate's Peel Powder as a Natural
Inhibitor for Mild Steel Corrosion. The study followed gravimetric and
electrochemical methods on mild steel, but with a single inhibitor concentration of 40
ppm in two different types of solutions, 5% of 𝐻𝐶𝑙 and in a separate test 5% of
𝐻2𝑆𝑂4both at 298 K. He claimed that chemical reaction and passivation (anodic) are
the main inhibition mechanisms by phenolic compounds. By immersing mild steel
sheets in HCl for 168 and 672 hours, IE was measured to be 88.2% and 95.4%
respectively, while immersing mild steel sheets in H2SO4 for 168 and 672 hours
resulted in measuring 81.9% and 78.7% IE, respectively. Under the same acids
concentrations Electrochemical Tafel Test method measured 80.4% and 99.9% IE
when immersed mild steel sheets in 𝐻𝐶𝑙 for 72 and 336 hours, respectively, while the
same method measured 90.8% and 95.6% when sheets were immersed in the same
concentration of 5% H2SO4 for 72 and 336 hours, respectively. The main observation
in this study was the increase in IE with longer testing time in 𝐻𝐶𝑙, while IE increase

32
with increasing the test period in H2SO4 until a certain time then decrease again when
acid restore its activity.
IE of Eucalyptus Camaldulenis leaves extract was investigated by Ghalib (
2013) on low carbon steel for 3 hours under normal temperatures of 25 – 55 oC by
gravimetric technique. The leaves were collected from a farm in AL-Adhamyia
garden. The tested extract was prepared by boiling weighed amounts of the dried and
ground leaves of Eucalyptus Camaldulenis for one hour in one liter bi-distilled water
and left overnight. Then, the solution was filtered and stored. The concentrations of
the extract were expressed as (g/l). Different concentrations of 2, 4, 6, 8, 10 gm/l were
tested, where 88.9% IE in 3 M HCl was achieved, and it was found that IE is increasing
with increasing corrosive medium’s temperature in the mentioned range. In this case,
inhibition was affecting by physical adsorption mechanism as an anodic inhibitor, and
also IE was increased with increasing concentration until reaching a saturation point,
where after that a small increase only is achieved against concentration, but on the
other hand, IE was reducing with time.
An interesting study was carried out on red apple fruit (Malus domestica) by
Saviour et al. (2015). Apple fruit extract (Felhi et al., 2017) was used as inhibitor and
prepared by cleaning apple fruit through washing them with distilled water. Fruit was
cut into small pieces and dried in an oven at 70 oC for 24 hours. The dried samples
were ground using electric blender, and 20 g of ground sample was boiled for 10
minutes in 1 L of 0.5M 𝐻𝐶𝑙 and then cooled. Cooled extract was filtered using
Whatman 1 filter paper to obtain the stock solution. The difference between the weight
of the dried residue and the initial weight of the dried plant material before extraction
was used to quantify the amount of plant material extracted into solution, and finally
stock solution was diluted with 0.5 M 𝐻𝐶𝑙 to obtain the desired concentrations of 500,

33
2500, 5000 ppm of inhibitor solution. Mild steel sheets were immersed in above acidic
solutions mixed with specified inhibitor concentrations for periods between 24 – 240
hours. As a result of this investigation the increase in extract concentration and testing
period (separate test) were reducing IE. The decrease in inhibition efficiency with
prolonged immersion time was expected to result from the instability of the protective
layer due to desorption of Apple Fruit Extract (Felhi et al., 2017) components and/ or
the diffusion process through the interface protective layer, while IE increased with
increasing medium temperature only between 30 – 60 oC at when kept solution and
inhibitor concentration constant. In that investigation red apple fruit’s extract was
acting as a mixed inhibitor at optimum inhibitor’s concentration of 5000 ppm to
achieve highest efficiency of 90% during experiment.
IE of aqueous extracts of Mango and Orange Peels were tested against carbon
steel by Cardozo et al. (2014), which was immersed in 1 M 𝐻𝐶𝑙 at normal temperature
of 25 oC for 1, 4 and 24 hours. The extract was prepared by washing the fruit under
running water and then peeled; the peels were then air-dried and crushed using a
blender. 10 g of the crushed peels were added to a Soxhlet apparatus and extracted
successively with three different solvents of increasing polarity: (a) hexane, (b) ethyl
acetate, and (c) ethanol until discoloration. The temperatures used in the extraction
were equal to the boiling temperatures of the solvents used. This previous step of
Soxhlet extraction was performed to eliminate nonpolar substances. Afterwards, the
extracts were obtained by simple water infusion, i.e., the remaining mass of the dried
peel from the Soxhlet extraction (approximately 5 grams) was added to a beaker
containing 100 mL of distilled water that had been freshly boiled and then allowed to
stand for 30 min without heat; this mixture was agitated sporadically. After extraction,
the sample was filtered, the volume was lyophilized, and the extract was stored in a

34
desiccator until the analysis. In this investigation, extract was found to be a mixed-
type inhibitor with predominantly anodic characteristics. Inhibition efficiency
increased as the extract concentration increased over a concentration range of 0-600
ppm varying from 79 to 96% (mango) and 84 to 91% (orange) using potentiodynamic
polarization curves (Tafel plots) and from 69 to 94% (mango) and 76 to 90% (orange)
using electrochemical impendence spectroscopy (Leidheiser, 1987).
Ginger Extract was investigated earlier as a green corrosion inhibitor by Fouda
et al. (2013) on steel with a chemical composition of (wt%): 0.005% Si, 0.248% Mn,
1.832% Zn and the remainder is iron. Carbon steel sheets were immersed in sulfide
polluted salt water, which was aerated but non-stirred 3.5% NaCl with 16 ppm sulfide
in the presence of investigated compound. Inhibitor was investigated with various
concentrations of 50, 100, 150, 200, 250 ppm. Test was conducted for short time
periods of 30 minutes only at 25 oC. Ginger was purchased from the local market and
ground into a fine powder to give 500 g of powdered materials which was extracted
later separately by soaking at room temperature for six times with methanol (5 L), then
the methanolic extract of the sample was concentrated to nearly dryness under reduced
pressure by using the rotary evaporator at 45 oC to achieve the crude methanolic extract
which was kept for further investigation. Extract was found to be mixed type inhibitor,
but mainly inhibit cathodic reaction. IE was investigated by potentiodynamic
polarization, EIS, and EFM techniques, to find adsorption process of the studied
extract on steel surface obeys Temkin adsorption isotherm and obtain IE of 83.9% with
250 ppm optimum concentration.
IE of lignin was investigated by Altwaiq et al. (2011) on different alloys with
different oxidation potential such as mild steel coupons with chemical composition of
0.17 C, 1.40 Mn, 0.55 Cu, 0.035 P, 0.035 S, 0.012 N, and balanced Fe. Another

35
coupons of stainless steel alloy had a chemical compositions of 68.88% Fe, 0.05% C,
18.0% Cr, 10.0% Ni 1.0% Si, 2.0% Mn, 0.05% P, 0.01% S, and 0.01% N, and
aluminum zinc alloy with a chemical compositions (wt%) of 5.1–6.1 % Zn, 1.2–2 %
Cu, 2.1–2.9 % Mg, 0.40% Si, 0.50% Fe, 0.30% Mn, 0.18–0.28% Cr, 0.20% Ti, and
balanced Al, where alloys were immersed separately in 0.10 − 1.0 M 𝐻𝐶𝑙 as the
corrosive medium for periods between 3 hours and 1 day in the most cases at normal
ambient temperature. Hard wood samples were used to prepare this extract, where
outer bark was peeled off, the log was chipped and dried. The chips were ground to
size between 70−120 mesh. After drying at 50 oC for 24 hours, the grinded wood chips
were subjected to an alkaline extraction by 7.5 % (w/v) 𝑁𝑎𝑂𝐻 at 90−100 oC for 6
hours under continuous agitation conditions. The ratio (m/M) of wood to liquid in the
extraction was 1:10. After gravity filtration, the filtrate was acidified by drop-wise
addition of 5.0 M sulfuric acid to a pH around 5.50. The hemicelluloses then were
isolated from the hydrolysates by precipitation of the neutralized hydrolyze in the three
volumes of ethanol. After filtration, the pellets of the hemicelluloses were washed with
70% ethanol and air-dried. After evaporation of ethanol, the alkali-soluble was
obtained by precipitation at pH 1.50 from the corresponding supernatants acidified by
drop-wise addition of 5.0 M sulfuric acid under continuous agitation. The precipitates
were isolated by filtration with glass filter and washed with warm diluted solution of
sulfuric acid 1% (v/v) to remove the dissolved polysaccharides. The precipitate then
was dried in the oven at 125 C to obtain pure alkali lignin. Five concentrations of
extracted alkali lignin 100, 300, 700, 1000 and 1500 mg/kg were implemented in this
experiment, where different corrosion monitoring techniques include weight loss
method, quantification of metal ion contents in the corrosive solutions, and surface
analysis methods using SEM and micro beam x-ray fluorescence. In addition,

36
quantification of metal contents in the corrosive solutions was done by Inductively
Coupled Plasma−Optical Emission Spectroscope ICPOES. The IE of alkali lignin
increased with increasing its concentration, while corrosion inhibiting effect of alkali
lignin became weaker by increasing the immersion time from 1 hour to 3 days, and the
highest IE obtained was 78.1 % at (3 hrs, 1000 mg.Kg-1) and 51.2 % at (24 hrs, 1000
mg.Kg-1).
Date palm leaf and seeds extract was investigated against Aluminum in 1M
𝐻𝐶𝑙 solution by (Al-Haj-Ali et al., 2014). Where clean, dry date palm leaves were
contacted with hot water at 80 ºC in a solid-to-liquid ratio of 1:50 for 3 hours in 2000
mL thermal-glass beaker under adequate shaking conditions. The extract was then
filtered by vacuum filtration apparatus through 0.45 μm pore size membrane and the
filtrate stored for corrosion inhibition experiments. 1M 𝐻𝐶𝑙 was used as a corrosive
medium in this experiment, where adsorption of extract components on metal surface
was shown to occur spontaneously and the data follow Langmuir isotherm model. 40
– 88% inhibition efficiency obtained with 200 – 600 ppm concentrations tested during
2 – 8 hours of immersion to claim optimum of 600 ppm under ambient temperatures.
In general, he found that inhibition efficiency increased with increasing extract
concentration and immersion time but decreased with increasing acid concentration
and temperature.
Summary of mentioned green inhibitors are shown in Table 2.2 which were
found to increase IE with the increase in extract concentration, except apple fruit.

37
Table 2.2: Green corrosion inhibitors
Reference Name Photograph Tested Part Inhibition Type
(Kamaraj et
al., 2014)
Podophyllum
Hexandrum
Fruit Extract
Fruit Mixed type inhibitor.
(Kumar et
al., 2011)
Psidium
guajava seed
extract
Fruit -
Leaves
Mixed type inhibitor.
Functions more as
cathodic inhibitor.
(Derfour et
al., 2014)
Artemisia
Herba Alba
Extract
Leaves Cathodic inhibitor.
(Sathiyanath
an et al.,
2005)
Ricinus
Communis
extract
Leaves Mixed type inhibitor.
(Mohammed,
2015)
Pomegranate'
s Peel
Powder
Peel Mixed type inhibitor.
(Ghalib,
2013)
Eucalyptus
Camalduleni
s Leaves
Extract
Leaves
Passivation
(Anodic).
(Saviour et
al., 2015)
Red Apple
Fruit (Malus
domestica)
Extract
Fruit
Mixed Type
inhibitor.
(Cardozo et
al., 2014)
Aqueous
Extracts of
Mango and
Orange Peel
Peel
Mixed-type inhibitor
with predominantly
anodic
characteristics.
(Fouda, et
al., 2013)
Ginger
Extract
Bark and
the
rhizomes
of ginger.
Mixed type inhibitor,
but mainly inhibit
cathodic reaction.
(Al-Haj-Ali
et al., 2014)
Date Palm
Leaf and
seeds Extract
Leaves and
seeds Not investigated.
(Altwaiq et
al., 2011)
extracted
alkali lignin
Hard wood
Not tested by
electrochemical
method.

38
Date pits, also called pips, stones, kernels, or seeds form part of the integral
date fruit in the order of, depending on variety and quality grade, 6-12% of its total
weight in the Tamr stage. Figure 2.2 display different parts of palm date. They become
available in concentrated quantities when pitted dates are produced in packing plants
or in industrial date processing plants based on juice extraction. In the latter case they
may still be mixed with the exhausted press cake or they have been screened out in the
process. At the rural level one may find some accumulation of date pits when immature
dates are pitted before sun drying (e.g. on the coast of Libya) or countries where dates
are pitted and preserved as a paste (Agwa). For the rest, date pits follow the dispersed
ways of distribution routes of the whole fruit and have no importance as an individual
raw material.
Figure 2.2: Different parts of palm date
(Ghnimi et al., 2016)
Since palm date pit (PDP) didn’t get enough investigation in earlier mentioned
literatures, also the methods which were used for producing extracts from different
plants were done for short period of time and limited types and amount of solvents,
and overall testing corrosion inhibition of this extract didn’t go through the proper

39
procedures, different method of extraction was investigated in this work. Another
drawback of earlier researches is utilizing wet extract to examine corrosion inhibition
efficiency, which would mostly affect both properties of corrosive medium, as well as
would change the composition of acidic medium. Such approach will not be applicable
on industrial scale and would require further separation of extract from 𝐻𝐶𝑙 solution
in later stages.
Important achievement aimed in this research is to obtain dry extract which
would only deposit on the metal surface without affecting the chemical properties of
corrosive medium.
2.9 PDP composition
Adopted from number of references (Dowson et al., 1962; Gabrial et al., 1981;
El- Shurafa et al., 1982; Strohecker, 1951; Sawaya et al., 1984) a rough estimation for
the chemical composition of the date seed has been summarized in Table 2.3.
Table 2.3: Approximate composition of date pits
Component Weight %
Moisture 5-10
Protein (N x 6.25) 5-7
Oil 7-10
Crude fiber 10-20
Carbohydrates 55-65
Ash 1-2
There are privation of data on the amino acid pattern of date pit protein but as
a result of studies on two Saudi varieties (Sawaya et al., 1984) it appears that half of
the total amino acid consists of glutamic acid, aspartic acid and arginine while the least
amino acid is tryptophan followed by isoleucine, and lysine as a border case in

40
reference to the FAO/WHO reference pattern of essential amino acids (for human
consumption).
The faint yellowish-green oil extracted from date pits has a favorable odor (Abd-El-
Mageed et al., 1987). The average characteristics of this oil are shown in Table 2.4.
Table 2.4: Physical characteristics of oil extracted from date pits
Characteristics Measurement
Specific Weight (15.5 oC) 0.9207
Specific Weight (20 oC) 0.9174
Refracting Index (40 oC) 1.458
Refracting Index (25 oC) 1.4633
Iodine Value 50-55
Saponification Value 205-210
Two independent analyses (analysis 1 conducted by Dowson (1962); analysis
2 conducted by Sawaya et al. (1984) showed the presented composition of fatty acids
in Table 2.5.
Table 2.5: Composition (%) of fatty acids in oil extracted from date pits
Fatty Acids Analysis 1 Analysis 2
Oleic acid (bulk of the total fatty acids) 44.3 52.2
Lauric acid 17.4 24.2
Myristic acid 11.5 9.3
Palmitic acid 10.3 9.9
Linoleic acid 8.5 -
Stearic Acid minor amounts -
Capric Acid minor amounts -
Caprylic acid minor amounts -
In Table 2.3, the most abundant component is “carbohydrates”. Sugar
represents a small portion, in order of a few percentage points, of these carbohydrates,
while the remainder being of a more convoluted nature. Together with crude fiber

41
content this part can be further split up into cellulose, hemicellulose, lignin and ash as
shown in Table 2.6 introduced by Yousef et al. (1989).
Table 2.6: Date pit carbohydrates content (excluding sugars) - (% of dry weight)
Component Percentage of dry weight
NDF 75.0 (neutral detergent fibre, total cell wall content)
ADF 57.5 (acid detergent fibre, NDF less hemicellulose)
Hemicellulose
17.5 (NDF minus ADG; hemicellulose is a long-chain
carbohydrate composed of pentoses. It is readily hydrolyzed by
dilute acids into mainly xylose)
Lignin 11.0 (determined by potassium lignin procedure on ADF residue,
oxydixing the lignin)
Cellulose 42.5 (burning above residue)
Ash 4.0 (what remains upon burning)
* NDF: Neutral Detergent fiber, ADF: Acid detergent fiber
On the other hand, date pits contain a considerable number of mineral elements
such as K, then with a less amount P, Mg and Ca and a low Na content. Most important
micro elements that can be found are Fe, Mn, Zn and Cu (Sawaya et al., 1984; El-
Shurafa et al., 1982; Mossa et al., 1986).
The fundament of corrosion inhibition is based on the absorption and
desorption of water by an organic corrosion inhibitor on the surfaces of the metal. The
corrosion inhibition efficiency of the organic compound depends on the strength of
this compound to substitute the adsorbed water molecules on the metal surfaces
(Kassim, et al. 2010).
Electronic structure, steric factor, aromaticity, electron density at donor site of
the inhibitor, other functional group that would present in the molecule, molecular
structure, molecular area and molecular weight of the inhibitor molecule, all are factors
that will significantly influence the adsorption ability of the green inhibitor on the
metal surface (Chauhan, 2007; El-Etre, 2006).

42
2.10 Phenolic compounds
These compounds are an important group of natural antioxidant with possible
beneficial effects on human health (Meyers et al., 2003). They can participate in
preventing harmful action of reactive oxygen species, mainly oxygen free radicals.
They are also able to acquire antioxidant activity as a result of its stability to reduce
free radical stability via electron or hydrogen-donating (Lee et al., 1999) . Polyphenols
earn their antioxidants activity due to the properties of their hydroxyl groups and the
structural relationships between different parts of their chemical structure (Rice-Evan
et al., 1996; Basuny et al., 2012).
Many literatures have paid attention to phytocompounds and herbal-based
extracts that are related to new, eco-friendly material protecting products. Based on
their ability to consume oxygen, reactive oxygen species and inhibition of microbial
development, extracts with enough concentration of polyphenols seems to satisfy most
of the cases where a composite anti-corrosion/anti-biodeterioration product is
demanded, also having the grace of being less toxic compared to other vegetal extracts
(for example alkaloids extracts).
Extracts with high amounts of quercetin acquire a high anti-corrosion potential
due to the highest antioxidant/ scavenger activity at the lowest concentration in
respective environment.
Fagus sylvatica leaves whole ethanol extraction process was conducted and
generated compounds abundant in chlorogenic acid derivates aside only small
quantities of flavonoid (quercetin, apigenin, kaempferol and catechin) derivates, but
containing some saponins derivates (Romassi et al., 1987) resulted in the most proper
protecting conditions on carbon steel corrosion in acidic (H2SO4) solution model.

43
Antioxidant activity of 18 polyphenolic compounds were investigated by Pirvu
(2014) and results are shown in Figure 2.3 as reported.
Phenolics and flavonoids were strongly and positively related to the
antioxidant capacities, both radical scavenging and reducing powers. Interestingly,
catechin but not epicatechin, was positively correlated with reducing the radical
scavenging powers. The low concentration of epicatechin in PDP might be the reason
behind this reduction of radical scavenging powers when compared to its content in
other plant products.
The relationship between the content of polyphenolic compounds and anti-
oxidation ability of the PDPE were investigated in the same work. The results obtained
were consistent with the results of previously conducted experiments on PDP (Al-Farsi
et al. , 2008b; Al-Farsi et al. 2008a; Al-Farsi et al., 2007). Remarkably, polyphenols
content and the antioxidant activity were much higher, up to 10 times, in PDP
compared to date fruits, and in the same study it was compared to other popular dietary
antioxidant-rich food products like tea extract and some other by-products like grape
seeds (Prieto, et al., 1999; Guendez et al., 2005; Al-Farsi et al. 2008b).

44
Figure 2.3: Antioxidant activity (CL method) of eighteen (18) commonly vegetal
polyphenols
(Pirvu, 2014)
As per investigation done by Platat et al. (2014), Polyphenols content in 18
date seeds extracts (total phenols, total flavonoids, catechin and epicatechin) are listed
in Table 2.7, while Table 2.8 summarize total antioxidant capacity of 18 date seeds
extracts varieties.
97
96
93
90
89
87
85
83
83
83
77
64
60
52
52
46
39
32
0 20 40 60 80 100 120
(-)-epicatechin
(+)-catechin
quercetin
kaempferol
rosmarinic acid
chlorogenic acid
gallic acid
ferullic acid
caffeic acid
apigenin
rutin
syringic acid
gentisic acid
cinnamic acid
umbelliferone
protocatechuic acid
naringenin
naringin
AA%

45
Table 2.7: Nutritional characteristics of eighteen varieties of date seeds:
micronutrients content (mg/100g)
Means and sd are presented (Platat et al., 2014)
Date Type
Total
Phenolics (mg
GAE/100g)
Total Flavonoids
(mg RE/100g)
Catechin
(mg /100g)
Epicatechin
(mg /100g)
Mean Mean Mean Mean
All varieties 3411.81 13327.38 5.71 0.72
Khalas 2459.75 6213.33 0.76 1.16
Barhe 1864.82 7510.67 2.15 0.39
Lulu 2923.11 9065.33 3.96 0.56
Shikat
alkahlas 3129.16 10997.33 2.76 0.51
Sokkery 3637.45 18179.67 8.8 0.82
Bomaan 2957.95 1810.8 5.78 1.51
Sagay 3984.2 21673.33 7.83 0.98
Shishi 4087.9 15017.33 8.12 0.64
Maghool 2940.66 9537.33 8.96 0.8
Sultana 3986.63 14656 6.06 0.36
Fard 4426.72 16113.33 6.74 0.49
Maktoomi 3849.92 9261.33 4.4 0.47
Naptit Saif 3422.71 12260 7.86 0.9
Jabri 3860.35 16049.33 7.77 1.05
Khodary 4768.87 18157.33 7.69 1.15
Dabbas 2848.16 5994.67 2.66 0.19
Raziz 2866.56 18186.67 5.04 0.31
Shabebe 3397.66 12912 6.49 0.62

46
Table 2.8: Antioxidant capacities of eighteen varieties of date seeds
(Platat et al., 2014)
Date type Total Antioxidant capacity (OD, nm) Mean
All varieties 0.04
Khalas 0.02
Barhe 0.01
Lulu 0.03
Shikat alkahlas 0.03
Sokkery 0.03
Bomaan 0.05
Sagay 0.05
Shishi 0.04
Maghool 0.03
Sultana 0.1
Fard 0.05
Maktoomi 0.04
Naptit Saif 0.04
Jabri 0.05
Khodary 0.05
Dabbas 0.03
Raziz 0.07
Shabebe 0.04
2.11 Solvent for de-fatting (non-polar extraction)
To obtain the highest possible fatty acids yield from PDP by solvent extraction
process, three main factors were investigated and proved to be significantly
influencing the process. These outcomes have been acquired from an experimental
work reported by Ali et al., (2015). In the first case, the effect of different solvents in
Table 2.9 was investigated while keeping the other two factors fixed; particle size (2
mm) and extraction time (4 h). In the second case, the particles size was changed
(0.425, 1 and 2 mm) for the same type of solvent and extraction period. In the third
case, extraction time was changed in each test 1, 2, 4 and 6 h (10 – 12 cycles/h) for the
same type of solvent and particle size. In this study 50 g of grinded pits were weighed

47
and transferred to a 30 mm × 200 mm cellulose thimble. It placed in the extraction
chamber of a 250 mL Soxhlet apparatus fitted with a condenser, which was placed on
a 500-mL distillation flask containing 250 mL of n-hexane solvent. Solvent was then
removed by using a heated rotary evaporator, under vacuum conditions. All extraction
processes were performed in triplicate, and the mean values were reported. In each
case of this study, effect was estimated by calculating the yield of oil extracts as a
percentage of the weight of extracts obtained from each extraction process relative to
the weight of date pits used (50 g) which is shown in equation [9].
Yield of oil extraction = weight of oil extracted
weight of date seeds used∗ 100% [9]
Table 2.9: Physical properties of various solvents applicable for de-fatting process
Solvents Boiling Point (oC) Density (kg/L) Relative Polarity
Chloroform 61 1.498 0.259
n-Hexane 69 0.655 0.09
2-Propanol 82 0.785 0.546
Toluene 111 0.867 0.099
By observing results obtained by Ali et al., (2015) which is displayed in Figure
2.4, oil yields from PDP varied significantly when various extraction solvents were
applied. In general, oil yields from PDP were better with non-polar solvents as
compared to those obtained with polar solvents. The highest yield was obtained by
Toluene which has the highest boiling point compared to other solvents and produce
higher amount of aromatic components compared to n-Hexane (Ali et al., 2015), so it
needs more heat to form vapor in any distillation recovery process compared to other
solvents. The high boiling point of toluene is the main reason for its high yield as
compared to n-hexane. The explanation of this phenomenon can be due to the contact
time between seed and solvent which is long, where the major amount of mass transfer

48
of oil from the seeds to solvent occurs when the accumulated solvent moves up purely
due to the hydrostatic pressure head (Dutta et al., 2014). Chloroform is not appropriate
solvent, because of the high concentration of aromatic components that was observed
in FTIR test and the low oil yield. Methanol and 2-propanol are not very suitable for
the recovery of oil probably because of its polar character. As a result of that research,
n-hexane (P = 0.09) was used as a solvent since it is less costly, and its yield is
comparable with that of the toluene. Also it was found that the varieties presenting the
highest antioxidant capacity are also those with the lowest amount of fat (Platat et al.,
2014).
Figure 2.4: Effect of solvent type on oil yield
(Ali et al., 2015)
2.12 Solvents for polar extraction
In order to select the best solvent that would maximize the yield of extraction
process, number of extraction processes were carried out by Ali et al., (2015) using
Soxhlet apparatus for pre-specified period of time (4 h) with the use of four different
0
1
2
3
4
5
6
7
Methanol 2-Propanol Chloroform n-Hexan Toluen
Oil
Yie
ld %
Solvent

49
solvents, Water: methanol: acetone: formic acid, that were applied on a predetermined
weight of palm date pits (50 g) and a grinded pits particle size of (2 mm). In each
individual test, extraction was executed at the boiling point of each solvent. The
physical properties of the solvents used are displayed in Table 2.10.
Table 2.10: Physical properties of various solvents applicable for polar extraction
Solvents Boiling Point (oC) Density (Kg/L) Relative Polarity
Acetone 56 0.791 0.355
Ethanol 78 0.816 0.654
Methanol 64.7 0.791 0.762
Water 100 1.000 1
Formic Acid 100.8 1.22 6.0
Extraction process by Basuny et al., (2012) concluded that the extent of total
polyphenolic compounds extraction is significantly affected by the extraction
temperature and type of solvent being used. In the same study, it has been revealed
that the type of solvent used would play an important role in extracting different types
of polyphenols. This can be explained as the solubility of polyphenolic compounds
depends on the relative polarity of solvent. Previous re-searchers supporting that
prospective (Cheung et al., 2003; Al-Rawahi et al., 2013) also reported that increasing
polarity of the solvent would result in a higher extraction yield of polyphenols and
different types of polyphenols present in the date-pits could exhibit different polarities,
thus affected the polyphenols in the extracts.
During these studies analytical measurements were carried out using classic
methods (Ancuceanu et al., 2017). Folin reagent method was used to measure total
phenols content and the results were expressed as gallic acid equivalents; and AlCl3
method in base (sodium acetate) medium was applied to measure total flavones content
and the results were expressed as quercetin*, respectively, rutin equivalents.

50
On testing all extracts, antioxidant activities ranged from the 9.77 mmol of
Fe++/100 g dry plant in pits of Khalas variety (methanol) to 38.00 mmol of Fe++/100 g
formic acid. Also, phenolic content ranged from the equivalent 900 μg Gallic acid /g
dry plant in pits (methanol) to 2015 μg Gallic acid /g dry plant in pits (formic acid).
Significant differences (P ≥ 0.05) were obtained among different solvents used, with
some exception. The highest antioxidant activity and total phenolic content were
obtained by extraction by the formic acid, whereas methanol resulted in the lowest
values. This result also supports the relation between phenolic compounds and
antioxidant activity of the extract.
The results of a previous study (Basuny et al., 2012) showed that the date pits
extract (Water: methanol: acetone: formic acid) had significantly the highest levels of
total polyphenols and antioxidant activity. These results can be observed in Figures
2.5 and 2.6 as reported by Basuny et al., (2012).
Figure 2.5: Antioxidant activity of Khalas variety of date pits using 4 different
solvents (as mmol Fe++/100 g)
(Basuny et al., 2012)
01020304050
Water Methanol:water
(50:50)
Methanol Water:
methanol:
acetone: formic
(20: 40: 40: 0.1)
An
tioxid
an
t act
ivit
y
Solvents

51
Figure 2.6: Total phenolic contents of Khalas variety of date pits using 4 different
solvents (as μg Gallic acid / g)
(Basuny et al., 2012)
2.13 Particle size effect on extraction process
According to a previous experimental work that was done on PDP to
investigate the maximum possible rate of extraction based on particle size, (Ali et al.,
2015) has presented the chart shown in Figure 2.7, where the decrease in particle size
resulted in an increase of extraction yield. This is expected because of an increase in
solvent-PDP contact surface area and as a result boosting mass transfer rate. In a
separate investigation on diffusion time of solvent into PDP particles, it was found that
the time needed for the solvent to diffuse inside the small particle is lower than large
particle (Kasim, 2012).
0500
1000150020002500
Water Methanol:water
(50:50)
Methanol Water:
methanol:
acetone: formic
(20: 40: 40: 0.1)
Tota
l p
hen
ol
(pp
m)
Solvents

52
Figure 2.7: The effect of particle size on oil yield at 120 min
(Ali et al., 2015)
2.14 Extraction time effect on oil yield
With reference to analysis results of a previous investigation done by Sulaiman
et al., (2013), which are displayed in Figure 2.8. His investigation was conducted for
coconut waste oil extraction. Obtained results illustrate the combined effect of the
extraction time and particle size on oil yield. By observing the curve slope in each
case, the rate of extraction was at the maximum when the process initiated because of
diffusion phenomena that resulted from high driving force for the mass transfer. Later
the rate is minimized when steady state was reached, where the rate is not increasing
although prolonged extraction period. The optimum extraction time was claimed in
that investigation to be about 2 h for all particle sizes. Just like PDP extraction in this
investigation, the driving force is the difference in concentrations of extract between
the liquid phase (solvent) and the solid phase (PDP).
0
1
2
3
4
5
6
7
8
9
0.425 1 2
Oil
Yie
ld %
Particle size (mm)

53
Figure 2.8: The oil yield vs. time for different particle size
(Sulaiman et al., 2013)
0
1
2
3
4
5
6
7
8
9
10
0 100 200 300 400
Oil
Yie
ld %
Time (min.)
0.425 mm 1 mm 2 mm

54
3.Chapter 3: Materials and Research Methods
3.1 Materials
This section is intended to introduce all materials and equipment which were
used in this research along with all related experimental work.
3.1.1 Khalas palm date pits
Khalas date fruits were gathered from palm trees of Madinat Zayed farms
located in Abu Dhabi city, during spring season of 2016. After the collection, seeds
were removed from the date flesh manually and then washed to remove the peels and
dried under the sun to remove maximum possible moisture. Finally, dry seeds were
grinded using mechanical grinder model.
3.1.2 Solvent for de-fatting (non-polar extraction)
Based on experimental work results reported by Ali et al., (2015), n-hexane
was used in this investigation to remove maximum possible fats from the PDP. The n-
hexane used was analytical reagent grade which was produced by QualiKems with the
following specifications displayed in Table 3.1.
Table 3.1: Specifications of n-hexane used for de-fatting process
Parameter UOM Measurement
Molecular weight g/mol 86.18
Density g/ml 0.655
Boiling range (95%) oC 65 - 70
Maximum limit of impurities
Non-volatile matter w/v % 0.001 %
Water w/v % 0.015 %
Acidity N/100 ml 0.002 %
Sulphur compounds w/v % 0.0003%
Bromine number - Max. 3.0
Copper (𝑪𝒖) w/v % 0.0001 %
Lead (𝑷𝒃) w/v % 0.0001 %
Iron (𝑭𝒆) w/v % 0.0001 %
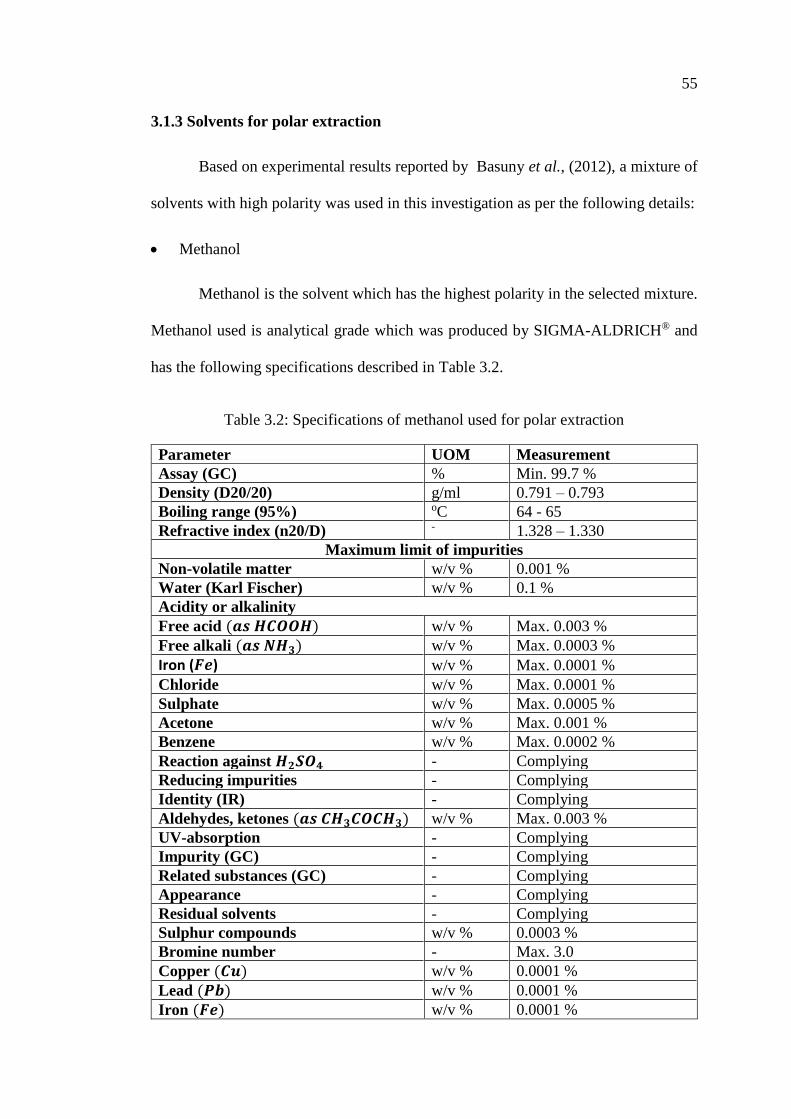
55
3.1.3 Solvents for polar extraction
Based on experimental results reported by Basuny et al., (2012), a mixture of
solvents with high polarity was used in this investigation as per the following details:
• Methanol
Methanol is the solvent which has the highest polarity in the selected mixture.
Methanol used is analytical grade which was produced by SIGMA-ALDRICH® and
has the following specifications described in Table 3.2.
Table 3.2: Specifications of methanol used for polar extraction
Parameter UOM Measurement
Assay (GC) % Min. 99.7 %
Density (D20/20) g/ml 0.791 – 0.793
Boiling range (95%) oC 64 - 65
Refractive index (n20/D) - 1.328 – 1.330
Maximum limit of impurities
Non-volatile matter w/v % 0.001 %
Water (Karl Fischer) w/v % 0.1 %
Acidity or alkalinity
Free acid (𝒂𝒔 𝑯𝑪𝑶𝑶𝑯) w/v % Max. 0.003 %
Free alkali (𝒂𝒔 𝑵𝑯𝟑) w/v % Max. 0.0003 %
Iron (𝑭𝒆) w/v % Max. 0.0001 %
Chloride w/v % Max. 0.0001 %
Sulphate w/v % Max. 0.0005 %
Acetone w/v % Max. 0.001 %
Benzene w/v % Max. 0.0002 %
Reaction against 𝑯𝟐𝑺𝑶𝟒 - Complying
Reducing impurities - Complying
Identity (IR) - Complying
Aldehydes, ketones (𝒂𝒔 𝑪𝑯𝟑𝑪𝑶𝑪𝑯𝟑) w/v % Max. 0.003 %
UV-absorption - Complying
Impurity (GC) - Complying
Related substances (GC) - Complying
Appearance - Complying
Residual solvents - Complying
Sulphur compounds w/v % 0.0003 %
Bromine number - Max. 3.0
Copper (𝑪𝒖) w/v % 0.0001 %
Lead (𝑷𝒃) w/v % 0.0001 %
Iron (𝑭𝒆) w/v % 0.0001 %

56
• Acetone
An important constituent in the solvent mixture is acetone, which represented
40% of the mixture volume. Analytical reagent grade of acetone which was produced
by CHEM-LAB was used IN THIS investigation with the following specifications in
Table 3.3.
Table 3.3: Specifications of acetone used for polar extraction
Parameter UOM Measurement
Assay v/v % 99.5 %
Molecular weight g/mole 58.08
Density g/ml 0.787-0.793
Colour APHA 10
Boiling range (95%) oC 56
Maximum limit of impurities
Copper (𝑪𝒖) w/v % < 0.000001 %
Cobalt (𝑪𝒐) w/v % < 0.000005 %
Manganese (𝑴𝒏) w/v % < 0.000001 %
Magnesium (𝑴𝒈) w/v % < 0.000001 %
Ethanol (𝑪𝟐𝑯𝟓𝑶𝑯) w/v % < 0.01 %
Methanol (𝑪𝑯𝟑𝑶𝑯) w/v % 0.01 %
Formaldehyde w/v % 0.0002 %
Water (𝑯𝟐𝑶) w/v % < 0.2 %
2-Propanol w/v % < 0.05 %
Lead (𝑷𝒃) w/v % < 0.000001 %
Nickel 𝑵𝒊 w/v % < 0.000005 %
Iron (𝑭𝒆) w/v % < 0.000001 %
Zinc(𝒁𝒏) w/v % < 0.000001 %
Acidity or alkalinity
Free acid w/v % < 0.002 %
Free alkali w/v % < 0.001 %
• Distilled water
As a strong polar solvent, distilled water represented 20% of the polar
extraction solvent mixture volume. Distilled water used complies with type I reagent
water in ASTM D1193-06(2018), which was produced by Fine Care company with
the following specifications summarized in Table 3.4.

57
Table 3.4: Specifications of distilled water used for polar extraction
Parameter UOM Measurement
pH 𝐻+ 6.3 – 6.7
Ingredient Type I Hipure water (ASTDM)
Conductivity Us/cm < 1.0
T.D.S. ppm <0.5
Total Hardness Ppm as 𝐶𝑎𝐶𝑂3 <0.01
Chloride ppm as 𝐶𝑙3 <0.002
Iron ppm as 𝐹𝑒 <0.02
Copper ppm as 𝐶𝑢 <0.03
Nickel ppm as 𝑁𝑖 <0.03
Oxygen ppm as 𝐶𝑢 <0.03
Silica ppm as 𝑂2 <0.03
Microbial Count c.f.u. <1
• Formic acid
Only 0.1% of formic acid was used in this process, as it was observed that a
slight increase in the acid amount increase the color extracted from the PDP with
minimum number of extraction cycles. The formic acid used in this investigation has
85% volume concentration and is analytical reagent grade produced by Qualikems
Fine Chemicals Pvt. Ltd. with the following specifications provided in Table 3.5.
Table 3.5: Specifications of formic acid used for polar extraction
Parameter UOM Measurement
Assay v/v% Min. 85.0%
Density g/ml 1.193 – 1.198
Boiling range oC 100.8
Molecular weight g/mole 46.03
Maximum limit of impurities
Non-volatile matter w/v% 0.005%
Iron (𝑭𝒆) % 0.0003%
Chloride (𝑪𝒍) w/v% 0.005%
Sulphate w/v% 0.005%
Acetate (𝑪𝑯𝟑𝑪𝑶𝑶) w/v% 0.3%

58
• Hexamethylenetetramine (𝐶6𝐻12𝑁4)
Hexamethylenetetramine was used in this experimental work in small
quantities for cleaning corrosion deposits on the metal surface. Chemical is analytical
reagent grade and was produced by Sigma-Aldrich. Table 3.6 summarizes
specifications of the product.
Table 3.6: Specifications of Hexamethylenetetramine used for coupon cleaning
Parameter UOM Measurement
Appearance (Color) - White
Appearance (Form) - Powder
Molecular weight g/mol 140.19
Infrared spectrum - Conforms to Structure
Infrared spectrum
Titration with (𝑵𝒂𝑶𝑯) w/w % ≥ 99.0 %
Dried basis analysis
Loss on drying w/w % ≤ 2.0 %
Residue on ignition (Ash) w/w % ≤ 0.1 %
Heavy metals (as Lead) w/w % ≤ 0.001 %
3.1.4 Hydrochloric acid
Efficiency of green inhibitor has been investigated in acidic medium of 2M
𝐻𝐶𝑙. 𝐻𝐶𝑙 (37% w/w) used in this investigation is analytical reagent grade which was
produced by Loba Chemie company. 500 ml acidic medium was prepared by adding
83.5 ml 𝐻𝐶𝑙 (37% w/w) to distilled water based on specifications shown in Table 3.7,
and as described in equations [10] and [11].

59
Table 3.7: Specifications of hydrochloric acid
Parameter UOM Measurement
Assay w/w % 37 %
Density g/ml 1.19
Boiling range oC 100.8
Molecular weight g/mole 36.5
Maximum limit of impurities
Non-volatile matter w/v % 0.01 %
Iron (𝑭𝒆) w/v % 0.001 %
Free chloride (𝑪𝒍−) w/v % 0.0005 %
Sulphuric acid (𝑯𝟐𝑺𝑶𝟒 w/v % 0.02 %
Lead 𝑷𝒃 w/v % 0.0005 %
∵ 𝐷𝑒𝑛𝑠𝑖𝑡𝑦 (𝜌) 𝑜𝑓 37% w/w 𝐻𝐶𝑙 = 1.19 kg/L
∵ 𝑤 𝑣⁄ 𝐻𝐶𝑙 = % 𝑤 𝑤⁄ 𝐻𝐶𝑙 ∗ ρ [10]
∴ 𝑤 𝑣⁄ 𝐻𝐶𝑙 = 0.37 ∗ 1.19 kg 𝐿⁄ = 0.44 𝑘𝑔 𝐿⁄
∵ 𝑚𝑜𝑙 𝑣⁄ = 𝑤 𝑣⁄ ∗ 𝑀𝑜𝑙𝑒𝑐𝑢𝑙𝑎𝑟 𝑤𝑒𝑖𝑔ℎ𝑡 (M. wt. ) [11]
∵ 𝑀𝑜𝑙𝑒𝑐𝑢𝑙𝑎𝑟 𝑤𝑒𝑖𝑔ℎ𝑡 (𝑀. 𝑤𝑡) 𝑜𝑓 37% w/w 𝐻𝐶𝑙 = 36.5 kg/L
∴ 𝑚𝑜𝑙 𝑣⁄ = 0.44 ∗ 36.5 = 12 𝑚𝑜𝑙 𝐿⁄ = 12 𝑀 = 12 𝑀𝑜𝑙𝑎𝑟𝑖𝑡𝑦
Hence, to prepare 2M 𝐻𝐶𝑙 solution, we require adding 2 mol/12M = 0.167 ml / L of
solution.
As a result, 500 ml solution will require only 83.3 ml of 37% w/w 𝐻𝐶𝑙
3.1.5 Sea water
Investigation was done to measure green inhibitor efficiency on carbon steel in
sea water solution as another corrosive medium. Sea water was collected from Abu
Dhabi city at the shore side of the Arabian Gulf in October 2018. Referred in this
investigation to analysis results of 20 samples which was reported by Environment
Agency of Abu Dhabi in 2016, and the official report was published by Abu Dhabi
statistics center in October 2017. Table 3.8 summarizes the results.

60
Table 3.8: Chemical measurements of Abu Dhabi marine water quality
Parameter UOM Measurement
Acidity pH 8.1
Salinity psu 45.0
Temperature oC 100.8
Dissolved Oxygen (DO) mg/l 4.9
Biological Oxygen Demand (Adejo,
Ekwenchib et al.) mg/l 2.9
Chlorophyll µg/l 0.7 – 3.5
Phosphate (𝑷𝑶𝟒) µg/l Average 141
Silicate (𝑺𝒊𝑶𝟒) µg/l Average 535
Nitrate (𝑵𝑶𝟑) µg/l 419
3.1.6 Commercial corrosion inhibitor
In this experimental work, liquid phase inhibitor was used under ambient
conditions to measure its efficiency for inhibiting or reducing corrosion rate. Inhibitor
was produced by General Electric process and water technologies and is a passivation
type consisting mainly of sodium nitrite (≥ 25% wt) in aqueous solution. Usually, this
type of chemicals is applicable to cooling water closed systems, where exposure to
oxidizing agent, such as 𝐻𝐶𝑙 would produce nitrates which is not effective in forming
metal oxide protective layer on metal surface. After examining the inhibitor, it was
found that it is not suitable for highly acidic mediums like 2M 𝐻𝐶𝑙 which was the
corrosive medium in this study. Hence, observed effect of the inhibitor can be
concluded because of higher pH value of 8.4 which would act to neutralize the pH of
acidic corrosive medium. Accordingly, as the commercial inhibitor concentration
increases the corrosion rate should decrease slightly because of pH neutralizing effect
apart from passivation act as the purpose of utilizing such chemical compound. Table
3.9 displays physical properties of the commercial inhibitor.

61
Table 3.9: Physical and chemical properties of commercial corrosion inhibitor
Parameter UOM Measurement
Color - Yellow
Physical state - Liquid
pH (concentrated product) - 8.4
Melting/freezing point oC < -20
Boiling point oC 104
Flash point oC > 100
Vapor pressure mmHg 18
Toxicity and Ecological information
Corrshield NT4292 LC50 Daphnia magna: 470 mg/l 96 hour
LC50 Fathead minnow: 930 mg/l 96 hour
Sodium Nitrite
EC50 Greasyback shrimp (Metapenaeus ensis): 16.14
– 26.61 mg/l48 hours
LC50 Channel catfish (Ictalurus punctatus): 0,048
mg/l 96 hoursSodium nitrite (7632-00-0)LC50 Fish:
0.56 – 1.78 mg/l 96 hour
COD (inorganic, has no TOC, BOD). mgO2/g 92
Classified as very toxic to aquatic organisms
Chlorophyll µg/l 0.7 – 3.5
3.1.7 Test sheets
Carbon steel strips, which are shown in Figure 3.1 were acquired by cutting a
carbon steel sheet into (45 mm x 15 mm x 2 mm) dimensions through using a laser
cutting machine, to eliminate dimensions variation between different metal strips.
Figure 3.1: Carbon steel specimens grade S355JR

62
Chemical analysis of tested metal was done by OES method EX-M-OP-CH-
AUH-MD101 and Table 3.10 shows the composition obtained where carbon steel
meets the requirements of BS EN 10025-2: 2004(E) grade S355JR.
Table 3.10: Chemical composition of carbon steel coupons
Element Amount (%)
Carbon (𝑪) 0.16
Silica (𝑺𝒊) 0.21
Manganese (𝑴𝒏) 1.52
Phosphorous (𝑷) 0.014
Sulphur (𝑺) 0.004
Chrome (𝑪𝒓) 0.05
Nickel (𝑵𝒊) 0.03
Molybdenum (𝑴𝒐) < 0.01
Cobber (𝑪𝒖) 0.01
Vanadium (𝑽) 0.01
Aluminum (𝑨𝒍) 0.014
3.2 Equipment and apparatuses
3.2.1 Screening mesh
The optimum size of 0.425 mm grinded palm date seed was screened by using
8-inch SS sieve trays of sizes 0.25 mm and 0.425 mm, respectively, to obtain the
highest extract yield in that range.
3.2.2 Extraction
For limited scale solvent extraction process, Soxhlet is the most common
applicable apparatus in this field. In this apparatus ingredients of palm date pits can be
extracted. Soxhlet apparatus consists of three parts as shown in Figure 3.2; the most
significant part is a glass extractor, fitted in between a round bottom distillation flask
at the bottom and a bulb condenser at the top. Soxhlet apparatus was selected in this
experiment to avoid over heating of PDP and minimize solvent amount.

63
Figure 3.2: Conventional Soxhlet extractor
3.2.3 Rotary evaporator (RE)
RE is used to evaporate solvents from extract at lower temperatures than
atmospheric boiling points by implementing vacuum pressure. Heating is done through
a water bath and rotating flask. DAIHAN digital rotary evaporator model WEV-1001V
was used to evaporate solvent from extract as described. Figure 3.3 displays the rotary
evaporator utilized in this process.

64
Figure 3.3: Rotary evaporator arrangement
3.2.4 Drying oven
After purifying extract in the rotary evaporator, solid and liquid extracts were
taken out and dried at temperature of 80 oC under vacuum for 30 minutes to remove
traces of solvent. Drying solid extract was necessary to assure evaporating all the
solvent content, and help avoiding any effect of solvent on corrosion rate by
prohibiting any dilution of corrosion medium. The same oven was utilized to dry
metallic corrosion coupons at 110 oC for 30 minutes before letting them to cool down
and being scaled. Figure 3.4 shows ThemoStable™ SOV oven utilized in this process.
Condenser
Condensate
flask
Rotating flask
(Solvents + Extract)
Water bath
Temperature
control/Display
Rotation
control/Display
Rotation
motor
Riser/
Holder
Vacuum
valve

65
Figure 3.4: Vacuum drying oven
3.2.5 Fourier-transform infrared spectrophotometer (FTIR)
Chemical composition of solid extract from PDP was investigated by FTIR
analysis. FTIR spectrophotometer used in this investigation was manufactured by
Thermo Nicolet (Nexus model 470/670/870). FTIR analysis results were used to
recognize the functional groups in each step from raw date pits throughout extracted
date pits. Analysis was also conducted on dry extract produced from the date pits. Such
separate analysis on each of the samples was important to characterize extracted
components at each stage of chemical extraction. Figure 3.5 displays FTIR
arrangement used in this research.
Figure 3.5: Fourier-transform infrared spectroscopy (FTIR)
Temperature
control/Display
Vacuum port
Oven
Pressure/
vacuum
gauge

66
3.2.6 Rotary grinding machine
BUEHLER-MET Bilicon Carbide grinding papers, which are listed in Table
3.11, were utilized with rotary grinding machine made by Metallurgical Services/
model 02145A, shown in Figure 3.6, was employed in this experiment.
Figure 3.6: Model 02145A grinding Machine.
3.2.7 Emery papers
Silicon carbide emery papers were used in the grinding machine to polish the
metal surface and reduce roughness. The emery papers were produced by BUEHLER-
MET® II. Seven different emery papers ranging from grade 80 to 1200 were used in
this preparation work, as shown in Table 3.11.

67
Table 3.11: Sequence of emery paper ratings
Sr.
No.
Emery Paper
Rating Photograph
Sr.
No.
Emery Paper
Rating Photograph
1
Bilicon Carbide
grinding paper
No 80. 2
Bilicon Carbide
grinding paper
No 120.
3
Bilicon Carbide
grinding paper
No 180. 4
Bilicon Carbide
grinding paper
No 240.
5
Bilicon Carbide
grinding paper
No 400. 6
Bilicon Carbide
grinding paper
No 800.
7
Bilicon Carbide
grinding paper
No 1200
3.2.8 Analytical weighing balance
In this type of analysis OHAUS analytical weighing balance was used to
measure the initial and final weight of each corrosion coupon and all other scaling
measurements. Specifications of the weighing balance are summarized in Table 3.12.
All coupons preparation and measurements were done according to ASTM G1 –
03(2017) e1 with minor modifications to suit the purpose of this research.
Table 3.12: Analytical balance specifications
Description UOM Measurement
Model - PA224
Resolution gm 0.0001
Range gm 0.0000 – 220
Min. weight mg 20
3.2.9 pH meter
WalkLab (TI-9000) pH meter was used in this research to measure pH value
of corrosive medium before and after adding inhibitor. The meter was selected with ±
0.01 measurement resolution for higher accuracy and temperature compensation in the
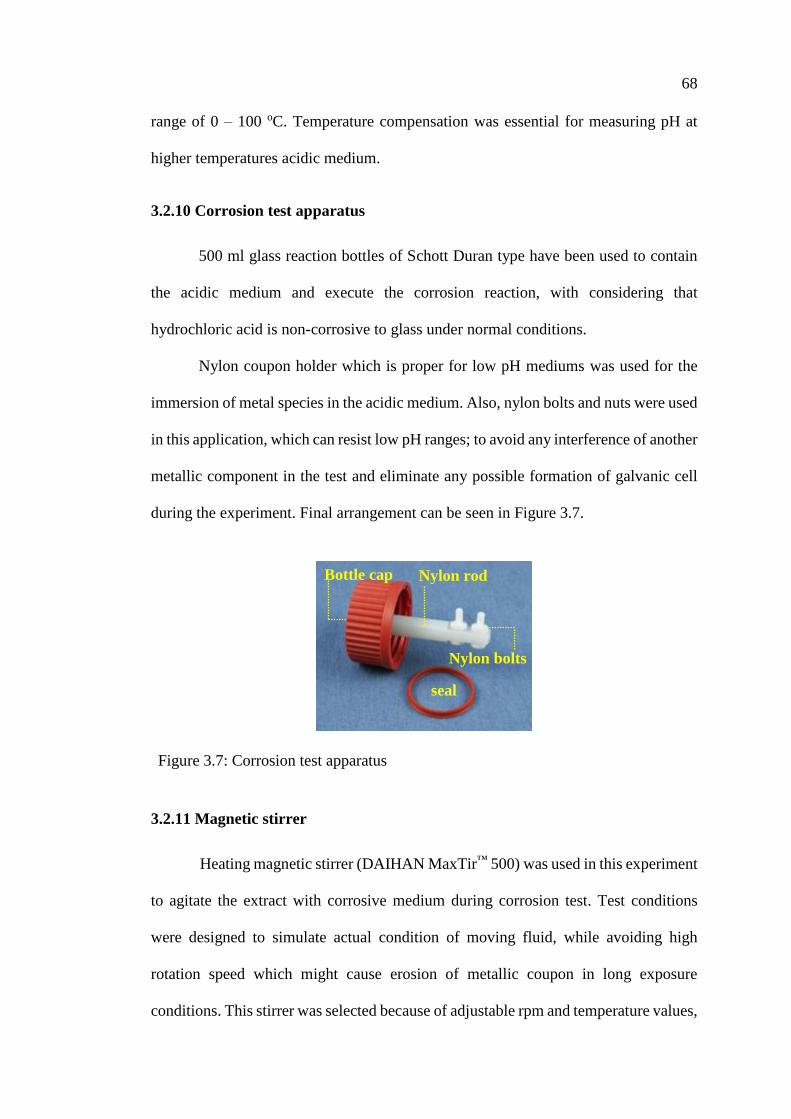
68
range of 0 – 100 oC. Temperature compensation was essential for measuring pH at
higher temperatures acidic medium.
3.2.10 Corrosion test apparatus
500 ml glass reaction bottles of Schott Duran type have been used to contain
the acidic medium and execute the corrosion reaction, with considering that
hydrochloric acid is non-corrosive to glass under normal conditions.
Nylon coupon holder which is proper for low pH mediums was used for the
immersion of metal species in the acidic medium. Also, nylon bolts and nuts were used
in this application, which can resist low pH ranges; to avoid any interference of another
metallic component in the test and eliminate any possible formation of galvanic cell
during the experiment. Final arrangement can be seen in Figure 3.7.
Figure 3.7: Corrosion test apparatus
3.2.11 Magnetic stirrer
Heating magnetic stirrer (DAIHAN MaxTir™ 500) was used in this experiment
to agitate the extract with corrosive medium during corrosion test. Test conditions
were designed to simulate actual condition of moving fluid, while avoiding high
rotation speed which might cause erosion of metallic coupon in long exposure
conditions. This stirrer was selected because of adjustable rpm and temperature values,
Nylon rod
Nylon bolts
seal
Bottle cap

69
which are intended to be identical for all tests within the same group in order to obtain
more accurate comparison between results.
3.2.12 Scanning electron microscopy (SEM)
SEM (NeoScope JCM-5000) was used to analyze the surface morphology of
steel specimens, which have undergone the weight loss analysis, and is shown in
Figure 3.8. This SEM was selected based on its capability to achieve magnification
value ranged from 10X – 20,000X.
Figure 3.8: Scanning electron microscopy (SEM)
3.3 Methodology
3.3.1 Screening and particle size
Final grinded PDP particles of a size range between 0.25 mm and 0.425 mm
has been obtained as shown in Figure 3.9 with reference to literature reviewed (Ali et
al., 2015).
Microscope Display

70
Figure 3.9: PDP particles obtained in the range of 0.25 to 0.425 mm
3.3.2 Defatting process (non-polar extraction)
Inside the glass extractor of Soxhlet apparatus, 50 grams of grinded solid
particles of date pits were placed 30 mm × 200 mm thimble holder made of cellulose.
500 ml of n-hexane is poured into round-bottom distillation flask and is heated up by
electro-thermal heating mantle to a temperature above 70 C°. When the solvent’s
temperature reaches bubble point, vapor is evolved and transfers up to the condenser,
where it starts to condense and flow down to collect in the extractor part. In this
section, the solvent encounters the grinded pits and initiate a mass transfer of
ingredients into solvent through being leached out of the pits. Because of increasing
hydrostatic pressure head, solvent start to move upward through the bed where
maximum mass transfer rate occurs. Amount of extraction yield is a function of the
type of solvent being used, surface area offered by the bed and the pits-solvent contact
time. In this experiment 50 gm of PDP with particle’s size between 0.25 mm and 0.425
mm were used. Each cycle consumed average of 4-5 minutes and average of 100 cycles
were completed in 7 hours and 30 minutes to ensure removal of maximum fats from
PDP compared to only 2 hours done earlier by Ali et al., 2015). Figure 3.10.a shows
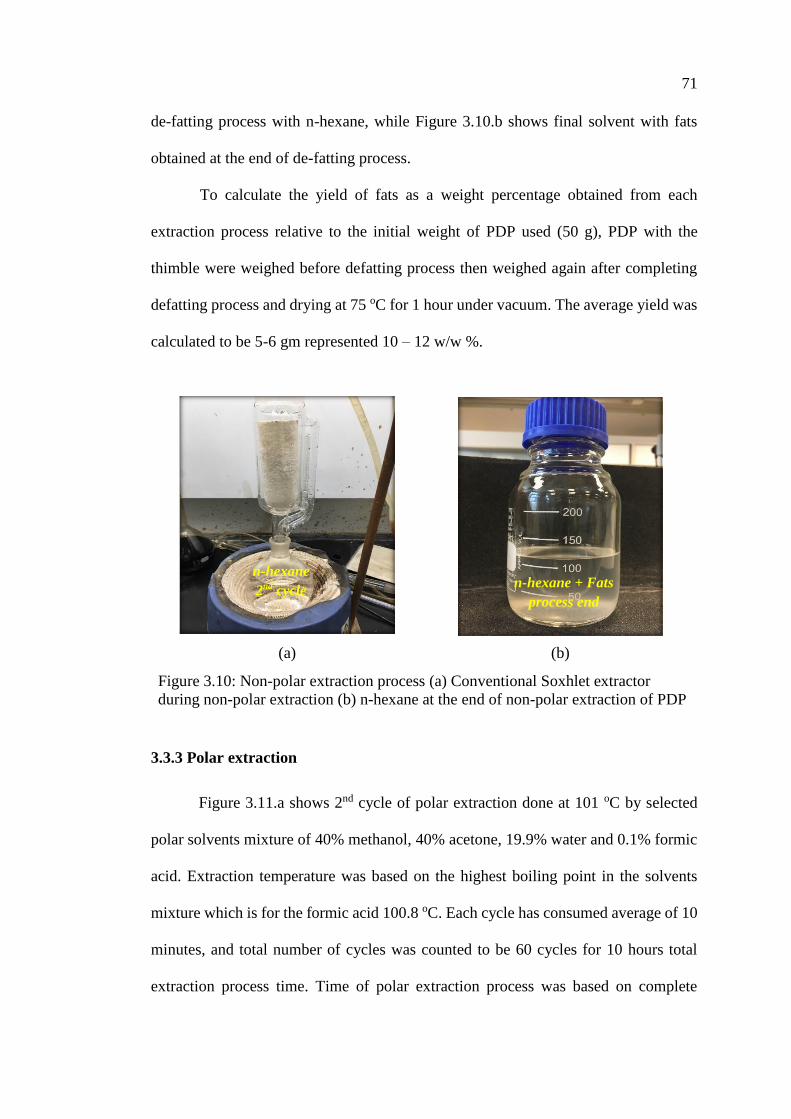
71
de-fatting process with n-hexane, while Figure 3.10.b shows final solvent with fats
obtained at the end of de-fatting process.
To calculate the yield of fats as a weight percentage obtained from each
extraction process relative to the initial weight of PDP used (50 g), PDP with the
thimble were weighed before defatting process then weighed again after completing
defatting process and drying at 75 oC for 1 hour under vacuum. The average yield was
calculated to be 5-6 gm represented 10 – 12 w/w %.
(a) (b)
Figure 3.10: Non-polar extraction process (a) Conventional Soxhlet extractor
during non-polar extraction (b) n-hexane at the end of non-polar extraction of PDP
3.3.3 Polar extraction
Figure 3.11.a shows 2nd cycle of polar extraction done at 101 oC by selected
polar solvents mixture of 40% methanol, 40% acetone, 19.9% water and 0.1% formic
acid. Extraction temperature was based on the highest boiling point in the solvents
mixture which is for the formic acid 100.8 oC. Each cycle has consumed average of 10
minutes, and total number of cycles was counted to be 60 cycles for 10 hours total
extraction process time. Time of polar extraction process was based on complete
n-hexane + Fats
process end
n-hexane
2nd cycle

72
extraction of the PDP, which was indicated by obtaining colorless liquid in the
Soxhlet’s extraction section at the end of the process compared to solvent’s color
shown in Figure 3.10.a. Figure 3.11.b shows the final solvent mixture with extract
obtained at the end of polar extraction process.
(a) (b)
Figure 3.11: Polar extraction process (a) Conventional Soxhlet during polar
extraction (b) Extract and solvent mixture at the end of polar extraction
To calculate the yield of extract as a weight percentage obtained from each
extraction process relative to de-fatted PDP, final PDP waste (PDPW) was dried at
85 oC under vacuum for 1 hour then weighted and compared to de-fatted PDP
measured earlier. Figure 3.12 shows the PDPW during drying and explain the
difference between the wet and dry waste. Final weight difference of 15 – 19 grams
between PDPW and defatted PDP was measured, which indicates average of 34 w/w
% extract out of the total initial weight of original PDP.
Solvents + Extract
process end
Solvents mixture
2nd cycle

73
Figure 3.12: Palm date pit waste at the end of extraction process
3.3.4 Extract purification
As indicated in Table 3.2, the highest boiling point is for formic acid at
100.8 oC. Hence, by using RE it was possible to evaporate solvent mixture under
vacuum at temperature below 90 oC to avoid any change in the extract composition
which might result from temperatures higher than 90 – 100 oC. A rotating speeds of
150 to 160 units were used to assist recovering evaporated solvent mixture which was
collected in another flask connected with RE, shown in Figure 3.13, which displays
the different stages of extract purification.
3.3.4.1 Liquid form extract
At this point of process, two forms of extract were obtained based on time spent
for purification process. Liquid form of PDP extract was obtained by heating the
solvent/extract mixture under vacuum until boiling stops and all solvents are
evaporated. Here, only liquid in the form of viscous syrup is obtained with traces of
solidified extract at the bottom of the collected product.
Dry
Wet

74
3.3.4.2 Solid form extract
When heating of the liquid (syrup) form under vacuum is continued, more solid
is obtained as a precipitate and can be separated for further drying as will be explained
in the next section.
(a) (b)
(c) (d)
(e) (f)
Figure 3.13: Extract purification process by Rotary evaporator (a) Rotary
evaporator arrangement (b) Rotating speed of RE (c) Solvent mixture with extract
(d) Recovered solvent (e) Wet PDPE after solvent evaporation (f) Quantities of
recovered solvent and wet extract

75
3.3.5 Extract drying
After solid form of extract was purified in the rotary evaporator, a mixture with
majority of solid extract was taken out and was dried at temperature of 80 oC for 30
minutes to remove possible traces of solvent. Drying extract was implemented in the
early stages of this investigation to ensure evaporating most of the solvent content, and
help avoiding any effect of liquid form on corrosion rate. Hence, prohibiting any
dilution on corroding environment. Figure 3.14 shows the final obtained extract.
Figure 3.14: Final extract after drying solvent (PDPE)
3.3.6 Chemical analysis
The FTIR technique is one of the fastest and cleanest techniques, since
reagents or pre-treatment of samples won’t be required, and it was able to
differentiate the original palm date pits powder, palm date pits extract and palm
date pits extraction residue, by providing information on the main vibrational
bands, which are related to the chemical composition and structure of the
compound produced. Figure 3.15 displays the samples exposed for FTIR analysis.

76
(a) (b) (c)
Figure 3.15: Different stages of PDP extraction (a) Original palm date pits before
extraction (PDP) (b) Palm date pits waste at the end of extraction (PDPW) after
drying (c) Dry palm date pits extract (PDPE)
3.3.7 Interferences
Corrosion test in this experiment aims to calculate corrosion rate according to
ASTM G31-12a standard guide for laboratory immersion corrosion testing of metals.
Under this practice, various factors, which have a great effect on test results, have been
considered. The first variable to be considered is the metal function, wither it is
exposed to hot liquids or a heat transfer surface. In the first experiment the metal was
tested under normal ambient temperature of 28.5 oC, with no heat flux introduced
throughout the experiment. In another experiment, the metal was tested under different
temperatures of corrosive medium to monitor the effect of temperature on the
corrosion inhibition efficiency.
This experiment will consider the corrosive effect of Hydrochloric acid in
aqueous solution without any other constituents; so that corrosive medium will not
require intermittently replenishing.
Test will be done on mild steel pieces only and no effect of other corrosion
products deposition from any other alloys in the system, or any galvanic corrosion. No
connections will be done to consider crevice corrosion. In the same time, no selective
corrosion on grain boundaries is considered separately in a general corrosion study

77
unless attack is sever enough to cause grains dropping. Upon testing mild steel species
in 2 M Hydrochloric acid, uniform corrosion occurred with no significant observation
of localized corrosion throughout the coupon surface.
Last variable in our check list was stress corrosion cracking, and in this
investigation no changing loads were exerted on the metal species during the test.
3.3.8 Pre-test specimen preparation
Rectangular shape strip of mild steel coupons with dimensions of 45 mm
length, 15 mm width, 2 mm thickness and total exposed area of 1590 mm2 were used
to investigate the inhibition effect. A large surface to mass ratio ranged between 1.72
and 1.89 cm2 / gm. A small ratio of edge area to total area of 0.0754 % have been
elaborated by laser machine cutting that resulted in minimum weight and dimension
variation between different metal strips. All dimensions in this research have been
determined to the third significant decimal, while all masses were determined to the
fifth significant decimal as per ASTM G1 – 03(2017)e1 standard practice for
preparing, cleaning, and evaluating corrosion test specimens.
In order to get more reproducible results and avoid results variation due to
original metallic surface, a substantial layer represent maximum 5% of metal thickness
was removed from each specimen. Grinding paper No. 80 through 1200 were used for
both surfaces as well as edges of the carbon steel coupons to abrade surfaces and
remove burrs. This has been modified from Practices A 262 and Test Method D 1384-
05 of ASTM standard for corrosion test of engine coolants in glassware which
recommends using emery paper No. 50 initially and No. 120 as a final stage before
testing. This was not sufficient to remove originally observed pitting on metal surface.
In this sense, additional five grinding papers up to No. 1200 were used in this

78
application, where surface was not worked hard with the use of grinding papers with
higher rates to avoid removal of segregated elements or surface contaminants. Cooling
with water was continuous throughout the grinding process. Figure 3.16.a through e
shows different grinding stages of metallic coupons.
metal sheets were rinsed with hydrochloric acid 37% v/v before being used
then rinsed with demineralized water. Acetone was used to remove any greasy
materials from the metal surface. Finally, the sheets were dried in a heater at a
temperature > 140 oC for 1 hour; in order to evaporate any moisture on the metal
surface.
(a)
(b)
Figure 3.16: Grinding stages of metallic coupons (a) Initial coupons before using
emery papers (b) Initial coupons after using emery papers no. 120

79
(c)
(d)
(e)
Figure 3.16: Grinding stages of metallic coupons (c) Coupons after using emery
papers no. 800 (d) Coupons after using emery papers no. 1200 (e) Coupons after
completing preparations (Continued)
To avoid error that might occur as a result of grease or lint, specimens were de-
greased by scrubbing the surface with bleach-free scouring powder, followed by
rinsing in demineralized water and in acetone solvent. Finally, they were air dried, and
then all prepared metal strips were stored in desiccator until exposure.
According to ASTM G31 – 12a (NACE, 2012), duplicate specimens were used
in each test run; to average the results which might be influenced by the differences in

80
contaminants within the different metal pieces or any other influence of different
surface structure.
The dried specimens were weighed by an analytical balance of 0.00001 mg
accuracy before and after each test. The initial surface to mass ratios of all coupons are
shown in Figure 3.17 and are observed to have a maximum deviation of 0.17 gm.
Figure 3.17: Initial surface to mass ratio of different metallic coupons
Each specimen was dried at temperature of 110 oC for a period of 30 minutes
to assure the removal of any moisture on the metal surface as a final step before initial
weighing.
3.3.9 Test conditions
Since the corrosion test doesn’t include quick flow of the corrosive medium,
or a heat flux, and oxygen concentration is not the scope of this study by keeping it at
normal level throughout the test. The only variable that was used to monitor the
solution is the pH. A pH meter was used on regular time periods to check the acid
concentration in the corrosive medium and found always at a value of pH = 1 for all
2M 𝐻𝐶𝑙 solutions at ambient temperature of 28.5 oC, while pH = 0.9, 0.6 and 0.1
values were measured for 2M 𝐻𝐶𝑙 at 37.5 oC, 62.5 oC and 78 oC, respectively. Another
1.61.651.7
1.751.8
1.851.9
1.95
10-1
10-2
10-3
10-4
11-1
11-2
11-3
11-4
11-5
11-6
12-1
12-2
12-3
12-4In
itia
l S
urf
ace
/mass
rati
o (
cm2/g
m)
Metal coupons tag numbers

81
corrosion test was done in a different medium of sea water and pH = 7.3 value was
measured at 28.5 oC.
3.3.9.1 Solution composition
All solutions were prepared accurately by using Chem-Lab 37% Hydrochloric
acid conforming to the Specifications of the Committee on Analytical Reagents of the
American Chemical Society. In the same time a constant source of demineralized
water was used in preparing all solutions to avoid any change in medium composition.
The water purity complied all the time with type IV reagent water in ASTM D1193-
06(2018), standard specification for reagent water, as stated by ASTM G1 –
03(2017)e1. Table 3.14 summarizes ASTM standard limits and measured values of
used reagent water. Tables 3.14 and 3.15 provides the corrosive medium composition.
Table 3.13: Comparison of distilled water properties with ASTM standard
Property UOM ASTM Limit Measurement
pH (25 oC) - 5.0 to 8.0 6.7
Max. Conductivity (25 oC) μS/cm <5.0 0.16
Min. Electrical resistivity (25 oC) Mcm 0.2 Not measured
Total organic carbon (Bertocci) μg/L, (pbb) No Limit Not measured
Sodium μg/L, (pbb) <50 Not measured
Chloride μg/L, (pbb) <50 Not measured
Total Silica μg/L, (pbb) No Limit Not measured
Microbiological contamination EU/ml 100/10 ml Negative
Table 3.14: 𝐻𝐶𝑙 corrosive medium composition
Element Concentration
Demineralized Water Most of the solution is aqueous
Hydrochloric Acid 37% 2 Molarity solution
Tested solid PDPE inhibitor
Different concentrations were tested (0,
2000, 4000, 6000, 8000, 10000, 16000,
20000 and 24000 ppm).
Tested liquid PDPE inhibitor Different concentrations were tested (0,
8000, 12000, 16000 and 24000 ppm).

82
Table 3.15: 𝑁𝑎𝐶𝑙 corrosive medium composition
Property Concentration
Concentration 100% sea water solution
TSS Filtered by 45 µm filter membrane
pH 7.1
Composition
Sodium 16290 ppm
Chloride 26120 ppm
Magnesium 1730 ppm
Calcium 520 ppm
Carbonate 11.29 ppm
Bicarbonate 70 ppm
Silica 4020
Tested liquid PDPE inhibitor Different concentrations were tested (0,
8000, 12000, 16000 and 24000 ppm).
All tests under the same conditions were duplicated by doubling the number of
coupons in the same test. By comparing results of each two coupons within the same
test, variation resulted in inhibition efficiency was in the range of (+/- 5 to 13%), which
reflects reproducible results.
3.3.9.2 Solution temperature
As the experiments were conducted in an air-conditioned laboratory,
temperature of corrosive solution was measured initially to be around 32 oC as a result
of exothermic reaction between 𝐻𝐶𝑙 and 𝐻2𝑂. Later, solution temperature was
measured frequently to be constant at 28.5 oC which is identical to ambient
temperature.
Other corrosion experiments were done on higher temperatures of 37.5, 62.5
and 78 oC at constant concentration of PDPE inhibitor; in order to investigate effect of
temperature on inhibition efficiency.

83
3.3.9.3 Solution aeration
According to ASTM G1 – 03(2017)e1 standard practice, corrosion tests were
done at natural atmospheric conditions. As the effect of dissolved oxygen is not the
scope of this research and by considering normal service conditions, where oxygen
exists in the normal surrounding rates, experiment will not require any aeration or
deration requirements. One important observation was the trapped Hydrogen gas
produced in the reaction of 𝐻𝐶𝑙 with Carbon Steel as one of the corrosion reaction
product, which was causing a reduction in the reaction rate as a result of the increase
in vapor pressure, as well as concentration, of hydrogen in the reaction system that
won’t allow further progress of corrosion reaction. So, in order to solve this issue and
keep reaction rate constant, hydrogen was released continuously from reaction system.
3.3.9.4 Solution velocity
Another variable is corrosive environment velocity relative to the metal pieces,
where in our test, no high speed is applied, and only agitation is applied through using
a slow rotating magnetic stirrer at 140 RPM.
3.3.9.5 Solution volume
As per ASTM D: G 31 – 12a and ASTM practice A 262, a minimum ratio of
test solution volume to the exposed area of coupon is 0.2 ml/mm2, so that was
considered in this experiment keeping a ratio of 0.314 ml/ mm2. This ratio was
designed above the minimum limit to avoid any significant change in the medium
corrosivity during the test, either through depletion of corrosive ingredients or by
precipitation of reaction products which might influence corrosion rates.

84
3.3.9.6 Test duration
The main procedures of evaluating effect of time on corrosion of metal or
corrosiveness of a medium have been introduced by Wacher et al. (1947) As the mild
steel in 2 M 𝐻𝐶𝑙 solution will not form an immediate protective film, the longer tests
run will be more realistic and representative for the results, as long as the original
specimen’s size or exposed area are not obviously changed.
In this research, the first corrosion test was conducted in 2 M 𝐻𝐶𝑙 without
addition of what is investigated as a green inhibitor. Average corrosion rate was
calculated to be 212 mpy. This value represents a moderate value of corrosion rate,
and so the suggested test duration can be calculated from equations [12] and [13]:
Hours = 2000/(Corrosion rate in mpy) [12]
Hours = 2000 / 212 = 9 hours and 26 minutes [13]
These equations were stated with reference to ASTMG31 - 12a standard and
practice A 262, where it found that most common time periods are 48 to 168 hours (2
to 7 days). These periods will give better comparison between different corrosion rates.
3.3.10 Method of supporting specimens
As it was displayed in Figure 3.7, section 3.2.6 of chapter 3, nylon coupon
holder of 20 mm diameter was used in this experiment to insulate the specimen
physically and electrically from any other metallic element that might interferes the
test results through creating galvanic corrosion cell. Cylindrical shape of coupon
holder with a square end cut was designed to ensure the free contact with the corrosive
medium. Nylon bolts and nuts were used to fix the coupon to the holder, which will
avoid the interference of metallic bolts or nuts in the corrosion type and rate.

85
3.3.11 Post-test specimen cleaning method
Cleaning out corrosion products from coupons is a crucial step, which if were
done improperly would cause the removal of sound metal and will result in misleading
results. Acetone was used as a degreasing solvent prior to application of any chemical
method of coupons cleaning.
Mechanical scrubbing of coupon surface was done with a bristle (nonmetallic)
brush to remove loose bulky corrosion products from the surface. Depending on
description mentioned in ASTM G1 – 03(2017)e1 with designation C.3.5, which is
proposed for iron and steel, a cleaning solvent described in Table 3.16 was used to
remove corrosion products from the coupon surface by immersing corroded specimens
in 1 L of solvent for 10 minutes at 20 to 25 oC. This method of cleaning is practiced
when the corrosion deposits can be easily removed from the metal surface, and the
weight loss method is followed to measure corrosion rate.
Table 3.16: Cleaning solution composition
Component UOM Quantity
Hydrochloric acid (𝐻𝐶𝑙, sp gr 1.19) ml 500
Hexamethylene Tetramine gm 3.5
Reagent water ml To make 1000 ml solution
In order to reduce the error that might result from base metal removal when
inadequate cleaning of corrosion products from tested specimens is done, or over
cleaning of specimens, different cleaning periods, replenished solution concentrations
and repetitive cleaning cycles were done to reduce the error in determining the results.
Average of 3 chemical cleaning cycles were done with the same cleaning
solvent’s concentration for all specimens by intermittently weighing of corroded
specimens until constant weight is detected during cleaning process.

86
3.3.12 Corrosion rate calculation
Based on SEM analysis photographs of metal’s surface morphology which are
shown in chapter 4, it is assumed that only general and pitting corrosion occurred in
this test and no separate reporting of internal corrosion. Accordingly, the equation [14]
was used to calculate corrosion rate with reference to ASTM G1-03(2017)e1 standard:
Corrosion rate = (K * W) / (A * T * D) [14]
Where:
K = a constant (see below)
T = time of exposure in hours to the nearest 0.01 h,
A = area in cm2 to the nearest 0.01 cm2,
W = mass loss in grams, to nearest 1 mg (corrected for any loss during cleaning) and
D = density of metal in g/cm3.
Constant (K) in Corrosion Rate Equation:
Mils per year (mpy) 3.45 x 10⁶
Inches per year (ipy) 3.45 x 10³
Inches per month (ipm) 2.87 x 10²
Millimeters per year (mm/y) 8.76 x 10⁴
Micrometers per year (μm/y) 8.76 x 10⁷
Picometers per second (pm/s) 2.78 x 10⁶
Grams per square meter per hour (g/m2·h) 1.003 x 10⁴ x DA
Milligrams per square decimeter per day (mdd) 2.403 x 10⁶ x DA
Micrograms per square meter per second (μg/m2·s) 2.783 x 10⁶ x DA
Each specimen in the corrosion test had been weighted in a sensitive weighting
machine mentioned in section 3.8 before being exposed to acidic medium electrolyte.

87
After completing test and cleaning procedures, the final weight was measured for each
coupon with the same weighting machine.
The different corrosion rates resulted from corrosion of carbon steel in 2 M
𝐻𝐶𝑙 medium in the absence and presence of different concentrations of inhibitors are
reported in chapter 4, where the corrosion rate, CR (g.day-1.cm-2) for the studied
specimen can also be determined by using the simplified relation in equation [15]
(Ituen et al., 2017):
𝐶𝑅 = 𝑊1− 𝑊2
𝐴.𝑡 [15]
Where W1 is the weight of the specimen before corrosion, W2 is the weight of
the specimen after corrosion in grams, A is the surface area of the specimen in cm2,
and t is the immersion time in days. Also, the percentage of inhibition efficiency was
calculated by using equation [16]:
% 𝐼𝐸 = 𝐶𝑅𝑜− 𝐶𝑅
𝐶𝑅0 [16]
Where CR0 and CR are the corrosion rates of mild steel in the absence and
presence of the inhibitors, respectively. It can be observed that IE increases with
increasing the concentrations until the optimum efficient concentration is reached.
Results are presented in chapter 4. Table 3.17 summarizes measured parameters which
were used to calculate corrosion rate.

88
Table 3.17: Measured parameters for corrosion rate calculation
PDPE Temp K T A W V D CR Avr.
CR
ppm oC 𝑥103 Hours cm2 gm cm3 gm/cm3 mpy mpy
Solid PDPE vs. 2M 𝑯𝑪𝒍 at ambient temperature (28.5 oC)
0 28.5 3453 168 15.9 0.9868 1.35 6.4702 197.14 212.28
0 28.5 3453 168 15.9 1.0989 1.35 6.2464 227.41
2000 28.5 3453 168 15.9 0.9664 1.35 6.2837 198.80 211.96
2000 28.5 3453 168 15.9 1.1127 1.35 6.3888 225.13
4000 28.5 3453 168 15.9 0.8722 1.35 6.2140 181.44 195.57
4000 28.5 3453 168 15.9 1.0260 1.35 6.3247 209.71
6000 28.5 3453 168 15.9 0.4882 1.35 6.4318 98.118 100.80
6000 28.5 3453 168 15.9 0.5043 1.35 6.2992 103.48
8000 28.5 3453 168 15.9 0.4915 1.35 6.4342 98.741 100.82
8000 28.5 3453 168 15.9 0.5013 1.35 6.2970 102.91
10000 28.5 3453 168 15.9 0.5195 1.35 6.5691 102.22 106.92
10000 28.5 3453 168 15.9 0.5262 1.35 6.0933 111.63
12000 28.5 3453 168 15.9 0.6153 1.35 6.8402 116.28 113.65
12000 28.5 3453 168 15.9 0.5759 1.35 6.7045 111.03
16000 28.5 3453 168 15.9 0.5205 1.35 6.7536 99.617 102.88
16000 28.5 3453 168 15.9 0.5478 1.35 6.6707 106.14
20000 28.5 3453 168 15.9 0.5764 1.35 6.4346 101.31 106.28
20000 28.5 3453 168 15.9 0.6065 1.35 6.1653 111.26
24000 28.5 3453 168 15.9 0.8076 1.35 6.3379 144.12 208.92
24000 28.5 3453 168 15.9 1.6086 1.35 6.6469 273.73
Liquid PDPE vs. 2M 𝑯𝑪𝒍 at ambient temperature (28.5 oC)
4000 28.5 3453 168 15.9 0.799 1.35 6.5867 156.80 187.49
4000 28.5 3453 168 15.9 1.1595 1.35 6.87 218.17
6000 28.5 3453 168 15.9 0.0973 1.35 6.77 18.57 94.26
6000 28.5 3453 168 15.9 0.0295 1.35 6.6949 5.69
8000 28.5 3453 168 15.9 0.4235 1.35 6.6918 81.80 87.11
8000 28.5 3453 168 15.9 0.4409 1.35 6.1665 92.42
12000 28.5 3453 168 15.9 0.4814 1.35 6.8765 90.49 89.58
12000 28.5 3453 168 15.9 0.4647 1.35 6.7741 88.67
16000 28.5 3453 168 15.9 0.293 1.35 6.716 56.39 58.49
16000 28.5 3453 168 15.9 0.309 1.35 6.5930 60.58
20000 28.5 3453 168 15.9 0.3116 1.35 6.7432 59.73 62.61
20000 28.5 3453 168 15.9 0.3381 1.35 6.6734 65.49
24000 28.5 3453 168 15.9 0.3516 1.35 6.8311 66.53 68.80
24000 28.5 3453 168 15.9 0.3437 1.35 6.2513 71.07

89
Table 3.17: Measured parameters for corrosion rate calculation (Continued)
PDPE Temp K T A W V D CR Avr.
CR
ppm oC 𝑥103 Hours cm2 gm cm3 gm/cm3 mpy mpy
Liquid PDPE vs. 100% 𝑵𝒂𝑪𝒍 at ambient temperature (28.5 oC)
0 28.5 3453 168 15.9 0.0638 1.35 6.8289 12.22 12.61
0 28.5 3453 168 15.9 0.0685 1.35 6.8866 13.01
8000 28.5 3453 168 15.9 0.0177 1.35 6.6052 3.51 2.77
8000 28.5 3453 168 15.9 0.0104 1.35 6.6237 2.05
12000 28.5 3453 168 15.9 0.0077 1.35 6.7818 1.46 1.61
12000 28.5 3453 168 15.9 0.0092 1.35 6.6972 1.77
16000 28.5 3453 168 15.9 0.0028 1.35 6.6379 0.54 0.42
16000 28.5 3453 168 15.9 0.0016 1.35 6.6239 0.32
24000 28.5 3453 168 15.9 0.0003 1.35 6.3107 0.06 0.06
24000 28.5 3453 168 15.9 0.0003 1.35 6.5439 0.06
Liquid PDPE vs. 2M 𝑯𝑪𝒍 at different temperatures
0 28.5 3453 168 15.9 0.9868 1.35 6.4702 197.14 212.28
0 28.5 3453 168 15.9 1.0989 1.35 6.2464 227.41
16000 28.5 3453 168 15.9 0.2930 1.35 6.7160 56.39 237.09
16000 28.5 3453 168 15.9 0.3090 1.35 6.5930 60.58
0 37.5 3453 168 15.9 0.0212 1.35 6.6629 230.32 71.96
0 37.5 3453 168 15.9 0.0215 1.35 6.3822 243.86
16000 37.5 3453 168 15.9 0.4336 1.35 5.9012 97.89 2671.45
16000 37.5 3453 168 15.9 0.2142 1.35 6.2002 46.02
0 62.5 3453 168 15.9 0.1988 1.35 6.5351 2642.5 1498.52
0 62.5 3453 168 15.9 0.2121 1.35 6.8229 2700.3
16000 62.5 3453 168 15.9 7.7236 1.35 6.5956 1560.1 10157.2
16000 62.5 3453 168 15.9 7.1119 1.35 6.5944 1436.8
0 78 3453 168 15.9 0.8517 1.35 6.5030 9480.8 5946.84
0 78 3453 168 15.9 1.0029 1.35 6.7013 10833
16000 78 3453 168 15.9 5.6068 1.35 6.5091 6235.5 237.09
16000 78 3453 168 15.9 5.2128 1.35 6.6691 5658.1
There are multiple methods of measuring corrosion rate, weight loss
measurement was practiced in this investigation as it represents the most conventional
and accurate method. In addition, surface coverage of inhibitor on metal’s surface can
be predicted from inhibition efficiency by using equation [17], (Ituen et al., 2017).
𝜃 = 0.01 ∗ 𝐸𝐼% [17]
Where, 𝜃 is a dimensionless degree of surface coverage.
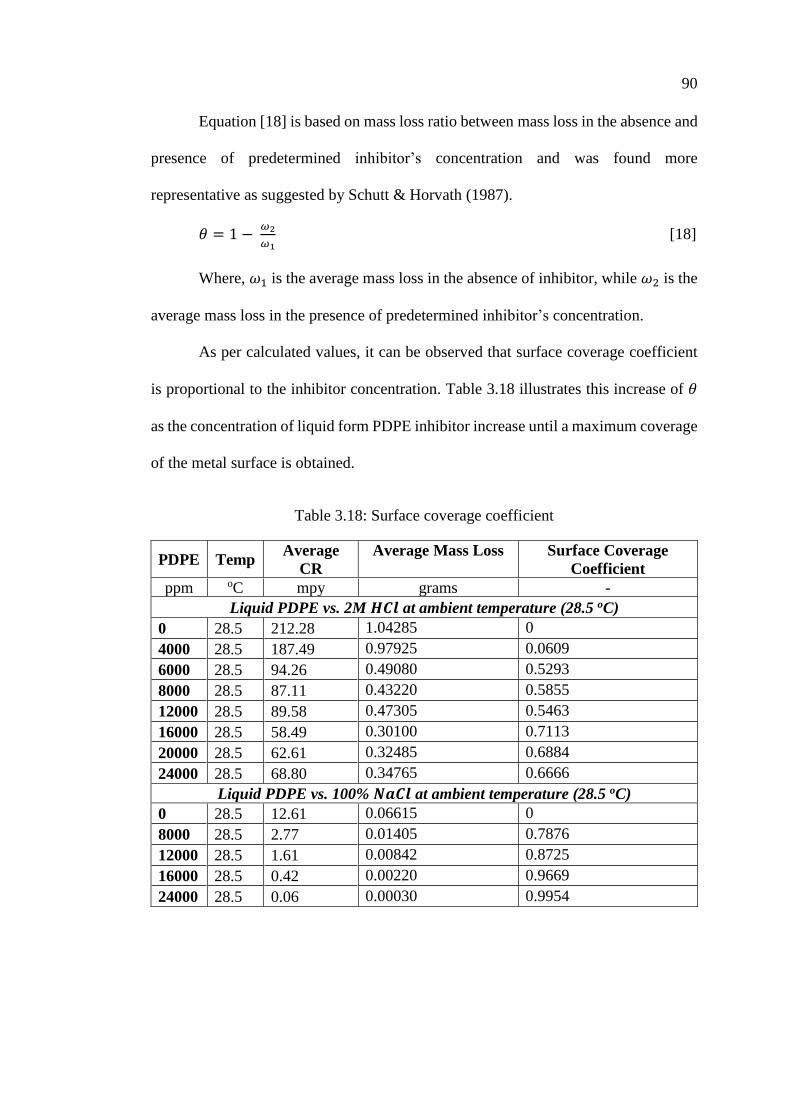
90
Equation [18] is based on mass loss ratio between mass loss in the absence and
presence of predetermined inhibitor’s concentration and was found more
representative as suggested by Schutt & Horvath (1987).
𝜃 = 1 − 𝜔2
𝜔1 [18]
Where, 𝜔1 is the average mass loss in the absence of inhibitor, while 𝜔2 is the
average mass loss in the presence of predetermined inhibitor’s concentration.
As per calculated values, it can be observed that surface coverage coefficient
is proportional to the inhibitor concentration. Table 3.18 illustrates this increase of 𝜃
as the concentration of liquid form PDPE inhibitor increase until a maximum coverage
of the metal surface is obtained.
Table 3.18: Surface coverage coefficient
PDPE Temp Average
CR
Average Mass Loss Surface Coverage
Coefficient
ppm oC mpy grams -
Liquid PDPE vs. 2M 𝑯𝑪𝒍 at ambient temperature (28.5 oC)
0 28.5 212.28 1.04285 0
4000 28.5 187.49 0.97925 0.0609
6000 28.5 94.26 0.49080 0.5293
8000 28.5 87.11 0.43220 0.5855
12000 28.5 89.58 0.47305 0.5463
16000 28.5 58.49 0.30100 0.7113
20000 28.5 62.61 0.32485 0.6884
24000 28.5 68.80 0.34765 0.6666
Liquid PDPE vs. 100% 𝑵𝒂𝑪𝒍 at ambient temperature (28.5 oC)
0 28.5 12.61 0.06615 0
8000 28.5 2.77 0.01405 0.7876
12000 28.5 1.61 0.00842 0.8725
16000 28.5 0.42 0.00220 0.9669
24000 28.5 0.06 0.00030 0.9954

91
4.Chapter 4: Results and Discussion
4.1 Chemical analysis results
A sample of original palm date pits was analyzed by IR spectroscopy before
implementing any extraction process and the sample was named as “PDP”. Chemical
analysis of three samples of solid extract obtained after extraction and purification of
PDP were investigated by the same method. The difference between the three samples
is the time of extraction where Figures 4.1.b, c and d display extract resulted from 8,
10 and 12 hours of polar extraction time, respectively. Hence, the samples were named
as “PDPE-6”, “PDPE-8” and “PDPE-12”, respectively. As per obtained results of IR-
analysis, it can be observed that the longer period of polar extraction is resulting in
higher concentration of different compounds in the extract as explained in detail in the
next paragraph. Last sample displayed in Figure 4.1.d displays IR-spectroscopy
analysis of waste left at the end of extraction process of “PDPE-8” and is named as
“PDPW-8”.
Based on previous similar analysis done on palm date pits and IR spectroscopy,
Table A.2 in appendixes, provides wave numbers of different organic groups which is
predicted for similar contents.
IR transmission in the range of 3100 – 3600 represents hydrogen and oxygen
bonded O-H stretch characterized by that peak appeared much broader than other IR
absorptions, and indicates the presence of exchangeable protons which is characterized
for phenols and alcohol, especially with another absorption appeared in the ranges of
1450 – 1500 and 1580 – 1600 which represents aromatic rings such as benzene ring.
Based on this observation and obtained FTIR (Figure 4.1.a) for original PDP, (Figures
4.1.b-d) for PDP solid extract and (Figure 4.1.e) for PDP waste left after extraction

92
completed, phenols and alcohol concentration can be observed higher in the PDP
extract composition in the form of unsaturated aromatics when compared to original
PDP.
(a)
(b)
Figure 4.1: FT-IR characterization (a) FTIR characterization of original PDP (b)
FTIR characterization of PDPE-6

93
(c)
(d)
Figure 4.1: FT-IR characterization (c) FTIR characterization of PDPE-8 (d) FTIR
characterization of PDPE-12 (Continued)

94
(e)
Figure 4.1: FT-IR characterization (e) FTIR characterization of PDPW (Continued)
When compared aromatic content in FTIR results obtained in Figures 4.1.b-d
for PDP extract with results in Figure 4.1.e for PDP waste, it can be observed that
aromatic content is less concentrated in PDP waste, and the peak between 1450 – 1600
represent traces of methanol, in the waste, which was used in polar extraction process.
This can be confirmed only since rotary evaporator temperature of up to 80 oC under
vacuum condition used in concentrating process of PDPE and would be sufficient to
evaporate most of the methanol from the extract.
Alkane C-H stretching absorptions just below 3000 cm-1 shown in Figures
4.1.a-e demonstrate the presence of saturated carbons, alkanes, while no signals are
shown just above 3000 cm-1 which demonstrate absence of unsaturation. The peaks at
2920 and 2850 are observed as a result of CH2 asymmetric stretch of methyl groups
mainly from lipids (Felhi et al., 2017).
Since no strong signal observed in the frequencies ranging from 2000 to 2800
cm-1, so the presence of alkyne or nitrile groups are nil in this chemical compound.
A slight absorption peak around 1746.1 cm−1 in Figure 4.1.a for original PDP
represents the stretching vibration of carbonyl group, such as Ketones, while this peak

95
is not seen in Figures 4.1.b-d demonstrating complete removal of acetone, which is
considered as a ketone, from PDP extract. Also, another two peaks at ranges lower
than 2000 cm-1 such as a strong peak around 1700 cm-1 which represents carbonyl
group, and a second strong signal around 1200 cm-1 which represents C-O bond are
not obtained in Figures 4.1.a-e, which demonstrates a complete removal of acetone
from the PDP extract.
The high absorption peak at 1635.1 cm-1 in Figures 4.1.b-d for PDP extract
reflects ring C─C stretch of phenyl (Felhi et al., 2017), which can also be seen as
aromatic ring of benzene and contributing phenolic compounds existence.
In the range of 1600 – 1650 cm-1, the peak represents alkene, where C=C bond
exists.
Carbonyl groups (C=O) and hydrogen bonded carbonyl group in cellulose and
hemicellulose showed significant bands at 1630 cm−1, for the original Khalas PDP
with 92% transmission. The same signal is shifted by 10 cm−1 down to 1620 cm−1 with
a lower transmission of average 79% in the PDPE, while shifted up with 20 cm−1 to
1650 cm−1 at medium transmission of 83%.
In discussion of the finger print range below 1500 cm-1, in Figures 4.1.a-e, a
slight peak detected at 1372.66 cm–1 represents in-plane C─O stretching vibration and
the ring stretch of phenyl. In the same figures, in the range of 1050 to 1200 cm–1, a
stretching absorption band of C─O for phenols can be observed which has the highest
absorption in PDP extract as per Figure 4.1.b-d, while showing less absorption strength
in Figure 4.1.a for original PDP and Figure 4.1.e for PDP waste.
The “shoulder” peak at 1160.0 cm–1 is from carbohydrate, whereas the
absorptions bands at 1055.4 and 984.0 cm–1 are derived from the vibrational frequency
of the CH2OH groups of carbohydrates (Felhi et al., 2017).

96
The bands at 1443, 1370 and 1280 cm−1 in spectrum (for original PDP)
attributed to methylene (C__H) deformation in cellulose and hemicellulose, ν(C__H)
deformation in lignin, and (C__H) vibration in cellulose, respectively indicate close-
packing of the original molecules in original PDP (Al-Saidi, 2016). The (C__O)
stretching vibration of alcoholic hydroxyl group at 1063
Finally, the band at 870 cm−1 which are assigned to the (C__H) deformation in
cellulose (Al-Saidi, 2016)
The peak at 1050 wave number might also represents esters or ethers, while
absorption at wave number 1620, with less transmission down to 68% in Figure 4.1.b-
d for PDP extract compared to 93% for original PDP in Figure 4.1.a and 85% for PDP
waste in Figure 4.1.e, represent C = O double bond that is expected to result from
benzene derivatives of phenolic compounds.
Finally, there is absence of other molecules such as C ≡ C and C ≡ N in the
range of 2250 cm-1, especially with the absence of strong peaks immediately above
3000 cm-1 wavenumber. Also, carboxylic acid is not presenting, since the wider unique
peak which is passing the 3000 cm-1 is not showing in any of the analyzed samples.
As a conclusion of FTIR results, content of phenolic compounds was detected
which is highly possible to influence corrosion inhibition.
In terms of PDP liquid extract, other phenolic content analysis was conducted
to demonstrate existence of phenolic compounds, where the total concentration of
382.5 ppm was measured.
4.2 Scanning electron microscopy (SEM)
Scanning electron microscopy was used in this research to identify the type of
corrosion or deny other types of corrosion on metallic surface.

97
4.2.1 Pre-test SEM
SEM was conducted on the prepared metallic coupons and prior to immersion
in acidic solution. Figures 4.2 a and b were captured from different locations on the
same coupon to ensure proper surface of the coupon and deny any types of pitting or
cracks that might not be visible to naked eye and might lead to unreliable results. Based
on SEM results, the coupon appear in good condition, and so any other type of
interferences due to inhomogeneous surface can be avoided. Minor surface corrosion
spots were observed as a result of the short time gap between coupon preparation and
analyzing under microscope, which would also reflect high sensitivity of coupons to
surrounding environment.
(a)
(b)
Figure 4.2: SEM analysis of prepared coupon’s surface morphology before
corrosion test (a) 200X SEM magnification of prepared coupon (b) 2000X SEM
magnification of prepared coupon
4.2.2 Post-test SEM
Once the test was accomplished, and before cleaning specimens, inhibitor layer
and corrosion products were observed and recorded. All specimens’ surfaces were
investigated by SEM after immersion in 2M 𝐻𝐶𝑙 solution and liquid extract of palm
date pits which has demonstrated higher efficiency than solid extract at different
Space
Metal Metal
Clean
surface
Clean
surface

98
concentrations, and based on obtained photographs, corrosion type can be defined as
a uniform corrosion. Photographs in Figures 4.3 a and b were also taken by SEM at
200X and 2000X magnification power to display nature of precipitating deposits on
corroded surface before cleaning corrosion products. Photographs would clearly
identify corrosion inhibition by physical deposition of PDPE on metallic surface to
form a barrier between the surface and corrosive medium.
(a)
(b)
Figure 4.3: SEM analysis of PDPE deposits on metal surface after 1-week
immersion in 2M HCl solution with 2000 ppm concentration of PDPE (a) 200X
SEM magnification of coupon surface (b) 2000X SEM magnification of coupon
surface
Other photographs of higher PDPE’s concentration in Figures 4.4.a and b are
clearly displaying a more uniform inhibitor’s precipitation and larger coverage of the
metal surface as the concentration of inhibitor increase from 2000 ppm, as shown in
Figure 4.3.b, to 16000 ppm, which is shown in Figure 4.4.b, and as a result lower
corrosion rate was obtained at the higher concentration. Based on scanning electro-
microscopy, this increment in coverage of metallic surface is expected to contribute
corrosion inhibition by blocking the reaction sites of the carbon steel surface
preventing corrosive medium from reaching metal surface. In other words, the surface
PDPE deposits on metal surface PDPE deposits on metal surface
Space Metal

99
area available for H+ ions was reduced while the actual reaction mechanism remains
unaffected.
(a)
(b)
Figure 4.4: SEM analysis of PDPE deposits on metal surface after 1-week
immersion in 2M HCl solution with 16000 ppm concentration of PDPE (a) 200X
SEM magnification of coupon surface (b) 2000X SEM magnification of coupon
surface
After 1 week of immersion in 2M 𝐻𝐶𝑙, 200X magnification of coupons surface
were compared as shown in Figures 4.5.a and b in 2000 and 16000 ppm concentrations,
respectively, and it was observed that larger surface coverage of inhibitor was obtained
at higher concentration.
(a)
(b)
Figure 4.5: Comparison of PDPE deposits on metal surface at 200X SEM after 1-
week immersion in 2M HCl solution with different concentrations of PDPE (a)
200X SEM magnification of coupon surface after 1-week immersion in 2M HCl
with 2000 ppm of PDPE (b) 200X SEM magnification of coupon surface after 1-
week immersion in 2M HCl with 16000 ppm of PDPE
Space
Metal
Space
Metal
PDPE
deposits on
metal
surface
Space
Metal
PDPE deposits
on metal
surface
PDPE
deposits on
metal
surface
More
uniform
PDPE
deposits
Less
uniform
PDPE
deposits

100
While under 2000X magnification of the same samples are displayed in Figures
4.6.a and b it was observed that more uniform layer of inhibitor was obtained at higher
concentration and is expected to cause lower corrosion rate.
(a)
(b)
Figure 4.6: Comparison of PDPE deposits on metal surface at 2000X SEM after 1-
week immersion in 2M HCl solution with different concentrations of PDPE (a) 2000X
SEM magnification of coupon surface after 1-week immersion in 2M HCl with 2000
ppm of PDPE (b) 2000X SEM magnification of coupon surface after 1-week
immersion in 2M HCl with 16000 ppm of PDPE
4.2.3 Final SEM after cleaning coupon
After cleaning corroded coupons, SEM was used finally to compare metal’s
surfaces obtained after immersion in 2M 𝐻𝐶𝑙, and another similar medium with the
addition of 16000 ppm of PDPE. Even if the concentration is not the optimum, this
step was done to differentiate the effect of PDPE on surface and observe the surface
morphology and identifying type of corrosion.
Based on SEM images captured in this experimental work, Figure 4.7.a
displays the 200X magnification of polished metal surface before immersion, while
Figure 4.7.b displays the cleaned surface after immersing in 2M 𝐻𝐶𝑙 solution for 1
week, and Figure 4.7.c displays the cleaned metal surface after immersing for 1 week
in 2M 𝐻𝐶𝑙 and 16000 ppm pf PDP liquid extract. It can be observed that more pitting
present on the metal surface with no inhibitor added compared with the metal surface
More gaps
More uniform layer Less uniform layer
Less gaps

101
in the presence of PDP extract, which has covered the metal surface to prevent acidic
medium from reacting with metal surface and consequently reduce corrosion rate.
These observations were compared with reference to earlier SEM investigation done
on corrosion of mild steel in hydrochloric acid solution by Karthik et al., (2016) and
Reetu et al., (2017), in Sulfuric acid solution by Mahgoub et al. (2016) and in caustic
soda solution by Jayakumar et al., (2014). Some atmospheric corrosion deposits can
be observed on naked metal surface after cleaning, due to high sensitivity to
atmospheric conditions occur in the short time gap between cleaning and SEM
analysis.
(a)
(b)
(c)
Figure 4.7: Comparison of metallic surface morphology at 200X SEM after
cleaning coupon demonstrating the effect of 16000 ppm concentration of PDPE (a)
200X SEM magnification of polished coupon surface before immersion (b) 200X
SEM magnification of coupon surface after 1-week immersion in 2M HCl without
PDPE after cleaning (c) 200X SEM magnification of coupon surface after 1-week
immersion in 2M HCl with 16000 ppm of PDPE after cleaning
Pitting corrosion can be observed with 2000X higher magnification shown in
Figures 4.8.a through c, where Figure 4.8.a displays the clean surface of metal before
corrosion test. In Figure 4.8.b, general corrosion was observed on cleaned metal
surface after immersing for 1 week in 2M 𝐻𝐶𝑙 without PDPE inhibitor, which has
caused severe damage reformatted the metal surface, in addition to smaller pittings
scattered on surface. While no general corrosion observed on the cleaned metal surface
Clean/polished
surface Less general
corrosion
Space
Space
Space

102
which was immersed for the same period of 1 week in 2M 𝐻𝐶𝑙 but with 16000 ppm
of PDPE inhibitor, and only small pitting corrosion spots could be observed on the
surface. This is expected due to gaps in the inhibitor’s film covered the metal surface
during immersion.
(a)
(b)
(c)
Figure 4.8: Comparison of metallic surface morphology at 2000X SEM after
cleaning coupon demonstrating the effect of 16000 ppm concentration of PDPE (a)
2000X SEM magnification of polished coupon surface before immersion (b) 2000X
SEM magnification of coupon surface after 1-week immersion in 2M HCl without
PDPE after cleaning (c) 2000X SEM magnification of coupon surface after 1-week
immersion in 2M HCl with 16000 ppm of PDPE after cleaning
4.3 Average corrosion rate and inhibition efficiency
Table 4.1 summarizes obtained results of carbon steel’s corrosion rates at
different inhibitors concentrations in 2M 𝐻𝐶𝑙, while Figure 4.9 is a chart of corrosion
rate results relative to each other. Table 4.2 summarizes obtained results of corrosion
inhibition efficiency IE% of different inhibitor’s concentrations when implemented in
2M 𝐻𝐶𝑙 solution, while Figure 4.10 is a chart of IE% results of different inhibitor’s
concentrations relative to each other.
Based on investigation results, it is observed that corrosion rate decreases and
IE% increases with increasing the PDP solid extract concentration until reaching
optimum experimented concentration of 8000 PPM, where Table. 4.2 shows a
maximum IE of 52.5% was achieved, after which corrosion rate become almost stable
More general
corrosion
Less general
corrosion
Clean/ polished
surface

103
until maximum tested concentration of 24000 PPM. PDP liquid extract was also
investigated, where Table 4.2 shows optimum concentration of PDP liquid extract to
be 16,000 ppm and achieved inhibition efficiency is 72.4%.
As a result of shorter extraction period, liquid extract was obtained by
following the same extraction procedures and after evaporating the distilled water as
the heaviest solvent at 99 oC under vacuum. The corrosion rates of the tested
concentrations (4000, 6000, 8000, 12000, 16000, 20000 and 24000 ppm) were lower
for liquid PDPE compared to solid extract as shown in Table 4.1, and as a result
inhibition efficiency was obtained higher as well for the liquid PDPE.
It was observed during investigation that liquid extract of PDP is turning from
liquid phase to solid phase when poured in the acidic medium of 𝐻𝐶𝑙, as well as in sea
water solution. Based on this fact, it can be concluded that solid extract phase from
liquid phase is forming smaller particles, and consequently has a higher contacting
surface area that would form a more uniform inhibitor layer on metal surface with less
gaps and as a result is expected to achieve a higher corrosion inhibition efficiency.
Increasing concentration of liquid extract in 2M 𝐻𝐶𝑙 solution beyond 16000
ppm up to 24000 ppm had no significant variation on the measured corrosion rate,
based on this finding and as pH = 1.0 value was monitored to be constant throughout
the corrosion test, even with implementing liquid PDPE; it can be concluded that the
reduction in corrosion rate is achieved only by inhibition effect without changing the
physical properties of corrosive medium.
As per Figures 4.9 and 4.10, optimum concentration of PDP solid extract is
8000 PPM for solid extract, beyond which corrosion rate doesn’t change significantly
with further increase in PDPE concentration, and consequently efficiency keeps stable.

104
While optimum concentration of PDP liquid extract tested was found to be 16000 ppm
and has achieved 72% inhibition efficiency.
For further evaluation of PDPE’s inhibition efficiency, corrosion rate was
measured and compared with 2000, 8000 and 16000 ppm of nitrite base passivating
commercial inhibitor in 2M 𝐻𝐶𝑙 under identical conditions. As a result of this
comparison tests, average corrosion rate of 164.17 mpy and maximum inhibition
efficiency value of 22.66% were achieved. Summary of corrosion rate results is shown
in Table 4.1 and Figure 4.9, while Table 4.2 and Figure 4.10. show summary of
inhibition efficiency EI%.
Table 4.1: Corrosion rates at different inhibitors concentrations in 2M 𝐻𝐶𝑙
Sample
no.
Inhibitor
concentration
(ppm)
Immersion
period
(Hours)
Average corrosion rate (mpy)
Solid
PDPE
Liquid
PDPE
Commercial
Inhibitor
1.1 0 168 212.28
1.2 0 168
2.1 2000 168 211.96 - 209.31
2.2 2000 168
3.1 4000 168 195.97 187.49 -
3.2 4000 168
4.1 6000 168 100.80 94.26 -
4.2 6000 168
5.1 8000 168 100.82 87.11 190.86
5.2 8000 168
6.1 10000 168 106.92 - -
6.2 10000 168
7.1 12000 168 - 89.58 -
7.2 12000 168
8.1 16000 168 113.65 58.49 171.48
8.2 16000 168
9.1 20000 168 102.88 62.61 -
9.2 20000 168
10.1 24000 168 106.28 68.80 164.17
10.2 24000 168

105
Figure 4.9: Average corrosion rates in 2M 𝐻𝐶𝑙 with different inhibitors
concentrations
Table 4.2: Corrosion IE% of different inhibitors concentrations in 2M 𝐻𝐶𝑙 solution
Test
No.
Inhibitor
Concentration
(ppm)
Immersion
Period
(Hours)
Corrosion Inhibition Efficiency %
Solid
PDPE
Liquid
PDPE
Commercial
Inhibitor
1.1 0 168 0
1.2 0 168
2.1 2000 168 0.14 - 1.39
2.2 2000 168
3.1 4000 168 7.68 11.67 -
3.2 4000 168
4.1 6000 168 52.51 55.59 -
4.2 6000 168
5.1 8000 168 52.50 58.96 10.09
5.2 8000 168
6.1 10000 168 49.63 - -
6.2 10000 168
7.1 12000 168 50.95 57.80 -
7.2 12000 168
8.1 16000 168 46.46 72.44 14.63
8.2 16000 168
9.1 20000 168 51.53 70.50 -
9.2 20000 168
10.1 24000 168 49.93 67.58 22.66
10.2 24000 168
0
50
100
150
200
250
0 5000 10000 15000 20000 25000 30000Aver
age
Corr
osi
on
Rate
(m
py)
Inhibitor Concentration (ppm)
Solid PDPE Liquid PDPE Commercial

106
Obtained results of EI% was compared with previous results obtained by Loto
(2017). He investigated the synergistic properties of BNV (combined admixture of
benzenecarbonitrile and 5-bromovanillin) on 1018 carbon steel in 1 molarity
concentration of 𝐻𝐶𝑙 by the same weight loss method. His findings are displayed in
Table 4.3. BNV was considered by the author as a suitable and effective inhibitor for
the same acidic medium, but with less acidic solution of 1M 𝐻𝐶𝑙. Also, it was chosen
for comparison with our green inhibitor based on similarity of inhibition mechanism
in terms of physical adsorption and reaction with chloride anions. The obtained results
of BNV are illustrated in Figure 4.10. The significant observation here is the higher
efficiency of 90% at concentration of 15000 ppm compared to 72.44% of PDPE at
16000 ppm concentration, but this can be justified due to less acidic medium used for
BNV investigation. Hence, inhibition efficiency of BNV is expected to be comparable
to our green inhibitor when exposed to the same acidic medium of 2M 𝐻𝐶𝑙.
Table 4.3: Corrosion IE% of BNV at different concentrations on 1018CS in 1M 𝐻𝐶𝑙 (Loto, 2017)
Test
No.
Inhibitor
Concentration
(ppm)
Weight
Loss
(g)
Immersion
Period
(Hours)
Corrosion Inhibition
Efficiency %
BNV Commercial Inhibitor
1 0 3.428 504 0
2 2500 1.923 504 43.91
3 5000 0.817 504 76.18
4 7500 0.661 504 80.73
5 10000 0.430 504 87.46
6 12500 0.331 504 90.34
7 15000 0.341 504 90.06

107
Figure 4.10: Corrosion IE% of different inhibitors concentrations in 2M 𝐻𝐶𝑙
Based on literatures reviewed in Chapter 2 and obtained experimental results,
inhibition mechanism can be explained because of a physical adsorption of PDPE on
the metal surface. Generally, physical adsorption results from electrostatic attraction
forces arise between the electric charges on the metal surface and organic ions or
dipoles of the inhibitor. Many evidences of this mechanism were observed. First, when
the inhibitor is added to a continuously stirred corrosive medium randomly. After some
time, inhibitor tends to be adsorbed spontaneously on the metal surface and inhibitor
formed layer was observed microscopically. Another evidence is that inhibitor layer
covering the metal surface is removed mechanically by using a non-metal brush and
without a requirement for chemical cleaning or activation energy, where the chemical
cleaning after corrosion test is only required to remove traces of corrosion products
from the metal surface. These facts would strongly proof that a weak electrostatic force
is established between metal surface and inhibitor’s particles, such as Van der Waal
force.
0
10
20
30
40
50
60
70
80
90
100
0 5000 10000 15000 20000 25000 30000
EI
%
Inhibitor Concentration (ppm)
Solid PDPE Liquid PDPE Commercial BNV

108
The difference in inhibiting efficiency of solid and liquid forms can be
explained when both forms are added randomly to identical stirred corrosive medium,
where solid extract particles are bounded with each other to form larger particles.
Large particles were observed to cover less surface of the metal and consequently,
more porous inhibitor layer on metal surface. On the other hand, when liquid form
extract is added to identical acidic corrosive medium, it reacts with 𝐻𝐶𝑙 medium and
turns also to solid particles but with finer sizes. Smaller particles were observed to
allow more coverage of the metal surface, or less porous inhibitor layer, which can
also be observed microscopically. Hence, higher inhibition efficiency and anti-
oxidation act against corrosive medium.
As an evidence on both observations of inhibiting mechanism and higher
efficiency of liquid form inhibitor, another corrosion test was done, after dipping the
metal coupon in liquid PDPE, under identical conditions of temperature and time.
Corrosion inhibition efficiency was even higher than earlier results and was calculated
to be 84%. This method of inhibiting corrosion was found to be consuming less amount
of inhibitor and results in less corrosion rate.
Addition of 4000 ppm concentration of liquid PDPE has reduced the corrosion
rate of carbon steel from 212.28 mpy to 187.49 mpy, but the corrosion rate was still
high. This can be justified by insufficient molecules to neutralize the action of chloride
ions. Covering metal with insufficient number of molecules would form a layered
major part of the metal surface which will act as a cathodic electrode while the naked
minor part will act as anodic electrode. Hence, the minor part will be corroding in a
faster rate by donating enough electrons for the cathodic major part of the metal
surface. When concentration of PDPE increased from 4000 ppm up to 6000 ppm the
corrosion rate has reduced significantly from 187.49 mpy to 94.26 mpy. This

109
concentration of 6000 ppm can be considered as a minimum limit or a critical
concentration beyond which sufficient molecules of inhibitor exists in the solution to
compose a uniform layer covering most of the metal surface. Hence, the uniform layer
will be more effective to suppress the redox reactions responsible for metal
deterioration. This suppression results from minimizing the rate at which 𝐹𝑒2+ions
tend be released in the solution in the form of dissolved 𝐹𝑒𝐶𝑙2 and consequently repeat
the reaction with the new oxidized 𝐹𝑒2+ ions on the metal surface. Based on
concentration, PDPE molecules is expected to protonate and allow more of its
molecules to donate unshared electrons and so increasing the efficiency by enabling a
stronger adsorption on the metal surface.
Since the liquid inhibitor was found more efficient in corrosion inhibition, it
was worthy to investigate effect of temperature on its inhibition efficiency, in order to
determine limitations of liquid PDPE application in different environmental
conditions. Hence, inhibition efficiency of 16000 ppm liquid PDPE on carbon steel in
2M 𝐻𝐶𝑙 solution was tested under different temperatures of 28.5, 37, 60 and 80 oC. As
a result, it was found that green inhibitor efficiency is reducing with increased
temperature. Table 4.4 summarize the corrosion rate and inhibition efficiency obtained
at each temperature, while Figures 4.11 and 4.12 display the same results relative to
each other. It can be observed that inhibition efficiency decreased as the temperature
was increased which is expected due to the decrease in the solubility of the inhibitor
and consequently less ions formation in the aqueous solution. This fact would also
support the suggested physical adsorption of the inhibitor on metal surface in addition
to other facts explained earlier in this section during the comparison of different
inhibitors.

110
Table 4.4: Temperature effect on average corrosion rates of carbon steel in 2M 𝐻𝐶𝑙 with 16000 ppm liquid PDPE
Run
No.
Inhibitor
Concentration
Immersion
Period
(Hours)
Temperature
(oC)
Average
Corrosion Rate
(mpy)
Efficiency
Without
Inhibitor
Liquid
PDPE IE%
1.1 16000 168 28.5 212.28 58.49 72.45
1.2 16000 168 28.5
2.1 16000 168 37.5 237 71.96 69.64
2.2 16000 168 37.5
3.1 16000 168 62.5 2671.45 1498.5 43.90
3.2 16000 168 62.5
4.1 16000 168 78 10157.26 5946.84 41.45
4.2 16000 168 78
Figure 4.11: Average corrosion rate of carbon steel with 16000 ppm in 2M 𝐻𝐶𝑙 solution at different temperatures
0
2000
4000
6000
8000
10000
12000
0
10
20
30
40
50
60
70
80
90
Aver
age
Corr
osi
on
Rate
(m
py)
Temperature (oC)
Liquid PDPE No Inhibitor

111
Figure 4.12: Temperature effect on IE% of 16000 ppm liquid PDPE in 2M 𝐻𝐶𝑙 solution
Based on effective concentration results which were obtained for liquid PDPE
on carbon steel in 2M 𝐻𝐶𝑙 solution, other tests were conducted to investigate inhibition
efficiency of liquid PDPE on carbon steel in sea water solution. Test was conducted
with different concentrations of 8000, 12000, 16000 and 24000 ppm of liquid PDPE.
As per experimentally obtained results, higher inhibition efficiency of 99.5 % was
achieved on carbon steel with 24000 ppm concentration of green inhibitor in sea water
environment under ambient temperature. Table 4.5 and Figure 4.13 display obtained
average corrosion rates in comparison with 2M 𝐻𝐶𝑙 solution, while Table 4.6 and
Figure 4.14 display average corrosion inhibition efficiency percentage of liquid PDPE
in sea water solution compared with 2M 𝐻𝐶𝑙 solution.
0
10
20
30
40
50
60
70
80
90
100
0
10
20
30
40
50
60
70
80
90
IE%
Temperature (oC)
16000 ppm Liquid PDPE

112
Table 4.5: Corrosion rate comparison of PDP liquid extract in 2M 𝐻𝐶𝑙 and sea water
Run
No.
Inhibitor
Concentration
Immersion
Period
(Hours)
Average Corrosion Rate of Carbon
Steel (mpy) with Liquid PDPE
2M 𝐻𝐶𝑙 Sea Water
1.1 0 168 212.28 12.61
1.2 0 168
2.1 4000 168 187.49 -
2.2 4000 168
3.1 6000 168 94.26 -
3.2 6000 168
4.1 8000 168 87.11 2.77
4.2 8000 168
5.1 12000 168 - 1.61
5.2 12000 168
6.1 16000 168 89.58 0.42
6.2 16000 168
7.1 20000 168 58.49 -
7.2 20000 168
8.1 24000 168 62.61 0.06
8.2 24000 168
Figure 4.13: Average corrosion rate of carbon steel with different concentrations of
liquid PDPE in 2M 𝐻𝐶𝑙 and sea water solutions
0
50
100
150
200
250
0 5000 10000 15000 20000 25000 30000
Aver
age
Corr
osi
on
Rate
(m
py)
Inhibitor Concentration ppm
2M HCl NaCl

113
Table 4.6: Average corrosion IE% of liquid PDPE in 2M 𝐻𝐶𝑙 and sea water solutions
Run
No.
Inhibitor
Concentration
Immersion
Period
(Hours)
Average corrosion Inhibition
Efficiency % with Liquid PDPE
2M 𝐻𝐶𝑙 Sea Water
1.1 0 168 0 0
1.2 0 168
2.1 4000 168 11.67 -
2.2 4000 168
3.1 6000 168 55.59 -
3.2 6000 168
4.1 8000 168 58.96 77.96
4.2 8000 168
5.1 12000 168 57.80 87.17
5.2 12000 168
6.1 16000 168 72.44 96.59
6.2 16000 168
7.1 20000 168 70.50 -
7.2 20000 168
8.1 24000 168 67.58 99.50
8.2 24000 168
Figure 4.14: Average IE% of liquid PDPE on carbon steel in 2M 𝐻𝐶𝑙 and sea water
solutions
0
10
20
30
40
50
60
70
80
90
100
0 5000 10000 15000 20000 25000 30000
Aver
age
IE%
Inhibitor Concentration ppm
2M HCl Sea Water

114
As a comparison of corroded metal in different corrosive mediums, it was
observed that a blackish layer of inhibitor was covering the metal surface when
immersed in 𝐻𝐶𝑙, while a different brownish layer of inhibitor was covering the metal
which was immersed in sea water solution. It is visible to normal human vision, as
shown in Figure 4.15, the difference in appearance of both layers.
Figure 4.15: Comparison of corroded carbon steel coupons with liquid PDPE in 2M
𝐻𝐶𝑙 and sea water solutions
After cleaning the corroded metal surface, both metal surfaces were observed
to have the same appearance which is displayed in Figure 4.16., but with more general
corrosion and pits in the metal which was immersed in 𝐻𝐶𝑙 with PDP liquid extract.
This would be a visible evidence of less inhibition efficiency of PDP liquid extract in
𝐻𝐶𝑙 solution compared to higher inhibition efficiency obtained for 1-week immersion
in sea water solution at identical concentration of 12000 ppm.
Corroded metal coupons
/ 2M 𝐻𝐶𝑙 solution +
12000 ppm liquid PDPE
Corroded metal coupons
/ Sea water solution +
12000 ppm liquid PDPE
Corroded metal coupons
/ 2M 𝐻𝐶𝑙 solution +
8000 ppm liquid PDPE

115
Figure 4.16: Comparison of cleaned carbon steel coupons with liquid PDPE in 2M
𝐻𝐶𝑙 and sea water solutions at identical inhibitor concentration of 12000 ppm
Cleaned metal coupons /
2M 𝐻𝐶𝑙 solution +
12000 ppm liquid PDPE
Cleaned metal coupons /
Sea water solution +
12000 ppm liquid PDPE
Cleaned metal coupons /
2M 𝐻𝐶𝑙 solution +
8000 ppm liquid PDPE
12000 ppm Liquid
PDPE
EI = 57.8%
2M 𝑯𝑪𝒍
12000 ppm Liquid
PDPE EI = 87.17%
Sea water

116
Chapter 5: Conclusion and Recommendations
This research has considered palm date pits as a recyclable waste material for
producing green corrosion inhibitor, while there are unlimited number of waste
materials which can be of significant value for industries as well as environment.
Based on the findings of this work, green corrosion inhibitor can be obtained
by recycling Khalas palm date pits. This can be done through polar extraction using a
mixture of 40% methanol, 40% acetone, 19.9% water and 0.1% formic acid as strong
polar solvents for this extraction. The solid form of palm date pits extract is effective
up to 52.5% in reducing corrosion rate of carbon steel grade S355JR in acidic medium
of 2M 𝐻𝐶𝑙, this efficiency can be achieved at 8000 ppm concentration beyond which
efficiency is stable.
Minimum limit of implementing PDPE was found to be 6000 ppm
concentration below which reduction in corrosion rate is not significant due to
insufficient coverage of the metal surface. However, liquid form of extract can achieve
a higher corrosion inhibition efficiency of 72.4% in 2M 𝐻𝐶𝑙 solution with 16000 ppm
concentration, beyond which efficiency is not increasing significantly with increasing
extract’s concentration.
In a different medium of sea water, the liquid form of palm date pits extract
could achieve 99.5% efficiency in sea water solution with extract’s concentration of
24000 ppm.
Upon completing each corrosion test, it was found that Khalas date pits extract,
in both forms, is forming a physical barrier by being adsorbed on metal surface, which
reduces contact of corrosive medium with metal surface. This layer prevents chloride
ions in 𝐻𝐶𝑙 solution to further attack reaction sites on the metal surface to form

117
𝐹𝑒𝐶𝑙2/𝐹𝑒𝐶𝑙3 salts which would lead to continuous corrosion and higher mass loss at
the same period.
Implementing liquid extract from palm date pits reduces corrosion rate without
changing the acidity of the corrosive medium.
Referring to experimental results obtained, liquid PDPE has shown more stable
performance compared to solid extract, which would result in more reliable and
anticipatable results.
Increasing temperature of corrosive medium from 28.5 oC to 78 oC reduces
corrosion inhibition efficiency of palm date pits liquid extract from 72.44% down to
41.45%.
Since liquid PDPE can be produced with shorter extraction and concentration
period, in addition to having higher corrosion efficiency, liquid extract can be
considered as more economic to produce.
Polyphenolic compounds exist in Khalas date pits, extracted chemically, can
also be used for reserving carbon steel in aggressive aqueous environment by reducing
the rate of redox reactions.
By experimentally comparing commercial inhibitor such as Corrshield
NT4292 and BNV, as passivating inhibitors, palm date pits extract achieved a
relatively high inhibition efficiency. This can be explained as the NT4292 is a nitrite
base which is immediately oxidized in the acidic medium to form nitrates which are
far less effective to inhibit corrosion on metal surface. On the other hand, PDPE can
be comparable to specialized compounds such as BNV to suppress the corrosion rate.
Consequently, another application of Khalas date pits will add potential value
to this waste product, which in turn would positively influence the national economy
and other producers of date and will assist in reserving environment and resources.

118
Recommendations
The following points are recommended for future work:
• Metal dissolution or reflux would produce electrical current for which density
can be measured in electrochemical circuit, so as per Faraday’s Law the current
density measured in electrochemical cell would represent corrosion rate. Based
on this law, corrosion rate and inhibition efficiency can be measured more
accurately through potentiostate.
• Extended experimental work can be done to electrochemically measure
corrosion rates and compare results with weight loss measurement which was
done in this research.
• Further studying of microorganism activities in the presence of PDPE in
different environments will be useful to monitor the influence of PDPE in terms
of microbial corrosion.
• Corrosion rate reduction of Khalas PDPE can be studied in comparison with
other commercial inhibitors.
• Additional measures can be taken to produce enough quantities of PDPE with
other extracting methods; such as using CO2 extraction or even using solar
heaters with the same extraction arrangement. From economic point of view,
this would aim to minimize energy consumption for extraction process, which
represents more than 90% of the production cost at this stage. Hence, reducing
carbon foot print of large scale production process. On the other hand, all
chemicals utilized in this experimental work were recovered and can be reused.
• Finding methods for separating or recovering the green inhibitor such as
filtration system can be integrated solution to minimize the consumption and
requirement for replenishing the inhibitor in the corrosive medium.

119
• Commercial inhibitor used in this investigation is not the best selection for very
low pH solutions like 2M 𝐻𝐶𝑙, due to minimum order quantities from
manufacturers. Hence, it is necessary to implement a fare comparison between
PDP extract and other commercial inhibitors which are suitable for highly acidic
electrolytes such as triple bonded hydrocarbons, acetylenic alcohols,
mercaptans, ...etc. and based on manufacturer recommendation.
• Further investigation of PDP extract’s efficiency can be conducted in different
conditions of weak and strong alkaline solutions.

120
References
Abd-El-Mageed, M. M., N. M. El-Shimi, Hassan and E.M. (1987). Supplementation
of snack food with pollen grains of date palm. Egyptian Journal of Food
Science 15(1): 25-27.
Adejo, S. O., M. M. Ekwenchib, J. A. Gbertyoa, T. Menengea and J. O. Ogbodoc
(2014). Determination of Adsorption Isotherm model best fit for methanol
leaf extract of Securinega virosa as corrosion inhibitor for corrosion of mild
steel in HCl. Journal of Advances in Chemistry 10(5): 2737-2742
Al-Farsi, M., C. Alasalvar, M. Al-Abid, K. Al-Shoaily, M. Al-Amry and F. Al-Rawahy
(2007). Compositional and functional characteristics of dates, syrups, and
their by-products. Food Chemistry 104(3): 943-947.
Al-Farsi, M. and L. Chang Yong (2008a). Optimization of phenolics and dietary fiber
extraction from date seeds. Journal of Food Chemistry 108(3): 977-985.
Al-Farsi, M. and C. Lee (2008b). Nutritional and functional properties of dates:
a review. Critical Reviews in Food Science and Nutrition 48(10): 877-887.
Al-Haj-Ali, A. M., N. A. Jarrah, N. D. Mu'azu and R. O. Rihan (2014).
Thermodynamics and Kinetics of Inhibition of Aluminum in Hydrochloric
Acid by Date Palm Leaf Extract. Journal of Applied Science and
Environmental Management 18(3): 543-551.
Al-Kharafi, F., A. Al-Hashem and F. Martrouk (1995). Economic Effects of Metallic
Corrosion in the State of Kuwait. Kuwait Institute for Scientific Research.
Final report no. 4761.
Al-Rawahi, A. S., M. S. Rahmani, N. Guizani and M. M. Essa (2013). Chemical
Composition, Water Sorption Isotherm, and Phenolic Contents in Fresh and
Dried Pomegranate Peels. Drying Technology 31: 257-263.
Al-Saidi, H. M. (2016). The fast recovery of gold(III) ions from aqueous solutions
using raw date pits: Kinetic, thermodynamic and equilibrium studies. Journal
of Saudi Chemical Society 20(6): 615-624.
Ali, M. A., T. A. Al-Hattab and I. A. Al-Hydary (2015). Extraction of Date Palm Seed
Oil (Phoenix Dacylifera) by Soxhlet Apparatus. International Journal of
Advances in Engineering and Technology 8(3): 261-271.
Altwaiq, A. m., S. i. J. Khouri, S. Al-luaibib, R. Lehmann, H. Drücker and C. Vogt
(2011). The role of extracted alkali lignin as corrosion inhibitor. Journal of
Material and Environment Science 2(3): 259-270.

121
Ancuceanu, R., M. V. Hovanet, A. I. Anghel and M. D. D. C. T. O. Popescu (2017).
Variation of Polyphenols and Iron Concentration in Metha X Piperita L. by
Development Stage and Soil Type. Farmacia 65(5): 749-758.
Antropov, L. I. (1961). Kinetics of Electrode Processes and Null Points of Metals. New
Delhi, Council of Scientific and Industrial Research 108(9): 219C.
Ash, M. and I. Ash (2011). Handbook of corrosion inhibitors. Endicott, N.Y., Synapse
Information Resources 23(2): 439-501.
ASM International (2015). Corrosion in the Petrochemical Industry, Second Edition,
ASM International: 116-118.
ASTM (1972). Annual Book of ASTM Standards. Part 10, Philadelphia, ASTM
International.
Bardal, E. (2003). Corrosion and protection 92. New York ; London, Springer.
Bardal, E., J. M. Drugli and P. O. Gartland (1999). A Review: The Behavior of
Corrosion Resistant Steels in Seawater. University of Delware Sea Grant
College Program, Corrosion Science 30: 343-353.
Basuny, A., S. M. A. and A. A. K. (2012). Antioxidant activities of date pits in a model
meat system. International Food Research Journal 19(1): 223-227.
Behrens, D. (1975). Research and development programme on ‘corrosion and
corrosion protection’ in the German federal republic. British Corrosion
Journal 10(3): 122-127.
Bertocci, U. (1987). Advances in Localized Corrosion: Proceedings of 2nd
International Conf. on Localized Corrosion. Orlando, FL, Nayional
Association of Corrosion Engineers 23: 127-136.
Bhaskaran, R., L. Bhalla, A. Rahman, S. Juneja, U. Sonik, S. Kaur and J. Kaur (2014).
Materials Selection & Design: An Analysis of the Updated Cost of Corrosion
in India 53(8): 56-65.
Cardozo, D. J., G. J. Ponciano and D. Eliane (2014). Aqueous Extracts of Mango and
Orange Peel as Green Inhibitors for Carbon Steel in Hydrochloric Acid
Solution. Materials Research 17(6): 1581-1587.
Chauhan, L. R. and G. Gunasekaran (2007). Corrosion inhibition of mild steel by plant
extract in dilute HCl medium. Journal of Corrosion Science and Engineering
49(3): 1143-1157.

122
Cherry, B. W. and B. S. Skerry (1983). Corrosion in Australia : the report of the
Australian National Centre for Corrosion Prevention and Control feasibility
study, June 1983 / B.W. Cherry and B.S. Skerry. Department of Materials
Engineering, Monash University, Clayton,Vic.
Cheung, L. M., P. C. K. Cheung and V. E. C. Ooi (2003). Antioxidant activity and total
phenolics of edible mushroom extracts. Food Chemistry 81: 249-255.
Cicek, V., B. Al-Numan and N. J. Salem (2011). Corrosion chemistry. Scrivener.
Combrade, P. (2002). Crevice Corrosion of Metallic Materials. Corrosion Mechanisms
in Theory and Practice. P. Marcus. New York, CRC Press: 451.
Council (2018). The U.A.E.'s growing manufacturing sector. 1. United States of
America. Retrieved from http://www.usuaebusiness.org/wp-
content/uploads/2018/01/Manufacturing-Report.pdf
Davis, J. R., WRLC EBSCO E-books and ebrary Inc (2000). Corrosion understanding
the basics. Materials Park, OH, ASM International 1: 2-3.
Derfour, H., Y. Harek and L. Larabi (2014). Corrosion Inhibition Effect of Artemisia
Herba Alba Extract on Carbon Steel in Hydrochloric Acid. International
Conference on Advances in Civil, Structural, Environmental & Bio-
Technology, Kuala Lumpur, Malaysia, Institute of Research Engineers and
Doctors. Inetrnational Journal of Environmental Engineering 1(2): 135-138.
Dexter, S. C. (1999). Galvanic Corrosion. University of Delware Sea Grant College
Program.
Dowson, V. H. W. and A. Aten (1962). Dates: handling, processing and packing.
Rome, Food and Agriculture Organization of the United Nations.
Development paper no. 72.
Dutta, R., S. U. and A. Mukherjee (2014). Extraction of oil from Crotalaria Juncea
seeds in a modified Soxhlet apparatus: Physical and chemical
characterization of a prospective bio-fuel. Fuel 116: 794-802.
Duwell, E. J., J. W. Todd and H. C. Butzke (1964). The mechanism of corrosion
inhibition of steel by ethynylcyclohexanol in acid solution. Corrosion Science
4(1-4): 435-441.
El-Etre, A. Y. (2006). Khillah extract as inhibitor for acid corrosion of SX 316 steel.
Applied Surface Science 258(24): 8521-8525.

123
El-Shurafa, M. Y., H. S. Ahmed and S. E. Abou-Naji (1982). Organic and inorganic
constituents of date palm pit (seed) in Libya. Date Palm Journal 1(2): 275-
284.
Felhi, Samir & Saoudi, Mongi & Daoud, Amal & Hajlaoui, Hafedh & Ncir, Marwa &
Chaabane, Rim & El Feki, Abdelfattah & Gharsallah, Neji & Kadri and Adel
(May 2017). Investigation of phytochemical contents, in vitro antioxidant and
antibacterial behavior and in vivo anti-inflammatory potential of Ecballium
elaterium methanol fruits extract. Food Science and Technology Campinas
37(4): 558-563.
Fontana, M. G. and N. D. Greene (1967). Corrosion engineering. New York ; London,
McGraw-Hill (3): 139-152.
Foroulis, Z. H. (1969). Proceedings Symposium Coupling of Basic and Applied
Corrosion Research. Houston, NACE International 52: 24-33.
Fouda, A. E., A. Abdelnazer, M. Ibrahim and M. Fakih (2013). Ginger Extract as
Green Corrosion Inhibitor for Steel in Sulfide Polluted Salt Water. Journal of
the Korean Chemical Society 57(2): 272-278.
Gabrial, G. N., El-Nahry, F. I., Awadalla, M. Z. and Girgis S.M. (1981).
Unconventional protein sources: date seeds. Zeitschrift für Ernährungs
wissenschaftZeitschrift für Ernährungs wissenschaft 20(4): 263-269.
Ghalib, A. L. (2013). The Inhibitive Effect Of Eucalyptus Camaldulenis Leaves
Extract On The Corrosion Of Low Carbon Steel In Hydrochloric Acid.
Journal of Engineering and Development 17(3): 155-169.
Ghnimi, S., S. Abdullah, A. Karim and A. Kamal-Eldin (2016). Date fruit (Phoenix
dactylifera L.): An underutilized food seeking industrial valorization.
National food science journal 6: 1-10.
Gileadi, E. (1967). Adsorption in Electrochemistry. Electrosorption. Springer US: 1-
18.
Great Britain. Committee on Corrosion and, P. and T. P. Hoar (1971). Report of the
Committee on Corrosion and Protection : a survey of corrosion and protection
in the United Kingdom. London.
Greene, N. D. (1982). Mechanisms and Application of Oxidizing Inhibitors. Journal
of Biological Chemistry 121: 20-33.

124
Guendez, R., S. Kallithraka, D. Makris and P. Kefalas (2005). An analytical survey of
the polyphenols of seeds of varieties of grape (Vitis vinifera) cultivated
in Greece: implications for exploitation as a source of value-added
phytochemicals. Phytochemical Analysis 16(1): 17-23.
Hatch, J. E., WRLC EBSCO E-books, Aluminum Association and American Society
for Metals (1984). Aluminum properties and physical metallurgy. Metals
Park, Ohio, American Society for Metals 33: 301-311.
Hutchings, I. M. (1986). The Erosion of Materials by Liquid Flow. Columbus,
Materials Technological Institute of the Chemical Processing Industry.
Ijsseling, F. P. and E. F. o. Corrosion (2000). Survey of Literature on Crevice
Corrosion (1979-1998). London, The Institute of Materials, Maney
Publishing.
Ituen, E., O. Akaranta and A. James (2017). Evaluation of Performance of Corrosion
Inhibitors Using Adsorption Isotherm Models: An Overview. Chemical
Science International Journal 18(1): 1-34.
Japan (2001). Cost of Corrosion in Japan. Anti-Corrosion Methods and Materials
50(11): 490-512.
Javaherdashti, R. and F. Akvan (2017). Hydrostatic Testing, Corrosion, and
Microbiologically Influenced Corrosion: A Field Manual for Control and
Prevention, CRC Press.
Jayakumar, R. P., J. V. D. Kaleekal, S. Ramkumar and M. K. Parayil (2014).
Investigation on the Effect of Green Inhibitor for Corrosion Protection of
Mild Steel in 1M NaOH Solution. International Journal of Corrosion 15: 1-5.
Kamaraj, P., M. Arthanareeswari, J. Arockiaselvi, R. Vennila and P. Ilamathi (2014).
Podophyllum Hexandrum Fruit Extract as Corrosion Inhibitor of Mild Steel
in 1N HCl. Indian Journal of Applied Research 4(6): 57-59.
Karthik, G. and M. Sundaravadivelu (2016). Studies on the inhibition of mild steel
corrosion in hydrochloric acid solution by atenolol drug. Egyptian Journal of
Petroleum 25(2): 183-191.
Karthik R., Muthukrishnan P., Elangovan A., Jeyaprabha B. and P. P. (2014). Extract
of Cassia senna as Green Inhibitor for the Corrosion of Mild Steel in 1M
Hydrochloric Acid Solution. Advances in Civil Engineering Materials 3(1):
417-430.
Kasim, F. H. (2012). In Situ Transesterification of Jatropha Curcas for Production
Biodiesel. PhD. Thesis, Newcastle University.

125
Kassim, M. J., W. J. Ming, M. H. Hussin and T. K. Wei (2010). Corrosion Inhibition
of Mild Steel in Acidic Solution by Ethanol Extract of Uncaria Gambir. The
Journal of Corrosion Science and Engineering 13: 1-14.
Ke, W. and Z. Li (2008). Survey of Corrosion Cost in China and Preventive Strategies.
Corrosion Science and Technology 7(5): 259-264.
Kruger, J., G. Long, M. Kuriyama and A. J. Goldman (1983). Passivity of Metals and
Semiconductors. Amsterdam, Elsevier Science Publishers: 163-168.
Kumar, K. P. V., M. S. N. Pillai and G. R. Thusnavis (2011). Seed Extract of Psidium
guajava as Ecofriendly Corrosion Inhibitor for Carbon Steel in Hydrochloric
Acid Medium. Material and science technology 27(12): 1143-1149.
Lee, S. E., H. S. Lee and Y. Ahn (1999). Scavenging effect of plant derived materials
on free radicals and active oxygen species. Agricultural Chemistry &
Biotechnology 42(1): 40-44.
Lees, D. J. (1982). Characteristics of Stress Corrosion Fracture Initiation and
Propagation, Metallurgist and Materials Technology: 29-38.
Leidheiser, H. (1987). Corrosion Mechanisms. New York: 183-186.
Leygraf, C. (1955). Atmospheric corrosion. New York, Hong Kong, Marcel Dekker.
Linderborg, S. (1967). Cost of corrosion in Finland. Anti-Corrosion Methods and
Materials 24(3): 234-248.
Lindsay, C. (2014). UAE date-palm production to be recognised as being of global
importance. The National Publication.
Loto, R. (2017). Anti-corrosion performance of the synergistic properties of
benzenecarbonitrile and 5-bromovanillin on 1018 carbon steel in HCl
environment. Scientific Reports 7. Sage Publications.
Mahgoub, F. M. and M. S. Al-Rashdi (2016). Investigate the Corrosion Inhibition of
Mild Steel in Sulfuric Acid Solution by Thiosemicarbazide. Open Journal of
Physical Chemistry 6: 54-66.
Marcus, P. (2011). Corrosion Mechanisms in Theory and Practice, Third Edition 87.
Corrosion Technology. Taylor and Francis.
McCafferty, E. (1979). Corrosion Control by Coatings. Princeton, Science Press.

126
Meyers, K. J., C. B. Watkins, M. P. Pritts and R. H. Liu (2003). Antioxidant and
antiproliferative activities of strawberries. Journal Agricultural Food
Chemistry 51(23): 6887-6892.
Mishra, M. (2018). Encyclopedia of Polymer Applications, 3 Volume Set, CRC Press:
639-647.
Mohammed, M. S. (2015). Study the Pomegranate's Peel Powder as a Natural Inhibitor
for Mild Steel Corrosion. International Journal of Materials Chemistry and
Physics 1(1): 74-81.
Mossa, J. S., M. S. Hifnawy and A. G. Mekkawi (1986). Phytochemical and biological
investigations on date seeds (Phoenix Dactylifera L.) produced in Saudi
Arabia. Arab Gulf Journal of Scientific Research 4(2): 52-66.
NACE, A. (2012). ASTM NACE / ASTMG31 - 12a Standard Guide for Laboratory
Immersion Corrosion Testing of Metals. United Staes, ASTM International.
Nuñez, M. (2007). Prevention of Metal Corrosion: New Research, Nova Science
Publishers 12: 7-18.
Papavinasam, S. (2013). Corrosion control in the oil and gas industry. Sage
Publications.
Pirvu, D. L. C. (2014). Polyphenols and Herbal-Based Extracts at the Basis of New
Antioxidant. National Institute of Chemical-Pharmaceutical R&D,
Department of Pharmaceutical Biotechnologies, Plant Extraction
Laboratories, Bucharest, Romania, CC BY: 181-192.
Platat, C., H. Habib, F. Al Maqbali, N. Jaber and W. Ibrahim (2014). Identification of
Date Seeds Varieties Patterns to Optimize Nutritional Benefits of Date Seeds.
Journal of Nutrition and Food Science 4(8): 8-20.
Pou, T. E., O. J. Murphy, J. O. M. Bockris, L. L. Tongson and M. Monkowski (1984,
2). Proceedings, 9th International Congress on Metallic Corrosion. Toronto
23: 141-152.
Prieto, P., M. Pineda and M. Aguilar (1999). Spectrophotometric quantitation
of antioxidant capacity through the formation of a phosphomolybdenum
complex: Specific application to the determination of vitamin E.
Analytical Biochemistry 269(2): 337-341.
Reetu and A. Hardeep (2017). Study of Corrosion Inhibition of Mild Steel in 0.01M
HCl by Corrosion Inhibitors: A comparative Study. International Journal of
ChemTech Research 10(15): 232-238.

127
Reichardt, C. and T. Welton (2011). Solvents and solvent effects in organic chemistry.
Weinheim, Germany, Wiley-VCH: 418-424.
Revie, R. W. and H. H. Uhlig (2008). Corrosion and corrosion control : an introduction
to corrosion science and engineering. John Wiley & Sons.
Riggs, O. L., C. E. Locke and N. E. Hamner (1973). Corrosion Inhibitors. Houston,
NACE International 12: 7-20.
Riggs, O. L., C. E. Locke and N. E. Hamner (1981). Anodic protection : theory and
practice in the prevention of corrosion. New York ; London, Plenum.
Roberge, P. R. (1999). Handbook of corrosion engineering. McGraw-Hill's
AccessEngineering 2nd Edition: 73-85.
Romassi, G., G. Bignardi and L. Fagus Sylvatica (1987). Terpenoids. Archive der
Pharmazie 320(20): 153-166.
Salas, B. V. and M. S. Wiener (2012). Green Corrosion Inhibitor. XXI International
Materials Research Congress 2012. Cancun, Mexico, National Society of
Corrosion Engineers 12: 1-13.
Sastri, V. S., E. Ghali and M. Elboujdaini (2007). Corrosion prevention and protection:
practical solutions. John Wiley & Sons.
Sathiyanathan, R. A. L., S. Maruthanuthu, M. Selvanayagam, S. Mohanan and N.
Palaniswamy (2005). Corrosion inhibition of mild steel by ethanolic extract
of Ricinus communis leaves. Indian Journal of Chemical Technology 12:
356-360.
Saviour, U., O. I. Bassey, G. Zuhair and O. N. Adewale (2015). Experimental and
Theoretical Studies of Red Apple Fruit Extract as Green Corrosion Inhibitor
for Mild Steel in HCl Solution. Journal of Dispersion Science and Technology
36(6): 789-802.
Sawaya, W. N., J. K. Khalil and W. J. Safi (1984). Chemical composition and
nutritional quality of date seeds. Journal of Food ScienceJournal of Food
Science 49(22): 21-34.
Schutt, H. U. and R. J. Horvath (1987). Crude column overhead corrosion problem
caused by oxidized sulfur species, NACE, Houston, Texas.
Schweitzer, P. A. (2009). Fundamentals of corrosion: mechanisms, causes, and
preventative methods, CRC Press.
Schweitzer, P. A. (1996). Corrosion Engineering Handbook, Taylor & Francis.
128
Shreir, L. L. (2010). 1.05-Basic Concepts of Corrosion. Shreir's Corrosion. Oxford:
Elsevier 23: 89-100.
Strehblow, H. H. (2002). Mechanisms of pitting Corrosion in Corrosion Mechanisms
in Theory and Practices, 2nd ed. New York, Basel, Marcel Dekker.
Strehblow, H. H. (2012). Corrosion mechanisms in theory and practice. Corrosion
Mechanisms in Theory and Practice. P. Marcus. Boca Raton, CRC Press.
Strohecker, R. (1951). Notiz über die Inhaltstoffe der dattelkerne. Deutsche
Lebensmittel Rundschau. Sage Publications.
Sulaiman, S., A. R. Abdul Aziz and M. K. Aroua (2013). Optimization and modeling
of extraction of solid coconut waste oil. Journal of Food Engineering 114:
228-234.
Thomas, J. C. (1976). Corrosion. London, Newnes Butterworths. Sage Publications.
Trabanelli, G. a. C., V. (1970). Advances in corrosion science and technology. New
York, Plenum Press.
Uhlig, H. H. (1950). The Cost of Corrosion to The United States. Corrosion Journal
6(1): 29-33.
Uhlig, H. H. (1971). Corrosion and corrosion control; an introduction to corrosion
science and engineering. New York, Wiley.
Wacher, A. and R. S. Treseder (June 1947). Corrosion Testing Evaluation of Metals
for Process Equipment. 43: 315-326.
Wallen, B. and T. Anderson (1986). Galvanic Corrosion of Copper Alloys in Contact
with a Highly Alloyed Stainless Steel in Seawater, 10th Scandinavian
Corrosion Congress 3: 149-154.
Xiangyu, H., G. Lili and C. Zhending (2018). Corrosion and protection of metal in the
sea water desalination. International Organization of Paleobotany 12: 23-36.
Yousef, A. Y., R. L. Belyea and J. M. Vandepopuliere (1989). Sodium hydroxide
treatment of date pits. Proc. 2nd Symposium on the Date Palm. Saudi Arabia
22: 575-582.
Zaki, A. (2006). Principles of Corrosion Engineering and Corrosion Control, Elsevier
Science & Technology.

129
Appendix
Table A.1: Physical properties of different solvents arranged based on relative
polarity by Reichardt et al., (2011)
Solvent Formula Boiling
point (oC)
Density
(g/mL)
Solubility in
H2O1 (g/100g)
Relative
polarity
Vapor pressure
20 oC
(hPa)
cyclohexane 𝐶6𝐻12 80.7 0.779 0.005 0.006 104
Pentane 𝐶5𝐻12 36.1 0.626 0.0039 0.009 573
Hexane 𝐶6𝐻14 69 0.655 0.0014 0.009 160
Heptane 𝐶7𝐻16 98 0.684 0.0003 0.012 48
carbon tetrachloride 𝐶𝐶𝑙4 76.7 1.594 0.08 0.052 120
carbon disulfide 𝐶𝑆2 46.3 1.263 0.2 0.065 400
p-xylene 𝐶8𝐻10 138.3 0.861 0.02 0.074 15
Toluene 𝐶7𝐻8 110.6 0.867 0.05 0.099 29
Benzene 𝐶6𝐻6 80.1 0.879 0.18 0.111 101
Ether 𝐶4𝐻10𝑂 34.6 0.713 7.5 0.117 587
methyl t-butyl ether 𝐶5𝐻12𝑂 55.2 0.741 4.8 0.124
diethylamine 𝐶4𝐻11𝑁 56.3 0.706 M 0.145 260
dioxane 𝐶4𝐻8𝑂2 101.1 1.033 M 0.164 41
N, N-dimethylaniline 𝐶8𝐻11𝑁 194.2 0.956 0.14 0.179
chlorobenzene 𝐶6𝐻5𝐶𝑙 132 1.106 0.05 0.188 12
Anisole 𝐶7𝐻8𝑂 153.7 0.996 0.10 0.198
ethyl acetate 𝐶4𝐻8𝑂2 77 0.894 8.7 0.228 97
ethyl benzoate 𝐶9𝐻10𝑂2 213 1.047 0.07 0.228
Diglyme 𝐶6𝐻14𝑂3 162 0.945 M 0.244
methyl acetate 𝐶3𝐻6𝑂2 56.9 0.933 24.4 0.253 220
chloroform 𝐶𝐻𝐶𝑙3 61.2 1.498 0.8 0.259 210
3-pentanone 𝐶5𝐻12𝑂 101.7 0.814 3.4 0.265
1,1-dichloroethane 𝐶2𝐻4𝐶𝑙2 57.3 1.176 0.5 0.269 240
cyclohexanone 𝐶6𝐻10𝑂 155.6 0.948 2.3 0.281 5
methylene chloride 𝐶𝐻2𝐶𝑙2 39.8 1.326 1.32 0.309 475
2-pentanone 𝐶5𝐻10𝑂 102.3 0.809 4.3 0.321
2-butanone 𝐶4𝐻8𝑂 79.6 0.805 25.6 0.327 105
1,2-dichloroethane 𝐶2𝐻4𝐶𝑙2 83.5 1.235 0.87 0.327
benzonitrile 𝐶7𝐻5𝑁 205 0.996 0.2 0.333 12
Acetone 𝐶3𝐻6𝑂 56.2 0.786 M 0.355 240
t-butyl alcohol 𝐶4𝐻10𝑂 82.2 0.786 M 0.389 41
Aniline 𝐶6𝐻7𝑁 184.4 1.022 3.4 0.420 0.4
acetonitrile 𝐶2𝐻3𝑁 81.6 0.786 M 0.460 97
3-pentanol 𝐶5𝐻12𝑂 115.3 0.821 5.1 0.463
2-pentanol 𝐶5𝐻12𝑂 119.0 0.810 4.5 0.488
2-butanol 𝐶4𝐻10𝑂 99.5 0.808 18.1 0.506
cyclohexanol 𝐶6𝐻12𝑂 161.1 0.962 4.2 0.509 1.2
1-octanol 𝐶8𝐻18𝑂 194.4 0.827 0.096 0.537
2-propanol 𝐶3𝐻8𝑂 82.4 0.785 M 0.546 44
1-heptanol 𝐶7𝐻16𝑂 176.4 0.819 0.17 0.549
i-butanol 𝐶4𝐻10𝑂 107.9 0.803 8.5 0.552
1-hexanol 𝐶6𝐻14𝑂 158 0.814 0.59 0.559
1-pentanol 𝐶5𝐻12𝑂 138.0 0.814 2.2 0.568
acetyl acetone 𝐶5𝐻8𝑂2 140.4 0.975 16 0.571
1-butanol 𝐶4𝐻10𝑂 117.6 0.81 7.7 0.586 6.3
benzyl alcohol 𝐶7𝐻8𝑂 205.4 1.042 3.5 0.608
1-propanol 𝐶3𝐻8𝑂 97 0.803 M 0.617
acetic acid 𝐶2𝐻4𝑂2 118 1.049 M 0.648 15.3
ethanol 𝐶2𝐻6𝑂 78.5 0.789 M 0.654 59
diethylene glycol 𝐶4𝐻10𝑂3 245 1.118 M 0.713 0.027
Methanol 𝐶𝐻4𝑂 64.6 0.791 M 0.762 128
ethylene glycol 𝐶2𝐻6𝑂2 197 1.115 M 0.790
water, heavy 𝐻2𝑂 101.3 1.107 M 0.991
Water 𝐻2𝑂 100.00 0.998 M 1.000

130
Table A.2: Principal IR Absorptions for Certain Functional Groups
Functional Group Names and
Example compounds
Absorption Ranges (cm-1) [Look for a single absorption in
these regions, unless stated
otherwise]
Type of Vibration Causing IR absorption
Alkanes:
Methane
3000-2800 (Note: The absorption can be
seen as several distinct peaks in
this regions)
H-C-H Asymmetric
and Symmetric
Stretch
1500-1440 H-C-H Bend
Alkenes:
1-Propene
3100-3000 C═C-H Asymmetric
Stretch
1675-1600 C-C═C Symmetric
Stretch
Alkynes:
Propyne
3300-3200 ≡C─H Stretch
2200-2100 C≡C Stretch
Aromatic Rings:
Benzene
3100-3000 C═C-H Asymmetric
Stretch
1600-1580 C-C═C Symmetric
Stretch
1500-1450 C-C═C Asymmetric
Stretch
Phenols and Alcohols:
Phenol Methanol
(Alcohol)
3600-3100 (Note: Phenols MUST have
Aromatic Ring Absorption too.).
Hydrogen bonded O-
H stretch (This peak usually
appears much broader
than the other IR
absorptions).
Carboxylic Acid:
Formic Acid
3400-2400 (This peak always covers the
entire region with a VERY
BROAD peak.)
Hydrogen-bond O-H
Stretch
(Note: This peak can
obscure other peaks
in this region.)
1730-1650 C═O Stretch
Ketones:
Acetone
1750-1625 C═O Stretch
Aldehydes:
Ethanal
1750-2625 C═O Stretch
2850-2800 C-H Stretch off
C═O
2750-2700 C-H Stretch off
C═O

131
Table A.2: Principal IR Absorptions for Certain Functional Groups (Continued)
Functional Group Names and
Example compounds
Absorption Ranges
(cm-1) [Look for a single
absorption in these
regions, unless stated
otherwise]
Type of Vibration Causing IR absorption
Esters:
Methyl Formate
1755-1650 C═O Stretch
(1300-1000) (C-O Stretch)
Ethers:
Diethyl Ether
(aka-Ethyl Ether)
(1300-1000) (C-O Stretch)
Amines-Primary:
Ethylamine
3500-3100
(TWO PEAKS!)
N─H Stretch
1640-1560 N─H Bend
Amines-Secondary:
N-Methylethylamine
3500-3100
(ONE PEAK!)
N─H Stretch
1550-1450 N─H Bend
Nitriles:
Methanenitrile
2300-2200 C≡N Stretch
Nitro Groups:
Nitromethane (Note: Both peaks are <200 cm-1 apart)
1600-1500 N═O Stretch
1400-1300 N═O Bend
Amides:
Methanamide
3500-3100 N-H Stretch (similar to
amines)
1670-1600 C═O Stretch
1640-1550 N-H Bend