THE EFFECT OF INTEREST RATE, INFLATION RATE, GDP, ON REAL ECONOMIC GROWTH RATE IN JORDAN

Available online at www.sciencedirect.com
(2007) 219–229www.elsevier.com/locate/chemgeo
Chemical Geology 245
Rate law for galena dissolution in acidic environment
Patricia Acero ⁎, Jordi Cama 1, Carlos Ayora 1
Institute of Earth Sciences “Jaume Almera”, CSIC, c/ Lluís Solé i Sabarís s/n, Barcelona 08028, Spain
Received 14 May 2007; received in revised form 10 August 2007; accepted 13 August 2007
Editor: J. Fein
Abstract
A dissolution rate law for galena in acidic environment was derived from the steady-state dissolution rates using flow-throughexperiments. The influence of temperature, dissolved oxygen concentration and pH between 1 and 3 was assessed. This rate lawcan be used for predicting galena dissolution behavior in a wide range of conditions analogous to Acid Rock Drainage.
For pH below 2, the dissolution rate law can be expressed as:
RGn;pHb2 ¼ 10�5:7F0:4e�23F3RT a0:43F0:05
Hþ
where RGn is the galena dissolution rate (mol m−2 s−1), R is the gas constant (kJ mol−1 K−1) , T is the temperature (K) and aHþ isthe activity of hydrogen ion in the solution.
Galena dissolution rate law for pH between 2 and 3 can be expressed as:
RGn;pH¼2�3 ¼ 10�8:5F0:4e�15F2RT a�0:78F0:04
Hþ a0:30F0:03O2 aqð Þ
where aO2 aqð Þ is the activity of dissolved oxygen.XPS (X-ray Photoelectron Spectroscopy) examination of the reacted galena samples shows the formation of a lead-deficient and
sulfur-rich surface layer, consistent with the observed non-stoichiometry between dissolved sulfur and lead in all the studiedsolutions.
Based on the S/Pb ratio observed in solution and the reacted surfaces and the pH and dissolved oxygen dependence of the rates,two possible reactions for galena dissolution in acidic aqueous solution are proposed; (1) at pH≤2 the rate seems to be determinedby the protonation of surface sulfur atoms, and (2) at pH≥2 the rate seems to be controlled by the attachment of oxygen to surfacesulfur atoms.
The values obtained for the activation energies (15±2 kJ mol−1 at pH 3 and 23±3 kJ mol−1 at pH 1) suggest that galenadissolution is controlled by diffusion processes or mixed-controlled by diffusion of reactants and products between the bulksolutions and the reacting surfaces.© 2007 Elsevier B.V. All rights reserved.
Keywords: Sulfides; Acid mine drainage; Dissolution kinetics; Lead
⁎ Corresponding author. Present address: Petrology and Geochemistry Area, Earth Sciences Department, University of Zaragoza, Spain. Tel.: +34976761000x3159; fax: +34 9761088.
E-mail address: [email protected] (P. Acero).1 Tel.: +34 934095410; fax: +34 411 0012.
0009-2541/$ - see front matter © 2007 Elsevier B.V. All rights reserved.doi:10.1016/j.chemgeo.2007.08.003

220 P. Acero et al. / Chemical Geology 245 (2007) 219–229
1. Introduction
Galena (PbS) is one of the most important sulfideminerals and the only lead mineral with economicalinterest. Together with other sulfide phases, galena ispresent in a large number of natural environments andmining sites and its weathering is very often an importantsource of pollution due to the release of lead to the soils,surface run-off and groundwaters. The mobility andpotential toxicity associated to galena dissolution isincreased in scenarios undergoing Acid Rock Drainage(ARD), not only because of the enhancement of thesolubility of lead aqueous species at low pH but alsobecause galena seems to dissolve faster in acidic aqueoussolutions (Hsieh and Huang, 1989; De Giudici et al.,2005).
Owing to its environmental implications, manystudies have focused on galena dissolution kinetics inthe last years. Most of the earlier works have focused onthe galena dissolution behavior in the very beginning ofits interaction with solutions (a few hours to a few days)under different conditions of pH, dissolved oxygen andtemperature. In one of the first kinetic studies, Hsieh andHuang (1989) studied the dissolution of galena at 20 °Cand at pH from 2.5 to 9 and observed that galenadissolution rate was almost independent on the avail-ability of dissolved oxygen but very pH-dependent,decreasing sharply when increasing pH in the studiedrange. Rimstidt et al. (1994) assessed the role of Fe(III) ingalena dissolution at pH around 2 and pointed out thatgalena dissolution kinetics was substantially differentfrom pyrite. More recently, De Giudici and Zuddas(2001) and De Giudici et al. (2005) studied thedissolution of freshly cleaved galena (001) surfaces atpH from 1 to around 6 and at temperatures ranging from25 to 75 °C in short experiments (b150 h) and observedthat galena dissolution rate increased with decreasingpH. Finally, two recent short batch studies (less than 1 hof interaction between galena and solutions) carried outunder acidic conditions proposed that galena dissolutionis non-oxidative (Pashkov et al., 2002; Zhang et al.,2004). Moreover, a first order dependence on [H+] wasproposed by (Zhang et al., 2004) for the initial rate ofgalena dissolution within the pH range from 0.43 to 2.45and in the presence of 1 mol l−1 NaCl solutions.
All these earlier studies have focused on the galenadissolution behavior in the very beginning of itsinteraction with solutions (a few hours to a few days).A short duration of experiments usually renders muchfaster dissolution rates than the ones obtained aftermonths (or years) of interaction with solutions becausethere is no time for true steady state to be achieved.
Hence, apparent rates obtained by short experiments arenot applicable for predicting mineral dissolution inscenarios where an extended interaction with solutions isexpected (e.g. in the pores of mine tailings or in acidstreams). In line with this affirmation, galena dissolutionrates obtained in earlier long-term dissolution experi-ments (Domènech et al., 2002; Cama et al., 2005) are upto three orders of magnitude slower than the initial rates.
Even though earlier studies have provided with avery valuable background on galena dissolution kineticsin the initial stages of interaction with solutions, therates and reactions taking place during galena long-termdissolution remain almost unknown. In fact, within theacidic pH range, the steady-state dissolution rate hasonly been obtained at pH 3, at 25 °C and in solutions inequilibrium with atmospheric oxygen (Domènech et al.,2002; Cama et al., 2005).
In an attempt to bridge a part of the existing gapbetween data from short-term dissolution studies andfield conditions, this paper is aimed at gaining insightinto the galena long-term dissolution behavior. The maininnovative aspect of this study with regard to previousworks dealing with galena dissolution is that dissolutionkinetic data were obtained at steady state. Therefore, theresults obtained will be useful for predicting galenadissolution kinetics during extended interaction withacidic solutions, as in environments undergoing ARD.With this goal, the influence of temperature, hydrogenion and dissolved oxygen concentrations at steady-statedissolution were exhaustively studied. As a result, a ratelaw accounting for the effects of these environmentalfactors on galena long-term dissolution was obtained.Moreover, the possible reactions controlling the overallgalena dissolution within the range of the studiedconditions were discussed, based on the observation ofthe evolution of solutions and reacting surfaces.
2. Materials and methods
2.1. Sample characterization
The galena sample used in this study was original fromEl Molar (Catalonian Coastal Range, Spain). X-rayDiffraction (XRD) was performed on thoroughly crushedsamples using a Bruker D5005 difractometer with Cu Kαradiation. Powdered samples were scanned from 0 to 60°2θ with a continuous scan at a rate of 0.083° 2θ perminute. XRD spectra of raw galena showed no evidenceof the presence of any other mineral phase. Microprobeanalysis was carried out in multiple points of the sampleusing an accelerating voltage of 20 kVand a beam currentof 15 nA. The microprobe results confirmed the high
Table 1Results (wt.% and at.%) of the microprobe analyses of galena used inthe experiments
Element Pb S Cu Fe Zn
wt.% 86.56 13.32 0.04 0.04 0.03at.% 50.03 49.74 0.08 0.10 0.06
221P. Acero et al. / Chemical Geology 245 (2007) 219–229
purity of the sample, which contained only trace amountsof copper, iron and zinc (Table 1).
Mineral samples were ground in agate mortar andsieved to obtain the fractionwith particle sizes between 10and 100 μm, used in the flow-through experiments. Thespecific surface area of the ground raw sample wasdetermined to be 0.18±0.03 m2 · g−1 by the BETmethod(Brunauer et al., 1938) using 5-point N2 adsorptionisotherms. Since the dissolution rates were to benormalized with respect to the surface area of the reactedsamples, and provided that the powders resulting fromusual milling operations do contain microparticlesattached to the grains, no attempt of removing fineparticles (smaller than 1μm) adhered to the initial surfaceswas done. On the other hand, one of the methodologicaladvantages of flow-through experiments is that it is notnecessary to carry out any pretreatment of the samples inorder to eliminate the microparticles initially present.Since the dissolution rates are calculated once the steadystate is attained and taking into account the specificsurface corresponding to that stage, the effect of thesample grain size on the rate is completely corrected bynormalization.
X-ray Photoelectron Spectroscopy (XPS) surfaceexamination of the initial and reacted powdered samples,mounted on carbon conducive tabs, was carried out with aPhysical Electronics (PHI) 5500 spectrometer using amonochromatic X-ray source (with an Al Kα line of1486.6 eVenergy and 350W) placed perpendicular to theanalyzer axis and calibrated using the 3d5/2 line of Agwith a width of 0.8 eVand a binding energy of 368.3 eV.All these measurements were made in an ultra highvacuum (UHV) chamber (pressure between 6.6·10−11
and 6.6 · 10−12 atm). The analyser pass energywas 23 eV.An electron flood gun at low energies (below 25 eV) wasused for charge compensation. Comparison of the relativepositions of the different peaks in all the studied spectraindicated that charge shifting can be considered uniform.In addition, examination of the peaks acquired simulta-neously for carbon and oxygen did not show anyasymmetry, which indicated that the asymmetry observedfor lead peaks in the spectra were due to the presence ofdifferent species and not to charge compensationproblems.
A deconvolution of the spectra into differentcomponents was carried out. Each spectrum was fittedby means of an iterative least-squares procedure withGaussian–Lorentzian bands. Bulk-like spectra for theinitial sample were obtained by using argon sputteringto remove any surface oxidation phase (Todd et al.,2003). Due to the low signal-to-noise ratio obtained forsulfur peaks in most of the spectra, they were only usedas supplementary information for the deconvolution oflead peaks. Spectra are shown as raw data corrected forthe peak shifting due to charge by adjusting the C1speak (corresponding to adventitious carbon) to abinding energy of 284.6 eV.
Atomic concentrations of lead and sulfur in the mineralsurfaceswere determined from theXPS peak areas dividedby atomic sensitivity factors, subsequent to Shirleybackground subtraction. According to the microprobeanalysis, the initial sample was assumed to be perfectlystoichiometric. XPS analyses are shown as normalised tolead and sulfur. Loss of potentially present elemental sulfurcould occur due to the lack of sample cooling whileacquiring the measurements. Therefore, even if thepresence of elemental sulfur was not confirmed, it willbe considered as a possibility in the discussion below.
Finally, Scanning Electron Microscopy (SEM) wasperformed on selected Au and C-coated samples inorder to observe the possible morphologic changesproduced during dissolution. SEM examinations werecarried out using an Hitachi H-4100FE instrument withintensity current between 15 and 20 kV.
2.2. Solutions
Input solutions of pH 1, 1.5, 2, 2.5 and 3 were preparedwith analytical reagent grade hydrochloric (HCl) andsulfuric (H2SO4) acids and distilled, double deionizedwater (18.2MΩ · cm). A Crisonmeter and combined glasselectrode with temperature compensation was used tomeasure pH and was calibrated regularly with 2, 4 and 7standard buffer solutions. Input and output pH was thesame (within ±0.05 pH units). When possible, redoxpotential was measured by an Orion combination Pt/Ag–AgCl redox electrode. Themeasurementswere corrected tobe referenced to the Standard Hydrogen Electrode (SHE).Reliable redox potential measurements could not system-atically be obtained because of a large drifting in therecorded values with time. This drifting can be caused bythe low concentrations of aqueous species in the targetsolutions (in most cases less than 10−5 mol L−1), by thepresence of H2S(g) or even by the absence of a clearlydominant redox couple (Nordstrom, 2000). In the cases thatthe redox potential could be measured it was above 0.3 V.

222 P. Acero et al. / Chemical Geology 245 (2007) 219–229
Dissolved oxygen concentrations were determinedusing a Hanna portable meter with compensation oftemperature, salinity and altitude with an accuracy of±0.45 mg L−1. Total lead and sulfur concentrations in thesolutions were determined by Inductively CoupledPlasma Atomic Emission Spectrometry (ICP−AES)using a Thermo Jarrel-Ash instrument with CID detector.Calibration with sets of standards was performed and theregression coefficient exceeded 0.999. Three laboratorystandards were analyzed with every 10 samples to checkfor accuracy and the error was estimated to be below 3%.The detection limits for Pb and S were determined to be4.8 · 10−8 and 3.5 · 10−6mol L−1, respectively.
2.3. Flow-through experiments
The experimental setup used in the present study hasbeen described elsewhere (Cama and Acero, 2005).Experiments were carried out using stirred (Table 2,experiments GA1 to GA15) and non-stirred (NSGA16 toNSGA23) flow-through Lexan reactors with a reactionchamber of 40 mL in volume. Input solutions at the
Table 2Experimental conditions, steady-state values and obtained galena dissolution
Experiment Acidtype
Flow rate(mL min−1)
pH DO(mg L−1)
T(°C)
Pb S
(mol L−1)
GA1 HCI 0.042 3.0 8.7 25 4.9 ·10−5 7GA2 HCI 0.045 2.5 8.7 25 1.6 ·10−5 7GA3 HCI 0.040 2.0 8.7 25 8.0 ·10−6 bGA4 HCI 0.038 1.5 8.7 25 1.9 ·10−5 1GA5 HCI 0.042 1.0 8.7 25 2.1 ·10−5 bGA6 HCI 0.041 3.0 8.7 50 6.4 ·10−5 bGA7 HCI 0.027 1.0 8.7 50 6.2 ·10−5 bGA8 HCI 0.039 3.0 8.7 70 1.0 ·10−4 7GA9 HCI 0.027 1.0 8.7 70 9.6 ·10−5 9GA10 HCI 0.033 3.0 2.0 25 3.4 ·10−5 5GA11 HCI 0.034 3.0 0.2 25 1.9 ·10−5 6GA12 HCI 0.033 1.0 2.0 25 2.0 ·10−5 bGA13 HCI 0.033 1.0 0.2 25 2.3 ·10−5 bGA14 H2SO4 0.045 1.0 8.7 25 1.5 ·10−5 nGA15 H2SO4 0.028 3.0 8.7 25 6.0 ·10−5 nNSGA16 HCI 0.029 3.0 8.7 25 2.3 ·10−5 6NSGA17 HCI 0.027 2.0 8.7 25 7.0 ·10−6 bNSGA18 HCI 0.027 1.0 8.7 25 1.8 ·10−5 bNSGA19 HCI 0.045 3.0 0.2 25 1.3 ·10−5 bNSGA20 HCI 0.034 1.0 0.2 25 1.2 ·10−5 bNSGA21 HCI 0.049 3.0 8.7 50 1.9 ·10−5 bNSGA22 HCI 0.049 3.0 8.7 70 2.2 ·10−5 bNSGA23 HCI 0.050 1.0 8.7 50 4.9 ·10−5 4
Experiments GA1 through GA15 were stirred and experiments NSGA16 thrs.s. = steady state.b.d.l. = below detection limit for S (3.5 ·10−6 mol L−1).n.d. = not determined (dissolved sulfur in experiments carried out with sulfuThe initial surface area in all the experiments was 0.18 m2 g−1. S/Pb represent
desired pH and DO concentrations were introduced inthe reactors by means of a peristaltic pump with a flowrate between 0.027 and 0.050 mL min−1 (Table 2).Reactors were immersed in thermostatized water baths tokeep the temperature at 25, 50 and 70 (±1) °C.
The experiments were carried out until steady statewas reached. By convention, it was considered to beattained when differences in the metal concentration ofthe output solution were within ±10% for at least 200 hand four consecutive leachate samples.
To ensure the desired dissolved oxygen concentration,in the experiments carried out at dissolved oxygenconditions lower than those in equilibrium with a freeatmosphere, input solutions were enclosed in a glove boxpurged with the corresponding O2/N2 gas mixtures (4.5%O2 in N2 for the experiment with 2.0 mg L−1 of dissolvedoxygen and pure N2 for the experiment with 0.2 mg L−1 ofdissolved oxygen). Owing to the technical difficulties tokeep the experiments stirred at the desired temperature intothe glove box, the experiments GA10 to GA13 (Table 2)were carried out by fully immersing the stirred flow-through reactors and tubing into a thermostatized water
rates
S/Pb
Masss.s (g)
Final BET area(m2 g−1)
Rate Pb log (rate Pb)
(mol m−2 s−1)
.4 ·10−6 0.1 0.76 0.30 1.5 ·10−10 −9.8
.0 ·10−6 0.4 0.78 0.28 5.7 ·10−11 −10.2
.d.l – 0.78 0.33 2.1 ·10−11 −10.7
.1 ·10−5 0.6 0.75 0.36 4.3 ·10−11 −10.4
.d.l – 0.80 0.28 6.4 ·10−11 −10.2
.d.l – 0.76 0.27 2.2 ·10−10 −9.7
.d.l – 0.78 0.32 1.1 ·10−10 −9.9
.0 ·10−6 0.1 0.73 0.28 3.3 ·10−10 −9.5
.2 ·10−6 0.1 0.77 0.25 2.2 ·10−10 −9.7
.0 ·10−6 0.1 0.77 0.30 8.0 ·10−11 −10.1
.5 ·10−6 0.1 0.76 0.32 4.6 ·10−11 −10.3
.d.l – 0.76 0.27 5.5 ·10−11 −10.3
.d.l – 0.77 0.35 4.6 ·10−11 −10.3
.d. – 0.80 0.26 5.3 ·10−11 −10.3
.d. – 0.78 0.31 1.1 ·10−10 −9.9
.6 ·10−6 0.3 0.22 0.30 1.6 ·10−10 −9.8
.d.l – 0.42 0.30 2.5 ·10−11 −10.6
.d.l – 0.42 0.30 7.0 ·10−11 −10.2
.d.l – 0.79 0.27 4.7 ·10−11 −10.3
.d.l – 0.75 0.24 3.7 ·10−11 −10.4
.d.l – 0.22 0.30 2.4 ·10−10 −9.6
.d.l – 0.21 0.30 2.8 ·10−10 −9.5
.1 ·10−6 0.1 0.77 0.36 1.5 ·10−10 −9.8
ough NSGA23 were non-stirred.
ric acid).s the ratio between measured sulfur and lead concentrations in solution.

223P. Acero et al. / Chemical Geology 245 (2007) 219–229
bath attached to the glove box in order to prevent anyatmospheric oxygen diffusion into the system. The validityof the obtained rates was examined by carrying out twoadditional non-stirred experiments (Table 2, experimentsNSGA19 and NSGA20) under virtually anoxic conditionsanalogous to experiments GA11 and GA13 (0.2 mg L−1 ofdissolved oxygen), but enclosing the whole experimentalset-up (input and output solutions, pumps and tubing) intothe glove box. In both types of experimental set-up, inputsolutions were also purged with the same gas mixturesfilling the glove box on a regular basis to ensure the desireddissolved oxygen concentrations, which were checked be-fore pumping into the reactors. The dissolution rates ob-tained in the respective duplicates were the same, withinerror, proving the validity of results (Table 2). Dissolvedoxygen variations in the output solutions were not contin-uously monitored because they were found to be withinmeasurement error during previous experimental tests.
After the experiments, the reacted samples werecollected, rinsed with double-distilled water, dried atroom temperature and stored in closed microvials untilexamination by Scanning Electron Microscopy (SEM),X-Ray Photoelectron Spectroscopy (XPS) and deter-mination of their BET surface area.
2.4. Calculation of steady-state dissolution rates
In a flow-through reactor, the steady-state dissolutionrate (r, in mol·m−2· s−1) is calculated according to thefollowing simple mass-balance equation
r ¼ q ci � c0i� �
viAð1Þ
where q is the flow rate of the solution through thereactor, νi is the stoichiometric coefficient of the ielement in the studied material and A is the total surfacearea of the mineral sample, in area units. The notationsci and ci
0 represent the out and in-flowing concentrationsof the i element, respectively.
The error associated with the calculated dissolutionrates was calculated by the Gaussian error propagationmethod (Barrante, 1974) to be around 16% and it wasdominated by the uncertainty of BET surface areameasurements (±15%).
Fig. 1. Variation in lead concentrations as a function of time in threerepresentative experiments at pH 3 (experiment GA1), pH 2 (GA3) and1 (GA5). Open symbols denote values of lead concentrations used tocalculate average steady states. Initial concentrations at pH 3 areomitted to improve the quality of the figure.
3. Results and discussion
The steady-state results of the flow-through experi-ments are presented in Table 2. Most of the experimentsran for 1200 to 1800 h, attaining steady state only after500 to 1000 h of interaction with the solutions. Steady
state was maintained in most cases for more than 300 hand calculated total dissolved mass of galena throughoutthe experiments was in all cases less than 5% of theinitial mass of the sample.
Lead and sulfur concentrations in the output solutionswere highest at the start of the experiments, decreasingthereafter until steady state was attained (Fig. 1). Sulfurconcentrations in the output solutions were always lowerthan the lead concentrations and H2S(g) odour was noticedduring collection of some of the output solutions. Hence,dissolution rates were based only on lead concentrations.Sulfur deficit in solution has not only been described inearlier works on galena dissolution (Fornasiero et al.,1994a;DeGiudici andZuddas, 2001; Pashkov et al. 2002;Cama and Acero, 2005; Cama et al., 2005; De Giudiciet al., 2005) but also in studies on the dissolution of othersulfide minerals, such as pyrite (Domènech et al., 2002);pyrrhotite (Janzen et al., 2000), chalcopyrite (Lu et al.,2000; Devi et al., 2000; Antonijevic and Bogdanovic,2004) or sphalerite (Buckley et al., 1989; Lochmann andPedlik, 1995; Weisener et al., 2003, 2004).
Dissolution rates were normalized to the estimatedfinal mass and BET surface area. The solution saturationstate was estimated assuming congruent galena dissolu-tion. According to calculations run with the PHREEQCcode (Parkhurst, 1995) using the lowest measured redoxpotential, output solutions were unsaturated with respectto galena or anglesite (PbSO4). The only exceptions werethe experiments carried out using sulfuric acid solution(experiments GA14 and GA15) in which supersaturationwith respect to anglesite was observed. However,
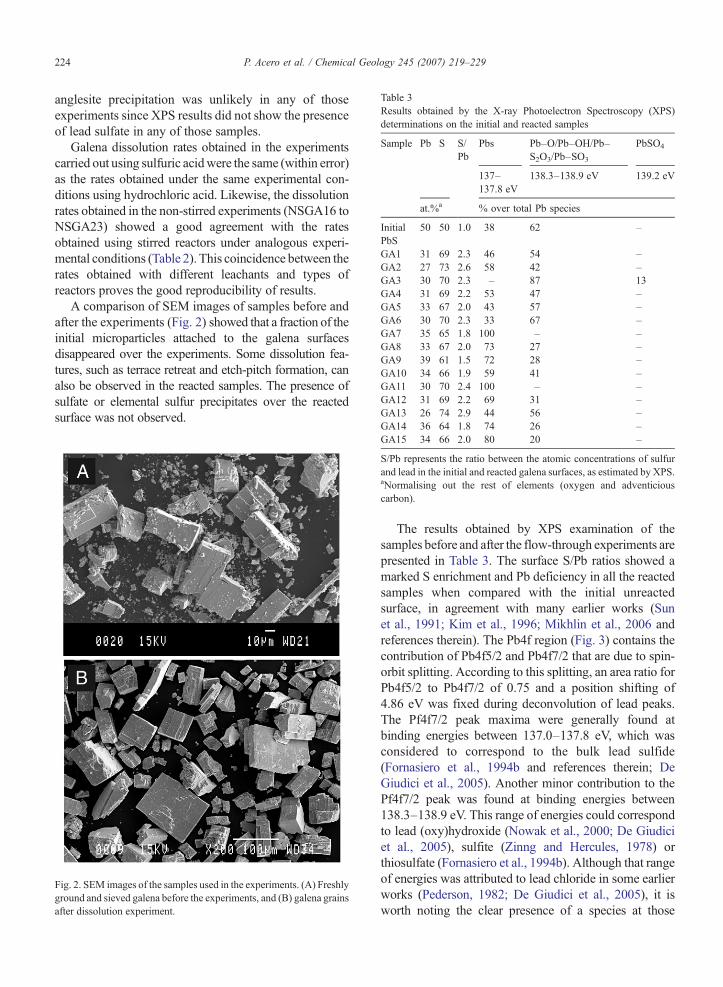
Table 3Results obtained by the X-ray Photoelectron Spectroscopy (XPS)determinations on the initial and reacted samples
Sample Pb S S/Pb
Pbs Pb–O/Pb–OH/Pb–S2O3/Pb–SO3
PbSO4
137–137.8 eV
138.3–138.9 eV 139.2 eV
at.%a % over total Pb species
InitialPbS
50 50 1.0 38 62 –
GA1 31 69 2.3 46 54 –GA2 27 73 2.6 58 42 –GA3 30 70 2.3 – 87 13GA4 31 69 2.2 53 47 –GA5 33 67 2.0 43 57 –GA6 30 70 2.3 33 67 –GA7 35 65 1.8 100 – –GA8 33 67 2.0 73 27 –GA9 39 61 1.5 72 28 –GA10 34 66 1.9 59 41 –GA11 30 70 2.4 100 – –GA12 31 69 2.2 69 31 –GA13 26 74 2.9 44 56 –
224 P. Acero et al. / Chemical Geology 245 (2007) 219–229
anglesite precipitation was unlikely in any of thoseexperiments since XPS results did not show the presenceof lead sulfate in any of those samples.
Galena dissolution rates obtained in the experimentscarried out using sulfuric acidwere the same (within error)as the rates obtained under the same experimental con-ditions using hydrochloric acid. Likewise, the dissolutionrates obtained in the non-stirred experiments (NSGA16 toNSGA23) showed a good agreement with the ratesobtained using stirred reactors under analogous experi-mental conditions (Table 2). This coincidence between therates obtained with different leachants and types ofreactors proves the good reproducibility of results.
A comparison of SEM images of samples before andafter the experiments (Fig. 2) showed that a fraction of theinitial microparticles attached to the galena surfacesdisappeared over the experiments. Some dissolution fea-tures, such as terrace retreat and etch-pitch formation, canalso be observed in the reacted samples. The presence ofsulfate or elemental sulfur precipitates over the reactedsurface was not observed.
Fig. 2. SEM images of the samples used in the experiments. (A) Freshlyground and sieved galena before the experiments, and (B) galena grainsafter dissolution experiment.
GA14 36 64 1.8 74 26 –GA15 34 66 2.0 80 20 –
S/Pb represents the ratio between the atomic concentrations of sulfurand lead in the initial and reacted galena surfaces, as estimated by XPS.aNormalising out the rest of elements (oxygen and adventiciouscarbon).
The results obtained by XPS examination of thesamples before and after the flow-through experiments arepresented in Table 3. The surface S/Pb ratios showed amarked S enrichment and Pb deficiency in all the reactedsamples when compared with the initial unreactedsurface, in agreement with many earlier works (Sunet al., 1991; Kim et al., 1996; Mikhlin et al., 2006 andreferences therein). The Pb4f region (Fig. 3) contains thecontribution of Pb4f5/2 and Pb4f7/2 that are due to spin-orbit splitting. According to this splitting, an area ratio forPb4f5/2 to Pb4f7/2 of 0.75 and a position shifting of4.86 eV was fixed during deconvolution of lead peaks.The Pf4f7/2 peak maxima were generally found atbinding energies between 137.0–137.8 eV, which wasconsidered to correspond to the bulk lead sulfide(Fornasiero et al., 1994b and references therein; DeGiudici et al., 2005). Another minor contribution to thePf4f7/2 peak was found at binding energies between138.3–138.9 eV. This range of energies could correspondto lead (oxy)hydroxide (Nowak et al., 2000; De Giudiciet al., 2005), sulfite (Zinng and Hercules, 1978) orthiosulfate (Fornasiero et al., 1994b). Although that rangeof energies was attributed to lead chloride in some earlierworks (Pederson, 1982; De Giudici et al., 2005), it isworth noting the clear presence of a species at those
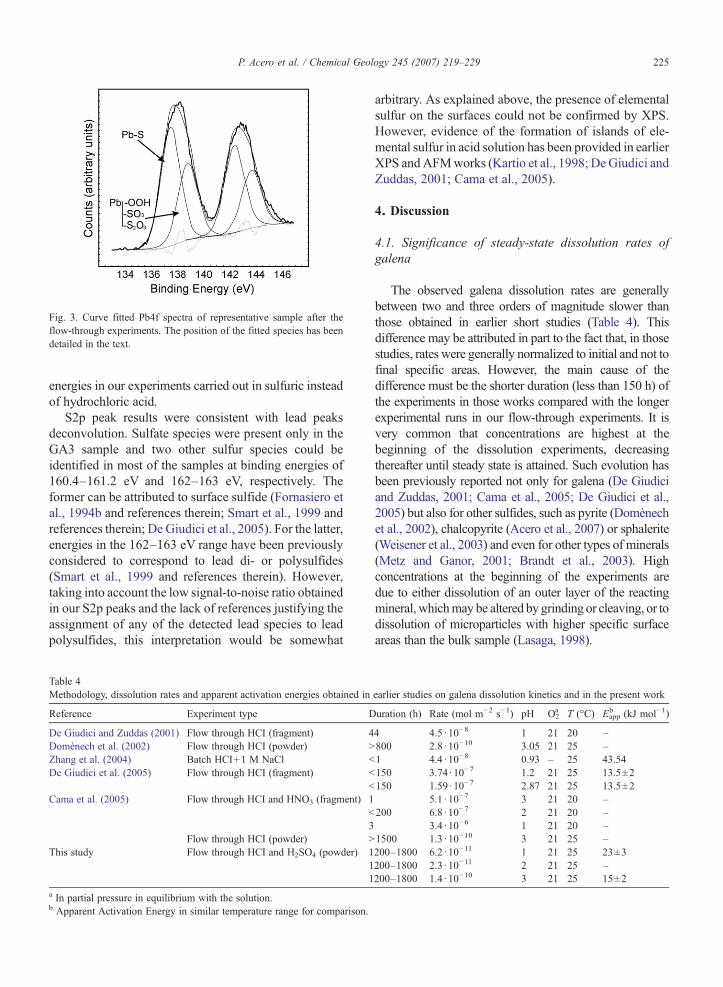
Fig. 3. Curve fitted Pb4f spectra of representative sample after theflow-through experiments. The position of the fitted species has beendetailed in the text.
225P. Acero et al. / Chemical Geology 245 (2007) 219–229
energies in our experiments carried out in sulfuric insteadof hydrochloric acid.
S2p peak results were consistent with lead peaksdeconvolution. Sulfate species were present only in theGA3 sample and two other sulfur species could beidentified in most of the samples at binding energies of160.4–161.2 eV and 162–163 eV, respectively. Theformer can be attributed to surface sulfide (Fornasiero etal., 1994b and references therein; Smart et al., 1999 andreferences therein; De Giudici et al., 2005). For the latter,energies in the 162–163 eV range have been previouslyconsidered to correspond to lead di- or polysulfides(Smart et al., 1999 and references therein). However,taking into account the low signal-to-noise ratio obtainedin our S2p peaks and the lack of references justifying theassignment of any of the detected lead species to leadpolysulfides, this interpretation would be somewhat
Table 4Methodology, dissolution rates and apparent activation energies obtained in
Reference Experiment type D
De Giudici and Zuddas (2001) Flow through HCI (fragment) 4Domènech et al. (2002) Flow through HCI (powder) NZhang et al. (2004) Batch HCI+1 M NaCl bDe Giudici et al. (2005) Flow through HCI (fragment) b
bCama et al. (2005) Flow through HCI and HNO3 (fragment) 1
b3
Flow through HCI (powder) NThis study Flow through HCI and H2SO4 (powder) 1
11
a In partial pressure in equilibrium with the solution.b Apparent Activation Energy in similar temperature range for comparison.
arbitrary. As explained above, the presence of elementalsulfur on the surfaces could not be confirmed by XPS.However, evidence of the formation of islands of ele-mental sulfur in acid solution has been provided in earlierXPS andAFMworks (Kartio et al., 1998; DeGiudici andZuddas, 2001; Cama et al., 2005).
4. Discussion
4.1. Significance of steady-state dissolution rates ofgalena
The observed galena dissolution rates are generallybetween two and three orders of magnitude slower thanthose obtained in earlier short studies (Table 4). Thisdifference may be attributed in part to the fact that, in thosestudies, rates were generally normalized to initial and not tofinal specific areas. However, the main cause of thedifference must be the shorter duration (less than 150 h) ofthe experiments in those works compared with the longerexperimental runs in our flow-through experiments. It isvery common that concentrations are highest at thebeginning of the dissolution experiments, decreasingthereafter until steady state is attained. Such evolution hasbeen previously reported not only for galena (De Giudiciand Zuddas, 2001; Cama et al., 2005; De Giudici et al.,2005) but also for other sulfides, such as pyrite (Domènechet al., 2002), chalcopyrite (Acero et al., 2007) or sphalerite(Weisener et al., 2003) and even for other types of minerals(Metz and Ganor, 2001; Brandt et al., 2003). Highconcentrations at the beginning of the experiments aredue to either dissolution of an outer layer of the reactingmineral, whichmay be altered by grinding or cleaving, or todissolution of microparticles with higher specific surfaceareas than the bulk sample (Lasaga, 1998).
earlier studies on galena dissolution kinetics and in the present work
uration (h) Rate (mol m−2 s−1) pH O2a T (°C) Eapp
b (kJ mol−1)
4 4.5 ·10−8 1 21 20 –800 2.8 ·10−10 3.05 21 25 –1 4.4 ·10−8 0.93 – 25 43.54150 3.74·10−7 1.2 21 25 13.5±2150 1.59·10−7 2.87 21 25 13.5±2
5.1 ·10−7 3 21 20 –200 6.8 ·10−7 2 21 20 –
3.4 ·10−6 1 21 20 –1500 1.3 ·10−10 3 21 25 –200–1800 6.2 ·10−11 1 21 25 23±3200–1800 2.3 ·10−11 2 21 25 –200–1800 1.4 ·10−10 3 21 25 15±2

Fig. 5. Galena dissolution rate dependence on dissolved oxygen at pH3 and 25 °C.
226 P. Acero et al. / Chemical Geology 245 (2007) 219–229
As explained above, steady state in flow-throughexperiments was attained only after 500 to 1000 h ofinteraction with the solutions. If lead concentrations at thebeginning of our experiments were considered to be insteady state, rates much closer to those previously reportedwould have been obtained. In line with this explanation,the galena dissolution rates obtained in the present studymatch very closely the rates proposed by Domènech et al.(2002) and Cama et al. (2005), which carried out the onlyearlier long-term dissolution studies (Table 4).
This discrepancy between initial and long-termdissolution rates highlights the necessity of findingdissolution rates based on true steady state if predictionof the long term behavior is intended. Even though batchor mixed flow-through experiments can be very useful togain insight into the reactions and mechanisms involvedin heterogeneous reactions, their results can not be ap-plied a priori for quantitative, long term prediction.
As described in Section 3, the dissolution rates obtainedin the experiments carried out in sulfuric acid were thesame, within error, as the rates obtained in hydrochloricacid. Therefore, the type of electrolyte used does not seemto exert any influence on galena dissolution under thestudied conditions. Hence, the dissolution rates here pre-sented can be used in prediction of galena dissolutionbehavior in natural ARD, in which sulfate is the mainanionic species.
4.2. Effects of pH, DO and temperature on galenadissolution rates
The variation of the galena dissolution rate with pHat 25 °C and 8.7 mg L−1 DO is shown in Fig. 4.Twodifferent trends in the dissolution rate with pH variations
Fig. 4. Galena dissolution rate dependence on pH at 25 °C and 8.7 mgL−1 of dissolved oxygen.
can be clearly appreciated. Whereas for pH valuesbetween 2 and 3, the rates increased with pH increase, adecrease in pH below 2 increased the galena dissolutionrate. Consequently, the minimum rate was obtained atpH 2. This evolution of the rates with pH was clearlyobserved in replicate experiments (Table 2 and Fig. 4).
Calculation of the reaction order of galena dissolutionwith respect to aHþ yielded a value of 0.43±0.05 for pHvalues below 2 and −0.78±0.04 for pH values above 2.The reaction order with respect to the hydrogen ionactivity at pH below 2 is lower than the order 1previously proposed by Zhang et al. (2004), which canonly be attributed to differences in the type of experimentcarried out (long-term flow-through vs. short batchexperiments).
The dependence of galena dissolution rate on dis-solved oxygen concentration and temperature was as-sessed at two different pH values (pH 1 and 3),representing the two pH ranges with different pH-depen-dence of the rate. Rates obtained at 25 °C and at threedifferent dissolved oxygen concentrations (8.7, 2.1 and0.2 mg L−1) showed that the galena dissolution rate at pH3 is DO-dependent, decreasing when the dissolvedoxygen concentration decreases (Fig. 5). This type ofdependence has been previously reported for other sulfideminerals, such as pyrite (Nicholson et al., 1988; William-son and Rimstidt, 1994; Domènech et al., 2002). Reactionorder of galena dissolution rate with respect to dissolvedoxygen at pH 3 was calculated to be 0.30±0.03.
On the contrary, galena dissolution rate is indepen-dent of dissolved oxygen concentrations at pH 1, beingthe rates obtained at the three different dissolved oxygenconcentrations the same within error (Table 2). Thisvariation on the DO-dependence of the dissolution rates

227P. Acero et al. / Chemical Geology 245 (2007) 219–229
with pH suggests that different dissolution reactions arepredominant at different pH ranges.
To obtain the apparent activation energies, severalexperiments were carried out at 25, 50 and 70 (±1 °C)whilst maintaining both pH and dissolved oxygen con-centration constant (pH 1 or 3 and 8.7 mg L−1 of dis-solved oxygen). The dissolution rates obtained are shownin Table 2 and in Fig. 6. The value obtained for theapparent activation energy was 23±3 kJ mol−1 at pH 1and 15±2 at pH 3.
4.3. Galena dissolution rate law
Overall dissolution rate of a mineral within a certainrange of far-from-equilibrium conditions is proportionalto a fractional power of the activity of catalysts orinhibitors, according to (modified from Lasaga et al.,1994):
r ¼ k e�Ea=RT jianii ð2Þ
where k is a rate constant, Ea is the apparent activationenergy of the overall dissolution reaction, R is the gasconstant, T is the temperature (K). In Eq. (2), airepresents the activity of any other species in solutionwhich could have catalytic or inhibitory effect in theoverall dissolution rate, being ni the reaction order of thedissolution rate with respect to ai.
The deduced reaction orders of the galena dissolutionrate with respect to the H+ activity, the dissolved oxygenactivity, the apparent activation energy (Ea) and thedissolution constant (k), estimated from multiple linearregression of the experimental dissolution rates, yieldthe galena dissolution rate laws. For pH below 2, the
Fig. 6. Galena dissolution rate dependence on temperature at pH 1(triangles) and 3 (circles) and 8.7 mg L−1 of dissolved oxygen.
galena dissolution rate law can be expressed as:
RGn;pHb2 ¼ 10�5:7F0:4e�23F3RT a0:43F0:05
Hþ ð3Þwhere RGn is the galena dissolution rate (mol m−2 s−1),R is the gas constant (kJ mol−1 K−1) , T is the tempera-ture (K) and aHþ is the activity of H+ in solution.
At pH between 2 and 3, the rate law for galenadissolution can be expressed as
RGn;pH¼2�3 ¼ 10�8:5F0:4e�15F2RT a�0:78F0:04
Hþ a0:30F0:03O2 aqð Þ ð4Þ
where aO2 aqð Þ is the activity of dissolved oxygen.
4.4. Galena dissolution reactions
Galena dissolution rates exhibited a clear pH-dependence within the range of conditions studied inthis paper, being lowest at pH around 2 and increasingfrom that point with any increase or decrease in thehydrogen ion activity in solution.
In the pH range from 1 to 2 dissolution rates wereindependent of the dissolved oxygen concentrations butincreased when H+ activity in solution was increased. Thisbehavior is consistent with a dissolution reaction consist-ing in protonation of the galena surface. The only proto-nation mechanism that has been proven to be energeticallyfavorable in aqueous solution consists of attachment ofthree H+ onto three surface S atoms surrounding a centralPb atom, which is then replaced by a fourth H+ (Gersonand O'Dea, 2003). According to these authors, thesubsequent removal of H2S(aq) following a second proto-nation of any of the surface S atoms is energeticallyunfavorable, which could lead to the formation of a Pb-deficient S-rich surface as observed in this study and inearlier works (Sun et al., 1991; Kim et al., 1996; Mikhlinet al., 2006 and references therein). Although the non-stoichiometry S/Pb in solution and theXPS examination ofthe reacted surfaces in our experiments are both perfectlyconsistent with that hypothesis, the observed H2S(g)volatilization suggests that a fraction of surface sulfur isreleased to solution as HS−, forming thereafter H2S(aq),which can be transformed to H2S(g) and lost.
In the range of pH from 2 to 3, galena dissolution ratesincreased with decreasing pH and also with increasingdissolved oxygen concentrations. These differences inbehavior, compared to the range from 1 to 2, suggest thatdifferent rate-determining reactions were taking place. Thefact that galena dissolution rates depend on the dissolvedoxygen concentration suggests that the rate-controllingdissolution reaction within this pH range is oxidative. Theresults obtained in our experiments are consistent with, at
228 P. Acero et al. / Chemical Geology 245 (2007) 219–229
least, one of the mechanisms for acidic aerobic dissolutionproposed byGerson andO'Dea (2003). According to theseauthors, an energetically possible mechanism of galenaoxidative dissolution is initiated when molecular O2
spontaneously disassociates if placed diagonally betweentwo surface S atoms. However, in acidic aqueous solutions,a fraction of sulfur surface atoms must be protonated. Itseems clear that themore protonated the galena surface, themore difficult the attachment of oxygen to sulfur surfaceatoms. This hypothesis would explain why galena dis-solution rates decreased with pH decreasing from 3 to 2. Inline with this hypothesis, the fact that the minimumrates were obtained at pH 2 would be related to thepresence around that pH value of the point of zero netcharge (PZNC) for galena. Although previously reportedPZNCgalena are fairly disperse, there is an almost generalagreement for values between 1.4 and 3 (Hsieh andHuang,1989 and references therein; Bebie et al., 1998).
The obtained apparent activation energies were around20 kJmol−1 (23 kJmol−1 at pH1 and 15 kJmol−1 at pH3).Values of the activation energy lower than 20 kJ mol−1 areusually considered to be associated with diffusion-controlled dissolution kinetics, whereas higher values areusually attributed to surface reaction control (Lasaga,1998), at least in silicates. According to these observations,galena dissolution seems to be controlled by diffusionprocesses or mixed-controlled by diffusion and surfaceprocesses. When the dissolution of a mineral is diffusion-controlled, the dissolution rate is expected to vary if thestirring rate is changed (Berner, 1980). As explained inSection 3, dissolution rates obtained with and withoutstirring were always the same within error under theexperimental conditions presented in this paper. At present,we do not have any explanation for this apparentcontradiction between diffusion-control and lack ofvariation of the rates with stirring, but future research onthis topic is granted.
5. Conclusions
Galena dissolution rates and reactions were studied bymeans of stirred and non-stirred flow-through experi-ments at pH from 1 to 3, at temperatures from 25 to 70 °Cand under three different dissolved oxygen concentra-tions. The obtained results showed that galena dissolutionrate is lowest at pH around 2, increasing from that pointwith any increase or decrease in the pH. The reactionorder with respect to H+ activity was found to be 0.43±0.05 at pH below 2 and −0.78±0.04 from pH 2 to 3.
At pH 1, galena dissolution rates were independent ofthe dissolved oxygen concentrations, whereas at pH 3dissolution rates increased with increasing dissolved
oxygen activity. In this last case, the reaction order withrespect to the dissolved oxygen activity was found to be0.30±0.03.
Measured dissolution rates increased with temperature,yielding apparent activation energies of 23±3 kJ mol−1 atpH 1 and 15±2 kJ mol−1 at pH 3. Both energy values areconsistent with a kinetic regime controlled by diffusionprocesses or mixed-controlled by diffusion and surfacereactions.
XPS examination of the samples showed that galenareacted surfaces were metal-deficient and S-rich com-pared to the initial unreacted sample. Taking into accountthe variations of the galena dissolution rate with pH anddissolved oxygen, the low S/Pb ratio in solution for all theexperiments carried out, the XPS results and previouslypublished thermodynamic calculations by Gerson andO'Dea (2003), two possible galena dissolution reactionsare proposed; 1) protonation of surface S atoms withsubsequent formation of a sulfur-rich surface layer andrelease of a part of sulfur as HS-, and 2) disassociation ofmolecular O2 and attachment to two surface sulfur atoms,with subsequent release of lead and sulfur.
Acknowledgements
This work was funded by the Research and Develop-ment Contracts REN 2000-1003-C03-01 and REN 2003-0950-C04-02 with the Spanish Government. PA wasfinancially supported by the Spanish Government withPhD fellowship. We gratefully acknowledge the fruitfuldiscussions with Araceli Garrido and VolkerMetz and theanalytical assistance of Javier Pérez, Rafael Bartrolí,Mercè Cabanes, SilviaMartínez and Josep Elvira from theInstituto de Ciencias de la Tierra “Jaume Almera”-CSIC,and Lorenzo Calvo, Joaquim Portillo and Joan Gámezfrom the SCT of the University of Barcelona. We thankthe Editor, Dr Jeremy B. Fein, for his help and comments.The constructive criticisms from Dr. J.D. Rimstidt and ananonymous reviewer have significantly improved theoriginal manuscript.
References
Acero, P., Cama, J., Ayora, C., 2007. Kinetics of chalcopyritedissolution at pH 3. Eur. J. Mineral. 19 (2), 173–182.
Antonijevic, M., Bogdanovic, G., 2004. Investigation of the leachingof chalcopyritic ore in acidic solutions. Hydrometallurgy 73 (3–4),245–256.
Barrante, J., 1974. Applied Mathematics for Physical Chemistry.Prentice-Hall, Inc.
Bebie, J., Schoonen, M., Fuhrmann, M., Strongin, D., 1998. Surfacecharge development on transition metal sulfides: an electrokineticstudy. Geochim. Cosmochim. Acta 62 (4), 633–642.

229P. Acero et al. / Chemical Geology 245 (2007) 219–229
Berner, R.A., 1980. Early diagenesis; a theoretical approach. PrincetonSeries in Geochemistry. Princeton University Press.
Brandt, F., Bosbach, D., Krawczyk-Barsch, E., Arnold, T., Bernhard,G., 2003. Chlorite dissolution in the acid pH-range: a combinedmicroscopic and macroscopic approach. Geochim. Cosmochim.Acta 67 (8), 1451–1461.
Brunauer, S., Emmet, P., Teller, E., 1938. Adsorption of gases inmultimolecular layers. J. Am. Chem. Soc. 60, 309–319.
Buckley, A., Woods, R., Wouterlood, H., 1989. An XPS investigationof the surface of natural sphalerites under flotation-relatedconditions. Int. J. Miner. Process. 26 (1–2), 29–49.
Cama, J., Acero, P., 2005. Dissolution of minor sulphides present in apyritic sludge at pH 3 and 25 °C. Geol. Acta 3, 15–26.
Cama, J., Acero, P., Ayora, C., Lobo, A., 2005. Galena surfacereactivity at acidic pH and 25 °C based on flow-through and in situAFM experiments. Chem. Geol. 214 (3–4), 309–330.
De Giudici, G., Zuddas, P., 2001. In situ investigation of galena dissolu-tion in oxygen saturated solution: evolution of surface features andkinetic rate. Geochim. Cosmochim. Acta 65 (9), 1381–1389.
De Giudici, G., Rossi, A., Fanfani, L., Lattanzi, P., 2005. Mechanismsof galena dissolution in oxygen-saturated solutions: evaluation ofpH effect on apparent activation energies and mineral-waterinterface. Geochim. Cosmochim. Acta 69 (9), 2321–2331.
Devi, N., Madhuchhanda, M., Rao, K., Rath, P., Paramguru, R., 2000.Oxidation of chalcopyrite in the presence of manganese dioxide inhydrochloric acid medium. Hydrometallurgy 57 (1), 57–76.
Domènech, C., de Pablo, J., Ayora, C., 2002. Oxidative dissolution ofpyritic sludge from the Aznalcollar mine (SW Spain). Chem. Geol.190 (1–4), 339–353.
Fornasiero, D., Li, F., Ralston, J., 1994a. Oxidation of Galena II.Electrokinetic Study. J. Colloid Interface Sci. 164 (2), 345–354.
Fornasiero, D., Li, F., Ralston, J., Smart, R.S.C., 1994b. Oxidation ofGalena surfaces I. X-ray photoelectron spectroscopic and disso-lution kinetic studies. J. Colloid Interface Sci. 164 (2), 333–344.
Gerson, A., O'Dea, A., 2003. A quantum chemical investigation of theoxidation and dissolution mechanisms of Galena. Geochim.Cosmochim. Acta 67 (5), 813–822.
Hsieh, Y., Huang, C., 1989. The dissolution of PbS(s) in dilute aqueoussolutions. J. Colloid Interface Sci. 131 (2), 537–549.
Janzen, M., Nicholson, R., Scharer, J., 2000. Pyrrhotite reaction kinetics:reaction rates for oxidation by oxygen, ferric iron, and for nonoxidativedissolution. Geochim. Cosmochim. Acta 64 (9), 1511–1522.
Kartio, I., Laajalehto, K., Suoninen, E., Buckley, A., Woods, R., 1998.The initial products of the anodic oxidation of galena in acidicsolution and the influence of mineral stoichiometry. Colloids Surf.,A Physicochem. Eng. Asp. 133 (3), 303–311.
Kim, B.S., Hayes, R., Prestidge, C., Ralston, J., Smart, R.S.C., 1996.In-situ scanning tunnelling microscopy studies of galena surfacesunder flotation-related conditions. Colloids Surf., A Physicochem.Eng. Asp. 117 (1–2), 117–129.
Lasaga, A., 1998. Kinetic Theory in the Earth Sciences. Princeton Seriesin Geochemistry. Princeton University Press, Princeton, New Jersey.
Lasaga, A., Soler, J., Ganor, J., Burch, T., Nagy, K., 1994. Chemicalweathering rate laws and global geochemical cycles. Geochim.Cosmochim. Acta 58 (10), 2361–2386.
Lochmann, J., Pedlik, M., 1995. Kinetic anomalies of dissolution ofsphalerite in ferric sulfate solution. Hydrometallurgy 37 (1),89–96.
Lu, Z., Jeffrey, M., Lawson, F., 2000. The effect of chloride ions on thedissolution of chalcopyrite in acidic solutions. Hydrometallurgy 56 (2),189–202.
Metz, V., Ganor, J., 2001. Stirring effect on kaolinite dissolution rate.Geochim. Cosmochim. Acta 65 (20), 3475–3490.
Mikhlin, Y.L., Romanchenko, A.S., Shagaev, A.A., 2006. Scanningprobemicroscopy studies of PbS surfaces oxidized in air and etchedin aqueous acid solutions. Appl. Surf. Sci. 252 (16), 5645–5658.
Nicholson, R., Gillham, R., Reardon, E., 1988. Pyrite oxidation incarbonate-buffered solution I. Expermental kinetics. Geochim.Cosmochim. Acta 52 (5), 1077–1085.
Nordstrom, D., 2000. Aqueous redox chemistry and the behavior of ironin acid mine waters. In: Wilkin, R.L.R.T., Ford, R. (Eds.),Proceedings of the Workshop on Monitoring Oxidation-ReductionProcesses for Ground-water Restoration, Dallas, Texas, April 25–27.Enviromental Protection Agency, pp. 43–47. EPA/600/R-02/002.
Nowak, P., Laajalehto, K., Kartio, I., 2000. A flotation related X-rayphotoelectron spectroscopy study of the oxidation of galena surface.Colloids Surf., A Physicochem. Eng. Asp. 161 (3), 447–460.
Parkhurst, D., 1995. User's guide to PHREEQC: a computer program forspeciation, reaction path, advective-transport, and inverse geochem-ical calculations. WRI USGS Geological Report, pp. 95–4227.
Pashkov, G., Mikhlina, E., Kholmogorov, A., Mikhlin, Y., 2002. Effectof potential and ferric ions on lead sulfide dissolution in nitric acid.Hydrometallurgy 63 (2), 171–179.
Pederson, L., 1982. Two-dimensional chemical-state plot for leadusing XPS. J. Electron Spectrosc. Relat. Phenom. 28 (3), 203–209.
Rimstidt, J., Chermak, J., Gagen, P., 1994. Rates of reaction of galena,sphalerite, chalcopyrite and arsenopyrite with Fe(III) in acidicsolutions. In: Alpers, A., Blowes, D. (Eds.), Environmental Geochem-istry of Sulphide Oxidation. American Chemical Symposium Series,vol. 550. American Chemical Society, Washington D.C., pp. 2–13.
Smart, R.S.C., Skinner, W., Gerson, A., 1999. XPS of sulphide mineralsurfaces: metal-deficient, polysulphides, defects and elementalsulphur. Surf. Interface Anal. 28 (1), 101–105.
Sun, Z., Forsling, W., Ronngren, L., Sjoberg, S., 1991. Surface-reactions in aqueous metal sulfide systems. i. fundamental surface-reactions of hydrous pbs and zns. Int. J. Miner. Process. 33 (1-4),83–93.
Todd, E., Sherman, D., Purton, J., 2003. Surface oxidation ofchalcopyrite (CuFeS2) under ambient atmospheric and aqueous(pH 2–10) conditions: Cu, Fe L- and OK-edge X-ray spectroscopy.Geochim. Cosmochim. Acta 67 (12), 2137–2146.
Weisener, C., Smart, R.S.C., Gerson,A., 2003.Kinetics andmechanisms ofthe leaching of low Fe sphalerite. Geochim. Cosmochim. Acta 67 (5),823–830.
Weisener, C., Smart, R.S.C., Gerson, A., 2004. A comparison of thekinetics and mechanism of acid leaching of sphalerite containing lowand high concentrations of iron. Int. J. Miner. Process. 74 (1–4),239–249.
Williamson, M., Rimstidt, J., 1994. The kinetics and electrochemicalrate-determining step of aqueous pyrite oxidation. Geochim.Cosmochim. Acta 58 (24), 5443–5454.
Zhang, S., Li, J., Wang, Y., Hu, G., 2004. Dissolution kinetics ofgalena in acid NaCl solutions at 25–75 °C. Appl. Geochem. 19 (6),835–841.
Zinng, D., Hercules, D., 1978. Electron-spectroscopy for chemical-analysis studies of lead sulfide oxidation. J. Phys. Chem. 82 (18),1992–1995.
Copyright © 2022 FDOKUMEN