NAADP mobilizes calcium from acidic organelles through two-pore channels
The effect of pH and temperature on smectite dissolution -1- 11/10/04
The combined effect of pH and temperature on smectite dissolution rate under acidic
conditions
Keren Amram and Jiwchar Ganor*
Department of Geological and Environmental Sciences, Ben-Gurion University of the Negev,
P. O. Box 653, Beer-Sheva 84105, Israel.
Phone ++972-8-6472-651 Fax ++972-8-6472-997 E-mail [email protected] WEB http://www.bgu.ac.il/geol/ganor/
Submitted to: Geochimica et Cosmochimica Acta, April, 2004
Revised and resubmitted, October, 2004
*Corresponding author.
Published in Geochimica et Cosmochimica Acta (2005) 69, 2535–2546

The effect of pH and temperature on smectite dissolution -2- 11/10/04
ABSTRACT
The main goal of this paper is to propose a new rate law describing the combined effect
of pH (1 to 4.5) and temperature (25°C to 70°C) on smectite dissolution rate, under far from
equilibrium conditions, as a step towards establishing the full rate law of smectite dissolution
under acidic conditions. Dissolution experiments were carried out using non-stirred flow-
through reactors fully immersed in a thermostatic water bath held at a constant temperature of
25.0°C, 50.0°C or 70.0°C ± 0.1°C. Smectite dissolution rates were obtained based on the
release of silicon and aluminum at steady state. The results show good agreement between
these two estimates of smectite dissolution rate. Low Al/Si ratios were obtained in
experiments that were conducted at pH≥ 4. These low Al/Si ratios are explained by
precipitation of gibbsite and/or diaspore.
Dissolution rate increases with temperature and decreases with increasing pH.
Dissolution rates of experiments in which ∆Gr≤-21kcal mol –1, are not affected by deviation
from equilibrium. Dissolution rates in most experiments are not affected by the addition of
up to 0.3 M NaNO3 to the input solution.
A simple model is used to describe the combined effect of pH and temperature on
smectite dissolution rate. According to this model, dissolution rate is linearly proportional to
the concentration of adsorbed protons on the mineral surface, and proton adsorption is
described using a Langmuir adsorption isotherm. All experimental results at pH<4 were fitted
to the model using a multiple non-linear regression. The resulting rate law is:
+
+
⋅⋅−⋅+
⋅⋅−⋅⋅−⋅=
H
HaRTe
aRTeRTeRate /1070061031
/107006103/17460220
where R is the gas constant, T is the temperature (K) and aH+ is the activity of protons in
solution.
According to the model, the dependence of dissolution rate on temperature is affected
by the activation energy and the adsorption enthalpy. The activation energy obtained from the
fitting (17±2 kcal/mol) is within error equal to the average value of 15 kcal/mol of apparent
activation energies for silicates dissolution rate (Lasaga et al., 1994). The obtained net

The effect of pH and temperature on smectite dissolution -3- 11/10/04
enthalpy of adsorption (-11±2 kcal/mol) is within the range of –7.9 to –23.1 kcal/mol,
experimentally obtained for oxides (Sverjensky and Sahai, 1998).
1 INTRODUCTION
Smectites are phyllosilicates with two tetrahedrally coordinated layers and one
octahedrally coordinated layer. Montmorillonites are the most abundant smectites in nature.
The structural formula of an ideal montmorillonite is:
M0.66[Mg0.66Al3.34][Si8]O20(OH)4·(H2O)n. M0.66 represents 0.66 monovalent cations or 0.33
divalent cations. In natural montmorillonites, the tetrahedrally coordinated Si is substituted
by up to 0.4 Al atoms, and octahedrally coordinated Al is considerably substituted by Mg,
FeIII or FeII. The structural charge resulting from the tetrahedral and octahedral substitution is
compensated by the presence of exchangeable interlayer cations, denoted by M in the
structural formula.
Smectites are generated in soils and sedimentary deposits by weathering, diagenesis or
hydrothermal processes, which can either involve degradation and transformation of
precursor phyllosilicates or precipitation from solution. Smectite is the most abundant mineral
in soils of temperate climates that are derived from basic igneous rocks, and from the clay
fraction of soils of arid climates derived from granitic pediment (Boettinger and Southard,
1995). Smectite, particularly montmorillonitic smectite, is the principal constituent of
bentonite clay deposits. These have been formed by the alteration of eruptive igneous rocks of
basic to intermediate composition.
Smectite-rich argillites and bentonites have been recognized as suitable clays to be used
as a sealant material in the multibarrier systems designed for storage of high level nuclear
waste in burial repositories (Chapman and McKinley, 1989). Due to its osmotic swelling
capacity (and consequently its plasticity and impermeability), smectite impedes groundwater
interaction with the metal canisters. The cation exchange reactions immobilize undesirable
cations from the radioactive waste, and retard its leakage from the canisters towards the local
groundwater. However, the durability of the smectite itself under confinement conditions is a
key parameter that must also be taken into consideration. For a repository in an argillaceous

The effect of pH and temperature on smectite dissolution -4- 11/10/04
formation, acidification may result from oxidation of pyrite, a common mineral phase in
claystone.
1.1 Previous studies on smectite dissolution rate and the motivation for the
present study
Only a few studies of smectite dissolution kinetics have been carried out in the last
decade (Furrer et al., 1993; Zysset and Schindler, 1996; Bauer and Berger, 1998; Cama et al.,
2000; Huertas et al., 2001; Metz, 2001; Metz et al., 2004a). All the experiment at 25°C and
the experiments of Metz (2001) and Metz et al. (2004a) at 50°C were conducted under acidic
conditions, whereas those at 20, 35, 40 and 60 to 80°C were conducted under basic (mostly
extremely basic) conditions. Furrer et al. (1993) and Zysset and Schindler (1996) conducted
both batch and flow-through dissolution experiments to study the proton-promoted
dissolution kinetics of K-montmorillonite. The dissolution experiments were conducted at
25°C in HCl / KCl solutions (pH = 1 to 5 and [KCl] = 0.03 to 1.0 M). The dissolution rate
increased with KCl concentrations and decreased with pH. At pH ≥ 3 the dissolution rate was
inhibited by aluminum (Furrer et al., 1993; Zysset and Schindler, 1996). Their observed
released rate ratio, RSi/RAl, depends on both the pH and KCl concentration. Bauer and Berger
(1998) conducted batch experiments at 35° and 80ºC in concentrated KOH solutions (0.1 to 4
M) to study the dissolution kinetics of industrial (Ibeco and Ceca) montmorillonite. They
found that under very basic conditions (11.5 ≤ pH ≤ 13.9) smectite dissolved independently of
aqueous silica or aluminum concentrations. They proposed a non-linear dependency of smectite dissolution rate, 06.0150 ±⋅= .
OH -a kRate . The apparent activation energy was found to
be 13 ± 1 kcal/mole. Huertas et al. (2001) measured bentonite dissolution in granitic
solutions (pH 7.6 to 8.5) in a semi-batch reactor at 20, 40 and 60°C. Sato et al. (2002; 2003)
conducted flow-through experiments on Na-montmorillonite dissolution at 30, 50 and 70°C at
pH 8.6 to 13.3 in NaOH-NaCl and KOH-KCl solutions. The effect of deviation from
equilibrium on the dissolution rate of smectite was studied by Cama et al. (2000) at pH 8.8
and 80°C, and by Metz (2001) at pH 3 and 50°C. Both studies show that smectite dissolution
rate is independent of deviation from equilibrium in the range of ∆Gr<-30 kcal mol –1. In
contrast to the observations of Furrer et al. (1993) and Zysset and Schindler (1996), Metz

The effect of pH and temperature on smectite dissolution -5- 11/10/04
(2001) found that far from equilibrium smectite dissolution rate is independent of both Al and
Si concentrations.
Besides dissolution kinetic studies on smectite powders employing batch and flow-
through reactors, a few papers about in-situ atomic force microscope (AFM) studies on
dissolution rates of single-cell smectite crystals have been recently published (Bickmore et
al., 1998; Bickmore et al., 1999; Bosbach et al., 2000; Bickmore et al., 2001). Smectite
dissolution rates determined in AFM studies appear to be faster than the rates determined in
flow-through or batch reactor studies at the same temperature and pH.
As part of our attempt to establish the full rate law of smectite dissolution under acidic
conditions, the present study introduces a new data set examining the effect of both
temperature (25°C to 70°C) and pH (1 to 4.5) on smectite dissolution rate. Cama et al. (2002)
demonstrated that in order to study the effect of temperature on kaolinite dissolution rate one
should distinguish between two effects: 1) the effect of temperature on the rate coefficient,
which may be modeled using the Arrhenius equation; and 2) the effect of temperature on the
adsorption of protons on the surface. The last effect cannot be studied independently of the
pH effect on the rate. Therefore, they presented a model describing the combined effect of pH
and temperature on kaolinite dissolution rate. The main objective of the present paper is to
model the experimental data using a rate law describing the combined effect of pH and
temperature, following the approach of Cama et al. (2002).
2 MATERIALS AND METHODS
2.1 Characterization and pretreatment of smectite
The smectite sample used in this study is the SAz-1, an international reference sample
of the Clay Mineral Society Source Clay Repository. Details about the origin of these
standard clay samples were published by Van Olphen and Fripiat (1979) and Moll (2001).
The sample is not a pure smectite, containing considerable amounts of silica phases (quartz,
cristobalite and/or amorphous silica) and minor quantities of alkali-feldspars, plagioclase and
carbonates. The structural formula of pure SAz-1 was determined by Metz et al. (2001;
2004a) to be K0.02Na0.05Ca0.41Mg0.18[Mg1.11Fe0.17Al2.77][Al0.30Si7.70]O20(OH)4. Using this structural

The effect of pH and temperature on smectite dissolution -6- 11/10/04
formula and the whole rock analysis, Metz et al. (2004a) calculated that the raw smectite
contains about 87% smectite, 8% excess SiO2 (probably mostly in amorphous silica). The
rest is mostly hydrated water.
The smectite was pretreated in 0.001 N HNO3 at 70°C for a few months, using the
procedure described in Ganor et al. (1995). The sample is composed of smectite aggregates
ranging in size from less than a micron to more than 100 micron (Metz et al., 2004a). BET
surface areas of raw SAz-1 sample determined in previous studies vary between 34 and 97 m2
g-1 (Metz et al., 2004b). Following dissolution experiments the BET surface area of SAz-1
increased to 127±13 m2 g-1. Using atomic force microscope, Metz et al. (2004b) determined
the edge surface area of SAz-1 to be 4.9 ± 0.7 m2 g-1.
2.2 Experimental setting
Dissolution experiments were carried out using non-stirred flow-through reactors (ca.
35 ml in volume) fully immersed in a thermostatic water-bath held at a constant temperature
of 25.0°C, 50.0°C or 70.0°C ± 0.1°C (Fig. 1). The reaction cells were composed of two
chambers, a lower chamber of 33-mm inner diameter and an upper chamber of 26-mm inner
diameter. The two chambers were separated by a fine (5 µm) nylon mesh, on which smectite
powder was placed. Some more details of the experimental procedure can be found in Metz
and Ganor (2001).
2.3 Solutions and Analyses
Input solutions were prepared at specific pH by diluting 1M HNO3 with double
deionized water. In experiments designed to study the effect of ionic strength, different
amounts of NaNO3 have been added into the input solution.
Input and output solutions were analyzed for Al, Si, and pH. Total Al and Si were
analyzed colorimetrically with a UV-visible spectrophotometer, using the Catechol violet
method (Dougan and Wilson, 1974) and Molybdate blue method (Koroleff, 1976),
respectively. The uncertainty in measured Al and Si was better than ± 5% for concentrations
above 4 µM. The precision dropped to ±15% and 33% for measurements at low
concentrations of 2 and 0.5 µM, respectively. The pH was measured at experimental

The effect of pH and temperature on smectite dissolution -7- 11/10/04
temperature on an unstirred aliquot of solution using a semi-micro 83-01 Orion Ross
combination electrode. The reported accuracy is ±0.02 pH units (±4.5% in H+ activities).
3 CALCULATIONS
The overall dissolution reaction of smectite sample SAz-1 under acidic conditions can
be expressed as:
(1) 44
332224207.73.077.217.011.118.041.005.002.0
7.707.317.029.141.005.002.0
8.62.13)())()((
SiOHAlFeMgCaNaK
OHHOHOSiAlAlFeMgMgCaNaK
++++++
⇔++++++++
+
The dissolution rate, Rate, (mol g-1 s-1) in steady state was based on the release of Al and Si
according to the expression:
(2) ),,( inpjCoutjC
mqRatej −−=⋅ν
where Cj,inp and Cj,out are the concentrations of component j (Al or Si) in the input and the
output solutions, respectively (mol m-3), νj is the stoichiometry coefficient of j in the
dissolution reaction, t is time (s), m is the sample mass (g) and q is the fluid volume flux
through the system (m3 s-1). Note that in our formalism, the rate is defined to be negative for
dissolution and positive for precipitation.
The common practice in experimental kinetics is to normalize the dissolution rate to the
total surface area of the pure mineral, which is measured by the Brunauer-Emmett-Teller
(BET) method, (Brunauer et al., 1938). In contrast to this common practice, Furrer et al.
(1993), Schlabach et al. (1999) and Zysset and Schindler (1996) normalized their smectite
dissolution rate data to the sample mass. They argued that normalization to surface area is
not appropriate, as long as it is not possible to measure exactly the extent of the edge surface
area of a smectite powder. Indeed, Metz et al. (2004b) showed that there is no correlation
between the total and the edge surface area of smectite, and as a result the BET surface area
cannot serve as a proxy for the reactive surface area of smectite. Therefore, we normalized
the dissolution rates by the mass of the smectite. The initial mass of the smectite in each
experiment was calculated from the product of the starting mass and the estimated percentage
of the smectite in SAz-1 (87%, Metz et al., 2004a). Following each stage (i.e., the time

The effect of pH and temperature on smectite dissolution -8- 11/10/04
between the replacements of two sequential output bottles), the remaining mass of each
mineral was updated based on the release rate of Al and the duration of the stage. The release
rate of Al and not of Si was used in the updating procedure following the conclusion of Metz
et al. (2004a) that the initial fast release of Si, before steady state, mainly reflects the
hydrolysis of a fast dissolving silica phase, while the initially slow release of Al reflects the
dissolution of the smectite itself. The error in the calculated rate is estimated using the
Gaussian error propagation method (Barrante, 1974) from the equation:
(3) ( )
2/12
2
∆
∂∂=∆ ∑
ii
ix
xPP
where ∆P is the uncertainty of the calculated parameter and ∆xi is the estimated uncertainty of
the measurements of the quantity xi.
The degree of saturation of the solution with respect to smectite dissolution is
calculated in terms of the Gibbs free energy of reaction ∆Gr
(4) )ln(
eqr K
IAPRTG =∆
where R is the gas constant, T is the absolute temperature, IAP is the ion activity product of
the solution, and Keq is the solubility constant. The activity coefficients and the activities of
the different species in solution were calculated using the EQ3NR module of the EQ3/6
software package (Wolery, 1992). Errors (∆P) in the above-calculated parameters (P), i.e.,
IAP and ∆Gr, were estimated according to the Gaussian error propagation equation (3). In the
absence of a specific Keq value for smectite sample SAz-1, the solubility constant of the
EQ3/6 thermodynamic data-set data0.com.R22a (Wolery, 1992) for Ca-endmember smectite
(Ca0.33[Mg0.66Al3.34][Si8]O20(OH)4) were used in the calculations. This proxy for the
solubility constant was selected so the calculation would be consistent with those of Metz
(2001).
4 RESULTS
The variations of output Al and Si concentrations in three representative flow-through
experiments as a function of time are shown in Fig. 2. Figures of all dissolution experiments

The effect of pH and temperature on smectite dissolution -9- 11/10/04
are presented in Amram (2002). Each of the experiments was composed of 1 to 5 stages,
where new stages were initiated by a change in the flow rate (e.g., 50-03.2, Fig. 2b) and/or in
the composition of the input solution (e.g., 70-15.2, Fig. 2c). The vertical lines in Fig. 2
delineate the different stages. Much of the noise in the non-steady state data results from
instabilities in flow rate. In several experiments, an established steady state was disturbed by
a long period of instabilities in flow, and thereafter a new steady state was established. In
such cases the new steady state was reported as a different stage (e.g., 50-03.3, Fig. 2b). The
experimental conditions of all the stages are compiled in Table 1. The first two digits in the
names of the experiments denote the experimental temperature. The last digit in the name
(following a dot) marked the consecutive stage number of the experiment. Al and Si analyses
used to calculate steady-state compositions are denoted by open symbols in Fig. 2. Si
concentrations were usually higher at the onset of the experiments (Fig. 2), after which Si
concentrations decreased until steady state was attained. A reversed trend was observed for
the release of Al, which increased usually from very low starting concentrations to higher
concentrations at steady state. The pH decreased continuously until steady state, where pH in
output solutions was close to the pH in the input solution (generally up to 0.2 pH units
higher).
Duration of experiments varies but mostly surpasses 1500 hours, and some last for more
than 10000 h. The time required to achieve the first steady state varied considerably. It was
usually shorter under conditions in which the dissolution rate was fast (high temperature and
low pH) and under higher ionic strength. In most of the experiments, steady state was easily
maintained for several hundred hours (up to 2500 h), as long as the flow rate was stable (e.g.,
Figs. 2a and b). The exceptions are experiments conducted under conditions in which
smectite dissolved very fast. In these experiments the mass of smectite decreased
significantly with time, and as a result the output Al and Si concentrations decreased as well
(e.g., 70-15.2, Fig. 2c). Several studies (e.g., Walther, 1996; Gautier et al., 2001) indicate
that the amount of time prior to steady state may influence the resulting steady-state
dissolution rate. Figure 2b shows the change in Al and Si concentrations in a multi-stage
experiment (50-03) at 50°C in which the flow rate varied between 0.013 and 0.04 ml/min.
The experiment attained the first steady state after about 6500 h. The dissolution rate at

The effect of pH and temperature on smectite dissolution -10- 11/10/04
steady state was 2.8±0.5x10⁻¹² mol g-1 s-1. After about 2000 h at steady state the flow rate
increased to 0.04 and a change in concentration was observed. The dissolution rate at this
steady state was the same, 2.8±0.5x10⁻¹² mol g-1 s-1. Following a period of instability in flow
rate a third steady state was obtained in which the rate was 2.6±0.5x10⁻¹² mol g-1 s-1.
Regardless of the changes with time the same dissolution rate was observed in the three
stages.
Release of elements was highly incongruent during the first few hundreds to few
thousands hours of the experiments. Metz et al. (2004a) showed that the enhanced release of
Si reflects the hydrolysis of a silica phase which dissolves faster than smectite, while the
initially slow release of Al reflects the dissolution of smectite itself. As we thoroughly
discussed this initial non-congruent stage of smectite dissolution in Metz et al. (2004a), the
present study is discussing only the steady state dissolution rate.
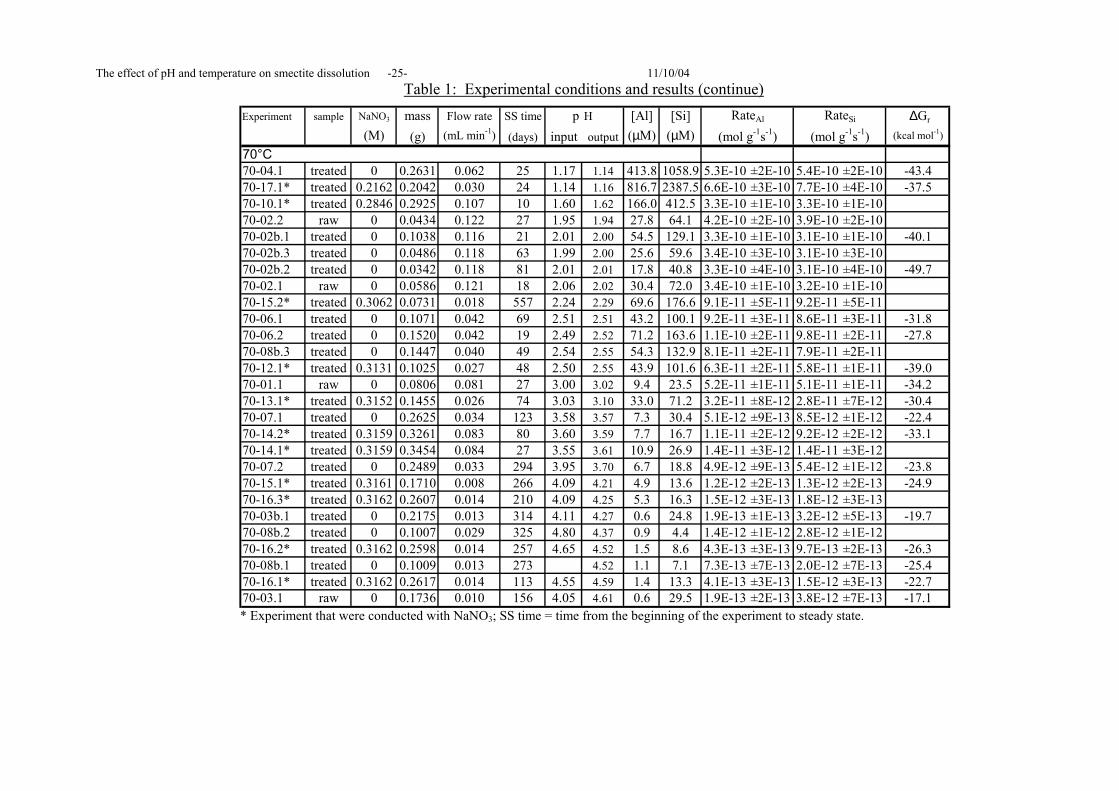
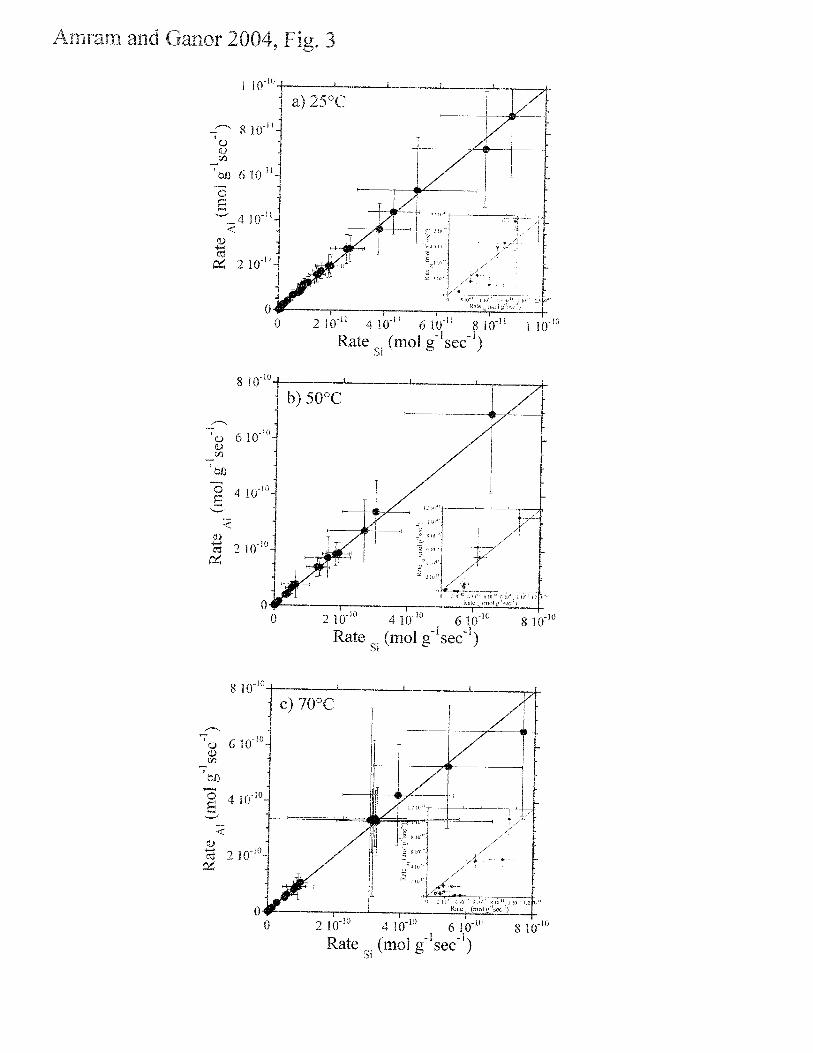
Smectite dissolution rates at steady state (eq. (2)) were obtained based on the release of
silicon (RateSi), and aluminum (RateAl) at steady state for each stage (Table 1). Figure 3 plots
the dissolution rates evaluated based on the release of Si versus those obtained based on the
release of Al. The solid lines in Fig. 3 are the 1/1 diagonals. Taking into account the
appropriate errors, a good agreement between the two estimates of smectite dissolution rate is
observed in most of the experiments. In these experiments, the steady-state dissolution rates
are measured at conditions of under-saturation with respect to gibbsite, diaspore, kaolinite
and boehmite. Some experiments conducted at pH ≥4 in which equilibrium with respect to
these minerals is achieved and, consequently, incongruent dissolution occurs. In these
experiments the dissolution rate is based only on Si release.
In general, pretreated smectite samples were used in the flow-through experiments. Raw
samples of smectite SAz-1 underwent nine flow-through experiments (Table 1). The same
kinetic behavior was observed in experiments with pretreated and raw SAz-1.

The effect of pH and temperature on smectite dissolution -11- 11/10/04
5 DISCUSSION
5.1 Are the calculated steady-state dissolution rates influenced by the presence of
accessory phases in the smectite sample?
As the dissolved sample contains about 8 wt.% excess SiO2 it is important to verify that
the dissolution of the Si-rich accessory phases does not affect the release of Si at steady-state.
Metz et al. (2004a) discussed the general case in which a mixture of a major phase (smectite
in the case of SAz-1) and a minor phase (Si-rich phase) is dissolved. Following their
argumentations, there are three possible scenarios: 1) the half life of the smectite is
significantly shorter than that of the Si-rich phase (i.e., the smectite dissolves faster); 2) the
two phases have similar half lives; and 3) the half life of the smectite is significantly longer
than that of the Si-rich phase. In the first case, the Si-rich phase is both less abundance and
less reactive than the smectite and therefore the contribution of the Si-rich phase is expected
to be negligible. In the last case, the Si-rich phase would be extinct before steady state, due to
its shorter half life (e.g., Fig. 6 of Metz et al. (2004a)). Only in the second case, in which the
Si-rich phase has a half life similar to that of the smectite, the steady state would reflect the
dissolution rate of the two phases.
The following observations indicate that this is not the case: 1) Metz et al. (2004a)
showed that the initial fast release of Si during the dissolution of SAz-1 (Fig. 2) reflects the
hydrolysis of a silica phase which dissolves faster than smectite. This fast dissolving Si-rich
phase is accounted for more than 60% of the excess Si in SAz-1 (Metz et al., 2004a). 2) Metz
et al. (2004a) measured the composition of raw SAz-1 using XPS. Since this measurement
has an information depth of 6 nm, the measured composition is hardly obscured by
contaminants, and is therefore a good approximation for the composition of pure SAz-1. In
the present study, the average Al/Si ratio at steady state is within error equal to the Al/Si ratio
of the XPS measurement of the raw sample, indicating that the steady-state ratio is not
significantly influenced by the dissolution of phases with significantly different Al/Si ratio.
3) Metz et al. (2004a) recovered powder from their flow-through experiments with SAz-1 and
found that the recovered powder contained significantly less excess Si. The average steady
state Al/Si ratio in the present study is within error equal to the Al/Si ratio of in the recovered

The effect of pH and temperature on smectite dissolution -12- 11/10/04
powder, which was analyzed by both SEM-EDS and XPS. Therefore, we conclude that the
release of Al and Si at steady-state is due to the dissolution of the smectite itself, and can be
used to calculate the dissolution rate of the smectite.
5.2 Separating the direct effects of pH and temperature from effects of other
environmental variables
In order to model the effects of pH and temperature on smectite dissolution rate it is
important to separate between direct and indirect effects of the environmental variables
involved. By direct effect we mean an effect related to surface processes and therefore, one
that can be used to understand the reaction mechanism. In addition to temperature and pH,
other environmental variables such as output Al and Si concentrations, ionic strength, and the
degree of saturation vary between the experiments. Therefore, their possible effects on the
smectite dissolution rate are examined below.
5.2.1 The effect of degree of saturation
The Gibbs free energy of reaction (∆Gr) of the smectite dissolution reaction is a strong
function of pH and of Al and Si concentrations. If the dissolution rate varied due to changes
in ∆Gr in the different experiments, as the pH and the output concentrations varied, then the
calculated effect of pH would include a spurious contribution. This problem would be
minimal only in the "far-from-equilibrium" dissolution plateau region, which is defined as the
region in rate vs. ∆G space where there is no direct effect of the degree of saturation on
dissolution rate. Metz (2001) studied the effect of deviation from equilibrium on smectite
dissolution rate under acidic conditions. According to his study, near equilibrium (0 ≥ ∆Gr ≥
-20 kcal/mole) the rates increase gradually with increasing undersaturation. Far from
equilibrium, at ∆Gr ≤ -30 kcal/mole, the dissolution rate is much faster and is independent of
the degree of saturation. The transition between these two regions occurs somewhere in the
range of -20 ≥ ∆Gr ≥ -30 kcal/mole. The ∆Gr during the first steady state in experiment 50-
03 (Fig. 2b) was ∆Gr =-20.1 kcal/mol. In order to examine if this experiment is conducted
under the conditions of the dissolution plateau, we increased the flow rate by a factor of 3.2.
As a result the Al and Si concentration decreased and the average ∆Gr during the new steady

The effect of pH and temperature on smectite dissolution -13- 11/10/04
state was -29.8 kcal/mol. Figure 2b shows that the concentration of Si decreases by the same
factor (3.2) as the increase in flow rate, and as a result the dissolution rates during the two
steady states were the same. If the experiment was close to equilibrium during the first steady
state, the consequential decrease in ∆Gr would bring to an increase in smectite dissolution
rate. Therefore, we conclude that the dissolution rates in experiments with ∆Gr≤-20.1
kcal/mol were independent of the deviation from equilibrium. According to the results of
experiment 50-03 the dissolution plateau region for smectite is in the range of ∆Gr≤-20.1
kcal/mol, which was the ∆Gr range of most of the experiments (Table 1). The results of
Mogollon et al. (1996) showed that the dissolution plateau for gibbsite at 25°C was in very
good agreement with the results of Nagy and Lasaga (1992) at 80°C. Assuming that the
dissolution plateau for smectite is similarly independent of temperature, the dissolution rates
in most of the experiments were independent of the deviation from equilibrium. Some
experiments, however, were conducted under close to equilibrium conditions (Table 1). All
these experiments where conducted at pH>4. Therefore, these experiments are not used in the
fitting of the proposed model.
5.2.2 The effects of silicon and aluminum on smectite dissolution rate
Metz (2001) examined the effects of silicon and aluminum on smectite dissolution rate
at 50°C. He found that under far from equilibrium conditions (∆Gr ≤ -30 kcal mol-1) smectite
dissolution rate is independent both of Al concentration (ranging between 3 to 16 µM at pH 3
and between 21 and 139 µM at pH2) and of Si concentration (ranging between 9 and 41 µM
at pH 3 and between 56 and 329 µM at pH2). This rate independency is also supported by an
observation from the present study that few experiments that were conducted at the same pH
and temperature and with different steady-state Al and Si concentrations showed similar
dissolution rate. We suggest that the changes in far from equilibrium dissolution rates
observed in the present study (Fig. 4) are not significantly influenced by the variability in Al
and Si concentration. It is important to note that the present study ranges of Al (0.05-843
µM) and Si (2.8-2387 µM) concentrations are significantly larger than the ranges which were
thoroughly studied by Metz (2001). Therefore, we cannot rule out the possibility that some of
the experimental noise may be related to effects of Al or Si on dissolution rate.

The effect of pH and temperature on smectite dissolution -14- 11/10/04
5.2.3 The effects of ionic strength, Na+ and NO3-
To establish the effect of pH on dissolution rate, one should conduct a series of
experiments that are identical in all factors except pH. However, adding acid changes the
ionic strength and the concentration of the balancing anion. Therefore, studying the effect of
pH may be conducted using two possible experimental designs: 1) The input solution contains
only an acid and therefore the concentration of the balancing anion (NO3 in the present study)
varies in the different experiments and is equal to the H+ concentration; 2) The input solution
is composed of a mixture of an acid and a salt (NaNO3 in the present study), so the
concentration of the balancing anion and the ionic strength are the same in all the
experiments. In this design the concentration of the salt cation varies in the different
experiments. In order to assess the effects of ionic strength and Na and NO3 concentrations
on the determination of the observed pH dependence of smectite dissolution rate, we used
both experimental designs. About half of the experiments were conducted with input solution
composed solely of HNO3. The ionic strength in these experiments ranges from 0.000032 M
(pH 4.5) to 0.1 M (pH 1). In the rest of the experiments the ionic strength and NO3-
concentration of ~ 0.32 M were maintained by adding suitable amounts of NaNO3 into the
input solutions. By doing this, Na+ concentration increases as the pH increases whilst NO3-
concentration remains constant (~0.32 M). Figure 4 compares dissolution rates in
experiments conducted under constant ionic strength to those obtained without adding
NaNO3, i.e., where H+=NO3-. In most experiments at pH<4 the differences between the two
sets are small. The exceptions are the 25°C experiments at pH < 1.8 and the 50ºC at pH of 3
and 2, where the dissolution rate under constant ionic strength is significantly slower than that
in the experiments in which H+=NO3-. Above pH of 4 the dissolution rates under constant
ionic strength are significantly slower at 50 and 70°C and faster at 25°C than those in the
experiments in which H+=NO3-. Taking into account the experimental noise, it is hard either
to prove that the observed differences between the experiments represent a real effect of the
addition of salt, nor to rule out this possibility. For the purpose of modeling the effects of pH
and temperature on smectite dissolution rate we decided to use the results of all the
experiments conducted at pH<4, regardless of their ionic strength. As the effect on the rate is

The effect of pH and temperature on smectite dissolution -15- 11/10/04
small to insignificant, the results of the modeling will be only slightly influenced by this
decision.
5.3 Modeling the effect of pH and temperature on dissolution rate
The model proposed below is a simple version of the model proposed by Cama et al.
(2002). The model is based on two assumptions: 1) The proton promoted reaction mechanism
consists of fast adsorption of a proton on a surface site followed by a slow hydrolysis step;
and 2) The adsorption of the protons on the surface site may be described by a simple
Langmuir adsorption isotherm:
(5) +
+
⋅+⋅
=H
HadsH ab
abFX
1,
where F is the maximum surface coverage of protons on the reactive surface site, b is a
constant related to the energy of adsorption and aH+ is the activity of protons in solution.
Adsorption of a proton on a surface site close to the metal influences the bond strength and
thus affects the dissolution rate. If steady-state conditions are maintained, the rate of this
reaction path is (Lasaga, 1981):
(6) adsHXksRate
,⋅=⋅ ρ
where k (s-1) is the rate coefficient, Rate is the observed dissolution rate (mol g-1 s-1) , s is the
specific surface area (m2 g-1), ρ (mol m-2) is the density of reactive surface sites on the mineral
surface and XH,ads is the molar fraction of the surface site that is protonated. Substituting the
Langmuir adsorption isotherm (equation (5)) into equation (6), gives:
(7) +
+
⋅+⋅
⋅=⋅ H
Hab
abFk
sRate
1ρ
Both the rate coefficient, k, and the adsorption coefficient, b, in equation (7) depend on
temperature. The temperature dependence of the dissolution rate generally follows the
Arrhenius law:

The effect of pH and temperature on smectite dissolution -16- 11/10/04
(8) RTaEAek /−=
where A (s-1) is the pre-exponential factor, Ea is the apparent activation energy, R is the gas
constant and T is the temperature (K). The temperature dependence of the adsorption
coefficient may be evaluated recalling that the b constant in the Langmuir adsorption
isotherm is the equilibrium constant of the protonation reaction, and therefore its temperature
dependence may be written as:
(9) RTHRTHRS eKeeb /
0// 000 ∆−∆−∆ ⋅=⋅=
where ∆S0 (cal mol-1 K-1) is the entropy, and ∆H0 (kcal mol-1) is the net enthalpy of
adsorption. Following Sverjensky and Sahai (1998), the standard states for both surface and
aqueous species are assumed to reflect hypothetical 1 molal solutions referenced to infinite
dilution and a surface potential of zero at 25°C. The temperature dependence of the b
constant in the Langmuir adsorption isotherm may be described using equation (9) and
assuming that the heat capacity, ∆Cp, is equal to zero, and therefore ∆H0 is temperature
independent. This last assumption was examined and justified for kaolinite by Cama et al.
(2002).
The combined effect of pH and temperature on smectite dissolution rate may be
described by substituting equations. (8) and (9) into equation (7):
(10) +
+
⋅⋅+
⋅⋅⋅⋅=
⋅ ∆−
∆−−
HRTH
HRTH
RTEaaeK
aeKFeA
sRate
/0
/0/0
0
1ρ
The coefficients k'=A.F. s.ρ, Ea, K0 and ∆H0 were calculated from a multiple non-linear
regression of equation (10) using least squares. For the fitting we used all the experimental
results at 25, 50 and 70°C at pH<4. The resulting coefficients are k'=220±750 mol g-1 s-1,
Ea=17460±2000 cal mol-1, K0=3±14.10-6 and ∆H0=-10700±2500 cal mol-1. The regression
coefficient is R2=0.93. Substituting these values into equation (10) yields,
(11) +
+
⋅⋅−⋅+
⋅⋅−⋅⋅−⋅=
H
HaRTe
aRTeRTeRate /1070061031
/107006103/17460220

The effect of pH and temperature on smectite dissolution -17- 11/10/04
A comparison between the prediction of equation (11) and the experimental data at 25°C,
50°C and 70°C is shown in Fig. 4.
The obtained activation energy, 17±2 kcal/mol, is similar to the activation energy of the
dissolution of the edge site of kaolinite (22 kcal/mol, Cama et al., 2002) and is within error
equal to the average value of 15 kcal/mol of apparent activation energies for silicates
dissolution rate (Lasaga et al., 1994). The obtained net enthalpy of adsorption of -11±2
kcal/mol is within the range of –7.9 to –23.1 kcal/mol, experimentally obtained for oxides
(Sverjensky and Sahai, 1998). The reasonable activation energy and net enthalpy of
adsorption, although not proving the proposed model, provide support for its validity.
5.4 Comparing the prediction of the model with measured adsorption isotherms
The relative adsorption/desorption of protons on mineral surfaces is commonly
measured using potentiometric surface titration. The term "surface titration" is somewhat
misleading as the measurements of the adsorption of proton onto the mineral surface are
based on changes in the pH of the solution. The relative surface concentration of protons is
determined by mass balance between the proton (or hydroxide) added to solution and the
measured proton concentration in solution after equilibration using the so-called proton
consumption function
(12) AVOHHCCC BAs ⋅+−−=∆ −+ ])[][(
where ∆Cs is the change in surface concentration of protons (mol m-2), CA and CB are the
concentrations of the acid and base added (mol l-1), respectively, [H+] and [OH-] are the
solution concentrations of H+ and OH- after equilibration (mol l-1), V is the fluid volume (l)
and A is the total surface area (m2). It is important to note that the value of the proton surface
charge obtained by surface titration is arbitrary until a value of zero charge is established
(Davis and Kent, 1990; Ganor et al., 2003), i.e., the titration measures a relative change in
surface concentration (as defined by the proton consumption function, Eq. (12)) and not the
absolute concentrations (Schroth and Sposito, 1997). Therefore, the calculation of the
absolute proton adsorption density is based on an assumption regarding the pHPZNPC. Figure 5
shows the surface titration data obtained by Zysset and Schindler (1996) at 25°C between pH

The effect of pH and temperature on smectite dissolution -18- 11/10/04
4 and 1. According to the interpretation of Zysset and Schindler (1996) the surface
protonation at this pH range is controlled by both adsorption of H+ on aluminol site and ion
exchange reaction: at pH≥2.5 protonation of the aluminol is dominant (black dots in Fig. 5),
whereas at pH<2.5 ion exchange significantly contributes to the concentration of adsorbed H+
(squares in Fig. 5).
A byproduct of the fitting of the proposed model (eq. (10)) is that it predicts the molar
fraction of surface protonation. This prediction of the proposed model may be compared to
protonation data of Zysset and Schindler (1996). Such a comparison is not straightforward.
Zysset and Schindler (1996) measured the concentration of adsorbed H+ ions (mol g-1), which
results from several reactions including adsorption and cation exchange (Stadler and
Schindler, 1993; Zysset and Schindler, 1996). In contrast, the fitting of the proposed model
predicts the molar fraction (and not the total concentration) of a protonated edge site that
governs the dissolution rate under the examined pH range. It is important to note that the rate
law proposed in the present study assumes that the dissolution rate is proportional to the
concentration of protons that are adsorbed on the reactive edge surface site and is independent
of protonation due to ion exchange reaction. This is the major difference between the present
study rate law and that of Zysset and Schindler (1996), who proposed that the rate is linearly
proportional to the sum of the proton concentrations on the aluminol and the cation exchange
sites (see eq. 20 in Zysset and Schindler, 1996).
Based on the present study prediction, the total concentration of adsorbed H+ ions
({H+}, mol g-1) may be calculated by multiplying the predicted molar fraction at the reactive
edge site by the total concentration of this site (θ, mol g-1).
(13)
+
++∆−
∆−++
⋅⋅−⋅+
⋅⋅−⋅⋅+=
⋅⋅+
⋅⋅⋅+=
+
+
H
H
HRTH
HRTH
aRTe
aRTeH
aeK
aeKHH /1070061031
/107006103}{
1}{}{ 0/
0
/0
0 0
0
θθ
In the calculations we assume that the concentration of adsorbed H+ ions on sites that are not
influencing the rate is constant in the examined pH range and their sum equals {H+}0. The
term {H+}0 may include contribution from the permanent charge of the mineral surface as
well as the real surface charge at the pH that was assumed to be the pHPZNPC. The coefficients

The effect of pH and temperature on smectite dissolution -19- 11/10/04
{H+}0 and θ may be obtained by fitting Eq. (13) to adsorption isotherm data using least
squares. As the dissolution rate is assumed to be independent of the extent of ion exchange,
and as according to Zysset and Schindler (1996) ion exchange significantly contributes to the
observed {H+} at pH<2.5, only the seven data points at pH≥2.5 (black dots in Fig. 5) were
used for the fitting. The solid line in Fig. 5 is the best-fit curve obtained for the surface
titration of Zysset and Schindler (1996) at 25°C in the pH range of 2.5 to 4. The obtained
coefficients are {H+}0=8.3±0.2.10-5 mol g-1 and θ=2.42±0.08.10-4 mol g-1, and the regression
coefficient R2=0.994. Figure 5 shows that the model proposed in the present study predicts
the concentration of adsorbed H+, between pH 1.5 and 4, although only the data at pH≤2.5
were used for the fitting. Following Zysset and Schindler (1996), we suggest that the excess
concentration of adsorbed H+ below pH 1.5 is due to ion exchange. According to Zysset and
Schindler interpretations below pH 2.5 ion exchange significantly contributes to the
concentration of adsorbed H+. In contrast, the prediction of the present study indicates that
the contribution of ion exchange is significant only below pH 1.5.
Surface titration curves are commonly interpreted in terms of protonation and
deprotonation of surface sites (see for example Davis and Kent, 1990; Parks, 1990;
Lutzenkirchen and Kienzler, 2002, and references therein). This interpretation involves a
critical stage in which the amount of protonation and deprotonation reactions is assumed. In
most cases, this assumption is based on the minimum amount of sites that are required to
obtain an adequate agreement between the surface speciation model and the observations.
Mathematically, it is always possible to add more reactions while keeping (or improving) the
quality of the fitting. The comparison between the predictions of the present study and the
observations of Zysset and Schindler (1996) is based on the assumption that between pH 2.5
and 4 the protons consumption is controlled by the protonation of a single surface site.
Neither the present study, nor the study of Zysset and Schindler (1996) provided any evidence
supporting this assumption. Taking into account that smectite contained many different
surface and interlayer sites that may adsorb and exchange protons, this assumption may be
questioned. Moreover, Stadler and Schindler (1993) argued that smectite protonation below
pH 4 is possibly dominated by ion exchange. Therefore, although the predictions of the
proposed model show a very good agreement with the total concentration of adsorbed H+
The effect of pH and temperature on smectite dissolution -20- 11/10/04
between pH 1.5 and 4, this agreement cannot serve as a proof for the proposed model, and the
obtained value of the total concentration of the reactive edge site (θ) should be regarded with
caution.
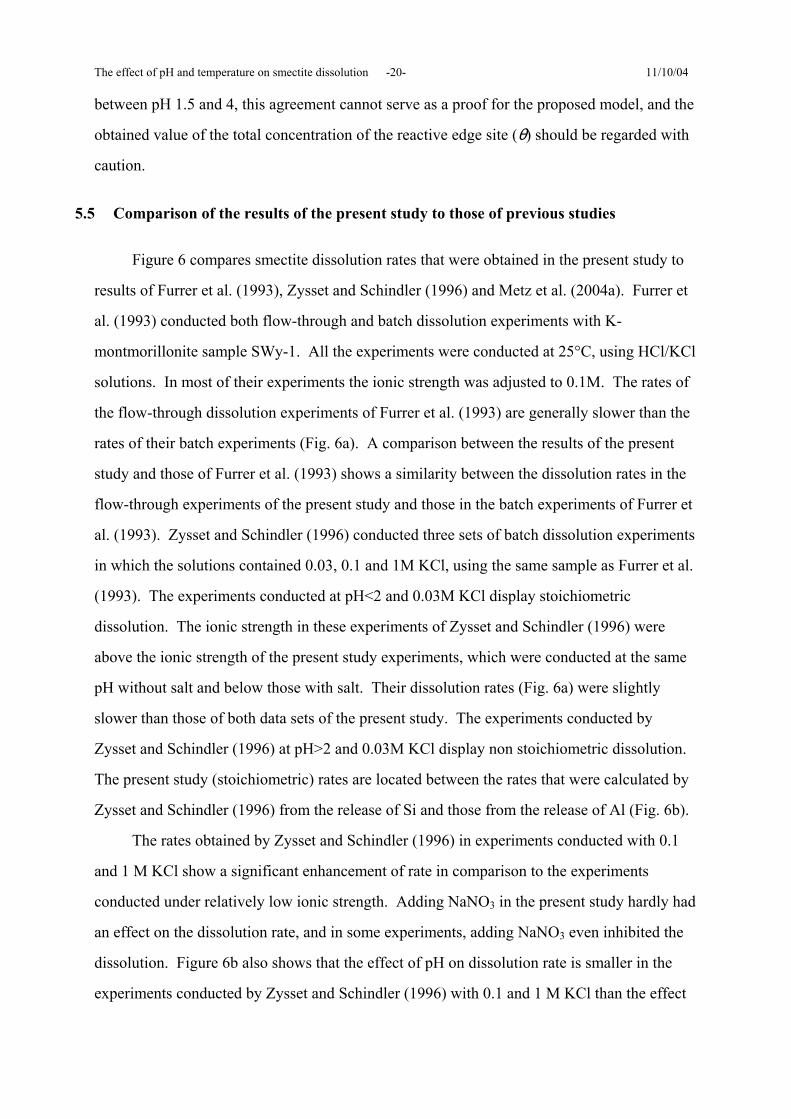
5.5 Comparison of the results of the present study to those of previous studies
Figure 6 compares smectite dissolution rates that were obtained in the present study to
results of Furrer et al. (1993), Zysset and Schindler (1996) and Metz et al. (2004a). Furrer et
al. (1993) conducted both flow-through and batch dissolution experiments with K-
montmorillonite sample SWy-1. All the experiments were conducted at 25°C, using HCl/KCl
solutions. In most of their experiments the ionic strength was adjusted to 0.1M. The rates of
the flow-through dissolution experiments of Furrer et al. (1993) are generally slower than the
rates of their batch experiments (Fig. 6a). A comparison between the results of the present
study and those of Furrer et al. (1993) shows a similarity between the dissolution rates in the
flow-through experiments of the present study and those in the batch experiments of Furrer et
al. (1993). Zysset and Schindler (1996) conducted three sets of batch dissolution experiments
in which the solutions contained 0.03, 0.1 and 1M KCl, using the same sample as Furrer et al.
(1993). The experiments conducted at pH<2 and 0.03M KCl display stoichiometric
dissolution. The ionic strength in these experiments of Zysset and Schindler (1996) were
above the ionic strength of the present study experiments, which were conducted at the same
pH without salt and below those with salt. Their dissolution rates (Fig. 6a) were slightly
slower than those of both data sets of the present study. The experiments conducted by
Zysset and Schindler (1996) at pH>2 and 0.03M KCl display non stoichiometric dissolution.
The present study (stoichiometric) rates are located between the rates that were calculated by
Zysset and Schindler (1996) from the release of Si and those from the release of Al (Fig. 6b).
The rates obtained by Zysset and Schindler (1996) in experiments conducted with 0.1
and 1 M KCl show a significant enhancement of rate in comparison to the experiments
conducted under relatively low ionic strength. Adding NaNO3 in the present study hardly had
an effect on the dissolution rate, and in some experiments, adding NaNO3 even inhibited the
dissolution. Figure 6b also shows that the effect of pH on dissolution rate is smaller in the
experiments conducted by Zysset and Schindler (1996) with 0.1 and 1 M KCl than the effect

The effect of pH and temperature on smectite dissolution -21- 11/10/04
observed in the present study. We do not have a good explanation for the differences
between the observation of the present study and those of Zysset and Schindler (1996). It is
interesting to note that the dissolution rate observed by Furrer et al. (1993) at ionic strength of
0.1M resembled the rate that was calculated based on Si by Zysset and Schindler (1996) at
0.03M.
Metz et al. (2004a) measured the dissolution rate of smectite sample SAz-1 at 50°C and
pH 2 and 3. The input solution in the far-from equilibrium experiments of Metz et al. (2004a)
was composed of pure HClO4 (no salt was added). Figure 6c shows that the dissolution rate
of smectite is not significantly influenced by the type of balancing anion (ClO4- vs. NO3
-).
6 SUMMARY AND CONCLUSIONS
Steady-state smectite dissolution rates were examined using non-mixed flow-through
reactors. The experiments were conducted at 25°C, 50°C and 70°C in a pH range of 1 to 4.5.
Most of the experiments were conducted under far-from equilibrium conditions (∆Gr< -21
kcal mol-1). Some experiments at pH>4, were conducted under conditions closer to
equilibrium. These experiments were not used in the fitting of the proposed model. In
general, smectite dissolution rate increases with temperature and decreases with pH.
The experimental results were fitted to a model, which is a simple variation of the
model proposed by Cama et al. (2002) for the proton-promoted reaction of kaolinite.
According to our model, the dissolution rate is proportional to the concentration of protons
that are adsorbed on the reactive edge surface site, which may be expressed using the
Langmuir adsorption isotherm. We do not have any information regarding the identity of this
active site. Zysset and Schindler (1996) postulated that the active site that controls the rate
under acidic conditions is either Al-O-Si or Al-OH-Al group. The results of the present study
neither support nor contradict this suggestion. The dependence of the dissolution rate on
temperature is affected by the activation energy and the adsorption enthalpy. From fitting our
results to the proposed model we found activation energy of 17±2 kcal/mol and enthalpy of
-11±2 kcal/mol.

The effect of pH and temperature on smectite dissolution -22- 11/10/04
Acknowledgments. This research was supported by THE ISRAEL SCIENCE
FOUNDATION (grant No. 174/01). We gratefully acknowledge thorough reviews by the
associate editor, Jacques Schott, and by Stephan .J. Köhler and Andreas Bauer. We thank
Volker Metz for both fruitful and knowledgeable discussions and for conducting the
thermodynamic calculations. The technical assistance of Ester Shani, Nivi Kesler, Ruth Talby
and Gony Yagoda is greatly acknowledged.

The effect of pH and temperature on smectite dissolution -23- 11/10/04
1 Table 1: Experimental conditions and results Experiment sample NaNO3 mass Flow rate SS time p H [Al] [Si] ∆Gr
(M) (g) (mL min-1) (days) input output (µM) (µM) (kcal mol-1)
25°C25-12.2* treated 0.2162 0.1341 0.010 512 1.00 1.08 48.9 122.2 2.0E-11 ±5E-12 2.0E-11 ±5E-12 -61.125-17.2* treated 0.2162 0.2532 0.085 58 1.12 1.12 24.3 59.3 4.4E-11 ±1E-11 4.3E-11 ±1E-1125-17.1* treated 0.2162 0.2801 0.025 22 1.12 1.12 74.6 193.2 3.7E-11 ±1E-11 3.8E-11 ±1E-11 -59.625-03.3 raw 0 0.1696 0.026 837 1.18 1.13 105.8 263.8 8.8E-11 ±3E-11 8.7E-11 ±3E-11 -52.925-07.4 treated 0 0.1523 0.039 531 1.00 1.14 52.1 139.1 7.3E-11 ±3E-11 7.7E-11 ±3E-11 -57.525-07.2* treated 0.2846 0.2329 0.038 412 1.57 1.59 31.5 76.4 2.8E-11 ±6E-12 2.7E-11 ±6E-12 -56.125-07.3* treated 0.2846 0.2111 0.039 435 1.71 27.3 64.1 2.7E-11 ±6E-12 2.6E-11 ±6E-1225-06.2 treated 0 0.0880 0.038 410 1.50 1.75 22.8 54.7 5.4E-11 ±2E-11 5.2E-11 ±2E-11 -52.525-02.1 raw 0 0.2337 0.012 60 1.95 1.94 62.8 143.9 1.7E-11 ±4E-12 1.6E-11 ±3E-12 -42.025-02.2 raw 0 0.1926 0.011 123 2.01 2.01 62.2 148.7 2.0E-11 ±5E-12 1.9E-11 ±5E-12 -39.825-11.1* treated 0.3062 0.1652 0.027 56 2.06 2.02 18.1 42.8 1.6E-11 ±3E-12 1.5E-11 ±3E-1225-11.2* treated 0.3062 0.1502 0.028 145 2.11 2.12 12.1 27.7 1.2E-11 ±3E-12 1.1E-11 ±2E-1225-11.3* treated 0.3062 0.1335 0.029 230 2.00 2.17 9.3 20.7 1.1E-11 ±3E-12 9.8E-12 ±2E-12 -55.725-12.1* treated 0.3131 0.1595 0.042 74 2.49 2.49 7.7 16.3 1.1E-11 ±2E-12 9.4E-12 ±2E-12 -52.525-15.1 treated 0 0.2438 0.013 250 2.49 2.54 26.3 65.8 7.7E-12 ±1E-12 7.6E-12 ±1E-12 -36.725-06.1 treated 0 0.1508 0.039 218 2.56 2.55 11.4 25.9 1.6E-11 ±4E-12 1.4E-11 ±3E-12 -41.625-16.1 treated 0 0.3136 0.009 281 2.51 2.56 63.0 147.3 9.7E-12 ±2E-12 9.1E-12 ±2E-12 -28.925-08.1 treated 0 1.7001 0.012 253 2.56 2.58 109.2 238.2 4.2E-12 ±8E-13 3.7E-12 ±7E-1325-13.1* treated 0.3152 0.1650 0.039 77 3.00 3.01 5.1 10.5 6.5E-12 ±1E-12 5.4E-12 ±1E-12 -47.725-01.2 raw 0 0.1164 0.040 100 3.05 3.01 4.7 11.2 8.9E-12 ±2E-12 8.4E-12 ±1E-12 -40.925-01.1 raw 0 0.1076 0.044 260 3.07 3.02 2.9 6.3 6.5E-12 ±3E-12 5.6E-12 ±1E-12 -44.925-07.1 treated 0 0.2583 0.038 225 3.53 3.57 3.5 7.5 2.7E-12 ±1E-12 2.4E-12 ±4E-13 -33.425-14.2* treated 0.3159 0.2438 0.032 278 3.57 3.58 3.3 6.1 2.3E-12 ±9E-13 1.7E-12 ±3E-13 -39.525-14.1* treated 0.3159 0.2452 0.032 242 3.56 3.71 3.4 6.3 2.4E-12 ±9E-13 1.8E-12 ±3E-13 -39.525-11.4* treated 0.316 0.1276 0.026 303 3.50 3.80 1.9 4.0 2.1E-12 ±2E-12 1.8E-12 ±5E-13 -41.425-11.5* treated 0.316 0.1272 0.030 335 3.88 3.90 1.3 2.8 1.6E-12 ±1E-12 1.5E-12 ±7E-1325-03.1 raw 0 0.2583 0.013 491 4.08 4.12 1.2 9.7 3.3E-13 ±3E-13 1.1E-12 ±2E-1325-03.2 raw 0 0.2572 0.014 656 4.10 4.20 1.5 5.0 4.3E-13 ±3E-13 5.8E-13 ±1E-13 -27.525-15.2* treated 0.3161 0.2297 0.010 388 4.05 4.30 6.4 13.6 1.5E-12 ±3E-13 1.3E-12 ±3E-13 -24.225-08.2 treated 0 1.6916 0.016 638 4.00 4.36 2.0 14.2 1.1E-13 ±4E-14 2.9E-13 ±5E-1425-16.2* treated 0.3162 0.2945 0.013 428 4.60 4.51 2.5 7.7 6.2E-13 ±3E-13 7.6E-13 ±2E-13 -26.0
(mol g-1s-1)RateAl RateSi
(mol g-1s-1)
* Experiment that were conducted with NaNO3; SS time = time from the beginning of the experiment to steady state.

The effect of pH and temperature on smectite dissolution -24- 11/10/04 2 Table 1: Experimental conditions and results (continue)
Experiment sample NaNO3 mass Flow rate SS time p H [Al] [Si] ∆Gr
(M) (g) (mL min-1) (days) input output (µM) (µM) (kcal mol-1)
50°C50-17.1* treated 0.2162 0.1898 0.029 21 1.14 1.11 843.1 1979.2 6.9E-10 ±3E-10 6.5E-10 ±3E-10 -40.450-07.2 treated 0 0.1323 0.034 227 1.55 1.55 191.4 479.7 2.7E-10 ±1E-10 2.7E-10 ±1E-10 -40.850-10.1* treated 0.2846 0.3468 0.135 15 1.60 1.60 159.7 359.0 3.4E-10 ±1E-10 3.0E-10 ±1E-1050-02b.1 treated 0 0.1471 0.111 17 2.00 1.98 33.7 83.4 1.4E-10 ±3E-11 1.4E-10 ±3E-11 -44.050-02b.2 treated 0 0.1330 0.111 26 2.01 2.00 30.7 71.1 1.4E-10 ±4E-11 1.3E-10 ±3E-11 -45.150-02b.3 treated 0 0.0865 0.112 53 2.00 2.00 24.6 57.1 1.7E-10 ±7E-11 1.6E-10 ±7E-11 -46.750-12.4* treated 0.3062 0.0595 0.015 343 2.00 2.02 55.2 116.8 7.6E-11 ±5E-11 6.4E-11 ±4E-11 -46.550-12.3* treated 0.3062 0.1052 0.008 194 2.00 2.02 146.8 300.6 6.3E-11 ±2E-11 5.2E-11 ±2E-1150-02.2 raw 0 0.0736 0.109 12 2.01 2.03 23.0 57.0 1.9E-10 ±4E-11 1.8E-10 ±4E-11 -46.750-02.1 raw 0 0.0818 0.119 5 2.03 2.04 24.0 61.2 1.9E-10 ±4E-11 1.9E-10 ±4E-11 -46.750-12.2* treated 0.3131 0.1277 0.038 81 2.47 2.48 23.6 52.0 3.8E-11 ±1E-11 3.3E-11 ±9E-12 -44.150-12.1* treated 0.3131 0.1407 0.044 40 2.46 2.48 25.4 59.3 4.3E-11 ±1E-11 4.0E-11 ±9E-12 -43.350-06.1 treated 0 0.1424 0.035 66 2.47 2.49 29.8 68.1 4.0E-11 ±9E-12 3.6E-11 ±8E-12 -35.550-01.1 raw 0 0.1102 0.094 32 2.96 2.97 8.6 21.2 4.0E-11 ±8E-12 3.9E-11 ±7E-12 -35.550-01.2 raw 0 0.1074 0.088 45 2.96 3.00 8.7 21.1 3.8E-11 ±8E-12 3.7E-11 ±7E-12 -35.550-13.2* treated 0.3152 0.1272 0.026 278 3.02 3.05 9.6 21.1 1.1E-11 ±3E-12 9.4E-12 ±3E-1250-13.1* treated 0.3152 0.1304 0.025 237 3.04 3.06 15.3 32.6 1.6E-11 ±4E-12 1.4E-11 ±4E-1250-07.1 treated 0 0.2501 0.033 133 3.55 3.58 6.8 16.0 4.9E-12 ±9E-13 4.6E-12 ±8E-13 -26.850-14.1* treated 0.3159 0.1451 0.083 230 3.55 3.62 2.1 3.5 6.4E-12 ±3E-12 4.4E-12 ±2E-12 -45.550-03.3 raw 0 0.1725 0.039 428 4.07 4.07 0.6 5.3 7.8E-13 ±6E-13 2.6E-12 ±5E-13 -29.650-03.2 raw 0 0.1733 0.041 386 4.10 4.12 0.8 5.5 1.1E-12 ±8E-13 2.8E-12 ±5E-13 -29.650-03.1 raw 0 0.1738 0.013 273 4.02 4.15 1.5 17.4 5.9E-13 ±5E-13 2.8E-12 ±5E-13 -20.150-15.2* treated 0.3161 1.7362 0.015 388 4.20 5.9 28.9 2.8E-13 ±5E-14 5.5E-13 ±1E-1350-15.1* treated 0.3161 1.7379 0.015 334 4.72 4.21 5.1 31.6 2.4E-13 ±4E-14 6.0E-13 ±1E-13 -20.450-16.2* treated 0.3162 1.7302 0.015 414 4.74 4.59 2.1 21.4 1.0E-13 ±4E-14 4.1E-13 ±7E-1450-16.1* treated 0.3162 1.7308 0.015 313 4.54 4.65 2.2 25.5 1.1E-13 ±4E-14 4.9E-13 ±8E-14 -17.050-08.2 treated 0 1.7391 0.037 461 4.17 4.80 0.1 43.8 6.2E-15 ±1E-14 2.0E-12 ±3E-13 -12.450-08.1 treated 0 1.7390 0.037 505 4.00 5.46 0.1 35.5 1.5E-14 ±3E-14 1.6E-12 ±3E-13 -10.5
RateAl RateSi
(mol g-1s-1) (mol g-1s-1)
* Experiment that were conducted with NaNO3; SS time = time from the beginning of the experiment to steady state.
The effect of pH and temperature on smectite dissolution -25- 11/10/04 3 Table 1: Experimental conditions and results (continue)
Experiment sample NaNO3 mass Flow rate SS time p H [Al] [Si] ∆Gr
(M) (g) (mL min-1) (days) input output (µM) (µM) (kcal mol-1)
70°C70-04.1 treated 0 0.2631 0.062 25 1.17 1.14 413.8 1058.9 5.3E-10 ±2E-10 5.4E-10 ±2E-10 -43.470-17.1* treated 0.2162 0.2042 0.030 24 1.14 1.16 816.7 2387.5 6.6E-10 ±3E-10 7.7E-10 ±4E-10 -37.570-10.1* treated 0.2846 0.2925 0.107 10 1.60 1.62 166.0 412.5 3.3E-10 ±1E-10 3.3E-10 ±1E-1070-02.2 raw 0 0.0434 0.122 27 1.95 1.94 27.8 64.1 4.2E-10 ±2E-10 3.9E-10 ±2E-1070-02b.1 treated 0 0.1038 0.116 21 2.01 2.00 54.5 129.1 3.3E-10 ±1E-10 3.1E-10 ±1E-10 -40.170-02b.3 treated 0 0.0486 0.118 63 1.99 2.00 25.6 59.6 3.4E-10 ±3E-10 3.1E-10 ±3E-1070-02b.2 treated 0 0.0342 0.118 81 2.01 2.01 17.8 40.8 3.3E-10 ±4E-10 3.1E-10 ±4E-10 -49.770-02.1 raw 0 0.0586 0.121 18 2.06 2.02 30.4 72.0 3.4E-10 ±1E-10 3.2E-10 ±1E-1070-15.2* treated 0.3062 0.0731 0.018 557 2.24 2.29 69.6 176.6 9.1E-11 ±5E-11 9.2E-11 ±5E-1170-06.1 treated 0 0.1071 0.042 69 2.51 2.51 43.2 100.1 9.2E-11 ±3E-11 8.6E-11 ±3E-11 -31.870-06.2 treated 0 0.1520 0.042 19 2.49 2.52 71.2 163.6 1.1E-10 ±2E-11 9.8E-11 ±2E-11 -27.870-08b.3 treated 0 0.1447 0.040 49 2.54 2.55 54.3 132.9 8.1E-11 ±2E-11 7.9E-11 ±2E-1170-12.1* treated 0.3131 0.1025 0.027 48 2.50 2.55 43.9 101.6 6.3E-11 ±2E-11 5.8E-11 ±1E-11 -39.070-01.1 raw 0 0.0806 0.081 27 3.00 3.02 9.4 23.5 5.2E-11 ±1E-11 5.1E-11 ±1E-11 -34.270-13.1* treated 0.3152 0.1455 0.026 74 3.03 3.10 33.0 71.2 3.2E-11 ±8E-12 2.8E-11 ±7E-12 -30.470-07.1 treated 0 0.2625 0.034 123 3.58 3.57 7.3 30.4 5.1E-12 ±9E-13 8.5E-12 ±1E-12 -22.470-14.2* treated 0.3159 0.3261 0.083 80 3.60 3.59 7.7 16.7 1.1E-11 ±2E-12 9.2E-12 ±2E-12 -33.170-14.1* treated 0.3159 0.3454 0.084 27 3.55 3.61 10.9 26.9 1.4E-11 ±3E-12 1.4E-11 ±3E-1270-07.2 treated 0 0.2489 0.033 294 3.95 3.70 6.7 18.8 4.9E-12 ±9E-13 5.4E-12 ±1E-12 -23.870-15.1* treated 0.3161 0.1710 0.008 266 4.09 4.21 4.9 13.6 1.2E-12 ±2E-13 1.3E-12 ±2E-13 -24.970-16.3* treated 0.3162 0.2607 0.014 210 4.09 4.25 5.3 16.3 1.5E-12 ±3E-13 1.8E-12 ±3E-1370-03b.1 treated 0 0.2175 0.013 314 4.11 4.27 0.6 24.8 1.9E-13 ±1E-13 3.2E-12 ±5E-13 -19.770-08b.2 treated 0 0.1007 0.029 325 4.80 4.37 0.9 4.4 1.4E-12 ±1E-12 2.8E-12 ±1E-1270-16.2* treated 0.3162 0.2598 0.014 257 4.65 4.52 1.5 8.6 4.3E-13 ±3E-13 9.7E-13 ±2E-13 -26.370-08b.1 treated 0 0.1009 0.013 273 4.52 1.1 7.1 7.3E-13 ±7E-13 2.0E-12 ±7E-13 -25.470-16.1* treated 0.3162 0.2617 0.014 113 4.55 4.59 1.4 13.3 4.1E-13 ±3E-13 1.5E-12 ±3E-13 -22.770-03.1 raw 0 0.1736 0.010 156 4.05 4.61 0.6 29.5 1.9E-13 ±2E-13 3.8E-12 ±7E-13 -17.1
RateAl RateSi
(mol g-1s-1) (mol g-1s-1)
* Experiment that were conducted with NaNO3; SS time = time from the beginning of the experiment to steady state.

The effect of pH and temperature on smectite dissolution -26- 11/10/04
7 FIGURE CAPTIONS
1 Fig. 1: Experimental set-up: a) Schematic illustration of the flow-through system;
b) A detailed view of the reaction cell.
2 Fig. 2: Variation of concentrations of Si and Al in three representative
experiments. The vertical lines delineate different experimental stages.
Analyses used to calculate average compositions at steady state are denoted
by open symbols. The inserts in (c) show enlargements of parts of the
experiment.
3 Fig. 3: Comparison of dissolution rates evaluated based on the release of Al,
RateAl, with those obtained based on the release of Si, RateSi at (a) 25°C, (b)
50°C and (c) 70°C. The solid lines are the 1/1 diagonals. The inserts are
enlargements of the sections that show experiments with slow dissolution
rates.
4 Fig. 4: Variation of log dissolution rate with pH: (a) at 25 ºC, (b) at 50 ºC and (c) at
70 ºC. The figure compares experiments conducted under constant ionic
strength (I) and NO3- concentration of ~ 0.32 M with those obtained without
adding NaNO3, i.e., where H+=NO3- (see section 5.3). The dashed curves
are a result of multiple non-linear regression of equation (10) to all the
measured rate data at pH<4

The effect of pH and temperature on smectite dissolution -27- 11/10/04
5 Fig. 5 Comparing the prediction of the proposed model (solid line) to surface
protonation data of Zysset and Schindler (1996) (symbols). The white and
the black squares represent data points at pH<2.5, in which according to the
interpretation of Zysset and Schindler (1996) surface protonation includes
a significantly contribution from ion exchange. The solid line is the best-fit
curve of Eq. (13) to adsorption isotherm data between pH 2.5 and 4 (black
dots). The model proposed in the present study predicts the concentration
of adsorbed H+, between pH 1.5 and 4 (black dots and squares), although
only the data at pH≤2.5 (black dots) were used for the fitting (see section
5.4).
6 Fig. 6: Comparison of the present study smectite dissolution rate to those obtained
by (a) Furrer et al. (1993), (b) Zysset and Schindler (1996) and (c) Metz et
al. (2004a). The dashed curve in (b) represents the model fitting of all the
present study measured rate data at pH<4.
8 REFERENCES
Amram K. (2002) Dissolution kinetics of smectite under acidic conditions (in Hebrew). MSc.
Thesis, Ben-Gurion University of the Negev.
Barrante J. R. (1974) Applied Mathematics for Physical Chemistry. Prentice-Hall, Inc.
Bauer A. and Berger G. (1998) Kaolinite and smectite dissolution rate in high molar KOH
solutions at 35° and 80°C. Applied Geochemistry 13, 905-916.
Bickmore B. R., Bosbach D., Hochella M. F., and Charlet L. (1998) Acid dissolution rates of
2:1 phyllosilicate clay minerals measured with in-situ atomic force microscopy.
Mineralogical Magazine 62A.
Bickmore B. R., Bosbach D., Hochella M. F. J., Charlet L., and Rufe E. (2001) In situ atomic
force microscopy study of hectorite and nontronite dissolution: Implications for
phyllosilicate edge structures and dissolution. American Mineralogist 86, 411-423.
Bickmore B. R., Hochella M. F. J., Bosbach D., and Charlet L. (1999) Methods for
performing atomic force microscopy imaging of clay minerals in aqueous solution. Clays
and Clay Minerals 47, 573-581.

The effect of pH and temperature on smectite dissolution -28- 11/10/04
Boettinger J. L. and Southard R. J. (1995) Phyllosilicate distribution in aridisols on a granitic
pediment, Western Mojave desert. Soil Science Society of America Journal 59, 1189-
1198.
Bosbach D., Charlet L., Bickmore B. R., and Hochella M. F. J. (2000) The dissolution of
hectorite: In-situ, real-time observations using Atomic Force Microscopy. American
Mineralogist 85, 1209-1216.
Brunauer S., Emmett P. H., and Teller E. (1938) Adsorption of gases in multimolecular
layers. J. Am. Chem. Soc. 60, 309-319.
Cama J., Ganor J., Ayora C., and Lasaga C. A. (2000) Smectite dissolution kinetics at 80°C
and pH 8.8. Geochimica et Cosmochimica Acta 64(15), 2701-2717.
Cama J., Metz V., and Ganor J. (2002) The effect of pH and temperature on kaolinite
dissolution rate under acidic conditions. Geochimica et Cosmochimica Acta 66(22), 3913-
3926.
Chapman N. A. and McKinley I. G. (1989) The Geological Disposal of Nuclear Waste. John
Wiley & Sons.
Davis J. A. and Kent D. B. (1990) Surface complexation modeling in aqueous geochemistry.
In Reviews in Mineralogy, Vol. 23 (ed. M. F. Hochella and A. F. White), pp. 177-260.
Mineralogical Society of America.
Dougan W. K. and Wilson A. L. (1974) The absorptiometric determination of aluminum in
water. A comparison of some chromogenic reagents and the development of an improved
method. Analyst 99, 413-430.
Furrer G., Zysset M., and Schindler P. W. (1993) Weathering kinetics of montmorillonite:
Investigations in batch and mixed-flow reactors. In Geochemistry of clay-pore fluid
interaction, Vol. 4 (ed. D. A. C. Manning, P. L. Hall, and C. R. Hughes), pp. 243-262.
Chapman & Hall.
Ganor J., Cama J., and Metz V. (2003) Surface protonation data of kaolinite - reevaluation
based on dissolution experiments. Journal of Colloid and Interface Science 264, 67-75.
Ganor J., Mogollon J. L., and Lasaga A. C. (1995) The effect of pH on kaolinite dissolution
rates and on activation energy. Geochimica et Cosmochimica Acta 59, 1037-1052.
Gautier J. M., Oelkers E. H., and Schott J. (2001) Are quartz dissolution rates proportional to
B.E.T. surface areas? Geochimica et Cosmochimica Acta 65, 1059-1070.
Huertas F. J., Caballero E., Jimenez de Cisneros C., Huertas F., and Linares J. (2001) Kinetics
of montmorillonite dissolution in granitic solutions. Applied Geochemistry 16, 397-407.

The effect of pH and temperature on smectite dissolution -29- 11/10/04
Koroleff F. (1976) Determination of silicon. In Methods of Seawater Analysis. (ed. K.
Grasshoff), pp. 149-158. Verlag Chemie.
Lasaga A. C. (1981) Rate laws of chemical reactions. In Kinetics of Geochemical Processes,
Vol. 8 (ed. A. C. Lasaga and J. R. Kirkpatrick), pp. 1-68. Mineralogical Society of
America.
Lasaga A. C., Soler J. M., Ganor J., Burch T. E., and Nagy K. L. (1994) Chemical weathering
rate laws and global geochemical cycles. Geochimica et Cosmochimica Acta 58(10),
2361-2386.
Lutzenkirchen J. and Kienzler B. (2002) Modelling of complexation equilibria. In Modelling
in Sciences (ed. T. Muller and H. Muller), pp. in press. Springer.
Metz V. (2001) Dissolution kinetics of smectite and kaolinite. Ph.D. Thesis, Ben-Gurion
University of the Negev.
Metz V., Amram K., and Ganor J. (2004a) Stoichiometry of smectite dissolution reaction.
Geochimica et Cosmochimica Acta Submitted.
Metz V. and Ganor J. (2001) Stirring Effect on Kaolinite Dissolution Rate. Geochimica et
Cosmochimica Acta 65(20), 3475-3490.
Metz V., Raanan H., Pieper H., Bosbach D., and Ganor J. (2004b) Towards the establishment
of a reliable proxy for the reactive surface area of smectite. Geochimica et Cosmochimica
Acta Submitted.
Mogollon J. L., Ganor J., Soler J. M., and Lasaga A. C. (1996) Column experiments and the
full dissolution rate law of gibbsite. American Journal of Science 296, 729-765.
Moll W. F. (2001) Baseline studies of the clay minerals society source clays: Geological
origin. Clays and Clay Minerals 49, 374-380.
Nagy K. L. and Lasaga A. C. (1992) Dissolution and precipitation kinetics of gibbsite at 80°C
and pH 3: The dependence on solution saturation state. Geochimica et Cosmochimica
Acta 56, 3093-3111.
Parks G. A. (1990) Surface energy and adsorption at mineral-water interfaces: an
introduction. In Reviews in Mineralogy (ed. M. F. Hochella and A. F. White), pp. 133-
175. Mineralogical Society of America.
Sato T., Kuroda M., Yokoyama S., Fukushi K., and Nakayama S. (2002) Effect of pH on
smectite dissolution rates under alkaline conditions. International Meeting on Clays in
Natural and Engineered Barriers for Radioactive Waste Confinement, 11-12.

The effect of pH and temperature on smectite dissolution -30- 11/10/04
Sato T., Kuroda M., Yokoyama S., Fukushi K., Tanaka T., and Nakayama S. (2003)
Mechanism and kinetics of smectite dissolution under alkaline conditions. Geochimica et
Cosmochimica Acta 67(18), A415.
Schlabach S., Techmer K., Heydemann A., and Heinrichs H. (1999) Experimentelle
Untersuchungen zum Einflub verschiedener Sauren auf den Losungsvorgang von
Kaolinit, Illit und Montmorillonit. 3. Geochemiker- Tagung der Deutschen
Mineralogischen Gesellschaft, 76-77.
Schroth B. L. and Sposito G. (1997) Surface charge properties of kaolinite. Clays and Clay
Minerals 45(1), 85-91.
Stadler M. and Schindler P. W. (1993) Modeling of H+ and Cu2+ adsorption on Calcium-
montmorillonite. Clays and Clay Minerals 41, 288-296.
Sverjensky D. A. and Sahai N. (1998) Theoretical prediction of single-site enthalpies of
surface protonation for oxides and silicates in water. Geochimica et Cosmochimica Acta
62(23/24), 3703-3716.
van Olphen H. and Fripiat J. J. (1979) Data handbook for clay minerals and other non-
metallic minerals. OECD and Clay Mineral Society. Pergamon Press.
Walther J. V. (1996) Relation between rates of aluminosilicate mineral dissolution, pH,
temperature, and surface charge. American Journal of Science 296, 693-728.
Wolery T. J. (1992) EQ3NR, a computer program for geochemical aqueous speciation-
solubility calculations: Theoretical manual, user´s guide and related documentation
(version 7.0)., pp. 262. Lawrence Livermore National Laboratory.
Zysset M. and Schindler P. W. (1996) The proton promoted dissolution kinetics of K-
montmorillonite. Geochimica et Cosmochimica Acta 60, 921-936.

o-ring
membrane
screen
nylon mesh
outlet
inlet
Amram and Ganor 2004, Fig. 1
b)
immersioncirculator
output
input pump
a)
thermostatic bath
smectite
o-ring

�
��
���
���
���
� ��� ��� ��� ��� ���� ���� ����
������������� � �
��� �� ���µ�
�
�������
�������
������ �
�����������
�������
������ �
�����������
�
���
���
���
���
� ���� ����� ����� �����
������������� ���
��� �� ���µ�
�
�������
�������
� !���
�������
� !��"
#������$�%�������&�'�(���
�������) � �
#����� �� �
*����� �� �
+ �+ ) ��$,
�
���
���
"��
���
���
����� �"��� ����� �����
��� �� ���µ�
�
�������
�
�
��
��
��
��
"�
"�
��
���� "��� ���� ���� ����
��� �� ���µ�
�
�������
�
��
��
��
��
���
� ���� ���� ���� ���� �����
������������� � �
��� �� ���µ�
�
�������
����"��
������ �
����"������
����"��
������ �
�����������
����"�"
������ �
���"�������


Copyright © 2022 FDOKUMEN