Modelling Dissolution of Precipitate Phases During ... - CORE
Upload
independentCategory
view
1download
0
This article appeared in a journal published by Elsevier. The attachedcopy is furnished to the author for internal non-commercial researchand education use, including for instruction at the authors institution
and sharing with colleagues.
Other uses, including reproduction and distribution, or selling orlicensing copies, or posting to personal, institutional or third party
websites are prohibited.
In most cases authors are permitted to post their version of thearticle (e.g. in Word or Tex form) to their personal website orinstitutional repository. Authors requiring further information
regarding Elsevier’s archiving and manuscript policies areencouraged to visit:
http://www.elsevier.com/copyright

Author's personal copy
Dissolution of illite in saline–acidic solutions at 25 �C
Irshad Bibi a, Balwant Singh a,⇑, Ewen Silvester b
a Faculty of Agriculture, Food and Natural Resources, University of Sydney, Sydney, NSW 2006, Australiab Department of Environmental Management and Ecology (DEME), La Trobe University, Albury-Wodonga Campus, Vic. 3690, Australia
Received 17 September 2010; accepted in revised form 11 March 2011; available online 23 March 2011
Abstract
The dissolution rate of illite, a common clay mineral in Australian soils, was studied in saline–acidic solutions under farfrom equilibrium conditions. The clay fraction of Na-saturated Silver Hill illite (K1.38Na0.05)(Al2.87Mg0.46Fe3+
0.39Fe2+0.28-
Ti0.07)[Si7.02Al0.98]O20(OH)4 was used for this study. The dissolution rates were measured using flow-through reactors at25 ± 1 �C, solution pH range of 1.0–4.25 (H2SO4) and at two ionic strengths (0.01 and 0.25 M) maintained using NaCl solu-tion. Illite dissolution rates were calculated from the steady state release rates of Al and Si. The dissolution stoichiometry wasdetermined from Al/Si, K/Si, Mg/Si and Fe/Si ratios. The release rates of cations were highly incongruent during the initialstage of experiments, with a preferential release of Al and K over Si in majority of the experiments. An Al/Si ratio >1 wasobserved at pH 2 and 3 while a ratio close to the stoichiometric composition was observed at pH 1 and 4 at the higher ionicstrength. A relatively higher K+ release rate was observed at I = 0.25 in 2–4 pH range than at I = 0.01, possibly due to ionexchange reaction between Na+ from the solution and K+ from interlayer sites of illite. The steady state release rates of K, Feand Mg were higher than Si over the entire pH range investigated in the study. From the point of view of the dominant struc-tural cations (Si and Al), stoichiometric dissolution of illite occurred at pH 1–4 in the higher ionic strength experiments and atpH63 for the lower ionic strength experiments. The experiment at pH 4.25 and at the lower ionic strength exhibited lower RAl
(dissolution rate calculated from steady state Al release) than RSi (dissolution rate calculated from steady state Si release),possibly due to the adsorption of dissolved Al as the output solutions were undersaturated with respect to gibbsite. The dis-solution of illite appears to proceed with the removal of interlayer K followed by the dissolution of octahedral cations (Fe, Mgand Al), the dissolution of Si is the limiting step in the illite dissolution process. A dissolution rate law showing the dependenceof illite dissolution rate on proton concentration in the acid-sulfate solutions was derived from the steady state dissolutionrates and can be used in predicting the impact of illite dissolution in saline acid-sulfate environments. The fractional reactionorders of 0.32 (I = 0.25) and 0.36 (I = 0.01) obtained in the study for illite dissolution are similar to the values reported forsmectite. The dissolution rate of illite is mainly controlled by solution pH and no effect of ionic strength was observed on thedissolution rates.� 2011 Elsevier Ltd. All rights reserved.
1. INTRODUCTION
Iron sulfide rich soil materials are termed as sulfidicmaterials and have the capacity to be converted to sulfuricmaterials (pH <4) on oxidation. Soils containing thesematerials are termed as acid sulfate soils and are a signifi-
cant environmental concern both for coastal and inlandareas around the world and in Australia (Fitzpatrick andShand, 2008). In extremely acidic conditions (pH <4) gen-erated in acid sulfate soils, the chemical weathering of alu-minosilicates is one of the few processes that can neutralizethe acidity on a long term basis; especially in many Austra-lian soils that contain small amounts of weatherable pri-mary minerals. Phyllosilicate minerals constitute the clayfraction of most soils and have a strong influence on phys-ical and chemical properties of soils. Illite, a dioctahedralmicaceous clay, occurs very widely and is the dominant clay
0016-7037/$ - see front matter � 2011 Elsevier Ltd. All rights reserved.
doi:10.1016/j.gca.2011.03.022
⇑ Corresponding author. Tel.: +61 2 9351 2237; fax: +61 0400117 107.
E-mail address: [email protected] (B. Singh).
www.elsevier.com/locate/gca
Available online at www.sciencedirect.com
Geochimica et Cosmochimica Acta 75 (2011) 3237–3249

Author's personal copy
mineral in many Australian soils (Norrish and Pickering,1983).
The extreme saline–acidic soil solutions resulting fromsulfide mineral oxidation may have strong impact on theweathering of phyllosilicate minerals. The relationship be-tween the input of acid to soils and the weathering ratesof minerals is of major significance, both for understandingthe weathering processes in soil and the management ofacid sulfate soils. It is very difficult to obtain reliable reac-tion rates of mineral dissolution under field conditions be-cause of non-stoichiometric release of elements due to: (i)precipitation of some of the released elements in secondarymineral phases, (ii) uncertainty in the measurements of min-eral surface area, and (iii) element release from a mixture ofminerals, each having different dissolution rate (Kalinowskiand Schweda, 1996). More reliable mineral dissolution ratescan be obtained from laboratory based experiments usingbatch reactors, flow-through reactor or column experi-ments. In flow-through reactors, the dissolved componentsare continuously removed to avoid saturation with respectto secondary phases (Kalinowski and Schweda, 2007). Pre-vious dissolution studies conducted on phyllosilicate miner-als indicate that the dissolution rates increase withincreasing acidity (Cama et al., 2002; Kohler et al., 2003;Rozalen et al., 2008). A considerable amount of work hasbeen done on phyllosilicate dissolution especially kaolinite(Nagy et al., 1991; Huertas et al., 1999; Huertas et al.,2001; Metz and Ganor, 2001; Cama and Ganor, 2006).There have also been a number of investigations on the dis-solution behaviour of smectite (Zysset and Schindler, 1996;Cama et al., 2000; Amram and Ganor, 2005; Golubev et al.,2006; Rozalen et al., 2008; Rozalen et al., 2009). To ourknowledge there is only one detailed study on illite dissolu-tion that used batch experiments (Kohler et al. (2003). Themain emphasis of this research was to determine the effectsof pH and temperature on the dissolution rate and the stoi-chiometry of illite dissolution.
This paper reports the first attempt to measure the disso-lution rates of illite in saline acid sulfate solutions using stir-red flow-through reactors. The aims of this study were todetermine the effects of acidity combined with varying levelsof salinity, commonly observed in saline acid sulfate soils inwetlands, on the dissolution rates and stoichiometry of illitedissolution. The dissolution rates of Silver Hill illite (aninternational reference sample from the Clay Minerals Soci-ety) were determined at a pH range of 1–4 (sulfuric acid)and at an ionic strength of 0.25 and 0.01 (maintained byusing NaCl). The results of these experiments could beapplicable to a range of environmental conditions wherethe natural weathering rates of phyllosilicate minerals areaffected by variations in salinity and acidity prevailing inthese systems.
2. MATERIALS AND METHODS
2.1. Pre-treatment and characterization
All the experiments were carried out on Silver Hill illite(IMt-2, Montana), an international reference mineral, ob-tained from the Source Clays Repository of the Clay
Minerals Society at the Purdue University, West Lafayette,USA.
The clay fraction (<2 lm) was separated by sedimenta-tion-resuspension using 0.1 M NaOH solutions to dispersethe clay suspension. The separated clay fraction was repeat-edly washed with 1 M NaCl solution (adjusted to pH 3) un-til the supernatant pH was 3. The clay was then repeatedlywashed with 0.01 M NaCl solution (pH 7.0) until the super-natant pH reached � 6; the suspension was centrifuged toremove excess water. The excess salts in the Na-saturatedclay were removed by dialysis. The purified sample wasfreeze dried and stored in polyethylene bottles.
The purified and partly-dissolved (sample taken aftersteady state dissolution) illite samples were mineralogicallycharacterized using X-ray diffraction (XRD). X-ray diffrac-tion patterns (GBC MMA: CoKa radiation, k = 1.7890 A,operating conditions of 35 kV and 28.5 mA) were obtainedon both randomly and basally oriented specimens (Brindleyand Brown, 1980). The randomly oriented XRD patternswere collected from 4� to 75� 2h at a step size of 0.02� 2hand a scan speed of 1.0� 2h min�1. The basally orientedXRD patterns of Mg and K saturated specimens were col-lected from 3� to 35� 2h and 3� to 20� 2h, respectively. Mg-ethylene glycol solvated specimens were scanned from 3� to20� 2h. The XRD patterns of the purified illite sampleshowed the presence of minor impurities of kaolinite andquartz.
A sub-sample of the Na-saturated purified mineral wasused for bulk chemical analysis using Philips PW2400 X-ray fluorescence (XRF) spectroscopy (Norrish and Hutton,1977). The detection limits of XRF for SiO2, Al2O3, TiO2,Fe2O3, MgO, CaO, K2O, and Na2O analyses were 61.5,25.6, 27.7, 11.7, 59.7, 12.4, 9.7, and 164.2 mg kg�1, respec-tively, and the accuracy of XRF results was better than 1%.Fe (II) content was determined by the 1, 10 phenanthrolinecolorimetric method (Amonette and Templeton, 1998). Theuncertainty associated with the Fe(II) analysis was±0.03 mg L�1. Based on the XRF and Fe (II) analyses ofthe Na-saturated illite, we obtained the structural formula:K1.38Na0.05(Al2.87Mg0.46Fe3+
0.39Fe2+0.28Ti0.07)[Si7.02Al0.98]
O20(OH)4 (Cicel and Komadel, 1994). The correspondingatomic ratios Al/Si, K/Si, Mg/Si and Fe/Si in the clayfraction of the illite are presented in Table 1.
The particle morphology of the purified and partly-dis-solved illite samples was determined using a Philips CM12transmission electron microscope (TEM) operated at120 kV at the Australian Centre for Microscopy and Micro-analysis of the University of Sydney. Samples for TEMwere prepared by dispersing a small amount of clay inBarnstead E-pure� (18.2 MX cm�1; Barnstead/Thermolyne
Table 1The atomic ratios for Silver Hill illite calculated from its chemicalcomposition determined by XRF analysis.
Atomic ratio Value
Al/Si 0.55K/Si 0.20Mg/Si 0.07Fe/Si 0.10
3238 I. Bibi et al. / Geochimica et Cosmochimica Acta 75 (2011) 3237–3249
Author's personal copy
Corp., Dubuque, IA, USA) water by ultrsonification. Adrop of the dispersed sample was placed on a carbon coatedCu grid for TEM analysis. The specific surface area of theclay sample was determined to be 42 ± 10 m2/g by five-point N2 Brunauer–Emmett–Teller (BET) method; heliumwas used as the carrier gas and the samples were outgassedat 105 �C (Braunauer et al., 1938).
2.2. Flow-through dissolution experiments
Dissolution experiments were carried out in stirred flow-through reactors (46 mL in volume) manufactured at thePolytechnic University of Catalonia, Spain; similar flow-through reactors have been used in recent dissolution stud-ies (Cama et al., 2002; Metz et al., 2005; Rozalen et al.,2008). The reactor consisted of three chambers with the in-put solution entering the reactor through the lower cham-ber where it was continuously stirred to homogenize theinput solution before it entered the middle chamber con-taining the mineral sample. The solution exited throughthe upper chamber. The clay sample was enclosed withinthe middle chamber of the reactor by a 0.22 lm Duraporemembrane filter and a fine nylon mesh assembly at the bot-tom and a 0.22 lm Durapore membrane filter at the top.The reactors were kept immersed in a thermostatic waterbath at a temperature of 25 ± 1 �C. The flow rates of the in-put solutions ranged from 0.02 to 0.05 mL min�1 and weremaintained by a Gilson peristaltic pump. The input solu-tions were prepared at a pH ranging from 1 to 4.25 by dilut-ing AR-grade H2SO4 with E-pure water and the ionicstrength of the solution maintained at either 0.25 or0.01 M using AR-grade NaCl. The flow rate and input solu-tion composition were kept constant for long enough timeto reach a steady state in each experiment. The steady statehas been considered to have reached when the difference inSi and Al concentrations of consecutive samples was <6%(Rozalen et al., 2008); and in this study Al and Si concen-trations of at least seven consecutive samples were used toconfirm the steady state. The residence time of the inputsolution in the flow-through reactor ranged between 15 h(for the experiments conducted at a flow rate of0.05 mL min�1) and 38 h (for the experiments conductedat a flow rate of 0.02 mL min�1).
2.3. Solution phase analyses
The output solutions were collected every 24 h and thetotal concentrations of Al, Si and K determined until thesteady state was reached. The experiments took between1500 and 2200 h to reach the steady state. The pH of outputsolution was measured immediately after collecting thesample using a pre-calibrated combined pH electrode(PHM 210 Radiometer pH meter, accuracy ±0.02 pHunits). Total Al and Si concentrations were determined col-orimetrically (Schimadzu UV mini 1240 spectrophotome-ter) by the catechol violet method (Dougan and Wilson,1974) and molybdate blue method (Koroleff, 1976), respec-tively. Potassium was determined by atomic absorptionspectrometry (AAS, Varian Spectra 220 FS). Concentra-tions of Ca, Fe, Mg and Na were determined for the steady
state samples by inductively coupled plasma atomic emis-sion spectroscopy (ICP-AES, Varian Vista AX). The useof glassware was avoided at all stages of the experimentto prevent Si contamination.
2.4. Solid phase analyses
The reactors were opened at the end of each experimentand the partly-dissolved illite sample was collected by cen-trifugation and washed with E-pure water. The residualmineral sample was dried at 35 �C and stored for subse-quent XRD, TEM and BET surface area measurements.
3. KINETICS CALCULATIONS
The dissolution reaction of illite in acidic systems can beexpressed as:
ðKþ1:38Naþ0:05ÞðAl3þ2:87Fe3þ
0:39Fe2þ0:28Mg2þ
0:46Ti4þ0:07Þ
� ½Si4þ7:02Al3þ
0:98�O20ðOHÞ4 þ 15:92Hþ
! 1:38Kþ þ 0:05Naþ þ 3:85Al3þ þ 0:39Fe3þ
þ 0:28Fe2þ þ 0:46Mg2þ þ 0:07Ti4þ þ 7:02SiO2
þ 9:96H2O ð1Þ
The dissolution rate Rj (mol m�2 s�1) at steady state wascalculated from the output solution concentrations of Si(RSi) and Al (RAl), respectively, by using the followingexpression (Cama et al., 2000):
Rj ¼ �1
V j� FSMðCjÞ ð2Þ
where Cj is the concentration (mol L�1) of component j (Alor Si) in the output solution, Vj is the stoichiometric coeffi-cient of the component j in the illite dissolution reaction(Eq. (1)), F is the fluid flow rate (L s�1), M is the samplemass (g) and S is the mineral specific surface area (m2/g).The analytical uncertainty in steady state dissolution ratewas calculated using the following equation (Miller andMiller, 1993):
rR
R¼
ffiffiffiffiffiffiffiffiffiffiffiffiffiffiffiffiffiffiffiffiffiffiffiffiffiffiffiffiffiffiffiffiffiffiffiffiffiffiffiffiffiffiffiffiffiffiffiffiffiffirC
C
� �2
þ rF
F
� �2
þ rS
S
� �2r
ð3Þ
where rR is the uncertainty in the calculated rate, rc is theuncertainty in the concentration of Al or Si in the outputsolution and rF and rS are the uncertainties associated withthe input flow rate and specific surface area, respectively.
The saturation state of the solution with respect to theillite dissolution was calculated in terms of the Gibbs freeenergy of reaction DG (Nagy, 1995):
DG ¼ �RT lnIAP
Keq
� �ð4Þ
where IAP is the ion activity product, Keq is the equilibriumconstant, T represents the absolute temperature and R isthe gas constant. The Eq. (4) can be simplified and re-writ-ten as:
DG ¼ �RT � 2:303 logIAP
Keq
� �ð5Þ
Dissolution study of illite in saline–acidic solutions 3239

Author's personal copy
DG ¼ �RT � 2:303 log IAP� log Keq ð6ÞDG ¼ �1:364 log IAP� log Keq ð7ÞDG ¼ �1:364� SI ð8Þ
where (log IAP � log Keq) = SI (Saturation Index). Aque-ous ion activities and saturation indices for Al, Si, Mgand Fe minerals were calculated by using the geochemicalspeciation software, PHREEQC Interactive Version 2.17with PHREEQC database (Parkhurst and Appelo, 1999;Yang and Steefel, 2008). The SI values were incorporatedin Eq. (8) to calculate the value of DG for selected mineralsof Al, Si, Mg and Fe. The equilibrium constant for illite dis-solution was estimated using the technique of Vieillard(2000). The method is based on the use of a parameterDGO2� MZ+(aq) for the prediction of Gibbs free energyof formation of hydrated clay minerals. The parameterDGO2� MZ+(aq) characterizes the oxygen affinity of a cat-ion M (where z is the charge on the cation) in a specific siteof the mineral and is calculated from the difference betweenthe Gibbs free energy of formation of the correspondingoxides and the Gibbs free energy of formation of aqueouscation. The Gibbs free energy of a hydrated clay mineralis a sum of the DGr of the formation of the constituent oxi-des and a second term DG�ox which characterizes the DGr offormation from constituent oxides (Vieillard, 2000). Theestimated DGr of formation for illite sample used in thisstudy was 5499.16 kJ mol�1. The estimated log Keq for illitedissolution reaction (Eq. (1)) at 25 �C is 10.51.
4. RESULTS
Transmission electron micrographs of the purified illiteand the illite after dissolution at pH 2 (I = 0.25 M) are pre-sented in Fig. 1(a) and (b), respectively. The TEM imagesshow the expected platy morphology for both purifiedand partly-dissolved illite. The original illite sample hasparticle aggregates, with individual particles ranging in sizefrom 200 to 500 nm. Prior to the dissolution illite particleshad predominantly straight and sharp edges (number ofcrystals measured, n = 10, average no. of straight edges = 3and average no. of non-straight edges = 1.7, Fig. 1a). Afterpartial dissolution, a minor corrosion on particle edges wasobserved which was confirmed by the increased frequencyof sub-rounded to rounded edges of illite particles(n = 10, average no. of straight edges = 0.8 and averageno. of non-straight edges = 3.2, Fig. 1b).
The temporal changes in pH and concentrations of Si,Al and K in all the experiments are given in the Figs. A1and A2, respectively. The experimental conditions, initialmineral mass, experiment durations and the steady stateconcentrations of Al, Si, K, Fe and Mg for experimentsat I = 0.25 M and I = 0.01 M are shown in Table 2. Theexperiments took between 1500 and 2200 h to reach thesteady state. The experiment conducted at pH 1 took theleast time to reach the steady state which is consistent withthe results of previous studies where the reactions with fas-ter rates (conducted at low pH and high temperature) at-tained the steady state earlier (Amram and Ganor, 2005).There is no concise definition of a steady state in flow-through dissolution experiments; we used at least seven
consecutive similar output concentrations of Al or Si todefine the steady state, following the approach used in re-cent studies (Cama et al., 2000; Rozalen et al., 2008). Therewas no significant difference in pH of the output solutioncompared with the input solutions in experiments con-ducted at pH 1–3 (Table 1) at the higher ionic strength.In the experiment conducted at pH 4 the pH dropped to3.88 after first few hundred hours but was the same as theinput solution pH (i.e. 4) at the steady state. For the lowerionic strength experiments, the output solution pH was ini-tially higher than the input solution pH, but decreased atlonger times; at steady state the output solution pH wasequal to the input solution pH, except for the experimentconducted at pH 4.25 where the steady state output solu-tion pH was 4.31.
The concentrations of elements (Si, Al and K) in the out-put solutions were relatively high at the onset of each exper-iment, followed by a gradual decrease until stable (steadystate) conditions were established. The stoichiometry of Il-lite dissolution was quantified through the use of relative re-lease rates of Al, K, Fe and Mg to Si in each experiment.These relative release rates are expressed in the form ofAl/Si, K/Si, Fe/Si and Mg/Si ratios, calculated using thefollowing equation:
RRRj ¼Rj outRSi out
Rj minRSi min
ð9Þ
where RRRj is the relative release rate of the element ‘j’,Rj out and RSi out are the concentrations of the element j andSi, respectively, in the output solution and Rj min and RSi min
are stoichiometric coefficients of the element j and Si in illite
Fig. 1. Transmission electron microscope images of illite (a) afterpre-treatment, and (b) after dissolution (steady state conditionsestablished) at pH 2.06 and ionic strength 0.25 (M).
3240 I. Bibi et al. / Geochimica et Cosmochimica Acta 75 (2011) 3237–3249

Author's personal copy
structural formula, respectively. For stoichiometric dissolu-tion of the mineral, a ratio of 1 is expected while a ratio >1indicates a preferential release of the element over Si andvalues <1 correspond to a preferential release of Si overthat element.
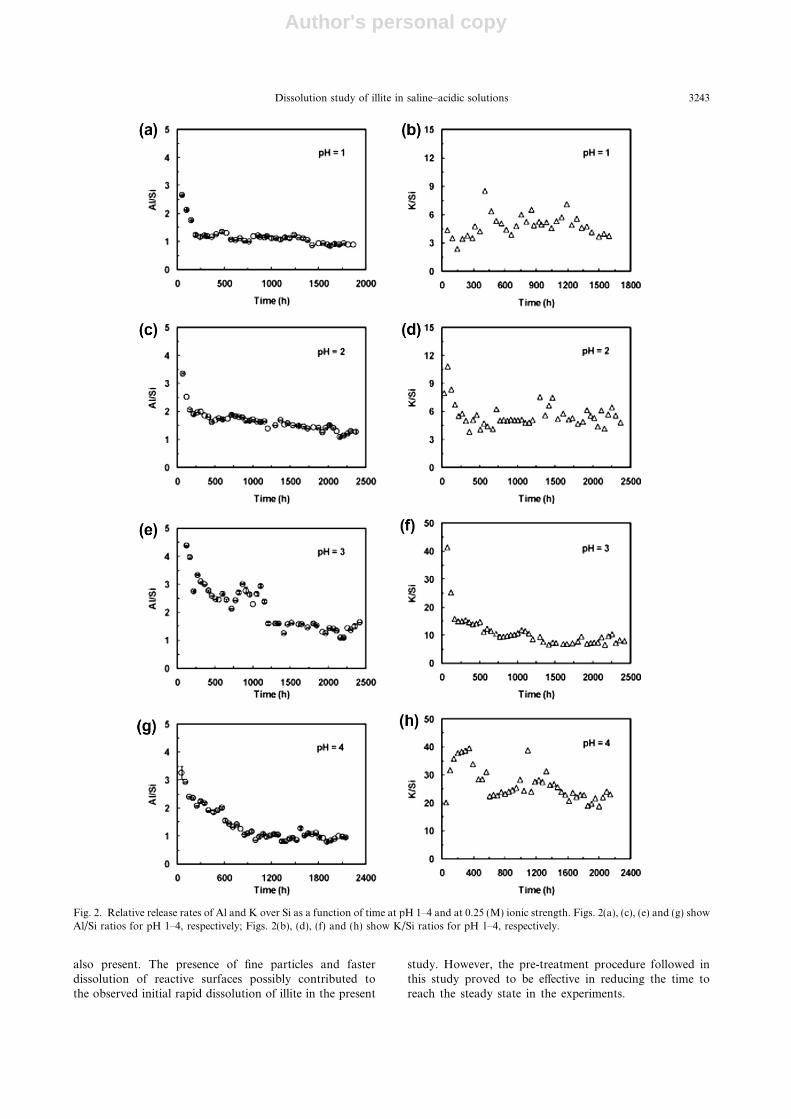
The Al/Si and K/Si ratios plotted against time areshown in Figs. 2 and 3, corresponding to high(I = 0.25 M) and low (I = 0.01 M) ionic strength, respec-tively. The release rates of Al and Si were highly non-stoi-chiometric during initial few hundred hours of theexperiments with a preferential release of Al over Si in mostexperiments. The highest initial preferential release of Alover Si was observed at pH 2 and 3 at the higher ionicstrength. In these experiments, the Al/Si ratio also de-creased continuously however, stoichiometric dissolutiondid not occur even after 2000 h of the experiment. The pref-erential release of Al over Si at pH 2 and 3 at I = 0.25 wasmaintained throughout the experiment (Fig. 2c and e); finalAl/Si ratios at pH 2 and 3 were 1.20 and 1.32, respectively.At pH 1 and 4, and 0.25 M ionic strength, the high Al/Siratios observed at the start of the experiments decreasedwith time and reached the stoichiometric ratio (i.e. Al/Si = 1) after 500 and 800 h, respectively (Fig. 2a and g),and ultimately decreasing to 0.90 indicating a slightly high-er release of Si over Al (Table 2). The experiments at thelower ionic strength also showed an initial rapid releaseof Al over Si at pH 1 and 2 (Fig. 3a and c). For experimentsconducted at pH <4, the Al/Si ratios at steady state wereclose to stoichiometric while at pH 4.25, a preferential re-lease of Si over Al was observed (Table 2).
The release rates of K at both ionic strengths and overthe pH range investigated followed the same trend as otherelements with high initial release at the start of each exper-iment followed by a gradual decrease over 1000–1500 h.Preferential release of K over Si was observed over the en-tire pH range studied at the higher ionic strength (Fig. 2).The steady state K/Si ratios at the higher ionic strength in-creased with increasing pH of the input solution; K/Si ra-tios at pH 1, 2, 3 and 4 were 4, 5, 8 and 21, respectively(Table 2 and Fig. 2). Similar trend was also observed forK/Si ratio at the lower ionic strength, and K release was2, 3, 4 and 10 times higher than Si at pH 1, 2, 3 and 4,respectively (Table 2 and Fig. 3).
Fig. 4 compares the K release rates for the two ionicstrengths. At both ionic strengths the steady state K releaserates increased with decreasing pH, with the greatestchange occurring between pH 1 and 2. K release rates werealso greater at the higher ionic strength over the pH range2–4 than the corresponding values at the lower ionicstrength (Fig. 4 and Table 2). Given that K occupies inter-layer sites in illite, the results are consistent with a K+ dis-placement mechanism involving both Na+ and H+ cations.
The concentrations of Fe and Mg in the output solu-tions were measured only for selected samples after steadystate Al and Si release was attained. At both ionic strengthsthe steady state concentrations of Fe decreased with anincreasing pH, except at pH 2 at the higher ionic strength(Table 2). The steady state Fe/Si ratios indicate a preferen-tial release of Fe over Si at both ionic strengths at all pHvalues. Magnesium concentrations in the output solutions
Tab
le2
Su
mm
ary
of
the
exp
erim
enta
lco
nd
itio
ns,
stea
dy
stat
eco
nce
ntr
atio
ns
(lm
ol/
Lg)
of
Al,
Si
and
K,
and
rate
sca
lcu
late
dfo
ril
lite
dis
solu
tio
nat
0.25
and
0.01
(M)
ion
icst
ren
gth
(I)
and
at25
�C.
Inp
ut
pH
Init
ial
mas
s(g
)S
tead
yst
ate
du
rati
on
(h)
Flo
wra
te(m
Lm
in�
1)
Ou
tpu
tso
luti
on
log
rate
aD
R(%
)
pH
Si
Al
KF
eM
gA
l/S
iK
/Si
Fe/
Si
Mg/
Si
Sia
Al
Sib
Al
I=
0.2
5
1.00
0.11
6318
900.
0431
1.03
72.9
135
.77
61.3
114
.62
5.16
0.90
4.20
2.01
1.01
�12
.75�
12.7
911
.111
.02.
060.
1667
2418
0.02
152.
0150
.45
33.3
546
.73
16.2
05.
221.
204.
633.
211.
48�
13.2
1�
13.1
211
.312
.32.
990.
1671
2442
0.02
182.
9530
.28
21.9
047
.40
3.41
3.11
1.31
7.83
1.13
1.47
�13
.42�
13.2
912
.012
.04.
000.
1173
2075
0.02
993.
9810
.66
5.28
45.6
91.
364.
260.
9021
.43
1.28
5.71
�13
.74�
13.7
810
.811
.2
I=
0.0
1
1.00
0.12
4414
800.
0208
1.00
164.
6379
.74
73.9
521
.62
11.3
30.
902.
251.
310.
98�
12.7
5�
12.8
013
.113
.22.
060.
1691
1700
0.02
602.
0946
.24
24.9
023
.95
17.1
56.
090.
982.
593.
711.
88�
13.1
7�
13.1
810
.811
.12.
990.
1400
2000
0.02
042.
9534
.57
18.0
724
.36
10.1
49.
710.
953.
522.
934.
01�
13.4
0�
13.4
211
.311
.04.
250.
1680
1700
0.02
084.
319.
402.
5019
.17
4.42
6.07
0.49
10.2
4.70
9.22
�13
.96�
14.2
710
.910
.8D
Lc
0.00
50.
003
0.03
0.1
0.05
SD
c±
0.00
1±
0.00
2±
0.00
5±
0.00
5±
0.00
6
aL
og
rate
Si
and
log
rate
Al
(mo
lm�
2s�
1)
are
the
dis
solu
tio
nra
tes
calc
ula
ted
fro
mth
ere
leas
era
tes
of
Si
and
Al,
resp
ecti
vely
.b
DR
Si
and
DR
Al
are
the
erro
rsin
the
calc
ula
ted
RS
ian
dR
Al,
resp
ecti
vely
.c
No
te:
DL
=D
etec
tio
nli
mit
and
SD
=S
tan
dar
dd
evia
tio
n.
Un
its
for
DL
and
SD
are
mg
L�
1.
Dissolution study of illite in saline–acidic solutions 3241

Author's personal copy
were greater in the lower ionic strength solution than thehigher ionic strength and did not show any consistent trendwith solution pH. A preferential release of Mg over Si wasalso observed under all conditions except in experimentsconducted at pH 1.0 at both ionic strengths where Mg re-lease was stoichiometric (Table 2).
Figs. 5 and 6 show the aqueous speciation of Al and Feunder steady state conditions, at the higher (I = 0.25 M)and lower (I = 0.01 M) ionic strengths, respectively. Atboth ionic strengths the dominant Al species are Al3+ andAlSO4
+, with AlSO4+ dominant at pH 1 and Al3+ domi-
nant at pH 4. The proportion of Al3+ in the higher ionicstrength solution increased with an increase in solutionpH from 37% at pH 1 to a maximum value of 87% at pH4. AlSO4
+ followed the reverse trend and its proportion de-creased from 61% at pH 1 to 2% at pH 4. At lower ionicstrength, the general trend for the distribution of Al3+
and AlSO4+ species was similar to the higher ionic strength.
Speciation of iron in the steady state solutions shows thatFe2+ was the pre-dominant species in the pH range for bothionic strengths. The contribution of FeCl+ was P15% atthe higher ionic strength over the pH range 1–4, however,it remained below 2% at the lower ionic strength.
The saturation state of the output solutions at steadystate was calculated in terms of Gibbs free energy of reac-tion DG, for illite, kaolinite, quartz and some selected Al,Fe and Mg containing mineral phases that could potentiallyprecipitate in the flow-through reactor experiments. The DG
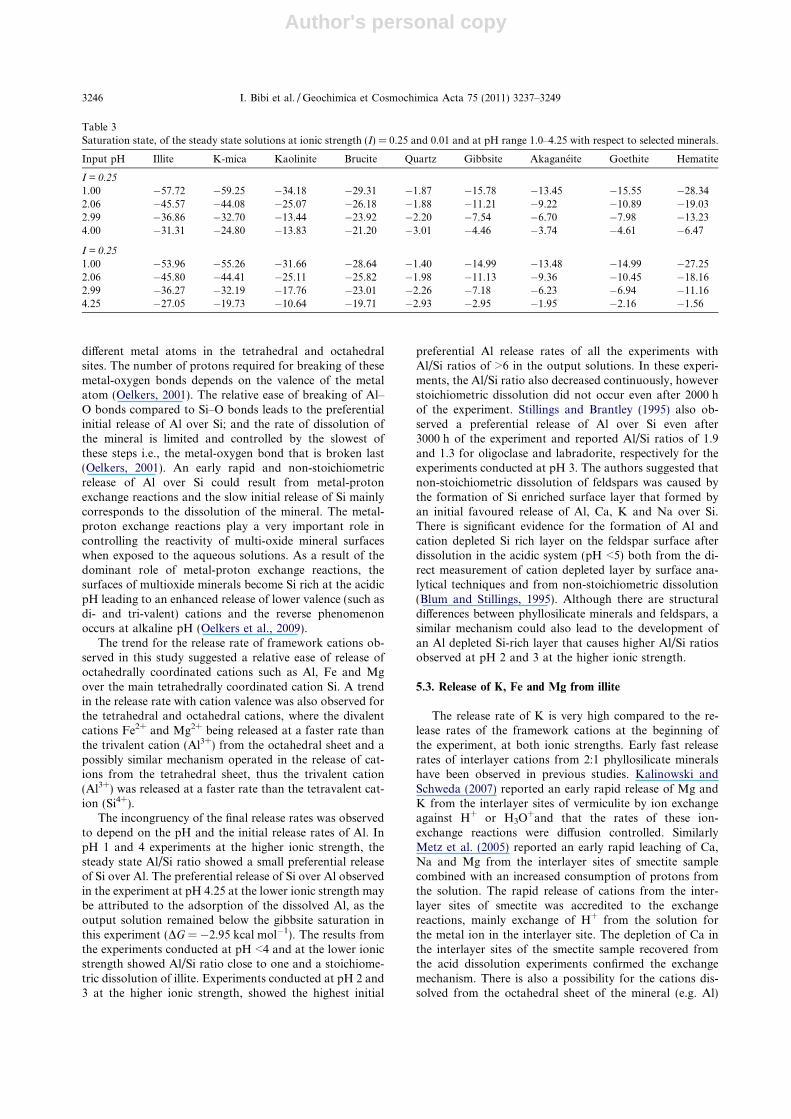
values for higher (I = 0.25 M) and lower ionic strengths(I = 0.01 M) are presented in Table 3. All the experimentswere undersaturated with respect to illite under steady stateconditions. The steady state solutions were also undersatu-rated with respect to kaolinite, quartz, gibbsite, brucite andsecondary iron oxides in all the experiments. The system atpH 4.25 and at the lower ionic strength reached close to thesaturation with respect to akaganeite, goethite and hema-tite. The DG values for all minerals except quartz increasedwith pH; quartz shows a reverse trend.
Surface area normalized steady state illite dissolutionrates are given in Table 2. The specific surface area of the ori-ginal illite sample was used in dissolution rate calculations;the specific surface area of the illite samples after dissolutionreactions was within error the same as that of the original il-lite sample (specific surface areas of post experiment illitesamples at pH 2 at the higher and lower ionic strengths were39 and 33 ± 10 m2/g, respectively). The dissolution rates ofphyllosilicate minerals decrease with increasing solutionpH in the acidic range. The (log) dissolution rates (Si) ob-served in this study ranged from �12.75 (pH 1.0) to�13.74 mol m�2 s�1 (pH 4.0) at the higher ionic strength,and between �12.75 (pH 1) and �13.96 mol m�2 s�1 (pH4.25) at the lower ionic strength. The uncertainty in the cal-culated dissolution rate values ranged between 10% and13% (Table 2). The major factor contributing to uncertaintyin the calculated dissolution rates arises from the surface areameasurements. The uncertainty associated with the mea-sured concentrations of Al and Si in the output solutionsand the fluid flow rates was <8% in each experiment.
5. DISCUSSION
5.1. Fast initial dissolution rates
An early rapid dissolution of illite during first 100 hwas observed in all the experiments conducted in the pres-ent study. Such a trend had been observed in previousstudies on phyllosilicate dissolution (Knauss and Wolery,1989; Cama et al., 2002) and ascribed to factors such asthe presence of fine particles in the mineral sample, fastdissolution of high energy surface sites, and the presenceof disrupted or strained surfaces formed during grindingof the mineral sample. Brandt et al. (2003) observed arapid initial dissolution rate during the first 50 h fromchlorite dissolution experiments conducted in mixedflow-reactors. The input solutions in their experimentscomprised of dilute HCl/NaClO4 solutions ranging inpH from 2 to 5. Malmstrom and Banwart (1997) alsoreported rapid dissolution rates of biotite during initialstage of the experiments with fast release of Si, Fe, Mgand Al into the output solution. The high dissolution ratesof biotite were followed by time independent steady staterates after 10–14 days of the experiments. Many pre-treat-ments have been applied in the previous studies to removeimpurities and attain a uniform clay particle size. Yangand Steefel (2008) cleaned Georgia kaolinite sample priorto dissolution and precipitation experiments to eliminateamorphous oxyhydroxide material by washing with 1 MNaCl solutions (pH 3) followed by repeated rinsing withultrapure water and vacuum filtration through 0.1 lmmembrane filter. Oelkers et al., 2008 removed the fine par-ticles from their muscovite powdered sample by cleaningthe sample ultrasonically in methanol. Golubev et al.(2006) obtained purified homoionic montmorillonite sam-ple by removing soluble salts, sparingly soluble mineralsand trace cation impurities, and converted the cleanedsample to Na-saturated form and separated a size fractionof <0.1 lm by centrifugation. In some other studies, thesmectite samples were pre-treated by keeping the sepa-rated clay fraction of the mineral samples in solutions sim-ilar to the one used for the dissolution experiments (Camaet al., 2000, 2002; Metz et al., 2005). The saturation of thephyllosilicate minerals with a single cation has been previ-ously reported to shorten the time necessary to reach thesteady state dissolution rate (Zysset and Schindler, 1996;Rozalen et al., 2008). The results from these studiessuggest that the pre-treatment of the mineral sample toremove impurities and to attain a uniform particle sizemay help in reducing the span of initial fast dissolution.In the present study, the pre-treatments included the sep-aration of clay size fraction of illite, which was saturatedwith Na by repeated washing with NaCl solutions ofdecreasing concentrations (Sposito and LeVesque, 1985).The initial NaCl (1 M) solution washing was done at pH3 to remove amorphous or poorly crystalline materials.The morphological characterization of the purified illitesample by TEM showed most particles ranging in sizefrom 200 to 500 nm, however, some fine particles were
3242 I. Bibi et al. / Geochimica et Cosmochimica Acta 75 (2011) 3237–3249
Author's personal copy
also present. The presence of fine particles and fasterdissolution of reactive surfaces possibly contributed tothe observed initial rapid dissolution of illite in the present
study. However, the pre-treatment procedure followed inthis study proved to be effective in reducing the time toreach the steady state in the experiments.
Fig. 2. Relative release rates of Al and K over Si as a function of time at pH 1–4 and at 0.25 (M) ionic strength. Figs. 2(a), (c), (e) and (g) showAl/Si ratios for pH 1–4, respectively; Figs. 2(b), (d), (f) and (h) show K/Si ratios for pH 1–4, respectively.
Dissolution study of illite in saline–acidic solutions 3243

Author's personal copy
5.2. Stoichiometry of dissolution reaction
A comparison of release rates of different elements froma mineral structure have been used to deduce information
about the stoichiometry of mineral dissolution and possibledissolution mechanisms. Incongruent dissolution duringinitial phase of the experiments has been observed for manyphyllosilicate minerals (Nagy, 1995; Oelkers, 2001; Brandt
Fig. 3. Relative release rates of Al and K over Si as a function of time at pH 1–4.25 and at 0.01 (M) ionic strength. Figs. 3(a), (c), (e) and (g)show Al/Si ratios for pH 1–4.25, respectively. Figs. 3(b), (d), (f) and (h) show K/Si ratios for pH 1–4.25, respectively.
3244 I. Bibi et al. / Geochimica et Cosmochimica Acta 75 (2011) 3237–3249

Author's personal copy
et al., 2003). In acid leaching studies on 2:1 phyllosilicates,the octahedral cations were found to be released more read-ily than the tetrahedral cations (Zysset and Schindler, 1996;
Kalinowski and Schweda, 2007; Rozalen et al., 2008). Sim-ilarly, in acidic conditions an initial preferential release ofMg, Fe and Al over Si was observed for biotite dissolution(Kalinowski and Schweda, 1996; Malmstrom and Banwart,1997). Kohler et al., 2003 reported an initial rapid release ofAl over Si for a batch experiment study on illite dissolutionand attributed this effect to a relative ease of breaking ofAl–O bonds compared to Si–O bonds. An early rapid re-lease of octahedral Mg over tetrahedral Si was reportedfor vermiculite dissolution in acidic solutions (Kalinowskiand Schweda, 2007). In this study, initial high Al/Si ratios(Figs. 2 and 3) were observed under all conditions corre-sponding to a preferential release of Al at the early stagesof dissolution. The initial non-stoichiometry of illite disso-lution reaction observed in this study could be attributedto various factors. One of these factors includes the positionof the metal atom in the mineral structure. The tetrahedralsheet in illite contains mainly Si with approximately 12 at.%Al substitution, while the octahedral sheets are mainlyoccupied by Al, with substantial substitutions of Fe andMg. The dissolution of illite requires the breaking of morethan one type of metal-oxygen bonds due to the presence of
Fig. 4. Steady state log concentrations (lmol/L g) of K as afunction of pH for high (I = 0.25 M) and low (I = 0.01 M) ionicstrength systems.
Fig. 5. Aqueous speciation of: (a) Al and (b) Fe in the steady stateoutput solutions at high (I = 0.25 M) ionic strength. Al concen-trations used for aqueous speciation are 4.16, 5.56, 3.66 and0.62 lM at pH 1–4, respectively. Fe concentrations used forspeciation calculations are 1.70, 2.70, 0.60 and 0.17 lM at pH 1–4,respectively.
Fig. 6. Aqueous speciation of: (a) Al and (b) Fe in the steady stateoutput solutions at low (I = 0.01 M) ionic strength. Al concentra-tions used for aqueous speciation are 9.92, 4.21, 2.53 and 0.42 lMat pH 1, 2, 3 and 4.25, respectively. Fe concentrations used forspeciation calculations are 2.69, 2.90, 1.42 and 0.74 lM at pH 1, 2,3 and 4.25, respectively.
Dissolution study of illite in saline–acidic solutions 3245
Author's personal copy
different metal atoms in the tetrahedral and octahedralsites. The number of protons required for breaking of thesemetal-oxygen bonds depends on the valence of the metalatom (Oelkers, 2001). The relative ease of breaking of Al–O bonds compared to Si–O bonds leads to the preferentialinitial release of Al over Si; and the rate of dissolution ofthe mineral is limited and controlled by the slowest ofthese steps i.e., the metal-oxygen bond that is broken last(Oelkers, 2001). An early rapid and non-stoichiometricrelease of Al over Si could result from metal-protonexchange reactions and the slow initial release of Si mainlycorresponds to the dissolution of the mineral. The metal-proton exchange reactions play a very important role incontrolling the reactivity of multi-oxide mineral surfaceswhen exposed to the aqueous solutions. As a result of thedominant role of metal-proton exchange reactions, thesurfaces of multioxide minerals become Si rich at the acidicpH leading to an enhanced release of lower valence (such asdi- and tri-valent) cations and the reverse phenomenonoccurs at alkaline pH (Oelkers et al., 2009).
The trend for the release rate of framework cations ob-served in this study suggested a relative ease of release ofoctahedrally coordinated cations such as Al, Fe and Mgover the main tetrahedrally coordinated cation Si. A trendin the release rate with cation valence was also observed forthe tetrahedral and octahedral cations, where the divalentcations Fe2+ and Mg2+ being released at a faster rate thanthe trivalent cation (Al3+) from the octahedral sheet and apossibly similar mechanism operated in the release of cat-ions from the tetrahedral sheet, thus the trivalent cation(Al3+) was released at a faster rate than the tetravalent cat-ion (Si4+).
The incongruency of the final release rates was observedto depend on the pH and the initial release rates of Al. InpH 1 and 4 experiments at the higher ionic strength, thesteady state Al/Si ratio showed a small preferential releaseof Si over Al. The preferential release of Si over Al observedin the experiment at pH 4.25 at the lower ionic strength maybe attributed to the adsorption of the dissolved Al, as theoutput solution remained below the gibbsite saturation inthis experiment (DG = �2.95 kcal mol�1). The results fromthe experiments conducted at pH <4 and at the lower ionicstrength showed Al/Si ratio close to one and a stoichiome-tric dissolution of illite. Experiments conducted at pH 2 and3 at the higher ionic strength, showed the highest initial
preferential Al release rates of all the experiments withAl/Si ratios of >6 in the output solutions. In these experi-ments, the Al/Si ratio also decreased continuously, howeverstoichiometric dissolution did not occur even after 2000 hof the experiment. Stillings and Brantley (1995) also ob-served a preferential release of Al over Si even after3000 h of the experiment and reported Al/Si ratios of 1.9and 1.3 for oligoclase and labradorite, respectively for theexperiments conducted at pH 3. The authors suggested thatnon-stoichiometric dissolution of feldspars was caused bythe formation of Si enriched surface layer that formed byan initial favoured release of Al, Ca, K and Na over Si.There is significant evidence for the formation of Al andcation depleted Si rich layer on the feldspar surface afterdissolution in the acidic system (pH <5) both from the di-rect measurement of cation depleted layer by surface ana-lytical techniques and from non-stoichiometric dissolution(Blum and Stillings, 1995). Although there are structuraldifferences between phyllosilicate minerals and feldspars, asimilar mechanism could also lead to the development ofan Al depleted Si-rich layer that causes higher Al/Si ratiosobserved at pH 2 and 3 at the higher ionic strength.
5.3. Release of K, Fe and Mg from illite
The release rate of K is very high compared to the re-lease rates of the framework cations at the beginning ofthe experiment, at both ionic strengths. Early fast releaserates of interlayer cations from 2:1 phyllosilicate mineralshave been observed in previous studies. Kalinowski andSchweda (2007) reported an early rapid release of Mg andK from the interlayer sites of vermiculite by ion exchangeagainst H+ or H3O+and that the rates of these ion-exchange reactions were diffusion controlled. SimilarlyMetz et al. (2005) reported an early rapid leaching of Ca,Na and Mg from the interlayer sites of smectite samplecombined with an increased consumption of protons fromthe solution. The rapid release of cations from the inter-layer sites of smectite was accredited to the exchangereactions, mainly exchange of H+ from the solution forthe metal ion in the interlayer site. The depletion of Ca inthe interlayer sites of the smectite sample recovered fromthe acid dissolution experiments confirmed the exchangemechanism. There is also a possibility for the cations dis-solved from the octahedral sheet of the mineral (e.g. Al)
Table 3Saturation state, of the steady state solutions at ionic strength (I) = 0.25 and 0.01 and at pH range 1.0–4.25 with respect to selected minerals.
Input pH Illite K-mica Kaolinite Brucite Quartz Gibbsite Akaganeite Goethite Hematite
I = 0.25
1.00 �57.72 �59.25 �34.18 �29.31 �1.87 �15.78 �13.45 �15.55 �28.342.06 �45.57 �44.08 �25.07 �26.18 �1.88 �11.21 �9.22 �10.89 �19.032.99 �36.86 �32.70 �13.44 �23.92 �2.20 �7.54 �6.70 �7.98 �13.234.00 �31.31 �24.80 �13.83 �21.20 �3.01 �4.46 �3.74 �4.61 �6.47
I = 0.25
1.00 �53.96 �55.26 �31.66 �28.64 �1.40 �14.99 �13.48 �14.99 �27.252.06 �45.80 �44.41 �25.11 �25.82 �1.98 �11.13 �9.36 �10.45 �18.162.99 �36.27 �32.19 �17.76 �23.01 �2.26 �7.18 �6.23 �6.94 �11.164.25 �27.05 �19.73 �10.64 �19.71 �2.93 �2.95 �1.95 �2.16 �1.56
3246 I. Bibi et al. / Geochimica et Cosmochimica Acta 75 (2011) 3237–3249
Author's personal copy
to exchange for the interlayer metal ion originally present inthe mineral structure (Breen et al., 1997).
Potassium concentrations were stabilized in the outputsolutions after approximately 1000 h of the experiments.Highest K release rates were observed at pH 1 for both io-nic strengths suggesting mainly H+ promoted exchange ofK+ from the interlayer sites at this pH. Potassium releaserate was not affected by the solution pH in 2–4 pH rangefor the two ionic strengths indicating the dominant roleof Na+ in exchanging interlayer K+. A significantly higherK release rate at the higher ionic strength than the lower io-nic strength during pH 2–4 range further strengthens theargument that the K release is mainly brought by exchangereaction with Na+ from the background solution. It ishighly likely for ions other than H+ to exchange for a metalion in the mineral structure especially when ions of a similarcharge and size are in abundance in the solution, for exam-ple the Na+ for K+ exchange from K-feldspar during albi-tization process. However, in the absence of ions of asimilar charge and size, H+ is the dominant ion involvedin the exchange reaction during the dissolution of a multi-oxide silicate mineral (Oelkers, 2001). In the present studyNa+ for K+ exchange in the interlayers appears to bemainly driven by a diffusion controlled process dependenton Na concentration in the solution, as the hydrated radiiof these ions are different.
At both ionic strengths, K was preferentially releasedover Si throughout the duration of experiments and K/Siratio was nearly double at the higher ionic strength thanthe lower ionic strength at all pH values. This supportsthe earlier argument that K+ release was driven by theNa+ for K+ exchange reaction. A rapid release of K+ overother cations from the acid dissolution of micas has beenobserved for biotite in previous studies and this has been as-cribed to ion-exchange with H+ present in the acidic solu-tions and Na+ for K+ in the salt solutions (Turpault andTrotignon, 1994; Malmstrom and Banwart, 1997). Kali-nowski and Schweda (1996) compared the dissolutionkinetics of biotite and phlogopite (trioctahedral micas)and muscovite (a dioctahedral mica) at pH range of 1–4and reported an increase in K release rate with decreasingpH of the input solution and that the pH effect was moresignificant for the trioctahedral micas.
The steady state concentrations of Fe showed that Fewas released at a faster rate than Si. Our saturation statedata illustrate that our steady state solutions in all theexperiments are undersaturated saturation state data whichshowed the dominance of Fe2+ species at both ionicstrengths (Figs. 5 and 6). It is proposed that the reductionof Fe3+ to Fe2+ is driving an enhanced release of Feobserved in the study.
A stoichiometric release of Mg was observed at pH 1which is similar to the results of Golubev et al. (2006) forNa-montmorillonite in HCl solutions at pH 1.1. A prefer-ential release of Mg over Si was observed at pH 2–4 at bothionic strengths. A higher Mg/Si ratio at the steady statehave been observed in many acid dissolution studies onphyllosilicates and has been attributed to rapid ion-ex-change reactions. Kohler et al. (2005) reported a steadystate Mg/Si ratio twice that of the unreacted illite in the
acidic pH range and the Mg concentrations in the outputsolutions were below the detection limit at pH >11 suggest-ing the precipitation of secondary Mg minerals. HigherMg/Si ratios at the steady state have also been reportedfor montmorillonite dissolution at pH <10 while a precipi-tation or adsorption of Mg on the mineral surface resultedin low Mg/Si ratios at pH >10 (Rozalen et al., 2008).
5.4. Saturation state of the steady state solutions
The steady state solutions from all the experimentsshowed undersaturation with respect to illite (Table 3).The value of DG increased with increasing pH and decreasein output Al and Si concentrations. The output solutionswere also undersaturated with respect to gibbsite, brucite,kaolinite, quartz and secondary iron mineral phases. Thesteady state solutions approached close to saturation withrespect to akaganeite, goethite and hematite in experimentat the highest pH and the lower ionic strength (Table 3).In natural environments precipitation of secondary ironoxides could be expected under these conditions.
The effect of degree of saturation on dissolution rate isminimized by conducting experiments under far from equi-librium conditions. Far from equilibrium dissolution regionis where the degree of saturation has no direct effect on thedissolution rate (Cama et al., 2002). For smectite, Amramand Ganor, 2005 have suggested that far from equilibriumdissolution occurs under conditions of DG 6 �21 kcalmol�1. The value of DG for far from equilibrium dissolu-tion region of illite has not yet been quantified. Consideringthe similarity in crystal structures of illite and smectite, acomparison of DG illite values calculated in the presentstudy with the value reported for smectite dissolution reac-tion by Amram and Ganor, 2005 suggests that all ourexperiments conducted in this study were under far fromequilibrium conditions.
5.5. Dissolution rates of illite at the steady state and a
comparison with the previous studies
The steady state log dissolution rates of illite calculatedfrom Al and Si release rates show a trend typically observedfor phyllosilicate dissolution in acidic pH range (Camaet al., 2002; Kohler et al., 2003; Metz et al., 2005; Rozalenet al., 2008). Both RSi and RAl decreased with increasing pHat both ionic strengths. Comparing dissolution rates at cor-responding pH values revealed that dissolution rates calcu-lated from Al and Si release are similar at pH 1–4 at thehigher ionic strength and at pH 63 at the lower ionicstrength (Table 1). The experiment conducted at pH 4.25at lower ionic strength showed a significantly lower RAl
than RSi. Kohler et al. (2003) also observed such an effectin the pH range 4–11 for illite and attributed this to the pre-cipitation of secondary Al phases or the adsorption of dis-solved Al on mineral surfaces. Saturation state calculationsof steady state solutions in this study did not predict theprecipitation of any Al phase; therefore, it is likely thatthe adsorption of dissolved Al at pH 4.25 caused the lowerRAl dissolution rate than RSi.
Dissolution study of illite in saline–acidic solutions 3247
Author's personal copy
In acidic pH range the dissolution of phyllosilicate min-erals is mainly controlled by protons and the pH depen-dence of the dissolution rate RH can be described by anempirical rate law (Zysset and Schindler, 1996):
RH ¼ k½Hþ�n ð10Þ
Where k is the rate constant, [H+] is the concentration ofprotons in the aqueous solution and n is a rationalexponent which implies a fractional reaction order. Thefractional reaction orders calculated from the linear regres-sion of plot of log Rsi against pH at the higher and lowerionic strength are 0.32 and 0.36, respectively (Fig. 7); corre-sponding values obtained from RAl were 0.32 and 0.44,respectively (plot not shown). The reaction orders obtainedin this study are similar to the reaction order of 0.40reported for proton promoted montmorillonite dissolutionin pH range of 1.0�4.3 and 0.01 M KNO3 backgroundsolution (Rozalen et al., 2008). Kalinowski and Schweda(1996) reported a stronger pH dependence of dissolutionrates of trioctahedral micas (phlogopite and biotite) ascompared to a dioctahedral mica (muscovite). The protondependent reaction order for trioctahedral micas ranged be-tween 0.35–0.61 compared to 0.14–0.20 for muscovite.Kohler et al. (2003) obtained a much higher fractional or-der value (0.60) for both acidic and alkaline pH ranges in0.1 M NaCl for illite dissolution rate using a batch experi-ment study.
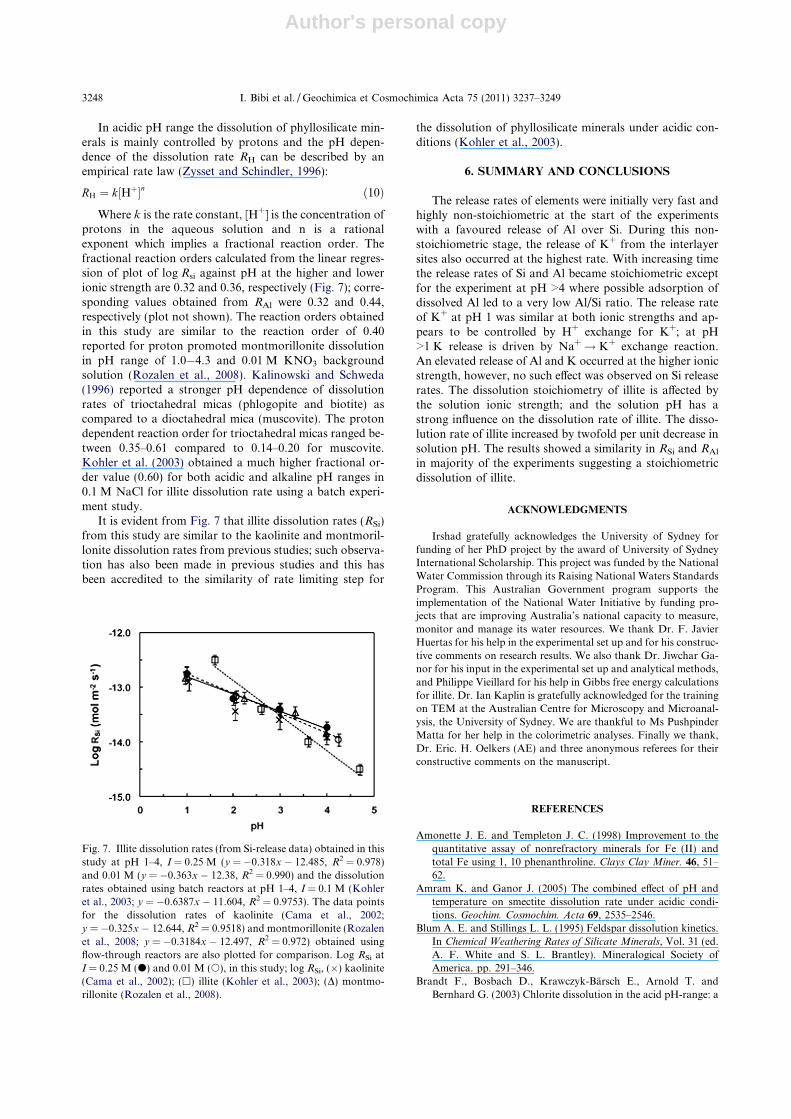
It is evident from Fig. 7 that illite dissolution rates (RSi)from this study are similar to the kaolinite and montmoril-lonite dissolution rates from previous studies; such observa-tion has also been made in previous studies and this hasbeen accredited to the similarity of rate limiting step for
the dissolution of phyllosilicate minerals under acidic con-ditions (Kohler et al., 2003).
6. SUMMARY AND CONCLUSIONS
The release rates of elements were initially very fast andhighly non-stoichiometric at the start of the experimentswith a favoured release of Al over Si. During this non-stoichiometric stage, the release of K+ from the interlayersites also occurred at the highest rate. With increasing timethe release rates of Si and Al became stoichiometric exceptfor the experiment at pH >4 where possible adsorption ofdissolved Al led to a very low Al/Si ratio. The release rateof K+ at pH 1 was similar at both ionic strengths and ap-pears to be controlled by H+ exchange for K+; at pH>1 K release is driven by Na+! K+ exchange reaction.An elevated release of Al and K occurred at the higher ionicstrength, however, no such effect was observed on Si releaserates. The dissolution stoichiometry of illite is affected bythe solution ionic strength; and the solution pH has astrong influence on the dissolution rate of illite. The disso-lution rate of illite increased by twofold per unit decrease insolution pH. The results showed a similarity in RSi and RAl
in majority of the experiments suggesting a stoichiometricdissolution of illite.
ACKNOWLEDGMENTS
Irshad gratefully acknowledges the University of Sydney forfunding of her PhD project by the award of University of SydneyInternational Scholarship. This project was funded by the NationalWater Commission through its Raising National Waters StandardsProgram. This Australian Government program supports theimplementation of the National Water Initiative by funding pro-jects that are improving Australia’s national capacity to measure,monitor and manage its water resources. We thank Dr. F. JavierHuertas for his help in the experimental set up and for his construc-tive comments on research results. We also thank Dr. Jiwchar Ga-nor for his input in the experimental set up and analytical methods,and Philippe Vieillard for his help in Gibbs free energy calculationsfor illite. Dr. Ian Kaplin is gratefully acknowledged for the trainingon TEM at the Australian Centre for Microscopy and Microanal-ysis, the University of Sydney. We are thankful to Ms PushpinderMatta for her help in the colorimetric analyses. Finally we thank,Dr. Eric. H. Oelkers (AE) and three anonymous referees for theirconstructive comments on the manuscript.
REFERENCES
Amonette J. E. and Templeton J. C. (1998) Improvement to thequantitative assay of nonrefractory minerals for Fe (II) andtotal Fe using 1, 10 phenanthroline. Clays Clay Miner. 46, 51–
62.
Amram K. and Ganor J. (2005) The combined effect of pH andtemperature on smectite dissolution rate under acidic condi-tions. Geochim. Cosmochim. Acta 69, 2535–2546.
Blum A. E. and Stillings L. L. (1995) Feldspar dissolution kinetics.In Chemical Weathering Rates of Silicate Minerals, Vol. 31 (ed.A. F. White and S. L. Brantley). Mineralogical Society ofAmerica. pp. 291–346.
Brandt F., Bosbach D., Krawczyk-Barsch E., Arnold T. andBernhard G. (2003) Chlorite dissolution in the acid pH-range: a
Fig. 7. Illite dissolution rates (from Si-release data) obtained in thisstudy at pH 1–4, I = 0.25 M (y = �0.318x � 12.485, R2 = 0.978)and 0.01 M (y = �0.363x � 12.38, R2 = 0.990) and the dissolutionrates obtained using batch reactors at pH 1–4, I = 0.1 M (Kohleret al., 2003; y = �0.6387x � 11.604, R2 = 0.9753). The data pointsfor the dissolution rates of kaolinite (Cama et al., 2002;y = �0.325x � 12.644, R2 = 0.9518) and montmorillonite (Rozalenet al., 2008; y = �0.3184x � 12.497, R2 = 0.972) obtained usingflow-through reactors are also plotted for comparison. Log RSi atI = 0.25 M (d) and 0.01 M (s), in this study; log RSi, (�) kaolinite(Cama et al., 2002); (h) illite (Kohler et al., 2003); (D) montmo-rillonite (Rozalen et al., 2008).
3248 I. Bibi et al. / Geochimica et Cosmochimica Acta 75 (2011) 3237–3249

Author's personal copy
combined microscopic and macroscopic approach. Geochim.
Cosmochim. Acta 67, 1451–1461.
Braunauer S., Emmet P. H. and Teller E. (1938) Adsorption ofgases in multimolecular layers. J. Chem. Soc. 60, 309–319.
Breen C., Zahoor F. D., Madejova J. and Komadel P. (1997)Characterization and catalytic activity of acid-treated, size-fractionated smectites. J. Phys. Chem. B 101, 5324–5331.
Brindley, G. W. and Brown, G. (1980) X-ray identificationprocedures for clay mineral identification. In Crystal structures
of clay minerals and their X-ray identification (ed. G. W.Brindley and G. Brown) Mineralogical Society of America. pp.305–359.
Cama J. and Ganor J. (2006) The effects of organic acids on thedissolution of silicate minerals: a case study of oxalate catalysis ofkaolinite dissolution. Geochim. Cosmochim. Acta 70, 2191–2209.
Cama J., Ganor J., Ayora C. and Lasaga C. A. (2000) Smectitedissolution kinetics at 80 �C and pH 8.8. Geochim. Cosmochim.
Acta 64, 2701–2717.
Cama J., Metz V. and Ganor J. (2002) The effect of pH andtemperature on kaolinite dissolution rate under acidic condi-tions. Geochim. Cosmochim. Acta 66, 3913–3926.
Cicel B. and Komadel P. (1994) Structural formulae of layersilicates. In Quantitative methods in soil mineralogy (ed. J. E.Amonette and L. W. Zelazny) pp. 114–136.
Dougan W. K. and Wilson A. L. (1974) Absorbtiometric determinationof aluminium in water-comparison of some chromogenic reagentsand development of an improved method. Analyst 99, 413–430.
Fitzpatrick, R. W. and Shand P. (2008) Inland acid sulfate soils:overview and conceptual models. In Inland Acid Sulfate Soil
Systems Across Australia, Thematic Vol. Chapter 1 (ed. R.Fitzpatrick and P. Shand), pp. 6–74.
Golubev S. V., Bauer A. and Pokrovsky O. S. (2006) Effect of pHand organic ligands on the kinetics of smectite dissolution at25 �C. Geochim. Cosmochim. Acta 70, 4436–4451.
Huertas F. J., Chou L. and Wollast R. (1999) Mechanism ofkaolinite dissolution at room temperature and pressure. Part II:Kinetic study. Geochim. Cosmochim. Acta 63, 3261–3275.
Huertas F. J., Chou L. and Wollast R. (2001) Kaolinite dissolutionrates in batch experiments at room temperature and pressure:Reply to “On the interpretation of closed system mineraldissolution experiments”, Comment by Eric H. Oelkers,Jacques Schott, and Jean-Luc Devidal. Geochim. Cosmochim.
Acta 65, 4433–4434.
Kalinowski B. E. and Schweda P. (1996) Kinetics of muscovite,phlogopite, and biotite dissolution and alteration at pH 1–4,room temperature. Geochim. Cosmochim. Acta 60, 367–385.
Kalinowski B. E. and Schweda P. (2007) Rates and nonstoichiom-etry of vermiculite dissolution at 22 �C. Geoderma 142, 197–209.
Knauss K. G. and Wolery T. J. (1989) Muscovite dissolutionkinetics as a function of pH and time at 70 �C. Geochim.
Cosmochim. Acta 53, 1493–1501.
Kohler S. J., Bosbach D. and Oelkers E. H. (2005) Do clay mineraldissolution rates reach steady state? Geochim. Cosmochim. Acta
69, 1997–2006.
Kohler S. J., Dufaud F. and Oelkers E. H. (2003) An experimentalstudy of illite dissolution kinetics as a function of pH from 1.4to 12.4 and temperature from 5 to 50 �C. Geochim. Cosmochim.
Acta 67, 3583–3594.
Koroleff F. (1976) Determination of silicon. In Methods of Sea
Water Analysis (eds. K. Grasshoff, M. Ehrhardt and K.Kremling). Verlag Chemie, USA, pp. 149–158.
Malmstrom M. and Banwart S. (1997) Biotite dissolution at 25 �C:the pH dependence of dissolution rate and stoichiometry.Geochim. Cosmochim. Acta 61, 2779–2799.
Metz V., Amram K. and Ganor J. (2005) Stoichiometry of smectitedissolution reaction. Geochim. Cosmochim. Acta 69, 1755–1772.
Metz V. and Ganor J. (2001) Stirring effect on kaolinite dissolutionrate. Geochim. Cosmochim. Acta 65, 3475–3490.
Miller J. C. and Miller J. N. (1993) Errors in classical analysis-statistics of repeated measurements. In Statistics for Analytical
Chemistry. Ellis Horwood Limited. pp. 33–51.Nagy K. L. (1995) Dissolution and precipitation kinetics of sheet
silicates. In Chemical Weathering Rates of Silicate Minerals,Vol. 31 (ed. A. F. White and S. L. Brantley). MineralogicalSociety of America. pp. 173–233.
Nagy K. L., Blum A. E. and Lasaga A. C. (1991) Dissolution andprecipitation kinetics of kaolinite at 80 �C and pH 3: Thedependence on solution saturation state. Am. J. Sci. 291, 649–
686.
Norrish K. and Hutton J. T. (1977) An accurate X-ray spectro-graphic method for the analysis of a wide range of geologicalsamples. Geochim. Cosmochim. Acta 33, 431–441.
Norrish K. and Pickering J. G. (1983) Clay minerals. In Soils: an
Australian viewpoint. CSIRO: Melbourne/Academic Press,London pp. 281–309.
Oelkers E. H. (2001) General kinetic description of multioxidesilicate mineral and glass dissolution. Geochim. Cosmochim.
Acta 65, 3703–3719.
Oelkers E. H., Schott J., Gauthier J. M. and Herrero-Roncal T.(2008) An experimental study of the dissolution mechanism andrates of muscovite. Geochim. Cosmochim. Acta 72, 4948–4961.
Oelkers E. H., Sergey V. G., Claire C., Pokrovsky O. S. and SchottJ. (2009) The surface chemistry of multi-oxide silicates.Geochim. Cosmochim. Acta 73, 4617–4634.
Parkhurst D. L. and Appelo C. A. J. (1999) User’s guide toPHREEQC (version 2)-a computor program for speciation,batch reaction, one-dimensional transport, and inverse geo-chemical calculations. U. S. Geol. Surv. Water Res. Inv. Rep.,99–4259.
Rozalen M., Huertas F. J. and Brady P. V. (2009) Experimentalstudy of the effect of pH and temperature on the kinetics ofmontmorillonite dissolution. Geochim. Cosmochim. Acta 73,
3752–3766.
Rozalen M. L., Heurtas F. J., Brady P. V., Cama J., Garcia-PalmaS. and Linares J. (2008) Experimental study of the effect of pHon the kinetics of montmorillonite dissolution at 25 �C.Geochim. Cosmochim. Acta 72, 4224–4253.
Sposito G. and LeVesque C. S. (1985) Sodium–Calcium–Magne-sium exchange on Silver Hill illite. Soil Sci. Soc. Am. J. 49,
1153–1159.
Stillings L. L. and Brantley S. L. (1995) Feldspar dissolution at25 �C and pH 3: reaction stoichiometry and the effect of cations.Geochim. Cosmochim. Acta 59, 1483–1496.
Turpault M. P. and Trotignon L. (1994) The dissolution of biotitesingle crystals in dilute HNO3 at 24 �C: evidence of ananisotropic corrosion process of micas in acidic solutions.Geochim. Cosmochim. Acta 58, 2761–2775.
Vieillard P. (2000) A new method for the prediction of Gibbs freeenergies of formation of hydrated clay minerals based on theelectronegativity scale. Clays Clay Miner. 48, 459–473.
Yang L. and Steefel C. I. (2008) Kaolinite dissolution andprecipitation kinetics at 22 �C and pH 4. Geochim. Cosmochim.
Acta 72, 99–116.
Zysset M. and Schindler P. W. (1996) The proton promoteddissolution kinetics of K-montmorillonite. Geochim. Cosmo-
chim. Acta 60, 921–931.
Associate editor: Eric H. Oelkers
Dissolution study of illite in saline–acidic solutions 3249
Copyright © 2022 FDOKUMEN