Identification of dual mTORC1 and mTORC2 inhibitors in melanoma cells: Prodigiosin vs. obatoclax
8
Identification of dual mTORC1 and mTORC2 inhibitors in melanoma cells: Prodigiosin vs. obatoclax M. Espona-Fiedler a , V. Soto-Cerrato a , A. Hosseini b , J.M. Lizcano c , V. Guallar b , R. Quesada d , T. Gao e , R. Pe ´ rez-Toma ´s a, * a Cancer Cell Biology Research Group, Department of Pathology and Experimental Therapeutics, Faculty of Medicine, University of Barcelona, E-08907 Barcelona, Spain b ICREA Joint BSC-IRB Research Program in Computational Biology, Barcelona Supercomputing Center, E-08034 Barcelona, Spain c Institute of Neuroscience and Department of Biochemistry and Molecular Biology – Faculty of Medicine, Autonomous University of Barcelona, E-08193 Barcelona, Spain d Department of Chemistry, Faculty of Science, University of Burgos, E-09001 Burgos, Spain e Markey Cancer Center, Department of Molecular and Cellular Biochemistry, University of Kentucky, Lexington, KY 40536-0509, United States 1. Introduction Prodigiosin (PG) and obatoclax (OBX) are two prodiginine family members which have emerged as promising anticancer drugs and are currently in clinical trials. Prodiginines are bacterial metabolites with a pyrrolylpyrromethene skeleton which have shown immunosuppressive and anticancer properties. PG has shown apoptotic activity against several cancer cell types with low cytotoxicity in non-malignant cells. The National Cancer Institute (www.dtp.nci.nih.gov) tested prodigiosin (and some of its derivates) against a collection of 60 cell lines with an average IC 50 (for PG) of 2.1 mM [1]. It has been described that the apoptotic process triggered by PG is mediated through the mitochondrial pathway and involves the induction of the proapoptotic gene NAG- 1 [2]. Nevertheless, the molecular target of this agent is still unknown. Further studies are also necessary to understand the mechanism of action of OBX. OBX is a synthetic indolylprodigiosin derivative, which was developed by GeminX Pharmaceuticals (recently acquired by Cephalon) and was described as a BH3 mimetic drug [3]. In the present report we identify the mammalian target of rapamycin (mTOR) as a new molecular target of the prodiginines. mTOR is an evolutionarily conserved serine/threonine protein kinase which is constituted by two signaling complexes: mTOR complex 1 (mTORC1) and mTOR complex 2 (mTORC2). Both complexes have specific effects on distinct cellular functions, such as controlling mRNA translation, ribosome biogenesis, autophagy and metabolism [4–6]. mTORC2 phosphorylates AGC kinases such as AKT, serum- and glucocorticoid-induced protein kinase-1 (SGK1) and protein kinase C-alpha (PKCa) [7–9]. AKT is one of the best-known downstream effectors of phosphatidyli- nositol-3 kinase (PI3K). Complete AKT activation depends on Biochemical Pharmacology 83 (2012) 489–496 A R T I C L E I N F O Article history: Received 28 October 2011 Accepted 25 November 2011 Available online 6 December 2011 Keywords: Prodigiosin Obatoclax Melanoma PI3K/AKT mTOR inhibitors mTOR complexes A B S T R A C T The PI3K/AKT/mTOR signaling pathway regulates cell proliferation, survival and angiogenesis. The mammalian target of rapamycin (mTOR) is a protein kinase ubiquitously expressed within cells that regulates cell growth and survival by integrating nutrient and hormonal signals. mTOR exists in two complexes, mTORC1 and mTORC2. Hyperactivation of the mTOR protein has been linked to development of cancer, raising mTOR as an attractive target for cancer therapy. Prodigiosin (PG) and obatoclax (OBX), two members of the prodiginines family, are small molecules with anticancer properties which are currently under clinical trials. In the present paper, we demonstrate that mTOR is a molecular target of both prodiginines in melanoma, a highly drug-resistant cancer model. The inhibition of mTORC1 and mTORC2 complexes by PG or OBX resulted in a loss of AKT phosphorylation at S473, preventing its full activation, with no significant effect on T308. The strongest activity inhibition (89%) was induced by PG on mTORC2. Binding assays using Surface Plasmon Resonance (SPR) provide kinetic and affinity data of the interaction of these small molecules with mTOR. In addition, in silico modeling produced a detailed atomic description of the binding modes. These results provide new data to understand the mechanism of action of these molecules, and provide new structural data that will allow the development of more specific mTOR inhibitors for cancer treatment. ß 2011 Elsevier Inc. All rights reserved. Abbreviations: PG, prodigiosin; OBX, obatoclax; Rap, rapamycin; mTOR, mammali- an target of rapamycin; PI3K, phosphoinositide 3-kinase; AKT/PKB, protein kinase B. * Corresponding author at: Cancer Cell Biology Research Group, Department of Pathology and Experimental Therapeutics, University of Barcelona, Pavello ´ Central, 5a planta, LR 5101C/Feixa Llarga s/n, E 08907 L’Hospitalet de Llobregat, Barcelona, Spain. Tel.: +34 934024288; fax: +34 934024288. E-mail address: [email protected] (R. Pe ´ rez-Toma ´ s). Contents lists available at SciVerse ScienceDirect Biochemical Pharmacology jo u rn al h om epag e: ww w.els evier.c o m/lo cat e/bio c hem p har m 0006-2952/$ – see front matter ß 2011 Elsevier Inc. All rights reserved. doi:10.1016/j.bcp.2011.11.027
Transcript of Identification of dual mTORC1 and mTORC2 inhibitors in melanoma cells: Prodigiosin vs. obatoclax

Biochemical Pharmacology 83 (2012) 489–496
Identification of dual mTORC1 and mTORC2 inhibitors in melanoma cells:Prodigiosin vs. obatoclax
M. Espona-Fiedler a, V. Soto-Cerrato a, A. Hosseini b, J.M. Lizcano c, V. Guallar b, R. Quesada d,T. Gao e, R. Perez-Tomas a,*a Cancer Cell Biology Research Group, Department of Pathology and Experimental Therapeutics, Faculty of Medicine, University of Barcelona, E-08907 Barcelona, Spainb ICREA Joint BSC-IRB Research Program in Computational Biology, Barcelona Supercomputing Center, E-08034 Barcelona, Spainc Institute of Neuroscience and Department of Biochemistry and Molecular Biology – Faculty of Medicine, Autonomous University of Barcelona, E-08193 Barcelona, Spaind Department of Chemistry, Faculty of Science, University of Burgos, E-09001 Burgos, Spaine Markey Cancer Center, Department of Molecular and Cellular Biochemistry, University of Kentucky, Lexington, KY 40536-0509, United States
A R T I C L E I N F O
Article history:
Received 28 October 2011
Accepted 25 November 2011
Available online 6 December 2011
Keywords:
Prodigiosin
Obatoclax
Melanoma
PI3K/AKT
mTOR inhibitors
mTOR complexes
A B S T R A C T
The PI3K/AKT/mTOR signaling pathway regulates cell proliferation, survival and angiogenesis. The
mammalian target of rapamycin (mTOR) is a protein kinase ubiquitously expressed within cells that
regulates cell growth and survival by integrating nutrient and hormonal signals. mTOR exists in two
complexes, mTORC1 and mTORC2. Hyperactivation of the mTOR protein has been linked to development
of cancer, raising mTOR as an attractive target for cancer therapy. Prodigiosin (PG) and obatoclax (OBX),
two members of the prodiginines family, are small molecules with anticancer properties which are
currently under clinical trials. In the present paper, we demonstrate that mTOR is a molecular target of
both prodiginines in melanoma, a highly drug-resistant cancer model. The inhibition of mTORC1 and
mTORC2 complexes by PG or OBX resulted in a loss of AKT phosphorylation at S473, preventing its full
activation, with no significant effect on T308. The strongest activity inhibition (89%) was induced by PG
on mTORC2. Binding assays using Surface Plasmon Resonance (SPR) provide kinetic and affinity data of
the interaction of these small molecules with mTOR. In addition, in silico modeling produced a detailed
atomic description of the binding modes. These results provide new data to understand the mechanism
of action of these molecules, and provide new structural data that will allow the development of more
specific mTOR inhibitors for cancer treatment.
� 2011 Elsevier Inc. All rights reserved.
Contents lists available at SciVerse ScienceDirect
Biochemical Pharmacology
jo u rn al h om epag e: ww w.els evier .c o m/lo cat e/b io c hem p har m
1. Introduction
Prodigiosin (PG) and obatoclax (OBX) are two prodigininefamily members which have emerged as promising anticancerdrugs and are currently in clinical trials. Prodiginines are bacterialmetabolites with a pyrrolylpyrromethene skeleton which haveshown immunosuppressive and anticancer properties. PG hasshown apoptotic activity against several cancer cell types with lowcytotoxicity in non-malignant cells. The National Cancer Institute(www.dtp.nci.nih.gov) tested prodigiosin (and some of itsderivates) against a collection of �60 cell lines with an averageIC50 (for PG) of 2.1 mM [1]. It has been described that the apoptotic
Abbreviations: PG, prodigiosin; OBX, obatoclax; Rap, rapamycin; mTOR, mammali-
an target of rapamycin; PI3K, phosphoinositide 3-kinase; AKT/PKB, protein kinase B.
* Corresponding author at: Cancer Cell Biology Research Group, Department of
Pathology and Experimental Therapeutics, University of Barcelona, Pavello Central,
5a planta, LR 5101C/Feixa Llarga s/n, E 08907 L’Hospitalet de Llobregat, Barcelona,
Spain. Tel.: +34 934024288; fax: +34 934024288.
E-mail address: [email protected] (R. Perez-Tomas).
0006-2952/$ – see front matter � 2011 Elsevier Inc. All rights reserved.
doi:10.1016/j.bcp.2011.11.027
process triggered by PG is mediated through the mitochondrialpathway and involves the induction of the proapoptotic gene NAG-1 [2]. Nevertheless, the molecular target of this agent is stillunknown. Further studies are also necessary to understand themechanism of action of OBX. OBX is a synthetic indolylprodigiosinderivative, which was developed by GeminX Pharmaceuticals(recently acquired by Cephalon) and was described as a BH3mimetic drug [3].
In the present report we identify the mammalian target ofrapamycin (mTOR) as a new molecular target of the prodiginines.mTOR is an evolutionarily conserved serine/threonine proteinkinase which is constituted by two signaling complexes: mTORcomplex 1 (mTORC1) and mTOR complex 2 (mTORC2). Bothcomplexes have specific effects on distinct cellular functions,such as controlling mRNA translation, ribosome biogenesis,autophagy and metabolism [4–6]. mTORC2 phosphorylates AGCkinases such as AKT, serum- and glucocorticoid-induced proteinkinase-1 (SGK1) and protein kinase C-alpha (PKCa) [7–9]. AKT isone of the best-known downstream effectors of phosphatidyli-nositol-3 kinase (PI3K). Complete AKT activation depends on

M. Espona-Fiedler et al. / Biochemical Pharmacology 83 (2012) 489–496490
phosphoinositide-dependent kinase-1 (PDK1) and mTORC2,which phosphorylate AKT at two key sites: the activation loop(T308) and the C-terminal hydrophobic motif (S473), respective-ly [10,11]. mTOR signaling is regulated through a network offeedback loops, protein partners, substrates, and regulators[12,13]. Among them, PRAS40 (proline-rich AKT substrate40 kDa) is a key regulator of mTORC1. Moreover, in contrast tomTORC2, which contains rictor (rapamycin-insensitive compan-ion of mTOR), mTORC1 contains raptor (regulatory associatedprotein of mTOR), which positively regulates mTOR activity andfunctions as a scaffold for recruiting mTORC1 substrates [14,15].PRAS40 interacts with raptor in insulin-deprived cells andinhibits the activation of mTORC1 pathway [16]. mTORC1regulates protein synthesis through S6-kinase and the transla-tion repressor protein 4E-BP1. mTORC1 phosphorylates thehydrophobic motif of p70S6K on T389 [17]. On the other hand,phosphorylation of 4E-BP1 at S65 by mTORC1 prevents thebinding of 4E-BP1 to the eIF4E translation initiation factoractivating cap-dependent translation [13].
Interest in identifying and developing new mTOR inhibitors hasincreased since the second generation of mTOR inhibitors showedencouraging results in the treatment of different types of cancer,including melanoma [18]. Melanoma is an extremely aggressivedisease with high metastatic potential and notoriously strongresistance to cytotoxic agents. Development of resistance has beenrelated to the presence of different feedback loops that link bothPI3K/AKT/mTOR and mitogen activated protein kinase (MAPK)pathways. These pathways are critical to melanoma progressionand both are deregulated in melanoma, but not in normal cells[19,20]. Thus, compounds that counteract these feedback loops areconsidered in cancer therapy.
Here, we report that prodiginines inhibit both mTORC1 andmTORC2 complexes and thus counteract the S6K-1/IRS-1 negativefeedback loop in melanoma. Moreover, binding assays provide dataon the stability and affinity of the interaction between these smallmolecules and mTOR. In addition, we describe several of therecognition motifs involved in these interactions by in silico model.
2. Material and methods
2.1. Reagents
Prodigiosin (2-methyl-3-pentyl-6-methoxyprodigiosene) wasprovided by Dr. R.J. Schultz of the National Cancer Drug Synthesisand Chemistry Branch Chemotherapeutic Agents Repository(Bethesda, MD). Obatoclax, a synthetic indol-containing prodigi-nine, was provided by Dr. Roberto Quesada of the University ofBurgos (Supplementary Fig. 1). Rapamycin (FRAP1/mTOR inhibi-tor) was purchased from Invitrogen (Carlsbad, CA). All stocksolutions were diluted in DMSO and stored at �20 8C.
2.2. Cell lines and culture conditions
Human melanoma cancer cell lines SK-MEL-28 and SK-MEL-5were purchased from American Type Culture Collection (Manassas,VA).
Stable control, mTOR knockdown and raptor knockdownhuman colon cancer cells SW480 were generated using lentivi-rus-based shRNA targeting mTOR or raptor as described in [21].
All cell types were cultured in Dulbecco’s Modified Eagle’sMedium (DMEM, Biological Industries, Beit Haemek, Israel)supplemented with 10% heat-inactivated fetal bovine serum(FBS; Life Technologies, Carlsbad, CA), 100 U/ml penicillin,100 mg/ml streptomycin, and 2 mM L-glutamine all from BiologicalIndustries. Cells were grown at 37 8C in a 5% CO2 atmosphere.
2.3. Cell viability assay
Cell viability was determined by MTT assay using 3-(4,5-dimethylthiazol-2-yl)-2,5-diphenyltetrazolium bromide (Sigma–Aldrich Chemical Co., St. Louis, MO) (see Supplementary materialand methods).
2.4. Hoescht staining
Cell morphology was evaluated by fluorescence microscopyfollowing Hoescht 33342 DNA staining (Sigma–Aldrich ChemicalCo., St. Louis, MO). Cells (2 � 105 cells/ml) were treated or not withPG for 24 h. They were washed in PBS and resuspended in 2 mg/mlHoescht 33342 and incubated for 30 min at 37 8C in the dark. Then,cells were washed in PBS and examined under a Carl Zeiss Jenamicroscope.
2.5. Kinase profiling
Kinase profiling was performed by The National Centre forProtein Kinase Profiling (MRC Protein Phosphorylation Unit,Dundee, UK). All kinase assays were carried out using a radioactive(33P-ATP) filter-binding assay in duplicate. Screening was carriedout at 10 mM and industry standard QC procedures were used tovalidate each assay.
2.6. Immunoblot analysis
Cells were treated with prodiginines before insulin (Sigma–Aldrich Chemical Co., St. Louis, MO) stimulation. Adherent andfloating cells were lysed in buffer (50 mM Tris pH 7.5, 60 mMglycerophosphate, 20 mM sodium pyrophosphate, 2 mM EGTA,5 mM EDTA, 30 mM NaF, 1 mM orthovanadate, 1 mM DTT, 1%Triton X-100, 1 mM PMSF, 5 mM pepstatin A, 10 mM leupeptin).Protein concentration was determined with the BCA proteinassay (Pierce, Rockford, IL) using bovine serum albumin asstandard. 40 mg of protein extracts was separated by SDS-PAGEand transferred to Immobilon-P membranes (Millipore,Bedford, MA). Immunoblots were developed with primaryantibodies according to the manufacturer’s instructions (seeSupplementary material and methods). DMSO was used as acontrol.
2.7. Immunoprecipitation and non-radioactive kinase activity assay
mTORC1 and mTORC2 complexes were immunoprecipitatedfrom SK-MEL5 cells (see Supplementary material and methods).Immunoprecipitates were assayed against recombinant proteinAKT1 and p70-S6K1 (Invitrogen, Carlsbad, CA), respectively, in afinal volume of 30 ml containing 50 mM Tris pH 7.5, 10 mMmagnesium chloride and 10 mM ATP which was incubated for30 min at 30 8C with gentle shaking. Assays were stopped byaddition of 5 ml Laemmli buffer and samples were then heated to100 8C for 5 min. Samples were loaded on SDS-PAGE gel andanalyzed by immunoblotting.
2.8. Surface Plasmon Resonance (SPR) assays
SPR assays were performed using Biacore T-100 (seeSupplementary material and methods), which is a sensitive,high-performance, flow-cell-based SPR biosensor used for theanalysis of protein–protein or protein–small molecule interac-tions [22]. This system incorporates software wizards whichassist with the analysis of every interaction parameter, includingkinetic and affinity evaluation and determination of bindingspecificity.

M. Espona-Fiedler et al. / Biochemical Pharmacology 83 (2012) 489–496 491
2.9. Theoretical methods
Using two separate computational approaches, (1) Blast + Mo-deller and (2) I-TASSER, we developed a homology modelingprocedure for mTOR. Both approaches identified templates fromthe PI3K protein kinase family with 24–28% identity, and both builtsimilar models. Additionally, two control in silico models from thePI3K family, PDK1 (pdbcode:2PE1) and PKC-alpha (pdbco-de:3IW4), were chosen for the protein–ligand simulations (seeSupplementary material and methods).
After preparing the models, we performed a cavity search withSiteMap, which confirmed the ATP binding site as the top rankedbinding cavity, followed by initial rigid ligand docking with Glide[23]. For PDK1 and PKC-alpha we docked the crystallographicligands together with PG. For mTOR we docked PG, OBX andPP242, a ligand that inhibits mTOR with an IC50 of 8 nM [24]. Theinduced fit was modeled by 600 iterations with PELE (ProteinEnergy Landscape Exploration), a stochastic method of mappinglarge conformational rearrangements and induced fit events inprotein–ligand interactions [25]. To map the change in affinityafter the protein–ligand induced fit, the PELE results wereclustered and representative structures were redocked withGlide.
Fig. 1. Cell death in PG- or OBX-treated SK-MEL-28 and SK-MEL-5 cells. (A) Cytotoxic ef
concentrations (0–8 mM) for 24 and (B) 48 h. Cell viability was determined by MTT assay.
control cells. Values are shown as mean � S.E.M. of three independent experiments p
mechanisms. Cells were treated with PG IC50 and cell extracts were assayed for LC-3, caspase
(D) PG induces apoptotic body formation and nuclear condensation. This was observed th
2.10. Statistical analysis
For analysis of activity kinase, results are expressed as themean � S.D. of three independent experiments. Statistical analysis(ANOVA) was carried out with the Statgraphics plus 5.1. statisticalpackage. P < 0.05 and P < 0.01 are represented by * and **,respectively.
3. Results
3.1. Prodiginines induce cell death in melanoma cells
To determine whether prodiginines could be potential mela-noma chemotherapeutical agents, we first examined their effect ontwo melanoma cell lines obtained from different stages ofmelanoma progression according to the broadly accepted Clarkmodel [26]. We examined SK-MEL-28 (radial growth phase) cellsderived from an in situ melanoma. We then examined the nextprogression stage SK-MEL-5 (vertical growth phase) cells derivedfrom a metastatic site (axilary node) of a melanoma-bearingpatient.
To compare the cytotoxic-inducing potential of PG and OBX onmelanoma cells, we treated SK-MEL-28 and SK-MEL-5 cells with
fect of PG is higher than that of OBX. Cells were treated with a range of PG or OBX
The percentage of viable cells was calculated as the ratio of A570 between treated and
erformed in triplicate. (C) PG induces activation of both autophagic and apoptotic
-9 and procaspase-3 expression by Immunoblotting. Actin was used as loading control.
rough Hoescht staining in cells treated with PG IC50 for 24 h.

M. Espona-Fiedler et al. / Biochemical Pharmacology 83 (2012) 489–496492
both compounds at concentrations ranging from 1 mM to 8 mM for24 and 48 h. Cell viability was reduced by PG in a dose-dependentmanner. PG showed a half inhibitory concentration (IC50) value of4.51 � 0.47 mM and 1.02 � 0.15 mM in SK-MEL-28 and SK-MEL-5cells, respectively (Fig. 1A and B). In contrast to PG, OBX had littleeffect on cell viability at 24 h. At 48 h of treatment, OBX showed anIC50 value of 2.2 mM � 0.43 and 1.8 mM � 0.21 in SK-MEL-28 and SK-MEL-5 cells, respectively.
Previous studies showed that OBX mediates cell death throughthe induction of autophagy and subsequent activation of apoptosis[27]. Therefore, we analyzed which cell death mechanism wastriggered by PG, using caspase-3, -9 and LC-3 proteins as apoptoticand autophagic markers, respectively. After PG treatment, thecytosolic form of LC-3 (LC-3 I) disappeared and the formconjugated to phosphatidylethanolamine (LC-3 II) appeared, in adose-dependent manner (Fig. 1C). It has been reported that LC-3 IIis recruited to autophagosomal membranes, thus participating inautophagy [28]. LC-3 II was induced at shorter time exposures thanthe activation of caspase-9, indicating that both processes aretriggered, but that autophagy precedes apoptosis. Moreover,caspase-3 proteolysis and the formation of apoptotic bodiescorroborate the apoptotic process (Fig. 1D).
In addition, these results demonstrate that the cytotoxic effectmediated by PG is higher than by OBX in melanoma cells,especially in SK-MEL-5.
3.2. Regulation of PI3K/AKT/mTOR and MAPK pathways is mediated
by prodigiosin
To analyze the potential of prodiginines as protein kinaseregulators a kinase profiling procedure was performed. The results
Fig. 2. Effect of PG on PI3K/AKT/mTOR and MAPK survival pathways. (A) PG induces inh
performed by the MRC Protein Phosphorylation Unit. PG 10 mM was screened in duplicate
(33P-ATP) filter-binding assay. (B) PI3K/AKT and MAPK pathways are activated in SK-M
protein levels of AKT and ERK1/2 were visualized by Immunoblotting. Actin was used as a
and SK-MEL-5 cells were treated with PG at a concentration of IC50 for 15 min to 1 h. Pho
control.
showed that PG (10 mM) suppressed the activity of few proteinkinases from a panel of 65 protein kinases encoded by the humangenome. The proteins that were significantly inhibited (>70%)were AKT, ribosomal S6 kinase (RSK)-2, mitogen and stressactivated protein kinase (MSK)-1, serum glucocorticoid-induciblekinase (SGK)-1, calmodulin-dependent kinase (CaMK)-1 andBruton’s tyrosine kinase (Btk) [29,30]. All these proteins partici-pate in PI3K/AKT/mTOR and MAPK pathways. Interestingly, otherproteins closely related to these pathways such as PDK1, insulingrowth factor (IGF)-I receptor, MAPK protein kinases (extracellularrelated kinases (ERK)-1/2, p38, c-Jun N-terminal kinase (JNK)-1/2)and inhibitor of nuclear factor kappa-B kinase (IKK) were notinhibited. Unfortunately, other proteins of interest such as mTORwere not included in this kinase profiling (Fig. 2A). These resultscharacterize PG as a multi-kinase inhibitor, and they provide arange of new potential targets of prodiginines, all of which play acritical role in the control of the cell cycle and tumor progression.
To elucidate the specific molecular mechanisms that induce thecytotoxic effect of prodiginines, and based on the kinase profilingresults, we studied the effect of PG and OBX on PI3K/AKT/mTORand MAPK pathways in melanoma cells. Both pathways regulatemelanoma cell death and proliferation [26].
We first examined the activation of the two key effector kinasesof these pathways, AKT and ERK1/2. Phosphorylation levels ofthese kinases were higher in SK-MEL-28 than in SK-MEL-5 cells(Fig. 2B). These differences in the up-regulation of pro-survivalprotein kinases might explain why resistance to prodigininetreatment depends on the cell line.
We then analyzed the effect of PG on both pathways. Cells weretreated with PG at the IC50 concentrations established as describedabove. PG reduced AKT phosphorylation on S473 in a time-
ibition of some PI3K and MAPK-related protein kinases in vitro. Kinase assays were
against a panel of 65 protein kinases. All assays were carried out using a radioactive
EL28 more strongly than in SK-MEL-5 melanoma cells. Phosphorylation and total
loading control. (C) PG-induced AKT but not ERK1/2 dephosphorylation. SK-MEL-28
sphorylation levels were visualized by Immunoblotting. Actin was used as a loading

Fig. 3. Prodiginines target mTOR pathway. (A) Effect of prodiginines on critical effectors of PI3K/AKT/mTOR pathway in melanoma cells. SK-MEL-28 and SK-MEL-5 cells were
deprived for 24 h and treated with PG or OBX at the indicated concentrations for 1 h before insulin-stimulation at 1 mM for 30 min. Cell extracts were analyzed by
Immunoblotting. Actin was used as loading control. (B) Inhibition of mTOR activity prevents from prodiginines-mediated cell death. Stable control and knockdown cells were
treated with PG or OBX at 4 mM for 48 h. The percentage of viable cells was calculated as the ratio of A570 between treated and control cells. Values are shown as mean � S.E.M.
of three independent experiments performed in triplicate. Statistical significance is shown as *P < 0.01.
M. Espona-Fiedler et al. / Biochemical Pharmacology 83 (2012) 489–496 493
dependent manner. Nevertheless, only a slight effect was observedon T308, and PG had no effect on PDK-1 or ERK1/2 (Fig. 2C). Theseresults, together with the kinase profiling, indicate that mTORsignaling might be down-regulated in the presence of prodiginines.
3.3. Inhibition of mTOR signaling by prodiginines in melanoma cells
After observing significant inhibitory effects of PG on AKT, wesought to confirm the inhibition of the AKT/mTOR/p70S6Ksignaling pathway by prodiginines in melanoma cells. Thus, weexamined the effect of prodiginines on the main regulators andsubstrates of this pathway. As shown in Fig. 3A, both PG and OBXinhibited mTORC2 activity, leading to an inhibition of the insulin-stimulated phosphorylation of AKT and PRAS40. Nevertheless, itwas necessary to use higher doses of OBX (10 mM) to obtain sameeffects as PG at 1 h of treatment. Insulin-stimulated phosphoryla-tion of PRAS40 at T246 by AKT suppresses its mTORC1 inhibitoryactivity. Therefore, insulin stimulation activates mTORC1 andincreases p70S6K phosphorylation [16]. After treatment withprodiginines, p70S6K and 4E-BP1, which are directly regulated bymTORC1 were also dephosphorylated. Dephosphorylation ofmTOR effectors suggests that prodiginines inhibit mTOR pathway.
To further confirm that prodiginines target mTOR pathway, wefirst determined whether knockdown of mTOR (sh-mTOR) or raptor(sh-raptor) in SW-480 cells prevented the cytotoxic effect inducedby prodiginines. Knockdown of mTOR or raptor resulted in 47% or74% reduction in endogenous protein expression, respectively,compared with stable control cells (sh-f) (Supplementary Fig. 2Aand B). The functional depletion of mTOR pathway was confirmed bydecreased phosphorylation levels of p70S6K and AKT in mTOR andraptor knockdown cells (Supplementary Fig. 2C). According toprotein depletion levels in both cell lines, results showed higherp70S6K inhibition in raptor knockdown cells. Complete AKTinhibition was observed after treatment with PG or OBX at 4 mMfor 1 h. After 6 h of treatment with both prodiginines, proteinexpression down-regulation was induced in both mTOR effectors.
We next assessed whether depletion of mTOR activityprevented from prodiginines-mediated cell death. Stable controlcells and knockdown cells were treated with a range ofconcentrations (0–4 mM) of PG or OBX for 24 or 48 h (Supplemen-tary Fig. 3A and B). Results showed greater cytotoxic effects in sh-fcells after treatment with PG than OBX, as observed in melanomacells. Nevertheless, the most significant results were obtained after48 h of treatment. At 4 mM of PG or OBX, sh-mTOR and sh-raptorcell death was reduced in a �35–40% compared with sh-f cells(Fig. 3B), demonstrating that mTOR complexes are critical forprodiginines cytotoxic effect.
3.4. Prodiginines counteract the activation of the S6K-1/IRS-1
negative feedback loop through mTORC1 and mTORC2 inhibition
We further examined the ability of PG and OBX to inhibitmTORC1 and mTORC2 complexes in melanoma cells. Inhibition ofmTORC1 induces activation of S6K-1/IRS-1 negative feedback [19].Dual inhibition of mTORC1 and mTORC2 might counteract thismechanism. With this in mind, we first compared the effect of bothcompounds with that of rapamycin, which inhibits mTORC1,leading to an increase in AKT phosphorylation through an IGF-1R-dependent mechanism. As expected, rapamycin alone decreasedphosho-p70S6K levels, while increasing phospho-AKT levels. Thegreatest effect of rapamycin was seen at 100 nM (SupplementaryFig. 4). As a further comparison, we co-treated both cell lines withPG (IC50) or OBX (10 mM) and 100 nM rapamycin for 1 h, beforeinsulin stimulation. In contrast to both prodiginines alone,treatment with rapamycin induced a stronger decrease in thephospho-p70S6K levels, suggesting that mTORC1 is not completelyinhibited by PG or OBX (Fig. 4A). Nevertheless, in both cell lines, PGrather than OBX counteracted the activation of this feedback loop,leaving AKT quite dephosphorylated.
To evaluate the inhibition on mTORC2 and mTORC1 complexes,further kinase activity assays were performed. We isolated activemTORC2 and mTORC1 complexes from melanoma cells afterinsulin stimulation. Active mTORC2 and mTORC1 were immuno-precipitated from the lysates using anti-rictor and anti-raptorantibodies, respectively. mTORC2 activity was analyzed usingrecombinant AKT as substrate. The inhibition of mTORC2 by PG orOBX resulted in a loss of AKT phosphorylation (Fig. 4B). We nextmeasured the effect of both molecules on mTORC1 activity usingp70S6 as a substrate (Fig. 4C). Both prodiginines markedlyinhibited both mTOR complexes. The strongest inhibition (89%)was induced by PG on mTORC2 (Fig. 4D).
3.5. Kinetic characterization
In order to further characterize the prodiginines as mTORinhibitors, we first monitored the interaction between mTOR andprodiginines by real-time interaction analysis. We used SurfacePlasmon Resonance (SPR) assays, which allow kinetic and affinityevaluation and determination of binding specificity betweenproteins and small molecules [22].
For binding experiments, we first immobilized the recombinantprotein mTOR (aa 1360–2549) on a sensor surface. The analytes(PG and OBX) were then injected in solution over the surface.Changes in SPR response were detected even at nanomolarconcentrations. The interactions of small molecule inhibitors with

Fig. 4. Prodiginines counteract S6K1/IGF-1R negative feedback loop through mTORC1 and mTORC2 inhibition. (A) Effect of PG on S6K1/IGF-1R negative feedback loop in
melanoma cells. Before insulin stimulation, deprived cells were pre-incubated with rapamycin 100 nM for 15 min and prodiginines were then added at the indicated
concentrations for 1 h. (B) Prodiginines inhibit mTORC2 and mTORC1 complexes. Active mTORC2 and mTORC1 complexes were immunoprecipitated from insulin-stimulated
SK-MEL-5 cells using anti-rictor or (C) anti-raptor antibodies, respectively. Immunoprecipitated were incubated with recombinant AKT or p70S6K (20 ng), 50 mM Tris pH 7.5,
10 mM magnesium chloride, 10 mM ATP and PG or OBX, both at 10 mM for 30 min. Kinase reaction was stopped with Laemmli buffer (5�) and phosphorylation levels of p70
S6K or AKT were visualized by Immunoblotting. (D) Data is expressed as the percentage of phospho-AKT or phospho-p70S6K levels (normalized by AKT or p70S6K levels),
respectively, and shown as the mean � S.D. Statistical significance is shown as *P < 0.05; **P < 0.01.
M. Espona-Fiedler et al. / Biochemical Pharmacology 83 (2012) 489–496494
mTOR were analyzed, providing kinetic and affinity data in thenanomolar range (Fig. 5A and B). The same order of magnitude inthe affinity data (KD) and the low dissociation rates (Kd) suggestthat both molecules form similar specific and stable binders.
Small molecule specificity was tested by performing interactionanalysis between these compounds and another protein kinase:
Fig. 5. Kinetic characterization of PG and OBX binding to mTOR by Surface Plasmon Re
between 0.06 mM and 1 mM over immobilized mTOR (aa 1360–2549). Sensograms and c
showed affinity (KD = Kd/Ka) constants of 416 � 49 nM for PG and 355 � 121 nM for OB
AKT. In this case, the data did not fit this interaction model usingPG as analyte. Moreover, using OBX no high-affinity saturablecomponent was obtained (Supplementary Fig. 5). These markeddifferences in the characteristics of the interactions compared tomTOR suggest that stable binding does not occur betweenprodiginines and AKT.
sonance (SPR) assays. (A) PG or (B) OBX were injected at a range of concentrations
urve fit (black lines) are shown. Kinetics and affinity evaluation of these sensograms
X, respectively. RU, resonance units.
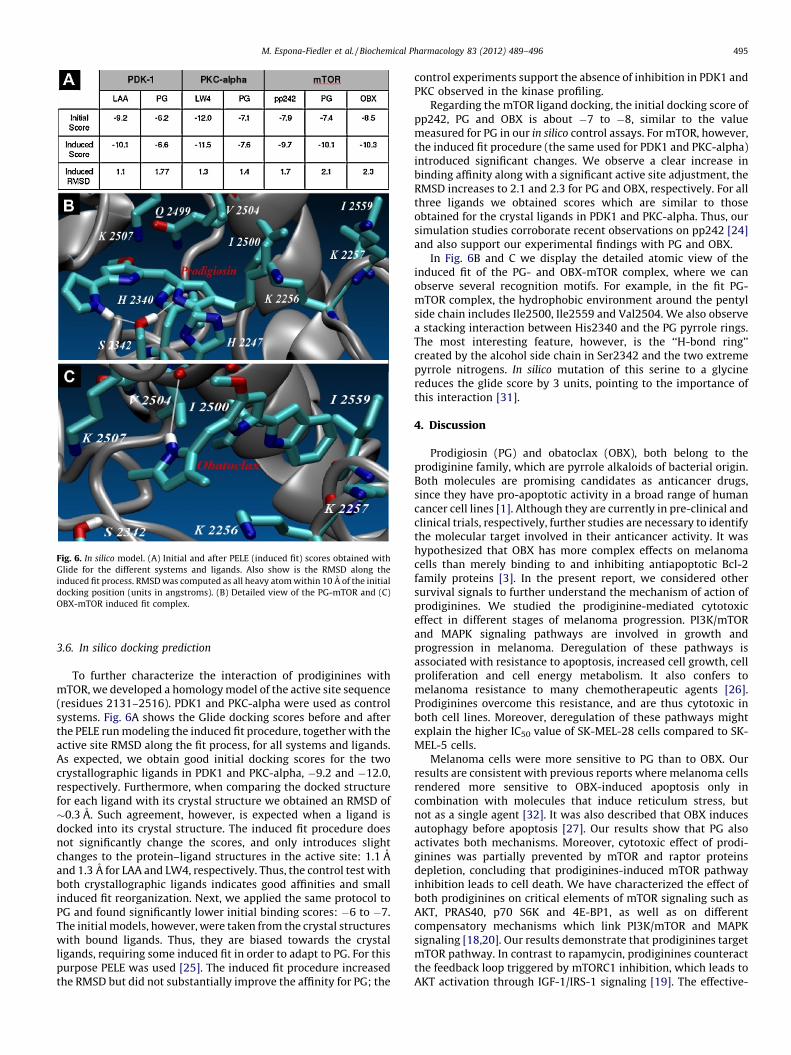
Fig. 6. In silico model. (A) Initial and after PELE (induced fit) scores obtained with
Glide for the different systems and ligands. Also show is the RMSD along the
induced fit process. RMSD was computed as all heavy atom within 10 A of the initial
docking position (units in angstroms). (B) Detailed view of the PG-mTOR and (C)
OBX-mTOR induced fit complex.
M. Espona-Fiedler et al. / Biochemical Pharmacology 83 (2012) 489–496 495
3.6. In silico docking prediction
To further characterize the interaction of prodiginines withmTOR, we developed a homology model of the active site sequence(residues 2131–2516). PDK1 and PKC-alpha were used as controlsystems. Fig. 6A shows the Glide docking scores before and afterthe PELE run modeling the induced fit procedure, together with theactive site RMSD along the fit process, for all systems and ligands.As expected, we obtain good initial docking scores for the twocrystallographic ligands in PDK1 and PKC-alpha, �9.2 and �12.0,respectively. Furthermore, when comparing the docked structurefor each ligand with its crystal structure we obtained an RMSD of�0.3 A. Such agreement, however, is expected when a ligand isdocked into its crystal structure. The induced fit procedure doesnot significantly change the scores, and only introduces slightchanges to the protein–ligand structures in the active site: 1.1 Aand 1.3 A for LAA and LW4, respectively. Thus, the control test withboth crystallographic ligands indicates good affinities and smallinduced fit reorganization. Next, we applied the same protocol toPG and found significantly lower initial binding scores: �6 to �7.The initial models, however, were taken from the crystal structureswith bound ligands. Thus, they are biased towards the crystalligands, requiring some induced fit in order to adapt to PG. For thispurpose PELE was used [25]. The induced fit procedure increasedthe RMSD but did not substantially improve the affinity for PG; the
control experiments support the absence of inhibition in PDK1 andPKC observed in the kinase profiling.
Regarding the mTOR ligand docking, the initial docking score ofpp242, PG and OBX is about �7 to �8, similar to the valuemeasured for PG in our in silico control assays. For mTOR, however,the induced fit procedure (the same used for PDK1 and PKC-alpha)introduced significant changes. We observe a clear increase inbinding affinity along with a significant active site adjustment, theRMSD increases to 2.1 and 2.3 for PG and OBX, respectively. For allthree ligands we obtained scores which are similar to thoseobtained for the crystal ligands in PDK1 and PKC-alpha. Thus, oursimulation studies corroborate recent observations on pp242 [24]and also support our experimental findings with PG and OBX.
In Fig. 6B and C we display the detailed atomic view of theinduced fit of the PG- and OBX-mTOR complex, where we canobserve several recognition motifs. For example, in the fit PG-mTOR complex, the hydrophobic environment around the pentylside chain includes Ile2500, Ile2559 and Val2504. We also observea stacking interaction between His2340 and the PG pyrrole rings.The most interesting feature, however, is the ‘‘H-bond ring’’created by the alcohol side chain in Ser2342 and the two extremepyrrole nitrogens. In silico mutation of this serine to a glycinereduces the glide score by 3 units, pointing to the importance ofthis interaction [31].
4. Discussion
Prodigiosin (PG) and obatoclax (OBX), both belong to theprodiginine family, which are pyrrole alkaloids of bacterial origin.Both molecules are promising candidates as anticancer drugs,since they have pro-apoptotic activity in a broad range of humancancer cell lines [1]. Although they are currently in pre-clinical andclinical trials, respectively, further studies are necessary to identifythe molecular target involved in their anticancer activity. It washypothesized that OBX has more complex effects on melanomacells than merely binding to and inhibiting antiapoptotic Bcl-2family proteins [3]. In the present report, we considered othersurvival signals to further understand the mechanism of action ofprodiginines. We studied the prodiginine-mediated cytotoxiceffect in different stages of melanoma progression. PI3K/mTORand MAPK signaling pathways are involved in growth andprogression in melanoma. Deregulation of these pathways isassociated with resistance to apoptosis, increased cell growth, cellproliferation and cell energy metabolism. It also confers tomelanoma resistance to many chemotherapeutic agents [26].Prodiginines overcome this resistance, and are thus cytotoxic inboth cell lines. Moreover, deregulation of these pathways mightexplain the higher IC50 value of SK-MEL-28 cells compared to SK-MEL-5 cells.
Melanoma cells were more sensitive to PG than to OBX. Ourresults are consistent with previous reports where melanoma cellsrendered more sensitive to OBX-induced apoptosis only incombination with molecules that induce reticulum stress, butnot as a single agent [32]. It was also described that OBX inducesautophagy before apoptosis [27]. Our results show that PG alsoactivates both mechanisms. Moreover, cytotoxic effect of prodi-ginines was partially prevented by mTOR and raptor proteinsdepletion, concluding that prodiginines-induced mTOR pathwayinhibition leads to cell death. We have characterized the effect ofboth prodiginines on critical elements of mTOR signaling such asAKT, PRAS40, p70 S6K and 4E-BP1, as well as on differentcompensatory mechanisms which link PI3K/mTOR and MAPKsignaling [18,20]. Our results demonstrate that prodiginines targetmTOR pathway. In contrast to rapamycin, prodiginines counteractthe feedback loop triggered by mTORC1 inhibition, which leads toAKT activation through IGF-1/IRS-1 signaling [19]. The effective-

M. Espona-Fiedler et al. / Biochemical Pharmacology 83 (2012) 489–496496
ness of prodiginines relies on their ability to inhibit mTOR activity.Therefore, the suppression of mTORC1 as well as mTORC2 activityimplies a reduction of phosphorylation of AKT at S473.
The kinetics and affinity evaluation revealed high-affinitybinding between mTOR and prodiginines. Nevertheless, althoughmTOR is a validated target for the treatment of cancer, it might benecessary to develop more effective prodiginine-derivates withimproved chemical properties that increase their bioavailability.
The second generation of mTOR inhibitors targets the ATP site.These compounds suppress AKT phosphorylation, leading to astronger antiproliferative effect than that of rapamycin [18,33].Therefore, prodiginines effect might be closer to the secondgeneration of mTOR inhibitors. Thus, it will be interesting tocompare prodiginines with other small molecules such as AZD-8055 (AstraZeneca), INK-128 (Intellikine), OSI-027 (OSI pharma-ceuticals) or pp242 which also block both mTORC1 and mTORC2complexes. pp242 is structurally similar to prodiginines [24]. In
silico models suggest that prodiginines, like pp242, could interactin the active-site of mTOR and provided several of the recognitionmotifs involved in their interaction. Moreover, these models alsoillustrate the importance of the alcohol side chain and the twoextreme pyrrole nitrogens of the prodiginines for the interactionon Ser2342 of mTOR.
These findings described here by PG and OBX as mTORC1 andmTORC2 inhibitors contribute to our understanding of themolecular mechanisms of action of both molecules and providedata about their structural properties that will allow thedevelopment of more-effective mTOR inhibitors in the future.
Acknowledgements
The authors thank Marta Taules for technical assistance fromCentres Cientıfics i Tecnologics (Universitat de Barcelona) andRobin Rycroft for language assistance. This work was supported bya research grant from Spanish government and the EuropeanUnion (FIS-PI10/00338).
Appendix A. Supplementary data
Supplementary data associated with this article can be found, inthe online version, at doi:10.1016/j.bcp.2011.11.027.
References
[1] Perez-Tomas R, Vinas M. New insights on the antitumoral properties ofprodiginines. Curr Med Chem 2010;17:2222–31.
[2] Soto-Cerrato V, Vinals F, Lambert JR, Kelly JA, Perez-Tomas R. Prodigiosininduces the proapoptotic gene NAG-1 via glycogen synthase kinase-3betaactivity in human breast cancer cells. Mol Cancer Ther 2007;6:362–9.
[3] Nguyen M, Marcellus RC, Roulston A, Watson M, Serfass L, Murthy Madiraju SR,et al. Small molecule obatoclax (GX15-070) antagonizes MCL-1 and overcomesMCL-1-mediated resistance to apoptosis. Proc Natl Acad Sci U S A2007;104:19512–7.
[4] Sarbassov DD, Ali SM, Kim DH, Guertin DA, Latek RR, Erdjument-Bromage H,et al. Rictor, a novel binding partner of mTOR, defines a rapamycin-insensitiveand raptor-independent pathway that regulates the cytoskeleton. Curr Biol2004;14:1296–302.
[5] Wullschleger S, Loewith R, Hall MN. TOR signaling in growth and metabolism.Cell 2006;124:471–84.
[6] Guertin DA, Sabatini DM. The pharmacology of mTOR inhibition. Sci Signal2009;2:pe24.
[7] Ali SM, Sabatini DM. Structure of S6 kinase 1 determines whether raptor-mTOR or rictor-mTOR phosphorylates its hydrophobic motif site. J Biol Chem2005;280:19445–8.
[8] Frodin M, Antal TL, Dummler BA, Jensen CJ, Deak M, Gammeltoft S, et al. Aphosphoserine/threonine-binding pocket in AGC kinases and PDK1 mediatesactivation by hydrophobic motif phosphorylation. EMBO J 2002;21:5396–407.
[9] Garcia-Martinez JM, Alessi DR. mTOR complex 2 (mTORC2) controls hydro-phobic motif phosphorylation and activation of serum- and glucocorticoid-induced protein kinase 1 (SGK1). Biochem J 2008;416:375–85.
[10] Alessi DR, Andjelkovic M, Caudwell B, Cron P, Morrice N, Cohen P, et al.Mechanism of activation of protein kinase B by insulin and IGF-1. EMBO J1996;15:6541–51.
[11] Manning BD, Cantley LC. AKT/PKB signaling: navigating downstream. Cell2007;129:1261–74.
[12] Schmelzle T, Hall MN. TOR, a central controller of cell growth. Cell2000;103:253–62.
[13] Fingar DC, Salama S, Tsou C, Harlow E, Blenis J. Mammalian cell size iscontrolled by mTOR and its downstream targets S6K1 and 4EBP1/eIF4E. GenesDev 2002;16:1472–87.
[14] Hara K, Maruki Y, Long X, Yoshino K, Oshiro N, Hidayat S, et al. Raptor, abinding partner of target of rapamycin (TOR), mediates TOR action. Cell2002;110:177–89.
[15] Kim DH, Sarbassov DD, Ali SM, King JE, Latek RR, Erdjument-Bromage H, et al.mTOR interacts with raptor to form a nutrient-sensitive complex that signalsto the cell growth machinery. Cell 2002;110:163–75.
[16] Sancak Y, Thoreen CC, Peterson TR, Lindquist RA, Kang SA, Spooner E, et al.PRAS40 is an insulin-regulated inhibitor of the mTORC1 protein kinase. MolCell 2007;25:903–15.
[17] Jefferies HB, Fumagalli S, Dennis PB, Reinhard C, Pearson RB, Thomas G, et al.Rapamycin suppresses 50TOP mRNA translation through inhibition of p70s6k.EMBO J 1997;16:3693–704.
[18] Huang S, Houghton PJ. Targeting mTOR signaling for cancer therapy. Curr OpinPharmacol 2003;3:371–7.
[19] Wan X, Harkavy B, Shen N, Grohar P, Helman LJ. Rapamycin induces feedbackactivation of Akt signaling through an IGF-1R-dependent mechanism. Onco-gene 2007;26:1932–40.
[20] Carracedo A, Ma L, Teruya-Feldstein J, Rojo F, Salmena L, Alimonti A, et al.Inhibition of mTORC1 leads to MAPK pathway activation through a PI3K-dependent feedback loop in human cancer. J Clin Invest 2008;118:3065–74.
[21] Liu J, Stevens PD, Gao T. mTOR-dependent regulation of PHLPP expressioncontrols the rapamycin sensitivity in cancer cells. J Biol Chem2011;286(8):6510–20.
[22] Nordin H, Jungnelius M, Karlsson R, Karlsson OP. Kinetic studies of smallmolecule interactions with protein kinases using biosensor technology. AnalBiochem 2005;340:359–68.
[23] Glide. version 5.6, Schrodinger. New York, NY: LLC; 2010.[24] Feldman ME, Apsel B, Uotila A, Loewith R, Knight ZA, Ruggero D, et al. Active-
site inhibitors of mTOR target rapamycin-resistant outputs of mTORC1 andmTORC2. PLOS Biol 2009;7:371–83.
[25] Borrelli K, Cossins B, Guallar V. Exploring hierarchical refinement techniquesfor induced fit docking with protein and ligand flexibility. J Comput Chem2010;31:1224–35.
[26] Miller AJ, Mihm Jr MC. Melanoma. N Engl J Med 2006;355:51–65.[27] Pan J, Cheng C, Verstovsek S, Chen Q, Jin Y, Cao Q. The BH3-mimetic GX15-070
induces autophagy, potentiates the cytotoxicity of carboplatin and 5-fluoro-uracil in esophageal carcinoma cells. Cancer Lett 2010;293:167–74.
[28] Kabeya Y, Mizushima N, Yamamoto A, Oshitani-Okamoto S, Ohsumi Y, Yoshi-mori T. LC3, GABARAP and GATE16 localize to autophagosomal membranedepending on form-II formation. J Cell Sci 2004;117:2805–12.
[29] Dalby KN, Morrice N, Caudwell FB, Avruch J, Cohen P. Identification ofregulatory phosphorylation sites in mitogen-activated protein kinase(MAPK)-activated protein kinase-1a/p90rsk that are inducible by MAPK. J BiolChem 1998;273:1496–505.
[30] Hanada M, Feng J, Hemmings BA. Structure, regulation and function of PKB/AKT – a major therapeutic target. Biochim Biophys Acta 2004;1697:3–16.
[31] Tirion MM. Large amplitude elastic motions in proteins from a single-param-eter, atomic analysis. Phys Rev Lett 1996;77:1905–8.
[32] Jiang CC, Wroblewski D, Yang F, Hersey P, Zhang XD. Human melanoma cellsunder endoplasmic reticulum stress are more susceptible to apoptosis inducedby the BH3 mimetic obatoclax. Neoplasia 2009;11(9):945–55.
[33] Liu Q, Throreen C, Wang J, Sabatini D, Gray NS. mTOR mediated anti-cancerdrug discovery. Drug Discov Today Ther Strateg 2009;6:47–55.