Inhibition of mTORC1 leads to MAPK pathway activation through a PI3K-dependent feedback loop in...
10
Research article The Journal of Clinical Investigation http://www.jci.org Volume 118 Number 9 September 2008 3065 Inhibition of mTORC1 leads to MAPK pathway activation through a PI3K-dependent feedback loop in human cancer Arkaitz Carracedo, 1,2,3 Li Ma, 2,3,4 Julie Teruya-Feldstein, 3 Federico Rojo, 5,6 Leonardo Salmena, 1,2,3 Andrea Alimonti, 1,2,3 Ainara Egia, 1,2,3 Atsuo T. Sasaki, 7,8 George Thomas, 9 Sara C. Kozma, 9 Antonella Papa, 1,2,3 Caterina Nardella, 1,2,3 Lewis C. Cantley, 7,8 Jose Baselga, 5,10 and Pier Paolo Pandolfi 1,2,3 1 Cancer Genetics Program, Beth Israel Deaconess Cancer Center and Department of Medicine and Pathology, Beth Israel Deaconess Medical Center, Harvard Medical School, Boston, Massachusetts, USA. 2 Cancer Biology and Genetics Program, 3 Department of Pathology, Sloan-Kettering Institute, Memorial Sloan-Kettering Cancer Center, New York, New York, USA. 4 Graduate Program in Physiology, Biophysics and Systems Biology, Weill Graduate School of Medical Sciences, Cornell University, New York, New York, USA. 5 Oncology Program and 6 Department of Pathology, Vall d’Hebron University Hospital, Barcelona, Spain. 7 Department of Systems Biology, Harvard Medical School, Boston, Massachusetts, USA. 8 Division of Signal Transduction, Beth Israel Deaconess Medical Center, Boston, Massachusetts, USA. 9 Department of Genome Science, Genome Research Institute, University of Cincinnati, Cincinnati, Ohio, USA. 10 Department of Oncology, Vall d’Hebron University Hospital, Barcelona, Spain. Numerous studies have established a causal link between aberrant mammalian target of rapamycin (mTOR) activation and tumorigenesis, indicating that mTOR inhibition may have therapeutic potential. In this study, we show that rapamycin and its analogs activate the MAPK pathway in human cancer, in what represents a novel mTORC1-MAPK feedback loop. We found that tumor samples from patients with biopsy-accessible solid tumors of advanced disease treated with RAD001, a rapamycin derivative, showed an administration schedule–dependent increase in activation of the MAPK pathway. RAD001 treatment also led to MAPK activa- tion in a mouse model of prostate cancer. We further show that rapamycin-induced MAPK activation occurs in both normal cells and cancer cells lines and that this feedback loop depends on an S6K-PI3K-Ras pathway. Significantly, pharmacological inhibition of the MAPK pathway enhanced the antitumoral effect of mTORC1 inhibition by rapamycin in cancer cells in vitro and in a xenograft mouse model. Taken together, our findings identify MAPK activation as a consequence of mTORC1 inhibition and underscore the potential of a combined therapeutic approach with mTORC1 and MAPK inhibitors, currently employed as single agents in the clinic, for the treatment of human cancers. Introduction Mammalian target of rapamycin (mTOR) integrates various cues, including growth factors, nutrients, energy, and stress, to regulate protein synthesis, cell growth and proliferation, early development, and memory, under physiological conditions (1). Recent studies have demonstrated that mTOR signals through 2 distinct complexes. As part of the mTORC1 complex, the mTOR protein senses the presence of growth factors and nutrients and orchestrates protein translation by regulating p70S6K and 4EBP1. mTORC1 is composed of regulatory-associated protein of mTOR (RAPTOR), mLST8 (also known as GβL), and proline-rich AKT substrate of 40 kDa (PRAS40). While RAPTOR positively regulates mTOR, PRAS40 acts as an inhibitor of mTOR kinase activity in a phosphorylation-dependent manner (2). mTORC1 function is tightly regulated by the PI3K-AKT and MAPK signaling pathways, through the function of the tuberous sclerosis complex 2 (TSC2) (3–6), which associates with TSC1 and controls mTORC1 by pro- moting the GTPase activity of the mTOR activator Rheb. Thus, TSC2 acts as a sensor of both PI3K-AKT and RAS-MAPK activa- tion, hallmarks of many cancers. Furthermore, aberrantly high mTOR activity appears to play a causal role in various cancers and hamartoma syndromes (7, 8), in which the function of the TSC complex is compromised. On the contrary, when associated with the mTORC2 complex, mTOR senses growth factors but not nutrients. Together with mLST8, rapamycin-insensitive companion of mTOR (RICTOR), SIN1, and protor are defining components of the mTORC2 complex (2, 9). This complex was recently recognized as the long- sought PDK2, which leads to the full activation of the AKT kinase via phosphorylation at Ser473 (10). mTOR kinase was named as the target of rapamycin, a macro- lide antibiotic produced by Streptomyces hygroscopicus. Rapamycin acts selectively on the mTORC1 complex through binding to FKBP12, without affecting mTORC2 (2). The ability of rapamy- cin to inhibit mTORC1 prompted the development of different clinical trials geared to block the progression of malignancies in which mTOR activation is a key component. Encouraged by the therapeutic potential, several pharmaceutical companies are now actively developing and evaluating mTORC1 inhibitors, includ- ing the rapamycin derivatives CCI-779 (Wyeth), AP23573 (ARIAD Pharmaceuticals Inc.), and RAD001 (everolimus; Novartis AG), in clinical trials as anticancer drugs. To date, rapamycin and its derivatives exhibit considerable antitumor activity against spe- cific tumors including renal cell carcinoma, mantle cell lympho- Nonstandard abbreviations used: MEF, mouse embryonic fibroblast; mTOR, mam- malian target of rapamycin; RTK, receptor tyrosine kinase; TSC2, tuberous sclerosis complex 2. Conflict of interest: The authors have declared that no conflict of interest exists. Citation for this article: J. Clin. Invest. 118:3065–3074 (2008). doi:10.1172/JCI34739. Related Commentary, page 3003
-
Upload
independent -
Category
Documents
-
view
1 -
download
0
Transcript of Inhibition of mTORC1 leads to MAPK pathway activation through a PI3K-dependent feedback loop in...
Research article
TheJournalofClinicalInvestigation http://www.jci.org Volume 118 Number 9 September 2008 3065
Inhibition of mTORC1 leads to MAPK pathway activation through a PI3K-dependent
feedback loop in human cancerArkaitz Carracedo,1,2,3 Li Ma,2,3,4 Julie Teruya-Feldstein,3 Federico Rojo,5,6 Leonardo Salmena,1,2,3
Andrea Alimonti,1,2,3 Ainara Egia,1,2,3 Atsuo T. Sasaki,7,8 George Thomas,9 Sara C. Kozma,9 Antonella Papa,1,2,3 Caterina Nardella,1,2,3 Lewis C. Cantley,7,8
Jose Baselga,5,10 and Pier Paolo Pandolfi1,2,3
1Cancer Genetics Program, Beth Israel Deaconess Cancer Center and Department of Medicine and Pathology, Beth Israel Deaconess Medical Center, Harvard Medical School, Boston, Massachusetts, USA. 2Cancer Biology and Genetics Program, 3Department of Pathology, Sloan-Kettering Institute,
Memorial Sloan-Kettering Cancer Center, New York, New York, USA. 4Graduate Program in Physiology, Biophysics and Systems Biology, Weill Graduate School of Medical Sciences, Cornell University, New York, New York, USA. 5Oncology Program and 6Department of Pathology, Vall d’Hebron University Hospital, Barcelona, Spain. 7Department of Systems Biology, Harvard Medical School, Boston, Massachusetts, USA.
8Division of Signal Transduction, Beth Israel Deaconess Medical Center, Boston, Massachusetts, USA. 9Department of Genome Science, Genome Research Institute, University of Cincinnati, Cincinnati, Ohio, USA. 10Department of Oncology, Vall d’Hebron University Hospital, Barcelona, Spain.
Numerousstudieshaveestablishedacausallinkbetweenaberrantmammaliantargetofrapamycin(mTOR)activationandtumorigenesis,indicatingthatmTORinhibitionmayhavetherapeuticpotential.Inthisstudy,weshowthatrapamycinanditsanalogsactivatetheMAPKpathwayinhumancancer,inwhatrepresentsanovelmTORC1-MAPKfeedbackloop.Wefoundthattumorsamplesfrompatientswithbiopsy-accessiblesolidtumorsofadvanceddiseasetreatedwithRAD001,arapamycinderivative,showedanadministrationschedule–dependentincreaseinactivationoftheMAPKpathway.RAD001treatmentalsoledtoMAPKactiva-tioninamousemodelofprostatecancer.Wefurthershowthatrapamycin-inducedMAPKactivationoccursinbothnormalcellsandcancercellslinesandthatthisfeedbackloopdependsonanS6K-PI3K-Raspathway.Significantly,pharmacologicalinhibitionoftheMAPKpathwayenhancedtheantitumoraleffectofmTORC1inhibitionbyrapamycinincancercellsinvitroandinaxenograftmousemodel.Takentogether,ourfindingsidentifyMAPKactivationasaconsequenceofmTORC1inhibitionandunderscorethepotentialofacombinedtherapeuticapproachwithmTORC1andMAPKinhibitors,currentlyemployedassingleagentsintheclinic,forthetreatmentofhumancancers.
IntroductionMammalian target of rapamycin (mTOR) integrates various cues, including growth factors, nutrients, energy, and stress, to regulate protein synthesis, cell growth and proliferation, early development, and memory, under physiological conditions (1). Recent studies have demonstrated that mTOR signals through 2 distinct complexes. As part of the mTORC1 complex, the mTOR protein senses the presence of growth factors and nutrients and orchestrates protein translation by regulating p70S6K and 4EBP1. mTORC1 is composed of regulatory-associated protein of mTOR (RAPTOR), mLST8 (also known as GβL), and proline-rich AKT substrate of 40 kDa (PRAS40). While RAPTOR positively regulates mTOR, PRAS40 acts as an inhibitor of mTOR kinase activity in a phosphorylation-dependent manner (2). mTORC1 function is tightly regulated by the PI3K-AKT and MAPK signaling pathways, through the function of the tuberous sclerosis complex 2 (TSC2) (3–6), which associates with TSC1 and controls mTORC1 by pro-moting the GTPase activity of the mTOR activator Rheb. Thus, TSC2 acts as a sensor of both PI3K-AKT and RAS-MAPK activa-
tion, hallmarks of many cancers. Furthermore, aberrantly high mTOR activity appears to play a causal role in various cancers and hamartoma syndromes (7, 8), in which the function of the TSC complex is compromised.
On the contrary, when associated with the mTORC2 complex, mTOR senses growth factors but not nutrients. Together with mLST8, rapamycin-insensitive companion of mTOR (RICTOR), SIN1, and protor are defining components of the mTORC2 complex (2, 9). This complex was recently recognized as the long-sought PDK2, which leads to the full activation of the AKT kinase via phosphorylation at Ser473 (10).
mTOR kinase was named as the target of rapamycin, a macro-lide antibiotic produced by Streptomyces hygroscopicus. Rapamycin acts selectively on the mTORC1 complex through binding to FKBP12, without affecting mTORC2 (2). The ability of rapamy-cin to inhibit mTORC1 prompted the development of different clinical trials geared to block the progression of malignancies in which mTOR activation is a key component. Encouraged by the therapeutic potential, several pharmaceutical companies are now actively developing and evaluating mTORC1 inhibitors, includ-ing the rapamycin derivatives CCI-779 (Wyeth), AP23573 (ARIAD Pharmaceuticals Inc.), and RAD001 (everolimus; Novartis AG), in clinical trials as anticancer drugs. To date, rapamycin and its derivatives exhibit considerable antitumor activity against spe-cific tumors including renal cell carcinoma, mantle cell lympho-
Nonstandardabbreviationsused: MEF, mouse embryonic fibroblast; mTOR, mam-malian target of rapamycin; RTK, receptor tyrosine kinase; TSC2, tuberous sclerosis complex 2.
Conflictofinterest: The authors have declared that no conflict of interest exists.
Citationforthisarticle: J. Clin. Invest. 118:3065–3074 (2008). doi:10.1172/JCI34739.
Related Commentary, page 3003
research article
3066 TheJournalofClinicalInvestigation http://www.jci.org Volume 118 Number 9 September 2008
ma, endometrial cancers (11), and TSC-associated benign tumors (12), while the clinical benefit for other tumors has yet to be fully determined despite efficient block of mTOR activity. For instance, response rates with CCI-779 in breast cancer and neuroendocrine carcinoma were consistently lower than 10% and administration of RAD001 or AP23573 as single agents in patients with various types of sarcoma also yielded a low efficacy (11), whereas a recent study associated the potential efficacy of rapamycin-induced mTOR inhibition with a reduction of tumor cell proliferation in a Phase I trial with PTEN-deficient glioblastoma patients (13).
Overall, rapamycin clinical trials performed in the absence of molecular and genetic stratification have turned out to be less successful than expected. A potential mechanism of resistance to mTORC1 inhibitors came about by the discovery of a negative feed-back loop in which mTORC1 inhibition leads to AKT activation through upregulation of receptor tyrosine kinases (RTKs, or sub-strates) such as PDGFRs (14, 15) and IRS-1 (16, 17). The relevance of this feedback is underscored by its existence in cancer patients (18).
To date, abrogation of the negative feedback loop by mTORC1 inhibitors has only been demonstrated to influence PI3K-AKT signaling, whereas the impact of mTORC1 inhibition in other prosurvival pathways has not been addressed. Here we report that mTORC1 inhibition leads to the activation of the ERK/MAPK (which we will refer to as “MAPK”) cascade in a cohort of patients with metastatic disease who had undergone therapy with RAD001. Moreover, feedback signal-ing to MAPK is evident in a variety of cancer cell lines and primary cultures after rapamycin treatment as well as in a mouse model of prostate cancer driven by Pten inactivation treated with RAD001. Mechanistically, our results suggest that ERK activation is mediated by an S6K-PI3K-Ras signal-ing pathway. Finally, we show that the combination of mTORC1 and MAPK inhibitors improves the growth inhib-itory effect of rapamycin in vitro and, more interestingly, that PD0325901 (an MEK1/2 inhibitor) enhances the antitumoral action of RAD001 in vivo. Together these results provide
what we believe to be a novel molecular basis for patient stratification and combinatorial use of these drug families for the treatment of cancer.
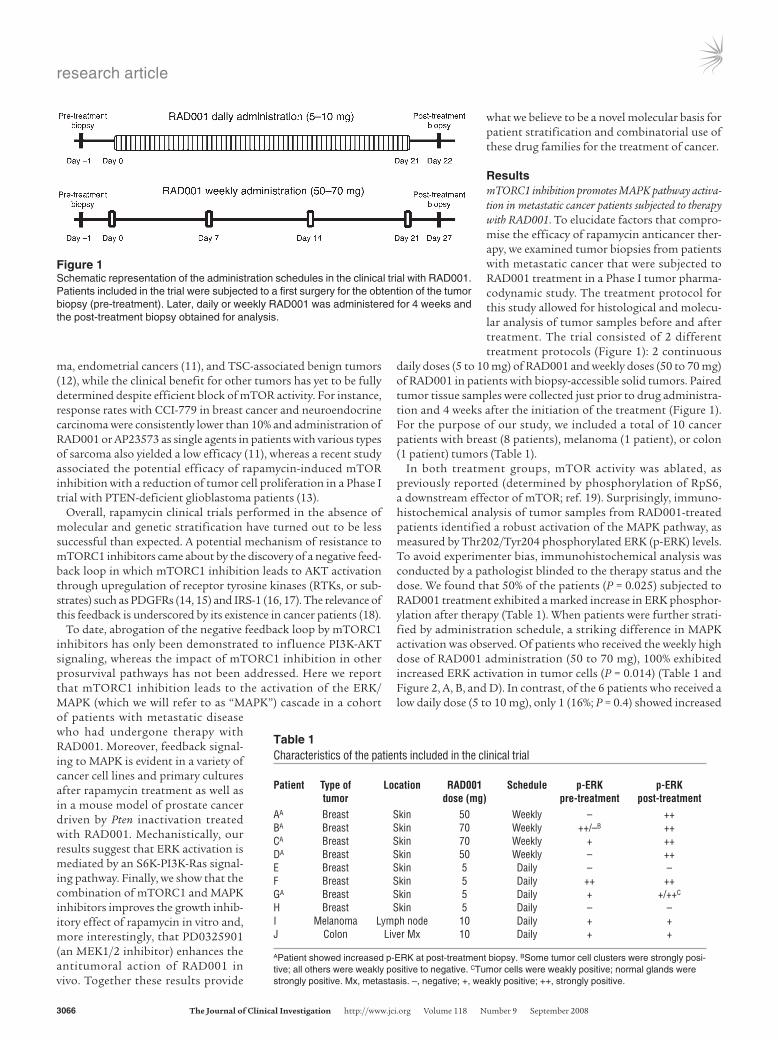
ResultsmTORC1 inhibition promotes MAPK pathway activa-tion in metastatic cancer patients subjected to therapy with RAD001. To elucidate factors that compro-mise the efficacy of rapamycin anticancer ther-apy, we examined tumor biopsies from patients with metastatic cancer that were subjected to RAD001 treatment in a Phase I tumor pharma-codynamic study. The treatment protocol for this study allowed for histological and molecu-lar analysis of tumor samples before and after treatment. The trial consisted of 2 different treatment protocols (Figure 1): 2 continuous
daily doses (5 to 10 mg) of RAD001 and weekly doses (50 to 70 mg) of RAD001 in patients with biopsy-accessible solid tumors. Paired tumor tissue samples were collected just prior to drug administra-tion and 4 weeks after the initiation of the treatment (Figure 1). For the purpose of our study, we included a total of 10 cancer patients with breast (8 patients), melanoma (1 patient), or colon (1 patient) tumors (Table 1).
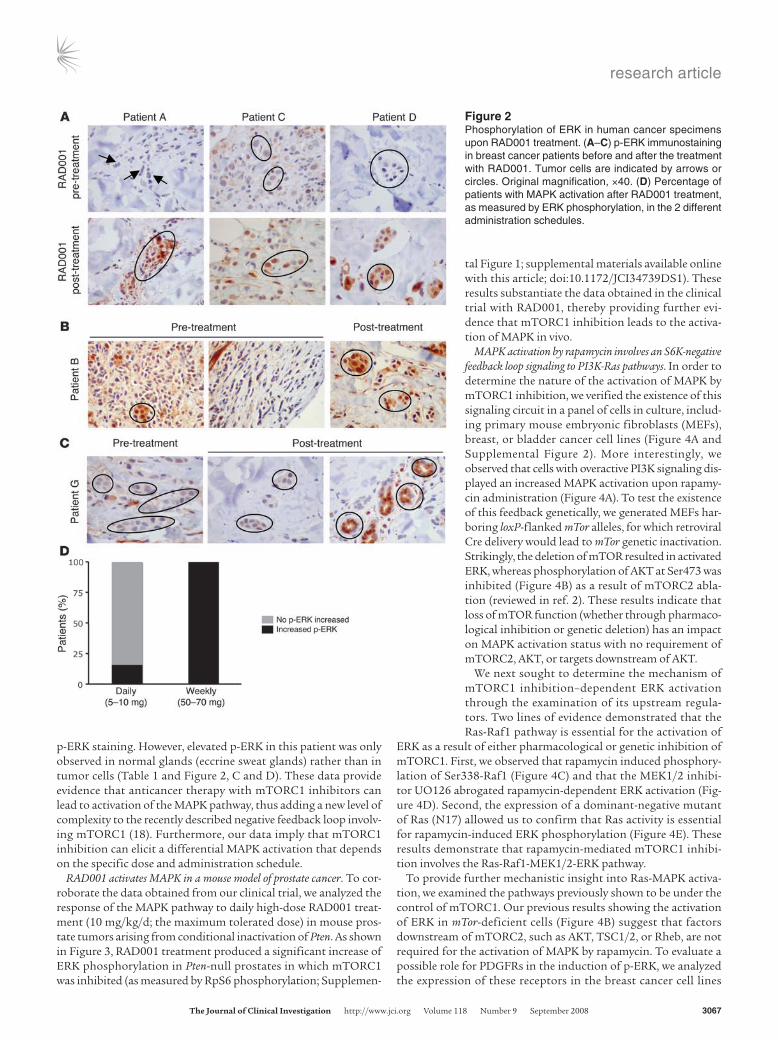
In both treatment groups, mTOR activity was ablated, as previously reported (determined by phosphorylation of RpS6, a downstream effector of mTOR; ref. 19). Surprisingly, immuno-histochemical analysis of tumor samples from RAD001-treated patients identified a robust activation of the MAPK pathway, as measured by Thr202/Tyr204 phosphorylated ERK (p-ERK) levels. To avoid experimenter bias, immunohistochemical analysis was conducted by a pathologist blinded to the therapy status and the dose. We found that 50% of the patients (P = 0.025) subjected to RAD001 treatment exhibited a marked increase in ERK phosphor-ylation after therapy (Table 1). When patients were further strati-fied by administration schedule, a striking difference in MAPK activation was observed. Of patients who received the weekly high dose of RAD001 administration (50 to 70 mg), 100% exhibited increased ERK activation in tumor cells (P = 0.014) (Table 1 and Figure 2, A, B, and D). In contrast, of the 6 patients who received a low daily dose (5 to 10 mg), only 1 (16%; P = 0.4) showed increased
Table 1Characteristics of the patients included in the clinical trial
Patient Typeof Location RAD001 Schedule p-ERK p-ERK tumor dose(mg) pre-treatment post-treatmentAA Breast Skin 50 Weekly – ++BA Breast Skin 70 Weekly ++/–B ++CA Breast Skin 70 Weekly + ++DA Breast Skin 50 Weekly – ++E Breast Skin 5 Daily – –F Breast Skin 5 Daily ++ ++GA Breast Skin 5 Daily + +/++C
H Breast Skin 5 Daily – –I Melanoma Lymph node 10 Daily + +J Colon Liver Mx 10 Daily + +
APatient showed increased p-ERK at post-treatment biopsy. BSome tumor cell clusters were strongly posi-tive; all others were weakly positive to negative. CTumor cells were weakly positive; normal glands were strongly positive. Mx, metastasis. –, negative; +, weakly positive; ++, strongly positive.
Figure 1Schematic representation of the administration schedules in the clinical trial with RAD001. Patients included in the trial were subjected to a first surgery for the obtention of the tumor biopsy (pre-treatment). Later, daily or weekly RAD001 was administered for 4 weeks and the post-treatment biopsy obtained for analysis.
research article
TheJournalofClinicalInvestigation http://www.jci.org Volume 118 Number 9 September 2008 3067
p-ERK staining. However, elevated p-ERK in this patient was only observed in normal glands (eccrine sweat glands) rather than in tumor cells (Table 1 and Figure 2, C and D). These data provide evidence that anticancer therapy with mTORC1 inhibitors can lead to activation of the MAPK pathway, thus adding a new level of complexity to the recently described negative feedback loop involv-ing mTORC1 (18). Furthermore, our data imply that mTORC1 inhibition can elicit a differential MAPK activation that depends on the specific dose and administration schedule.
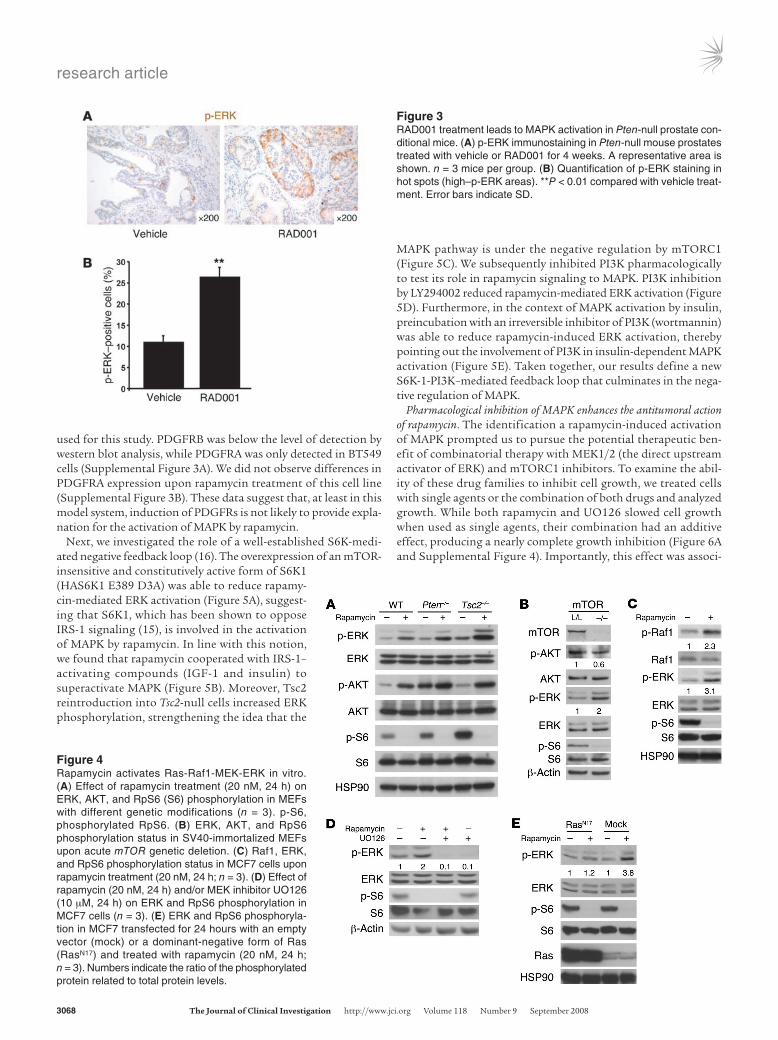
RAD001 activates MAPK in a mouse model of prostate cancer. To cor-roborate the data obtained from our clinical trial, we analyzed the response of the MAPK pathway to daily high-dose RAD001 treat-ment (10 mg/kg/d; the maximum tolerated dose) in mouse pros-tate tumors arising from conditional inactivation of Pten. As shown in Figure 3, RAD001 treatment produced a significant increase of ERK phosphorylation in Pten-null prostates in which mTORC1 was inhibited (as measured by RpS6 phosphorylation; Supplemen-
tal Figure 1; supplemental materials available online with this article; doi:10.1172/JCI34739DS1). These results substantiate the data obtained in the clinical trial with RAD001, thereby providing further evi-dence that mTORC1 inhibition leads to the activa-tion of MAPK in vivo.
MAPK activation by rapamycin involves an S6K-negative feedback loop signaling to PI3K-Ras pathways. In order to determine the nature of the activation of MAPK by mTORC1 inhibition, we verified the existence of this signaling circuit in a panel of cells in culture, includ-ing primary mouse embryonic fibroblasts (MEFs), breast, or bladder cancer cell lines (Figure 4A and Supplemental Figure 2). More interestingly, we observed that cells with overactive PI3K signaling dis-played an increased MAPK activation upon rapamy-cin administration (Figure 4A). To test the existence of this feedback genetically, we generated MEFs har-boring loxP-flanked mTor alleles, for which retroviral Cre delivery would lead to mTor genetic inactivation. Strikingly, the deletion of mTOR resulted in activated ERK, whereas phosphorylation of AKT at Ser473 was inhibited (Figure 4B) as a result of mTORC2 abla-tion (reviewed in ref. 2). These results indicate that loss of mTOR function (whether through pharmaco-logical inhibition or genetic deletion) has an impact on MAPK activation status with no requirement of mTORC2, AKT, or targets downstream of AKT.
We next sought to determine the mechanism of mTORC1 inhibition–dependent ERK activation through the examination of its upstream regula-tors. Two lines of evidence demonstrated that the Ras-Raf1 pathway is essential for the activation of
ERK as a result of either pharmacological or genetic inhibition of mTORC1. First, we observed that rapamycin induced phosphory-lation of Ser338-Raf1 (Figure 4C) and that the MEK1/2 inhibi-tor UO126 abrogated rapamycin-dependent ERK activation (Fig-ure 4D). Second, the expression of a dominant-negative mutant of Ras (N17) allowed us to confirm that Ras activity is essential for rapamycin-induced ERK phosphorylation (Figure 4E). These results demonstrate that rapamycin-mediated mTORC1 inhibi-tion involves the Ras-Raf1-MEK1/2-ERK pathway.
To provide further mechanistic insight into Ras-MAPK activa-tion, we examined the pathways previously shown to be under the control of mTORC1. Our previous results showing the activation of ERK in mTor-deficient cells (Figure 4B) suggest that factors downstream of mTORC2, such as AKT, TSC1/2, or Rheb, are not required for the activation of MAPK by rapamycin. To evaluate a possible role for PDGFRs in the induction of p-ERK, we analyzed the expression of these receptors in the breast cancer cell lines
Figure 2Phosphorylation of ERK in human cancer specimens upon RAD001 treatment. (A–C) p-ERK immunostaining in breast cancer patients before and after the treatment with RAD001. Tumor cells are indicated by arrows or circles. Original magnification, ×40. (D) Percentage of patients with MAPK activation after RAD001 treatment, as measured by ERK phosphorylation, in the 2 different administration schedules.
research article
3068 TheJournalofClinicalInvestigation http://www.jci.org Volume 118 Number 9 September 2008
used for this study. PDGFRB was below the level of detection by western blot analysis, while PDGFRA was only detected in BT549 cells (Supplemental Figure 3A). We did not observe differences in PDGFRA expression upon rapamycin treatment of this cell line (Supplemental Figure 3B). These data suggest that, at least in this model system, induction of PDGFRs is not likely to provide expla-nation for the activation of MAPK by rapamycin.
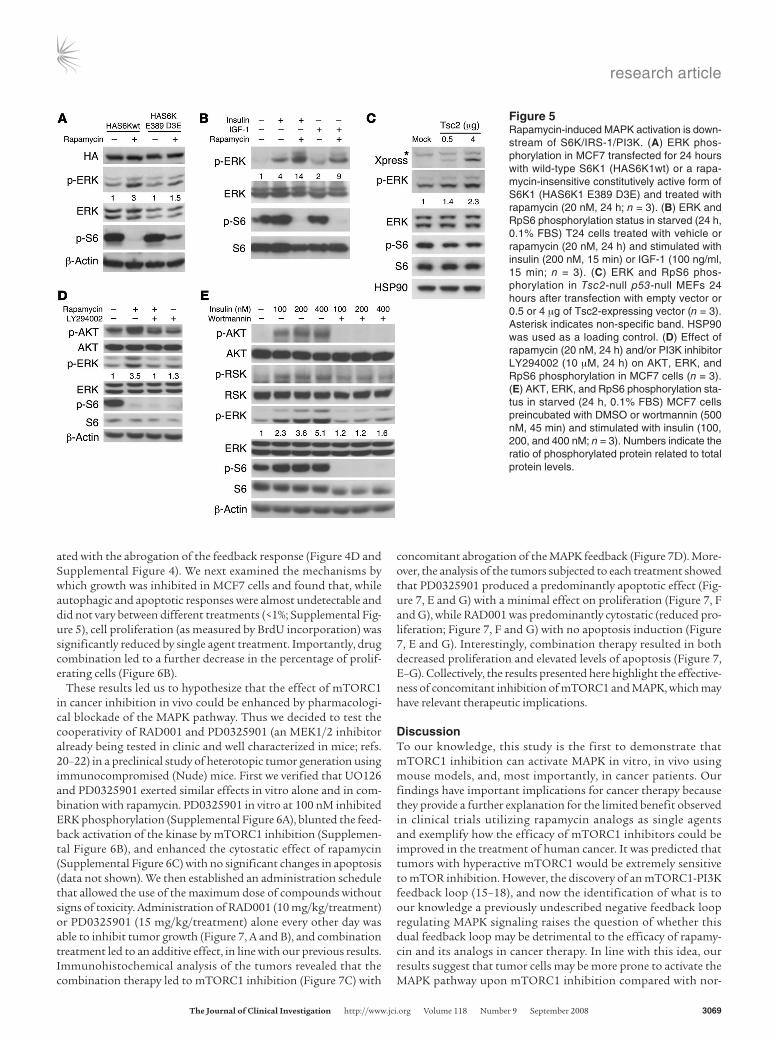
Next, we investigated the role of a well-established S6K-medi-ated negative feedback loop (16). The overexpression of an mTOR-insensitive and constitutively active form of S6K1 (HAS6K1 E389 D3A) was able to reduce rapamy-cin-mediated ERK activation (Figure 5A), suggest-ing that S6K1, which has been shown to oppose IRS-1 signaling (15), is involved in the activation of MAPK by rapamycin. In line with this notion, we found that rapamycin cooperated with IRS-1– activating compounds (IGF-1 and insulin) to superactivate MAPK (Figure 5B). Moreover, Tsc2 reintroduction into Tsc2-null cells increased ERK phosphorylation, strengthening the idea that the
MAPK pathway is under the negative regulation by mTORC1 (Figure 5C). We subsequently inhibited PI3K pharmacologically to test its role in rapamycin signaling to MAPK. PI3K inhibition by LY294002 reduced rapamycin-mediated ERK activation (Figure 5D). Furthermore, in the context of MAPK activation by insulin, preincubation with an irreversible inhibitor of PI3K (wortmannin) was able to reduce rapamycin-induced ERK activation, thereby pointing out the involvement of PI3K in insulin-dependent MAPK activation (Figure 5E). Taken together, our results define a new S6K-1-PI3K–mediated feedback loop that culminates in the nega-tive regulation of MAPK.
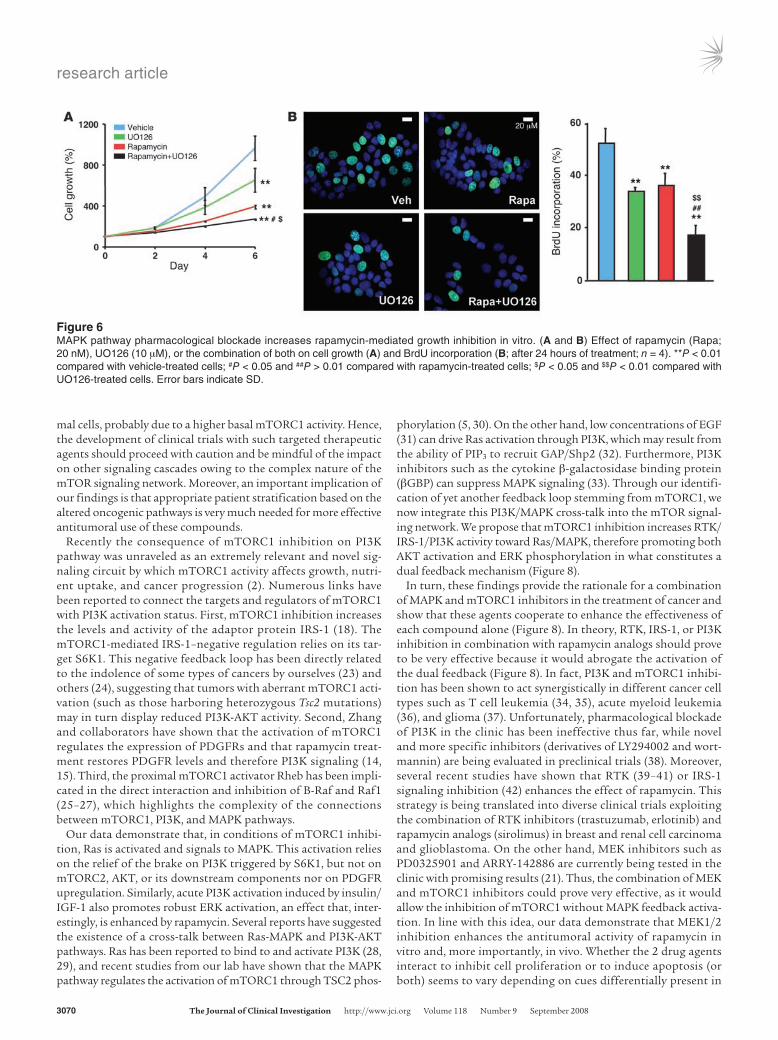
Pharmacological inhibition of MAPK enhances the antitumoral action of rapamycin. The identification a rapamycin-induced activation of MAPK prompted us to pursue the potential therapeutic ben-efit of combinatorial therapy with MEK1/2 (the direct upstream activator of ERK) and mTORC1 inhibitors. To examine the abil-ity of these drug families to inhibit cell growth, we treated cells with single agents or the combination of both drugs and analyzed growth. While both rapamycin and UO126 slowed cell growth when used as single agents, their combination had an additive effect, producing a nearly complete growth inhibition (Figure 6A and Supplemental Figure 4). Importantly, this effect was associ-
Figure 3RAD001 treatment leads to MAPK activation in Pten-null prostate con-ditional mice. (A) p-ERK immunostaining in Pten-null mouse prostates treated with vehicle or RAD001 for 4 weeks. A representative area is shown. n = 3 mice per group. (B) Quantification of p-ERK staining in hot spots (high–p-ERK areas). **P < 0.01 compared with vehicle treat-ment. Error bars indicate SD.
Figure 4Rapamycin activates Ras-Raf1-MEK-ERK in vitro. (A) Effect of rapamycin treatment (20 nM, 24 h) on ERK, AKT, and RpS6 (S6) phosphorylation in MEFs with different genetic modifications (n = 3). p-S6, phosphorylated RpS6. (B) ERK, AKT, and RpS6 phosphorylation status in SV40-immortalized MEFs upon acute mTOR genetic deletion. (C) Raf1, ERK, and RpS6 phosphorylation status in MCF7 cells upon rapamycin treatment (20 nM, 24 h; n = 3). (D) Effect of rapamycin (20 nM, 24 h) and/or MEK inhibitor UO126 (10 μM, 24 h) on ERK and RpS6 phosphorylation in MCF7 cells (n = 3). (E) ERK and RpS6 phosphoryla-tion in MCF7 transfected for 24 hours with an empty vector (mock) or a dominant-negative form of Ras (RasN17) and treated with rapamycin (20 nM, 24 h; n = 3). Numbers indicate the ratio of the phosphorylated protein related to total protein levels.
research article
TheJournalofClinicalInvestigation http://www.jci.org Volume 118 Number 9 September 2008 3069
ated with the abrogation of the feedback response (Figure 4D and Supplemental Figure 4). We next examined the mechanisms by which growth was inhibited in MCF7 cells and found that, while autophagic and apoptotic responses were almost undetectable and did not vary between different treatments (<1%; Supplemental Fig-ure 5), cell proliferation (as measured by BrdU incorporation) was significantly reduced by single agent treatment. Importantly, drug combination led to a further decrease in the percentage of prolif-erating cells (Figure 6B).
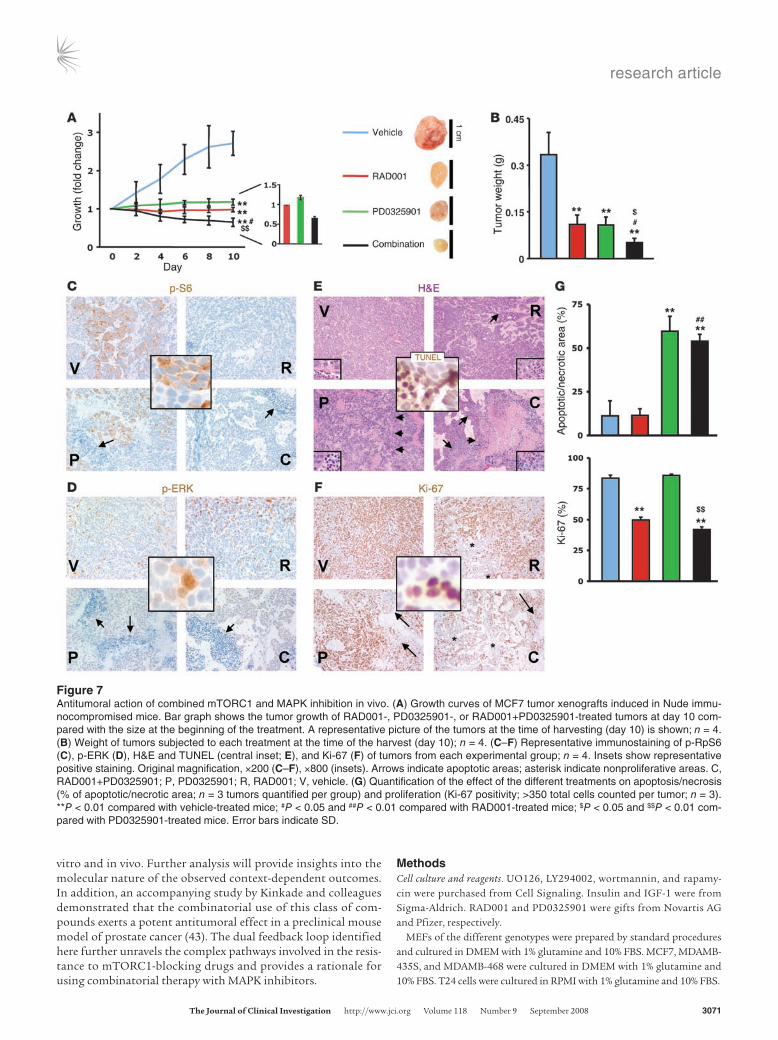
These results led us to hypothesize that the effect of mTORC1 in cancer inhibition in vivo could be enhanced by pharmacologi-cal blockade of the MAPK pathway. Thus we decided to test the cooperativity of RAD001 and PD0325901 (an MEK1/2 inhibitor already being tested in clinic and well characterized in mice; refs. 20–22) in a preclinical study of heterotopic tumor generation using immunocompromised (Nude) mice. First we verified that UO126 and PD0325901 exerted similar effects in vitro alone and in com-bination with rapamycin. PD0325901 in vitro at 100 nM inhibited ERK phosphorylation (Supplemental Figure 6A), blunted the feed-back activation of the kinase by mTORC1 inhibition (Supplemen-tal Figure 6B), and enhanced the cytostatic effect of rapamycin (Supplemental Figure 6C) with no significant changes in apoptosis (data not shown). We then established an administration schedule that allowed the use of the maximum dose of compounds without signs of toxicity. Administration of RAD001 (10 mg/kg/treatment) or PD0325901 (15 mg/kg/treatment) alone every other day was able to inhibit tumor growth (Figure 7, A and B), and combination treatment led to an additive effect, in line with our previous results. Immunohistochemical analysis of the tumors revealed that the combination therapy led to mTORC1 inhibition (Figure 7C) with
concomitant abrogation of the MAPK feedback (Figure 7D). More-over, the analysis of the tumors subjected to each treatment showed that PD0325901 produced a predominantly apoptotic effect (Fig-ure 7, E and G) with a minimal effect on proliferation (Figure 7, F and G), while RAD001 was predominantly cytostatic (reduced pro-liferation; Figure 7, F and G) with no apoptosis induction (Figure 7, E and G). Interestingly, combination therapy resulted in both decreased proliferation and elevated levels of apoptosis (Figure 7, E–G). Collectively, the results presented here highlight the effective-ness of concomitant inhibition of mTORC1 and MAPK, which may have relevant therapeutic implications.
DiscussionTo our knowledge, this study is the first to demonstrate that mTORC1 inhibition can activate MAPK in vitro, in vivo using mouse models, and, most importantly, in cancer patients. Our findings have important implications for cancer therapy because they provide a further explanation for the limited benefit observed in clinical trials utilizing rapamycin analogs as single agents and exemplify how the efficacy of mTORC1 inhibitors could be improved in the treatment of human cancer. It was predicted that tumors with hyperactive mTORC1 would be extremely sensitive to mTOR inhibition. However, the discovery of an mTORC1-PI3K feedback loop (15–18), and now the identification of what is to our knowledge a previously undescribed negative feedback loop regulating MAPK signaling raises the question of whether this dual feedback loop may be detrimental to the efficacy of rapamy-cin and its analogs in cancer therapy. In line with this idea, our results suggest that tumor cells may be more prone to activate the MAPK pathway upon mTORC1 inhibition compared with nor-
Figure 5Rapamycin-induced MAPK activation is down-stream of S6K/IRS-1/PI3K. (A) ERK phos-phorylation in MCF7 transfected for 24 hours with wild-type S6K1 (HAS6K1wt) or a rapa-mycin-insensitive constitutively active form of S6K1 (HAS6K1 E389 D3E) and treated with rapamycin (20 nM, 24 h; n = 3). (B) ERK and RpS6 phosphorylation status in starved (24 h, 0.1% FBS) T24 cells treated with vehicle or rapamycin (20 nM, 24 h) and stimulated with insulin (200 nM, 15 min) or IGF-1 (100 ng/ml, 15 min; n = 3). (C) ERK and RpS6 phos-phorylation in Tsc2-null p53-null MEFs 24 hours after transfection with empty vector or 0.5 or 4 μg of Tsc2-expressing vector (n = 3). Asterisk indicates non-specific band. HSP90 was used as a loading control. (D) Effect of rapamycin (20 nM, 24 h) and/or PI3K inhibitor LY294002 (10 μM, 24 h) on AKT, ERK, and RpS6 phosphorylation in MCF7 cells (n = 3). (E) AKT, ERK, and RpS6 phosphorylation sta-tus in starved (24 h, 0.1% FBS) MCF7 cells preincubated with DMSO or wortmannin (500 nM, 45 min) and stimulated with insulin (100, 200, and 400 nM; n = 3). Numbers indicate the ratio of phosphorylated protein related to total protein levels.
research article
3070 TheJournalofClinicalInvestigation http://www.jci.org Volume 118 Number 9 September 2008
mal cells, probably due to a higher basal mTORC1 activity. Hence, the development of clinical trials with such targeted therapeutic agents should proceed with caution and be mindful of the impact on other signaling cascades owing to the complex nature of the mTOR signaling network. Moreover, an important implication of our findings is that appropriate patient stratification based on the altered oncogenic pathways is very much needed for more effective antitumoral use of these compounds.
Recently the consequence of mTORC1 inhibition on PI3K pathway was unraveled as an extremely relevant and novel sig-naling circuit by which mTORC1 activity affects growth, nutri-ent uptake, and cancer progression (2). Numerous links have been reported to connect the targets and regulators of mTORC1 with PI3K activation status. First, mTORC1 inhibition increases the levels and activity of the adaptor protein IRS-1 (18). The mTORC1-mediated IRS-1–negative regulation relies on its tar-get S6K1. This negative feedback loop has been directly related to the indolence of some types of cancers by ourselves (23) and others (24), suggesting that tumors with aberrant mTORC1 acti-vation (such as those harboring heterozygous Tsc2 mutations) may in turn display reduced PI3K-AKT activity. Second, Zhang and collaborators have shown that the activation of mTORC1 regulates the expression of PDGFRs and that rapamycin treat-ment restores PDGFR levels and therefore PI3K signaling (14, 15). Third, the proximal mTORC1 activator Rheb has been impli-cated in the direct interaction and inhibition of B-Raf and Raf1 (25–27), which highlights the complexity of the connections between mTORC1, PI3K, and MAPK pathways.
Our data demonstrate that, in conditions of mTORC1 inhibi-tion, Ras is activated and signals to MAPK. This activation relies on the relief of the brake on PI3K triggered by S6K1, but not on mTORC2, AKT, or its downstream components nor on PDGFR upregulation. Similarly, acute PI3K activation induced by insulin/IGF-1 also promotes robust ERK activation, an effect that, inter-estingly, is enhanced by rapamycin. Several reports have suggested the existence of a cross-talk between Ras-MAPK and PI3K-AKT pathways. Ras has been reported to bind to and activate PI3K (28, 29), and recent studies from our lab have shown that the MAPK pathway regulates the activation of mTORC1 through TSC2 phos-
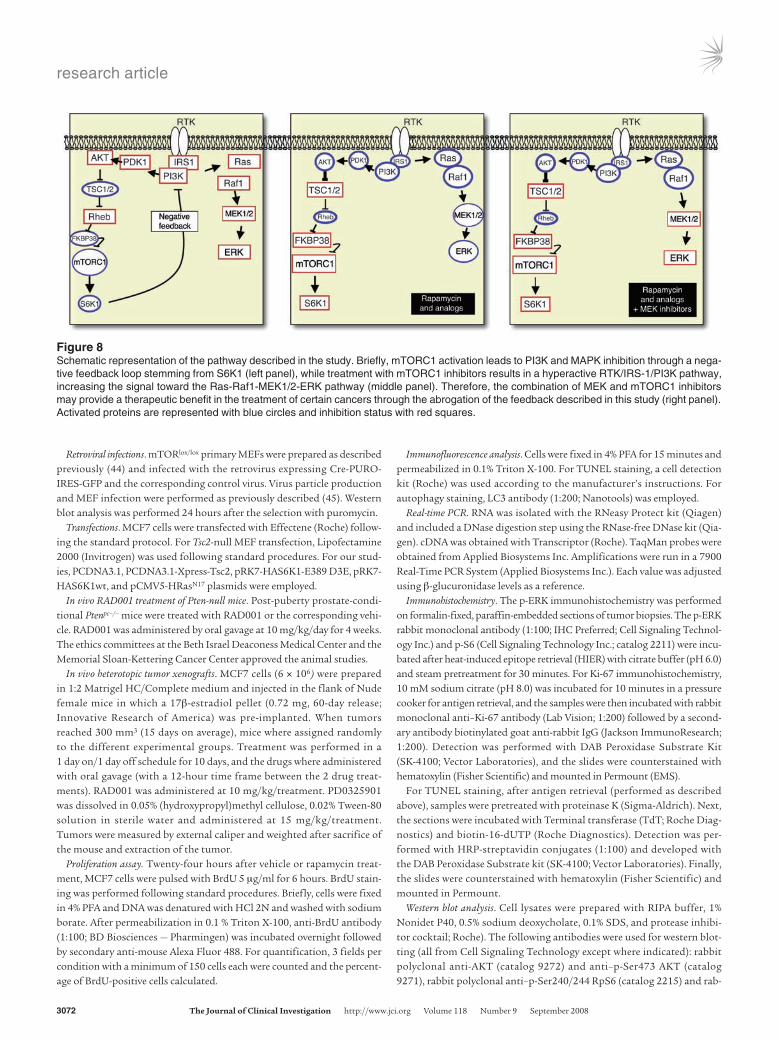
phorylation (5, 30). On the other hand, low concentrations of EGF (31) can drive Ras activation through PI3K, which may result from the ability of PIP3 to recruit GAP/Shp2 (32). Furthermore, PI3K inhibitors such as the cytokine β-galactosidase binding protein (βGBP) can suppress MAPK signaling (33). Through our identifi-cation of yet another feedback loop stemming from mTORC1, we now integrate this PI3K/MAPK cross-talk into the mTOR signal-ing network. We propose that mTORC1 inhibition increases RTK/IRS-1/PI3K activity toward Ras/MAPK, therefore promoting both AKT activation and ERK phosphorylation in what constitutes a dual feedback mechanism (Figure 8).
In turn, these findings provide the rationale for a combination of MAPK and mTORC1 inhibitors in the treatment of cancer and show that these agents cooperate to enhance the effectiveness of each compound alone (Figure 8). In theory, RTK, IRS-1, or PI3K inhibition in combination with rapamycin analogs should prove to be very effective because it would abrogate the activation of the dual feedback (Figure 8). In fact, PI3K and mTORC1 inhibi-tion has been shown to act synergistically in different cancer cell types such as T cell leukemia (34, 35), acute myeloid leukemia (36), and glioma (37). Unfortunately, pharmacological blockade of PI3K in the clinic has been ineffective thus far, while novel and more specific inhibitors (derivatives of LY294002 and wort-mannin) are being evaluated in preclinical trials (38). Moreover, several recent studies have shown that RTK (39–41) or IRS-1 signaling inhibition (42) enhances the effect of rapamycin. This strategy is being translated into diverse clinical trials exploiting the combination of RTK inhibitors (trastuzumab, erlotinib) and rapamycin analogs (sirolimus) in breast and renal cell carcinoma and glioblastoma. On the other hand, MEK inhibitors such as PD0325901 and ARRY-142886 are currently being tested in the clinic with promising results (21). Thus, the combination of MEK and mTORC1 inhibitors could prove very effective, as it would allow the inhibition of mTORC1 without MAPK feedback activa-tion. In line with this idea, our data demonstrate that MEK1/2 inhibition enhances the antitumoral activity of rapamycin in vitro and, more importantly, in vivo. Whether the 2 drug agents interact to inhibit cell proliferation or to induce apoptosis (or both) seems to vary depending on cues differentially present in
Figure 6MAPK pathway pharmacological blockade increases rapamycin-mediated growth inhibition in vitro. (A and B) Effect of rapamycin (Rapa; 20 nM), UO126 (10 μM), or the combination of both on cell growth (A) and BrdU incorporation (B; after 24 hours of treatment; n = 4). **P < 0.01 compared with vehicle-treated cells; #P < 0.05 and ##P > 0.01 compared with rapamycin-treated cells; $P < 0.05 and $$P < 0.01 compared with UO126-treated cells. Error bars indicate SD.
research article
TheJournalofClinicalInvestigation http://www.jci.org Volume 118 Number 9 September 2008 3071
vitro and in vivo. Further analysis will provide insights into the molecular nature of the observed context-dependent outcomes. In addition, an accompanying study by Kinkade and colleagues demonstrated that the combinatorial use of this class of com-pounds exerts a potent antitumoral effect in a preclinical mouse model of prostate cancer (43). The dual feedback loop identified here further unravels the complex pathways involved in the resis-tance to mTORC1-blocking drugs and provides a rationale for using combinatorial therapy with MAPK inhibitors.
MethodsCell culture and reagents. UO126, LY294002, wortmannin, and rapamy-cin were purchased from Cell Signaling. Insulin and IGF-1 were from Sigma-Aldrich. RAD001 and PD0325901 were gifts from Novartis AG and Pfizer, respectively.
MEFs of the different genotypes were prepared by standard procedures and cultured in DMEM with 1% glutamine and 10% FBS. MCF7, MDAMB-435S, and MDAMB-468 were cultured in DMEM with 1% glutamine and 10% FBS. T24 cells were cultured in RPMI with 1% glutamine and 10% FBS.
Figure 7Antitumoral action of combined mTORC1 and MAPK inhibition in vivo. (A) Growth curves of MCF7 tumor xenografts induced in Nude immu-nocompromised mice. Bar graph shows the tumor growth of RAD001-, PD0325901-, or RAD001+PD0325901-treated tumors at day 10 com-pared with the size at the beginning of the treatment. A representative picture of the tumors at the time of harvesting (day 10) is shown; n = 4. (B) Weight of tumors subjected to each treatment at the time of the harvest (day 10); n = 4. (C–F) Representative immunostaining of p-RpS6 (C), p-ERK (D), H&E and TUNEL (central inset; E), and Ki-67 (F) of tumors from each experimental group; n = 4. Insets show representative positive staining. Original magnification, ×200 (C–F), ×800 (insets). Arrows indicate apoptotic areas; asterisk indicate nonproliferative areas. C, RAD001+PD0325901; P, PD0325901; R, RAD001; V, vehicle. (G) Quantification of the effect of the different treatments on apoptosis/necrosis (% of apoptotic/necrotic area; n = 3 tumors quantified per group) and proliferation (Ki-67 positivity; >350 total cells counted per tumor; n = 3). **P < 0.01 compared with vehicle-treated mice; #P < 0.05 and ##P < 0.01 compared with RAD001-treated mice; $P < 0.05 and $$P < 0.01 com-pared with PD0325901-treated mice. Error bars indicate SD.
research article
3072 TheJournalofClinicalInvestigation http://www.jci.org Volume 118 Number 9 September 2008
Retroviral infections. mTORlox/lox primary MEFs were prepared as described previously (44) and infected with the retrovirus expressing Cre-PURO-IRES-GFP and the corresponding control virus. Virus particle production and MEF infection were performed as previously described (45). Western blot analysis was performed 24 hours after the selection with puromycin.
Transfections. MCF7 cells were transfected with Effectene (Roche) follow-ing the standard protocol. For Tsc2-null MEF transfection, Lipofectamine 2000 (Invitrogen) was used following standard procedures. For our stud-ies, PCDNA3.1, PCDNA3.1-Xpress-Tsc2, pRK7-HAS6K1-E389 D3E, pRK7-HAS6K1wt, and pCMV5-HRasN17 plasmids were employed.
In vivo RAD001 treatment of Pten-null mice. Post-puberty prostate-condi-tional Ptenpc–/– mice were treated with RAD001 or the corresponding vehi-cle. RAD001 was administered by oral gavage at 10 mg/kg/day for 4 weeks. The ethics committees at the Beth Israel Deaconess Medical Center and the Memorial Sloan-Kettering Cancer Center approved the animal studies.
In vivo heterotopic tumor xenografts. MCF7 cells (6 × 10⁶) were prepared in 1:2 Matrigel HC/Complete medium and injected in the flank of Nude female mice in which a 17β-estradiol pellet (0.72 mg, 60-day release; Innovative Research of America) was pre-implanted. When tumors reached 300 mm3 (15 days on average), mice where assigned randomly to the different experimental groups. Treatment was performed in a 1 day on/1 day off schedule for 10 days, and the drugs where administered with oral gavage (with a 12-hour time frame between the 2 drug treat-ments). RAD001 was administered at 10 mg/kg/treatment. PD0325901 was dissolved in 0.05% (hydroxypropyl)methyl cellulose, 0.02% Tween-80 solution in sterile water and administered at 15 mg/kg/treatment. Tumors were measured by external caliper and weighted after sacrifice of the mouse and extraction of the tumor.
Proliferation assay. Twenty-four hours after vehicle or rapamycin treat-ment, MCF7 cells were pulsed with BrdU 5 μg/ml for 6 hours. BrdU stain-ing was performed following standard procedures. Briefly, cells were fixed in 4% PFA and DNA was denatured with HCl 2N and washed with sodium borate. After permeabilization in 0.1 % Triton X-100, anti-BrdU antibody (1:100; BD Biosciences — Pharmingen) was incubated overnight followed by secondary anti-mouse Alexa Fluor 488. For quantification, 3 fields per condition with a minimum of 150 cells each were counted and the percent-age of BrdU-positive cells calculated.
Immunofluorescence analysis. Cells were fixed in 4% PFA for 15 minutes and permeabilized in 0.1% Triton X-100. For TUNEL staining, a cell detection kit (Roche) was used according to the manufacturer’s instructions. For autophagy staining, LC3 antibody (1:200; Nanotools) was employed.
Real-time PCR. RNA was isolated with the RNeasy Protect kit (Qiagen) and included a DNase digestion step using the RNase-free DNase kit (Qia-gen). cDNA was obtained with Transcriptor (Roche). TaqMan probes were obtained from Applied Biosystems Inc. Amplifications were run in a 7900 Real-Time PCR System (Applied Biosystems Inc.). Each value was adjusted using β-glucuronidase levels as a reference.
Immunohistochemistry.The p-ERK immunohistochemistry was performed on formalin-fixed, paraffin-embedded sections of tumor biopsies. The p-ERK rabbit monoclonal antibody (1:100; IHC Preferred; Cell Signaling Technol-ogy Inc.) and p-S6 (Cell Signaling Technology Inc.; catalog 2211) were incu-bated after heat-induced epitope retrieval (HIER) with citrate buffer (pH 6.0) and steam pretreatment for 30 minutes. For Ki-67 immunohistochemistry, 10 mM sodium citrate (pH 8.0) was incubated for 10 minutes in a pressure cooker for antigen retrieval, and the samples were then incubated with rabbit monoclonal anti–Ki-67 antibody (Lab Vision; 1:200) followed by a second-ary antibody biotinylated goat anti-rabbit IgG (Jackson ImmunoResearch; 1:200). Detection was performed with DAB Peroxidase Substrate Kit (SK-4100; Vector Laboratories), and the slides were counterstained with hematoxylin (Fisher Scientific) and mounted in Permount (EMS).
For TUNEL staining, after antigen retrieval (performed as described above), samples were pretreated with proteinase K (Sigma-Aldrich). Next, the sections were incubated with Terminal transferase (TdT; Roche Diag-nostics) and biotin-16-dUTP (Roche Diagnostics). Detection was per-formed with HRP-streptavidin conjugates (1:100) and developed with the DAB Peroxidase Substrate kit (SK-4100; Vector Laboratories). Finally, the slides were counterstained with hematoxylin (Fisher Scientific) and mounted in Permount.
Western blot analysis. Cell lysates were prepared with RIPA buffer, 1% Nonidet P40, 0.5% sodium deoxycholate, 0.1% SDS, and protease inhibi-tor cocktail; Roche). The following antibodies were used for western blot-ting (all from Cell Signaling Technology except where indicated): rabbit polyclonal anti-AKT (catalog 9272) and anti–p-Ser473 AKT (catalog 9271), rabbit polyclonal anti–p-Ser240/244 RpS6 (catalog 2215) and rab-
Figure 8Schematic representation of the pathway described in the study. Briefly, mTORC1 activation leads to PI3K and MAPK inhibition through a nega-tive feedback loop stemming from S6K1 (left panel), while treatment with mTORC1 inhibitors results in a hyperactive RTK/IRS-1/PI3K pathway, increasing the signal toward the Ras-Raf1-MEK1/2-ERK pathway (middle panel). Therefore, the combination of MEK and mTORC1 inhibitors may provide a therapeutic benefit in the treatment of certain cancers through the abrogation of the feedback described in this study (right panel). Activated proteins are represented with blue circles and inhibition status with red squares.
research article
TheJournalofClinicalInvestigation http://www.jci.org Volume 118 Number 9 September 2008 3073
bit monoclonal anti-RpS6 (catalog 2217), rabbit polyclonal anti–p-p42/p44 MAPK (catalog 9101) and rabbit polyclonal anti-p42/p44 MAPK (catalog 9102), rabbit polyclonal anti–p-p90RSK (catalog 9341) and rab-bit monoclonal anti-RSK1/2/3 (catalog 9347), mouse monoclonal anti–β-actin (Sigma-Aldrich; catalog A5316), mouse monoclonal anti-HSP90 (BD Biosciences — Pharmingen; catalog 610419), mouse monoclonal anti-HA (Covance), rabbit monoclonal anti–p-Ser338 Raf1 (catalog 9427), rabbit polyclonal anti-Raf1 (catalog 9422), mouse monoclonal anti-Ras (BD Biosciences — Pharmingen), mouse monoclonal anti-PDGFRB (cata-log 3175), mouse monoclonal anti–cyclin B1 (catalog 4135), and rabbit monoclonal anti-PDGFRA (catalog 3174). After standard SDS-PAGE and western blotting procedures, proteins were visualized using the ECL sys-tem (Amersham Biosciences) and quantified using the ImageJ software from NIH on Macintosh computers.
Cell growth analysis.For cell proliferation, 1 × 10⁴ breast cancer cells or 2 × 10⁴ MEF cells were plated in triplicate in 12-well dishes. Twenty-four hours later, the cells considered day 0 were fixed in formalin 10%. The same procedure was performed on the days indicated in Figure 6A and Supple-mental Figure 4. Cell growth was measured by staining with crystal violet (0.1% in 20% methanol) for 45 minutes. The precipitate was solubilized in 10% acetic acid, and the absorbance was measured at 595 nm.
Samples from Phase I clinical trial with RAD001. The entry criteria for the Phase I clinical trial with RAD001 were that participating patients had advanced disease that had progressed on standard therapies and that the patients had tumor available for biopsy. Treatment was given until disease progression. The timing of the biopsies was different between the daily and weekly schedules (Figure 1). With the daily schedule, tissue samples were obtained at baseline and before dosing at day 2 in week 4. With the weekly schedule, the samples were obtained at baseline and between days 4 and 6 following dose administration in week 4. After surgery, the biop-sies were stored until analysis at the Molecular Oncology Laboratory at Vall d’Hebron University Hospital. Inhibition of mTORC1 signaling was observed at all dose levels and schedules. Tissue samples were immediately placed into a 4°C pre-cooled 4% neutral buffered formalin solution and fixed for 8 to 16 hours. Fixed specimens were further processed through routine specimen dehydration using graded ethanol to xylene. Specimens
were embedded in paraffin wax under vacuum at 60°C. Two investigators performed the pathological analysis of the biopsies to discriminate nor-mal and neoplastic areas. All patients gave informed consent. The ethics committee at Vall d’Hebron University Hospital approved the study, which followed the Declaration of Helsinki and good clinical practice guidelines (for detailed information about the clinical trial, see ref. 19).
Statistics. Statistical evaluations were carried out using SigmaStat 2.03 (SPSS). For all tests, the level of statistical significance was set at P < 0.05 or P < 0.01. Unless otherwise specified, Student’s t test was used. Error bars throughout the figures indicate SD.
AcknowledgmentsWe are grateful to Marina Asher in the Pathology Core Laboratory (Memorial Sloan-Kettering Cancer Center) and to the Beth Israel Deaconess Cancer Center pathology core for technical expertise in antibody characterization and immunohistochemistry. We are very grateful to John Blenis, Novartis AG, and Pfizer for providing S6K1 constructs, RAD001, and PD0325901, respectively. We also thank members of the Pandolfi laboratory for discussion and com-ments, and in particular to Min Sup Song for technical support. This work is supported by an NIH/NCI grant (CA84292, to P.P. Pandolfi). A. Carracedo and L. Salmena were supported by EMBO Long-Term and Human Frontiers fellowships, respectively.
Received for publication December 12, 2007, and accepted in revised form June 25, 2008.
Address correspondence to: Pier Paolo Pandolfi, 77 Avenue Louis Pasteur, NRB-1038, Boston, Massachusetts 02115, USA. Phone: (617) 667-2901; Fax: (617) 667-0610; E-mail: [email protected].
Li Ma’s present address is: Whitehead Institute for Biomedical Research, Cambridge, Massachusetts, USA.
Arkaitz Carracedo and Li Ma contributed equally to this work.
1. Wullschleger, S., Loewith, R., and Hall, M.N. 2006. TOR signaling in growth and metabolism. Cell. 124:471–484.
2. Guertin, D.A., and Sabatini, D.M. 2007. Defining the role of mTOR in cancer. Cancer Cell. 12:9–22.
3. Ballif, B.A., et al. 2005. Quantitative phosphoryla-tion profiling of the ERK/p90 ribosomal S6 kinase-signaling cassette and its targets, the tuberous scle-rosis tumor suppressors. Proc. Natl. Acad. Sci. U. S. A. 102:667–672.
4. Inoki, K., Li, Y., Zhu, T., Wu, J., and Guan, K.L. 2002. TSC2 is phosphorylated and inhibited by Akt and suppresses mTOR signalling. Nat. Cell Biol. 4:648–657.
5. Ma, L., Chen, Z., Erdjument-Bromage, H., Tempst, P., and Pandolfi, P.P. 2005. Phosphorylation and functional inactivation of TSC2 by Erk implica-tions for tuberous sclerosis and cancer pathogen-esis. Cell. 121:179–193.
6. Manning, B.D., Tee, A.R., Logsdon, M.N., Blenis, J., and Cantley, L.C. 2002. Identification of the tuber-ous sclerosis complex-2 tumor suppressor gene product tuberin as a target of the phosphoinositide 3-kinase/akt pathway. Mol. Cell. 10:151–162.
7. Inoki, K., Corradetti, M.N., and Guan, K.L. 2005. Dysregulation of the TSC-mTOR pathway in human disease. Nat. Genet. 37:19–24.
8. Tee, A.R., and Blenis, J. 2005. mTOR, translational control and human disease. Semin. Cell Dev. Biol. 16:29–37.
9. Pearce, L.R., et al. 2007. Identification of Protor as a novel Rictor-binding component of mTOR com-plex-2. Biochem. J. 405:513–522.
10. Sarbassov, D.D., Guertin, D.A., Ali, S.M., and Saba-tini, D.M. 2005. Phosphorylation and regulation of Akt/PKB by the rictor-mTOR complex. Science. 307:1098–1101.
11. Faivre, S., Kroemer, G., and Raymond, E. 2006. Cur-rent development of mTOR inhibitors as antican-cer agents. Nat. Rev. Drug Discov. 5:671–688.
12. Franz, D.N., et al. 2006. Rapamycin causes regres-sion of astrocytomas in tuberous sclerosis complex. Ann. Neurol. 59:490–498.
13. Cloughesy, T.F., et al. 2008. Antitumor activity of rapamycin in a Phase I trial for patients with recur-rent PTEN-deficient glioblastoma. PLoS Med. 5:e8.
14. Zhang, H., et al. 2007. PDGFRs are critical for PI3K/Akt activation and negatively regulated by mTOR. J. Clin. Invest. 117:730–738.
15. Zhang, H., et al. 2003. Loss of Tsc1/Tsc2 acti-vates mTOR and disrupts PI3K-Akt signaling through downregulation of PDGFR. J. Clin. Invest. 112:1223–1233.
16. Harrington, L.S., et al. 2004. The TSC1-2 tumor suppressor controls insulin-PI3K signaling via reg-ulation of IRS proteins. J. Cell Biol. 166:213–223.
17. Shah, O.J., Wang, Z., and Hunter, T. 2004. Inap-propriate activation of the TSC/Rheb/mTOR/S6K cassette induces IRS1/2 depletion, insulin resistance, and cell survival deficiencies. Curr. Biol.
14:1650–1656. 18. O’Reilly, K.E., et al. 2006. mTOR inhibition induces
upstream receptor tyrosine kinase signaling and activates Akt. Cancer Res. 66:1500–1508.
19. Tabernero, J., et al. 2008. Dose- and schedule-depen-dent inhibition of the mammalian target of rapa-mycin pathway with everolimus: a phase I tumor pharmacodynamic study in patients with advanced solid tumors. J. Clin. Oncol. 26:1603–1610.
20. Brown, A.P., Carlson, T.C., Loi, C.M., and Graziano, M.J. 2007. Pharmacodynamic and toxicokinetic evaluation of the novel MEK inhibitor, PD0325901, in the rat following oral and intravenous adminis-tration. Cancer Chemother. Pharmacol. 59:671–679.
21. Kohno, M., and Pouyssegur, J. 2006. Targeting the ERK signaling pathway in cancer therapy. Ann. Med. 38:200–211.
22. Wang, J.Y., Wilcoxen, K.M., Nomoto, K., and Wu, S. 2007. Recent advances of MEK inhibitors and their clinical progress. Curr. Top. Med. Chem. 7:1364–1378.
23. Ma, L., et al. 2005. Genetic analysis of Pten and Tsc2 functional interactions in the mouse reveals asym-metrical haploinsufficiency in tumor suppression. Genes Dev. 19:1779–1786.
24. Manning, B.D., et al. 2005. Feedback inhibition of Akt signaling limits the growth of tumors lacking Tsc2. Genes Dev. 19:1773–1778.
25. Im, E., et al. 2002. Rheb is in a high activation state and inhibits B-Raf kinase in mammalian cells. Oncogene. 21:6356–6365.
research article
3074 TheJournalofClinicalInvestigation http://www.jci.org Volume 118 Number 9 September 2008
26. Karbowniczek, M., et al. 2004. Regulation of B-Raf kinase activity by tuberin and Rheb is mammalian target of rapamycin (mTOR)-independent. J. Biol. Chem. 279:29930–29937.
27. Karbowniczek, M., Robertson, G.P., and Henske, E.P. 2006. Rheb inhibits C-raf activity and B-raf/C-raf heterodimerization. J. Biol. Chem. 281:25447–25456.
28. Gupta, S., et al. 2007. Binding of ras to phos-phoinositide 3-kinase p110alpha is required for ras-driven tumorigenesis in mice. Cell. 129:957–968.
29. Rodriguez-Viciana, P., et al. 1994. Phosphatidylino-sitol-3-OH kinase as a direct target of Ras. Nature. 370:527–532.
30. Ma, L., et al. 2007. Identification of S664 TSC2 phosphorylation as a marker for extracellular sig-nal-regulated kinase mediated mTOR activation in tuberous sclerosis and human cancer. Cancer Res. 67:7106–7112.
31. Wennstrom, S., and Downward, J. 1999. Role of phosphoinositide 3-kinase in activation of ras and mitogen-activated protein kinase by epidermal growth factor. Mol. Cell. Biol. 19:4279–4288.
32. Sampaio, C., et al. 2008. Signal strength dictates PI3K contribution to Ras/ERK1-2 activation via differential Gab1/Shp2 recruitment: consequenc-es for resistance to EGFR inhibition. Mol. Cell. Biol. 28:587–600.
33. Wells, V., Downward, J., and Mallucci, L. 2007. Functional inhibition of PI3K by the betaGBP mol-ecule suppresses Ras-MAPK signalling to block cell proliferation. Oncogene. 26:7709–7714.
34. Breslin, E.M., White, P.C., Shore, A.M., Clement, M., and Brennan, P. 2005. LY294002 and rapamy-cin co-operate to inhibit T-cell proliferation. Br. J. Pharmacol. 144:791–800.
35. Ikezoe, T., et al. 2007. Longitudinal inhibition of PI3K/Akt/mTOR signaling by LY294002 and rapa-mycin induces growth arrest of adult T-cell leuke-mia cells. Leuk. Res. 31:673–682.
36. Tamburini, J., et al. 2008. Mammalian target of rapamycin (mTOR) inhibition activates phospha-tidylinositol 3-kinase/Akt by up-regulating insu-lin-like growth factor-1 receptor signaling in acute myeloid leukemia: rationale for therapeutic inhibi-tion of both pathways. Blood. 111:379–382.
37. Fan, Q.W., et al. 2007. A dual phosphoinositide-3-kinase alpha/mTOR inhibitor cooperates with blockade of epidermal growth factor receptor in PTEN-mutant glioma. Cancer Res. 67:7960–7965.
38. Hennessy, B.T., Smith, D.L., Ram, P.T., Lu, Y., and Mills, G.B. 2005. Exploiting the PI3K/AKT path-way for cancer drug discovery. Nat. Rev. Drug Discov. 4:988–1004.
39. Buck, E., et al. 2006. Rapamycin synergizes with
the epidermal growth factor receptor inhibitor erlotinib in non-small-cell lung, pancreatic, colon, and breast tumors. Mol. Cancer Ther. 5:2676–2684.
40. Wang, L.H., Chan, J.L., and Li, W. 2007. Rapamy-cin together with herceptin significantly increased anti-tumor efficacy compared to either alone in ErbB2 over expressing breast cancer cells. Int. J. Cancer. 121:157–164.
41. Wang, M.Y., et al. 2006. Mammalian target of rapa-mycin inhibition promotes response to epidermal growth factor receptor kinase inhibitors in PTEN-deficient and PTEN-intact glioblastoma cells. Can-cer Res. 66:7864–7869.
42. Oliveira, J.C., et al. 2008. Antineoplastic effect of rapamycin is potentiated by inhibition of IRS-1 sig-naling in prostate cancer cells xenografts. J. Cancer Res. Clin. Oncol. 134:833–839.
43. Kinkade, C.W., et al. 2008. Targeting AKT/mTOR and ERK MAPK signaling inhibits hormone-refrac-tory prostate cancer in a preclinical mouse model. J. Clin. Invest. 118:3051–3064.
44. Maeda, T., et al. 2005. Role of the proto-oncogene Pokemon in cellular transformation and ARF repression. Nature. 433:278–285.
45. Chen, Z., et al. 2005. Crucial role of p53-dependent cellular senescence in suppression of Pten-deficient tumorigenesis. Nature. 436:725–730.