Identification and validation of novel prognostic markers in ...
40
PHD THESIS DANISH MEDICAL JOURNAL DANISH MEDICAL JOURNAL 1 This review has been accepted as a thesis together with four original papers by Uni- versity of Southern Denmark 25 th of May 2016 and defended on 17 th of June 2016. Tutors: Niels Marcussen, Steen Walter, Ralf Köhler, Boye L. Jensen Official opponents: Jørn Herrstedt, Martin Johansson, Gregers G. Hermann Correspondence: Department of Pathology, Odense University Hospital, Winsløw- parken 15, 5000 Odense C E-mail: [email protected] Dan Med J 2017;64(10):B5339 The 4 original papers are: 1. Rabjerg M, Mikkelsen MN, Walter S, Marcussen N. Inci- dental renal neoplasms: is there a need for routine screening? A Danish single-center epidemiological study. APMIS. 2014 Aug; 122(8):708-14 2. Rabjerg M, Oliván-Viguera A, Hansen LK, Sevelsted- Møller L, Walter S, Jensen BL, Marcussen N, Köhler R. High expression of KCa3.1 in patients with Clear Cell Re- nal Carcinoma predicts high metastatic risk and poor sur- vival. PLoS One. 2015 Apr 7;10(4). 3. Rabjerg M, Bjerregaard H, Halekoh U, Jensen BL, Walter S, Marcussen N. Molecular characterization of Clear Cell Renal Cell Carcinoma identifies CSNK2A1, SPP1 and DEFB1 as promising novel prognostic markers. APMIS. 2016 May; 124(5):372-83. 4. Rabjerg M, Guerra B, Oliván-Viguera A, Mikkelsen MN, Köhler R, Issinger OG, Marcussen N. Nuclear localization of the CK2α-subunit correlates with poor prognosis in Clear Cell Renal Cell Carcinoma. Oncotarget. 2016 Nov 29. Doi: 10.18632/oncotarget.13693. Funding This study was supported by grants from the Department of Urol- ogy, OUH, the Department of Pathology, OUH, the Region of Southern Denmark, University of Southern Denmark, the Arvid Nilssons Foundation, Overlægerådets Legatudvalg, the Memorial Foundation of Knud and Edith Erikson and Odense University Hos- pital. ABBREVIATIONS AJCC American Joint Committee on Cancer ccRCC Clear cell Renal Cell Carcinoma cDNA Complementary DNA ChRCC Chromophobic Renal Cell Carcinoma CT Computer Tomography DAB 3.3’-Diaminobenzidin DMEM Dulbecco’s modified Eagle medium DMSO Dimethyl sulfoxide DSS Disease Specific Survival FFPE Formalin-fixed paraffin-embedded HE Hematoxylin Eosin HEPES 4-(2-hydroxyethyl)-1-piperazineethanesulfonic acid HIER Heat-induced-epitope-retrieval HR Hazard Ratio HRP Horse radish peroxidase IF Immunofluorescence IHC Immunohistochemistry IMDC International Metastatic Renal-Cell Carcinoma Database Consortium ISUP International Society of Urological Pathology KCa Calcium-activated potassium channel KCa1.1 Large-conductance, voltage and calcium-acti- vated potassium channel KCa3.1 Intermediate-conductance calcium-activated potassium channel MR Magnetic resonance mRCC Metastatic RCC mRNA messenger RNA MSKCC Memorial Sloan Kettering Cancer Center NUC Nuclear staining OS Overall Survival OV-DAB Optiview-DAB PCR Polymerase Chain Reaction PFS Progression Free Survival PRCC Papillary Renal Cell Carcinoma PV Power Vision RCC Renal Cell Carcinoma RO Renal Oncocytoma qRT-PCR Quantitative Reverse Transcriptase Polymerase Chain Reaction TMA Tissue Micro Array TNM Tumor Node Metastasis UcRCC Unclassifiable Renal Cell Carcinoma UISS UCLA’s Integrated Staging System US Ultrasound Identification and validation of novel prognostic markers in Renal Cell Carcinoma Maj Rabjerg
-
Upload
khangminh22 -
Category
Documents
-
view
0 -
download
0
Transcript of Identification and validation of novel prognostic markers in ...
PHD THESIS DANISH MEDICAL JOURNAL
DANISH MEDICAL JOURNAL 1
This review has been accepted as a thesis together with four original papers by Uni-versity of Southern Denmark 25th of May 2016 and defended on 17th of June 2016. Tutors: Niels Marcussen, Steen Walter, Ralf Köhler, Boye L. Jensen Official opponents: Jørn Herrstedt, Martin Johansson, Gregers G. Hermann Correspondence: Department of Pathology, Odense University Hospital, Winsløw-parken 15, 5000 Odense C E-mail: [email protected] Dan Med J 2017;64(10):B5339 The 4 original papers are:
1. Rabjerg M, Mikkelsen MN, Walter S, Marcussen N. Inci- dental renal neoplasms: is there a need for routine screening? A Danish single-center epidemiological study. APMIS. 2014 Aug; 122(8):708-14
2. Rabjerg M, Oliván-Viguera A, Hansen LK, Sevelsted-Møller L, Walter S, Jensen BL, Marcussen N, Köhler R. High expression of KCa3.1 in patients with Clear Cell Re-nal Carcinoma predicts high metastatic risk and poor sur-vival. PLoS One. 2015 Apr 7;10(4).
3. Rabjerg M, Bjerregaard H, Halekoh U, Jensen BL, Walter S, Marcussen N. Molecular characterization of Clear Cell Renal Cell Carcinoma identifies CSNK2A1, SPP1 and DEFB1 as promising novel prognostic markers. APMIS. 2016 May; 124(5):372-83.
4. Rabjerg M, Guerra B, Oliván-Viguera A, Mikkelsen MN, Köhler R, Issinger OG, Marcussen N. Nuclear localization of the CK2α-subunit correlates with poor prognosis in Clear Cell Renal Cell Carcinoma. Oncotarget. 2016 Nov 29. Doi: 10.18632/oncotarget.13693.
Funding This study was supported by grants from the Department of Urol-ogy, OUH, the Department of Pathology, OUH, the Region of Southern Denmark, University of Southern Denmark, the Arvid Nilssons Foundation, Overlægerådets Legatudvalg, the Memorial Foundation of Knud and Edith Erikson and Odense University Hos-pital.
ABBREVIATIONS AJCC American Joint Committee on Cancer ccRCC Clear cell Renal Cell Carcinoma cDNA Complementary DNA ChRCC Chromophobic Renal Cell Carcinoma CT Computer Tomography DAB 3.3’-Diaminobenzidin DMEM Dulbecco’s modified Eagle medium DMSO Dimethyl sulfoxide DSS Disease Specific Survival FFPE Formalin-fixed paraffin-embedded HE Hematoxylin Eosin HEPES 4-(2-hydroxyethyl)-1-piperazineethanesulfonic
acid HIER Heat-induced-epitope-retrieval HR Hazard Ratio HRP Horse radish peroxidase IF Immunofluorescence IHC Immunohistochemistry IMDC International Metastatic Renal-Cell Carcinoma
Database Consortium ISUP International Society of Urological Pathology KCa Calcium-activated potassium channel KCa1.1 Large-conductance, voltage and calcium-acti-
vated potassium channel KCa3.1 Intermediate-conductance calcium-activated
potassium channel MR Magnetic resonance mRCC Metastatic RCC mRNA messenger RNA MSKCC Memorial Sloan Kettering Cancer Center NUC Nuclear staining OS Overall Survival OV-DAB Optiview-DAB PCR Polymerase Chain Reaction PFS Progression Free Survival PRCC Papillary Renal Cell Carcinoma PV Power Vision RCC Renal Cell Carcinoma RO Renal Oncocytoma qRT-PCR Quantitative Reverse Transcriptase Polymerase
Chain Reaction TMA Tissue Micro Array TNM Tumor Node Metastasis UcRCC Unclassifiable Renal Cell Carcinoma UISS UCLA’s Integrated Staging System US Ultrasound
Identification and validation of novel prognostic markers in Renal Cell Carcinoma
Maj Rabjerg

DANISH MEDICAL JOURNAL 2
WB Western Blotting WHO World Health Organization WTS Whole tissue slides.
INTRODUCTION RENAL CELL CARCINOMA
Classification Renal Cell Carcinomas (RCCs) are tumors derived from the epithe-lial components of the nephron and constitutes 80-85% of all pri-mary renal neoplasms. The worldwide incidence of RCC is 338.000 per year (2.4% of total cancer cases in the world) and estimated cancer deaths from RCC are 144.000 (1.7% of all cancer deaths) (1). The yearly number of new cases in Denmark are 480 males (2.5%) and 249 females (1.4%) (2). During the last two decades there has been an annual increase of approximately 2% in incidence (3). In 1981 the World Health Organization published their first classi-fication of adult renal epithelial neoplasms (4). This included ade-noma and carcinoma in terms of renal cell carcinoma and others. Earlier on, there had been disagreements in the perception of the origin of the renal carcinoma, but in 1959, Oberling gave evidence of a renal epithelial origin (5). Based on this, it was recognized that the RCC exhibited a variety of different morphological subtypes. However, these were not described in the WHO classification until 1998, where the second Renal Tumor Classification was formu-lated. This adopted some of the features of the Mainz Classification published by Thoenes et al in 1990 (6), where the various RCC mor-phological subtypes were related to tissues of origin within the nephron. In 2004, the third WHO classification was published. In this classification, the four main morphological tumor types of the Mainz Classification (clear cell RCC, papillary RCC, chromophobe RCC and collecting duct carcinoma), were supplemented by five ad-ditional distinctive tumors; multilocular ccRCC, Xp11.2 transloca-tion carcinomas, mucinous tubular and spindle cell carcinoma, car-cinoma associated with neuroblastoma and renal medullary carcinoma, besides also the unclassifiable RCC (7). Multilocular cystic ccRCC was recognized as an effectively benign low-grade tu-mor, but classified as a carcinoma. Following the publication of the third WHO classification in 2004, several new forms have been de-scribed and refinements have been made to the diagnostic criteria for a number of recognized entities. For this reason, the Interna-tional Society of Urological Pathology (ISUP) formulated the Van-couver Classification in 2012 recognizing five new tumor types (8). A number of benign renal tumors also exist, including oncocytoma and papillary adenoma.
Histology of most common subtypes The histological diagnosis of RCC is made on the basis of morpho-logical characteristics and in some circumstances ancillary studies. Clear cell RCC is the most common subtype representing more than 70% of kidney malignancies. It can display a variety of growth pat-terns, including solid, alveolar, tubular, cystic, pseudo-papillary and papillary patterns (9). It is derived from cortically based tu-bules and approximately half of ccRCCs are confined to the kidney at the time of surgery (pT1-pT2). Characteristically, the cells display a “clear” cytoplasm, due to the presence of glycogen and lipid, which is not visible with routine hematoxylin-eosin (HE) stain, Fig-ure 1A. Ancillary studies can in some cases confirm the diagnosis and biomarker analyses have shown that ccRCCs are typically neg-
ative for CK7, positive for CD10 and RCC antigen and variable posi-tive for AMACR. Carbonic anhydrase (CAIX) is diffusely positive in most ccRCCs, but is not restricted to ccRCC only (10). The papillary RCC (PRCC) is the second most common subtype of RCC and accounts for 15% of renal epithelial neoplasms. Many PRCCs are confined to the kidney and are associated with a more favorable prognosis (9). In the light microscopy, PRCC is dominated by a papillary architecture with tumor cells lining a fibrovascular core. PRCC can be separated into Type 1 and Type 2 based on the cytology of the tumor, Figure 1B. Unlike ccRCC, PRCC is typically positive for CK7, AMACR and CD10 and negative for CAIX. The chromophobe RCC (ChRCC) is a relatively uncommon subtype of RCC and accounts for approximately 5% of all renal epithelial tu-mors (11). Most ChRCCs are lowgrade tumors confined to the kid-ney and have a favorable outcome. However, a small subset be-haves aggressively and these cases are associated with atypia, sarcomatoid differentiation, necrosis and higher stage (12). Classi-cally, the ChRCC presents with large tumor cells with a granulated cytoplasm separated by long parallel blood vessels in fibrotic sep-tae, Figure 1C. The distinction between the benign oncocytoma and ChRCC can be difficult, since both tumors originate from the distal nephron and morphologically can appear alike. The oncocy-toma is characterized by a densely granular eosinophilic cytoplasm and round and regular nuclei, Figure 1D. It comprises 3-9% of all primary renal neoplasms (13). A panel of CD82, MOC-31 and S100A1 has been proposed in the discrimination between the two tumor types (14).
Figure 1. Different histological subtypes of RCC and the benign oncocytoma. A.Clear cell RCC, B. Papillary RCC, type 1 and 2, C. Chromophobe RCC, D. Renal Oncocytoma. Magnification 200x.
Aetiology Aetiological factors include lifestyle variables such as smoking, obesity and hypertension and having a first-degree relative with kidney cancer (15). It is estimated, that 5-10% of all RCCs are inher-ited (16). Several genetic diseases have been shown to be associ-ated with RCC, leading to development of different histological subtypes. Patients with von Hippel-Lindau syndrome have a muta-tion in the VHL-gene and develop ccRCC. 70-85% of sporadically occurring ccRCCs have a gene abnormality of VHL (17, 18). Heredi-tary PRCC is associated with a mutation in the c-MET protoonco-

DANISH MEDICAL JOURNAL 3
gene. A gene abnormality in the BHD-gene located on the short arm of chromosome 17 leads to the Birt-Hogg-Dubé syndrome as-sociated with development of multiple oncocytic kidney tumors (ChRCC and RO), but also ccRCC. In total, seven familial renal tumor syndromes have been recognized, each with a characteristic pa-thology, associated physical findings and with mutations in a spe-cific gene, see Table A2 in the Appendix (16).
Clinical presentation, diagnosis and grading Many patients with RCC remain asymptomatic until the late stages of disease. The classical symptoms include flank pain, macroscopic haematuria and a palpable abdominal mass, but only 10-15 % pre-sent with all three symptoms, also known as the classic triad of RCC (19). RCC is most often diagnosed accurately at either US, CT or MR and can be classified as either solid or cystic based on the imaging findings. However, solid benign tumors such as oncocytomas and fat-free angiomyolipomas cannot reliably be distinguished from malignant tumors on CT or MR. Hence, percutaneous renal tumor biopsies are increasingly being used for histological diagnosis. In addition, it can provide information of histology before ablative treatment, help to select patients with small tumors for surveil-lance approaches and to select the most suitable treatment strat-egy for metastatic RCC (20-22). Currently, the staging of patients with RCC is based on macroscopic tumor characteristics and the presence or absence of lymph node and distant metastases, which are incorporated into the American Joint Committee on Cancer (AJCC) TNM staging system (23). The latest classification was published in 2009, and describes the cur-rently used definitions for TNM staging, Table 1. The Fuhrman nuclear grading system was introduced in 1982 by Fuhrman et al and defines 4 different tumor categories based on their nuclear features, Figure 2 (24). The grades (G) where defined
by increasing nuclear size, irregularity and nucleolar prominence and it was shown that the Fuhrman grading system was the most effective parameter to predict development of distant metastasis. The main limitation of this grading system as a prognostic factor is the need to cluster two different G categories together to obtain a significant difference in survival rate (25). Intra- and inter-observer variability in the assessment of nuclear grade may also significantly influence the reproducibility of results, but collapsing the Fuhrman grading into a two-tiered scheme can improve the reproducibility (26). At the 2012 ISUP Consensus Conference, a grading system based on nucleolar prominence was proposed and the ISUP Grad-ing System for RCC was recommended as a substitute for Fuhrman grading. This grading system is 4-tiered and is applicable to ccRCC and PRCC (27). Nevertheless, the Fuhrman grading system is still being used widely in the clinical routine.
Treatment of RCC - the era of targeted therapies For localized RCC, surgery is the only curative treatment and de-pending of stage, either partial or radical nephrectomy is the main choice (3), Table 1. Thermal ablation is another option. It is a mini-mally invasive approach, indicated in cases with small renal masses in elderly comorbid patients considered unfit for surgery, in those with a genetic predisposition to develop multiple tumors and in pa-tients with bilateral tumors (3). The escalated use of imaging pro-cedures procedures has resulted in an increase in the detection of small renal masses (lesions < 4 cm) and renal tumors detected in-cidentally. Subsequently, concerns regarding over-diagnosis and over-treatment of patients with small renal masses and low-risk disease has arisen and has led to the introduction of active surveil-lance. Candidate patients with small renal masses are stratified to active surveillance based on life expectancy, comorbidities and pre-exist-ing chronic kidney disease (28).
Table 1. TNM classification, treatment and control of RCC.
TNM Surgery Targeted therapy (first line) Control T1a Tumor 4 cm or less Partial nephrectomy or
Radical nephrectomy Leibovic 0-2:
yearly in 5 years Leibovich 3-5: every 6 months in 3 years, yearly until 5 years Leibovich ≥ 6: ¼ yearly in 1 year, ½ yearly in 2 years, yearly un-til 5 years
T1b Tumor < 7 cm but > 4 cm Radical nephrectomy T2 Tumor > 7 cm, limited to the kid-
ney Radical nephrectomy
T3 Tumor extends into major veins or perinephric tissue but not into the ipsilateral adrenal gland and not beyond Gerota’s fascia
Radical nephrectomy
T4 Tumor invades beyond Gerota’s fascia
Radical nephrectomy
T1-T4, N+, M0
Metastasis in regional lymph nodes*
Radical nephrectomy Lymphadenektomy
T1-T4, N+,M+
Distant metastasis Debulking nephrectomy Lymphadenektomi Metastasektomy (Cytoreductiv nephrectomy)
Clear cell (favorable/intermediate MSKCC risk group): Sunitinib, Pazo-panib or Bevacizumab + IFN Clear cell (poor risk group): Temsiroli-mus Non-clear cell any group: Sunitinib, Everolimus or Temsirolimus**
* The regional lymph nodes are the hilar, abdominal para-aortic and paracaval nodes. ** Adapted from Table 5, Ljungberg et al 2015(3).
DANISH MEDICAL JOURNAL 4
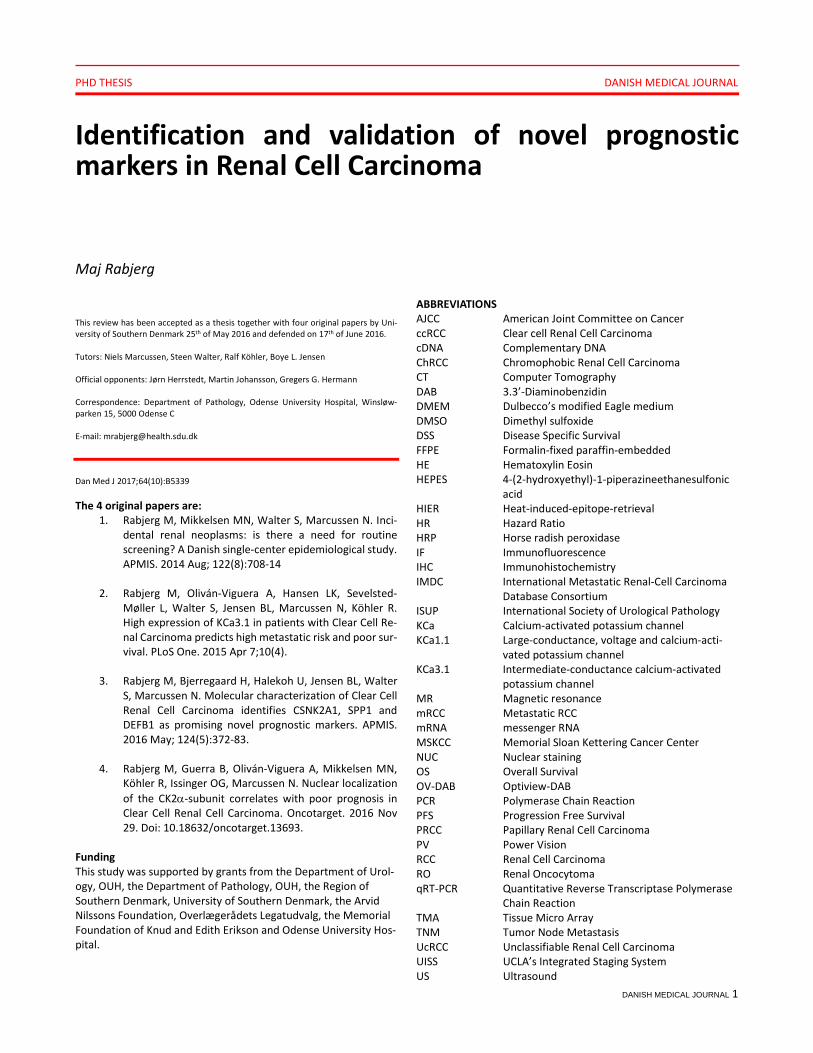
Figure 2. Representation of the four Fuhrman nuclear grades in ccRCC. Mag-nification 400x. However, even small lesions have shown ability to metastasize and differentiating between benign or low-grade lesions and high-grade aggressive phenotypes is still challenging (9, 29). Renal bi-opsy, radiographic assessment and clinical nomograms are used to evaluate the probability of whether a small renal mass has the characteristics of an aggressive cancer. These diagnostic tools have value, but the ultimate goal would be the ability to individualize treatment strategy to match specific tumor biology (30). Metastatic disease is present in 30% of the RCC patients at time of diagnosis. In addition, 20-40% of patients curatively treated with nephrectomy for localized RCC will develop a recurrence (31). Un-fortunately, RCC is resistant to conventional oncological therapies such as chemotherapy and radiation, which previously resulted in very poor survival (32). ccRCC is characterized by loss of the short arm (p) of chromosome 3, where the von Hippel Lindau (VHL) tumor suppressor gene is lo-cated (9). Somatic loss secondary to mutation or silencing by meth-ylation leads to accumulation of hypoxia-inducible factors (HIF-1α, HIF-2α and HIF-3α) which in turn leads to increased transcription of a number of genes accountable for angiogenesis (VEGF, PDGF), tumor proliferation (TGF-α), metabolism (Glut-1, CAIX, EPO) and immunosuppression (IL-6) (33-35). During the last decade, first the introduction of immunotherapy and later the development of novel targeted therapies directed against these tumorigenic and angiogenic pathways has led to an improvement in clinical out-come of RCC (36). Nevertheless, these therapies are not curative, but only life prolonging. At present, there are eight drugs approved in the USA and Europe for treating mRCC. These include five agents targeting either VEGF (sunitinib, sorafenib, pazopanib, axitinib) or its receptor (VEGFR; bevacizumab, used in combination with IFN-α), two mTOR inhibitors (temsirolimus, everolimus) and recombi-nant Il-2 (3, 37). Each of them targets different receptors or path-ways related to tumor growth (Figure 3).
Figure 3. Biological pathways and treatment targets in RCC for both ap-proved and novel treatments. Figure reprinted from Capitanio et al, 2015 with permission from Elsevier provided by Copyright Clearance Center (38).
Many new drugs are being investigated, for instance Nivolumab, which is a human IgG4 monoclonal antibody that binds to the PD-1 receptor and restores T-cell immune activity (38). The role of ad-juvant therapy after surgery in non-metastatic RCC is also being in-vestigated, but no benefit has yet been found with adjuvant VEGF inhibitors in patients at high risk of recurrence (3). In spite of how the targeted therapy era has altered the landscape of mRCC treatment, the prognosis remains bad for mRCC with 5-year survival rates at 10%. This is due to the fact, that the majority of patients develop treatment resistance at some point (32). Three mechanisms for developing treatment resistance have been iden-tified; (a) genetic modification results in structural changes of tar-get proteins preventing drug binding; (b) cancer cells engage alter-native signaling pathways not targeted by drug, and (c) cancer cells may upregulate production of drug-targeted proteins to bypass drug-induced inhibition (32).
Prognostic factors Prognostic factors in RCC include anatomical (TNM classification, tumor size), histological (Fuhrman grade, histologic subtype, pres-ence of sarcomatoid component, tumor necrosis and micro-vascu-lar invasion), clinical (symptoms and performance status) and mo-lecular features (39). An increasing number of prognostic models combining the prognostic factors have been designed in order to improve predictive accuracy. The extent of control after nephrectomy in localized RCC is based on prognostic algorithms. Currently, the three preferred algo-rithms are 1) the Leibovich algorithm (40), 2) UCLA’s Integrated Staging System (UISS) (41) and 3) the Karakiewicz algorithm (42). The Leibovich algorithm is calculated based on histopathological data (stage, tumor size, positive lymph nodes, Fuhrman grade and presence of microscopic necrosis) and is currently considered the most applicable way to estimate individual risk. In Denmark, this algorithm is used to stratify patients into three different surveil-lance groups (43). These integrated prognostic models seem to perform better than the TNM staging system alone, but none of

DANISH MEDICAL JOURNAL 5
them are 100% precise in their prediction of prognosis (18). A sub-stantial amount of work has therefore been placed in the effort to discover novel molecular markers to predict prognosis. Patients with mRCC are allocated to treatment on the basis of a prognostic model developed by Robert Motzer from the Memorial Sloan Kettering Cancer Center (MSKCC) (44). This model is based on 5 risk factors for short survival; 1) Karnofsky performance status 70 or lower, 2) absence of prior nephrectomy, 3) high serum lac-tate dehydrogenase (LDH), 4) low hemoglobin and 5) high cor-rected serum calcium. These were used as risk factors to categorize patients into three risk groups with different survival times. The good prognosis group have 0 risk factors, the intermediate 1-2, and the poor prognosis group ≥ 3 risk factors (Table 1). The model was established in the era of cytokines, and IMDC (International Metastatic Renal-Cell Carcinoma Database Consortium) redefined the criteria for patients treated in the era of targeted therapies. LDH was removed from the model and neutrophilia and thrombo-cytosis were added (45).
Genomic alterations and biomarkers in ccRCC A great work has been placed in the search of novel molecular bi-omarkers, both prognostic and predictive. Prognostic biomarkers predict clinical outcomes independent of therapy and predictive biomarkers reflect the likelihood of differential responses to cer-tain interventions (46). Our understanding of RCC tumor biology has been growing exponentially. A major problem is the tumor complexity, i.e. the presence of different histologies and molecular alterations resulting in substantial intra- and inter-patient hetero-geneity (47). Recently, exome sequencing has lead to the identification of a sec-ond major cancer gene in ccRCC besides VHL, PBRM1 or polybromo-1 (48). PBRM1 is also located on chromosome 3p and encodes the BAF180 protein, which is one of the chromatin-target-ing subunits of the PBAF SWI/SNF chromatin remodeling complex (49). PBRM1 mutations are observed in 41% of ccRCC and in asso-ciation with 3p loss. PBRM1 functions as a tumor suppressor gene in the kidney and genetic inactivation plays an important role in the pathogenesis and progression of ccRCC. Additional genomic studies have more recently identified recurrent mutations in BAP1, SETD2 and JARID1C/KDM5C/SMCX, genes that are all involved in chromatin-remodeling or histone modification (50, 51). Mutations in BAP1 are associated with aggressive disease and a poor risk group (MSKCC) (52). An ongoing study (RECORD3) investigates BAP1, PBRM1 and KDM5C as predictive biomarkers. In addition to mutations on chromosome 3p, chromosomal aber-rations in terms of copy number gain on chromosome 5q are also very frequent. On this chromosome, a number of genes are recur-rently overexpressed, including genes with roles in histone modifi-cation (EZH2) and stress response (STC2). Moreover, also epige-netic silencing of a large number of genes has been identified in ccRCC (53). Even so, the full spectrum of somatic mutations in ccRCC has not yet been realized. A number of other potential biomarkers have been identified, in-cluding CAIX (carbonic anhydrase IX), VEGF (vascular endothelial growth factor, HIF-1α, HIF-α and polymorphisms of especially VEGF), survivin, mTOR, PTEN, S6K, cytokines CCL5 and CXCL9, cave-olin-1 and others (54). None of the suggested potential biomarkers have been validated for use in the clinic, and at present, no biolog-ical marker is routinely used to guide therapy choice (47).
HETEROGENEITY IN RCC It is clear, that RCC comprises a very heterogeneous group of his-tologically and molecularly distinct tumor subtypes that also shows significant intra-tumor heterogeneity, which in turn leads to heter-ogeneous clinical responses (55). Gerlinger et al employed next-generation sequencing to characterize intra-tumor heterogeneity in primary ccRCC and metastases (56, 57). On average, only 67% of somatic mutations were detected in all regions of the tumor. Zal-dumbide et al investigated intra-tumor heterogeneity in 48 ccRCCs using histological tools such as tumor size, cell type (clear vs. eo-sinophilic), Fuhrman grade, and immunohistochemical expression of CAIX, BAP-1, COX-2 and Ki67 (58). They detected intra-tumor heterogeneity in 54% of cases, most frequently in cell type, grade and Ki67 index. When using singly-biopsy procedures, the risk of underestimating the genetic complexity of a tumor is therefore present (59). Moreover, it poses a considerable challenge to the development of individualized targeted therapies. All together, RCC imposes several different challenges in terms of diagnosis, assessment of prognosis at early stage and development of personalized targeted therapies. Novel tissue and genetic mark-ers are expected to improve accuracy of renal biopsy in character-izing histology and disease aggressiveness (indolent mass vs. clini-cally relevant malignancy) in the future (38). In the last decade, a large part of the ongoing research in RCC has focused on identify-ing these novel markers. Many of the interesting molecular mark-ers are investigated in several different cancers, which have the advantage, that when a suitable therapeutic target is discovered, a lot of patients will benefit from it. Below follows a description of molecular markers that have been investigated in other cancer types, but also could be interesting in the context of RCC.
CALCIUM-ACTIVATED POTASSIUM CHANNELS Ion channels are transmembrane proteins that facilitate the per-meation of specific ions between intracellular and extracellular en-vironments. By controlling ion fluxes, they are involved in prolifer-ation, volume regulation, apoptosis, migration and cell adhesion in non-excitable cells. Hence, they are able to contribute to malignant progression (60). Potassium channels can be classified into four main families: voltage-gated K+ channels, calcium-activated K+ channels, inward-rectifier K+ channels and two-pore-domain K+ channels according to the stimulus to which they respond (61). The calcium-activated potassium channel (KCa) family consists of 8 dif-ferent channels (Table 2). The potassium channels investigated in this thesis (Study II) are highlighted in bold. Table 2. Nomenclature of the calcium-activated potassium channels. Adap-ted from Wei et al, 2005 (62).
IUPHAR Gene Class Aliases KCa1.1 KCNMA1 Large conductance BK, slo1, Maxi-
K KCa2.1 KCNN1 Small conductance SK1 KCa2.2 KCNN2 SK2 KCa2.3 KCNN3 SK3 KCa3.1 KCNN4 Intermediate con-
ductance IK1, SK4
KCa4.1 KCNT1 - Slack, Slo2.2 KCa4.2 KCNT2 Slick, Slo2.1 KCa5.1 KCNU1 Slo3
KCa3.1 KCa3.1 is a calcium-activated intermediate-conductance potas-sium ion channel, consisting of six transmembrane domains linked

DANISH MEDICAL JOURNAL 6
together in a homo-tetrameric structure that regulate the efflux of potassium ions activated by rise in intracellular Ca2+ concentra-tions. KCa3.1 has been found in various cell types, including T cells, B-lymphocytes, vascular endothelial and smooth muscle cells, fi-broblasts, erythrocytes, macrophages and secretory epithelial cells (salivary gland, mammary gland, trachea, prostate and intestine) (63, 64). KCa3.1 is normally not expressed in the kidney tubular sys-tem (64). Up-regulation of the KCa3.1 channel has been reported in several human cancer cell lines, including GL-15 glioblastoma, MCF7 breast carcinoma, LNCaP and PC-3 prostate carcinoma (65-67) and in numerous solid cancers (68-73). Recent molecular and immunohistochemical evidence from our own group has shown that KCa3.1 mRNA and protein are up-regulated in glioblastoma (74). In addition, selective blockers of KCa3.1 are shown to be able to inhibit in-vitro proliferation of cancer cell lines (75).
KCa1.1 KCa1.1, also known as the BK channel, is composed of a tetramer of pore-forming α and accessory β-subunits. It serves multiple functions in a variety of tissues, including the brain, smooth muscle and epithelia. BK channel expression has been observed in nearly all segments of the nephron, and it functions as the mediator of flow-induced potassium secretion in the distal nephron (76). Simi-lar to KCa3.1, it plays an active role in tumor biology, providing mechanisms by which cell division and migration can occur (77), Figure 4.
Figure 4. Illustration showing the influence of ion channel dysfunction on neoplastic transformation. Reprinted with permission from Bose et al, 2015 (78).
PROTEIN KINASE CK2 Protein kinase CK2 is a tetrameric enzyme composed of two cata-lytic subunits (α and/or α’) and two regulatory β-subunits. It is a highly conserved, constitutively active protein kinase and it regu-lates multiple pathways including PI3K/Akt and WNT signaling cas-cades, NF-κB transcription and the DNA damage response. It has been described as a non-oncogene with pro-proliferative and anti-
apoptotic properties and high expression of CK2 has been linked to a poor prognosis in multiple cancers (79, 80). It is believed that CK2 promotes both intrinsic and extrinsic processes such as regulating cell-cycle proteins, PI3K/Akt signaling and apoptosis pathways, an-giogenesis and regulation of hypoxia-inducible transcription factor 1 alpha (HIF-1α) activity (81). Several research groups have re-ported that inhibition of CK2 induced apoptosis and prevented the proliferation of cancer cells (82, 83).
DESCRIPTION OF APPLIED TECHNIQUES
Real-time quantitative PCR Quantitative real time reverse transcriptase PCR (qRT-PCR) is a method to study gene expression by measuring the abundance of a gene-specific transcript. The method is characterized by a very high sensitivity with detection down to one copy. There are three phases in a basic PCR run: 1) the initiation phase, where the emit-ted fluorescence can not be distinguished from the baseline, 2) the exponential phase, where the gene product is doubled for each cy-cle (assuming 100% reaction efficiency), and 3) the plateau phase, where the reaction has stopped and no more products are made (Figure 5).
Figure 5. Phases of a PCR amplification curve. In the initiation phase the fluorescent signal does not exceed the background level. In the exponential phase, the fluorescence increases exponentially. After a number of cycles, the PCR efficiency decreases and the reaction reaches a plateau. The Ct value is defined as the PCR cycle at which the sample reaches the threshold. In qRT-PCR, the exponential phase is used for quantitation of gene transcript. Two values are calculated by the real-time PCR instru-ment; the threshold which is the level of detection at which a re-action reaches a fluorescent intensity above background, and CT,
the PCR cycle at which the sample reaches the threshold. The CT value is used in absolute or relative quantitation. Absolute quanti-fication is based on standard curves obtained by analyzing amplifi-cation of the target in samples and in a standard dilution series of known copy number. Data from the standard dilution series are used to generate the standard curve from which the absolute quantity of the target gene in the samples can be interpolated. In relative quantitation the changes in gene expression of a target
DANISH MEDICAL JOURNAL 7
gene is compared to that of one or more reference genes using the comparative CT method (∆∆CT). Normalization by a reference gene is based on the premise that expression levels are stable and con-stant between samples. To validate the presumed stable expression of a given control gene, prior knowledge of a reliable measure to normalize this gene is re-quired. A gene-stability measure has been developed to determine the expression stability of control genes on the basis of non-nor-malized expression levels (84). The calculations can be done auto-matically in the Visual Basic Application for Microsoft Excel termed GeNorm. For every control gene the pairwise variation with all other control genes as the standard deviation of the logarithmically transformed expression ratios is determined. The gene-stability measure M is the average pairwise variation of a particular gene with all other control genes. Genes with the lowest M values have the most stable expression. In addition, the systematic variation is calculated as the pairwise variation, V, for repeated RT-PCR exper-iments on the same gene, reflecting the inherent machine, enzy-matic and pipet variation. In order to measure expression levels accurately, normalization by multiple reference genes is required (84). For reference genes to be considered stably expressed in a panel of heterogeneous sam-ples, the gene stability values M should be less than 1.5 and the coefficient of variation CV should be less than 0.5 (85, 86).
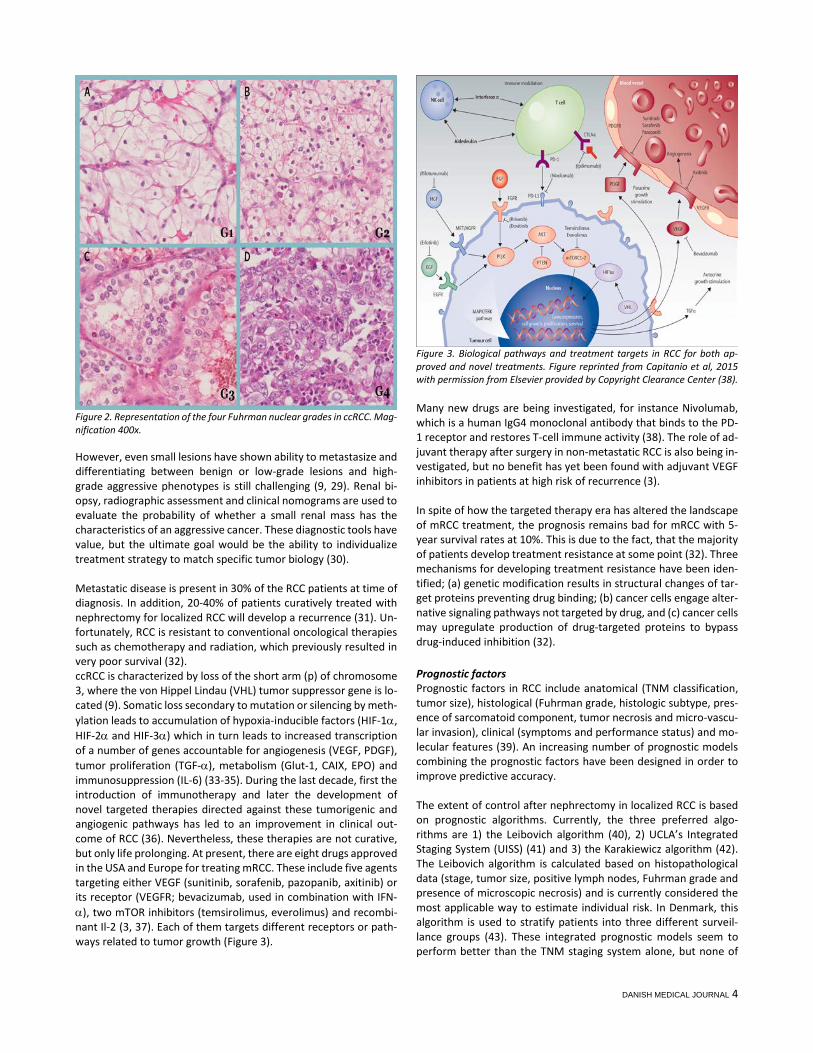
The TaqMan® Array The TaqMan® array is a 384-well microfluidic card allowing the sim-ultaneous investigation of up to 384 genes per sample. It has been proven to be more specific and sensitive than microarray analysis since a 2-fold change in gene expression can be detected. The for-mat allows for 1-8 samples to be run in parallel. Each card has 8 sample-loading ports which each connect to a set of 48 reaction wells. In each well, a pair of unlabeled PCR primers and a TaqMan probe is preloaded from the manufacturer. The TaqMan probe have a FAM dye label on the 5’ end and a minor groove binding (MGB) and a nonfluorescent quencher on the 3’ end. During PCR, the TaqMan probe anneals specifically to a complementary se-quence between the forward and reverse primer sites. The quencher keeps the reporter dye from emitting fluorescence. Fol-lowing DNA polymerization, the DNA polymerase cleaves the probes that are hybridized to the target. Cleavage separates the reporter dye from the quencher dye and results in increased fluo-rescence by the reporter (Figure 6). This happens only if the target sequence is complementary to the probe and is amplified during PCR. Hence, nonspecific amplification is not detected. The advantage of this method is the high specificity and sensitivity and the minimum of labor acquired for preparing the cards for the PCR run.
Tissue Micro Arrays The term “Tissue Micro Array” covers the sampling of cores from whole tissue blocks and insertion of these into a recipient block, which then represents tissue from many patients. Since the intro-duction of Tissue Micro Array (TMA) it has become a very popular method of undertaking high-throughput tissue-based studies. There are a lot of advantages to this method, since the speed of biomarker analysis can be considerably increased and technical sources of variation between cores on the same slide can be elim-inated.
Figure 6. Schematic drawing of the different steps in PCR by TaqMan. 1) The TaqMan MGB (minor groove binder) probe anneals specifically to a comple-mentary sequence between the forward and reverse primer. 2) When the DNA polymerase cleaves the TaqMan probe, the reporter dye is separated from the quencher dye, resulting in 3) an increase in fluorescence. 4) Polymerization of the strand continues, but because the 3’ end of the probe is blocked, no extension occurs. Through appropriate sampling, also reproducibility and heteroge-neity of biomarker expression can be regarded. Costs can be lim-ited due to reduced use of chemical reagents and other consuma-bles. Studies have suggested that 2-4 representative cores punched out from donor paraffin blocks and inserted into a recipi-ent block will give adequate representation of the tumor compris-ing also the heterogeneity of many tumors (87). More cores will in addition ensure a better representation of the sampled tumor since sections are more prone to tissue loss than are whole tissue slides (WTS). A study investigating specifically the number of cores to use for RCC could conclude that 2-3 cores were sufficient for most biomarkers, although some biomarkers needed larger repre-sentation of the tissue (88). Hence, the number of TMA cores was biomarker dependent. Tissue cores should be arrayed randomly in the recipient block with each orientation carefully registered, so that the identity of each individual core is ensured. Generally it is recommended, to optimize antibodies on WTS or multi-tissue blocks (containing tissues of different origin) before performing a TMA experiment.
Immunohistochemistry Immunohistochemistry (IHC) is the standard approach to visualize protein expression in tissues and it is used routinely within the field of pathology. It is based on the process of antigen-antibody com-plex binding, visualized by a fluorescent dye or a chromogen. The protein or antigen contains smaller areas known as epitopes too which the antibody can bind. The fixation process of the tissue, of-ten by formaldehyde and subsequently embedding in paraffin, causes immobilization of the epitopes. Retrieval or unmasking is therefore a necessary step to retrieve immune-reactivity. One of the most commonly applied detection systems uses perox-idase as enzyme label. Since endogenously peroxidase activity ex-ists in a number of human cells, including erythrocytes, macro-phages and monocytes, is it necessary to block this activity by hydrogen peroxide before proceeding with epitope unmasking. Af-terwards, retrieval (unmasking of epitopes) can be done in two ways; 1) heat-induced epitope retrieval (HIER) using different buff-ers or 2) treatment with proteolytic enzymes, i.e. protease, trypsin or pepsin. Importantly, every staining procedure should be opti-mized by investigating different epitope retrieval methods and dif-ferent concentrations of the antibody before proceeding with the final staining.

DANISH MEDICAL JOURNAL 8
A number of different systems for detecting or visualizing the bind-ing of the antibody to the antigen exist. Most commonly used is the indirect technique, where the signal is amplified by a polymer backbone. In the PowerVision system, a 3-layer polymer enhance-ment technique provides a strong reaction and an improvement in sensitivity compared to other systems. It consists of a primary an-tibody, linked to a horse radish peroxidase (HRP) -conjugated ter-tiary antibody through a secondary linking antibody, which contrib-utes to enhanced amplification (Figure 7). HRP is the preferred enzyme label in immunohistochemistry. Since HRP is colorless, vis-ualization can occur by a chromogene catalyzing the complex, such as DAB (3,3’-Diaminobenzidin) that gives a brownish reaction prod-uct (89). In this thesis, we chose the PowerVision+ system as the detection system for most of the antibodies we used, due to the high sensitivity of this particular method.
Figure 7. The PowerVision+ detection system. The primary antibody binds to the epitopes of the protein. A secondary linking antibody (added as “Post-antibody Blocking”) enhances the amplification signal. The tertiary anti-body is linked to compact polymers containing HRP enzyme molecules. Adapted from Vyberg (89).
Patch clamping Patch clamping is a technique that enables the study of ion chan-nels through measurements of currents across the cell membrane. In patch clamp recording, a glass micropipette is used as a record-ing electrode. An electrode in the buffer functions as reference electrode. The micropipette is used to enclose a membrane surface area (patch) that contains one or few ion channel molecules (90). To obtain a high resistance seal, the micropipette is pressed against the cell membrane and suction is applied. Several variations of the basic technique exist, including excised patch techniques, where the patch is removed from the main body of the cell and whole-cell patch techniques allowing the researcher to study the resistance across the whole cell membrane. The technique provides a direct readout of ion channel function with data extraction of high quality (91). Adding activators or blockers of specific ion channels to the cells microenvironment makes it possible to reveal their contribu-tion to the current across the cell membrane.
AIMS AND HYPOTHESES An accurate model for predicting patient prognosis will allow bet-ter selection of patients most likely to benefit from novel as well as established therapies. Hence, novel molecular markers are needed
to better predict clinical outcomes of RCC. Our overall aim of this thesis was to identify and validate novel molecular markers for an improved assessment of prognosis in renal cancer patients. The specific hypotheses of this thesis are
1. The symptom presentation of RCC has an impact on prognosis.
2. Calcium-activated potassium channels are important mediators in proliferation and migration of clear cell re-nal carcinoma cells.
3. Using TaqMan® Array it is possible to identify novel prog-nostic markers with correlation to clinical outcome, suit-able for use in clinical routine.
4. On the basis of recognition of specific prognostic markers we hypothesized that novel targeted therapies could be identified
The definition of these hypotheses led to the more specific formu-lation of aims for each paper included in the thesis: Study I Our aim was to identify the patterns of presentation of renal neo-plasms in Region of Southern Denmark and to elucidate the fre-quency of symptoms leading to diagnosis. In addition we also wished to define if presenting symptoms at the time of diagnosis could have an impact on prognosis. Based on this we discussed possibilities or requirements for imposing a systematic screening program in Denmark. Study II Our aim was to investigate the importance of Calcium-activated potassium channels on the clear cell renal cell carcinomas ability to migrate and thereby metastasize and hence, if inhibiting the chan-nels could impact the growth of tumor cells. In addition, we aimed at identifying any prognostic role of the intermediate calcium-acti-vated potassium channel KCa3.1 in ccRCC. Study III Our aim was to validate the TaqMan® Array as a tool to discover novel prognostic molecular markers in ccRCC suitable for use in the clinical routine by focusing on pre-investigated genes. Study IV Our aim was to further evaluate the prognostic value of CK2α and to investigate the protein expression of CK2α in the different sub-types of RCC and oncocytoma. In addition, our goal was to investi-gate the functional role of CK2α in ccRCC and the possible inhibi-tory actions of the specific inhibitors of CK2α, CX-4945 and E9.
METHODS STUDY I Paper I describes an observational retrospective study in which we reviewed patient charts followed by statistical analysis. Our cohort consisted of patients who had undergone surgical treatment for a renal neoplasm, or had a biopsy of a renal neoplasm in the years 2011-2012 in Region of Southern Denmark. Prior to collecting pa-tient data, we defined specific inclusion and exclusion criteria. In-clusion criteria were: surgical treatment or biopsy of a primary adult renal neoplasm in 2011-2012 in Region of Southern Denmark. Exclusion criteria were: Kidney tumors in children, tumors found
DANISH MEDICAL JOURNAL 9
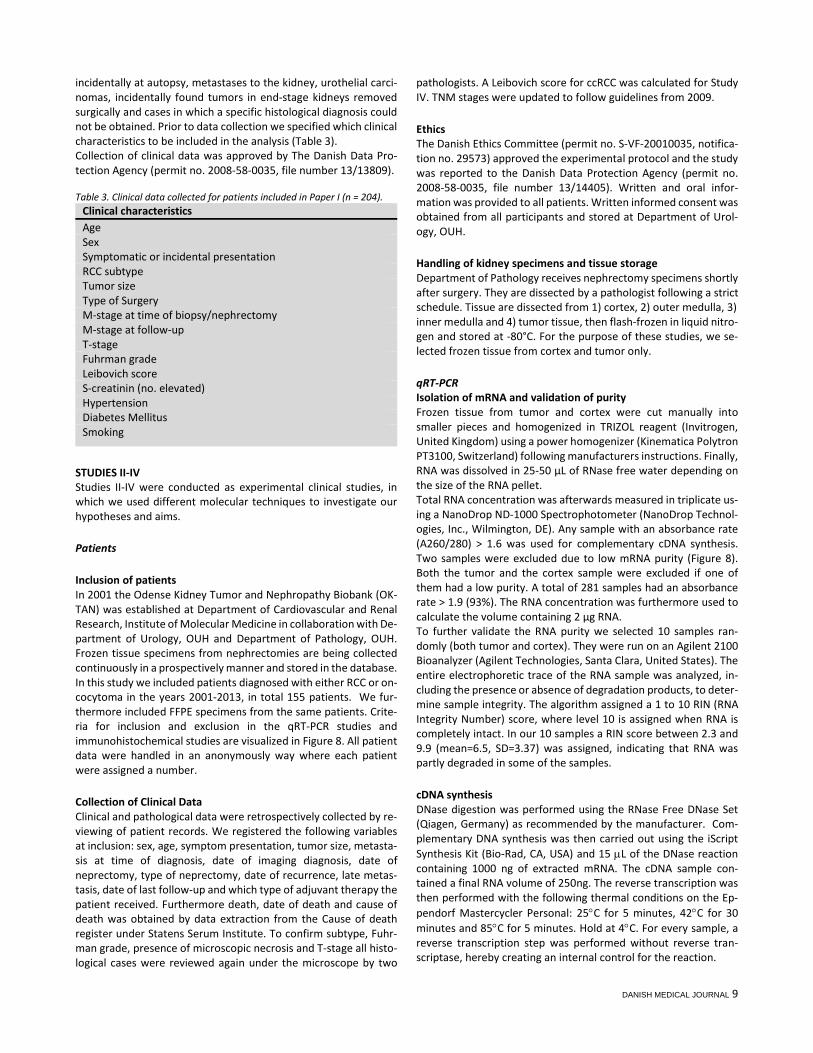
incidentally at autopsy, metastases to the kidney, urothelial carci-nomas, incidentally found tumors in end-stage kidneys removed surgically and cases in which a specific histological diagnosis could not be obtained. Prior to data collection we specified which clinical characteristics to be included in the analysis (Table 3). Collection of clinical data was approved by The Danish Data Pro-tection Agency (permit no. 2008-58-0035, file number 13/13809). Table 3. Clinical data collected for patients included in Paper I (n = 204).
Clinical characteristics Age Sex Symptomatic or incidental presentation RCC subtype Tumor size Type of Surgery M-stage at time of biopsy/nephrectomy M-stage at follow-up T-stage Fuhrman grade Leibovich score S-creatinin (no. elevated) Hypertension Diabetes Mellitus Smoking
STUDIES II-IV Studies II-IV were conducted as experimental clinical studies, in which we used different molecular techniques to investigate our hypotheses and aims.
Patients
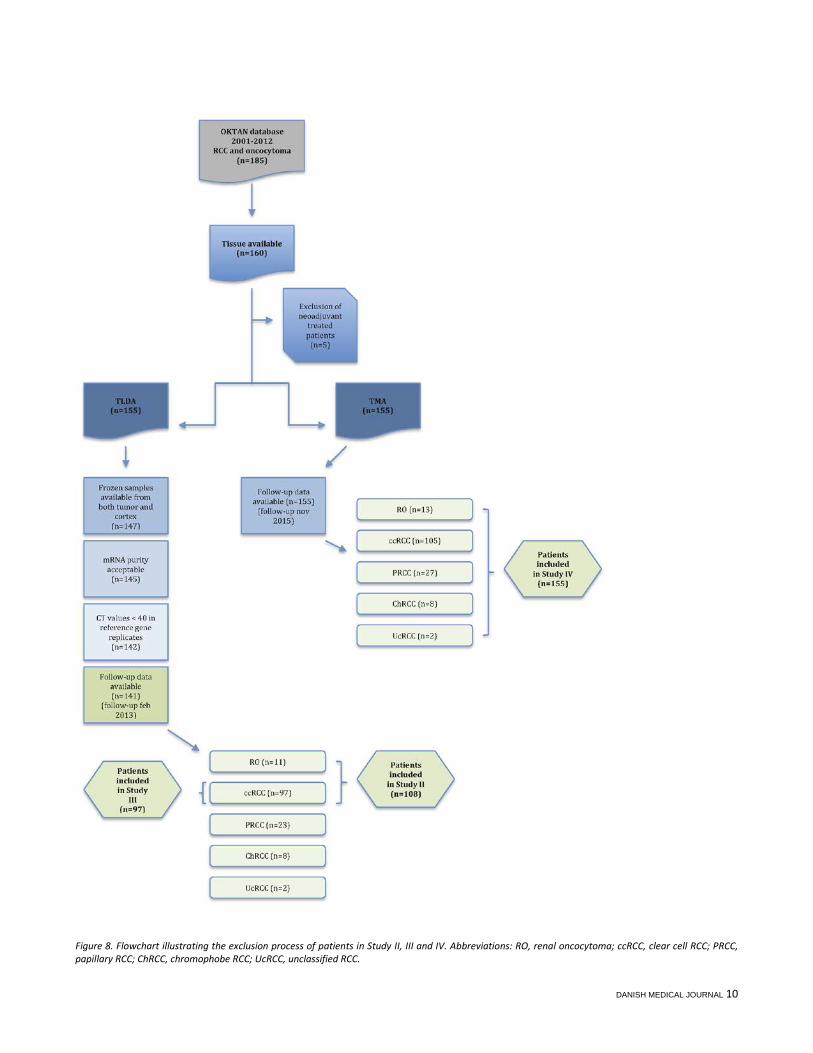
Inclusion of patients In 2001 the Odense Kidney Tumor and Nephropathy Biobank (OK-TAN) was established at Department of Cardiovascular and Renal Research, Institute of Molecular Medicine in collaboration with De-partment of Urology, OUH and Department of Pathology, OUH. Frozen tissue specimens from nephrectomies are being collected continuously in a prospectively manner and stored in the database. In this study we included patients diagnosed with either RCC or on-cocytoma in the years 2001-2013, in total 155 patients. We fur-thermore included FFPE specimens from the same patients. Crite-ria for inclusion and exclusion in the qRT-PCR studies and immunohistochemical studies are visualized in Figure 8. All patient data were handled in an anonymously way where each patient were assigned a number.
Collection of Clinical Data Clinical and pathological data were retrospectively collected by re-viewing of patient records. We registered the following variables at inclusion: sex, age, symptom presentation, tumor size, metasta-sis at time of diagnosis, date of imaging diagnosis, date of neprectomy, type of neprectomy, date of recurrence, late metas-tasis, date of last follow-up and which type of adjuvant therapy the patient received. Furthermore death, date of death and cause of death was obtained by data extraction from the Cause of death register under Statens Serum Institute. To confirm subtype, Fuhr-man grade, presence of microscopic necrosis and T-stage all histo-logical cases were reviewed again under the microscope by two
pathologists. A Leibovich score for ccRCC was calculated for Study IV. TNM stages were updated to follow guidelines from 2009.
Ethics The Danish Ethics Committee (permit no. S-VF-20010035, notifica-tion no. 29573) approved the experimental protocol and the study was reported to the Danish Data Protection Agency (permit no. 2008-58-0035, file number 13/14405). Written and oral infor-mation was provided to all patients. Written informed consent was obtained from all participants and stored at Department of Urol-ogy, OUH.
Handling of kidney specimens and tissue storage Department of Pathology receives nephrectomy specimens shortly after surgery. They are dissected by a pathologist following a strict schedule. Tissue are dissected from 1) cortex, 2) outer medulla, 3) inner medulla and 4) tumor tissue, then flash-frozen in liquid nitro-gen and stored at -80°C. For the purpose of these studies, we se-lected frozen tissue from cortex and tumor only.
qRT-PCR Isolation of mRNA and validation of purity Frozen tissue from tumor and cortex were cut manually into smaller pieces and homogenized in TRIZOL reagent (Invitrogen, United Kingdom) using a power homogenizer (Kinematica Polytron PT3100, Switzerland) following manufacturers instructions. Finally, RNA was dissolved in 25-50 μL of RNase free water depending on the size of the RNA pellet. Total RNA concentration was afterwards measured in triplicate us-ing a NanoDrop ND-1000 Spectrophotometer (NanoDrop Technol-ogies, Inc., Wilmington, DE). Any sample with an absorbance rate (A260/280) > 1.6 was used for complementary cDNA synthesis. Two samples were excluded due to low mRNA purity (Figure 8). Both the tumor and the cortex sample were excluded if one of them had a low purity. A total of 281 samples had an absorbance rate > 1.9 (93%). The RNA concentration was furthermore used to calculate the volume containing 2 μg RNA. To further validate the RNA purity we selected 10 samples ran-domly (both tumor and cortex). They were run on an Agilent 2100 Bioanalyzer (Agilent Technologies, Santa Clara, United States). The entire electrophoretic trace of the RNA sample was analyzed, in-cluding the presence or absence of degradation products, to deter-mine sample integrity. The algorithm assigned a 1 to 10 RIN (RNA Integrity Number) score, where level 10 is assigned when RNA is completely intact. In our 10 samples a RIN score between 2.3 and 9.9 (mean=6.5, SD=3.37) was assigned, indicating that RNA was partly degraded in some of the samples.
cDNA synthesis DNase digestion was performed using the RNase Free DNase Set (Qiagen, Germany) as recommended by the manufacturer. Com-plementary DNA synthesis was then carried out using the iScript Synthesis Kit (Bio-Rad, CA, USA) and 15 µL of the DNase reaction containing 1000 ng of extracted mRNA. The cDNA sample con-tained a final RNA volume of 250ng. The reverse transcription was then performed with the following thermal conditions on the Ep-pendorf Mastercycler Personal: 25°C for 5 minutes, 42°C for 30 minutes and 85°C for 5 minutes. Hold at 4°C. For every sample, a reverse transcription step was performed without reverse tran-scriptase, hereby creating an internal control for the reaction.
DANISH MEDICAL JOURNAL 10
Figure 8. Flowchart illustrating the exclusion process of patients in Study II, III and IV. Abbreviations: RO, renal oncocytoma; ccRCC, clear cell RCC; PRCC, papillary RCC; ChRCC, chromophobe RCC; UcRCC, unclassified RCC.

DANISH MEDICAL JOURNAL 11
Figure 9. Example of Electrophoresis Run on a sample with a RIN score of 9.9.
qRT-PCR with SYBR green qRT-PCT for KCa1.1 was carried out using SYBR-green methodology in a 96-well format. All samples were run in triplicate on the Strat-agene MX3000P qPCR Instrument. A total of 10 ccRCCs and 11 on-cocytomas were investigated, together with normal renal cortex parenchyma from each patient. The efficiency of each primer was tested by a serial dilution, and was all between 90-100%. The qPCR cycles were run as follows: 95°C for 3 min (1 cycle), 95°C for 20 sec, 60°C for 20 sec and 72°C for 20 sec (40 cycles), 95°C for 1 min (1 cycle). Taqman Gene Expression Array For the purpose of generating qRT-PCR data for Studies II, III and IV we used the TaqMan® Array. An array configuration of 24 genes was chosen (23 investigator selected genes and 1 obligatory con-trol (GAPDH)). 23 gene specific primer-probes were selected from the web catalogue. The assay with the best coverage was always chosen, i.e. the assay that detected the maximum number of tran-scripts, did not detect homologs, was designed across an exon-exon junction and with the shortest possible amplicon size to opti-mize the PCR reaction. We selected the genes included in Study III based on a master’s thesis, where a literature search was per-formed with the purpose of identifying genes suitable for diagnos-tic and prognostic application in the clinic (92). 31 genes were in this master’s thesis identified and gene expression levels between cortex and RCC tumor tissue were investigated. Based on these re-sults, 19 of these 31 genes were selected for inclusion in Study III (Table A1). The arrays were loaded with one sample into each well, thereby investigating 8 samples per card with every sample analyzed in du-plicate. Each sample consisted of 50µL of cDNA synthesized from 250 ng of total RNA and 50 µL TaqMan universal PCR Master Mix 2x (Applied Biosystems) giving a total of 100 µL loaded into each well. Tumor and cortex from the same patient was always run on the same card. Two different types of controls were included in the array. A minus RT (Reverse Transcriptase) control where cDNA was synthesized without the reverse transcriptase to test that signals do come from reverse transcribed RNA and not from contaminat-ing DNA and a NTC (No Template Control) to test that signals in-deed come from the added cDNA template. The arrays were loaded, spun and sealed as recommended by the manufacturer (Figure 10) and all RT-qPCR were run on an ABI PRISM 7900HT Se-quence detecting system (Applied Biosystems, Foster City, CA,
USA) for 2 min at 50°C, 10 min at 94.5°C, 50 cycles of 30 sec at 97°C and 1 min at 59.7°C.
Figure 10. Each of the 8 wells are loaded with cDNA and TaqMan Universal PCR Master Mix. The mixture is distributed to each of the wells by centrifug-ing.
Reference gene stability We pre-selected three genes to function as reference genes (HMBS, TBP, PPIA) based on two previous studies on reference genes in RCC (93, 94). The expression stability of all genes was in-vestigated using the GeNorm algorithm (86) in order to identify the most stably expressed genes and to test the stability of our pre-selected genes. A gene expression stability value (M) was calcu-lated for each gene and the genes were ranked according to their stability (Figure 11).
Figure 11. Average expression stability M of the 6 most stable genes. HMBS, PPIA and TBP had the lowest value M and the highest stability. Table 4. Expression gene stability value M and Coefficient of variation CV for each chosen reference gene.
Reference target Gene stabi-lity value M
Coefficient of variation CV
HMBS 0.9 0.38 PPIA 0.8 0.36 TBP 0.8 0.34 Average 0.85 0.36

DANISH MEDICAL JOURNAL 12
The combination of HMBS, PPIA and TBP were considered the best combination of reference genes to use in this study. This group of reference genes had an average stability value M of 0.85. GAPDH, the gene pre-chosen by the manufacturer and a commonly used reference gene had an average stability value M of 1.38, which in-dicates a higher instability in RCC than the reference genes we chose to apply in this study (Figure 11). GAPDH was therefore not used as a reference gene.
Data analysis After the TaqMan assays were run on the ABI PRISM 7900HT Se-quence detecting system, PCR data were collected and evaluated with SDS 2.4 software (Applied Biosystems). SDS is a fully inte-grated software solution integrated in the Applied Biosystems 7900HT Fast Real-Time PCR system. A manual threshold detection for fluorescence intensity was set in the exponential phase of the amplification curve. All PCR reactions were run in duplicate and cut-offs for including duplicates in further analysis was as follows:
• ∆CT > 1 between duplicates at Ct values below 30 cycles • ∆CT > 1.5 between duplicates at Ct values between 30-
33 cycles • All duplicates with Ct values above 33 cycles were con-
sidered valid After exclusion of duplicates not complying with the above rules, the mean Ct for each duplicate measurement were exported to the software qBasePlus (95) where normalization to the three chosen reference genes was done (TBP, PPIA, HMBS) according to the modified ∆∆CT method (85). Three samples were excluded since Ct values were above the limit of detection in 2 out of 2 replicates in the reference genes (Figure 8).
Survival endpoints The choice of survival endpoints is important when investigating prognostic markers. Here we used both overall survival (OS), dis-ease specific survival (DSS) – also known as cancer specific survival and progression free survival (PFS). By using all three endpoints in Study II, III and IV, comparison to results published by others are made more feasible. We defined OS as the interval from date of imaging diagnosis to the date of death from all causes. Patients who did not die during the follow-up period were censored at the date of last follow-up contact at either Department of Urology or Department of Oncology in a hospital in Region of Southern Den-mark. DSS was defined as OS, with the exception that only deaths from RCC was considered an endpoint. PFS was defined as the in-terval from the date of imaging diagnosis to the date of progression or death from all causes. Patients alive at the end of the follow-up, who did not experience progression during the study period, where censored at the date of last follow-up. We finished collecting follow-up data in February 2013 for Studies II and III. The gathering of follow-up data for Study IV was com-pleted in November 2015.
Tissue Micro Array and Immune staining
Production of Tissue Micro Arrays The Tissue Micro Arrays produced for this study contained three morphologically representative cores from tumor and one non-sclerotic core from renal cortex parenchyma from each patient. Every full HE slide was prior to punching of the paraffin block eval-uated under the microscope to avoid areas with necrosis and
haemorrhage and to choose the areas most representative of tu-mor regarding Fuhrman grade, sarcomatoid growth and heteroge-neity. The selected areas were punched out from paraffin blocks as 3.0 mm biopsies and arrayed into new recipient paraffin blocks. Fifteen TMAs was produced, each containing 5-7 patient cases. An-other 11 TMAs was included in the study, produced for a Masters Thesis in the same way as described above (92), Figure 12. In order to evaluate the final TMAs, HE stained slides was produced from each TMA block.
Figure 12. TMA blocks containing tissue from 155 patients with different subtypes of RCC and oncocytoma. From each patient, tumor is represented by three cores and normal renal cortex by one core.
Immunohistochemical staining To discover the optimal concentration and type of epitope re-trieval, pilot studies were performed independently for each non-routinely used antibody (CK2α, KCa1.1 and KCa3.1). A dilution se-ries was made for each primary antibody and tested together with different epitope retrieval, i.e. heat induced epitope retrieval (in TRS, T-EG and citrate buffer) and with protease. The results were compared to similar staining reported in the literature. Several dif-ferent antibodies were tested for each antigen, before an optimal one was chosen. We used a TMA multiblock containing normal tis-sue and cancers from a variety of different organs as positive con-trol for all of the different antibodies. Omitting the primary anti-body on the same TMA block served as negative control. Western blot analysis confirmed the specificity of the antibodies directed against KCa3.1, KCa1.1 and CK2α. Immunohistochemistry and im-munofluorescence was processed as described in Studies II and IV (Table 5). All slides stained for CD31 were scanned on a digital slide scanner, NanoZoomer 2.0-HT slide scanner (Hamamatsu, Japan).
Quantification of staining Determination of microvessel density for Study II was done using the NewCast Whole Slide Stereology module in the software pro-gram Visiopharm Integrated System (Visiopharm, Hørsholm, Den-mark). Sample images from each core were collected randomly us-ing meander fraction-based sampling. Sampling was performed at 20 times magnification with a sample fraction of 10-25% of the to-tal core area. In each image, CD31 positive vessels were marked and counted manually. To determine microvessel density, results were averaged and the number of CD31-positive vessels was di-vided by the total area of the sample fraction of each core. CK2α staining was evaluated semi-quantitatively as described in Study IV. Each TMA core was evaluated independently and blinded by two pathologists following a pre-determined scoring system. Nuclei and cytoplasm was scored independently and only a mod-erate to strong intensity was graded. The cytoplasm was scored as 0 or 1+, when more than 10% of the cytoplasm area showed posi-tivity. The nuclei were scored as 0 (0%), 1+(1-25%), 2+(26-50%), 3+

DANISH MEDICAL JOURNAL 13
(51-75%) or 4+ (76-100%). All cases were then re-evaluated by both pathologists and a mean score for the cytoplasm and nuclei was obtained for the three tumor cores from the same patient. A final score was finally assigned each patient as a sum of scores of nuclei and cytoplasm (0-5+). Mutations in VHL were assessed by immunohistochemical staining. The three tumor cores from each patient were evaluated together and the patients were divided into two groups: Normal (>10% of cells positive for VHL) and mutated (≤ 10% VHL positivity) according to the method described by Weber et al (96).
Cell culturing and Electrophysiological experiments Primary cell cultures from four patients with ccRCC and one patient with oncocytoma were generated for the purpose of electrophysi-ological experiments and proliferation/scratch assays. Two differ-ent types of cell culturing were tested in order to retrieve the best growing culture. We tested primary explantation versus disaggre-gation with tissue from a single donor.
Table 5. Antibodies used in the thesis. Antibody Clone, producent Conc. Type Retrieval Detection Instrument KCa3.1 #AV35098
Sigma-Aldrich IHC: 1:2000 Rabbit polyclo-
nal T-EG
IHC: PV+ HRP None
#HPA053841 Sigma-Aldrich
IHC: 1:500 IF: 1:125
Rabbit polyclo-nal
T-EG IHC: PV+ HRP IF: Goat Anti Rabbit IgG Alexa Fluor 488
None
KCa1.1 #P4872 Sigma-Aldrich
IHC: 1:2000 Rabbit polyclo-nal
T-EG IHC: PV+ HRP None
CD31 #JC70A Dako
IHC: 1:25 IF: 1:12.5
Mouse mo-noclonal
CC1 IHC: OV-DAB IF: Goat Anti Mouse IgG Alexa Fluor 594
Benchmark Ultra
CD8 #CD8/144B Dako
IF: 1:25 Mouse mo-noclonal
T-EG IF: Goat Anti Mouse IgG Alexa Fluor 594
None
CK2α #HOM5 Made in-house
IHC: 1:400 Rabbit polyclo-nal
TRS IHC: PV+ HRP Autostainer Plus (Dako)
VHL #Sc-5575 Santa Cruz
IHC: 1:400 Rabbit polyclo-nal
Protease 1 OV-DAB Benchmark Ultra (Ventana)
Abbreviations: PV+HRP (PowerVision+ Horse Radish Peroxidase), IHC (immunohistochemistry), IF (immunofluorescence), OV-DAB (Optiview-DAB) In primary explant, a small fragment of donor tissue adheres to the growth surface which gives rise to an outgrowth of cells. In a disaggregated culture, the tissue is mechanically or enzymatically disaggregated and the suspension of cells will contain a propor-tion of cells capable of attachment to a solid substrate, forming a monolayer (97). The best results for our study were retrieved with the disaggregated culture in which we obtained a monolayer of confluent cells. The other primary cultures where created from the same protocol, Figure 13. In order to verify the content of tu-mor cells in the cultures we made a panel of immunohistochemi-cal stainings (PAX-8, CK7, VIM). Electron microscopy was per-formed on a cytospin of the oncocytoma cell line, to verify the presence of mitochondria in the cytosol. The fastest growing primary ccRCC cell culture and the oncocy-toma cell culture, together with two commercially ccRCC cell cul-tures (Caki-1 and Caki-2), were all cultured in a 1:1 mixture of DMEM containing 25 mM HEPES and DMEM+ GlutaMAX, supple-mented with 10% newborn calf serum and 1% penicillin/strepto-mycin in a humidified 5% CO2 incubator at 37°C. The primary cell cultures underwent senescence after a number of passages and we therefore chose to use the first subcultures for our electro-physiogical studies, immunocytochemistry and assays.
Patchclamping In Study II we used the whole-cell patchclamping method to inves-tigate the presence and activity of KCa channels in the tumor cell membranes of the cell lines shown in Figure 13. Moreover, our aim was to test the efficiency of the selective KCa3.1 blocker, TRAM-34 and Paxilline, an inhibitor of KCa1.1.
The argument for choosing this method is the very high precision and sensitivity for measuring currents and thereby also directly measure ion channel function.
Figure 13. HE stains of cell lines used in the electrophysiological experiments in Study II and IV. A. Primary oncocytoma cell line. B. Primary ccRCC cell line. C. Caki-1 cell line. D. Caki-2 cell line. 200x magnification.
Proliferation and scratch assays For the purpose of investigating whether pharmacological inhibi-tion of KCa channels decreases ccRCC cell proliferation in vitro, we performed a proliferation assay and a scratch assay in Study II. Moreover, to determine if pharmacological inhibition of CK2 could decrease ccRCC cell proliferation, a proliferation study was per-formed for Study IV. A great variety of assays for cell quantitation have been developed, often based on the detection of a linear relationship between cell
DANISH MEDICAL JOURNAL 14
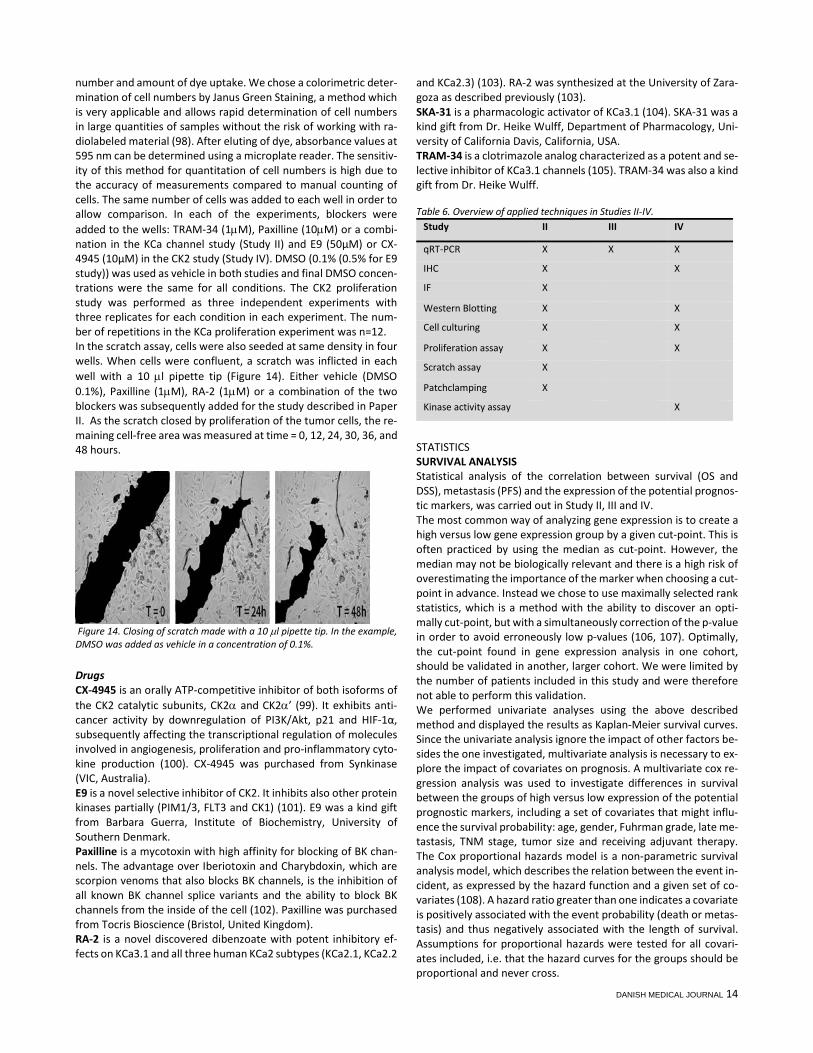
number and amount of dye uptake. We chose a colorimetric deter-mination of cell numbers by Janus Green Staining, a method which is very applicable and allows rapid determination of cell numbers in large quantities of samples without the risk of working with ra-diolabeled material (98). After eluting of dye, absorbance values at 595 nm can be determined using a microplate reader. The sensitiv-ity of this method for quantitation of cell numbers is high due to the accuracy of measurements compared to manual counting of cells. The same number of cells was added to each well in order to allow comparison. In each of the experiments, blockers were added to the wells: TRAM-34 (1µM), Paxilline (10µM) or a combi-nation in the KCa channel study (Study II) and E9 (50μM) or CX-4945 (10μM) in the CK2 study (Study IV). DMSO (0.1% (0.5% for E9 study)) was used as vehicle in both studies and final DMSO concen-trations were the same for all conditions. The CK2 proliferation study was performed as three independent experiments with three replicates for each condition in each experiment. The num-ber of repetitions in the KCa proliferation experiment was n=12. In the scratch assay, cells were also seeded at same density in four wells. When cells were confluent, a scratch was inflicted in each well with a 10 µl pipette tip (Figure 14). Either vehicle (DMSO 0.1%), Paxilline (1µM), RA-2 (1µM) or a combination of the two blockers was subsequently added for the study described in Paper II. As the scratch closed by proliferation of the tumor cells, the re-maining cell-free area was measured at time = 0, 12, 24, 30, 36, and 48 hours.
Figure 14. Closing of scratch made with a 10 µl pipette tip. In the example, DMSO was added as vehicle in a concentration of 0.1%.
Drugs CX-4945 is an orally ATP-competitive inhibitor of both isoforms of the CK2 catalytic subunits, CK2α and CK2α’ (99). It exhibits anti-cancer activity by downregulation of PI3K/Akt, p21 and HIF-1α, subsequently affecting the transcriptional regulation of molecules involved in angiogenesis, proliferation and pro-inflammatory cyto-kine production (100). CX-4945 was purchased from Synkinase (VIC, Australia). E9 is a novel selective inhibitor of CK2. It inhibits also other protein kinases partially (PIM1/3, FLT3 and CK1) (101). E9 was a kind gift from Barbara Guerra, Institute of Biochemistry, University of Southern Denmark. Paxilline is a mycotoxin with high affinity for blocking of BK chan-nels. The advantage over Iberiotoxin and Charybdoxin, which are scorpion venoms that also blocks BK channels, is the inhibition of all known BK channel splice variants and the ability to block BK channels from the inside of the cell (102). Paxilline was purchased from Tocris Bioscience (Bristol, United Kingdom). RA-2 is a novel discovered dibenzoate with potent inhibitory ef-fects on KCa3.1 and all three human KCa2 subtypes (KCa2.1, KCa2.2
and KCa2.3) (103). RA-2 was synthesized at the University of Zara-goza as described previously (103). SKA-31 is a pharmacologic activator of KCa3.1 (104). SKA-31 was a kind gift from Dr. Heike Wulff, Department of Pharmacology, Uni-versity of California Davis, California, USA. TRAM-34 is a clotrimazole analog characterized as a potent and se-lective inhibitor of KCa3.1 channels (105). TRAM-34 was also a kind gift from Dr. Heike Wulff. Table 6. Overview of applied techniques in Studies II-IV.
Study II III IV
qRT-PCR X X X
IHC X X
IF X
Western Blotting X X
Cell culturing X X
Proliferation assay X X
Scratch assay X
Patchclamping X
Kinase activity assay X
STATISTICS SURVIVAL ANALYSIS Statistical analysis of the correlation between survival (OS and DSS), metastasis (PFS) and the expression of the potential prognos-tic markers, was carried out in Study II, III and IV. The most common way of analyzing gene expression is to create a high versus low gene expression group by a given cut-point. This is often practiced by using the median as cut-point. However, the median may not be biologically relevant and there is a high risk of overestimating the importance of the marker when choosing a cut-point in advance. Instead we chose to use maximally selected rank statistics, which is a method with the ability to discover an opti-mally cut-point, but with a simultaneously correction of the p-value in order to avoid erroneously low p-values (106, 107). Optimally, the cut-point found in gene expression analysis in one cohort, should be validated in another, larger cohort. We were limited by the number of patients included in this study and were therefore not able to perform this validation. We performed univariate analyses using the above described method and displayed the results as Kaplan-Meier survival curves. Since the univariate analysis ignore the impact of other factors be-sides the one investigated, multivariate analysis is necessary to ex-plore the impact of covariates on prognosis. A multivariate cox re-gression analysis was used to investigate differences in survival between the groups of high versus low expression of the potential prognostic markers, including a set of covariates that might influ-ence the survival probability: age, gender, Fuhrman grade, late me-tastasis, TNM stage, tumor size and receiving adjuvant therapy. The Cox proportional hazards model is a non-parametric survival analysis model, which describes the relation between the event in-cident, as expressed by the hazard function and a given set of co-variates (108). A hazard ratio greater than one indicates a covariate is positively associated with the event probability (death or metas-tasis) and thus negatively associated with the length of survival. Assumptions for proportional hazards were tested for all covari-ates included, i.e. that the hazard curves for the groups should be proportional and never cross.

DANISH MEDICAL JOURNAL 15
Table 7. Statistical analyses used in the four studies. Description Statistical method
Study I Comparison of continuous variables between sympto-matic and incidentally discovered RCCs Comparison of categorical variables between sympto-matic and incidentally discovered RCCs
Student’s t-test χ2-test χ2-test for trend Fisher’s exact test
Study II Comparison of non-parametric matched samples Comparison of non-parametric independent samples Comparison of means of more than two samples Longitudinal studies: survival analysis Regression analysis of survival data
Wilcoxon-signed rank test Mann-Whitney U test One-way ANOVA followed by Tukey post hoc test Maximally selected rank statistics Cox Regression
Study III Comparison of non-parametric matched samples Comparison of categorical data Longitudinal studies: survival analysis Regression analysis of survival data
Wilcoxon signed rank test Fisher’s exact test Maximally selected rank statistics Cox Regression
Study IV Comparison of non-parametric matched samples Comparison of differences among groups Comparison of categorical variables Longitudinal studies: survival analysis Regression analysis of survival data
Wilcoxon-signed rank test Kruskal-Wallis test followed by Dunn’s multiple compar-isons test χ2-test Log-rank test Cox Regression
RESULTS The main and most important results from each study are pre-sented below.
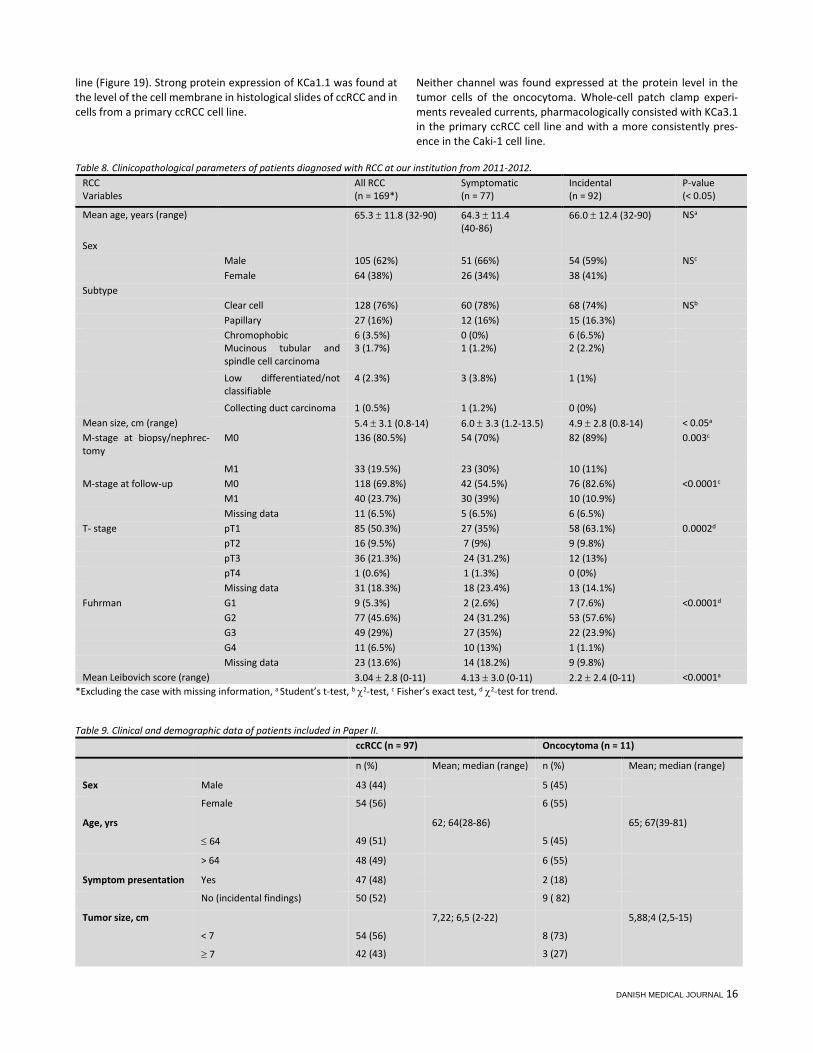
STUDY I A total number of 204 patients diagnosed with a renal neoplasm in the years 2011-2012 were included in the study (Table 8). Patho-logical diagnosis showed RCC in 170 patients (83%), a benign tumor in 33 cases (16%) and a neuroendocrine carcinoma in one case (0.5%). Eighty-nine patients (44%) had symptoms and 113 (55%) had an incidentally discovered renal tumor. Hematuria (55%) and flank pain (52%) were the most frequent symptoms. Patient characteristics of the 169 patients with RCC (one patient was excluded from analysis due to missing data on initial symp-toms) are presented in Table 8. Significant differences were ob-served between the groups of symptomatic RCC and incidental RCC: Tumors in the incidental group were significantly smaller (p<0.05) and were more frequently of lower stage (p<0.001), lower Fuhrman grade (p<0.001) and with a lower Leibovich score
(p<0.0001). Also distant metastases at presentation (p=0.003) and at follow-up (p<0.0001) were less common in the incidental group.
STUDY II In paper II, 97 patients with ccRCC and 11 oncocytomas were in-cluded. Table 9 shows their characteristics. Gene expression levels of KCa3.1 was 2-fold higher in tumor tissue (ccRCC) compared to normal renal cortex (p<0.001) and 12-fold higher in ccRCC compared to the benign oncocytoma (p<0.001). The mRNA expression of KCa1.1 was 3-fold higher in ccRCC than in oncocytoma, but no difference between the expression levels in tumor versus normal renal cortex was found. A high mRNA expres-sion of KCa3.1 was significantly associated with progression free survival (PFS) in univariate analysis (p=0.02) and in multivariate analysis (HR=3.37, p=0.012) (Figure 15). By immunohistchemistry, presence of KCa3.1 protein in tumor ves-sels and in one third of CD8-positive T-cells was demonstrated (Fig-ure 16, 17, 18). In addition, positive KCa3.1 staining was found pre-dominantly in or around the nucle of cells in a primary ccRCC cell
DANISH MEDICAL JOURNAL 16
line (Figure 19). Strong protein expression of KCa1.1 was found at the level of the cell membrane in histological slides of ccRCC and in cells from a primary ccRCC cell line.
Neither channel was found expressed at the protein level in the tumor cells of the oncocytoma. Whole-cell patch clamp experi-ments revealed currents, pharmacologically consisted with KCa3.1 in the primary ccRCC cell line and with a more consistently pres-ence in the Caki-1 cell line.
Table 8. Clinicopathological parameters of patients diagnosed with RCC at our institution from 2011-2012. RCC Variables
All RCC (n = 169*)
Symptomatic (n = 77)
Incidental (n = 92)
P-value (< 0.05)
Mean age, years (range) 65.3 ± 11.8 (32-90) 64.3 ± 11.4 (40-86)
66.0 ± 12.4 (32-90) NSa
Sex Male 105 (62%) 51 (66%) 54 (59%) NSc Female 64 (38%) 26 (34%) 38 (41%) Subtype Clear cell 128 (76%) 60 (78%) 68 (74%) NSb Papillary 27 (16%) 12 (16%) 15 (16.3%) Chromophobic 6 (3.5%) 0 (0%) 6 (6.5%) Mucinous tubular and
spindle cell carcinoma 3 (1.7%) 1 (1.2%) 2 (2.2%)
Low differentiated/not classifiable
4 (2.3%) 3 (3.8%) 1 (1%)
Collecting duct carcinoma 1 (0.5%) 1 (1.2%) 0 (0%) Mean size, cm (range) 5.4 ± 3.1 (0.8-14) 6.0 ± 3.3 (1.2-13.5) 4.9 ± 2.8 (0.8-14) < 0.05a M-stage at biopsy/nephrec-tomy
M0 136 (80.5%) 54 (70%) 82 (89%) 0.003c
M1 33 (19.5%) 23 (30%) 10 (11%) M-stage at follow-up M0 118 (69.8%) 42 (54.5%) 76 (82.6%) <0.0001c M1 40 (23.7%) 30 (39%) 10 (10.9%) Missing data 11 (6.5%) 5 (6.5%) 6 (6.5%) T- stage pT1 85 (50.3%) 27 (35%) 58 (63.1%) 0.0002d pT2 16 (9.5%) 7 (9%) 9 (9.8%) pT3 36 (21.3%) 24 (31.2%) 12 (13%) pT4 1 (0.6%) 1 (1.3%) 0 (0%) Missing data 31 (18.3%) 18 (23.4%) 13 (14.1%) Fuhrman G1 9 (5.3%) 2 (2.6%) 7 (7.6%) <0.0001d G2 77 (45.6%) 24 (31.2%) 53 (57.6%) G3 49 (29%) 27 (35%) 22 (23.9%) G4 11 (6.5%) 10 (13%) 1 (1.1%) Missing data 23 (13.6%) 14 (18.2%) 9 (9.8%) Mean Leibovich score (range) 3.04 ± 2.8 (0-11) 4.13 ± 3.0 (0-11) 2.2 ± 2.4 (0-11) <0.0001a
*Excluding the case with missing information, a Student’s t-test, b χ2-test, c Fisher’s exact test, d χ2-test for trend.
Table 9. Clinical and demographic data of patients included in Paper II. ccRCC (n = 97) Oncocytoma (n = 11)
n (%) Mean; median (range) n (%) Mean; median (range)
Sex Male 43 (44) 5 (45)
Female 54 (56) 6 (55)
Age, yrs 62; 64(28-86) 65; 67(39-81)
≤ 64 49 (51) 5 (45)
> 64 48 (49) 6 (55)
Symptom presentation Yes 47 (48) 2 (18)
No (incidental findings) 50 (52) 9 ( 82)
Tumor size, cm 7,22; 6,5 (2-22) 5,88;4 (2,5-15)
< 7 54 (56) 8 (73)
≥ 7 42 (43) 3 (27)

DANISH MEDICAL JOURNAL 17
TNM stage I 40 (41) .
II 18 (19) .
III 31 (32) .
IV 8 (8) .
Fuhrman grade G1+G2 53 (55) .
G3+G4 44 (45) .
Vessel invasion Yes 21 (22) .
No 76 (78) .
Adjuvant therapy Yes 24 (25) .
No 73 (75) .
Follow-up (months) 33; 29(0.92-106) 21; 4 (1.2-77.5)
Progression free survival (months)
28; 25 (0.03-86)
Death 34 (35) 2 (18)
Death from RCC 23 (24) 0 (0)
The currents were completely abolished by the selective KCa3.1 blocker, TRAM-34. Both primary ccRCC cells and Caki-1 cells dis-played typical KCa1.1 currents that could be inhibited by Paxilline. On the contrary, no currents of either KCa3.1 or KCa1.1 were found in oncocytoma cells (Figure 20). In a proliferation assay, we tested the impact of pharmacological inhibition of the KCa channels on ccRCC cell proliferation in vitro (using commercial Caki cells). Inhibition of KCa3.1 by TRAM-34 re-duced Caki cell proliferation to a minor degree (≈ 10%). Paxilline or the combination of Paxilline and TRAM-34 did not have any impact on the proliferation in vitro. A cell scratch assay revealed that nei-ther KCa3.1 nor KCa1.1 contributed to the mechanisms of cell mi-gration under these in-vitro conditions.
STUDY III In Paper III, we included the same 97 patients with ccRCC that were also included in Paper II. Reliable qRT-PCR data was generated for all patients. 28 patients experienced metastatic disease. The clini-cal and demographic data for these patients are presented in Table 9, first column. Eleven gene products were found to be significantly upregulated in the tumor tissue of ccRCC compared to normal renal cortex (AMACR, CSNK2A1, CSNK2A2, LGALS3, NNMT, PLIN2, STC2, TOP2A, UGCG, VEGFA, VIM). Six gene products were significantly downreg-ulated (CLCNKB, DEFB1, EGF, PVALB, RRAGB, SPP1). In univariate analysis, a high expression of CSNK2A1 was signifi-cantly associated with a poor OS (HR=5.01, p<0.001), DSS (HR=6.21, p=0.007) and PFS (HR =5.93, p=0.005), Figure 21A-C. Two other genes were also associated with a poor PFS (SPP1 (HR=4.41, p=0.04) and TOP2A (HR=4.7, p=0.03)) while DEFB1 correlated with better PFS (HR = 0.24, p=0.006), (Figure 21). A high expression of VEGFA was associated with a better OS and DSS. However, when patients treated with tyrosine kinase inhibitors were extracted from the analysis, VEGFA lost its relevance as a prognostic marker. In multivariate cox regression analysis three genes were signifi-cantly associated with OS: CSNK2A1 (HR = 3.56, 95% CI [1.4-9.06], p = 0.008), PLIN2 (HR = 2.97, 95% CI [1.06-8.32], p = 0.04) and VIM
(HR = 0.37, 95% CI [0.16-0.85], p = 0.02). Two genes correlated sig-nificantly with DSS; PLIN2 (HR = 0.21, 95% CI [0.06-0.73], p = 0.015) and VIM (HR = 0.30, 95 % CI [0.1-0.85], p = 0.02). Six genes correlated significantly with PFS; CSNK2A1 (HR = 3.84, 95% CI [1.5-9.8], p = 0.005), DEFB1 (HR = 0.37, 95% CI [0.15-0.89], p = 0.03), SPP1 (HR = 3.46, 95% CI[1.4-8.55], p = 0.007), LRP2 (HR = 0.38, 95% CI [0.16-0.93], p = 0.035), NNMT (HR = 2.66, 95% CI [1.17-6.08], p = 0.02), RRAGB (HR = 2.61, 95% CI [1.08-6.3], p = 0.03). Only CSNK2A1 (encoding CK2α subunit), SPP1 (encoding Osteopon-tin) and DEBF1 (encoding β-defensin) were significant in both uni-variate and multivariate analysis (Table 10). CSNK2A1, SPP1, TOP2A and HMGA1 correlated with high Fuhrman grade and the presence of metastasis. CSNK2A1 correlated further-more with high TNM stage (Table 11). DEFB1 was significantly as-sociated with not having metastasis.
STUDY IV Patient characteristics from the 155 patients included in Manu-script IV are presented in Table 12. Gene expression levels of CSNK2A1 (encoding CK2α subunit), CSNK2A2 (encoding CK2α’ subunit) and CSNK2B (encoding CK2β subunit) was investigated by TaqMan® Array (qRT-PCR). We in-cluded the following patients in the analysis of CSNK2A1 and CSNK2A2: ccRCC, n=97, PRCC, n=23, ChRCC, n=8 and RO, n=11 and in the analysis of CSNK2B: ccRCC, n=41, PRCC, n=5, ChRCC, n=3 and RO, n=6. Here we could show an up-regulation of CK2α, α’ and β subunits in tumor tissue of ccRCC compared to normal renal cortex, as de-picted in Figure 22. No significant differential expression of any of the subunits was found between ccRCC, ChRCC, PRCC and RO. Im-munohistochemical staining of the TMAs gave evidence of a high protein expression of CK2α in 19 ccRCCs (18%), 5 PRCCs (19%), 1 ChRCC (13%) and 4 ROs (30%). Strong expression was defined as a score of 3+ or more when a sum of nuclear and cytoplasmic stain-ing was made. Representative images of CK2α staining are shown in Figure 23. Based on the results obtained in Paper III, where we

DANISH MEDICAL JOURNAL 18
gave evidence of a significant correlation between high mRNA ex-pression of CK2α and poor prognosis in ccRCC, we investigated the impact of high CK2α protein expression on prognosis. A positive nuclear staining in high stage ccRCC (pT3-4) was associated with poor PFS (log-rank, p=0.02, HR =8.11). In addition we noticed a ten-dency toward a correlation with DSS (log-rank, p=0.06, HR=5.6) (Figure 24). Having a positive protein expression in the cytoplasm in addition to a positive nuclear staining did not seem to have any impact on prognosis.
Figure 15. High expression of KCa3.1 is associated with poor Progression Free Survival. We then compared CK2α in high stage ccRCC to gender, age, Fuhr-man grade, tumorsize, Leibovich score, T-stage, metastasis and
VHL mutation status. A positive nuclear staining of CK2α correlated significantly with late metastasis (Table 14). However, nuclear ex-pression of CK2α did not independently correlate with survival in multivariate analysis (Table 15).
Figure 16. Representative KCa3.1 and KCa1.1 immunohistochemical stain-ing of ccRCC and RO. (A-B) A positive KCa3.1 staining was primarily found in vessels (long arrow) and immune cells (block arrow) (C) Positive KCa1.1 staining of the ccRCC tumor cell membrane (long arrow). (D) Oncocytoma tumor cells were negative of KCa1.1. “Block” arrow indicates staining of im-mune cells. Magnification 200x.
Figure 17. (A-B) Representative CD31 immunohistochemical staining of ccRCC and oncocytoma. (C) No difference in microvessel density was found between the two tumor types. Data are given as mean ± SEM. Number of patients: n=7. *** p<0.001. We investigated protein expression of CK2α in ccRCC by both im-munohistochemistry (n=105) and western blotting (n=6). No dif-ference between normal renal cortex and tumor could be detected

DANISH MEDICAL JOURNAL 19
by IHC, whereas on the contrary, a significantly higher protein ex-pression was found by immunoblotting in samples from 6 ran-domly selected patients (p=0.03), Figure 25. Similarly, kinase activ-ity of CK2 was significantly higher in ccRCC compared to normal renal cortex, p = 0.03.
Figure 18. (A-B) Double immunofluorescence staining, KCa3.1 (green) and CD8 (red), of ccRCC and oncocytoma. Long arrows indicate immune cells positive for both KCa3.1 and CD8, block arrows indicate CD8 positive T-lym-phocytes. Grey arrows indicate erythrocytes. (C) Quantification of CD8+ and KCa3.1+ immune cells. One third of CD8+ cells were also KCa3.1 positive. Data are given as mean ± SEM. Number of tumors: n=7 of each. *p<0.05. On the basis of these results we wished to elucidate whether inhi-bition of the protein kinase CK2 could have any impact on tumor growth. We then performed a proliferation assay on the Caki-2 cell lines. Two distinctive inhibitors of CK2 (E9 and CX-4945) were added in specific concentrations (CX-4945 = 10μM and E9 = 50μM) and the cells ability to proliferate was followed during the next week. E9 did not seem to have any effect on growth at the chosen concentration (50μM), whereas CX-4945 (10μM) in-hibited Caki-2 cell growth to approximately 50% compared to con-trol cells in vehicle (DMSO) (Figure 26). ADDITIONAL RESULTS Figure 27, 28, 29 and Table 16 displays additional results, which were not included in the four studies. Figure 27 depicts overall sur-vival by Kaplan Meier survival estimates for the different subtypes of RCC and RO included in this thesis. In the TaqMan array we also included samples from other subtypes than ccRCC (PRCC (n=23), ChRCC (n=8) and RO (n=11), see Figure 8). Figure 28 displays results from gene expression analyses comparing the expression in meta-static and non-metastatic RCC and Figure 29 the gene expression levels in different subtypes of RCC and oncocytoma.
Five genes showed an overall much higher gene expression than the rest (HMGA1, KCNN4, PVALB, STC2 and TOP2A). A significant difference between non-metastatic and metastatic RCC (including all subtypes) was found in KCNN4, DEFB1 and TOP2A (unpaired t-test). As depicted in Figure 28, the variation of gene expression among the different subtypes was very large in some genes. KCNN4, LRP2, NNMT, PLIN2, STC2, TOP2A, VEGFA and VIM were primarily ex-pressed in ccRCC. CLCNKB, DEFB1, EGF, HMGA1, LGALS3 and PVALB were primarily expressed in tumors derived from the distal tubules (ChRCC and RO).
Figure 19. Immunostaining of KCa3.1 and KCa1.1 in different cell lines of ccRCC and oncocytoma. (A-B) Similar pattern of KCa3.1 staining in the pri-mary ccRCC cell line and Caki-1. (C) The oncocytoma cell line was devoid of KCa3.1 protein. (D) KCa3.1-transfected HEK cells served as positive control. (E) Weak KCa1.1 staining of the membrane of ccRCC cells. (F) Oncocytoma tumor cells were negative of KCa1.1 (G) A glioblastoma multiforme cell line (U251 MG) served as positive control for KCa1.1. (H) The negative control consisted of omission of the primary antibody. Magnification 200x.

DANISH MEDICAL JOURNAL 20
Figure 20. (A). Electrophysiological characterization of KCa3.1 channels in ccRCC and oncocytoma cell lines. (B) Electrophysiological characterization of KCa1.1 channels in ccRCC and oncocytoma cell lines.
Figure 21. Univariate analyses of genes with significant impact on progno-sis, presented as Kaplan Meier survival curves.
Figure 22. (A) Subunits of CK2 are overexpressed in ccRCC compared to nor-mal renal cortex. (B-D) mRNA expression of subunits in different subtypes of RCC and in oncocytoma (RO). No significant difference was found. Data are given as mean ± SEM.
Table 10. Multivariate Cox Regression Analyses including clinical variables and selected gene products significant in both univariate and multivariate anal-yses.
Variables Overall survival Disease specific survival Progression free survival HR (95% CI) p HR (95%CI) p HR (95% CI) p Age (years) ≤ 64 1.00 1.00 1.00 > 64 2.25 (0.92-5.48) 0.08 1.85 (0.58-5.86) 0.3 1.35 (0.56-3.24) 0.5 Stage I+II 1.00 1.00 1.00 III+IV 1.19 (0.46-3.06) 0.72 1.58 (0.46-5.35) 0.5 2.96 (1.17-7.47) 0.02 Fuhrman G1+G2 1.00 1.00 1.00 G3+G4 0.8 (0.34-1.9) 0.6 1.98 (0.64-6.08) 0.24 3.59 (1.38-9.35) 0.009 Tumor size (cm) < 7 1.00 1.00 1.00 ≥ 7 0.55 (0.24-1.23) 0.14 0.69 (0.26-1.81) 0.45 1.72 (0.65-4.56) 0.28 Metastasis No 1.00 1.00 - - Yes 2.6 (1.06-6.41) 0.04 5.94 (1.74-20.25) 0.004 - - CSNK2A1 Low 1.00 1.00 1.00 High 3.56 (1.40-9.06) 0.008 1.97 (0.66-5.9) 0.23 3.84 (1.5-9.8) 0.005 Age (years) ≤ 64 1.00 1.00 1.00

DANISH MEDICAL JOURNAL 21
> 64 2.11 (0.8-5.38) 0.12 1.76 (0.5-6.3) 0.4 1.15 (0.5-2.67) 0.74 Stage I+II 1.00 1.00 1.00 III+IV 1.58 (0.66-3.79) 0.31 2.01 (0.58-6.53) 0.3 3.06 (1.33-7.04) 0.009 Fuhrman G1+G2 1.00 1.00 1.00 G3+G4 0.88 (0.36-2.12) 0.77 1.94 (0.58-6.5) 0.3 3.09 (1.19-8.06) 0.02 Tumor size (cm) < 7 1.00 1.00 1.00 ≥ 7 0.61 (0.27-1.33) 0.21 0.7 (0.28-1.88) 0.5 2.16 (0.86-5.43) 0.1 Metastasis No 1.00 1.00 - - Yes 2.70 (1.16-6.28) 0.02 5.8 (1.75-19.23) 0.004 - - SPP1 Low 1.00 1.00 1.00 High 1.87 (0.7-4.77) 0.19 1.59 (0.51-4.99) 0.4 3.46 (1.4-8.55) 0.007 Age (years) ≤ 64 1.00 1.00 1.00 > 64 2.53 (.03-6.23) 0.04 2.21 (0.68-7.13) 0.19 2.09 (0.85-5.19) 0.11 Stage I+II 1.00 1.00 1.00 III+IV 1.56 (0.64-3.81) 0.3 2.18 (0.63-7.58) 0.22 2.63 (1.09-6.36) 0.03 Fuhrman G1+G2 1.00 1.00 1.00 G3+G4 1.12 (0.52-2.43) 0.8 2.86 (0.91-8.95) 0.07 3.29 (1.27-8.52) 0.01 Tumor size (cm) < 7 1.00 1.00 1.00 ≥ 7 0.59 (0.27-1.28) 0.2 0.73 (0.28-1.88) 0.52 1.92 (0.73-5.01) 0.2 Metastasis No 1.00 1.00 . Yes 2.86 (1.17-6.98) 0.02 5.26 (1.53-18.02) 0.008 . . DEFB1 Low 1.00 1.00 1.00 High 0.95 (0.39-2.3) 0.9 0.54 (0.17-1.73) 0.3 0.37 (0.15-0.89) 0.027
Table 11. Correlation between the clinicopathological variables and expression of CSNK2A1, SPP1, VEGF, TOP2A, DEFB1, and HMGA1.
Factors Patients (%) CK2α High (p)
SPP1 High (p)
VEGF High (p)
TOP2A High (p)
DEFB1 High (p)
HMGA1 High (p)
Sex Male 54 (56) 7 10 29 7 47 10 Female 43 (44) 7 (0.77) 10 (0.62) 27 (0.4) 4 (0.75) 35 (0.57) 9 (0.8) Age, years ≤ 64 49 (51) 6 5 28 7 40 9 > 64 48 (49) 8 (0.77) 15 (0.01*) 28 (1.0) 4 (0.52) 42 (0.58) 10 (0.8) Tumor size, cm < 7 54 (56) 6 12 31 3 48 8 ≥ 7 42 (44)§ 8 (0.38) 8 (0.8) 24 (1.0) 8 (0.05) 34 (0.38) 11 (0.2) TNM stage I+II 58 (60) 4 8 35 3 52 7 III+IV 39 (40) 10 (0.02*) 12 (0.07) 21 (0.5) 8 (0.03) 30 (0.15) 12 (0.04*) Fuhrman grade G1+G2 53 (55) 4 5 37 2 48 4 G3+G4 44 (45) 10 (0.04*) 15 (0.005**) 19 (0.01*) 9 (0.02*) 34 (0.09) 15 (0.002**) Metastasis No 68 (71) 5 9 44 3 64 7 Yes 28 (29) § 9 (0.003**) 11 (0.01*) 12 (0.07) 8 (0.002**) 17 (0.0001***) 11 (0.003**)
§Missing information on one patient. * p <0.05, ** p< 0.01, *** p<0.001 Table 12. Clinical and demographic data of the 155 patients included in the TMAs.
ccRCC (n=105) PRCC (n=27) ChRCC (n=8) RO (n=13) UcRCC (n=2) Sex Male 60 (57) 22 (81.5) 5 (62.5) 6 (46.2) 1 (50) Female 45 (43) 5 (18.5) 3 (37.5) 7 (53.9) 1 (50)
Age, years 62.2(28.1-86.4) 61.2 (28.4-81.0) 51.5 (38.6-63.9) 66.2(39.5-81.5) 70.5 (69.6-71.4)
Tumor size, cm
7.2 (2-22) 4.99 (1.5-11) 7.44 (3.7-11.5) 5.58(2.2-15)
10.5 (8-13)
pT stage § pT1 a/b 43 (41) 17 (65.4) 2 (25) . 0 pT2 a/b 22 (21) 3 (11.5) 3 (37.5) . 1 (50) pT3 a/b 39 (37) 5 (19.2) 3 (37.5) . 1 (50) pT4 1 (1) 1 (3.9) 0 (0) . 0
Late metastasis
32 (30.5) 6 (22.2) 0 (0) . 1 (50)
Fuhrman grade
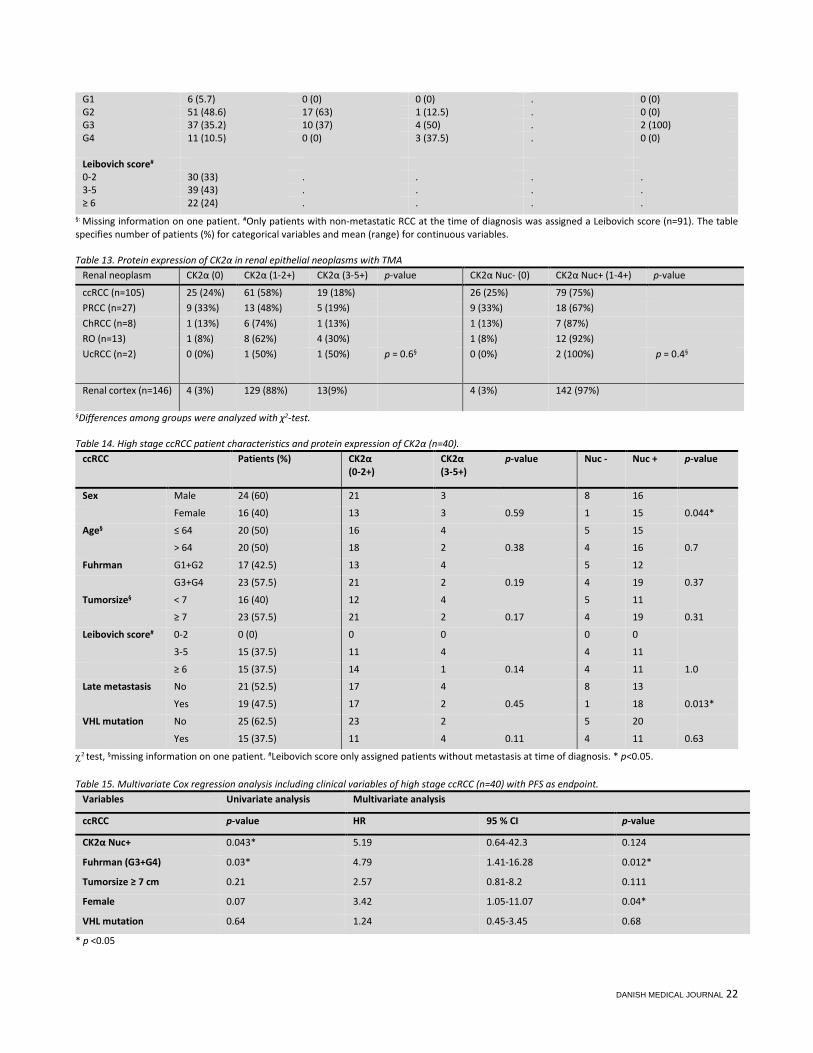
DANISH MEDICAL JOURNAL 22
G1 6 (5.7) 0 (0) 0 (0) . 0 (0) G2 51 (48.6) 17 (63) 1 (12.5) . 0 (0) G3 37 (35.2) 10 (37) 4 (50) . 2 (100) G4 11 (10.5) 0 (0) 3 (37.5) . 0 (0)
Leibovich score# 0-2 30 (33) . . . . 3-5 39 (43) . . . . ≥ 6 22 (24) . . . .
§: Missing information on one patient. #Only patients with non-metastatic RCC at the time of diagnosis was assigned a Leibovich score (n=91). The table specifies number of patients (%) for categorical variables and mean (range) for continuous variables. Table 13. Protein expression of CK2α in renal epithelial neoplasms with TMA
Renal neoplasm CK2α (0) CK2α (1-2+) CK2α (3-5+) p-value CK2α Nuc- (0) CK2α Nuc+ (1-4+) p-value
ccRCC (n=105) 25 (24%) 61 (58%) 19 (18%) 26 (25%) 79 (75%) PRCC (n=27) 9 (33%) 13 (48%) 5 (19%) 9 (33%) 18 (67%) ChRCC (n=8) 1 (13%) 6 (74%) 1 (13%) 1 (13%) 7 (87%) RO (n=13) 1 (8%) 8 (62%) 4 (30%) 1 (8%) 12 (92%) UcRCC (n=2) 0 (0%) 1 (50%) 1 (50%) p = 0.6§ 0 (0%) 2 (100%) p = 0.4§
Renal cortex (n=146) 4 (3%) 129 (88%) 13(9%) 4 (3%) 142 (97%)
§Differences among groups were analyzed with χ2-test. Table 14. High stage ccRCC patient characteristics and protein expression of CK2α (n=40).
ccRCC Patients (%) CK2α (0-2+)
CK2α (3-5+)
p-value Nuc - Nuc + p-value
Sex Male 24 (60) 21 3 8 16
Female 16 (40) 13 3 0.59 1 15 0.044*
Age§ ≤ 64 20 (50) 16 4 5 15
> 64 20 (50) 18 2 0.38 4 16 0.7
Fuhrman G1+G2 17 (42.5) 13 4 5 12
G3+G4 23 (57.5) 21 2 0.19 4 19 0.37
Tumorsize§ < 7 16 (40) 12 4 5 11
≥ 7 23 (57.5) 21 2 0.17 4 19 0.31
Leibovich score# 0-2 0 (0) 0 0 0 0
3-5 15 (37.5) 11 4 4 11
≥ 6 15 (37.5) 14 1 0.14 4 11 1.0
Late metastasis No 21 (52.5) 17 4 8 13
Yes 19 (47.5) 17 2 0.45 1 18 0.013*
VHL mutation No 25 (62.5) 23 2 5 20
Yes 15 (37.5) 11 4 0.11 4 11 0.63
χ2 test, §missing information on one patient. #Leibovich score only assigned patients without metastasis at time of diagnosis. * p<0.05. Table 15. Multivariate Cox regression analysis including clinical variables of high stage ccRCC (n=40) with PFS as endpoint.
Variables Univariate analysis Multivariate analysis
ccRCC p-value HR 95 % CI p-value
CK2α Nuc+ 0.043* 5.19 0.64-42.3 0.124
Fuhrman (G3+G4) 0.03* 4.79 1.41-16.28 0.012*
Tumorsize ≥ 7 cm 0.21 2.57 0.81-8.2 0.111
Female 0.07 3.42 1.05-11.07 0.04*
VHL mutation 0.64 1.24 0.45-3.45 0.68
* p <0.05

DANISH MEDICAL JOURNAL 23
Figure 23. Protein expression of CK2α in different subtypes of RCC and oncocytoma. (A-D) High protein expression of CK2α (3-5+) in ccRCC (5+), ChRCC (4+), PRCC (3+) and oncocytoma (4+). (E-H) Representative staining scores of CK2α in ccRCC. Scalebar indicates 0-250 μm. 400x magnification The expression levels of CSNK2A1, CSNK2A2 and RRAGB did not vary significantly among the different subtypes (Table 16). Using gene expression levels as a diagnostic tool could be very attractive. However, none of the genes investigated were able to distinguish
between RO and ChRCC, which is the most common challenge in daily clinical routine.

DANISH MEDICAL JOURNAL 24
DISCUSSION The results presented in this thesis are all based on studies aiming at investigating the prognostic role of selected gene and protein
expressions in RCC. Below follows a general discussion of the meth-ods used and results obtained, followed by a more focused discus-sion for each study. A brief overview of strengths and limitations of each study is provided in Table 17.
Figure 24 (A-C). Nuclear expression of CK2α is significantly correlated with poor PFS.
Figure 25. (A) Whole cell lysates from normal (Renal cortex) and tumor (ccRCC) tissue samples (30 g) were subjected to CK2 kinase activity assay. The activity is expressed as percentage of control (Renal cortex). (B) 30 g of whole cell lysates from control (C, renal cortex) and tumor (T, ccRCC) were subjected to SDS-polyacrylamide gel electrophoresis (PAGE). Separated pro-teins were transferred to polyvinylidene difluoride (PVDF) membrane by western blot. Proteins were visualized by probing the membranes with an-tibodies against CK2α and β-actin, respectively. Densitometric analysis of protein bands is expressed as percentage of control. E9 (B) did not have any inhibitory effect on cell proliferation. Experiment was repeated three times with three replicates for each condition. *p<0.05.
GENERAL DISCUSSION
INCLUSION OF PATIENTS The number of patients included in the qRT-PCR studies in this the-sis was naturally limited by the amount of tissue available as frozen samples. All patients were included retrospectively and this gives rise to some limitations since data were not gathered for the spe-cific purpose of our studies. One major problem in this setting is missing data (109). For this reason we chose to exclude patients with missing follow-up data, although this could result in missing important information.

DANISH MEDICAL JOURNAL 25
Figure 26. Proliferation assay. Inhibition of CK2 by CX-4945 (A) modulated cell proliferation of Caki-2 cells significantly, compared to vehicle (DMSO).
Figure 27. Kaplan Meier survival estimates for the different subtypes of RCC and RO. Only few other clinical data were missing, such as tumor size, pathological T-stage and information on metastasis in one patient and to not diminish the number of patients further, we chose to include these. We chose to exclude patients where frozen tissue from either cortex or tumor was missing, and one can argue whether this was necessary, although it simplified the following statistical calculations. Nevertheless, we would have had a higher number of patients included, if we had only chosen to exclude pa-tients without available tumor tissue. The relative 5-year survival of our ccRCC cohort (n=97) was 62%, CI (0.45-0.76), which is fairly comparable to the relative 5-year sur-vival of 58%, CI (0.55-0.60) in Denmark (2009-2013), as stated by
Engholm et al (110). On this background, we consider our cohort to be representable for ccRCC patients in Denmark.
Figure 28. Gene expression levels of all included genes in the TaqMan array in metastatic and non-metastatic RCC. Data are given as mean ± SEM. *p < 0.05, ** p < 0.005, *** p < 0.001. All tumors were evaluated and reclassified according to subtype, Fuhrman grade and Leibovich score by two pathologists according to the new WHO classification from 2004. Among the different sub-types, the number of ccRCC cases was sufficiently high to make multivariate analysis possible. Since various studies have sug-gested that for each candidate predictor studied, at least 10 events are required (111, 112), the limited number of the other subtypes restricted further prognostic studies on these. Due to the fact that different subtypes of RCC have specific molecular features we found it important to investigate each subtype separately and it makes the comparison to other prognostic studies more feasible.
Endpoints Traditionally, Overall Survival (OS) has been considered the golden standard in evaluating clinical benefits, since death is easy to de-fine, is easily compared across disease sites and is not subject to investigator bias. Disease specific survival (also known as cancer-specific survival or RCC-specific survival) is a more specific end-point, since only death from RCC is considered and the prognosis is not “contaminated” by deaths due to other diseases. Reporting DSS requires access to a death cause register. Progression free survival is another frequently used endpoint. It is an intermediate endpoint and is defined by the length of time after a treatment where the disease does not progress (defined by ei-ther radiologic or clinical measures). In this thesis, evidence of pro-gression was obtained merely by radiologic examination (CT scan) and not by clinical evaluation. PFS has the benefit of not being af-fected by contamination of subsequent active cancer therapies,

DANISH MEDICAL JOURNAL 26
but detection of progression can be affected by the timing and fre-quency of assessments, by measurement bias or by patient factors, including missed or late evaluations. These issues do not affect OS. The use of OS requires long-term follow-up and because of a lower event rate, it also requires a larger number of patients than PFS. PFS is considered a valid and appropriate outcome measure in mRCC and also a possible surrogate measure for OS (113). In this thesis we chose to report all three endpoints (OS, DSS and PFS) due to a relatively low patient number and to clarify the impact of the
prognostic markers on all endpoints. This makes comparisons to other prognostic studies more feasible. All three endpoints were measured from date of imaging diagnosis to either date of death (OS), date of death from RCC (DSS) or date of progression (PFS). We chose date of imaging diagnosis instead of date of surgery as inclu-sion date since we observed a negative number of days when cal-culating PFS in the patients already having metastasis at the time of diagnosis.
Table 16. Results from Dunn’s multiple comparisons test investigating differences of gene expression levels between subtypes.
ccRCC vs. PRCC ccRCC vs. ChRCC ccRCC vs. RO PRCC vs. ChRCC PRCC vs. RO ChRCC vs. RO
AMACR ** ns **** *** **** ns
CLCNKB ns ** **** * ** ns
CSNK2A1 ns ns ns Ns ns ns
CSNK2A2 ns ns ns Ns ns ns
DEFB1 **** ** **** Ns ns ns
EGF ns *** ** **** *** ns
HMGA1 ns *** ns Ns ns ns
KCNN4 *** ns ** Ns ns ns
LGALS3 ns ** * ** ns ns
LRP2 ns ** **** Ns *** ns
NNMT ns *** **** Ns ** ns
PLIN2 **** ** **** Ns ns ns
PVALB ns *** *** **** **** ns
RRAGB ns ns ns Ns ns ns
SPP1 **** ns ns Ns ** ns
STC2 **** ns **** Ns ns ns
TOP2A *** ns **** Ns ns ns
UGCG ns ns ** Ns ** ns
VEGFA **** ** **** Ns ns ns
VIM **** **** **** Ns ns ns
*p <0.05, **p< 0.005, ***p<0.001, ****p<0.0001 Treatment during follow-up During the last decade, substantial changes in the treatment op-tions for metastatic RCC has occurred and the survival has im-proved as a consequence. These changes in treatment are also re-flected in our patient cohort and hence, very few patients have received the same treatment. This complicates a prognostic study, since different treatment modalities may have an impact on prog-nosis. In addition, with a relatively small patient number as used in this thesis, the search for a predictive biomarker is very difficult. Our focus was therefore on the discovery of novel prognostic bi-omarkers, which are more independent of therapy. For the same reasons, therapy was not included in the multivariate regression analysis in Study III and IV.
Methodological considerations The kidney was dissected macroscopically on the arrival at Depart-ment of Pathology and relevant representative areas of tumor and adjacent renal cortex was collected for storage. It is well known,
that high grade RCCs can have small satellite nodules or infiltrate between the renal tubular structures (114), and hence the risk of having smaller amounts of tumor tissue represented in the col-lected normal kidney tissue is present, although this is probably not the common case. The single-biopsy issues touched upon in the introduction of this thesis may also be applicable to qRT-PCR studies. The recent iden-tification of significant intra-tumoral heterogeneity may compli-cate studies investigating molecular marker expression like ours, where only a smaller amount of tumor tissue is used for purifica-tion. This is a limitation to our study, but for future research pur-poses, pieces from several parts of the tumor could be used for gene expression analyses.
Real-time qRT-PCR by TaqMan® Array Our prognostic studies included gene expression analyses carried out by qRT-PCR using the TaqMan® Array. Another option would have been a microarray analysis. The benefit of this method is the exploration of the whole genome profile. However, microarray

DANISH MEDICAL JOURNAL 27
Figure 29. Gene expression in different subtypes of RCC (ccRCC (n=97), PRCC (n=23), ChRCC (n=8)) and oncocytoma (n=11). Differences between sub-types were investigated by One-Way ANOVA followed by Dunn’s multiple comparisons test (Table 16). P-values below 0.05 were considered statistical significant. analyses of RCC have been performed to a large extent earlier on and the future challenges lies in validating the genes found to have an importance in these studies (115-123). In addition, qRT-PCR is a more sensitive method for detecting changes in gene expression levels and is therefore the preferred method when it comes to val-idating a few selected genes. We did also a minor study analyzing gene expression levels of KCa1.1 using SYBR green, another type of qRT-PCR. SYBR-Green based detection is also a highly specific type of chemistry to detect PCR products. It has the advantage of not requiring probes, which reduces the assay setup and running costs. The recommendations from the manufacturers were carefully followed in the process and the MIQE (Minimum Information for Publication of Quantitative Real-Time PCR Experiments) guidelines were used throughout the study (124). In the following section, some of the issues/concerns
we experienced while conducting the PCR experiments are dis-cussed. RNA from all cases was extracted by TRIZOL, a very commonly used method (125). This is a single-step RNA isolation method based on Guanidine isothiocyanate/phenol/chloroform extrac-tion. The advantages of this method are that it is less time-con-suming, since it can be completed within hours and the RNA yield from this method is often higher than from column-based meth-ods such as RNeasy. The disadvantage is that it requires use of toxic chemicals like phenol/chloroform. There is also a risk of con-tamination of the total RNA by residue organics or genomic DNA. We therefore treated all of our samples with DNase to eliminate genomic DNA contamination before proceeding with cDNA syn-thesis. The amount of RNA was tested for all samples by Nanodrop and for 10 randomly chosen samples by the Agilent 2100 Bioanalyzer, which gave us a good impression of the RNA quality. In some of our samples, the RNA was partially degraded, as shown by lack of 18S and 28S bands. The 260nm/280nm ab-sorbance was lower than 1.6 in a minor part of our samples, sug-gesting significant protein contamination. These samples were excluded from the study (n=2). According to the MIQE guidelines, normalization against a single reference gene is not acceptable. The optimal number and choice of reference genes must be experimentally determined for the particular tissue included in the study (124). In order to fulfill these requirements we used the GeNorm algorithm to investigate the stability of reference genes previously reported to be stable and suitable for gene expression analysis in RCC. This led to the inclusion of three very stable reference genes (HMBS, TBP, PPIA) and the exclusion of GAPDH, an otherwise very used reference gene. Technical replicates, meaning several measurements on the same sample, are used for reflection of the intra-assay variation and to test the reproducibility of the method. Using triplicates is considered the best choice, since the risk of having to exclude a sample due to large variations is diminished, but the expenses in-creases heavily by this choice. When using single replicates, the reproducibility of the method cannot be tested, and we chose therefore to use duplicates in our study. This resulted in the ex-
clusion of three samples due to Ct values above the limit of detec-tion in 2/2 replicates in the reference genes. We chose the TaqMan® Array as the qRT-PCR method for our prog-nostic studies. Some of the advantages of this method are that it detects only specific amplification products and since specific hy-bridization between probe and target is required to generate a flu-orescent signal, background and false positives are significantly re-duced. The disadvantage of this method is the relative high running costs since a different probe has to be synthesized for each unique target sequence. The transcripts of most human genes are alternatively spliced, meaning that different exons of a gene may be included or ex-cluded in the final messenger RNA produced from that gene (124). Consequently, the proteins translated may have various amino acid sequences and different biological functions. This is important when conducting a qRT-PCR experiment, since assays spanning only 1-2 exons may not be sufficient to describe the expression level of a certain gene. For this reason, we carefully selected the assays spanning most exons and with the best coverage in the Taq-Man run.
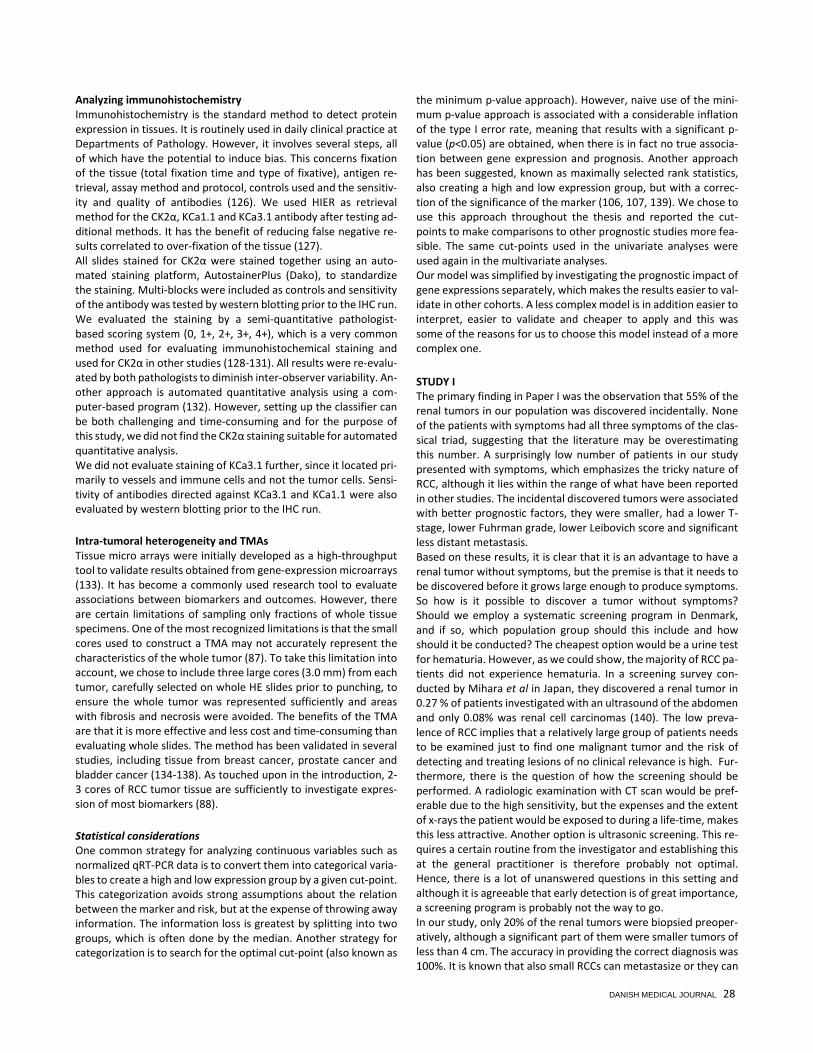
DANISH MEDICAL JOURNAL 28
Analyzing immunohistochemistry Immunohistochemistry is the standard method to detect protein expression in tissues. It is routinely used in daily clinical practice at Departments of Pathology. However, it involves several steps, all of which have the potential to induce bias. This concerns fixation of the tissue (total fixation time and type of fixative), antigen re-trieval, assay method and protocol, controls used and the sensitiv-ity and quality of antibodies (126). We used HIER as retrieval method for the CK2α, KCa1.1 and KCa3.1 antibody after testing ad-ditional methods. It has the benefit of reducing false negative re-sults correlated to over-fixation of the tissue (127). All slides stained for CK2α were stained together using an auto-mated staining platform, AutostainerPlus (Dako), to standardize the staining. Multi-blocks were included as controls and sensitivity of the antibody was tested by western blotting prior to the IHC run. We evaluated the staining by a semi-quantitative pathologist-based scoring system (0, 1+, 2+, 3+, 4+), which is a very common method used for evaluating immunohistochemical staining and used for CK2α in other studies (128-131). All results were re-evalu-ated by both pathologists to diminish inter-observer variability. An-other approach is automated quantitative analysis using a com-puter-based program (132). However, setting up the classifier can be both challenging and time-consuming and for the purpose of this study, we did not find the CK2α staining suitable for automated quantitative analysis. We did not evaluate staining of KCa3.1 further, since it located pri-marily to vessels and immune cells and not the tumor cells. Sensi-tivity of antibodies directed against KCa3.1 and KCa1.1 were also evaluated by western blotting prior to the IHC run.
Intra-tumoral heterogeneity and TMAs Tissue micro arrays were initially developed as a high-throughput tool to validate results obtained from gene-expression microarrays (133). It has become a commonly used research tool to evaluate associations between biomarkers and outcomes. However, there are certain limitations of sampling only fractions of whole tissue specimens. One of the most recognized limitations is that the small cores used to construct a TMA may not accurately represent the characteristics of the whole tumor (87). To take this limitation into account, we chose to include three large cores (3.0 mm) from each tumor, carefully selected on whole HE slides prior to punching, to ensure the whole tumor was represented sufficiently and areas with fibrosis and necrosis were avoided. The benefits of the TMA are that it is more effective and less cost and time-consuming than evaluating whole slides. The method has been validated in several studies, including tissue from breast cancer, prostate cancer and bladder cancer (134-138). As touched upon in the introduction, 2-3 cores of RCC tumor tissue are sufficiently to investigate expres-sion of most biomarkers (88).
Statistical considerations One common strategy for analyzing continuous variables such as normalized qRT-PCR data is to convert them into categorical varia-bles to create a high and low expression group by a given cut-point. This categorization avoids strong assumptions about the relation between the marker and risk, but at the expense of throwing away information. The information loss is greatest by splitting into two groups, which is often done by the median. Another strategy for categorization is to search for the optimal cut-point (also known as
the minimum p-value approach). However, naive use of the mini-mum p-value approach is associated with a considerable inflation of the type I error rate, meaning that results with a significant p-value (p<0.05) are obtained, when there is in fact no true associa-tion between gene expression and prognosis. Another approach has been suggested, known as maximally selected rank statistics, also creating a high and low expression group, but with a correc-tion of the significance of the marker (106, 107, 139). We chose to use this approach throughout the thesis and reported the cut-points to make comparisons to other prognostic studies more fea-sible. The same cut-points used in the univariate analyses were used again in the multivariate analyses. Our model was simplified by investigating the prognostic impact of gene expressions separately, which makes the results easier to val-idate in other cohorts. A less complex model is in addition easier to interpret, easier to validate and cheaper to apply and this was some of the reasons for us to choose this model instead of a more complex one.
STUDY I The primary finding in Paper I was the observation that 55% of the renal tumors in our population was discovered incidentally. None of the patients with symptoms had all three symptoms of the clas-sical triad, suggesting that the literature may be overestimating this number. A surprisingly low number of patients in our study presented with symptoms, which emphasizes the tricky nature of RCC, although it lies within the range of what have been reported in other studies. The incidental discovered tumors were associated with better prognostic factors, they were smaller, had a lower T-stage, lower Fuhrman grade, lower Leibovich score and significant less distant metastasis. Based on these results, it is clear that it is an advantage to have a renal tumor without symptoms, but the premise is that it needs to be discovered before it grows large enough to produce symptoms. So how is it possible to discover a tumor without symptoms? Should we employ a systematic screening program in Denmark, and if so, which population group should this include and how should it be conducted? The cheapest option would be a urine test for hematuria. However, as we could show, the majority of RCC pa-tients did not experience hematuria. In a screening survey con-ducted by Mihara et al in Japan, they discovered a renal tumor in 0.27 % of patients investigated with an ultrasound of the abdomen and only 0.08% was renal cell carcinomas (140). The low preva-lence of RCC implies that a relatively large group of patients needs to be examined just to find one malignant tumor and the risk of detecting and treating lesions of no clinical relevance is high. Fur-thermore, there is the question of how the screening should be performed. A radiologic examination with CT scan would be pref-erable due to the high sensitivity, but the expenses and the extent of x-rays the patient would be exposed to during a life-time, makes this less attractive. Another option is ultrasonic screening. This re-quires a certain routine from the investigator and establishing this at the general practitioner is therefore probably not optimal. Hence, there is a lot of unanswered questions in this setting and although it is agreeable that early detection is of great importance, a screening program is probably not the way to go. In our study, only 20% of the renal tumors were biopsied preoper-atively, although a significant part of them were smaller tumors of less than 4 cm. The accuracy in providing the correct diagnosis was 100%. It is known that also small RCCs can metastasize or they can

DANISH MEDICAL JOURNAL 29
be of an indolent nature, where active surveillance would be a good solution and diagnostic biopsy is therefore of great im-portance in distinguishing between these groups. Of even greater benefit it would be if a prognostic molecular marker could be im-posed, that could predict prognosis in the small renal tumors on biopsy material. The present study has some limitations. First, it only includes pa-tients from a single region in Denmark, which means that demo-graphic differences are not taken into account. All patients were Caucasians from Northern Europe, and the study may not be appli-cable to other ethnicities. Second, the study is retrospective. One of the known limitations in retrospective studies is missing data (109). To make this limitation visible, we reported the number of missing cases in the demographic tables.
STUDY II In Paper II we investigated the expression of two different calcium-activated potassium channels in ccRCC and oncocytoma. The ex-pression of KCa3.1 was correlated with survival data.
KCa3.1 We found a significant correlation between high mRNA expression of KCa3.1 and poor PFS in ccRCC. A multivariate analysis resulted in the same findings. The prognostic impact of KCa3.1 on other can-cer types has been reported in other studies (68-73), but still our study is one of the first studies that demonstrates prognostic value of KCa3.1 in cancer patients and specifically in ccRCC. Up- or down-regulation at transcript level is not necessarily reflected in the translation into functional proteins, so to demonstrate protein ex-pression of KCa3.1 we stained TMAs including the same patient group as included in the TaqMan Array. KCa3.1 protein localized predominantly to tumor vessels and infiltrating immune cells, and not the tumor cells as expected. The high mRNA expression can be due to the high extent of KCa3.1 in vessels and immune cells or there can be a posttranscriptional regulation from mRNA to pro-tein, not yet clarified. High expression of KCa3.1 may contribute to neoangiogenesis and in creating a tumor-friendly microenviron-ment. It has previously been shown, that an intra-tumor T-lympho-cytic infiltrate is associated with higher tumor grades and a worse survival in RCC patients (141). We could show a significant higher degree of CD8+ T-cell infiltration in ccRCC compared to oncocy-toma and there was a tendency towards a higher amount of KCa3.1 protein in the T-lymphocytes in ccRCC. These experiments were performed on a small subset of patient tissue (n=7) and larger stud-ies including more patients could be interesting. Tumor cells in the ccRCC cell lines was to a high extent positive for KCa3.1, with protein expression located primarily in or around the nuclei, but also in the cytoplasm, presumable in ribosomes (site of protein synthesis). The difference in protein expression between histological solid cancer tissue and cell lines can perhaps be ex-plained by factors such as differences in fixation procedures and staining protocols. Or, pronounced differences in molecular pro-files between cell lines and tumor samples could be the reason. Commercially available tumor cell lines are often used as models in cancer research. However, in a study by Domcke et al on ovarian cancer cell lines, it was shown that the most commonly used cell lines did not resemble the solid cancer very well, when it came to genomic alterations (142). To take this into consideration, we chose to create our own primary ccRCC cell line from a solid cancer and compare this to the commercially available Caki cell line. In the
whole-cell patch-clamp experiments, the KCa3.1 expression in the ccRCC primary cell line were less distinctive and expressed in fewer cells than in the Caki-cell line, in which virtually all tumor cells were KCa3.1-positive, suggestive of a difference between the cell lines. Overall, the knowledge of ion channel expression in renal cell car-cinoma is rather limited and our study provides new insights within this field. From our preliminary functional studies on KCa3.1 as a novel therapeutic target, we could conclude that the channel by itself does not seem to impact on the proliferation of tumor cells. Or at least, the chosen concentrations of TRAM34 and RA-2 where not able to inhibit tumor cell proliferation to a very high degree (≈10%). However, extended studies such as assays further investi-gating concentrations of the inhibitors, preferable on different re-nal cancer cell lines and Western blots investigating expres-sion/phosphorylation of proteins involved in the cell death process could provide novel insights.
KCa1.1 The study investigating KCa1.1 expression in ccRCC was conducted as a minor pilot study, since we did not include the gene in the larger TaqMan array to begin with. Results from this are however intriguing since we could show a very strong protein expression in the cell membrane of the tumor cells in ccRCC and not in oncocy-toma. In the patchclamping experiments we could confirm that this protein expression was indeed functional and placed in the cell membrane, since we could observe KCa1.1 currents in ccRCC tu-mor cells, sensitive for Paxilline. Our functional studies did how-ever not support the hypothesis of KCa1.1 being a driver of tumor cell proliferation. Nonetheless, KCa1.1 has in several other cancer types been shown to drive tumor cell proliferation (143-146) and our preliminary findings could therefore provide a basis for further investigations of the prognostic and functional role of KCa1.1 in RCC. The present study has some limitations. First of all, we were not able to divide the patients into a test group and a validation group due to the relatively low number of patients with ccRCC. This would have provided a better foundation for the statistical anal-yses. Furthermore, a multivariate analysis with a correction of the estimate and the significance has yet not been established and our results from these analyses may overestimate the true significance of the molecular marker. Secondly, patients with mRCC were not treated uniformly throughout the follow-up period, which might be important for prognosis. In summary, we have found indications that the intermediate cal-cium-activated potassium channel, KCa3.1, are implicated in RCC pathogenesis, either by contributing to neo-angiogenesis or by providing a tumor-friendly environment through the immune sys-tem. KCa3.1 can furthermore function as a prognostic marker in ccRCC.
STUDY III In Paper III, we analyzed our ccRCC patient material for expression of promising prognostic markers and correlated these with survival data. The genes were chosen from a set of previously investigated genes in a masters thesis, where the aim was to discover significant differences between tumor and cortex (92). OS, DSS and PFS were used as separate endpoints.

DANISH MEDICAL JOURNAL 30
Identification of the optimal cut-point (also known as the minimal p-value approach) for gene expression was performed with a cor-rection of the p-value to avoid overestimation of the importance of the marker, as suggested by Altman et al (139). The three genes with significant impact on prognosis in both univariate and multi-variate analysis were CSNK2A1, encoding CK2α, SPP1, encoding Os-teopontin and DEFB1, encoding β-defensin. CSNK2A1 and SPP1 were markers with an adverse prognostic effect, both with a pro-nounced relation to PFS and CSNK2A1 furthermore with the ability to predict OS. DEFB1 was a marker with correlation to a good prog-nosis (PFS). CSNK2A1 seemed to be the strongest and most in-formative predictor of prognosis since it had valuable effects on prognosis in all three endpoints in the univariate analysis and in two out of three endpoints in the multivariate analysis. Patients who experience metastasis are more likely to die from the disease and so PFS should optimally be reflected in OS or DSS. We identified also VEGFA and HMGA1 as predictors of prognosis in the univariate analysis. Interestingly, high expression of VEGFA was associated to a good prognosis, which is contradictory to what other studies reported, although these studies focus on serum lev-els and protein expression of VEGF and thus may not be directly comparable to mRNA expression of VEGF (147-150). However, when extracting the patients treated with tyrosine kinase inhibi-tors (targeting VEGF signaling) from the statistical analysis, this ad-vantage of high VEGF expression disappeared, suggesting the treatment is reflected in prognosis. Since we chose to investigate ccRCC separately and thereby limited the patient number to 97, it was necessary to include all patients in the entire statistical data set, which thereby served as a training set. We had therefore no patients to include in a separate valida-tion set. The genes found to have prognostic impact in this study needs to be validated in independent data sets preferably in larger and perhaps non-Danish cohorts. CSNK2A1 has not previously been investigated as a prognostic marker in ccRCC, but serves as a prognostic marker in several other malignancies (131, 151, 152). In a study by Matusan et al, protein expression of SPP1 was found to correlate with a worse prognosis in ccRCC (153). Matusan-Ilijas et al performed a study in which they could show that the role of SPP1 in ccRCC progression could be partially mediated by anti-apoptotic activity in tumor cells associated with the NF-κB pathway (154). In addition, SPP1 is also found to be of prognostic value in other malignancies, such as mamma cancer (155) and esophageal squamous cell carcinoma (156). DEFB1 has also previously been in-vestigated in RCC. In a study by Donald et al, immunohistochemical staining showed significant cancer-specific loss of DEFB1 in 90% of renal cancers. However, no distinction between the subtypes was made and they did not investigate the prognostic impact of DEFB1. The results obtained in study III are therefore of a certain novelty, since other studies did not investigate the prognostic impact of mRNA expression, although the results obtained by others support our findings. Overall, our gene expression analyses led to the discovery of three promising novel prognostic markers in ccRCC. These results may provide a basis for further validation in larger patient cohorts for the purpose of including molecular markers in the existing prog-nostic algorithms for ccRCC.
STUDY IV In Study IV we analyzed CK2 gene expression by TaqMan Array and protein expression by immunohistochemistry and Western blot. The main findings of this study were that mRNA expressions of all three subunits of CK2 are significantly up-regulated in tumor tissue compared to normal renal cortex. However, only high mRNA ex-pression of CK2α correlated with poor prognostic markers (high tu-mor stage, high Fuhrman grade and late metastasis). By immuno-histochemistry, we could show that a nuclear localization of CK2α was associated with poor PFS in the high stage ccRCC patient group. Enzyme activity analyses revealed a higher protein kinase activity in the tumor tissue compared to normal renal cortex. Fi-nally, in our functional cell proliferation assays we discovered an inhibitory effect of CX-4945 on Caki-2 cell growth. Interestingly, E9 did not inhibit Caki-2 cell growth. The perception of CK2α staining as a categorical variable makes in-terpretation and statistics easier. The protein expression seems however to be of weaker prognostic importance, since no signifi-cance was found in the multivariate analysis. In comparison is the gene expression analysis for CSNK2A1 (gene name of CK2α) per-formed in study III of greater prognostic value. The reasons for this difference between gene expression and protein expression can be multiple. First of all, translation into functional protein is probably not the case for all mRNA transcripts and secondly, the semi-quan-titative scoring method we used may induce a bias. This becomes obvious when comparing protein expression by immunohisto-chemistry and Western blot. We observed a significant difference between normal renal cortex and ccRCC tumor tissue by Western blot, but could not demonstrate the same difference by immuno-histochemistry. The semi-quantitative evaluation is very observer dependent and although we tried to eliminate intra-observer vari-ations by scoring the staining both separately and together, it seems that this method might induce a bias. Third, choice of anti-body and immunohistochemical staining protocol can induce bias by itself. The choice of gene expression levels as a prognostic marker may on the contrary also lead to difficulties, since the opti-mally derived cut-point in this ccRCC cohort might not be optimal in other, larger cohorts. It is therefore of great importance to vali-date the results in larger patient material. The TMAs used in this thesis was produced with three large cores (3.0 mm) from each tumor and one core from renal cortex paren-chyma. Using this approach provided us with sufficient material to analyze biomarker expression and no patients were lost in the cut-ting process. However, we lost nine cores from normal renal cor-tex. One can argue whether it was necessary to include normal tis-sue from all patients, so in this setting the loss of nine normal cores is less problematic. The results obtained in our functional analyses are novel and very intriguing. The two inhibitors of CK2 investigated in this study, act on different cellular pathways. As touched upon in the introduc-tion, the transcription factor HIF-1α is often overexpressed in renal cancer due to mutations in the tumor suppressor gene, VHL. Both of the inhibitors targets HIF-1α, but by different cellular pathways, which could be the reason for the very different inhibitory effect on Caki-2 cells observed in the proliferation assays. Another reason could be concentration dependent, since we did not test whether the CK2 kinase was inhibited equally by the chosen concentrations of CX-4945 and E9. Also, it is also worth mentioning that E9 was found much less soluble and required a higher DMSO-concentra-tion. Therefore we cannot fully exclude that E9 was ineffective due to such solubility issues.

DANISH MEDICAL JOURNAL 31
Interestingly, in another study presented at the 7th International Conference on Protein kinase CK2, the activity of CK2 and the ex-pression of the subunits were investigated in a small cohort of RCC tumors (n= 15) (157). CK2 catalytic subunits were found up-regu-lated at protein level and this overexpression correlated with in-creased CK2 kinase activity. However, at mRNA level, they reported a strong downregulation of the subunit transcripts in tumor sam-ples compared with normal tissue, which is entirely opposite to our findings. One must bear in mind that analyzing such a small mate-rial may lead to bias in interpreting the results. The group did not investigate the subtypes separately but included all RCCs and they used other reference genes for normalization, which could be rea-sons for this large difference in our results. They furthermore in-vestigated the ability of CX-4945 to down-regulate the CK2 cata-lytic activity in three different RCC cell lines, showing that the proliferation of these were all inhibited in a concentration-depend-ent fashion by CX-4945. These findings are quite similar to the re-sults we obtained in Study IV. We believe that the findings of our study are of great importance, since we could show that CK2 represents a promising therapeutic target in RCC. CX-4945 has already been tested in a dose-escalation Phase 1 trial, including also renal cell cancer, with the purpose of testing the safety, tolerability and highest safe dose level of CX-4945 (158) Currently, Phase II trials including patients with cholan-giocarcinoma are ongoing, with the purpose of measuring the Max-imum Tolerated Dose of CX-4945 in combination with gemcitabine plus cisplatin (159). The focus on CK2 as an attractive targeted ap-proach in treatment of cancer is therefore already present and with this study we have added novel knowledge of the expression and activity of CK2 in RCC.
CONCLUSIONS STUDY I, II, III AND IV
• Incidentally discovered renal cell carcinomas present with smaller tumor size, lower stage and lower frequency of metastasis entailing a more favorable prognosis.
• However, the available evidence does not allow for a rec-ommendation of a screening program for RCC, but em-phasizes the importance of diagnostic biopsy on small re-nal tumors.
• High expression levels of KCa3.1 are of prognostic value in ccRCC and correlates with poor progression free sur-vival and development of metastasis.
• KCa3.1 may favor neoangiogenesis and provide a tumor friendly environment through the immune system
• High expression levels of CSNK2A1 and SPP1 are associ-ated with poor outcome in ccRCC
• High expression levels of DEFB1 correlates with better prognosis in ccRCC
• Nuclear localization of the CK2α-subunit correlates with poor progression free survival in patients with high stage ccRCC
• CK2 is a novel molecular therapeutic target in RCC and inhibition of CK2 by CX-4945 is promising as a new treat-ment of RCC.
Table 17. Strengths and limitations in Study I-IV. Study Strengths Limitations I All patients with renal tumor
in years 2011-2012 included Retrospective study design
Demographic differences not represented
II Relatively large patient cohort
Retrospective study design
Long follow-up
No validation group in qRT-PCR
P-value statistical corrected in survival data to minimize overestimation of biomarker importance
Patients not uniformly trea-ted
No variations in tissue pro-cessing since all tissue was from same department
Two different qRT-PCR methods used (TaqMan and SYBR green)
qRT-PCR data normalized with multiple validated refer-ence genes
Concentration-dependent assay not performed for in-hibitors of KCa3.1 and KCa1.1
Both primary and commer-cially cell lines used
IHC performed on same pa-tient group as qRT-PCR
III Same lab protocols used for RNA extraction, cDNA synthe-sis and qRT-PCR
Retrospective study design
P-value statistical corrected in survival data to minimize overestimation of biomarker importance
No validation group
Relatively large patient cohort
No statistical correction of p-value in multivariate analysis
Long follow-up All samples analyzed over a limited time period
qRT-PCR data normalized with multiple validated refer-ence genes
IV Relatively large patient cohort
Retrospective study design
Long follow-up Semi-quantitative scoring of CK2α may be pathologist dependent
Semi-quantitative scoring of CK2α done as described in lit-erature
Concentration-dependent assay not performed for CK2 inhibitors
Immunohistochemical stain-ing performed with Auto-stainer in one run
CLINICAL IMPLICATIONS AND PERSPECTIVES The new era of targeted therapies in RCC places high demands on the identification of novel predictive and prognostic molecular markers that can be integrated into the currently established prog-nostic models. We have, with the four studies presented in this thesis, contributed to the search for novel prognostic markers with an observational study, gene expression analyses, protein expres-sion analyses and functional cell assays.

DANISH MEDICAL JOURNAL 32
We have in detail provided novel information on the expression and functional localization of the two calcium-activated potassium channels, KCa1.1 and KCa3.1. Yet, future studies could clarify whether the localization of KCa3.1 in vessels and lymphocytes di-rectly influences on prognosis by performing double immunofluo-rescence staining on a larger patient cohort. Also the prognostic role of KCa1.1 in RCC is an obvious aim for future studies. The re-lated KCa2.3 channel could also be an interesting aim for additional prognostic studies. Our functional cell assays did not detect any significant inhibition of cell growth by treatment with ion channel inhibitors. However, this could be concentration dependent and so, different concentrations in different cell lines need to be inves-tigated before we finally can reject the hypothesis of KCa3.1 and KCa1.1 being novel therapeutic targets of RCC. Several studies have investigated the prognostic significance of in-cidentally discovered renal tumors, since the occurrence of these are rising due to increased use of imaging. Our observational study adds information to this area on patients in Denmark. It would be interesting to investigate whether some of the prognostic markers discovered in Study III, could be used as prognostic markers on sin-gle biopsy material from the incidentally discovered tumors. Espe-cially CSNK2A1 (CK2α) seems to be a valuable marker. However, the known issues regarding heterogeneity of RCCs could hamper the conclusions of such studies. A solution to these concerns would be to biopsy more than a single area of the tumor. Before proceed-ing to implement the promising prognostic markers into clinical routine, validation in larger well-characterized cohorts is neces-sary. In order to standardize and make future studies comparable, use of the same assay (TaqMan® array) is preferable. Protein kinase CK2 has been extensively investigated in different cancers in recent years. It is a very promising prognostic molecular
marker and several studies have also reported CK2 to be a novel therapeutic target. Our results from Study III and IV adds new in-formation to this field of CK2 research and we have provided clear evidence for the prognostic role of CK2 in RCC. Future functional cell studies could clarify the different inhibitory pathways of E9 and CX-4945 in several different renal cancer cell lines. The next step would obviously be to include patients with RCC in a randomized clinical trial investigating the treatment effects of CX-4945 in com-bination with other targeted treatments (Tyrosine kinase inhibi-tors). If we put on the future glasses, the perspectives for RCC patients look considerable brighter than what have been the reality until today. Approximately half of all patients with RCC will at some point experience metastatic disease and the treatment options have in many years been non-existent for these patients, leading to a very poor prognosis. With first the development and imple-mentation of cytokines and later the targeted therapy with kinase inhibitors, we have come some of the way towards improving the life expectancies of these patients. However, we have not yet reached the ultimate goal in management of RCC patients. The fu-ture ambitions are high, implicating the hope of discovery of novel molecular markers that could act both as diagnostic and prognostic tools at the time of diagnosis. Ultimately, markers that could also function as predictive markers, enabling individualized treatment and with the ability to monitor the disease after nephrectomy in blood or urine would bring the management of RCC into a whole new era. With the ongoing studies of today we are moving fast to-wards this future goal and with the results presented in this thesis, we believe that we have added a small step towards a future im-proved clinical management of RCC.
APPENDIX Table A1. The 21 target genes (gene specific assays) included in the thesis. Genes marked with * were used as reference genes. Gene reference sequences and assay location are also listed.
Gene symbol Gene Name Assay ID NCBI Gene Reference Sequence
Function of Gene Assay location (am-plicon size)
AMACR Alpha-methyl-CoA race-mase
Hs01091294_m1 NM_001167595.1 NM_014324.5 NM_203382.2
Enzyme 830 (97)
CLCNKB Chloride channel, voltage-sensitive Kb
Hs01114443_m1 NM_000085.4 NM_001165945.2
Voltage-gated chlo-ride channel
2086 (68) 1634 (68)
CSNK2A1 Casein kinase 2, alpha 1 polypeptide
Hs00601957_m1 NM_177559.2 Serine/threonine protein kinase
169 (118)
CSNK2A2 Casein kinase 2, alpha prime polypeptide
Hs00176505_m1 NM_001896.2 Catalytic subunit al-pha’ gene of human protein kinase CK2
1213 (63)
CSNK2B Casein kinase 2, beta po-lypeptide
Hs00365835_m1 NM_001320.5 Beta subunit of hu-man protein kinase CK2
413 (83)
DEFB1 Defensin, beta 1 Hs00608345_m1 NM_005218.3 Antimicrobial pep-tide
216 (117)
EGF Epidermal growth factor Hs01099999_m1 NM_001178130.1 NM_001178131.1 NM_001963.4
Growth factor 3328 (70) 3325 (70) 3451 (70)
HMBS* Hydroxymethylbilane synthase
Hs00609297_m1 NM_000190.3 NM_001258208.1
Enzyme of heme bio-synthetic pathway
186 (64) 186 (64)
HMGA1 High mobility group AT-hook 1
Hs00431242_m1 NM_145905.2 Non-histone protein 169 (101)
KCNN4 Intermediate calcium-acti-vated potassium channel
Hs00158470_m1 NM_002250.2 Ion-channel 1218 (148)
LGALS3 Lectin, galactoside-bin-ding
Hs00173587_m1 NM_001177388.1 NM_002306.3
Beta-galactoside bin-ding protein
427 (64) 427 (64)

DANISH MEDICAL JOURNAL 33
LRP2 Low density lipoprotein
receptor-related protein 2 Hs00189742_m1 NM_004525.2 Multiligand endo-
cytic receptor 5862 (72)
NNMT Nicotinamide N-methyl-transferase
Hs00196287_m1 NM_006169.2 N-methylation 1105 (71)
PLIN2 Perilipin 2 Hs00765634_m1 NM_001122.3 Involved in lipid me-tabolism
189 (73)
PPIA* Peptidylprolyl isomerase A
Hs99999904_m1 NM_021130.3 Cyclosporin binding-protein
433 (98)
PVALB Parvalbumin Hs00161045_m1 NM_002854.2 Calcium ion binding protein
350 (77)
RRAGB Ras-related GTP binding B
Hs00234913_m1 NM_006064.4 NM_016656.3
Signal transducer 943 (79) 1027 (79)
SPP1 Secreted phosphoprotein 1
Hs00959010_m1 NM_000582.2 NM_001040058.1 NM_001040060.1 NM_001251829.1 NM_001251830.1
Cytokine 657 (84) 699 (84) 618 (84) 576 (84) 888 (84)
STC2 Stanniocalcin 2 Hs00175027_m1 NM_003705.1 Secreted glycopro-tein
1608 (72)
TBP* TATA box binding protein Hs00427621_m1 NM_001172085.1 NM_003194.4
Modulates DNA bin-ding activity
666 (65) 868 (65)
TOP2A Topoisomerase II alpha Hs03063307_m1 NM_001067.3 Involved in transcrip-tion of DNA
3160 (72)
UGCG UDP-glucose ceramide glucosyltransferase
Hs00234293_m1 NM_003358.1 Enzyme 1027 (68)
VEGFA Vascular endothelial growth factor A
Hs00900055_m1 NM_001025366.2 Growth factor 1352 (59)
VIM Vimentin Hs00185584_m1 NM_003380.3 Intermediate fila-ment
978 (73)
Table A2. Familial renal tumor syndromes
Syndrome Description Histology of renal tumor Gene Von-Hippel Lindau Tumors in a number of organs (kid-
ney, adrenal gland, pancreas, re-productive adnexae, CNS, retina)
ccRCC Renal cysts
VHL
Birt-Hogg-Dubé Renal tumors as well as benign cu-taneous tumors, fibrofolliculomas, pulmonary cysts and recurrent pneumothorax
ChRCC, ccRCC, RO Renal cysts Hybrid-oncocytic
BHD
Hereditary papillary RCC Renal tumors Type 1 PRCC MET Tuberous sclerosis Renal tumors, cutaneous lesions,
CNS hamartomas and pulmonary cysts.
Angiomyolipoma ccRCC RO
TSC1 TSC2
Hereditary leiomyomatosis RCC Germline mutation of the Krebs cy-cle enzyme, fumarate hydratase
Type 2 PRCC Renal cysts
FH
Familial pheochromocytoma/para-ganglioma
Succinate dehydrogenase B-associ-ated renal cancer. Risk of pheo-chromocytoma or neck paragangli-oma.
ccRCC, ChRCC Type 2 PRCC RO
SDHB
Familial renal oncocytoma Bilateral multifocal oncocytoma RO Loss of chromosome 1
SUMMARY Kidney cancer (Renal Cell Carcinoma (RCC)) is one of the most deadly malignancies due to frequent late diagnosis and poor treat-ment options. Histologically, RCC embraces a wide variety of dif-ferent subtypes with the clear cell variant (ccRCC) being the most common, accounting for 75-90% of all RCCs. At present, the surveillance protocols for follow-up of RCC patients after radical nephrectomy are based on the American Joint Com-mittee on Cancers (AJCC) pathological tumor-node-metastasis (TNM) classification system. Other comprehensive staging modali-ties have emerged and have been implemented in an attempt to
improve prognostication by combining other pathological and clin-ical variables, including Fuhrman nuclear grade and Leibovich score. However, even early stage tumors remain at risk of meta-static progression after surgical resection and 20-40% of patients undergoing nephrectomy for clinically localized RCC will develop a recurrence. Identifying this high-risk group of RCC patients remains a challenge. Hence, novel molecular prognostic biomarkers are needed to better predict clinical outcomes. An intensive search within this field has been ongoing in the past few years, and the three main predictive and prognostic markers validated in RCC are Von Hippel Lindau (VHL), vascular endothelial growth factor (VEGF)
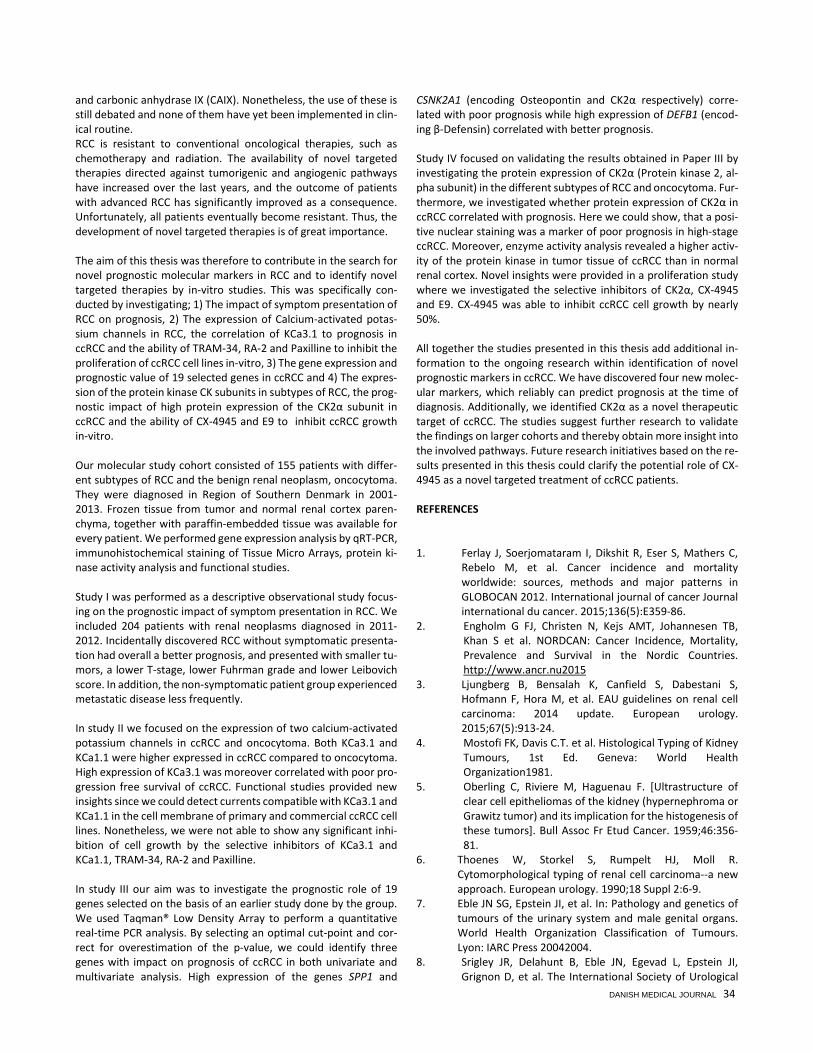
DANISH MEDICAL JOURNAL 34
and carbonic anhydrase IX (CAIX). Nonetheless, the use of these is still debated and none of them have yet been implemented in clin-ical routine. RCC is resistant to conventional oncological therapies, such as chemotherapy and radiation. The availability of novel targeted therapies directed against tumorigenic and angiogenic pathways have increased over the last years, and the outcome of patients with advanced RCC has significantly improved as a consequence. Unfortunately, all patients eventually become resistant. Thus, the development of novel targeted therapies is of great importance. The aim of this thesis was therefore to contribute in the search for novel prognostic molecular markers in RCC and to identify novel targeted therapies by in-vitro studies. This was specifically con-ducted by investigating; 1) The impact of symptom presentation of RCC on prognosis, 2) The expression of Calcium-activated potas-sium channels in RCC, the correlation of KCa3.1 to prognosis in ccRCC and the ability of TRAM-34, RA-2 and Paxilline to inhibit the proliferation of ccRCC cell lines in-vitro, 3) The gene expression and prognostic value of 19 selected genes in ccRCC and 4) The expres-sion of the protein kinase CK subunits in subtypes of RCC, the prog-nostic impact of high protein expression of the CK2α subunit in ccRCC and the ability of CX-4945 and E9 to inhibit ccRCC growth in-vitro. Our molecular study cohort consisted of 155 patients with differ-ent subtypes of RCC and the benign renal neoplasm, oncocytoma. They were diagnosed in Region of Southern Denmark in 2001-2013. Frozen tissue from tumor and normal renal cortex paren-chyma, together with paraffin-embedded tissue was available for every patient. We performed gene expression analysis by qRT-PCR, immunohistochemical staining of Tissue Micro Arrays, protein ki-nase activity analysis and functional studies. Study I was performed as a descriptive observational study focus-ing on the prognostic impact of symptom presentation in RCC. We included 204 patients with renal neoplasms diagnosed in 2011-2012. Incidentally discovered RCC without symptomatic presenta-tion had overall a better prognosis, and presented with smaller tu-mors, a lower T-stage, lower Fuhrman grade and lower Leibovich score. In addition, the non-symptomatic patient group experienced metastatic disease less frequently. In study II we focused on the expression of two calcium-activated potassium channels in ccRCC and oncocytoma. Both KCa3.1 and KCa1.1 were higher expressed in ccRCC compared to oncocytoma. High expression of KCa3.1 was moreover correlated with poor pro-gression free survival of ccRCC. Functional studies provided new insights since we could detect currents compatible with KCa3.1 and KCa1.1 in the cell membrane of primary and commercial ccRCC cell lines. Nonetheless, we were not able to show any significant inhi-bition of cell growth by the selective inhibitors of KCa3.1 and KCa1.1, TRAM-34, RA-2 and Paxilline. In study III our aim was to investigate the prognostic role of 19 genes selected on the basis of an earlier study done by the group. We used Taqman® Low Density Array to perform a quantitative real-time PCR analysis. By selecting an optimal cut-point and cor-rect for overestimation of the p-value, we could identify three genes with impact on prognosis of ccRCC in both univariate and multivariate analysis. High expression of the genes SPP1 and
CSNK2A1 (encoding Osteopontin and CK2α respectively) corre-lated with poor prognosis while high expression of DEFB1 (encod-ing β-Defensin) correlated with better prognosis. Study IV focused on validating the results obtained in Paper III by investigating the protein expression of CK2α (Protein kinase 2, al-pha subunit) in the different subtypes of RCC and oncocytoma. Fur-thermore, we investigated whether protein expression of CK2α in ccRCC correlated with prognosis. Here we could show, that a posi-tive nuclear staining was a marker of poor prognosis in high-stage ccRCC. Moreover, enzyme activity analysis revealed a higher activ-ity of the protein kinase in tumor tissue of ccRCC than in normal renal cortex. Novel insights were provided in a proliferation study where we investigated the selective inhibitors of CK2α, CX-4945 and E9. CX-4945 was able to inhibit ccRCC cell growth by nearly 50%. All together the studies presented in this thesis add additional in-formation to the ongoing research within identification of novel prognostic markers in ccRCC. We have discovered four new molec-ular markers, which reliably can predict prognosis at the time of diagnosis. Additionally, we identified CK2α as a novel therapeutic target of ccRCC. The studies suggest further research to validate the findings on larger cohorts and thereby obtain more insight into the involved pathways. Future research initiatives based on the re-sults presented in this thesis could clarify the potential role of CX-4945 as a novel targeted treatment of ccRCC patients. REFERENCES 1. Ferlay J, Soerjomataram I, Dikshit R, Eser S, Mathers C,
Rebelo M, et al. Cancer incidence and mortality worldwide: sources, methods and major patterns in GLOBOCAN 2012. International journal of cancer Journal international du cancer. 2015;136(5):E359-86.
2. Engholm G FJ, Christen N, Kejs AMT, Johannesen TB, Khan S et al. NORDCAN: Cancer Incidence, Mortality, Prevalence and Survival in the Nordic Countries. http://www.ancr.nu2015
3. Ljungberg B, Bensalah K, Canfield S, Dabestani S, Hofmann F, Hora M, et al. EAU guidelines on renal cell carcinoma: 2014 update. European urology. 2015;67(5):913-24.
4. Mostofi FK, Davis C.T. et al. Histological Typing of Kidney Tumours, 1st Ed. Geneva: World Health Organization1981.
5. Oberling C, Riviere M, Haguenau F. [Ultrastructure of clear cell epitheliomas of the kidney (hypernephroma or Grawitz tumor) and its implication for the histogenesis of these tumors]. Bull Assoc Fr Etud Cancer. 1959;46:356-81.
6. Thoenes W, Storkel S, Rumpelt HJ, Moll R. Cytomorphological typing of renal cell carcinoma--a new approach. European urology. 1990;18 Suppl 2:6-9.
7. Eble JN SG, Epstein JI, et al. In: Pathology and genetics of tumours of the urinary system and male genital organs. World Health Organization Classification of Tumours. Lyon: IARC Press 20042004.
8. Srigley JR, Delahunt B, Eble JN, Egevad L, Epstein JI, Grignon D, et al. The International Society of Urological

DANISH MEDICAL JOURNAL 35
Pathology (ISUP) Vancouver Classification of Renal Neoplasia. The American journal of surgical pathology. 2013;37(10):1469-89.
9. Hirsch MS, Signoretti S, Dal Cin P. Adult Renal Cell Carcinoma: A Review of Established Entities from Morphology to Molecular Genetics. Surg Pathol Clin. 2015;8(4):587-621.
10. Reuter VE, Argani P, Zhou M, Delahunt B, Members of the IIiDUPG. Best practices recommendations in the application of immunohistochemistry in the kidney tumors: report from the International Society of Urologic Pathology consensus conference. The American journal of surgical pathology. 2014;38(8):e35-49.
11. Przybycin CG, Cronin AM, Darvishian F, Gopalan A, Al-Ahmadie HA, Fine SW, et al. Chromophobe renal cell carcinoma: a clinicopathologic study of 203 tumors in 200 patients with primary resection at a single institution. The American journal of surgical pathology. 2011;35(7):962-70.
12. Amin MB, Paner GP, Alvarado-Cabrero I, Young AN, Stricker HJ, Lyles RH, et al. Chromophobe renal cell carcinoma: histomorphologic characteristics and evaluation of conventional pathologic prognostic parameters in 145 cases. The American journal of surgical pathology. 2008;32(12):1822-34.
13. Lopez-Beltran A, Carrasco JC, Cheng L, Scarpelli M, Kirkali Z, Montironi R. 2009 update on the classification of renal epithelial tumors in adults. International journal of urology : official journal of the Japanese Urological Association. 2009;16(5):432-43.
14. Kuroda N, Tanaka A, Ohe C, Nagashima Y. Recent advances of immunohistochemistry for diagnosis of renal tumors. Pathol Int. 2013;63(8):381-90.
15. Pischon T, Lahmann PH, Boeing H, Tjonneland A, Halkjaer J, Overvad K, et al. Body size and risk of renal cell carcinoma in the European Prospective Investigation into Cancer and Nutrition (EPIC). International journal of cancer Journal international du cancer. 2006;118(3):728-38.
16. Linehan WM. Genetic basis of bilateral renal cancer: implications for evaluation and management. Journal of clinical oncology : official journal of the American Society of Clinical Oncology. 2009;27(23):3731-3.
17. Flanigan RC. Renal tumors: the good, the bad, and the ugly. International journal of urology : official journal of the Japanese Urological Association. 2007;14(7):575-80.
18. Eichelberg C, Junker K, Ljungberg B, Moch H. Diagnostic and prognostic molecular markers for renal cell carcinoma: a critical appraisal of the current state of research and clinical applicability. European urology. 2009;55(4):851-63.
19. Patard JJ, Leray E, Rodriguez A, Rioux-Leclercq N, Guille F, Lobel B. Correlation between symptom graduation, tumor characteristics and survival in renal cell carcinoma. European urology. 2003;44(2):226-32.
20. Schmidbauer J, Remzi M, Memarsadeghi M, Haitel A, Klingler HC, Katzenbeisser D, et al. Diagnostic accuracy of computed tomography-guided percutaneous biopsy of renal masses. European urology. 2008;53(5):1003-11.
21. Leveridge MJ, Finelli A, Kachura JR, Evans A, Chung H, Shiff DA, et al. Outcomes of small renal mass needle core
biopsy, nondiagnostic percutaneous biopsy, and the role of repeat biopsy. European urology. 2011;60(3):578-84.
22. Abel EJ, Culp SH, Matin SF, Tamboli P, Wallace MJ, Jonasch E, et al. Percutaneous biopsy of primary tumor in metastatic renal cell carcinoma to predict high risk pathological features: comparison with nephrectomy assessment. The Journal of urology. 2010;184(5):1877-81.
23. Edge SB, Compton CC. The American Joint Committee on Cancer: the 7th edition of the AJCC cancer staging manual and the future of TNM. Ann Surg Oncol. 2010;17(6):1471-4.
24. Fuhrman SA, Lasky LC, Limas C. Prognostic significance of morphologic parameters in renal cell carcinoma. The American journal of surgical pathology. 1982;6(7):655-63.
25. Ficarra V, Righetti R, Martignoni G, D'Amico A, Pilloni S, Rubilotta E, et al. Prognostic value of renal cell carcinoma nuclear grading: multivariate analysis of 333 cases. Urologia internationalis. 2001;67(2):130-4.
26. Bektas S, Bahadir B, Kandemir NO, Barut F, Gul AE, Ozdamar SO. Intraobserver and interobserver variability of Fuhrman and modified Fuhrman grading systems for conventional renal cell carcinoma. Kaohsiung J Med Sci. 2009;25(11):596-600.
27. Delahunt B, Srigley JR, Montironi R, Egevad L. Advances in renal neoplasia: recommendations from the 2012 International Society of Urological Pathology Consensus Conference. Urology. 2014;83(5):969-74.
28. Smaldone MC, Corcoran AT, Uzzo RG. Active surveillance of small renal masses. Nat Rev Urol. 2013;10(5):266-74.
29. Uhlman MA, Pate SC, Brown JA. Explosive growth of a renal tumor during active surveillance. Can J Urol. 2013;20(2):6739-41.
30. Uzzo RG. Renal masses--to treat or not to treat? If that is the question are contemporary biomarkers the answer? The Journal of urology. 2008;180(2):433-4.
31. Williamson TJ, Pearson JR, Ischia J, Bolton DM, Lawrentschuk N. Guideline of Guidelines: follow-up after nephrectomy for renal cell carcinoma. BJU international. 2015.
32. Penticuff JC, Kyprianou N. Therapeutic challenges in renal cell carcinoma. Am J Clin Exp Urol. 2015;3(2):77-90.
33. Rini BI, Campbell SC, Escudier B. Renal cell carcinoma. Lancet. 2009;373(9669):1119-32.
34. Kaelin WG, Jr. The von Hippel-Lindau tumor suppressor gene and kidney cancer. Clinical cancer research : an official journal of the American Association for Cancer Research. 2004;10(18 Pt 2):6290S-5S.
35. Cohen HT, McGovern FJ. Renal-cell carcinoma. N Engl J Med. 2005;353(23):2477-90.
36. Coppin C, Kollmannsberger C, Le L, Porzsolt F, Wilt TJ. Targeted therapy for advanced renal cell cancer (RCC): a Cochrane systematic review of published randomised trials. BJU international. 2011;108(10):1556-63.
37. Chan JY, Choudhury Y, Tan MH. Predictive molecular biomarkers to guide clinical decision making in kidney cancer: current progress and future challenges. Expert review of molecular diagnostics. 2015;15(5):631-46.
38. Capitanio U, Montorsi F. Renal cancer. Lancet. 2015.

DANISH MEDICAL JOURNAL 36
39. Volpe A, Patard JJ. Prognostic factors in renal cell carcinoma. World J Urol. 2010;28(3):319-27.
40. Leibovich BC, Blute ML, Cheville JC, Lohse CM, Frank I, Kwon ED, et al. Prediction of progression after radical nephrectomy for patients with clear cell renal cell carcinoma: a stratification tool for prospective clinical trials. Cancer. 2003;97(7):1663-71.
41. Zisman A, Pantuck AJ, Wieder J, Chao DH, Dorey F, Said JW, et al. Risk group assessment and clinical outcome algorithm to predict the natural history of patients with surgically resected renal cell carcinoma. Journal of clinical oncology : official journal of the American Society of Clinical Oncology. 2002;20(23):4559-66.
42. Karakiewicz PI, Briganti A, Chun FK, Trinh QD, Perrotte P, Ficarra V, et al. Multi-institutional validation of a new renal cancer-specific survival nomogram. Journal of clinical oncology : official journal of the American Society of Clinical Oncology. 2007;25(11):1316-22.
43. DaRenCa. Kliniske retningslinier Nyrecancer 2013 http://ducg.dk/fileadmin/www.ducg.dk/DARENCA_retningslinjer_2013.pdf2013
44. Motzer RJ, Mazumdar M, Bacik J, Berg W, Amsterdam A, Ferrara J. Survival and prognostic stratification of 670 patients with advanced renal cell carcinoma. Journal of clinical oncology : official journal of the American Society of Clinical Oncology. 1999;17(8):2530-40.
45. Heng DY, Xie W, Regan MM, Harshman LC, Bjarnason GA, Vaishampayan UN, et al. External validation and comparison with other models of the International Metastatic Renal-Cell Carcinoma Database Consortium prognostic model: a population-based study. Lancet Oncol. 2013;14(2):141-8.
46. Maroto P, Rini B. Molecular biomarkers in advanced renal cell carcinoma. Clinical cancer research : an official journal of the American Association for Cancer Research. 2014;20(8):2060-71.
47. Sonpavde G, Choueiri TK. Precision medicine for metastatic renal cell carcinoma. Urol Oncol. 2014;32(1):5-15.
48. Varela I, Tarpey P, Raine K, Huang D, Ong CK, Stephens P, et al. Exome sequencing identifies frequent mutation of the SWI/SNF complex gene PBRM1 in renal carcinoma. Nature. 2011;469(7331):539-42.
49. Reisman D, Glaros S, Thompson EA. The SWI/SNF complex and cancer. Oncogene. 2009;28(14):1653-68.
50. Pena-Llopis S, Vega-Rubin-de-Celis S, Liao A, Leng N, Pavia-Jimenez A, Wang S, et al. BAP1 loss defines a new class of renal cell carcinoma. Nat Genet. 2012;44(7):751-9.
51. Dalgliesh GL, Furge K, Greenman C, Chen L, Bignell G, Butler A, et al. Systematic sequencing of renal carcinoma reveals inactivation of histone modifying genes. Nature. 2010;463(7279):360-3.
52. Hakimi AA, Ostrovnaya I, Reva B, Schultz N, Chen YB, Gonen M, et al. Adverse outcomes in clear cell renal cell carcinoma with mutations of 3p21 epigenetic regulators BAP1 and SETD2: a report by MSKCC and the KIRC TCGA research network. Clinical cancer research : an official journal of the American Association for Cancer Research. 2013;19(12):3259-67.
53. Cancer Genome Atlas Research N. Comprehensive molecular characterization of clear cell renal cell carcinoma. Nature. 2013;499(7456):43-9.
54. Mickley A, Kovaleva O, Kzhyshkowska J, Gratchev A. Molecular and immunologic markers of kidney cancer-potential applications in predictive, preventive and personalized medicine. EPMA J. 2015;6:20.
55. Haddad AQ, Margulis V. Tumour and patient factors in renal cell carcinoma-towards personalized therapy. Nat Rev Urol. 2015;12(5):253-62.
56. Gerlinger M, Horswell S, Larkin J, Rowan AJ, Salm MP, Varela I, et al. Genomic architecture and evolution of clear cell renal cell carcinomas defined by multiregion sequencing. Nat Genet. 2014;46(3):225-33.
57. Gerlinger M, Rowan AJ, Horswell S, Larkin J, Endesfelder D, Gronroos E, et al. Intratumor heterogeneity and branched evolution revealed by multiregion sequencing. N Engl J Med. 2012;366(10):883-92.
58. Zaldumbide L, Erramuzpe A, Guarch R, Cortes JM, Lopez JI. Large (>3.8 cm) clear cell renal cell carcinomas are morphologically and immunohistochemically heterogeneous. Virchows Arch. 2015;466(1):61-6.
59. Tomaszewski JJ, Uzzo RG, Smaldone MC. Heterogeneity and renal mass biopsy: a review of its role and reliability. Cancer Biol Med. 2014;11(3):162-72.
60. Leanza L, Manago A, Zoratti M, Gulbins E, Szabo I. Pharmacological targeting of ion channels for cancer therapy: In vivo evidences. Biochimica et biophysica acta. 2015.
61. Comes N, Serrano-Albarras A, Capera J, Serrano-Novillo C, Condom E, Ramon YCS, et al. Involvement of potassium channels in the progression of cancer to a more malignant phenotype. Biochimica et biophysica acta. 2015;1848(10 Pt B):2477-92.
62. Wei AD, Gutman GA, Aldrich R, Chandy KG, Grissmer S, Wulff H. International Union of Pharmacology. LII. Nomenclature and molecular relationships of calcium-activated potassium channels. Pharmacological reviews. 2005;57(4):463-72.
63. Wulff H, Kolski-Andreaco A, Sankaranarayanan A, Sabatier JM, Shakkottai V. Modulators of small- and intermediate-conductance calcium-activated potassium channels and their therapeutic indications. Current medicinal chemistry. 2007;14(13):1437-57.
64. Thompson-Vest N, Shimizu Y, Hunne B, Furness JB. The distribution of intermediate-conductance, calcium-activated, potassium (IK) channels in epithelial cells. Journal of anatomy. 2006;208(2):219-29.
65. Fioretti B, Castigli E, Micheli MR, Bova R, Sciaccaluga M, Harper A, et al. Expression and modulation of the intermediate- conductance Ca2+-activated K+ channel in glioblastoma GL-15 cells. Cellular physiology and biochemistry : international journal of experimental cellular physiology, biochemistry, and pharmacology. 2006;18(1-3):47-56.
66. Ouadid-Ahidouch H, Roudbaraki M, Delcourt P, Ahidouch A, Joury N, Prevarskaya N. Functional and molecular identification of intermediate-conductance Ca(2+)-activated K(+) channels in breast cancer cells: association with cell cycle progression. American journal of physiology Cell physiology. 2004;287(1):C125-34.
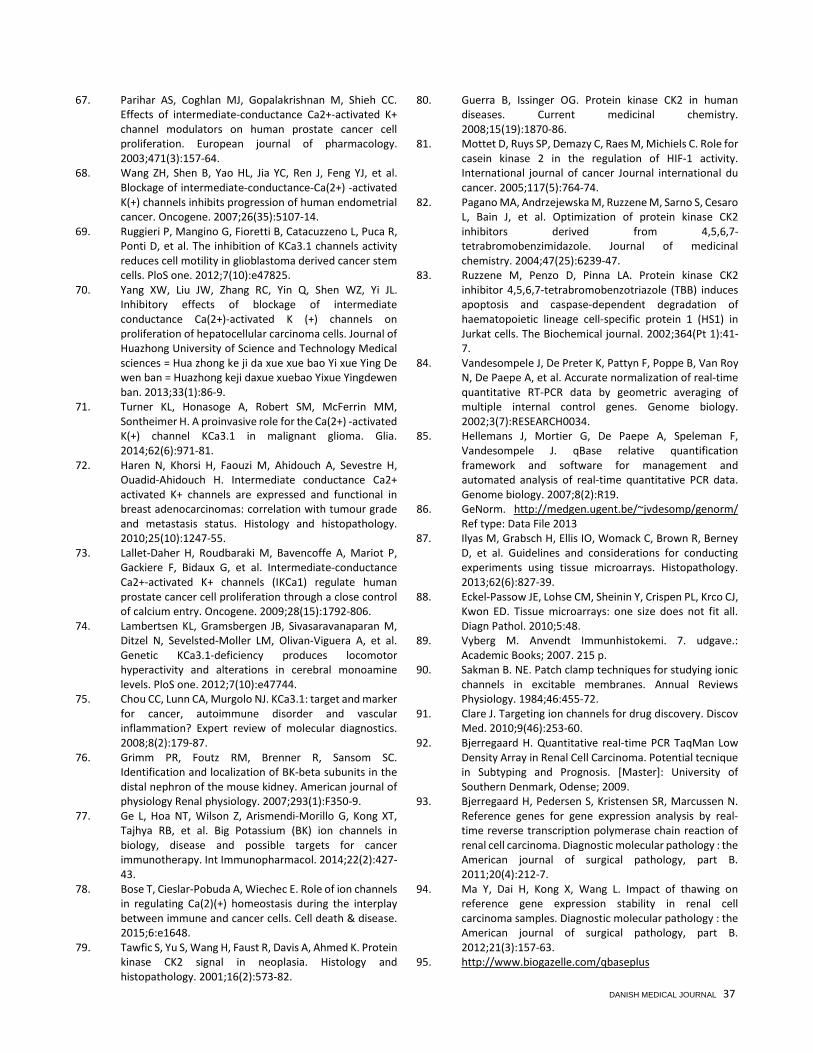
DANISH MEDICAL JOURNAL 37
67. Parihar AS, Coghlan MJ, Gopalakrishnan M, Shieh CC. Effects of intermediate-conductance Ca2+-activated K+ channel modulators on human prostate cancer cell proliferation. European journal of pharmacology. 2003;471(3):157-64.
68. Wang ZH, Shen B, Yao HL, Jia YC, Ren J, Feng YJ, et al. Blockage of intermediate-conductance-Ca(2+) -activated K(+) channels inhibits progression of human endometrial cancer. Oncogene. 2007;26(35):5107-14.
69. Ruggieri P, Mangino G, Fioretti B, Catacuzzeno L, Puca R, Ponti D, et al. The inhibition of KCa3.1 channels activity reduces cell motility in glioblastoma derived cancer stem cells. PloS one. 2012;7(10):e47825.
70. Yang XW, Liu JW, Zhang RC, Yin Q, Shen WZ, Yi JL. Inhibitory effects of blockage of intermediate conductance Ca(2+)-activated K (+) channels on proliferation of hepatocellular carcinoma cells. Journal of Huazhong University of Science and Technology Medical sciences = Hua zhong ke ji da xue xue bao Yi xue Ying De wen ban = Huazhong keji daxue xuebao Yixue Yingdewen ban. 2013;33(1):86-9.
71. Turner KL, Honasoge A, Robert SM, McFerrin MM, Sontheimer H. A proinvasive role for the Ca(2+) -activated K(+) channel KCa3.1 in malignant glioma. Glia. 2014;62(6):971-81.
72. Haren N, Khorsi H, Faouzi M, Ahidouch A, Sevestre H, Ouadid-Ahidouch H. Intermediate conductance Ca2+ activated K+ channels are expressed and functional in breast adenocarcinomas: correlation with tumour grade and metastasis status. Histology and histopathology. 2010;25(10):1247-55.
73. Lallet-Daher H, Roudbaraki M, Bavencoffe A, Mariot P, Gackiere F, Bidaux G, et al. Intermediate-conductance Ca2+-activated K+ channels (IKCa1) regulate human prostate cancer cell proliferation through a close control of calcium entry. Oncogene. 2009;28(15):1792-806.
74. Lambertsen KL, Gramsbergen JB, Sivasaravanaparan M, Ditzel N, Sevelsted-Moller LM, Olivan-Viguera A, et al. Genetic KCa3.1-deficiency produces locomotor hyperactivity and alterations in cerebral monoamine levels. PloS one. 2012;7(10):e47744.
75. Chou CC, Lunn CA, Murgolo NJ. KCa3.1: target and marker for cancer, autoimmune disorder and vascular inflammation? Expert review of molecular diagnostics. 2008;8(2):179-87.
76. Grimm PR, Foutz RM, Brenner R, Sansom SC. Identification and localization of BK-beta subunits in the distal nephron of the mouse kidney. American journal of physiology Renal physiology. 2007;293(1):F350-9.
77. Ge L, Hoa NT, Wilson Z, Arismendi-Morillo G, Kong XT, Tajhya RB, et al. Big Potassium (BK) ion channels in biology, disease and possible targets for cancer immunotherapy. Int Immunopharmacol. 2014;22(2):427-43.
78. Bose T, Cieslar-Pobuda A, Wiechec E. Role of ion channels in regulating Ca(2)(+) homeostasis during the interplay between immune and cancer cells. Cell death & disease. 2015;6:e1648.
79. Tawfic S, Yu S, Wang H, Faust R, Davis A, Ahmed K. Protein kinase CK2 signal in neoplasia. Histology and histopathology. 2001;16(2):573-82.
80. Guerra B, Issinger OG. Protein kinase CK2 in human diseases. Current medicinal chemistry. 2008;15(19):1870-86.
81. Mottet D, Ruys SP, Demazy C, Raes M, Michiels C. Role for casein kinase 2 in the regulation of HIF-1 activity. International journal of cancer Journal international du cancer. 2005;117(5):764-74.
82. Pagano MA, Andrzejewska M, Ruzzene M, Sarno S, Cesaro L, Bain J, et al. Optimization of protein kinase CK2 inhibitors derived from 4,5,6,7-tetrabromobenzimidazole. Journal of medicinal chemistry. 2004;47(25):6239-47.
83. Ruzzene M, Penzo D, Pinna LA. Protein kinase CK2 inhibitor 4,5,6,7-tetrabromobenzotriazole (TBB) induces apoptosis and caspase-dependent degradation of haematopoietic lineage cell-specific protein 1 (HS1) in Jurkat cells. The Biochemical journal. 2002;364(Pt 1):41-7.
84. Vandesompele J, De Preter K, Pattyn F, Poppe B, Van Roy N, De Paepe A, et al. Accurate normalization of real-time quantitative RT-PCR data by geometric averaging of multiple internal control genes. Genome biology. 2002;3(7):RESEARCH0034.
85. Hellemans J, Mortier G, De Paepe A, Speleman F, Vandesompele J. qBase relative quantification framework and software for management and automated analysis of real-time quantitative PCR data. Genome biology. 2007;8(2):R19.
86. GeNorm. http://medgen.ugent.be/~jvdesomp/genorm/ Ref type: Data File 2013
87. Ilyas M, Grabsch H, Ellis IO, Womack C, Brown R, Berney D, et al. Guidelines and considerations for conducting experiments using tissue microarrays. Histopathology. 2013;62(6):827-39.
88. Eckel-Passow JE, Lohse CM, Sheinin Y, Crispen PL, Krco CJ, Kwon ED. Tissue microarrays: one size does not fit all. Diagn Pathol. 2010;5:48.
89. Vyberg M. Anvendt Immunhistokemi. 7. udgave.: Academic Books; 2007. 215 p.
90. Sakman B. NE. Patch clamp techniques for studying ionic channels in excitable membranes. Annual Reviews Physiology. 1984;46:455-72.
91. Clare J. Targeting ion channels for drug discovery. Discov Med. 2010;9(46):253-60.
92. Bjerregaard H. Quantitative real-time PCR TaqMan Low Density Array in Renal Cell Carcinoma. Potential tecnique in Subtyping and Prognosis. [Master]: University of Southern Denmark, Odense; 2009.
93. Bjerregaard H, Pedersen S, Kristensen SR, Marcussen N. Reference genes for gene expression analysis by real-time reverse transcription polymerase chain reaction of renal cell carcinoma. Diagnostic molecular pathology : the American journal of surgical pathology, part B. 2011;20(4):212-7.
94. Ma Y, Dai H, Kong X, Wang L. Impact of thawing on reference gene expression stability in renal cell carcinoma samples. Diagnostic molecular pathology : the American journal of surgical pathology, part B. 2012;21(3):157-63.
95. http://www.biogazelle.com/qbaseplus
DANISH MEDICAL JOURNAL 38
96. Weber T, Meinhardt M, Zastrow S, Wienke A, Fuessel S, Wirth MP. Immunohistochemical analysis of prognostic protein markers for primary localized clear cell renal cell carcinoma. Cancer Invest. 2013;31(1):51-9.
97. Freshney RI. Basic Principles of Cell Culture. In: Vunjak-Novakovic G, editor. Culture of Cells for Tissue Engineering: John Wiley & Sons, Inc.; 2006.
98. Raspotnig G, Fauler G, Jantscher A, Windischhofer W, Schachl K, Leis HJ. Colorimetric determination of cell numbers by Janus green staining. Anal Biochem. 1999;275(1):74-83.
99. Pierre F, Chua PC, O'Brien SE, Siddiqui-Jain A, Bourbon P, Haddach M, et al. Pre-clinical characterization of CX-4945, a potent and selective small molecule inhibitor of CK2 for the treatment of cancer. Molecular and cellular biochemistry. 2011;356(1-2):37-43.
100. Kim J, Kim SH. Druggability of the CK2 inhibitor CX-4945 as an anticancer drug and beyond. Arch Pharm Res. 2012;35(8):1293-6.
101. Guerra B, Rasmussen TD, Schnitzler A, Jensen HH, Boldyreff BS, Miyata Y, et al. Protein kinase CK2 inhibition is associated with the destabilization of HIF-1alpha in human cancer cells. Cancer Lett. 2015;356(2 Pt B):751-61.
102. Petkov GV. Central role of the BK channel in urinary bladder smooth muscle physiology and pathophysiology. Am J Physiol Regul Integr Comp Physiol. 2014;307(6):R571-84.
103. Olivan-Viguera A, Valero MS, Coleman N, Brown BM, Laria C, Murillo MD, et al. A novel pan-negative-gating modulator of KCa2/3 channels, fluoro-di-benzoate, RA-2, inhibits endothelium-derived hyperpolarization-type relaxation in coronary artery and produces bradycardia in vivo. Molecular pharmacology. 2015;87(2):338-48.
104. Sankaranarayanan A, Raman G, Busch C, Schultz T, Zimin PI, Hoyer J, et al. Naphtho[1,2-d]thiazol-2-ylamine (SKA-31), a new activator of KCa2 and KCa3.1 potassium channels, potentiates the endothelium-derived hyperpolarizing factor response and lowers blood pressure. Molecular pharmacology. 2009;75(2):281-95.
105. Wulff H, Miller MJ, Hansel W, Grissmer S, Cahalan MD, Chandy KG. Design of a potent and selective inhibitor of the intermediate-conductance Ca2+-activated K+ channel, IKCa1: a potential immunosuppressant. Proceedings of the National Academy of Sciences of the United States of America. 2000;97(14):8151-6.
106. Hothorn T, Lausen B. On the exact distribution of maximally selected rank statistics. Comput Stat Data An. 2003;43(2):121-37.
107. Lausen B, Schumacher, M. Maximally Selected Rank Statistics. Biometrics. 1992;48(1):73-85.
108. Bradburn MJ, Clark TG, Love SB, Altman DG. Survival analysis part II: multivariate data analysis--an introduction to concepts and methods. British journal of cancer. 2003;89(3):431-6.
109. McShane LM, Hayes DF. Publication of tumor marker research results: the necessity for complete and transparent reporting. Journal of clinical oncology : official journal of the American Society of Clinical Oncology. 2012;30(34):4223-32.
110. Engholm G FJ, Christensen N, Storm HH. www-dep.iarc.fr/NORDCAN/DK 2009-2013 [
111. Concato J, Peduzzi P, Holford TR, Feinstein AR. Importance of events per independent variable in proportional hazards analysis. I. Background, goals, and general strategy. J Clin Epidemiol. 1995;48(12):1495-501.
112. Peduzzi P, Concato J, Feinstein AR, Holford TR. Importance of events per independent variable in proportional hazards regression analysis. II. Accuracy and precision of regression estimates. J Clin Epidemiol. 1995;48(12):1503-10.
113. Hotte SJ, Bjarnason GA, Heng DY, Jewett MA, Kapoor A, Kollmannsberger C, et al. Progression-free survival as a clinical trial endpoint in advanced renal cell carcinoma. Curr Oncol. 2011;18 Suppl 2:S11-9.
114. Kapur P, Christie A, Raman JD, Then MT, Nuhn P, Buchner A, et al. BAP1 immunohistochemistry predicts outcomes in a multi-institutional cohort with clear cell renal cell carcinoma. The Journal of urology. 2014;191(3):603-10.
115. Moch H, Schraml P, Bubendorf L, Mirlacher M, Kononen J, Gasser T, et al. High-throughput tissue microarray analysis to evaluate genes uncovered by cDNA microarray screening in renal cell carcinoma. The American journal of pathology. 1999;154(4):981-6.
116. Young AN, Amin MB, Moreno CS, Lim SD, Cohen C, Petros JA, et al. Expression profiling of renal epithelial neoplasms: a method for tumor classification and discovery of diagnostic molecular markers. The American journal of pathology. 2001;158(5):1639-51.
117. Skubitz KM, Skubitz AP. Differential gene expression in renal-cell cancer. The Journal of laboratory and clinical medicine. 2002;140(1):52-64.
118. Yamazaki K, Sakamoto M, Ohta T, Kanai Y, Ohki M, Hirohashi S. Overexpression of KIT in chromophobe renal cell carcinoma. Oncogene. 2003;22(6):847-52.
119. Takahashi M, Yang XJ, Sugimura J, Backdahl J, Tretiakova M, Qian CN, et al. Molecular subclassification of kidney tumors and the discovery of new diagnostic markers. Oncogene. 2003;22(43):6810-8.
120. Jones J, Otu H, Spentzos D, Kolia S, Inan M, Beecken WD, et al. Gene signatures of progression and metastasis in renal cell cancer. Clinical cancer research : an official journal of the American Association for Cancer Research. 2005;11(16):5730-9.
121. Schuetz AN, Yin-Goen Q, Amin MB, Moreno CS, Cohen C, Hornsby CD, et al. Molecular classification of renal tumors by gene expression profiling. The Journal of molecular diagnostics : JMD. 2005;7(2):206-18.
122. Yao M, Tabuchi H, Nagashima Y, Baba M, Nakaigawa N, Ishiguro H, et al. Gene expression analysis of renal carcinoma: adipose differentiation-related protein as a potential diagnostic and prognostic biomarker for clear-cell renal carcinoma. The Journal of pathology. 2005;205(3):377-87.
123. Sultmann H, von Heydebreck A, Huber W, Kuner R, Buness A, Vogt M, et al. Gene expression in kidney cancer is associated with cytogenetic abnormalities, metastasis formation, and patient survival. Clinical cancer research : an official journal of the American Association for Cancer Research. 2005;11(2 Pt 1):646-55.
124. Bustin SA, Benes V, Garson JA, Hellemans J, Huggett J, Kubista M, et al. The MIQE guidelines: minimum
DANISH MEDICAL JOURNAL 39
information for publication of quantitative real-time PCR experiments. Clinical chemistry. 2009;55(4):611-22.
125. Chomczynski P, Sacchi N. The single-step method of RNA isolation by acid guanidinium thiocyanate-phenol-chloroform extraction: twenty-something years on. Nature protocols. 2006;1(2):581-5.
126. Taylor CR, Levenson RM. Quantification of immunohistochemistry--issues concerning methods, utility and semiquantitative assessment II. Histopathology. 2006;49(4):411-24.
127. D'Amico F, Skarmoutsou E, Stivala F. State of the art in antigen retrieval for immunohistochemistry. J Immunol Methods. 2009;341(1-2):1-18.
128. Zou J, Luo H, Zeng Q, Dong Z, Wu D, Liu L. Protein kinase CK2alpha is overexpressed in colorectal cancer and modulates cell proliferation and invasion via regulating EMT-related genes. J Transl Med. 2011;9:97.
129. Zhang X, Yan L, Jiao W, Ren J, Xing N, Zhang Y, et al. The clinical and biological significance of MICA in clear cell renal cell carcinoma patients. Tumour Biol. 2015.
130. Lin KY, Tai C, Hsu JC, Li CF, Fang CL, Lai HC, et al. Overexpression of nuclear protein kinase CK2 alpha catalytic subunit (CK2alpha) as a poor prognosticator in human colorectal cancer. PloS one. 2011;6(2):e17193.
131. Laramas M, Pasquier D, Filhol O, Ringeisen F, Descotes JL, Cochet C. Nuclear localization of protein kinase CK2 catalytic subunit (CK2alpha) is associated with poor prognostic factors in human prostate cancer. Eur J Cancer. 2007;43(5):928-34.
132. Camp RL, Chung GG, Rimm DL. Automated subcellular localization and quantification of protein expression in tissue microarrays. Nat Med. 2002;8(11):1323-7.
133. Kononen J, Bubendorf L, Kallioniemi A, Barlund M, Schraml P, Leighton S, et al. Tissue microarrays for high-throughput molecular profiling of tumor specimens. Nat Med. 1998;4(7):844-7.
134. Camp RL, Charette LA, Rimm DL. Validation of tissue microarray technology in breast carcinoma. Laboratory investigation; a journal of technical methods and pathology. 2000;80(12):1943-9.
135. Gillett CE, Springall RJ, Barnes DM, Hanby AM. Multiple tissue core arrays in histopathology research: a validation study. The Journal of pathology. 2000;192(4):549-53.
136. Hoos A, Urist MJ, Stojadinovic A, Mastorides S, Dudas ME, Leung DH, et al. Validation of tissue microarrays for immunohistochemical profiling of cancer specimens using the example of human fibroblastic tumors. The American journal of pathology. 2001;158(4):1245-51.
137. Nocito A, Bubendorf L, Tinner EM, Suess K, Wagner U, Forster T, et al. Microarrays of bladder cancer tissue are highly representative of proliferation index and histological grade. The Journal of pathology. 2001;194(3):349-57.
138. Rubin MA, Dunn R, Strawderman M, Pienta KJ. Tissue microarray sampling strategy for prostate cancer biomarker analysis. The American journal of surgical pathology. 2002;26(3):312-9.
139. Altman DG, Lausen B, Sauerbrei W, Schumacher M. Dangers of using "optimal" cutpoints in the evaluation of prognostic factors. Journal of the National Cancer Institute. 1994;86(11):829-35.
140. Mihara S, Nagano K, Kuroda K, Yoshioka R, Sawatari M, Koba H, et al. Efficacy of ultrasonic mass survey for abdominal cancer. J Med Syst. 1998;22(2):55-62.
141. Geissler K, Fornara P, Lautenschlager C, Holzhausen HJ, Seliger B, Riemann D. Immune signature of tumor infiltrating immune cells in renal cancer. Oncoimmunology. 2015;4(1):e985082.
142. Domcke S, Sinha R, Levine DA, Sander C, Schultz N. Evaluating cell lines as tumour models by comparison of genomic profiles. Nat Commun. 2013;4:2126.
143. Basrai D, Kraft R, Bollensdorff C, Liebmann L, Benndorf K, Patt S. BK channel blockers inhibit potassium-induced proliferation of human astrocytoma cells. Neuroreport. 2002;13(4):403-7.
144. Bloch M, Ousingsawat J, Simon R, Schraml P, Gasser TC, Mihatsch MJ, et al. KCNMA1 gene amplification promotes tumor cell proliferation in human prostate cancer. Oncogene. 2007;26(17):2525-34.
145. Van Coppenolle F, Skryma R, Ouadid-Ahidouch H, Slomianny C, Roudbaraki M, Delcourt P, et al. Prolactin stimulates cell proliferation through a long form of prolactin receptor and K+ channel activation. The Biochemical journal. 2004;377(Pt 3):569-78.
146. Oeggerli M, Tian Y, Ruiz C, Wijker B, Sauter G, Obermann E, et al. Role of KCNMA1 in breast cancer. PloS one. 2012;7(8):e41664.
147. Na X, Wu G, Ryan CK, Schoen SR, di'Santagnese PA, Messing EM. Overproduction of vascular endothelial growth factor related to von Hippel-Lindau tumor suppressor gene mutations and hypoxia-inducible factor-1 alpha expression in renal cell carcinomas. The Journal of urology. 2003;170(2 Pt 1):588-92.
148. Jacobsen J, Grankvist K, Rasmuson T, Bergh A, Landberg G, Ljungberg B. Expression of vascular endothelial growth factor protein in human renal cell carcinoma. BJU international. 2004;93(3):297-302.
149. Jacobsen J, Rasmuson T, Grankvist K, Ljungberg B. Vascular endothelial growth factor as prognostic factor in renal cell carcinoma. The Journal of urology. 2000;163(1):343-7.
150. Guethbrandsdottir G, Hjelle KM, Frugard J, Bostad L, Aarstad HJ, Beisland C. Preoperative high levels of serum vascular endothelial growth factor are a prognostic marker for poor outcome after surgical treatment of renal cell carcinoma. Scand J Urol. 2015:1-7.
151. O-charoenrat P, Rusch V, Talbot SG, Sarkaria I, Viale A, Socci N, et al. Casein kinase II alpha subunit and C1-inhibitor are independent predictors of outcome in patients with squamous cell carcinoma of the lung. Clinical cancer research : an official journal of the American Association for Cancer Research. 2004;10(17):5792-803.
152. Kim JS, Eom JI, Cheong JW, Choi AJ, Lee JK, Yang WI, et al. Protein kinase CK2alpha as an unfavorable prognostic marker and novel therapeutic target in acute myeloid leukemia. Clinical cancer research : an official journal of the American Association for Cancer Research. 2007;13(3):1019-28.
153. Matusan K, Dordevic G, Stipic D, Mozetic V, Lucin K. Osteopontin expression correlates with prognostic

DANISH MEDICAL JOURNAL 40
variables and survival in clear cell renal cell carcinoma. J Surg Oncol. 2006;94(4):325-31.
154. Matusan-Ilijas K, Damante G, Fabbro D, Dordevic G, Hadzisejdic I, Grahovac M, et al. Osteopontin expression correlates with nuclear factor-kappaB activation and apoptosis downregulation in clear cell renal cell carcinoma. Pathology, research and practice. 2011;207(2):104-10.
155. Rudland PS, Platt-Higgins A, El-Tanani M, De Silva Rudland S, Barraclough R, Winstanley JH, et al. Prognostic significance of the metastasis-associated protein osteopontin in human breast cancer. Cancer research. 2002;62(12):3417-27.
156. Shimada Y, Watanabe G, Kawamura J, Soma T, Okabe M, Ito T, et al. Clinical significance of osteopontin in esophageal squamous cell carcinoma: comparison with common tumor markers. Oncology. 2005;68(2-3):285-92.
157. Roelants C. GS, Duchemin-Pelletier E., McLeer-Florin A., Tisseyre C., Aubert C, Champelovier P., Boutonnat J.,
Descotes JL, Rambeaud J, Arnoux V., Long JA, Pasquier D, Laramas M, Kassern M, David-Boudet L, Schoutteten L, Bestgen B, Pillet C, Cochet C, Filhol O. Dysregulated Expression of Protein Kinase CK2 in Renal Cancer. In: Achmed K IO, Szyszka R, editor. Protein Kinase CK2 Cellular Function in Normal and Disease States: Springer International Publishing 2015. p. 241-57.
158. Pharmaceuticals C. Dose-escalation Study of Oral CX-4945 https://clinicaltrials.gov/ct2/show/NCT00891280?term=CX-4945&rank=32011
159. Pharmaceuticals C. Study of CX-4945 in Combination with Gemcitabine and Cisplatin for Frontline Treatment of Cholangiocarcinoma https://clinicaltrials.gov/ct2/show?term=CX-4945&rank=12015