Hyperhomocysteinemia and Increased Risk of Retinopathy: A cross-sectional, case-control study in...
17
OBSERVATIONS Vitreous Levels of Placenta Growth Factor and Vascular Endothelial Growth Factor in Patients With Proliferative Diabetic Retinopathy P lacenta growth factor (PlGF) is a close homolog of vascular endothe- lial growth factor (VEGF), shares re- ceptors with VEGF, and stimulates angiogenesis (1). Intravitreous PlGF lev- els are elevated in proliferative diabetic retinopathy (PDR) (2), but the relation- ship between PlGF levels and VEGF levels or clinical activity remains unclear. We attempted to ascertain whether intravitre- ous PlGF levels correlate with VEGF lev- els or clinical activity in PDR. We assayed PlGF and VEGF levels in vitreous samples from 50 consecutive pa- tients with PDR (31 patients) and macular hole (nondiabetic control subjects, 19 pa- tients) who underwent pars plana vitrec- tomy. The PDR stage was classified as active (16 patients) if there were new pre- retinal capillaries and as quiescent (15 pa- tients) if the vasoproliferation consisted of only large vessels (3, 4). Informed consent was obtained from each patient. The un- diluted vitreous samples were collected during the vitrectomy before intraocular infusion. Vitreous PlGF and VEGF con- centrations were measured using an enzyme-linked immunosorbent assay (ELISA) for PlGF and VEGF (R&D Sys- tems, Minneapolis, MN) according to the manufacturer’s protocol. The total pro- tein concentration of the vitreous humor was measured using a BCA protein assay kit (Pierce Chemical, Rockford, IL). The Mann-Whitney U test was used to com- pare vitreous concentrations of PlGF and VEGF. Spearman’s rank correlation test was used to examine correlations. PlGF and VEGF levels (median range) in PDR (PlGF, 100.6 pg/ml, range 7.6 – 1,038.6; VEGF 653.9 pg/ml, 9.0– 5,423.8) were significantly higher (P 0.0001) than in the control (PlGF 7.0 pg/ ml, 7.0 –12.1; VEGF 9.0 pg/ml, 9.0 – 10.0). Moreover, the differences remained highly significant (P 0.0001) when the ratio of PlGF and VEGF to pro- tein was considered (PlGF 14.6, 1.5– 250.7 vs. 2.6, 1.1– 4.1; VEGF 95.5, 2.0 – 904.0 vs. 3.0, 1.4 –5.3) (4,5). The ratio of PlGF and VEGF to pro- tein in active PDR patients was signifi- cantly higher than that in quiescent PDR patients (PlGF 33.5, 2.7–250.7 vs. 11.1, 1.5–35.8, P 0.0039; VEGF 130.1, 7.8 – 904.0 vs. 73.9, 2.0 –150.3, P 0.0328). Intravitreous PlGF levels significantly correlated with intravitreous VEGF levels in both PDR patients (r 0.824, P 0.0001) and total subjects (r 0.857, P 0.0001). Neovascularization is the most im- portant event in PDR. PlGF stimulates an- giogenesis in vivo (1). PlGF is detected in the fibrovascular membranes of PDR (2), and PlGF mRNA expression significantly increases in retina during diabetic reti- nopathy (6). In this study, intravitreous PlGF levels were significantly higher in active PDR than in quiescent PDR, sug- gesting that PlGF is involved in the devel- oping stages of PDR. PlGF does not directly induce endo- thelial cell proliferation or vascular per- meability but acts indirectly by potentia- ting the activity of VEGF (7,8). Genetic studies indicate a synergism between PlGF and VEGF in pathological angiogen- esis (9). In the present study, intravitre- ous PlGF levels significantly correlated with VEGF levels. Taken together, these results suggest that PlGF might have a co- operative role with VEGF in the progres- sion of PDR. YOSHINORI MITAMURA, MD 1 ASAKO TASHIMO, MD 1 YASUSHI NAKAMURA, MD 1 HIROSHI TAGAWA, MD 1 KENJI OHTSUKA, MD 1 YUKA MIZUE, PHD 2 JUN NISHIHIRA, MD 3 From the 1 Department of Ophthalmology, School of Medicine, Sapporo Medical University, Sapporo, Ja- pan; the 2 Sapporo Immunodiagnostic Laboratory, Sapporo, Japan; and the 3 Department of Molecular Biochemistry, Hokkaido University Graduate School of Medicine, Sapporo, Japan. Address corre- spondence to Yoshinori Mitamura, Department of Ophthalmology, School of Medicine, Sapporo Med- ical University, S-1, W-16, Chuo-ku, Sapporo 060- 8543, Japan. E-mail: [email protected]. ●●●●●●●●●●●●●●●●●●●●●●● References 1. Ziche M, Maglione D, Ribatti D, Mor- bidelli L, Lago CT, Battisti M, Paoletti I, Barra A, Tucci M, Parise G, Vincenti V, Granger H, Viglietto G, Persico MG: Pla- centa growth factor-1 is chemotactic, mi- togenic, and angiogenic. Lab Invest 76:517–531, 1997 2. Khaliq A, Foreman D, Ahmed A, Weich H, Gregor Z, McLoad D, Boulton M: In- creased expression of placenta growth factor in proliferative diabetic retinopa- thy. Lab Invest 78:109 –116, 1998 3. Aiello LP, Avery RL, Arrigg PG, Keyt BA, Jampel HD, Shah ST, Pasquale LR, Iwamoto HTMA, Park JE, Nguyen HV, Ai- ello LM, Ferrara N, King GL: Vascular en- dothelial growth factor in ocular fluid of patients with diabetic retinopathy and other retinal disorders. N Engl J Med 331: 1480 –1487, 1994 4. Katsura Y, Okano T, Noritake M, Kosano H, Nishigori H, Kado S, Matsuoka T: He- patocyte growth factor in vitreous fluid of patients with proliferative diabetic reti- nopathy and other retinal disorders. Dia- betes Care 21:1759 –1763, 1998 5. Burgos R, Mateo C, Canton A, Hernandez C, Mesa J, Simo R: Vitreous levels of IGF-1, IGF binding protein 1, and IGF binding protein 3 in proliferative diabetic retinopathy. Diabetes Care 23:80 – 83, 2000 6. Spirin KS, Saghizadeh M, Lewin SL, Zardi L, Kenney MC, Ljubimov AV: Basement membrane and growth factor gene ex- pression in normal and diabetic human retinas. Curr Eye Res 18:490 – 499, 1999 7. Park JE, Chen HH, Winer J, Houck KA, Ferrara N: Placenta growth factor: poten- tiation of vascular endothelial growth fac- tor bioactivity, in vitro and in vivo, and high affinity binding to Flt-1 but not Flk- 1/KDR. J Biol Chem 269:25646 –25654, 1994 8. Dull RO, Yuan J, Chang YS, Tarbell J, Jain Rk, Munn LL: Kinetics of placenta growth factor/vascular endothelial growth factor synergy in endothelial hydraulic conduc- tivity and proliferation. Microvasc Res 61: 203–210, 2001 9. Carmeliet P, Moons L, Luttun A, Vincenti V, Compernolle V, Mol MD, Wu Y, Bono F, Devy L, Beck H, Scholz D, Acker T, DiPalma T, Dewerchin M, Noel A, Stal- mans I, Barra A, Blacher S, Vanden- driessche T, Ponten A, Eriksson U, Plate KH, Foidart JM, Schaper W, Charnock- Jones DS, Hicklin DJ, Herbert JM, Collen D, Persico MG: Synergism between vascu- lar endothelial growth factor and placen- tal growth factor contributes to angio- genesis and plasma extravasation in pathological conditions. Nat Med 7:575– 583, 2001 LETTERS 2352 DIABETES CARE, VOLUME 25, NUMBER 12, DECEMBER 2002
-
Upload
moscowstate -
Category
Documents
-
view
0 -
download
0
Transcript of Hyperhomocysteinemia and Increased Risk of Retinopathy: A cross-sectional, case-control study in...
OBSERVATIONS
Vitreous Levels ofPlacenta GrowthFactor and VascularEndothelial GrowthFactor in PatientsWith ProliferativeDiabetic Retinopathy
P lacenta growth factor (PlGF) is aclose homolog of vascular endothe-lial growth factor (VEGF), shares re-
ceptors with VEGF, and stimulatesangiogenesis (1). Intravitreous PlGF lev-els are elevated in proliferative diabeticretinopathy (PDR) (2), but the relation-ship between PlGF levels and VEGF levelsor clinical activity remains unclear. Weattempted to ascertain whether intravitre-ous PlGF levels correlate with VEGF lev-els or clinical activity in PDR.
We assayed PlGF and VEGF levels invitreous samples from 50 consecutive pa-tients with PDR (31 patients) and macularhole (nondiabetic control subjects, 19 pa-tients) who underwent pars plana vitrec-tomy. The PDR stage was classified asactive (16 patients) if there were new pre-retinal capillaries and as quiescent (15 pa-tients) if the vasoproliferation consisted ofonly large vessels (3, 4). Informed consentwas obtained from each patient. The un-diluted vitreous samples were collectedduring the vitrectomy before intraocularinfusion. Vitreous PlGF and VEGF con-centrations were measured using anenzyme-linked immunosorbent assay(ELISA) for PlGF and VEGF (R&D Sys-tems, Minneapolis, MN) according to themanufacturer’s protocol. The total pro-tein concentration of the vitreous humorwas measured using a BCA protein assaykit (Pierce Chemical, Rockford, IL). TheMann-Whitney U test was used to com-pare vitreous concentrations of PlGF andVEGF. Spearman’s rank correlation testwas used to examine correlations.
PlGF and VEGF levels (median range)in PDR (PlGF, 100.6 pg/ml, range 7.6–1,038.6; VEGF 653.9 pg/ml, 9.0 –5,423.8) were significantly higher (P �0.0001) than in the control (PlGF 7.0 pg/ml, 7.0 –12.1; VEGF 9.0 pg/ml, 9.0 –
10.0) . Moreover, the di f ferencesremained highly significant (P � 0.0001)when the ratio of PlGF and VEGF to pro-tein was considered (PlGF 14.6, 1.5–250.7 vs. 2.6, 1.1–4.1; VEGF 95.5, 2.0–904.0 vs. 3.0, 1.4–5.3) (4,5).
The ratio of PlGF and VEGF to pro-tein in active PDR patients was signifi-cantly higher than that in quiescent PDRpatients (PlGF 33.5, 2.7–250.7 vs. 11.1,1.5–35.8, P � 0.0039; VEGF 130.1, 7.8–904.0 vs. 73.9, 2.0–150.3, P � 0.0328).
Intravitreous PlGF levels significantlycorrelated with intravitreous VEGF levelsin both PDR patients (r � 0.824, P �0.0001) and total subjects (r � 0.857,P � 0.0001).
Neovascularization is the most im-portant event in PDR. PlGF stimulates an-giogenesis in vivo (1). PlGF is detected inthe fibrovascular membranes of PDR (2),and PlGF mRNA expression significantlyincreases in retina during diabetic reti-nopathy (6). In this study, intravitreousPlGF levels were significantly higher inactive PDR than in quiescent PDR, sug-gesting that PlGF is involved in the devel-oping stages of PDR.
PlGF does not directly induce endo-thelial cell proliferation or vascular per-meability but acts indirectly by potentia-ting the activity of VEGF (7,8). Geneticstudies indicate a synergism betweenPlGF and VEGF in pathological angiogen-esis (9). In the present study, intravitre-ous PlGF levels significantly correlatedwith VEGF levels. Taken together, theseresults suggest that PlGF might have a co-operative role with VEGF in the progres-sion of PDR.
YOSHINORI MITAMURA, MD1
ASAKO TASHIMO, MD1
YASUSHI NAKAMURA, MD1
HIROSHI TAGAWA, MD1
KENJI OHTSUKA, MD1
YUKA MIZUE, PHD2
JUN NISHIHIRA, MD3
From the 1Department of Ophthalmology, School ofMedicine, Sapporo Medical University, Sapporo, Ja-pan; the 2Sapporo Immunodiagnostic Laboratory,Sapporo, Japan; and the 3Department of MolecularBiochemistry, Hokkaido University GraduateSchool of Medicine, Sapporo, Japan. Address corre-spondence to Yoshinori Mitamura, Department ofOphthalmology, School of Medicine, Sapporo Med-ical University, S-1, W-16, Chuo-ku, Sapporo 060-8543, Japan. E-mail: [email protected].
● ● ● ● ● ● ● ● ● ● ● ● ● ● ● ● ● ● ● ● ● ● ●
References1. Ziche M, Maglione D, Ribatti D, Mor-
bidelli L, Lago CT, Battisti M, Paoletti I,Barra A, Tucci M, Parise G, Vincenti V,Granger H, Viglietto G, Persico MG: Pla-centa growth factor-1 is chemotactic, mi-togenic, and angiogenic. Lab Invest76:517–531, 1997
2. Khaliq A, Foreman D, Ahmed A, WeichH, Gregor Z, McLoad D, Boulton M: In-creased expression of placenta growthfactor in proliferative diabetic retinopa-thy. Lab Invest 78:109–116, 1998
3. Aiello LP, Avery RL, Arrigg PG, Keyt BA,Jampel HD, Shah ST, Pasquale LR,Iwamoto HTMA, Park JE, Nguyen HV, Ai-ello LM, Ferrara N, King GL: Vascular en-dothelial growth factor in ocular fluid ofpatients with diabetic retinopathy andother retinal disorders. N Engl J Med 331:1480–1487, 1994
4. Katsura Y, Okano T, Noritake M, KosanoH, Nishigori H, Kado S, Matsuoka T: He-patocyte growth factor in vitreous fluid ofpatients with proliferative diabetic reti-nopathy and other retinal disorders. Dia-betes Care 21:1759–1763, 1998
5. Burgos R, Mateo C, Canton A, HernandezC, Mesa J, Simo R: Vitreous levels ofIGF-1, IGF binding protein 1, and IGFbinding protein 3 in proliferative diabeticretinopathy. Diabetes Care 23:80–83,2000
6. Spirin KS, Saghizadeh M, Lewin SL, ZardiL, Kenney MC, Ljubimov AV: Basementmembrane and growth factor gene ex-pression in normal and diabetic humanretinas. Curr Eye Res 18:490–499, 1999
7. Park JE, Chen HH, Winer J, Houck KA,Ferrara N: Placenta growth factor: poten-tiation of vascular endothelial growth fac-tor bioactivity, in vitro and in vivo, andhigh affinity binding to Flt-1 but not Flk-1/KDR. J Biol Chem 269:25646–25654,1994
8. Dull RO, Yuan J, Chang YS, Tarbell J, JainRk, Munn LL: Kinetics of placenta growthfactor/vascular endothelial growth factorsynergy in endothelial hydraulic conduc-tivity and proliferation. Microvasc Res 61:203–210, 2001
9. Carmeliet P, Moons L, Luttun A, VincentiV, Compernolle V, Mol MD, Wu Y, BonoF, Devy L, Beck H, Scholz D, Acker T,DiPalma T, Dewerchin M, Noel A, Stal-mans I, Barra A, Blacher S, Vanden-driessche T, Ponten A, Eriksson U, PlateKH, Foidart JM, Schaper W, Charnock-Jones DS, Hicklin DJ, Herbert JM, CollenD, Persico MG: Synergism between vascu-lar endothelial growth factor and placen-tal growth factor contributes to angio-genesis and plasma extravasation inpathological conditions. Nat Med 7:575–583, 2001
L E T T E R S
2352 DIABETES CARE, VOLUME 25, NUMBER 12, DECEMBER 2002
Is AcanthosisNigricans a Markerof Insulin Resistancein Obese Children?
A canthosis nigricans (AN) was pro-posed as an insulin resistancemarker and an independent risk
factor for type 2 diabetes (1). A number ofstudies had associated AN with insulin re-sistance (IR) and much higher prevalenceof type 2 diabetes in childhood. (2)
Although children with AN are oftenobese, only few studies have consideredthe roles of BMI and AN as independentmarkers of IR. The purpose of this re-search was to compare several indexes ofIR (i.e., homeostasis model assessment ofIR [HOMA-IR], insulin-like growth factorbinding protein 1 [IGFBP1] levels, andbase insulinemia) in obese children withand without AN and to determine the rateof association between AN and BMI, HDL,triglycerides, and other predictors of type2 diabetes.
A total of 1,250 Hispanic subjects(mean age 12.4 � 1.4 years) who con-sulted the pediatric department betweenApril and November 2001 were evalu-ated; 288 of these children were obese(BMI �95th percentile). Of these chil-dren, we took a randomized sample of 74obese children (40 girls). Data for birthweight (BW), positive family history forobesity and/or type 2 diabetes, BMI, pres-ence of AN, blood pressure, and Tannerstage were obtained. An oral glucose tol-erance test (OGTT) and measurements oflipid profile, insulinemia, and IGFBP1were performed. All of the children wereof Tanner stage �2 (all were in puberty)and had a positive family history. Therewas a high rate of AN (n � 41; 55.4%).There was no statistical difference regard-ing age and sex between the group withAN (n � 41) and the group without AN(n � 33). In the group with AN, four wereglucose intolerant; in the group without,only two were glucose intolerant. Nonepresented type 2 diabetes. A Student’s ttest was used to compare both groups.The group with AN showed a statisticaldifference with the other group in BMI(30.6 vs. 27.3 kg/m2, P � 0.00039), basalglucose (5.3 vs. 5.0 mmol/l, P � 0.01),HDL (39.2 vs. 45.1 mg/dl, P � 0.02), andBW (3.23 vs. 3.61 kg, P � 0.0021). ANshowed an univariate association with
BMI (r2 � 0.45, P � 0.00038), BW (r2 ��0.37, P � 0.0021), basal glucose (r2 �0.30, P � 0.009), and HDL (r2 � �0.25,P � 0.03). There was no difference for allthe IR indexes (HOMA-IR [6.6 vs. 4.9,P � 0.19], base insulinemia [27.3 vs.21.5, P � 0.27], IGFBP1 [8.2 vs. 8.3, P �0.98]) between the two groups. Likewise,there was no univariate association be-tween AN and the markers of IR (baseinsulinemia [r2 � 016, P � 0.16],HOMA-IR [r2 � 0.2, P � 0.06], andIGFBP1 [r2 � 0.07; P � 0.69]). Eventhough there were greater fasting insulinlevels and HOMA-IR in the group withAN, the difference between both groupswas not significant. Consistent with theseresults, a previous study showed that eventhough fasting insulin levels andHOMA-IR in obese children with ANwere twice as high as those without AN;after adjusting for fat mass, there was nodifference between both groups (3). Thepresence of AN showed a positive corre-lation with BMI (odds ratio [OR]1.30,95% CI 1.08–1.57; P � 0.018) and a neg-ative correlation with BW (OR 0.23, 95%CI 0.07–0.71; P � 0.03) in the multivar-iate analysis. BMI of subjects in the groupwith AN was significantly greater than inthe group without AN, suggesting thatAN may reflect only increased obesity.We conclude that AN predicts obesityand is not an independent marker of IR inour population.
VALERIA HIRSCHLER
CLAUDIO ARANDA
ADRIANA ONETO
CLAUDIO GONZALEZ
MAURICIO JADZINSKY
From the Department of Nutrition and Diabetes ofBuenos Aires Durand Hospital, Buenos Aires, Ar-gentina.
Address correspondence to Valeria Hirschler,Maipu 812 5° M. 1006, Capital Federal, Argentina.E-mail: [email protected].
● ● ● ● ● ● ● ● ● ● ● ● ● ● ● ● ● ● ● ● ● ● ●
References1. American Diabetes Association: Type 2
diabetes in children and adolescents(Consensus Statement). Diabetes Care 23:381–389, 2000
2. Stuart CH, Gikinson CH, Smith M, BosmaA, Bruce K, Nagamani M: Acanthosis nig-ricans as a risk factor for non insulin de-pendent diabetes mellitus. Clin Pediatr 37:73–80, 1998
3. Nguyen TT, Keil MF, Russell DL, Pathom-vanich A, Uwaifo GI, Sebring NG, Reyn-
olds JC, Janovski JA: Relation ofacanthosis nigricans to hyperinsulinemiaand insulinsensitivity in overweight Afri-can American and white children. J Pedi-atr 138:474–480, 2001
A Subtype ofMarkedly AbruptOnset With AbsoluteInsulin Deficiency inIdiopathic Type 1Diabetes inJapanese Children
Idiopathic type 1 diabetes, by definition,has no known etiology. Although onlya minority of type 1 diabetic patients
fall into this category, it is reported thatthe majority are of African or Asian de-scent. Individuals with this form ofdiabetes are considered to present heter-ogeneous clinical manifestations (1). Ima-gawa et al. (2) reported a new subtype oftype 1 diabetes characterized by fulmi-nant onset, absolute insulin deficiency,and absence of �-cell autoimmunity inJapanese adults. We reported similarcases of idiopathic type 1 diabetes in Jap-anese children.
Among 85 Japanese children withtype 1 diabetes, 14 (16.5%) were classi-fied as having idiopathic type 1 diabeteswith no evidence of anti-islet autoanti-bodies. Of these 14 patients, 6 had a sub-type of markedly abrupt onset. Theyconsisted of five girls and one boy, aged1.9–15.1 years at onset. Five of the sixchildren had suffered viral infections be-fore the onset of disease: two with Cox-sackie virus B, one with influenza virus,one with mumps virus, and one with vi-rus of unknown origin. The duration ofhyperglycemic symptoms before the on-set of overt diabetes was �18 days (range5–18) in all six patients. Three patientshad a particularly shorter symptomaticperiod of �7 days. Although all the pa-tients showed high plasma glucose levels(565–772 mg/dl), all but one had HbA1cvalues �8.0% (6.6 –7.6) at diagnosis.This suggests that the short symptomaticperiod before the onset of overt diabetesmight be reflected by a low HbA1c value.All had ketoacidosis with bicarbonate lev-els �18 mmol/l (13–18) at onset. Fourpatients experienced impaired conscious-ness. They exhibited low or undetectable
Letters
DIABETES CARE, VOLUME 25, NUMBER 12, DECEMBER 2002 2353
values (0.3– 0.4 ng/ml) of serum C-peptide. This implies that �-cells werecompletely destroyed from the time of on-set. One patient had first-degree relativeswith type 2 diabetes, while none had fam-ily members with type 1 diabetes. All thepatients had high-risk HLA typing (eitherHLA-DR4 or -DR9) for type 1 diabetes.
From these findings, the rapid onsetform of idiopathic type 1 diabetes may notbe rare in the Japanese population. Thisform is characterized by markedly abruptonset with a severe metabolic disorderand absolute deficiency of insulin secre-tion at onset. Viral infection may be asso-ciated with the rapid destruction of�-cells. Ethnic and environmental factorsmay play a role in the etiology and clinicalheterogeneity of idiopathic type 1 diabetes.
TATSUHIKO URAKAMI, MD
MAKIO NAKAGAWA, MD
SHIGEO MORIMOTO, MD
SHIGEKI KUBOTA, MD
MISAO OWADA, MD
KENSUKE HARADA, MD
From the Department of Pediatrics, Nihon Univer-sity School of Medicine, Tokyo, Japan.
Address correspondence to Tatsuhiko Urakami,MD, Department of Pediatrics, Nihon UniversitySchool of Medicine, 1-8-13 Kandasurugadai,Chiyoda-ku, Tokyo, 101-8309 Japan. E-mail:[email protected].
● ● ● ● ● ● ● ● ● ● ● ● ● ● ● ● ● ● ● ● ● ● ●
References1. The Expert Committee on the Diagnosis
and Classification of Diabetes Mellitus:Report of the Expert Committee on theDiagnosis and Classification of DiabetesMellitus. Diabetes Care 21 (Suppl. 1):5–19, 1998
2. Imagawa A, Hanafusa T, Miyagawa J, Mat-suzawa Y: A novel subtype of type I dia-betes mellitus characterized by a rapidonset and an absence of diabetes-relatedantibodies. N Engl J Med 342:301–307,2000
Blood PressureProfiles inAdolescents WithRecently DiagnosedType 2 Diabetes
T ype 2 diabetes in children is a recentphenomenon, and current evidenceabout diabetes and hypertension is
based on adult studies. Adults with dia-
betes have changes in 24-h ambulatoryblood pressure (BP) profiles, including adecrease in sleep dip (the decline in BPthat normally occurs during sleep) andincreased systolic blood pressure (SBP),that are associated with early cardiovascu-lar disease (1).
This cross-sectional study compared24-h BP and heart rate (HR) profiles ofHispanic and African-American adoles-cents recently diagnosed with type 2 dia-betes with the profiles of two groups of 10healthy control subjects matched for age,sex, height, and race/ethnicity (2). BP andHR were monitored every 30 min for 24 husing an ambulatory monitor (model90207; SpaceLabs, Redmond, Washing-ton). Simultaneous recording of activitywas monitored by the Motionlogger acti-graph (Ambulatory Monitoring, Ardsley,New York). A mixed-model approach wasused to examine differences in individualBP and HR measurements in the studyand comparison groups.
The study group consisted of 10 ado-lescents with type 2 diabetes (6 males and4 females). Mean age at diagnosis was13.58 years, mean length of diagnosis was10 months, and mean blood glucose onthe day of monitoring was 149.30 mg/dl(SD 81.99). Mean weight was 82.53 kg(range 62.7–129.3) in the study groupand averaged 60.89 kg (43–85) in thecomparison groups. Compared with ado-lescents without diabetes, adolescentswith type 2 diabetes had significantlysmaller mean sleeping SBP dip even aftercontrolling for weight (P � 0.008).
The model for SBP indicated a signif-icant difference by group, [F (2, 799) �4.84, P � 0.0082], position [F (2, 799) �28.28, P � 0.0001], and group by posi-tion interaction [F (4, 799) � 4.92, P �0.0006]. Reclining and sitting positionswere associated with lower SBP comparedwith a standing position in the compari-son groups, whereas only reclining wasassociated with lower SBP in the groupwith diabetes. The least-squares meanSBP decreased an average 12.5 pointswhile reclining in the comparison groups,but it was only 3.8 points lower in thesubjects. The model for HR indicated asignificant difference in group-by-activityinteraction, [F (2, 801) � 3.55, P �0.0291], group effect [F (2, 801) � 24.13,P � 0.0001], position [F (2, 801) �77.62, P � 0.0001], and activity [F (1,801) � 4.12, P � 0.0428]. HR was sig-nificantly lower in the reclining and sit-
ting positions for all subjects, but thegroup with diabetes had higher HR onaverage than either comparison group.Activity was unrelated to HR in the groupwith type 2 diabetes, while it was posi-tively related in the two comparisongroups.
This study provided evidence thatchanges in BP and HR are evident early inthe course of type 2 diabetes in adoles-cents and may predict increased cardio-vascular morbidity during youngadulthood.
CHRISTINE A. BROSNAN, DRPH, RN1
JANET C. MEININGER, PHD, RN, FAAN1
PAUL R. SWANK, PHD2
LISA R. REYES, MSN, RN1
PATRICK G. BROSNAN, MD2
From the 1University of Texas Health Science CenterSchool of Nursing, Systems and Technology, Hous-ton, Texas; and the 2University of Texas Health Sci-ence Center School of Medicine, Department ofPediatrics, Houston, Texas.
Address correspondence to Christine A. Brosnan,University of Texas Health Science Center School ofNursing, Systems and Technology, 1100 HolcombeBlvd., Suite 5.518, Houston, TX 77030. E-mail:[email protected].
● ● ● ● ● ● ● ● ● ● ● ● ● ● ● ● ● ● ● ● ● ● ●
References1. Jermendy G, Ferenczi J, Hernandez E, Far-
kas K, Nadas J: Day-night blood pressurevariation in normotensive and hypertensiveNIDDM patients with asymptomatic auto-nomic neuropathy. Diabetes Res Clin Pract34:107–114, 1996
2. Meininger JC, Liehr P, Mueller WH, ChanW, Smith GL, Portman RJ: Stress-inducedalterations of blood pressure and 24 h am-bulatory blood pressure in adolescents.Blood Press Monit 4:115–120, 1999
White Blood CellCount Is PositivelyCorrelated WithAlbumin ExcretionRate in Subjects WithType 2 Diabetes
White blood cell (WBC) count isone of the main inflammatorymarkers that predict cardiovas-
cular events (1) and is a component (innondiabetic subjects) of the insulin resis-tance syndrome (2), a clustering of car-diovascular risk factors showing insulin
Letters
2354 DIABETES CARE, VOLUME 25, NUMBER 12, DECEMBER 2002
resistance as a common denominator (3).It is not known whether WBC count cor-relates with albumin excretion rate (AER),a component of the insulin resistance syn-drome conferring a particularly strongrisk of cardiovascular morbidity andmortality (3).
To evaluate whether WBC count cor-relates with AER in type 2 diabetes, weevaluated 659 Italian type 2 diabetic pa-tients (354 men and 305 women) fol-lowed-up at the University Diabetes Unitof the San Luigi Gonzaga Hospital in Or-bassano, Turin, Italy, who were not af-fected by neoplastic, inflammatory,infective, or liver diseases. AER was deter-mined by nephelometric method (Beck-man, Milan, Italy). Patient characteristicswere (means � SD) as follows: age62.00 � 9.48 years; known diabetes du-ration 9.59 � 8.21 years; BMI 29.04 �4.94 kg/m2; therapy: diet 38.2%, oral hy-poglycemic agents (OHAs) 44.4%, OHAs� insulin 7.2%, insulin alone 10.2%; ac-tual/previous/never smokers: 21/24/55%;and normo-, micro- and macroalbumin-uric subjects (i.e., AER �20, 20–200, and�200 �g/min): 72.2, 21.2, and 6.6%.WBC count (mean 7,028.8 � 1,782.2/�l)was higher in microalbuminuric(7,359 � 1,882/�l, P � 0.0051) andmacroalbuminuric (7,574 � 1981/�l,P � 0.0143) than in normoalbuminuricsubjects (6,882 � 1,713/�l) and corre-lated with AER by simple regression (r �.180, P � 0.0001). WBC count washigher in current (7,648 � 2,108/�l)than in previous (6,929 � 1,655/�l, P �0.0012) and in never (6,844 � 1,656/�l,P � 0.0001) smokers and was similar inmen and women. The correlation be-tween WBC count and AER remained sig-nificant when subjects were dividedaccording to sex (r � 0.140, P � 0.0072in men; r � 0.220, P � 0.0001 in women)and smoking status (r � 0.150, P �0.0004 in never and past smokers; r �0.230, P � 0.0072 in current smokers)and when only the 544 patients withouthistory of cardiovascular events were con-sidered (r � 0.230, P � 0.0001). WBCcount correlated with AER (Std coeffi-cient � 0.102, P � 0.0120) also in a mul-tiple regression model considering age,known diabetes duration, BMI, systolicand diastolic blood pressure, HbA1c, totaland HDL cholesterol, triglycerides, uricacid, creatinine, erythrocyte sedimenta-tion rate, fibrinogen, and hematocrit.When subjects were divided in tertiles ac-
cording to WBC count (�6,140/�l: i.e.,5,300 � 645/�l; 6,140–7,500/�l: i.e.,6,778 � 372/�l; and �7,500/�l: i.e.,9,001 � 1,424/�l), they differed for BMI(28.6 � 4.7, 28.8 � 4.6, and 29.7 � 5.4kg/m2, ANOVA P � 0.0417), HbA1c(7.6 � 1.3, 7.7 � 1.3, and 8.0 � 1.5%,ANOVA P � 0.0026), HDL cholesterol(1.33 � 0.42, 1.31 � 0.40, and 1.20 �0.37 mmol/l, ANOVA P � 0.0016), logtriglycerides (0.023 � 0.003, 0.024 �0.002, and 0.025 � 0.003 mmol/l,ANOVA P � 0.0001), fibrinogen(324.8 � 79.0, 325.8 � 69.6, and363.2 � 84.6 mg/dl, ANOVA P �0.0001), hematocrit (40.7 � 3.2, 41.4 �3.8, and 42.0 � 3.9 mg/dl, ANOVA P �0.0008), and log AER (1.05 � 0.56,1.07 � 0.57, and 1.28 � 0.67 �g/min,ANOVA P � 0.0001). For all of the pa-rameters, the first and the second tertilesdid not differ, whereas statistical differ-ences were observed between the thirdand the first and/or the third and the sec-ond tertiles (P � 0.01–0.0001). Thus, pa-tients with highest WBC values differedfor AER, markers of insulin resistance(BMI, HDL cholesterol, and triglycer-ides), and inflammation (fibrinogen). Inconclusion, in type 2 diabetes, AER cor-relates with WBC count, one of the majorcomponents of the chronic subclinical in-flammation associated with both insulinresistance and atherosclerosis (1,2).
FRANCO CAVALOT, MD
PAOLA MASSUCCO, MD
PAOLO PERNA, MD
MONICA TRAVERSA, MD
GIOVANNI ANFOSSI, MD
MARIELLA TROVATI, MD
From the Diabetes Unit, Department of Clinical andBiological Sciences of the University of Turin, SanLuigi Gonzaga Hospital, Orbassano (Turin), Italy
Address correspondence to Mariella Trovati, MD,Diabetes Unit, Department of Clinical and BiologicalSciences of the University of Turin, San LuigiGonzaga Hospital, 10043 Orbassano (Torino) Italy.E-mail: mariella.trovati@ unito.it.
● ● ● ● ● ● ● ● ● ● ● ● ● ● ● ● ● ● ● ● ● ● ●
References1. Danesh J, Collins R, Appleby P, Peto R:
Association of fibrinogen, C-reactive pro-tein, albumin and leukocyte count withcoronary heart disease: meta-analysis ofprospective studies. JAMA 279:1477–1482, 1998
2. Festa A, D’Agostino R, Howard G, Myk-kanen L, Tracy RP, Haffner SM: Chronicsubclinical inflammation as part of the in-
sulin resistance syndrome: the Insulin Re-sistance Atherosclerosis Study (IRAS).Circulation 102:42–47, 2000
3. Isomaa B, Almgren P, Tuomi T, Forsen B,Lahti K, Nissen M, Taskinen MR, GroopL: Cardiovascular morbidity and mortal-ity associated with the metabolic syn-drome. Diabetes Care 24:683–689, 2001
Early Detection ofSmall-FiberNeuropathy inDiabetes
A laser-induced painsomatosensory-evoked potentialsand pupillometric study
O ver the last 15 years, many authorshave pointed out that small nervefibers may be selectively damaged
in the early stages of diabetes, leading toan early impairment of pain and temper-ature sensations and to a decline in auto-nomic nervous function (1,2).
The CO2 pain-induced laser somato-sensory-evoked potential (pSEP) evalua-tion may represent a new quantitative andobjective approach to evaluate pain andtemperature sensation functions (3–8).Recently, Agostino et al. (9) reportedsmall-fiber dysfunction assessed bypSEPs in diabetic patients with differentdegrees of peripheral nerve damage.
A total of 27 diabetic patients (12 type1 [group 1] and 15 type 2 [group 2]) and27 age-, sex-, and height-matched controlsubjects were included in the study. Ingroup 1 (6 men and 6 women), the meanage was 33.6 � 9 years, the duration ofdiabetes was 13.5 � 6.7 years, and theglycated hemoglobin was 6.1 � 1.3%;two patients had nephropathy and threehad background retinopathy. In group 2(7 men and 8 women), the mean age was55.3 � 8.8 years, the duration of diabeteswas 8.2 � 6.2 years, and the glycated he-moglobin was 6.8 � 1.5%; three patientshad nephropathy and four had back-ground retinopathy. The patients report-ed no history of autonomic and somaticneuropathy and had negative clinicalexaminations (evaluated using the Neu-ropathy Symptom Score [NSS], the Neu-rological Symptom Profile [NSP], and
Letters
DIABETES CARE, VOLUME 25, NUMBER 12, DECEMBER 2002 2355
the Neurologic Disability Score [NDS])(10); normal nerve conduction velocityand P100 latency at visual-evoked poten-tials (VEPs) recording; no severe diabeticretinopathy or other opthalmological dis-eases; no recurrent ketoacidosis, keto-nuria, or hypoglycemia; no psychiatricdisorders or alcohol consumption; nocognitive impairment; and no other dis-eases or treatment with medicationsknown to influence nervous system func-tion. Two control groups (groups 3 and 4)were included in the study. Group 3 (6men and 6 women, aged 34.1 � 8 years)comprised healthy subjects age-, sex-,and height-matched with patient group 1,and group 4 (7 men and 8 women, aged55.5 � 8.7 years) comprised healthy sub-jects age-, sex-, and height-matched withpatient group 2. All subjects were in-formed about the aim of the study andgave their consent. The experimental de-sign of the study was approved by the eth-ics committee of “la Sapienza” Universityof Rome. Diabetic- and control-subjectfindings were compared with those ob-tained in our laboratories in a large num-ber (60) of normal subjects acting as anormal reference control group.
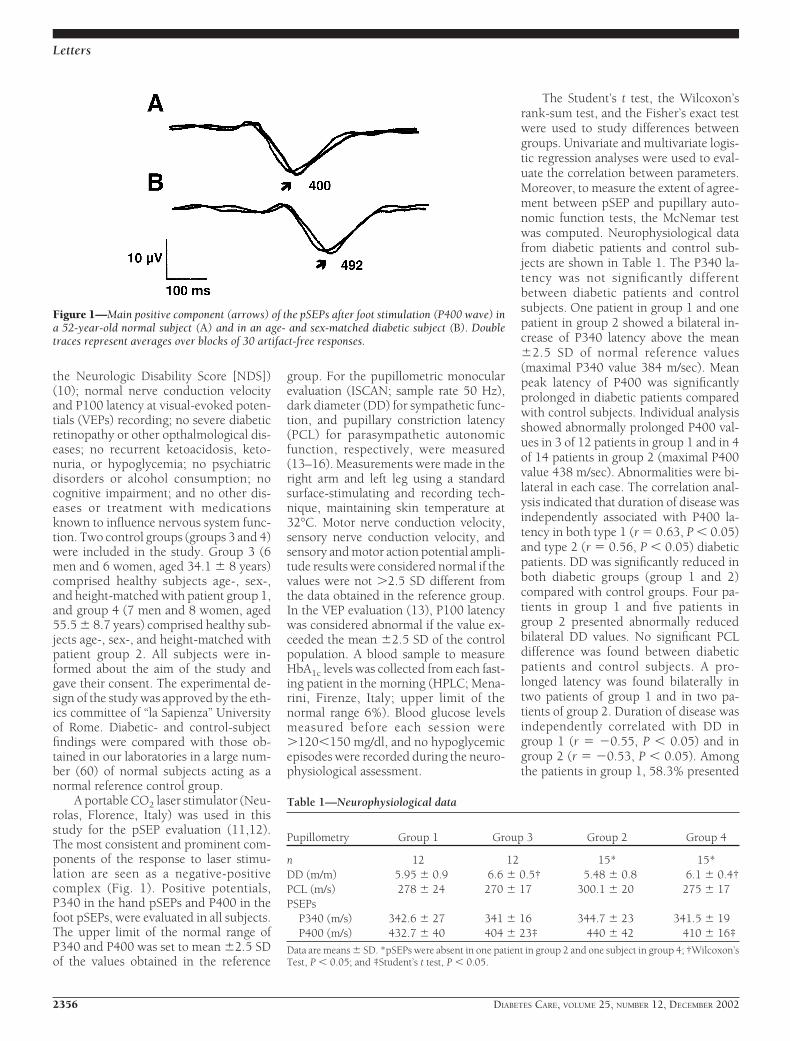
A portable CO2 laser stimulator (Neu-rolas, Florence, Italy) was used in thisstudy for the pSEP evaluation (11,12).The most consistent and prominent com-ponents of the response to laser stimu-lation are seen as a negative-positivecomplex (Fig. 1). Positive potentials,P340 in the hand pSEPs and P400 in thefoot pSEPs, were evaluated in all subjects.The upper limit of the normal range ofP340 and P400 was set to mean �2.5 SDof the values obtained in the reference
group. For the pupillometric monocularevaluation (ISCAN; sample rate 50 Hz),dark diameter (DD) for sympathetic func-tion, and pupillary constriction latency(PCL) for parasympathetic autonomicfunction, respectively, were measured(13–16). Measurements were made in theright arm and left leg using a standardsurface-stimulating and recording tech-nique, maintaining skin temperature at32°C. Motor nerve conduction velocity,sensory nerve conduction velocity, andsensory and motor action potential ampli-tude results were considered normal if thevalues were not �2.5 SD different fromthe data obtained in the reference group.In the VEP evaluation (13), P100 latencywas considered abnormal if the value ex-ceeded the mean �2.5 SD of the controlpopulation. A blood sample to measureHbA1c levels was collected from each fast-ing patient in the morning (HPLC; Mena-rini, Firenze, Italy; upper limit of thenormal range 6%). Blood glucose levelsmeasured before each session were�120�150 mg/dl, and no hypoglycemicepisodes were recorded during the neuro-physiological assessment.
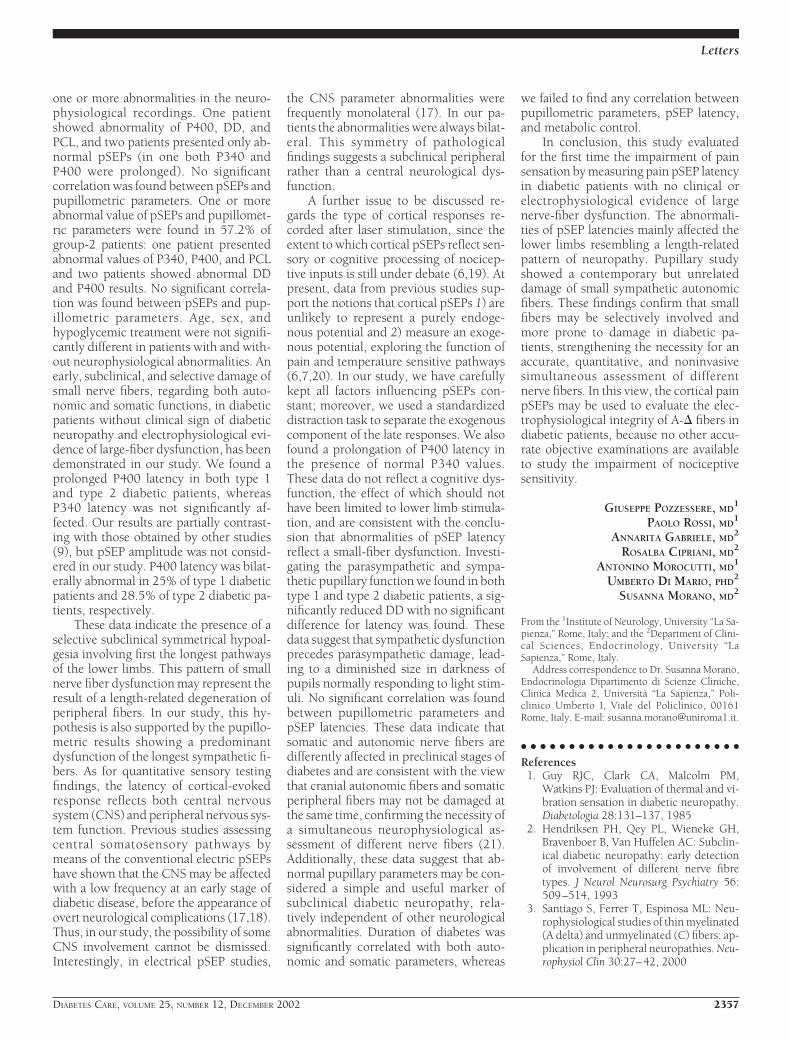
The Student’s t test, the Wilcoxon’srank-sum test, and the Fisher’s exact testwere used to study differences betweengroups. Univariate and multivariate logis-tic regression analyses were used to eval-uate the correlation between parameters.Moreover, to measure the extent of agree-ment between pSEP and pupillary auto-nomic function tests, the McNemar testwas computed. Neurophysiological datafrom diabetic patients and control sub-jects are shown in Table 1. The P340 la-tency was not significantly differentbetween diabetic patients and controlsubjects. One patient in group 1 and onepatient in group 2 showed a bilateral in-crease of P340 latency above the mean�2.5 SD of normal reference values(maximal P340 value 384 m/sec). Meanpeak latency of P400 was significantlyprolonged in diabetic patients comparedwith control subjects. Individual analysisshowed abnormally prolonged P400 val-ues in 3 of 12 patients in group 1 and in 4of 14 patients in group 2 (maximal P400value 438 m/sec). Abnormalities were bi-lateral in each case. The correlation anal-ysis indicated that duration of disease wasindependently associated with P400 la-tency in both type 1 (r � 0.63, P � 0.05)and type 2 (r � 0.56, P � 0.05) diabeticpatients. DD was significantly reduced inboth diabetic groups (group 1 and 2)compared with control groups. Four pa-tients in group 1 and five patients ingroup 2 presented abnormally reducedbilateral DD values. No significant PCLdifference was found between diabeticpatients and control subjects. A pro-longed latency was found bilaterally intwo patients of group 1 and in two pa-tients of group 2. Duration of disease wasindependently correlated with DD ingroup 1 (r � �0.55, P � 0.05) and ingroup 2 (r � �0.53, P � 0.05). Amongthe patients in group 1, 58.3% presented
Figure 1—Main positive component (arrows) of the pSEPs after foot stimulation (P400 wave) ina 52-year-old normal subject (A) and in an age- and sex-matched diabetic subject (B). Doubletraces represent averages over blocks of 30 artifact-free responses.
Table 1—Neurophysiological data
Pupillometry Group 1 Group 3 Group 2 Group 4
n 12 12 15* 15*DD (m/m) 5.95 � 0.9 6.6 � 0.5† 5.48 � 0.8 6.1 � 0.4†PCL (m/s) 278 � 24 270 � 17 300.1 � 20 275 � 17PSEPs
P340 (m/s) 342.6 � 27 341 � 16 344.7 � 23 341.5 � 19P400 (m/s) 432.7 � 40 404 � 23‡ 440 � 42 410 � 16‡
Data are means � SD. *pSEPs were absent in one patient in group 2 and one subject in group 4; †Wilcoxon’sTest, P � 0.05; and ‡Student’s t test, P � 0.05.
Letters
2356 DIABETES CARE, VOLUME 25, NUMBER 12, DECEMBER 2002
one or more abnormalities in the neuro-physiological recordings. One patientshowed abnormality of P400, DD, andPCL, and two patients presented only ab-normal pSEPs (in one both P340 andP400 were prolonged). No significantcorrelation was found between pSEPs andpupillometric parameters. One or moreabnormal value of pSEPs and pupillomet-ric parameters were found in 57.2% ofgroup-2 patients: one patient presentedabnormal values of P340, P400, and PCLand two patients showed abnormal DDand P400 results. No significant correla-tion was found between pSEPs and pup-illometric parameters. Age, sex, andhypoglycemic treatment were not signifi-cantly different in patients with and with-out neurophysiological abnormalities. Anearly, subclinical, and selective damage ofsmall nerve fibers, regarding both auto-nomic and somatic functions, in diabeticpatients without clinical sign of diabeticneuropathy and electrophysiological evi-dence of large-fiber dysfunction, has beendemonstrated in our study. We found aprolonged P400 latency in both type 1and type 2 diabetic patients, whereasP340 latency was not significantly af-fected. Our results are partially contrast-ing with those obtained by other studies(9), but pSEP amplitude was not consid-ered in our study. P400 latency was bilat-erally abnormal in 25% of type 1 diabeticpatients and 28.5% of type 2 diabetic pa-tients, respectively.
These data indicate the presence of aselective subclinical symmetrical hypoal-gesia involving first the longest pathwaysof the lower limbs. This pattern of smallnerve fiber dysfunction may represent theresult of a length-related degeneration ofperipheral fibers. In our study, this hy-pothesis is also supported by the pupillo-metric results showing a predominantdysfunction of the longest sympathetic fi-bers. As for quantitative sensory testingfindings, the latency of cortical-evokedresponse reflects both central nervoussystem (CNS) and peripheral nervous sys-tem function. Previous studies assessingcentral somatosensory pathways bymeans of the conventional electric pSEPshave shown that the CNS may be affectedwith a low frequency at an early stage ofdiabetic disease, before the appearance ofovert neurological complications (17,18).Thus, in our study, the possibility of someCNS involvement cannot be dismissed.Interestingly, in electrical pSEP studies,
the CNS parameter abnormalities werefrequently monolateral (17). In our pa-tients the abnormalities were always bilat-eral. This symmetry of pathologicalfindings suggests a subclinical peripheralrather than a central neurological dys-function.
A further issue to be discussed re-gards the type of cortical responses re-corded after laser stimulation, since theextent to which cortical pSEPs reflect sen-sory or cognitive processing of nocicep-tive inputs is still under debate (6,19). Atpresent, data from previous studies sup-port the notions that cortical pSEPs 1) areunlikely to represent a purely endoge-nous potential and 2) measure an exoge-nous potential, exploring the function ofpain and temperature sensitive pathways(6,7,20). In our study, we have carefullykept all factors influencing pSEPs con-stant; moreover, we used a standardizeddistraction task to separate the exogenouscomponent of the late responses. We alsofound a prolongation of P400 latency inthe presence of normal P340 values.These data do not reflect a cognitive dys-function, the effect of which should nothave been limited to lower limb stimula-tion, and are consistent with the conclu-sion that abnormalities of pSEP latencyreflect a small-fiber dysfunction. Investi-gating the parasympathetic and sympa-thetic pupillary function we found in bothtype 1 and type 2 diabetic patients, a sig-nificantly reduced DD with no significantdifference for latency was found. Thesedata suggest that sympathetic dysfunctionprecedes parasympathetic damage, lead-ing to a diminished size in darkness ofpupils normally responding to light stim-uli. No significant correlation was foundbetween pupillometric parameters andpSEP latencies. These data indicate thatsomatic and autonomic nerve fibers aredifferently affected in preclinical stages ofdiabetes and are consistent with the viewthat cranial autonomic fibers and somaticperipheral fibers may not be damaged atthe same time, confirming the necessity ofa simultaneous neurophysiological as-sessment of different nerve fibers (21).Additionally, these data suggest that ab-normal pupillary parameters may be con-sidered a simple and useful marker ofsubclinical diabetic neuropathy, rela-tively independent of other neurologicalabnormalities. Duration of diabetes wassignificantly correlated with both auto-nomic and somatic parameters, whereas
we failed to find any correlation betweenpupillometric parameters, pSEP latency,and metabolic control.
In conclusion, this study evaluatedfor the first time the impairment of painsensation by measuring pain pSEP latencyin diabetic patients with no clinical orelectrophysiological evidence of largenerve-fiber dysfunction. The abnormali-ties of pSEP latencies mainly affected thelower limbs resembling a length-relatedpattern of neuropathy. Pupillary studyshowed a contemporary but unrelateddamage of small sympathetic autonomicfibers. These findings confirm that smallfibers may be selectively involved andmore prone to damage in diabetic pa-tients, strengthening the necessity for anaccurate, quantitative, and noninvasivesimultaneous assessment of differentnerve fibers. In this view, the cortical painpSEPs may be used to evaluate the elec-trophysiological integrity of A- fibers indiabetic patients, because no other accu-rate objective examinations are availableto study the impairment of nociceptivesensitivity.
GIUSEPPE POZZESSERE, MD1
PAOLO ROSSI, MD1
ANNARITA GABRIELE, MD2
ROSALBA CIPRIANI, MD2
ANTONINO MOROCUTTI, MD1
UMBERTO DI MARIO, PHD2
SUSANNA MORANO, MD2
From the 1Institute of Neurology, University “La Sa-pienza,” Rome, Italy; and the 2Department of Clini-cal Sciences, Endocrinology, University “LaSapienza,” Rome, Italy.
Address correspondence to Dr. Susanna Morano,Endocrinologia Dipartimento di Scienze Cliniche,Clinica Medica 2, Universita “La Sapienza,” Poli-clinico Umberto I, Viale del Policlinico, 00161Rome, Italy. E-mail: [email protected].
● ● ● ● ● ● ● ● ● ● ● ● ● ● ● ● ● ● ● ● ● ● ●
References1. Guy RJC, Clark CA, Malcolm PM,
Watkins PJ: Evaluation of thermal and vi-bration sensation in diabetic neuropathy.Diabetologia 28:131–137, 1985
2. Hendriksen PH, Qey PL, Wieneke GH,Bravenboer B, Van Huffelen AC: Subclin-ical diabetic neuropathy: early detectionof involvement of different nerve fibretypes. J Neurol Neurosurg Psychiatry 56:509–514, 1993
3. Santiago S, Ferrer T, Espinosa ML: Neu-rophysiological studies of thin myelinated(A delta) and unmyelinated (C) fibers: ap-plication in peripheral neuropathies. Neu-rophysiol Clin 30:27–42, 2000
Letters
DIABETES CARE, VOLUME 25, NUMBER 12, DECEMBER 2002 2357
4. Low PA: Diabetic autonomic neuropathy.Semin Neurol 16:143–151, 1996
5. Zaslansky R, and Yarnitsky D: Clinical ap-plication of quantitative sensory testing(QST). J Neurol Sci 153:219–238, 1998
6. Bromm B, Lorenz J: Neurophysiologicalevaluation of pain. Electroenceph Clin Neu-rophysiol 107:227–253, 1998
7. Kakigi R, Watanabe S, Yamasaki H: Pain-related somatosensory evoked potentials.J Clin Neurophysiol 17:295–305, 2000
8. Bromm B, Treede RD: Laser-evoked cere-bral potentials in the assessment of cuta-neous pain sensitivity in normal subjectsand patients. Rev Neurol (Paris) 147:625–643, 1991
9. Agostino R, Cruccu G, Romaniello A, In-nocenti P, Inghilleri M, Manfredi M: Dys-function of small myelinated afferents indiabetic polyneuropathy, as assessed bylaser evoked potentials. Clinical Neuro-physiology 111:270–276, 2000
10. Dyck PJ, Kratz KM, Lehman KA, KarnesJL, Melton LJ 3rd, O’Brien PC, Litchy WJ,Windenbank AJ, Smith BE, Low PA: TheRochester Diabetic Neuropathy Study:design, criteria for types of neuropathy,selection bias, and reproducibility of neu-ropathic tests. Neurology 41:799–807,1991
11. Rossi P, Serrao M, Amabile G, Parisi L,Pierelli F, Pozzessere G: A simple methodfor estimating conduction velocity of thespinothalamic tract in healthy humans.Clinical Neurophysiology 111:1907–1915,2000
12. Siedenberg R, Treede RD: Laser-evokedpotentials: exogenous and endogenouscomponents. Electroenceph clin Neuro-physiol 100:240–249, 1996
13. Pozzessere G, Rossi P, Valle E, Froio CP,Petrucci AFG, Morocutti C: Autonomicinvolvement in multiple sclerosis: a pup-illometric study. Clin Auton Res 7:315–319, 1997
14. Straub RH, Thies U, Jeron A, Palitzsch D,Scholmerich J: Valid parameters for inves-tigation of the pupillary light reflex in nor-mal and diabetic subjects shown by factoranalysis and partial correlation. Diabetolo-gia 37:414–419, 1994
15. Papakostopoulos D, Hart JC, Corrall RJ,Harney B: The scotopic electroretinogramto blue flashes and pattern reversal visualevoked potentials in insulin dependentdiabetes. Int J Psychophysiol 21:33–43,1996
16. Isotani H, Fukumoto Y, Kitaoka H, Fu-rukawa K, Ohsawa N, Utsumi T: Oval pu-pil in patients with diabetes mellitus:examination by measurement of the dark-adapted pupillary area and pupillary lightreflex. Diabetes Res Clin Pract 29:43–48,1995
17. Pozzessere G, Rizzo PA, Valle E, MollicaMA, Meccia A, Morano S, Di Mario U,
Andreani D, Morocutti C: Early detectionof Neurological involvement in IDDMand NIDDM: multimodal evoked poten-tials versus metabolic control. DiabetesCare 11:473–480, 1988
18. Di Mario U, Morano S, Valle E, PozzessereG: Electrophysiological alterations of cen-tral nervous system in diabetes mellitus.Diab Met Rev 11:259–277, 1995
19. Garcia-Larrea L, Peyron R, Laurent B,Mauguiere F: Association and dissocia-tion between laser-evoked potentials andpain perception. Neuroreport 8:3785–3789, 1997
20. Becker DA, Yingling CD, Fein G: Identi-fication of pain, intensity and P300 com-ponents in the pain evoked potential.Electroenceph Clin Neurophysiol 88:290–301, 1993
21. Toyry JP, Partanen JV, Niskanen LK, Lan-simies EA, Uusitupa MI: Divergent devel-opment of autonomic and peripheralsomatic neuropathies in NIDDM. Diabe-tologia 40:953–958, 1997
Early Improvementof Unstable DiabeticRetinopathy AfterSolitary PancreasTransplantation
S olitary pancreas transplantation(SPT) can significantly improve thequality of life of diabetic patients by
eliminating the need for exogenous insu-lin, frequent home glucose monitoring,and many of the dietary restrictions im-posed by the disease. In addition, success-ful SPT is able to eliminate acute diabetescomplications, such as hypoglycemicand/or hyperglycemic episodes (1).
The effects of SPT on long-term com-plications of diabetes is less clear, but res-toration of long-lasting normoglycemiaseems to have several beneficial actions,including improvement of neuropathyand nephropathy (2). Little information iscurrently available on the role of SPT onthe evolution of diabetic retinopathy.Ramsay et al. (3) studied the progressionof retinopathy in solitary pancreas recipi-ents and found some beneficial effect at 3years after transplant.
An SPT program in type 1 diabeticpatients has recently started in our center.Inclusion criteria are as recommended(1). In a group of nine patients (fourmen and five women who were aged35 � 10 years, had duration of diabetes
of 24 � 11 years, and received SPT withportal drainage), we evaluated the earlyeffects of the transplant on unstable dia-betic retinopathy, a condition character-ized by a drop in visual acuity of at least 2Snellen lines, and/or an episode of vitre-ous hemorrhage, and/or laser treatmentand/or vitrectomy in the 2 years beforetransplantation (4).
Normalization of glucose levels withno exogenous insulin administration wasquickly achieved and maintained by SPT.Fasting plasma glucose concentrations,HbA1c levels, and C-peptide concentra-tions pretransplant and at 6 months post-grafting were 13.9 � 0.4 and 4.6 � 0.2mmol/l, 9.1 � 0.3 and 5.8 � 0.1%, and0.02 � 0.00 vs. 3.2 � 0.2 ng/ml, respec-tively (all P � 0.01). All of the patientswere examined with corrected visual acu-ity, slit lamp examination, measurementof intraocular pressure, indirect and di-rect retinoscopy, and two nonstereo-scopic 45° retinal photographs for eacheye (4,5). Compared with pretransplantexamination, at 6 months from SPT, twopatients showed an improvement ofvisual acuity of �2 Snellen lines. Thenumber of microaneurisms and microhe-morrhages decreased, respectively, from17 � 4 to 9 � 3 and from 12 � 3 to 5 �2 per field (both P � 0.05). The numberof hard hessudates did not change signif-icantly (8 � 2 vs. 7 � 2 per field). Macularlesions of varying degree were present insix eyes (four patients) before transplan-tation and disappeared in five eyes (threepatients) after 6 months from grafting. In-traocular pressure remained unchanged.No negative ocular event occurred in thisearly post-transplant follow-up.
The effects of pancreas transplanta-tion on diabetic retinopathy are stillcontroversial. In recent work (2,4), im-provement or stabilization of advanceddiabetic retinopathy was shown when thepancreas was transplanted together with akidney to also treat renal insufficiency.Scant information is available as for theeffects of solitary pancreas grafting on ret-inopathy in type 1 diabetic patients. In aprevious article, a group of patients (mostof them with proliferative retinopathy)were followed up to 3 years from SPT (3).At 2 years after SPT, the incidence of pro-gression to a higher grade of retinopathywas the same in the eyes of recipients withversus without pancreas function. How-ever, after 3 years, no further progressionoccurred in the patients with surviving
Letters
2358 DIABETES CARE, VOLUME 25, NUMBER 12, DECEMBER 2002
graft, and 70% with failed pancreas trans-plants advanced to a higher grade of reti-nopathy by 5 years (2). In the presentletter, we provide evidence of stabiliza-tion or improvement of pretransplant un-stable retinopathy, early after pancreastransplantation. Although this findingneeds to be confirmed in larger series, andlong-term follow-up is obviously re-quired, this is the first reported evidencethat normalization of blood glucose levelsin type 1 diabetic patients, as achieved bysuccessful SPT, can quickly improvesome lesions of diabetic retinopathy.
Acknowledgments— This work was sup-ported in part by grants from the Italian Min-istero dell’Universita e Ricerca Scientifica eTecnologica (COFIN 2000).
ROSA GIANNARELLI, MD
ALBERTO COPPELLI, MD
MARIA S. SARTINI, MD
MICHELE ARAGONA, MD
UGO BOGGI, MD
FRANCO MOSCA, MD
MICHELE NARDI, MD
STEFANO DEL PRATO, MD
PIERO MARCHETTI, MD
From the Department of Endocrinology and Metab-olism, Metabolic Unit, University of Pisa, Pisa, Italy.
Address correspondence to Piero Marchetti, MD,Department of Endocrinology and Metabolism,Metabolic Unit, Ospedale Cisanello, via Paradisa 2,56100-P i s a , I t a l y . E -ma i l : marchan [email protected].
● ● ● ● ● ● ● ● ● ● ● ● ● ● ● ● ● ● ● ● ● ● ●
References1. American Diabetes Association: Pancreas
transplantation for patients with type 1diabetes (Position Statement). DiabetesCare 25 (Suppl. 1):S111, 2002
2. Sutherland DER, Grussner RWG, DunnDL, Matas AJ, Humar A, Kandaswamy R,Mauer SM, Kennedy WR, Goetz FC, Rob-ertson RP, Gruessner AC, Najaran JS: Les-sons learned from more than 1,000pancreas transplant at a single institution.Ann Surg 233:463–501, 2000
3. Ramsay RC, Goetz FC, Sutherland DE,Mauer SM, Robison LL, Cantrill HL, Kno-bloch WH, Najarian JS: Progression of di-abetic retinopathy after pancreastransplantation for insulin-dependent di-abetes mellitus. N Engl J Med 318:208–214, 1988
4. Pearce IA, Ilango B, Sells RA, Wong D:Stabilisation of diabetic retinopathy fol-lowing simultaneous pancreas and kidneytransplant. Br J Ophthalmol 84:736–740,2000
5. Aldington SJ, Kohner EM, Meuer S,Klein R, Sjolie AK: Methodology for ret-inal photography and assessment of di-abetic retinopathy: the EURODIABIDDM Complications Study. Diabetolo-gia 38:437– 444, 1995
Efficacy ofGlimepiride for theTreatment ofDiabetes OccurringDuringGlucocorticoidTherapy
Approximately 5–25% of patients re-ceiving glucocorticoids exhibitovert diabetes (1). Glucocorticoids
may precipitate diabetes in individualswith impaired insulin secretion by reduc-ing insulin sensitivity (2). The relative im-portance of �-cell dysfunction and insulinresistance for the pathophysiology of theglucocorticoid-induced diabetes is notwell defined. Therefore, there is no con-sensus treatment for glucocorticoid-induced diabetes. Glimepiride is asulfonylurea that lowers blood glucoselevels by stimulating insulin secretionfrom pancreatic �-cells and secondarilyby increasing glucose uptake in periph-eral tissues (3). Such action mechanismsmight be suitable for the treatment of glu-cocorticoid-induced diabetes. Here weexamined the effects of glimepiride on pa-tients with newly diagnosed diabetes dur-ing glucocorticoid therapy.
Three Japanese female patients whohad been taking oral glucocorticoids werenewly diagnosed with diabetes. Patient 1(aged 68 years) had systemic lupus ery-thematodes, patient 2 (aged 65 years) hadBehcet’s disease, and patient 3 (aged 48years) had angiolymphoid hyperplasiawith eosinophilia. They had been initiallygiven 20–40 mg/day prednisolone. Thedosage of prednisolone was tapered andmaintained at 5–10 mg/day. The status ofthese diseases was well controlled withthe glucocorticoid treatment. At 1–2years after starting the glucocorticoidtherapy, they showed overt diabetes, withmean fasting blood glucose 12.6 � 0.7mmol/l and HbA1c 9.5 � 1.5% (means �SE). Their index for pancreatic �-cellfunction (HOMA-%�), as determined by
the correct homeostasis model assess-ment evaluation (4), was 27 � 8%, signif-icantly (P � 0.001) lower than that (72 �4% [range 44–111%]) in 24 healthy Jap-anese control subjects (mean age 47 � 2years) who had normal glucose toleranceby 75-g oral glucose tolerance test. Theindex for insulin sensitivity (HOMA-%S)(4) was 56 � 15% in the patients, signif-icantly (P � 0.01) lower than in healthycontrol subjects (144 � 10% [81–273%]). We administered glimepiride tothese patients (1 mg/day for patient 1 and3 mg/day for patients 2 and 3). The dos-age of prednisolone was unchangedthroughout the observation period (24weeks). Fasting blood glucose declined 4weeks after the glimepiride administra-tion and was kept below 7 mmol/l until24 weeks. HbA1c significantly decreased 4weeks after the treatment, decreasing to6.7 � 0.6% after 8 weeks and maintainingthat level until 24 weeks. HOMA-%� andHOMA-%S increased to the control levels(76 � 9% and 108 � 54%, respectively) 8weeks after the treatment, remainingwithin the control ranges at 24 weeks(60 � 3% and 99 � 55%).
In three patients with glucocorticoid-induced diabetes, HOMA-%� andHOMA-%S were lower than in healthycontrol subjects. After the treatment withglimepiride, HOMA-%� and HOMA-%Sincreased to control ranges, in associationwith remarkable improvement of glyce-mic controls persisting until 24 weeks.This is suggested to be attributable to thedual effects of glimepiride on �-cell func-tion and insulin sensitivity. It has beenshown that a thiazolidinedione has a po-tential for the glucocorticoid-induced di-abetes (5). From our study, glimepiride isalso a strong candidate for the treatmentof the glucocorticoid-induced diabetes.
SOJI KASAYAMA, MD1
TOSHIO TANAKA, MD1
KUNIHIKO HASHIMOTO, MD2
MASAFUMI KOGA, MD2
ICHIRO KAWASE, MD1
From the 1Department of Molecular Medicine,Osaka University Graduate School of Medicine,Osaka, Japan; and the 2Department of Internal Med-icine, Kinki Central Hospital, Itami, Japan
Address correspondence to Soji Kasayama, MD,Department of Molecular Medicine, Osaka Univer-sity Graduate School of Medicine (C-4), 2-2Yamada-oka, Suita, Osaka 565-0871, Japan. E-mail:[email protected].
Letters
DIABETES CARE, VOLUME 25, NUMBER 12, DECEMBER 2002 2359
● ● ● ● ● ● ● ● ● ● ● ● ● ● ● ● ● ● ● ● ● ● ●
References1. Hirsch IB, Paauw DS: Diabetes manage-
ment in special situations. EndocrinolMetab Clin North Am 26:631–645, 1997
2. Henriksen JE, Alford F, Ward GM, Beck-Nielsen H: Risk and mechanism of dexa-methasone-induced deterioration of glucosetolerance in non-diabetic first-degree rel-atives of NIDDM patients. Diabetologia40:1439–1448, 1997
3. Clark HE, Matthews DR: The effects ofglimepiride on pancreatic �-cell functionunder hypoglycaemic clamp and hypoin-sulinaemic, englycaemic clamp condi-tions in non-insulin-dependent diabetesmellitus. Horm Metab Res 28:445–450,1996
4. Levy JC, Matthews DR, Hermans MP:Correct homeostasis model assessment(HOMA) evaluation uses the computerprogram. Diabetes Care 21:2191–2192,1998
5. Fujibayahi K, Nagasaka S, Itabashi N,Kawakami A, Nakamura T, Kusaka I, Ish-ikawa S, Saito T: Troglitazone efficacy in asubject with glucocorticoid-induced dia-betes. Diabetes Care 22:2088–2089, 1999
Increased Risk ofType 2 DiabetesDespite SameDegree of Adiposityin Different RacialGroups
A s indigenous people of the SouthPacific have rates of type 2 diabetesand obesity among the highest in
the world (1,2), diabetes risk reductionstrategies include identification of high-risk individuals. Different cutoffs to de-fine overweight and obesity have beensuggested for some indigenous people be-cause they have more lean mass and lessadipose tissue than Europeans with com-parable BMIs (3). However, cutoffs forBMI should be based on risk of comor-bidities associated with a given BMI, notsimply with lean body mass. To furtherassist the process of defining appropriateBMI levels for South Pacific people, wehave investigated insulin sensitivity inNew Zealand women of Maori and Euro-pean descent who have similar levels ofBMI, fat, and lean mass.
A total of 88 European and 23 Maoriwomen consented to participate in anethically approved study to measure body
composition (using dual-energy absorpti-ometry) and insulin sensitivity (using theeuglycemic insulin clamp). Smoking his-tory, weight, height, blood pressure, BMI,and waist circumference were recorded,and fasting plasma glucose and insulinlevels were measured. The methodologiesare described elsewhere (4). The signifi-cance of differences between the twogroups was tested by regression analysis.
The Maori women were on average 7years (95% CI 3–11) younger, had ahigher prevalence of smoking (39 vs.7%), and had higher fasting glucose levels(difference � 0.7 [95% CI 0.3–1.1]) thanthe European women. The fasting insulinlevel was 1.5 (1.1–2.0) times higher inMaori women compared with Europeanwomen. There was no significant differ-ence between Maori and Europeans forweight, BMI, waist circumference, bloodpressure, total fat, truncal fat, or leanmass. There was no evidence of reducedadiposity or increased lean mass for agiven BMI in Maori women.
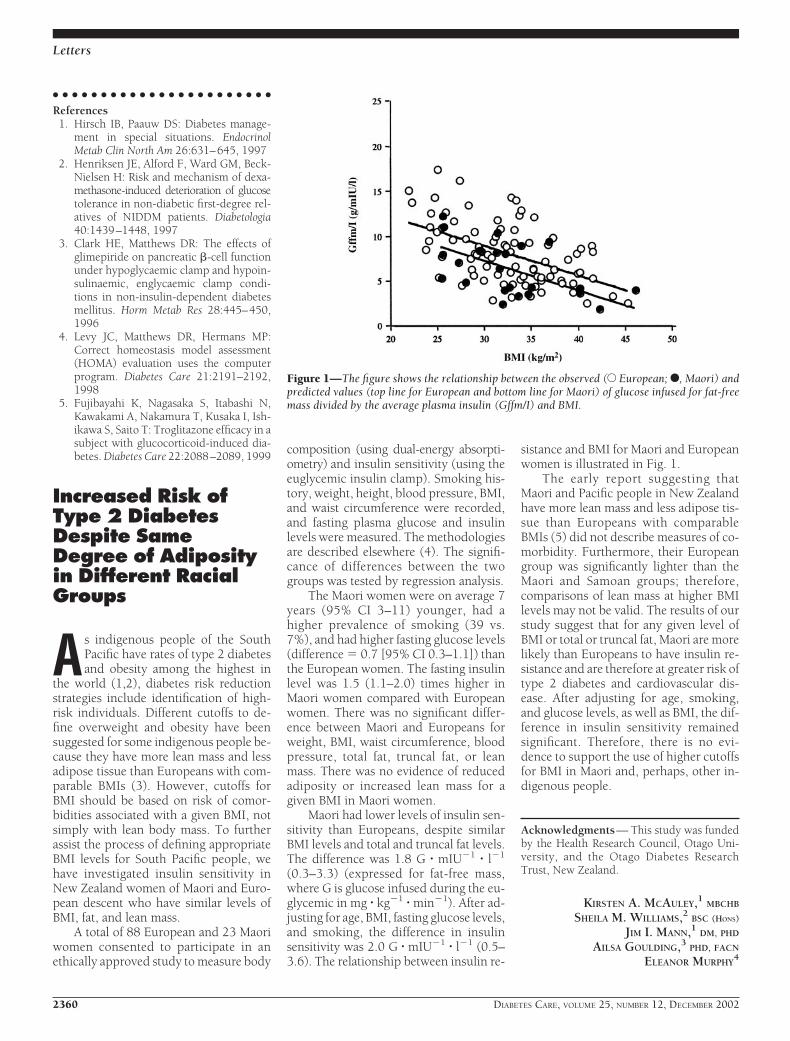
Maori had lower levels of insulin sen-sitivity than Europeans, despite similarBMI levels and total and truncal fat levels.The difference was 1.8 G � mIU�1 � l�1
(0.3–3.3) (expressed for fat-free mass,where G is glucose infused during the eu-glycemic in mg � kg�1 � min�1). After ad-justing for age, BMI, fasting glucose levels,and smoking, the difference in insulinsensitivity was 2.0 G � mIU�1 � l�1 (0.5–3.6). The relationship between insulin re-
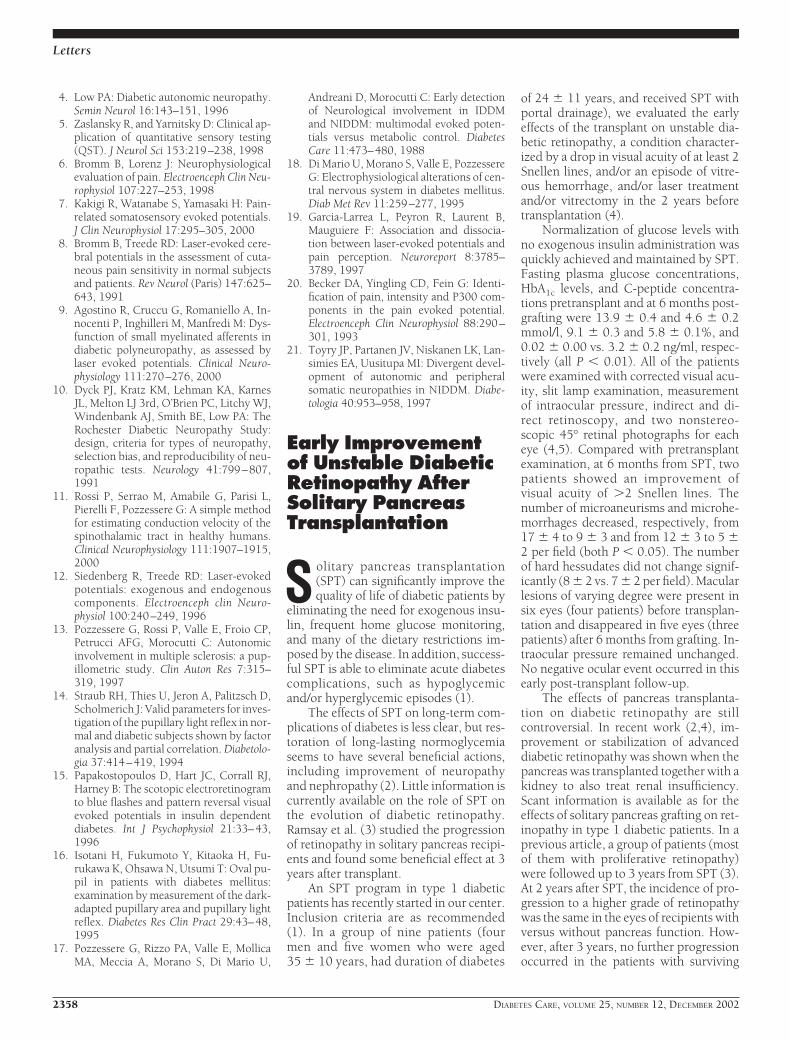
sistance and BMI for Maori and Europeanwomen is illustrated in Fig. 1.
The early report suggesting thatMaori and Pacific people in New Zealandhave more lean mass and less adipose tis-sue than Europeans with comparableBMIs (5) did not describe measures of co-morbidity. Furthermore, their Europeangroup was significantly lighter than theMaori and Samoan groups; therefore,comparisons of lean mass at higher BMIlevels may not be valid. The results of ourstudy suggest that for any given level ofBMI or total or truncal fat, Maori are morelikely than Europeans to have insulin re-sistance and are therefore at greater risk oftype 2 diabetes and cardiovascular dis-ease. After adjusting for age, smoking,and glucose levels, as well as BMI, the dif-ference in insulin sensitivity remainedsignificant. Therefore, there is no evi-dence to support the use of higher cutoffsfor BMI in Maori and, perhaps, other in-digenous people.
Acknowledgments— This study was fundedby the Health Research Council, Otago Uni-versity, and the Otago Diabetes ResearchTrust, New Zealand.
KIRSTEN A. MCAULEY,1 MBCHB
SHEILA M. WILLIAMS,2 BSC (HONS)
JIM I. MANN,1 DM, PHD
AILSA GOULDING,3 PHD, FACN
ELEANOR MURPHY4
Figure 1—The figure shows the relationship between the observed (E European; F, Maori) andpredicted values (top line for European and bottom line for Maori) of glucose infused for fat-freemass divided by the average plasma insulin (Gffm/I) and BMI.
Letters
2360 DIABETES CARE, VOLUME 25, NUMBER 12, DECEMBER 2002
From the 1Department of Human Nutrition, Univer-sity of Otago, Dunedin, New Zealand; the 2Depart-ment of Preventive and Social Medicine, Universityof Otago, Dunedin, New Zealand; the 3Departmentof Medical and Surgical Sciences, University ofOtago, Dunedin, New Zealand; and the 4DiabetesDepartment, Dunedin Hospital, HealthCare Otago,Dunedin, New Zealand.
Address correspondence to Dr. Kirsten McAuley,Department of Human Nutrition, University ofOtago, P.O. Box 56, Dunedin, New Zealand.E-mail:[email protected].
● ● ● ● ● ● ● ● ● ● ● ● ● ● ● ● ● ● ● ● ● ● ●
References1. Simmons D: The epidemiology of diabe-
tes and its complications in New Zealand.Diabet Med 13:371–375, 1996
2. Wilson B, Wilson N, Russell D: Obesityand body fat distribution in the New Zea-land population. N Z Med J 114:127–130,2001
3. World Health Organization: Report of aWHO Consultation on Obesity: Preventingand Managing the Global Epidemic. Geneva,WHO, 1998
4. McAuley KA, Williams SM, Mann JI,Walker RJ, Lewis-Barned NJ, DuncanAW: Diagnosing insulin resistance in thegeneralpopulation.DiabetesCare24:460–464, 2001
5. SwinburnBA, Ley SJ, Carmichael HE, PlankLD: Body size and composition in Polyne-sians. Int J Obes 23:1178–1183, 1999
Hyperhomocysteine-mia and IncreasedRisk of Retinopathy
A cross-sectional, case-controlstudy in patients with type 2diabetes
I ncreased total plasma homocysteine(tHcy) level—secondary to excessivealcohol intake, cigarette smoking, or
deficiency of methylene-tetrahydrofolatereductase—is one new identified risk fac-tor for atherosclerotic cardiovascular dis-eases and for macrovascular complicationsof diabetes (1,2). Homocysteine (Hcy)-induced vascular damage is probably ini-tiated by reactive oxygen species formedduring Hcy auto-oxidation in plasma andresults in decreased nitric oxide produc-tion, platelet activation, impaired arterialvasodilatation, and isolated systolic hy-pertension (1).
To assess whether hyperhomocys-
teinemia is also an independent risk factorfor microvascular complications, wecross-sectionally studied the relationsamong tHcy levels, diabetic retinopathy(diagnosed by indirect ophtalmoscopyand retinal photography), insulin sensi-tivity and glomerular filtration rate (mea-sured by euglycemic-hyperinsulinemicclamp and unlabeled iohexol plasmaclearance, respectively), lipid profile,overnight urinary albumin excretion rate,and other clinical and laboratory param-eters in 11 consecutive type 2 diabeticsubjects with retinopathy (case subjects)and 26 age- and sex-matched type 2 dia-betic subjects without retinopathy (con-trol subjects). To limit the confoundingeffect of decreased tHcy clearance associ-ated with advanced renal insufficiency,only subjects with serum creatinine �2.0mg/dl were considered. Patients gavewritten informed consent. The EthicalCommittee of the Clinical Research Cen-ter, “Aldo & Cele Dacco,” Mario Negri In-stitute, Italy, approved the protocol.
Altogether, 1 case subject had pro-liferative and 10 subjects had non-proli ferative diabetic retinopathy.Prevalence of hyperhomocysteinemia(54.5 vs. 26.9%) and tHcy levels (17.2 �6.6 vs. 12.3 � 4.1 �mol/l, P � 0.05) werehigher in case than in control subjects.Case subjects also had longer diabetes du-ration (171 � 96 vs. 73 � 75 months),lower BMI (27 � 5 vs. 31 � 5 kg/m2),higher systolic blood pressure (155 � 15vs. 145 � 12 mmHg) and albumin excre-tion rate (412 � 600 vs. 212 � 385 �g/min), and were more frequently micro- ormacroalbuminuric (P � 0.05 for all com-parisons). Age, sex distribution (with amale prevalence in both groups), smok-ing habit, HbA1c level, diastolic bloodpressure, insulin sensitivity, lipid profile(total cholesterol, HDL cholesterol, LDLcholesterol, and triglycerides), serum cre-atinine, glomerular filtration rate, and an-tidiabetic and antihypertensive treatmentswere comparable in both groups. At uni-variate logistic regression analysis, onlylonger duration of diabetes, higher sys-tolic blood pressure, and increased tHcylevels were associated with diabetic reti-nopathy. Glomerular filtration rate wasnot related to diabetic retinopathy (P �0.05). At multivariate forward stepwiselogistic regression, tHcy (� � 4.47, P �0.019), diabetes duration (� � 2.10, P �0.009), and systolic blood pressure (� �
0.09, P � 0.020) were independent mark-ers of diabetic retinopathy. Altogether,they predicted the disease with 86.5% ac-curacy (model 2 � 23.19, P � 0.0001).
Thus, hyperhomocysteinemia is asso-ciated with an increased risk of diabeticretinopathy and clusters with longer dia-betes duration and systolic hypertensionas an independent marker. The findingthat case subjects had higher albumin ex-cretion rates than control subjects andwere more frequently micro- or mac-roalbuminuric suggests that hyper-homocysteinemia is also an indicator ofoverall microvascular damage in type 2diabetes.
Hcy evaluation may serve to identifydiabetic patients predisposed to sight-threatening complications who may ben-efit from intensified screening andtreatment strategies, including folic acidand vitamin B6 and B12 supplements,aimed to limit or prevent the incidenceand progression of micro- and macrovas-cular complications.
ANELIYA PARVANOVA, MD,1
ILIAN ILIEV, MD,1,2
BORISLAV D. DIMITROV, MD, MSC1,3
FEDERICA ARNOLDI, RES NURSE1
JELKA ZALETEL, MD1,5
GIUSEPPE REMUZZI, MD, FRCP1,4
PIERO RUGGENENTI, MD1,4
From the 1Clinical Research Center for Rare Dis-eases “Aldo e Cele Dacco,” Mario Negri Institute forPharmacological Research, Bergamo, Italy; the 2Unitof Opthalmology, Azienda Ospedaliera, OspedaliRiuniti, Bergamo, Italy; the 3Department of SocialMedicine and Health Management, Medical Univer-sity, Plovdiv, Bulgaria; the 4Unit of Nephrology,Azienda Ospedaliera, Ospedali Riuniti, Bergamo,Italy; and the 5Department of Endocrinology, Dia-betes and Metabolic Diseases, University MedicalCenter, Ljubljana, Slovenia.
Address correspondence to Piero Ruggenenti,MD, “Mario Negri” Institute for Pharmacological Re-search, Negri Bergamo Laboratories, Via Gavazzeni,11-24125 Bergamo, Italy. E-mail: [email protected].
● ● ● ● ● ● ● ● ● ● ● ● ● ● ● ● ● ● ● ● ● ● ●
References1. Gerhard GT, Duell B: Homocysteine and
atherosclerosis. Curr Opinion Lipidol 10:417–428, 1999
2. Welch GN, Loscalzo J: Homocysteine andatherothrombosis.NEnglJMed338:1042–1050, 1998
Letters
DIABETES CARE, VOLUME 25, NUMBER 12, DECEMBER 2002 2361
COMMENTS ANDRESPONSES
Comment on study byPerkins et al.
The results of the study by Perkins etal. (1) are surprising since it is usu-ally possible to make an electro-
physiological diagnosis of carpal tunnelsyndrome (CTS) even in the presence of aperipheral neuropathy. It is not clear fromthe report whether they made an electro-physiological diagnosis of CTS in any oftheir cases.
When routine antidromic sensorynerve conduction studies are nondiag-nostic median/ulnar palmar latencies at 8cm, median/radial antidromic latencies tothe thumb at the same distance or medi-an/ulnar motor to lumbrical/second in-terosseous muscle (2) recordings at thesame distance should be used. Segmentalsensory nerve conduction studies can lo-calize the slowing of a prolonged medianantidromic latency to the carpal tunnel (3).
Perhaps the criteria used for the clin-ical diagnosis of CTS in diabetic patientswith a peripheral neuropathy did not dis-criminate well. The sensory symptomsexperienced by patients with CTS arequite varied (4), and the addition of a di-abetic neuropathy can further obscure thepicture. The study required any four of sixcriteria to make the diagnosis. Patientswith a condition other than CTS, such asulnar neuropathy, cervical radiculopathy,diffuse peripheral neuropathy, or eventhoracic outlet syndrome, might havebeen included as having CTS. Since theirpatients may have hand paresthesias fromneuropathy, do we need to rely on morespecific symptoms such as nocturnalawakening, relief by shaking the hand,and aggravation by reading, driving, etc.?Thenar muscle weakness is a late sign andnot helpful in most cases. Perhaps theCTS cases of Perkins et al. were mostlymild. Subclinical slowing of median nerveconduction at the wrist is very common indiabetic subjects, and it’s surprising thatthis did not show up in their data.
Repeating the study using one of themuch more appropriate nerve conduc-tion techniques listed above and with dif-ferent clinical inclusion criteria would beof considerable interest.
J. CLARKE STEVENS, MD
C. MICHEL HARPER, MD
From the Department of Neurology, Mayo Clinic,Rochester, Minnesota.
Address correspondence to J. Clark Stevens,Mayo Clinic, 200 SW First St., Rochester, MN55905. E-mail: [email protected].
● ● ● ● ● ● ● ● ● ● ● ● ● ● ● ● ● ● ● ● ● ● ●
References1. Perkins BA, Olaleye D, Bril V: Carpal tun-
nel syndrome in patients with diabeticpolyneuropathy. Diabetes Care 25:565–569, 2002
2. Vogt T, Mika A, Thomke F, Hopf HC:Evaluation of carpal tunnel syndrome inpatients with polyneuropathy. MnuscleNerve 20:153–157, 1997
3. Hansson S: Segmental median nerve con-duction measurements discriminate car-pal tunnel syndrome from diabeticpolyneuropathy. Muscle Nerve 18:445–453, 1995
4. Stevens JC, Smith BE, Weaver AL, BoschEP, Deen HG, Wilkens JA: Symptoms of100 patients with electromyographicallyverified carpal tunnel syndrome. MuscleNerve 22:1448–1456, 1999
Response to Stevensand Harper
W e thank Stevens and Harper (1)for their response to our studyand for identifying citations that
help to highlight the important issues as-sociated with research in this field. Theaim of our study (2) was to determine thebest standard nerve conduction study(NCS) marker of clinical carpal tunnelsyndrome (CTS), in diabetic subjects, un-der the hypothesis that at least one param-eter would reliably identify CTS.Surprisingly, the results indicated thatstandard NCS techniques fail to reliablydistinguish the presence or absence ofCTS in subjects with diabetes. From theresults, we were able to infer that the elec-trophysiological changes at the wrist mostlikely arise from diffuse nerve injury asso-ciated with diabetes rather than signifyingthe specific symptomatic entrapment ofthe median nerve. Stevens and Harper ex-press two main concerns with the study:the methods of electrophysiological eval-uation and the potential for misclassifica-tion bias in clinical CTS cases.
Stevens and Harper recommend andcite specific methods for which they sug-
gest exclusion from the NCS evaluationinvalidates our study results. We stronglyfeel, however, that the recommendedmethods either do not diverge signifi-cantly from our protocol or do not havereasonable support from the literature.Further ratio testing such as median-to-radial latencies may be of interest, al-though similar techniques using median-to-ulnar and median-to-sural ratios wereconducted in our study and were nondis-criminatory for symptomatic CTS. In thisregard, neither were median-to-ulnar mo-tor latency ratios. The authors cite thestudy of Vogt et al. (3), in which the re-sults appear contradictory: the differencein abductor pollicis brevis and abductordigiti minimi (ADM) latencies, whichmight be expected to be consistent withthe more divergent difference in lumbri-cal and interosseous latencies (L-I DIFF),were minor. Furthermore, it appearedthat a diffuse increase in ADM and lum-brical latencies existed across groupswhether CTS or diabetic polyneuropathy(DPN) were present exclusively or incombination. L-I DIFF values are associ-ated with large variance, and statisticalcomparisons were not provided. Further-more, the comparison relevant to this dis-cussion was underpowered (only 30subjects with DPN and 22 subjects withDPN and coexistent symptomatic CTSwere studied). Although this observationmay be a very important one, the studyfrom which it arose is not sufficient tosuggest that a study excluding this tech-nique is invalid or inappropriate. Thestudy by Hansson (4) compared segmen-tal median nerve conduction measure-ments between three mutually exclusivegroups: those with CTS and without dia-betes, those with diabetes and CTS andwithout DPN, and those with DPN ex-cluding coexistent CTS. Although we par-tially evaluated segmental conductions (atthe elbow and the wrist) in our study, wefeel it necessary to highlight this article asone that we strongly considered in ourstudy design—we aimed to achieve amethod that would discriminate CTS re-gardless of diabetes or DPN status andthus made no effort to create an artificialcase-control comparison in which condi-tions were mutually exclusive. We feelthat the studies by Vogt et al. and Hanssonhave provided very important contribu-tions, but they did not offer convincingevidence for us to undertake methodol-ogy that diverges from standard tech-
Letters
2362 DIABETES CARE, VOLUME 25, NUMBER 12, DECEMBER 2002
niques. Furthermore, our study aimed toanswer a separate question altogether: in apopulation of diabetic patients with vary-ing degrees of DPN, can NCS discriminateCTS findings? Excluding or minimizingthose with both conditions serves to limitthe generalizability of the clinical methodwe aimed to identify. We do, however, en-courage investigators to consider non-standard techniques in the context ofclinical studies that are similarly general-izable, but, based on our study results,remain skeptical.
Drs. Stevens and Harper very appro-priately raise the issue of misclassificationbias. The inclusion criteria in our reportare based on those recommended by theAmerican Academy of Neurology (5) fordiagnosis of CTS, and thus were consid-ered appropriate. The requirement thatfour of six clinical criteria be present toestablish a diagnosis of clinical CTS, withthe requirement in all subjects for a dis-crepancy between lower limb and upperlimb paresthesiae, are reasonable in thisclinical context. As Stevens and Harpernote, symptoms of CTS, even in thosewithout diabetes, vary widely (6), andthus a diagnostic instrument for clinicalCTS requires the ability to select from alist of criteria. Our criteria included thepredominance of radial digit involve-ment, the presence of nocturnal awaken-ing, and the precipitation of paresthesiaeby activity as suggested. The presence ofcervical or shoulder pain with radiationand of ulnar nerve palsies were excludedbased on clinical neurological evaluation.Although we agree that misclassificationbias is a potential factor in the negativestudy results, we feel comfortable that itscontribution is minor for the reasonsstated, and we note further that the crite-ria we used compare favorably with thecriteria used in the references cited byStevens and Harper. Furthermore, in-creasing the stringency for case definitionmay serve to create misclassification ofcontrol subjects (and thus a biased anddeceptively elevated specificity), and re-striction of case and control subjectswould have even further limited the gen-eralizability of a potential diagnosticmethod.
In summary, the criticisms and cita-tions raised by Stevens and Harper high-light the difficulty in designing adiagnostic study for a syndromic diagno-sis without an unequivocal gold standard.The usual selection of subjects limits gen-
eralizability of results and thus fails to an-swer broad clinical questions. We thereforeremain comfortable with and stress theimportance of our inferences: the ubiqui-tous nature of nerve injury, and not theabsence of distal median nerve changes,defeated the diagnostic ability of NCS toidentify symptomatic CTS in this diabeticpopulation.
BRUCE PERKINS, MD1
VERA BRIL, MD2
From the 1Joslin Diabetes Center, Boston, Massa-chusetts; and the 2University Health Network, To-ronto, Ontario, Canada.
Address correspondence to Vera Bril, MD, De-partment of Medicine (Neurology), University ofToronto, EN11-209, TGH, UHN, 200 Elizabeth St.,Toronto, Ontario, Canada M5G 2C4. E-mail:[email protected].
● ● ● ● ● ● ● ● ● ● ● ● ● ● ● ● ● ● ● ● ● ● ●
References1. JC Stevens, CM Harper: Comment on
study by Perkins et al. (Letter). DiabetesCare 25:2362, 2002
2. Perkins BA, Olaleye D, Bril V: Carpal tun-nel syndrome in patients with diabeticpolyneuropathy. Diabetes Care 25:565–569, 2002
3. Vogt T, Mika A, Thomke F, Hopf HC:Evaluation of carpal tunnel syndromein patients with polyneuropathy. MuscleNerve 20:153–157, 1997
4. Hansson S: Segmental median nerveconduction measurements discriminatecarpal tunnel syndrome from diabeticpolyneuropathy. Muscle Nerve 18:445–453, 1995
5. American Academy of Neurology Qual-ity Standards Subcommittee: PracticeParameters: carpal tunnel syndrome(summary statement). Neurology 43:2406 –2409, 1993
6. Stevens JC, Smith BE, Weaver AL, BoschEP, Deen HG, Wilkens JA: Symptoms of100 patients with electromyographicallyverified carpal tunnel syndrome. MuscleNerve 22:1448–1456, 1999
ClinicalHeterogeneity ofPatients With Adult-Onset Diabetes andGAD Autoantibodies
W e read with great interest the re-cent article by Takeda et al. (1)reporting that GAD autoanti-
body (GADab)-positive non–insulin-deficient patients differ from GADab-
positive insulin-deficient patients withrespect to clinical characteristics, hu-moral autoimmunity to other organ-specific autoantibodies, and HLA class IIgenes.
The prevalence of GADab in Takeda’sstudy was lower than that in our study(3.8 vs. 6.8%; P � 0.0009 by 2 analysis),even in patients who were initially diag-nosed as having type 2 diabetes (2). Theauthors should present the number of pa-tients with insulin-deficient and non–insulin-deficient diabetes and theprevalence of GADab in both groups ofpatients. We speculate that the lowerprevalence of GADab might have beendue to a higher number of non–insulin-deficient patients in their study than inour study because the prevalence ofGADab is reported to be higher in insulin-deficient patients than in non–insulin-deficient patients (3). The authors definedinsulin-deficient patients as those patientswith typical type 1 diabetes and slowlyprogressive type 1 diabetes. The authorsstated that there are distinct differencesbetween typical type 1 diabetes (rapidprogression to insulin dependency) andslowly progressive type 1 diabetes (slowlyprogressive deterioration of �-cell func-tion through the non–insulin-dependentstate and ultimately to insulin dependen-cy). Therefore, the authors should havefurther divided these phenotypes into twosubgroups in order to investigate the dif-ferences in clinical characteristics, hu-moral autoimmunity to other organ-specific autoantibodies, and HLA class IIgenes.
The results of this study are in accor-dance with those of our study in that bothstudies demonstrate that HLA-DRB1 al-leles contributed to the prognosis of Jap-anese patients with diabetes who arepositive for GADab (4). The prevalence ofHLA-DRB1*0405, which is one of thesusceptible alleles to typical type 1 diabe-tes, was significantly lower, and the prev-alence of HLA-DRB1*1502, which is oneof the protective alleles to typical type 1diabetes, was significantly higher in non–insulin-deficient diabetic patients posi-tive for GADab than in typical type 1diabetic patients positive for GADab.
Furthermore, we demonstrated a sig-nificantly greater proliferative response ofperipheral blood mononuclear cells toGAD in type 2 diabetes positive forGADab (5), especially in those with allelessusceptible to typical type 1 diabetes; the
Letters
DIABETES CARE, VOLUME 25, NUMBER 12, DECEMBER 2002 2363
responses were useful markers for thelater development of insulin deficiency intype 2 diabetes positive for GADab. Inter-estingly, low GADab levels declined tonegative levels during a few years in ourstudy (5). Low levels of GADab in non–insulin-deficient diabetic patients maydecline to negative levels, which demon-strates the possibility of pseudopositiveGADab. Higher levels of GADab (6),seropositivity for GADab with humoralautoimmunity to other organ-specific au-toantibodies, HLA class II genes, or cellu-lar response to GAD may be useful forpredicting the clinical course of diabeticpatients positive for GADab.
Finally, Kobayashi et al. (7) reportedthat small doses of subcutaneous insulinin islet cell antibody–positive patientswith type 2 diabetes resulted in improvedserum C-peptide response. Non–insulin-deficient diabetic patients with GADabwithout insulin therapy in Takeda’s studymay prefer to be treated with insulin toreserve residual �-cell function.
MICHIAKI FUKUI, MD1
YOSHIHIRO KITAGAWA, MD1
NAOTO NAKAMURA, MD2
TOSHIKAZU YOSHIKAWA, MD2
From the 1Department of Endocrinology and Hema-tology, Osaka General Hospital of West Japan Rail-way Company, Osaka, Japan; and the 2FirstDepartment of Internal Medicine, Kyoto PrefecturalUniversity of Medicine, Kyoto, Japan.
Address correspondence to Michiaki Fukui, MD,Department of Endocrinology and Hematology,Osaka General Hospital of West Japan RailwayCompany, 1-2-22 Matsuzaki-cho, Abeno-ku, Osaka545-0053, Japan. E-mail: [email protected].
● ● ● ● ● ● ● ● ● ● ● ● ● ● ● ● ● ● ● ● ● ● ●
References1. Takeda H, Kawasaki E, Shimizu I, Konoue
E, Fujiyama M, Murao S, Tanaka K, MoriK, Tarumi Y, Seto I, Fujii Y, Kato K,Kondo S, Takada Y, Kitsuki N, Kaino Y,Kida K, Hashimoto N, Yamane Y,Yamawaki T, Onuma H, Nishimiya T,Osawa H, Saito Y, Makino H: Clinical, au-toimmune, and genetic characteristics ofadult-onset diabetic patients with GADautoantibodies in Japan (Ehime Study).Diabetes Care 25:995–1001, 2002
2. Fukui M, Nakano K, Maruya E, Saji H,Ohta K, Ohta M, Obayashi H, Mori H,Kajiyama S, Wada S, Shigeta H, KitagawaY, Nakamura N, Kondo M: Diagnostic sig-nificance of antibodies to glutamic aciddecarboxylase in Japanese diabetic pa-tients with secondary oral hypoglycemicagents failure. Clin Immunol Immunopathol85:182–186, 1997
3. Tuomi T, Groop LC, Zimmet PZ, RowleyMJ, Knowles W, Mackay IR: Antibodies toglutamic acid decarboxylase reveal latentautoimmune diabetes mellitus in adultswith a non–insulin-dependent onset ofdisease. Diabetes 42:359–362, 1993
4. Fukui M, Nakano K, Nakamura N, Ma-ruya E, Saji H, Obayashi H, Ohta K, OhtaM, Mori H, Kajiyama S, Wada S, Kida Y,Kosaka K, Deguchi M, Shigeta H, Kita-gawa Y, Kondo M: HLA-DRB1 alleles con-tribute to determining the prognosis ofJapanese diabetes mellitus positive for an-tibodies to glutamate decarboxylase. J ClinImmunol 18:89–92, 1998
5. Fukui M, Nakamura N, Nakano K, Ka-jiyama S, Matsuo S, Obayashi H, Ohta M,Shigeta M, Shigeta H, Kitagawa Y, KondoM: HLA-associated cellular response toGAD in type 2 diabetes with antibodies toGAD. Endocrine J 47:753–761, 2000
6. Kasuga A, Maruyama T, Nakamoto S,Ozawa Y, Suzuki Y, Saruta T: High-titerautoantibodies against glutamic acid de-carboxylase plus autoantibodies againstinsulin and IA-2 predicts insulin require-ment in adult diabetic patients. J Autoim-mun 12:131–135, 1999
7. Kobayashi T, Nakanishi K, Murase T, Ko-saka K: Small doses of subcutaneous in-sulin as a strategy for preventing slowlyprogressive �-cell failure in islet cell anti-body–positive patients with clinical fea-tures of NIDDM. Diabetes 45:622–626,1996
The ClinicalHeterogeneity ofAdult-Onset DiabeticPatients With GADAutoantibodies inJapan
Response to Fukui et al.
W e would like to thank Fukui et al.(1) for the interest in our article(2) and the editor for the oppor-
tunity to clarify the several points raised.As stated several times in our article, thisis a cross-sectional and hospital-basedstudy to investigate the clinical, autoim-mune, and genetic characteristics inadult-onset diabetic patients with GADantibodies (GADab). All diabetic patientswho visited our hospital during 1998 and1999, including those with typical type 1diabetes (a slowly progressive form oftype 1 diabetes [SPIDDM]) and type 2 di-abetes, regardless of their therapy, were
recruited into this study. In our EhimeStudy, the overall prevalence of GADab inpatients with adult-onset diabetes was3.8%. Among them, the prevalence ofGADab in patients with type 1 diabeteswas 61% (72 of 118). The prevalence ofGADab in patients with non–insulin-dependent diabetes was 2.0%, which issimilar to that reported by Abiru et al.(2.4% in patients with non–insulin-deficient diabetes) (3). The lower preva-lence of GADab in our study comparedwith the study by Fukui et al. (4) is ascrib-able to several points.
First, the proportion of the patientstreated with insulin in the two studies isquite different. The number of patientsunder insulin treatment in Japan has beenestimated to be �20% (5). However, theproportion of the insulin-treated patientsin their study is extremely high (�50%),which probably resulted in the higherprevalence of GADab in their subjects. Infact, the prevalence of GADab in 392 type2 diabetic patients was 3.1% in theirstudy, which is not significantly differentfrom our data. Second, the GADab assayused in their study is different from ourradioassay, which can measure GAD65-specific autoantibodies. They used radio-immunoassay with purified rat brainGAD as antigen that contains bothGAD65 and GAD67. It is well known thatthere are a certain number of patientswith type 1 diabetes who are positive foronly GAD67ab. Although the predictivepower of GAD67ab on future insulindeficiency in GADab-positive non–insulin-dependent diabetes has not beenestablished yet, Fukui et al. might haveoverestimated the prevalence of GADabin their patients.
In this Ehime Study, we are prospec-tively following the GADab� patientswith non–insulin-dependent diabetes toclarify the factors that distinguish thenonprogressors from those who developthe insulin-dependent state. Therefore,with the successful completion of thestudy, the clinical characteristics, hu-moral autoimmunity to other organ-specific autoantibodies, and HLA class IIgenes in patients with slowly progressiveform of type 1 diabetes will be clarified.
Fukui et al. misread in part our resultson the frequency of HLA-DRB1 haplo-types shown in Table 3 of our article.They pointed out that the prevalence ofHLA-DRB1*0405 in GADab� patientswith non–insulin deficiency was signifi-
Letters
2364 DIABETES CARE, VOLUME 25, NUMBER 12, DECEMBER 2002
cantly lower than GADab� patients withinsulin deficiency. However, as shown inTable 3 of our article, the frequency ofDRB1*0405 was increased in bothGADab� patients with insulin deficiency(28.5%) and non–insulin deficiency(21.0%) compared with healthy controlsubjects (11.3%), and no difference wasobserved between two groups. On theother hand, DRB1*0901 was decreased infrequency in GADab� patients with non–insulin deficiency compared withGADab� patients with insulin deficiency.Then only the DRB1*0405 was frequentin GADab� patients with non–insulindeficiency, which may be one of the char-acteristics in Japanese non–insulin-deficient pat ients with ant i - i s le tautoantibodies. We agree that one of thefeatures that distinguishes GADab� non–insulin-deficient patients from insulin-deficient patients is the frequencies oftype 1 diabetes–protective HLA haplo-types DRB1*1501 and *1502. We kindlyask Fukui et al. to read our article again toresolve these misinterpretations.
Recently, the results of a randomizedcontrolled clinical trial to prevent the on-set of type 1 diabetes in islet cell anti-body–positive relatives of patients withtype 1 diabetes who were using prophy-lactic parenteral insulin has been re-ported; there was no effect on thedevelopment of diabetes (6). Although apilot study in islet cell antibody–positivepatients with type 2 diabetes has sug-gested that the small doses of subcutane-ous insulin improve the serum C-peptideresponse (7), the large randomized con-trolled trials are necessary to provewhether prophylactic insulin administra-tion can alter the course of developmentof insulin deficiency.
EIJI KAWASAKI, MD1
HARUHIKO OSAWA, MD2
HIDEICHI MAKINO, MD2
EHIME DIABETES STUDY GROUP
From the 1Unit of Metabolism/Diabetes and ClinicalNutrition, Nagasaki University School of Medicine,Nagasaki, Japan; and the 2Department of LaboratoryMedicine, Ehime University School of Medicine,Ehime, Japan.
Address correspondence Hideichi Makino, MD,Department of Laboratory Medicine, Ehime Univer-sity School of Medicine, Shigenobu, Ehime 791-0295, Japan. E-mail: [email protected].
● ● ● ● ● ● ● ● ● ● ● ● ● ● ● ● ● ● ● ● ● ● ●
References1. Fukui M, Kitagawa Y, Nakamura N, Yo-
shikawa T: Clinical heterogeneity of pa-
tients with adult-onset diabetes and GADautoantibodies (Letter). Diabetes Care 25:2363–2364, 2002
2. Takeda H, Kawasaki E, Shimizu I, KonoueE, Fujiyama M, Murao S, Tanaka K, MoriK, Tarumi Y, Seto I, Fujii Y, Kato K,Kondo S, Takada Y, Kitsuki N, Kaino Y,Kida K, Hashimoto N, Yamane Y,Yamawaki T, Onuma H, Nishimiya T,Osawa H, Saito Y, Makino H: Clinical, au-toimmune, and genetic characteristics ofadult-onset diabetic patients with GADautoantibodies in Japan (Ehime Study).Diabetes Care 25:995–1001, 2002
3. Abiru N, Takino H, Yano M, Kawasaki E,Yamasaki H, Yamaguchi Y, Akazawa S,Nagataki S: Clinical evaluation of non-in-sulin-dependent diabetes mellitus pa-tients with autoantibodies to glutamicacid decarboxylase. J Autoimmun 9:683–688, 1996
4. Fukui M, Nakano K, Maruya E, Saji H,Ohta K, Ohta M, Obayashi H, Mori H,Kajiyama S, Wada S, Shigeta H, KitagawaY, Nakamura N, Kondo M: Diagnostic sig-nificance of antibodies to glutamic aciddecarboxylase in Japanese diabetic pa-tients with secondary oral hypoglycemicagents failure. Clin Immunol Immunopathol85:182–186, 1997
5. Nakagawa S: Insulin treatment in Japan.Diabetes Res Clin Pract 24 (Suppl.):S247–S250, 1994
6. Diabetes Prevention Trial-Type 1 Diabe-tes Study Group: Effects of insulin in rel-atives of patients with type 1 diabetesmellitus. N Engl J Med 346:1685–1691,2002
7. Kobayashi T, Nakanishi K, Murase T, Ko-saka K: Small doses of subcutaneous in-sulin as a strategy for preventing slowlyprogressive beta-cell failure in islet cellantibody-positive patients with clinicalfeatures of NIDDM. Diabetes 45:622–626,1996
The ACE Insertion/DeletionPolymorphism Is NotAssociated With theMetabolic Syndrome(WHO Definition) inBrazilian Type 2Diabetic Patients
The ACE gene has received substan-tial attention in recent years as can-didate for a variety of diseases. The
most common polymorphism in ACEgene is the insertion-deletion (I/D) poly-
morphism located in intron 16. The Dallele is associated with higher levels ofACE, and it is considered to be a risk fac-tor for development diseases such as cor-onary artery disease, hypertension, type 2diabetes, or related complications (1). Re-cently, the presence of the metabolic syn-drome (MS), according to World HealthOrganization (WHO) criteria (2), wasassociated with the D allele in Chinesepatients with type 2 diabetes (3). The au-thors found that patients with MS weremore often carriers of the D allele (DD/ID)than the patients without the MS (58 vs.42%, P � 0.01). The prevalence of MS inthis sample of Chinese diabetic patientswas 75%. The observation that the Dallele is associated with the MS is an in-teresting finding, suggesting that the MScomponents (glucose homeostasis abnor-malities and/or insulin resistance, hyper-tension, dyslipidemia, obesity, and/ormicroalbuminuria) might share a com-mon genetic predisposition. We geno-typed the ACE I/D polymorphism in 643type 2 diabetic patients originally fromthe state of Rio Grande do Sul in thesouthernmost part of Brazil. Of the 643subjects, 86% of the state population isfrom European ancestry and self-classified as white (4); 4 and 8.4% areblack and mixed-race, respectively (4).Type 2 diabetes and MS diagnosis fol-lowed WHO definitions (2). The ACEgenotyping was done as previously re-ported (5). The prevalence of carriers(DD/ID) and noncarriers of the D allele(II) was compared among the patientswith and without the MS.
The MS prevalence in our sample was75% and did not differ between whitesubjects and nonwhite subjects. The ge-notypes were in Hardy-Weinberg equilib-rium (DD 30%; ID 50%; and II 20%). Inthe total group, the frequency of the car-riers of the D allele among patients withMS was similar to that of those withoutMS (81 vs. 76%, P � 0.18). It also did notdiffer among white subjects (81 vs. 76%,P � 0.19) and nonwhite subjects (80 vs.77%, P � 0.69). The power of our studyto detect an association of the same mag-nitude as described by Lee and Tsai (3)was �95%. There were also no differ-ences regarding age, duration of diabetes,proportion of males, or any other featureof the MS between carriers or noncarriersof the D allele.
At first glance, an apparent explana-tion for the discrepancy between our re-
Letters
DIABETES CARE, VOLUME 25, NUMBER 12, DECEMBER 2002 2365
sults and those reported by Lee and Tsai(3) would be due to ethnic reasons, as aresult of I/D polymorphism interactionwith other DNA sequence changes or en-vironmental factors. It is well known thatthe allele frequency of ACE I/D polymor-phism varies according to the ethnicgroup (6). The D allele is less frequentamong Asian subjects than Caucasiansubjects. In fact, the allele frequency inour sample of white individuals washigher than the Chinese study (33 vs.55%, P � � 0.01), and it was similar tothat described among other Caucasianpopulations (6). We do not believe thatethnic factors explain the differences be-tween the two studies. If the ACE genehad a major role in MS predisposition, wewould expect to observe lower prevalenceof MS among Chinese patients thanamong Caucasian patients. Nevertheless,the prevalence was almost identical inboth studies. An alternative hypothesis,still too complex to be proved, wouldbe that the association reported in theChinese study was found by chance andnot casually related to the development ofthe syndrome. Further studies in otherpopulations will be very informative inthis regard.
LUCIANA A. COSTA, MD
LUIS H. CANANI, MD
ANA L. MAIA, MD
JORGE L. GROSS, MD
From the Hospital de Clinicas de Porto Alegre, Ser-vico de Endocrinologia, Porto Alegre, RS, Brazil.
Address correspondence to Jorge L. Gross, Hos-pital de Clinicas de Porto Alegre, Servico de Endo-crinologia, Rua Ramiro Barcellos 2350/Predio 12-4o.Andar, Porto Alegre, RS, Brazil 90035-003. E-mail:[email protected].
● ● ● ● ● ● ● ● ● ● ● ● ● ● ● ● ● ● ● ● ● ● ●
References1. Niu T, Chen X, Xu X: Angiotensin con-
verting enzyme gene insertion/deletionpolymorphism and cardiovascular dis-ease: therapeutic implications. Drugs 62:977–993, 2002
2. World Health Organization, Departmentof Noncommunicable Disease Surveil-lance: Definition, Diagnosis and Classi-fication of Diabetes Mellitus and itsComplications. I. Diagnosis and Classificationof Diabetes Mellitus: Report of a WHO Con-sultation. Geneva, World Health Org., 1999
3. Lee YJ, Tsai JC: ACE gene insertion/dele-tion polymorphism associated with 1998World Health Organization definition ofmetabolic syndrome in Chinese type 2 di-abetic patients. Diabetes Care 25:1002–1008, 2002
4. Instituto Brasileiro de Geografia e Estatıs-tica–Censo Demografico: CaracterısticasGerais da Populacao e Instrucao-Rio Grandedo Sul [Article online], 1991. Ministeriodo Planejamento e Orcamento: Rio de Ja-neiro. (Available from http://www.ibge.gov.br. Accessed 23 July 2002.
5. Azevedo MJ, Dalmaz CA, Caramori ML,Pecis M, Esteves JF, Maia AL, Gross JL:ACE and PC-1 polymorphisms in nor-moalbuminuric type 1 diabetic patients: a10-year prospective study. J DiabetesComplications 16:255–262, 2002
6. Fujisawa T, Ikegami H, Kawaguchi Y,Hamada Y, Ueda H, Shintani M, FukudaM, Ogihara T: Meta-analysis of associa-tion of insertion/deletion polymorphismof angiotensin I-converting enzyme genewith diabetic nephropathy and retinopa-thy. Diabetologia 41:47–53, 1998
Response to Costa
I am very grateful to Costa et al. (1) fortheir letter in this issue of DiabetesCare, because their findings give me
the opportunity to clarify several impor-tant points. Our recent paper (2) associ-ated ACE gene insertion/deletion (I/D)polymorphism with metabolic syndrome(MS) in Chinese type 2 diabetic patients.Although Costa et al. showed a similarprevalence of MS in Brazilian type 2 dia-betic patients, they did not find any asso-c i a t ion be tween ACE gene I /Dpolymorphism and MS. While we believetheir findings are interesting, we do notbelieve that they can be used to supporttheir claim that our findings came aboutby chance. The prevalence of MS in pa-tients with type 2 diabetes among differ-ent ethnic populations could not beevaluated and compared until MS was de-fined by the World Health Organizationin 1998 (3). According to Zimmet et al.(4), the incidence of type 2 diabetes ischanging and ethnic differences exist inglobal distribution. Furthermore, whilethe incidence of type 2 diabetes may besimilar among Chinese, Caucasian, andBrazilian populations, the prevalence ofindividual components of MS are quitedifferent. While the prevalence of obesity,hypertension, and dyslipidemia (WHOcriteria) are similar in our study and werecomparable to those of the Botnia study inFinland and Sweden (5), the prevalenceof “microalbumiura-nephropathy” dif-fered. The prevalence of nephropathy washigher in Chinese than Caucasians in theBotnia group (41 vs. 17%). In fact, ethnic
differences in macrovascular and micro-vascular morbidity and mortality have al-ready been reported in one WHOMSVDD study (6), which showed that theprevalence of proteinuria-albuminuria re-nal failure was especially higher in AsianChinese than in other populations stud-ied. That same WHO Multinational Studyof Vascular Disease in Diabetes (MSVDD)study also revealed that the major cause ofdeath in Asian type 2 diabetic subjectswas stroke, while the major cause of deathin Western type 2 diabetic populationswas ischemic coronary disease. Thus,based on our study and those of others, itis clear that ethnic differences exist in thephenotype presentation of MS, and fromthese differences it may be implied thatthe genetic mechanism of type 2 diabetesis also different. It is important to notethat Costa et al. mention that the allelefrequency of ACE gene I/D polymorphismvaries according to the ethnic group.
ACE gene I/D polymorphism is asso-ciated with MS in our study mostly be-cause we associated it with nephropathy.We have found ACE gene I/D polymor-phism to be strongly associated with ne-phropathy in our patients when only 300cases were studied. The more cases wecollected, the stronger the statistical sig-nificance. Using correlation analysis foreach component of MS, we found the cor-relation between ACE gene I/D polymor-phism and dyslipidemia to be weak, butthe association between ACE gene I/Dpolymorphism and MS to be strong. Infact, the association of ACE gene I/D poly-morphism with individual components ofMS and major cardiovascular diseases hasbeen extensively reviewed (7), and our re-sults are quite similar to those of others.Our only novel finding was that there wasa strong association between the ACEgene I/D polymorphism and nephropathyin Chinese subjects with type 2 diabetes,thus contributing to those subjects withMS. Although the prevalence of the indi-vidual components of MS are not actuallyshown by Costa et al., we believe that iftheir prevalence of individual compo-nents of MS were revealed, the differencesbetween Chinese and Brazilian subjectswith regard to MS would be found. Costaet al. found no association between ACEgene I/D polymorphism with individualcomponents of MS, and no associationwith MS at all. Thus, the major differencebetween our article and the article byCosta et al. may be the prevalence of
Letters
2366 DIABETES CARE, VOLUME 25, NUMBER 12, DECEMBER 2002
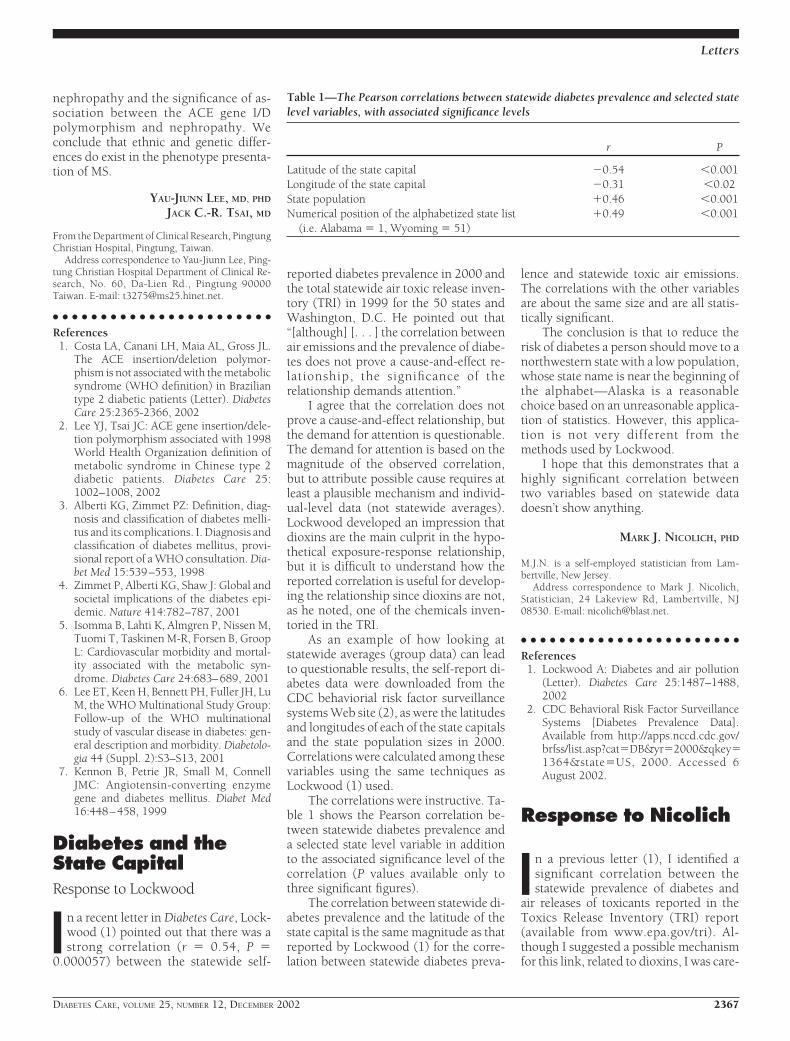
nephropathy and the significance of as-sociation between the ACE gene I/Dpolymorphism and nephropathy. Weconclude that ethnic and genetic differ-ences do exist in the phenotype presenta-tion of MS.
YAU-JIUNN LEE, MD, PHD
JACK C.-R. TSAI, MD
From the Department of Clinical Research, PingtungChristian Hospital, Pingtung, Taiwan.
Address correspondence to Yau-Jiunn Lee, Ping-tung Christian Hospital Department of Clinical Re-search, No. 60, Da-Lien Rd., Pingtung 90000Taiwan. E-mail: [email protected].
● ● ● ● ● ● ● ● ● ● ● ● ● ● ● ● ● ● ● ● ● ● ●
References1. Costa LA, Canani LH, Maia AL, Gross JL.
The ACE insertion/deletion polymor-phism is not associated with the metabolicsyndrome (WHO definition) in Braziliantype 2 diabetic patients (Letter). DiabetesCare 25:2365-2366, 2002
2. Lee YJ, Tsai JC: ACE gene insertion/dele-tion polymorphism associated with 1998World Health Organization definition ofmetabolic syndrome in Chinese type 2diabetic patients. Diabetes Care 25:1002–1008, 2002
3. Alberti KG, Zimmet PZ: Definition, diag-nosis and classification of diabetes melli-tus and its complications. I. Diagnosis andclassification of diabetes mellitus, provi-sional report of a WHO consultation. Dia-bet Med 15:539–553, 1998
4. Zimmet P, Alberti KG, Shaw J: Global andsocietal implications of the diabetes epi-demic. Nature 414:782–787, 2001
5. Isomma B, Lahti K, Almgren P, Nissen M,Tuomi T, Taskinen M-R, Forsen B, GroopL: Cardiovascular morbidity and mortal-ity associated with the metabolic syn-drome. Diabetes Care 24:683–689, 2001
6. Lee ET, Keen H, Bennett PH, Fuller JH, LuM, the WHO Multinational Study Group:Follow-up of the WHO multinationalstudy of vascular disease in diabetes: gen-eral description and morbidity. Diabetolo-gia 44 (Suppl. 2):S3–S13, 2001
7. Kennon B, Petrie JR, Small M, ConnellJMC: Angiotensin-converting enzymegene and diabetes mellitus. Diabet Med16:448–458, 1999
Diabetes and theState CapitalResponse to Lockwood
In a recent letter in Diabetes Care, Lock-wood (1) pointed out that there was astrong correlation (r � 0.54, P �
0.000057) between the statewide self-
reported diabetes prevalence in 2000 andthe total statewide air toxic release inven-tory (TRI) in 1999 for the 50 states andWashington, D.C. He pointed out that“[although] [. . . ] the correlation betweenair emissions and the prevalence of diabe-tes does not prove a cause-and-effect re-lationship, the significance of therelationship demands attention.”
I agree that the correlation does notprove a cause-and-effect relationship, butthe demand for attention is questionable.The demand for attention is based on themagnitude of the observed correlation,but to attribute possible cause requires atleast a plausible mechanism and individ-ual-level data (not statewide averages).Lockwood developed an impression thatdioxins are the main culprit in the hypo-thetical exposure-response relationship,but it is difficult to understand how thereported correlation is useful for develop-ing the relationship since dioxins are not,as he noted, one of the chemicals inven-toried in the TRI.
As an example of how looking atstatewide averages (group data) can leadto questionable results, the self-report di-abetes data were downloaded from theCDC behaviorial risk factor surveillancesystems Web site (2), as were the latitudesand longitudes of each of the state capitalsand the state population sizes in 2000.Correlations were calculated among thesevariables using the same techniques asLockwood (1) used.
The correlations were instructive. Ta-ble 1 shows the Pearson correlation be-tween statewide diabetes prevalence anda selected state level variable in additionto the associated significance level of thecorrelation (P values available only tothree significant figures).
The correlation between statewide di-abetes prevalence and the latitude of thestate capital is the same magnitude as thatreported by Lockwood (1) for the corre-lation between statewide diabetes preva-
lence and statewide toxic air emissions.The correlations with the other variablesare about the same size and are all statis-tically significant.
The conclusion is that to reduce therisk of diabetes a person should move to anorthwestern state with a low population,whose state name is near the beginning ofthe alphabet—Alaska is a reasonablechoice based on an unreasonable applica-tion of statistics. However, this applica-tion is not very different from themethods used by Lockwood.
I hope that this demonstrates that ahighly significant correlation betweentwo variables based on statewide datadoesn’t show anything.
MARK J. NICOLICH, PHD
M.J.N. is a self-employed statistician from Lam-bertville, New Jersey.
Address correspondence to Mark J. Nicolich,Statistician, 24 Lakeview Rd, Lambertville, NJ08530. E-mail: [email protected].
● ● ● ● ● ● ● ● ● ● ● ● ● ● ● ● ● ● ● ● ● ● ●
References1. Lockwood A: Diabetes and air pollution
(Letter). Diabetes Care 25:1487–1488,2002
2. CDC Behavioral Risk Factor SurveillanceSystems [Diabetes Prevalence Data].Available from http://apps.nccd.cdc.gov/brfss/list.asp?cat�DB&yr�2000&qkey�1364&state�US, 2000. Accessed 6August 2002.
Response to Nicolich
In a previous letter (1), I identified asignificant correlation between thestatewide prevalence of diabetes and
air releases of toxicants reported in theToxics Release Inventory (TRI) report(available from www.epa.gov/tri). Al-though I suggested a possible mechanismfor this link, related to dioxins, I was care-
Table 1—The Pearson correlations between statewide diabetes prevalence and selected statelevel variables, with associated significance levels
r P
Latitude of the state capital �0.54 �0.001Longitude of the state capital �0.31 �0.02State population �0.46 �0.001Numerical position of the alphabetized state list
(i.e. Alabama � 1, Wyoming � 51)�0.49 �0.001
Letters
DIABETES CARE, VOLUME 25, NUMBER 12, DECEMBER 2002 2367
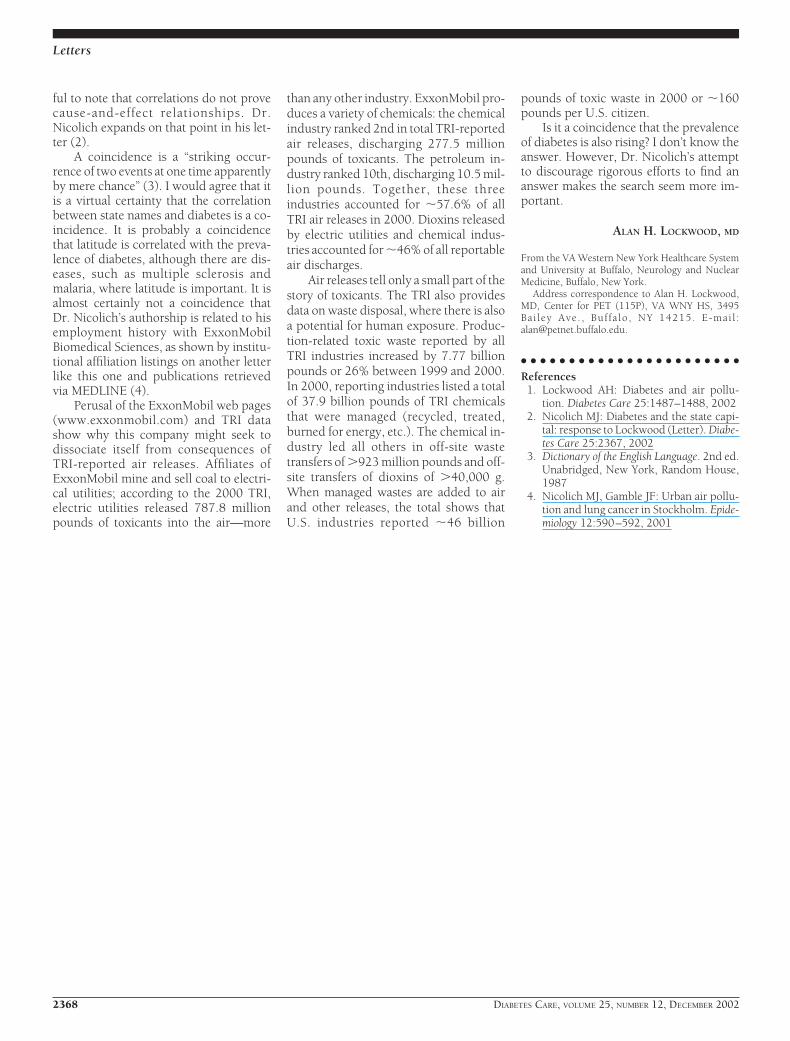
ful to note that correlations do not provecause-and-effect relationships. Dr.Nicolich expands on that point in his let-ter (2).
A coincidence is a “striking occur-rence of two events at one time apparentlyby mere chance” (3). I would agree that itis a virtual certainty that the correlationbetween state names and diabetes is a co-incidence. It is probably a coincidencethat latitude is correlated with the preva-lence of diabetes, although there are dis-eases, such as multiple sclerosis andmalaria, where latitude is important. It isalmost certainly not a coincidence thatDr. Nicolich’s authorship is related to hisemployment history with ExxonMobilBiomedical Sciences, as shown by institu-tional affiliation listings on another letterlike this one and publications retrievedvia MEDLINE (4).
Perusal of the ExxonMobil web pages(www.exxonmobil.com) and TRI datashow why this company might seek todissociate itself from consequences ofTRI-reported air releases. Affiliates ofExxonMobil mine and sell coal to electri-cal utilities; according to the 2000 TRI,electric utilities released 787.8 millionpounds of toxicants into the air—more
than any other industry. ExxonMobil pro-duces a variety of chemicals: the chemicalindustry ranked 2nd in total TRI-reportedair releases, discharging 277.5 millionpounds of toxicants. The petroleum in-dustry ranked 10th, discharging 10.5 mil-lion pounds. Together, these threeindustries accounted for �57.6% of allTRI air releases in 2000. Dioxins releasedby electric utilities and chemical indus-tries accounted for �46% of all reportableair discharges.
Air releases tell only a small part of thestory of toxicants. The TRI also providesdata on waste disposal, where there is alsoa potential for human exposure. Produc-tion-related toxic waste reported by allTRI industries increased by 7.77 billionpounds or 26% between 1999 and 2000.In 2000, reporting industries listed a totalof 37.9 billion pounds of TRI chemicalsthat were managed (recycled, treated,burned for energy, etc.). The chemical in-dustry led all others in off-site wastetransfers of �923 million pounds and off-site transfers of dioxins of �40,000 g.When managed wastes are added to airand other releases, the total shows thatU.S. industries reported �46 billion
pounds of toxic waste in 2000 or �160pounds per U.S. citizen.
Is it a coincidence that the prevalenceof diabetes is also rising? I don’t know theanswer. However, Dr. Nicolich’s attemptto discourage rigorous efforts to find ananswer makes the search seem more im-portant.
ALAN H. LOCKWOOD, MD
From the VA Western New York Healthcare Systemand University at Buffalo, Neurology and NuclearMedicine, Buffalo, New York.
Address correspondence to Alan H. Lockwood,MD, Center for PET (115P), VA WNY HS, 3495Bai ley Ave. , Buf fa lo , NY 14215. E-mai l :[email protected].
● ● ● ● ● ● ● ● ● ● ● ● ● ● ● ● ● ● ● ● ● ● ●
References1. Lockwood AH: Diabetes and air pollu-
tion. Diabetes Care 25:1487–1488, 20022. Nicolich MJ: Diabetes and the state capi-
tal: response to Lockwood (Letter). Diabe-tes Care 25:2367, 2002
3. Dictionary of the English Language. 2nd ed.Unabridged, New York, Random House,1987
4. Nicolich MJ, Gamble JF: Urban air pollu-tion and lung cancer in Stockholm. Epide-miology 12:590–592, 2001
Letters
2368 DIABETES CARE, VOLUME 25, NUMBER 12, DECEMBER 2002