a cross-sectional study of Malaysian schoolchildren's attitudes
14
RESEARCH ARTICLE Open Access Reading the mind of children in response to food advertising: a cross-sectional study of Malaysian schoolchildren’ s attitudes towards food and beverages advertising on television See Hoe Ng 1 , Bridget Kelly 2 , Chee Hee Se 1 , Sharmela Sahathevan 1 , Karuthan Chinna 3 , Mohd Noor Ismail 4 and Tilakavati Karupaiah 1* Abstract Background: Television food advertising (TVFA) is the most dominant medium in the obesogenic environment promoting unhealthy food choices in children. Methods: This cross-sectional study investigated children’s attitudes towards TVFA by examining four well-cited induction factors namely advertisement recognition, favourite advertisement, purchase request, and product preference. Malaysian urban schoolchildren (7 to 12 years) of equal ethnic distribution were voluntarily recruited (n = 402). Questionnaire administration was facilitated using a food album of 24 advertised food products. Results: Majority of children were older (66.2 %), girls (56.7 %) with one-third either overweight or obese. TV viewing time for weekend was greater than weekdays (4.77 ± 2.60 vs 2.35 ± 1.40 h/day) and Malay children spent more time watching TV compared to Chinese (p < 0.001) and Indian (p < 0.05) children. Chinese children spent significantly more time surfing the internet compared to either Malay or Indian (p < 0.01). Median score trend was advertisement recognition > favourite advertisement and product preference > purchase request, and significantly greater (p < 0.001) for non-core than core food advertisements. TV viewing time and ethnicity significantly influenced all induction factors for non-core foods. After correcting for all influencing factors, ‘favourite advertisement’ (IRR final adj : 1.06; 95 % CI: 1.04 to 1.08), ‘purchase request’ (IRR final adj : 1.06; 95 % CI: 1.04 to 1.08) and ‘product preference’ (IRR final adj : 1.04; 95 % CI: 1.02 to 1.07) still were significantly associated with TV viewing time. For every additional hour of TV viewing, the incidence rates increased significantly by 1.04 to 1.06 for ‘favourite advertisement’, ‘purchase request’ and ‘product preference’ related to non-core foods amongst Malay and Indian children. However, Chinese children only demonstrated a significant association between TV viewing time and ‘favourite advertisement’ (IRR adj : 1.06; 95 % CI: 1.01 to 1.10). Conclusion: This study highlights TVFA as a powerful medium predisposing the mind of children to non-core foods through appealing TV commercials, promoting purchase request and generating unhealthy food preferences in early childhood. Keywords: Television food advertising, Advertisement recognition, Favourite advertisement, Purchase request, Product preference, Obesogenic environment, Appealing food advertisement * Correspondence: [email protected] 1 Dietetics Programme, School of Healthcare Sciences, Faculty of Health Sciences, National University of Malaysia, Kuala Lumpur, Malaysia Full list of author information is available at the end of the article © 2015 Ng et al. Open Access This article is distributed under the terms of the Creative Commons Attribution 4.0 International License (http://creativecommons.org/licenses/by/4.0/), which permits unrestricted use, distribution, and reproduction in any medium, provided you give appropriate credit to the original author(s) and the source, provide a link to the Creative Commons license, and indicate if changes were made. The Creative Commons Public Domain Dedication waiver (http://creativecommons.org/publicdomain/zero/1.0/) applies to the data made available in this article, unless otherwise stated. Ng et al. BMC Public Health (2015) 15:1047 DOI 10.1186/s12889-015-2392-z
-
Upload
khangminh22 -
Category
Documents
-
view
0 -
download
0
Transcript of a cross-sectional study of Malaysian schoolchildren's attitudes

RESEARCH ARTICLE Open Access
Reading the mind of children in response tofood advertising: a cross-sectional study ofMalaysian schoolchildren’s attitudes towards foodand beverages advertising on televisionSee Hoe Ng1, Bridget Kelly2, Chee Hee Se1, Sharmela Sahathevan1, Karuthan Chinna3, Mohd Noor Ismail4
and Tilakavati Karupaiah1*
Abstract
Background: Television food advertising (TVFA) is the most dominant medium in the obesogenic environmentpromoting unhealthy food choices in children.
Methods: This cross-sectional study investigated children’s attitudes towards TVFA by examining four well-citedinduction factors namely advertisement recognition, favourite advertisement, purchase request, and productpreference. Malaysian urban schoolchildren (7 to 12 years) of equal ethnic distribution were voluntarily recruited(n = 402). Questionnaire administration was facilitated using a food album of 24 advertised food products.
Results: Majority of children were older (66.2 %), girls (56.7 %) with one-third either overweight or obese. TVviewing time for weekend was greater than weekdays (4.77 ± 2.60 vs 2.35 ± 1.40 h/day) and Malay children spentmore time watching TV compared to Chinese (p < 0.001) and Indian (p < 0.05) children. Chinese children spentsignificantly more time surfing the internet compared to either Malay or Indian (p < 0.01). Median score trend wasadvertisement recognition > favourite advertisement and product preference > purchase request, and significantlygreater (p < 0.001) for non-core than core food advertisements. TV viewing time and ethnicity significantly influencedall induction factors for non-core foods. After correcting for all influencing factors, ‘favourite advertisement’ (IRRfinal adj:1.06; 95 % CI: 1.04 to 1.08), ‘purchase request’ (IRRfinal adj: 1.06; 95 % CI: 1.04 to 1.08) and ‘product preference’ (IRRfinal adj:1.04; 95 % CI: 1.02 to 1.07) still were significantly associated with TV viewing time. For every additional hour of TVviewing, the incidence rates increased significantly by 1.04 to 1.06 for ‘favourite advertisement’, ‘purchase request’ and‘product preference’ related to non-core foods amongst Malay and Indian children. However, Chinese children onlydemonstrated a significant association between TV viewing time and ‘favourite advertisement’ (IRRadj: 1.06; 95 % CI: 1.01to 1.10).
Conclusion: This study highlights TVFA as a powerful medium predisposing the mind of children to non-core foodsthrough appealing TV commercials, promoting purchase request and generating unhealthy food preferences in earlychildhood.
Keywords: Television food advertising, Advertisement recognition, Favourite advertisement, Purchase request, Productpreference, Obesogenic environment, Appealing food advertisement
* Correspondence: [email protected] Programme, School of Healthcare Sciences, Faculty of HealthSciences, National University of Malaysia, Kuala Lumpur, MalaysiaFull list of author information is available at the end of the article
© 2015 Ng et al. Open Access This article is distributed under the terms of the Creative Commons Attribution 4.0International License (http://creativecommons.org/licenses/by/4.0/), which permits unrestricted use, distribution, andreproduction in any medium, provided you give appropriate credit to the original author(s) and the source, provide a link tothe Creative Commons license, and indicate if changes were made. The Creative Commons Public Domain Dedication waiver(http://creativecommons.org/publicdomain/zero/1.0/) applies to the data made available in this article, unless otherwise stated.
Ng et al. BMC Public Health (2015) 15:1047 DOI 10.1186/s12889-015-2392-z

BackgroundThe global burden of non-communicable disease (NCDs)is a deep concern to the public health community espe-cially when driven by escalating rates for overweight andobesity in children, occurring across many regions andnations as reported by a systematic analysis of obesityprevalence data from 1980 to 2013 [1]. Malaysia has thehighest rates of obesity in South East Asia, with estimatedprevalence rates of 22.5 % in boys and 19.1 % in girls whoare less than 20 years old. This is a serious problem asNCDs such as diabetes, hypertension, fatty liver, andcardiovascular diseases of adulthood are associated withchildhood obesity [2, 3]. The obesogenic environment ofchildhood in this context deserves attention as a modifi-able risk factor. It is a combination of influences that pro-mote obesity from all surroundings, opportunities orconditions of life [4]. Determinants of obesity are broad,and include cultural, environmental and psychologicaltriggers, as described in the UK Foresight Report [5].Within this matrix of determinants, the social psychologycluster inclusive of television (TV) watching and mediaavailability is influential at the societal level. In this envir-onment, it is well understood that TV food advertising(TVFA) is the most dominant medium to promoteunhealthy foods and food choices to young viewers [6–8].Over the past three decades, marketing has evolved
considerably in the food environment to accommodatethe food industry’s definition on what is acceptable anddesirable to eat [9]. Generally, food advertising portraysfood advertisements as exciting and fun, and users ofthese products as equally appealing [10]. A systematicreview on the nature, extent and effects of food market-ing to children has indicated that most food advertisingdirected to children are those low in positive nutrientsand energy-dense [11]. Techniques such as animation,story-telling, visual effects, premium offers (e.g. free toys)and product endorsements with licensed characters ormovie industry tie-ins have been shown to influencechildren [10, 12]. It is thus observed that animation usedin marketing aims to capture the attention of children bymerging the fictional world of advertisements and the realworld. Advertising on TV also penetrates the mind of chil-dren more easily than other static media, as they are morelikely to develop a receptive memory with visual simula-tion generated by TV [13].Evidence from scientific literature suggests that food
marketing influences children in various ways. Qualita-tive surveys on children’s natural reaction when exposedto TVFA has revealed modest evidence that advertisingattracts children’s attention and enhances acceptance,preference and demand for advertised products [11].Additionally, an experimental study concluded TVFA in-creased children’s food consumption when they watchedfood advertisements and with a greater likelihood for
overweight and obese children to consume energy-densesnacks compared to normal weight children [14]. Ofconcern, the lasting effect of early TVFA exposure leadsto the development of unhealthy eating habits, mediatedby perceived taste for highly advertised unhealthy food[15]. The aetiology of this pattern would be throughincreasing product awareness, generating positive atti-tudes towards junk foods, influencing children’s foodpreferences, and arousing cues for purchasing requestsas noted in some studies [7, 16–18].Children’s age is a major factor in their ability to com-
prehend TVFA messages. Children were found capableof recognising TV commercials as early as six years old,through identifying short breaks between programmesusing cues such as voice-over, jingles, pace, and editing[19, 20]. Food advertising messages may then also bereinforced through watching TV advertisements, as evi-denced by parents’ observations that their childrenrepeat an advertised product’s slogans or taglines duringtheir daily lives [13]. It is hypothesised that childrenneed to acquire three ascending levels of understandingbefore they are truly able to comprehend messagesportrayed by food advertisers [21]. These include: (i) theability to distinguish programme content from commer-cials; (ii) the ability to recognise the basic intention offood advertising, which is to sell or promote their prod-ucts (to distinguish selling intent) and; (iii) scepticismand awareness of biased messages related to advertisedfood products (to distinguish persuasive intent). Chil-dren up to 12 years old are still vulnerable to food adver-tising and less able to be sceptical about any messagecontent [22]. Recent scientific evidence emphasise re-striction of food promotion targeting children up to12 years of age [21, 23].The effectiveness of TVFA directed to children can be
attributed to several influencing factors. Amongst these,it is suggested that the impact of advertising message onchildren may differ due to sociocultural differences, butthere is a gap in knowledge regarding this aspect [24]. InCalifornia, an ethnic-specific content analysis of TVchannels indicated Spanish-language TV channels weredominated by fast foods (~30 %), followed by breakfastcereals and candy [25]. According to Kent et al. [26],French-speaking children in Quebec, Canada were ex-posed to lesser high fat, sugar, or sodium (81.0 %) foodadvertisements compared to English-speaking childrenfrom Ontario (89.8 %) and Quebec (96.6 %). Thisphenomenon warrants a need to measure the influenceof food marketing based on ethnicity related to minoritypopulations and this should be taken into account inpolicy development [27]. A study reported that childrenof Muslim cultures in the Middle East are governed bytheir parents in relation to moderating purchasingrequests [13], whereas in Western countries ‘pestering’
Ng et al. BMC Public Health (2015) 15:1047 Page 2 of 14

behaviours are noted [7]. Gender is another influencingfactor as girls are shown to be more resistant to advertis-ing messages and persuasion compared to boys, asshown for fast food advertising [8]. The availability ofTV sets within children’s bedrooms is linked to higherscreen time [28], which predicts future requests foradvertised food products [29]. Lastly, children’s pocketmoney would be another influencing factor related tothe purchasing power of children for unhealthy fooditems [30].Observational studies indicate that Malaysian TV food
marketing is dominated by foods high in fat, refinedsugars, and salt (HFSS), such as sugar sweetened bever-ages, unhealthy snacks, confectionery, instant noodles,biscuits and chocolate [31, 32]. These are unhealthyfoods and designated as ‘non-core’ as opposed to ‘core’foods which are healthy foods [33]. However, the impactof this type of TVFA on Malaysian children has not beenstudied extensively. Further, a recent multi-countrystudy comparing TVFA patterns across Asian countriessubstantiated that non-core foods dominated TVFA inMalaysia, with a ratio of 7.6 non-core food advertise-ments for every one advertisement for core foods [34].Given the gap in knowledge relating to the Malaysianobesogenic environment, there is a strong justificationto investigate the impact of TVFA on children inMalaysia. This study aimed to provide a snapshot ofchildren’s attitudes about TVFA of non-core foods byevaluating four induction factors and the relationship ofthese factors with TV viewing duration. The four induc-tion factors include (i) recognition of advertised foodproducts (advertisement recognition), (ii) liking the foodadvertisements on TV (favourite advertisement), (iii) pur-chase requests induced by TVFA (purchase request), and(iv) product preference generated by TVFA (product pref-erence). These factors were drawn from a literature review[7, 16–18] and we used the term ‘induction’ as an appro-priate label for these factors. In contrast, this study alsoexplores the relationships between potential influencingfactors such as gender, age, ethnicity, body mass index andthe cited four induction factors.
MethodsStudy design, ethics statement, and subject recruitmentAccording to the census conducted in 2010, FederalTerritory of Kuala Lumpur was reported to have a popu-lation of 1,517,998 and it was the highest populationdensity (6891 persons per square km) in Malaysia [35].Additionally, childhood obesity in Kuala Lumpur is well-studied and a major public health concern was thatabout 34 % children were overweight or obese [36, 37].For these reasons, it was decided that a cross-sectionalstudy would be conducted in Kuala Lumpur. Ethical ap-proval was obtained from the Research Ethics Committee
of National University of Malaysia (UKM NN-070-2013)and approval to conduct the study in government-runschools was sought from the Ministry of Education andschool administrators.First, the list of primary schools registered with the
Ministry of Education in Federal Territory of KualaLumpur was obtained. As per the source, there were 197primary schools in this location, of which 141 schoolswere national, Malay-centric primary schools, followedby 41 Chinese and 15 Indian vernacular schools [38]. Inorder to better capture the impact of TVFA on children,Gregori et al. [39] stressed that understanding the influ-ence of multi-cultures and relation to patterns of eatingshould be a fundamental objective of research design.Hence, in this study, the schools were clustered into 3zones as per demographic ethnic group based on local-ity: there were eight schools in Bandar Tun Razak(mainly Malays), five in Bukit Bintang (mainly Chinese),and four in Batu and Titiwangsa (mainly Indians).Within each cluster, all the school headmasters or head-mistresses were contacted for consent. Of the 17 schools,after taking account of refusal reasons such as interferingwith school activities, sport days, and examination period,15 schools consented to participate in the study. Withineach cluster, schools were selected randomly: two fromBandar Tun Razak, two from Bukit Bintang, and threefrom Batu and Titiwangsa. Data collection was carriedout from June to December 2013. Figure 1 shows theflowchart of school selection for this study.
Questionnaire developmentAn assessment on the impact of food advertising relatedto children’s food preference is suggested to be morecomprehensive and realistic with a questionnaire-based tool[14]. We therefore designed an interviewer-administeredquestionnaire to assess the impact of TVFA related to chil-dren’s food preferences. The initial version of the question-naire was drafted in English content and face validity of thequestionnaire were established through parents, teachersand nutrition experts. The final version of the questionnairewas translated into Malay and Mandarin languages by tworesearch dietitians, who were native speakers of these twolanguages. The modified questionnaire was subsequentlypilot-tested for clarity amongst 30 children from the differ-ent ethnic denominations. A copy of this final questionnaireis available as an additional file (Additional file 1).The questionnaire was organised to provide:
(i) Background information- Demographic details such asgender, ethnic, age and school details were included.Children were asked about their frequency and type(s)of physical activity carried out in the past one week.Time spent on physical activity and internet surfingwas recorded. A questionnaire sheet was included
Ng et al. BMC Public Health (2015) 15:1047 Page 3 of 14

mainly to probe for the amount of children’s TVviewing time. In the sheet, one blank clock figure fora.m. period and one blank clock figure for p.m. periodwere designated separately for weekdays and weekend.As indicated by a sample clock, time was quantifiedby the child for each TV viewing session by a‘triangulation’ of starting and completion times withthe centre of the clock. More than one triangle couldbe drawn per clock to designate different TV viewingsessions. Time was quantified for each TV viewingsession by subtracting the starting time from thecompletion time of viewing. The amount of TVviewing time was quantified in hours.
(ii)Induction factors and food advertisement album – Inorder to probe induction factors, we utilised a foodalbum constructed of most frequently advertisedcore and non-core food products. Core foods aredefined as low-calorie, nutrient-dense food products,while non-core foods are foods high in fat, refinedsugars, and salt (HFSS) [33]. Table 1 lists the foodproducts included in the food album, which comprised24 food products including 9 core or healthy foods and15 non-core or unhealthy foods. These food productswere selected based on their advertising frequency as
determined through a content analysis of TVFAdata on Malaysian free-to-air channels collectedbetween September and October 2012 [34]. Thedisproportionate ratio between core to non-corefood products in the food album was reflective ofthe dominating non-core food advertising onMalaysian TV channels. Subjects were required toindicate ‘yes’ (coded as “1”) or ‘no’ (coded as “0”)for each listed food product on the questionnairesheet by referring to the food album for picturesof the advertised product. This feedback wasobtained for each induction factor whichincluded (i) advertisement recognition (ii)favourite advertisement (iii) purchase request, and(iv) product preference.
Interviewing protocolA signed written consent form was obtained fromparents or guardians prior to proceeding with the datacollection on children. Caregivers were required to pro-vide sociodemographic information on monthly house-hold income and pocket money given to their childdaily. Children were selected if they met the followingcriteria: (i) watched TV at least half an hour per week,(ii) were physically and mentally healthy and (iii) only
Fig. 1 The flowchart of school selection. Abbreviation: n = number of schools
Ng et al. BMC Public Health (2015) 15:1047 Page 4 of 14

one child per household could participate. Carter et al.[23] suggest a small group interview facilitates a betterexploration of children’s thoughts as this helps them tobe at ease and help each other out if required. Thisapproach was adopted in the study design by which sub-jects were randomly assigned into small groups of fourto six boys and girls of similar age in each session. Eachgroup session was facilitated by at least two trainedinterviewers. However, subjects were informed not toreveal their responses to others in the group butprovide written answers in the questionnaire to preventpeer bias.The role of trained facilitators was to probe through
questions emphasising the impact of TVFA on each in-duction factor for each food product shown in the foodalbum. For example, for (i) advertisement recognition –“Have you seen this TV advert before?”; (ii) favouriteadvertisement – “Do you like the advert?”; (iii) purchaserequest – “Will you ask your parent to buy it?”; and (iv)product preference – “Do you like to eat or drink thisfood product?”. Subjects were also asked to choose rea-son(s) from a list of ten as to why they liked advertisedfood products shown. The list included tasty, good forhealth, cartoon (endorsed by promotional character), freegifts (premium offered), storyline, music, jingles (slogan orcatchy songs) or colourful visuals used during food adver-tisements, special effects (such as animation). Any reasonnot within this list was to be listed under others.
Anthropometric measurementsWeight measurements using an electronic TANITA HD-309 digital scale (TANITA Corporation, Japan) were
recorded to the nearest 0.5 kg, whilst measurements forheight using a SECA 206 body-meter (Seca GmbH & Co.KG., Germany) were recorded to the nearest 0.1 cm. Datafor weight and height measurements were transferred intoAnthroPlus software (World Health Organization) tocompute body mass index (BMI). Z-scores for BMI werecomputed with this software which uses cut-pointsspecific to gender and age as per the World HealthOrganization [40].
Data interpretationAll time-related factors such as physical activity, internetsurfing and TV viewing during the past one week werereported as daily time spent in hours. Subject responseto each induction factor was differentiated as per core(n = 9) and non-core (n = 15) food categories. Medianscores for each induction factor (ranging from 0.00 to1.00) were computed based on sum of food items inagreement (yes) divided by total number of food prod-ucts for core or non-core food categories.
Statistical analysisAnalyses were conducted using Statistical Packagefor Social Sciences, version 16.0 (SPSS Statistics Inc.Chicago IL. USA). Demographic variables such as eth-nic, age, gender, BMI, TV viewing duration, TV set inthe bedroom, internet surfing time, physical activity,daily pocket money, and monthly household incomewere described as percentage (%) or mean ± SD. Ethnicdifferences in time spent on TV viewing, physical activ-ity and internet surfing were analysed using one-wayANOVA and Kruskal Wallis Test. When significant,
Table 1 Food advertisements listing in the food album
Core food products (n = 9) Non-core food products (n = 15)
FP1 Low sugar, high fibre breakfast cereal (Brand 1) FP2 Cultured milk food with added sugar
FP6 Plain bread (Brand 1) FP3 High sugar breakfast cereal
FP9 Plant based margarine FP4 Chocolate
FP13 Frozen low fat yoghurt FP5 Cultured drink with high sugar content
FP14 Low sugar, high fibre breakfast cereal (Brand 2) FP7 Sugar-sweetened soft drink
FP17 Plain bread (Brand 2) FP8 Processed crispy fried chicken
FP18 Plain cream cracker FP10 Sweet biscuit
FP21 Soya bean milk FP11 Sweet cake
FP22 Rice, plain FP12 Extruded snack (Brand 1)
FP15 Ice-confectionery
FP16 Ice-cream
FP19 Sugar-sweetened beverage
FP20 Extruded snack (Brand 2)
FP23 Fast food
FP24 Instant noodle
FP = food product (range 1–24 as per randomised sequence of food products shown in the food album)Note: Core foods are defined as low-calorie, nutrient-dense food products, while non-core foods are foods high in fat, refined sugars, and salt (HFSS) [33]
Ng et al. BMC Public Health (2015) 15:1047 Page 5 of 14

post-hoc analyses were performed using Tukey (ifLevene test p > 0.05) or Dunnett T3 (if Levene testp < 0.05) to identify the pairwise difference. Wilcoxonsigned-rank test was used to determine the medianscore differences between core and non-core foodsfor each induction factor.The four induction factors considered in this study are
(i) advertisement recognition, (ii) favourite advertise-ment, (iii) purchase request, and (iv) product preference,with each of these factors as a count measure. To iden-tify factors influencing the induction factors, Poissonregression was used. If the assumption for Poissonregression was not met, the negative binomial regressionprocedure was applied. For ease interpretation, incidencerate ratios (IRR) were reported. The influencing factorsconsidered were TV viewing time, age, gender, ethni-city, TV set in bedroom, physical activity, internet surf-ing time, daily pocket money of child, and monthlyhousehold income. Analyses were also done to test theassociation between TV viewing time and the induc-tion factors, controlling for all other demographic vari-ables. The effect of TV viewing time on the inductionfactors were also tested for each ethnic group, separ-ately. A p-value of 0.05 was considered to be statisti-cally significant.
ResultsChildren’s characteristicsA total of 402 primary schoolchildren participated inthe survey (Table 2). The majority of subjects were girls(56.7 %) and were equally distributed amongst thethree ethnic groups (Malay = 38.3 %, Chinese = 31.1 %and Indian = 30.6 %). The average age was 9.85 ±1.38 years and nearly two-thirds of children weremore than 9 years old. More than half the children(54.5 %) had a normal BMI, whilst one-third wereclassified as possible risk of overweight (15.7 %) andoverweight or obese (18.9 %). Children’s pocketmoney averaged RM 3.13 ± 1.80 (approximately USD1.00 ± 0.60) daily.Subjects spent an average 1.15 ± 0.68 h performing
physical activity daily. Additionally, 230 subjects re-ported spending an average of 1.65 ± 1.58 h on the inter-net each day. TV viewing was more intense duringweekend (4.77 ± 2.60 h) compared to weekdays (2.35 ±1.40 h) with an average TV viewing time of 3.03 ± 1.52 hdaily. In addition, one-fifth of subjects (20.9 %) reportedhaving a TV in their bedroom. Figure 2 shows Malaychildren spent more time watching TV compared toChinese (p < 0.001) and Indian (p < 0.05) children. Incontrast, Chinese children spent significantly more timesurfing internet compared to Malay and Indian children(p < 0.01).
Induction factors shaping attitudes towards advertisedfood categoriesTable 3 indicates median scores (25th percentile to 75th
percentile) for all induction factors as per core and non-core food categories. Notably, a total of 191 children(47.5 %) reported spending three hours or more watchingTV daily. Overall, advertisement recognition achieved thehighest scores among induction factors as subjects signifi-cantly recognised more non-core foods compared to corefoods (p < 0.001) as evidenced by a score of 0.93 (0.80–1.00) for non-core foods compared to 0.78 (0.56–0.89) forcore foods. For the induction factor ‘favourite advertise-ment’, a similar pattern was observed with the medianscore for non-core foods (0.73, 0.53–0.87) remaining
Table 2 Demographic data of children (n = 402)
Characteristics n (%) Mean ± S.D.
Gender
Boys 174 (43.3) -
Girls 228 (56.7) -
Ethnic
Malay 154 (38.3) -
Chinese 125 (31.1) -
Indian 123 (30.6) -
Age (year) 402 (100.0) 9.85 ± 1.38
Younger children (≤9 years old) 136 (33.8) 8.22 ± 0.84
Older children (>9 years old) 266 (66.2) 10.7 ± 0.69
Body Mass Index, BMIa
Severely wasted and wasted(Below −2 Z-score)
44 (10.9) -
Normal (1≤ Z-score≤ −2) 219 (54.5) -
Possible risk of overweight (1 < Z-score≤ 2) 63 (15.7) -
Overweight and obese (Above 2 Z-score) 76 (18.9) -
Daily Physical Activity (hrs) 402 (100.0) 1.15 ± 0.68
Less than once weekly 24 (6.0) 0.82 ± 0.50
1–3 times weekly 245 (60.9) 1.03 ± 0.58
4–6 times weekly 78 (19.4) 1.30 ± 0.72
Everyday 55 (13.7) 1.58 ± 0.83
Daily Internet Surfingb (hrs) 230 (100.0) 1.65 ± 1.58
Daily TV Viewing time (hrs) 402 (100.0) 3.03 ± 1.52
Weekday (hrs) 402 (100.0) 2.35 ± 1.40
Weekend (hrs) 402 (100.0) 4.77 ± 2.60
Television in Bedroom
Yes 84 (20.9) -
No 318 (79.1) -
Daily Pocket Money (RM) 402 (100.0) 3.13 ± 1.80aCategories were based on Z-score of WHO classification [40]. Two newcategories were formed due to very few subjects (severely wasted mergedwith wasted category; overweight merged with obese category)bOnly 260 subjects reported having internet access at home, but only 230children were allowed online access by parents/ guardians
Ng et al. BMC Public Health (2015) 15:1047 Page 6 of 14

significantly greater (p < 0.001) than for the core foods cat-egory (0.44, 0.22–0.56). This trend was also repeated for‘purchase request’ (non-core foods = 0.60 (0.40–0.80) >core foods = 0.33 (0.11–0.44); p < 0.001) and for ‘productpreference’ (non-core foods = 0.73 (0.60–0.87) > corefoods = 0.44 (0.22–0.56); p < 0.001). Amongst all inductionfactors the lowest median score was for core foods‘purchase request (0.33, 0.11–0.44). Notably, scores fornon-core compared to core foods for all induction factorswere significantly higher (p < 0.001) for all sub-groups byTV viewing time, gender, ethnic, age, children’s BMI, TV setin the bedroom, daily physical activity, daily pocket money,daily internet surfing time and monthly household income.Therefore, the following analyses focuses only on examininginduction factors related to non-core food advertising.
Non-core food induction factors vs influencing factorsResults from univariate Poisson regression analyses foreach induction factor are presented in the form of Forestplots in Fig. 3a-d. TV viewing time (IRR: 1.03; 95 % CI:1.01–1.04) and ethnicity (Malay vs non-Malay, IRR: 1.14;95 % CI: 1.08–1.20) were significantly associated withadvertisement recognition as shown in Fig. 3a. Favouriteadvertisement (Fig. 3b) was significantly associated withTV viewing time (IRR: 1.07; 95 % CI: 1.04–1.09), age(IRR: 0.98; 95 % CI: 0.96–0.99), ethnicity (Malay vs non-Malay, IRR: 1.11; 95 % CI: 1.05–1.19), and daily pocketmoney (IRR: 0.98; 95 % CI: 0.96–0.99). In the context ofpurchase request, TV viewing time (IRR: 1.06; 95 % CI:1.04–1.09), gender (IRR: 1.07; 95 % CI: 1.01–1.14), age(IRR: 0.96; 95 % CI: 0.94–0.98), ethnicity (Malay vs non-Malay, IRR: 1.17; 95 % CI: 1.09–1.25), and physical activ-ity level (1–3 times vs less than once weekly, IRR: 1.24;
95 % CI: 1.06–1.45 and 4–6 times vs less than onceweekly, IRR: 1.25; 95 % CI: 1.06–1.48) were significantlyassociated with purchase request (Fig. 3c). Additionally,product preference (Fig. 3d) was significantly associatedwith children’s TV viewing time (IRR: 1.05; 95 % CI:1.03–1.07) and ethnicity (Malay vs non-Malay, IRR: 1.41;95 % CI: 1.07–1.21).
The effect of TV viewing time on induction factors fornon-core foodsIn multivariate analysis, when corrected for other vari-ables, TV viewing time was still significant (p < 0.001)with favourite advertisement (IRRfinal adj: 1.06; 95 % CI:1.04–1.08), purchase request (IRRfinal adj: 1.06; 95%CI:1.04–1.08) and product preference (IRRfinal adj: 1.04;95 % CI: 1.02–1.07), but not advertisement recognition(IRRfinal adj: 1.02; 95%CI: 1.00–1.04) (Table 4).
Influence of ethnicity on induction factors for non-core foodsIn the analyses by ethnic groups, TV viewing timewas not associated with non-core food recognitionacross all ethnic groups (Table 5). Generally, for everyadditional hour of TV viewing amongst Malay chil-dren, the incidence rates for them to find non-corefood advertisements to be attractive (IRRadj: 1.05;95 % CI: 1.01–1.08), purchase request on these prod-ucts (IRRadj: 1.06, 1.02–1.10) and prefer these types offoods (IRRadj: 1.04; 95 % CI 1.01–1.08) were signifi-cantly higher. Similarly, the incidence rates for everyadditional hour of TV viewing by Indian childrenwere significantly increased for favourite advertise-ment (IRRadj: 1.06; 95 % CI: 1.02–1.10), purchaserequest (IRRadj: 1.05; 95%CI: 1.01–1.09) and product
Fig. 2 Distribution of time spent daily by children. The average time spent daily (hour ± standard error of mean) by children as per ethnic groupsfor TV viewing, physical activity and internet surfing (only analysed children who reported using internet, n = 230)
Ng et al. BMC Public Health (2015) 15:1047 Page 7 of 14
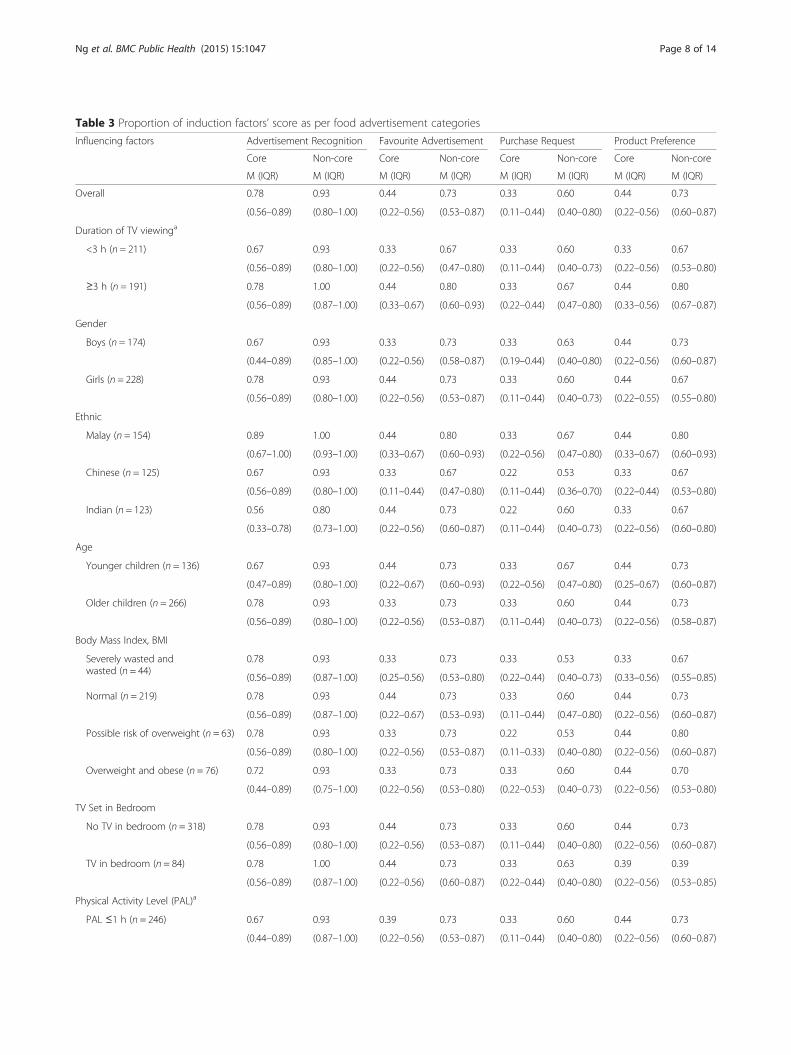
Table 3 Proportion of induction factors’ score as per food advertisement categories
Influencing factors Advertisement Recognition Favourite Advertisement Purchase Request Product Preference
Core Non-core Core Non-core Core Non-core Core Non-core
M (IQR) M (IQR) M (IQR) M (IQR) M (IQR) M (IQR) M (IQR) M (IQR)
Overall 0.78 0.93 0.44 0.73 0.33 0.60 0.44 0.73
(0.56–0.89) (0.80–1.00) (0.22–0.56) (0.53–0.87) (0.11–0.44) (0.40–0.80) (0.22–0.56) (0.60–0.87)
Duration of TV viewinga
<3 h (n = 211) 0.67 0.93 0.33 0.67 0.33 0.60 0.33 0.67
(0.56–0.89) (0.80–1.00) (0.22–0.56) (0.47–0.80) (0.11–0.44) (0.40–0.73) (0.22–0.56) (0.53–0.80)
≥3 h (n = 191) 0.78 1.00 0.44 0.80 0.33 0.67 0.44 0.80
(0.56–0.89) (0.87–1.00) (0.33–0.67) (0.60–0.93) (0.22–0.44) (0.47–0.80) (0.33–0.56) (0.67–0.87)
Gender
Boys (n = 174) 0.67 0.93 0.33 0.73 0.33 0.63 0.44 0.73
(0.44–0.89) (0.85–1.00) (0.22–0.56) (0.58–0.87) (0.19–0.44) (0.40–0.80) (0.22–0.56) (0.60–0.87)
Girls (n = 228) 0.78 0.93 0.44 0.73 0.33 0.60 0.44 0.67
(0.56–0.89) (0.80–1.00) (0.22–0.56) (0.53–0.87) (0.11–0.44) (0.40–0.73) (0.22–0.55) (0.55–0.80)
Ethnic
Malay (n = 154) 0.89 1.00 0.44 0.80 0.33 0.67 0.44 0.80
(0.67–1.00) (0.93–1.00) (0.33–0.67) (0.60–0.93) (0.22–0.56) (0.47–0.80) (0.33–0.67) (0.60–0.93)
Chinese (n = 125) 0.67 0.93 0.33 0.67 0.22 0.53 0.33 0.67
(0.56–0.89) (0.80–1.00) (0.11–0.44) (0.47–0.80) (0.11–0.44) (0.36–0.70) (0.22–0.44) (0.53–0.80)
Indian (n = 123) 0.56 0.80 0.44 0.73 0.22 0.60 0.33 0.67
(0.33–0.78) (0.73–1.00) (0.22–0.56) (0.60–0.87) (0.11–0.44) (0.40–0.73) (0.22–0.56) (0.60–0.80)
Age
Younger children (n = 136) 0.67 0.93 0.44 0.73 0.33 0.67 0.44 0.73
(0.47–0.89) (0.80–1.00) (0.22–0.67) (0.60–0.93) (0.22–0.56) (0.47–0.80) (0.25–0.67) (0.60–0.87)
Older children (n = 266) 0.78 0.93 0.33 0.73 0.33 0.60 0.44 0.73
(0.56–0.89) (0.80–1.00) (0.22–0.56) (0.53–0.87) (0.11–0.44) (0.40–0.73) (0.22–0.56) (0.58–0.87)
Body Mass Index, BMI
Severely wasted andwasted (n = 44)
0.78 0.93 0.33 0.73 0.33 0.53 0.33 0.67
(0.56–0.89) (0.87–1.00) (0.25–0.56) (0.53–0.80) (0.22–0.44) (0.40–0.73) (0.33–0.56) (0.55–0.85)
Normal (n = 219) 0.78 0.93 0.44 0.73 0.33 0.60 0.44 0.73
(0.56–0.89) (0.87–1.00) (0.22–0.67) (0.53–0.93) (0.11–0.44) (0.47–0.80) (0.22–0.56) (0.60–0.87)
Possible risk of overweight (n = 63) 0.78 0.93 0.33 0.73 0.22 0.53 0.44 0.80
(0.56–0.89) (0.80–1.00) (0.22–0.56) (0.53–0.87) (0.11–0.33) (0.40–0.80) (0.22–0.56) (0.60–0.87)
Overweight and obese (n = 76) 0.72 0.93 0.33 0.73 0.33 0.60 0.44 0.70
(0.44–0.89) (0.75–1.00) (0.22–0.56) (0.53–0.80) (0.22–0.53) (0.40–0.73) (0.22–0.56) (0.53–0.80)
TV Set in Bedroom
No TV in bedroom (n = 318) 0.78 0.93 0.44 0.73 0.33 0.60 0.44 0.73
(0.56–0.89) (0.80–1.00) (0.22–0.56) (0.53–0.87) (0.11–0.44) (0.40–0.80) (0.22–0.56) (0.60–0.87)
TV in bedroom (n = 84) 0.78 1.00 0.44 0.73 0.33 0.63 0.39 0.39
(0.56–0.89) (0.87–1.00) (0.22–0.56) (0.60–0.87) (0.22–0.44) (0.40–0.80) (0.22–0.56) (0.53–0.85)
Physical Activity Level (PAL)a
PAL ≤1 h (n = 246) 0.67 0.93 0.39 0.73 0.33 0.60 0.44 0.73
(0.44–0.89) (0.87–1.00) (0.22–0.56) (0.53–0.87) (0.11–0.44) (0.40–0.80) (0.22–0.56) (0.60–0.87)
Ng et al. BMC Public Health (2015) 15:1047 Page 8 of 14

preference (IRRadj: 1.05; 95 % CI: 1.01–1.09). However, TVviewing time for Chinese children was not significantlyassociated (p > 0.05) with all induction factors exceptfavourite advertisements (IRRadj: 1.06; 95 % CI: 1.01-1.10).
Why would children be attracted to TVFA?Almost four in five children responded that ‘tastiness ofadvertised food product’ was the topmost attraction to likea food advertisement (Fig. 4). More than half of children(n = 231, 57.5 %) said they would prefer advertised foods ifthe advertisements were labelled as good for health. Persua-sive techniques used by food advertisers in TV commercialssuch as product endorsements with promotional characters(49.0 %), premiums offers such as free gifts (44.3 %) andusing a storyline (43.0 %) were reported to gain children’sattention. However, just one in four children reported aninterest in TVFA if they carried elements of colourfulvisuals and special effects.
DiscussionOur study in urban Kuala Lumpur confirmed a reprodu-cible pattern of children’s TV viewing time compared to aprevious Malaysian study conducted in Sabah state [8].During weekends, approximately 44 % children watchedmore than 3 h per day of TV compared to fewer hours
during weekdays [8]. In our study, self-reported TV viewingtime indicated 191 children (47.5 %) spent three hours ormore watching TV daily (Table 3). However, this figure of47.5 % reported for this Malaysian study was comparativelyhigher to Thailand and Nigeria where parental reports indi-cated 28 % and 36 % of children respectively, spent ≥3 hdaily viewing TV [41]. A longer TV viewing time suggests agreater exposure to TVFA could influence preferences for,and possibly increases frequency of consumption of, un-healthy advertised foods such as soft drinks, snacks and fastfoods among children [42–44].Findings in this study revealed that Malaysian school chil-
dren were more attracted to unhealthy TV advertisementsthan healthier core food advertisements. For every add-itional hour of TV viewing, the probability for children tolike non-core food advertisements as their favourite TVadvertisements increases by 1.05 to 1.06 times, irrespectiveof their ethnic groups. The favourite advertisements of thestudied children were sugar-sweetened beverage, fast food,ice-confectionery, high sugar and/or low fibre breakfastcereal and extruded snack (Brand 2). We observed theseproducts shared similar characteristics to obtain marketshare, such as being tasty (enhanced by high refined sugar,fat and salt), endorsed by promotional characters that werebranded and offered free gift. All these techniques would
Table 3 Proportion of induction factors’ score as per food advertisement categories (Continued)
Influencing factors Advertisement Recognition Favourite Advertisement Purchase Request Product Preference
Core Non-core Core Non-core Core Non-core Core Non-core
M (IQR) M (IQR) M (IQR) M (IQR) M (IQR) M (IQR) M (IQR) M (IQR)
PAL >1 h (n = 156) 0.78 0.93 0.44 0.70 0.33 0.60 0.44 0.73
(0.56–0.89) (0.87–1.00) (0.22–0.56) (0.53–0.87) (0.22–0.44) (0.40–0.80) (0.33–0.56) (0.55–0.87)
Pocket Moneya
RM 2.50 and less or≤ USD 0.80per day (n = 175)
0.67 0.93 0.44 0.73 0.33 0.60 0.44 0.73
(0.56–0.89) (0.80–1.00) (0.22–0.67) (0.53–0.87) (0.11–0.44) (0.40–0.73) (0.22–0.56) (0.60–0.87)
More than RM 2.50 or > USD 0.80per day (n = 227)
0.78 0.93 0.33 0.73 0.33 0.60 0.44 0.73
(0.56–0.89) (0.87–1.00) (0.22–0.56) (0.53–0.87) (0.22–0.44) (0.40–0.80) (0.22–0.56) (0.60–0.87)
Internet Surfing Time (ST)a
ST ≤30 min (n = 220) 0.67 0.93 0.33 0.73 0.22 0.60 0.44 0.73
(0.44–0.89) (0.80–1.00) (0.22–0.56) (0.53–0.87) (0.11–0.44) (0.40–0.78) (0.22–0.56) (0.60–0.87)
ST >30 min (n = 182) 0.78 0.93 0.44 0.73 0.33 0.60 0.44 0.73
(0.56–1.00) (0.87–1.00) (0.22–0.56) (0.53–0.87) (0.22–0.44) (0.40–0.80) (0.22–0.56) (0.53–0.87)
Household Income
Low [≤RM 2300 or≤ USD 720per month] (n = 190)
0.78 0.93 0.44 0.73 0.33 0.60 0.44 0.73
(0.56–0.89) (0.80–1.00) (0.22–0.67) (0.53–0.87) (0.11–0.47) (0.40–0.80) (0.22–0.56) (0.60–0.87)
Medium and high [>RM2300or > USD 720 per month] (n = 212)
0.78 0.93 0.33 0.73 0.33 0.60 0.39 0.67
(0.56–0.89) (0.87–1.00) (0.22–0.56) (0.53–0.87) (0.11–0.44) (0.42–0.80) (0.22–0.56) (0.60–0.87)
M=median, IQR = interquartile range, core = core foods, non-core = non-core foodsNote: Core foods are defined as low-calorie, nutrient-dense food products, while non-core foods are foods high in fat, refined sugars, and salt (HFSS) [33]aCategorisation for influencing factors was based on median of subjects*Significance for core to non-core food in each induction factor comparison were recorded as p < 0.001
Ng et al. BMC Public Health (2015) 15:1047 Page 9 of 14

draw children’s attention when exposed to TVFA. In par-ticular toy premiums or giveaways were the most commontechniques used by fast food restaurants on TV to targetchildren [45].Generally, most children in this study recognised 13/15
advertised food products from the non-core foods categoryshown in the food album. Sugar sweetened beverages, high
sugar and/ or low fibre breakfast cereal, fast food and ice-confectionery were non-core foods commonly recognised.Interestingly, we observed a parallel scenario between thetypes of food products recognised by children in this studywith exposure rates for non-core food advertisements onMalaysian TV channels [34]. However, our observationsshowed that children’s recognition of non-core foods waspartially mediated by the TV viewing duration (IRR: 1.03;95 % CI 1.01 to 1.04) in a univariate analysis. Rather, inMalaysia, ethnicity plays a major role in children's adver-tisements recognition as a local content analysis of threemajor ethnic channels highlighted there was a significantdifference in food advertising exposure between ethnic-specific channels [32]. We also noted that the probabilityfor Malay children to recognise non-core food advertise-ments was 1.14 times higher compared to the other ethnicgroups. Perhaps, this phenomenon could be explained by alocal content analysis showing high rates of non-core foodexposure observed in Malay-centric children’s popular TVchannels, in particular during school holidays [32]. Further
Table 4 Effect of TV viewing time on induction factors for non-core food advertising after correcting for all influencing factors
Induction factors IRRfinal adj (95 % CI)
Advertisement Recognition 1.02 (1.00–1.04)
Favourite Advertisement 1.06 (1.04–1.08)*
Purchase Request 1.06 (1.04–1.08)*
Product Preference 1.04 (1.02–1.07)*
Dependent variable was score of each induction factors. Independent variablewas TV viewing time and adjusted for other influencing factors such as (i)ethnicity, (ii) BMI status of child, (iii) age of child, (iv) gender, (v) TV set inbedroom, (vi) physical activity of child daily, (vii) daily pocket money of child,(viii) daily internet surfing time of child, and (ix) monthly household income*Poisson regression model with the significance level at p < 0.05
Fig. 3 a-d Weighted unadjusted incidence rate ratio (IRR) for induction factors related to non-core TVFA targeting children. Incidence rate ratio ofscores for (a) advertisement recognition, (b) favourite advertisement, (c) purchase request, and (d) product preference related to influencing factorssuch as TV viewing time, TV in bedroom, gender (Male vs Females), age, ethnic (Malay vs Non-Malay; Chinese vs Non-Chinese; Indian vs Non-Indian),body mass index of children [BMI] (Severely wasted or Wasted or Possible risk of overweight or Overweight/ Obese or Obese vs normal),physical activity level [PAL] (1–3 times or 4–6 times or Everyday vs Less than once weekly), daily internet surfing time, daily pocket moneyand monthly household income (Low: ≤RM2300 vs Medium and high: >RM2300). Note: A vertical line represents incidence rate ratio of 1. If the valueof 1 falls within 95 % confidence interval, there is no significant association between tested induction factors and influencing factors (p > 0.05).
Ng et al. BMC Public Health (2015) 15:1047 Page 10 of 14

analysis of the association between TV viewing time as perethnicity and non-core food recognition after adjustmentfor influencing factors was not significant (p < 0.05). Thiscould be due to high non-core food recognition score forall ethnic groups (median score as 0.93) and hence TVviewing time became irrelevant.Age is an influencing factor to determine effectiveness
of TVFA. Our univariate analyses showed that the prob-ability of children to perceive advertised non-core foods asfavourite advertisements (IRR: 0.98; 95 % CI: 0.96-0.99)and trigger purchase request for these foods (IRR: 0.96; 95% CI: 0.94-0.98) reduced as they become older. Perhaps,this observation could be explained as younger childrenusually recall more peripheral information and displayfalse beliefs about foods using persuasive marketing tech-niques rather than the products nutritional attributes [46].In this study, every additional hour of TV viewing
increased the incidence rate of purchase requestamongst Malay and Indian children for advertised non-core foods by 1.05 to 1.06 times, after correcting forother influencing factors. In our previous study, Indianpopular TV channels in Malaysia screened very littleTVFA compared to other ethnic centric channels [32]. Itis therefore probable that Indian children were less
familiar with food advertising and hence are inex-perienced in navigating food commercial messa-ges. As a result, Indian children might becomevulnerable to induction into purchase requestingbehaviour with increased TV viewing time as ob-served in this study. Ghimire and Rao [47] indicatedthat Indian children were more likely to purchaseadvertised products if their favourite models or ac-tors were in the TV advertising. In contrast, childrenwho did not initiate purchase requests after long TVviewing time and exposure to TVFA, could be dueto self-repression of this desire. Mehta et al. [48]hypothesize repression may be due to parental ignor-ing of the first request which develops into condi-tioning behaviour to anticipated parental refusal asthe child grows older.Notably, for every additional hour of TV viewing
time, the probability of Malay and Indian children toprefer advertised non-core food products increasesby 1.04 and 1.05 times, respectively. In a prospectivecohort study in Denmark, Hare-Bruun et al. [49]found that TV viewing time was significantly associ-ated with unhealthy food preferences and foodhabits, which might be a result of TV commercials.
Table 5 Effect of TV viewing time on induction factors for non-core food advertisements as per ethnicity
EthnicGroup
Advertisement Recognition Favourite Advertisement Purchase Request Product Preference
IRRadj (95 % CI) IRRadj (95 % CI) IRRadj (95 % CI) IRRadj (95 % CI)
Malay 1.01 (0.98–1.05) 1.05 (1.01–1.08)* 1.06 (1.02–1.10)* 1.04 (1.01–1.08)*
Chinese 1.02 (0.98–1.06) 1.06 (1.01–1.10)* 1.07 (0.90–1.25)a 1.04 (0.99–1.09)
Indian 1.02 (0.98–1.05) 1.06 (1.02–1.10)* 1.05 (1.01–1.09)* 1.05 (1.01–1.09)*
Dependent variable was score of each induction factors. Independent variable was TV viewing time and adjusted for other influencing factors such as (i) BMIstatus of child, (ii) age of child, (iii) gender, (iv) TV set in bedroom, (v) daily physical activity of child, (vi) daily pocket money of child, (vii) daily internet surfingtime of child, and (viii) monthly household incomeaBased on negative binomial procedure*Poisson regression model with the significance level at p < 0.05
Fig. 4 Attractive reasons of food advertisements targeting children. Cited reasons among children to be attracted towards favourite advertisements (n= 402)
Ng et al. BMC Public Health (2015) 15:1047 Page 11 of 14

Fundamentally, the model of persuasion explains thatchanges in children’s attitudes and behaviour caused byfood advertising is attributed to the combination ofattractiveness and credibility of sources, incentives andrepetition of messages [50]. Therefore, credible celebrityendorsement in food advertisements might be mistakenby children as ‘super foods’. In the social learning theoryproposed by Bandura [51], children would imitate the be-haviour of these characters to consume foods endorsed bythem and further establish food preference at an early age.In this study, effect of watching TV time among Chinese
children did not show any association with inductionfactors except favourite advertisements. We observed thatChinese vernacular schools in urban Malaysia place greatemphasis on school grade achievement, hence studentswere often given greater school workload. This isevidenced by TV viewing time amongst Chinese childrenbeing the lowest compared to Malay and Indian children(p < 0.05). Hence, the focus on academic achievement inChinese children attending vernacular schools couldperhaps act as a mitigating mechanism to reduce exposureto TVFA in Malaysia.In summary, our findings indicate every additional
hour of TV viewing would affect children’s attitudes to-wards non-core TVFA. Thus, these advertisements be-come incrementally appealing causing these foodproducts more likely to be requested and preferred. Ofconcern, children who repress their purchase requestmight translate induction effects of TVFA into positiveattitudes particularly for non-core food products andthis could become a future health risk for children [52].Contemporary social cognitive theory explains food ad-vertising might increase food consumption without hun-ger, advertising awareness or mood factors [53]. If pre-established attitudes persist into adulthood, this couldbe the biggest challenge for young people to reversetheir positive attitudes towards unhealthy foods. Defin-ing proper age range to protect children from TVFA inpolicy development has been called for by publichealth professionals [21, 23]. This study will thereforecontribute a better understanding on the impact ofTVFA on children and add insights into future policydevelopment.This research serves as a single, self-reported and
cross-sectional study to evaluate impacts of TVFA onfour induction factors. Further longitudinal studieswould better elucidate information about the long termimpacts of TVFA on children. An acknowledged limita-tion was we did not assess actual caloric intake andnutrients of these advertised products to translate into ameasure of actual consumption by the children. Apartfrom this, children recruited were from a metropolitanarea and these results need to be interpreted cautiouslywhen generalised to populations covering rural areas.
The strength of this study was that it included threemajor ethnic groups and trained interviewers wereable to converse in the language preferred by children(such as Mandarin, Tamil, Malay or English).
ConclusionsOur findings indicate that food industries in Malaysiahave successfully manipulated the mind of children byusing attractive TV commercials, promoting purchaserequests and instilling early childhood preference fornon-core foods. We observed a difference in media con-sumption pattern and advertisement attitudes betweenethnic groups, which should be critically considered inpolicy development. The observation that early foodpreferences might persist into young adulthood happenswhen the mind of young school children essentiallyswitches into becoming lifelong consumers. Any effortsto initiate prevention in early childhood would beviewed as critical to protect the children from any mis-leading exaggerated claims from food advertisements,especially unhealthy TVFA.
Additional file
Additional file 1: Questionnaire survey. (DOCX 327 kb)
AbbreviationsANOVA: Analysis of variance; BMI: Body mass index; CI: Confidence interval;HFSS: Foods high in fat refined sugars and salt; IQR: Interquartile range;IRR: Incidence rate ratio (unadjusted); IRRadj: Adjusted incidence rate ratio; IRRfinaladj: Final adjusted incidence rate ratio; M: Median; NCDs: Non-communicablediseases; PAL: Physical activity level; ST: Internet surfing time; TV: Television;TVFA: Television food advertising; UK: United Kingdom.
Competing interestsThe authors declare that they have no competing interests.
Authors’ contributionsTK and SHN designed the study; SHN, CHS and SS performed dataacquisition. SHN, BK, TK and KC interpreted data; KC performed statisticalanalysis; TK and SHN contributed equally in writing the manuscript; allauthors contributed to manuscript revision and approved the final version ofthe manuscript.
AcknowledgementsThis project was funded by Ministry of Higher Education, Malaysia (FRGS/1/2013/ SS03/ 321 UKM/02/5) and Universiti Kebangsaan Malaysia (DLP-2014-017). We appreciate the participation of consenting schools and assistance fromtheir staff, as well as permission granted by parents to allow their children toparticipate in this study. We acknowledge additional research support fromMenagah Ezhumalai and Roopini Padmanabhan. We also acknowledge the roleof the project management team of The University of Sydney and viewershipdata sponsored by Nielsen Television Audience Measurement, Malaysia.
Author details1Dietetics Programme, School of Healthcare Sciences, Faculty of HealthSciences, National University of Malaysia, Kuala Lumpur, Malaysia. 2Early StartResearch Institute, Faculty of Social Sciences, University of Wollongong,Wollongong, NSW, Australia. 3Julius Centre University Malaya, Department ofSocial and Preventive Medicine, University of Malaya, Kuala Lumpur, Malaysia.4School of Hospitality, Tourism and Culinary Arts, Taylor’s University, SelangorDarul Ehsan, Malaysia.
Ng et al. BMC Public Health (2015) 15:1047 Page 12 of 14

Received: 19 March 2015 Accepted: 7 October 2015
References1. Ng M, Fleming T, Robinson M, Thomson B, Graetz N, Margono C, et al.
Global, regional, and national prevalence of overweight and obesity inchildren and adults during 1980–2013: a systematic analysis for the GlobalBurden of Disease Study 2013. Lancet. 2014;384(9945):766–81.
2. Daniels SR. Complications of obesity in children and adolescents. Int J Obes.2009;33(1):S60–5.
3. Owen CG, Whincup PH, Orfei L, Chou QA, Rudnicka AR, Wathern AK, et al. Isbody mass index before middle age related to coronary heart disease risk inlater life? Evidence from observational studies. Int J Obes. 2009;33:866–77.
4. Swinburn B, Eggar G, Raza F. Dissecting obesogenic environments: Thedevelopment and application of a framework for identifying and prioritizingenvironmental interventions for obesity. Prev Med. 1999;29:563–70.
5. Foresight. Tackling obesities: Future choices – Project report. GovernmentOffice for Science. 2007. https://www.gov.uk/government/uploads/system/uploads/attachment_data/file/287937/07-1184x-tackling-obesities-future-choices-report.pdf. Accessed 4 Jul 2014.
6. Boyland EJ, Harrold JA, Kirkham TC, Halford JCG. Persuasive techniques usedin television advertisements to market foods to UK children. Appetite.2012;58:658–64.
7. World Health Organization. The Extent, Nature and Effects of FoodPromotion to Children: A Review of the Evidence to December 2008.Geneva: World Health Organization; 2009.
8. Totu A, Igau OA, Halik M. TV commercials and choice of food amongchildren in Sabah, Malaysia. IOSR-J Humanit Soc Sci. 2013;15(6):81–9.
9. Harris JL, Pomeranz JL, Lobstein T, Brownell KD. A crisis in marketplace: howfood marketing contributes to childhood obesity and what can be done.Annu Rev Public Health. 2009;30:211–25.
10. Lewis MK, Hill AJ. Food advertising on British children’s television. A contentanalysis and experimental study with nine-year olds. Int J Obes Relat MetabDisord. 1998;22:206–14.
11. Cairns G, Angus K, Hastings G, Caraher M. Systematic reviews of evidence onthe nature, extent and effects of food marketing to children. A retrospectivesummary. Appetite. 2013;62:209–15.
12. Wicks J, Warren R, Fosu I, Wicks RH. Dual-modality disclaimers, emotionalappeals, and production techniques in food advertising airing duringprograms rated for children. J Advert. 2009;38:93–105.
13. Nassar MA, Al-Zien A. Effects of television advertising on children in theMiddle East. Educ Bus Soc Contemp Middle E Issues. 2012;5(4):267–80.
14. Halford JCG, Boyland EJ, Hughes GM, Stacey L, McKean S, Dovey TM.Beyond-brand effect of television food advertisements on food choice inchildren: the effects of weight status. Public Health Nutr. 2008;11(9):897–904.
15. Harris JL, Bargh JA. Television viewing and unhealthy diet: Implications forchildren and media interventions. Health Commun. 2009;24(7):660–73.
16. Australian Psychological Society. Special report: The new national registrationand accreditation scheme for psychologists. Protecting children from junkfood advertising. Bulletin in InPsych. 2009. http://www.psychology.org.au/inpsych/junkfood/. Accessed 30 Jun 2014.
17. Keller SK, Schulz PJ. Distorted food pyramid in kids programmes: A contentanalysis of television advertising watched in Switzerland. Eur J Public Health.2010;21(3):300–5.
18. Livingstone S, Helsper E. Advertising Foods to Children: UnderstandingPromotion in the Context of Children’s Daily Lives. London: Dept of Media andCommunications, London School of Economics and Political Science; 2004.
19. Blades M, Oates C, Li S. Children’s recognition of advertisements ontelevision and on Web pages. Appetite. 2013;62:190–3.
20. Levin S, Petros T, Petrella F. Preschoolers awareness of television advertising.Child Dev. 1982;53:933–7.
21. Graff S, Kunkel D, Mermin SE. Government can regulate food advertising tochildren because cognitive research shows that it is inherently misleading.Health Aff. 2012;2:392–8.
22. Mills C, Keil F. The development of cynicism. Psychol Sci. 2005;16(5):385–90.23. Carter OBJ, Patterson LJ, Donovan RJ, Ewing MT, Roberts CM. Children’s
understanding of the selling versus persuasive intent of junk foodadvertising: Impactions for regulation. Soc Sci Med. 2011;72:962–8.
24. Lobstein T. Research needs on food marketing to children. Report of theStanMark project. Appetite. 2013;62:185–6.
25. Fleming-Milici F, Harris JL, Sarda V, Schwartz MB. Amount of Hispanic youthexposure to food and beverage advertising on Spanish- and Englsh-languagetelevision. JAMA. 2013;167(8):723–30.
26. Kent MP, Dubois L, Wanless A. A nutritional comparison of foods andbeverages marketed to children in two advertising policy environments.Obesity. 2012;20:1829–37.
27. Harris JL, Brownell KD, Bargh JA. The food marketing defense model:Integrating psychological research to protect youth and inform publicpolicy. Soc Issues Policy Rev. 2009;3(1):211–71.
28. Rey-Lopez JP, Vicente-Rodriguez G, Ortega FB, Ruiz JR, Martinez-Gomez D,De Henauw S, et al. Sedentary patterns and media availability in Europeanadolescents: The HELENA study. Prev Med. 2010;51:50–5.
29. Chamberlain LJ, Wang Y, Robinson TN. Does children’s screen timepredict requests for advertised products? Arch Pediatr Adolesc Med.2006;160:363–8.
30. Das JR, Mohanty AK, Das GP, Jena D, Dash M. Children and advertisement –The purchasing behaviour of school aged children. Eur J Soc Sci.2013;36(3):358–71.
31. Karupaiah T, Chinna K, Loi HM, Lim SM, Noor MI. What’s on MalaysianTelevision? - A survey on food advertising targeting children. Asia PacJ Clin Nutr. 2008;17:483–91.
32. Ng SH, Kelly B, Se CH, Chinna K, Sameeha MJ, Krishnasamy S, et al. Definingthe role of television food advertising in the obesogenic food environmenttargeting children in Malaysia. Glob Health Action. 2014;7:25169.doi:10.3402/gha.v7.25169.
33. Kelly B, Halford JC, Boyland EJ, Chapman K, Bautista-Castano I, Berg C, et al.Television food advertising to children: A global perspective. Am J PublicHealth. 2010;100:1730–6.
34. Kelly B, Hebden L, King L, Xiao Y, Yu Y, He G, et al. Children’s exposure tofood advertising on free-to-air television: an Asia-Pacific perspective. HealthPromot. 2014; doi:10.1093/heapro/dau055.
35. Department of Statistics. Population distribution and basic demographiccharacteristics. Malaysia: Department of Statistics; 2010.
36. Khor GL, Chee WSS, Shariff ZM, Poh BK, Arumugam M, Rahman JA, et al.High prevalence of vitamin D insufficiency and its association with BMI-for-age among primary school children in Kuala Lumpur, Malaysia. BMC PublicHealth. 2011;11:95.
37. Wee BS, Poh BK, Bulgiba A, Ismail MN, Ruzita AT, Hills AP. Risk of metabolicsyndrome among children living in metropolitan Kuala Lumpur: A casecontrol study. BMC Public Health. 2011;11:333.
38. Kuala Lumpur Federal Territory Education Department. EducationalManagement Information System (EMIS): Senarai sekolah rendah di WPKuala Lumpur. Putrajaya: Ministry of Education Malaysia; 2011.
39. Gregori D, Ballali S, Gafare GE, Casella A, Stefanini G, de Sousa AR, et al.Investigating the obesogenic effects of marketing snacks with toys: anexperimental study in Latin America. Nutr J. 2013;12(95):1–11.
40. World Health Organization. Training course on child growth assessment.Geneva: World Health Organization; 2008.
41. Braithwaite I, Stewart AW, Hancoz RJ, Beasley R, Murphy R, Mitchell EA, etal. The worldwide association between television viewing and obesity inchildren and adolescents: Cross sectional study. PLoS One.2013;8(9):e74263.
42. Buijzen M, Schuurman J, Bomhof E. Associations between children’stelevision advertising exposure and their food consumption patterns: Ahousehold diary-survey study. Appetite. 2008;50:231–9.
43. Dixon HG, Scully ML, Wakefield MA, White VM, Crawford DA. Theeffects of television advertisements for junk food versus nutritious foodon children’s food attitudes and preferences. Soc Sci Med.2007;65:1311–23.
44. Utter J, Scragg R, Schaaf D. Associations between television viewing andconsumption of commonly advertised foods among New Zealand childrenand young adolescents. Public Health Nutr. 2006;9(5):606–12.
45. Bernhardt AM, Wilking C, Adachi-Mejia AM, Bergamini E, Marijnissen J, SargentJD. How television fast food marketing aimed at children compares with adultadvertisements. PLoS One. 2013;8(8):e72479.doi:10.1371/journal.pone.0072479.
46. Sanft H. The Role of Knowledge in the Effects of Television Advertising onChildren. Assoc Consum Res. 1986;13:147–52.
47. Ghimire N, Rao A. Comparative evaluation of the influence of televisionadvertisements on children and caries prevalence. Glob Health Action.2013;6:20066.
Ng et al. BMC Public Health (2015) 15:1047 Page 13 of 14

48. Mehta K, Coveney J, Ward P, Magarey A, Spurrier N, Udell T. Australianchildren’s views about food advertising on television. Appetite.2010;55:49–55.
49. Hare-Bruun H, Nielsen BM, Kristensen PL, Møller NC, Togo P, Heitmann BL.Television viewing, food preferences, and food habits among children: Aprospective epidemiological study. BMC Public Health. 2011;11:311.
50. Hovland CI, Janis IL, Kelly HH. Communication and persuasion: Psychologicalstudies of opinion change. New Haven: Yale University Press; 1953.
51. Bandura A. Social foundation of thought and action: A social cognitivetheory. Englewood Cliffs, NJ: Prentice-Hall; 1986.
52. Hastings G, McDermott L, Angus K, Stead M, Thomson S. The extent, nature,and effects of food promotion to children: a review of the evidence. UnitedKingdom: Institute for Social Marketing, University of Stirling and the OpenUniversity; 2006.
53. Harris JL, Bargh JA, Brownell KD. Priming effects of television foodadvertising on eating behaviour. Health Psychol. 2009;28(4):404–13.
Submit your next manuscript to BioMed Centraland take full advantage of:
• Convenient online submission
• Thorough peer review
• No space constraints or color figure charges
• Immediate publication on acceptance
• Inclusion in PubMed, CAS, Scopus and Google Scholar
• Research which is freely available for redistribution
Submit your manuscript at www.biomedcentral.com/submit
Ng et al. BMC Public Health (2015) 15:1047 Page 14 of 14