Microscopic Methods for Determining Cross-sectional cell ...
22
U. S. FOREST SERVICE RESEARCH PAPER FPL 79 OCTOBER 1967 U. S. DEPARTMENT OF AGRICULTURE FOREST SERVICE FOREST PRODUCTS LABORATORY MADISON, WISCONSIN MICROSCOPIC METHODS FOR DETERMINING CROSS -SECTIONAL CELL DIMENSIONS
-
Upload
khangminh22 -
Category
Documents
-
view
1 -
download
0
Transcript of Microscopic Methods for Determining Cross-sectional cell ...

U. S. FOREST SERVICE RESEARCH PAPER FPL 79 OCTOBER 1967
U. S. DEPARTMENT OF AGRICULTURE FOREST SERVICE FOREST PRODUCTS LABORATORY MADISON, WISCONSIN
MICROSCOPIC METHODS FOR DETERMINING CROSS -SECTIONAL CELL DIMENSIONS
SUMMARY
Microscopic techniques for determining cross-sectional cell dimensions are reviewed, with the emphasis on their relative accuracy and efficiency when applied to large-scale studies. The possibility of estimating cell wall thickness from specific gravity determinations is also considered.
MICROSCOPIC METHODS FOR DETERMINING CROSS-SECTIONAL CELL
DIMENSIONS By
DIANA M. SMITH, Research Technologist
FOREST PRODUCTS LABORATORY FOREST SERVICE
U. S. DEPARTMENT
INTRODUCTION
The physical and mechanical properties of wood are directly re la ted to the composition and arrangement of the tissue elements, to the shape and size of the cells, and to thickness and
of the cell walls. In any one species, the arrangement of the tissue elements is rela-tively constant and is used as a diagnostic factor in wood identification. However, the dimensions and often the shape of the component cells vary over a wide range, giving rise. to concomitant variations in technological properties.
This paper discusses some of problems involved in determining the cross-sectional dimensions of wood cells and gives a brief out-line of the microscopic techniques in current use. The techniques will be discussed primarily from the standpoint of their application to col-lecting large quantities of data, and will, there-fore, be evaluated on the basis of precision with which the measurements can be made, and the general efficiency.
The efficiency of a technique is largely depend-ent upon the time required for preparation of the
OF AGRICULTURE
material for examination. However, because many of the microscopic techniques of measurement can be used in conjunction with different methods of preparation, the methods will be considered separately. Finally, the estimation of average cross-sectional cell dimensions from some more easily determined characteristics will be con-sidered.
PRACTICAL CONSIDERATIONS
Before discussing the various methods for measuring cross-sectional cell dimensions, the peculiarities of wood structure must be con-sidered. Softwoods, being simpler in structure than hardwoods, will be considered first.
Structure of Softwoods
Longitudinal tracheids (or fibers) comprise approximately 90 percent of the volume of soft-woods. The shape and arrangement of the tracheids are important considerations for any measure-
1 Maintained at Madison, Wis., in cooperation with the University of Wisconsin.
ments of cross-sectional dimensions. In general, their length is approximately 100 times their diameter. Their tips tend to be wedge with the taper in the tangential plane extending over approximately 25 percent of their length. In the radial direction they are characteristically free from taper. The tracheids are arranged in regular radial rows, interspersed by very narrow wood rays, and tend to alined longitudinally within any one row. By contrast, tangential to the growth rings the alinement is more or less random. Many of the softwood species contain resin ducts. Longitudinal resin ducts are randomly dispersed among the tracheids: horizontal resin ducts are associated with fusiform wood rays. Longitudinal and transverse resin ducts comprise approximately 1 percent of wood volume. Transverse, radial, and tangential surfaces of a typical softwood (Douglas-fir) are illustrated in figure 1.
Structure of Hardwoods
are more complicated in structure than softwoods and are considerably more diver-sified in types and arrangement of cells. The fibers are shorter, narrower. and less systemati-cally arranged than those of softwoods, and their tips taper in both the radial and tangential directions. Interspersed among the fibers are thin-walled parenchyma and large-diameter vessels. The vessels vary in size and distribution among the hardwoods. The rays axe usually wider and comprise a larger proportion of the wood volume than do softwood rays. Transverse, radial, and tangential surfaces of a typical hard-wood (black walnut) are illustrated in figure
Selecting Cells for Measurement
The average cross-sectional diameter of soft-wood tracheids can be measured with greater precision on the transverse surface of the wood than on the radial or tangential surfaces. This is because a single transverse cut will intersect the tracheids randomly with respect to their length and because definition is best on this surface.
Measurement of contiguous tracheids in the radial and tangential directions should give repre-sentative values provided the ultimate tips are excluded from measurement.
Because definite radial trends exist in cell diameter and wall thickness across a growth ring, all tracheids in any one row should be measured. The rows should be selected at random. This procedure is preferable to complete random sampling of cells because of the difficulty of selecting cells at random within the cross section and the time required for recording individual measurements.
is unnecessary to measure the thickness of the radial cell walls the: direction tangential to the growth rings because the radial and tan-gential walls not differ appreciably within individual tracheids. This is fortunate for several reasons: In the tangential direction, the measur-ing procedure is made more difficult less precise because walls are not alined parallel to one another; in the earlywood, they are interrupted by frequent bordered pits; and adja-cent cell walls are frequently separated by wood rays.
Finally, and perhaps most important, although the variation in wall thickness in the direction parallel to the growth ring is truly random, the average values for each line of traverse will reflect radial trend in wall thickness. The resulting variation between tangential traverses would mean, an increase in number of measure-ments required for a given level of precision.
When comparable values for radial and tan-gential wall thickness must be obtained, measure-ments should be made on same cells and p r e f e r a b l y , on contiguous cells in randomly selected radial rows. This will take into account both the random variations and the systematic trends within the growth ring.
The number of rows on which measurements must be made �or any given cross section of an annual ring at any given position will depend primarily on the number of cells laid down radially. a wide growth ring there may be several hundred cells per row; in narrow rings there may be as few as 3 to 10 cells. Tangentially to the growth ring, there is little restriction on the number of measurements that can be made. However, the number of measurements required to establish a reliable mean will be relatively constant.
Estimates of number of sets of contiguous cells that should be measured--to obtain an average cell diameter within a specified standard error of the mean--have been made for Douglas-
FPL 79 2
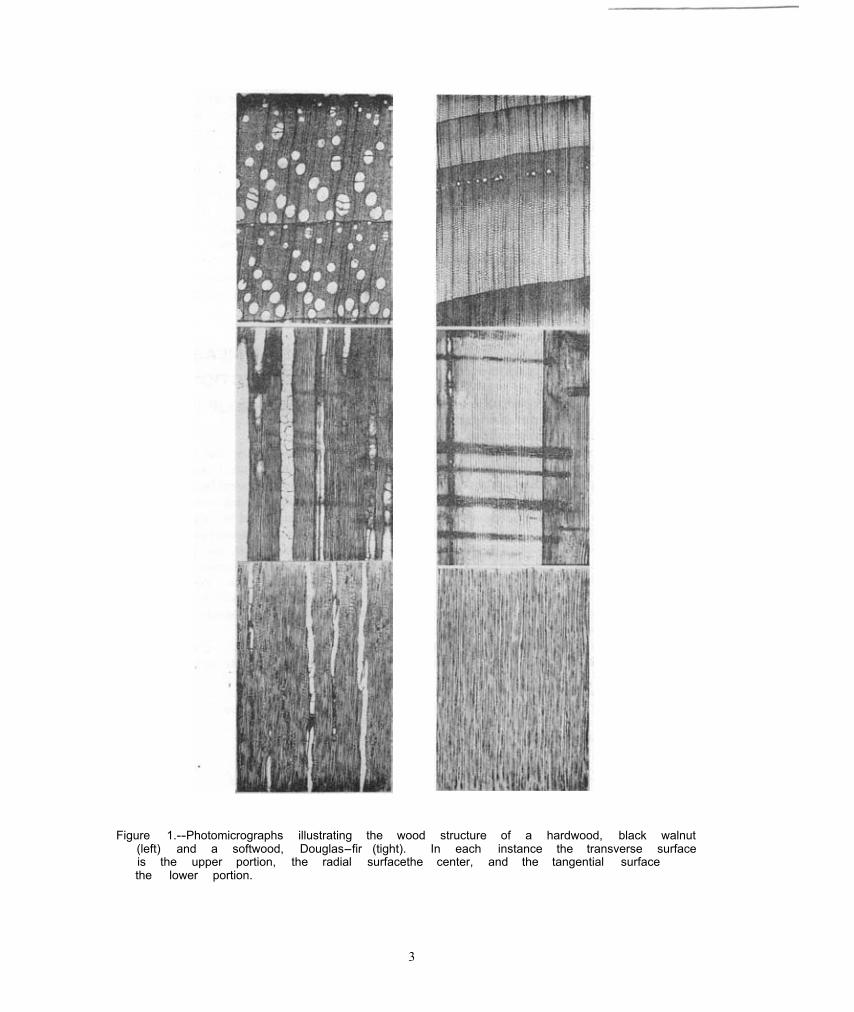
Figure 1.--Photomicrographs illustrating the wood structure of a hardwood, black walnut (left) and a softwood, Douglas-fir (tight). In each instance the transverse surface is the upper portion, the radial surfacethe center, and the tangential surface the lower portion.
3
fir and redwood (41).2 It was found that, in the directions. In such cases, series of traverses tangential direction, two sets of 150 contiguous oriented randomly with respect to the growth cells should give an average tracheid diameter to within ±1µ for either earlywood or latewood. To obtain the same precision for average radial diameter, four sets would be required for early-wood and eight for latewood. The estimated num-ber of sets reflects the fact that average tan-gential cell diameter is relatively constant across the growth sing. whereas radial diameter is more variable, and latewood more variable than early-wood.
For tangential cell wall thickness, 10 sets should give an average double wall thickness between adjacent lumens, within ±0.5µ of mean. The limit of resolution for the visual light microscope is considered to be 0.2µ under optimum conditions; therefore, under ordinary working a precision of ±0.5µ on
measurements is quite adequate in most cases.
The percentage of the wood volume occupied by rays can best be determined on the tangential surface of the specimen because rays, once formed, continuously in the direction from pith to bark; therefore, the percentage by area measured on the tangential surface is equivalent to the percentage by volume. However, since new rays may arise at greater depths in the specimen, measurements should be on both tangential surfaces and values for both sur-faces averaged.
The procedures for measuring the cross-sectional dimensions of hardwood elements are essentially similar to softwoods. However, in certain hardwoods because of the ramdom arrange-ment of the fibers it is not necessary to make measurements in both the radial and tangential
rings will provide estimates of the average cross-sectional dimensions of these fibers.
In addition to cross-sectional dimensions of hardwood elements, information is often needed on the proportional volume occupied by the various elements (rays, vessels, fibers, and parenchyma). As in the case of softwoods, ray volumes are best measured on the tangential surface of the specimen, while the proportional volume occupied by the other elements can be determined most precisely on the cross-sectional surface. The latter values must then be adjusted for the discrepancy in ray volume between the two surfaces.3
METHODS OF CROSS-SECTIONAL
DIMENSIONS OF CELLS
Methods for measuring the cross-sectional dimensions of cells, with a microscope, are
discussed under three general headings: prepara-tion of the specimen for microscopic examina-
tion; linear measurement of cell diameter and cell wall thickness; and measurement of propor-tional area of tissue and the amount and distribution of cell wall material. Finally, a description of the dual-linear traversing micro-meter included in this section because it was designed specifically for measuring the anatomi-cal features of wood,
The methods selected will, of course, depend upon the equipment available in the laboratory.
2Underlined numbers in parentheses refer to Literature Cited a t the end of the report.
3The procedure used for adjusting proportional
Measured Volume
(percent)
Tangent ia l Surface Rays 33 Nonrays 67
Transverse Surface Rays 28 Nonrays 72
volumes is as follows:
Adjustedvolume
(percent)
33
VesseIs 8 (8/72)67= 7.4 Fibers and parenchyma 64 (64/72)67= 59.6
FPL 39 4
When large-scale anatomical studies are to be undertaken, an initial investment in the most up-to-date equipment will be more than offset by the speed and precision withwhich the measure-ments can be made.
Preparation of Specimen for Microscopic Examination
Preparation of the wood specimen for micro-scopic examination often constitutes a large share of total time required for making cell measure-ments. It is, in most cases, the area in which the greatest economy may be effected.
It has been customary to measure cell dimen-sions on slide preparations of thinly cut micro-tome sections of the specimen Once prepared, these slides be used with any of the micro-scopic techniques, with either incident or trans-mitted light, Preparation of slides, however, is a lengthy and exacting process. In addition to the time required to cut, stain, and mount the sections, consideration must also be given to all the related aspects of the operation. This includes sharpening the microtome knives, separating specimen into suitably sized blocks, and any softening procedure that may be required.
Finally, treatment of the sections may cause changes in the cell dimensions so that the measurements no longer represent the material in either the green or the dry condition.
The best procedure for green material is to make the measurements directly on the surface of freshly cut specimens, or those that have been 'saturated in using incident light. Flooding the surface of the specimen with water will not only prevent it from drying out, will increase the optical resolution. Water immersion objec-tives can be used for magnifications up to 1,000X. The only necessary precaution is to ensure that all surface air bubbles are evacuated with an aspirator. For specimens in the dry condition, similar measurements can be made using incident light and oil immersion objectives.
Surfaces can be prepared by hand-smoothing, on a microtome. Hand-smoothed surfaces.
although not completely even, are quite satisfac-tory. When linear measurements are to be made with a traversing micrometer or Filar-type eye-piece micrometer, and for area determinations by the test point sampling method, it is not essential that the entire field of view be in
perfect focus at one time. It is only necessary to adjust the focus for each element as it is being measured or counted. ordinary eyepiece micrometers are to be used, or for projection or photographic hand-surfacing is not recommended,
Hand-smoothing, of course, is faster than surfacing on a microtome because the specimen is kept intact and only the portion required for measurement needs to be prepared. For cross-sectional disks, a medical scalpel with replaceable blades gives the best surface because the flexi-bility of the blade allows a radial “path” to be cut across the annual rings. The slight depression in the surface, caused by the “path,” can be flooded with water. Increment cores are best surfaced in a core holder with a small microtome knife or Rolls razor blade. The core should then be transferred to a core holder mounted in a trough and its surface flooded with water. Very small specimens, too flexible to be hand-surfaced, can be prepared for examination on a freezing microtome (2, 41, 52).
The contrast between cell wall and lumen can be increased by the use of dyes.4 Excellent results can also be obtained, without dyes, by blue-light fluorescence microscopy, described by Marts (27, 28). Such a procedure was used by Goggans (13) to measure the cross-sectional cell dimensions of loblolly pine with a Filar micrometer on hand-smoothed surfaces of small blocks.
Linear Measurement
There are, essentially, three microscopic methods for measuring linear cross-sectional dimensions of cells: (1) direct comparison with a graduated scale as exemplified by thetraversing micrometers; (2) micrometer eyepieces; and (3) measurement with a graduated rule on pro-jected images. An description of these methods has been given by Isenberg in Chapter 5 of Pulp and Paper Microscopy (18).
Discussing the accuracy of linear microscopic measurements, Isenberg (18) summarizes the essential points as follows:
The limit of the precision depends, apartfrom the mechanical inaccuracy of the apparatus used, upon the sharpness and fineness of the scale of the micrometer, the points of the object between which the measurements
4A mixture of 0.015 gram of malachite green and 0.015 gram of methylene blue in 25 centimeters of 15 percent e thy l alcohol i s satisfactory.
5
are made, the coarseness of the image of the markings the micrometer scale, and the extent to which they are magnified. The outlines and details of the object vary in apparent width, and depend the focus, the illumination, the refractive index of the preparation, and the resolving power of the microscope. The limit is finally dependent upon the breadth of the dark diffraction line which outlines microscopic structures, and is approximately equivalent to the resolving power of the optical system.
Therefore, when delicate measurements, such as cell wall thickness, are to be made, optical system that will give the best possible revolution and definition should be used, Great care must be taken in preparing the specimen for examination.
in cross-sectional shape of adjacent wood cells makes accurate measurements on the radial and tangential diameters of individual cells difficult. It is considerably easier to measure
maximum diameters as they appear in the cross-section than to obtain a measure of their “average” diameter. The result is an overall average that is biased upward. The information generally sought is the average diameter of a number of contiguous cells. Thus the most accu-rate and efficient method is to count a large number of cells in the radial, or the tangential, direction over a measured distance and divide the measurement by the count (23, 31, 41, 44).
To obtain comparable measurements average lumen diameter, the best procedure is to subtract the average double cell wall thickness (calculated
. from the sum of the double walls between adjacent lumina) from the average cell diameter. Cell wall thickness is conventionally measured as half the width of the double cell wall between adjacent lumina at its narrowest point. This method of measuring average linear dimensions, therefore, obviates problems that would otherwise arise from irregularities in the cross-sectional shape of individual cells. It is also advantageous because the recording of data is minimized.
When measuring cell dimensions of contiguous tracheids in the tangential direction, a arises with respect to wood says. Because wood rays pass between the radial of tracheids, they cause a slight constriction in the lumina of the tracheids adjacent to the rays. However, the ray crossings occupy only a small percentage of the overall length of the tracheids. Therefore, in determining average cell diameter, and average
diameter, the width of rays should be accumulated with the tracheid dimensions. If this is done less bias will result than if the width of the rays were excluded from the accumulated measurements.
T r a v e r s i n g micrometers.--A traversing micrometer is preferable to micrometer eye-pieces for measuring cell dimensions-provided that the scale graduations are sufficiently fine (recording to the nearest micron) and that their accuracy has been checked against a stage micro-meter.
The traversing micrometers have a number of advantages:
1. The size of the field over which the measure-ments can be made in a single operation is limited only by the traversing movement and is, there-fore, independent of the magnification of the system used.
2. Scale readings are direct recordings of actual measurements and also independent of magnification. Thus, any combination of ocular and objective can be used without determining the magnification factor.
3. Measurements are always taken in the same position with regard to ocular and objective (in the center of the field of view), which tends to compensate for any aberration that may be present in the optics.
4. When measuring the average cell diameter of contiguous cells, the crosshairs will serve as a marker for counting the cells as they pass under them.
The utility of the traversing micrometer for measuring cell dimensions can be greatly increased if it is provided with dual- or multiple-linear movement. For instance, average lumen diameter and average cell wall thickness of con-tiguous cells can be obtained simultaneously by accumulating these features on separate scales (21, 41, 42, 48). Or, the average radial and average tangential diameter of vessels can be accumulated simultaneously (25).
The principal disadvantages of micrometers available on the market are that they are equipped with microscopes that are too low powered, the scale readings are too for wall thickness measurements (they should record to the nearest micron), or the distance of traverse is very restricted.
Micrometer eyepieces.--There are a number of constructed micrometer eyepieces on
FPL 79 6

the market, and they vary greatly in the fineness and accuracy of their graduations. They all require that the graduations be calibrated for each combination of ocular and objective used and for tube length Accurate calibrations require considerable time, care, and skill.
The Filar-type screw- micrometer eyepieces ensure a considerably higher degree of accuracy in measuring than the ordinary micrometer eye-pieces. This is because they incorporate both a fixed field scale and a lateral micrometer head that moves a measuring line across the field scale. The micrometer head is graduated with 100 intervals, and is So designed that one com-plete revolution of the head coincides with one interval of the fixed eyepiece scale.
Filar eyepiece micrometers were used by Goggans (13) to measure cell wall thickness on the hand-smoothed surface of loblolly pine blocks with incident blue-light fluorescence They were also used by Saucier (35) to measure fiber wall thickness and fiber diameter of green ash on permanently mounted transverse micro-tome sections. However, micrometer eyepieces, when measurements must be read directly from an eyepiece scale, cause considerably more eye-strain than when measurements are made with a traversing micrometer equipped with a single cross hair.
Jones (21) measured cell wall thickness in Norway spruce, and compared direct measure-ments made with an eyepiece scale with those made on drawings of projected images. The results were almost identical, Jones preferred the latter method because there was less eyestrain.
Measurements on projected images.--The prin-cipal advantage gained by measuring projected microscope images, or photomicrographs, is the tremendous increase in magnification that is possible. Once the magnification has been deter-mined, the actual size of the elements can be computed from direct measurements on the pro-jected image, or photomicrograph, with a gradu-ated scale. These measurements can be made in any direction Without reorienting the preparation. The obvious disadvantage of the projection method, as opposed to photomicrographs, is that the measurements and scale readings must be made in a darkened room. For both methods, only perfect slide preparations can be used, and focusing is critical.
The projection method has been used to measure
cross-sectional cell dimensions on thinly cut microtome sections of wood (15, 21, 32), and to measure fiber diameter and cell wall thickness of macerated fibers (33, 36, 54). The diameter of macerated fibers is conventionally measured in the area of their maximum width. Photomicro-graphs have been used to determine cell cross-sectional dimensions and proportional areas of tissue types in oak (51).
If only the average wall thickness of a number of cells is required, the most efficient procedure is to accumulate the cell wall widths on a pair of dividers. Then, the average value can be computed from a single scale reading. This procedure was used by Bernhart (3) to estimate the average cell wall thickness of Norway spruce on projected images. Bernhart holds that the procedure gives a very low error for the average value of one measuring field (for instance, approximately ±4 percent for earlywood and ±1 percent for latewood). Haywood (14) used the same procedure to measure cross-sectional dimensions of fibers on photomicrographs of 55 species.
Isenberg (18) has suggested that when trans-mitted light is used, a simple, convenient method of measuring is projecting a scale of known value into the field of view with the substage condenser.
Area Measurement
The proportional areas of tissue types and the amount and distribution of cell wall material can be determined by three methods: (1) the test point method, the line integration method, and (3) the cut-out or planimetric methods. The accu-racy with which area measurements can be made by any one of these methods depends upon the preparation of the specimen surface and the degree of optical differentiation of the various tissues in the preparation,
The degree of optical differentiation can be increased considerably by use of selective stains, polarized light, or microscopy techniques. For slide preparations, under trans-mitted white light or polarized light, excellent differentiation can be achieved with biological stains. When measuring tissue types on smoothed surfaces, particularly of hardwoods. a combination of fluorescent stains and ultra-violet incident light will provide the necessary differentiat ion.
7

Test point method.--By this method the propor-tional areas of component elements are deter-mined by counting the numbers of sample points which fall on each component and expressing them as a ratio of the total number of points counted. Ideally the test points should be randomly posi-tioned within the given field. If the area of the field and number of cells contained within the field are known, it is possible to calculate the cross-sectional area of the average cell, its wall area, and lumen area.
In 1929, (23) described a method of test point sampling in which the image of the trans-verse wood section is projected onto a card pierced by 100 minute holes, distributed at random, and illuminated from below. noted the impracticality of increasing the sampling points over 100 per field because ofchance of missing a point in the count and the considerable increase in counting time. He also emphasized the importance of randompositioning of the test points as opposed to the uniform grid method described by Schulz (38, 39). With the uniform grid method, there is always the danger, especially in the case of softwoods, which tend to have a uniform pattern in cross section, that the sampling points “fall in step” with the cells being examined.
Schulz, however. used the method to determine tissue proportions in red beech poplar clones (counting 500 and 1,000 points per annual ring for beech and poplar, respectively). The fact that the points are systematically arranged makes them considerably easier to count than randomly distributed points, and there is less chance of missing a point in the count (50).
The projection of transverse sections onto a grid was also used by Wedel (53) to measure the percentage cell types in maple, and by Kellogg and Ifju (22) to measure the fiber wall area as a percentage of total wall area of 21 species of hardwoods and softwoods.
Tsoumis (50) found no significant difference in the regression equations relating specific gravity to percentage of cell wall area when determined by the random test point and the uniform grid method. Percentage cell wall area measurements were based on 49 random and 50 uniform points per field over 20 fields, selected at random, on twelve 1- by 1-centimeter cross-sections of white pine (Pinus strobus L.).
The integrating eyepiece with test point
FPL 79
graticule, manufactured by Carl Zeiss, has only 25 test points asymmetrically arranged within a circle. The relatively few test points, and the fact that they are connected by straight lines, facilitates counting. By rotating the eyepiece (and therefore the graticule) after each counting, it is possible to obtain as many measuring positions as desired within the same sampling field.
The eyepiece graticule, as opposed to the projection method of Ladell and Tsoumis, allows measurements to be made directly on the surface of hand-smoothed specimens. at any desired magnification, with a considerable saving in the time required for Although the surface may not be completely even as a result of hand smoothing, each point can be brought into perfect focus as it is counted.
The test point sampling method is best suited to large scale anatomical studies because of the speed and precision with which the determinations can be made.
Line integration method.--The line integration method, according to Rosiwal (34), has been incorporated into the Leitz integrating stage, and integrating eyepiece, so that the widths of individ-ual components, measured along a series of line traverses. can be accumulated separately on independently operating spindles, These instru-ments are no longer on the market; however, they will be discussed briefly because they have been used, very successfully, to measure the proportional area, or volume, of the various tissue types (17, 19, 25, 46, 48) as well as average cell diameter (19, 46), average fiber wall thick-ness (36), and proportional area of cell wall (19, 36). These integrators are equipped with six spindles that record separately the amount of each tissue crossed in a straight line traverse. This up to six different constituents to be measured under the microscope in one operation.
accumulated widths of the various tissues traversed, expressed as a percentage of the entire length of the traverse, are equivalent to the percentages by area, or by volume, according to Rosiwal’s method (34).
Apart from the mechanical precision of the spindles, that read to 0.01 millimeter operate through approximately 25 millimeters, the accu-racy of this method of measuring depends on the degree of differentiation of the various tissues in the preparation and their distribution. The accuracy will also depend upon the number,
8

length, and distribution of traverses made across the specimen, To avoid considerable error, care must be taken to record each tissue, as it is encountered, on the correct spindle. The probabil-ity of making such recording errors increases with the number of being evaluated in a single operation and their dispersion across the surface of the specimen. The probability of making this error is very low when only two components are being evaluated.
Measurements to determine the proportional volume of tissue types on cross-sections of hard-woods should run diagonally across the growth ring at an angle between 45° and 60° to the border of the ring (16, 17, 25) so that all component tissues are traversed. However, if the change in tissue: proportions across the growth ring is to be described, the traverses should run tangen-tially, parallel to ring (16, 17, 36). The number of traverses required will vary according to the structure of the wood, but usually four to six traverses are made (17) parallel to one another. The length of the traverses should be nut less than millimeters (17, 46).
The line integration method is a cumbersome method to use compared with the test point method that has supplanted it.
Cut-out and planimetric methods.--The most commonly used methods fer determining propor-tional areas are the cut-out and the planimetric methods. In the cut-out, the weight of the selected field on an enlarged photomicrograph is deter-mined and then the portions of the field occupied by particular elements tissues under consideration are cut out and weighed. The second weight, expressed as a percentage of the first, gives the percentage of area, or volume, of wood occupied by the component. Measure-ment errors are reduced if the photographic paper is of uniform density and is done under standardized humidity conditions.
The method was used by DeSmidt (10) and Myer (30) to determine the percentage of ray area by preparing greatly enlarged photomicro-graphs of tangential microtome sections. The method has also been used to determine the proportional area, or volume, occupied by other tissue types (6, 7).
Elwood and Wilcox (11) used the cut-out method to determine transverse area of the cell walls and cell lumina of redwood. Van Buijtenen (9) used the method to measure
the cell wall area and lumen area of slash pine as a check on the values obtained by light trans-mission and found that corresponding measure-ments agreed quite well,
The planimetric method is similar to the cut-out method. It has been used on projected images of sections of wood, photomicrographs, or camera lucida drawings. First, the area of the total wood image is determined with a planimeter. Then, the area occupied by the particular element or tissues under consideration is measured and expressed as a percentage of first measure-ment. This method is not considered to be as accurate as the cut-out method (7), although the accuracy can be increased by taking the average of three planimetric determinations. The com-pensating polar planimeter, with a tracer lens, has a 5 percent error on areas of 1 square centimeter .
Barner (1) determined planimetrically the vessel lumen areas on projected unstained cross-sections of poplar and calculated the percentage vessel lumen area in the annual ring. By counting the number of vessels in each area, he also obtained average vessel lumen area.
Leopold and McIntosh (24) traced the images of fibers from projected photomicrographs of microtome cross-sections at 3,500X. The area of the lumen and fiber wall of individual fibers were then measured the tracing with a plani-meter. The same procedure was used by Yiannos (55) to determine the solid fraction of the wood of six softwood species. Bethel (5) also used the planimetric method to determine individual cell wall areas on projected images of the cell cross-section.
Neither the cut-out nor planimetric methods are to be recommended for large-scale studies because, apart from the limitations on the size of the fields that can be accurately measured, the techniques are quite laborious. They are, perhaps, best suited to the measurement of cross-sectional areas of individual fibers.
Dual-Linear Traversing Micrometer
The U. S. Forest Products Laboratory has developed a dual-linear traversing micrometer, ideally suited to the collection of large quantities of anatomical data. The instrument was built commercially according to the Laboratory’s specifications. The prototype has been operation
9
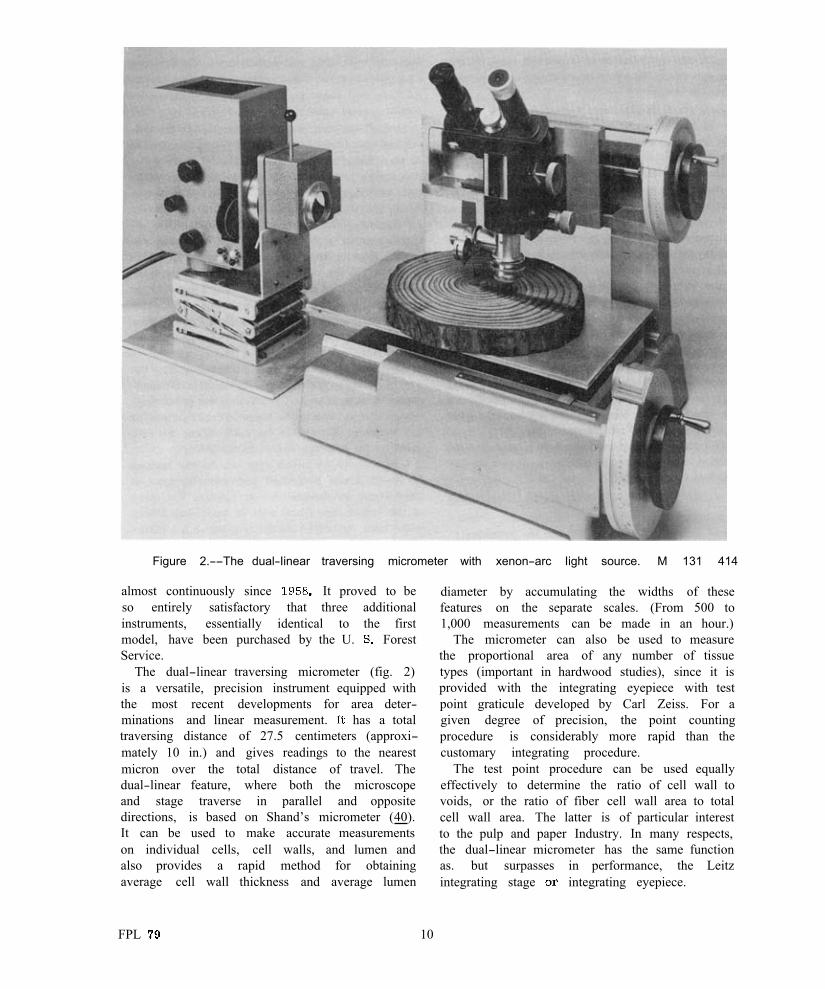
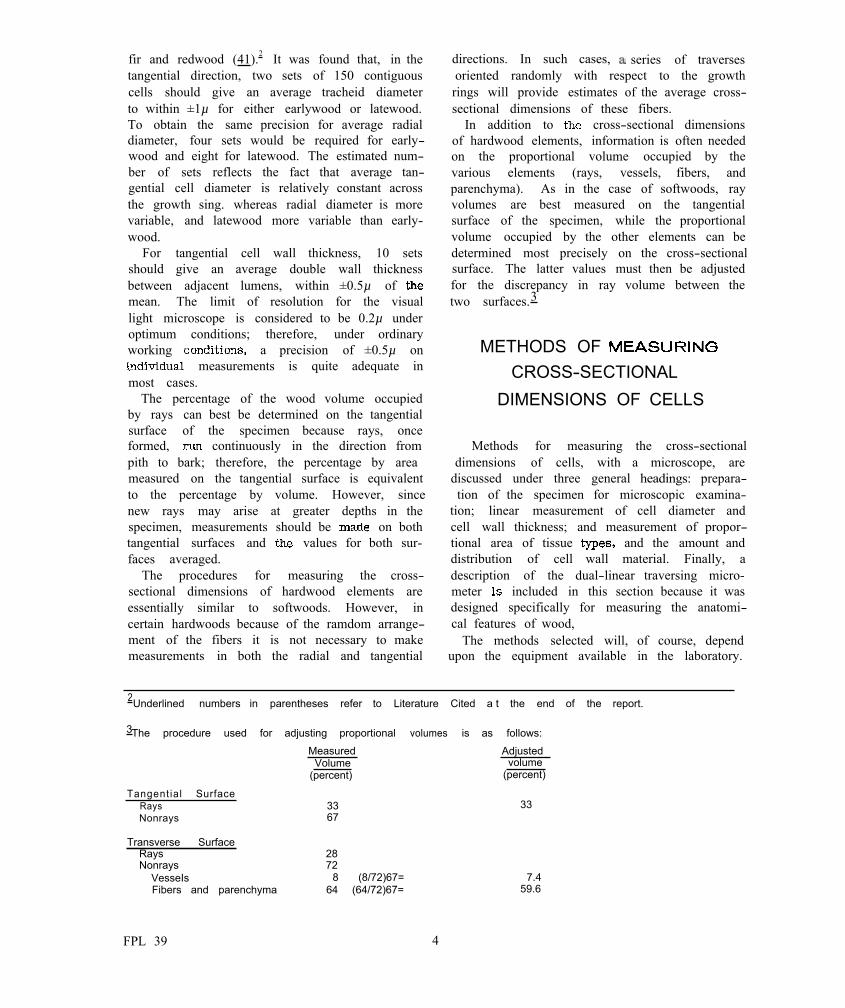
Figure 2.--The dual-Iinear traversing micrometer with xenon-arc Iight source. M 131 414
almost continuously since It proved to be so entirely satisfactory that three additional instruments, essentially identical to the first model, have been purchased by the U. Forest Service.
The dual-linear traversing micrometer (fig. 2) is a versatile, precision instrument equipped with the most recent developments for area deter-minations and linear measurement. has a total traversing distance of 27.5 centimeters (approxi-mately 10 in.) and gives readings to the nearest micron over the total distance of travel. The dual-linear feature, where both the microscope and stage traverse in parallel and opposite directions, is based on Shand’s micrometer (40). It can be used to make accurate measurements on individual cells, cell walls, and lumen and also provides a rapid method for obtaining average cell wall thickness and average lumen
diameter by accumulating the widths of these features on the separate scales. (From 500 to 1,000 measurements can be made in an hour.)
The micrometer can also be used to measure the proportional area of any number of tissue types (important in hardwood studies), since it is provided with the integrating eyepiece with test point graticule developed by Carl Zeiss. For a given degree of precision, the point counting procedure is considerably more rapid than the customary integrating procedure.
The test point procedure can be used equally effectively to determine the ratio of cell wall to voids, or the ratio of fiber cell wall area to total cell wall area. The latter is of particular interest to the pulp and paper Industry. In many respects, the dual-linear micrometer has the same function as. but surpasses in performance, the Leitz integrating stage integrating eyepiece.
FPL 10

The microscope that is mounted on the dual-linear micrometer is a Leitz research microscope with Ultrapak illuminator. Illumination is provided by a Xenon arc light source. The design of the microscope, with its interchangeable monocular and binocular tubes, the high intensity light source, and appropriate filters, all combine to reduce the eyestrain involved in making measure-ments. For material in the green condition, a water-immersion objective is used to increase r e s o l u t i o n (it will give magnifications up to approximately 1,000X for cell wall thickness measurements). For intermediate moisture con-tents, an oil immersion system can be used. Although there is no provision for transmitted light, slide preparations can be measured equally effectively on this instrument with incident light. The general efficiency of the measuring procedure can be improved considerably by making the measurements directly on the hand-smoothed surface of disks or increment cores (the micro-scope will accommodate disks up to 4 inches in thickness and 10 inches in diameter).
The micrometer has another useful feature. A mechanical rotating stage with two directions of movement at to each other, may be attached to the traversing stage of the micrometer for easy alinement of the test specimen. The mechani-cal stage also serves to bridge over gaps in the specimen or interruptions in the tissue types without affecting the scale readings because it moves independently of the basic stage.
Finally, the efficiency of operation has been further increased by providing the micrometer with an automatic recording system for trans-ferring the scale readings directly onto punch tape for processing on an electronic computer. This feature virtually eliminates the possibility of recording errors and permits, without any increase in measuring time, the recording of individual cell measurements.
Estimation of Cross-Sectional Dimensions
Undoubtedly, the best method for determining the average cell dimensions of a piece of wood is direct measurement. However, the reliability of the average values will depend upon the appro-priateness of the sampling procedure used, the number of cells measured, and the accuracy with which the measurements are made.
Instruments capable of making large numbers
of measurements with speed and accuracy have been developed. Such instruments, however, are often not readily available, and, even under optimum conditions, measurements, such as of cell wall thickness, must be made under high magnification, and they are tedious. Therefore, the possibility of calculating cell wall thickness from some more easily determined character-istic, such as specific gravity, has been explored.
Stamm (44, 45) and Brown et al. (8) have shown that, if one assumes a theoretical model for the cross-sectional shape of coniferous tracheids, it is possible to calculate the average cell wall thickness from a knowledge of the specific gravity of the wood and the number of tracheids per unit of cross-sectional surface. The latter can be determined with a high degree of precision, and at fairly low magnification, by number of tracheids over a measured length for several traverses across the specimen in both the radial and tangential directions (31).
The equations commonly used for estimating cell wall thickness (8, 26, 42, 45) are based on the assumption that the cross-sectional cell wall area of the average tracheid can be calculated as follows:
For tracheids with circular or square cross-sections
(1)
For tracheids with rectangular cross-sections
(2)
A is the average cross-sectional cell wall c area in square microns, D is the average cell diameter, assuming the cells are circular or square in cross-section, and T and R are the average tangential and radial diameters if the cells are assumed to be rectangular in cross section. All measurements are expressed in microns. G is the specific gravity of the wood m and ρm is the specific gravity of the cell wall.
All determinations should be based on some specified moisture content, m, which may be the ovendry condition or the green condition above fiber saturation.
In equations (1) and (2) it is assumed that the
11

specific gravity of the dry cell wall is the same as that of cell wall substance itself (1.46 by helium displacement and 1.53 by water displace-ment (45)). It is also assumed that the specific gravity of the cell wall at any intermediate mois-ture content between the fiber saturation and the dry condition can be computed from the following equation (45):
(3)
where ρso is the true specific gravity of the dry
cell wall substance determined by helium dis-placement, M is the absorbed moisture content (below saturation of the fibers) in gram per gram of dry wood substance, and ρw is the average
specific of the absorbed water. The average specific gravity of the absorbed water at fiber saturation is 1.115, and can be calculated for intermediate moisture contents (43). The specific gravity of the completely swollen cell wall at or above fiber saturation can also be calculated from the equation (45):
(4)
where psm is the specific gravity of the dry cell
wall substance determinedby water displacement. In this case, the specific gravity of absorbed water need not be known (45). The equation gives false results below the fiber saturation point.
The average cell wall thickness in microns is then obtained by substitution as follows:
For a circular cross-sectional model
(5)
For a square cross-sectional model
(6)
For a rectangular cross-sectional model
(7)
where W is the average single cell wallthickness, D is the average measured cell diameter, T and R are the average cell diameters measured in the tangential and radial directions, G is the m specific gravity of the extractive-free wood determined experimentally at some moisture content m and ρ m is the specific gravity of the
cell wall at the same moisture content m. All measurements are expressed in microns. Equa-tion (7) can also be modified to allow the lumen to vary from almost rectangular to elliptical (41).
For coniferous species in general, Stamm (45) suggests that the cross-sectional shape of the average tracheid of complete annual rings is best represented by the square or the circular model, whereas isolated earlywood and latewood are best represented by the rectangular model (20, 41, 42). For compression wood, the circular model, or the elliptical-lumen model, is the most representa-tive (41).
It is obvious from equations (5) to (7) that the precision with which cell wall thickness can be estimated will depend upon whether the theoretical model applies to the material being investigated. It will also depend upon the value of the constant that is substituted for the specific gravity of the cell wall under the specified moisture conditions. The value substituted for ρm in equations (5) to
(7) is much more critical for thick-walled late-wood where the greater part of the specimen volume is occupied by cell wall material, than for thin-walled earlywood where the greater part of the volume is occupied by cell lumina.
There is increasing evidence that the cell wall is porous in nature (47). However, there is no agreement in the literature on the magnitude of the pore space, even for a given species, although it appears to be considerable (4, 19, 29, 41, 42, 50, 55). This disagreement may be due to the difference in the procedures that were used for the determinations. It is not always certain whether the values quoted are for extractive-free or nonextracted material, or whether they represent material in the green, dry, or some intermediate moisture content. For instance, Besley (4), reporting on Worrall’s study of Douglas-fir, hemlock, spruce, and fir, states that earlywood has a cell wall specific gravity of about 0.7 and latewood about 0.8, based on measurements made with a microphotometer on prepared microtome sections (presumably repre-
FPL 79 12

senting material in the almost dry condition). This would indicate cell wall voids of approxi-mately 52 percent for earlywood and 45 percent for latewood.
Smith (41) obtained average cell wall specific gravity values of 0.96 and 0.97 for two independ-ent samples of Douglas-fir composed of separated earlywood and latewood. The values were com-puted from direct measurements of cell diameter and wall thickness made on both transverse surfaces of the specific gravity specimens (in the completely water-swollen condition and after extraction with alcohol-benzene) according to a rectangular model for the cross-sectional shape of the tracheids (fig. 3). The corresponding void
volumes are, therefore, about 10 percent to 8 per-cent for the cell wall in the swollen condition.
Using a similar procedure, Smith and Miller (42) obtained estimates of average cell wall specific gravity for unextracted redwood, in the water-swollen condition, of 0.80 for earlywood and 0.94 for latewood. McIntosh (29) obtained values of 0.97 for cell wall specific gravity for both the earlywood and latewood of loblolly pine from one log, presumably for material in the swollen condition. However, this is not clear. McIntosh’s values were computed from the “basic density” of the wood and from measurements of cell wall area made on prepared microtome sections; furthermore, it is not clear whether
Figure 3.--Relationship between cell wall cross-sectional area of separated earlywood and latewood of Douglas-fir, calculated from linear measurements of cell diameter and tangential wall thickness (according to a rectangular model) and specific gravity (determined by the maximum moisture method). The lines are the lines of best fit calculated for the data to pass through the origin. Their slopes provide estimates of the specific gravity of the cell wall. The two specimens of compression wood were not included in the calculation. M 129 265
13
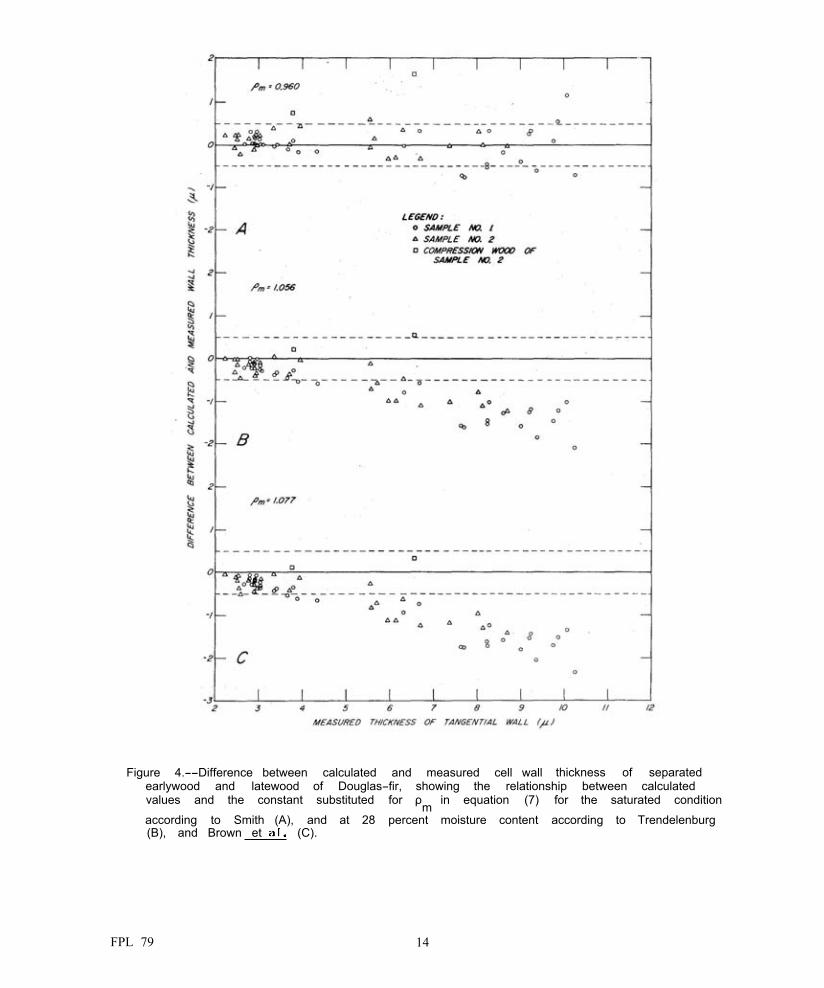
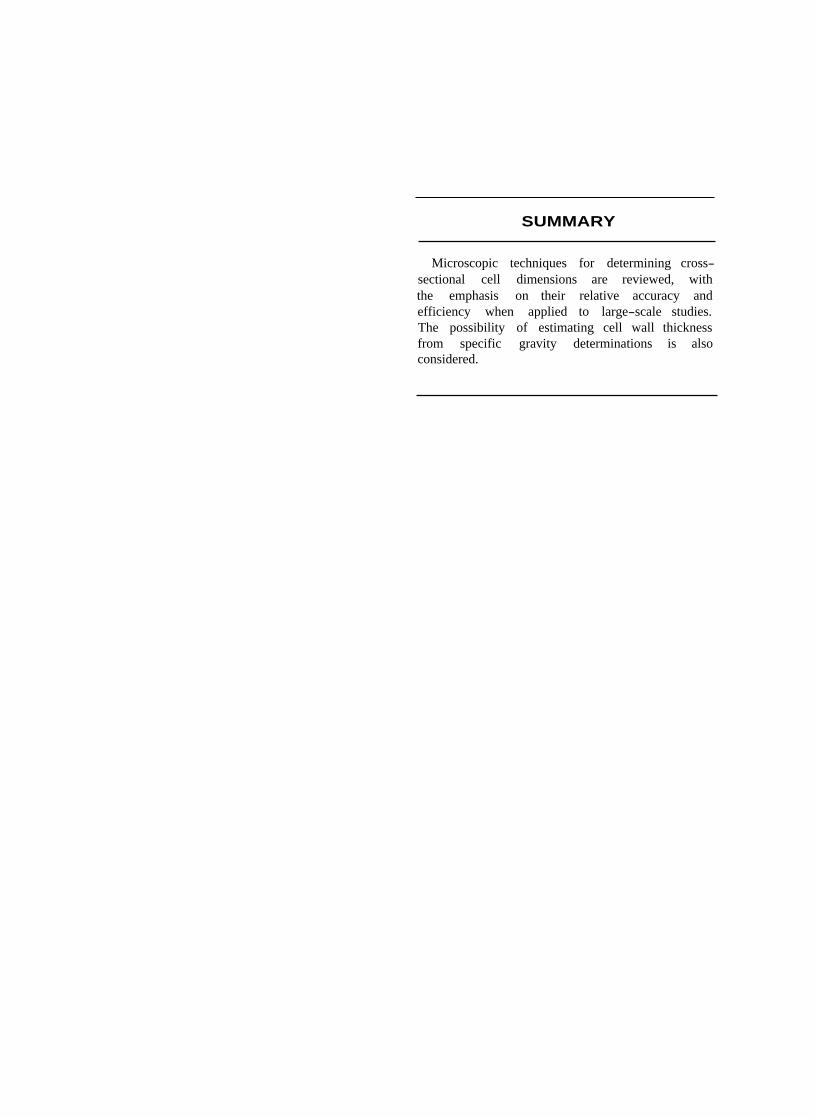
Figure 4.--Difference between calculated and measured cell wall thickness of separated earlywood and latewood of Douglas-fir, showing the relationship between calculated values and the constant substituted for ρm in equation (7) for the saturated condition
according to Smith (A), and at 28 percent moisture content according to Trendelenburg(B), and Brown et (C).
FPL 79 14

they represent material in the extractive-free or nonextracted condition.
It is possible that the estimated values for cell wall gravity, such as those quoted in the preceding paragraph, do not represent the “real” condition of the cell wall in terms of actual porosity. They may be only “index” values that incorporate all the experimental errors peculiar to the combination of techniques employed in arriving at these estimate’s. Even so, they maybe very useful in calculating cell wall thickness according to the same combination of techniques by providing a more realistic value for ρ for m substitution in equations (5) to (7) than those suggested by Stamm (45), Brown et al. (8), and Trendelenburg (49) as illustrated in figure 4.
Whatever procedure is adopted, before being generally applied, must be tested on a representa-tive sample for the species by comparing the estimated values with those determined by direct measurement. The measurements of average cell dimensions and the specific gravity data from an earlier study on Douglas-fir (41) have been re-analyzed to make such a test. The value for cell wall specific gravity (ρm = 0.96, fig. 2)
determined for the first and more restricted5sample-was substituted in equation (7) to predict the wall thickness of the second sample6 that was randomly selected and more representative
of the species. The difference between estimated values and the
average thickness of the tangential walls, based on many hundreds of measurements per speci-men, have been plotted in figure 3A against the measured values. A X2-test of accuracy (12) indicated that for normal wood, or wood contain-ing only moderate amounts of compression wood, it is possible to predict average cell wall thick-ness of Douglas-fir to within ±0.5µ of the measured value unless a 1-in-20 chance has occurred.
Unfortunately, such procedures for predicting cell wall thickness do not apply to hardwoods because of their complicated structure. How-ever, Scaramuzzi and Ferrari (37), in an investi-gation of poplar species, have found that 90 percent of the total variation in specific gravity of the wood is associated with variations in wall thick-ness and fiber diameter. They suggest that it may be possible, through multiple regression analyses, to evaluate cross-sectional dimensions of poplar fibers from the specific gravity of the wood (36).
The procedures discussed in this section should be explored further as they offer a solution to the discouraging prospect of measuring directly the cell wall thickness of many hundreds of thousands of tracheids in the course of a single investigation.
5The first sample consisted of 16 specimens of earlywood and 16 specimens of latewood selected to represent the extremes in specific gravity from a larger sample taken from 2 veneer logs grown near Challenge, Calif.
6The second sample comprised the separated earlywood and latewood of 14 annual rings, selected completely at random, from the Forest Products Laboratory wood collection and included material grown in Scotland, Mexico, Arizona, California, Oregon, Washington, Idaho, and Montana. Two of the specimens consisted entirely of compression wood as indicated by pronounced checks in the walls of all visible tracheids. They had rounded lumina and the intercellular spaces that one would normally expect to find were filled with wall substance; therefore, the rectangular lumen overestimated the wall thickness, as is evident from figures 3 and 4. If the elliptical lumen model had been used, the predicted wall thickness values would have approached more closely the actual measured values for these two specimens.
15
1.
2.
3.
4.
5.
6.
7.
8.
9.
10.
LITERATURE CITED 11. Ellwood, E.L., and Wilcox, W.W. 1962. The shrinkage of cell walls and cell
cavities in wood microsections. For-Barner, J. est Prod. J. 12:235-42.1963. Jahrringhistometrische Ergebnisse als 12. Freese, F.Kriterien für die und Reak- 1960. Testing accuracy. Forest Sci. 6:
tion von Bäumen gegenüber ökologi- 139-45.schen Einwirkungen. Allg. Forst- und 13. Goggans, J.F.Jagdztg. 134:322-29. 1962. The correlation, variation, and inherit-
Beiser, W. ance of wood properties in loblolly1933. Mikrophotographische Quellungsunter- pine (Pinus taeda L.). School of
suchungen von Fichten und Buchen- Forestry, N. State College, Tech.holz an Mikrotomschnitten imdurch- Rep. No. 14.fallenden Licht und an Holzklözchen 14. Haywood, G.im auffallenden Licht. Kolloid- 1950. Effect of variations in size and shape
Bernhart, Zeitschrift 65:203-11, of fibers on papermaking properties.
A. Tappi 33:370-83.1964. Über die Rohdichte von Fichtenholz. 15. Hiller, C.H.
Holz als und Werkstoff 22: 1964. Estimating the size of the fibril angle215-28. in latewood tracheids of slash pine.
Besley, L. J. Forestry 62:249-52.The significance of fiber geometry and 16. Hirai, S.distribution in assessing pulpwood Constructive proportion of wood ele-
Bethel, J. quality. Tappi 47(11):183A-184A. ments in important Japanese trees.
Bull. Tokyo Univ. of Forestry, No. 56,1964. The developing architecture of second- pp. 399-413.
ary xylem in conifers. Forest Sci. 17. Huber, B., and Prütz, G.10:89-91.
Bosshard, H.H., and Bariska, M. Über den Anteil von Fasern, Gefässen
Statistical analysis of the wood struc-und Parenchymam Aufbau verschied-ener Hölzer. Holz als Roh- und Werk-
ture of beech (Fagus silvatica L.). stoff 1:377-81.Bull, Int. Assoc. of Wood Anatomists Isenberg, I.H.1967/1:7-15.
Brown, H.P., Panshin, A. J., and Forsaith, C. 1958. Pulp and Paper Microscopy, 3d ed.
200 pp. Inst. Pap, Chem., Appleton,Textbook of Wood Technology. Vol. 1, Wis.
pp. 122-23. McGraw-Hill, N.Y. , Panshin, A.J., and Forsaith, C.C.
19. Jayme, G., and Krause, T.
1949. Textbook of Wood Technology. Vol. 2, 1963. Über die Packungsdichte der Zellwände
in Laubhölzern. Holz als Roh- und pp. 50-51. McGraw-Hill, N.Y. Werkstoff 21: 14-19.
Buijtenen, J.P. Van 20. Johansson, D. 1964. Anatomical factors influencing wood 1939. Något Om Vår- Och Höstved Hos Tall
specific gravity of slashpines and the Och Gran Och Dess Inverkan På implications for the development of Sulfit- Och Sulfatmassans Egen-a high-quality pulpwood. Tappi 47: skaper . Suomen Paperi- ja Putta-401-4. varalehti Vol. 21(7A):54-72.
DeSmidt, W. J. 21. Jones, G.B. Studies in the distribution and volume 1958. Variations in cell size and cell wall of the wood rays of slippery elm, thickness in Norway spruce, Picea Ulmus fulva Michx. J. Forestry 20: abies Karst. J. Oxford Univ. Forest 352-62. Sac. (Ser. 4) No. 6, pp.
FPL 79 16
22.
23.
24.
25.
Kellogg, R.M., and Ifju, G. 1962. Influence of specific gravity and cer-
tain other factors on the tensile properties of wood. Forest Prod. J. 12:463-70.
Ladell, J.L. A method of measuring the amount
and distribution of cell wall material in transverse microscope sections of wood. J. Inst. Wood Sci. 3:43-46.
Leopold, B., and McIntosh, D.C. 1961. Chemical composition and physical
properties of wood fibers. 111. Ten-sile strength of individual fibers from alkali extracted loblolly pine holocellulose. Tappi 44:235-40.
Liese, W., and Meyer-Uhlenried, K.H. 1957. Zur quantitativen Bestimmungder ver-
schiedenen Zellarten im Holz. Zeit-schrift für wissenschaftliche Mikro-skopie und mikroskopische Technik. 63:269-275.
26. Marian, J.E., and Stumbo, D.A.
27.
28.
29.
30.
1960. A new method of growth ring analysis and the determination of density by surface texture measurements. For-est Sci. 6:276-91.
Marts, R.O. 1950. Application of fluorescence microscopy
and photomicrography to woody tis-sues. Stain Technol. 25:41-44.
1955. Wood and fiber structure by incident fluorescence microscopy. J. Biol. Photogr. Assoc. 23:151-55.
McIntosh, D.C. 1964. Wall structure of loblolly pine sum-
merwood holocellulose fibers in rela-tion to individual fiber strength. Cellular of Woody Plants. Edited by W. A. Côté, Jr. Proc. Advanced Sci. Seminar, Pine-brook Conf. Center, Upper Saranac Lake, N.Y., Sept.
Myer, J.E. 1922. Ray volumes of the commercial woods
of the United States and their signifi-cance. J. Forestry 20:337-51.
31.
32.
33.
34.
35.
36.
37.
38.
39.
1930. The strength and structure of four North American woods as influenced by range, habitat, and position in the tree. N.Y. State Coll. of Forestry, Tech. Publ. 31.
Pew, J.C., and Knechtges, R.G. 1939. Cross-section dimensions of fibers in
relation to papermaking properties of loblolly pine. Southern Pulp Pap. J. Sept., pp. 7-9.
Posey, C.E. 1964. The effects of fertilization upon wood
properties of loblolly pine (Pinus taeda L.). School of Forestry, N.C. State. Tech. Rep. No.
Rosiwal, A. 1898. Über geometrische Gesteinsanalysen.
Ein einfacher Weg zur ziffermässigen Feststellung des Quantitätsverhalt-nisses der Mineralbestandtheile gemengter Gesteine. Verhandlungen der k.k. geolog. Reichsanstalt, Wien. No. 5 and 6, pp. 143-75.
Saucier, J.R. Within tree variation of fiber charac-teristics of green ash. M.S. thesis. Univ. of Georgia, Athens, Ga.
Scaramuzzi, G. and Ferrari, G. 1963. Relation of specific gravity to struc-
ture in poplar wood. Proc. of the Int. Union of Forestry Res. Organ., Meeting of Section 41, Forest Prod-ucts, held at U.S. Forest Products Laboratory, Madison, Sept. 11-13, 1963. 6 pp. and Ferrari,
1964. Relation of wood density to wood struc-ture in populus. Int. Assoc. Wood Anatomists News Bull. April 1964.
Schulz, H. 1957. Der Anteil der einzelnen Zellarten an
dem Holz der Rotbuche. Holz als Roh- und Werkstoff 15:113-18.
Über den Einfluss extremer Wuchs-bedingungen auf das Holz verschied-ener Pappelklone. Holz als Roh- und Werkstoff 20: 347-51.
17
40. Shand, S.J. 1916. A recording micrometer for geometri-
cal rock analysis, Geol. 24:394-404, 41. Smith, D.M.
1965. Rapid measurement of average tra-cheid cross-sectional dimension of conifers: Its application to specific gravity determinations. Forest Prod, J. 15:325-34.
42. , and Miller, R.B. 1964. Methods of measuring and estimating
tracheid wall thickness of redwood (Sequoia sempervirens (D. Don) Endl.). Tappi 47:599-604.
Stamm, A.J. 1938. Calculation of the void volume in wood.
Ind. Eng. Chem. 30:1280-1281. 44.
1946. Passage of liquids, vapors, and dis-solved materials through softwoods. U.S. Dep. Agr. Tech, Bull. No. 929.
45. 1964. Wood and Cellulose Science, Ronald
Press Co., New York.
46. Stiever, J. 1965. Variations in some properties of the
wood in Turkey oak(Quercus cerris). Stud i e s in Quantitative Xylotomy. Drevarsky Vyskum Vol. 1, pp.
47. Stone, J.E. The porous structure of wood and fibers. Pulp Pap. Mag. Can. 65(1): T3-T12.
48. Taylor, F. Differences in the wood of yellow-poplar. Forest Farmer, Nov., pp. 8-9, 19.
49. Trendelenburg, R. Das Holz als Rohstoff, p. 235. Edited
by Mayer-Wegelin. Carl Hanser Verlag, Munchen.
50. Tsoumis, G. 1964. Microscopic measurement of the
amount of cell wall substance in wood and its relationship to specific gravity. Tappi 47: 675-677.
Vikhrov, V.E. 1953. Stroenie i fiziko-mekhanicheskie
svoistva rannei i pozdnei drevesiny duba. (Structure and physico-mechanical properties of spring- and summerwood of oak), Akademiya Nauk SSSR. Trudy Instituta Lesa 9: 29-38. Translated from the Russian IPST Cat. No. 1137. Office Tech. Serv., U.S. Dep. of Commerce, Washington, D. C.
Weaver, G.M., and Layne, R.E.C. 1965. Cryostat sectioning of woody plant
materials. Can. J. Bot. 43:478-81. 53. Wedel, K. von
1964. Untersuchungen über Eigenschaften, Verwertung und Verwendung d e s Ahornholzes. D i s s e r t a t i o n zur E r l a n g u n g des Doktorgrades der Forstlichen F a k u 1 t at der Georg-August-Universitat zu Göttingen in Hann. Munden.
Williams, R.F., and Hamilton, J.R 1961. The effect of fertilization on four wood
properties of slash pine. J. Forestry 59:662-65.
55. Yiannos, P.N. 1964. The apparent cell-wall density of wood
and pulp fibers. Tappi 47:468-71.
FPL 79 18

Acknowledgement
The author greatefully acknowledges the assis-tance of Frank Freese of this Laboratory for his advise and suggestions.
Late Addition
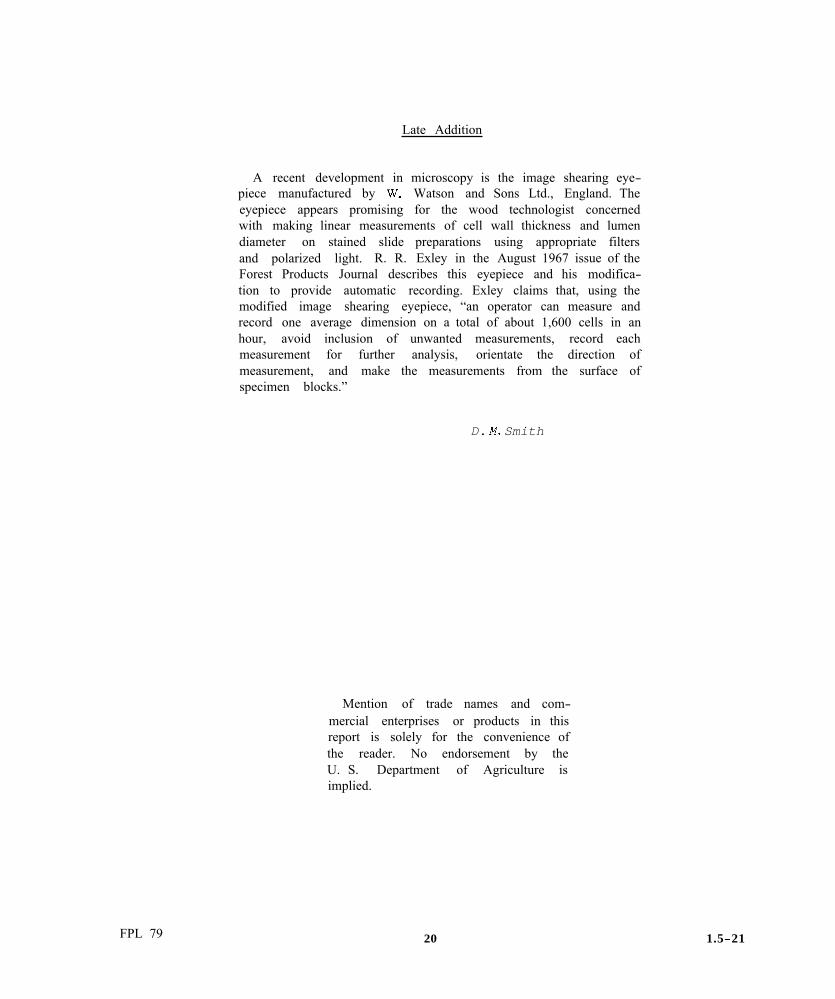
A recent development in microscopy is the image shearing eye-piece manufactured by Watson and Sons Ltd., England. The eyepiece appears promising for the wood technologist concerned with making linear measurements of cell wall thickness and lumen diameter on stained slide preparations using appropriate filters and polarized light. R. R. Exley in the August 1967 issue of the Forest Products Journal describes this eyepiece and his modifica-tion to provide automatic recording. Exley claims that, using the modified image shearing eyepiece, “an operator can measure and record one average dimension on a total of about 1,600 cells in an hour, avoid inclusion of unwanted measurements, record each measurement for further analysis, orientate the direction of measurement, and make the measurements from the surface of specimen blocks.”
D. Smith
Mention of trade names and com-mercial enterprises or products in this report is solely for the convenience of the reader. No endorsement by the U. S. Department of Agriculture is implied.
FPL 79 20 1.5-21