Association of MTHFR 677C>T genetic polymorphism with hyperhomocysteinemia in type 2 diabetes...
11
Chakraborty et al., Cogent Medicine (2015), 2: 1017973 http://dx.doi.org/10.1080/2331205X.2015.1017973 BASIC MEDICAL SCIENCES | RESEARCH ARTICLE Association of MTHFR 677C>T genetic polymorphism with hyperhomocysteinemia in type 2 diabetes patients Arpita Chakraborty 1 , Arindam Chakraborty 2 , Subhankar Chowdhury 3 , Sanghamitra Sengupta 1 * and Maitree Bhattacharyya 1 * Abstract: To explore the association of serum hyperhomocysteinaemia with 677C>T polymorphism in MTHFR gene among metformin-treated patients with type 2 diabetes. Serum-homocysteine levels of 227 diabetic subjects were measured before and after the metformin administration were analyzed statistically with respect to their genotype data for MTHFR 677C>T polymorphism. CC was the most prevalent genotype at MTHFR 677C>T in our sample and associated with the lowest homocysteine level. The patients with TT genotype had significantly elevated homocysteine compared with CC following metformin use (OR Baseline = 3.434 and 95% CI:0.622–4.127 vs. OR Endpoint = 4.466 95% CI:3.124–5.53). A distinct statistical association between hyperhomocysteinaemia and the carriage of MTHFR 677C>T polymorphism was established among Indian diabetic patients who were treated with metformin. Our study underscores the importance of phamacogenetic analysis in diabetes-related therapeutics. Subjects: Endocrinology; Genetics; Statistics for the Biological Sciences Keywords: T2DM; MTHFR; hyperhomocysteinaemia; polymorphism; pharmacogenetics *Corresponding authors: Sanghamitra Sengupta and Maitree Bhattacharyya, Department of Biochemistry, University of Calcutta, 35, Ballygunge Circular Road, Kolkata 700019, India E-mails: [email protected] (Sanghamitra Sengupta); bmaitree@ gmail.com (Maitree Bhattacharyya) Reviewing editor: Udo Schumacher, University Medical Center Hamburg-Eppendorf, Germany Additional information is available at the end of the article ABOUT THE AUTHORS Arpita Chakrabarty is a scientist working in the field of diabetes, who collected the blood samples from patients in Government Hospitals. Arindam Chakrabarty is a statistician teaching in Viswa-Bharati University. He works in the area of biostatistics. Shubhankar Chowdhury is a diabetologist as well as a potential researcher in the field of diabetes and associated complications. Sanghamitra Sengupta is an assistant professor in Department of Biochemistry, University of Calcutta, India. She is a potential researcher working in the field of disease genomics and pharmacogenomics. Maitree Bhattacharyya is a researcher, working in Department of Biochemistry, University of Calcutta, India. Her current research interest includes understanding the stress response in Diabetes mellitus, its association with cardiovascular disorder and dyslipidemia, identification of signature biomarkers in diabetes, and pharmacogenomics in diabetes mellitus. She has published several papers in various peer- reviewed journals and books. PUBLIC INTEREST STATEMENT This research article is a first report regarding the influence of drug target and gene polymorphism in metformin-treated type 2 diabetic subjects in East Indian population. Type 2 diabetes is a lifestyle disorder of recent time and an emerging health problem worldwide. The development of new classes of blood glucose-lowering medications to supplement the older therapies has improved the process of treatment options available for type 2 diabetes, although there are always some questions about the comparative betterment of medical management system in hyperglycemia. In this study, we attempt to explore the association of serum hyperhomocysteinaemia with 677C>T polymorphism in MTHFR gene among metformin-treated type 2 diabetic subjects. A distinct statistical association between hyperhomocysteinaemia and the carriage of MTHFR 677C>T polymorphism was established among Indian diabetic patients treated with metformin. Received: 28 October 2014 Accepted: 04 February 2015 © 2015 The Author(s). This open access article is distributed under a Creative Commons Attribution (CC-BY) 4.0 license. Page 1 of 11
Transcript of Association of MTHFR 677C>T genetic polymorphism with hyperhomocysteinemia in type 2 diabetes...
Chakraborty et al., Cogent Medicine (2015), 2: 1017973http://dx.doi.org/10.1080/2331205X.2015.1017973
BASIC MEDICAL SCIENCES | RESEARCH ARTICLE
Association of MTHFR 677C>T genetic polymorphism with hyperhomocysteinemia in type 2 diabetes patientsArpita Chakraborty1, Arindam Chakraborty2, Subhankar Chowdhury3, Sanghamitra Sengupta1* and Maitree Bhattacharyya1*
Abstract: To explore the association of serum hyperhomocysteinaemia with 677C>T polymorphism in MTHFR gene among metformin-treated patients with type 2 diabetes. Serum-homocysteine levels of 227 diabetic subjects were measured before and after the metformin administration were analyzed statistically with respect to their genotype data for MTHFR 677C>T polymorphism. CC was the most prevalent genotype at MTHFR 677C>T in our sample and associated with the lowest homocysteine level. The patients with TT genotype had significantly elevated homocysteine compared with CC following metformin use (ORBaseline = 3.434 and 95% CI:0.622–4.127 vs. OREndpoint = 4.466 95% CI:3.124–5.53). A distinct statistical association between hyperhomocysteinaemia and the carriage of MTHFR 677C>T polymorphism was established among Indian diabetic patients who were treated with metformin. Our study underscores the importance of phamacogenetic analysis in diabetes-related therapeutics.
Subjects: Endocrinology; Genetics; Statistics for the Biological Sciences
Keywords: T2DM; MTHFR; hyperhomocysteinaemia; polymorphism; pharmacogenetics
*Corresponding authors: Sanghamitra Sengupta and Maitree Bhattacharyya, Department of Biochemistry, University of Calcutta, 35, Ballygunge Circular Road, Kolkata 700019, IndiaE-mails: [email protected] (Sanghamitra Sengupta); [email protected] (Maitree Bhattacharyya)
Reviewing editor:Udo Schumacher, University Medical Center Hamburg-Eppendorf, Germany
Additional information is available at the end of the article
ABOUT THE AUTHORSArpita Chakrabarty is a scientist working in the field of diabetes, who collected the blood samples from patients in Government Hospitals.
Arindam Chakrabarty is a statistician teaching in Viswa-Bharati University. He works in the area of biostatistics.
Shubhankar Chowdhury is a diabetologist as well as a potential researcher in the field of diabetes and associated complications.
Sanghamitra Sengupta is an assistant professor in Department of Biochemistry, University of Calcutta, India. She is a potential researcher working in the field of disease genomics and pharmacogenomics.
Maitree Bhattacharyya is a researcher, working in Department of Biochemistry, University of Calcutta, India. Her current research interest includes understanding the stress response in Diabetes mellitus, its association with cardiovascular disorder and dyslipidemia, identification of signature biomarkers in diabetes, and pharmacogenomics in diabetes mellitus. She has published several papers in various peer-reviewed journals and books.
PUBLIC INTEREST STATEMENTThis research article is a first report regarding the influence of drug target and gene polymorphism in metformin-treated type 2 diabetic subjects in East Indian population. Type 2 diabetes is a lifestyle disorder of recent time and an emerging health problem worldwide. The development of new classes of blood glucose-lowering medications to supplement the older therapies has improved the process of treatment options available for type 2 diabetes, although there are always some questions about the comparative betterment of medical management system in hyperglycemia. In this study, we attempt to explore the association of serum hyperhomocysteinaemia with 677C>T polymorphism in MTHFR gene among metformin-treated type 2 diabetic subjects. A distinct statistical association between hyperhomocysteinaemia and the carriage of MTHFR 677C>T polymorphism was established among Indian diabetic patients treated with metformin.
Received: 28 October 2014Accepted: 04 February 2015
© 2015 The Author(s). This open access article is distributed under a Creative Commons Attribution (CC-BY) 4.0 license.
Page 1 of 11
Page 2 of 11
Chakraborty et al., Cogent Medicine (2015), 2: 1017973http://dx.doi.org/10.1080/2331205X.2015.1017973
1. IntroductionThe incidence of type 2 diabetes mellitus (T2DM) has emerged in epidemic proportions and prevalence of this disease has led to different macrovascular and microvascular complications. This complex metabolic disorder is caused by concerted interaction of environmental risk factors and genetic prevalence (Adak, Sengupta, Chowdhury, & Bhattacharya, 2010). Among the various kinds of oral antihyperglycemic drugs that are currently being used to prevent this complication, Biguanide family is the most widely prescribed one (Chakraborty, Karmakar, Chowdhury, & Bhattacharyya, 2012). Metformin has greatly improved the prognosis of diabetic patients by improving insulin sensitivity, especially in the patients with obesity and insulin resistance (Chakraborty, Chowdhury, & Bhattacharyya, 2011). Metformin does not increase basal- or meal-induced insulin secretion, but delays intestinal absorption of sugar and starches and reduces hepatic glucose production. Therefore, it does not induce hypoglycemia. Metformin is cleared from the body by tubular secretion and excreted unchanged in the urine. In spite of these features and the beneficial role of metformin on T2DM patients, few detrimental side effects of this drug have been documented.
Prolonged administration of metformin induces depletion of vitamin B12 in blood serum (De Jager et al., 2010; Sullivan et al., 2011). According to the metabolic pathway folic acid, vitamin B6 and B12 influence the level of Homocysteine (Hcy) (Song, Cook, & Albert, 2009). Hcy is a classical risk factor for the progression of cardiovascular disease (CVD) (Kang et al., 2012). The amino acid homocysteine (Das, Ghose, Borah, & Chaudhury, 2010), formed from methionine has profound importance in health and diseases. In normal circumstances, it is converted to cysteine and partly remethylated to methionine with the help of vitamin B12 and folate (Kim, Lim, Song, Kang, & Lee, 2009). However, when normal metabolism is disturbed, due to deficiency of cystathionine-beta-synthase (CBS), which requires vitamin B6 for its activation, Hcy is accumulated in the blood with an increase in methionine. Elevated level of plasma Hcy can also result from metabolic disturbances in the remeth-ylation and transsulfuration pathways (Herrmann, 2006).
More than 15 different genes were investigated for their possible influence on plasma homocysteine levels of which methylenetetrahydrofolate reductase (MTHFR) and CBS were the most studied ones (Yakub et al., 2012). The enzyme MTHFR is associated with remethylation pathway and converts 5,10-methylenetetrahydrofolate to 5-methyltetrahydrofolate, a reaction which is required for the multistep process that converts the amino acid homocysteine to methionine. A C>T transition at 677 nucleotide position of MTHFR gene (1p36.3) results in a non-synonymous change (Ala to Val) and formation of a thermolabile form of the enzyme with reduced enzymatic activity. This thermolabile form of MTHFR enzyme is a crucial factor for the accumulation of Hcy or homocystinuria (Sukla & Raman, 2012). Cysteine-beta-synthase encode by CBS gene (21q22.3) regulates transsulfuration pathway. Heterozygous carrier of the mutant form of CBS gene (844ins68, T833C) produces a premature termination codon, resulting in the formation of non-functional CBS enzyme which is thought to be another major cause of hyperhomocysteinemia (Tsai, Bignell, Schwichtenberg, & Hanson, 1996).
It is well documented that prolonged administration of Metformin in T2DM patients leads to the hyperhomocysteinemia, which is directly associated with CVD (Kang et al., 2012). In our study, we attempted to explore if the polymorphisms in MTHFR (677C>T) and CBS (844 in 68, T833C) genes influence the Hcy level in patients with T2DM from an Eastern Indian cohort who were on metformin treatment. Each individual with type 2 diabetes has a unique phenotype that points out intricate associations between genetic and environmental factors. Apart from a complex variety of life-style factors, genetic heterogeneity which results in interindividual variability in drug response demands assessment of the role of genetic factors in diabetes therapy for a single individual. To this end, our work highlights the importance of studying pharmacogenetic factors for the efficacy and adverse effects of the oral antidiabetic drug metformin in the therapy of T2DM.
Dow
nloa
ded
by [
Uni
vers
ity o
f C
alcu
tta ]
at 2
2:14
13
Apr
il 20
15
Page 3 of 11
Chakraborty et al., Cogent Medicine (2015), 2: 1017973http://dx.doi.org/10.1080/2331205X.2015.1017973
2. Material methods
2.1. Study populationThe study was conducted for a duration of 24 weeks among Type 2 diabetic patients who visited the out patients department of diabetic medical clinic in IPGMER/SSKM hospital, Kolkata, India. Eligible patients were 30–70 years old, had a BMI of 23–29 kg/m2, HbA1c > 7% and suffering from type 2 diabetes for at least 1 year but no longer than 5 years. Patients, who had been treated with any hypoglycemic agents, had been free from therapeutic drugs for at least 2 weeks before screening. After primary screening, the base line data were recorded and patients were assigned for metformin. Control blood samples were collected from volunteer donors. The study was approved by the Calcutta University Biosafety and Ethics Committee and informed consent forms were received from the patients. Patients were treated with metformin at a dose ranging from 850 to 2000 mg/day. After primary screening, medications were administered once daily (before breakfast) during the 1st week and twice daily (before breakfast and evening meal) during the 2nd week. Amendment of medications was performed if the mean daily glucose level was greater than 130 mg/dl and the HbA1C was greater than 7.5%. The maximum allowable total daily doses were 2,000 mg for metformin. Patients with subsequent conditions including noticeable abnormal renal function, anemia, addicted to smoking, previous history of severe cardiomyopathy, and those who were taking vitamin capsules were eliminated from the study. The study includes: physical check-up, glucose monitoring, counseling on diet, exercise programs, and laboratory data analysis were performed during clinical visits. Informed consent was obtained from all the participants.
Initially, 315 patients were enrolled for the study. Out of them, 227 of (Male = 157, Female = 70) metformin-treated patients were finally able to continue and remaining patients were excluded due to loss of follow up. The control blood samples (non-diabetic individuals; n = 44, Male = 22, Female = 22) were also collected from healthy volunteers from the Department of Biochemistry, University of Calcutta and SSKM hospital, Kolkata.
2.2. Assay of serum homocysteineSerum Hcy level was determined by spectrophotometric method using assay kit (Spinreact). According to Spinreact kit in control patient, threshold value of Hcy was 15 μmol/l. The concentration of Hcy in the sample was indirectly proportional to the amount of NADH converted to NAD+ measured at an optical density of 340 nm.
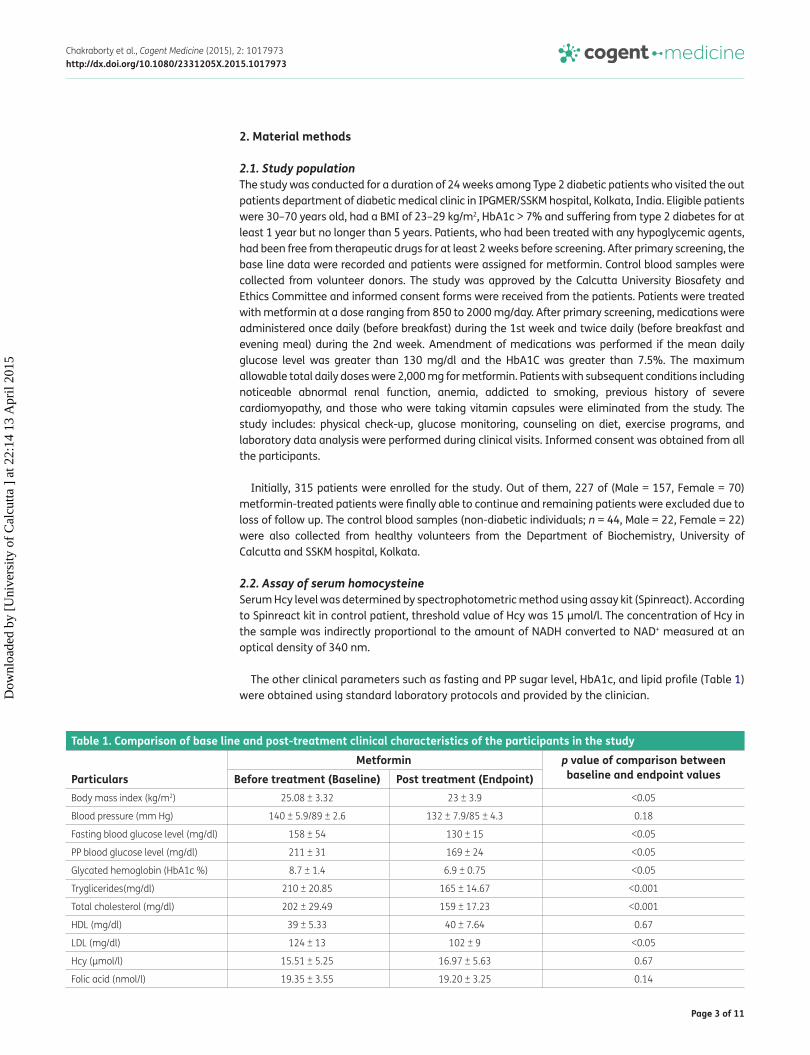
The other clinical parameters such as fasting and PP sugar level, HbA1c, and lipid profile (Table 1) were obtained using standard laboratory protocols and provided by the clinician.
Table 1. Comparison of base line and post-treatment clinical characteristics of the participants in the study
ParticularsMetformin p value of comparison between
baseline and endpoint valuesBefore treatment (Baseline) Post treatment (Endpoint)Body mass index (kg/m2) 25.08 ± 3.32 23 ± 3.9 <0.05
Blood pressure (mm Hg) 140 ± 5.9/89 ± 2.6 132 ± 7.9/85 ± 4.3 0.18
Fasting blood glucose level (mg/dl) 158 ± 54 130 ± 15 <0.05
PP blood glucose level (mg/dl) 211 ± 31 169 ± 24 <0.05
Glycated hemoglobin (HbA1c %) 8.7 ± 1.4 6.9 ± 0.75 <0.05
Tryglicerides(mg/dl) 210 ± 20.85 165 ± 14.67 <0.001
Total cholesterol (mg/dl) 202 ± 29.49 159 ± 17.23 <0.001
HDL (mg/dl) 39 ± 5.33 40 ± 7.64 0.67
LDL (mg/dl) 124 ± 13 102 ± 9 <0.05
Hcy (μmol/l) 15.51 ± 5.25 16.97 ± 5.63 0.67
Folic acid (nmol/l) 19.35 ± 3.55 19.20 ± 3.25 0.14
Dow
nloa
ded
by [
Uni
vers
ity o
f C
alcu
tta ]
at 2
2:14
13
Apr
il 20
15
Page 4 of 11
Chakraborty et al., Cogent Medicine (2015), 2: 1017973http://dx.doi.org/10.1080/2331205X.2015.1017973
2.3. Vitamin B12 and folic acid assaySerum vitamin B12 and Folic acid were estimated using radioimmunoassay technique (SimulTrac-SNB Radioassay Kit). Co57 and I125 isotopes were used to estimate vitamin B12 and folic acid, respec-tively. According to SimulTrac-SNB Radioassay Kit reference, range of vitamin B12 was 118–716 pmol/l and normal range of serum folic acid level was >3.4 nmol/l.
2.4. Genetic analysisDNA was extracted from peripheral blood leukocyte using salting out method (Miller, Dykes, & Polesky, 1998). Genotyping of 677C>T in MTHFR and 844ins68, T833C in CBS genes were performed using PCR-coupled restriction fragment length polymorphism analysis. The quantity and purity of DNA were as-sessed by spectrophotometric analysis by estimating the absorbance at 260 and 280 nm. PCR was performed using 100 ng genomic DNA using specific primer pairs designed for 677C>T MTHFR (5′-TGAAGGAGAAGGTGTCTGCGGGA-3′ and 5′-AGGACGGTGCGGTGAGAGTG-3′) and 844ins68, T833C in CBS (5′-CTGGCCTTGAGCCCTGAA-3′5′-GGCCGGGCTCTGGACTC-3′). PCR was performed using a master mix consisting of 1X PCR buffer, 250 uMdNTPs, 5 pmol of primers, and 1 U Taq DNA polymerase (SibEnzyme) in a reaction volume of 20 μl. Thermocycling started with a single denaturation step for 5 min at 94°C, following 35 cycles of denaturation for 30 s at 94°C, annealing for 30 s at temperatures ranging from 58 and 62°C for MTHFR and CBS gene-specific primers, respectively, and extension at 72°C for 30 s. One fi-nal extension step was added for 5 min at 72°C. Seven microliters of MTHFR and CBS PCR product was digested with 5 U of HinfI and BsrI, respectively, following the manufacturer’s instructions. The digested product was subjected to electrophoresis on a 2.5% agarose gel (SRL) containing 250 nmol/l ethidium bromide. The homozygous product of MTHFR 677 gene C/C remained 198 bp after digestion, whereas T/T product was cleaved into 175 bp and 23 bp. The product was visualized in gel documentation system (Bio-Rad). The PCR products pertaining to CBS primers showed a single band at 184 bp after BsrI diges-tion. MTHFR PCR products of 50 randomly chosen samples were sequenced using the forward primer on ABI 3100 Genetic Analyzer using Big-Dye Terminator v3.1 (Applied Biosystems) to validate the genotype status obtained by RFLP analysis.
2.5. Statistical analysisThe polymorphism in the CBS gene was monomorphic in our population. Hardy–Weinberg equilibrium was tested using the χ2 goodness-of fit test in T2DM subject groups (cases) and healthy subjects (controls) for MTHFR C677T. Existence of any alliance between the phenotypic variability and the gen-otype categories of MTHFR polymorphism was examined using a statistical model which was described below. The phenotype value (Hcy level) of the ith individual was described by the following linear model:
where Genotype was defined as:
Here xi was assumed to follow three distinct distributions with common variance but different means. Alternative to this three component normal mixture distribution, a recessive model which followed two component normal mixture distributions with common variance but different means was also likely. And for that the assumption was as follows:
To test the hypothesis regarding the number of components in the mixture model, a bootstrap-based test was performed and describe below.
(1)xi= �0 + �1 × Agei + �2 × Sexi + �3 × BMI + �4 × Fasting
+ �5 × PPi + �6 × Dieti + �7 × Genotypei
Genotypei =
⎧⎪⎨⎪⎩
+1 for 11
0 for 12
−1 for 22
Genotypei =
{+1 for 11
−1 for 12 or 22
Dow
nloa
ded
by [
Uni
vers
ity o
f C
alcu
tta ]
at 2
2:14
13
Apr
il 20
15
Page 5 of 11
Chakraborty et al., Cogent Medicine (2015), 2: 1017973http://dx.doi.org/10.1080/2331205X.2015.1017973
Let xi be the HCY value for the ith patient. Let us denote the density function of xi as f(xi|θ).
H0: Density of HCY was a 3-component normal mixture with common variance vs.
H1: Density of HCY was a 2-component normal mixture with common variance
The likelihood ratio test statistic could be defined as:
The above statistic did not follow any asymptotic chi-squared distribution. To infer the distribution of this the test statistic under null hypothesis, a bootstrap approach was used with an objective to obtain the number of components in the mixture to fit the mixture model.
For K genotypes with relative frequencies �1, �2,… �K, probability density which signified the expression of a genotype k with parameter �k became fk(xi|θ). Thus, the likelihood for a mixture model with K components might be expressed as:
Here, it was assumed that fk(xi|θ) was a normal density. To fit the above model, the expectation–maximization (EM) algorithm (Dempstar, Laird, & Rubin, 1977) was used. We defined:
where each of zi ∼ Multinomial (K, �1, �2,… , �k). For sake of simplicity, it was assumed that fk(xi|�) = f (xi|�) for all k = 1,…, K. The E-step would lead to
Next, to estimate the relative risk for a particular genotype against a referent genotype, logistic regression was performed. Under the mixture-of-genotypes model, the likelihood of observed xi given that the subject had genotype g was
where � denoted normal density.
Let wg(xi) be a weight function is defined as:
The weight function was used as predictor for the logistic model
(2)−2 log � = −2
n∑i=1
logf0(xi|�0
)
f1(xi|�1
)
(3)n∏i=1
K∑k=1
�kfk(xi|�k
)
zik =
{1 if xi belongs to genotype k
0 otherwise
(4)zik =�kf (xi��)∑K
j=1 �j f (xi��)
1
��
(xi − �g
�
)
wg(xi) =�g�
�xi−�g
�
�
∑3
g=1 �g�
�xi−�g
�
�
(5)log
(E(yi)
1 − E(yi)
)= log
(�i
1 − �i
)= �0 +
3∑g=1
�gwg(yi)
Dow
nloa
ded
by [
Uni
vers
ity o
f C
alcu
tta ]
at 2
2:14
13
Apr
il 20
15
Page 6 of 11
Chakraborty et al., Cogent Medicine (2015), 2: 1017973http://dx.doi.org/10.1080/2331205X.2015.1017973
3. Results
3.1. Comparison of relevant clinical parameters in different groupsThe demographic and baseline hematological characteristics such as levels of fasting blood glucose, total cholesterol, LDL, and triglycerides were presented in Table 1. The post-treatment phase in case of metformin-treated patients revealed significant disparity in total cholesterol and triglycerides (p < 0.001). Metformin also exerts important effect in case of BMI, fasting, PP, HbA1C, and LDL (p ≤ 0.05). But HDL level (p = 0.67) did not differ significantly after treatment period. The comparison of baseline and endpoints serum total Hcy levels in the patients did not show any statistically significant difference (p = 0.67).
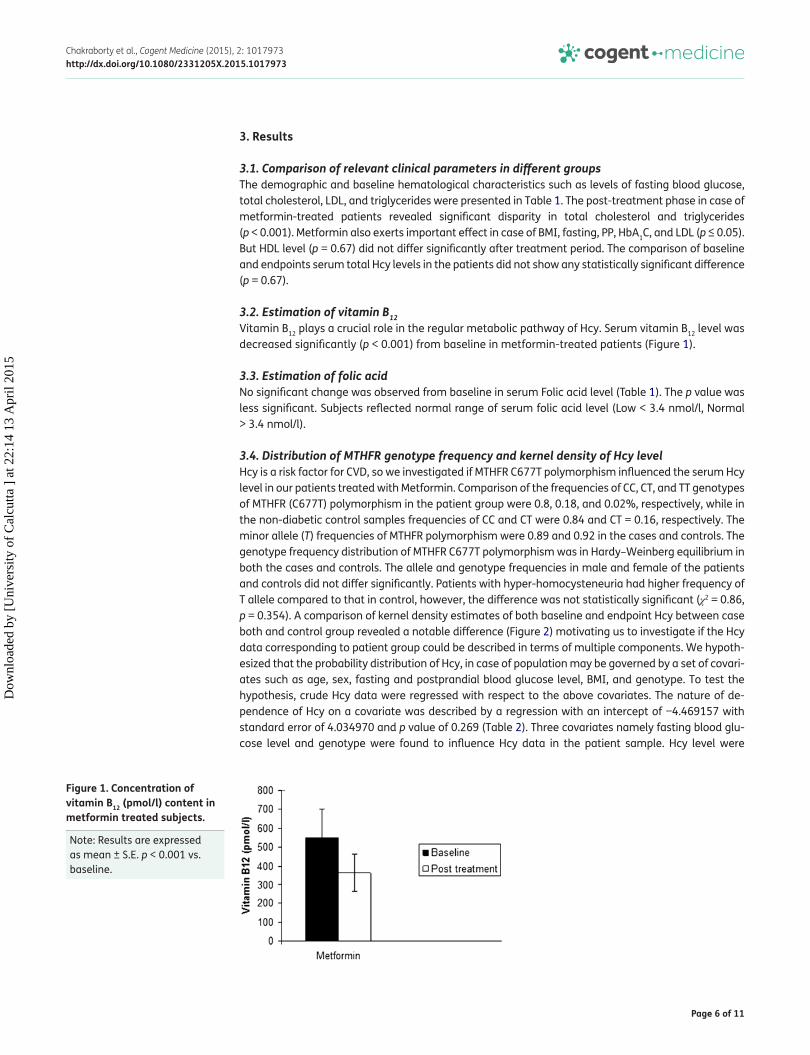
3.2. Estimation of vitamin B12Vitamin B12 plays a crucial role in the regular metabolic pathway of Hcy. Serum vitamin B12 level was decreased significantly (p < 0.001) from baseline in metformin-treated patients (Figure 1).
3.3. Estimation of folic acidNo significant change was observed from baseline in serum Folic acid level (Table 1). The p value was less significant. Subjects reflected normal range of serum folic acid level (Low < 3.4 nmol/l, Normal > 3.4 nmol/l).
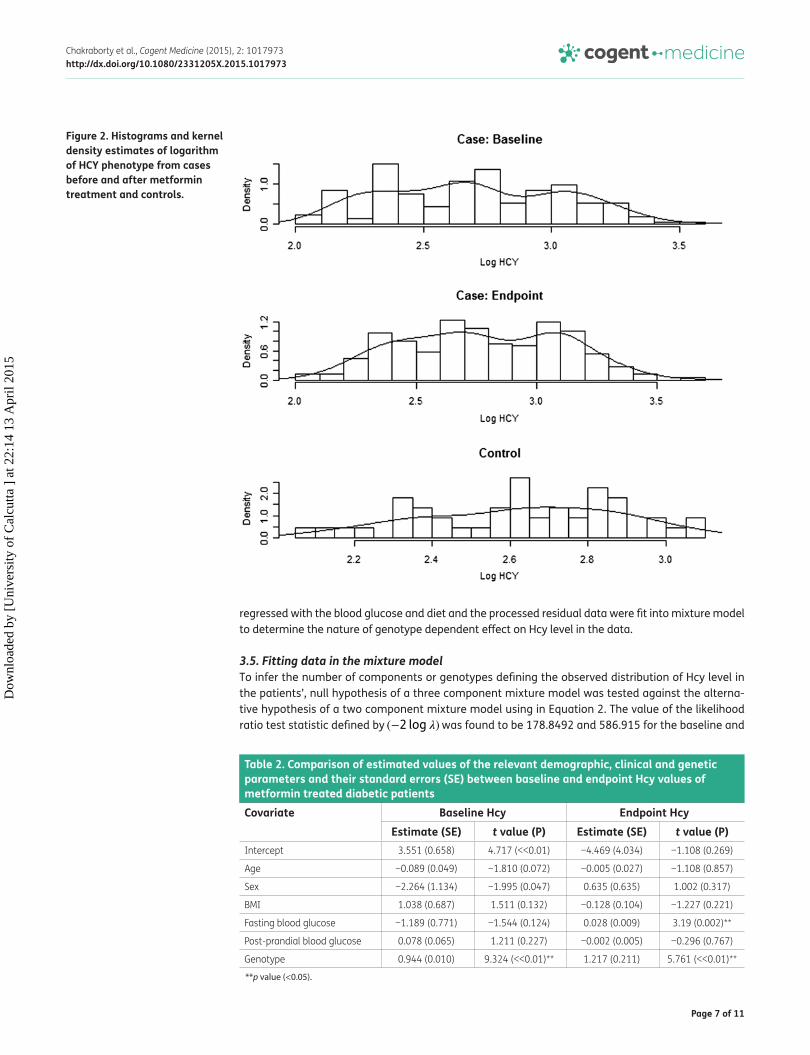
3.4. Distribution of MTHFR genotype frequency and kernel density of Hcy levelHcy is a risk factor for CVD, so we investigated if MTHFR C677T polymorphism influenced the serum Hcy level in our patients treated with Metformin. Comparison of the frequencies of CC, CT, and TT genotypes of MTHFR (C677T) polymorphism in the patient group were 0.8, 0.18, and 0.02%, respectively, while in the non-diabetic control samples frequencies of CC and CT were 0.84 and CT = 0.16, respectively. The minor allele (T) frequencies of MTHFR polymorphism were 0.89 and 0.92 in the cases and controls. The genotype frequency distribution of MTHFR C677T polymorphism was in Hardy–Weinberg equilibrium in both the cases and controls. The allele and genotype frequencies in male and female of the patients and controls did not differ significantly. Patients with hyper-homocysteneuria had higher frequency of T allele compared to that in control, however, the difference was not statistically significant (χ2 = 0.86, p = 0.354). A comparison of kernel density estimates of both baseline and endpoint Hcy between case both and control group revealed a notable difference (Figure 2) motivating us to investigate if the Hcy data corresponding to patient group could be described in terms of multiple components. We hypoth-esized that the probability distribution of Hcy, in case of population may be governed by a set of covari-ates such as age, sex, fasting and postprandial blood glucose level, BMI, and genotype. To test the hypothesis, crude Hcy data were regressed with respect to the above covariates. The nature of de-pendence of Hcy on a covariate was described by a regression with an intercept of −4.469157 with standard error of 4.034970 and p value of 0.269 (Table 2). Three covariates namely fasting blood glu-cose level and genotype were found to influence Hcy data in the patient sample. Hcy level were
Figure 1. Concentration of vitamin B12 (pmol/l) content in metformin treated subjects.
Note: Results are expressed as mean ± S.E. p < 0.001 vs. baseline.
Dow
nloa
ded
by [
Uni
vers
ity o
f C
alcu
tta ]
at 2
2:14
13
Apr
il 20
15
Page 7 of 11
Chakraborty et al., Cogent Medicine (2015), 2: 1017973http://dx.doi.org/10.1080/2331205X.2015.1017973
regressed with the blood glucose and diet and the processed residual data were fit into mixture model to determine the nature of genotype dependent effect on Hcy level in the data.
3.5. Fitting data in the mixture modelTo infer the number of components or genotypes defining the observed distribution of Hcy level in the patients’, null hypothesis of a three component mixture model was tested against the alterna-tive hypothesis of a two component mixture model using in Equation 2. The value of the likelihood ratio test statistic defined by (−2 log �) was found to be 178.8492 and 586.915 for the baseline and
Figure 2. Histograms and kernel density estimates of logarithm of HCY phenotype from cases before and after metformin treatment and controls.
Table 2. Comparison of estimated values of the relevant demographic, clinical and genetic parameters and their standard errors (SE) between baseline and endpoint Hcy values of metformin treated diabetic patientsCovariate Baseline Hcy Endpoint Hcy
Estimate (SE) t value (P) Estimate (SE) t value (P)Intercept 3.551 (0.658) 4.717 (<<0.01) −4.469 (4.034) −1.108 (0.269)
Age −0.089 (0.049) −1.810 (0.072) −0.005 (0.027) −1.108 (0.857)
Sex −2.264 (1.134) −1.995 (0.047) 0.635 (0.635) 1.002 (0.317)
BMI 1.038 (0.687) 1.511 (0.132) −0.128 (0.104) −1.227 (0.221)
Fasting blood glucose −1.189 (0.771) −1.544 (0.124) 0.028 (0.009) 3.19 (0.002)**
Post-prandial blood glucose 0.078 (0.065) 1.211 (0.227) −0.002 (0.005) −0.296 (0.767)
Genotype 0.944 (0.010) 9.324 (<<0.01)** 1.217 (0.211) 5.761 (<<0.01)**
**p value (<0.05).
Dow
nloa
ded
by [
Uni
vers
ity o
f C
alcu
tta ]
at 2
2:14
13
Apr
il 20
15
Page 8 of 11
Chakraborty et al., Cogent Medicine (2015), 2: 1017973http://dx.doi.org/10.1080/2331205X.2015.1017973
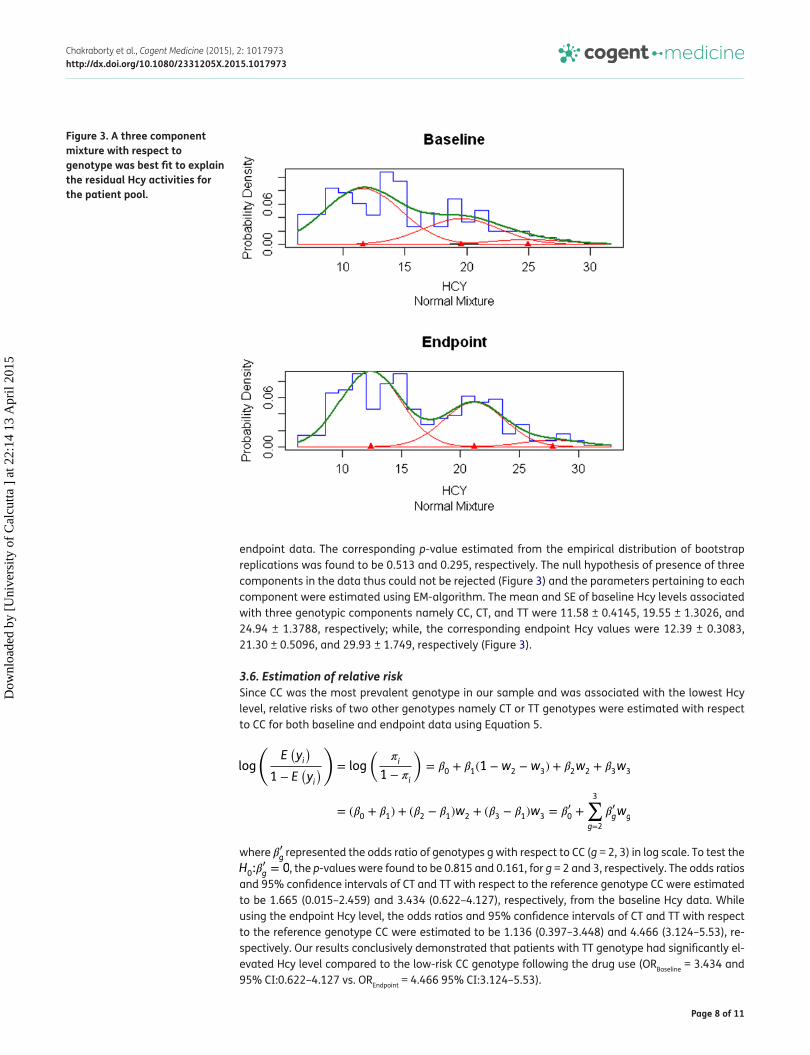
endpoint data. The corresponding p-value estimated from the empirical distribution of bootstrap replications was found to be 0.513 and 0.295, respectively. The null hypothesis of presence of three components in the data thus could not be rejected (Figure 3) and the parameters pertaining to each component were estimated using EM-algorithm. The mean and SE of baseline Hcy levels associated with three genotypic components namely CC, CT, and TT were 11.58 ± 0.4145, 19.55 ± 1.3026, and 24.94 ± 1.3788, respectively; while, the corresponding endpoint Hcy values were 12.39 ± 0.3083, 21.30 ± 0.5096, and 29.93 ± 1.749, respectively (Figure 3).
3.6. Estimation of relative riskSince CC was the most prevalent genotype in our sample and was associated with the lowest Hcy level, relative risks of two other genotypes namely CT or TT genotypes were estimated with respect to CC for both baseline and endpoint data using Equation 5.
where �′
g represented the odds ratio of genotypes g with respect to CC (g = 2, 3) in log scale. To test the H0:�
�
g = 0, the p-values were found to be 0.815 and 0.161, for g = 2 and 3, respectively. The odds ratios and 95% confidence intervals of CT and TT with respect to the reference genotype CC were estimated to be 1.665 (0.015–2.459) and 3.434 (0.622–4.127), respectively, from the baseline Hcy data. While using the endpoint Hcy level, the odds ratios and 95% confidence intervals of CT and TT with respect to the reference genotype CC were estimated to be 1.136 (0.397–3.448) and 4.466 (3.124–5.53), re-spectively. Our results conclusively demonstrated that patients with TT genotype had significantly el-evated Hcy level compared to the low-risk CC genotype following the drug use (ORBaseline = 3.434 and 95% CI:0.622–4.127 vs. OREndpoint = 4.466 95% CI:3.124–5.53).
log
(E(yi
)
1 − E(yi
))
= log
(�i
1 − �i
)= �0 + �1(1 −w2 −w3) + �2w2 + �3w3
= (�0 + �1) + (�2 − �1)w2 + (�3 − �1)w3 = ��
0 +
3∑g=2
��
gwg
Figure 3. A three component mixture with respect to genotype was best fit to explain the residual Hcy activities for the patient pool.
Dow
nloa
ded
by [
Uni
vers
ity o
f C
alcu
tta ]
at 2
2:14
13
Apr
il 20
15
Page 9 of 11
Chakraborty et al., Cogent Medicine (2015), 2: 1017973http://dx.doi.org/10.1080/2331205X.2015.1017973
4. DiscussionThe concept of pharmacogenetics which correlates the variation in drug response with genetic variation is widely recognized for better therapeutic management. Our study reveals the clinical utility of genetic information in improving the quality of life for Type 2 diabetic subjects. This report on metformin pharmacogenetics will help to combat enhanced risk of CVD as well as stimulating the research to design therapeutic target considering the aspects of personalized medicine. T2DM has emerged as the leading non-communicable disease all over the world casting a liability on personal and medical resources. In addition to pharmacologic agents, physicians stress the life style related approaches of diet modification, weight control, and regular exercise effective management of the disease. Pharmacologically nine major classes of approved drugs were used to treat T2DM. These medications include insulin and its analogues, sulfonylureas, biguanides, thiazolidinediones (TZDs), meglitinides, α-glucosidase inhibitors, amylin analogues, incretin hormone mimetics, and dipeptidyl peptidase 4 (DPP4) inhibitors. However, clinical response to these drugs often exhibits significant variation among individuals. For the different oral antidiabetic drugs, pharmacogenomic evidence has accumulated demonstrating an association between specific gene polymorphisms and interindividual variability in their therapeutic and adverse reaction effects (DiStefano & Watanabe, 2010). Overall, it appears that pharmacogenomics has the potential to improve the management of T2DM and help clinicians in the effective prescribing of oral antidiabetic medications. To this end, the present study attempts to analyze the quantitative effect of metformin drugs in diabetic patients with regard to polymorphism in MTHFR gene. Metformin is an insulin-sensitizing agent with antihyperglycemic properties that is widely used for the treatment of type-2 diabetes. Metformin is associated with small, but potentially adverse metabolic changes by increasing plasma homocysteine via mechanisms that involve cofactor depletion (Does metformin increase the serum total homocysteine level in non-insulin-dependent diabetes mellitus? 1997). Elevated plasma homocysteine is independently associated with risk of CVD (Wierzbicki, 2007).
Homocysteine is a byproduct of transmethylation reactions and detoxified by methionine synthetase, which is dependent on vitamin B12 and folate as coenzymes for its proper function (Wijekoon, Brosnan, & Brosnan, 2007). Determinants of hyperhomocysteinemia are low concentrations of folate, B-vitamin coenzymes, and altered activities of enzymes involved in the conversion of homocysteine metabolism (Buvat, 2004). Carlsen et al. demonstrated a significant decrease in serum vitamin B12, and a consequent increase in Hcy levels among the patients treated with metformin compared with those in the non-metformin group. In our earlier study, the endpoint level of serum vitamin B12 in metformin-treated patients was significantly lower than the baseline (p = 0.001), values which is in agreement with the observation of Carlsen et al. (1997). The proposed contributors of metformin-induced vitamin B12 deficiency include competitive inhibition or inactivation of vitamin B12 absorption, alterations in intrinsic factor levels, bacterial flora, gastrointestinal motility, or ileal morphological structure, and interaction with the cubulin endocytic receptor (Liu, Dai, & Jean, 2006; Sato, Ouchi, Funase, Yamauchi, & Aizawa, 2013). However, it should be borne in mind that due to the robust source of vitamin B12 in the total body pool of (2–3 mg), food supplements and reabsorption of vitamin B12 in the biliary system, several years (4–7 years) may be needed to induce vitamin B12 deficiency even with a complete block in the vitamin B12 absorption.
Of the several enzymes in the homocysteine metabolism pathway, MTHFR is the most studied one for its genetic association with hyperhomocysteinemia. In this case-only study, by employing mixture model and EM algorithm, the most likely estimates of mean values of Hcy levels were deduced for the three genotypes after regressing Hcy data for two covariates other than genotype that affect serum Hcy level. It is noteworthy in this context that the three covariates are fasting blood glucose level, diet, and genotype. The statistical modeling of patients Hcy data, clearly indicates that Hcy levels, both baseline and endpoint, follow a codominant model in which genotype and CC is the most prevalent one and associated with lowest level of serum Hcy (HcyBaseline = 11.58 ± 0.4145, Hcyendpoint = 12.39 ± 0.3083). We estimated the relative risks of other two genotypes with respect to CC using both baseline and endpoint data and noted a significant increase in odds ratio for the TT genotype in metformin-treated patients (ORBaseline = 3.434 and 95% CI:0.622–4.127 vs. OREndpoint = 4.466 95% CI:3.124–5.53).
Dow
nloa
ded
by [
Uni
vers
ity o
f C
alcu
tta ]
at 2
2:14
13
Apr
il 20
15
Page 10 of 11
Chakraborty et al., Cogent Medicine (2015), 2: 1017973http://dx.doi.org/10.1080/2331205X.2015.1017973
Our study, nevertheless, indicates clinical utility of genetic information in improving the pharma-cotherapeutic management of Type 2 diabetes such that specific genetic variants can modify responses to diabetic medication. The finding of the present study can serve as the basis of targeted personalized medicine which is a promise for new generation therapeutics. This first report on met-formin pharmacogenetics in Indian T2DM patients addresses the risk of increased Hcy and may help to provide quality life for diabetic patients.
Abbreviations
T2DM: Type 2 diabetes mellitusMTHFR: Methylenetetrahydrofolate reductaseCBS: Cystathionine-beta-synthaseHcy: Homocysteine
AcknowledgmentsWe express our heartfelt gratitude to all the subjects of this study but regret our inability to acknowledge them individually.
FundingWe acknowledge UGC-RFSMS program for providing fellowship to the first author and RSSDI Ref. A/F/125/4 S 2090/2008 for financial support to perform this work. We are grateful to UGC-CAS (Phase-I) and DST-FIST, World Bank funding for providing the instruments and infrastructure to our department of Biochemistry. We acknowledge Grant No. RSSDI Ref. A/F/125/4 S 2090/2008 for their funding to support this work.
Competing InterestsThe authors declare no competing interests.
Author detailsArpita Chakraborty1
E-mail: [email protected] Chakraborty2
E-mail: [email protected] Chowdhury3
E-mail: [email protected] Sengupta1
E-mail: [email protected] Bhattacharyya1
E-mail: [email protected] Department of Biochemistry, University of Calcutta, 35,
Ballygunge Circular Road, Kolkata 700019, India.2 Department of Statistics, Visva-Bharati University, Siksha
Bhavana, Santiniketan 731235, West Bengal, India.3 Institute of Postgraduate Medical Education and Research,
Government of West Bengal, 224, Acharyya Jagadish Chandra Bose Road, Kolkata 700020, India.
Citation informationCite this article as: Association of MTHFR 677C>T genetic polymorphism with hyperhomocysteinemia in type 2 diabetes patients, Arpita Chakraborty, Arindam Chakraborty, Subhankar Chowdhury, Sanghamitra Sengupta & Maitree Bhattacharyya, Cogent Medicine (2015), 2: 1017973.
ReferencesAdak, S., Sengupta, S., Chowdhury, S., & Bhattacharya, M.
(2010). Co-existence of risk and protective haplotypes of calpain 10 gene to type 2 diabetes in the eastern Indian population. Diabetes and Vascular Disease Research, 7, 63–68. http://dx.doi.org/10.1177/1479164109351370
Buvat, D. R. (2004). Use of metformin is a cause of vitamin B12 deficiency. American Family Physician, 69, 264–266.
Carlsen, S. M., Følling, I., Grill, V., Bjerve, K. S., Schneede, J., & Refsum, H. (1997). Metformin increases total serum homocysteine levels in non-diabetic male patients with coronary heart disease. Scandinavian Journal of Clinical & Laboratory Investigation, 57, 521–527. http://dx.doi.org/10.3109/00365519709084603
Chakraborty, A., Chowdhury, S., & Bhattacharyya, M. (2011). Effect of metformin on oxidative stress, nitrosative stress and inflammatory biomarkers in type 2 diabetes patients. Diabetes Research and Clinical Practice, 93, 56–62. http://dx.doi.org/10.1016/j.diabres.2010.11.030
Chakraborty, A., Karmakar, T., Chowdhury, S., & Bhattacharyya, M. (2012). Effect of metformin on pathological indices related to cardiovascular disease in diabetes. American Journal of Bio-Pharmacology Biochemistry and Life Sciences, 1, 53–64.
Das, M., Ghose, M., Borah, N. C., & Chaudhury, N. (2010). A community based study of the relationship between homocysteine and some of the life style factors. Indian Journal of Clinical Biochemistry, 25, 295–301. http://dx.doi.org/10.1007/s12291-010-0044-8
De Jager, J., Kooy, A., Lehert, P., Wulffelé, G. M., Kolk, J. V. D., Bets, D., ... Stehouwer, C. D. A. (2010). Long term treatment with metformin in patients with type 2 diabetes and risk of vitamin B-12 deficiency: Randomized placebo controlled trial. BMJ, 20(340), 1–7.
Dempster, A. P., Laird, N. M., & Rubin, D. B. (1977). Maximum likelihood from incomplete data via the EM algorithm. Journal of the Royal Statistical Society, 39, 1–38.
Does metformin increase the serum total homocysteine level in non-insulin-dependent diabetes mellitus? (1997). Journal of Internal Medicine, 242, 389–394.
DiStefano, J. K., & Watanabe, R. M. (2010). Pharmacogenetics of anti-diabetes drugs. Pharmaceuticals, 3, 2610–2646. http://dx.doi.org/10.3390/ph3082610
Herrmann, W. (2006). Significance of hyperhomocysteinemia. Clinical Laboratory, 52, 367–374.
Kang, J. Y., Park, I. K., Lee, J. Y., Sung, S. H., Chang, Y. K., Park, Y. K., & Choi, T. I. (2012). Use of serum homocysteine to predict cardiovascular disease in Korean men with or without metabolic syndrome. Journal of Korean Medical Science, 27, 500–505. http://dx.doi.org/10.3346/jkms.2012.27.5.500
Kim, S. J., Lim, K. S., Song, M. S., Kang, Y., & Lee, S. Y. (2009). Prevalence of hyperhomocysteinemia and related factors in a community-based health examination survey: A cross-sectional study. Journal of Preventive Medicine and Public Health, 42, 337–342. http://dx.doi.org/10.3961/jpmph.2009.42.5.337
Liu, K. W., Dai, L. K., & Jean, W. (2006). Metformin-related vitamin B12 deficiency. Age Ageing, 35, 200–201. http://dx.doi.org/10.1093/ageing/afj042
Dow
nloa
ded
by [
Uni
vers
ity o
f C
alcu
tta ]
at 2
2:14
13
Apr
il 20
15
Page 11 of 11
Chakraborty et al., Cogent Medicine (2015), 2: 1017973http://dx.doi.org/10.1080/2331205X.2015.1017973
© 2015 The Author(s). This open access article is distributed under a Creative Commons Attribution (CC-BY) 4.0 license.You are free to: Share — copy and redistribute the material in any medium or format Adapt — remix, transform, and build upon the material for any purpose, even commercially.The licensor cannot revoke these freedoms as long as you follow the license terms.
Under the following terms:Attribution — You must give appropriate credit, provide a link to the license, and indicate if changes were made. You may do so in any reasonable manner, but not in any way that suggests the licensor endorses you or your use. No additional restrictions You may not apply legal terms or technological measures that legally restrict others from doing anything the license permits.
Cogent Medicine (ISSN: 2331-205X) is published by Cogent OA, part of Taylor & Francis Group. Publishing with Cogent OA ensures:• Immediate, universal access to your article on publication• High visibility and discoverability via the Cogent OA website as well as Taylor & Francis Online• Download and citation statistics for your article• Rapid online publication• Input from, and dialog with, expert editors and editorial boards• Retention of full copyright of your article• Guaranteed legacy preservation of your article• Discounts and waivers for authors in developing regionsSubmit your manuscript to a Cogent OA journal at www.CogentOA.com
Miller, S. A., Dykes, D. D., & Polesky, H. F. (1998). A simple salting out procedure for extracting DNA from human nucleated cells. Nucleic Acids Research, 16, 1215.
Sato, Y, Ouchi, K, Funase, Y, Yamauchi, K, & Aizawa, T (2013). Relationship between metformin use, vitamin B12 deficiency, hyperhomocysteinemia and vascular complications in patients with type 2 diabetes. Endocrine Journal, 60, 1275–1280. http://dx.doi.org/10.1507/endocrj.EJ13-0332
Song, Y., Cook, N. R., & Albert, C. M. (2009). Effect of homocysteine-lowering treatment with folic acid and B vitamins on risk of type 2 diabetes in women. Diabetes, 58, 1921–1928. http://dx.doi.org/10.2337/db09-0087
Sukla, K. K., & Raman, R. (2012). Association of MTHFR and RFC1 gene polymorphism with hyperhomocysteinemia and its modulation by vitamin B12 and folic acid in an Indian population. European Journal of Clinical Nutrition, 66, 111–118. http://dx.doi.org/10.1038/ejcn.2011.152
Sullivan, D., Forder, P., Simes, J., Whiting, M., Kritharides, L., Merrifield, A., … Keech, A. (2011). Associations between
the use of metformin, sulphonylureas, or diet alone and cardiovascular outcomes in 6005 people with type 2 diabetes in the FIELD study. Diabetes Research and Clinical Practice, 94, 284–290. http://dx.doi.org/10.1016/j.diabres.2011.07.028
Tsai, M. Y., Bignell, M., Schwichtenberg, K., & Hanson, Q. (1996). High prevalence of a mutation in the cystathionine I-synthase gene. American Journal of Human Genetics, 59, 1262–1267.
Wierzbicki, A. S. (2007). Homocysteine and cardiovascular disease: A review of the evidence. Diabetes & Vascular Disease Research: Official Journal of the International Society of Diabetes and Vascular Disease, 4, 143–150. http://dx.doi.org/10.3132/dvdr.2007.033
Wijekoon, E. P., Brosnan, M. E., & Brosnan, J. T. (2007). Homocysteine metabolism in diabetes. Biochemical Society Transactions, 35, 1175–1179.
Yakub, M., Moti, N., Parveen, S., Chaudhry, B., Azam, I., & Iqbal, M. P. (2012). Polymorphisms in MTHFR, MS and CBS genes and homocysteine levels in a Pakistani population. PLoS ONE, 7(3), e33222. http://dx.doi.org/10.1371/journal.pone.0033222
Dow
nloa
ded
by [
Uni
vers
ity o
f C
alcu
tta ]
at 2
2:14
13
Apr
il 20
15