Hydrological implications of land use and land cover change: Spatial analytical approach at regional...
18
Hydrological implications of land use and land cover change: Spatial analytical approach at regional scale in the closed basin of the Cuitzeo Lake, Michoacan, Mexico M.E. Mendoza 1 , G. Bocco 1 , E. López-Granados 2 and M. Bravo Espinoza 3 1 Centro de Investigaciónes en Geografía Ambiental, Universidad Nacional Autónoma de Mexico (UNAM), Morelia, Michoacan, Mexico 2 Departamento de Geología y Mineralogía, Instituto de Investigaciones Metalúrgicas, Universidad Michoacana de San Nicolás de Hidalgo, Morelia, Michoacan, Mexico 3 Instituto de Nacional de Investigaciones Forestales, Agrícolas y Pecuarias, Uruapan, Michoacan, Mexico Correspondence: M.E. Mendoza (email: [email protected]) A spatially distributed water balance model was used to assess the influence of regional land use and land cover change in a poorly gauged basin for the years 1975 and 2000. To carry out this study in the Cuitzeo Lake basin in Michoacan, Mexico, remote sensing and geographic information system tools were integrated in the water balance model. In addition, a transition matrix analysis was used to determine the dynamic change of categories of related hydrologic processes. The analysis of the water balance components, based on landforms and transition matrix, indicated a tendency of improvement in the regional hydrologic conditions in the basin. As a consequence of urban land use growth, however, plains and footslopes of the basin showed an increase of runoff values. In addition, in both years, the topographic lower sections of the basin exhibited a high demand for water from the increased urban land use, along with degradation of Cuitzeo Lake, particularly by pollution and reduction of water supply. The approach used here is suitable for understanding the change in quantity and spatial distribution of water available in poorly gauged basins. Keywords: geographic information systems (GIS), land use and land cover change (LULCC), regional analysis, remote sensing, transition matrix, water balance Introduction The water cycle and its components including groundwater recharge are central topics in hydrology. These components present great spatial and temporal variation and play a critical role in diverse physical, chemical and biological processes that regulate the terrestrial system, within which human activity is inseparable from natural events (Dunne & Leopold, 1978; Elkaduwa & Sakthivadivel, 1998). Humans are altering the hydrological cycle at local and global scales. Highly fragmented land cover associated with agriculture expansion, urbanization and pollution has a significant influence on the hydrological processes, which makes it necessary to investigate the hydrological implications in small basins and at the regional scale (Sahagian, 2000; Sharma et al., 2000; Bronstert et al., 2002; Fohrer, et al., 2002; Sullivan et al., 2004). Water balance (WB) modelling at the regional scale requires hydrological models that can be applied without calibration at basin level on wide geographical domains (Arnell, 1999). The usefulness of hydrological modelling, either in small basins or at the regional level, has been broadly demonstrated in the evaluation of the impacts of both land use and land cover change (LULCC) (Henderson-Sellers et al., 1993; Kite, 1993; Harbor, doi:10.1111/j.1467-9493.2010.00400.x Singapore Journal of Tropical Geography 31 (2010) 197–214 © 2010 The Authors Journal compilation © 2010 Department of Geography, National University of Singapore and Blackwell Publishing Asia Pty Ltd
-
Upload
independent -
Category
Documents
-
view
1 -
download
0
Transcript of Hydrological implications of land use and land cover change: Spatial analytical approach at regional...

sjtg_400 197..214
Hydrological implications of land use and landcover change: Spatial analytical approach at
regional scale in the closed basin of theCuitzeo Lake, Michoacan, Mexico
M.E. Mendoza1, G. Bocco1, E. López-Granados2 and M. Bravo Espinoza3
1Centro de Investigaciónes en Geografía Ambiental, Universidad Nacional Autónoma de Mexico (UNAM),
Morelia, Michoacan, Mexico2Departamento de Geología y Mineralogía, Instituto de Investigaciones Metalúrgicas, Universidad Michoacana
de San Nicolás de Hidalgo, Morelia, Michoacan, Mexico3Instituto de Nacional de Investigaciones Forestales, Agrícolas y Pecuarias, Uruapan, Michoacan, Mexico
Correspondence: M.E. Mendoza (email: [email protected])
A spatially distributed water balance model was used to assess the influence of regional land use
and land cover change in a poorly gauged basin for the years 1975 and 2000. To carry out this study
in the Cuitzeo Lake basin in Michoacan, Mexico, remote sensing and geographic information
system tools were integrated in the water balance model. In addition, a transition matrix analysis
was used to determine the dynamic change of categories of related hydrologic processes. The
analysis of the water balance components, based on landforms and transition matrix, indicated a
tendency of improvement in the regional hydrologic conditions in the basin. As a consequence of
urban land use growth, however, plains and footslopes of the basin showed an increase of runoff
values. In addition, in both years, the topographic lower sections of the basin exhibited a high
demand for water from the increased urban land use, along with degradation of Cuitzeo Lake,
particularly by pollution and reduction of water supply. The approach used here is suitable for
understanding the change in quantity and spatial distribution of water available in poorly gauged
basins.
Keywords: geographic information systems (GIS), land use and land cover change (LULCC),
regional analysis, remote sensing, transition matrix, water balance
Introduction
The water cycle and its components including groundwater recharge are central topicsin hydrology. These components present great spatial and temporal variation and playa critical role in diverse physical, chemical and biological processes that regulate theterrestrial system, within which human activity is inseparable from natural events(Dunne & Leopold, 1978; Elkaduwa & Sakthivadivel, 1998). Humans are altering thehydrological cycle at local and global scales. Highly fragmented land cover associatedwith agriculture expansion, urbanization and pollution has a significant influence onthe hydrological processes, which makes it necessary to investigate the hydrologicalimplications in small basins and at the regional scale (Sahagian, 2000; Sharma et al.,2000; Bronstert et al., 2002; Fohrer, et al., 2002; Sullivan et al., 2004). Water balance(WB) modelling at the regional scale requires hydrological models that can be appliedwithout calibration at basin level on wide geographical domains (Arnell, 1999).
The usefulness of hydrological modelling, either in small basins or at the regionallevel, has been broadly demonstrated in the evaluation of the impacts of both land useand land cover change (LULCC) (Henderson-Sellers et al., 1993; Kite, 1993; Harbor,
doi:10.1111/j.1467-9493.2010.00400.x
Singapore Journal of Tropical Geography 31 (2010) 197–214
© 2010 The Authors
Journal compilation © 2010 Department of Geography, National University of Singapore and Blackwell Publishing Asia Pty Ltd

1994; Bhaduri et al., 1997; Sharma et al., 2000; Bronstert et al., 2002; Fohrer, et al., 2002;Sullivan et al., 2004) and long-term climatic change (Gleick, 1987; Vörösmarty &Moore, 1991; Rind et al., 1992; Nikolaidis et al., 1993; Xu, 2000). If the modellingincludes the dynamics of carbon, nutrients and silt it might be useful as a semimechani-cal tool to quantify material transport and nonpoint pollution processes (Vörösmartyet al., 1989; Olivera, 1996).
Integrated watershed management provides the conceptual and spatial frameworksfor elaborating and implementing norms and conservation practices based on theunderstanding of ecological and social processes. These are needed to ensure theecological integrity of the basin and the supply of products and services for an increasinghuman population. In addition, watershed management is a way of controlling pro-cesses and activities in the watershed to reduce the impact of anthropogenic impacts onhydrological processes (EPA, 1995; Ersten, 1999; Jain et al., 2000). However, accuratediagnoses or appropriate management recommendations cannot be made if hydrologi-cal data are insufficient for regional analysis (see Bergström & Graham, 1998). Theproblem has been approached by using lumped hydrologic models that conceptualizeprocesses based on simple often homogeneous approximations which lack sufficienttemporal and spatial resolution and thus impede management of resources (Arnell,1999; Bastiaanssen, 2000a; Xu, 2000).
In hydrology the development of new measurement methods has led to significantadvances in the knowledge of functional relationships in a basin. However, the absenceor scarcity of hydrometeorological data results in methodological inadequacies for theanalysis of basins (Mendoza et al., 2002). In many regions hydrometeorological net-works are sparse or even nonexistent, among other reasons because their establishmentand maintenance is particularly onerous in terms of the cost of the equipment, opera-tion and development of databases. Hence the need to develop indirect methods forassessing the quantity and spatial distribution of available water in order to estimatehydrologic processes (Meijerink et al., 1994; Beek, 1996; Osman, 1996; Olsson & Pilesjö,2002; Bastiaanssen, 2000a; Bastiaanssen, 2000b; Fuentes et al., 2004). From a noncon-ventional perspective, indirect methods are required to recognize the characteristics andspatial distribution of runoff, as well as biotic and abiotic components of the basins andtheir spatial and seasonal relationships (Schumm, 1964).
This paper reports the analysis of the spatial distribution of the mean WB for 1975and 2000 in the Cuitzeo Lake basin in Michoacan, Central Mexico. This aimed tounderstand the implications of a highly fragmented regional LULCC on quantity andspatial distribution of available water in a poorly gauged basin. Understanding theregional hydrological change based on monthly WB models can provide bases forterrestrial and water resources planning and management in large basins (>1000 km2)(Xu & Vandewiele, 1994; Mendoza et al., 2002).
Study area
The closed basin of the Cuitzeo Lake is located within the Trans-Mexican Volcanic Beltin Central Mexico (19°30′N to 20°05′N and 100°35′W to 101°30′W) and occupies asurface of approximately 4000 km2 (Figure 1). In the lowland part of this basin there isa shallow (1–2 m) and brackish lake that occupies an area of about 300 km2.
The topography presents a limited altitudinal range formed by hills and plains.Geologically the area is dominated by volcanic rocks of intermediate and basic compo-sition dating from the Miocene and Quaternary periods (Pasquarè et al., 1991; Mendoza
198 M.E. Mendoza, G. Bocco, E. López-Granados et al.

et al., 2006). The predominant LULCC forms a highly fragmented landscape in whichshrubland, forest and agricultural land are combined in a mosaic pattern (López et al.,2006).
Recent research (Mendoza et al., 2006) has demonstrated that precipitation recordsfrom selected stations show three relatively dry periods in the watershed that were alsoexpressed in changes of the surface area of the lake (viz. 1940–60, 1980–90 and1995–2000). In addition, a time-series analysis of the period 1974–2000 indicated thatthe surface area of Cuitzeo Lake is sensitive to the meteorological conditions (precipi-tation and temperatures) of the previous year. However, trend analyses indicated thatthe changes in precipitation, the Palmer Drought Severity Index and temperature in thelast 75 years were not statistically significant.
Materials and methods
In the model used for the present study, we first considered the runoff as a function ofthe biophysical characteristics – landforms, slope, soil texture and depth and landuse/land cover (LULC) – of the basin. Subsequently, we subtracted runoff from precipi-tation in order to calculate the infiltration. Interception loss was considered as a fractionof the total water loss by evapotranspiration. Evapotranspiration was computed in orderto calculate water deficit, after which it was assumed that the soil water surplus is in thiscase mainly groundwater recharge. The procedure used to estimate the components ofthe spatially distributed WB is described in Figure 2. In summary, the steps followedduring the present research were: (i) elaboration of LULC maps for 1975 and 2000; (ii)elaboration of mean annual T and P maps; (iii) calculation of spatially distributeddynamic WBs for 1975 and 2000 using the Thornthwaite and Mather (1957) method;and (iv) computation of indicators of hydrologic conditions for both years and theircomparison by means of transition matrices.
Water balanceThe WB model developed by Thornthwaite and Mather (1957) can be used for a smallsoil volume and an entire basin. In essence, the method allows elaboration of a monthlyaccounting of soil moisture, actual evapotranspiration, drainage and runoff amounts,derived from precipitation records and potential evapotranspiration and from vegetationand soil observations (Dunne & Leopold, 1978). In a geographical information system(GIS), the WB is modelled at the pixel level by taking into account the spatial distribu-
270000 285000 300000 315000
2160000
2175
00
02
1900
00
22
050
00
22
20
00
0
0 10 20 km
N
Cuitzeo Lake
MoreliaCity
16
24
O
O
O
104 96112
Gulf of Mexico
PACIFIC OCEAN
Legend
State boundary
International boundary 0 200 400 km
N
104 96112 88O O O O
UNITED STATES
16
24
32O
O
O
MEXICOD.F.
GUATEMALA
Michoacan
Morelia city
Figure 1. Location of the Cuitzeo Lake basin study area in Michoacan, Mexico.
Hydrological implications of LULCC 199

tion of precipitation, potential evapotranspiration and soil characteristics. Thegeneral model that describes the surface WB is given in the equation 1 (Juryet al., 1991):
P R ET D W− = + + (1)
whereP = PrecipitationR = Surface runoff (overland flow and the through flow together)ET = Evapotranspiration.D = PercolationW = Water storage change.
In this model the intercepted water that is evaporated (interception loss) is a fraction ofthe total evapotranspiration. In the original Thornthwaite and Mather model (1957),the surface runoff estimation (their ‘water surplus’) was obtained as a proportion of thewater that cannot be stored in the soil. They suggested that for large basins 50 per centof the surplus of water for any month is the surface runoff and the remaining 50 per centis retained temporarily in the basin to supply the runoff for the next month (also seeDunne & Leopold, 1978). (We did not make this assumption here because runoff iscalculated at the beginning of the processes.)
Geomorphology and land use/coverGeomorphological mapping was derived from 1975 aerial photographs atan approximate scale of 1:50 000. Standard photointerpretation keys (Verstappen &Van Zuidam, 1991) were used in order to differentiate landforms in a hierarchicalclassification system (Mendoza et al., 2001). LULC maps were derived by interpreta-tion of 1975 and 2000 panchromatic aerial photographs at approximatescales of 1:50 000 and 1:37 000 (López et al., 2006). The interpretation of the LULCwas carried out using physiognomic and structural criteria for classification (Andersonet al., 1976) that considered the categories required in the hydrological model used forthis work.
Slope
Digital terrainmodel
Soils Meteorologicaldata
Daylighthours
Temperature
Etp
PrecipitationInfiltration rate
Runoff %
Land use/cover1975–2000
Reclassifiedland use/cover1975–2000
Runoff
InfiltrationLandformsActualstorage
Eta
If Etp < Inf + storage (month-1)then Eta = Etp
If Etp > Inf + storage (month-1)then Eta = storage (month-1) + PefEffective soil
depth
Stoniness
Texture
Storagefactor
Storagemonth-1
Soil waterholdingcapacity
Water surplus1975 and 2000
Comparison andchange analyses
Water deficit1975 and 2000
If deficit 0then deficit =0
else storage + storage (month-1)
Figure 2. Procedure used to estimate the components of the spatially distributed water balance.
200 M.E. Mendoza, G. Bocco, E. López-Granados et al.

Inputs: precipitation and temperaturePrecipitation and temperature are the main inputs of the WB model. Their appropriaterepresentation in a hydrological model is very important, but difficult. The interpolationof isohyets and isotherms is complex when the coverage of meteorological stations isrelatively poor, as is the case for the Cuitzeo Lake basin. In this work, the mean monthlyprecipitation and mean monthly temperature were calculated from historical datarecords of 42 meteorological stations located in the basin and their surroundings; thecalculations were carried out using linear interpolation techniques based on the inversedistance method.
Water balance components calculationPotential evapotranspiration (PET). Calculated using a modified version of an equationsuitable for intertropical conditions (Serruto, 1993), this considers two variablesincluded in Thornthwaite and Mather’s (1957) model: mean monthly temperature andsolar radiation; the latter calculated for different latitudes by FAO (1976). Following thisprocedure the monthly distribution of PET was computed by equation 2:
PET SR T 0.88= × ( ) + × ( )( ) ×0 003 0 16 312 5. ..(2)
whereT = Mean monthly temperature in °C (obtained from corrected maps)SR = Solar radiation in equivalent of evaporation in mm day-1
Surface runoff. Diverse methods exist to measure and estimate the portion of theprecipitation that does not infiltrate or accumulate on the soil surface, but rather runsoff downslope as irregular sheets or as a concentrated flow of water (Chow et al., 1988).The method used here considers that runoff takes place from the excess of water that isgenerated in the entire basin and is a function of precipitation, soil depth and texture,infiltration rate, LULC and slope gradients (SCS, 1964; Beek, 1996).
For practical means, permeability and infiltration rates were analyzed ina combined manner (SARH-CP, 1991). Permeability is a physical characteristic relatedto the distribution, size and continuity of pores (Hillel, 1998) and it is very probable,although not necessary, that a soil with high porosity exhibits a high infiltrationrate. Thus, infiltration might be estimated from soil texture (SARH-CP, 1991). Toestimate soil texture, a soil map elaborated by the National Institute of Statistics,Geography and Informatics, the federal mapping agency (INEGI), with data from 1971and 1983 was used to identify three soil texture categories: fine, medium and coarse.These textural categories were translated into corresponding low, medium and highinfiltration rates respectively (SARH-CP, 1991).
LULC maps for 1975 and 2000 were overlaid with the infiltration rate map to obtaina two-dimensional table for each year. The resulting two-dimensional table was againcross-referenced with the slope gradient map, obtaining a new two-dimensional tablewhich was used to classify potential runoff in percentage (SCS, 1964). The slopegradient was derived from the application of directional filters to the digital elevationmodel (DEM).
Finally, potential monthly runoff maps were multiplied with each mean monthlyprecipitation map to generate the mean monthly runoff time-series. By subtracting eachmap of mean monthly runoff from the corresponding precipitation map, 12 infiltrationmaps were calculated for each year.
Hydrological implications of LULCC 201

Soil water holding capacity. The total amount of water stored in the soil is crucial for aWB. The maximum that can be stored in a soil profile can be defined by a relationshipbetween soil texture and stoniness, since both characteristics modify such capacity(Landon, 1984; Poesen & Ingelmo-Sanchez, 1992).
Stoniness was estimated for the entire basin both as a function of some physicalproperties and soil associations mapped by INEGI and by our own fieldwork. From thissoil map, the stoniness property was extracted and cartographically cross-referencedwith the soil associations. For each association with stoniness the potential percentageof stoniness was estimated.
Soil depth and soil texture distributions were initially mapped by landform reclas-sification based on the soil texture and depth punctual data from INEGI. The details of156 soil profile descriptions and their corresponding physicochemical characterizationwere derived from INEGI’s pedalogical maps (dated 1971, 1973, 1979, 1982 and 1983,at 1:50 000). To include in the modelling the volcanic characteristics of the basin and thewater retention capacity of such units, volcanic cones and lava flow categories wereextracted from the geomorphological map elaborated for this research. Volcanic unitshave high permeability. The final soil texture map was derived by the integration ofvolcanic cones and lava flows in the initial mapping; the texture and stoniness mapswere combined in a two-dimensional table.
Actual soil moisture storageThe soil moisture storage varies in time and space with the monthly infiltration (whichcontributes water) and evapotranspiration (which subtracts it). According to the Thorn-thwaite and Mather model (1957), monthly variations should take into account thatwater from the previous month can be stored in the soil. Whenever precipitation ishigher than evapotranspiration the soil will increase its moisture storage. Water will bestored up to the capacity of soil (referred to as ‘potential storage’), which is determinedby the sizes, shapes and continuity of soil’s porosity, depth, texture, organic mattercontent and structure. In the WB it is considered that any excess that surpasses the fieldcapacity will become water surplus that will percolate. The relationship is given inequation 3:
S Inf S PETa a month( ) ( ) −= + −1 (3a)with:
0 S Sa p≤ ≥( ) ( ) (3b)whereS(a) = Actual storage in mmInf = Infiltration in mmS(a) month-1 = Actual storage from previous monthS(p) = Potential storageEtp = Potential evapotranspiration
Actual evapotranspirationWhereas potential evapotranspiration is the quantity of water that can theoreticallyevaporate if water is available, actual evapotranspiration is the quantity of water thatevaporates. If there is enough water the potential and actual evapotranspiration areequal; if there is not then actual evapotranspiration is less than the potential. Based onthe model used, actual rates depend on monthly infiltration, potential evapotranspira-tion and the previous month’s soil water storage as follows:
202 M.E. Mendoza, G. Bocco, E. López-Granados et al.

if Inf S PET
then AET PET
else AET Inf S
a month 1
a month 1
+ ≥== +
( ) −
( ) −(4)
The calculations began in June, the first month in the year presenting soil moisturestorage (May is the first month with rainfall). For June, the actual soil moisture storagecapacity map was used as a value for the water storage of May. In the following months,storage was calculated with the value of the previous month for every subsequentmonth, considering June as the initial month. When the calculated values of actualstorage were negative, they were reclassified as zero.
Monthly water mean deficit in soilSoil water amount will decrease when monthly infiltration is smaller than potentialevapotranspiration, reaching a storage equal to zero. However, since plants still requirewater to transpire a water deficit occurs. In our model the calculations began in June,obtaining a water deficit (Wd) map for every month (equation 5):
Wd PET Inf S a month 1= − +( )( ) − (5)
Mean monthly water surplus in soilWhen monthly infiltration is larger than the potential evapotranspiration, the quantityof water stored in the soil increases up to the maximum level allowed by the potentialstorage capacity. If more water enters the soil, the model considers it as water surplusthat will percolate. A map of soil water surplus (Ws) was calculated for every month(equation 6):
Ws Inf AET S Sa a month 1= − − +( ) ( ) − (6)
Annual water balanceThe maps of each monthly mean WB component for 1975 and 2000 were aggregated togenerate mean annual WB component maps for both years. Based on these componentmaps a total mean WB component map was derived and normalized. The mean,standard deviation, minimum value and maximum value were calculated and, with thisdata the mean annual WB component maps were reclassified in five categories (veryhigh, high, moderate, low and very low), each interval having an amplitude of onestandard deviation; the mean value is located in the moderate interval, which meansthat the typical runoff values are in this category. These runoff values are around313 000 m3 per year.
Finally, changes in the WB components were analyzed for the entire basin. First, thegeneral change of each category by component was calculated, and second, the changedynamics were analyzed through a transition matrix. In every matrix, the diagonalrepresents the probability of each category to remain unchanged from time one to timetwo (Luenberger, 1979). In this work, transition matrices were built with the obtainedsurfaces of every map that represents the WB components in 1975 and 2000. Transitionprobability (Pij) of each class of the matrix is proportional to the remaining surface of thesame class between 1975 and 2000 (equation 7):
P S 1975 S 2000ijA ij j= ( ) ( ) (7)
Hydrological implications of LULCC 203

where Sij is the surface of the element ‘ij’ from the transition matrix of each componentof WB in 1975, and ‘Sj’ corresponds to the surface of the class of each component of WB‘j’ in 2000. That is, for each category of each component ‘j’, SPij = 1.
Results and discussion
Land use and land cover changeThe predominant LULC in the basin in 1975 and in 2000 corresponded to agriculture(44 per cent and 32 per cent respectively) and to forests and dense vegetation (17 and20 per cent respectively). In the years studied, the forests and dense vegetation, grass-lands and open forests, and shrublands increased 18, 28 and 20 per cent, respectively(Figures 3 and 4). A study by López et al. (2006) presented a detailed analysis of LULCC.
Mean annual runoffAn analysis of the error of the monthly runoff estimations was carried out based onmonthly runoff data records from 1975 for two subbasins of the Cuitzeo Lake study area(Mendoza, 2002). Results indicated that the annual overestimation was of 2.2 and 1.6
2160000
2180000
2220000
2200000
2220000
2160000
0 10 20 km
N
260000240000 320000300000
280000 300000 320000260000
Forest/dense vegetation
Water bodies
Areas without vegetation
Agriculture
Shrublands
Open forest/grasslands
Legend
Cuitzeo Lake
Figure 3. Land use and land cover in Cuitzeo Lake basin in 2000.
Forest/densevegetation
Grasslands/open forest
Shrublands Agriculture Areaswithout
vegetation
Waterbodies
Land use and land cover
0
40
80
120
160
200
Hecta
res
(’0
00
)
1975 2000
Figure 4. Areal extent of land use and land cover change in Cuitzeo Lake basin between 1975 and 2000.
204 M.E. Mendoza, G. Bocco, E. López-Granados et al.

times respectively, averaging < 2 times; the result obtained in the present work is locatedbetween the runoff overestimation and underestimation ranges previously obtained inother large basins based on spatially distributed models (Wood & Blackburn, 1984;Arnell, 1999).
Runoff estimations based on conceptual WB models for such large areas are gener-ally difficult because of high spatial variability of each one of the parameters included ina model, such as temperature and precipitation data recorded from a few stations andsoil texture data collected from a few soil profiles and pits (Warrick & Nielsen, 1980;Lopes, 1996; Mohamed et al., 2004; Tchienkoua & Zech, 2004).
Considering that precipitation is a critical variable that is measured as an input forestimating the WB and that runoff is the first variable estimated in the model used inthis paper, a sensitivity analysis between mean annual precipitation and runoff wascarried out. First, mean monthly maps for precipitation were calculated (as describedearlier). Subsequently, four theoretical maps were made considering increases in pre-cipitation of 20, 40, 60 and 80 per cent, and based on these maps, mean monthly runoffmaps were made (as described in the methods section). Mean annual precipitation maps(original and +20 per cent, +40 per cent, +60 per cent, +80 per cent), and annual runoffmaps (original and +20 per cent, +40 per cent, +60 per cent, +80 per cent) wereaggregated. According to the analysis, an increase of one unit in precipitation producesan increase of half of a unit of magnitude in runoff. This means that the model has anadequate performance for regional analysis, but is certainly not totally appropriate formore detailed analysis.
In consequence, analysis of the LULCC implications for WB was carried out based onqualitative reclassified maps instead of quantitative value maps. From classified maps,the surfaces by class were calculated for every year, as well as the surface of change(Figure 5). The predominant category in both years was moderate (66 and 64 per cent,respectively), followed by the low class (16 and 18 per cent), with the largest changeoccurring in the very low, low and moderate classes. These results suggest that, incomparison with 1975, the capacity of the basin to produce runoff decreased for the year2000. One of the probable reasons of this decrease in runoff capacity was the increasein the vegetation cover within the basin mentioned earlier.
The most representative categories of runoff by landforms corresponded to the lowand moderate classes in both years. The dynamics between years indicated moderateimprovement of hydrological conditions; 16 landforms decreased their surface in themoderate class and increased their surface in the low class. Plains, wide valleys, lowerfootslopes, summits and isolated elevations were more affected by an increase in thesurface runoff; the landforms that increased their surface in the low class includedfluvial plains, flooded plains, mesas, and upper and undifferentiated footslopes.
0
30
60
90
120
150
180
210
240
270
Hecta
res
(’00
0)
1975 2000
Very low Low Moderate High Very highWater bodies
Runoff
Figure 5. Change in mean annual runoff between 1975 and 2000.
Hydrological implications of LULCC 205

Reduction in surface runoff has a positive influence on infiltration because higherrunoff will reduce infiltration and vice versa. Infiltration has a positive influence on soilmoisture because more water on this compartment means more water for percolation.These relationships occurred in forests and dense vegetation, grasslands and shrublandareas which had increased in the basin between 1975 and 2000; however, agriculturallands under a short fallow system (1 to 2 years) produced more runoff than the densevegetation covers (Harbor, 1994; Bhaduri et al., 1997; Ziegler et al., 2004).
This change in runoff was also consistent with the limited water erosion observed byvisual interpretation in the watershed; gully areas occupied less than 2 per cent of thewatershed in 2000 (Mendoza, 2002) and are concentrated upstream of the Cointzioreservoir, which is the largest dam within the watershed.
Mean annual infiltrationBased on monthly infiltration mappings, the largest surface corresponds to the low (47and 44 per cent respectively) and moderate classes (43 and 46 per cent respectively).Change analyses for the two years indicated that there was an increment of around1200 ha in the moderate class as a result of a decrease of the same magnitude in the lowclass (Figure 6a). The results suggested that there was a larger accumulation of water inthe soil in 2000 than in 1975 (Figure 6a).
The categories more representative by landforms corresponded to the low andmoderate classes, which covered approximately 90 per cent of the landform classes inboth years. Conditions of relative improvement are also present in the basin: 12landforms increased their surface of infiltration from low to moderate; the landformswith the greatest increase in their surface in the moderate class were salty plains,flooded plains and medium footslopes; only three landforms (isolated elevations, plainswith aquatic vegetation and lower footslopes) changed from moderate to low.
Mean annual actual evapotranspirationThe predominant categories of actual evapotranspiration for 1975 and 2000 were thelow (46 and 43 per cent respectively) and moderate (44 and 47 per cent) categories.Evapotranspiration change by categories indicates a reduction of almost 1200 ha in thelow class while the surfaces of the moderate class increased in the same proportion; thisis a result of an increase of forests and shrublands (Figure 6b).
The increases in surface percentages of landforms occurred mainly in the low (3 percent) and moderate (13 per cent) actual evapotranspiration classes as to be expected asa consequence of an increase in land cover with larger capacity to evaporate water. The
0
100
200
300
Hecta
res
( ’0
00)
1975 2000
Very low Low Moderate High Very high Water bodies
Actual evapotranspiration
(b)
0
40
80
120
160
200
He
cta
res
( ’0
00)
1975 2000
Very low Low Moderate High Very high Water bodies
Infiltration
(a)
Figure 6. Change in (a) mean annual infiltration change and (b) mean annual actual evapotranspiration
between 1975 and 2000.
206 M.E. Mendoza, G. Bocco, E. López-Granados et al.

landforms that most increased their surface in the moderate class were flooded andfluvial plains and those of the low class were plains with aquatic vegetation, isolatedhills and lower footslopes.
Mean annual water deficitThe predominant categories of water deficit for 1975 and 2000 were moderate (41 and48 per cent, respectively) and high (45 and 42 per cent) (Figure 7). However, themoderate category reduced its surface by more than 14 000 ha and the high categoryincreased its surface by more than 12 000 ha (Figure 8).
Landforms were characterized as having moderate and high mean annual waterdeficit. However the regional hydrological conditions per landform also presented amoderate improvement: 3 landforms changed from moderate to high deficit (lowerfootslopes, isolated elevations and plains with aquatic vegetation), and 11 landformschanged from high to moderate. The landforms experiencing the most importantchanges were fluvial plains, saline flooded plains and middle footslopes.
Mean annual water surplusThe mean annual water surplus was so low in 1975 and 2000 that more than half of thebasin was classified in the very low class (73 and 74 per cent respectively) (Figure 9). In1975, 16 per cent of the basin was classified as low, while for 2000, the low classincreased by 2 per cent (Figure 10). The most representative categories were very lowand low; it is also noticeable that most of the landforms were classified in the very lowwater surplus class over a large area and in both years. However, the depicted estima-
N
260000
260000240000
280000 300000
300000
300000
320000
320000
2160000 2160000
2180000
2200000
2220000 2220000
0 10 20 km
Very lowLowModerateHighVery highWater bodies
Legend
Cuitzeo Lake
a)
260000240000
280000 300000 320000
320000
2160000
2180000
2200000
2220000 2220000
b)
Cuitzeo Lake
Very lowLowModerateHighVery highWater bodies
Legend
2160000
0 10 20 km
N
300000
260000
Figure 7. Mean annual water deficit (a) in 1975 and (b) in 2000.
Very lowWater bodies Moderate High Very highLow0
30
60
90
120
150
180
210
Hect
are
s(’0
00)
Water deficit
1975 2000
Figure 8. Change in mean annual water deficit between 1975 and 2000.
Hydrological implications of LULCC 207

tions suggest a tendency to increase the water surplus of landforms during the interval.Landforms changed from the very low to the low (6 per cent) class. This dynamicsuggests a slight improvement of the hydrological conditions in the Cuitzeo Lake basin,mainly owing to an increase in the vegetation cover. The landforms with an importantsurface increase in the low class corresponded to flooded plains, saline flooded plainsand undifferentiated footslopes.
Analysis of water balance components changes by transition matricesMean annual runoff. In Table 1, the transition matrix shows that the high and very highclasses have relatively low probabilities of permanence (smaller than 70 per cent),whereas the change probability from very high to high classes was relatively high at 45per cent, and from high to moderate it was 36 per cent. These percentages indicate arelative improvement in the runoff conditions in the basin. However, the very low classtends to change to low by 19 per cent and from low to moderate by 22 per cent.
Mean annual Infiltration. Transition values (Table 2) showed that infiltration has a lowpermanence in the very low class (52 per cent), of which 48 per cent changed to the lowclass. Also notable was the high permanence of the very high class (94 per cent). Theanalyses of transition matrixes confirmed, in general terms, a better hydrological con-dition at the regional level.
Mean annual actual evapotranspiration. The transition matrix (Table 3) indicated that thegreater permanence is in the moderate class (86 per cent), with 13 per cent having
N
260000
260000240000
280000 300000
300000
300000
320000
320000
2160000 2160000
2180000
2200000
2220000 2220000
0 10 20 km
Very lowLowModerateHighVery highWater bodies
Legend
a)
Cuitzeo Lake
260000240000
280000 300000 320000
320000
2160000
2180000
2200000
2220000 2220000
b)
Very lowLowModerateHighVery highWater bodies
Legend
2160000
0 10 20 km
N
300000
260000
Cuitzeo Lake
Figure 9. Mean annual water surplus (a) in 1975 and (b) in 2000.
1975 2000
30
60
90
120
150
180
210
240
270
300
Hecta
res
( ’0
00)
Moderate High Very highWater bodies Very low Low0
Water surplus
Figure 10. Change in mean annual water surplus between 1975 and 2000.
208 M.E. Mendoza, G. Bocco, E. López-Granados et al.
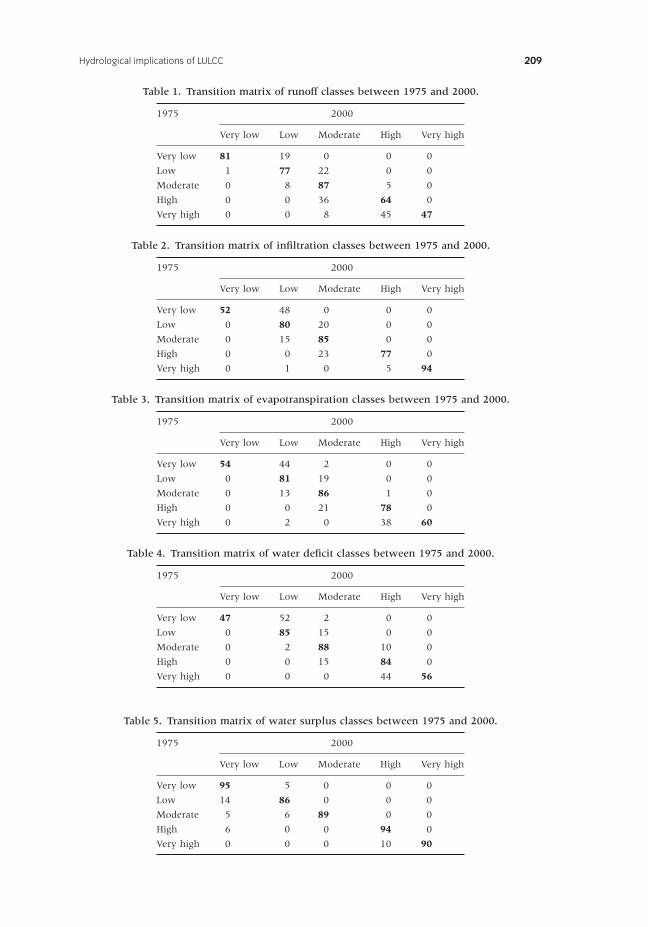
Table 1. Transition matrix of runoff classes between 1975 and 2000.
1975 2000
Very low Low Moderate High Very high
Very low 81 19 0 0 0
Low 1 77 22 0 0
Moderate 0 8 87 5 0
High 0 0 36 64 0
Very high 0 0 8 45 47
Table 2. Transition matrix of infiltration classes between 1975 and 2000.
1975 2000
Very low Low Moderate High Very high
Very low 52 48 0 0 0
Low 0 80 20 0 0
Moderate 0 15 85 0 0
High 0 0 23 77 0
Very high 0 1 0 5 94
Table 3. Transition matrix of evapotranspiration classes between 1975 and 2000.
1975 2000
Very low Low Moderate High Very high
Very low 54 44 2 0 0
Low 0 81 19 0 0
Moderate 0 13 86 1 0
High 0 0 21 78 0
Very high 0 2 0 38 60
Table 4. Transition matrix of water deficit classes between 1975 and 2000.
1975 2000
Very low Low Moderate High Very high
Very low 47 52 2 0 0
Low 0 85 15 0 0
Moderate 0 2 88 10 0
High 0 0 15 84 0
Very high 0 0 0 44 56
Table 5. Transition matrix of water surplus classes between 1975 and 2000.
1975 2000
Very low Low Moderate High Very high
Very low 95 5 0 0 0
Low 14 86 0 0 0
Moderate 5 6 89 0 0
High 6 0 0 94 0
Very high 0 0 0 10 90
Hydrological implications of LULCC 209

changed to the low class. The categories with smaller permanence were the very high(60 per cent) and the very low (54 per cent). Twenty-one per cent of the high classchanged to the moderate class, while the change from the very high to the high classwas 38 per cent. The very low class has changed by 44 per cent to the Low class, whilethe Low class can change to the Moderate class by 19 per cent. These results indicatesmaller water losses.
Mean annual water deficit. The transition matrix (Table 4) shows a slight negativechange in this component. The low, moderate and high classes have the larger perma-nence (respectively 85, 88 and 84 per cent). The very low class has only 47 per centpermanence that may change to the low (52 per cent) and moderate (2 per cent) classes.The change from the low to the moderate class was 15 per cent. The very high classshowed a 44 per cent change to the high class, and the high class has changed to themoderate class by 15 per cent.
Mean annual water surplus. In relation to the mean annual water surplus, the analysisshowed that a slight negative change occurred between 1975 and 2000: all classeshave relatively high permanence (greater than 85 per cent) in the transition matrix(Table 5), especially the high and very high classes (94 per cent and 90 per centrespectively).
Water reservoir change analysis. There was a pronounced increase in the number of waterreservoirs and their surface area during the study period. In 1975, 75 water bodiescovering 1205 ha were mapped while in 2000, 146 water reservoirs covering 1630 hawere located. In 25 years, the direct evaporation surface of artificial water bodiesincreased by 26 per cent and the number of structures for water retention doubled (mostcomprising less than 3 ha). Water reservoirs were mainly located on plains, volcanicmesas, gently convex hillslopes, rectilinear gently hillslopes and undifferentiated foot-slopes. Most of the water bodies were developed in cattle grazing areas, rather than inrainfed agricultural areas.
The Cuitzeo Lake had a surface of 346 km2 in 1975 and 300 km2 in 2000; thedifference is approximately 15 per cent. A part of the former open water body has beentransformed into aquatic vegetation (13 per cent) and has been used for irrigated andrainfed agriculture (2 per cent). Aquatic vegetation has increased most probably as aconsequence of organic matter and fertilizer inputs, transported through drainagechannels reaching the central sector of the Cuitzeo Lake – where, for example, theconcentration of sodium (Na+) is extremely high while that of potassium (K+) is fairlyhigh and chloride (Cl-) is higher than normal.
Conclusions
During the study years 1975 and 2000, the changes in regional WB components wererelatively small. The analysis of change in WB components by landform confirmed thatin semiquantitative terms the regional hydrological conditions of the basin improvedmildly. However, plains and transitional forms (footslopes) showed an increase inrunoff, explained by the increased surface used for human settlements and agriculturethat are mainly associated with these landforms.
For both years, a strong pressure on water resources existed in the lower areas ofthe basin. Nevertheless, the regional hydrological conditions of the basin were at least
210 M.E. Mendoza, G. Bocco, E. López-Granados et al.

as good as those of 25 years ago. The Cuitzeo Lake showed high degrees of deterio-ration owing to pollution and lack of water, which does not reach the lake because itis used in improper irrigation systems and because of greater consumption in expand-ing human settlements (Soto-Galera et al., 1999; Mendoza et al., 2006). In the urbanarea of Morelia City, the capital of the state of Michoacan, population has sextupledin 37 years (López et al., 2001). Additionally, historical piezometric levels registeredfrom Morelia City from 1994 to 1998 indicate a net groundwater depletion trend. Themean annual depletion is of 1.16 m; this means that the total depletion in 21 years isof around 22 m.
The analysis of variation and spatial distribution of water reservoirs indicates that thenumber of reservoirs as well as their surface area increased by 26 per cent and thatthe number of structures for water retention (mostly smaller than 3 ha) doubled. Theincrease of reservoirs here does not reflect an increase of plant production but rathercattle production in the basin.
The decrease of the surface of the Cuitzeo Lake is not linked to hillslope degradationby deforestation, erosion and deposition but is a result of a water decrease in thedrainage system caused by the increase in population, and consequent increase in waterconsumption, as well as by the improper use of water for agricultural irrigation. Addi-tionally, the increase of aquatic vegetation by almost 45 km2 between 1975 and 2000has reduced the connectivity between the central and east sectors of the lake.
The integration of remote sensing techniques, GIS, spatial distribution WB modelsand techniques of change dynamics analysis represent a suitable alternative to under-stand the hydrological effect of LULCC over large areas without sufficient hydrometeo-rological stations. This modelling enabled recognition of the change in water distributionand quantity on hillslopes. This model did not directly evaluate the WB of the lake.
Comparison of the values estimated by the model in both years is possible becausethe error estimations have the same magnitude for both years. However, the estimationsperformed are within the range of overestimated and underestimated values obtainedby other models (See Arnell, 1999; Wood & Blackburn, 1984).
In this study, as in that of the Himalayas (Sharma et al., 2000), the results are basedon stages with high degrees of uncertainty and inadequate information for modelvalidation. The lack of streamflow records for hydrological modelling is a commonproblem in most developing countries. The approach used in this work could be usefulwhen there are limited data that permit the validation of the results obtained withspatially distributed modelling.
The results of the present study also suggest that when the effect of LULCC onregional hydrology is evaluated in poorly gauged areas using spatially distributedmodels, it is possible to estimate hydrological conditions before and after LULCC,although the values per se are not as relevant as the difference detected.
Acknowledgments
This research was funded by the CONACyT (SIMORELOS Program), research project: Ecological
Zoning, Conservation and Land Use Planning in Cuitzeo Lake Watershed. M.E. Mendoza’s doctoral
research also benefitted from a grant from CONACyT and DGEP-UNAM. We thank V. Salinas and A.
Acosta for helping in database construction and compilation, and Víctor Garduño and Víctor Medina
for providing piezometric depurated data. We also thank C. Xu (Uppsala University), L.M. Morales
(UNAM), W. Osterkamp (USGS) and S. Zárate for their comments on a previous version of this
paper.
Hydrological implications of LULCC 211

References
Anderson JR, Hardy EE, Roach JT, Witmer RE (1976) A Land Use and Land Cover Classification System
for Use with Remote Sensing Data. US Geological Survey Professional Paper 964, United States
Government Printing Office, Washington, DC. Available at http://landcover.usgs.gov/pdf/
anderson.pdf (last accessed May 2010).
Arnell NW (1999) A simple water balance model for simulation of streamflow over large geo-
graphic domain. Journal of Hydrology 217, 314–35.
Bastiaanssen WGM (2000a) Shared Water Resources Information From Space New Management Oppor-
tunities or Unwanted Interference? Department of Water Resources and Environmental Studies,
Faculty of Geo-Information Science and Earth Observation of the University of Twente (ITC),
Enschede. Available at http://wwwitcnl/wres/basti_texthtml (accessed on 10 April 2001).
Bastiaanssen WGM (2000b) SEBAL-based sensible and latent heat fluxes in the irrigated Gediz
Basin Turkey. Journal of Hydrology 229, 87–100.
Beek M (1996) Drainage Pattern Analysis and Extraction of Hydrologic Properties From Digital
Elevation Models. MSc thesis, Silsoe College, Cranfield University, UK.
Bergström S, Graham LP (1998) On the scale problem in hydrological modeling. Journal of
Hydrology 211, 235–65.
Bhaduri B, Grove M, Lowry C, Harbor J (1997) Assessment of long-term hydrologic effects of land
use change. The curve number technique for calculating runoff is modified to estimate lost
groundwater recharge. Journal of American Water Works Association 89 (11), 94–106.
Bronstert A, Niehoff D, Bürger G (2002) Effects of climate and land-use change on storm runoff
generation: present knowledge and modelling capabilities. Hydrological Processes 16, 509–29.
Chow VT, Maidment DR, Mays LW (1988) Applied Hydrology. McGraw-Hill, New York.
Dunne T, Leopold LB (1978) Water in Environmental Planning. W.H. Freeman and Co., San
Francisco.
Elkaduwa WKB, Sakthivadivel R (1998) Use of Historical Data as a Decision Support Tool in Watershed
Management: A Case Study of the Upper Nilwala basin in Sri Lanka. Report 26, International Water
Management Institute, Colombo.
Environmental Protection Agency (EPA) (1995) Watershed Protection a Project Focus. Assessment and
Watershed Division, Office of Wetlands, Oceans and Watersheds, US Environmental Protection
Agency, Washington, DC.
Ersten ACD (1999) Ecohydrological impact-assessment modelling an example for terrestrial eco-
systems in Nord-Holland, the Netherlands. Environmental Modelling and Assessment 4, 13–22.
Food and Agricultural Organization (FAO) (1976) Las necesidades de agua de los cultivos [The water
needs of crops]. FAO Irrigation and Drainage Study No 24, Rome.
Fohrer N, Haverkamp S, Eckhardt K, Frede HG (2002) Hydrologic response to land use changes on
the catchment scale. Physics and Chemistry of the Earth (B) 26 (7–8), 577–82.
Fuentes JJ, Bravo M, Bocco G (2004) Water balance and landscape degradation of an ungauged
mountain watershed case study of the Pico de Tancitaro National Park. Journal of Environmental
Hydrology 12 (March), Paper 5. E-journal available at http://hydroweb.com/jeh/jeh2004/
fuente.pdf (last accessed May 2010).
Gleick PH (1987) The development and testing of a water balance model for climate impact
assessment: modeling the Sacramento basin. Water Resources Research 23 (6), 1049–61.
Harbor J (1994) A practical method for estimating the impact of land-use change on surface runoff
groundwater recharge and wetland hydrology. Journal of the American Planning Association 60(1), 95–108.
Henderson-Sellers A, Dickinson RE, Durbidge TB, Kennedy PJ, McGuffie K, Pitman AJ (1993)
Tropical deforestation modeling local- to regional-scale climate change. Journal of Geophysical
Research 98 (D4), 7289–351.
Hillel D (1998) Environmental Soil Physics. Academic Press, San Diego.
Jain A, Rai SC, Sharma E (2000) Hydro-ecological analysis of a sacred lake watershed system in
relation to land-use cover change from Sikkim Himalaya. Catena 4, 263–78.
212 M.E. Mendoza, G. Bocco, E. López-Granados et al.

Jury WA, Gardner WR, Gardner WH (1991) Soil Physics. John Wiley & Sons, New York.
Kite GW (1993) Application of a land class hydrological model to climate change. Water Resources
Research 29, 2377–84.
Landon JR (ed) (1984) Booker Tropical Soil Manual: A Handbook for Soil Survey and Agricultural Land
Evaluation in the Tropics and Subtropics. Longman, London.
Lopes VL (1996) On the effect of uncertainty in spatial distribution of rainfall on catchment
modeling. Catena 28, 107–19.
López E, Bocco G, Mendoza ME, Duahu E (2001) Predicting land-cover and land-use change in the
urban fringe: a case in Morelia city Mexico. Landscape and Urban Planning 55 (4), 271–85.
López E, Bocco G, Mendoza ME, Velázquez A, Aguirre R (2006) Peasant emigration and land-use
change at the watershed level. A GIS-based approach in Central Mexico. Agricultural Systems 90(1–3), 62–78.
Luenberger DG (1979) Introduction to Dynamic Systems: Theory, Models, and Applications. John Wiley &
Sons, New York.
Meijerink AMJ, de Brouwer HAM, Mannaerts CM, Valenzuela CR (1994) Introduction to the Use of
Geographical Information Systems for Practical Hydrology. ITC-UNESCO Publ. No. 23, International
Hydrology Programme, Enschede.
Mendoza ME (2002) Regional Land Cover and Land Use Change Implications in Water Balance:
The Case of Cuitzeo’s Lake Watershed [in Spanish]. PhD dissertation, Instituto de Geofísica,
National Autonomous University of Mexico (UNAM), Mexico.
Mendoza ME, Bocco G, Bravo M (2002) Spatial prediction in hydrology status and implications in
the estimation of hydrological processes for applied research. Progress in Physical Geography 26(3), 319–38.
Mendoza, ME, López-Granados E, Bocco G (2001) Regionalización ecológica, conservación de
recursos y ordenamiento territorial [Ecological regionalisation, natural resource conservation
and land use planning]. Final report submitted to the SIMORELOS–CONACyT Program.
Department of Natural Resource Ecology, Instituto de Ecología, UNAM, Mexico DF.
Mendoza ME, Bocco G, Bravo M, López E, Osterkamp WR (2006) Predicting water-surface
fluctuation of continental lakes: a RS and GIS based approach in central Mexico. Water Resources
Management 20 (2), 291–311.
Mohamed YA, Bastiaanssen WGM, Savenije HHG (2004) Spatial variability of evaporation and
moisture storage in the swamps of the upper Nile studied by remote sensing techniques. Journal
of Hydrology 289, 145–64.
Nikolaidis NP, Hu H-L, Ecsedy C, Lin JD (1993) Hydrologic response of freshwater to climatic
variability model development. Water Resources Research 29, 3317–28.
Olivera F (1996) Spatial Distributed Modeling of Storm Runoff and Non-point Source
Pollution Using Geographic Information Systems. PhD dissertation, University of Texas at
Austin. Available from http://www.ceutexas.edu/prof/olivera/disstn/ (accessed 15 May 2000).
Olsson L, Pilesjö P (2002) Approaches to spatially distributed hydrological modelling in a GIS
environment. In Skidmore A (ed) Environmental Modelling with GIS and Remote Sensing, 166–200.
Taylor & Francis, London and New York.
Osman BET (1996) GIS-hydrological Modelling in Arid Lands: A Geographical Synthesis of Surface
Waters for the African Dead Sea Region in the Sudan. PhD dissertation, Lund University,
Sweden.
Pasquarè G, Ferrari L, Garduño VH, Bibaldi A, Vezzoli L (1991) Geologic map of central sector of Mexican
Volcanic Belt, State of Guanajuato and Michoacán, México. GSA Map and Chart Series MCH072,
Geological Society of America, Boulder.
Poesen, JW, Ingelmo-Sanchez F (1992) Runoff and sediment yield from topsoils with different
porosity as affected by rock fragment cover and position. Catena 19, 451–74.
Rind D, Rosenzweig C, Goldberg R (1992) Modelling the hydrological cycle in assessment of
climate change. Nature 358, 119–21.
Sahagian D (2000) Global physical effects of anthropogenic hydrological alterations sea level and
water redistribution. Global and Planetary Change 25, 39–48.
Hydrological implications of LULCC 213

Secretaría de Agricultura y Recursos Hidraúlicos- Colegio de Posgraduados (SARH-CP) (1991)
Manuel de Conservación del Suelo y el Agua [Handbook of Soil and Water Conservation]. SARH-
CP-SPP, Mexico DF.
Schumm SA (1964) Airphotos and Water Resources. Trans. UNESCO Symposia, Aerial Survey and
Integrated Studies, 70–80, UNESCO, Tolouse.
Soil Conservation Service (SCS) (1964) Hydrology. Section 4, National Engineering Handbook. US
Department of Agriculture, Washington DC.
Serruto CR (1993) Una nueva fórmula para el cálculo de la evapotranspiración potencial [A new equation
for potential evapotranspiration estimation]. Programa interinstitucional de Waru Waru, Fac-
ultad de Ciencias, Universidad Nacional del Altiplano, Puno.
Sharma KVP, Vorösmarty CJ, Moore III B (2000) Sensitivity of the Himalayan hydrology to land
use and climatic changes. Climatic Change 47, 117–39.
Soto-Galera E, Paulo-Maya J, López-López E, Serna-Hernández JA, Lyons J (1999) Environmental
auditing change in fish fauna as indication of aquatic ecosystem condition in Río Grande de
Morelia–Lago de Cuitzeo Basin Mexico. Environmental Management 24 (1), 133–40.
Sullivan A, Ternan JL, Williams AG (2004) Land use change and hydrological response in the
Camel catchment Cornwall. Applied Geography 24 (2), 119–37.
Tchienkoua M, Zech W (2004) Statistical analysis of soil variability in a humid forest landscape of
central Cameroon. International Journal of Applied Earth Observation and Geoinformation 51,69–79.
Thornthwaite CW, Mather JR (1957) Instructions and tables for computing potential evapotrans-
piration and the water balance. Publications in Climatology X (3), 311.
Verstappen HTh, van Zuidam R (1991) The ITC System of Geomorphologic Survey: A Basis for the
Evaluation on Natural Resources and Hazards. ITC Publ. No. 10, Enschede.
Vörösmarty CJ, Moore III B (1991) Modeling basin-scale hydrology in support of physical climate
and global biogoechemical studies an example using the Zambezi River. Surveys in Geophysics 12,271–311.
Vörösmarty CJ, Moore III B, Grace AL et al. (1989) Continental scale models of water balance and
fluvial transport an application to South America. Global Biogeochemical Cycles 3 (3), 242–65.
Warrick AW, Nielsen DR (1980) Spatial variability of soil physics properties in the field. In Hillel D
(ed) Application of Soil Physics, 319–44. Academic Press, New York.
Wood MK, Blackburn WH (1984) An evaluation of hydrologic soil groups as used in the SCS runoff
method on rangelands. Water Resources Bulletin 20, 379–89.
Xu CY (2000) Climate change and hydrologic models: a review of existing gaps and recent research
developments. Water Resources Management 13, 369–82.
Xu CY, Vandewiele GL (1994) Sensitivity of rainfall-runoff models to input errors and data length.
Hydrological Science Journal 39 (2), 157–76.
Ziegler AD, Giambelluca TW, Tran LT et al. (2004) Hydrological consequences of landscape frag-
mentation in mountainous northern Vietnam: evidence of accelerated overland flow genera-
tion. Journal of Hydrology 287, 124–46.
214 M.E. Mendoza, G. Bocco, E. López-Granados et al.