Robust output feedback control of nonlinear stochastic systems using neural networks
Upload
khangminh22Category
view
0download
0
How Robust is the Relationship between Neural Processing Speed and Cognitive
Abilities?
Anna-Lena Schubert1, Christoph Löffler12, Dirk Hagemann2, and Kathrin Sadus2
1Department of Psychology, University of Mainz, Mainz, Germany
2Institute of Psychology, Heidelberg University, Heidelberg, Germany
Author Note
This work was supported by the German Research Foundation (DFG) [grant numbers
SCHU 3266/1-1 and SCHU 3266/2-1]. The data and code supporting the findings of the study
are available in the Open Science Framework repository at https://osf.io/3wud6/.
We would like to thank our research assistants – Johanna Hein, Florian Kaulhausen, Jan
Göttmann, and Larissa Kunoff – who supported us with the recruitment of participants, data
collection, project organization, and data management.
We have no conflicts of interest to disclose.
Correspondence concerning this article should be addressed to Anna-Lena Schubert,
Johannes Gutenberg University Mainz, Institute of Psychology, D-55099 Mainz, Germany,
Phone: +49 (0) 6131-3924928, E-mail: [email protected]

PROCESSING SPEED AND COGNITIVE ABILTIES 2
Abstract
Individual differences in processing speed are consistently related to individual differences in
cognitive abilities, but the mechanisms through which a higher processing speed facilitates
reasoning remain largely unknown. To identify these mechanisms, researchers have been
using latencies of the event-related potential (ERP) to study how the speed of cognitive
processes associated with specific ERP components is related to cognitive abilities. Although
there is some evidence that latencies of ERP components associated with higher-order
cognitive processes are related to intelligence, results are overall quite inconsistent. These
inconsistencies likely result from variations in analytic procedures and little consideration of
the psychometric properties of ERP latencies in relatively small sample studies. Here we used
a multiverse approach to evaluate how different analytical choices regarding references, low-
pass filter cutoffs, and latency measures affect the psychometric properties of P2, N2, and P3
latencies and their relations with cognitive abilities in a sample of 148 participants. Latent
correlations between neural processing speed and cognitive abilities ranged from -.49 to -.79.
ERP latency measures contained about equal parts of measurement error variance and
systematic variance, and only about half of the systematic variance was related to cognitive
abilities, whereas the other half reflected nuisance factors. We recommend addressing these
problematic psychometric properties by recording EEG data from multiple tasks and
modeling relations between ERP latencies and covariates in latent variable models. All in all,
our results indicate that there is a substantial and robust relationship between neural
processing speed and cognitive abilities when those issues are addressed.
Keywords: cognitive abilities; intelligence; ERP latencies; multiverse analyses; replication

PROCESSING SPEED AND COGNITIVE ABILTIES 3
How Robust is the Relationship between Neural Processing Speed and Cognitive
Abilities?
It is well-known that individual differences in processing speed predict individual
differences in cognitive abilities. Smarter people process information and language more
quickly and react faster than less intelligent people (Chiappe & Chiappe, 2007; Jensen, 2006;
Sheppard & Vernon, 2008). In general, behavioral measures of processing speed and
measures of intelligence are moderately and consistently related, typically sharing up to 10
percent of variance (Doebler & Scheffler, 2016; Neubauer & Knorr, 1997; Schubert, 2019;
Sheppard & Vernon, 2008). The shared variance between the two constructs increases to
about 20 to 50 percent if broad batteries of reaction time tasks are used instead of single-task
measures (Frischkorn et al., 2019; Jensen, 2006; Kranzler & Jensen, 1991; Miller & Vernon,
1996; Schubert et al., 2017). Although processing speed is hence known to contribute to
individual differences in intelligence, the mechanisms through which a higher processing
speed facilitates reasoning and thinking remain largely unknown.
To address this question, recent approaches decomposed the neurocognitive processes
leading to overt reaction times and related the resulting parameters of these processes to
cognitive abilities to identify the neurocognitive processes that are most strongly associated
with cognitive abilities. (e.g., Bazana & Stelmack, 2002; Jungeblut et al., 2021; Lerche et al.,
2020; McGarry-Roberts et al., 1992; Ratcliff et al., 2010, 2011; Schmiedek et al., 2007;
Schmitz & Wilhelm, 2016; Schubert et al., 2015, 2017, 2021; Troche et al., 2009). For this
purpose, researchers used the diffusion model (Ratcliff, 1978), a mathematical model of
decision making, to estimate parameters of latent cognitive processes giving rise to response
behavior in experimental tasks. They consistently found across many different studies that
more intelligent individuals showed specific advantages in the speed of information-uptake,
but not in the speed of encoding or motor response processes (for an overview see Frischkorn
& Schubert, 2018; Schubert & Frischkorn, 2020). Using the diffusion model, researchers

PROCESSING SPEED AND COGNITIVE ABILTIES 4
conversely demonstrated that older adults performed worse in speeded intelligence tests than
younger adults not because of a slower speed of information-uptake, but rather because of
slower encoding and motor response processes (Schubert et al., 2020; von Krause et al.,
2020).
Another approach to decompose continuous information-processing into somewhat
distinct stages is given by the event-related potential (ERP). The ERP approach decomposes
task-evoked electrophysiological activity into functionally, temporally, and topographically
distinct components that are characterized by their amplitudes and latencies (Kappenman &
Luck, 2011). Because ERP components are associated with specific cognitive processes, their
latencies can be used to make inferences about the speed of those cognitive processes.
Correlations between latencies of ERP components and cognitive abilities have been largely
inconsistent (Schulter & Neubauer, 2005), with evidence gradually emerging for a moderately
negative relationship between latencies of ERP components associated with higher-order
cognitive processing and cognitive abilities (Euler & Schubert, 2021).
Among studies on the relationship between ERP latencies and intelligence, the P3
component has probably received the most attention. The P3 (sometimes called P300 or P3b)
is a task-evoked ERP component that occurs about 300 ms after stimulus onset, has a positive
polarity, and is largest at parietal electrode sites (Polich, 2011; Verleger, 2020). It has been
associated with a number of higher-order cognitive processes, including the transmission and
updating of information in working memory (Polich, 2007), stimulus evaluation (McCarthy &
Donchin, 1981), context updating (Donchin, 1981; Donchin & Coles, 1988), decision making
(O’Connell et al., 2018), the reactivation of stimulus-response bindings (Verleger et al.,
2016b), and response facilitation (Nieuwenhuis et al., 2005). The P3 is most frequently
studied in the oddball task, where the component is elicited by the appearance of a rare non-
target stimulus that is occasionally interspersed into more frequent target stimuli (e.g.,
Verleger et al., 2016a). In the oddball task, more intelligent participants consistently showed

PROCESSING SPEED AND COGNITIVE ABILTIES 5
shorter P3 latencies than less intelligent ones, with correlations in the approximate range from
-0.20 to -0.40 (e.g., Bazana & Stelmack, 2002; Saville et al., 2016; Troche et al., 2009;
Walhovd et al., 2005). In other choice reaction time tasks, however, associations between
individual differences in P3 latencies and intelligence were much less consistent (e.g., Euler,
2018; Euler et al., 2017; Houlihan et al., 1998; Jungeblut et al., 2021; McGarry-Roberts et al.,
1992; Saville et al., 2016; Schubert et al., 2015, 2018; Troche et al., 2017).
There are three factors that may contribute to these inconsistencies: (1) Small sample
sizes and homogeneous sample compositions, (2) a high degree of variation in analytic
procedures, and (3) low reliabilities as well as task-dependencies of ERP latencies.
Because it takes much longer to collect EEG data than it takes to collect behavioral data,
samples typically only contain up to about 100 participants (for notable exceptions see Euler
et al., 2017; Kapanci et al., 2019; Schubert et al., 2017), with many studies consisting of even
fewer than 50 participants (e.g., Amin et al., 2015; Caryl, 1994; Schubert et al., 2015, 2018;
Sculthorpe et al., 2009; Walhovd et al., 2005). Those small sample sizes pose a serious
problem, because correlations in the range of 0.20 to 0.40 only become stable in samples of at
least 180 to 240 participants (Schönbrodt & Perugini, 2013). Hence, correlations between
ERP latencies and cognitive abilities have often been estimated with a large degree of
uncertainty. Moreover, many samples consisted of undergraduate university students (e.g.,
Bazana & Stelmack, 2002; Caryl, 1994; Jaušovec & Jaušovec, 2000; Kapanci et al., 2019;
McGarry-Roberts et al., 1992; Russo et al., 2008; Schubert et al., 2018; Troche et al., 2009),
limiting (at least in more competitive study programs) the variance in cognitive abilities and
possibly resulting in an underestimation of the relationship between ERP latencies and
intelligence.
A second problem stems from the many degrees of freedom researchers have when
analyzing ERP latency data, not only regarding the preprocessing of the continuously
recorded EEG data but also regarding the measurement of latencies of ERP components. In

PROCESSING SPEED AND COGNITIVE ABILTIES 6
general, EEG data quality in large individual differences datasets tends to be rather poor,
because participants often complete a large battery of tasks, which limits the number of
experimental trials per task and negatively affects the signal-to-noise ratio (Wascher et al.,
2021). Moreover, researchers have to rely more on automatic preprocessing pipelines and
algorithms for artifact detection when analyzing large-scale individual-differences data sets
than when analyzing smaller experimental studies, because visual inspection of single trials
quickly becomes too time-consuming (Wascher et al., 2021). Therefore, analytical choices
have a large impact on data quality and differences in analytical choices may contribute to
inconsistencies in the estimated relationships between ERP latencies and intelligence across
different labs.
To reduce their degrees of freedom, researchers should use or adapt validated
preprocessing pipelines that demonstrably improve data quality in large-scale data sets (e.g.,
Bigdely-Shamlo et al., 2015; Cowley et al., 2017; Gabard-Durnam et al., 2018; Rodrigues et
al., 2021). Moreover, they should choose references, filter cut-offs, and latency measures that
maximize the reliability as well as the factorial, construct, and criterion validity of ERP
latency estimates. This is easier said than done, however, because systematic analyses of best
practices for measuring ERP latencies in large-scale datasets are scarce (but see Wascher et al.
(2021) for a comparison of different latency measures in big noisy datasets). Referencing and
filtering in particular can have unpredictable effects on downstream analyses and may blur
electrophysiological correlates of cognitive processes in time (Bigdely-Shamlo et al., 2015;
Rousselet, 2012; Vanrullen, 2011; Widmann & Schröger, 2012), but may also positively
affect the signal-to-noise ratio by removing high-frequency noise and reducing the number of
local maxima a component shows (Liesefeld, 2018; Luck, 2014). Even more complicated,
peak latency measures are more strongly affected by high-frequency noise than fractional area
latency measures (Hansen & Hillyard, 1980; Luck, 2014), a phenomenon that may result in
unexpected interactions between the choice of reference, filter cut-off, and latency measure.

PROCESSING SPEED AND COGNITIVE ABILTIES 7
All in all, this brief review illustrates that there is no established standard on how to analyze
ERP latency data in individual differences research, a regrettable state of affairs that
inevitably introduces many researcher degrees of freedom (Simmons et al., 2011) that
contribute to inconsistencies in the relationship between ERP latencies and intelligence across
different studies.
A third problem arises from the low reliabilities and task-dependencies of ERP latency
measures. In a rigorous simulation study, Kiesel et al. (2008) demonstrated that the power to
detect latency shifts in between-subject designs is generally low, regardless of latency
measure, and that between-subject effects on ERP latencies can be virtually impossible to
detect using single-participant latency estimates. Compared to behavioral measures of
processing speed, electrophysiological measures show a larger heterogeneity of their
reliabilities, ranging from -.06 to .91 (Cassidy et al., 2012; Morand-Beaulieu et al., 2021).
Hence, low reliabilities may have contributed to underestimations of the relationship between
ERP latencies and cognitive abilities. Moreover, neural measures of processing speed are
more task-dependent than behavioral measures (Euler & Schubert, 2021; Schubert et al.,
2017). ERP latencies recorded during three elementary cognitive tasks, for example, were
shown to contain about as much task-specific variance as they contained task-invariant
variance (Schubert et al., 2017). In other words, participants’ neural processing speed is not
only determined by their general processing speed, but also by the speed of specific processes
tapped by an experimental task. Together, the low reliabilities and task-dependencies of ERP
latency measures have likely muddied the relationship between neural measures of processing
speed and cognitive abilities.
Taken together, these three issues – (1) Small sample sizes and homogeneous sample
compositions, (2) a high degree of variation in analytic procedures, and (3) low reliabilities as
well as task-dependencies of ERP latencies – pose serious methodological problems limiting
the consistency and generalizability of findings on the relationship between ERP latencies and
PROCESSING SPEED AND COGNITIVE ABILTIES 8
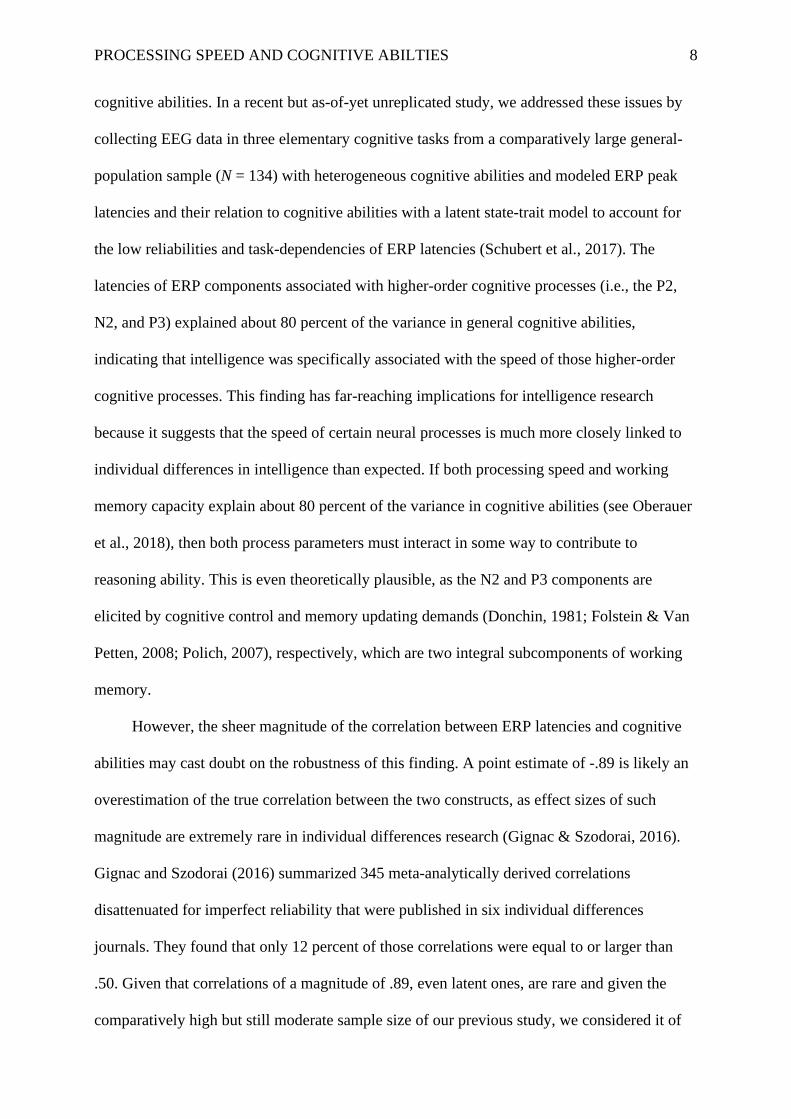
cognitive abilities. In a recent but as-of-yet unreplicated study, we addressed these issues by
collecting EEG data in three elementary cognitive tasks from a comparatively large general-
population sample (N = 134) with heterogeneous cognitive abilities and modeled ERP peak
latencies and their relation to cognitive abilities with a latent state-trait model to account for
the low reliabilities and task-dependencies of ERP latencies (Schubert et al., 2017). The
latencies of ERP components associated with higher-order cognitive processes (i.e., the P2,
N2, and P3) explained about 80 percent of the variance in general cognitive abilities,
indicating that intelligence was specifically associated with the speed of those higher-order
cognitive processes. This finding has far-reaching implications for intelligence research
because it suggests that the speed of certain neural processes is much more closely linked to
individual differences in intelligence than expected. If both processing speed and working
memory capacity explain about 80 percent of the variance in cognitive abilities (see Oberauer
et al., 2018), then both process parameters must interact in some way to contribute to
reasoning ability. This is even theoretically plausible, as the N2 and P3 components are
elicited by cognitive control and memory updating demands (Donchin, 1981; Folstein & Van
Petten, 2008; Polich, 2007), respectively, which are two integral subcomponents of working
memory.
However, the sheer magnitude of the correlation between ERP latencies and cognitive
abilities may cast doubt on the robustness of this finding. A point estimate of -.89 is likely an
overestimation of the true correlation between the two constructs, as effect sizes of such
magnitude are extremely rare in individual differences research (Gignac & Szodorai, 2016).
Gignac and Szodorai (2016) summarized 345 meta-analytically derived correlations
disattenuated for imperfect reliability that were published in six individual differences
journals. They found that only 12 percent of those correlations were equal to or larger than
.50. Given that correlations of a magnitude of .89, even latent ones, are rare and given the
comparatively high but still moderate sample size of our previous study, we considered it of

PROCESSING SPEED AND COGNITIVE ABILTIES 9
utmost importance to replicate this main finding in an independent sample. Moreover, given
the impact that analytical choices can have on the results of EEG studies, we also considered
it critical to assess how the correlation between ERP latencies and cognitive abilities and the
interrelations between ERP latencies across different tasks and components may vary as a
function of analytical choices.
The aims of the present study were therefore threefold: We collected data from an
independent sample of 151 participants with heterogeneous cognitive abilities who completed
three elementary cognitive tasks to replicate the previously found substantial relationships
between P2, N2, and P3 latencies with cognitive abilities. Moreover, we used a multiverse
approach to investigate how different analytical choices regarding references, low-pass filter
cutoffs, and latency measures affected these relationships to evaluate the robustness and
generalizability of the association between neural processing speed and cognitive abilities.
Finally, we also analyzed how these different analytical choices affected the psychometric
properties of ERP latency estimates to develop recommendations for determining ERP
latencies in future individual differences research. In particular, we evaluated how analytical
choices affected the reliabilities of ERP latency estimates and their interrelations across
different tasks and components.
Methods
Participants
We recruited participants via local newspaper advertisements, announcements on our
website, distribution of flyers, and the departmental participant pool. A sample of N = 151
participants between 18 and 60 years from different educational and occupational
backgrounds completed three elementary cognitive tasks and a psychometric test battery
distributed over three measurement sessions. 142 of those participants (94.04 %) completed
both EEG measurement sessions and 139 of those participants (91.39 %) additionally
completed a psychometric testing session. We did not use data from three participants who

PROCESSING SPEED AND COGNITIVE ABILTIES 10
discontinued the study as per their request. The remaining sample of 148 participants (96
females, 51 males, one other) had a mean age of M = 31.52 (SD = 13.91).
A minimum sample size of N = 72 would be needed to test the hypothesis of close fit
(H0: ε ≤ .05, H1: ε ≥ .10) as suggested by Browne and Cudeck (1992) for the structural
equation model shown in Figure 1 (df = 78), an alpha error of α = .05, and a power of
1 – β = .80. The actual sample size of 148 participants yielded a power of 99 % to test the
hypothesis of close fit.
All participants had normal or corrected to normal vision and no mental illness.
Participants signed an informed consent form prior to their participation. They received 75 €
and could receive feedback about their intelligence test results as reward for their
participation. The study was approved by the ethics committee of the faculty of behavioral
and cultural studies, Heidelberg University. All procedures were conducted in accordance
with the declaration of Helsinki.
Material
Elementary cognitive tasks
Choice reaction time (CRT) task. In each trial, participants saw two adjacent grey
squares in the center on a black screen while their index fingers rested on the “D” and “L”
keys of a standard keyboard. A fixation cross was shown between squares. After 1000–1500
ms, a grey cross appeared in one of the two squares and participants had to indicate its
location by pressing the corresponding left or right key. The cross appeared equally often in
each of the two squares. It was shown until participants responded, but at least for 1000 ms
and at most for 3000 ms, followed by an inter-trial interval that consisted of a black screen
and lasted 1000–1500 ms. Trials were randomized, with no target location repeated more than
three times in a row. Participants completed 20 practice trials with feedback and 100
experimental trials without feedback.

PROCESSING SPEED AND COGNITIVE ABILTIES 11
Sternberg memory scanning (SMS) task. In each trial, participants viewed a memory
set of five grey digits (0–9) that were presented sequentially for 400–1000 ms with a blank
inter-stimulus interval of 400–600 ms on a black screen. After the final digit was presented,
participants saw a black screen with a grey question mark for 1800–2200 ms. Subsequently,
they were shown a single digit as a memory probe and had to decide whether the digit had
been included in the previously presented memory set by pressing the “D” or “L” key on a
standard keyboard. The memory probe was part of the previously presented memory set in
50 % of the trials. The digit was shown until participants responded, but at least for 1000 ms
and at most for 3000 ms, followed by an inter-trial interval that consisted of a black screen
and lasted 1000–1500 ms. Trials were randomized, with none of the conditions (match vs. no
match) occurring more than three times in a row and none of the probe stimuli occurring
twice in a row. Participants completed 20 practice trials with feedback and 100 experimental
trials without feedback.
Posner letter matching (PLM) task. In each trial, participants saw a pair of grey letters
on a black screen and had to decide if their names were identical by pressing the “D” or “L”
key on a standard keyboard. Letters were identical in 50 % of the trials. Following the
presentation of a grey fixation cross shown for 1000–1500 ms, the pair of letters was shown
until participants responded, but at least for 1000 ms and at most for 3000 ms, followed by an
inter-trial interval that consisted of a black screen and lasted 1000–1500 ms. Trials were
randomized, with none of the conditions (name-identical vs. not name-identical) occurring
more than three times in a row. Participants completed 20 practice trials with feedback and
120 experimental trials without feedback.
Berlin Intelligence Structure Test (BIS)
Participants completed the short version of the Berlin Intelligence Structure Test (Jäger
et al., 1997) as a measure of general intelligence. The short version of the BIS distinguishes
between four operation-related components (processing capacity, processing speed, memory,

PROCESSING SPEED AND COGNITIVE ABILTIES 12
creativity) and three content-related components (verbal, numerical, figural). Each of the 15
subtests assess different combinations of the components. For our analyses, we calculated
participants’ operation-related component scores by aggregating the normalized z-scores of all
subtests measuring the respective component. Participants had a mean test score of M = 97.09
(SD = 10.61)1. Participants had a mean processing capacity score of M = 101.61 (SD = 7.12),
a mean processing speed score of M = 101.14 (SD = 7.12), a mean memory score of
M = 98.59 (SD = 7.16), and a mean creativity score of M = 98.15 (SD = 6.97). The four
subscales show low-to-moderate internal consistencies, ranging from α = .45 to α = .75.
Procedure
Participants completed three measurement session that lasted about 3–3.5 hours each
and were about four months apart. Due to a two-month break in data collection at the outbreak
of COVID-19, some participants had to be rescheduled, resulting in longer gaps between
measurement sessions. At the first measurement session, participants filled out a demographic
questionnaire and completed the SMS task while their EEG was recorded. At the second
measurement session, they completed the CRT and PLM tasks while their EEG was recorded.
At each of those measurement sessions, participants also completed a number of other
cognitive tasks not reported here (see Schubert et al., 2022). During EEG recordings,
participants were seated in a dimly lit, sound-attenuated, and electrically shielded EEG cabin.
At the third measurement session, participants completed a psychometric test battery in
groups of up to four participants. The test battery consisted of the short version of the BIS,
two brief highly speeded intelligence tests (data not reported here), a working memory test
battery (data not reported here), a pretzel task (data not reported here), and a mind-wandering
questionnaire (data not reported here). One participant completed the BIS via video chat
1 Please note that the BIS is normed to a mean value of 100 and a SD of 10.

PROCESSING SPEED AND COGNITIVE ABILTIES 13
because they were unwilling to visit the lab for the final measurement session due concerns
related to COVID-19.
EEG recording
The EEG was recorded with 32 equidistant Ag-AgCl electrodes, with aFz as a ground
electrode. Impedances were kept below 5 kΩ. Electrodes were online referenced to Cz and
later rereferenced to an either average reference or linked mastoids. The EEG signal was
recorded continuously with a sampling rate of 1000 Hz. EEG data from two participants
recorded during the first measurement session and four participants recorded during the
second measurement session had to be discarded due to recording errors.
Data preprocessing
Behavioral data
For each task, we discarded any trials with logarithmized RTs exceeding ± 3 SD of each
participant’s mean RT. Subsequently, we calculated the mean RT of correct trials and the
accuracy rate per participant for each of the three tasks and z-standardized those variables for
further analyses.
EEG data
We preprocessed the EEG data with the open source toolbox EEGLAB (Delorme &
Makeig, 2004) in MATLAB (The MathWorks Inc., Natick, Massachusetts). We introduced
three experimental factors into the preprocessing of EEG data to analyze how variations in
those factors affected the factor structure of ERP latencies and their relationship with
intelligence: We systematically varied a) the upper limit of the low-pass filter (8 Hz vs. 16 Hz
vs. 32 Hz), b) the offline reference (average reference vs. linked mastoids), and c) the method
of latency estimation (peak latency vs. 50 % fractional area latency), resulting in a combined
total of twelve different preprocessing pipelines (see Table 1 for an overview of the twelve
combinations).

PROCESSING SPEED AND COGNITIVE ABILTIES 14
Table 1
Overview of the different combinations of preprocessing steps
8 Hz low-pass filter 16 Hz low-pass filter 32 Hz low-pass filter
average reference
peak
latency
50 % FA
latency
peak
latency
50 % FA
latency
peak
latency
50 % FA
latency
linked mastoids peak
latency
50 % FA
latency
peak
latency
50 % FA
latency
peak
latency
50 % FA
latency
Note. FA = fractional area.
We first discarded any incorrect trials and trials with logarithmized RTs exceeding ± 3
SD of each participant’s mean RT. EEG data were filtered with a band-pass filter of 0.1–8 Hz,
0.1–16 Hz, or 0.1–32 Hz (corresponding to the experimental factor low-pass filter) and down-
sampled to 500 Hz. We created separate data sets for independent-component analyses (ICA)
with the data down-sampled to 200 Hz and filtered with a high-pass filter of 1 Hz instead of
0.1 Hz to optimize the decomposition quality. The following preprocessing steps were then
applied to both datasets. Bad channels were identified, subsequently removed, and later
interpolated if they showed a flatline for longer than 5 seconds, more line noise relative to its
signal than four standard deviations, or were weakly (i.e., r < .80) correlated to their
neighboring channels. Data were then offline re-referenced to an average reference or to
linked mastoids (corresponding to the experimental factor reference). Segments were 1200 ms
long and started 200 ms before stimulus onset. Artifact-containing segments were
automatically detected and rejected with 1000 μV as the threshold for detecting large
fluctuations, 5 SDs as the probability threshold for the detection of improbable data, and 5 %
as the maximum number of segments to be rejected per iteration. We then conducted an ICA
of the separate data set down-sampled to 200 Hz and applied the decomposition matrices to
the data set down-sampled to 500 Hz to identify and remove artifacts and generic
discontinuities with the ICLabel algorithm (Pion-Tonachini et al., 2019). Subsequently, we
repeated the automatic detection and rejection of artifact-containing segments using the same
specifications as before to remove any remaining artifacts and further improve data quality.

PROCESSING SPEED AND COGNITIVE ABILTIES 15
We then calculated each participant’s ERP separately for each of the three tasks, for
each of the three low-pass filter conditions, and for each of the two reference conditions by
averaging across all trials of the respective task. We determined the latency of the P2
component at the fronto-central electrode on the midline, and of the N2 and P3 components at
the parietal electrode on the midline. Those electrode positions were chosen in accordance
with previous research (see Schubert et al., 2017, 2018, 2021). The on- and offset of each
participant’s ERP components were identified in a semi-automated manner because a fully
automated detection procedure yielded spurious and unreliable latency estimates, likely due to
substantial interindividual variability in the timing of ERP components. We applied two
methods, peak latencies and 50 % fractional area latencies (corresponding to the experimental
factor method of latency estimation), to determine the latencies of ERP components. The peak
latency measure reflects the time point at which an ERP component reaches its maximum,
whereas the 50 % fractional area latency measure reflects the time point that divides the area
under the curve of an ERP component into two regions of equal area (Hansen & Hillyard,
1980; Kiesel et al., 2008; Lopez-Calderon & Luck, 2014). Latency estimates were z-
standardized for further analyses.
Data analysis
We used structural equation models to evaluate the factorial structure and psychometric
properties of ERP latency estimates across components and tasks and to estimate their latent
correlation with participants’ general intelligence. For this purpose, we specified hierarchical
models separately for ERP latency estimates of each of the twelve different combinations of
preprocessing steps as illustrated in Figure 1.
Models were fitted with the R package lavaan (Rosseel, 2012) with the maximum
likelihood algorithm with robust Huber-White standard errors and a scaled test statistic equal
to the Yuan-Bentler test statistic to account for the nonnormality of some variables and
possible deviations from multivariate normality. In some cases, non-significant residual

PROCESSING SPEED AND COGNITIVE ABILTIES 16
variances were estimated to have values below zero; in those cases, we refitted the model with
the corresponding residual variances fixed to zero.
Figure 1
Illustration of path model
Note. Path coefficients of solid links were fixed to one; path coefficients of dashed lines were
estimated freely. Residuals of manifest variables are not shown. CRT = choice reaction time;
SMS = Sternberg memory scanning; PLM = Posner letter matching; PC = processing capacity;
PS = processing speed; M = memory; C = creativity; ERP = event-related potential; g = general
intelligence.
We evaluated goodness-of-fit based on the comparative fit index (CFI; Bentler, 1990)
and the root mean square error of approximation (RMSEA; Browne & Cudeck, 1992) and
compared model fits with likelihood ratio tests. We considered CFI values > .90 and RMSEA
values < .08 to indicate acceptable model fit and CFI values > .95 and RMSEA values < .06
to indicate good model fit, as recommended by Browne and Cudeck (1992) and Hu and
Bentler (1999). The statistical significance of model parameters was assessed with the two-
sided critical ratio test.

PROCESSING SPEED AND COGNITIVE ABILTIES 17
Results
Descriptive statistics of behavioral data and ERP latencies are shown in Table 2 and
Supplementary Table S1, respectively. The grand averages of the ERPs are shown in Figure 2.
Table 2
Means (SDs in brackets) of accuracy rates and response times (in milliseconds)
CRT task SMS task PLM task
n = 136 n = 143 n = 140
RT ACC RT ACC RT ACC
383.55 (50.29) 1.00 (0.01) 918.94 (230.88) 0.96 (0.04) 707.89 (125.93) 0.97 (0.02)
Note. CRT = choice reaction time; SMS = Sternberg memory scanning; PLM = Posner letter
matching.
ERP latencies showed moderate convergent validities across the twelve preprocessing
pipelines (see Supplementary Tables S2 to S10). Correlations between latency estimates
derived from different preprocessing pipelines ranged from r = .02 to r = .97 with an average
correlation of r = .52 between latency estimates. There was no experimental task or ERP
component that stood out from the rest by showing a noticeably lower or higher convergent
validity across the twelve preprocessing pipelines than the other tasks or components. On
average, only about 27 percent of variance was shared between latency measures across
different preprocessing pipelines. This implies that choosing any specific combination of low-
pass filter, offline reference, and method of latency estimation has a substantial impact on
downstream analyses and should therefore be done after careful consideration.
To evaluate how preprocessing affected the relationship between ERP latencies and
cognitive abilities and the psychometric properties of ERP latency variables, we estimated
structural equation models separately for latency estimates of each of the twelve different
combinations of preprocessing steps. All models for ERP latency variables estimated from
EEG data referenced to an average reference provided an at least acceptable account of the
data (95.21 ≤ χ² ≤ 140.15, .000. ≤ p ≤ .078, .78 ≤ CFI ≤ .94, 0.04 ≤ RMSEA ≤ 0.07).

PROCESSING SPEED AND COGNITIVE ABILTIES 18
Figure 2
Grand averages of the event-related potentials
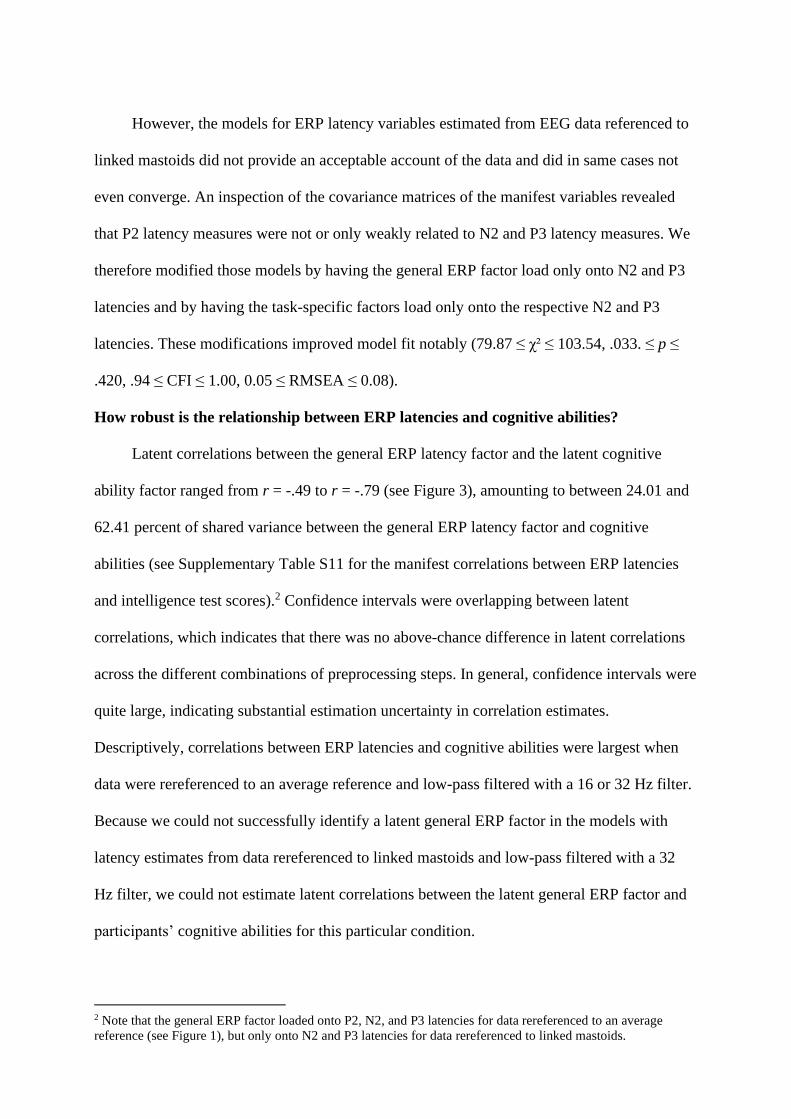
However, the models for ERP latency variables estimated from EEG data referenced to
linked mastoids did not provide an acceptable account of the data and did in same cases not
even converge. An inspection of the covariance matrices of the manifest variables revealed
that P2 latency measures were not or only weakly related to N2 and P3 latency measures. We
therefore modified those models by having the general ERP factor load only onto N2 and P3
latencies and by having the task-specific factors load only onto the respective N2 and P3
latencies. These modifications improved model fit notably (79.87 ≤ χ² ≤ 103.54, .033. ≤ p ≤
.420, .94 ≤ CFI ≤ 1.00, 0.05 ≤ RMSEA ≤ 0.08).
How robust is the relationship between ERP latencies and cognitive abilities?
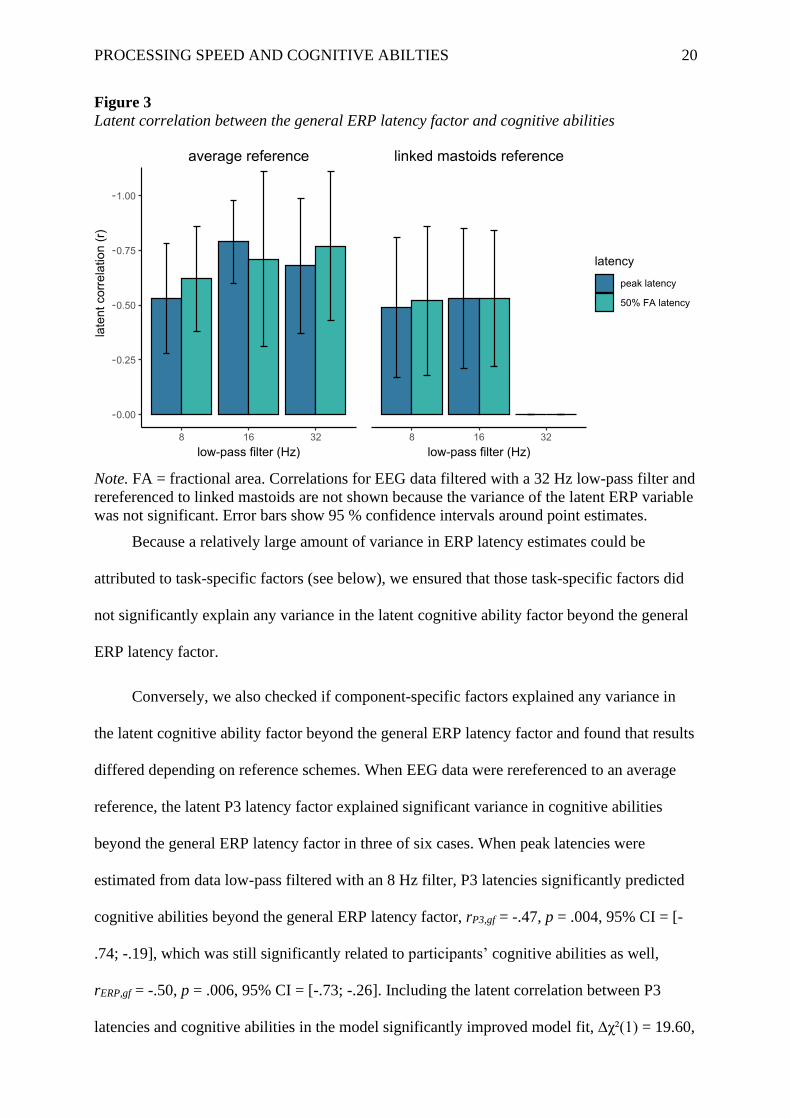
Latent correlations between the general ERP latency factor and the latent cognitive
ability factor ranged from r = -.49 to r = -.79 (see Figure 3), amounting to between 24.01 and
62.41 percent of shared variance between the general ERP latency factor and cognitive
abilities (see Supplementary Table S11 for the manifest correlations between ERP latencies
and intelligence test scores).2 Confidence intervals were overlapping between latent
correlations, which indicates that there was no above-chance difference in latent correlations
across the different combinations of preprocessing steps. In general, confidence intervals were
quite large, indicating substantial estimation uncertainty in correlation estimates.
Descriptively, correlations between ERP latencies and cognitive abilities were largest when
data were rereferenced to an average reference and low-pass filtered with a 16 or 32 Hz filter.
Because we could not successfully identify a latent general ERP factor in the models with
latency estimates from data rereferenced to linked mastoids and low-pass filtered with a 32
Hz filter, we could not estimate latent correlations between the latent general ERP factor and
participants’ cognitive abilities for this particular condition.
2 Note that the general ERP factor loaded onto P2, N2, and P3 latencies for data rereferenced to an average
reference (see Figure 1), but only onto N2 and P3 latencies for data rereferenced to linked mastoids.
PROCESSING SPEED AND COGNITIVE ABILTIES 20
Figure 3
Latent correlation between the general ERP latency factor and cognitive abilities
Note. FA = fractional area. Correlations for EEG data filtered with a 32 Hz low-pass filter and
rereferenced to linked mastoids are not shown because the variance of the latent ERP variable
was not significant. Error bars show 95 % confidence intervals around point estimates.
Because a relatively large amount of variance in ERP latency estimates could be
attributed to task-specific factors (see below), we ensured that those task-specific factors did
not significantly explain any variance in the latent cognitive ability factor beyond the general
ERP latency factor.
Conversely, we also checked if component-specific factors explained any variance in
the latent cognitive ability factor beyond the general ERP latency factor and found that results
differed depending on reference schemes. When EEG data were rereferenced to an average
reference, the latent P3 latency factor explained significant variance in cognitive abilities
beyond the general ERP latency factor in three of six cases. When peak latencies were
estimated from data low-pass filtered with an 8 Hz filter, P3 latencies significantly predicted
cognitive abilities beyond the general ERP latency factor, rP3,gf = -.47, p = .004, 95% CI = [-
.74; -.19], which was still significantly related to participants’ cognitive abilities as well,
rERP,gf = -.50, p = .006, 95% CI = [-.73; -.26]. Including the latent correlation between P3
latencies and cognitive abilities in the model significantly improved model fit, ∆χ²(1) = 19.60,

PROCESSING SPEED AND COGNITIVE ABILTIES 21
p < .001. When 50% fractional area latencies were estimated from data low-pass filtered with
a 16 Hz filter, P3 latencies significantly predicted cognitive abilities beyond the general ERP
latency factor, rP3,gf = -.39, p = .024, 95% CI = [-.69; -.08], which was still significantly
related to participants’ cognitive abilities as well, rERP,gf = -.58, p = .013, 95% CI = [-.89; -
.27]. Including the latent correlation between P3 latencies and cognitive abilities in the model
significantly improved model fit, ∆χ²(1) = 8.49, p = .004. When peak latencies were estimated
from data low-pass filtered with a 32 Hz filter, P3 latencies significantly predicted cognitive
abilities beyond the general ERP latency factor, rP3,gf = -.61, p = .001, 95% CI = [-.85; -.37].
This general ERP latency factor was then no longer significantly related to participants’
cognitive abilities, rERP,gf = -.11, p = .803, 95% CI = [-.58; .36]. Including the latent
correlation between P3 latencies and cognitive abilities in the model significantly improved
model fit, ∆χ²(1) = 16.30, p < .001.
When EEG data were rereferenced to linked mastoids, the latent P2 latency factor
explained significant variance in cognitive abilities beyond the general ERP latency factor in
all but two cases. This latent correlation was already included in all estimated models because
P2 latencies did not load onto the general ERP factor. Latent correlations between the P2
latencies and cognitive abilities ranged from r = -.32 to r = -.44, all ps ≤ .015, except when
either peak or 50 % fractional area latencies were estimated from data low-pass filtered with a
32 Hz filter, all rs ≥ -.15. and all ps ≥ .246. The latent N2 and P3 latency factors did never
explain any significant variance in cognitive abilities beyond the general ERP latency factor
in EEG data referenced to linked mastoids.
Psychometric properties of ERP latencies
To evaluate the psychometric properties of ERP latency estimates, we evaluated
separately for each model how much of the total variance in latency estimates could be
accounted for by a general ERP factor, a component-specific factor, and a task-specific factor

PROCESSING SPEED AND COGNITIVE ABILTIES 22
(see Figure 4). Finally, we assessed the reliability of latency estimates by calculating the
amount of their variance accounted for by those latent factors.
How much of the variance in ERP latencies can be accounted for by a general factor
across components and tasks?
Across all twelve different combinations of preprocessing steps, 11.01 % of variance
(SD = 8.28 %) could be accounted for by a general latent factor across components and tasks
(see the areas shaded in teal in Figure 4). This psychometric property was affected by the
choice of low-pass filter and offline reference, but not by the method of latency estimation.
Lowering the upper value of the low-pass filter systematically increased the amount of
variance accounted for in latency estimates by a general latent factor across components and
tasks: Whereas only on average 6.64 % (SD = 5.57 %) of the variance was accounted for by a
general factor when EEG data were filtered with a low-pass filter of 32 Hz, on average
11.72 % (SD = 6.27 %) of variance was accounted for by a general factor when EEG data
were filtered with a low-pass filter of 16 Hz, and on average 14.67 % (SD = 10.27 %) of
variance was accounted for by a general factor when EEG data were filtered with a low-pass
filter of 8 Hz. In addition, more variance in latency estimates could be attributed to a general
latent factor across components and tasks when EEG data were offline rereferenced to an
average reference (M = 14.59 %, SD = 8.78%) than when they were rereferenced to linked
mastoids (M = 7.43 %, SD = 5.95 %). In comparison, the choice of latency estimate had only
little influence on the results, with on average 11.20 % (SD = 9.15 %) of the variance in peak
latency estimates and on average 10.81 % (SD = 7.39 %) of the variance in 50 % fractional
area latency estimates accountable for by a general factor.
How much of the variance in ERP latencies can be accounted for by component-specific
factors?
Across all twelve different combinations of preprocessing steps, 13.31 % of variance
(SD = 14.08 %) could be accounted for by component-specific factors (see the areas shaded in

PROCESSING SPEED AND COGNITIVE ABILTIES 23
cyan blue in Figure 4). This psychometric property was most strongly affected by the choice
of offline reference, whereas it was only moderately affected by the choice of low-pass filter
and only hardly affected by the method of latency estimation.
Much more variance in ERP latency estimates could be attributed to component-specific
factors when EEG data were offline rereferenced to linked mastoids (M = 17.11 %,
SD = 17.78 %) than when they were rereferenced to an average reference (M = 9.52 %,
SD = 7.42%). In addition, more variance in ERP latency estimates could be accounted for by
component-specific factors when EEG data were filtered with a 32 Hz (M = 14.69 %,
SD = 14.89 %) or a 16 Hz (M = 14.25 %, SD = 16.21 %) low-pass filter than when they were
more strongly filtered with an 8 Hz low-pass filter (M = 11.00 %, SD = 10.65 %). Yet again,
the choice of latency estimate had only little influence on the results, with on average 12.06 %
(SD = 13.75 %) of the variance in peak latency estimates and on average 14.57 %
(SD = 14.57 %) of the variance in 50 % fractional area latency estimates accounted for by a
component-specific factors.
How much of the variance in ERP latencies can be accounted for by task-invariant factors?
Adding the amount of variance accounted for by a general factor across components and
tasks to the amount of variance accounted for by component-specific factors yields the
amount of variance in ERP latency estimates that is consistent across tasks. In the present
study, the amount of variance in ERP latency estimates consistent across tasks ranged on
average from 21.33 % to 25.39 %. This result indicates that the specific choice of
preprocessing steps has little influence on how much variance in ERP latencies is consistent
across tasks, but that it rather affects the ratio of task-invariant variance accounted for by
component-invariant and component-specific factors.
How much of the variance in ERP latencies can be accounted for by task-specific factors?
Across all twelve different combinations of preprocessing steps, 24.11 % of variance
(SD = 21.16 %) could be accounted for by task-specific factors (see the areas shaded in dark

PROCESSING SPEED AND COGNITIVE ABILTIES 24
blue in Figure 4). This psychometric property was most strongly affected by the choice of
offline reference, whereas it was only moderately affected by the choice of low-pass filter and
only hardly affected by the method of latency estimation.
Much more variance in ERP latency estimates could be attributed to task-specific
factors when EEG data were offline rereferenced to linked mastoids (M = 32.15 %,
SD = 26.81 %) than when they were rereferenced to an average reference (M = 18.48 %,
SD = 12.96 %). In addition, we observed a non-linear effect of low-pass filtering: When EEG
data were filtered with a 16 Hz low-pass filter, on average 19.17 % (SD = 17.29 %) of
variance was accounted for by task-specific factors, whereas on average 26.81 %
(SD = 22.61 %) and 26.36 % (SD = 22.83 %) of variance was accounted for by task-specific
factors when EEG data were filter with a 8 Hz or 32 Hz low-pass filter, respectively. Yet
again, the choice of latency estimate had only little influence on the results, with on average
24.20 % (SD = 21.31 %) of the variance in peak latency estimates and on average 24.02 %
(SD = 21.21 %) of the variance in 50 % fractional area latency estimates accounted for by
task-specific factors.
How reliable are ERP latencies?
We estimated reliabilities by calculating the amount of variance in manifest latency
estimates accounted for by the general factor, the component-specific factors, and the task-
specific factors. On average, ERP latencies were only moderately reliable (M = 0.48,
SD = 0.17). However, they also showed considerable variability in their reliabilities, ranging
from 0.20 to 0.85 (see the overall height of bars in Figure 4).
Of the three preprocessing components varied in the present study, the choice of offline
reference had the largest effect on reliabilities, as reliabilities tended to be about 1.4 times
larger when EEG data were rereferenced with linked mastoids (M = 0.57, SD = 0.18) than
when they were rereferenced with an average reference (M = 0.41, SD = 0.13). The choice of
low-pass filter only had a moderate effect on reliabilities: ERP latencies showed an average

PROCESSING SPEED AND COGNITIVE ABILTIES 25
reliability of 0.52 (SD = 0.17) when filtered with an 8 Hz filter, an average reliability of 0.45
(SD = 0.16) when filtered with a 16 Hz filter, and an average reliability of 0.48 (SD = 0.18)
when filtered with a 32 Hz filter. The choice of latency estimate did not strongly affect
reliabilities, with an average reliability of 0.47 (SD = 0.18) for peak latency estimates and an
average reliability of 0.49 (SD = 0.17) for 50 % fractional area latency estimates.
Reliability estimates also varied across experimental tasks and ERP components.
Compared across the three different tasks, they were highest for ERP latencies in the
Sternberg memory scanning task (M = 0.59, SD = 0.16), second highest ERP latencies in the
Posner letter matching task (M = 0.47, SD = 0.18), and lowest for ERP latencies in the choice
reaction time task (M = 0.39, SD = 0.12). Compared across the three ERP components, they
were highest for P3 latencies (M = 0.55, SD = 0.19), second highest for N2 latencies
(M = 0.49, SD = 0.18), and lowest for P2 latencies (M = 0.41, SD = 0.10). It is important to
note, however, the N2 and P3 latencies were determined at the same parietal electrode site,
whereas P2 latencies were determined at a frontal electrode site.
Taken together, these results illustrate that the choice of offline reference, the choice of
upper limit for the low-pass filter, the choice of task, and the specific ERP component studied
had considerable effects on the reliabilities of ERP latencies.
Discussion
We replicated the previously found large relationships between P2, N2, and P3 latencies
and cognitive abilities (Schubert et al., 2017) in an independent sample and evaluated the
robustness of the relationship between neural processing speed and cognitive abilities by
assessing how it was affected by different analytical choices regarding references, low-pass
filter cutoffs, and latency measures using a multiverse approach. In addition, we also analyzed
how these different analytical choices affected the psychometric properties of ERP latency
estimates to develop recommendations for using ERP latencies in future individual
differences research.

PROCESSING SPEED AND COGNITIVE ABILTIES 26
Figure 4
Amount of variance in ERP latencies explained by latent factors in structural models
Note. CRT = choice reaction time; SMS = Sternberg memory scanning; PLM = Posner letter matching, ref. = reference; PL = peak latency; FAL = 50 % fractional area latency.

PROCESSING SPEED AND COGNITIVE ABILTIES 27
In general, multiverse analysis addresses the one-to-many mapping from theories to
statistical hypotheses and their auxiliary assumptions by providing a detailed picture of how
strongly conclusions depend on certain analytical choices (Harder, 2020; Steegen et al.,
2016). Multiverse approaches of data preprocessing pipelines have become increasingly
popular in EEG research (e.g., Clayson et al., 2021; Dien, 2017; Hagemann et al., 1998;
Klawohn et al., 2020; Nikolin et al., 2022; Sandre et al., 2020; Šoškić et al., 2022; Wascher et
al., 2021; Williams et al., 2021), because they allow evaluating how the large number of
analytical choices readily available to researchers may affect the consistency of their results
and the reliabilities of their measures. In the present study, we applied a multiverse analysis of
EEG data in the context of individual differences research, where goals of data preprocessing
may differ substantially from experimental research. In particular, individual differences
researchers aim to increase the convergent and criterion validity of measures, whereas
experimental researchers aim to maximize the effect size of experimental effects. Moreover,
the former strive to measure variables with high temporal stabilities, high consistencies, and
high reliabilities, and to maximize between-subject variance in variables, whereas the latter
tend to measure state- and task-specific variables and typically strive to minimize
uncontrolled between-subject variance in variables. Taking a dedicated individual differences
perspective, the present study focused on the criterion validity of ERP latencies, which we
assessed based on their correlation with individual differences in cognitive abilities, and their
psychometric properties (i.e., consistencies and reliabilities) to evaluate the robustness of the
relationship between neural processing speed and cognitive abilities and to develop
recommendations for future research on individual differences in ERP latencies.
Evidence for a robust and strong correlation between neural processing speed and
cognitive abilities
The most important finding of the present study is that there is a substantial, replicable,
and robust relationship between latencies of ERP components associated with higher-order
processing and cognitive abilities. As argued by Oreskes (2019), the convergence of results

PROCESSING SPEED AND COGNITIVE ABILTIES 28
across different methods generally speaks to the trustworthiness of scientific findings. We
were able to replicate our earlier results by demonstrating that the previously estimated latent
correlation of r = -.89 was contained in the 95 % CI of the latent correlation estimated in the
present study when EEG data were preprocessed in the same way as in our previous study
(Schubert et al., 2017). Moreover, and more importantly, the multiverse analysis
demonstrated that a large latent relationship between ERP latencies and cognitive abilities
could be consistently observed irrespective of the specific combination of preprocessing steps,
as long as the model included a latent general factor of ERP latencies. Across all ten
combinations of preprocessing steps where this was the case, we observed an average latent
correlation of r = -.63 and a range of latent correlations from r = -.49 to r = -.79. In other
words, individual differences in ERP latencies explained between 24 and 62 percent of
variance in individual differences in cognitive abilities across different methods.
Our finding has important implications for theories of human intelligence differences
because it suggests that the speed of ERP components associated with higher-order cognitive
processes is strongly and robustly related to individual differences in reasoning. Hence,
process theories of general intelligence need to either explain how a higher speed of neural
information processing facilitates reasoning or which third variable may give rise to the
association between neural processing speed and general intelligence. We previously found
that an experimental increase in neural processing speed by nicotine administration did not
result in a concomitant increase in intelligence test performance (Schubert et al., 2018), which
indicates that a third variable (e.g., structural or functional brain properties) affects both the
speed of neural processing and general intelligence. Candidate variables may be structural and
functional properties of brain networks associated with higher-order cognitive processes that
are not easily altered by one-time changes in neurotransmitter concentration. Research on the
structural and functional connectivity within and between regions support this idea, because
measures of white matter tract integrity and functional connectivity within and between
frontoparietal brain regions have been repeatedly associated with individual differences in

PROCESSING SPEED AND COGNITIVE ABILTIES 29
behavioral or neural processing speed (Ferrer et al., 2013; Kievit et al., 2016; Penke et al.,
2012; Schubert et al., 2021) and with individual differences in cognitive abilities (Booth et al.,
2013; Cole et al., 2012; Fuhrmann et al., 2020; Hilger et al., 2017; Kievit et al., 2016; Pineda-
Pardo et al., 2016; Schubert et al., 2021; Tamnes et al., 2010; Wendelken et al., 2017).
Overall, these findings support the idea that a higher structural and functional connectivity of
frontoparietal brain networks positively affects the speed of neural information processing,
which in turn positively affects the efficiency of intermediate cognitive processes by
facilitating the transfer of information between frontal attention and working memory
processes and temporal-parietal processes of memory storage, which in turn positively affects
reasoning ability (Schubert & Frischkorn, 2020). Whether this neurocognitive process cascade
stands at the center of the positive manifold or is only one of several processes contributing to
its emergence remains an open question (Kovacs & Conway, 2016).
Recommendations for future studies on individual differences in ERP latencies
Based on the results of our multiverse analysis, we can develop recommendations for
the design of studies, and the preprocessing and data analysis of EEG data in future research
on individual differences in ERP latencies. We found that on average only about 27 percent of
variance was shared between latency measures across different preprocessing pipelines, which
implies that choosing any specific combination of preprocessing steps has a substantial impact
on downstream analyses and should therefore be done deliberately.
First, we cannot stress enough the need to either model ERP latencies as latent variables
or to calculate aggregate measures to account for the low reliabilities and substantial task-
specificities of single ERP latency measures. ERP latencies showed an average reliability of
0.48, which is much lower than reliabilities of behavioral tasks or cognitive task batteries. To
make matters worse, on average only 21 to 26 percent of variances in single ERP latency
measures could be attributed to task-invariant factors (i.e., the general ERP latency factor or
component-specific factors), whereas about the same amount of variance (on average 24
percent) could be attributed to task-specific factors. Those task-specific factors were unrelated

PROCESSING SPEED AND COGNITIVE ABILTIES 30
to individual differences in cognitive abilities and should therefore be considered as nuisance
factors in this specific research context (this may clearly differ for other research questions).
In other words, ERP latency measures contained about equal parts of measurement error
variance and systematic variance, and only about half of the systematic variance was related
to individual differences in cognitive abilities, whereas the other half reflected nuisance
factors. Future research on individual differences in ERP latencies should address these
problematic psychometric properties of ERP latency measures, e.g., by correcting for
attenuation, calculating aggregate measures, estimating factor scores in exploratory factor
analyses, or using latent variable models.
Second, we recommend to always record EEG data from multiple tasks to account for
the relatively high degree of task-specificity of ERP latency measures. By recording EEG data
from multiple tasks, average measures become less task-specific and exploratory and
confirmatory factor analyses can model task-specific factors orthogonal to task-invariant
sources of variation.
Third, we more tentatively recommend to reference EEG data to an average reference
rather than to linked mastoids for three reasons. First, ERP latencies tended to show higher
criterion validities when estimated from EEG data referenced to an average reference than
when estimated from EEG data referenced to linked mastoids as indicated by their slightly
higher correlations with general intelligence (r = .53 to r = .79 vs. r = .49 to r = .53).
However, confidence intervals were overlapping between all latent correlations. Second, the
hierarchical model displayed in Figure 1 showed a better fit to ERP latency data estimated
from EEG data referenced an average reference than to ERP latency data estimated from EEG
data referenced to linked mastoids, for which model adjustments were necessary. Hence, the
data referenced to an average reference were more in agreement with the principle of
parsimony (Occam’s razor) than the data referenced to linked mastoids. Nevertheless, because
the true factorial structure of ERP latency estimates is unknown, we cannot make any
inferences about the comparative validity of the two factorial solutions beyond their

PROCESSING SPEED AND COGNITIVE ABILTIES 31
differences in parsimony. Third, previous research found that EEG measures derived from
data referenced to linked mastoids contained higher levels of noise and showed larger
between-trial variability than EEG measures derived from data referenced to an average
reference (Clayson et al., 2021; Dien, 2017). These findings likely reflect that an average
reference yields a higher signal-to-noise ratio because averaging activity across all channels
reduces random noise in the ensuing aggregate reference. We therefore tentatively
recommend using an average reference scheme, ideally in conjunction with high-density
montages to ensure sufficient electrode coverage of the whole head surface (Dien, 1998).
To summarize, we recommend (1) to model ERP latencies as latent variables or to
calculate aggregate measures to account for their low reliabilities, (2) to always record EEG
data from multiple tasks to account for the relatively high degree of task-specificity of ERP
latency measures, and (3) to use an average reference scheme to improve the criterion validity
and factorial parsimony of ERP latency estimates.
Suggestions for task selection and data analysis in large-scale data collection projects
Large-scale data collection projects such as the Human Connectome Project (HCP; Van
Essen et al., 2013), the Nathan Kline Institute-Rockland Sample (NKI-RS; Nooner et al.,
2012), or the Adolescent Brain Cognitive Development study (ABCD; Volkow et al., 2018)
are playing an important role in research on individual differences in cognitive abilities and
cognitive development, because they allow studying relations between neurocognitive process
parameters – sometimes even longitudinally – in samples of hundreds or thousands of
participants (Kievit et al., 2022). Study protocols for these kinds of large-scale projects are
designed to assess a large number of variables relevant for different research questions, which
inevitably leads to a tradeoff between the breadth and depth of included measures. Hence, it is
unlikely that an entire EEG measurement session can be dedicated to an optimal measurement
of ERP latencies in two-choice reaction time tasks in large-scale data collection projects. We
therefore try to give some tentative recommendations for which of the tasks included in the
present study to choose and how to best analyze the resulting single-task EEG data if

PROCESSING SPEED AND COGNITIVE ABILTIES 32
including multiple tasks is not an option. Our recommendations are given based on the
assumption that large research consortia prefer including reliable and valid measures of broad
constructs (e.g., neural processing speed) over including equally reliable and valid but
narrower task-specific measures. Therefore, we recommend including tasks and choosing
combinations of preprocessing steps that yield the maximum amount of task-invariant
variance in observed measures.
Based on our analysis of psychometric properties (see Figure 4), we recommend using
either of the three experimental tasks, an average reference scheme, and an 8 or 16 Hz low-
pass filter to generate ERP latency estimates containing an above-average amount of task-
invariant variance.3 Both peak latency and 50 % fractional area latency estimates could be
used, because the choice of latency estimation method had only negligible effects on the
psychometric properties of ERP latencies in our data. Moreover, before averaging EEG
activity across trials, we suggest conducting an odd-even split of trial data, calculating ERPs
separately for odd and even trials, and subsequently estimating ERP latencies separately for
odd and even trials. This does not only allow to estimate the reliabilities of ERP latencies
based on odd-even correlations, but also to fit latent variable models where a latent ERP
latency factor loads onto latency estimates from odd and even trial data, respectively (see
Schubert et al., 2022, for an example). Finally, researchers should think carefully about
whether they want to study latencies of a specific component (e.g., the P3) or of several
components associated with higher-order processing (e.g., the P2, N2, and P3), because being
able to average or model latent variables across components will further improve their
analyses psychometrically.
Although these recommendations can be derived from the present multiverse analysis
and will yield improved psychometric properties in comparison to a set of arbitrary
3 Although it may seem an obvious choice to recommend using the Sternberg memory scanning task and
referencing EEG data to linked mastoids due to the high reliabilities of the resulting latency estimates, we would
like to caution against this. The high reliabilities of these ERP latency estimates were mainly due to large
amounts of task-specific variance. In comparison, the amounts of task-invariant variance were smaller for these
latency measures than for latency measures estimated from EEG data referenced to an average reference. Hence,
this is only an optimal choice if researchers are interested in analyzing correlates of task-specific ERP latencies.

PROCESSING SPEED AND COGNITIVE ABILTIES 33
preprocessing and analysis choices, we would like to once again stress that improving single-
task measurement is no substitute for multi-task measurement given the high degree of task-
specificity of ERP latency measures found in the present study. Hence, EEG data should
always be recorded from multiple tasks whenever possible to reduce the likelihood that
correlations between ERP latencies and other variables are underestimated due to the task-
specificity of latency estimates.
Limitations
In the present multiverse analysis, we selected a narrow set of preprocessing choices
that we systematically varied to study their effects on the relationship between neural
processing speed and cognitive abilities. By deciding to explore the effects of these three
preprocessing steps systematically, we implicitly decided to not study the effects of other
preprocessing choices on the relationship between neural processing speed and cognitive
abilities. This is not a specific limitation of the present study, but rather of any kind of
multiverse analysis, in which light can always only be shed on a small sliver of all possible
data preprocessing choices. Other factors that could be systematically assessed include the
cut-off value of high-pass filters (Clayson et al., 2021), the choice of baseline period (Clayson
et al., 2021; Sandre et al., 2020), channel selection (Clayson et al., 2021; Dien, 2017;
Klawohn et al., 2020; Sandre et al., 2020), and procedures for artifact correction (Clayson et
al., 2021).
Moreover, our conclusions cannot be generalized beyond the elementary cognitive tasks
used in the present study. These tasks are among the most popular tasks in chronometric
research on individual differences in intelligence (Jensen, 2006), because the influences of
previous experiences with the respective tasks and individual differences in strategy use on
task performance are minimized (Carroll, 1993). Furthermore, these tasks have been
frequently used to study the relationship between neural processing speed and intelligence
(e.g., Euler et al., 2017; Houlihan et al., 1998; Schubert et al., 2015, 2017; Troche et al.,
2017). However, that relationship has also been studied in both more (e.g., Saville et al.,

PROCESSING SPEED AND COGNITIVE ABILTIES 34
2016; Schubert et al., 2021) and less (e.g., Bazana & Stelmack, 2002; Saville et al., 2016;
Troche et al., 2009; Walhovd et al., 2005) demanding tasks. Because the influence of
preprocessing choices may vary as a function of task and signal complexity, future research
could conduct similar multiverse analyses of EEG data recorded during different tasks, ideally
starting with the popular oddball task (Picton, 1992).
Finally, although the sample of the present study was larger and more heterogeneous
than in most previous studies on electrophysiological correlates of intelligence and the sample
size was chosen to provide sufficient power for the hypothesis of close fit and to include more
than five observations for each estimated parameter in the structural equation model, it was
still relatively small. As a result, confidence intervals of latent correlations between neural
processing speed and cognitive abilities were quite large and overlapping between different
combinations of preprocessing steps. To overcome the limitations of moderate sample sizes,
researchers working on electrophysiological correlates of intelligence may consider
coordinating so-called “many-labs” studies (Botvinik-Nezer et al., 2019; Klein et al., 2014;
Pavlov et al., 2021) that allow collecting even larger sample sizes and assessing the
robustness of relations between neuroscientific measures and intelligence across different
recording settings.
Conclusions
Individual differences in the latencies of ERP components associated with higher-order
cognitive processes (P2, N2, P3) were substantially related to individual differences in
cognitive abilities across different preprocessing pipelines. On average, they explained 40
percent of variance in general intelligence, a finding that has significant implications for
theories of intelligence, because it indicates that individual differences in processing speed
contribute significantly to individual differences in intelligence. Based on these findings, we
argue that process theories of general intelligence need to either explain how a higher speed of
neural information processing facilitates reasoning or propose which third variable may give

PROCESSING SPEED AND COGNITIVE ABILTIES 35
rise to the association. Moreover, they need to account for the fact that both working memory
capacity (Gignac, 2014; Kane et al., 2005; Oberauer et al., 2005) and processing speed are
strongly related to general intelligence. We believe that it will be crucial to understand how
the speed of neural processing limits the capacity working memory to understand how the two
neurocognitive process parameters jointly contribute to individual differences in intelligence.
Based on a multiverse analysis approach and psychometric analyses, we derived
recommendations for the estimation and analysis of ERP latencies in individual differences
research. We found that on average only about 27 percent of variance was shared between
latency measures across different preprocessing pipelines, which implies that choosing any
specific combination of preprocessing steps has a substantial impact on downstream analyses
and should therefore be done deliberately. We suggest (1) modeling ERP latencies as latent
variables or to calculate aggregate measures to account for their low reliabilities, (2) always
recording EEG data from multiple tasks to account for the relatively high degree of task-
specificity of ERP latency measures, and tentatively (3) using an average reference scheme to
improve the criterion validity and factorial parsimony of ERP latency estimates. In
comparison to these factors, the choice of cutoff values for low-pass filtering and the choice
of latency estimates had only little effect on the psychometric properties of ERP latencies and
their relation to cognitive abilities.
Taken together, our results show that it is paramount to account for the psychometric
properties of ERP latencies (and likely also other EEG measures) when using them as person
parameters in individual differences research. The previous inconsistencies in associations
between ERP latencies and cognitive abilities may have resulted from variation in analytic
procedures and little consideration of the psychometric properties of ERP latencies in
relatively small sample studies. Future research should therefore aim to estimate ERP
latencies across multiple tasks and model them as latent factors to account for their task-
specificities and low reliabilities. Accounting for the psychometric properties of ERP

PROCESSING SPEED AND COGNITIVE ABILTIES 36
latencies by means of structural equation modeling, we found evidence for a substantial,
replicable, and robust relationship between neural processing speed and cognitive abilities.

PROCESSING SPEED AND COGNITIVE ABILTIES 37
References
Amin, H. U., Malik, A. S., Kamel, N., Chooi, W.-T., & Hussain, M. (2015). P300 correlates
with learning & memory abilities and fluid intelligence. Journal of NeuroEngineering and
Rehabilitation, 12(1), 87. https://doi.org/10.1186/s12984-015-0077-6
Bazana, P. G., & Stelmack, R. M. (2002). Intelligence and information processing during an
auditory discrimination task with backward masking: An event-related potential analysis.
Journal of Personality and Social Psychology, 83(4), 998–1008.
https://doi.org/10.1037/0022-3514.83.4.998
Bentler, P. M. (1990). Comparative fit indexes in structural models. Psychological Bulletin,
107(2), 238–246.
Bigdely-Shamlo, N., Mullen, T., Kothe, C., Su, K.-M., & Robbins, K. A. (2015). The PREP
pipeline: Standardized preprocessing for large-scale EEG analysis. Frontiers in
Neuroinformatics, 9, 16. https://doi.org/10.3389/fninf.2015.00016
Booth, T., Bastin, M. E., Penke, L., Maniega, S. M., Murray, C., Royle, N. A., Gow, A. J.,
Corley, J., Henderson, R. D., Valdés Hernández, M. del C., Starr, J. M., Wardlaw, J. M., &
Deary, I. J. (2013). Brain white matter tract integrity and cognitive abilities in community-
dwelling older people: The lothian birth cohort, 1936. Neuropsychology, 27(5), 595–607.
https://doi.org/10.1037/a0033354
Botvinik-Nezer, R., Iwanir, R., Holzmeister, F., Huber, J., Johannesson, M., Kirchler, M.,
Dreber, A., Camerer, C. F., Poldrack, R. A., & Schonberg, T. (2019). FMRI data of mixed
gambles from the Neuroimaging Analysis Replication and Prediction Study. Scientific
Data, 6(1), 106. https://doi.org/10.1038/s41597-019-0113-7
Browne, M. W., & Cudeck, R. (1992). Alternative ways of assessing model fit. Sociological
Methods & Research, 21(2), 230–258. https://doi.org/10.1177/0049124192021002005
Carroll, J. B. (1993). Human cognitive abilities: A survey of factor-analytic studies.
Cambridge University Press. https://doi.org/10.1017/CBO9780511571312

PROCESSING SPEED AND COGNITIVE ABILTIES 38
Caryl, P. G. (1994). Early event-related potentials correlate with inspection time and
intelligence. Intelligence, 18(1), 15–46. https://doi.org/10.1016/0160-2896(94)90019-1
Cassidy, S. M., Robertson, I. H., & O’Connell, R. G. (2012). Retest reliability of event-related
potentials: Evidence from a variety of paradigms. Psychophysiology, 49(5), 659–664.
https://doi.org/10.1111/j.1469-8986.2011.01349.x
Chiappe, D. L., & Chiappe, P. (2007). The role of working memory in metaphor production
and comprehension. Journal of Memory and Language, 56(2), 172–188.
https://doi.org/10.1016/j.jml.2006.11.006
Clayson, P. E., Baldwin, S. A., Rocha, H. A., & Larson, M. J. (2021). The data-processing
multiverse of event-related potentials (ERPs): A roadmap for the optimization and
standardization of ERP processing and reduction pipelines. NeuroImage, 245, 118712.
https://doi.org/10.1016/j.neuroimage.2021.118712
Cole, M. W., Yarkoni, T., Repovš, G., Anticevic, A., & Braver, T. S. (2012). Global
connectivity of prefrontal cortex predicts cognitive control and intelligence. Journal of
Neuroscience, 32(26), 8988–8999. https://doi.org/10.1523/JNEUROSCI.0536-12.2012
Cowley, B. U., Korpela, J., & Torniainen, J. (2017). Computational testing for automated
preprocessing: A Matlab toolbox to enable large scale electroencephalography data
processing. PeerJ Computer Science, 3, e108. https://doi.org/10.7717/peerj-cs.108
Delorme, A., & Makeig, S. (2004). EEGLAB: an open source toolbox for analysis of single-
trial EEG dynamics including independent component analysis. Journal of Neuroscience
Methods, 134(1), 9–21. https://doi.org/10.1016/j.jneumeth.2003.10.009
Dien, J. (1998). Issues in the application of the average reference: Review, critiques, and
recommendations. Behavior Research Methods, Instruments, & Computers, 30(1), 34–43.
https://doi.org/10.3758/BF03209414
Dien, J. (2017). Best practices for repeated measures ANOVAs of ERP data: Reference,
regional channels, and robust ANOVAs. International Journal of Psychophysiology, 111,
42–56. https://doi.org/10.1016/j.ijpsycho.2016.09.006

PROCESSING SPEED AND COGNITIVE ABILTIES 39
Doebler, P., & Scheffler, B. (2016). The relationship of choice reaction time variability and
intelligence: A meta-analysis. Learning and Individual Differences, 52, 157–166.
https://doi.org/10.1016/j.lindif.2015.02.009
Donchin, E. (1981). Surprise!… Surprise? Psychophysiology, 18(5), 493–513.
https://doi.org/10.1111/j.1469-8986.1981.tb01815.x
Donchin, E., & Coles, M. G. H. (1988). Is the P300 component a manifestation of context
updating? Behavioral and Brain Sciences, 11(3), 357–374.
https://doi.org/10.1017/S0140525X00058027
Euler, M. J. (2018). Intelligence and uncertainty: Implications of hierarchical predictive
processing for the neuroscience of cognitive ability. Neuroscience & Biobehavioral
Reviews, 94, 93–112. https://doi.org/10.1016/j.neubiorev.2018.08.013
Euler, M. J., McKinney, T. L., Schryver, H. M., & Okabe, H. (2017). ERP correlates of the
decision time-IQ relationship: The role of complexity in task- and brain-IQ effects.
Intelligence, 65, 1–10. https://doi.org/10.1016/j.intell.2017.08.003
Euler, M. J., & Schubert, A.-L. (2021). Recent developments, current challenges, and future
directions in electrophysiological approaches to studying intelligence. Intelligence, 88,
101569. https://doi.org/10.1016/j.intell.2021.101569
Ferrer, E., Whitaker, K. J., Steele, J. S., Green, C. T., Wendelken, C., & Bunge, S. A. (2013).
White matter maturation supports the development of reasoning ability through its
influence on processing speed. Developmental Science, 16(6), 941–951.
https://doi.org/10.1111/desc.12088
Folstein, J. R., & Van Petten, C. (2008). Influence of cognitive control and mismatch on the
N2 component of the ERP: A review. Psychophysiology, 45(1), 152–170.
https://doi.org/10.1111/j.1469-8986.2007.00602.x
Frischkorn, G. T., & Schubert, A.-L. (2018). Cognitive models in intelligence research:
Advantages and recommendations for their application. Journal of Intelligence, 6(3), 34.
https://doi.org/10.3390/jintelligence6030034

PROCESSING SPEED AND COGNITIVE ABILTIES 40
Frischkorn, G. T., Schubert, A.-L., & Hagemann, D. (2019). Processing speed, working
memory, and executive functions: Independent or inter-related predictors of general
intelligence. Intelligence, 75, 95–110. https://doi.org/10.1016/j.intell.2019.05.003
Fuhrmann, D., Simpson-Kent, I. L., Bathelt, J., Holmes, J., Gathercole, S., Astle, D., Manly,
T., Kievit, R., & Kievit, R. A. (2020). A hierarchical watershed model of fluid intelligence
in childhood and adolescence. Cerebral Cortex, 30(1), 339–352.
https://doi.org/10.1093/cercor/bhz091
Gabard-Durnam, L. J., Mendez Leal, A. S., Wilkinson, C. L., & Levin, A. R. (2018). The
Harvard Automated Processing Pipeline for Electroencephalography (HAPPE):
Standardized Processing Software for Developmental and High-Artifact Data. Frontiers in
Neuroscience, 0. https://doi.org/10.3389/fnins.2018.00097
Gignac, G. E. (2014). Fluid intelligence shares closer to 60% of its variance with working
memory capacity and is a better indicator of general intelligence. Intelligence, 47, 122–
133. https://doi.org/10.1016/j.intell.2014.09.004
Gignac, G. E., & Szodorai, E. T. (2016). Effect size guidelines for individual differences
researchers. Personality and Individual Differences, 102, 74–78.
https://doi.org/10.1016/j.paid.2016.06.069
Hagemann, D., Naumann, E., Becker, G., Maier, S., & Bartussek, D. (1998). Frontal brain
asymmetry and affective style: A conceptual replication. Psychophysiology, 35(4), 372–
388. https://doi.org/10.1111/1469-8986.3540372
Hansen, J. C., & Hillyard, S. A. (1980). Endogenous brain potentials associated with selective
auditory attention. Electroencephalography and Clinical Neurophysiology, 49(3–4), 277–
290. https://doi.org/10.1016/0013-4694(80)90222-9
Harder, J. A. (2020). The Multiverse of Methods: Extending the Multiverse Analysis to
Address Data-Collection Decisions. Perspectives on Psychological Science, 15(5), 1158–
1177. https://doi.org/10.1177/1745691620917678

PROCESSING SPEED AND COGNITIVE ABILTIES 41
Hilger, K., Ekman, M., Fiebach, C. J., & Basten, U. (2017). Efficient hubs in the intelligent
brain: Nodal efficiency of hub regions in the salience network is associated with general
intelligence. Intelligence, 60, 10–25. https://doi.org/10.1016/j.intell.2016.11.001
Houlihan, M., Stelmack, R., & Campbell, K. (1998). Intelligence and the effects of perceptual
processing demands, task difficulty and processing speed on P300, reaction time and
movement time. Intelligence, 26(1), 9–25. https://doi.org/10.1016/S0160-2896(99)80049-
X
Hu, L., & Bentler, P. M. (1999). Cutoff criteria for fit indexes in covariance structure
analysis: Conventional criteria versus new alternatives. Structural Equation Modeling: A
Multidisciplinary Journal, 6(1), 1–55. https://doi.org/10.1080/10705519909540118
Jäger, A. O., Süß, H.-M., & Beauducel, A. (1997). Berliner Intelligenzstruktur-Test. Form 4.
Hogrefe.
Jaušovec, N., & Jaušovec, K. (2000). Correlations between ERP parameters and intelligence:
A reconsideration. Biological Psychology, 55(2), 137–154. https://doi.org/10.1016/S0301-
0511(00)00076-4
Jensen, A. R. (2006). Clocking the mind: Mental chronometry and individual differences (1st
ed.). Elsevier Science.
Jungeblut, H. M., Hagemann, D., Löffler, C., & Schubert, A.-L. (2021). An Investigation of
the Slope Parameters of Reaction Times and P3 Latencies in the Sternberg Memory
Scanning Task – A Fixed-Links Model Approach. Journal of Cognition, 4(1), 26.
https://doi.org/10.5334/joc.158
Kane, M. J., Hambrick, D. Z., & Conway, A. R. A. (2005). Working memory capacity and
fluid intelligence are strongly related constructs: Comment on ackerman, beier, and boyle
(2005). Psychological Bulletin, 131(1), 66–71. https://doi.org/10.1037/0033-2909.131.1.66
Kapanci, T., Merks, S., Rammsayer, T. H., & Troche, S. J. (2019). On the relationship
between P3 latency and mental ability as a function of increasing demands in a selective
attention task. Brain Sciences, 9(2), 28. https://doi.org/10.3390/brainsci9020028

PROCESSING SPEED AND COGNITIVE ABILTIES 42
Kappenman, E. S., & Luck, S. J. (2011). The Oxford Handbook of Event-Related Potential
Components. In The Oxford Handbook of Event-Related Potential Components. Oxford
University Press. https://doi.org/10.1093/oxfordhb/9780195374148.001.0001
Kiesel, A., Miller, J., Jolicoeur, P., & Brisson, B. (2008). Measurement of ERP latency
differences: A comparison of single-participant and jackknife-based scoring methods.
Psychophysiology, 45(2), 250–274. https://doi.org/10.1111/j.1469-8986.2007.00618.x
Kievit, R. A., Davis, S. W., Griffiths, J., Correia, M. M., Cam-CAN, & Henson, R. N. (2016).
A watershed model of individual differences in fluid intelligence. Neuropsychologia, 91,
186–198. https://doi.org/10.1016/j.neuropsychologia.2016.08.008
Kievit, R. A., McCormick, E. M., Fuhrmann, D., Deserno, M. K., & Orben, A. (2022). Using
large, publicly available data sets to study adolescent development: Opportunities and
challenges. Current Opinion in Psychology, 44, 303–308.
https://doi.org/10.1016/j.copsyc.2021.10.003
Klawohn, J., Meyer, A., Weinberg, A., & Hajcak, G. (2020). Methodological choices in
event-related potential (ERP) research and their impact on internal consistency reliability
and individual differences: An examination of the error-related negativity (ERN) and
anxiety. Journal of Abnormal Psychology, 129(1), 29–37.
https://doi.org/10.1037/abn0000458
Klein, R. A., Ratliff, K. A., Vianello, M., Adams, R. B., Bahník, Š., Bernstein, M. J., Bocian,
K., Brandt, M. J., Brooks, B., Brumbaugh, C. C., Cemalcilar, Z., Chandler, J., Cheong, W.,
Davis, W. E., Devos, T., Eisner, M., Frankowska, N., Furrow, D., Galliani, E. M., …
Nosek, B. A. (2014). Investigating Variation in Replicability. Social Psychology, 45(3),
142–152. https://doi.org/10.1027/1864-9335/a000178
Kovacs, K., & Conway, A. R. A. (2016). Process overlap theory: A unified account of the
general factor of intelligence. Psychological Inquiry, 27(3), 151–177.
https://doi.org/10.1080/1047840X.2016.1153946

PROCESSING SPEED AND COGNITIVE ABILTIES 43
Kranzler, J. H., & Jensen, A. R. (1991). The nature of psychometric g: Unitary process or a
number of independent processes? Intelligence, 15(4), 397–422.
https://doi.org/10.1016/0160-2896(91)90003-V
Lerche, V., von Krause, M., Voss, A., Frischkorn, G. T., Schubert, A.-L., & Hagemann, D.
(2020). Diffusion modeling and intelligence: Drift rates show both domain-general and
domain-specific relations with intelligence. Journal of Experimental Psychology. General,
149(12), 2207–2249. https://doi.org/10.1037/xge0000774
Liesefeld, H. R. (2018). Estimating the Timing of Cognitive Operations With MEG/EEG
Latency Measures: A Primer, a Brief Tutorial, and an Implementation of Various Methods.
Frontiers in Neuroscience, 0. https://doi.org/10.3389/fnins.2018.00765
Lopez-Calderon, J., & Luck, S. J. (2014). ERPLAB: An open-source toolbox for the analysis
of event-related potentials. Frontiers in Human Neuroscience, 8.
https://www.frontiersin.org/article/10.3389/fnhum.2014.00213
Luck, S. J. (2014). An introduction to the event-related potential technique (2nd ed.). MIT
Press Ltd.
McCarthy, G., & Donchin, E. (1981). A metric for thought: A comparison of P300 latency
and reaction time. Science, 211(4477), 77–80. https://doi.org/10.1126/science.7444452
McGarry-Roberts, P. A., Stelmack, R. M., & Campbell, K. B. (1992). Intelligence, reaction
time, and event-related potentials. Intelligence, 16(3–4), 289–313.
https://doi.org/10.1016/0160-2896(92)90011-F
Miller, L. T., & Vernon, P. A. (1996). Intelligence, reaction time, and working memory in 4-
to 6-year-old children. Intelligence, 22(2), 155–190. https://doi.org/10.1016/S0160-
2896(96)90014-8
Morand-Beaulieu, S., Perrault, M.-A., & Lavoie, M. E. (2021). Test-Retest Reliability of
Event-Related Potentials Across Three Tasks. Journal of Psychophysiology.
https://doi.org/10.1027/0269-8803/a000286

PROCESSING SPEED AND COGNITIVE ABILTIES 44
Neubauer, A. C., & Knorr, E. (1997). Elementary cognitive processes in choice reaction time
tasks and their correlations with intelligence. Personality and Individual Differences,
23(5), 715–728. https://doi.org/10.1016/S0191-8869(97)00108-6
Nieuwenhuis, S., Aston-Jones, G., & Cohen, J. D. (2005). Decision making, the P3, and the
locus coeruleus—Norepinephrine system. Psychological Bulletin, 131(4), 510–532.
https://doi.org/10.1037/0033-2909.131.4.510
Nikolin, S., Chand, N., Martin, D., Rushby, J., Loo, C. K., & Boonstra, T. W. (2022). Little
evidence for a reduced late positive potential to unpleasant stimuli in major depressive
disorder. Neuroimage: Reports, 2(1), 100077. https://doi.org/10.1016/j.ynirp.2022.100077
Nooner, K. B., Colcombe, S. J., Tobe, R. H., Mennes, M., Benedict, M. M., Moreno, A. L.,
Panek, L. J., Brown, S., Zavitz, S. T., Li, Q., Sikka, S., Gutman, D., Bangaru, S.,
Schlachter, R. T., Kamiel, S. M., Anwar, A. R., Hinz, C. M., Kaplan, M. S., Rachlin, A. B.,
… Milham, M. P. (2012). The NKI-Rockland Sample: A Model for Accelerating the Pace
of Discovery Science in Psychiatry. Frontiers in Neuroscience, 6, 152.
https://doi.org/10.3389/fnins.2012.00152
Oberauer, K., Lewandowsky, S., Awh, E., Brown, G. D. A., Conway, A., Cowan, N., Donkin,
C., Farrell, S., Hitch, G. J., Hurlstone, M. J., Ma, W. J., Morey, C. C., Nee, D. E.,
Schweppe, J., Vergauwe, E., & Ward, G. (2018). Benchmarks for models of short-term and
working memory. Psychological Bulletin, 144(9), 885–958. psyh.
https://doi.org/10.1037/bul0000153
Oberauer, K., Schulze, R., Wilhelm, O., & Süss, H.-M. (2005). Working memory and
intelligence--their correlation and their relation: Comment on Ackerman, Beier, and Boyle
(2005). Psychological Bulletin, 131(1), 61–65; author reply 72-75.
https://doi.org/10.1037/0033-2909.131.1.61
O’Connell, R. G., Shadlen, M. N., Wong-Lin, K., & Kelly, S. P. (2018). Bridging Neural and
Computational Viewpoints on Perceptual Decision-Making. Trends in Neurosciences,
41(11), 838–852. https://doi.org/10.1016/j.tins.2018.06.005

PROCESSING SPEED AND COGNITIVE ABILTIES 45
Oreskes, N. (2019). Why Trust Science? Princeton University Press.
Pavlov, Y. G., Adamian, N., Appelhoff, S., Arvaneh, M., Benwell, C. S. Y., Beste, C., Bland,
A. R., Bradford, D. E., Bublatzky, F., Busch, N. A., Clayson, P. E., Cruse, D., Czeszumski,
A., Dreber, A., Dumas, G., Ehinger, B., Ganis, G., He, X., Hinojosa, J. A., … Mushtaq, F.
(2021). #EEGManyLabs: Investigating the replicability of influential EEG experiments.
Cortex, 144, 213–229. https://doi.org/10.1016/j.cortex.2021.03.013
Penke, L., Maniega, S. M., Bastin, M. E., Valdés Hernández, M. C., Murray, C., Royle, N. A.,
Starr, J. M., Wardlaw, J. M., & Deary, I. J. (2012). Brain white matter tract integrity as a
neural foundation for general intelligence. Molecular Psychiatry, 17(10), 1026–1030.
https://doi.org/10.1038/mp.2012.66
Picton, T. W. (1992). The P300 Wave of the Human Event-Related Potential. Journal of
Clinical Neurophysiology, 9(4), 456–479.
Pineda-Pardo, J. A., Martínez, K., Román, F. J., & Colom, R. (2016). Structural efficiency
within a parieto-frontal network and cognitive differences. Intelligence, 54, 105–116.
https://doi.org/10.1016/j.intell.2015.12.002
Pion-Tonachini, L., Kreutz-Delgado, K., & Makeig, S. (2019). ICLabel: An automated
electroencephalographic independent component classifier, dataset, and website.
NeuroImage, 198, 181–197. https://doi.org/10.1016/j.neuroimage.2019.05.026
Polich, J. (2007). Updating P300: An integrative theory of P3a and P3b. Clinical
Neurophysiology, 118(10), 2128–2148. https://doi.org/10.1016/j.clinph.2007.04.019
Polich, J. (2011, December 15). Neuropsychology of P300. The Oxford Handbook of Event-
Related Potential Components. https://doi.org/10.1093/oxfordhb/9780195374148.013.0089
Ratcliff, R. (1978). A theory of memory retrieval. Psychological Review, 85(2), 59–108.
https://doi.org/10.1037/0033-295X.85.2.59
Ratcliff, R., Thapar, A., & McKoon, G. (2010). Individual differences, aging, and IQ in two-
choice tasks. Cognitive Psychology, 60(3), 127–157.
https://doi.org/10.1016/j.cogpsych.2009.09.001

PROCESSING SPEED AND COGNITIVE ABILTIES 46
Ratcliff, R., Thapar, A., & McKoon, G. (2011). Effects of aging and IQ on item and
associative memory. Journal of Experimental Psychology: General, 140(3), 464–487.
https://doi.org/10.1037/a0023810
Rodrigues, J., Weiß, M., Hewig, J., & Allen, J. J. B. (2021). EPOS: EEG Processing Open-
Source Scripts. Frontiers in Neuroscience, 0. https://doi.org/10.3389/fnins.2021.660449
Rosseel, Y. (2012). lavaan: An R Package for Structural Equation Modeling. Journal of
Statistical Software, 48(2), 1–36.
Rousselet, G. A. (2012). Does Filtering Preclude Us from Studying ERP Time-Courses?
Frontiers in Psychology, 3, 131. https://doi.org/10.3389/fpsyg.2012.00131
Russo, P. M., De Pascalis, V., Varriale, V., & Barratt, E. S. (2008). Impulsivity, intelligence
and P300 wave: An empirical study. International Journal of Psychophysiology: Official
Journal of the International Organization of Psychophysiology, 69(2), 112–118.
https://doi.org/10.1016/j.ijpsycho.2008.03.008
Sandre, A., Banica, I., Riesel, A., Flake, J., Klawohn, J., & Weinberg, A. (2020). Comparing
the effects of different methodological decisions on the error-related negativity and its
association with behaviour and gender. International Journal of Psychophysiology, 156,
18–39. https://doi.org/10.1016/j.ijpsycho.2020.06.016
Saville, C. W. N., Beckles, K. D. O., MacLeod, C. A., Feige, B., Biscaldi, M., Beauducel, A.,
& Klein, C. (2016). A neural analogue of the worst performance rule: Insights from single-
trial event-related potentials. Intelligence, 55, 95–103.
https://doi.org/10.1016/j.intell.2015.12.005
Schmiedek, F., Oberauer, K., Wilhelm, O., Süß, H.-M., & Wittmann, W. W. (2007).
Individual differences in components of reaction time distributions and their relations to
working memory and intelligence. Journal of Experimental Psychology: General, 136(3),
414–429. https://doi.org/10.1037/0096-3445.136.3.414
Schmitz, F., & Wilhelm, O. (2016). Modeling mental speed: Decomposing response time
distributions in elementary cognitive tasks and correlations with working memory capacity

PROCESSING SPEED AND COGNITIVE ABILTIES 47
and fluid intelligence. Journal of Intelligence, 4(4), 13.
https://doi.org/10.3390/jintelligence4040013
Schönbrodt, F. D., & Perugini, M. (2013). At what sample size do correlations stabilize?
Journal of Research in Personality, 47(5), 609–612.
https://doi.org/10.1016/j.jrp.2013.05.009
Schubert, A.-L. (2019). A meta-analysis of the worst performance rule. Intelligence, 73, 88–
100. https://doi.org/10.1016/j.intell.2019.02.003
Schubert, A.-L., & Frischkorn, G. T. (2020). Neurocognitive psychometrics of intelligence:
How measurement advancements unveiled the role of mental speed in intelligence
differences: Current Directions in Psychological Science, 29(2), 140–146.
https://doi.org/10.1177/0963721419896365
Schubert, A.-L., Hagemann, D., & Frischkorn, G. T. (2017). Is general intelligence little more
than the speed of higher-order processing? Journal of Experimental Psychology. General,
146(10), 1498–1512. https://doi.org/10.1037/xge0000325
Schubert, A.-L., Hagemann, D., Frischkorn, G. T., & Herpertz, S. C. (2018). Faster, but not
smarter: An experimental analysis of the relationship between mental speed and mental
abilities. Intelligence, 71, 66–75. https://doi.org/10.1016/j.intell.2018.10.005
Schubert, A.-L., Hagemann, D., Löffler, C., & Frischkorn, G. T. (2020). Disentangling the
Effects of Processing Speed on the Association between Age Differences and Fluid
Intelligence. Journal of Intelligence, 8(1), 1. https://doi.org/10.3390/jintelligence8010001
Schubert, A.-L., Hagemann, D., Löffler, C., Rummel, J., & Arnau, S. (2021). A chronometric
model of the relationship between frontal midline theta functional connectivity and human
intelligence. Journal of Experimental Psychology. General, 150(1), 1–22.
https://doi.org/10.1037/xge0000865
Schubert, A.-L., Hagemann, D., Voss, A., Schankin, A., & Bergmann, K. (2015).
Decomposing the relationship between mental speed and mental abilities. Intelligence, 51,
28–46. https://doi.org/10.1016/j.intell.2015.05.002

PROCESSING SPEED AND COGNITIVE ABILTIES 48
Schubert, A.-L., Löffler, C., & Hagemann, D. (2022). A neurocognitive psychometrics
account of individual differences in attentional control. Journal of Experimental
Psychology: General, No Pagination Specified-No Pagination Specified.
https://doi.org/10.1037/xge0001184
Schulter, G., & Neubauer, A. C. (2005). Zentralnervensystem und Persönlichkeit (pp. 35–
190). https://doi.org/10.1007/978-3-8274-3089-2_2
Sculthorpe, L. D., Stelmack, R. M., & Campbell, K. B. (2009). Mental ability and the effect
of pattern violation discrimination on P300 and mismatch negativity. Intelligence, 37(4),
405–411. https://doi.org/10.1016/j.intell.2009.03.006
Sheppard, L. D., & Vernon, P. A. (2008). Intelligence and speed of information-processing: A
review of 50 years of research. Personality and Individual Differences, 44(3), 535–551.
https://doi.org/10.1016/j.paid.2007.09.015
Simmons, J. P., Nelson, L. D., & Simonsohn, U. (2011). False-Positive Psychology:
Undisclosed Flexibility in Data Collection and Analysis Allows Presenting Anything as
Significant. Psychological Science, 22(11), 1359–1366.
https://doi.org/10.1177/0956797611417632
Šoškić, A., Styles, S. J., Kappenman, E. S., & Kovic, V. (2022). Garden of forking paths in
ERP research – effects of varying pre-processing and analysis steps in an N400
experiment. PsyArXiv. https://doi.org/10.31234/osf.io/8rjah
Steegen, S., Tuerlinckx, F., Gelman, A., & Vanpaemel, W. (2016). Increasing Transparency
Through a Multiverse Analysis. Perspectives on Psychological Science, 11(5), 702–712.
https://doi.org/10.1177/1745691616658637
Tamnes, C. K., Østby, Y., Walhovd, K. B., Westlye, L. T., Due‐Tønnessen, P., & Fjell, A. M.
(2010). Intellectual abilities and white matter microstructure in development: A diffusion
tensor imaging study. Human Brain Mapping, 31(10), 1609–1625.
https://doi.org/10.1002/hbm.20962

PROCESSING SPEED AND COGNITIVE ABILTIES 49
Troche, S. J., Houlihan, M. E., Stelmack, R. M., & Rammsayer, T. H. (2009). Mental ability,
P300, and mismatch negativity: Analysis of frequency and duration discrimination.
Intelligence, 37(4), 365–373. https://doi.org/10.1016/j.intell.2009.03.002
Troche, S. J., Merks, S., Houlihan, M. E., & Rammsayer, T. H. (2017). On the relation
between mental ability and speed of information processing in the Hick task: An analysis
of behavioral and electrophysiological speed measures. Personality and Individual
Differences, 118, 11–16. https://doi.org/10.1016/j.paid.2017.02.027
Van Essen, D. C., Smith, S. M., Barch, D. M., Behrens, T. E. J., Yacoub, E., Ugurbil, K., &
WU-Minn HCP Consortium. (2013). The WU-Minn Human Connectome Project: An
overview. NeuroImage, 80, 62–79. https://doi.org/10.1016/j.neuroimage.2013.05.041
Vanrullen, R. (2011). Four Common Conceptual Fallacies in Mapping the Time Course of
Recognition. Frontiers in Psychology, 0. https://doi.org/10.3389/fpsyg.2011.00365
Verleger, R. (2020). Effects of relevance and response frequency on P3b amplitudes: Review
of findings and comparison of hypotheses about the process reflected by P3b.
Psychophysiology, 57(7), e13542. https://doi.org/10.1111/psyp.13542
Verleger, R., Grauhan, N., & Śmigasiewicz, K. (2016a). Go and no-go P3 with rare and
frequent stimuli in oddball tasks: A study comparing key-pressing with counting.
International Journal of Psychophysiology: Official Journal of the International
Organization of Psychophysiology, 110, 128–136.
https://doi.org/10.1016/j.ijpsycho.2016.11.009
Verleger, R., Grauhan, N., & Śmigasiewicz, K. (2016b). Is P3 a strategic or a tactical
component? Relationships of P3 sub-components to response times in oddball tasks with
go, no-go and choice responses. NeuroImage, 143, 223–234.
https://doi.org/10.1016/j.neuroimage.2016.08.049
Volkow, N. D., Koob, G. F., Croyle, R. T., Bianchi, D. W., Gordon, J. A., Koroshetz, W. J.,
Pérez-Stable, E. J., Riley, W. T., Bloch, M. H., Conway, K., Deeds, B. G., Dowling, G. J.,
Grant, S., Howlett, K. D., Matochik, J. A., Morgan, G. D., Murray, M. M., Noronha, A.,

PROCESSING SPEED AND COGNITIVE ABILTIES 50
Spong, C. Y., … Weiss, S. R. B. (2018). The conception of the ABCD study: From
substance use to a broad NIH collaboration. Developmental Cognitive Neuroscience, 32,
4–7. https://doi.org/10.1016/j.dcn.2017.10.002
von Krause, M., Lerche, V., Schubert, A.-L., & Voss, A. (2020). Do Non-Decision Times
Mediate the Association between Age and Intelligence across Different Content and
Process Domains? Journal of Intelligence, 8(3), 33.
https://doi.org/10.3390/jintelligence8030033
Walhovd, K. B., Fjell, A. M., Reinvang, I., Lundervold, A., Fischl, B., Salat, D., Quinn, B. T.,
Makris, N., & Dale, A. M. (2005). Cortical volume and speed-of-processing are
complementary in prediction of performance intelligence. Neuropsychologia, 43(5), 704–
713. https://doi.org/10.1016/j.neuropsychologia.2004.08.006
Wascher, E., Sharifian, F., Gutberlet, M., Schneider, D., Getzmann, S., & Arnau, S. (2021).
Mental chronometry in big noisy data. OSF Preprints.
https://doi.org/10.31219/osf.io/7ncwr
Wendelken, C., Ferrer, E., Ghetti, S., Bailey, S. K., Cutting, L., & Bunge, S. A. (2017).
Frontoparietal structural connectivity in childhood predicts development of functional
connectivity and reasoning ability: A large-scale longitudinal investigation. The Journal of
Neuroscience: The Official Journal of the Society for Neuroscience, 37(35), 8549–8558.
https://doi.org/10.1523/JNEUROSCI.3726-16.2017
Widmann, A., & Schröger, E. (2012). Filter Effects and Filter Artifacts in the Analysis of
Electrophysiological Data. Frontiers in Psychology, 0.
https://doi.org/10.3389/fpsyg.2012.00233
Williams, C. C., Ferguson, T. D., Hassall, C. D., Abimbola, W., & Krigolson, O. E. (2021).
The ERP, frequency, and time–frequency correlates of feedback processing: Insights from
a large sample study. Psychophysiology, 58(2), e13722. https://doi.org/10.1111/psyp.13722

PROCESSING SPEED AND COGNITIVE ABILTIES 51
Supplementary Material
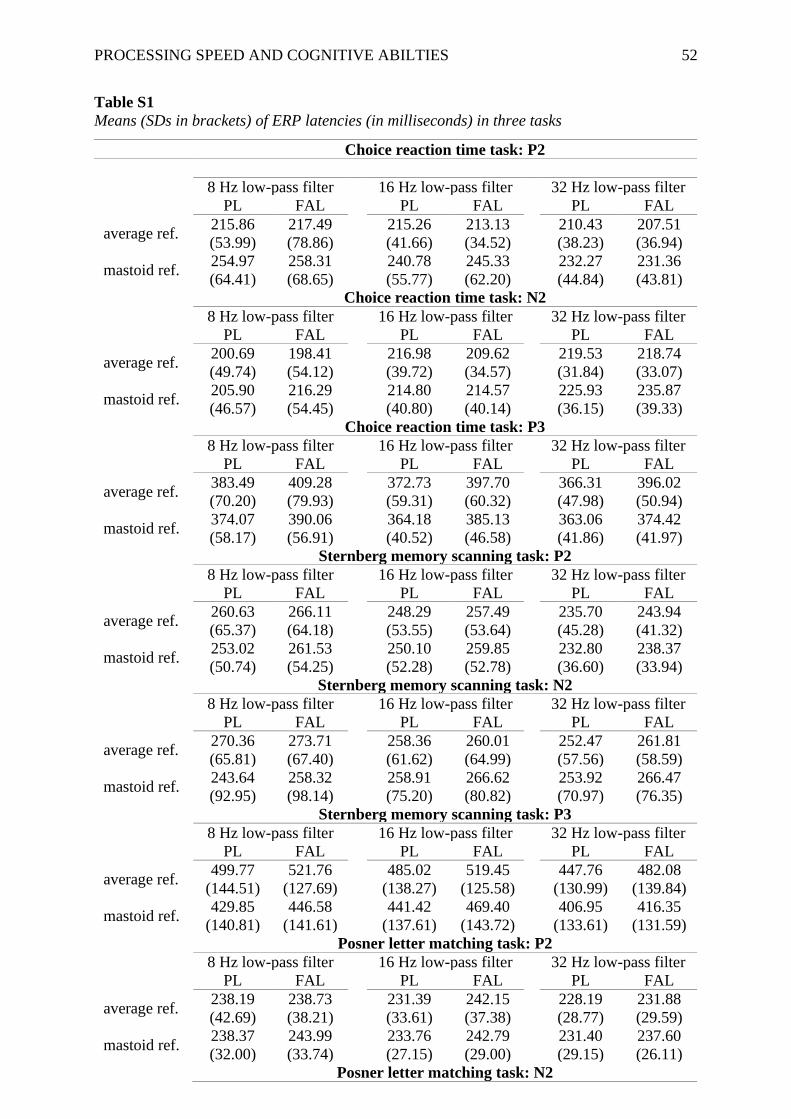
PROCESSING SPEED AND COGNITIVE ABILTIES 52
Table S1
Means (SDs in brackets) of ERP latencies (in milliseconds) in three tasks
Choice reaction time task: P2
8 Hz low-pass filter 16 Hz low-pass filter 32 Hz low-pass filter
PL FAL PL FAL PL FAL
average ref. 215.86
(53.99)
217.49
(78.86)
215.26
(41.66)
213.13
(34.52)
210.43
(38.23)
207.51
(36.94)
mastoid ref. 254.97
(64.41)
258.31
(68.65)
240.78
(55.77)
245.33
(62.20)
232.27
(44.84)
231.36
(43.81)
Choice reaction time task: N2
8 Hz low-pass filter 16 Hz low-pass filter 32 Hz low-pass filter
PL FAL PL FAL PL FAL
average ref. 200.69
(49.74)
198.41
(54.12)
216.98
(39.72)
209.62
(34.57)
219.53
(31.84)
218.74
(33.07)
mastoid ref. 205.90
(46.57)
216.29
(54.45)
214.80
(40.80)
214.57
(40.14)
225.93
(36.15)
235.87
(39.33)
Choice reaction time task: P3
8 Hz low-pass filter 16 Hz low-pass filter 32 Hz low-pass filter
PL FAL PL FAL PL FAL
average ref. 383.49
(70.20)
409.28
(79.93)
372.73
(59.31)
397.70
(60.32)
366.31
(47.98)
396.02
(50.94)
mastoid ref. 374.07
(58.17)
390.06
(56.91)
364.18
(40.52)
385.13
(46.58)
363.06
(41.86)
374.42
(41.97)
Sternberg memory scanning task: P2
8 Hz low-pass filter 16 Hz low-pass filter 32 Hz low-pass filter
PL FAL PL FAL PL FAL
average ref. 260.63
(65.37)
266.11
(64.18)
248.29
(53.55)
257.49
(53.64)
235.70
(45.28)
243.94
(41.32)
mastoid ref. 253.02
(50.74)
261.53
(54.25)
250.10
(52.28)
259.85
(52.78)
232.80
(36.60)
238.37
(33.94)
Sternberg memory scanning task: N2
8 Hz low-pass filter 16 Hz low-pass filter 32 Hz low-pass filter
PL FAL PL FAL PL FAL
average ref. 270.36
(65.81)
273.71
(67.40)
258.36
(61.62)
260.01
(64.99)
252.47
(57.56)
261.81
(58.59)
mastoid ref. 243.64
(92.95)
258.32
(98.14)
258.91
(75.20)
266.62
(80.82)
253.92
(70.97)
266.47
(76.35)
Sternberg memory scanning task: P3
8 Hz low-pass filter 16 Hz low-pass filter 32 Hz low-pass filter
PL FAL PL FAL PL FAL
average ref. 499.77
(144.51)
521.76
(127.69)
485.02
(138.27)
519.45
(125.58)
447.76
(130.99)
482.08
(139.84)
mastoid ref. 429.85
(140.81)
446.58
(141.61)
441.42
(137.61)
469.40
(143.72)
406.95
(133.61)
416.35
(131.59)
Posner letter matching task: P2
8 Hz low-pass filter 16 Hz low-pass filter 32 Hz low-pass filter
PL FAL PL FAL PL FAL
average ref. 238.19
(42.69)
238.73
(38.21)
231.39
(33.61)
242.15
(37.38)
228.19
(28.77)
231.88
(29.59)
mastoid ref. 238.37
(32.00)
243.99
(33.74)
233.76
(27.15)
242.79
(29.00)
231.40
(29.15)
237.60
(26.11)
Posner letter matching task: N2

PROCESSING SPEED AND COGNITIVE ABILTIES 53
Note. PL = peak latency; FAL = 50 % fractional area latency.
8 Hz low-pass filter 16 Hz low-pass filter 32 Hz low-pass filter
PL FAL PL FAL PL FAL
average ref. 249.05
(40.03)
255.76
(42.07)
253.11
(36.03)
260.32
(38.43)
250.60
(30.20)
259.36
(37.14)
mastoid ref. 267.18
(66.55)
279.29
(71.92)
264.76
(50.09)
272.48
(58.33)
257.25
(57.30)
268.20
(60.69)
Posner letter matching task: P3
8 Hz low-pass filter 16 Hz low-pass filter 32 Hz low-pass filter
PL FAL PL FAL PL FAL
average ref. 488.28
(88.81)
522.86
(63.20)
475.12
(89.05)
515.14
(60.26)
458.02
(84.24)
498.99
(73.00)
mastoid ref. 466.67
(108.26)
488.15
(105.89)
453.28
(104.66)
487.93
(100.81)
444.08
(110.83)
455.61
(111.32)

PROCESSING SPEED AND COGNITIVE ABILTIES 54
Table S2
Convergent validities (manifest correlations) between P2 latencies in the choice reaction time task
Choice reaction time task: P2
average reference linked mastoid reference
peak latency fractional area latency peak latency fractional area latency
8 Hz filter 16 Hz filter 32 Hz filter 8 Hz filter 16 Hz filter 32 Hz filter 8 Hz filter 16 Hz filter 32 Hz filter 8 Hz filter 16 Hz filter
avg. ref. PL 8 Hz
16 Hz 0.45
32 Hz 0.24 0.73
FA 8 Hz 0.97 0.44 0.17
16 Hz 0.36 0.57 0.58 0.3
32 Hz 0.31 0.67 0.79 0.27 0.61
mast. ref. PL 8 Hz 0.45 0.25 0.22 0.45 0.33 0.31
16 Hz 0.4 0.54 0.5 0.39 0.34 0.49 0.45
32 Hz 0.33 0.42 0.37 0.31 0.38 0.51 0.42 0.61
FA 8 Hz 0.43 0.2 0.19 0.44 0.32 0.28 0.92 0.4 0.36
16 Hz 0.4 0.55 0.51 0.4 0.33 0.48 0.43 0.91 0.52 0.4
32 Hz 0.29 0.42 0.35 0.28 0.35 0.5 0.4 0.6 0.95 0.36 0.54
Note. avg. ref. = average reference; mast. Ref. = linked mastoid reference; PL = peak latency; FAL = 50 % fractional area latency

PROCESSING SPEED AND COGNITIVE ABILTIES 55
Table S3
Convergent validities (manifest correlations) between N2 latencies in the choice reaction time task
Choice reaction time task: N2
average reference linked mastoid reference
peak latency fractional area latency peak latency fractional area latency
8 Hz filter 16 Hz filter 32 Hz filter 8 Hz filter 16 Hz filter 32 Hz filter 8 Hz filter 16 Hz filter 32 Hz filter 8 Hz filter 16 Hz filter
avg. ref. PL 8 Hz
16 Hz 0.27
32 Hz 0.44 0.33
FA 8 Hz 0.97 0.31 0.42
16 Hz 0.59 0.5 0.4 0.58
32 Hz 0.44 0.31 0.86 0.44 0.48
mast. ref. PL 8 Hz 0.39 0.39 0.37 0.37 0.25 0.43
16 Hz 0.43 0.38 0.41 0.38 0.41 0.43 0.61
32 Hz 0.24 0.31 0.51 0.21 0.24 0.49 0.46 0.5
FA 8 Hz 0.4 0.4 0.41 0.4 0.28 0.5 0.95 0.56 0.46
16 Hz 0.41 0.35 0.41 0.36 0.41 0.46 0.62 0.95 0.44 0.58
32 Hz 0.27 0.29 0.51 0.24 0.31 0.51 0.42 0.5 0.86 0.45 0.45
Note. avg. ref. = average reference; mast. Ref. = linked mastoid reference; PL = peak latency; FAL = 50 % fractional area latency

PROCESSING SPEED AND COGNITIVE ABILTIES 56
Table S4
Convergent validities (manifest correlations) between P3 latencies in the choice reaction time task
Choice reaction time task: P3
average reference linked mastoid reference
peak latency fractional area latency peak latency fractional area latency
8 Hz filter 16 Hz filter 32 Hz filter 8 Hz filter 16 Hz filter 32 Hz filter 8 Hz filter 16 Hz filter 32 Hz filter 8 Hz filter 16 Hz filter
avg. ref. PL 8 Hz
16 Hz 0.69
32 Hz 0.58 0.46
FA 8 Hz 0.88 0.70 0.49
16 Hz 0.62 0.81 0.45 0.76
32 Hz 0.67 0.58 0.63 0.72 0.73
mast. ref. PL 8 Hz 0.35 0.26 0.48 0.32 0.26 0.39
16 Hz 0.37 0.37 0.65 0.23 0.31 0.5 0.51
32 Hz 0.37 0.3 0.69 0.29 0.35 0.56 0.43 0.76
FA 8 Hz 0.48 0.32 0.44 0.46 0.4 0.55 0.81 0.45 0.43
16 Hz 0.37 0.3 0.48 0.32 0.38 0.63 0.28 0.67 0.61 0.53
32 Hz 0.31 0.28 0.64 0.26 0.31 0.54 0.44 0.77 0.75 0.52 0.74
Note. avg. ref. = average reference; mast. Ref. = linked mastoid reference; PL = peak latency; FAL = 50 % fractional area latency

PROCESSING SPEED AND COGNITIVE ABILTIES 57
Table S5
Convergent validities (manifest correlations) between P2 latencies in the Sternberg memory scanning task
Sternberg memory scanning task: P2
average reference linked mastoid reference
peak latency fractional area latency peak latency fractional area latency
8 Hz filter 16 Hz filter 32 Hz filter 8 Hz filter 16 Hz filter 32 Hz filter 8 Hz filter 16 Hz filter 32 Hz filter 8 Hz filter 16 Hz filter
avg. ref. PL 8 Hz
16 Hz 0.6
32 Hz 0.45 0.56
FA 8 Hz 0.91 0.59 0.49
16 Hz 0.5 0.87 0.48 0.56
32 Hz 0.43 0.54 0.89 0.5 0.52
mast. ref. PL 8 Hz 0.63 0.61 0.52 0.67 0.52 0.52
16 Hz 0.58 0.74 0.61 0.62 0.64 0.62 0.78
32 Hz 0.43 0.49 0.59 0.46 0.44 0.54 0.5 0.65
FA 8 Hz 0.63 0.6 0.52 0.69 0.55 0.54 0.95 0.74 0.49
16 Hz 0.57 0.71 0.58 0.66 0.71 0.61 0.73 0.89 0.6 0.75
32 Hz 0.36 0.52 0.56 0.43 0.5 0.54 0.5 0.61 0.89 0.5 0.63
Note. avg. ref. = average reference; mast. Ref. = linked mastoid reference; PL = peak latency; FAL = 50 % fractional area latency

PROCESSING SPEED AND COGNITIVE ABILTIES 58
Table S6
Convergent validities (manifest correlations) between N2 latencies in the Sternberg memory scanning task
Sternberg memory scanning task: N2
average reference linked mastoid reference
peak latency fractional area latency peak latency fractional area latency
8 Hz filter 16 Hz filter 32 Hz filter 8 Hz filter 16 Hz filter 32 Hz filter 8 Hz filter 16 Hz filter 32 Hz filter 8 Hz filter 16 Hz filter
avg. ref. PL 8 Hz
16 Hz 0.52
32 Hz 0.35 0.7
FA 8 Hz 0.9 0.56 0.41
16 Hz 0.45 0.89 0.68 0.54
32 Hz 0.34 0.66 0.91 0.44 0.71
mast. ref. PL 8 Hz 0.02 0.07 0.03 0.03 0.06 0.03
16 Hz 0.38 0.64 0.44 0.39 0.6 0.42 0.37
32 Hz 0.21 0.35 0.18 0.25 0.36 0.24 0.35 0.56
FA 8 Hz 0.03 0.07 0.05 0.03 0.06 0.06 0.97 0.38 0.35
16 Hz 0.39 0.63 0.42 0.41 0.61 0.43 0.38 0.94 0.54 0.4
32 Hz 0.2 0.31 0.17 0.25 0.35 0.25 0.39 0.51 0.92 0.39 0.56
Note. avg. ref. = average reference; mast. Ref. = linked mastoid reference; PL = peak latency; FAL = 50 % fractional area latency

PROCESSING SPEED AND COGNITIVE ABILTIES 59
Table S7
Convergent validities (manifest correlations) between P3 latencies in the Sternberg memory scanning task
Sternberg memory scanning task: P3
average reference linked mastoid reference
peak latency fractional area latency peak latency fractional area latency
8 Hz filter 16 Hz filter 32 Hz filter 8 Hz filter 16 Hz filter 32 Hz filter 8 Hz filter 16 Hz filter 32 Hz filter 8 Hz filter 16 Hz filter
avg. ref. PL 8 Hz
16 Hz 0.62
32 Hz 0.59 0.57
FA 8 Hz 0.9 0.58 0.56
16 Hz 0.58 0.87 0.54 0.62
32 Hz 0.57 0.52 0.87 0.59 0.56
mast. ref. PL 8 Hz 0.22 0.31 0.34 0.26 0.34 0.39
16 Hz 0.43 0.54 0.6 0.46 0.51 0.58 0.63
32 Hz 0.17 0.26 0.39 0.22 0.3 0.34 0.59 0.61
FA 8 Hz 0.18 0.29 0.34 0.27 0.34 0.4 0.96 0.61 0.58
16 Hz 0.4 0.48 0.54 0.48 0.5 0.58 0.63 0.93 0.55 0.65
32 Hz 0.15 0.24 0.38 0.23 0.31 0.35 0.6 0.62 0.96 0.62 0.61
Note. avg. ref. = average reference; mast. Ref. = linked mastoid reference; PL = peak latency; FAL = 50 % fractional area latency

PROCESSING SPEED AND COGNITIVE ABILTIES 60
Table S8
Convergent validities (manifest correlations) between P2 latencies in the Posner letter matching task
Posner letter matching task: P2
average reference linked mastoid reference
peak latency fractional area latency peak latency fractional area latency
8 Hz filter 16 Hz filter 32 Hz filter 8 Hz filter 16 Hz filter 32 Hz filter 8 Hz filter 16 Hz filter 32 Hz filter 8 Hz filter 16 Hz filter
avg. ref. PL 8 Hz
16 Hz 0.49
32 Hz 0.42 0.55
FA 8 Hz 0.78 0.58 0.44
16 Hz 0.44 0.44 0.52 0.49
32 Hz 0.43 0.49 0.76 0.42 0.64
mast. ref. PL 8 Hz 0.61 0.61 0.32 0.73 0.24 0.34
16 Hz 0.37 0.54 0.56 0.39 0.4 0.51 0.65
32 Hz 0.43 0.38 0.7 0.47 0.35 0.55 0.55 0.77
FA 8 Hz 0.66 0.61 0.4 0.85 0.39 0.44 0.9 0.55 0.58
16 Hz 0.44 0.46 0.57 0.53 0.55 0.71 0.54 0.7 0.71 0.71
32 Hz 0.43 0.41 0.66 0.5 0.41 0.62 0.56 0.72 0.88 0.64 0.8
Note. avg. ref. = average reference; mast. Ref. = linked mastoid reference; PL = peak latency; FAL = 50 % fractional area latency

PROCESSING SPEED AND COGNITIVE ABILTIES 61
Table S9
Convergent validities (manifest correlations) between N2 latencies in the Posner letter matching task
Posner letter matching task: N2
average reference linked mastoid reference
peak latency fractional area latency peak latency fractional area latency
8 Hz filter 16 Hz filter 32 Hz filter 8 Hz filter 16 Hz filter 32 Hz filter 8 Hz filter 16 Hz filter 32 Hz filter 8 Hz filter 16 Hz filter
avg. ref. PL 8 Hz
16 Hz 0.54
32 Hz 0.62 0.51
FA 8 Hz 0.89 0.52 0.6
16 Hz 0.66 0.59 0.56 0.75
32 Hz 0.66 0.54 0.75 0.74 0.75
mast. ref. PL 8 Hz 0.18 0.19 0.07 0.15 0.21 0.12
16 Hz 0.28 0.36 0.26 0.24 0.28 0.25 0.57
32 Hz 0.31 0.16 0.25 0.18 0.23 0.24 0.58 0.5
FA 8 Hz 0.18 0.21 0.12 0.17 0.24 0.19 0.97 0.57 0.58
16 Hz 0.33 0.35 0.26 0.32 0.31 0.35 0.51 0.84 0.42 0.56
32 Hz 0.3 0.16 0.22 0.19 0.22 0.28 0.47 0.44 0.86 0.53 0.47
Note. avg. ref. = average reference; mast. Ref. = linked mastoid reference; PL = peak latency; FAL = 50 % fractional area latency

PROCESSING SPEED AND COGNITIVE ABILTIES 62
Table S10
Convergent validities (manifest correlations) between P3 latencies in the Posner letter matching task
Posner letter matching task: P3
average reference linked mastoid reference
peak latency fractional area latency peak latency fractional area latency
8 Hz filter 16 Hz filter 32 Hz filter 8 Hz filter 16 Hz filter 32 Hz filter 8 Hz filter 16 Hz filter 32 Hz filter 8 Hz filter 16 Hz filter
avg. ref. PL 8 Hz
16 Hz 0.67
32 Hz 0.53 0.6
FA 8 Hz 0.81 0.59 0.45
16 Hz 0.69 0.66 0.5 0.78
32 Hz 0.65 0.62 0.72 0.61 0.68
mast. ref. PL 8 Hz 0.43 0.36 0.29 0.46 0.47 0.41
16 Hz 0.37 0.49 0.33 0.41 0.54 0.45 0.66
32 Hz 0.35 0.43 0.37 0.32 0.46 0.44 0.66 0.73
FA 8 Hz 0.44 0.42 0.25 0.5 0.53 0.46 0.87 0.61 0.64
16 Hz 0.3 0.4 0.29 0.35 0.51 0.48 0.5 0.85 0.62 0.5
32 Hz 0.26 0.35 0.3 0.27 0.42 0.38 0.61 0.7 0.95 0.64 0.62
Note. avg. ref. = average reference; mast. Ref. = linked mastoid reference; PL = peak latency; FAL = 50 % fractional area latency

Table S11
Manifest correlations between ERP latencies and mean intelligence test scores
Note. PL = peak latency; FAL = 50 % fractional area latency.
Choice reaction time task: P2
8 Hz low-pass filter 16 Hz low-pass filter 32 Hz low-pass filter
PL FAL PL FAL PL FAL
average ref. -.21 -.27 -.17 -.17 -.05 -.05
mastoid ref. -.23 -.20 -.20 -.23 -.09 -.09
Choice reaction time task: N2
8 Hz low-pass filter 16 Hz low-pass filter 32 Hz low-pass filter
PL FAL PL FAL PL FAL
average ref. -.15 -.15 -.32 -.12 -.02 -.03
mastoid ref. -.21 -.22 -.17 -.18 -.17 -.19
Choice reaction time task: P3
8 Hz low-pass filter 16 Hz low-pass filter 32 Hz low-pass filter
PL FAL PL FAL PL FAL
average ref. -.25 -.24 -.25 -.28 -.28 -.23
mastoid ref. -.23 -.27 -.21 -.22 -.21 -.28
Sternberg memory scanning task: P2
8 Hz low-pass filter 16 Hz low-pass filter 32 Hz low-pass filter
PL FAL PL FAL PL FAL
average ref. -.19 -.12 -.21 -.18 -.16 -.10
mastoid ref. -.21 -.22 -.20 -.22 -.06 -.07
Sternberg memory scanning task: N2
8 Hz low-pass filter 16 Hz low-pass filter 32 Hz low-pass filter
PL FAL PL FAL PL FAL
average ref. -.24 -.27 -.20 -.25 -.24 -.29
mastoid ref. -.16 -.18 -.20 -.22 -.32 -.30
Sternberg memory scanning task: P3
8 Hz low-pass filter 16 Hz low-pass filter 32 Hz low-pass filter
PL FAL PL FAL PL FAL
average ref. -.29 -.26 -.31 -.23 -.28 -.26
mastoid ref. -.17 -.12 -.26 -.15 -.24 -.18
Posner letter matching task: P2
8 Hz low-pass filter 16 Hz low-pass filter 32 Hz low-pass filter
PL FAL PL FAL PL FAL
average ref. -.26 -.24 -.24 -.24 .06 -.04
mastoid ref. -.13 -.18 -.03 -.10 .03 .01
Posner letter matching task: N2
8 Hz low-pass filter 16 Hz low-pass filter 32 Hz low-pass filter
PL FAL PL FAL PL FAL
average ref. -.23 -.28 -.38 -.27 -.13 -.26
mastoid ref. -.14 -.18 -.07 -.16 -.09 -.13
Posner letter matching task: P3
8 Hz low-pass filter 16 Hz low-pass filter 32 Hz low-pass filter
PL FAL PL FAL PL FAL
average ref. -.22 -.20 -.22 -.25 -.18 -.29
mastoid ref. -.07 -.08 -.17 -.22 -.15 -.13
Copyright © 2022 FDOKUMEN