HKEX Investor Presentation - HKEX Group
50
HKEX Investor Presentation Investor Relations Apr, 2021
-
Upload
khangminh22 -
Category
Documents
-
view
0 -
download
0
Transcript of HKEX Investor Presentation - HKEX Group

HKEX Investor Presentation
Investor Relations
Apr, 2021

Disclaimer
The information contained in this document is for general informational purposes only and does not constitute an offer, solicitation, invitation or
recommendation to subscribe for or purchase any securities, or other products or to provide any investment advice or service of any kind. This
document is solely intended for distribution to and use by professional investors. This document is not directed at, and is not intended for
distribution to or use by, any person or entity in any jurisdiction or country where such distribution or use would be contrary to law or regulation or
which would subject Hong Kong Exchanges and Clearing Limited (“HKEX”) to any registration requirement within such jurisdiction or country.
This document contains forward-looking statements which are based on the current expectations, estimates, projections, beliefs and
assumptions of HKEX about the businesses and the markets in which it and its subsidiaries operate. These forward-looking statements are not
guarantees of future performance and are subject to market risk, uncertainties and factors beyond the control of HKEX. Therefore, actual
outcomes and returns may differ materially from the assumptions made and the statements contained in this document.
Where this document refers to Shanghai-Hong Kong Stock Connect and/or Shenzhen-Hong Kong Stock Connect (together, the “Stock Connect”
programs), please note that currently, access to northbound trading is only available to intermediaries licensed or regulated in Hong Kong;
southbound trading is only available to intermediaries licensed or regulated in Mainland China. Direct access to the Stock Connect is not
available outside Hong Kong and Mainland China.
Where this document refers to Bond Connect, please note that currently, access to northbound trading is only available to foreign investors that
are able to trade onshore bonds on the China Foreign Exchange Trade System & National Interbank Funding Centre.
Although the information contained in this document is obtained or compiled from sources believed to be reliable, HKEX does not guarantee the
accuracy, validity, timeliness or completeness of the information or data for any particular purpose, and shall not accept any responsibility for, or
be liable for, errors, omissions or other inaccuracies in the information or for the consequences thereof. The information set out in this document
is provided on an “as is” and “as available” basis and may be amended or changed. It is not a substitute for professional advice which takes
account of your specific circumstances and nothing in this document constitutes legal advice. HKEX shall not be responsible or liable for any loss
or damage, directly or indirectly, arising from the use of or reliance upon any information provided in this document.

Agenda
01 | Key Performance and Growth Drivers
02 | Group Financial Update
03 | Strategic Plan 2019-2021
04 | China Connectivity
05 | Appendix

HKEX – leading vertically integrated exchange group
Note: Figures for FY2020 (unless otherwise stated)
1. From 2009 to 2020
2. Corporate items accounted for 5% of total revenue in 2020 and are not shown on this slide.
HKEX GROUP
Leading diversified exchange group in the Asian Time Zone
HK’s only exchange group
World’s leading IPO venue – ranked #1 in 7 of the past 12 years1
Pioneer in Mainland capital markets connectivity
London Metal Exchange – globally leading base metals exchange
REVENUE:
HK$16.3bn
EBITDA:
HK$12.3bn
PAT:
HK$9.4bn
EPS:
HK$7.49
DPS:
HK$6.71(90% payout)
Cash EquitiesEquity & Financial
DerivativesCommodities
TechnologyPost Trade
Primary & Secondary Markets Post Trade Market Access
2020
Revenue
Share2
26% 17% 7%40%
5%
Market Data
FY2019
REVENUE:
HK$ 19.2bn
EBITDA:
HK$14.6bn
PAT:
HK$11.5bn
EPS:
HK$9.11
DPS:
HK$8.17(90% payout)
FY2020
Financials
4

Q1 2021 key highlights
1 | Financial Performance
• Record quarterly revenue and other income of HK$5,956mn (+49% YoY) with core
business revenue up by 35% YoY, driven by record headline ADT
• Record quarterly Stock Connect revenue and other income of HK$737mn (+82% YoY)
• Net investment income of HK$418mn (Q1 2020: HK$47mn loss)
• Profit attributable to shareholders at record quarterly high of HK$3,840mn (+70% YoY)
2 | Business and Strategy
• Strong IPO market – #3 globally by IPO funds raised (HK$137bn, more than 9x
Q1 2020)
• Published a consultation paper on proposals to enhance and streamline listing regime
for overseas issuers
• Strong Connect schemes performance – record high ADT across all platforms
• Ongoing market microstructure, technology enhancements and product launches
• Appointment of new CEO-designate, Nicolas Aguzin
• Published a consultation paper in April on proposed enhancements to the Corporate
Governance Code and related Listing Rules
5

21.830.0 33.9
25.216.4
36.6 40.151.6
17
110 122138 126
174
218183
154
0
50
100
150
200
250
0
20
40
60
80
100
120
2021
Core business well-positioned for organic and structural growth
Source: HKEX, Dealogic.
1. Shanghai-HK and Shenzhen-HK Stock Connect was launched in Nov 2014 and Dec 2016 respectively.
2. Buy + Sell ADT.
3. 2021 YTD as of Mar 2021.
Broad Product Ecosystem Attracting Diverse Mainland and International Investor Base
Transformational Growth from China’s Opening1IPOs Driving ADT Growth
Southbound Connect
Jumbo IPOs
Global Investors
Risk Management
Algo / Quant Investors
After-hours Trading
+10.8% +11.4%
Futures OptionsCAGR
CAGR
+72.3% +51.6%
Northbound ADT2
(RMB billion)
Southbound ADT2
(HK$ billion)
CAGR CAGR
Total IPO funds raised (US$ billion)
# of IPOs
New Economy Listing
Reforms
• Biotech
• WVR
• Secondary Listings
Strong Pipeline of
Mainland and
International Listings
Global fundraising rank Continuing Portfolio
Diversification
A-share Inclusion in
Global Benchmarks
SB Connect Limited by
Investor Eligibility Cap
Securities ADT
(HK$ billion)
Derivatives ADV
(’000 contracts)
A
B C
Focus on Revenue Growth and Cost DisciplineD
3 3
3 3
2016
2013
2018
2014
2017
2015
2019
Global fundraising rank
2020
3
63 69
106
6788
10787
129
2242015
2013
2020
2014
2019
2016
2017
2018
2021
2013
2014
2015
2016
2017
2018
2019
2020
2021
533 577
769 762870
1,2041,069
1,133
1,410
#3 #2 #1 #1 #3 #1 #1 #2 #3
6 5 1020
42
91
127
2018
2019
2017
2015
2021
2016
2020
3 410
13 11
24
61
2020
2019
2015
2016
2017
2018
2021
32
6

Diverse international investor base attracted to broad product ecosystem
1. HKEX signed a licence agreement with MSCI to introduce futures contracts on the MSCI China A Index, subject to regulatory approval and market conditions.
2. See next pages for details
A
Short
Selling
Stock
Options Stock
Futures
DWs
CBBCs
Index
Futures
OTC
ETPs Currency
Futures
Stock
Connect
Bond
Connect
A-share
Derivatives1
Stocks
Recent initiatives and future focus
Market microstructure enhancements: leading to better price
discovery and trade efficiency
Targeted marketing and client support: onboarding 10+ clients
each year
Incentives: driving increased volumes
Product cross-selling: creating arbitrage opportunities
Algo / Quant Participation in Cash Market
Due to…
• Presence of stamp duty
• Minimal high frequency trading
• Single market structure
Relatively low(circa. 10-20% of ADT)
Algo / Quant Participation in Derivatives Market
Relatively high(circa. 40-60% of ADV)
Driven by…
• No stamp duty
• Market maker participation
• Capital efficiency
Asia & EM
Index Futures2
7

New MSCI Suite – growing product ecosystem to connect global trades
1. All contracts denominated in USD unless otherwise specified
2. Started trading in HKEX since 2018
A
Key Dynamics
Expanding our product UNDERLYING
Licenced a suite of MSCI indexes in Asia and Emerging
Markets to introduce 40+ futures and options contracts
Broadening and deepening LIQUIDITY
Allow investors to Trade Asia, in Asia
Complement existing HSI and HSCEI index futures
Enhancing our COMPETITIVENESS
Better capital efficiency
Creating a competitive one-stop shop for China and Asian
exposures
Reinforces Hong Kong’s role as the leading global market in the Asian Time Zone, with the broadest suite of MSCI
derivatives products
NTRSingle country
Price ReturnSingle country
Options
MSCI Taiwan
MSCI Australia
MSCI China Free
MSCI Hong Kong
MSCI India
MSCI Indonesia
MSCI Japan
MSCI Japan (JPY)
MSCI Malaysia
MSCI New Zealand
MSCI Philippines
MSCI Singapore
MSCI Singapore Free
MSCI Taiwan
MSCI Taiwan 25/50
MSCI Thailand
MSCI Vietnam
Regional
MSCI AC Asia ex Japan2
MSCI EM Asia
MSCI EM Asia ex China
MSCI EM Asia ex Korea
MSCI EM EMEA
MSCI EM ex China
MSCI EM ex Korea
MSCI EM LatAm
MSCI Emerging Markets
MSCI Pacific
MSCI Pacific ex Japan
Regional
MSCI China Free
MSCI India
MSCI Indonesia
MSCI Japan (JPY)
MSCI Malaysia
MSCI Philippines
MSCI Taiwan 25/50
MSCI Thailand
MSCI Singapore Free
(SGD)
MSCI Taiwan
MSCI Vietnam
MSCI Emerging Markets
HKEX MSCI Product Suite1
MSCI China Free
8
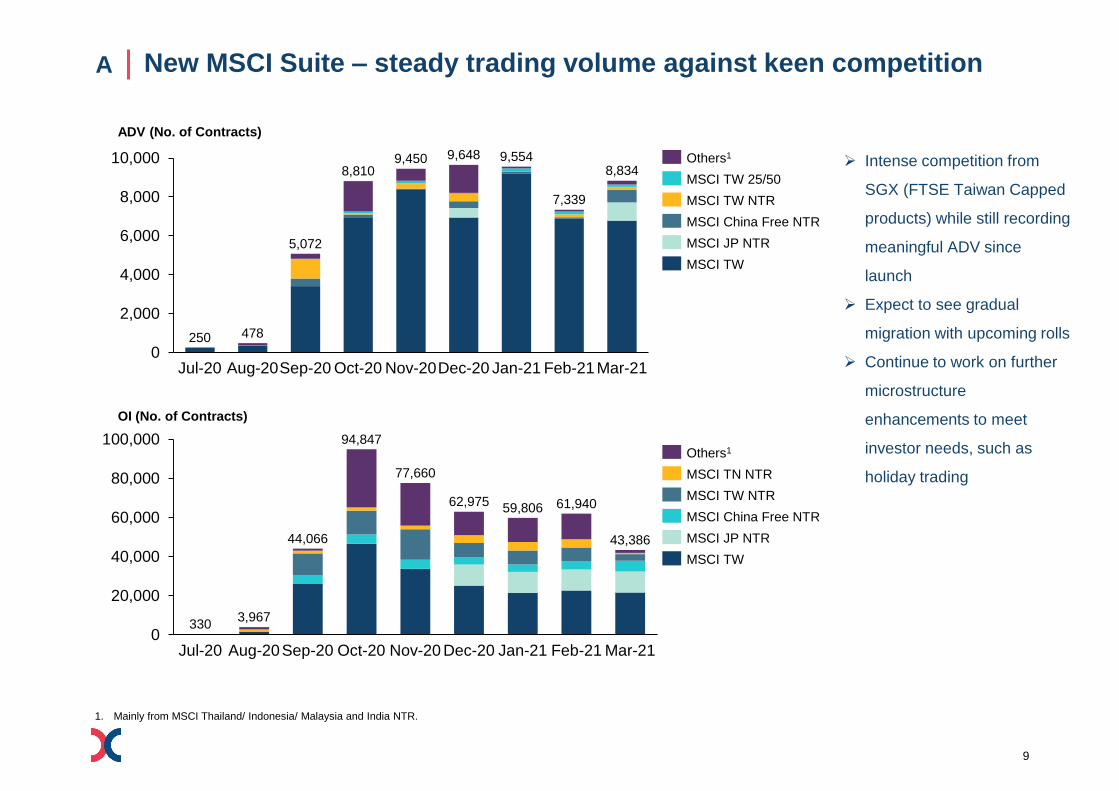
New MSCI Suite – steady trading volume against keen competitionA
0
2,000
4,000
6,000
8,000
10,000
Aug-20Jul-20
478250
Sep-20 Oct-20 Nov-20Dec-20 Jan-21
5,072
8,8109,450 9,648 9,554
8,834
Feb-21Mar-21
7,339
MSCI JP NTR
Others1
MSCI TW 25/50
MSCI TW NTR
MSCI China Free NTR
MSCI TW
0
20,000
40,000
60,000
80,000
100,000
330
Jul-20 Jan-21Aug-20 Nov-20Oct-20Sep-20 Dec-20
3,967
44,066
94,847
Mar-21
77,660
62,97559,806
Feb-21
61,940
43,386
Others1
MSCI TN NTR
MSCI JP NTR
MSCI TW NTR
MSCI China Free NTR
MSCI TW
ADV (No. of Contracts)
Intense competition from
SGX (FTSE Taiwan Capped
products) while still recording
meaningful ADV since
launch
Expect to see gradual
migration with upcoming rolls
Continue to work on further
microstructure
enhancements to meet
investor needs, such as
holiday trading
OI (No. of Contracts)
1. Mainly from MSCI Thailand/ Indonesia/ Malaysia and India NTR.
9

No. of IPO
– Total
– New Economy1
– Biotech2
IPO Funds Raised by Segments
Source: HKEX, as of Mar 2021.
1. Include Non-18A Biotech companies
2. Only include Chapter 18A Biotech companies
IPO Funds Raised
(HK$ bn)
2021 Jan – March Fundraising Summary
174 218 183
14 27 38
0 5 9
IPO Funds Raised
(#3 globally)18 New Economy
& Biotech Companies Listed…
…raising
HK$129.2bn
+846% YoY +3,061% YoY
HK$136.6bn
84.1 145.5 159.6 142.7
7.5
18.5 16.1 40.4
7.2
44.4
124.0 138.5
217.0
121.9
0
100
200
300
400
2017 2018 2019 2020 2021
Others Biotech New Economy
128.5
288.0
314.2
154
36
14
400.2
Strongly performing IPO market boosted by new economy issuers and
secondary listings
B
World’s second-largest fund raising hub for biotech
companies
HKEX was delighted to host its first ever Southeast Asia
Forum on 3 Dec 2020
Dialogues with the Biotech Community with PhiRDA -
attracted 292,000+ views
HKEX Biotech Summit 2020 (Virtual) – received
extensive interest from scientists, biotech entrepreneurs,
investors, technology experts and policymakers
Ongoing listing reforms
Shortening of IPO settlement cycle
Enhancing listing regime for overseas issuers
Enhancing the bookbuilding and price discovery aspects
of IPOs (cornerstone investors, pricing flexibility,
clawback mechanism)
136.6
32
15
3
10

% of respective ADT
% of single stock option ADV
Source: HKEX, as of Mar 2021. S – Secondary listings; W – Weighted Voting Rights; H – H shares
In 2021, 24% of cash ADT and 22% of stock option ADV is contributed by the top 31 IPOs since 2018
31 Jumbo IPOs > US$1bn (HK$7.8bn) since Jan 2018
Rank Company name IPO date IPO size
(HK$bn)
1 Alibaba Group - SW 26/11/2019 101.20
2 China Tower - H 08/08/2018 58.80
3 Kuaishou Technology - W 05/02/2021 48.30
4 Budweiser Brewing APAC 30/09/2019 45.08
5 Xiaomi Corporation - W 09/07/2018 42.61
6 JD.COM - SW 18/06/2020 34.56
7 Meituan Dianping - W 20/09/2018 33.14
8 JD Health International 08/12/2020 31.00
9 Netease - S 11/06/2020 24.26
10 Baidu - SW 23/03/2021 23.94
11 Bilibili - SW 29/03/2021 23.23
12 Yum China - S 10/09/2020 17.27
13 China Bohai Bank - H 16/07/2020 15.90
14 GDS - SW 02/11/2020 14.88
15 Evergrande Property 02/12/2020 14.27
16 ESR Cayman Ltd. 01/11/2019 14.06
17 Tigermed - H 07/08/2020 12.31
18 China Resources Mixc Lifestyle 09/12/2020 12.27
19 New Oriental - S 09/11/2020 11.65
20 Blue Moon Group Holdings Limited 16/12/2020 11.31
21 ZTO Express - SW 29/09/2020 11.28
22 Shimao Services 30/10/2020 9.95
23 Nongfu Spring - H 08/09/2020 9.60
24 Shenwan Hongyuan - H 26/04/2019 9.09
25 Hansoh Pharmaceutical Group 14/06/2019 9.04
26 Topsports International 10/10/2019 9.01
27 Ping An Healthcare and Technology 04/05/2018 8.77
28 Jiangxi Bank - H 26/06/2018 8.60
29 WuXi AppTec - H 13/12/2018 8.28
30 Smoore 10/07/2020 8.19
31 Sunac Service 19/11/2020 8.00
Rising contribution to volumes from Jumbo IPOs
3.0%
10.5%
7.3%
24.3%
15.6%
3.3
9.2
31.4
53.5
2018 2019 2020 2021 YTD
Cash Market ADT (HK$ bn) contributed
by the Jumbo IPOs and related Structured Products ADT
1.3%
3.0%
23.9%
21.5%
Jumbo IPOs contributing to increased trading activityB
11

Alibaba, NetEase and JD.com secondary listings contributed to ~6% of Hong Kong market’s ADT in Q1 2021, with a clear
trend of ADR conversion to HK shares
Source: HKEX, FactSet, as of 31 Mar 2021 (quarterly update)
Note: Alibaba is listed on NYSE, while NetEase and JD.com are listed on NASDAQ (figures as bold)
1. Based on total CCASS balance deducting the balance of main custodian bank as reference
ADT/ADV in HKEXAlibaba,
NetEase & JDMarket Total %
Equities + DWs + CBBCs
(HK$ bn)13.7 224.4 6.1
SSO
(Volume, ‘000)43.8 826.7 5.3
Strong Boost to HK Markets Trading
ADR conversion to HK shares
Number of Hong Kong (freely traded) shares as % of total issued shares globally
Alibaba NetEase JD.com
HKEX Trading Share – YTD Mar 2021
26/11/2019
(IPO)
31/03/2021
20.7%
2.5%
726%
11/06/2020
(IPO)
8.6%
31/03/2021
4.5%
90%
18/06/2020
(IPO)
31/03/2021
14.2%
5.1%
178%
Continuous trading volume migration and ADR conversion from
secondary listings
B
% of
TradingAlibaba NetEase JD.com
SEHK 18.3% 27.3% 20.8%
FINRA ADF 31.4% 21.8% 25.8%
NYSE 15.2% 1.2% 1.7%
NASDAQ 10.1% 29.0% 26.0%
NYSE Arca 8.0% 6.9% 8.3%
Other US
Exchanges17.1% 13.7% 17.4%
12

0
100
200
300
400
500
600
0.0%
0.5%
1.0%
1.5%
2.0%
2.5%
3.0%
3.5%
4.0%
Transformational growth from China’s opening
Source: HKEX, Bond Connect, ChinaBond, SCH;
1. Shanghai-HK and Shenzhen-HK Stock Connect was launched in Nov 2014 and Dec 2016 respectively.
2. Foreign participation in CIBM was first allowed in 2010 when the PBOC rolled out a Pilot Scheme to allow foreign financial institutions to invest in CIBM.
3. Data as of Mar 31st, 2021.
Benefiting from the increased capital flow into and out of Mainland China,
in particular inbound flows driven by international index inclusions
C
Stock Connect1 Bond Connect
+79.7%+78.7%
Northbound(RMB billion)
Southbound(HK$ billion)
Portfolio Value Portfolio Value
Total Foreign Participation in CIBM2
(RMB billion)
Bond Connect
launch
Foreign Holdings in Chinese Bonds
(US$ bn)
Foreign
Ownership (%)
US$547bn
3.4%
Continuing portfolio diversification by Mainland and
international investors
Inclusion of A shares into major global benchmarks
Increasing selection of new economy companies in
Southbound Stock Connect
Inclusion of Mainland bonds into global fixed income
indices
Easier access to the Mainland bond market via more
trading platforms
Increasing use of RMB globally and need to reinvest
into RMB assets
Investors
Onboarded
=2,450
YTD ADT
RMB25.3bn
CAGRCAGR
333
125 186
531668
1,429
2,340 2,360
2015
2021
2018
2017
2016
2019
2020
115
364
927789
1,138
2,097
2,550
2018
2015
2017
2016
2019
2020
2021
13
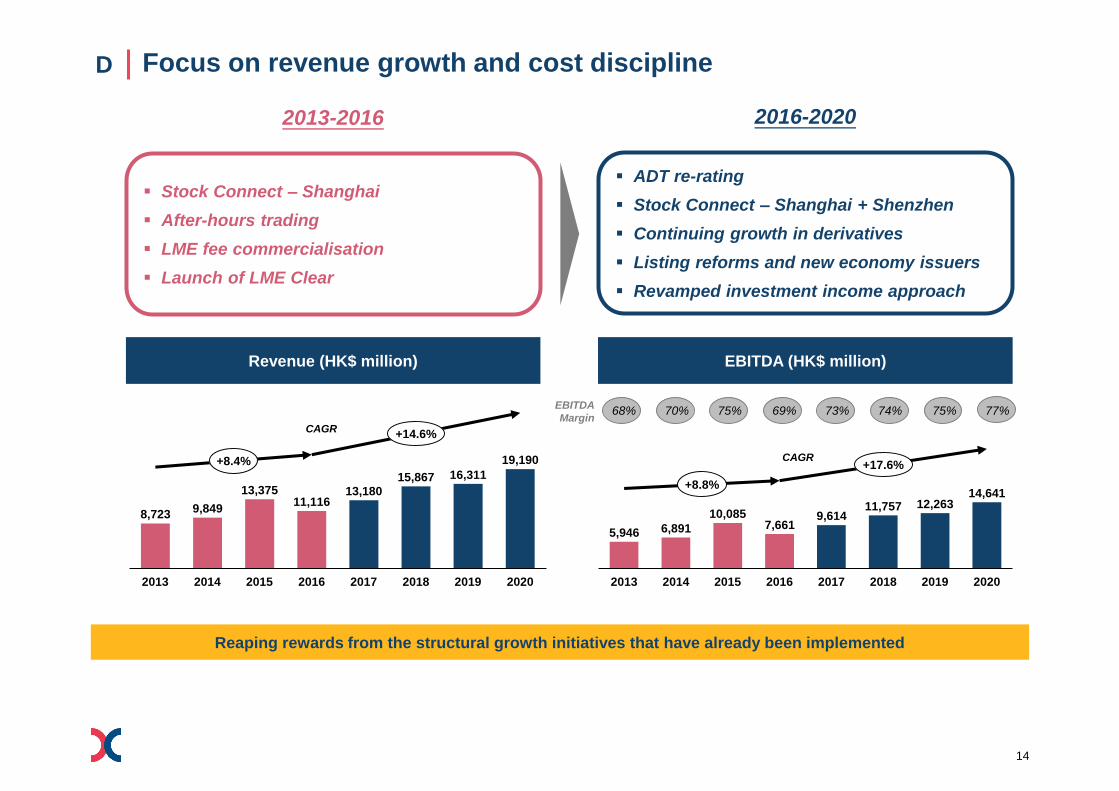
Focus on revenue growth and cost discipline
Reaping rewards from the structural growth initiatives that have already been implemented
D
Revenue (HK$ million) EBITDA (HK$ million)
2013-2016 2016-2020
Stock Connect – Shanghai
After-hours trading
LME fee commercialisation
Launch of LME Clear
ADT re-rating
Stock Connect – Shanghai + Shenzhen
Continuing growth in derivatives
Listing reforms and new economy issuers
Revamped investment income approach
CAGR
EBITDA
Margin
CAGR
8,7239,849
13,37511,116
13,18015,867 16,311
19,190
201820142013 201920162015 20202017
+8.4%
+14.6%
5,946 6,891
10,0857,661
9,61411,757 12,263
14,641
20192013 20172014 2015 2016 2018 2020
+8.8%
+17.6%
68% 70% 75% 69% 73% 74% 75% 77%
14

Focus on revenue growth and cost discipline
Increased operating leverage from revenue growth, delivered by structural drivers combined with opex discipline
D
Operating Expenses (HK$ million) Profit Attributable to Shareholders (HK$ million)
2013-2016 2016-2020
Investment in growth initiatives to capture
China opportunities
Upgrading core infrastructure to strengthen
technological foundation
Reaping rewards of past investments and
benefiting from operating leverage
Increased cost discipline
Investment in automation and operational
efficiency
CAGR
Net Profit
Margin
CAGR
2,777 2,9583,290 3,455 3,566
4,110 4,0484,549
20162013 2014 2015 2017 20192018 2020
+7.6%
+7.1%
4,552 5,165
7,9565,769
7,4049,312 9,391
11,505
2013 20172014 2015 20192016 2018 2020
+8.2%
+18.8%
1. If the impact of HKFRS 16 were excluded, 2019 Operating Expense would be HK$4,362 million and the 2016-2019 CAGR would be 8.1%.
52% 52% 59% 52% 56% 59% 58% 60%
1
15

Sustainability is at our core, and is business critical
Progressing our financial markets and communities for the benefit of all
OUR MARKETS
Swift COVID-19 response with timely disclosure &
AGM guidance and communications
Ongoing promotion of ESG standards with the
updated ESG Guide, new e-Learning series and
updated ESG guidance letter and active
involvement in global ESG standardisation
engagement
Promoting sustainable and green finance with the
launch of STAGE and the LME’s sustainability plan
Enhancing Corporate Governance Code -
published a consultation paper in April outlining
proposed enhancement to corporate governance
standards among listed issuers in Hong Kong,
specifically in the areas of director independence,
diversity and ESG
OUR PEOPLE
Official launch of HKEX Foundation with the
flagship $20m Charity Partnership Programme,
$10m COVID-19 emergency relief donations and
HKEX University Scholarship, as well as other
ongoing donations and e-volunteering activities for
the community
Supporting employees’ wellbeing across the
Group, especially during COVID-19
Championing workplace diversity through internal
training, advocacy and partnership with
professional groups, universities and NGOs
OUR OPERATIONS
Engaged the markets in adopting sustainable
business practices, e.g. e-IPO regime, LME
passport
Internal evaluations of board performance
Ongoing enhancement of employees’ awareness of
our legal and compliance obligations
Implementation of HKEX Future Workplace and
digitalisation of internal workflows to improve
efficiency and reduce paper consumption
TALENT ENGAGEMENTRISK CULTUREREPUTATION
Recognised as a sustainability leader with the constituent status in various sustainability indexes,
e.g., Dow Jones Sustainability Indexes, FTSE4Good, Hang Seng Corporate Sustainability Index series
16

Agenda
01 | Key Performance and Growth Drivers
02 | Group Financial Update
03 | Strategic Plan 2019-2021
04 | China Connectivity
05 | Appendix

Q1 2021: Record financial results
Revenue and profit at record quarterly highs
Higher investment income YoY, due to external portfolio gains
1. All percentage changes are computed based on amounts reported in financial statements.
2. Represents gross revenue and other income before deducting transaction-related expenses (Q1 2020: HK$17mn; Q1 2021: HK$45mn)
3. Core business revenue represents total revenue and other income, excluding net investment income and HKEX Foundation donation income (Q1 2020: HK$Nil; Q1 2021: HK$46mn).
4. EBITDA margin is calculated based on EBITDA divided by revenue and other income less transaction-related expenses.
EBITDA
+61%
Margin(4)
75% 81%
$3.0bn
Q1 2020
$4.8bn
Q1 2021
Core business revenue(3) Net investment income
+35% N/A
$4.1bn
Q1 2020
$5.5bn
Q1 2021
$(47)mn
Q1 2020
$418mn
Q1 2021
+49%
Total revenue & other income(2)
$4.0bn
Q1 2020
$6.0bn
Q1 2021
PAT
+70%
$2.3bn
Q1 2020
$3.8bn
Q1 2021
(HK$)
Basic earnings per share
+68%
$1.80
Q1 2020
$3.03
Q1 2021
18

Q1 2021 vs Q1 2020: Record quarterly revenue and profit due to record
headline ADT and strong Stock Connect trading volumes
1. Represents gross revenue and other income before deducting transaction-related expenses (Q1 2020: HK$17mn; Q1 2021: HK$45mn)
2. Excludes transaction-related expenses, depreciation and amortisation, finance costs, and share of results of joint ventures
3. For the purpose of this presentation, tax impact of NII is not considered when calculating the PAT attributable to NII.
4. EBITDA margin is calculated based on EBITDA divided by revenue and other income less transaction-related expenses.
5. From July 2020 onwards, the donation income from the Stock Code Balloting Charity Scheme was received by HKEX Foundation (HKEXFN), and then the amounts previously paid by issuers
directly to the Hong Kong Community Chest were paid by HKEX Foundation. As a result, HKEX records both donation income under revenue and other income, and HKEX Foundation
charitable donations under operating expenses.
Basic earnings per shareOperating
expenses(2) EBITDAProfit attributable to HKEX
shareholders(3)
Opex due to higher staff costs
and IT expenses
Foundation donations(5)
EBITDA margin 6% PAT % more than EBITDA
due to a one-off deferred tax
charge arising from UK tax
rate from 17% to 19% in Q1
2020, and lower % increase in
D&A
EPS % less than PAT due to
shares issued for scrip dividends
in April 2020
Revenue and
other income(1)
Trading & clearing fees from
record headline ADT and
Northbound ADT
Depository fees from e-IPO
and Stock Connect portfolio fees
Net investment income (NII) due
to HK$680mn from external
portfolio (Q1 2020: HK$521mn
losses; Q1 2021: HK$159mn gains)
partly offset by interest income
Core business4,056
Core business5,492
Core business1,007
Core business1,077
Core business3,032
Core business4,370
Core business2,310
Core business3,401
Core business1.84
Core business2.68
HKEXFN46
HKEXFN1
HKEXFN25
HKEXFN(1)
HKEXFN21
HKEXFN(1)
HKEXFN21
HKEXFN0.02
NII (47)
NII 418
NII (47)
NII 418
NII (47)
NII 418
NII (0.04)
NII 0.33
4,009
5,956
1,008 1,102
2,984
4,809
2,262
3,840
1.80
3.03
Q1 2020 Q1 2021 Q1 2020 Q1 2021 Q1 2020 Q1 2021 Q1 2020 Q1 2021 Q1 2020 Q1 2021
ADTMargin(4)75% 81%
HK$120.9bn +86% HK$224.4bn
Total
+70%
Core business
+47%
Core business
+44%
Total
+49%
Total
+61%
Core business
+35%
(HK$ mn)
Total
+68%
Core business
+46%
(HK$)
Total
+9%
Core business
+7%
19

Q1 2021 vs Q4 2020: PAT up 31% due to record headline ADT and lower
Opex, partly offset by decrease in net investment income
Revenue and other income(1)
Trading and clearing fees from record
headline ADT and Northbound ADT
Stock Exchange listing fees from in
newly listed DWs and CBBCs
Partly offset by:
NII due to HK$257mn gains from
external portfolio (Q4 2020: HK$416mn; Q1
2021: HK$159mn) and interest income
Operating expenses(2) EBITDAProfit attributable to
HKEX shareholders(3)
Staff costs due to special gratuity
payments in Q4 2020
Foundation donations
Remaining decrease due to seasonality
EBITDA margin 7% due to in
revenue and in opex
PAT % more than EBITDA due to
D&A
Core business4,282
Core business5,492
Core business1,246
Core business1,077
Core business2,996
Core business4,370
Core business2,163
Core business3,401
HKEXFN72
HKEXFN46
HKEXFN55
HKEXFN25
HKEXFN17
HKEXFN21
HKEXFN17
HKEXFN21
NII 745
NII 418
NII 745
NII 418
NII 745
NII 418
5,099
5,956
1,301 1,102
3,758
4,809
2,925
3,840
Q4 2020 Q1 2021 Q4 2020 Q1 2021 Q4 2020 Q1 2021 Q4 2020 Q1 2021
HK$224.4bnHK$141.0bnMargin(4) 81%74%
+59%
ADT
Total
+31%
Core business
+57%
Core business
+28%
Core business
+46%
Total
+17%
Total
+28%
(HK$ mn)
1. Represents gross revenue and other income before deducting transaction-related expenses (Q4 2020: HK$40mn; Q1 2021: HK$45mn).
2. Excludes transaction-related expenses, depreciation and amortisation, finance costs, and share of results of joint ventures
3. For the purpose of this presentation, tax impact of NII is not considered when calculating the PAT attributable to NII.
4. EBITDA margin is calculated based on EBITDA divided by revenue and other income less transaction-related expenses.
Core business
-14%
Total
-15%
20

Higher revenue for most segments
External portfolio saw gains of $159mn
Trading fees &
tariffs from
record ADT of
equity products
and Northbound
ADT
Trading fees &
tariffs from DWs,
CBBCs & warrants
from ADT
Trading fees from
futures and
options from
HKFE ADV, partly
offset by stock
options ADV
Listing fees due
to record newly
listed DWs and
CBBCs
Trading fees
from LME
chargeable ADV
Clearing fees
from ADT &
SIs, and record
Stock Connect
clearing revenue
Depository fees
from e-IPO fees
and Stock
Connect portfolio
fees
Investment income
due to interest
income from lower
interest rates
Network fees
due to usage
of the Orion
Central Gateway
& China Connect
Central Gateway,
and new
throttle fees
Net investment
income (NII)
from gains
from external
portfolio but partly
offset by interest
income
HKEX Foundation
donation income
$46m
(HK$ mn)
Change year-on-year
%
(42)
658113
496 36686
4,009
5,956
YTD Q1 2020 Cash Equity and FinancialDerivatives
Commodities Post Trade Technology Corporate Items YTD Q1 2021Q1 2020 Q1 2021
N/A+57% +13% -10% +28% +17% +49%
Segmental revenue
1. Headline ADT up 86% (Q1 2020: HK$120.9bn; Q1 2021: HK$224.4bn); ADT of equity products included under Cash segment up 91% (Q1 2020: HK$103.4bn; Q1 2021: HK$198.0bn); ADT of
DWs, CBBCs and warrants included under Equity and Financial Derivatives segment up 51% (Q1 2020: HK$17.5bn; Q1 2021: HK$26.4bn)
21

Higher EBITDA for all segments except for Commodities
1. EBITDA margin is calculated based on EBITDA divided by revenue and other income less transaction-related expenses.
EBITDA
1,027741 238
1,535
143
2,984
1,673
801197
2,009
180
4,809
Trading fees & tariffs
$646m from record ADT of
equity products and record
Stock Connect trading
revenue
Opex $12m due to staff
costs and IT costs
Trading fees & tariffs from DWs,
CBBCs & warrants $76m from
ADT
Trading fees from futures and options
$62m from HKFE ADV, partly
offset by stock options ADV
Listing fees $105m due to record
newly listed DWs and CBBCs
Transaction-related expenses
$19m due to MSCI license fees
Opex $34m due to allocated
costs of Listing Division from listing
fees from DWs and CBBCs, and MSCI
incentives
Trading fees $54m from
LME chargeable ADV
Clearing fees $482m from
record ADT, and record Stock
Connect clearing revenue
Depository fees $186m
from e-IPO service fees &
Stock Connect portfolio fees
Investment income $174m
due to interest return
Opex $13m due to staff
costs and IT costs
EBITDA margin 6%
Network fees $27m due to
usage of the Orion Central
Gateway & China Connect
Central Gateway, and new
throttle fees
+63% +8% -17% +31% +26% +61%
CashEquity & Financial
DerivativesCommodities Post Trade Technology
Group Total
(incl. Corp. Items)
Share of Group EBITDA (before Corporate Items)
%
28% 34%
EBITDA Margin
88% 92% 84% 82% 59% 55% 88% 90% 67% 73%
75% 81%
20% 17% 6% 4% 42% 41% 4% 4%
Q1 2020 Q1 2021
%
($ million)
100% 100%
Q1 2020 Q1 2021 Q1 2020 Q1 2021 Q1 2020 Q1 2021 Q1 2020 Q1 2021 Q1 2020 Q1 2021
(1)
22

Higher YoY net investment income due to gains from external portfolio
External portfolio – improved performance reflecting market
valuations
Internal funds – lower income from reduced interest rates, partly
offset by higher fund sizes
(HK$ mn)
Net investment income by category of investments
Debt
securities
Collective
investment
schemes
Cash &
bank
depositsFX
478
22
(521)
(26)
235
13159
11
Average fund size
15.7 22.8
146.8
186.2
29.4
34.0
Corporate Funds
Margin Funds
Clearing HouseFunds
Q1 2020 Q1 2021
191.9
243.0(HK$ bn)
(521)
101
340
33
159
60
193
6
Net investment income by funds
(HK$ mn)
Corporate Funds (External Portfolio)
Margin
Funds
Corporate Funds (Internal)
Clearing
House Funds
Q1
2020
Q1
2021
Q1
2020
Q1
2021Q1
2020
Q1
2021
Q1
2020
Q1
2021
Q1
2020
Q1
2021
Q1 2021: income of HK$418mn (Q1 2020: loss of HK$47mn)
Q1
2020
Q1
2021
Q1
2020
Q1
2021
Q1
2020
Q1
2021
23
Agenda
01 | Key Performance and Growth Drivers
02 | Group Financial Update
03 | Strategic Plan 2019-2021
04 | China Connectivity
05 | Appendix

The Global Markets Leader in the Asian Time Zone –
Connecting China, Connecting the World
Our 2019-2021 Strategic Vision
Global
Markets
Global
Liquidity
China
Markets
Global
Underlying
China
Liquidity
China
Underlying
Globally ConnectedChina Anchored Technology Empowered
Facilitating China’s
internationalisation and
investment diversification
Bringing global liquidity
to China and Asia Pacific
underlying
Leveraging new technology
for modernisation and
growth
25
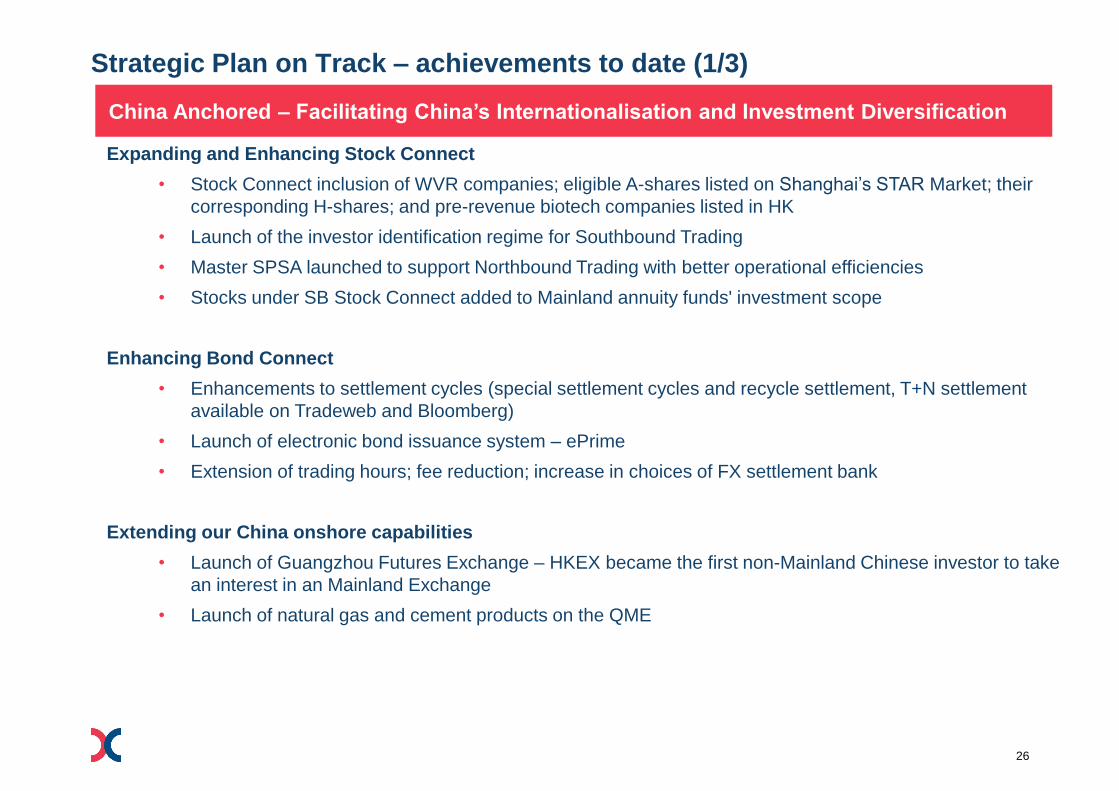
China Anchored – Facilitating China’s Internationalisation and Investment Diversification
Expanding and Enhancing Stock Connect
• Stock Connect inclusion of WVR companies; eligible A-shares listed on Shanghai’s STAR Market; their
corresponding H-shares; and pre-revenue biotech companies listed in HK
• Launch of the investor identification regime for Southbound Trading
• Master SPSA launched to support Northbound Trading with better operational efficiencies
• Stocks under SB Stock Connect added to Mainland annuity funds' investment scope
Enhancing Bond Connect
• Enhancements to settlement cycles (special settlement cycles and recycle settlement, T+N settlement
available on Tradeweb and Bloomberg)
• Launch of electronic bond issuance system – ePrime
• Extension of trading hours; fee reduction; increase in choices of FX settlement bank
Extending our China onshore capabilities
• Launch of Guangzhou Futures Exchange – HKEX became the first non-Mainland Chinese investor to take
an interest in an Mainland Exchange
• Launch of natural gas and cement products on the QME
Strategic Plan on Track – achievements to date (1/3)
26

3 | Strategic Plan on Track – 2020 HighlightsGlobally Connected – Bringing Global Liquidity to China and Asia Pacific Underlying
Enhancing our IPO regime
• New grandfather arrangements to enable qualifying issuers with Corporate WVR to seek secondary
listings in Hong Kong
• Shortening of the structured product listing cycle from five to three trading days
• Published a consultation paper on proposals to enhance and streamline the listing regime for
overseas issuers
Broadening our product ecosystem across asset classes
• MSCI suite of Asia and Emerging Markets Index Futures and Options
• Hang Seng TECH Index Futures and Options; Inline Warrants; Weekly Index options
• USD and CNH denominated Silver Futures; New cash-settled metals futures on LME
Developing into the ETF issuance and trading hub of the Asia time zone
• Welcomed new types of ETPs – active equity ETF, ESG China A shares ETF, commodity-based L&I
Product, HK – listed biotech companies focused ETF, ETF tracking the Shanghai’s STAR Market
• Launched the Hong Kong-Mainland ETF Cross-listing Scheme
• Introduced a new spread table and continuous quoting market making obligations to enhance
liquidity; cross-listing link with Euroclear; buy-in exemption
Improving market microstructure
• Enhanced Volatility Control Mechanism (VCM) and Pre-Opening Session (POS)
• Temporary migrated LME trading activities from the Ring to electronic pricing
• LME launched electronic warranting solution to replace paper warrants
Strategic Plan on Track – achievements to date (2/3)
Globally Connected – Bringing Global Liquidity to China and Asia Pacific Underlying
27

3 | Strategic Plan on Track – 2020 HighlightsTechnology Empowered – Leveraging New Technology for Modernisation and Growth
Modernising our systems
• FINI concept paper for shortening of IPO settlement cycle
• Relocation of the secondary data centre to become a Tier 3 data centre
• Completion of the derivatives system infrastructure upgrade
Leveraging new technology
• Announced launch of Synapse in Q1 2022 to automate and streamline post trade workflow for
Northbound Stock Connect
• Deployed new technologies (e.g., Robotic Process Automation, AI) across HKEX businesses
• Continued to scale up our Robotic Process Automation (RPA) programme and AI usage across our
businesses to improve operational efficiency
Expanding our horizons
• Launch of Fusion Bank, a new virtual bank in partnership with multiple leading HK businesses (HKEX
has minority shareholding)
• Minority investment in Huakong TsingJiao, which specialises data and multi-party computation
technologies
Strategic Plan on Track – achievements to date (3/3)
Technology Empowered – Leveraging New Technology for Modernisation and Growth
28

2019-2021 Strategy – FICC themes
FIXED INCOME AND CURRENCY COMMODITIES
Facilitate CNY access
Enhance Bond Connect
Expand suite of offshore rates / FX
derivatives on onshore underlying
Build post-trade infrastructure(custody, settlement, collateral management, FX)
Expand product suite
Market structure evolution
Asian Time Zone expansion
Commodity Connect
29

Key components of our FIC strategy
Expand Existing Platform
Capture CNY Opportunities
Invest in Post-Trade Infrastructure
Bond Connect enhancements
Listed bonds and derivatives
Southbound Bond Connect
CNY accessibility – repository, tracking and monitoring
IRS and repo + Derivatives Connect
CNY trading platform
Custody, settlement and collateral management
Trade repository and monitoring
International linkages
30

LME volume softened recently given pandemic battered global
economic activities…
Source: LME data as of Mar 2021
1. Excluding Admin Trades, 2021 YTD: 547,320 lots.
475
584 634
676 700
670 619 624
730 697
610 564
0
200
400
600
800
1,000
2010 2011 2012 2013 2014 2015 2016 2017 2018 2019 2020 2021YTD
ADV (‘000 lots)6 Dec 2012
HKEX
acquisition
22 Sep 2014
LME Clear
Launch
Post-acquisition
integration and
LME Clear launch
Commercialisation
of the platform
with LP and new
trader programme
Strategic pathway, future
platform development and
revised fee structure
1
31

…while multiple enhancements are on track
• Continuing the success of the Strategic
Pathway, with new contracts continue to
build liquidity especially in ferrous suite
• 2020 prioritisation of electronic options
market to simplify and standardise areas of
its market structure
• Aim to provide feedback in Q2 2021 on
Market Structure Discussion Paper, based
on the market feedback received in Q1
Strategic Pathway
• Continued embedding of responsible sourcing requirements into the LME brand lists, ensuring that LME
brand listing is a clear indicator of good ethical standing
• Launch of 2020 sustainability strategy proposals to reflect market interest in broader sustainability story
with a focus on low carbon aluminium
Sustainability focus
• Significant investment in new trading
platform
• Supporting industry initiatives to enhance
security of off-warrant metal storage
• Investigating solutions to enable the spot
trading and sourcing of specific metal types
• Insourcing warrant depository to streamline
the warrant lodgement and withdrawal
process, and provide significant operational
efficiencies
Continued innovation
• Promoting the highest standards of fair and orderly trading on the LME’s market
• Delivery of off-warrant stock reporting to provide better industry-wide metals stock transparency
• Deliver a modern market structure by close collaboration with external and internal stakeholders
Market leadership
32

Market microstructure enhancements at HKEX
We have achieved 30+ enhancements in the last 2 years and will continue to ensure
competitiveness and efficiency of our markets
Areas of Focus Key Achievements so far Since 2019
Improve Ease
of Access
• Better client onboarding
• Participants system testing enhancements
• Northbound throttle expansion (Stock Connect)
Reduce Frictional
Trading Costs
• Expand Closing Auction Session (Cash)
• After-hours trading extension to 3am (Derivatives)
• New spread table, Market Making enhancements and stamp duty exemption on ETP
market
Improve
Capital Efficiency
• Better cash interest rebates to participants
• Flexibility in Clearing Participants (CP) setup in HK and Stock Connect markets
• Flexibility for Non-CPs in clearing arrangements
Enhance Risk
Management
& Market Integrity
• Revamp Pre-Opening Session and Volatility Control Mechanism (Cash)
• Self-Match Prevention (Derivatives)
• Holiday trading and trading hour enhancements for MSCI products
• Shorten IPO settlement cycle
• Pre-Trade Risk Management Enhancements
• Increase Position Limit for certain products
Selected Initiatives in the Pipeline
We aim to build a quality market and a sustainable ecosystem of policies, participants and products
33

Agenda
01 | Key Performance and Growth Drivers
02 | Group Financial Update
03 | Strategic Plan 2019-2021
04 | China Connectivity
05 | Appendix

The penetration level of equity market through Stock Connect
Source: Wind, HKEX
1. Data as of Mar 2021.
Stock Connect covers the majority of the market by market cap and turnover
Stock Connect Coverage(% of all Mainland & HK listed companies)
32%
37%
20%
% of domestic market included in Stock Connect
MUTUAL MARKET
80%
80%
80%
73%
75%
87%
By
Market
Cap
By
Turnover
By
Number
78%of total market cap
76%of total turnover
29%of total number of
companies
SSE
SSE
SSE
SZSE
SZSE
SZSE
519
587
885
35

24.6 30.3 21.4 21.6 37.1 31.6
56.2 48.1 74.2 75.7
62.5 21.1 26.6 21.4 23.9
47.944.8
75.2
63.3
92.8 88.7
69.0
7.5 6.8
6.3 6.9
12.910.6
13.9
14.1
35.2 33.4
22.3
4.3 3.8
3.6 4.3
8.7 8.8
13.2
13.6
34.6 38.0
24.6
6.4 6.0 8.6 10.9 13.5 17.9 21.6 30.6
43.6 37.8
32.0 34.4
57.4 67.5
52.8 56.8
106.795.8
158.5
139.1
236.8 235.8
178.4
1.7%2.3%
3.7% 3.9%4.8% 5.3% 5.7% 6.1%
6.8%6.1%
5.4% 4.8%5.8% 5.6%
6.4%7.3%
9.0% 8.5%9.6% 9.9%
14.2%15.3%
11.8%
-15.0%
-10.0%
-5.0%
0.0%
5.0%
10.0%
15.0%
0
50
100
150
200
250
300
Q1 16 Q2 16 Q3 16 Q4 16 Q1 17 Q2 17 Q3 17 Q4 17 Q1 18 Q2 18 Q3 18 Q4 18 Q1 19 Q2 19 Q3 19 Q4 19 Q1 20 Q2 20 Q3 20 Q4 20 Jan 21 Feb 21 Mar 21
Stock Connect – trading trends
Stock Connect revenue continued to set record highs,
reaching 12% of the Group’s total revenue and other income in Q1 2021 (FY 2020 and Q1 2020: 10%)
Stock Connect generated record revenue of HK$737mn in Q1 2021, 82% higher than Q1 2020 (HK$404mn)
Stock Connect Northbound and Southbound Trading ADT reached RMB126.8bn and HK$60.8bn respectively in Q1 2021
Shanghai Northbound (1)
Shenzhen Northbound (1)
Shanghai Southbound
Total average daily trading volume
Percentage of Southbound turnover of Hong Kong Market
Stock Connect average daily trading volume (HK$ bn)
Source: HKEX, SSE and SZSE data
1. Northbound (NB) trading is conducted in RMB; the NB figures in the chart are converted to HKD based on the month-end exchange rate.
2. May not add up due to roundings
Shenzhen Southbound NB record of
RMB191.2bn on
7 Jul 2020
SB record
of HK$100.3bn
on 24 Feb 2021
36

Stock Connect (Northbound)
Portfolio Value
RMB billion
4.79.6
20.4
41.7
91.3
126.8
34.731.7
77.3
84.3
124.3MSCI
rebalancing
days
Average Daily Turnover
2018
2017
2019
RMB billion
20212,461 2,452
2,360
785
9511,033
1,050
9321,043
1,054
1,094
1,160
1,2211,264
1,429
601 576 566 592686 662 698 680 719
621 679 668
202 233 253 270 301347 366 404 437
491 502 530
1,437 1,439
1,298
1,450 1,518
1,687
1,9522,013
1,8921,950
2,089
2,340
Jan Feb Mar Apr May Jun Jul Aug Sep Oct Nov Dec
Source: HKEX
1. Data as of 31 Mar 2021.
2020
37

Source: HKEX, SGX, CFFEX, FIA
1. As of Mar 2021.
2. CSI 300 Index Futures was launched in Apr 2010.
3. Numbers in brackets represent the number of constituents within the underlying index.
* 2021 data as of Mar 2021.
Index futures on China underlying
ADV (’000 contracts)
Hang Seng Index Futures (52)3 HSCEI Futures (51)3
NOTIONAL VALUE1
US$180kNOTIONAL VALUE1
US$70k
FTSE China A50 Index Futures (SGX) (50)3 CSI 300 Index Futures (CFFEX) (300)3
NOTIONAL VALUE1
US$17kNOTIONAL VALUE1
US$233k
2
MAINLAND CHINA
Trading Fee: RMB36.93/contract, 0.0023% to notional value
Trading Fee: HK$3.50/contract, 0.0006% to notional value
Trading Fee: US$1.10/contract, 0.0061% to notional value
Trading Fee: HK$10.00/contract, 0.0007% to notional value
38%62%
WEIGHTING COMPOSITION1
OTHER
85 94 83 80 6986
131 127
234209
167 164
20162014 20192010 2013 20172011 2012 2015 2018 2020 2021*
5061 65
86 89
135 134117
152139 146
133
20152011 20202010 20172012 2013 2014 2016 2018 2019 2021*
2 1239
84
159
369
270 260
339
391 383412
2014 20182010 20172011 2012 201620152013 2019 2020 2021*
251 207
432
812884
1,136
17 17 3196 123 147
201720122010 20142011 20162013 2015 20202018 2019 2021*
38

Tapping into China’s vast bond market
Source: CBIRC (Feb 2021), PBOC, SSZ and SZSE (Mar 2021), BIS and IMF (Dec 2019 for the Bond vs GDP chart)
0
25
50
US China Japan UK FR
Bank Assets Equities Bonds
US$49tn
US$12tn
US$16tn
International
Investors
China’s Bond
Market
Key Policy Drivers
• Risk migration from banking sector to bond market
• Greater credit differentiation amid ongoing market
reforms
• Funding needs for economic transition and
infrastructure projects – e.g. Belt & Road; Panda
bonds
• Enhanced bond issuance and disclosure standards
Growing International Demand
• Yield differential against developed markets
• Inclusion in emerging market bond indexes
• Geographical and asset class diversification
• Growing convertibility of RMB / SDR inclusion
• More efficient access – Bond Connect
Outstanding,
US$ tn Relative to GDP
192%
99% 244%
173%222%
39

0
100
200
300
400
500
600
Pilot scheme
to access
CIBM
RQFII
investment
QFII
investment
Long-only
investment
Bond
Connect
launch
(1)0.0%
0.5%
1.0%
1.5%
2.0%
2.5%
3.0%
3.5%
4.0%
Bond Connect has significantly grown foreign participation in China’s bond market
Source: ChinaBond + SCH, Bloomberg, BIS
1. Foreign participation in the CIBM data as of Mar 2021
2. BBGA is Bloomberg Barclay Global-Aggregate, GBI-EM is J.P. Morgan Government Bond Index-Emerging Markets series, WGBI is FTSE World Government Bond Index
Foreign participation in the CIBM increased by 322% since launch of Bond Connect in July 2017(1)
Number of Bond Connect participants has grown to 2,450 as of Mar 2021
Bond Connect Mar 2021 YTD ADT: RMB 25.3bn
68%64%
46%41% 39% 38%
29%
13%8%
~3%
DE FR AU UK IT CA US RU JP China
Growth DriversForeign Participation in the CIBM
Average: 38.5% 15%
Achievable
target
Foreign Ownership %
US$547bn
Foreign Holdings in Chinese Bonds
(US$ billion)
Foreign Ownership (%)Inclusion of Mainland bonds in global fixed income
indexes (BBGA, GBI-EM, WGBI)2
Greater adoption of RMB globally and
need to reinvest in RMB assets
Improving access to the Mainland bond market
3.4%
1
40
Agenda
01 | Key Performance and Growth Drivers
02 | Group Financial Update
03 | Strategic Plan 2019-2021
04 | China Connectivity
05 | Appendix

Financial highlights – Income Statement
(HK$ mn, unless stated otherwise) Q1 2021% of Revenue &
Other IncomeQ1 2020
% of Revenue &
Other IncomeYoY Change
Results
Revenue and other income 5,956 100% 4,009 100% 49%
Less: Transaction-related expenses (45) (1%) (17) (0%) 165%
Revenue and other income less transaction-related
expenses5,911 99% 3,992 100% 48%
Operating expenses (1,102) (19%) (1,008) (25%) 9%
EBITDA 4,809 81% 2,984 74% 61%
Depreciation and amortisation (327) (5%) (274) (7%) 19%
Operating profit 4,482 75% 2,710 68% 65%
Finance costs and share of results of joint ventures (23) (0%) (30) (1%) (23%)
Profit before taxation 4,459 75% 2,680 67% 66%
Taxation (632) (11%) (422) (11%) 50%
Loss attributable to non-controlling interests 13 0% 4 0% 225%
Profit attributable to HKEX shareholders 3,840 64% 2,262 56% 70%
Capex 331 216 53%
Basic earnings per share HK$3.03 HK$1.80 68%
Headline ADT on the Stock Exchange HK$224.4 bn HK$120.9 bn 86%
1. % does not add up due to roundings.
42

Performance by operating segment
HK$ mn Cash
Equity &
Financial
Derivatives
Commodities Post Trade TechnologyCorporate
Items
Group
Q1 2021
Group
Q1 2020
Revenue and other income 1,820 1,011 361 2,248 248 268 5,956 4,009
% of Group Total 31% 17% 6% 38% 4% 4% 100% 100%
Less: Transaction-related
expenses- (33) - (12) - - (45) (17)
Revenue and other income less
transaction-related expenses1,820 978 361 2,236 248 268 5,911 3,992
Operating expenses (147) (177) (164) (227) (68) (319) (1,102) (1,008)
EBITDA 1,673 801 197 2,009 180 (51) 4,809 2,984
% of Group Total 35% 16% 4% 42% 4% (1%) 100% 100%
EBITDA margin(1) 92% 82% 55% 90% 73% N/A 81% 75%
Depreciation and amortisation (327) (274)
Finance costs (39) (49)
Share of results of joint ventures 16 19
Profit before taxation 4,459 2,680
1. EBITDA margin is calculated based on EBITDA divided by revenue and other income less transaction-related expenses.
43

Operating expenses and depreciation & amortisation
Staff costs due to
payroll adjustments
due to
maintenance
expenses for new IT
systems and
network upgrades
Stable Professional fees
incurred for strategic
initiatives (e.g.
consulting fee for
HKATS review in
2020)
due to IT
systems rolled out
in 2020 (e.g. Orion
Risk Platform for
Cash Market)
Incentives
relating to MSCI
index futures
contracts
Total opex due to
staff costs, IT
costs and
Foundation
donations, partly
offset by
professional fees
1. Includes product marketing and promotion expenses
2. Excludes transaction-related expenses, depreciation and amortisation, finance costs, and share of results of joint ventures
(HK$ mn)
+ 10% - 3% - 41% + 9% + 19%+ 9%
89
703 765
152 167
29 28 34 20 1 2597
1,0081,102
274327
Staff costs and
related expenses
IT & computer
maintenance expPremises expenses Professional fees
Other operating
expenses (1) Total opex (2) Depreciation and
amortisation
Q1 2020 Q1 2021
+ 9%+ 2,400%
HKEX Foundation
charitable donations
2021 amount mainly
represents
donations made by
HKEX Foundation
to HK Community
Chest
Investment in talent and infrastructure
+ 7%Excl.
donations
Q1 2020 Q1 2021Q1 2020 Q1 2021 Q1 2020 Q1 2021 Q1 2020 Q1 2021 Q1 2020 Q1 2021 Q1 2020 Q1 2021 Q1 2020 Q1 2021
44

1,4321,553 1,543
1,241
1,716 1,777
2,0331,878
2,562 2,479 2,443
1,828
2,608 2,597
2,2071,979
2,262
2,971
3,347
2,925
3,840
2,751 2,879 2,848 2,6383,048
3,155 3,4543,523
4,150 4,044 4,1023,571
4,288 4,290
3,987
3,746
4,009
4,773
5,309 5,099
5,956
842 825 825 924823 869 877 957 920 971 1,012
1,153956 970 937
1,134 1,008 1,037 1,0931,301
1,102
1,897 2,045 2,014
1,705
2,2152,277
2,567 2,555
3,215 3,061 3,077
2,404
3,3183,307
3,038
2,600
2,984
3,722
4,177
3,758
4,809
Q1 Q2 Q3 Q4 Q1 Q2 Q3 Q4 Q1 Q2 Q3 Q4 Q1 Q2 Q3 Q4 Q1 Q2 Q3 Q4 Q1
Profit attributable to shareholders
Revenue and other income
Operating expenses
EBITDA
Q1 2021 performance above historical trendline
HKEX saw a strong start to 2021 with record quarterly financial results driven by robust trading volumes in the Cash Market
1. Represents gross revenue and other income before deducting transaction-related expenses
2. Operating expenses exclude transaction-related expenses, depreciation and amortisation, finance costs, share of results of joint ventures, and costs arising from the proposed combination with
London Stock Exchange Group plc (LSEG).
3. Dotted trend lines are illustrative and do not constitute a forward forecast.
(2)
Quarterly performance
(HK$ mn)
(1)
2016 2017 2018 2019 2020 2021
45

Comparison of trading activity across global Exchanges
*Source: WFE and Bloomberg as of Mar 2021. Except NYSE and Cboe as of Dec 2020, B3, Euronext and DB as of Feb 2021, NSE as of Jan 2021.
1. ADT and turnover velocity takes into account both on-exchange and block trading. For Nasdaq, NYSE and Cboe, trades executed on their trading platforms include those listed on other US
exchanges, hence their turnover velocity covers the whole US market.
2. HKEX ADT includes equities only, excluding ETPs and structured products.
ADT & Velocity (1) of Major Global Exchanges (US$ billion)
= Last 6 months (Oct 20 - Mar 21) velocity*
= Last month (Mar 21) velocity
= ADT
176% 88% 51% 87% 195% 117% 61% 125% 362% 205% 78% 116% 330% 207% 76% 147% 41%
369% 223% 86%
287.5
112.4
68.3
8.8 6.217.4
9.7 8.3
73.9
56.2
19.631.1 26.8
10.94.7 9.3
1.0
NASDAQ Deutsche
Börse
B3CboeNYSE TMX ENXLSE
Group
SZSE SSE HKEX(2) ASXJPX KRX NSE TWSE SGX
46

21.83
6.63
10.79
9.17
10.61
1.410.98
0.57 0.41
CME Group ICE (incl.LIFFE)
SHFE DCE ZCE HKEXDerivatives
SGX LME CFFEX
ADV in million
2.57(5 tons equivalent)
No. of contracts
(in million)
% of volume in
commodities0.0%13.9% 56.6% 100.0% 100.0% 100.0% 0.05% 10.5% 100.0%
Global derivatives trading landscape
Source: Company website, data as of Mar 2021.
160(5 tons equivalent)
1,331 409 626 532 616 86 61 36 24
47

Northbound(1): RMB2,360bn; Southbound(2): HK$2,550bn
Stock Connect shareholding value
Northbound Top 25(3)
Rank Stock nameShare value in CCASS
(RMB million)
% of issued shares Venue
1 Kweichow Moutai Co.,Ltd. 192,750 7.63% SH
2 Midea Group Co., Ltd. 86,419 14.91% SZ
3 Ping An Insurance (Group) * 69,926 8.20% SH
4 China Merchants Bank Co.,Limited * 65,167 6.18% SH
5 Gree Electric Appliances,Inc. 62,098 16.46% SZ
6 Jiangsu Hengrui Medicine Co.,Ltd. 60,217 12.32% SH
7 Wuliangye Yibin Co.,Ltd. 57,223 5.50% SZ
8 China Tourism Group Duty Free 57,107 9.55% SH
9 Contemporary Amperex Technology 49,000 6.52% SZ
10 Ping An Bank Co., Ltd. 46,389 10.86% SZ
11 Longi Green Energy Technology Co., 31,330 9.43% SH
12 Foshan Haitian Flavouring And Food 31,244 6.03% SH
13 Inner Mongolia Yili Industrial Group 30,044 12.65% SH
14 Shenzhen Mindray Bio-Medical 28,291 5.83% SZ
15 Sany Heavy Industry Co.,Ltd 26,703 9.22% SH
16 China Yangtze Power Co.,Ltd. 26,276 5.38% SH
17 Nari Technology Co., Ltd. 19,639 13.73% SH
18 Wuxi Apptec Co., Ltd. * 19,464 9.40% SH
19 Wanhua Chemical Group Co.,Ltd. 19,381 12.89% SH
20 Beijing Oriental Yuhong Waterproof 19,257 16.03% SZ
21 China Vanke Co., Ltd. * 18,380 6.30% SZ
22 Anhui Conch Cement Company * 17,725 8.65% SH
23 Focus Media Information Technology 16,487 12.10% SZ
24 Aier Eye Hospital Group Co.,Ltd. 16,430 6.72% SZ
25 Hangzhou Tigermed Consulting 16,387 14.56% SZ
Southbound Top 25(3)
Rank Stock nameShare value in CCASS
(HK$ million)
% of issued shares
1 Tencent Holdings Limited 375,061 6.40%
2 China Construction Bank Corporation* 182,003 11.57%
3 Industrial And Commercial Bank Of China 143,997 29.73%
4 Meituan 111,553 6.34%
5 Hsbc Holdings Plc 89,385 9.46%
6 Xiaomi Corporation 81,566 12.56%
7 China Mobile Limited 79,585 7.62%
8 Cnooc Limited 44,665 12.30%
9 Hong Kong Exchanges And Clearing Limited 42,111 7.25%
10 Semiconductor Manufacturing International* 36,934 18.92%
11 Anta Sports Products Limited 34,512 10.06%
12 Wuxi Biologics (Cayman) Inc. 30,104 7.33%
13 China Resources Beer (Holdings) Company 29,615 14.97%
14 Sunny Optical Technology (Group) Company 28,081 14.44%
15 Sunac China Holdings Limited 25,743 16.54%
16 Agricultural Bank Of China Limited* 25,530 26.70%
17 Great Wall Motor Company Limited 25,300 37.87%
18 China Pacific Insurance (Group) Co. Ltd.* 23,290 27.37%
19 Smoore International Holdings Limited 22,829 0.00%
20 Country Garden Services Holdings Company 21,095 8.95%
21 Bank Of China Limited* 18,888 7.62%
22 Innovent Biologics, Inc. 18,017 15.69%
23 China Feihe Limited 17,989 9.14%
24 Kingsoft Corporation Limited 17,803 25.12%
25 Man Wah Holdings Limited 16,245 25.44%
Source: Bloomberg and HKEX as of Mar 2021 (* A&H shares), does not add up due to roundings.
1. Shanghai Northbound: RMB1,282bn; Shenzhen Northbound: RMB1,078bn
2. Shanghai Southbound: HK$1,503bn; Shenzhen Southbound: HK$1,046bn
3. Ranked by share value in CCASSS
48

Comparison of Exchanges – Top 10 stocks by turnover value(1)
Source: Bloomberg data as of Mar 2021
1. Ranked by YTD ADT (US$m).
* Dual class voting share
New economy stocks now account for significant portions of the turnover
Company(RED =
Chinese companies)
YTD ADT
A-Share YTD ADT
Mkt. Cap
Rank
TENCENT 2,285 - 1
MEITUAN-W 1,173 - 4
ALIBABA 1,059 - 2
XIAOMI-W 998 - 14
CHINA MOB 722 - 6
KUAISHOU 631 - 8
HKEX 552 - 12
BAIDU 502 - 17
BYD 461 1,302 56
SMIC 438 301 68
CompanyYTD ADT
NIO* 5,520
ALIBABA* 4,689
BAIDU* 3,596
FUTU* 1,556
PINDUODUO* 1,375
JD* 1,050
BILIBILI* 910
XPENG* 909
GSX TECHEDU* 713
TENCENT MUSIC* 693
CompanyYTD ADT
H-Share YTD ADT
Mkt. Cap
Rank
KWEICHOW MOUTAI
CO LTD-A1,557 - 1
LONGI GREEN ENERGY
TECHNOL-A1,334 - 16
PING AN INSURANCE
GROUP CO-A1,281 437 5
SANY HEAVY
INDUSTRY CO LTD-A807 - 24
TONGWEI CO LTD-A 776 - 46
ZIJIN MINING GROUP
CO LTD-A705 126 35
CHINA TOURISM
GROUP DUTY F-A694 - 9
CHINA MERCHANTS
BANK-A691 155 3
CHINA NORTHERN
RARE EARTH -A646 - 102
CITIC SECURITIES CO-
A618 76 25
CompanyYTDADT
H-Share YTD ADT
Mkt. Cap
Rank
EAST MONEY
INFORMATION CO-A1,453 - 15
BYD CO LTD -A 1,302 461 11
WULIANGYE YIBIN CO
LTD-A1,234 - 1
BOE TECHNOLOGY
GROUP CO LT-A1,104 - 20
CONTEMPORARY
AMPEREX TECHN-A1,076 - 2
TIANQI LITHIUM CORP-A 851 - 92
TCL TECHNOLOGY
GROUP CORP-A843 - 34
SUNGROW POWER
SUPPLY CO LT-A840 - 47
LUXSHARE PRECISION
INDUSTR-A737 - 18
GANFENG LITHIUM CO
LTD-A687 94 42
Top 10: 35% of Total ADT Top 10: 14% of Total ADT Top 10: 12% of Total ADT Top 10: 70% of Total ADT
HKEX SSE SZSEUS Listed
Chinese Stocks
49

86
166
101 72 70 63 67 64 74 78 93 107
146 107 92 86 101 95
77 77
121 114 141 141
246 234 198
0
5,000
10,000
15,000
20,000
25,000
30,000
35,000
-
50
100
150
200
250
300
350
400
1Q 2Q 3Q 4Q 1Q 2Q 3Q 4Q 1Q 2Q 3Q 4Q 1Q 2Q 3Q 4Q 1Q 2Q 3Q 4Q Q1 Q2 Q3 Q4 Jan Feb Mar
2015 2016 2017 2018 2019 2020 2021
394
868 499 377
215 184 193 221 201 195 231 203 227 173 129 134 260 260 186 168 313 240 400 299 448 408 345
303
712
428 537
323 342 309 296 242 247 277 250 246 232 171 187
332 325 272 273
518 400
609 475
609 529
442
698
1,579
927 914
537 526 502 517 443 442 508 453 474 405 300 321
593 585
459 440
831
640
1,009
774
1,058 937
787
0
1,000
2,000
3,000
4,000
5,000
6,000
0
500
1,000
1,500
2,000
2,500
3,000
3,500
1Q 2Q 3Q 4Q 1Q 2Q 3Q 4Q 1Q 2Q 3Q 4Q 1Q 2Q 3Q 4Q 1Q 2Q 3Q 4Q 1Q 2Q 3Q 4Q Jan Feb Mar
2015 2016 2017 2018 2019 2020 2021
2020:-3%
Index
IndexADT RMB billion
ADT HK$ billion
SSE ADT (LHS) SZSE ADT (LHS) CSI 300 (RHS)
2015 :+6% 2016: -11%
2015: -7% 2016:+0.4%
2017: +22%
2017: +36%
HKEX ADT (LHS) Hang Seng Index (RHS)
2018: -25% 2019:+36%
2019:+9%2018: -14%
2020:+27%
Source: HKEX, SSE, SZSE & Bloomberg
Note: Data as of Mar.
1. SSE ADT excludes STAR companies.
2. Does not add up due to roundings.
2021:+4%
2021:-3%
Market activity in Mainland and Hong Kong markets
50