High Throughput Screening Method to Explore Protein Interactions with Nanoparticles
15
RESEARCH ARTICLE High Throughput Screening Method to Explore Protein Interactions with Nanoparticles Irem Nasir 1 , Warda Fatih 2 , Anja Svensson 2 , Dennis Radu 2 , Sara Linse 1 , Celia Cabaleiro Lago 1 , Martin Lundqvist 1,2 * 1 Center for Molecular Protein Science, Department of Biochemistry and Structural Biology, Lund University, Lund, Sweden, 2 Upper 2nd school, Klippan, Sweden * [email protected] Abstract The interactions of biological macromolecules with nanoparticles underlie a wide variety of current and future applications in the fields of biotechnology, medicine and bioremediation. The same interactions are also responsible for mediating potential biohazards of nanoma- terials. Some applications require that proteins adsorb to the nanomaterial and that the pro- tein resists or undergoes structural rearrangements. This article presents a screening method for detecting nanoparticle-protein partners and conformational changes on time scales ranging from milliseconds to days. Mobile fluorophores are used as reporters to study the interaction between proteins and nanoparticles in a high-throughput manner in multi-well format. Furthermore, the screening method may reveal changes in colloidal stabil- ity of nanomaterials depending on the physicochemical conditions. Introduction Technical, biological and biomedical applications of nanoparticles depend on the interaction between nanoparticles and biomolecules such as proteins [1–6] and lipids [6–8]. Important considerations in biological fluids with ten thousands of biomolecules competing for the nano- particle surface are affinities, specificities and exchange rates [9–11]. The technical applicability as well as potential biohazards will depend also on the structural and functional perturbations of the interacting proteins [12, 13]. High throughput and accurate screening methods for detection of interactions between proteins and nanoparticles are therefore desirable, in fields such as bionanotechnology, nano-safety and nano-medicine. Both qualitative and quantitative screening methods are needed for identification of interacting proteins and measurements of the interaction parameters in terms of rate and equilibrium constants, conformational transi- tions and functional consequences. Many different analytical methods have been applied to study the interaction between a protein and a nanoparticle surface and the influence of an interaction on the native state of the protein, among others: circular dichroism [11, 14], ellipso- metry [15], infrared spectroscopy [16], atomic force microscopy [17], fluorescence labelling of PLOS ONE | DOI:10.1371/journal.pone.0136687 August 27, 2015 1 / 15 OPEN ACCESS Citation: Nasir I, Fatih W, Svensson A, Radu D, Linse S, Cabaleiro Lago C, et al. (2015) High Throughput Screening Method to Explore Protein Interactions with Nanoparticles. PLoS ONE 10(8): e0136687. doi:10.1371/journal.pone.0136687 Editor: Reza Khodarahmi, Kermanshah University of Medical Sciences, ISLAMIC REPUBLIC OF IRAN Received: May 31, 2015 Accepted: August 6, 2015 Published: August 27, 2015 Copyright: © 2015 Nasir et al. This is an open access article distributed under the terms of the Creative Commons Attribution License, which permits unrestricted use, distribution, and reproduction in any medium, provided the original author and source are credited. Data Availability Statement: All relevant data are within the paper and its Supporting Information files. Funding: This work was supported by the Marianne and Marcus Wallenberg Foundation, https://www. wallenberg.com/mmw/, M.L.; Magnus Bergvall Foundation, www.magnbergvallsstiftelse.nu/, M.L.; the Swedish Research Council, www.vr.se, C.C.L.; the Crafoord Foundation, www.crafoord.se/, C.C.L.; and the Swedish Research Council (VR) via OMM, www.omm.lu.se/, S.L. The funders had no role in study design, data collection and analysis, decision to publish, or preparation of the manuscript.
Transcript of High Throughput Screening Method to Explore Protein Interactions with Nanoparticles
RESEARCH ARTICLE
High Throughput Screening Method toExplore Protein Interactions withNanoparticlesIrem Nasir1, Warda Fatih2, Anja Svensson2, Dennis Radu2, Sara Linse1, Celia CabaleiroLago1, Martin Lundqvist1,2*
1 Center for Molecular Protein Science, Department of Biochemistry and Structural Biology, Lund University,Lund, Sweden, 2 Upper 2nd school, Klippan, Sweden
AbstractThe interactions of biological macromolecules with nanoparticles underlie a wide variety of
current and future applications in the fields of biotechnology, medicine and bioremediation.
The same interactions are also responsible for mediating potential biohazards of nanoma-
terials. Some applications require that proteins adsorb to the nanomaterial and that the pro-
tein resists or undergoes structural rearrangements. This article presents a screening
method for detecting nanoparticle-protein partners and conformational changes on time
scales ranging from milliseconds to days. Mobile fluorophores are used as reporters to
study the interaction between proteins and nanoparticles in a high-throughput manner in
multi-well format. Furthermore, the screening method may reveal changes in colloidal stabil-
ity of nanomaterials depending on the physicochemical conditions.
IntroductionTechnical, biological and biomedical applications of nanoparticles depend on the interactionbetween nanoparticles and biomolecules such as proteins [1–6] and lipids [6–8]. Importantconsiderations in biological fluids with ten thousands of biomolecules competing for the nano-particle surface are affinities, specificities and exchange rates [9–11]. The technical applicabilityas well as potential biohazards will depend also on the structural and functional perturbationsof the interacting proteins [12, 13]. High throughput and accurate screening methods fordetection of interactions between proteins and nanoparticles are therefore desirable, in fieldssuch as bionanotechnology, nano-safety and nano-medicine. Both qualitative and quantitativescreening methods are needed for identification of interacting proteins and measurements ofthe interaction parameters in terms of rate and equilibrium constants, conformational transi-tions and functional consequences. Many different analytical methods have been applied tostudy the interaction between a protein and a nanoparticle surface and the influence of aninteraction on the native state of the protein, among others: circular dichroism [11, 14], ellipso-metry [15], infrared spectroscopy [16], atomic force microscopy [17], fluorescence labelling of
PLOSONE | DOI:10.1371/journal.pone.0136687 August 27, 2015 1 / 15
OPEN ACCESS
Citation: Nasir I, Fatih W, Svensson A, Radu D,Linse S, Cabaleiro Lago C, et al. (2015) HighThroughput Screening Method to Explore ProteinInteractions with Nanoparticles. PLoS ONE 10(8):e0136687. doi:10.1371/journal.pone.0136687
Editor: Reza Khodarahmi, Kermanshah University ofMedical Sciences, ISLAMIC REPUBLIC OF IRAN
Received: May 31, 2015
Accepted: August 6, 2015
Published: August 27, 2015
Copyright: © 2015 Nasir et al. This is an openaccess article distributed under the terms of theCreative Commons Attribution License, which permitsunrestricted use, distribution, and reproduction in anymedium, provided the original author and source arecredited.
Data Availability Statement: All relevant data arewithin the paper and its Supporting Information files.
Funding: This work was supported by the Marianneand Marcus Wallenberg Foundation, https://www.wallenberg.com/mmw/, M.L.; Magnus BergvallFoundation, www.magnbergvallsstiftelse.nu/, M.L.;the Swedish Research Council, www.vr.se, C.C.L.;the Crafoord Foundation, www.crafoord.se/, C.C.L.;and the Swedish Research Council (VR) via OMM,www.omm.lu.se/, S.L. The funders had no role instudy design, data collection and analysis, decision topublish, or preparation of the manuscript.

the protein [18], nuclear magnetic resonance [11, 19–21], analytical ultracentrifugation [11],limited proteolytic cleavage in combination with mass spectrometry [22] and dynamic lightscattering coupled with z potential change [23].
Interactions between proteins and nanoparticles are governed by size, shape, material (andsurface modification) of the particle, and the medium conditions [24, 25]. Proteins that adsorb(i.e. interact with dissociation constants below 10−7–10−5 M) [26, 27] to nanoparticles mayresist or undergo structural changes [1, 10, 11, 20, 22, 28–30], which compromises functionsthat rely on the native structure (i.e. an enzyme may lose its catalytical ability [18, 31–33]), ormay lead to the exposure of new epitopes [13, 34] that trigger unwanted biological responses invivo. Methods for high throughput and non laborious screening of interaction parameters andconsequences of a particular combination of protein and nanoparticle would make the designof future bionanomaterials more efficient to improve the applicability and minimizing biohaz-ards at early stages.
Method OutlineThis article presents a high throughput method to screen for protein interactions with nano-particles. Many partners can be screened simultaneously using appropriate fluorophores and aplate reader with fluorescence detection. The kinetics of the interactions and the potential pro-tein structural rearrangements can be followed on time scales from milliseconds to days. Thescreening method can also be used to study nanoparticles’ colloidal stability in different buffers,with or without proteins, over time. Fig 1 outlines the steps in the proposed screening method.
At Step 1 the system to study is selected in terms of nanoparticles, peptide/protein, buffer,and fluorophore. In principle, all fluorophores that are water soluble and undergo a significantchange in emission spectrum upon interactions with different surfaces can be used with thismethod. For the particular purpose of this article, we have chosen two solvatochromic dyes,8-Anilino-1-naphthalenesulfonic acid (ANS) and Nile red (NR), for which the emission inten-sity and maximum shift in response to changes in the polarity of the surrounding environment[35, 36]. ANS and NR have been used in numerous protein unfolding studies [35], and, ANShas been used to study the interactions between proteins and nanoparticles [14]. Hence, pro-tein interaction/adsorption with or without subsequential unfolding event(s) can be trackedusing these commercially available dyes. However, the screening method per se is not limitedto these dyes. Other flourophores may be selected, for some examples see Klymchenko andMely [36]. The plate reader has to be set up with excitation and emission filters that match thefluorophore that will be used or a monochromator that spans the excitation and emissionwavelengths of the selected fluorophores.
At Step 2 a test experiment is conducted in order to optimize the experimental setup for thesystem under study in terms of mixing time, spacing of time points and gain. Furthermore, thecolloidal stability of the nanoparticles, both in selected buffer and in presence of the dye, andtheir signal contribution due to fluorescence or light scattering at the selected wavelengths areimportant aspects to be sorted out before starting a large-scale screening experiment.
One more aspect to take into consideration is that the adsorption process and structuralrearrangements can occur at different time scales [11]. If this process occurs within secondsafter mixing, the screening method needs to be adapted. To be able to capture the changes thattake place within milliseconds either particle or protein has to be injected into the sample well,using an automatic injector in the plate reader, to minimize the time between mixing and thestart of the measurement.
To acquire the best signal to noise ratio and to avoid data overflow in Step 3, the samplesfrom the test experiment are used to calibrate the gain. Ideally, the fluorescence intensity (IF)
Screening Method to Explore Protein Interactions with Nanoparticles
PLOS ONE | DOI:10.1371/journal.pone.0136687 August 27, 2015 2 / 15
Competing Interests: The authors have declaredthat no competing interests exist.

should not exceed 80–90% of the instrument limit and the gain is adjusted using the samplewith the highest IF after a sufficiently long incubation time (e.g. overnight) in the testexperiment.
At step 3 the detailed large-scale experiment is executed with predefined parameters fromstep 2. Sample mixing is done in following order: buffer, fluorophore, protein and particles.This order enables a competition between protein and fluorophore to adsorb on the particlesurface, if applicable. Depending on the system that is going to be studied and the criteria thatare of interest, the sample mixing order can be adjusted. For example, if the fluorophore prefer-entially binds to the active site of a protein, it can be added last to investigate if the nanoparticleblocks the access to the active site[14]. Step 4 includes data analysis and at step 5 the interac-tions are confirmed using complementary methods.
Fig 1. Method outline. Short description of the method.
doi:10.1371/journal.pone.0136687.g001
Screening Method to Explore Protein Interactions with Nanoparticles
PLOS ONE | DOI:10.1371/journal.pone.0136687 August 27, 2015 3 / 15
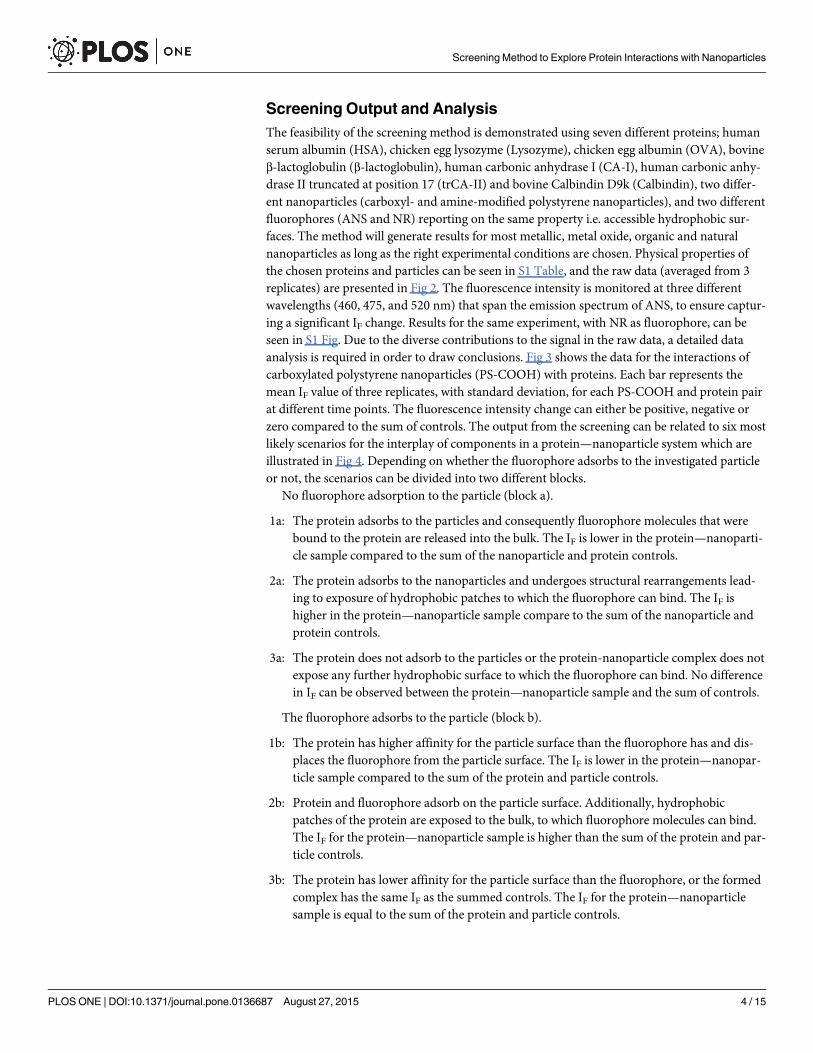
Screening Output and AnalysisThe feasibility of the screening method is demonstrated using seven different proteins; humanserum albumin (HSA), chicken egg lysozyme (Lysozyme), chicken egg albumin (OVA), bovineβ-lactoglobulin (β-lactoglobulin), human carbonic anhydrase I (CA-I), human carbonic anhy-drase II truncated at position 17 (trCA-II) and bovine Calbindin D9k (Calbindin), two differ-ent nanoparticles (carboxyl- and amine-modified polystyrene nanoparticles), and two differentfluorophores (ANS and NR) reporting on the same property i.e. accessible hydrophobic sur-faces. The method will generate results for most metallic, metal oxide, organic and naturalnanoparticles as long as the right experimental conditions are chosen. Physical properties ofthe chosen proteins and particles can be seen in S1 Table, and the raw data (averaged from 3replicates) are presented in Fig 2. The fluorescence intensity is monitored at three differentwavelengths (460, 475, and 520 nm) that span the emission spectrum of ANS, to ensure captur-ing a significant IF change. Results for the same experiment, with NR as fluorophore, can beseen in S1 Fig. Due to the diverse contributions to the signal in the raw data, a detailed dataanalysis is required in order to draw conclusions. Fig 3 shows the data for the interactions ofcarboxylated polystyrene nanoparticles (PS-COOH) with proteins. Each bar represents themean IF value of three replicates, with standard deviation, for each PS-COOH and protein pairat different time points. The fluorescence intensity change can either be positive, negative orzero compared to the sum of controls. The output from the screening can be related to six mostlikely scenarios for the interplay of components in a protein—nanoparticle system which areillustrated in Fig 4. Depending on whether the fluorophore adsorbs to the investigated particleor not, the scenarios can be divided into two different blocks.
No fluorophore adsorption to the particle (block a).
1a: The protein adsorbs to the particles and consequently fluorophore molecules that werebound to the protein are released into the bulk. The IF is lower in the protein—nanoparti-cle sample compared to the sum of the nanoparticle and protein controls.
2a: The protein adsorbs to the nanoparticles and undergoes structural rearrangements lead-ing to exposure of hydrophobic patches to which the fluorophore can bind. The IF ishigher in the protein—nanoparticle sample compare to the sum of the nanoparticle andprotein controls.
3a: The protein does not adsorb to the particles or the protein-nanoparticle complex does notexpose any further hydrophobic surface to which the fluorophore can bind. No differencein IF can be observed between the protein—nanoparticle sample and the sum of controls.
The fluorophore adsorbs to the particle (block b).
1b: The protein has higher affinity for the particle surface than the fluorophore has and dis-places the fluorophore from the particle surface. The IF is lower in the protein—nanopar-ticle sample compared to the sum of the protein and particle controls.
2b: Protein and fluorophore adsorb on the particle surface. Additionally, hydrophobicpatches of the protein are exposed to the bulk, to which fluorophore molecules can bind.The IF for the protein—nanoparticle sample is higher than the sum of the protein and par-ticle controls.
3b: The protein has lower affinity for the particle surface than the fluorophore, or the formedcomplex has the same IF as the summed controls. The IF for the protein—nanoparticlesample is equal to the sum of the protein and particle controls.
Screening Method to Explore Protein Interactions with Nanoparticles
PLOS ONE | DOI:10.1371/journal.pone.0136687 August 27, 2015 4 / 15

Fig 2. Screening raw data, generated by the plate reader. The interactions between 7 proteins and 2 particles was followed with ANS fluorescencemonitored at 3 emission wavelength; blue = 460 nm, green = 475 and red = 520 nm, over time. The shown results are the average of three sample replicates.
doi:10.1371/journal.pone.0136687.g002
Screening Method to Explore Protein Interactions with Nanoparticles
PLOS ONE | DOI:10.1371/journal.pone.0136687 August 27, 2015 5 / 15

Positive interaction hits are given only by scenarios 1a, 1b, 2a, and 2b. The method isdesigned for high throughput screening and additional experiments are strongly encouraged tovalidate a specific observation (for example isothermal calorimetry, analytical ultracentrifuga-tion, circular dichroism, intrinsic flourescence etc). This pertains both to positive (scenario 1and 2) and negative (scenario 3) hits. As an example, results that indicate no adsorption of aspecific protein on a specific particle has to be confirmed with another complementary methodsince a negative result does not necessarily imply absence of interactions. However, dependingon the aim of the investigation, the screening results will clearly indicate for which systems amore thorough investigation is necessary to reveal the mode of interaction.
The present method is designed for high throughput; however, there will be situations forwhich other approaches may be more suitable. For example, instead of using fluorophores inbulk one can chose to specifically label the protein with a fluorophore, specifically label the par-ticle surface with a fluorophore or label the protein with stable isotopes. However, also thesementioned methods have their own drawbacks and require more steps, compromising the highthroughput advantage of the method described here.
Summary of Screening Data for PS-COOH ParticlesThe different scenarios described above can be used for analyzing the results presented in Fig 3which shows the time evolution of the IF for the combined protein-nanoparticle (PS-COOH)samples as well as the controls monitored with ANS and NR. The data indicate that ANS doesnot adsorb to the PS-COOH particles since there is no difference between IF of ANS in bufferand IF of ANS with particles (see also S2 Fig for nanoparticle:ANS titration results). Giventhose evidences, scenarios 1a, 2a and 3a are possible for the combined systems monitored byANS. Similarly, Fig 3B shows that NR readily adsorbs to the PS-COOH particles, as demon-strated by the titration results in S2 Fig, which means that scenarios 1b, 2b and 3b are validwhen NR is used. With this in mind, the different samples have been classified according to thesix different scenarios.
Fig 3. Screening results for 7 proteins and PS-COOH, ANS data in panel A and NR data in panel B, with corresponding controls. Bars represent themean intensity value from three individual samples, with standard deviation in corresponding error bars, at 6 different time points; 0 min (blue), 15 min (red),30 min (gray), 2 h (yellow), 5 h (dark blue) and 8 h (green) for the ANS data and 10 h (green) for the NR data. Fluorescence intensity of fluorophore with 1:Buffer only, 2: Particle only, 3: Lysozyme + particle, 4: HSA + particle, 5: OVA + particle, 6: CA-I + particle, 7: trCA-II + particle, 8: β-lactoglobulin + particle, 9:Calbindin + particle. Sky blue lines show the protein controls (i.e. protein with fluorophore) IF at each time point. In both panels a yellow dashed line is drawnacross all samples representing the mean fluorescence from the particle control at time point 0 min. In panel A, two insets are also shown for trCA-II (number7) and for β-lactoglobulin(number 8) data.
doi:10.1371/journal.pone.0136687.g003
Screening Method to Explore Protein Interactions with Nanoparticles
PLOS ONE | DOI:10.1371/journal.pone.0136687 August 27, 2015 6 / 15

Considering the classification obtained by the analysis of the screening experiment and DLSdata (see Table 1) on the protein-nanoparticle system, the following conclusions can be drawn:
- Lysozyme can be sorted to follow scenarios 2a and 1b. The IF of the Lysozyme-nanoparti-cle sample increases over time when ANS is used as a reporter fluorophore, however,Lysozyme alone binds ANS resulting in an increase of IF over time which complicates theinterpretation. A closer inspection of the data reveals that the IF changes of the Lysozyme-nanoparticle sample is higher than the combined controls (Fig 3A). This indicates that
Fig 4. Schematic illustration of the 6 scenarios leading to the observed fluorescence intensity. Left side shows the situation when the fluorophore donot adsorb to the nanoparticle (1a, 2a, and 3a) and the right side shows the situations when the fluorophore do adsorb to the nanoparticles (1b, 2b, and 3b).
doi:10.1371/journal.pone.0136687.g004
Screening Method to Explore Protein Interactions with Nanoparticles
PLOS ONE | DOI:10.1371/journal.pone.0136687 August 27, 2015 7 / 15

Lysozyme adsorbs to the PS-COOH surface and undergoes structural changes exposingnew hydrophobic patches to which ANS can bind; i.e. scenario 2a. This finding is alsoconfirmed by a lower IF value of the particle-protein system compared to the controlswhen monitored by NR, scenario 1b. Moreover, the particles aggregate in presence ofLysozyme as confirmed by DLS, see Table 1. This fact can arise from the unfolding ofLysozyme at the particle surface which trigger the aggregation of nanoparticle-proteincomplex by screening the nanoparticles surface charges.
- trCA-II also shows a significant and immediate increase of the IF, see inset labelled 8 inFig 3A, indicating an instant adsorption with an immediate conformational change, sce-nario 2a.
- β-lactoglobulin shows an immediate significant decrease of the IF in the ANS experiment,see inset labelled 7 in Fig 3A, indicating an instant adsorption to the particle surface withrelease of protein bound ANS as a result, scenario 1a.
- Finally, the NR data indicate that Calbindin interacts with PS-COOH-NR complex lead-ing to a higher IF than the combined controls, scenario 2b.
The other proteins fall into scenarios that suggest no interaction between protein andPS-COOH. However, a negative hit must always be confirmed with alternative methods, asstated earlier.
Summary of Screening Data for PS-NH2 ParticlesSimilar analysis can be done for the amine-modified polystyrene (PS-NH2) nanoparticle-pro-tein systems, see Fig 5. However, PS-NH2 is not colloidally stable and aggregates in presence ofANS as strongly supported by DLS experiments (Table 1), presumably due to the screening ofelectrostatic interactions that keeps the colloidal solution stable. Because the particles aggregateinto micron size aggregates and fall out of the solution, the results cannot be evaluated accord-ing to any of the described scenarios above. However, the data still reveal interesting aspectsespecially when evaluated in combination with a technique that measures particle (aggregate)size like DLS (see above). On the other hand, NR does not compromise the colloidal stability of
Table 1. NP sizes before and after screening experiment.
PS-COOH + ANS1 PS-COOH + NR2 PS-NH2 + ANS1 PS-NH2 + NR2
Size (nm) ± Std dev Size (nm) ± Std dev Size (nm) ± Std dev Size (nm) ± Std dev
In Hepes buffer 46.1 ± 0.3 46.1 ± 0.3 52.7± 0.7 52.7 ± 0.7
+ Fluorophore 51.1 ± 1.3 47.6 ± 0.7 Aggregated 57.3 ± 1.0
With protein:
Lysozyme V.A.3 V.A.3 V.A.3 51 ± 6.1
HSA 52.3 ± 1.0 50.4 ± 0.5 ~64 and 250 V.A.3
OVA 50.2± 0.8 50.6 ± 0.6 ~90 and 300 V.A.3
CA-I 52.3± 1.0 48.5 ± 1.4 V.A.3 58.8 ± 1.6
trCA-II 52.5± 0.5 50.5 ± 1.6 V.A.3 56.1 ± 3.8
β-Lactoglobulin 53.3± 0.9 48.9 ± 1.6 144.5± 5.1 V.A.3
Calbindin 52.7± 0.3 49.4 ± 0.5 V.A. 3 V.A. 3
1 Size measured by DLS, ~48 h after sample mixture.2 Size measured by DLS, ~12 h after sample mixture.3 Visible precipitated aggregates
doi:10.1371/journal.pone.0136687.t001
Screening Method to Explore Protein Interactions with Nanoparticles
PLOS ONE | DOI:10.1371/journal.pone.0136687 August 27, 2015 8 / 15

the PS-NH2 particles (see Table 1) but adsorb to the particles as evident from the titrationcurves in S2 Fig. Hence, the different samples can be classified into scenarios 1b, 2b and 3b.
Combining the data from the screening experiment with two different dyes and DLS for thePS-NH2 particles, the following can be concluded:
- According to the ANS data, Lysozyme affects the stability of PS-NH2–ANS and acceler-ates the co-precipitation of the whole system, eventually leading to higher IF than the sumof protein and particle controls. The co-precipitation process goes on throughout theexperiment. On the other hand, NR data show that Lysozyme falls within the standarddeviation of the particle control IF, and DLS data show that the sample is colloidal stableat nominal size. The last described findings indicate no or weak interaction (Scenario 3b)between Lysozyme and PS-NH2.
- Data for HSA, OVA and β-lactoglobulin are more complex. At early time points in theNR experiment, the IF of the protein-particle sample is lower than the sum of the controlsi.e. it implies scenario 1b, hence, these proteins compete with NR to adsorb to the particlesurface. However, with longer incubation times an increase in the IF can be observed, rep-resenting major structural rearrangements, aggregation or both. DLS data (see Table 1)obtained 12 hours after sample mixing or later, indicate that the HSA, OVA, and β-lacto-globulin samples contain visible aggregates, however, this does not rule out the possibilitythat the proteins undergo structural rearrangements at the nanoparticle surface. The ANSdata further strengthen the observation that HSA, OVA, and β-lactoglobulin adsorbs toPS-NH2. As shown in Fig 5, the IF is constant over time compared to the particle control.Hence, these proteins interact with and stabilize the nanoparticle suspension. The DLSdata, Table 1, confirm this observation. No precipitation of aggregated material isobserved in contrast to the particle control. However, aggregates are still formed withsizes significantly larger than the nominal nanoparticle size. This means that protein-par-ticle systems are more colloidal stable than the particle control. Hence, these set of pro-teins screen the ANS—NP interaction by competing for the nanoparticles surface. This
Fig 5. Screening results for 7 proteins and PS-NH2, ANS data in panel A and NR data in panel B, with corresponding controls. Bars represent themean intensity value from three individual samples, with standard deviation in corresponding error bars, at 6 different time points; 0 min (blue), 15 min (red),30 min (gray), 2 h (yellow), 5 h (dark blue) and 8 h (green) for the ANS data and 10 h (green) for the NR data. Fluorescence intensity of fluorophore with 1:Buffer only, 2: Particle only, 3: Lysozyme + particle, 4: HSA + particle, 5: OVA + particle, 6: CA-I + particle, 7: trCA-II + particle, 8: β-lactoglobulin + particle, 9:Calbindin + particle. Sky blue lines show the protein controls (i.e. protein with fluorophore) IF at each time point. In both panels a yellow dashed line is drawnacross all samples representing the mean fluorescence from the particle control at time point 0 min.
doi:10.1371/journal.pone.0136687.g005
Screening Method to Explore Protein Interactions with Nanoparticles
PLOS ONE | DOI:10.1371/journal.pone.0136687 August 27, 2015 9 / 15

could be further explored by changing the sample mixing order and adding the fluoro-phore last but that is beyond the scope of the article.
- Calbindin shows similar results as HSA, OVA and β-lactoglobulin, however, it lacks the IFincrease in the NR data and does not distinguish itself from the particle control in the NRexperiment. The Calbindin-nanoparticle sample generated large aggregates out of thedetection range of the DLS instrument but they did not precipitate. Hence, it needs to befurther investigated.
- CA-I and trCA-II shows opposite trends for the NR, ANS and DLS experiments com-pared with HSA, OVA and β-lactoglobulin. NR shows that CA-I and trCA-II most likelydo not adsorb to the PS-NH2 particles, they fall into scenario 3b. DLS measurements ofthe NR sample also show that the particles are colloidally stable and the measured sizes donot differ or deviate from the particle control. On the other hand, the ANS data showsthat CA-I and trCA-II only initially stabilize the particle which aggregates afterwards,indicating a transient interaction between the proteins and the nanoparticle, see Fig 5 andTable 1. This transient interaction is then replaced by the ANS adsorption that eventuallydestabilizes the system and triggers the precipitation of the colloidal particles.
According to the NR data for the PS-NH2 systems; Lysozyme, CA-I, trCA-II, and Calbindinall falls into scenario 3b, hence, this should in principle account for no interaction. However asindicated previously a negative hit cannot be interpreted as a lack of interaction. In fact theANS data suggest that some of those proteins interact either with particles or particle-flouro-phore complexes (see above). Inspection of the NR data also reveals that the standard deviationfor the particle control is quite large compared to most of the protein-particle samples indicat-ing that the proteins contribute to stabilizing the mixture.
Screening Results Compared to Published DataThe conclusions regarding interactions from the screening of the seven different proteins withtwo different surface modified polystyrene nanoparticles are summarized in Table 2. This dataset demonstrates many of the possibilities and some of the limitations of the method. For someof the systems used to benchmark the method for screening of interactions between proteinsand nanoparticles the results obtained can be compared to previously published data.
Cukalevski et al. has reported interactions between Lysozyme and HSA with PS-COOH (24nm diameter) and PS-NH2, by circular dichroism and intrinsic tryptophan fluorescence [10].Even though there are differences in experimental conditions (i.e. sample buffer and PS-COOHparticle size), some general comparisons can be made. Both our ANS and NR data, show thatLysozyme adsorbs to the PS-COOH and the ANS data indicate that Lysozyme undergoes struc-tural changes which is also in line with Cukalevski et al. findings [10]. To further evaluate thescreening method an experiment was set up to study the effect of conducting the screening inPBS compared to HEPES for Lysozyme and HSA, see S3 Fig. In the case of Lysozyme andPS-COOH nanoparticles it is evident that the buffer difference does not significantly changethe trends; Lysozyme undergoes structural rearrangement in both buffers. When it comes toLysozyme and PS-NH2, the NR experiment indicate that there are no or very limited interac-tion between the protein and particle which is along the results that Cukalevski et al. hasreported [10].
Both ANS and NR show that a prospective interaction between HSA and PS-COOH thatdoes not cause any major structural changes in the protein which is in line with what Cuka-levski et al. showed before [10]. However, the screening cannot detect the interaction (not evenin PBS, see S3 Fig) that could be responsible for the decrease of intrinsic fluorescence that
Screening Method to Explore Protein Interactions with Nanoparticles
PLOS ONE | DOI:10.1371/journal.pone.0136687 August 27, 2015 10 / 15

Cukalevski et al. showed. Whether the differences arise from the different size of PS-COOHparticles used or the reporting properties of the fluorophore has to be further investigated.trCA-II do adsorb to PS-COOH while CA-I do not, according to the screening results. This iscompatible with ITC results presented by Assarsson et al. [37].
ConclusionIn summary, the presented method is flexible and can readily be adjusted to different condi-tions. It is high throughput and generates a significant amount of data as many protein—parti-cle combinations can be quickly explored in parallel and even at different emissionwavelengths since a multi well plate is used instead of a cuvette. Moreover, interactions andstructural changes that occur on a time scale from milliseconds (for plate readers equippedwith an injector) to days can be monitored. The method takes advantage of the high sensitivityof fluorescence spectroscopy together with the diverse selection of fluorophores that could beused. Moreover, different protein-nanoparticle interaction properties can be monitored byusing different property-sensitive dyes. Furthermore, low sample amount is required andtherefore considerable amount of data is obtained at lower cost. Finally, the method also gener-ates information about the colloidal stability of particles.
Materials
Plate readerPlate reader measurements were done in BMG FLUOstar for ANS measurements and CLAR-IOstar for NR measurements. For ANS experiments, filters were set as following: λex: 320 nm,λem: 460, 475, and 520 nm. For NR experiments, monochromator range was set as following:λex: 550±10 nm, λem: 600±10 nm and 660±10 nm. In all experiments, samples were excited andemission was read from the bottom, in order to avoid the interference from the formed menis-cus. Any plate reader with similar capacities can be used.
Table 2. Summary of the screening data.
PS-COOH PS-NH2
+ ANS + NR + ANS + NR
Protein Sce.a Sce.a C. A.b Sce.a Sce.a C. A.b
Lysozyme 2a 1b Adsc n/ad 3b -
HSA 3a 3b - n/ad 1b Adsc
OVA 3a 3b - n/ad 1b Adsc
CA-I 3a 3b - n/ad 3b -
trCA-II 2a 3b Adsc n/ad 3b -
β-lactoglobulin 1a 3b Adsc n/ad 1b Adsc
Calbindin 3a 2b Adsc n/ad 3b -
a Scenario No. as presented in the text and Fig 4.b Combined Analysis taken in consideration also the DLS data in Table 1.c The protein adsorbs to the nanoparticle.d not applicable.
doi:10.1371/journal.pone.0136687.t002
Screening Method to Explore Protein Interactions with Nanoparticles
PLOS ONE | DOI:10.1371/journal.pone.0136687 August 27, 2015 11 / 15

Plates96 well half-area plate of black polystyrene with clear bottom and non-binding surface (Corn-ing 3881) was used for all screening experiments. Any plate, with different volume and wellnumber from a different manufacturer can be used.
Fluorophore8-Anilino-1-naphthalenesulfonic acid ammonium salt (ANS) were purchased from SigmaAldrich and used without further purification. ANS was dissolved in filtered water to reach astock concentration of 1.3 mg/ml which is diluted to a final concentration of 0.195 mg/ml inthe well. NR was a kind gift from Prof. Lo Gorton. NR was dissolved in DMSO to get a stock of100 μM. In order to limit the amount of DMSO in the sample wells, final NR concentrationwas set to 1 μM.
Sample buffer10 mMHEPES buffer pH 7.4 was used throughout all experiments except for some data shownin S3 Fig which was with PBS buffer pH 7.4.
ProteinsHuman Serum Albumin (lyophilized powder, essentially fatty acid free), Chicken Egg Lyso-zyme (lyophilized powder, protein�90%,�40,000 units/mg protein), Chicken Egg Albumin(lyophilized powder, protein 99%) and Bovine β-lactoglobulin (lyophilized powder, contains aand b) were purchased from Sigma Aldrich and used without further purification. Wild typeHuman carbonic anhydrase I was a kind gift from Prof. Bengt-Harald Jonsson. The plasmidfor production of Truncated at position 17 in the N-terminal Human carbonic anhydrase IIpseudo wilt type was a kind gift from Prof. Bengt-Harald Jonsson and the protein wasexpressed and purified according to [38]. Calbindin D9k expressed and purified according to[39, 40].
All proteins were dissolved in working buffer and centrifuged at 14000 rpm for 5 minutes toget rid of big aggregates. Concentrations were determined spectrophotometrically using (a Shi-madzu UV-1800 or Agilent 8453 spectrophotometer) with extinction coefficients: 37970 M-1.cm-1, 34445 M-1.cm-1, 31775 M-1.cm-1, 46800 M-1.cm-1, 44100 M-1.cm-1, 17210 M-1.cm-1 and1490 M-1.cm-1 for Lysozyme, HSA, OVA, CA-I, trCA-II, β-lactoglobulin and Calbindin,respectively. Final concentrations for all proteins in the well were set to 0.1 mg/ml.
All measurements were conducted at 30°C.
ParticlesParticles were purchased from Bangs Laboratories, Inc. and Polyscience. All particles were dia-lyzed against water, diluted with buffer to a stock solution of around 2 mg/ml and the concen-tration checked using absorbance (measured at 270 and compared to a standard curve donebeforehand using the manufacturer mass concentration of the stock solution) before use. Theparticle size in sample buffer was estimated using DLS; being 48 nm for the PS-COOH and 53nm for the PS-NH2 particles. The mass concentration, mean size and density of the particleswere used in the calculation to ensure a fixed total particle surface area in the samples (the cal-culation assumes that the particles are spherical and homogeneous) and the final particle con-centration in the wells were 0.2 and 0.23 mg/ml for PS-COOH and PS-NH2 respectively. Thecharacterization of the particles is reported in S1 Table. Prior to each experiment, the hydrody-namic diameters of NPs was checked using a DLS plate reader (DynaPro Plate Reader II,
Screening Method to Explore Protein Interactions with Nanoparticles
PLOS ONE | DOI:10.1371/journal.pone.0136687 August 27, 2015 12 / 15
Wyatt Technology, Santa Barbara, CA) operating with a 158° scattering angle at 30°C using aclear, flat-bottom 96 well black plate (Costar). 3 replicates of each sample were measured with10 acquisitions per sample. Each acquisition was set to 5 seconds. A general purpose analysismodel (cumulant fit for monomodal dispersions and regularization fit for multimodal disper-sions) was employed to determine the hydrodynamic diameter of the particles.
Supporting InformationS1 Fig. NR Screening raw data generated by the plate reader. The interactions between 7 pro-teins and 2 particles was followed with NR fluorescence monitored at 2 emission wavelength;black = 600 nm and gray = 660 nm, over time. The showed results are the average of three sam-ple replicates.(TIF)
S2 Fig. Change of fluorescence intensity upon titration of nanoparticles into 1 μM fluoro-phore. The graphs shows the results from titration experiments which were conducted to fur-ther investigate how the fluorophores interacts with the nanoparticles. The IF does not changesignificantly for the ANS:PS-COOH system, which is a clear indication that ANS does notadsorb to the PS-COOH surface. For the other 3 combination a clear change in IF are observed,which is a clear indication that the fluorophores adsorbs to the particle surface. Each data pointrepresents the average of three measurements and the error bars shows the standard deviation.(TIF)
S3 Fig. Processed screening results for Lysozyme + PS-COOH and HSA + PS-COOH sys-tems with ANS as reporter fluorophore for two different buffer systems; PBS and HEPES.Bars represent the mean intensity value from three individual samples, with correspondingerror bars, at 6 different time points; 0 min (blue), 15 min (red), 30 min (gray), 2 h (yellow), 5 h(dark blue) and 8 h (green).(TIF)
S1 Table. Particle Properties and Protein Molecular Weights, Theoretical pIs and ExPASyAccession Numbers.(DOCX)
AcknowledgmentsAuthors acknowledge Dr. Sebastian Rämisch for valuable discussions. This study was sup-ported by: M.L., the Marianne and Marcus Wallenberg Foundation and Magnus BergvallFoundation (M.L.), the Swedish Research Council, VR, (C.C.L.), the Crafoord Foundation (C.C.L.), and the Swedish Research Council, VR, via OMM (S.L.).
Author ContributionsConceived and designed the experiments: IN CCL ML. Performed the experiments: IN MLCCLWF AS DR. Analyzed the data: IN CCL MLWF AS DR SL. Contributed reagents/materi-als/analysis tools: IN CCL MLWF AS DR SL. Wrote the paper: IN CCL ML SL.
References1. Lundqvist M, Nygren P, Jonsson BH, Broo K. Induction of Structure and Function in a Designed Peptide
upon Adsorption on a Silica Nanoparticle. Angewandte Chemie International Edition. 2006; 45(48):8169–73. doi: 10.1002/anie.200600965
2. Caruso F, Schuler C. Enzymemultilayers on colloid particles: Assembly, stability, and enzymatic activ-ity. Langmuir. 2000; 16(24):9595–603. doi: 10.1021/la000942h
Screening Method to Explore Protein Interactions with Nanoparticles
PLOS ONE | DOI:10.1371/journal.pone.0136687 August 27, 2015 13 / 15

3. Rosi NL, Mirkin CA. Nanostructures in biodiagnostics. Chemical Reviews. 2005; 105(4):1547–62. doi:10.1021/cr030067f PMID: 15826019
4. Vinoba M, Bhagiyalakshmi M, Jeong SK, Nam SC, Yoon Y. Carbonic Anhydrase Immobilized onEncapsulated Magnetic Nanoparticles for CO2 Sequestration. Chemistry-a European Journal. 2012;18(38):12028–34. doi: 10.1002/chem.201201112
5. Yonzon CR, Stuart DA, Zhang XY, McFarland AD, Haynes CL, Van Duyne RP. Towards advancedchemical and biological nanosensors—An overview. Talanta. 2005; 67(3):438–48. doi: 10.1016/j.talanta.2005.06.039 PMID: 18970187
6. Sailor MJ, Park J-H. Hybrid Nanoparticles for Detection and Treatment of Cancer. Advanced Materials.2012; 24(28):3779–802. doi: 10.1002/adma.201200653 PMID: 22610698
7. He XC, Lin M, Li F, Sha BY, Xu F, Qu ZG, et al. Advances in studies of nanoparticle-biomembrane inter-actions. Nanomedicine. 2015; 10(1):121–41. doi: 10.2217/nnm.14.167 PMID: 25597773
8. Yohan D, Chithrani BD. Applications of Nanoparticles in Nanomedicine. Journal of Biomedical Nano-technology. 2014; 10(9):2371–92. doi: 10.1166/jbn.2014.2015 PMID: 25992462
9. Cedervall T, Lynch I, Lindman S, Berggård T, Thulin E, Nilsson H, et al. Understanding the nanoparti-cle-protein corona using methods to quantify exchange rates and affinities of proteins for nanoparticles.Proc Natl Acad Sci U S A. 2007; 104(7):2050–5. doi: 10.1073/pnas.0608582104 PMID: 17267609
10. Cukalevski R, Lundqvist M, Oslakovic C, Dahlback B, Linse S, Cedervall T. Structural Changes in Apo-lipoproteins Bound to Nanoparticles. Langmuir. 2011; 27(23):14360–9. doi: 10.1021/la203290a PMID:21978381
11. Lundqvist M, Sethson I, Jonsson BH. Protein Adsorption onto Silica Nanoparticles: ConformationalChanges Depend on the Particles' Curvature and Protein Stability. Langmuir. 2004; 20:10639–47. doi:10.1021/la0484725 PMID: 15544396
12. Lynch I, Cedervall T, Lundqvist M, Cabaleiro-Lago C, Linse S, Dawson KA. The nanoparticle—proteincomplex as a biological entity; a complex fluids and surface science challenge for the 21st century.Advances in Colloid and Interface Science. 2007; 134–35:167–74. doi: 10.1016/j.cis.2007.04.021
13. Lynch I, Dawson KA, Linse S. Detecting cryptic epitopes created by nanoparticles. Science's STKE:signal transduction knowledge environment. 2006; 327:pe14. doi: 10.1126/stke.3272006pe14
14. Billsten P, Freskgård PO, Carlsson U, Jonsson BH, Elwing H. Adsorption to silica nanoparticles ofhuman carbonic anhydrase II and truncated forms induce a molten-globule-like structure. Febs Letters.1997; 402(1):67–72. doi: 10.1016/S0014-5793(96)01431-7 PMID: 9013861
15. Wahlgren M, Arnebrant T. Removal of T4 lysozyme from silicon oxide surfaces by sodium dodecyl sul-fate: A comparison between wild type protein and a mutant with lower thermal stability. Langmuir. 1997;13(1):8–13. doi: 10.1021/la960171a
16. Tarasevich YI, Monakhova LI. Interaction between globular proteins and silica surfaces. Colloid J.2002; 64(4):482–7. doi: 10.1023/A:1016828322434
17. Kim DT, Blanch HW, Radke CJ. Direct imaging of lysozyme adsorption onto mica by atomic forcemicroscopy. Langmuir. 2002; 18(15):5841–50. doi: 10.1021/la0256331
18. Karlsson M, Carlsson U. Protein adsorption orientation in the light of fluorescent probes: Mapping of theinteraction between site-directly labeled human carbonic anhydrase II and silica nanoparticles. Bio-physical Journal. 2005; 88(5):3536–44. doi: 10.1529/biophysj.104.054809 PMID: 15731384
19. Lundqvist M, Sethson I, Jonsson BH. Transient interaction with nanoparticles "freezes" a protein in anensemble of metastable near-native conformations. Biochemistry. 2005; 44(30):10093–9. doi: 10.1021/bi0500067 PMID: 16042386
20. Lundqvist M, Sethson I, Jonsson BH. High-resolution 2D H-1-N-15 NMR characterization of persistentstructural alterations of proteins induced by interactions with silica nanoparticles. Langmuir. 2005; 21(13):5974–9. doi: 10.1021/la050569j PMID: 15952849
21. Engel MFM, Visser A, van Mierlo CPM. Conformation and orientation of a protein folding intermediatetrapped by adsorption. Proc Natl Acad Sci U S A. 2004; 101(31):11316–21. doi: 10.1073/pnas.0401603101 PMID: 15263072
22. Lundqvist M, Andresen C, Christensson S, Johansson S, Karlsson M, Broo K, et al. Proteolytic Cleav-age Reaveals Interacton Patterns between Silica Nanoparticles and Two Variants of Human CarbonicAnhydrase. Langmuir. 2005; 21:11903–6. doi: 10.1021/la050477u PMID: 16316131
23. Fornaguera C, Caldero G, Mitjans M, Vinardell MP, Solans C, Vauthier C. Interactions of PLGA nano-particles with blood components: protein adsorption, coagulation, activation of the complement systemand hemolysis studies. Nanoscale. 2015; 7(14):6045–58. doi: 10.1039/C5NR00733J PMID: 25766431
24. Saptarshi SR, Duschl A, Lopata AL. Interaction of nanoparticles with proteins: relation to bio-reactivityof the nanoparticle. Journal of Nanobiotechnology. 2013; 11:26. doi: 10.1186/1477-3155-11-26 PMID:23870291
Screening Method to Explore Protein Interactions with Nanoparticles
PLOS ONE | DOI:10.1371/journal.pone.0136687 August 27, 2015 14 / 15

25. Xia X- R, Monteiro-Riviere NA, Riviere JE. An index for characterization of nanomaterials in biologicalsystems. Nat Nano. 2010; 5(9):671–5. doi: 10.1038/nnano.2010.164
26. Kasche V. Physico-chemical boundaries in the continuous and one-step discontinuous affinity-chro-matographic isolation of proteins. Journal of Biochemical and Biophysical Methods. 2001; 49(1–3):49–62. doi: 10.1016/s0165-022x(01)00188-9 PMID: 11694272
27. Li N, Zeng S, He L, ZhongW. Probing Nanoparticle-Protein Interaction by Capillary Electrophoresis.Analytical Chemistry. 2010; 82(17):7460–6. doi: 10.1021/ac101627p PMID: 20672831
28. Ferreira SA, Oslakovic C, Cukalevski R, Frohm B, Dahlback B, Linse S, et al. Biocompatibility of man-nan nanogel-safe interaction with plasma proteins. Biochimica Et Biophysica Acta-General Subjects.2012; 1820(7):1043–51. doi: 10.1016/j.bbagen.2012.04.015
29. Huang R, Carney RP, Stellacci F, Lau BLT. Protein-nanoparticle interactions: the effects of surfacecompositional and structural heterogeneity are scale dependent. Nanoscale. 2013; 5(15):6928–35. doi:10.1039/c3nr02117c PMID: 23787874
30. NordeW, Lyklema J. Interfacial behaviour of proteins, with special reference to immunoglobulins. Aphysicochemical study. Advances in Colloid and Interface Science. 2012; 179:5–13. doi: 10.1016/j.cis.2012.06.011 PMID: 22795486
31. Assarsson A, Pastoriza-Santos I, Cabaleiro-Lago C. Inactivation and Adsorption of Human CarbonicAnhydrase II by Nanoparticles. Langmuir. 2014; 30(31):9448–56. doi: 10.1021/la501413r PMID:24999988
32. Talbert JN, Goddard JM. Influence of nanoparticle diameter on conjugated enzyme activity. Food andBioproducts Processing. 2013; 91(C4):693–9. doi: 10.1016/j.fbp.2013.08.006
33. Zheng X, Su Y, Chen Y, Wan R, Liu K, Li M, et al. Zinc Oxide Nanoparticles Cause Inhibition of Micro-bial Denitrification by Affecting Transcriptional Regulation and Enzyme Activity. Environmental Science& Technology. 2014; 48(23):13800–7. doi: 10.1021/es504251v
34. Lynch I, Cedervall T, Lundqvist M, Cabaleiro-Lago C, Linse S, Dawson KA. The nanoparticle-proteincomplex as a biological entity; a complex fluids and surface science challenge for the 21st century.Advances in Colloid and Interface Science. 2007; 134–135:167–74. doi: 10.1016/j.cis.2007.04.021PMID: 17574200
35. Hawe A, Sutter M, Jiskoot W. Extrinsic fluorescent dyes as tools for protein characterization. Pharma-ceutical Research. 2008; 25(7):1487–99. doi: 10.1007/s11095-007-9516-9 PMID: 18172579
36. Klymchenko AS, Mely Y. Fluorescent Environment-Sensitive Dyes as Reporters of Biomolecular Inter-actions. In: Morris MC, editor. Fluorescence-Based Biosensors: From Concepts to Applications. Prog-ress in Molecular Biology and Translational Science. 1132013. p. 35–58.
37. Assarsson A. Adding charge. Effects of charged compounds on amyloid beta and human carbonicanhydrase. Lund: Lund University; 2014.
38. Aronsson G, Martensson LG, Carlsson U, Jonsson BH. Folding and stability of the N-terminus ofHuman carbonic-anhydrase-II. Biochemistry. 1995; 34(7):2153–62. doi: 10.1021/bi00007a008 PMID:7857926
39. Brodin P, Drakenberg T, Thulin E, Forsen S, Grundstrom T. Selective proton labeling of amino-acids indeuterated Bovine Calbindin D9K - a way to simplify H-1-NMR spectra. Protein Engineering. 1989; 2(5):353–8. doi: 10.1093/protein/2.5.353 PMID: 2928298
40. Johansson C, Brodin P, Grundstrom T, Thulin E, Forsen S, Drakenberg T. Biophysical studies of engi-neered mutant proteins based on Calbindin-D9K modified in the pseudo EF-hand. European Journal ofBiochemistry. 1990; 187(2):455–60. doi: 10.1111/j.1432-1033.1990.tb15325.x PMID: 2404767
Screening Method to Explore Protein Interactions with Nanoparticles
PLOS ONE | DOI:10.1371/journal.pone.0136687 August 27, 2015 15 / 15