
Process Validation and Screen Reproducibility in High-Throughput Screening
12
http://jbx.sagepub.com/ Journal of Biomolecular Screening http://jbx.sagepub.com/content/14/1/66 The online version of this article can be found at: DOI: 10.1177/1087057108326664 2009 14: 66 J Biomol Screen Manuel Valmaseda and Ricardo Macarron Isabel Coma, Liz Clark, Emilio Diez, Gavin Harper, Jesus Herranz, Glenn Hofmann, Mark Lennon, Nicola Richmond, Process Validation and Screen Reproducibility in High-Throughput Screening Published by: http://www.sagepublications.com On behalf of: Journal of Biomolecular Screening can be found at: Journal of Biomolecular Screening Additional services and information for http://jbx.sagepub.com/cgi/alerts Email Alerts: http://jbx.sagepub.com/subscriptions Subscriptions: http://www.sagepub.com/journalsReprints.nav Reprints: http://www.sagepub.com/journalsPermissions.nav Permissions: http://jbx.sagepub.com/content/14/1/66.refs.html Citations: What is This? - Jan 26, 2009 Version of Record >> by guest on October 11, 2013 jbx.sagepub.com Downloaded from by guest on October 11, 2013 jbx.sagepub.com Downloaded from by guest on October 11, 2013 jbx.sagepub.com Downloaded from by guest on October 11, 2013 jbx.sagepub.com Downloaded from by guest on October 11, 2013 jbx.sagepub.com Downloaded from by guest on October 11, 2013 jbx.sagepub.com Downloaded from by guest on October 11, 2013 jbx.sagepub.com Downloaded from by guest on October 11, 2013 jbx.sagepub.com Downloaded from by guest on October 11, 2013 jbx.sagepub.com Downloaded from by guest on October 11, 2013 jbx.sagepub.com Downloaded from by guest on October 11, 2013 jbx.sagepub.com Downloaded from by guest on October 11, 2013 jbx.sagepub.com Downloaded from
-
Upload
independent -
Category
Documents
-
view
3 -
download
0
Transcript of Process Validation and Screen Reproducibility in High-Throughput Screening

http://jbx.sagepub.com/Journal of Biomolecular Screening
http://jbx.sagepub.com/content/14/1/66The online version of this article can be found at:
DOI: 10.1177/1087057108326664
2009 14: 66J Biomol ScreenManuel Valmaseda and Ricardo Macarron
Isabel Coma, Liz Clark, Emilio Diez, Gavin Harper, Jesus Herranz, Glenn Hofmann, Mark Lennon, Nicola Richmond,Process Validation and Screen Reproducibility in High-Throughput Screening
Published by:
http://www.sagepublications.com
On behalf of:
Journal of Biomolecular Screening
can be found at:Journal of Biomolecular ScreeningAdditional services and information for
http://jbx.sagepub.com/cgi/alertsEmail Alerts:
http://jbx.sagepub.com/subscriptionsSubscriptions:
http://www.sagepub.com/journalsReprints.navReprints:
http://www.sagepub.com/journalsPermissions.navPermissions:
http://jbx.sagepub.com/content/14/1/66.refs.htmlCitations:
What is This?
- Jan 26, 2009Version of Record >>
by guest on October 11, 2013jbx.sagepub.comDownloaded from by guest on October 11, 2013jbx.sagepub.comDownloaded from by guest on October 11, 2013jbx.sagepub.comDownloaded from by guest on October 11, 2013jbx.sagepub.comDownloaded from by guest on October 11, 2013jbx.sagepub.comDownloaded from by guest on October 11, 2013jbx.sagepub.comDownloaded from by guest on October 11, 2013jbx.sagepub.comDownloaded from by guest on October 11, 2013jbx.sagepub.comDownloaded from by guest on October 11, 2013jbx.sagepub.comDownloaded from by guest on October 11, 2013jbx.sagepub.comDownloaded from by guest on October 11, 2013jbx.sagepub.comDownloaded from by guest on October 11, 2013jbx.sagepub.comDownloaded from

66 www.sbsonline.org © 2009 Society for Biomolecular Sciences
Process Validation and Screen Reproducibilityin High-Throughput Screening
ISABEL COMA,1 LIZ CLARK,2 EMILIO DIEZ,1 GAVIN HARPER,3 JESUS HERRANZ,4 GLENN HOFMANN,5
MARK LENNON,6 NICOLA RICHMOND,3 MANUEL VALMASEDA,7 and RICARDO MACARRON8
The use of large-scale compound screening has become a key component of drug discovery projects in both the pharmaceuti-cal and the biotechnological industries. More recently, these activities have also been embraced by the academic communityas a major tool for chemical genomic activities. High-throughput screening (HTS) activities constitute a major step in the ini-tial drug discovery efforts and involve the use of large quantities of biological reagents, hundreds of thousands to millions ofcompounds, and the utilization of expensive equipment. All these factors make it very important to evaluate in advance of theHTS campaign any potential issues related to reproducibility of the experimentation and the quality of the results obtained atthe end of these very costly activities. In this article, the authors describe how GlaxoSmithKline (GSK) has addressed the needof a true validation of the HTS process before embarking in full HTS campaigns. They present 2 different aspects of the so-called validation process: (1) optimization of the HTS workflow and its validation as a quality process and (2) the statisticalevaluation of the HTS, focusing on the reproducibility of results and the ability to distinguish active from nonactive compoundsin a vast collection of samples. The authors describe a variety of reproducibility indexes that are either innovative or have beenadapted from generic medical diagnostic screening strategies. In addition, they exemplify how these validation tools have beenimplemented in a number of case studies at GSK. (Journal of Biomolecular Screening 2009:66-76)
Key words: high-throughput screening, pharmacological screening validation, process variation, reproducibility, screening tests
INTRODUCTION
THE IN VITRO PHARMACOLOGICAL SCREENING IN EARLY
DISCOVERY has undergone critical changes in the pastdecade with the delivery of a mature discipline in pharmaceu-tical R&D, known as high-throughput screening (HTS). Thesechanges have covered all aspects of the HTS process from com-pound management to the production and evaluation of hits.
The large-scale pharmacological screening has now beenembraced by most of the pharmaceutical and biotechnologicalindustry, as well as by the academic community in the chemi-cal genomic field. Nowadays, compound libraries are typicallyabove 1 million compounds in size and are easily accessible for
diversity screening. Biochemical and cellular assays (screens)are carried out in high-density plates with final assay volumesin the range of one to tens of microliters per well. Assay platesare large-scale processed by robots or workstation platforms.The quantity and speed of data production have increased thebenchmark values of the 1990s for throughput by more than20-fold. A typical day of HTS operation provides more than100,000 data points. Such volumes of data need to be properlymanaged, stored, and analyzed.
As these in-depth changes in “industrial” data productionhave settled down, an important requirement has emerged morestrongly than ever—that is, “cost-efficient” management of theHTS processes. The new HTS systems need to minimize wasteand rework, improve cycle time, and decrease the likelihoodthat product problems (poor-quality data) may be passed on tothe therapeutic area teams. Organizations have tried to solve theproblem by seeking and adapting traditional quality strategies,including quality control and quality assurance methods. Theresult is the “screening quality” culture in which “screeningquality control” forms the core.1,2
In general, any quality system uses a variety of tools todetect and minimize assignable variability to a given process. Itincludes many procedures such as preventive maintenance,instrument function checks, and validation tests.
GlaxoSmithKline R&D Pharmaceuticals, 1Screening and Compound Profiling,Tres Cantos, Spain; 2Screening and Compound Profiling, Harlow, UK;3Computational and Structural Chemistry, Stevenage, UK; 4Computational andStructural Chemistry, Tres Cantos, Spain; 5Screening and Compound Profiling,Upper Providence, Collegeville, Pennsylvania; 6Discovery Statistics,Stevenage, UK; 7Information Technology, Tres Cantos, Spain; and 8CompoundManagement, Upper Providence, Collegeville, Pennsylvania.
Received Jul 24, 2008, and in revised form Sep 15, 2008. Accepted for publi-cation Sep 17, 2008.
Journal of Biomolecular Screening 14(1); 2009DOI: 10.1177/1087057108326664
JBSc326664.qxd 12/22/2008 7:10 PM Page 66

It is well established that validation of procedures is a keycomponent of any quality strategy.3 In the past years, differentgroups have noted the importance of HTS validation not onlyin the field compound screening arena but also more recentlyusing large collections of RNAi.
4-8 In this article, we provide acomprehensive statistical analysis of the validation of HTS offile compounds.
Two sets of goals have to be addressed during HTS validation:the first one is about optimization of the HTS workflow and theevaluation of its quality as a process. Validated HTS proceduresare the best way to provide cost-effective HTS campaigns. Byoptimized cost-effective HTS, we refer to the assurance that a spe-cific HTS process will deliver data that meet predeterminedspecifications (i.e., validated parameters). We also refer to theinvestigation of predicted process error rates and their minimiza-tion. Every screen needs a specific quality planning. We defineHTS validation as the statistical platform used to design the base-line quality goals and planning for each screening campaign.
The second group of key goals in validation focuses on thestatistical evaluation of the screen reproducibility and diagnos-tic value of an HTS campaign. The screen diagnostic value orcapability can be defined as the ability to accurately distinguishhits from nonhits in a large collection of samples.9 The capa-bility evaluation that we propose here is based on a variety ofreproducibility indexes that are either innovative or have beenadapted from generic screening strategies.10
This article describes how we perform prospective HTSvalidation to produce operational screening protocols atGlaxoSmithKline. We provide the definitions of the statisticalqualifiers as well as the software tools developed for that pur-pose. We also refer to the business rules that help decision mak-ing about the final acceptability of the process and their outputs.
Finally, we present some case examples. These will serve asmeans to discuss how our HTS validation helps to optimizeresults and also will illustrate how to set the baseline quality forthe best efficiency of production. We also describe how valida-tion predicts the key quality indicators obtained in subsequentHTS campaigns.
MATERIALS AND METHODS
Table 1 summarizes the main steps and objectives carried outduring HTS validation. Step 0 refers to the initial test of reagentsin the HTS laboratory at the bench. This is always done whenthe assay has been transferred from an external laboratory.
Step 1 is about the design of the operational procedure orworkflow for the campaign. Factors that need to be consideredinclude actual availability of resources and cycle time objec-tives. A clear judgment needs to be made about the key vari-ables acting on the process to be validated. For instance,depending on the process design, the number of pipetting stepsmay not be so crucial compared with adding/not adding a lid to
the plates or being/not being flexible for a certain incubationperiod. Normally, the most efficient processes have standard-ized workflows—for example, Ca2+ mobilization assays carriedout in a fluorescent imaging plate reader (FLIPR) or typicalkinase assays. Nevertheless, a complete process standardiza-tion is not always possible due to the variety of conditions andformats that the screen might require. A clear working plan andworkflow have to be decided before advancing to HTS valida-tion. Further on, we focus on the optimization of individualequipment. Special attention is required for the validation ofthe liquid handler and reader protocols. First, we prepare sev-eral “DMSO plates,” which are plates with positive controls(maximal signal; e.g., uninhibited enzyme reaction) and nega-tive controls or blanks (background; e.g., substrate withoutenzyme or with inhibitor). Using both total signal and back-ground, we can identify error in the pipetting units, and weeventually set the pipetting conditions of the liquid handler forthe entire HTS campaign. This preautomated phase is in ourexperience absolutely critical, particularly when the HTS cam-paign is going to be attempted in 1536.
Slight differences in reagents or buffer composition (i.e.,presence of glycerol, bovine serum albumin [BSA], DMSO,scintillation proximity assay [SPA] beads, cells, etc.) couldaffect liquid density, viscosity, or stability of reagents, and thesefactors could have a dramatic impact on the optimization of thepipetting variables. Some liquid handlers may offer from 10 tomore than 20 variables of pipetting options, including pipettingspeed, height, pretip soaking, sequence of reagent addition,delay between additions, quantity of partial volumes, mixing,tip washing, tip change, and so on. Setting a default collectionof standard pipetting protocols is highly recommended to helpwith standardization and faster assay setup. These standardpipetting protocols can be obtained by using 2 or more reagents,including fluorescein as a probe (see Taylor et al.11 for furtherdetails on standard operation procedures for liquid handling inHTS). In any case, each screen will further need a particularoptimization of the default protocol—not only because everyscreen needs a proper and careful state-of-the-art pipetting pro-cedure but also because the global schedule of the robotic plat-form or workstation will be conditioned by its duration. In termsof time, the global efficiency of the workflow relies on the opti-mization of the individual pieces, protocols, or subprocesses.
The objectives of steps 2 and 3 illustrated in Table 1 includenot only making valid the HTS machinery and process but alsotesting statistical parameters of the assay, determining baselinevalues for monitoring quality during primary screening, andchecking assay reproducibility and ability to properly classifyhits and nonhits.
Simulating the continuous operation with runs of the appro-priate length is strongly recommended, particularly when thereis a high level of process automation. This can be achieved byrunning the protocol with empty plates and interleaving reaction
Journal of Biomolecular Screening 14(1); 2009 www.sbsonline.org 67
Process Validation and Screen Reproducibility in High-Throughput Screening
JBSc326664.qxd 12/22/2008 7:10 PM Page 67

68 www.sbsonline.org Journal of Biomolecular Screening 14(1); 2009
plates at certain intervals. This test is important for assessingplatform operation, reagent stability under platform environ-ment, getting initial quality assessment of results (automated Z′),and confirming all the data-handling machinery.
Step 3 comprises running a validation collection of samplesin triplicate. The validation set that we use at GlaxoSmithKline(GSK) contains close to 10,000 compounds representing awide diversity of chemotypes present in the HTS collection.The general principles of the validation experimental designare that each compound is tested in triplicate, and plates aretested in random order. The standard concentration for valida-tion is the same concentration that we use during the HTS cam-paign. Also important is that validation runs are independentand mimic production runs as close as possible. The length ofthe validation runs is adjusted by interjecting DMSO platesand/or empty plates in between sample plates.
Analytical and software tools for the validation set
Only plates with acceptable quality control (QC) as deter-mined by GSK Screening Quality Control (SQC) software cri-teria are included in the validation analysis. The SQC softwareincludes a variety of analytical tools for QC in HTS. During thevalidation stage, the SQC software provides information that issimilar to that provided during the HTS campaign with com-plete information and recommendations on go/no-go decisionsfor each plate according to certain business rules. These busi-ness rules apply to different criteria, including intraplate Z′,
variability and trends of controls, systematic errors in plates,and proportion of false positives and false negatives in controlpopulations (see Martin et al.2 for further details on GSK SQCsoftware).
If a whole run fails or more than a given number of plates,then it is repeated after careful analysis of causes to avoid thesame situation happening again in the repetition (and later inproduction).
A pattern recognition step is highly recommended beforeproceeding with any reproducibility analysis in validation (seeMartin et al.,2 Root et al.,12 and Makarenkov et al.13 for furtherdetails on pattern recognition and correction procedures). Thepurpose of a pattern recognition analysis is to detect systematicresult bias present in plate areas before inferring any repro-ducibility analysis. A visual inspection of gross patterns usingheat maps may be enough at this stage. Another level of analy-sis is required when the purpose is centered on the potentialimpact of a pattern correction. We show an example of this(case 3) in the next section.
Different parameters are used to give information about thepower of the assay to classify samples. All the reproducibilityindexes described are provided by VIT (Validation IT Tool), aGSK-developed software tool based on SpotFire. VIT codes allthe graphical, numerical, and tabular information according tothe specifications defined in this article.
In order to keep internal coherence with our informationtechnology (IT) outputs and tables, we use the terms hit andinactive to refer to any sample that produces a response above
Coma et al.
Table 1. Experimental Steps and Objectives in High-Throughput Screening (HTS) Validation
Step Experiment Objectives
0 Reproduce assay parameters on bench Do reagents work in our hands?Reproduce pharmacology of tool compounds on bench
Partial Validation
1 Workflow design Dry scheduling: Produce platform protocol and full workflowOptimization of liquid handler protocol Optimize throughput Check/optimize reader conditionsStudy operational options
Full Workflow Validation
2 Simulation run with empty plates Assess platform operationSimulation run with interdispersed reaction plates Assess reagent stability under platform environment
Get initial quality assessment of results (automated Z′)Assess data-handling machinery
3 Run validation collection in triplicate Validate the HTS machinery and processTest statistical quality of the assayDetermine baseline values for monitoring quality in primary screeningLearn from initial valuesValidate assay capability: reproducibility parameters, false positives, false negatives,
predicted confirmation rateProduce operational HTS protocol
JBSc326664.qxd 12/22/2008 7:10 PM Page 68

Journal of Biomolecular Screening 14(1); 2009 www.sbsonline.org 69
or below a threshold and that has not been confirmed by a sub-sequent experiment. We use the terms true hit (or true active)and true inactive to define confirmed activities. Any other termfollows criteria according to the glossary of terms of theSociety for Biomolecular Screening (SBS).14
Reproducibility for the entire range of activity
1. Average range among replicates (Rob AR)
Rob AR = robust mean [(max – min)j], (1)
where Rob is robust calculation (see Analytical MethodsCommittee15 and Appendix section for details about robustalgorithm). Max and min are the maximum and minimum val-ues among triplicates or duplicates for each compound j.
The VIT software provides warning limits for classifyingreproducibility as “good,” “moderate,” and “bad.”
2. Intraclass correlation coefficient (ICC)
The ICC is a reliability measurement. It is used to quantifythe similarity between various sets of repeated measurements(duplicate and triplicate data). It is defined as the ratio of thevariance associated with the observations over the sum of thevariance associated with observations plus the error variance.2,16
There are also warning limits to detect “poor correlation”according to the ICC index.
Reproducibility of inactives
The population of inactive samples is comprised in everyvalidation run by all samples below the cutoff or thresholdvalue. The objective is to assess consistency among the distrib-utions obtained in each replicate and hence among the corre-sponding partial cutoffsi.
The cutoff is defined as a multiple of the standard deviationabove the mean for the population of inactive samples (seeMartin et al.2 and Analytical Methods Committee15 for furtherdetails on this matter).
There is a warning limit in VIT when the cutoff surpasses adefined limit in the 3 validation runs.
Reproducibility of potential actives
Each validation run is named Vi, where i = 1, 2, or 3.Max, min, and mid are the maximum, minimum, and mid-
dle values among the 3 replicates for a compound.Rob meani is the robust mean of all samples of validation run Vi.Rob SDi is the robust standard deviation of all samples of
validation run Vi.Rob SD is the mean of the 3 Rob SDi.
N3x represents the total number of triplicates.Hitni represents the number of hits in Vi (i.e., samples above
cutoffi).Our definitions for classifying a sample as a true active (TA)
or true inactive (TI) according to its triplicate results are shownin Fig. 1.
A false positive (FP) in run Vi occurs when the max value of1 triplicate for a compound is higher that the cutoffi, the midand min values are below the cutoffi, and the max-mid valuesdiffer more than 2-fold from the Rob SD. An extreme false pos-itive (EFP) occurs when max value of 1 triplicate has a nor-malized response above 70%.
A false negative (FN) in run Vi occurs when min value of 1triplicate is below the cutoffi, mid and max values are above thecutoffi, and mid-min values differ more than 2-fold from theRob SD. An extreme false negative (EFN) occurs when min hasa normalized response below 15%.
Equations (2) to (9) define all the relative indexes, includingthe true active rate (TAR), the predicted confirmation rate(PCR), the hit rate (HR), the false-negative rate (FNR), and thefalse-positive rate (FPR).
1. TAR for validation is defined as
TAR (%) = 100*TAn/N3x, (2)
where TAn is the total number of TA.
Process Validation and Screen Reproducibility in High-Throughput Screening
FIG. 1. Definitions for classifying a sample as a true active (TA) ortrue inactive (TI). A TA in validation occurs when at least 2 replicatesare hits (i.e., above the corresponding cutoffi) in their respective runs.A TI in validation occurs when at least 2 replicates are nonhits (i.e.,below the corresponding cutoffi) in their respective runs.
JBSc326664.qxd 12/22/2008 7:10 PM Page 69

2. Predicted confirmation rate for validation i (PCRi) isdefined as
PCRi (%) = 100*(TA > cutoffi )n/Hitni, (3)
where (TA > cut-offi)n is the number of TA above cutoffi invalidation run i.
Predicted confirmation rate for validation is defined as
PCR = average (PCR1, PCR2, PCR3). (4)
3. Hit rate for validation i (HRi) is defined as
HRi (%) = 100*Hitni/N3x. (5)
Hit rate for validation is defined as
HR = average (HR1, HR2, HR3). (6)
4. False-negative rate for validation i (FNRi) is defined as
FNRi (%) = 100*FNni/TAn, (7)
where FNni is the number of FN in run Vi.
False-negative rate for validation is defined as
FNR = average (FN1, FN2, FN3). (8)
5. False-positive rate for validation i (FPRi) is defined as
FPRi (%) = 100*FPni/TIn, (9)
where FPni is the number of FP in run Vi, and TIn is the totalnumber of TI.
False-positive rate for validation is defined as
FPR = average (FP1, FP2, FP3). (10)
Warning limits and go/no-go criteria
Most of the warnings limits as well as the go/no-go businessrules for HTS validation were set after cost-benefit analysismade on a wide range of validation cases. The analysis was car-ried out by a multidisciplinary team in charge of the definitionof the HTS validation specifications at GSK. Some other partic-ular warnings (e.g., the ICC limit) are derived from the litera-ture.2,16 Every warning is evaluated and conclusions documentedin a validation report and shared at a peer review that precedesproduction. Those who implement the methods described in thisarticle should follow a similar procedure that agrees with thetolerance limits for their own labs and ensures appropriate edu-cation about their meaning in the context of HTS.
RESULTS
The power of the HTS validation method is exemplified inFig. 2 to 4 by the analysis of 3 different cases.
Case 1 results are summarized in Fig. 2. The screen is basedon a DNA-dependent enzyme test using a scintillation proximityassay. The workflow comprises 3 additions with 2 mixing steps (5μL final assay volume). In this particular HTS, the assay designincluded a 10-min preincubation time, an 80-min reaction time,and 3 h for bead sedimentation. It requires the use of 1536-wellplates, with plate lidding optional. Every plate spends 5 min in thereader. The period of the workflow under validation includes 10 hof full operation (throughput 70 × 1536-well plates per day).
Fig. 2A shows how the kinetic reaction had a slower coursein 1536- than in 384-well plates. A second unpredicted situa-tion discovered in the validation process was a gradient effectobserved in plates full of controls when laid on the robotic plat-form hotel for a given time. To solve this problem, we coveredthe plates with opaque lids. The pipetting requirements of theprocedure were especially complex to refine. The best pipettingprotocol got benchmark values of 9% to 11% coefficient ofvariation (CV) 0.7%-2.4% outliers when using fluoresceinesolutions. Variation went up to 15% CV (1.7%-2.5% of out-liers) when using full assay components.
Results of the validation runs following the automated work-flow are depicted in Fig. 2B-G. Fig. 2B illustrates the distribu-tion of the Z′ values for the controls included in the assay platesof the validation collection. Fig. 2C shows a heat map visualiza-tion of 1 plate with controls and DMSO in all wells (a “DMSOplate”) as it was presented by the SQC software. The correlationscatterplots and the VIT parameter table are summarized inFig. 2D-G. Results indicate that (a) the Z′ distribution is low cen-tered and dispersed (mean Z′ = 0.44; SD Z′ = 0.12). The risk ofplate QC failure due to low Z′ is more than 10%. The analysis ofDMSO plates points out the variation of inactive wells as themain cause of Z′ dispersion. This is due to both random andextreme variation (CV of DMSO samples 15%-18%; 1.7% out-liers). (b) There is a large standard deviation for the inactive pop-ulation of samples, as denoted by the Rob SDi (17%-20%), thesignificant cutoff (>50%), and the robust average range (26%)values. (c) There is also a low “constitutive” or “true hit rate” forthis target (true active rate <0.1%). (d) There are high result ratesof false positives and extreme false positives, and as a conse-quence, the confirmation rate (CR) is too low (CR <10%). (e)False negatives are at high levels as well, although assurance isneeded due to the low true hit rate found. Case 1 is an exampleof screen workflow that results in a poor diagnostic value due toinsufficient quality and high process variability.
Case 2 is an opposite example where most of the statisticaloutputs indicate a good quality. Case 2 screen targets a bacter-ial enzyme. It is tested in a kinetic assay based on fluorescenceintensity and carried out in a 1536-well plate format (5 μL final
70 www.sbsonline.org Journal of Biomolecular Screening 14(1); 2009
Coma et al.
JBSc326664.qxd 12/22/2008 7:10 PM Page 70

Journal of Biomolecular Screening 14(1); 2009 www.sbsonline.org 71
assay volume). Fig. 3A shows the reaction course in 1536wells. The raw data used to normalize results during the HTScampaign are the slope of the reaction in each well. The stan-dard error of the slope, the endpoint of the reaction, and theintercept points at time 0 were recorded and used for in-wellquality control analysis. Case 2 involves 2 additions with nomixing requirements. It demands 15 min preincubation time,30 min reaction time (room temperature), and 5 min for readingout. The workflow was sent for validation in a fully automatedplatform with 2 readers on-line. Throughput was 110 plates/dayin a 10-h total operation time. Fig. 3B-G sums up the resultsobtained for the workflow validation of case 2, including the Z′distribution (B), a heat map visualization of a DMSO plate (C),
the scatterplots for the validation collection (D-F), and the VITparameter table (G). Results indicate that (a) in terms of Z′,there is a very good assay performance (mean Z′ = 0.71, SD Z′ =0.1); (b) process variation is kept below warning levels as theRob SDi (11%-13%) and the robust average range (13%) valuescorroborate; and (c) all the reproducibility indicators rendergood quality as there are no significant rates of false positivesand false negatives. The predictive confirmation rate is verygood (PCR = 84%), with the active rate about 3% for a 40%significant cutoff.
Case 3 is based on the data for an HTS searching forinhibitors of another bacterial metabolic enzyme that was mea-sured by fluorescence intensity upon product generation. The
Process Validation and Screen Reproducibility in High-Throughput Screening
FIG. 2. Analysis of high-throughput screening validation for case 1. (A) Reaction time course in 384 and 1536 wells. (B) Z′ distribution forthe 3 validation runs. Each Z′ is calculated from the positive and negative controls of a plate. (C) Plate map of a plate containing DMSO and con-trols as displayed by the Screening Quality Control software. Yellow wells in columns 25 and 26 represent active controls (plus inhibitor). Yellowwells in the rest of the plate represent pipetting errors. (D-F) Correlation plots for the 3 copies of the validation collection. (G) Validation IT Tool(VIT) parameters table for the 3 copies of the validation collection. ni is the number of samples in each run; Rob Mean is the calculated robustmean for the population of inactives; Rob SD represents the calculated robust standard deviation for the population of inactives; cutoffi is the cal-culated cutoff for each validation run; Rob AR is the average range of the triplicates; ICC is the intraclass correlation coefficient; TAR (%) is thecalculated true active rate; HR (%) is the calculated hit rate; PCR (%) is the calculated predicted confirmation rate; FPR (%) is the calculatedfalse-positive rate; EFPR (%) is the calculated extreme false-positive rate; FNR (%) is the calculated false-negative rate; EFNR (%) is the calcu-lated extreme false-negative rate. The last row of the table shows average values for the corresponding parameters.
JBSc326664.qxd 12/22/2008 7:10 PM Page 71

72 www.sbsonline.org Journal of Biomolecular Screening 14(1); 2009
assay was fully automated with 2 readers in the platform. Thiscase illustrates an example where the inspection and analysis ofpatterns in validation helped to make a better decision for theHTS campaign based on the comparison of the validationindexes. Fig. 4A represents a visual inspection of patterns usingheat maps. Images in the left column in Fig. 4A show how thecentral areas of the plates are systematically giving higher val-ues than the peripheral areas. The pattern was qualified, quan-tified, and mathematically corrected according to patterncorrection algorithms developed at GSK.2 The central columnrepresents the mathematical model of the pattern, and imagesin the right column illustrate the results after applying the
pattern recognition algorithm. Fig. 4B represents some of val-idation parameters with and without pattern correction. For thisparticular case, data indicate that pattern correction created abenefit for the global screen capability, not only by a slightenhancement on the predicted confirmation rate (63% to 65%)of the screen but also by a decrease of the significant cutoff(from 34% to 25% response) and an increase in the number ofcaptured hits and true actives (hit rate from 1.1% to 2%, trueactive rate from 0.8% to 1.5%).
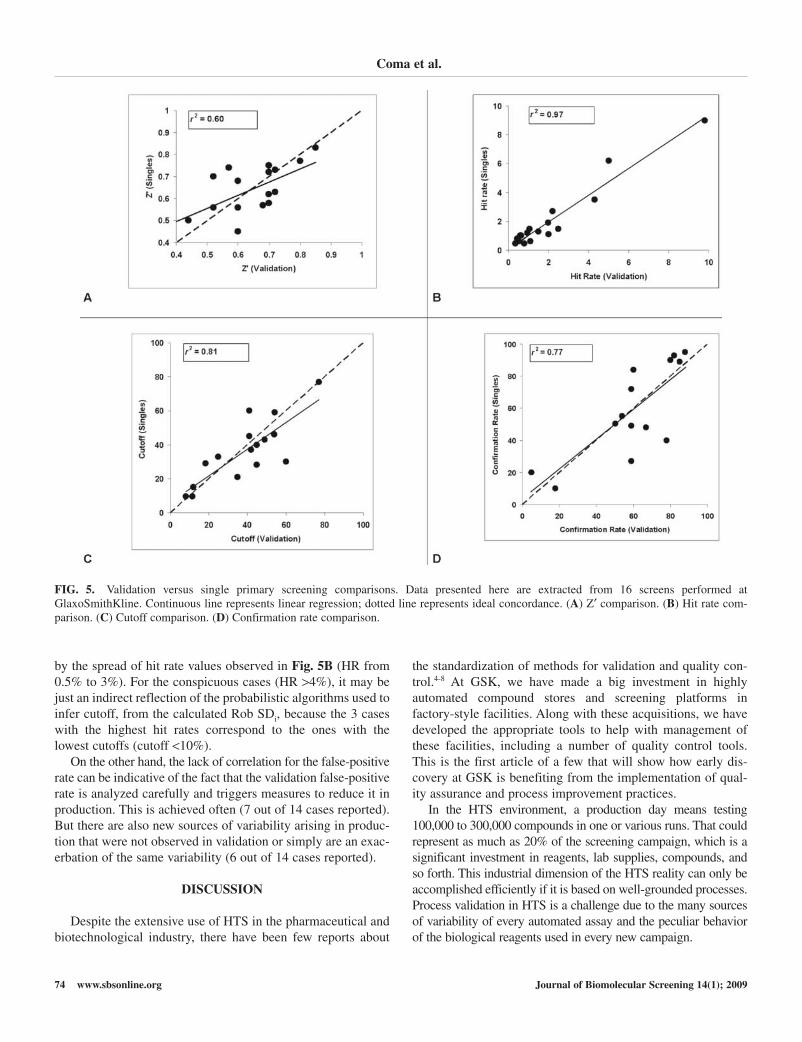
Fig. 5 shows the correlation plots for different indexes invalidated screen workflows compared with the outputsobtained in their subsequent HTS campaigns. They comprise
Coma et al.
FIG. 3. Analysis of high-throughput screening validation for case 2. (A) Reaction time course in 1536 wells and the parameters recorded. S isthe slope of the reaction, EE is the standard error of the slope, di is intercept point at time 0, and df is the intercept point after a 30-min reactiontime. (B) Z′ distribution for the 3 validation runs. Each Z′ is calculated from the positive and negative controls of a plate. (C) Plate map of a platecontaining DMSO and controls as displayed by the Screening Quality Control software. Yellow wells in columns 25 and 26 represent active con-trols (plus inhibitor). Yellow wells in the rest of the plate represent pipetting errors. (D-F) Correlation plots for the 3 validation runs.(G) Validation IT Tool (VIT) table for the 3 validation runs. ni is the number of samples; r mean is the calculated robust mean for the populationof inactives; r sd represents the calculated robust standard deviation for the population of inactives; cutoffi is the calculated cutoff for each vali-dation run; rob AR is the average range of the triplicates; ICC is the intraclass correlation coefficient; TAR (%) is the calculated true active rate;HR (%) is the calculated hit rate; PCR (%) is the calculated predicted confirmation rate; FPR (%) is the calculated false-positive rate; EFPR (%)is the calculated extreme false-positive rate; FNR (%) is the calculated false-negative rate; EFNR (%) is the calculated extreme false-negativerate. The last row of the table shows average values for the corresponding parameters.
JBSc326664.qxd 12/22/2008 7:10 PM Page 72

Journal of Biomolecular Screening 14(1); 2009 www.sbsonline.org 73
examples of ordinary screen formats in HTS, including enzy-matic, receptor binding, and Ca2+ mobilization cell-basedassays. As can be observed in Fig. 5, there is a good correlationfor hit rate and cutoff values and only moderate correlationof Z′ and confirmation rate values. It should be notedthat the values for validation presented here are taken from thevalidation runs closer to production. Quite often, a first iterationunveils issues that require significant changes of procedures,reagents, and/or instruments. It is our practice to repeat the val-idation with the final process to be used in HTS prior to pro-duction. Nevertheless, the HTS process is not frozen after start,and tweaks are implemented if quality control results identifyany undesirable trend or production failure during the HTScampaign.
The modest correlation of Z′ in validation and in HTS maywell be a reflection of the variability interbatch of high controlsfor many assays such as cellular assays. As reflected in otherindexes such as cutoff or hit rate, even the highest Z′ discrep-ancies (more than 0.15 Z′ units for 3 of 16 cases) have a lim-ited influence in the HTS output.
The observed variation of inactive samples (i.e., SDi) can betheoretically considered as the sum of various components.These factors include actual assay variability, organic load (i.e.,matrix effect of compounds), and process variability sensustricto. Assuming that the two first elements are kept constantfor a given assay configuration, Rob SDi changes can be asso-ciated with changes of variation due to process. In this sense,the cutoff obtained in validation is an indirect quality indicatorof process variation for a given screen workflow. The good cor-relation observed for this parameter is shown in Fig. 5C. Itindicates that the validation procedure generally reflects themajor components of process variation that can be expected in
the massive HTS campaign. This fact is confirmed by the goodcorrelation obtained for hit rate in Fig. 5B.
Confirmation rate is the composite of 2 independent vari-ables: number of true actives detected as hits and number offalse positives. The lack of correlation in the middle range ofthe plot in Fig. 5D can be traced to the behavior of both com-ponents. Surprisingly, the true active rate is predicted very wellin validation (R2 = 0.93), whereas the false-positive rate is not(R2 = 0.37). In terms of prediction of the true active rate, wealways understood that the coverage of chemical diversity inthe HTS collection within the validation set was limited, thusallowing only a rough estimate of the final true active rate.Moreover, the GSK validation set was built from the HTS col-lection handled by GSK in 2002. Since then, the collection sizehas quadrupled, reaching in 2008 up to 2 million compounds;this growth has come mainly from addition of chemotypes notrepresented previously. The examples shared in Fig. 5 corre-spond to screens run in 2004-2007 against collections rangingfrom 800,000 to 1,500,000 chemical compounds with newdiversity not represented in the validation set. It is thus unex-pected to observe an almost perfect correlation of the trueactive rate between validation and HTS. True hits of interest arerare and far apart; therefore, this finding indicates that lists ofhits confirming in the HTS assay (true actives) are populated byartifacts, nonspecific hits, nuisance compounds, and so on,which are predictable per target, together with a small popula-tion of hits from the few series of prospective interest that needto be identified in subsequent steps from a forest of undesirablehits. This observation has been reported recently for a beta-lactamase screen17 in which most hits were found to be aggre-gators. Interestingly, nuisance effects such as aggregation seemto show up in different degrees for different targets as inferred
Process Validation and Screen Reproducibility in High-Throughput Screening
FIG. 4. Analysis of high-throughput screening validation for case 3. (A) Heat map visualizations of the pattern. Red wells represent positiveresponse; blue wells represent negative response values related to assay controls. Left column depicts actual values, central column shows mod-eled patterns, and right column represents corrected values. (B) Comparison of validation parameters before and after pattern correction. N3x is thetotal number of triplicated compounds; Rob Mean is the calculated robust mean for the population of inactives; Rob SD represents the calculatedrobust standard deviation for the population of inactives; cutoff is the mean value of each validation cutoffi; HR (%) is the calculated hit rate; PCR(%) is the calculated predicted confirmation rate; TAR (%) is the calculated true active rate; FPR (%) is the calculated false-positive rate.
JBSc326664.qxd 12/22/2008 7:10 PM Page 73
74 www.sbsonline.org Journal of Biomolecular Screening 14(1); 2009
by the spread of hit rate values observed in Fig. 5B (HR from0.5% to 3%). For the conspicuous cases (HR >4%), it may bejust an indirect reflection of the probabilistic algorithms used toinfer cutoff, from the calculated Rob SDi, because the 3 caseswith the highest hit rates correspond to the ones with thelowest cutoffs (cutoff <10%).
On the other hand, the lack of correlation for the false-positiverate can be indicative of the fact that the validation false-positiverate is analyzed carefully and triggers measures to reduce it inproduction. This is achieved often (7 out of 14 cases reported).But there are also new sources of variability arising in produc-tion that were not observed in validation or simply are an exac-erbation of the same variability (6 out of 14 cases reported).
DISCUSSION
Despite the extensive use of HTS in the pharmaceutical andbiotechnological industry, there have been few reports about
the standardization of methods for validation and quality con-trol.4-8 At GSK, we have made a big investment in highlyautomated compound stores and screening platforms infactory-style facilities. Along with these acquisitions, we havedeveloped the appropriate tools to help with management ofthese facilities, including a number of quality control tools.This is the first article of a few that will show how early dis-covery at GSK is benefiting from the implementation of qual-ity assurance and process improvement practices.
In the HTS environment, a production day means testing100,000 to 300,000 compounds in one or various runs. That couldrepresent as much as 20% of the screening campaign, which is asignificant investment in reagents, lab supplies, compounds, andso forth. This industrial dimension of the HTS reality can only beaccomplished efficiently if it is based on well-grounded processes.Process validation in HTS is a challenge due to the many sourcesof variability of every automated assay and the peculiar behaviorof the biological reagents used in every new campaign.
Coma et al.
FIG. 5. Validation versus single primary screening comparisons. Data presented here are extracted from 16 screens performed atGlaxoSmithKline. Continuous line represents linear regression; dotted line represents ideal concordance. (A) Z′ comparison. (B) Hit rate com-parison. (C) Cutoff comparison. (D) Confirmation rate comparison.
JBSc326664.qxd 12/22/2008 7:10 PM Page 74

Journal of Biomolecular Screening 14(1); 2009 www.sbsonline.org 75
Instrumentation used in early discovery is often based on veryinnovative functionality rather than on reliability. Moreover, multi-ple assay technologies are typically required to allow screening ofunrelated targets that confirm typical drug discovery portfolios. Allthese circumstances make the design of the HTS production linesvery heterogeneous in terms of equipment and level of automationand preclude simple application of manufacturing principles in atypical HTS facility.2 It is therefore extremely important to carryout a very detailed analysis of the HTS production for each partic-ular assay, not only from the point of view of instrument reliabilitybut also from the point of view of final assay quality.
In this article, we have described an HTS validation methodbased on a step-by-step procedure. The mathematical basis isfounded on the statistics for screening tests, including originalapproaches developed from the information of a triplicateexperimental design. The examples shown have demonstratedhow effective this method can be applied not only to validate anHTS procedure as a whole but also to make a diagnosis onparticular quality aspects and therefore work on qualityimprovement. The parameters that we have chosen have beendefined to provide a good control of the HTS process, deliver-ing very useful information for decision making. These parame-ters, some of them unrelated, have demonstrated internalcoherence, and they allow us to successfully establish warningalarms (i.e., go/no-go criteria) based on the absolute and relative
values. We have also demonstrated that they present an objectiveview about the capability of the HTS process under evaluation.
It is also worth highlighting the importance of the experi-mental design in validation with special emphasis on practicalrestrictions of the process. Appropriate sampling, randomiza-tion, and independent experimentation must be carried out toensure an adequate diagnosis.
In summary, we believe that the time spent in carrying out adetailed analysis of the process, together with a good statisticalvalidation of the HTS, helps to obtain better results and aids thescreening scientists in knowing when to “turn the green lighton” for a particular HTS.
ACKNOWLEGMENTS
The authors are greatly indebted to Julio J. Martin, MikeSnowden, Chris Molloy, Andy Vines, Dave Bolton, andJavier Sanchez-Vicente for the productive discussions abouthow to best implement statistical methodologies in the HTSprocess at GlaxoSmithKline. Likewise, we thank many othercolleagues in IT and Screening for their ideas and experi-mental data. SQC software has been the result of a joint col-laborative effort with Tessella. We are also grateful to RobertHertzberg and Stephen Pickett for their support in the writingof this manuscript.
Process Validation and Screen Reproducibility in High-Throughput Screening
APPENDIXOutline of Robust Statistic Algorithm
Below is a step-by-step outline of how the robust algorithm proposed by the Analytical Methods Committee15 works:
1. The initial average (μ) is estimated from the median (50th percentile) of the data. The initial standard deviation (σ) is estimated from1.48*MAD. The median absolute difference (MAD) represents the median difference obtained by calculating the absolute differenceof each observation from the median.
2. A set of upper and lower cutoff limits are calculated, and values outside this range are defined as outliers. The top cutoff is calculatedas μ + c*σ, and the bottom cutoff is μ – c*σ, where c is a tuning constant. The tuning constant determines the sensitivity of the algo-rithm and is based on the expected number of outliers. The tuning constant should be a value between 1 and 2, and the lower it is, themore sensitive the algorithm. For our purposes, the tuning constant has been set at 1.5.
3. All the values larger than the top cutoff are replaced by the top cutoff value, and all the values lower than the lower cutoff are replacedby the lower cutoff value.
4. The new values for the average and standard deviation are calculated from these adjusted data. The new μ (no longer the median) is
the arithmetic average of the data, and the new σ is calculated as , where
, where N is a standard normal deviate.
Note: when c = 1.5, β = 0.778. Our estimate of σ is adjusted upwards because by setting values equal to the upper and lower cutoff, as definedin step 3, we potentially have a number of observations that are identical, and this gives a downward biased estimate of σ. Hence, we have to cor-rect for this bias.
5. Go back to step 2 and repeat with the new estimates of μ and σ until convergence is met. Convergence is met when σ is <1% differ-ent from the last iteration (note: you would also want to enter a maximum number of iterations so that the program cannot get stuckin a never-ending loop).
β= θ+ c2ð1− θÞ−2c e −c2
2
� �ffiffiffiffiffiffi2πp :
θ=PðjNj< cÞ
σffiffiffiβp
JBSc326664.qxd 12/22/2008 7:10 PM Page 75

76 www.sbsonline.org Journal of Biomolecular Screening 14(1); 2009
REFERENCES
1. Macarron R: Critical review of the role of HTS in drug discovery. DrugDiscov Today 2006;11;277-279.
2. Martin J, Coma I, Herranz J: Statistics and decision making in highthroughput screening. In (ed): High Throughput Screening. 2nd ed.Totowa, NJ: Humana, in press.
3. US Food and Drug Administration: Guidance on General Principles ofProcess Validation. Rockville, MD: US Food and Drug Administration;1987. [Online]. Retrieved from http://www.fda.gov/CDER/GUIDANCE/pv.htm
4. Gribbon P, Lyons R, Laflin P, Bradley J, Chambers C, Williams BS, et al:Evaluating real-life high-throughput screening data. J Biomol Screen2005;10:99-107.
5. Gunter B, Brideau C, Pikounis B, Liaw A: Statistical and graphicalmethods for quality control determination of high-throughput screeningdata. J Biomol Screen 2003;8:624-633.
6. Padmanabha R, Cook L, Gill J: HTS quality control and data analysis: aprocess to maximize information from a high-throughput screen. CombChem High Throughput Screen 2005;8:521-527.
7. Eli Lilly and Company and the National Institutes of Health ChemicalGenomics Center: Assay Guidance: Assay Validation. 2008. [Online].Retrieved from http://www.ncgc.nih.gov/guidance/section2.html#replicate-experiment-study
8. Zhang X, Espeseth A, Johnson E, Chin J, Gates A, Mitnaul L, et al:Integrating experimental and analytic approaches to improve data qualityin genome-wide RNAi screens. J Biomol Screen 2008;13:378-389.
9. Macarron R, Hertzberg R: Design and implementation of high through-put screening assays. In (ed): High Throughput Screening. 2nd ed.Totowa, NJ: Humana, in press.
10. Buck AA, Gart JJ: Comparison of a screening test and a reference test inepidemiology studies: I. Indices of agreement and their relation to preva-lence. Am J Epidemiol 1966;83:586-592.
11. Taylor PB, Ashman S, Baddeley SM, Bartram SL, Battle CD, Bond BC,et al: A standard operation procedure for assessing liquid handler perfor-mance in high-throughput screening. J Biomol Screen 2002;7:554-569.
12. Root DE, Kelley BP, Stockwell BR: Detecting spatial patterns in biolog-ical array experiments. J Biomol Screen 2003;8:393-398.
13. Makarenkov V, Zentilli P, Kevorkov D, Gagarin A, Malo N, Nadon R: Anefficient method for the detection and elimination of systematic error inhigh-throughput screening. Bioinformatics 2007;23:1648-1657.
14. Society for Biomolecular Sciences: Glossary of terms used in biomolec-ular screening [Online]. Retrieved from http://www.sbsonline.com/links/terms.php
15. Analytical Methods Committee of the Royal Society of Chemistry:Robust statistics: how not to reject outliers. Analyst 1989;114:1693-1697.
16. Sackett DL: A primer on the precision and accuracy of the clinical exper-imentation. JAMA 1992;267:2638-2644.
17. Babaoglu K, Simeonov A, Lrwin JJ, Nelson ME, Feng B, Thomas CJ,et al: Comprehensive mechanistic analysis of hits from high-throughput anddocking screens against beta-lactamase. J Med Chem 2008;51:2502-2511.
Address correspondence to:Isabel Coma
GlaxoSmithKline R&D PharmaceuticalsMolecular Discovery Research (Screening and Compound
Profiling)Centro de Investigación Básica (CIB)
Santiago Grisolía, 428760 Madrid, Spain
E-mail: [email protected]
Coma et al.
JBSc326664.qxd 12/22/2008 7:10 PM Page 76