
Transonic Flow Around Diamond-shaped Profile at Reynolds Number Re = 1 000 000
Upload
khangminh22Category
view
6download
0
NASA CP-2009
High Reynolds Number Research
A workshop held at Langley Research Center Hampton, Virginia October 27-28, 1976
NI\SI\
CASE FILE COpy

NASA CP-2009
High Reynolds Number Research
Edited by Donald D. Baals
A workshop sponsored by
Joint Institute for Advancement of Flight Sciences, The George Washington University, and NASA Langley Research Center
and held at Hampton, Virginia October 27-28, 1976
NI\SI\ Scientific and Technical Information Office 1977 NATIONAL AERONAUTICS AND SPACE ADMINISTRATION
Washington, D.C.

For sale by the National Technical Information Service Springfield, Virginia 22161 Price: $7.50

PREFACE
The Workshop on High Reynolds Number Research was organized to provide a national forum for interchange of plans and ideas for future research in the high Reynolds number area. In addition, the workshop provided an opportunity to review for potential users the operational characteristics and design features of the National Transonic Facility (NTF) which is now in the final design phases at Langley Research Center. Since the NTF is truly a national facility, participation in the workshop included technical experts representing a crosssection of potential users from NASA, DOD, other governmental agencies, the aerospace industry, and the university community. A list of the attendees is included in this volume.
The basic purpose of the workshop was the examination of the fundamental aerodynamic questions for which high Reynolds number experimental capability is required. A directed effort was made to outline and prioritize potential experiments which would maximize the early research returns from the use of the National Transonic Facility. These recommendations are recorded in this Conference Publication.
The workshop was organized into five technical panels for initial research planning:
- Fluid Mechanics - Applied Theoretical Aerodynamics - Configuration Aerodynamics - Propulsion Aerodynamics - Dynamics and Aeroelasticity
The workshop on High Reynolds Number Research was sponsored by the Joint Institute for Advancement of Flight Sciences, The George Washington University, in association with the National Aeronautics and Space Administration, Langley' Research Center. We would like to express our appreciation to the Chairmen, Vice-Chairmen, and Technical Advisers of the various technical panels for their efforts in selection of candidate panel members, conduct of the panel discussions, and the presentation and documentation of the panel recommendations. Special recognition is due the Langley staff for their documentation of the technical aspects of NTF and to J. Lloyd Jones for his presentation of the theme topic, his services as moderator of the round-table discussion, and his general counsel. A note of special appreciation goes to Dr. Alan Lovelace, newly appointed NASA Deputy Administrator, who took time from his busy schedule to address the workshop attendees.
Donald D. Baals
L. Wayne McKinney
Hampton, Virginia 1977
iii

Page intentionally left blank

WORKSHOP on
HIGH REYNOLDS NUMBER RESEARCH
Sponsored by
JOINT INSTITUTE FOR ADVANCEMENT OF FLIGHT SCIENCES THE GEORGE WASHINGTON UNIVERSITY
In association with
NATIONAL AERONAUTICS AND SPACE ADMINISTRATION LANGLEY RESEARCH CENTER
General Chairman:
October 27-28, 1976 NASA Langley Research Center
Hampton, Virginia
PROGRAM
Co-Chairman: Donald D. Baals L. Wayne McKinney Senior Research Associate The George Washington University
Head, Transonic Research Requirements Group, NTF
Langley Research Center
WEDNESDAY, OCTOBER 27, 1976
Morning Registration at Activities Building (Building 1222)
Opening Remarks by General Chairman
Welcome to Langley Research Center
Langley GWU/JIAFS Program
v
Donald Baals
Donald Hearth Director, LaRC
John Duberg Assoc. Director, LaRC
John Whitesides GWU/JIAFS

THEME TOPIC
The Transonic Reynolds Number Problem J. Lloyd Jones
Chief, Planning and Analysis Office Ames Research Center
SESSION I: INTRODUCTION TO THE NATIONAL TRANSONIC FACILITY
Chairman: Oran W. Nicks, Deputy Director, Langley Research Center
A. NTF As a National Facility Oran W. Nicks
B. Technical Overview of the National Transonic Facility Robert H. Howell, Manager, NTF Project Office
C. Wind-Tunnel Cryogenic Technology Robert A. Kilgore
D. Transonic Wind-Tunnel Wall Interference William B. Kemp
E. Model Design and Support Systems Vernon P. Gillespie
F. Instrumentation and Data Acquisition System Joseph F. Guarino
Afternoon
Visits to:
O.3-m Transonic Cryogenic Tunnel
National Transonic Facility Site
SESSION II: HIGH REYNOLDS NUMBER SUBSONIC/TRANSONIC RESEARCH
Chairman: Richard E. Kuhn, Chief, Subsonic/Transonic Aerodynamics Division
INTRODUCTORY STATEMENTS BY PANEL CHAIRMEN
A. Fluid Mechanics Alfred Gessow, NASA Headquarters
B. Applied Theoretical Aerodynamics Percy J. Bobbitt
vi

C. Configuration Aerodynamics Richard T. Whitcomb
D. Propulsion Aerodynamics David N. Bowditch, Head, ,Propulsion Aero Branch, Lewis Research Center
E. Dynamics and Aeroelasticj~y John C. Houbolt
ORGANIZE INTO PANELS AND INITIATE DISCUSSION ON RESEARCH PROGRAMS AND PRIORITIES
Evening
Morning
Afternoon
BANQUET
Guest Speaker - Dr. Alan Lovelace NASA Deputy Administrator
THURSDAY, OCTOBER 28, 1976
SESSION III: CONTINUATION OF PANEL WORK SESSIONS
SESSION IV: PANEL PRESENTATIONS AND DISCUSSION
Chairman: J. Lloyd Jones
PRESENTATIONS BY PANEL CHAIRMEN
ROUND TABLE DISCUSSION Moderator: J. Lloyd Jones
WORKSHOP CLOSING COMMENTS
vii

THE TRANSONIC REYNOLDS NUMBER PROBLEM
J. Lloyd Jones
NASA Ames Research Center
INTRODUCTION
The purpose of this paper is to establish the theme-for this meeting and to provide a base for departure in (a) the contemplation of the various needs for experimental research investigations utilizing the National Transonic Facility (NTF) and in (b) the consideration of the relative priorities that should be given within and across subdisciplines for guidance in planning for the most effective initial use of the facility. This purpose will be approached by reviewing some of the concerns that led to the advocacy for such a test capability and by giving a brief review of the activities that led to the current situation. There is nothing new in what is presented herein. Little, if anything, new in the understanding of the scaling of aerodynamic data has come about in the past eight years.
A
'a
b
c m
C P
c
c
E
SYMBOLS
area
speed of sound
wing span
drag coefficient
lift coefficient
section lift coefficient
section' pitching-moment coefficient
pressure coefficient
chord
mean geometric chord
bulk modulus of elasticity
characteristic length

M Mach number
m mass
p pressure
Pt,max maximum total pressure
q dynamic pressure
R Reynolds number
R- Reynolds number based on mean geometric chord c
T stagnation temperature
T.S. test section
T maximum stagnation temperature t,max
u local velocity in flow direction
V velocity
y direction normal to flow
~ incremental value
n percent semispan location on wing
~ kinematic viscosity
p density
00 free-stream conditions
FLOW MODELING SIMILARITY CRITERIA
It is fitting to begin with a brief review of Reynolds number and its significance as a scaling parameter in transonic-flow simulations. Osborne Reynolds initially noted the significance of the parameter pV£/~ as a criteria for determining whether the flow of water in pipes would be laminar or "sinuous," that is, turbulent. He advanced the idea that the state of affairs in fluid flow in geometrically similar systems depends only on this parameter, but he did not comprehend its full significance. It remained for Lord Rayleigh and others to establish Reynolds'number (pV£/~) as a basic dynamic characteristic that qualifies the state of viscous fluid motion in the sense that two steady flows are similar if the Reynolds numbers are the same; that is, that the ratio of inertia forces to viscous forces is the same in both instances, as
2

illustrated in figure 1. Of course; similitude also requires that the ratio of inertia forces to pressure forces be the same for both flows, but this is automatically satisfied in steady flows when the Reynolds numbers are the same. Hence, the condition of dynamic similarity is completely satisfied by making the Reynolds numbers equal at corresponding points in the flows.
Reynolds, of course, was working with the flow of water !n pipes, or incompressible flows. At transonic speeds in air, for flow similarity, equal Reynolds numbers is not enough. The elastic forces due to compressibility also must be considered. To assure dynamic similarity for compressible fluids, it is therefore necessary to maintain the same ratio of inertia forces to elastic forces. The criteria for this requirement is to keep the Mach number equal for both flows, as is indicated in figure 2. Hence, for transonic windtunnel flows, one must assure the same Mach number and the same Reynolds number to truly simulate the flight conditions.
REYNOLDS NUMBER SENSITIVE FLOW PHENOMENA
Reynolds number is a very important parameter in the modeling of flows about flight vehicles because the viscous surface flow is extremely important in determining the resultant forces and moments. Many Reynolds number sensitive flow phenomena for various types of flight vehicles are listed in figure 3. Obviously, there is not time to discus& each of these phenomena, nor would such a discussion at this time really contribute to the purpose of this workshop. Generalizations can be made, however, in the definition of Reynolds number sensitive flows to obtain a clear view of their importance. Reynolds number sensitive flow simulation problems are encountered when the geometric scaling of viscous flow is important or when the coupling between the viscous surface flow and the external flow field is strong. In the first instance, the concern would be for the evaluation of skin friction or heat transfer. At transonic speeds, heat transfer is not an important problem; thus, it may be eliminated for the purpose of this discussion.
Skin friction, or friction drag, varies with Reynolds number. However, it varies in a manner that is predictable, and extrapolation can be made with reasonable confidence and precision if the flow is fully turbulent (or if the relative areas of laminar or turbulent flows are well defined) and if no appreciable areas of flow separation exist. The generally accepted practice in model testing is to fix transition near the leading edge, where it would occur in flight. This method is widely used, and drag results have been reasonably reliable, but some difficulties have been encountered in obtaining correct moment extrapolations because of the greater relative thickness of the turbulent boundary layer at low Reynolds numbers and its interaction with local shocks. This experience is illustrated in figure 4, where it may be seen that the correct prediction of flight pitching moment would be unlikely from the windtunnel results.
Viscous-inviscid flow coupling occurs when there are separated flows present. Vortex flows are included in this category. Flow separations and the attendant high drag and interference effects are very sensitive to Reynolds
3

number and presently cannot be extrapolated with confidence. Flow separation generally occurs when the kinetic energy in the boundary layer is diminished by encountering adverse pressure gradients, such as in regions of expansion on rearward sloping surfaces or through shock waves. Particular problems have been encountered at transonic speeds where local imbedded or recompression shocks occur on the surface of the vehicle.
CONSEQUENCES OF LIMITATIONS IN SIMULATION
There are 8 number of examples where problems that have been encountered in flight test have been attributed to Reynolds number effects. Some of these are listed in figure 5. Perhaps the most publicized is the experience with the C-141 aircraft which is illustrated in figure 6. The interaction of the relatively thicker turbulent boundary layer, resulting from the lower windtunnel test Reynolds number, with the external inviscid and locally supersonic flow-field results in the recompression shock being located relatively farther forward on the wing. The corresponding wing pressure distributions are also shown in the figure. The consequence of the misprediction was additional cost for the reanalysis of the structure and a 9-month delay in the initial operational availability of the aircraft.
Another example, illustrated in figure 7, is the underprediction by 0.02 of the drag rise Mach number for the C~SA from wind-tunnel tests. If the true value had been predicted, a thicker and thus lighter wing could have been used, and the wing fatigue life problems encountered as a result of the reduction of structural margins to keep the gross weight within bounds might have been avoided. Replacement costs of the C-SA wings have been estimated to be about $900 million.
A third example is the effect of Reynolds number on engine afterbody drag, as determined in an experimental program at the NASA Lewis Research Center and illustrated in figure 8. There have been unresolved questions raised about the proper accounting of tunnel-wall interference effects in these data because of the large size of the model in the wind tunnel; however, it appears that the extrapolation of the tunnel data in the absence of flight data could hardly be expected to predict the flight values correctly.
AERODYNAMIC FACILITY STATUS
It will be noted that the examples cited for the manifestation of Reynolds number sensitive flow modeling problems have been mostly in the transonic-speed regime. In subsonic wind tunnels, problems of flow separation are encountered primarily at high-angle-of-attack attitudes with high-lift devices deployed as required for landing or take-off. The establishment of the maximum lift coefficient attainable is a task for the wind tunnel in the design process for a new aircraft. For many years, it was generally accepted that a Reynolds number of about 7xl06 was adequate for the prediction of C
L . However, as
,max
4

high-lift systems have become more complex for swept-wing aircraft and leadingedge devices have been employed, this test Reynolds number no longer provides the confidence required for design purposes. The low local Reynolds numbers of the flow about leading-edge devices and the problem of maintaining geometric similarity for very thin model surfaces are thought to be responsible. This country has, however, gone to the expedient of providing very large subsonic tunnels capable of producing essentially "full-scale" test conditions for many aircraft partly because of the concern about properly predicting high-lift characteristics.
In the supersonic regime, the area of interest for aircraft is generally very slender configurations at small angles of attack or sideslip. As a result, there are no appreciable areas of separated flow, and ext~apolation of smallscale data can be done with some confidence. An exception is for fighter aircraft in combat maneuvering flight attitudes, but in this case, the attendant drag in flight is so large that the speed quickly drops into the transonic regime. All things being considered, relatively small scale supersonic wind tunnels seem to be satisfactory for aircraft test purposes.
The major problems thus have been at transonic speeds, and it is here that the inadequacy of wind-tunnel test capabilities have been most critical in recent years. The complex, interacting flow fields in this speed regime are illustrated by the schlieren photograph of transonic flow over a wing section in figure 9. It is true that successful aircraft can and have been built to operate at transonic speeds. However, some serious and costly problems have been encountered, as illustrated herein. In the attempt to avoid such problems, the aircraft designers have been rather conservative in their design approach. Clearly, this has been the prudent approach, because the financial risk for a performance deficiency or major problem is very large. As a result, potential advances in performance and efficiency have not been realized. The limitations of transonic aerodynamic test facilities also have been a handicap to research personnel in identifying and establishing technology advances.
IDENTIFICATION OF DEFICIENCY IN TRANSONIG TEST CAPABILITY
The limitations in the existing transonic wind-tunnel facilities and the importance of those limitations have been recognized for some time. There has been general agreement in Industry and in Government since about 1967 that existing tunnels are inadequate for research and for the confident development of current and future aircraft, and that an urgent need exists to provide an improved transonic test capability. It has been recognized that a conventional continuous-flow tunnel with high Reynolds number capability would require an impractical amount of drive power. There has been general agreement that energy storage systems should be considered to reduce the power requirements. It generally has been agreed that anything less than "full scale" represented a compromise in the simulation. Until recently there has been no agreement on what compromise was acceptable. Figure 10 shows the maximum chord Reynolds number achievable in existing U. S. transonic wind tunnels and-the flight Reynolds numbers for future aircraft as projected in 1969. (Here, the wing
5
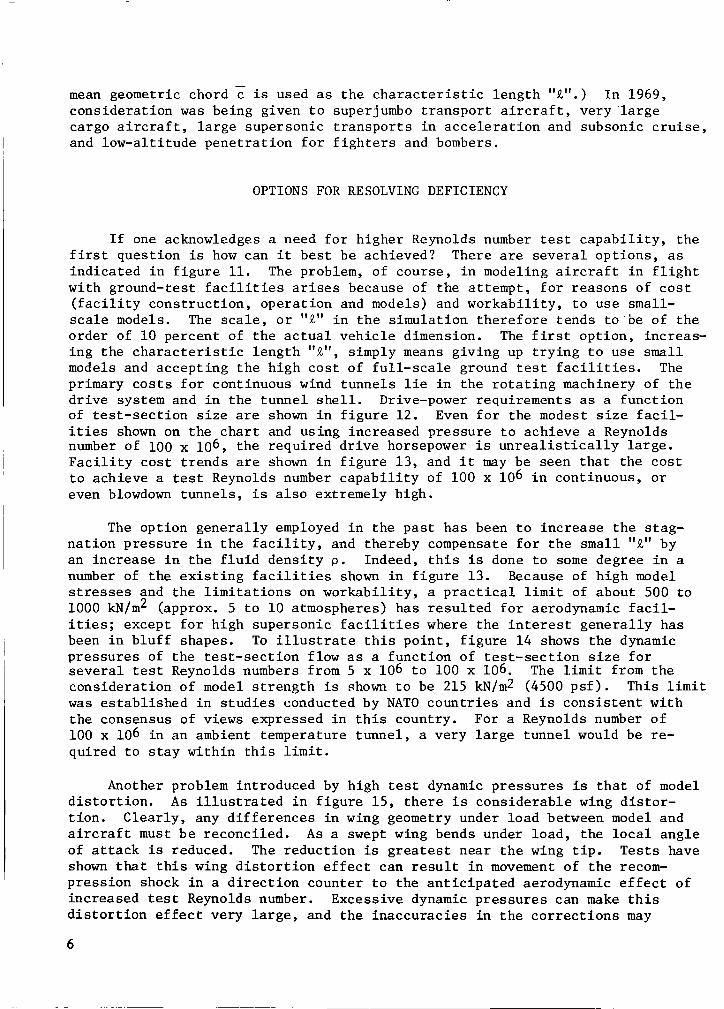
mean geometric chord c is used as the characteristic length "t".) In 1969, consideration was being given to superjumbo transport aircraft, very large cargo aircraft, large supersonic transports in acceleration and subsonic cruise, and low-altitude penetration for fighters and bombers.
OPTIONS FOR RESOLVING DEFICIENCY
If one acknowledges a need for higher Reynolds number test capability, the first question is how can it best be achieved? There are several options, as indicated in figure 11. The problem, of course, in modeling aircraft in flight with ground-test facilities arises because of the attempt, for reasons of cost (facility construction, operation and models) and workability, to use smallscale models. The scale, or "t" in the simulation therefore tends to·be of the order of 10 percent of the actual vehicle dimension. The first option, increasing the characteristic length "t", simply means giving up trying to use small models and accepting the high cost of full-scale ground test facilities. The primary costs for continuous wind tunnels lie in the rotating machinery of the drive system and in the tunnel shell. Drive-power requirements as a function of test-section size are shown in figure 12. Even for the modest size facilities shown on the chart and using increased pressure to achieve a Reynolds number of 100 x 106 , the required drive horsepower is unrealistically large. Facility cost trends are shown in figure 13, and it may be seen that the cost to achieve a test Reynolds number capability of 100 x 106 in continuous, or even blowdown tunnels, is also extremely high.
The option generally employed in the past has been to increase the stagnation pressure in the facility, and thereby compensate for the small "t" by an increase in the fluid density p. Indeed, this is done to some degree in a number of the existing facilities shown in figure 13. Because of high model stresses and the limitations on workability, a practical limit of about 500 to 1000 kN/m2 (approx. 5 to 10 atmospheres) has resulted for aerodynamic facilities; except for high supersonic facilities where the interest generally has been in bluff shapes. To illustrate this point, figure 14 shows the dynamic pressures of the test-section flow as a function of test-section size for several test Reynolds numbers from 5 x 10⁶ to 100 x 106. The limit from the consideration of model strength is ~hown to be 215 kN/m2 (4500 psf). This limit was established in studies conducted by NATO countries and is consistent with the consensus of views expressed in this country. For a Reynolds number of 100 x 106 in an ambient temperature tunnel, a very large tunnel would be required to stay within this limit.
Another problem introduced by high test dynamic pressures is that of model distortion. As illustrated in figure 15, there is considerable wing distortion. Clearly, any differences in wing geometry under load between model and aircraft must be reconciled. As a swept wing bends under load, the local angle of attack is reduced. The reduction is greatest near the wing tip. Tests have shown that this wing distortion effect can result in movement of the recompression shock in a direction counter to the anticipated aerodynamic effect of increased test Reynolds number. Excessive dynamic pressures can make this distortion effect very large, and the inaccuracies in the corrections may
6

therefore significantly affect the validity of the projected aircraft characteristics. Other important consequences of high test dynamic pressures are the large geometric distortions of the model aft-end region required to accommodate the large support sting, and the attendant increased sting interference effects on the flow over the model.
The third option (fig. 11) for increasing test Reynolds number capability in a ground facility is to reduce the temperature of the test gas. The resultant changes in gas properties for a given Mach number and stagnation pressure are illustrated in figure 16. As the gas temperature is decreased, the resulting increase in density and reduction in viscosity are much stronger effects on Reynolds number than the reduction in velocity through the decrease in the speed of sound; therefore, there is a net increase in Reynolds number.
The dynamic pressure, however, remains unchanged with a change in temperature. Since dynamic pressure is proportional to the square of the velocity (V-/'f) and directly to the density (p-l/T), this Reynolds number increase is achieved with no increase in dynamic pressure. Furthermore, since drive power is proportional to the product of dynamic pressure and velocity, the power required to operate a continuous-flow facility actually decreases with decreasing temperature of the test gas (power - alT ).
An additional and highly important benefit in test capability also results from this approach, as illustrated in figure 17. The ability to vary both temperature and pressure opens up a tes~ envelope never before available in large transonic test facilities. This feature makes possible pure Reynolds number studies at a constant dynamic pressure (thus eliminating the undesirable variables of model distortion) as well as pure aeroelastic studies at a constant Reynolds number.
EVOLUTION OF NATIONAL TRANSONIC FACILITY
This third option, achieved through the use of cryogenic nitrogen, is the concept employed in the National Transonic Facility. This facility will provide the United States with a long-needed and significant advance in transonic aerodynamic test capability. It has come about as the result of a number of studies, proposals, and deliberations. A brief summary of the highlights in this process is shown on figure 18. The Ludwieg tube concept for a transonic aerodynamic test facility was favored early because it was the least costly approach to attain very high test Reynolds numbers. It is essentially an energy storage concept and thereby does not require the high power drive system needed for a large continuous facility at high pressure. Studies of hydraulic drive and injector drive facilities were made in the 1969 to 1974 time period as alternative concepts using energy storage and avoiding very large and costly electrical drive systems. The Ludwieg tube concept "HIRT" (High Reynolds Number Tunnel) was in fact approved by DOD and NASA in 1971 to be proposed as a National Facility. The short run time and the very high dynamic pressures characteristic of the facility, however, limited its test flexibility and prompted continued consideration of alternatives. The
7

cryogenic-facility concept emerged in 1971 with small, low-speed pilot tunnel experiments conducted over the following year to verify its potential. In 1973 the Langley pilot cryogenic tunnel became operational and validated the cryogenic concept at transonic Mach numbers and higher Reynolds numbers.
In 1973, it was determined in a special study effort that two separate facilities, a Ludwieg tube and a cryogenic fan-driven facility, represented the least costly way to achieve the very high Reynolds numbers sought by the Air Force for development and evaluation, and the longer run times at more moderate Reynolds numbers (~ 80 x 106) with much lower dynamic pressures sought by NASA for research. NASA and the DOD agreed to propose this dual facility concept and the Congress authorized HIRT in 1974. A reassessment of costs, which reflected the large increase in construction costs in 1974, resulted in a more than twofold increase in the estimated cost for HIRT, and the Air Force decided not to proceed. A joint DOD/NASA review team then made some difficult compromises and, as a result, recommended a single cryogenic fan-driven facility having an intermediate Reynolds number capability between the Air Force and NASA stated needs. This facility was approved by DOD and NASA in 1975 and proposed to the Congress as an alternative approach, and Congress authorized its construction by NASA in 1976. This new facility, known as the National Transonic Facility, is to be located at the Langley Research Center and jointly operated by NASA and DOD for both research and development testing, as indicated in figure 19. The subjects listed under Research and Technology are, of course, the subjects to be addressed at this workshop. The first topic encompasses both fluid mechanics and applied theoretical aerodynamics.
UTILIZATION OF NTF
In addition to utilizing this new facility in an efficient and expeditious way to increase our understanding of the physical phenomena in the disciplinary areas shown, it is equally important to establish at an early time, through the capabilities of the NTF, the limits of capabilities of existing transonic facilities. In other words, it is important to determine where these facilities can and cannot be used with confidence. This knowledge will permit more effective and efficient use of the Nation's total test capabilities.
8

[ Inertia forces J L Viscous forcesJ
CD
Inertia forces Viscous forces
[ Inertia forces]
= L Viscous forcesJ®
mV _ PV2f2 _ PW
J1,Vf JL
RCD = R® for dynamic similarity
<
(ReYnoldS)\ number,
R
f f ®
Figure 1.- Dynamic similarity of viscous fluid motions.
CD
[ Inertia forces ~ Elastic forces +:D
Inertia forces Elastic forces
4=
[Inertia forces] = L Elastic forces J
@
mV PV2f2 Pv2 -""":;"-'--- ---- --- -Stress x Area Ef 2 E
MCD = M® for dynamic similarity
( f ®
L ( Mach )2 2 numMber,
a
Figure 2.- Dynamic similarity of compressible fluid motions.
9

10
VEHICLE TYPE
SUBSONIC SUPERSONIC LAUNCH
MANEUVER TRANSPORT CRUISE HYPERSONIC VEHICLES AND CRUISE
BOUNDARY-LAYER GROWTH X X AND SEPARATION
X X X
BOUNDARY-LAYER TRANSITION X X X
TURBULENT BOUNDARY LAYERS X X X X X
BOUNDARY LAYER/SHOCK X X INTERACTIONS
X X X
SEPARATED FLOWS X X X
VISCOUS CROSS FLOW X X X X X
VISCOUS CORNER FLOW X
VISCOUS MIXING EFFECTS X X X X X
BASE FLOW AND WAKE X X DYNAMICS
X X X
BASE RECIRCULATION X X
BASE DRAG X X
SKIN FRICTION X X X
ROUGHNESS, PROTUBERANCE DRAG
X X X X X
PRESSURE FLUCTUATION X X
VORTEX FLOWS X X X X X
INTERFERENCE FLOW FIELDS X X X X X
JET PLUME INTERFERENCE X X X X X
BLUFF BODY AERODYNAMICS X X
HEAT TRANSFER X X
Figure 3.- Reynolds number sensitive phenomena for various types of flight vehicles.
o
-_04
-.08
.12
-_16
1
Scale effects on wing section pitching moment
17 = 0.389 b/2
17 = 0_637 b/2
2
~~
4 6 10
Reynolds number
M = 0.825; cl = 0_4
17 = 0_637
1 2
o Transition fixed at O_lc
o Transition free
D. Flight test
4 6 10
Reynolds number
17 = 0.389
88
Figure 4.- Transition fixing in wind tunnels.

Aircraft Problems
C-141 -Wing flow incorrectly predicted, Stability, structural loads, and performance affected. Structural reevaluation testing and modifications cost 1 year and millions of dollars.
F-ll1 -Transonic-flow interference effects incorrectly predicted. Airframe drag underestimated. Redesign and modifications costly.
B-58 } Improper aerodynamiC optimizations at transonic speeds. Low transonic B-70 - acceleration margin resulted in range and maneuverability limitations YF-12 reducing aircraft effectiveness.
F-I02
CIVIL
-Transonic drag rise improperly predicted caused major reconiiguration followed by replacement by F-I06. Transonic base drag problems plagued both aircraft.
-Two jet transport aircraft required some redesign because of flow interactions between engines and Wings. Uncertainties in prediction of pitching moments, drag, and maximum lift a concern in most cases.
Figure 5.- Problems discovered in flight test attributed to Reynolds number effects.
Mao = 0.85
• 20% change shock location
• 11% change nose-down moment
• ReanalySiS of structure
.9 month delay in operational capability
.181 kg (400 lb) ballast
Natural transition
Flight
----Shock
-1.2
High Reynolds number -.8
Shock
Wind tunnel
Local pressure coefficient, Cp
-.4
o
Low Reynolds number
20
Wind tunnel (transition fixed)
Full-scale flight
40 60 Chordwise location, percent
Figure 6.- Shock-induced flow separation.
80 100
11

12
.0080
CL = 0.45
Wind tunnel} /
//Flight
+ +} .0015
O----~--~~~~~~~--~ .70
M
.'Wind tunnel prediction of drag rise Mach number .02 lower than flight results
."Rule of thumb" ..... 2%increase in wing thickness results in about .02 reduction in drag-rise
Mach number
• Represents 3% wing weight reduction
.Weight reduction program resulted in reduced structural margins and caused fatigue life problem for wing
.Problem might have been avoided if drag-rise Mach number had been predicted accurately
in wind tunnel and choice of thicker wing was permitted earlier in development cycle
Boattail drag
coefficient
o
Figure 7.- C-SA wing fatigue life problem.
.. Wind-tunnel flight
Mach 0.9
, 20 40
In wind tunnel
Reynolds number
Flow -1I[; separation _ -
~
60
Figure 8.- Effect of Reynolds number on engine afterbody drag.

Figure 9.- Complex transonic flows vary with Reynolds number.
x 106 180
Bombers
160
140 Transports
120
Chord 100
Reynolds number 80
60
40
20
0 .5 1.0 1.5
Mach number
Figure 10 . - 1969 projected flight Reynolds number.
13
- -~

14
R = pVQ p.
• INCREASE SIZE (INCREASE Q)
• INCREASE PRESSURE (INCREASE p)
• REDUCE TEMPERATURE (CHANGE P, V, AND p.)
Figure 11.- Ways of increasing Reynolds number in a given gas.
Drive
hp MW
1200r 900
x 103
800
1000
700
800 600
500
600
400
400 300 R-c 100 x 106
200
200 50 100
10 o 0
1.5
I I 4 6
M ~ 1; ambient temperature
I I I 2.0 2.5 3.0 3.5 4.0 4.5
I 8 10 12 14
Equivalent test-section height, """est section
Figure 12.- Drive power requirements.
5.0 5.5 m
I I 16 18 ft

1000 Cost normalized to 1975;
R- based on O.I.ttest-section area; c M = 1
1975 do.lIars 100
ill millions
Dynamic
pressure.,
q
Rc
Heppe, 0' Laughlin and Celniker
A and A March, 1968 M = 0.8; Re = 9.8 x 10⁶ / m (28 x 106/ft)
He based on 0.0833 Y'test section area (Cost normalized to 1975)
Figure 13.- Wind-tunnel cost trends.
psf
1200 r 24 x 10 3
1000 20
800 16
600 12
400
4 200
0 0
4
M = 1; Ambient temperatures
100
e = . h/~est section
Rc o = Maximum for existing tunnels
Recommended / limit
LRC
I I I
10 ~ CALSPAN 5 ~ Q ARC
LRC ( 0 AEDC
1.5 2.0 2.5 3.0 3.5 4.0
6 10 12 14 16 18 ft
Equivalent test-section height, V~est section
Figure 14.- Dynamic pressure at various test Reynolds numbers.
15

• WING AND BALANCE STRESS • STING INTERFERENCE
• WING DISTORTION • FUSELAGE DISTORTION
b------.£.&--3 INCREASING ~'q" ~
INCREASING "q"
Figure 15.- Some dynamic pressure problems.
Moo = 1.0; Constant Pt and size
Gas properties Test conditions and drive power
4 8 P
R
3 6
Values relative 2 4
to 322K
1 2
a q
IJ. Power
0 100 200 300 400 0 100 200 300 400
Stagnation temperature, K
Figure 16.- Effect of temperature reduction.
16

Moo; 1.0, 2.5 m X 2.5 m (8.2 ft X 8.2 ft) test section
Dynamic pressure,
q
250 Tt,max ; 342 K (155°F) 5000 Pt a ; 557 kN/m2 (5.5 atm) ,m x
4000 200
3000 150
psf kN/m2
2000 100 __ Pure Reynolds number studies
1000 t Pure aeroelastic studies
0 0 lO 20 30 40 50 60 70
Reynolds number, Rc
Figure 17.- Test envelope for a cryogenic wind tunnel.
1966-1975 -Air force design development of Ludweig tube facility (HIRT)
1969-1970 -NASA study of hydraulic drive conventional tunnel
1969 -19 72 -NASA design studies of injector dr iven tunnels
1971 -NASA/DOD (AACB) approves lllRT to propose as a national facility
1972-1973 -NASA experiments with cryogenic low-speed pilot tunnel
1973 -AACB study recommends lllRT (development) plus cryogenic TRT (research)
1974 - Congress authorizes Air Force to build HIRT
1974 - Construction cost escalations result in Air Force decision not to go forward with HIRT and AACB to make a reevaluation of transonic facilities
1975 -AACB approves cryogenic NTF as single facility to be jointly operated by NASA and DOD for research and development testing
1976 -Congress authorizes construction of NTF by NASA. Appropriates funds.
Figure 18.- National high Reynolds number wind tunnel planning.
17

RESEARCH & TECHNOLOGY
A. THEORY DERIVATION/CONFIRMATION
B. CONFIGURATION AERODYNAMICS
C. PROPULSION AERODYNAMICS
D. DYNAMICS & AEROELASTICITY
SYSTEMS DEVELOPMENT & EVALUATION
A. COMPON ENT STUDI ES
B. PRELIMINARY DESIGN ASSESSMENT
C. CONFIGURATION DEVELOPMENT
D. FINAL AERODYNAMIC DESIGN EVALUATION
Figure 19.- National transonic facility utilization.
18

THE NTF AS A NATIONAL FACILITY
Oran W. Nicks
NASA Langley Research Center
As Lloyd Jones made abundantly clear in his keynote talk, the needs for high Reynolds number test capability were well established prior to the planning of a National Transonic Facility (NTF). To set the frame for the discussions to follow, some background on the activities which led to the definition of the NTF and the general agreements reached regarding its use and operations is given.
Both the Air Force and NASA began proposing high Reynolds number transonic tunnels in the late 1960's. Prominent configurations were a Ludwieg tube proposed by the Arnold Engineering Development Center (AEDC), and high-pressure b1owdown and continuous-flow facilities proposed by NASA. In the 1972-73 period, Langley work with cryogenic technology provided theoretical and experimental data which led to serious consideration of this approach.
In 1973 and 1974, both NASA and the USAF developed firm plans for transonic facilities. The Air Force had obtained congressional approval in the FY 75 budget for an intermittent operation high Reynolds number tunnel (HIRT) and NASA had planned for a fan-driven cryogenic transonic research tunnel (TRT) to be included in the FY 76 budget. Both the NASA and USAF tunnel projects encountered the abrupt escalation of construction costs in 1974; this consideration caused the USAF to defer construction of HIRTand the NASA to withhold the TRT from its FY 76 budget request. DOD and NASA officials then agreed to undertake an additional joint study under the cognizance of the Aeronautics and Astronautics Coordinating Board (AACB) to seek other ways for satisfying national transonic wind tunnel needs. A subpanel of the AACB was formed with a charge and membership as shown in figure 1. These members were to be supported by other NASA/DOD personnel and have involvement with industry to a significant extent. During an initial meeting on November 1, 1974, the pattern was set for a major coordinated effort involving government and industry which has continued to the present time.
One of the most significant actions of the subpanel was to develop a mission model for consideration in the selection of appropriate facilities. Thought was given to the types of aircraft which had experienced transonic problems and to a projection into the future to insure tunnel conditions capable of meeting the performance envelopes of families of military and civil aircraft. Several aircraft were selected as representing typical designs of the future. VelOCity/altitude performance maps for these aircraft were then translated into maps of Reynolds number against Mach number, as indicated in figures 2 to 4. Not only were the envelopes of importance, but the cruise points were highlighted for long-range aircraft. In the case of combat aircraft, high angle-of-attack maneuvering conditions requiring small models to prevent blockage were an important consideration. For supersonic transports, the climb to cruise conditions through the transonic regime and the subsonic cruise for
19

overland flights were critical since as much as 30 percent of the fuel for a given mission could be expended in this period. For the hypersonic reentry vehicles, such as the space shuttle, energy management during the transonic region was extremely important to the landing footprint. It was also recognized that control loads and other aerodynamic effects caused by blunt bodies were Reynolds number sensitive and would benefit greatly from such high Reynolds number data.
Matching of wind tunnels to these requirements was possible as indicated in figure 4. Illustrated is a transport aircraft envelope with various tunnel pressures and horsepowers overlaid to show portions of the flight envelope covered. ·This clearly allowed assessments of variations in tunnel horsepower and pressure for a given wind-tunnel size. Another illustration of this matching process for all the sample aircraft considered is shown in figure 5 for different tunnel pressures, if the same 2.5-meter-square test section and the necessary horsepower at Mach 1 are assumed. From such an approach it was possible to reach agreement on a maximum Reynolds number requirement, a testsection size, and a maximum operating pressure and horsepower required for the tunnel fan drive.
Costs were always considered as a driving factor in the facilities study. The range of cost options considered is illustrated in figure 6, with the TRT and HIRT representing thoroughly studied designs used as anchor points. The strong relationship between Reynolds number and cost is obvious.
After it appeared that the cryogenic concept offered the lowest cost approach and after the wind-tunnel size was determined, detailed studies were made of the productivity to be expected. In addition to identifying aircraft types for use in projected programs, the mission model provided estimates for the NTF use on the basis of numbers of polars per year. Although this represented a simplified basis for approximation, the approach was tested with detailed mission models and was found to be suitable for planning purposes. It was concluded that 8000 polars per year or its equivalent would form a good baseline for assumed operational cycles. It appeared that this amount of testing could be accommodated with between one and two shifts/day of operation, and also allowed for additional testing if required. Sample operating costs per year were calculated and compared with other Langley tunnels, as indicated in figure 7. The NTF estimated operating costs are highly dependent on the cost of liquid nitrogen. For these estimates, current nitrogen costs of $70 per ton have been assumed.
Another task placed on the subpanel was the matter of considering an operating arrangement. In summary, the subpanel recommended that the NTF operation be patterrted after the Unitary Plan with management at a local level under the overview of a joint NASA/DOD Board of Directors (fig. 8). It was strongly urged that both development and research users be recognized in a way to provide balance in the beneficial use of the facility. A study of the exact approach is continuing under an extended frame of reference for the subpanel.
Over a period of approximately one year, a concentrated effort led by the special AACB Subpanel resulted in a facility technical and management proposal
20

supported by NASA/DOD and industry spokesmen. Agreement was reached that the facility should be built at the Langley Research Center and approval was obtained through NASA,Office of Management & Budget (OMB~and the Congress for the first Fiscal Year funding. Plans are well along for the construction of the facility. It is indeed timely that you are attending this workshop to discuss the highest priority research uses for the facility in order to guarantee immediate benefit when. the NTF becomes operational.
21

22
Charge:
Members:
• Redefine test requirements
• Develop low cost options
• Consider a single transonic facility -use existing hardware if feasible
• Recommend facility concept(s)
• Propose acquisition schedule
Co-chairman B. P. Osborne - DOD
Co-chairman O. W. Nicks - NASA
H. A. Morse - Army
H. R. Chaplin - Navy
R. O. Dietz - AF
J. G. Mitchell - AF
S. L. Treon - NASA
D. D. Baals - NASA
Figure 1.- 1974 AACB Subpane1 for transonic facilities.
200 x 106 c ~ 7.62 m (25 ft)
200 x 106 ~
~ He 100 ~
c = 5.2 m (17 It)
100
o o M M
c • 9.14 m (30 tt)
c • 4.34 m (14.24 ft)
200 x 106 200 x 106
100 He 100
o .5 1.0 o
M M
Figure 2.- Requirements for military aircraft.

300 x 106 300 x 106
200
~ 200
Ri! Ri! C = 23.5 m (77 tt)
<:1 100 D ,- .. " m '''.'"'
100
0 .5 1.0
M M
200 'u 200 ~ Ri! 100 Re 100 ~"." m ,,, •• n,
f. 16.8 m (55 tt)
M M
Figure 3.- Requirements for commercial aircraft.
Tunnel power, MW (Hp)
M
Figure 4.- Matching of transport aircraft flight performance with cryogenic wind tunnels of various pressure levels. Test section size 2.5 by 2.5 m (8.2 by 8.2 ft).
23

24
280: x 106
240
200
160
Rc at
.M"l 120
.89 (130)
80
40
0 Subsonic transport
\ \
\ \
\ \
\
• Cruise points.
0- Figure of merit points
\7_ Design limits t:::. :3- Transonic operating range
Bomber
Figure 5.- Operating Reynolds numbers. Typical aircraft, 2.5 m square test section.
Millions of dollars
100
80
60
40
20
o
RC at M • 1
Cryogenic tunnel 2.5 by 2.5 m ,
(8.2 ft square) continuous
c .0.1.r;;;:- . 'I .. test sechon
Figure 6.- Cost options considered.
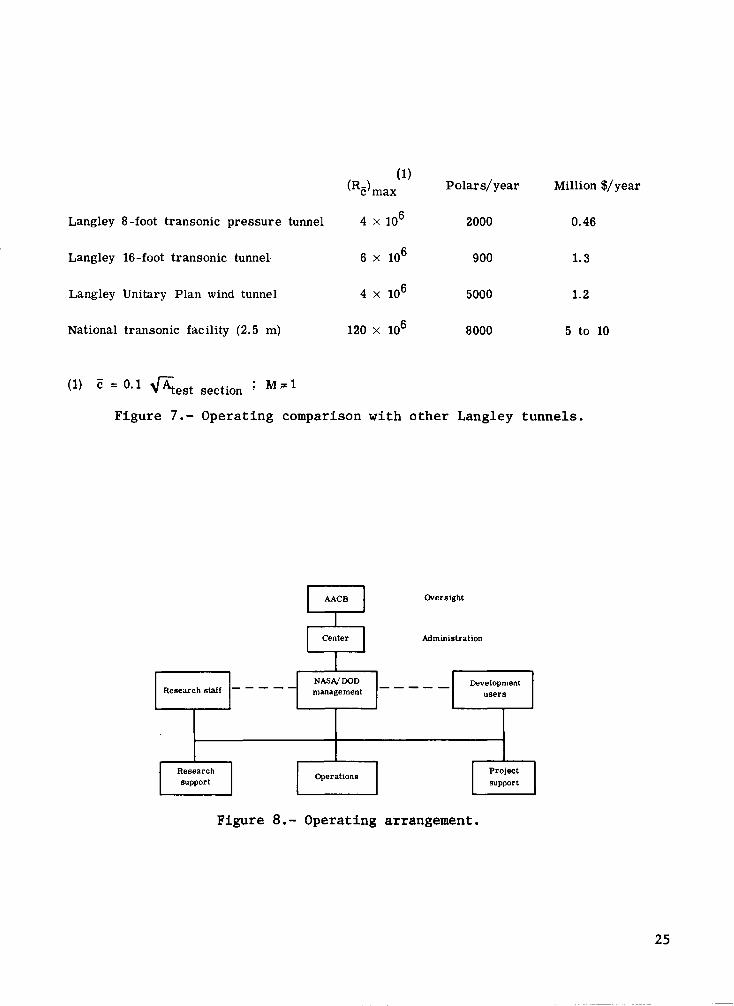
(RC) max (1)
Polars/year Million $/ year
Langley 8 -foot transonic pressure tunnel 4 x 10⁶ 2000 0.46
Langley 16-foot transonic tunnel 6 x 10⁶ 900 1.3
Langley Unitary Plan wind tunnel 4 x 10⁶ 5000 1.2
National transonic facility (2.5 m) 120 x 106 8000 5 to 10
(1) c = 0.1 .fA"test section ; M:o: 1
Figure 7.- Operating comparison with other Langley tunnels.
Research stair - - - -NASA/DOD management
Operations
Oversight
Administration
Development users
Figure 8.- Operating arrangement.
25

Page intentionally left blank

THE U.S. 2.5-METER CRYOGENIC HIGH REYNOLDS NUMBER TUNNEL*
Robert R. Howell and Linwood W. McKinney
NASA Langley Research Center
SUMMARY
The U.S. 2.5-meter cryogenic high Reynolds number tunnel is a fan-driven transonic wind tunnel scheduled for operation in 1981. It will operate at Mach numbers from 0.1 to 1.2, stagnation pressures from 1 to 9 bars, and stagnation temperatures from 352 to 80 K. The maximum Reynolds number capability will be 120 x 106 at a Mach number of 1.0 based on a reference length of 0.25 meter. This paper describes the basis for the conceptual approach, the engineering design including unique features, and the performance operating envelopes for the tunnel.
INTRODUCTION
As man hones the perfection of his technology, his design tools must become more sophisticated. So it is with the field of aerodynamics. The continual review, both in the United States and in Europe, of our understanding in this field has identified areas where improvements in our testing and research tools will result in markedly more accurate predictions of the flight performance of full-scale vehicles. The implementation of some of the improved tools, however, involves significant capital investment.
Over the past decade, the United States has wrestled with the problems of inadequate Reynolds number in its wind tunnels, particularly for transonic aerodynamic testing. Starting in 1967, a number of different approaches have been proposed for the solution of this facility problem - most of which were prohibitively expensive. In 1974, a panel of experts was convened to review again the high Reynolds number testing requirements for the United States and make recommendations as to the criteria for a single facility to satisfy those needs. This panel worked for a period of 6 months and produced criteria and recommendations summarized in figure 1.
The cost of obtaining high Reynolds number data was a driving factor in the establishment of practical limits. Thus, this figure reflects the panel's
*Paper presented at 10th Congress of International Council of Aeronautical Sciences (ICAS), Ottawa, Canada, Oct. 3-9, 1976. Reprinted by permission of ICAS.
27

view of the minimum acceptable criteria rather than all that was desirable. The criteria define a transonic wind tunnel (Mach range between 0.1 and 1.2) which has the Reynolds number capability at M = 1.0 of 120 x 106 based on a length equal to 0.1 fATS. A test-section size of 2.5 meters by 2.5 meters was identified as the minimum acceptable size. Additionally, since it is viewed as a national facility and therefore required to do the necessary testing for the nation, it must have a relatively high test and data productivity. Lastly, because of the broad range of types of research and development testing envisioned for the facility, it was specified to have essentially continuous running capability (10 minutes minimum).
These criteria were accepted as guidelines for the design and construction of what is currently known as the National Transonic Facility. The National Aeronautics and Space Administration was given the responsibility for the design and construction of the facility and the Langley Research Center was selected as the site.
This paper will describe the results of the process used in selecting the facility to satisfy these requirements, and the engineering design and facility
'performance that has evolved.
A
c
p
~ q
q
Rc
T
SYMBOLS
cross-sectional area
average wing chord
liquid nitrogen
Mach number
pressure
loss in static pressure through screen divided by dynamic pressure at the screen face
dynamic pressure
Reynolds number based on average wing chord
stagnation temperature
turbulence level, root mean square of fluctuating velocity component
Subscripts
L referenced to local conditions
SC stilling chamber
28

TS test section
T referenced to conditions in stilling chamber
SELECTION OF APPROACH
The NASA Langley Research Center had, during the period between 1972 and 1974, established the practicality of the cryogenic approach to achieving high Reynolds numbers. (See refs. 1 to 9) As a result of their review of the experimental demonstrations of this concept, the panel endorsed the approach in their recommendations. Although the cryogenic concept would afford about a fivefold increase in Reynolds number at near atmospheric pressure (ref. 1), the concept would not meet the maximum Reynolds number criteria by itself and operation at elevated pressures was an obvious requirement. Thus, in the selection of the baseline wind-tunnel design, the leading factors considered were maximum operating pressure (which directly affected the loads on models), facility cost or capital investment, energy consumption, and productivity.
At this point, basic decisions and selection of concepts regarding the baseline facility were made. These are shown in figure 2. First, to cover the Mach range between 0.1 and 1.2, a slotted test-section approach was selected based on design and performance experience with existing tunnels; second, to satisfy the la-minute minimum run time and to minimize energy consumption, a closed-circuit fan-drive wind-tunnel concept was selected; third, we incorporated the cryogenic approach to high Reynolds number as the only practical means available to achieving desired Reynolds number goals with manageable capital costs and model loads; and, fourth, we would require highly automated controls and data acquisition system to satisfy productivity requirements.
In reviewing this set of design concepts, it was recognized that the only really new technology that is being incorporated was the cryogenic approach to achieving high Reynolds numbers. Additional studies were made, therefore, to assure that the incorporation of this concept did not render the design impractical.
Energy Considerations
A comparison of the cryogenic approach with the conventional fan-driven tunnel, which is recognized as the most efficient form of wind tunnel, is shown in figure 3 where the energy for 1 hour of running is presented as a function of operating (stagnation) pressure for a constant Reynolds number of 120 x 106 at a Mach number of 1.0. For the cryogenic tunnel, the energy required is broken into that part required to drive the tunnel (electrical energy) and that required to keep the tunnel cold. In thi~ case, cryogenic cooling is accomplished by injecting liquid nitrogen into the circuit and using it to absorb the heat of compression. There is, therefore, a continual flow of liquid nitrogen into the tunnel while it is operating. In this study, it was assumed that 1000 kWh are required to produce a ton of LN2. In the conventional tunnel, the energy is associated with the electric drive only. It is noted that for the constant Reynolds number of 120 x 106 , the energy for the conventional wind
29

tunnel is considerably larger than the cryogenic tunnel at the same stagnation pressure and that the drive energy is larger than the combined drive and cooling energy for the cryogenic tunnel. Moreover, the drive energy for the cryogenic tunnel is relatively insignificant in this comparison. This fact, that the drive power required goes down with decreasing temperature, is one of the features that makes the cryogenic tunnel practical.
Dynamic Pressure Considerations
The impact of the cryogenic approach on dynamic pressure is shown in figure 4. In this figure, dynamic pressure is presented as a function of test-section height (assuming a square test section) for a conventional operating temperature (T = 320 K) and a cryogenic temperature (T = 122 K) and for a Reynolds number of 120 x 106 at a Mach number of 1.0. It is observed that the dynamic pressure is reduced by about a factor of 4 in going from a stagnation temperature of T = 320 K to T = 122 K. Additionally, the test-section size required to produce a Reynolds number of 120 x 106 is reduced by a factor of 4 by reducing the temperature from T = 320 K to T = 122 K. Thus, the cryogenic approach affords a more reasonable dynamic pressure as well as a more practical (less costly) facility size.
Variable Temperature Considerations
Another highly desirable feature of the cryogenic tunnel is that it affords temperature as a test variable. This additional test variable permits independent control of dynamic pressure and Reynolds number. A typical operating map for the cryogenic tunnel is compared with the conventional tunnel operating curves in figure 5. In the conventional fan-driven tunnel, since stagnation temperature is relatively constant, there is a fixed relationship between Mach number, dynamic pressure, and Reynolds number. Thus, as you traverse the Mach number range, model deformation (due to change in dynamic pressure) and Reynolds number also vary and it is impossible to experimentally separate these effects with a single model. In the cryogenic tunnel, because of the ability to vary temperature, the dynamic pressure (model deformation) can be held constant and Reynolds number and Mach number can be varied. Also, Reynolds number can be held constant and dynamic pressure and Mach number varied. As a consequence of this new capability, the effects of model deformation, Reynolds number, and Mach number can be completely separated. The cryogenic approach, therefore, in addition to providing practical solutions to otherwise costly requirements also affords a new research capability heretofore unavailable.
SELECTION OF SIZE-PRESSURE COMBINATION
Since it was clear that elevated pressure operation was required for the tunnel to keep the initial cost within bounds, an engineering consultant was hired to provide cost estimates for a series of fan-driven cryogenic tunnels scaled in size and pressure to meet a common test requirement. From these data empirical cost curves were developed (fig. 6). The cost numbers given by the curves represent U.S. dollars as of January 1975 and do not include any
30

contingency or escalation. The dashed line shows the various tunnel size and pressure combinations that provide 120 x 106 Reynolds number at a Mach number of 1.0. The significant cost reduction associated with increasing the operating pressure of the tunnel for a given design Reynolds number is graphically illustrated. It is clear that the tunnel designer is forced to design for a maximum practical dynamic pressure from capital cost considerations. For the NTF, the maximum dynamic pressure was chosen as 3.3 bars at a Mach number of 1 and Reynolds number of 120 x 106 . This resulted in a 2.5-meter-square test section and a maximum stagnation pressure of 8.96 bars.
ENGINEERING DESIGN
The definition of the desired wind tunnel has evolved through the.establishment of a set of criteria and the exercising of cost and dynamic pressure constraints. The resulting wind tunnel will have a 2.5-meter square test section, operate at pressures up to 8.96 bars, over a temperature range from 352 K to 80 K, and a Mach number range from 0.1 to 1.2. At this point, engineering design has been applied to further define the physical characteristics of the tunnel. To minimize initial costs, the NTF will be constructed on the site of the deactivated 4-foot supersonic pressure tunnel. The existing drive motors and their associated control system, as well as existing office building and cooling towers will be utilized.
Test Section
The NTF will have a slotted test section (fig. 7) similar to the existing Langley 8-foot transonic pressure tunnel which is known to be efficient and have good quality flow. The length of the slotted region is approximately three test-section heights. The top and bottom walls have six longitudinal slots each and the wall divergence angle is adjustable to compensate for boundary-layer growth. The parallel sidewalls are fixed with two longitudinal slots in each wall. The design will allow the slot open width and edge shape to be easily modified. Remotely adjustable reentry flaps are provided at the end of each slot. The position of these flaps during tunnel operation will be programmed to control Mach number gradients through the test section and minimize power consumption. The model support system is an arc sector with a nominal travel of 30°. The arc sector is located downstream of the test-section reentry flaps to minimize interference effects and power consumption. The center of rotation is 3.96 meters downstream of the test-section throat. This places the model well ahead of the aft end of the test· section for minimization of interference effects over the base of the model. This combination has the attendant disadvantage of making the model support sting long and creates problems particularly at the high loads which the NTF is capable of generating. Additional angle-of-attack range is provided by offset stings over a reduced load range. The sting will have a roll mechanism capable of rolling the model through 270°. Model pitch rage is controllable in either a continuous or pitch-pause mode at rates from 0° to 4° per second.
31

Contraction Ratio - Screen
The attainment of satisfactory flow quality is influenced by the contraction ratio from the stilling chamber to the test section from both a direct effect of contraction (ref. 10) and an indirect effect on antiturbu1ence screen design. Analysis of the data bf reference 10 indicates that to achieve turbulence levels in the test section of 0.1 percent, turbulence damping screens are required. Therefore, a comprehensive analysis of screen design including the effects of contraction ratio, number of screens, wire diameter, and pressure loss through the screens was made. The results of this analysis are summarized in figures 8 and 9. The symbols on figure 8 indicate various contraction ratio-screen combinations that satisfy the turbulence requirement of 0.1 percent in the test section for an initial turbulence of 1.7 percent in the stilling chamber. (This initial level was assumed based on ref. 11.) It will be noted that the turbulence requirement is met over a range of contraction ratios from about 8 to 16. The effect of increased contraction ratio is to reduce the pressure loss through the screens which impacts the wire stresses and horsepower loss. This effect is summarized in figure 9. The symbols correspond to conditions where the test-section turbulence requirement was met in figure 8. The stresses vary from about 415 x 106 N/m2 down to 120 x 106 N/m2 at contraction ratios from 8 to 16 with associated horsepower losses from well in excess of 8000 down to 1000. The yield stress for 0.762 mm wire without joints is about 520 x 106 N/m2 . Limited data available indicate joint efficiencies for butt-welded joints of about 70 percent. This results in a yield stress of about 365 x 106 N/m2 for a screeR system with joints.
Based on the considerations of adequate safety margin on wire stress and conservation of horsepower due to losses through the screens, a contraction ratio of 15 was selected for the NTF. To insure flow quality requirements can be met, up to five screens are provided for.
Overall Tunnel Circuit
With the test-section size and the upstream contraction ratio established, the rest of the tunnel circuit layout was accomplished using near optimum conical diffusers (fig. "10). In the case of the National Transonic Facility, however, there was concern to keep the volume of the circuit as small as practical in order to keep the cost of the pressure shell within bounds and to minimize nitrogen fill costs during operation. To achieve this goal, a "rapid diffuser," an approach used in several European wind tunnels, was employed as a method of final deceleration into the stilling chamber. This method of deceleration requires a resistance in the flow at the diffuser exit equal to
approximately five times the local dynamic pressure (~p = 5) to assure absence of separation. q
In the current design, the resistance of a water-cooling coil is used "for this purpose. This coil will be used as a heat exchanger only when the tunnel is operated at relatively high (near atmospheric) temperatures. The resistance could have been supplied by a number of other techniques.
The projected overall circuit performance in terms of compression ratio is
32

presented as figure 11 where the compression ratio is presented as a function of Mach number. This curve was generated by accumulating losses in the circuit including losses in the turning vanes, screens, cooling coil, test section, and diffusers. Losses include both viscous and momentum losses. The test-section loss estimate is based on experimental data obtained from a l/5-scale model of the tunnel high-speed leg from the rapid diffuser upstream of the test section to the end of the high-speed diffuser. These data have been corrected for dif-' ferences in Reynolds number. This compression ratio curve (fig. 11) has been used in defining the tunnel performance maps to be presented later.
Test-Section Isolation System
Although the cryogenic approach using LN2 has been proven to require the least capital investment and be the most energy conservative approach to high Reynolds number testing, the cost per data point for high Reynolds number tests will be considerably higher than for usual low Reynolds number data. Consequently, every step possible is being taken to conserve nitrogen which is the largest contributor to operating costs. One of the provisions made to conserve nitrogen is test-section isolation valves (fig. 12) which will be capable of isolating the test section so that the pressure can be reduced to atmospheric and personnel entry can be made to service models without venting the entire circuit.
The operation of the system requires that with the flow at rest, the contraction upstream of the test section and the high-speed diffuser downstream of the test section be disconnected from the pressure bulkhead at either end of the test-section plenum and moved away from the test section. Isolation valves are then remotely moved into the closed position and locked to the pressure bulkhead. The test section can then be vented to the atmosphere. When the pressure has been reduced to 1 atmosphere, the test-section sidewalls are lowered and work access tunnels are inser,ted from either side capturing the test model and sealing around the model support sting. A "shirt sleeve" work environment is maintained by fans which circulate air through the access tunnel and heaters which are used to warm the cold model to an acceptable level. After the model change or service has been completed, the process is reversed. The work access tunnels are withdrawn, the outer shell access doors are closed, the test-section walls are raised to operating position, and the pressure is equalized across the pressure bulkheads. When the pressure differential is zero, the isolation valves are remotely moved to the stored position; the contraction section and high-speed diffuser are returned to the operating position and locked to the pressure bulkheads, and the tunnel is ready to resume operation.
Drive System
The cryogenic concept requires that the drive system be capable of producing a constant compression ratio over a large temperature range. This requirement has a major impact on the design of the drive system, since with a fixed geometry fan, the rpm required for a constant compression ratio varies as the square root of the gas temperature entering the fan. The desired
33
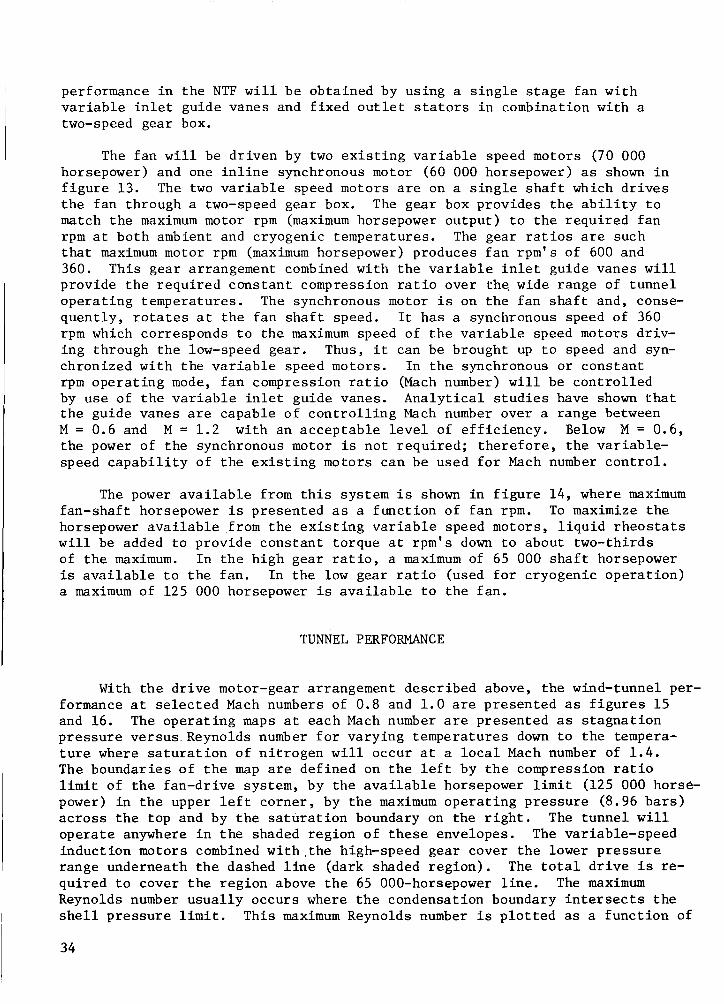
performance in the NTF will be obtained by using a single stage fan with variable inlet guide vanes and fixed outlet stators in combination with a two-speed gear box.
The fan will be driven by two existing variable speed motors (70 000 horsepower) and one inline synchronous motor (60 000 horsepower) as shown in figure 13. The two variable speed motors are on a single shaft which drives the fan through a two-speed gear box. The gear box provides the ability to match the maximum motor rpm (maximum horsepower output) to the required fan rpm at both ambient and cryogenic temperatures. The gear ratios are such that maximum motor rpm (maximum horsepower) produces fan rpm's of 600 and 360. This gear arrangement combined with the variable inlet guide vanes will provide the required constant compression ratio over th~ wide range of tunnel operating temperatures. The synchronous motor is on the fan shaft and, consequently, rotates at the fan shaft speed. It has a synchronous speed of 360 rpm which corresponds to the maximum speed of the variable speed motors driving through the low-speed gear. Thus, it can be brought up to speed and synchronized with the variable speed motors. In the synchronous or constant rpm operating mode, fan compression ratio (Mach number) will be controlled by use of the variable inlet guide vanes. Analytical studies have shown that the guide vanes are capable of controlling Mach number over a range between M = 0.6 and M = 1.2 with an acceptable level of efficiency. Below M = 0.6, the power of the synchronous motor is not required; therefore, the variablespeed capability of the existing motors can be used for Mach number control.
The power available from this system is shown in figure 14, where maximum fan-shaft horsepower is presented as a function of fan rpm. To maximize the horsepower available from the existing variable speed motors, liquid rheostats will be added to provide constant torque at rpm's down to about two-thirds of the maximum. In the high gear ratio, a maximum of 65 000 shaft horsepower is available to the fan. In the low gear ratio (used for cryogenic operation) a maximum of 125 000 horsepower is available to the fan.
TUNNEL PERFORMANCE
With the drive motor-gear arrangement described above, the wind-tunnel performance at selected Mach numbers of 0.8 and 1.0 are presented as figures 15 and 16. The operating maps at each Mach number are presented as stagnation pressure versus. Reynolds number for varying temperatures down to the temperature where saturation of nitrogen will occur at a local Mach number of 1.4. The boundaries of the map are defined on the left by the compression ratio limit of the fan-drive system, by the available horsepower limit (125 000 horsepower) in the upper left corner, by the maximum operating pressure (8.96 bars) across the top and by the saturation boundary on the right. The tunnel will operate anywhere in the shaded region of these envelopes. The variable-speed induction motors combined with ,the high-speed gear cover the lower pressure range underneath the dashed line (dark shaded region). The total drive is required to cover the region above the 65 OOO-horsepower line. The maximum Reynolds number usually occurs where the condensation boundary intersects the shell pressure limit. This maximum Reynolds number is plotted as a function of
34

Mach number in figure 17. This overall maximum tunnel Reynolds number capability is bounded by the shell operating pressure limit for Mach numbers up to 1.0. Between M = 1.0 and 1.2, the performance is limited by the maximum horsepower available. Above M = 1.2, the fan maximum compression ratio limits the performance. Note that the goal of a Reynolds number of 120 x 106 for M = 1.0 is achieved.
At the bottom of figure 17 is an overall envelope of the Reynolds number capability of all wind tunnels in the United States. The NTF will be capable of increasing ground-test Reynolds number by about one order of magnitude over currently existing capability.
UNCONVENTIONAL FEATURES
Internal Insulation
As mentioned previously, the NTF will employ in its design an internal insulation. Although internal insulation complicates the design, it affords many overriding advantages. Its principal advantage is that it minimizes the temperature excursions of the large pressure shell. In doing so, it (1) greatly reduces the liquid nitrogen required to approach steady-state operating conditions and thus reduces operating cost, (2) it minimizes the thermal stress in the pressure shell and thereby alleviates thermal fatigue as a major problem and enhances the service life of the pressure shell, and (3) it affords an opportunity to combine thermal insulation and acoustic attenuation functions into a system which will reduce the noise in the tunnel circuit. The baseline design of the insulation system (fig. 18) employs about 15 cm of fibrous insulation with perforated aluminum foil laid in at about 2.54 cm thicknesses. The aluminum foil is included to inhibit free circulation. The insulation system is enclosed by glass cloth and covered with a corrugated flow liner which is supported by tee-shaped rings welded to the pressure shell and insulated from the liner. The liner is corrugated to absorb the circumferential thermal strain. Slip joints are provided for the longitudinal movement. The tee rings are about 1.2 meters apart. Filler blocks are used under the corrugation to block flow from one insulation segment to the next. The possibility of a fire inside a pressurized wind tunnel is always a concern and a concerted effort is being made to minimize the accumulation of flammable materials. Obviously, there are a number of additional concerns such as the impact of noise on the service life of the system as well as the thermal performance of the system under a flowing cryogenic environment. These concerns are the subject of an extensive verification test program.
Model Loads
Another somewhat unconventional feature of the NTF will be the model loads it will be capable of generating. The dynamic pressure is independent of temperature and is a function only of stagnation pressure and Mach number. In figure 19 lines of constant dynamic pressure are superimposed on the overall performance map of the tunnel. Most existing transonic wind tunnels operate at dynamic pressure levels up to about 0.5 bar. There are a few tunnels which
35

have dynamic pressure capability up to about I bar. The NTF will have a maximum dynamic pressure capability of 3.3 bars. Although the NTF, by virtue of employing the cryogenic approach, will have a much lower dynamic pressure to Reynolds number ratio as compared to the other approaches to high Reynolds nu~ ber testing, it can still produce model loads of more than three times those experienced in existing wind tunnels.
Technology appears to be in hand to accommodate these loads. However,. force measuring balances, sting deflections, and model deformation will tend to take on more importance as we attempt to use this new facility up to its maximum Reynolds number capability.
Cryogenic Operation
As previously discussed, the requirement for tunnel operation at temperatures down to about 80 K requires the use of liquid nitrogen as a heat absorber. The operation utilizes the vaporization of LN2 sprayed into the circuit to absorb the heat of compression of the fan. Venting of gaseous nitrogen is then required to control pressure. The operational system, figure 20, therefore, includes a bulk storage of liquid nitrogen (250 000 u.s. gal) with pumps capable of supplying liquid nitrogen at rates up to 545 kg/sec to spray nozzles in the circuit upstream of the fan, and a large vent stack to properly disperse the gaseous discharge. The vent stack poses some unusual design problems since it is required to operate over a very wide range of flow rates and pressure ratios. Additionally, it is used to provide a means of alleviating hazards associated with cold nitrogen gas both with regard to leaks in the valves and piping and from the discharge.
Cryogenic Nitrogen Environment
Although nitrogen is the major constituent of air and is readily acceptable as an aerodynamic test gas under usual conditions, its use at cryogenic temperatures presents some unusual considerations. At cryogenic temperatures its density is high, and it ,can accumulate in low areas and create a hazard. To alleviate this concern, special procedures and equipment are required when the test section is opened to allow model servicing. As discussed previously, special access tunnels incorporating environmental conditioning equipment are necessary to allow personnel to enter the space around the model in a reasonable length of time. Oxygen monitors will be provided to assure breathable air (proper oxygen content).
Models for testing in this cryogenic environment will also require some extension of technology. The cryogenic temperature and higher loads will result in the selection of high strength alloy steels which have acceptable levels of ductility at cryogenic temperatures. Because of the thin boundary layer at high Reynolds number, the materials must be machinable to a very smooth finish. Methods of fastening and filling suitable for this environment are being identified.
36

Productivity
The NTF is being designed to satisfy a national need for high Reynolds number test capability at transonic speeds. Moreover, as a national facility it must accommodate the projected workload of NASA, the DOD, and industrial users. As a consequence of this, as well as the need to conserve energy, the NTF is being designed to produce data at a relatively high rate. Typical existing wind tunnels produce data at about 26 000 specific sets of test conditions in a year where a set of test conditions per year is defined by a combination of Mach number, Reynolds number, angle of attack, angle of yaw, and so forth. The NTF is targeted to produce measurements at 104 000 sets of test conditions or four times the conventional rate. To achieve this goal, the tunnel control and data acquisition system will be highly automated. Computer control will be used extensively to insure optimum procedures and safety in the tunnel operation. Modern data acquisition will be provided with "quick look" data capability to minimize retesting due to improper measurements.
INTEGRATED FACILITY
The current concept of the National Transonic Tunnel is shown in perspective in figure 21. The tunnel will -be constructed on the site of the Langley 4-foot by 4-foot supersonic pressure tunnel. This tunnel will be removed and the new facility erected in its place! As mentioned previously, the NTF will make use of the existing drive motors and their drive control, the cooling tower and its mechanical equipment, and the office building. Also, as pointed out previously, the unusual features of the facility are the large liquid nitrogen bulk storage which will be used to achieve cryogenic temperatures and the large vent stack for the discharge of gaseous nitrogen to maintain constant operating pressure.
FULL-SCALE REYNOLDS NUMBER TESTING CAPABILITY
An indication of the ability of NTF to perform the desired high Reynolds number development testing is found by assessing its ability to test at fullscale Reynolds numbers for various aircraft configurations. In figures 22 and 23, the Reynolds number capability of the NTF is compared with the flight Reynolds number of current and future aircraft. The comparison is made on the basis of Reynolds number based on the average chord of the configuration, Rc . Rc is presented as a function of Mach number for the flight vehicle (solid curve) and for the model in the NTF (dashed curve). The cruise point for the vehicle is indicated by the solid dot. At the bottom of each figure, the crosshatched envelope indicates the corresponding capability of existing wind tunnels.
In s1z1ng the models for the NTF, the span was limited to 0.6 of the width of the test section and the blockage was limited to 0.5 percent - whichever was reached first limited the model size.
37

In figure 22 comparisons are made for a large subsonic transport, a future supersonic transport, an advanced subsonic transport, and the space shuttle. The boundaries of the airplane flight envelope are determined by sea-level flight (upper left), flutter or buffet (upper right), thrust limitations (maximum Mach number), and maximum lift (lower boundary). The maximum lift and maximum Mach number boundaries are the more critical from aerodynamic performance considerations.
For large subsonic transports of the Boeing 747 category, the NTF will provide full-scale test conditions for the cruise point as well as for the high-speed "max q" load condition. The high Reynolds number peak at M = 0.6 cannot be met by the design NTF performance envelope. This is not considered a significant deficiency, however, since the Reynolds number effects for unseparated, fully subsonic flows are usually small and predictable at high Reynolds number levels. For the advanced transport concept, such as the "span loader" in the 1. 0 million kg gross weight category, the NTF can attain fullscale test conditions at the cruise point. The high-speed "max q" load condition will require the use of half-span model techniques, which are generally an acceptable approach for obtaining loads data on relatively high-aspect-ratio configurations.
For the large supersonic transport type configurations, full-scale test conditions can be attained for the subsonic cruise point (M = 0.95). The high Reynolds number requirements at the subsonic Mach numbers (M $ 0.5) can largely be covered by the use of larger sized models, acceptable f~r testing at the low subsonic speeds. Full-scale test conditions for the space shuttle type configuration can be attained throughout the subsonic/transonic flight regime.
The ability of the NTF to meet full-scale testing requirements of current and advanced military aircraft is illustrated in figure 23. It will be noted that the NTF design performance envelope provides essentially full-scale test capability at subsonic/transonic ~peeds for a typical variable-sweep bomber in both the subsonic cruise and high-speed configurations.
The flight envelope of a typical fighter is also well covered. The cruise point for the conceptual large transport, however, falls slightly above the Reynolds number capability of the NTF. The use of the previously considered half-span model techniques, combined with limited Reynolds number extrapolation, will largely close the Reynolds number gap for this type of configuration as well as the off-design areas of the other airplane envelopes.
SUMMARY
In summary, this paper has described the approach being taken in the United States to achieve full-scale Reynolds numbers in a transonic wind tunnel. The facility design and planned construction represent a significant step forward in the continual requirement for new and improved research and development tools for aeronautics. It involves the incorporation of the cryogenic approach to high Reynolds number which brings full-scale Reynolds numbers
38

within practical reach insofar as capital costs and drive horsepower are concerned. There appear to be no insurmountable design problems. The facility is projected to be operational in 1981.
REFERENCES
1. Goodyer, M. J.; and Kilgore, R. A.: High Reynolds Number Cryogenic Wind Tunnel. Paper 72-995 at AIAA Seventh Aerodynamics Testing Conference (Palo Alto, California), Sept. 3-15, 1972 (AIAA J., vol. 11, no. 5, May 1973, pp. 613-619).
2. Kilgore, R. A.; Adcock, J. B.; and Ray, E. J.: Flight Simulation Characteristics of the Langley High Reynolds Number Cryogenic Transonic Tunnel. Paper 72-80 at AIAA 12th Aerospace Sciences Meeting (Washiogton, D.C.), Jan. 30-Feb. 1, 1974, (AIAA J. of Aircraft, vol. II, no. 10, Oct. 1974).
3. Kilgore, R. A.: The Cryogenic Wind Tunnel for High Reynolds Number Testing. Ph.D. Thesis, The University of Southampton, Feb. 1974. (Available as NASA TM X-70207.)
4. Wilson, J. F.; Ware, G. D.; and Ramsey, J. W., Jr.: Pilot Cryo Tunnel: Attachments, Seals, and Insulation. Presented at the ASCE National Structural Meeting (Cincinnati, Ohio), Apr. 22-26, 1974.
5. Ray, E. J.; Kilgore, R. A.; Adcock, J. B.; and Davenport, E. E.: Test Results From the Langley High Reynolds Number Cryogenic Transonic Tunnel. Paper 74-631 at AIAA Eighth Aerodynamic Testing Conference (Bethesda, Maryland), July 8-10, 1974.
6. Kilgore, R. A.: Design Features and Operational Characteristics of the Langley Pilot Transonic Cryogenic Tunnel. NASA TM X-720l2, 1974.
7. Polhamus, E. C.; Kilgore, R. A.; Adcock, J. B.; and Ray, E. J.: The Langley Cryogenic High Reynolds Number Wind-Tunnel Program. Astronaut. & Aeronaut., vol. 12, no. 10, Oct. 1974.
8. Kilgore, R. A.; Goodyer, M. J.; Adcock, J. B.; and Davenport, E. E.: The Cryogenic Wind-Tunnel Concept for High Reynolds Number Testing. NASA TN D-7762, 1974.
9. Kilgore, R. A.; Adcock, J. B.; and Ray, E. J.: Simulation of Flight Test Conditions in the Langley Pilot Transonic Cryogenic Tunnel. NASA TN D-7811 , 1974.
10. MiniLaWs Working Group: A Further Review of Current Research Aimed at the Design and Operation of Large Wind Tunnels. AGARD Advisory Report No. 83. Sept. 1975.
11. Dryden, Hugh L.; and Schubauer, G. B.: Reduction of Wind Tunnel Turbulence.
The Use of Damping Screens for the J. Aeronaut. Sci., Apr. 1947.
39

40
U. S. 2.5-METER-HIGH REYNOLDS NUMBER TRANSONIC WIND TUNNEL (NATI ONAl TRANSON I C FAC III TY - NTF)
• R- = 120 x 106
AT M = 1.0 c
• MACH NUMBER RANGE - 0.1 TO 1.2
• CONTI NUOUS OPERATlON( (10 MI NUTE MI NI MUM)
• HIGH PRODUCTIVITY Figure 1.- Basic high Reynolds number testing requirement as specified
by Facilities Review Panel.
* • CRYOGENI C CONCEPT
• SLOTTED TEST SECTION
• FAN-DRIVEN CLOSED-CIRCUIT PRESSURE WIND TUNNEL
• HI GHlY AUTOMATED CONTROLS AND DATA ACQUI S ITION SYSTEM
*ONlY NEW TECHNOLOGY Figure 2.- Approach selected to meeting high Reynolds number
testing requirement.
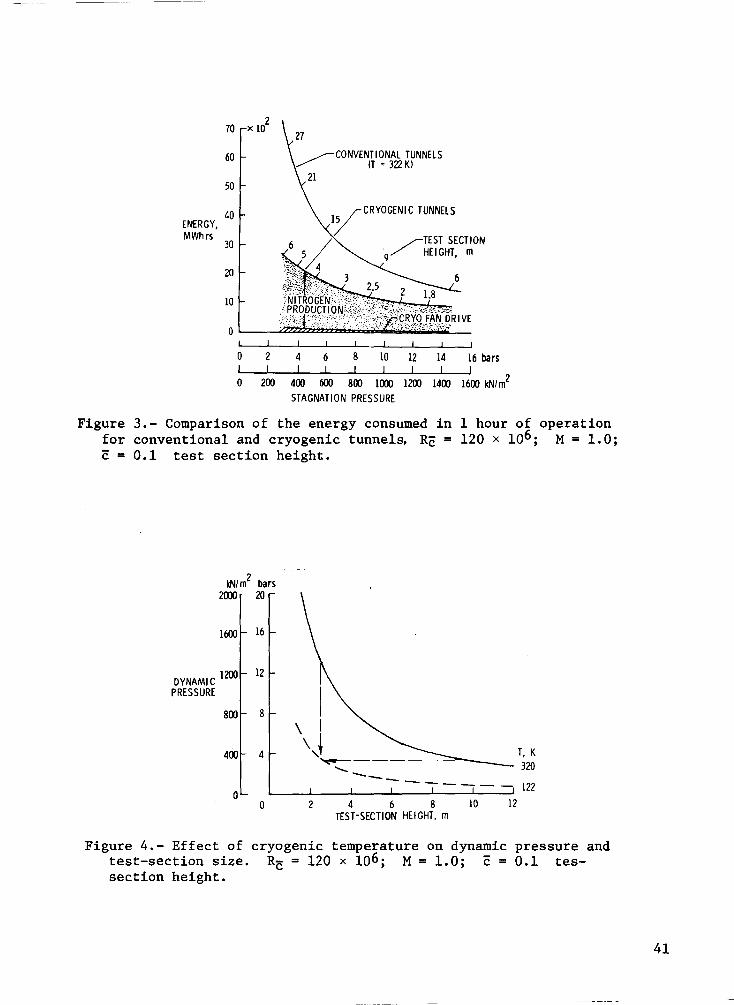
70 x10 2
60 ~CONVENTIONAL TUNNELS ../' IT = 322 K)
21 50
40 ENERGY, MWhrs
30
20
10
0
.5 /CRYOGENI C TUNNELS 1/ 6 /. ........--TEST SECTION
, 5 9/ HEIGHT, m
1~$\~~t~i;~~},i~~~;eRIVE o 4 6 8 10 12 14 16 bars
I I I I
o 200 400 600 800 1000 1200 1400 1600 kNlm2
STAGNATION PRESSURE
Figure 3.- Comparison of the energy consumed in 1 hour of operation for conventional and cryogenic tunnels, Rc = 120 x 106 ; M = 1.0; C = 0.1 test section height.
kNlm2 bars 2000 20
1600 16
DYNAMI C 1200 12
PRESSURE
800 8
400 4
0 0
I \ I
\J ~-----~--
T, K 320 ---- ----- - 122
2 4 6 8 10 12 TEST-SECTION HEIGHT, m
Figure 4.- Effect of cryogenic temperature on dynamic pressure and test-section size. Rc = 120 x 106; M = 1.0; C = 0.1 tessection height.
41

kN/m2 bars NTF
x 10-6 50 .5 LaRC 16' TUNNEL
kN/m2 bars M = 1.0 T :::: CONST. . 2)
R-c
42
8
6
4
2
0
q
40 .4 4 \MAX = 352K / qMAX = 3.3bars\330 kN/m
30 .3 3 v-™IN
20 .2 q 200 2 - PURE REYNOLDS NUMBER STUDIES
10 .1 100 1
0 0 0 .4 .8 1.2 0 20 40 60 80 100 120 x 10
6
MACH NUMBER, M REYNOLDS NUMBER, R-c
Figure 5.- The impact of having temperature as a test variable on research test capability.
200
160
COST, 120 MILLIONS OF
kNI m2
500 400 300 DYNAMIC PRESSURE (5) :4) ~ 3'
(bars) 200
1)
1975 U. S. DOLLARS
80
40
o 2 3 4 TEST-SECTION HE I GHT. m
Figure 6.- Variation of tunnel cost with test-section size and dynamic pressure, M = 1. 0; T = 122 K .•

FLOW~
I: 7.62m-l
3.96m-~1
LTEST SECTI ON 2.5 m SQUARE REENTRY FLAPS
lpLENUM 8.23 m (dia)
Figure 7.- Plan view of the slotted test section •
• 20 LOSS PER SCREEN, ~p
.16 0 q (NO SCREENS
ETS
.12 .5
ESC
.08
3 SCREENS (0.762 mm WI RE)
.04
o 4 8 12 16 20 CONTRACTION RATIO, Asci ATS
Figure 8.- Effect of contraction and screens on turbulence attenuation. M = 1.0; ESC = 0.017.
43

WIRE STRESS, MN/m2
LOSS 600 YIELD kW Hp _£ ~IT,HOUT JOINTS) 5968 8 x 10³
500
400 4476 6
LOSS PER LOSS PER 300 SCREEN 2984 4 SCREEN
~p/q ~p/q 200 1.5 1.5
1.0 1492 2 1.0
100 0.5 0.5
o 5 W o o CONTRACTION RATIO, ASC/ATS CONTRACTION RATIO, ASCIATS
Figure 9.- Effect of contraction ratio on screen stress level and screen loss for three levels of screen pressure drop. Three screens; 0.76 mm wire diameter; Pt = 896 kN/m2 (8.96 bars); 0.61 m sag.
44
1---------60. 96 __ -------=ct=---O_F_FA-----,N~Z-___I ~ 16.15 -( 8.841
COOL! NG co I L
DIMENSIONS I N METERS
Figure 10.- Lines of the aerodynamic circuit of the National Transonic Facility.

1.20
1.16
1.12 COMPRESSION
RATIO 1.08
1.04
1.00 ~----'-------L---....I.....-_--.JL-_--L __ .....J
o .2 .4 .6 .8 1.0 1.2 MACH NUMBER, M
Figure 11.- Compression ratio required to drive the National Transonic Facility as a function of Mach number.
I SOLATION VALVE (CLOSED)
. CONTRACT I ON SECT I ON RETRACTED
I SOLATION VALVE (STORED)
Figure 12.- Schematic of the test-section pressure isolation system for the National Transonic Facility.
45

46
FAN
NEW SYNCHRONOUS MOTOR 44 760 kW \60000 HORSEPOWER)
r TWO-SPEED GEAR BOX
r---~---'
EXISTI NG VAR IA BLE SPEED MOTORS
52220 kW (70000 HORSEPOWER)
Figure 13.- Schematic of National Transonic Facility drive system.
kW Hp X 103
104440 140
89520 120 T 74600 100
SYNCHRONOUS MOTOR \ 60000 Hp:
44760 kW
EXISTING ADJUSTABLE 59680 80 SPEED MOTORS
FAN GEAR RATIO SHAFT 600
POWER 44760 60 840 360
29840 40 840\
14920 20
0 0 200 400 600
FAN, rpm
Figure 14.- NTF drive system horsepower available as a function of drive fan rpm.

kN/m2 bars 900 9
800 8
700
STAGNATlON600 6
" , PRESSURE 500 /~M =14 L •
400 4
300
200 2
100
0 140 x 10
6 0 20 40 60 80 100 120
REYNOLDS NUMBER, Rc
Figure 15.- NTF operating envelope in terms of operating pressure, temperature, and Reynolds number for a Mach number of 0.8.
kNI m2 bars 900 9
800 8
700
600
STAGNATlON5OO PRESSURE
400 4
300
200
100
o o
:.1:::';"·'ir:"'~12~ 000 Hp, 93250 kW
"-M = 14 L •
65 000 H p) 48490 kW
20 40 60 80 100 120 140 x 106
REYNOLDS NUMBER, Rc
Figure 16.- NTF operating envelope in terms of operating pressure, temperature, and Reynolds number for a Mach number of 1.0.
47

48
120 x 106
2 100 Pr kNI ~
80 R-e
60
40 EXI STI NG TUNNELS
20
o .2 .4 .6 .8 1.0 1.2 MACH NUMBER, M
Figure 17.- Maximum Reynolds number as a function of Mach number.
CORRUGATED ALUMINUM LINER
,7l§~5E~~:;::::;77:·.::~>:<7<:·:§i:7<7··.··:··:.~PERFORATED ~?"7~"'H~~~4~~~ ,...~~~~~ .... ~.::."""" .. :: .. '""'" .... :: ALUMINUM
FOIL
.J.. ~~~~&::~~~~2.54 em TYPICAL
1"
Figure 18.- Sketch showing internal insulation system employing fibrous insulation with interlayered perforated aluminum foil.
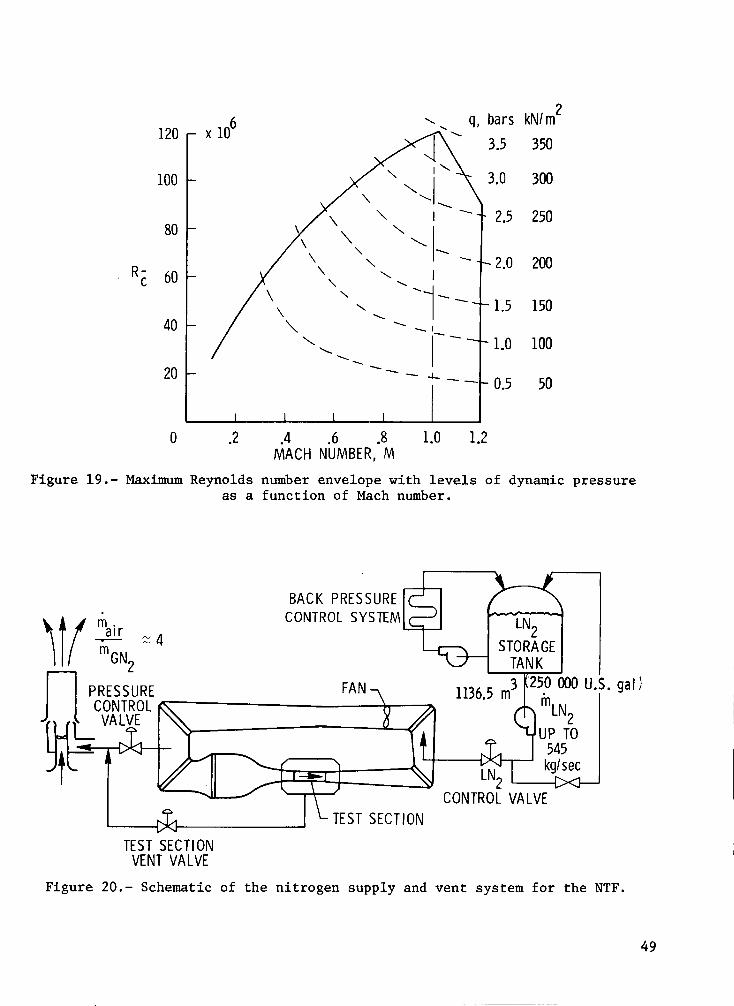
x 106 "'- q, bars kN/m2 120 ....
J ........
3.5 350
" I' 3.0 300 100
"'- ........ 1 "- ........ "- I - 2.5 250 \ 80 "- "- "I-"-
" 2.0 200 R- 60 "- I c "'- -1---\ , 1.5 150
........ 40 "- - __ I
"- ,-- l.0 100 " -20 - - -L. -- 0.5 50
o .2 .4 .6 .8 l.0 l.2 MACH NUMBER, M
Figure 19.- Maximum Reynolds number envelope with levels of dynamic pressure as a function of Mach number.
~\t( ~N ~4 2
BACK PRESSURE CONTROL SYSTEM
LN2 STORAGE
TANK n PRESSURE CONTROL ,:s:-----------t~___'7'lo
1136.5 m3 "25.0 000 U.S. gal) m
LN FAN
~ VALVE
TEST SECTI ON VENT VALVE
TEST SECTION
2 UP TO
545 kg/sec
Figure 20.- Schematic of the nitrogen supply and vent system for the NTF.
49

Figure 21.- Perspective of the National Transonic Facility.
300
200
R-c
100
0
200
R- 100 c
0
6SUBSO~IC TRANSPORT X 10 c = 8.53 m
3~ NTF
.;-,,- [ EXISTI NG WIND /' TUNNELS
ADVANCED TRANS PORT
XD·:~\ /' I
/ I I
0.5 1.0 1.5 MACH NUMBER, M
0
SUPERSONIC TRANSPORT C = 23.47 m
SHUTILE
C = 11.89~
/-, \
\
0.5 1.0 1.5 MACH NUMBER, M
Figure 22.- Comparisons of Reynolds number and Mach number envelopes for fullscale flight vehicles, the NTF, and existing wind tunnels. Typical commercial aircraft.
50
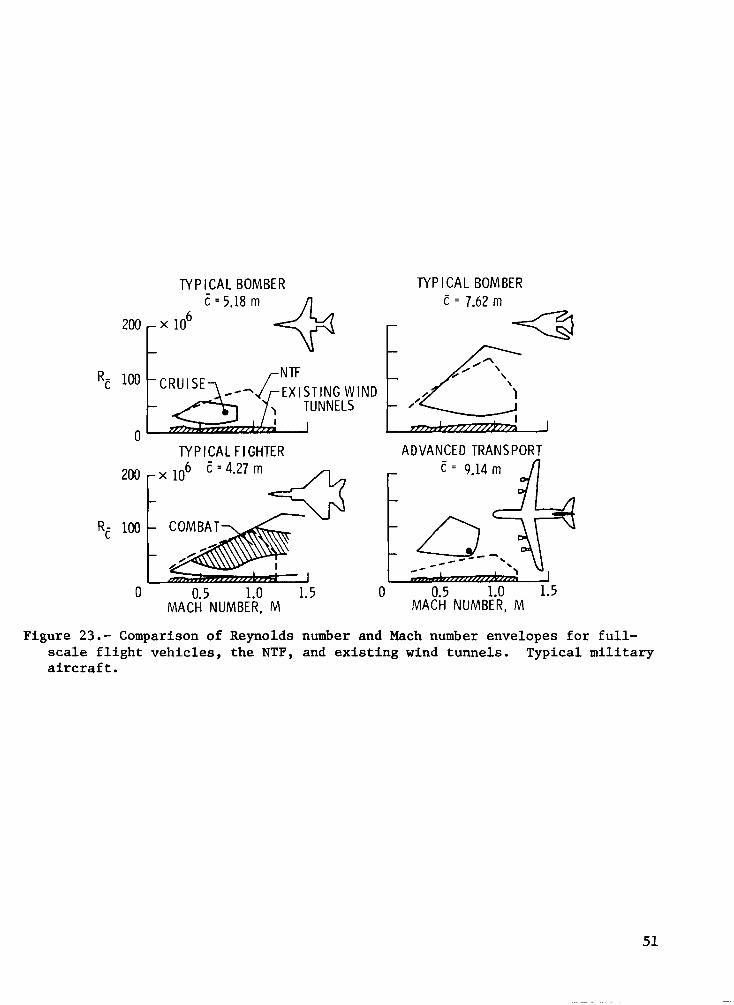
TYPICAL BOMBER c=5.18m ~
200 x 106 ~
200
R- 100 c
NTF _---!rEXISTING WIND
~- TUNNELS
o 0.5 1.0 1.5 MACH NUMBER, M
TYPICAL BOMBER c = 7.62 m
ADVANCED TRANSPORT C = 9.14 m
u_--- , -- , -- 'I
o 0.5 1.0 1.5 MACH NUMBER, M
Figure 23.- Comparison of Reynolds number and Mach number envelopes for fullscale flight vehicles, the NTF, and existing wind tunnels. Typical military aircraft.
51

Page intentionally left blank

CRYOGENIC WIND-TUNNEL TECHNOLOGY
Robert A. Kilgore
NASA Langley Research Center
SUMMARY
As a result of theoretical studies and experience gained during the development and operation of both a low-speed cryogenic tunnel and the Langley O.3-m transonic cryogenic tunnel, the cryogenic wind tunnel has been shown to be a practical concept and to offer many advantages with respect to achieving full-scale Reynolds number in a moderate size tunnel at reasonable levels of dynamic pressure. After a brief review of the cryogenic concept, this paper presents some of the aspects which must be considered during the development of a cryogenic wind tunnel that uses gaseous nitrogen as the test gas. Based on work by Adcock, it is shown that even though the values of the compressibility factor and the ratio of specific heats of nitrogen depart significantly from their ideal-gas values at cryogenic temperatures, both the isentropic flow parameters and the normal-shock flow parameters are insignificantly affected by these real-gas effects. Based on work by Hall, it is shown that it is possible to operate at stagnation temperatures even lower than those corresponding to the free-stream saturation boundary without encountering condensation effects. Should this mode of operation be possible for arbitrary models, an additional increase in Reynolds number of about 17 percent may be realized at a given operating pressure. Alternatively, for a given Reynolds number, operating at the free-stream saturation boundary temperature will allow testing at reduced pressure, drive power, and liquid nitrogen consumption.
INTRODUCTION
The cryogenic wind tunnel is a relatively new aerodynamic research tool. The first cryogenic tunnel was built at Langley in 1971. Although the demonstrated application to wind tunnels is relatively recent, it is interesting to note that the science of cryogenics, just as the wind tunnel itself, dates back to the previous century. As will be discussed, the technology developed has been very valuable in the present application.
Historically, capital and operating costs have tended to keep transonic tunnels small, while the host of problems encountered at high pressures have tended to keep operating pressures low. The net result has been that existing (ambient temperature) tunnels operate at Reynolds numbers which are too low to insure adequate simulation of the flow experienced in flight - particularly with regard to shock -- boundary-layer interactions encountered on modern high subsonic and transonic aircraft. The application of cryogenics to wind tunnels
53

has thus been brought about by the need for higher test Reynolds numbers in tunnels of reasonable size operating at reasonable pressures.
Although the study which started in the fall of 1971 was directed toward application of the cryogenic concept to increase the Reynolds number capability of a small wind tunnel equipped with a magnetic suspension and balance system, the advantages and possibility of applying the concept to a large transonic tunnel were recognized at that time. In the late 1960's and early 1970's there were several transonic tunnel concepts being studied in the United States which were to provide this country with a greatly increased Reynolds number capability. Because the cryogenic tunnel concept avoided many of the shortcomings of the various competing ambient-temperature tunnel concepts, our efforts for the past five' years have been spent full time on the cryogenic tunnel concept and only now are we resuming our work on magnetic suspension and balance systems.
SYMBOLS
a speed of sound
c chord of two-dimensional airfoil
c mean geometric chord
linear dimension of model or test section
M Mach number
p pressure
R Reynolds number, pVi/~
R Universal gas constant
T temperature
v velocity
v specific volume
z compressibility factor, Z pv/RT
y ratio of specific heats
viscosity
p density
54

Subscripts:
c based on c
c based on c
L local conditions
max maximum
t stagnation conditions
I upstream
2 downstream
00 free stream
THE CRYOGENIC CONCEPT
The use of low temperatures in wind tunnels was first proposed as a means of reducing tunnel drive-power requirements at constant values of test Mach number, Reynolds number, and stagnation pressure. Reynolds number, which is the ratio of the inertia force to the viscous force, is given by
R Inertia force Viscous force
which reduces to the well-known equation
R II II
As the temperature is decreased, the density p increases and the viscosity II decreases. As can be seen from these equations, both of these changes result in increased Reynolds number. With decreasing temperature, the speed of sound a decreases. For a given Mach number, this reduction in the speed of sound results in a reduced velocity V which, while offsetting to some extent the Reynolds number increase due to the changes in p and ll, provides advantages with respect to dynamic pressure, drive power, and energy consumption.
It is informative to examine the underlying mechanism through which changes in pressure and temperature influence Reynolds number. To the first order II and a are not functions of pressure whereas p is directly proportional to pressure. Thus, increasing pressure produces an increase in Reynolds number by increasing the inertia force with a commensurate increase in model, balance, and sting loads. Also, to the first order, p ~ T-I, V ~ TO.5, and II ~ TO.9. Thus, decreasing temperature leaves the inertia force unchanged at a
55

given Mach number because of the compensating effects of temperature on p and V2. The increase in Reynolds number with decreasing temperature thus is due strictly to the large reduction in the viscous force term as a result of the changes in ~ and V with temperature.
The effect of a reduction in temperature on the gas properties, test conditions, and drive power are illustrated in figure 1. For comparison purposes, a stagnation temperature of 322 K (120 0 F) for normal ambient temperature tunnels is assumed as a datum. It can be seen that an increase in Reynolds number by more than a factor of 6 is obtained with no increase in dynamic pressure and with a large reduction in the required drive power. To obtain such an increase in Reynolds number without increasing either the tunnel size or the operating pressure while actually reducing the drive power is extremely attractive and makes the cryogenic approach to a high Reynolds number transonic tunnel much more desirable than previous approaches.
ASPECTS CONSIDERED DURING CRYOGENIC TUNNEL DEVELOPMENT
Planning for the design of a cryogenic wind tunnel falls into two basic areas. First is the area of fluid dynamics. There is a question as to whether the test gas at cryogenic temperatures will provide data from the wind tunnel (e.g., forces, moments, and pressures on the model) which can be used to predict the loads and aerodynamic characteristics of the full-scale vehicle in free flight. The second area includes the design of the tunnel and its operation at cryogenic temperatures. Figure 2 lists the items under the areas of "Fluid Dynamics" and "Design and Operation."
Fluid Dynamics
The first item under Fluid Dynamics is "Knowledge of gas properties." Its obvious that one needs to know such things as the speed of sound and the viscosity of the test gas. Although nothing thus far in the operation of the lowspeed cryogenic tunnel (ref. 1) or the Langley 0.3-m transonic cryogenic tunnel (ref. 2) has indicated that existing values for any given property of nitrogen are not sufficiently accurate, the magnitudes of some of the probable errors are somewhat larger than one would like, especially at the high pressures proposed for the NTF. In order to be sure there are no problems in this area, Langley is funding work at the Cryogenics Division of the National Bureau of Standards (NBS) in Boulder, Colorado, which will improve our knowledge of the properties of nitrogen, especially at the higher pressures, and at the same time provide a simplified equation of state limited to the range of temperatures and pressures of interest for cryogenic wind tunnels.
Jerry Adcock is in charge of the area of "Proper flow simulation" which, as indicated in the figure, includes both analytical and experimental work. The early experimental work was done in the low-speed tunnel at atmospheric pressure whereas the recent work has been done at pressures up to 506.5 kN/m2 (5 atm) in the Langley 0.3-m transonic cryogenic tunnel.
56

Typical of the analytical studies being made (ref. 3) are those related to isentropic expansions and normal-shock flows in nitrogen. First, the thermodynamic properties for nitrogen were obtained from an NBS program based on work by Jacobsen (ref. 4). The NBS program was then modified so that isentropic expansions could be made. The various ratios which describe an isentropic expansion were then c~lculated by using the real-gas properties of nitrogen and were compared with ratios derived from ideal-gas equations and ideal values of the compressibility factor (Z = 1) and the ratio of specific heats (y = 1.4) for a diatomic gas. An example of the results is presented in figure 3, where the ratio of the real and ideal pressure ratios necessary to expand isentropically to M = 1.0 is presented as a function of tunnel stagnation temperature and pressure. As can be seen, the real-gas effects are extremely small and, for Rc = 50 x 106 at cryogenic temperatures, the real-gas pressure ratio differs from the ideal-gas pressure ratio by only about 0.2 percent. It is interesting to note that the real-gas effect at cryogenic temperature is actually less than the real-gas effect at ambient temperatures, where for the same size test section a considerably higher stagnation pressure is required to obtain RC = 50 x 106.
The other real-gas ratios used to describe an isentropic expansion in nitrogen also differ from the ideal-gas ratios by this same small percentage. In many cases, such as the determination of tunnel Mach number, the real-gas equations can be used to avoid even this small error of 0.1 percent to 0.2 percent. However, errors of such magnitude are of the same order as the uncertainty in measurements and would be co~sidered insignificant in most windtunnel work.
For the normal-shock flow studies, Adcock modified the NBS program so that the various ratios which describe normal-shock flow could be calculated by using the real-gas properties, and compared these with the corresponding idealgas ratios. An example of the results is shown in figure 4 where the ratio of the real to the ideal static pressure ratio across a normal shock is shown as a function of tunnel stagnation temperature at stagnation pressures of 101.3 and 506.5 N/m2 (1 and 5 atm). ,As in the case of isentropic expansions, the effects are extremely small, and for Rc = 50 x 106 , the real pressure ratios differ from the ideal-gas pressure ratio by only about 0.2 percent. The other realgas ratios associat'ed with normal-shock flow in nitrogen also differ from the ideal ratios by this same small percentage. As in the case of isentropic expansion, even in those situations where the real-gas equations cannot be used to take these effects into account, an error of this magnitude would usually be considered insignificant. Thus, even though the values of Z and y for nitrogen depart significantly from their ideal-gas values at cryogenic temperatures, both the isentropic flow parameters and the normal-shock flow parameters are insignificantly affected by these real-gas effects.
Design and Operation
In figure 2, under the heading "Design and Operation", are listed several areas which, depending on the type of cryogenic tunnel being considered, will receive various amounts of attention. Each of these areas has been covered to some extent in previous publications so it will not be necessary to consider
57

them here. The one area that will be discussed briefly is "Condensation," which is being studied here at Langley under the direction of Robert Hall.
As shown in figure 5, the test Reynolds number increases rapidly as temperature is reduced. Marked on the curve of Reynolds number against temperature are three "boundaries" which, for the conditions of this example are set by a maximum local Mach number over the model of 1.2, a free-stream Mach number of 0.85, and a settling chamber Mach number of O. As reported in detail by Hall (ref. 5), effects of condensation were not seen on the airfoil used for these tests until the tunnel was operated at temperatures below those associated with free-stream saturation. His results indicate that for a given size tunnel and model and for a constant tunnel pressure, an additional increase in test Reynolds number of about 17 percent may be realized by operating at temperatures corresponding to those of the free-stream saturation boundary.
Another way to take advantage of being able to operate beyond the local saturation boundary would be to reduce the operating pressure for testing at a given Reynolds number. This should be of considerable practical importance for the NTF with its extremely high (by present standards) operating pressures. If the minimum operating temperature in the NTF can be reduced from the present arbitrary limit (corresponding to a saturation boundary based on an assumed local Mach number of 1.4) to a lower temperature without condensation effects occurring, then the tunnel operating pressure can be lowered correspondingly. And, of course, when the operating pressure is reduced, both drive power and LN2 consumption are also reduced.
As can be seen from figure 6, if operation is possible at temperatures corresponding to free-stream saturation, tunnel pressure can be reduced by about 15 percent (from 895.5 to 760.8 kN/m2 (8.84 to 7.51 atm)) and LN2 flow rate, which is directly related to operating costs, is reduced by about 16 percent.
SOURCES OF INFORMATION
Relative to the cryogenic tunnel development areas listed in figure 2, several sources of information have been found useful and are generally available. Since there is familiarity with the design of ambient temperature tunnels, sources related to the aerodynamics of tunnel design are not listed. The problem is really one of applying good cryogenic engineering to the type of tunnel required.
In the United States the best source of information by far on the cryogenic aspects of a cryogenic tunnel are the publications and people of the Cryogenics Division of the National Bureau of Standards. Although the cryogenic wind tunnel is a recent application of cryogenic technology, most of the information needed on materials, insulation, instrumentation, liquid nitrogen systems, safety, and so forth has been documented by the NBS and is readily available. If there is need to know something that is not documented, the chances are excellent that the NBS Cryogenic Division can be of help.
58

In addition to the NBS and the work being done here at Langley in the 0.3-m transonic cryogenic tunnel and on the NTF design, there are several other places where cryogenic tunnels are being designed and built. Figure 7 lists the various tunnels and provides information about each of the projects such as the size of the test section, the type of tunnel, the location, and the actual or anticipated date of operation. As one can see, there is considerable activity going on around the world related to the development and use of cryogenic wind tunnels. Since this is such a new field, one must keep informed as to what is going on, not only on his own projects, but around the world, if duplication of effort is to be avoided and the full potential of the cryogenic wind tunnel is to be realized as quickly as possible.
REFERENCES
1. Kilgore, Robert A.; Goodyer, Michael J.; Adcock, Jerry B.; and Davenport, Edwin E.: The Cryogenic Wind-Tunnel Concept for High Reynolds Number Testing. NASA TN D-7762, 1974.
2. Kilgore, Robert A.: Design Features and Operational Characteristics of the Langley 0.3-Meter Transonic Cryogenic Tunnel. NASA TN D-8304, 1976.
3. Adcock, Jerry B.: Real-Gas Effects Associated With One-Dimensional Transonic Flow of Cryogenic Nitrogen. NASA TN D-8274, 1976.
4. Jacobsen, Richard T.: The Thermodynamic Properties of Nitrogen From 65 to 2000 K With Pressures to 10,000 Atmospheres. Ph. D. Thesis, Washington State Univ., 1972. (Available as NASA CR-128 526.)
5. Hall, Robert M.: An Analysis of Data Related to the Minimum Temperatures for Valid Testing in Cryogenic Wind Tunnels Using Nitrogen as the Test Gas. NASA TM X-73924, 1976.
59

GAS PROPERTIES TEST COND ITI ONS AND
4 8 DR IVE POWER P
REYNOLDS NUMBER 3 6
VALUES RELATIVE 2 4 TO 322K
1 2
o
Figure 1.- Effect of temperature reduction on gas properties, test conditions, and drive power. Moo = 1.0; constant stagnation pressure and tunnel size •
60
• Fluid dynamics - Knowledge of gas properties - Proper flow simulation
-. • Analytical • Experimental
- Low-speed tunnel - Transonic tunnel
• Design and operation
- Materials of construction - Drive system - Insulation - Method of cooling - Vent system - Models - Ihstrumentation - Operating procedure
• Tunnel dynamics ... Condensation - Safety
Figure 2.- Some aspects considered during cryogenic tunnel development.

1.004
(I ) 1.002 P Pt NITROGEN
SATURATI ON, ML =
1.0
1.4
R- = 50 x 106 (2.5 BY 2.5m TEST SECTION) c
Pt atm kN/m2
101.3 (p/Pt) I DEAL
1. 000 r------------..
~------ 5 506.5 .998
.996
50
-10
RC = 50 x 106
(2.5 BY 2.5m TEST SECTION) ~15
I I I I
100 150 200 250 300 STAGNATION TEMPERATURE, K
Figure 3.- Isentropic expansion pressure ratio of nitrogen. Pressure ratio p/Pt; Mb = 1.
1.004 Ml = 1.4 INN ITROGEN
1.002
1013.0
1519.5
350
Pt ' atm kNI m2
1.000 t-----:-::::::=~1~:__=::::====----
(:~j .998 ) REAL
f- P2 \ 996
\~) IDEAL' .994
.992
.990 0
SATURATION R_ = 50 x 106 c
(2.5- BY 2.5- m TEST SECTION)
100 200 300 STAGNATION TEMPERATURE, T
t• K
Figure 4.- Normal shock pressure ratio in nitrogen.
400
61

62
Chord Reynolds number,
Rc
40
30
20
10
M", • 0.85; Pt • 456 kN/m2(4.5 atm); c. 0.137 m
~ [ML'Jl1ax
Md~~ ~
Total temperature, T t' K
Figure 5.- Potential benefits of operation below saturation temperature.
100
LN2
flow rate, 90 percent
M", • 1.0; Rc • 120 X 106 Pt • 896 kN/m2 (8.84 atm)
Saturation at ML • 1. 4
Pt • 761 kN/m2 (7.51 atm)
Free-stream saturation
.8~~OO~------------71~10~------------~12~0~------------1!30
Total temperature, 'It, K
Figure 6.- LN2 consumption as a function of temperature.

• Initial 0.178 x 0.279 m Low-speed/fan NASA-LRC
• Present 0.3 m Transonic /fan NASA-LRC 0.10 x 0.10 m Low-speed/fan University of Southampton
• Studies of conversion of existing tunnels 0.30 x 0.30 m TWT/blowdown McDonnell - EI Segundo 1.22 x 1.22 m TWT/blowdown McDonnell - EI Segundo
1.22 x 1.22 m Transonic/blowdown British Aircraft Corp.
• Design of new cryogenic tunnels 2.5 x 2.5 m Transonic/fan
Transonic /Ludwieg tube 1.4 x 1.4 m Transonic /blowdown 1.6 x 2 m Transon~c /fan
NTF (Langley) DFVLR - AVA (Holland) FFA (Germany) LEHRT (AGARD)
Figure 7.- Some sources of cryogenic tunnel design and operational experience.
1972
1973 1977
1977 1978
1981
63

Page intentionally left blank

TRANSONIC WIND-TUNNEL WALL INTERFERENCE
William B. Kemp, Jr.
NASA Langley Research Center
INTRODUCTION
The possibility of eliminating Reynolds number mismatch as a source of wind-tunnel testing error in the National Transonic Facility (NTF) places additional importance on the reduction of testing error due to other sources including wall interference. Accordingly, an expanded research program on wall interference in transonic wind-tunnel test sections was initiated at Langley Research Center in 1974. This paper will describe some progress under this program as well as its possible impact on NTF.
At the beginning of the program, the capability for assessing transonic tunnel wall interference was qualitative at best. The experimental approach, through carefully controlled comparative tests, was rarely accurate enough to produce definitive results. The theoretical approach suffered from inadequate knowledge of the slotted or perforated wall boundary conditions as well as the uncertainty of applying the classical linearized definition of the wall-induced velocity perturbation to the nonlinear transonic problem. As a result, the existing transonic test sections had been designed empirically, and wall interference was generally addressed only by imposing rule-of-thumb constraints on model size.
The adaptive-wall concept, which was receiving increasing attention at that time (see refs. 1 and 2) represented a departure from the traditional approach of applying wall-interference corrections to the wind-tunnel data. Instead, some property of the walls would be adjusted until a calculated interference-free criterion was satisfied for each tunnel data point. The Langley research program has been shaped by the belief that the most practical solution to the transonic wall-interference problem would involve a mixture of wall adjustment and data correction, and would require improved methods of expressing the wall-boundary conditions and of assessing the wall-induced velocity perturbation field.
a
C P
K
M
SYMBOLS
slot spac ing
pressure coefficient
parameter in slotted-wall boundary condition
Mach number
65

R
u w
v w
x
a.
slot edge radius
wall-induced blockage velocity
wall-induced upwash velocity
tunnel reference velocity
longitudinal coordinate
vertical location of model
angle of attack
angle of sideslip
slot width
SLOTTED-WALL BOUNDARY CONDITION
One accomplishment under the program is the clarification of the longrecognized discrepancy between the theoretically derived slotted-wall boundary conditions developed by Davis and Moore (r~f. 3) and Chen and Mears (ref. 4). In the Chen and Mears method, the cross section of a slotted wall is represented by an intermittent series of doublet rods as illustrated in figure 1. For a particular doublet strength, the dividing streamline between the recirculating doublet flow and the general tunnel flow assumes the figure-eight shape illustrated, which has zero thickness halfway between slots. For a slot width of 2 percent of the slot spacing, the slot parameter Kia predicted by Chen and Mears is about 15 times that predicted by the Davis and Moore method. Chen and Mears, however, had mistakenly defined the slot width as the gap between doublet rod ends instead of the gap between dividing streamlines. By using the corrected slot width, the Chen and Mears value of the slot parameter is reduced to about three times' the Davis and Moore value. Note, however, that even this so-called "zero thickness slat" has a generous radius of curvature adjacent to the slot in contrast to the Davis and Moore derivation which applies to a truly sharp-edged slot. In the Chen and Mears model, the slot edge radius of curvature can be varied by changing the doublet strength. The solid curves on figure 2 show the resulting slot parameter as a function of slot edge radius for several values of slot width. The corresponding Davis and Moore results, plotted at zero radius, now appear to be reasonably correlated with the corrected Chen and Mears results as indicated by the dashed portions of the curves. This work, reported in more detail in reference 5, has exposed the previously unrecognized importance of slot-edge curvature as a determining parameter in the slotted-wall boundary condition.
66

EXPERIMENTAL BOUNDARY VALUES
The work just described is aimed at improving the accuracy of the boundary condition used to represent slotted test-section walls in wall-interference analyses. In a completely different approach, the need for any such a priori statement of the wall boundary condition is eliminated by imposing instead the pressure distribution on or near the tunnel walls, measured during the actual wind-tunnel test, as boundary values to be matched in the wall-interference analysis. This principle has been embodied in a low-speed two-dimensional analysis method and is used to examine the wall interference in airfoil tests in a flexible-wall tunnel used in both a straight-wall mode and a self-streamlined or adaptive-wall mode. The straight-wall results are shown in figure 3 where the u and v components (blockage and upwash components, respectively) of the wall-induced velocity distribution along the tunnel center line are plotted for several airfoil angles of attack. The boundary values used in this analysis were simply the pressure distributions on both the airfoil and the upper and lower tunnel walls. The results, however, exhibit the characteristics expected from classical solid-wall interference theory. The upwash crosses zero near the airfoil quarter-chord with a gradient that increases with angle of attack. The blockage peaks over the airfoil and approaches a finite asymptote downstream that is indicative of wake blockage. Note in particular, the large blockage associated with the stalled flow at an angle of attack of 12°. This illustrates that even though the analysis is formulated by using potential flow relations, the effects of viscous phenomena are inherent in the experimental boundary values used.
The effect of streamlining the walls for an airfoil angle of attack of 6° is shown in figure 4. The analysis results confirm that the wall-induced velocities were nearly eliminated except for a small upwash gradient resulting from the finite length of the streamlined wall 'region. This work is described in more detail in reference 6 which also presents an outline of principles which may be used to extend this wall-interference assessment procedure to threedimensional transonic conditions. These principles avoid the assumption of linear superposition of perturbations in extracting the wall-induced velocity field.
APPLICATIONS TO NTF
The Langley research program on transonic tunnel wall interference is expected to interface with the NTF project in several ways. At the preliminary tunnel design stage, reconunendat'ions were made to the NTF proj ect to assure that the baseline test-section design exploited the best current understanding of the wall-interference problem and to assure that the basic structure and systems of the tunnel would not unduly inhibit future modification or replacement of the test section.
At present, the NTF is visualized as evolving toward the mode of operation described in figure 5 as the correctable-interference transonic tunnel. This
67

mode would combine the capability for accurate assessment of wall interference with a limited capability for wall control. The assessment capability would be utilized to categorize the interference existing at each data point as negligible, correctable, or uncorrectab1e, and to apply corrections where they are valid. The wall-control capability would be used only for those cases assessed as uncorrectab1e, and then, only to the extent needed to reduce the gradients in wall-induced velocity at the model to an acceptable level.
Four areas in which research is needed to achieve the correctab1einterference tunnel are indicated on figure 5. In view of the progress noted above in the two areas contributing to the wall-interference assessment capability, it is believed that this capability can be in hand by the time that NTF becomes operational and that it can be implemented in .the baseline test section. The assessment capability alone will provide accurate wall-interference corrections where they are valid, and accurate knowledge of their limits of validity. Such an understanding of wall interference has not previously existed for transonic tunnels.
Full implementation of the correctable-interference mode in NTF will require significant effort to develop a suitable wall configuration and its control logic. It should be pointed out that the wall-control requirements are less restrictive than those for the fully adaptive tunnel aimed at zero interference; therefore, the correctable-interference wall might be simpler to develop and implement.
REFERENCES
1. Sears, W. R.: Self Correcting Wind Tunnels. Aeronaut. J., vol. 78, no. 758/759, Feb./Mar. 1974, pp. 80-89.
2. Ferri, A.; and Baronti, P.: A. Method for Transonic Wind-Tunnel Corrections. AIAA J., vol. 11, no. 1, Jan. 1973, pp. 63-66.
3. Davis, Don D., Jr.; and Moore, Dewey: Analytical Studies of B1ockage- and Lift-Interference Corrections for Slotted Tunnels Obtained by the Substitution of an Equivalent Homogeneous Boundary for the Discrete Slots. NACA RM L53E07b, 1953.
4. Chen, C. F.; and Mears, J. W.: Experimental and Theoretical Study of Mean Boundary Conditions at Perforated and Longitudinally Slotted Wind Tunnel Walls. AEDC TR-57-20, Dec. 1957.
5. Barnwell, Richard W.: Improvements in the Slotted-Wall Boundary Condition. AIAA Ninth Aerodynamic Testing Conference, June 1976.
6. Kemp, William B., Jr.: Toward the Correctable-Interference Transonic Wind Tunnel. AIAA Ninth Aerodynamic Testing Conference, June 1976.
68
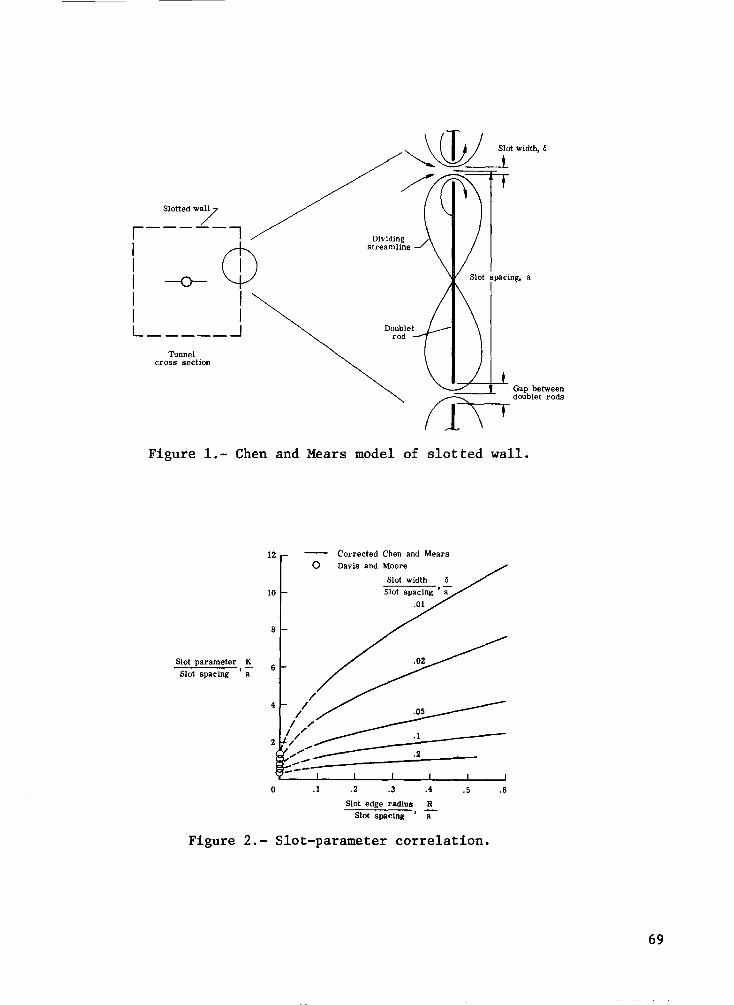
SlottedW/
r------,
i-o-0 I I I I L _____ .J
Tunnel cross section
Doublet rod
Slot width, 6
t
Figure 1.- Chen and Mears model of slotted wall.
Slot parameter K Slot spacing , -;-
12
10
o
.1
Corrected Chen and Mears Davis and. Moore
.2 .3 .4
Slot edge radius R Slot spacing , a
.5
Figure 2.- Slot-parameter correlation.
.6
69

70
Exp"im'nta~ input Cp _~ __ _
.16 a, deg
(UW).8 VR YM
12
8
0 ~~~~~~~-+ ____ ~ ____ ~ __ -= __ 4, 0
.04
(::t 0
-.04
10 20 30 40 50 60 70
x, em
80 90
12 8 4 o
Figure 3.- Wall-induced velocities on tunnel axis. Straight tunnel walls .
. 08 0 Streamlined walls o Straight walls
-.04
10 20 30 40 50 60 70
X, em
Figure 4.- Effect of streamlined walls. a = 60.
80 90
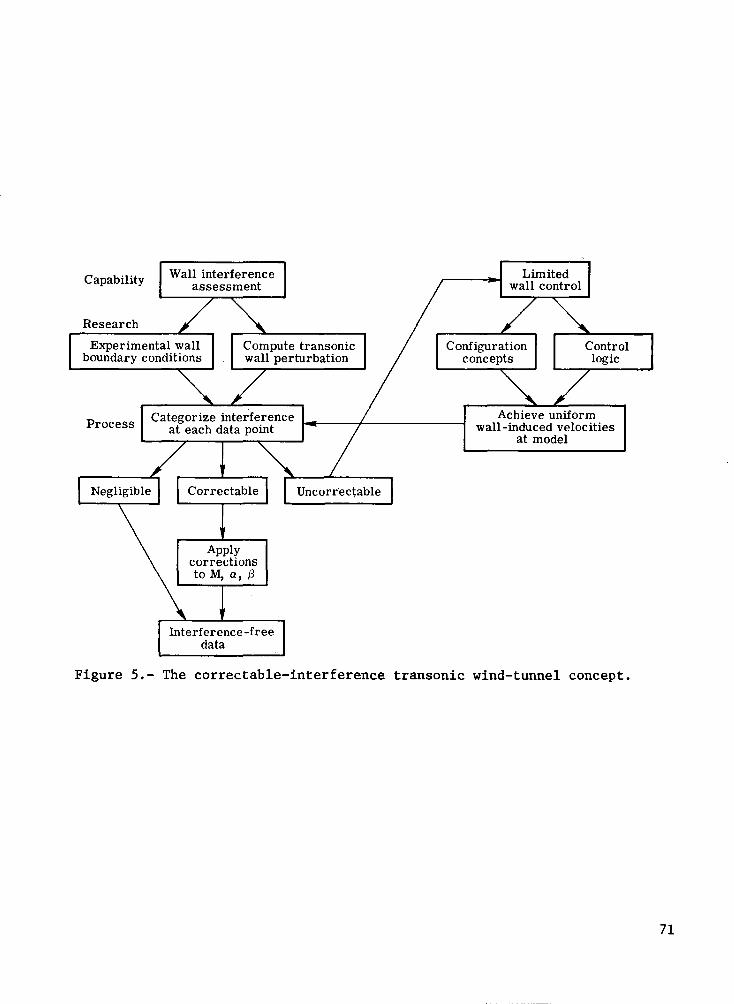
Capability
Research
Process Achieve uniform
wall-induced velocities at model
Figure 5.- The correctable-interference transonic wind-tunnel concept.
71

Page intentionally left blank

THE DESIGN OF MODELS FOR CRYOGENIC WIND TUNNELS
Vernon P. Gillespie
.NASA Langley Research Center
Wind-tunnel research at cryogenic temperatures has become a reality in the past few years and its advantage and importance are increasing. Cryogenics as a science has been pursued for about 75 years; however, large-scale industrial application of cryogenics is less than 25 years old. Langley Research Center currently has in operation a 0.3-meter transonic wind tunnel that operates with stagnation temperatures in the cryogenic range; it also has in the design phase the National Transonic Facility (NTF) that will operate at cryogenic temperatures. Wind-tunnel testing of models at cryogenic temperatures requires detailed consideration of areas not normally germane to the model designer.
The NTF will operate at Mach numbers from 0.1 to 1.2, stagnation temperatures from 352 K to 80 K and stagnation pressures from 103.4 kN/m2 (15 psia) to 896.3 kN/m2 (130 psia). Model design for the NTF will require that detailed technical consideration be given to three unique areas imposed by these operating capabilities. First, consideration must be given to the high model loads imposed by the high operating pressures. Wing root stress on many configurations will be in excess of 0.69 GN/m2 (100 000 psi). Materials capable of such stress levels, including the customary safety factors that are normally associated with wind-tunnel model design, do not exist.
The second area that must be considered is the thermal environment. Although a vast amount of practical engineering has been accomplished involving cryogenics, only limited experience with the design of wind-tunnel models to operate in the cryogenic environment exists. It is not particularly difficult to design low-temperature apparatus, but attention to the details of the design is required from the outset. There are changes in the physical properties of all materials that must be taken into account. The most striking change in many materials is that of embrittlement. Carbon steel, for example, may fail catastrophically due to embrittlement at temperatures only slightly below ambient. Many materials, however, withstand the low-temperature environment very well and a~e used extensively in cryogenic applications (most austenitic stainless steels are a good example).
The third and probably the most complex area of consideration for NTF model design is the conflicting requirements imposed by the combination of the aerodynamic loads and the thermal environment. To the wind-tunnel model designer, the most important material properties have been yield and tensile strength. Only on rare occasion did any other material property dictate the material design selection. The yield and tensile strength of most materials increase with decreasing temperature. Figure 1 illustrates the increase in tensile strength with decreasing temperature for three commonly used materials~ For polycrystalline face-centered cubic metals, the yield strength at ,20 K is between
73

two and three times the room-temperature yield strength. For the designer of models to be tested in the NTF, this increase in strength can be advantageous.
Examination of the candidate materials, however, cannot end with the strength properties alone. Probably the most important and least understood of the mechanical properties at low temperature is that of toughness. The most common methods for inferring toughness are the tensile elongation, impact tests, and notch tests. Generally, material toughness decreases with decreasing temperature. Figure 2 illustrates the decrease in elongation of some commonly used materials with decreasing temperature. The figure demonstrates the classic ductile-to-brittle transition of carbon steel at low temperatures. Materials which have a ductile-to-brittle transition in the operating temperature range must be avoided.
In the short time the Langley 0.3-m transonic cryogenic tunnel has been operational, several types of models have been designed, fabricated, and tested in the facility. (See fig. 3) The models range from simple wooden shapes to support strain-gage balance testing, two-dimensional airfoils fabricated from a commonly used model material (304 stainless steel), to a complex 0.45-percentscale model of the space shuttle. High wing loads at both cryogenic and ambient temperatures combined with a low deflection requirement resulted in a serious material problem for the space shuttle model. An iron-based, nickelcobalt superalloy (HP-9-4-30) was chosen for the shuttle wing structure as it had an ultimate strength of 1.7 GN/m2 (250 000 psi) and excellent toughness throughout the test temperature range.
Experience with the design and fabrication of an early two-dimensional airfoil which spans the jet and is attached to the test-section side walls (fig. 4) illustrates the attention to detail that is required of models to be tested in a cryogenic environment. Design analysis indicated customary mounting procedures were not adequate. If there was too little preload in the mounting, the model would be loose upon tunnel cool down. If there was too much preload, the mounting would be overstressed at room temperature. Model fasteners were a continual problem. When the model was delivered for testing, it was discovered that carbon steel screws (not stainless steel screws as specified) had been supplied with the model, thereby incurring the danger of a brittle fracture at cryogenic temperatures.
Another difficulty arose in the testing of the airfoil shown in figure 4. During the testing at cryogenic temperatures, small droplets appeared and froze along the joint between the solder used to cover the pressure tubes and the parent material. Further examination of the droplets revealed these to be machine oil trapped during the fabrication process. A procedure was subsequently developed to adequately remove the oil so that the airfoil tests could continue.
In recognition of the unique technical considerations which must be given to the design of models for the NTF, the Langley Systems Engineering Division and the NTF Project Office established an NTF Model Task to assemble the technology required to design and fabricate models for NTF. It appears the technology required to design and fabricate models for the NTF generally exists. Engineering design involving cryogenics has been a reality for a number of
74

years, and the task will be to assemble the necessary information into a format easily usable by the model designer. Generally, "the object of the Models Task is to determine and document the requirements for the design of models to be tested in the NTF and, as required, to develop the technology necessary to meet the design requirements."
The specific objectives of the Model Design Task are outlined in table I. The outline also serves as the plan or the order in which the subjects will be addressed during the five-year study. The first objective will be to establish a generalized criteria of information to be supplied for model design. Probably one of the most time-consuming objectives will be the detailed investigation of components for NTF models. It is under this objective that the critical material questions will be addressed. One of the more difficult material problems appears to be the use of fillers. Certainly the "body fillers" commonly used in current wind-tunnel testing are not acceptable in the cryogenic environment. If an acceptable substitute is not found, the cost of models could increase significantly.
Although integration of instrumentation into the model design is an objective of this task, the detail design of research instrumentation such as balances will be accomplished by a separate task. It is anticipated that special fabrication techniques will be required to meet some of the NTF requirements; therefore, an ongoing effort will be used to address these problems as they arise from experience in the Langley 0.3-m transonic cryogenic tunnel or from other objectives of the task. As the NTF is planned to be a high productivity facility, there will be requirements imposed on the model design to accommodate work schedules, high data-acquisition rates, and automated c.ontro1.
Late in the study it is planned to design and fabricate a "pathfinder" model using the information learned in the study. To conserve resources and evaluate earlier study results on a real problem, the model will be designed for testing in the Langley 8-foot transonic pressure tunnel but will meet NTF requirements. Finally, it is planned to establish and document design guidelines for NTF model design. At the present time it is anticipated that the design guidelines will be published in a format similar to the recently published Langley ha~dbook "User-Furnished Wind-Tunnel Model Criteria," LHB 8850.1. The guidelines and requirements contained in this handbook will allow the model designer maximum flexibility while insuring the integrity of the models to be tested.
It is planned that the results of the NTF Model Design Task will be documented at least one year before the NTF is operational so that all users will have timely access to the study results.
75

TABLE I
MODEL DESIGN TASK OBJECTIVES
I. Establish a Generalized Criteria of Information to be Supplied for Model Design
II. Establish Specific Representative Design Values for Above Criteria to be Used' in Future Studies
A. Fighter Configuration B. Transport Configuration C. Space Shuttle
III. Determine Specialized Requirements Associated with NTF Environment
A. Components B. Fabrication C. Instrumentation
IV. Investigate (Analytically or Experimentally as Appropriate) Components for NTF Models
76
A. Materials 1. Types
(a) Metals (b) Nonmetals (c) Fillers
2. Properties (a) Mechanical (b) Environmental Compatibility (c) Cost Cd) Availability (e) Others
B. Instrumentation 1. Balance 2. Pressure Techniques 3. Temperature Techniques 4. Other as Required
C. Fasteners D. Devices
1. Motors 2. Bearings 3. Others as Required

V. Investigate (Analytically or Experimentally as Appropriate) Special Fabrication Techniques
A. Review Problems with O.3-Meter Facility and Others B. Determine Capability to Meet Special Requirements
VI. Study Model Elastic Effects
A. Determine Seriousness B. Method of Reduction C. Effect on Model Design D. Other Factors
VII. Determine Model Handling Requirements
A. Facility Compatibility B. Time Constraints C. Model Stability D. Effect of Sting and Instrumentation E. Others as Required
VIII. Design and Fabrication of Pathfinder Model and Sting
A. Design to NTF Requirements B. Design for Testing Langley 8-foot Transonic Pressure Tunnel C. Should be a Research Model (Not Just an Engineering Test Apparatus) D. Fabricate to Test System
IX. Establish Design Guidelines for Model Design
A. Design Margins B. Recommended Materials of Construction C. Facility Constraints D. Recommended Construction Techniques
X. Document Requirements and Recommendations as Appropriate
77

78
TENSILE STRENGTH
REFERENCED TO
2.5
2.0
300 K (80 of) 1.5
'\ '\.
"\.1
LN2 TEMPERATURE
'(6Al-4V TITANIUM
""
i" : '-.. : "
~6061 ALUMI~M- ......... __
: ---- --
ROOM TEMPERATURE
: --: ---_ ......... -: -~
100 200 300 K
-400 -300 -200 -100 o TEMPERATU RE
Figure 1.- Change in tensile strength of typical model construction materials.
1.2
1.0
0.8
PERCENT 0.6 ELONGATION REFERENCED
TO 300 K (80 of) 0.4
0.2
; LN2 TEMPERATURE
1010 CARBON STEEL
-------:::::------::;:::--y. ----~ 316 STAINLESS STEEL
- I 1 / i
/ 1 / 1
/ 1 6Al-4V
TITAN IUM
ROOM TEMPERATURE
O~---------~~~-----------------~----------------J 200 300 K
I I -400 -300 -200 -100 o
TEMPERATURE
Figure 2.- Change in percent elongation of typical model construction materials.

l STRAlN GAGE BAlANCE mrs WING·BOOY INTERFERENCE
BOA n All PRESSURES
Figure 3.- O.3-meter transonic cryogenic tunnel tests.
L-74-5962 Figure 4.- Fabrication of airfoil.
79
--~-----
_I

Page intentionally left blank

INSTRUMENTATION AND DATA ACQUISITION SYSTEMS
Joseph F. Guarino
NASA Langley Research Center
INTRODUCTION
The National Transonic Facility (NTF), with its unique operating characteristics, imposes new and demanding requirements on instrumentation and measurement systems. Cryogenic operation - a new dimension in wind-tunnel testing - high dynamic pressure, and the need for fast data rates are factors which individually or collectively affect virtually all instrument designs and, in some cases, dictate new approaches. Furthermore, the uniqueness of this facility also dictates the need for an extensive tunnel calibration and process monitoring system. Over 2000 individual measurements have been identified to date; these measurements include the traditional tunnel survey and flow-quality measurements and the monitoring o~ critical facility systems and components.
To meet these requirements, a comprehensive and integrated measurement system has been identified and a design and development effort has been initiated to meet the criteria imposed by the NTF operating environment. Specific measurement areas receiving concentrated attention include: data acquisition, force measurement, pressure instrumentation, flow-visualization techniques, model attitude and model deformation measurement, and temperature measurement. A description of the ongoing work in each of these areas is presented with particular emphasis on the approaches being considered and the status of the current work.
NTF INSTRUMENT COMPLEX
Introduction
The NTF instrument complex (fig. 1) will be centered around four 32-bit, l-microsecond-cycle-time central processing units connected in a multipointdistributed network configuration. The principal activities to be supported by these computers are (1) data base management and processing, (2) research measurement data acquisition and display, (3) tunnel and model control, and (4) process monitoring and communication control. The distributed network approach has been chosen to modularize the functional software into definable and imp lemen table parts by the various groups involved in the design and to permit use of similar hardware configurations to improve reliability and maintainability. This design can allow essential processes to continue when primary hardware failures occur by central processing unit (CPU) substitution and elimination of
81

desirable but.nonessential activities. Research measurement data acquisition and tunnel and model control are identified as essential functions.
Data Base Management and Central Processing Unit (CPU)
This 256K byte main memory computer will control all standard peripheral equipment. It will maintain master files of all processors, library routines, user application programs~ archival data for comparison, and logical files of information for the other three computers.
Part of its memory will be shareable and organized so that it can function similar to common memory in a conventional computer system. The 32K-byteshared memory will be more powerful in that read and write control can be selectively exercised from the various other computers. For example, part of this shared memory will be designated as writeable from the research measurement data-acquisition computer. Acquired research measurements will be stored in this shared memory for use by the other computers; however, this part of memory will be read only from the other computers. In this way, the data management CPU can use the data for plotting, listing, etc., while the tunnel con-trol CPU uses the same measurement in control calculations without the possibility of destroying the original value.
Job-entry control will be by means of a standard alphanumeric cathode ray tube (CRT). Two card readers operating at 1000 cards per minute will allow input of logical files to be used by this CPU or passed to the various other CPU's.
Display devices will include two 1000 lines-per-minute line printers. An interactive 10- by l5-inch plotter will provide report quality graphs. A 19-inch interactive graphic CRT will provide online presentation of test progress and will include hardcopy output and floppy-disk storage for retention and comparison of test results.
Recording devices will include three magnetic tape units. These units will be nine-track 800/1600 bits per inch with recording speeds of 60K to l20K bytes per second. Three types of disk units will be used to cover the various mass storage requirements. Floppy disks will be used,to conveniently store user source program files and provide compatibility with CRT plot data files. A medium-capacity high-transfer-rate cartridge disk will be compatible with the disk files used on the other three processors. Storage of 25 megabytes with transfer rates of 200K bytes per second will be typical for these units. The third disk will be the large capacity archival type with over 100 megabytes capacity.
In addition to the shared memory communication with the other processors, a standard input/output (I/O) channel interface or communication channel interface will exist to permit multipoint intercommunication of the systems. This will allow various levels of communications in the software structure to improve system reliability.
82

The data management CPU will also include an interface to the new highspeed pressure measurement system to provide recording and processing of these measurements.
Data Acquisition and Display Central Processing Unit (CPU)
The data acquisition and display CPU, as well as the tunnel and model control and process monitoring and communications CPU's, will each include a 32-bit, l-microsecond-cycle-time, 256K-bytes-memory CPU. Each of these three systems will have an alphanumeric console CRT for system control and a mediumcapacity disk unit for program and local data storage. Accumulated data will be transferred from the local disk to the data management system where it will be either recorded directly if a magnetic tape unit is available or temporarily stored on the archival disk. Since each local disk unit will be of the cartridge type, the data can be physically transferred to the data management CPU and recorded directly after the test, if necessary.
This system will be principally concerned with the management of the 384 research measurements from the tunnel and three static test setup areas. Up to 256 channels will be available to the tunnel test, the remaining 128 channels being shared by the three setup areas. The Data Acquisition Unit (DAU) will acquire data at rates up to50 000 samples per second. Each low-level differential channel will include programable gain ranges from 8 to 64 mV full scale. Antialiasing filters with several different cutoffs from 5 Hz to 1000 Hz will be supplied. Automatic calibration for gain and offset will be under software control. Overall inaccuracy is expected to be no more than 0.1 percent.
An interface to a l4-channel FM tape recorder will permit post-run digitization and playback. Function inputs/outputs will be available to provide controls to powered or movable surface models, drive numeric digital indicators with coefficients, run numbers, Mach numbers, etc., and to accept inputs from user-oriented data acquisition control panels.
Tunnel and Model Control Central Processing Unit (CPU)
The CPU, console CRT, and disk for this system will be as described in the section "Data Acquisition and Display Central Processing Unit." The DAU will be similar; however, it will be limited to a total of 64 input channels. The function inputs/outputs will be interfaced with a group of 10 subprocess controllers which will perform the actual closed-loop control. These subprocess controllers are envisioned as either microprocessors or hybrid dedicated controllers and will be used for control of (1) inlet guide vane, (2) model roll and pitch, (3) spoiler flaps, (4) test-section walls, (5) reentry flaps, (6) pressure, (7) temperature, (8) cooling water flow, (9) liquid nitrogen, and (10) drive speed. Additional inputs will be monitored to insure that hardware interlocks and permissives are in order and that safe operation can be achieved.
Process Monitoring and Communication Central Processing Unit (CPU)
The CPU, console CRT, and disk for this system will be as described previously. The DAU will be much slower - 25 to 100 channels per second. Some inputs will be single-ended ±lOV full scale whereas others are of the low-level
83

differential type. The process variables monitored will include such measurements as tunnel pressure and stress, drive-system temperatures and vibration, power consumption, etc. Function inputs/outputs will drive alarms such as bells and visual displays to indicate out-of-limit conditions.
This system will include'a communication handler to provide access to sources such as the NASA Langley Instrument Research Division for program dev~lopment, test, and debugging, and the central computer complex at Langley Analysis and Computation Division for transmittal of test data for complete data reduction. Several other synchronous and asynchronous lines will be available at rates from 110 to 9600 baud to connect to any national computing facility using major line protocols supported by IBM, CDC, and Univac. This access is believed to be beneficial to groups scheduling tests which require customized processing by permitting machine access for program development and debugging prior to the actual scheduled test. It can also be used to return unclassified data to outside sources concurrent with the ongoing test.
FORCE INSTRUMENTATION
The National Transonic Facility tunnel imposes rather severe requirements on the measurement of aerodynamic forces and moments. Not only does the cryogenic environment present an unusual surrounding for the force balances but also, because of the tunnel's high density capability, the magnitude of the load to be measured is about five times that of a conventional tunnel. Although extending the state of the art, initial studies indicate that a family of six-component high-capacity force balances can be built to satisfy NTF requirements. To cope with the cryogenic environment, thermal protection in the form of a "heat jacket" or resistance heating was considered; however, early investigations indicated that strain-gage balances behave predictably in the cryogenic environment without thermal control.
Balance Loads
The maximum balance loads to be experienced from a typical transport model have been estimated as follows:
Component Load
Normal force N(lb) 86736 (19 500) Axial force N(lb) 6939 (1 560) Pitch moment Nm(in-lb) 2937 (26 000) Roll moment Nm(in-lb) 1762 (15 600) Yaw moment Nm(in-lb) 1762 (15 600) Side force N(lb) 17347 (3 900)
These loads represent the upper extreme of the NTF operating envelope and will seldom be reached; however, a preliminary balance design test was performed that indicates an 8.89-cm diameter (3.5-inch) configuration shown in figure 2
84

could satisfy these requirements with a maximum stress level of less than 689 MN/m2 (100 000 psi). A high-strength alloy steel will be utilized to provide a safety factor of approximately 2.5 based on the yield strength. Since it is unlikely that all listed loads would be experienced at one time, realistically the balance safety factor is greater than 2.5.
A curve illustrating current Langley Research Center (LaRC) high-capacity balance capability is shown in figure 3. A plot of balance normal-force capacity against balance diameter is given; this plot is based on the assumption that all six components are loaded simultaneously. Obviously, if some of the components are reduced, the normal-force capacity can be increased even further. Two immediate consequences of going to extremely high capacity balances are increased balance deflections for a given size and more critical or demanding calibration procedures. With increasing deflections, second-order interactions become more pronounced and make it imperative that cross-load combinations be applied in the calibration procedure. Evaluation of all second-order terms has long been a Langley Research Center policy; therefore, this procedure presents no new requirement.
Temperature Considerations
When the Langley 0.3-meter transonic cryogenic tunnel became operational, an electrical resistance heated strain-gage balance was designed and used to measure the aerodynamic loads. Since water-cooled balances have long been used successfully in high-temperature facilities, it was logical to use a heated balance in a cold facility. Five heating stations with feedback sensors were located along the length of the balance to eliminate gradients. During the actual tunnel runs, it was found to be extremely difficult to maintain or control temperature throughout the balance because the heat-transfer rate changed drastically with angle of attack. Tunnel runs were made at several balance control temperatures; some of the results are shown in figure 4. These data indicate that less balance differential temperature is experienced when no thermal control is used and that, in general, the runs all fell close, that is, within the +O.5-percent full-scale uncertainty quotation of the balance. These loads were measured, however, at the low end of the balance design range; therefore, the percent uncertainty would be greater when referenced to the applied load.
The data obtained in the 0.3-m transonic cryogenic tunnel tests are only part of a more comprehensive balance evaluation and development effort. Several projects are underway to evaluate candidate cements and strain-gage bonding procedures, solders, strain gages, and balance materials for cryogenic operation. Data obtained from standard test beams loaded at room temperature as a baseline, and at reduced temperatures are used to evaluate these factors. In one rather severe test, a beam was loaded while at room temperature and was submerged in liquid nitrogen. The results indicated a decreased output (sensitivity) at the lower temperature as expected; but, more importantly, the data were linear with load and displayed no hysteresis or zero shift. In addition, a conventional balance has been evaluated at various temperatures from 297 K to 77 K (+75° F to -320° F). The results (fig. 5) again show a decrease in component sensitivity at reduced temperatures and a slight change in the two interactions from their room-temperature value. The variation in interactions is attributed to
85

temperature differentials in the balance resulting from a less than ideal test setup. Here again, the balance performed very well and nothing from the test seems to preclude the use of balances at cryogenic temperatures. To compensate for the reduced sensitivity, work is being performed to better match the straingage characteristics with the changing balance material modulus.
In addition, balance material is also being investigated. The usual balance materials, l8-percent nickel grace 300 maraging steel and l7-4PH stainless steel, each have relatively low fracture toughness and impact strengths in the cryogenic region. Some of the candidate materials and their characteristics are shown in figure 6. Maraging steel grade 200 and 250 appear to have high yield strengths and also good impact qualities. Several of the candidate materials will be evaluated and instrumented with selected gages for testing over the NTF operating temperature range.
MODEL PRESSURE MEASUREMENTS
Because of the high operating cost of the NTF wind tunnel, pressure measurements will be taken in either a fast "pitch-pause" sequence or a continuouspitch mode. To accommodate these modes of operation, a pressure measure-ment system with a high data rate is required. This requirement for a high data rate rules out the use of conventional electromechanically scanned pressure sampling techniques and makes it necessary to use individual pressure sensors placed in the model to eliminate long tube lengths and their corresponding slow pressure response. The use of commercially available individual pres~ure sensors is often impractical because (1) pressure sensors that have the accuracy needed are too large, (2) pressure sensors that are small enough to be placed in the model (such as the semiconductor pressure sensors) do not have the required accuracy, and (3) the cost of individual transducers is sometimes prohibitive when hundreds of pressure measurements are needed. These problems have prompted the Langley Research· Center to develop for the NTF (and its other wind-tunnel facilities) a pressure sensor module that largely overcomes the above-mentioned drawbacks of size, accuracy, and cost. This module utilizes miniature silicon diaphragm pressure sensors, miniature electronic multiplexers, a miniature multiport, and a pneumatically operated pressure selector switch to achieve small size, high data rate, and high accuracy through a full in situ calibration capability.
A photograph of the first generation of these pressure sensor modules is shown in figure 7. This module consists of a substrate containing 16 solidstate pressure-sensor chips and signal, multiplexing electronics (shown in figure 8) mounted to a four-position pressure selector switch. The use of silicon diaphragm pressure sensor chips as the pressure-sensing elements allows the sensor substrate to be made very small (4.3 cm by 2.48 cm by 0.1 cm) and at the same time give high sensitivity. By using miniature electronic multiplexers to sample the sensor's analog output, the sensor's output can be electronically scanned at a high data rate (in excess of 50 000 measurements per second) and large numbers of wires are eliminated. The pressure selector switch occupies most of the volume of the sensor module but is absolutely necessary in order that a full in situ calibration of each sensor be made. Thus, corrections
86

for zero and sensitivity shifts usually associated with these semiconductor sensors can be made and an acceptable accuracy be obtained. This firstgeneration pressure sensor module, in addition to the calibration position, can be switched to three "use" positions where 16 sets of pressure. ports can be measured. This scheme allows 48 pressure ports to be measured with 16 sensors by pneumatically multiplexing the input pressure ports to the sensor substrate board. However, when all 48 channels are used, a data rate of only approximately 800 samples per second (SPS) is possible, because it takes about 20 milliseconds to pneumatically multiplex the pressure selector switch. When it is used as a l6-channel pressure sensor module, only two positions of the pressure selector switch, the calibrate and one "use" position are used. This operating mode allows the sensors to be calibrated in less than 1 second and then switch to one of the "use" positions where the 16 sensors can be read out at a rate of greater than 50 000 SPS. The use of the pressure sensor module for 16 measurements rather than 48 allows a much higher data rate, but causes. a threefold increase in sensor volume per channel.
The design for this first-generation general-purpose pressure sensor module was adopted after considering tradeoffs between size, data rate, accuracy, part count, repairability, cost, and reliability with the constraint that only existing and readily available technology be employed. A second generation of these pressure sensor modules is planned for use in the NTF. These modules will have only a two-position selector switch - one position for calibration and one for measurements of unknown pressures. The pressure selector switch* for a l6-channel module that has been developed is roughly one-third the size (1.2 cm by 2.5 cm by 1.5 cm) of the first pressure switch*. The sensor substrate for this module will be of a monolithic design with the 16 sensors etched into a silicon substrate 1.2 cm by 2.5 cm by 0.05 cm in dimension. Modules of this design can be ganged together to provide as many channels as necessary.
The large number of sensors involved, the high data rate required, and the need for controlling and addressing of the pressure sensor modules have also prompted LaRC to develop a special-purpose, computer-oriented data acquisition and control system for use with these modules. A block diagram of this pressure measurement system (PMS) is shown in figures 9 and 10. It is essentially a stand-alone computer-based data acquisition and processing system that is treated as a peripheral for pressure measurements by the central computer. The PMS is controlled by the researcher (through the central computer) by an instruction set that allows various modes of operation (each with several options) to be selected. The PMS is also modular and thereby allows the system to be expandable from a minimum size of 256 ports with 25K data storage capacity to a maximum size of 3584 ports through the use of 14 data acquisition and control units (DACU), each with 25K of storage. The maximum data rate of each DACU is 50 000 SPS. Higher system data rates can be achieved by parallel operation of the DACU's. The DACU's also have a preprocessing capability that allows data averaging and statistical analysis to be performed before the data is transferred to the central computer.
*Pressure selector switches were developed for Langley Research Center by the Scanivalve Corporation, San Diego, CA.
87

Various parameters for the PMS are shown in figure 11 for 300 and 1000 pressure-port operation. For the 300 pressure-port operation, two DACU's, each utilizing 150 ports would be used. This configuration allows 166 measurements per port to be taken in 0.5 second at a data rate of 100 000 SPS (twice the basic data rate of 50 000 of the DACU since two DACU's are being used) for a total of 50 000 measurements stored in the two DACU's. Time between measurements on the same port is 3 milliseconds. For the pitch-pause mode of operation with a 2.5-second period for each pitch-pause sequence, the data would be averaged and the standard deviation computed during the pitch phase; these 333 data points will be transmitted to the central computer for display and analysis storage. For a 1000 pressure-port operation, four DACU's, each utilizing 250 ports, would be used. This configuration allows 100 measurements per port to be taken in 0.5 second at a system data rate of 200 000 SPS. for a total of 100 000 data points. The lapse time between measurements on the same port is 5 milliseconds. As before, these data would be averaged and th~ standard deviation computed during the pitch cycle, and the results transmitted back to the central computer. In both the 300- and 1000-port operation, the electronic scanning pressure (ECP) modules would be calibrated before and after each polar.
For a continuous pitch operation, the sensor modules would also be calibrated before and after each polar. Calibration coefficient data and the raw pressure measurement data for the continuous-pitch mode of operation would be transferred from the DACU's after each polar to the central computer for processing, display, analysis, and storage, since the PMS has a limited processing capability. This data transfer would take less than 1 second. For the 300-and 1000-port operation, a total of 166 and 100 pressure measurements per port, respectively, would be taken for each polar. Selected pressure measurements can be displayed during the test.
The Langley Research Center is developing a special-purpose pressuremeasurement system that will allow measurement rates several orders of magnitude greater than those currently obtainable with electromechanical pressure sampling type and with no loss of measurement accuracy. This system is characterized by in situ calibration, small size, high data rate, stand-alone operation, modular design, and a user-oriented software instruction set. This system will allow either pitch-pause or continuous-pitch operation.
FLOW VISUALIZATION
The current NTF design does not include any flow-visualization systems for initial operation. However, to insure the ability to incorporate such systems in the future, work is underway on the conceptual design of a schlieren system and a laser velocimeter system compatible with tunnel design constraints.
The principal constraint on the schlieren system design is the requirement that it be completely contained within the tunnel plenum. Because of the cryogenic environment, the schlieren system components will be housed in environmentally controlled cylinders mounted on each side of the test section. The design will permit the cylinders to be traversed for alinement and desired
88
viewing positions. Conceptually, the present design (fig. 12) uses 61 cmdiameter (24-inch) f/5 parabolic mirrors. The cylinders will be insulated and the internal pressure equalized with the plenum static pressure. Positioning of the elements of the system will be accomplished by remote control. Quartz windows with diameters of 61 cm (24 inch) will be used in the cylinders. These windows will be subjected to severe thermal shock and must function with a large temperature gradient across them without degrading the quality of the schlieren image. An experimental program, utilizing a specially designed test apparatus, is currently underway to investigate these effects. Future activities will include study of component alinement requirements, vibration and mounting effects, and insulation and temperature control requirements. The end product of these studies will be the design criteria required for developing a final schlieren system design for NTF.
Similar design constraints are imposed on an operational laser velocimeter (LV) system for NTF. Mounting of the system components in environmentally controlled cylinders as described for the schlieren system will be required. The LV system installed in the schlieren system cylinder will provide measurements of the u- and v- velocity components. Obtaining the u components presents a major problem. The problem arises because the presently envisioned method for obtaining this measurement requires an additional laser-optics package, containment cylinder, supporting mechanisms, and viewing ports in the overhead or floor area of the test, section. This location is prohibited and therefore an alternate scheme must be developed. Also of primary concern, and an item which will be investigated is the development of a suitable and acceptable "seeding" technique compa'tible with the cryogenic flow medium in NTF.
MODEL ATTITUDE
The traditionally difficult model-attitude measurement problem is compounded by the cryogenic environment in NTF, the need for fast response for efficient tunnel operation, and the new requirement for measuring both pitch and roll angles simultaneously as dictated by the two-degree-of-freedom sting motion. Two basic approaches are being pursued for this measurement. These include the application of inertial sensors, which is the most common technique employed at LaRC and elsewhere, and the development of an optical angle sensing system.
The inertial sensor approach would require three sensors encased in an environmentally controlled container to be mounted in the model to provide both pitch and roll sensing. Also included would be a precision electrolytic bubble sensor to serve as a "zero" reference. This approach is straightforward and relies on existing and known techniques. However, the principal disadvantages of this approach include the relatively large size, the slow signal-response characteristics (resulting from required heavy signal filtering), and limited accuracy due to susceptibility of the inertial sensor to vibration.
Optical techniques show a great deal of promise for model attitude measurement. Their principal advantages include: fast response, high resolution and accuracy, insensitivity to vibrations, and remote sensing capability
89

requiring only minor model space or interference. Two basic approaches are under study. The first employs a differential photocell mounted in the model surface and illuminated by a laser light source located in the plenum. It may be possible to configure the optical sensor to measure angles about both axes; thus, the simultaneous pitch-roll measurement requirement is satisfied. Future work will be directed toward developing techniques for increasing the current range from +5° to the required values in NTF (+45°) and to developing temperature~tolerant photosensors or thermal protection techniques. A second, and very promising approach, is basically an interferometric system offering very high accuracy, good range, and very fast response characteristics. Only a passive reflector is required on the model, most of the optics and electronics being located in the plenum. This approach differs from other interferometric systems in that it is basically insensitive to tunnel-flow perturbations. A private firm is currently working on a proof-of-concept system at Langley's request. A test will be conducted in the near future, the results of which will determine future effort and the required funding to develop a prototype system.
MODEL DEFORMATION MEASUREMENT
Model deformation measurements at Langley have in the past been restricted to double exposure photography. (See ref. 1.) More recently, stereophotography has been used at the Langley 8-foot transonic pressure tunnel for wingdeformation measurements with an accuracy of about 0.125 mm. Other techniques which have been advocated such as interferometry (both conventional and holographic), geometrical techniques (including Moire fringe methods), and modulated light-beam methods have had little or no success in actual wind-tunnel tests. Several of the techniques rely heavily on recently developed technology in semiconductor lasers and photodiodes.
Since various groups across the country are actively working on the interferometric and geometrical methods, the effort at Langley has been directed toward the modulated, light-beam technique. In this technique, a light source (such as a laser diode) is amplitude-modulated at-microwave frequencies. The phase of the received light reflected from the target'mounted on the model is then compared with the phase of the transmitted light to provide displacement. This technique is currently in use in several surveying instruments (ref. 2) but these instruments are neither accurate nor versatile enough for direct application to NTF.
An earlier prototype system at Langley employed a light-emitting diode and an avalanche photodiode (ref. 3). By use of a retroreflector, laboratory displacement measurements were made at a modulation frequency of 1.5 GHz at a range of 1 meter. The present laboratory setup (fig. 13) consists of a commercially packaged laser diode which can be operated as a continuous wave at room temperature. A high-frequency signal from a 50-ohm output impedance signal generator (after impedance matching to the low dynamic impedance of the diode) is used to modulate the output of the laser diode about its dc bias point. A XlO microscope objective is used to quasi-collimate the 8200° A laser light. The light is directed to a 90° prism which folds the beam 180° and introduces
90

a slight spatial offset. The return beam is focused and directed to the active area of the PIN photodiode. Movement of the 90° prism along the optical axis introduces phase shifts in the return beam which can then be compared with the phase of the outgoing beam. With this system, modulation frequencies of up to 2.4 GHz have been used.
The phase difference has been measured in several ways. The most direct way is to feed a small part of the signal that is used to modulate the laser to one channel of a high-speed dual-trace oscilloscope while feeding the signal from the photodiode to the other channel. By triggering both channels from the reference modulating signal, the phase of the signals can be compared. Phase differences on the order of 3° can be detected by using this method, which for a 500-MHz modulating frequency corresponds to a resolution of 2.5 mm. The two signals can also be mixed with a dc-coupled mixer. The dc output of the mixer is proportional to the phase difference. Another way to determine the phase is to frequency downshift both the reference and phase-shifted signals (to about 100 kHz) with a common local oscillator. The phase of the two downshifted signals is then compared with a commercial phasemeter with a resolution of 0.1°. This more accurate means of monitoring phase showed the phase difference between the two beams to drift with time. Both modulator and detector introduce phase shifts which vary with time and temperature (ref. 2). For this reason it is more accurate to measure phase by comparing the modulated reference and signal light beams directly. This can be done by superimposing the two light beams at the detector. Since the instrument is not being operated in an optical frequency interferometric mode, alinement and beam path mismatch are not critical. When the light arriving at the detector from the two beams is in the phase, a maximum output from the detector occurs.
In conclusion, it should be emphasized that while laboratory studies are currently being restricted to the modulated-light method, other techniques may be considered. Comments and suggestions on other remote displacement measurement systems which might be applicable to NTF are invited.
MACH NUMBER MEASUREMENT
The accurate determination of the operating Mach number in the NTF to within a ~M of +0.002 is complicated by very wide pressure range of 35 x 103 to 896 x-l03 N/m2 (5 to 130 psia) to be covered and the rapid pressuresensing response necessary to minimize operating costs. In addition,the control of Mach number to within this ~M tolerance requires a pressure measurement uncertainty of no greater than 400 N/m2 (0.06 psi) when the total pressure is 480 kN/m2 (69.6 psia). However, pressure measurement instrumentation, such as manometers, fused-quartz-type gages, and other types, which can satisfy this measurement requirement suffer from limited frequency response.
Research is underway to evaluate the dynamic characteristics of an electronic mercury manometer and to identify other pressure measurement problems which may affect the performance of the National Transonic Facility. Automation of the NTF tunnel operation can lead to maximizing data production while minimizing tunnel operation cost. To maintain such tunnel parameters as Mach
91

number, dynamic pressure, etc., automatic control regulation is necessary. Inherent in the control loop are transducer dynamics as well as the tunnel characteristics. In the case of pressure-related regulation, where required measurement accuracy may be less than 24 N/m2 (0.5 psf), mercury type manometers are best suited. For the manpmeter selected, the response to a 2400 N/m2 (50 psf) pressure change requires about 6 seconds to settle to within the required accuracy limits. In question, then, is how to maintain the accuracy of parameter regulation with a minimum of settling time to required accuracy limits. In this work, a manometer dynamic model was developed and experimental data provided which demonstrated the feasibility of predicting the manometer's dynamic input from the manometer output by means of the generated model. This demonstration suggests a viable approach to eliminating substantially the manometer dynamics from the control-loop characteristics.
From experimental data, two representative models of the manometer were developed. For small disturbances, a linear, second-order relation was found. For large dynamic input changes, a nonlinear first-order relationship was developed. The data supporting the models indicate the relatively large settling time and response lag to input pressure changes.
The manometer is a U-tube type with a built-in restriction in the base of the U. The gross effect of this restriction is to create drag on the flow of the mercury proportional to the square of the flow rate. In addition, analysis of experimental data indicates that this damping effect virtually dominates any inertial terms in the dynamics of the manometer.
Employing these empirically developed dynamic response equations, the feasibility of input pressure prediction was demonstrated by simulation of the response algorithm on experimental data with a computer (fig. 14) for a pressure change of about 1000 N/m2 (20.9 psf). In all cases, the predicted input did remarkedly well, especially in the presence of large rate of changes. The raggedness of the predicted signal is a result of insufficient quantization in the transient recorder. Th~ eight-bit quantization allowed ±10 N/m2 (0.2 psf) uncertainty. This uncertainty plus the conversion uncertainty through the BCD digital-to-analog ~onverter created a net ±14 N/m2 (0.3 psf) uncertainty in recording M. Similar data for a sinusoidal, 0.16 Hz, changing pressure is shown in figure 15.
Experimental data and analysis have yielded a reasonable dynamic model for the manometer. From this model, experimental results have shown how the dynamic characteristic of the input can be estimated from the output of the manometer. By using better quantization, the prediction model should perform even better. With refined digital recording and analytical techniques, the nonlinear model coefficient could be more accurately identified.
The significance of employing a predictor is that the gross dynamic effect of the manometer is virtually removed from the closed-loop control. Directly, the control systems' bandwidth would be raised; thus, faster response to pressure parameter disturbances is allowed. In addition, the predictor could provide accurate pressure indication prior to the manometer having completely settled out. Either of the above-mentioned features would result in timeresponse improvement in the tunnel-data acquisition test point interarrival time.
92

Other high accuracy instrumentation such as all-electronic servoed fused quartz gages and resonating quartz crystal transducers will be evaluated to determine their applicability to this measurement problem.
TEMPERATURE
The basic technology covering temperature measurement over the NTF operating range is well established and offers a variety of applicable sensing techniques. Consequently, the principal effort will be directed at evaluating and selecting specific approaches tailored to specific measurement applications and developing an in-house expertise and application capability in the cryogenic temperature measurement domain.
The experience gained in temperature instrumentation of the Langley 0.3-meter transonic cryogenic tunnel is a confident foundation for this effort. Nevertheless, problems such as sensor life and calibration accuracy might be anticipated.
REFERENCES
1. Yates, E. Carson, Jr.; and Gibson, Fredwick W.: Some Wind-Tunnel Measurements of Effects of Aeroelasticity on Transonic Aerodynamic Characteristics of a Supersonic Transport. NASA TM X-l098, 1965.
2. Bullock, Michael L.; and Warren, Richard E.: Electronic Total Station Speeds Survey Operations. Hewlett-Packard Journal, April 1976, pp. 2-12.
3. Holmes, Harlan K.: Remote Displacement Sensor Using Microwave Modulated Light. Thesis, University of Virginia, August 1969.
93

94
RECORDING
DATA ACQUISITION
a DISPLAY CPU
DAU
MODEL CONTROLLER NUMERIC DISPLAYS PANELS DAC'S
1-------384 RESEARCH a MODEL PREPARATION MEASUREMENTS
DATA BASE MANAGEMENT a
PROCESSING CPU
SHARED MEMORY
DAU
TUNNEL a MODEL
CONTROL CPU
PERMISSIVES INTERLOCKS
CONTROL SUBPROCESSOR
1----64 1-------10 CONTROL CONTROL MEASUREMENTS SETPOINTS
Figure 1.- NTF instrument complex.
8,89cm. DIA.
DAU
DIS!:LAY
PROCESS MONITORING
a COMMUNICATION CPU
ALARMS
COMMUNICATION HANDLER
1----320 PROCESS MEASUREMENTS
1---5 NATIONAL ACCESS
7.62cm. DIA.
~-----------------------------------56cm.------------------------------------~
SIMUL T ANe;OUS LOADING
NORMAL, N AXIAL, N PITCH, Nm ROLL, Nm YAW, Nm SIDE, N
*86736 * 7784 * 3389 * 2260
* 1977 *44480
(195001b ) (I 750lb )
(30 000 In-Ib ) (20000 In-Ib ) (17 500 In-lb. ) (10000 lb.)
Figure 2.- NTF 86.7 kN (19 500 1b) balance.
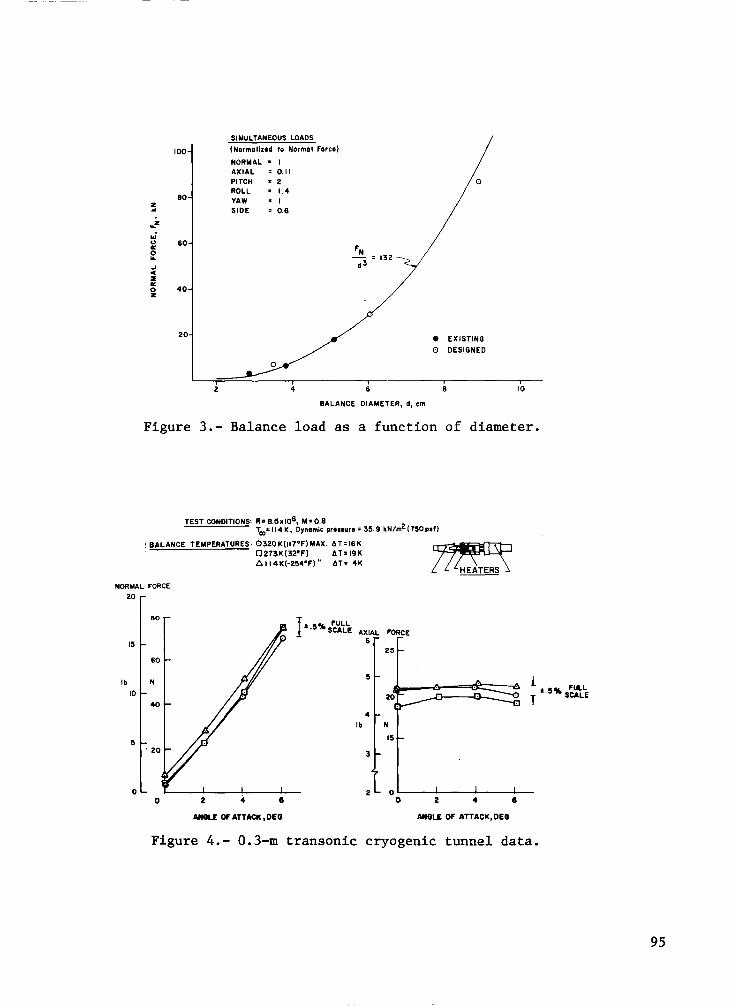
100
eo
~
... z
..; u 60
'" 0 ... .J C ::I
'" 0 40 z
20
SIMULTANEOUS LOADS
(Normollzed to Normol Forel)
NORMAL = I AXIAL 0.11 PITCH • 2 ROLL 1.4 YAW . I SIDE 0.6
4 6
BALANCE DIAMETER, d, cm
o
• EXISTING
o DESIGNED
10
Figure 3.- Balance load as a function of diameter.
TEST CONDITIONS' Ra e.Sxl06, M=O.e Tco '"4K, Dynamic pr .. og,,: 35.9 kN/m2 (750 pol)
~ BALANCE TEMPERATURES' 0320K(1I7°F)MAX. IIT:16K D273K(32°F) II T= 19K 6 114K(-254°F) " liT: 4K
NORMAL FORCE 20
15
Ib
10
5
0
80
60
N
40
, 20
0 2 • ANGLE OF ATTACK ,OEQ
I· .5% s~~ti AXIAL FORCE 6
25
20
4 Ib N
15
3
0 0 2 4
ANGLE OF ATTACK,DEII
•
1 5% FULL T •. SCALE
Figure 4.- O.3-m transonic cryogenic tunnel data.
95

NORMAL SENSITIVITY, mV
4.7
4.6
4.5
4.4
100
0 0
150
PITCH INTERACTION ON NORMAL FORCE,
percent normal force
'Ot 0 0 loti
I 100 150
0 0
200 250
0
0
I I 200 250
TEMPERATURE, K
0
300
0
I 300
PITCH SENSITIVITY, mV
100 150 200 250 300
NORMAL FORCE INTERACTION ON PITCH, percent pitching moment
8.0
o o 7.5 o
7.0
o o
100 150 200 250 300
TEMPERATURE, K
Figure 5.- Balance laboratory calibration as a function of temperature.
Material Yield strength (MN/m2) at - Charpy impact strength, Nm at -
298 K 78 K 298 K 78 K
Maraging 200 1427 1793 49 38
Maraging 250 1758 2206 26 16
Maraging 300 2000 2427 23 15
Titanium alloy 917 1475 52 19
Beryllium 1034 1275 8 8 copper alloy
17-4PH 1241 1675 41 5
Figure 6.- Materials under consideration for balance cryogenic application.
96

L-75-7317 Figure 7.- 48-channe1 pressure sensor module.
L-75-7316 Figure 8.- Pressure sensor substrate board.
97

I/o master computer
Host controller GP-IB bus
GP-IB" General purpose interface bus
16/48 Px " either the 16 port or 48 port module
Px " port number
ESP sensor modules
DACU* 1
DACU* 2
• • •
DACU* ..... E-----I 14
*Data acquisition and control unit
• • •
16/48 Px .---, A 16/48 Px
16/48 Px
16/48 Px
16/48 Px
16/48 Px
16/48 Px
, w, ........ _ 16/48 Px
16/48 Px
Figure 9.- Prototype electronic scanning pressure (ESP) measurement system.
98
GP-IB interface
Control panel
Read only memorylROM)
system firmware
I/o bus Microprocessor
Random access memory(RAM) data storage
up to 25K
ESP = Electronic scanning pressure
Sensor Sensor bus control
Analog front end
Ul ;:l
..0 A/D a converter (1) .... Ul
~
Pressure standard
Sensor positioll Calibrate
'-----I control Position
Figure 10.- Data acquisition and control unit (DACU).
ESP 1
ESP 2
ESP 3

Total number of pressure ports 300
Number of DACU' s 2
Number of channels/DACU 150
DACU data rate, measurement/sec 50 000
System data rate, measurement/sec 100000
Maximum number data points/Pressure port 166
Lapse time between measurement on some port, msec 3
Calibration time, sec 1
Figure 11.- Typical operation of pressure measuring system for 300 and 1000 pressure ports.
____ ----.JI ~ ~--.::-~.j - Schlieren light source module
Tunnel windows
Schlieren data and viewing module
1+
1M
Schlieren housing
Schlieren system for Langley 0.3-meter transonic cryogenic tunnel
Test section 20.3 x 61 cm (8 x 24 in) rectangular
Figure 12.- NTF schlieren concept.
1000
4
250
50000
200 000
100
5
1
99

1200
1000
800 C'<I
S Z-as 600 M ::s fJl fJl III M Po
400
200
o
100
Signal generator
1.0
dc bias and temperature control
Pin photodiode
Figure 13.- Laboratory setup.
M
2.0 3.0
Time, sec
Figure 14.- Step-response data.
• •
25
20
.... 15 III 0-
as M
p - Input pressure 61 III
p* - Predicted input III M
10 Po M - Manometer output
5
o 4.0 5.0

1200
1000
,800
400
200
o 2.0 4.0 6.0
Time, sec
p - Input pressure p* - Predicted input M - Manometer output
8.0 10.0
Figure 15.- Sinusoidal (0.16 Hz) response data.
25
20
5
o
101

Page intentionally left blank

INTRODUCTION TO WORKSHOP PANEL SESSIONS
Richard E. Kuhn
NASA Langley Research Center
Lloyd Jones in his theme paper fully covered the problems that identified the need for a new transonic tunnel which could attain full-scale Reynolds numbers. Robert Howell and others have reviewed the National Transonic Facility, its capabilities, and the cryogenic principle on which .it is designed.
The purpose of this workshop is to bring together the collective thoughts, ideas, and concerns of experts in the various technical disciplines that need and can use the capabilities of this new facility. Toward this purpose this workshop has been organized into five panels:
Fluid Mechanics
Applied Theoretical Aerodynamics
Configuration Aerodynamics
Propulsion Aerodynamics
Dynamics and Aeroelasticity
Each panel member is requested to consider the needs for high Reynolds number testing within his area, to exploit the capability of the NTF as a tool in these investigations, and t~ provide a "first cut" at a recommended program for the NTF.
In identifying such a program it will be desirable to identify a number of specific investigations. It is requested that. each investigation be identified by a title along with the following information:
(a) Statement of the objective
(b) Brief review of the background and need or justification of the investigation
(c) Identification of special considerations unique to the discipline and investigation
(d) A review of precursor work that should be done prior to the availability of NTF (including work that could be done in the present Langley 0.3-m transonic cryogenic tunnel)
103

(e) Comments as to the extent to which work should be undertaken "inhouse" by Langley or as a grant/contract activity.
It is almost a certainty that the panels will produce a suggested program which will be more than can be accommodated in the early operational schedule of NTF, and it will be necessary to establish priorities for the items of the recommended panel program. The roundtable discussion at the conclusion of the workshop should provide a further assessment of research priorities. The primary assignment of the panels is to identify the important research and the work needed to prepare for it.
The output of this workshop will be sent to all participants in the form of a Conference Publication (CP). At some time in the future, after the Langley staff has had a chance to assimilate the workshop recommendations and to progress toward initial NTF operation, a follow-up meeting to this· workshop is planned for a more complete review of the initial research progress for NTF.
104

FLUID MECHANICS PANEL
Chairman Alfred Gessow
Vice-Chairman Edward Polhamus
Technical Adviser Samuel Katzoff
Panel Members
Seymour Bogdonoff John Peterson
Ivan Beckwith William Rae
Albert Braslow Eli Reshotko
Dennis Bushnell Frank Steinle
Eugene Covert Thomas Weeks
Robert Kilgore
105

Page intentionally left blank

INTRODUCTORY REMARKS
Alfred Gessow
NASA Headquarters
On a number of occasions such as this, one of the many advantages of representing the fluid mechanics research area is that it generally puts one at the beginning of the program agenda with its attendant benefits. Fluid mechanics has such a place, of course, because it deals with fundamentals which underlie the various aerodynamic specialties. In order to avoid extensive overlap with the other panels, it is suggested that the fluid mechanics area be considered as concerned with research to provide insight and understanding of phenomena involved in practical aircraft problems. By contrast, the rational use of data generated from the applied aerodynamics areas is limited only to the specific configuration tested and to the range of parameters covered. Thus, the approach to testing in fluid mechanics is to obtain generalized information, which in many cases can be obtained by the use of simplified models and idealized configurations.
In considering the test programs for the National Transonic Facility (NTF), the unique capabilities of cryogenic tunnels and the NTF in particular (fig. 1) should be kept in mind and taken advantage of. Obviously, the tests should explore high Reynolds number effects. More than that, however, and in contrast to the manner in which tests are run in existing tunnels, the tests should investigate viscous (that is, Reynolds number) effects independently of compressibility effects or aeroelastic distortion. This unique capability of the cryogenic tunnel is illustrated in figure 2 where it can be seen that the ratio of the test-section dynamic pressure q to the model modulus of elasticity E can be held constant as Reynolds number is increased. This test capability eliminates the variation of model shape with changing Reynolds number that occurs in noncryogenic tunnels. In addition, although of lesser priority, studies should be made of compressibility (that is, Mach number) effects independently of Reynolds number or aeroelastic effects (fig. 3).
With the preceding thoughts as a guide, suggested fluid mechanics research areas for the NTF are listed in figure 4. The basic problems shown in the top grouping are ubiquitous phenomena which underlie almost all practical aerodynamic problems that arise in the design of modern aircraft. The second grouping of items are tunnel-related effects which tend to obscure the aerodynamic results obtained in conventional tunnels. By investigating and isolating such effects in the NTF, it should be possible to increase the usefulness of existing tunnels. The third item listed in the figure emphasizes the importance of using the new tunnel for experiments which are expressly designed to provide empirical inputs or validation data for computational aerodynamics. To the extent that the future can be predicted at all, it seems clear that aerodynamic theory is becoming less of an adjunct and more of a partner to experiment in aircraft design, and this role must be recognized through more selective test programs which take fullest advantage of the capabilities of both partners.
107

Detailed test programs should be examined and proposed for all the areas listed in figure 4. These programs can be illustrated briefly with a few examples. Turbulent skin friction must be looked at in the manner shown in figure 5. Of all the parameters shown, flat-plate Reynolds number effects are most basic, and an extension of the test data shown in figure 6 should be considered as an early priority.
Data are needed on the detailed characteristics of the turbulent boundary layer prior to, during, and following the interaction with a shock wave. The most useful information might be that obtained in a systematic investigation at both high and low Reynolds numbers on a supercritical airfoil of current interest (fig. 7). Specifically, the following boundary-layer characteristics are of interest: effects of Reynolds number on shock location, effects of chordwise extent of supercritical flow and Reynolds number on trailing-edge separation, and effects of Reynolds number on off-design characteristics. Although, for the case shown, the two-dimensional transonic theory shows changes in shock location to continue at Reynolds numbers beyond NTF capability, it should be noted that a most important part of the investigation could probably bE carried out two-dimensionally in the Langley 0.3-m transonic cryogenic tunnel. Obviously, it should be kept in mind that the smaller cryogenic facility or other existing facilities should be utilized to the greatest extent possible for "precursor" testing in order to reduce the test load on the NTF.
In addition to shock-induced separation, viscous separation resulting from cross flows is extremely important in high-angle-of-attack flight dynamics for both aircraft and missiles. As shown in figure 8, Reynolds number can change drastically the forces and moments acting on both simple two-dimensional bo'dies and complete aircraft. These two cases are related to the same phenomena, and basic studies on the nature of viscous separation at high Reynolds number and high subsonic speeds are very much in order. Another type of flow separation is shown in figure 9, in which the separation occurs at the leading edge of delta wings. In such cases of pra~tical interest, the separation leads to a vortex system which provides large vortex-lift increments and greatly alters the pressure distribution over the wing and thus dominates the flow field. For rounded leading edges, the effect of Reynolds number on the vortex-lift characteristics can, of course, be very large and high Reynolds number data are needed. However, even for the sharp-leading-edge case" illustrated in figure 9, the effect of Reynolds number on the secondary vortex can be appreciable for the very slender wing case. For this case high Reynolds number data are needed to establish the full-scale surface load distributions and to verify the suction analogy theory as the true asymptote for the overall lift. Generalized research is needed in this area to investigate such phenomena as primary and secondary vortex separation and reattachment, vortex breakdown and asymmetry, and multiple (that is, fuselage and wing) vortex interference.
An example of the potential of the NTF to evaluate and improve the capability of existing transonic facilities is shown in figure 10. This figureshowE that the wide range of temperatures available in the NTF can be used for tunnelwall interference studies by testing models of various sizes at constant Mach and Reynolds numbers and constant dynamic pressure. (Interference studies
108

in existing tunnels, in contrast, would involve extraneous aeroelastic or Reynolds number effects in attempting to use the large and small model approach.)
It is appropriate to conclude these remarks with a reminder that dynamicpressure changes during Reynolds number tests in conventional tunnels may mask or dominate true Reynolds number effects. Examples are shown in figure 11. In the left side of the figure, the aeroelastic deflection of the aft portion of a supercritical airfoil model is shown to cause a significant shift in chordwise shock location. In the right side of the figure, the increase in dynamic pressure which was required for a modest increase in the Reynolds number from 2 x 10⁶ to 3 x 10⁶ resulted in a change in aeroelastic distortion sufficient to cause a large forward movement of the shock, instead of the aft movement which would be expected from the increase in Reynolds number. Thus, the NTF with its unique ability to isolate effects of Reynolds number and aeroelasticity will provide information that will aid in the proper interpretation of data obtained at lower Reynolds numbers in conventional tunnels.
PANEL CONSIDERATIONS AND RECOMMENDATIONS
Samuel Katzoff
DEGREE OF EFFORT IN BASIC STUDIES
In most NASA wind tunnels, even in those that are heavily involved in studying specific configurations, a certain amount of effort is devoted to fairly basic studies. Such studies, which are often suggested by the results of the configuration tests, are made not only to help understand the results of the tests but also to obtain information applicable to other configurations. In a unique national facility like the NTF, however, the pressures for ad hoc testing may be so strong that studies directed toward understanding the basic aerodynamic phenomena and thus generalizing the results of the ad hoc tests could be forced into very low priority. Long-term gain would thus be sacrificed to immediate needs.
These anticipated pressures ought to be resisted to the extent necessary for relevant basic studies. Where feasible, the configuration studies themselves might be extended in order to clarify the aerodynamics associated with the measurements. More basic studies with special, idea~ized models must also be included. It is estimated that 10 percent to 15 percent of the total time and effort could profitably be dedicated to such basic studies.
WIND-TUNNEL CALIBRATION
For a wind tunnel like the NTF, which is intended to provide very exceptional capabilities, the nature of the test-section flow is a matter of
109

particular moment. A number of items in the NTF design and in its anticipated characteristics merit special consideration in this regard.
The high anticipated noise level at full power, 150 dB, has occasioned concern that the noise could ,affect boundary-layer transition or separation, although turbulent skin friction would not be affected. Actually, present information indicates that a nominal 150 dB level is somewhat too low to affect transition although the certainty of this conclusion may somewhat depend on the noise spectrum. When the superimposed effects of stream turbulence and tunnel vibration are considered, however, any reduction in noise level would be reassuring. Some help may be available from noise-reduction experience at other facilities (Arnold Engineering Development Center (AEDC); also some British wind-tunnel work). Rounding the test-section slots is also known to reduce noise. In any case, the NTF noise spectrum should be determined for both the slots-open and slots-closed conditions, and a similar determination should be made for the Langley 0.3-m transonic cryogenic tunnel.
The settling chamber in the present design is considered somewhat too short to achieve much smoothing out of a very rough and irregular entering flow. Three screens may not suffice to eliminate the remaining roughness and flow nonuniformity and to provide a smooth, low-turbulence test stream. This problem should be thoroughly studied well before the tunnel design is fixed, probably with the aid of a model tunnel.
In the conversion of the Langley 19~ft pressure tunnel to the present Langley transonic dynamics tunnel (TDT) , the enlarged nacelle caused some degradation of the flow in the long return leg; however, model tests showed where to install a low-pressure-drop screen in this leg in: order to prevent separation of this flow. No reduction in tunnel efficiency seemed to result from installation of this screen. Another method of avoiding boundary-layer separation on the wall of a return passage is to use the pressure of the air (or gas) in the tunnel to blowout some of the boundary layer through slots just ahead of the separation region.
To some extent, comparison of data obtained in the NTF with reputable data previously obtained in other high Reynolds number wind tunnels will aid in certifying the NTF and its test techniques; however, good agreement at lower Reynolds numbers cannot be assumed to extend to the higher Reynolds numbers that only the NTF can attain, especially since the tunnel noise and vibration increase rapidly as maximum power is approached. For these studies it would be advisable, at subcritical Mach numbers at least, to make measurements both with the test-section slots open and with the slots closed. In the latter condition, the noise, and perhaps flow irregularity and turbulence, should be reduced so that the flow deterioration in the slots-open condition could be thereby evaluated.
One test article that is now available for intertunnel comparisons is the 10° cone that Steinle and Dougherty have been testing in various facilities. Other suitable models should also be available.
Precise relationships of stream turbulence characteristics to transition and separation may not now be clearly defined. In any case, a thorough study
110

of the turbulence and other flow nonuniformities in the test section, as a function of pressure, temperature, and Mach number, and with slots open and closed, ought to be included in the initial tunnel calibration. Furthermore, periodic recalibration of the tunnel is advisable since tunnel characteristics may change with time.
Finally, it should be noted that tunnel calibration will be intimately involved in other research areas (for example, skin friction and wind-tunnel interference). Hence, it will hardly be considered as a finished project after the initial calibration studies have been made.
FLAT-PLATE SKIN FRICTION
An important fundamental study, which would also tie in with the tunnel certification, is the determination of skin friction on a flat plate. Present data extend to Reynolds numbers of about S x 108 • A 6-meter flat plate in the NTF could provide Reynolds numbers up to 3 x 10⁹• However, where high Reynolds numbers are obtained by increased gas density and lowered viscosity, turbulent skin friction is especially sensitive to surface roughness. In the NTF at the highest unit Reynolds number, the roughness effect on turbulent skin friction is estimated to begin when roughness exceeds 2 x la-Scm (8 x 10⁻⁶ inches). The 6-meter-long surface, if polished to this degree, will be expensive if made of metal; a sheet of plate glass may be more practical. Such definitive skin-friction studies at high Reynolds numbers have important practical applications. It has been stated that a la-percent difference in skin friction can correspond to the difference between successful and unsuccessful operation of a big airplane.
Certain basic boundary-layer and skin-friction studies at high unit Reynolds numbers can be done more simply and more cheaply in the Langley 0.3-m transonic cryogenic tunnel (both with slots open and slots closed) or in other wind tunnels. Among such studies are those concerning the effects of roughness and waviness on transition and skin friction. In particular, the abovementioned estimate of the maximum allowable roughness for a smooth surface needs to be verified, not only as basic research but also so that the surface finish on test models can be specified. The nature and extent of the noncharacteristic turbulent boundary layers just downstream of transition strips also have to be studied. Some of the results might be verified in the NTF as part of the calibration studies.
FLOW-VISUALIZATION AND MEASUREMENT TECHNIQUES
Flow-visualization methods have been useful for both qualitative and quantitative understanding of aerodynamic phenomena, and efforts must be made to adapt these methods to the low temperatures of the NTF. The vapor-screen method seems especially to deserve some concentrated development effort, although it is not yet obvious that a suitable substance for these temperatures exists. An appropriate "smoke" should also be sought since localized smoke
111

injection has often been useful in identifying very local phenomena. Both of these methods contaminate the flow; however, since there is continuous exchange with fresh nitrogen, some degree of contamination should be acceptable.
There is probably no substance that can serve as the "oil" for surface oil-flow studies. Substances might be found, however, that are suitable for the sublimation method. This method can differentiate turbulent-flow areas from laminar-flow and separated-flow areas, but cannot, in general, show local flow directions. Infrared observations of surface temperatures using a liquid-helium-cooled detector may also serve to differentiate laminar-flow areas from turbulent-flow areas at transonic Mach numbers.
Methods of measuring local velocities and directions, quantitatively and with known accuracy, need to be developed. Intrusive devices - hot wires and survey tubes - are well known, although the high pressures and the thin boundary layers in the NTF greatly increase the difficulty of use. There are high hopes for the laser-doppler velocimeter (LDV) , since it is a remote-observation, nonintrusive device. It is already a useful tool, and by the time that the NTF is built, it should be routinely operational.
LEADING-EDGE SEPARATION
For a swept wing with a sharp leading edge or a small-radius leading edge, the flow at angle of attack is characterized by leading-edge separation with large conical vortices along the upper surface behind the leading edges on both wing panels. Within each vortex is an oppositely rotating secondary vortex, and detailed studies have shown still smaller inner vortices. With increasing angle of attack the leading-edge vortices increase in size until they "burst"; that is, the separation surface that starts at the leading edge and encloses the vortex now no longer returns to the upper surface of the wing, and the spinning, highly structured vortex flow is replaced by a low-energy, almost unstructured, stall flow.
These phenomena, including the forces, pressur-e distributions, and the angles of attack at which the vortices burst, are known to be influenced by Reynolds number. The NTF would be useful for studying these phenomena on various swept-wing configurations over a range of Reynolds numbers up to the highest values obtainable. Force tests, visual-flow studies, and flow surveys are all desirable.
HIGH-ANGLE-OF-ATTACK SEPARATION
An important area of research is separation on cylinders (with circular and other types of cross sections) at high angles of attack and at high Reynolds numbers. The subject is important with regard to the aerodynamics of fuselages and missiles (or launch vehicles), but it has received inadequate development. Available information indicates that scale effect is appreciable
1;12

but less well understood than for wings. The studies should include flow visualization and measurements of local velocities along with forces and pressures.
High-angle separation on wings, both two- and three-dimensional, remains an important area for research. Because of the variety of airfoil sections and airplane configurations, however, a good choice for a research model is difficult to identify. At this time it may be best merely to recommend that such research be given high priority as particularly important airfoil sections or configurations arise, or when particular test models in the NTF become strongly involved with separation phenomena.
SHOCK-BOUNDARY LAYER INTERACTION
The pressure rise across a wing shock causes thickening or separation of the wing boundary layer. Even where separation does not occur, both analytical and experimental studies show large deviations of airfoil characteristics from the theoretical zero-viscosity characteristics. These scale effects have emphasized the desirability of extending the experimental studies of shock-boundary-layer interaction to the highest attainable Reynolds numbers. The unique ability of the cryogenic wind tunnel to isolate Mach number, Reynolds number, and aeroelastic effects is very important for shock-boundary-Iayer interaction studies on three-dimensional wings. In ambient temperature tunnels where the dynamic pressure varies with Reynolds number, the accompanying aeroelastic effects can completely mask the Reynolds number effects being studied.
The shock-boundary-Iayer interaction is also important for fuselages and nacelles, and especially for the afterbody boattails where the interaction is associated with large drag effects. There will doubtless be requests for the NTF to be involved with this important area of research, but any proposal will need an especially clear definition of purpose and approach. For example, if sting size and hence sting interference is minimized, the experiment, at least, is clearly defined, but the jet effect is not represented. At the other extreme, the jet might actually be modeled, as by a high-speed flow of warm nitrogen. Although there is a considerable body of experience relevant to this technique, it is difficult and troublesome at best, and urging the development of this technique at this time may not be reasonable.
STUDIES OF SUBMARINE SHAPES
The study of low-drag, low-noise submarine configurations is hampered by the Reynolds number limitations of available facilities. Some involvement in both force tests and basic flow studies of such configurations may be anticipated after the NTF becomes operational. This work, involving threedimensional boundary layers and separation, would have general interest and applicability.
113

LOW-SPEED STUDIES OF CYLINDERS NORMAL TO FLOW
There remains considerable interest in the forces on large cylinders with their axes normal to the win~, not only for application to launch vehicles on the launch pads but also for application to various industrial shapes, such as smoke stacks and the large cylinders that shield off-shore oil-well drilling equipment.
Studies in 1969 in the Langley TDT of dynamic forces on a large cylinder gave results for static cylinders for Reynolds numbers up to 10 x 106 (in addition to results for oscillating cylinders). At this Reynolds number, most of the oscillating forces observed at the lower Reynolds numbers had died out, but one oscillating cross-wind force remained, with an amplitude that seemed to be gradually decreasing with increasing Reynolds number. It would be desirable to extend the data up to the highest Reynolds number attainable in the NTF at low Mach numbers. At M = 0.2, the NTF could provide a Reynolds number of 80 x 106 for a 50-cm-diameter test cylinder.
WALL-INTERFERENCE EFFECTS
In calibrating a new transonic tunnel, a considerable effort is put into studies of wall interference on the flow "at the model, and into determining optimum wall slot design and slot setting, plenum-chamber pressure, etc., in order to minimize interference and optimize flow uniformity and tunnel efficiency. Analytical and experimental studies for the NTF are already under way and will presumably be continued and extended during the next 5 years. One should anticipate that after the NTF is put into operation, an especially large amount of time and effort will have to go into this phase of the calibration because the wall boundary-layer characteristics will vary widely with tunnel pressure and Mach number •. Optimum wall slot settings will probably correspondingly vary from one situation to another.
Because of the large range of temperatures over which the NTF can operate, it will be possible to test geometrically similar models of different sizes at constant Mach number without changing Reynolds number or dynamic pressure. The ability to hold dynamic pressure constant serves to avoid the problem of model distortion due to changing model stresses between the various sizes of models. If the smallest model has negligible wall interference, then assessment of wall interference for the larger models will follow directly from comparison of the sets of data. Such a comparison would be especially significant for transonic testing in the case where the small model has a supersonic region over the wing that extends only a short distance from the surface, wherea~ the corresponding supersonic region over the large model approaches or extends to the tunnel wall. Programs such as these would further exploit the unique research capability of the NTF.
114

eHigh Reynolds number
e Independent control of:
• Reynolds number (viscous effects)
• Mach number (compressibility effects)
• Dynamic pressure (aeroelastic effects)
Figure 1.- Some unique capabilities in cryogenic tunnels for fluid mechanics research.
2.0 x 10⁻⁶
Drive power limit \: f Pt limit 896 kN/m2(130 psia)
1.6 /--- -/ • • • / ..
1.2 / q/E /
"- Saturation limit (ML = 1.4) / .8 I
I
.4 • Pure R effect (constant model shape)
Figure 2.- NTF pure Reynolds number test capability. Steel models (9% Ni); M = 0.90; C = 0.25 m.
115

116
1.6 x 10⁻⁶ Drive power limit
1.2 2 PI limit 896 kN/m (130 psla)
q/E .8 • • • • • .4
• Pure compressibility effect Saturation limit (ML •
o
M
Figure 3.- NTF pure compressibility test capability. Steel models (9% Ni); Rc = 50 x 106 ; C = 0.25 m •
• Basic problems - Turbulent boundary layers (including effects of 3-D flow
and adverse pressure gradients)
- Separated flows (resulting from adverse pressure gradients, shock-boundary-Iayer interactions, roughness/concavities,
and 3-D effects)
-vortex flows (emanating from wings and fuselage noses at high
angles of attack, from wing-fuselage junctions; multiple vortex interactions; vortex breakdown; vortex asymmetries)
• Evaluation and improvement of wind-tunnel test fechniques
- Fixed-transition correlations versus free-transition correlations
-Wall boundary effects
- Aeroelastic effects
-Support interference effects
• Computational aerodynamics (empirical inputs and validation, e.g.,
turbulence modeling data)
Figure 4.- Fluid mechanics.

Effects of:
• Reynolds number
• Mach number
• Surface roughness
• Wall temperature
• Pressure gradient
Figure 5.- Turbulent skin friction .
. 0026
.0024
.0022
.0020
CF I, S.L.)
.0018
.0016
.0014
. 0012
Smith-Walker y .......... Karman-Schoenherr .....................
Schultz-Grunow
I I NTF (6. \ m (20 it) Plate) ..
3 x 10⁷ 108
Figure 6.- Effect of Reynolds number on flat-plate skin friction.
117

118
.7
.6
.4
.3
Rc
Langley 0.3-m cryogenic
transonic tunnel
{) ()I NTF .1
Figure 7.- Effect of Reynolds number on shock location.
+
+
Stable
Supercritical airfoil; M = 0.8.
'-~~
,?-M = 0.8 ~ , / e = 50
--j-----------------------~----------------1M. 0.5
II 3 -dimensional
NTF M = 0.3
'9r
Figure 8.- Some effects of viscous cross flow.

.7
.6
Primary vortex
.4
.3
'm'~ (,om,. -:=>~ } Suction analogy ~
Attached flow th:~~ __
Vo.rtex flow
theories
Figure 9.- Effect of Reynolds number on leading-edge vortex flow.
Chord Height
A = 0.52 delta; M = 0.90; a = 200 .
. 12
tj);;;;;;;; q • 143.6 kN/m2(3000 pst) .10
.08
Ambient temperature tunnel
.06
.04 q • 574.6 kN/m2(12,OOO pst)
.02
((((/lor _ ~ H
~ I;;;;;;;;
O~ ____________ ~ ____________ ~~ __________ ~
100 200 300 400
Figure 10.- NTF capability for wall interference studies. M = 0.90; Rc = 15 x 106 .
119

120
o
Airfoil tests (RAE calculations)
M • 0.82; R- • 60 x 106
Pt • 10 13 kN/m 2(10 atm)
, I Rigid I
Elastic J' I \ '--
.5
xlc
Swept-wing tests
(LRC 8' TPT tests)
q • 28.7 kN/m2(600 psi) (Rc •
.5
xlc
1.0
Figure 11.- Examples of aeroe1astic problems in pressure tunnels. q varying with R.

THEORETICAL AERODYNAMICS PANEL
Chairman
Vice-Chairman
Technical Adviser
Woodrow Bonner
James Blackwell
Gianky DaForno
Lars Erickson
Julius Harris
William Igoe
Panel Members
Percy Bobbitt
Robert Melnick
James Carter
Kalle Kaups
William Kemp
John Lee
Harry Morgan
Paul Rubbert
121

Page intentionally left blank

REPORT OF THE PANEL ON THEORETICAL AERODYNAMICS
Percy J. Bobbitt and James E. Carter
NASA'Langley Research Center
INTRODUCTION
There is little doubt that the main use of the NTF, at least in its early years, will be to provide data on configurations which are intended to fly at Reynolds numbers beyond those that the present production-oriented wind tunnels can attain. This utilization is reasonable since elimination of uncertainties related to Reynolds number scaling can have enormous benefits. Adverse scaling effects can be identified in "early time," various cures examined, and the unpleasant surprises minimized or eliminated. If more accurate Reynolds number scaling provides an unexpected "plus," then the possibilities of exploiting it are greatly enhanced.
Clearly, the near~term payoff of the NTF will be in terms of more efficient aircraft (that is, in range, speed, economy, and maneuverability) than those arrived at by using the age-old procedure of desiga, test, and then re-design. The difference with the advent of the NTF is that redesign will be done on the basis of data taken at full- rather than sub-scale Reynolds numbers. It is equally clear that the more important long-range benefits will be the improvement in the design tools and a better understanding of how to utilize the present wind tunnels to obtain more meaningful data.
TUNNEL ENVIRONMENT
The NTF is nearing its final stages of design; therefore, large changes in its primary components are not likely. Still it behooves those in a position to effect design changes or additions to keep an open mind toward suggestions aimed at making the data to be obtained in the facility more accurate and more representative of the free-air environment. Hence, the members of the Applied Theoretical Aerodynamics Panel concluded that in view of the strong general concern expressed by a number of panels at the workshop, the NTF design team should examine closely the suggestions made herein with respect to flow quality. Since the panel was clearly not cognizant of all the flow quality studies which have been made, these suggestions will have to be examined in light of past considerations.
With the high Reynolds number capability of the NTF, designers and theoreticians are most anxious to determine the ability of their design tools and computational techniques to predict high Reynolds number phenomena as well as to simply scale up low Reynolds number data. This presupposes in some minds that the NTF will provide an absolute result, one identical to that obtainable in free air. Free-air flow quality can never be achieved; however, it can
123

be approximated dependant upon the effort expended to obtain as low turbulence and low noise environment as possible (or needed). In addition, errors brought about by nonuniform flow and tunnel-wall interference must be understood to the point where corrections can be made for them or minimization of them is possible through limitations on model size and tunnel test conditions.
Flow Quality
The flow-quality goals for the NTF are given in figure 1. Also shown for comparison are numbers indicative of the environments of the Langley 8-foot transonic pressure tunnel and the Langley l6-foot tunnel. Clearly, the turbulence-intensity and fluctuating-static-pressure levels proposed for the NTF are substantially lower than the existing levels of the other two facilities.
In the case of turbulence intensity Tu it would appear on the basis of the data shown in figure 2 (taken from ref. 1) that a turbulence intensity goal of 0.001 is sufficiently low to insure that further reductions would not yield any further increases in transition Reynolds number. However, figure 2 also shows a variation in transition Reynolds number from one data source to another at turbulence levels below 0.002. This variation in transition Reynolds number could be due to noise.
The proposed noise level of the NTF in terms of fluctuating static pressure is ~Cp=0.002, which corresponds to 131 dB and 150 dB at total pressures of 101.3 kN/m2 (1 atm) and 911.9 kN/m2 (9 atm), respectively. This level is very low; in fact, it is sufficiently low to permit the tunnel to be used to establish buffet boundaries according to reference 2. Unfortunately, there is no certainty that this goal can be achieved by NTF. Since the measured ~Cp
levels in the Langley 8-foot transonic pressure tunnel and l6-foot tunnel are about six times greater than that proposed for the NTF, it is evident that special design and acoustic treatments will be required for the NTF to attain the design noise level.
For example, the design of the plenum, slots, and ejectors should be implemented with acoustic materials and the use of finite edge radii where possible. Another area where noise treatment could be beneficial where none is now planned is in the corners and on the turning vanes. Unnecessary turbulence and noise can be generated by the turning vanes if they are not designed by using the best methods now available. Also, the vanes will extract more energy from the flow than necessary (requiring more power) if they are not as efficient as can be produced. The panel recommends that a review of the turning-vane design procedures be reviewed with NASA and industry experts to determine whether the best procedures have been used.
Tunnel-Wall Interference
The walls of the NTF, like every subsonic/transonic tunnel, will cause errors in the measured pressures, forces, and moments. At subsonic speeds,
124

wall-interference correction procedures based on linear theory do an adequate job; at transonic speeds, the phenomenon is nonlinear and present understanding of it is incomplete. A number of activities are in progress which will ameliorate the situation, but they will not get to the point by the startup of the NTF where corrections can be applied without experimental verification of their applicability.
In order to achieve the required confidence in NTF data, it is necessary to be assured that the measured Reynolds number effects are not affected by wall interference effects. This is a difficult job in conventional tunnels; it becomes even more complex for the NTF. The performance of the slots in providing blockage relief is dependent to some degree on the thickness of the incoming boundary layer. When the Reynolds number can change by an order of magnitude as in the NTF, one can expect the slot performance to change also. This effect is shown schematically in figure 3. Hence, the anxiety over the ability to separate Reynolds number and wall interference effects is real.
To aid in making more intelligent tunnel wall corrections for the NTF, the panel proposes that as a part of the tunnel calibration, two simple wing-body models of different size be tested. Pressures on the model and near the wall should be measured as well as the model lift, drag, and pitching moment. Correction techniques using "wall" pressures should then be applied to assess and correct for wall interference. Corrected forces and moments for the large model will be compared with those for the small model which are assumed to be "interference-free" data. The big problem here is that the interferencecorrection techniques are not now available. Hopefully, current research efforts will yield such a tool.
PROBLEMS IN THEORETICAL AERODYNAMICS
In recent years significant progress (see refs. 3 to 5) has been made in the development of computational techniques for the prediction of complicated flow fields. Considerable effort is currently being expended to develop both viscous-inviscid interaction techniques and numerical procedures for solving the time-averaged Navier-Stokes equations for flows containing separated regions. I~ addition, inviscid computations have reached a point where calculations can now be made over a wide Mach number range for practical shapes of significant complexity. In time, as more confidence is gained in these procedures, they wil~ become a more integral part of the design process and replace many of those in current use. In order to gain greater confidence, experimental verification is required and the NTF facility will provide an excellent opportunity because of its large Reynolds number range.
In many cases the aerodynamic quantity of interest may be only a weak function of Reynolds number and can be predicted with good accuracy without accounting for viscous effects. The lift force on a wing body at low speeds and angles of attack sometimes falls in this category. At transonic speeds almost everything, including lift, becomes very sensitive to Reynolds number variation. In the following paragraphs a number of viscous-flow topic areas of concern to the theoretician will be discussed.
125
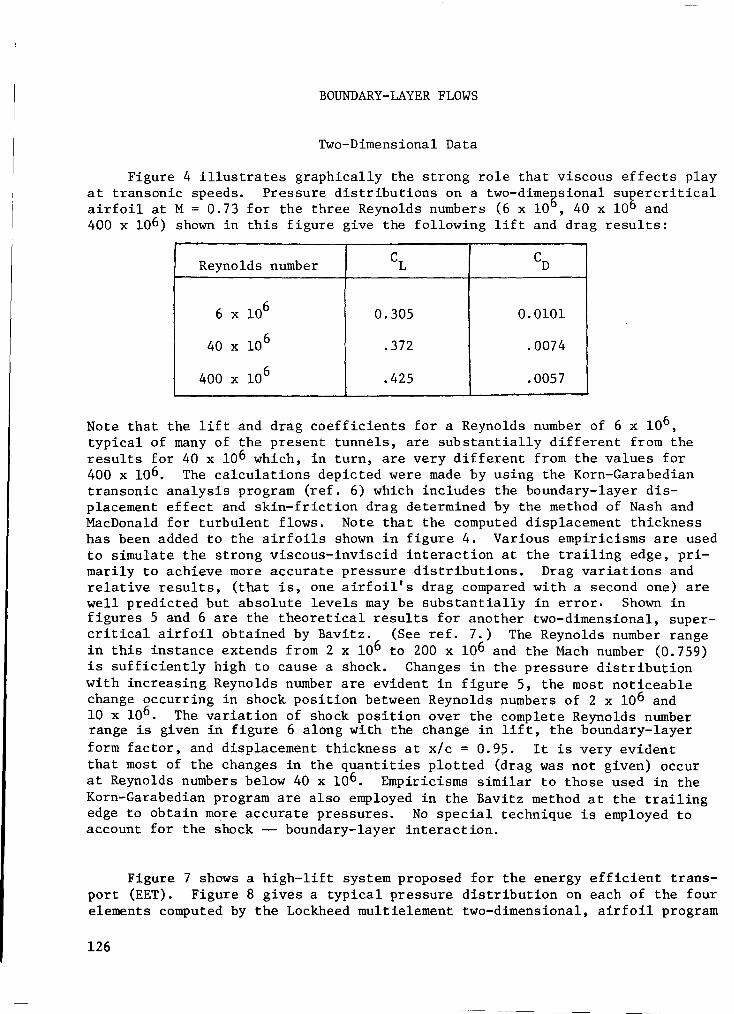
BOUNDARY-LAYER FLOWS
Two-Dimensional Data
Figure 4 illustrates graphically the strong role that viscous effects play at transonic speeds. Pressure distributions on a two-dimensional supercritical airfoil at M = 0.73 for the three Reynolds numbers (6 x 10⁶ , 40 x 100 and 400 x 106) shown in this figure give the following lift and drag results:
Reynolds number CL CD
6 x 10⁶ 0.305 0.0101
40 x 106 .372 .0074
400 x 106 .425 .0057
Note that the lift and drag coefficients for a Reynolds number of 6 x 10⁶ , typical of many of the present tunnels, are substantially different from the results for 40 x 106 which, in turn, are very different from the values for 400 x 106• The calculations depicted were made by using the Korn-Garabedian transonic analysis program (ref. 6) which includes the boundary-layer displacement effect and skin-friction drag determined by the method of Nash and MacDonald for turbulent flows. Note that the computed displacement thickness has been added to the airfoils shown in figure 4. Various empiricisms are used to simulate the strong viscous-inviscid interaction at the trailing edge, primarily to achieve more accurate pressure distributions. Drag variations and relative results, (that is, one airfoil's drag compared with a second one) are well predicted but absolute levels may be substantially in error· Shown in figures 5 and 6 are the theoretical results for another two-dimensional, supercritical airfoil obtained by Bavitz. (See ref. 7.) The Reynolds number range in this instance extends from 2 x 10⁶ to 200 x 106 and the Mach number (0.759) is sufficiently high to cause a shock. Changes in the pressure distribution with increasing Reynolds number are evident in figure 5, the most noticeable change occurring in shock position between Reynolds numbers of 2 x 10⁶ and 10 x 106 . The variation of shock position over the complete Reynolds number range is given in figure 6 along with the change in lift, the boundary-layer form factor, and displacement thickness at x/c = 0.95. It is very evident that most of the changes in the quantities plotted (drag was not given) occur at Reynolds numbers below 40 x 106. Empiricisms similar to those used in the Korn-Garabedian program are also employed in the Bavitz method at the trailing edge to obtain more accurate pressures. No special technique is employed to account for the shock -- boundary-layer interaction.
Figure 7 shows a high-lift system proposed for the energy efficient transport (EET). Figure 8 gives a typical pressure distribution on each of the four elements computed by the Lockheed multielement two-dimensional, airfoil program
126

(ref. 8) which includes viscous interaction. Figure 9 shows an interesting result; that is, the total drag coefficient as computed by this program continues to decrease as the Reynolds number increases from the present windtunnel levels to a Reynolds number of 100 x 106 • Verification of this prediction could be made by the NTFfacility.
Research is underway to put the trailing-edge-interaction calculation on a firmer theoretical base, and it appears it will come to fruition in the next 3 to 4 years. Parallel research in the interaction of a shock with a boundary layer at transonic speeds is underway and should start paying off at about the same time as the trailing-edge research. The need for high Reynolds number data is clear in order to evaluate these predictive techniques and to gain confidence in their flight Reynolds number capability. It is likely that the NTF will provide some of the needed two-dimensional data; however, most of its contributions will come in the three-dimensional flow field studies.
Three-Dimensional Data
The airfoil calculations discussed so far and the problems attendant thereto have their counterpart in three-dimensional flows. With the extra dimension the viscous flow phenomena are naturally more complex, and consequently, the state of the art of 3-D theory lags behind that of 2-D. There are several 3-D boundary-layer computer codes (for example, see refs. 9 and 10) that have emerged during the past few years, but 3-D shock and trailing-edge interactions have not even been attempted. Results fro~ one of these 3-D boundary-layer codes (ref. 9) are plotted in figure 10. Chordwise variations of the chordwise and spanwise components of the skin-friction coefficient for the F-8 supercritical wing at the 52 percent semispan station are shown. This type of 3-D boundary-layer codes requires validation at both high and low Reynolds numbers. This validation requires measurements of boundary-layer quantities such as skinfriction, velocity profiles, etc.
New methods for treating viscous flow in the juncture region of intersecting surfaces and near wing tips will also require experimental checks. Hopefully, much of this work which is diagnostic in nature can be done in existing facilities with only a few high Reynolds number spot checks in the NTF.
Transition
There are other basic problems in 3-D boundary-layer theory which require diagnostic measurements in order to be properly evaluated. The prediction of transition, with and without suction, and of separation are crucial to the ultimate success of any comprehensive boundary-layer or Navier-Stokes program. Hopefully, the NTF can attain a flow quality high enough to aid in the formulation and validation of improved transition criteria for incorporation into the vis-cous codes. /
There are transition criteria based on stability analyses and test data which have had mixed success. For some configurations and/or flow regimes, the lack of accuracy is not critical. For supercritical airfoils (wings) at transonic speeds, this is not true. Figure 11 shows for a Reynolds number of 6 x 10⁶ the changes in pressure distribution, lift, and drag for the airfoil of
127

figure 4 that occur when the transition location is changed from the leading edge to 0.3 chord. Note that when transition is fixed at the 0.3 chord location, the lift (0.381) and drag (0.0072) coefficients are very nearly the values obtained at the 40 x 106 Reynolds number in figure 4 with transition at the leading edge. Theoretical calculations can be used in this way to set transition locations (trip strips) in low Reynolds number facilities so as to simulate the flow at a higher Reynolds number. This technique implies that forced and natural transition will yield the same downstream boundary layer. Even when transition can be fixed to give a good approximation of the high Reynolds number displacement thickness and consequently lift, there is no assurance that the velocity profiles and, hence, the skin-friction drag are equally well approximated. The questions regarding the use of transition strips should be looked at in the NTF where both simulation and full-scale experiments can be conducted. This problem will be discussed in more detail in the "Experiments" section.
Turbulence Model
One final and perhaps the most important element in the boundary-layer and Navier-Stokes codes is the turbulence model. At the present time, turbulence modeling is the pacing item in the further development of these codes for flow fields involving separation. In addition, for 3-D attached boundary-layer flows, it is not clear how to model the component of Reynolds stress involving the cross-flow velocity. It is recognized that the NTF facility is a difficult environment in which to make hot-wire measurements. In addition, special considerations will have to be given to the difficulties incurred due to the thin boundary layer which exists at large Reynolds numbers. Detailed velocityprofile measurements in the boundary layer with a pitot probe coupled with skin-friction measurements at flight Reynolds numbers could contribute immeasurably to the data base required for turbulence model evaluation. Configurations yielding pressure gradients and separation'are required.
FLOW SEPARATION
Flow separation appears in varying degrees and at a variety of locations on an aircraft. The conditions under which flow separation will occur, and the extent of the separated region when there is reattachment, are dependent on Reynolds number. The prediction of these flow phenomena has been attempted by using a variety of techniques and governing equations, but they are generally without substantiation at high Reynolds numbers. The NTF could be most useful in establishing the Reynolds number dependence of the separation point (line) location for some well chosen 2-D (or 3-D) configurations.
Two-Dimensional Data
Airfoil separation can occur at the leading edge, at the foot of a shock if the flow is transonic, and at the trailing edge. Each of these separation phenomena is sensitive to Reynolds number, particularly the first since the shape of the leading-edge separation bubble is strongly influenced by the transition from laminar to turbulent flow. A phenomena which is not well
128

understood and not yet satisfactorily analyzed is that of leading-edge bubble bursting. Flow separation can also start at the trailing edge and work its way forward with increasing angle of attack until the entire top side of the wing is separated. The result of an approximate analysis of such a flow field by an inviscid analysis of Barnwell (ref. 11) is shown in figures 12 and 13. In these calculations the separation point is prescribed; more realistically one would like to perform the computations free of such empiricisms. Again the corroboration of such a theory would be aided by the wide Reynolds range capability of the NTF in establishing a correlation of separation point and Reynolds number.
Axisymmetric Flow
Two important areas of flow separation research are the understanding and successful prediction of the flow at the aft end of a fuselage and the boat tail -- jet-plume interaction. Many questions remain unanswered. For example, how is the boat tail -- jet-plume interaction region affected by the change from current wind-tunnel Reynolds numbers to those at flight conditions? With an increase in Reynolds number the jet entrainment is altered which in turn alters the boattail flow field and, hence, the separation point location. Hopefully, the NTF facility can be used to simulate such a flow field by injecting room-temperature nitrogen through a jet nozzle and measuring the resulting boattail pressure distribution.
Three-Dimensional Data
Computations of 3-D viscous, separated flow fields is beyond the current state of the art. Typical of the current efforts in computing 3-D flows with leading-edge separation is the inviscid technique of Weber, Brune, Johnson, Lu, and Ruppert given in reference 12. In this procedure, the separated leadingedge vortex is represented by vortex paneling; the panel positions and singularity strengths are solved for iteratively. Unfortunately, one cannot expect complete success of an inviscid theory in describing the separated flow over a low-aspect-ratio wing as evidenced by the large Reynolds number sensitivity depicted in figure 14, which was taken from reference 13. Clearly, this phenomena is a viscous one and, in time, after viscous codes are developed to analyze such flows, the NTF could serve to verify -such procedures over a wide Reynolds number range.
NTF ROLE IN THEORY DEVELOPMENT
Most of the current subsonic and transonic tunnels spend a part of their test time obtaining data required by the aerodynamicist to check the accuracy of his theoretical methods. This testing can take many forms and can vary considerably in complexity. In the early development stage of a theoretical method, tests on a simple idealized configuration may be required; for a mature technique a very complex, "realistic" geometry may be tested for validation purposes. If one is just starting out to develop a method or if large discrepancies occur between prediction and experiment by using an existing method,
129

the need for detailed diagnostic measurements in the flow field and/or surface pressures can be paramount. Thus the tunnel is used not only to validate predictive methods but also to improve mathematical models of various flow phenomena.
The panel enV1Slons the role of the NTF in theory development as similar to that just described for the conventional tunnel. Implementation, however, will be much more difficult than in the past. The low temperatures and high dynamic pressures associated with the highest Reynolds numbers present unique environmental problems for the diagnostic instrumentation. In addition, the thinness of the boundary layer at high Reynolds numbers presents resolution problems much more severe than those encountered now on comparably sized models at lower Reynolds numbers. The panel suggests that an increased effort in cryogenic tunnel instrumentation be made to include diagnostic instrumentation such as surface hot-wire gages, hot-wire probes, floating Cf gages, Preston tubes, razor-blade and thin-flim gages, and laser velocimeters. Rake support requirements is another area which requires attention.
EXPERIMENTS
In this section seven experiments are proposed for the NTF facility by the panel. These proposed experiments are based on the unique capabilities of the proposed NTF facility to aid in better understanding of the problems in theoretical aerodynamics discussed previously.
130

EXPERIMENT 1: THEORY VALIDATION FOR HIGH-ASPECT RATIO WING-BODY COMBINATION
Objective: Code verification for configurations typical of subsonic/transonic transport aircraft
Background:
(1) Lack of validated scaling laws
(a) Little confidence in turbulent attached-flow scaling
(b) No guidelines where separated flows present - including vortex flows
(2) Methodology requires checks and calibration at high Reynolds number
(3) Lack of fundamental aerodynamic modeling data
(a) Little at low Reynolds numbers
(b) Nonexistent at high Reynolds numbers
(4) 3-D design codes require validation
Justification:
(1) More efficient flight vehicles
(2) Increased level of confidence in design
(3) Reduce flight test time
(4) Understanding of flow mechanisms at high Reynolds number
Special considerations:
(1) Instrumentation
(a) Skin friction gages
(b) Thin-film and razor-blade gages
(c) Laser doppler velocimeter
(2) Measurements
(a) Boundary-layer profiles
(b) Wakes (rake measurements)
(c) Turbulence
131

(d) Flow visualization:
Shear flows
Limiting streamlines
Transition location
Precursor work desired:
(1) All instrumentation development completed in O.3-m transonic cryogenic tunnel prior to NTF on line
(2) Continued theoretical and experimental research for code development in available facilities to as high Reynolds number as possible
(3) Configuration selection
(a) Wing body - typical of 1984 transport optimized for high Reynolds number
(b) Test in low Reynolds number facility with trip strips
Joint effort NASA/Industry:
(1) Research ideas
(2) Cost sharing of computer code verification
Priority:
First priority
132

EXPERIMENT 2: THEORY VALIDATION FOR LOW-ASPECT-RATIO MODERATELY SWEPT WING
Objective: Validate 1982 wing-body viscous-inviscid codes
Background:
(a) Superior transonic maneuvering
(b) Advanced aerodynamic concepts; e.g., variable camber, L.E. and T.E. devices
Approach:
(a) 3-D wing-body-tail model, no nacelles
(b) Component build up
(c) 2 wings: low camber/high camber
(d) Rc = 50 x 106
(e) Angles of attack through stall
(f) Forces, moments, pressures
Special considerations:
(a) If possible, visualization; skin-friction
(b) Strain gages for loads
(c) Buffet instrumentation
Precursor:
~)
(b)
Complete validation (boundary-layer details) of 2-D methods: Rc = 5 x 10⁶ ~ 20 x 106
Complete validation (boundary-layer details) of 3-D wing theory; R- = 5 x 10⁶
C
(c) Test projected NTF model at RC = 5 x 10⁶ and correlate with theories (if correlation indicates problems, test only isolated wing in NTF for R effects)
(d) Use theories to predict NTF results
NTF test:
Joint effort with theory developers
Priority:
First priority
133

EXPERIMENT 3: THEORY VALIDATION FOR LOW-ASPECT-RATIO HIGHLY-SWEPT WING
Objective: Code verification for configurations typical of supersonic cruise aircraft
Background:
(a) Flows over wing upper surface dominated by leading-edge vortex at design conditions
(b) Primary vortex induces secondary vortex - position and strength of vortices sensitive to R at low R; high R sensitivity unknown
(c) Only low Reynolds number data available to check inviscid models of wing flow fields
(d) Need for theoretical and empirical scaling law for highly swept wings
(e) High Reynolds number effect on control-surface effectiveness unknown
Approach:
(a) Use existing arrow-wing models
(b) Modify as required for cryogenic environment
(c) Flat, twisted, and cambered wings will be available with leading edge and trailing edge control surfaces
Special considerations:
Flow visualization if possible for high and low Reynolds number leading-edge vortex studies
Precursor:
Continued development of viscous and inviscid codes for highly-swept wing using available facilities
Priority:
Second priority
134

------------------------------ ---------- -------- ---
EXPERIMENT 4: THEORY VALIDATION FOR HIGH-LIFT SYSTEMS ON HIGH-A~PECT RATIO WINGS
Objective: Validation of existing 2-D and 3-D computational techniques for pressure distribution, forces and moments
Background:
(a) Design and wind-tunnel validation at low R has historically produced more complex flap systems than needed at flight R
(b) New analysis/design techniques available
Types of measurements:
(a)
(b)
(c)
(d)
(e)
Total forces and moments
C on wing and flap p
Confluent boundary-layer properties
Separated flow location and flow-field properties
Flow-field details of wing/flap tip vortex rollup
Special considerations:
(a) Small flap elements to instrument
(b) Separated flow measurements
(c) Thin boundary layers on flap elements
Precursor tests:
2-D tests of hig~-lift systems in Langley LTPT facility
Priority:
Second priority
135

EXPERIMENT 5: REYNOLDS NUMBER SCALING
Objective: Use NTF as a facility for developing and validating Reynolds number scaling techniques, so as to render conventional wind tunnels more reliable for configuration development work
Justification: Operational environment of NTF precludes heavy use as a configuration development facility, since rapid tunnel entry and quick, on-line model tailoring are required in a configuration development and refinement program. NTF can establish the limits within which conventional tunnels can be effectively and reliably used.
Special considerations:
(a) Probably configuration oriented. Test series organized about specific categories of configuration shapes, flow phenomena, etc.
(b) Requires detailed flow diagnostic measurements.
Forces
Moments
Detailed boundary-layer measurements
Shock structure and posltions
Surface shear stress directions
Trailing-edge boundary-layer measurements
(c) NTF must be validated as providing truthful full-scale R data with free transition that is representative of atmospheric flight.
(d) Program may have to be duplicated in several conventional tunnels because of differences among them (i.e., turbulence level, etc.).
Precursor work required:
(a) Flow diagnostic technique development:
Boundary-layer and near-wake surveys
Wall flow visualization (e.g. oil flow)
Shock-wave visualization
Identify test configuration(s)
136

(b) Explore concept of "Reynolds Number Incremented Geometry;" i. e., design to maximum performance at low R , and apply a "data base (or theory) generated" geometry change to arrive at a near-optimum high R shape for a one-shot validation test.
(c) Joint NASA/Industry effort:
Scaling techniques must be validated for the conventional developmental tunnels in use by Industry.
Priority:
First priority. This endeavor will enable NTF to have a near-term impact on real airplane designs configura ted for optimal performance at flight Reynolds numbers.
137

EXPERIMENT 6: DYNAMIC SHOCK - BOUNDARY-LAYER INTERACTION
Objective: Definition of the effect of free boundary-layer transition on shock - boundary-layer interaction under dynamic (and static) flow conditions.
Background:
(a) Dynamic shock - boundary-layer interaction is a problem of fundamental importance with great impact on structural design and performance of advanced aircrafts.
(b) The effect of upstream free transition on shock location is well known. It is also well documented that there is a strong coupling between free transition and the airfoil motion.
Approach:
(a) Static tests can define shock dependence on a at different R (and q) with and without tripping devices. Dynamic tests can define the motion dependence of the shock for the above parameters.
(b) Static test with pressure instrumentation and flow visualization. Dynamic test, forced oscillations, and a-ramps using fluctuating pressure transducers.
Percursor work required:
(a) Tests in tunnels with less instrumentation difficulties could provide definition of the tests needed in NTF to extend information to high R in both 2-D and 3-D tests.
(b) Select moderate aspect-ratio-wing geometry.
Priority:
Second priority.
138

EXPERIMENT 7: EFFECT OF R and Moo ON DYNAMIC STALL
Objective: The NTF facility can provide the separation of variables needed to define the individual effects of R and M~.
Background:
(a) The negative aerodynamic damping and associated stall flutter is dependent upon static characteristics from which unsteady perturbation is made.
(b) Both CL MAX and the deep stall characteristics are sensitive to Moo·
(c) All present static and dynamic stall data are contaminated by undefined compressibility effects and are only at low R.
(d) The large R-range possible in NTF at various levels of dynamic pressure could also help resolve the sidewall or side-plate interference problem in 2-D tests.
Approach:
(a) Static tests with balance and/or pressure instrUmentation.
(b) Dynamic tests with forced oscillations and a-ramps using dynamic balance and/or fluctuating pressure transducers.
Precursor:
Select moderate aspect-ratio-wing geometry.
Priority:
Second priority.
139

REFERENCES
1. Michel, R.: Effects of Flow Turbulence and Noise on Aerodynamic Phenomena and Wind Tunnel Results. AGARD-R-6l5, June 1974.
2. Mabey, Dennis G.: Some Remarks on the Design of Transonic Tunnels With Low Levels of Flow Unsteadiness. NASA CR-2722, Aug. 1976.
3. Aerodynamic Analyses Requiring Advanced Computers. NASA SP-347, Parts I and II, Conference Held at Langley Research Center, Hampton, Virginia, Mar. 4-6, 1975.
4. Taylor, T. D.: Numerical Methods for Predicting Subsonic, Transonic, and Supersonic Flow. AGARDograph No. 187, Jan. 1974.
5. Peyret, R.; and Viviand, H.: Computation of Viscous Compressible Flows Based on the Navier-Stokes Equations. AGARDograph No. 212, Sept. 1975.
6. Bauer, Frances; Garabedian, Paul; Korn, David; and Jameson, Antony. Supercritical Wing Sections II. Lecture Notes in Economics and Mathematical Systems, Springer Verlag, New York, 1975.
7. Bavitz, P.: Analysis Method for Two Dimensional Transonic Viscous Flow. NASA TN D-77l8, 1974.
8. Stevens, W. A.; Goradia, S. H.; and Braden, J. A.: Mathematical Model for Two-Dimensional Multi-Component Airfoils in Viscous Flow. NASA CR-1843, 1971.
9. Cebeci, Tuncer; Kaups, Kalle; and Rams~y, Judy A.: A General Method for Calculating Three-Dimensional Compressible Laminar and Turbulent Boundary Layers on Arbitrary Wings. NASA CR-2777, 1977.
10. McLean, J. Douglas: Three-Dimensional Boundary Layer Calculations for Swept Wings. AIAA Paper 77-3, 1977.
11. Barnwell, R. W.: About Airfoils.
Two Inviscid Computational Simulations of Separated Flow AIAA Paper No. 76-379, 1976.
12. Weber, James A.; Brune, Guenter W.; Johnson, Forrester, T.; Lu, Paul; and Rubbert, Paul E.: A Three-Dimensional Solution of Flows Over Wings With Leading Edge Vortex Separation. Aerodynamic Analyses Requiring Advanced Computers, NASA SP-347, 197?, pp. 1013-1032.
13. Smith, J. H. B.: Improved Calculations of Leading-Edge Separation From Slender Delta Wings. RAE Tech. Rep. No. 66070, Mar. 1966.
140

National Langley 8-foot Langley 16-foot transonic transonic facility pressure
tunnel
Flow uniformity, 4r ±0.001 - -
Turbulence intensity, Tu 0.001 0.008
Fluctuating static pressure, AC P
0.002 0.014
Noise (SPL) Pt = 101.3 kN/m2(1 atm) 131 dB - -
Pt = 911.7 kN/m2(9 atm) 150 dB
Figure 1.- Flow quality indicators.
4000 ~
5 x 10⁶
4--~
....
o
0
3 3000 000 0
0 0 .0
BOO 2
2000 r- 0
1 I 0 2/1000
Tu
• Zysina-Molozhen et al
o Sinclair-Wells
\l Boltz et al
o Schubauer et al
0
• O. 0
0 0 • I I
4/1000
tunnel
- -
0.007
0.012
143 dB
Figure 2.- Insufficiency of turbulence intensity as parameter for transition at low free-stream turbulence. Acoustic phenomena? (Flat-plate incomp~essible flow.)
: 141

Tunnel wall zzzzzzzzz~zzzzzzzzzzzzzzzzzzv . _
.- --=:::::_ HIgh Reynolds number - --Streamlines ___ --- ---Low Reynolds number
Figure 3.- Effect of Reynolds number on wind-tunnel wall interference.
142

Cp
Cp
-2.0
-1.5
-1.0
-.5
0 Cp
.5
1.0
1.5 C -
R = 6 x 10⁶• , Co 0.0101;
CL • 0.305.
-2.0
-1.5
-1.0
-.5
0
.5
1.0
1.5 c: ..........
R:z 400 X 106; CD = 0.0057;
CL :: 0.425.
-2.0
-1.5
-1.0
-.5
0
.5
1.0
1.5 ~ -
R '" 40 x 106; CD • 0.0074;
CL ... 0.372.
-'2.0
-1.5
-1.0
-.5
o
.5
1.0
1.5 p_--" No viscosity; CL '" 0.589.
Figure 4.- Effect of Reynolds number on lift and drag of a supercritical airfoil at Mb = 0.730.
143
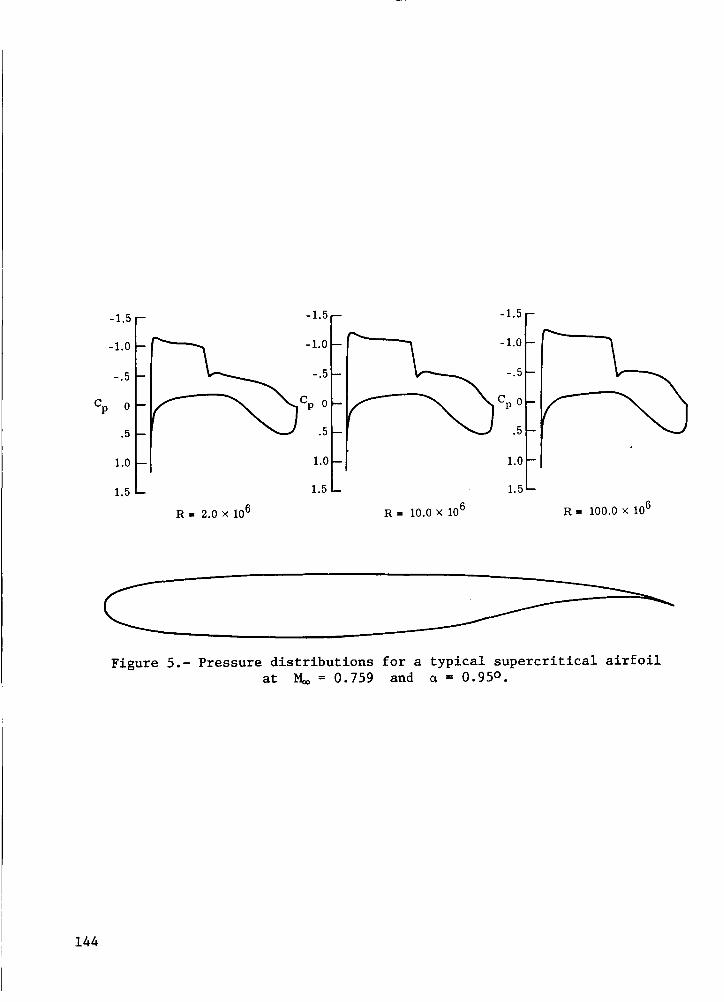
-1.5 -1.5 -1.5
-1.0 -1.0 -1.0
-.5 -.5
Cp 0 Cp 0 Cp 0
.5 .5 .5
1.0 1.0 1.0
1.5 1.5 1.5
R. 2.0 x 10⁶ R. 10.0 x 10⁶ R. 100.0 x 10⁶
c ___ -----------
144
Figure 5.- Pressure distributions for a typical supercritica1 airfoil at Moo = 0.759 and a = 0.950 .

.009 o Calculation pOints
.007 * o Ic
.005
.003
2.4
2.2 H
2.0
1.8 I 0 40 80
R 120 160 200 x 106
Boundary-layer characteristics; upper surface; x/c = 0.95 .
. 8 o Calculation points ---- Inviscid solution
.6 x/c
.4
.2
1.2
---- Inviscid solution 1.0
Cl 0 0 .8 -r ~------o
.6 I I I 0 40 80
R 120 160 200 x 106
Exte rnal flow characteristics
Figure 6.- Variation of selected quantities with Reynolds number at ~ = 0.759 and a = 0.95°.
145

.3
.2
.1
0
z/c c -.1
-.2
-.3
-.4 -.1
x/c
Figure 7.- Sketch of energy efficient transport medium-vane, double-slotted flap.
-12
-10
-8
-6 Cp
-4
-2
0
2
.2~ f, .1 z/c 0
I~I -.1 -.2 I I
0 .2 0 .2 .4 .6 .8 cc o .2 0 .2 .4
x/c
Figure 8.- Pressure distribution on EET medium vane, double-slotted flap. Moo = 0.2; a = 5.00 •
146

.10
.08
.06
.04
.02
o~ __________ ~ ____ ~ ____ ~~ ________ ~~ __________ ~ 6 1 3 10 30 100 x 10
R
Figure 9.- Drag coefficient versus Reynolds number for energy efficient transport (EET) medium vane, double-slotted flap. Mb = 0.2; a = 5.00 ,
8 x 10⁻³
6
I , , 4 ,
I cf I I
'2 0
0
-2 0
Figure 10.-of local
r-- Cfn
.. 0.52 I .
x/c
Results from Cebeci 3-D boundary-layer program; chordwise variation skin friction coefficients. Mb = 0.99; z = 0.52; R = 4.9 x 10⁶•
147

-2.0 0.02 -2.0 x T = 0.1 x T •
-1.5 -1.5
-1.0 -1.0
-.5 -.5 Cp
0 Cp
0
.5 .5
1.0 1.0
1.5 1.5 C :: C -
Co • 0.0101; CL = 0.305. CD = 0.0092; CL = 0.317.
-2.0 x T = 0.2 -2.0 xT = 0.3
.. 1.5 -1.5
-1.0 -1.0
Cp -.5 -.5
Cp 0 0
.5 .5
1.0 1.0
1.5 - 1.5 e ... c == -CD = 0.0080; CL = 0.352. CD = 0.0072; CL = 0.381.
Figure 11.- Effect of transition location on the lift and drag of a supercritica1 airfoil. Moo = 0.730; R = 6 x 10⁶•
148

-7
-6
-5
-4
-2
-1
o
1
o .2 .4 x/c
o Experiment: R .. 6 X 10⁶
Analysis-design version
.6 .8 1.0
Figure 12.- Pressure distribution for separated flow for GA(W)-l airfoil. ~ = 0.15; a = 16.040.
2.5 --- Experiment; R. 6 X 10⁶
o Analysis-design version
2.0 o
1.5
1.0
.5
o o 5 10 15 20 25
0, deg
Figure 13.- Dependence of lift coefficient on angle of attack. ~ = 0.15.
149

-1.6
-1.4
-1.0
- .8
6 0.8 x 10 ...... "
/ I
/ I
l
2.5 x 10⁶
Transition free Transition fixed
-.6~~«-____ ~ ________ ~ __________ ~ ________ ~ ________ ~ .4 .6.7.8.9
y/s
A = 1
Figure 14.- Suction peaks for various Reynolds numbers (after Gregory and Love).
150

CONFIGURATION AERODYNAMICS PANEL
Chairman Richard Whitcomb
Vice-Chairman Lloyd Goodmanson
Technical Adviser Laurence Loftin, Jr.
Panel Members
Philip Antonatos
Werner Dahm
Ed Danforth
Beverly Henry
George Kaler
Thomas Kelly
L. Wayne McKinney
Alexander Money
Jack Nugent
Frank O'Brimski
Robert Rainey
Warner Robins
Ed Rutowski
Edwin Saltzman
George Upton
151

Page intentionally left blank

INTRODUCTORY REMARKS
Richard Whitcomb
NASA Langley Research Center
The principal point to be made in this report is that the designs of aircraft intended for flight at transonic speeds are probably less than optimum because of the lack of full-scale Reynolds number wind-tunnel data. Also, the need for sorting the effects of Reynolds number and aeroelasticity, which can be done in 'the NTF, will be addressed briefly.
Advanced transonic configurations, such as the supercritical wing, are inherently more sensitive to Reynolds number than earlier configurations because the pressure recovery gradients imposed on the boundary layer are generally steeper. The results of two-dimensional supercritical airfoil investigations and theoretical calculations have shown this effect. In recognition of this problem, a technique for approximately simulating full-scale Reynolds number characteristics at present wind-tunnel Reynolds numbers for near-cruise conditions is utilized at the Langley Research Center. The transition strip, which in the past has been located near the leading edge of the wing, is rearward so that the relative displacement thickness of the boundary layer at the trailing edge of the wing is the same as might be expected on a full-scale configuration with the transition near the leading edge. Two-dimensional wind-tunnel results indicate that the technique provides a very good simulation of airfoil characteristics at 'full-scale Reynolds number.
The variation of drag coefficient with lift coefficient is presented in figure 1 for an advanced supercritical wing designed for full-scale Reynolds numbers at a Mach number of 0.78 and a chord Reynolds number of approximately 2 x 10⁶ . Results are shown for conditions with the transition strip at 10 and 35 percent of the chord. Calculations indicate that with the transition at 35 percent of the chord, full-scale boundary-layer conditions are approximately simulated. This comparison shows that for the lift coefficient range near cruise (approximately 0.6), the drag with the rearward transition location is approximately 50 counts (0.0050) less than with the forward transition. This difference is far greater than the simple reduction in skin friction associated with the more rearward transition location. Surface oil-flow studies indicate that with the forward transition location on the supercritical wing, there are substantial areas of boundary-layer separation on the upper surface and on the lower surface in the rearward cusp. With the transition rearward, no significant separation is apparent.
It is the writer's strong belief that the results obtained with the rearward location are indicative of the drag characteristics which would be obtained at full-scale conditions. However, if this technique for simulating fullscale Reynolds number is not accepted as valid by an aircraft designer and the higher drags with transition forward are used, the supercritical wing configuration for which the results are shown would be completely unacceptable for a long-range cruise type aircraft. The designer would probably design a wing
153
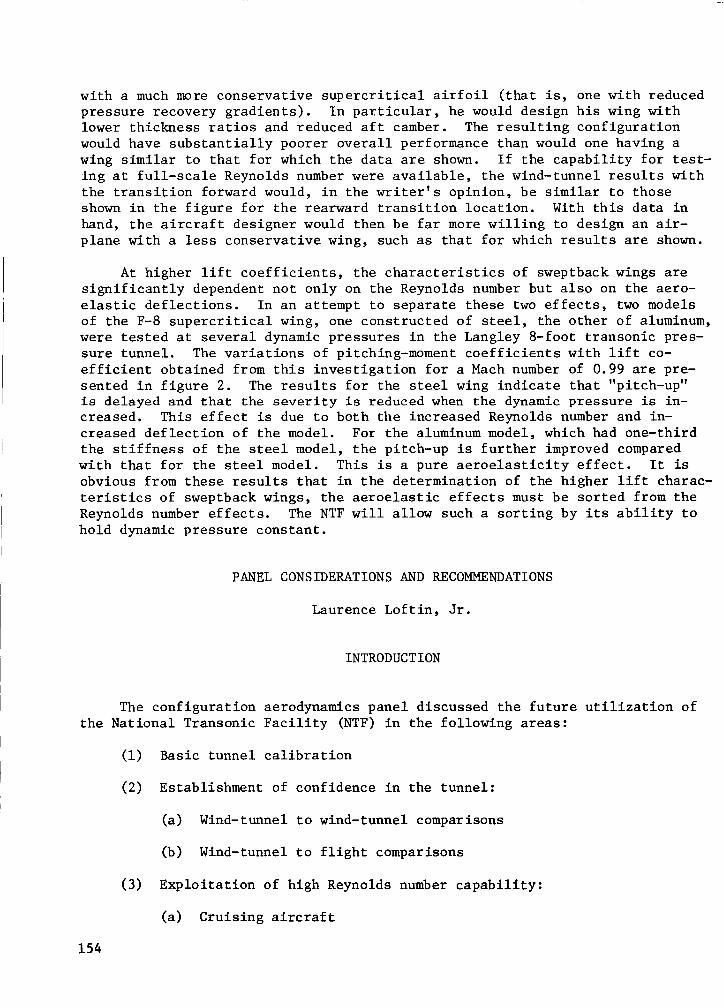
with a much more conservative supercritical airfoil (that is, one with reduced pressure recovery gradients). In particular, he would design his wing with lower thickness ratios and reduced aft camber. The resulting configuration would have substantially poorer overall performance than would one having a wing similar to that for which the data are shown. If the capability for testing at full-scale Reynolds number were available, the wind-tunnel results with the transition forward would, in the writer's opinion, be similar to those shown in the figure for the rearward transition location. With this data in hand, the aircraft designer would then be far more willing to design an airplane with a less conservative wing, such as that for which results are shown.
At higher lift coefficients, the characteristics of sweptback wings are significantly dependent not only on the Reynolds number but also on the aeroelastic deflections. In an attempt to separate these two effects, two models of the F-8 supercritical wing, one constructed of steel, the other of aluminum, were tested at several dynamic pressures in the Langley 8-foot transonic pressure tunnel. The variations of pitching-moment coefficients with lift coefficient obtained from this investigation for a Mach number of 0.99 are presented in figure 2. The results for the steel wing indicate that "pitch-up" is delayed and that the severity is reduced when the dynamic pressure is increased. This effect is due to both the increased Reynolds number and increased deflection of the model. For the aluminum model, which had one-third the stiffness of the steel model, the pitch-up is further improved compared with that for the steel model. This is a pure aeroelasticity effect. It is obvious from these results that in the determination of the higher lift characteristics of sweptback wings, the aeroelastic effects must be sorted from the Reynolds number effects. The NTF will allow such a sorting by its ability to hold dynamic pressure constant.
PANEL CONSIDERATIONS AND RECOMMENDATIONS
Laurence Loftin, Jr.
INTRODUCTION
The configuration aerodynamics panel discussed the future utilization of the National Transonic Facility (NTF) in the following areas:
(1) Basic tunnel calibration
(2) Establishment of confidence in the tunnel:
(a) Wind-tunnel to wind-tunnel comparisons
(b) Wind-tunnel to flight comparisons
(3) Exploitation of high Reynolds number capability:
(a) Cruising aircraft
154

(b) Highly maneuverable aircraft
(c) Other
(4) Specialized experimental techniques
(5) New directions
The first three of these areas relate to experimental activities (listed in order of priority) which the panel thought should be considered for early irnr plementation in the NTF. Areas four and five are of a somewhat different nature. The significant points made in the discussions in each area will be outlined in the following paragraphs.
BASIC TUNNEL CALIBRATION
Anomalies found in the comparison of data obtained from different wind tunnels have sometimes been traced to uncertainties in tunnel calibration. Accordingly, an accurate calibration of the NTF was considered to be of top priority. The calibration should include not only the usual pressure surveys but also measurements of the turbulence level. The use of the hot-wire technique at cryogenic temperatures was suggested as a subject for study in the time period before the NTF is brought into operation. The need for periodic checks on the tunnel calibration was also cited since the calibration of wind tunnels has been known to vary with time because of deterioration, minor alterations, etc. The measurement of certain critical aerodynamic characteristics ona "standard" model of some type was recommended as a possible means for obtaining a quick check on the tunnel. Such a technique was employed in the Langley two-dimensional low-turbulence pressure tunnel in the 1940's as a means for detecting any significant change in the tunnel turbulence.
ESTABLISHMENT OF CONFIDENCE IN TUNNEL
The conduct of investigations aimed at establishing confidence in the validity of results obtained in the NTF was considered as next in priority after the basic tunnel calibration was completed. These investigations were thought to be comprised of the following elements:
(1) Comparison of results from the NTF with data from other existing wind tunnels
(2) Comparison of results from the NTF with data obtained in flight.
The proposed comparative wind-tunnel investigations would involve tests of the same model in the NTF and in the various transonic facilities which are presently available. Measurements would first be made at the same values of the Reynolds number and Mach number in each facility, after which the investigation would be extended in the NTF to Reynolds numbers higher than those achievable
155
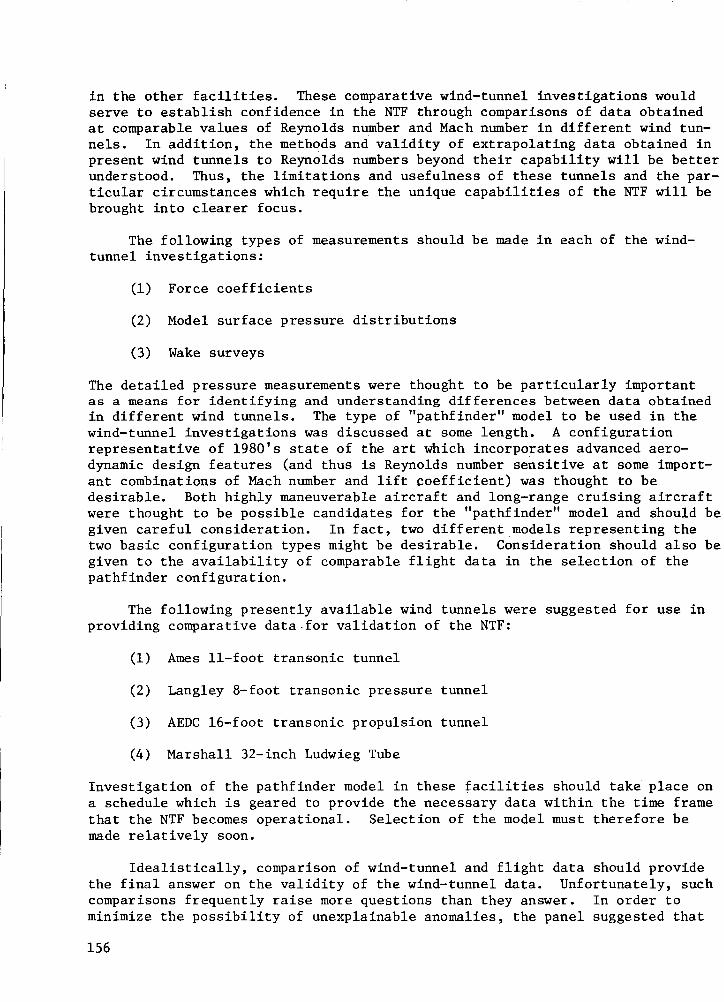
in the other facilities. These comparative wind-tunnel investigations would serve to establish confidence in the NTF through comparisons of data obtained at comparable values of Reynolds number and Mach number in different wind tunnels. In addition, the methods and validity of extrapolating data obtained in present wind tunnels to Reynolds numbers beyond their capability will be better understood. Thus, the limitations and usefulness of these tunnels and the particular circumstances which require the unique capabilities of the NTF will be brought into clearer focus.
The following types of measurements should be made in each of the windtunnel investigations:
(1) Force coefficients
(2) Model surface pressure distributions
(3) Wake surveys
The detailed pressure measurements were thought to be particularly important as a means for identifying and understanding differences between data obtained in different wind tunnels. The type of "pathfinder" model to be used in the wind-tunnel investigations was discussed at some length. A configuration representative of 1980's state of the art which incorporates advanced aerodynamic design features (and thus is Reynolds number sensitive at some important combinations of Mach number and lift coefficient) was thought to be desirable. Both highly maneuverable aircraft and long-range cruising aircraft were thought to be possible candidates for the "pathfinder" model and should be given careful consideration. In fact, two different models representing the two basic configuration types might be desirable. Consideration should also be given to the availability of comparable flight data in the selection of the pathfinder configuration.
The following presently available wind tunnels were suggested for use in providing comparative data·for validation of the NTF:
(1) Ames II-foot transonic tunnel
(2) Langley 8-foot transonic pressure tunnel
(3) AEDC l6-foot transonic propulsion tunnel
(4) Marshall 32-inch Ludwieg Tube
Investigation of the pathfinder model in these facilities should take place on a schedule which is geared to provide the necessary data within the time frame that the NTF becomes operational. Selection of the model must therefore be made relatively soon.
Idealistically, comparison of wind-tunnel and flight data should provide the final answer on the validity of the wind-tunnel data. Unfortunately, such comparisons frequently raise more questions than they answer. In order to minimize the possibility of unexplainable anomalies, the panel suggested that
156

direct comparisons of drag measurements made in flight and in the wind tunnel should be deemphasized because of the difficulties in obtaining the measurement of engine thrust in flight. Instead, wake surveys, boundary-layer measurements, and pressure distributions were thought to provide the best bases for comparing wind-tunnel and flight data. The aircraft chosen for comparative tests should be of modern design and be properly instrumented. A precise airdata system for measurement of Mach number and dynamic and static pressure is required, as is an accurate means for measuring angle of attack and angle of sideslip. Detailed measurements of structural deformation are mandatory.
Selection of the aircraft for the comparative tests is directly related to the configu~ation of the pathfinder model which has been discussed previously. The flight data should be available on a timely basis for comparison with windtunnel test results. Early implementation of the flight investigation is accordingly indicated.
Two aircraft were discussed as possible candidates for consideration. These were the F-lll transonic aircraft technology (TACT) and one of the advanced military STOL aircraft (AMST). The TACT aircraft employs a supercritical wing, is highly instrumented, and will provide detailed data within the required time period. It has the possible disadvantage of operating at a relatively low transonic Reynolds number (40 x 106 maximum). Both candidate AMST aircraft employ straight, supercritica1 wings but are relatively slow. The selection of the aircraft and the associated pathfinder model requires detailed study and should be resolved in a timely manner.
EXPLOITATION OF HIGH REYNOLDS NUMBER CAPABILITY
Exploitation of the high Reynolds number capability of NTF was considered in relation to long-range cruising aircraft, highly maneuverable aircraft, and certain other types of vehicles. There was considerable discussion as to the relative priority of experimental studies of long-range cruising aircraft and highly maneuverable aircraft. An unanimous conclusion was not reached; however, the consensus was that studies of long-range cruising aircraft should rank next in priority after the experimental investigations needed to establish confidence in the validity of data obtained in the facility.
Long-range cruising aircraft comprise civil passenger and freight transports, military logistics aircraft, bombers, and long endurance aircraft. Future investigations of this class of aircraft in the NTF should be focused on an advanced technology aircraft intended for operation in the 1990 time period. Some of the important aerodynamic phenomena which might be characteristic of such an aircraft and which would probably require the high Reynolds number capability of the NTF are:
(1) Shock -- boundary-layer interaction and flow separation together with their associated effects on the load distribution and the force and moment characteristics of the aircraft
157

(2) High-speed buffet together with the pitching and rolling characteristics at high speed
(3) Interference drag at high speed
(4) Control-surface effectiveness and hinge moments at high speed
In addition to these items, much work was thought to be needed in the development of improved high-speed airfoils, and the formulation of criteria and methods for the design of these airfoils. The presently available Langley O.3-m transonic cryogenic tunnel was considered suitable for much of the experimental airfoil work. This work could begin in the very near future. Lowspeed problems involving stall, buffet, and development of high-lift devices might also be undertaken on a two-dimensional basis in the O.3-m transonic cryogenic tunnel. At a later date, three-dimensional studies might be desirable in the NTF.
The Reynolds number sensitive features discussed for long-range cru1s1ng aircraft are also inherent in highly maneuverable aircraft. The requirement for simultaneous operation at high subsonic speeds and high-lift coefficients, however, suggests Reynolds number sensitive design features in future highly maneuverable aircraft which are not found in long-range cruising aircraft. Advanced maneuvering aircraft, for example, might incorporate one or more of the following design features:
-(I) Variable geometry for increased maneuverability. Concepts such as variable leading- and trailing-edge shapes and flaps, as well as thrust vectoring, integrated in the aerodynamic design of the aircraft might be considered
(2) Vortex-lift concepts which might involve fixed strakes or closecoupled canards might also be considered
Models involving combinations of these design features, as well as others which may evolve, should be studied in the NTF. In addition to measurement of the usual pressures, forces, and moments, attention must be given to buffet onset and intensity at various combinations of high lift and Mach number. The effect of various design features on buffet and high-speed stall is considered to be particularly important.
A number of other classes of vehicles, for example, missiles and spacecraft, were discussed as possible candidates for exploiting the unique capabilities of the NTF; however, no recommendations were made for specific programs in these areas.
SPECIALIZED EXPERIMENTAL TECHNIQUES
The need for development of a number of specialized experimental techniques for use in the NTF was discussed and several recommendations were made. The development of techniques for measuring turbulence at cryogenic temperatures has already been mentioned in the discussion of tunnel calibration, but
158

it is introduced again at this point. Development of methods of flow visualization at cryogenic temperatures was thought to be very important and should be the subject of study in the Langley O.3-m transonic cryogenic tunnel in the near future.
The NTF, as now being designed, is equipped with a sting-support system. The panel recommended that consideration should also be given to the development of several additional types of support system. One of these was the "plate" support. In this type of support, the model is mounted on a vertical plate (a1ined with the airstream) which extends from the bottom of the fuselage to the tunnel floor. The forces and moments are measured at the juncture of the model and the plate. This system avoids the need for distorting the rear of the fuselage to accept the sting. The plate support is considered as complementary to and not a replacement for the sting-support system. Other support systems thought to be in need of design and development for NTF are
(1) Semispan support
(2) Systems for measuring dynamic stability derivatives
(3) Two-dimensional support
(4) Support for flight-path trajectory simulation. This type of support involves two stings which can position one model in relation to another. For example, the forces and moments on a store following separation from an aircraft can be measured and the resulting motion of the store computed to provide the next point on the trajectory.
NEW DIRECTIONS
Investigations at high Reynolds numbers in the NTF will no doubt suggest opportunities for improved aircraft performance which are not now anticipated. The experimental studies of long-range cruising aircraft and highly maneuverable aircraft which have already been discussed may suggest new means for cruise and maneuver enhancement. Various types of boundary-layer control may provide new opportunities, and the ability to achieve large leading-edge Reynolds numbers on three-dimensional wings may yield unanticipated improvements.
The large independent variation of dynamic pressure· for a given Mach number provides an important means of aeroelastic tailoring which has not been available before. These are only a few examples of ways in which the capabilities of the NTF may reveal new possibilities for improvement. Many others no doubt exist and will be explored and exploited as new programs are undertaken in the tunnel.
159

ROUND-TABLE DISCUSSION
A question was raised during the round-table discussion subsequent to the panel meeting as to why f1ight,and wind-tunnel comparisons were necessary on advanced technology aircraft. It was pointed out that the supercritica1 wing and other advanced design features pose most of the Reynolds number sensitive questions. It was further pointed out, however, that the advanced state of the art pathfinder model involves an inconsistency. The problem is how to select, in the near future, an advanced configuration for which substantiating flight data will be available by 1981.
Another commenter cautioned against placing too great an emphasis on early wind-tunnel and flight correlation. Correlation between wind tunnel and flight is extremely difficult at present and will improve only as the state of the art of both wind-tunnel and flight measurements improve. Furthermore, NTF is a unique facility which should not be bogged down on comparisons of data for old aircraft, which may not have the Reynolds number problems characteristics of more advanced configurations.
Another commenter- suggested that a most useful program would involve the design of configurations optimized for operation in the chord Reynolds number range from 50 x 106 to 60 x 106• Performance of such configurations when tested at a Reynolds number of 5 x 10⁶ to ;0 x 106 might be very poor but be outstanding at the higher Reynolds number. The importance of analytical techniques in such high Reynolds number designs was emphasized.
160
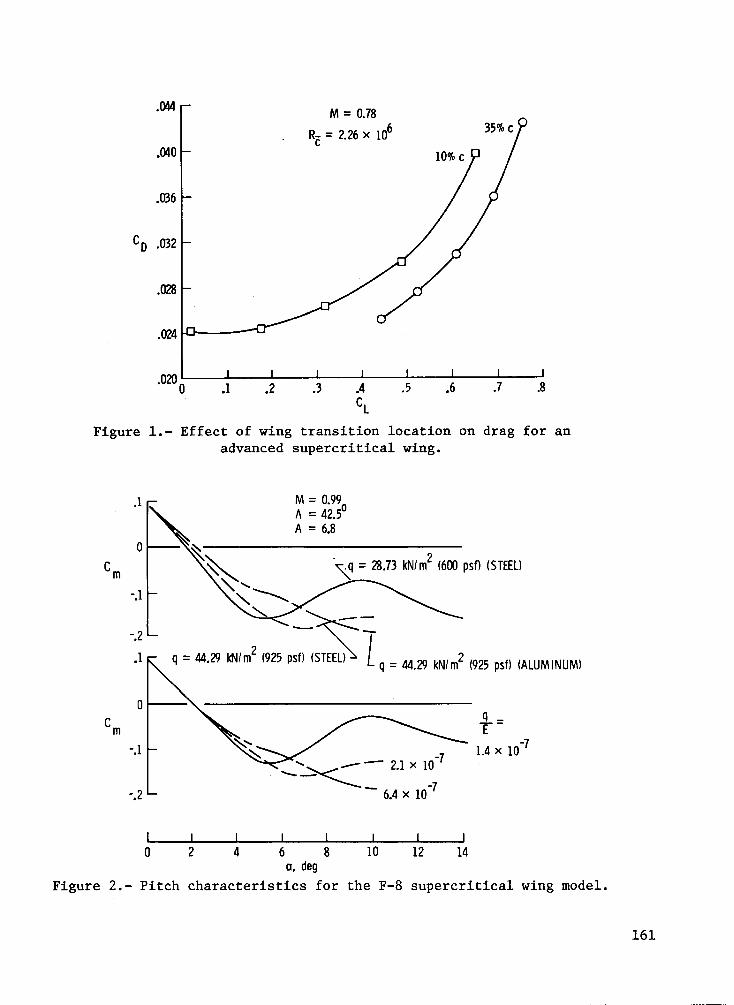
.044
.040
.036
Co .032
.028
.024
.0200 .1 .2
M = 0.78
Rc = 2.26 x 10⁶
.3 .4 C
L
.5
Figure 1.- Effect of wing transition location on drag for an
.1
0
em
-.1
-.2
.1
0 C m
-.1
-.2
I 0
advanced supercritica1 wing.
~ ~ ~ ...... ,---.........
M = 0.990 " = 42.5
A = 6.8
- 2 ~ = 28.73 kNlm (600 pst) (STEEl)
- : ~S~ q - 44.29 kNlm (925 pst) (STEEl) L q = 44.29 kNlm2 (925 pst) (ALUMINUM)
............... --...... _- 2.1 x 10⁻⁷
-~ -- 6.4 x 10 7
2 4 6 8 10 12 a, deg
14
q -y-
1.4 x 10⁻⁷
Figure 2.- Pitch characteristics for the F-8 supercritica1 wing model.
161

Page intentionally left blank

PROPULSION AERODYNAMICS PANEL
Chairman
Vice-Chairman
Technical Adviser
Bobby Berrier
Emanuel Boxer
Robert Grossman
Thomas Kennedy
D. Randall Kent
Helmut Korst
Daniel Lahti
David Bowditch
Lowell Hasel
Mark Nichols
Panel Members
Allen Laughrey
Richard Martens
Jack Nugent
David Powell
Jack Ross
Jack Runckel
William Usab
163

Page intentionally left blank

REPORT OF THE PANEL ON PROPULSION AERODYNAMICS
David Bowditch
NASA Lewis Research Center
INTRODUCTION
Effort allocated to wind-tunnel investigations of propulsion-system installations has increased in recent years because of the dramatically increasing impact of these installations on overall airplane performance and on the cost and duration of flight-test programs. Unfortunately, the effectiveness of this effort has been seriously limited by a lack of knowledge of the degr"ee of accuracy with which wind-tunnel data can be used to predict propulsion-system installation performance under actual flight conditions. Experience to date has been spotty, the degree of agreement between wind-tunnel-derived results and flight results ranging from excellent to very poor.
The discrepancies noted between propulsion aerodynamic characteristics as predicted from wind-tunnel tests and as measured in flight appear to arise from four basic sources:
(1) Difficulties involved in obtaining accurate wind-tunnel data: The models used tend to be much more complex than the usual external aerodynamics models because of the necessity for simulating and modulating engine and auxiliary airflows, for representing inlet and exit geometries in extensive detail, for providing an unusually large amount of instrumentation (sometimes including separate force measurements on inlet and nozzle components) and for using nonstandard types of model support systems
(2) Uncertainties in the corrections applied to the wind-tunnel data to allow for sting tares, blockage, wall effects, etc.
(3) Uncertainties involved in extrapolating the corrected wind-tunnel data from tunnel conditions to full-scale flight conditions
(4) Difficulties involved in obtaining comparable and accurate flight data.
Propulsion aerodynamic data obtained in the National Transonic Facility (NTF) at subflight Reynolds numbers will be subject to all these problems. The variable Reynolds number capability of this facility, however, will for the first time provide the analyst a tool for understanding and quantifying the factors involved in item (3) - the process of extrapolating the model data to full-scale conditions. This capability is believed to be a very important contribution.
165

FOCUS
There was a consensus that the NTF would be of outstanding value as a propulsion aerodynamics research facility. The discussion of the panel was focused in the following areas related to such usage:
(1) Identification of research emphasis and primary objectives
(2) Identification of special provisions, equipment, instrumentation, etc. considered either necessary or desirable
(3) Identification and prioritization of specific propulsion aerodynamics problems believed to merit investigation in the facility at Reynolds numbers extending beyond present facility capabilities
(4) Identification of precursor research and studies which can and should be undertaken prior to utilization of the facility for this type of research.
PROPULSION AERODYNAMICS RESEARCH EMPHASIS AND PRIMARY OBJECTIVES
The panel was in general agreement that emphasis in propulsion aerodynamics investigations in the NTF should be placed on the study of Reynolds number sensitive phenomena. It was felt that in addition to helping to clarify data extrapolation problems, the data obtained would be of direct use to the designer. Further, by permitting checks of theory against experiment at realistic conditions, the data would lead to the development of greatly improved analytical and theoretical methods. An important consensus of the group was that one of the primary services of the tunnel will be that of providing a standard for judging the capabilities and limitations of other propulsion aerodynamics research facilities. There is no question but that facilities other than NTF will have to carry the large bulk of propulsion aerodynamics research for the foreseeable future; hence, it was emphasized that the capabilities and limitations of these othe~ facilities must be established reliably.
FACILITY AND EQUIPMENT CONSIDERATIONS
The panel was in agreement with the other panels and with the NTF program personnel in the belief that the first order of business in the NTF is research on the tunnel itself. In addition to the establishment of the operating envelope, considerable effort must be devoted to achieving a high-quality testsection flow (flow uniformity, turbulence and noise levels, etc.), to insuring that the various tunnel interference and blockage effects have been minimized adequately in the design and are predictable, and to achieving avery precise tunnel calibration. In addition, the boundary-layer development at the cryogenic condition must be compared with boundary-layer development in flight at similar Reynolds numbers. Transition, turbulence spectrum, separation,
166

reattachment, etc., all need to be studied in order to verify that the viscous flows are similar at wind-tunnel and flight conditions. The panel was emphatic on the need for this effort inasmuch as the forces, pressures, and viscous flow development for some propulsion models (especially jet nozzle-afterbody models) seem to be very sensitive to these factors.
Up to the present time, only limited attention has been given to utilization of the NTF as a propulsion aerodynamics research facility. The only pertinent feature noted specifically in the workshop presentations was the allocation of 50 cm2 (7.8 in2) of flow area in the standard sting for the piping of internal flow gases at a pressure of 41.4 MN/m2 (6000 psi). This and many other features require detailed study. Concern was expressed, for example, relative to the time required for model changes in the tunnel. Propulsion aerodynamics studies, especially jet-exit-afterbody investigations, characteristically require much more frequent tunnel entries than do more straightforward aerodynamic tests. Unless tunnel entry time can be decreased to a major extent or the models can be automated to an as yet unprecedented degree (or both) only very basic propulsion tests with very simple models will be practicable.
Certain equipment, in addition to that currently planned, was identified by the panel as necessary to permit utilization of the NTF for propulsion research. This equipment as an initial minimum included:
(1) Jet and secondary-flow gas supply systems
(2) Special support systems (for example, a "double hockey, flow-through sting")
(3) "Flow-through" and other special propulsion balances
(4) Boundary-layer measurement instrumentation
(5) Surface flow visualization equipment
Other equipment such as high-angle-of-attack stings or sting knuckles (up to an angle of attack of 70° for fighter models), flow-field visualization equipment, and dynamic-flow measurement instrumentation obviously is desirable and should not be forgotten in equipment planning.
Provision of some of the listed items will necessitate rather extensive research and development activities in their own right. Inherent in the gas supply systems, for example, is an extensive research program needed to determine and validate jet-simulation techniques for the special conditions encountered in the NTF. A similar effort may also be needed to establish techniques for controlling and measuring internal model flows. It is understood that research is either under way or pldnned to examine model surface finish requirements (hopefully, including effects of roughness, gaps, and steps) and to establish pressure-orifice size requirements. Such information is necessary to the efforts of the propulsion model designer.
167

INITIAL PROPULSION AERODYNAMICS STUDIES PROPOSED FOR THE NTF
The three propulsion aerodynamics studies considered by the panel to be of greatest interest for early implementation in the NTF are now discussed in descending order of priority.
Effects of Reynolds Number on Drag of Simple Afterbody Models Incorporating Simulated Jets
As illustrated by sketch (a), current data from various facilities on the effects of Reynolds number on the drag of a given afterbody shape are often inconsistent.
Pressure drag
,..-, / ,
/ ............... / -- --' ~~ " ~ =
Reynolds number
'Sketch (a)
M=K
The objective of the research would be to clarify the situation with consideration given to such factors as body shape, exhaust-plume characteristics, and effects of adjacent airframe components. The model proposed for investigation is illustrated in the upper left corner of figure 1.
The single jet model would be a simple body of revolution with an ogival nose and with several afterbody shapes, including boattails with and without flow separation. Provision would be made for the addition of tail surfaces. Instrumentation would be provided to determine afterbody forces and surface pressure distributions, forebody pressure distributions (to detect forebody drag changes which might offset observed afterbody drag changes), and boundarylayer separation and reattachment locations. Subsonic and transonic testing, first as a pressure model and then as a force model, would be conducted jet on, jet off, and with solid jet simulators. Test results would be compared with theory and with test results for the same models in other facilities. Such comparisons would be of assistance in studying the wall-interference and
168

blockage-correction problems of the NTF and would provide some insight regarding flow quality effects. A further objective of the tunnel-to-tunnel comparison testing would be the establishment of criteria for facility selection for propulsion aerodynamics testing. It is anticipated that one of, the boattailed body configurations eventually would be chosen as a reference standard calibration model similar to the current Supersonic Tunnel Association standard nozzle.
For later testing, after the highest priority tests have been completed, the single-jet model could be modified into twin-jet and nonaxisymmetric models, as illustrated in the center and bottom right of figure 1. The conventional twin-jet model would be used to study base and interfairing problems and jetto-jet interference problems. The nonaxisymmetric twin jet, in addition to providing jet-shape-effects data, also would be used to study thrust-vectoring and induced-lift effects.
Correlation of Propulsion Aerodynamics Test Data From Wind Tunnel and Flight Tests At or Near Flight Reynolds Number Conditions
The preceding recommended program would be expected to clarify the basic effects of test Reynolds number on the wind-tunnel to wind-tunnel propulsion aerodynamics data correlat:ioll problem. It still will be necessary, however, to close the loop by extending the study to a comparison of wind-tunnel and flight data. This extension will require investigation in the NTF of propulsion models of complete aircraft. As an initial step, it is proposed that some 1980-era fighter be selected beeause, by then it will already have been subjected to extensive propulsive aerodynamics tests in other wind tunnels and in flight. A fighter configuration is believed to be a better choice for the study than either a bomber or a commercial transport because the model size of its propulsion system for a given permissible model frontal area is much greater than those for the other two classes of aircraft.
The first objective of the model tests in the NTF would be to obtain pressure-distribution data in model regions near the inlets and exits for the exac~ configurations and the exact subsonic and transonic operating conditions that have been explored previously in flight. Boundary-layer profiles at critical points on the configuration should also be compared. It is believed that it would be satisfactory to delay very high angle-of-attack studies and the procurement of overall drag correlation data to later phases of the program. Pressure-distribution data would be obtained at lower than flight Reynolds nu~ bers for wind-tunnel to wind-tunnel data correlation purposes.
Effects of Reynolds Number on Inlet Transonic Drag
No data concerning the effects of Reynolds number on inlet spillage drag exist for either conventional or supercritical lip shapes. This is an important deficiency inasmuch as all supersonic aircraft are being designed currently with rounded rather than with sharp inlet lips. This information deficiency will extend to the case of subsonic aircraft as progressive thinning of the inlet lips accompanies extension of the subsonic design cruise Mach number to 'values beyond about 0.9. The possibility exists that important performance gains can be attained by optimizing the inlet-lip and afterbody shapes. Such optimization requires experimental design data over a wide range of
169

flight-level Reynolds numbers. An isolated drag model of a rectangular supersonic inlet is proposed for the initial study. Drag tests would be conducted over the Mach number range from 0.7 to 1.2, over the Reynolds number range from current wind-tunnel levels to NTF maximum values, and over appropriate ranges of mass-flow ratio and angle of attack. Pressure-distribution and flowvisualization measurements would be conducted separately at appropriate stages of the investigation to study flow phenomena and to guide the inlet-lip development effort. A circular inlet also would be studied in a later stage of the investigation. Special requirements for the investigation are: the development of accurate flow through balances to function in the cryogenic highdynamic-pressure environment, definition of model surface finish requirements, and accommodation of a large number (approximately 200) of pressure measurements.
Additional Propulsion Aerodynamics Problems
Additional propulsion aerodynamics problems considered by the panel to have merit for future investigation in the NTF were:
(1) Effects of Reynolds number on inlet-flow distortion (consideration given to forebody flow fields, inlet lip shapes, internal contours, etc.)
(2) Exploration of propulsive lift concepts (cruise and maneuver cases with wing in influence of jet)
(3) Study of effects of Reynolds number on jet-flow-field interactions
(4) Study of close-coupled inlet-exit systems.
PRECURSOR EFFORT
It was the strong opinion of the panel that a large amount of precursor research and engineering development work needs to be undertaken now so that the NTF can be utilized for propulsion aerodynamics research within a reasonably short time after it is placed in research operation. A good example is the need for studies to determine the requirements for achieving valid jet simulation. Other examples are mentioned in the foregoing discussion. The consensus of the panel was that if such work cannot be done in-house within a suitable time frame, outside assistance should be enlisted through the medium of suitable contracts or grants.
170

Single
Nonaxisymmetric
Figure 1.- Basic research models.
171

Page intentionally left blank

DYNAMICS AND AEROELASTICITY PANEL
Chairman John Houbolt
Vice-Chairman Wilmer Reed
Technical Adviser Harry Runyan
Panel Members
Eugene Baird Blair Gloss
Jack Bartley William Grosser
Richmond Boyden Perry Hanson
Charles Coe Henry Katz
Dale Cooley Edwin Ryan
Atlee Cunningham Frank Sevart
Robert Doggett Frank Tarzanin
Chester Furlong
173

Page intentionally left blank

REPORT OF THE PANEL ON DYNAMICS AND AEROELASTICITY
John Houbolt
NASA Langley Research Center
INTRODUCTION
Flutter is a dynamic phenomenon which involves the interaction of elastic, inertial, aerodynamic, and temperature-induced forces. (See fig. 1.) At speeds below the flutter point, these forces are interrelated in such a way that any induced excitation of the lifting-surface structure will rapidly damp; at speeds above the flutter point, induced excitations will grow in amplitude (unless restricted by nonlinear effects) and will lead to destruction of the structure.
In view of these possible catastrophic effects, all commercial and military aircraft must be shown to be flutter free by a combination of analysis and experiment. The experimental investigation usually involves the proof testing of complex models which may cost as much as one-half million dollars. To provide an adequate proof test, properly scaled models and specialized wind tunnels are required.
Model scaling will first be reviewed; this review is followed by a brief description of the characteristics of the Langley transonic dynamics tunnel (TDT), a tunnel which was specifically designed for flutter testing. The unique characteristics of the National Transonic Facility (NTF) will be reviewed in the light of dynamic testing. Overlap considerations will be mentioned and will be followed by several recommended test programs.
MODEL SCALING
The model-scaling laws may be obtained by examination of the equations of motion. The scaling parameters are
Mass ratio:
m m
Mach number:
V m
a m
(1)
(2)
175

Reduced frequency:
w b wAbA mm = V VA m
(3)
Froude Number:
gmbm gAbA
V2 V2 m A (4)
where
m structural mass per unit length
p fluid density
b half-chord
V velocity
a speed of sound
w frequency
g gravity
Subscripts:
m designated model
A full-scale airplane
Another parameter which has essentially been neglected in flutter work is Reynolds number (R):
R = P V b mmm
jJm
when jJ is the kinematic viscosity.
(5)
For the noncryogenic tunnel, scaling parameters (eqs. (1), (2) and (3» have been found to be adequate for dynamic model testing of high-speed aircraft. The Froude number (gravity ratio, eq. (4» is used when static deflections are important. With the advent of theNTF, then it is possible for a dynamic model to be scaled according to the scaling parameters of equations (1), (2) and (3), and to maintain a full-scale Reynolds number capability. As an example of possible model scaling, the following table contrasts a fighter-type model at M = 1 (where the model span has been selected as 0.6 of the test section width) where the model was scaled for both the TDT (in freon) and the NTF.
176

Model/Full-scale values: TDT NTF
Length 0.2 0.1
Velocity 0.46 0.56
Temperature 1.1 0.31
Dynamic pressure 0.19 4.2
Density 0.9 13.2
Reynolds Number 0.11 1.0
Model Weight, kg (lb) 130 (287) 244 (538)
Model frequency, Hz 16 38
Wing density, kg/m3 (lb/in 3 ) 305 (.011) 4430 (0.16)
Stress ratio 1 3
The wing density for the NTF model is about one-half that of steel, and thus it appears possible to construct the wing of steel. The high dynamic pressure experienced by the model in NTF is about 22 times that experienced by the model in the TDT, which could pose a serious static loads problem. For the example noted, however, the NTF test Rey~olds number is an order of magnitude greater than that for the TDT.
An important characteristic of a cryogenic tunnel on model construction is related to the ability of the tunnel temperature to be changed independently of Mach number. As pointed out in reference 1, a single model could be tested near 273 K (32°F) with a temperature variation of only +40 K (+ 72°F) and meet the scaling requirement for M = 0.6 to M = 1.3 and maintain the proper mass ratio for each flight altitude. At these conditions, however, the Reynolds number would not be satisfied.
CHARACTERISTICS OF THE LANGLEY TRANSONIC DYNAMICS TUNNEL
The Langley transonic dynamics tunnel is an example of a tunnel which was designed specifically for dynamics testing, and it is thought to be appropriate to review some of the characteristics of the tunnel which should be considered early in the design of the NTF if it is to be used as an adjunct to the TDT. Figure 2 illustrates the slotted test-section including a cable-mounted model.
177

Transonic Capability
The tunnel operates from low subsonic speeds to M = 1.2. The critical flutter region is from moderate subsonic speeds through the transonic speed to low supersonic speeds. A typical flutter boundary is shown in figure 3, where the dynamic pressure is plotted against Mach number. Note the typical dip in the flutter boundary as the transonic region is approached. The TDT performance capability is also given in the figure. The radial lines emanating from the origin are constant total pressure lines. (The tunnel may be operated from a low pressure to atmospheric.) A typical test would be conducted along a radial line (constant pressure) until the flutter condition was found. The pressure in the tunnel is then changed so that an intersection would be determined at a different Mach number, and thus the flutter boundary is traced.
Test Medium
The TDT utilizes either air or freon as a testing medium. The use of freon has two advantages: (1) Its density is four times that of air: thus the construction of dynamic models is made much easier since one of the primary nondimensional flutter parameters is m/npb2 where m is the structural mass per unit length, p is the density of the test medium, and b is the halfchord. (2) Its low speed of sound (one-half that of air) not only reduces the power required for tunnel operation for a given Mach number but also reduces the model scaled frequencies leading to simplified model construction (e.g. lower frequency requirements on model control surface actuators and instrumentation).
Test-Section Size
In order to simulate structural details, large models are generally re~ quired. The 4.88m (16-foot) test-section size of the TDT has been very adequate for this purpose.
Rapid Tunnel Shutdown
Some of the flutter models tested in TDT hav~ cost about one-half million dollars, and during an extensive series of flutter te~ts, it is mandatory that the model be saved from destructive flutter. To obtain the capability of reducing the dynamic pressure quickly, a valve was installed in the tunnel which reduces the dynamic pressure by 1.91 kN/m2 (40 psf) within a few seconds.
Model Visibility
The TDT has a very large plenum chamber. In order to allow the operators of flutter tests to observe the model directly during tests, a control room, accessible to the outside, was constructed inside the plenum chamber so that observation windows could be installed in the tunnel wall. Thus, during a test, an operator can directly view the model and can operate the valve which quickly reduces the tunnel dynamic pressure if flutter occurs.
178

Tunnel Protection
The possibility always exists that a flutter model will be destroyed and the debris carried around the tunnel to the fan. The TDT has specially designed screens to protect the machinery.
Model Support
Models in TDT are supported by three methods: (1) wall mount, (2) sting mount, and (3) cable support. The cable-support system was devised so that free-flight motions could be ascertained in flutter model tests.
Data Acquisition and Instrumentation
Instrumentation for dynamic studies includes the use of pressure cells for measurement of unsteady pressures, strain gages and accelerometers to measure frequencies, and transducers to measure wing and control surface positions. The use of these transducers in a cryogenic environment must be investigated, and the Langley O.3-m transonic cryogenic tunnel (TCT) should be used in this development.
The presently proposed data system for NTF should be examined to determine whether the frequency response is suitable for dynamic testing. It should be pointed out that the TDT has recently acquired a $2.7 million dynamic data system. This system is proving to be exceedingly valuable, particularly in reducing the tunnel test time in that a complete test can be programed and run, the data being automatically recorded, analyzed, and plotted. In some cases, the data system is used during the test to analyze a record of random model motion at speeds below the flutter velocity and extract the system damping. During the test the engineer can decide whether to proceed to a higher tunnel speed or extrapolate to the flutter point without actually encountering flutter.
Model Construction and Checkout
The models used in TDT are constructed from a variety of materials including balsa wood, composites, aluminum, titanium, and steel. The question arises as to the construction techniques which may be necessary for a model to withstand the cryogenic temperature as well as the high dynamic pressures in the NTF. Normally, a flutter model is designed on the basis of the flutter scaling parameters and is tested at near zero angle of attack because the loadcarrying ability is very low. This is necessary so that the model will flutter within the operating range of the tunnel. In order to utilize the potential of the NTF, namely, high Reynolds number, a high pressure Which results in very high dynamic pressures is required. This raises the question of whether a flutter model can be constructed to withstand the severe environment and still provide an adequate flutter test. Therefore, it is suggested that a flutter model be designed for the purpose of determining the practicability of constructing a model to be used in NTF. The model materials must be adequate to withstand the possibility of thermal shock as well as fatigue.
179

Flutter models are exhaustively tested before entering the tunnel. For instance, the model is vibrated to insure that both frequency and mode shape are within the range desired to simulate a full-scale airplane. Thus, a separate "cold room" facility may be required for NTF in which models would be remotely tested under the anticipated conditions of the test.
Many of the models will require actuators to oscillate the complete wing or control surfaces. Miniaturized hydraulic and/or electrical actuators will be required. The effect of cryogenic temperatures and high dynamic pressures on their operation must be investigated.
CHARACTERISTICS OF NTF OF SPECIAL IMPORTANCE FOR DYNAMICS AND AEROELASTICITY
There are two major characteristics of the NTF which make it useful for dynamic or flutter testing. First, with the ability to adjust fluid temperature independent of Mach number, the potential exists for flutter testing a given model at different values of the mass ratio m/TIpb2 at a given Mach nu~ber. The second unique feature is, of course, the ability to test at fullscale Reynolds number.
Mass Ratio Variation
For flutter test in the TDT, a model is constructed for one particular mass ratio, which corresponds to a specific altitude and Mach number. A test in TDT proceeds along one of the radial lines of constant pressure until it intersects the flutter boundary, and the intersection could correspond to the value of mass ratio for which the model was designed (see fig. 3). If one desires to determine the complete flutter dip near M = 1 in the TDT, a different tunnel pressure is selected and the test proceeds in the same manner, and another intersection with the flutter curve is obtained. The mass ratio for this point will not exactly correspond to the altitude-Mach number relationship desired. If the flutter curve is well above the operation curve, the effect may be ignored. On the other hand, one could analytically correct the flutter speed to account for the improper density. Also, for the TDT, it is conceiv~ able that a series of models could be constructed, each having the proper density ratio for a certain Mach number and altitude. This is not usually done.
The use of the NTF could obviate this difficulty since the temperature can be independently controlled and thus the proper density-Mach number relationship can be obtained.
Reynolds Number
The primary justification for the NTF is the ability to obtain full-scale Reynolds number at transonic speeds. For flutter, the effect of Reynolds number has been largely ignored, principally because no facility existed to establish Reynolds number effects over a significant range. With the advent of the NTF, it now appears likely that this assumption may be investigated. Actually, for wing flutter, theory and model experiments have been in rather
180

good accord. The principal discrepancies in flutter speed have occurred in control surface flutter, and it is in this area that it is thought that the greatest contribution can be made. Control surface aerodynamic derivatives have notoriously been in serious error, and it has been usually attributed to flow breakdown and Reynolds number effects.
Accurate control surface aerodynamics are needed not only for flutter but also for the accurate design of optimal control systems for ride quality, stabilization, reduced static margin, etc.
A plot of the Reynolds number capability of the TDT and the NTF is shown in figure 4, and it is apparent that the new tunnel would open up the whole range of Reynolds number. Therefore, it is strongly recommended that the initial tests in the NTF be concerned with the measurement of wing and control surface oscillating aerodynamic derivatives.
Tied in with this concept, an investigation should be made to determine whether the NTF can be used as an adjunct to complete flutter model tests in the TDT. That is, conduct tests on simplified models at full-scale Reynolds numbers and in the NTF, then, by use of this data, design adjusted flexible dynamic models to be flutter tested later in the TDT.
SOME REMARKS CONCERNING CHANGES TO NTF FOR DYNAMIC TESTING
The features of the TDT which make it unique for flutter testing have already been discussed. If the NTF is to be used for flutter testing·, some of these TDT features would be highly desirable. These are:
(1) Rapid tunnel shutdown
(2) Ability for operator to observe model during test
(3) Protective screens for fans to contain debris after destructive flutter
(4) Several types of model support systems (namely, provisions for a wall mount and a "soft" model suspension system)
(5) A rapid dynamic data-acquisition system
(6) A room for checkout of the model at cryogenic temperatures.
OVERLAP ASPECTS
Because of the high dynamic pressure in the tunnel, it is very probable that models designed for static investigation may experience undesirable response. Some possible problem areas are
181

(1) Large unwanted structural distortions which may obscure the Reynolds number effects being investigated
(2) Stresses so high that the model is destroyed
(3) Divergence
(4) Flutter
(5) Buffeting
(6) Dynamic response due to shock interaction
It appears that a complete criteria document should be written that outlines the tunnel conditions, the possible model instabilities, and the depth of analysis required to obviate these potential problems. Possibly, an inhouse group should be organized to provide the necessary guidance and know-how to check any model design before it enters the tunnel.
RECOMMENDED PROGRAM FOR THE NTF
Before embarking on extensive programs in the NTF, it was felt by the panel that a considerable amount of precursor work could be done in the Langley O.3-m transonic cryogenic (O.3-m TCT) tunnel. For instance, it is entirely possible that some of the proposed programs for NTF could be considerably modified or eliminated if the O.3-m TCT were used with the viewpoint of assisting in designing the test for the NTF, including the development of instrumentation, test techniques, etc.
It is felt that it would be highly desirable for the NTF design group and the aeroe1astic group to hold meetings in the near future to assure that the items brought out in this report may be discussed in greater depth and thereby provide a greater appreciation of the viewpoints of other scienttsts.
Some of the dynamic problems which can be studied in the NTF are contro1-surface buzz, unsteady shocks, effects of boundary layer (steady and unsteady), buffet, stall flutter, basic unsteady aerodynamic derivatives, dynamic stability derivatives, flow over bluff bodies, tests of small, full-scale rockets, and ground wind loads on models of large launch vehicles.
Of these problem areas, the panel selected four specific topics which should be initially programed for tests in the NTF. The programs are presented in order of the priority assigned by the panel:
PROBLEM AREAS
1. Reynolds Number Effects on Control Surface Unsteady Aerodynamics
182

Objective: Obtain unsteady aerodynamic force, moment, and pressure measurements due to control surface motion at flight Reynolds numbers.
Background/Need/Justification:
Lack of available data on control surface unsteady aerodynamics at flight Reynolds numbers.
Reynolds number effects are important for control surface aerodynamics due to boundary-layer growth on the trailing edge and interaction with shocks.
Needed for:
Design of control-configured vehicles (CCV)
Prevention of "buzz"
Avoidance of control-surface flutter
Preventing control-system instabilities
2. Effect of Reynolds Number on Buffet Onset and Loads
Objective: Establish significance of Reynolds number effects and aeroelastic effects separately on buffet onset and intensity change with Mach number and/or angle of attack.
Background:
Discrepancies between tunnel-predicted and flight-measured buffet loads indicate Reynolds number and/or aeroelastic effects
Uncertainty in predictability has resulted in undesirable buffet characteristics in flight
Late identification of problems result in costly redesign after flight test
Special Considerations:
Flexible model in high dynamic pressure environment
Dynamic pressure transducers to 1000 Hz (approximately 50 required)
Accelerometers (approximately 6 required)
High-response strain gage balance
Flow visualization is desirable
183

Precursor Work (in-house or joint effort):
Instrumentation development
Preliminary model design
Configuration choice
3. Transonic Unsteady Aerodynamics
Objective: Evaluate effects of Reynolds number, Mach number, and amplitude and frequency on unsteady pressures on oscillating airfoils and wing p1anforms
Justification:
Same as for steady-state aerodynamics
Present disparity between maximum wind-tunnel capability and flight
Need sufficient data to evaluate and improve results from lower cost wind tunnels
Validate computational methods
Special Considerations:
Provisions for forced oscillation system
Dynamic pressure transducers
Dynamic boundary-layer measurements
Visual model monitoring
Precursor Work:
2-D tests in Langley O.3-m transonic cryogenic tunnel
4. Flutter
Objective: Evaluate Reynolds number effects on flutter characteristics of wing p1anforms and airfoils; develop guidelines for improving full-scale test simulation in TDT (e.g., boundary-layer modifiers)
Justification:
Present aircraft designs are strongly influenced by flutter
Full-scale (flight Reynolds numbers) flutter test not feasible
184
Present Reynolds number uncertainties lead to overconservatism in design
Special Considerations:
Model construction and calibration
Temperature effects on structural characteristics (e.g., damping)
Construction with dissimilar materials
Pre-entry vibration testing at cryogenic conditions
Screens (e.g., model failure)
Fast "q" change or tunnel shutdown
Precursor Work:
Test in Langley O.3-m Transonic cryogenic tunnel
CONCLUSIONS AND RECOMMENDATIONS
The panel offers the following conclusions and recommendations:
1. The NTF can be a very valuable adjunct to the Langley TDT for aeroelastic studies and flutter studies.
2. Precursor dynamic tests should be made in the Langley O.3-m transonic cryogenic tunnel to develop instrumentation, strategies for the NTF, and possibly to eliminate some proposed NTF tests.
3. Several overlap considerations should be investigated. When testing at the very high dynamic-pressure conditions in the NTF, all models should have a flutter and aeroe1astic clearance performed by a competent group.
4. To utilize the NTF as a dynamics facility, several characteristics of the Langley TDT should be considered, including
(a) Fast tunnel shutdown
(b) Model visibility
(c) Tunnel protection
(d) Dynamic model support systems
(3) Dynamic data-acquisition system
185

5. A theoretical investigation should be made to determine the feasibility of constructing and testing a flutter model in the NTF.
6. The initial series of tests in the NTF should be concerned with the determination of the effect of Reynolds number on wing- and control-surface derivatives by measuring oscillating pressures on "rigid" models which would be externally oscillated ..
7. For flutter models, the potential of utilizing in the NTF one model for a complete altitude range should be investigated.
REFERENCES
1. Destuynder, Roger: FeaSibility of Dynamically Similar Flutter Models for Pressurized Wind Tunnels, Paper presented to Fluid Dynamics Panel, AGARD, Sep. 14, 1976.
186

L_
AERODYNAMICS
TEMPERATURE ELASTIC ITY
MASS
Figure 1. - Aerothermoelast i city .
L- 76- 6766 Figure 2.- Flutter model installed on cable support system in Langley l6 - foot
transonic dynamics tunnel .
1 87
I J

psf kN/m2
500 25
MAXIMUM OPERATING ENVELOPE
400 20
TOTAL PRESSURE.
300 15 kN/m2 (atm)
DYNAMIC PRESSURE,
200 10
100 5
o o .6 .8 l.2 MACH NUMBER
Figure 3.- Flutter testing procedure in Langley transonic dynamics tunnel.
188
120 x 106
100
80
R-c 60
40
20
o .2 .4 .6 .8 1.0 1.2 MACH NUMBER
Figure 4.- Operating envelope of National transonic factility (NTF) and transonic dynamics tunnel (TDT).

LIST OF ATTENDEES
Non-Langley Attendees
Philip P. Antonatos Aero Engr AFFDL/CD Wright Patterson AFT, OH 45433 Phone: (513) 255-4012
Eugene F. Baird Chief Dynamic Scientist Grumman Aerospace Corp. Bethpage, NY 11714 Phone: (516) 575-3997
Jack Bartley Flutter Supervisor The Boeing Co. P.O. Box 3707, M/S 69-45 Seattle, WA 98124 Phone: (206) 237-2324
James Blackwell Scientist (Specialist) Lockheed-Georgia Company S. Cobb Drive Marietta, GA 30063 Phone: (404) 424-2383
s. M. Bogdonoff Chairman, Aeronautical and Mechanical Sciences Dept.
D-2l4 EQ Princeton University Princeton, NJ 08540
Ellwood Bonner Membe~ Tech Staff Rockwell Int. International Airport AB 67 Los Angeles, CA Phone: (213) 670-9151 Ext. 2455
David N. Bowditch Chief, Propulsion Aerodynamics Br. NASA Lewis Research Center 21000 Brookpark Road Cleveland, OH 44135 Phone: (216) 433-4000 Ext. 6123
Charles F. Coe Staff Scientist NASA Ames, N 227-4 Moffett Field, CA 94035 Phone: (415) 965-5858
Dale E. Cooley Technical Manager, Aeroe1astic Group Air Force Flight Dynamics Lab AFFDL/FBR Wright Patterson AFB, OH 45433 Phone: (513) 253-0877
Eugene E. Covert, Professor MIT Room 33-217 Cambrige, MA 02139 Phone: (617) 253-6159
Atlee M. Cunningham, Jr. Proj. Structures Engr General Dynamics/Ft. Worth P.O. Box 748 Fort Worth, TX 76101 Phone: (817) 732-4811
Gianky Daforno Grumman Aerospace Corp. So. Oyster Bay Road Bethpage, NY 11771 Phone: (516) 575-3662
Werner K. Dahm Chief, Aerophysics Division NASA/MSFC Marshall Space Flight Center, AL 35812 Phone: (205) 453-3017
189

Ed Danforth Div. Engr, Flight Sciences Lockheed Calif. Co. Dept. 75/40 Burbank, CA Phone: (213) 847-1772
Lars E. Ericsson Consulting Engineer Lockheed Missiles & Space Co. 1518 Fordham Way Mt. View, CA 94040 Phone: (480) 743-2535
G. Chester Furlong Technical Advisor Directorate of Test AECD Arnold AFS, TN 37389 Phone: (615) 455-2611 Ext. 7621
Alfred Gessow NASA Headquarters Code RAA Washington, DC 20546 Phone: (202) 755-2397
Lloyd T. Goodmanson Dir. Prelim. Design The Boeing Co. P.O. Box 3707 Seattle, WA 98124 Phone: (206) 655-8401
William F. Grosser Flutter & Vibration R&D Staff Engr Lockheed Georgia Co. Dept. 72-23, Zone 80 86 South Cobb Drive Marietta, GA 30063 Phone: (404) 424-4039
Robert L. Grossman Head, Fluid Mechanics Grumman Aerospace Corp. Propulsion Plant 35 Bethpage, NY 11714 Phone: (516) 575-2119
J. Lloyd Jones Chief, Planning and Analysis Office NASA Ames Research Center Moffett Field, CA 94035 Phone: (415) 965-5222 190
George M. Kaler Manager of Aerodynamics General Dynamics P.O. Box 748 MZ 2880 Fort Worth, TX 76101 Phone: (817) 732-4811
Henry Katz Branch Chief, Technology McDonnell Douglas Co. P.O. Box 516 St. Louis, MO 63166 Phone: (314) 232-2513
Kalle Kaups Senior Engineer Douglas Aircraft Co. 3885 Lakewood Blvd. Long Beach, CA Phone: (213) 593-3738
Thomas L. Kennedy Supervisor ARO, Inc. Arnold AF Station, TN 37389 Phone: (615) 455-2611
D. Randall Kent Director, Aerospace Technology General Dynamics/Ft. Worth Mail Zone 2868 P.O. Box 748 Fort Worth, TX 76101 Phone: (817) 732-4811 Ext. 4511
Relmut F. l<orst Professor of ME University of Illinois 11210 MEL Urbanna, IL 61801 Phone: (217) 333-1175
Daniel J. Lahti Senior Engineer General Electric Co. Simson Rd. & 1-75, Mail Drop E-198 Cincinnati, OH Phone: (513) 243-4996

James A. Laughrey Aerospace Engineer AFFDL/FXM Wright-Patterson AFB, OR 45433 Phone: (513) 255-4586
John D. Lee Director, Aero-Astro Res. Lab Ohio State University 3300 Case Road Columbus, OR 43210 Phone: (614) 422-1241
Richard E. Martens Section Chief, Propulsion McDonnell Aircraft Co., Box 516 St. Louis, MO 63166 Phone: (314) 232-3918
Robert E. Melnik Director Aerophysics Grumman Aerospace Corp. Research Dept. Plant 35 Bethpage, NY 11714 Phone: (516) 575-2226
Alexander F. Money USAF/AEDC Aerospace Engineer R&D Division, Technology Dir. Arnold AFB, TN 37388 Phone: (615) 455-2611 Ext. 7835
Jack Nugent Staff Engineer NASA Dryden Research Center Box 273 Edwards, CA 93523 Phone: (805) 258-3311 Ext. 264
F. J. 0' Brimski Senior Design Engineer Naval Air Systems Command Washington, DC 20361
David T. Powell Chief, Propulsion Research The Boeing Co. P.O. Box 3707 Seattle, WA 98124 Phone: (206) 237-2362
William J. Rae Member Tech Staff, Aerodynamic Research
Dept. Calspan Corp. 4455 Genesee Street Buffalo, NY 14221 Phone: (716) 632-7500 Ext. 8813
Eli Reshotko Professor of Engineering Case Western Reserve University Cleveland, OR 44106 Phone: (216) 368-2940
Jack W. Ross Manager (Acting) - Flight Sciences Rockwell International Los Angeles Aircraft Div., AB-7l Los Angeles International Airport Los Angeles, CA Phone: (213) 670-9151 Ext. 1765
Paul E. Rubbert Supervisor, Aero Research The Boeing Co. P.O. Box 3999 Mail Stop 77/06 Seattle, WA 98124
Edward S. Rutowski Chief, Aerodynamics Engineer-Technology
Develop. Douglas Aircraft Co. 3855 Lakewood Blvd. Long Beach, CA Phone: (213) 593-1770
Edwin M. Ryan Department of the Navy Naval Air Systems Command Code 5l0B Washington, DC 20361
Edwin Saltzman Performance Aerodynamics Branch NASA Dryden Research Center Box 273 Edwards, CA 93523 Phone: (805) 258-3311 Ext. 606
191

Francis D. Sevart Specialist Engr The Boeing Company 3801 S. Oliver Wichita, KS 67210 Phone: (316) 687-3295
Frank W. Steinle, Jr. Asst. Chief, Experimental Investiga-
tions Branch NASA Ames Research Center 227-5 Code FAX Moffett Field, CA Phone: (415) 965-5850
Frank Tarzanin Supervisor, Rotor Loads Boeing Vertol Philadelphia, PA Phone: (215) 522-7531
George T. Upton Vice Pres., Engineering Vought Corp. P. O. Box 5907 Dallas, TX 5907 Dallas, TX 75222 Phone: (214) 266-5615
William J. Usab Sr. Project Engr Pratt & Whitney EB-2J 400 Main Street E. Hartford, CT Phone: (203) 565-3128
Thomas M. Weeks Tech Mgr., External Aero. Air Force Flight Dynamics Lab AFFDL/FXM Wright Patterson AFB, OH 45433 Phone: (513) 255-5564
Langley Attendees
Ivan E. Beckwith Bobby L. Berrier Percy J. Bobbitt Emanuel Boxer Richmond P. Boyden Albert L. Braslow Dennis M. Bushnell James E. Carter Robert V. Doggett, Jr. John E. Duberg Vernon P. Gillespie Blair B. Gloss Joseph F. Guarino Perry W. Hanson Julius E. Harris Lowell E. Hasel Donald P. Hearth Beverly Z. Henry
Donald D. Baals Samuel Katzoff Laurence K. Loftin, Jr.
192
John C. Houbolt Robert H. Howell William B. Igoe Thomas C. Kelly William B. Kemp, Jr. Robert A. Kilgore Richard E. Kuhn L. Wayne McKinney Harry L. Morgan, Jr. Oran W. Nicks John B. Peterson, Jr. Edward C. Polhamus Robert W. Rainey Wilmer H. Reed, III A. Warner Robins Jack F. Runckel Richard T. Whitcomb
The George Washington University
Mark R. Nichols Harry L. Runyan, Jr. John L. Whitesides
NASA-Langl ey, 1977
Copyright © 2022 FDOKUMEN