modeling, analysis and optimization of cylindrical stiffened
Upload
khangminh22Category
view
1download
0
This content has been downloaded from IOPscience. Please scroll down to see the full text.
Download details:
IP Address: 128.252.67.66
This content was downloaded on 16/10/2016 at 22:03
Please note that terms and conditions apply.
You may also be interested in:
Prediction of Darcy--Forchheimer drag for micro-porous structures of complex geometry using the
lattice Boltzmann method
Namgyun Jeong, Do Hyung Choi and Ching-Long Lin
The design, fabrication and characterization of a silicon microheater for an integrated MEMS gas
preconcentrator
Junghoon Yeom, Christopher R Field, Byunghoon Bae et al.
Numerical modeling of three-dimensional compressible gas flow in microchannnels
V Jain and C X Lin
Modeling of liquid–gas meniscus for textured surfaces: effects of curvature and local slip length
Anvesh Gaddam, Mayank Garg, Amit Agrawal et al.
Experimental observations and lattice Boltzmann method study of the electroviscous effect for
liquid flow
G H Tang, Zhuo Li, Y L He et al.
Stokes flow through a rectangular array of circular cylinders
C Y Wang
Low Reynolds number flow across an array of cylindrical microposts in a microchannel and
figure-of-merit analysis of micropost-filled microreactors
View the table of contents for this issue, or go to the journal homepage for more
2009 J. Micromech. Microeng. 19 065025
(http://iopscience.iop.org/0960-1317/19/6/065025)
Home Search Collections Journals About Contact us My IOPscience
IOP PUBLISHING JOURNAL OF MICROMECHANICS AND MICROENGINEERING
J. Micromech. Microeng. 19 (2009) 065025 (10pp) doi:10.1088/0960-1317/19/6/065025
Low Reynolds number flow across anarray of cylindrical microposts in amicrochannel and figure-of-merit analysisof micropost-filled microreactorsJ Yeom, D D Agonafer, J-H Han and M A Shannon
Department of Mechanical Science and Engineering, University of Illinois at Urbana-Champaign,Urbana, IL 61801, USA
E-mail: [email protected]
Received 19 September 2008, in final form 21 February 2009Published 22 May 2009Online at stacks.iop.org/JMM/19/065025
AbstractMicropost-filled reactors are commonly found in many micro-total analysis systemapplications because of their large surface area for the surrounding volume. Design rules formicropost-filled reactors are presented here to optimize the performance of amicro-preconcentrator, which is a component of a micro-gas chromatography system. A keyfigure of merit for the performance of the micropost-filled preconcentrator is to minimize thepressure drop while maximizing the surface-area-to-volume ratio for a given overall channelgeometry. Several independent models from the literature are used to predict the flowresistance across the micropost-filled channels for low Reynolds number flows. The pressuredrop can be expressed solely as a function of a couple of design parameters: β = a/s, the ratioof the radius of each post to the half-spacing between two adjacent posts, and N, the number ofmicroposts in a row. Pressure drop measurements are performed to experimentally corroboratethe flow resistance models and the optimization scheme using the figure of merit. As thenumber of microposts for a given β increases in a given channel size, a greatersurface-area-to-volume ratio will result for a fixed pressure drop. Therefore, increasing thearrays of posts with smaller diameters and spacing will optimize the microreactor for largersurface area for a given flow resistance, at least until Knudsen flow begins to dominate.
(Some figures in this article are in colour only in the electronic version)
1. Introduction
Arrays of microscale posts inside a microchannel havebeen fabricated as components within microreactors [1, 2],micro heat exchangers [3–6] and micro-total analysis systems(μTAS) [7, 8]. The microposts are utilized to enhance heattransfer, adsorption/desorption and surface chemical reactionsdue to an increase in the surface area for the volume occupied.The goal for the design of many microscale devices, suchas the preconcentrators for micro-gas chromatographs, is toreduce size while increasing the surface-area-to-volume ratio.As the device size is reduced and the surface-area-to-volumeratio (SA/V) goes up, the energy required for pumping fluid
through the posted chamber goes up, since the higher flowresistance that occurs requires a higher pressure drop to passa given volume of fluid. A key performance metric that canprovide engineers with a design rule to fabricate more efficientμTAS devices is the pressure drop across a microchannel filledwith arrays of posts as a function of post-spacing and number,and hence SA/V.
The flow across arrays of cylinders, also known as flowacross banks of tubes, has been studied extensively in thepast century. For macroscale devices where the characteristicdimensions are large, the typical flow condition is either intransition or turbulent (medium to high Reynolds numbers),for which analytical solutions are not available. Therefore,
0960-1317/09/065025+10$30.00 1 © 2009 IOP Publishing Ltd Printed in the UK
J. Micromech. Microeng. 19 (2009) 065025 J Yeom et al
the majority of these studies focused on developing empiricalrelationships such as between the friction factor and thepressure drop and between the Nusselt number and the heatertransfer coefficient [9–14]. These correlations have beenextremely useful in designing heat exchangers, reactors, filters,etc.
When the characteristic length of the system is reduced toa millimeter or below, the flow is likely to be in the laminarregime. Current trends in miniaturization of electronic devicesand active cooling systems to mitigate ever-increasing heatdissipation from these devices have spurred a great deal ofresearch in forced flow across a bank of micron sized pinfins. Interestingly, it has been reported that the correlationsused to predict the pressure drop for fluid flow across pinfin-tube bundles in conventional scale systems need to bemodified for microscale counterparts [15]. These microscalehydrodynamic correlations have been developed in recentyears for a variety of geometric fin configurations (aligned andstaggered), fin types (tubular or non-tubular) and their aspectratios (ratio of the height of a pin to its diameter) [16–18].
In some cases where the flow rate is relatively small, theReynolds number (Re) of the flow is often on the order of 1 ormuch less (so-called creeping flow), and analytical solutionsto the Navier–Stokes (N-S) equation can be derived withreasonable assumptions (Stokes’ approximation). Analyticalexpressions for the flow resistance across arrays of cylindricalposts in this flow regime have been proposed by numerousresearchers [19–27], as a function of the geometric parameterssuch as the ratio of the center distance between adjacent postsand the diameter of each post. Instead of this ratio, the porosityor cylinder density is often used to facilitate the comparisonto various cylinder arrangements [25]. Many of these modelswere developed for a flow across a periodic array of circularcylinders compared to the experimental results obtained froma flow across randomly arranged fibers (typically found in airfilters) [28]. Since no exact information is known for thedegree of randomness of arrangement, uniformity of diameterand degree of straightness of fiber, direct comparison to thetheoretical model is limited to the finite range of the fiberdensity. A few experimental results from a periodic array ofcylinders with tight dimensional control have been reportedand compared with these idealized models, especially inmicrochannels.
In this paper, we utilize the MEMS fabrication technologyto create arrays of high-aspect-ratio silicon microposts withaccurate dimensions and alignment, and then perform seriesof experiments to collect pressure drop data for variousgeometrical settings. Several independent models to predictthe drag and pressure drop across a square array of circularcylinders for a creeping flow are reviewed and compared tothe experimentally obtained pressure drop results from themicrofabricated structures. Models that give the best fit to theexperimental data are chosen to create a hybrid solution validover the entire cylinder density.
In addition, we report on a key figure of merit (FOM)for the design of micropost-filled reactors, based on theflow resistance models developed here. The performance ofthe microreactors can be enhanced by increasing the SA/V.
H
2s
2s
a
U
(a)
10 kV X180 100 μm
(b)
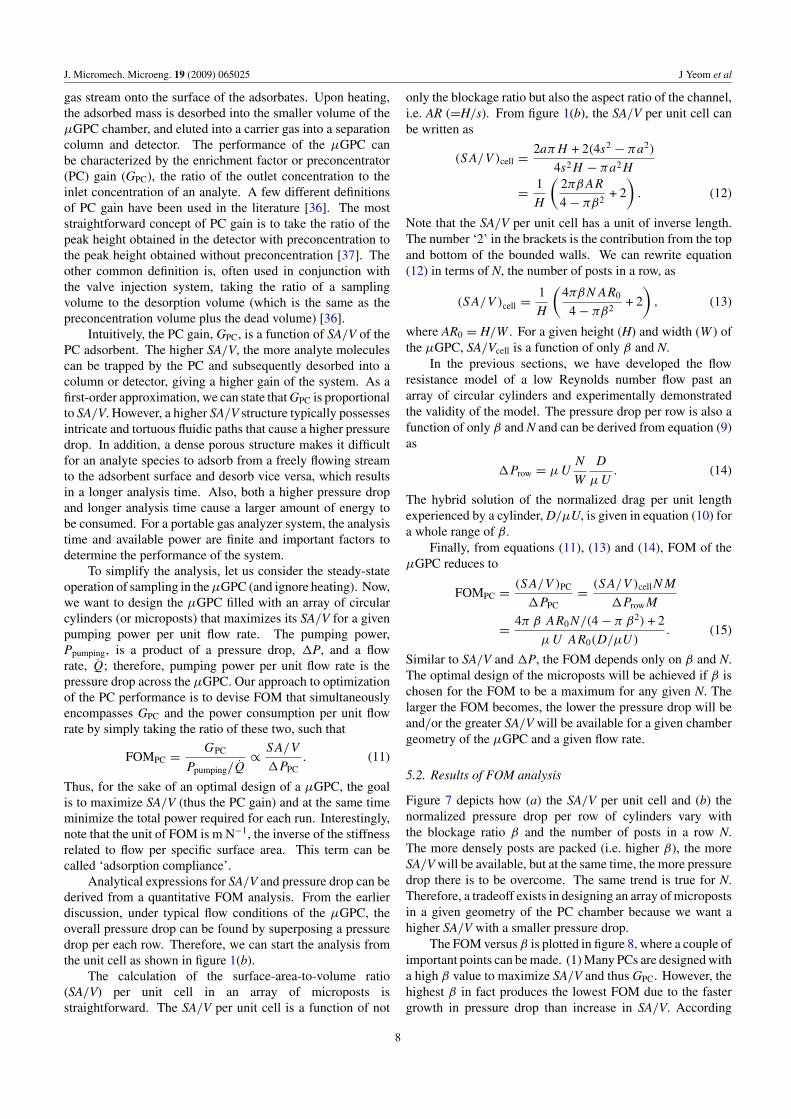
Figure 1. (a) A SEM image of an array of micropost structures inthe μGPC, and (b) a schematic of a unit cell for modeling. Eachpost has a radius of a, a half spacing of s and a height of H, andexperiences a transverse flow of velocity U.
Unfortunately, higher SA/V ratios of a system frequentlycome at the penalty of a larger pressure drop, requiringoptimization to find the best SA/V and pressure drop for theapplication in mind. In this study, a micro-gas preconcentrator(μGPC), a key component of a micro-gas chromatographysystem, is selected to analyze as micropost-filled reactors[29, 30]. The preconcentration gain is proportional to thenumber of molecules adsorbed and desorbed from the μGPC,and thus the gain is closely related to the micro-postedchamber’s SA/V. To optimize the performance of the μGPC,we introduce a key FOM that can be adjusted to maximizeSA/V but at the same time minimize the pressure drop for agiven geometry and flow rate.
2. Theory
Figure 1 shows an example of a part of a μGPC device,a microchannel filled with microscale posts, which can beviewed as a square array of circular cylinders bounded bythe channel geometry. A representative scanning electronmicroscopy image of the μGPC is shown in figure 1(a), and thecorresponding unit cell of the fluid volume to be analyzed isshown in figure 1(b). Each post has a radius of a, a half spacingof s and a height of H. An important geometric parameter, β—a blockage ratio, is defined as the ratio of a radius to a halfspacing (β = a/s). The blockage ratio is commonly used in thecase of a square array, but alternatively, the porosity (ε) or thecylinder density (c) can be used in any cylinder arrangementsand related to β. For a square array of circular cylinders, ε = 1− (π/4)β2 and c = (π/4)β2. For typical flow conditions in aμGPC device (0.1–10 sccm of N2 flow), the Reynolds numberranges from 0.05 to 5, allowing us to use a low Reynoldsnumber approximation.
Typically, fluid flow through arrays of posted structuresis three dimensional, and an extensive computational codeis used to estimate the flow field. For the moment, wewill disregard the third dimension, i.e. assuming an array ofinfinitely long cylinders, or at least H � a. Then, the problembecomes a steady motion of two-dimensional incompressiblelow Reynolds number flow past a square array of circularcylinders. In the case of an unbounded Stokes’ flow pasta single infinitely long circular cylinder, Lamb’s classicalsolution is widely accepted as a first approximation [31].
2

J. Micromech. Microeng. 19 (2009) 065025 J Yeom et al
For the low Reynolds number flow transverse to an arrayof circular cylinders, many analytical solutions for the dragper unit length on each cylinder are available in the literature[19–22, 25, 27]. The basic assumption of the approach isthat the Reynolds number is low enough that each cylinderis considered to be streamlined, i.e. the separation of flow inthe boundary layer occurs at the rear stagnation point. Thisassumption holds for Re < 5 [10] and implies that one needs toconsider only the first row of the array for calculating the dragbecause the subsequent rows would experience the same flowcondition. The total drag can be obtained by superimposingindividual drag terms row by row. Another assumption hasto do with the finite number of cylinders in the array for theactual experiments, in which a typical parabolic flow pattern isexpected before the first row of the array for a fully developedlaminar flow. All the analytical models to be discussed here arebased on a transverse flow over an infinite number of cylindersin a row, and a uniform incoming flow for each row. Thisassumption should hold as long as the number of cylinders ina row is sufficiently large enough that the effect of the channelwalls is negligibly small for the large majority of posts.
Even if all of the above-mentioned assumptions are valid,no exact solutions for creeping flow in a periodic array ofcylinders are yet available for the entire range of a blockageratio [23]. Instead, a closed-form solution can be obtained fortwo limiting cases of cylinder arrangements: (i) for a smallβ value when the cylinders are spaced far apart and (ii) for alarge β value when the cylinders are tightly spaced.
2.1. Dilute array (β � 1)
For a flow with a small blockage ratio (β), researchersattempted to solve either Stokes’ equation of motion or Oseen’slinearized equation of motion for flow. Tamada and Fujikawa[20] directly solved Oseen’s equations and calculated thenormalized drag per unit length of a cylinder (D) in the formof power series in a blockage ratio, β, such that
D
μU= 8π
�0+ O(Re2), (1)
where
�0 = 1 − 2 ln(π β) +1
6(πβ)2 − 1
144(π β)4 +
1
1080(π β)6
− 53
345 600(π β)8 +
139
5443 200(π β)10 + O((π β)12).
Inspired by Tamada and Fujikawa, Miyagi [21] employedthe same approach to attack Stokes’ equations and obtainedthe consistent expansion formula for D/μU as a power seriesin β up to the 14th power with far simpler computation.Taking into account the periodicity of the flow field, Hasimoto[22] developed the periodic fundamental solutions to Stokes’equations in Fourier series and obtained the normalized dragper unit length on one of the cylinders as
D
μU= 4π
ln(2/β) − 1.3105 + π(β/2)2 + O{(β/2)4} . (2)
Sangani and Acrivos [23] extended Hasimoto’s approach toobtainD
μU
= 4π
0.5 ln(1/c) − 0.738 + c − 0.887 c2 + 2.038 c3 + O(c4).
(3)
The method of singularities to biharmonic equations wasadapted by Drummond and Tahir [24], and their solution to asquare of array of cylinders isD
μU= 8π
ln(1/c) − 1.476 335 97 + 2c−0.795 897 81c2
1+0.489 192 41c−1.604 869 42c2
.
(4)
Another common approach to a creeping flow of dilutearrays is a free-surface model in which the fluid mediumassociated with each cylinder is lumped into a concentriccylinder with appropriate boundary conditions. This so-calledflow cell model is effective when cylinders are spaced farenough apart, for the exact shape of the outer boundary willlittle affect the flow around the cylinder. While a no-slipcondition is applied on the cylinder surface, two differentboundary conditions have been suggested and applied at theouter cell surface of the fluid envelop. Happel [25] used ano-shear stress condition to calculate the normalized drag perunit length:
D
μU= 4π
ln(
2√πβ
) − 12 · 16−(
√πβ)4
16+(√
πβ)4
. (5)
Kuwabara [26], on the other hand, implemented a vorticity-free boundary condition and acquired
D
μU= 4π
ln(
2√πβ
) − 0.75 + π4 β2 − π2
64 β4. (6)
The common feature of these solutions is that the dragexperienced by one of the cylinders is of Stokes’ type anddirectly proportional to the product of the viscosity and theupstream velocity. Note that the normalized drag per cylinderis dimensionless. In addition, the drag per each cylinder inan array is always greater than that given by Stokes’ formulafor an isolated cylinder, which manifests the interference ofviscous forces.
Table 1 presents a comparison of values of the normalizeddrag per unit length on a cylinder (D/μU) computed from theabove-mentioned models for the whole range of the blockageratio β. It can be noted that all solutions correctly predict thelimiting case of β approaching zero and produce similar values.Up to β = 0.4, the normalized drag for each model is in goodagreement (within 7%) with an exception of Happel’s model.The accuracy of the no-shear stress condition at the outer cellboundary in Happel’s model has been questioned [24], whichcan explain its underprediction of the drag. Poorer agreementsamong the models are observed at a larger β as expectedfrom the assumption of the array being sparse. Moreover,at the other extreme case (β → 1), no solutions show theexpected diverging trend in D/μU, where the drag increasesto infinity as the cylinders touch. A model is needed thatcan account for increasing interfering viscous effects betweenadjacent cylinders for high β values.
3

J. Micromech. Microeng. 19 (2009) 065025 J Yeom et al
Table 1. Values of the dimensionless normalized drag (D/μU) experienced by one of the cylinders in a square array. These models weredeveloped for a dilute array of cylinders (β � 1).
β Hasimoto [22] Miyagi [21] Kuwabara [26] Happel [25] Sangani [23] Drummond [24]
0.01 3.15 3.17 3.16 2.97 3.15 3.150.1 7.42 7.54 7.47 6.53 7.42 7.420.2 12.28 12.60 12.42 10.21 12.29 12.290.3 19.12 19.92 19.51 15.15 19.22 19.230.4 29.60 31.74 30.74 22.74 30.30 30.340.5 46.18 52.82 50.14 35.80 49.57 50.110.6 71.31 94.88 87.05 61.11 82.94 88.570.7 101.21 170.76 166.94 118.04 115.19 152.980.8 115.88 121.01 376.07 275.42 87.69 149.200.9 101.19 26.52 1128.41 881.55 43.32 61.000.99 77.35 6.54 5097.23 4323.68 22.18 19.41
2.2. Concentrated array (β → 1)
Miyagi [21] noted that his expansion formula suffered frompoor convergence in large β and could thus be hardlyapplicable beyond the value of β = 0.7. He proposed thefollowing formula for this range of difficulty [21], such that
D
μU= c2
(1 − β)2. (7)
The form of equation (7) is supported by another independentstudy on Stokes’ flow past a flat screen [32]. The unknownconstant, c2, was evaluated to be 15.8 by matching numericalvalues with Miyagi’s other solution (developed for dilute array)at β = 0.7. Keller [27] assumed that most of the flow resistancecame from the narrow gap between adjacent cylinders andapplied the theory of lubrication (as a result of the Stokesequation) to determine the flow in the gap. With a few moreapproximations, the normalized drag per unit length on eachcylinder can then be expressed in terms of β as
D
μU= 12 β
(1 − β2)2+
18 β2
(1 − β2)5/2
(arctan
(β√
1 − β2
)+
π
2
).
(8)
This lubrication approach has been adopted for dense arraysby other researchers as well [23, 33]. Since a large valueof β means that the cylinders are closely spaced, the viscouseffect of the flow around a cylinder readily interacts with itsadjacent cylinders and dominates over the inertial effect of theflow. We note that, just as in the case of low beta values,the drag experienced by each cylinder takes a form of Stokes’solution for high β. Table 2 shows the comparison valuesof the normalized drag per unit length on a cylinder (D/μU)as a function of the blockage ratio for Keller’s and Miyagi’smodels. Both models correctly present the diverging behaviorof the drag force as the blockage ratio approaches 1. WhileKeller’s model underpredicts the drag at low β, Miyagi’s modelfalls short of having zero drag in the limit of β = 0.
2.3. Hybrid model
Since none of the above-mentioned solutions (equations (1)–(8)) per se can describe the drag per cylinder in the entirerange of β, we propose to combine the solutions obtained fora dilute array with the ones for a concentrated array. Miyagi
Table 2. Values of the dimensionless normalized drag (D/μU)experienced by one of the cylinders in a square array. These modelswere developed for a concentrated array of cylinders (β → 1).
β Keller [22, 27] Miyagi [21]
0.01 0.12 16.120.1 1.53 19.510.2 4.12 24.690.3 8.19 32.250.4 15.63 43.890.5 30.01 63.200.6 61.37 98.750.7 143.70 175.560.8 444.16 395.000.9 2 792.14 1 580.000.99 977 411.80 158 000.00
[21] matched equations (1) and (7) at β ∼ 0.7 by adjusting aconstant, but his approach lacks a smooth transition betweentwo different models. Bruschke and Advani [33] introduceda so-called hybrid method using an interpolation function tocombine the solutions from the free-surface model and thelubrication model. A similar approach was also utilized bySangani and Acrivos to develop a solution which is validover the full β range [23]. Later in this paper, we will firstselect the solutions from each regime that give best fits to theexperimental results and adopt the hybrid approach to combinetwo different solutions with a smooth transition.
3. Experimental details
To verify the trend shown by the analytical solutions,a number of millimeter-wide channels filled with DRIE-etched microposts of various β values have been fabricated.Figure 2(a) shows the configuration of a 2D fluid flow acrossthe channel and an N by M array of microposts. Notethat N refers to the number of posts in a row and M tothe number of posts in a column. The diameters of themicroposts range from 200 μm to less than 10 μm, and thespacing between them ranges from 400 μm to 40 μm. Thesedimensions are chosen to allow β to vary between 0.2 and0.95 and are recorded using a calibrated optical microscopeto account for any discrepancy that may arise during thelithographic and etching processes. The SEM images of
4

J. Micromech. Microeng. 19 (2009) 065025 J Yeom et al
(a)
(b)
Figure 2. (a) A sketch of the microchannel filled with an N by Marray of microposts. Channel dimensions are also defined. (b) TheSEM images of exemplary Si micropost arrays. Scale: width of thechannel = 2 mm.
arrays of the microposts with different β values are shown infigure 2(b). The blockage ratio and the number of posts invarious arrays, N and M, are summarized in table 3. In total, 23devices are fabricated on a 100 mm diameter Si wafer (SiliconQuest International, N-type 〈1 0 0〉, 1–10 � cm) by means ofconventional double-sided photolithography and subsequentDRIE etching (Plasma-Therm SLR770). Each Si die is etchedto a uniform depth (about 200 μm) and bonded with a 1 mmthick microscope slide that had been cut, the same size as a Sidie. A thermally curable epoxy-based adhesive is transferredto a Si die via contact printing [34], and a glass top is then
Table 3. A summary of the experimental parameters in variousarrays of microposts.
Sample a (μm) s (μm) β N M
1 207.0 253.4 0.817 8 322 202.6 247.1 0.820 8 213 54.1 223.0 0.243 9 234 57.3 223.1 0.257 9 365 100.4 221.2 0.454 9 236 105.6 222.5 0.475 9 367 158.9 218.1 0.728 9 238 168.3 222.3 0.757 9 369 199.3 221.3 0.901 9 36
10 199.9 216.1 0.926 9 2311 207.6 221.4 0.938 9 3612 10.6 40.9 0.259 40 10013 13.3 39.8 0.335 40 14014 14.2 40.1 0.355 40 10015 19.0 39.6 0.480 40 14016 21.4 40.6 0.528 40 10017 22.5 40.2 0.559 40 10018 22.1 39.4 0.562 40 14019 23.9 39.1 0.610 40 14020 25.7 39.4 0.651 40 10021 27.1 39.3 0.689 40 14022 28.5 38.9 0.733 40 10023 29.4 39.4 0.747 40 140
pressed down onto the adhesive-coated Si die on a 130 ◦Chotplate for a gas-tight seal.
All bonded samples are housed in the custom-built SLA(Stereo Lithography Apparatus) packages that provide a leak-free fluidic connection via holes in a Si die. A high purityN2 gas (S Smith, 99.9%) from high pressure source tankis filtered and fed to the flow meter (MKS, 2179A), whichregulates the flow rate of the gas via the computer software ofthe data acquisition system. The various flow rates used in theexperiments are 0.5, 1, 5, 10, 20 and 50 sccm. Two commercialpressure sensors (PX142, Omega Engineering Inc.) that havea linear response up to 7000 Pa with a 5 V span (givinga resolution of about 1.4 Pa mV−1) are placed in the inletand outlet of the SLA package to measure pressure at eachpoint. First, the pressure drop (�P = Pinlet − Poutlet) in all 23samples is measured individually at various flow rates. Thenthe pressure drop across dummy samples of the same channeldimensions, but without micropost structures, is measuredto give the baseline control value for the overall geometricstructure, which is later subtracted from the previous pressuredrop measurements of the channel with micropost structures.Therefore, �Pcorrected = �P − �Pcontrol. The pressure dropmeasurements are repeated five times to provide a statisticalbasis for the error analysis.
4. Results
The Reynolds number of the flow depends on which dimensionis chosen as a characteristic length for calculation. Thediameter of each post, center distance between two adjacentposts and height of the channel can all be used for thecharacteristic length. With 10 sccm fixed flow rate, theReynolds number regardless of the choice of the characteristic
5

J. Micromech. Microeng. 19 (2009) 065025 J Yeom et al
0
50
100
150
200
0.2 0.3 0.4 0.5 0.6 0.7
Miyagi
Hasimoto
Happel
Kuwabara
Sangani
Drummond
CFD
EXP (N = 8,9)
EXP (N = 40)
β
Figure 3. The normalized drag per unit length experienced by eachcylinder versus blockage ratio (β) from experimental data,analytical solutions (equations (1)–(6)) and CFD simulations isplotted for a dilute square array (0.2 < β < 0.7). Experimental dataare not available below 0.2 of β due to the fabrication challenges.The flow rate used is 10 sccm.
length ranges from 0.1 to 2, for which Stokes’ approximationis valid. Another key dimensionless parameter in this analysisis the Knudsen number (Kn), the ratio of the mean free path ofa gas medium to the characteristic length. Under atmosphericpressure and room temperature, the mean free path of N2
(which is the choice of gas in the experiment) is around65 nm while the characteristic length in the arrays of postsis in the order of 10 μm. Therefore, the resulting Kn is smallerthan 0.01, in which the continuum assumption is in effect.Finally, the aspect ratio (=H/D) of the majority of micropostsranges from 1 to 20. The effect of the aspect ratio on theexperiments is not clear at this point and is subject to furtherstudy.
In order to compare the pressure drop data collected inmicropost-filled channels with the theoretical models of thedrag force experienced by each post, we need to establish therelation between the two. The pressure drop across each rowin the array (�Prow) is assumed to be uniform and thus relatedto the total corrected pressure drop as �Prow = �Pcorrected/M
(refer to figure 2 for M). Since W = 2 s N, the drag per unitlength experienced by each post can be related to �Prow,
D
μU= 2s
μU�Prow = W
μU
�Pcorrected
NM. (9)
For all the experiments, the width (W ) of the channel isfixed to be 2 mm, and the viscosity (μ) for N2 is 1.85 ×10⁻⁵ N m s−1. The upstream velocity (U) can be deducedfrom the flow rate, which stays constant during each set ofexperiments. Equation (9) suggests that the pressure drop ina row is a function of the number of posts in a row as well asthe blockage ratio, while the drag per cylinder is a function ofthe blockage ratio only.
The experimentally obtained normalized drag per cylinder(equation (9)) is compared to the theoretical values from thevarious models as shown in figures 3 and 4. Following thetheoretical discussion, we present experimental results in twoseparate plots: figure 3 for a dilute array (β < 0.7) and figure4 for a concentrated array (β > 0.7). For β smaller than
100
1000
10000
0.7 0.8 0.9 1
Miyagi
Keller
CFD
EXP (N = 8,9)
EXP (N = 40)
β
Figure 4. The normalized drag per unit length experienced by eachcylinder (in log) versus a blockage ratio (β) from experimental data,analytical solutions (equations (7) and (8)) and CFD simulations isplotted for a concentrated square array (β > 0.7). The flow rate usedis 10 sccm.
0.7, three solutions from Miyagi, Kuwabara and Drummondqualitatively agree with the trend observed in the experimentalvalues of the drag (see figure 3). Although Hasimoto’s modelis in line with other models for β < 0.4, it underestimates thedrag beyond that point. Note that in equation (2) the highestorder in the expansion of the power series in β is 2; therefore,the higher order terms need to be included in the calculationfor estimating the drag in the larger β regime. In fact,Sangani’s model (equation (3)) improves Hasimoto’s solutionby adding a higher order term but starts to deteriorate at β >
0.6. Due to the fabrication challenges faced when etchingvery small diameter posts to high-aspect-ratio structures [35],data from samples with β < 0.2 are unavailable. Owingto the mathematical simplicity of its solution, Kuwabara’smodel is selected as the choice of model for a dilutearray.
For β greater than 0.7, the agreement of the pressuredrop measurements with Keller’s model suggests that theviscous shear dominates the pressure drop of the closely spacedposts, validating the one-dimensional flow approximation (seefigure 4). Though both Keller’s and Miyagi’s models fit theexperimental data reasonably well, we select Keller’s modelwhich exhibits faster convergence to infinity as β approaches1 (see table 2). The CFD solution of the incompressible 2DNavier–Stokes equation is obtained for various β values usingthe commercial package FEMLAB 3.0 and also plotted infigures 3 and 4. The boundary conditions employed are (i)no-slip conditions at solid walls, (ii) fully developed parabolicvelocity distribution at inlet and (iii) an outflow defined bythe pressure and the normal component of the viscous forceequaling zero. Good agreements (within 13% for Kuwabara’smodel and 18% for Keller’s model) are shown between thepressure drop predicted from the models and the simulationover the entire β range.
Once the models that give the best fit to experimental datain each limiting case of β are selected—Kuwabara’s model fora dilute array and Keller’s model for a concentrated array—wecan combine two solutions to generate a hybrid solution thatcan predicts the drag per cylinder over the entire range of β.
6

J. Micromech. Microeng. 19 (2009) 065025 J Yeom et al
1
10
100
1000
10000
0 0.2 0.4 0.6 0.8 1
Keller
Kuwabara
hybrid
β
Figure 5. The comparison of the normalized drag per unit lengthexperienced by each cylinder with the blockage ratio (β) for asquare array. The hybrid solution asymptotically approachesKuwabara’s solution (free-surface model) at β � 1 and Keller’ssolution (lubrication model) at β → 1.
Thus the normalized drag per unit length experienced by eachcylinder can be written as [33](
D
μU
)overall
= η1(β)
(D
μU
)Kuwabara
+ η2(β)
(D
μU
)Keller
.
(10)
The weighting functions, η1(β) and η2 (β), need tobe chosen such that the overall solution asymptoticallyapproaches Kuwabara’s solution at β → 0 and Keller’s solutionat β → 1 and exhibits a smooth transition in the middle regime.After some trial and error, we obtain η1(β) = 1 − e−(1−β)/β
and η2(β) = 1 − e−β/(1−β) that satisfy these requirements.Figure 5 shows the comparison of the normalized drag per unitlength of each cylinder with the blockage ratio for the hybridmodel and two limited solutions. This hybrid solution willlater be used to optimize the performance of the micropost-filled microreactors.
Pressure drop measurements were also conducted usingvarious flow rates, covering Re from 0.1 to 10. The normalizeddrag per unit length experienced by each cylinder is plotted asa function of Re for a range of blockage ratios (see figure 6).For the range of Re of interest in this study, the normalizeddrag per cylinder is independent of Re, which is also seen inequations (1)–(8), since D/μU is a function of β only. Furtherstudy is geared toward measuring pressure drop with higherflow rates and identifying Re at which the above-mentionedmodels start to deviate. We should note that all the analyticalmodels discussed in this work assume standard continuumfluid flow. As the half spacing approaches the mean free pathlength, the flow regime will transition to Knudsen flow, andthe solution will likely depart from the analyses.
5. Figure-of-merit analysis of micro-gaspreconcentrators
The rest of the paper focuses on optimizing the performanceof a micropost-filled μGPC, where we need to maximize thenumber of molecules adsorbed and desorbed for a given flowrate and channel geometry. We propose a figure of merit
0
20
40
60
80
100
120
140
160
0.01 0.1 1 10 100
Re
0.01 0.1 1 10 100
Re
D/μ
UD
/μU
= 0.26
= 0.45
= 0.56
= 0.61
= 0.69
100
1000
10000
= 0.76
= 0.83
= 0.93
β
β
β
β
β
β
β
β
(a)
(b)
Figure 6. The normalized drag per unit length experienced by eachcylinder is plotted with a range of Re (square: N = 9, circle: N =40). The blue dotted lines in (a) and green dotted lines in (b) are fornumerical values from Kuwabara’s and Keller’s models,respectively, at given blockage ratios. Note that (a) in linear scaleand (b) in log scale.
(FOM) that can be adjusted to minimize the pressure drop butat the same time maximize SA/V for a given overall channelgeometry. To this end, we utilize analytical models for alow Reynolds number flow past a square array of the circularcylinders in a micropost-filled channel as discussed in theprevious sections.
5.1. Definition of the FOM in the μGPC
The μGPC works by increasing the mass of the desired analyteper unit volume and therefore increases the overall sensitivityand detection limit of the system. A relatively large samplevolume at a low concentration of the analyte is first pumpedinto the μGPC chamber and preferentially adsorbed from a
7
J. Micromech. Microeng. 19 (2009) 065025 J Yeom et al
gas stream onto the surface of the adsorbates. Upon heating,the adsorbed mass is desorbed into the smaller volume of theμGPC chamber, and eluted into a carrier gas into a separationcolumn and detector. The performance of the μGPC canbe characterized by the enrichment factor or preconcentrator(PC) gain (GPC), the ratio of the outlet concentration to theinlet concentration of an analyte. A few different definitionsof PC gain have been used in the literature [36]. The moststraightforward concept of PC gain is to take the ratio of thepeak height obtained in the detector with preconcentration tothe peak height obtained without preconcentration [37]. Theother common definition is, often used in conjunction withthe valve injection system, taking the ratio of a samplingvolume to the desorption volume (which is the same as thepreconcentration volume plus the dead volume) [36].
Intuitively, the PC gain, GPC, is a function of SA/V of thePC adsorbent. The higher SA/V, the more analyte moleculescan be trapped by the PC and subsequently desorbed into acolumn or detector, giving a higher gain of the system. As afirst-order approximation, we can state that GPC is proportionalto SA/V. However, a higher SA/V structure typically possessesintricate and tortuous fluidic paths that cause a higher pressuredrop. In addition, a dense porous structure makes it difficultfor an analyte species to adsorb from a freely flowing streamto the adsorbent surface and desorb vice versa, which resultsin a longer analysis time. Also, both a higher pressure dropand longer analysis time cause a larger amount of energy tobe consumed. For a portable gas analyzer system, the analysistime and available power are finite and important factors todetermine the performance of the system.
To simplify the analysis, let us consider the steady-stateoperation of sampling in the μGPC (and ignore heating). Now,we want to design the μGPC filled with an array of circularcylinders (or microposts) that maximizes its SA/V for a givenpumping power per unit flow rate. The pumping power,Ppumping, is a product of a pressure drop, �P, and a flowrate, Q̇; therefore, pumping power per unit flow rate is thepressure drop across the μGPC. Our approach to optimizationof the PC performance is to devise FOM that simultaneouslyencompasses GPC and the power consumption per unit flowrate by simply taking the ratio of these two, such that
FOMPC = GPC
Ppumping/Q̇∝ SA/V
�PPC. (11)
Thus, for the sake of an optimal design of a μGPC, the goalis to maximize SA/V (thus the PC gain) and at the same timeminimize the total power required for each run. Interestingly,note that the unit of FOM is m N−1, the inverse of the stiffnessrelated to flow per specific surface area. This term can becalled ‘adsorption compliance’.
Analytical expressions for SA/V and pressure drop can bederived from a quantitative FOM analysis. From the earlierdiscussion, under typical flow conditions of the μGPC, theoverall pressure drop can be found by superposing a pressuredrop per each row. Therefore, we can start the analysis fromthe unit cell as shown in figure 1(b).
The calculation of the surface-area-to-volume ratio(SA/V) per unit cell in an array of microposts isstraightforward. The SA/V per unit cell is a function of not
only the blockage ratio but also the aspect ratio of the channel,i.e. AR (=H/s). From figure 1(b), the SA/V per unit cell canbe written as
(SA/V )cell = 2aπH + 2(4s2 − πa2)
4s2H − πa2H
= 1
H
(2πβAR
4 − πβ2+ 2
). (12)
Note that the SA/V per unit cell has a unit of inverse length.The number ‘2’ in the brackets is the contribution from the topand bottom of the bounded walls. We can rewrite equation(12) in terms of N, the number of posts in a row, as
(SA/V )cell = 1
H
(4πβNAR0
4 − πβ2+ 2
), (13)
where AR0 = H/W . For a given height (H) and width (W ) ofthe μGPC, SA/Vcell is a function of only β and N.
In the previous sections, we have developed the flowresistance model of a low Reynolds number flow past anarray of circular cylinders and experimentally demonstratedthe validity of the model. The pressure drop per row is also afunction of only β and N and can be derived from equation (9)as
�Prow = μUN
W
D
μU. (14)
The hybrid solution of the normalized drag per unit lengthexperienced by a cylinder, D/μU, is given in equation (10) fora whole range of β.
Finally, from equations (11), (13) and (14), FOM of theμGPC reduces to
FOMPC = (SA/V )PC
�PPC= (SA/V )cellNM
�ProwM
= 4π β AR0N/(4 − π β2) + 2
μU AR0(D/μU). (15)
Similar to SA/V and �P, the FOM depends only on β and N.The optimal design of the microposts will be achieved if β ischosen for the FOM to be a maximum for any given N. Thelarger the FOM becomes, the lower the pressure drop will beand/or the greater SA/V will be available for a given chambergeometry of the μGPC and a given flow rate.
5.2. Results of FOM analysis
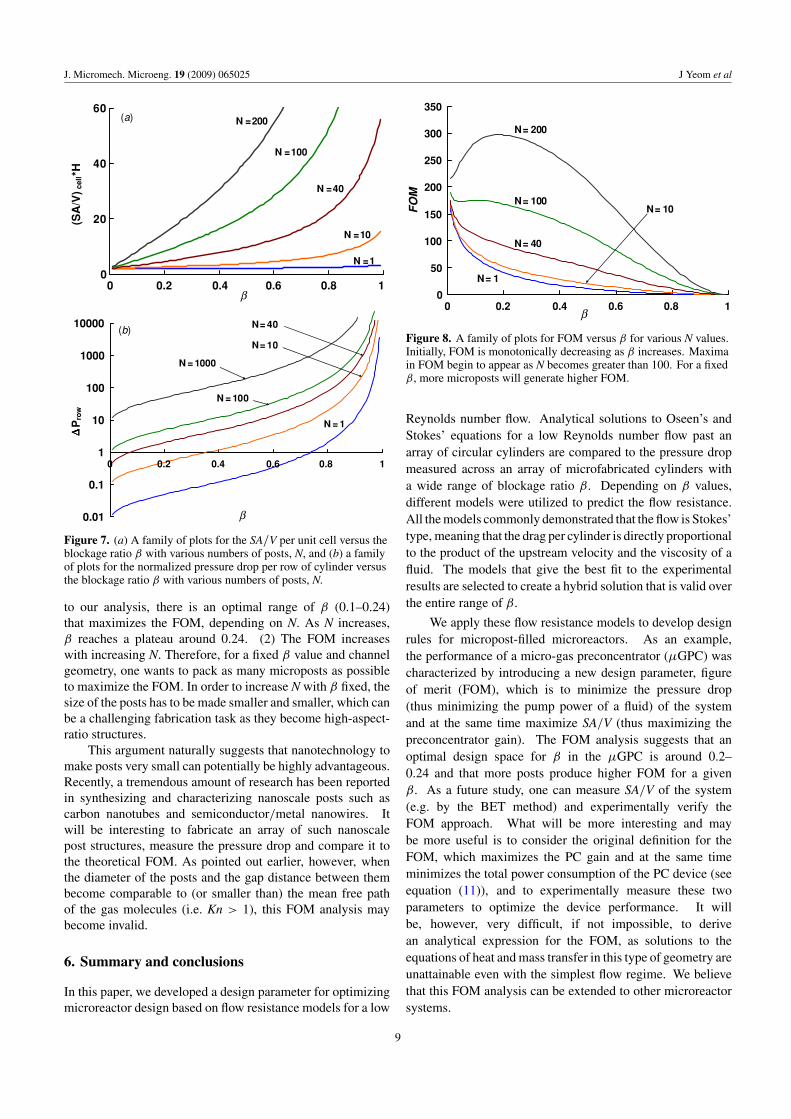
Figure 7 depicts how (a) the SA/V per unit cell and (b) thenormalized pressure drop per row of cylinders vary withthe blockage ratio β and the number of posts in a row N.The more densely posts are packed (i.e. higher β), the moreSA/V will be available, but at the same time, the more pressuredrop there is to be overcome. The same trend is true for N.Therefore, a tradeoff exists in designing an array of micropostsin a given geometry of the PC chamber because we want ahigher SA/V with a smaller pressure drop.
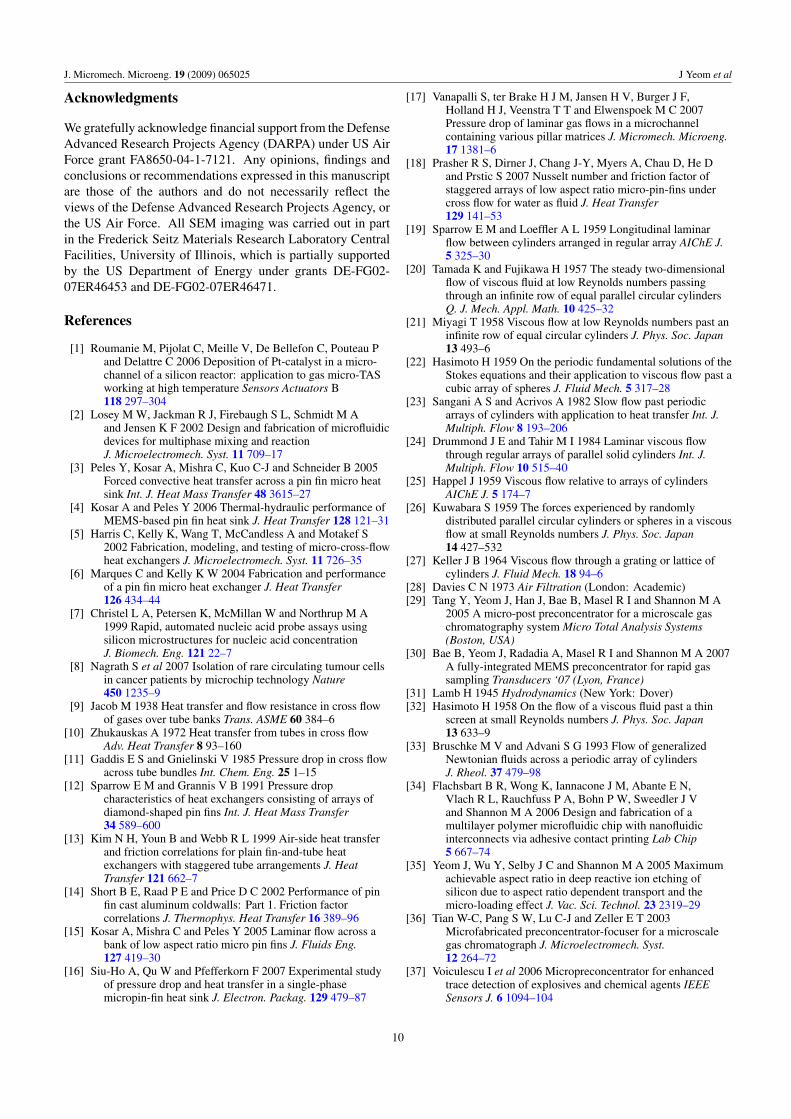
The FOM versus β is plotted in figure 8, where a couple ofimportant points can be made. (1) Many PCs are designed witha high β value to maximize SA/V and thus GPC. However, thehighest β in fact produces the lowest FOM due to the fastergrowth in pressure drop than increase in SA/V. According
8
J. Micromech. Microeng. 19 (2009) 065025 J Yeom et al
0
20
40
60
0 0.2 0.4 0.6 0.8 1
(SA
/V) c
ell*H
N = 200
N = 100
N = 40
N = 10
N = 1
0.01
0.1
1
10
100
1000
10000
0 0.2 0.4 0.6 0.8 1
Pro
w
N = 1
N = 10
N = 40
N = 1000
N = 100
(a)
(b)
ΔΔΔΔ
β
β
Figure 7. (a) A family of plots for the SA/V per unit cell versus theblockage ratio β with various numbers of posts, N, and (b) a familyof plots for the normalized pressure drop per row of cylinder versusthe blockage ratio β with various numbers of posts, N.
to our analysis, there is an optimal range of β (0.1–0.24)that maximizes the FOM, depending on N. As N increases,β reaches a plateau around 0.24. (2) The FOM increaseswith increasing N. Therefore, for a fixed β value and channelgeometry, one wants to pack as many microposts as possibleto maximize the FOM. In order to increase N with β fixed, thesize of the posts has to be made smaller and smaller, which canbe a challenging fabrication task as they become high-aspect-ratio structures.
This argument naturally suggests that nanotechnology tomake posts very small can potentially be highly advantageous.Recently, a tremendous amount of research has been reportedin synthesizing and characterizing nanoscale posts such ascarbon nanotubes and semiconductor/metal nanowires. Itwill be interesting to fabricate an array of such nanoscalepost structures, measure the pressure drop and compare it tothe theoretical FOM. As pointed out earlier, however, whenthe diameter of the posts and the gap distance between thembecome comparable to (or smaller than) the mean free pathof the gas molecules (i.e. Kn > 1), this FOM analysis maybecome invalid.
6. Summary and conclusions
In this paper, we developed a design parameter for optimizingmicroreactor design based on flow resistance models for a low
0
50
100
150
200
250
300
350
0 0.2 0.4 0.6 0.8 1
FO
M
N = 1
N = 10
N = 40
N = 200
N = 100
β
Figure 8. A family of plots for FOM versus β for various N values.Initially, FOM is monotonically decreasing as β increases. Maximain FOM begin to appear as N becomes greater than 100. For a fixedβ, more microposts will generate higher FOM.
Reynolds number flow. Analytical solutions to Oseen’s andStokes’ equations for a low Reynolds number flow past anarray of circular cylinders are compared to the pressure dropmeasured across an array of microfabricated cylinders witha wide range of blockage ratio β. Depending on β values,different models were utilized to predict the flow resistance.All the models commonly demonstrated that the flow is Stokes’type, meaning that the drag per cylinder is directly proportionalto the product of the upstream velocity and the viscosity of afluid. The models that give the best fit to the experimentalresults are selected to create a hybrid solution that is valid overthe entire range of β.
We apply these flow resistance models to develop designrules for micropost-filled microreactors. As an example,the performance of a micro-gas preconcentrator (μGPC) wascharacterized by introducing a new design parameter, figureof merit (FOM), which is to minimize the pressure drop(thus minimizing the pump power of a fluid) of the systemand at the same time maximize SA/V (thus maximizing thepreconcentrator gain). The FOM analysis suggests that anoptimal design space for β in the μGPC is around 0.2–0.24 and that more posts produce higher FOM for a givenβ. As a future study, one can measure SA/V of the system(e.g. by the BET method) and experimentally verify theFOM approach. What will be more interesting and maybe more useful is to consider the original definition for theFOM, which maximizes the PC gain and at the same timeminimizes the total power consumption of the PC device (seeequation (11)), and to experimentally measure these twoparameters to optimize the device performance. It willbe, however, very difficult, if not impossible, to derivean analytical expression for the FOM, as solutions to theequations of heat and mass transfer in this type of geometry areunattainable even with the simplest flow regime. We believethat this FOM analysis can be extended to other microreactorsystems.
9
J. Micromech. Microeng. 19 (2009) 065025 J Yeom et al
Acknowledgments
We gratefully acknowledge financial support from the DefenseAdvanced Research Projects Agency (DARPA) under US AirForce grant FA8650-04-1-7121. Any opinions, findings andconclusions or recommendations expressed in this manuscriptare those of the authors and do not necessarily reflect theviews of the Defense Advanced Research Projects Agency, orthe US Air Force. All SEM imaging was carried out in partin the Frederick Seitz Materials Research Laboratory CentralFacilities, University of Illinois, which is partially supportedby the US Department of Energy under grants DE-FG02-07ER46453 and DE-FG02-07ER46471.
References
[1] Roumanie M, Pijolat C, Meille V, De Bellefon C, Pouteau Pand Delattre C 2006 Deposition of Pt-catalyst in a micro-channel of a silicon reactor: application to gas micro-TASworking at high temperature Sensors Actuators B118 297–304
[2] Losey M W, Jackman R J, Firebaugh S L, Schmidt M Aand Jensen K F 2002 Design and fabrication of microfluidicdevices for multiphase mixing and reactionJ. Microelectromech. Syst. 11 709–17
[3] Peles Y, Kosar A, Mishra C, Kuo C-J and Schneider B 2005Forced convective heat transfer across a pin fin micro heatsink Int. J. Heat Mass Transfer 48 3615–27
[4] Kosar A and Peles Y 2006 Thermal-hydraulic performance ofMEMS-based pin fin heat sink J. Heat Transfer 128 121–31
[5] Harris C, Kelly K, Wang T, McCandless A and Motakef S2002 Fabrication, modeling, and testing of micro-cross-flowheat exchangers J. Microelectromech. Syst. 11 726–35
[6] Marques C and Kelly K W 2004 Fabrication and performanceof a pin fin micro heat exchanger J. Heat Transfer126 434–44
[7] Christel L A, Petersen K, McMillan W and Northrup M A1999 Rapid, automated nucleic acid probe assays usingsilicon microstructures for nucleic acid concentrationJ. Biomech. Eng. 121 22–7
[8] Nagrath S et al 2007 Isolation of rare circulating tumour cellsin cancer patients by microchip technology Nature450 1235–9
[9] Jacob M 1938 Heat transfer and flow resistance in cross flowof gases over tube banks Trans. ASME 60 384–6
[10] Zhukauskas A 1972 Heat transfer from tubes in cross flowAdv. Heat Transfer 8 93–160
[11] Gaddis E S and Gnielinski V 1985 Pressure drop in cross flowacross tube bundles Int. Chem. Eng. 25 1–15
[12] Sparrow E M and Grannis V B 1991 Pressure dropcharacteristics of heat exchangers consisting of arrays ofdiamond-shaped pin fins Int. J. Heat Mass Transfer34 589–600
[13] Kim N H, Youn B and Webb R L 1999 Air-side heat transferand friction correlations for plain fin-and-tube heatexchangers with staggered tube arrangements J. HeatTransfer 121 662–7
[14] Short B E, Raad P E and Price D C 2002 Performance of pinfin cast aluminum coldwalls: Part 1. Friction factorcorrelations J. Thermophys. Heat Transfer 16 389–96
[15] Kosar A, Mishra C and Peles Y 2005 Laminar flow across abank of low aspect ratio micro pin fins J. Fluids Eng.127 419–30
[16] Siu-Ho A, Qu W and Pfefferkorn F 2007 Experimental studyof pressure drop and heat transfer in a single-phasemicropin-fin heat sink J. Electron. Packag. 129 479–87
[17] Vanapalli S, ter Brake H J M, Jansen H V, Burger J F,Holland H J, Veenstra T T and Elwenspoek M C 2007Pressure drop of laminar gas flows in a microchannelcontaining various pillar matrices J. Micromech. Microeng.17 1381–6
[18] Prasher R S, Dirner J, Chang J-Y, Myers A, Chau D, He Dand Prstic S 2007 Nusselt number and friction factor ofstaggered arrays of low aspect ratio micro-pin-fins undercross flow for water as fluid J. Heat Transfer129 141–53
[19] Sparrow E M and Loeffler A L 1959 Longitudinal laminarflow between cylinders arranged in regular array AIChE J.5 325–30
[20] Tamada K and Fujikawa H 1957 The steady two-dimensionalflow of viscous fluid at low Reynolds numbers passingthrough an infinite row of equal parallel circular cylindersQ. J. Mech. Appl. Math. 10 425–32
[21] Miyagi T 1958 Viscous flow at low Reynolds numbers past aninfinite row of equal circular cylinders J. Phys. Soc. Japan13 493–6
[22] Hasimoto H 1959 On the periodic fundamental solutions of theStokes equations and their application to viscous flow past acubic array of spheres J. Fluid Mech. 5 317–28
[23] Sangani A S and Acrivos A 1982 Slow flow past periodicarrays of cylinders with application to heat transfer Int. J.Multiph. Flow 8 193–206
[24] Drummond J E and Tahir M I 1984 Laminar viscous flowthrough regular arrays of parallel solid cylinders Int. J.Multiph. Flow 10 515–40
[25] Happel J 1959 Viscous flow relative to arrays of cylindersAIChE J. 5 174–7
[26] Kuwabara S 1959 The forces experienced by randomlydistributed parallel circular cylinders or spheres in a viscousflow at small Reynolds numbers J. Phys. Soc. Japan14 427–532
[27] Keller J B 1964 Viscous flow through a grating or lattice ofcylinders J. Fluid Mech. 18 94–6
[28] Davies C N 1973 Air Filtration (London: Academic)[29] Tang Y, Yeom J, Han J, Bae B, Masel R I and Shannon M A
2005 A micro-post preconcentrator for a microscale gaschromatography system Micro Total Analysis Systems(Boston, USA)
[30] Bae B, Yeom J, Radadia A, Masel R I and Shannon M A 2007A fully-integrated MEMS preconcentrator for rapid gassampling Transducers ‘07 (Lyon, France)
[31] Lamb H 1945 Hydrodynamics (New York: Dover)[32] Hasimoto H 1958 On the flow of a viscous fluid past a thin
screen at small Reynolds numbers J. Phys. Soc. Japan13 633–9
[33] Bruschke M V and Advani S G 1993 Flow of generalizedNewtonian fluids across a periodic array of cylindersJ. Rheol. 37 479–98
[34] Flachsbart B R, Wong K, Iannacone J M, Abante E N,Vlach R L, Rauchfuss P A, Bohn P W, Sweedler J Vand Shannon M A 2006 Design and fabrication of amultilayer polymer microfluidic chip with nanofluidicinterconnects via adhesive contact printing Lab Chip5 667–74
[35] Yeom J, Wu Y, Selby J C and Shannon M A 2005 Maximumachievable aspect ratio in deep reactive ion etching ofsilicon due to aspect ratio dependent transport and themicro-loading effect J. Vac. Sci. Technol. 23 2319–29
[36] Tian W-C, Pang S W, Lu C-J and Zeller E T 2003Microfabricated preconcentrator-focuser for a microscalegas chromatograph J. Microelectromech. Syst.12 264–72
[37] Voiculescu I et al 2006 Micropreconcentrator for enhancedtrace detection of explosives and chemical agents IEEESensors J. 6 1094–104
10
Copyright © 2022 FDOKUMEN