Low-Reynolds-number effects on near-wall turbulence
20
J. Fluid Mech. (1994), vol. 276, pp. 61-80 Copyright 0 1994 Cambridge University Press 61 Low-Reynolds-number effects on near-wall turbulence By R. A. ANTONIA' AND J. KIM' Department of Mechanical Engineering, University of Newcastle, NSW 2308, Australia Mechanical, Aerospace and Nuclear Engineering Department, University of California, Los Angeles, CA 90024-1597, USA (Received 8 March 1993 and in revised form 18 March 1994) Direct numerical simulations of a fully developed turbulent channel flow for two relatively small values of the Reynolds number are used to examine its influence on various turbulence quantities in the near-wall region. The limiting wall behaviour of these quantities indicates important increases in the r.m.s. value of the wall pressure fluctuations and its derivatives, the r.m.s. streamwise vorticity and in the average energy dissipation rate and the Reynolds shear stress. If the normalization is based on the wall shear stress and the kinematic viscosity, these changes are shown to be consistent with an increase in strength - but not the average diameter or average location - of the quasi-streamwise vortices in the buffer region. Evidence of this strengthening is provided by the increased sum of the stretching terms for the mean- square streamwise vorticity. It is also shown that a normalization based on Kolmogorov velocity and lengthscales, defined at the wall, is more appropriate in the near-wall region than scaling on the wall shear stress and kinematic viscosity. 1. Introduction Direct numerical simulations (DNS) of turbulent flows have had a major impact on near-wall modelling (Mansour, Kim & Moin 1988, 1989; Mansour 1991; Rodi & Mansour 1993) since they have provided estimates from terms in transport equations of the quantities --_ that are usually modelled (e.g. the turbulent kinetic energy k = +? = f(u2 +v2+ w2), and its corresponding dissipation rate e; u, v, w denote the velocity fluctuations in the streamwise (x), wall-normal (y) and spanwise (z) directions, respectively; note that the quantities ul, u2, u3, xl, x2, x3 may be used interchangeably with u, v, w, x, y, 2). Many of these terms, especially those involving spatial derivatives, have yet to be measured reliably in the wall region. The success of the use of DNS databases in connection with near-wall modelling can be gauged from the improved calculation of E in the near-wall region (e.g. So, Zhang & Speziale 1991 b). One limitation of the current DNS databases relates to the low Reynolds numbers at which they have been obtained so that extrapolation of the results to high Reynolds numbers requires caution. The DNS databases for both the boundary layer (Spalart 1988) and the channel flow (Kim, Moin & Moser 1987; Kim 1989) have been obtained at sufficiently different values of the Reynolds number to allow some insight into low- Reynolds-number effects, especially in the near-wall region. This is important since these databases are being used to model terms in transport equations for k, e and the Reynolds stresses down to the wall. In Antonia et al. (1992), the channel flow DNS data were examined in conjunction with data obtained from experiments in the same flow. Both data sets indicated 3 FLM 276
-
Upload
independent -
Category
Documents
-
view
2 -
download
0
Transcript of Low-Reynolds-number effects on near-wall turbulence

J. Fluid Mech. (1994), vol. 276, pp. 61-80 Copyright 0 1994 Cambridge University Press
61
Low-Reynolds-number effects on near-wall turbulence
By R. A. ANTONIA' A N D J. KIM' Department of Mechanical Engineering, University of Newcastle, NSW 2308, Australia Mechanical, Aerospace and Nuclear Engineering Department, University of California,
Los Angeles, CA 90024-1597, USA
(Received 8 March 1993 and in revised form 18 March 1994)
Direct numerical simulations of a fully developed turbulent channel flow for two relatively small values of the Reynolds number are used to examine its influence on various turbulence quantities in the near-wall region. The limiting wall behaviour of these quantities indicates important increases in the r.m.s. value of the wall pressure fluctuations and its derivatives, the r.m.s. streamwise vorticity and in the average energy dissipation rate and the Reynolds shear stress. If the normalization is based on the wall shear stress and the kinematic viscosity, these changes are shown to be consistent with an increase in strength - but not the average diameter or average location - of the quasi-streamwise vortices in the buffer region. Evidence of this strengthening is provided by the increased sum of the stretching terms for the mean- square streamwise vorticity. It is also shown that a normalization based on Kolmogorov velocity and lengthscales, defined at the wall, is more appropriate in the near-wall region than scaling on the wall shear stress and kinematic viscosity.
1. Introduction Direct numerical simulations (DNS) of turbulent flows have had a major impact on
near-wall modelling (Mansour, Kim & Moin 1988, 1989; Mansour 1991; Rodi & Mansour 1993) since they have provided estimates from terms in transport equations of the quantities - - _ that are usually modelled (e.g. the turbulent kinetic energy k = +? = f(u2 +v2+ w2), and its corresponding dissipation rate e; u, v, w denote the velocity fluctuations in the streamwise (x), wall-normal ( y ) and spanwise ( z ) directions, respectively; note that the quantities ul, u2, u3, xl, x2, x3 may be used interchangeably with u, v, w, x, y , 2) . Many of these terms, especially those involving spatial derivatives, have yet to be measured reliably in the wall region. The success of the use of DNS databases in connection with near-wall modelling can be gauged from the improved calculation of E in the near-wall region (e.g. So, Zhang & Speziale 1991 b).
One limitation of the current DNS databases relates to the low Reynolds numbers at which they have been obtained so that extrapolation of the results to high Reynolds numbers requires caution. The DNS databases for both the boundary layer (Spalart 1988) and the channel flow (Kim, Moin & Moser 1987; Kim 1989) have been obtained at sufficiently different values of the Reynolds number to allow some insight into low- Reynolds-number effects, especially in the near-wall region. This is important since these databases are being used to model terms in transport equations for k, e and the Reynolds stresses down to the wall.
In Antonia et al. (1992), the channel flow DNS data were examined in conjunction with data obtained from experiments in the same flow. Both data sets indicated
3 F L M 276
62 R. A . Antonia and J. Kim
significant low-Reynolds-number effects, comparable to those reported for the boundary layer by Spalart (1988). In particular, the data in the inner region of the flow indicated that scaling on wall variables is not appropriate, various wall-normalized quantities exhibiting different Reynolds number dependences. Several possible causes for these dependences were investigated. While no evidence was found for any direct interaction between inner regions on opposite channel walls, it was suggested that observed effects of h+ (= hU,/v, h is the channel half-width, U, is the friction velocity and v the kinematic viscosity of the fluid; the superscript + denotes normalization __ by U, and v) on u'+ (the prime denotes an r.m.s. value) and the Reynolds shear stress u+u+ were likely to be associated with the increased stretching of quasi-streamwise vortices in the wall region. In the present paper, we focus on the near-wall behaviour of several turbulence quantities (using the DNS channel flow database) primarily to relate more directly the low-Reynolds-number effects to the near-wall vortical structure. For this purpose, we consider statistics for the velocity and pressure fluctuations and examine the constituent terms in the transport equations for the Reynolds stresses and the mean-square vorticities. Of particular interest are the stretching terms in the vorticity budgets in that they provide a means of quantifying the vortex stretching, with the caveat that the equivalence between vorticity and vortices may be tenuous.
After recalling in 5 3 the asymptotic near-wall form of various turbulence quantities, we quantify in $4 the Reynolds-number dependence of the wall values of these quantities. The Reynolds-number dependence of the transport equations for the Reynolds stresses and the mean square vorticity is considered in $ 5 and an attempt is made in $6 to relate this dependence, in particular that of the stretching terms in the vorticity budget, to that inferred from a simple near-wall model of quasi-streamwise vortices. Evidence in support of the appropriateness of a Kolmogorov-based scaling for the near-wall region is presented in $7.
2. DNS details The database used here was obtained from direct numerical simulations (DNS) of
a fully developed channel flow at two values of h+ (180, 400). Details of the computations can be found in Kim et al. (1987). Uniform meshes were used in the homogeneous x (= xl) and z (= x3) directions. For h: 1: 180, Ax+ N 11 and Az+ 1: 4 while for h+ = 400, Ax+ N 7 and Az+ N 4. A non-uniform mesh was used in the wall- normal y (= xz) direction with the minimum spacing of about 0.05 (for both h+) at the wall and a maximum spacing (Ay+ N 4.4 for h+ = 180 and 5.5 for h+ = 400) at the channel centreline. In the region y+ 5 10, the Kolmogorov lengthscale v+ is about 1.5 for both h+ (see Antonia, Kim & Browne 1991); Ay' = 1.5 at y+ x 10 for both h+, and the computational resolution appears to be therefore quite adequate for this flow region.
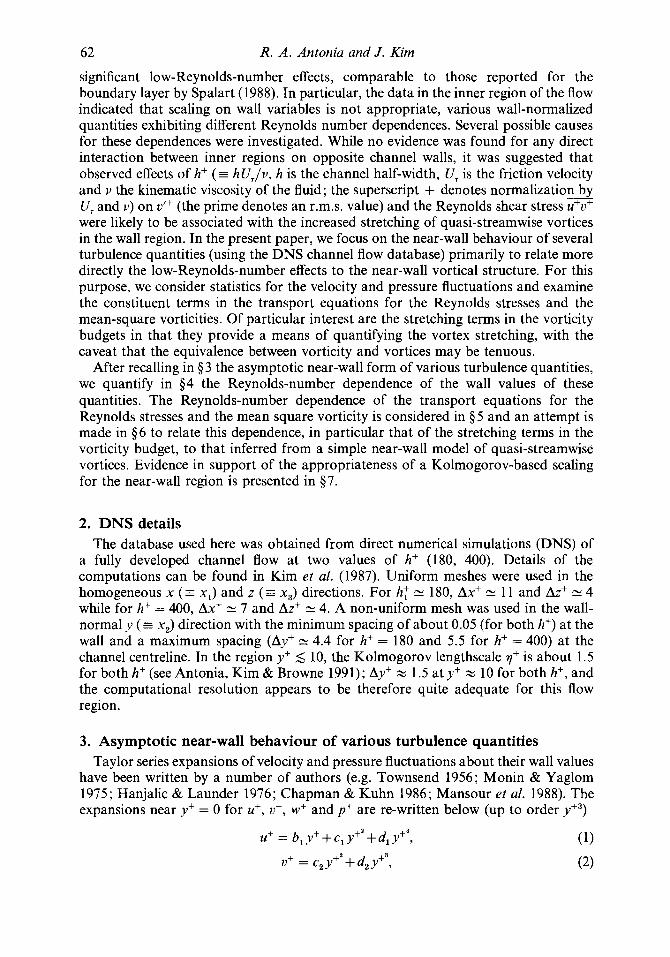
3. Asymptotic near-wall behaviour of various turbulence quantities Taylor series expansions of velocity and pressure fluctuations about their wall values
have been written by a number of authors (e.g. Townsend 1956; Monin & Yaglom 1975; Hanjalic & Launder 1976; Chapman & Kuhn 1986; Mansour et at. 1988). The expansions near y+ = 0 for u+, u+, w+ and p + are re-written below (up to order Y + ~ )

Low-Reynolds-number eflects on near-wall turbulence 63
W+ = b, y+ + C, y+' + d, y f 3 , (3)
pt = a,+b,y++~,y+~+d,y+~, (4)
where the coefficients are functions of x+, z+ and t+. The continuity equation and the momentum equations allow a few relations between these coefficients to be written (e.g. Mansour et al. 1988)
( 5 )
ap,l = 2c1, ( 6 )
2c2 = - (bl, 1 + ' 3 , 3 ) ,
a,,, = 2c3,
b, = 2c2,
where bl,l ZE abl/i3x+, b,,, = ab,/az+, etc. Note that relations (6) and (7) reflect the equalities which exist at the wall between the instantaneous pressure gradients (in either xf or z+) and the y+-derivatives of either w l or OJ;, namely
aP - a", aP - a", ax ay ' az ay .
-- _ _
Expressions for several turbulence quantities can be derived from (1)-(4). For example, the components of the vorticity fluctuation vector are given by (to order y2)
OJ; wT2 -ZIT, = b, + 2c3y+ + (3d3 - c2,,)y+', "+ y = - U+ ,3-w:1 = (b1,3-b3,1)Y+,
"+= - V , + - u:. = - b, - 2c, y+ + (c2, - 3d1) y+'.
U+V+ = b, c2 Y + ~ .
(9) (10) (1 1)
There is no y+' term in (10) since (C~ , , -C , ,~ ) is zero as a result of conditions (6) and (7). The product U+V+ is given by (to order y3)
(12)
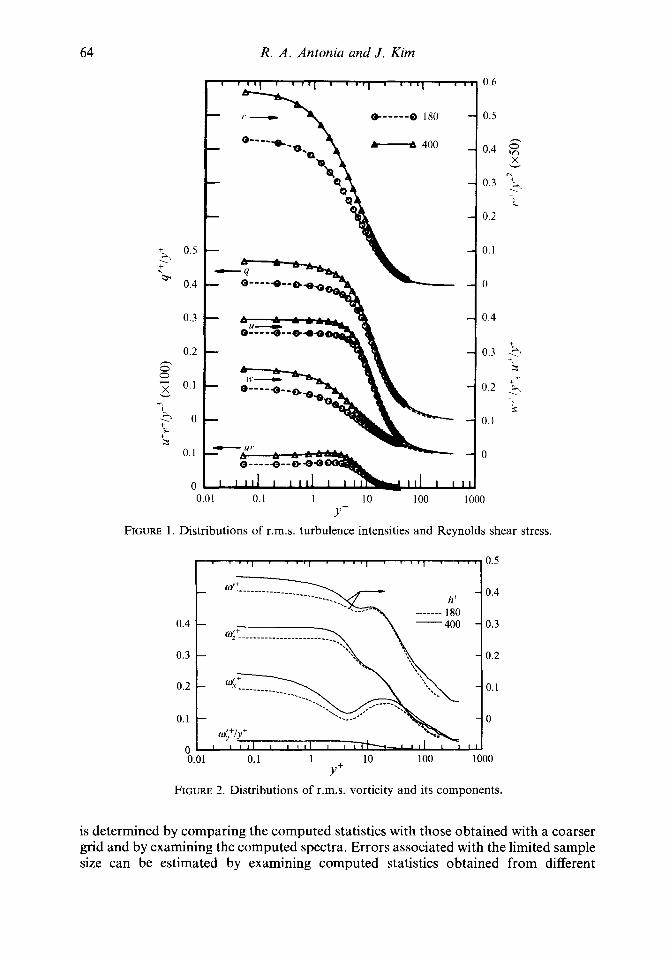
4. Effect of Reynolds numbers on velocity, pressure and vorticity statistics Distributions of r.m.s. values of the three velocity fluctuations and of the Reynolds
shear stress are shown in figure 1, together with the distributions of q", where q' = ?"*. Root mean square vorticity fluctuations are shown in figure 2 while the r.m.s. values ofp and its spatial derivatives are given in figures 3 and 4. Although all the data in one half of the channel are plotted in these figures, the logarithmic scale for y+ highlights the near-wall behaviour of the plotted quantities. The shapes of the curves at small values of y+ suggest a limiting wall behaviour which is consistent with the dominance of the first terms on the right-hand sides of (1) to (4) and (9) to (12). In every case, the curves exhibit a clear tendency towards constancy as y+ + 0.
The r.m.s. values of the coefficients of the first terms in ( 1 ) to (4) and (9) to (1 1 ) are shown in table 1 (the subscript w will be used to denote wall values). Also shown are the average values of the coefficient in (12) as well as those of the coefficients of the first terms in the expansions for q' and c. Not all the estimates shown in the table are independent. For example, (u'+/y+), and w& should be identical as should those of ( W ' + / Y + ) ~ and uzw. The differences reflect the numerical uncertainties of these estimates. There are two sources of errors, numerical (truncation errors) and statistical (limited sample size). The former are always difficult to estimate since the maximum available grid resolution is usually used for final computations. The adequacy of the resolution
3-2
64 R. A . Antonia and J . Kim
L
1 '3
FIGURE 1
0.6
e - - - - - O 180 0.5 - 400 h
0.4 X v
PI
0.3 ' +, 3 -
0.2
0.5 0.1
0.4 0
0.3 0.4
+ 0.2 0.3 5
+. 3
0.1 0.2 & +.
L +
0 0.1
0.1 0
0 0.01 0. I I 10 I00 1000
Y+ . Distributions of r.m.s. turbulence intensities and Reynolds shear stress
, , , , ., I . I , , I , I , , . I . ,-0.5
-400 - 0.3
0.3 -
0.1 -
0.01 0.1 1 10 100 1000
FIGURE 2. Distributions of r.m.s. vorticity and its components.
Y+
is determined by comparing the computed statistics with those obtained with a coarser grid and by examining the computed spectra. Errors associated with the limited sample size can be estimated by examining computed statistics obtained from different
3
F+
0
65
I I I , , . I I I I I I , ' I I . , ' I I 3 . .
2 - -
- 1 -
I ( I " I I l l ' I l k ' I I # ' I I I I
o,ll 0.05
A A+ - 400
(w.\-Y+ .............................. J!'' (splay)' + ,I
-----------____________I_/
%.!I1 0. I 1 I 10 I I I " 100 I I I I ' 1000 Y+
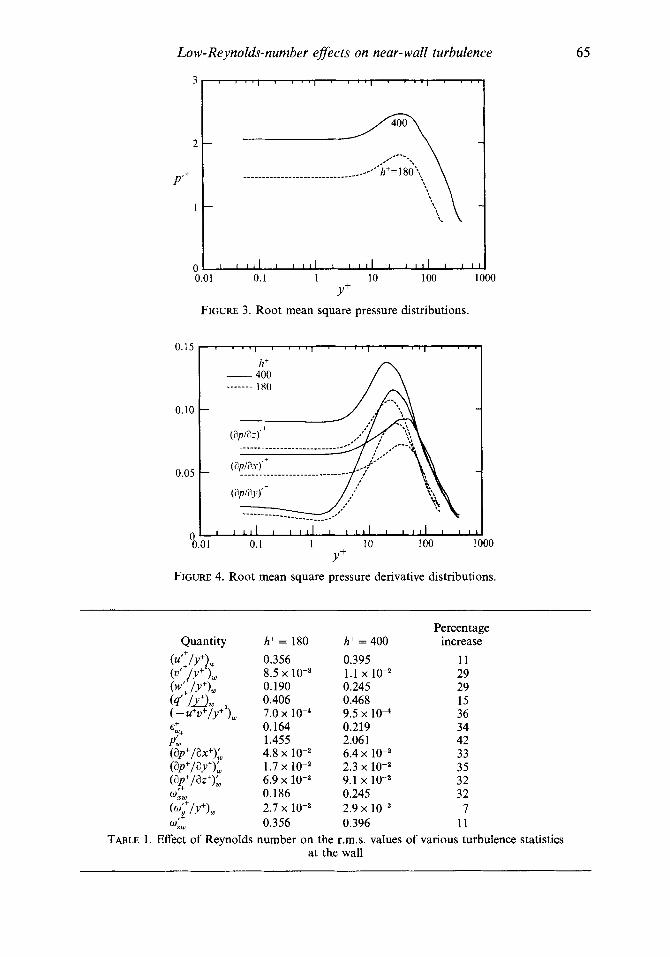
FIGURE 4. Root mean square pressure derivative distributions.
Percentage Quantity h+ = 180 h+ = 400 increase
(QY+), 0.356 0.395 11 (u' l Y + )w 8.5 x 10⁻³ 1.1 x 10⁻² 29 (w: / Y + L 0.190 0.245 29 (q' MW 0.406 0.468 15 ( - u + u + / Y + ~ ) , 7.0 x 10⁻⁴ 9.5 x 10⁻⁴ 36 €+ 0.164 0.219 34
1.455 2.061 42 Y+ P w
@ P + P X + ) l , 4.8 x 6.4 x 33 @P+FY+)l, 1.7 x 2.3 x lo-* 35 @P+FJZ+)l , 6.9 x 9.1 x 32
0.186 0.245 32 W Z W
wz, 0.356 0.396 11
I +
( ( p Y +) w 2.7 x 2.9 x 7
TABLE 1. Effect of Reynolds number on the r.m.s. values of various turbulence statistics at the wall

66
(4 0.4
0.2
0
-0.2
-0.4
R. A . Antonia and J . Kim
I ' ' " I ' ' " ' ' " I ' ' 1 k
1 1 1 1 1 1 1 1 I l l 1 1 1 1 1 1 I L
0.01 0.1 1 10 100 1000
(b) 0.04
0.02
0
-0.02 0.01 0.1 1 10 100 1000
Y+
FIGURE 5 (a, b). For caption see facing page.
numbers of computational fields; for any of the quantities shown in table 1, the limited sample size error is comfortably smaller than the percentage increases (also given in the table) between the two Reynolds numbers. The estimated uncertainty due to the sample size in wrw and w,,, for example, is about 2%.
The increase in (u'+/y+), (= bi) with h+ is smaller than that in either (v'+/y''), (= ci) or (w'+/y+), (= bk). The increase in ( q ' + / ~ + ) ~ (= b: + bf") , which is dominated by the contribution from u+', is comparable to that in ( ~ ' ~ / y + ) ~ ~ The increase in (-U~U~/Y+~), is slightly larger than that for either ( ~ ' ~ / y + ~ ) , or (w' /y+),.
Other quantities which show important Reynolds number variations include wj-' (figure 2), p'+ (figure 3) and all three r.m.s. pressure derivatives (figure 4). In general, the three r.m.s. pressure derivatives are roughly of the same order of magnitude and their percentage increases with h+ is approximately the same as that for u;. Kim (1989) showed that the dominant source term in the Poisson equation for pressure was related to streamwise vortices in the buffer layer (this is discussed in $6). It is therefore reasonable that the r.m.s. pressure and pressure derivatives are increased by roughly the same order of magnitude as the streamwise vorticity in the buffer layer.
The percentage increase in c' (figure 5d) is comparable to that for -UfUf/y+3 (figure 1) and is virtually identical to that of w'+ (figure 2). The latter result is not surprising in
If

Low-Reynolds-number eflects on near-wall turbulence
(c) 0.2
0.1 -
0 .
-0.1 '
- 4\
L
1
67
FIGURE 5 . Budgets of the Reynolds normal stressesand o f the i rw (i.eLhe turbulent energy). (The numbers refer to the terms in equation (13)) (a) u+'; (b) of'; (c) w+'; (d ) qC2. h+: ---, 180; -, 400.
view of the near equality between E+ and uf2 in the present flow (cf. Antonia et al. 1991 for details). Note that, in the buffer region, uc is the only vorticity component to be significantly affected by h+. Note also that (ap+/ay+)' is approximately twice as large as d+/y+', in reasonable agreement with the Neumann boundary condition at the wall, i.e. equation (8). It should further be noted that the Reynolds-number variations exhibited by table 1 are not unique to this flow; similar variations may be observed in Spalart's (1988) boundary-layer data (e.g. pr+ increases by about 42 % between R, = 300 and R, = 1410, where R, is based on the free-stream velocity and momentum thickness of the layer).
( ~ : / y + ) ~ is practically unchanged, reflecting the apparent insensitivity of w; on the Reynolds number. (The ratio u;/y+ is plotted in figure 2 instead of wk which goes to zero as y++O, cf. equation (lo).) It is also of interest to note that several quantities, which may be expressed as ratios of those shown in table 1 , are essentially unaffected by the increase in h+. For example, the limiting wall value of the structure parameter (-ufv+/y+q+') is about 43 x lop4. The limiting wall value of the turbulent timescale (?/y+*~+) is equal to 1. It follows that (-u"i30+/ay+)/(y+3~+), which is the limiting wall value of the ratio of turbulent energy production to turbulent energy dissipation rate, is also unchanged.
-

68 R. A. Antonia and J . Kim
5. Budgets of mean-square velocity and vorticity fluctuations It is of interest to examine how the Reynolds-number dependence of the mean-
square values of the velocity and vorticity fluctuations is apportioned among the various terms in the transport equations for ~ these quantities.
The equations for the Reynolds stresses u: u; are given by
1 2 3 4 5 (13)
where terms 1,2,3 represent the production, turbulent diffusion or turbulent transport, and velocity-pressure gradient correlation terms, respectively, while terms 4 and 5 are the viscous diffusion and turbulent dissipation rate terms, respectively. The distributionsf t k a b m e terms are shown in figures 5(a) (& 5(b) (u+"), 5(c) (3); 5 ( d ) (q+' = u+'+ u+' + w+') and figure 6 (u") ; the numbers in the figures correspond to the term numbers in (13). Although the distributions at h+ = 180 have already been presented and discussed in Mansour et a f . (1988), the emphasis here is on the Reynolds- number dependensof the various terms which make up the Reynolds stress budgets.
In the case of u+', the major effect of h+ outside the sublayer is confined to the production and velocity-pressure gradient terms. Outside the sudayer, the velocity- pressure gradient term is the dominant production term in the u+' and w+' budgets. It is significantly affected by the Reynolds number, possibly reflecting the effect of h+ on the r.m.s. pressure derivatives (figure 4). The increase in the velocity-pressure gradient terms is matched by an increase in the dissipation rate (and a somewhat smaller increasein thLturbulent diffusionAerm). The difference between the h+ dependence of u+' and wf2 relative to thatof u+' in theregion y + 2 10 seems consistent with the larger effect of h+ on a+' (and w+') than on u+' for this flow region (Antonia et af. 1992). The budget of y+' (figure 5 d ) is essentially identical to that of Uf2, reflecting the major contribution of u+' to the total energy (note that exaggerated scales are used in figures 5(b) and S(c), relative to those in figures 5(a) or 5(d)) . Figures 5(a) and 5(d ) stressthe relatively minor role played by the velocity-pressure gradient correlation in the u+' and q+' budgets.
The budget of the Reynolds shear stress (figure 6) contrasts significantly - with that of the normal stresses. Although the major source term is, as in the case of - u + ~ , provided by the production term (note that negative values represent a gain for the u+u+ budget), this term is now balanced by the velocity-pressure gradient and the turbulent diffusion terms. Outside the sublayer, the viscous diffusion and the dissipation rate terms are negligible (Mansour ~ et af. 1988, noted that the viscosity plays a minor role in the dynamics of u+u+ because the sum of the __ two viscous terms is small throughout the channel), a trend which is also seen in the u+u+ budget presented by Spalart (1988) for the boundary layer. The effect of the Reynolds number is significant both on the major source and sink terms.
Transport equations for w:oT have been written by several authors (e.g. Corrsin 1953; Tennekes & Lumley 1972). In the present form, the advection term is zero and the equations are given by
-- __- ~- - u : w ; q i -f(uj + + + wi w& +co,,tw;u;j +w;o ; U l j +w;u;jQ2i' +;(w:w:) .. --of of ,u, I % , 3 2.4
Y V V V V V V
1 2 3 4 5 6 7 = 0. (14)
Tennekes & Lumley (1972) have interpreted 1 and 2 as the gradient production and
Low-Reynolds-number eflects on near-wall turbulence 69
0.10
0.05
0
-0.05
I ' ' " I ' ' " I ' ' " I ' ' 1.
3
-0.10 0.01 0.1 1 10 100
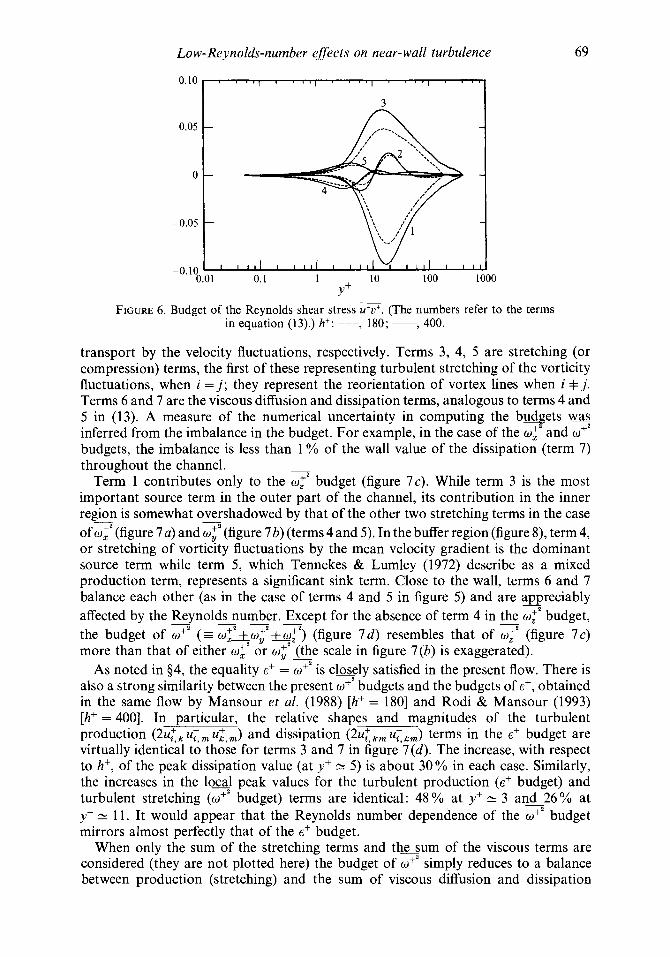
Y+ FIGURE 6. Budget of the Reynolds shear stress z. (The numbers refer to the terms
in equation (13).) hi: ---, 180; -, 400.
transport by the velocity fluctuations, respectively. Terms 3, 4, 5 are stretching (or compression) terms, the first of these representing turbulent stretching of the vorticity fluctuations, when i = J ; they represent the reorientation of vortex lines when i + j . Terms 6 and 7 are the viscous diffusion and dissipation terms, analogous to terms 4 and 5 in (13). A measure of the numerical uncertainty in computing the b w t s was inferred from the imbalance in the budget. For example, in the case of the w,' and w+' budgets, the imbalance is less than 1 YO of the wall value of the dissipation (term 7 ) throughout the channel. -
Term 1 contributes only to the 0;' budget (figure 7c). While term 3 is the most important source term in the outer part of the channel, its contribution in the inner region is somewhat overshadowed by that of the other two stretching terms in the case o f z (figure 7 a) a n d 3 (figure 7b) (terms 4 and 5). In the buffer region (figure 8), term 4, or stretching of vorticity fluctuations by the mean velocity gradient is the dominant source term while term 5 , which Tennekes & Lumley (1972) describe as a mixed production term, represents a significant sink term. Close to the wall, terms 6 and 7 balance each other (as in the case of terms 4 and 5 in figure 5 ) and are appreciably __
affected by the - Reynolds - - - number. Except for the absence of term 4 in - the w:' budget, the budget of w+' (= w%w$'+&) (figure 7 d ) resembles that of w:' (figure 7c) more than that of either w,' or w+ Y - (the scale in figure 7(b) is exaggerated).
As noted in 94, the equality e+ = w+' is closely satisfied in the present flow. There is also a strong similarity between the present w+' budgets and the budgets of e+, obtained in the same flow by Mansour et al. (1988) [h+ = 1801 and Rodi & Mansour (1993) [A+ = 4001. In particular, the relative shapes and magnitudes of the turbulent production ( 2 4 u: , uz, ,) and dissipation (22.4: km u: km) terms in the c+ budget are virtually identical to those for terms 3 and 7 in figure 7(d ) . The increase, with respect to h+, of the peak dissipation value (at y+ N 5 ) is about 30% in each case. Similarly, the increases in the 1 0 ~ 1 peak values for the turbulent production (c+ budget) and turbulent stretching (w+' budget) terms are identical: 48% at y+ N 3 an126% at y+ N 11. It would appear that the Reynolds number dependence of the w+' budget mirrors almost perfectly that of the e+ budget.
When only the sum of the stretching terms and thcsum of the viscous terms are considered (they are not plotted here) the budget of w+' simply reduces to a balance between production (stretching) and the sum of viscous diffusion and dissipation

70 R. A . Antonia and J. Kim
(,)0.010
0.005
-0.005
-0.010
, , , , I , , , , , , , , , I , , , ,, , , , ,
- -
0 - -
- -
1 1 1 1 I I 1 1 1 1 1 1 1 I I I
O’Oo3 0.002 j
-0.001 O t
FIGURE 7 (a, b). For caption see facing page,
terms, the turbulent transport being virtuallyaegligible. In this sense, the budget of 7 differs in a significant manner from that of q+’ where the magnitude of the turbulent transport is comparable to the production and dissipation terms.
6. Reynolds-number dependence through increased vortex stretching The Reynolds-number dependence of the various quantities considered in 994 and 5
(see also Antonia et al. 1992) can be explained, at least qualitatively, in terms of increased stretching (when normalized by wall variables) of the vortices in the wall region, or, perhaps equivalently, in terms of an active motion which intensifies as h+ increases. This equivalence seems plausible if the vortical structures in the inner region of the flow play a dominant role in transferring momentum and heat in this flow domain. The active - motion (Townsend 1961 ; Bradshaw 1967) should be the major contributor to u+v+ in this region. The inactive motion can make important contributions to the Reynolds normal stresses but is unlikely to contribute to the Reynolds shear stress in the inner region.
In the buffer region, Robinson (1991a) showed that there is a close association between quasi-streamwise vortices (which occur singly with much higher probability

Low-Reynolds-number eSfec fs on near-wall turbulence
0.005
-0.005
-0.010
-0.015
71
- -
0 - -
- -
- -
' ' ' ' I ' ' ' I ' ' ' ' ' I I l ' " I ' I '
(c) 0.010 , , , , , I , , , , , , , , 1 , , , , , 1 , , '1
(4 0.015
0.010
0.005
0
-0.005
-0.010
-0.015 0.01 0.1 1 10 100 1000
Y+
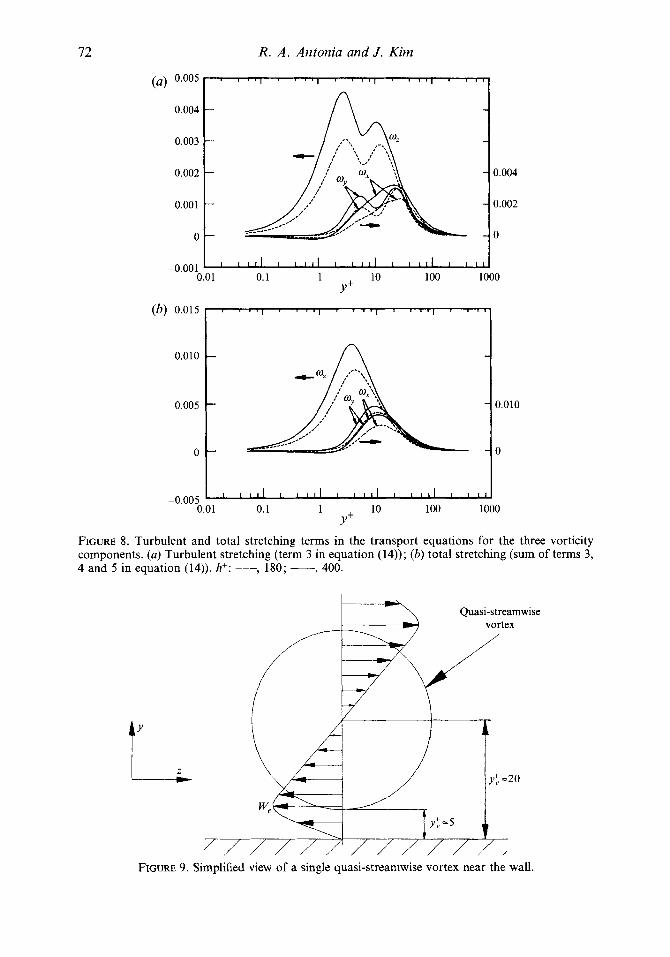
FIGURE 7. Budgets of mean square vorticity components andAeir sum. (The numbers refer to the terms in equation (14).) (a) 0;'; (b) 0;'; (c) w:'; ( d ) o+'; h': ---, 180; -, 400.
than counter-rotating pairs) and both outward ejections of low-speed fluid and wallward - sweeps of high-speed fluid. Since these events dominate the contribution to u+u+, the above association implies a close link between the active motion and the quasi-streamwise vortices. Relatively direct evidence that the quasi-streamwise vortices in the buffer region are increasingly stretched as h+ increases is provided by the stretching terms in figure 7. The terms representing stretching by the turbulent fluctuations (term 3) are replotted using a bigger scale in figure 8 (a). The sum of all the stretching terms (3,4 and 5 ) is shown in figure 8 (b). Figure 8 (a) confirms the significant increase ( N 37 %) with h+ in the turbulent stretching of the w,' fluctuations at y+ N 25 (near the most probable location of the streamwise vortex centres). At this location, there is a negligible increase in the turbulent stretching of w;. For w:, the turbulent stretching terms exhibits local peaks at y+ N 3 and y+ N 11, the peak at y+ N 3 having the slightly larger magnitude. The percentage increases with h+ are about 51% at y+ N 3 and 25 % at y+ = 11. It should be noted, however, that the peak values of terms 4 and 5 are larger (for each vorticity component) than the peak value of term 3. Term 4 has the largest peak in the case of 0,' and 0; while term 5 is largest for 0:. It seems therefore appropriate to turn our attention to the effect of h+ on the sum of the three
72
0.005- I I I I I I I I I , .
0.004 - -
- 0.003 -
0.002 - -
0.001 - -
0 -
-0.001 I " ' I ' I l l ' I I l l 1 ' ' I L ' ' I "
R. A . Antonia and J . Kim
0.004
0.002
- 0
(b) 0.015 r I r 8 1 I 1 9 1 8 8 3 1 1 9 8 0 1 9 3 8
0.010 - -
0.005 - -
0 -
-0.005 ~ I ' ' I ' I ' ' I ' ' ' ' I ' I ' ' ' I ' ' ' I
0.010
- 0
t FIGURE 9.
Quasi-streamwise vortex
Simplified view of a single quasi-streamwise vortex near the wall.

Low-Reynolds-number eflects on near-wall turbulence 73
stretching terms (figure 8 b). The major increase ( N 41 YO) occurs in m i , the increases in w i and w: being equal to about 16 YO and 31 YO, respectively. The locations at which these increases occur ( y+ 1: 1 1 for 0,' and oY+, y+ N 3 for w:) correspond approximately to those for the peak values of the largest stretching terms. It seems reasonable to attribute the increases in the sum of the stretching terms for w i and w$ mainly to an increased stretching of the quasi-streamwise vortices in the buffer region. Conjecturally, the increase in the sum of the stretching terms for w r may be attributed to the strengthening of the splatting motion induced by the quasi-streamwise vortices. This motion (e.g. Moin & Kim 1982; Chapman & Kuhn 1986) can be described as wallward moving fluid which, on encountering the wall, is deflected in both positive and negative z-directions. This results in 8w/az being large and positive. One would expect this motion to result in fairly large and positive (i.e. negative 0,; the boundary-layer measurements of Bah t , Wallace & Vukoslavcevic (199 1) indicate that intense spanwise vorticity stretching dominates over spanwise vorticity compression in the near-wall region) at the wall. Consequently, the correlations w,"(aw/az) (the main contributor to term 3) and w,(aw/az) SZ, (term 5 ) should be positive and large close to the wall (it seems plausible that this occurs near the edge of the sublayer, as indicated by figure 8).
The increased stretching of the quasi-streamwise vortices would be consistent with the major increase in the Reynolds shear stress and the smaller increases in the Reynolds normal stresses (which received contributions from the inactive motion). It should also be consistent with the significant increase in the r.m.s. pressure and pressure derivative values (figures 3 and 4) as discussed in 94. Strong vortices in unsteady viscous flow are also expected to have low-pressure cores, accounting for the strong correspondence between low-pressure regions and quasi-streamwise vortices (Robinson 1991 b). The joint probability density functions betweenp+ and w,' presented by Kim (1989) at y+ = 30 and 100 in a fully developed turbulent channel flow indicated that large w,' fluctuations are likely to be associated with large negative p+ fluctuations although the reverse is not necessarily true.
Kim et al. (1987) explained their distribution of wj-' (at h+ = 180) in terms of a (simplified) flow module comprising single streamwise Oseen-like vortices (see figure 9). The average position y l of the vortex centre, where w c exhibits a local maximum w;, was assumed to be equal to 20 while the average vortex diameter Itt was taken to be equal to 15 (wj-' has a local minimum at y t N 5 , where the magnitude of w has a local maximum). With such a model, it can be shown that (Kim et al. 1987)
where w c is the value of w c at yf = 0. Although the data in figure 2 indicate that the peak in w, is fairly broad (and not accurately defined), the selected values of yt; and yt; seem reasonable. The data in figure 2 indicate values of 0.74 (h+ = 180) and 0.71 (h+ = 400) for the left-hand side of (15); the ratios of the left-hand and right-hand sides of (15) are 1.11 (h+ = 180) and 1.06 (h+ = 400). Spalart's (1988) boundary-layer distributions of w;' provide reasonable support for the choices of y l (1: 15) and yt; ( 1 ~ 4); the ratio w(z: /wL (0.72, 0.67 and 0.64 for R, = 300, 670 and 1410, respectively; the corresponding values of 6+, where 6 is the boundary-layer thickness, are 161, 315 and 651) is also in reasonable agreement with (15).
It is relevant to comment on the near-wall behaviour of aw/ay (see figure 9) which is caused by the presence of the quasi-streamwise vortices. For the clockwise vortex shown in figure 9, the negative aw/ay at the wall should be associated with negative
Y +

74
0.001
+ ̂ 0 -
F 1,
3 - -0.001 + ̂F +a s -0.002
+ rc)
tu
-0.003
R. A . Antonia and J. Kim
I ' ' " I ' ' " 1 ' ' " I ' ' "
-
-
+ I ' I ' I I '
1 .o
0.5
0
-0.5
-1.0 I I I 1 I -20 0 20 40 60
AY+ FIGURE 11. Two-point correlation coefficients of the three vorticity components in the
y+-direction. The reference location is at y+ = 15. hi: ---, 180; -, 400.
values of av/az and hence positive values for the product (av/az) @w/2y). Similarly, counterclockwise vortices would induce positive values of (aw/ay), (av/az) and their product. The correlation (av/az) (aw/ay) should therefore be positive close to the wall; figure 10 shows that there is a positive maximum near y+ = 3. The magnitude of this peak is, however, small compared with that of the negative maximum at y+ N 30 (i.e. near the average location of the vortex centre). As noted earlier, the product (av/az)(aw/ay) is the major nonlinear source term in Poisson's equation for the pressure fluctuation (Kim 1989). It seems therefore reasonable to expect the peak value ofp' to occur near y+ = 30. For the present data, pkax occurs at y+ N 32 (figure 3) for the two values of h+. For Spalart's data, pkax occurs at y+ N 24, independently of a+.
The above considerations suggest that the dependence of O J ~ on h+ may be explained in terms of an increase in strength of the vortex, without any significant change to its size. Figure 11 shows that the correlation coefficient
PW,,, = OJx(Y) OJAY + AY)/w;(Y) 4 ( Y + AY)

Low-Reynolds-number efSects on near-wall turbulence 75
0.6
0.4
0.2
0
-0.2
P W
1
-0.4 I I I I I 1 0 20 40 60 80 100
Az+
FIGURE 12. Two-point correlation coefficient of u in the z+-direction. The reference location is at y+ = 15. hi: 0, 180; 0, 400.
at y+ = 15 is virtually unaffected by h+. The rather large negative value of the coefficient near the wall (at Ay+ = - 15) reflects the presence of vorticity of opposite sign to that of the overlying vortex which results from the no-slip condition at the wall (figure 9). The correlation coefficient pwrwy at y+ = 15 (figure 11) is unaffected by h+. This, and the 0;’ distributions in figure 2, suggests that both the scale and the strength of wy are unaffected by h+. For completeness, p,,,, is also included in figure 11. As in the case of w, and wy, the lengthscale of w, is the same at the two values of h+. While the lengthscales associated with w, and w, are roughly comparable, the scale associated with wy is appreciably larger. This appears to be consistent with the continuity requirement (namely the solenoidality of vorticity) and the expectation (at least for homogeneous turbulence) that ‘longitudinal’ scales should be larger than ‘lateral’ scales. The distance between the local minima of p,,,, may be loosely identified with an average vortex diameter. A value of Ctt is consistent with that previously assumed with the model of figure 10. Further support for this magnitude is provided by two- point u-correlations in the z-direction. The distribution of pvv(Az+), calculated at y+ = 15 (figure 12) exhibits a clear minimum at Az’ N 30 at both h+, confirming that the average streamwise vortex diameter scales on U, and v.
Robinson (1990, 1991 b) computed several statistics for the locations, size and strength of streamwise and spanwise vortices using the DNS boundary-layer database of Spalart (1988). His results point to a clustering of quasi-streamwise vortices near the wall. The most probable values for the location and diameter of these vortices are very similar to the present suggestions. Robinson also computed the circulation r (by integrating w, over the vortex area) for quasi-streamwise vortices which were identified visually from instantaneous sectional streamlines in the ( y , 2)-plane and obtained a peak value for P of about 63. P can be estimated from the relation Ty = wic($ui+*). For the present data, P is about 104 at h+ = 180 and about 114 at h+ = 400. For Spalart’s data, P increases from 68 (6+ = 160) to 74 (6+ = 650). The relatively small increase in I-+ for Spalart’s data reflects the small increase (with 6+) of w c or wcw (see figure 13). Jimenez (1993) estimated a value of P of about 150 (for the present database at h+ = 180) for the most intense vortices (8 was about 15). As noted by Robinson and Jimenez, there is unavoidable arbitrariness in identifying vortices and this would partly account for the spread in the above values of P. Because of the
76 R. A . Antonia and J . Kim
I I 1 I I I I 3.0
0- 1:
0- 0
-AA
-0
0 I I I I I I 0 100 200 300 400 500 600 700
6+ or h+
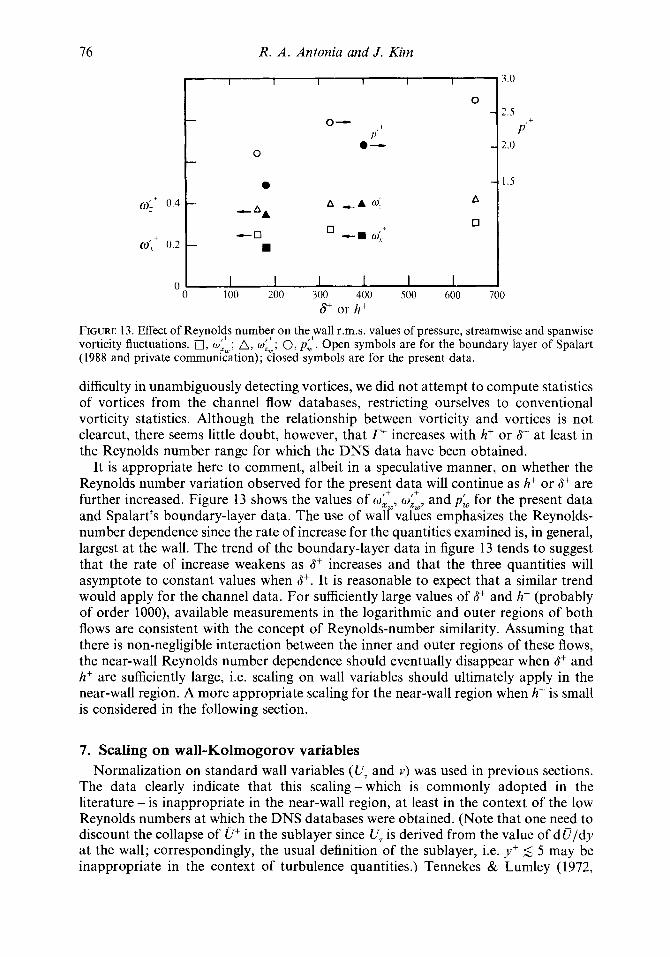
FIGURE 13. Effect of Reynold+s number on the+wall r.m.s. values of pressure, streamwise and spanwise vorticity fluctuations. D, wLw; A, oZw; 0, pl, . Open symbols are for the boundary layer of Spalart (1988 and private communication); closed symbols are for the present data.
difficulty in unambiguously detecting vortices, we did not attempt to compute statistics of vortices from the channel flow databases, restricting ourselves to conventional vorticity statistics. Although the relationship between vorticity and vortices is not clearcut, there seems little doubt, however, that P increases with h+ or 6+ at least in the Reynolds number range for which the DNS data have been obtained.
It is appropriate here to comment, albeit in a speculative manner, on whether the Reynolds number variation observed for the present data will continue as h+ or 6+ are further increased. Figure 13 shows the values of wj-', w& and ph) for the present data and Spalart's boundary-layer data. The use of walr values emphasizes the Reynolds- number dependence since the rate of increase for the quantities examined is, in general, largest at the wall. The trend of the boundary-layer data in figure 13 tends to suggest that the rate of increase weakens as S+ increases and that the three quantities will asymptote to constant values when a+. It is reasonable to expect that a similar trend would apply for the channel data. For sufficiently large values of S+ and h+ (probably of order lOOO), available measurements in the logarithmic and outer regions of both flows are consistent with the concept of Reynolds-number similarity. Assuming that there is non-negligible interaction between the inner and outer regions of these flows, the near-wall Reynolds number dependence should eventually disappear when 6+ and h+ are sufficiently large, i.e. scaling on wall variables should ultimately apply in the near-wall region. A more appropriate scaling for the near-wall region when h+ is small is considered in the following section.
,+
7. Scaling on wall-Kolmogorov variables Normalization on standard wall variables (U, and v) was used in previous sections.
The data clearly indicate that this scaling- which is commonly adopted in the literature - is inappropriate in the near-wall region, at least in the context of the low Reynolds numbers at which the DNS databases were obtained. (Note that one need to discount the collapse of U' in the sublayer since U, is derived from the value of d U/dy at the wall; correspondingly, the usual definition of the sublayer, i.e. y+ 5 5 may be inappropriate in the context of turbulence quantities.) Tennekes & Lumley (1972,
Low-Reynolds-number effects on near-wall turbulence
fl 77
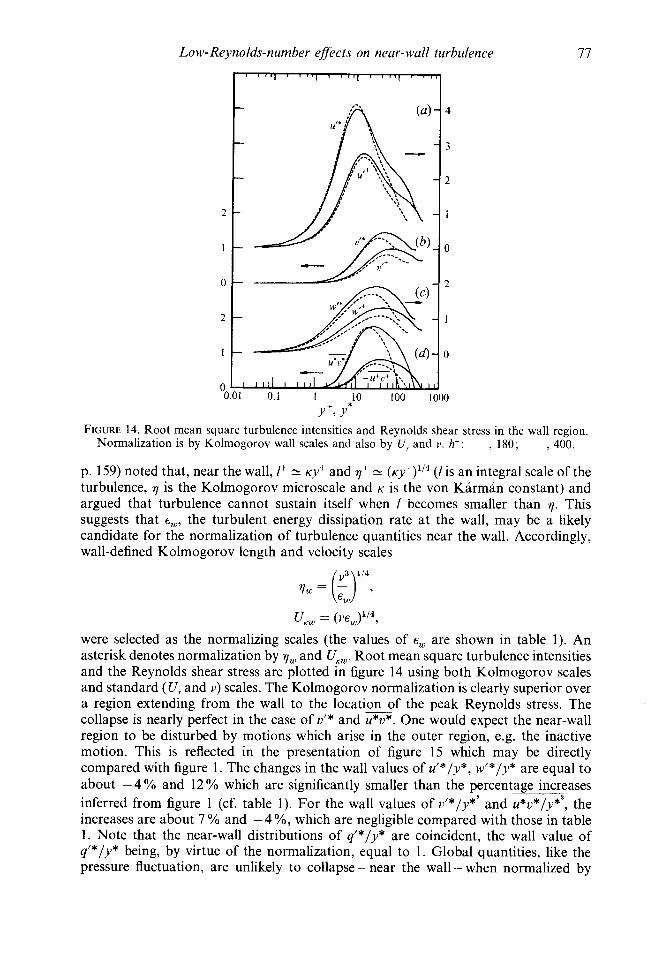
FIGURE 14. Root Normalization
mean is by
0.ot 0.1 1 10 100 1000
Y+, Y* square turbulence intensities and Reynolds shear Kolmogorov wall scales and also by U, and v. hi
stress _ _ _
in the 180; ~
wall ~
region. 400.
p. 159) noted that, near the wall, 1' N ICY+ and 1: (~y+) l / ' (1 is an integral scale of the turbulence, 7 is the Kolmogorov microscale and K is the von Karman constant) and argued that turbulence cannot sustain itself when I becomes smaller than 3. This suggests that e,, the turbulent energy dissipation rate at the wall, may be a likely candidate for the normalization of turbulence quantities near the wall. Accordingly, wall-defined Kolmogorov length and velocity scales
7 w = ( f )v ' , u,, = ( V E w ) 1 / 4 ,
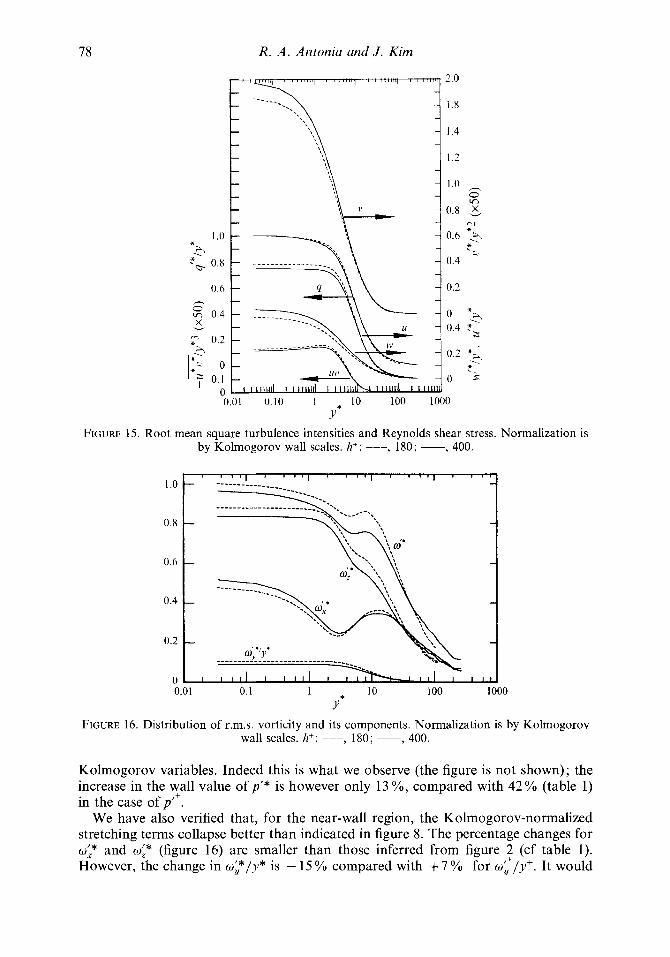
were selected as the normalizing scales (the values of c, are shown in table 1). An asterisk denotes normalization by 7, and UKw. Root mean square turbulence intensities and the Reynolds shear stress are plotted in figure 14 using both Kolmogorov scales and standard (U, and v) scales. The Kolmogorov normalization is clearly superior over a region extending from the wall to the location - of the peak Reynolds stress. The collapse is nearly perfect in the case of d* and u*o*. One would expect the near-wall region to be disturbed by motions which arise in the outer region, e.g. the inactive motion. This is reflected in the presentation of figure 15 which may be directly compared with figure 1. The changes in the wall values of u'*/y*, w'*/y* are equal to about -4 Yo and 12 YO which are significantly smaller than the percentage increases inferred from figure 1 (cf. table 1). For the wall values of d*/y*' and u*u*/Y*~, the increases are about 7 % and -4%, which are negligible compared with those in table 1 . Note that the near-wall distributions of q'*/y* are coincident, the wall value of q'*/y* being, by virtue of the normalization, equal to 1. Global quantities, like the pressure fluctuation, are unlikely to collapse - near the wall - when normalized by
78 R. A . Antonia and J . Kim
0.01 0.10 1 * 10 100 1000 Y
FIGURE 15. Root mean square turbulence intensities and Reynolds shear stress. Normalization is by Kolmogorov wall scales. h + : ---, 180; -, 400.
1 .o
0.8
0.6
0.4
0.2
0 0.01 0.1 1 10 100 1000
Y*
FIGURE 16. Distribution of r.m.s. vorticity and its components. Normalization is by Kolmogorov wall scales. h+: ---, 180; -, 400.
Kolmogorov variables. Indeed this is what we observe (the figure is not shown); the increase in the wall value of p‘* is however only 13 %, compared with 42 % (table 1) in the case of p” .
We have also verified that, for the near-wall region, the Kolmogorov-normalized stretching terms collapse better than indicated in figure 8. The percentage changes for w? and wi* (figure 16) are smaller than those inferred from figure 2 (cf table 1). However, the change in wiT/y* is - 15% compared with + 7 % for w c / y + . It would

Low-Reynolds-number efects on near-wall turbulence 79
appear that U, and v are more appropriate scales for w;. The wy correlations in figures 1 1 and 12 and the commonly reported average wall streak spacing of about lOOv/U, for a wide range of Reynolds numbers would seem to support this claim.
As discussed in the previous section, one would expect EL to asymptote to a constant value for sufficiently large h+. When this occurs, normalization by Kolmogorov scales becomes equivalent to the standard normalization since U, - U,, (this follows from U, v w / v = EL +constant, since U,, r,/v is, by definition, equal to 1).
-114
8. Conclusions and discussion The present results, obtained from direct numerical simulations of a fully developed
turbulent channel flow at two values of the Reynolds number, emphasize the significant low-Reynolds-number effects that exist in the near-wall region. In particular, important increases (with Reynolds number) occur for the r.m.s. streamwise vorticity and pressure fluctuations as well as the Reynolds shear stress and average turbulent energy dissipation rate. These increases are consistent with the strengthening of both quasi- streamwise and spanwise vortices in the wall region. In view of the relatively close association of these vortices with the events that make dominant contributions to the Reynolds shear stress, the intensification of these vortices is equivalent to a strengthening of the active motion. The vortex statistics obtained by Robinson (1990, 1991 b) and the present data indicate that the quasi-streamwise vortices are likely to be more important in the near-wall region than the spanwise vortices, the influence exerted by the latter tending to increase further away from the wall. The simple model in figure 9 is consistent with quasi-streamwise vortices which become more intense but whose average location yz and diameter dt remain approximately unchanged as the Reynolds number increases. Support for a constant value of dt is provided by two- point w, correlations in the y-direction and two-point 0 correlations in the z-direction.
Some insight into the strengthening of the quasi-streamwise vortices was provided by the budgets of the mean-square vorticity fluctuations. These budgets indicate that, although the stretching of vorticity fluctuations by the turbulent velocity fluctuations is most important in the outer region (where it is approximately balanced by the dissipation rate), its influence in the wall region may be overshadowed by that of the other two stretching terms, which bring into play either the mean velocity gradient aO/ay or the mean spanwise vorticity a,. When the sum of the three stretching - terms is considered, the largest increase with respect to h+ occurs, in the case of wz2, at y+ N y i , where y t is the average location of thevortex centre. There is a significant increase in the sum of the stretching terms in the w:' budget but, arguably, this increase is associated with the more vigorous splatting motion induced by the quasi-streamwise vortices.
In the near-wall region, most of the turbulence quantities scale better, though not perfectly, on Kolmogorov velocity scales and lengthscales (based on E , and v) than on the standard variables (U, and v). This is not unexpected given that, in this region, the mean flow field is dominated by the viscous stress while turbulence cannot sustain itself when the lengthscales become smaller than the Kolmogorov lengthscale. At sufficiently large h+, perhaps of the order of 1000, normalization by U, and v should become equivalent to normalization by Kolmogorov wall scales.
R. A. A. acknowledges the support of the Australian Research Council.
80 R. A . Antonia and J . Kim
R E F E R E N C E S
ANTONIA, R. A., KIM, J . & BROWNE, L. W. B. 1991 Some characteristics of small-scale turbulence in a turbulent duct flow. J . Fluid Mech. 233, 369-388.
ANTONIA, R. A,, TEITEL, M., KIM, J. & BROWNE, L. W. B. 1992 Low Reynolds number effects in a fully developed turbulent channel flow. J. Fluid Mech. 236, 579-605.
BALINT, J.-L., WALLACE, J . M. & VUKOSLAVCEVIC, P. 1991 The velocity and vorticity vector fields of a turbulent boundary layer. Part 2. Statistical properties. J . Fluid Mech. 228, 53-86.
BRADSHAW, P. 1967 ‘Inactive’ motion and pressure fluctuations in turbulent boundary layers. J . Fluid Mech. 30, 241-258.
CHAPMAN, D. R. & KUHN, G. D. 1986 The limiting behaviour of turbulence near a wall. J . Fluid Mech. 170, 265-292.
CORRSIN, S. 1953 Remarks on turbulent heat transfer: an account of some features of the phenomenon in fully turbulent regions. Proc. Iowa Therodynamics Symp., pp. 5-30.
HANJALIC, K. & LAUNDER, B. E. 1976 Contribution towards a Reynolds-stress closure for low- Reynolds-number turbulence. J . Fluid Mech. 74, 593-6 10.
JIMENEZ, J. 1993 Small scale vortices in turbulent flows. In New Approaches and Concepts in Turbulence (ed. T. Dracos & A. Tsinober), pp. 95-110. Basel: Birkhauser.
KIM, J. 1989 On the structure of pressure fluctuations in simulated turbulent channel flow. J . Fluid Mech. 205, 421451.
KIM, J. & HUSSAIN, F. 1992 Propagation velocity and space-time correlation of perturbations in turbulent channel flow. N A S A T M 103932.
KIM, J., MOIN, P. & MOSER, R. 1987 Turbulence statistics in fully developed channel flow at low Reynolds number. J . Fluid Mech. 177, 133-166.
MANSOUR, N. N. 1991 The use of direct numerical simulation data in turbulence modelling. AIAA Paper 91-0221.
MANSOUR, N. N., KIM, J . & MOIN, P. 1988 Reynolds-stress and dissipation-rate budgets in a turbulent channel flow. J . Fluid Mech. 194, 1544.
MANSOUR, N. N., KIM, J. & MOIN, P. 1989 Near-wall k - e turbulence modeling. A I A A J . 27,
MOIN, P. & KIM, J. 1982 Numerical investigation of turbulent channel flow. J . Fluid Mech. 118,
MONIN, A. S. & YAGLOM, A. M. 1975 In Statistical Fluid Mechanics: Mechanics of Turbulence (ed. J. L. Lumley), vol. 2. MIT Press.
ROBINSON, S. K. 1990 A review of vortex structures and associated coherent motions in turbulent boundary layers. In Struclure of Turbulence and Drag Reduction (ed. A. Gyr), pp. 23-50. Springer.
ROBINSON, S. K. 1991 a Coherent motions in the turbulent boundary layer. Ann. Rev. Fluid Mech.
ROBINSON, S. K. 1991 b The kinematics of turbulent boundary layer structure. N A S A TM103859. RODI, W. & MANSOUR, N. N. 1993 Low Reynolds number k--R modelling with the aid of direct
simulation data. J . Fluid Mech. 250, 509-529. So, R. M. C., LAI, Y. G., ZHANG, H. S. & HWANG, B. C. 1991 a Second-order near-wall turbulence
closures: a review. AIAA J . 29, 1819-1835. So, R. M. C., ZHANG, H. S. & SPEZIALE, C. G. 1991 b Near-wall modelling of the dissipation-rate
equation. AIAA. J . 29, 2069-2076. SPALART, P. R. 1988 Direct simulation of a turbulent boundary layer up to R, = 1410. J . Fluid
Mech. 187, 61-98. TENNEKES, H. & LUMLEY, J. L. 1972 A First Course in Turbulence. MIT Press. TOWNSEND, A. A. 1956 The Structure of Turbulent Shear Flow. Cambridge University Press. TOWNSEND, A. A. 1961 Equilibrium layers and wall turbulence. J. Fluid Mech. 11, 97-120. WEI, T. & WILLMARTH, W. W. 1989 Reynolds number effects on the structure of a turbulent channel
flow. J . Fluid Mech. 204, 57-95.
1068-1073.
341-377.
23, 601-609.