Submerged explosives detection platforms using immunosensing technology
Upload
khangminh22Category
view
0download
0
Draft
Turbulence Measurements in Submerged Hydraulic Jumps
with Baffle Blocks
Journal: Canadian Journal of Civil Engineering
Manuscript ID cjce-2015-0480.R1
Manuscript Type: Article
Date Submitted by the Author: 04-Feb-2016
Complete List of Authors: Habibzadeh, Alireza; University of Alberta, Department of Civil and Environmental Engineering Loewen, Mark; University of Alberta, Department of Civil and Environmental Engineering Rajaratnam, N.; University of Alberta, Department of Civil and Environmental Engineering
Keyword: submerged hydraulic jump, Hydrotechnical Eng., fluid mech & hydrodyn < Hydrotechnical Eng., water supply-irrig;drain < Hydrotechnical Eng., hydraulic structures (HS) < Construction
https://mc06.manuscriptcentral.com/cjce-pubs
Canadian Journal of Civil Engineering
Draft
PAGEPAGEPAGEPAGE 1
Turbulence Measurements in Submerged Hydraulic Jumps with Baffle Blocks
Alireza Habibzadeh1, Mark R. Loewen
2, and Nallamuthu Rajaratnam
3
Abstract
Laboratory measurements of turbulence in submerged hydraulic jumps with blocks
downstream of a sluice gate are presented. As observed previously two flow regimes were
distinguished; the deflected surface jet (DSJ) and the reattaching wall jet (RWJ) regimes. In the
DSJ regime considerable turbulent kinetic energy (TKE) was generated just downstream of the
blocks and the rate of dissipation of TKE was found to be very high resulting in a rapid decay of
TKE. In the RWJ flow regime the magnitude of both the TKE and the dissipation rate were
considerably lower but because the TKE decayed more slowly higher levels of TKE persisted
further downstream. This study provides insights into the production and dissipation of
turbulence in submerged flows and helps to explain why a submerged jump with blocks with a
low submergence factor; i.e. the DSJ flow regime, is as effective as a free jump in dissipating
energy.
Keywords: Baffle block; submerged hydraulic jump; energy dissipation; turbulence.
1 Introduction
Hydraulic jumps are often used to dissipate energy downstream of hydraulic structures
such as spillways, sluice gates and drops. These structures are generally designed to operate with
1 Northwest Hydraulic Consultants, 9819-12 Avenue SW, Edmonton, AB, Canada T6X 0E3
2 Professor, Dept. of Civil and Environmental Engineering, University of Alberta, Edmonton AB, Canada T6G 2W2
3 Emeritus Professor, Dept. of Civil and Environmental Engineering, University of Alberta, Edmonton AB, Canada
T6G 2W2
Corresponding Author: Alireza Habibzadeh (Email: [email protected])
Page 1 of 33
https://mc06.manuscriptcentral.com/cjce-pubs
Canadian Journal of Civil Engineering
Draft
PAGEPAGEPAGEPAGE 2
a free jump, but when tailwater depths increase, the jump becomes submerged. In the past,
submerged hydraulic jumps were generally believed to be less efficient in dissipating energy and
thus less effective at reducing the downstream velocity compared to free jumps (Rajaratnam
1967). Recent studies have shown that the use of baffle walls (Wu and Rajaratnam 1995) or
baffle blocks (Habibzadeh et al. 2012 and 2014) significantly increases the amount of energy
dissipated in a submerged jump. However, these studies only included observations of mean
flow properties and time-averaged velocities and, as a result, the role baffle walls or blocks play
in the generation and subsequent dissipation of turbulent kinetic energy is poorly understood.
Furthermore, no information is available regarding the turbulence properties within a hydraulic
jump with baffle blocks.
The turbulent flow field in free hydraulic jumps has been studied by numerous researchers.
Rouse et al. (1958) were the first to conduct detailed measurements of turbulence in a hydraulic
jump. The structure of the turbulence in free hydraulic jumps was studied more recently using
Particle Image Velocimetry (PIV) (Lin et al. 2012), Laser Doppler Anemometer (LDA)
(Svendsen et al. 2000) and Acoustic Doppler Velocimeter (ADV) (Mignot and Cienfuegos 2011,
Liu et al. 2004). The flow downstream of a hydraulic jump has also been studied experimentally
to identify the required length for the transition to open channel flow (Zobeyer et al. 2010, Wu
and Rajaratnam 1996). These studies have shown that a length equal to ~10 times the subcritical
sequent depth is required for the momentum dominated flow in the jump to make the transition
to an open channel flow.
Long et al. (1990) were the first to study the turbulence properties in submerged hydraulic
jumps using an LDA. The decay of the turbulence intensities and Reynolds stress in the
streamwise direction was found to be more rapid than a wall jet. Dey and Sarkar (2008) studied
Page 2 of 33
https://mc06.manuscriptcentral.com/cjce-pubs
Canadian Journal of Civil Engineering
Draft
PAGEPAGEPAGEPAGE 3
the effect of bed roughness on the turbulence properties in a submerged jump, and observed that
roughness causes the turbulence intensities and Reynolds stress to decay more rapidly.
The mean flow in a submerged jump with a baffle wall was studied by Wu and Rajaratnam
(1995). They found that, depending on the flow properties and the baffle wall height and
location, the flow could either be deflected towards the water surface or reattach to the bed just
downstream of the baffle. These two flow patterns were called the deflected surface jet (DSJ)
and the reattaching wall jet (RWJ) flow regimes, respectively. The time-averaged flow
characteristics were studied and it was observed that in the DSJ flow regime, the maximum
longitudinal velocity component decayed more rapidly. As a result, they concluded that the DSJ
flow regime could potentially be used as an energy dissipator downstream of submerged outlets.
A study of the submerged hydraulic jump with 3D baffle blocks downstream of a sluice
gate was conducted by Habibzadeh et al. (2012). The flow patterns were studied and they found
that the flow classification proposed by Wu and Rajaratnam (1995) was also valid for submerged
jumps with baffle blocks. Therefore, following Wu and Rajaratnam (1995), they classified the
flow into two regimes, the deflected surface jet (DSJ) and reattaching wall jet (RWJ) regimes.
Habibzadeh et al. (2012) concluded that the DSJ regime dissipates energy as efficiently as the
corresponding free jump. In a second series of experiments Habibzadeh et al. (2014) investigated
the time-averaged properties of the two flow regimes in submerged hydraulic jumps with blocks.
The mean flow field, decay of the maximum longitudinal velocity and bulk energy dissipation
were compared and the DSJ regime was found to be more effective than the RWJ regime in
reducing the longitudinal component of the velocity and dissipating the excess energy of the
incoming flow.
Page 3 of 33
https://mc06.manuscriptcentral.com/cjce-pubs
Canadian Journal of Civil Engineering
Draft
PAGEPAGEPAGEPAGE 4
These studies conducted by Habibzadeh et al. (2012 and 2014) covered a wide range of
flow parameters but were limited to time-averaged quantities by design. This data could not then
be used to examine the spatial and temporal properties of the turbulence within the two flow
regimes. Such a data set; i.e. spatial and temporal time series of the turbulent flow properties
within a submerged jump with blocks, is, to the knowledge of the authors, missing from the
literature. Therefore, a new series of experiments was designed to investigate the properties of
the turbulence produced in submerged hydraulic jumps with blocks. Habibzadeh et al. (2012)
had previously studied the effects of the flow parameters (e.g. Froude number and block
arrangement) and therefore the current study is focused on the turbulence properties for a given
baffle block arrangement. In order to quantify the effect of the blocks on the turbulent flow field,
measurements were also made in the corresponding submerged jumps without baffle blocks. The
experiments were designed to cover practical ranges of the Froude number and submergence
factor, and to encompass both flow regimes. This required a longer duration of the turbulent
velocity sampling at each measurement point to ensure accurate turbulence data was acquired.
The turbulence properties of the flow field and the effects of the blocks on turbulence intensity,
Reynolds stress, kinetic energy, and energy dissipation rate were investigated in detail. The
effect of the blocks on the dissipation of turbulent kinetic energy was of particular interest. The
experimental data presented herein is the first set of data collected in this type of flow and fills
the gap in the available data on turbulence properties of submerged jumps with blocks.
Furthermore, the results provide an insight into the mechanism of energy dissipation and
elucidate why a flow regime with a smaller submergence factor; i.e. the DSJ regime, is more
efficient in dissipating energy by rapidly reducing the mean kinetic energy.
Page 4 of 33
https://mc06.manuscriptcentral.com/cjce-pubs
Canadian Journal of Civil Engineering
Draft
PAGEPAGEPAGEPAGE 5
2 Experimental Setup and Procedures
The experiments were conducted in a flume located in the Hydraulics Laboratory of the
Department of Civil and Environmental Engineering at the University of Alberta. A schematic
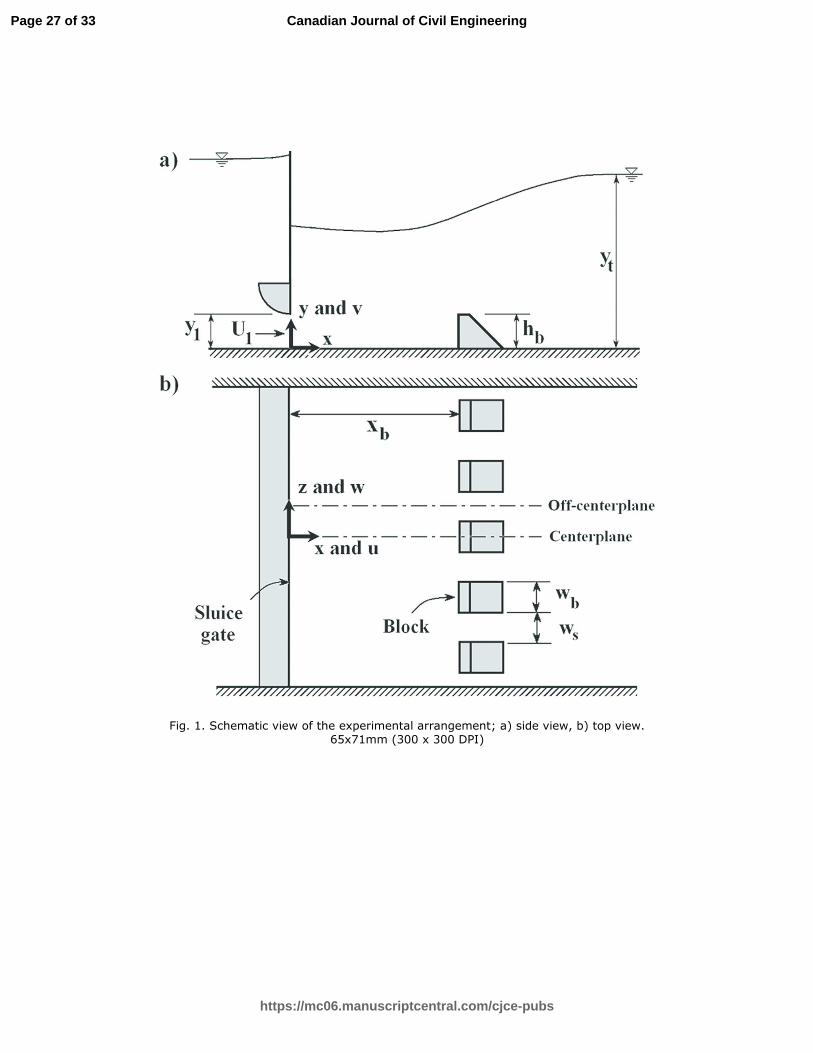
view of the experimental setup is shown in Fig. 1. Submerged hydraulic jumps were generated
using a sluice gate with a streamlined edge and an opening of y1=19.1 mm that produced a
supercritical stream with an approximately uniform velocity distribution that flowed into a
horizontal flume with a width of 0.467 m, height of 0.60 m, and length of 7.5 m. A more detailed
description of the experimental setup can be found in Habibzadeh et al. (2014).
Three Froude numbers of F1≈3.4, 5.3, and 6.9 were evaluated. Here, the Froude number at
the gate opening is defined as F1=U1/√gy1, where U1 is the velocity at the gate opening and g is
the gravitational acceleration. For each Froude number two submergence factors (S) were tested
such that both flow regimes; i.e. DSJ and RWJ regimes, were covered. Submergence factor S is
defined as S=(yt - y2)/y2; where yt is the tailwater depth and y2 is the subcritical sequent depth of
the corresponding free jump, computed from the Belanger momentum equation (Chow 1959).
Also, each flow condition was tested with baffle blocks (BB series) and without baffles blocks
(NB series). The experimental parameters for all runs are tabulated in Table 1. A discussion of
the estimated uncertainty in the measurements can be found in Habibzadeh et al. (2012).
For the BB series, five baffle blocks were fabricated using the design guidelines of the
USBR for the standard USBR Basin III (Peterka 1984). The height and width of the blocks were
hb=3.8 cm (hb/y1=2.0), and wb=4.5 cm, respectively and the space between the blocks (ws) was
equal to the block width; i.e. wb= ws (see Fig. 1). The blocks were mounted on the bed with their
upstream face located at xb=19.1 cm from the gate, which corresponds to xb/y1=10. The Reynolds
Page 5 of 33
https://mc06.manuscriptcentral.com/cjce-pubs
Canadian Journal of Civil Engineering
Draft
PAGEPAGEPAGEPAGE 6
number at the sluice gate (R1) was larger than 27,000 in all cases, where R1 was defined as
R1=U1y1/ν, and ν is the kinematic viscosity of water.
Velocity measurements were made using a Nortek Vectrino acoustic Doppler velocimeter
(ADV) at a sampling frequency of 100 Hz. The ADV has a cylindrical control volume with a
diameter of 6 mm and a height that is adjustable from 2 mm to 15 mm. The control volume is
located 5 cm below the transmitting probe. Velocities were measured in two longitudinal planes;
the centerplane at z=0 of the flume (passing through the center of the central block) and the off-
centerplane, the plane passing between the blocks at z=wb (see Fig. 1), and at eight longitudinal
stations measured from the gate, starting at x/y1=5 (upstream of the blocks) and ending at
x/y1=60. Velocity time series were sampled for a duration of five minutes based on a sensitivity
analysis that demonstrated that this duration was sufficient for accurate computation of the
turbulence parameters of interest (e.g. Reynolds stresses). Spikes were removed from the
sampled time series by the iteration-free method recently developed by Islam and Zhu (2013).
The time series at each point were, then, corrected for Doppler noise and filtering effects, using
the method developed by Romagnoli et al. (2012). Further details on data analysis can be found
in Habibzadeh (2013).
In the presence of a 3D obstacle, the flow field is disturbed such that the turbulence field is
inhomogeneous and highly anisotropic and estimates of the dissipation rate typically require the
measurement of a number of component gradients (Hussein and Martinuzzi, 1996). As a result, a
method based on dimensional analysis was used to estimate the rate of dissipation of turbulent
kinetic energy per unit mass (ε). This method has been developed for highly turbulent mixing
flows; e.g. mixing tanks (Wu and Patterson 1989). In this method, energy dissipation is related to
a characteristic turbulent velocity (Vt) and length scale (Lt) as follows,
Page 6 of 33
https://mc06.manuscriptcentral.com/cjce-pubs
Canadian Journal of Civil Engineering
Draft
PAGEPAGEPAGEPAGE 7
t
t
LV
A3
=ε (1)
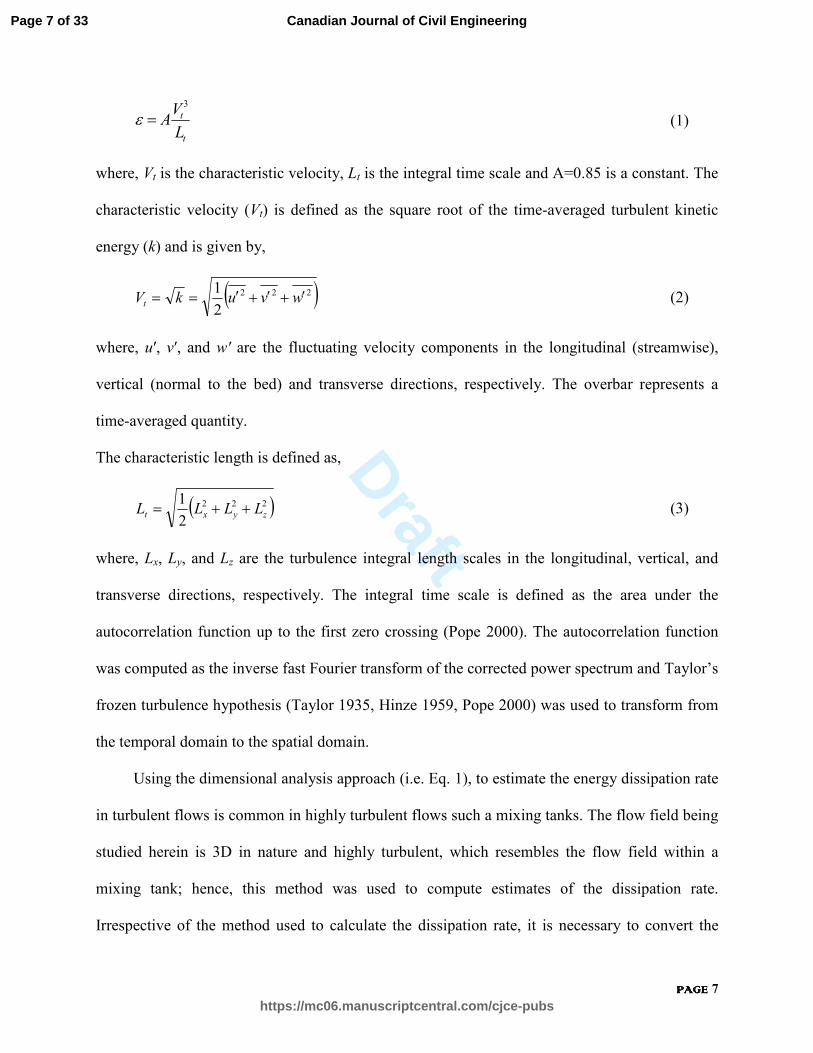
where, Vt is the characteristic velocity, Lt is the integral time scale and A=0.85 is a constant. The
characteristic velocity (Vt) is defined as the square root of the time-averaged turbulent kinetic
energy (k) and is given by,
( )222
2
1wvukVt ′+′+′== (2)
where, u′, v′, and w′ are the fluctuating velocity components in the longitudinal (streamwise),
vertical (normal to the bed) and transverse directions, respectively. The overbar represents a
time-averaged quantity.
The characteristic length is defined as,
( )222
2
1zyxt LLLL ++= (3)
where, Lx, Ly, and Lz are the turbulence integral length scales in the longitudinal, vertical, and
transverse directions, respectively. The integral time scale is defined as the area under the
autocorrelation function up to the first zero crossing (Pope 2000). The autocorrelation function
was computed as the inverse fast Fourier transform of the corrected power spectrum and Taylor’s
frozen turbulence hypothesis (Taylor 1935, Hinze 1959, Pope 2000) was used to transform from
the temporal domain to the spatial domain.
Using the dimensional analysis approach (i.e. Eq. 1), to estimate the energy dissipation rate
in turbulent flows is common in highly turbulent flows such a mixing tanks. The flow field being
studied herein is 3D in nature and highly turbulent, which resembles the flow field within a
mixing tank; hence, this method was used to compute estimates of the dissipation rate.
Irrespective of the method used to calculate the dissipation rate, it is necessary to convert the
Page 7 of 33
https://mc06.manuscriptcentral.com/cjce-pubs
Canadian Journal of Civil Engineering
Draft
PAGEPAGEPAGEPAGE 8
measurements from the time domain to the space domain, using Taylor’s frozen turbulence
hypothesis (Taylor 1935). This hypothesis requires that the turbulence intensity be small
compared with the mean flow velocity. That is, the advection velocity of turbulence needs to be
much greater than the velocity scale of the turbulence itself, such that the changes at a fixed point
are simply due to the passage of an unchanging pattern of turbulent motion past the fixed point
(Townsend 1976). As it will be shown in the following, this assumption is satisfied in this flow
field. That is, the ratio of the turbulent fluctuations to the mean velocity, is on average ~0.07.
Taylor’s frozen turbulence hypothesis has been widely used to approximate turbulence scales
when measurements were made using single-point measuring instruments such as ADV or LDA.
For example, the frozen turbulence hypothesis has been formerly applied in hydraulic jumps to
approximate eddy sizes and energy dissipation rates (e.g. Mignot and Cienfuegos 2011, Liu et al.
2004). Furthermore, the frozen turbulence hypothesis has also been used to estimate dissipation
in shear flows; e.g., boundary layer flow and fully developed pipe flows (Azad and Kassab,
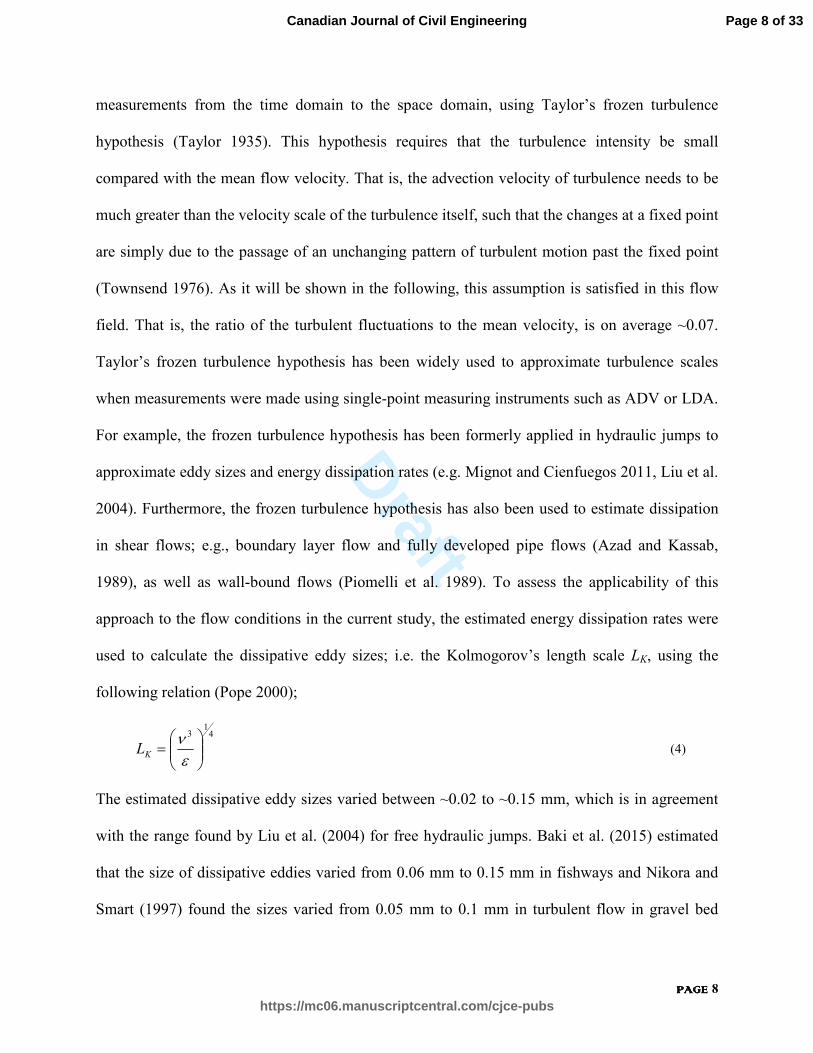
1989), as well as wall-bound flows (Piomelli et al. 1989). To assess the applicability of this
approach to the flow conditions in the current study, the estimated energy dissipation rates were
used to calculate the dissipative eddy sizes; i.e. the Kolmogorov’s length scale LK, using the
following relation (Pope 2000);
41
3
=
εν
KL (4)
The estimated dissipative eddy sizes varied between ~0.02 to ~0.15 mm, which is in agreement
with the range found by Liu et al. (2004) for free hydraulic jumps. Baki et al. (2015) estimated
that the size of dissipative eddies varied from 0.06 mm to 0.15 mm in fishways and Nikora and
Smart (1997) found the sizes varied from 0.05 mm to 0.1 mm in turbulent flow in gravel bed
Page 8 of 33
https://mc06.manuscriptcentral.com/cjce-pubs
Canadian Journal of Civil Engineering
Draft
PAGEPAGEPAGEPAGE 9
rivers. The fact that the estimated dissipative eddy sizes in this study are within the same range
as these previous studies confirms that the estimated dissipation rates are reasonably accurate.
The moving block bootstrap method with 1000 repetitions was used to evaluate the confidence
intervals of all turbulence parameters (Garcia et al. 2006, and Politis and White 2004).
3 Results and Discussion
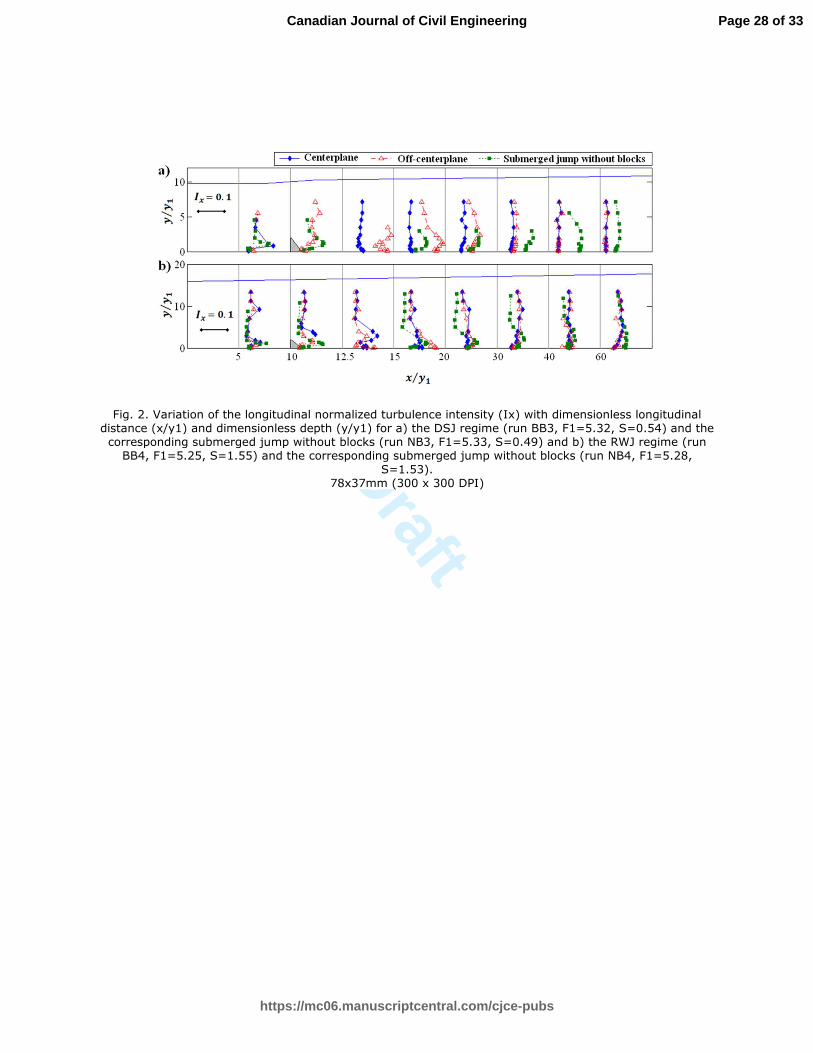
An example of vertical profiles of the longitudinal turbulence intensities in the centerplane
and off-centerplane and the corresponding submerged jump without baffles (NB series) are
shown in Figs. 2a and b for the DSJ and RWJ flow regimes, respectively. The longitudinal and
vertical turbulence intensities (Ix and Iy) are defined as,
1
2
1
2
,Uv
IUu
I yx
′=
′= (5)
where, x and y refer to the longitudinal (streamwise) and vertical (normal to bed) directions,
respectively (see Fig. 1). The random error associated with Ix was estimated to be less than 4%
based on the moving block bootstrap technique (error bars are not shown on the figure for
simplicity). At the blocks (x/y1=10), the measured time series just above the blocks in the
centerplane consisted of a large percentage of spikes (more than 60%). This can be attributed to
the large velocity gradients created by the deflected jet in this region. As a result, the
measurements at this station in the centerplane were excluded from subsequent analysis.
Furthermore, the presence of air bubbles upstream from the blocks (i.e., x/y1=5) near the water
surface (i.e., y/y1>5) in the DSJ regime resulted in poor quality data which were also excluded
from subsequent analysis. Also, the data sampled furthest from the bed for the NB series at
stations x/y1=15, 20, and 30 were not included because of the presence of spikes due to the shear
Page 9 of 33
https://mc06.manuscriptcentral.com/cjce-pubs
Canadian Journal of Civil Engineering
Draft
PAGEPAGEPAGEPAGE 10
layer formed at the lower edge of the recirculating surface roller. This is why the vertical profiles
at these stations are shorter.
It can be observed in Fig. 2a that the magnitude of Ix in the DSJ flow regime is
significantly influenced by the blocks. Ix values in the centerplane and off-centerplane are
considerably different just downstream of the blocks; i.e. for 12.5≤ x/y1≤25. At x/y1=15, Ix values
in the centerplane are smaller than those in the series without blocks; but values of Ix in the off-
centerplane are larger than the NB series. Moving downstream, the intensities in the off-
centerplane decrease and for x/y1≥30, the intensities are almost identical in the two planes. It is
observed in Fig. 2b that in the RWJ regime there are only minor differences between the Ix
intensities in the two planes, except near the blocks at 10≤x/y1≤15 and y/y1<5.0. In this region,
the intensities in the centerplane have a maximum at y/y1≈3.0, which coincides with the shear
interface created by flow separation at the leading top edge of the block. The location of the
maximum Ix behind bluff bodies such as spheres has been reported to occur at the shear interface
(e.g. Dey et al. 2011). It can be observed in Fig. 2 that the magnitude of Ix at the furthest station
downstream (i.e. x/y1= 60) is approximately 0.03 and 0.08 in the DSJ and RWJ flow regimes,
respectively. This indicates that the DSJ regime is much more effective at reducing the
turbulence intensity compared to the RWJ regime. It should be noted, that these turbulence
intensities are higher than the average values observed in open channel flows. The turbulence
intensity, scaled using the local depth-averaged velocity, in a fully-developed turbulent open
channel flow is typically ~5% (Nakagawa and Nezu, 1993), which corresponds to Ix≈ 0.005
when it is scaled using the velocity at the gate as it is here. Urban et al. (2005) reported that
downstream of a stilling basin the turbulence decays to open channel flow levels in a distance of
~50 times the tailwater depth, which corresponds to x/y1 > 200.
Page 10 of 33
https://mc06.manuscriptcentral.com/cjce-pubs
Canadian Journal of Civil Engineering
Draft
PAGEPAGEPAGEPAGE 11
A comparison of the profiles in Figs. 2a and 2b, shows that, when compared to the
submerged jumps without blocks, larger turbulence intensities are generated by the blocks in the
DSJ regime. However, turbulence intensities in the DSJ regime decay considerably faster than
the RWJ regime. This is clearly seen at the furthest downstream station, where the turbulence
intensities in the DSJ regime are considerably smaller than the submerged jump without blocks
(Fig. 2a); while the turbulence intensities at this station in the RWJ regime have comparable
magnitudes to those of submerged jumps without blocks (Fig. 2b). Typical profiles of the vertical
turbulence intensities Iy (not shown here), followed a similar trend to that of the longitudinal
turbulence intensities Ix.
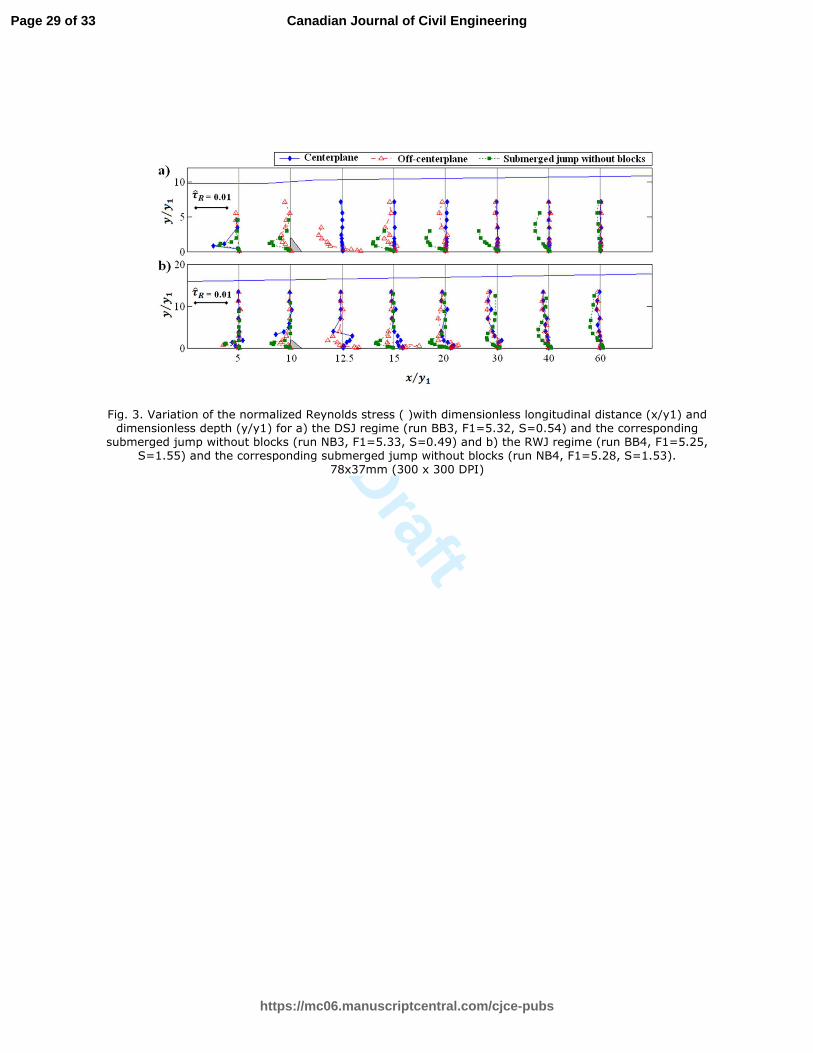
Vertical profiles of the normalized Reynolds stresses ( Rτ̂ ), defined as,
2
1
ˆU
vuR
′′−=τ (6)
are plotted in Figs. 3a and b for the DSJ and RWJ regimes, respectively. Also plotted for
comparison in these figures are profiles for the corresponding submerged jumps without blocks
(NB series). It can be observed in Figs. 3a and b that three profiles of Rτ̂ upstream of the blocks
at x/y1=5, are all similar with a peak at the shear interface which is typical in submerged jumps
(Dey and Sarkar 2008, Long et al. 1990). Comparing, Figs. 3a and b, it is clear that the largest
difference between the magnitudes of the Reynolds stress in the centerplane and off-centerplane
of both flow regimes occurs just downstream of the blocks at x/y1=12.5. The difference is more
pronounced in the DSJ regime because of the significant shear interface generated between these
two planes in this regime. In the RWJ regime, the region of high Reynolds stress; i.e. x/y1=12.5
and 15 in the centerplane, coincides with the boundary of the eddy formed downstream of the
blocks due to flow separation. Further downstream, at x/y1≥15, the location of the maximum
Page 11 of 33
https://mc06.manuscriptcentral.com/cjce-pubs
Canadian Journal of Civil Engineering

Draft
PAGEPAGEPAGEPAGE 12
Reynolds stress in both planes in the RWJ regime moves towards the bed due to reattachment of
the flow, and the peak in the Reynolds stress curve gradually diminishes at x/y1=20 to 30. This
observation is consistent with the previous findings (Habibzadeh et al. 2013, and Castro and
Robins 1977).
The turbulent kinetic energy (k) is defined as the mean kinetic energy per unit mass in the
fluctuating velocity field (Pope 2000). The magnitude of k is a measure of turbulence intensity
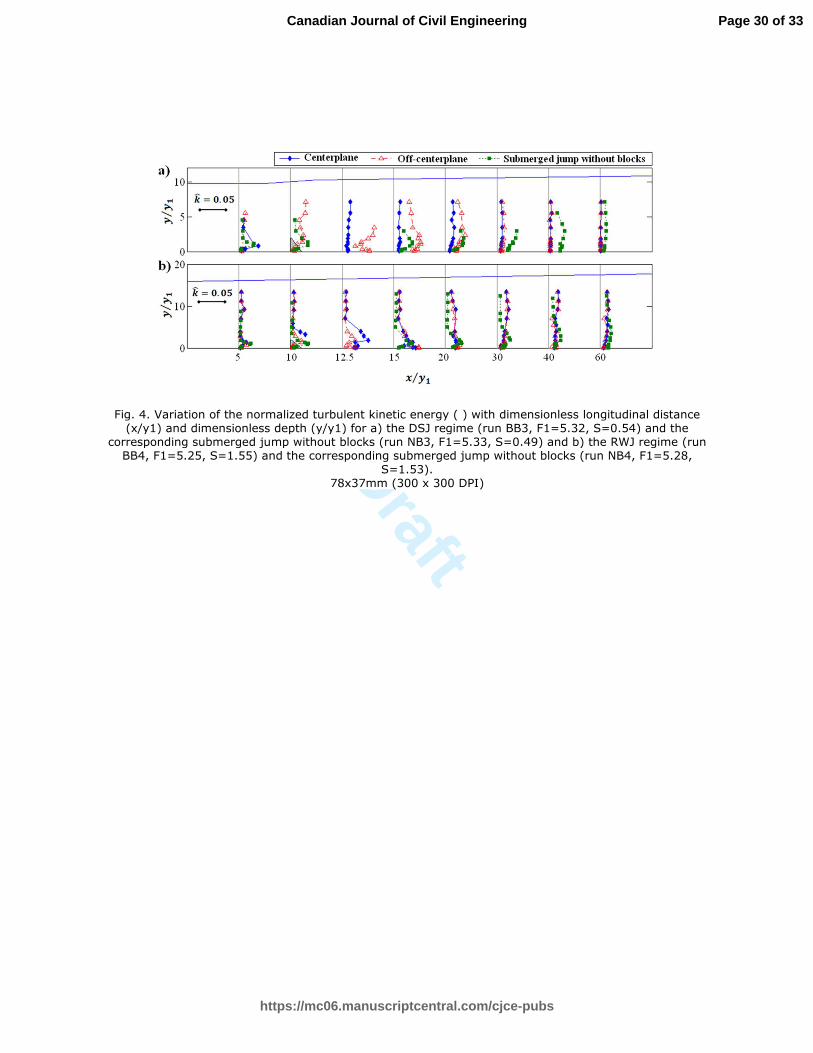
and decreases in its magnitude are an indication of energy dissipation. In Fig. 4, typical profiles
of the normalized time-averaged turbulent kinetic energy ( k̂ ) are plotted for the two flow
regimes and the corresponding submerged jump without blocks. Here, k̂ is given by,
( )2
121
222
21
2
121
ˆU
wvu
Uk
k′+′+′
== (7)
In Fig. 4a, the largest magnitudes of k̂ are observed in the DSJ regime downstream of the blocks
in the off-centerplane where the magnitude of k̂ in the off-centerplane at x/y1=12.5 and 15.0 is
approximately four times larger than in the centerplane. Large magnitudes of k̂ indicate a high
rate of conversion of mean flow kinetic energy to turbulent kinetic energy in the off-centerplane
of the DSJ regime. A peak in the value of k̂ in the RWJ regime is observed in the centerplane
just behind the blocks at x/y1=12.5, which coincides with the shear interface located at the
boundary of the standing eddy behind the block (see Fig. 4b). The magnitudes of k̂ in the RWJ
regime are, in general, smaller than those in the DSJ regime, representing the lower rate of decay
of the mean kinetic energy in the former flow regime, as reported in a previous study
(Habibzadeh et al. 2014).
Comparing Figs. 2 to 4, it is evident that the turbulence characteristics are significantly
different in the centerplane and off-centerplane of the DSJ flow regime. Downstream of the
Page 12 of 33
https://mc06.manuscriptcentral.com/cjce-pubs
Canadian Journal of Civil Engineering
Draft
PAGEPAGEPAGEPAGE 13
blocks, the turbulence intensities and turbulent kinetic energy are smaller in the centerplane, and
larger in the off-centerplane, compared to the submerged jump without blocks. But, this
difference rapidly diminishes and for x/y1≥30, the magnitudes in the two planes are less than
those in the submerged jump without blocks. This rapid recovery of the flow is similar to that
observed in wall-wakes behind spherical obstacles (Dey et al. 2011). In the RWJ flow regime,
however, the difference between the two planes is only significant (i.e. more than 5%) in the
vicinity of the blocks, that is, for y/y1≤4 at 10≤x/y1≤20. Therefore, the blocks have a much larger
impact on the flow field in the DSJ regime compared to the RWJ. In the DSJ regime more shear-
induced mixing occurs and therefore significantly more turbulence is generated.
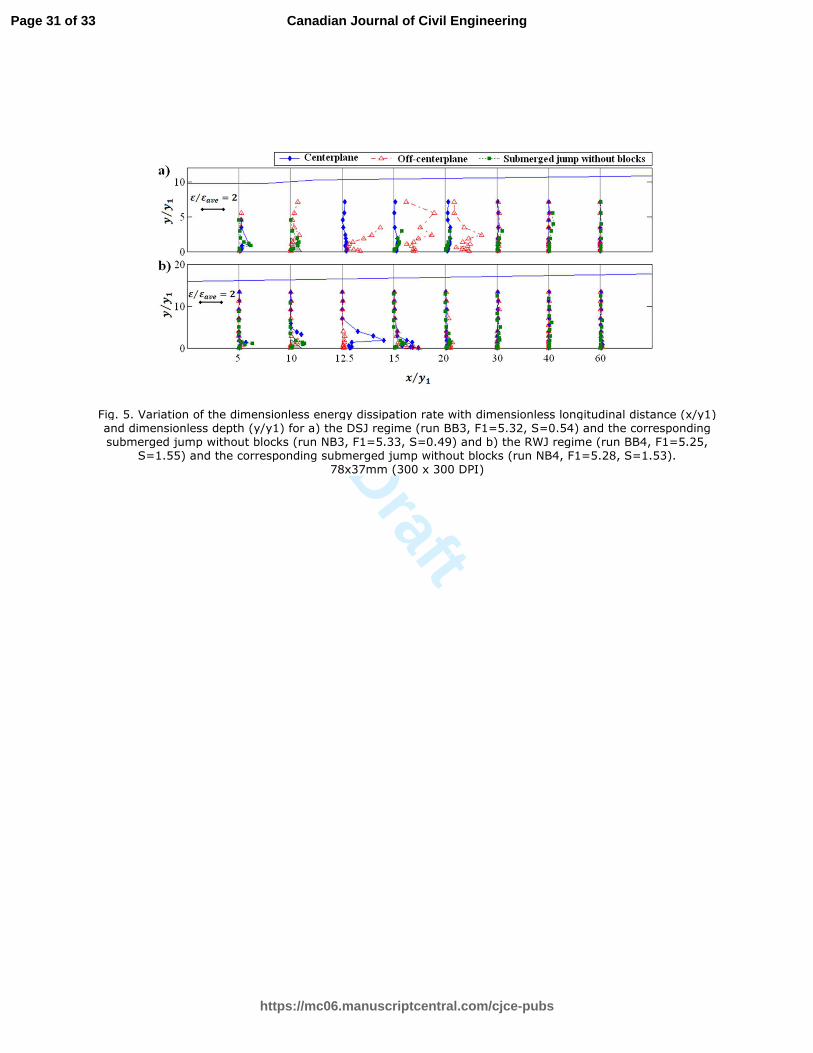
Vertical profiles of the dimensionless turbulent kinetic energy dissipation rate per unit
mass, ε/εave, are plotted in Fig. 5. The average dissipation rate per unit mass of the corresponding
free jump εave following Liu et al. (2004) is given by,
( ) 2/21 yyBLhgQ
jave +
∆=ρ
ρε (8)
where, Q is the discharge, ∆h is the head loss in the free jump, Lj is the length of the free jump
assumed to be equal to 6y2 following Peterka (1984), and B=0.467 m is the width of the channel.
The ratio ε/εave represents the relative magnitude of the local energy dissipation rate per unit mass
compared to the volumetric average of the energy dissipation in the corresponding free jump. In
Fig. 5, it can be seen that the maximum energy dissipation rate in the DSJ regime, ε/εave≈4,
occurs in the off-centerplane at x/y1=12.5 and 15. Also, at these stations, the energy dissipation
rates are approximately 5 to 6 times larger than those in the corresponding NB series. In the RWJ
regime, however, the maximum value of ε/εave≈4 occurs at only one point, in the centerplane just
downstream of the blocks at x/y1=12.5 at a height of y/y1≈2.0, which coincides with the upper
boundary of the reattaching jet. At other locations, the energy dissipation rate in the RWJ regime
Page 13 of 33
https://mc06.manuscriptcentral.com/cjce-pubs
Canadian Journal of Civil Engineering
Draft
PAGEPAGEPAGEPAGE 14
is comparable to the NB series and negligible compared to the corresponding free jump.
Comparing the two flow regimes in Figs. 5a and b, it is clear that, in the DSJ flow regime, the
maximum dissipation occurs over a greater vertical extent in the off-centerplane and persists for
a longer distance downstream compared to the RWJ regime.
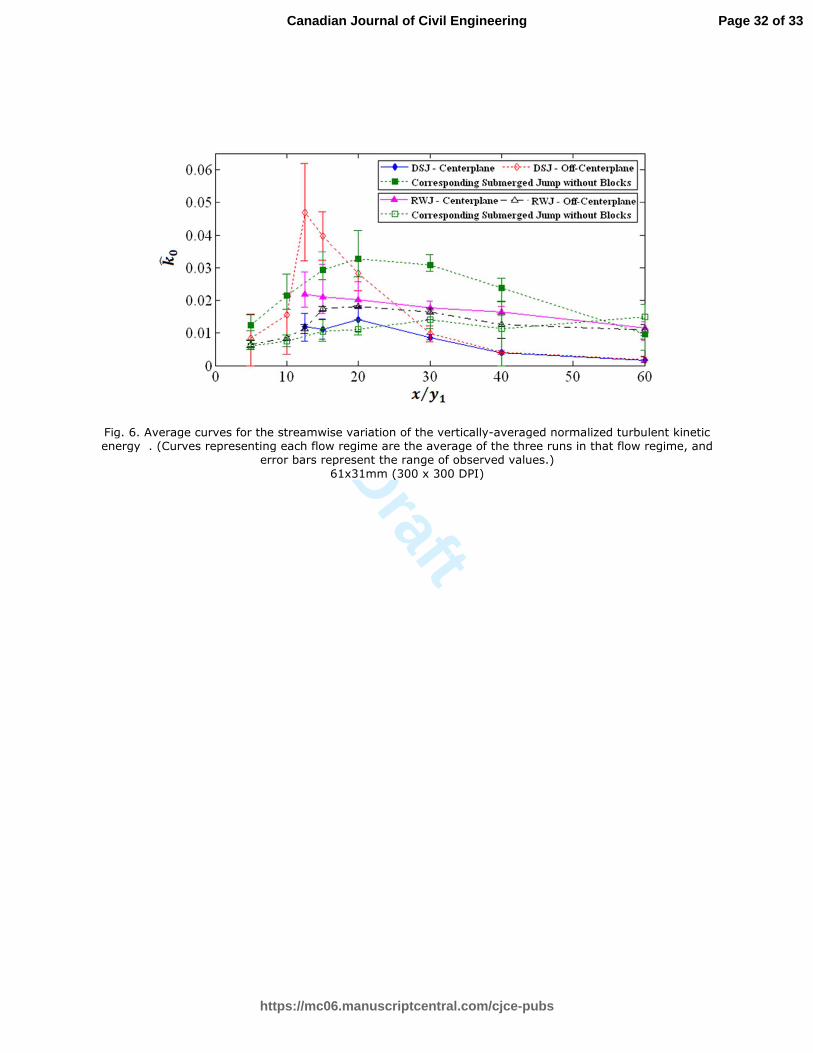
The normalized vertically-averaged turbulent kinetic energy 0k̂ is defined as,
= ∫
0
00
2
1210
11ˆ ydyk
yUk (9)
where y0 is the height of the highest point at which velocity measurements were conducted. It
should be noted that the “vertically-averaged” magnitude herein refers to the representative
magnitude averaged over the depth which was covered in the measurements and not the total
depth of the flow. The average longitudinal variations of 0k̂ are plotted in Fig. 6 for the DSJ and
RWJ flow regimes. Each curve is the result of averaging over the three experimental runs for
each flow regime. The error bars in this figure represent the range of observed values at each
location. In Fig. 6 the magnitudes of 0k̂ in the centerplane of the DSJ regime increase slightly at
x/y1≈20 and then steadily decrease moving downstream. For 12.5≤x/y1≤30, the magnitudes of 0k̂
in the centerplane of the DSJ regime are, on average, 30% to 50% of those in the corresponding
submerged jump without blocks. The peak of 0k̂ in the off-centerplane of the DSJ regime occurs
at x/y1=12.5, with a magnitude approximately twice of that in the corresponding submerged jump
without blocks. This is followed by a rapid reduction for 12.5≤x/y1≤30 and a more gradual
decreasing trend for x/y1>30. For x/y1<30, 0k̂ magnitudes are considerably different in the two
planes of the DSJ flow regime but this difference decreases moving in the streamwise direction.
The maximum difference between the two planes occurs at x/y1=12.5, where 0k̂ is approximately
Page 14 of 33
https://mc06.manuscriptcentral.com/cjce-pubs
Canadian Journal of Civil Engineering
Draft
PAGEPAGEPAGEPAGE 15
five times larger in the off-centerplane compared to the centerplane. For 30 ≤ x/y1 ≤ 60 the
values of 0k̂ in the two planes are approximately equal and their magnitudes are approximately
20% of those in the corresponding submerged jump without blocks.
The values of 0k̂ in the centerplane of the RWJ regime decrease gradually downstream of
the blocks in Fig. 6. The values in the off-centerplane, however, first increase to a peak at
x/y1≈20, and then gradually decrease. In both planes of the RWJ regime, the values of 0k̂ are
larger than those of the corresponding submerged jump without blocks (except at x/y1=60). At
x/y1=60, 0k̂ magnitudes in the two planes of the RWJ regime are ~0.015, which is comparable to
the value observed in the submerged jump without blocks and approximately nine times larger
than the values observed in both planes of the DSJ regime.
The region 12.5≤x/y1≤20, where large values of 0k̂ are observed in the off-centerplane of
the DSJ regime, plays an important role in extracting kinetic energy from the mean flow and
converting it into turbulent kinetic energy. It is within this reach that a rapid reduction of the
longitudinal velocity is observed; i.e. mean kinetic energy is significantly reduced (see
Habibzadeh et al. 2014, Fig. 13). Also, the large difference in 0k̂ values in the two planes of the
DSJ regime indicates the presence of a large shear interface in the off-centerplane which creates
intense turbulent mixing. As a result, in a short distance; i.e. 12.5≤x/y1≤30, the turbulent kinetic
energy decays and reaches the same value in the two planes which is appreciably less than the
corresponding values in the RWJ regime and the submerged jump without blocks; e.g. 0k̂
magnitudes at x/y1=40 in the DSJ regime are approximately four and seven times smaller than
the RWJ and submerged jump without blocks, respectively. This indicates that kinetic energy of
Page 15 of 33
https://mc06.manuscriptcentral.com/cjce-pubs
Canadian Journal of Civil Engineering
Draft
PAGEPAGEPAGEPAGE 16
the mean flow is being converted to turbulent kinetic energy in the region 12.5≤x/y1≤30 in the
off-centerplane of the DSJ regime.
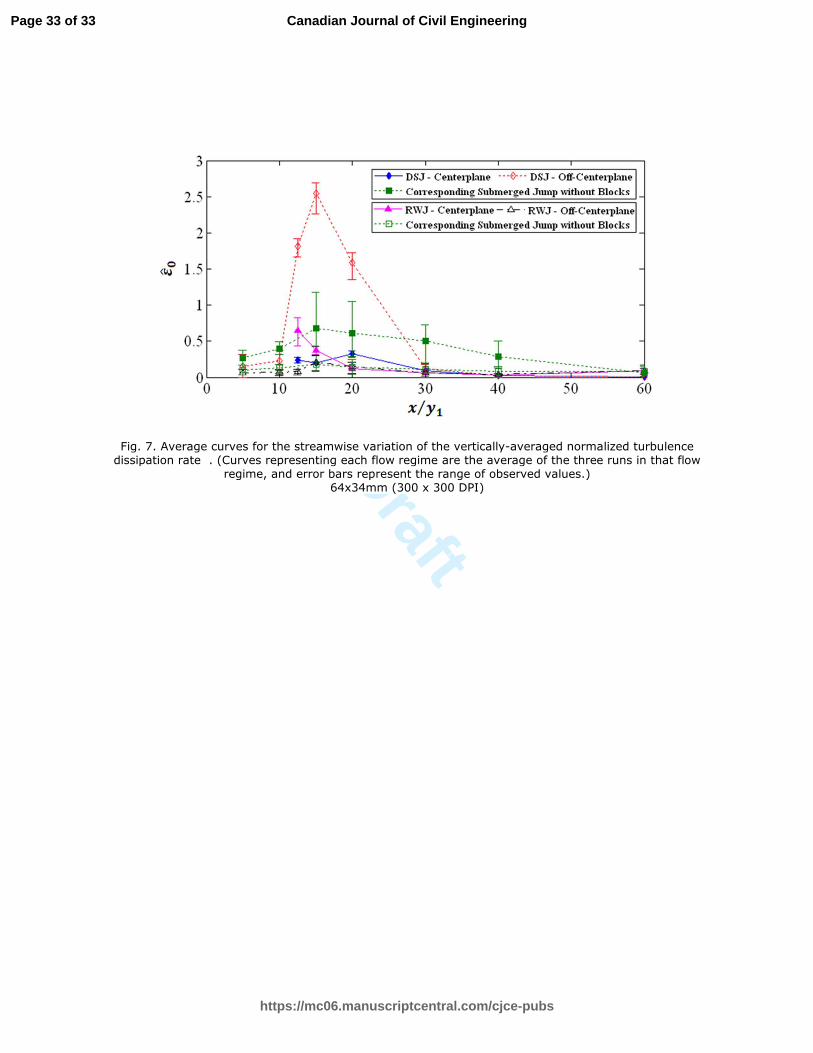
The dimensionless vertically-averaged turbulent kinetic energy dissipation rate per unit
mass 0̂ε is defined as,
= ∫
0
00
0
11ˆ
y
ave
dyy
εε
ε (10)
This parameter is the average energy dissipation rate per unit mass at each station with respect to
the average value of the energy dissipation rate in the corresponding free jump. Average curves
of 0̂ε are presented in Fig. 7 for the DSJ and RWJ regimes and the corresponding submerged
jump without blocks. The vertical average was calculated in the same manner as described
previously and the error bars in Fig. 7 represent the range of values at each point. The
magnitudes of 0̂ε in the centerplane of the DSJ flow regime are seen to be relatively small in
Fig. 7 ( 0̂ε <0.33) at all locations. In the off-centerplane, however, the magnitude of 0̂ε is
significantly larger just downstream of the blocks; for i.e. 12.5≤x/y1≤20, with a peak value of
0̂ε ≈2.5 at x/y1=15. The dissipation rate in the corresponding submerged jump without blocks
reaches a maximum value of 0̂ε ≈0.68 at x/y1=15 and then gradually decreases downstream. In the
range 10≤x/y1≤20, the dissipation rate in the off-centerplane of the DSJ regime is significantly
larger compared to the corresponding submerged jump without blocks but for x/y1>30 it is
smaller. Fig. 7 also shows that the dissipation rate in the off-centerplane of the RWJ regime and
the corresponding submerged jump without blocks follow a similar trend with magnitudes of 0̂ε
not exceeding 0.2. In the centerplane, the values of 0̂ε are larger, 0.65 and 0.38 at x/y1=12.5 and
15, respectively and this coincides approximately with the location of the eddy behind the
Page 16 of 33
https://mc06.manuscriptcentral.com/cjce-pubs
Canadian Journal of Civil Engineering
Draft
PAGEPAGEPAGEPAGE 17
blocks. An interesting feature in Fig. 7 is that the energy dissipation rates are larger than the
corresponding free jump; i.e. 10̂ >ε , only in the off-centerplane of the DSJ regime within the
region 12.5≤x/y1≤20. That is, within this reach, the local energy dissipation rate is 1.5 to 2.5
times larger than the average dissipation rate of the corresponding free jump.
The difference between the two flow regimes can be explained by comparing the
turbulence parameters downstream of the blocks; i.e. x/y1>10. In the DSJ flow regime, the
longitudinal and vertical turbulence intensities (Ix and Iy) are, on average, 50% larger in the off-
centerplane compared to the centerplane for 12.5≤x/y1≤20. This difference between the two
planes is because of a shear interface located between the two which leads to intense mixing.
The shear interface is caused by the fact that in the centerplane, the flow deflects sharply
upwards and in the off-centerplane it deflects at a smaller angle as reported by Habibzadeh et al.
(2014). This leads to large mean velocity differences between the two planes hence a shear layer
or interface. As a result of the intense mixing associated with this shear interface, the difference
in the intensities in the two planes becomes negligible in a short distance downstream. In the
RWJ flow regime, however, the turbulence intensities are of the same order in the two planes and
comparable to the submerged jump without blocks even at the furthest downstream station at
x/y1=60. This is due to the fact that no large shear interface occurs as the extent of the flow field
which is disturbed by the blocks in the RWJ regime is limited to approximately the size of the
eddy behind the blocks. This clearly demonstrates that in the DSJ flow regime the blocks are
much more effective at generating turbulence compared to the RWJ regime. This is also evident
from the fact that in the DSJ flow regime considerably larger turbulent kinetic energy levels are
observed just downstream of the blocks. This increase in turbulent kinetic energy is associated
with extraction of energy from the mean flow, as was reported by Habibzadeh et al. (2014) who
Page 17 of 33
https://mc06.manuscriptcentral.com/cjce-pubs
Canadian Journal of Civil Engineering
Draft
PAGEPAGEPAGEPAGE 18
observed a rapid reduction of the mean kinetic energy. The production of large amounts of
turbulent kinetic energy then leads to significant energy dissipation rates just downstream of the
blocks. The kinetic energy of the mean flow supplies energy to the fluctuating flow components
in the form of the turbulent kinetic energy (Pope 2000). That is, if the turbulent kinetic energy
increases dramatically, the mean kinetic energy is expected to decrease and if the longitudinal
velocity component is the dominant velocity component, then, this velocity component (and the
mean kinetic energy) would be expected to decrease significantly as was observed by
Habibzadeh et al. (2014).
4 Summary and Conclusions
This study is the first attempt to experimentally evaluate turbulence properties of the flow
field within submerged hydraulic jumps with baffle blocks and to compare them with the
corresponding submerged jump without blocks. The two flow regimes of submerged hydraulic
jumps with baffle blocks; i.e. deflected surface jet (DSJ) and reattaching wall jet (RWJ), were
examined at three different Froude numbers ranging from approximately 3.3 to 7.0. It was
observed that the turbulence in both the centerplane and off-centerplane was influenced by the
blocks in both flow regimes. The turbulence intensities, Reynolds stress and turbulent kinetic
energy gradually decreased with distance downstream of the blocks in the centerplane of the
DSJ. The turbulent kinetic energy in the off-centerplane of the DSJ regime reached its peak value
just downstream of the blocks and then rapidly decreased with distance. The largest energy
dissipation rates (up to ~2.5 times larger than the average dissipation rate in the corresponding
free jump) were observed in the off-centerplane of the DSJ regime and this coincided with a
rapid reduction of the turbulent kinetic energy.
Page 18 of 33
https://mc06.manuscriptcentral.com/cjce-pubs
Canadian Journal of Civil Engineering
Draft
PAGEPAGEPAGEPAGE 19
The interaction of mean velocity gradients, created by the deflected flow in the DSJ
regime, with the large Reynolds stresses, observed in the off-centerplane, resulted in the
generation of significant amounts of turbulent kinetic energy via shear production. Generation of
turbulent kinetic energy by shear production coincides with a decrease in the mean kinetic
energy because turbulent shear production extracts energy from the mean flow. It follows then
that if the transport and buoyant production terms in the turbulent kinetic energy equation are
negligible compared to the production and dissipation terms, then large shear production of
turbulent kinetic energy will be counter-balanced by large dissipation rates (Pope 2000). This
process defined the patterns observed downstream of the blocks in the Reynolds stress, turbulent
kinetic energy and the dissipation rate in the off-centerplane of the DSJ regime.
In the DSJ regime the presence of the baffle blocks resulted in the conversion of large
quantities of mean flow energy into turbulent kinetic energy that is then dissipated a short
distance downstream. As a result, the turbulence intensity and kinetic energy in the DSJ regime
are reduced significantly (compared to their values just downstream of the blocks) within a short
distance. In the RWJ regime, these processes occur but because the flow is not deflected sharply
upward the mean velocity gradients and Reynolds stresses are smaller in magnitude resulting in
less shear production and smaller rates of dissipation of turbulent kinetic energy.
In the absence of blocks, very large Reynolds stresses occur near the bed in the shear layer
created by the wall-jet and these are associated with the production of significant turbulent
kinetic energy and its subsequent dissipation. However, in this case the high turbulence levels
persist much further downstream compared to the DSJ regime. It was found that turbulence
intensities and turbulent kinetic energy in the DSJ regime are significantly reduced within a
length approximately equal to 30 times the incoming supercritical flow depth which is
Page 19 of 33
https://mc06.manuscriptcentral.com/cjce-pubs
Canadian Journal of Civil Engineering
Draft
PAGEPAGEPAGEPAGE 20
comparable to the length of a USBR Type III stilling basin. The turbulence intensities beyond
downstream of this location in the DSJ regime are still larger than those of a fully-developed
open channel flow; this, however, is also the case in free jump stilling basins. Somewhat elevated
turbulence levels in the flow just downstream of a stilling basin is accepted in the design, so that
a shorter and more economic stilling basin can be used. To prevent scouring by the remaining
turbulence in the flow, the river bed just downstream of the stilling basin is typically protected
using bed armor (e.g. riprap). The experimental data presented in this study provides insights
into the processes responsible for the production and dissipation of turbulence in submerged
flows and help to explain why a submerged jump with blocks with a low submergence factor; i.e.
the DSJ flow regime, is as effective as a free jump in dissipating energy.
References
Azad, R. S., and Kassab, S. Z. 1989. “New method of obtaining dissipation.” Exp. Fluids, Vol. 7,
pp. 81–87.
Baki, A.B.M., Zhu, D.Z., and Rajaratnam, N. 2015. “Turbulence Characteristics in a Rock-
Ramp-Type Fish Pass.” ASCE J. Hydr. Engrg., 141(2), Paper 04014075.
Castro, I. P., and Robins, A. G. 1977. “The flow around a surface-mounted cube in uniform and
turbulent streams.” J. Fluid Mech., 79(2): 307-335.
Chow, V. 1959. Open-channel hydraulics. McGraw-Hill, New York.
Dey, S., and Sarkar, A. 2008. “Characteristics of Turbulent Flow in Submerged Jumps on Rough
Beds.” ASCE J. Engrg. Mech., 134(1): 49-59.
Page 20 of 33
https://mc06.manuscriptcentral.com/cjce-pubs
Canadian Journal of Civil Engineering
Draft
PAGEPAGEPAGEPAGE 21
Dey, S., Sarkar, S., Bose, S. K., Tait, S., and Castro-Orgaz, O. 2011. “Wall-Wake Flows
Downstream of a Sphere Placed on a Plane Rough Wall.” ASCE Journal of Hydraulic
Engineering, 137(10): 1173-1189.
Garcia, C. M., Jackson, P. R., and Garcia, M. H. 2006. “Confidence intervals in the
determination of turbulence parameters.” Experiments in Fluids, 40, pp. 514-522.
Habibzadeh, A. 2013. “Experimental Study of Submerged Hydraulic Jumps with Baffle Blocks.”
PhD thesis. Department of Civil and Environmental Engineering, University of Alberta,
Edmonton, AB, Canada.
Habibzadeh, A., Loewen, M. R., and Rajaratnam, N. 2012. “Performance of Baffle Blocks in
Submerged Hydraulic Jumps.” ASCE J. Hydr. Engrg., 138(10): 902-908.
Habibzadeh, A., Loewen, M. R., and Rajaratnam, N. 2014. “Mean Flow in a Submerged
Hydraulic Jump with Baffle Blocks.” ASCE J. Engrg. Mech., 140(5), 04014020.
Hinze, J.O. Turbulence, An Introduction to Its Mechanism and Theory, McGraw-Hill Book
Company, New York, 1959.
Hussein, H. J., and Martinuzzi, R. J. 1996. “Energy balance for turbulent flow around a surface
mounted cube placed in a channel.” AIP Phys. Fluids 8(3): 764-780.
Islam, M. and Zhu, D. 2013. ”Kernel Density–Based Algorithm for Despiking ADV Data.” J.
Hydraul. Eng., 139(7): 785–793.
Lin, C., Hsieh, S. C., Lin, I. J., Chang, K. A., and Raikar, R. V. 2012. “Flow property and self-
similarity in steady hydraulic jumps.” Exp. Fluids, 53, pp. 1591-1616.
Liu, M., Zhu, D. Z., and Rajaratnam, N. 2004. “Turbulence structure of hydraulic jumps of low
Froude numbers.” ASCE Journal of Hydraulic Engineering, 130(6): 511-520.
Page 21 of 33
https://mc06.manuscriptcentral.com/cjce-pubs
Canadian Journal of Civil Engineering
Draft
PAGEPAGEPAGEPAGE 22
Long, D., Steffler, P. M., and Rajaratnam, N. 1990. “LDA study of flow structure in submerged
hydraulic jump.” J. Hydraul. Res., 28(4): 437-460.
Mignot, E., and Cienfuegos, R. 2011. “Spatial evolution of turbulence characteristics in weak
hydraulic jumps.” J. Hydraul. Res., 49(2): 222-230.
Nakagawa, H., and Nezu, I. 1993. Turbulence in Open Channel Flows. IAHR Monograph Series,
Taylor & Francis.
Nikora, V. I., and Smart, G. M. 1997. “Turbulence characteristics of New Zealand gravel-bed
rivers.” J. Hydraul. Eng., 123(9): 764–773.
Peterka, A. J. 1984. "Hydraulic design of stilling basins and energy dissipators." Engineering
Monograph No. 25, 8th Ed. US Bureau of Reclamation, Denver, USA.
Piomelli, U., Balint, J.L., and Wallace, J. M., 1989. “On the validity of Taylor's hypothesis for
wall-bounded flows.”, Phys. Fluids, A1 (3): 609-611.
Politis, D. N., and White, H. 2004. “Automatic Block-Length Selection for the Dependent
Bootstrap.” Econometric Reviews, 23(1): 53-70.
Pope, S. 2000, Turbulent Flows, Cambridge University Press, New York, USA
Rajaratnam, N. 1967. "Hydraulic Jumps." Advances in Hydroscience Vol. 4, Academic Press
Inc., 197-280.
Romagnoli, M., Garcia, C. M., and Lopardo, R. A. 2012. “Signal processing technique and
uncertainty analysis of ADV turbulence measurements on free hydraulic jumps.” ASCE Journal
of Hydraulic Engineering, 138(4): 353-357.
Rouse, H., Siago, T. T., and Nagaratnam, S. 1958. “Turbulence characteristics of the hydraulic
jump.” J. Hyd. Div., 84(HY1), 1-30.
Page 22 of 33
https://mc06.manuscriptcentral.com/cjce-pubs
Canadian Journal of Civil Engineering
Draft
PAGEPAGEPAGEPAGE 23
Svendsen, IB A., Veeramony, J., Bakunin, J., and Kirby, J. T. 2000. “The flow in weak turbulent
hydraulic jumps.” J. Fluid Mech., Vol. 418: 25-57.
Taylor, G. I. 1935. “Statistical Theory of Turbulence, Part I.” Proceedings of the Royal Society
of London. Series A, Mathematical and Physical Sciences, 151(873): 421-444.
Townsend, A. A., 1976. The Structure of Turbulent Shear Flow, 2nd
Edition, Cambridge
University Press, New York, USA.
Urban. A. L., Wilhelms, S. C., and Gulliver, J. S. 2005. “Decay of turbulence downstream of a
stilling basin.” J. Hydr. Engrg., 131(9): 825-829.
Wu, H., and Patterson, G. K. 1989. “Laser-Doppler measurements of turbulent-flow parameters
in a stirred mixer.” Chemical Engineering Science, 44(10): 2207-2221.
Wu, S., and Rajaratnam, N. 1995. "Effect of Baffles on Submerged Flows." J. Hydr. Engrg.,
121(9): 644-652.
Wu, S., and Rajaratnam, N. 1996. "Transition from hydraulic jump to open channel flow.” J.
Hydr. Engrg., 122(9): 526-528.
Zobeyer, A.T.M.H., Jahan, N., Islam, Z., Singh, G., and Rajaratnam, N. 2010. “Turbulence
characteristics of the transition region from hydraulic jump to open channel flow.” J. Hydraul.
Res., 48(3): 395-399.
Page 23 of 33
https://mc06.manuscriptcentral.com/cjce-pubs
Canadian Journal of Civil Engineering
Draft
PAGEPAGEPAGEPAGE 1
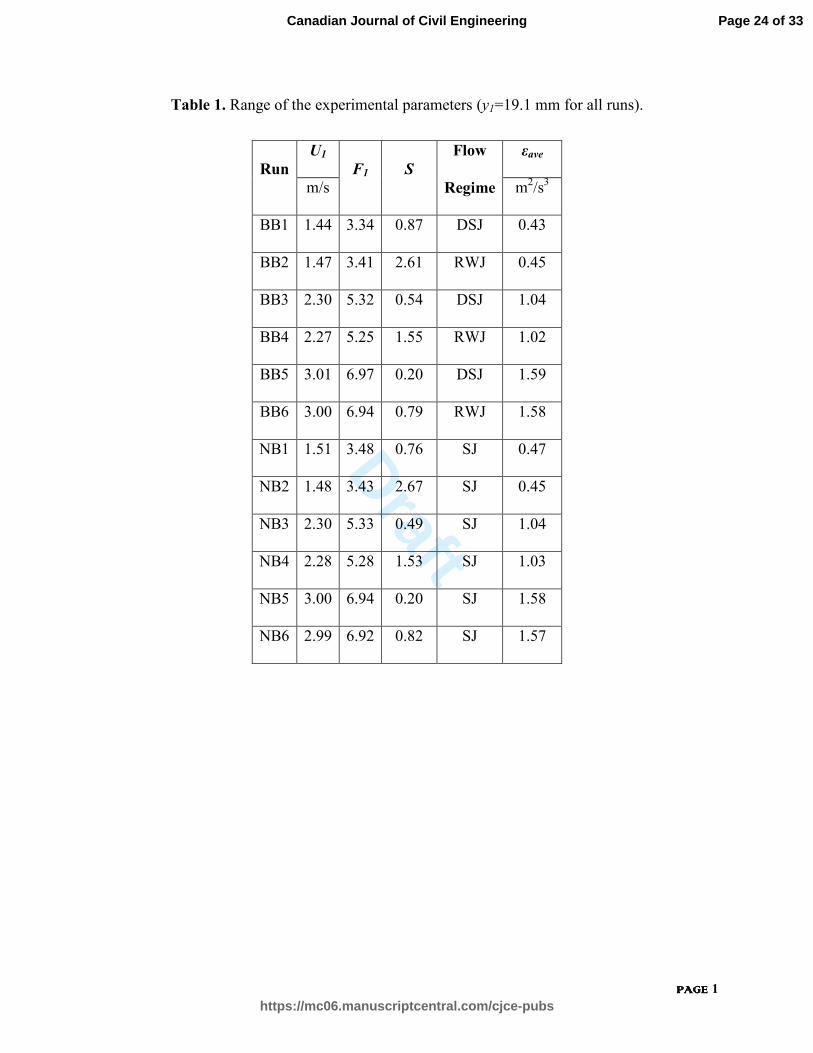
Table 1. Range of the experimental parameters (y1=19.1 mm for all runs).
Run
U1
F1 S
Flow εave
m/s Regime m2/s3
BB1 1.44 3.34 0.87 DSJ 0.43
BB2 1.47 3.41 2.61 RWJ 0.45
BB3 2.30 5.32 0.54 DSJ 1.04
BB4 2.27 5.25 1.55 RWJ 1.02
BB5 3.01 6.97 0.20 DSJ 1.59
BB6 3.00 6.94 0.79 RWJ 1.58
NB1 1.51 3.48 0.76 SJ 0.47
NB2 1.48 3.43 2.67 SJ 0.45
NB3 2.30 5.33 0.49 SJ 1.04
NB4 2.28 5.28 1.53 SJ 1.03
NB5 3.00 6.94 0.20 SJ 1.58
NB6 2.99 6.92 0.82 SJ 1.57
Page 24 of 33
https://mc06.manuscriptcentral.com/cjce-pubs
Canadian Journal of Civil Engineering
Draft
PAGEPAGEPAGEPAGE 1
Fig. 1. Schematic view of the experimental arrangement; a) side view, b) top view.
Fig. 2. Variation of the longitudinal normalized turbulence intensity (Ix) with dimensionless
longitudinal distance (x/y1) and dimensionless depth (y/y1) for a) the DSJ regime (run BB3,
F1=5.32, S=0.54) and the corresponding submerged jump without blocks (run NB3, F1=5.33,
S=0.49) and b) the RWJ regime (run BB4, F1=5.25, S=1.55) and the corresponding submerged
jump without blocks (run NB4, F1=5.28, S=1.53).
Fig. 3. Variation of the normalized Reynolds stress ( Rτ̂ )with dimensionless longitudinal distance
(x/y1) and dimensionless depth (y/y1) for a) the DSJ regime (run BB3, F1=5.32, S=0.54) and the
corresponding submerged jump without blocks (run NB3, F1=5.33, S=0.49) and b) the RWJ
regime (run BB4, F1=5.25, S=1.55) and the corresponding submerged jump without blocks (run
NB4, F1=5.28, S=1.53).
Fig. 4. Variation of the normalized turbulent kinetic energy ( k̂ ) with dimensionless longitudinal
distance (x/y1) and dimensionless depth (y/y1) for a) the DSJ regime (run BB3, F1=5.32, S=0.54)
and the corresponding submerged jump without blocks (run NB3, F1=5.33, S=0.49) and b) the
RWJ regime (run BB4, F1=5.25, S=1.55) and the corresponding submerged jump without blocks
(run NB4, F1=5.28, S=1.53).
Fig. 5. Variation of the dimensionless energy dissipation rate with dimensionless longitudinal
distance (x/y1) and dimensionless depth (y/y1) for a) the DSJ regime (run BB3, F1=5.32, S=0.54)
Page 25 of 33
https://mc06.manuscriptcentral.com/cjce-pubs
Canadian Journal of Civil Engineering
Draft
PAGEPAGEPAGEPAGE 2
and the corresponding submerged jump without blocks (run NB3, F1=5.33, S=0.49) and b) the
RWJ regime (run BB4, F1=5.25, S=1.55) and the corresponding submerged jump without blocks
(run NB4, F1=5.28, S=1.53).
Fig. 6. Average curves for the streamwise variation of the vertically-averaged normalized
turbulent kinetic energy 0k̂ . (Curves representing each flow regime are the average of the three
runs in that flow regime, and error bars represent the range of observed values.)
Fig. 7. Average curves for the streamwise variation of the vertically-averaged normalized
turbulence dissipation rate 0̂ε . (Curves representing each flow regime are the average of the three
runs in that flow regime, and error bars represent the range of observed values.)
Page 26 of 33
https://mc06.manuscriptcentral.com/cjce-pubs
Canadian Journal of Civil Engineering
Draft
Fig. 1. Schematic view of the experimental arrangement; a) side view, b) top view. 65x71mm (300 x 300 DPI)
Page 27 of 33
https://mc06.manuscriptcentral.com/cjce-pubs
Canadian Journal of Civil Engineering
Draft
Fig. 2. Variation of the longitudinal normalized turbulence intensity (Ix) with dimensionless longitudinal distance (x/y1) and dimensionless depth (y/y1) for a) the DSJ regime (run BB3, F1=5.32, S=0.54) and the corresponding submerged jump without blocks (run NB3, F1=5.33, S=0.49) and b) the RWJ regime (run
BB4, F1=5.25, S=1.55) and the corresponding submerged jump without blocks (run NB4, F1=5.28, S=1.53).
78x37mm (300 x 300 DPI)
Page 28 of 33
https://mc06.manuscriptcentral.com/cjce-pubs
Canadian Journal of Civil Engineering
Draft
Fig. 3. Variation of the normalized Reynolds stress ( )with dimensionless longitudinal distance (x/y1) and dimensionless depth (y/y1) for a) the DSJ regime (run BB3, F1=5.32, S=0.54) and the corresponding
submerged jump without blocks (run NB3, F1=5.33, S=0.49) and b) the RWJ regime (run BB4, F1=5.25, S=1.55) and the corresponding submerged jump without blocks (run NB4, F1=5.28, S=1.53).
78x37mm (300 x 300 DPI)
Page 29 of 33
https://mc06.manuscriptcentral.com/cjce-pubs
Canadian Journal of Civil Engineering
Draft
Fig. 4. Variation of the normalized turbulent kinetic energy ( ) with dimensionless longitudinal distance (x/y1) and dimensionless depth (y/y1) for a) the DSJ regime (run BB3, F1=5.32, S=0.54) and the
corresponding submerged jump without blocks (run NB3, F1=5.33, S=0.49) and b) the RWJ regime (run BB4, F1=5.25, S=1.55) and the corresponding submerged jump without blocks (run NB4, F1=5.28,
S=1.53). 78x37mm (300 x 300 DPI)
Page 30 of 33
https://mc06.manuscriptcentral.com/cjce-pubs
Canadian Journal of Civil Engineering
Draft
Fig. 5. Variation of the dimensionless energy dissipation rate with dimensionless longitudinal distance (x/y1) and dimensionless depth (y/y1) for a) the DSJ regime (run BB3, F1=5.32, S=0.54) and the corresponding submerged jump without blocks (run NB3, F1=5.33, S=0.49) and b) the RWJ regime (run BB4, F1=5.25,
S=1.55) and the corresponding submerged jump without blocks (run NB4, F1=5.28, S=1.53). 78x37mm (300 x 300 DPI)
Page 31 of 33
https://mc06.manuscriptcentral.com/cjce-pubs
Canadian Journal of Civil Engineering
Draft
Fig. 6. Average curves for the streamwise variation of the vertically-averaged normalized turbulent kinetic energy . (Curves representing each flow regime are the average of the three runs in that flow regime, and
error bars represent the range of observed values.)
61x31mm (300 x 300 DPI)
Page 32 of 33
https://mc06.manuscriptcentral.com/cjce-pubs
Canadian Journal of Civil Engineering
Draft
Fig. 7. Average curves for the streamwise variation of the vertically-averaged normalized turbulence dissipation rate . (Curves representing each flow regime are the average of the three runs in that flow
regime, and error bars represent the range of observed values.) 64x34mm (300 x 300 DPI)
Page 33 of 33
https://mc06.manuscriptcentral.com/cjce-pubs
Canadian Journal of Civil Engineering
Copyright © 2022 FDOKUMEN