High Octane Number Fuels in Advanced Combustion Modes ...
117
High Octane Number Fuels in Advanced Combustion Modes for Sustainable Transportation AMIR AZIZ ENERGY SCIENCES | FACULTY OF ENGINEERING | LUND UNIVERSITY
-
Upload
khangminh22 -
Category
Documents
-
view
4 -
download
0
Transcript of High Octane Number Fuels in Advanced Combustion Modes ...

High Octane Number Fuels in Advanced Combustion Modes for Sustainable TransportationAMIR AZIZ
ENERGY SCIENCES | FACULTY OF ENGINEERING | LUND UNIVERSITY

Faculty of EngineeringDepartment of Energy Sciences
ISBN 978-91-7895-662-3 ISRN LUTMDN/TMHP-19/1162-SE
ISSN 0282-1990 9789178
956623

High Octane Number Fuels in Advanced Combustion Modes for Sustainable Transportation


High Octane Number Fuels in Advanced Combustion Modes for
Sustainable Transportation
by Amir Aziz
DOCTORAL DISSERTATION
Thesis main advisor: Professor Martin Tunér Thesis co-advisor: Associate Professor Antonio Garcia Martinez
Faculty opponent: Professor Fabrice Foucher
To be presented, with the permission of the Faculty of Engineering of Lund University, for public criticism in the KC: A lecture hall at the Kemicentrum, LTH
on Thursday, the 19th of November 2020 at 10:15

Organization: Lund University
Document name Doctoral Dissertation
Department of Energy Sciences Box 188 SE–221 00 LUND Sweden
Date of disputation 2020-11-19
Author: Amir Bin Aziz
Sponsoring organization: Ministry of Higher Education Malaysia, (MoHE) Universiti Malaysia Pahang, (UMP) KCFP Engine Research Center
Title: High Octane Number Fuels in Advanced Combustion Modes for Sustainable Transportation
Abstract
The research community recently proposed a low-temperature combustion (LTC) concept that can simultaneously reduce Nitrogen Oxides (NOx) and soot emissions while maintaining high engine efficiency. Given that diesel fuel is prone to igniting, gasoline-like fuel with high octane number is utilised to provide sufficient ignition delay and extend the load range. Understanding the influence of high-octane fuel on ignition delay is a key parameter to achieve higher loads in LTC. However, understanding is still lacking on the combustion characteristics of high-octane fuel under LTC in real engines, and the effect of fuel spray–piston interaction is not well documented. Despite the extended load limits offered by high-octane fuels, they require energy-intensive production during the refinery processes, a condition that raises an issue with well-to-wheel carbon dioxide (CO2). To mitigate the issue of CO2 emission, research proposed methanol as a high-octane renewable fuel. This thesis focuses on assessing the impact of higher-octane number fuels in LTC under a low load condition. To achieve this objective, the work was divided into two parts. The first part was devoted to evaluating the required ignition delay of high-octane fuels and explaining the effect of fuel spray–piston interactions. In this work, the fuels were evaluated under similar operating conditions in a light-duty multi-cylinder engine. The experimental results revealed a linear correlation between octane number and required ignition delay for lower octane fuels. However, an exponential correlation was observed for higher number octane fuel because of the fuel spray–piston geometry interaction. The second part aimed to evaluate the effect of injection strategies and air dilution on methanol combustion in a heavy-duty engine. A comparison was performed between methanol and primary reference fuel isooctane (PRF100) under injection timing sweep. Methanol was then compared at two intake pressures. Later, double and triple injection strategies with different mass proportions and dwells were performed on methanol under the partially premixed combustion regime. Additionally, numerical simulations were used to interpret the experimental results. The results revealed that the φ-stratification of methanol is less sensitive to the injection timing compared to that of PRF100. Soot emission was always low for methanol and insensitive to injection timing. When the intake pressure was increased, the mixture became globally lean, resulting in a lower NOx and unburned hydrocarbon (UHC) but a minor penalty on carbon monoxide (CO) emission. The gross indicated efficiency of methanol was improved at the later injection timing for the boosted case. Subsequently, when compared with single injection, the double injection strategy with lower pilot mass and shorter pilot-main dwell showed an effective strategy to simultaneously reduce UHC and CO emissions and increase engine efficiency at the expense of a minor rise in NOx emission. Interestingly, the results demonstrated that the triple injection strategy was capable of achieving similar engine efficiency as the single and double injection strategies. Although a minor rise in CO emission occurred, the triple injection strategy demonstrated its potential to significantly decrease NOx and UHC emissions compared to other strategies.
Key words: Octane number, Low temperature combustion, Ignition delay, Methanol, HCCI, PPC, Multiple injection strategy, φ-stratification
Classification system and/or index terms (if any)
Supplementary bibliographical information Language English
ISSN and key title 0282-1990
ISBN 978-91-7895-662-3 (print) 978-91-7895-663-0 (pdf)
Recipient’s notes Number of pages: 174
Price
Security classification
I, the undersigned, being the copyright owner of the abstract of the above-mentioned dissertation, hereby grant to all reference sources permission to publish and disseminate the abstract of the above-mentioned dissertation.
Signature: Date: 2020-10-12
High Octane Number Fuels in Advanced Combustion Modes for
Sustainable Transportation
by Amir Aziz

A doctoral thesis at a university in Sweden takes either the form of a single, cohesive research study (monograph) or a summary of research papers (compilation thesis), which the doctoral student has written alone or together with one or several other author(s).
In the latter case the thesis consists of two parts. An introductory text puts the research work into context and summarizes the main points of the papers. Then, the research publications themselves are reproduced, together with a description of the individual contributions of the authors. The research papers may either have been already published or are manuscripts at various stages (in press, submitted, or in draft).
Funding information: The thesis work is financially supported by the Ministry of Higher Education Malaysia, (MOE), Universiti Malaysia Pahang, (UMP) and KCFP Engine Research Center.
Front cover: I-40 highway in North Carolina by digidreamgrafix ©123rf.com Back cover: Methanol word cloud concept by Borislav Marinic ©123rf.com
Faculty of Engineering, Department of Energy Sciences
ISBN: 978-91-7895-662-3 (print) ISBN: 978-91-7895-663-0 (pdf) ISRN: LUTMDN/TMHP-19/1162-SE ISSN: 0282-1990
Printed in Sweden by Media-Tryck, Lund University, Lund 2020

Verily, with every difficulty, there is relief...
(Holy Quran. Ash-Sharh: 6)


I
Contents
List of Publications V
Abstract VII
Popular Summary IX
Abbreviations and Symbols XI
1 Introduction 1 1.1 Introduction 1 1.2 Framework of Internal Combustion Engines 1 1.3 Research Scope and Objectives 3 1.4 Thesis Contributions 6 1.5 Thesis Outline 7
2 Advanced Combustion Strategies in CI Engines 9 2.1 Introduction 9 2.2 Conventional Diesel Combustion 9 2.3 Low-temperature Combustion 12
2.3.1 Homogeneous Charge Compression Ignition 13 2.3.2 Reactivity Controlled Compression Ignition 13 2.3.3 Uniform Bulky Combustion System 14 2.3.4 Modulated Kinetics Combustion 14 2.3.5 Partially Premixed Combustion 14
2.4 Summary and Research Gaps 23
3 Tools and Methodology 25 3.1 Introduction 25 3.2 Volvo Light-Duty Multi-Cylinder Engine 25
3.2.1 Engine Characteristics 25 3.2.2 Fuel Injection Systems 26 3.2.3 Air Supply System 26 3.2.4 Exhaust System 27 3.2.5 Engine Speed Regulation System 27 3.2.6 Instrumentation and Measurement Equipment 27

II
3.3 Scania Heavy-Duty Single-Cylinder Engine 29 3.3.1 Engine Characteristics 29 3.3.2 Fuel Injection System 30 3.3.3 Air Supply System 30 3.3.4 Exhaust System 31 3.3.5 Engine Speed Regulation System 31 3.3.6 Instrumentation and Measurement Equipment 31
3.4 Post-Processing Procedure 33 3.4.1 Heat Release Analysis 33 3.4.2 Exhaust Gas Analysis 36 3.4.3 Mean Effective Pressure and Efficiency 37
3.5 General Method 38 3.6 Conclusion 38
4 Effect of Octane Number in Low Temperature Combustion 39 4.1 Introduction 39 4.2 Method 40
4.2.1 Experiment Conditions 41 4.2.2 Numerical Simulation Model 42
4.3 Combustion Characteristics 42 4.3.1 Injection Timing and Ignition Delay Results 42 4.3.2 Combustion Rate and Duration 43
4.4 Emissions 49 4.5 Conclusions 50
5 Effect of Injection Strategies and Air Dilution on Methanol Combustion 53 5.1 Introduction 53 5.2 Method 54
5.2.1 Experiment Conditions 54 5.2.2 Numerical Simulation Model 56
5.3 Combustion Characteristics 57 5.3.1 Required Intake Air Temperature 58 5.3.2 Local φ and Temperature Stratification 60 5.3.3 Ignition Location 62 5.3.4 Combustion Rate and Duration 62
5.4 Emissions 66 5.4.1 Soot 67 5.4.2 NOx 67 5.4.3 CO 69 5.4.4 UHC 70

III
5.5 Performance 71 5.5.1 Combustion Efficiency 71 5.5.2 Gross Indicated Efficiency 74
5.6 Conclusions 75
6 Summary and Future Work 77 6.1 Introduction 77 6.2 Summary 77
6.2.1 Effect of Octane Number in LTC 77 6.2.2 Effect of Injection Strategies & Air Dilution on Methanol Combustion 78
6.3 Suggestion for Future Work 79
7 Summary of Publications 81 7.1 Publication I 81 7.2 Publication II 82 7.3 Publication III 82 7.4 Publication VI 83
Acknowledgments 85
References 88


V
List of Publications
This thesis is based on the following papers:
I. Amir Aziz, Changle Li, Sebastian Verhelst, and Martin Tuner
The Relevance of Different Fuel Indices to Describe Autoignition Behaviour of Gasoline in Light Duty DICI Engine under PPC Mode. SAE 2019-01-1147
II. Amir Aziz, Changle Li, Leilei Xu and Martin Tuner
Impact of Octane Number and Injection Timing on Autoignition Behaviour of Gasoline and PRF in PPC. SAE 2019-01-2167
III. Amir Aziz, Clarisse Dos Santos, Antonio Garcia and Martin Tuner
Impact of Multiple Injection Strategies on Performance and Emissions of Methanol PPC under Low Load Operation. SAE 2020-01-0556
IV. Amir Aziz, Leilei Xu, Antonio Garcia and Martin Tuner
Influence of Injection Timing on Equivalence Ratio Stratification of Methanol and Isooctane in a Heavy-Duty Compression Ignition Engine. SAE 2020-01-2069


VII
Abstract
The research community recently proposed a low-temperature combustion (LTC) concept that can simultaneously reduce Nitrogen Oxides (NOx) and soot emissions while maintaining high engine efficiency. Given that diesel fuel is prone to preignition with early injection, gasoline-like fuel with high octane number is utilised to provide sufficient ignition delay and extend the load range. Understanding the influence of high-octane fuel on ignition delay is a key parameter to achieve higher loads in LTC. However, understanding is still lacking on the combustion characteristics of high-octane fuel under LTC in real engines, and the effect of fuel spray–piston interaction is not fully understood. Despite the extended load limits offered by high-octane fuels, they require energy-intensive production during the refinery processes, a condition that raises an issue with well-to-wheel carbon dioxide (CO2). To mitigate the issue of CO2 emission, research proposed methanol as a high-octane renewable fuel.
This thesis focuses on assessing the impact of higher-octane number fuels in LTC under a low load condition. To achieve this objective, the work was divided into two parts. The first part was devoted to evaluating the required ignition delay of high-octane fuels and explaining the effect of fuel spray–piston interactions. In this work, the fuels were evaluated under similar operating conditions in a light-duty multi-cylinder engine. The experimental results revealed a linear correlation between octane number and required ignition delay for lower octane fuels. However, an exponential correlation was observed for higher number octane fuel because of the fuel spray–piston geometry interaction.
The second part aimed to evaluate the effect of injection strategies and air dilution on methanol combustion in a heavy-duty engine. A comparison was performed between methanol and isooctane (primary reference fuel, PRF100) under injection timing sweep. Methanol was then compared at two intake pressures. Later, double and triple injection strategies with different mass proportions and dwells were performed on methanol under the partially premixed combustion. Additionally, numerical simulations were used to interpret the experimental results. The results revealed that the φ-stratification of methanol is less sensitive to the injection timing compared to that of PRF100. Soot emission was always low for methanol and insensitive to injection timing, compare to PRF100. When the intake pressure was increased, the mixture

VIII
became globally lean, resulting in a lower NOx and unburned hydrocarbon (UHC) but a minor penalty on carbon monoxide (CO) emission. The gross indicated efficiency of methanol was improved at the later injection timing for the boosted case.
Subsequently, when compared with single injection, the double injection strategy with lower pilot mass and shorter pilot-main dwell showed an effective strategy to simultaneously reduce UHC and CO emissions and increase engine efficiency at the expense of a minor rise in NOx emission. Interestingly, the results demonstrated that the triple injection strategy was capable of achieving similar engine efficiency as the single and double injection strategies. Although a minor rise in CO emission occurred, the triple injection strategy demonstrated its potential to significantly decrease NOx and UHC emissions compared to other strategies.

IX
Popular Summary
Growing populations have led to an increasing demand on transportation for people and goods. For decades, internal combustion engines have played an important role in the transportation sector to develop the society, but their widespread utilisation has contributed to massive global energy consumption and pollutant emissions. For instance, an estimated 24% of CO2 emissions in the world come from the transportation sector. This scenario creates a dual challenge, which is to satisfy the growing transportation needs by keeping the energy demands and risks of climate change at the minimum level.
Historically, the high torque output and fuel efficiency of diesel engines make them a very attractive power source for the transportation sector. However, these engines come with high NOx and soot emissions, which cause a wide variety of environmental and health impacts. For instance, long-term exposure to NOx and soot can potentially decrease the lung function and increase the risk of damaging the respiratory system. Moreover, NOx contributes to acid deposition and nutrient enrichment problems, which can adversely affect both land and aquatic life. As exhaust emissions are harmful to humans and the environment, the European Commission was motivated to implement the emissions legislation Euro I in 1992 regulating NOx, particulate matter, carbon monoxide and hydrocarbons. Since then, the emissions regulations have been increasingly stringent to reduce progressively the negative impact of diesel engines.
To meet stringent emissions legislations, the research community has proposed new combustion strategies based on low-temperature combustion (LTC), which has the potential to achieve a simultaneous reduction in NOx and soot emissions while reducing energy demands through improved efficiency. Typically, gasoline-like fuels with high ignition resistance are utilised in diesel engines to achieve LTC. However, to also meet future legislation on CO2 emissions, researchers have been working towards renewable fuels, such as methanol. A combination of methanol and LTC strategy can be a future solution to develop clean and sustainable combustion engines.
The goal of this thesis is to explain the relation between fuels with high ignition resistance and the fuel injection process while using LTC. This knowledge was extended by implementing a fully renewable fuel. To reveal the underlying

X
phenomenon, a combination of engine experiments and computer simulations was employed.
The results showed that increasing ignition resistance among the fuels requires increasingly earlier fuel injection. The combustion chamber shape interacts with the spray of the fuel injection, and this study shows how these interactions can be exploited to lower emissions and improve energy use. The use of methanol fuel combined with LTC and triple injection removes soot emissions all together, and a favourable compromise between very low amounts of regulated emissions and low energy consumption can be reached. The results provide engine manufacturers with a preliminary platform for strategies with methanol fuel to meet current and future emissions legislations.
XI
Abbreviations and Symbols
AFR Air fuel ratio (A/F)S Stoichiometric air fuel ratio aTDC After top dead center BDC bottom dead center C1 One-carbon molecules C2 Two-atom molecules CA Crank angle CA5 CA at 5% of the fuel burnt CA10 CA at 10% of the fuel burnt CA50 CA at 50% of the fuel burnt CA90 CA at 90% of the fuel burnt CAD Crank angle degree CDC Conventional diesel combustion CFD Computational fluid dynamics CFR Cooperative Fuel Research CI Compression ignition CLMEP Combustion loss mean effective pressure CO Carbon monoxide CO2 Carbon dioxide COV Coefficient of variation D17 Double injection with 17% mass by weight in the pilot D50 Double injection with 50% mass by weight in the pilot D83 Double injection with 83% mass by weight in the pilot DAQ Data acquisition DICI Direct injection compression ignition ED95 Ethanol-95%, diesel-15% EGR Exhaust gas recirculation EOI End of injection FuelMEP Fuel indicated mean effective pressure GIE Gross indicated efficiency HC Hydrocarbon

XII
HCCI Homogeneous charge compression ignition ICE Internal combustion engine IMEPg Gross indicated mean effective pressure IVC Intake valve closing LTC Low temperature combustion MK Modulated kinetics MON Motor octane number N2 Nitrogen NOx Oxides of nitrogen: NO, NO2 NVO Negative valve overlap O2 Oxygen OI Octane Index ON Octane number PID Proportional–integral–derivative PM Particulate matter PPC Partially premixed combustion rc Compression ratio RCCI Reactivity controlled compression ignition RoHR Rate of heat release RON Research octane number rpm Rotation per minute S Octane Sensitivity (RON-MON) SI Spark ignited SOC Start of the combustion SOI Start of injection SRM Stochastic reactor model T20 Triple injection with 20 % mass in the pilot and post TDC Top dead center Tin Intake temperature TTW Tank-to-wheel UHC Unburned hydrocarbon UNIBUS Uniform bulky combustion system WTT Well-to-tank WTW Well-to-wheel γ Specific heat ratio φ Equivalence ratio φmean Mean effective equivalent ratio

1
1 Introduction
1.1 Introduction
This chapter presents the general technological framework within which this study is developed. Initially, the chapter shows the impact of on-road transportation on global energy consumption and CO2 emissions. It then briefly explains the most common technological solution adopted by engine manufacturers to fulfil current emissions legislation. Next, the scope of this research is described by summarising the main characteristics of the advanced combustion concepts based on low-temperature combustion (LTC). Finally, the structure of the document is described to provide an overview of all the work performed.
1.2 Framework of Internal Combustion Engines
Increasing population growth has led to a rising demand on energy for human development. This scenario creates a dual challenge, which is to satisfy the growing energy demands of transportation and keep the risks of climate change at the minimum level. Figure 1.1 (left) represents the global energy-related carbon dioxide (CO2) emissions by fuel from 2000 to 2019. This trend was mainly driven by the high demand of global energy based on fossil fuels. Between 2005 and 2012, energy consumption decreased due to the recession. From 2018 to 2019, the coal-fired power plant sector contributed around 30% of the global CO2 emissions, due to the economic growth in some Asian countries [1, 2]. Nevertheless, it is worth mentioning that, in 2019, the transport sector contributed 24% of the total CO2 emissions in the world, as shown in Figure 1.1 (right).
The Intergovernmental Panel on Climate Change reported that the large growth in global CO2 emissions has had a substantial impact on the global average temperature [3]. Moreover, if no climate policies are applied, then an estimated 4.1°C–4.8°C warming will occur by 2100 [4]. With CO2 emissions directly associated with the fuel consumption of carbon-containing fuels, the development of future internal combustion engines (ICEs) will require simultaneously high efficiency and low

2
emissions. This scenario brings new challenges and opportunity to the engine research community and manufacturers.
Figure 1.1. Global energy-related CO2 emissions by fuel in 2000–2019 (left) and sector in 2019 (right). Adapted from [2]
Historically, the low fuel consumption of compression ignition (CI) engines compared to that of spark ignition (SI) engines has led CI engines to be utilised in heavy-duty transportation. However, despite offering higher efficiency, CI engines with diesel fuel typically emit higher exhaust emissions, such as NOx and particulate matter (PM). NOx and PM cause a wide variety of environmental and health impacts. For instance, long-term exposure to NOx and PM can potentially decrease the lung function and increase the risk of damaging the respiratory systems. Moreover, NOx contributes to acid deposition and nutrient enrichment problems (eutrophication), which can adversely affect both land and aquatic life [5].
Other regulated emissions, such as unburned hydrocarbon (UHC) and carbon monoxide (CO), are also harmful for the health and the environment as they may cause coma, heart failure (long exposure to CO), cancer and photo-chemical smog [6]. With exhaust emissions harmful to humans and the environment, the European Commission was motivated to implement the emissions legislation Euro I in 1992. (Table 1.1) [7]. Since then, stringent emissions regulations have been introduced through the years to reduce progressively the negative impact of CI engines.
Table 1.1. EU emission standards for heavy-duty CI (diesel) engines: Steady-state testing. Data from [7].
Stage Date CO HC NOx PM PN
g/kWh 1/kWh
Euro I 1992 (≤ 85 kW) 4.5 1.1 8.0 0.612 - 1992 (> 85 kW) 4.5 1.1 8.0 0.36 -
Euro II 10/1996 4.0 1.1 7.0 0.25 -10/1998 4.0 1.1 7.0 0.15 -
Euro III 10/2000 2.1 0.66 5.0 0.10a - Euro IV 10/2005 1.5 0.46 3.5 0.02 - Euro V 10/2008 1.5 0.46 2.0 0.02 - Euro VI 10/2013 1.5 0.13 0.40 0.01 8.0×10¹¹

3
To fulfil the emissions legislation, engine manufacturers have responded with the development of aftertreatment systems. However, aftertreatment systems add considerable extra volume as well as total weight and cost to the vehicle [8]. Therefore, parallel to the development of aftertreatment systems, researchers and engine manufacturers have been exploring different in-cylinder strategies to minimise the formation of NOx and soot emissions during the combustion of CI engines. In this way, the requirements for aftertreatment systems can be minimised, in terms of reducing the base price due to the smaller size and the operational costs due to the lower fuel consumption.
Engine manufacturers have introduced several strategies to reduce soot emission, such as higher injection pressure, multiple injections, smaller nozzle hole diameters and optimised piston design. All these strategies aim to improve the mixture formation and avoid a locally rich mixture in the cylinder, which is the source of soot emissions. To suppress the NOx emission, an exhaust gas recirculation (EGR) system that dilutes the in-cylinder charge, resulting in the reduction of the combustion flame temperature, has been introduced. Temperature is reduced for two reasons: the first is due to the limited availability of oxygen because some fraction of fresh air is replaced by the exhaust gases, and the second is due to the greater heat-absorbing capacity (higher γ) of the non-reacting gases from the EGR [9].
However, the replacement of fresh air with exhaust gases reduced the oxygen availability for soot oxidation, resulting in higher soot formation. This led to the typical dilemma of diesel engines, known as NOx and soot trade-off. The application of EGR can also decrease the durability of the engines [10], which led several truck manufacturers (e.g. Cummins and Scania) to introduce non-EGR engines in their line of new-generation heavy-duty engines [11, 12]. This development means that NOx reduction will be highly dependent on the aftertreatment system, which may increase the maintenance and overall cost of the vehicle. Therefore, there is a crucial need to investigate and propose new in-cylinder strategies so that less NOx and soot emissions are formed in the first place.
1.3 Research Scope and Objectives
Recently, the research community has been investing considerable efforts in exploring new combustion strategies based on LTC, which has the potential to achieve a simultaneous reduction in NOx and soot emissions while maintaining high efficiency. In these combustion strategies, the fuel is injected slightly earlier than in conventional

4
diesel combustion (CDC). This extended ignition delay provides sufficient time for the fuel to reach locally leaner equivalence ratios prior to the start of combustion, thus minimising the soot formation process. To suppress NOx formation, high EGR levels are typically used to lower the peak combustion temperature. Thermal efficiency is also improved because of two main reasons. The first is the fast heat release occurring when the proper in-cylinder conditions are reached, thereby increasing the effective expansion ratio, and the second is the lower heat transfer losses because of the lower peak in-cylinder temperature [13].
However, when an engine is moved to a higher load operation, a high cetane number (CN) fuel (e.g. diesel) is prone to preignition with early injection and so the limit of load range is reduced. To extend the load, the research community utilises gasoline-like fuels with high octane number, which can promote sufficient ignition delay because of their higher ignition resistance [14]. Understanding the influence of high-octane fuel on ignition delay in a real engine is a key parameter to achieve higher loads. However, the research community claims that there is still lack of understanding on the combustion characteristics of high-octane fuel under LTC in a real engine [15-17]. Moreover, the effect of fuel spray–piston interaction on the ignition delay is not fully understood [18]. Despite the extended load limits offered by high-octane fuels, they require energy-intensive production during the refinery processes, a condition that raises an issue with well-to-wheel (WTW) CO2 [19]. To mitigate the issue of CO2 emission, research proposed high-octane renewable fuels such as ethanol and methanol [20, 21].
Compared to ethanol, methanol can be produced more easily from the captured CO2 through hydrogenation and electrochemical processes [22]. Therefore, the released CO2 from methanol combustion can be recycled back, which then effectively closes the carbon loop [23]. Methanol production is actually the most efficient and cost effective compared to other biofuels [24]. Methanol also has unique properties, such as high research octane number (RON) and high heat of vaporisation. The high RON of methanol makes it possible to run at high compression ratios due to the high knock resistance [25]. The high heat of vaporisation helps cool down the fuel–air charge and makes it denser to promote favourable specific heat ratio and therefore increase thermodynamic efficiency. In fact, one of the advantages when running methanol in ICEs is the ultralow soot emissions [26-28]. Therefore, a combination of methanol as a high-octane renewable fuel and LTC could be a promising future solution to develop clean and sustainable combustion engines.
However, issues associated with combustion efficiency become severe, especially when LTC is run with high-octane fuel under low load. During the low load operation, a long ignition delay may result in the formation of overly lean regions, which can lead

5
to excessive CO and UHC emissions [29, 30]. This issue can be alleviated by modifying the local and global equivalence ratios (φ). Local φ-stratifications can be modified, for instance, by sweeping the injection timing with single injection [31-34] or utilising multiple injection strategies [35, 36]. Global φ can likewise be modified by introducing air dilution at a constant fuelling rate.
Based on the statement above, the main objective of this study was to enhance our understanding on the influence of fuels with higher octane number in the LTC under low load condition. To achieve this objective, two research questions were formulated as follow:
• How do fuels with high octane number influence the combustion characteristics and emissions under low-temperature combustion?
• How do injection strategies and air dilution impact low-temperature combustion with a high-octane renewable fuel?
To answer the first question, the methodological approach proposed the use of 11 gasoline-like fuels and 8 PRFs as the high-octane fuels. The ignition delay of these fuels was evaluated with a similar experimental condition in a light-duty multi-cylinder engine under LTC.
For the second question, a heavy-duty modified single-cylinder engine was utilised to study the primary reference fuel (PRF100) as a high-octane fuel and methanol as the high-octane renewable fuel. A comparison was performed between methanol and PRF100 under injection timing sweep from homogeneous charge compression ignition (HCCI) to partially premixed combustion (PPC) regimes at two intake pressures, boosted and non-boosted conditions. Later, double and triple injection strategies with different mass proportions and dwells were performed on methanol under the PPC regime.
Some of the operating points from the experimental results of light-duty and heavy-duty engines were reproduced using three-dimensional computational fluid dynamics tools to help interpret the experimental results.

6
1.4 Thesis Contributions
The work presented in this thesis contributes to improving our understanding and knowledge on the impact of fuels with higher octane numbers in the LTC under low load condition. The main contributions are listed below:
• The experimental study on the required ignition delay of gasoline-like fuelsrevealed a linear correlation between octane number and required ignitiondelay for fuels with RON below than 90. However, an exponential correlationwas observed in the required ignition delay for higher octane fuels, rangingfrom RON90 to RON100. The numerical and experimental resultsinterpreted the interaction between fuel spray and piston geometry that causesthe phenomenon of large increase (an exponential correlation) in the requiredignition delay of the higher-octane fuel.
• A lower octane fuel requires late injection timing, which is characterised by ahigher peak of RoHR and a shorter premixed combustion followed by a latecombustion phase. Late injection timing has the benefit of lower UHC andCO but higher NOx emission. By contrast, a higher-octane fuel requires earlyinjection timing, which is characterised by a lower peak of RoHR and longcombustion duration. Higher UHC and CO but lower NOx emissions wererevealed with early injection.
• A comparison was performed between methanol and PRF100 that shows theφ-stratification of methanol is less sensitive to the injection timing. Inaddition, a lower (A/F)s of methanol provides benefit in achieving astoichiometric and leaner mixture more rapidly than PRF100, which isadvantageous in lowering NOx emissions at late injection timing. In general,methanol demonstrated higher UHC but lower CO than PRF100. Formethanol, soot is always low and insensitive to injection timing and intakepressure.
• The comparison between boosted and non-boosted condition for methanoldemonstrated that by increasing the boost pressure, with a constant fuellingrate, the mixture becomes globally lean, resulting in a lower NOx emission. Atthe earlier injection timing, lower UHC was achieved but a minor penalty onCO emission was found. A slight reduction in combustion efficiency occurredfor the boosted case compared to the non-boosted case, but there was somegain in the gross indicated efficiency at later injection timing.

7
• Compared with the single injection strategy, double injection with a lower pilot mass and a shorter pilot-main dwell showed an effective strategy to reduce the UHC and CO but a minor penalty on NOx. With this strategy, a higher combustion efficiency and gross indicated efficiency were revealed.
• Different injection strategies were evaluated with the fixed main injection timing. The results demonstrated that triple injection strategy has comparable combustion and gross indicated efficiency with single and double injection. Despite the minor rise in CO emission, triple injection strategy demonstrated significantly lower NOx and UHC emissions compared to other strategies.
1.5 Thesis Outline
This thesis is organised in six main chapters, including the current introduction. A short description of the contents for the following chapters is provided here.
Chapter 2 presents a brief literature review about CDC. It then describes in detail the different in-cylinder strategies under LTC. Next is a brief explanation on the conventional method to measure the fuel octane number followed by the benefits and challenges of utilising methanol as fuel in ICEs. Later, the chapter explains in detail the strategies to modify local φ-stratification particularly in PPC. Finally, the section concludes with the research gaps this work attempts to answer.
Chapter 3 describes two engine test set ups used in this thesis: a light-duty multi-cylinder and a heavy-duty modified single-cylinder engine. The test set ups for both engines are briefly described, including the instrumentation and measurement equipment. The theoretical calculation behind the analysis of the combustion process is briefly explained as well.
Chapter 4 explains the effect of fuel octane number on the required ignition delay. The underlying phenomenon of the fuel spray–piston interaction on the ignition delay of high-octane fuels is explained in detail together with the numerical results.
Chapter 5 describes how the local and global equivalence ratios impact the combustion characteristics, emission and performance of methanol. Multiple injection strategies are used to evaluate the local equivalence ratio (φ), and different intake pressures are employed to evaluate the global φ. Additionally, numerical work is used to explain the distribution of the local equivalence ratio and temperature in the cylinder.
Chapter 6 summarises all the results obtained and draws the main conclusions of this work. Some suggestions for future works on this research topic are likewise provided.


9
2 Advanced Combustion Strategies in CI Engines
2.1 Introduction
The chapter starts with a brief overview of CDC. Then, it describes the different combustion concepts under LTC. The following sections will briefly focus on the benefits and challenges of fossil and renewable high-octane fuels in CI engines. Next, strategies to modify the fuel–air stratification particularly in PPC are explained. The final section presents the knowledge gaps and describes how to fill these gaps through the work presented in this thesis.
2.2 Conventional Diesel Combustion
Typically, CDC or diesel engine ignites a low ignition resistance fuel (e.g. diesel) using CI. On the other hand, SI engine uses a spark plug to ignite a fuel with high ignition resistance (e.g. gasoline). In the SI engine, the fuel is well mixed with the air and the combustion happens through flame propagation with a premixed flame [37]. By contrast, the combustion of CDC happens through a different sequence of process and combustion phases.
Figure 2.1 illustrates the heat release diagram of a typical CDC. The start of injection (SOI) of fuel, denoted as a, is made a few crank angle degrees before the top dead centre (TDC). Generally, the fuel is injected into the cylinder with very high injection pressure so that the fuel will be atomised to a smaller droplet size. The fuel then absorbs heat from the surrounding and is vaporised and mixed with the air. As the piston moves towards the TDC, the air is compressed and the in-cylinder charge temperature increases. At the same time, the fuel–air mixture reaches the ignitibility limit and starts

10
to ignite at b. The time between SOI and start of ignition is measured in crank angle degree and known as ignition delay period.
Figure 2.1. Typical diagram of the heat release rate of CDC using DI engine [38]
A relatively short ignition delay provides a few crank angle degrees for the fuel to mix with the air and form a rapid premixed combustion phase, resulting in a higher combustion rate, denoted between b and c. Once the premixed combustion mixture has released some of its energy, the burning rate continues with spray-driven combustion. During this process, the injector continuously injects fuel into the cylinder until the end of injection (EOI). The remaining fuels that do not combust during the premixed combustion phase will continue burning in the mixing-controlled combustion phase until it reaches d. Later, as the piston moves towards the bottom dead centre (BDC), the volume expands and the remaining fuels burn in the late combustion phase that has a lower combustion rate.
CDC typically runs at lean condition or with a surplus of air to avoid soot emission. SI engines run at close to stoichiometric mixture to ensure the three-way catalyst can work in the exhaust system. Generally, diesel engines have higher engine efficiency because of their high compression ratio and lack of throttling losses compared to SI engines. According to Equation (2.1), the thermodynamic efficiency ηt of diesel engines can be improved by either increasing the compression ratio rc or increasing the specific heat ratio γ [16].
111
−
−=
γ
ηc
t r(2.1)

11
The γ value can be increased by providing more air into the cylinder, which can be done, for instance, by using a turbocharger. The surplus of air will increase the specific heat ratio at constant pressure Cp of the fuel–air mixture, leading to a higher specific heat ratio γ. The heat capacity of air in the cylinder increases with a higher γ, hence more heat is absorbed during the combustion, resulting in lower combustion temperature. Eventually, the thermodynamic efficiency increases because of less heat transfer losses and the relatively low temperature difference between the combustion chamber and the cylinder wall. A high compression ratio of diesel engine also leads to a higher in-cylinder pressure and temperature at the TDC, resulting in a higher thermodynamic efficiency. However, because of a high in-cylinder temperature, the diesel engine produces higher NOx. Moreover, diesel fuel consists of long hydrocarbon (HC) and aromatic compounds, which are prone to form soot and lead to higher PM emissions. To reduce NOx and soot emissions, the research community has contributed a considerable amount of effort towards understanding how these emissions are formed in diesel engine.
Figure 2.2 illustrates a conceptual schematic of a direct injected diesel fuel spray proposed by Dec [39], which shows the location of the soot and NOx formation. Once the liquid fuel is injected and enters the cylinder, it atomises and hot air entrains, vaporising the fuel and forming a different part of the fuel–air, φ mixture in the spray. The core part that contains the rich mixture, which is the location of the soot formation, has modest temperature. By contrast, NOx forms at the periphery of the spray that has φ around one and high temperature. By understanding the location and characteristics of the local φ that produces NOx and soot, the research community has proposed another in-cylinder strategy to reduce NOx and soot emissions, known as LTC.
Figure 2.2. Conceptual schematic of direct injection diesel spray, from [39]

12
2.3 Low-temperature Combustion
Figure 2.3 illustrates the local equivalence ratio against the local in-cylinder temperature as proposed by Kimura et al. [40]. Several key parameters can be extracted from this diagram. First, the NOx started to form in a local temperature around 2200 K and local φ around one before rapidly increasing at a local temperature above 2600 K. Meanwhile, soot forms in a higher local φ with moderate local temperature. Inaddition, to avoid incomplete combustion, the local in-cylinder temperature must beabove 1400K.
The blue line illustrates a simplified path of the spray from the direct injection diesel combustion without using EGR. The fuel spray injected into the cylinder initially has high local equivalence ratio and low local mixture temperature. Then, the fuel absorbs the heat and is vaporised, mixed with the air and ignited. This process can be observed from a decrease of the local φ but an increase of local temperature. Since the onset of ignition happens just after fuel injection, there can be a locally fuel rich mixture that has high temperature, which enters the soot formation zone. As the fuel is consumed through the combustion and fuel–air mixing continues, the local φ approaches around 1 and the local temperature increases, resulting in NOx formation. Finally, in the late combustion phase, some fraction of the fuel spray that has very low φ, which is not consumed during the combustion, enters the incomplete combustion zone.
Figure 2.3. Regions of NOx and soot formation in local equivalence ratio versus local temperature [40]

13
The concept of LTC is most easily understood by referring to the green box in Figure 2.3, representing the sweet spot to achieve LTC. To simultaneously avoid the soot and NOx formation zones, the local equivalence ratio has to be sufficiently lean and have an intermediate combustion temperature. An effective approach to have a lean mixture is by using air dilution with EGR or higher boost pressure. High diluted air will reduce the combustion temperature associated with the reduction of global φ, resulting in low soot and NOx formation. Another strategy is to advance the SOI so that a longer premixing time and a lean mixture are available, leading to lower combustion temperature. Nevertheless, a local overly lean mixture may cause misfire because the fuel is under the ignitability limit.
The concept of LTC has attracted the research community and engine manufacturers to further explore the potential of this in-cylinder strategy to reduce soot and NOx emissions. Several new concepts under LTC have been introduced, such as HCCI, reactivity controlled compression ignition (RCCI), uniform bulky combustion system (UNIBUS), modulated kinetics (MK) and PPC, all of which will be briefly explained in the following subsections.
2.3.1 Homogeneous Charge Compression Ignition
The HCCI concept was firstly introduced by Onosihi [41] in 1979 and later by Foster in 1983 [42]. The fuel injection for HCCI is commonly done very early before compression to provide a long ignition delay, resulting in a homogeneous mixture or low level of φ-stratification. With these strategies, HCCI combustion has shown the potential to achieve near-zero NOx and smoke emissions. Nevertheless, there are challenges associated with combustion efficiency (i.e. UHC and CO emissions), including narrow operable load range and high pressure rise rates. Particularly, in HCCI, it is difficult to control combustion timing because the initiation of combustion is governed by chemical kinetics [33, 34]. Moreover, high maximum pressure-rise rates during high load is one of the main limitations of HCCI [43]. For HCCI, the potentials are very low soot and NOx emissions while the challenges are high CO and HC emissions, low controllability and a narrow operating load range.
2.3.2 Reactivity Controlled Compression Ignition
RCCI is an LTC concept that utilises two fuels having very different cetane numbers (CNs). Low CN fuel indicates a fuel with high ignition resistance, such as gasoline with high octane number. On the other hand, high CN fuel indicates a low ignition resistance fuel such as diesel.

14
In an RCCI engine, the gasoline is introduced very early during the intake stroke to mix with the ambient gas in the cylinder and form a homogeneous mixture. Next, before the piston reaches the TDC, the diesel is injected to initiate the combustion. By injecting the diesel close to the TDC, stratifications of the equivalence ratio and chemical reactivity are established, resulting in good combustion stability and noise reduction [44, 45]. The combustion event can be controlled by changing the proportions of these two fuels. However, one issue with RCCI is the high UHC emission that originates from crevices associated with the early injection of gasoline [46]. Another concern is the need to have and maintain two sets of fuel injection systems and two fuel tanks.
2.3.3 Uniform Bulky Combustion System
In 1997, Toyota Motor Corporation introduced UNIBUS in the market [47]. UNIBUS is an LTC concept that utilises diesel fuel. The working principle of UNIBUS is using two-stage injection. The first stage is injecting the fuel during the compression stroke to have a premixed mixture and initiate the low temperature reaction. The second stage is by injecting the fuel before TDC to trigger the main combustion event [48]. However, liquid-spray impingement on the cylinder liner often happens because of the early injection [49].
2.3.4 Modulated Kinetics Combustion
In 1998, MK combustion was introduced to the market by Nissan Motor Company [50, 51]. In MK combustion, high levels of EGR are used to dilute the charge and prolong the ignition delay of diesel fuel. In addition, high injection pressure is used to shorten the injection duration and high swirl to enhance fuel–air mixing. Eventually, the injection event takes place after the TDC to allow the combustion to happen late in the expansion phase. By doing so, a high-temperature diffusion flame is avoided, and MK is dominated by premixed combustion, resulting in lower soot and NOx emissions. However, because combustion occurs during the expansion, MK combustion suffers from high UHC and CO emissions and thus lower combustion and engine efficiency.
2.3.5 Partially Premixed Combustion
To overcome the limitations of HCCI and MK, a concept named PPC was proposed. In contrast to MK, the fuel is introduced in the last quarter of the compression stroke

15
in PPC. To achieve the LTC, this fuel injection strategy is combined with high levels of EGR, resulting in high thermal efficiency while still keeping away from the soot and NOx formation zones [13, 52, 53]. Moreover, compared to HCCI, the PPC concept allows some degree of control on the combustion phasing through fuel injection events. However, using diesel as fuel in PPC requires excessive amounts of EGR to provide sufficient ignition delay for premixing, resulting in limitations during high load operation [53]. Therefore, to achieve sufficiently long ignition delay and extend the load range, fuels suitable for PPC are those with high ignition resistance, typically known as high-octane fuels [54-56].
2.3.5.1 High-octane fuels Fuel properties are significantly important parameters for LTC operation and offer possibilities of achieving higher loads. One of the key factors of fuel properties is chemical reactivity (resistance to autoignition), which is described as RON and motor octane number (MON).
For a standard measurement on the octane rating of a gasoline fuel, the cooperative fuel research (CFR) engine is employed. Based on the standard method, the compression ratio of the CFR engine needs to be tuned to achieve a specific knock intensity. Then, the required compression ratio for a fuel is compared to the compression ratios for PRFs (blends of isooctane and n-heptane). Eventually, the fuel is assigned to the octane rating RON or MON based on the corresponding PRF.
The two main differences between RON and MON tests are the intake air temperature and engine speed. The engine operating condition in the RON test is 52°C (measured before fuel injection) and an engine speed of 600 rpm [57]. For the MON test, the intake mixture temperature (measured after the fuel injection) is 149°C with an engine speed of 900 rpm [58]. However, modern engine systems typically have direct injection and air intake boosting, which questions the relevancy of the RON and MON octane rating systems. The research community also claims that RON and MON cannot accurately describe the autoignition behaviour of gasoline fuels under LTC [15, 16, 59-63].
To support the lack of accuracy of RON and MON, Kalghatgi introduce the octane index (OI) for characterising fuel anti-knock quality in SI engines and, subsequently, extended for HCCI combustion [64, 65]. However, Liu et al. [66] reported that the OI is not consistent enough to describe the autoignition properties of fuels in HCCI combustion [67]. Later, Truedsson et al. [62, 63] proposed a new method and index to describe the autoignition behaviour of gasoline-like fuels in HCCI mode.
Recently, Aziz et al. [17] investigated the relevancy of different indices in describing the autoignition behaviour of gasoline fuels under PPC condition. The results support

16
the literature evidence and argue the relevancy of MON in describing the autoignition behaviour of modern gasoline fuels in PPC mode. Moreover, they reported that fuel spray and piston interactions have a significant impact on the ignition delay of gasoline with high octane number. However, this phenomenon has not been fully understood, and there is lack of literature describing this phenomenon.
Despite the extended load limits offered by high-octane fuels [13, 68], there is an issue associated with WTW CO2 emission, which is defined by the summation of well-to-tank (WTT) and tank-to-wheel (TTW). WTT refers to CO2 generated during the production and transport of fuel to the service station, while TTW is associated with the CO2 generated during vehicle operation. Higher octane fuels requires energy-intensive production during the refinery processes, resulting in a corresponding WTT CO2 [19].
To mitigate the issue of CO2 emission, methanol as a high-octane renewable fuel has been introduced. Methanol has unique properties for LTC meant for WTW CO2 benefits, making it a potential fuel. Compared to ethanol, methanol can be easily produced from the captured CO2 through hydrogenation and electrochemical processes [22]. Hence, once methanol combusts, it will release CO2 which can then be recycled back, effectively closing the carbon loop [23]. Moreover, it is important to point out that methanol is one of the most efficient and cost-effective biofuels to produce [24]. Therefore, a combination of methanol and LTC concepts to improve efficiency and reduce emissions can be a future solution to develop sustainable and clean combustion engines.
However, there are some challenges associated with the application of methanol fuel in CI engines due to its high ignition resistance (RON109) [69] and high heat of vaporisation. In a single injection strategy, a large amount of fuel is injected into the cylinder at once, which promotes charge cooling effect and cooling down of the in-cylinder temperature. For typical conditions at the TDC, the in-cylinder temperature during the compression stroke is insufficient to achieve autoignition requirements for methanol. Therefore, numerous ignition-assist strategies for methanol fuelling have been employed, including glow plug [70-72], ignition improver [27], increased compression ratio [26, 73-75], increased intake temperature [20, 75, 76] and pilot injection [77].
2.3.5.2 Single injection Injection timing plays a key role in the combustion process and pollutant formation. It affects the ignition delay because the in-cylinder charge temperature significantly changes towards the TDC. During early injection timing, the initial in-cylinder charge

17
temperature is lower so ignition delay will increase. On the other hand, retarding the injection timing (i.e. closer to TDC) when the in-cylinder charge temperature is higher leads to a shorter ignition delay. Therefore, finding the optimum injection timing for best performance and lesser emissions is required. Previous studies reveal that sweeping the injection timing from HCCI to PPC can lead to a regime that simultaneously produces low emissions and high efficiency [31, 78-84].
The initial experimental work on the injection timing sweep from HCCI to PPC was reported in 2004 by Nordgren et al. [85], who performed experimental work on a heavy-duty single-cylinder optical engine using isooctane (PRF100). They reported a narrow PPC window that can simultaneously produce lower NOx and UHC (Figure 2.4). However, no detailed explanation behind this phenomenon and no data on efficiency were reported. Later, Li Cao et al. [86] studied the impact of injection timing on mixture preparation in PPC using experimental and numerical results and briefly explained the onset of ignition that occurs in a locally rich mixture. In 2015, Shen et al. [78] carried out similar experiments on the injection timing sweep using double injection strategies. They reported the high efficiency regime during late injection timing and explained the phenomenon using energy balance analysis. However, the effect of injection timing on φ-stratification was not well documented.
Figure 2.4. Effect of injection timing on the HC and NOx emissions [85]
Recently, Li et al. [31, 81, 84] investigated the effect of injection timing sweep on the required intake temperature, emission and efficiency of gasoline-like fuels using different piston geometries. From the studies, Li [87] proposed a conceptual plot to visualise the impact of injection timing sweep on the required intake temperature, as
18
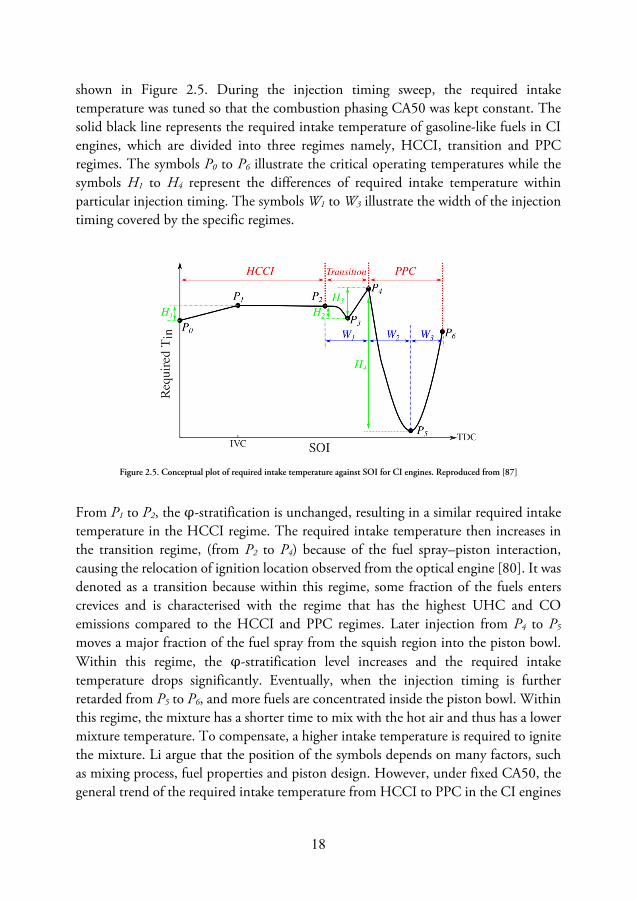
shown in Figure 2.5. During the injection timing sweep, the required intake temperature was tuned so that the combustion phasing CA50 was kept constant. The solid black line represents the required intake temperature of gasoline-like fuels in CI engines, which are divided into three regimes namely, HCCI, transition and PPC regimes. The symbols P0 to P6 illustrate the critical operating temperatures while the symbols H1 to H4 represent the differences of required intake temperature within particular injection timing. The symbols W1 to W3 illustrate the width of the injection timing covered by the specific regimes.
Figure 2.5. Conceptual plot of required intake temperature against SOI for CI engines. Reproduced from [87]
From P1 to P2, the φ-stratification is unchanged, resulting in a similar required intake temperature in the HCCI regime. The required intake temperature then increases in the transition regime, (from P2 to P4) because of the fuel spray–piston interaction, causing the relocation of ignition location observed from the optical engine [80]. It was denoted as a transition because within this regime, some fraction of the fuels enters crevices and is characterised with the regime that has the highest UHC and CO emissions compared to the HCCI and PPC regimes. Later injection from P4 to P5 moves a major fraction of the fuel spray from the squish region into the piston bowl. Within this regime, the φ-stratification level increases and the required intake temperature drops significantly. Eventually, when the injection timing is further retarded from P5 to P6, and more fuels are concentrated inside the piston bowl. Within this regime, the mixture has a shorter time to mix with the hot air and thus has a lower mixture temperature. To compensate, a higher intake temperature is required to ignite the mixture. Li argue that the position of the symbols depends on many factors, such as mixing process, fuel properties and piston design. However, under fixed CA50, the general trend of the required intake temperature from HCCI to PPC in the CI engines

19
will have a spoon-shaped trend [87]. This argument can be supported by previous and present studies that used heavy-duty engines [28, 85].
Interestingly, similar results were reported from another research group that investigated PRF70 and gasoline fuels for advanced combustion engines (FACE I) in light-duty optical engine [82]. The gasoline FACE I has RON70 and octane sensitivity, (S = 0.7) while PRF70 has S = 0. The research group performed the experiment by sweeping the injection timing from −180° aTDC to −15° aTDC at fixed CA50 by tuning the required intake temperature. The degree of stratification was estimated from the intensities of images. Both fuels were reported to exhibit a ‘spoon-shaped’ pattern of required intake temperature, as shown in Figure 2.6.
A similar required intake temperature during early injection was reported due to the similar degree of stratification. However, when the group retarded the injection timing, the degree of stratification increased and peaked at the later injection, which resulted in a very high required intake temperature. The φ-sensitive fuel (FACE I) was reported to be more prone to autoignition at the rich mixture, resulting in lower required intake temperature during late injection timing. Note that the combustion duration also takes a spoon-shaped pattern, similar to the intake air temperature, for both FACE I gasoline and PRF70. The combustion duration matches for these two fuels during the whole injection sweep, with an exception at very late injection timing. Towards later injection, the increased intake air temperature promotes the spray-driven combustion to prolong the combustion duration.
Figure 2.6. Variation of intake air temperature (left) and combustion duration (right) with respect to SOI of different fuels.
Reproduced from [82]
The first experimental results from Li [31] attracted another researcher to further investigate and understand the impact of injection timing sweep on the combustion characteristics using optical diagnostic [79, 80, 88] and numerical simulations [34, 77,
20
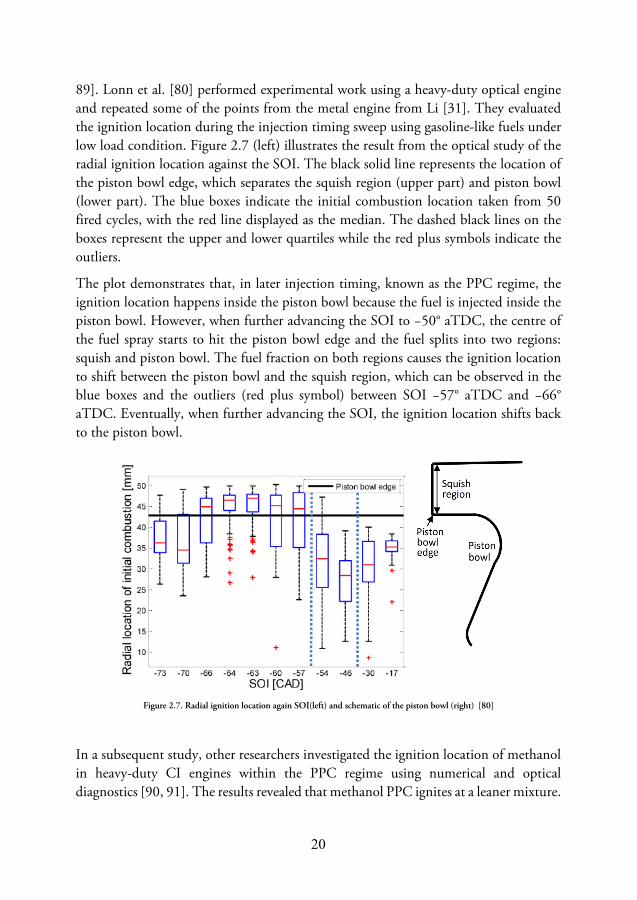
89]. Lonn et al. [80] performed experimental work using a heavy-duty optical engine and repeated some of the points from the metal engine from Li [31]. They evaluated the ignition location during the injection timing sweep using gasoline-like fuels under low load condition. Figure 2.7 (left) illustrates the result from the optical study of the radial ignition location against the SOI. The black solid line represents the location of the piston bowl edge, which separates the squish region (upper part) and piston bowl (lower part). The blue boxes indicate the initial combustion location taken from 50 fired cycles, with the red line displayed as the median. The dashed black lines on the boxes represent the upper and lower quartiles while the red plus symbols indicate the outliers.
The plot demonstrates that, in later injection timing, known as the PPC regime, the ignition location happens inside the piston bowl because the fuel is injected inside the piston bowl. However, when further advancing the SOI to −50° aTDC, the centre of the fuel spray starts to hit the piston bowl edge and the fuel splits into two regions: squish and piston bowl. The fuel fraction on both regions causes the ignition location to shift between the piston bowl and the squish region, which can be observed in the blue boxes and the outliers (red plus symbol) between SOI −57° aTDC and −66° aTDC. Eventually, when further advancing the SOI, the ignition location shifts back to the piston bowl.
Figure 2.7. Radial ignition location again SOI(left) and schematic of the piston bowl (right) [80]
In a subsequent study, other researchers investigated the ignition location of methanol in heavy-duty CI engines within the PPC regime using numerical and optical diagnostics [90, 91]. The results revealed that methanol PPC ignites at a leaner mixture.

21
The reason behind this is presumably due to the charge cooling effect of methanol that prevents autoignition in the rich zone [77]. Additionally, an optical study by Matamis et al. [88] found that, in early injection timings, the ignition of methanol occurs at a leaner mixture concentration and propagates towards a richer concentration; however the opposite happens in late injection timings. Nevertheless, these studies only focus on the PPC regime, and data are lacking on the combustion characteristics, emissions and performance during the whole sweep from HCCI to PPC.
Later, Svensson conducted a preliminary study using stochastic reactor model (SRM) to investigate the trends of peak pressure rise rate, equivalence ratio and thermal stratification of methanol and gasoline under injection timing sweep from HCCI to PPC regime [92]. The results indicated that thermal stratification increases when moving from early to late injection. Moreover, Svensson claimed that gasoline demonstrates a significantly higher peak pressure rise rate and plateau trend compared to methanol. However, the study did not consider piston geometry, which makes the finding arguable because, as stated in the literature, fuel spray–piston interactions contribute significantly to the local φ-stratification and combustion characteristics.
Another study on methanol with single injection strategy focuses on medium and high load operations. However, with a standard diesel engine comprising a compression ratio between 15:1 and 17:1, the in-cylinder temperature during the compression stroke is insufficient to achieve autoignition requirements for methanol [28]. For instance, Shamun et al. reported that an intake temperature up to 175°C is required when running methanol in medium load with a standard compression ratio of 15:1 [73]. Although the low compression ratio benefits the lower peak pressure rise rate during high load operation, a challenge of ignition during low load raises an issue. Thus, in the subsequent study, Shamun performed experimental works using piston with a compression ratio of 27:1 [74]. The study reported that methanol can be ignited easily, and a stable combustion was achieved without preheating the air. However, there was a penalty of higher peak pressure rise rate during higher load conditions.
From both works, it can be concluded that a low compression ratio will allow flexibility in high load operation but likely lead to an issue during cold start and low load operation. On the other hand, increasing compression will ease the ignition but be an issue during high load operation due to the high pressure rise rate. This issue inspired Svensson et al. [93] to perform a numerical investigation using SRM on a multi-cylinder heavy-duty engine to find an optimal compression ratio for methanol engine. They used data from single-cylinder metal engines to develop and verify the model. They proposed the geometric compression ratio of 21.6:1 for methanol engines, which they claim would significantly increase the engine efficiency at light load.

22
In terms of emissions, a previous study reported no soot and NOx trade-off for methanol [26, 73, 94]. Lower NOx emission was reported at medium load with methanol because of combustion temperature reduction associated with the high charge cooling effect of methanol [75]. For the performance, Shamun reported 52.8% gross indicated efficiency during medium load operation with a compression ratio of 27:1 [74]. Nevertheless, relatively high UHC emissions were recorded because increasing the compression ratio requires the piston bowl to be shallow and/or have a relatively smaller diameter, that is, have a bigger surface in the squish regions. Therefore, the increase in UHC is due to the fuel ending up in the squish regions. However, this issue can be alleviated by using multiple injection strategies [95, 96].
2.3.5.3 Multiple injections Nowadays, the availability of fast piezo-electric injectors with high pressure common rail technology allows a very high degree of flexibility in the injection timing and mass proportion control of multiple injection strategies [97]. Figure 2.8 represents a simplified diagram of a multiple injection strategy used in conventional engines. A small amount of pilot injection is commonly used for noise and NOx reductions. On the other hand, closed couple between main and post injection is used to reduce soot emissions. Late post injection helps improve the exhaust gas temperature for soot regeneration and provides HCs for the NOx adsorber catalyst.
Figure 2.8. Schematic of multiple injection strategy [97]
In LTC, single injection strategy at high load operation is not preferable because of the combustion noise and controllability issues associated with excessive high maximum pressure rise rate [14]. To mitigate these issues, a pilot injection was introduced for NOx and noise reduction [9, 98]. A previous study performed an experimental evaluation on the ethanol PPC under low and medium load using double injection strategies in a single-cylinder heavy-duty engine [99]. The dwell between pilot and main injection were varied and only two mass ratios of pilot injection were utilised to study the combustion characteristics, emissions and efficiency. During the experiment,

23
the intake temperature was kept constant at the given loads. The study found that double injection strategy is suitable for ethanol PPC over single injection because of combustion controllability enhancement, noise reduction and efficiency improvement.
Recently, Lonn et al. performed optical diagnostic and numerical work on double injection strategies with methanol PPC [77]. They evaluated the required intake temperature of methanol with double injection by varying the dwell and pilot mass. The results revealed that, with a proper mass and dwell, a reduction of around 50°C on required intake temperature can be achieved compared to single injection. The reason is that a sufficiently small mass fraction of pilot injection will absorb some heat from the compressed gas to evaporate and combust, which cause a mild increase in the in-cylinder pressure and temperature, eventually shortening the main ignition delay [100, 101]. However, no complete data on emissions and performance have been reported by Lonn.
On the other hand, post injection is used to reduce UHC emissions. A previous study has shown that, for long ignition delay conditions, over-leaning mixtures near the injector region after the EOI causes the local equivalence ratio to fall below the ignitability limit, thus contributing to UHC emissions [29]. Later, several researchers investigated the effect of post injection strategies in a heavy-duty optical engine to solve this issue [95, 102]. The results revealed that UHC emission can be reduced depending on the injection timing and the mass proportion of post injection. A very small post injection together with short dwell between the main and post injection can reduce the UHC emission by enriching the local fuel air mixtures near the injector up to the ignitibility limit. In fact, no data has been reported on methanol using triple injection strategy under low temperature combustion.
2.4 Summary and Research Gaps
The previous discussions briefly reviewed the advantages and disadvantages of CDC. Higher engine efficiency and lack of throttling losses are the main benefits of conventional diesel engines over SI engines. However, NOx and soot emissions are the main challenges for conventional diesel engines. To mitigate this issue, the research community has proposed HCCI, which promotes low soot and NOx emissions. However, the main drawbacks of HCCI are high CO and HC emissions, combustion controllability and a narrow operating load range.
With the aim of improving the controllability and engine efficiency experienced with HCCI and MK, the PPC concept was proposed. However, the application of these
24
concepts with diesel fuel was found to be limited at high load conditions due to the high reactivity of diesel fuel. To extend the PPC operation towards higher loads, gasoline-like fuels with high octane number were explored. The investigations confirmed PPC with high octane number fuels as a promising method to extend the ignition delay while providing a simultaneous reduction in NOx and soot emissions. However, the production of high-octane fuel is energy intensive, which contributes to WTW CO2 emission. Therefore, methanol as a high-octane renewable fuel has been chosen.
In recent years, substantial progress has been made in understanding the high-octane number fuels in LTC, particularly HCCI and PPC combustion strategy. However, the literature review suggested that there are some research gaps to be studied to further increase the potential and understanding of high-octane fuels. Accordingly, additional research is required in several areas:
• Even though there has been substantial research on high-octane fuels underLTC, there is still a lack of understanding on the autoignition behaviour ofhigh-octane fuels in real engines under the LTC. Particularly, the impact offuel spray and piston interaction on the combustion characteristics andemissions of high-octane fuel in PPC has not been fully understood.
• A considerable amount of literature has been published on the transition fromHCCI to PPC using gasoline-like fuels. However, no studies have beenconducted to explore the influence of injection timing on the local equivalenceratio and temperature stratification of methanol and how it impacts thecombustion characteristics, emission and performance. Moreover, much of thecurrent literature pays particular attention only on single intake pressure, butno study has been conducted to compare and explain the impact of differentintake pressures, particularly on methanol within this HCCI to PPC sweep.
• Experimental results using multiple injection strategies on high-octane fuelsunder LTC are plentiful in the literature. However, using methanol as PPCfuel is a new research area, and there is a need to investigate how multipleinjection strategies works with methanol PPC. Moreover, there were no studiesthat reported on triple injection for methanol under the PPC mode.Specifically, there were no data published on the effect of post injection on theemissions of methanol.

25
3 Tools and Methodology
3.1 Introduction
This chapter covers the two engine test set ups that were used in this thesis: the Volvo light-duty multi-cylinder and Scania heavy-duty modified single-cylinder engines. The experimental facilities for both engines that were set up are briefly described herein, including the emission measurement systems and the data acquisition system. Furthermore, the post-processing calculations are briefly explained. Finally, the fundamentals of the theoretical calculation used to analyse the combustion process are briefly explained in section 3.4.
3.2 Volvo Light-Duty Multi-Cylinder Engine
3.2.1 Engine Characteristics
All the experiments on the light-duty presented in this thesis were performed on a 4-cylinder Volvo D4 2 L diesel engine. Figure 3.1 shows a schematic diagram of the different subsystems present in the test cell. The engine used the standard combustion system with a re-entrant piston bowl shape, and the engine specifications are presented in Table 3.1.
Table 3.1. Engine characteristics
Bore (mm) 82 Stroke (mm) 93.2 Connecting-rod length (mm) 147 Displacement per cylinder [L] 0.492 Geometrical rc [-] 15.8:1 Number of valves 4

26
Figure 3.1. Schematic diagram of the Volvo D4 engine test cell.
3.2.2 Fuel Injection Systems
The fuel injection is provided by a Denso G4S common-rail direct-injection system. The main specifications of the diesel injectors are illustrated in Table 3.2. This solenoid injector is reliable to use with gasoline, as reported by Solaka et al. [103], unlike the piezo injector, which has low reliability when operated with gasoline due to the low viscosity of gasoline compared to that of diesel. The engine control system obtains the rail pressure feedback from an additional pressure sensor installed in the rail volume, and controls the high-pressure pump accordingly via a proportional–integral–derivative (PID) controller.
Table 3.2. Main characteristics of the Volvo D4 diesel injector
Type Solenoid Steady flow rate @ 100 bar (ml/min) 800 Number of holes 8 Hole diameter (μm) 125 Spray angle (o) 155
3.2.3 Air Supply System
The original turbo-charging system was removed. Instead, external compressed air is employed to provide the desired boosting levels. The air intake pressure is regulated via a pressure regulator coupled to a three-way proportional control valve, which directly detects the feedback pressure from the engine intake manifold. After pressure regulation, the airflow was measured using an airflow meter. To achieve a higher intake air temperature, an external heater was installed, which is controlled by an industrial

27
PID controller. The air intake pressure is monitored at the intake manifold while the individual port temperatures are measured as close as possible to the intake ports.
3.2.4 Exhaust System
The absence of a turbo-charging system results in a lower exhaust manifold pressure. Therefore, to resemble the effect of the original turbocharger and to generate a positive pressure gradient between the exhaust and intake manifolds, an electronically controlled valve is mounted after the exhaust manifold to create a certain degree of backpressure (~0.2 bar over the air intake pressure). This then enabled the use of short-route exhaust gas recirculation (EGR). The flow is controlled by the position of a valve governed by a servomotor. The EGR ratio was defined as the ratio of CO2 concentrations measured in the intake manifold to the CO2 concentrations measured in the exhaust gases from the engine.
3.2.5 Engine Speed Regulation System
An electrical dyno motor is used to maintain the engine at the desired rotational speed. It is controlled via a dedicated control system based on a variable-frequency drive and regulator with ±1 rpm precision. A portable remote device is used for the stop and start commands as well as the desired engine speed. This solution allows engine motoring without fuel injection enabled, thus enabling engine characterisation via motored tests.
3.2.6 Instrumentation and Measurement Equipment
3.2.6.1 Piston Position and Speed The high-sampling-frequency control system is based on a crank angle incremental encoder placed on the free end of the crankshaft. The encoder works based on optical scanning of a periodic structure, which results in two different digital output signals. The resolution for the signals is 0.2 CAD, and the signals are used for triggering the acquisition of fast-sampling-frequency sensor signals as well as calculating the engine speed. The signal at the TDC is synched with the mechanical engine (TDC position).
3.2.6.2 High-Sampling-Frequency Data Each in-cylinder pressure is acquired using four nearly flush-mounted, uncooled AVL piezoelectric pressure sensors with a combination of glow plug adapters and amplifier. The sensors are capable of measuring a range from 0 to 250 bar. Furthermore, the

28
electrical-current profiles from the direct injectors are measured using current clamps while a standard common rail pressure sensor is employed for measuring the common rail injection pressure.
3.2.6.3 Low-Sampling-Frequency Data The control system in this engine test cell is centralised in the PXI computer. All the measurement data are connected directly to the different cards installed in the PXI computer, except the emission measurement data. In particular, the K-type thermocouples are mounted in different locations, such as in the intake, exhaust, cooling, and lubrication systems. At the same time, the pressures from the intake and exhaust are measured using a pressure sensor with a 0−5 bar measurement range.
3.2.6.4 Flow Measurement The test cell is equipped with a mass flow meter to measure the airflow. The fuel flow was measured by means of Sartorius balance. The scale weight was logged for more than 10 min, and then a linear regression model was fitted to the data to calculate its slope (e.g. fuel consumption).
3.2.6.5 Exhaust Gas Measurement The exhaust gas flow is measured by an AVL AMA i60 exhaust measurement system. The CO2 concentration is also measured in the intake manifold for measuring the EGR flow. The emission meter was calibrated with synthetic calibration gas before each engine test.
Table 3.3 presents the main characteristics of the measurement sensors that were used in this study.
Table 3.3. Specifications of the sensors used in the Volvo D4 engine test cell
Sensor Model Measurement Range Precision
CA encoder Leine & Linde RSI503 0−6,000 rpm ±0.02 CAD Cylinder pressure AVL GH14P 0−250 bar ±1.25 bar Fuel inj. pressure OEM Sensor 0−2,750 bar Torque HBM T40B 0−10,000 Nm ±0.05% Generic pressure Keller 23SY 0−5 bar ±0.7% Generic temperature Pentronic 8105000 0−1,100℃ ±2.5 ℃ Airflow meter Bronkhorst F106CI 0−900 kg/hr ±0.1% Fuel flow meter Sartorius MSE12201S 0−12,200 g ±0.1 g
O2 ETAS ES635 LSU4.9 0−25%
CO/CO2 CO2 EGR NOx TUHC O2 CH4
AVL AMA i60
0−1/16% 0−25% 0−5,000 ppm 0−10,000 ppm 0−25% 0−10,000 ppm
±1% ±1% ±1% ±1% ±1% ±1%

29
3.3 Scania Heavy-Duty Single-Cylinder Engine
3.3.1 Engine Characteristics
The engine that was used in these experiments was a Scania D13 heavy-duty engine. It has six in-line cylinders, each with a displacement volume of 2.12 L. Five of the six cylinders were deactivated by removing the intake and exhaust valves from the cylinder head, hence making it operate with only one cylinder. The schematic diagram of the test cell and the main characteristics of the engine are shown in Figure 3.2 and Table 3.4, respectively. The piston that was used was the standard stepped bowl with a 17.3:1 compression ratio, which is the same piston that was used by the previous studies [84, 104].
Figure 3.2. Schematic diagram of the Scania D13 engine test cell.
Table 3.4. Engine characteristics
Displaced volume [cm3] 2124 Stroke [mm] 160 Bore [mm] 130 Connecting-rod length [mm] 255 Geometrical rc [-] 17.3:1 Number of valves [-] 4 Swirl ratio [-] 2.1 Exhaust valve open [-] 137o aTDC Inlet valve open [-] −141o aTDC

30
3.3.2 Fuel Injection System
A low-pressure pump receives fuel from the fuel tank and supplies the fuel to the high-pressure pump. The fuel injection system was converted into alcohol operation with the ED95 fuelling system. This fuelling system was made for the Scania ED95 engine, which is used to run on 95% ethanol fuel. The high-pressure pump was factory modified in terms of the fuel flow rate and by changing the different gaskets and materials that are in contact with the fuel. This is necessary to keep the pump operation reliable when utilising low-lubricity, low-viscosity, corrosive fuels such as methanol.
The high-pressure pump then compressed the fuel and supplied it to the Scania XPI common-rail injection system. To regulate the fuel injection pressure, the engine control system receives rail pressure feedback from an extra pressure sensor installed in the common rail and controlled via a PID controller. Next, the common rail supplies the fuel to a solenoid injector. The injectors that were used in this work were also modified so that they could withstand methanol corrosivity and supply fuel at a higher flow rate, which accommodates the lower energy content of methanol. The main characteristics of the injector is shown in Table 3.5 which has a bigger hole diameter as well as more holes compared to a standard diesel injector.
Table 3.5. Main characteristics of the injector
Actuation Type [-] Solenoid
Flow rate [pound per hour] 600 Number of holes [-] 12 Hole diameter [um] 230 Included spray angle [o] 120
The fuel flow was measured using a gravity scale with two-digit precision from Sartorius. The fuel tank weight was continuously acquired during the operation, the data were buffered, and a linear regression model was continuously fitted. Under steady-state conditions, the slope of the linear model represents the fuel consumption.
3.3.3 Air Supply System
The intake air was provided by an external in-house air compressor. The air intake pressure was then tuned by remotely controlling the air intake pressure valve using an in-house-built LabVIEW real-time control system. Next, the airflow after the air intake pressure valve was measured using an airflow meter. After the intake air passed through the airflow meter, an externally powered air heater was used to heat it towards the desired inlet temperature. The intake heater was controlled using a PID controller with ±0.5°C accuracy. Downstream of the intake heater was a settling chamber, which was

31
installed before the intake manifold to reduce the pressure waves from the air compressor.
3.3.4 Exhaust System
After combustion, the exhaust gases came out of the cylinder and were channelled towards the exhaust line, which was equipped with a backpressure valve. For the operating conditions that requires boosting, the backpressure was kept slightly higher than the air intake pressure to simulate the use of a turbocharger in a real engine. The exhaust line was equipped with a lambda sensor and a gas analyser. An ETAS LA4 lambda meter was used to monitor the real-time lambda value.
3.3.5 Engine Speed Regulation System
An electric-motoring dyno was used to maintain the engine speed when the engine was fired, or to drive the engine at the desired speed during the motored condition.
3.3.6 Instrumentation and Measurement Equipment
Data acquisition (DAQ) is the process of measuring an electrical or physical phenomenon such as voltage, current, temperature or pressure with a computer. A DAQ system consists of sensors, DAQ measurement hardware and a computer with programmable software. Depending on the signal acquisition sampling frequency, the signals can be divided into high-frequency signals (up to 30 kHz, engine crank angle based) and low-frequency signals (up to 50 Hz, time based). A schematic drawing of the data flow in the DAQ system is presented in Figure 3.3. As can be seen, there are three groups of data saved by the control computer. These groups can be divided into high-sampling-frequency data, low-sampling-frequency data and exhaust gas data.
Figure 3.3. A schematic drawing of the data flow in the DAQ system. Adapted from [87].

32
3.3.6.1 High-Sampling-Frequency Data The high-sampling-frequency control system is based on a crank angle encoder. It provides two different output signals: the crank position measurement and a TDC position. The crank position measurement is conducted with a photoelectric scanning technique. This measurement technique consists of a disk located on the crankshaft. The disk has teeth and rotates at the same speed as the crank shaft of the engine. The encoder produces a digital pulse every time two teeth move relative to the scanning reticle, which in the case of this work is every 0.2 CAD. At the same time, the encoder sends one pulse per revolution in a separate channel. This pulse is used for detecting completed engine revolutions and for engine speed calculation. This signal is then synched with the mechanical-engine TDC position. The in-cylinder pressure was measured using a water-cooled cylinder quartz sensor, a piezoelectric pressure sensor mounted onto the cylinder head. It provides an electrical signal that must be converted into a voltage and amplified. After the amplification, the signal is sent to the DAQ system, which converts the voltage into a pressure value every 0.2 CAD depending on the magnitude of the voltage.
3.3.6.2 Low-Sampling-Frequency Data
• Data logger: The first group of low-sampling-frequency data was from thedata logger. The signals from the intake, exhaust, lubrication and coolingsystems were directly acquired via a separate logger unit. The temperatureswere measured using K-type thermocouples while the pressures of the differentfluids were measured by piezoresistive transducers.
• Horiba gas analyser: The gaseous-emission measurements were conductedusing a Horiba Mexa 7000 exhaust gas analyser. The emission equipmentconsisted of different units that were used to measure and evaluate differentemissions from the exhaust. The CO and CO2 should be measured cold anddry using a non-dispersive infrared measurement technique. A flame ionisationdetector (FID) was used to measure the wet concentration of the THCemissions. The sample gas for FID should be heated to avoid condensation ofhydrocarbon (HC). A paramagnetic detector was then used to measure the O2
concentration, during which the sample should be cold and dry. The NO- andNO2 were measured using the chemiluminescence technique. The emissionmeter was calibrated with synthetic calibration gas before each engine test.
• AVL smoke meter: The soot emission was measured by an AVL Micro SootSensor (MSS), which has a 0.001−50 mg/m3 measurement range. The unit usesthe photoacoustic method to measure the amount of soot in the exhaust gases.The photoacoustic method assumes that the soot particles are completely black

33
and are able to strongly absorb modulated light with a 808 nm wavelength. This modulated light is irradiated towards the flow path of the diluted exhaust gas. The heating and cooling due to radiation causes the soot particles to expand and contract, thus producing a sound wave. The sound wave is then detected by sensitive microphones and then translated into a concentration of soot. The sound level corresponds to the number of soot particulates in the emissions [105].
Table 3.6 presents the main characteristics of the measurement sensors that were used in Scania D13 engine.
Table 3.6. Specifications of the sensors used in the Scania engine test cell
Sensor Model Measurement Range Precision
CA encoder Leine & Linde RSI503 0−6,000 rpm ±0.02 CAD Cylinder pressure AVL GH14P 0−250 bar ±1.25 bar Fuel inj. pressure OEM Sensor 0−2,400 bar Torque HBM T40B 0−10,000 Nm ±0.03% Generic pressure Keller 23SY 0−5 bar ±0.25% Generic temperature Pentronic 8105000 0−1,100℃ ±2.5 ℃ Airflow meter Bronkhorst F106CI 0−900 kg/hr ±0.1% Fuel flow meter Sartorius MSE12201S 0−12,200 g ±0.1 g Soot AVL, MSS 0.001−50 mg/m3 ± 0.001 mg/m3
O2 ETAS ES635 LSU4.9 0−25%
CO/CO2 NOx TUHC CH4
Horiba Mexa 7000
0−1/20% 10−10,000 ppm 10−20,000 ppm 10−20,000 ppm
±0.5% ±0.5% ±0.5% ±0.5%
3.4 Post-Processing Procedure
The following subsection will present the main calculation procedure. The calculation targets were mainly the heat release rate, emissions and efficiencies. The main references for this section are [38, 106].
3.4.1 Heat Release Analysis
The heat release analysis consists of a theoretical formulation that describes the combustion process. It is based on the first law of thermodynamics applied to an open system, where the combustion chamber is modelled as a single zone in which the pressure, temperature and composition are homogeneous. The cylinder head, cylinder

34
walls and piston form the control volume. Consequently, the first law of thermodynamics applied to the control volume results in the equation below.
ch s hti i
dQ dU dQ dW h mdt dt dt dt
= + + + (3.1)
Equation (3.1) demonstrates that the heat released in the chamber during combustion (Qch) is connected to the internal energy (Us), the heat transfer through the chamber walls (Qht), the work performed by the piston (W) and the enthalpies (hi) across the system boundary due to the mass flows (mi). In this thesis, simplification was made by neglecting the heat transfer through the combustion chamber walls and the mass term. The reason for neglecting the heat transfer was that under low-load conditions, the energy estimated by the heat transfer model was a significant fraction of the total energy. This will affect the calculation of the combustion phasing. Therefore, these simplifications imply that:
ch sdQ dU dWdt dt dt
= +.
(3.2)
As the mass flux over the control volume is neglected, the internal energy can be expressed as a function of the bulk gas temperature:
( )sv
dU dTmC Tdt dt
= (3.3)
The specific heat capacity at constant volume, Cv, is an index that depends on the gas composition and temperature. By using the assumption that the in-cylinder gas follows the ideal gas model,
dV dp dTP V mRdt dt dt
+ = (3.4)
The combination of Equation (3.3) and (3.4) results in the equation below.
s vdU C dV dpP Vdt R dt dt
= +
(3.5)
The mechanical work produced by the gas inside the chamber is thus defined by the equation below.
dW dVPdt dt
= (3.6)
Inserting Equation (3.5) and (3.6) in Equation (3.2) leads to the equation below.
ch vdQ C dV dp dVP V Pdt R dt dt dt
= + +
(3.7)

35
To simplify Equation (3.7), the specific gas constant R and the ratio of specific heats are expressed as
p vR C C= − , and (3.8)
p
v
CC
γ =, (3.9)
which are in combination with Equation (3.7):
11 1
chdQ dV dpP Vdt dt dt
γγ γ
= +− −
(3.10)
Usually, the pressure and volume in the combustion chamber are expressed in terms of crank angle, :
11 1
chdQ dV dpP Vd d d
γθ γ θ γ θ
= +− −
(3.11)
The final equation of heat release, Equation (3.11), correlates with the changes in volume and pressure in the combustion chamber. This expression is usually referred to as the apparent rate of heat release (RoHR). Therefore, three different parameters must be known for computing the apparent heat release: the in-cylinder pressure (P), in-cylinder volume (V) and specific heat ratio (γ).
• In-cylinder pressure: In this work, the in-cylinder pressure measurement was based on piezoelectric pressure sensors, which give the relative pressure. The calculation of heat release is based on the absolute pressure. This fact introduces the need for referencing the pressure signal to an absolute level. This process is known as pegging. The method that was used in this work was to set the cylinder pressure at the inlet BDC to equal the intake manifold pressure. However, the cylinder pressure at the inlet BDC point may have large cycle-to-cycle variations. To avoid this, the mean value of the cylinder pressures from 5° CA before BDC to 5° CA after BDC was used, as shown in Equation (3.12).
int ( 5 ) : ( 5 )o oakeP P BDC BDC= − + (3.12)
• In-cylinder volume: The in-cylinder volume as a function of the crank angle degrees is defined in Equation (3.13). Where Vc is the clearance volume, Vd corresponds to the displacement volume and r is the ratio between the connecting rod and the crank radius. Additionally, as the volume calculation is not based on the encoder trigger

36
signals, which control the acquisition of in-cylinder pressure data, there might exist an offset between the in-cylinder pressure sensor data and the calculated associated volume trace. This is normally referred to as TDC offset and is caused by the inaccurate calibration of the crank angle encoder signals. This offset is normally empirically adjusted so that the peak in-cylinder pressure during motored conditions would occur at a certain fixed location (referred to as thermodynamic loss angle; usually between −0.3° and −0.5° aTDC) [71]. In this case, the in-cylinder peak pressure during motored conditions is forced to be located at −0.4° aTDC.
12 2 21 cos ( sin )
2d
cVV V r rθ θ
= + + − − −
(3.13)
• Specific heat ratio: In this thesis, a simplified method was used to estimate thevariable heat capacity ratio during the compression and expansion strokes. First, the in-cylinder condition at the intake valve closing (IVC) time was set as the initial condition.The in-cylinder pressure and temperature at the crank angle degree (CAD) weredenoted as P0 and T0. By referring to the equivalence ratios during the experiment, theinitial value of γ:γ0 can be decided [38]. Next, the cylinder temperature at an arbitrarycrank angle timing was calculated using Equation (3.14). The γ at that timing was thendetermined according to Equation (3.15).
0 0
0
PV PVT T
= (3.14)
0300 0.0813
1000Tγ γ −= − × (3.15)
3.4.2 Exhaust Gas Analysis
With the gaseous emission meter, the concentrations of the following species were measured: UHC (unburnt fuel), CO2 (exhaust), CO, O2, NOx (NO and NO2). With these values, the air/fuel (λ) can be calculated using Equation (3.16). In the equation, a, b and c represent the quantities of the C, H and O2 atoms in a fuel molecule, respectively, and x represents the concentration of a gas species.
( )2 22
1 . 2.2
4 2
xa c xUHC xH O xCO xCO xNO c
b c a xHC xCO xCOaλ
= × × + + + + − + + × + −
(3.16)

37
3.4.3 Mean Effective Pressure and Efficiency
The energy flow in an engine from fuel energy to effective work is illustrated in Figure 3.4 [106]. The energy flow, however, is not expressed in energy but is normalised with the engine displacement volume (Vd) and expressed as mean effective pressures (MEPs). The main purpose of this is to enable comparison between different engines with varying sizes. In this work, the brake mean effective pressure (BMEP) and the brake efficiency were not calculated because only single-cylinder engines were used in the experiments.
Figure 3.4. Sankey diagram of the engine energy distribution.
The calculation of the energy distribution begins with calculating the fuel indicated
mean effective pressure (FuelMEP) using Equation (3.17).
f LHV f T LHV
d d
m Q m n QFuelMEP
V N V× × ×
= =×
, (3.17)
Where is the fuel flow, nT is the stroke factor, QLHV is the energy density of the fuel, N is the engine speed and Vd is the engine displacement. During the experiment, incomplete combustion will produce intermediate species such as HC species and CO, which contribute to the combustion loss mean effective pressure (CLMEP). The combustion efficiency is then described in Equation (3.18). Where M is the molar mass, xi is the dry exhaust gas fraction, xH2O is the water fraction, while i and f represent for exhaust and fuel, respectively.
fm

38
( )2 ,
,
1 (1 )ii LHV i
pC
LHV f
M Ax xH O Q FMQ
η
∗ − +=
(3.18)
Part of the heat is then converted into mechanical work on the piston (IMEPg) while the rest is lost as heat transfer to the surrounding walls (HTMEP) and as exhaust gas heat losses (EXMEP). In this work, the mechanical work transferred to the piston was calculated via the in-cylinder pressure and volume traces. If the mechanical work is evaluated over the compression and expansion strokes, it is normally referred to as gross indicated mean effective pressure (IMEPg) and is defined in Equation (3.19), where P is the cylinder pressure and V is the cylinder volume.
180
180
1C Eg
D D
W WIMEP PdVV V −
+= = (3.19)
3.5 General Method
Data measurement was started after the engine oil and coolant temperature reached 85°C. This can be done either by motoring the engine or injecting some fuel to induce combustion. The calculation of the indicated emissions and combustion characteristics was based on the calculated lambda from the emissions measurements while the lambda meter values were used to monitor the real-time data during the experiments. The reason for this is that the lambda meter has low accuracy when measuring a mixture at a lean condition. During the experiment, 300 cycles were saved and averaged for every operating point under steady -state conditions.
3.6 Conclusion
This chapter presented the two engine facilities that were used to develop this doctoral thesis. First, the experimental setup of a light-duty multi-cylinder engine was described, paying special attention to the test cell characteristics and the accuracy of the sensors and the measuring tools. The modified single-cylinder heavy-duty engine was then described, together with the test cell characteristics. Finally, the post-processing procedure that was used to evaluate the experiment data and the general hypotheses and principles of the study were introduced.

39
4 Effect of Octane Number in Low Temperature Combustion
4.1 Introduction
As mentioned in Chapter 2, it is important to understand the autoignition properties of the fuel when exploring the advancements in low-temperature combustion. Recent evidence suggests that the classical research octane number (RON) and motor octane number (MON) indexes cannot accurately describe the autoignition behaviour of fuels in low-temperature combustion [15, 16, 59-63]. To support these indexes, the research community has proposed new indexes, such as the HCCI-number and the octane index (OI) [64, 65]. Nevertheless, these new indexes have some limitations in predicting the autoignition behaviour of gasoline fuels with different blends [66, 67]. Additionally, other researchers proposed a fuel index that has better autoignition behaviour prediction capability for lower-octane fuels, but it shows less accuracy when it comes to the higher-octane fuels [107].
The aim of the first study [17] was to investigate how well the current fuel index can predict the autoignition behaviour of gasoline-like fuels under partially premixed combustion (PPC) conditions, and to propose a new fuel index: PPC number. One of the important results of the study was that the fuel indexes RON, MON, OI, HCCI number and others could not accurately predict the ignition delay of higher-octane fuels when there were fuel spray-piston interactions. Additionally, the results revealed an interesting phenomenon when the fuel spray moves from the piston bowl to the squish region via the piston bowl edge, which has a significant impact on the required ignition delay. There is no complete explanation of this phenomenon in the literature.
Considering the aforementioned research gap, this chapter explores the influence of higher-octane fuels and injection timing on the combustion characteristics and emissions. Particularly, this work revealed the fundamental phenomenon using experiment and numerical results. The primary reference fuel (PRF) blends were

40
selected for the numerical study due to their well-known properties and available chemical mechanisms.
4.2 Method
This study tested 11 gasoline-like fuels (from naphtas to the conventional gasoline) supplied by Chevron, and eight different PRFs prepared by the author. PRF is a mixture of isooctane with RON 100 and n-heptane with RON 0. The volume of isooctane will determine the RON number of the PRF. For instance, 60% isooctane mixed with 40% n-heptane by volume will produce a PRF with RON 60. In this paper, it is named PRF60. To increase the lubricity and to prevent damage to the injection system, 100 ppm Infineum R655 (lubricity additive) was added to each fuel. The properties of the gasoline-like fuels and PRFs are shown in Table 4.1 and Table 4.2, respectively.
Table 4.1. Properties of gasoline-like fuel blends
RON MON H/C O/C AFR
95.1 90.7 2.253 0 15.14194.0 86.0 2.053 0 14.86791.1 80.2 1.907 0 14.66285.9 81.5 2.053 0 14.86783.1 79.4 2.219 0.101 15.09678.5 77.2 2.143 0.059 14.99274.1 72.2 2.053 0 14.86772.1 67.5 1.765 0 14.45767.2 63.2 2.119 0 14.95961.2 59.5 2.053 0 14.86754.5 52.3 2.037 0 14.845
Table 4.2. Properties of PRF blends
Fuels RON MON H/C O/C AFR
PRF100 100 100 2.250 0 15.031 PRF97 97 97 2.251 0 15.031PRF95 95 95 2.252 0 15.033PRF93 93 93 2.253 0 15.032PRF90 90 90 2.254 0 15.035PRF80 80 80 2.258 0 15.040PRF75 75 75 2.260 0 15.043PRF65 65 65 2.264 0 15.048

41
4.2.1 Experiment Conditions
The initial goal of this work was to evaluate the ignition delay of gasoline-like fuels and PRFs with wide RON ranges using similar experiment conditions. There were a number of constraints involved in setting the operating conditions, which have been described in detail in the first study [17]. The first constraint was that results that could be linked with the previous results obtained using a single-cylinder heavy-duty engine had to be to obtained [108]. Hence, the author tried to create comparable operating conditions while using a light-duty engine. Several parameters were replicable, but the intake air temperature and intake pressure were not.
The second constraint was that there had to be an intake air temperature−pressure combination that could provide a minimum inlet charge temperature for the fuel in the study that was most difficult to ignite, which was PRF100. The third constraint was that there had to be a stable combustion with coefficient of variation of IMEP, (COVIMEP) ≤ 5%. With these three constraints, the operating conditions were set, and at the given setting, all the fuels, from those with a low RON to those with a high RON, could be operated under the same operating conditions.
Table 4.3 shows the experiment conditions for each fuel and the detailed operating conditions. In this study, CA5 was defined as the start of the combustion and was set to be constant at 1° aTDC, as in the previous study [108]. CA5 was the crank angle at which 5% of the fuel was burnt. During the experiment, the injection timing for a particular fuel needed to be tuned to maintain the same CA5, because each fuel has a unique ignition resistance. Later, the ignition delay was calculated as the crank angle degree between the start of the injection and the start of combustion.
Table 4.3. Experiment conditions
Engine Speed 1,200 rpm
IMEPg ~5 bar
Intake air temperature 110˚C
Air intake pressure 1.8 bar
CA5 1˚ ATDC
EGR 40%
Injection pressure 750 bar
Start of injection (SOI) Tuned for CA5 constant
Injection duration Tuned to have a constant load

42
4.2.2 Numerical Simulation Model
To understand the interaction between the fuel spray and the piston at different injection timings, the computational fluid dynamics (CFD) code KIVA3V [109] coupled with CHEMKIN [110] was employed to perform numerical simulation. The selected PRF experiment data were used for the numerical work. Figure 4.1 shows the combustion chamber and the computational mesh in this study. The computational mesh was made up of a 45° sector of the combustion chamber, which corresponds to one spray plume. The modelling studies started from the intake valve closing at −186° aTDC and ended at the exhaust valve opening at 163° aTDC.
For the initial conditions, the charge temperature, pressure and species concentrations in the entire combustion chamber were assumed to be uniform. In the simulation study, the EGR was simplified as the mixture of CO2, N2 and O2, and was assumed to be well mixed with air at IVC. The initial flow inside a cylinder was assumed to be a solid-body rotational flow with a 2.1 swirl ratio (in accordance with the experiments). The total number of grid cells was 8,064 at TDC and 25,851 at BDC, with the smallest mesh size approximately 1 mm.
Figure 4.1. Schematic of the combustion chamber (left) and computational mesh of the combustion chamber (right).
4.3 Combustion Characteristics
4.3.1 Injection Timing and Ignition Delay Results
Figure 4.2 shows the ignition delay values of the PRFs and gasoline-like fuels, indicating that a longer ignition delay is required for higher-octane fuels and a shorter ignition delay is required for lower-octane fuels. It is noteworthy that there is a large increase in ignition delay between two gasoline-like fuels, RON91.1 and RON94 (around 17 CAD), even though they have only a minor difference in octane rating. A similar phenomenon was observed for the PRF fuels, with PRF90 and PRF97 having a 15 CAD ignition delay difference between them.

43
Figure 4.2. Ignition delay values of the PRFs and gasoline-like fuels.
To explain this phenomenon, the combustion characteristics and emissions of the PRFs and gasoline-like fuels from the experiment results were analysed. In addition, some of the PRFs’ data were selected for the numerical simulations to explain the phenomenon inside the cylinder.
4.3.2 Combustion Rate and Duration
Figure 4.3 shows the in-cylinder pressures and RoHRs of the PRFs in this study. According to the figure, the lower PRFs (the PRFs with a lower RON) have a shorter ignition delay, and their combustion is characterised by a higher RoHR peak, a shorter premixed combustion duration followed by the late combustion phase. On the other hand, the higher PRFs (the PRFs with a higher RON) have a longer ignition delay, and their combustion is characterised by a lower RoHR peak and a longer premixed combustion duration. It should be noted that the height of the fuel signal does not reflect the amount of fuel injected but was designed that way to make it visible to the reader.
Figure 4.3. In-cylinder pressures, RoHRs and injector signals of the PRFs.
Cyl
inde
r Pre
ssur
e, (b
ar)
Rat
e of
Hea
t Rel
ease
, (J/
CAD
)

44
To understand how the injection timing influences the combustion characteristics, the spray targets of several PRFs were plotted in Figure 4.4 together with the in-cylinder temperatures associated with the start of injection (SOI). The plot of in-cylinder temperatures demonstrates an increasing trend when it further retards the injection timing. This is expected because when the piston moves towards the TDC, the in-cylinder pressure and temperature increase due to the compression. Moreover, based on the figure of the spray target, in the lower-RON fuels, the injection was made inside the piston bowl. With increasing RON, the fuel required advanced injection timing, which was associated with the higher ignition resistance.
Figure 4.4. Spray targets and in-cylinder temperatures of the PRFs associated with the SOI.
Figure 4.5 was plotted to reveal the influence of the injection timing on the local φ distribution at the TDC. In addition, the mean effective equivalent ratios (φmean) were plotted corresponding to the SOI. The φmean in Equation (4.1) is defined as the mass-weighted average of equivalence ratio in the entire cylinder while index i denotes the local grid cell. Summation was made for all the grid cells in the cylinder. mi /mf is the ratio of the mass from the fuel in the i-th cell to the total mass of the fuel in the cylinder.
This equation reveals that the cells with more fuel will have more weight in the mean of equivalence ratio [104]. Therefore, they can better represent the reactivity of the mixture and the fuel stratification. The plot of the φmean’s in Figure 4.5 illustrates that the φ-stratification increases when it retards the injection timing because more fuel is concentrated inside the piston bowl.

45
1
cellni
mean ii f
mm
ϕ ϕ=
= (4.1)
Moreover, the plot in Figure 4.5 demonstrates that when the injection timing is advanced from −11° aTDC (PRF90) to −24° aTDC (PRF97), the spray target moves from the piston bowl to the piston bowl edge, respectively. When the fuel spray hits the piston bowl edge, a fuel spray-piston interaction occurs, which splits the fuel into two streams: one into the piston bowl and the other towards the squish region. Additionally, in the earliest injection timing (SOI −34° aTDC), the major fraction of the fuel spray hits the squish region. When the piston moves towards the TDC, a fraction of the fuels is pushed into the crevices and the piston bowl while a fraction remains in the squish regime. The local in-cylinder temperature in the crevices and squish regime were lower because of the high heat losses associated with the heat transfer to the cylinder wall and cylinder head, respectively.
Figure 4.5. In-cylinder φ distribution of the PRFs at different SOIs (at TDC).
In the optical study by Lonn et al. [80], the ignition location shifted between the piston bowl and the squish region when the fuel spray hit the piston bowl edge and split into two. Furthermore, Lonn reported a significant increase in the required intake air temperature when the fuel spray moved from the piston bowl to the piston bowl edge, which is similar to the results that were found in the metal engines [28, 84].
Previous studies classified different regimes according to the location of the fuel spray target and the spray-piston interactions that influence the local φ stratification [84,

46
90]. For instance, the late PPC regime for the fuel injection inside the piston bowl. Then, the early PPC regime when the injection target moves from the piston bowl to the piston bowl edge. Later, the transition regime when the fuel spray hit the squish regime and crevices.
Interestingly, a similar phenomenon was found in this study, which showed that a significantly longer ignition delay is needed for the high-octane fuels that have a fuel spray split into two regions. Generally, a high-octane fuel has higher ignition resistance, which means that it requires a higher ignition temperature. Therefore, by having a longer ignition delay, the fuel has more available time to mix with the hot air in the combustion chamber to increase the mixture temperature before the onset of ignition. So, the author anticipated a significant increase in the ignition delay for the high-octane fuels because of the changing of the combustion regimes.
To support this argument, Figure 4.6 was plotted to gain an understanding of the relationship between injection timing and combustion duration. The combustion duration was estimated based on the crank angles at which 90% and 10% of the fuel were burnt, respectively, as shown in Equation (4.2).
10 90 90 10CA CA CA− = − (4.2)
On the basis of Figure 4.6, it is apparent that the combustion duration takes a spoon shape pattern in the PPC region, which corresponds to a similar finding reported in the past studies [82]. Based on this plot, the SOI can be divided into three main regimes according to the combustion duration: transition, early-SOI PPC and late-SOI PPC.
Figure 4.6. Combustion duration of the PRFs and gasoline-like fuels at different SOIs.

47
Figure 4.7 (left) illustrates the late combustion phase, which causes a longer combustion duration for the fuels with an injection timing within the late-SOI PPC regime. In the late-SOI PPC, the fuel spray penetration was the shortest due to the higher ambient pressure [111]. Moreover, the fuel was concentrated inside the bowl. When the piston moves towards the TDC, the in-cylinder temperature increases and ignites the fuel. However, because the mixing time was too short, the fuel was not fully vaporised. Eventually, after the premixed combustion phase, the remaining fuel vaporises, mixes and burns in the late combustion phase.
Figure 4.7. Late combustion phase in late-SOI PPC (left) and cylinder pressure, RoHR and injector signal at early-SOI (right).
On the other hand, in the early-SOI PPC regime, the ignition delay is sufficiently long for the fuel to mix with the air prior to ignition. Also, the injection signal and the heat release rate in Figure 4.7(right) confirm that there was a full separation between the end of the injection (EOI) and the start of the combustion (SOC).
However, when the injection timing is further advanced, the fuel spray hits the piston bowl edge and further progresses to hit the squish zone. In this regime, a major fraction of the fuel was spread throughout the squish zone while a fraction of the fuel entered the crevices. This causes a higher heat loss rate because of the fuel trapped in the squish region [112-114].
Additionally, the experiment and numerical data were plotted together in Figure 4.8 (left). The aim was to support the explanation of the phenomenon of the longer ignition delay observed in the PRFs and gasoline-like fuels. In this figure, the in-cylinder averaged temperature was calculated based on the in-cylinder pressure at the

48
SOI of the PRF, which showed a higher in-cylinder temperature towards the late injection timing.
In addition, the φmean’s with regard to the RONs of the PRFs were plotted against the SOI. This plot illustrates that lower-octane fuels have late injection timings and higher φmean’s. The reason for this is that during late injection timing, the fuel has a shorter ignition delay and thus less time available for it to mix, leading to a higher φ stratification or a higher φmean. Moreover, a linear correlation can be observed between the RON (RON65 to RON90) and the SOI within the late-SOI PPC regime. This relation was expected because a longer ignition delay is required for the higher-octane-number fuels.
Figure 4.8. RON, φmean and Tiin-cylinder vs. SOI of the PRFs (left). Centre of the fuel spray at the given SOI (right).
It is noteworthy that when the octane number was increased from RON90 to RON100 an exponential correlation was observed between RON and SOI. The reason for this is that when SOI −11° aTDC was moved to SOI −24° aTDC (Figure 4.8 (right)), the fuel spray moved towards the piston bowl edge, which caused the fuel to split into the squish region and the piston bowl, entering the transition regime. The literature demonstrates that injection into this regime makes the ignition location shift between the piston bowl and the squish region, consequently making the fuel harder to ignite [80]. Several studies have proven that injection within a transition regime requires a higher intake air temperature [28, 31].
It must be mentioned here that the intake air temperature and pressure in this experiment were fixed. Therefore, to compensate for this with a fixed intake air temperature, a sufficiently long ignition delay is required so that the fuel-air mixture will have enough time to absorb the heat from its surroundings, increase the mixture

49
temperature and ignite. Eventually, a longer ignition delay is required for the higher-octane-number fuels, which gives rise to an exponential correlation. In other words, the large difference in ignition delay between PRF90 and PRF100 was clearly due to the transition in combustion mode from late-SOI PPC to the transition regime.
4.4 Emissions
In this study, the soot emission was not measured because the initial study focused on evaluating the ignition characteristics. However, other regulated emissions, such as the UHC, CO and NOx, were measured using an AVL exhaust measurement system.
Figure 4.9 illustrates similar trends of UHC and CO emissions for the PRFs and gasoline-like fuels at different regimes. Both emissions increased slowly from the late- to the early-SOI PPC regime but significantly increased when the injection timing moved to the transition regime. In the early injection timing, the fuel has a longer spray penetration, causing more fuel to enter the crevices and the squish region, resulting in incomplete combustion [87, 113].
In contrast, at late injection timing, a major fraction of the fuel was inside the piston bowl, resulting in lower UHC emission. Moreover, the higher in-cylinder temperature in the later injection timing enhanced the CO oxidation, resulting in lower CO emission. Figure 4.10 shows the lower NOx emission within the transition and early-SOI PPC regimes due to the lower local in-cylinder temperature associated with the locally lean mixture. On the other hand, in the late-SOI PPC regime, the fuel has a locally rich mixture, leading to a higher combustion temperature and to the NOx formation.
Figure 4.9. UHC and CO emissions.

50
Figure 4.10. NOx emission.
4.5 Conclusions
This chapter demonstrated that the required ignition delay varies with different octane numbers at otherwise fixed operating conditions. One of the clear trends that was found is that a lower-octane fuel has a shorter ignition delay while a higher-octane fuel needs a longer ignition delay. This is due to the lower ignition resistance associated with a lower autoignition temperature for the low-octane fuels. Therefore, at the given operating condition, low-octane fuels require a shorter premixing time to have a local mixture that achieves the ignition temperature. On the other hand, higher-octane fuels require earlier injection timing so that the fuel would have sufficient time to mix with the hot air, increase the mixture temperature and achieve ignition temperature before onset ignition.
Late injection timing provides a shorter premixing time, causing a higher φ stratification (a higher φmean) characterised by a higher RoHR peak and shorter premixed combustion followed by the late combustion phase. Moreover, a major fraction of the fuel spray was injected inside the piston bowl; thus, late injection timing has the benefit of lower UHC as a lower fraction of the fuel enters the squish region. In addition, the CO emission was lower because of the higher oxidation rate associated with a higher combustion temperature, which is a drawback for NOx emission.
Early injection timing provides a longer premixing time, resulting in a lower φ stratification (a lower φmean) characterised by a lower RoHR peak and a longer combustion duration. Furthermore, in the advanced injection timing, a major fraction of fuel enters the squish region and crevices and causes higher UHC and CO. However,

51
a lower NOx due to the lower combustion temperature is associated with the locally lean mixture.
The phenomenon of the large difference in ignition delay of the higher-octane fuels was due to the changing of the combustion regimes. When the fuel spray moves from the early-SOI PPC regime to the transition regime, fuel spray-piston interaction occurs, which splits the fuel into two regions: the squish region and the piston bowl. This fuel split causes the shifting of the ignition location between the piston bowl and the squish region, which makes it difficult for the fuel to ignite. To compensate for this with a fixed intake air temperature, a sufficiently long ignition delay is required for a high-octane fuel so it would have a sufficiently long time to mix with the hot air and to increase the mixer temperature prior to ignition.
The results of this work have provided a better understanding of how high-octane fuels impact the required ignition delay as well as the φ-stratification, the combustion characteristics and the emissions under LTC. The literature review in Chapter 2 has proven that high-octane fuels have the potential to improve the higher load limits for low-temperature combustion due to their greater ignition resistance. Nevertheless, the production and transport of higher-octane fuels require energy-intensive refinery processes, which generate higher well-to-tank (WTT) CO2 emissions [19]. The literature review indicated that methanol is one of the renewable fuels that have a high-octane number as well as a unique property that makes it a potential fuel for well-to-wheel (WTW) CO2 benefits. Therefore, based on the approach employed in this work, the author has continued investigating the influence of injection strategies on the combustion characteristics of methanol under a low load, which will be discussed in the next chapter.


53
5 Effect of Injection Strategies and Air Dilution on Methanol Combustion
5.1 Introduction
The literature review in Chapter 2 has proposed that the combination of a renewable high-octane fuel, methanol, and low-temperature combustion could be a promising future solution for a sustainable and clean combustion engine. Several researchers have reported the combustion characteristics of methanol in medium to high loads under LTC that can produce ultra-low soot and high engine efficiency [74, 93]. However, a major problem with this concept is the higher CO and UHC emissions in low-load operation. One of the factors contributing to this is a long ignition delay, which causes an over-leaning mixtures near the injector region after the EOI [29, 115]. Nevertheless, this can be reduced by modifying the local and global equivalence ratio. There has been little discussion to date, however, about how the local φ of methanol evolves during an injection timing sweep from HCCI to PPC. Moreover, no previous study has investigated triple-injection strategies with methanol PPC.
Therefore, the work presented in this chapter aimed to improve the understanding of how the local φ evolves during the injection timing sweep from HCCI to PPC, and how it influences the combustion characteristics, emission and performance of methanol. In addition, the double- and triple-injection strategies were employed to evaluate their impact on the methanol PPC. The chapter starts with an investigation of the influence of injection timing sweep (from HCCI to PPC) and air intake pressure on the local and global φ distribution of methanol. Under injection timing sweeps, only single injection was employed. In addition, PRF100 was used as a high-octane fuel to evaluate the effects of the fuel properties, which mainly compared with those of methanol under injection timing sweep.
Later, the double- and triple-injection strategies, which particularly focus on improving the methanol PPC regime, were introduced. Under multiple-injection strategies, the mass proportions and pilot and/or post dwells were varied to evaluate their impact on

54
the local φ and temperature stratification. The emission plots were compared with the Euro VI standard to evaluate the potential of methanol and different injection strategies for meeting the recently legislated emission requirement. Additionally, some of the experiment data were used for the CFD simulation to gain insight into the in-cylinder φ and temperature stratification of different injection strategies.
5.2 Method
Table 5.1 presents the properties of methanol (chemical grade, 99.85% purity) and PRF100, which were employed in this work. Even though the fuelling system was changed to the alcohol ED95 fuelling system, lubricity additives were still added in both fuels to prevent damage in the system. A 100 ppm fraction of Infineum R655 was added to both fuels, which is supposed to have a negligible influence on the combustion and emission characteristics [116].
Table 5.1. Selected fuel properties
Properties Methanol PRF100
RON [-] ∼109 100
MON [-] 92 100 H/C 4 2.25O/C 1 0Lower heating value [MJ/kg] 19.9 44.3 (A/F)S [-] 6.45 15.13 Heat of vaporisation [kJ/kg] 1103 308
5.2.1 Experiment Conditions
All the experiments in this work involved a 1,200 rpm constant engine speed and 800 bar injection pressure, and no EGR was conducted (Table 5.2). A low load of around 4 bar IMEPg was selected and was maintained by tuning the injection duration. The combustion phasing CA50 (crank angle degree at 50% mass fraction burned) was set to around 3° aTDC. This combustion phasing was chosen to ensure that a high-efficiency engine could be achieved, and to have a proper combustion state. Too early combustion phasing may cause a higher peak pressure rise rate, which can increase the heat transfer losses and the engine damage. On the other hand, too late combustion phasing may lead to a lower effective expansion ratio, resulting in lower efficiency.

55
To determine how the injection timing influences the local φ-stratification, the injection timing was swept from HCCI to PPC with a single injection, at around 1 bar air intake pressure. Typically, during the injection timing sweep, the combustion phasing is changed due to the changes in the local φ-stratification. To maintain the combustion phasing at around 3° aTDC, the intake air temperature was tuned accordingly. Additionally, to decrease the error from the bias, the injection timing sweep was done at random order. Later, to understand how the global φ impacts the combustion characteristics and emissions of methanol, the procedure was repeated but with a 1.25 bar air intake pressure. Finally, on the bases of the results of the injection timing sweep, a region that has high efficiency and low emissions (the PPC regime) was selected for further improvement using multi-injection strategies.
Table 5.2. Experiment conditions
Engine speed [rpm] 1200 Injection pressure [bar] 800 Engine load [bar] 4 IMEPg Injection duration Tuned to 4 bar IMEPg Intake air temp. [oC] Tuned to CA50 at ~3° aTDC CA50 ~3° aTDC EGR % 0 Air intake pressure [bar] 1.0 bar ± 0.02 1.25 bar ± 0.02
Fuels Methanol, PRF100 Methanol, PRF100 Methanol Methanol
Injection strategies Single Single Double Triple SOI [° aTDC] -140 to -15 -140 to -10 Refer to Table 5.3
Table 5.3 presents the injection timings for the double- and triple-injection strategies. The aim was to evaluate the effects of the pilot and post dwells, and of the pilot and post mass proportions. To achieve this, the injection dwell and the mass of pilot injection were simultaneously varied as shown in Table 5.4. Each case was named based on the strategy used and the mass proportion in the pilot injection. For instance, D17 represents double injection with a 17% mass by weight in the pilot injection while T20 corresponds to triple injection with a 20% mass by weight in the post and pilot injections. The injection mass was calculated based on the fuel injection model proposed by Xu et al. [117].
Table 5.3. Multiple-injection strategy
Strategies Cases SOIpilot SOImain SOIpost
Double D17, D50 and D83 -60, -50, -40 and -30 -20 0 Triple T20 -50 -20 -2, -4, -6

56
Table 5.4. Mass proportions at different injection strategies
Actual mass (g/cycle) Σmass (g/cyc)
Mass (%)
Cases Pilot Main Post Pilot Main Post
Single 0.113 0.113 100
CaseD17 0.023 0.113 0.136 17 83
CaseD50 0.080 0.080 0.160 50 50
CaseD83 0.108 0.022 0.130 83 17
CaseT20 0.020 0.059 0.020 0.099 20 60 20
5.2.2 Numerical Simulation Model
To gain an understanding of how the local φ evolves inside the cylinder, numerical work was performed using OpenFOAM version 7, a CFD software. The calculation of different physical processes was based on several models, as shown in Table 5.5.
Table 5.5. Models for different physical processes
Physical process Model
Turbulence RNG [118]Injection rate Xu et al. [117] Breakup Hybrid KHRT [119] Collision model O’Rourke [120] Combustion Skeletal mechanism [121] Chemical speed CCM [122]
The characteristics of the metal combustion system, such as a flat cylinder head and the geometrical compression ratio, were replicated in the numerical work. The squish height and the crevices volume were tuned based on the actual compression ratio. To optimise the computational resources, the entire combustion chamber was represented by a 30° mesh computational sector, which corresponds to one spray plume, as illustrated in Figure 5.1. The numerical simulation started from the IVC at −141° aTDC and ended at the exhaust valve opening (EVO) at 137° aTDC. The calculation of the initial condition was simplified by assuming that the in-cylinder charge temperature, pressure and concentration of the species in the entire combustion chamber were uniform. Moreover, the initial flow inside the cylinder was assumed to be a solid-body rotational flow with a swirl ratio of 2.1 (following the experiments).
During the numerical work, the total number of grid cells was 124,250 at TDC while the larger number of grid cells at BDC (458,360) corresponded to a larger volume. The smallest mesh size was approximately 1 mm.

57
Figure 5.2 compares the experiment and simulated in-cylinder pressure and heat release rates at different injection timings. The simulation results well matched the experiment results.
Figure 5.1. Computational mesh.
Figure 5.2. In-cylinder pressure and RoHR from the experiment and simulation for methanol at SOI -50 (left) and SOI-15° aTDC (right).
5.3 Combustion Characteristics
This section covers several main combustion characteristics of the single- and multiple-injection strategies, such as the required intake air temperature, the location of the ignition, the distribution of φ and the temperature, followed by the combustion rate and duration. The numerical results were provided to support and explain some of the experimental work.
-40 -30 -20 -10 0 10 20 30 400
2
4
6
8
10
Incy
linde
r Pre
ssur
e (M
Pa)
Crank Angle (oCA ATDC)
Exp. Sim.
0
400
800
1200
1600
2000
AH
RR (J
/o CA)
-40 -30 -20 -10 0 10 20 30 400
2
4
6
8
10In
cylin
der P
ress
ure
(MPa
)
Crank Angle (oCA ATDC)
Exp. Sim.
0
400
800
1200
1600
2000
AH
RR (J
/o CA
)

58
5.3.1 Required Intake Air Temperature
For the single-injection strategy, the injection timing was swept from HCCI to PPC, with a constant CA50 at around 3° aTDC for both methanol and PRF100. To achieve this CA50, the required intake air temperature was tuned accordingly. To simplify the analysis, the same definition and width were used for each regime, as in the previous study [84]. The main reason for this was that this work did not attempt to provide a detailed explanation of how to define the regime; rather, it aimed to advance the understanding of how different fuel properties, particularly those of methanol, impact the φ-tratification and the overall trend of the required intake air temperature from HCCI to PPC.
Figure 5.3 presents the required intake air temperature against the SOI of two fuels with two different air intake pressures. There are several observations that can be made from this plot. First, methanol has a significantly higher required intake air temperature than PRF100, which can be seen at both air intake pressures. The reason for this is that in a part of a slightly higher RON, a significant amount of charge evaporative cooling effect significantly affects the required intake air temperature of methanol [28]. The second observation is that for both fuels there were minor differences in the required intake air temperature when the injection timing was moved from the HCCI regime to the transition regime.
Figure 5.3. Intake air temperature of methanol and PRF100
This result is expected because at an earlier injection timing, the fuel and air will have a long premixing time. As a result, much of the fuel is premixed and creates minor differences in the φ-stratification level. In the case of PRF100, however, when the

59
injection timing was further retarded to the early PPC regime, there was a significant drop in the required intake air temperature, which was driven by an increase in the φ-stratification level. Then, in the later injection timing, the required intake air temperature increased significantly. Interestingly, for the methanol case, there were only minor differences within the early and late PPC regimes. These small differences translate into the minor changes in the local φ-stratification level.
Figure 5.3 also shows that with a boosted condition, a slightly lower required intake air temperature for both fuels can be achieved, as shown by the dotted lines. This is due to a minor reduction in ignition delay, which is translated into a reduction in the required intake air temperature with increased ambient density. Although O2 is held constant as the boost is increased, reduced ignition delay is caused by a greater absolute O2 number density at a higher boost [123].
As mentioned in the literature review, methanol ignition can be assisted using several methods, such as a higher compression ratio and a glow plug. However, with a standard combustion system, a pilot injection can ease the ignition and therefore reduces the required intake air temperature. Figure 5.4 presents the required intake air temperature of methanol with 50% of pilot mass (case D50), which shows that a lower required intake air temperature can be achieved by retarding the main injection close to the top dead centre (TDC) while keeping a sufficient dwell. A dwell is important for separating the fuel packages and preventing an excess of charge cooling effect from the bulk of methanol introduced in the cylinder.
Figure 5.4. Required intake air temperature (methanol, pin at 1.25 bar) [124].

60
A sufficient mass of pilot injection will absorb less energy from the compressed gas during evaporation, and will therefore combust with a shorter ignition delay. As the pilot heat release increases the in-cylinder temperature at the main injection, the ignition delay for the main injection will be significantly reduced. Therefore, with the double-injection strategy, it is possible to have a lower intake air temperature than that obtained with the single-injection strategy, given that the load, speed and all other control parameters are set equally.
5.3.2 Local φ and Temperature Stratification
Figure 5.5 illustrates the numerical predictions of the local φ against the local mixture temperature plot with three different injection timings for PRF100 and methanol. In general, the plot shows that in the early injection (SOI -80° aTDC, black colour), there was a larger spread of the temperature stratification and lower φ-stratification. The ignition delay was also longer; thus, the fuel had a longer premixing time and spread in a larger volume of the combustion chamber. Consequently, the mixture became leaner (lower φ-stratification) and created a larger spread of the temperature stratification.
On the other hand, the later injections (SOI -30° aTDC, red colour) had a smaller temperature stratification spread but a higher level of φ-stratification. The reason for this is that in later injection (shorter ignition delay), the fuel is more concentrated in the piston bowl and less spread in the cylinder. As such, the fuel is locally rich (higher φ-stratification), and there is a shorter temperature stratification spread.
Figure 5.5. Local equivalence ratio vs. local mixture temperature at -4° aTDC of PRF100 (left) and methanol (right).

61
It should be noted that methanol generally has a larger temperature stratification spread but lower φ-stratification compared with PRF100 at the same injection timing. For example, with regard to the local φ of both fuels at SOI -40° aTDC (green colour), methanol has φ ≤ 1 while PRF100 has φ ≤ 1.4. This is due to the lower stoichiometric air-fuel ratio of methanol compared to isooctane (6.45 vs. 15.13). Therefore, once methanol is injected into the cylinder, it will vaporise, mix with the air, and achieve a stoichiometric mixture faster than PRF100. Because of this, at a given premixing time, the local φ-stratification of methanol will be lower than that of PRF100. It is worth noting that in spite of the fact that it has higher temperature stratification, methanol has a fraction of φ that has a local in-cylinder temperature below 850 K, which can be seen for SOI -30° and -40° aTDC in Figure 5.5.
Figure 5.6. Negative heat release and injection current of methanol and PRF100.
Figure 5.6 was plotted to illustrate the injection signal and negative heat release for methanol and PRF100 at SOI -30° aTDC. It can be seen that methanol has a longer injection duration than PRF100. Due to its lower energy content, a greater volume of methanol needs to be injected into the cylinder to maintain the target load; hence, it has a longer injection duration. Moreover, methanol has more than three times higher heat of vaporisation than PRF100. The combination of these two characteristics will cause a significant amount of charge cooling effect. As such, a larger fraction of heat is absorbed after the fuel injection, which causes a large fraction of the negative heat release for methanol.

62
5.3.3 Ignition Location
Figure 5.7 illustrates the distribution of the equivalence ratio and local in-cylinder temperature of both fuels at CA 2° aTDC for the single-injection case at SOI -30° aTDC. Due to the low heating value of methanol, more fuel is required to maintain the same load. Therefore, methanol has more fuel in the cylinder, as can be seen in the φ distribution in Figure 5.7(a). Moreover, the fuel is distributed at the bottom part of the piston and at the centreline of the cylinder.
It is worth noting that as shown in Figure 5.7(c) the onset of ignition of methanol occurs at nearly the leanest mixtures. This is presumably due to the charge cooling effect of methanol, which prevents autoignition in the rich zone as reported by the previous studies [77, 88]. In contrast, the φ distribution of PRF100 is more concentrated at the bottom corner of the piston bowl, as can be seen in Figure 5.7(b). Moreover, ignition onset occurs in the rich zone, as illustrated in Figure 5.7(d).
Figure 5.7. φ -T of methanol (left) and PRF100 (right) at CA 2° aTDC and SOI -30° aTDC.
5.3.4 Combustion Rate and Duration
Figure 5.8 presents the combustion rates of PRF100 and methanol at three different injection timings. It is worth noting that there was a significant difference in RoHR peak between SOI -30° (dashed black line) and SOI -140° (dotted blue line) for PRF100 because of the large difference in φ-stratification level. In contrast, methanol had a minor difference in RoHR peak at the same SOI because of the minor difference in φ-stratification level.

63
Figure 5.8. RoHR at different injection timings for PRF100 (left) and methanol (right).
Moreover, later injection is characterised by a shorter combustion duration, which can be clearly seen in the case of PRF100, because the fuel is more concentrated at the bottom corner of the cylinder. Therefore, once the mixture reaches the autoignition condition, it combusts and the flame propagates throughout the mixture. As the φ’s are distributed very close to one another, the flame rapidly propagates and thus ra§ises the combustion rate and shortens the combustion duration.
On the other hand, at the earlier injection timing, the φ-stratification is low, but the thermal stratification is higher. Hence, upon ignition, the combustion takes a relatively longer time to propagate from the hottest to the coldest part of the mixture. As such, the combustion extends and exhibits a longer combustion duration. Figure 5.9 demonstrates the RoHR and in-cylinder pressure of methanol and PRF100 at SOI -30° aTDC, which proves that methanol has a longer combustion duration and a lower RoHR peak than PRF100.
Figure 5.9. Cylinder pressure, HRR and injection signal at the late PPC regime (pin 1.0 bar).

64
Figure 5.10 shows the RoHR peaks and the combustion durations of methanol and PRF100. The RoHR peak is the maximum value of RoHR while the combustion duration is defined from Equation (4.2). At the same air intake pressure of 1 bar, PRF100 exhibited a higher RoHR peak and a shorter combustion duration than methanol, which could be seen through the whole injection sweep.
Figure 5.10. RoHR peaks (left) and combustion durations (right) of methanol and PRF100.
Interestingly, however, there was a dip in the RoHR peak of PRF100 at SOI -70° aTDC. This was presumably because the centre of the spray injection hit the piston crevices and caused a higher fraction of fuel to enter the crevices and the squish region. As a result, the higher heat transfer losses and lower in-cylinder temperature caused a lower RoHR peak. It is worth noting that when the injection timing is further retarded from the early to the late PPC regime, the RoHR peak significantly rises, which can be clearly seen in the case of PRF100.
Moreover, in the case of methanol, increasing the air intake pressure reduces the RoHR peak, which can be observed in the HCCI and transition regimes. However, the RoHR peak and the combustion duration are less sensitive when moving into the early and late PPC regimes. Later, multiple-injection strategies were applied to methanol to evaluate how it impacts the RoHR characteristics.
Figure 5.11 illustrates the RoHR peak and combustion duration of methanol with different pilot masses (17%, 50% and 83% by weight) and pilot injection timings. The main injection was fixed at -20° aTDC as the pilot injection was swept between -60° aTDC and -30° aTDC to provide dwells between the pilot and main injections. Additionally, the results of the single injection at SOI -20° were plotted on the same figures to gain an understanding of how the pilot injection impacts the combustion characteristics.

65
Figure 5.11. RoHR peak (left) and combustion duration (right) for the double-injection strategy.
The plot in Figure 5.11 demonstrates that increasing the pilot mass from D17 to D83 reduces the RoHR peak and extends the combustion duration, which can be supported by the plot in Figure 5.12. This is because a higher fraction of the fuel from the pilot injection is mixed with the air and becomes leaner. It then presumably creates a larger temperature stratification spread and lower φ-stratification.
When the pilot injection is moved towards the main injection, the RoHR peak increases because of the higher φ-stratification associated with the shorter ignition delay of the pilot injection [125]. In addition, Figure 5.11 shows an excessive RoHR peak in the case of D17 at the pilot injection timing of -30° aTDC. To understand this phenomenon, the in-cylinder pressure and RoHR were plotted in Figure 5.13, and it was revealed that for this case, D17 has a slightly advanced combustion phasing, which causes a higher RoHR peak and pressure rise rate.
Overall, the results of double injection strategy demonstrate that the combustion duration and RoHR peak are insensitive to the pilot injection timing for the case with a low pilot mass. On the other hand, with the increase of the pilot injection mass, the RoHR peak and combustion duration become more sensitive to the pilot injection timing.
Figure 5.12. RoHR, in-cylinder pressure and injection signal, pilot injection at -50 and main injection at -20.

66
Figure 5.13. RoHR, in-cylinder pressure and injection signal, pilot injection at -30 and main injection at -20.
Figure 5.14 is plotted to evaluate the impact of post injection on the combustion characteristics. The results illustrate that the triple-injection strategy generally has a slightly lower RoHR peak and a slightly longer combustion duration than the single-injection strategy.
Figure 5.14. RoHR peak and combustion duration for the triple-injection strategy.
5.4 Emissions
This section presents the regulated emissions for the single- and multiple-injection strategies. The NOx, CO and UHC results were discussed, covering both single injection and multiple injections. However, the soot emission results revealed that methanol emitted ultra-low soot. As such, soot emission from methanol under the multiple-injection strategy will not be tackled in this study.

67
5.4.1 Soot
Figure 5.15 presents the soot emission results of PRF100 and methanol at two different intake air pressures, which indicate that soot is always low and insensitive to injection timing and intake pressure. This result is consistent with the findings of previous studies [26, 73, 94]. The reason for this is that methanol is a C1 fuel and the first soot precursor consists of C2 components [94]. Moreover, it is anticipated that because of its lower (A/F)s, methanol will be able to rapidly achieve a leaner mixture and avoid the soot formation zone, leading to less soot emission.
Figure 5.15. Soot emissions.
In contrast, PRF100 emitted soot with the later injection timings. The reason for this is that when the injection timing is further retarded, the mixture becomes more stratified and creates a locally rich mix. This locally rich mixture is presumably the source of soot formation, as mentioned in a previous study [40]. However, at a higher air intake pressure, the soot emission of PRF100 was reduced because of the globally lean mixture. Interestingly, a similar trend of soot emission dip when moving to the late PPC regime was observed. However, the location of the dip shifted towards the TDC at a higher air intake pressure. There is yet no clear explanation for this phenomenon, but numerical works or optical diagnostics can help come up with one.
5.4.2 NOx
Figure 5.16 illustrates the NOx emission results of PRF100 and methanol at two different air intake pressures. The red solid line represents the Euro VI standard for NOx emission. There are two observations that can be made from this plot. First, at 1 bar air intake pressure for both fuels (green and black solid lines), NOx starts to increase

68
when it moves from the early to the late PPC regime due to the increase in φ stratification. Moreover, at very late injection timing, methanol emitted significantly lower NOx amounts compared to PRF100. The reason for this is that during the late injection timing, methanol achieved a locally leaner mixture than PRF100 due to its lower (A/F)s mixture.
A second observation can be made: with a higher air intake pressure, the NOx emission was reduced. This is expected because the mixture is globally lean, thus creating a lower global in-cylinder temperature and resulting in lower NOx formation. Surprisingly, the results demonstrated that methanol could meet the Euro VI standard for NOx emission with a boosted condition for the whole sweep.
Figure 5.16. NOx emission at different air intake pressures.
Figure 5.17 (left) illustrates the NOx emissions from the double- and single-injection strategies. The results show that reducing the pilot mass while retarding the pilot injection timing contributes to an increment in the NOx emission. The reason for this is that a higher mass fraction in the main injection that has a shorter ignition delay creates a locally rich mixture, which raises the flame temperature and contributes to NOx formation.
It is worth noting that the NOx increment was too high in the case of D17, especially at the pilot injection timing of -30° aTDC. The results of the previous analysis shown in Figure 5.13 revealed a higher RoHR peak resulting from a high combustion temperature for this particular case. Therefore, the excessive NOx emission in the case of D17 at the pilot injection timing of -30° aTDC was due to the higher combustion temperature. Figure 5.17 (right) compares the NOx emissions of the single-, double- and triple-injection strategies at the same main injection. The plot reveals that a further NOx reduction can be achieved with the use of the triple-injection strategy, because of the locally lean mixture.

69
Figure 5.17. NOx emission for the double-injection strategy (left) and for the triple-injection strategy (right).
5.4.3 CO
Figure 5.18 demonstrates the impact of the injection timing sweep and air intake pressure on the CO emissions of PRF100 and methanol. The red solid line represents the Euro VI standard for CO emission. At the same air intake pressure of 1 bar, methanol has a slightly lower CO emission than PRF100. Presumably, the O2 content of methanol enhances the oxidation rate. However, when there is an increase in air intake pressure, the CO emissions of methanol significantly increase. This is presumably due to its local overly lean mixture with a lower temperature, which cannot oxidise CO to CO2. It is worth noting that methanol emitted very low CO amounts in the later injection, thus meeting the Euro VI standard.
Figure 5.18. CO emissions at different air intake pressures.
Figure 5.19 (left) illustrates the CO emissions of the single- and double-injection strategies at -20° aTDC. The plot shows that reducing the pilot mass and retarding the pilot injection will result in CO reduction. Figure 5.19 (right) illustrates the CO emission from the triple-injection strategy, which shows a minor penalty for the CO emissions from the use of the triple-injection strategy presumably due to the overly lean mixture from the pilot injection with an early injection timing (-50° aTDC).

70
Figure 5.19. CO emission for the double-injection strategy (left) and for the triple-injection strategy (right).
5.4.4 UHC
Figure 5.20 demonstrates the UHC emissions of PRF100 and methanol, which reveal that both fuels emit higher UHC in the HCCI and transition regimes. This is expected because a fraction of the fuel enters the crevices and the squish region with a lower local temperature, and becomes the source of the UHC emissions [89]. However, methanol has a significantly higher UHC in both regimes.
Figure 5.20. Methanol vs. PRF100 at different boost pressures.
This phenomenon can be explained by referring to the φ-T diagram in Figure 5.5, which proves that during early injection timing, methanol has a fuel fraction with a very low local temperature that may not be burned during the combustion. Nevertheless, when further retarded to the early and late PPC regimes, the UHC emission drops significantly. The reason for this is that fuel spray is injected inside the piston bowl during the later injection, and a lower fraction of fuel enters the squish region, resulting in more complete combustion.

71
It is worth noting that the UHC emission of methanol is reduced when the air intake pressure is increased. It is anticipated that the spray penetration will become shorter at a higher air intake pressure because of the higher air density, and will increase the air entrainment rate. Therefore, a lower fuel fraction penetrates the crevices, resulting in lower UHC emission in the HCCI and transition regimes. Additionally, the study results indicated that methanol’s UHC emission was slightly above the Euro VI standard. This is expected, however, because the in-cylinder temperature and pressure are lower at a light-load condition than at a high-load condition, which causes poor combustion and unburned HC [76].
Figure 5.21(left) shows that the UHC emissions for the double-injection strategy have a similar trend as the CO emissions. Figure 5.21(right) demonstrates that the triple-injection strategy has significantly lower UHC emissions than the single- and double-injection strategies. Previous studies have proven that a very small mass in the post injection together with a short dwell between the main and post injections can enrich the locally lean mixtures near the injector so that the mixture can reach the ignitibility limit [95, 102], hence reducing the UHC emission. This result demonstrates the potential approach for UHC reduction with post injection during low load, to meet the Euro VI limit.
Figure 5.21. UHC emission for the double-injection strategy (left) and for the triple-injection strategy (right).
5.5 Performance
5.5.1 Combustion Efficiency
The combustion efficiency was calculated to measure how much of the fuel energy was converted into heat. In an ideal case scenario, the fuel reacts with the O2 and generates exhaust gases containing only CO2, H2O and N2.

72
However, in reality, there is a vast variety of gaseous species emitted from the exhaust. Thus, the calculation is simplified and considers only three emissions and the unburned HC (Table 5.6) when determining the combustion efficiency. Therefore, the combustion loss is the amount of these species measured in the exhaust gases multiplied by their heating value. Soot emissions typically have a negligible impact on the combustion efficiency of methanol because of ultra-low soot. Therefore, the analysis of the combustion efficiency is sensitive to the UHC and CO emissions.
Table 5.6. Heating value of the main species
Species Energy density [MJ/kg]
UHC QLHV
CO 10.1
H2 120
Soot 32.8
Figure 5.22 illustrates the effect of the injection timing sweep and air intake pressure on the combustion efficiency of methanol. Generally, early injection timimg exhibits a slightly lower combustion efficiency, which is demonstrated in the HCCI and transition regimes. The analysis of the emissions showed that UHC and CO dominantly contribute to the lower combustion efficiency.
Figure 5.22. Combustion efficiency of methanol at different air intake pressures.
Nevertheless, when the injection timing is retarded from the transition to the early PPC regime, the UHC and CO emissions are reduced, which is associated with the higher fraction of fuel injected into the piston bowl and the lower fraction of fuel injected into the squish zone, resulting in a rise in combustion effficiency. Additionally, when the air intake pressure was increased, there were minor reductions that could be observed within the HCCI and transition regimes. Nevertheless, the combustion efficiency at

73
different air intake pressures within the early PPC regime was comparable to that within the late PPC regime.
It is worth noting that there is a significant increase in combustion efficiency when the injection timing is retarded from SOI -50° to SOI -40° aTDC. This was due to the spray injection moves from the squish region to the piston bowl edge, which lowered the fraction of fuel that entered the squish region, as shown in Figure 5.23. Later injection led to the late PPC regime with injection inside the piston bowl, which contributes to the nearly complete combustion.
Figure 5.23. Spray injection of methanol at (left) SOI -50° aTDC and (right) SOI -40° aTDC.
Figure 5.24 (left) presents the combustion efficiency of the double-injection strategy, which indicates that the combination of late pilot injection and a small fraction of the pilot mass is a means to achieve higher combustion efficiency. At the given main injection timing of -20° aTDC, a shorter pilot−main dwell allows both injected fuels to be inside the piston bowl, which reduces the fraction of fuels entering the squish region and the crevices. Therefore, a higher combustion efficiency can be achieved in association with the lower CO and UHC emissions. Figure 5.24 (right) illustrates the combustion efficiency of the triple-injection strategy. The plot shows that there was comparable combustion efficiency for the triple-injection other strategies.
Figure 5.24. Combustion efficiency for the double-injection strategy (left) and for the triple-injection strategy (right).

74
5.5.2 Gross Indicated Efficiency
Figure 5.25 presents the gross indicated efficiency (GIE) of methanol at different air intake pressures, showing minor differences in the HCCI and late PPC regimes. However, there was a significant difference in GIE in the early PPC regime. With a higher intake pressure, the specific heat ratio, γ, will increase due to the surplus air. At a higher γ, the combustion temperature is reduced, resulting in a smaller temperature gradient between the wall and the combustion chamber. Thus, there will be less heat transfer losses and the GIE will be improved.
Figure 5.25. GIE for the single-injection strategy.
5.5.2.1 Multiple-Injection Strategies Figure 5.26 (left) demonstrates the GIE of the double-injection strategy compared with the single-injection case at SOI -20° aTDC. The plot reveals that an excessive mass proportion (case D83) in the pilot creates a drawback on the GIE. Moreover, the previous analysis has demonstrated lower combustion efficiency associated with higher UHC and CO emissions for case D83. Thus, less energy is converted into work, resulting in lower engine efficiency. On the other hand, a sufficient mass proportion with a shorter dwell between the pilot and main injection timings shows a potential to improve the GIE.
It is worth noting that for case D17, there was a dip in the GIE when the pilot injection timing was retarded. The plot in Figure 5.13 proves that a higher peak pressure rise rate is associated with a higher RoHR peak. An excessive peak pressure rise rate can cause standing waves inside the cylinder, leading to a higher heat transfer rate from the combustion chamber to the in-cylinder walls [126]. This in turn causes higher heat transfer losses and reduced engine efficiency. For the triple-injection strategy, there was comparable GIE between the triple- and single-injection strategies as shown in Figure 5.26 (right).

75
Figure 5.26. GIE for the double-injection strategy (left) and for triple injection strategy (right).
5.6 Conclusions
The results of the injection timing sweep from HCCI to PPC for methanol and PRF100 demonstrate that the required intake air temperature for both fuels changes because of the local φ-stratification evolution. Moreover, φ-stratification of methanol is less sensitive to the injection timing, resulting in a minor difference in the required intake air temperature and combustion rate. Interestingly, methanol requires a significantly higher intake air temperature than PRF100 because of its higher RON and higher heat of vaporisation.
In addition, the lower air-fuel stoichiometric ratio of methanol provides benefits in achieving a stoichiometric and lean mixture more rapidly than PRF100, at the same injection timing. This property characterised the combustion of methanol at a lower combustion rate and a longer combustion duration (compared to PRF100), which is associated with the lower φ-stratification and larger temperature stratification, respectively. In emission perspectives, methanol has no trade-off between soot and NOx because soot is always low for methanol and is insensitive to injection timing and intake pressure. On the other hand, CO and UHC emissions are sensitive to temperature stratification but less so to φ stratification. Methanol shows higher UHC but generally lower NOx and CO emissions.
When the intake pressure is increased, the ambient in-cylinder density rises during the injection and combustion processes. With a constant fuelling rate, the mixture becomes globally lean, resulting in lower NOx emissions due to the lower flame temperature. Moreover, the UHC emissions at the earlier injection timing was reduced presumably due to the shorter lift of length; thus, there was less fuel penetration of the crevices. On the other hand, there is a minor penalty for CO emissions due to an overly lean mixture that could not reach the oxidation temperature. Even though there was a slight reduction in combustion efficiency for the boosted case compared to the non-boosted

76
case, there was some gain in GIE. This was mainly due to the surplus air, which increases the ratio of the specific heat. Thus, more combustion heat was absorbed, resulting in a lower combustion temperature and less heat transfer losses, leading to a higher GIE.
When comparing the single- and double-injection strategies in terms of the increase of the pilot injection mass, the combustion characteristics become more sensitive to the pilot injection timing because the φ and the temperature stratification are dominated by the pilot injection. Moreover, the study demonstrated that the double-injection strategy reduces the pilot mass and shortens the pilot-main dwell, thus resulting in lower UHC and CO emissions but slightly raised NOx emission compared to the single-injection case. In addition, improved combustion efficiency and GIE can be achieved with a lower pilot mass and late pilot injection.
In the triple-injection strategy, a post injection is introduced close to the main injection. Compared with the single- and double-injection strategies, the triple-injection strategy reveals comparable combustion and GIE. However, it is worth mentioning that significantly lower NOx and UHC emissions were achieved with the triple-injection strategy compared to the single- and double-injection strategies, with a minor increment of CO emission.

77
6 Summary and Future Work
6.1 Introduction
This chapter aims to summarise the main conclusions of the work carried out in this thesis, hence providing a global view of the entire investigation performed. This will allow us to verify how the results obtained from the chapters have contributed to fulfilling the proposed objectives. Finally, several suggestions for future works are presented in the last section of this chapter.
6.2 Summary
As stated in Chapter 1.3, the main objective of this study is to improve the understanding and knowledge on the impact of fuels with higher octane number in the LTC under low load condition. To achieve this objective, the first part of the work is dedicated to evaluate the effect of the required ignition delay of high-octane fuels and explain the effect of fuel spray–piston interactions on the combustion characteristics and emissions under LTC. The second part of the work aims to evaluate the effect of injection strategies and air dilution on methanol under LTC.
6.2.1 Effect of Octane Number in Low Temperature Combustion
In the first part of the work, the ignition delay of 11 gasoline-like fuels and eight PRFs spanning low to high octane numbers was evaluated under similar operating conditions. To compensate for the fixed operating conditions, a sufficiently long ignition delay was required for high-octane fuels. The result demonstrated a linear correlation between octane number and required ignition delay for lower octane fuel below RON90. By contrast, an exponential correlation was observed in the required ignition delay for higher octane fuels, ranging from RON90 to RON100.
The reason is that high-octane fuels requires advance injection timing, which moves the spray target from the piston bowl to the squish region via the piston bowl edge.

78
Interestingly, when the spray target moves around the piston bowl edge, an interaction between fuel spray and piston geometry happens. This interaction causes the fuel to split into the squish regions and the piston bowl, making the mixture harder to ignite. Owing to the advance injection timing, higher-octane fuel also has longer premixing time, which lowers the φ-stratification level, leading to the lower combustion rate and long combustion duration. As a result, lower NOx but higher UHC and CO emissions are realised.
In addition, low octane number fuel has shorter ignition delay and requires later injection timing. The later injection targeting the fuel spray into the piston bowl, concentrates a major fraction of the fuel inside the bowl and creates a high level of φ-stratification, resulting in high combustion rate. Higher NOx but lower UHC and CO emissions were demonstrated by late injection timing.
6.2.2 Effect of Injection Strategies & Air Dilution on Methanol Combustion
In the second part of the work, a single injection strategy was initially applied to methanol and PRF100 by sweeping the injection timing from HCCI to PPC at two different intake pressures. Later, multiple injection strategy was utilised at a boosted condition. Numerical simulation was performed to interpret the underlying phenomenon. The results demonstrated the φ-stratification of methanol is less sensitive to the injection timing compared to PRF100. This can be proven from the minor difference of required intake temperature and combustion characteristics of methanol. A lower (A/F)s of methanol likewise contributed to achieving a stoichiometric and leaner mixture more rapidly than did PRF100. This outcome creates a larger spread of local in-cylinder temperature and a lower level of local φ-stratification of methanol, resulting in longer combustion duration but lower combustion rate, respectively.
The NOx emission of methanol is lower than PRF100 at later injection timing because of its lower combustion rate associated with lower φ-stratification. In general, methanol shows higher UHC but lower CO emissions than does PRF100. There is no trade-off between soot and NOx emissions present for methanol because soot is always low and insensitive to injection timing and intake pressure.
For methanol, by increasing the intake pressure, the global φ increases, resulting in a slight reduction of combustion rate and longer combustion duration at early injection, but an exception at later injection timing. Furthermore, a significant reduction is found in the NOx and UHC emissions but a minor penalty on CO emission, leading to a

79
slight reduction in combustion efficiency with higher intake pressure. However, some gain in the gross indicated efficiency is found with the boosted case. Keeping the same intake pressure and applying the multiple injection strategies further improve the efficiency and lower the emissions.
With double injection strategy, a lower pilot mass together with a shorter pilot-main dwell shows an effective strategy to lower UHC and CO emissions, resulting in a higher combustion and gross indicated efficiency but a minor penalty on NOx.
The triple injection strategy reveals comparable combustion and gross indicated efficiency with single and double injection. However, it is worth mentioning that even though a minor rise in CO emission is achieved, the triple injection strategy demonstrates potential to achieve significantly lower NOx and UHC emissions.
6.3 Suggestion for Future Work
Methanol is one of the potential fuels for future sustainable transportation. However, data are still lacking on the use of methanol in modern CI engines under LTC. Therefore, based on the research conducted in this study, the following works for future studies are suggested:
• The work in this study proves that methanol emits ultralow soot emission. However, given that current and future legislations will consider the particulate number (PN), it is crucial to evaluate the PN and PM of methanol at higher engine loads and global engine maps under conventional and low-temperature combustion.
• The result from this study reveals the benefits of the double and triple injection strategies in low load in supressing emissions and improving engine efficiency. Therefore, a future study is suggested to explore the multiple injection strategy with methanol under high load conditions.
• The combustion system used in this study is a standard piston for CDC that has relatively low compression ratio for methanol. Therefore, it would be interesting to investigate how the combination of optimised compression ratio [93] and methanol piston [127] influences the combustion characteristics, emissions and performance of methanol in LTC.


81
7 Summary of Publications
7.1 Publication I
The Relevance of Different Fuel Indices to Describe Autoignition Behaviour of Gasoline in Light Duty DICI Engine under PPC Mode
Amir Aziz, Changle Li, Sebastian Verhelst and Martin Tuner Division of Combustion Engines, Lund University, Sweden SAE Technical paper SAE 2019-01-1147 DOI: https://doi.org/10.4271/2019-01-1147
The objective of this publication is to evaluate the relevancy of different fuel indices in describing the autoignition behaviour of fuels under PPC condition by using a proposed index called PPC Number. The ignition delays of PRF were used to develop a reference curve where a PPC metric for gasoline could be based on. The PPC Number of a specific gasoline is defined as the octane number of the PRF, which has the same ignition delay as gasoline under the same operating condition. Twelve different gasolines with RON values between 55 and 95 were tested at two different operating conditions of 0% EGR and 40% EGR levels. Results revealed that spray target has a big impact on the autoignition behaviour of the fuels which cannot be described by classical and current indices.
I designed and performed the experiments together with Changle Li. I post-processed the data and synthesised the results with the help of Martin Tuner. I had the main responsibility of writing the paper. Martin Tuner and Sebastian Verhelst also helped in reviewing the paper and giving valuable information and feedback.

82
7.2 Publication II
Impact of Octane Number and Injection Timing on Autoignition Behaviour of Gasoline and PRF in PPC
Amir Aziz1, Changle Li1, Leilei Xu2 and Martin Tuner1 1Division of Combustion Engines, Lund University, Sweden 2Division of Fluid Mechanics, Lund University, Sweden SAE Technical paper SAE 2019-01-2167 This study was conducted to understand the impact of the interaction between the octane number, SOI and piston geometry on the autoignition behaviour of gasoline and PRF during PPC mode. The PRF fuels were used to represent the fuel reactivity of the gasoline. The numerical results were also used to understand the spray target, fuel distribution and autoignition behaviour of the fuels.
I designed and performed the metal engine experiments together with Changle Li. Simulations of fuel sprays were performed by Leilei Xu. I post-processed the experimental data and had the main responsibility of writing the paper. Martin Tuner helped in reviewing the paper, and Leilei Xu helped by giving valuable information and interpretation of the simulation results.
7.3 Publication III
Impact of Multiple Injection Strategies on Performance and Emissions of Methanol PPC Under Low Load Operation
Amir Aziz1, Clarisse Dos Santos2, Antonio Garcia3 and Martin Tuner1 1Division of Combustion Engines, Lund University, Sweden 2Universitat Politecnica de Valencia. CMT Motores teremicos 3 ISAE-ENSMA SAE Technical paper SAE 2020-01-0556
This study was carried out to investigate the influence of multiple injection strategies on the performance and emissions with methanol fuel in PPC. Specifically, the main objective was to reduce HC and CO and simultaneously increase the gross indicated efficiency compared to the single injection strategy. The work was performed with a single-cylinder heavy-duty engine operated at 4 bar gross, which indicated the mean effective pressure, and an engine speed of 1200 rpm. Double and triple injections were implemented with varying dwells, injection timings and fuel mass proportions. The

83
experimental results were analysed with a merit function to select the optimal injection strategy. Concerning emissions, the constraints for the merit function were based on the EURO VI limits while the highest gross indicated efficiency for single injection was used to define the performance constraint. Results revealed that with proper dwell and mass proportion, multiple injection strategies can improve the gross indicated efficiency and reduce the emissions compared to the single injection strategy.
I designed the experiments together with Antonio Garcia. Then I performed the experimental work together with an internship student, Clarisse. I post-processed the experimental data while the analysis of merit function was performed by Clarisse. I had the main responsibility of writing the paper. Antonio Garcia and Martin Tuner helped in reviewing the paper and giving valuable information and feedback.
7.4 Publication VI
Influence of Injection Timing on Equivalence Ratio Stratification of Methanol and Isooctane in a Heavy-Duty Compression Ignition Engine
Amir Aziz1, Leilei Xu1, Antonio Garcia2 and Martin Tuner1 1Division of Combustion Engines, Lund University, Sweden 2Universitat Politecnica de Valencia. CMT Motores teremicos SAE Technical paper SAE 2020-01-2069
This work was performed mainly to understand how the phi-stratification of methanol evolves during the injection timing sweep from HCCI to PPC. The work was performed with a single-cylinder heavy-duty engine running under constant load of 4 bar IMEPg. Generally, during the injection timing sweep the local phi-stratification evolves and will impact the combustion characteristics, particularly the combustion phasing. The intake temperature was tuned accordingly to maintain the combustion phasing around 3° aTDC. To improve understanding on how the fuel properties influence the phi-stratification, isooctane (PRF100) was also used to compare the results with methanol. One of the interesting results obtained from this study revealed that methanol typically has lower phi-stratification but larger temperature stratification compared to methanol. In addition, the low stoichiometric air–fuel ratio of methanol gives the advantage of lower NOx emissions in late injection timing compared to the PRF100. Methanol also emits ultra-low soot emissions and is insensitive to injection timing while PRF100 starts to emit soot in late injection timing.

84
I designed and performed the experimental work and did the post-processing and analysis of data. Leilei Xu performed the numerical simulation results based on the selected experimental data. I had the main responsibility of writing the paper. Antonio Garcia and Martin Tuner helped in reviewing the paper and giving valuable information and feedback.

85
Acknowledgments
In the name of Allah, the Most Gracious and the Most Merciful All Praise to Allah the Almighty, for giving me the blessing, the strength, the chance and endurance to complete this study. Throughout this 4 years and 3 months PhD journey, many people have helped me, and I will do my best to express my grateful to all of those who have made it a memorable one.
I would first like to express my sincere appreciation to my supervisor, Martin Tunér, for his unconditional support and for the freedom he gave me to explore my own interests and ideas in my studies. Knowing him these past years, I’ve learned that he’s not only a great researcher, but also a car enthusiast. I would also express my deepest appreciation to Antonio, my co-supervisor during my last two years, for his invaluable assistance and active supervision. He is not only an excellent researcher but also a good educator and friend who can see and bring out my potential. Thanks, for believing in me even when I didn’t. I will always remember the hectic but super-efficient summer of 2019. Gracias Antonio…
I would like to express my gratitude to all the other seniors, especially from the Division of Combustion Engines, who have had an impact on this work. Special thanks to Per, who almost never failed to answer all of my questions (except when we were in Indianapolis); Öivind for his inspiring book, Efficient Scientific Writing; and Sebastian, who I admired the most for his teaching and presentation skills, especially during his mock teaching in 2018. All of them have a sense of humour which made the Friday meeting always amusing. To Marcus, thanks for being a good PhD friend and a chief technician. Thanks also to Magnus Genrup for being a friendly and supportive head of the department. I would also like to acknowledge the daily support that the administration and IT groups (Catarina, Elna, Julia, Isabelle, Robert, etc.) have provided to the rest of employees of the Department of Energy Science. Tack så mycket!
I am also very grateful to all the technicians in our lab. Without their contributions to the engine, it would have been impossible to conduct the experiments and finish my study. Special thanks to Anders Olsson for helping me change the whole combustion system for the TC9 after I broke it with methanol. Special thanks are also owed to

86
Patrick Johansson, Thomas Lindén and Tommy Petersen. Each one of them are specialists in their field and I believe they are among the best technician in the Europe.
I would like to thank all my colleagues and friends who have contributed to my PhD journey with so much knowledge, fun and life experiences, too many to be named in here, but none forgotten. I am grateful to my officemates during my first year, Pravesh and Giacomo, for the pleasant discussion on the engine research; Pablo, who helped me with the Labview and engine-related problem; and Sam and Changle for the valuable discussions that inspired me to combined the research of methanol with the "spoon shape" idea. I also want to show my gratitude to my "Guru", Vikram, for his endless help with Matlab, Labview, engine settings and many other things. I may have bothered him a lot in these few years. Thanks againVikram. Special thanks to Leilei for the contribution to the numerical work and valuable discussion. Thanks to Carlos for the pleasant discussion on the Scania truck. Thanks also to Maja and Erik; the trip to Japan would not have been so fun without both of you. Merci to Clarisse for helping me with the experimental work during the summer. Grazie, Elena and Giulia, for the nice talks during lunch. Thanks to Rafael for providing me with the engine drawings. Yann, Slavey, Mengqin, Christian Ibron, Mateusz, Burak, Ted, Sara, Niko, Nhut, Xinda, Miao and André Olson, thank you for the great memories.
I would also like to express my deepest appreciation to my best friend, Nika Alemahdi, for always believing in me. The journey would never be too hard when you have a best friend to support you. It is such a blessing to know you, Nika. We hope to see you, Ali, and Soren in Malaysia!!
To my Malaysian and Singaporean friends, thanks for the makan-makan and for being my regular customers for the bike service! It was such a great experience to have all of you here. I would also like to thank Hisfazilah and Iqbal, who helped me during my past years in Sweden. Nab, thanks for taking care of Al Amin while we were waiting for Annur to be born. Ena and Faizal, Yob, Aya and Thomas, June and Gustav, MokNa, Alia, Kak Lina, Kak Chah, Lin and Ayie, Kak Lang and Abg Zahar, thank you for the good memories. Bob and Atie, thanks for the great fishing and camping trips. Deeban and Belinda, thanks for the lamb curry. We will miss it.
My apologies to everyone who cannot read it, but I must write these last words in Malay. Mok, Ramlah Jusoh dan Ayoh, Aziz Othman terima kasih besarkan dan sentiasa doakan mir. Alhamdulillah berkat doa Mok dan Ayoh, mir buleh gi blajor jauh sapa ke Sweden. Terima kasih jugak pada adik beradik yang menjaga Mok dan Ayoh, serta sentiasa memberi sokongan dan kiriman doa dari jauh. Pada Mak, Zaiton Mohammad dan Abah, Ghazali Abdul Karim, terima kasih kerana sanggup datang melawat kami di sini dan

87
tidak penah lupa mendoakan kami. Pada Along dan Angah sekeluarga, terima kasih kerana menjaga Mak dan Abah serta sentiasa memberi sokongan pada kami sekeluarga.
For my late uncle, Aemizal Abdul Rahman; you must be proud of this achievement. Thanks for the advice and unconditional support. I dedicate my PhD to you. May Allah grant you Jannah. I miss you Pok Su…
To my wife, Siti Fatihah, who always be with me throughout this journey, and especially during the toughest time when preparing this thesis. I wish to acknowledge her excellent support and unconditional love. Within these four years, you have been a good listener and amazing motivator to me. Thank you for always supporting and believing in me when I was down. I do believe that there is no one who understands me better than you. I'm really proud of you as my wife and the mother of our kids. To Al Amin, Annur, and the baby AA, Walid apologise for not spending much time with you, especially during these final weeks. But I appreciate all the time we spend together and thank you for the prayers you did for me every single morning. You are one of my greatest motivators during my days. This PhD thesis, we all made it together!!
Finally, I would acknowledge Ministry of Higher Education Malaysia and Universiti Malaysia Pahang for the scholarship award.


89
References
1. Global Energy & CO2 Status Report: The latest trend in energy and emissions in 2018. 2018, International Energy Agency.
2. Energy Technology Perspective 2020. 2020, International Energy Agency. 3. Stocker, T.F., et al., IPCC, 2013: Climate Change 2013: The Physical Science Basis.
Contribution of Working Group I to the Fifth Assessment Report of the Intergovernmental Panel on Climate Change 2013.
4. Roser, H.R.a.M., CO₂ and Greenhouse Gas Emissions. 2017, Published online at OurWorldInData.org.
5. Nitrogen Oxides (NOx), Why and How They Are Controlled. 1999, Clean Air Technology Center (MD-12).
6. Manisalidis, I., et al., Environmental and Health Impacts of Air Pollution: A Review. Frontiers in public health, 2020. 8: p. 14-14.
7. EU: Heavy-Duty Truck and Bus Engines. 8. Francisco Posada, S.C., and Kate Blumberg, Costs of Emission Reduction Technologies
For Heavy-Duty Diesel Vehicles. 2016, International Council on Clean Transportation. 9. Manente, V., et al., Influence of Inlet Pressure, EGR, Combustion Phasing, Speed and Pilot
Ratio on High Load Gasoline Partially Premixed Combustion. 2010, SAE International. 10. Abd-Alla, G.H., Using exhaust gas recirculation in internal combustion engines: a review.
Energy Conversion and Management, 2002. 43(8): p. 1027-1042. 11. Scania introduces Euro VI engine without EGR. 2014. 12. Cummins unveils new QSM12 without EGR at BAUMA. 2013. 13. Manente, V., et al., An Advanced Internal Combustion Engine Concept for Low Emissions
and High Efficiency from Idle to Max Load Using Gasoline Partially Premixed Combustion. 2010, SAE International.
14. Manente, V., B. Johansson, and P. Tunestal, Partially Premixed Combustion at High Load using Gasoline and Ethanol, a Comparison with Diesel. 2009, SAE International.
15. Prakash, A., et al., Understanding the Octane Appetite of Modern Vehicles. SAE Int. J. Fuels Lubr., 2016. 9(2): p. 345-357.
16. Niemeyer, K.E., et al., A Novel Fuel Performance Index for Low-Temperature Combustion Engines Based on Operating Envelopes in Light-Duty Driving Cycle Simulations. Journal of Engineering for Gas Turbines and Power, 2015. 137(10): p. 101601-101601-6.
17. Aziz, A., et al., The Relevance of Different Fuel Indices to Describe Autoignition Behaviour of Gasoline in Light Duty DICI Engine under PPC Mode. 2019, SAE International.

90
18. Aziz, A., et al., Impact of Octane Number and Injection Timing on Autoignition Behaviour of Gasoline and PRF in PPC. 2019, SAE International.
19. Akihama, K., et al., An Investigation of High Load (Compression Ignition) Operation of the “Naphtha Engine” - a Combustion Strategy for Low Well-to-Wheel CO2 Emissions. 2008, SAE International.
20. Blumreiter, J., et al., Mixing-Limited Combustion of Alcohol Fuels in a Diesel Engine. 2019, SAE International.
21. Çelebi, Y. and H. Aydın, An overview on the light alcohol fuels in diesel engines. Fuel, 2019. 236: p. 890-911.
22. Goeppert, A., et al., Recycling of carbon dioxide to methanol and derived products – closing the loop. Chemical Society Reviews, 2014. 43(23): p. 7995-8048.
23. Cheng, L.B.a.W.K., Methanol as an alternative transportation fuel in the US: Options for sustainable and/or energy-secure transportation, in Final report. 2010, Massachusetts Institute of Technology.
24. Landälv, I., Methanol as A Renewable Fuel –A Knowledge Synthesis, f. Report No 2015:08, Editor. 2017, The Swedish Knowledge Centre for Renewable Transportation Fuels, Sweden.
25. Verhelst, S., et al., Methanol as a fuel for internal combustion engines. Progress in Energy and Combustion Science, 2019. 70: p. 43-88.
26. Shamun, S., et al., Detailed Characterization of Particulate Matter in Alcohol Exhaust Emissions. The international symposium on diagnostics and modeling of combustion in internal combustion engines, 2017. 2017.9: p. B304.
27. Michael, S., et al., CI Methanol and Ethanol combustion using ignition improver. 2019, SAE International.
28. Aziz, A., et al., Influence of Injection Timing on Equivalence Ratio Stratification of Methanol and Isooctane in a Heavy-Duty Compression Ignition Engine. 2020, SAE International.
29. Lachaux, T. and M.P.B. Musculus, In-cylinder unburned hydrocarbon visualization during low-temperature compression-ignition engine combustion using formaldehyde PLIF. Proceedings of the Combustion Institute, 2007. 31(2): p. 2921-2929.
30. Kim, D., et al., In-cylinder CO and UHC Imaging in a Light-Duty Diesel Engine during PPCI Low-Temperature Combustion. 2008, SAE International.
31. Li, C., et al., Transition from HCCI to PPC: the Sensitivity of Combustion Phasing to the Intake Temperature and the Injection Timing with and without EGR. 2016, SAE International.
32. Kook, S., S. Park, and C. Bae, Influence of Early Fuel Injection Timings on Premixing and Combustion in a Diesel Engine. Energy & Fuels, 2008. 22(1): p. 331-337.
33. Dempsey, A.B., S.J. Curran, and R.M. Wagner, A perspective on the range of gasoline compression ignition combustion strategies for high engine efficiency and low NOx and soot emissions: Effects of in-cylinder fuel stratification. International Journal of Engine Research, 2016. 17(8): p. 897-917.
91
34. Xu, L., et al., Combustion characteristics of gasoline DICI engine in the transition from HCCI to PPC: Experiment and numerical analysis. Energy, 2019. 185: p. 922-937.
35. Benajes, J., et al., Investigation on Multiple Injection Strategies for Gasoline PPC Operation in a Newly Designed 2-Stroke HSDI Compression Ignition Engine. 2015.
36. Svensson, E., M. Tuner, and S. Verhelst, Influence of Injection Strategies on Engine Efficiency for a Methanol PPC Engine. 2019, SAE International.
37. Heywood, J.B., Internal Combustion Engine Fundamentals. Vol. Second Edition. 2018: McGraw-Hill Education.
38. Heywood, J.B., Internal Combustion Engine Fundamentals. 1988: McGraw-Hill. 39. Dec, J.E., A Conceptual Model of DI Diesel Combustion Based on Laser-Sheet Imaging*.
1997, SAE International. 40. Akihama, K., et al., Mechanism of the Smokeless Rich Diesel Combustion by Reducing
Temperature. 2001, SAE International. 41. Onishi, S., et al., Active Thermo-Atmosphere Combustion (ATAC) - A New Combustion
Process for Internal Combustion Engines. 1979, SAE International. 42. Najt, P.M. and D.E. Foster, Compression-Ignited Homogeneous Charge Combustion.
1983, SAE International. 43. Solaka, H., et al., Investigation of Partially Premixed Combustion Characteristics in Low
Load Range with Regards to Fuel Octane Number in a Light-Duty Diesel Engine. 2012, SAE International.
44. Hanson, R.M., et al., An Experimental Investigation of Fuel Reactivity Controlled PCCI Combustion in a Heavy-Duty Engine. 2010, SAE International.
45. Nieman, D.E., A.B. Dempsey, and R.D. Reitz, Heavy-Duty RCCI Operation Using Natural Gas and Diesel. 2012, SAE International.
46. Splitter, D., et al., Effect of Compression Ratio and Piston Geometry on RCCI Load Limits and Efficiency. 2012, SAE International.
47. Yanagihara, H., Y. Sato, and J.i. Mizuta, A study of DI diesel combustion under uniform higher-dispersed mixture formation. JSAE Review, 1997. 18(4): p. 361-367.
48. Hildingsson, L., et al., Optical Diagnostics of HCCI and UNIBUS Using 2-D PLIF of OH and Formaldehyde. 2005, SAE International.
49. Dec, J.E., Advanced compression-ignition engines—understanding the in-cylinder processes. Proceedings of the Combustion Institute, 2009. 32(2): p. 2727-2742.
50. Kimura, S., et al., New Combustion Concept for Ultra-Clean and High-Efficiency Small DI Diesel Engines. 1999, SAE International.
51. Kimura, S., et al., Ultra-Clean Combustion Technology Combining a Low-Temperature and Premixed Combustion Concept for Meeting Future Emission Standards. 2001, SAE International.
52. Borgqvist, P., P. Tunestal, and B. Johansson, Gasoline Partially Premixed Combustion in a Light Duty Engine at Low Load and Idle Operating Conditions. 2012, SAE International.
53. Alriksson, M. and I. Denbratt, Low Temperature Combustion in a Heavy Duty Diesel Engine Using High Levels of EGR. 2006, SAE International.

92
54. Hildingsson, L., et al., Fuel Octane Effects in the Partially Premixed Combustion Regimein Compression Ignition Engines. 2009, SAE International.
55. Bakker, P.C., et al., Characterization of Low Load PPC Operation using RON70 Fuels.2014, SAE International.
56. Leermakers, C.A.J., et al., Experimental Study of Fuel Composition Impact on PCCICombustion in a Heavy-Duty Diesel Engine. 2011, SAE International.
57. ASTM, Standard Test Method for Research Octane Number of Spark-Ignition Engine Fuel.2016.
58. ASTM, Standard test method for motor octane number of spark-ignition engine fuel. 2016.59. Swarts, A., et al., A Further Study of Inconsistencies between Autoignition and Knock
Intensity in the CFR Octane Rating Engine. 2005, SAE International.60. Perumal, M. and G. Floweday, An Investigation of Cascading Autoignition and Octane
Number using a Multi-zone Model of the CFR Engine. SAE International Journal ofEngines, 2011. 4(1): p. 976-997.
61. Yates, A.D.B., A. Swarts, and C.L. Viljoen, An Investigation Of Anomalies IdentifiedWithin The ASTM Research And Motor Octane Scales. 2003, SAE International.
62. Truedsson, I., et al., Development of New Test Method for Evaluating HCCI FuelPerformance. 2014, SAE International.
63. Truedsson, I., The HCCI Fuel Number - Measuring and Describing Auto-ignition forHCCI Combustion Engines, in Department of Energy Sciences, Lund University. 2014,Lund University: Lund.
64. Kalghatgi, G.T., Fuel Anti-Knock Quality - Part I. Engine Studies. 2001, SAEInternational.
65. Kalghatgi, G.T., Auto-Ignition Quality of Practical Fuels and Implications for FuelRequirements of Future SI and HCCI Engines. 2005, SAE International.
66. Liu, H., et al., Influence of Fuel and Operating Conditions on Combustion Characteristicsof a Homogeneous Charge Compression Ignition Engine. Energy & Fuels, 2009. 23(3): p.1422-1430.
67. Rapp, V.H., et al., Predicting Fuel Performance for Future HCCI Engines. CombustionScience and Technology, 2013. 185(5): p. 735-748.
68. Lewander, C.M., B. Johansson, and P. Tunestal, Extending the Operating Region ofMulti-Cylinder Partially Premixed Combustion using High Octane Number Fuel. 2011,SAE International.
69. Larsson, T., O. Stenlaas, and A. Erlandsson, Future Fuels for DISI Engines: A Review onOxygenated, Liquid Biofuels. 2019, SAE International.
70. Havenith, C., H. Kuepper, and U. Hilger, Performance and Emission Characteristics ofthe Deutz Glow Plug Assisted Heavy-Duty Methanol Engine. 1987, SAE International.
71. Richards, B.G., Methanol-Fueled Caterpillar 3406 Engine Experience in On-HighwayTrucks. 1990, SAE International.
72. Mueller, C.J. and M.P. Musculus, Glow Plug Assisted Ignition and Combustion ofMethanol in an Optical DI Diesel Engine. 2001, SAE International.

93
73. Shamun, S., et al., Exhaust PM Emissions Analysis of Alcohol Fueled Heavy-Duty Engine Utilizing PPC. 2016.
74. Shamun, S., et al., Experimental investigation of methanol compression ignition in a high compression ratio HD engine using a Box-Behnken design. Fuel, 2017. 209: p. 624-633.
75. Shamun, S., et al., Quantification and Analysis of the Charge Cooling Effect of Methanol in a Compression Ignition Engine Utilizing PPC Strategy. 2018(51982): p. V001T02A007.
76. Zincir, B., et al., Investigation of Effects of Intake Temperature on Low Load Limitations of Methanol Partially Premixed Combustion. Energy & Fuels, 2019. 33(6): p. 5695-5709.
77. Pucilowski, M., et al., Numerical Investigation of Methanol Ignition Sequence in an Optical PPC Engine with Multiple Injection Strategies. 2019, SAE International.
78. Shen, M., S. Lonn, and B. Johansson, Transition from HCCI to PPC Combustion by Means of Start of Injection. 2015, SAE International.
79. Wang, Z., et al., Transition from HCCI to PPC: Investigation of Fuel Distribution by Planar Laser Induced Fluorescence (PLIF). SAE Int. J. Engines, 2017. 10(4): p. 1465-1481.
80. Lonn, S., et al., Optical Study of Fuel Spray Penetration and Initial Combustion Location under PPC Conditions. 2017, SAE International.
81. Li, C., et al., Comparison of Gasoline and Primary Reference Fuel in the Transition from HCCI to PPC. 2017, SAE International.
82. Vedharaj, S., et al., Combustion Homogeneity and Emission Analysis during the Transition from CI to HCCI for FACE I Gasoline. 2017, SAE International.
83. An, Y., et al., Analysis of Transition from HCCI to CI via PPC with Low Octane Gasoline Fuels Using Optical Diagnostics and Soot Particle Analysis. 2017, SAE International.
84. Li, C., et al., Effect of Piston Geometry on Stratification Formation in the Transition from HCCI to PPC. 2018, SAE International.
85. Nordgren, H., A. Hultqvist, and B. Johansson, Start of Injection Strategies for HCCI-combustion. 2004, SAE International.
86. Li Cao, A.B., Haiyun Su, Sebastian Mosbach, Markus Kraft, Antonis Dris, Robert M. McDavid, Influence of Injection Timing and Piston Bowl Geometry on Diesel PCCI Combustion and Emissions, in Department of Chemical Engineering. 2009, University of Cambridge.
87. Li, C., Stratification and Combustion in the Transition from HCCI to PPC, in Faculty of Engineering Department of Energy Sciences Division of Combustion Engines. 2018, Lund University: Lund.
88. Alexios Matamis, et al. Optical characterization of Methanol Compression-Ignition Combustion in a Heavy Duty Engine. in Proceedings of the Combustion Institute. 2020.
89. Xu, L., et al., Emission characteristics and engine performance of gasoline DICI engine in the transition from HCCI to PPC. Fuel, 2019. 254: p. 115619.
90. Pucilowski, M., et al., Effect of Start of Injection on the Combustion Characteristics in a Heavy-Duty DICI Engine Running on Methanol. 2017, SAE International.

94
91. Matamis, A., et al., Optical Characterization of Methanol Sprays and Mixture Formation in a Compression-Ignition Heavy-Duty Engine. 2020, SAE International.
92. Svensson, E., System Simulation of Partially Premixed Combustion in Heavy-Duty Engines, in Department of Energy Science. 2019, Lund University: Lund
93. Svensson, E. and S. Verhelst, Numerical Optimization of Compression Ratio for a PPC Engine running on Methanol. 2019, SAE International.
94. Svensson, E., et al., Potential Levels of Soot, NOx, HC and CO for Methanol Combustion. 2016, SAE International.
95. Lundgren, M.O., et al., Effects of Post-Injections Strategies on UHC and CO at Gasoline PPC Conditions in a Heavy-Duty Optical Engine. 2017, SAE International.
96. Yin, L., et al., High efficient internal combustion engine using partially premixed combustion with multiple injections. Applied Energy, 2019. 233-234: p. 516-523.
97. Mohan, B., W. Yang, and S.k. Chou, Fuel injection strategies for performance improvement and emissions reduction in compression ignition engines—A review. Renewable and Sustainable Energy Reviews, 2013. 28: p. 664-676.
98. Yao, C., et al., Injection Strategy Study of Compression Ignition Engine Fueled with Naphtha. 2015, SAE International.
99. Kaiadi, M., et al., Experimental Investigation on different Injection Strategies for Ethanol Partially Premixed Combustion. 2013, SAE International.
100. Jorques Moreno, C., O. Stenlaas, and P. Tunestal, Influence of Small Pilot on Main Injection in a Heavy-Duty Diesel Engine. 2017, SAE International.
101. Hotta, Y., et al., Achieving Lower Exhaust Emissions and Better Performance in an HSDI Diesel Engine with Multiple Injection. 2005, SAE International.
102. Chartier, C., et al., Effects of Post-Injection Strategies on Near-Injector Over-Lean Mixtures and Unburned Hydrocarbon Emission in a Heavy-Duty Optical Diesel Engine. 2011, SAE International.
103. Solaka, H., M. Tunér, and B. Johansson, Investigation on the Impact of Fuel Properties on Partially Premixed Combustion Characteristics in a Light Duty Diesel Engine. 2012(44663): p. 335-345.
104. Xu, L., et al., Emission characteristics and engine performance of Gasoline DICI engine in the transition from HCCI to PPC. 2019.
105. MSSplus - AVL Micro Soot Sensor. 9.10.2020]; Available from: https://www.avl.com/-/mssplus-avl-micro-soot-sensor.
106. Bengt Johansson, O.A., Per Tunestal and Martin Tuner, Combustion Engines. Vol. 1. 2016, Lund University.
107. Niemeyer, K.E., et al., Investigation of the LTC fuel performance index for oxygenated reference fuel blends. Fuel, 2015. 155: p. 14-24.
108. Changle, L., et al., PPC Number: A New Way to Evaluate the Auto Ignition Quality of Gasolines in Partially Premixed Combustion. Manuscript submitted for publication. 2019.
109. A. A. Amsden, M.F., Kiva-3V: A block-structured KIVA program for engines with vertical or canted valves. 1997, Los Alamos National Laboratory

95
110. R. J. Kee, F.M.R., J. A. Miller, Chemkin-II: A fortran chemical kinetics package for theanalysis of gas-phase chemical kinetics. 1989, Sandia National Labs.: Livermore CA (USA)
111. Yanzhao, A., et al., Combustion stability study of partially premixed combustion with low-octane fuel at low engine load conditions. Applied Energy, 2019. 235: p. 56-67.
112. Kodavasal, J., et al., Computational Fluid Dynamics Simulation of Gasoline CompressionIgnition. Journal of Energy Resources Technology, 2015. 137(3): p. 032212-032212-13.
113. Cung, K., et al., Parametric Study of Ignition and Combustion Characteristics From aGasoline Compression Ignition Engine Using Two Different Reactivity Fuels.2016(50503): p. V001T03A011.
114. Maghbouli, A., et al., Numerical Investigation of PPCI Combustion at Low and HighCharge Stratification Levels. 2017, SAE International.
115. Musculus, M.P.B., et al., End-of-Injection Over-Mixing and Unburned HydrocarbonEmissions in Low-Temperature-Combustion Diesel Engines. 2007, SAE International.
116. Solaka, H., et al., Gasoline Surrogate Fuels for Partially Premixed Combustion, of TolueneEthanol Reference Fuels. 2013, SAE International.
117. Xu, L., et al., Experimental and modeling study of liquid fuel injection and combustion indiesel engines with a common rail injection system. Applied Energy, 2018. 230: p. 287-304.
118. Han, Z. and R.D. Reitz, Turbulence Modeling of Internal Combustion Engines UsingRNG - Models. Combustion Science and Technology, 1995. 106(4-6): p. 267-295.
119. Beale, J.C. and R.D. Reitz, Modeling Spray Atomization with The Kelvin-Helmholtz/Rayleigh-Taylor Hybrid Model. 1999. 9(6): p. 623-650.
120. O'Rourke, P.J., Collective drop effects on vaporizing liquid sprays. 1981, ; Los AlamosNational Lab., NM (USA). p. Medium: X; Size: Pages: 357.
121. Liu, X., et al., Development of a reduced toluene reference fuel (TRF)-2,5-dimethylfuran-polycyclic aromatic hydrocarbon (PAH) mechanism for engine applications. Combustionand Flame, 2016. 165: p. 453-465.
122. Jangi, M. and X.-S. Bai, Multidimensional chemistry coordinate mapping approach forcombustion modelling with finite-rate chemistry. Combustion Theory and Modelling,2012. 16(6): p. 1109-1132.
123. Colban, W.F., P.C. Miles, and S. Oh, Effect of Intake Pressure on Performance andEmissions in an Automotive Diesel Engine Operating in Low Temperature CombustionRegimes. 2007, SAE International.
124. Aziz, A., et al., Impact of Multiple Injection Strategies on Performance and Emissions ofMethanol PPC under Low Load Operation. 2020, SAE International.
125. Kim, D. and C. Bae, Application of double-injection strategy on gasoline compressionignition engine under low load condition. Fuel, 2017. 203: p. 792-801.
126. Shamun, S., Characterization of the Combustion of Light Alcohols in CI Engines:Performance, Combustion Characteristics and Emissions, in Department of Energy Science,.2019, Lund University: Sweden.
127. Pucilowski, M., et al., Heat Loss Analysis for Various Piston Geometries in a Heavy-DutyMethanol PPC Engine. 2018, SAE International.