Alcohol Fuels for Spark-Ignition Engines - MDPI
31
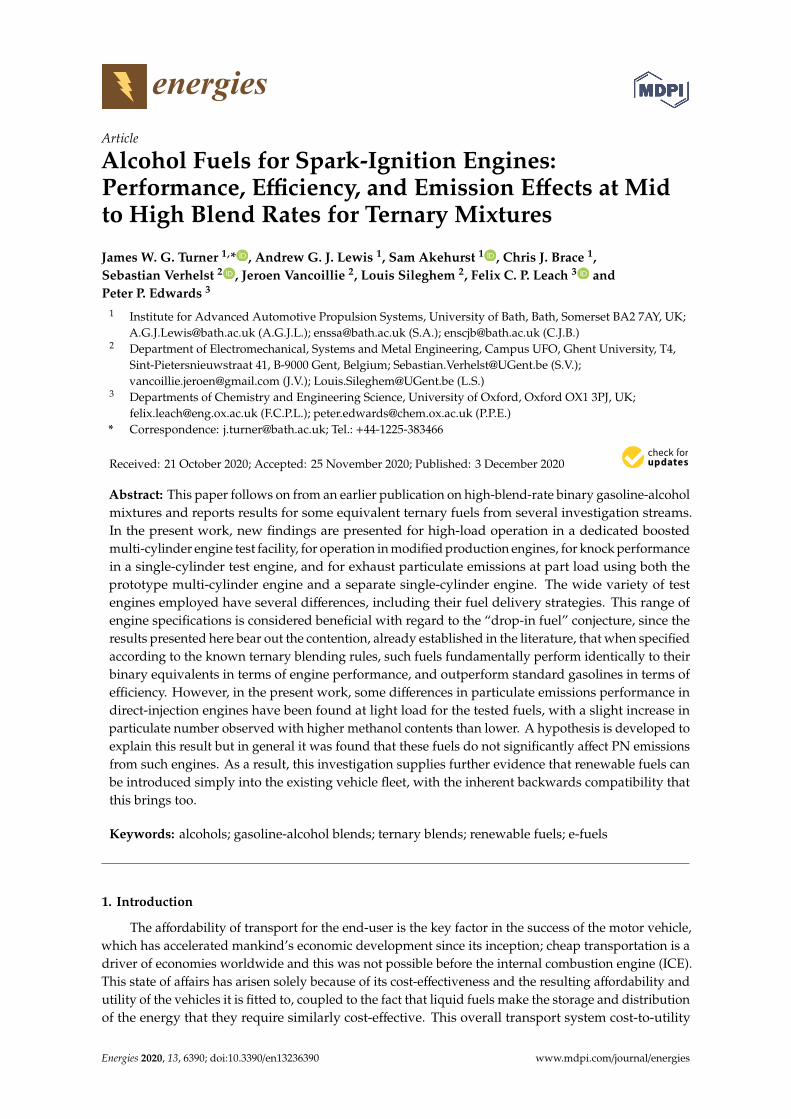
energies Article Alcohol Fuels for Spark-Ignition Engines: Performance, Efficiency, and Emission Effects at Mid to High Blend Rates for Ternary Mixtures James W. G. Turner 1, * , Andrew G. J. Lewis 1 , Sam Akehurst 1 , Chris J. Brace 1 , Sebastian Verhelst 2 , Jeroen Vancoillie 2 , Louis Sileghem 2 , Felix C. P. Leach 3 and Peter P. Edwards 3 1 Institute for Advanced Automotive Propulsion Systems, University of Bath, Bath, Somerset BA2 7AY, UK; [email protected] (A.G.J.L.); [email protected] (S.A.); [email protected] (C.J.B.) 2 Department of Electromechanical, Systems and Metal Engineering, Campus UFO, Ghent University, T4, Sint-Pietersnieuwstraat 41, B-9000 Gent, Belgium; [email protected] (S.V.); [email protected] (J.V.); [email protected] (L.S.) 3 Departments of Chemistry and Engineering Science, University of Oxford, Oxford OX1 3PJ, UK; [email protected] (F.C.P.L.); [email protected] (P.P.E.) * Correspondence: [email protected]; Tel.: +44-1225-383466 Received: 21 October 2020; Accepted: 25 November 2020; Published: 3 December 2020 Abstract: This paper follows on from an earlier publication on high-blend-rate binary gasoline-alcohol mixtures and reports results for some equivalent ternary fuels from several investigation streams. In the present work, new findings are presented for high-load operation in a dedicated boosted multi-cylinder engine test facility, for operation in modified production engines, for knock performance in a single-cylinder test engine, and for exhaust particulate emissions at part load using both the prototype multi-cylinder engine and a separate single-cylinder engine. The wide variety of test engines employed have several differences, including their fuel delivery strategies. This range of engine specifications is considered beneficial with regard to the “drop-in fuel” conjecture, since the results presented here bear out the contention, already established in the literature, that when specified according to the known ternary blending rules, such fuels fundamentally perform identically to their binary equivalents in terms of engine performance, and outperform standard gasolines in terms of efficiency. However, in the present work, some differences in particulate emissions performance in direct-injection engines have been found at light load for the tested fuels, with a slight increase in particulate number observed with higher methanol contents than lower. A hypothesis is developed to explain this result but in general it was found that these fuels do not significantly affect PN emissions from such engines. As a result, this investigation supplies further evidence that renewable fuels can be introduced simply into the existing vehicle fleet, with the inherent backwards compatibility that this brings too. Keywords: alcohols; gasoline-alcohol blends; ternary blends; renewable fuels; e-fuels 1. Introduction The affordability of transport for the end-user is the key factor in the success of the motor vehicle, which has accelerated mankind’s economic development since its inception; cheap transportation is a driver of economies worldwide and this was not possible before the internal combustion engine (ICE). This state of affairs has arisen solely because of its cost-effectiveness and the resulting affordability and utility of the vehicles it is fitted to, coupled to the fact that liquid fuels make the storage and distribution of the energy that they require similarly cost-effective. This overall transport system cost-to-utility Energies 2020, 13, 6390; doi:10.3390/en13236390 www.mdpi.com/journal/energies
-
Upload
khangminh22 -
Category
Documents
-
view
0 -
download
0
Transcript of Alcohol Fuels for Spark-Ignition Engines - MDPI
energies
Article
Alcohol Fuels for Spark-Ignition Engines:Performance, Efficiency, and Emission Effects at Midto High Blend Rates for Ternary Mixtures
James W. G. Turner 1,* , Andrew G. J. Lewis 1, Sam Akehurst 1 , Chris J. Brace 1,Sebastian Verhelst 2 , Jeroen Vancoillie 2, Louis Sileghem 2, Felix C. P. Leach 3 andPeter P. Edwards 3
1 Institute for Advanced Automotive Propulsion Systems, University of Bath, Bath, Somerset BA2 7AY, UK;[email protected] (A.G.J.L.); [email protected] (S.A.); [email protected] (C.J.B.)
2 Department of Electromechanical, Systems and Metal Engineering, Campus UFO, Ghent University, T4,Sint-Pietersnieuwstraat 41, B-9000 Gent, Belgium; [email protected] (S.V.);[email protected] (J.V.); [email protected] (L.S.)
3 Departments of Chemistry and Engineering Science, University of Oxford, Oxford OX1 3PJ, UK;[email protected] (F.C.P.L.); [email protected] (P.P.E.)
* Correspondence: [email protected]; Tel.: +44-1225-383466
Received: 21 October 2020; Accepted: 25 November 2020; Published: 3 December 2020�����������������
Abstract: This paper follows on from an earlier publication on high-blend-rate binary gasoline-alcoholmixtures and reports results for some equivalent ternary fuels from several investigation streams.In the present work, new findings are presented for high-load operation in a dedicated boostedmulti-cylinder engine test facility, for operation in modified production engines, for knock performancein a single-cylinder test engine, and for exhaust particulate emissions at part load using both theprototype multi-cylinder engine and a separate single-cylinder engine. The wide variety of testengines employed have several differences, including their fuel delivery strategies. This range ofengine specifications is considered beneficial with regard to the “drop-in fuel” conjecture, since theresults presented here bear out the contention, already established in the literature, that when specifiedaccording to the known ternary blending rules, such fuels fundamentally perform identically to theirbinary equivalents in terms of engine performance, and outperform standard gasolines in terms ofefficiency. However, in the present work, some differences in particulate emissions performance indirect-injection engines have been found at light load for the tested fuels, with a slight increase inparticulate number observed with higher methanol contents than lower. A hypothesis is developed toexplain this result but in general it was found that these fuels do not significantly affect PN emissionsfrom such engines. As a result, this investigation supplies further evidence that renewable fuels canbe introduced simply into the existing vehicle fleet, with the inherent backwards compatibility thatthis brings too.
Keywords: alcohols; gasoline-alcohol blends; ternary blends; renewable fuels; e-fuels
1. Introduction
The affordability of transport for the end-user is the key factor in the success of the motor vehicle,which has accelerated mankind’s economic development since its inception; cheap transportation is adriver of economies worldwide and this was not possible before the internal combustion engine (ICE).This state of affairs has arisen solely because of its cost-effectiveness and the resulting affordability andutility of the vehicles it is fitted to, coupled to the fact that liquid fuels make the storage and distributionof the energy that they require similarly cost-effective. This overall transport system cost-to-utility
Energies 2020, 13, 6390; doi:10.3390/en13236390 www.mdpi.com/journal/energies
Energies 2020, 13, 6390 2 of 31
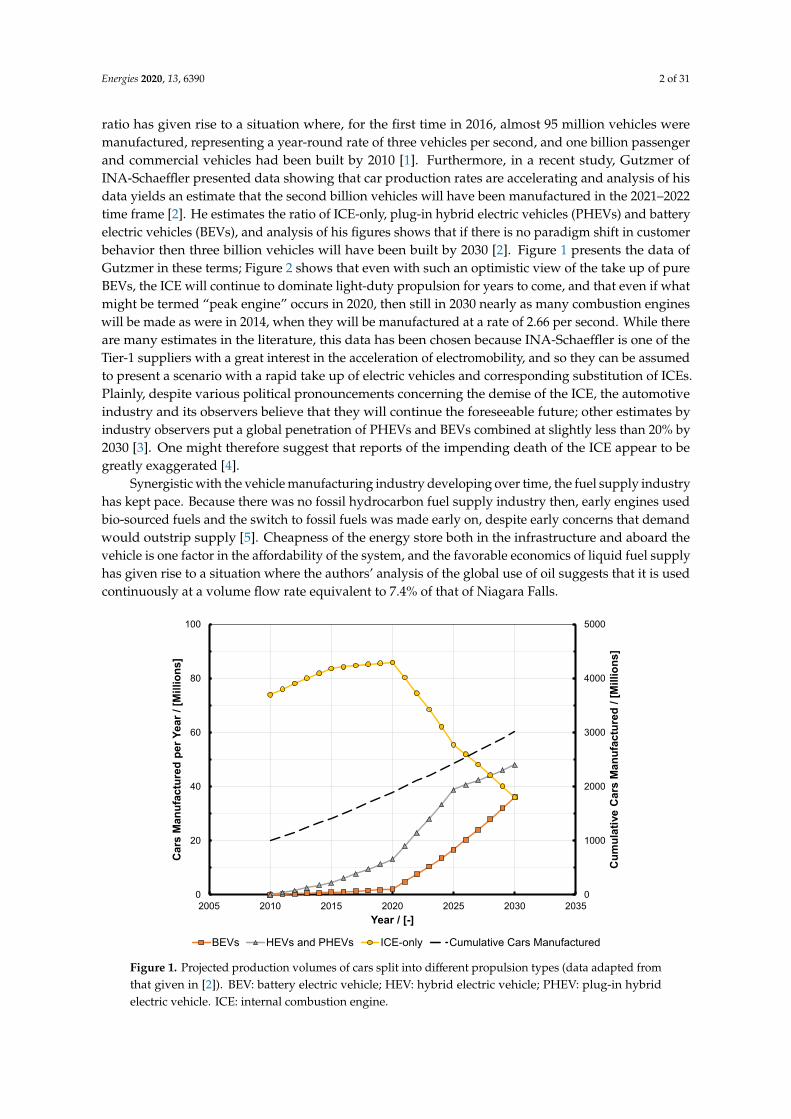
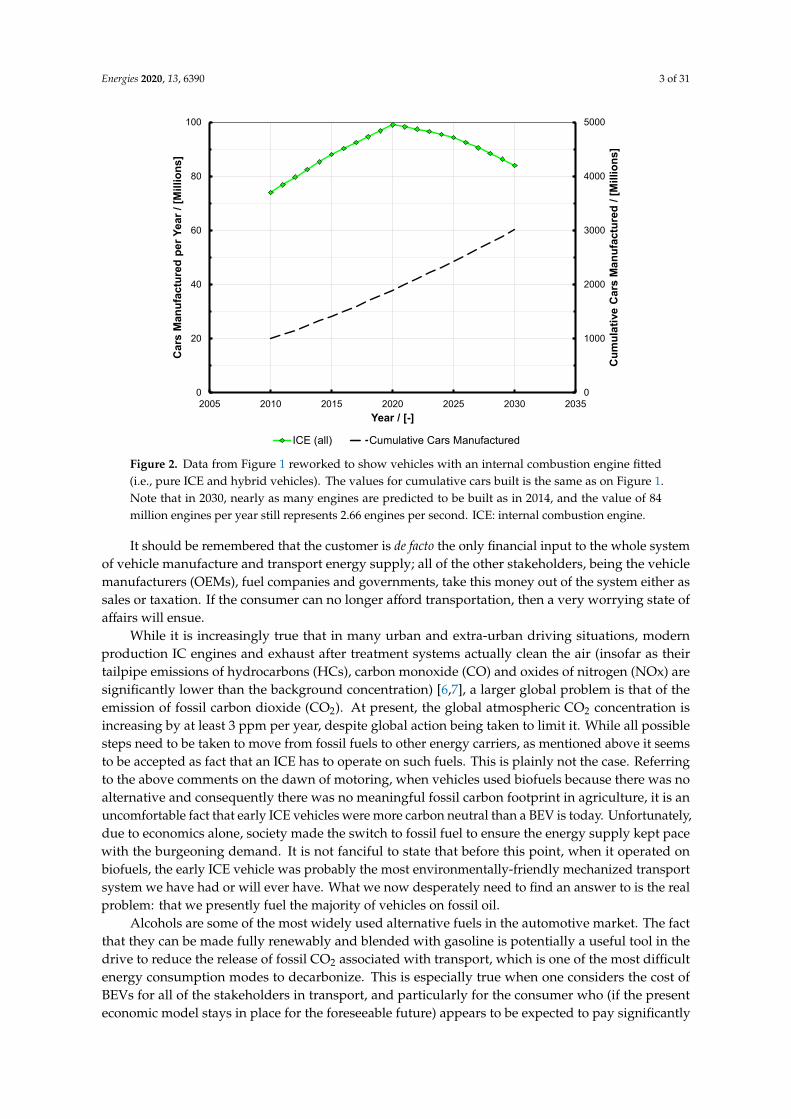
ratio has given rise to a situation where, for the first time in 2016, almost 95 million vehicles weremanufactured, representing a year-round rate of three vehicles per second, and one billion passengerand commercial vehicles had been built by 2010 [1]. Furthermore, in a recent study, Gutzmer ofINA-Schaeffler presented data showing that car production rates are accelerating and analysis of hisdata yields an estimate that the second billion vehicles will have been manufactured in the 2021–2022time frame [2]. He estimates the ratio of ICE-only, plug-in hybrid electric vehicles (PHEVs) and batteryelectric vehicles (BEVs), and analysis of his figures shows that if there is no paradigm shift in customerbehavior then three billion vehicles will have been built by 2030 [2]. Figure 1 presents the data ofGutzmer in these terms; Figure 2 shows that even with such an optimistic view of the take up of pureBEVs, the ICE will continue to dominate light-duty propulsion for years to come, and that even if whatmight be termed “peak engine” occurs in 2020, then still in 2030 nearly as many combustion engineswill be made as were in 2014, when they will be manufactured at a rate of 2.66 per second. While thereare many estimates in the literature, this data has been chosen because INA-Schaeffler is one of theTier-1 suppliers with a great interest in the acceleration of electromobility, and so they can be assumedto present a scenario with a rapid take up of electric vehicles and corresponding substitution of ICEs.Plainly, despite various political pronouncements concerning the demise of the ICE, the automotiveindustry and its observers believe that they will continue the foreseeable future; other estimates byindustry observers put a global penetration of PHEVs and BEVs combined at slightly less than 20% by2030 [3]. One might therefore suggest that reports of the impending death of the ICE appear to begreatly exaggerated [4].
Synergistic with the vehicle manufacturing industry developing over time, the fuel supply industryhas kept pace. Because there was no fossil hydrocarbon fuel supply industry then, early engines usedbio-sourced fuels and the switch to fossil fuels was made early on, despite early concerns that demandwould outstrip supply [5]. Cheapness of the energy store both in the infrastructure and aboard thevehicle is one factor in the affordability of the system, and the favorable economics of liquid fuel supplyhas given rise to a situation where the authors’ analysis of the global use of oil suggests that it is usedcontinuously at a volume flow rate equivalent to 7.4% of that of Niagara Falls.
Energies 2020, 13, x FOR PEER REVIEW 2 of 32
million vehicles were manufactured, representing a year-round rate of three vehicles per second, and one billion passenger and commercial vehicles had been built by 2010 [1]. Furthermore, in a recent study, Gutzmer of INA-Schaeffler presented data showing that car production rates are accelerating and analysis of his data yields an estimate that the second billion vehicles will have been manufactured in the 2021–2022 time frame [2]. He estimates the ratio of ICE-only, plug-in hybrid electric vehicles (PHEVs) and battery electric vehicles (BEVs), and analysis of his figures shows that if there is no paradigm shift in customer behavior then three billion vehicles will have been built by 2030 [2]. Figure 1 presents the data of Gutzmer in these terms; Figure 2 shows that even with such an optimistic view of the take up of pure BEVs, the ICE will continue to dominate light-duty propulsion for years to come, and that even if what might be termed “peak engine” occurs in 2020, then still in 2030 nearly as many combustion engines will be made as were in 2014, when they will be manufactured at a rate of 2.66 per second. While there are many estimates in the literature, this data has been chosen because INA-Schaeffler is one of the Tier-1 suppliers with a great interest in the acceleration of electromobility, and so they can be assumed to present a scenario with a rapid take up of electric vehicles and corresponding substitution of ICEs. Plainly, despite various political pronouncements concerning the demise of the ICE, the automotive industry and its observers believe that they will continue the foreseeable future; other estimates by industry observers put a global penetration of PHEVs and BEVs combined at slightly less than 20% by 2030 [3]. One might therefore suggest that reports of the impending death of the ICE appear to be greatly exaggerated [4].
Synergistic with the vehicle manufacturing industry developing over time, the fuel supply industry has kept pace. Because there was no fossil hydrocarbon fuel supply industry then, early engines used bio-sourced fuels and the switch to fossil fuels was made early on, despite early concerns that demand would outstrip supply [5]. Cheapness of the energy store both in the infrastructure and aboard the vehicle is one factor in the affordability of the system, and the favorable economics of liquid fuel supply has given rise to a situation where the authors’ analysis of the global use of oil suggests that it is used continuously at a volume flow rate equivalent to 7.4% of that of Niagara Falls.
Figure 1. Projected production volumes of cars split into different propulsion types (data adapted from that given in [2]). BEV: battery electric vehicle; HEV: hybrid electric vehicle; PHEV: plug-in hybrid electric vehicle. ICE: internal combustion engine.
0
1000
2000
3000
4000
5000
0
20
40
60
80
100
2005 2010 2015 2020 2025 2030 2035
Cum
ulat
ive
Car
s M
anuf
actu
red
/ [M
illio
ns]
Car
s M
anuf
actu
red
per Y
ear /
[Mill
ions
]
Year / [-]
BEVs HEVs and PHEVs ICE-only Cumulative Cars Manufactured
Figure 1. Projected production volumes of cars split into different propulsion types (data adapted fromthat given in [2]). BEV: battery electric vehicle; HEV: hybrid electric vehicle; PHEV: plug-in hybridelectric vehicle. ICE: internal combustion engine.
Energies 2020, 13, 6390 3 of 31Energies 2020, 13, x FOR PEER REVIEW 3 of 32
Figure 2. Data from Figure 1 reworked to show vehicles with an internal combustion engine fitted (i.e., pure ICE and hybrid vehicles). The values for cumulative cars built is the same as on Figure 1. Note that in 2030, nearly as many engines are predicted to be built as in 2014, and the value of 84 million engines per year still represents 2.66 engines per second. ICE: internal combustion engine.
It should be remembered that the customer is de facto the only financial input to the whole system of vehicle manufacture and transport energy supply; all of the other stakeholders, being the vehicle manufacturers (OEMs), fuel companies and governments, take this money out of the system either as sales or taxation. If the consumer can no longer afford transportation, then a very worrying state of affairs will ensue.
While it is increasingly true that in many urban and extra-urban driving situations, modern production IC engines and exhaust after treatment systems actually clean the air (insofar as their tailpipe emissions of hydrocarbons (HCs), carbon monoxide (CO) and oxides of nitrogen (NOx) are significantly lower than the background concentration) [6,7], a larger global problem is that of the emission of fossil carbon dioxide (CO2). At present, the global atmospheric CO2 concentration is increasing by at least 3 ppm per year, despite global action being taken to limit it. While all possible steps need to be taken to move from fossil fuels to other energy carriers, as mentioned above it seems to be accepted as fact that an ICE has to operate on such fuels. This is plainly not the case. Referring to the above comments on the dawn of motoring, when vehicles used biofuels because there was no alternative and consequently there was no meaningful fossil carbon footprint in agriculture, it is an uncomfortable fact that early ICE vehicles were more carbon neutral than a BEV is today. Unfortunately, due to economics alone, society made the switch to fossil fuel to ensure the energy supply kept pace with the burgeoning demand. It is not fanciful to state that before this point, when it operated on biofuels, the early ICE vehicle was probably the most environmentally-friendly mechanized transport system we have had or will ever have. What we now desperately need to find an answer to is the real problem: that we presently fuel the majority of vehicles on fossil oil.
Alcohols are some of the most widely used alternative fuels in the automotive market. The fact that they can be made fully renewably and blended with gasoline is potentially a useful tool in the drive to reduce the release of fossil CO2 associated with transport, which is one of the most difficult energy consumption modes to decarbonize. This is especially true when one considers the cost of BEVs for all of the stakeholders in transport, and particularly for the consumer who (if the present economic model stays in place for the foreseeable future) appears to be expected to pay significantly more for vehicles than he or she presently does. While electricity may be cheap on a cost-per-MJ basis
0
1000
2000
3000
4000
5000
0
20
40
60
80
100
2005 2010 2015 2020 2025 2030 2035
Cum
ulat
ive
Car
s M
anuf
actu
red
/ [M
illio
ns]
Car
s M
anuf
actu
red
per Y
ear /
[Mill
ions
]
Year / [-]
ICE (all) Cumulative Cars Manufactured
Figure 2. Data from Figure 1 reworked to show vehicles with an internal combustion engine fitted(i.e., pure ICE and hybrid vehicles). The values for cumulative cars built is the same as on Figure 1.Note that in 2030, nearly as many engines are predicted to be built as in 2014, and the value of 84million engines per year still represents 2.66 engines per second. ICE: internal combustion engine.
It should be remembered that the customer is de facto the only financial input to the whole systemof vehicle manufacture and transport energy supply; all of the other stakeholders, being the vehiclemanufacturers (OEMs), fuel companies and governments, take this money out of the system either assales or taxation. If the consumer can no longer afford transportation, then a very worrying state ofaffairs will ensue.
While it is increasingly true that in many urban and extra-urban driving situations, modernproduction IC engines and exhaust after treatment systems actually clean the air (insofar as theirtailpipe emissions of hydrocarbons (HCs), carbon monoxide (CO) and oxides of nitrogen (NOx) aresignificantly lower than the background concentration) [6,7], a larger global problem is that of theemission of fossil carbon dioxide (CO2). At present, the global atmospheric CO2 concentration isincreasing by at least 3 ppm per year, despite global action being taken to limit it. While all possiblesteps need to be taken to move from fossil fuels to other energy carriers, as mentioned above it seemsto be accepted as fact that an ICE has to operate on such fuels. This is plainly not the case. Referringto the above comments on the dawn of motoring, when vehicles used biofuels because there was noalternative and consequently there was no meaningful fossil carbon footprint in agriculture, it is anuncomfortable fact that early ICE vehicles were more carbon neutral than a BEV is today. Unfortunately,due to economics alone, society made the switch to fossil fuel to ensure the energy supply kept pacewith the burgeoning demand. It is not fanciful to state that before this point, when it operated onbiofuels, the early ICE vehicle was probably the most environmentally-friendly mechanized transportsystem we have had or will ever have. What we now desperately need to find an answer to is the realproblem: that we presently fuel the majority of vehicles on fossil oil.
Alcohols are some of the most widely used alternative fuels in the automotive market. The factthat they can be made fully renewably and blended with gasoline is potentially a useful tool in thedrive to reduce the release of fossil CO2 associated with transport, which is one of the most difficultenergy consumption modes to decarbonize. This is especially true when one considers the cost ofBEVs for all of the stakeholders in transport, and particularly for the consumer who (if the presenteconomic model stays in place for the foreseeable future) appears to be expected to pay significantly
Energies 2020, 13, 6390 4 of 31
more for vehicles than he or she presently does. While electricity may be cheap on a cost-per-MJbasis at the moment, and BEVs are approximately three times more efficient in their energy utilizationthan combustion engines, the price of such vehicles remains cost-prohibitive for many people, and islikely to remain so (especially considering total cost of ownership) even if future stretch targets forautomotive traction battery costs are met [8].
Although, for the consumer, electrical energy is cheap in relation to transportation (liquid) fuelcosts, there is of course no guarantee that this will continue to be the case. The application of life-cycleanalysis (LCA) may also see increasing numbers of questions raised over the ecological impact ofelectrification, especially since many of the minerals and elements used in the manufacture of tractionbatteries and motors are extremely rare (for example cobalt, neodymium, dysprosium, and to a lesserextent lithium). There is also the danger of energy security concerns being swapped for concernsover commodity security—although it is true that, unlike the use of fossil fuels in combustion-enginevehicles, commodity security affects only the construction of EVs and not necessarily their use. There aremoral concerns regarding how cobalt in particular is obtained, too. Therefore, due to the fact thatalcohols can either be used as pure fuels in their own right or blended in many ways with existingfossil hydrocarbon fuels [9–24], there is, in the authors’ opinion, considerable merit in continuing toinvestigate them as a potential future automotive energy vector.
As stated, this paper follows on from a previous work in which the performance of severaldifferent mid- and high-blend alcohols were tested and compared to the performance of regular andpremium gasolines in a variety of test engines [9]. A key tenet in the previous paper was that thebinary blends tested, being either gasoline-ethanol or gasoline-methanol mixtures, were configuredwith the same stoichiometry. The paper showed that such fuels perform essentially identically inany given combustion system, at least in terms of engine torque, power, and brake specific fuelconsumption (BSFC) at the same spark advance, and they could also reduce emissions of oxidesof nitrogen dramatically; however, particulate matter reduction (tested in a direct-injection engine)was found to be more blend dependent, with that finding being presented for the first time there.This new work conducts similar tests for so-called ternary blends, configured from gasoline, ethanol,and methanol such that they have the same stoichiometry as the binary blends discussed in the previouswork. Blends made from these components are termed ‘GEM’ blends here.
The present work utilizes fundamentally the same test engines and equipment as the previousinvestigation. While the ternary blend results are presented for the first time here, some referencewill be made to the previous tests where pertinent, since many of the binary gasoline-alcohol blendsreported there have the same stoichiometry as the GEM fuels investigated here; in fact in the space ofpossible blends at any given stoichiometry, the binary ones actually represent limit cases. This will bereturned to later. This paper is constructed in the following manner, similar to how the authors dealtwith the subject of binary blending of alcohols in gasoline [9]:
Section 2 discusses the rationale for and a method of introducing methanol into the bulk transportfuel pool, namely iso-stoichiometric blend formulation. This helps to set the context for work presentedin the rest of this paper.
Section 3 discusses the testing of iso-stoichiometric GEM blends in the “Ultraboost” extremedownsizing 4-cylinder demonstrator engine at the University of Bath. The very high brake meaneffective pressure (BMEP) that this engine is capable of operating at means that the data shown hererepresents testing of the hypothesis of identical performance from any blend configured according tothe rules to a level not published before. Furthermore, the interaction with exhaust gas recirculation(EGR), already known to have excellent synergies with alcohol fuels, is shown. Some particulateemissions results are reported here, pertinent to the high-load operating conditions reported.
Section 4 discusses tests conducted at Ghent University using three different engines: twoport-fuel-injection naturally-aspirated engines—one a production 4-cylinder and the other asingle-cylinder research engine configured with a high compression ratio (CR)—and one multi-cylinder
Energies 2020, 13, 6390 5 of 31
direct-injection engine. The blends tested correspond to the stoichiometry of E85 and in terms of knockall of the blends perform identically and fundamentally the same as E100.
Section 5 presents data gathered at the University of Oxford in which the particulate emissionsperformance of GEM blends is investigated in a single-cylinder test engine at light load. These findingshave not been presented before, and how they reinforce the findings from the binary blend testsconducted in the first part of this investigation is discussed.
Finally, this paper ends with a Conclusions section.
2. A Strategy for Introducing Methanol into Transport Fuel by Configuring Ternary Blends asDrop-In Fuels
The two “light alcohols”, i.e., those with no isomers, ethanol and methanol, have for years beenblended with gasoline to create fuels for SI engines, with E85 and M85 being examples of binary blendswhich have been commercialized for several years. For these fuels, the number represents the volumepercentage of the alcohol (abbreviated to E and M) in admixture with gasoline. In fact all of the alcoholsare miscible with gasoline to a greater or lesser extent and this gives rise to the potential to createmulti-component blends to a target stoichiometry, provided this value is within an upper and lowertarget range.
The ternary—or three component—blends used to in this paper are all mixtures of gasoline and thelight alcohols ethanol and methanol. Collectively, they are referred to as ‘GEM’ blends; and specifically“GXX EYY MZZ”, where XX, YY and ZZ are the volume percentages of the three individual components,respectively. The process by which such blends can be formulated and how they can offer a route toincreased penetration of renewable energy in the fuel pool has been discussed before [17–20,22,24].Both engine and vehicle tests of such blends have been reported, the latter showing that when ternaryblends are configured with the same stoichiometric air-fuel ratio (AFR) as E85 (this nominally being ablend of 85% ethanol and 15% gasoline by volume)—approximately 9.7:1—then they are undetectableby a flex-fuel vehicle engine management system when such a vehicle has already been calibrated tobe capable of taking any proportion of gasoline and E85 put into its fuel tank [17,18]. This is essentiallydue to near-identical volumetric energy content (the volumetric lower heating value (LHV)) in theblends as well their producing a near-identical response from a flex-fuel vehicle’s ethanol concentrationsensor. Furthermore, in [18], it was shown that increasing the methanol content actually improved thecold startability of the vehicle, providing a further mechanism to keep increased renewable energycontent in the fuel pool all year round.
All of these previous reports show that if followed, these ternary blending rules permit a methodof simply creating fuel blends equivalent to any original binary gasoline-ethanol mixture. Recently,Pearson and co-workers [24] have defined more completely the blending rules for such an approach,and have shown the effect of water on AFR and volumetric LHV if this is left in ethanol (whichcould be very beneficial from a production energetics point of view). (Note that unlike all the otheralcohols, methanol does not form an azeotrope with water, and consequently simple distillation issufficient to dry it fully. By contrast, ethanol cannot be dried by simple distillation beyond 4.4% v/vwater. In the case of the distillation of the water formed in a production process utilizing CO2 tosynthesize methanol, the process can utilize the waste heat generated within the exothermic synthesisprocess itself, supporting the contention that once the feed stocks have been obtained using sustainableprocesses, all downstream processes and products can be maintained as fully sustainable too.) Pearsonand co-workers show that blending for constant oxygen content is just as viable as blending for constantstoichiometry or volumetric energy content, and furthermore that the magnitude of the differencesbetween the approaches are effectively negligible [24]. Importantly, when such ternary blends areconfigured in this manner, all such possible blends have near-identical volumetric LHV, practically thesame octane numbers, and extremely close enthalpies of vaporization (to +/− 2%, the variation arisingfrom treating the components on a mass basis) [17,18], all properties which need to be the same orsimilar for any fuel to capable of being ‘dropped in’ to an existing vehicle fuel and combustion system.
Energies 2020, 13, 6390 6 of 31
It has also been shown that for any given amount of ethanol that can be introduced into thetotal fuel pool, the ease of synthesis and hence supply of methanol means that introducing it to makeGEM blends suitable for the vehicles already in the market effectively displaces gasoline [17]. In [17],the authors also show that within certain wide price limits, the resulting blends can be cheaper thangasoline on a per-unit-energy basis; furthermore in [25], it was shown that a taxation system basedon taxing units of energy and applying a multiplier based on the fossil CO2 impact of supplyingthe energy in that form could provide a government with the means to encourage renewable energyat the expense of fossil fuels while keeping the overall taxation revenue gathered constant. Thus,a framework could be created to encourage the consumer to move away from fossil fuels based ontheir being more expensive to use than renewable fuels, while maintaining economic viability for all ofthe stakeholders.
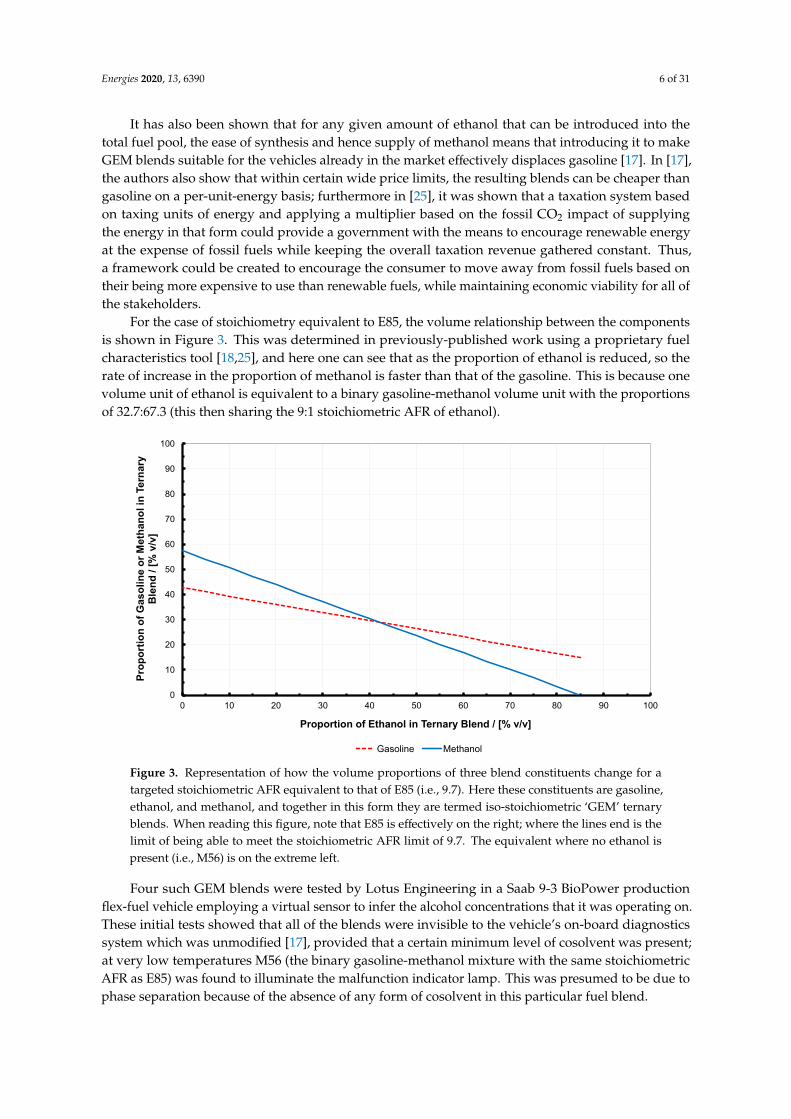
For the case of stoichiometry equivalent to E85, the volume relationship between the componentsis shown in Figure 3. This was determined in previously-published work using a proprietary fuelcharacteristics tool [18,25], and here one can see that as the proportion of ethanol is reduced, so therate of increase in the proportion of methanol is faster than that of the gasoline. This is because onevolume unit of ethanol is equivalent to a binary gasoline-methanol volume unit with the proportionsof 32.7:67.3 (this then sharing the 9:1 stoichiometric AFR of ethanol).
Energies 2020, 13, x FOR PEER REVIEW 6 of 32
authors also show that within certain wide price limits, the resulting blends can be cheaper than gasoline on a per-unit-energy basis; furthermore in [25], it was shown that a taxation system based on taxing units of energy and applying a multiplier based on the fossil CO2 impact of supplying the energy in that form could provide a government with the means to encourage renewable energy at the expense of fossil fuels while keeping the overall taxation revenue gathered constant. Thus, a framework could be created to encourage the consumer to move away from fossil fuels based on their being more expensive to use than renewable fuels, while maintaining economic viability for all of the stakeholders.
For the case of stoichiometry equivalent to E85, the volume relationship between the components is shown in Figure 3. This was determined in previously-published work using a proprietary fuel characteristics tool [18,25], and here one can see that as the proportion of ethanol is reduced, so the rate of increase in the proportion of methanol is faster than that of the gasoline. This is because one volume unit of ethanol is equivalent to a binary gasoline-methanol volume unit with the proportions of 32.7:67.3 (this then sharing the 9:1 stoichiometric AFR of ethanol).
Figure 3. Representation of how the volume proportions of three blend constituents change for a targeted stoichiometric AFR equivalent to that of E85 (i.e., 9.7). Here these constituents are gasoline, ethanol, and methanol, and together in this form they are termed iso-stoichiometric ‘GEM’ ternary blends. When reading this figure, note that E85 is effectively on the right; where the lines end is the limit of being able to meet the stoichiometric AFR limit of 9.7. The equivalent where no ethanol is present (i.e., M56) is on the extreme left.
Four such GEM blends were tested by Lotus Engineering in a Saab 9-3 BioPower production flex-fuel vehicle employing a virtual sensor to infer the alcohol concentrations that it was operating on. These initial tests showed that all of the blends were invisible to the vehicle’s on-board diagnostics system which was unmodified [17], provided that a certain minimum level of cosolvent was present; at very low temperatures M56 (the binary gasoline-methanol mixture with the same stoichiometric AFR as E85) was found to illuminate the malfunction indicator lamp. This was presumed to be due to phase separation because of the absence of any form of cosolvent in this particular fuel blend.
In GEM blends, the function of a cosolvent in mixtures of gasoline and methanol is undertaken by the ethanol provided some minimum volume is used. This minimum volume was investigated in later tests in a vehicle certified to a higher emissions standard utilizing a physical sensor for alcohol concentration. However, in this later series of tests, despite repeated cold soaks and related cold start tests at −20 °C, [18] a minimum requirement for ethanol was not found. Even M56 (i.e., the binary
0
10
20
30
40
50
60
70
80
90
100
0 10 20 30 40 50 60 70 80 90 100
Prop
ortio
n of
Gas
olin
e or
Met
hano
l in
Tern
ary
Ble
nd /
[% v
/v]
Proportion of Ethanol in Ternary Blend / [% v/v]
Gasoline Methanol
Figure 3. Representation of how the volume proportions of three blend constituents change for atargeted stoichiometric AFR equivalent to that of E85 (i.e., 9.7). Here these constituents are gasoline,ethanol, and methanol, and together in this form they are termed iso-stoichiometric ‘GEM’ ternaryblends. When reading this figure, note that E85 is effectively on the right; where the lines end is thelimit of being able to meet the stoichiometric AFR limit of 9.7. The equivalent where no ethanol ispresent (i.e., M56) is on the extreme left.
Four such GEM blends were tested by Lotus Engineering in a Saab 9-3 BioPower productionflex-fuel vehicle employing a virtual sensor to infer the alcohol concentrations that it was operating on.These initial tests showed that all of the blends were invisible to the vehicle’s on-board diagnosticssystem which was unmodified [17], provided that a certain minimum level of cosolvent was present;at very low temperatures M56 (the binary gasoline-methanol mixture with the same stoichiometricAFR as E85) was found to illuminate the malfunction indicator lamp. This was presumed to be due tophase separation because of the absence of any form of cosolvent in this particular fuel blend.
Energies 2020, 13, 6390 7 of 31
In GEM blends, the function of a cosolvent in mixtures of gasoline and methanol is undertakenby the ethanol provided some minimum volume is used. This minimum volume was investigated inlater tests in a vehicle certified to a higher emissions standard utilizing a physical sensor for alcoholconcentration. However, in this later series of tests, despite repeated cold soaks and related cold starttests at −20 ◦C, [18] a minimum requirement for ethanol was not found. Even M56 (i.e., the binarygasoline-methanol mixture) started satisfactorily, suggesting that such GEM blends could help todisplace more gasoline from the fuel pool year round (for a fixed volume of ethanol that is available).
From the vehicle testing program conducted by Lotus, it was deduced that, since all of the vehiclesin the parc do not all use the same alcohol concentration-sensing technology, a minimum ethanolconcentration would in fact be needed to ensure the satisfactory operation of the entire fleet, and thatthis minimum level would be in the region of 10% by volume [18]. In turn, this implies that, withoutthe addition of any other type of cosolvent, the E85-equivalent ternary blend with the maximummethanol concentration that could be used is G40 E10 M50.
A further important finding from this earlier work was that regardless of the technology used tosense the alcohol concentration in the fuel system near to the engine, energetic efficiency improvementson the order of 5% were possible. This was true for any of the ternary blends tested at the E85-equivalentstoichiometric AFR of 9.7:1 [17,18]. This is important when considering the amount of renewableenergy that would have to be supplied to synthesize such fuels by the electrofuel route as per theapproach discussed by various authors [26–33]. Later sections in this paper will provide furthervalidation of the efficiency improvements possible.
Issues of material compatibility were investigated in another publication [20], together withresults showing that exhaust emissions do not change significantly as the blends are altered, withall E85-equivalent ternary blends essentially out-performing gasoline in this respect. However, itshould be noted that particulate and aldehyde emissions were not measured in these tests. Further,Pitcher et al. [21] investigated the spray morphology of GEM blends in an optical direct-injectionengine, this being important because of its bearing on emissions and fuel consumption in enginesusing such fuel introduction technologies. They showed that there was no significant difference inmorphology across the full spectrum of E85-equivalent blends. In the present work, Section 5 buildson this work and presents new data from GEM blends with regards to their soot-formation tendency,which is especially important with respect to Euro 6c (and higher) emissions legislation. These testswere conducted in a different optical engine, and represent the first time such particulate matter datafrom such blends has been presented by this group.
Considerable additional work on the GEM concept has been reported by Sileghem and co-workersin both port-fuel-injection (PFI) and direct-injection (DI) engines [34,35]. All of this work has shownthat in terms of engine and combustion system performance any GEM blend configured accordingto the rules established by Pearson and Turner will perform in the same manner using the sameengine control settings. Note that it is possible to produce ternary blends of other alcohols withgasoline, or even quaternary (or higher number) blends. Similarly, water can be included in suchblends; the physicochemical characteristics of such these blends was investigated [24], although,practically speaking, phase separation would become an issue with the presence of water, the lightalcohols being especially prone to this when in admixture with gasoline. Other authors havediscussed physicochemical, performance, and blending aspects of binary gasoline-alcohol blend fuelsin detail [36–39], but while it is accepted that challenges exist in blending alcohols with gasoline (suchas high vapor pressure and evaporative emissions effects aboard the vehicle, or phase separation andblend stability in the distribution system, with materials compatibility issues in both), it is the authors’belief that these are understood and by no means insurmountable, as evidenced by the amount ofhigh-blend-rate binary mixtures of either ethanol or methanol that is or has been used around the worldand the number of fully-homologated vehicles that have been sold that are capable of taking them.
From all of this initial work, the inherent compatibility of existing production flex-fuel technologywith ternary blends with stoichiometric AFRs matched to fuels already in the market place has been
Energies 2020, 13, 6390 8 of 31
established. It is therefore believed that a progressive rollout of such fuels, by methanol percentageand region, could allow staged introduction of methanol as a transport fuel. This has the potential tomeaningfully reduce greenhouse gas emissions, improve energy security, and provide better air quality.Once the market has accepted the new fuel, it enables widespread use of an energy carrier which couldeventually be completely decarbonized using the electrofuel approach [26–33], with methanol thenbecoming a chemically-liquefied form of hydrogen as an extension of the hydrogen economy [40].At this point in time, a practical liquid fuel that has been fully decarbonized will have been realized.
3. Ternary Gasoline-Alcohol Blend Tests in the “Ultraboost” Extreme DownsizingDemonstrator Engine
The “Ultraboost” collaborative project, more properly known as “Ultra Boost for Economy”,was part-funded by the UK Technology Strategy Board (now Innovate UK) and started in 2010. Itsought to demonstrate the potential to provide a vehicle-level CO2 reduction of 35% in an SUV byemploying a heavily downsized (and ‘down-cylindered’) engine. One major target was that thisnew engine should be capable of generating the torque curve of the Jaguar Land Rover AJ133 V8engine. That engine is of 5.0 L capacity and is naturally aspirated (NA). This performance had to berealized while operating on 95 research octane number (RON) standard pump gasoline [41] (in fact theproject did indeed show that this CO2 reduction target was achievable and in fact greater than this wasdemonstrated by vehicle simulation using the dynamometer data gathered).
At the start of Ultraboost, there was no pre-ordained engine swept volume, but the final versionof the engine was of in-line 4-cylinder configuration, with a compound-charging system and 2.0 Lswept volume [41]. However, the first iteration of the design (termed ‘UB100’) was externally boostedby a charge air handling unit (CAHU) system at the University of Bath facility, where all of the enginetest work, including taking the results reported here, was carried out. Specifications for this engineare given in Table 1. For detailed information on the other project partners and their responsibilities,the individual stages of the project, and the test facility, the reader is referred to [41].
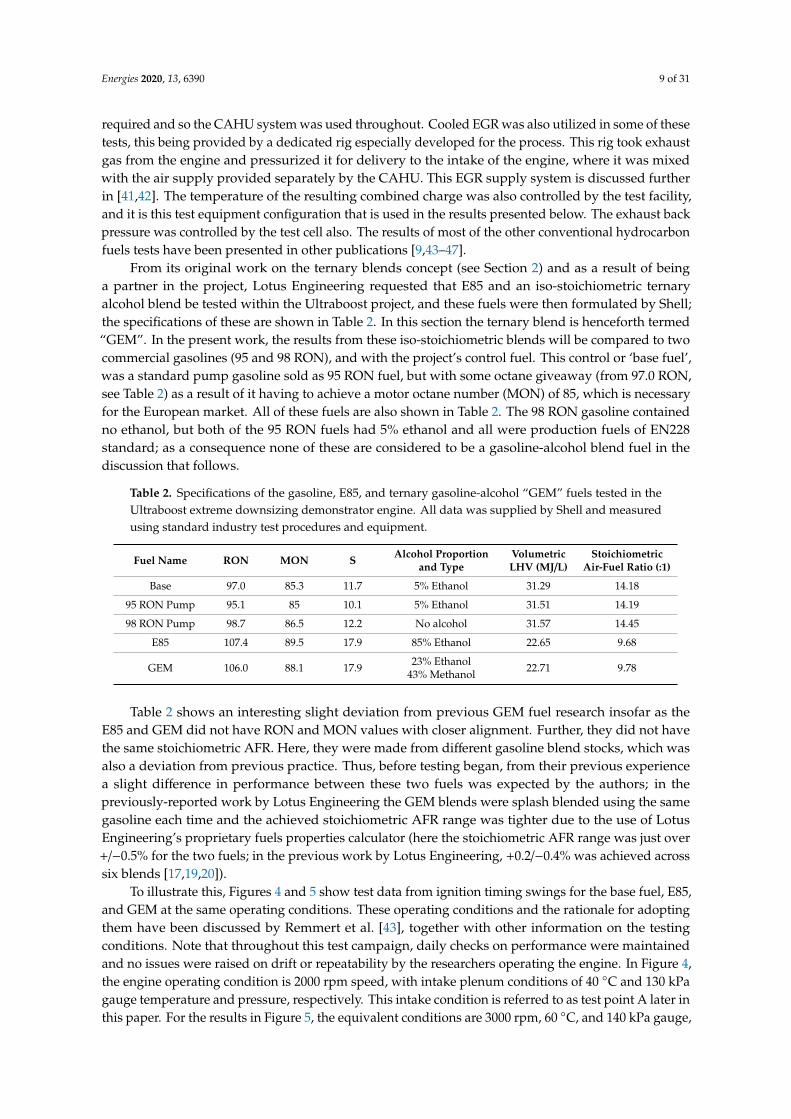
Table 1. Specifications of the Ultraboost extreme downsizing demonstrator engine in theexternally-boosted “UB100” configuration, as used for the fuel blends testing reported here [41].
General architecture 4-cylinder in-line with 4 valves per cylinder and double overhead camshafts
Construction
All aluminumJaguar Land Rover AJ133 cylinder block converted to single-bank operation on theright-hand sideSiamesed liner pack to facilitate reduced bore diameterDedicated cylinder head
Firing order 1–3–4–2
Bore (mm) 83
Stroke (mm) 92
Swept volume (cc) 1991
Combustion system
Pent-roof combustion chamber with asymmetric central direct injection and spark plugHigh-tumble intake portsAuxiliary port-fuel injectionPossible second spark plug position in an under-intake-port location
Compression ratio (:1) 9.0
Valve gearChain-driven double overhead camshaft (DOHC) with fast-acting dualcontinuously-variable camshaft phasersCam profile switching tappets on inlet and exhaust
Engine management system Lotus ‘T6’ engine control unit
As well as for its prime aim as being a platform for the development of a self-contained technologydemonstrator package, the engine was used for an extensive series of fuel tests within the program.For these fuel investigations accurate control of the engine’s plenum temperature and pressure was
Energies 2020, 13, 6390 9 of 31
required and so the CAHU system was used throughout. Cooled EGR was also utilized in some of thesetests, this being provided by a dedicated rig especially developed for the process. This rig took exhaustgas from the engine and pressurized it for delivery to the intake of the engine, where it was mixedwith the air supply provided separately by the CAHU. This EGR supply system is discussed furtherin [41,42]. The temperature of the resulting combined charge was also controlled by the test facility,and it is this test equipment configuration that is used in the results presented below. The exhaust backpressure was controlled by the test cell also. The results of most of the other conventional hydrocarbonfuels tests have been presented in other publications [9,43–47].
From its original work on the ternary blends concept (see Section 2) and as a result of beinga partner in the project, Lotus Engineering requested that E85 and an iso-stoichiometric ternaryalcohol blend be tested within the Ultraboost project, and these fuels were then formulated by Shell;the specifications of these are shown in Table 2. In this section the ternary blend is henceforth termed“GEM”. In the present work, the results from these iso-stoichiometric blends will be compared to twocommercial gasolines (95 and 98 RON), and with the project’s control fuel. This control or ‘base fuel’,was a standard pump gasoline sold as 95 RON fuel, but with some octane giveaway (from 97.0 RON,see Table 2) as a result of it having to achieve a motor octane number (MON) of 85, which is necessaryfor the European market. All of these fuels are also shown in Table 2. The 98 RON gasoline containedno ethanol, but both of the 95 RON fuels had 5% ethanol and all were production fuels of EN228standard; as a consequence none of these are considered to be a gasoline-alcohol blend fuel in thediscussion that follows.
Table 2. Specifications of the gasoline, E85, and ternary gasoline-alcohol “GEM” fuels tested in theUltraboost extreme downsizing demonstrator engine. All data was supplied by Shell and measuredusing standard industry test procedures and equipment.
Fuel Name RON MON S Alcohol Proportionand Type
VolumetricLHV (MJ/L)
StoichiometricAir-Fuel Ratio (:1)
Base 97.0 85.3 11.7 5% Ethanol 31.29 14.18
95 RON Pump 95.1 85 10.1 5% Ethanol 31.51 14.19
98 RON Pump 98.7 86.5 12.2 No alcohol 31.57 14.45
E85 107.4 89.5 17.9 85% Ethanol 22.65 9.68
GEM 106.0 88.1 17.9 23% Ethanol43% Methanol 22.71 9.78
Table 2 shows an interesting slight deviation from previous GEM fuel research insofar as theE85 and GEM did not have RON and MON values with closer alignment. Further, they did not havethe same stoichiometric AFR. Here, they were made from different gasoline blend stocks, which wasalso a deviation from previous practice. Thus, before testing began, from their previous experiencea slight difference in performance between these two fuels was expected by the authors; in thepreviously-reported work by Lotus Engineering the GEM blends were splash blended using the samegasoline each time and the achieved stoichiometric AFR range was tighter due to the use of LotusEngineering’s proprietary fuels properties calculator (here the stoichiometric AFR range was just over+/−0.5% for the two fuels; in the previous work by Lotus Engineering, +0.2/−0.4% was achieved acrosssix blends [17,19,20]).
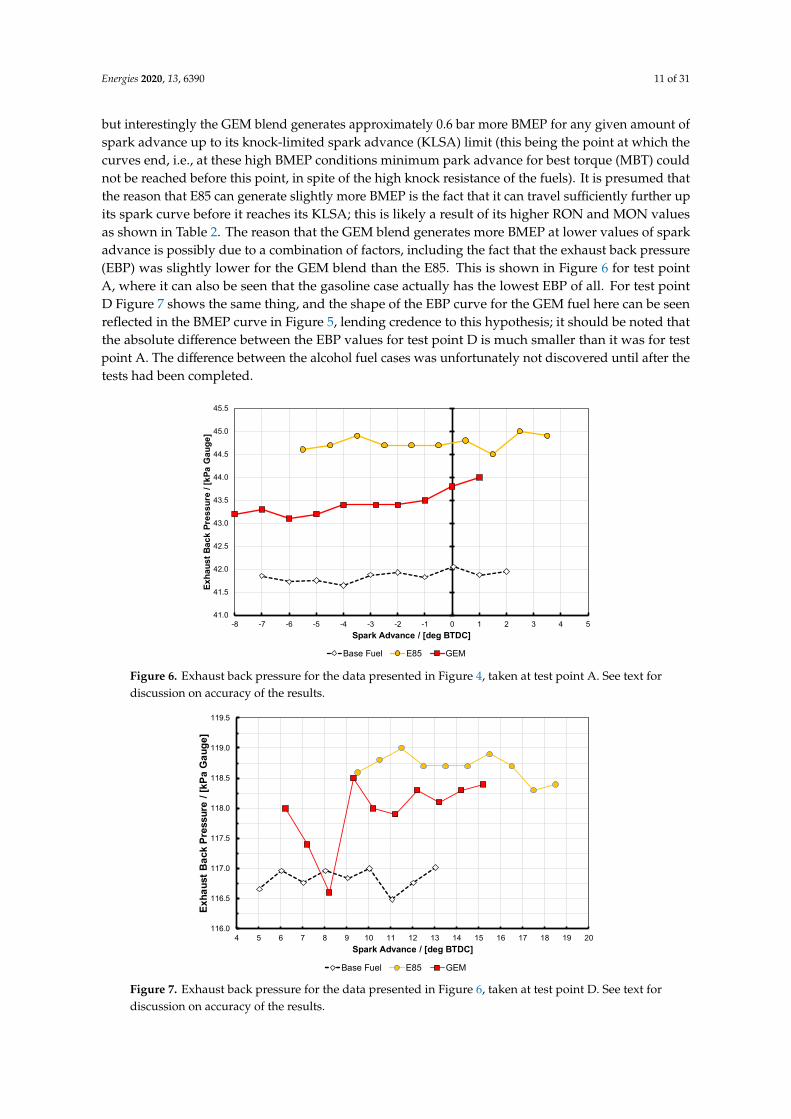
To illustrate this, Figures 4 and 5 show test data from ignition timing swings for the base fuel, E85,and GEM at the same operating conditions. These operating conditions and the rationale for adoptingthem have been discussed by Remmert et al. [43], together with other information on the testingconditions. Note that throughout this test campaign, daily checks on performance were maintainedand no issues were raised on drift or repeatability by the researchers operating the engine. In Figure 4,the engine operating condition is 2000 rpm speed, with intake plenum conditions of 40 ◦C and 130 kPagauge temperature and pressure, respectively. This intake condition is referred to as test point A later inthis paper. For the results in Figure 5, the equivalent conditions are 3000 rpm, 60 ◦C, and 140 kPa gauge,
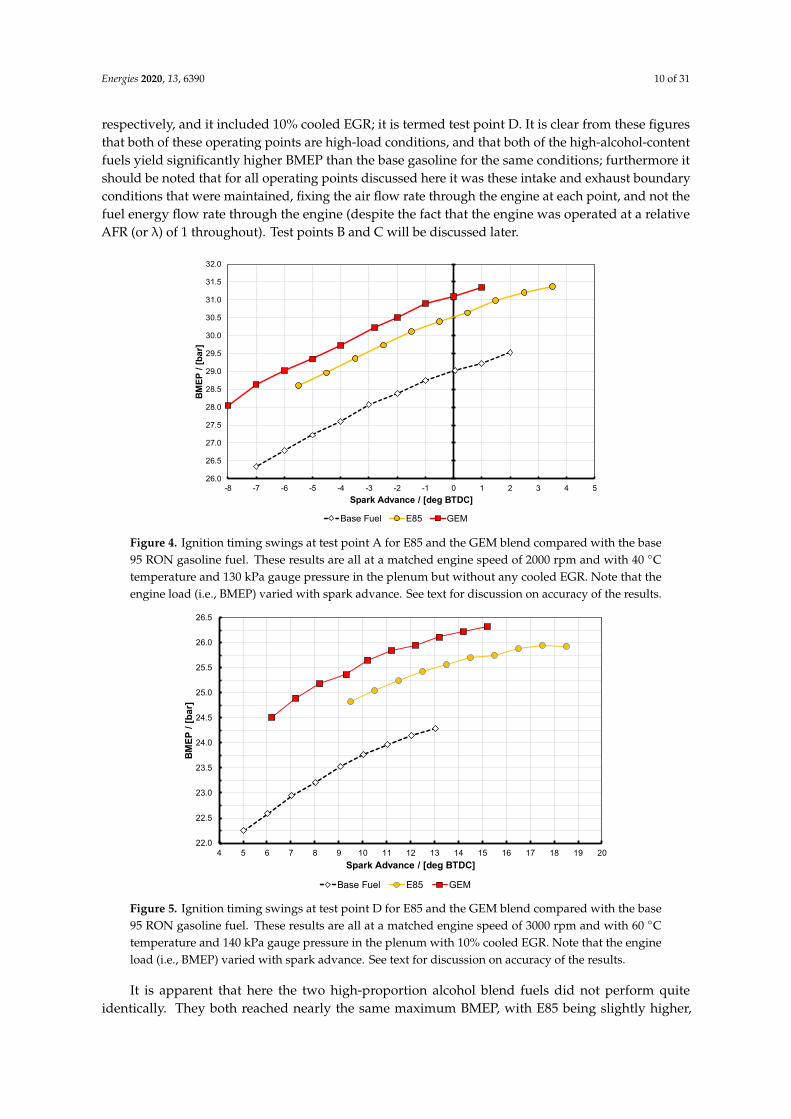
Energies 2020, 13, 6390 10 of 31
respectively, and it included 10% cooled EGR; it is termed test point D. It is clear from these figuresthat both of these operating points are high-load conditions, and that both of the high-alcohol-contentfuels yield significantly higher BMEP than the base gasoline for the same conditions; furthermore itshould be noted that for all operating points discussed here it was these intake and exhaust boundaryconditions that were maintained, fixing the air flow rate through the engine at each point, and not thefuel energy flow rate through the engine (despite the fact that the engine was operated at a relativeAFR (or λ) of 1 throughout). Test points B and C will be discussed later.
Energies 2020, 13, x FOR PEER REVIEW 10 of 32
engine was operated at a relative AFR (or λ) of 1 throughout). Test points B and C will be discussed later.
Figure 4. Ignition timing swings at test point A for E85 and the GEM blend compared with the base 95 RON gasoline fuel. These results are all at a matched engine speed of 2000 rpm and with 40 °C temperature and 130 kPa gauge pressure in the plenum but without any cooled EGR. Note that the engine load (i.e., BMEP) varied with spark advance. See text for discussion on accuracy of the results.
Figure 5. Ignition timing swings at test point D for E85 and the GEM blend compared with the base 95 RON gasoline fuel. These results are all at a matched engine speed of 3000 rpm and with 60 °C temperature and 140 kPa gauge pressure in the plenum with 10% cooled EGR. Note that the engine load (i.e., BMEP) varied with spark advance. See text for discussion on accuracy of the results.
It is apparent that here the two high-proportion alcohol blend fuels did not perform quite identically. They both reached nearly the same maximum BMEP, with E85 being slightly higher, but interestingly the GEM blend generates approximately 0.6 bar more BMEP for any given amount of spark advance up to its knock-limited spark advance (KLSA) limit (this being the point at which the curves end, i.e., at these high BMEP conditions minimum park advance for best torque (MBT) could not be reached before this point, in spite of the high knock resistance of the fuels). It is presumed that the reason that E85 can generate slightly more BMEP is the fact that it can travel sufficiently further
26.0
26.5
27.0
27.5
28.0
28.5
29.0
29.5
30.0
30.5
31.0
31.5
32.0
-8 -7 -6 -5 -4 -3 -2 -1 0 1 2 3 4 5
BMEP
/ [b
ar]
Spark Advance / [deg BTDC]
Base Fuel E85 GEM
22.0
22.5
23.0
23.5
24.0
24.5
25.0
25.5
26.0
26.5
4 5 6 7 8 9 10 11 12 13 14 15 16 17 18 19 20
BMEP
/ [b
ar]
Spark Advance / [deg BTDC]
Base Fuel E85 GEM
Figure 4. Ignition timing swings at test point A for E85 and the GEM blend compared with the base95 RON gasoline fuel. These results are all at a matched engine speed of 2000 rpm and with 40 ◦Ctemperature and 130 kPa gauge pressure in the plenum but without any cooled EGR. Note that theengine load (i.e., BMEP) varied with spark advance. See text for discussion on accuracy of the results.
Energies 2020, 13, x FOR PEER REVIEW 10 of 32
engine was operated at a relative AFR (or λ) of 1 throughout). Test points B and C will be discussed later.
Figure 4. Ignition timing swings at test point A for E85 and the GEM blend compared with the base 95 RON gasoline fuel. These results are all at a matched engine speed of 2000 rpm and with 40 °C temperature and 130 kPa gauge pressure in the plenum but without any cooled EGR. Note that the engine load (i.e., BMEP) varied with spark advance. See text for discussion on accuracy of the results.
Figure 5. Ignition timing swings at test point D for E85 and the GEM blend compared with the base 95 RON gasoline fuel. These results are all at a matched engine speed of 3000 rpm and with 60 °C temperature and 140 kPa gauge pressure in the plenum with 10% cooled EGR. Note that the engine load (i.e., BMEP) varied with spark advance. See text for discussion on accuracy of the results.
It is apparent that here the two high-proportion alcohol blend fuels did not perform quite identically. They both reached nearly the same maximum BMEP, with E85 being slightly higher, but interestingly the GEM blend generates approximately 0.6 bar more BMEP for any given amount of spark advance up to its knock-limited spark advance (KLSA) limit (this being the point at which the curves end, i.e., at these high BMEP conditions minimum park advance for best torque (MBT) could not be reached before this point, in spite of the high knock resistance of the fuels). It is presumed that the reason that E85 can generate slightly more BMEP is the fact that it can travel sufficiently further
26.0
26.5
27.0
27.5
28.0
28.5
29.0
29.5
30.0
30.5
31.0
31.5
32.0
-8 -7 -6 -5 -4 -3 -2 -1 0 1 2 3 4 5
BMEP
/ [b
ar]
Spark Advance / [deg BTDC]
Base Fuel E85 GEM
22.0
22.5
23.0
23.5
24.0
24.5
25.0
25.5
26.0
26.5
4 5 6 7 8 9 10 11 12 13 14 15 16 17 18 19 20
BMEP
/ [b
ar]
Spark Advance / [deg BTDC]
Base Fuel E85 GEM
Figure 5. Ignition timing swings at test point D for E85 and the GEM blend compared with the base95 RON gasoline fuel. These results are all at a matched engine speed of 3000 rpm and with 60 ◦Ctemperature and 140 kPa gauge pressure in the plenum with 10% cooled EGR. Note that the engineload (i.e., BMEP) varied with spark advance. See text for discussion on accuracy of the results.
It is apparent that here the two high-proportion alcohol blend fuels did not perform quiteidentically. They both reached nearly the same maximum BMEP, with E85 being slightly higher,
Energies 2020, 13, 6390 11 of 31
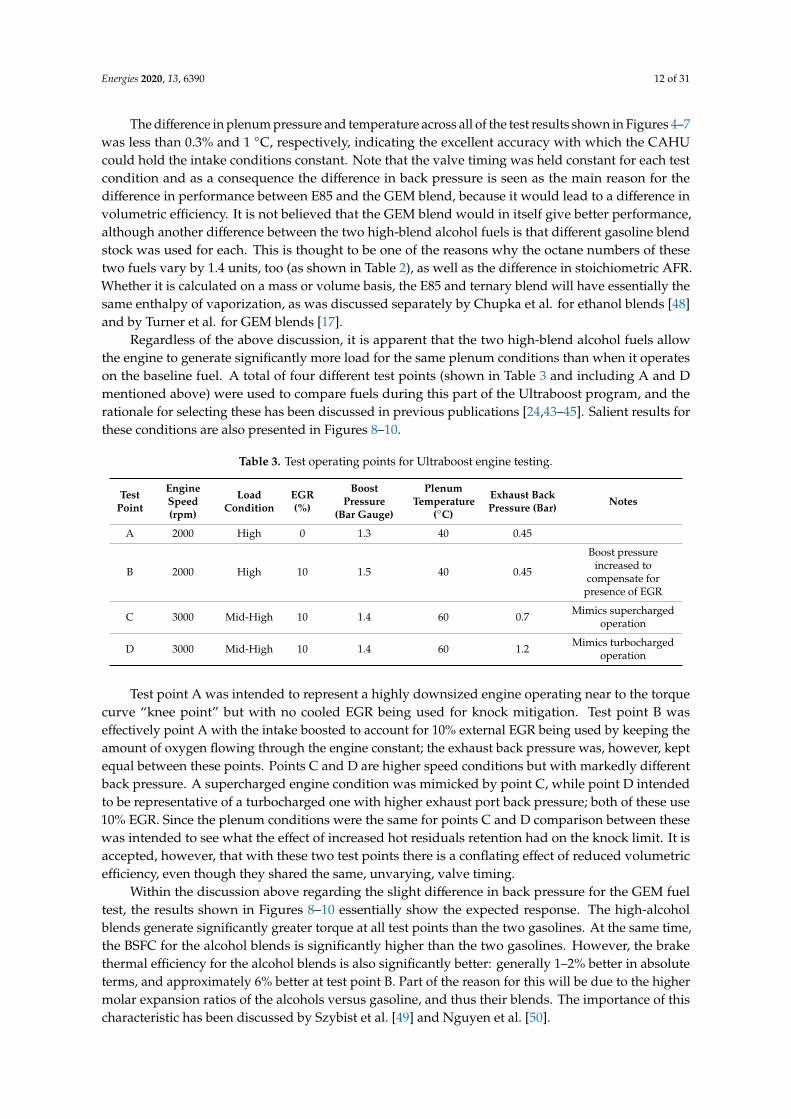
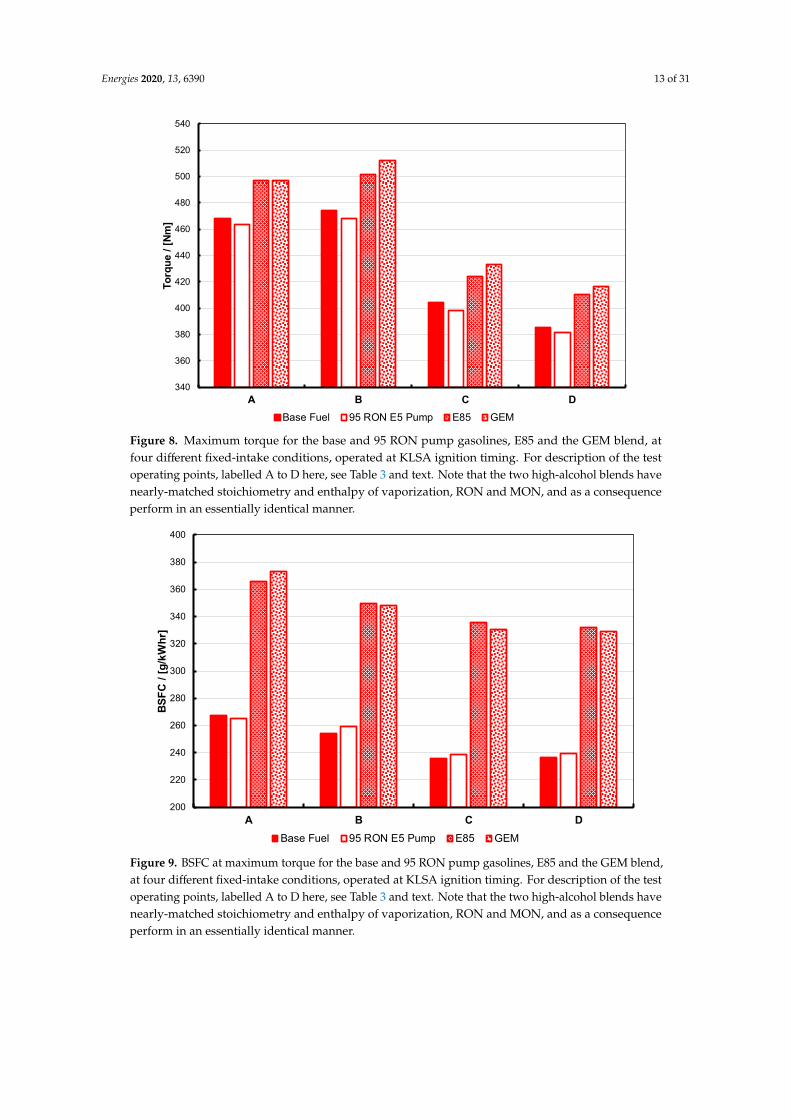
but interestingly the GEM blend generates approximately 0.6 bar more BMEP for any given amount ofspark advance up to its knock-limited spark advance (KLSA) limit (this being the point at which thecurves end, i.e., at these high BMEP conditions minimum park advance for best torque (MBT) couldnot be reached before this point, in spite of the high knock resistance of the fuels). It is presumed thatthe reason that E85 can generate slightly more BMEP is the fact that it can travel sufficiently further upits spark curve before it reaches its KLSA; this is likely a result of its higher RON and MON valuesas shown in Table 2. The reason that the GEM blend generates more BMEP at lower values of sparkadvance is possibly due to a combination of factors, including the fact that the exhaust back pressure(EBP) was slightly lower for the GEM blend than the E85. This is shown in Figure 6 for test pointA, where it can also be seen that the gasoline case actually has the lowest EBP of all. For test pointD Figure 7 shows the same thing, and the shape of the EBP curve for the GEM fuel here can be seenreflected in the BMEP curve in Figure 5, lending credence to this hypothesis; it should be noted thatthe absolute difference between the EBP values for test point D is much smaller than it was for testpoint A. The difference between the alcohol fuel cases was unfortunately not discovered until after thetests had been completed.
Energies 2020, 13, x FOR PEER REVIEW 11 of 32
up its spark curve before it reaches its KLSA; this is likely a result of its higher RON and MON values as shown in Table 2. The reason that the GEM blend generates more BMEP at lower values of spark advance is possibly due to a combination of factors, including the fact that the exhaust back pressure (EBP) was slightly lower for the GEM blend than the E85. This is shown in Figure 6 for test point A, where it can also be seen that the gasoline case actually has the lowest EBP of all. For test point D Figure 7 shows the same thing, and the shape of the EBP curve for the GEM fuel here can be seen reflected in the BMEP curve in Figure 5, lending credence to this hypothesis; it should be noted that the absolute difference between the EBP values for test point D is much smaller than it was for test point A. The difference between the alcohol fuel cases was unfortunately not discovered until after the tests had been completed.
Figure 6. Exhaust back pressure for the data presented in Figure 4, taken at test point A. See text for discussion on accuracy of the results.
Figure 7. Exhaust back pressure for the data presented in Figure 6, taken at test point D. See text for discussion on accuracy of the results.
The difference in plenum pressure and temperature across all of the test results shown in Figures 4–7 was less than 0.3% and 1 °C, respectively, indicating the excellent accuracy with which the CAHU could hold the intake conditions constant. Note that the valve timing was held constant for each test condition and as a consequence the difference in back pressure is seen as the main reason for the
41.0
41.5
42.0
42.5
43.0
43.5
44.0
44.5
45.0
45.5
-8 -7 -6 -5 -4 -3 -2 -1 0 1 2 3 4 5
Exha
ust B
ack
Pres
sure
/ [k
Pa G
auge
]
Spark Advance / [deg BTDC]
Base Fuel E85 GEM
116.0
116.5
117.0
117.5
118.0
118.5
119.0
119.5
4 5 6 7 8 9 10 11 12 13 14 15 16 17 18 19 20
Exha
ust B
ack
Pres
sure
/ [k
Pa G
auge
]
Spark Advance / [deg BTDC]
Base Fuel E85 GEM
Figure 6. Exhaust back pressure for the data presented in Figure 4, taken at test point A. See text fordiscussion on accuracy of the results.
Energies 2020, 13, x FOR PEER REVIEW 11 of 32
up its spark curve before it reaches its KLSA; this is likely a result of its higher RON and MON values as shown in Table 2. The reason that the GEM blend generates more BMEP at lower values of spark advance is possibly due to a combination of factors, including the fact that the exhaust back pressure (EBP) was slightly lower for the GEM blend than the E85. This is shown in Figure 6 for test point A, where it can also be seen that the gasoline case actually has the lowest EBP of all. For test point D Figure 7 shows the same thing, and the shape of the EBP curve for the GEM fuel here can be seen reflected in the BMEP curve in Figure 5, lending credence to this hypothesis; it should be noted that the absolute difference between the EBP values for test point D is much smaller than it was for test point A. The difference between the alcohol fuel cases was unfortunately not discovered until after the tests had been completed.
Figure 6. Exhaust back pressure for the data presented in Figure 4, taken at test point A. See text for discussion on accuracy of the results.
Figure 7. Exhaust back pressure for the data presented in Figure 6, taken at test point D. See text for discussion on accuracy of the results.
The difference in plenum pressure and temperature across all of the test results shown in Figures 4–7 was less than 0.3% and 1 °C, respectively, indicating the excellent accuracy with which the CAHU could hold the intake conditions constant. Note that the valve timing was held constant for each test condition and as a consequence the difference in back pressure is seen as the main reason for the
41.0
41.5
42.0
42.5
43.0
43.5
44.0
44.5
45.0
45.5
-8 -7 -6 -5 -4 -3 -2 -1 0 1 2 3 4 5
Exha
ust B
ack
Pres
sure
/ [k
Pa G
auge
]
Spark Advance / [deg BTDC]
Base Fuel E85 GEM
116.0
116.5
117.0
117.5
118.0
118.5
119.0
119.5
4 5 6 7 8 9 10 11 12 13 14 15 16 17 18 19 20
Exha
ust B
ack
Pres
sure
/ [k
Pa G
auge
]
Spark Advance / [deg BTDC]
Base Fuel E85 GEM
Figure 7. Exhaust back pressure for the data presented in Figure 6, taken at test point D. See text fordiscussion on accuracy of the results.
Energies 2020, 13, 6390 12 of 31
The difference in plenum pressure and temperature across all of the test results shown in Figures 4–7was less than 0.3% and 1 ◦C, respectively, indicating the excellent accuracy with which the CAHUcould hold the intake conditions constant. Note that the valve timing was held constant for each testcondition and as a consequence the difference in back pressure is seen as the main reason for thedifference in performance between E85 and the GEM blend, because it would lead to a difference involumetric efficiency. It is not believed that the GEM blend would in itself give better performance,although another difference between the two high-blend alcohol fuels is that different gasoline blendstock was used for each. This is thought to be one of the reasons why the octane numbers of thesetwo fuels vary by 1.4 units, too (as shown in Table 2), as well as the difference in stoichiometric AFR.Whether it is calculated on a mass or volume basis, the E85 and ternary blend will have essentially thesame enthalpy of vaporization, as was discussed separately by Chupka et al. for ethanol blends [48]and by Turner et al. for GEM blends [17].
Regardless of the above discussion, it is apparent that the two high-blend alcohol fuels allowthe engine to generate significantly more load for the same plenum conditions than when it operateson the baseline fuel. A total of four different test points (shown in Table 3 and including A and Dmentioned above) were used to compare fuels during this part of the Ultraboost program, and therationale for selecting these has been discussed in previous publications [24,43–45]. Salient results forthese conditions are also presented in Figures 8–10.
Table 3. Test operating points for Ultraboost engine testing.
TestPoint
EngineSpeed(rpm)
LoadCondition
EGR(%)
BoostPressure
(Bar Gauge)
PlenumTemperature
(◦C)
Exhaust BackPressure (Bar) Notes
A 2000 High 0 1.3 40 0.45
B 2000 High 10 1.5 40 0.45
Boost pressureincreased to
compensate forpresence of EGR
C 3000 Mid-High 10 1.4 60 0.7 Mimics superchargedoperation
D 3000 Mid-High 10 1.4 60 1.2 Mimics turbochargedoperation
Test point A was intended to represent a highly downsized engine operating near to the torquecurve “knee point” but with no cooled EGR being used for knock mitigation. Test point B waseffectively point A with the intake boosted to account for 10% external EGR being used by keeping theamount of oxygen flowing through the engine constant; the exhaust back pressure was, however, keptequal between these points. Points C and D are higher speed conditions but with markedly differentback pressure. A supercharged engine condition was mimicked by point C, while point D intendedto be representative of a turbocharged one with higher exhaust port back pressure; both of these use10% EGR. Since the plenum conditions were the same for points C and D comparison between thesewas intended to see what the effect of increased hot residuals retention had on the knock limit. It isaccepted, however, that with these two test points there is a conflating effect of reduced volumetricefficiency, even though they shared the same, unvarying, valve timing.
Within the discussion above regarding the slight difference in back pressure for the GEM fueltest, the results shown in Figures 8–10 essentially show the expected response. The high-alcoholblends generate significantly greater torque at all test points than the two gasolines. At the same time,the BSFC for the alcohol blends is significantly higher than the two gasolines. However, the brakethermal efficiency for the alcohol blends is also significantly better: generally 1–2% better in absoluteterms, and approximately 6% better at test point B. Part of the reason for this will be due to the highermolar expansion ratios of the alcohols versus gasoline, and thus their blends. The importance of thischaracteristic has been discussed by Szybist et al. [49] and Nguyen et al. [50].
Energies 2020, 13, 6390 13 of 31Energies 2020, 13, x FOR PEER REVIEW 13 of 32
Figure 8. Maximum torque for the base and 95 RON pump gasolines, E85 and the GEM blend, at four different fixed-intake conditions, operated at KLSA ignition timing. For description of the test operating points, labelled A to D here, see Table 3 and text. Note that the two high-alcohol blends have nearly-matched stoichiometry and enthalpy of vaporization, RON and MON, and as a consequence perform in an essentially identical manner.
Figure 9. BSFC at maximum torque for the base and 95 RON pump gasolines, E85 and the GEM blend, at four different fixed-intake conditions, operated at KLSA ignition timing. For description of the test operating points, labelled A to D here, see Table 3 and text. Note that the two high-alcohol blends have nearly-matched stoichiometry and enthalpy of vaporization, RON and MON, and as a consequence perform in an essentially identical manner.
340
360
380
400
420
440
460
480
500
520
540
A B C D
Torq
ue /
[Nm
]
Base Fuel 95 RON E5 Pump E85 GEM
200
220
240
260
280
300
320
340
360
380
400
A B C D
BSFC
/ [g
/kW
hr]
Base Fuel 95 RON E5 Pump E85 GEM
Figure 8. Maximum torque for the base and 95 RON pump gasolines, E85 and the GEM blend, atfour different fixed-intake conditions, operated at KLSA ignition timing. For description of the testoperating points, labelled A to D here, see Table 3 and text. Note that the two high-alcohol blends havenearly-matched stoichiometry and enthalpy of vaporization, RON and MON, and as a consequenceperform in an essentially identical manner.
Energies 2020, 13, x FOR PEER REVIEW 13 of 32
Figure 8. Maximum torque for the base and 95 RON pump gasolines, E85 and the GEM blend, at four different fixed-intake conditions, operated at KLSA ignition timing. For description of the test operating points, labelled A to D here, see Table 3 and text. Note that the two high-alcohol blends have nearly-matched stoichiometry and enthalpy of vaporization, RON and MON, and as a consequence perform in an essentially identical manner.
Figure 9. BSFC at maximum torque for the base and 95 RON pump gasolines, E85 and the GEM blend, at four different fixed-intake conditions, operated at KLSA ignition timing. For description of the test operating points, labelled A to D here, see Table 3 and text. Note that the two high-alcohol blends have nearly-matched stoichiometry and enthalpy of vaporization, RON and MON, and as a consequence perform in an essentially identical manner.
340
360
380
400
420
440
460
480
500
520
540
A B C D
Torq
ue /
[Nm
]
Base Fuel 95 RON E5 Pump E85 GEM
200
220
240
260
280
300
320
340
360
380
400
A B C D
BSFC
/ [g
/kW
hr]
Base Fuel 95 RON E5 Pump E85 GEM
Figure 9. BSFC at maximum torque for the base and 95 RON pump gasolines, E85 and the GEM blend,at four different fixed-intake conditions, operated at KLSA ignition timing. For description of the testoperating points, labelled A to D here, see Table 3 and text. Note that the two high-alcohol blends havenearly-matched stoichiometry and enthalpy of vaporization, RON and MON, and as a consequenceperform in an essentially identical manner.
Energies 2020, 13, 6390 14 of 31Energies 2020, 13, x FOR PEER REVIEW 14 of 32
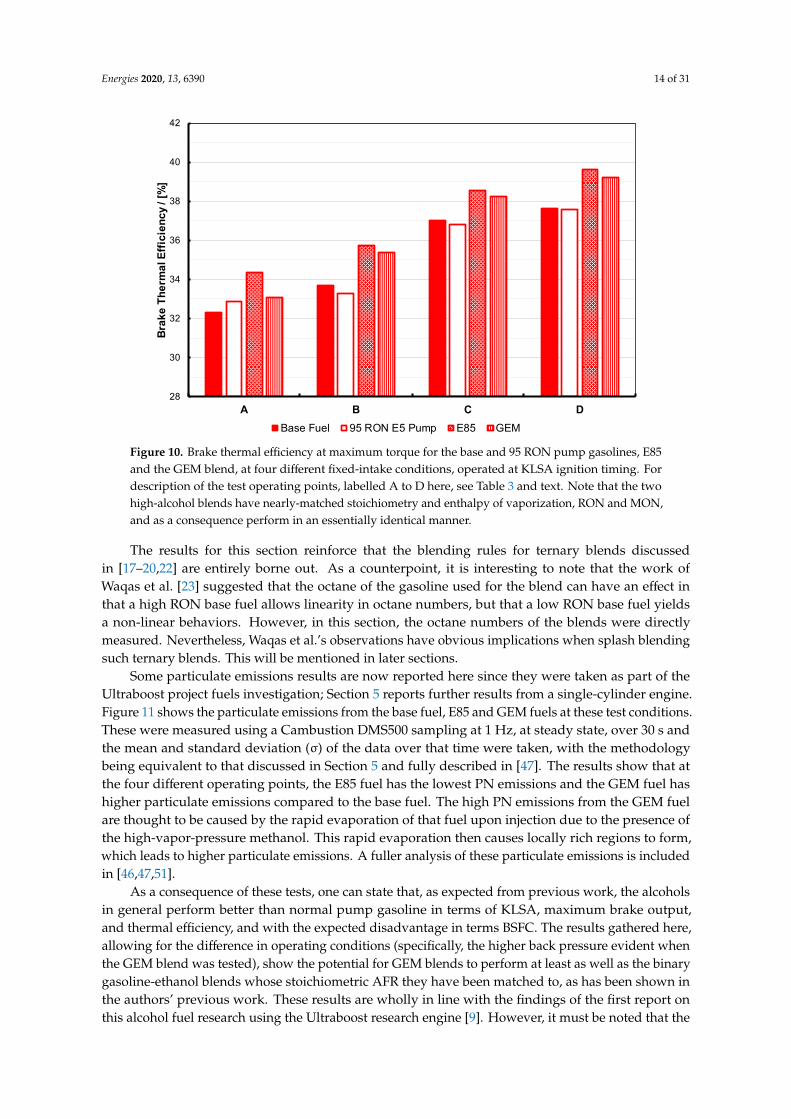
Figure 10. Brake thermal efficiency at maximum torque for the base and 95 RON pump gasolines, E85 and the GEM blend, at four different fixed-intake conditions, operated at KLSA ignition timing. For description of the test operating points, labelled A to D here, see Table 3 and text. Note that the two high-alcohol blends have nearly-matched stoichiometry and enthalpy of vaporization, RON and MON, and as a consequence perform in an essentially identical manner.
The results for this section reinforce that the blending rules for ternary blends discussed in [17–20,22] are entirely borne out. As a counterpoint, it is interesting to note that the work of Waqas et al. [23] suggested that the octane of the gasoline used for the blend can have an effect in that a high RON base fuel allows linearity in octane numbers, but that a low RON base fuel yields a non-linear behaviors. However, in this section, the octane numbers of the blends were directly measured. Nevertheless, Waqas et al.’s observations have obvious implications when splash blending such ternary blends. This will be mentioned in later sections.
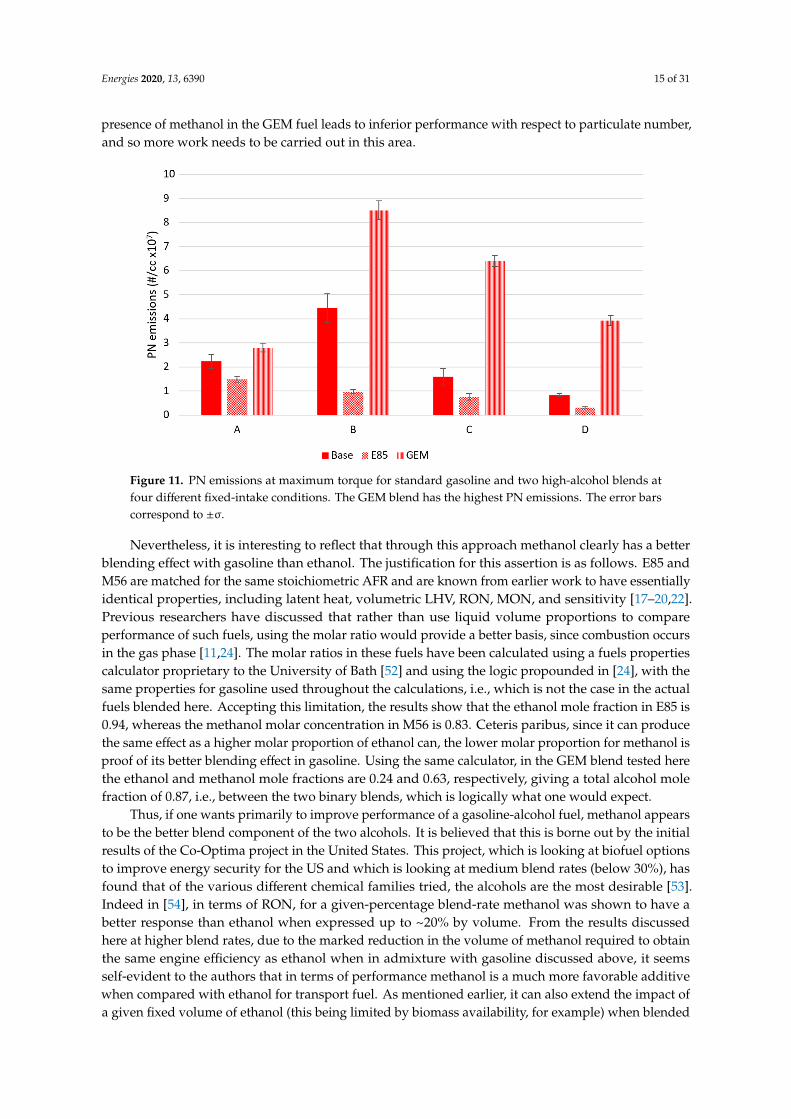
Some particulate emissions results are now reported here since they were taken as part of the Ultraboost project fuels investigation; Section 5 reports further results from a single-cylinder engine. Figure 11 shows the particulate emissions from the base fuel, E85 and GEM fuels at these test conditions. These were measured using a Cambustion DMS500 sampling at 1 Hz, at steady state, over 30 s and the mean and standard deviation (σ) of the data over that time were taken, with the methodology being equivalent to that discussed in Section 5 and fully described in [47]. The results show that at the four different operating points, the E85 fuel has the lowest PN emissions and the GEM fuel has higher particulate emissions compared to the base fuel. The high PN emissions from the GEM fuel are thought to be caused by the rapid evaporation of that fuel upon injection due to the presence of the high-vapor-pressure methanol. This rapid evaporation then causes locally rich regions to form, which leads to higher particulate emissions. A fuller analysis of these particulate emissions is included in [46,47,51].
As a consequence of these tests, one can state that, as expected from previous work, the alcohols in general perform better than normal pump gasoline in terms of KLSA, maximum brake output, and thermal efficiency, and with the expected disadvantage in terms BSFC. The results gathered here, allowing for the difference in operating conditions (specifically, the higher back pressure evident when the GEM blend was tested), show the potential for GEM blends to perform at least as well as the binary gasoline-ethanol blends whose stoichiometric AFR they have been matched to, as has been shown in the authors’ previous work. These results are wholly in line with the findings of the first report on this alcohol fuel research using the Ultraboost research engine [9]. However, it must be
28
30
32
34
36
38
40
42
A B C D
Brak
e Th
erm
al E
ffici
ency
/ [%
]
Base Fuel 95 RON E5 Pump E85 GEM
Figure 10. Brake thermal efficiency at maximum torque for the base and 95 RON pump gasolines, E85and the GEM blend, at four different fixed-intake conditions, operated at KLSA ignition timing. Fordescription of the test operating points, labelled A to D here, see Table 3 and text. Note that the twohigh-alcohol blends have nearly-matched stoichiometry and enthalpy of vaporization, RON and MON,and as a consequence perform in an essentially identical manner.
The results for this section reinforce that the blending rules for ternary blends discussedin [17–20,22] are entirely borne out. As a counterpoint, it is interesting to note that the work ofWaqas et al. [23] suggested that the octane of the gasoline used for the blend can have an effect inthat a high RON base fuel allows linearity in octane numbers, but that a low RON base fuel yieldsa non-linear behaviors. However, in this section, the octane numbers of the blends were directlymeasured. Nevertheless, Waqas et al.’s observations have obvious implications when splash blendingsuch ternary blends. This will be mentioned in later sections.
Some particulate emissions results are now reported here since they were taken as part of theUltraboost project fuels investigation; Section 5 reports further results from a single-cylinder engine.Figure 11 shows the particulate emissions from the base fuel, E85 and GEM fuels at these test conditions.These were measured using a Cambustion DMS500 sampling at 1 Hz, at steady state, over 30 s andthe mean and standard deviation (σ) of the data over that time were taken, with the methodologybeing equivalent to that discussed in Section 5 and fully described in [47]. The results show that atthe four different operating points, the E85 fuel has the lowest PN emissions and the GEM fuel hashigher particulate emissions compared to the base fuel. The high PN emissions from the GEM fuelare thought to be caused by the rapid evaporation of that fuel upon injection due to the presence ofthe high-vapor-pressure methanol. This rapid evaporation then causes locally rich regions to form,which leads to higher particulate emissions. A fuller analysis of these particulate emissions is includedin [46,47,51].
As a consequence of these tests, one can state that, as expected from previous work, the alcoholsin general perform better than normal pump gasoline in terms of KLSA, maximum brake output,and thermal efficiency, and with the expected disadvantage in terms BSFC. The results gathered here,allowing for the difference in operating conditions (specifically, the higher back pressure evident whenthe GEM blend was tested), show the potential for GEM blends to perform at least as well as the binarygasoline-ethanol blends whose stoichiometric AFR they have been matched to, as has been shown inthe authors’ previous work. These results are wholly in line with the findings of the first report onthis alcohol fuel research using the Ultraboost research engine [9]. However, it must be noted that the
Energies 2020, 13, 6390 15 of 31
presence of methanol in the GEM fuel leads to inferior performance with respect to particulate number,and so more work needs to be carried out in this area.
Energies 2020, 13, x FOR PEER REVIEW 15 of 32
noted that the presence of methanol in the GEM fuel leads to inferior performance with respect to particulate number, and so more work needs to be carried out in this area.
Figure 11. PN emissions at maximum torque for standard gasoline and two high-alcohol blends at four different fixed-intake conditions. The GEM blend has the highest PN emissions. The error bars correspond to ±σ.
Nevertheless, it is interesting to reflect that through this approach methanol clearly has a better blending effect with gasoline than ethanol. The justification for this assertion is as follows. E85 and M56 are matched for the same stoichiometric AFR and are known from earlier work to have essentially identical properties, including latent heat, volumetric LHV, RON, MON, and sensitivity [17–20,22]. Previous researchers have discussed that rather than use liquid volume proportions to compare performance of such fuels, using the molar ratio would provide a better basis, since combustion occurs in the gas phase [11,24]. The molar ratios in these fuels have been calculated using a fuels properties calculator proprietary to the University of Bath [52] and using the logic propounded in [24], with the same properties for gasoline used throughout the calculations, i.e., which is not the case in the actual fuels blended here. Accepting this limitation, the results show that the ethanol mole fraction in E85 is 0.94, whereas the methanol molar concentration in M56 is 0.83. Ceteris paribus, since it can produce the same effect as a higher molar proportion of ethanol can, the lower molar proportion for methanol is proof of its better blending effect in gasoline. Using the same calculator, in the GEM blend tested here the ethanol and methanol mole fractions are 0.24 and 0.63, respectively, giving a total alcohol mole fraction of 0.87, i.e., between the two binary blends, which is logically what one would expect.
Thus, if one wants primarily to improve performance of a gasoline-alcohol fuel, methanol appears to be the better blend component of the two alcohols. It is believed that this is borne out by the initial results of the Co-Optima project in the United States. This project, which is looking at biofuel options to improve energy security for the US and which is looking at medium blend rates (below 30%), has found that of the various different chemical families tried, the alcohols are the most desirable [53]. Indeed in [54], in terms of RON, for a given-percentage blend-rate methanol was shown to have a better response than ethanol when expressed up to ~20% by volume. From the results discussed here at higher blend rates, due to the marked reduction in the volume of methanol required to obtain the same engine efficiency as ethanol when in admixture with gasoline discussed above, it seems self-evident to the authors that in terms of performance methanol is a much more favorable additive when compared with ethanol for transport fuel. As mentioned earlier, it can also extend the impact of a given fixed volume of ethanol (this being limited by biomass availability, for example)
Figure 11. PN emissions at maximum torque for standard gasoline and two high-alcohol blends atfour different fixed-intake conditions. The GEM blend has the highest PN emissions. The error barscorrespond to ±σ.
Nevertheless, it is interesting to reflect that through this approach methanol clearly has a betterblending effect with gasoline than ethanol. The justification for this assertion is as follows. E85 andM56 are matched for the same stoichiometric AFR and are known from earlier work to have essentiallyidentical properties, including latent heat, volumetric LHV, RON, MON, and sensitivity [17–20,22].Previous researchers have discussed that rather than use liquid volume proportions to compareperformance of such fuels, using the molar ratio would provide a better basis, since combustion occursin the gas phase [11,24]. The molar ratios in these fuels have been calculated using a fuels propertiescalculator proprietary to the University of Bath [52] and using the logic propounded in [24], with thesame properties for gasoline used throughout the calculations, i.e., which is not the case in the actualfuels blended here. Accepting this limitation, the results show that the ethanol mole fraction in E85 is0.94, whereas the methanol molar concentration in M56 is 0.83. Ceteris paribus, since it can producethe same effect as a higher molar proportion of ethanol can, the lower molar proportion for methanol isproof of its better blending effect in gasoline. Using the same calculator, in the GEM blend tested herethe ethanol and methanol mole fractions are 0.24 and 0.63, respectively, giving a total alcohol molefraction of 0.87, i.e., between the two binary blends, which is logically what one would expect.
Thus, if one wants primarily to improve performance of a gasoline-alcohol fuel, methanol appearsto be the better blend component of the two alcohols. It is believed that this is borne out by the initialresults of the Co-Optima project in the United States. This project, which is looking at biofuel optionsto improve energy security for the US and which is looking at medium blend rates (below 30%), hasfound that of the various different chemical families tried, the alcohols are the most desirable [53].Indeed in [54], in terms of RON, for a given-percentage blend-rate methanol was shown to have abetter response than ethanol when expressed up to ~20% by volume. From the results discussedhere at higher blend rates, due to the marked reduction in the volume of methanol required to obtainthe same engine efficiency as ethanol when in admixture with gasoline discussed above, it seemsself-evident to the authors that in terms of performance methanol is a much more favorable additivewhen compared with ethanol for transport fuel. As mentioned earlier, it can also extend the impact ofa given fixed volume of ethanol (this being limited by biomass availability, for example) when blended
Energies 2020, 13, 6390 16 of 31
together with gasoline, as has been discussed by Turner et al. [17]. Ternary blending of the threecomponents can also make the distillation curve more acceptable than binary blending, overcomingone of the drawbacks listed by the Co-Optima project. As the Co-Optima project moves forward,methanol has been eliminated as a candidate blend agent, primarily on the grounds of blend stabilityat lower concentrations than discussed here. To the authors of this work methanol would seem to be apreferred choice when considering ternary blends and with engine performance as the sole criterion;unfortunately there has not been such consideration of ternary blends within Co-Optima. The effect ofternary blending of gasoline with the light alcohols on engine performance will be further investigatedin the following sections of the present paper.
4. Performance and Emissions of Iso-Stoichiometric GEM Blends in Production Engines andBlend Knock-Limited Spark Advance Tests
Ghent University has operated several engines using pure methanol in a research streaminvestigating the desirable characteristics of methanol combustion in optimized engines. The alcoholsin general have the potential to increase power and efficiency of SI engines [55,56], and their interestingproperties allow different load control strategies to be used as well [57]. These studies have shown thatany potential improvement is dependent upon the method of engine operation, but with this biasedtowards the alcohol such benefits can be provided while still maintaining the functional advantage offlex-fuel capability (i.e. so that gasoline could still be used, albeit with lower performance or efficiency,when the alcohol fuel is unavailable). To investigate this concept further, three naturally-aspiratedengines were operated on gasoline, methanol and several GEM blends. These were a 4-cylinder PFIproduction-type Volvo engine, a single-cylinder research engine based on an Audi PFI engine, and a4-cylinder Hyundai production engine utilizing DI. Details of these engines are shown in Table 4.
Table 4. Test engine specifications.
Engine Type Volvo 1.8 L Audi/NSU Hyundai
Cylinders 4 in-line 1 4 in-line
Valves 16 2 16
Valvetrain Double overheadcamshaft (DOHC)
Overhead camshaft(OHC)
Double overheadcamshaft (DOHC)
Bore (mm) 83 77.5 88
Stroke (mm) 82.4 86.4 97
Displacement (cc) 1783 407.3 2360
Compression ratio(:1) 10.3 13.1 11.3
Fuel system PFI PFI DI
Induction Atmospheric Atmospheric Atmospheric
Engine managementsystem MoTeC M800 MoTeC M4 Hyundai
All the measurements presented here were taken at steady-state operating conditions at variousspeeds and loads. Stoichiometric operation was adopted in order to enable the use of a three-waycatalyst (TWC). For the Hyundai engine, fitted with DI, tests were conducted with early injection.This resulted in a homogeneous mixture using a closed-loop feedback to control the air/fuel ratioto stoichiometric conditions. MBT spark timing was applied, except for knock-limited operatingconditions, where KLSA-2◦ crank angle was used.
The notion that blends of methanol and ethanol with gasoline with the same stoichiometry as E85can be used in flex-fuel engines has been investigated on the Volvo 1.8 L engine and Hyundai 2.4 L.The performance, efficiency and emissions of different GEM blends were measured and compared to
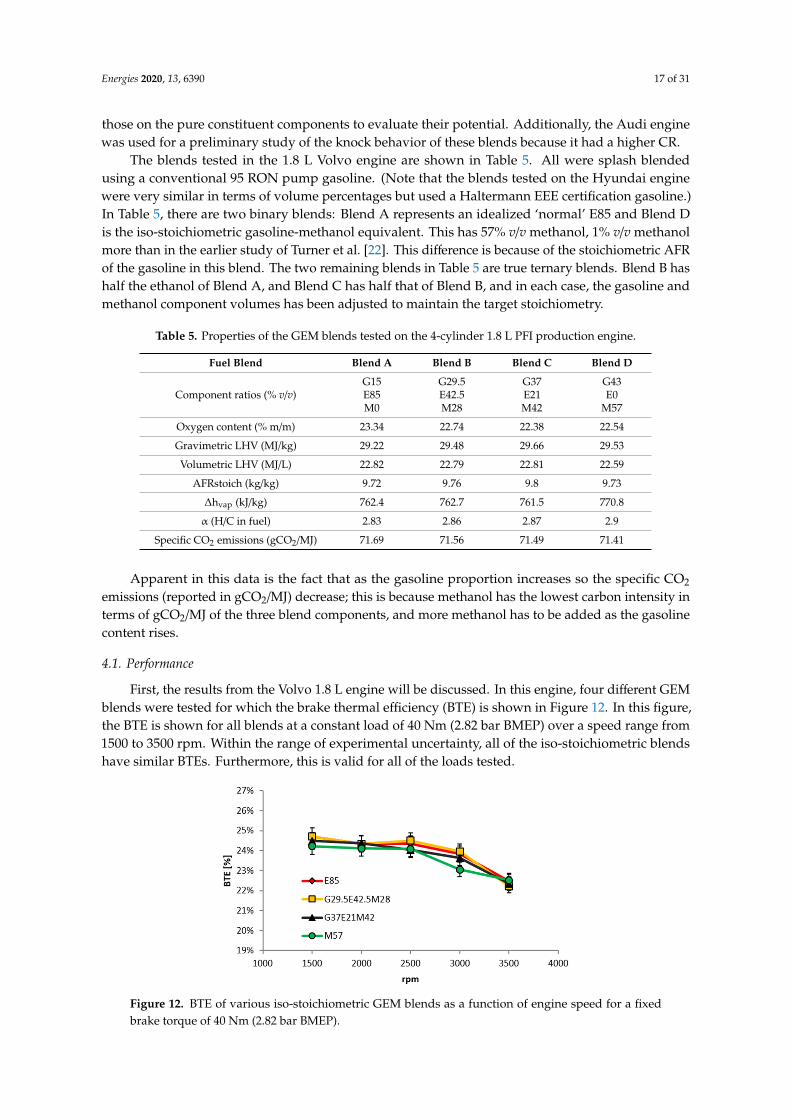
Energies 2020, 13, 6390 17 of 31
those on the pure constituent components to evaluate their potential. Additionally, the Audi enginewas used for a preliminary study of the knock behavior of these blends because it had a higher CR.
The blends tested in the 1.8 L Volvo engine are shown in Table 5. All were splash blendedusing a conventional 95 RON pump gasoline. (Note that the blends tested on the Hyundai enginewere very similar in terms of volume percentages but used a Haltermann EEE certification gasoline.)In Table 5, there are two binary blends: Blend A represents an idealized ‘normal’ E85 and Blend Dis the iso-stoichiometric gasoline-methanol equivalent. This has 57% v/v methanol, 1% v/v methanolmore than in the earlier study of Turner et al. [22]. This difference is because of the stoichiometric AFRof the gasoline in this blend. The two remaining blends in Table 5 are true ternary blends. Blend B hashalf the ethanol of Blend A, and Blend C has half that of Blend B, and in each case, the gasoline andmethanol component volumes has been adjusted to maintain the target stoichiometry.
Table 5. Properties of the GEM blends tested on the 4-cylinder 1.8 L PFI production engine.
Fuel Blend Blend A Blend B Blend C Blend D
Component ratios (% v/v)G15E85M0
G29.5E42.5M28
G37E21M42
G43E0
M57
Oxygen content (% m/m) 23.34 22.74 22.38 22.54
Gravimetric LHV (MJ/kg) 29.22 29.48 29.66 29.53
Volumetric LHV (MJ/L) 22.82 22.79 22.81 22.59
AFRstoich (kg/kg) 9.72 9.76 9.8 9.73
∆hvap (kJ/kg) 762.4 762.7 761.5 770.8
α (H/C in fuel) 2.83 2.86 2.87 2.9
Specific CO2 emissions (gCO2/MJ) 71.69 71.56 71.49 71.41
Apparent in this data is the fact that as the gasoline proportion increases so the specific CO2
emissions (reported in gCO2/MJ) decrease; this is because methanol has the lowest carbon intensity interms of gCO2/MJ of the three blend components, and more methanol has to be added as the gasolinecontent rises.
4.1. Performance
First, the results from the Volvo 1.8 L engine will be discussed. In this engine, four different GEMblends were tested for which the brake thermal efficiency (BTE) is shown in Figure 12. In this figure,the BTE is shown for all blends at a constant load of 40 Nm (2.82 bar BMEP) over a speed range from1500 to 3500 rpm. Within the range of experimental uncertainty, all of the iso-stoichiometric blendshave similar BTEs. Furthermore, this is valid for all of the loads tested.
Energies 2020, 13, x FOR PEER REVIEW 17 of 32
engine was used for a preliminary study of the knock behavior of these blends because it had a higher CR.
The blends tested in the 1.8 L Volvo engine are shown in Table 5. All were splash blended using a conventional 95 RON pump gasoline. (Note that the blends tested on the Hyundai engine were very similar in terms of volume percentages but used a Haltermann EEE certification gasoline.) In Table 5, there are two binary blends: Blend A represents an idealized ‘normal’ E85 and Blend D is the iso-stoichiometric gasoline-methanol equivalent. This has 57% v/v methanol, 1% v/v methanol more than in the earlier study of Turner et al. [22]. This difference is because of the stoichiometric AFR of the gasoline in this blend. The two remaining blends in Table 5 are true ternary blends. Blend B has half the ethanol of Blend A, and Blend C has half that of Blend B, and in each case, the gasoline and methanol component volumes has been adjusted to maintain the target stoichiometry.
Table 5. Properties of the GEM blends tested on the 4-cylinder 1.8 L PFI production engine.
Fuel Blend Blend A Blend B Blend C Blend D
Component ratios (% v/v) G15 E85 M0
G29.5 E42.5 M28
G37 E21 M42
G43 E0
M57 Oxygen content (% m/m) 23.34 22.74 22.38 22.54 Gravimetric LHV (MJ/kg) 29.22 29.48 29.66 29.53 Volumetric LHV (MJ/L) 22.82 22.79 22.81 22.59
AFRstoich (kg/kg) 9.72 9.76 9.8 9.73 ∆hvap (kJ/kg) 762.4 762.7 761.5 770.8 α (H/C in fuel) 2.83 2.86 2.87 2.9
Specific CO2 emissions (gCO2/MJ) 71.69 71.56 71.49 71.41
Apparent in this data is the fact that as the gasoline proportion increases so the specific CO2 emissions (reported in gCO2/MJ) decrease; this is because methanol has the lowest carbon intensity in terms of gCO2/MJ of the three blend components, and more methanol has to be added as the gasoline content rises.
4.1. Performance
First, the results from the Volvo 1.8 L engine will be discussed. In this engine, four different GEM blends were tested for which the brake thermal efficiency (BTE) is shown in Figure 12. In this figure, the BTE is shown for all blends at a constant load of 40 Nm (2.82 bar BMEP) over a speed range from 1500 to 3500 rpm. Within the range of experimental uncertainty, all of the iso-stoichiometric blends have similar BTEs. Furthermore, this is valid for all of the loads tested.
Figure 12. BTE of various iso-stoichiometric GEM blends as a function of engine speed for a fixed brake torque of 40 Nm (2.82 bar BMEP).
Figure 12. BTE of various iso-stoichiometric GEM blends as a function of engine speed for a fixedbrake torque of 40 Nm (2.82 bar BMEP).
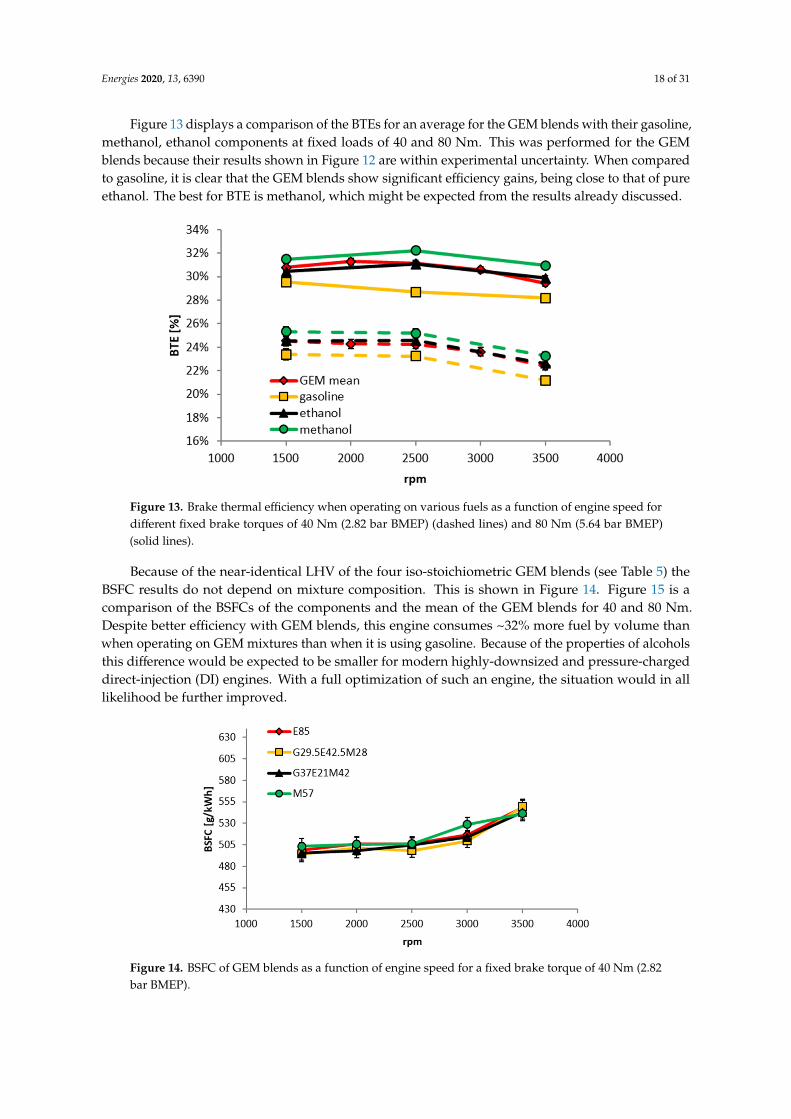
Energies 2020, 13, 6390 18 of 31
Figure 13 displays a comparison of the BTEs for an average for the GEM blends with their gasoline,methanol, ethanol components at fixed loads of 40 and 80 Nm. This was performed for the GEMblends because their results shown in Figure 12 are within experimental uncertainty. When comparedto gasoline, it is clear that the GEM blends show significant efficiency gains, being close to that of pureethanol. The best for BTE is methanol, which might be expected from the results already discussed.
Energies 2020, 13, x FOR PEER REVIEW 18 of 32
Figure 13 displays a comparison of the BTEs for an average for the GEM blends with their gasoline, methanol, ethanol components at fixed loads of 40 and 80 Nm. This was performed for the GEM blends because their results shown in Figure 12 are within experimental uncertainty. When compared to gasoline, it is clear that the GEM blends show significant efficiency gains, being close to that of pure ethanol. The best for BTE is methanol, which might be expected from the results already discussed.
Figure 13. Brake thermal efficiency when operating on various fuels as a function of engine speed for different fixed brake torques of 40 Nm (2.82 bar BMEP) (dashed lines) and 80 Nm (5.64 bar BMEP) (solid lines).
Because of the near-identical LHV of the four iso-stoichiometric GEM blends (see Table 5) the BSFC results do not depend on mixture composition. This is shown in Figure 14. Figure 15 is a comparison of the BSFCs of the components and the mean of the GEM blends for 40 and 80 Nm. Despite better efficiency with GEM blends, this engine consumes ~32% more fuel by volume than when operating on GEM mixtures than when it is using gasoline. Because of the properties of alcohols this difference would be expected to be smaller for modern highly-downsized and pressure-charged direct-injection (DI) engines. With a full optimization of such an engine, the situation would in all likelihood be further improved.
Figure 14. BSFC of GEM blends as a function of engine speed for a fixed brake torque of 40 Nm (2.82 bar BMEP).
Figure 13. Brake thermal efficiency when operating on various fuels as a function of engine speed fordifferent fixed brake torques of 40 Nm (2.82 bar BMEP) (dashed lines) and 80 Nm (5.64 bar BMEP)(solid lines).
Because of the near-identical LHV of the four iso-stoichiometric GEM blends (see Table 5) theBSFC results do not depend on mixture composition. This is shown in Figure 14. Figure 15 is acomparison of the BSFCs of the components and the mean of the GEM blends for 40 and 80 Nm.Despite better efficiency with GEM blends, this engine consumes ~32% more fuel by volume thanwhen operating on GEM mixtures than when it is using gasoline. Because of the properties of alcoholsthis difference would be expected to be smaller for modern highly-downsized and pressure-chargeddirect-injection (DI) engines. With a full optimization of such an engine, the situation would in alllikelihood be further improved.
Energies 2020, 13, x FOR PEER REVIEW 18 of 32
Figure 13 displays a comparison of the BTEs for an average for the GEM blends with their gasoline, methanol, ethanol components at fixed loads of 40 and 80 Nm. This was performed for the GEM blends because their results shown in Figure 12 are within experimental uncertainty. When compared to gasoline, it is clear that the GEM blends show significant efficiency gains, being close to that of pure ethanol. The best for BTE is methanol, which might be expected from the results already discussed.
Figure 13. Brake thermal efficiency when operating on various fuels as a function of engine speed for different fixed brake torques of 40 Nm (2.82 bar BMEP) (dashed lines) and 80 Nm (5.64 bar BMEP) (solid lines).
Because of the near-identical LHV of the four iso-stoichiometric GEM blends (see Table 5) the BSFC results do not depend on mixture composition. This is shown in Figure 14. Figure 15 is a comparison of the BSFCs of the components and the mean of the GEM blends for 40 and 80 Nm. Despite better efficiency with GEM blends, this engine consumes ~32% more fuel by volume than when operating on GEM mixtures than when it is using gasoline. Because of the properties of alcohols this difference would be expected to be smaller for modern highly-downsized and pressure-charged direct-injection (DI) engines. With a full optimization of such an engine, the situation would in all likelihood be further improved.
Figure 14. BSFC of GEM blends as a function of engine speed for a fixed brake torque of 40 Nm (2.82 bar BMEP).
Figure 14. BSFC of GEM blends as a function of engine speed for a fixed brake torque of 40 Nm (2.82bar BMEP).
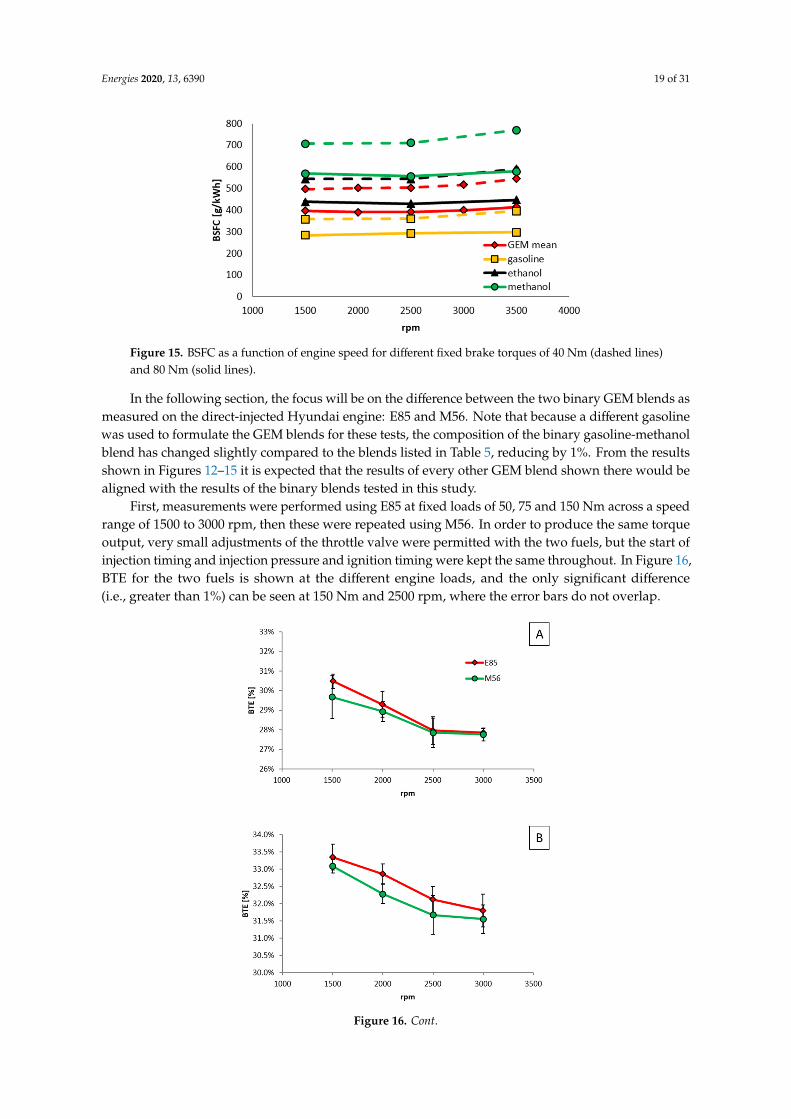
Energies 2020, 13, 6390 19 of 31Energies 2020, 13, x FOR PEER REVIEW 19 of 32
Figure 15. BSFC as a function of engine speed for different fixed brake torques of 40 Nm (dashed lines) and 80 Nm (solid lines).
In the following section, the focus will be on the difference between the two binary GEM blends as measured on the direct-injected Hyundai engine: E85 and M56. Note that because a different gasoline was used to formulate the GEM blends for these tests, the composition of the binary gasoline-methanol blend has changed slightly compared to the blends listed in Table 5, reducing by 1%. From the results shown in Figures 12–15 it is expected that the results of every other GEM blend shown there would be aligned with the results of the binary blends tested in this study.
First, measurements were performed using E85 at fixed loads of 50, 75 and 150 Nm across a speed range of 1500 to 3000 rpm, then these were repeated using M56. In order to produce the same torque output, very small adjustments of the throttle valve were permitted with the two fuels, but the start of injection timing and injection pressure and ignition timing were kept the same throughout. In Figure 16, BTE for the two fuels is shown at the different engine loads, and the only significant difference (i.e., greater than 1%) can be seen at 150 Nm and 2500 rpm, where the error bars do not overlap.
Figure 15. BSFC as a function of engine speed for different fixed brake torques of 40 Nm (dashed lines)and 80 Nm (solid lines).
In the following section, the focus will be on the difference between the two binary GEM blends asmeasured on the direct-injected Hyundai engine: E85 and M56. Note that because a different gasolinewas used to formulate the GEM blends for these tests, the composition of the binary gasoline-methanolblend has changed slightly compared to the blends listed in Table 5, reducing by 1%. From the resultsshown in Figures 12–15 it is expected that the results of every other GEM blend shown there would bealigned with the results of the binary blends tested in this study.
First, measurements were performed using E85 at fixed loads of 50, 75 and 150 Nm across a speedrange of 1500 to 3000 rpm, then these were repeated using M56. In order to produce the same torqueoutput, very small adjustments of the throttle valve were permitted with the two fuels, but the start ofinjection timing and injection pressure and ignition timing were kept the same throughout. In Figure 16,BTE for the two fuels is shown at the different engine loads, and the only significant difference(i.e., greater than 1%) can be seen at 150 Nm and 2500 rpm, where the error bars do not overlap.
Energies 2020, 13, x FOR PEER REVIEW 19 of 32
Figure 15. BSFC as a function of engine speed for different fixed brake torques of 40 Nm (dashed lines) and 80 Nm (solid lines).
In the following section, the focus will be on the difference between the two binary GEM blends as measured on the direct-injected Hyundai engine: E85 and M56. Note that because a different gasoline was used to formulate the GEM blends for these tests, the composition of the binary gasoline-methanol blend has changed slightly compared to the blends listed in Table 5, reducing by 1%. From the results shown in Figures 12–15 it is expected that the results of every other GEM blend shown there would be aligned with the results of the binary blends tested in this study.
First, measurements were performed using E85 at fixed loads of 50, 75 and 150 Nm across a speed range of 1500 to 3000 rpm, then these were repeated using M56. In order to produce the same torque output, very small adjustments of the throttle valve were permitted with the two fuels, but the start of injection timing and injection pressure and ignition timing were kept the same throughout. In Figure 16, BTE for the two fuels is shown at the different engine loads, and the only significant difference (i.e., greater than 1%) can be seen at 150 Nm and 2500 rpm, where the error bars do not overlap.
Figure 16. Cont.
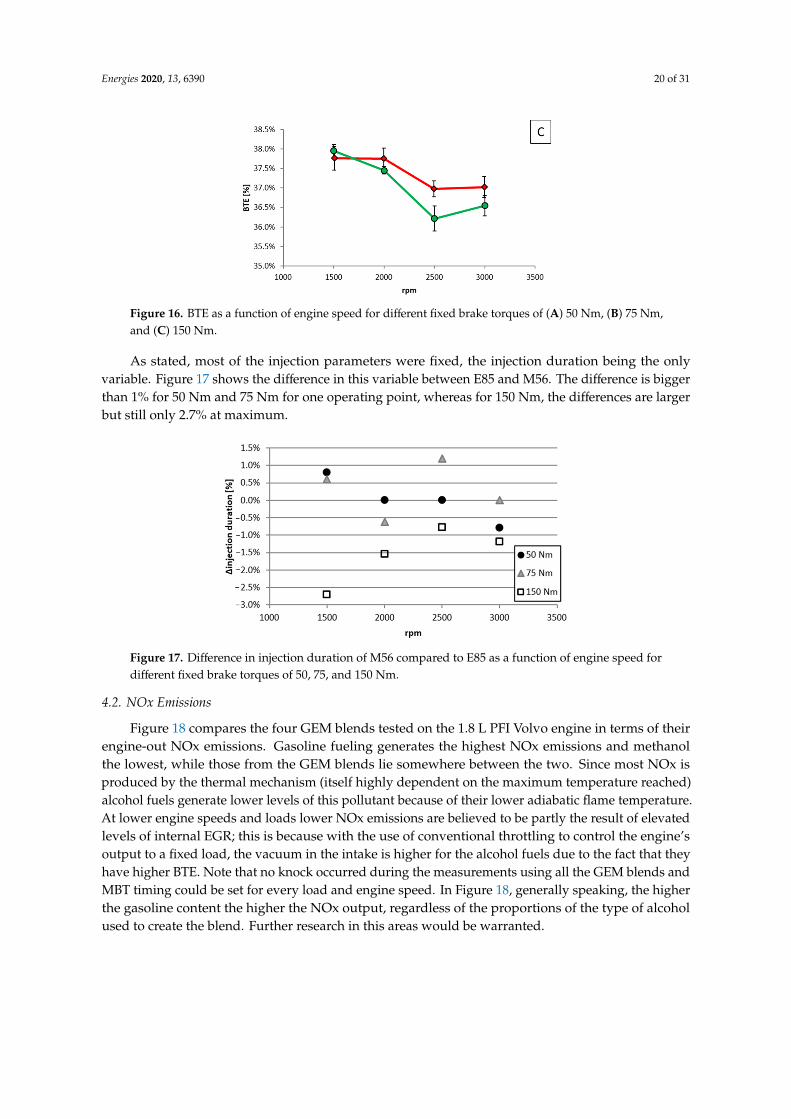
Energies 2020, 13, 6390 20 of 31
Energies 2020, 13, x FOR PEER REVIEW 20 of 32
Figure 16. BTE as a function of engine speed for different fixed brake torques of (A) 50 Nm, (B) 75 Nm, and (C) 150 Nm.
As stated, most of the injection parameters were fixed, the injection duration being the only variable. Figure 17 shows the difference in this variable between E85 and M56. The difference is bigger than 1% for 50 Nm and 75 Nm for one operating point, whereas for 150 Nm, the differences are larger but still only 2.7% at maximum.
Figure 17. Difference in injection duration of M56 compared to E85 as a function of engine speed for different fixed brake torques of 50, 75, and 150 Nm.
4.2. NOx Emissions
Figure 18 compares the four GEM blends tested on the 1.8 L PFI Volvo engine in terms of their engine-out NOx emissions. Gasoline fueling generates the highest NOx emissions and methanol the lowest, while those from the GEM blends lie somewhere between the two. Since most NOx is produced by the thermal mechanism (itself highly dependent on the maximum temperature reached) alcohol fuels generate lower levels of this pollutant because of their lower adiabatic flame temperature. At lower engine speeds and loads lower NOx emissions are believed to be partly the result of elevated levels of internal EGR; this is because with the use of conventional throttling to control the engine’s output to a fixed load, the vacuum in the intake is higher for the alcohol fuels due to the fact that they have higher BTE. Note that no knock occurred during the measurements using all the GEM blends and MBT timing could be set for every load and engine speed. In Figure 18, generally speaking, the higher the gasoline content the higher the NOx output, regardless of the proportions of the type of alcohol used to create the blend. Further research in this areas would be warranted.
Figure 16. BTE as a function of engine speed for different fixed brake torques of (A) 50 Nm, (B) 75 Nm,and (C) 150 Nm.
As stated, most of the injection parameters were fixed, the injection duration being the onlyvariable. Figure 17 shows the difference in this variable between E85 and M56. The difference is biggerthan 1% for 50 Nm and 75 Nm for one operating point, whereas for 150 Nm, the differences are largerbut still only 2.7% at maximum.
Energies 2020, 13, x FOR PEER REVIEW 20 of 32
Figure 16. BTE as a function of engine speed for different fixed brake torques of (A) 50 Nm, (B) 75 Nm, and (C) 150 Nm.
As stated, most of the injection parameters were fixed, the injection duration being the only variable. Figure 17 shows the difference in this variable between E85 and M56. The difference is bigger than 1% for 50 Nm and 75 Nm for one operating point, whereas for 150 Nm, the differences are larger but still only 2.7% at maximum.
Figure 17. Difference in injection duration of M56 compared to E85 as a function of engine speed for different fixed brake torques of 50, 75, and 150 Nm.
4.2. NOx Emissions
Figure 18 compares the four GEM blends tested on the 1.8 L PFI Volvo engine in terms of their engine-out NOx emissions. Gasoline fueling generates the highest NOx emissions and methanol the lowest, while those from the GEM blends lie somewhere between the two. Since most NOx is produced by the thermal mechanism (itself highly dependent on the maximum temperature reached) alcohol fuels generate lower levels of this pollutant because of their lower adiabatic flame temperature. At lower engine speeds and loads lower NOx emissions are believed to be partly the result of elevated levels of internal EGR; this is because with the use of conventional throttling to control the engine’s output to a fixed load, the vacuum in the intake is higher for the alcohol fuels due to the fact that they have higher BTE. Note that no knock occurred during the measurements using all the GEM blends and MBT timing could be set for every load and engine speed. In Figure 18, generally speaking, the higher the gasoline content the higher the NOx output, regardless of the proportions of the type of alcohol used to create the blend. Further research in this areas would be warranted.
Figure 17. Difference in injection duration of M56 compared to E85 as a function of engine speed fordifferent fixed brake torques of 50, 75, and 150 Nm.
4.2. NOx Emissions
Figure 18 compares the four GEM blends tested on the 1.8 L PFI Volvo engine in terms of theirengine-out NOx emissions. Gasoline fueling generates the highest NOx emissions and methanolthe lowest, while those from the GEM blends lie somewhere between the two. Since most NOx isproduced by the thermal mechanism (itself highly dependent on the maximum temperature reached)alcohol fuels generate lower levels of this pollutant because of their lower adiabatic flame temperature.At lower engine speeds and loads lower NOx emissions are believed to be partly the result of elevatedlevels of internal EGR; this is because with the use of conventional throttling to control the engine’soutput to a fixed load, the vacuum in the intake is higher for the alcohol fuels due to the fact that theyhave higher BTE. Note that no knock occurred during the measurements using all the GEM blends andMBT timing could be set for every load and engine speed. In Figure 18, generally speaking, the higherthe gasoline content the higher the NOx output, regardless of the proportions of the type of alcoholused to create the blend. Further research in this areas would be warranted.
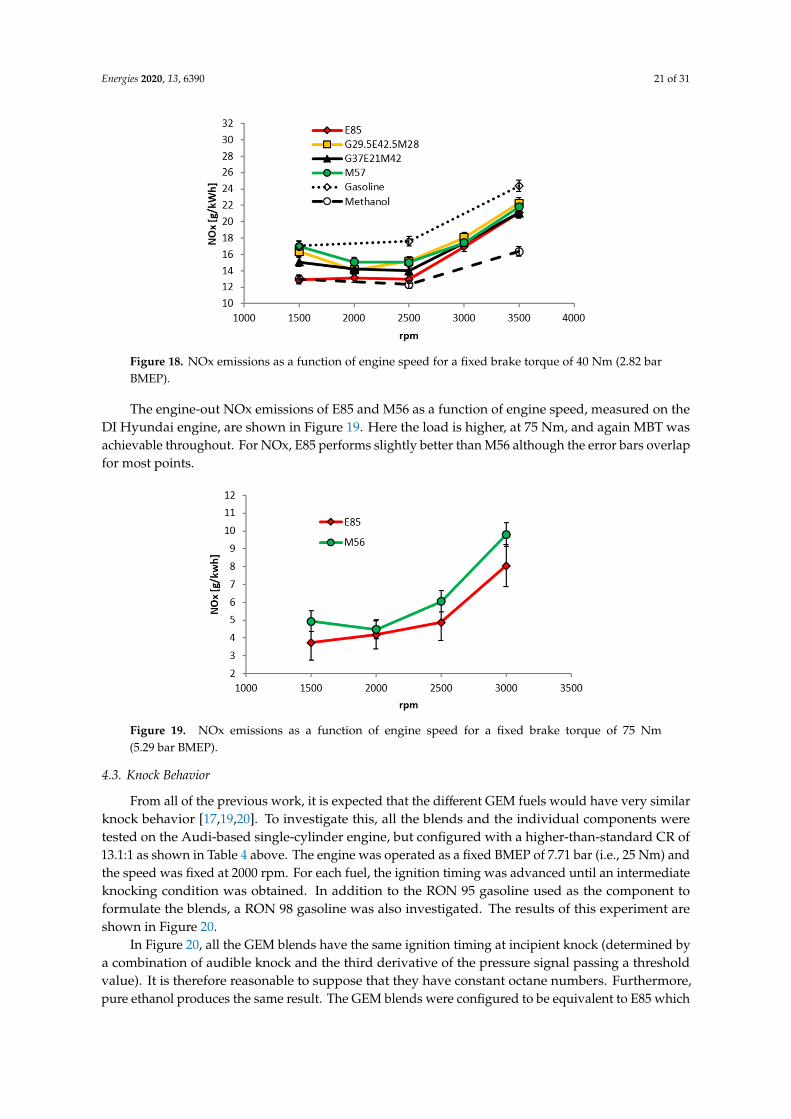
Energies 2020, 13, 6390 21 of 31Energies 2020, 13, x FOR PEER REVIEW 21 of 32
Figure 18. NOx emissions as a function of engine speed for a fixed brake torque of 40 Nm (2.82 bar BMEP).
The engine-out NOx emissions of E85 and M56 as a function of engine speed, measured on the DI Hyundai engine, are shown in Figure 19. Here the load is higher, at 75 Nm, and again MBT was achievable throughout. For NOx, E85 performs slightly better than M56 although the error bars overlap for most points.
Figure 19. NOx emissions as a function of engine speed for a fixed brake torque of 75 Nm (5.29 bar BMEP).
4.3. Knock Behavior
From all of the previous work, it is expected that the different GEM fuels would have very similar knock behavior [17,19,20]. To investigate this, all the blends and the individual components were tested on the Audi-based single-cylinder engine, but configured with a higher-than-standard CR of 13.1:1 as shown in Table 4 above. The engine was operated as a fixed BMEP of 7.71 bar (i.e., 25 Nm) and the speed was fixed at 2000 rpm. For each fuel, the ignition timing was advanced until an intermediate knocking condition was obtained. In addition to the RON 95 gasoline used as the component to formulate the blends, a RON 98 gasoline was also investigated. The results of this experiment are shown in Figure 20.
Figure 18. NOx emissions as a function of engine speed for a fixed brake torque of 40 Nm (2.82 barBMEP).
The engine-out NOx emissions of E85 and M56 as a function of engine speed, measured on theDI Hyundai engine, are shown in Figure 19. Here the load is higher, at 75 Nm, and again MBT wasachievable throughout. For NOx, E85 performs slightly better than M56 although the error bars overlapfor most points.
Energies 2020, 13, x FOR PEER REVIEW 21 of 32
Figure 18. NOx emissions as a function of engine speed for a fixed brake torque of 40 Nm (2.82 bar BMEP).
The engine-out NOx emissions of E85 and M56 as a function of engine speed, measured on the DI Hyundai engine, are shown in Figure 19. Here the load is higher, at 75 Nm, and again MBT was achievable throughout. For NOx, E85 performs slightly better than M56 although the error bars overlap for most points.
Figure 19. NOx emissions as a function of engine speed for a fixed brake torque of 75 Nm (5.29 bar BMEP).
4.3. Knock Behavior
From all of the previous work, it is expected that the different GEM fuels would have very similar knock behavior [17,19,20]. To investigate this, all the blends and the individual components were tested on the Audi-based single-cylinder engine, but configured with a higher-than-standard CR of 13.1:1 as shown in Table 4 above. The engine was operated as a fixed BMEP of 7.71 bar (i.e., 25 Nm) and the speed was fixed at 2000 rpm. For each fuel, the ignition timing was advanced until an intermediate knocking condition was obtained. In addition to the RON 95 gasoline used as the component to formulate the blends, a RON 98 gasoline was also investigated. The results of this experiment are shown in Figure 20.
Figure 19. NOx emissions as a function of engine speed for a fixed brake torque of 75 Nm(5.29 bar BMEP).
4.3. Knock Behavior
From all of the previous work, it is expected that the different GEM fuels would have very similarknock behavior [17,19,20]. To investigate this, all the blends and the individual components weretested on the Audi-based single-cylinder engine, but configured with a higher-than-standard CR of13.1:1 as shown in Table 4 above. The engine was operated as a fixed BMEP of 7.71 bar (i.e., 25 Nm) andthe speed was fixed at 2000 rpm. For each fuel, the ignition timing was advanced until an intermediateknocking condition was obtained. In addition to the RON 95 gasoline used as the component toformulate the blends, a RON 98 gasoline was also investigated. The results of this experiment areshown in Figure 20.
In Figure 20, all the GEM blends have the same ignition timing at incipient knock (determined bya combination of audible knock and the third derivative of the pressure signal passing a thresholdvalue). It is therefore reasonable to suppose that they have constant octane numbers. Furthermore,pure ethanol produces the same result. The GEM blends were configured to be equivalent to E85 which
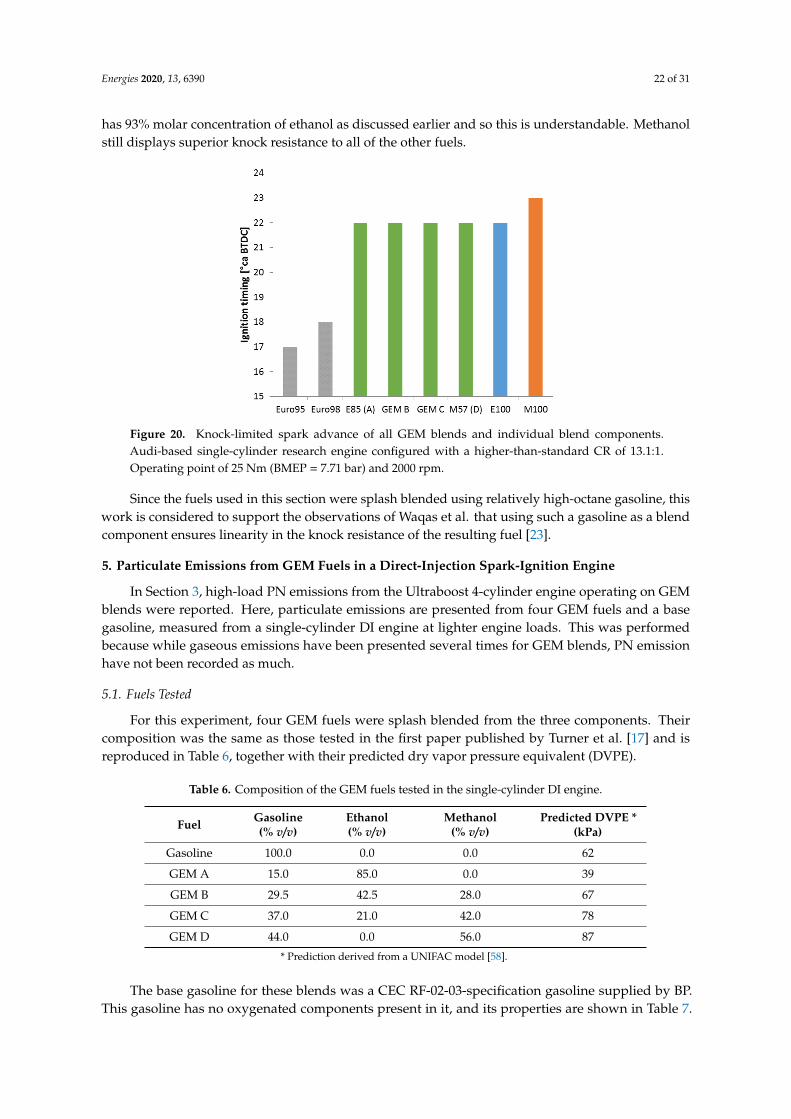
Energies 2020, 13, 6390 22 of 31
has 93% molar concentration of ethanol as discussed earlier and so this is understandable. Methanolstill displays superior knock resistance to all of the other fuels.Energies 2020, 13, x FOR PEER REVIEW 22 of 32
Figure 20. Knock-limited spark advance of all GEM blends and individual blend components. Audi-based single-cylinder research engine configured with a higher-than-standard CR of 13.1:1. Operating point of 25 Nm (BMEP = 7.71 bar) and 2000 rpm.
In Figure 20, all the GEM blends have the same ignition timing at incipient knock (determined by a combination of audible knock and the third derivative of the pressure signal passing a threshold value). It is therefore reasonable to suppose that they have constant octane numbers. Furthermore, pure ethanol produces the same result. The GEM blends were configured to be equivalent to E85 which has 93% molar concentration of ethanol as discussed earlier and so this is understandable. Methanol still displays superior knock resistance to all of the other fuels.
Since the fuels used in this section were splash blended using relatively high-octane gasoline, this work is considered to support the observations of Waqas et al. that using such a gasoline as a blend component ensures linearity in the knock resistance of the resulting fuel [23].
5. Particulate Emissions from GEM Fuels in a Direct-Injection Spark-Ignition Engine
In Section 3, high-load PN emissions from the Ultraboost 4-cylinder engine operating on GEM blends were reported. Here, particulate emissions are presented from four GEM fuels and a base gasoline, measured from a single-cylinder DI engine at lighter engine loads. This was performed because while gaseous emissions have been presented several times for GEM blends, PN emission have not been recorded as much.
5.1. Fuels Tested
For this experiment, four GEM fuels were splash blended from the three components. Their composition was the same as those tested in the first paper published by Turner et al. [17] and is reproduced in Table 6, together with their predicted dry vapor pressure equivalent (DVPE).
Table 6. Composition of the GEM fuels tested in the single-cylinder DI engine.
Fuel Gasoline (% v/v)
Ethanol (% v/v)
Methanol (% v/v)
Predicted DVPE * (kPa)
Gasoline 100.0 0.0 0.0 62 GEM A 15.0 85.0 0.0 39 GEM B 29.5 42.5 28.0 67 GEM C 37.0 21.0 42.0 78 GEM D 44.0 0.0 56.0 87
* Prediction derived from a UNIFAC model [58].
Figure 20. Knock-limited spark advance of all GEM blends and individual blend components.Audi-based single-cylinder research engine configured with a higher-than-standard CR of 13.1:1.Operating point of 25 Nm (BMEP = 7.71 bar) and 2000 rpm.
Since the fuels used in this section were splash blended using relatively high-octane gasoline, thiswork is considered to support the observations of Waqas et al. that using such a gasoline as a blendcomponent ensures linearity in the knock resistance of the resulting fuel [23].
5. Particulate Emissions from GEM Fuels in a Direct-Injection Spark-Ignition Engine
In Section 3, high-load PN emissions from the Ultraboost 4-cylinder engine operating on GEMblends were reported. Here, particulate emissions are presented from four GEM fuels and a basegasoline, measured from a single-cylinder DI engine at lighter engine loads. This was performedbecause while gaseous emissions have been presented several times for GEM blends, PN emissionhave not been recorded as much.
5.1. Fuels Tested
For this experiment, four GEM fuels were splash blended from the three components. Theircomposition was the same as those tested in the first paper published by Turner et al. [17] and isreproduced in Table 6, together with their predicted dry vapor pressure equivalent (DVPE).
Table 6. Composition of the GEM fuels tested in the single-cylinder DI engine.
Fuel Gasoline(% v/v)
Ethanol(% v/v)
Methanol(% v/v)
Predicted DVPE *(kPa)
Gasoline 100.0 0.0 0.0 62
GEM A 15.0 85.0 0.0 39
GEM B 29.5 42.5 28.0 67
GEM C 37.0 21.0 42.0 78
GEM D 44.0 0.0 56.0 87
* Prediction derived from a UNIFAC model [58].
The base gasoline for these blends was a CEC RF-02-03-specification gasoline supplied by BP.This gasoline has no oxygenated components present in it, and its properties are shown in Table 7.
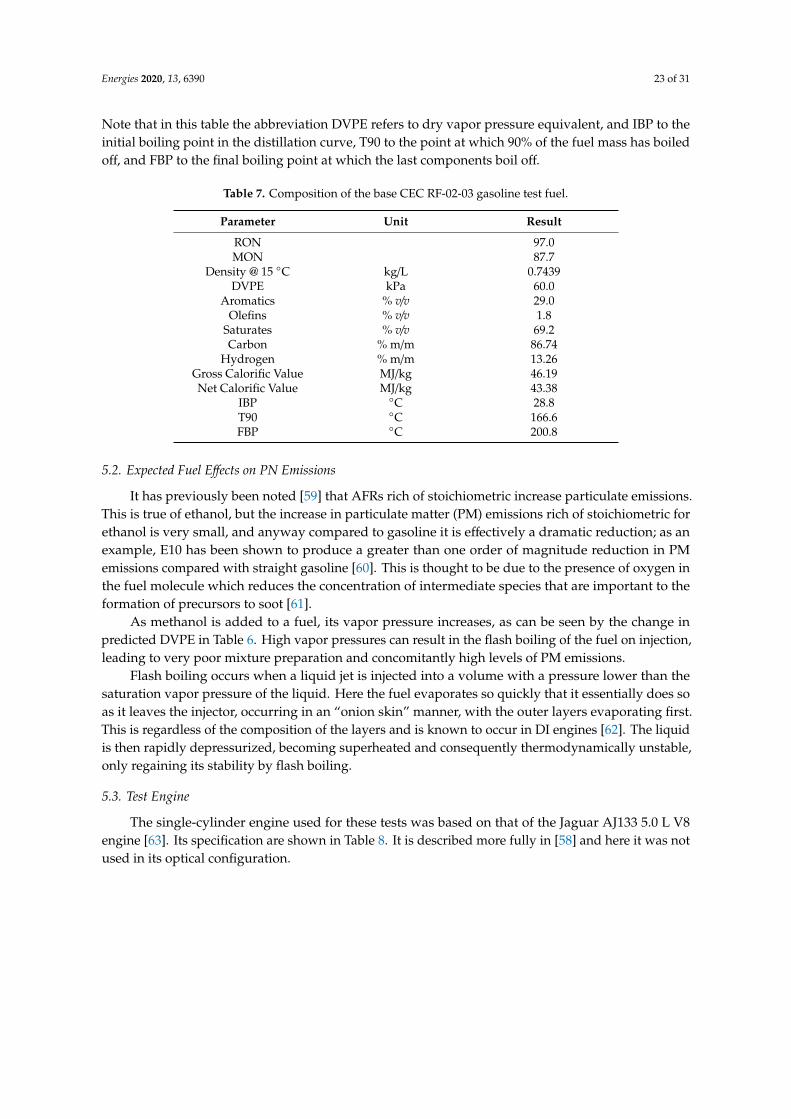
Energies 2020, 13, 6390 23 of 31
Note that in this table the abbreviation DVPE refers to dry vapor pressure equivalent, and IBP to theinitial boiling point in the distillation curve, T90 to the point at which 90% of the fuel mass has boiledoff, and FBP to the final boiling point at which the last components boil off.
Table 7. Composition of the base CEC RF-02-03 gasoline test fuel.
Parameter Unit Result
RON 97.0MON 87.7
Density @ 15 ◦C kg/L 0.7439DVPE kPa 60.0
Aromatics % v/v 29.0Olefins % v/v 1.8
Saturates % v/v 69.2Carbon % m/m 86.74
Hydrogen % m/m 13.26Gross Calorific Value MJ/kg 46.19Net Calorific Value MJ/kg 43.38
IBP ◦C 28.8T90 ◦C 166.6FBP ◦C 200.8
5.2. Expected Fuel Effects on PN Emissions
It has previously been noted [59] that AFRs rich of stoichiometric increase particulate emissions.This is true of ethanol, but the increase in particulate matter (PM) emissions rich of stoichiometric forethanol is very small, and anyway compared to gasoline it is effectively a dramatic reduction; as anexample, E10 has been shown to produce a greater than one order of magnitude reduction in PMemissions compared with straight gasoline [60]. This is thought to be due to the presence of oxygen inthe fuel molecule which reduces the concentration of intermediate species that are important to theformation of precursors to soot [61].
As methanol is added to a fuel, its vapor pressure increases, as can be seen by the change inpredicted DVPE in Table 6. High vapor pressures can result in the flash boiling of the fuel on injection,leading to very poor mixture preparation and concomitantly high levels of PM emissions.
Flash boiling occurs when a liquid jet is injected into a volume with a pressure lower than thesaturation vapor pressure of the liquid. Here the fuel evaporates so quickly that it essentially does soas it leaves the injector, occurring in an “onion skin” manner, with the outer layers evaporating first.This is regardless of the composition of the layers and is known to occur in DI engines [62]. The liquidis then rapidly depressurized, becoming superheated and consequently thermodynamically unstable,only regaining its stability by flash boiling.
5.3. Test Engine
The single-cylinder engine used for these tests was based on that of the Jaguar AJ133 5.0 L V8engine [63]. Its specification are shown in Table 8. It is described more fully in [58] and here it was notused in its optical configuration.
Energies 2020, 13, 6390 24 of 31
Table 8. Single-cylinder DI engine specifications. IVO = intake valve opens; IVC = intake valve closes;EVO = exhaust valve opens; EVC = exhaust valve closes; ATDC = after top dead center; ABDC = afterbottom dead center; BBDC = before bottom dead center.
Bore (mm) 89Stroke (mm) 90.3
Cylinder capacity (cc) 562Compression ratio (:1) 11.1
Fuel injection pressure (bar) 150IVO (◦ATDC) 33.5IVC (◦ABDC) 61.5EVO (◦BBDC) 65EVC (◦ATDC) 5
5.4. Particulate Measurements
A Cambustion DMS500 [64] was used to measure PN emissions. While this was not a legislativetest, in order to make these results representative of PN emissions measured during such a test, a Wiebefilter was used to mimic the effect of the PMP legislatively-compliant protocol [65]. Measurements at1 Hz were taken for 60 s at steady state, and the mean and standard deviation (σ) of the data over thattime were taken.
5.5. Results
For these experiments, the engine was operated at two fixed indicated mean effective pressure(IMEP) points (corresponding to low and medium loads) at 1500 rpm as shown as in Table 9. For eachload, open-loop AFR control was used at λ = 0.9 and 1.01. λ = 1.01 was chosen to avoid any small richmixture excursions which are known to have a large effect on the PM emissions from non-oxygenatedfuels [59]. Because of this, these rich excursions tend to dominate drive cycle PM results, hence testingwas also conducted at λ = 0.9.
Table 9. Engine operating conditions for GEM fuels and gasoline. BTDC = before top dead center.
IMEP (bar) 2.6 and 4.9Inlet air temperature (◦C) 40Coolant temperature (◦C) 60
Relative AFR (λ) 0.9 and 1.01Engine speed (rpm) 1500
Start of ignition (◦BTDC) 35Start of injection (◦BTDC) 280
Figure 21 shows the PN emissions from the GEM fuels at light load (2.6 bar IMEP). In these results,there is a clear trend of increasing PN emissions for the GEM fuels from blends A to C as the methanolquantity increases. Confidence in these results is provided by the fact that the experimental sequencewas randomized and a single repeat of GEM D was undertaken with highly repeatable results.
In Figure 21, it also is shown clearly that once a certain level of methanol is passed in the fuel (sayGEM Blend C), there is no further increase in PN emissions. Furthermore the base gasoline values fallhalf way in the sequence, i.e., gasoline gives higher levels of PN emissions than GEM B, but lower thanGEM C. At this load point, this in turn suggests that the presence of ethanol reduces PN while methanoldoes the opposite, despite a higher proportion of oxygenated components; it is flash boiling that alsoexplains this. Since the methanol component flashes first, this results in poor mixture preparation andhence increases PN emissions. As the amount of methanol in the fuel is reduced, its deleterious effectin this regard is reduced, and instead other factors that cause oxygenate fuels to reduce particulateemissions become important, causing PN emissions to then be reduced from the gasoline levels.
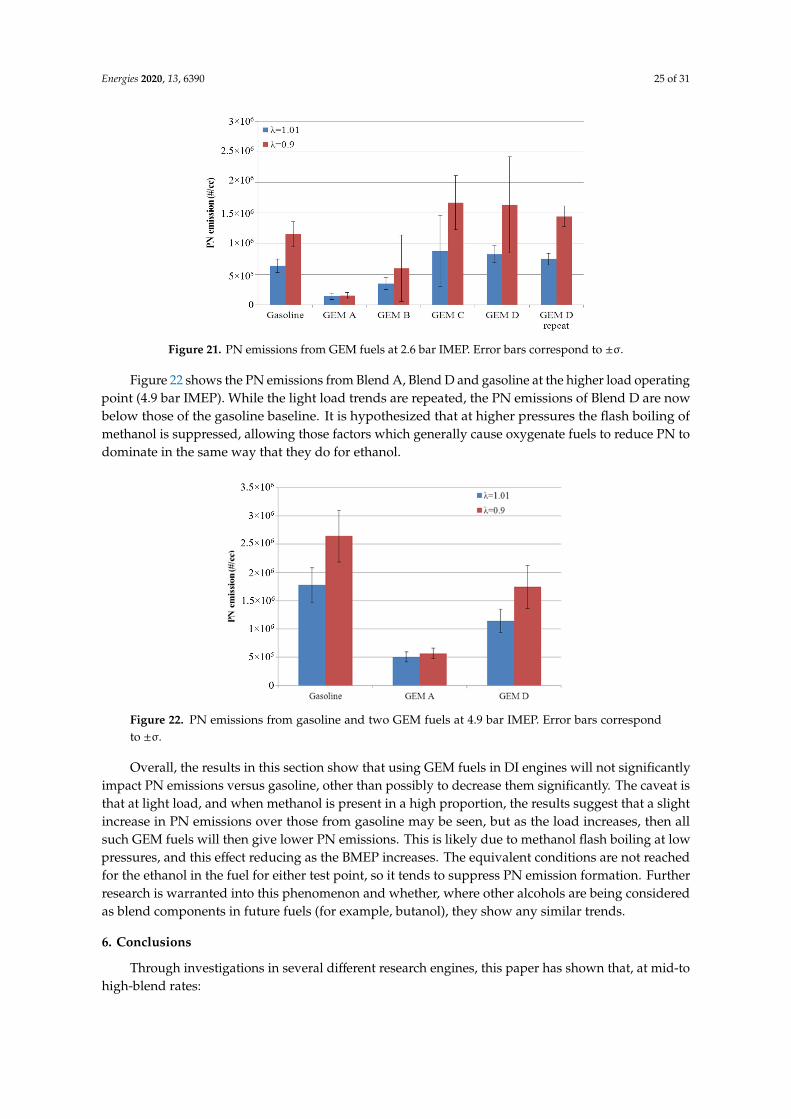
Energies 2020, 13, 6390 25 of 31Energies 2020, 13, x FOR PEER REVIEW 25 of 32
Figure 21. PN emissions from GEM fuels at 2.6 bar IMEP. Error bars correspond to ±σ.
In Figure 21, it also is shown clearly that once a certain level of methanol is passed in the fuel (say GEM Blend C), there is no further increase in PN emissions. Furthermore the base gasoline values fall half way in the sequence, i.e., gasoline gives higher levels of PN emissions than GEM B, but lower than GEM C. At this load point, this in turn suggests that the presence of ethanol reduces PN while methanol does the opposite, despite a higher proportion of oxygenated components; it is flash boiling that also explains this. Since the methanol component flashes first, this results in poor mixture preparation and hence increases PN emissions. As the amount of methanol in the fuel is reduced, its deleterious effect in this regard is reduced, and instead other factors that cause oxygenate fuels to reduce particulate emissions become important, causing PN emissions to then be reduced from the gasoline levels.
Figure 22 shows the PN emissions from Blend A, Blend D and gasoline at the higher load operating point (4.9 bar IMEP). While the light load trends are repeated, the PN emissions of Blend D are now below those of the gasoline baseline. It is hypothesized that at higher pressures the flash boiling of methanol is suppressed, allowing those factors which generally cause oxygenate fuels to reduce PN to dominate in the same way that they do for ethanol.
Figure 22. PN emissions from gasoline and two GEM fuels at 4.9 bar IMEP. Error bars correspond to ±σ.
Overall, the results in this section show that using GEM fuels in DI engines will not significantly impact PN emissions versus gasoline, other than possibly to decrease them significantly. The caveat is that at light load, and when methanol is present in a high proportion, the results suggest that a slight increase in PN emissions over those from gasoline may be seen, but as the load increases, then all such GEM fuels will then give lower PN emissions. This is likely due to methanol flash boiling at
Figure 21. PN emissions from GEM fuels at 2.6 bar IMEP. Error bars correspond to ±σ.
Figure 22 shows the PN emissions from Blend A, Blend D and gasoline at the higher load operatingpoint (4.9 bar IMEP). While the light load trends are repeated, the PN emissions of Blend D are nowbelow those of the gasoline baseline. It is hypothesized that at higher pressures the flash boiling ofmethanol is suppressed, allowing those factors which generally cause oxygenate fuels to reduce PN todominate in the same way that they do for ethanol.
Energies 2020, 13, x FOR PEER REVIEW 25 of 32
Figure 21. PN emissions from GEM fuels at 2.6 bar IMEP. Error bars correspond to ±σ.
In Figure 21, it also is shown clearly that once a certain level of methanol is passed in the fuel (say GEM Blend C), there is no further increase in PN emissions. Furthermore the base gasoline values fall half way in the sequence, i.e., gasoline gives higher levels of PN emissions than GEM B, but lower than GEM C. At this load point, this in turn suggests that the presence of ethanol reduces PN while methanol does the opposite, despite a higher proportion of oxygenated components; it is flash boiling that also explains this. Since the methanol component flashes first, this results in poor mixture preparation and hence increases PN emissions. As the amount of methanol in the fuel is reduced, its deleterious effect in this regard is reduced, and instead other factors that cause oxygenate fuels to reduce particulate emissions become important, causing PN emissions to then be reduced from the gasoline levels.
Figure 22 shows the PN emissions from Blend A, Blend D and gasoline at the higher load operating point (4.9 bar IMEP). While the light load trends are repeated, the PN emissions of Blend D are now below those of the gasoline baseline. It is hypothesized that at higher pressures the flash boiling of methanol is suppressed, allowing those factors which generally cause oxygenate fuels to reduce PN to dominate in the same way that they do for ethanol.
Figure 22. PN emissions from gasoline and two GEM fuels at 4.9 bar IMEP. Error bars correspond to ±σ.
Overall, the results in this section show that using GEM fuels in DI engines will not significantly impact PN emissions versus gasoline, other than possibly to decrease them significantly. The caveat is that at light load, and when methanol is present in a high proportion, the results suggest that a slight increase in PN emissions over those from gasoline may be seen, but as the load increases, then all such GEM fuels will then give lower PN emissions. This is likely due to methanol flash boiling at
Figure 22. PN emissions from gasoline and two GEM fuels at 4.9 bar IMEP. Error bars correspondto ±σ.
Overall, the results in this section show that using GEM fuels in DI engines will not significantlyimpact PN emissions versus gasoline, other than possibly to decrease them significantly. The caveat isthat at light load, and when methanol is present in a high proportion, the results suggest that a slightincrease in PN emissions over those from gasoline may be seen, but as the load increases, then allsuch GEM fuels will then give lower PN emissions. This is likely due to methanol flash boiling at lowpressures, and this effect reducing as the BMEP increases. The equivalent conditions are not reachedfor the ethanol in the fuel for either test point, so it tends to suppress PN emission formation. Furtherresearch is warranted into this phenomenon and whether, where other alcohols are being consideredas blend components in future fuels (for example, butanol), they show any similar trends.
6. Conclusions
Through investigations in several different research engines, this paper has shown that, at mid-tohigh-blend rates:
Energies 2020, 13, 6390 26 of 31
1. In support of earlier work by the authors and other research groups, ternary (threecomponent) mixtures of gasoline, ethanol, and methanol (or GEM) can be formulated usingan iso-stoichiometric approach to provide a drop-in alternative fuel for any given binarygasoline-ethanol blend.
2. When so configured, such GEM fuels have matched gravimetric lower heating values, heats ofvaporization, and molar concentrations of reactants in the charge. The latter two characteristicsgives rise to similar molar expansion ratios and extremely close RON and MON values. With thesecome very close sensitivities.
3. The improvement in full-load performance of such high-blend-rate fuels in terms of KLSA,and the associated better BMEP and thermal efficiency, is entirely in line with what is expected forhigh-blend alcohols over conventional gasoline fuels. There is also the expected disadvantage interms of BSFC due to the reduction in gravimetric energy content in relation to pure hydrocarbonfuels. These results are consistent with the literature and regardless of EGR being used or theamount of exhaust back pressure applied to the combustion system (to simulate turbocharged orsupercharged operation of an engine).
4. NOx emissions are shown to be lower with the alcohol blends (and lowest with pure methanol).Furthermore they are consistent for the iso-stoichiometric formulations, with a suggestion thatwithin such GEM blends increased methanol content tends to lower NOx emissions further.
5. When tested in a single-cylinder engine, the knock performance of the tested blends is essentiallyidentical, and at the high blend rate (equivalent to the stoichiometry of E85) the same as pureethanol and very close to that of methanol. This result is in line with the previous observationson the RON, MON, and sensitivity performance of such blends.
6. In terms of particulate emissions, the results presented here show that using GEM fuels is unlikelyto impact the PN emissions from DI engines significantly, and that many of these fuels candecrease the magnitude observed.
7. GEM fuels with a higher proportion of methanol do tend to generate more PN emissions thangasoline at low load, which is attributed to higher degrees of flash boiling at lower in-cylinderpressures. However, this result reverses with increased load and may be due to the change inthe dominance of flash boiling effects, with the presence of oxygen in the fuel then reducing thenumber of particulate precursors formed in combustion.
8. At lower loads the presence of a high proportion of ethanol in a blend significantly reduces PNemissions compared to gasoline. This is again believed to be due to the molecule containingoxygen; the flash boiling effect is also lower for ethanol than it is for methanol, which is believedto contribute to this result.
Because methanol can be manufactured using low- and zero-net-carbon pathways (using biologicalroutes which remove CO2 from the atmosphere via plant growth or by direct air capture and utilizationin a fully synthetic manufacturing route, respectively), there is thus the potential to introduce it intothe fuel pool used by the more than 9 million E85-gasoline flex-fuel vehicles in existence via GEMternary blends. The lower price of methanol could also beneficially impact the fuel cost on a per unitenergy basis, which is generally not the case for E85. Furthermore, although only demonstrated here ata blend rate equivalent to E85, the approach is also viable for any gasoline-ethanol binary blend.
Author Contributions: Conceptualization, J.W.G.T., S.V., F.C.P.L., and P.P.E.; methodology, J.W.G.T., A.G.J.L.,L.S., and F.C.P.L.; validation, A.G.J.L., J.V., L.S., and F.C.P.L.; formal analysis, J.W.G.T., S.V., L.S., and F.C.P.L.;investigation, A.G.J.L., L.S., and F.C.P.L.; resources, S.A., S.V., and F.C.P.L.; data curation, J.W.G.T., A.G.J.L., L.S.,and F.C.P.L.; writing—original draft preparation, J.W.G.T, L.S., S.V., and F.C.P.L.; writing—review and editing,A.G.J.L., S.A., C.J.B., J.V., L.S., F.C.P.L., and P.P.E.; funding acquisition, S.A., C.J.B., S.V., and F.C.P.L. All authorshave read and agreed to the published version of the manuscript.
Funding: Elements of the reported research took place as part of the “Ultra Boost for Economy” project partfunded by the Technology Strategy Board, now Innovate UK, the United Kingdom’s innovation agency; theirsupport is similarly gratefully acknowledged. J. Vancoillie and L. Sileghem gratefully acknowledge fellowshipsfrom the Research Foundation—Flanders (FWO09/ASP/030 and FWO11/ASP/056).
Energies 2020, 13, 6390 27 of 31
Acknowledgments: Although too numerous to detail here, the historical support and encouragement of manyindividuals and organizations involved in the methanol industry and flex-fuel vehicle production is verygratefully acknowledged. Their faith in what was initially a purely academic finding concerning the propertiesof iso-stoichiometric GEM fuels has been extremely valuable and encouraging throughout the conduct of allaspects of this research. The partners in the Ultraboost project were Jaguar Land Rover, Lotus Engineering, GEPrecision Engineering, Shell Global Solutions, CD-adapco, the University of Bath, Imperial College London, andthe University of Leeds, and all of their help and contributions to the reported work are gratefully acknowledged.
Conflicts of Interest: The authors declare no conflict of interest.
Abbreviations
ABDC After top dead centerAFR Air-fuel ratioATDC After top dead centerBBDC Before bottom dead centerBEV Battery electric vehicleBMEP Brake mean effective pressureBSFC Brake specific fuel consumptionBTDC Before top dead centerBTE Brake thermal efficiencyCAHU Charge air handling unitCO Carbon monoxideCO2 Carbon dioxideCR Compression ratioDI Direct injectionDOHC Double overhead camshaftDVPE Dry vapor pressure equivalentEGR Exhaust gas recirculationEVC Exhaust valve closesEVO Exhaust valve opensFBP Final boiling point (at which the last components boil off in the distillation curve)GEM Gasoline-ethanol–methanolHC HydrocarbonsIBP Initial boiling point (at which the first components boil off in the distillation curve)ICE Internal combustion engineIMEP Indicated mean effective pressureITE Indicated thermal efficiencyIVC Intake valve closesIVO Intake valve opensKLSA Knock-limited spark advanceLHV Lower heating valueMBT Minimum spark advance for best torqueMON Motor octane numberNOx Oxides of nitrogenOHC Overhead camshaftPFI Port fuel injectionPM Particulate matterPN Particle numberppm Parts per millionRON Research octane numberSI Spark ignitionT90 Point at which 90% of the fuel mass has boiled off (in the distillation curve)TWC Three-way catalyst∆hvap Heat of vaporizationσ Standard deviation
Energies 2020, 13, 6390 28 of 31
References
1. Gross, M. A planet with two billion cars. Curr. Biol. 2016, 26, R307–R310. [CrossRef]2. Gutzmer, P. Mobility for Tomorrow—Between the Poles of Electrification. In Proceedings of the 26th Aachen
Colloquium, Aachen, Germany, 9–11 October 2017.3. Woodward, M. New Market. New Entrants. New Challenges. Battery Electric Vehicles. Deloitte. 2019.
Available online: https://www2.deloitte.com/content/dam/Deloitte/uk/Documents/manufacturing/deloitte-uk-battery-electric-vehicles.pdf (accessed on 19 June 2020).
4. Leach, F.C.P.; Akehurst, S.; Brace, C.; Busch, H.; Cairns, A.; Davy, M.; Gavaises, M.; Heikal, M.H.; Linne, M.;Shayler, P.; et al. Road bumps for electric cars (letter). Economist 2017, 413, 16.
5. White, T.L. Alcohol as a Fuel for the Automobile Motor; SAE Technical Paper Series; SAE International:Warrendale, PA, USA, 1907. [CrossRef]
6. Niizato, T. Future direction of Engine and PHEV technology at Honda. In Proceedings of the 14th InternationalConference on Engines for Vehicles, Hokkaido, Japan, 27–31 August 2017.
7. Fraidl, G.; Kapus, P.; Mitterecker, H.; Weißbäck, M. Internal Combustion Engine 4.0. MTZ Worldw. 2018, 79,26–33. [CrossRef]
8. Powell, N.; Hill, N.; Bates, J.; Bottrell, N.; Biedka, M.; White, B.; Pine, T.; Carter, S.; Patterson, J.; Yucel, S. ImpactAnalysis of Mass EV Adoption and Low Carbon Intensity Fuels Scenarios. CONCAWE Report RD18-001538-4;24 August 2018. Available online: https://www.fuelseurope.eu/wp-content/uploads/Mass-EV-Adoption-and-Low-Carbon-Fuels-Scenarios.pdf (accessed on 30 November 2020).
9. Turner, J.W.G.; Lewis, A.G.J.; Akehurst, S.; Brace, C.J.; Verhelst, S.; Vancoillie, J.; Sileghem, L.; Leach, F.C.P.;Edwards, P.P. Alcohol fuels for spark-ignition engines: Performance, efficiency and emission effects at mid tohigh blend rates for binary mixtures and pure components. Proc. Inst. Mech. Eng. Part D J. Automob. Eng.2018, 232, 36–56. [CrossRef]
10. Foong, T.M.; Morganti, K.J.; Brear, M.J.; da Silva, G.; Yang, Y.; Dryer, F.L. The octane numbers of ethanolblended with gasoline and its surrogates. Fuel 2014, 115, 727–739. [CrossRef]
11. Anderson, J.E.; Leone, T.G.; Shelby, M.H.; Wallington, T.J.; Bizub, J.J.; Foster, M.; Lynskey, M.G.; Polovina, D.Octane Numbers of Ethanol-Gasoline Blends: Measurements and Novel Estimation Method from MolarComposition. SAE Technical Paper 2012-01-1274. In Proceedings of the SAE 2012 World Congress, Detroit,MI, USA, 24–26 April 2012. [CrossRef]
12. Bergström, K.; Melin, S.-A.; Jones, C.C. The New ECOTEC Turbo BioPower Engine from GMPowertrain—Utilizing the Power of Nature’s resources. In Proceedings of the 28th International ViennaMotor Symposium, Vienna, Austria, 26–27 April 2007.
13. Bergström, K.; Nordin, H.; Königstein, A.; Marriott, C.D.; Wiles, M.A. ABC—Alcohol Based CombustionEngines—Challenges and Opportunities. In Proceedings of the 16th Aachen Colloquium, Aachen, Germany,7 October 2007; pp. 1031–1071.
14. Turner, J.W.G.; Pearson, R.J.; Holland, B.; Peck, B. Alcohol-Based Fuels in High Performance Engines. SAETechnical Paper 2007-01-0056. In Proceedings of the SAE Fuels and Emissions Conference, Cape Town,South Africa, 23–25 January 2007. [CrossRef]
15. Wallner, T.; Miers, S.A. Combustion Behavior of Gasoline and Gasoline/Ethanol Blends in a ModernDirect-Injection 4-Cylinder Engine. SAE Technical Paper 2008-01-0077. In Proceedings of the SAE 2008World Congress, Detroit, MI, USA, 14–17 April 2008. [CrossRef]
16. West, B.H.; López, A.J.; Theiss, T.J.; Graves, R.L.; Storey, J.M.; Lewis, S.A. Fuel Economy and Emissions ofthe Ethanol-Optimized Saab 9-5-Biopower. SAE Technical Paper 2007-01-3994. In Proceedings of the SAEPowertrain & Fluid Systems Conference and Exhibition, Rosemont, IL, USA, 29 October–1 November 2007.[CrossRef]
17. Turner, J.W.G.; Pearson, R.J.; Purvis, R.; Dekker, E.; Johansson, K.; Bergström, K. GEM Ternary Blends:Removing the Biomass Limit by using Iso-Stoichiometric mixtures of Gasoline, Ethanol and Methanol. SAEPaper Number 2011-24-0113. In Proceedings of the 10th International Conference on Engines and Vehicles,Capri, Naples, Italy, 11–16 September 2011. [CrossRef]
Energies 2020, 13, 6390 29 of 31
18. Turner, J.W.G.; Pearson, R.J.; Dekker, E.; Iosefa, B.; Dolan, G.A.; Johansson, K.; Bergström, K. Evolutionof alcohol fuel blends towards a sustainable transport energy economy. In Proceedings of the 2012 MITEnergy Initiative Symposium: Prospects for Flexible- and Bi-Fuel Light Duty Vehicles, Cambridge, MA, USA,19 April 2012.
19. Turner, J.W.G.; Pearson, R.J.; McGregor, M.A.; Ramsay, J.M.; Dekker, E.; Iosefa, B.; Dolan, G.A.; Johansson, K.;Bergström, K. GEM Ternary Blends: Testing Iso-Stoichiometric mixtures of Gasoline, Ethanol and Methanolin a Production Flex-Fuel Vehicle Fitted with a Physical Alcohol Sensor. SAE Paper Number 2012-01-1279.In Proceedings of the SAE 2012 World Congress, Detroit, MI, USA, 24–26 April 2012. [CrossRef]
20. Turner, J.W.G.; Pearson, R.J.; de Goede, S.B.A.; Woolard, C. GEM Ternary Blends: Investigations into ExhaustEmissions, Blend Properties and Octane Numbers. SAE Paper Number 2012-01-1586. In Proceedings of theSAE Powertrains, Fuels and Lubricants Meeting, Malmo, Sweden, 18–20 September 2012.
21. Pitcher, G.; Turner, J.W.G.; Pearson, R.J. GEM Ternary Blends of Gasoline, Ethanol and Methanol: An InitialInvestigation into Fuel Spray and Combustion Characteristics in a Direct-Injected Spark-Ignition OpticalEngine using Mie Imaging. SAE Technical Paper 2012-01-1740. In Proceedings of the SAE Powertrains, Fuelsand Lubricants Meeting, Malmo, Sweden, 18–20 September 2012. [CrossRef]
22. Turner, J.W.G.; Pearson, R.J.; Dekker, E.; Iosefa, B.; Dolan, G.; Johansson, K.; Bergström, K. Extending therole of alcohols as transport fuels using iso-stoichiometric ternary blends of gasoline, ethanol and methanol.Appl. Energy 2013, 102, 72–86. [CrossRef]
23. Waqas, M.; Naser, N.; Sarathy, M.; Feijs, J.; Morganti, K.; Nyrenstedt, G.; Johansson, B. Auto-Ignition ofIso-Stoichiometric Blends of Gasoline-Ethanol-Methanol (GEM) in SI, HCCI and CI Combustion Modes.SAE Technical Paper 2017-01-0726. In Proceedings of the SAE 2017 World Congress, Detroit, MI, USA,4–6 April 2017. [CrossRef]
24. Pearson, R.J.; Turner, J.W.G.; Bell, A.; de Goede, S.; Woolard, C.; Davy, M.H. Iso-stoichiometric fuel blends:Characterisation of physicochemical properties for mixtures of gasoline, ethanol, methanol and water.Proc. Inst. Mech. Eng. Part D J. Automob. Eng. 2014, 229, 111–139. [CrossRef]
25. Turner, J.W.G.; Pearson, R.J.; Harrison, P.; Marmont, A.; Jennings, R.; Verhelst, S.; Vancoillie, J.; Sileghem, L.;Pecqueur, M.; Martens, K.; et al. Evolutionary decarbonization of transport: A contiguous roadmap toaffordable mobility using Sustainable Organic Fuels for Transport. In Proceedings of the Institution ofMechanical Engineers Sustainable Vehicle Technologies Conference, Gaydon, UK, 15–16 November 2012.
26. Pearson RJTurner, J.W.G.; Eisaman, M.D.; Littau, K.A. Extending the Supply of Alcohol Fuels for EnergySecurity and Carbon Reduction. SAE Technical Paper 2009-01-2764. In Proceedings of the SAE Powertrain,Fuels and Lubricants Meeting, San Antonio, TX, USA, 2–4 November 2009. [CrossRef]
27. Pearson, R.J.; Eisaman, M.D.; Turner, J.W.G.; Edwards, P.P.; Jiang, Z.; Kuznetsov, V.L.; Littau, K.A.; di Marco, L.;Taylor, S.R.G. Energy storage via carbon-neutral fuels made from CO2, water, and renewable energy. Proc.IEEE 2012, 100, 440–460. [CrossRef]
28. Verhelst, S.; Turner, J.W.G.; Sileghem, L.; Vancoillie, J. Methanol as a fuel for internal combustion engines.Prog. Energy Combust. Sci. 2019, 70, 43–88. [CrossRef]
29. Steinberg, M. Production of synthetic methanol from air and water using controlled thermonuclear reactorpower—I. Technology and energy requirement. Energy Convers. 1977, 17, 97–112. [CrossRef]
30. Olah, G.A.; Goeppert, A.; Prakash, G.K.S. Beyond Oil and Gas: The Methanol Economy, 2nd ed.; Wiley-VCHVerlag GmbH & Co. KGaA: Weinheim, Germany, 2009; ISBN 98-3-527-32422-4.
31. Bandi, A.; Specht, M.; Weimer, T.; Schaber, K. CO2 recycling for hydrogen storage andtransportation—Electrochemical CO2 removal and fixation. Energy Convers. Manag. 1995, 36, 899–902.[CrossRef]
32. Stucki, S.; Schuler, A.; Constantinescu, M. Coupled CO2 recovery from the atmosphere and water electrolysis:Feasibility of a new process for hydrogen storage. Int. J. Hydrog. Energy 1995, 20, 653–663. [CrossRef]
33. Weimer, T.; Schaber, K.; Specht, M.; Bandi, A. Methanol from atmospheric carbon dioxide: A liquid zeroemission fuel for the future. Energy Convers. Manag. 1996, 37, 1351–1356. [CrossRef]
34. Sileghem, L.; Coppens, A.; Casier, B.; Vancoillie, J.; Verhelst, S. Performance and emissions of iso-stoichiometricternary GEM blends on a production SI engine. Fuel 2014, 117, 286–293. [CrossRef]
35. Sileghem, L.; Ickes, A.; Wallner, T.; Verhelst, S. Experimental Investigation of a DISI Production EngineFuelled with Methanol, Ethanol, Butanol and ISO-Stoichiometric Alcohol Blends. SAE Technical Paper2015-01-0768. In Proceedings of the SAE 2015 World Congress, Detroit, MI, USA, 21–23 April 2015. [CrossRef]
Energies 2020, 13, 6390 30 of 31
36. Shirazi, S.A.; Abdollahipoor, B.; Martinson, J.; Windom, B.; Foust, T.D.; Reardon, K.F. Effects of dual-alcoholgasoline blends on physiochemical properties and volatility behavior. Fuel 2019, 252, 542–552. [CrossRef]
37. Larsson, T.; Stenlaas, O.; Erlandsson, A. Future Fuels for DISI Engines: A Review on Oxygenated, LiquidBiofuels. SAE Technical Paper 2019-01-0036. In Proceedings of the SAE 2018 World Congress, Detroit, MI,USA, 10–12 April 2018. [CrossRef]
38. Shirazi, S.A.; Abdollahipoor, B.; Windom, B.; Reardon, K.F.; Foust, T.D. Effects of blending C3-C4 alcohols onmotor gasoline properties and performance of spark ignition engines: A review. Fuel Process. Technol. 2020,197, 106194. [CrossRef]
39. Bergthorson, J.M.; Thomson, M.J. A review of the combustion and emissions properties of advancedtransportation biofuels and their impact on existing and future engines. Renew. Sustain. Energy Rev. 2015, 42,1393–1417. [CrossRef]
40. Züttel, A.; Remhof, A.; Borgschulte, A.; Friedrichs, O. Hydrogen: The future energy carrier. Phil. Trans. R.Soc. Part A 2010, 368, 3329–3342. [CrossRef]
41. Turner, J.W.G.; Popplewell, A.; Patel, R.; Johnson, T.; Darnton, N.J.; Richardson, S.; Bredda, S.W.; Jackson, R.;Bithell, C.; Tudor, R.; et al. Ultra Boost for Economy: Extending the Limits of Extreme Engine Downsizing.SAE Technical Paper 2014-01-1185. In Proceedings of the SAE 2014 World Congress, Detroit, MI, USA,8–10 April 2014; Volume 7. [CrossRef]
42. Lewis, A.G.J.; Akehurst, S.; Turner, J.W.G.; Patel, R.; Popplewell, A. Observations on the measurement andperformance impact of catalyzed vs. non-catalyzed EGR on a heavily downsized DISI engine. SAE TechnicalPaper 2014-01-1196. In Proceedings of the SAE 2014 World Congress, Detroit, MI, USA, 8–10 April 2014;Volume 7. [CrossRef]
43. Remmert, S.M.; Cracknell, R.; Head, B.; Schuetze, A.; Lewis, A.G.J.; Akehurst, S.; Turner, J.W.G.; Popplewell, A.Octane Response in a Downsized, Highly Boosted Direct Injection Spark Ignition Engine. SAE TechnicalPaper 2014-01-1397. In Proceedings of the SAE 2014 World Congress, Detroit, MI, USA, 8–10 April 2014;Volume 7. [CrossRef]
44. Campbell, S.; Remmert, S.; Cracknell, R.; Schuetze, A.; Warnecke, W.; Lewis, A.; Akehurst, S.; Turner, J.W.G.;Patel, R.; Popplewell, A. Fuel Effects in a Downsized, Highly Boosted Direct Injection Spark Ignition Engine.In Proceedings of the 23rd Aachen Colloquium, Aachen, Germany, 6–8 October 2014.
45. Remmert, S.; Campbell, S.; Cracknell, R.; Schuetze, A.; Lewis, A.; Giles, K.; Akehurst, S.; Turner, J.W.G.;Popplewell, A.; Patel, R. Octane Appetite: The Relevance of a Lower Limit to the MON Specification in aDownsized, Highly Boosted DISI Engine. SAE Technical Paper 2014-01-2718. In Proceedings of the SAE 2014Powertrain, Fuels and Lubricants Conference, Birmingham, UK, 20–23 October 2014; Volume 7. [CrossRef]
46. Leach, F.C.P.; Stone, C.R.; Richardson, D.; Lewis, A.G.J.; Akehurst, S.; Turner, J.W.G.; Remmert, S.; Campbell, S.;Cracknell, R.F. The effect of oxygenate fuels on PN emissions from a highly boosted GDI engine. Fuel 2018,225, 277–286. [CrossRef]
47. Leach, F.C.P.; Stone, R.; Richardson, D.; Lewis, A.G.J.; Akehurst, S.; Turner, J.W.G.; Remmert, S.; Campbell, S.;Cracknell, R.F. Particulate emissions from a highly boosted gasoline direct injection engine. Int. J. Engine Res.2018, 19, 347–359. [CrossRef]
48. Chupka, G.M.; Christensen, E.; Fouts, L.; Alleman, T.L.; Ratcliff, M.A.; McCormick, R.L. Heat of VaporizationMeasurements for Ethanol Blends Up to 50 Volume Percent in Several Hydrocarbon Blendstocks andImplications for Knock in SI Engines. SAE Technical Paper 2015-01-0763. In Proceedings of the SAE 2015World Congress, Detroit, MI, USA, 21–23 April 2015; Volume 8. [CrossRef]
49. Szybist, J.P.; Chakravathy, K.; Daw, C.S. Analysis of the Impact of Selected Fuel Thermochemical Propertieson Internal Combustion Engine Efficiency. Energy Fuels 2012, 26, 2798–2810. [CrossRef]
50. Nguyen, K.-D.; Szybist, J.; Sileghem, L.; Verhelst, S. Effects of molar expansion ratio of fuels on engineefficiency. Fuel 2020, 263, 116743. [CrossRef]
51. Leach, F.C.P.; Stone, R.; Richardson, D.; Lewis, A.G.J.; Akehurst, S.; Turner, J.W.G.; Shankar, V.; Chahal, J.;Cracknell, R.F.; Aradi, A. The effect of fuel composition on particulate emissions from a highly boosted GDIengine—An evaluation of three particulate indices. Fuel 2019, 252, 598–611. [CrossRef]
52. Millwood, D.; Turner, J.W.G. Fuel Properties Calculator; Proprietary Software; University of Bath: Bath,UK, 2020.
Energies 2020, 13, 6390 31 of 31
53. Sluder, C.S. Estimation of the Fuel Efficiency Potential of Six Gasoline Blendstocks Identified by the U.S.Department of Energy’s Co-Optimization of Fuels and Engines Program. SAE Technical Paper 2019-01-0017.In Proceedings of the SAE 2019 Powertrain, Fuels and Lubricants Conference, San Antonio, TX, USA, 22–24January 2019. [CrossRef]
54. McCormick, R.L.; Fioroni, G.; Fouts, L.; Christensen, E.; Yanowitz, J.; Polikarpov, E.; Albrecht, K.; Gaspar, D.J.;Gladden, J.; George, A. Selection Criteria and Screening of Potential Biomass-Derived Streams as FuelBlendstocks for Advanced Spark-Ignition Engines. SAE Int. J. Fuels Lubr. 2017, 10, 442–460. [CrossRef]
55. Vancoillie, J.; Verhelst, S.; Demuynck, J.; Sierens, R.; Rusu, E.; Pantile, V. Efficiency Comparison betweenHydrogen, Methanol and Gasoline on a Production-Type Four-Cylinder Engine. In Proceedings of the 13thEAEC European Automotive Conference, Valencia, Spain, 14–16 June 2011.
56. Pearson, R.J.; Turner, J.W.G.; Peck, A.J. Gasoline-ethanol-methanol tri-fuel vehicle development and its rolein expediting sustainable organic fuels for transport. In Proceedings of the IMechE Low Carbon VehiclesConference, London, UK, 20–21 May 2009.
57. Naganuma, K.; Vancoillie, J.; Verhelst, S.; Sileghem, L.; Turner, J.W.G.; Pearson, R.J.; Martens, K. Drive cycleanalysis of load control strategies for methanol fuelled ICE vehicle. SAE Technical Paper 2012-01-1606.In Proceedings of the SAE International Powertrains, Fuels and Lubricants Meeting, Malmo, Sweden,18–20 September 2012.
58. Leach, F.C.P.; Richardson, D.; Stone, R. The Influence of Fuel Properties on Particulate Number Emissionsfrom a Direct Injection Spark Ignition Engine. SAE Technical Paper 2013-01-1558. In Proceedings of the SAE2013 World Congress, Detroit, MI, USA, 16–18 April 2013. [CrossRef]
59. Peckham, M.S.; Finch, A.; Campbell, B.; Price, P.; Davies, M.T. Study of Particle Number Emissions from aTurbocharged Gasoline Direct Injection (GDI) Engine Including Data from a Fast-Response Particle SizeSpectrometer. SAE Technical Paper 2011-01-1224. In Proceedings of the SAE 2011 World Congress, Detroit,MI, USA, 12–14 April 2011. [CrossRef]
60. Chen, L.; Braisher, M.; Crossley, A.; Stone, R. The Influence of Ethanol Blends on Particulate Matter Emissionsfrom Gasoline Direct Injection Engines. SAE Technical Paper 2010-01-0793. In Proceedings of the SAE 2010World Congress, Detroit, MI, USA, 13–15 April 2010. [CrossRef]
61. Litzinger, T.; Stoner, M.; Hess, H.; Boehman, A. Effects of oxygenated blending compounds on emissionsfrom a turbocharged direct injection diesel engine. Int. J. Engine Res. 2000, 1, 57–70. [CrossRef]
62. Davy, M.H.; Williams, P.A. The Effects of Flash Boiling on Mixture Formation in a Firing Direct-InjectionSpark-Ignition (DISI) Engine. In Proceedings of the International Congress on Direkteinspritzung imOttomotor II (Gasoline Direct Injection Engines), Munich, Germany, 16–17 November 1999; pp. 154–170.
63. Sandford, M.; Page, G.; Crawford, P. The All New AJV8. SAE Technical Paper 2009-01-1060. In Proceedingsof the SAE 2009 World Congress, Detroit, MI, USA, 20–23 April 2009. [CrossRef]
64. Reavell, K.; Hands, T.; Collings, N. A Fast Response Particulate Spectrometer for Combustion Aerosols. SAETechnical Paper 2002-01-2714. In Proceedings of the SAE Powertrain & Fluid Systems Conference, San Diego,CA, USA, 21–24 October 2002. [CrossRef]
65. Andersson, J.; Giechaskiel, B.; Muñoz-Bueno, R.; Sandbach, E.; Dilara, P. Particle Measurement Programme(PMP) Light-Duty Inter-Laboratory Correlation Exercise (ILCE_LD) Final Report; European Commission JointResearch Centre Institute for Environment and Sustainability: Ispra, Italy, 2007.
Publisher’s Note: MDPI stays neutral with regard to jurisdictional claims in published maps and institutionalaffiliations.
© 2020 by the authors. Licensee MDPI, Basel, Switzerland. This article is an open accessarticle distributed under the terms and conditions of the Creative Commons Attribution(CC BY) license (http://creativecommons.org/licenses/by/4.0/).