
Enabling Alternate Fuels for Commercial Aircraft - Cranfield ...
187
School of Engineering Ph.D. THESIS D. DAGGETT Enabling Alternate Fuels for Commercial Aircraft Supervisor: R. Singh Submitted January 2010 © Cranfield University 2009. All rights reserved. No part of this publication may be reproduced without the written permission of the copyright owner.
-
Upload
khangminh22 -
Category
Documents
-
view
0 -
download
0
Transcript of Enabling Alternate Fuels for Commercial Aircraft - Cranfield ...

School of Engineering
Ph.D. THESIS D. DAGGETT
Enabling Alternate Fuels for Commercial Aircraft
Supervisor: R. Singh Submitted January 2010
© Cranfield University 2009. All rights reserved. No part of this publication may be reproduced without the written permission of the copyright owner.

School of Engineering
All students must complete the details on this form before signing at the bottom. This form must then be attached by the student as a cover sheet to the front of every piece of assessed work including theses. Where coursework is marked anonymously, this form will be placed in the student's file by the course administrator, otherwise it must remain attached to the front of the work.
Student Name David L. Daggett
PhD Course SOE, Propulsion
Title of Work Enabling Alternate Fuels for Commercial Aircraft
January, 2010 Due Date
Work submitted without this form as the cover sheet will not be marked. Cranfield University defines plagiarism as follows Plagiarism is the use, without acknowledgement, of the intellectual work of other people, and the act of representing the ideas or discoveries of others as one’s own in any work submitted for assessment or presented for publication. To copy sentences, phrases or even striking expressions without acknowledgement of the source (either by inadequate citation or failure to indicate verbatim quotations) is plagiarism; to paraphrase without acknowledgement is also plagiarism. I confirm that • I understand the above definition of plagiarism • that the work contained in the attached report is all my own work except where it has been
referenced accordingly. • all electronic and hard copy versions of my reports are identical
Signed December 31, 2009 . Date
Cranfield Examiner
ii

Disclaimer The following report is the opinion of the author only and it does not reflect
the opinions of The Boeing Company. Further, this report should not be construed as advice to make financial decisions. In no event will the author or The Boeing Company will be liable for any loss or damage including without limitation, indirect or consequential loss or damage, or any loss or damage whatsoever arising from or arising out of, or in connection with the use of this information.
iii
ABSTRACT
The following reports on the past four years of work to examine the feasibility, sustainability and economic viability of developing a renewable, greenhouse-gas-neutral, liquid biofuel for commercial aircraft.
The sharp increase in environmental concerns, such as global warming, as well as the volatile price fluctuations of fossil fuels, has ignited a search for alternative transportation fuels. However, commercial aircraft can not use present alternative fuels that are designed for ground transportation. Aircraft also have much longer service lives, are capital intensive to purchase, require a complex refueling infrastructure, and are specifically designed to use petroleum-type liquid jet fuels. Synthetic jet fuel, manufactured using a Fischer-Tropsch process from coal, is currently the only alternative jet fuel commercially available to aviation, but it presently experiences environmental challenges. Biojet fuels are currently not commercially available for aviation, but have the potential to become quite acceptable
If passenger growth increases at 5%/year, it appears the only way that the aviation industry can meets its environmental goals of reducing CO2 emissions would be through commercialization of carbon-neutral fuels. This research shows that biojet fuels can be developed that do not compete with food or fresh water resources, will not lead to deforestation and will not cause other adverse environmental or social impacts.
The approach of using a “drop in” jet fuel replacement, which would consist of a blend of kerosene and up to 50% biofuel will be possible for use in existing and future aircraft. A 60-80% lifecycle CO2 emission reduction is calculated for the biofuel portion with no performance degradation. New biofuel processing techniques (i.e. hydroprocessing, isomerization & distillation) and next generation feedstock sources (e.g. halophyte and algal biomass) appear to be the best pathways to enable the large scale deployment of sustainable and economically competitive biojet fuels in the near future.
iv

Table of Contents
Abstract iv
List of Figures vii
List of Tables xiv
Glossary xv
1.0 Introduction 1 1.1 Objective 1 1.2 Background 1 1.3 Report structure 3
2.0 Literature 5 2.1 Need for alternative aviation fuels 5 2.2 The state of aviation alternate fuels prior to the study 8
3.0 Methods 17 3.1 Fuels Considered 17
3.1.1 Baseline Jet-A1 fuel 18 3.1.2 Ester biojet fuel 21 3.1.3 Bio-SPK 22
3.2 Feedstocks Considered 26 3.2.1 Oil Seed Feedstocks 26 3.2.2 Other oil containing feedstocks 30
3.3 Flight Demonstrations 32 3.3.1 The reason for a flight demonstration of biofuel 32 3.3.2 Flight Demonstration Plans 37
4.0 Results 41 4.1 Feasibility 41
4.1.1 Fuel Suppliers 42 4.1.2 Biofuel descriptions, test procedures and results 45 4.1.3 Engine performance 58 4.1.4 Engine emissions measurements 61 4.1.5 Feedstock 67 4.1.6 Feedstock processing methods 91 4.1.7 Biofuel Flight Demonstration 103
4.2 Sustainability 109 4.2.1 Availability 110 4.2.2 Environmental Factors 112 4.2.3 Life Cycle Assessment (LCA) 114 4.2.4 Energy balance of biofuels 120
4.3 Cost/Benefit analysis of biojet fuel 122
v

4.3.1 Biojet fuel cost estimate 124 4.3.2 Estimated feedstock prices 125 4.3.3 Total Estimated Biojet Fuel Costs 129
5.0 Discussion 131 5.1 Sustainable fuel processes 131 5.2 Commercialization and scale-up 140 5.4 Airline adoption 147
6.0 Conclusion 149 6.1 Achievements 149 6.2 Statement of Conclusion 153 6.3 Further work required 153
7.0 References 156
Appendices: A: CAAFI alternative fuel roadmaps A-1 B: Anonymity of Boeing subcontractor identities B-1
vi

LIST OF FIGURES
Page Figure 1: The rate of oil discovery is falling while the rate of oil consumption is
increasing. 2
Figure 2: Alternate fuel sources will need to be developed to offset the anticipated peak production of conventional oil supply. 2
Figure 3. Oil prices have fluctuated widely recently prompting airlines to seek alternatives. 3
Figure 4. Growing atmospheric CO2 emissions are of concern because they are understood to lead to climate change. 3
Figure 5. The future growth in air travel is expected to lead to higher demand for fuel in an era of diminishing oil reserves. 5
Figure 6. Jet fuel is a significant portion of an aircraft operator’s cash expenses 6
Figure 7. For the first time in jet aircraft history, fuel costs have risen above labour costs 6
Figure 8. Biofuels appear to be one of the few options available to constrain CO2 growth. 7
Figure 9. There are several classifications of military and commercial jet fuels in the US. 8
Figure 10. Aircraft fuels need to have high energy content per unit weight and volume. 9
Figure 11. Regular bio-diesel fuel (left) can not be used in an airplane because it freezes at the cold (e.g. -40 °C) operating conditions of aircraft (right.)29 10
Figure 12. Over time, biodiesel (right) can experience stability issues (left). 11
Figure 13. First turbine powered flight on biofuel was thought to be in 1984, in Brazil with an EMB-110 using biokerosene “prosene.”31 11
Figure 14. F-T fuel manufacturing plant and F-T aviation fuel sample 12
Figure 15. Reduction of exhaust emission particulates has been found small APUs when using F-T fuel blended in JP-8.38 13
Figure 16. Thermal deposition of various fuels in the AFRL single tube flow reactor test rig shows that F-T fuels have excellent thermal stability characteristics. 14
Figure 17. F-T synthetic fuels (S-8 and S-5, synthetic replacements of JP-8 and JP-5) also have very good cold flow qualities38. 14
Figure 18. F-T fuels exhibit high life-cycle CO2 emissions, requiring unproven carbon capture and sequestration during the manufacturing phase. 15
vii

Figure 19. The most commonly known feedstocks for alternate jet fuels prior to the study 16
Figure 20. BioJet Fuel Study Pathway 17
Figure 21. A few processing methods for biofuels 18
Figure 22. C11H24 is a common length fuel molecule in Jet-A1 fuel. 19
Figure 23. Baseline Jet-A1 was a mixture of various length HC molecules. 20
Figure 24. ASTM D-1655 jet fuel performance specifications 21
Figure 25 Transesterification process was used to create one ester-based biojet fuel 22
Figure 26. A Hydrotreated Vegetable Oil process produces a biofuel with excellent cold flow properties. 24
Figure 27. Camelina, which belongs to the same family as Rapeseed and Canola, was chosen as a feedstock to study 27
Figure 28. Jatropha Curcas plant 28
Figure 29. The Castor plant, from which Castor oil is derived, was another feedstock candidate chosen for this study. 29
Figure 30. The halophyte “Salicornia” was chosen as a feedstock candidate 30
Figure 31. Algae are a promising feedstock that was chosen to study. 31
Figure 32. A protytype algae production using large open ponds and fuel gas has been demonstrated. 32
Figure 33. A competitive business model is used as a template to understand the commercial jet fuel market.69 33
Figure 34. The present business situation in the aviation fuel industry offers little choice for airline customers. 34
Figure 35. Desired fuel situation is one of choice and customer-driven 35
Figure 36. Example of how to increase rivalry to enable commercialization of alternative jet fuel. 36
Figure 37. Biofuel flight plan flow chart 37
Figure 38. A biofuel selection, flight demonstration, return to service, and risk reduction plans were created to help direct the flight demonstrations and satisfy the CAA. 38
Figure 39. Biofuel testing process 39
Figure 40. The flight demo used biofuel in tank #4 and ran only #4 engine to avoid contaminating any other part of the aircraft 40
Figure 41. All of the milestones established in early 2006 were accomplished. 41
Figure 42. Several partners were engaged to help enable biofuels 42
Figure 43. Seven fuel suppliers provided biofuel for evaluation 42
Figure 44. One process used Urea to help separate the high freezepoint saturated SME from the low freezepoint unsaturated SME70. 43
viii

Figure 45. Initial results of the modified ester fuel showed it contained few saturates, had a low Cloud Point (CP) and Freeze Point (FP)70 44
Figure 46. One HVO process (HBIO) used to make biojet fuel 44
Figure 47. Biofuel screening testing process employed for the flight demonstrations 45
Figure 48. Summary of important biofuel performance factors 47
Figure 49. Imperium FAME biofuel test results 48
Figure 50. Summary of baseline Jet-A1 fuel, a CTL fuel, the Imperium FAME and an early HVO candidate. 49
Figure 51. Test results for UOP’s HVO Bio-SPK fuel 50
Figure 52. Imperium FAME HC chain lengths were similar to Jet-A1 51
Figure 53. Early HVO fuel candidate’s carbon chain lengths were longer than Jet-A172 52
Figure 54. CTL fuel had similar HC composition as JP-8 fuel.72 52
Figure 55. UOP’s bio-SPK fuel had similar composition to Jet-A fuel regardless of biofuel feedstock73 53
Figure 56. Biodiesel acquires a frosty appearance when it freezes 53
Figure 57. Early biofuels that were tested failed to meet the minimum -40C freezepoint requirement 55
Figure 58. The FAME biojet fuel exhibited unusual freezepoint behaviour when blended with Jet-A1 fuel. 56
Figure 59. Early biojet fuels failed the high temperature thermal oxidation tests 57
Figure 60. The Imperium 100% FAME (Bio #4) and early HVO (Bio #5) both had good thermal breakpoint results 57
Figure 61. FAME biofuels lead to more seal swell while HVO biofuels lead to less seal swell as compared to Jet-A1 fuel. 58
Figure 62. Ground tests performed on biofuels prior to flight demonstration 59
Figure 63. Fuels with lower heat value (e.g. Esters) resulted in loosing margin on the lean blowout limit. 60
Figure 64. Fuels with lower LHV also resulted in longer engine start times.77 60
Figure 65. Biofuel (upper left) was tested in a CFM56 engine (lower right) and emissions were gathered via a rake (lower left) and analyzed in a portable lab facility (upper right)77 62
Figure 66. A decrease in particulate emissions was observed in the CFM56 engine while operating on the F-T fuel compared to Jet-A1 fuel. 63
Figure 67. A decrease in the particulate mass (Elm) and number (EIn) were observed when operating on the Imperium Biojet and F-T fuels in the CFM56 engine.78 64
Figure 68. Speciated HC were distinct for alternate fuels, especially aromatic HC emissions.78 65
ix

Figure 69. Emission data was also collected for Jet A-1, blend of 50% Jet A-1 and 50% early HVO biofuel and 100% HVO in a PWC small turbofan engine. 66
Figure 70. Emissions were also measured on later UOP bio-SPK fuel ground tests of a CFM56-7B engine at (18K) and highest (27K) thrust ratings 66
Figure 71. Several providers supplied biomass oils to the project 68
Figure 72. Focus was on near term viable fuels that had high productivity 68
Figure 73. Halophytes were found to have a wide range of potential productivities 69
Figure 74. There are several ideal locations for halophyte farms through out the world.82 69
Figure 75. Some Salicornia R&D is already advancing to commercialization. 70
Figure 76. One contractor is performing validation studies of various types of Salicornia. 70
Figure 77. Subcontract was issued to create test plot to evaluate feasibility of Euphorbia Tirucalli as a feedstock for biofuel. 71
Figure 78. The E. Tirucalli plant’s growth productivity was good while growing on saline water. 72
Figure 79. Two year old Jatropha plantation in Brazil 73
Figure 80. Jatropha oil yield will vary greatly depending on the amount of water and fertility of the soil. 74
Figure 81. Jatropha may actually be a water intensive plant in order to generate sufficient oil for biofuel. 75
Figure 82. Poor soil conditions were observed to result in poor Jatropha root growth. 75
Figure 83. Creating a shorter, high density Castor plant would enable mechanical harvesting. 79
Figure 84. Camelina oil may be allowed for human consumption (Salad oil shown.) 80
Figure 85. Many steps & technologies are involved in generating algal oil. 81
Figure 86. Laboratory and native E. Washington algal strains produced various percentages of oil. 82
Figure 87. Algae grown from sewage waste water or from prime brackish water appear to have the same HC chain characteristics. 83
Figure 88. Several different fresh water algal strains were field tested at electric powerplants to evaluate their feasibility to produce oil. 84
Figure 89. Conditioning or stressing the algae results in higher lipid (oil) accumulation115 84
Figure 90. Various marine (salt water) algal species are being tested for suitability for oil production 85
x
Figure 91. Large open ponds are one approach to growing commercial alga 86
Figure 92. Closed photobioreactors (bag system on the leftError! Bookmark not
defined. and tubular on the right) are another approach for growing algae. 87
Figure 93. A hybrid (open pond + photobioreactor) system is another option that was developed and studied 88
Figure 94. Production of biomass and lipid in Scenedesmus cells maintained in a hybrid cultivation system. Growth (A), nitrate level (B), and total lipid (C).115 89
Figure 95. GMO cyanobacteria, to produce and excrete oil, were studied by two microbiology consultants in 2009. 90
Figure 96. Large scale cyanobacteria systems were evaluated for feasibility. 91
Figure 97. Subcontractors provided information on processing methods for biofuel feedstocks 92
Figure 98. Low cost inoculation system was developed 92
Figure 99. Dissolved Air Floatation system is a common harvesting approach 94
Figure 100. Micro Ultra Filtration (MUF) system was developed. 95
Figure 101. T-C filtration system was investigated for algal/water separation 96
Figure 102. Soxhlet oil extraction hardware was utilized to gather data on algal oil.121 97
Figure 103. Using data obtained in Figure 102, a commercial extraction process was estimated to cost $0.135/gallon of algae oil. 98
Figure 104. A prototype microwave oil assist extraction process was developed to reduce production costs. 98
Figure 105. Electroporation system was developed that might reduce separation and extraction costs 99
Figure 106. Algal cells show disruption after electroporation process122 100
Figure 107. A supercritical oil extraction system can be used to extract algae oil. 100
Figure 108. An algal biomass demonstration was performed from a decommissioned waste water plant.112 102
Figure 109. A commercial algae company was engaged to evaluate algal biomass growing and processing costs. 103
Figure 110. Worked with several OEMs to flight demonstrate biojet fuel. 104
Figure 111. First flight demonstration used biofuel developed by Imperium renewables. 104
Figure 112. Dielectric value for the Imperium FAME differed from Jet-A 106
Figure 113. The first flight demonstration generated a lot of public press which enabled follow-on flight demonstrations and biofuel development. 107
xi

Figure 114. A B747-400 (top) was used for the 1st flight demonstration with oil from the Babassu nut (lower right) to make the biojet fuel which was run in engine #4 (lower left) 108
Figure 115. Subsequent flight demonstrations were led by Tim Rahmes (BCA) with Air New Zealand (upper left) Continental (upper right) and JAL (lower) 109
Figure 116. The US and Brazil are the largest producers of biofuels. 110
Figure 117. To provide the world’s commercial aviation fleet with biofuel in 2004, would require an area the size of Europe if soy was used, but only the size of Belgium if algae was used. 111
Figure 118. Brazil has sufficient arable land to meet ethanol-motor-fuel replacement demands. 112
Figure 119. Biofuels must not encourage deforestation as this is a major contributor to global warming. 113
Figure 120. Deforestation is a continuing problem, especially in Brazil and Indonesia 113
Figure 121. In Brazil, the states of Mato Grosso and Para are the areas of highest deforestation, not the Amazon as is widely believed. 114
Figure 122. Several Universities were engaged to support biojet fuel LCA studies 116
Figure 123. Some typical LCA biofuel pathways to consider 116
Figure 124. Other gaseous emissions, such as Methane and N2O, also lead to global warming and are included in LCAs. 117
Figure 125. A wide range of CO2 emissions from algae-based biojet fuel could be expected, depending on the oil and fuel production processes used. 118
Figure 126. One University interacted with other contractors to perform a multi-feedstock LCA for biojet fuels. 119
Figure 127. An internal analysis of biojet fuel yielded similar trends as was seen in the multi-feedstock LCA 119
Figure 128. Biojet fuel is thought to be much more of an energy efficient process than other alternative fuels.145 120
Figure 129. Processing energy of biojet fuel will vary depending on the feedstock 121
Figure 130. HVO using algae oil appears to be the most efficient feedstock and process to make biojet fuel. 122
Figure 131. Biofuel price trends have followed fossil fuel prices 122
Figure 132. As demand for biofuels increase with crude oil prices, feedstock prices closely follow fossil fuel price trends153 123
Figure 133. Biodiesel capacity has outstripped production. 123
Figure 134. UOP claims that a biodiesel facility capital costs would be higher than for a HVO facility. 125
xii

Figure 135. Camelina oil is estimated to cost less to produce than rapeseed oil in Ireland. 126
Figure 136. Future high production algae oil costs are estimated at $3.69/US gallon for an algal system that produces 3,400 gal/acre/yr 128
Figure 137. Total biojet fuel costs may range from $2.41 to $4.46/US gallon. 130
Figure 138. Small farmers, such as this one in Brazil (middle), could form a co-op to grow drought tolerant, high productivity Castor. 133
Figure 139. Biojet fuel could be made from locally grown sustainable crops that don’t compete with food. 134
Figure 140. Halophytes could be an attractive crop to produce food and fuel. 134
Figure 141. Many process technologies need to be developed to commercialize low cost algae oil derived biofuel 136
Figure 142. Low cost algae production would need to use free water, nutrients and CO2, while utilizing low-cost open ponds, harvesting, dewatering & extraction processes. 137
Figure 143. Algae that use sea water and waste water, such as this sewage treatment plant (left) and have access to free CO2, such as this powerplant (right) would be an attractive option. 138
Figure 144. Free water would most likely come from waste and sea water, nutrients from waste products and CO2 from smoke stack effluent. 139
Figure 145. Perennial crops, like switchgrass, could help provide feedstock for biofuels. 141
Figure 146. Others corroborate the potential of cellulosic waste products as a feedstock for biofuels. 142
Figure 147. Africa and Central/South America will have a much better chance at using biofuel to meet their energy needs. 144
Figure 148. It is uncertain if enough biojet fuel refining plants and feedstock could be provided to meet the growth demands in commercial aviation 146
Figure 149. Potential cost savings for an EU airline, by using biofuel to avoid ETS charges, could be substantial. 148
Figure 150. First biofuel meeting lead to the development of an industry consortium, Commercial Aviation Alternative Fuel Initiative (CAAFI) to develop biojet fuels 150
Figure 151. Flight demonstrations of biofuel helped progress the development and certification of biojet fuels at a record pace. 150
Figure 152. New biojet fuels were encouraged to be developed 151
Figure 153. Biofuel feedstock R&D was accelerated 152
Figure 154. Aviation groups rushed forward to claim biofuel implementation goals 152
Figure 155. Future work is needed to mature the most promising biofuel feedstocks such as algae and its processing system. 155
xiii

LIST OF TABLES
Table 1. Composition of typical Jet-A fuel HC compounds and melting points. 19
Table 2, Biomass feedstock sustainability ground rules 26
Table 3. Airplane Return to Service summary for biofuel demo flight 40
Table 4. Reported Jatropha Oil Yields 74
Table 5. Wasteland area in India that could be partially or fully cultivated with Jatropha (in million ha) 77
Table 6. Comparison of different separation methods 93
Table 7. Biofuel blend tests required before VAA flight demonstration 105
Table 8. Plantation costs of several oil crops 127
xiv

xv
GLOSSARY
AFRL Air Force Research Laboratory (US) AFQRFJOS Aviation Fuel Quality Requirements For Jointly Operated
Systems ATM Air Traffic Management ANZ Air New Zealand BCA Boeing Commercial Airplane company Bio-SPK Biologically derived Synthetic Paraffinic Kerosene BOCLE Ball On Cylinder Lubricity Evaluator test procedure BTL Bio To Liquid fuel CAA Civil Aviation Administration (UK) CAAFI Commercial Aviation Alternative Fuels Initiative CAL Continental Air Lines CO Carbon Monoxide CTL Coal to Liquid fuel EASA European Aviation and Space Administration EINOx Emissions index for NOx given as grams of NOx/Kg fuel EISA Energy Independence and Security Act FAME Fatty Acid Methyl Ester FAA Federal Aviation Administration (US) DFDR Digital Flight Data Recorder F-T Fischer-Tropsch fuel FQIS Fuel Quantity Indicator System GAL Gallon (US) GEAE General Electric Aero Engine GTL Gas to Liquid GWP Global Warming Potential HC Hydro-Carbon HVO Hydrotreated Vegetable Oil ICAO International Civil Aviation Organization IRI Imperium Renewables Inc. JAL Japan Air Lines JFTOT Jet Fuel Thermal Oxidation Test kg kilogram lb pound LBO Lean Blow Out LH2 Liquid Hydrogen LHR London Heathrow airport LHV Lower Heating Value of fuel (BTU/LB) LTO Landing Take-Off cycle NGO Non Government Organization NOx Nitrogen Oxides (i.e. NO, NO2, N2O) OEM Original Equipment Manufacturer (e.g. Boeing, GE, etc.) PWC Pratt & Whitney Canada SME Soy Methyl Ester SPK Synthetic Paraffinic Kerosene VAA Virgin Atlantic Airways

1.0 INTRODUCTION
1.1 Objective
The objective of the project was to evaluate the use of alternate fuels for use in commercial aircraft. The alternate fuels were to be considered a “drop in” replacement, meaning that the fuel could directly supplement or replace the use of current fossil-fuel-derived jet fuels. Although Fischer-Tropsch fuels, derived from fossil fuels, were briefly considered, the main work focused on bio-derived fuels and their blends. The research involved three areas: 1) technical feasibility of biofuels for commercial aircraft, 2) environmental sustainability of these fuels, and 3) evaluating plausible economic business cases for the use of sustainable biofuels in commercial aviation.
As the drop in fuel would use the same infrastructure, and presumably be produced from many of the current jet fuel providers, the ultimate objective of the alternate fuel project was to encourage the fuel suppliers to develop, and industry to certify, an environmentally progressive non-fossil fuel derived jet fuel that can supplement or replace current jet fuel supplies.
This report provides summary information that was generated over the past 4 years. Initially the project was worked internally to the Boeing Company with one researcher (Dave Daggett). However, it grew to involve several fuel suppliers, research institutes, government organizations, and commercial airlines. Prior to this project, no biofuels were known to be available for commercial aircraft. This report will show that aviation biofuels are now feasible, environmentally acceptable, and may become economically attractive in the near future.
1.2 Background
Demand for air travel continues to grow, so much so that the industry’s growth rate is anticipated to outstrip aviation’s fuel-efficiency gains. Underlying this growth projection is an assumption that the industry will not be constrained by fuel availability or undue fuel price escalations. Future crude oil production may not be able to keep pace with world oil demand1 thereby forcing the transition to use alternative fuels.
Several sources have documented the diminishing discovery of new petroleum sources and the ever-increasing global demand (Fig. 1).
1

Figure 1: The rate of oil discovery is falling while the rate of oil consumption is
increasing2.
Some sources state we may have already reached a point where half of the world’s crude oil has been consumed34, while others indicate that it will happen mid-century (Figure 2). In any regard, mitigation options must be implemented many years, perhaps decades, in advance of the actual peak oil event to assure a smooth transition to alternate fuels5,6.and avoid a possible collapse of our current society.7
Figure 2: Alternate fuel sources will need to be developed to offset the
anticipated peak production of conventional oil supply8.
By 2026 the world’s jet fuel consumption could reach 221 billion gallons (836 million liters) per year. Replacing 10% with an alternative jet fuel would be similar in scale to current world-wide liquid biofuels (ethanol and biodiesel) production. These new energy sources will also help to address world energy demands that may soon outstrip crude oil supply. Of particular note are the growing energy demands of developing countries. For example, China expects
2

to build 600 coal-fired power plants and India close to 200 over the next 25 years9.
Jet fuel prices have closely followed the price of crude oil, which has fluctuated wildly in price the last few years (Figure 3.) Crude oil prices were just starting to increase prior to the commencement of this project. As a result of the relatively stable fuel prices in the prior 20 years to this project, there was very little motivation to develop alternate fuels for aviation.
Start of project
Figure 3. Oil prices have fluctuated widely recently prompting airlines to seek
alternatives.
Combustion of fossil fuel results in the formation of CO2 gas which is typically released as engine emissions. For every kilogram (kg) of fuel burned, 3.155 kg of CO2 are formed. It is accepted within the scientific community that these fossil fuel emissions have resulted in increases in atmospheric CO2 levels. As CO2 is a well known greenhouse gas, these emissions are thought to be associated with a rise in global temperatures (Figure 4) which will cause changes to the climate. Although commercial aviation contributes only 2-3% of the world’s CO2 emissions10, aviation has been under scrutiny, especially in Europe11, to reduce its share of emissions.
Figure 4. Growing atmospheric CO2 emissions are of concern because they are understood to lead to climate change.12
1.3 Report structure
This report will discuss: why the commercial aviation sector has become so interested in alternate fuels, the types of biofuels that were developed and analyzed over the past 4 years, the characteristics of the successful biofuels, the reasons for flight demonstrating biofuels in commercial aircraft, a summary of the test results and the prospects of commercializing biofuels for aviation in the future.
3

This project was funded by Boeing Research & Technology, initially at a very low level, but then increasing to a relatively significant amount. Subcontractors were engaged to supply biomass samples and to perform other supporting research. This report will include a summary of the results of those subcontracts. However, due to concerns at the Boeing company, the identity of all of these researchers will not necessarily be disclosed (Appendix B.)
4

2.0 LITERATURE
2.1 Need for alternative aviation fuels
The airline industry is interested in alternate jet fuels primarily for 3 reasons: (1) the creation of additional fuel supplies, (2) the potential for cost reduction, and (3) environmental benefits. Currently, nearly 100% of all aviation fuel is petroleum derived. It is based on conventional and well-known refining technology with the ability to supply billions of gallons of jet fuel annually. In the past, these sources have been highly reliable and cost effective. However, the vulnerability and uncertainty of petroleum resources have demonstrated a propensity for gyrating costs and doubts of availability. Environmental concerns have also recently become very important considerations. 1.2.1 Projected growth in aviation fuel use-- Current aircraft have experienced dramatic improvements in fuel efficiency since the introduction of commercial jet aircraft in the 1960s. Next-generation aircraft, such as the Boeing 787, will see another 15% to 20% improvement in fuel efficiency, making air travel one of the most efficient means of transportation.
Commercial aviation travel is anticipated to resume growing, at an average annual rate of 4-6% per year (Figure 5.) Although recent commercial aircraft designs have achieved some 70% reduction in fuel consumption, the industry growth rate is anticipated to outstrip future efficiency increases. Therefore, additional fuel will be needed. As a consequence, the aviation industry is interested in alternate energy sources and alternate liquid fuels in particular.
Trav
el -
Bill
ions
RPK
s
Long-Term Growth Rates:GDP = 3%
Passengers = 5%Cargo = 6%
0
2,000
4,000
6,000
8,000
10,000
1970 1975 1980 1985 1990 1995 2000 2005 2010 2015 2020
Data
Projected
Trav
el -
Bill
ions
RPK
s
Long-Term Growth Rates:GDP = 3%
Passengers = 5%Cargo = 6%
0
2,000
4,000
6,000
8,000
10,000
1970 1975 1980 1985 1990 1995 2000 2005 2010 2015 2020
Data
Projected
Figure 5. The future growth in air travel is expected to lead to higher demand for
fuel in an era of diminishing oil reserves.13
1.2.2. Fuel costs— Jet fuel costs have traditionally been the 2nd or 3rd most costly cash operating expense for aircraft operators and makes up a significant portion of the daily operating budget (Figure 6.)
5

Crew
Fuel
Ground Handling
Maintenance
Landing Fees
Navigation
Cash Airplane Related Operating Costs for 787 Aircraft
Figure 6. Jet fuel is a significant portion of an aircraft operator’s cash expenses
With the escalating cost of jet fuel and increasing labor productivity, which results in lower effective labor costs, fuel has recently overtaken labor as the most expensive cash cost for airlines (Figure 7.)
0.0
0.5
1.0
1.5
2.0
2.5
3.0
3.5
4.0
4.5
1970 1975 1980 1985 1990 1995 2000 2005Year
Uni
t Ope
ratin
g C
ost,
cent
s / a
vaila
ble
seat
km
(not
adj
uste
d fo
r inf
latio
n)
LaborFuel
Figure 7. For the first time in jet aircraft history, fuel costs have risen above
labour costs14
The increased need for aviation fuels, and the projected decrease in future fuel availability will no doubt increase the volatility of aviation fuel prices. Although the world is not anticipated to run out of crude oil anytime soon, alternative energy sources need to be developed quickly to help address the end of “cheap oil.” One key issue centers on finding a sustainable source of fuel for the future that will keep jet fuel costs at a reasonable level. Airlines are therefore
6

interested in developing alternative fuels so that this added fuel supply may help stabilize future jet fuel prices.
1.2.3 Environmental drivers for aviation -- Because of the increasing concentration of CO2 in the atmosphere, alternative fuels must also address global warming issues. Commercial aviation leaders have set a goal that future growth in the industry aspires to be carbon-neutral15. Thus, carbon-neutral, or low carbon renewable jet fuels are a critical environmental need for aviation.
The Commercial Aviation Alternative Fuels Initiative (CAAFI) and the Boeing company have both set a goal of certifying a blended renewable jet fuel in the 2010 time frame16. By 2020, the FAA has set a goal of a 17% reduction of commercial aviation CO2 emissions as compared to a 2005 baseline. IATA has a goal of a 50% reduction by 2050 and the US Air Force has a goal of using 50% biofuel use for military aviation by 2017. Achieving these goals will require an enormous amount of biofuel to be brought on line. Not only will biofuel need to displace a large amount of the existing fossil fuel use, but it will have to contend with the increase in industry growth. Replacing older aircraft with higher efficiency aircraft, airplane technology improvements, and investments in Air Traffic Management (ATM) efficiency improvements may only be able to offset only a portion of the growth in CO2 emissions (Figure 8).
2050Carbon Neutral Timeline
CO
2Em
issi
ons
Baseline
Low Carbon Fuels
ATM Investments / Improvements
Ongoing Fleet Renewal / Technology Development
Forecasted Emissions Growth w/o Reduction Measures
2050Carbon Neutral Timeline
CO
2Em
issi
ons
Baseline
Low Carbon Fuels
ATM Investments / Improvements
Ongoing Fleet Renewal / Technology Development
Forecasted Emissions Growth w/o Reduction Measures
Figure 8. Biofuels appear to be one of the few options available to constrain
CO2 growth.17
It has become apparent that no single energy source, or alternative fuel, will be able to replace the enormous amount of fossil fuels that will be used in the near term. The solution will most likely be a mix of improving energy efficiency, development of alternative fuels, and shifting of other sectors (e.g. automobiles) to alternative energy sources, such as batteries or fuel cells. These technologies are better suited to ground transportation, as their power density is not sufficient to be used by commercial aircraft for propulsion. Commercial aircraft will continue improving their fuel efficiency, while the US
7

ground transportation sector may want to reverse its recent worsening fuel efficiency trend.
2.2 The state of aviation alternate fuels prior to the study
Some work was previously performed in an attempt to use biodiesel-type fuels in jet aircraft. However, when this study was started, there were no known aviation biofuels in existence that were suitable for commercial aviation. The only alternate commercial aviation fuel that was available in 2006 was a Coal To Liquid (CTL) fuel made in S. Africa.
Aircraft jet fuels, such as Jet-A (commercial), JP-8 (US military common fuel), AVTUR (UK military standard)18, and others (Figure 9) have been developed over many years to have relatively high energy per unit weight and volume19. These fuels also have high flashpoints (for safety), low freeze points (for use in extreme environmental climates) and are also easily stored inside the aircraft’s wings20.
Specification ReferenceCommercial Fuel
U.S. Military Specification MIL-DTL-83133E. JP-8 also meets the requirements of the British Specification DEF STAN 91-87 AVTUR/FSII (formerly DERD 2453). NATO Code F-34.
JP-8
Military Specification MIL-DTL-5624U Grade JP-5 (as of Jan 5, 2004, JP-4 and 5 meet the same US Military Specification).
British Specification DEF STAN 91-86 AVCAT/FSII (formerly DERD 2452). NATO Code F-44.
JP-5
Specification MIL-DTL-5624U Grade JP-4 (as of Jan 5, 2004, JP-4 and 5 meet the same US Military Specification)
British Specification DEF STAN 91-88 AVTAG/FSII (formerly DERD 2454),where, where FSII stands for Fuel Systems Icing Inhibitor. NATO Code F-40
JP-4Military Fuels
ASTM D6615, Canadian Specification CAN/CGSB 3.23Jet-BASTM D1655, British specification DEF STAN (Defense Standard) 91-91Jet-A1
ASTM D1655Jet-A
Figure 9. There are several classifications of military and commercial jet fuels in
the US.
Currently, almost all alternative fuels present some challenges to implement when compared with conventional kerosene jet fuel21. For example, Figure 10 shows that hydrogen has superior energy content per unit weight but exhibits a high specific volume. Thus, an aircraft designed to use hydrogen would have to incorporate a fuel tank that is about 4 times larger than that for jet fuel. However, the fuel would only weigh about 1/3 as much. Alcohols, such as ethanol, have both poorer volumetric and weight performance as compared to Jet-A fuel. Jet-A fuel, and identical alternates, are the best per unit volume and so this results in the least amount of fuel tank structure and associated weight.
8

*Equivalent Energy
LiquidHydrogen
Jet ASyn-JetBio-Jet
1.0
4.20
Volume(ft3/BTU)
Ethanol
1.641.0
1.6
Weight(lb/BTU)
0.36
Ethanol
Good
Good
Jet ASyn-JetBio-Jet
LiquidHydrogen
Jet-A is best per
unit volume
Hydrogen is best per unit weight
*Equivalent Energy
LiquidHydrogen
Jet ASyn-JetBio-Jet
1.0
4.20
Volume(ft3/BTU)
Ethanol
1.641.0
1.6
Weight(lb/BTU)
0.36
Ethanol
Good
Good
Jet ASyn-JetBio-Jet
LiquidHydrogen
Jet-A is best per
unit volume
Hydrogen is best per unit weight
Figure 10. Aircraft fuels need to have high energy content per unit weight and
volume.
The fundamental performance requirements for a commercial jet fuel are that it has: (1) a low weight per unit heat of combustion (BTU) to allow the transport of revenue-producing payload and (2) a low volume per BTU to allow fuel storage without compromising aircraft size, weight, or performance.
The type of fuel of immediate interest to aviation is termed a “drop in” fuel (i.e., direct replacement) and is one that can be blended with, or completely replace, Jet-A without necessitating any substantial modifications to engine or aircraft.22
2.2.1 Hydrogen Fuel (H2): Hydrogen, publicized as the most environmentally benign alternative to petroleum, is actually just an energy transfer media and has drawbacks. The production of renewable H2 needs an abundant source of affordable energy, such as electrical power produced from future nuclear reactors, and a large source of clean water.
Although combustion of H2 emits no carbon dioxide (CO2) emissions and is lightweight, its production, handling, infrastructure, and storage offer significant challenges. The volumetric heat of combustion for Liquid Hydrogen (LH2) is so poor that it would force airplane design compromises.
The use of LH2 would also require entirely new and more complex ground transportation, storage, distribution, and vent capture system.
LH2 not only presents very substantial airport infrastructure and airplane
design issues, but because of the need for heavy fuel tanks, a short-range airplane would experience a 28% decrease in energy efficiency while on a 500- nautical-mile (nmi) mission. However, because airplanes need to carry much more fuel for a long range flights, and LH2 fuel is quite lightweight, the lighter takeoff weight of the long range airplane results in an energy efficiency loss of only 2% while on a 3,000-nm mission.23
2.2.2 Other Liquefied Fuels. The liquefied petroleum gases, propane and butane, are not cryogens, but they have many of the same storage and transfer problems associated with a cryogen. In-depth studies of these fuels have not
9

been conducted because the natural supply of these fossil fuels is not sufficient to support the added burden of the worldwide aviation fleet. Manufacturing propane or butane offers no availability, cost, or environmental advantage as a replacement for conventional jet fuel because it is fossil fuel based.
2.2.3 Alcohols. As illustrated in Figure 10, alcohols (methanol and ethanol) have very poor mass and volumetric heats of combustion and are therefore not satisfactory for use as a commercial aircraft fuel. Even though they are not useful for commercial aviation, their widespread production and use could in-fluence the supply and cost of conventional jet fuel by freeing up additional petroleum resources for aircraft. Their production might have merit in that context.
Alcohol fuels result in airplane performance penalties. Ethanol takes up 64% more room and weighs 60% more compared with Jet-A fuel. An alternative-fueled airplane design of this type would experience a 15% decrease in fuel efficiency on a 500-nmi mission and a 26% efficiency decrease on a 3,000-nmi mission compared with a Jet-A fueled airplane23.
2.2.4 Biofuels - Biofuels are fuels that are typically derived from biomass or recently living biological organisms24. Since living organisms tend to absorb atmospheric CO2 in their growing cycle, these fuels have the advantage of potentially being less carbon intensive over their entire life cycle when compared to fossil fuels. As such, many biofuels can be very attractive fuel candidates.
Plant-derived biofuel feedstocks include biomass such as soybean oils, palm oils, corn, switchgrass, and algae. These resources are considered renewable, but most would require large areas for plant nurturing. Current crops with high oil content such as soybeans, rapeseed, canola, and sunflowers are currently the starting materials used to produce bio-oils for biofuel production which can then be mixed with petroleum fuels25.
The oil is obtained by first cleaning, cracking, and conditioning the plant’s beans or oil seeds. The beans are subsequently compressed into flakes. The oil can then be extracted through mechanical press or by a solvent extraction process. The primary components of bio-oils are fatty acids26. The first process in utilizing these bio-oils for current generation biofuels, such as biodiesel, is to convert the raw oil into an ester. These esters can be used directly, such as for biodiesel27,28 or can be modified into a variety of products. The ester from soybeans is sometimes referred to as SME (soy methyl ester) and from rapeseed, RME.
One of the challenges of using SME in a commercial aircraft is its propensity to freeze at normal operating cruise temperatures (Figure 11).
Figure 11. Regular bio-diesel fuel (left) can not be used in an airplane because it freezes at the cold (e.g. -40 °C) operating conditions of aircraft (right.)29
Another challenge of SME is the stability of the oil over time. Currently, it is advised that the product be used within 6 months of manufacture26. The lack of product consistency and storage stability, as exhibited by the cloudiness shown in Figure 12, can be common problems of biodiesel fuels. For these reasons, SME is usually blended with petroleum diesel in the US at a 20% blend.
10

Figure 12. Over time, biodiesel (right) can experience stability issues (left).29
For biofuels to be viable in the commercial aviation industry, significant technical hurdles needed to be overcome. Although biodiesel is not adequate for commercialization for aviation, the task was not insurmountable to create an improved biojet fuel for evaluation purposes. For commercialization, aircraft equipment manufacturers and regulatory agencies will require evaluation and testing to make sure the biojet fuel does not have the same issues as biodiesel and to assure it meets performance requirements before biofuels can be approved.
Ethanol currently provides about 2.85% of the US gasoline fuel needs while biodiesel supplies 0.21% of the US diesel fuel needs.30 This report will show that some specially processed biofuels can be blended with current jet fuel to enable this sector’s use of biofuel. This bio–derived jet fuel can be made from the same present and future sustainable plant products that biodiesel uses, which makes it attractive as a step toward a sustainable “carbon neutral” aviatiofuel that will help address global warm
n ing issues.
2.2.4.1 Previous biofuels for aviation – Driven by the energy crisis of the early 1980’s, research was begun in Brazil to find and develop alternative fuels for transportation. Their current successful ethanol program is a result of those efforts and is well known, but aviation was also included in similar research. From 1980 to 1984, trials were performed using biodiesel as a replacement to jet fuel and the development of PROSENE®, an alternative biokerosene jet fuel, was undertaken. The flight tests were made using Prosene in an EMBRAER turbo-prop powered aircraft. This accomplishment was considered to be of strategic national interest and the results could not be published at the time.31
The biokerosene tests were concluded on October 23rd, 1984, on “Aviator’s Day”, with a flight from São Paulo to Brasilia, with a flight time of 4 hours. The aircraft used for the trial flight was a Brazilian “Bandeirante” 110, manufactured by EMBRAER (Figure 13.)
Figure 13. First turbine powered flight on biofuel was thought to be in 1984, in
Brazil with an EMB-110 using biokerosene “prosene.”31
However, as will be shown in section 4 of this report, after a more thorough examination of the biokerosene ester fuel was performed in Boeing laboratories, the results revealed that the fuel lacked sufficient thermal stability and energy content to be considered further as a candidate.
11
There were also a few efforts to utilize bio-fuels in aviation turbines at Purdue University32 and at Baylor University’s Renewable Aviation Fuels Development Center33. David Stanley at Purdue University and his team tested various soy methyl esters blended into Jet-A fuel on a Garrett TPE 331-3U turboprop engine. Some promising results in terms of improved emissions were reported. R. O. Dunn also performed some work on evaluating the feasibility of utilizing vegetable lipid derived methyl esters as jet fuel extenders25.
Two liquid biofuels were known to have been flight tested in aviation prior to this work; one was the aforementioned Prosene34, and the other was a refined biodiesel a. However, neither of these fuels would meet the current jet fuel performance specifications in order to be considered a “drop in” replacement.
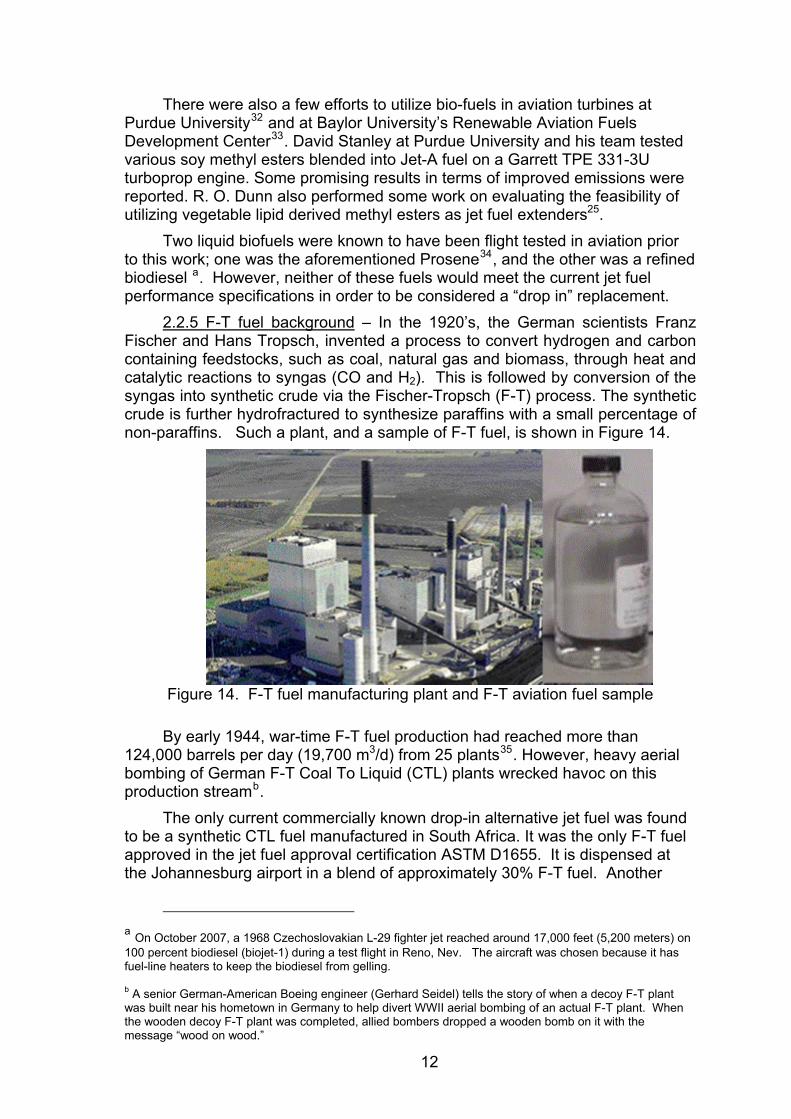
2.2.5 F-T fuel background – In the 1920’s, the German scientists Franz Fischer and Hans Tropsch, invented a process to convert hydrogen and carbon containing feedstocks, such as coal, natural gas and biomass, through heat and catalytic reactions to syngas (CO and H2). This is followed by conversion of the syngas into synthetic crude via the Fischer-Tropsch (F-T) process. The synthetic crude is further hydrofractured to synthesize paraffins with a small percentage of non-paraffins. Such a plant, and a sample of F-T fuel, is shown in Figure 14.
Figure 14. F-T fuel manufacturing plant and F-T aviation fuel sample
By early 1944, war-time F-T fuel production had reached more than 124,000 barrels per day (19,700 m3/d) from 25 plants35. However, heavy aerial bombing of German F-T Coal To Liquid (CTL) plants wrecked havoc on this production streamb.
The only current commercially known drop-in alternative jet fuel was found to be a synthetic CTL fuel manufactured in South Africa. It was the only F-T fuel approved in the jet fuel approval certification ASTM D1655. It is dispensed at the Johannesburg airport in a blend of approximately 30% F-T fuel. Another
a On October 2007, a 1968 Czechoslovakian L-29 fighter jet reached around 17,000 feet (5,200 meters) on 100 percent biodiesel (biojet-1) during a test flight in Reno, Nev. The aircraft was chosen because it has fuel-line heaters to keep the biodiesel from gelling. b A senior German-American Boeing engineer (Gerhard Seidel) tells the story of when a decoy F-T plant was built near his hometown in Germany to help divert WWII aerial bombing of an actual F-T plant. When the wooden decoy F-T plant was completed, allied bombers dropped a wooden bomb on it with the message “wood on wood.”
12

synthetic liquid fuel, which is expected to soon become commercially available, is derived from natural gas and is called a Gas To Liquid fuel or GTL36. These alternative aviation fuels, also synthesized through the Fischer-Tropsch process, are suited to supplement conventional kerosene fuels. Although these fuels can exhibit poorer environmental performance than other fossil fuels, it was found to be the most readily available near term alternative. As these fuels are at the commercialization phase, this report will only provide cursory reporting of F-T fuels. Prior to the start of this alternative fuels project, almost all work on alternative fuels was relegated to F-T fuels.
The positive attributes of F-T fuels include a cleaner fuel with no sulfur, higher thermal stability, and lower particulate engine emissions. The negative attributes include poorer lubricating properties, lower volumetric heat content, a probable contributor to fuel system elastomer leakage (in high percentage blends,) and possible increased CO2 emissions during its manufacture.
The US Air Force Research Laboratory (AFRL) has been conducting lab, ground and flight tests of F-T fuels over the past 4 years38. The Air Force motivation for developing these fuels are the same as the commercial airline sector, except that fuel availability and security might be considered a higher priority due to US national defense reasons. Environmental issues are still important.
The approval for the use of other generic synthetic F-T fuels in modern aero engines was recently approved under ASTM D 7566 certification with supporting work conducted by major engine and airframe manufacturers.
2.2.5.1 Synthetic-Fueled Engine Tests. Compared with conventional kerosene fuel, synthetic F-T fuels are characterized by a higher hydrogen-to-carbon ratio (H/C-ratio) which may also help lowering particulate exhaust emissions. Tests performed so far with older style turbine engines demonstrated a significant reduction in particulate emissions (Figure 15). However, the results are highly dependent on engine technology status.
Reduced particulate emissions have also been seen as one of the benefits observed in diesel engines37. This emissions reduction phenomenon in gas turbines has only recently been substantiated in newer technology, large turbine engine tests that will be discussed in section 4.0
Figure 15. Reduction of exhaust emission particulates has been found small
APUs when using F-T fuel blended in JP-8.38
Another positive attribute of synthetic F-T fuels is their higher thermal stability, resulting in less fuel system deposits, which is of importance to high performance military aircraft engines. Figure 16 illustrates thermal stability test results for F-T fuels at the AFRL. The traditional baseline military JP-8 jet fuel, which is similar to Jet-A fuel, results in about 325 micrograms of carbon deposit in the AFRL tube flow reactor test unit. Using a thermal oxidation stabilizer additive (Betz +100), the thermal deposits decreased to about a 1/3. JP-7 fuel, a very expensive, but very high performing jet fuel, exhibited almost no deposits as did the 100% F-T fuel. A 50/50 blend of the CTL F-T fuel also showed very low thermal degradation deposits.
13

Figure 16. Thermal deposition of various fuels in the AFRL single tube flow reactor test rig shows that F-T fuels have excellent thermal stability
characteristics38.
Compared with conventional jet fuels, F-T fuels show excellent low-temperature properties and maintain low viscosity at lower ambient temperatures than petroleum jet fuels. This could improve high-altitude operability and low-temperature starts of the engine. Figure 17 shows the viscosity of the various fuels versus the temperature.
Figure 17. F-T synthetic fuels (S-8 and S-5, synthetic replacements of JP-8 and
JP-5) also have very good cold flow qualities38.
The negative attributes of F-T fuel include poorer lubrication properties, lower volumetric heat content, possible contributor to fuel system elastomer leakage (lack of aromatics reduces seal swell), and possible increased CO2 emissions during its manufacture. This negative environmental attribute of F-T fuel may be the largest hurdle to overcome as fuel additives can help address the other shortfalls, such as lubricity.
Large quantities of energy are used during the manufacturing process of CTL fuels, which results in the release of about twice the CO2 into the
14

atmosphere as compared with that of crude oil derived jet fuel. Figure 18 shows the relative life cycle CO2 emissions from various fuels, using current jet fuel as the baseline. CTL fuels can only be considered as a viable alternative to petroleum if the CO2 emissions generated during production can be captured and permanently sequestered. However, this can add substantially to the cost of F-T fuels39.
Figure 18. F-T fuels exhibit high life-cycle CO2 emissions, requiring unproven
carbon capture and sequestration during the manufacturing phase.40 Recently, section 526 of the 2007 Energy Independence & Security Act
was approved in the US which prohibits the purchase of alternative fuels which would result in higher CO2 emissions as compared to fossil fuel petroleumc. As the F-T fuels tend to be much higher emitters of CO2, this bill has caused a shift in alternative fuel thinking at many parts of the US Department of Defense from F-T fuels to biofuels. 2.2.6 Feedstocks – Prior to the study, a survey of commonly known feedstocks for alternative aviation fuel was conducted (Figure 19.) The most commonly known are fossil fuels, such as natural gas and coal. Other feedstocks for oil-based biofuels are: fats, oil seeds, oleoresins, waste products and the oil containing organism algae. Sugars that are derived from cellulosic biomass are also well known as a feedstock for ethanol.
c Section 526 - Prohibits a federal agency from entering into a contract for
procurement of an alternative or synthetic fuel, including a fuel produced from nonconventional petroleum sources, for any mobility-related use (other than for research or testing), unless the contract specifies that the lifecycle greenhouse gas emissions associated with the production and combustion of the fuel supplied under the contract must, on an ongoing basis, be less than or equal to such emissions from the equivalent conventional fuel produced from conventional petroleum sources.
15

Oleoresins (hydrocarbon resin secretions) CopaibaOther Sources -Algal sources Bacteria (e.g. cyanobacteria) Sugars –Cellulosic biomassWaste Products -Waste vegetable oil / Municipal Waste?
Fats –Animal fats (e.g. tallow, lard, yellow grease) Fossil Fuels -Natural GasCoal Oil Seeds –Castor Halophytes JatrophaPalm oil Rapeseed, Canola or Camelina SoyOther oilseed crops (e.g. peanut, sunflower)
Figure 19. The most commonly known feedstocks for alternate jet fuels prior to the study
The basic technical feasibility of producing biofuels from vegetable oils and similar sources, that have the same or better properties than conventional jet fuels and F-T fuels, has now been proven through flight demonstrations by Boeing, several airline partners and four aircraft engine OEMs (Original Equipment Manufacturers)41 that will be discussed in the next section.
16

3.0 METHODS
The study pathway (Figure 20) provides an overview of the methodology employed in this study to assess whether biofuels for aviation were feasible.
Establish viability of emerging feedstocks
FeedstocksAssessment
Ensure sustainable biofuels meet fuel properties req’mts.
FuelsDevelopmentEnsure sustainable biofuels meet fuel properties req’mts.
FuelsDevelopment
FlightDemos
Promote awareness and innovation of
sustainable biofuels for aviation.
FlightDemos
Promote awareness and innovation of
sustainable biofuels for aviation.
Jatropha LCA (A3)
Halophyte LCA (A7)Halophyte Agron (A6).
Algae Strains (A12)
Algae prototype system(A15)
Algae Oil Extract (A13).
Algae Culture Sys.(A11)
Algae Dewater (A14)
Key:
Study Outcome-
Biojet Feasibility
Outcome
Modified Castor LCA & econ(A1)
Task (number)
Modified Jatropha (A5)
Fuel Cert Testing (B3)
Aircraft systemstesting (B2)
Algae LCA (A10)
Scale-up Study (A19)
Jatropha Harvesting (A4)
Virgin Demo (C1)AirNZ Demo(C2)CAL Demo (C3)JAL Demo (C4)
Demonstrated performance
Viable site/crop/agronomy/processing
combinations identified
Fuel processing assessment (B1)
Demo/pilot scale farms (A16)
2nd Gen Feedstock Feasibility
Ongoing Feedstock Assessment (A18)
Halophyte demo farms (A8) Halophyte harvest &
Extraction (A9)
Algae Co-prods (A17)
Camelina LCA (A2)
Sustainability go/no go
3rd Gen Feedstock
(algae) Feasibility
Techno/Eco Analysis (A20)
ASTM certificationefforts (B4)
Viable alternate fuel
combinations proven
Figure 20. BioJet Fuel Study Pathway
There were 3 major study thrusts in the project: fuel development, feedstock assessment and flight demonstrations. The fuel development process ensured that a biojet fuel could be developed that would be suitable as a “drop in” replacement and could later be certified for commercial use. Feedstocks for the biofuels were also assessed as it was seen as a critical element in determining the feasibility of a commercialized biojet fuel supply. Lastly, a flight demonstration was seen as a very valuable step in helping to speed the entire process along.
3.1 Fuels Considered
One of the ground rules, or methods, used in this study was that all of the fuels evaluated were to be derived from biomass. These fuels are hence referred to as sustainable aviation biofuels or simply “biojet.” Two basic types of feedstock to make the biojet are considered: plant oils and cellulose. There are many types of processing methods to convert the feedstock into a biojet fuel46. Depending on the process used, the end result will produce either an ester type of biofuel or a biological-derived Synthetic Paraffinic Kerosene (bio-SPK). Figure 21 provides a simple illustration of these different options and the fuel processing steps used for each type of feedstock conversion.
17

Deoxygenation
Cracking
Isomerization
Transesterification
Bio-SPK
Ester Biofuel
Bio-SPKBio-SPK
Distillation
Transesterification
Hydrotreated Vegetable Oil (HVO)
Synthetic Biology
Bio-SPKBio-SPK
Hydrocracking
Fractionator
FractionatorSelective Cracking
GMO microbe conversion to alkaneGMO microbe conversion to alkane
Blend various alkenes into cocktail blend
PlantCellulose
PlantCellulose
Enzymatic breakdown of Lignin
Sugar (Zylose) extractionSugar (Zylose) extraction
PlantOils
PlantOils
PlantOils
Figure 21. A few processing methods for biofuels
As will be discussed in section 4.0, the ester biofuels were found to not be suitable for commercialization for aviation biojet fuels, but are nevertheless discussed because one of the fuels used in a flight demonstration was indeed an ester. Hydrotreating of vegetable oils is a good option that was found to be suitable to create bio-SPK fuels and this process was used to create 3 of the 4 fuels used for flight demonstrations. Hydrocracking will be briefly discussed as it is a widely used process for refining fossil fuels into jet fuels. Lastly, synthetic biology is a very promising, but immature, processing technology for making bio-SPK.
The following discussion provides more detail on the makeup and differences between ester biofuels and bio-SPK as well as several processing methods that could be used to manufacture bio-SPK. The reasoning for each is discussed.
3.1.1 Baseline Jet-A1 fuel – A baseline fossil jet fuel was selected in order to compare the biojet fuels against. The two types of jet fuels most used are Jet-A fuel and Jet-A1. These fuels are very similar, but Jet-A1 has a lower freezepoint of -47C while Jet-A fuel is -40C. Because of the lower freezepoint of Jet-A1, this fuel was chosen as the baseline comparison fuel. It was also chosen as the blending agent for the flight demonstrations in the event that a 100% pure (NEAT) biojet fuel was not able to achieve the -40C freezepoint by itself. As a result, a poorer performing biojet fuel could theoretically be blended with a better performing Jet-A1 so as to achieve an overall -40C freezepoint of the blended fuel.
One of the attributes of jet fuel is that it is s a blend of different hydrocarbon molecules, many of which are straight chained varietiess. Other components are cyclic compounds (e.g. aromatics) or branched molecules (e.g. Iso-paraffins.)42 Figure 22 illustrates one of the more common hydrocarbon molecules in Jet-A1, a straight chained C11H24.
18

H-C-C-C-C-C-C-C-C-C-C-C-H
H-H-H-H-H-H-H-H-H-H-H
H-H-H-H-H-H-H-H-H-H-H
⏐ ⏐ ⏐ ⏐ ⏐ ⏐ ⏐ ⏐ ⏐ ⏐ ⏐
⏐ ⏐ ⏐ ⏐ ⏐ ⏐ ⏐ ⏐ ⏐ ⏐ ⏐
Figure 22. C11H24 is a common length fuel molecule in Jet-A1 fuel.
The various HC compounds making up jet fuel and their melting points are found in the table below.
Table 1. Composition of typical Jet-A fuel HC compounds and melting points.43
Hydrocarbon type Wt% Melting point (C)
Iso-octane 3.66 -107.4
Methylcyclohexane 3.51 -126.9
m-xylene 3.95 -47.4
Cyclo-octane 4.54 14
Decane 16.08 -30
Butylbenzene 4.72 -75
1,2,4,5-
Tetramethylbenzene 4.28 77
Tetralin 4.14 5.3
Dodecane 22.54 -10
1-
Methylnaphthalene 3.49 N/A
Tetradecane 16.87 5.5
Hexadecane 12.22 18.14
There are also different length HC chains in jet fuel as illustrated in Figure 22. Figure 23 illustrates the distribution of the various carbon lengths of hydrocarbons in Jet-A1 fuel that was performed in the Boeing fuel laboratory. The bottom portion of the figure is a Gas Chromatograph analysis of the baseline Jet-A1 fuel while the top portion of the figure shows the distribution of molecules in the makeup. Clearly, the highest percentage of HC molecules is the C11 variety, making up about 30% of the fuel. The range of chain lengths for the baseline Jet-A1 typically varies between C8 and C15.
19

5 10 15 20 25 30
C15 C16C11 C12 C13 C14 C17 C18C10C9C7 C8
Jet A-1
0
0.1
0.2
0.3
0.4
0 5 10 15 20 25 30
Fuel Carbon Number
Am
ount
(%)
Jet-A10
0.1
0.2
0.3
0.4
0 5 10 15 20 25 30
Fuel Carbon Number
Am
ount
(%)
Jet-A1
Figure 23. Baseline Jet-A1 was a mixture of various length HC molecules.
In order to achieve a “drop in” alternate fuel that has the same performance characteristics at jet fuel, it will be important for it to have a similar HC chain makeup profile. As will be discussed later in this report, longer chained HC molecules tend of have better energy density characteristics (per unit volume) but can be more difficult to ignite. The shorter chained molecules tend to have better freezepoint and ignition characteristics but exhibit poorer energy density.44 Having too many HC compounds on either extreme of this distribution will adversely impact the airplane energy operating characteristics, safety, or airplane flight endurance. Therefore, one of the study methods of this endeavor was to evaluate the alternate fuel’s ability to mimic the compositional makeup of the baseline petroleum jet fuel.
ASTM is the main technical organization that specifies and maintains jet fuel performance testing specifications. Figure 24 illustrates the main performance requirements for Jet-A and Jet-A1 fuels.
20
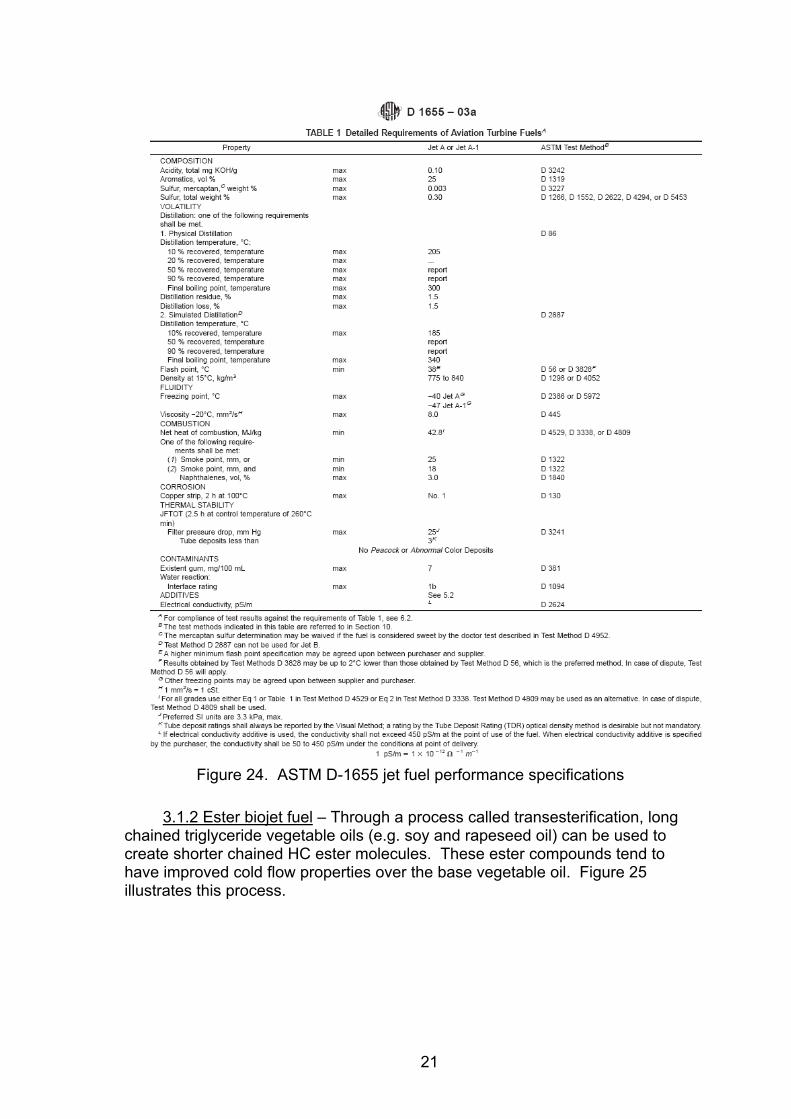
Figure 24. ASTM D-1655 jet fuel performance specifications
3.1.2 Ester biojet fuel – Through a process called transesterification, long chained triglyceride vegetable oils (e.g. soy and rapeseed oil) can be used to create shorter chained HC ester molecules. These ester compounds tend to have improved cold flow properties over the base vegetable oil. Figure 25 illustrates this process.
21

O
OR1
O
OR1
O
R2
O
O
R3
OVegetable oil
Fatty AcidMethyl Ester
Triglyceride
O
OR1
O
OR1
H3C3
Transesterification Process + methanol & catalyst
Methyl Esters (3)(biofuel)
OHOHHO
Glycerol(by product)
OHOHHO
Glycerol(by product)
+
Figure 25 Transesterification process was used to create one ester-based biojet
fuel
Vegetable oils contain hydrocarbon compounds (R1, R2 and R3), of various carbon chain lengths that are joined together to form a triglyceride. During the transesterification process, the vegetable oil is heated to about 60C and a mixture of about 20-22% (volume) methanol and catalyst (typically Potassium Hydroxide) are added to the warm vegetable oil. During a short period of agitation (about 20 minutes) the triglyceride molecule is split apart into three Methyl Ester compounds while one Glycerol compound is formed as a by product. The mixture is then allowed to settle wherein the glycerol settles to the bottom of the mixture that can then be removed. The remaining esters can be further filtered, washed and dried to create a Fatty Acid Methyl Ester (FAME) fluid that is commonly known as biodiesel.
Since biodiesel has similar fluid properties to diesel fuel, and diesel fuel has similar properties to jet fuel, it was originally thought that a transesterification process could be successfully used to create a biojet fuel that might have acceptable properties.
3.1.2.1 Transesterification Post-processing - This process uses a modified transesterification process wherein an additional processing step takes the biodiesel fuel and removes the high freeze point carbon chains (saturated long chained alkenes) through urea and a centrifuging process. This process was also evaluated in the study as it had the opportunity to create biojet fuel, through a low energy conversion process, which would presumably be less expensive than other processing methods.
3.1.3 Bio-SPK – Several fuel processing methods are available to transform biomass into a bio-SPK fuel. Some of the more common processes are briefly covered as well as the most promising near term hydrotreating method to create a bio-SPK.
3.1.3.1 Hydrotreated Vegetable Oil (HVO) - This process actually involves several different steps to create a suitable biojet fuel that can meet all of the Jet-
22

A fuel performance specifications. These steps can include: a pre-conditioning/cleaning step, an oligomerization step, a decarboxylation (de-oxygenation) reaction, selective cracking, isomerization, and distillation.
First, the oil is cleaned to remove impurities using standard oil cleaning procedures. In one HVO process45, the oil goes through an oligomerization step to extend the carbon chain length of the HC compounds. This is aimed at building up short chained compounds that could then be effectively utilized in the rest of the HVO steps.
The next (decarboxylation) step involves removal of the oxygen atoms from the compound. This involves adding hydrogen, under high temperature and pressure, to the oil mixture and passing it through a catalyst. As Figure 26 illustrates, the triglyceride (vegetable oil) can then be converted into an oleic acid. For HC molecules that are saturated (have no double bonds) such that all carbon molecules are attached to other carbon/hydrogen atoms, these molecules may be directly converted into an Alkane or Paraffin. For those that are unsaturated (have double bonds,) selective cracking occurs under high temperatures and pressures to break the double bond in the compound and add a hydrogen atom which then becomes a straight chained alkane or paraffin. By removing the oxygen atoms, the fuel’s heat of combustion is increased and its thermal stability will also be increased. The removal of the heteroatoms (e.g. Nitrogen and Sulfur) by hydrotreating also increases the thermal stability of the fuel. Therefore, the resulting fuel has a higher heat of combustion as compared to nominal jet fuel as well as excellent thermal stability. It is thought that straight chained hydrocarbons do not exhibit as good of freezepoint as branched molecules, and so an additional isomeriziation step is used to create branched chain molecules that will further improve freezepoint.
The next isomerization step breaks or cracks the paraffins to mostly branched paraffins, which are by now almost completely saturated, thereby improving the freeze point of the fuel. This end product is largely independent of the source bio-oil.
23

CH4 + (C18H34O2)3
monounsaturated fatty acid
O
OR1
O
OR1
O
R2
O
O
R3
OCH (C18H33O2)3Vegetable oil
Oleic Acid
Alkane(pariffin)
nCO2 + nH20 + (C18H36)3
Linear saturated hydrocarbon
Triglyceride
Low FreezepointAlkane
C18H35
Branched saturated hydrocarbon Figure 26. A Hydrotreated Vegetable Oil process produces a biofuel with
excellent cold flow properties.45
The last step is to select the proper fraction of HC molecules that have the same carbon chain lengths as Jet-A fuel so as to mimic the same carbon distribution (Figure 23.) A fractionation process can be used for this process. Some of the by products will either be shorter or longer chained HC molecules than are needed for the bio-SPK. Therefore, only a portion of the feedstock that goes into the fractionation process will be used as biojet fuel … typically around 50%. The rest could be used for other fuels, such as green diesel.
The closer the original oil HC carbon chain length is to jet fuel, the higher the yield of biojet fuel will be experienced and the less processing will be required. Thus, an ideal bio-oil feedstock will have a preponderance of C10-C14 molecules. For longer length HC molecules, a more severe cracking process will be needed to break down the chains into suitably smaller chains, especially for molecules that have no (weak) double bonds and those that are fully saturated (very stable.)
This HVO process is probably most suitable for making biojet fuels from (preferably unsaturated) vegetable oils. The process operates at moderate temperatures (250-350C) and pressures (normally 0-5 MPa but up to 20 MPa)45. This process was a prime candidate to make biojet fuel, because several refining companies suggested this process held the most hope for a lower energy conversion process than hydrocracking.
3.1.3.2 Cracking Process. There are several cracking processes that are typically used to refine crude oil; thermal cracking, catalytic cracking and catalytic hydrocracking46. The same cracking process could conceivably be used with a blend of crude oil & bio-oil to manufacture a semi-biojet fuel. However, these processing methods tend to be run at higher temperatures (350-420C) and pressures (6.9-13.8 MPa)47 as compared to the hydrotreating
24

process used for HVO. This cracking processing method may therefore be moreenergy intensive, resulting in a fuel that either has a higher carbon footprint or abiojet fuel that is more expensive. As cracking is a well known technology, and it might not produce a biofuel with as good of environmental performance, it wanot pursued further for this wo
s rk.
3.1.3.3 Synthetic Biology Process. - This is a relatively new field and process. It involves engineering bacteria to will make specific hydrocarbons from sugars. A two-step process is envisioned. First, lignocellulosic material is digested with enzymes that break down the lignin that binds the sugar strands (i.e. Zylose) into cellulosic material. This is a somewhat similar process to that is used in the “cellulosic ethanol” process. Next, a fermentation process uses genetically designed microbes to convert the sugars into single chain hydrocarbon molecules.48 These HC compounds could then be blended in small quantities with conventional jet fuel (to maintain current performance properties) or be mixed with different length HC chains that were built with different microbes. All of these single chain biojet mixtures could then be blended into a biojet “cocktail” that has similar carbon to hydrogen ratio distributions as petroleum jet fuels.
Although this process looks very promising, its immaturity resulted in it not being considered feasible for near term use. However, one fuel sample was evaluated and will be reported on in the next section.
3.1.3.4 Thermal Bio To Liquid (BTL) Processes. There are several basic pathways to producing renewable biojet fuels from lower cost lignocellulosic (e.g. woody mass, switchgrass, corn stover) feedstocks. While biodiesel and bio-ethanol production so far only use parts of a plant (i.e. oil, sugar, starch or cellulose,) BTL production uses the whole plant. Because BTL can use all of the plant material, it has the potential to use less land area per unit of energy produced as compared with traditional feedstocks currently used to produce biodiesel or bio-ethanol.
A thermochemical process can be used to convert the lignocellulosic biomass into either a “pyrolytic oil” or a mixture of H2 and CO gas, either of which can then be used to catalytically produce a synthetic biojet fuel. However, this process can also be energy intensive, having to partially combust the biomass to bring the gas mixture up to 1,500C with pressures up to 30 Bar49.
This process was also not pursued for the same reasons as was described in section 3.1.3.2. (Cracking). It was thought to be too energy intensive to be environmentally acceptable. However, to validate this assumption, its life cycle analysis impact was investigated and will be reported in the next section.
3.1.3.5 Hybrid F-T Process - In this catalytic depolymerization process, heat and pressure are used to separate usable fuel from hydrocarbon wastes. It converts the feedstock molecules directly to biojet fuel without breaking them down too far (i.e. H2, CO, O2) before resynthesising them back to the intended larger molecular structures. Therefore depolymerization can achieve the same result with less energy than is required for a BTL fuel. However, controlling the reactions is a challenge. In another embodiment, this depolymerization technique could be combined with other processes, such as enzymatic processing, to generate an efficient biojet fuel. As this process is rather
25
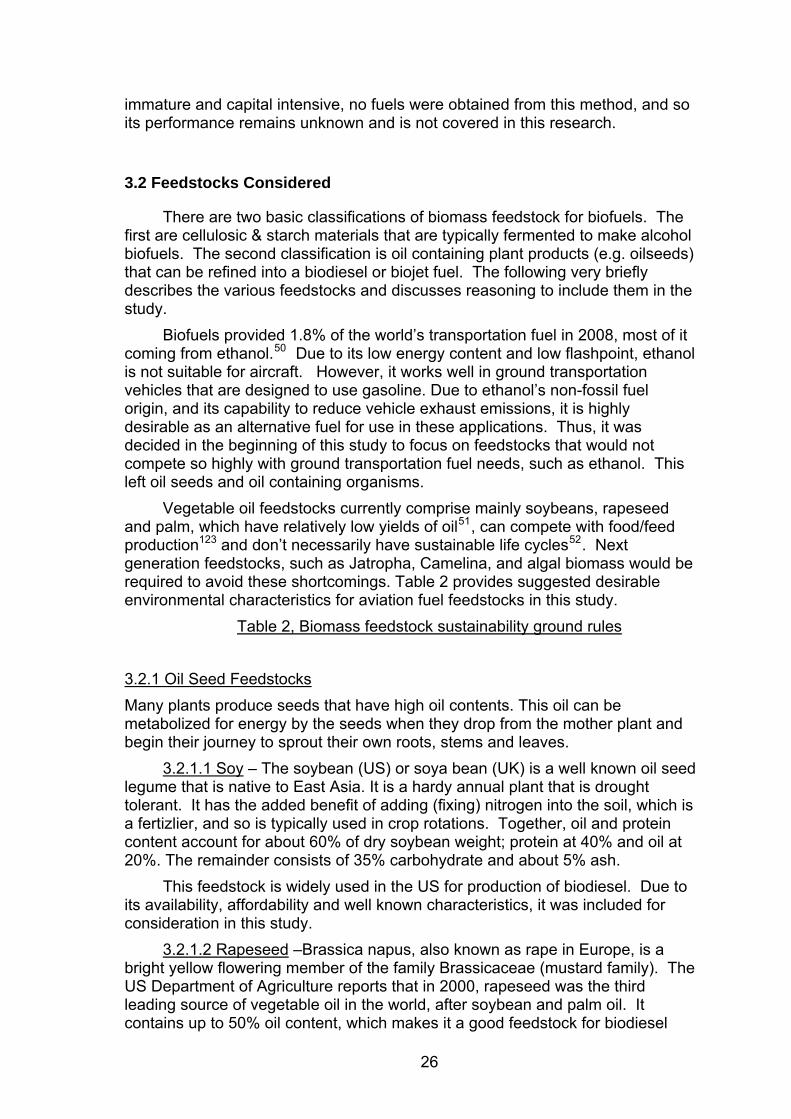
immature and capital intensive, no fuels were obtained from this method, and so its performance remains unknown and is not covered in this research.
3.2 Feedstocks Considered
There are two basic classifications of biomass feedstock for biofuels. The first are cellulosic & starch materials that are typically fermented to make alcohol biofuels. The second classification is oil containing plant products (e.g. oilseeds) that can be refined into a biodiesel or biojet fuel. The following very briefly describes the various feedstocks and discusses reasoning to include them in the study.
Biofuels provided 1.8% of the world’s transportation fuel in 2008, most of it coming from ethanol.50 Due to its low energy content and low flashpoint, ethanol is not suitable for aircraft. However, it works well in ground transportation vehicles that are designed to use gasoline. Due to ethanol’s non-fossil fuel origin, and its capability to reduce vehicle exhaust emissions, it is highly desirable as an alternative fuel for use in these applications. Thus, it was decided in the beginning of this study to focus on feedstocks that would not compete so highly with ground transportation fuel needs, such as ethanol. This left oil seeds and oil containing organisms.
Vegetable oil feedstocks currently comprise mainly soybeans, rapeseed and palm, which have relatively low yields of oil51, can compete with food/feed production123 and don’t necessarily have sustainable life cycles52. Next generation feedstocks, such as Jatropha, Camelina, and algal biomass would be required to avoid these shortcomings. Table 2 provides suggested desirable environmental characteristics for aviation fuel feedstocks in this study.
Table 2, Biomass feedstock sustainability ground rules
3.2.1 Oil Seed Feedstocks Many plants produce seeds that have high oil contents. This oil can be metabolized for energy by the seeds when they drop from the mother plant and begin their journey to sprout their own roots, stems and leaves.
3.2.1.1 Soy – The soybean (US) or soya bean (UK) is a well known oil seed legume that is native to East Asia. It is a hardy annual plant that is drought tolerant. It has the added benefit of adding (fixing) nitrogen into the soil, which is a fertizlier, and so is typically used in crop rotations. Together, oil and protein content account for about 60% of dry soybean weight; protein at 40% and oil at 20%. The remainder consists of 35% carbohydrate and about 5% ash.
This feedstock is widely used in the US for production of biodiesel. Due to its availability, affordability and well known characteristics, it was included for consideration in this study.
3.2.1.2 Rapeseed –Brassica napus, also known as rape in Europe, is a bright yellow flowering member of the family Brassicaceae (mustard family). The US Department of Agriculture reports that in 2000, rapeseed was the third leading source of vegetable oil in the world, after soybean and palm oil. It contains up to 50% oil content, which makes it a good feedstock for biodiesel
26

production. Other varieties of the Brassicaceae family include Camelina and Canola (which was engineered in Canada to have a low acid content to improve its taste.) Plants in the Brassica family have the ability to be able to be grown under rain-fed conditions and in colder climates
3.2.1.3 Camelina – This crop is from the same Brassicaceae family as Rapeseed. Camelina sativa is an ancient plant, originating in Northern Europe, and was originally used as a food crop. It can be used as a rotation crop with other food crops, such as wheat. Although this feedstock is edible, it was chosen as a candidate because of its current availability in the US, it’s relatively low cost, and because it is not currently approved for human consumption in the US. Because of its tendency to be used as a rotation crop, it has the potential to not compete directly with food crops … at least until it is approved for human consumption by the USDA.
Figure 27. Camelina, which belongs to the same family as Rapeseed and
Canola, was chosen as a feedstock to studyd
3.2.1.4 Jatropha – Jatropha is a genus of approximately 175 plants, shrubs and trees from the Euphorbiaceae family. Jatropha Curcas is native to Central America and has become naturalized in many tropical and subtropical areas, including India, Africa, and North America.53 The mature small trees bear separate male and female flowers. As with many members of the family Euphorbiaceae, several varieties of Jatropha contain compounds that are highly toxic and so have earned the common name of “black vomit bean.”54 However, the Jatropha bean does typically contain 27-40% oil (average: 34.4%).55
d Photo provided by Tim Rahmes, The Boeing Company
27
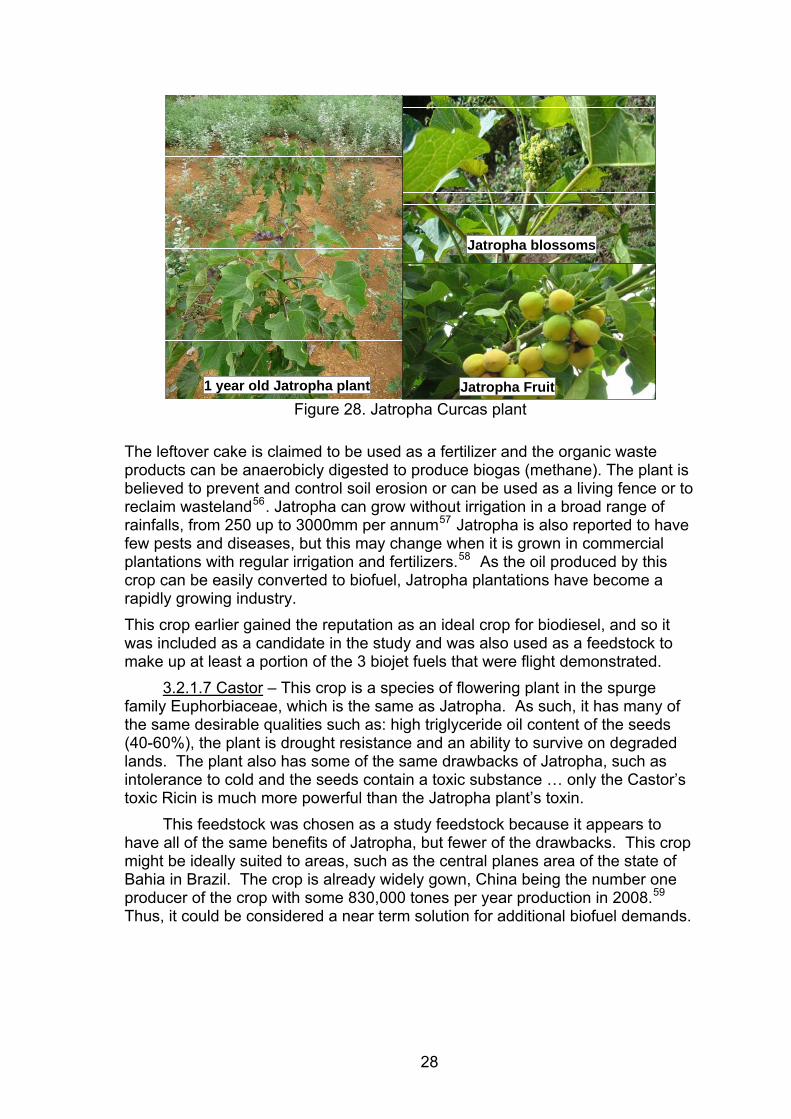
1 year old Jatropha plant
Jatropha blossoms
Jatropha Fruit Figure 28. Jatropha Curcas plant
The leftover cake is claimed to be used as a fertilizer and the organic waste products can be anaerobicly digested to produce biogas (methane). The plant is believed to prevent and control soil erosion or can be used as a living fence or to reclaim wasteland56. Jatropha can grow without irrigation in a broad range of rainfalls, from 250 up to 3000mm per annum57 Jatropha is also reported to have few pests and diseases, but this may change when it is grown in commercial plantations with regular irrigation and fertilizers.58 As the oil produced by this crop can be easily converted to biofuel, Jatropha plantations have become a rapidly growing industry. This crop earlier gained the reputation as an ideal crop for biodiesel, and so it was included as a candidate in the study and was also used as a feedstock to make up at least a portion of the 3 biojet fuels that were flight demonstrated.
3.2.1.7 Castor – This crop is a species of flowering plant in the spurge family Euphorbiaceae, which is the same as Jatropha. As such, it has many of the same desirable qualities such as: high triglyceride oil content of the seeds (40-60%), the plant is drought resistance and an ability to survive on degraded lands. The plant also has some of the same drawbacks of Jatropha, such as intolerance to cold and the seeds contain a toxic substance … only the Castor’s toxic Ricin is much more powerful than the Jatropha plant’s toxin.
This feedstock was chosen as a study feedstock because it appears to have all of the same benefits of Jatropha, but fewer of the drawbacks. This crop might be ideally suited to areas, such as the central planes area of the state of Bahia in Brazil. The crop is already widely gown, China being the number one producer of the crop with some 830,000 tones per year production in 2008.59 Thus, it could be considered a near term solution for additional biofuel demands.
28

Figure 29. The Castor plant, from which Castor oil is derived, was another
feedstock candidate chosen for this study.
3.2.1.5 Halophytes – These are salt (halo) tolerant plants (phytes) that grow in saline conditions. Most plants do not tolerate very high levels of salt and so there are very few species that can be classified as a true halophyte, on the order of only 2% of plants60 with potentially 250 varieties that could be cultivated for crops.61 97% Earth’s water is seawater and 43% Earth’s land is arid or semi-arid. There are 1-2 billion hectares of natural saline soils and another billion acres of desert that overlies saline aquifers61. Many of these plants could therefore be used to simultaneously make food, fodder and bio-oil, so halophytes were a good candidate to include in the study.
Salicornia bigalovii (glasswort) is a good example of a plant that tolerates very high levels of salt water, growing well at up to 70 grams per litre (gm/ltr) of dissolved salts62. Sea water typically contains 40 (gm/ltr) of dissolved salts (mostly sodium chloride).
29
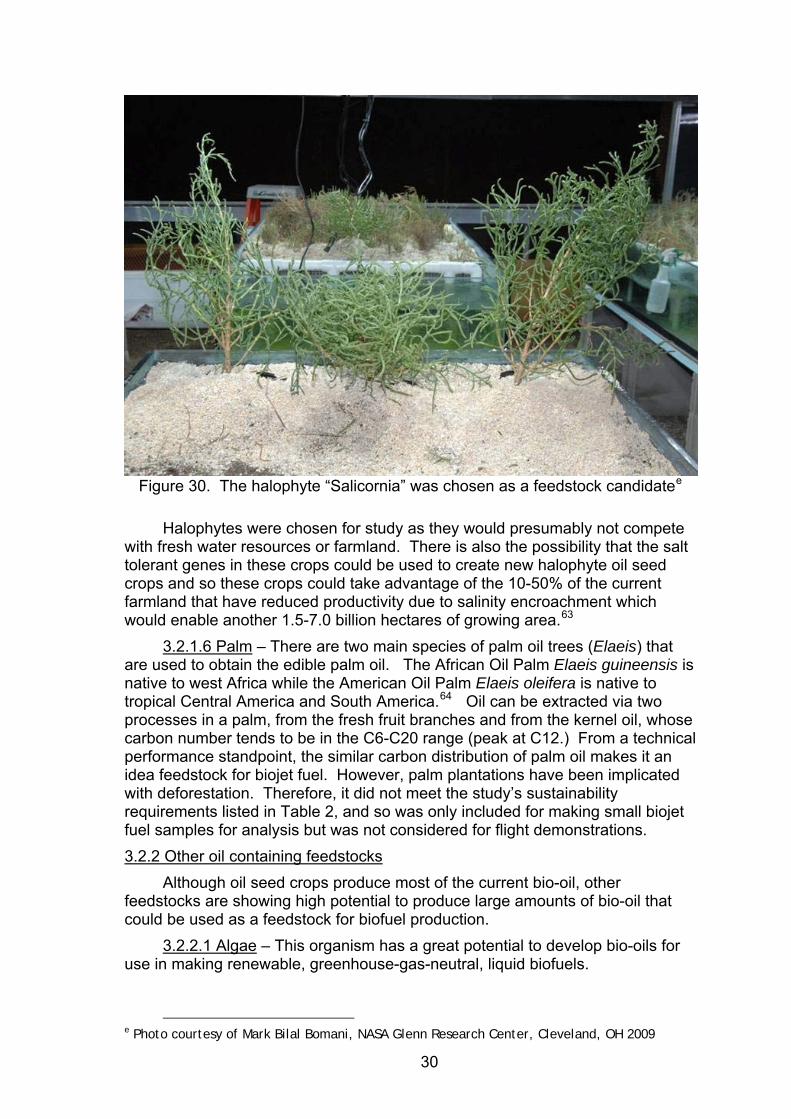
Figure 30. The halophyte “Salicornia” was chosen as a feedstock candidatee
Halophytes were chosen for study as they would presumably not compete with fresh water resources or farmland. There is also the possibility that the salt tolerant genes in these crops could be used to create new halophyte oil seed crops and so these crops could take advantage of the 10-50% of the current farmland that have reduced productivity due to salinity encroachment which would enable another 1.5-7.0 billion hectares of growing area.63
3.2.1.6 Palm – There are two main species of palm oil trees (Elaeis) that are used to obtain the edible palm oil. The African Oil Palm Elaeis guineensis is native to west Africa while the American Oil Palm Elaeis oleifera is native to tropical Central America and South America.64 Oil can be extracted via two processes in a palm, from the fresh fruit branches and from the kernel oil, whose carbon number tends to be in the C6-C20 range (peak at C12.) From a technical performance standpoint, the similar carbon distribution of palm oil makes it an idea feedstock for biojet fuel. However, palm plantations have been implicated with deforestation. Therefore, it did not meet the study’s sustainability requirements listed in Table 2, and so was only included for making small biojet fuel samples for analysis but was not considered for flight demonstrations. 3.2.2 Other oil containing feedstocks
Although oil seed crops produce most of the current bio-oil, other feedstocks are showing high potential to produce large amounts of bio-oil that could be used as a feedstock for biofuel production.
3.2.2.1 Algae – This organism has a great potential to develop bio-oils for use in making renewable, greenhouse-gas-neutral, liquid biofuels.
e Photo courtesy of Mark Bilal Bomani, NASA Glenn Research Center, Cleveland, OH 2009
30
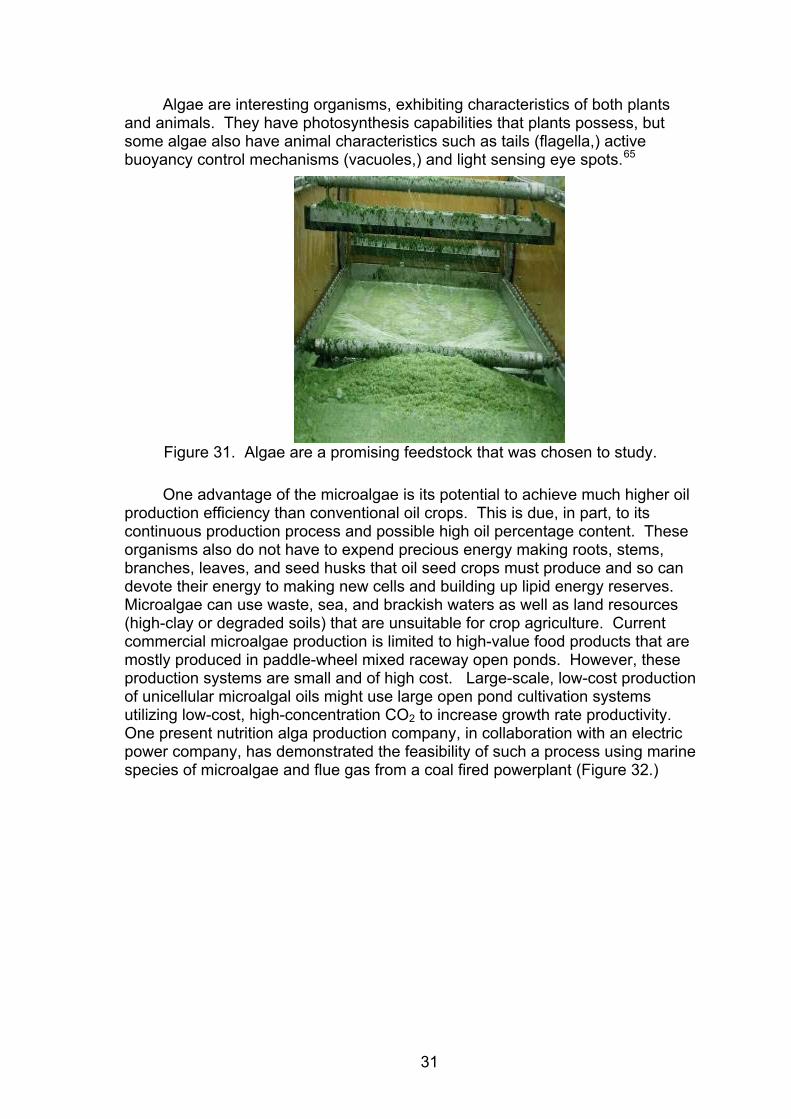
Algae are interesting organisms, exhibiting characteristics of both plants and animals. They have photosynthesis capabilities that plants possess, but some algae also have animal characteristics such as tails (flagella,) active buoyancy control mechanisms (vacuoles,) and light sensing eye spots.65
Figure 31. Algae are a promising feedstock that was chosen to study.
One advantage of the microalgae is its potential to achieve much higher oil production efficiency than conventional oil crops. This is due, in part, to its continuous production process and possible high oil percentage content. These organisms also do not have to expend precious energy making roots, stems, branches, leaves, and seed husks that oil seed crops must produce and so can devote their energy to making new cells and building up lipid energy reserves. Microalgae can use waste, sea, and brackish waters as well as land resources (high-clay or degraded soils) that are unsuitable for crop agriculture. Current commercial microalgae production is limited to high-value food products that are mostly produced in paddle-wheel mixed raceway open ponds. However, these production systems are small and of high cost. Large-scale, low-cost production of unicellular microalgal oils might use large open pond cultivation systems utilizing low-cost, high-concentration CO2 to increase growth rate productivity. One present nutrition alga production company, in collaboration with an electric power company, has demonstrated the feasibility of such a process using marine species of microalgae and flue gas from a coal fired powerplant (Figure 32.)
31

Figure 32. A protytype algae production using large open ponds and fuel gas
has been demonstratedf.
Worldwide investments in alga were $32 million in 2007 and surpassed the $300-million-dollar mark in 2008; Sapphire Energy led with a $100 million dollar investment in research and development from Bill Gates.66, 67 Today, more than 50 companies have received funding to focus on algae fuels.68
Although currently immature and too expensive for use as a biofuel, algal biomass systems were considered a prime feedstock candidate as they have a good potential for large scale commercialization. Two of the flight demonstrations used a small amount of oil derived from algal biomass.
3.3 Flight Demonstrations
3.3.1 The reason for a flight demonstration of biofuel Due to the need for the highest levels of safety in commercial aviation, as
well as the very high capital costs of jet airplanes, the aviation fuel industry are a conservative lot. They need to make sure the fuel they approve is safe for passengers and for the airframe/engine systems. As such, introducing a new alternative fuel to this cautious group of individuals would normally be a long and arduous process. It was thought that by performing a flight demonstration of biojet fuel, it would then create a situation of competitive advantage, thereby encouraging fuel suppliers, airlines, OEMs and certification entities to all try and rush ahead of their respective competitors and claim the honor of being the biofuel “first.”
f Picture compliments of Ami Ben-Amotz of Seambiotic, Ltd. Israel
32

The present situation within the aviation fuel supply structure is one of little choice. In order to describe this situation in more detail, a business model is used (Figure 33) to describe a competitive business model situation69. This model will be modified to understand the situation in the jet fuel industry.
Firm Strategy,Structure, and
Rivalry
Firm Strategy,Structure, and
Rivalry
FactorConditions
FactorConditions
Demand ConditionsDemand
Conditions
Related andSupportingIndustries
Related andSupportingIndustries
* M. Porter, “The Competitive Advantage of Nations” 1990
Nat. Resources,Skilled LaborInfrastructure,
Etc.
Sustainable, Competitive
RegionalSuppliers
Desire for Company’s
Product
Local Government, Culture, Management
and Local Competitors
Figure 33. A competitive business model is used as a template to understand
the commercial jet fuel market.69
Figure 34 illustrates the present competitive situation in the commercial aviation fuel industry. From the supply side, it is a fact that jet fuel is presently fossil fuel based, has a limited supply, offers no environmentally progressive options, and has been victim of wildly fluctuating costs. On the demand side, jet fuel has been in increasing demand. Its airline customers are more sophisticated than typical automobile customers, but the airlines do not control a large amount of the oil market, having only about 6.3% of the global oil demand. The airlines are faced with increasing regulations and environmental pressures. The jet fuel supply structure is controlled by a relatively small number of oil refiners and fuel distributors. The related and supporting industries are few, to non-existent, as the jet fuel needs to be certified before it can be used in commercial airplanes. Thus, airlines presently have little choice but to purchase what fuels are offered them.
33

Firm Strategy,Structure, and
Rivalry
Firm Strategy,Structure, and
Rivalry
FactorConditions
FactorConditions
Demand ConditionsDemand
Conditions
Related andSupportingIndustries
Related andSupportingIndustries
•Oil-based•Limited supply•No green options•Rising costs
•Increasing demand•Not major industry
(6.3% of global oil)•Sophisticated users•Regulations affecting users
•Oil refiners define product•A few competitors
•Crude oil suppliers can be unstable•Other suppliers not feasible due to ASTM fuel specifications.
Figure 34. The present business situation in the aviation fuel industry offers little
choice for airline customers.
The desired condition for the jet fuel industry, from an airline perspective, would be one of having several regional fuel choices and is customer-driven. Figure 35 illustrates the circumstances surrounding the alternate jet fuel scenario. The factor conditions would see several affordable feedstocks being available throughout the world. The feedstock would be suited for the local climate and regional topography. The processed alternate fuel would be “drop in” so that it could use the existing fuel infrastructure (e.g. airport refueling system.) On the demand side, airlines could be a driver in setting up biofuel suppliers. They could also become directly engaged in feedstock supplies as well, procuring the biomass or perhaps even the biomass supplier base itself. Having such a system would allow open competition between the refiners as well as the biomass suppliers. As this biofuel system would no doubt be environmentally preferred over fossil fuels, it would allow the aviation industry unconstrained growth without having undue worries about fuel availability, price and carbon footprint.
34

Firm Strategy,Structure, and
Rivalry
Firm Strategy,Structure, and
Rivalry
FactorConditions
FactorConditions
Demand ConditionsDemand
Conditions
Related andSupportingIndustries
Related andSupportingIndustries
* M. Porter, “The competitive advantage of Nations” 1990
•Airline driven
•Several crude suppliers•Open to competition
•Several affordable feedstock choices
•Regional involvement
•Use present infrastructure
•Lots of refiners•Several approved fuels available•Unconstrained growth
Figure 35. Desired fuel situation is one of choice and customer-driven
In order to create such a customer-driven system, increased competition will be needed. Figure 36 illustrates the dynamics of creating such a competitive jet fuel market place. It can also be used to describe the reason for performing a flight demonstration of biofuel.
For the first jet fuel market scenario, competition can be established in the overall marketplace by introducing new products (i.e. biofuels) and having the threat of new entrants, such as Boeing, back this endeavor. Although Boeing was not intending to become a biofuel supplier itself, its backing of the concept helped bolster the credibility of new entrants in the biojet fuel industry. Next, the bargaining power of the fuel buyers (airlines) needs to be consolidated. This can be done through consortiums, industry associations (e.g. Air Transport Association) or initiatives (e.g. Commercial Aviation Alternative Fuels Initiative.) This helps organize the airlines and provides one voice. In response, the fuel suppliers will need to prove the technical feasibility of the biofuels, help certify the alternate fuels, prove its environmental benefit, show how large amounts of fuel could be provided in the future, and assure a competitive price with fossil fuels.
This same model can be used to help describe the dynamics behind a flight demonstration of biofuel. The purpose of this exercise was to help overcome recalcitrance in the aviation fuel testing and certification community in order to speed up the introduction of biofuels into aviation … to show it can be done. To apply this to the business model … the threat of substitute products is the same – biojet fuel. The new entrant was Boeing. Although some efforts were previously made by other potential entrants to develop biojet fuels31, 34, having a credible large corporation, such as Boeing, step up to the concept of biojet fuel development made a significant difference. Having the bargaining power of a buyer (airline) was also important. In this case the airline was Virgin Atlantic Airways, who in 2006 made a public statement that they wanted to fly an
35
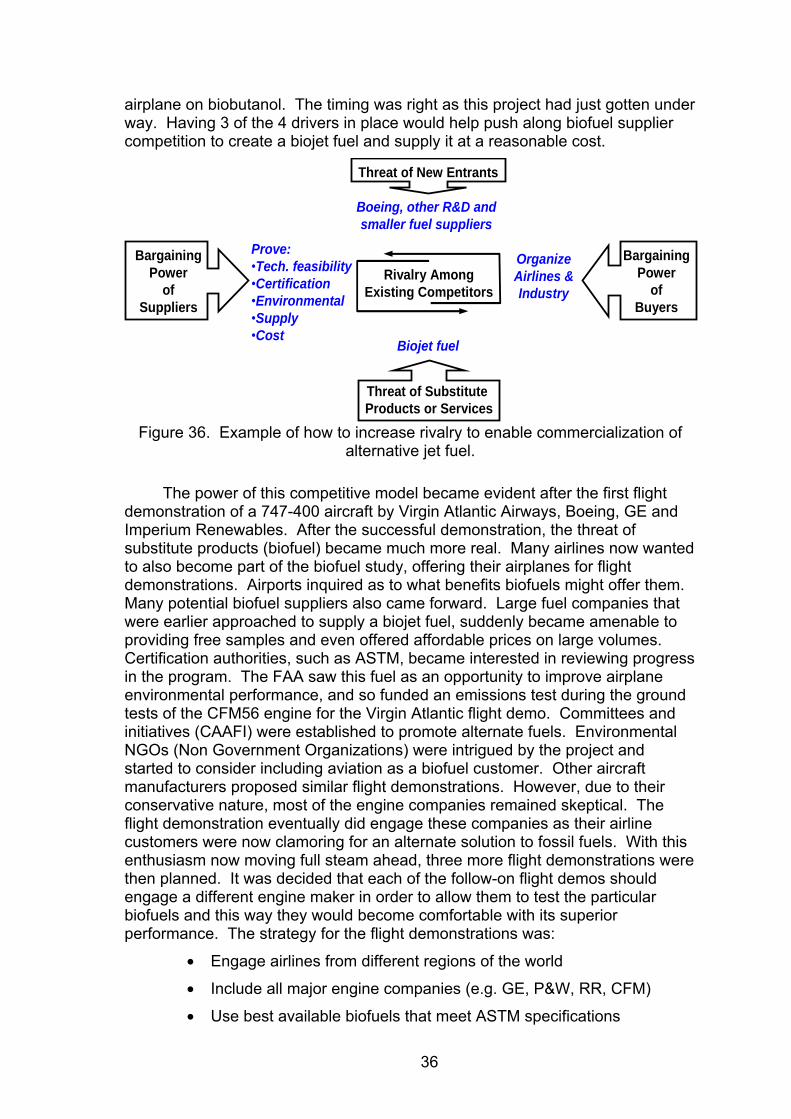
airplane on biobutanol. The timing was right as this project had just gotten under way. Having 3 of the 4 drivers in place would help push along biofuel supplier competition to create a biojet fuel and supply it at a reasonable cost.
Threat of New Entrants
Threat of Substitute Products or Services
Bargaining Power
of Suppliers
BargainingPower
of Buyers
Rivalry AmongExisting Competitors
Boeing, other R&D and smaller fuel suppliers
Biojet fuel
OrganizeAirlines &Industry
Prove:•Tech. feasibility•Certification•Environmental•Supply•Cost
Figure 36. Example of how to increase rivalry to enable commercialization of
alternative jet fuel.
The power of this competitive model became evident after the first flight demonstration of a 747-400 aircraft by Virgin Atlantic Airways, Boeing, GE and Imperium Renewables. After the successful demonstration, the threat of substitute products (biofuel) became much more real. Many airlines now wanted to also become part of the biofuel study, offering their airplanes for flight demonstrations. Airports inquired as to what benefits biofuels might offer them. Many potential biofuel suppliers also came forward. Large fuel companies that were earlier approached to supply a biojet fuel, suddenly became amenable to providing free samples and even offered affordable prices on large volumes. Certification authorities, such as ASTM, became interested in reviewing progress in the program. The FAA saw this fuel as an opportunity to improve airplane environmental performance, and so funded an emissions test during the ground tests of the CFM56 engine for the Virgin Atlantic flight demo. Committees and initiatives (CAAFI) were established to promote alternate fuels. Environmental NGOs (Non Government Organizations) were intrigued by the project and started to consider including aviation as a biofuel customer. Other aircraft manufacturers proposed similar flight demonstrations. However, due to their conservative nature, most of the engine companies remained skeptical. The flight demonstration eventually did engage these companies as their airline customers were now clamoring for an alternate solution to fossil fuels. With this enthusiasm now moving full steam ahead, three more flight demonstrations were then planned. It was decided that each of the follow-on flight demos should engage a different engine maker in order to allow them to test the particular biofuels and this way they would become comfortable with its superior performance. The strategy for the flight demonstrations was:
• Engage airlines from different regions of the world
• Include all major engine companies (e.g. GE, P&W, RR, CFM)
• Use best available biofuels that meet ASTM specifications
36

• Use different sustainable feedstocks for each flight Although the flight demonstrations were a great success, it was indeed a
risk to propose such a feat since there were no acceptable biofuels available at the time. 3.3.2 Flight Demonstration Plans
Prior to the first flight demonstration a plan was put together that would help organize the procurement and testing of the biofuels, lay a path for discussions with the engine and airline partners, and help visualize the steps needed in the testing process (Figure 37.) The plan envisioned that two parallel biofuel procurement and testing paths would be followed, that of FAME, and a hydrotreated vegetable oil. Two finalist fuels would be down selected and then one final fuel chosen for the flight demonstration. Once partners were chosen, the ground and flight test requirements would be established and the fuels would progress through component tests, engine ground tests, aircraft ground tests and taxi tests. When all of these tests were completed, as well as approval from the engine manufacturer that the fuel met “fit for purpose” requirements (met additional performance requirements beyond that those listed in the ASTM D 1655), then the demonstration flight would be performed.
Figure 37. Biofuel flight plan flow chart
This process was discussed with the US’ FAA and the UK’s CAA in order to receive CAA and EDSA approval for the flight demonstration. The FAA was included early in the process as the CAA typically consults with the FAA on questions that involve unusual or uncertain risk. The CAA then requested more formal documents on the following: (1) fuel testing plan, (2) flight demonstration plan, (3) return to service plan, and (4) risk reduction plan. These documents
37

were generated (Figure 38) and submitted to both CAA and EDSA with a request for special flight authorization for the demonstration flight between London Heathrow (LHR) airport and Amsterdam Schiphol airport.
Figure 38. A biofuel selection, flight demonstration, return to service, and risk
reduction plans were created to help direct the flight demonstrations and satisfy the CAA.
In the illustration below, Figure 39 shows an overview of the fuel testing procedure. A full suite of tests were not performed on all of the candidate fuels. It was determined that freezepoint, density, pour-point and flashpoint would be some of the most difficult, yet easy to test, variables for the biofuels, so every candidate fuel would first be subject to these suite of tests and be rejected if it did not meet these first 4 test requirements of meeting the ASTM D 1655 specifications.
Fuels that did meet the first 4 tests would be passed on to a second suite of tests consisting of viscosity, distillation, a more accurate density test, acidity, distillation and Jet Fuel Thermal Oxidation Test (JFTOT.) Of the successful fuel candidates that met these requirements, it was planned that a larger fuel sample would then be forwarded to the US NASA Glenn research center for additional tests that were laborious and expensive, such as fuel breakpoint and GC analysis. However, due to lengthy and time consuming contractual paperwork, the US Air Force Research Lab in Dayton Ohio ended up performing these tests prior to the first flight demonstration. In parallel with these AFRL tests, Boeing would perform specific tests that would validate the fuel’s suitability for use in its airframe designs, such as material compatibility (i.e. won’t degrade fuel cycle materials that were on the Boeing 747 aircraft), and dielectric tests to make sure the Fuel Quantity Indicator System (FQIS) would perform satisfactorily.
38

Of the fuel(s) that passed these requirements, the best fuel candidate sample would then have to be provided to the engine company so that they could test the fuel for special properties that are needed to establish if the fuel meets “fit for purpose” properties that are required for use in the aircraft engine, such as lubricity and compatibility with high temperature materials contained in the engine turbine blades.
If the fuel met these requirements, it would then be tested on the ground in a commercial aircraft engine test stand for operability, with special emphasis on lean blowout characteristics. If the fuel performed satisfactorily in this engine test, then it would be approved for airplane ground run-up tests and eventual flight demonstration. It was intended that the flight demonstration would then perform additional tests, such as altitude relight and fuel suction tests. However, this didn’t happen on the first flight as it was desired to have as low a risk approach for this very visible first flight demonstration as possible.
Follow on testing, that were deemed to be less critical for the flight demonstration and would involve more time and expense, could also be performed before or after the flight demonstration. Among these were the laboratory elipseometer testing which would validate the JFTOT thermal deposition results.
Boeing Screening Test #1
Boeing Screening Test #2
Boeing Screening Test #3
Engine Co Tests (P&W)
Flight Demo(s)
Follow-on Testing
FreezeFlashpointPour PointDensity (hydrometer)
ViscosityDistillationAcidityJFTOTDensity (D1298)
NASA tests?(1-2 biofuel)
Thermal BreakpointHeat of combustionKineticsGC Mass. SpecFlame Tube Tests:
- Lightoff- Temperature- Operability- Emissions
Material compatibilityLubricityDielectric
Carbon distributionMetalsMaterial compatibility
Ground operabilityTaxi testsFlight operabilityAltitude relight
ConductivityGC analysisElipseometerStorageBulk modulusSurface Tension
AllBiojet fuels
3-4 successfulfuels
3 bestfuels
1-2 bestfuels 1 fuel
Figure 39. Biofuel testing process
One of the outcomes from the meeting with the CAA was that a more detailed return to service plan was needed. They were especially concerned that the biofuel, which was to be located in the B747 tank #4 (right most wing tank) would not “contaminate” another parts of the aircraft’s fuel system. A
39

detailed plan was put together explaining how the biofuel blend in tank #4 would be managed and fed only to engine #4 (Figure 40).
Tank #4
Tank #3
Biojet
Figure 40. The flight demo used biofuel in tank #4 and ran only #4 engine to
avoid contaminating any other part of the aircraft
The below table summarizes the process of return to service after the biofuel demonstration flight.
Table 3. Airplane Return to Service summary for biofuel demo flight • Purge engine #4 that was run on biofuel with Jet-A by cross bleeding with
tank #3
• Defuel biofuel tank and keep sample for analysis
• Flush biofuel tank with 100 gallons of Jet-A fuel
• Replace LP and HP fuel filters
• Borescope engine
• Perform “C” check
• Visually inspect the tank #4 that was run on biofuel for anomalies, comparing it with other Jet-A only fuel tanks on the aircraft.
40

4.0 RESULTS
In 2006, a study plan was formulated to achieve the study objective of “evaluate the feasibility, sustainability and business case of biojet fuels” (Figure 41.) The project was effectively managed such that time and resources were available to timely complete all of the milestones, including the final project milestone (this report/thesis.)
For biojet feasibility (section 4.1), results will be reported on the biojet fuels or bio-oils that could be refined into biojet fuel. Test results from several developmental biojet fuels will be reported as well as emissions results and feedstock results. For sustainability (section 4.2), the potential of different types of biomass feedstocks and the environmental attributes (i.e. Life Cycle Analysis) of some types of biofuels will be reported. For the business case (section 4.3), a cost-benefit analysis of the most promising scaled up biojet fuel (HVO made from algae oil) will be estimated.
Biojet suppliers Energy balance
Determination of suitability for commercialization
IncentivesCost of biojet fuel
Flight Demo
Feedstock sustainability
1.0 Feasibility
2.0 Sustainability
3.0 Business Case
Task 2006 2007 2008 2009 2010
1st test Engine & NASA tests
Bus. Case Final Report
Figure 41. All of the milestones established in early 2006 were accomplished.
4.1 Feasibility
Several factors determine the feasibility of a biojet fuel to be commercialized, such as: (1) identifying a company that would be able to produce and supply a biofuel, (2) having the ability to produce a biojet fuel that will meet the ASTM jet fuel performance specifications, (3) finding that the turbine engine performs the same or better on biofuel, (4) having the engine exhibit the same or better engine exhaust emissions, and (5) finding one or more feedstocks that could provide sufficient bio-oil for refining.
A plan was developed, and several partners were engaged, to help address the feasibility issues of several biofuels made from various feedstocks (Figure 42.) All of the identified hurdles were found to be achievable in the study and are discussed below.
41

X,XXSmall scale demo
XX,XFeedstock (GMO) Enhancements
XXCost Estimate
TBDCo-products
XX,X,XXXSustainability, Social viability
X,XXOil Extraction
XXHarvesting
XSupport systems
XX,X,XX, X,XGrowing methods
BCABCABCABCASecure samples & Lab analysis
Other Feedstocks(Castor)
Cellulose & Synthetic Biology
AlgaeHalophytesJatropha
Proc
ess
Screening
Producability
EconomicViability
Demonstration
Relatively mature tech, so little R&D req;d X = number of researchers engaged
Figure 42. Several partners were engaged to help enable biofuels
4.1.1 Fuel Suppliers Although many potential biofuel suppliers were initially identified, there were
only 7 companies that were eventually able to supply biofuel samples for analysis (Figure 43). All of the major oil companies were contacted, as well as several smaller companies, but only a few responded positively to the request to provide a biojet fuel sample.
Syn Bio
HVO
BoeingBoeing
HVO
Mod-Ester
Ester
HVO
Ester
Figure 43. Seven fuel suppliers provided biofuel for evaluation
Except for the two biofuels that were used in the actual flight demonstrations, the remaining biofuel candidates that were supplied to the programme shall remain anonymous (Appendix B.) Test results will be listed by the type of fuel provided.
Ester Biofuel –The ester fuel samples that were provided used a traditional transesterification process to create a biodiesel type ester fuel. In two ester biofuels, coconut oil was chosen as the feedstock since it had a similar carbon chain length to that of fossil fuel Jet-A and would provide a better freezepoint.
Modified Ester Biofuel– This fuel employed a unique process to inexpensively separate the saturated and unsaturated HC molecules that are found in biodiesel Soy Methyl Esters (SME.) It was found that saturated SME
42

exhibited much poorer cold flow properties than unsaturated SME. Previous work by B. Tau and D. Stanley70 showed that such a separation process could be used to transform a portion of biodiesel into an ester with very good cold flow properties. Figure 44 illustrates the process.
Saturated methyl ester Urea Channel
double bond structure does not allow effective clathration
Unsaturated methyl ester (double bond structure)
+
+
=
=
Unmixed Mixed
Figure 44. One process used Urea to help separate the high freezepoint
saturated SME from the low freezepoint unsaturated SME70.
As every carbon atom in a saturated SME molecule is either attached to another carbon or hydrogen molecule, there are no double bonds (e.g. Figure 22.) Unsaturated SMU molecules have double bonds. Straight chained saturated molecules bind easily with urea and create heavier solidified molecules (clathration) that can be easily centrifuged out of the biofuel liquid. The double bond SME molecules, with good freezepoint, do not bind with the urea and stay in the liquid solution.
Initial lab results at the supplier’s lab indicated that these unsaturated SME molecules indeed exhibited much better cold flow properties. For example, Figure 45 shows that a biodiesel with only 1.41% saturated SME content, exhibited a -45C cloud pointg and -42C freezepointh… at least when using the local lab’s test procedures. However, that was not accustomed to performing aeronautical jet fuel testing processes and so their fuel test results did not match those of the Boeing fuel lab who used ASTM approved fuel testing equipment and procedures.
g Cloudpoint is defined as the point in a test where the fuel has been gradually cooled to the point that the fluid takes on a cloudy appearance. h Freezepoint is defined as the point in the test at which all frozen compounds have melted (after the fuel sample has been frozen and then gradually warmed up)
43

Figure 45. Initial results of the modified ester fuel showed it contained few
saturates, had a low Cloud Point (CP) and Freeze Point (FP)70
Hydrotreated Vegetable Oil (HVO) Biofuel–There are several hydrotreating processes used in the industry to create biofuels with good cold flow properties. One such advertized technique is the HBIO process (Figure 46)
Figure 46. One HVO process (HBIO) used to make biojet fuel71
A similar process is Neste Oil’s NEXBTL process. This process is believed to be very similar to the methods described in the Koivusalmi patent45. Several suppliers were chosen to supply HVO samples.
Synthetic Biology Biofuel – This process may be able to create a next-generation biofuel that might be cost-effective and compatible with current jet fuels. Using sugars derived from feedstocks such as cellulose, the fuel would be composed of single chained hydrocarbon molecules. It was thought that a small amount of this alkane fuel could be added to jet fuel, or that a cocktail mixture of
44

various length chained HC molecules could be created to make a biojet fuel blend.
Several companies were identified as having this technology capability. Upon discussion with one or more of these companies, it was determined that a large volume of biojet fuel could not have been created in time for the flight demonstration, and so this fuel was disqualified for the flight demonstrations. 4.1.2 Biofuel descriptions, test procedures and results
Prior to the first flight demonstration with VAA, several biofuel samples were tested in the Boeing fuels lab (Jean Ray et. al.), by Southwest Research Institute (SwRI), AFRL, NASA Glenn research center, and by GE. Standard ASTM and company specific fuel test procedures were employed. Figure 47 illustrates the respective tests performed by all the parties.
Boeing Initial Screening Tests (for all candidates) :1 Freezing point (D 5972)2 Flash point (D 56 or D 3828)3 Pour point (D 97 or equivalent4 Density (D 1298 or D 4052)
Boeing 2nd Screening Tests* (for those passing above):1 Viscosity @ -20C2 Distillation3 Acidity4 JFTOT5 Density6 Sulfur7 Heat of Combustion8 Water Separation (D 1094 & D 3948)
Baere/SwRI Validation Tests*1 Flash point2 Freezing point3 Density4 JFTOT
NASA or AFRL Tests (for 1 or 2 best fuels):1 JFTOT Break point3 Combustor (sector) lightoff4 Sector pattern factor temperature profile5 Sector operability6 Emissions (NOx, CO, UHC, Particulates)7 Kinetics analysis
Boeing 3rd Screening (for the final 2 passing fuels):1 Material compatibility*
8 Lubricity (D 5001)
2 Dielectric constant (Boeing test)
GE Tests for 2 best fuels:1 Carbon distribution (Mass spec)2 Metals (D 7111 - ICP)3 High temp material compatibility*4 High temp matereials - pin test
Flight Tests:1 Ground operability2 Taxi tests3 Flight operability4 Altitude relight
Follow-on (as required) Lab Tests:1 Storage stability
Figure 47. Biofuel screening testing process employed for the flight demonstrations
Seven different biofuel fuel candidates were screened for the first flight demonstration. A summary of some of the most important performance characteristics are shown in Figure 48 below. Missing data indicates the fuel was disqualified for any of a variety of reasons that will be explained. Testing
45

then ceased on that biofuel. The following describes the fuel listed in the below figure:
(1) This was a FAME, or ester fuel. The fuel exhibited very poor freezepoint as it was essentially a biodiesel. It also had an unsatisfactory high flashpoint, probably as a result of leftover methanol. Lastly, it also failed the JFTOT test as it was only able to pass the test when mixed with a maximum 2% mixture to 98% Jet-A1.
(2) This is also an ester fuel that was supplied in two different samples (2a and 2b). Upon discovery that the first fuel (2a) exhibited poor freezepoint, flashpoint and thermal stability characteristics, a different processing method was used to create a second sample (2b) which was later supplied to the Boeing fuel lab. Although this fuel passed the flashpoint and had an improved freezepoint, it still exhibited very poor thermal stability and so both of these fuels were disqualified.
(3) This fuel used a hydroprocessing method. This fuel was almost able to meet the -40C freezepoint, but only in a 15% blend. Higher biofuel blends failed the freezepoint test. As it was desired to have at least a 20% biofuel blend for the flight demonstration, this fuel was also disqualified.
(4) This fuel used a hydrotreating, isomerization process. Several samples were provided to Boeing, the performance increasing each time, and eventually the final fourth sample was able to meet all of the ASTM performance specifications (after the VAA flight demonstration.) The third sample provided is listed below. It met all the requirements in a 20% blend. The primary reason this fuel was not chosen for the flight demonstration was that the feedstock was switched from rapeseed to palm oil just before the flight, and it was thought that using this feedstock would provide poor public relations.
(5) Imperium Renewables of Seattle provided the 5th fuel. This fuel was an ester, made from coconut oil (including Babassu). It surpassed the freezepoint and thermal stability requirements. It marginally failed the energy density requirements, achieving 41.6 MJ/kg versus the required minimum of 42.8 per ASTM D 1655. However, considering the feedstock was deemed sustainable, and the cost of procuring the biofuel for the flight demonstration was affordable, this fuel was chosen as the successful candidate for the flight demonstration.
(6) This fuel was synthesized from a cocktail of pure alkenes to mimic the synthetic biology process. It easily met all of the requirements. However, only a limited amount of this fuel could be produced within the flight demonstration programme timeframe and so this fuel was not selected.
(7) This was made from soy using the HVO process. It easily met all of the ASTM performance requirements in blends up to 50/50. However, this fuel was not selected as (again) only a limited
46

amount of fuel could be produced in the laboratory at the time of the first flight demonstration.
(8) UOP supplied fuel sample #8. It also was able to meet all of the ASTM requirements in blends up to 50%. However, this fuel was not supplied until after the VAA flight demonstration. The subsequent 3 flight demonstrations all used this fuel as it had excellent performance characteristics and it was affordable to the test programme.
(9) This fuel was a traditional B99 biodiesel (99% biodiesel, 1% diesel) procured from a local automotive petrol station. This fuel was not intended to be used for a biojet fuel, but was tested as a comparison biofuel. It failed all of the ASTM D 1655 jet fuel performance specifications.
Fuel # ASTM D 1655 Spec. 1 2a 2b 3 4 5 6 7 8 9 (Biodiese
Processing Type N/A Ester Ester Ester HVO? Hydrotreat Ester Syn Bio HVO HVO EsterBiojet Blend (%) N/A 100 100 100 15 20 20 100 100 100 100Freezing point, (deg C) -40 max -1 -6.6 -22 -41 -44 -52 -68 -57 -57 2.5Flash point, (deg C) 38 min >93 Fail 37 47 44 48 45 57 48 >125JFTOT <3 Fail Fail Fail 1 1 1 1 1 1.5 FailEnergy (MJ/kg) 42.8 min 44.5 43.5 41.6 45 44.4 45.4 38.7Density (kg/m3) 0.775-0.840 0.874 0.892 0.816 0.797 0.808 0.801 0.78 0.762 0.87Seal Swell Fit for Purpose Pass PassDistillation 340C Fail Pass Pass Pass Pass Pass
Figure 48. Summary of important biofuel performance factors
A more detailed description of the two chosen biofuel candidates (i.e. Imperium, and UOP fuels) follows:
Imperium Renewables: A two gallon sample of the Imperium Renewables Incorporated (IRI) biojet fuel was first screened in the Boeing fuels lab. As this fuel met most of the initial screening results, a larger 5 gallon sample was then procured and sent to the AFRL for additional testing. A much larger volume was also procured and shipped to AFRL for blending with Jet-A1 and was used in ground testing at GE. Figure 49 presents the detailed test results that AFRL performed on the 100% IRI fuel, which was assigned the fuel test sample number 5238.
Particular parameters to take note of are the excellent (for FAME) freezepoint of -45C and lubricity of 0.49 BOCLE (Ball On Cylinder Lubricity Evaluator.) The poorer performance items were the heat of combustion of 36.9 MJ/kg (fail) as well as the 10% distillation curve (229C) and final residue (1.7), both of which failed. This is due to the characteristics of FAME fuels having oxygen atoms attached to the HC molecules which results in displacing hydrogen atoms and results in poorer energy content. The fuel also had slightly longer HC chains than Jet-A, which is reflected in the failed 10% distillation test. It probably also had some contaminants or very long chained HC molecules as the distillation boil-off residue was high (1.7 versus 1.5 passing.) FAMES tend to have a very good lubricity characteristic which is reflected in the good BOCLE scar test.
47

Figure 49. Imperium FAME biofuel test results
Figure 50 summarizes some of the more important fuel performance properties of the previously discussed fuels: a blended Imperium FAME fuel, an early version of a HVO fuel, the baseline Jet-A and Jet-A1 fuels, as well as a 50/50 blend of a Fischer-Tropsch fuel. The F-T fuel performed quite well but was not chosen as a successful candidate due to the sustainability challenges of this Coal-To-Liquid fuel.
48
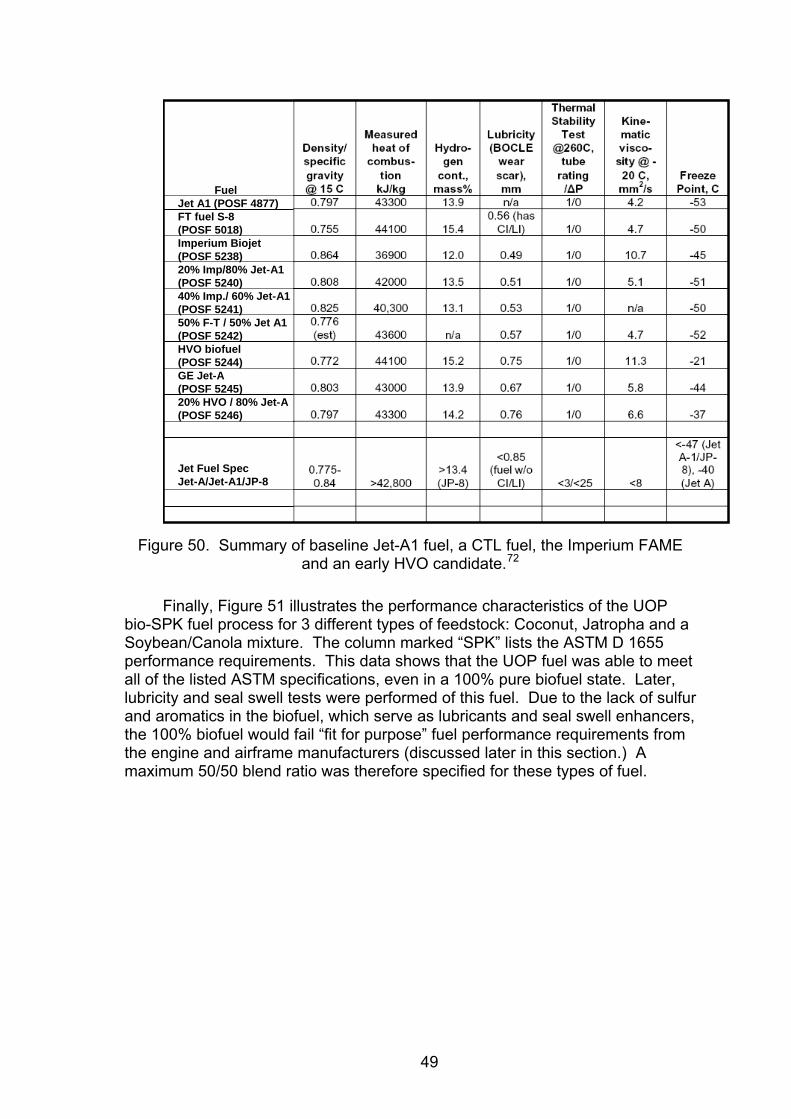
FuelJet A1 (POSF 4877)FT fuel S-8(POSF 5018)Imperium Biojet(POSF 5238)20% Imp/80% Jet-A1(POSF 5240)40% Imp./ 60% Jet-A1(POSF 5241)50% F-T / 50% Jet A1(POSF 5242)HVO biofuel(POSF 5244)GE Jet-A(POSF 5245)20% HVO / 80% Jet-A(POSF 5246)
Jet Fuel SpecJet-A/Jet-A1/JP-8
Figure 50. Summary of baseline Jet-A1 fuel, a CTL fuel, the Imperium FAME
and an early HVO candidate.72
Finally, Figure 51 illustrates the performance characteristics of the UOP bio-SPK fuel process for 3 different types of feedstock: Coconut, Jatropha and a Soybean/Canola mixture. The column marked “SPK” lists the ASTM D 1655 performance requirements. This data shows that the UOP fuel was able to meet all of the listed ASTM specifications, even in a 100% pure biofuel state. Later, lubricity and seal swell tests were performed of this fuel. Due to the lack of sulfur and aromatics in the biofuel, which serve as lubricants and seal swell enhancers, the 100% biofuel would fail “fit for purpose” fuel performance requirements from the engine and airframe manufacturers (discussed later in this section.) A maximum 50/50 blend ratio was therefore specified for these types of fuel.
49

Figure 51. Test results for UOP’s HVO Bio-SPK fuel73
A more in-depth discussion of the biofuels will now be covered and is arranged by performance topic (e.g. carbon distribution, freezepoint, thermal stability, material compatibility, etc.)
Figure 52 illustrates the carbon chain length distribution of the neat (100% pure blend) Imperium biojet fuel as compared to Jet-A fuels. It shows that the HC chain lengths are similar, which would help to explain how this FAME fuel met the freezepoint characteristics. Coconut oil has a similar distribution, and so the choice of this feedstock, as well as running the fuel through a distillation process, were crucial steps in achieving most of the ASTM performance requirements for the ester fuel.
50
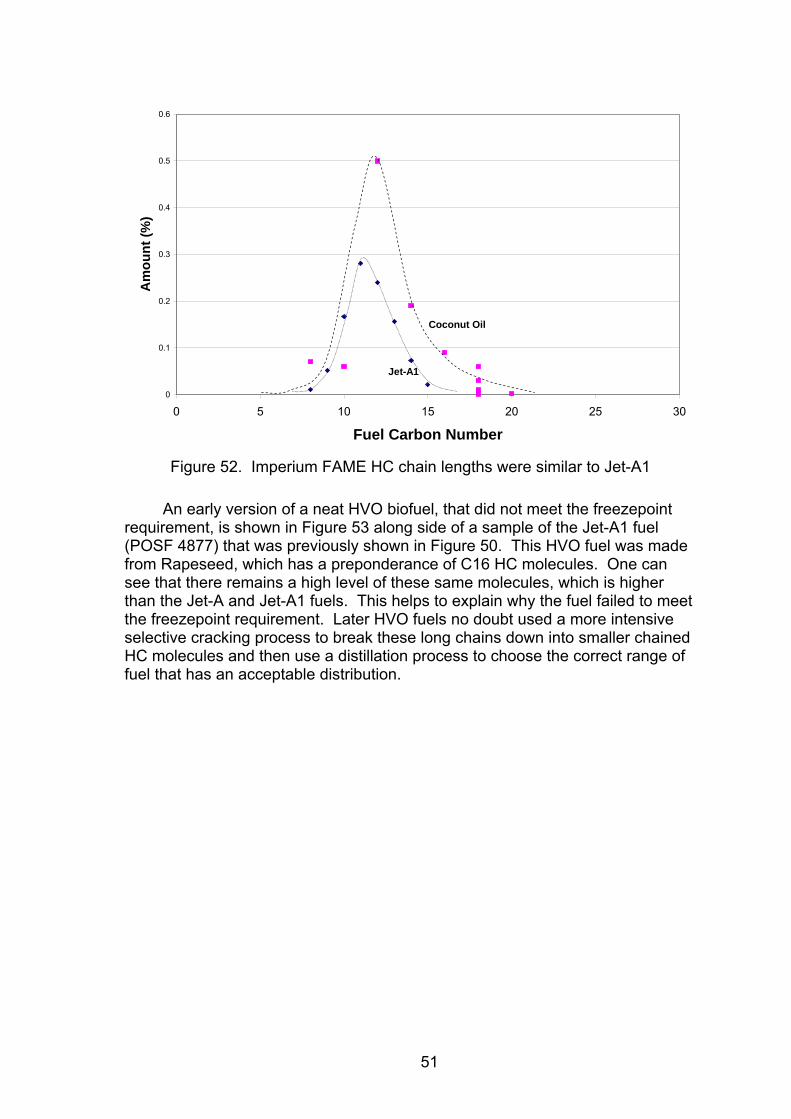
0
0.1
0.2
0.3
0.4
0.5
0.6
0 5 10 15 20 25 30
Fuel Carbon Number
Am
ount
(%)
Jet-A1
Coconut Oil
Figure 52. Imperium FAME HC chain lengths were similar to Jet-A1
An early version of a neat HVO biofuel, that did not meet the freezepoint requirement, is shown in Figure 53 along side of a sample of the Jet-A1 fuel (POSF 4877) that was previously shown in Figure 50. This HVO fuel was made from Rapeseed, which has a preponderance of C16 HC molecules. One can see that there remains a high level of these same molecules, which is higher than the Jet-A and Jet-A1 fuels. This helps to explain why the fuel failed to meet the freezepoint requirement. Later HVO fuels no doubt used a more intensive selective cracking process to break these long chains down into smaller chained HC molecules and then use a distillation process to choose the correct range of fuel that has an acceptable distribution.
51

Branched Alkanes
5 10 15 20 25 30Time-->
C15
C16
C11 C12 C13 C14
C17 C18C10C9C7 C8 C11 C12 C13 C14
C17 C18C10C9C7 C8
Early HVO
Jet A-1
Figure 53. Early HVO fuel candidate’s carbon chain lengths were longer than
Jet-A172
The F-T process of a CTL fuel resulted in a better distribution of HC molecules as illustrated in Figure 54. One can see the HC range closely matches that of JP-8 fuel, which is very similar to Jet-A1 fuel.
F-T CTL Fuel
JP-8 Fuel
Figure 54. CTL fuel had similar HC composition as JP-8 fuel.72
Lastly, the HC distribution for four biojet fuels made from four different feedstocks, when using a refined HVO process, is shown in Figure 55. One can see that the feedstock made little difference in the HC distribution makeup when using UOP’s refined HVO process and that the peak distribution of the HC chains are in the C10-C12 range, which is the same as petroleum derived jet fuels.
52

Figure 55. UOP’s bio-SPK fuel had similar composition to Jet-A fuel regardless
of biofuel feedstock73
In order for alternative jet fuels to be implemented today, they must meet current performance specifications so that they can be mixed with traditional jet fuels, use the same distribution and refueling infrastructure, and not require recertification of engines or airplanes. A particular challenge is that of meeting the ASTM D 1655 freezepoint requirements of -40oC for commercial Jet-A fuel and -47oC for military JP-8 fuel74.
Figure 56 shows 3 different fuels at -30C temperature … Jet-A fuel, neat biojet fuel, and neat standard biodiesel. As fuel freezes, the individual HC molecules tend to clump together to form larger masses which results in a very viscous fluid. In this picture, the biodiesel fuel has changed states and appears as a very viscous, lard-like, compound.
Figure 56. Biodiesel acquires a frosty appearance when it freezesi
Certain characteristics of the fuel feedstock makeup can influence the freezepoint of some biojet fuels, or in the case of HVO, influence the amount of processing needed to convert the bio-oil into an acceptable biojet fuel. Bio-oils that are closer in compositional makeup to the biojet end product will require less conversion effort.
i Picture provided by Baere Aerospace, 2006
53
Some of the feedstock characteristics that influence the fuel’s cold flow performance, or in the case of the HVO process, influence the ease of conversion from bio-oil to bio-SPK are:
• Lower carbon number HC chains (C10-C14 preferred) • Molecular weight • Branched molecular structures • Weak intermolecular forces between atoms • Non-heteroatomic molecules
Each feedstock typically exhibits different molecular makeup which determines the above characteristics. Depending on the feedstock’s makeup, different fuel processing methods may be chosen to address the more challenging feedstocks. The feedstock qualities that tend to improve freezepoint performance are short chain length (C12-C14), branched hydrocarbon chains and no heterocyclic atoms (O, N, etc.) If the feedstock has too many long chained hydrocarbons (i.e. >18) or lacks double bonds (i.e. are completely saturated), then hydrotreating /isomerization will be less effective in producing large volumes of cold flow biofuel. A more intensive process, involving hydrocracking, will be needed to achieve the required performance.46
Figure 57 shows the test results from various biojet fuel blends carried out before the VAA demonstration flight. The first three neat biojet fuels were tested at 100% biofuel mixture ratios but failed to achieve the required -40oC ASTM D 1655 freezepoint requirement. The FAME biofuels even failed when mixed at dilute ratios of 2% biojet with 98% Jet-A1 fuel (i.e. a B2 mixture). The first HVO fuel provided to the project (#3) only met the freezepoint requirement in blends up to 15%. The FAME biojet fuel #4 from Imperium was only able to meet the freezepoint at mixture ratios of up to 20%. Fuels #5 through #8 could meet the freezepoint at blends of 20% and up. This research demonstrates that the R&D progression from early FAME biojet fuels to later, refined HVO bio-SPK fuels now proves that these biojet fuels can meet the challenging ASTM freezepoint specifications for commercial jet fuels.
54

-60
-50
-40
-30
-20
-10
0
10
Jet-A Biodiesel Bio #1 Bio #2a Bio #2b Bio #3 Bio #4 Bio #5 Bio #6
Free
zing
Poi
nt, (
C)
- 40 C, Minimum Jet-A Spec
DLD
06-1
3.xl
s
B100Syn Bio
B20HVO
B20FAME
B2FAME
B100FAME
B2FAME
B2FAME
B15HVO?
B85HVO
B0Petro
Bio #7
B100HVO
Bio #8
Pass
Figure 57. Early biofuels that were tested failed to meet the minimum -40C
freezepoint requirement
Given two different fuel types with differing freezepoints, it was unknown if there would be a linear relationship between the mixture ratio of the fuels and the blended freezepoint, and so tests were performed to assess this characteristic. The HVO fuels did seem to exhibit this linear tendency, but the FAME biojet fuel displayed unusual results. Figure 58 shows that an early HVO fuel (HVO #1), the UOP bio-SPK (HVO #2), and the synthetic biology fuel exhibited fairly linear freezepoint relationships when blended in various ratios with Jet-A1 fuel. However, the Imperium FAME biofuel exhibited unusual behavior. When blended in ratios up to 20%, the poorer performing FAME biofuel did not adversely affect the freezepoint of the better performing Jet-A1 fuel. However, after this 20% point, the FAME fuel quickly deteriorated the performance of the blended Jet-A1/FAME fuel. The test was re-run to assure these test results were correct. In addition, manual and automatic freezepoint tests were performed to validate these results. The unusual freezepoint phenomenon remains unexplained.
55
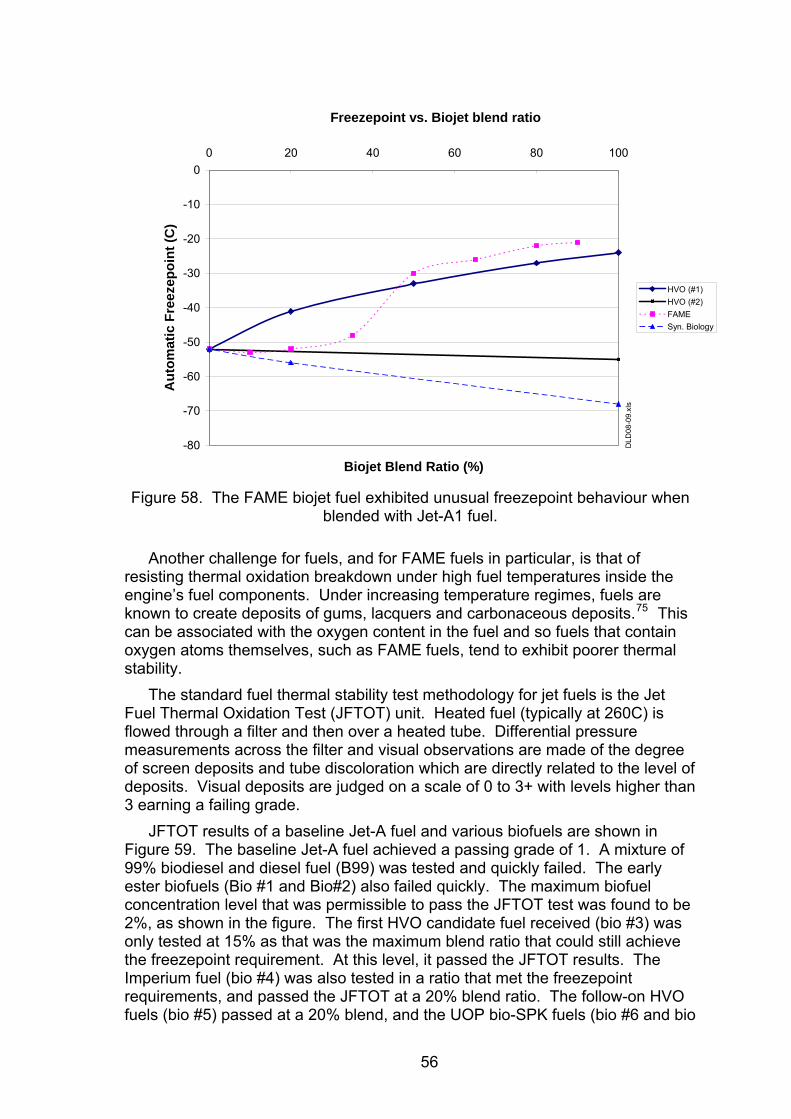
Freezepoint vs. Biojet blend ratio
-80
-70
-60
-50
-40
-30
-20
-10
00 20 40 60 80 100
Biojet Blend Ratio (%)
Aut
omat
ic F
reez
epoi
nt (C
)
HVO (#1)HVO (#2)FAMESyn. Biology
DLD
08-0
9.xl
s
Figure 58. The FAME biojet fuel exhibited unusual freezepoint behaviour when
blended with Jet-A1 fuel.
Another challenge for fuels, and for FAME fuels in particular, is that of resisting thermal oxidation breakdown under high fuel temperatures inside the engine’s fuel components. Under increasing temperature regimes, fuels are known to create deposits of gums, lacquers and carbonaceous deposits.75 This can be associated with the oxygen content in the fuel and so fuels that contain oxygen atoms themselves, such as FAME fuels, tend to exhibit poorer thermal stability.
The standard fuel thermal stability test methodology for jet fuels is the Jet Fuel Thermal Oxidation Test (JFTOT) unit. Heated fuel (typically at 260C) is flowed through a filter and then over a heated tube. Differential pressure measurements across the filter and visual observations are made of the degree of screen deposits and tube discoloration which are directly related to the level of deposits. Visual deposits are judged on a scale of 0 to 3+ with levels higher than 3 earning a failing grade.
JFTOT results of a baseline Jet-A fuel and various biofuels are shown in Figure 59. The baseline Jet-A fuel achieved a passing grade of 1. A mixture of 99% biodiesel and diesel fuel (B99) was tested and quickly failed. The early ester biofuels (Bio #1 and Bio#2) also failed quickly. The maximum biofuel concentration level that was permissible to pass the JFTOT test was found to be 2%, as shown in the figure. The first HVO candidate fuel received (bio #3) was only tested at 15% as that was the maximum blend ratio that could still achieve the freezepoint requirement. At this level, it passed the JFTOT results. The Imperium fuel (bio #4) was also tested in a ratio that met the freezepoint requirements, and passed the JFTOT at a 20% blend ratio. The follow-on HVO fuels (bio #5) passed at a 20% blend, and the UOP bio-SPK fuels (bio #6 and bio
56

#7) passed the JFTOT in 85% and 100% ratios. The synthetic biology fuel (bio #8) easily passed the JFTOT tests.
Failed when >2% blend
0
0.5
1
1.5
2
2.5
3
3.5
Jet-A Biodiesel Bio #1 Bio #2a Bio #2b Bio #3 Bio #4 Bio #5 Bio #6
JFTO
T* R
eadi
ng @
260
C
Fail
* Jet Fuel Thermal Oxidation Test
B100Syn Bio
B20HVO
B20FAME
B2FAME
Blend Ratio:
B100FAME
B2FAME
B2FAME
B15HVO?
B85HVO
B0Petro
Bio #7
B100HVO
Bio #8
B99
Figure 59. Early biojet fuels failed the high temperature thermal oxidation tests
As it is standard practice to test Jet fuels at 260C, a breakpoint test can be performed to see where the fuel actually breaks down and fails the JFTOT test. Figure 60 shows that a 100% Imperium FAME biofuel exhibited a breakpoint of 260C while an early HVO biofuel had a breakpoint of 360C, which is quite good for these fuels. Therefore, there were no fears of building up deposits inside the engine fuel systems while using these fuels in flight demonstrations.
0
50
100
150
200
250
300
350
400
Bre
akpo
int (
C)
Bio #4(Ester)
Bio #5(HVO)
Figure 60. The Imperium 100% FAME (Bio #4) and early HVO (Bio #5) both had good thermal breakpoint results
57

Material compatibility is a “fit for purpose” test that engine and airframe manufacturers need to perform to make sure fuels do not degrade sealants, elastomers or other materials. There are no particular ASTM tests or methods established for these tests. They are determined by the manufacturer. One such test at Boeing is to immerse a standard Viton O-Ring into a baseline fuel and a similar O-ring into a neat fuel for 160 hours and then compare the weight and swell of the two O-Rings.
O-Rings are typically designed into aircraft equipment with the expectation that fuel, oil and other fluids will have some swelling impact on the elastomer, thereby assuring continued sealing qualities throughout its life. If this swell were to become absent, especially in older O-Rings that have been in service for some time, the seal would not be maintained and one could expect fuel or other liquid leakage. Too much swell indicates that the elastomeric material is experiencing degradation which will also lead to a fuel system leak, especially when standard operating conditions and fluids are returned.
Figure 61 illustrates the “fit for purpose” tests of the Imperium and early HVO biofuel. After 160 hours immersion at room temperature in the Jet-A1 baseline fuel, a Parker V0747-001 Viton O-Ring exhibited 0.64% increase in swell. The Imperium FAME fuel blend of 20% and 40% showed a swell of 1.47 and 2.64% respectively. At 100% Imperium biofuel blend, the swell was much, much higher at 123.33%. The early HVO fuel showed less swell than normal, of only 0.38 and 0.41%, for a 20% and 40% biofuel blend respectively. The interpretation of these results is somewhat subjective, but it was determined that use of either the Imperium or HVO fuels at 20% or 40% would be acceptable with Viton O-Rings. The neat Imperium fuel would not be acceptable from a materials compatibility standpoint, even with Viton materials that exhibit much less swell variation than Nitrile or Buna-N O-ring materials.
Summary of the average volume swell of Viton O-Ring (Parker V0747-001) after 160 hours at room temperature
Baseline Jet-A1 Fuel
Imperium Ester (5238) blends
Early HVO (5239) blends
Imperium Ester Fuel
More swell than normal
Less swell than normal
Much more swell than normal!
Figure 61. FAME biofuels lead to more seal swell while HVO biofuels lead to
less seal swell as compared to Jet-A1 fuel.76
4.1.3 Engine performance In order to assure the biofuel flight demonstration would be uneventful, it
was determined that a ground test should be performed of the biofuel in a modern gas turbine engine. Therefore, the two finalist fuels from the earlier lab testing would be conducted by the engine OEM that manufactured the engines on the flight demonstration airplane.
The engines on the Boeing 747-400 aircraft that was operated by VAA, and was selected as the test platform, were a CF6 turbofan engine manufactured by GE. Since a smaller engine manufactured by GE/Snecma, the CFM56-7B, used similar combustor technology, and since there was a limited amount of fuel
58

available for ground testing, it was determined that a ground test of a CFM56 engine would suffice. GE agreed to perform the tests on an engine that was available in the appropriate time frame at their Peebles facility in Ohio. A test plan was generated where various fuels would be tested through a power calibration and emissions measurement phase and then an operability phase. Figure 62 shows the anticipated operating time, power settings, and test parameters for the ground engine tests.
Ground Engine Tests (CFM56-7B Engine )Repeat tests below for each fuel-blend and baseline fuel (4 total)
A.) Power Cal + Emissions (2 power cals per fuel-blend)•Operating conditions: G/I, 7%, 30%, 45%, 65%, 85%,100% •6 minutes per test condition, total of 106 minutes per power cal including 10min warm-up•Measure emissions and steady-state engine data at each conditionB.) Operability•LBO, Accel-time / thrust-response, Start-time•1-2 hours per fuel blend
Figure 62. Ground tests performed on biofuels prior to flight demonstration
The engine was operated for 6 minutes at each of the following settings: Ground Idle (GI), 7, 30, 45, 65, 85 and 100% thrust ratings. Engine data and emissions were gathered at each power condition. The engine was also evaluated for start time, throttle vs. thrust response and Lean Blow Out (LBO) limit. These tests were performed on a baseline Jet-A and Jet-A1 fuel. Various blends of the alternative fuels (Imperium FAME, Early HVO and F-T) were then subjected to the same engine test procedure. After these tests were performed, the engine was then run again on the same Jet-A fuel that was used at the start of the test to assure the engine was delivering the same performance.
A turbofan engine typically is designed with additional operating margin so that the engine never experiences Lean Blow Out (LBO) or flameout (F/O). As an engine ages, some of this margin may be lost, but it will still not experience a LBO event. It was thought that using a fuel with less energy content might result in some loss in LBO margin, and so engine operability tests were performed on various biofuels to quantify this result.
Figure 63 illustrates the results of LBO margin deterioration with baseline jet fuels and alternatives for the CFM56-7B engine tested at the GE Peebles facility. For a baseline Jet-A fuel, the engine’s combustor would be able to experience a 15-16.5% leaner air/fuel mixture before it is in danger of LBO. However, for the worst case, a 40% blend of the Imperium FAME fuel, the engine’s combustor would only be able to tolerate a 5-6.5% leaner air/fuel ratio before it is in danger of a LBO event. This was thought to be related to the poorer Lower Heating Value (LHV) (BTU/lb) of the FAME fuel. The other fuels, with similar LHV to the baseline Jet-A fuel, did not appear to experience any deterioration in LBO limits.
59

Figure 63. Fuels with lower heat value (e.g. Esters) resulted in loosing margin
on the lean blowout limit.77
The start times of the engine were similarly affected when fuels with a lower LHV were used. Figure 64 shows that there was a 10% increase in start time when using a 20% mix of the Imperium FAME fuel blend, and a 24% increase in start time when using a 40% mix of the Imperium FAME fuel. Other fuels, with similar LHV values to Jet-A fuel, exhibited similar start times as the baseline fuel.
Star
t Tim
e (%
cha
nge)
Jet-ABaseline
20% Ester
40% Ester
50/50 F-T
100% F-T
20% HVO
Jet-ABaseline 2
Jet-ABaseline
20% Ester
40% Ester
50/50 F-T
100% F-T
20% HVO
Jet-ABaseline 2
30
25
20
15
10
5
0
Figure 64. Fuels with lower LHV also resulted in longer engine start times.77
One concern was that the biofuel-powered engine could experience an increase in carbonaceous deposits inside the combustor. A visual borescope inspection was performed on the CFM56 engine before testing and after testing while using biofuels. There were no visible increases in deposits observed near the fuel nozzle or swirl cup.
Another concern was that the GE CF6 flight demonstration engine on the B747 could have some pre-existing deterioration conditions that might be falsely attributed to using the biofuel during the short 1-hour flight demonstration and so
60

a borescope inspection was performed both before and after the flight demonstration. Due to the high time of this engine, there was some deterioration to the combustor’s thermal barrier coatings near the swirl cups. There was also some normal carbon deposits observed. There did not appear to be any further deterioration or deposits after the 1 hour demonstration flight on the FAME biofuel. 4.1.4 Engine emissions measurements
Concurrent with the ground test of the CFM56-7B engine, an emissions test was conducted to gather gaseous emissions (i.e. NOx, CO and HC species) as well as particulate emissions. The FAA provided a grant to two research agencies to gather detailed emissions tests and provide analysis. GE also used their emissions test equipment for traditional measurements of gaseous and particulate emissions.
The emissions tests were performed at the GE Peebles facility. The fuels used were: Jet-A, Jet-A1, and blends of Imperium’s FAME, a CTL F-T fuel, and the early HVO fuel. Unfortunately, due to a delay in testing and schedule constraints for the portable emissions equipment, the last fuel to be tested (early HVO) was not measured with the high precision emissions measuring equipment.
Figure 65 shows the biofuel supply tanks (upper left), The portable emissions measuring equipment (upper right), the CFM56-7B engine (lower right) and the emissions sampling probes (lower left.) The biofuel was provided by Boeing while the Jet-A and Jet-A1 fuel, as well as the mixing of the fuels, was provided by the AFRL. GE provided the engine, test facilities and staff. Under the US FAA PARTNER program (FAA Grant 07-C-NE-UMR, Amendment No. 003,004,006), funding was provided to two research agencies for the emissions measurements.
61

Figure 65. Biofuel (upper left) was tested in a CFM56 engine (lower right) and emissions were gathered via a rake (lower left) and analyzed in a portable lab
facility (upper right)77
Particulate emissions were gathered by the portable measuring equipment and are shown in Figure 66 for both the Jet-A1 baseline fuel and the F-T fuel. A decrease in the number of particulate was observed while operating on the 100% F-T fuel at all power settings. At high power settings, there appeared to be a small decrease in the size of the particulate as well. The decrease in the size and number of particulate is thought to be as a result of the F-T fuel having no sulfur or aromatic compounds. HVO and bio-SPK fuels will most likely exhibit the same performance characteristics.
62

Particulate Size (micron)
Num
ber o
f Par
ticul
ates
Figure 66. A decrease in particulate emissions was observed in the CFM56
engine while operating on the F-T fuel compared to Jet-A1 fuel.78
A percentage decrease in the Emissions Index Mass (EIm) and Emissions Index Number (EIn) of particulate was also observed for 20% and 40% mixtures of the Imperium FAME biofuel as shown in Figure 67. 50% and 100% F-T fuel are also shown.
63

Figure 67. A decrease in the particulate mass (Elm) and number (EIn) were observed when operating on the Imperium Biojet and F-T fuels in the CFM56
engine.78
Speciated hydrocarbons were also measured during the emissions tests with baseline, F-T and FAME fuels. Figure 68 illustrates that there was little variation in acetaldehyde in the fuel blends. However, when neat alternate fuels were used, an increase in acetaldehyde emissions was observed. This could become a problem in future scenarios where a high percentage of biofuel blends are used in aircraft. These aromatics may be of concern for their propensity to adversely impact local air quality thereby negatively impacting public health.
64

Figure 68. Speciated HC were distinct for alternate fuels, especially aromatic
HC emissions.78
Because the early HVO fuel’s emissions characteristics were not able to be tested at the GE Peebles facility, an emissions test was also performed on a small Pratt & Whitney Canada (PWC) engine at another test facility. Figure 69 shows gaseous emissions (NOx, HC & CO) as a function of engine thrust level, as well as traditional aviation smoke measurements (i.e. visual observation of filter paper) taken for a baseline Jet-A1 fuel, a 50% and 100% blend of the early HVO fuel. There appeared to be no discernable impact on gaseous emissions. However, smoke emissions were significantly reduced when using the biofuel, which was similar to that seen in the GE Peebles emissions tests on the CFM56 engine.
65

Figure 69. Emission data was also collected for Jet A-1, blend of 50% Jet A-1 and 50% early HVO biofuel and 100% HVO in a PWC small turbofan engine.79
After the later UOP HVO biofuel was developed, emissions tests were again performed on these fuel blends in a CFM56-7B engine at 18K and 27K thrust ratings at GE’s Peebles facility using conventional gaseous and particulate emissions measuring equipment. Test were performed on two blends, a 25% HVO/75% Jet-A fuel, and a 50/50 blend, which are shown in Figure 70 for the 18K thrust rating (left) and 27K thrust rating (right.)
-40%
-30%
-20%
-10%
0%
10%
20%
30%
40%
50%
NOx CO HC Smoke #
% C
hang
e w
rt J
et A
25/75 Jatropha-Algae/Jet A50/50 Jatropha-Algae/Jet A
CFM56-7B18
-20%
-10%
0%
10%
20%
30%
40%
50%
NOx CO HC Smoke #
% C
hang
e w
rt J
et A
CFM56-7B27
Figure 70. Emissions were also measured on later UOP bio-SPK fuel ground
tests of a CFM56-7B engine at (18K) and highest (27K) thrust ratings80
These test results show similar trends as the previous emissions tests, suggesting that a significant reduction in smoke/particulate emissions can be
66

achieved by using alternative fuels with reduced sulfur and aromatics. More variation was observed in the gaseous emissions than previous tests. It was theorized that this was because the UOP bio-SPK fuel has higher hydrogen to carbon content than Jet-A fuel. This may result in a lower peak flame temperatures, which are typically related to NOx emissions and inversely proportional to HC and CO emissions (e.g. lower flame temperature = lower NOx but higher HC & CO.)
The emissions in the above figure are shown in terms of percent reduction from ICAO LTO (Landing Take Off) cycle emissions81. Some of the variation, especially HC, may be explained because of the very low HC baseline emissions level and the test gathering variation anomalies normally found in emissions measuring equipment.
Recent tests conducted in February 2009 at NASA's Dryden Flight Research Center under the name of the Alternative Aviation Fuels Experiment (AAFEX) should provide more information in the future on how alternative fuels impact engine emissions. 4.1.5 Feedstock
Large scale availability of sustainable materials that will provide the oil for the biofuel (i.e. feedstock) is a crucial factor in determining if biofuels have the potential to truly become a feasible option for commercial aviation.
A literature search was performed to investigate present, first generation, feedstock sources. It was quickly determined that these feedstocks were either unsustainable or lacked the capability to provide the enormous amounts of oil required to displace aviation jet fuel. In addition, these first generation feedstocks were already busy supplying biofuel to the ground transportation sector. Therefore, it was decided that next generation feedstocks would be needed if aviation were ever to implement large scale production of biojet fuel.
Algae oil was an early leading candidate that was identified, but other nearer term feedstock candidates were needed. A search was conducted to uncover Universities, R&D and other organizations that were helping to develop these next generation non-algae feedstocks. Figure 71 shows the types of feedstocks that organizations were researching and were engaged to help research various next generation feedstocks. They include several algae organizations, 3 organizations researching salt water plants, and 3 other organizations developing other oil-seed crops. In most cases, subcontracts were issued to perform specific R&D that would help advance the science and serve to catalyze the industry to develop these feedstocks.
67

Boeing
Seashore Mallow
Hal
ophy
tes
Alg
ae O
ilsO
ther
Oils CastorJatropha
Salt waterAlga
E. Tirucalli
Camelina
MultipleHalophytes
Fresh waterAlga
Fresh waterAlga
Salt waterAlga
Fresh waterAlga
Fresh waterAlga
Fresh waterAlga
Fresh waterAlga
Figure 71. Several providers supplied biomass oils to the project
The degree of R&D directed towards the different types of feedstocks was based on the apparent potential of the feedstock and the need for industry support. For example, Figure 72 shows that algae has the most potential to supply large amounts of algae oil, and at the time that this study was started, little R&D was being expended, especially since the demise of the Aquatic Species Program in the 1980’s. Halophytes appeared to be a promising, sustainable, crop and so a moderate amount of R&D was initiated. These plants are claimed to have the potential to provide relatively large amounts of oil per acre and may one day approach that of algae (Figure 73.) Jatropha was being touted as a “wonder crop” and already had substantial investment taking place from other sources, so very little work was invested in this area. Soy was judged to be unsustainable and had a very low yield, so this crop was also not investigated.
Oil
yiel
d (g
allo
ns p
er y
ear/a
cre)
(Halophyte) (Halophyte)
0
500
1,000
1,500
2,000
Soybean Salicornia Jatropha Euphorbia Algae
Oil
yiel
d (g
allo
ns p
er y
ear/a
cre)
(Halophyte) (Halophyte)
0
500
1,000
1,500
2,000
Soybean Salicornia Jatropha Euphorbia Algae
Figure 72. Focus was on near term viable fuels that had high productivity
68

Figure 73. Halophytes were found to have a wide range of potential
productivities82
Seashore Salicornia (Halophyte) Halophytes appear to be an ideal solution to providing biomass without compromising fresh water irrigation supplies. There are several locations throughout the world where saline water sources, such as saline aquifers, could supply halophyte plantations that would be located in areas with abundant sunlight and suitable planting media (Figure 74.)
Figure 74. There are several ideal locations for halophyte farms through out the
world.82
Some commercial demonstration ventures have implemented specially designed halophyte growing systems that utilize different types of plants (e.g. Salicornia, Mangrove) with various salt tolerance, and different water saline contents to demonstrate the viability of small scale systems (Figure 75.)
69

Figure 75. Some Salicornia R&D is already advancing to commercializationj.
R&D funding was provided to one University to investigate the feasibility of generating very salt water tolerant, high oil productivity, and low nutrient demand Salicornia plant for biofuel commercialization. This program included the development of (1) a large scale in vitro regeneration system, (2) plantlet growth evaluation in order to select optimal species, and (3) small scale farming evaluation (Figure 76.) Different growing media, nutrients, growth conditions and resulting plant growth rates were evaluated in order to choose an optimal Salicornia species for biofuels. This research program is currently in the middle of the 3rd phase of small scale farming evaluation and so oil productivity results have yet to be gathered. However, the first and second phase of the programme has produced some very promising Salicornia plant species.
Year 3 – Gather data on suitability of halophytes for large scale jet fuel production
Year 1 - Develop an in-vitro regeneration system
Year 2 - Identify & characterize germplams.
Figure 76. One contractor is performing validation studies of various types of
Salicornia.k
j Photo provided by Carl Hodges, Global Seawater Inc.
70

Euphorbia Euphorbia Tirucalli is a plant belonging to the Euphorbiaceae family, which
is not strictly classified as a halophyte. The plant contains a milky latex sap, which contains di- or triterpene esters. In the energy crisis of the 1970’s it was reported that because of its high isoprene content, this particular plant would become a boon to the biofuel industry thereby solving the world’s energy needs.83 Little was found on the makeup of this particular plant, and no quantitative information was found to back up these claims, so a small R&D effort was funded with another University to validate the earlier claims.
An experimental plot of 0.5ha was established in the Arava valley near a Kibbutz named “Elifaz.” It is a very arid site in the desert with extreme temperatures. An automatic trickle irrigation system was installed that used brackish reclaimed sewage water. The EC of the water was ~5.5, with only minor fluctuations in salinity. As the water is reclaimed sewage, no fertilizers were added (Figure 77.)
Figure 77. Subcontract was issued to create test plot to evaluate feasibility of
Euphorbia Tirucalli as a feedstock for biofuel.l
k Photos provided by Cliff Louime l Photo provided by Amram Eshel, Tel Aviv U.
71

The plant requires modest quantities of water for growth and under laboratory experiments was shown that it can use saline water of up to 200 mM NaCl.
Vegetative reproduction material was later collected from the following countries: Zanzibar, Tanzania (Lake Manyara, Ngorongoro, Aldubai), Rowanda, Borundi, Morocco, South Africa, Namibia, Senegal and New York Botanic Gardens. Some material was also obtained from Haiti and from the Botanic Garden in Kyoto, Japan. These were tested to determine the most salt tolerant, high productivity plants.
Cuttings were selected from some of the most productive species and were planted at a density of 2500 cuttings/ha. Rooting success was over 95%. After approximately 5 months, an increase of the plants' weight indicated that they grew rather fast, reaching a weight of 672 kg per hectare, that is an average of 3.2X increase over their initial weight. During the first month’s growth, plants normally grow slower than average due to lag time needed to establish new root systems.
The test results (Figure 78) showed that the yield of crude latex extract of the plant surpassed the yields of most other Euphorbia plants as reported in the literature. The total yield potential of Euphorbia Tirucalli is much higher by an order of magnitude.
FW = Fresh Weight, DW = Dry Weight Figure 78. The E. Tirucalli plant’s growth productivity was good while growing on
saline water.84
However, preliminary lab results showed that the level of useful hydrocarbons was disappointing and so its value may be much less than was earlier reported. The value of the latex material to make biofuel is also currently being evaluated by a major oil corporation.
72

Jatropha: Jatropha Curcas is a drought tolerant tree and member of the
Euphorbiaceae family. It is seen as a promising feedstock for producing oil for biofuel on degraded lands (Figure 79), reducing soil erosion and generating rural employment.
Jatropha Plants
Figure 79. Two year old Jatropha plantation in Brazil
Before Jatropha became a popular candidate for biodiesel, its growing was confined to applications such as natural fencing, and other limited uses. There was no commercial market for Jatropha oil and so there was no experience with its large scale growing and, as a result, no reliable data was available. However, due to its drought tolerance characteristics, and claimed ability to grow very successfully on degraded lands, it fell victim to public hype and became known as a “wonder crop” for biodiesel production86. Although it is still promising as a niche crop for biofuel production, it is most likely not the “wonder crop” that it has been built up to be.
Crop yields will vary depending on inputs, climate and the skill of the farmer. Claims of Jatropha yields appear to be varying considerably.85 For example, the following Jatropha yields are reported from various sources (assuming 35% oil content).
73

Table 4. Reported Jatropha Oil Yields Source Jatropha
Oil Yield (tons/hectare)
Reference
Jatropha handbook
.09-2.1 Jatropha Handbook, 2nd edition, 2009
Agroforest, China
0.63 http://www.springerlink.com/content/954p8k84427123w7/
Frost & Sullivan
1-5 http://www.frost.com/prod/servlet/market-insight-top.pag?docid=36738184
Agro 1.5-2 http://findarticles.com/p/articles/mi_m0CYH/is_15_7/ai_107215410/
Biofuels Revolution
3.5 http://www.biofuelsrevolution.com/jatropha/
BAIF Dev.t Research Foundat’n
0.5-2.5 http://www.baif.org.in/aspx_pages/pdf/Agroforesty/SouthernRailway.pdf
Business Insider
0.16-3.9 http://www.businessinsider.com/is-jatropha-a-viable-alternative-energy-source-2009-2
Philippine Nat’l oil
5.25 http://www.pnoc-afc.com.ph/newsroom_view.php?news_id=28
UNCTAD 3.5 http://www.unctad.org/sections/wcmu/docs/ditc_comb_Jatropha001_en.pdf
In 2007, Wageningen University and Research Center (a primary center for Jatropha research) found that many early claims about Jatropha yields "seem to have emerged from incorrect combinations of unrelated observations, often based on measurements of singular and elderly Jatropha Curcas trees." These findings have been confirmed by several more recent sources86,87. Jatropha is realizing less than half its projected yields in most projects, and less than a third of optimistic estimates. Figure 80 illustrates that the Jatropha tree indeed behaves like most other plants … it produces much more when it is supplied with good soil and optimal amounts of water.
Figure 80. Jatropha oil yield will vary greatly depending on the amount of water
and fertility of the soil.
Jatropha not only gained the reputation that it can thrive in poor soil conditions, it also gained the reputation as a crop that thrives with limited water.
74
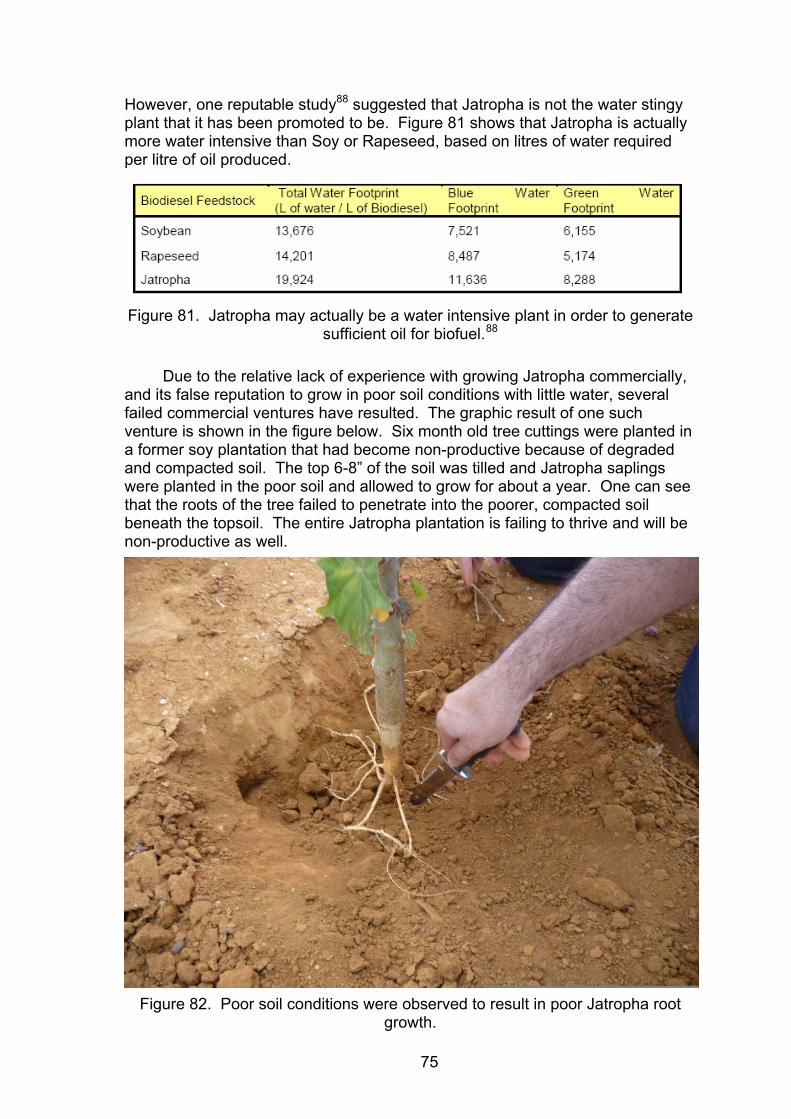
However, one reputable study88 suggested that Jatropha is not the water stingy plant that it has been promoted to be. Figure 81 shows that Jatropha is actually more water intensive than Soy or Rapeseed, based on litres of water required per litre of oil produced.
Figure 81. Jatropha may actually be a water intensive plant in order to generate
sufficient oil for biofuel.88
Due to the relative lack of experience with growing Jatropha commercially, and its false reputation to grow in poor soil conditions with little water, several failed commercial ventures have resulted. The graphic result of one such venture is shown in the figure below. Six month old tree cuttings were planted in a former soy plantation that had become non-productive because of degraded and compacted soil. The top 6-8” of the soil was tilled and Jatropha saplings were planted in the poor soil and allowed to grow for about a year. One can see that the roots of the tree failed to penetrate into the poorer, compacted soil beneath the topsoil. The entire Jatropha plantation is failing to thrive and will be non-productive as well.
Figure 82. Poor soil conditions were observed to result in poor Jatropha root
growth.
75

One study revealed that other reports had erroneously estimated that an area of 900,000 hectares of Jatropha had been planted globally. Only 14 projects out of the 242 projects were larger than 1,000 hectares while 80% of the projects were in test plots and small scale farming. The report also indicated that the Jatropha industry is dominated by government programs, with few commercial players.89 Jatrophabook concluded that the realistic area of commercial Jatropha cultivation for 2009 is approximately 350,000-400,000 hectares90. It estimates that the main difference in reporting and true production is due to the low uniformity of measurements and unreliable information received from Asian state programs.
R&D areas to invest in Jatropha to enable its successful commercialization include:
• Insufficient information on its suitability for specific areas • Lack of a mechanical harvesting system • Lack of species improvement programmes through organized selection
and breeding • Limited agronomic studies on inputs and productivity under various
climatic conditions • Lack of economic studies on market systems and environmental
acceptability. According to Biofuels International, the biggest hurdle for commercialization
of Jatropha may turn out to be time. Since the Jatropha trees require 3–5 years to reach optimal yields, breeding Jatropha to achieve an optimal oil yield is an extremely lengthy process. Only after first yields are observed can one assess which varieties would be promising to potentially breed. This then requires an additional period to observe results from such high throughput breeding techniques. This practically means that Jatropha breeding will take at the least 10-15 years.
It appears that many of the Jatropha commercialization efforts are encountering the realization of the practical issues just discussed. Some background on commercial Jatropha is discussed below--
Jatropha, JV commercialization- One major joint venture was formed in October 2007. This endeavor claims to account for approximately 25% of planted Jatropha area. The focus of their plantation efforts have been in Africa and India. According to the JV’s 2008 annual report, it successfully produced its first quantities (1,000 tons) of crude Jatropha oil in 2008, making its first sale in Africa (at $1,800/ton). According to the report, the JV has been supporting the planting of Jatropha since 2006. However, meaningful volumes of oil can only be expected during 2009 as the Jatropha trees need to mature and younger trees become productive. In its June 2009 interim report, the company did not report the sale of any crude Jatropha oil.91
The JV’s operations in Africa have proven disappointing. They have experienced a management restructuring and announced that “the planting position will continue to be kept under review.” In March 2008, it reported 192,016 hectares were under cultivation. Overall the company reported 257,370 hectares under cultivation at the end of 2008, the majority in northeast India in another JV with a tea producer92 By mid-2009 the reported area had decreased
76
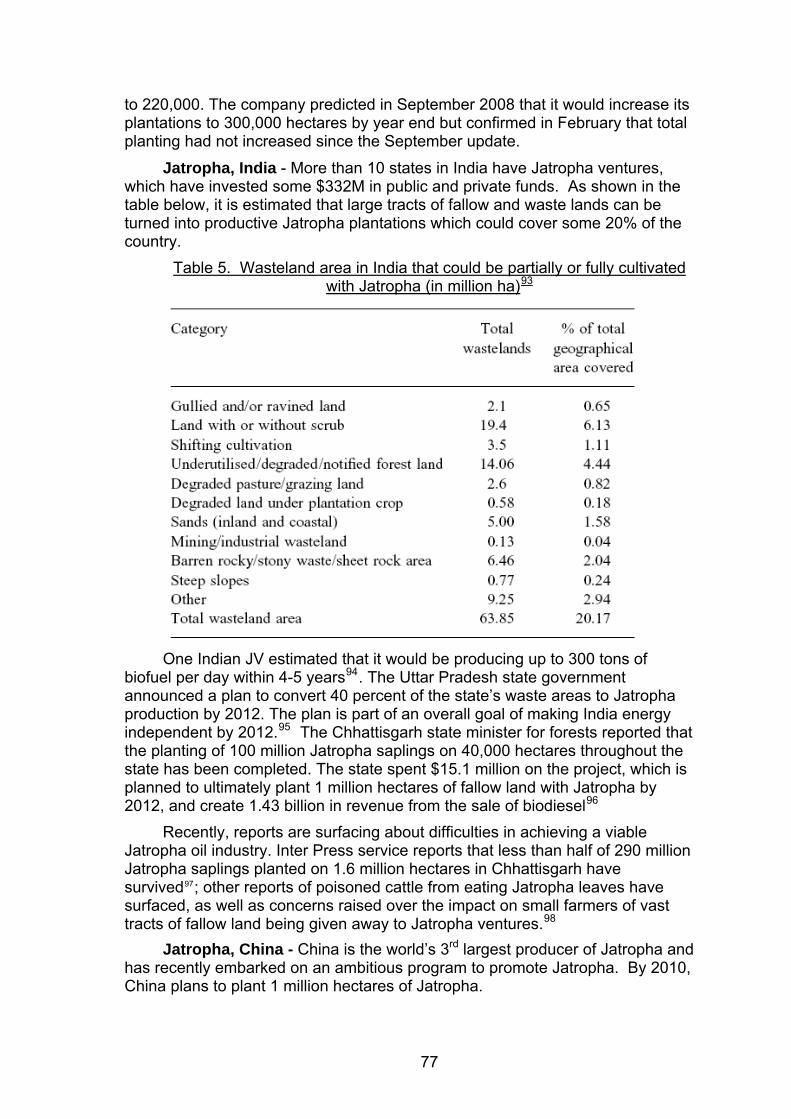
to 220,000. The company predicted in September 2008 that it would increase its plantations to 300,000 hectares by year end but confirmed in February that total planting had not increased since the September update.
Jatropha, India - More than 10 states in India have Jatropha ventures, which have invested some $332M in public and private funds. As shown in the table below, it is estimated that large tracts of fallow and waste lands can be turned into productive Jatropha plantations which could cover some 20% of the country.
Table 5. Wasteland area in India that could be partially or fully cultivated with Jatropha (in million ha)93
One Indian JV estimated that it would be producing up to 300 tons of
biofuel per day within 4-5 years94. The Uttar Pradesh state government announced a plan to convert 40 percent of the state’s waste areas to Jatropha production by 2012. The plan is part of an overall goal of making India energy independent by 2012.95 The Chhattisgarh state minister for forests reported that the planting of 100 million Jatropha saplings on 40,000 hectares throughout the state has been completed. The state spent $15.1 million on the project, which is planned to ultimately plant 1 million hectares of fallow land with Jatropha by 2012, and create 1.43 billion in revenue from the sale of biodiesel96
Recently, reports are surfacing about difficulties in achieving a viable Jatropha oil industry. Inter Press service reports that less than half of 290 million Jatropha saplings planted on 1.6 million hectares in Chhattisgarh have survived97; other reports of poisoned cattle from eating Jatropha leaves have surfaced, as well as concerns raised over the impact on small farmers of vast tracts of fallow land being given away to Jatropha ventures.98
Jatropha, China - China is the world’s 3rd largest producer of Jatropha and has recently embarked on an ambitious program to promote Jatropha. By 2010, China plans to plant 1 million hectares of Jatropha.
77

Jatropha was introduced to China about 250-300 years ago and was traditionally used as a natural hedge-row fence. In 2007, China banned the use of food-based feedstocks for biofuel and embarked on a program for the provincial governments of Southwest China to plant Jatropha on marginal lands.99 Jatropha is distributed mainly in Yunnan, Sichuan, Guangxi, Guangdong, Hainan and other China provinces in the South that have warm-to-hot climates. In March 2006, the Yunnan province established “the province's forest biomass energy-biodiesel raw material forest development planning”, anproposed to develop Jatropha plantations on 666,666 hectares of land. According to Yunnan forestry department’s statistics, Yunnan’s existing swild and planted Jatropha Curcas has reached about 33,333 hectares to daCommercial plantation production rates are claimed to be averaging 1.8 tons/hectare
d
emi-te.
y in Table 4.)
asted crop in a nation where 1/3 of the childr
fuel
f Haiti
ar), and then this application might be
an ideal niche application for Jatropha.
rn mechanical equipment to bring down costs to be
od
it t
roductive seeds for biofuel production within a relatively short time
t a s,
irrigated farming practices of planting high water demand crops such as corn.
100 (~0.63 tons oil/hectare) which seems to be more of a realistic yield than was being reported earlier by many other entities (shown previousl
Jatropha, Myanmar - The Myanmar government set out in 2006 to cultivate 3.42 million hectares of Jatropha, requiring each state to plant at least202,000 hectares of Jatropha. Unfortunately, this lead to the displacement of food crops, imprisonment of farmers who wouldn’t cooperate, and due to a lack of harvesting equipment, a disastrous w
en suffer from malnourishment.101 Jatropha, Haiti – Currently 75% of this country’s energy is supplied by
wood, which has left the country almost entirely deforested.102 NGO’s have proposed that Jatropha may be a good crop to reforest the hilly regions owhich would then provide biofuel and useful byproducts.103 It has been suggested that if Jatropha could be re-introduced to Haiti, while assuring it wouldnot compete with food crops (e.g. Myanm
Castor: While Jatropha could be a suitable crop for reforestation of hilly regions, a
modified Castor plant, which comes from the same family as Jatropha, wouldprobably be the preferred crop for flatter lands. These crops could be mass produced and harvested with mode
competitive with fossil fuels. The Castor bush is a drought resistant, fast growing plant, producing an
abundance of seeds within 9 months of planting versus the 5 year optimal perifor Jatropha tree. The Castor plant can also produce seeds in the 2nd and 3rd year of life, but the optimal seed production occurs in the first year.104 Because the plant is fast growing and produces seeds quickly, another advantage is that can be modified by “high throughput breeding” techniques to produce the mosdesirable and p
frame.105 On a visit to the plains of the state of Bahia in Brazil, it was observed tha
drought had killed most of the corn and bean food crops of the local farmerwhile Castor was surviving. It was also observed that the water table had dropped precipitously in recent years due to the unsustainable
78
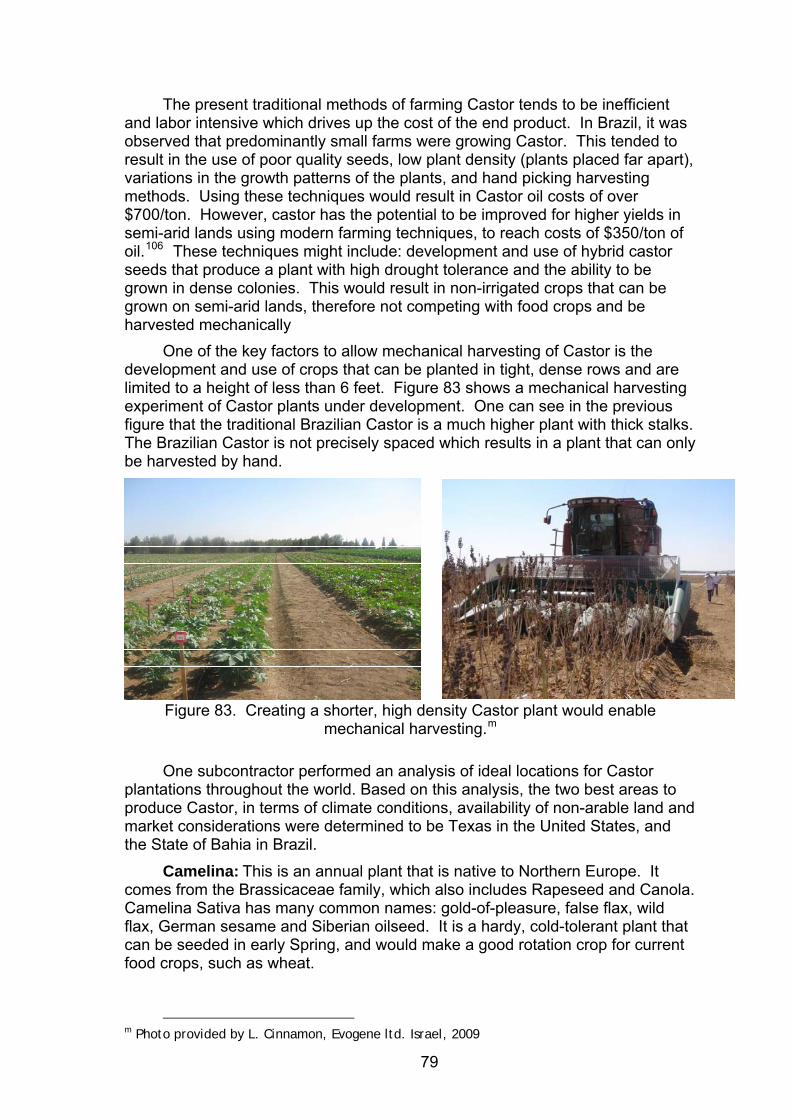
The present traditional methods of farming Castor tends to be inefficient and labor intensive which drives up the cost of the end product. In Brazil, it was observed that predominantly small farms were growing Castor. This tended to result in the use of poor quality seeds, low plant density (plants placed far apart), variations in the growth patterns of the plants, and hand picking harvesting methods. Using these techniques would result in Castor oil costs of over $700/ton. However, castor has the potential to be improved for higher yields in semi-arid lands using modern farming techniques, to reach costs of $350/ton of oil.106 These techniques might include: development and use of hybrid castor seeds that produce a plant with high drought tolerance and the ability to be grown in dense colonies. This would result in non-irrigated crops that can be grown on semi-arid lands, therefore not competing with food crops and be harvested mechanically
One of the key factors to allow mechanical harvesting of Castor is the development and use of crops that can be planted in tight, dense rows and are limited to a height of less than 6 feet. Figure 83 shows a mechanical harvesting experiment of Castor plants under development. One can see in the previous figure that the traditional Brazilian Castor is a much higher plant with thick stalks. The Brazilian Castor is not precisely spaced which results in a plant that can only be harvested by hand.
Figure 83. Creating a shorter, high density Castor plant would enable
mechanical harvesting.m
One subcontractor performed an analysis of ideal locations for Castor plantations throughout the world. Based on this analysis, the two best areas to produce Castor, in terms of climate conditions, availability of non-arable land and market considerations were determined to be Texas in the United States, and the State of Bahia in Brazil.
Camelina: This is an annual plant that is native to Northern Europe. It comes from the Brassicaceae family, which also includes Rapeseed and Canola. Camelina Sativa has many common names: gold-of-pleasure, false flax, wild flax, German sesame and Siberian oilseed. It is a hardy, cold-tolerant plant that can be seeded in early Spring, and would make a good rotation crop for current food crops, such as wheat.
m Photo provided by L. Cinnamon, Evogene ltd. Israel, 2009
79

The small seed’s oil is well suited to producing biodiesel or biojet fuel. It consists of about 43% oil and the content of unsaturated oil is about 90%. About 50% of the total fatty acids are polyunsaturated-linoleic acid (18:2n− 6) and α-linolenic acid (18:3n− 3).107
The leftover meal from the seed is a protein-rich feed source that can be used for cattle or swine in the US. An effort by an industry coalition is under way to enable the meal to be used for all animal feeds. In addition, selective breeding work is being conducted on more than 120 Camelina populations, or pools of genetic material, which should help identify and select superior genetic lines for improved Camelina varieties under various climate, nutrition, and water conditions.108
Camelina has unique traits which could substantially reduce, or perhaps eliminate, requirements for field tilling and annual weed control. The compatibility of Camelina for no-till seeding, coupled with its ability to compete with weeds and low fertilizer demands, could enable this crop to have the lowest input cost of any oilseed. At a seeding rate of 6 to 14 kg/ha, Camelina could inexpensively be applied by air or machine-broadcast in early winter or spring on stubble ground without special equipment. Further utilization and breeding research is required to more fully make use of the unique agronomic qualities that this crop possesses. 109
Although this ancient crop has been cultivated in Europe for over 6,000 years for food and fuel, its use for human consumption has not been developed to any extent in the US. Camelina oil is a rich source of omega-3-fatty acids and vitamin E that could potentially be used to produce high value human foods and cosmetics. Some health food specialty distributors are already beginning to capitalize on this market (Figure 84.) The leftover meal could also be used to enhance livestock products, such as high omega-3 eggs, meat and dairy products. Establishment of this value-added industry would likely commence when FDA GRAS and AFFCO certifications are achieved.110 In the mean time, the use of Camelina oil for biofuel production would be an excellent solution to help develop this crop within the agro community and also help feed the biofuel industry’s oil needs until other higher potential feedstocks, such as halophytes and algae, are developed.
Figure 84. Camelina oil may be allowed for human consumption (Salad oil shown.)n
n Photo from Marx Foods, Inc. www.marxfoods.com
80
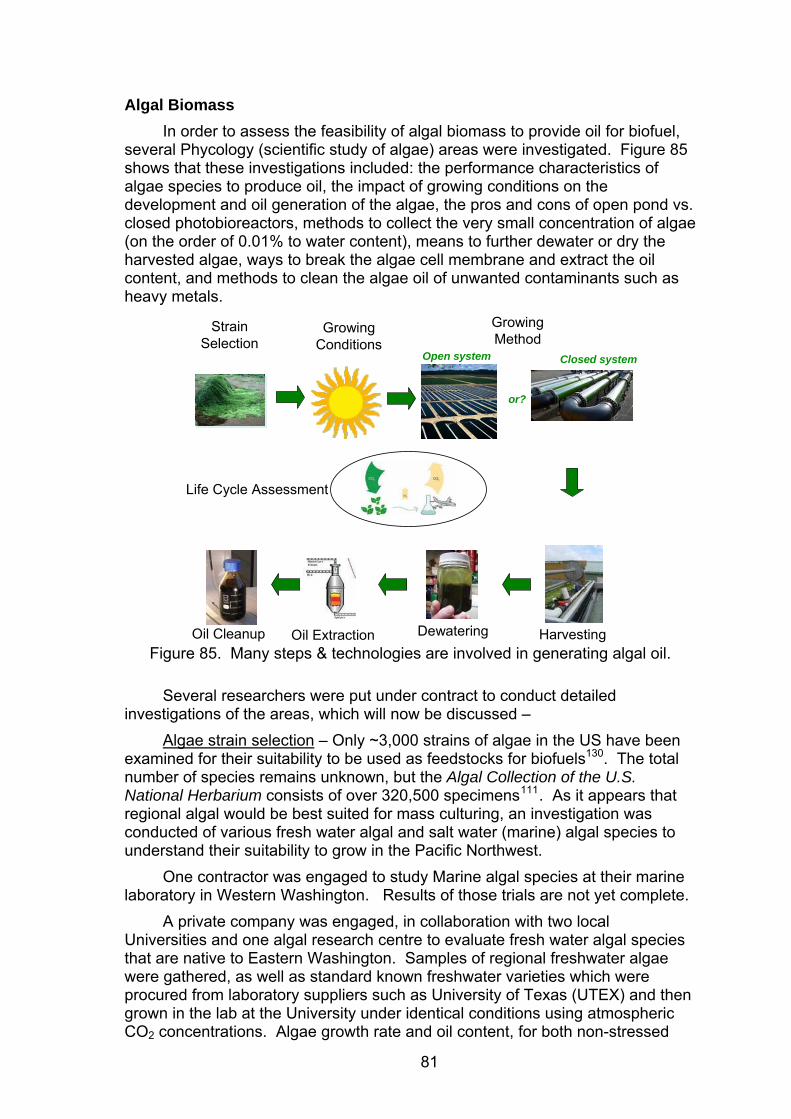
Algal Biomass In order to assess the feasibility of algal biomass to provide oil for biofuel,
several Phycology (scientific study of algae) areas were investigated. Figure 85 shows that these investigations included: the performance characteristics of algae species to produce oil, the impact of growing conditions on the development and oil generation of the algae, the pros and cons of open pond vs. closed photobioreactors, methods to collect the very small concentration of algae (on the order of 0.01% to water content), means to further dewater or dry the harvested algae, ways to break the algae cell membrane and extract the oil content, and methods to clean the algae oil of unwanted contaminants such as heavy metals.
StrainSelection
GrowingMethod
Harvesting
GrowingConditions
DewateringOil ExtractionOil Cleanup
or?
Open system Closed system
Life Cycle Assessment
Figure 85. Many steps & technologies are involved in generating algal oil.
Several researchers were put under contract to conduct detailed investigations of the areas, which will now be discussed –
Algae strain selection – Only ~3,000 strains of algae in the US have been examined for their suitability to be used as feedstocks for biofuels130. The total number of species remains unknown, but the Algal Collection of the U.S. National Herbarium consists of over 320,500 specimens111. As it appears that regional algal would be best suited for mass culturing, an investigation was conducted of various fresh water algal and salt water (marine) algal species to understand their suitability to grow in the Pacific Northwest.
One contractor was engaged to study Marine algal species at their marine laboratory in Western Washington. Results of those trials are not yet complete.
A private company was engaged, in collaboration with two local Universities and one algal research centre to evaluate fresh water algal species that are native to Eastern Washington. Samples of regional freshwater algae were gathered, as well as standard known freshwater varieties which were procured from laboratory suppliers such as University of Texas (UTEX) and then grown in the lab at the University under identical conditions using atmospheric CO2 concentrations. Algae growth rate and oil content, for both non-stressed
81

and stressed (i.e. nutrient deprivation) conditions were evaluated. Figure 86 shows the results of the various varieties, most of which were unclassified or unknown.
Figure 86. Laboratory and native E. Washington algal strains produced various
percentages of oil.112
One algae species, EG (short for “El Gordo,” “the fat one”), was particularly interesting because of its rapid growth and good oil content. EG was isolated as a robustly growing contaminant from small water tanks (Figure 88) using coal flue gas in a coal-fired electrical powerplant in Boardman, OR. EG is a biflagellate green alga with a striking resemblance to members of the Dunaliella genus.
Another unknown was the composition of the HC makeup of the algal oil. Figure 87 shows an analysis of two varieties of algae oil, one was a specially cultivated Dunaliella Maritima. The other oil was obtained from unknown algal varieties harvested by a contractor that were grown in sewage wastewater
82

obtained from the Everett wastewater treatment facility in Everett, Washington. It shows that the algal oil HC chain distribution is similar to that of other vegetable oils, with a distribution peak in the C16-C18 range. The Dunaliella algae exhibited some branched chains, which is desirable for conversion into low freezepoint biojet fuel. The wastewater algae tended to exhibit slightly longer chains. The degree of branched chains was not evaluated for this algae oil.
0
0.1
0.2
0.3
0.4
0.5
0.6
0 5 10 15 20 25 30
Fuel Carbon Number
Am
ount
(%)
Jet-A1
Algae Oil (from waste water)
Duniella Maritima
Branched
Figure 87. Algae grown from sewage waste water or from prime brackish water
appear to have the same HC chain characteristics.
Algal Growing Conditions – Algal biomass rarely performs as well in the field as in the laboratory setting. Therefore, the influence of growing conditions on the algae was investigated. The variability of growing conditions included: using smoke stack effluent for enhanced CO2 supply, open vs. closed tanks, levels of natural sunlight and temperatures variations, as well as the durability of the algae to resist natural algal feeding predators. Small water tanks were set up by one contractor at the Boardman coal fired powerplant with the algal species Chlorella sorokiniana, PF1, UN1, Ankistrodesmus sp., PF2, and EG where they are currently undergoing field testing (Figure 88.) Results should become available in 2010.
83

Control Tanks
ExperimentalTanks
Figure 88. Several different fresh water algal strains were field tested at electric
powerplants to evaluate their feasibility to produce oil.o
Similar to humans, the algae has a growing phase in its developing phase of life and can also have a fat accumulation phase, especially once it has matured. The fat (lipid) accumulation phase is triggered by an environmental stressor such as a lack of nutrients; usually nitrogen. When the cells run out of the nutrient, excess carbon substrate continues to be assimilated by the cells and converted into storage fat113. Figure 89 shows the green algal biomass in the growing phase on the left. In this phase, they are consuming the nutrients, and increasing their mass. However, when the nutrients are reduced, the algal stop producing, and use the CO2 to start producing fats. The figure on the right shows accumulation of fat globules within the cell walls of each alga.
Stress
Green algae Oil droplets
Growing Phase(eating nutrients and CO2)
Conditioning Phase(storing fat/oil)
Figure 89. Conditioning or stressing the algae results in higher lipid (oil)
accumulation115
o Photos supplied by Stan Barnes, Seattle, WA
84
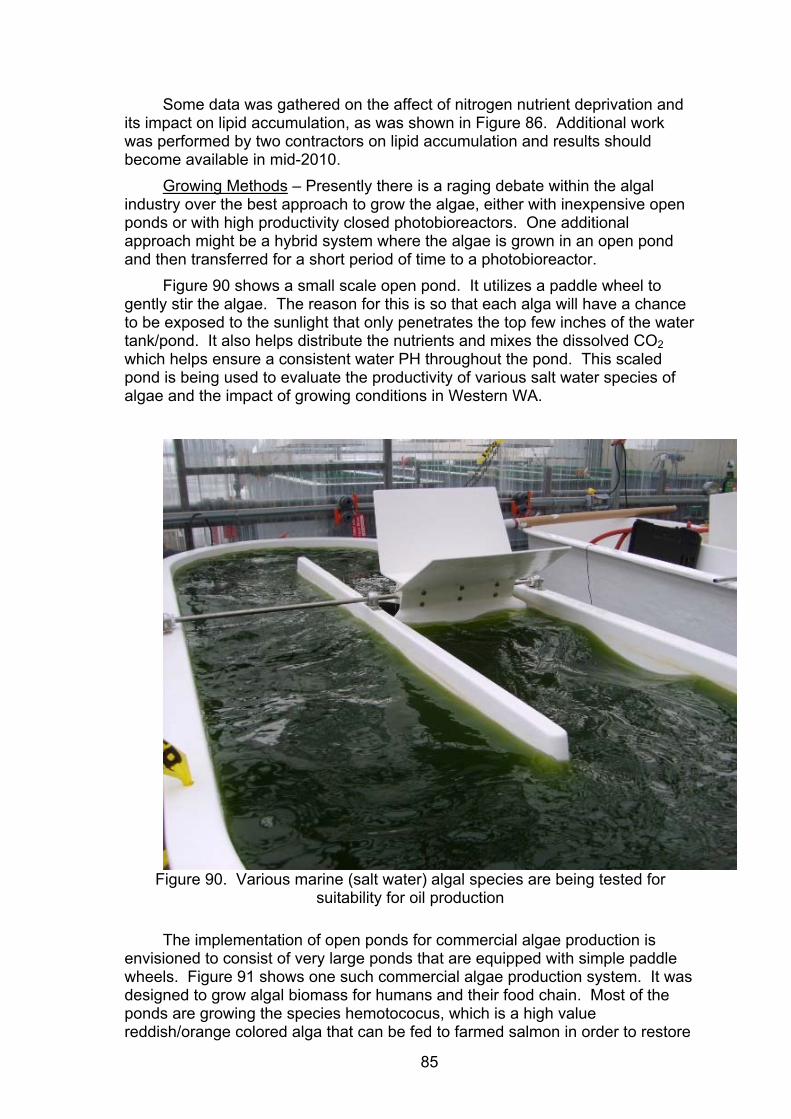
Some data was gathered on the affect of nitrogen nutrient deprivation and its impact on lipid accumulation, as was shown in Figure 86. Additional work was performed by two contractors on lipid accumulation and results should become available in mid-2010.
Growing Methods – Presently there is a raging debate within the algal industry over the best approach to grow the algae, either with inexpensive open ponds or with high productivity closed photobioreactors. One additional approach might be a hybrid system where the algae is grown in an open pond and then transferred for a short period of time to a photobioreactor.
Figure 90 shows a small scale open pond. It utilizes a paddle wheel to gently stir the algae. The reason for this is so that each alga will have a chance to be exposed to the sunlight that only penetrates the top few inches of the water tank/pond. It also helps distribute the nutrients and mixes the dissolved CO2 which helps ensure a consistent water PH throughout the pond. This scaled pond is being used to evaluate the productivity of various salt water species of algae and the impact of growing conditions in Western WA.
Figure 90. Various marine (salt water) algal species are being tested for
suitability for oil production
The implementation of open ponds for commercial algae production is envisioned to consist of very large ponds that are equipped with simple paddle wheels. Figure 91 shows one such commercial algae production system. It was designed to grow algal biomass for humans and their food chain. Most of the ponds are growing the species hemotococus, which is a high value reddish/orange colored alga that can be fed to farmed salmon in order to restore
85

the pinkish coloring of the flesh of the farmed Salmon (only wild Salmon have pink flesh.) For two of the 747-400 biofuel flight demonstrations, algae oil was extracted from these hemotococus algae.
The overwhelming advantage of open ponds system is their low capital cost, which will be critical to achieve low cost biofuel. The principle disadvantage of an open pond is that its environmental conditions can not be controlled as well as in a photobioreactor.
Figure 91. Large open ponds are one approach to growing commercial alga p
A closed photobioreactor is one that is typically sealed from the ambient environment and whose conditions can be more closely regulated. Figure 92 shows two examples of closed photobioreactors. The picture on left illustrates a prototype flexible bag system for evaluation of an algal system to capture and sequester flue gas CO2. The photobioreactor on the right is a rigid tube system that was in order to grow hemotococus. Flat panel systems are the 3rd variety.
p Picture complements of Cyanotech, Hawaii, http://www.cyanotech.com/
86

Figure 92. Closed photobioreactors (bag system on the leftError! Bookmark not defined.
and tubular on the right) are another approach for growing algae.
The advantages of closed photobioreactors are that: invading species and predators can be discouraged (they can still invade though), there is the potential for increased surface area for more light exposure and, environmental conditions (e.g. water evaporation) may be controlled more closely. The disadvantages are that these systems are very expensive and can not be scaled up to the very large volumes (i.e. 1,000 hectares) needed for low cost algal production. There can also be issues of biofilm buildup inside the reactor, overheating in the hot summer weather and oxygen poisoning of the algae by not effectively removing the O2 gas that is produced by the algae.
Another option considered was a hybrid system that used open ponds for the growing phase, which typically takes 20-30 days, and then transfers the water/algal mixture into photobioreactors for a few days to condition the algal biomass to increase lipid content. Figure 93 shows such a prototype system being developed by a contractor. Scaled raceway ponds with paddle wheels were constructed as shown in the lower part of the picture. Various algal species will eventually be grown and tested. Scenedesmus was first grown in these ponds and then transferred into the closed flat plate photobioreactors, as shown on the right part of picture of the figure, where the temperature, PH, dissolved gasses, and nutrients can be closely controlled. The argument is that the increased cost of the photobioreactors can be justified by the much higher yielding oil content of the conditioned algal biomass, which should only take a few days of conditioning in the photobioreactor versus several days of growing in the open pond system.
87
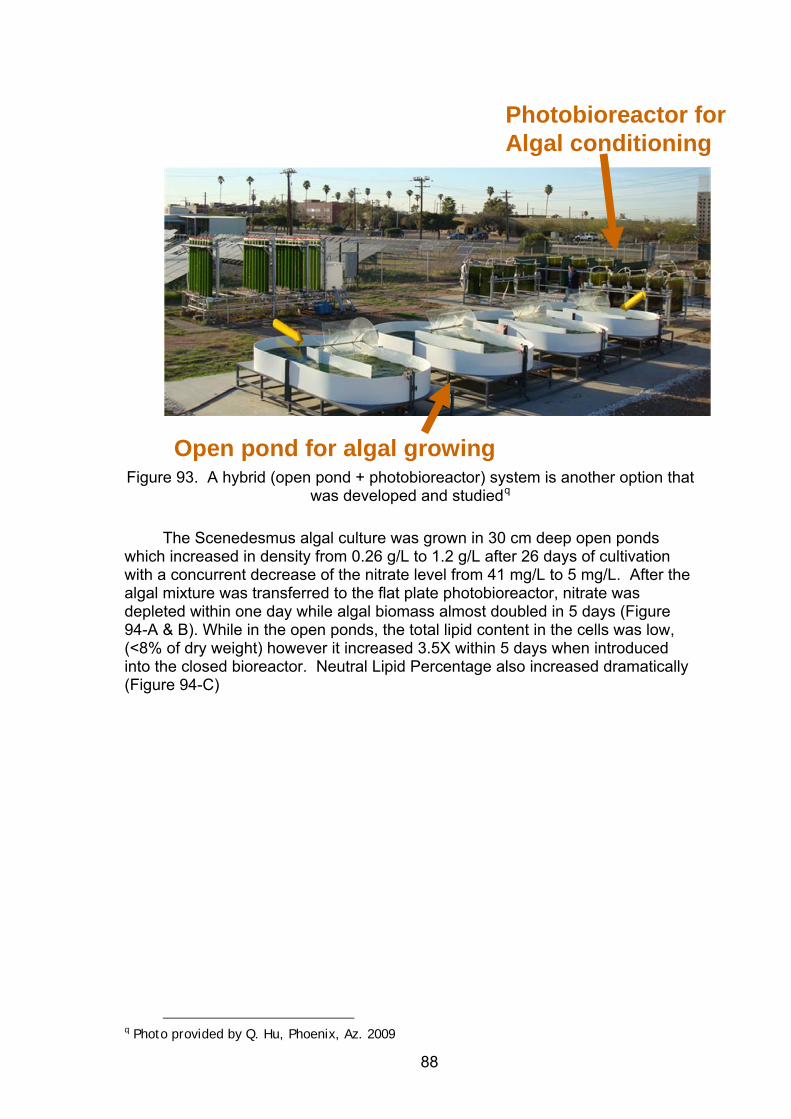
Open pond for algal growing
Photobioreactor forAlgal conditioning
Figure 93. A hybrid (open pond + photobioreactor) system is another option that
was developed and studiedq
The Scenedesmus algal culture was grown in 30 cm deep open ponds which increased in density from 0.26 g/L to 1.2 g/L after 26 days of cultivation with a concurrent decrease of the nitrate level from 41 mg/L to 5 mg/L. After the algal mixture was transferred to the flat plate photobioreactor, nitrate was depleted within one day while algal biomass almost doubled in 5 days (Figure 94-A & B). While in the open ponds, the total lipid content in the cells was low, (<8% of dry weight) however it increased 3.5X within 5 days when introduced into the closed bioreactor. Neutral Lipid Percentage also increased dramatically (Figure 94-C)
q Photo provided by Q. Hu, Phoenix, Az. 2009
88
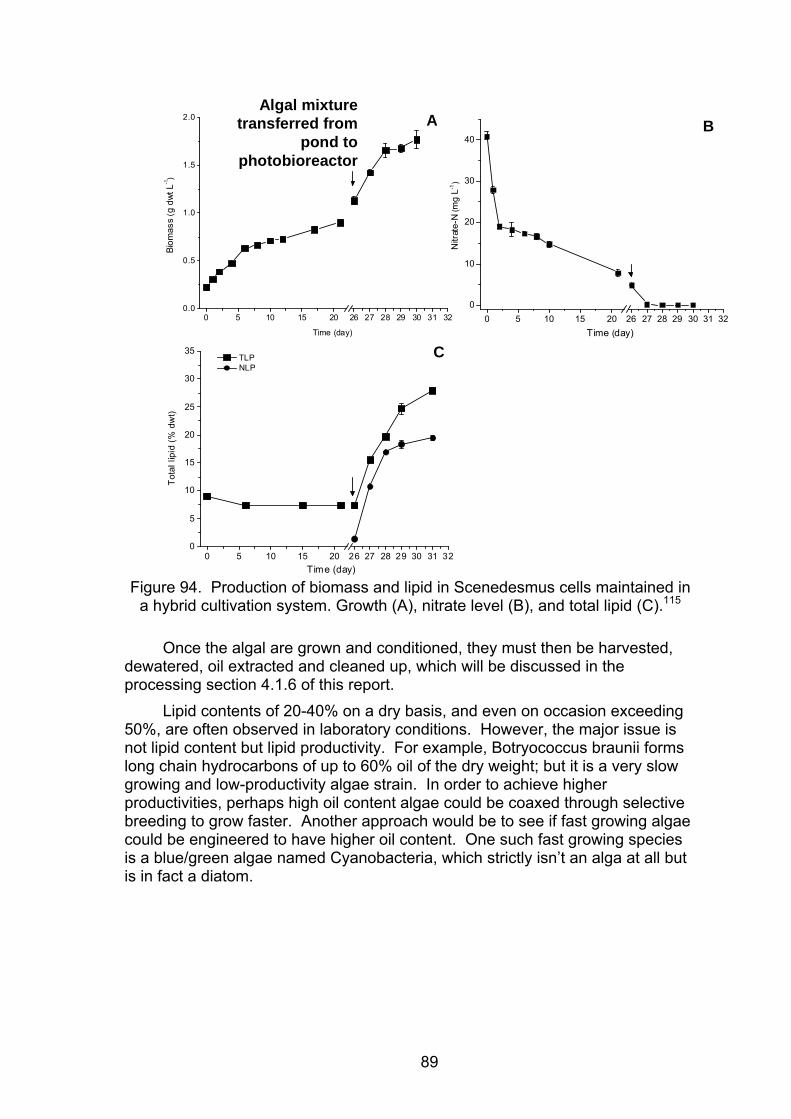
0 5 10 15 20 26 27 28 29 30 31 320
5
10
15
20
25
30
35
TLP NLP
Time (day)
Tota
l lip
id (%
dw
t)
C
0 5 10 15 20 26 27 28 29 30 31 320
10
20
30
40
Time (day)
Nitr
ate-
N (m
g L-1
)
B
0 5 10 15 20 26 27 28 29 30 31 320.0
0.5
1.0
1.5
2.0
Time (day)
Biom
ass
(g d
wt L
-1)
Algal mixture transferred from
pond to photobioreactor
A B
C
Figure 94. Production of biomass and lipid in Scenedesmus cells maintained in
a hybrid cultivation system. Growth (A), nitrate level (B), and total lipid (C).115
Once the algal are grown and conditioned, they must then be harvested, dewatered, oil extracted and cleaned up, which will be discussed in the processing section 4.1.6 of this report.
Lipid contents of 20-40% on a dry basis, and even on occasion exceeding 50%, are often observed in laboratory conditions. However, the major issue is not lipid content but lipid productivity. For example, Botryococcus braunii forms long chain hydrocarbons of up to 60% oil of the dry weight; but it is a very slow growing and low-productivity algae strain. In order to achieve higher productivities, perhaps high oil content algae could be coaxed through selective breeding to grow faster. Another approach would be to see if fast growing algae could be engineered to have higher oil content. One such fast growing species is a blue/green algae named Cyanobacteria, which strictly isn’t an alga at all but is in fact a diatom.
89

Cyanobacteria (Blue/Green Algae) Two consultants were put under contract to explore the feasibility of an oil-
producing system that would use a Genetically Modified Organism (GMO) from Cyanobacteria that would also have the ability to produce bio-oil. While Dunaliella algae have been observed to have growth rates of up to 25 g/M2/day at the Seambiotic facility, it is theorized that a GMO Cyanobacteria could exhibit growth rates of up to 100 g/M2/day114. Although this species has much higher growth rates, it suffers from the disadvantage of not having any lipid producing genes.
Figure 95 shows a concept of GMO cyanobacteria designed for oil production. The key factors involved in this organism are the introduction of genes that: (1) utilize a broader spectrum of the sunlight in photosynthesis, (2) produce lipids in the form of free fatty acids, (3) exhibit pores in the cell’s membrane that can continuously excrete the oil. Production of such an organism would enable continuous oil production at much higher efficiencies and would undoubtedly provide much lower operating costs as the harvesting, dewatering and oil collection steps that algae require would be eliminated by GMO cyanobacteria.
Figure 95. GMO cyanobacteria, to produce and excrete oil, were studied by two
microbiology consultants in 2009.
The cyanobacteria growing system would require the use of a closed photobioreactor. This would help prevent contamination and would also help in preventing the GMO bacteria from escaping into the environment. Some sort of insurance gene would also most likely be inserted so that the bacteria couldn’t live outside the specially constructed and operated photobioreactor. Figure 96 shows an example of a GMO cyanobacteria concept.
90

Figure 96. Large scale cyanobacteria systems were evaluated for feasibility.
Due to the immaturity of such a GMO program and construction of an appropriate operating system, the capital costs remain unknown. Such a system may provide the greatest amount of bio-oil for global energy consumption, but a much more in-depth study will be required to determine its feasibility and economic viability. 4.1.6 Feedstock processing methods
Once the biofuel feedstock is grown, it must be gathered and processed into the bio-oil product. Oil seed crops, such as soybeans, have been used for a number of years and so the processing methods for oilseeds are relatively mature. However, some of the new generation feedstocks, such as algae, are relatively immature and so affordable processing methods must be researched and developed in order to assess the economic feasibility of commercializing these feedstocks.
Several small contracts were issued to the various research organizations listed in Figure 97 to evaluate new processing methods for algal biomass. These included Universities (oval markers), private research organizations (rounded boxes) and consultants (boxes.)
91

BoeingBoeing
University “A” Consultant “A”
University “B”
University “C”
University “D”
University “E”
University “F”
University “G” Company “C”
Company “B”
Company “A”
Consultant “B”
Consultant “C”
Figure 97. Subcontractors provided information on processing methods for
biofuel feedstocks
4.1.6.1 Algal inoculum growing systems In the process of growing algae, large quantities of seed algae need to be
introduced back into the open ponds that have been freshly harvested and refilled with water. In order to inoculate the ponds with this algal starter, a high purity specimen needs to be grown in an affordable, controlled, inoculum growing system. This will help avoid introducing algae of unknown origins into the ponds and a sealed system will help reduce the likelihood of algae predators (grazers) from destroying the culture.
One University’s agricultural biology department was engaged to apply their expertise in low cost greenhouse construction to design and construct a prototype low-cost algal inoculum system. Figure 98 shows a picture of the system that was developed.
(Cover removed)
Figure 98. Low cost inoculation system was developedr
The inoculum system consists of circular, lined pond, with a floating arm that rotates around a center post to stir the algae. The key feature that makes this system affordable is an inflatable, clear dome that covers the pond. The
r Photo provided by Phil Saddler, Phoenix, AZ, 2009
92
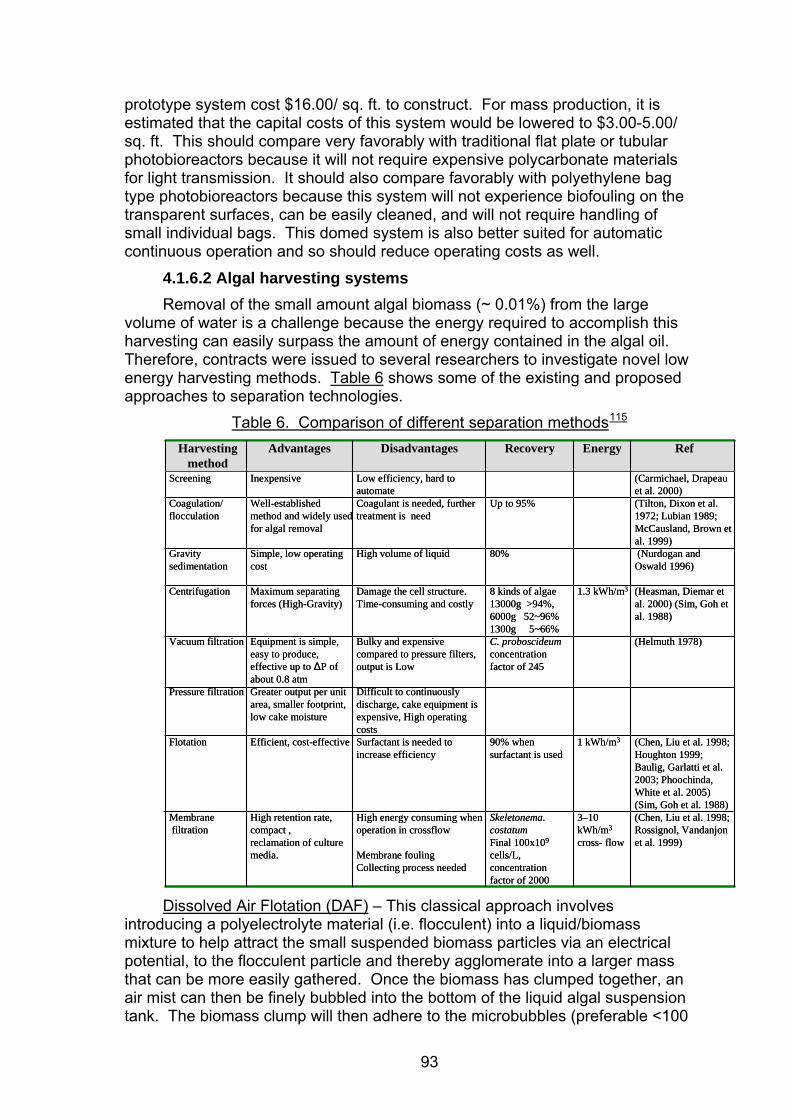
prototype system cost $16.00/ sq. ft. to construct. For mass production, it is estimated that the capital costs of this system would be lowered to $3.00-5.00/ sq. ft. This should compare very favorably with traditional flat plate or tubular photobioreactors because it will not require expensive polycarbonate materials for light transmission. It should also compare favorably with polyethylene bag type photobioreactors because this system will not experience biofouling on the transparent surfaces, can be easily cleaned, and will not require handling of small individual bags. This domed system is also better suited for automatic continuous operation and so should reduce operating costs as well.
4.1.6.2 Algal harvesting systems Removal of the small amount algal biomass (~ 0.01%) from the large
volume of water is a challenge because the energy required to accomplish this harvesting can easily surpass the amount of energy contained in the algal oil. Therefore, contracts were issued to several researchers to investigate novel low energy harvesting methods. Table 6 shows some of the existing and proposed approaches to separation technologies.
Table 6. Comparison of different separation methods115
(Carmichael, Drapeau et al. 2000)(Tilton, Dixon et al. 1972; Lubian 1989; McCausland, Brown et al. 1999)(Nurdogan and
Oswald 1996)
(Heasman, Diemar et al. 2000) (Sim, Goh et al. 1988)
(Helmuth 1978)
(Chen, Liu et al. 1998; Houghton 1999; Baulig, Garlatti et al. 2003; Phoochinda, White et al. 2005)(Sim, Goh et al. 1988)(Chen, Liu et al. 1998; Rossignol, Vandanjonet al. 1999)
1.3 kWh/m3
1 kWh/m3
3–10 kWh/m3
cross- flow
Up to 95%
80%
8 kinds of algae13000g >94%,6000g 52~96%1300g 5~66%C. proboscideumconcentration factor of 245
90% when surfactant is used
Skeletonema. costatumFinal 100x109
cells/L, concentration factor of 2000
Low efficiency, hard to automateCoagulant is needed, further treatment is need
High volume of liquid
Damage the cell structure. Time-consuming and costly
Bulky and expensive compared to pressure filters, output is Low
Difficult to continuously discharge, cake equipment is expensive, High operating costsSurfactant is needed to increase efficiency
High energy consuming when operation in crossflow
Membrane foulingCollecting process needed
Inexpensive
Well-established method and widely used for algal removal
Simple, low operating cost
Maximum separating forces (High-Gravity)
Equipment is simple, easy to produce, effective up to ΔP of about 0.8 atmGreater output per unit area, smaller footprint, low cake moisture
Efficient, cost-effective
High retention rate,compact ,reclamation of culture media.
Screening
Coagulation/flocculation
Gravity sedimentation
Centrifugation
Vacuum filtration
Pressure filtration
Flotation
Membranefiltration
RefEnergyRecoveryDisadvantagesAdvantagesHarvesting method
Dissolved Air Flotation (DAF) – This classical approach involves
introducing a polyelectrolyte material (i.e. flocculent) into a liquid/biomass mixture to help attract the small suspended biomass particles via an electrical potential, to the flocculent particle and thereby agglomerate into a larger mass that can be more easily gathered. Once the biomass has clumped together, an air mist can then be finely bubbled into the bottom of the liquid algal suspension tank. The biomass clump will then adhere to the microbubbles (preferable <100
93

micron) and float to the top of the tank where it can be skimmed off116. Figure 99 shows this concept and one application in use to gather algae biomass (topicture.)
p 117
Figure 99. Dissolved Air Floatation system is a common harvesting approachs
The advantage of this system is that it is a proven system that has been in use for many years. The main disadvantage is cost. Namely, the chemical requirements, especially flocculants such as the commercial “Chitosan”, can result in a continuous cost that can be quite significant. Alum and ferric chloride are more affordable flocculants, but would still be too expensive for a large scale algae biofuel commercialization project. Bubbling the compressed gas through the huge amount of liquid can also be energy intensive, at least when compared to the amount of energy that will be contained in the algal oil. Thus, a careful cost analysis would need to be performed on the DAF machinery and the flocculants in order for this system to be considered as a cost effective algal harvesting system.
Filtration System – Another approach to filtering suspended algal biomass from the water is through the use of a membrane filtration system. Figure 100 shows one such concept and bench scale system that was developed under contract.
s Photo from Aquaflow (New Zealand) and DAF schematic from wikipedia.com
94
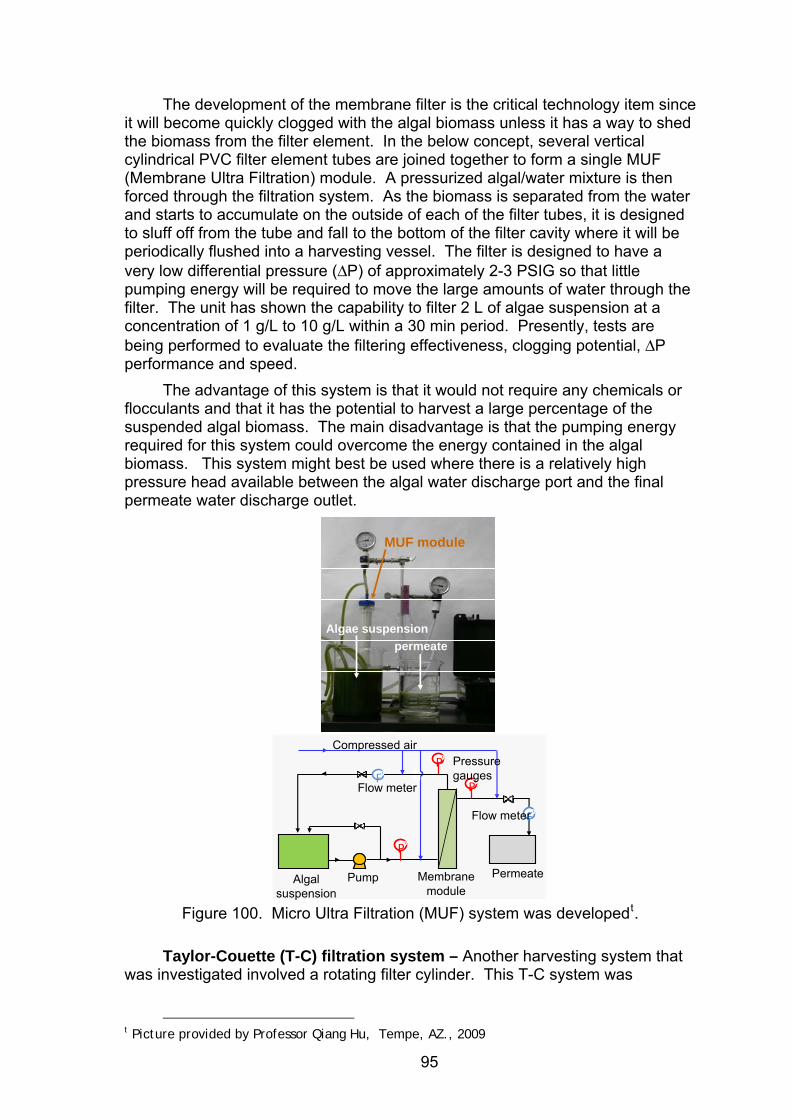
The development of the membrane filter is the critical technology item since it will become quickly clogged with the algal biomass unless it has a way to shed the biomass from the filter element. In the below concept, several vertical cylindrical PVC filter element tubes are joined together to form a single MUF (Membrane Ultra Filtration) module. A pressurized algal/water mixture is then forced through the filtration system. As the biomass is separated from the water and starts to accumulate on the outside of each of the filter tubes, it is designed to sluff off from the tube and fall to the bottom of the filter cavity where it will be periodically flushed into a harvesting vessel. The filter is designed to have a very low differential pressure (ΔP) of approximately 2-3 PSIG so that little pumping energy will be required to move the large amounts of water through the filter. The unit has shown the capability to filter 2 L of algae suspension at a concentration of 1 g/L to 10 g/L within a 30 min period. Presently, tests are being performed to evaluate the filtering effectiveness, clogging potential, ΔP performance and speed.
The advantage of this system is that it would not require any chemicals or flocculants and that it has the potential to harvest a large percentage of the suspended algal biomass. The main disadvantage is that the pumping energy required for this system could overcome the energy contained in the algal biomass. This system might best be used where there is a relatively high pressure head available between the algal water discharge port and the final permeate water discharge outlet.
PFPF
MUF module
permeate
PPPP
PPPP
PPPP
PF
Algalsuspension
Membranemodule
PermeatePump
Compressed airPressuregauges
Flow meter
Flow meter
Algae suspension
Figure 100. Micro Ultra Filtration (MUF) system was developedt.
Taylor-Couette (T-C) filtration system – Another harvesting system that was investigated involved a rotating filter cylinder. This T-C system was
t Picture provided by Professor Qiang Hu, Tempe, AZ., 2009
95
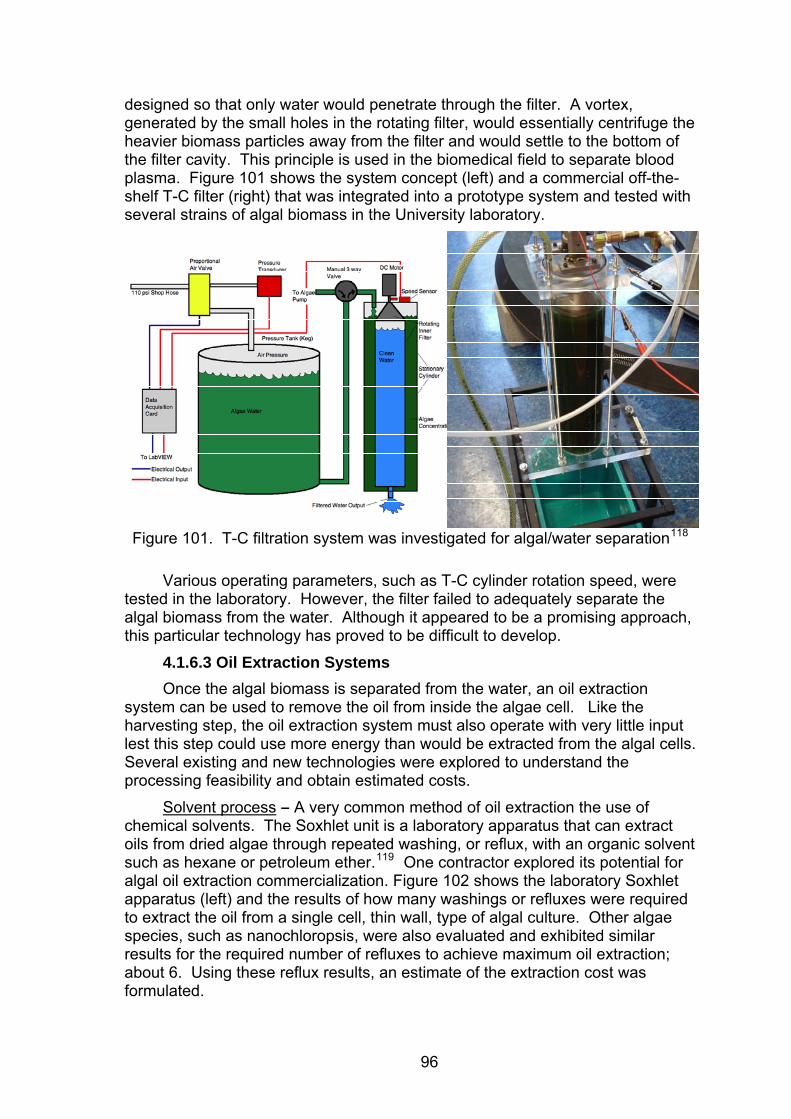
designed so that only water would penetrate through the filter. A vortex, generated by the small holes in the rotating filter, would essentially centrifuge the heavier biomass particles away from the filter and would settle to the bottom of the filter cavity. This principle is used in the biomedical field to separate blood plasma. Figure 101 shows the system concept (left) and a commercial off-the-shelf T-C filter (right) that was integrated into a prototype system and tested with several strains of algal biomass in the University laboratory.
Figure 101. T-C filtration system was investigated for algal/water separation118
Various operating parameters, such as T-C cylinder rotation speed, were tested in the laboratory. However, the filter failed to adequately separate the algal biomass from the water. Although it appeared to be a promising approach, this particular technology has proved to be difficult to develop.
4.1.6.3 Oil Extraction Systems Once the algal biomass is separated from the water, an oil extraction
system can be used to remove the oil from inside the algae cell. Like the harvesting step, the oil extraction system must also operate with very little input lest this step could use more energy than would be extracted from the algal cells. Several existing and new technologies were explored to understand the processing feasibility and obtain estimated costs.
Solvent process – A very common method of oil extraction the use of chemical solvents. The Soxhlet unit is a laboratory apparatus that can extract oils from dried algae through repeated washing, or reflux, with an organic solvent such as hexane or petroleum ether.119 One contractor explored its potential for algal oil extraction commercialization. Figure 102 shows the laboratory Soxhlet apparatus (left) and the results of how many washings or refluxes were required to extract the oil from a single cell, thin wall, type of algal culture. Other algae species, such as nanochloropsis, were also evaluated and exhibited similar results for the required number of refluxes to achieve maximum oil extraction; about 6. Using these reflux results, an estimate of the extraction cost was formulated.
96

Reflux 1Reflux 2
Reflux 3Reflux 4
Reflux 5Reflux 6
Reflux 7Reflux 8
Reflux 12Reflux 16
Reflux 20
0.00%5.00%
10.00%15.00%20.00%25.00%30.00%35.00%40.00%45.00%50.00%
% o
f dry
wei
ght
Figure 102. Soxhlet oil extraction hardware was utilized to gather data on algal
oil.121
In order to estimate the costs for solvent extraction, a current commercial process for extraction of vegetable oil was used as the baseline assumption. As shown in the left part of Figure 103, every section of the commercial extractor has a drain tray to catch the solvent that has percolated through that section. The contents of this tray are then pumped to the top of the extractor and used in the next extractor stage. The right part of Figure 103 shows the study results for both Soy and Algae. The plot shows two parameters, Qf which represents the fraction of the oil that remains in the solid at the extractor outlet (i.e., oil lost with the solid), and Cu, which is the concentration of oil in the solvent at the reactor outlet. The algae solid flow rate through the baseline extractor was varied from 0.5-50 kg/s. The solvent becomes saturated at 30% oil content. This type of process was estimated to cost $0.135/US gallon of oil extracted.
97

Solvent Inlet
Solvent Collection and Recycle to Top Solvent
Outlet
Raw Solid Inlet
Spent Solid Outlet
Qa
Qt
Qd
Mn
Qs
QP
Qs
Qf
0
0.5
1
1.5
2
2.5
3
3.5
0 5 10 15 20 25
Algal mass flow rate [kg s-1]
Oil
outle
t flo
w ra
te [k
g s-
1]
Algae
Soybean
Figure 103. Using data obtained in Figure 102, a commercial extraction
process120 was estimated to cost $0.135/gallon of algae oil.121
The value of this technique is that it is a proven technology already in use and that the solvent is reused for each cycle. The disadvantage is that the algae biomass needs to be dried, which can be a substantial energy cost. Microwave Assisted Extraction Process – A prototype microwave apparatus for oil extraction was assembled under contract (Figure 104.) Preliminary tests with dried algal biomass suggest that the microwave-assisted extraction may considerably reduce the extraction time and solvent use over conventional solvent-based extraction methods. Next steps would be to conduct quantitative and comparative assessments of the microwave-assisted extraction process versus conventional solvent extraction methods (see above) with respect to: a) quantity of solvent used, b) extraction time per batch, c) the number of batch extraction cycles, and d) oil analysis.
- Figure 104. A prototype microwave oil assist extraction process was developed
to reduce production costs.u
u Photo provided by Q. Hu, Tempe, AZ, 2009
98
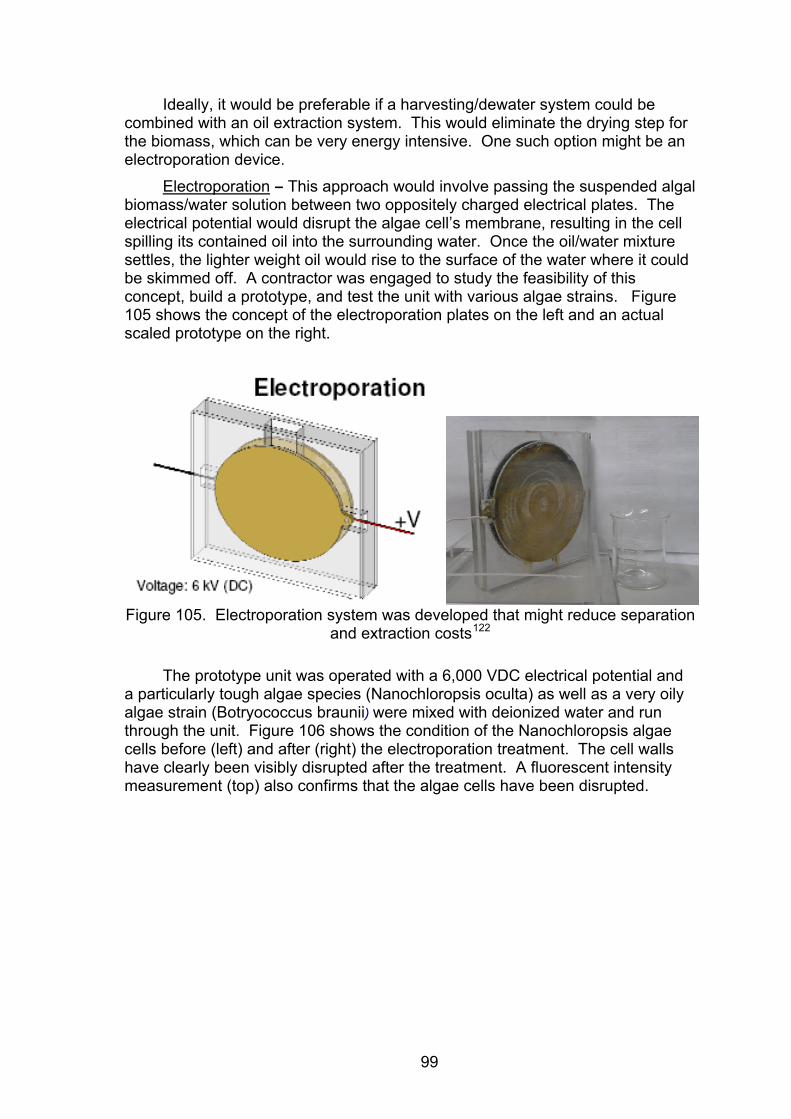
Ideally, it would be preferable if a harvesting/dewater system could be combined with an oil extraction system. This would eliminate the drying step for the biomass, which can be very energy intensive. One such option might be an electroporation device.
Electroporation – This approach would involve passing the suspended algal biomass/water solution between two oppositely charged electrical plates. The electrical potential would disrupt the algae cell’s membrane, resulting in the cell spilling its contained oil into the surrounding water. Once the oil/water mixture settles, the lighter weight oil would rise to the surface of the water where it could be skimmed off. A contractor was engaged to study the feasibility of this concept, build a prototype, and test the unit with various algae strains. Figure 105 shows the concept of the electroporation plates on the left and an actual scaled prototype on the right.
Figure 105. Electroporation system was developed that might reduce separation
and extraction costs122
The prototype unit was operated with a 6,000 VDC electrical potential and a particularly tough algae species (Nanochloropsis oculta) as well as a very oily algae strain (Botryococcus braunii) were mixed with deionized water and run through the unit. Figure 106 shows the condition of the Nanochloropsis algae cells before (left) and after (right) the electroporation treatment. The cell walls have clearly been visibly disrupted after the treatment. A fluorescent intensity measurement (top) also confirms that the algae cells have been disrupted.
99

Nannochloroposis oculata Before After Electroporation Treatment
Figure 106. Algal cells show disruption after electroporation process122
A test was re-run with an improved second generation electroporation device that had liquid media (Eshreibers) with higher conductivity in order to assess the device’s suitability to operate in liquids that would be similar to that found in-service. Results were very similar to the above.
Supercritical extraction process – This is a process where a gas (typically CO2) is cooled and compressed (~50 bar) to bring the gas to a supercritical state where it can then be used to wash oil from a host media. The CO2 is then expanded back into a gas, and the oil remains. It is a well known approach to extracting precious oils. The diagram in Figure 107 shows such a supercritical system for algal biomass.
http://en.wikipedia.org/wiki/File:SFEschematic.jpg
Algal flakes in cell
Algal Oil Collection
Figure 107. A supercritical oil extraction system can be used to extract algae oil.
100

The disadvantage of such a system is that bringing the CO2 to supercritical state is very energy intensive. In addition, the pressure vessel where the media (algal flakes) are introduced to the supercritical fluid will tend to be expensive because of the high pressures involved. Another disadvantage is that the algal biomass needs to be thoroughly dried.
However, others have proposed that a supercritical extraction system could be built that used the algal water for the supercritical fluid. An algal/water mixture would be pressurized and heated. After this process, the effluent would be depressurized into a holding tank. The algal biomass would then separate from the water and form a paste which would settle on the bottom an accumulation tank where it could be easily harvested. The algal paste could then be run through a solvent extraction system to extract the oil. The operating and capital cost of this system was undetermined. However, due to the high pressures and temperatures of the supercritical system, as well as the costs of the subsequent solvent extraction process, it is thought that such a system might push the ultimate cost of the algal oil beyond reasonable levels for biofuel.
Algal Growing System Demonstrations The construction and operation small scale algae growing systems will help
in understanding all of the challenges posed by a commercial system. Therefore, three projects were investigated. These included the design, build and demonstration of various algal growing systems. It also included dewatering and oil extraction technology demonstrations. The first demonstration involved a contract with a small private company to demonstrate the entire algal growing, harvesting and oil extraction process. The second project was solely a collaborative project where a private company would supply algal oil and cost data from their already developed demonstration system to Boeing for chemical analysis and scale up cost estimates. The third was collaboration with a large commercial electric power company.
First algal demonstration – This startup company was to evaluate the feasibility of growing algal biomass in small scale facilities in Eastern Washington, which has sufficient sunlight to address the photosynthetic needs of the algal cultures. Two demonstration sites were undertaken; an abandoned agricultural waste water facility in Moxie, WA and an operating coal-fired powerplant in Boardman, WA. Figure 108 shows the Moxie facility. This facility was originally designed to remove excess nutrients contained in agricultural wastewater runoff before the water could be discharged into a nearby stream. The facility (Figure 108) consists of a small raceway pond with paddle wheel, a nutrient-rich source of free water, a lab building and additional land that could be used to construct additional raceway ponds. The lab contains a UV system that could be used to assure that invading organisms or species from the agricultural water are sterilized prior to introduction into the algae pond. At this facility, several strains of algae were grown in small containers (lower portion of the below figure) with waste water and atmospheric CO2 to evaluate the productivity of various strains.
101

Lab Building
Growing Ponds
Growing Ponds
Raceway Pond
Figure 108. An algal biomass demonstration was performed from a
decommissioned waste water plant.112
Several local unidentified varieties of algae (i.e. UN1, PF1, PF2, and EG) were gathered and grown in these ponds. In addition, known control specimens, such as Chlorella and Ankistrodesmus, were selected and grown in identical conditions at the demonstration site. The results of these field tests were similar to the results obtained in the controlled laboratory conditions as was shown in Figure 86. Some of the more promising varieties that were identified at the Moxie facility were later grown at the Boardman facility which used flue gas CO2 to increase the productivity of the algal biomass growth (Figure 88.) This portion of the Boardman demonstration should be complete by mid-2010. Algae oil was extracted and analyzed.
The second company engaged in this study was a commercial alga grower where Boeing and the company would collaborate to evaluate the costs of an already built prototype flue gas algal biomass production system.
The collaborator’s main business for several years has been to grow Dunaliella algal for the health food industry. A Dunaliella bardawil algal growing system for production of beta-carotene food supplement was established in the 1980s. This ten hectare farm uses open raceway ponds, paddle wheel mixers, and high-tech harvesting/drying techniques to produce a dry algal biomass powder with high natural beta-carotene content for export to the Far East (Figure 109).
102

Figure 109. A commercial algae company was engaged to evaluate algal
biomass growing and processing costs.
With this experience in hand, a subsidiary company was created in collaboration with an electric utility company to build and demonstrate a 0.05 hectare (0.1 acre) algal growing plant using flue-gas from a coal-burning electric power plant to supply the needed CO2. The algal biomass production was about 25-30 ton/acre-year (~60-70 metric tons of biomass dry weight/hectare-year) with a ~25% lipid content. Algal productivity as well as capital and operating costs were scaled up from this operation to assess the economic feasibility of a large scale algal oil production system and are discussed in section 4.3.2 of this report. 4.1.7 Biofuel Flight Demonstration
Four flight demonstrations were performed with various airlines, engine companies, biofuels and feedstocks. In every flight demonstration, no airplane performance anomalies were observed. Figure 110 shows each of the partners that were engaged in the flight demonstrations.
The first flight demonstration was performed on 28 February, 2008 with Virgin Atlantic Airways on a Boeing 747-400 aircraft equipped with GE CF6 engines. The FAME biofuel was manufactured by Imperium Renewables from a coconut oil base.
The remaining flight demonstrations used a bio-SPK fuel manufactured by UOP from various bio-oil sources listed in the below figure. Air New Zealand and JAL flight demonstrations were performed with Boeing 747 aircraft while the Continental airways flight was performed with a Boeing 737-800 aircraft.
103

Coconut &Babassu
20% bio contentFeb 28, 2008
50% JatrophaDec 30, 2008
47.5% Jatropha2.5% AlgaeJan 7, 2009
42% Camelina~8% Jatropha/Algae
Jan 30, 2009
Figure 110. Worked with several OEMs to flight demonstrate biojet fuel.
For the VAA flight demonstration, twelve 55 US gallon drums of biojet FAME fuel were shipped from the Imperium facility in Seattle (Figure 111) via air freight to VAA’s facility at London Heathrow airport and stored in a specially arranged, sealed hanger facility (required by airport authority.)
Figure 111. First flight demonstration used biofuel developed by Imperium
renewables.
A 20% FAME biojet/80% Jet-A1 fuel blend was filled via the over wing filling port into tank #4 and run in engine #4 on a 45 minute flight from London Heathrow airport to Schiphol Amsterdam airport. Due to the short duration of the flight, the maximum cruising altitude reached was 28,000 ft.
104
The Boeing and the London Heathrow (LHR) refueling teams constructed a quality test procedure that should be performed on the biofuel blend prior to the ground and flight demonstration as shown in the table below.
Table 7. Biofuel blend tests required before VAA flight demonstration 1) A visual examination of the fuel per Part III of the IATA Guidance Material for Aviation
Turbine Fuels Specification or Standards For Jet Fuel Quality Control at Airports, ATA 103; “white bucket test”
Acceptance: The fuel should have a rating of “Clear and Bright.” A haze is acceptable.
2) A free water test using one of the tests identified in the IATA or ATA documents (i.e. Shell Water detection kit, Velcon Hydrokit, etc.).
Acceptance: The fuel should have less than 30 ppm of free water. Free water up to 400 ppm is acceptable.
3) Freezing point per ASTM D1655.
Acceptance: The fuel should have a freezing point of -40 C or lower. However, because this is a short flight, freezing point up to -30 C is acceptable.
4) Flash point per ASTM D1655.
Acceptance: The fuel should have a flash point of 38 C or greater. Aircraft are approved for TS-1 fuel so flash point as low as 28 C is acceptable.
5) Density per ASTM D1655
Acceptance: The fuel should have a density between 775 to 840 kg/m3
Contingency: The above property test results that do not meet minimum requirements or are outside the acceptance criteria will be assessed by the onsite Boeing and GE representatives with consultation with their company technical people. They have ultimate authority to accept or reject the fuel for the flight demo.
6) Other laboratory fuel testing to be conducted will be to send a fuel sample out for laboratory testing per issue 22 of AVIATION FUEL QUALITY REQUIREMENTS FOR JOINTLY OPERATED SYSTEMS (AFQRJOS) These are the normal fuel property tests conducted by refinery and pipeline companies for release of petroleum jet fuel. The specific tests and test methods are identified in AFQRJOS.
Acceptance: The results from the aboratory tests will not be used in acceptance or rejection of the blended biojet fuel and are being taken for documentation purposes
The fuel team at LHR supplied the Jet-A1 fuel, performed the fuel blending,
conducted standard fuel testing, and refueled the aircraft. Two days before the flight demonstration, the 12 drums (approximately 2,350 litres) of neat Imperium biofuel were transferred to the fuel tanker (i.e. bouser) and then 2,482 US gallons (9,400 litres) of Jet A-1 were added. This was then recirculated to ensure a fully mixed 20% biojet/80% Jet A-1 blend (3,104 US Gal or 11,750 litres in total.) Samples of the biofuel/Jet A-1 fuel blend were drawn off by the fuel team for retention and analysis. Prior to refueling the aircraft, the tanker underwent standard preflight fuel checks and results were:
105

Test 1 - Visual Test - Clear & Bright = Pass Test 2 - Free Water Test = Pass Test 3 - Freezing Point - Three samples tested Sample 1 = -32.7 deg C Sample 2 = -32.4 deg C Sample 3 = -32.9 deg C Average = -32.7 deg C = Pass Test 4 - Flash Point = 44 Deg C = Pass Test 5 - Density = 814.3kg/m3 @15 deg C = Pass
A full AFQRJOS Check List series of fuel tests was concurrently carried out at the fuels laboratory and the full results were available just prior to the flight demonstration.
Although the FAME biojet fuel blend was previously achieving a -52C freezepoint in laboratory testing, the fuel blend at the ground test was then showing only a -33C freezepoint when using the standard field test procedures. This point did not meet standard freezepoint levels of -40C for ASTM D 1655 Jet-A fuel. Fortunately, it was previously determined by the Boeing team that for the short duration of the demonstration flight, the freezepoint requirement could be relaxed to -30C. The laboratory test results later confirmed the fuel was indeed achieving a -51C freezepoint. This discrepancy of achieving two different test results when using two different test methods was also observed in the Boeing fuels lab, and so it was determined that this phenomenon was also taking place between the BP fuel field tests and the Sunbury laboratory tests. Thus, the fuel was meeting all requirements when using the more laborious fuel test methods.
13,781 lb (6,250 kg) total biofuel blend was loaded into tank #4 for the ground tests on the day before the flight demonstration. After the fuel was loaded, manual dipstick readings were taken to verify the fuel quantity with the airplane’s Fuel Quantity Indicator System (FQIS). A discrepancy was then found in the FQIS system that was recording an erroneous amount of fuel that did not agree with the actual fuel quantity that was loaded into the aircraft. It was determined that the dielectric value for the Imperium FAME fuel, which somehow had not been performed on time in the Boeing laboratory testing process, was outside the normal range of values for the aircraft fuel indicator system in order for it to record the fuel quantity correctly (Figure 112.) However, as the CF6 engine does not use this measurement in its fuel metering system, it was determined that this out-of-range condition would not adversely affect the operation of the engine.
100% US Oil Jet A Kerosene: DE @ 60F (+/- 0.0005) = 2.0999 80/20% US Oil Jet A Kerosene / Imperium Biofuel 0379: DE @ 60F (+/- 0.0005) = 2.4125
Figure 112. Dielectric value for the Imperium FAME differed from Jet-A
106
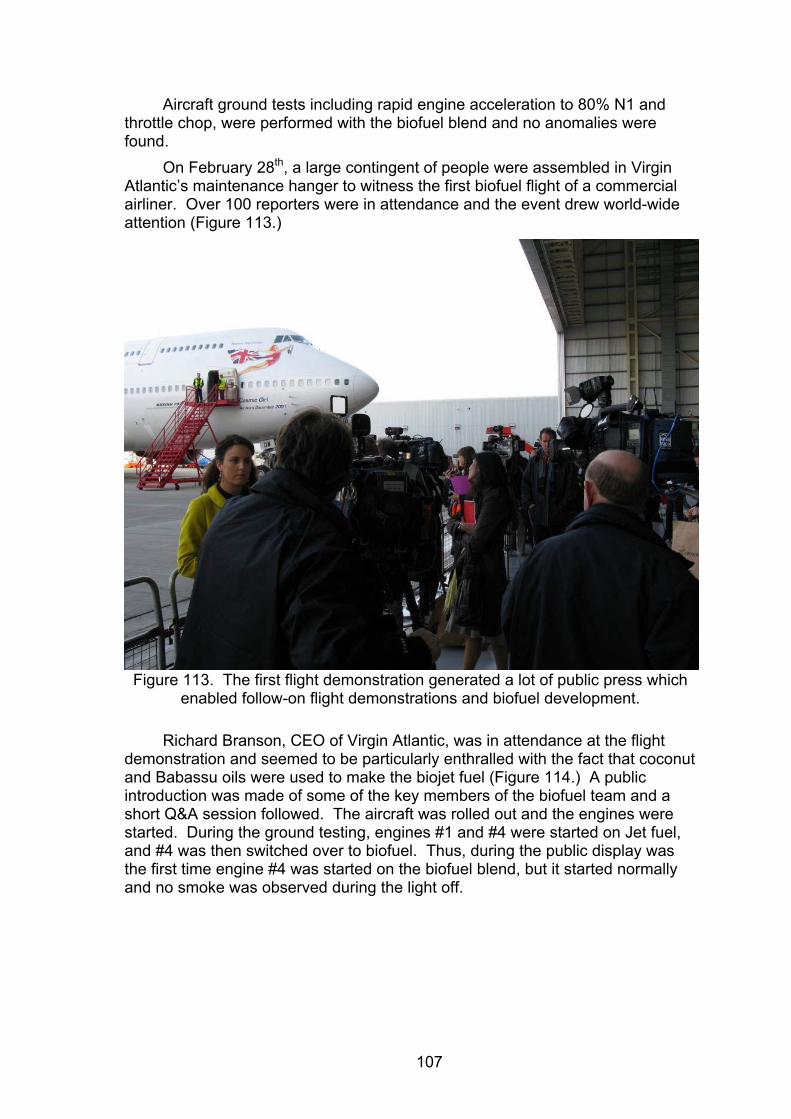
Aircraft ground tests including rapid engine acceleration to 80% N1 and throttle chop, were performed with the biofuel blend and no anomalies were found.
On February 28th, a large contingent of people were assembled in Virgin Atlantic’s maintenance hanger to witness the first biofuel flight of a commercial airliner. Over 100 reporters were in attendance and the event drew world-wide attention (Figure 113.)
Figure 113. The first flight demonstration generated a lot of public press which
enabled follow-on flight demonstrations and biofuel development.
Richard Branson, CEO of Virgin Atlantic, was in attendance at the flight demonstration and seemed to be particularly enthralled with the fact that coconut and Babassu oils were used to make the biojet fuel (Figure 114.) A public introduction was made of some of the key members of the biofuel team and a short Q&A session followed. The aircraft was rolled out and the engines were started. During the ground testing, engines #1 and #4 were started on Jet fuel, and #4 was then switched over to biofuel. Thus, during the public display was the first time engine #4 was started on the biofuel blend, but it started normally and no smoke was observed during the light off.
107
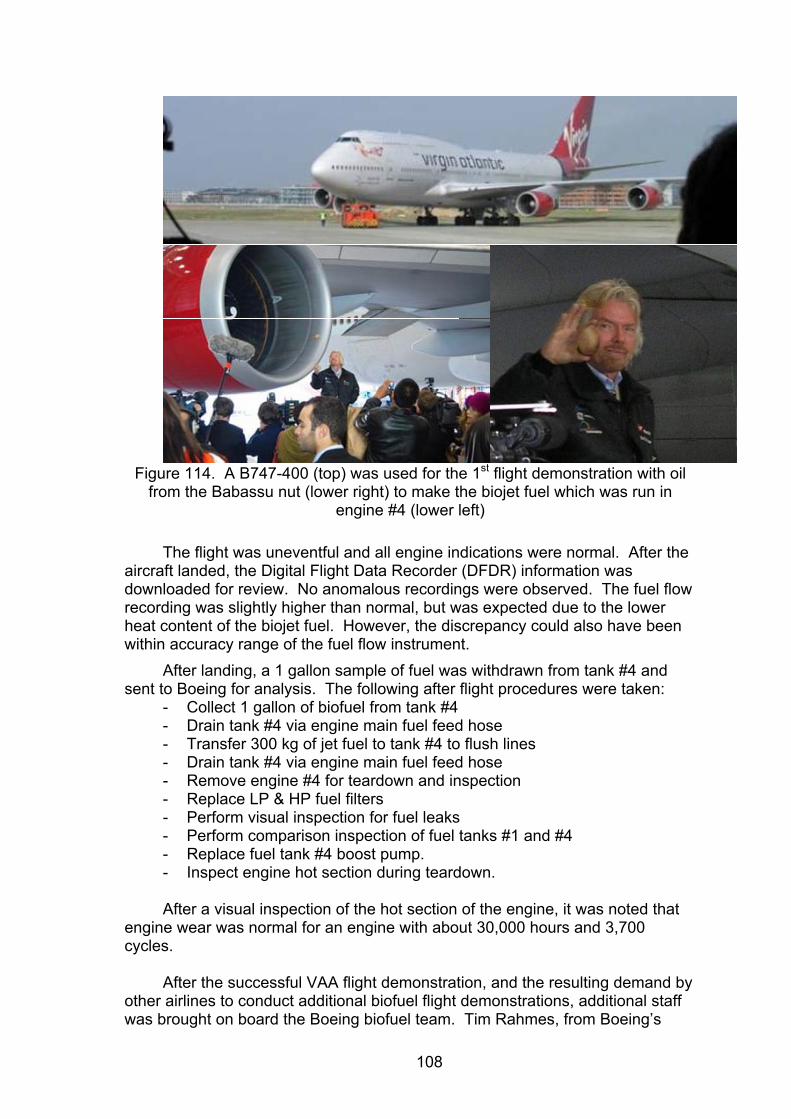
Figure 114. A B747-400 (top) was used for the 1st flight demonstration with oil
from the Babassu nut (lower right) to make the biojet fuel which was run in engine #4 (lower left)
The flight was uneventful and all engine indications were normal. After the aircraft landed, the Digital Flight Data Recorder (DFDR) information was downloaded for review. No anomalous recordings were observed. The fuel flow recording was slightly higher than normal, but was expected due to the lower heat content of the biojet fuel. However, the discrepancy could also have been within accuracy range of the fuel flow instrument.
After landing, a 1 gallon sample of fuel was withdrawn from tank #4 and sent to Boeing for analysis. The following after flight procedures were taken:
- Collect 1 gallon of biofuel from tank #4 - Drain tank #4 via engine main fuel feed hose - Transfer 300 kg of jet fuel to tank #4 to flush lines - Drain tank #4 via engine main fuel feed hose - Remove engine #4 for teardown and inspection - Replace LP & HP fuel filters - Perform visual inspection for fuel leaks - Perform comparison inspection of fuel tanks #1 and #4 - Replace fuel tank #4 boost pump. - Inspect engine hot section during teardown. After a visual inspection of the hot section of the engine, it was noted that
engine wear was normal for an engine with about 30,000 hours and 3,700 cycles.
After the successful VAA flight demonstration, and the resulting demand by
other airlines to conduct additional biofuel flight demonstrations, additional staff was brought on board the Boeing biofuel team. Tim Rahmes, from Boeing’s
108

emissions group, took the lead in performing the follow-on flight demonstrations with Air New Zealand, JAL and Continental Airlines.
Three follow-on flight demonstrations (Figure 115) on the UOP bio-SPK
fuel were performed and no aircraft engine performance issues were noted. The only variables of note were that UOP fuel’s dielectric properties also resulted in a slightly skewed reading on the airplane’s FQIS and that the fuel flow readings in the aircraft indicated a slightly lower fuel flow reading. The lower fuel flow reading was because the bio-SPK fuel has a higher energy density (more BTU/lb fuel) than petroleum jet fuel and so this is to be expected. The FQIS reading will be within tolerance when biofuel ratios of 50/50 or less are used. For higher biofuel ratios, an aircraft software change to the FQIS can resolve the issue.
Figure 115. Subsequent flight demonstrations were led by Tim Rahmes (BCA)
with Air New Zealand (upper left) Continental (upper right) and JAL (lower)
More detail about the 3 follow-on flight demonstrations can be found in the AIAA paper 2009-7002 (Tim. E. Rahmes, 2009)
4.2 Sustainability
In order for a renewable fuel to be considered sustainable, it should be able to be produced for an indefinite period without damaging the environment, or without depleting a resource. This involves determining the amount of renewable fuel that could be continuously produced, understanding possible adverse environmental impacts on the ecosystem by performing a quantitative analysis of this impact over the entire life cycle of the biofuel, as well as considering a multitude of other social/economic factors such as making sure the biofuel doesn’t displace food production123. A more detailed assessment of all
109

the issues involved in establishing the sustainability of biofuels is addressed by the “Roundtable on Sustainable Biofuels”124, the AFRL “rules & tools” guidance document125 as well as others who are involved in the LCA community.126 4.2.1 Availability
One of the most important factors to consider in the scale-up of commercial biojet fuel production is the amount of bio-oil that can be produced from feedstocks without adversely impacting fresh water supplies, productive farmland or food production.
The US and Brazil are the two largest producers of biofuel (Figure 116.) In the US, ethanol is able to supply 2.85% of the gasoline needs while biodiesel supplies 0.21% of the diesel market needs30.
Figure 116. The US and Brazil are the largest producers of biofuels.
Unfortunately, many countries would be unable to grow sufficient fuel feedstock to produce enough biofuel to supply the country’s energy needs. When considering the present first-generation feedstocks (e.g. soy) that are typically grown on farmland, biofuels are not capable of supplying a large percentage of fuel without displacing human food production123. Thus, conventional feedstocks such as soybeans and rapeseed may limit the scale up of biojet fuel127. For example, in 2004, the US commercial aircraft fleet used ~13.6B US gallons (51.5B Litres) of jet fuel. The use of a 15% biojet and 85% Jet-A blend in the U.S. domestic commercial aircraft fleet would have required more than 2.04B US gallons (7.7B litres) of biojet fuel. Considering that soy’s yield is about 40 bushel/acre128 @ 1.5 gal bio-fuel/bushel or 60 gal/acre, the production of this amount of fuel would require 34 million acres (13.8M hectares) of land, which is about the size of the state of Florida or 10% of all agricultural farmland available in the US (349M acres.) A similar situation exists in other parts of the world where energy demands by far outstrip the ability to produce
110

the required amount of biofeedstock129. Thus, other feedstocks will need to be considered.
One promising next generation feedstock is algal biomass which has been evaluated by the US DOE. The peak output from this feedstock was projected under laboratory conditions to produce up to 12.6k gallons/acre/year of bioderived oil.130 Although the theoretical maximum is 38k gal/ac/yr (354,000 ltr/ha/yr), more typical field cases range from 4.4k–5.7k gal/ac/yr (40,700–53,200 ltr/ha/yr) of unrefined oil.131 Commercial mass production in open ponds may more likely be in the neighborhood of 2k gal/ac/yr, which is about 33 times more oil than a crop of soybeans.
In 2004, the world’s commercial aviation fleet used 85B gallons (322B Litres) of jet fuel. At 60 gallons/acre yield of soy, 1,421M acres (575M hectares or 5.75 million sq km) of land would be required to grow that much bio-oil, which is about the size of Europe. Assuming a future optimistic algal oil yield of 10K gal/ac/yr (94,000 ltr/ha/yr), a land area of 8.46M acres (34,250 sq km or 3.4 million hectares) would be required … about the size of Belgium or Amsterdam (Figure 117.)
= 322 billion litres of biojet fuel(85 billion gallons)
Algae94,000 ltr/hectare
AlgaeAlgae94,000 ltr/hectare94,000 ltr/hectare
Soybeans560 ltr/hectare
SoybeansSoybeans560 ltr/hectare560 ltr/hectare
Figure 117. To provide the world’s commercial aviation fleet with biofuel in 2004,
would require an area the size of Europe if soy was used, but only the size of Belgium if algae was used.
Every region throughout the world will have specific solutions tailored to their climate, land and resource availability.
For a few counties that have lower oil demand and more arable land, such as Brazil, the answer could be different. The United States uses about 9.5 times more oil than Brazil, a country about the size of US and with 1/3 the arable land. Since the last energy crisis of the early 80’s, Brazil has emphasized ethanol fuel development. By using 26% of their arable land to grow sugarcane (at 4.33
111

tones/hectare) for ethanol, Brazil has the bio-potential to produce all their motor-fuel needs, as shown in Figure 118. Using nearly 2.1M bbl/day of oil, with a total annual energy use of 9.8 Quad, Brazil also has the bio-potential to become energy independent and the first to become CO2 neutral.
Figure 118. Brazil has sufficient arable land to meet ethanol-motor-fuel
replacement demands. Another sustainable solution that could be applied to biodiesel or biojet fuel
production might be to harvest oilseed nuts obtained from castor plants or the native Brazilian palm tree called “Babassu.” The Babassu tree grows best in native agricultural settings in South America but is much less productive when placed in monoculture, mass production systems.132 Therefore, it is conceivable that commercialization of these trees in native settings could actually prevent deforestation. For lands that have already experienced deforestation to create grazing land or farm land, the agricultural productivity of these soils tends to be poor and so they can sustain farm production only for a few years. These unproductive lands could be returned to productive use by planting Castor (or Jatropha) to prevent soil erosion, enhance soil condition by returning organic material, and provides income to local farmers.
Although a few countries, such as Ukraine, Africa and Brazil, have relatively low oil demands and large amounts of arable land, most industrialized countries would be able to replace only a small percentage of their oil needs with biofuels derived from first generation feedstocks.
Land use changes from native settings can have drastic adverse environmental impacts. Making additional land available to produce biomass for biojet fuel must not result in a negative environmental impact if it is to be considered environmentally “sustainable.” 4.2.2 Environmental Factors For a long-term energy solution, a fuel should be renewable and sustainable. Fuels generated from a renewable energy source, such as solar, wind, or hydroelectric, are considered sustainable. Biofuels that are derived from plants may be considered sustainable if a sufficient quantity of crops can be continuously grown to support the demand for fuel133. Synthetic fuels derived from nonrenewable energy sources, such as coal or natural gas, are not considered sustainable. Global warming issues with synthetic fuel would ultimately also make it unsustainable. Depending on land use changes and land availability, biofuels that are produced from first generation feedstocks ultimately will be unsustainable on a large scale.
A recent trend has been to develop soybean crops as feedstock for oil-based biofuels. Even if this feedstock were not edible, land use changes to produce additional farmland for soy can have a devastating environmental effect. For example, in order to create sufficient farm land capacities, deforestation, using slash-and-burn practices, can take an extreme environmental toll. The resulting CO2 emissions from deforestation are anticipated to exacerbate global warming issues. Thus, great care has to be taken to assure that biofeedstocks are sustainable and will not cause new anthropogenic issues through deforestation as shown in Figure 119.
112

Slash and burn deforestation
Global CO2 emissions that cause global warming
Source: www.Nature.org, 2007
Petroleum31%
Natural Gas15%
Coal26%
Deforestation25%
Other3%
Figure 119. Biofuels must not encourage deforestation as this is a major
contributor to global warming. Although Brazil has great potential to become a major biomass producer, it
is also facing a huge challenge in that it is experiencing the highest amount of deforestation in the world (Figure 120.)
*Although mostly due to cattle ranching in Brazil
*
Figure 120. Deforestation is a continuing problem, especially in Brazil and
Indonesia134
Much of the illegal deforestation in Brazil is occurring in the inland portion of the country that is effectively unpoliced and difficult to monitor. The highest
113

rate of deforestation is occurring in the state of Mato Grosso, which has a preferable climate for grazing land and farming over the wetter Amazon region. Figure 121 shows the ratio of land that has been deforested. By 2007, approximately 224,000 square kilometers of land had been deforested in the Northwest part of Brazil alone.
224,058 sq. kmTOTAL
3411Tocantins2626Roraima
32439Rondônia69570Pará86962Mato Grosso11164Maranhão10848Amazonas
168Amapá6867Acre
(km²)
Area Deforeste
dState
224,058 sq. kmTOTAL
3411Tocantins2626Roraima
32439Rondônia69570Pará86962Mato Grosso11164Maranhão10848Amazonas
168Amapá6867Acre
(km²)
Area Deforeste
dState
38.8%
3%
<1%
5% 5%31%
15%
1%
2%
Figure 121. In Brazil, the states of Mato Grosso and Para are the areas of
highest deforestation, not the Amazon as is widely believed.135
The four flight demonstrations that were performed on biofuel to demonstrate reduced greenhouse gas emissions underscores the importance the airline industry is placing on the environmental impact of global climate change. Therefore, it is imperative that increases in biomass production, to satisfy aviation needs, not encourage further deforestation. This could offset, and indeed create a worse situation, for the environmental benefits of biofuels. A methodical study of the environmental impacts, over the entire life cycle of the biofuel production process, will provide an informed assessment of any environmental benefits that biofuels have to offer. 4.2.3 Life Cycle Assessment (LCA)
A LCA study is a systematic set of procedures for compiling and examining the inputs and outputs of materials and energy and the associated environmental impacts directly attributable to the functioning of a product or service system throughout its life cycle136. For aircraft alternate fuels, we will operate on the assumption that it is the life-cycle evaluation of the greenhouse gas emissions of transportation fuels, which means assessing all emissions from the farmer’s field to the aircraft’s fuel tank and from tank to the turbine engine’s exhaust. This scope of emission assessment is frequently referred to as a “well-to-wheels”, or in the case of aviation, a “well-to-wake” analysis.
The LCA can be thought of as falling into three levels, listed in order of decreasing level of comprehensiveness, data quality, level of effort requirement, and confidence in analysis results137. Typically, the degree of resolution for analysis falls into three levels:
114
Level I - Comprehensive Level II - Standard Level III - Screening
There is some variability in LCA methodology and terminology, but the most widely accepted definition has been laid out by the International Standards Organization (ISO 14000) series of standards138 that includes:
Step 1: Determine the goal and scope of the assessment. Step 2: Develop an inventory of the greenhouse gas emissions throughout the life cycle system. Step 3: Assess the climate change impacts of the life cycle inventory. Step 4: Interpret the LCA results. The National Research Council (NRC) in 2007 recommended that the LCA
model development, documentation, and evaluation processes include: • Peer reviews • Communication of model uncertainty • The effective integration of models and measurements • Retrospective analyses of models • Assessment of the balance between the levels of detail incorporated into
models and the ability to evaluate the performance of these model features (model parsimony)
• Overall model management.
LCA studies are becoming much more important in the selection of alternative fuels. Section 526 of the US Energy Independence and Security Act139 (EISA) of 2007, states that that:
No Federal agency shall enter into a contract for procurement of an alternative or synthetic fuel, including a fuel produced from nonconventional petroleum sources, for any mobility-related use, other than for research or testing, unless the contract specifies that the lifecycle greenhouse gas emissions associated with the production and combustion of the fuel supplied under the contract must, on an ongoing basis, be less than or equal to such emissions from the equivalent conventional fuel produced from conventional petroleum sources.
To meet the specific requirements for aviation fuels, Life Cycle Assessments for both a baseline petroleum Jet-A fuel and the alternative biofuels were developed by subcontractors and collaborators for the various feedstocks shown in Figure 122. Collaborative work was also engaged with one University to perform a level 2 LCA assessment of many types of alternate fuels. Boeing supplied algae feedstock information from other contractors to that University.
115

Algae (Growing only)
Jatropha
Castor
Multi-feedstock Algae(LCA only)
BoeingBoeing
Figure 122. Several Universities were engaged to support biojet fuel LCA
studies
All of the LCA studies commissioned by Boeing compared the Green House Gas (GHG) generated over the life cycle from a bio-fuel against a conventional fossil fuel derived Jet fuel. Figure 123 illustrates the major steps involved in the analysis.
Fertilizer, H2O, CO2
Figure 123. Some typical LCA biofuel pathways to consider140
Three of the most significant impacts that were found in the study was that of land use changes, followed by N2O (Nitrous Oxide) emissions from fertilizers, and water use. Namely, as was discussed previously, the CO2 generated from deforestation to create farmland to grow the feedstock will greatly outweigh any environmental benefits to be gained from biofuel use. Another large impact is that of applying nitrogen-containing fertilizer to the feedstock. Fertilizers tend to outgas nitrous oxide. Nitrogen compounds tend to combine with hydrocarbon compounds and with the addition of sunlight, a resultant formation of ozone-containing smog will be generated in the troposphere which acts as a global warming agent. Although NO2 environmental impact is relatively short lived (on
116

the order of a week) as compared to CO2 (on the order of 100 years) it is a much more potent gas. Figure 124 shows that the Global Warming Potential (GWP) of nitrous oxide is 298 times worse than CO2 over the period of 100 years.
298Nitrous oxide
25Methane
1Carbon dioxide
GWP over 100 yearsGreenhouse Gas
298Nitrous oxide
25Methane
1Carbon dioxide
GWP over 100 yearsGreenhouse Gas
Figure 124. Other gaseous emissions, such as Methane and N2O, also lead to
global warming and are included in LCAs.141
Using feedstock that does not require nitrogen fertilizers would be preferable, but its use is mandatory in agricultural feedstocks if acceptable productivity is to be gained, and so these emissions need to be accounted for in the life cycle. One of the most common LCA tools used in the industry, and is a standard in the US government, is the GREET (Greenhouse Gases, Regulated Emissions, and Energy Use in Transportation) LCA model142. This tool was used in most of the LCA studies in this study.
For the level 3 (screening) algal-derived biojet fuel, an attributional assessment was performed in addition to a consequential assessment. The attributional results assess just the GHG emissions generated from the algal-biofuel process itself. The consequential LCA takes the evaluation a step further and evaluates the implications to other systems. One example might be the effect of using massive amounts of fresh water to grow algal biomass. This would cause a water shortage which might result in the construction of desalination plants which would use electrical power which would produce more CO2 emissions.
In the alga LCA study it was found that the selection of optimal water and CO2 sources can swing a negative environmental result to a positive one. The method of algal biomass processing will also have a large impact, as well as the process used to convert the algal oil into biojet fuel. Figure 125 shows the attributional LCA of an algal-based biojet fuel to be on the order of 66 kg of CO2 produced per mmBTU of fuel produced. However, depending on the consequential impacts to other systems, that value can be as low as a 165kg savings, or as high as a 585kg contribution of CO2 per mmBTU of fuel produced. As algae technology is still rather immature, there are large uncertainties in these estimates. The most important findings were that fresh water must not be used to grow algae, that land use changes are secondary to water issues, and that waste CO2 (e.g. flue gas) should be used to grow the algal biomass.
117

Attributional LCA and Consequential LCA (min & max) per 1 mmBTU of fuel Figure 125. A wide range of CO2 emissions from algae-based biojet fuel could
be expected, depending on the oil and fuel production processes used.143
One University conducted a level 2 (standard) LCA of conventional fossil-based jet fuels as well as F-T fossil fuels, and bio-SPK fuels derived from many sources (Figure 126.) The most important finding in this work was that land use changes have a significant impact on the environmental performance of biofuels. Several land use change scenarios were evaluated for soy, palm, Salicornia and F-T biomass derived fuels. For example, in the case of palm oil derived biofuel, it could have the worst environmental performance of any fuel if it resulted in the conversion of tropical rainforests, or nearly the best environmental performance if no land use changes occurred. Some land use changes would actually be beneficial. In the case of Salicornia, conversion of desert lands into a farmland could help reduce global warming impacts and provide the lowest carbon footprint of any fuel evaluated.
118

Soy HRJ Pathway Scenarios
LUC-S0 No land use change
LUC-S1 Grassland conversion to soybean field
LUC-S2 World wide conversion of non-cropland (Searchinger)
LUC-S3 Tropical rainforest conversion to soybean field
Palm HRJ Pathway Scenarios
LUC-P0 No land use change
LUC-P1 Logged over forest conversion to palm plantation
LUC-P2 Tropical rainforest conversion to palm plantation
LUC-P3 Peatland rainforest conversion to palm plantation
Salicornia SPK Pathway Scenarios
LUC-H0 No land use change
LUC-H1 Desert converted to salicornia cultivation
F-T Biomass Type (BTL and CBTL)
BTL Waste Corn Stover
CBTL Waste Corn Stover
Figure 126. One University interacted with other contractors to perform a multi-
feedstock LCA for biojet fuels.144
Boeing also used the standard GREET model, with its default values, to validate the above findings. Figure 127 shows agreement with the other models in that biojet fuels have the potential to achieve a lower carbon footprint than petroleum Jet-A fuel, and that F-T fuels derived from fossil fuels (esp. coal) will have higher carbon footprints than Jet-A fuel.
1.00
1.15
2.42
1.11
0.16
0.28
0.0 0.5 1.0 1.5 2.0 2.5 3.0
Jet-A
F-T Coal w/Seq.
F-T Coal No Seq.
F-T Natural Gas
F-T Biomass
Bio-Jet
Relative CO2 Emissions 1.0=Jet Fuel from Crude Oil Biojet from Soybeans
F-T Biomass from Woody BiomassResults sensitive to biomass source, co-generation, and other efficiency assumptions (ongoing research and analysis)
Significant Uncertainty Exists for Many of These Processes
- This is an area of ongoing research at Boeing and elsewhere
Figure 127. An internal analysis of biojet fuel yielded similar trends as was seen
in the multi-feedstock LCA145
One of the factors not usually considered in an LCA is the efficiency of use of the biomass, which should be a consideration in the scale up of biofuels. For instance, Figure 126 and Figure 127 show that Biomass To Liquid (BTL) fuels have one of the lowest carbon footprints of all biofuels. However, this
119
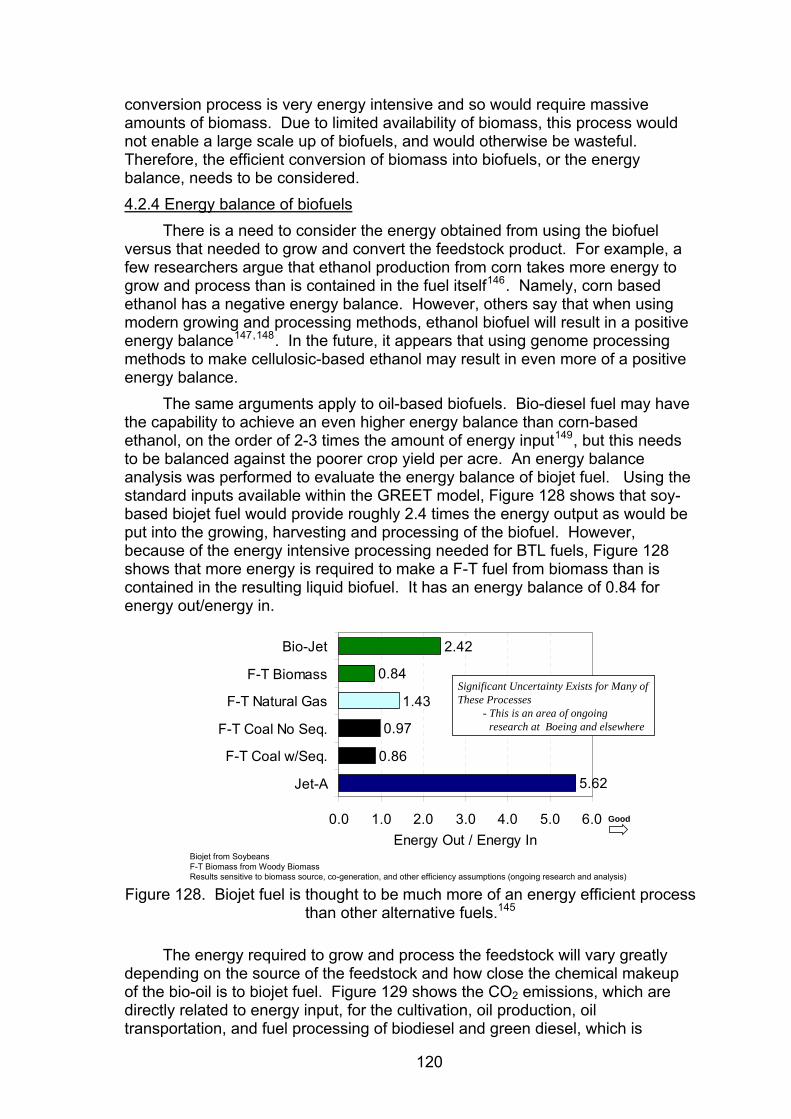
conversion process is very energy intensive and so would require massive amounts of biomass. Due to limited availability of biomass, this process would not enable a large scale up of biofuels, and would otherwise be wasteful. Therefore, the efficient conversion of biomass into biofuels, or the energy balance, needs to be considered. 4.2.4 Energy balance of biofuels
There is a need to consider the energy obtained from using the biofuel versus that needed to grow and convert the feedstock product. For example, a few researchers argue that ethanol production from corn takes more energy to grow and process than is contained in the fuel itself146. Namely, corn based ethanol has a negative energy balance. However, others say that when using modern growing and processing methods, ethanol biofuel will result in a positive energy balance147,148. In the future, it appears that using genome processing methods to make cellulosic-based ethanol may result in even more of a positive energy balance.
The same arguments apply to oil-based biofuels. Bio-diesel fuel may have the capability to achieve an even higher energy balance than corn-based ethanol, on the order of 2-3 times the amount of energy input149, but this needs to be balanced against the poorer crop yield per acre. An energy balance analysis was performed to evaluate the energy balance of biojet fuel. Using the standard inputs available within the GREET model, Figure 128 shows that soy-based biojet fuel would provide roughly 2.4 times the energy output as would be put into the growing, harvesting and processing of the biofuel. However, because of the energy intensive processing needed for BTL fuels, Figure 128 shows that more energy is required to make a F-T fuel from biomass than is contained in the resulting liquid biofuel. It has an energy balance of 0.84 for energy out/energy in.
Biojet from SoybeansF-T Biomass from Woody BiomassResults sensitive to biomass source, co-generation, and other efficiency assumptions (ongoing research and analysis)
5.62
0.86
0.97
1.43
0.84
2.42
0.0 1.0 2.0 3.0 4.0 5.0 6.0
Jet-A
F-T Coal w/Seq.
F-T Coal No Seq.
F-T Natural Gas
F-T Biomass
Bio-Jet
Energy Out / Energy In
Significant Uncertainty Exists for Many of These Processes
- This is an area of ongoing research at Boeing and elsewhere
Good
Figure 128. Biojet fuel is thought to be much more of an energy efficient process
than other alternative fuels.145
The energy required to grow and process the feedstock will vary greatly depending on the source of the feedstock and how close the chemical makeup of the bio-oil is to biojet fuel. Figure 129 shows the CO2 emissions, which are directly related to energy input, for the cultivation, oil production, oil transportation, and fuel processing of biodiesel and green diesel, which is
120

essentially the same as HVO biojet fuel. As most CO2 is produced during the cultivation phase of biofuel, fuels that rely on waste products for the bio-oil, such as tallow, would have very low carbon footprint.
Soybean OilGreen DieselRapeseed OilPalm OilBiogas Combustion
Meaning
SBOGD
RSOPOBC
Acronym
Soybean OilGreen DieselRapeseed OilPalm OilBiogas Combustion
Meaning
SBOGD
RSOPOBC
Acronym
TransportationFuel ProductionOil ProductionCultivation
PetroleumDiesel
RSO Green Diesel
TallowGreen Diesel
POGreenDiesel
SBOBiodiesel
90
gC
O2
eq./M
J
80
70
60
50
40
30
20
10
0PO
GreenDieselw/BC
Figure 129. Processing energy of biojet fuel will vary depending on the
feedstock150
Ignoring the massive capital cost challenges of a Coal Biomass To Liquid (CBTL) processing facility; this fuel may have the possibility to become a candidate for alternative fuel in the future. It has been reported that it only has a slightly higher carbon footprint than algal based biojet fuel (Figure 126) and has a relatively low biomass requirement of 0.09 kg per MJ of fuel produced (Figure 130.) A feedstock such as switchgrass has been shown to produce enough material to make up to 1,000 U.S. gallons of ethanol per acre, dependant upon ambient temperature, irrigation, and fertilizer application151. If the ground transportation sector moves away from IC engines that operate on gasoline/ethanol blends, the corn stover and switchgrass feedstocks used to make ethanol might then become a good feedstock for CBTL or synthetic biology processes to produce alternate jet fuels.
Figure 130 shows that algal-based biojet fuel has the highest potential production of 24,265 ltr/ha/yr and has the lowest biomass needed per MJ of biofuel produced.
121

Figure 130. HVO using algae oil appears to be the most efficient feedstock and
process to make biojet fuel.152
Considering all of the sustainability, environmental and energy efficiency factors, it appears as though algal based biojet fuel offers the best all around solution in the near future to produce massive amounts of biojet fuel.
4.3 Cost/Benefit analysis of biojet fuel
At today’s crude oil prices, biofuels are starting to become cost competitive. Crude oil prices have fluctuated dramatically in the past few years, and with it diesel fuel and jet fuel prices have also fluctuated155. The present biodiesel supply chain is relatively inelastic, and so when fuel prices recently escalated, biofuels also escalated because of increased demand and inability to rapidly increase supply.
Figure 131. Biofuel price trends have followed fossil fuel prices153
122
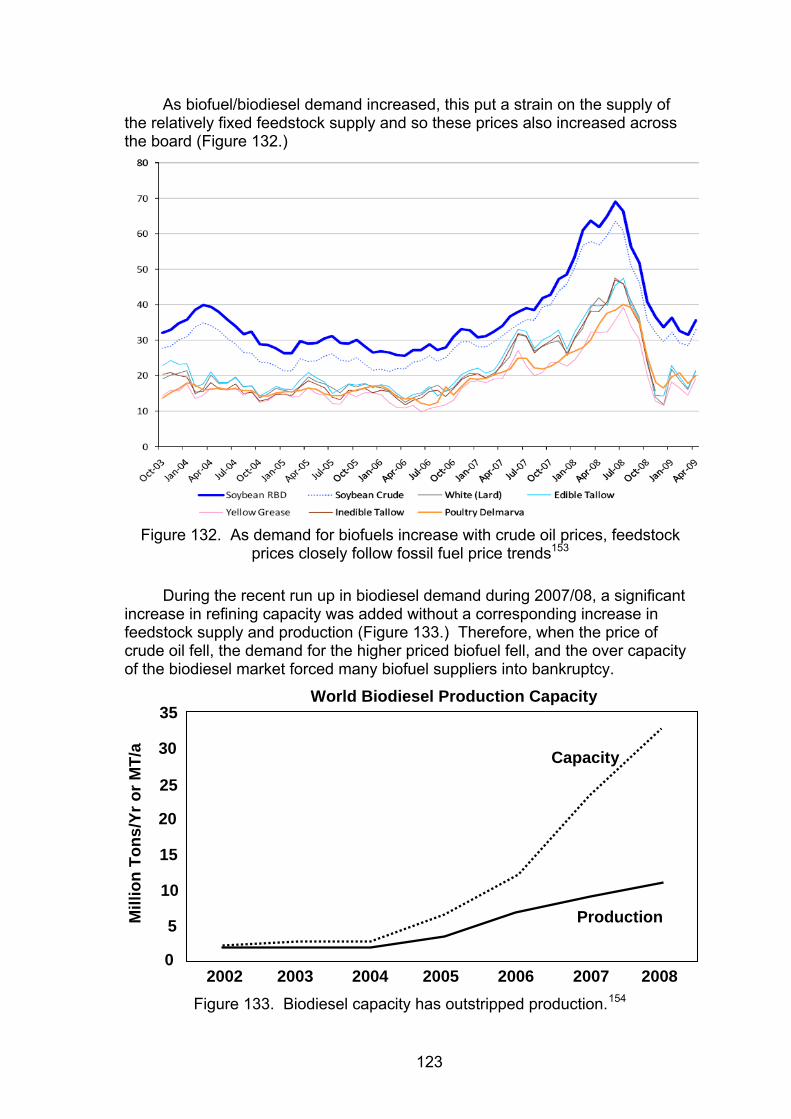
As biofuel/biodiesel demand increased, this put a strain on the supply of the relatively fixed feedstock supply and so these prices also increased across the board (Figure 132.)
Figure 132. As demand for biofuels increase with crude oil prices, feedstock
prices closely follow fossil fuel price trends153
During the recent run up in biodiesel demand during 2007/08, a significant increase in refining capacity was added without a corresponding increase in feedstock supply and production (Figure 133.) Therefore, when the price of crude oil fell, the demand for the higher priced biofuel fell, and the over capacity of the biodiesel market forced many biofuel suppliers into bankruptcy.
Mill
ion
Tons
/Yr o
r MT/
a
2002 2003 2004 2005 2006 2007 2008
35
30
25
20
15
10
5
0
Production
Capacity
World Biodiesel Production Capacity
Figure 133. Biodiesel capacity has outstripped production.154
123

This retraction of the biodiesel market should serve as good experience for the potential biojet fuel market. Namely, biojet feedstocks need to be systematically ramped up so that will be cost competitive with jet fuel prices, and at the same time match biojet fuel production capacity. 4.3.1 Biojet fuel cost estimate
The feedstock cost of biofuel is typically the largest single component of production costs, followed by fuel processing costs. Biodiesel transesterification process costs: It is valuable to know the costs of the biodiesel production process, because it uses the same feedstock as biojet fuel and can therefore be considered a competing industry to biojet fuel. If biodiesel could be made for much less than biojet fuel, it could effectively limit the scale up of biojet fuel production because biodiesel would use up all the available feedstock. For the biodiesel transesterification process, it is estimated that for each gallon, 0.083 kilowatt-hours of electricity and 38,300 BTU of natural gas are used in its production.155 EIA estimates energy costs of 18 cents per gallon in 2004 and 16 cents per gallon in 2005 and 2006.156
NREL provided estimates of other biodiesel production costs. Based on transesterification of oil with methyl alcohol catalyzed by sodium hydroxide, operating expenses were estimated at 31 cents per gallon (in 2002), excluding the cost of the oil or grease and energy155.
The EIA estimates that the capital costs of a new biodiesel plant would amount to $1.04 per annual gallon of capacity. EIA assumes that the plant is financed by equity with an annualized return of 10 percent over 15 years. Treating the hypothetical income stream as an annuity over 15 years, the estimated capital cost is $1.36 million per year, or 13.6 cents per gallon (in 2002) at full output.
Adjusting the above costs by the Consumer Price Index (CPI) to 2009 provides a biodiesel processing cost of $0.789 per US gallon. This does not include the glycerol, which can either cost the biodiesel plant to dispose of, or may provide some cost offset if it is used for power generation or in other industrial processes. This cost will be used for comparison with the biojet hydrotreating process discussed next.
Bio-SPK fuel processing cost estimates: The four major cost factors to consider in hydrotreating bio-oil are: 1) Bio-oil cost, 2) Capital cost, 3) Hydrogen cost, and 4) Relative product value.
The cost of capital is significant for this high-pressure, high-temperature HVO process. Therefore the processing volume is a critical factor to optimize in order to reduce the capital cost per unit processed.
Hydrogen that is consumed in the HVO process is a significant cost. It typically can be generated by steam reforming from byproduct gases. To minimize the cost of the reforming systems and the cost of procured hydrogen, the hydrogen consumption should be efficiently focused on the reactions which provide the product properties of importance, that is, the removal of oxygen atoms and other undesirable contaminants.
124

For a 100K bbl/day hydrotreating facility, total capital costs in 1981 ranged from $527.9 million for the Sun Tech-HRI process for severe hydrorefining, to $691.2 million for another case that incorporated a gas oil hydrocracker157. This equates to $1,125 to $1,642 million in 2009 dollars. Neste oil estimates $43,000/bbl/day capital costs, or $4,300 million for a 100K bbl/day facility158 which is about 3 times higher than the previous estimates in 1981. Still, UOP estimates that capital costs for a 2K bbl/day transesterification biodiesel facility would be higher than for a similarly sized HVO facility (Figure 134.) It is unknown how the capital costs scale with the facility size, but the UOP estimate is significantly less than those estimated by Neste and the earlier studies (H.E. Reif, 1981.)
Figure 134. UOP claims that a biodiesel facility capital costs would be higher
than for a HVO facility159.
Averaging the capital costs from the above 4 sources provides a cost of about $2B for a 100K/bbl/day facility (excluding the low UOP value brings it to $2.4B). Using the same amortized capital cost variable as the previous transesterification capital cost analysis (i.e. 10% over 15 years) brings the capital cost of a $2B HVO facility to $257M per year or about $0.21/gallon (for 300 days/year operation) which is lower than the $0.79/gallon cost estimated for a biodiesel facility. The range could be as low as $0.054/gallon, using the Sun-Tech data, to as high as $0.44/gallon using the Neste estimate. Despite the cost variation, the trend of a lower capital cost/gallon for a HVO facility versus a biodiesel facility agrees with that presented in Figure 134.
Depending on the price of hydrogen, UOP estimates operating costs of a hydrotreating unit to be $0.012 to $0.024 per gallon of product.160 This is not too far from the costs estimated from other sources stating that severe hydrotreating of diesel fuel costs around $0.037 per gallon161.
4.3.2 Estimated feedstock prices
The cost of the bio-oil is typically the largest component in the production costs of biofuel. Therefore, the following section is devoted to these costs.
125

Tallow - One of the lowest cost feedstocks presently is yellow grease (Figure 132,) but its supply is limited, and it has other uses than fuel. For example, yellow grease is used as an animal feed additive and in the production of soaps and detergents. From 1993 to 1998, the average supply of yellow grease in the US was 2.633 billion pounds; enough to make 344 million gallons (22,440 bbl/day) of biodiesel.25 However, EIA estimates that competing uses would limit biodiesel production from yellow grease to 100 million gallons per year (6,523 bbl/day).162 For this reason, tallow is not considered a viable candidate to scale up to the massive quantities of biojet fuel needed in the future.
Camelina - Although Camelina sativa is an ancient crop, there was less independent cost information available, and so cost estimation is an area that could be further validated. However, one commercial entity claims that Camelina could be produced at $.40-$.70 per US gallon less than soybean & palm oil.163 The Montana State University (MSU) Agricultural Research Center conducted a multi-year, multi-species oilseed trial of nine different oilseed crops (sunflower, safflower, soybean, rapeseed, mustard, flax, crambe, canola, and Camelina) and found that Camelina was very promising. Evaluation criteria included: input costs, production costs, harvest costs, and yield. Camelina was found to not always provide the highest yielding oilseed crop but, because it required minimal inputs, it was the most economical crop to produce.164 It was estimated that oil costs would be in the $2.00/US gallon range.165. Other studies also suggest that the production cost for Camelina oil may be substantially lower than many other oil crops such as rapeseed, corn, and soybean.166 As shown in Figure 135, an EU commissioned report also estimated that bio-oil from Camelina would be less expensive to produce than rapeseed oil.
Figure 135. Camelina oil is estimated to cost less to produce than rapeseed oil
in Ireland.167
As tallow, and other attractive near term crops such as Camelina, would only be able to supply a small amount of the needed biofuel, many other low cost feedstocks will be needed around the world.
Other Oil Seed Crops - For several other oilseed crops, the estimated plantation costs, in US dollars per hectare and US $ per kg and gallon of oil, are
126

illustrated in Table 8 for several edible and non-edible crops. The difference in the plantation cost is due to different operating costs required during the plantation process, such as cost of tilling, fertilizers and insecticides. Except for palm oil, the cost of these plantation crops, in terms of $ per kg oil, the non-edible oil crops are lower in cost than the edible oil crops. High requirements on soil nutrient and irrigation system during the cultivation of edible oil crops lead to cost. For Jatropha, the high costs are due to the lack of automated harvesting processes. In the case of palm oil, the low cost is achievable because of the high oil yield of the plant. This allows palm oil to be cost competitive with petroleum. The low costs for Castor and Pongamia are because these two crops require minimal fertilizer and irrigation.
Table 8. Plantation costs of several oil crops 168
Oil crops Plantation cost
(US $/ha)
(US $/kg oil) (US $/gal oil)
Non-edible oil
Jatropha 620 0.39 6.86
Castor 140–160 0.12–0.14 2.12 - 2.46
Pongamia pinnata 310 0.25 4.40
Sea mango (estimated) 360–690 N/A N/A
Edible oil
Soybeanv 615 0.24 4.17
Palm (estimated) 950 0.19 3.34
Rapeseed 336 0.34 5.98
Castor was identified as one of the potentially lowest cost feedstocks that are currently available (Guia, 2008.) This is predicated on the use of modern farming practices. One contractor was engaged to provide a further detailed cost breakdown of this crop. In areas with approximately 450-550 mm rainfall, improved castor varieties are expected to yield 4.5-5 ton seeds/ha. Such plant’s oil productivity represents production costs of $350 per ton of oil, or $1.30 per US gallon.
Halophyte cost estimate – Cost estimates for this feedstock were not produced as some of the feedstocks, such as Euphorbia Tirucalli, were so immature that it was impossible to determine the cost of useable hydrocarbons (if any) from these plants. Other plants, such as Salicornia, lacked hard, quantifiable support data that could be used to form a cost estimate.
Algae oil cost estimate – As algal biomass production is one of the most promising long term feedstocks for biofuel, an estimate was conducted of the
v Soy was re-calculated from original document using 60 gal/acre yields. US $/gallon cost was calculated using a common 7.98 lb/gal oil density.
127

possible costs that would be associated with a large scale commercial algae farm.
Current techniques of growing and harvesting high-value food-grade algae are not economically viable for algal fuel production. Assuming that R&D hurdles are solved (e.g. ability to stably cultivate selected algal strains at high productivity with high-oil content, harvesting by self-flocculating algae strains, simple oil extraction, etc.), it is possible to arrive at algal oil production costs that could be competitive with crude petroleum costs similar to recent (mid-2008) high crude oil prices. Figure 136 presents such a scenario based on extrapolating cost data from prototype algal plants to a very large-scale system, as well as data obtained from prior techno-economic studies.169,170 Figure 136 illustrates the design assumptions necessary to project such low oils costs, including scaling to a 1,000 hectare system to achieve maximum economies of scale, relatively low labor inputs (one person per 8 hectares), and many favorable site specific assumptions, as well as an average (over 330 days per year) productivity of 25 grams/square meter per day of biomass with a 35% lipid content. Although challenging, these are not unreasonable goals given sufficient research gains are achieved.
Assumptions:• 1000 hectares, open ponds, 90%utilization/yr• Algae yield: 25 g/m2/day, 35% lipid• Staff: 1 person/8 hectares, $50K/person/yr• Electricity: $0.125/kwH, 3.6 kwH/hectare• Seawater: $0.01/m3, 300 m3/hectare/day• Freshwater: $0.20/m3, 2.0 m3/hectare/day• Wastewater: free, 16.9 m3/hectare/day• CO2: free (pumping costs are included in electricity usage)• Nutrients: derived from waste water, flue gas & recycled• Co-product value: $100/ton (for methane & power generation)• Cap cost: $10/m2 (ponds, extraction, digester & support equip)• Finance: 9% interest, 30 year loan, 5%/yr depreciation
Estimated costs:• Labor: $ 6.25M/yr• Electricity: $ 3.65M/yr• Water: $ 0.99M/year• Tax, insurance, maintenance & supplies: $ 6.00M/yr• Interest & depreciation: $ 14.00M/yr• Byproduct credit: $<5.40M/yr>• Total Plant Operating Cost $25.5M/yr• Algae cost: $3.69/gallon
Figure 136. Future high production algae oil costs are estimated at $3.69/US gallon for an algal system that produces 3,400 gal/acre/yr
In present algae growing systems, purchased CO2 and nutrients are major operating expenses that would escalate algae oil costs beyond viability for fuel. Therefore, CO2 is assumed to be supplied free of charge from an industrial emitter while nutrients are obtained at no cost via recycling and utilization of
128

municipal wastewaters, animal wastes or similar. Such systems might even receive income from using these waste products, saving the cost of alternative treatment, and thus lower the cost of the algae oil, but this is not included in the present scenario as it would both restrict the location and scale of such a system.
Another major assumption is that the algae would be harvested by a low cost harvesting method, such as spontaneous flocculation-settling mechanism (“bioflocculation”), but its application to specific algal species remains to be demonstrated.
A third important assumption is the beneficial use of by-products. In this model, it is assumed that the residue of the algae biomass after oil extraction (65% of dry weight) is fed into low cost anaerobic digesters to produce methane fuel, which would then be burned to generate electricity, with the residual nutrients recycled back to the algal growth ponds. This is likely the most direct approach to economically utilize the residual biomass as it would make such a system independent of external electricity supplies and would allow for the export of electric power.
Perhaps the most important assumption is that the capital costs for such a 1,000 ha plant would be $100 million, or $100,000 per hectare. Although the pond cost is estimated to be in the $3.50/m2 range, the overall capital cost approaches $10.00/m2 when including the harvesting, dewatering, oil extraction and anaerobic digesting systems. It should be noted that these costs are for simple clay-lined ponds (assuming nearby available clay or clay soils) as any plastic lining would nearly double the pond cost. As a rough estimate, the annual capital charge is estimated at 14% of capital costs (including cost of capital and depreciation).
A credit of $100/ton of biomass is estimated from the methane by-product that is used to generate electric power. The algal oil is extracted (but is not further processed) using a three-phase centrifuge separation process171. Pre-processing of the algae may be required in some cases, but will be species specific. The final cost of algae the oil is estimated at about $3.69 per gallon (i.e. $155/barrel oil equivalent.) It is plausible that the additional fuel processing costs to convert the crude algal bio-oil into biojet fuel will be offset by the carbon credits resulting from using a carbon neutral fuel. Clearly, this is a very high level analysis as the technology is too immature to predict else wise, but it serves to both point to the potential of this technology and the R&D needed to achieve such process economics, as will be discussed in a latter “R&D needs” section of the report. 4.3.3 Total Estimated Biojet Fuel Costs
The major variables that were identified to influence the cost of biojet fuel were: transportation, fuel processing and bio-oil production.
UOP quotes a transportation charge of $2 per barrel was assumed for biofeedstocks in their cost analysis of biofuels. This is based on typical rail transportation costs for grease and oils172.
Fuel processing was discussed in section 4.3.1. The capital and operating costs per gallon ranged from an estimated low of $0.17/gallon to a high of $0.81/gal.
129

The cost of the bio-oil was discussed in section 4.3.2. The lowest cost feedstock was estimated at $2.24/gallon for Castor. Of the more promising feedstock candidates considered in this report (i.e. Tallow, Castor, Camelina & Algae) the highest estimated cost was $3.69 for the algal oil feedstock.
Considering, transportation, fuel processing and bio-oil, the cost of biojet fuel is estimated to range from $2.41 to $4.46 per US gallon with a mean of $3.42/gal (Figure 137.)
0.00
0.50
1.00
1.50
2.00
2.50
3.00
3.50
4.00
4.50
5.00
Transport Processing Bio-oil Total
Cos
t US
$
DLD
09-1
6.xl
s
Cos
t ($/
US
Gal
)
Figure 137. Total biojet fuel costs may range from $2.41 to $4.46/US gallon.
At the time of this writing, Jet-A fuel costs an average of $2.02/gallon in the world market. Thus, biojet fuel is estimated to presently cost more than petroleum based jet fuel. However, when Jet-A fuel peaked at over $4.00/gallon in July 2008, biofuel would have been competitive. The value of carbon trading and the anticipated future price escalation of crude oil will no doubt determine how competitive the price of biojet fuel will be against Jet-A in the near future.
130

5.0 DISCUSSION
The objective of this study was to investigate three areas: 1) determine the technical feasibility of bio fuels for commercial aircraft, 2) evaluate the environmental sustainability of these fuels, and 3) evaluate plausible economic business cases for the use of sustainable biofuels in commercial aviation. After conducting research into these areas, it has been determined that biojet fuel is indeed technically feasible, it can be sustainable, and it is possible to be cost competitive against fossil fuel derived Jet-A fuel when petroleum prices are high. The following discussion provides some insights on possible avenues that might be successful in establishing a biojet fuel supply chain.
5.1 Sustainable fuel processes
Producing biojet fuel and so-called “green diesel” from vegetable oils (plant triglycerides and hydrocarbons) can best be accomplished through an energy efficient thermochemical hydrotreating process, using hydrogen and catalysts. It operates at lower temperatures and pressures than that required for the refining of crude oil through the cracking process. Hydrotreating removes oxygen and other contaminants from the vegetable oil triglycerides and transforms them into paraffins. To improve the cold flow properties, the oil can be isomerized, by breaking the fatty acid double bonds, such as found in oleic acid, and then building a more desirable branched chain alkane. Further improvements can be achieved by fractionating the biofuel mixture to obtain the proper HC distribution. As was discussed in section 4.0, the technical feasibility of producing a biojet fuel has now been proven. Hydroprocessing of vegetable oil, to create a bio-SPK fuel, proved to be the lowest cost and most energy efficient process examined. Several fuel processing companies are in the planning phase to commercialize bio-SPK fuels through this process. The biojet fuel is anticipated to pass ASTM certification by the end of 2010 and should be available for use shortly after.
The single largest hurdle to overcome for large scale commercialization of biojet fuel is the supply of massive amounts of affordable, sustainable bio-derived oil. There does not seem to be any one “miracle” crop that can supply the biofuel needs of the commercial aviation sector. Instead, multiple solutions will be required throughout the world. Depending on the regional climate and natural/human resources, some of the most promising near term approaches might involve the development of halophytic crops that can use saline water in coastal arid regions (i.e. <25cm rain/year), and Castor in semi-arid regions (25-50cm rain/year) that have dwindling fresh water resources and insufficient or unreliable rain for food crops. Existing Jatropha plantations will also be a regional solution for areas that have already embarked on this approach, such as India and China. One of the most promising long term solutions is the production of bio-oil from algal biomass.
For immediate implementation, Camelina (commonly known as False Flax or Gold of Pleasure) appears to be a good candidate crop to start up the biojet fuel business. Camelina does not require high inputs of nutrients and pesticides; it also grows well in semiarid regions in soils with low fertility and in colder climates. Camelina possesses unique agronomic traits which could substantially
131
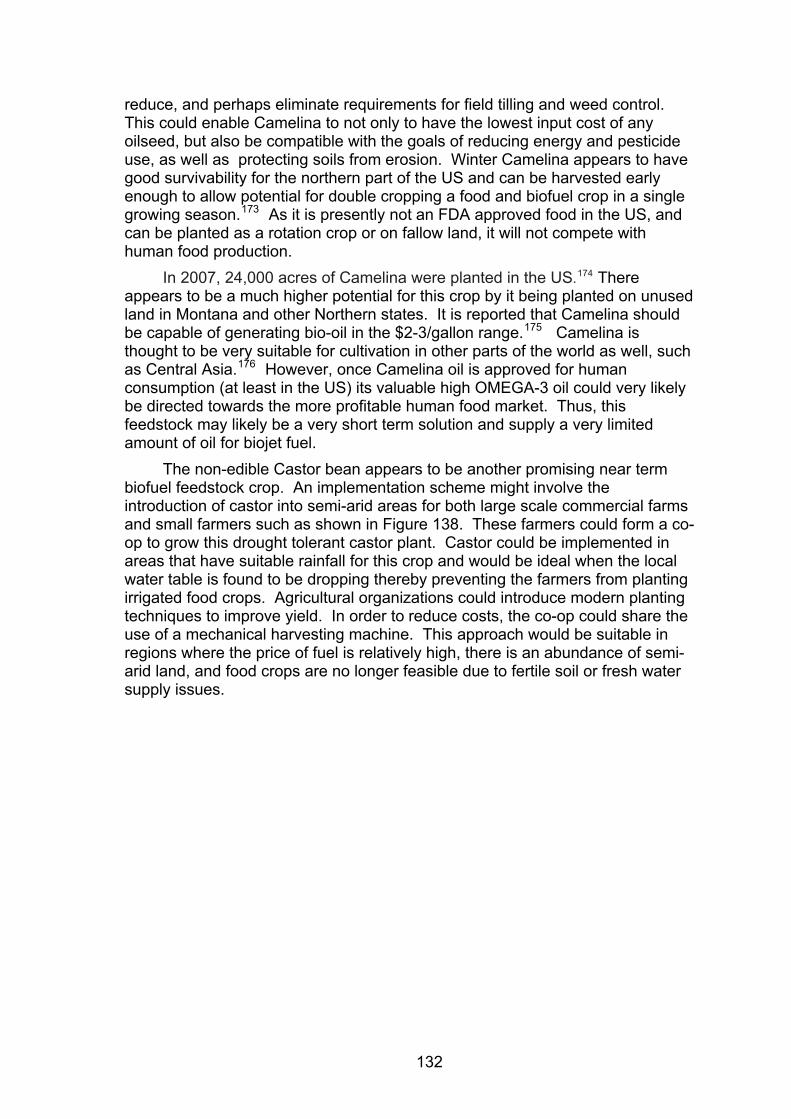
reduce, and perhaps eliminate requirements for field tilling and weed control. This could enable Camelina to not only to have the lowest input cost of any oilseed, but also be compatible with the goals of reducing energy and pesticide use, as well as protecting soils from erosion. Winter Camelina appears to have good survivability for the northern part of the US and can be harvested early enough to allow potential for double cropping a food and biofuel crop in a single growing season.173 As it is presently not an FDA approved food in the US, and can be planted as a rotation crop or on fallow land, it will not compete with human food production.
In 2007, 24,000 acres of Camelina were planted in the US.174 There appears to be a much higher potential for this crop by it being planted on unused land in Montana and other Northern states. It is reported that Camelina should be capable of generating bio-oil in the $2-3/gallon range.175 Camelina is thought to be very suitable for cultivation in other parts of the world as well, sas Central Asia.
uch n 176 However, once Camelina oil is approved for huma
consumption (at least in the US) its valuable high OMEGA-3 oil could very likely be directed towards the more profitable human food market. Thus, this feedstock may likely be a very short term solution and supply a very limited amount of oil for biojet fuel.
The non-edible Castor bean appears to be another promising near term biofuel feedstock crop. An implementation scheme might involve the introduction of castor into semi-arid areas for both large scale commercial farms and small farmers such as shown in Figure 138. These farmers could form a co-op to grow this drought tolerant castor plant. Castor could be implemented in areas that have suitable rainfall for this crop and would be ideal when the local water table is found to be dropping thereby preventing the farmers from planting irrigated food crops. Agricultural organizations could introduce modern planting techniques to improve yield. In order to reduce costs, the co-op could share the use of a mechanical harvesting machine. This approach would be suitable in regions where the price of fuel is relatively high, there is an abundance of semi-arid land, and food crops are no longer feasible due to fertile soil or fresh water supply issues.
132
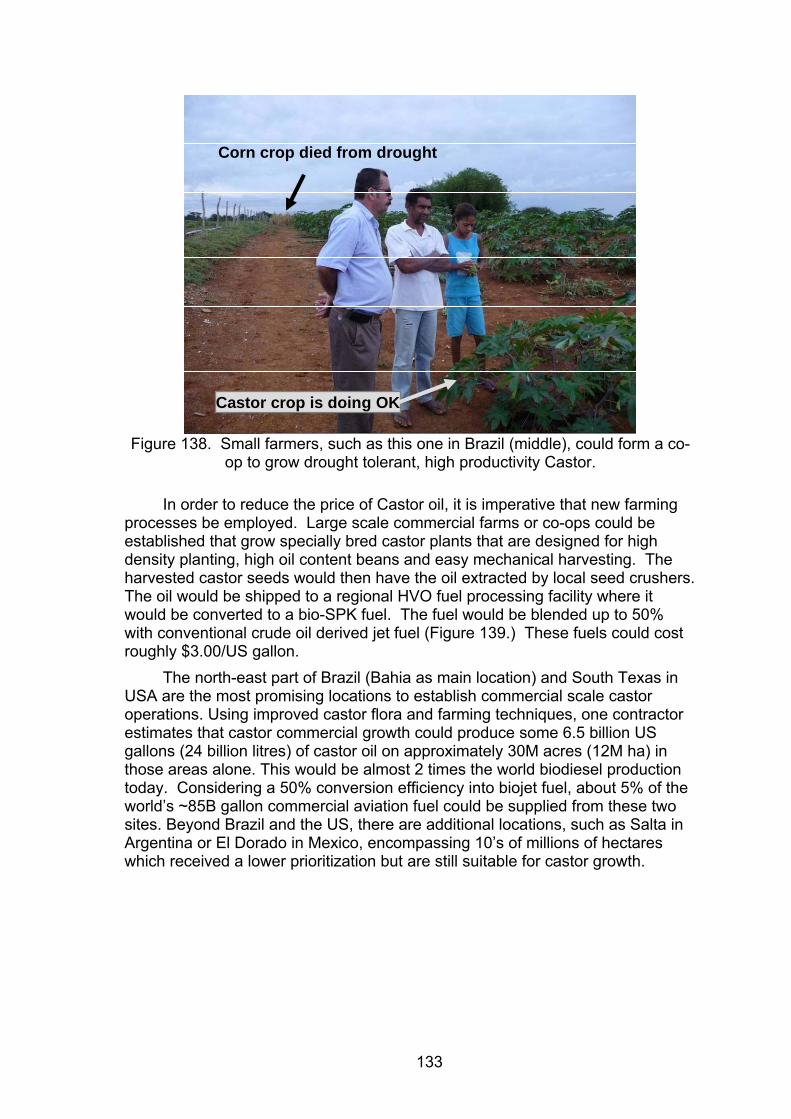
Corn crop died from drought
Castor crop is doing OK
Figure 138. Small farmers, such as this one in Brazil (middle), could form a co-op to grow drought tolerant, high productivity Castor.
In order to reduce the price of Castor oil, it is imperative that new farming processes be employed. Large scale commercial farms or co-ops could be established that grow specially bred castor plants that are designed for high density planting, high oil content beans and easy mechanical harvesting. The harvested castor seeds would then have the oil extracted by local seed crushers. The oil would be shipped to a regional HVO fuel processing facility where it would be converted to a bio-SPK fuel. The fuel would be blended up to 50% with conventional crude oil derived jet fuel (Figure 139.) These fuels could cost roughly $3.00/US gallon.
The north-east part of Brazil (Bahia as main location) and South Texas in USA are the most promising locations to establish commercial scale castor operations. Using improved castor flora and farming techniques, one contractor estimates that castor commercial growth could produce some 6.5 billion US gallons (24 billion litres) of castor oil on approximately 30M acres (12M ha) in those areas alone. This would be almost 2 times the world biodiesel production today. Considering a 50% conversion efficiency into biojet fuel, about 5% of the world’s ~85B gallon commercial aviation fuel could be supplied from these two sites. Beyond Brazil and the US, there are additional locations, such as Salta in Argentina or El Dorado in Mexico, encompassing 10’s of millions of hectares which received a lower prioritization but are still suitable for castor growth.
133

Make sustainable bio-SPK from Castor oil
Castor seeds
Crush the seeds to extract oil
Use modified Castor plants for mechanized harvest
Regional biofuel solutions Figure 139. Biojet fuel could be made from locally grown sustainable crops that
don’t compete with food.
Means to detoxify the bean cake’s Ricin are being undertaken and expect to be complete within the next few years.177 The plant’s biomass and detoxified byproducts could be turned under into the soil to enrich the loam. This crop is thought to be quite sustainable and might actually help prevent soil erosion in abandoned, unproductive farms that were cleared from forested areas.
Another attractive biofuel feedstock that could be sustainably scaled up is an oil-producing salt water tolerant plant (Halophyte). The crops could be used to not only produce oil, but they could also provide protein that could be used for animal or possibly human food178, and cellulose that could be fermented and turned into ethanol (Figure 140.)
Processing Biojet
SaltWater
Bio-crudeOil
Animal Feed18% oil
EthanolCellulose conversion
CO2
Nutrients
Sunlight
30% protein
52% cellulose
Figure 140. Halophytes could be an attractive crop to produce food and fuel.
134

Roughly 43% of the world’s landmass is arid or semi-arid while 97% of the earth’s water is sea-water. It is estimated that there is about 2.5B acres of salt affected land with another 2.5B acres of desert lands above brackish aquifers. Examining coastal lands that would be suitable for halophyte agriculture, there is about 130M hectares of available land world-wide.179 The yield of oil varies upon the plant species, soil condition, water and fertilizer rates. Using preliminary yields from test plots of Salicornia bigelovii of 223 gal/acre/ykg oil/hectare/yr)
r (2,000
ears term solution.
179, if 5B acres of salt affected and desert lands were planted with this plant, it might be capable of supplying 1,115B gallons of oil per year, which would yield about 558B gallons of biojet fuel per year which is about 6 ½ X more fuel than the commercial fleet used in 2004. One LCA (Figure 126) suggests that biofuel derived from this source might be one of the most environmentally friendly options. However, as the study of this feedstock is still in progress, the oil production costs are still unknown. Work has been under way to identify the salt-tolerant plant gene180 that could possibly lead to further improvements in oil-yielding halophytic plants. This feedstock presently apppromising and could be considered as a possible mid-
Another promising, albeit longer term solution, might be the production of biojet fuel derived from algal oil. The advantage of microalgae is its potential to achieve much higher productivities than conventional oil crops, in part due to its continuous production process and high percentage of oil content. Namely, the algae cell does not have to grow roots, stalks, stems, leaves and seed husks, so the amount of oil produced from this organism is a much higher percentage of the total biomass of the plant. Research was conducted with several organizations to understand the challenges and possible solutions to enable algal biomass production for biofuel.
Previous techno-economic analyses of microalgae oil production have been carried out in the past, concluding that low-cost algal biomass and oil production is possible in principle, but requires a number of very favorable assumptions, from high productivity and oil content, to culture stability and harvestability.130, 170
Figure 141 illustrates an envisioned algal derived biojet fuel process. Sea water and sewage waste water are used to grow the algal biomass in large racetrack open ponds. The algae species are harvested through a very low energy process which results in clean water discharge for the sewage treatment plant, and algal biomass. Oil is extracted from the algal biomass through a very low energy process, cleaned and then sent to a refining facility that turns the algal oil into a sustainable biofuel.
Alternative energy recovery and conversion processes can be considered for either the whole algal biomass or the residues remaining after oil extraction. Gasification at near-supercritical water conditions (e.g. high pressure and temperature) has been proposed and reported in numerous publications as this process has the advantage of not requiring drying of the biomass, and recovering the nitrogen content in the form of ammonia, which can be recycled to the algae growth ponds181. However, gasification is a “brute-force” technology which breaks down the organic carbon to CO and H2 and is better suited to low-cost lignocellulosic biomass. Other thermochemical processes (e.g. pyrolysis, conventional gasification, even combustion) would require a dry biomass and
135
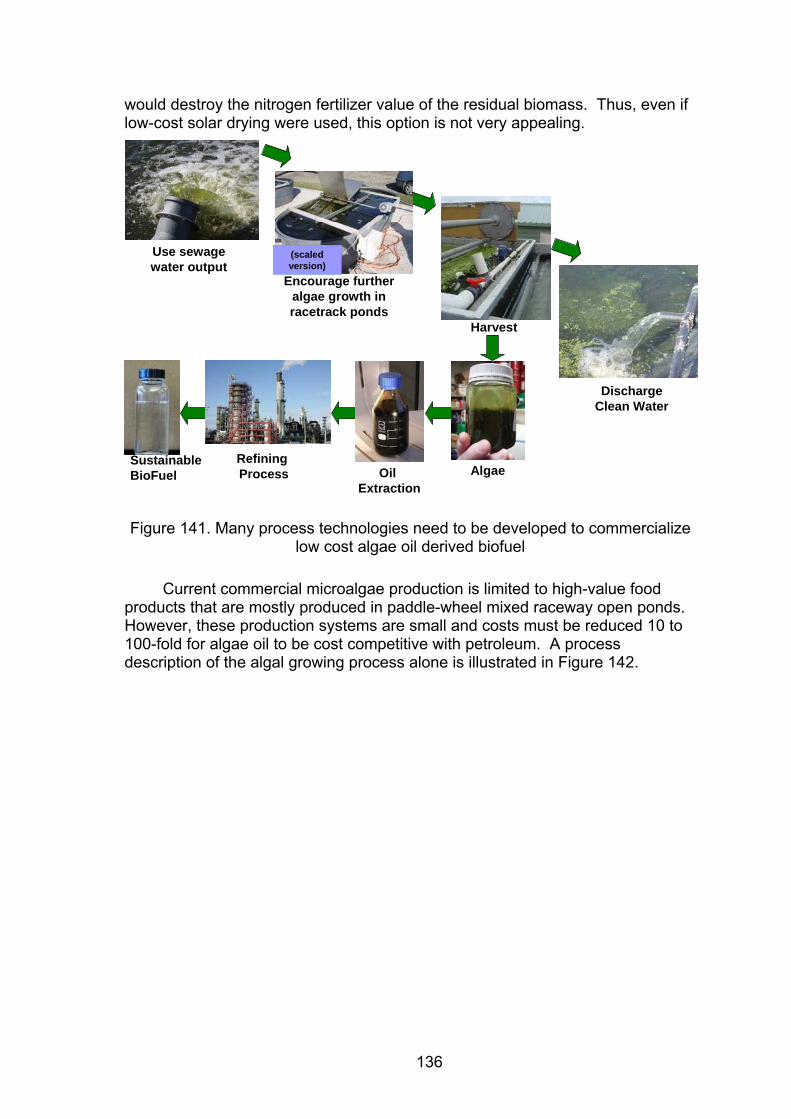
would destroy the nitrogen fertilizer value of the residual biomass. Thus, even if low-cost solar drying were used, this option is not very appealing.
Use sewage water output
Encourage further algae growth in racetrack ponds
Harvest
Discharge Clean Water
Refining Process
Sustainable BioFuel Oil
ExtractionAlgae
(scaled version)
Daggett, David L., Jet Fuel Asia/China Summit 2008, Hong Kong Figure 141. Many process technologies need to be developed to commercialize
low cost algae oil derived biofuel
Current commercial microalgae production is limited to high-value food products that are mostly produced in paddle-wheel mixed raceway open ponds. However, these production systems are small and costs must be reduced 10 to 100-fold for algae oil to be cost competitive with petroleum. A process description of the algal growing process alone is illustrated in Figure 142.
136

Water
Nutrients
CO2
Requirements
InoculumSystem
Mass Culture Ponds
Harvesting
Dewatering
Extraction
oilProcessing
by-product
Process
wat
er
Figure 142. Low cost algae production would need to use free water, nutrients
and CO2, while utilizing low-cost open ponds, harvesting, dewatering & extraction processes.
The preferred embodiment for algal growth systems are ones that would have access to plentiful, free water, such as that from waste water treatment facilities as well as plentiful and virtually free amounts of high concentration of CO2, such as that found from industrial flue gas (Figure 143.) Without these “free” resources, the cost of procuring water and fertilizer would drive the cost of the algae beyond reason for biofuels. A higher CO2 concentration than atmospheric levels is required in order to achieve the growing efficiencies needed to make algal oil affordable.
137

Figure 143. Algae that use sea water and waste water, such as this sewage treatment plant (left) and have access to free CO2, such as this powerplant
(right) would be an attractive option.w
Microalgae can use waste, sea, and brackish waters and land resources (high-clay or degraded soils) that are unsuitable for crop agriculture. Large-scale, low-cost production of algal oils would first cultivate unicellular microalgal cultures in an inoculum system. A series of ever increasing circular ponds are envisioned where the algae are grown to a predetermined concentration (based on the algae species,) and then moved into a larger circular inoculum pond for continued growing, and then into the next larger pond and so on. This system reduces capital costs by not having too large of a pond for the algal biomass when they are in a very dilute solution. Introducing a very small amount of algae culture into a large pond may also result in its failure to thrive. Once a large enough algae culture is grown in the inoculum system ponds, it is introduced into the large racetrack open ponds.
The racetrack ponds are filled with seawater and a small amount of nutrient-containing wastewater. Depending on the makeup of the wastewater, a small amount of fertilizer may be needed to achieve the proper balance of Nitrogen, Phosphorus and Potassium needed by the algae. Organic material, obtained from the leftover biomass retrieved from the anaerobic digesters, is also added back into the ponds to provide a sufficient carbon source. Smokestack effluent is added to the pond for added nitrogen and CO2, which feeds the algae and regulates the water PH. Lastly, sunlight is needed to support the algae’s photosynthesis process which then converts the hydrogen molecules found in the water and the carbon molecules found in the gaseous CO2 and water-born organics into a hydrocarbon containing oil.
Light, nutrients, temperature, salinity, pH, and other environmental factors can all affect the type and level of lipids produced. Lipid contents of 20-40% on a dry basis, and even on occasion exceeding 50%, are often observed. However, the major issue is not lipid content but lipid productivity. For example, Botryococcus braunii forms long chain hydrocarbons of up to 60% of the dry weight; but it is a very slow growing and low-productivity algae strain. The total neutral lipids in Dunaliella Salina, which has a much faster growth rate, exceed 30%, and therefore their production would be preferred.
w Image obtained from Google Maps, 2009
138

The output from the pond are: oxygen (during daylight operation) which is formed from the photosynthesis process, clean water which is created by the removal of the organic materials from the waste water, and algal biomass from which the bio-oil and remaining biomass are separated.
Was
te w
ater
Nut
rient
s (N
,P,K
,)
Org
anic
s (C
arbo
n)
Sewage plant water effluent
Sunlight
CleanSea Water
Algae
Oil Biomass
Sea Water
Smoke Stack Gas
CO
2, N
Ox
Smoke Stack Gas
CO
2, N
Ox
O2O2
Figure 144. Free water would most likely come from waste and sea water,
nutrients from waste products and CO2 from smoke stack effluent.
After the algae are harvested and the oil is extracted from the biomass, the residual biomass could be used to either produce animal feeds or methane gas by anaerobic digestion. Although animal feeds may appear of higher value, when the additional costs of drying, marketing and adding replacement nutrients (N, P, etc.) are included, this may not actually be the better option, in that the methane can be used for power generation and the nutrients, including carbon, can be recycled from both the digester residues. For algae derived from sewage wastewater, methane production may be the only likely plausible choice for disposal of the residues after oil extraction due to sanitary concerns.
Finally, some have proposed fermenting the leftover algal biomass, or more specifically any carbohydrate storage materials (e.g. starch in green algae), to ethanol. Such fermentations could be carried out by the algae themselves or by conventional yeast. However, these processes have been little studied, and are not thought to be directly relevant to oil production for jet fuel. Neither are approaches where the algae are the fermentation agents and convert starch and sugars to oils in the dark through a heterotrophic process. Also, the issue arises of the sustainability of such approaches and the potential competition with food of using these crop products for biofuels. Thus the focus here is on direct algal oil production with sunlight (i.e. phototrophic process.)
Due to the potential high productivity of algal oil generation, the production of algal oil may be able to easily meet aviation biofuel demands well into the future. The main challenge is achieving the required economics of such
139

production systems. However, with sufficient technical progress, it is estimated that this oil could be produced for less than $4.00/ US gallon. As previously stated, many of the algal species can grow in sea or brackish water, which means that algae farming will not put additional demand on freshwater supplies needed for domestic, industrial and agricultural use. Algae technology offers the opportunity to utilize land and water resources that are unsuitable for other uses and so is very sustainable.
In order for biojet fuel to be considered “sustainable, it must be produced from renewable oils that do not result in adverse land-use changes which could result in large releases of other GHGs. This constraint places a severe limit on the amount of climate-friendly biojet fuel that can be immediately produced and implemented. In order to be widely viable in the commercial aviation industry, biofuels need to overcome several technical hurdles. However, the task is not insurmountable, and there is no single issue making biofuel unfit for commercialization for aviation.
5.2 Commercialization and scale-up
In most instances when considering near term implementation, biojet fuel will no doubt have to compete with other biofuels, such as ethanol and biodiesel, for the same feedstocks. It is therefore prudent to evaluate the scale up potential of feedstocks for all biofuels. Most of the work performed to date by other researchers on the scale up potential of feedstocks, has been in regard to corn or cellulose for the production of ethanol. These studies are still applicable as the cellulose that can be used to make sugars for ethanol, can also be used to create pure hydrocarbon molecules through synthetic biology processes. Aside from a potential feedstock, it is also important to consider these studies for their potential to supply biofuel to the competing ground transportation sector. Namely, if this sector uses all available land for the production of ethanol, there will be little land available for the production of oilseed crops which would support immediate biodiesel and biojet production.
A majority of researchers appear to agree that biomass growth can sustainably support the production of large quantities of biofuel. The most well known, and often sited, reference is the “Billion-ton” study performed by the US DOE and USDA who estimated that 1.3 billion tons of cellulosic biomass could be harvested from US farming waste products (e.g. corn stover) and forests which could then provide up to 1/3 of the petroleum needs of US transportation by 2030. This figure is probably too optimistic as the study did not consider the need to return a certain amount of carbon to the soil to maintain loam health, and so a follow-on study is schedule to be completed in 2010 which will result in an estimate of approximately 1 billion tons/year availability.182 Other work suggests that the billion tons/year potential is achievable by adding perennial energy crops, like switchgrass to underutilized prairie lands.
140

Includes soybeansIncludes soybeans
Includes perennial energy crops like switchgrass
Includes perennial energy crops like switchgrass
Figure 145. Perennial crops, like switchgrass, could help provide feedstock for
biofuels.183
Similar positive results were found by a study conducted by Sandia National Labs and GM who estimated 90B gallons/year of ethanol could be produced by 2030 at an equivalent price of $70-$120/bbl of oil. Hoogwijk (2008) suggested in her Ph.D. thesis, which supported the basis of an IPCC study, that biofuel could supply anywhere from 0 to 8X the amount of biofuel needed globally. In her optimistic scenario, biomass could be grown on 1) abandoned agricultural land, 2) fallow lands and 3) low productivity lands. Lifestyle changes would need to be adopted, such as elimination of red meat and dairy products, because cattle grazing makes inefficient use of lands that could be used to grow biofuel feedstocks. Other researchers (e.g. Yamamoto, BR&Di, IPCC 2008, DOE roadmap (2003), and DOE study (2009) all suggest that increasing biomass for biofuel is very possible and could make a significant impact on biofuel production. These studies are summarized below --
141

Positive biofuel sustainability studies:184 “Billion-Ton” study, DOE & USDA (2005)
1.3 tons biomass/year by 2030 to replace 1/3 of petroleum. “90-Billion Gallon” study, Sandia & GM (2008)
15B from corn ethanol & 85B from cellulosic by 2030. Biomass Ph.D. thesis, M. Hoogwijk (2004)
Abandoned agricultural land and “at rest” land could supply 4-8X the world’s liquid fuel demands.
Increasing biomass feedstock study, BR&Di (2008) Can the US meet the future renewable fuel standards? – Yes! Bio-energy resources model, H. Yamamoto (1999)
Large supply of energy crops available in developed countries but developing countries will have greatest supply from crop residues.
Renewable energy scoping study, IPCC (2008) Biomass and solar are under-developed. Detailed model to follow.
Agricultural biomass roadmap, DOE (2003) A sustainable billion tons/year of biomass by 2030 is possible. R&D is required for it to be affordable.
Strategies for GHG-reducing technology commercialization, DOE (2009) 300 Federal policies are in place to help overcome many risks … cost is the greatest challenge. These data seem to be reasonable and are supported by another PNAS (liquid transportation fuels from coal and biomass) study projection that estimates biomass could be increased from a present 399 tons of biomass/year to 548T/yr as shown below --
Biomass Type Billion Ton PNAS
Current 2030 Current 2020
Agricultural 194 998 216 324
Forest/woody 142 368 200 224
Total 336 1366 399 548
Biomass Type Billion Ton PNAS
Current 2030 Current 2020
Agricultural 194 998 216 324
Forest/woody 142 368 200 224
Total 336 1366 399 548
Figure 146. Others corroborate the potential of cellulosic waste products as a feedstock for biofuels.185
Other researchers disagree with the potential of biofuel to make a significant contribution to future energy needs. The most well-know of these is D. Pimentel who has written several papers on the unsustainable nature of corn-derived ethanol. According to his LCA calculations, more energy is required to grow and process the feedstock than is gained from its use. This may indeed be the case for old-style processing methods, and so these results need to be considered in light of the newer cellulosic ethanol processes currently being developed. Another researcher (M. Hoffert) argues that the use of energy is growing so rapidly, that in order to produce a future global need of 10 terawatts of power in the future, if biomass were used, it would require more than 10% of the world’s surface area, which is equivalent to all of the present human agricultural lands. This study points to the need for improved energy conservation to curb energy
142

demand in the future. It also shows that implementation of other power sources, such as geo-power and nuclear, should be developed for electrical generation needs as well as ground transportation vehicles. Other environmental groups point to the dire outcome of deforesting lands that would enable the increased production of biomass for biofuel. This is indeed a very real issue to address for the future commercialization of biofuels. It illustrates the need to develop next generation feedstocks, such as halophytes and algal biomass, which would not be well suited to grow on deforested lands.
Not so positive biofuel sustainability studies:184 Corn ethanol opponent, D. Pimentel (at least 11 papers from 1979-2008
“Large-scale biofuel production is not an alternative to the current use of oil and is not even an advisable option to cover a significant fraction of it.”
Photosynthesis too inefficient, M. Hoffert (2002) Energy demand growth is too high. 10TW of from biomass requires >10% of earths surface (all present human agriculture)
Food Vs. Fuel debate, environmental groups (2008/2009) “Mandating the use and production of these fuels without fully understanding their effect on food production and the environment - as current US biofuel policy does - is irresponsible and dangerous.”
“The Clean Energy Scam” (Grunwald; May 2008; Time) Land use changes (i.e. deforestation) to grow biomass will overwhelm any benefits.
To assess the potential of high productivity oilseed crops to supply biojet fuel throughout various regions of the world, Figure 147 was created from IEA 2006 data to show the jet fuel supply and demand in 2005 as well as total liquid biofuel production for transport vehicles. Biofuel production currently makes up a small percentage of liquid fuel needs. Even when compared just to jet fuel demand, all of the biofuel produced in the US would only be able to supply 17% of its jet fuel needs and Europe could only meet 12% of its jet fuel needs. However, the potential for biofuel production may be much higher. For example, the World Soil Resources report (2000) states that only 49% of the arable rain-fed land in the US is presently used for agriculture. If all of the remaining land were planted with a high yielding (i.e.100 gal/acre) biofuel feedstock then this added biofuel production could have met aviation’s fuel needs in 2005. Other regions of the world have much better potential. For example, only 14% of the arable rain-fed land in central and South America are planted. This leaves 2.06B acres of available land for potential biomass production. This amount of land could produce 206B gallons/year of bio-oil, which would be enough to supply the entire world’s aviation biofuel needs. A similar story is found in Sub-Sahara Africa. The environmental impacts of developing this much land is unclear, but there appears to be the most potential for biofuel feedstock development in these two regions of the world.
143
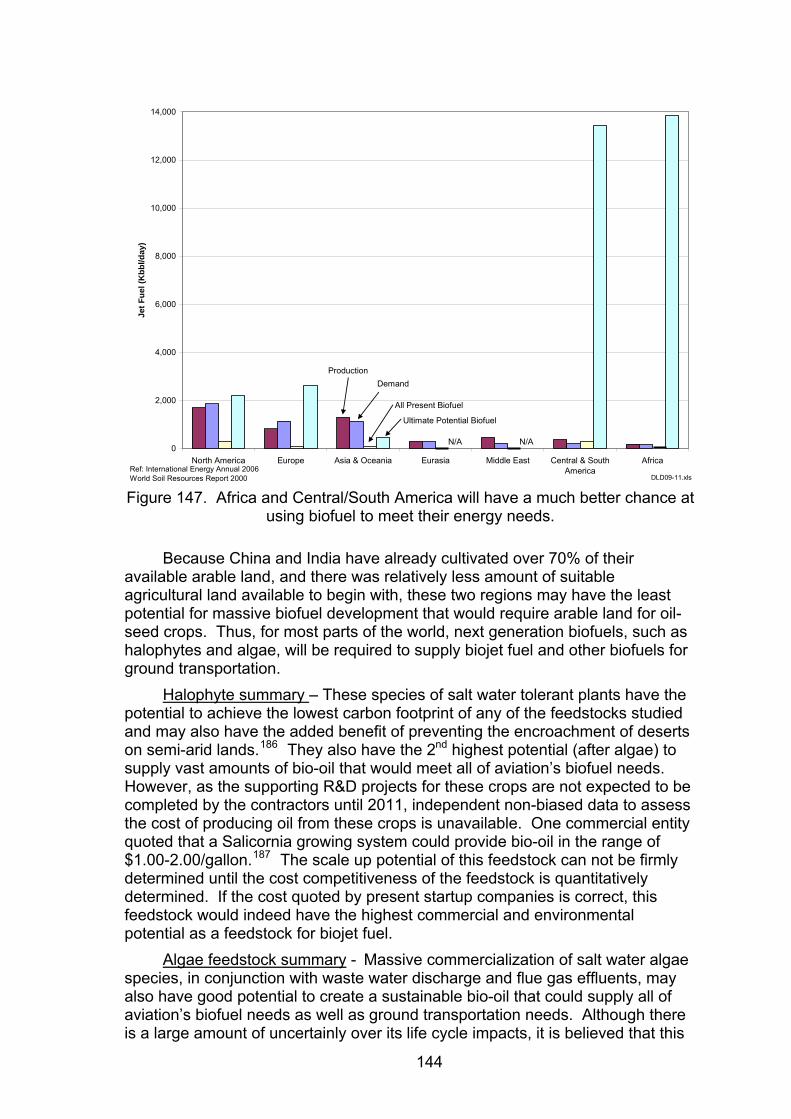
0
2,000
4,000
6,000
8,000
10,000
12,000
14,000
North America Europe Asia & Oceania Eurasia Middle East Central & SouthAmerica
Africa
Jet F
uel (
Kbb
l/day
)
Demand
All Present Biofuel
Ultimate Potential Biofuel
N/A N/A
DLD09-11.xlsRef: International Energy Annual 2006World Soil Resources Report 2000
Production
Figure 147. Africa and Central/South America will have a much better chance at
using biofuel to meet their energy needs.
Because China and India have already cultivated over 70% of their available arable land, and there was relatively less amount of suitable agricultural land available to begin with, these two regions may have the least potential for massive biofuel development that would require arable land for oil-seed crops. Thus, for most parts of the world, next generation biofuels, such as halophytes and algae, will be required to supply biojet fuel and other biofuels for ground transportation.
Halophyte summary – These species of salt water tolerant plants have the potential to achieve the lowest carbon footprint of any of the feedstocks studied and may also have the added benefit of preventing the encroachment of deserts on semi-arid lands.186 They also have the 2nd highest potential (after algae) to supply vast amounts of bio-oil that would meet all of aviation’s biofuel needs. However, as the supporting R&D projects for these crops are not expected to be completed by the contractors until 2011, independent non-biased data to assess the cost of producing oil from these crops is unavailable. One commercial entity quoted that a Salicornia growing system could provide bio-oil in the range of $1.00-2.00/gallon.187 The scale up potential of this feedstock can not be firmly determined until the cost competitiveness of the feedstock is quantitatively determined. If the cost quoted by present startup companies is correct, this feedstock would indeed have the highest commercial and environmental potential as a feedstock for biojet fuel.
Algae feedstock summary - Massive commercialization of salt water algae species, in conjunction with waste water discharge and flue gas effluents, may also have good potential to create a sustainable bio-oil that could supply all of aviation’s biofuel needs as well as ground transportation needs. Although there is a large amount of uncertainly over its life cycle impacts, it is believed that this
144

fuel would contribute about 40% less GHG emissions than a petroleum derived jet fuel. This is not as favorable as the halophyte LCA. The cost for this fuel is estimated at $3.00-4.00/gallon. Several technology hurdles need to be overcome and assumptions have been made in drawing this conclusion. They include:
1. The cost of building dedicated CO2 and water handling infrastructure is very significant for a large scale operation. It is therefore most likely that the economics will require the first plant to "ride" the existing infrastructure of coal or gas burning power plants, therefore avoiding such costs.
2. Significant CO2 credits (for instance $20 to $30/MT) would have a very positive impact on the economic feasibility of such a project since 2 MT of CO2 are required to generate 1MT of biomass.
3. While it is expected that water and CO2 maybe be provided at no cost by an existing power plant, fertilizer is another significant cost center. Demonstrating that the flue gas is actually making a significant enough nitrogen feed contribution on developing organisms with nitrogen fixing capability is required. Utilization of waste water treatment facility effluent will assist in offsetting the fertilizer needs.
5. More efficient generation of lipids is another key target to address. The goal of producing 25 grams/m2 /day of biomass with a 35% lipid content was assumed in this study, which has been demonstrated on a small prototype system at Seambiotic in Israel.
6. Capital costs are critical to address. Assuming that an open pond could be built that would achieve a 25g/m2/day production, such a system could not economically support an overall capital cost above $10/m2 of captured light. For a closed photobioreactor system, a 100g/m2 bioreactor productivity is unlikely to be able to support an overall system capital cost of above $80/m2 (more likely $50/m2) of captured light.
7. Overall operating costs for the facility (excluding water, CO2 and fertilizer) are likely to need to be below $100/MT (more likely $50/MT).
Until the price of crude oil returns to high levels (i.e. $155/bbl), or a substantial incentive is provided to low CO2 fuels, the large scale commercial potential for algae oil is only marginal. Until demand for low CO2 fuels increases dramatically, other feedstocks, such as Camelina, Castor or Jatropha, might be better able to supply the small amounts of bio-oil needed for a small scale up in biojet fuel production. There might be more opportunity for biofuels in regions that have higher biomass growing potential, such as in South America and Africa. Regions that have low biomass growing potential, such as the middle east, might be better suited to growing halophyte feedstocks. The environmental costs of shipping bio-oil to different regions throughout the world would reduce the biofuel’s environmental benefits. For a high biofuel growth rate scenario to take effect, halophytes and/or algae would need to be introduced in regions that have high oil demand and lower agricultural resources.
Although it would be a monumental task to provide the commercial aviation industry with enough biojet fuel to offset its projected growth rate, there are no technical fuel processing challenges in processing that much fuel. Supply of enough feedstock is the critical factor whose success will ultimately depend on
145

the cost of the competing fossil fuels and the resulting degree of investment put into developing the biomass feedstock market for biofuels.
To consider the enormity of the task, Figure 148 shows that in 2005, the IEA estimated that 5.77M bbl/day of jet fuel was supplied globally. If aviation fuel demand were to grow at about 4% per year, and if biojet fuel is certified in 2011, then the first large scale plants might be brought on line in 2013. At this rate of demand, 1,286 refining plants (@100M gal/yr capacity) would have to be built by 2030 to supply the additional 8.4 million barrels oil equivalent (mboe) per day demand for biojet fuel. That equates to a scale up rate of about new 80 biofuel plants being built per year by the year 2030. Assuming 50% bio-oil conversion efficiency, that means 257B gallons/yr of bio-oil would need to be supplied by 2030 for aviation alone. This amount of biofuel scale up is clearly beyond the capabilities of first generation feedstocks and would require massive implementation of next generation feedstocks, such as halophytes and algal biomass, to supply commercial aviation with its increased fuel needs in the future.
0
2
4
6
8
10
12
14
16
18
20
2000 2005 2010 2015 2020 2025 2030
Year
Jet F
uel
(Mill
ion
Bar
rels
Per
Day
)
Jet-A fuel availability(based on CERA crude oil growth prediction, 2006)
Jet-A need(based on jet fuel growth of 4%/year)
Biojet growth rate (80 plants/year @ 100M gal/year plant cap)
Figure 148. It is uncertain if enough biojet fuel refining plants and feedstock
could be provided to meet the growth demands in commercial aviation
The supply of biofuel for aviation can not be taken into context without considering the liquid fuel needs of other sectors. Other transportation sectors will no doubt demand low carbon fuels as well and so aviation will have to compete with these sectors. Considering that aviation only uses about 6% of the world’s crude oil supply, that aviation is projected to resume its rapid growth rate, that environmental pressures will undoubtedly increase, that global oil reserves are shrinking, and that there is a looming peak oil production in 2030 (after which a falloff in oil supply occurs), the supply of biofuel is seen as a very much needed commodity. However, the amount of biofuel that is needed to close this world-wide energy gap in the future is a very challenging scenario to consider.
146

Other organizations, such as the IPCC’s Committee on Climate Change also are concerned that biofuels can only supply a small percentage (perhaps 10%) of aviation’s fuel needs by 2050.188 Nevertheless, much more R&D and biomass commercialization work should have begun several years ago in anticipation of these events. Business cases need to be developed that show a positive return on investment on biojet fuel so that the biofuel industry can grow and help prevent an impending crisis in the aviation industry.
5.4 Airline adoption
Airlines will adopt biojet fuel when it makes good business sense. The previous discussion showed that biojet fuels would most likely have a difficult time competing against the present price of fossil fuel derived Jet-A fuel. Until oil prices rise precipitously again, other considerations might make biojet fuel cost competitive in the near term. One factor to consider is the European Emissions Trading Scheme (ETS) that will essentially tax commercial aviation operators on their aircraft CO2 emissions. Figure 149 shows three scenarios where biofuel is implemented by a representative European airline whose fuel use would amount to 700M gallons of jet fuel in the EU. Assuming this airline’s EU fuel use grows at 4%/year, they would essentially double their fuel use by 2025. Given a EU CO2 trading credit of $20/ton in 2011 and that it grows to $50/ton by 2015, three scenarios are presented in Figure 149. The first “low” biofuel use scenario assumes biojet fuel is certified and available for purchase in 2017 and that biofuel use ramps up to 10% by 2017. By 2025, the savings to the airline from using biojet fuel would be $78M/yr. In the “medium” scenario, biofuel is certified and available in 2014. Its use increases from 2% in 2014 to 20% in 2018. By 2025, the airline would save $156M in ETS fee avoidance by using this percentage of biofuel. In the “high” use scenario, biofuel is certified in 2011 and is ramped up to 20% use by 2014. Increased biofuel blend ratio capability and an increase in the availability of affordable biomass enables biofuel to then be ramped up to 50% use by 2019. This would result in the savings of $390M/yr savings. All of these scenarios are predicated on the assumption that biojet fuel would cost the same as fossil jet fuel.
147
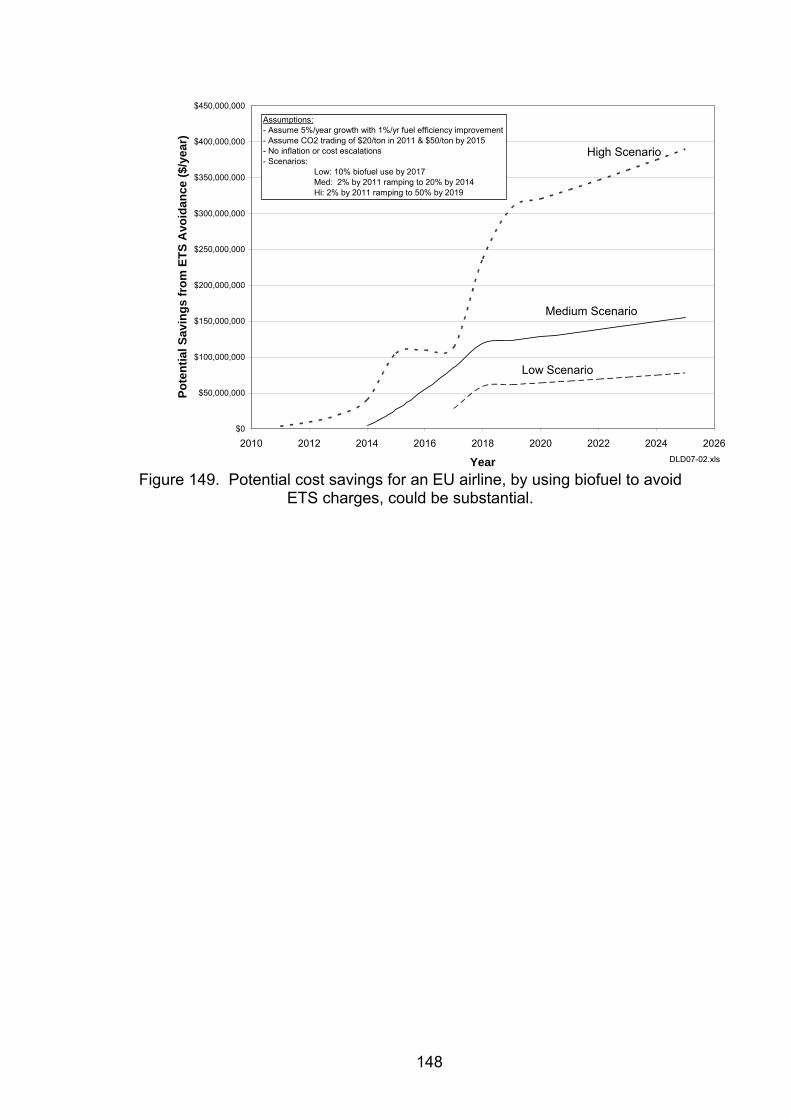
$0
$50,000,000
$100,000,000
$150,000,000
$200,000,000
$250,000,000
$300,000,000
$350,000,000
$400,000,000
$450,000,000
2010 2012 2014 2016 2018 2020 2022 2024 2026
Year
Pote
ntia
l Sav
ings
from
ETS
Avo
idan
ce ($
/yea
r)
Low Scenario
Medium Scenario
High Scenario
DLD07-02.xls
Assumptions:- Assume 5%/year growth with 1%/yr fuel efficiency improvement- Assume CO2 trading of $20/ton in 2011 & $50/ton by 2015- No inflation or cost escalations- Scenarios: Low: 10% biofuel use by 2017 Med: 2% by 2011 ramping to 20% by 2014 Hi: 2% by 2011 ramping to 50% by 2019
Figure 149. Potential cost savings for an EU airline, by using biofuel to avoid
ETS charges, could be substantial.
148
6.0 CONCLUSION
6.1 Achievements
This alternate fuels project accomplished the following major achievements:
• Was instrumental in establishing an industry initiative (CAAFI) to promote aviation alternate fuels
• Performed 4 flight demonstrations of different biojet fuels and feedstocks.
• Enabled the creation of technically viable biojet fuels.
• Accelerated development of biofuel feedstocks
• Catapulted the aviation industry to embrace biojet fuels CAAFI - At the beginning of this study, it was determined that visitation
would be needed to each of the major oil companies and to biofuel companies that might have the capability to create a biojet fuel. As travel budget was constrained at the start of this project, it was decided to hold an alternate jet fuel meeting in Seattle in 2006 and invite stakeholders to Boeing Seattle. The FAA was also invited. The meeting was very informative and successful. It appears that this was the first such industry meeting on the topic, and so the FAA became very interested in the concept and offered to host the next meeting. They also engaged the Aerospace Industries Association (AIA), the Air Transport Association (ATA) and the Airports Council International of North America (AIA NA) to assist and the annual meeting evolved into the formation of the Commercial Aviation Alternative Fuels Initiative (CAAFI). Today there are over 300 members of CAAFI who represent stakeholders in alternative fuels throughout the world (Figure 150.)
In 2007 and 2008 annual meetings, the CAAFI team members utilized the experience gained under this biofuel feasibility study to create an alternative fuels roadmap (Appendix A) that is currently used within several US government agencies to address R&D needs and funding.
149

MembersMembers
SponsorsSponsors
AerospaceIndustriesAssociation
AerospaceIndustriesAssociation
Aircraft Engine OEMs
Aircraft OEMs
Aircraft Equip Cos
Aircraft Engine OEMs
Aircraft OEMs
Aircraft Equip Cos
DOCDOEUSDA
USAF
USNDARPA
US Army
DESC
NISTNASA
DOCDOEUSDA
USAF
USNDARPA
US Army
DESC
NISTNASA Oil
Companies
Energy Companies
ASTMCRC
Bio-Fuels Companies
Oil Companies
Energy Companies
ASTMCRC
Bio-Fuels Companies
Airports Council International
Airports Council International
Federal Aviation AdministrationFederal Aviation Administration
Air Transport AssociationAir Transport Association
UK MoD
Bauhaus
NRC Canada
ANP Brazil
UK MoD
Bauhaus
NRC Canada
ANP Brazil
UniversitiesThink Tanks
ConsultantsUniversities
Think Tanks
Consultants
Airlines
ALPA
Air Cargo
Airport Operators
NetJets
Airlines
ALPA
Air Cargo
Airport Operators
NetJets
Figure 150. First biofuel meeting lead to the development of an industry
consortium, Commercial Aviation Alternative Fuel Initiative (CAAFI) to develop biojet fuels189
Flight Demonstrations – At the CAAFI 2007 meeting in Atlanta, GA, one Boeing attendee (Oren Hadaller) mentioned that CAAFI could easily “turn into a group of people who sit around a table and just talk about alternate fuels.” After some thought on the flight back to Seattle, it was determined that a “lighthouse” project would help guide the CAAFI participants towards an end goal of proving the feasibility of biojet fuel. About the same time, Richard Branson of Virgin Atlantic Airways publicly stated he wanted to fly an airplane on biofuel. After much coordination between Boeing and GE, VAA was approached with the idea of a flight demonstration on biojet fuel, who quickly agreed. The flight demonstration was very successful and lead to 3 other follow-on flight demonstrations (Figure 151.)
Figure 151. Flight demonstrations of biofuel helped progress the development
and certification of biojet fuels at a record pace.x
Although the first flight demonstration involved quite a bit of publicity, that event generated the enthusiasm needed within the industry to: enable the development of better performing biojet fuels, perform follow-on flight tests with other airlines, enable laboratory fuel and (very expensive) engine testing to be
x Photos obtained from Boeing photo gallery, 2009
150

funded by the (skeptical) aero engine companies. This lead to fast-track biofuel certification, and created a discussion on the sustainability needs of biojet fuel.
Biojet Fuel Creation - The first flight demonstration used a FAME type of biofuel. Although this fuel did not provide all of the desired fuel performance characteristics, it was chosen because it: met the cold flow requirements, used a sustainable feedstock and was an affordable fuel for this fledgling study in 2006/2007. Other fuel manufacturers were approached in the beginning of the study, but their development costs (i.e. about $1M to 2M) to provide biojet fuel for the flight demos were prohibitive. After the first flight demonstration, many of those companies decided to bear the R&D costs themselves and much better performing “drop in” biojet fuels were then developed.
New BiojetExisting Biodiesel
Figure 152. New biojet fuels were encouraged to be developed
Feedstock Development – Prior to this study, biofuel feedstock R&D was directed toward ground vehicles and focused on first generation oil feedstocks, such as soy and rapeseed. During the study, it became apparent that these first generation feedstocks were not necessarily environmentally sound52 and were of limited supply, so research was catalyzed to find environmentally acceptable feedstocks that could help aviation meet its biofuel demand goals. The R&D funding was primarily directed towards (affordable) University staff. It focused on the development of next generation feedstock, ways to process those feedstocks, and small scale demonstration projects (Figure 153.) Two of the most promising environmentally progressive feedstocks were found to be salt water tolerant plants (halophytes) and algae. For algae, many hurdles remain to make this feedstock affordable enough to be burned as a fuel. Among some of the processing achievements the subcontractors made were: development of a low cost photobioreactor for an inoculum system, algal dewatering investigations, algal oil extraction experiments, and demonstration of small scale algal biomass growing systems using waste water and flue gas effluent.
151

Feedstock Development
Biofuel Feedstock Processing R&D
Algae Demonstration Projects Figure 153. Biofuel feedstock R&D was accelerated
Industry acceptance of Biofuels –as a result of the biofuel project, the visibility and desirability of biojet fuel became elevated within the global aviation industry. Not only did aviation groups embrace the feasibility of biojet fuels, organizations such as the FAA, IATA, USAF and GIACC actually set growth goals through the use of carbon neutral fuels (i.e. biojet fuel) as shown in Figure 154.
50%2017USAF
Agency Carbon Neutral Growth Target
Emissions Reduction Target
Baseline Year
FAA 2020 17% in 2020 2005
IATA 2020 50% in 2050 2005
GIACC 2020 2005
50%2017USAF
Agency Carbon Neutral Growth Target
Emissions Reduction Target
Baseline Year
FAA 2020 17% in 2020 2005
IATA 2020 50% in 2050 2005
GIACC 2020 2005
Figure 154. Aviation groups rushed forward to claim biofuel implementation goals
6.2 Statement of Conclusion
The objective of this study was to examine the feasibility, sustainability and economic viability of developing a renewable, greenhouse-gas-neutral, liquid
152

biofuel for commercial aircraft. The study proved that this concept is indeed feasible.
The study showed that using an approach of a “drop in” jet fuel replacement, which would consist of a blend of kerosene and up to 50% biofuel is now possible for use in existing and future aircraft. Depending on the biomass feedstock, about a 60-80% lifecycle CO2 emission reduction for the biofuel can be achieved. When using modern bio-SPK processing methods (i.e. hydroprocessing, isomerization & distillation techniques), no degradation in biojet fuel performance was found over conventional jet fuels. In fact, better environmental performance was observed in the form of particulate emissions reduction and an increase in energy density (BTU/lb fuel). Providing enough feedstock sources to manufacture large amounts of biojet fuel at reasonable prices is the greatest remaining challenge. It appears as though high-productivity next generation feedstocks (e.g. algal biomass) will need to be developed to enable large scale deployment of sustainable biofuel and also so that that they can become economically competitive in the near future. Biojet fuels can become economically competitive once crude oil prices increase again. Other incentives, such as ETS, will help provide stimulus to develop biofuels for aviation.
6.3 Further work required
As the largest remaining challenge for biojet fuel implementation is the production of massive amounts of low-cost bio-oil, further work is needed in the development of promising biomass materials, such as algae. Figure 155 illustrates an envisioned process of growing, harvesting and extracting algae oil and its byproduct. Needed R&D is listed in each step to bring down production costs.
Although some Life Cycle Analysis studies have been initiated, algae technology is sufficiently immature that large uncertainties exist in the LCA results. When the technology matures, more LCA studies would be warranted to assure that algae-derived biofuels are indeed an environmentally preferred option.
The algal biofuel business case analysis presented in this report is based on immature technology and optimistic assumptions of overcoming many processing hurdles. The business analysis will need to be updated as the technology hurdles are overcome.
A capacity study will be needed to establish the viability of growing algae around the world in various climates and physical locations. Optimally, in order to maintain the environmental benefits of algae, the oil should not have to be shipped to distant locations for processing. This will require local growing facilities near the oceans (for water availability,) and even some inland, where relatively small amounts of waste water, nutrients and CO2 are available. The capability of biomass to offset the enormous amount of fossil fuel currently used remains to be proven.
As the many algae growing/processing plants throughout the world will most likely need to use native algal species, R&D will need to be performed to identify the many remaining unidentified species and characterize their oil production productivity.
153

Large-scale, closed-system inoculum photobioreactor systems will be needed to grow the algal biomass seedstock prior to introduction into the open ponds. Research needs to be applied to investigate ways to reduce the capital costs of these photobioreactors.
Capital costs also need to be reduced on the construction of open ponds. One example of useful R&D would be for the development of very low cost pond liners and water mixing systems.
Scalability studies need to be conducted to find the optimal size of the open ponds for maximum algal biomass productivity and lowest operating costs.
Optimal growing conditions for peak productivity need to be established for each strain of algae being cultivated. This would include water temperature, light exposure, algae water mixing, PH, CO2 level, effluent gas makeup content, nutrient loading, growth phase vs. oil accumulation phase, inoculation intensity, as well as seasonal effects.
Methods to enhance lipid content need to be further investigated, whether they are through nutrient deprivation, high throughput breeding, new strain development, or hybrid growing methods (i.e. open pond for rapid cell growth and then photobioreactor for lipid enhancement.)
As the algal biomass makes up about 0.01% of a concentrated algae/water mixture, developing low operating and capital cost harvesting systems are a very important area to pursue. This might involve multiple technologies, such as using algae with auto biofloculation tendencies (i.e. when the pond water isn’t stirred, the algae rapidly settle to the bottom) and microscreening process.
Once the algal biomass is harvested from the ponds, it may be necessary to de-water the remaining algae/water mixture to the consistency of a paste. Therefore, processes need to be developed that can do this in an energy efficient manner.
The bio-oil then needs to be extracted from the algae paste in an energy efficient process to make sure that more energy isn’t used processing the algae oil than is contained in the algae itself.
Depending on the nutrient, water and CO2 sources, the algae could contain high levels of contaminants that would need to be removed prior to the oil being processed into biofuel.
Lastly, as over ½ of the algae biomass will be a leftover by-product, a useful market will need to be created for a co-product. As the oil portion of the algal biomass is desired to be relatively affordable, it would be helpful for the co-product to have high value.
154

Water
Nutrients
CO2
Requirements
InoculumSystem
Mass Culture Ponds
Harvesting
Dewatering
Extraction
oilProcessing
Needs
- Hardy, high lipid content native algae- Low cost inoculum photobioreactors
- Low cost open pond construction- Scaleability studies- Growing methods & conditions
- Lipid enhancement processes- Low cost harvesting methods- Bioflocculation, microstraining, other?
by-product
- Low energy process to separate algae
- New production methods for oil extraction
-Inexpensive algae oil cleanup processes-Establish market for co-products
- Life cycle studies- Business case analysis- Capacity study & planning
Process
wat
er
Figure 155. Future work is needed to mature the most promising biofuel
feedstocks such as algae and its processing system.
For further work on Halophyte biomass, one of the core questions that remain is that of cost for the bio-oil and other co-products. Can bio-oil from Halophytes indeed be produced for $1-2/gallon? Other areas of R&D that have been identified190 are:
- establishment of a halophyte germplasm collection - development of marketable products - establishment of an international coordination centre - establish a world halophyte garden By far, the most work left to accomplish is to educate the public on how
precious fossil fuels are, the diminishing fossil fuel reserves191, and how difficult it is to create massive amounts of environmentally preferred alternatives.
155

156
7.0 REFERENCES
1 Campbell, Colin J., “Oil & Gas Liquid 2004 Scenario,” Uppsala Hydrocarbon Depletion Study
Group, May 15, 2004.
2 Campbell, C.J., Chart provided directly, but also appeared in ASPO newsletter, Feb. 2006.
3 Deffeyes, K.S., “Hubberts’ Peak, The Impending World Oil Shortage”, Princeton Press, 2001
4 Zucchetto, James, “Trends in oil supply and demand, the potential for peaking of conventional oil production, and possible mitigation options,” The National Academies Press, Washington, D.C. 2006
5 Hirsch, Robert L., “Peaking of World Oil Production: Impacts, Mitigation, & Risk Management,” SAIC Project, U.S. Government, Feb. 2005.
6 Witze, Alexandra, “That’s Oil, Folks”, Nature, Vol 445, January 2007
7 Diamond, J., “Collapse, How Societies Choose to Fail or Succeed”, Penguin Publishers, 2005
8 Jackson, Peter M., “Why the Peak Oil Theory Falls Down: Myths, Legends, and the Future of Oil Resources,” Cambridge Energy Research Associates, Nov. 2006.
9 Burke, T., “Fuelling the Future,” The World Today, vol. 61, no. 10, October 2005.
10 Intergovernmental Panel on Climate Change, UNEP, Fourth Assessment Report, Cambridge University Press, www.ipcc.ch, 2007.
11 Goodger, E., “Transport Fuelling, Update on Alternatives,” Landfall Press, 2006.
12 Carbon Dioxide Information Analysis Center, Oak Ridge National Laboratory, U.S. Department of Energy, 2007.
13 Boeing current market outlook, www.Boeing.com, 2008.
14 Graph provided by the International Air Transport Association, 2008.
15 IATA Signs Global Declaration on Aviation and Climate Change, IATA Press Room, http://www.iata.org/pressroom/pr/2008-04-22-01, 2008.
16 Price, H. “FAA Fact Sheet- Commercial Aviation Alternative Fuels Initiative”, http://www.faa.gov/news/fact_zsheets/news_story.cfm?newsId=10112, 2009.
17 Presented to ICAO GIAAC/3 by Paul Steele on behalf of ACI, CANSO, IATA and ICCAIA, February 2009.
18 Goodger, E., “Aviation Fuel Technology”, London, U.K. Macmillan press. 1985.
19 Goodger, E., “Transport Fuels Technology,” London, U.K. Portland Press, 11/2000.
20 Chevron Oil Corporation, “Aviation Fuels Technical Review”, 2006.
21 Energy Management Institute, “Alternative Fuels Index, New York, NY, 2007.
22 Chevron Oil Corporation, “Alternative Jet Fuels”, 2006.
23 Daggett, D.L., et. al., “Alternative Fuels and their Potential Impact on Aviation”, ICAS paper 2006-5.8.2, 2006.
24 U.S. Dept. of Energy, “Biofuels and Biomass Digest” ISBN 1-4220-0081-8, 2006.
25 Dunn R. O., “Alternate Jet Fuels from Vegetable Oils,” Published by the American Society of Agricultural and Biological Engineers, St. Joseph, Michigan www.asabe.org Vol. 44(6) pp 1751–1757, 2001.
26 Tickell, Joshua, “Biodiesel America,” 1st edition, Yorkshire Press, 2006.
27 Carter, Dan, et. Al., “How to Make Biodiesel,” Lightening Source, Milton Keynes, UK, ISBN 0-9549171-0-3, 2005.

157
28 Alovert, Maria, “Biodiesel Homebrew Guide,” Edition 10, [email protected], 3 Jan, 2005.
29 Thom, Melanie. Personal conversation. Baere Aerospace, Indiana. May 2008.
30 “Biofuels in the U.S. Transportation Sector”, US Energy Information Administration Agency, Independent Statistical Analysis, Oct, 2007.
31 Parente, Expedito, “Lipofuels : Biodiesel & Biokerosene”, presented at the Boeing biofuel summit, Seattle, WA., 24 May, 2006.
32 Stanley, David., Purdue University. www.tech.purdue.edu/at/appliedresearch/fac_research.cfm, 2009.
33 Shauck, M. E., Sanin, M.G., “Transitioning to biomass fuels in general aviation”, Renewable Aviation Fuels Development Center, Baylor University, Waco, Texas 76706, 2006.
34 Biello, David, “Biodiesel takes to the sky”, Scientific American, http://www.scientificamerican.com/article.cfm?id=biodiesel-takes-to-the-sky, 30 November, 2007.
35 "The Early Days of Coal Research". Fossil Energy. United States Department of Energy. http://www.fe.doe.gov/aboutus/history/syntheticfuels_history.html. Retrieved 09 Nov, 2008.
36 Qatar airways press release, “World's First Commercial Passenger Flight Powered By Fuel Made From Natural Gas Lands In Qatar”, http://www.qatarairways.com/global/en/newsroom/archive/press-release-12Oct09-2.html#, 2 October 2009.
37 Tickell, Joshua, “From the Fryer to the Fuel Tank,” 3rd edition, Tickell Energy, Hollywood, Ca., 2003.
38 Harrison, W.E., and Zabarnick, S.: “The OSD Assured Fuels Initiative⎯Military Fuels Produced From Coal,” Proceedings of 2006 Clearwater Coal Conference, May 2006.
39 Intergovernmental Panel on Climate Change, “Carbon Dioxide Capture and Storage,” ISBN 92−9169−119−4, 2005.
40 Daggett, D.L., “Alternate Fuels for use in Commercial Aircraft”, ISABE-2007-1196, Sept., 2007
41 Boeing Announces Big Virgin Atlantic Order—Plane Maker to Partner With U.K. Carrier To Develop a Biofuel for Jets. http://www.msnbc.msn.com/id/ 18288682/ Accessed April 25, 2007.
42 Coordinating Research Council, “Handbook of Aviation Fuel Properties”, CRC report 530., Atlanta, GA. 1983.
43 Cited in: Bomb, C. “Opportunities and barriers for biodiesel and bioethanol in Germany, the United Kingdom and Luxembourg”, IIIEE Master’s Theses 2005:XX, Internationella miljöinstitutet, Sept 2005
44 LeFebvre, A. H., “Gas Turbine Combustion”, Taylor & Francis, 1983.
45 Koivusalmi, et. al. “Process for Processing a Saturated Hydrocarbon Component”, US Patent 2007/0131579 A1, June 14, 2007.
46 Gary, James H., Handwerk, Glenn E. “Petroleum Refining: Technology and Economics” (4th Edition.) Marcell Dekker, New York. 2001.
47 Gary, James H., Handwerk, G., Kaiser, M., “Petroleum Refining”, CRC Press, 2007.
48 Stephanopoulos, G., “Challenges in Engineering Microbes for Biofuels Production “, Science, Vol. 315. no. 5813, pp. 801 – 804, 9 February 2007.
49 Rudloff, M., “Biomass-to-Liquid Fuels (BtL) - Made by CHOREN Process, Environmental Impact and Latest Developments”, Automobile & Environment at Belgrade EAEC Congress, 5/2005.

158
50 Towards Sustainable Production and Use of Resources: Assessing Biofuels". United Nations
Environment Programme. http://www.unep.fr/scp/rpanel/pdf/Assessing_Biofuels_Full_Report.pdf., 10/2009.
51 Daggett, D. “Commercial Aviation Alternative Fuels”, TRB Presentation. http://www.trbav030.org/pdf2007/TRB07_alt_fuel.pdf, January 2007.
52 Searchinger, T. et. al. “Use of U.S. Croplands for Biofuels Increases Greenhouse Gases through Emissions from Land Use Change.” Science in press, 2008.
53 Achten WMJ, Verchot L, Franken YJ, Mathijs E, Singh VP, Aerts R, et al. Jatropha bio-diesel production and use. Biomass and Bioenergy, doi:10.1016/j.biombioe.2008.03.003 2008.
54 Makkar, H., et. al. “Comparative analysis of non-toxic and toxic varieties of Jatropha Curcas for chemical composition, digestibility, protein degradability and toxic factors”, Elsenviner Press, 1995.
55 Achten WMJ, Verchot L, Franken YJ, Mathijs E, Singh VP, Aerts R, Muys B “Jatropha bio-diesel production and use.”Biomass and Bioenergy 32(12), pp 1063-1084, 2008.
56 Francis G, Edinger R, Becker K. A concept for simultaneous wasteland reclamation, fuel production, and socioeconomic development in degraded areas in India: need, potential and perspectives of Jatropha plantations. Natural Resources Forum pp 29:12–24, 2005.
57 Foidl N, Foidl G, Sanchez M, Mittelbach M, Hackel S. Jatropha curcas L. as a source for the production of biofuel in Nicaragua. Bioresource Technology, pp 58:77–82. 1996.
58 Sharma N. “Pest disease management”, FACT seminar on Jatropha curcas L. agronomy and genetics, Wageningen, The Netherlands, March 26–28. Article #26, 2007.
59 Food and Agriculture Organization of the United Nations, FAOSTAT web site, http://faostat.fao.org/site/567/DesktopDefault.aspx?PageID=567#ancor
60 Glenn, E. P., Brown, J. J., and Blumwald, E. (1999). "Salt Tolerance and Crop Potential of Halophytes", Critical Review in Plant Sciences, Vol. 18, No. 2, pp. 227-255
61 Yensen, N.P., “New developments in the world of saline agriculture”, Prospects for Saline Agriculture, Kluwer Academic Publishers, 2002.
62 Glenn, E. P.; Brown, J. J.; O'Leary, J. W. (1998). "Irrigating Crops with Seawater", Scientific American, Vol. 279, no. 8, pp. 56-61, Aug. 1998
63 Leith, H., et. Al., “Developing Cash Crops from Halophytes”, Prospects for Saline Agriculture, pp 309-319, Kluwer Academic Press, 2002.
64 Collins Guide to Tropical Plants, ISBN 0002191121, 2009.
65 Van Den Hoek, C., Mann, D.G., Jahns, H.M., “Algae, an introduction to Phycology”, Cambridge University Press, 1995.
66 GreentechMedia.com, Algae Biofuel Investments Explode, September 18, 2008, , http://www. greentechmedia.com/articles/read/algae-biofuel-investmentsexplode-1434/, accessed 12 Jan. 2009.
67 AquaticBiofuel.com, 2008 the year of algae investments, December 5, 2008, http://aquaticbiofuel.com/2008/12/05/2008-the-year-of-algaeinvestments/. accessed 30 June, 2009.
68 GreentechMedia.com, Solix:Another Me-Too Algae Company Raises $10.5M, http://www.greentechmedia.com/articles/solix-another-me-too-algaecompany-raises-105m-5151.html., accessed 11 November, 2008.
69 Porter,M., “The competitive advantage of Nations” 1990
70 Tau, B., “Fractionated Biodiesel for Aviation Jet Fuel”, presented at the FAA Alternative Fuel Workshop, Atlanta, GA., 2006.
71 Figure provided by Petrobras, Rio de Janerio, Brazil, 2008.
72 Graph provided by Tim Edwards, AFRL, Dayton, OH. 2008.

159
73 Chart provided by Jennifer Holmgren, UOP. 2009.
74 Heminghaus, G., et. al. “Aviation Fuels Technical Review”, Chevron Global Aviation, http://www.chevronglobalaviation.com/docs/aviation_tech_review.pdf, 2006.
75 Daggett, D., “The design of a Aviation Fuel Thermal oxidation test System”, ASTM Paper 94-GT-217, 1994.
76 Results provided by Don Minus, AFRL, Dayton, OH and John Grapham & Richard Striebich, Univerisity of Dayton Research Institute, 26 March 2006.
77 Chart provided by Art Johnson, GEAE, Cincinnati, OH 2008.
78 Chart provided by Phil Whitefield, U. of Missouri, Rolla, 2008.
79 Chart provided by Pratt & Whitney, E. Hartford, CT, 2009.
80 Rahmes, T. E., et. al., “Sustainable Bio-Derived Synthetic Paraffinic Kerosene (Bio-SPK) Jet Fuel Flights and Engine Tests Program Results”, AIAA paper 2009-7002, 2009.
81 IPCC. Aviation and the Global Atmosphere. Intergovernmental Panel on Climate Change, London: Cambridge University Press, 1999.
82 Hendricks, R. and Bushnell, D., “Halophytes Energy Feedstocks: Back to our Roots”, ISROMAC12–2008–20241 paper. 2008.
83 Calvin, Melvin., “Petroleum Plantations for Fuel and Materials”, BioScience, Vol. 29, No. 9, pp. 533-538, Sep., 1979.
84 Eshel, A., Waisel, Y., “Final report to Boeing on Euphorbia Tirucalli, 2009. (unpublished report)
85 Daey Ouwens, K., et. al. “Position paper on Jatropha curcas. State of the art, small and large scale project development.” Seminar held at Wageningen University, Netherlands, 3/2007.
86 Helen Burley, H., Griffiths, H., “Jatropha: wonder crop? Experience from Swaziland”, Friends of the Earth, http://www.foe.co.uk/resource/reports/jatropha_wonder_crop.pdf , May 2009.
87 e360 digest, “Jatropha ‘Wonder Crop’ Requires Huge Quantities of Water, Report Finds”, 10 Jun 2009.
88 Gerbens-Leenes, W., Hoekstra, A., van der Meer, T., “The Water Footprint of Bioenergy”, PNAS, Early Edition, www.pnas.org, 2009.
89 GEXSI (Global Exchange for Social Investment) global study, released on behalf of the World Wildlife Fund (WWF), 2008.
90 http://www.jatrophabook.com/home.asp, Accessed November, 2009.
91 Di semi-annual report, http://www.d1plc.com/pdf/news/408_478_D1%20Oils%20plc%20-%20Jun%2009%20interim%20report%20-%20v3.pdf, June 2009.
92 D1 information web site, http://www.d1plc.com/news.php?article=185, 2 April, 2009.
93 Francis, G., Edinger, R., Becker, K., “A concept for simultaneous wasteland reclamation, fuel production, and socio-economic development in degraded areas in India: Need, potential and perspectives of Jatropha plantations”, Natural Resources Forum 29, pp 12-24, 2005.
94 Asia Cleantech, http://asiacleantech.wordpress.com/2007/11/22/jatropha-to-provide-500000-jobs-in-chhattisgarh-india/, 22 November, 2007.
95 Biofuels Digest e-newsletter , “India’s Uttar Pradesh targets 40 percent of waste lands for jatropha production by 2012”, http://www.biofuelsdigest.com/blog2/2008/08/19/indias-uttar-pradesh-targets-40-percent-of-waste-lands-for-jatropha-production-by-2012/, 2009.
96 Biofuels Digest e-newsletter , “India’s Chhattisgarh state completes plantation of 100 million jatropha saplings; 1 million hectares planted by 2012”, http://www.biofuelsdigest.com/blog2/2009/02/12/indias-chhattisgarh-state-completes-plantation-of-100-million-jatropha-saplings-1-million-hectares-planted-by-2012/, 2009.
http://www.d1plc.com/pdf/news/408_478_D1%20Oils%20plc%20-%20Jun%2009%20interim%20report%20-%20v3.pdf
http://www.d1plc.com/pdf/news/408_478_D1%20Oils%20plc%20-%20Jun%2009%20interim%20report%20-%20v3.pdf
http://asiacleantech.wordpress.com/2007/11/22/jatropha-to-provide-500000-jobs-in-chhattisgarh-india/

160
97 Acharya, Keya, “ENERGY-INDIA: Biofuelling Confusion”,
http://www.ipsnews.net/news.asp?idnews=45949, accessed Oct 2009.
98 Lane, Jim, “The Blunder Crop, Jatropha biofuels development”, Biofuels Digest special report, 24 March, 2009.
99 Horst Weyerhaeuser, Timm Tennigkeit, Su Yufang, and Fredrich Kahrl, “Biofuels in China: An Analysis of the Opportunities and Challenges of Jatropha Curcas in Southwest China”, World Agroforestry Centre, ICRAF Working Paper Number 53, 2007.
100 Ye, M., et. al., “Current situation and prospects of Jatropha Curcas as a multipurpose tree in China”, Agroforest Syst, 76:487-497, 2009.
101 Time Magazine., “Biofuel Gone Bad: Burma’s Atrophying Jatropha”, 13 March, 2009.
102 Ray, R., Cardell, J. “Renewable Energy Prospects in Haiti’s Nord-Est Department”, Smith College, Northhampton, MA, Oct 2008.
103 Laurent, M. “What Haitian Americans Ask of the New US President”, http://www.margueritelaurent.com/campaigns/campaignsix/c6mission.html, 2009.
104 Personal conversation with Napoleao Beltrao, Brazilian Director of Agricultural Research, EBRAPA, Brazil., 2009.
105 Personal conversation with Assaf Oron of Evogene Ltd, Israel. 2009.
106 “Economic potential of castor oil as a source for biojet production” Final Report to Boeing, Evogene Ltd. 13 Gad Feinstein St., PO Box 2100, Rehovot,76121 Israel, 2009. (unpublished report.)
107 Zubr. J., “Oil-seed crop: Camelina sativa”, Industrial Crops & Products, Elsevier Press. 1997.
108 Sustainable Oils, http://www.susoils.com/, 2009.
109 Putnam, D.H., J.T. Budin, L.A. Field, and W.M. Breene. 1993. Camelina: A promising low-input oilseed. New crops. Wiley, New York. pp 314-322, 1993.
110 Pilgeram, Alice, “The Scoop on Camelina Sativa”, Biobased Products Institute - Montana State University, http://www.montana.edu/biobased/projects/CamelinaInfo.html, 2009.
111 Algae Herbarium. National Museum of Natural History, Department of Botany. http://botany.si.edu/projects/algae/herbarium.htm. Accessed 12/2009.
112 Barnes, S., “Identification of Promising Algae strains for cultivation in Western Washington, and cultivation of selected strains”, Final report to Boeing from Bioalgene. 2009.
113 Ratledge, C., Wynn, J., “The biochemistry and molecular biology of Lipid Accumulation in Oleaginous Microorganims”, Advances in Applied Microbioloty, V51, 2002.
114 Personal conversation with Dr. Alan J. Bauer, 49 Usshiskin St., Jerusalem, Israel, 9/2008.
115 Hu, Q, Sommerfeld, M, Chen, Y., Proposal 9M-PS01-MRS08-077 submitted to Boeing Co., “Development of Several Key technologies Involved in Algae-Based Jet Fuel Production”, Department of Applied Biological Sciences, Arizona State University, Polytechnic campus, 3/2008. (Unpublished report.)
116 Solid Separation Systems for the Pig Industry Case Study 11, “DAF Case Study 11 – DISSOLVED AIR FLOTATION”, www.fsaconsulting.net/pdfs/Case%20Study%2011%20-%20DAF.pdf, 10/2000.
117 http://en.wikipedia.org/wiki/Aquaflow_Bionomic_Corporation, Accessed Oct, 2009.
118 Behner, R., et. al., “Taylor Courette Filtration System”, ME Senior Design Final Report to Boeing, University of Colorado, 2009. (Unpublished report.)
119 AUTOMATIC SOXHLET EXTRACTION". cyberlipid.org. http://www.cyberlipid.org/extract/extr0010.htm. accessed Aug 2006.

161
120 Veloso, G. O., V. G. Krioukov, and H. A. Vielmo, “Mathematical modeling of vegetable oil
extraction in a counter-current crossed flow horizontal extractor”, Journal of Food Engineering 66, pp 477 – 486, 2005.
121 Damon Frashure, D., Kramlich, J., Mescher, A., “Technical and Economic Analysis of Industrial Algal Oil Extraction”, SAE Paper 09-01-3235, 2009.
122 Bratzel, G., Mayther, I., Woolsey, P. & Schumann, T., “Mechanical Algae Lipid Extractor”, Final Report from Seattle University to Boeing, 2009. (Unpublished report.)
123 Edwards, M. “Biowar I, Why Battles over Food and Fuel Lean to World Hunger”, Talent DNA Press, 2008.
124 Ecole Polytechnique Federale De Lausanne, “Global Principles and Criteria for sustainable Biofuels Production”, Roundtable on Sustainable Biofuels, Version Zero, 13 August, 2008.
125 The Aviation Fuel Life Cycle Assessment Working Group, “Framework and Guidance for Estimating Greenhouse Gas Footprints of Aviation Fuels”, PROPULSION AND POWER RAPID RESPONSE RESEARCH AND DEVELOPMENT (R&D) SUPPORT, Delivery Order 0011, AFRL-RZ-WP-TR-2009-XXX, April 2009.
126 Liska, A., Cassman, K., “Towards Standardization of Life-Cycle Metrics for Biofuels: Greenhouse Gas Energy Mitigation and Net Energy Yield”, Journal of Biobased Materials and Bioenergy, V2, pp187-203, American Scientific Publishers, 2008.
127 Lieberz, S. “Biodiesel in Germany – an overview”, USDA report #GM2021, 10/2002.
128 Leer, S. “Agronomists: Long-term corn, soybean yield trends acres apart”. Purdue News, Purdue University. Dept. of Agriculture. July 2004.
129 “Rapeseed Production Insufficient for Expanding Biodiesel Industry”, USDA Production Estimates and Crop Assessment Division, Foreign Agricultural Service, 20 November, 2002.
130 Sheehan, John, et al., “A Look Back at the U.S. Department of Energy’s Aquatic Species Program⎯Biodiesel From Algae,” NREL/TP−580− 24190, pp 11-12, July 1998.
131 Kristina M. Weyer, K., Bush, D., Darzins, A., Willson, B., “Theoretical Maximum Algal Oil Production”, Journal BioEnergy Research, ISSN 1939-1242 (Online), Springer New York, 10/2009.
132 Personal conversation with Expedito Parente, TecBio, Fortaleza, Brazil 2007.
133 “Useful Information about Conventional and Alternate Fuels and their Feedstocks,” National Renewable Energy Lab, National Bioengineering Center, June 2004.
134 Food and Agriculture Organization of the United Nations (FAO), 2009.
135 Raimundo Santos do Nascimento, INPE - Instituto Nacional de Pesquisas Espaciais, 2007.
136 Peer Center, http://www.peercenter.net/about/glossary.cfm, accessed 31 December 2009.
137 British Standards Institute; The Carbon Trust; UK Department for Environment, Food and Rural Affairs. Publicly Available Specification for the Assessment of greenhouse gas emissions of goods and services. London: British Standards Institute, 2008.
138 Available at: http://www.iso.org/iso/iso_14000_essentials, accessed Oct, 2009.
139 HR 6, available at: http://frwebgate.access.gpo.gov/cgibin/getdoc.cgi?dbname=110_cong_bills&docid=f:h6enr.txt.pdf, accessed Oct 2009.
140 AFRL-RZ-WP-TR-2009-XXX, Propulsion & Power Rapid Response R&D Support, Delivery Order 0011: Framework and Guidance for Estimating Greenhouse Gas Footprints of Aviation Fuels, April 2009
141 Forster, P., et. Al., “Changes in Atmospheric Constituents and in Radiative Forcing”, Climate Change 2007: The Physical Science Basis. Contribution of Working Group I to the Fourth Assessment Report of the Intergovernmental Panel on Climate Change [Solomon,
162
S., D. Qin, M. Manning, Z. Chen, M. Marquis, K.B. Averyt, M.Tignor and H.L. Miller (eds.)]. Cambridge University Press, Cambridge, United Kingdom and New York, NY, USA. Table 2.14., 2007.
142 Wang, Michael. “Greenhouse Gases, Regulated Emissions, and Energy Use in Transportation (GREET) Model”, Argonne National Laboratory, Ann Arbor: Department of Energy, 2008.
143 Cooper, Joyce. Final report, “Algae-to-Jet: Process Modeling and Consequential Life Cycle Assessment”, 10 December, 2009. (Unpublished report.)
144 Wong, H. M., “Life-cycle Assessment of greenhouse Gas Emissions from Alternative Jet Fuels”, MS thesis submitted to MIT, 2009. (Unpublished report.)
145 Chart provided by Marty Bradley, Boeing Research & Technology, Huntington Beach, CA. 2008
146 Pimentel, D. and T. W. Patzek, “Ethanol Production Using Corn, Switchgrass, and Wood; Biodiesel Production Using Soybean and Sunflower,” Natural Resources Research, vol. 14, no. 1, March 2005.
147 Shapouri, H., Duffield, J. A., McAloon, A and Wang, M, “The 2001 Net Energy Balance of Corn-Ethanol,” Corn Utilization and Technology Conference, Indianapolis, IN, 7-9 June, 2004.
148 Petroleum Review, “Meeting the Energy Gap”, Vol 60, No 718,November 2006.
149 Sheehan, J., V. Camobreco, J. Duffield, M. Graboski, and H. Shapouri, Life Cycle Inventory of Biodiesel and Petroleum Diesel for Use in an Urban Bus, Final Report, National Renewable Energy Laboratory, NREL/SR-580-24089 UC Category 1503, May 1998.
150 Fuel processing information extracted from UOP presentation titled “The Future of Biofuels”, 2009 Refining R&D Panel, Rome, Italy, 6-9 May, 2009.
151 Kreider, J.F., Curtiss, P.S., “Comprehensive Evaluation of Impact from Potential, Future Automotive Fuel Replacements”, Proceedings of ES2007 Energy Sustainability, ES2007-36234, pp5., 27-30 June, 2007,
152 GIACC/3-IP/4, “Opportunities for mitigating climate impacts,” presented to the 3rd Meeting of the Group on International Aviation and Climate Change (GIACC/3), http://www.icao.int/env/meetings/2009/GIACC_3/GIACC_3.html, 17-19 Feb, 2009.
153 Centrec Consulting Group, LLC, “Soybeans and Biodiesel: Key Price Relationships”, www.plateforme-biocarburants.ch/medias/download.php?get=280, Accessed July 2009.
154 Data obtained from: “World Biodiesel Production Capacity”, Multi-Client Study, 2nd Edition (2008 release), Published by Emerging Markets Online, 2009
155 Teall, R., “Study to Evaluate the Feasibility of Biodiesel Production Facilities in Nevada & California Utilizing Grease Trap & Waste Cooking Oils as Feedstocks”, Appendix #3—Feasibility Study, pp. 38-42, web site www.westbioenergy. org/reports/55034/55034fin.pdf. 2002.
156 Energy Information Administration, Annual Energy Outlook 2004, DOE/EOA-0383(2004) (Washington, DC, January 2004), Table 3, “Industrial Gas and Electricity Prices,” web site www.eia.doe.gov/oiaf/aeo/pdf/aeotab_3.pdf. accessed Dec 2009.
157 Reif, H. E., “An Exploratory Research & Development Program Leading to Specifications for Aviation Turbine Fuel from Whole crude Shale Oil”, part 3, US Air Force Research document AFWAL-TR-81-2087, 1981.
158 Linhardt, H., “Neste steps up biodiesel production by hydrotreating”, Neste Oil steps up biodiesel production by hydrotreating process http://www.glgroup.com/News/Neste-Oil-steps-up-biodiesel-production-by-hydrotreating-process-35260.html, 2009 .
159 McCall, M, et. al., “Opportunities for Biorenewables in Petroleum Refineries”, UOP 4434A-01, 2005.

163
160 “MeroxTM Process for Kerosene/Jet Fuel Sweetening”,
http://www.uop.com/objects/4%20Merox%20Kero%20jet.pdf, 2007.
161 Yamaguchi, N.D., “Costs of Reducing Diesel Sulphur: A Quantitative Assessment of China”, cse.polyu.edu.hk, 2002.
162 Radich, A., “Biodiesel Performance, Costs, and Use”, US Energy Information Agency, http://www.eia.doe.gov/oiaf/analysispaper/biodiesel/, 2009.
163 McElroy, D., “Engineering the Nation’s First Dedicated Biofuel Crop”, 2008 BIO World Congress, Chicago, IL, 30 April, 2008.
164 Pilgeram, A. L., “Camelina sativa, A Montana Omega-3 and Fuel Crop “, Reprinted from: Issues in new crops and new uses. ASHS Press, Alexandria, VA. 2007.
165 Williams, W., “MSU Researchers Say New Crop Could Produce Affordable Biodiesel”, Bozeman Daily Chronicle, 19 May, 2005.
166 Putnam, D. H.; Budin, J. T.; Field, L. A.; Breene, W. M. In New Crops; Simon, J. E., Ed.; Wiley: New York, 1993.
167 Rice, B., “Opportunities For Industrial Crop Production in Ireland”, IENICA is a project funded under the FAIR programme by DG X11 of the European Commission, http://www.ienica.net/reports/ireland.pdf, Accessed Nov, 2009.
168 Guia. M.M. & Bhatiaa. S., “Feasibility of edible oil vs. non-edible oil vs. waste edible oil as biodiesel feedstock”, Energy, Volume 33, Issue 11, pp 1646-1653, 11/2008
169 Sheehan, J., Dunahay, T., Benemann, J., Roessler, P., Weissman, J. “A look Back at the U.S. Department of Energy's Aquatic Species Program: Biodiesel from Algae; Close-Out Report.” 325 pp.; NREL Report No. TP-580-24190 available on: http://www.nrel.gov/docs/legosti/fy98/24190.pdf, 1998.
170 Benemann, J.R.., Oswald, W.J. “Systems and economic analysis of microalgae ponds for conversion of CO2 to biomass.” Final report. US DOE http://www.osti.gov/bridge/servlets/purl/493389-FXQyZ2/webviewable/493389.pdf 1996.
171 Van Harmelen, T., Oonk, H. “Microalgae Biofixation Process: Applications and Potential Contributos to Greenhouse Gas Mitigation Options”, EniTechnologie, Milan, Italy, http://www.co2captureandstorage.info/networks/Biofixation.htm, May 2006.
172 Marker T, J Petri, T Kalnes, M McCall, D Mackowiak, B Jerosky, B Regan, L Nemeth, M Krawczyk, S Czernik, D Elliot, and D Shonnard., “Opportunities for Biorenewables in Oil Refineries.” UOP, Des Plaines, Illinois. http://www.osti.gov/energycitations/product.biblio.jsp?osti_id=861458, 2005.
173 Gesch, R., Archer, D., “New Crops and Management Strategies to Improve Cropping Efficiency in Short-Season High-Stress Environments”, ASA-CSSA-SSSA Annual Meeting., Pittsburgh, PA., 1-5 Nov., 2009.
174 McVay, K.A., “Camelina Production in Montana”, Southern Agricultural Research Center, and P.F. Lamb, Research Associate, Northern Agricultural Research Center, http://msuextension.org/publications/AgandNaturalResources/MT200701AG.pdf, 2008.
175 Personal conversation with CEO Thomas Todaro, Targeted Growth, Seattle, WA., 2008.
176 “Camelina Plant Offers Intriguing New Biofuel”, Oilprice.com, http://www.nuwireinvestor.com/articles/camelina-plant-offers-intriguing-new-biofuel-54139.aspx, Nov 2009.
177 Personal conversation with Napoleao Beltrao, Brazilian Director of Agricultural Research, EMBRAPA, 2009.
178 Ahmad, R., Malik, K., “Prospects for Saline Agriculture”, Kluwer Academic Publications, 2002.
179 Glenn, E.P., et. al., “Irrigating Crops with Seawaer”, Scientific American, pp. 76-81, Aug 1998.

164
180 International Center for Biosaline Agriculture, Dubai, UAE
181 Huesemann, M., and J.R. Benemann, “Biofuels from Microalgae: Review of Products, Processes and Potential, with Special Focus on Dunaliella sp.” The Alga Dunaliella, Biodiversity, Physiology, Genomic and Biotechnology,Science Publishers, 445-474, 2009.
182 Personal conversation with John E. Ferrell, Office of the Biomass Program, Energy Efficiency and Renewable Energy, US Department of Energy, Washington, DC 20585. June 2009.
183 Perlack, B., et al. “Resource Potential: The Billion-ton Study, 30x30 Workshop, http://bcsmain.com/mlists/files/30x30/Documents/30x30BillionTon-Aug1-06.pdf, 2006.
184 Cited in: Lynd, Lee R., “Biofuels: A Strategic Perspective”, University of Minnesota, Minneapolis, St. Paul, 25 March, 2009.
185 Liquid Transportation Fuels from Coal and Biomass, Report of the Panel of Alternative Liquid Transportation Fuels, National Academy of Sciences, May, 2009.
186 Glenn, E., et. al., “Potential for carbon sequestration in the drylands”, Water, Air & Soil Pollution, Vol 70 #1-3, Nov 1993.
187 Personal conversation with Dr. Carl Hodges, Global Seawater Foundation, July 2008.
188 Kennedy, D., et. al., “Meeting the UK aviation target – options for reducing emissions to 2050”, Committee on Climate Change, London, England. www.theccc.org.uk., December 2009.
189 Altman, R., “CAAFI overview presentation”, www.CAAFI.org, 2009.
190 Böer, Bruno, “Halophyte Research and Development: What Needs to be Done Next?”, Tasks for Vegetation Science, pp 397-39., Springer Netherlands Publishers, 2006.
191 Simmons, Mathew R., “Twilight in the Desert,” John Wiley & Sons, 2005.

__________________________________________________________________________
Page A-1
Appendix A
CAAFI Alternative Fuels Roadmap

__________________________________________________________________________
Page A-2
Alg
ae
stra
in
stud
y
Oil
See
d P
lant
s
Sep
t 5, 2
008
2008
2009
2014
2015
2010
2011
2012
2013
Sep
t 5, 2
008
2008
2009
2014
2015
2010
2011
2012
2013
Hal
ophy
teas
sess
men
t
Alga
e de
mo
plan
ts
Euph
orbi
apr
otot
ype
plot
s
New
alg
aeTe
chs
read
yC
yano
bact
eria
Scal
ed d
emo
GM
O
Hal
ophy
tete
st p
lot
Hal
ophy
tes
Alg
ae
Cel
lulo
sic
Jatro
pha
harv
estin
g pr
otot
ype
Eup
horb
iaan
alys
is
Sal
icor
nia
anal
ysis
Sea
shor
em
allo
w a
naly
sis
Dew
ater
st
udy Oil
extra
ctio
n
Opt
imiz
ed
cast
or
stud
y
Opt
imiz
ed
cast
or p
lot
Cya
noba
cter
iast
udy
GM
O
Cya
no-
bact
eria
stud
y
Larg
e sc
ale
alga
e pl
ants
de
velo
ped
Oth
er
USD
A
feed
stoc
k ro
adm
ap
US
DA
feed
stoc
k ra
nkin
gs &
R
&D
pla
n
= D
one
= In
wor
k=
Not
Fun
ded
Larg
e sc
ale
“reg
iona
l so
lutio
n”fa
rms
deve
lope
d
Larg
e sc
ale
Hal
ophy
te fa
rms
deve
lope
d
Cya
noba
cter
iapl
ant d
evel
oped
Opt
imiz
edH
alop
hyte
sM
odifi
ed
Hal
ophy
te
prot
otyp
e pl
ots
CAA
FI
biof
eeds
tock
road
map
Cam
elin
a as
sess
men
t
Hea
vy m
etal
re
mov
al s
tudy
Terr
a Pr
eta
test
plo
t for
C
BTL
Res
ults
fro
m
DAR
PA
proj
ect
Ligh
t &
CO
2le
vel
stud
y
DO
E’s
CBT
L st
udy
done
DO
E’s
C
BTL
&
alga
e de
mos
do
ne
GM
O
alga
e
8M to
ns
salic
orni
aoi
l (20
19)
USD
A ad
vanc
ed
biof
uel
sum
mar
y
Rev
ise
EIS
A to
incl
ude
biom
ass
cred
it
USD
A
alga
e fu
ndin
g re
port
Cos
t of a
lgae
stu
dy
9K g
al o
f sal
icor
nia
oil
Oils
eed
inve
ntor
y st
udy
*LC
Asof
bio
fuel
s ar
e in
clud
ed in
the
Envi
ronm
enta
l tea
m’s
road
map
CA
AFI
R&
D T
eam
Roa
dmap
(1 o
f 6)
Feed
stoc
k
BCIW
Gre
port
Larg
e sc
ale
cellu
lose
farm
sO
RN
L Bi
llion
Ton
stud
yC
ellu
lose
/ sug
ar/
alga
e pr
otot
ype
dem
o
GM
O p
lant
s fo
r sug
ar
Cel
lulo
sic
Etha
nol
beco
mes
cos
t co
mpe
titiv
e
Cel
lulo
se to
bi
ojet
dem
o pl
ant
(via
pyr
olys
is)
Cel
lulo
se to
bio
jet
fligh
t dem
o(v
ia s
ynth
etic
bio
logy
)
DO
E A
lgae
Roa
dmap
3/17
/09
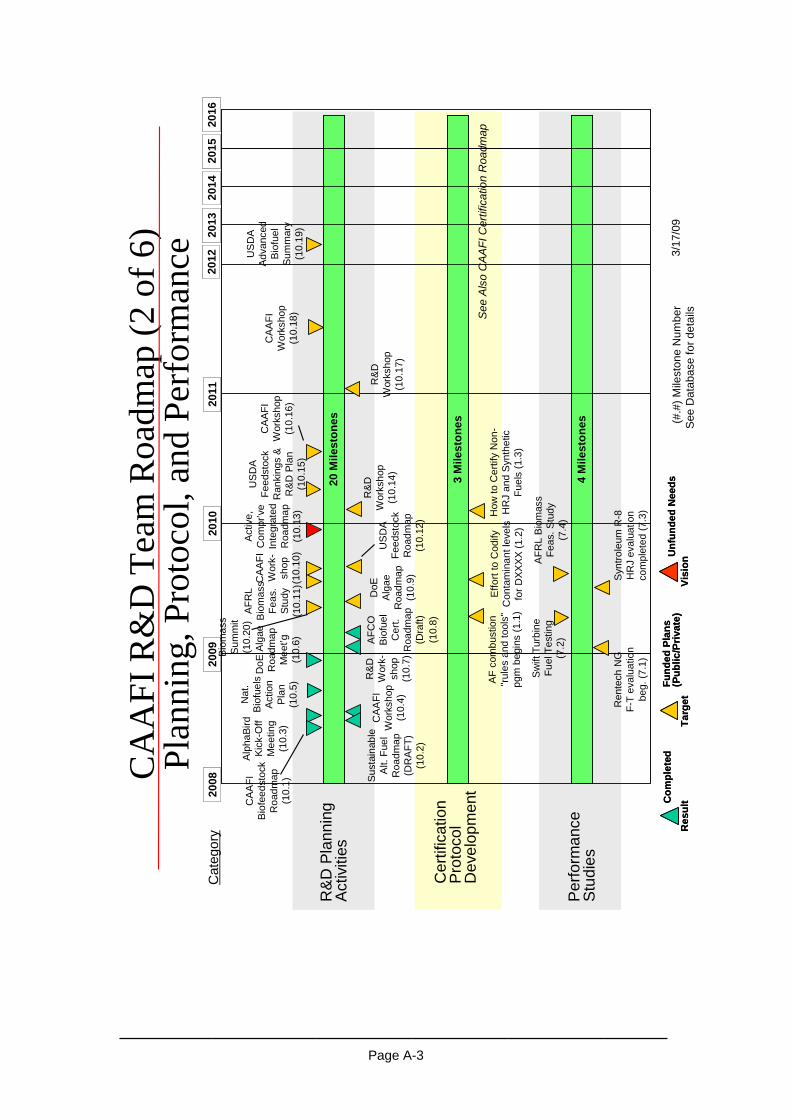
__________________________________________________________________________
Page A-3
250
Cat
egor
y
R&
D P
lann
ing
Act
iviti
es
CA
AFI
R&
D T
eam
Roa
dmap
(2 o
f 6)
Plan
ning
, Pro
toco
l, an
d Pe
rfor
man
ce
CAA
FI
Wor
ksho
p (1
0.4)
R&
D
Wor
k-sh
op
(10.
7)
R&D
W
orks
hop
(10.
14)
R&D
W
orks
hop
(10.
17)
Per
form
ance
S
tudi
es
Cer
tific
atio
n P
roto
col
Dev
elop
men
t
Fund
ed P
lans
(P
ublic
/Priv
ate)
Com
plet
edU
nfun
ded
Nee
dsR
esul
tTa
rget
Visi
on
Fund
ed P
lans
(P
ublic
/Priv
ate)
Com
plet
edU
nfun
ded
Nee
dsR
esul
tTa
rget
Visi
on
Nat
. Bi
ofue
ls
Act
ion
Pla
n (1
0.5)
DoE
Alga
e R
oadm
ap
Mee
t’g(1
0.6)
Sust
aina
ble
Alt.
Fue
l R
oadm
ap
(DR
AFT)
(1
0.2)
AFR
L Bi
omas
s Fe
as.
Stud
y (1
0.11
)
Alp
haBi
rdKi
ck-O
ff M
eetin
g (1
0.3)
DoE
Alg
ae
Roa
dmap
(1
0.9)
CA
AFI
Wor
ksho
p (1
0.16
)
CA
AFI
Wor
ksho
p (1
0.18
)
Act
ive,
C
ompr
’ve
Inte
grat
ed
Roa
dmap
(1
0.13
)
20 M
ilest
ones
3 M
ilest
ones
4 M
ilest
ones
2010
2011
2012
2009
2014
2008
2016
2013
2015
20 M
ilest
ones
3 M
ilest
ones
4 M
ilest
ones
2010
2011
2012
2009
2014
2008
2016
2013
2015
2010
2011
2012
2009
2014
2008
2016
2013
2015
CAA
FI
Wor
k-sh
op
(10.
10)
3/17
/09
(#.#
) Mile
ston
e N
umbe
rS
ee D
atab
ase
for d
etai
ls
AFR
L Bi
omas
s Fe
as. S
tudy
(7
.4)
Ren
tech
NG
F-
T ev
alua
tion
beg.
(7.1
)
Swift
Tur
bine
Fu
el T
estin
g (7
.2)
Synt
role
umR
-8
HR
J ev
alua
tion
com
plet
ed (7
.3)
AF
com
bust
ion
"rul
es a
nd to
ols"
pg
mbe
gins
(1.1
)
AFC
O
Biof
uel
Cer
t. R
oadm
ap
(Dra
ft)(1
0.8)
US
DA
Feed
stoc
k R
oadm
ap(1
0.12
)
US
DA
Feed
stoc
k R
anki
ngs
&
R&D
Pla
n(1
0.15
)
USD
A
Adva
nced
Bi
ofue
l Su
mm
ary
(10.
19)
Effo
rt to
Cod
ify
Con
tam
inan
t lev
els
for D
XXXX
(1.2
)
How
to C
ertif
y N
on-
HR
J an
d Sy
nthe
tic
Fuel
s (1
.3)
CAA
FI
Biof
eeds
tock
Roa
dmap
(1
0.1)
Bio
mas
s S
umm
it(1
0.20
)
See
Als
o C
AA
FI C
ertif
icat
ion
Roa
dmap

__________________________________________________________________________
Page A-4
250
2010
2011
2012
2009
2014
2008
2016
2013
2015
250
2010
2011
2012
2009
2014
2008
2016
2013
2015
2010
2011
2012
2009
2014
2008
2016
2013
2015
2010
2011
2012
2009
2014
2008
2016
2013
2015
Cat
egor
y
CA
AFI
R&
D T
eam
Roa
dmap
(3 o
f 6)
Fuel
Pro
pert
y T
estin
g
Fund
ed P
lans
(P
ublic
/Priv
ate)
Com
plet
edU
nfun
ded
Nee
dsR
esul
tTa
rget
Visi
on
Fund
ed P
lans
(P
ublic
/Priv
ate)
Com
plet
edU
nfun
ded
Nee
dsR
esul
tTa
rget
Visi
on3/
17/0
9(#
.#) M
ilest
one
Num
ber
See
Dat
abas
e fo
r det
ails
Fuel
Pro
perty
Te
stin
g
Shel
l in
situ
S
hale
ker
o ev
alua
tion
(5.1
)
Res
earc
h R
epor
t 50%
H
RJ
(5.8
)
Swift
Tur
bine
Fu
el M
ater
ials
co
mpa
tibilit
y (5
.7)
Fuel
The
rmal
S
tabi
lity
Stud
ies
for 3
F-
T (5
.9)
Fuel
The
rmal
S
tabi
lity
Stud
ies
for a
vaila
ble
Bio
fuel
s (5
.14)
Fuel
The
rmal
S
tabi
lity
Stud
ies
for
new
alte
rnat
ive
fuel
s (5
.18)
Che
mic
al K
inet
ics
Mec
hani
sm
Dev
elop
men
t for
C
ombu
stio
n of
F-T
Fu
els
(5.1
2)
Sw
ift T
urbi
ne
Fuel
Fo
rmul
atio
n S
tudi
es (5
.10)
Fuel
Pro
perty
Te
stin
g
Shel
l in
situ
S
hale
ker
o ev
alua
tion
(5.1
)
Res
earc
h R
epor
t 50%
H
RJ
(5.8
)
Swift
Tur
bine
Fu
el M
ater
ials
co
mpa
tibilit
y (5
.7)
Fuel
The
rmal
S
tabi
lity
Stud
ies
for 3
F-
T (5
.9)
Fuel
The
rmal
S
tabi
lity
Stud
ies
for a
vaila
ble
Bio
fuel
s (5
.14)
Fuel
The
rmal
S
tabi
lity
Stud
ies
for
new
alte
rnat
ive
fuel
s (5
.18)
Che
mic
al K
inet
ics
Mec
hani
sm
Dev
elop
men
t for
C
ombu
stio
n of
F-T
Fu
els
(5.1
2)
Sw
ift T
urbi
ne
Fuel
Fo
rmul
atio
n S
tudi
es (5
.10)
Basi
c Fu
el
Pro
p. (5
.2)
Gov
’tFu
el
Buy
1
(5.3
)Spec
. P
rop.
(5
.4)
Fit-f
or-
Purp
ose
Prop
. (5.
6)
HR
J E
xten
ded
Pro
p.
(5.1
1)
Eva
l. of
M
at
Com
pat.
Can
d. 1
(5
.13)
Gro
und
Fire
P
rote
ct
(5.1
5)
Fuel
Sys
. C
omp’
nts
(5.1
6)
Eval
. of
Mat
. C
ompa
t. C
and.
2
(5.1
7)
Sur
viva
bilit
y/V
ulne
rabi
lity
(5.1
9)
Infra
-st
ruct
ure
(5.2
0)
Eval
. of F
uel
Tox.
Can
d. 1
(5
.21)
HR
J SE
&V
(5.2
2)
Gov
’tFu
el
Buy
2 (5
.5)
Eval
. of F
uel
Tox.
Can
d. 2
(5
.23)
Fuel
Pro
perty
Te
stin
g (M
ilitar
y)Fr
om A
FRL/
AFC
O C
ombi
ned
Roa
dmap
-B
ioJe
tCer
tific
atio
n -D
RA
FT

__________________________________________________________________________
Page A-5
250
2010
2011
2012
2009
2014
2008
2016
2013
2015
250
2010
2011
2012
2009
2014
2008
2016
2013
2015
2010
2011
2012
2009
2014
2008
2016
2013
2015
2010
2011
2012
2009
2014
2008
2016
2013
2015
Cat
egor
y
CA
AFI
R&
D T
eam
Roa
dmap
(4 o
f 6)
Com
pone
nt a
nd E
ngin
e T
estin
g
Fund
ed P
lans
(P
ublic
/Priv
ate)
Com
plet
edU
nfun
ded
Nee
dsR
esul
tTa
rget
Visi
on
Fund
ed P
lans
(P
ublic
/Priv
ate)
Com
plet
edU
nfun
ded
Nee
dsR
esul
tTa
rget
Visi
on3/
17/0
9(#
.#) M
ilest
one
Num
ber
See
Dat
abas
e fo
r det
ails
Com
pone
nt &
E
ngin
e Te
stin
g
Test
ing
of
F-T
and
Biof
uels
C
once
pt 1
(2
.10)
Bio
fuel
C
omb
Rig
Tes
t (2
.8)
Test
ing
of
F-T
and
Bio
fuel
s C
once
pt
2 (2
.20)
Test
ing
of
F-T
and
Bio
fuel
s C
once
pt 3
(2
.24)
Biof
uel
APU
&
Eng
Tes
t (2
.9)
Eval
uatio
n of
Bio
fuel
s U
sing
N
ASA
DC
-8
(2.2
9)
Indi
ana
F-16
S
tudy
(2
.11)
Sw
ift F
uel
Eng
Test
ing
(2.1
1 an
d 2.
12)
Eva
l. of
2
F-T
Fuel
s U
sing
N
ASA
DC
-8
(2.1
5)
Swift
Fu
el E
ng
Test
ing
(2.1
6)
Com
ngld
. (FT
/Bio
) A
/B A
PU
(2
.27)
HR
J G
ov’t
Fuel
Buy
3
(2.5
)
HR
J G
ov’t
Fuel
Buy
4
(2.1
3)
HR
J C
and.
Fu
el 1
A/B
En
g. T
est
(2.2
3)
HR
J Sm
all
Engi
ne
Dem
o (2
.17)
HR
J C
ompn
’tTe
sts
(2.7
)
Can
d. F
uel
2 A/
B E
ng.
Test
(2.2
8)
HR
J PF
2
Initi
al
Del
iver
y (2
.21)
HR
J C
and.
1
APU
Tes
t (2
.22)
HR
J C
omng
ld.
(FT/
Bio)
A
/B E
ng.
(2.1
9)
HR
J PF
1
Initi
al
Del
iver
y (2
.14)
HR
J C
and.
2
APU
Tes
ts
(2.2
6)
F-15
F-T
Fu
el E
ng
Test
(2
.2)
F-T
Fuel
G
SE/
ESO
H/
Infra
stru
ctur
e C
ertif
icat
ion
(2.3
)F-22
F-
T En
g Te
st
(2.4
)
F-16
F-T
En
g Te
st
(2.6
)
F-35
F-T
E
ng T
est
(2.1
8)
All U
SAF
Sys
F-T
C
ertif
icat
ion
(2.2
5)
Com
pone
nt &
E
ngin
e Te
stin
g(M
ilitar
y)Fr
om A
FRL/
AFC
O C
ombi
ned
Roa
dmap
-B
ioJe
tCer
tific
atio
n -D
RA
FT
See
Als
o C
AA
FI C
ertif
icat
ion
Roa
dmap
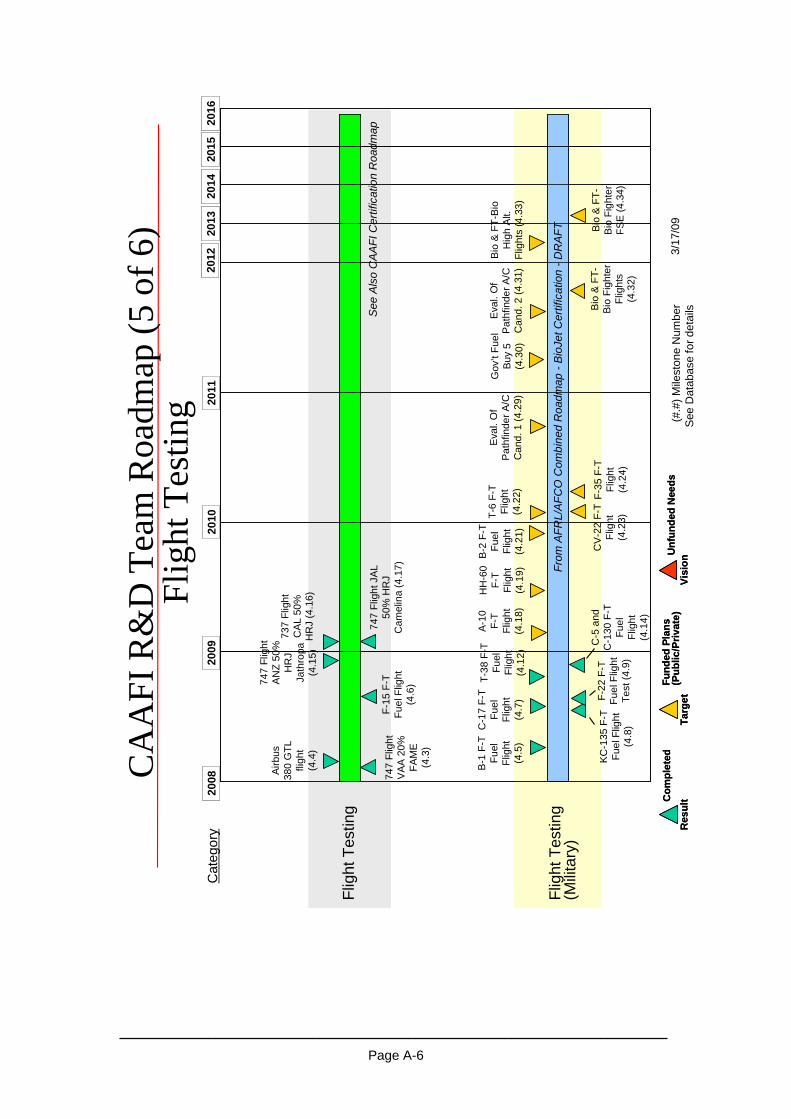
__________________________________________________________________________
Page A-6
250
2010
2011
2012
2009
2014
2008
2016
2013
2015
250
2010
2011
2012
2009
2014
2008
2016
2013
2015
2010
2011
2012
2009
2014
2008
2016
2013
2015
2010
2011
2012
2009
2014
2008
2016
2013
2015
Cat
egor
y
Fund
ed P
lans
(P
ublic
/Priv
ate)
Com
plet
edU
nfun
ded
Nee
dsR
esul
tTa
rget
Visi
on
Fund
ed P
lans
(P
ublic
/Priv
ate)
Com
plet
edU
nfun
ded
Nee
dsR
esul
tTa
rget
Visi
on3/
17/0
9(#
.#) M
ilest
one
Num
ber
See
Dat
abas
e fo
r det
ailsBi
o &
FT-
Bio
Figh
ter
Flig
hts
(4.3
2)
Gov
’tFu
el
Buy
5 (4
.30)
Bio
& F
T-Bi
o H
igh
Alt.
Fl
ight
s (4
.33)
Bio
& F
T-B
io F
ight
er
FSE
(4.3
4)
Eva
l. O
f Pa
thfin
der A
/C
Can
d. 1
(4.2
9)
Eva
l. O
f Pa
thfin
der A
/C
Can
d. 2
(4.3
1)
Airb
us
380
GTL
fli
ght
(4.4
)
747
Flig
ht
VAA
20%
FA
ME
(4
.3)
747
Flig
ht
ANZ
50%
H
RJ
Jath
ropa
(4.1
5)
737
Flig
ht
CAL
50%
H
RJ
(4.1
6)
747
Flig
ht J
AL
50%
HR
J C
amel
ina
(4.1
7)
Flig
ht T
estin
g
B-1
F-T
Fu
el
Flig
ht
(4.5
)
C-1
7 F-
T Fu
el
Flig
ht
(4.7
)
KC
-135
F-T
Fu
el F
light
(4
.8)
F-15
F-T
Fu
el F
light
(4
.6)
F-22
F-T
Fu
el F
light
Te
st (4
.9)
T-38
F-T
Fu
el
Flig
ht
(4.1
2)
B-2
F-T
Fu
el
Flig
ht
(4.2
1)
C-5
and
C
-130
F-T
Fu
el
Flig
ht
(4.1
4)
A-10
F-
T Fl
ight
(4
.18)
HH
-60
F-T
Flig
ht
(4.1
9)
T-6
F-T
Flig
ht
(4.2
2)
CV
-22
F-T
Flig
ht
(4.2
3)
F-35
F-T
Fl
ight
(4
.24)
Flig
ht T
estin
g (M
ilitar
y)
CA
AFI
R&
D T
eam
Roa
dmap
(5 o
f 6)
Flig
ht T
estin
g
From
AFR
L/A
FCO
Com
bine
d R
oadm
ap -
Bio
JetC
ertif
icat
ion
-DR
AFT
See
Als
o C
AA
FI C
ertif
icat
ion
Roa
dmap

__________________________________________________________________________
Page A-7
Cat
egor
y
CA
AFI
R&
D T
eam
Roa
dmap
( 6
of 6
)Pr
oduc
tion
Stud
ies
and
R&
D
Fund
ed P
lans
(P
ublic
/Priv
ate)
Com
plet
edU
nfun
ded
Nee
dsR
esul
tTa
rget
Visi
on
Fund
ed P
lans
(P
ublic
/Priv
ate)
Com
plet
edU
nfun
ded
Nee
dsR
esul
tTa
rget
Visi
on
6 M
ilest
ones
14 M
ilest
ones
7 M
ilest
ones
2010
2011
2012
2009
2014
2008
2016
2013
2015
6 M
ilest
ones
14 M
ilest
ones
7 M
ilest
ones
2010
2011
2012
2009
2014
2008
2016
2013
2015
2010
2011
2012
2009
2014
2008
2016
2013
2015
4/17
/09
(#.#
) Mile
ston
e N
umbe
rSe
e D
atab
ase
for d
etai
ls
Pro
duct
ion
Stu
dies
DA
RP
A
Alg
al B
iofu
el
Kic
k-O
ff (9
.1)
DA
RP
A
Alg
al
Bio
fuel
P
hase
I C
ompl
ete
(8.6
)
DA
RP
A
Alg
al B
iofu
el
Pha
se II
C
ompl
ete
(8.9
)
Pro
duct
ion
R&
D
DA
RP
A A
lgal
B
iofu
el K
ick-
Off
(8.2
)
Nap
hthe
nic
drop
-in H
RJ
–P
oC(8
.1)
Bas
ic E
ng P
acka
ge
for C
omm
erci
al H
RJ
Pla
nt (8
.3)
Nap
hthe
nic
drop
-in H
RJ
-P
ilot d
emo
(8.4
)
F-T
Rea
ctor
Bas
elin
e S
tudi
es (8
.5)
F-T
Rea
ctor
S
tudi
es a
nd
Cat
alys
t D
evel
opm
ent
(8.7
)
Nap
hthe
nic
drop
-in
HR
J –
subs
cale
(8.8
)
Oth
er
CR
C A
viat
ion
fuel
s m
eetin
g (6
.4)
LCA
Con
fere
nce
(6.2
) OM
EG
A-
Avi
atio
n (6
.3)
CR
C A
viat
ion
Fuel
s M
eet’g
(6.1
)
Com
plet
ed D
esig
n fo
r ren
ewab
le O
il R
efin
ery
(6.5
)
Con
stru
ctio
n of
R
enew
able
Oil
Ref
iner
y (6
.6)
Com
mis
sion
and
S
tart-
up o
f Ren
ewab
le
Oil
Ref
iner
y (6
.7)
DA
RP
A
Alg
al B
iofu
el
Phas
e I
Com
plet
e (9
.2)
DA
RP
A
Alg
al B
iofu
el
Pha
se II
C
ompl
ete
(9.3
)
Stu
dy –
Req
. B
iom
ass
&
Pro
d.
Qua
ntiti
es
(9.4
)
DO
E C
BTL
R&
D
Aw
ards
(8.1
0)
DO
E C
BTL
Stu
dy
(9.5
)
Stud
y -A
lt.
Bio
mas
s P
roce
sses
C
ellu
losi
c(9
.6)
Alt.
Bio
mas
s P
roce
sses
C
ellu
losi
c(8
.11-
8.14
)
See
Als
o C
AA
FI B
usin
ess
Roa
dmap
See
Als
o C
AA
FI E
nviro
nmen
t Roa
dmap
Aro
mat
ics
for G
reen
Jet
from
lig
no-c
ellu
losi
c py
roly
sis
oil p
ilot
with
woo
d, c
orn
stov
er(8
.15)
DoE
Cel
lulo
sic
Eth
anol
Dem
o (8
.16)
Cel
lulo
sic
etha
nol
olig
imer
izat
ion
to J
et la
b/P
ilot (
8.17
)
Aro
mat
ic fr
actio
n fo
r G
reen
Jet
from
lig
noce
llulo
sic
pyro
lysi
soi
l com
mer
cial
(6.8
)
Cel
lulo
sic
Etha
nol
olig
imer
izat
ion
to
Jet c
omm
erci
al
(6.9
)

__________________________________________________________________________
Page B-1
Appendix B
Anonymity of Boeing subcontractor identities The Boeing Company provided funding to carry out the research described in this thesis. In evaluating the tradeoff of disclosing R&D information that could possibly provide a competitive advantage to Boeing, the decision was made that this information would be of value to society and the entire commercial aviation sector, and so the information is released into the public domain in the hope that it will encourage the development of environmentally preferred fuels. As part of the study, subcontracts were issued to several additional researchers to support research and development in the area of alternative fuels. The effort to establish a biofuel R&D supplier database was a substantial undertaking. However, as the alternative fuels field is rapidly expanding, there are no doubt other endeavors and companies that have not been fully explored. Therefore, in order to avoid suggesting that one subcontractor may be preferred over another, the names of most subcontractors were kept anonymous in this report. With most researchers, nondisclosure agreements were issued to each subcontractor specifying that neither Boeing nor the researcher were to publicly disclose the identity of the other party unless a disclosure agreement has been mutually signed. In these cases, the researcher was contacted to gain their approval for use of the jointly developed information in this report. It was difficult to know how far to apply anonymity to the other researchers or companies. In some cases, references are made to specific researchers or supporting research. However, this in no way suggests that this is the only or best source of the R&D information. In the case where information was previously published by the subcontractor, that information was freely used in this report without further approval.