Cranfield University - CORE
384
Cranfield University MAUD SERAFFON PERFORMANCES OF AIR PLASMA SPRAYED THERMAL BARRIER COATINGS FOR INDUSTRIAL GAS TURBINES School of Applied Sciences Centre for Energy and Resource Technology Cranfield University, Cranfield, Bedfordshire MK43 0AL
-
Upload
khangminh22 -
Category
Documents
-
view
1 -
download
0
Transcript of Cranfield University - CORE

Cranfield University
MAUD SERAFFON
PERFORMANCES OF AIR PLASMA SPRAYED THERMAL BARRIER COATINGS
FOR INDUSTRIAL GAS TURBINES
School of Applied Sciences
Centre for Energy and Resource Technology Cranfield University, Cranfield, Bedfordshire MK43 0AL

_____________________________________________________________________________
ii ______________________________________________________________________

_____________________________________________________________________________
iii ______________________________________________________________________
PhD Thesis Cranfield University
School of Applied Sciences
Academic year 2012
MAUD SERAFFON
PERFORMANCES OF AIR PLASMA SPRAYED THERMAL BARRIER COATINGS
FOR INDUSTRIAL GAS TURBINES
Supervisors: Pr. John Nicholls and Dr. Nigel Simms
This thesis is submitted in fulfilment of the requirements for the degree of Doctor of Philosophy

_____________________________________________________________________________
iv ______________________________________________________________________

_____________________________________________________________________________
v ______________________________________________________________________
ACKNOWLEDGMENTS
I would like to thank the people who have assisted me throughout the 3 years
and a half of my PhD. studies at Cranfield University, and without whom this work
would not have been possible.
Firstly I would like to express my deepest gratitude to my academic supervisors,
Dr. Nigel Simms and Prof. John Nicholls for their advice, discussions and support
during the entire PhD. Even if very busy, they were always available and enthusiastic to
encourage me, answer questions and tackle endless corrections. I am also very grateful
to them for allowing me to present this work in UK and US renowned conferences and
meetings.
This work was supported by industrial partners (Alstom Power Ltd., Doosan
Babcock, E.ON, National Physical Laboratory, Praxair Surface Technologies Ltd,
QinetiQ, Rolls-Royce plc, RWE npower, Siemens Industrial Turbomachinery Ltd. and
Tata Steel) and universities (Loughborough, Bristol and Nottingham University) as part
of the Supergen PLE project. Dave Rickerby from Rolls-Royce always gave his honest
opinions, helpful suggestions and practical knowledge on gas turbines and thermal
barrier coatings. The visit to Tilbury coal power plant organised by RWE was also a
very enjoyable and educational experience. From Loughborough University, Prof.
Rachel Thompson allowed me to use the facilities, where I was supervised by Dr.Geoff
West. Dr. Mudith Karuaratne’s expertise enabled me to understand better certain
aspects of elemental diffusion. From Bristol University, were I spent memorable week-
ends, I would like to acknowledge the wonderful Dong Liu with whom it was a pleasure
to work. Her supervisor Prof. Peter Flewitt advice was very constructive. I would like to
thank other PhD students and staff from the Supergen project, especially Alexandros
Skouras, Sabrina Yan, Troy Liu, Mikolaj Lukaszewicz and Tomasz Dudziak for making
the meetings seem shorter.
Many people from the staff at Cranfield contributed to this work, by technical
advices and sharing their experience: Dr. Joy Sumner and her attention to details taught
me to perfect my writing skills. Mr Tim Pryor always here to help with the high
temperature facilities and especially those furnace dials I never managed to set up
myself. Mr Andrew Dyers for his patience during the time I spent using the

_____________________________________________________________________________
vi ______________________________________________________________________
metallographic facilities but above all for his help with the nano-indentor and the FIB.
Mrs Christine Kempton and Mr. Matt Kershaw trained me on the SEM and the XRD.
Mr Xian Wei Liu helped me with the SEM and TEM analysis. Mr Andrew Potter
helped in the oxidation lab. Dr Jeff Rao’s help and patience to sort out the endless
problem with the stubborn CVCI and Leybold were inestimable. The technical
knowledge of Andrew Stellard and Matthew Taunt were also priceless around the
sputtering machines. I still blame Dr. Mark Craig and Tim Rose for the abominable
achy legs, arms and abs after circuit training. There was way too much berpees. Sharing
an office with Christine Chalk and Sandra Craig was a delight. A thought to Dr. Richard
Wellman and his non-stop taunting about Pandas. I would also like to thank the
adorable and helpful Sharon McGuire and Jessica Greenwood without whom the
organisation of meetings and communication with the project partners would have been
a struggle. I will miss the lively morning tea breaks with all of them.
My years at Cranfield would not have been the same without friends I met there,
especially Marina, Grant, Julien, Julian, Yannick, Marc, Roy and Jean-Bernard. I still
believe the Frenchies produced the best music this University will ever hear. My loving
thought to Andy who went through all my mood swings and still stayed with me those
past few years.
At last, I would like to thank my family; they were always here during good and
difficult times.
_____________________________________________________________________________
vii ______________________________________________________________________
ABSTRACT
Future industrial gas turbines will be required to operate at higher temperatures
to increase operating efficiencies and will be subjected to more frequent thermal cycles.
The temperatures that the substrates of components exposed in the harshest
environments experience can be reduced using air-cooling systems coupled with
ceramic thermal barrier coatings (TBCs); however, few studies have been carried out at
the substrate temperatures encountered in industrial gas turbines (e.g. 900 – 1000 °C).
Better understanding of their behaviour during service and, their various potential
failure mechanisms, would allow more accurate prediction of TBC lifetimes and
improve coatings.
The aim of this research, as a part of the Supergen Plant Life Extension (PLE)
project, was (a) to investigate the influence of industrial gas turbine blade geometry on
TBC system lifetimes, and (b) to extend knowledge on the effect of bond coat
composition on the oxide growth at temperatures below 1000 °C.
The main results of this thesis, obtained using mass change and characterisation
techniques, increase the understanding of the significant interactions between the
different coating layers, samples’ geometry, interdiffusion and failure mechanisms
involved during oxidation. Curvature was found to affect the quality of manufacture and
thus promoted premature failure at the convex features of modified aerofoil-shaped
samples. In parallel new bond coat compositions, suitable for industrial gas turbines
were suggested from the wide range investigated in oxidation exposures. The selective
growth of protective Cr2O3 or Al2O3 oxides or other mixed oxides was observed and
mapped in ternary diagrams. Furthermore two novel techniques were successfully used
during this project. Pulsed flash thermography proved to be efficient in identifying areas
of sub-surface TBC delamination non-destructively. Magnetron co-sputtering using 2
and 3 targets was found to be a flexible method to deposit thick coatings with a wide
range of compositions.

_____________________________________________________________________________
viii ______________________________________________________________________
_____________________________________________________________________________
ix ______________________________________________________________________
CONTENTS ACKNOWLEDGMENTS ............................................................................................................. v
ABSTRACT ................................................................................................................................ vii
CONTENTS ................................................................................................................................. ix
LIST OF FIGURES .................................................................................................................... xiv
LIST OF TABLES .................................................................................................................. xxvii
ABBREVIATIONS .................................................................................................................. xxix
CHAPTER I - INTRODUCTION ................................................................................................. 1
1.1 Challenges of electricity generation .............................................................................. 1
1.2 What is a Gas Turbine? ................................................................................................. 3
1.3 How to improve gas turbine efficiency? ....................................................................... 5
1.4 The project .................................................................................................................... 6
CHAPTER II - LITERATURE REVIEW .................................................................................... 9
2.1 Thermal barrier coating systems ................................................................................... 9
2.1.1 The superalloy substrate ............................................................................................. 10
2.1.2 The ceramic top coat .................................................................................................. 11
2.1.3 The bond coating ........................................................................................................ 14
2.1.4 The thermally grown oxide ........................................................................................ 16
2.2 Oxidation ..................................................................................................................... 17
2.2.1 Oxidation mechanisms ............................................................................................... 18
2.2.2 Diffusion of elements between the different layers of a TBC system ........................ 20
2.2.3 Growth of a TGO ....................................................................................................... 21
2.2.4 The effect of BC composition on the TGO growth .................................................... 24
2.3 Failure of a TBC system .............................................................................................. 27
2.3.1 Depletion of the Al reservoir in a BC......................................................................... 28
2.3.2 Roughness and uneven growth of the TGO ............................................................... 31
2.3.3 Evolution of stresses in a TBC system ....................................................................... 34
2.3.4 Initiation and propagation of cracks ........................................................................... 38
2.3.5 Effect of blade curvature on the failure of the TBC systems ..................................... 41
2.4 Prediction of TBC systems lifetime through modelling .............................................. 43
2.4.1 Models based on stress distribution ............................................................................ 44
2.4.2 Models based on elemental diffusion ......................................................................... 46
2.4.3 Models based on the TGO growth ............................................................................. 48
CHAPTER III – AIM AND OBJECTIVES ................................................................................ 53

_____________________________________________________________________________
x ______________________________________________________________________
3.1 1st part: Experimental evaluation of the integrity of APS/TBCs ....................................... 53
3.2 2nd part: Improving the efficiency of MCrAlY bond coats undergoing oxidation ............ 54
CHAPTER IV - EXPERIMENTAL PROCEDURE AND EQUIPMENT ................................. 55
4.1 Oxidation of the modified aerofoil-shaped samples .................................................... 55
4.1.1 The modified aerofoil-shaped samples ....................................................................... 55
4.1.2 Experimental procedure ............................................................................................. 56
4.1.3 Additional curved samples ......................................................................................... 58
4.1.4 Flash Pulsed Thermography ....................................................................................... 59
4.2 Deposition of new BC compositions ........................................................................... 61
4.2.1 Principle of magnetron sputtering .............................................................................. 61
4.2.2 Sapphire substrates ..................................................................................................... 64
4.2.3 Magnetron sputtering equipment................................................................................ 65
4.2.5 Sample holders ........................................................................................................... 67
4.2.6 Calibration .................................................................................................................. 67
4.2.7 Oxidation of coated sapphire discs ............................................................................. 72
4.3 Analytical and observation tools ................................................................................. 72
4.3.1 Scanning Electron Microscopy (SEM) ....................................................................... 72
4.3.2 X-Ray Diffraction (XRD) .......................................................................................... 74
4.3.3 Focussed ion beam (FIB) ........................................................................................... 74
4.3.4Transmission electronic microscopy (TEM) ............................................................... 76
PART I - EFFECT OF THE SAMPLE GEOMETRY ON THE APS/TBC SYSTEM’S OXIDATION BEHAVIOUR ...................................................................................................... 77
CHAPTER V- THE INFLUENCE OF CURVATURE ON FAILURE, DIFFUSION AND OXIDE GROWTH MECHANISMS .......................................................................................... 79
5.1 The influence of geometry on the failure of modified aerofoil-shaped samples ......... 79
5.1.1 Evolution of damage on the oxidised modified aerofoil-shaped samples .................. 79
5.1.2 Pulsed flash thermography of the modified aerofoil-shaped samples ........................ 81
5.1.3 Observations of crack development using SEM ........................................................ 87
5.1.4 Summary .................................................................................................................... 88
5.2 Influence of the curvature on the evolution of the BC microstructure ........................ 90
5.2.1 Understanding the effect of exposure time on the oxidation behaviour of an APS/TBC system ................................................................................................................ 90
5.2.2 Understanding the effect of exposure temperature on the oxidation behaviour of an APS/TBC system ................................................................................................................ 99
5.2.3 Discussion ................................................................................................................ 107

_____________________________________________________________________________
xi ______________________________________________________________________
5.2.4 Summary .................................................................................................................. 108
5.3 Quantification of APS/TBC features as a function of curvature ............................... 109
5.3.1 Influence of curvature on TC and BC thicknesses ................................................... 109
5.3.2 Influence of curvature on the β-phase ...................................................................... 113
5.3.3 Influence of curvature on TGO growth .................................................................... 118
5.3.4 Distinction between effect of BC thickness and effect of curvature ........................ 121
5.3.5 Discussion - Why is spinel and mixed oxide formation influenced by curvature? .. 125
5.3.6 Summary .................................................................................................................. 126
CHAPTER VI – INFLUENCE OF BC, TC/BC INTERFACE AND TC MICROSTRUCTURE ON THE BEHAVIOUR AND FAILURE OF APS/TBC ......................................................... 129
6.1 Influence of Roughness of the TBC/BC interface and BC thickness ........................ 129
6.1.1 Roughness as a function of curvature ....................................................................... 129
6.1.2 The influence of BC thickness: the case of thin BCs ............................................... 131
6.1.3 The influence of BC thickness: the case of thick BCs ............................................. 136
6.1.4 FIB results and study of TGO/BC interface grain boundaries. ................................ 139
6.1.5 Discussion – Difference in Al diffusion behaviour depending on BC thickness. .... 143
6.1.6 Summary .................................................................................................................. 149
6.2 Effect of the modified aerofoil-shaped sample’s geometry on the behaviour of the TC and the TC/BC interface. ....................................................................................................... 150
6.2.1 Influence of the geometry on TC microstructure ..................................................... 151
6.2.2 The TC/TGO interface’s microstructure .................................................................. 156
6.2.3 Study of the initial stages of oxidation (Rolls-Royce samples) ............................... 162
6.2.4 Discussion – The effect of micro and macro geometry on the TC/BC interface behaviour. .......................................................................................................................... 171
6.2.5 Summary .................................................................................................................. 179
CHAPTER VII – GENERAL DISCUSSION (PART I) ........................................................... 181
7.1 Why does failure of the modified aerofoil-shaped samples occur in convex locations? 181
7.1.1 Thickness of BC influences the type of failure ........................................................ 181
7.1.2 Higher probability of failure in convex areas ........................................................... 184
7.2 TGO thickness development model .......................................................................... 187
7.2.1 Modelling the TGO growth on the modified aerofoil-shaped samples .................... 187
7.2.2 Modelling the transition between θ- Al2O3 and α- Al2O3 ...................................... 191
7.3 Conclusion (Part I) .................................................................................................... 192
PART II - OPTIMISING BOND COATINGS FOR GAS TURBINE APPLICATION .......... 195
_____________________________________________________________________________
xii ______________________________________________________________________
CHAPTER VIII – OXIDATION OF Ni-Cr-Al COATINGS AT 900 – 950 °C ....................... 197
8.1 Oxidation of Ni-Cr-Al systems at 950 °C ................................................................. 197
8.1.1 Physical changes of samples with exposure ............................................................. 197
8.1.2 Mass change of samples ........................................................................................... 202
8.1.3 Identification of oxides ............................................................................................. 207
8.1.4 Oxidation of the coatings obtained from 3 target co-sputtering ............................... 218
8.1.5 Discussion - Ni-Cr-Al ternary oxidation map at 950 °C .......................................... 220
8.2 Oxidation of Ni-Cr-Al systems at 900 °C ................................................................. 223
8.2.1 Physical changes of samples with exposure ............................................................. 225
8.2.2 Mass change of samples ........................................................................................... 228
8.2.3 Identification of oxides ............................................................................................. 231
8.2.4 Oxidation of the coatings obtained from 3 target co-sputtering ............................... 242
8.2.5 Discussion- Ni-Cr-Al ternary oxidation map at 900 °C. .......................................... 244
8.3 Discussion - Influence of Ni-Cr-Al compositions and exposure temperature on the nature and growth of oxides. ................................................................................................. 246
8.4 Summary ................................................................................................................... 250
CHAPTER IX – OXIDATION OF THE Co-Ni-Cr-Al COATINGS AT 900-950 °C .............. 253
9.1 Study of the Co-Ni-Cr-Al system – oxidation at 950 °C .......................................... 253
9.1.1 Physical changes of samples with exposure ............................................................. 254
9.1.2 Mass change of samples ........................................................................................... 256
9.1.3 Identification of oxides ............................................................................................. 258
9.1.4 Discussion - An attempt to map the oxide composition as a function of the Ni-Co-Cr-Al content at 950 °C. ......................................................................................................... 267
9.2 Study of the Co-Ni-Cr-Al system – oxidation at 900 °C .......................................... 269
9.2.1 Physical changes of samples with exposure ............................................................. 269
9.2.2 Mass change of samples ........................................................................................... 272
9.2.3 Identification of oxides ............................................................................................. 274
9.2.4 Discussion-An attempt to map the oxide composition as a function of the Ni-Co-Cr-Al content at 900 °C. ......................................................................................................... 283
9.3 Discussion - Effect of Co-Ni-Cr-Al compositions and temperature on the coating behaviour ............................................................................................................................... 284
9.3.1 The effect of temperature on the Co-Ni-Cr-Al system ............................................. 284
9.4 Summary ................................................................................................................... 288
CHAPTER X – GENERAL DISCUSSION (PART II) ............................................................ 289
10.1 How does composition and temperature affect spinel/mixed oxide formation? ....... 289

_____________________________________________________________________________
xiii ______________________________________________________________________
10.2 What would be the best coating? ............................................................................... 295
10.3 Conclusion (part II) ................................................................................................... 297
CHAPTER XI – CONCLUSIONS ........................................................................................... 299
REFERENCES .......................................................................................................................... 303
APPENDIX A – MOUNTING MOULD (DESIGN)................................................................ 323
APPENDIX B – MASS CHANGE CURVES OF MODIFIED AEROFOIL-SHAPED SAMPLES ................................................................................................................................. 325
APPENDIX C – MEASURED BOND COAT AND TOP COAT THICKNESSES ON MODIFIED AEROFOIL-SHAPED SAMPLES (µm) .............................................................. 329
APPENDIX D – TGO THICKNESSES MEASURED ON MODIFIED AEROFOIL-SHAPED SAMPLES (µm) ........................................................................................................................ 333
APPENDIX E – MEASURED OUTWARD AND INWARD β-DEPLETION ZONES THICKNESSES ON MODIFIED AEROFOIL-SHAPED SAMPLES (µm) ........................... 343
APPENDIX F – REMAINING β-PHASE MEASUREMENTS ON MODIFIED AEROFOIL-SHAPE SAMPLE ..................................................................................................................... 347
APPENDIX G – FRACTION OF SPINELS/MIXED OXIDES IN TGO ON MODIFIED AEROFOIL-SHAPE SAMPLE ................................................................................................ 349
APPENDIX H – MEASURED SECONDARY REACTION ZONE THICKNESSES ON MODIFIED AEROFOIL-SHAPED SAMPLES (µm) .............................................................. 351
APPENDIX I – MODIFIED AEROFOIL-SHAPED SAMPLES (REFERENCE SHEET) ..... 353
_____________________________________________________________________________
xiv ______________________________________________________________________
LIST OF FIGURES
Figure 1.1 World energy consumption in TWh from 1990 to 2010 [2]. ....................................... 1 Figure 1.2 Evolution from 1971 to 2008 of world total final consumption by fuel (Mtoe) [3]. ... 1 Figure 1.3 Europe gross inland consumption of resources in 2009 [5]. ........................................ 2 Figure 1.4 (a) A frame type gas turbine engine [7] (b) schematic of the main components of a gas turbine engine [1]. ................................................................................................................... 4 Figure 1.5 (a) Ideal Brayton cycle describing cycle of gas in a gas turbine and (b) Ideal Rankine cycle describing cycle of steam in a boiler [11]. ........................................................................... 5 Figure 2.1 Schematic representation of a TBC system [12]. ....................................................... 10 Figure 2.2 SEM images of (a) an as-deposited EB-PVD/TBC system [25] and (b) an as-deposited APS/TBC system. ....................................................................................................... 13 Figure 2.3 Relative oxidation and corrosion resistance of different high temperature coatings systems [32]. ............................................................................................................................... 16 Figure 2.4 SEM image of spinels present in TGO. ..................................................................... 17 Figure 2.5 Simplified model for diffusion-controlled oxidation [12]. ........................................ 18 Figure 2.6 SEM image of the β-NiAl phase in the BC in a sample oxidised at 900°C for 4000h. ..................................................................................................................................................... 20 Figure 2.7 Schematic temperature-time transformation diagram for the high temperature oxidation of β-NiAl [53]. ............................................................................................................ 23 Figure 2.8 SEM image of the NiAl surface morphology after 100 hours at 1000 °C [56]. ........ 23 Figure 2.9 Compositional effects on the oxidation (over 1000 °C) of Ni-Cr-Al ternary alloys [40], cited in reference [12] and [63]. I) NiO + internal oxidation of Al and Cr ; II) Cr2O3 + internal oxidation of Al ; III) an Al2O3 external scale. ................................................................ 26 Figure 2.10 Oxide morphology map for ternary NiCrAl alloys at 950 °C [63]. ......................... 27 Figure 2.11 Schematic diagram describing the model proposed by [74]. (a) Sufficient Al present in asperity to grow Al2O3, (b) rapid depletion and restricted replenishment reducing Al levels in asperity, (c) remaining BC oxidise rapidly and form non protective oxide. Rehealing occurs at the base of asperity where Al levels are high enough. ................................................. 32 Figure 2.12 Schematic of alumina scale formation and Y-Al precipitation [82]. ....................... 32 Figure 2.13 SEM image of repeated TGO-cracking/re-growth during cyclic oxidation at 1050 °C in an APS/TBC system with NiCoCrAlY/BC [68]. ...................................................... 33 Figure 2.14 Sketch illustrating the attempt of the compressed TGO to lengthen in order to reduce stress [21]. ........................................................................................................................ 35 Figure 2.15 SEM image of damage introduced by thermal cycling at TC/BC interface [91]. .... 36 Figure 2.16 Model microstructures and the calculated residual stress (sy) for the TBC system [91]. ................................................................................................................................. 37 Figure 2.17 Cracking sequence suggested by the stresses due to growth and thermal misfit [21]. ..................................................................................................................................................... 40 Figure 2.18 Schematic illustration defining various types of cracks in the TGO and its vicinity in an APS/TBC [98]. ................................................................................................................... 41 Figure 2.19 Basic failure mechanisms of a TBC; example: turbine blade [100]. ....................... 42 Figure 2.20 Schematic illustration of the main steps that lead to the field stress due to oxide formation [106]. .......................................................................................................................... 44

_____________________________________________________________________________
xv ______________________________________________________________________
Figure 2.21 Finite Element model of the out-of-plane stress in a component cooled down from 1000°C to room temperature for 61, 167 and 241 hours (from left to right) [105]. .................... 45 Figure 2.22 (a) Plots of Al diffusion into the substrate and consumed by TGO growth, and (b) spallation lifetime due to BC depletion of Al with internal oxidation of different APS/TBC systems at 850-1250 °C (CMSX4 coated with 150 µm Abler Ni 192-8; IN738 coated with 150 µm Abler Ni 192-8 and IN738 coated with 150 µm SC2231) [72]. ........................................... 47 Figure 2.23 Model of breakaway oxidation, based on equation (10) [115]. ............................... 50 Figure 4.1 Picture of a modified aerofoil-shaped sample (a) and its schematic representation (b). Upper case letters correspond to convex areas, lower case to concave. This figure can also be found at the end of thesis (Appendix I). ...................................................................................... 56 Figure 4.2 Pictures of as received Rolls-Royce samples, (a) RR1 and (b) RR5. ........................ 59 Figure 4.3 Representation of pulsed flash thermography [122]. ................................................. 60 Figure 4.4 A schematic representation of a DC-magnetron sputtering system [120]. ................ 62 Figure 4.5 Schematic representation of a deposition chamber in a 2 targets co-sputtering system (side view). .................................................................................................................................. 63 Figure 4.6 Schematic representation of the 3 targets co-sputtering process (top view). ............. 64 Figure 4.7 Picture of deposition chambers of (a) CVC I (2 target co-sputtering) and (b) Leybold (3 target co-sputtering). ............................................................................................................... 65 Figure 4.8 Composition lines of deposit superimposed on Ni-Cr-Al ternary oxidation diagram [12, 40, 63]. ................................................................................................................................. 66 Figure 4.9 Location of samples on the sample holder used for 2 target co-sputtering. ............... 68 Figure 4.10 Location of samples on the sample holder used for 3 target co-sputtering. ............. 68 Figure 4.11 Compositions along the sample holder for 2 target co-sputtering (Ni-10wt%Cr+Al). ..................................................................................................................................................... 69 Figure 4.12 Compositions along the sample holder for 2 target co-sputtering (Ni-20wt%Cr+Al). ..................................................................................................................................................... 69 Figure 4.13 Compositions along the sample holder for 2 target co-sputtering (Ni-50wt%Cr+Al). ..................................................................................................................................................... 69 Figure 4.14 Compositions along the sample holder for 2 target co-sputtering (Ni-40wt%Co-20wt%Cr+Al). ............................................................................................................................. 70 Figure 4.15 Compositions along the sample holder for 2 target co-sputtering (Ni-20wt%Co-40wt%Cr+Al). ............................................................................................................................. 70 Figure 4.16 Atomic Percentage of Ni (a), Cr (b) and Al (c) along the sample holder for 3 targets co-sputtering (Ni-wt%10Cr+Ni-50wt%Cr+Al). The top left corner of the sample holder is located above the Ni-50wt%Cr target and the top right corner above the Ni-wt%10Cr target. .. 71 Figure 4.17 FIB images of the preparation of a lift-out sample. (a) the thin section at the TC/TGO and TGO/BC interface being thinned down and (b) the sample being lifted-out. ....... 76 Figure 5.1 Photographs of sample 81-BSYA-15 oxidised at 950 °C for (a) 3750, (b) 4000, and (c) (d) 5000 hours. Black arrows point to coating delamination. ................................................ 80 Figure 5.2 Photographs of sample 81-BSYA-23 oxidised at 1000 °C for (a) 1350, and (b) 1500 hours. Black arrows point to coating delamination. ........................................................... 80 Figure 5.3 Schematic representation of the damage evolution in sample 81-BSYA-17 oxidised at 1000 °C. Sample was oxidised for (a) 1050; (b) 1350; and (c) 1500 hours. Damage beneath the ceramic TC appears in grey. .................................................................................................. 81
_____________________________________________________________________________
xvi ______________________________________________________________________
Figure 5.4 Schematic representation of the damage evolution in sample 81-BSYA-19 oxidised at 1000 °C. Sample was for oxidised for (a) 1050; (b) 1350 and (c) 1500 hours. Damage beneath the ceramic TC appears in grey. .................................................................................... 82 Figure 5.5 Schematic representation of the damage evolution in sample 81-BSYA-23 oxidised at 1000 °C. Sample was oxidised for (a) 1050; (b) 1350; and (c) 1500 hours. Damage beneath the ceramic TC appears in grey. Delamination of the ceramic TC appears in dark grey. ........... 83 Figure 5.6 Schematic representation of the damage evolution in sample 81-BSYA-36 oxidised at 975 °C. Sample was oxidised for (a) 1950; (b) 2850; and (c) 3000 hours. Damage beneath the ceramic TC appears in grey. ........................................................................................................ 84 Figure 5.7 Schematic representation of the damage evolution in sample 81-BSYA-37 oxidised at 975 °C. Sample was oxidised for (a) 900; (b) 1950; and (c) 2700 hours. Damage beneath the ceramic TC appears in grey. ........................................................................................................ 84 Figure 5.8 Schematic representation of the damage evolution in sample 81-BSYA-10 oxidised at 950 °C. Sample was oxidised for (a) 4500; and (b) 4760 hours. Damage beneath the ceramic TC appears in grey. ..................................................................................................................... 85 Figure 5.9 Schematic representation of the damage evolution in sample 81-BSYA-11 oxidised at 950 °C. Sample was oxidised for (a) 4500; and (b) 4760 hours. Damage beneath the ceramic TC appears in grey. ..................................................................................................................... 85 Figure 5.10 Schematic representation of the damage evolution in sample 81-BSYA-28 oxidised at 925 °C. Sample was oxidised for (a) 740; (b) 5500; and (c) 8740 hours. Damage beneath the ceramic TC appears in grey. ........................................................................................................ 86 Figure 5.11 Optical microscope image of cracks in a modified aerofoil shaped sample exposed at 950 °C for 3000 hours with flash thermography data. ............................................................ 87 Figure 5.12 SEM image of a crack running (a) through the TGO (b) at the TGO/BC interface (c) at the TGO/TC interface (d) through the TC (e) through spinel and (f) vertically through the TC. ..................................................................................................................................................... 88 Figure 5.13 Flash thermography data showing damage evolution in a sample isothermally oxidised at 1000 °C for exposure times of (a) 1050; (b) 1350; and (c) 1500 hours. Light contrast indicates sub-surface damage. ..................................................................................................... 89 Figure 5.14 Flash thermography data showing damage evolution in a sample isothermally oxidised at 950 °C for exposure times of (a) 4000; (b) 4500; and (c) 4760 hours. Light contrast indicates sub-surface damage. ..................................................................................................... 89 Figure 5.15 Evolution of the APS/TBC system under oxidation at 925 °C. SEM images of the BC and TGO in location C of (a) an as-deposited sample; and samples exposed for (b) 100 hours; (c) 4000 hours; and (d) 7000 hours. Dotted white arrows indicated β-depletion zones. .. 91 Figure 5.16 Median TGO thickness at different location around samples oxidised at 925 °C against time. Plain, dotted and dashed lines respectively correspond to convex, flat and concave curvatures. ................................................................................................................................... 92 Figure 5.17 SEM images of TGO layer in sample oxidised at 950 °C for 4000 hours. Pictures of spinels/mixed oxides at (a) location D and (b) location c. .......................................................... 93 Figure 5.18 EDX mapping of spinel/mixed oxides in TGO from location a in sample oxidised at 925 °C for 7000 hours. Spinel/mixed oxide is circled in red. ..................................................... 94 Figure 5.19 Composition in at% of different phases constituting a spinel/mixed oxide and precipitates present in the TGO. The black bars show the composition of the dark grey phase. The dark grey bars show the composition of the light grey phase. The light grey bars show the composition of a white precipitate. ............................................................................................. 95

_____________________________________________________________________________
xvii ______________________________________________________________________
Figure 5.20 Evolution of SRZ with time. SEM images of BC/Substrate interface in location C on as-deposited sample (a) and samples exposed at 900 °C for 7000 hours (b); and 15,000 hours (c). ............................................................................................................................................... 96 Figure 5.21 EDX mapping of the SRZ. Image of location F on an etched sample exposed for 7000 hours at 900 °C. (a) and (b) are SEM images of an etched sample. (c),(d) and (e) are the scans of (a) and (b). (f) is a SEM image of the SRZ at location F before etching. Dotted lines represent the limit between the SRZ and the BC. Red circles correspond to a Cr rich precipitate in the SRZ. .................................................................................................................................. 97 Figure 5.22 SRZ thickness as a function of time in samples oxidised at 900 °C. Plain, dotted and dashed lines respectively correspond to convex, flat and concave curvatures. See nomenclature on reference sheet at end of thesis. .............................................................................................. 98 Figure 5.23 Average mass change of samples exposed to temperatures between 900 and 1000 °C as a function of time. ............................................................................................................ 100 Figure 5.24 Average TGO thicknesses of samples exposed to temperatures between 900 and 1000 °C as a function of time. Errors bars represent the standard deviation. ........................... 100 Figure 5.25 β-NiAl depletion in location C on samples oxidised at temperatures between 900 and 950°C. The dotted line is an estimation of the β-depletion trend. ...................................... 101 Figure 5.26 Al-Ni binary phase diagram [127]. Added dashed lines represent the temperatures of 900 and 1000 °C. Grey arrow represents the phase change when the amount of Al decreases. ................................................................................................................................................... 102 Figure 5.27 SEM images of phases present in the BC in location C on samples exposed at (a) 900 °C; (b) 975 °C; and (c) 1000 °C for 15,000, 3000 and 1050 hours respectively (samples are close to failure). Black arrows correspond to the outward and inward depletion zones. .......... 103 Figure 5.28 Effect of the temperature on the microstructure of the SRZ. SEM images (enhanced contrast) of the BC/substrate interface in location C on (a) samples exposed at 950 °C for 4000 hours (b) exposed at 975 °C for 2700 hours; (c) and exposed at 1000 °C for 1050 hours. The black dotted lines represent the BC/Substrate interface. The white arrows represent the SRZ. 104 Figure 5.29 Average SRZ thicknesses of samples exposed to temperatures between 900 and 1000 °C compared to a model derived from a parabolic behaviour (Equation (1)) as a function of time. Error bars represent standard error. ............................................................................. 105 Figure 5.30 Inward (plain line) and outward (dashed line) β-depletion zone thickness at 900 (black), 925 (red) and 950 (grey) as a function of time. ........................................................... 106 Figure 5.31 Time of exposure after which damage was observed for the first time (by eye, under SEM or using pulsed flash thermography) for samples oxidised at temperatures between 900 and 1000 °C. .............................................................................................................................. 108 Figure 5.32 Thickness of the TC (black symbols) and the BC (grey symbols) as a function of sample curvature. As deposited sample (diamond) and samples oxidised at 900 °C for 2780 (squares), 4000 (triangles), 7000 (circles), 10,000 (crosses), 15,000 (stars) and 20,000 hours (empty diamonds). Red circles highlight location B and red dashed line is a trend estimation, excluding the data at location B. ............................................................................................... 110 Figure 5.33 Thickness of the TC (black symbols) and the BC (grey symbols) as a function of sample curvature. As deposited sample (diamond) and samples oxidised at 925 °C for 100 (cross,) 2740 (squares), 4000 (triangles), 7000 (circles) and 10,000 hours (stars). Red circles highlight location B and red dashed line is a trend estimation, excluding the data at location B. ................................................................................................................................. 111

_____________________________________________________________________________
xviii ______________________________________________________________________
Figure 5.34 Thickness of the TC (black symbols) and the BC (grey symbols) as a function of sample curvature. As deposited sample (diamond) and samples oxidised at 950 °C for 2780(squares), 4000 (triangles) and 5000 hours (circles). Red circles highlight location B and red dashed line is a trend estimation, excluding the data at location B. .................................... 111 Figure 5.35 Thickness of the TC (black symbols) and the BC (grey symbols) as a function of sample curvature. As deposited sample (diamond) and samples oxidised at 975 °C for 2700 (squares) and 4000 hours (triangles). Red circles highlight location B and red dashed line is a trend estimation, excluding the data at location B. ................................................................... 112 Figure 5.36 Thickness of the TC (black symbols) and the BC (grey symbols) as a function of sample curvature. As deposited sample (diamond) and samples oxidised at 1000°C for 1050 (squares) and 1500 hours (triangles). Red circles highlight location B and red dashed line is a trend estimation, excluding the data at location B. ................................................................... 112 Figure 5.37 Comparison of the β-NiAl concentration with the BC thickness (black symbols) and the β-NiAl concentration with the sample curvature (grey symbols). Samples oxidised at 900 °C for 2780 (squares), 4000 (triangles), 7000 (circles), 10,000 (diamonds), 15,000 (stars) and 20,000 hours (crosses). Dashed lines are trend estimations. ..................................................... 113 Figure 5.38 Comparison of the β-NiAl concentration with the BC thickness (black symbols) and the β-NiAl concentration with the sample curvature (grey symbols). Samples oxidised at 925 °C for 100 (cross), 2740 (squares), 4000 (triangles), 7000 (circles) and 10,000 hours (diamonds). Dashed lines are trend estimations. ........................................................................................... 114 Figure 5.39 Comparison of the β-NiAl concentration with the BC thickness (black symbols) and the β-NiAl concentration with the sample curvature (grey symbols). Samples oxidised at 950°C for 2780 (squares), 4000 (triangles), and 5000 hours (circles). Dashed lines are trend estimations................................................................................................................................. 114 Figure 5.40 Thickness of the β inward depletion zone (black symbols) and the β outward depletion zone (grey symbols) as a function of sample curvature. Samples oxidised at 900 °C for 4000 (triangles), 7000 (circles), 10,000 (diamonds) 15,000 (stars) and 20,000 hours (crosses)..................................................................................................................................... 115 Figure 5.41 Thickness of the β inward depletion zone (black symbols) and the β outward depletion zone (grey symbols) as a function of sample curvature. Samples oxidised at 925 °C for 100 (crosses), 2740 (squares), 4000 (triangles), 7000 (circles) and 10,000 hours (diamonds). ................................................................................................................................................... 117 Figure 5.42 Thickness of the β inward depletion zone (black symbols) and the β outward depletion zone (grey symbols) as a function of sample curvature. Samples oxidised at 950 °C for 2780 (squares,) and 4000 hours (triangles).......................................................................... 117 Figure 5.43 Thickness of the β inward depletion zone (black symbols) and the β outward depletion zone (grey symbols) as a function of sample curvature. Samples oxidised at 975 °C for 2700 hours (squares) and at 1000 °C for 1050 hours (diamonds). ...................................... 118 Figure 5.44 Thickness of the TGO thickness as a function of sample curvature. Samples oxidised at 900 (black symbols), 925 (dark grey symbols), 950 (mid grey symbols), 975 (light grey symbols) and 1000 °C (empty symbols) for 1500 (diamond), ~ 2700 (squares), 4000 (triangles) and 5000 hours (circles). .......................................................................................... 119 Figure 5.45 Values of kp at 900 (black symbols), 925 (dark grey symbols), 950 (mid grey symbolss), 975 (light grey symbols) and 1000 °C (empty symbols) as a function of curvature. ................................................................................................................................................... 120

_____________________________________________________________________________
xix ______________________________________________________________________
Figure 5.46 Fraction of spinel as a function of sample curvature. Samples oxidised at 900 (black symbols), 925 (red symbols), 950 (mid grey symbols), 975 (light grey symbols) and 1000 °C (empty symbols) for 1500 (diamond), ~ 2700 (squares), 4000 (triangles) and 5000 hours (circles). Red arrow points to the curvature of location F. ........................................................ 121 Figure 5.47 Relative comparison of the BC thickness in region C (diamonds) and D (squares). ................................................................................................................................................... 122 Figure 5.48 Relative comparison of the β-inward diffusion depletion zone thickness in region C (diamonds) and D (squares). ..................................................................................................... 123 Figure 5.49 Relative comparison of the β-outward diffusion depletion zone thickness in region C (diamonds) and D (squares). .................................................................................. 123 Figure 5.50 Relative comparison of the median TGO thickness in region C (diamonds) and D (squares). ................................................................................................................................... 123 Figure 5.51 Relative comparison of the amount of spinel in the TGO in region C (diamonds) and D (squares). ........................................................................................................................ 124 Figure 5.52 SEM images of a TGO and spinels in samples exposed at 925 °C for 2740 hours at (a) location D, (b) location E and (c) location c. ....................................................................... 125 Figure 6.1 SEM images of the TGO and spinels in a sample exposed at 900 °C for 4000 hours. (a) 110 µm thick BC at convex region D and (b) 125 µm thick BC at concave region c. ........ 130 Figure 6.2 SEM images of location B’s BC in samples exposed at 900 °C for (a) 2780 hours; (b) 7000 hours; (c) 10,000 hours and (d) 15,000 hours. The BC is respectively 54, 45, 64, and 54 µm thick on average. ................................................................................................................. 132 Figure 6.3 TGO thicknesses against exposure time at 900 °C for different locations around the modified aerofoil-shaped samples. Plain, dotted and dashed lines respectively correspond to convex, flat and concave curvatures. ........................................................................................ 133 Figure 6.4 Amount of Al (at%) in depleted BCs at location B from the TGO/BC to the BC/substrate interface after exposure at 900 °C for 2780 to 20,000 hours. .............................. 134 Figure 6.5 SEM images of BC and SRZ at Location B on (a) as-deposited sample and on samples exposed at 900 °C for (b) 4000, (c) 7000 and (d) 15,000 hours. Red dashed line delimits the BC/SRZ interface. White arrows represent the propagation of the γ’-Ni 3Al phase. White circle indicate intrusion of SRZ into BC. ....................................................................... 136 Figure 6.6 SEM image of location C’s BC in a sample exposed at 900 °C for 7000 hours. Dashed line indicates limits of outward β-depletion. Dashed circles indicate spinels/mixed oxides. White arrows are used as reference to show the distance between the TGO and the limit of the β-depletion zone. ............................................................................................................. 137 Figure 6.7 SEM image of (a) the BC and (b) the TC/BC interface at location A on as-coated sample etched with phosphoric acid. ......................................................................................... 138 Figure 6.8 SEM image of the BC in (a) location D and (c) location c in an etched sample oxidised at 900 °C for 2780 hours (cracking caused by etching with hydrochloric acid). ........ 139 Figure 6.9 FIB image of a lift-out being cut. ............................................................................ 140 Figure 6.10 TEM image of a FIB lift-out from sample 81-BSYA-8 exposed for 15,000 hours at 900 °C. Light grey contrast corresponds to α-Al 2O3, dark grey at the top of the image to the ceramic TC and at the bottom of the image to the BC. ............................................................. 140 Figure 6.11 TEM image of a FIB lift-out from sample 81-BSYA-8 exposed for 15,000 hours at 900 °C. (a) Light grey contrast corresponds to α-Al 2O3 and dark grey to γ-Ni. Areas analysed by EDX appear in red in (b). .......................................................................................................... 141 Figure 6.12 Element composition along a grain boundary in the BC. ...................................... 142
_____________________________________________________________________________
xx ______________________________________________________________________
Figure 6.13 Schematic mechanism of the evolution of phases caused by the diffusion of Al in thin BC. (a) Represents the coating system as-deposited, (b) to (d) show the evolution of phases with exposure and (e) illustrates the hypothesis of reverse diffusion of Al after Al depletion of the BC reduces levels to below those in the substrate. .............................................................. 145 Figure 6.14 SEM image of BC at location C after oxidation at 925 °C for 100 hours. Arrows represent the Al outward diffusion depletion zone and the zone containing γ’ close to the BC/SRZ interface. ..................................................................................................................... 146 Figure 6.15 SEM image of the tip of a crack propagating at the TGO/BC interface at location F in a sample oxidised at 900 °C for 15,000 hours....................................................................... 146 Figure 6.16 SEM image of BC asperities in location D on a sample oxidised at 900 °C for 7000 hours (a) and measurements of Al concentration along Line 1 and Line 2 (b). Line 1 was repeated at higher magnification in (c)...................................................................................... 148 Figure 6.17 SEM image of TC in location C in (a) as-deposited sample and (b) its schematical representation as well as SEM images of samples oxidised at 925 °C for (c) 100 hours and (d) 7000 hours. White arrows on left hand side represent deposition layers. ................................. 151 Figure 6.18 SEM image of TC in location A in sample oxidised at 925 °C for (a) 100, (b) 4000 and (c) 7000 hours. White arrows on left hand side (a) represent deposition layers. Red arrows (c) point at vertical cracking...................................................................................................... 153 Figure 6.19 (a) SEM image of TC in location F in sample oxidised at 925 °C for 4000 hours and (b) its schematic representation. ................................................................................................ 153 Figure 6.20 SEM image of TC in location a in (a) an as-deposited sample and samples oxidised at 925 °C for (b) 2740 and (c) 7000 hours. Red arrows point at vertical micro cracks. ............ 154 Figure 6.21 SEM image of TC/BC interface from (a) location B, (b) location D, (c) location F and (d) location A, in sample oxidised at 925 °C for 100 hours. Highlighted areas represent YSZ powder particles. ....................................................................................................................... 157 Figure 6.22 SEM image of cracks running into the TGO at TC/TGO in the case of (a) Type 2, (b) Type 3 and (c) Type 4 microstructures. (d) Without TGO undulation cracks were located at TGO/BC interface. .................................................................................................................... 158 Figure 6.23 SEM image of (a) spinel/mixed oxides in TGO at location b in sample oxidised at 925 °C for 7000 hours and (b) crack propagating through infiltrated TC at location c in sample oxidised at 975 °C for 2700 hours. Black dashed arrows point to diffusion of oxide into the ceramic TC. ............................................................................................................................... 160 Figure 6.24 EDX mapping of oxide showed in Figure 6.23(a). ................................................ 160 Figure 6.25 SEM image of spinel/mixed oxides in TGO from location a in sample oxidised at 925 °C for 7000 hours. (a) Original image. (b) Red dashed lines are cracks/splat boundaries linked to spinels. ........................................................................................................................ 161 Figure 6.26 SEM images of as-received RR sample, taken at a flat location, showing a (a) continuous and (b) discontinuous TGO between the APS/TBC and BC. ................................. 163 Figure 6.27 SEM image of as-received RR sample, taken at a concave location, showing the absence of TGO between the TBC and BC. .............................................................................. 164 Figure 6.28 SEM images of (a) as-received RR sample and samples exposed for (b) 50 and (c) 150 hours at 925 °C, showing the presence of pores in the BC close to the TBC/BC interface. ................................................................................................................................................... 165 Figure 6.29 SEM images of RR sample exposed for 50 hours, taken at a flat location, of the TGO (a). Image is magnified in (b). Red numbers indicate location of EDX analysis. ............ 166

_____________________________________________________________________________
xxi ______________________________________________________________________
Figure 6.30 SEM images of samples exposed for (a) 150 and (b) 200 hours, taken at a flat location, of the interdiffusion between TC and TGO. ............................................................... 166 Figure 6.31 SEM images of as-coated modified aerofoil-shaped samples’ TC/BC interface at locations (a) B, (b) C, (c) c and (d) F. Sample shown in (d) was etched using phosphoric acid. ................................................................................................................................................... 167 Figure 6.32 SEM image of internal oxidation isolating islands of BC on a modified aerofoil-shaped sample exposed for 100 at 925 °C. ................................................................................ 168 Figure 6.33 SEM images of the interdiffusion between TC and TGO on modified aerofoil-shaped samples exposed (a) for 100 hours at 925 °C and (b) for 7000 hours at 900 °C. .......... 169 Figure 6.34 TEM image of the TC/TGO interface taken on sample exposed for 15,000 hours at 900 °C. ...................................................................................................................................... 169 Figure 6. 35 EDX measurements along a line through the TBC, mixed zone and Al2O3. ........ 170 Figure 6.36 SEM images of modified aerofoil-shaped samples exposed for (a) 100 and (b) 4000 hours at 925 °C, of pores between TC and BC being filled by the growth of the TGO. ........... 171 Figure 6.37 Schematic representation of YSZ splats configurations found in TC protrusions into the BC. Red arrows and lines are potential cracks paths. .......................................................... 174 Figure 6.38 Thermodynamic stability diagram of the Ni-Al-O system [21]. ............................ 176 Figure 6.39 Schematic representation of spinels/mixed oxides growth in isolated BC islands with exposure at high temperatures (chronologically from (a) the initial stage of oxidation to (f) the final form of the spinel/mixed oxide). ................................................................................. 178 Figure 7.1 SEM image of the BC in location F on an etched sample oxidised at 900 °C for 2780 hours. Tip of the trailing edge (a) and adjacent to the tip of trailing edge (b). ......................... 183 Figure 7.2 Thermographs of sample 81-BSYA-37, oxidised at 975 °C for 4000 hours. Light grey contrast corresponds to detached ceramic. ........................................................................ 186 Figure 7.3 SEM image taken at location F of samples oxidised for 2780 hours at 950 °C showing cracks propagating at TGO/BC interface and through the TC. Red circles highlight TC protrusions into the TGO........................................................................................................... 187 Figure 7.4 Inaccurate comparison of experimental mass change data and model. ................... 189 Figure 7.5 Comparison of experimental mass change data and corrected model. .................... 190 Figure 7.6 wθc as a function of temperature. .............................................................................. 190 Figure 7.7 Arrhenius plot of ln(wθc) for the oxidation of the APS/TBC system. ...................... 191 Figure 7.8 CFD simulation of hot spots in a high pressure turbine stage [143]. ....................... 193 Figure 8.1 Pictures showing evolution of 130510B3 (10.6 at%Cr, 1.9 at% Al), 130510e3 (8.2 at% Cr, 15.5 at% Al), 170510F2 (6.7 at% Cr, 31.7 at% Al) and 130510h2 (0.9 at% Cr, 88.4 at% Al) (Ni-10wt%Cr+Al) with exposure time at 950 °C. Red arrows point at damage in coatings. ................................................................................................................................................... 200 Figure 8.2 Pictures showing evolution of the oxides on 080710B2 (22.1 at% Cr, 0.5 at% Al), 080710D2 (20.2 at% Cr, 2.6 at% Al), 080710F2 (14.6 at% Cr, 21.5 at% Al) and 080710h2 (2.5 at% Cr, 83.5 at% Al) (Ni-20wt%Cr+Al) with exposure time at 950 °C. Red arrows point at damage in coatings. ................................................................................................................... 201 Figure 8.3 Pictures showing evolution of the oxides on 290610d3 (51.8 at% Cr, 12.1 at% Al), 290610E3 (48.2 at% Cr, 18.2 at% Al), 290610F2 (44.9 at% Cr, 32.6 at% Al) and 290610H3 (5.1 at% Cr, 90.8 at% Al ) (Ni50Cr+Al) with exposure time at 950 °C. .................................. 201 Figure 8.4 Mass change of Ni-10wt%Cr+Al coatings against time of exposure at 950 °C. Red curves represent samples growing protective oxides. ............................................................... 203

_____________________________________________________________________________
xxii ______________________________________________________________________
Figure 8.5 Mass change of Ni-20wt%Cr+Al coating against time of exposure at 950 °C. Red curves represent samples growing protective oxides. ............................................................... 203 Figure 8.6 Mass change of Ni-50wt%Cr+Al coating against time of exposure at 950 °C. Red curves represent samples growing protective oxides. ............................................................... 205 Figure 8.7 Mass change of (a) Ni-10wt%Cr+Al, (b) Ni-20wt%Cr+Al and (c) Ni-50wt%Cr+Al coatings against Cr/Al content (in at %). Gaps in the curve correspond to sample failure (absence of data). ...................................................................................................................... 206 Figure 8.8 XRD spectrum from the surface of sample 130510B3 (10.6 at% Cr, 1.9 at% Al)(Ni-10wt%Cr + Al) after 220 hours exposure showing the presence of NiO. ................................. 208 Figure 8.9 XRD spectrum from the surface of sample 290610D2 (55.9 at% Cr, 6.0 at% Al)(Ni-50wt%Cr + Al) after 500 hours exposure showing the presence of NiO and Cr2O3. ................ 208 Figure 8.10 XRD spectrum from the surface of sample 130510e3 (8.2 at% Cr, 15.5 at% Al)(Ni-10wt%Cr + Al) after 500 hours exposure showing the first traces of Al2O3. ............................ 209 Figure 8.11 XRD spectrum from the surface of sample 170510F2 (6.7 at% Cr, 31.7 at% Al)(Ni-10wt%Cr + Al) after 500 hours exposure showing Al2O3. ...................................................... 209 Figure 8.12 XRD spectrum from the surface of sample 080710F2 (14.6 at% Cr, 21.5 at% Al) (Ni-20wt%Cr + Al) after 500 hours exposure showing Al 2O3. ................................................. 210 Figure 8.13 XRD spectrum from the surface of sample 290610E3 (48.2 at% Cr, 18.2 at% Al)(Ni-50wt%Cr + Al) after 500 hours exposure showing the first traces of Al2O3 growing with Cr2O3. ........................................................................................................................................ 210 Figure 8.14 XRD spectrum from the surface of sample 080710B2 (22.1 at% Cr, 0.5 at% Al)(Ni-20wt%Cr + Al) after 80 hours exposure showing the presence of Cr2O3 as well as spinels. .... 211 Figure 8.15 XRD spectrum from the surface of sample 290610d3 (51.8 at% Cr, 12.1 at% Al)(Ni-50wt%Cr + Al) after 500 hours exposure showing the presence of Cr2O3 , as well as spinels and mixed oxides........................................................................................................... 212 Figure 8.16 Cross sections SEM images of (a) 170510d2, (b) 130510E2, (c) 130510e3 and (d) 170510F2................................................................................................................................... 215 Figure 8.17 Cross sections SEM images of as deposited (a) 080710A2, (b) 080710D3, (c) 080710G2 and (d) 080710H2. ................................................................................................... 216 Figure 8.18 Cross sections SEM images of (a) 290610d3, and (b) 290610 F2. ........................ 216 Figure 8.19 Effect of the initial Ni-Cr-Al coating composition on the (Cr,Al)2O3 oxides formed at 950°C. .................................................................................................................................... 218 Figure 8.20 Oxide compositions grown on Ni-Cr-Al coatings after 500 hours at 950 °C (diagram in at%). ...................................................................................................................................... 221 Figure 8.21 Oxide compositions grown on Ni-Cr-Al coatings after 500 hours at 950 °C compared to data obtained by Nicholls et al. [63](diagram in at%). ......................................... 222 Figure 8.22 Oxide compositions grown on Ni-Cr-Al coatings after 500 hours at 950 °C completed with the data obtained from 3 target co-sputtering and compared to data obtained by Nicholls et al. [63](diagram in at%). ......................................................................................... 223 Figure 8.23 Pictures showing the evolution of the oxides on 130510D2 (9.9 at% Cr, 4 at% Al), 170510E2 (9.2 at% Cr, 9.4 at% Al), 170510e2 (8.2 at% Cr, 15.5 at% Al), 170510F3 (6.7 at% Cr, 31.7 at% Al ) and 130510i3 (0.4 at% Cr, 93.6 at% Al)(Ni-10wt%Cr+Al) with exposure at 900 °C. Red arrows point at damage in coatings. ..................................................................... 226 Figure 8.24 Pictures showing the evolution of the oxides, during the first stage of oxidation, on 080710d3 (18.5 at% Cr, 4.5 at% Al), 080710E3 (17.9 at% Cr, 7.8 at% Al), 080710e2 (16.3 at%

_____________________________________________________________________________
xxiii ______________________________________________________________________
Cr, 14.6 at% Al) and 080710h3 (2.5 at% Cr, 83.5 at% Al)(Ni-20wt%Cr+Al) with exposure at 900 °C. ...................................................................................................................................... 227 Figure 8.25 Pictures showing the evolution of the oxides, during the first stage of oxidation, on 290610D3 (55.9 at% Cr, 6.0 at% Al), 290610E2 (48.2 at% Cr, 18.2 at% Al), 290610F3 (32.6 at% Cr, 44.9 at%Al) and 290610H2 (5.1 at% Cr, 90.8 at5 Al) (Ni-50wt%Cr+Al) with exposure at 900 °C. ................................................................................................................................... 227 Figure 8.26 Mass change of Ni-10wt%Cr+Al coating against time of exposure at 900 °C. ..... 228 Figure 8.27 Mass change of Ni-20wt%Cr+Al coating against time of exposure at 900 °C. ..... 229 Figure 8.28 Mass change of Ni-50wt%Cr+Al coating against time of exposure at 900 °C. ..... 230 Figure 8.29 XRD spectrum from the surface of sample 130510d2 (9.7 at% Cr, 5.8 at% Al) (Ni-10wt%Cr+Al) after 120 hours exposure, showing the presence of Cr2O3, NiO and presumably transient γ-Al 2O3. ...................................................................................................................... 232 Figure 8.30 XRD spectrum from the surface of sample 170510E2 (9.2 at% Cr, 9.4 at% Al) (Ni-10wt%Cr+Al) after 500 hours exposure, showing the presence of Cr2O3, NiO and mixed oxides. ................................................................................................................................................... 232 Figure 8.31 XRD spectrum from the surface of sample 130510e2 (8.2 at% Cr, 15.5 at% Al)(Ni-10wt%Cr+Al) after 100 hours observation, showing the presence of NiO and α-Al 2O3. ......... 233 Figure 8.32 XRD spectrum from the surface of sample 170510F3 (6.7 at% Cr, 31.7 at% Al) (Ni-10wt%Cr+Al) after 500 hours oxidation, showing the presence of transient γ- and θ-Al 2O3 as well as α-Al 2O3. ......................................................................................................................... 233 Figure 8.33 XRD spectrum from the surface of sample 080710d3 (18.5 at% Cr, 4.5 at% Al) (Ni-20wt%Cr+Al) after 500 hours exposure, showing the presence of Cr2O3, NiO and spinels. .... 234 Figure 8.34 XRD spectrum from the surface of sample 080710e2 (16.3 at5 Cr, 14.6 at% Al) (Ni-20wt%Cr+Al) after 500 hours exposure, showing the presence of Cr2O3 and α-Al 2O3. .... 234 Figure 8.35 XRD spectrum from the surface of sample 080710F3 (14.6 at% Cr, 21.5 at% Cr) after 140 and 500 hours exposure (Ni-20wt%Cr+Al) showing the presence of transient θ-Al 2O3 as well as α-Al 2O3. .................................................................................................................... 235 Figure 8.36 XRD spectrum from the surface of sample 290610D3 (55.9 at% Cr, 6.0 at% Al) (Ni-50wt%Cr+Al) after 500 hours exposure, showing the presence of Cr2O3, transient δ-Al 2O3 and spinels. ................................................................................................................................ 235 Figure 8.37 XRD spectrum from the surface of sample 290610E2 (48.2 at% Cr, 18.2 at% Al) (Ni-50wt%Cr + Al) after 500 hours exposure, showing the presence of Cr2O3, transient δ-Al 2O3, α-Al 2O3 and spinels. .................................................................................................................. 236 Figure 8.38 Cross sections SEM images of (a) 130510d2, (b) 170510E2, (c) 130510e2 and (d) 170510F3................................................................................................................................... 238 Figure 8.39 Cross sections SEM images of (a) 080710d3, (b) 080710E2, (c) 080710e2 and (d) 080710F3................................................................................................................................... 240 Figure 8.40 Cross sections SEM images of (a) 290610D3 and (b) 290610E2. ......................... 240 Figure 8.41 Effect on the initial composition on the oxides formed at 900°C. ......................... 242 Figure 8.42 Oxide compositions grown on Ni-Cr-Al coatings after 500 hours at 900 °C (diagram in at%). ...................................................................................................................................... 244 Figure 8.43 Oxide compositions grown on Ni-Cr-Al coatings after 500 hours at 900 °C including the data obtained from 3 target co-sputtering(diagram in at%). ................................ 245 Figure 8.44 Oxide compositions grown on Ni-Cr-Al coatings after 500 hours at 900 °C Boundaries of Al2O3 formers are compared to those obtained at 950 °C in this work and by Nicholls et al. [63](diagram in at%). ......................................................................................... 246

_____________________________________________________________________________
xxiv ______________________________________________________________________
Figure 8.45 Compositional effects on the oxidation of Ni-Cr-Al ternary alloys, at over 1000 °C [65], cited in reference [12] and [63], compared to the data gathered at 950 °C on the coated sapphire discs. Black doted lines represent the boundaries at 1000 °C and the red ones, the boundaries at 950 °C. I) NiO + internal oxidation of Al and Cr ; II) Cr2O3 + internal oxidation of Al ; III) an Al 2O3 external scale. ............................................................................................... 249 Figure 8.46 Compositional effects on the oxidation of Ni-Cr-Al ternary alloys, at over 1000 °C [65], cited in reference [12] and [63], compared to the data gathered at 950 °C on the coated sapphire discs. Black doted lines represent the boundaries at 1000 °C and the red ones, the boundaries at 950 °C. I) NiO + internal oxidation of Al and Cr ; II) Cr2O3 + internal oxidation of Al ; III) an Al 2O3 external scale. ............................................................................................... 250 Figure 9.1 Pictures showing the evolution of oxides on 160810d2 (21.6 at% Cr, 7.4 at% Al), 160810E4 (18.2 at% Cr, 20.1 at% Al), 160810e3 (15.4 at% Cr, 33.5 at% Al) and 160810H1(2.35 at% Cr, 88.8 at% Al) (Ni-40wt%Co-20wt%Cr+Al) with exposure at 950 °C. Red arrows point at damage in coatings. ................................................................................... 255 Figure 9.2 Pictures showing the evolution of oxides on 130910d3 (41.6 at% Cr, 8.8 at% Al), 130910e2 (38.1 at% Cr, 16.7 at% Al), 130910f3 (27.8 at% Cr and 40.2 at% Al) and 130910H2 (5.8 at% Cr and 86.3 at% Al) (Ni-20wt%Co-40wt%Cr+Al) with exposure at 950 °C. Red arrows point at damage in coatings. .......................................................................................... 255 Figure 9.3 Mass change of Ni-20wt%Co-40wt%Cr+Al coating against time of exposure at 950 °C. ...................................................................................................................................... 257 Figure 9.4 Mass change of Ni-40wt%Co-20wt%Cr+Al coating against time of exposure at 950 °C. ...................................................................................................................................... 257 Figure 9.5 XRD spectrum from surface of sample 130910d3 (41.6 at% Cr, 8.8 at% Al) (Ni-20wt%Co-40wt%Cr+Al) after 500 hours exposure, showing the presence of Cr2O3, transient δ-Al 2O3, spinels, NiO and CoO. ................................................................................................... 259 Figure 9.6 XRD spectrum from surface of sample 130910F2 (29.2 at% Cr, 36.6 at% Al) (Ni-20wt%Co-40wt%Cr+Al) after 500 hours exposure, showing the presence of Cr2O3, transient δ-Al 2O3 and α-Al 2O3. .................................................................................................................... 260 Figure 9.7 XRD spectrum from surface of sample 130910f3 (27.8 at% Cr, 40.2 at% Al) (Ni-20wt%Co-40wt%Cr+Al) after 500 hours exposure, showing the presence of transient δ and γ-Al 2O3, α-Al 2O3, spinels and CoO. ............................................................................................. 260 Figure 9.8 XRD spectrum from surface of sample 130910H2 (5.8 at% Cr, 86.3 at% Al) (Ni-20wt%Co-40wt%Cr+Al) after 500 hours exposure, showing the presence α-Al 2O3 and spinels. ................................................................................................................................................... 261 Figure 9.9 XRD spectrum from surface of sample 160810E4 (18.2 at% Cr, 20.1 at% Al) (Ni-40wt%Co-20wt%Cr+Al) after 500 hours exposure, showing the presence of NiO, mixed (Co,Ni)O and spinels. ................................................................................................................ 262 Figure 9.10 XRD spectrum from surface of sample 160810F4 (13.4 at% Cr, 40.9 at% Al) (Ni-40wt%-Cowt%20Cr+Al) after 500 hours exposure, showing the presence of α-Al 2O3 and Co3O4. ................................................................................................................................................... 263 Figure 9.11 XRD spectrum from surface of sample 160810g1(4.4 at% Cr, 78.5 at5 Al) (Ni-40wt%Co-20wt%Cr + Al) after 500 hours exposure, showing the presence of α-Al 2O3 , transient θ-Al 2O3 CoO and Cr2O3. ........................................................................................................... 263 Figure 9.12 Cross sections SEM images of (a) 130910d3, (b) 130910e2 and (c) 130910F2. ... 265 Figure 9.13 Cross sections SEM images of (a) 160810d2, (b) 160810e3, (c) 160810F4 and (d) 160810f4. .................................................................................................................................. 266

_____________________________________________________________________________
xxv ______________________________________________________________________
Figure 9.14 Effect of Cr/Al and Co/Ni ratios (at%) on oxide compositions observed after 500 hours at 950 °C. Red diamonds correspond to α-Al 2O3, black squares to transient Al2O3, green dots to Cr2O3 and grey crosses to Ni or Co oxides. Beneath black dotted line are samples capable of forming transient Al2O3. Beneath red dotted line are samples capable of forming α-Al 2O3. ........................................................................................................................................ 268 Figure 9.15 Pictures showing the evolution of oxides on 160810c2 (22.9 at% Cr, 3.0 at% Al), 160810D3 (22.4 at% Cr, 4.5 at% Al), 160810E2 (18.2 at% Cr, 20.1 at% Al) and 160810e2 (15.4 at% Cr, 33.5 at% Al) (Ni-40wt%Co-20wt%Cr+Al) with exposure at 900 °C. Red arrows point at damage in coatings. ............................................................................................................... 270 Figure 9.16 Pictures showing the evolution of oxides on 130910c2 (44.3 at% Cr, 3.6 at% Al), 130910e3 (38 at% of Cr, 16.7 at% of Al), 130910f2 (27.8 at% Cr, 40.2 at% Al) and 130910H1 (5.8 at% Cr, 86.3 at% Al) (Ni-20wt%Co-40wt%Cr+Al) with exposure at 900 °C. Red arrows point at damage in coatings. ...................................................................................................... 271 Figure 9.17 Mass change of Ni-20wt%Co-40wt%Cr+Al coating against time of exposure at 900 °C. ...................................................................................................................................... 273 Figure 9.18 Mass change of Ni-20wt%Co-40wt%Cr+Al coating against time of exposure at 900 °C. ...................................................................................................................................... 274 Figure 9.19 XRD spectrum from surface of sample 130910c2 (44.3 at% Cr, 3.6 at% Al) (Ni-20wt%Co-40wt%Cr + Al) after 500 hours exposure, showing the presence of δ-Al 2O3, Cr2O3 and NiCr2O4. .............................................................................................................................. 275 Figure 9.20 XRD spectrum from surface of sample 130910e3 (38.1 at% Cr, 16.7 at% Al) (Ni-20wt%Co-40wt%Cr + Al) after 500 hours exposure, showing the presence of α-Al 2O3 δ-Al 2O3, Cr2O3 and NiCr2O4. ................................................................................................................... 276 Figure 9.21 XRD spectrum from surface of sample 130910H1 (5.8 at%Cr, 86.3 at% Al) (Ni-20wt%Co-40wt%Cr + Al) after 500 hours exposure, showing the presence of γ-Al 2O3, α-Al 2O3 and NiCr2O4. .............................................................................................................................. 276 Figure 9.22 XRD spectrum from surface of sample 160810c2 (22.9 at% Cr, 3.0 at% Al) (Ni-40wt%Co-20wt%Cr + Al) after 500 hours exposure, showing the presence of Cr2O3, CoO, (Co,Ni)O and Co2O3. ................................................................................................................. 277 Figure 9.23 XRD spectrum from surface of sample 160810E2 (18.2 at% Cr, 20.1 at% Al) (Ni-40wt%Co-20wt%Cr + Al) after 500 hours exposure, showing the presence of θ-Al 2O3, Cr2O3, (Co,Ni)O and (Co,Ni)Cr2O4. ..................................................................................................... 278 Figure 9.24 XRD spectrum from surface of sample 160810e2 (15.4 at% Cr, 33.5 at% Al) (Ni-40wt%Co-20wt%Cr + Al) after 500 hours exposure, showing the presence of γ-Al 2O3, α-Al 2O3 and NiCr2O4. .............................................................................................................................. 278 Figure 9.25 Cross sections SEM images of (a) 130910d2, (b) 130910E1, (c) 130910e3 and (d) 130910F3................................................................................................................................... 281 Figure 9.26 BSE SEM images of cross-sections through (a) and (b) 160810E2, and (c) 160810e2. .................................................................................................................................. 282 Figure 9.27 Effect of Cr/Al and Co/Ni ratios (at%) on oxide compositions observed after 500 hours at 900 °C. Red diamonds correspond to α-Al 2O3, black squares to transient Al2O3, green dots to Cr2O3 and grey crosses to Ni or Co oxides. Beneath black dotted line are samples capable of forming transient Al2O3. Beneath red dotted line are samples capable of forming α-Al 2O3. ........................................................................................................................................ 283

_____________________________________________________________________________
xxvi ______________________________________________________________________
Figure 9.28 Compositional effects on the oxidation gathered at (a) 950 °C and (b) 900 °C on the coated sapphire discs. Black doted lines represent the Al2O3 formers boundaries and the circles highlight commercial coatings out of Al2O3 formers domain at 950 °C. .................................. 286 Figure 10.1 Comparison of the Al2O3 forming domains at 900 (black) and 950 °C (red) for the Ni-Cr-Al (plain lines) and the Co-Ni-Cr-Al systems (dotted lines). ......................................... 293

_____________________________________________________________________________
xxvii ______________________________________________________________________
LIST OF TABLES Table 3.1 Thermal expansion coefficients of the different layers of a TBC system [21]. .......... 34 Table 4.1 Composition (in wt%) of modified aerofoil-shaped sample’s substrate and BC. ....... 55 Table 4.2 TC, BC thicknesses and curvatures at different positions around the modified aerofoil-shaped sample (Approximation after measurements carried out on 23 samples (Appendix C). Upper case design convex curvatures and lower case concave ones. ......................................... 56 Table 4.3 Exposure of APS/TBC system on modified aerofoil-shaped samples. ....................... 57 Table 4.4 Modified aerofoil-shaped samples’ identifications, oxidation temperatures and total exposure times. ............................................................................................................................ 57 Table 4.5 RR samples identification, oxidation temperatures and total exposure times. ............ 59 Table 4.6 Targets used to deposit NiAl, NiCrAl and NiCoCrAl coatings using co-sputtering. .. 66 Table 4.7 Process conditions used to deposit Ni-Al, Ni-Cr-Al and Ni-Co-Cr-Al coatings using 2 and 3 targets co-sputtering (chamber pressure 23 mTorr and 10mTorr respectively). ............... 68 Table 5.1 Table 1 Value of SRZ Growth rate with temperature. .............................................. 106 Table 502 Oxidation kinetics (values of kp) at different locations and exposure temperatures of the BCs on the modified aerofoil-shaped samples. ................................................................... 119 Table 5.3 Oxidation conditions of data used in Figures 5.45 to 5.49. ....................................... 122 Table 6.1 Results of EDX analysis conducted on areas indicated in Figure 6.11. .................... 142 Table 6.2 Summary of observations of particular features observed in ceramic TCs depending on curvature, made in samples oxidised from 900 °C to 1000 °C. ........................................... 156 Table 6.3 Summary of observation, made in samples oxidised from 900 °C to 1000 °C, of particular features observed at the TC/BC interface. ................................................................ 162 Table 8.1 Compositions of Ni-Cr-Al coatings resulting from 2 target co-sputtering and oxidised at 950 °C. ................................................................................................................................... 198 Table 8.2 Ni-Cr-Al samples producing slow lowest oxidation levels. ...................................... 205 Table 8.3 Different oxide phases identified using XRD on the samples exposed at 950 °C. ... 213 Table 8.4 Composition (obtained by EDX analysis) of the oxide layers observed on the cross-sections of selected Ni-Cr-Al samples exposed at 950°C. ........................................................ 217 Table 8.5 Ni-Cr-Al compositions of coatings resulting from 3 targets co-sputtering and oxidised at 950 °C .................................................................................................................................... 219 Table 8.6 Different oxide species identified using XRD on the samples exposed at 950 °C for 40 hours. ......................................................................................................................................... 219 Table 8.7 Compositions of Ni-Cr-Al coatings resulting from 2 target co-sputtering and oxidised at 900 °C. Numbers in italic correspond to samples removed prematurely for observation purposes..................................................................................................................................... 224 Table 8.8 Different oxide phases identified using XRD on the samples exposed at 900 °C. ... 237 Table 8.9 Composition (obtained by EDX analysis) of the oxide layers observed on the cross-sections of selected Ni-Cr-Al samples exposed at 900°C. ........................................................ 241 Table 8.10 Ni-Cr-Al compositions of coatings resulting from 3 targets co-sputtering and oxidised at 900 °C. .................................................................................................................... 243 Table 8.11 Different oxide species identified using XRD on the samples exposed at 900 °C for 40 hours. .................................................................................................................................... 243 Table 9.1 Compositions of Co- Ni-Cr-Al coatings resulting from 2 target co-sputtering and oxidised at 950 °C. .................................................................................................................... 253 Table 9.2 Different oxide species identified using XRD on the surface of samples exposed at 950 °C. ...................................................................................................................................... 264

_____________________________________________________________________________
xxviii ______________________________________________________________________
Table 9.3 Composition (obtained by EDX analysis) of the oxide layers observed on the cross-sections of selected Co-Ni-Cr-Al samples at 950°C. ................................................................ 267 Table 9.4 Compositions of Co-Ni-Cr-Al coatings resulting from 2 target co-sputtering and oxidised at 900 °C. .................................................................................................................... 269 Table 9.5 Different oxide species identified using XRD on the samples exposed at 900 °C.... 279 Table 9.6 Composition (obtained by EDX analysis) of the oxide layers observed on the cross-sections through selected Co-Ni-Cr-Al samples at 900°C. ....................................................... 282 Table 9.7 Commercial overlay coatings used as commercial reference in ternary diagrams in Figure [60,150,151]. Y (at%) is not taken into account. ........................................................... 287 Table 10.1 Chosen samples for comparisons between the Ni-Cr-Al and Co-Ni-Cr-Al systems, their compositions and oxide formed. ....................................................................................... 290 Table 10.2 Coating compositions forming Al2O3, with the lower final mass gain after 500 hours at 950 °C. ................................................................................................................................... 296 Table 10.3 Coating compositions forming Al2O3, with the lower final mass gain after 500 hours at 900 °C. ................................................................................................................................... 297

_____________________________________________________________________________
xxix ______________________________________________________________________
ABBREVIATIONS
Chemical elements are abbreviated according to the periodic table (e.g. Fe for iron…) 81-BSYA-xx: Modified aerofoil-shaped samples code name APS: Air Plasma Spray BC: Bond Coat CCGT: Combined Cycle Gas Turbine CFD: Computational Fluid Dynamics DC: Direct Current EB-PVD: Electron Beam Physical Vapour Deposition EDX: Energy Dispersive Spectrometry ESEM: Environmental Scanning Electron Microscope FIB: Focused Ion Beam HVOF: High Velocity Oxy-Fuel IGCC: Integrated Gasification Combined Cycle InCF: Intrinsic Chemical Failure LPPS: Low Pressure Plasma Spray MICF: Mechanically Induced Chemical Failure NDE: Non-destruction examination NPL: National Physical Laboratory OGCT: Open-Cycle Gas Turbine PVD: Physical Vapour Deposition RF: Radio Frequency RR-xx: Rolls-Royce samples code name SEM: Scanning Electron Microscope SFEG: Field Emission Gun SEM SRZ: Secondary Reaction Zone TBC: Thermal Barrier Coating TC: Top Coat TCP phases: Topologycally Closed Pack phases TEM: Transmission Electron Microscope TGO: Thermally Grown Oxide VPS: Vacuum Plasma Spray XRD: X-Ray Diffraction YSZ : Yttria Stabilized Zirconia

_____________________________________________________________________________
xxx ______________________________________________________________________

Introduction ____________________________________________________________________________
1 ______________________________________________________________________
CHAPTER I - INTRODUCTION
1.1 Challenges of electricity generation
World energy consumption has been continually increasing over the past
decades (Figure 1.1) and is expected to increase by 57 % from 2004 to 2030, in order to
satisfy the demand by industrial, transportation, domestic and commercial service
sectors. Thus, the consumption of fuels employed to provide energy is projected to
increase as well, but by different degrees for the various fuels types (Figure 1.2) [1-3].
Figure 1.1 World energy consumption in TWh from 1990 to 2010 [2].
Figure 1.2 Evolution from 1971 to 2008 of world total final consumption by fuel (Mtoe) [3].
Coal/peatCombustible renewables and waste
OilElectricity
Gas
Other

Introduction ____________________________________________________________________________
2 ______________________________________________________________________
Europe, whose energy intensity (gross consumption divided by domestic
product) dropped for six consecutive years (2003-2009), is facing great challenges,
including regulations to reduce its impact on the climate change, its increasing import
dependence and higher energy prices. EU energy import dependence is expected to
reach 65 % by 2030. Reliance on imports of gas are projected to increase from 57 % to
84 % and of oil from 82 % to 93 % by 2030 (gas and oil are the main type of fuels used
in Europe (Figure 1.3)) [4].
Figure 1.3 Europe gross inland consumption of resources in 2009 [5].
Combine Cycle Gas Turbines (CCGTs) are a suitable approach to the challenge
of electricity generation because their cost is low (35-45 €/MWh compare to 40-50
€/MWh for coal (Integrated Gasification Combined Cycle)), they are highly efficient
(50 % compared to 30 % for IGCC), and release fewer emissions (400 Kg CO2 eq/MWh
compared to 750 Kg CO2 eq/MWh for IGCC) [4]. However, the price of gas supplies,
Renewables9.0%
Hard Coal
10.7%Lignite5.5%
Oil36.6%
Natural Gas24.9%
Nuclear13.3%

Introduction ____________________________________________________________________________
3 ______________________________________________________________________
RAMO (reliability, availability, maintainability and operability) and the political risk
accompanying the increasing need to import natural gas will dominate their ability to
supply electricity profitably [4,6]. The solution to this issue is to increase the cyclic
operation as well as the inlet temperature of the gas turbine and to use cheaper (and thus
more corrosive) gases, while optimising engine materials [6].
1.2 What is a Gas Turbine?
The gas turbine, which has found increasing service in the past 40 years in the
power industry, is a critical component within various combined cycle power plant
[1,7,8]. It is composed of three main parts [7,9] (Figure 1.4). Firstly, the compressor
pressurizes (pressure ratio of 1.05 to 1.3 per stage [7]) a working fluid (air or gas).
Secondly, the compressed working fluid (up to ~ 30 bars) enters a combustion chamber
where fuel is injected. All gas turbine combustors perform the same function which is to
increase the temperature of the compressed gas (~800 to ~1430°C). Thirdly, the
combustion products expand through multiple turbine blade rows, and the spinning
shaft generates electricity and drives the air compressor. The first stage (combination of
stator and rotor) experiences the most severe conditions [10]. Hot gases leave the gas
turbine via the exhaust at temperatures around 600°C and a pressure of 1 bar [1].
The simplest gas-fired power station uses an open-cycle gas turbine (OGCT)
that ideally operates according to the Brayton cycle (Figure 1.5(a)). However, in real
life, the hot exhaust gases are vented to the atmosphere and most of the heat energy they
contained is wasted causing their efficiency to rarely rise above 33% [1,11]. In order to
improve that number, it is possible to combine two or more thermodynamic cycles. In a
CCGT, the exhaust gases are reused to heat water to produce steam which drives a

____________________________________________________________________________
______________________________________________________________________
steam turbine and electricity generator. In that case, the Rankine
a steam turbine and Brayton cycle of a gas turbine are used simultan
efficiency can be improved to 60
Figure 1.4 (a) A frame type gas turbine engine [7] (b) schematic of the main components of a gas turbine engine [1].
Compressor
Combustora)
Introduction ____________________________________________________________________________
4 ______________________________________________________________________
turbine and electricity generator. In that case, the Rankine cycle (Figure
a steam turbine and Brayton cycle of a gas turbine are used simultan
efficiency can be improved to 60-65 % [1,7,11].
(a) A frame type gas turbine engine [7] (b) schematic of the main components of a gas
Compressor Turbine
Combustor
____________________________________________________________________________
______________________________________________________________________
(Figure 1.5(b)) of
a steam turbine and Brayton cycle of a gas turbine are used simultaneously and the
(a) A frame type gas turbine engine [7] (b) schematic of the main components of a gas
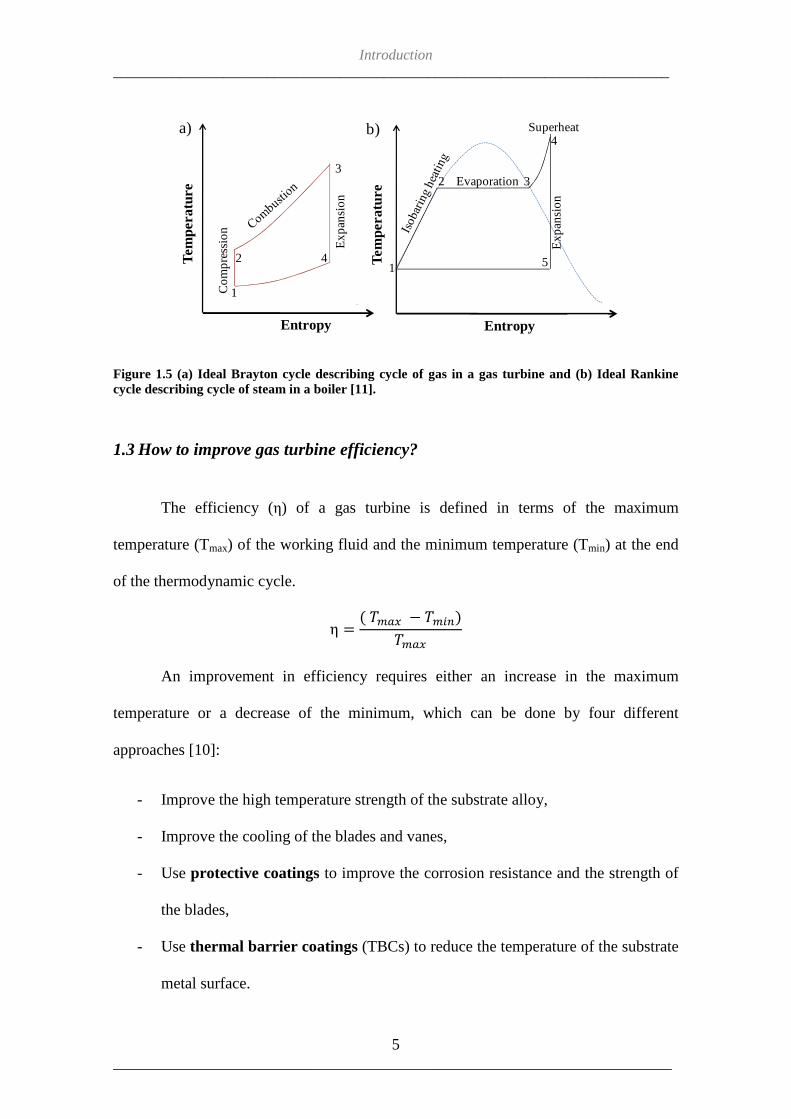
Introduction ____________________________________________________________________________
5 ______________________________________________________________________
Figure 1.5 (a) Ideal Brayton cycle describing cycle of gas in a gas turbine and (b) Ideal Rankine cycle describing cycle of steam in a boiler [11].
1.3 How to improve gas turbine efficiency?
The efficiency (η) of a gas turbine is defined in terms of the maximum
temperature (Tmax) of the working fluid and the minimum temperature (Tmin) at the end
of the thermodynamic cycle.
η = ( ���� − ���)����
An improvement in efficiency requires either an increase in the maximum
temperature or a decrease of the minimum, which can be done by four different
approaches [10]:
- Improve the high temperature strength of the substrate alloy,
- Improve the cooling of the blades and vanes,
- Use protective coatings to improve the corrosion resistance and the strength of
the blades,
- Use thermal barrier coatings (TBCs) to reduce the temperature of the substrate
metal surface.
Tem
pera
ture
Entropy
Evaporation
Superheat
Exp
ansi
on
Tem
pera
ture
Entropy
Co
mp
ress
ion
Exp
ansi
on
1
2 3
4
5
1
2 4
3
b)a)

Introduction ____________________________________________________________________________
6 ______________________________________________________________________
1.4 The project
To improve their efficiency, gas fired gas turbines will be subjected to more
frequent thermal cycles in more corrosive environments. This is why, it is critical to
perfect the TBCs protecting turbine parts and to understand failure behaviour.
Material issues focus on the assessment of the potential behaviour of coatings, as
it is important to avoid expensive and unpredictable failure. Research also focuses on
the production of improved coating meeting new life time requirements.
The Engineering and Physical Sciences Research Council (EPSRC) supports the
SUPERGEN Consortium on “Conventional Power Plant Lifetime Extension”. This
project including several industrial partners and four universities investigates increased
efficiency and extending components lifetime in power plants. Cranfield University
concentrates on the influence of oxidation and corrosion on components behaviour.
This PhD project will investigate the oxidative degradation mechanisms of air
plasma sprayed (APS) TBCs coated CMSX4 and the effect of the components’ shape on
its behaviour. Experimental data will be generated to improve existing models for the
prediction of turbine components’ lives. In a second part, new coating compositions will
be deposited by magnetron sputtering and oxidised in order to achieve a better
knowledge of MCrAlYs behaviour under oxidation.
After this introduction, the second chapter of this thesis is a literature review
covering current state of the art of TBC systems, oxidation mechanisms, understanding
and modelling of the degradation modes, and current development in new type of high
temperature protective coatings for industrial gas turbine environment.
The second chapter will describe in detail the aim and objectives of this thesis.

Introduction ____________________________________________________________________________
7 ______________________________________________________________________
The results and discussion concerning the effect of curvature of the substrate on
the behaviour and failure of APS/TBCs will be gathered in Part I. This section is
divided into Chapter V, VI and VII. Chapter V describes the effect of the macro-
geometry of the samples on the oxidation mechanisms within the APS/TBC and on the
failure of the coating system. Chapter VI focuses on the effect of the micro-geometry of
the interface between the ceramic and metallic bond coatings on failure mechanisms.
Finally, Chapter VII is a general discussion of the two previous chapters.
Part II, made of Chapters VII, IX and X covers the work done on the study of
new bond coating compositions for industrial gas turbine applications. Chapter VIII
focuses on the behaviour of Ni-Cr-Al coatings at 900 and 950 °C while Chapter IX
describes the behaviour of Co-Ni-Cr-Al ones at the same temperatures. The results are
then discusses in Chapter X.

Introduction ____________________________________________________________________________
8 ______________________________________________________________________

Literature review _____________________________________________________________________________
9 ______________________________________________________________________
CHAPTER II - LITERATURE REVIEW
2.1 Thermal barrier coating systems
Commercial advanced TBC systems are typically four-layer structures
(Figure 2.1) [12]. A ceramic top coat (TC) is used for thermal protection of components
exposed to hot gases (e.g. turbine guide vanes and blades). Coupled with an active
cooling system, they are known to lower the substrate temperature by about 100 to
150 °C [7,12-14]. Beneath the ceramic TC is deposited a metallic bond coat (BC). It
enhances the adhesion of the TC and provides oxidation and/or corrosion protection.
Under exposure to high temperature conditions, a protective alumina (Al2O3) layer
(thermally grown oxide, TGO) is formed. Its structure and morphology is defined by the
chemistry and microstructure of the BC. The BC must be sufficiently rich in Al to form
a protective TGO scale of α-Al 2O3. Underneath these three layers is the superalloy
substrate [12]. The first TBC systems were designed in the 1950s for aircraft engine
components. They were Al2O3 and ZrO2 ceramics applied directly to the component
surface by flame spraying. Important developments included new depositing
technologies such as plasma spraying and electron beam – physical vapour deposition
(EB-PVD), the introduction of a BC (usually MCrAlY overlay coatings) and a new
ceramic TC made of Y2O3-stabilized ZrO2 (YSZ) [12]. Up to the 1980s, TBCs were
only used in low risk regions of the turbine section such as vane platforms since they
still had poor surface finish, high heat transfer coefficient, low erosion resistance and
poor mechanical compliance [13,14]. Because of the potential for TBCs to improve
components life, they have been used in the early stages of power turbines for
components, such as blades and vanes, that experience the highest gas temperatures (i.e.

Literature review _____________________________________________________________________________
10 ______________________________________________________________________
the earliest stages of the combustion turbine). It has only been since the early 2000s that
such coating systems have been used on highly stressed components within commercial
gas turbines [15].
Section 2.1 introduces the four different layers of TBC systems, explaining their
role, properties and conditions of use.
Figure 2.1 Schematic representation of a TBC system [12].
2.1.1 The superalloy substrate
In a gas turbine, the high pressure turbine blade operates under the most arduous
conditions of temperature and stress compared to the other components. The stresses
imposed on the blades are complex, being a mix between centrifugal stresses due to the
high angular rotational speed; bending stresses caused by the high pressures involved;
and high vibrations. The metal has to experience through thickness temperature
gradients, rapid temperature transients and the hot gases surrounding the blade are
highly oxidising and corrosive. The blades experience a complex thermal and
mechanical history during a typical cycle operation, consisting of start-up, steady-state

Literature review _____________________________________________________________________________
11 ______________________________________________________________________
operation, shut-down and emergency shut-down [16]. When temperatures exceed
~540 °C, steels and Ti alloys are no longer strong enough for this application [17,18].
Nickel based superalloys are the only materials possessing the properties required for
turbines blades [9]. Their advantage comes from their austenitic face centred cubic
(FCC) (the γ phase) structure which has the capability of maintaining good tensile,
rupture and creep properties. Al, Ti and Nb are added to the alloy to help the formation
of the FCC γ’-phase (Ni3(Al,Ti)) which is the main strengthening phase. Its lattice is
derived from the γ phase by ordering Al/Ti atoms on the cube corners and Ni atoms at
the face centres [1,19]. Three main classes of those superalloys exist: Ni-base, NiFe-
base (Inconels - Fe is substituted in part of Ni for cost purposes) and Co-base (less
subject to hot corrosion) [20].
Grain shape and orientation affect greatly the mechanical and physical properties
of any metal/alloy. The way alloys are processed can control the growth of the grain and
therefore enhance the qualities of a chosen material. The evolution of the processing of
turbine blades went from polycrystalline to directionally solidified gains and finally to
single crystal directionally solidified. The later do not show grain boundaries (but still
show a dendritic structure) and are endowed with ultra high strength [17].
2.1.2 The ceramic top coat
The material used for the ceramic TC must possess properties criteria in order to
be a potential candidate for a TBC. It should be refractory, chemically inert, have a
good wear resistance, good mechanical strength, thermal shock and erosion resistance,
be phase stable, but most of all, it must possess a low thermal conductivity and have a
thermal expansion coefficient similar to the nickel based superalloy substrate [14]. ZrO2

Literature review _____________________________________________________________________________
12 ______________________________________________________________________
is the best oxide fulfilling all the requirement but it needs to be alloyed with other
oxides because of it polymorphisms [14].
The main function of the ceramic TC is to reduce the heat transfer to the metal
substrate. It has a low thermal conductivity (~1 W/m² K) which is an order of
magnitude below the one of Ni-based superalloys. YSZ has one of the lowest
conductivities at elevated temperatures of all known ceramics [13,21,22].
Air plasma spray (APS) and electron beam physical vapour deposition (EB-
PVD) are the two main techniques used to deposit TBCs. EB-PVD/TBCs are usually
found in aeroengine turbine vanes and blades, while APS/TBCs are mainly used to
protect larger components in stationary gas-turbine engines because their different
properties are appropriate to the different conditions and requirements encountered in
those fields [23]. Current industrial gas turbines for power generation application
operate with temperatures going up to an average of 1430 °C, while jet engines use
hotter firing temperatures that can reach 1550 °C. Coatings used for aeroengine
applications undergo shorter thermal cycles at higher temperatures (around 950 ºC with
peaks of up to 1100 °C) compared to those deposited on parts used in industrial gas
turbines (800 to 900 ºC). Industrial gas turbines, in contrast to aeroengines, should be
ramped slowly to their operating temperature and remain there for thousands of hours
[24].
The EB-PVD coatings, as shown in Figure 2.2(a), consist of columnar grains
with multiscale porosity. During their processing, the oxides are evaporated from ingots
and the vapours directed onto preheated substrates. The columnar structure brings strain
tolerance to the coating [12,13]. When tested for aeroengines conditions, it has been
found that the EB-PVD TC systems also improve the adhesion to the bond coat, have a

Literature review _____________________________________________________________________________
13 ______________________________________________________________________
better surface finish and erosion resistance [23]. The APS coatings as shown in Figure
2.2(b), consist of layers of splats. This can be explained by the different processing
route in which a powder is fed into a plasma, heated (until molten) and sprayed onto the
substrate. This produces a porous and microcraked coating. The cracks are necessary for
an improved strain tolerance and the pores allow a reduction in the thermal conductivity
of the coating as it increases the phonon and photon scattering. APS is a lower cost
process compared to EB-PVD [12-14].
Figure 2.2 SEM images of (a) an as-deposited EB-PVD/TBC system [25] and (b) an as-deposited APS/TBC system.
The majority of TCs are ZrO2 stabilized with 7-8 wt% of Y2O3. Above 1050°C
and under equilibrium conditions, this amount of Y2O3 enters the ZrO2 solid solution
and stabilizes its tetragonal crystal structure. Then when cooling, the t-phase can
transform to a blend of monoclinic and cubic YSZ. This transformation causes an
unwanted cracking of the ceramic. For kinetic reasons and because of the rapid
deposition rate of the TC, the YSZ exists in a metastable tetragonal-prime structure.
This phase does not change when cooled down [14,23].
100 µm
EB-PVD TC
BC
Substrate
a)
200 µm
APS TC
BC
Substrate
b)

Literature review _____________________________________________________________________________
14 ______________________________________________________________________
2.1.3 The bond coating
Evans et al. [21] affirm that the BC is the most crucial component of the TBC
system as it influences the durability of the coating. Indeed, its chemistry and
microstructure define the structure and morphology of the TGO created as it oxidises.
Moreover, as the TC has high oxygen permeability, it means that the metallic BC has to
be resistant to oxidation attack. As a consequence, the bond coat must be sufficiently
rich in Al to form a protective TGO scale of α-Al 2O3 [23].
BCs are of two categories. One is based on a diffusion coating, such as Pt
aluminides. As it is not the main interest of this thesis, it will only be presented briefly.
The components’ surface is enriched by diffusion. The BC is fabricated by first the
electroplating of a thin layer of Pt onto the superalloy and then, aluminizing by pack
cementation (a relatively low cost process) or chemical vapour deposition. The
microstructure of the coating as-processed consists typically of single-phase-β, with Pt
in solution and this evolves into γ’ phase at the β grain boundaries as Al diffuses when
oxidised [21,26,27].
The other category consists of overlay MCrAlX systems, where M is Ni, Co or a
combination of Ni and Co, and X is an active oxygen element such as Y, Si, Ta or Hf.
The composition of this kind of BC influences the oxidation resistance, the corrosion
resistance and the coating ductility. It is therefore important to select one that provides a
good balance between those properties. The active oxygen element improves the oxide
scale adhesion and decreases the oxidation rate [15,28]. It was observed that the
addition of Y resulted in flat TGOs, promoted the fine columnar growth of Al2O3 and
favoured the diffusion of oxygen anions over Al cations helping the formation of slow
growing α-Al 2O3 [29,30]. Methods to deposit MCrAlY coatings include EB-PVD, APS

Literature review _____________________________________________________________________________
15 ______________________________________________________________________
and more recently, high velocity oxy-fuel spraying (HVOF) and low pressure plasma
spraying (LPPS). All those processes bring advantages and disadvantages to the coating.
Commercial EB-PVD, despite its high capital cost, allow the uniform deposition of a
dense coating with good adhesion. APS has the advantage of being able to deposit a
wide range of materials and generates homogeneous coatings with a fine equiaxed
grained microstructure. Yet, the process requires complex robotic manipulation, reactive
elements often oxidise if the spraying is conducted in air and the coating contains a
porous structure. HVOF spraying has the inconvenience of a spraying process but on
another hand has the advantage of lowering the powder temperature and increasing the
kinetic energy of the particle impacting. The resulting coating is denser with less
degradation of the powder during spraying. The BC strength is higher and the porosity
reduced [15]. Also, HVOF plasma spraying deposits relatively smooth coating
compared to other spraying techniques (e.g. LPPS or Shrouded Air Plasma Sprayed)
[31].
The key property of a BC is to provide oxidation and corrosion resistance.
Classic overlay coatings, with 18-22 wt% Cr and 8-12 wt% Al, are designed to perform
better at temperatures above 900°C where oxidation is the dominant failure mode.
Whereas CoCrAlYs are more efficient against type II corrosion (650-800°C), NiCrAlYs
and NiCoCrAlYs perform better under highly oxidising conditions [15]. Figure 2.3
sums up the performances of the different types of coating systems [32].

Literature review _____________________________________________________________________________
16 ______________________________________________________________________
Figure 2.3 Relative oxidation and corrosion resistance of different high temperature coatings systems [32].
2.1.4 The thermally grown oxide
The TGO is a layer, consisting predominantly of Al2O3, which forms between
the ceramic TC and the BC. It has a major influence on the TBC lifetime [21]. The
presence of a α-Al 2O2 layer is preferred because its growth rate is low, thanks to the
highly stoichiometric structure of Al2O3 and its large bad gap which makes electronic
conduction difficult [33], and its adherence is better [34]. Al2O3 at high temperatures
transforms from an amorphous state through various transient polymorphs to the stable
form, α-Al 2O3 [35]. Its crystallography consists of hexagonally close-packed oxygen
ions with two thirds of the octahedral interstices filled with trivalent cations [33]. While
α-Al 2O3 is the most favourable oxide to protect the system from oxidation, other less
protective oxide forms can grow on the alloy, as it has been reported that mixed

Literature review _____________________________________________________________________________
17 ______________________________________________________________________
(Al,Cr)2O3 oxides, spinels (Ni(Cr,Al)2O4) and nickel oxides (NiO), were also produced
during oxidation, as shown in Figure 2.4 [36].
Figure 2.4 SEM image of spinels present in TGO.
Spinels are ionic compounds formed from strongly electropositive metal ions
and strongly electronegative non-metal ions. The mechanisms of spinel formation
depend on the nature of the spinel. Ni and Co aluminates (solid-state formation between
(Ni,Co)O and Al2O3) are formed by an inverse cation diffusion. It is believed that
chromites can be explained by vapour phase transport of Cr2O3 to the (Ni,Co)O [37,38].
2.2 Oxidation
Oxidation denotes the reaction between a metal and air or oxygen in the absence
of water or an aqueous phase. High temperature will drive most metals to oxidation and
may cause loss of material, failure of components in service, etc. Thus, for gas turbine
application, it is a necessity to understand and to control the high temperature oxidation
behaviour of a material.
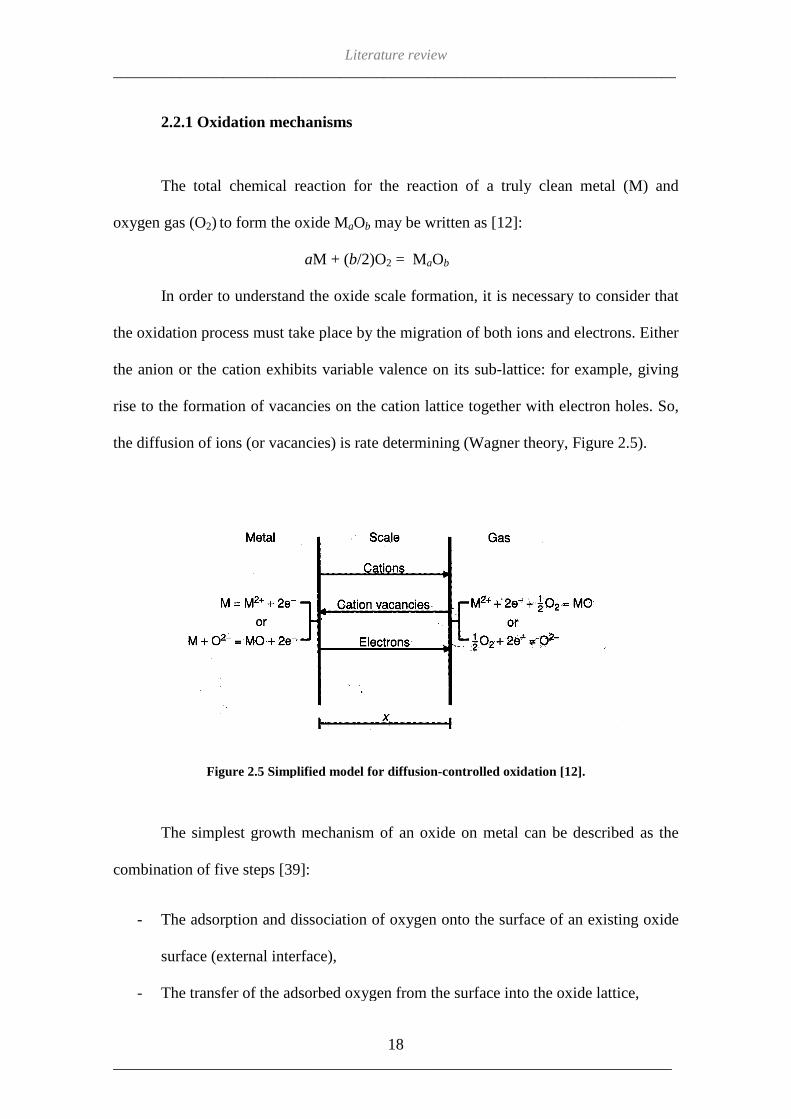
_____________________________________________________________________________
______________________________________________________________________
2.2.1 Oxidation mechanisms
The total chemical reaction for the reaction of a truly clean metal (M) and
oxygen gas (O2) to form the oxide M
In order to understand the oxide scale formation, it
the oxidation process must tak
the anion or the cation exhibits vari
rise to the formation of vacancies on the cation lattice together with electron holes. So,
the diffusion of ions (or vacancies)
Figure 2.5 Simplified model for diffusion
The simplest growth mechanism of an oxide on metal can be described as the
combination of five steps [39
- The adsorption and dissociation o
surface (external interface),
- The transfer of the adsorbed oxygen from the surface into the oxide lattice,
Literature review _____________________________________________________________________________
18 ______________________________________________________________________
Oxidation mechanisms
The total chemical reaction for the reaction of a truly clean metal (M) and
to form the oxide MaOb may be written as [12]:
aM + (b/2)O2 = MaOb
In order to understand the oxide scale formation, it is necessary to consider
the oxidation process must take place by the migration of both ions and electrons. E
the anion or the cation exhibits variable valence on its sub-lattice: for example,
rise to the formation of vacancies on the cation lattice together with electron holes. So,
(or vacancies) is rate determining (Wagner theory, Figure
Simplified model for diffusion-controlled oxidation [12].
The simplest growth mechanism of an oxide on metal can be described as the
39]:
ption and dissociation of oxygen onto the surface of an
surface (external interface),
The transfer of the adsorbed oxygen from the surface into the oxide lattice,
_____________________________________________________________________________
______________________________________________________________________
The total chemical reaction for the reaction of a truly clean metal (M) and
is necessary to consider that
both ions and electrons. Either
lattice: for example, giving
rise to the formation of vacancies on the cation lattice together with electron holes. So,
, Figure 2.5).
controlled oxidation [12].
The simplest growth mechanism of an oxide on metal can be described as the
f oxygen onto the surface of an existing oxide
The transfer of the adsorbed oxygen from the surface into the oxide lattice,

Literature review _____________________________________________________________________________
19 ______________________________________________________________________
- The transport of the adsorbed oxygen through the oxide lattice,
- Reaction of the oxygen with the metal surface. Transfer of metal atoms into the
oxide lattice which leads to the creation of vacancies in the metal lattice,
- Annihilation of cation vacancies through the climbing of interfacial dislocations
at the oxide-metal interface.
The oxidation of an alloy must take into account many more parameters than for
the oxidation of a metal alone. Different components in the alloy have different
affinities for the oxygen and there are also different diffusion rates through the metal
lattice(s) and the oxide(s). Moreover, the oxidation mechanisms can change during
exposure, according to the establishment of different metal activity gradients (as a result
of preferential consumption of one element) and gas pressure [40]. Reactants may travel
through short-circuit paths such as dislocations or grain boundaries for example [41,42].
Rapid, short circuit, gaseous entry from the atmosphere is favoured by porous layers.
When the layer is less porous, the oxide nearer the outer surface has a higher oxygen
potential than the one at the inner surface, and can dissociate to provide gaseous supply
to build oxide nearer the metal [43].
When an alloy is oxidised, the oxides produced may be completely miscible or
partially miscible enabling, respectively, oxide solid solutions or multiphase scales [43].
For the Ni-Co alloys, NiO and CoO give a single solid solution of composition
(Co,Ni)O. Certain Ni-Cr alloys form a double oxide layer which may give a complete
surface layer of variable composition. If the reaction is incomplete, particles are
incorporated into a matrix of NiO. If the Ni-Cr alloy is reasonably rich in Cr, an
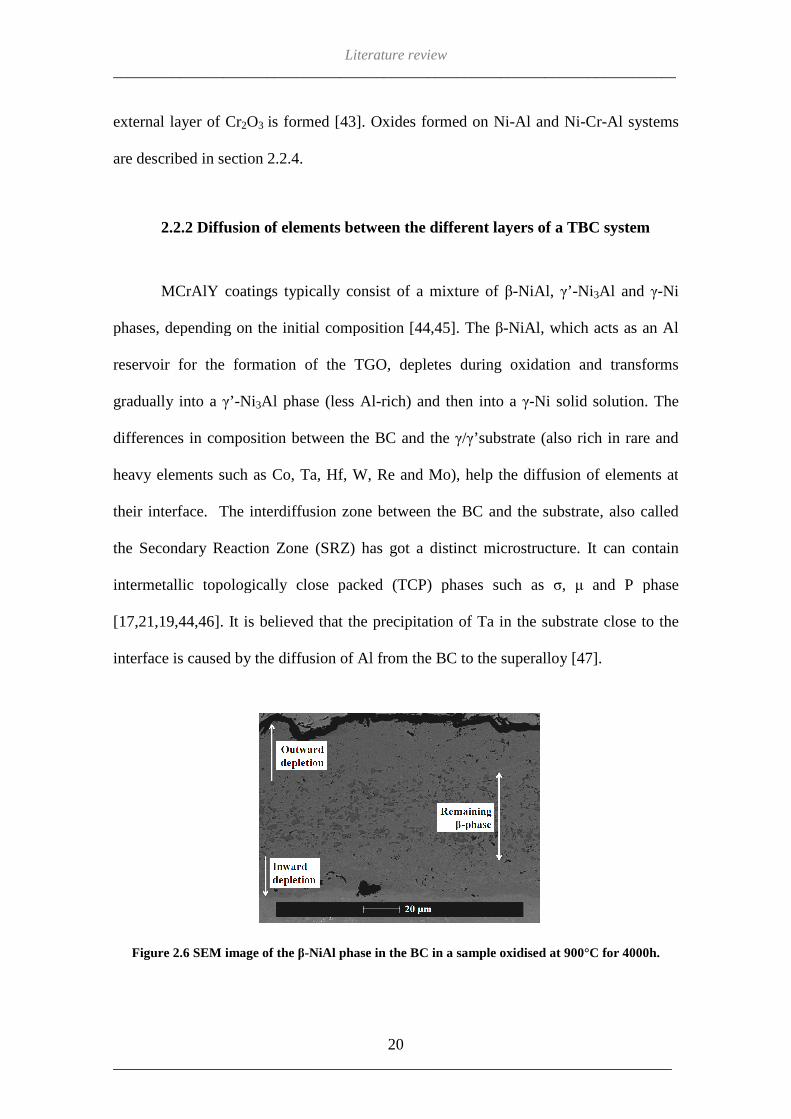
_____________________________________________________________________________
______________________________________________________________________
external layer of Cr2O3 is formed [43].
are described in section 2.2.4.
2.2.2 Diffusion of elements between the different layers of a TB
MCrAlY coatings typically consist of a mixture of
phases, depending on the initial composition [
reservoir for the formation of the TGO, depletes during oxidation and transform
gradually into a γ’-Ni 3Al phase (
differences in composition between the BC and the
heavy elements such as Co, Ta, Hf, W, Re and Mo), help the diffusion of elements at
their interface. The interdiffusion zone between the BC and the substrate, also called
the Secondary Reaction Zone (SRZ) has got a distinct microstructure. It can contain
intermetallic topologically close packed (TCP) phases such as
[17,21,19,44,46]. It is believed that the precipitation of Ta in the substrate close to the
interface is caused by the diffusion of Al from the BC to the superalloy
Figure 2.6 SEM image of the
Literature review _____________________________________________________________________________
20 ______________________________________________________________________
is formed [43]. Oxides formed on Ni-Al and Ni
are described in section 2.2.4.
2.2.2 Diffusion of elements between the different layers of a TB
MCrAlY coatings typically consist of a mixture of β-NiAl, γ’
phases, depending on the initial composition [44,45]. The β-NiAl, which acts as
reservoir for the formation of the TGO, depletes during oxidation and transform
Al phase (less Al-rich) and then into a γ-Ni solid solution.
composition between the BC and the γ/γ’substrate (also rich in rare and
heavy elements such as Co, Ta, Hf, W, Re and Mo), help the diffusion of elements at
their interface. The interdiffusion zone between the BC and the substrate, also called
Secondary Reaction Zone (SRZ) has got a distinct microstructure. It can contain
intermetallic topologically close packed (TCP) phases such as σ, µ
It is believed that the precipitation of Ta in the substrate close to the
interface is caused by the diffusion of Al from the BC to the superalloy [
SEM image of the β-NiAl phase in the BC in a sample oxidised at 900°C for 4000h.
_____________________________________________________________________________
______________________________________________________________________
Al and Ni-Cr-Al systems
2.2.2 Diffusion of elements between the different layers of a TBC system
γ’ -Ni3Al and γ-Ni
NiAl, which acts as an Al
reservoir for the formation of the TGO, depletes during oxidation and transforms
Ni solid solution. The
’substrate (also rich in rare and
heavy elements such as Co, Ta, Hf, W, Re and Mo), help the diffusion of elements at
their interface. The interdiffusion zone between the BC and the substrate, also called
Secondary Reaction Zone (SRZ) has got a distinct microstructure. It can contain
σ, µ and P phase
It is believed that the precipitation of Ta in the substrate close to the
[47].
a sample oxidised at 900°C for 4000h.

Literature review _____________________________________________________________________________
21 ______________________________________________________________________
As a result of the Al diffusion, two β-phase depletion zones develop, one close
to the substrate and the other next to the TGO (Figure 2.6), and after longer exposure
time, the β-phase disappears completely [48].
The composition of the depletion zone does not vary with the test temperature
and time; its Al content is around 4 wt% [49]. Rabiei and Evans [48] have oxidised Ni-
based superalloy samples coated with a CoNiCrAlY BC and APS/TBC at 1100°C and
observed their cross-sections after different exposure times. Using EMPA scans they
found that the depleted zones coincide with reduced concentration of Al, reinforcing the
idea that the β-phase is the Al reservoir and implying that diffusion of Al towards the
substrate as well as towards the TC controls the microstructural evolution.
2.2.3 Growth of a TGO
Prior to oxidation, the TGO is a very thin layer the thickness of which does not
exceed 0.5 µm. After exposure, its thickness can reach an average of 7 µm (depending
on the type of coating and substrate). Wu et al. [50] have measured, TGO thicknesses
reaching 12 µm just before spalling.
The growth of the TGO between the TC and BC can be divided into three
stages: a transient stage, when all thermodynamically stable oxides can form; a steady-
state stage, when the long-term most stable oxide phase (α-Al 2O3) is established; and
finally a breakaway stage, when protective oxides are no longer produced anymore
resulting in the failure of the scale. The transient stage lasts from only seconds to days
and is defined by rapid weight gain, whereas for the steady-state stage, the oxidation
kinetics decrease to a near parabolic rate [51].

Literature review _____________________________________________________________________________
22 ______________________________________________________________________
In the early stages of oxidation, the fast growing metastable oxides γ-Al 2O3, δ-
Al 2O3 and θ- Al2O3 grow. Brumm and Grabke [52] observed that cubic γ-Al 2O3 and δ-
Al 2O3 were the first forms of Al2O3. A few hours later (16 hours at 900 °C) those oxides
transformed to the monoclinic θ-Al 2O3. The first traces of hexagonal α-Al 2O3 mixed
with θ-Al 2O3 were found after 135 hours of oxidation at 900 °C and after 60 hours at
950 °C. At higher temperatures, γ-Al 2O3, δ-Al 2O3 and θ-Al 2O3 were more difficult to
detect [52].
The TGO growth becomes more important to the long-term TBC stability during
the steady-state oxidation stage, the duration of which depends on the alloy system, the
oxidizing atmosphere and the temperature [23]. For industrial turbines, α-Al 2O3 is the
most stable oxide only at the highest operating temperatures, while α+θ Al2O3 or θ-
Al 2O3 co-exist at lower temperatures. In 1999, Grabke [53] developed a temperature-
time transformation diagram for the high temperature oxidation of β-NiAl describing
which phases form at given time and temperatures. Figure 2.7 illustrates the Al2O3
transformation.
During the formation of transient Al2O3, the outward transport of Al is preferred.
These oxides exhibit special features during growth such as needle-, pyramid-, plate-
like grains and whiskers. The transformation of the unstable Al2O3 into α-Al 2O3 causes
stresses which result in a ridge structure, as seen on Figure 2.8 [54,55].
Where growth is diffusion controlled, rather than interface controlled, the
growth of the TGO is theorized to be in most cases parabolic until spalling occurs:
h² = 2kpt + C (1)
where h is the thickness, t time, kp the parabolic rate constant and C a constant
depending on the system and oxidation conditions. The Al2O3 component of the TGO is

_____________________________________________________________________________
______________________________________________________________________
known to grow mostly by inward diffusion of anions along the TGO grain boundaries.
However, an outward growth, sensitive to cations dissolved in the
to contribute to the overall rate constant
Figure 2.7 Schematic temperatureof β-NiAl [53].
Figure 2.8 SEM image of the NiAl surface morphology after 100 hours at 1000 °C [56].
Literature review _____________________________________________________________________________
23 ______________________________________________________________________
mostly by inward diffusion of anions along the TGO grain boundaries.
However, an outward growth, sensitive to cations dissolved in the Al2O3
the overall rate constant kp [21,57,58].
Schematic temperature-time transformation diagram for th e high temperature oxidation
SEM image of the NiAl surface morphology after 100 hours at 1000 °C [56].
2 µm
_____________________________________________________________________________
______________________________________________________________________
mostly by inward diffusion of anions along the TGO grain boundaries.
3, is also thought
e high temperature oxidation
SEM image of the NiAl surface morphology after 100 hours at 1000 °C [56].

Literature review _____________________________________________________________________________
24 ______________________________________________________________________
Niranatlumpong et al. [57], observed that for long exposure (up to 1000 hours at
1100 °C), the growth kinetics went from parabolic to sub-parabolic. This was associated
with the depletion of Al from the BC and the formation of less protective oxides
beneath the Al2O3 layer. The oxidation behaviour of the TGO varies as a function of the
exposure temperature and the composition of the BC [40,59]. Kvernes and Kofstad [40]
by oxidising a range of Ni-Cr-Al alloys at 800 °C – 1300 °C for 50 hours found that at
lower temperatures (up to 900 °C), the oxidation kinetics tended to be linear and then
became parabolic. Also the rate of reaction went through a maximum between 1000 and
1200 °C, reflecting a change in oxidation behaviour with temperature [40].
2.2.4 The effect of BC composition on the TGO growth
Variation in coating compositions provides different protective properties due to
the nature of the oxides growing on them. The composition of the MCrAlY, as well as
the exposure time and temperature, greatly influence the oxide layer(s) created. Ni-Cr-
Al and Co-Cr-Al ternary systems undergoing oxidation above 1000 °C have been
subjected to extensive studies since the original work of Talboom et al. [60] in 1970.
However, this is not the case for oxidation at lower temperatures. Information on the
oxidation performance of the Co-Ni-Cr-Al quaternary system is also difficult to find. Co
is added to the NiCrAl system for its high corrosion resistance properties and high
strength at high temperatures. It has a good high temperature resistance to softening as
well as good wear resistance compared to Ni alone [61]. It reduces the solubility of
aluminium in the Ni-Cr matrix, thus increasing the γ’ solvus temperature, which allows
the maintenance of strength at higher temperatures [19].

Literature review _____________________________________________________________________________
25 ______________________________________________________________________
When looking at the Ni-Al binary system at temperatures above 800 °C, only
Al 2O3 forms on β-NiAl. On γ’-Ni 3Al, an external layer of Ni-rich oxide, either NiO
and/or NiAl2O4, grows above the Al2O3 layer. The addition of Cr to the Ni-Al system
promotes Al2O3 formation by the “third element effect”, i.e. Cr has the effect of
increasing the Al activity so that protective Al2O3 scales are formed at lower Al
concentrations. A possible mechanism to explain this phenomenon is that Cr2O3 initially
develops, and reduces the entry of oxygen into the alloy, thus helping preferential
oxidation of Al2O3, which requires less oxygen to form. It promotes the growth of a
complete external layer of Al2O3 beneath the Cr2O3 layer rather than its precipitation as
an internal oxide [43,52,62,63]. Brumm and Grabke [52] also proposed that a higher
fraction of Cr accelerates the transition from transient θ-Al 2O3 to stable α-Al 2O3. This
was confirmed by Klumpes et al. [56] as they found that Cr particles in θ-Al 2O3 oxides
acted as nuclei for this transformation. However, the amount of Cr did not influence the
nodular morphology of the scale, indicating the outward growth of the θ-phase, and the
ridged structure, associated with the α-phase [56]. As the “third element effect” reduces
the Al concentration needed in the alloy to form an Al2O3 scale, it therefore helps avoid
brittleness, a common issue in high Al concentration alloys [64]. In the early stages of
oxidation (transient oxidation), NiCrAl alloys grow an outer layer of NiO and an inner
layer consisting of mixed oxides (Ni(Al,Cr)2O4), Cr2O3 and θ-Al 2O3, regardless of the
temperature of exposure. However, the same alloy exposed for longer oxidation times
and at higher temperatures forms a continuous α-Al 2O3 layer, while at temperatures
between 900 °C and 1000 °C, layers of NiO, Cr2O3 and Al2O3 are still present [40,59].

Literature review _____________________________________________________________________________
26 ______________________________________________________________________
Figure 2.9 Compositional effects on the oxidation (over 1000 °C) of Ni-Cr-Al ternary alloys [40], cited in reference [12] and [63]. I) NiO + internal oxidation of Al and Cr ; II) Cr 2O3 + internal oxidation of Al ; III) an Al 2O3 external scale.
Over 1000 °C, the Ni-Cr-Al compositions that lead to the formation of α-Al 2O3
scales have been well researched and documented, as summarized in Figure 2.9, an
oxide predominance diagram. Three primary oxidation regions are observed,
corresponding to: (I) a NiO external scale + Al2O3/Cr2O3 internal oxides; (II) a Cr2O3
external scale + Al2O3 internal oxides; and, (III) an Al2O3 external scale [12,65,66].
For temperatures below 1000 °C, only one Ni-Cr-Al ternary oxide predominance
diagram exists. This is at 950 °C from the works of Nicholls et al. [63] who studied the
behavior of a range of Ni-Cr-Al compositions (deposited by magnetron sputtering)
using combinatorial techniques to create an isothermal oxidation map as a function of
alloy composition (Figure 2.10). By comparing Figures 2.9 and 2.10, it can be seen that
lower temperatures would appear to promote the formation of mixed oxides. The
optimum oxidation resistance observed in this study was obtained for coatings

Literature review _____________________________________________________________________________
27 ______________________________________________________________________
containing between 20 and 30 at% Al and above 13 at% Cr (values were converted from
wt% to at% for the purpose of this thesis) [63]; i.e. at Al levels greater than the
minimum observed to form an Al2O3 scale, which was found to be 15 at%.
Figure 2.10 Oxide morphology map for ternary NiCrAl alloys at 950 °C [63].
2.3 Failure of a TBC system
The lifetime of a TBC system can be affected by a lot of factors depending on
operating conditions. However, it is well understood that the BC oxidation stands as a
crucial parameter for the coating’s life. The time to failure depends on the oxidation
temperature and on the thermal loading conditions. Trunova et al. [67] observed that
pure thermal cycling caused spallation of the ceramic TC with cracks within the TBC
itself, while isothermal exposure led to cracks propagating mainly in the TGO. The
coating system failure was generally associated with the Al-depletion in the BC causing
the formation of spinel/mixed oxides. However, failing of the coating prior to critical

Literature review _____________________________________________________________________________
28 ______________________________________________________________________
depletion in most of the cases shows this phenomenon on its own does not explain the
process [68].
Indeed, failures of APS/TBC systems under oxidation are complex processes
involving several general phenomena [69]:
- thermal expansion mismatch stress,
- growth of a TGO at an undulating BC/TC interface,
- depletion of Al in the BC leading to the formation of spinels (more brittle oxides
than Al2O3),
- sintering of the porous ceramic TC leading to a deterioration of strain tolerance
and thermal resistivity,
- degradation of the metal/ceramic interface toughness,
- cracking, crack coalescence and delamination.
2.3.1 Depletion of the Al reservoir in a BC
Shillington and Clarke [70] suggested, amongst other researchers, that the Al
depletion from the BC could lead to failure of the coating system. They associated
depletion with a compositional change in the TGO from α-Al 2O3 to a mixture of Cr2O3
and spinels. Their observation of failed sample surfaces, exposing BCs, revealed high
concentrations of Cr compared to low amounts of Al, Co, Ni, Ti and Nb. A more
accurate EDX analysis showed that the surface was mainly composed of Cr2O3 and a
(Co,Ni)(Cr,Al) spinel phase. Less Al2O3 and ZrO2 were present. It had been noticed that
failure of the TC occurred during cooling, when the TGO had converted from a
continuous Al2O3 layer to a scale of Cr2O3 and spinels. The delamination, driven by
increasing stresses from the rough shape of the coating, suggested that the fracture

Literature review _____________________________________________________________________________
29 ______________________________________________________________________
resistance of the interface of spinels/mixed oxide with the TC was lower than the one of
an Al2O3/TC interface.
The formation of a spinel/mixed oxide layer is linked to the Al-depletion
occurring during the oxidation of the coating. Indeed, as the Al activity in the BC
decreases, those Cr phases can form more easily [70]. For the Ni-rich phases to form,
the oxygen must be higher than the one favouring the growth of the Al2O3 layer [71].
Their location between the Al2O3 and the TC are caused by the cracking of the Al2O3
layer during cooling. The Al2O3 layer cracks because of its high curvature and
expansion mismatch [70]. On re-heating, those cracks provide a direct transport path
through the layer for oxygen to react with the BC. A high oxygen partial pressure is
maintained at the interface. If the BC is locally depleted in Al, other oxides can form.
This leads to further cracking of the Al2O3 scale, enhancing the formation of Cr2O3 and
spinels. This phenomenon is found more for coatings undergoing cyclic oxidation, as
they are more subject to cooling and reheating cycles [70]. Renusch et al. [72]
developed a model confirming the effect of the Al depletion on the system’s lifetime;
predicting that TC systems with larger Al reservoirs had longer lifetimes. They assumed
that lifetime was limited by the BC properties, such as: temperature dependent oxidation
kinetics, the BC thickness, the Al content and the inter-diffusion of Al into the substrate.
Their model took into account the substrate acting as a part of the Al reservoir,
assuming that the Al could come from the γ’-Ni 3Al phase. Evans et al. [73,74],
suggested that the BC, especially the sprayed ones, contained regions diffusionally
isolated from the bulk of the coating as a result of the formation of Al2O3 layers at splat
boundaries. Such regions would experience different Al depletion and the overall
reservoir consumption would be enhanced.

Literature review _____________________________________________________________________________
30 ______________________________________________________________________
The failure caused by severe depletion of Al from the BC can divided in two
categories: (a) intrinsic chemical failure (InCF) where the formation of Al2O3 is
replaced by Cr mixed oxides or Ni-based spinels; (b) mechanically induced chemical
failure (MICF) where the Al2O3 layer cracks and then cannot heal [73,74]. Eschler et al.
[75] assumed that those two types of failure, when leading to spallation, have different
mechanisms with different temperature dependences. InCF is based on BC properties
while MICF depends mostly on the TC properties. Evans et al. [73], while studying
diffusion cells in MCrAlY BCs, produced the hypothesis that MICF happened before
InCF if the Al2O3 layer cracked. If the integrity of the Al2O3 layer was maintained,
MICF could not be initiated and the system lifetime would depend on InCF. Evans et al.
[73] also wrote that chemical failure would trigger at different times along the sample
because of different diffusion cells (deposition splats) sizes in the BC. However,
subsequent study of LPPS coatings showed that the presence of diffusion cells
depended on the type of spraying deposition used [76]. No splat boundaries were found
within the BC after oxidation but only “bead-like” lines of internal oxidation having no
influence on the diffusion of Al to the TGO [76].
The growth of the less protective spinels/mixed oxides instead Al2O3 is
frequently reported [36,48,51,59,68,70,77-81] and is detrimental for the integrity of the
coating for several reasons. First, their porosity is much higher than the Al2O3 layer
[48,79,81] providing an easy path for the oxygen to reach the BC and enhance the
oxidation kinetics [69,81]. Also, a higher growth rate of these spinel/mixed oxides could
be due to the high amount of Cr promoting diffusion [49,77]. Secondly the high volume
increases that accompany the growth of the spinel/mixed oxides result in the build-up of
stress between the TC and the BC [36,59,80], and this finally leads to the initiation of

Literature review _____________________________________________________________________________
31 ______________________________________________________________________
cracks, followed by crack propagation and the delamination of the TC [36,50,78,79].
However, it has also been reported that spinels/mixed oxides had no effect on the
adhesion of the ceramic TC [51] and the crack pattern [48], showing that the influence
of these oxides on the lifetime of the TBC systems still needs to be understood.
2.3.2 Roughness and uneven growth of the TGO
The TC/BC interface roughness can be caused before oxidation purposefully by
the deposition process (to improve adherence) and during oxidation (by the deformation
of the layer due to stress formation and relaxation).
Previous research has shown that the TC/BC interface roughness influences the
depletion of Al. Taylor et al. [74] believed that depletion happened at a higher rate in
BC asperities promoting the formation of less protective oxides (Figure 2.11). Their fast
growth led to larger out-of-plane stresses between the asperities and added to the
stresses generated by the growth of the TGO. The uneven surface profile of the BC
caused an upward displacement of the TC and as a consequence, the TC experiences a
range of strains to maintain continuity.
Taylor et al. [74] proposed a model to explain the rapid depletion of Al and the
formation of less-protective oxides around BC peaks. They assumed that “the Al
concentration was determined by the balance between the flux of Al entering the oxide
layer and that arriving at the asperity from the bulk of the coating” and that the high
surface to volume ratio in BC peaks accelerated Al depletion resulting in a gradient of
Al concentration. Their model predicted the bulk of the BC asperity would only contain
1 at% of Al [74].

Literature review _____________________________________________________________________________
32 ______________________________________________________________________
Figure 2.11 Schematic diagram describing the model proposed by [74]. (a) Sufficient Al present in asperity to grow Al2O3, (b) rapid depletion and restricted replenishment reducing Al levels in asperity, (c) remaining BC oxidise rapidly and form non protective oxide. Rehealing occurs at the base of asperity where Al levels are high enough.
Figure 2.12 Schematic of alumina scale formation and Y-Al precipitation [82].
On the effect of roughness, Naumenko et al. [68] found that it was causing the
inhomogeneous growth of the TGO. Convex surface areas were showing a thin Al2O3
scale accompanied by the formation of spinels/mixed oxides. On the other hand,
γ-phaseβ-phaseAl2O3Yttrium-Aluminate

Literature review _____________________________________________________________________________
33 ______________________________________________________________________
concave surface areas were growing thicker Al2O3 containing Y-rich pegs and few if
any spinels/mixed oxides. They explained these uneven TGO thicknesses by the high
fraction of Y-Al oxides in concave areas enhancing the scale growth rate (Figure 2.12)
[68,82].
Uneven growth of the TGO was also observed and modelled by Che et al. [83]
who stated that the TGO was thicker at “peaks” (convex areas) than at “valleys”
(concave areas) of the undulations. They did not, however, differentiate the Al2O3 from
spinels/mixed oxides in their measurements which means that they are not contradicting
Naumenko et al. [68]. Another reason for local accumulation of the TGO can be the
cracking and rehealing of the oxide layer during oxidation (Figure 2.13) [84], happening
generally during thermal cyclic oxidation at temperatures above 1000 °C. After
cracking of the first TGO layer, oxygen penetrates through the cracks in the delaminated
TGO layer and reacts with the fresh BC, and this easy ingress of oxygen accelerates the
BC oxidation, thus reforming a TGO [68,69,84].
Figure 2.13 SEM image of repeated TGO-cracking/re-growth during cyclic oxidation at 1050 °C in an APS/TBC system with NiCoCrAlY/BC [68].
20 µm
APS/TBC
repeated cracking

Literature review _____________________________________________________________________________
34 ______________________________________________________________________
2.3.3 Evolution of stresses in a TBC system
The amount of stress generated during oxidation in a metal system is so
considerable that it is common to observe that metal surfaces do not stay flat but instead
wrinkle (or buckle) because of the presence of large compressive stresses in the oxide
scale [85]. The understanding of the generation of stresses and their evolution in the
complex four layered TBC system is challenging but necessary to forecast and delay
TBC failure.
There are two main sources of stress during the oxidation of the TBC system.
The most important of them are the thermal expansion misfit upon cooling (Table 3.1)
and the strains caused by the TGO growth [21,86]. The stress caused by the thermal
expansion misfit depends on the rate at which the system cools down. The slower the
sample is cooled, the more time there is for creep relaxation to happen [87].
Material Thermal expansion coefficient (C-1 ppm)
TGO 8-9
BC 13-16
TC 11-13
Table 3.1 Thermal expansion coefficients of the different layers of a TBC system [21].
2.3.3.1 Stresses in the TGO and BC
The strains involved during the TGO growth represent the overall volume
increase when the alloy is converted into Al2O3 and other oxides. Formation of new
TGO at the BC interface produces normal thickening strains with a corresponding rigid
body displacement, meaning that lateral strains are induced on the grain boundaries

Literature review _____________________________________________________________________________
35 ______________________________________________________________________
normal to the interface [86]. Those strains induce compression, which when large
enough suppress internal TGO formation. Eventually, the growth stresses reduce
because of the creep strength of the TGO [86]. Relaxation can also happen in the BC
through metal deformation and the proportion of those two simultaneous stress-
relaxation processes in the BC and in the TGO are determined by the stress values in
both layers, which will change depending on the oxide-metal thickness ratio [86]. The
displacement of the TGO, called “buckling” (Figure 2.14), increases the roughness of
the TC/BC layer and induces tensile stresses normal to the interface, especially on crests
(convex areas) and valleys (concave areas) of the wrinkling, which in the end can cause
delamination [85].
The oxidation temperature also affects greatly the amount of stress developing in
the oxide scale. Above 950 °C, creep in the metal limits the stresses in the oxide while
at lower temperatures, elastic thermal-stress behaviour is maintained [84].
Figure 2.14 Sketch illustrating the attempt of the compressed TGO to lengthen in order to reduce stress [21].
2.3.3.2 Stresses in the ceramic
Ceramic spallation is known to be caused by the cyclic thermal stresses resulting
from the differential thermal expansion between the ceramic and metal [21,60,88-94].
The evolution of residual stresses in the ceramic TC greatly affects the lifetime of the

Literature review _____________________________________________________________________________
36 ______________________________________________________________________
APS/TBC system. Residual tensile stresses tend to induce coating failure normal to the
TC/BC interface (vertical cracking through thickness), while compressive residual
stresses can provide a driving force for buckling when the in-plane stresses exceed a
critical value [95]. Thermal expansion misfit induces compression stresses reaching 3 to
4 GPa. Non-planarity of the rough plasma-spayed coating causes those stresses to
redistribute. Shear stresses exist at inclined sections [34]. This local TC/BC interface
geometry (roughness) has been found to greatly influence the nature and evolution of
stresses in the ceramic as well as in the TGO. Protrusions of ZrO2 into the BC are
preferred sites for damage initiation (Figure 2.15), as the sintering effects at high
temperature in such a small volume fixed by the geometry of the BC will produce
localized tensile stresses. In the same time, the thermal shrinking of the substrate during
cooling determines the strains in the axial direction. Hoop stresses are created by the
displacement of the layer system in the radial direction [90].
Figure 2.15 SEM image of damage introduced by thermal cycling at TC/BC interface [91].
The coefficient of thermal expansion of the BC is larger than that of the TC.
Therefore, the BC induces tensile stresses in “peak regions” (convex areas) of the layer
10 µm
ZrO 2 TC
BC
Al 2O3 TGO

Literature review _____________________________________________________________________________
37 ______________________________________________________________________
and compressive ones in “valleys” (concave areas) (Figure 2.16). However, the TGO
has the opposite effect and causes tensile stresses in the “valleys” and compressive ones
in the “peaks” because of its smaller coefficient of thermal expansion. It determines the
stresses occurring in the system during the cooling phase of a thermal load [89,90,96].
These tensile out-of-plane stresses on the “peaks” of the rough surface, lead to crack
initiation at the TGO/BC interface. The resistance of the interface to delamination
depends on the toughness of the interface, the TGO-thickness and the radius of the
curvature [68]. Heating stresses tend to counteract compressive residual cooling stresses
near the TC/BC interface. Cooling stresses are usually more compressive near the
interface and get more tensile towards the surface (in the case of isothermal oxidation)
[92,93].
Figure 2.16 Model microstructures and the calculated residual stress (sy) for the TBC system [91].
Also at temperatures over a 1000 °C, the properties of the initially tetragonal
ceramic, gradually evolve because of sintering and changes in microstructure into the
monoclinic phase (more precisely during cooling). This mechanism is controlled by the
Model microstruture σy
Mpa50
0
-50
Literature review _____________________________________________________________________________
38 ______________________________________________________________________
grain size and the chemical composition (amount of Y2O3) of the tetragonal phase. In
APS systems, more monoclinic phase develops at the bottom of the ceramic TC. The
monoclinic phase is not the preferred form for the YSZ as it is responsible for a
toughening of the ceramic [94].
Oxidation also causes the microcracks and pores of the APS ceramic to close.
The reduction of porosity increases the value of the Young modulus resulting in a
ceramic less tolerant to strain and more subject to cracking [97].
2.3.4 Initiation and propagation of cracks
The zones of the coating that experience normal tensile stresses are the most
important from a life predicting viewpoint, because those stresses are responsible for
nucleating and propagating cracks. For example, radial cracks form in the TC as the
TGO thickens but, the creep ductility of the TGO prevents the TC cracks from
penetrating the TGO, even with appreciable hoop tension, as it redistributes
concentrated stresses at the front of the radial crack in the TC. This phenomenon is
helped by the compressive stresses at the TGO/BC interface. Cracks forming during
thermal exposure should be thus confined to the TC [48]. However, during cooling, the
“peaks” lead to the generation of tensile stresses in the TGO, which in turn lead to crack
initiation at the TGO/BC interface. Cracks propagate along the interface following the
rough profile, and when they propagate towards a “valley”, the out-of-plane tensile
stresses decrease and in-plane shear stresses increase. At some point, a critical shear
stress is reached and fracture of the Al2O3 scale happens, after which the crack, initially
confined to the TGO/BC interface, penetrates the oxide layer [68]. Figure 2.17
represents schematically the crack growth process. The oxidation temperature

Literature review _____________________________________________________________________________
39 ______________________________________________________________________
influences the rate of crack propagation. It also depends on the microstructure of the
TGO and the TC. Porosity in the TC is known to reduce its elastic modulus and thus
decrease the driving force for crack propagation [94]. Echsler et al. [98] reported that
for APS/TBC systems undergoing isothermal oxidation, a temperature of 1050°C or
higher was needed to produce failure within an exposure time of 5000 hours. Tests were
carried out at 950, 1000, 1050 and 1100 °C. The damage observed in samples’ cross-
sections prior to final failure was represented by micro-cracks in the vicinity of the
TGO. Those cracks were oriented parallel to the BC/TGO/TC interface and seemed to
start in the TGO or at the TGO/BC interface (Type C). When the samples underwent
longer exposure, longest cracks were spotted within the TGO (Type B) and these
penetrated into the ceramic TC (Type D). Figure 2.18 shows the different types of
cracks identified by Echsler et al. [98]. Trunova et al. [67] also noticed that some cracks
initiated at the TC/TGO interface after only 100 hours of isothermal exposure. After
longer time cracks were found within the TGO as well as at the TGO/BC interface.
Further exposure of the samples led to crack coalescence and formation of macroscopic
cracks in the TGO. It was found that when reaching 50% of the total coating life,
cracks penetrated into the ceramic TC, leading to delamination crack propagation
through the TGO and the TC [67]. TC spallation is not a sudden fracture but rather the
result of continuous damage evolution.

Literature review _____________________________________________________________________________
40 ______________________________________________________________________
Figure 2.17 Cracking sequence suggested by the stresses due to growth and thermal misfit [21].

Literature review _____________________________________________________________________________
41 ______________________________________________________________________
Figure 2.18 Schematic illustration defining various types of cracks in the TGO and its vicinity in an APS/TBC [98].
2.3.5 Effect of blade curvature on the failure of the TBC systems
Over the past few years, the effect of blade geometry on the lifetime of TBC
coating systems has aroused curiosity. It is well known that during service in a gas
turbine, the blade features are exposed at different temperatures causing temperature
gradients around different geometries (as well as through the walls). The hottest regions
exposed are the leading edge of the blade and the trailing edge (Figure 2.19) (from a
maximum of 1100 °C to 600 °C in the centre of the aerofoil, in the case of a use in
aeroengines), causing the oxidation extent to be more or less aggressive at different
location of the blade [1,18,99].
Several researchers have observed the spallation of TBC system from service
blades reaching the end of their lifetime. Sjöström and Brodin [100] explained that three
sorts of spallation happen around a blade: (i) spallation on convex surfaces; (ii)
spallation on flat surfaces; and (iii) spallation at sharp edges (Figure 2.19). Sohn et al.
[101] observed that failures were localized near the tip of blades on both the pressure
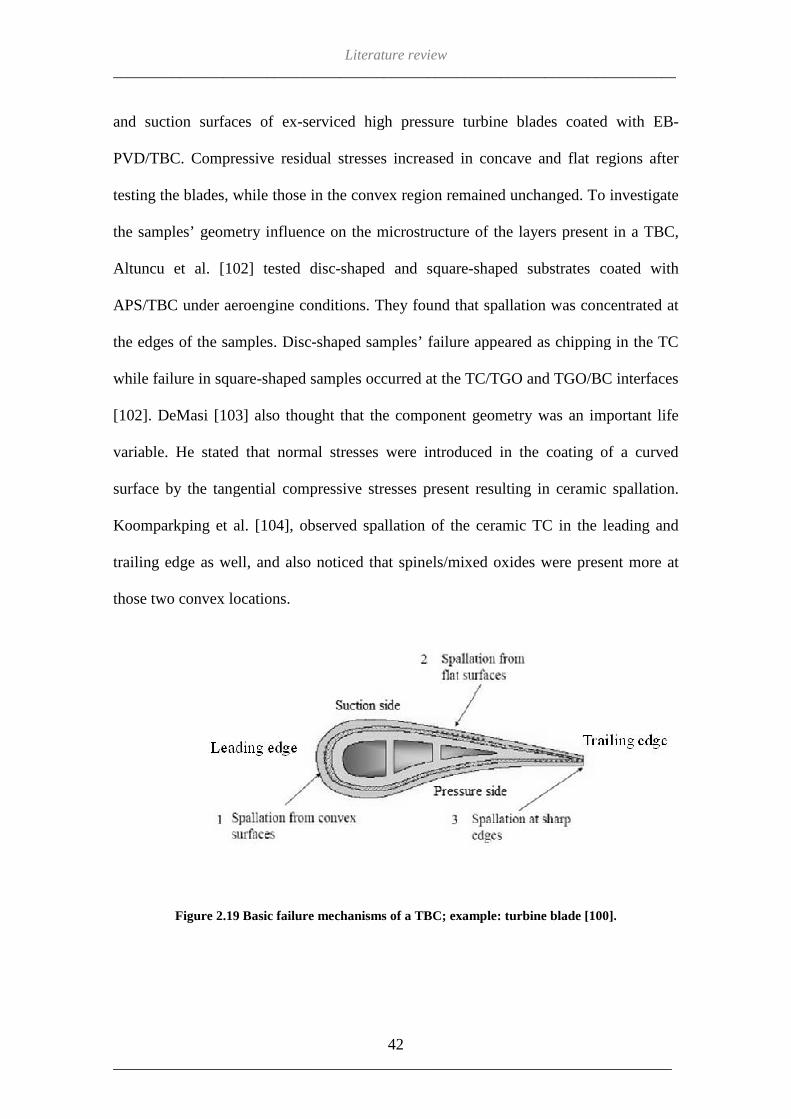
_____________________________________________________________________________
______________________________________________________________________
and suction surfaces of ex
PVD/TBC. Compressive residual stress
testing the blades, while those in
the samples’ geometry influence on the microstructure of the layers present in a TBC,
Altuncu et al. [102] tested disc
APS/TBC under aeroengine conditions. They found that spallation was concentrated at
the edges of the samples. Disc
while failure in square-shaped samples occ
[102]. DeMasi [103] also thought that
variable. He stated that normal stresses were
surface by the tangential compressive
Koomparkping et al. [104],
trailing edge as well, and also
those two convex locations.
Figure 2.19 Basic failure mechanisms of a TBC; example: turbine blade [100].
Literature review _____________________________________________________________________________
42 ______________________________________________________________________
ex-serviced high pressure turbine blades coated with EB
PVD/TBC. Compressive residual stresses increased in concave and flat regions after
those in the convex region remained unchanged. T
the samples’ geometry influence on the microstructure of the layers present in a TBC,
] tested disc-shaped and square-shaped substrates coated with
APS/TBC under aeroengine conditions. They found that spallation was concentrated at
s. Disc-shaped samples’ failure appeared as chipping in the TC
shaped samples occurred at the TC/TGO and TGO/BC
] also thought that the component geometry was an
variable. He stated that normal stresses were introduced in the coating of a curved
surface by the tangential compressive stresses present resulting in ceramic spallation
[104], observed spallation of the ceramic TC in the leading and
and also noticed that spinels/mixed oxides were present more
those two convex locations.
Basic failure mechanisms of a TBC; example: turbine blade [100].
_____________________________________________________________________________
______________________________________________________________________
serviced high pressure turbine blades coated with EB-
increased in concave and flat regions after
the convex region remained unchanged. To investigate
the samples’ geometry influence on the microstructure of the layers present in a TBC,
shaped substrates coated with
APS/TBC under aeroengine conditions. They found that spallation was concentrated at
s’ failure appeared as chipping in the TC
urred at the TC/TGO and TGO/BC interfaces
geometry was an important life
in the coating of a curved
ceramic spallation.
observed spallation of the ceramic TC in the leading and
noticed that spinels/mixed oxides were present more at
Basic failure mechanisms of a TBC; example: turbine blade [100].

Literature review _____________________________________________________________________________
43 ______________________________________________________________________
Observations of different aspects of the effect of geometry on coating lifetime
can be easily found in the literature. However, a holistic mechanism has not been
identified to include the stress and microstructural behaviour of the different layers of
the coatings at different curvatures, to explain the way the TBC systems fail around
blades.
2.4 Prediction of TBC systems lifetime through modelling
The ability to predict the lifetime of TBC is a high priority for industrial gas
turbine manufacturers and users, and a lot of research has been carried out with the aim
of modelling the behaviour of coatings and creating predictive models for their failure.
Those models generally require data to be acquired from material systems exposed to
“similar” conditions to real components in operating plant, and then cover different
aspects of the failure processes such as: environmental degradation, mechanical factors,
synergistic effects and component end-of life criteria [6,105]. However models are
usually “simplified” to deal with only one aspect of the coating failure mechanism. For
the effect of oxidation different models concentrate on the stress distribution in the
different layers and how this affects the initiation and propagation of cracks [105-107].
Other models predict the depletion of elements using diffusion calculations
[72,108,109] and some relate the end of a component’s lifetime to a critical oxide scale
thickness [1,110-115]. It is believed that different TBC systems (APS≠EB-PVD and
MCrAlY ≠ Pt-Aluminides) behave differently; making prediction models very specific
of the system that was studied in the first place. This section presents examples of
modelling methods used in research (different TBC systems).

Literature review _____________________________________________________________________________
44 ______________________________________________________________________
2.4.1 Models based on stress distribution
This research does not focus on the stress distributions in the TBC system so
such modelling is only described briefly. Using the finite element and starting with an
undamaged TBC system, calculations allow the stress states and deformation inside the
individual layers to be predicted. The superposition of several kinds of strains leads to
prediction of the mechanical failure of the TBC and the TGO (Figure 2.20). These
failures result from the external loading during the operation of the component, from
temperature changes (as a result of the different thermal expansion coefficients of the
different materials) and from the formation of the TGO. When the total strain exceeds a
critical value, strain relief mechanisms occur in the ceramic layer [106,107].
Figure 2.20 Schematic illustration of the main steps that lead to the field stress due to oxide formation [106].

Literature review _____________________________________________________________________________
45 ______________________________________________________________________
Busso et al. [105] thought of a methodology to predict the lifetime of EB-
PVD/TBC based on stress measurements, which uses three steps:
- Step 1: Quantifying TBC damage and integrating this information into a model.
This links the damage measurements at each time to a critical roughness for a
given thermal cycle.
- Step 2: Interpolating the finite element results to obtain a relationship between
time and the accumulation of local stress responsible for crack initiation.
- Step 3: Predict lifetime by using a curve generated by finite element analysis.
Such TBC system finite element models are unfortunately often simplified
(Figure 2.21) and do not take into account the uneven roughness and growth of the TGO
or the imperfections found into the oxide layer which may make estimations, if not
inaccurate, then at least have a high error margin. The system is often assumed to be in
a stress-free state before oxidation even though residual stresses exist in an APS coating
[96].
Figure 2.21 Finite Element model of the out-of-plane stress in a component cooled down from 1000°C to room temperature for 61, 167 and 241 hours (from left to right) [105].
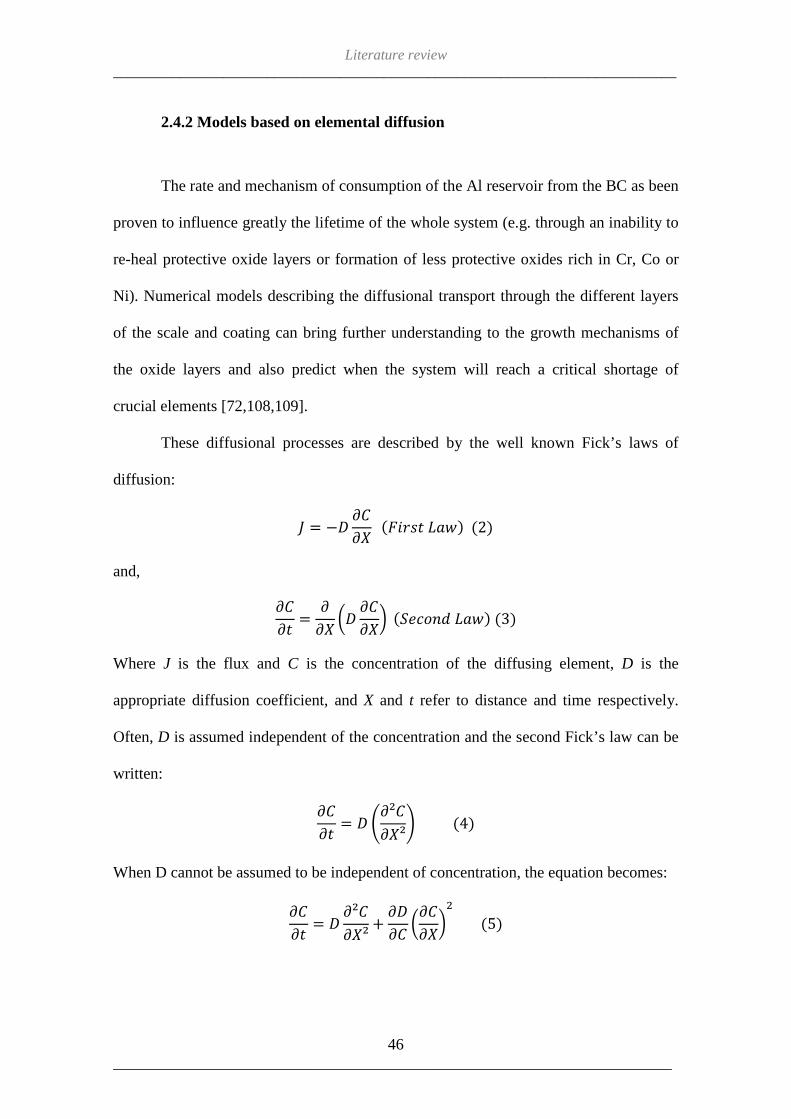
Literature review _____________________________________________________________________________
46 ______________________________________________________________________
2.4.2 Models based on elemental diffusion
The rate and mechanism of consumption of the Al reservoir from the BC as been
proven to influence greatly the lifetime of the whole system (e.g. through an inability to
re-heal protective oxide layers or formation of less protective oxides rich in Cr, Co or
Ni). Numerical models describing the diffusional transport through the different layers
of the scale and coating can bring further understanding to the growth mechanisms of
the oxide layers and also predict when the system will reach a critical shortage of
crucial elements [72,108,109].
These diffusional processes are described by the well known Fick’s laws of
diffusion:
= −� ���� (����� ���) (2)
and,
���� = �
�� �� ����� (��� !" ���) (3)
Where J is the flux and C is the concentration of the diffusing element, D is the
appropriate diffusion coefficient, and X and t refer to distance and time respectively.
Often, D is assumed independent of the concentration and the second Fick’s law can be
written:
���� = � $�²�
��²& (4)
When D cannot be assumed to be independent of concentration, the equation becomes:
���� = � �²�
��² + ���� ���
���) (5)

Literature review _____________________________________________________________________________
47 ______________________________________________________________________
Solutions to Fick’s laws can describe many situations involving high-temperature
processes such as solute oxidation in binary or ternary alloys, internal oxidation and
moving boundaries. However, simplifying assumptions for the diffusion coefficients,
the isothermal conditions, the geometry and the boundary condition are required for
such models to be solved [108]. Recently Renusch et al. [72] proposed a model to
predict the failure of the TBC system due to the depletion of the aluminium. They used
the Fick’s laws to describe the diffusion of Al to both the BC and the substrate (Figure
2.22(a)) and then related it to the growth and stress generation of the TGO layer, thus
allowing the prediction of the end-of-life of the coating (Figure 2.22(b)). In a general
manner, such models have demonstrated that TBC life should be longest for coatings
with the highest amount of Al in the BC [114].
Figure 2.22 (a) Plots of Al diffusion into the substrate and consumed by TGO growth, and (b) spallation lifetime due to BC depletion of Al with internal oxidation of different APS/TBC systems at 850-1250 °C (CMSX4 coated with 150 µm Abler Ni 192-8; IN738 coated with 150 µm Abler Ni 192-8 and IN738 coated with 150 µm SC2231) [72].
Al c
onte
nt (
wt)
Distance from TGO (µm)
a)
Life
time
(hou
rs)
Temperature (°C)
b)

Literature review _____________________________________________________________________________
48 ______________________________________________________________________
2.4.3 Models based on the TGO growth
Initial crack growth is believed to be related to the thickness of the TGO on the
BC. After exceeding a critical thickness, crack propagation is governed by stresses
induced by thermal mismatch and TGO growth [58]. Lifetimes can be predicted using
equations taking into account the oxide growth rate, the initial Al content, oxide
adherence and the component geometry [110]. This semi-empirical method requires the
data from long term oxidation of commercial and/or model TBC systems.
Such models can be based on the mass gain of samples caused by the growth of
the TGO and use the equations describing the growth kinetics of the oxide layer:
∆m2 = kpt (6)
where ∆m is the mass gain per unit area at time t and kp the parabolic rate constant [111-
113]. The parabolic rate constant kp is temperature dependant and follows the Arrhenius
law:
+,(�) = � . �./ �−01. �� (7)
where the parameters C and Q are determined and used for the interpolation of kp and R
is the gas constant [58]. Newer models consider the two stages of oxidation, the
transient stage which has a higher rate and coincides with the formation of θ-Al 2O3 (and
other transient oxides) followed by the steady-state stage characterised by the slow
growth of α-Al 2O3 using two equations [1]:
�3�45 �) = 6+,4. �7 + � (�8 � < �:) (8)
�3�<5 �) = �3�4:5 �) + +,<(� − �:) (�8 � > �:) (9)

Literature review _____________________________________________________________________________
49 ______________________________________________________________________
where ∆w is the mass change in mg, A the material surface area in cm2, +,4, the rate
constant for the θ-Al 2O3 in mg2/cm4h, +,< the rate constant for the α-Al 2O3 in mg2/cm4h,
wc the critical weight in mg/cm2, t the time, tc the critical time and C an integration
constant. This model was used by Nalin [1] and reproduced accurately the mass gain of
coated systems oxidized at 850°C and 900°C, but was less accurate at higher
temperatures. Also a gradual transition between the two oxidation rates is not taken into
account.
Another attempt to describe the mechanism of α-Al 2O3 failure and to predict
lifetime was made by considering both the diffusion of Al from a FeCrAlY material to
α-Al 2O3 and the thickening of this oxide layer (e.g. through the mass gain of samples)
[112,115]. The model is formulated based on certain understanding such as:
- A FeCrAlY, with a density of ρm and a surface to volume ratio of V/A, initially
gains mass due to the uptake of oxygen in forming a surface scale of density
ρox(formation of α-Al 2O3),
- The scale growth leads to the loss of Al from the alloy,
- After a critical time tc, the Al content of the alloy may decrease below some
critical level Cc such that α-Al 2O3 can no longer form (i.e. the beginning of
breakaway oxidation).
In this model, the onset of chemical failure is predicted by modelling the rate of
Al depletion in the alloy. An accelerated rate of depletion caused by the spallation of the
oxide scale (and growth of new oxide on freshly exposed depleted alloy) is also
accounted for. The equation is composed of two terms, one describing the oxide
spallation and the other the oxide growth and goes as follow:

Literature review _____________________________________________________________________________
50 ______________________________________________________________________
? +,�:3. + (1 − ?)6+,�:7A )B = 0.89 D�DE�(�E − �:)(1 − �:)
F5 (10)
where β is the statistical function that defines the likely fraction of surface area to spall
and ∆x the mean oxide thickness that spalls. If no spallation occurs, β=0 and if it
dominates, β approaches 1 and equation (10) suggests a linear relationship between the
time to breakaway and the geometry of the sample (V/A). It is important to note that in
this study, kp is in µm2/s in equation (10) meaning that it is calculated from the oxide
thickness [112,115]. It could be similarly calculated from mass change data. The second
term describing the oxide growth is based on the following equation and equation (6):
5G �����H �� = D�F5 . (�I − �:)
(1 − �:) (11)
Figure 2.23 Model of breakaway oxidation, based on equation (10) [115].
Kpt
c(µ
m2 )
1x10⁴
1x10³
1x10²
1x101
0.01 0.10 1.00 10.00
β=1.0
β=0.1 MICF
InCF
β=0.0
Volume/surface area (mm)
Literature review _____________________________________________________________________________
51 ______________________________________________________________________
A simplified validation of the model is provided in Figure 2.23. Data for a range
of FeCrAl alloys are plotted at 1300 °C. The empty symbols represent samples that did
not go into breakaway oxidation while filled symbols represent the ones that did. MICF
and InCF refer to the different mechanisms of the coating system failure caused by Al
depletion [73]. Prior to the onset of spalling, the TGO growth follows a generalised rate
law. However, in areas that have spalled, the oxide repairs following either parabolic or
sub-parabolic kinetics. To allow this model to be correct, several assumptions on the Al
diffusion, the initial condition and the oxidation were made (given in reference [115]).

Aim and objectives _____________________________________________________________________________
52 ______________________________________________________________________

Aim and objectives _____________________________________________________________________________
53 ______________________________________________________________________
CHAPTER III – AIM AND OBJECTIVES
3.1 1st part: Experimental evaluation of the integrity of APS/TBCs
The first task of this thesis was to obtain quantitative data on the failure modes
that can lead APS/TBCs to spallation after exposure at temperatures similar to those
found in gas turbines (900-1000 °C). The thesis focuses on the effect of the
components’ shape, i.e. macro and micro geometry, as it has appeared recently that the
bulk sample shape affects the TBC’s integrity (Section 2.3.5).
The modelling of the modified aerofoil-shaped samples’ behaviour will be
established from the data obtained from their oxidation and observation of the
progression of TBC spallation. Moreover, assessing the behaviour of several features
such as the TGO, spinels, the β-phase in the BC, TC microstructure and crack
propagation, will enable the understanding of the role of aerofoils’ curvature. With
exposure to high temperatures, the change of the different layers’ microstructure, of the
TGO thickness and the evolution of stress states influence the integrity of the whole
system in ways that were more or less explained in literature. Indeed, the separate
mechanisms happening in the BC, TC and TGO are in general well understood.
However, the way they interact, coupled with the effect of geometry still needs to be
investigated. In addition improving an existing TGO growth model with this input will
enable the prediction of their lifetime in industrial gas turbines.

Aim and objectives _____________________________________________________________________________
54 ______________________________________________________________________
3.2 2nd part: Improving the efficiency of MCrAlY bond coats undergoing
oxidation
As a second task of the thesis, different MCrAlY BC compositions were
obtained by magnetron sputtering and were analyzed. The extensive research that has
been undertaken over many years to find the best BC composition has been targeted at
aero-engines and so assumed bond coat temperatures over 1000 °C. Few studies have
been carried out at temperatures encountered in industrial gas turbines (e.g. bond coat
temperatures of 900 – 1000 °C).
This is why, a profile indicating the best composition resisting 900-950°C
oxidation will be drawn. This will include mass change data and the mapping of the
oxides created at those temperatures. An improved BC, tailored to be used in industrial
gas turbines will results from this project, added to a better understanding of the effect
of composition and temperature on the nature of oxides grown on the coatings. Also, the
manufacturability of such coatings using 2 or 3 target magnetron co-sputtering will be
assessed as well as the limitations of this technique.

Influence of curvature on failure, diffusion and oxide growth mechanisms _____________________________________________________________________________
55 ______________________________________________________________________
CHAPTER IV - EXPERIMENTAL PROCEDURE AND EQUIPMENT
4.1 Oxidation of the modified aerofoil-shaped samples
4.1.1 The modified aerofoil-shaped samples
Modified aerofoil-shaped samples were designed and manufactured (by Siemens
Industrial Turbomachinery Ltd) to recreate curvatures found on industrial gas turbine
blades (Figure 4.1). A CoNiCrAlY BC was deposited on the CMSX4 Ni-superalloy
substrates (Table 4.1) by HVOF spraying of AMDRY 995 powder (Table 4.1). On top
of the BC an YSZ TC was deposited by APSing. TC and BC were deposited by Praxair
Surface Technologies Ltd. The manufacturing process caused the TC and BC
thicknesses to vary with curvature. The BC thickness measured between 50 and
135 µm, while the TC measured between 130 and 250 µm (Table 4.2). In the as-sprayed
conditions, the ceramic coatings were grey. This can be explained by the formation of
Zr2O3 in the reduced gas atmosphere during APSing. It depends on the Ar/H2 ratio
during deposition [116-118]. The TC regained its white colour during exposure (oxygen
stoichiometry restored). The locations’ curvatures (Table 4.2) chosen around the
modified aerofoil-shaped samples for observation are the inverse of the radii calculated
from the samples’ design sheet (Appendix I).
Alloy Ni Cr Co Al W Ti Mo Ta Re Hf Y CMSX-4 base 6.5 9.6 5.6 6.4 1 0.6 6.5 3 0.1
AMDRY 995 32 21 base 8 0.5
Table 4.1 Composition (in wt%) of modified aerofoil-shaped sample’s substrate and BC.

Influence of curvature on failure, diffusion and oxide growth mechanisms____________________________________________________________________
______________________________________________________________________
Figure 4.1 Picture of a modified aerofoilUpper case letters correspond to convex areas, lower case to concave. This figure can also be found at the end of thesis (Appendix I).
Location TC thickness (µm)A B C D E F a b c
Table 4.2 TC, BC thicknesses and curvatures at different positions around the modified aerofoilshaped sample (Approximation afteUpper case design convex curvatures and lower case concave ones.
4.1.2 Experimental procedure
Laboratory oxidation experiments consisted of exposing the samples in furnace
assemblies for various temperatures and times of exposure, under oxidative conditions
similar to those found within operating gas turbines.
carried out on 37 samples in resistance
cycle, lasting 150, 250 or 500 hours depending on temperature
were slowly removed from the hot furnace over a 2
Selected samples were removed for destructive examination after periods of 100, 300,
Influence of curvature on failure, diffusion and oxide growth mechanisms____________________________________________________________________
56 ______________________________________________________________________
Picture of a modified aerofoil-shaped sample (a) and its schematic representation (b). Upper case letters correspond to convex areas, lower case to concave. This figure can also be found at the end of thesis (Appendix I).
.
TC thickness (µm) BC thickness(µm) 190 90 190 50 220 110 210 100 170 80 130 50 220 130 230 130 250 135
TC, BC thicknesses and curvatures at different positions around the modified aerofoilshaped sample (Approximation after measurements carried out on 23 samplesUpper case design convex curvatures and lower case concave ones.
al procedure
Laboratory oxidation experiments consisted of exposing the samples in furnace
assemblies for various temperatures and times of exposure, under oxidative conditions
similar to those found within operating gas turbines. Long cycle exposure tests were
in resistance heated furnaces from 900 to 1000 °C. After each
cycle, lasting 150, 250 or 500 hours depending on temperature (Table 4.3), the
were slowly removed from the hot furnace over a 20 minute period and cooled in air.
Selected samples were removed for destructive examination after periods of 100, 300,
Influence of curvature on failure, diffusion and oxide growth mechanisms _____________________________________________________________________________
______________________________________________________________________
shaped sample (a) and its schematic representation (b). Upper case letters correspond to convex areas, lower case to concave. This figure can also be found
Curvature (mm -1) 0.85 0.14 0.01 0.18
Theoretical 0 2.86 -0.06 -0.05 -0.20
TC, BC thicknesses and curvatures at different positions around the modified aerofoil-samples (Appendix C).
Laboratory oxidation experiments consisted of exposing the samples in furnace
assemblies for various temperatures and times of exposure, under oxidative conditions
Long cycle exposure tests were
heated furnaces from 900 to 1000 °C. After each
(Table 4.3), the samples
0 minute period and cooled in air.
Selected samples were removed for destructive examination after periods of 100, 300,

Influence of curvature on failure, diffusion and oxide growth mechanisms _____________________________________________________________________________
57 ______________________________________________________________________
1050, 1500, ~ 3000, 4000, 7000, 10,000, 15,000 and 20,000 hours (Table 4.3). Table 4.4
summarises the oxidation conditions for every sample. The oxidation tests employed
horizontal tube furnaces in which the samples were located within a zone where the
temperature is within ±5ºC of the target test temperature.
Oxidation temperature (°C) Cycle length (hours) Total exposure time (hours) 900 250 then 500 ≤ 20,000 925 250 ≤ 10,000 950 250 ≤ 5000 (failure) 975 150 ≤ 4000 (failure) 1000 150 ≤ 1500 (failure)
Table 4.3 Exposure of APS/TBC system on modified aerofoil-shaped samples.
81-BSYA-
Oxidation Temp. ( °C)
Total exposure time
(hours) 81-
BSYA- Oxidation
Temp. ( °C) Total exposure time (hours)
1 900 4000 20 1000 1050 2 900 10,000 21 1000 1050 3 900 2780 22 1000 1050 4 900 2780 23 1000 1500 5 900 20,000 24 1000 1050 6 900 4000 25 925 10,000 7 900 7000 26 925 100 8 900 15,000 27 925 4000 9 950 4000 28 925 >10,000 10 950 5000 29 925 2740 11 950 5000 30 925 2740 12 950 2780 31 925 7000 13 950 4000 32 925 >10,000 14 950 2780 33 975 4000 15 950 5000 34 975 3000 16 950 5000 35 975 300 17 1000 1500 36 975 3000 18 1000 1050 37 975 2700 19 1000 1500
Table 4.4 Modified aerofoil-shaped samples’ identifications, oxidation temperatures and total exposure times.

Influence of curvature on failure, diffusion and oxide growth mechanisms _____________________________________________________________________________
58 ______________________________________________________________________
Metrology was applied to the samples before and after exposure. This consisted
of an accurate measurement of samples dimensions to quantify material degradation in
terms of mass gain. The most useful data for accurate and reliable material life time
predictions were identified as oxide thickness gain, interdiffusion zone thicknesses, β-
depletion depths and TC/BC microstructures; this information could only be collected
through a destructive method of analysis.
Both scanning electron microscopy (SEM) and energy dispersive X-ray
spectroscopy (EDX) were used to observe sample cross-sections in order to characterize
their microstructure (as described in Section 4.3). Selected samples were etched for 5
seconds with a solution of hydrochloric acid and copper sulphate diluted in distilled
water to reveal and then observe the grain boundaries in the BC.
4.1.3 Additional curved samples
Additional APS/TBC samples were provided by Rolls-Royce (RR) in order to
gather more information on the initial stages of oxidation. The BC deposited on top of
the CMSX-4 substrate is a diffused Al coating coupled with a LPPS MCrAlY. The BC
was heat treated for 1h at 1100°C before deposition of TBC which is an APS YSZ. As
shown in Figure 4.2, each sample comprises 2 flat areas and a concave bend enabling
the study of the geometry effects if needed.
In order to investigate the initial stages of oxidation, those samples were
oxidised isothermally for a short time, specified in Table 4.5. Similarly to the modified
aerofoil shaped samples, the RR samples were weighed before oxidation and between
cycles. SEM and EDX were used to observe cross-sections’ microstructure.

Influence of curvature on failure, diffusion and oxide growth mechanisms _____________________________________________________________________________
59 ______________________________________________________________________
Figure 4.2 Pictures of as received Rolls-Royce samples, (a) RR1 and (b) RR5.
RR- Oxidation Temperature ( °C) Total exposure time (hours) 1 925 0 2 925 0 3 925 0 4 925 50 5 925 200 6 925 150 7 925 100 8 925 100 9 925 150 10 925 50 11 925 200
Table 4.5 RR samples identification, oxidation temperatures and total exposure times.
4.1.4 Flash Pulsed Thermography
4.1.4.1 Flash pulsed thermography system
The flash thermography system used was based at the National Physical
Laboratory (NPL). It consisted of a 316 x 255 pixel Pheonix FLIR system MWIR
camera, 12 bit data, 50 Hz frame rate infrared camera with a Thermalwave commercial
image processing software package called Mosaic. The total pulse duration was
measured to be 31 ms, with a radiant power of 2815 Wm-2. The wavelength distribution

Influence of curvature on failure, diffusion and oxide growth mechanisms _____________________________________________________________________________
60 ______________________________________________________________________
of the emitted light ranges between 350 nm to 1800 nm with some 80 % in the region
400 to 800 nm [119].
4.1.4.2 Principle of flash pulsed thermography
Flash thermography looks at a sample’s thermal response to heating (or cooling)
to determine the presence of subsurface defects and/or the material properties of the
target. Thermography (Figure 4.3(a)) is based on measuring the temperature loss on a
sample surface after heat is applied with a pulsed light. The heat is gradually conducted
through the sample and an infrared camera records changes in the surface temperature.
Irradiating the cold TBC sample with infra-red radiation causes its surface to warm up
quickly, because its thermal capacity is small and its thermal conductivity low (Figure
4.3(b)). The coating conducts some of this heat to the substrate below [120,121].
Figure 4.3 Representation of pulsed flash thermography [122].
As the sample cools down, any loss of bonding in the coating creates additional
interfaces that interfere with the heat flow through the system, so that the local surface
temperature is affected by internal flaws such as disbinding, voids or inclusions
a) b) c)

Influence of curvature on failure, diffusion and oxide growth mechanisms _____________________________________________________________________________
61 ______________________________________________________________________
(Figure 4.3(c)). In the absence of any defects, the surface cools down uniformly. If the
propagating heat encounters a defect with different thermal properties, it will flow either
faster (if it has higher thermal diffusivity) or more slowly (lower diffusivity). The
camera, which can only see the surface temperature, makes such defects appear with a
different contrast on the pictures taken of the cooling sample surface. [120,121].
4.2 Deposition of new BC compositions
4.2.1 Principle of magnetron sputtering
The mechanism of sputtering consists of ejecting of atoms from a target
(cathode) which then land on a substrate. To be more accurate, the charged ions travel
through an Ar plasma where they acquire energy from the voltage drop. Then, they hit
the target’s surface with a momentum that is immediately transferred to the cathode
material. Neutral atoms are therefore ejected from this surface, fly back through the
plasma and are deposited on the substrate.
The most important concern in sputter deposition is to enhance the ion
bombardment rate on the cathode so that a good deposition rate can be achieved. That is
why means to increase the secondary electron production are designed to improve the
sputtering rate. The invention of magnetron sputtering (Figure 4.4), where the use of an
electromagnetic field improves the trapping of electrons, greatly assisted the deposition
rate and made sputtering the leading technique for physical vapour deposition (PVD)
[123].
In magnetron sputtering, the electrons are confined close to the cathode (which
they normally tend to move away from), making it much easier to sustain an electrical
discharge at low pressure. Consequently, the required residual gas pressure can be

Influence of curvature on failure, diffusion and oxide growth mechanisms _____________________________________________________________________________
62 ______________________________________________________________________
reduced to enable the transfer of sputtering material without so many collisions. A
better deposition rate is reported, as well as a good quality coating [124].
Instead of applying a direct current (DC) field to create the plasma, a radio
frequency (RF) field can be used to achieve sputtering. In the latter case, only electrons
can respond to the alternating current whereas the ions act as if the field was DC. The
advantage of rf sputtering is that no charge accumulates at the target since the electrons
are oscillating with the field. The RF technique is mostly used for deposition on
insulating or semi-conducting materials [123]. Another way to raise the deposition rate
is to provide an additional amount of power to the Ar plasma. Most of this power is
absorbed by the target which needs to be water-cooled.
Figure 4.4 A schematic representation of a DC-magnetron sputtering system [120].
In the case of magnetron co-sputtering, several targets (up to 3 in this thesis),
connected to different power supplies, are used at the same time in order to create
coatings that are composed of a blend of the targets’ compositions. For example, in
Figure 4.5, substrates located beneath target 1 are expected to be rich in elements

Influence of curvature on failure, diffusion and oxide growth mechanisms _____________________________________________________________________________
63 ______________________________________________________________________
present in that target. Reciprocally, samples placed close to target 2 will be rich in
elements from this target. Such process allows depositing a range of compositions
depending on the location of the substrate with respect to the targets. The fact that
magnetron sputtering achieves deposition atom by atom, and due to the high amount of
energy involved in the process, coatings created via co-sputtering are homogeneous.
Each target however behaves differently and needs to be calibrated separately. The
interaction between plasmas, while running the equipment, also affects deposition rates
and must therefore be taken into account during calibration. 3 target co-sputtering is
shown in Figure 4.6.
Figure 4.5 Schematic representation of a deposition chamber in a 2 targets co-sputtering system (side view).
Target 2Target 1

Influence of curvature on failure, diffusion and oxide growth mechanisms _____________________________________________________________________________
64 ______________________________________________________________________
Figure 4.6 Schematic representation of the 3 targets co-sputtering process (top view).
4.2.2 Sapphire substrates
A PVD technique, magnetron sputtering, was used to deposit the coatings. A
range of Ni-Cr-Al-Co coatings have been deposited onto 10 mm diameter and 3 mm
thick sapphire substrates. Sapphire substrates were chosen instead of metallic alloy to
reduce diffusion between the MCrAlY and substrate. They were manufactured by Pi-
Kem Ltd.
Target 1
Target 2
Al Target

Influence of curvature on failure, diffusion and oxide growth mechanisms _____________________________________________________________________________
65 ______________________________________________________________________
4.2.3 Magnetron sputtering equipment
Research work was undertaken in CVCI (Figure 4.7(a)) and Leybold L560®
(Figure 4.7(b)) coaters equipped with two and three 3-inch (75mm) magnetrons
respectively.
Figure 4.7 Picture of deposition chambers of (a) CVC I (2 target co-sputtering) and (b) Leybold (3 target co-sputtering).
The first stage of experimentation using only 2 target co-sputtering was achieved
sputtering of 76.2 mm diameter and 6.35 mm thick targets: (1) either a Ni-10wt%Cr,
Ni-20wt%Cr, Ni-50wt%Cr, Ni-20wt%Co-40wt%Cr or Ni-20wt%Co-40wt%Cr target
(changed between successive deposition runs) and (2) pure Al target. Targets were
supplied by Testbourne and Pi-Kem (Table 4.6).
Ni, Ni-10wt%Cr, Ni-20wt%Cr, and Ni-50wt%Cr targets (coupled with a pure Al
target) were chosen for these combinatorial studies because they allow investigation of
the different potential oxidation behaviours in the Ni-Cr-Al system. Figure 4.8 presents
a ternary diagram, superimposed on Figure 2.9, where the dotted lines represent the
alloy ranges obtained with the different target combinations (Ni + Al, Ni-10%Cr + Al,
Ni-20%Cr + Al).

Influence of curvature on failure, diffusion and oxide growth mechanisms____________________________________________________________________
______________________________________________________________________
Deposition Set 1 Set 2 NiSet 3 NiSet 4 NiSet 5 Ni-20wt%Set 6 Ni-40wt%Set 7 Ni
Table 4.6 Targets used to deposit NiAl, NiCrAl and NiCoCrAl coatings using co
Figure 4.8 Composition lines of deposit superimposed on Ni
The addition of Co, with the use of the Ni
20wt%Cr targets, was intended to extend
deposit coatings with compositions closer to commercial MCrAlYs.
Influence of curvature on failure, diffusion and oxide growth mechanisms____________________________________________________________________
66 ______________________________________________________________________
Target 1 Target 2 Ni Al
Ni-10wt%Cr Al Ni-20wt%Cr Al Ni-50wt%Cr Al wt%Co-40wt%Cr Al wt%Co-20wt%Cr Al Ni-10wt%Cr Ni-50wt%Cr
Targets used to deposit NiAl, NiCrAl and NiCoCrAl coatings using co
Composition lines of deposit superimposed on Ni-Cr-Al ternary oxidation diagram [12, 40, 63].
The addition of Co, with the use of the Ni-20wt%Co-40wt%Cr or Ni
targets, was intended to extend these studies to quaternary systems in order
deposit coatings with compositions closer to commercial MCrAlYs.
Influence of curvature on failure, diffusion and oxide growth mechanisms _____________________________________________________________________________
______________________________________________________________________
Target 3
Al
Targets used to deposit NiAl, NiCrAl and NiCoCrAl coatings using co-sputtering.
Al ternary oxidation diagram [12,
40wt%Cr or Ni-40wt%Co-
these studies to quaternary systems in order to

Influence of curvature on failure, diffusion and oxide growth mechanisms _____________________________________________________________________________
67 ______________________________________________________________________
4.2.5 Sample holders
In this combinatorial study, 150 samples with varying compositions were
produced by magnetron sputtering. They were produced in batches of 20 to 40, with the
substrates arranged between two sputtering targets of different compositions, to produce
a range of BC compositions. Specially designed sample holders, shown in Figures 4.9
and 4.10, allowed precise substrate location. This figure also shows the sample labeling
scheme used in this study.
4.2.6 Calibration
Several deposition runs were carried out on glass slides instead of sapphire discs
in order to find the best parameters to give a large range of coating compositions, as
well as the best deposition rates. It was not possible to deposit very thick films of the
Ni-Al alloys using magnetron sputtering because the paramagnetic nature of Ni reduced
the Ni deposition rate. To achieve deposition, the chamber was pumped to a vacuum of
23 mTorr under the inert Ar gas. A DC plasma was used with plasma densities of 0.8 x
104 - 1.7 x 10⁴ W/m2 (details in Table 4.7). Once, the best deposition parameters were
found, sapphire discs were used. Energy dispersive X-ray (EDX) analysis was used to
characterize the exact composition of each sample prior to oxidation. Compositions are
plotted for each set of experiment in Figures 4.11 to 4.15. The compositions of the
samples used for exposure can be found in Tables from Chapters VIII and IX.

Influence of curvature on failure, diffusion and oxide growth mechanisms _____________________________________________________________________________
68 ______________________________________________________________________
Figure 4.9 Location of samples on the sample holder used for 2 target co-sputtering.
Figure 4.10 Location of samples on the sample holder used for 3 target co-sputtering.
Set Target 1
Power density (W/m2) Target 2
Power density (W/m2)
Target 3
Power density (W/m2)
1 Ni 1.7 x 10⁴ Al 0.5 x 10⁴
2 Ni-10wt%Cr 1.4 x 10⁴ Al 1.1 x 10⁴
3 Ni-20wt%Cr 1.4 x 10⁴ Al 1.1 x 10⁴
4 Ni-50wt%Cr 0.9 x 10⁴ Al 1.1 x 10⁴
5 Ni-20wt%Co-
40wt%Cr 1.4 x 10⁴ Al 0.8 x 10⁴
6 Ni-40wt%Co-
20wt%Cr 1.1 x 10⁴ Al 1.1 x 10⁴
7 Ni-10wt%Cr 5.5 x 10³ Ni-50wt%Cr 10 x 104 Al 1.4 x 10⁴
Table 4.7 Process conditions used to deposit Ni-Al, Ni-Cr-Al and Ni-Co-Cr-Al coatings using 2 and 3 targets co-sputtering (chamber pressure 23 mTorr and 10mTorr respectively).
80m
m
160m
m
200mm
100mm
Ø 10.5mm
Ø 9 mm
Ø 11 mm
5mm
2.8m
m
A a h I i J
1 2 3.. .
11

Influence of curvature on failure, diffusion and oxide growth mechanisms _____________________________________________________________________________
69 ______________________________________________________________________
Figure 4.11 Compositions along the sample holder for 2 target co-sputtering (Ni-10wt%Cr+Al).
Figure 4.12 Compositions along the sample holder for 2 target co-sputtering (Ni-20wt%Cr+Al).
Figure 4.13 Compositions along the sample holder for 2 target co-sputtering (Ni-50wt%Cr+Al).
0102030405060708090
100
0 50 100 150 200
at%
Distance from Ni10Cr target (mm)
NiCrAl
ASample
B C D E F G H I
0102030405060708090
100
0 50 100 150 200
at %
Distance from Ni20Cr target (mm)
Ni
Cr
Al
0102030405060708090
100
0 50 100 150 200
at%
Distance from Ni50Cr target
Ni
Cr
Al

Influence of curvature on failure, diffusion and oxide growth mechanisms _____________________________________________________________________________
70 ______________________________________________________________________
Figure 4.14 Compositions along the sample holder for 2 target co-sputtering (Ni-40wt%Co-20wt%Cr+Al).
Figure 4.15 Compositions along the sample holder for 2 target co-sputtering (Ni-20wt%Co-40wt%Cr+Al).
The X-axis of the graphs in Figures 4.11 to 4.15 represent the locations of the
samples between the targets; 0 being under the Ni-XCowt%-Ywt%Cr target (X= 0, 20
or 40 and Y=10, 20 or 40) and 200 being under the Al target. For example in Figure
4.11, sample A has got the following composition: ~90 at% Ni, ~10 at% Cr and ~0 at%
Al. Similarly, sample F would have the following composition: ~ 55 at% Ni, ~ 5 at% Cr
0102030405060708090
100
0 50 100 150 200
at%
Distance from Ni40Co20Cr target (mm)
Ni
Cr
Al
Co
0
10
2030
40
50
60
7080
90
100
0 50 100 150 200
at%
Distance from Ni20Co40Cr target (mm)
Ni
Cr
Al
Co

Influence of curvature on failure, diffusion and oxide growth mechanisms _____________________________________________________________________________
71 ______________________________________________________________________
and 45 at% Al. The variation of composition vertically along the sample holder was
found to be negligible.
Figure 4.16 Atomic Percentage of Ni (a), Cr (b) and Al (c) along the sample holder for 3 targets co-sputtering (Ni-wt%10Cr+Ni-50wt%Cr+Al). The top left corner of the sample holder is located above the Ni-50wt%Cr target and the top right corner above the Ni-wt%10Cr target.
Ni50Cr Ni10Cr
Al
a) Ni50Cr Ni10Cr
Al
b)
Ni50Cr Ni10Cr
Al
c)

Influence of curvature on failure, diffusion and oxide growth mechanisms _____________________________________________________________________________
72 ______________________________________________________________________
Figure 4.16 shows the gradient of elemental composition along the sample
holder, measured with EDX analysis of the samples’ surface, used during the 3 target
co-sputtering deposition of coatings (with the Ni-10wt%Cr, Ni-50wt%Cr and Al
targets).
4.2.7 Oxidation of coated sapphire discs
Sample metrology showed that the magnetron co-sputtering method successfully
deposited 30 to 50 µm thick coatings depending on substrate placement. The coatings
were then isothermally oxidised in air for 500 hours in furnaces set at 900 and 950 °C.
All samples were weighed every 20 hours, which allowed the evaluation of the
oxidation kinetics. Energy dispersive X-ray (EDX) analysis was used to characterise the
composition of the oxides post-exposure. Additionally, X-ray diffraction (XRD) was
used to identify the oxides formed during these exposures. The selective growth of
protective Cr2O3 or Al2O3 oxides, or less protective NiO, CoO and mixed oxides, was
observed depending on the initial coating composition.
4.3 Analytical and observation tools
4.3.1 Scanning Electron Microscopy (SEM)
SEM was extensively used in this study because sample preparation is fast and
high magnifications allow the observation of features present in TBC systems which
can measure less than a micron.

Influence of curvature on failure, diffusion and oxide growth mechanisms _____________________________________________________________________________
73 ______________________________________________________________________
Two different kind of SEM were used during the project: first by a SFEG-SEM
(FEG stands for Field Emission Gun): FEI XL30 SFEG. This alternative to a classical
SEM with a W filament source of electrons, gives a much narrower electron beam
allowing high resolution pictures, up to 300,000X. Secondly an ESEM (Environmental
Scanning Electron Microscope): FEI KL30 ESEM. This SEM uses a classical source of
electrons, but the chamber can be doped with water vapour, which allows observations
to be carried out in a relatively low vacuum. It also makes it possible to image non-
conductive materials, as water vapour prevents electron charge build up; this was used
for surface observations on oxidised samples, which could not be coated with a
conductive carbon or gold/palladium coating. However the resolution of this SEM is
lower than the SFEG’s.
Energy Dispersive X-ray Analysis (EDX) was extensively used to identify and
quantify the chemical species in the substrate, coatings or oxide scales. The X-Ray
detector is an addition to the SEM chamber. The atoms of the material react to the
electron irradiation caused by the X-Ray bombardment by releasing a photon during the
energy relaxation of electrons from the electronic cloud surrounding the atom core. The
energy of the dispersed photon is equal to the difference in energy level between the
excited and the standard status of the concerned electron, which is typical for each
element of the periodic table [125]. The size of the region observed using the EDX is
1µm2 for the SEM whereas spatial resolution is 0.2nm2 in TEM.
Modified aerofoil-shaped samples were mounted in hard resin (filled with glass
beads (ballotini)) in a specially design mould (Appendix A), cut in half, polished and
then coated with a thin coating of Au and Pd before being put in the SFEG-SEM
chamber. Observations were usually carried using settings of 20 KV and a spot size of

Influence of curvature on failure, diffusion and oxide growth mechanisms _____________________________________________________________________________
74 ______________________________________________________________________
5. Single point quantitative analysis, concentration line profiles (number of points per
line depending on the area to characterise) and mapping were carried out using EDX.
NiCoCrAl coatings deposited on sapphire discs were observed under the ESEM
and their compositions characterised using single point EDX quantitative analysis.
Since they are metallic coatings, they did not require the application of any conducting
film. Cross-sections were mounted in Durocit resin and polished.
4.3.2 X-Ray Diffraction (XRD)
XRD was used as an analytical tool. XRD of coated sapphire discs, as deposited,
or oxidised were carried out in order to make a qualitative analysis of the compounds or
oxides in the system. The diffractometer was mainly used with a typical θ/2θ layout in
vertical diffractometer mode. The XRD system is a Siemens D5005 loaded with a Cu
K-alpha X-ray tube [125]. 2-2-1 slits were used during this project.
4.3.3 Focussed ion beam (FIB)
FIB system use a finely focused beam of gallium ions that can be operated at
low beam currents for imaging or high beam currents for site specific sputtering or
milling (unlike SEMs that use a beam of electrons). At low current, typically between 1
and 70pA, FIB is used for imaging, as the sputtering yield is very low for these values.
Above 70pA, the beam is energetic enough to noticeably mill the substrate. Increasing
the current transfers more energy to the surface: increasing the current reduces the
milling time. However, it increases the thermal affected zone around the milled section.
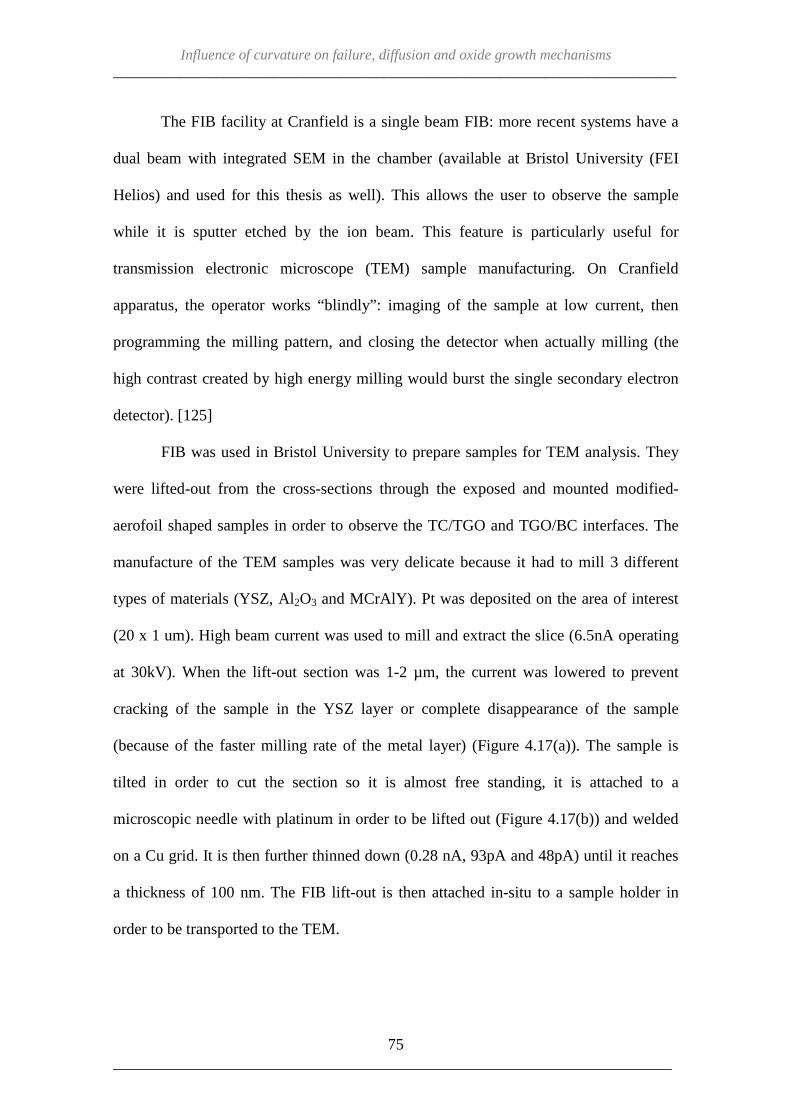
Influence of curvature on failure, diffusion and oxide growth mechanisms _____________________________________________________________________________
75 ______________________________________________________________________
The FIB facility at Cranfield is a single beam FIB: more recent systems have a
dual beam with integrated SEM in the chamber (available at Bristol University (FEI
Helios) and used for this thesis as well). This allows the user to observe the sample
while it is sputter etched by the ion beam. This feature is particularly useful for
transmission electronic microscope (TEM) sample manufacturing. On Cranfield
apparatus, the operator works “blindly”: imaging of the sample at low current, then
programming the milling pattern, and closing the detector when actually milling (the
high contrast created by high energy milling would burst the single secondary electron
detector). [125]
FIB was used in Bristol University to prepare samples for TEM analysis. They
were lifted-out from the cross-sections through the exposed and mounted modified-
aerofoil shaped samples in order to observe the TC/TGO and TGO/BC interfaces. The
manufacture of the TEM samples was very delicate because it had to mill 3 different
types of materials (YSZ, Al2O3 and MCrAlY). Pt was deposited on the area of interest
(20 x 1 um). High beam current was used to mill and extract the slice (6.5nA operating
at 30kV). When the lift-out section was 1-2 µm, the current was lowered to prevent
cracking of the sample in the YSZ layer or complete disappearance of the sample
(because of the faster milling rate of the metal layer) (Figure 4.17(a)). The sample is
tilted in order to cut the section so it is almost free standing, it is attached to a
microscopic needle with platinum in order to be lifted out (Figure 4.17(b)) and welded
on a Cu grid. It is then further thinned down (0.28 nA, 93pA and 48pA) until it reaches
a thickness of 100 nm. The FIB lift-out is then attached in-situ to a sample holder in
order to be transported to the TEM.
Influence of curvature on failure, diffusion and oxide growth mechanisms _____________________________________________________________________________
76 ______________________________________________________________________
Figure 4.17 FIB images of the preparation of a lift-out sample. (a) the thin section at the TC/TGO and TGO/BC interface being thinned down and (b) the sample being lifted-out.
4.3.4Transmission electronic microscopy (TEM)
TEM is used for high resolution imaging, and can go up to a magnification of
1000kX in transmission mode with the facility used. TEM was not extensively used
in this study, and observations were carried out with a specialised operator. The
machine used was a Philips CM20 transmission Electron Microscopecouple with an
Oxford Instruments INCA X-ray Microanalysis system (EDX).
The samples lift-out using the FIB were observed using the TEM and had to be
extremely thin. For observations, the beam of high energy electrons was driven through
a series of electromagnetic lenses, through the substrate and then focused onto a screen.
The acceleration voltage was 200kV.
30 µm 10 µm

_____________________________________________________________________________
77 ______________________________________________________________________
PART I - EFFECT OF THE SAMPLE GEOMETRY ON THE APS/TBC SYSTEM’S
OXIDATION BEHAVIOUR
The effect of aerofoil geometry on the behaviour of TBC systems at the
microscopic scale is of interest due to its possible effect on their life. Coating
detachments have been noted on blades’ leading edges, pressure sides and trailing edges
[100]. To account for this DeMasi and Sheffler [103] stated that normal stresses could
be introduced to a curved surface’s coating by the tangential compressive stresses
present and these could result in ceramic spallation.
The oxidative degradation mechanisms of an APS/TBC coated superalloy and
the effect the aerofoil shape had on its behaviour has been investigated. Details of the
TGO’s microstructural evolution, the BC and the interdiffusion between the BC and

_____________________________________________________________________________
78 ______________________________________________________________________
substrate were characterized (Chapter V). In order to detect and track the spread of
cracks beneath the TBCs before spalling, flash thermography, a novel non-destructive
examination (NDE) technique was used (Chapter VI). The following results describe
the experimentation done on a range of modified aerofoil-shaped samples, coated with a
HVOF sprayed BC plus an APS/TBC and tested under conditions appropriate for an
industrial gas turbine TBC system (exposure in the temperature range of 900 to 1000
ºC). While initially focussing on the effect of curvature, the investigations expanded to
consider the effect of BC and TC thicknesses and interface roughnesses on the diffusion
behaviour of the different elements present in the coating system. An attempt to explain
the intricate influence of curvature, thickness and roughness of both BC and TC is
presented in this chapter (Chapter VII).
To begin with, the damage evolution on the modified aerofoil-shaped samples is
presented along with the results of the pulsed flash thermography experiments. Then,
after explaining the evolution of the BC microstructure with exposure time and
temperature, the effect of curvature will be compared to BC behaviour. Part of the
following discussion is aimed at explaining why the geometry affects the BC and how it
modifies the lifetime of the whole system, by focussing on the TGO growth (protective
Al 2O3 and less-protective spinels/mixed oxides) and Al diffusion as well as the TC
microstructure. Some of the work in this chapter has been presented in a published
paper (Materials at High Temperatures) [126].

Influence of curvature on failure, diffusion and oxide growth mechanisms ____________________________________________________________________________
79 ______________________________________________________________________
CHAPTER V- THE INFLUENCE OF CURVATURE ON FAILURE, DIFFUSION AND OXIDE GROWTH
MECHANISMS
5.1 The influence of geometry on the failure of modified aerofoil-shaped samples
The effect of the modified aerofoil-shaped samples’ geometry on the behaviour
of the APS/TBC system subject to oxidation at 900-1000 °C was investigated. The
initiation and propagation of cracks on samples were observed using NDE methods (i.e.
optical microscopy and pulsed flash thermography) and destructive methods (i.e. SEM).
Coating characteristics such as the BC, TGO and spinels were compared as a function
of curvature. The different features of the modified aerofoil-shaped samples are
described using the nomenclature given in Figure 4.1, or in a reference sheet in
Appendix I. In figures describing the samples, the concave side refers to the pressure
side of the blade and convex to the suction side.
5.1.1 Evolution of damage on the oxidised modified aerofoil-shaped samples
Important damage occurred on samples oxidised above 950 °C and was characterised
by the appearance of cracks initiating at the edges of the samples. Figure 5.1 depicts the
evolution of cracks on sample 81-BSYA-15, oxidised at 950 °C for up to 5000 hours. Cracks
were first spotted on this sample after 1350 hours (Figure 5.1(a)) and were located on the
leading edge of the blade (locations A and B). After 4000 hours, these cracks had propagated
toward the suction side of the blade (Figure 5.1(b)). Finally after 5000 hours, damage appeared
at location D and E of the sample and after a day out of the furnace, critical delamination of the

Influence of curvature on failure, diffusion and oxide growth mechanisms___________________________________
______________________________________________________________________
ceramic TC happened on the blade’s suction side. Damage was located at the same location on
the sample oxidised at 1000 °C, as shown in
23, the TBC coating gradually delaminated at location D and E, between 1350 and 1500 hours.
Figure 5.1 Photographs of sample5000 hours. Black arrows point t
Figure 5.2 Photographs of sampleBlack arrows point to coating delamination.
Such damage could be seen when the cracks propagated greatly and samples
approached the end of their life. Ordinary characterisation methods do not enable the extent of
failure propagation to be checked without destroying the sample. This is why a novel
technique (called pulse flash thermography) was used to observe the extent of cracking beneath
the ceramic TC.
Influence of curvature on failure, diffusion and oxide growth mechanisms____________________________________________________________________________
80 ______________________________________________________________________
ceramic TC happened on the blade’s suction side. Damage was located at the same location on
sample oxidised at 1000 °C, as shown in Figure 5.2. In these pictures of sample 81
23, the TBC coating gradually delaminated at location D and E, between 1350 and 1500 hours.
sample 81-BSYA-15 oxidised at 950 °C for (a) 3750, (b)Black arrows point to coating delamination.
sample 81-BSYA-23 oxidised at 1000 °C for (a) 1350, and Black arrows point to coating delamination.
Such damage could be seen when the cracks propagated greatly and samples
approached the end of their life. Ordinary characterisation methods do not enable the extent of
failure propagation to be checked without destroying the sample. This is why a novel
technique (called pulse flash thermography) was used to observe the extent of cracking beneath
Influence of curvature on failure, diffusion and oxide growth mechanisms _________________________________________
______________________________________________________________________
ceramic TC happened on the blade’s suction side. Damage was located at the same location on
In these pictures of sample 81-BSYA-
23, the TBC coating gradually delaminated at location D and E, between 1350 and 1500 hours.
(b) 4000, and (c) (d)
, and (b) 1500 hours.
Such damage could be seen when the cracks propagated greatly and samples
approached the end of their life. Ordinary characterisation methods do not enable the extent of
failure propagation to be checked without destroying the sample. This is why a novel NDE
technique (called pulse flash thermography) was used to observe the extent of cracking beneath

Influence of curvature on failure, diffusion and oxide growth mechanisms ____________________________________________________________________________
81 ______________________________________________________________________
5.1.2 Pulsed flash thermography of the modified aerofoil-shaped samples
Samples were regularly taken to NPL to observe internal damage using pulsed
flash thermography. As a result of the alteration of heat conduction with cracks present
beneath the ceramic, the IR camera could detect damage. On the thermographs, flaws
appeared with a different contrast to the rest of the sample, making identification easy.
The damage evolution on modified aerofoil-shaped samples oxidised at 1000°C
is shown in Figures 5.3 to 5.5. The light grey colour represents cracking in the coating.
The dark grey colour represents coating delamination. Samples were observed after
1050, 1350 and 1500 hours oxidation. Looking at Figure 5.3, after 1050 hours of
oxidation of sample 81-BSYA-17, a small crack appeared at B (position given in Figure
4.1 and Appendix I) on the right hand side of the sample (Figure 5.3(a)). 300 hours
later, the crack in B propagated and another initiated in A (Figure 5.3(b)). After 1500
hours of oxidation, the crack starting at A and B joined. The sample also began to be
damaged at D and E (Figure 5.3(c)).
Figure 5.3 Schematic representation of the damage evolution in sample 81-BSYA-17 oxidised at 1000 °C. Sample was oxidised for (a) 1050; (b) 1350; and (c) 1500 hours. Damage beneath the ceramic TC appears in grey.
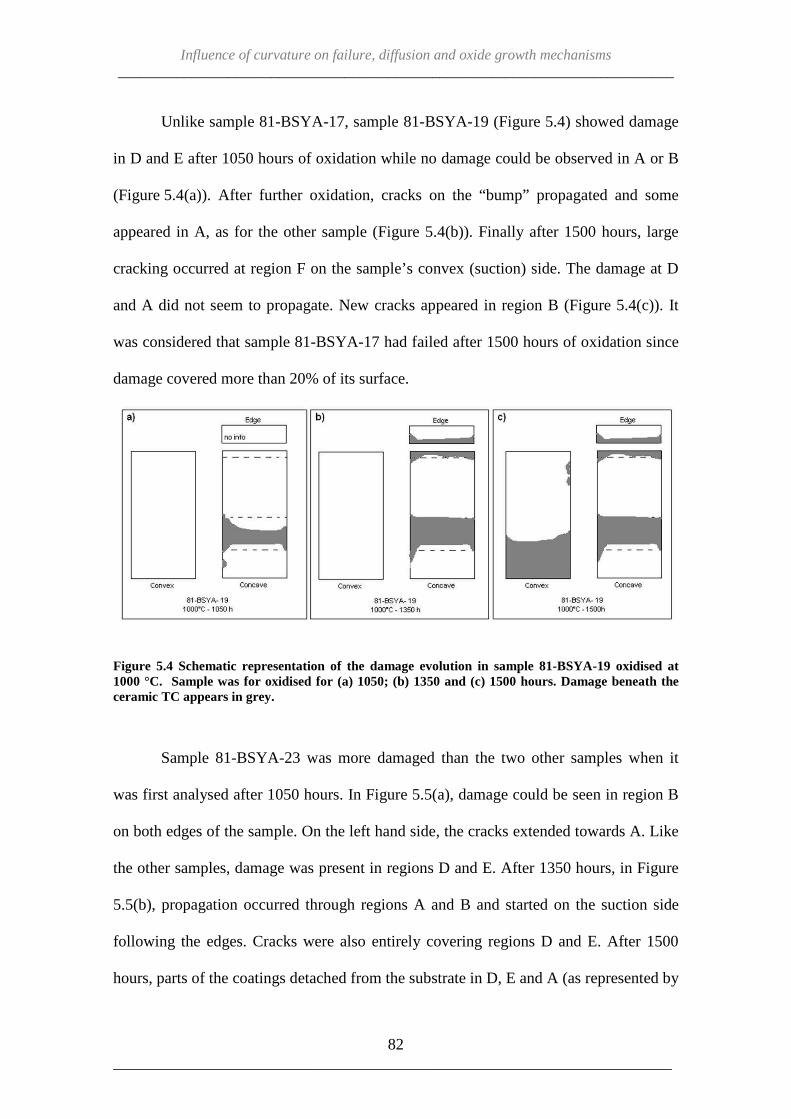
Influence of curvature on failure, diffusion and oxide growth mechanisms ____________________________________________________________________________
82 ______________________________________________________________________
Unlike sample 81-BSYA-17, sample 81-BSYA-19 (Figure 5.4) showed damage
in D and E after 1050 hours of oxidation while no damage could be observed in A or B
(Figure 5.4(a)). After further oxidation, cracks on the “bump” propagated and some
appeared in A, as for the other sample (Figure 5.4(b)). Finally after 1500 hours, large
cracking occurred at region F on the sample’s convex (suction) side. The damage at D
and A did not seem to propagate. New cracks appeared in region B (Figure 5.4(c)). It
was considered that sample 81-BSYA-17 had failed after 1500 hours of oxidation since
damage covered more than 20% of its surface.
Figure 5.4 Schematic representation of the damage evolution in sample 81-BSYA-19 oxidised at 1000 °C. Sample was for oxidised for (a) 1050; (b) 1350 and (c) 1500 hours. Damage beneath the ceramic TC appears in grey.
Sample 81-BSYA-23 was more damaged than the two other samples when it
was first analysed after 1050 hours. In Figure 5.5(a), damage could be seen in region B
on both edges of the sample. On the left hand side, the cracks extended towards A. Like
the other samples, damage was present in regions D and E. After 1350 hours, in Figure
5.5(b), propagation occurred through regions A and B and started on the suction side
following the edges. Cracks were also entirely covering regions D and E. After 1500
hours, parts of the coatings detached from the substrate in D, E and A (as represented by

Influence of curvature on failure, diffusion and oxide growth mechanisms ____________________________________________________________________________
83 ______________________________________________________________________
dark grey colour in Figure 5.5(c)). Cracks propagated on the suction side of the sample
and in region F.
Figure 5.5 Schematic representation of the damage evolution in sample 81-BSYA-23 oxidised at 1000 °C. Sample was oxidised for (a) 1050; (b) 1350; and (c) 1500 hours. Damage beneath the ceramic TC appears in grey. Delamination of the ceramic TC appears in dark grey.
The damage evolution in samples oxidised at 975 °C is shown in Figures 5.6 and
5.7. For sample 81-BSYA-36, after 1950 hours of exposure, the first signs of cracking
could be seen in locations A and B (Figure 5.6(a)). In location A, the crack propagated
across the leading edge of the sample. Damage could be also observed on the pressure
side of the blade in region a. After further oxidation, it did not propagate and was
therefore considered not to be caused by high temperature exposure. The cracks
propagated greatly between 1950 and 2850 hours and covered most of the suction side
of the sample as well as location D, E and c on the pressure side (Figure 5.6(b)). Finally
after 3000 hours, when the sample exposure was terminated, the damage propagated on
the bump and initiated at location F (Figure 5.6(c)).
In sample 81-BSYA-37 (also oxidised at 975 °C), cracks similarly propagated
on the convex side of the blade and on the bump (Figure 5.7). After 2850 hours, damage
could be spotted in location F (Figure 5.7(b)). The extent of oxidation of this sample
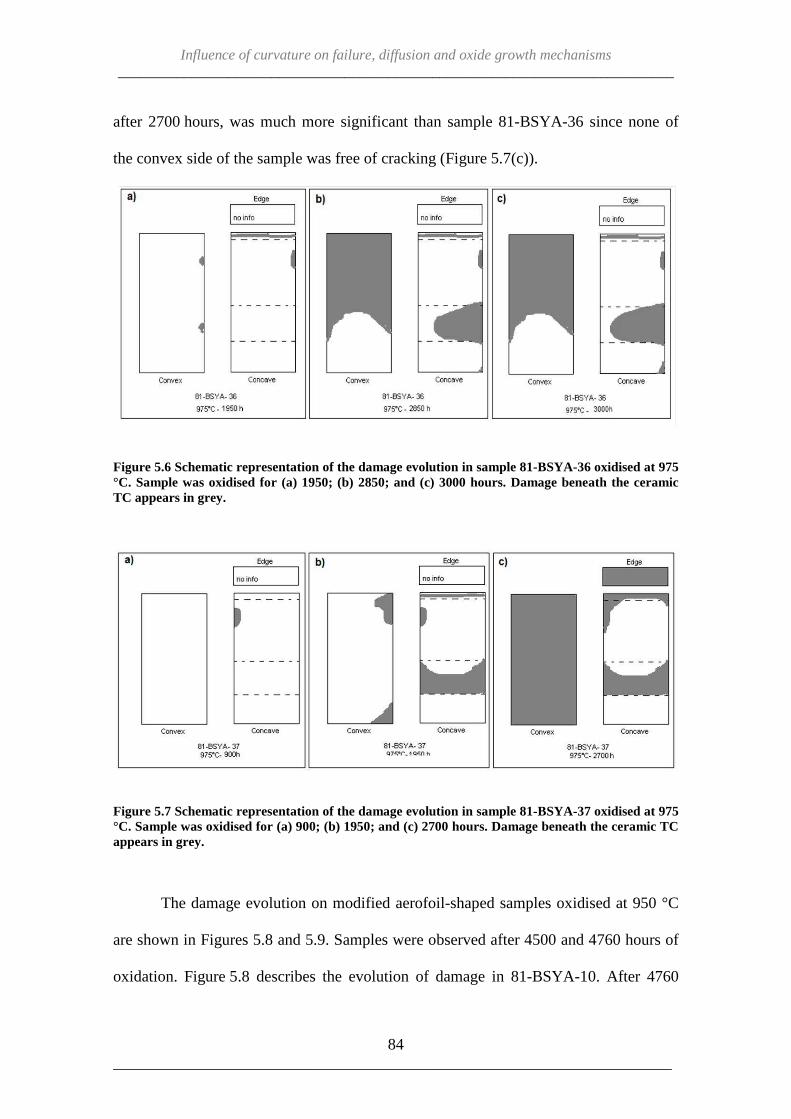
Influence of curvature on failure, diffusion and oxide growth mechanisms ____________________________________________________________________________
84 ______________________________________________________________________
after 2700 hours, was much more significant than sample 81-BSYA-36 since none of
the convex side of the sample was free of cracking (Figure 5.7(c)).
Figure 5.6 Schematic representation of the damage evolution in sample 81-BSYA-36 oxidised at 975 °C. Sample was oxidised for (a) 1950; (b) 2850; and (c) 3000 hours. Damage beneath the ceramic TC appears in grey.
Figure 5.7 Schematic representation of the damage evolution in sample 81-BSYA-37 oxidised at 975 °C. Sample was oxidised for (a) 900; (b) 1950; and (c) 2700 hours. Damage beneath the ceramic TC appears in grey.
The damage evolution on modified aerofoil-shaped samples oxidised at 950 °C
are shown in Figures 5.8 and 5.9. Samples were observed after 4500 and 4760 hours of
oxidation. Figure 5.8 describes the evolution of damage in 81-BSYA-10. After 4760

Influence of curvature on failure, diffusion and oxide growth mechanisms ____________________________________________________________________________
85 ______________________________________________________________________
hours, damage had initiated in region B on the right hand edge of the sample
(Figure 5.8(b)). This was similar to sample 81-BSYA-17 in Figure 5.3 oxidised at
1000°C. No other damage could be seen in this sample.
Figure 5.8 Schematic representation of the damage evolution in sample 81-BSYA-10 oxidised at 950 °C. Sample was oxidised for (a) 4500; and (b) 4760 hours. Damage beneath the ceramic TC appears in grey.
Figure 5.9 Schematic representation of the damage evolution in sample 81-BSYA-11 oxidised at 950 °C. Sample was oxidised for (a) 4500; and (b) 4760 hours. Damage beneath the ceramic TC appears in grey.

Influence of curvature on failure, diffusion and oxide growth mechanisms ____________________________________________________________________________
86 ______________________________________________________________________
Much more cracking was recorded on sample 81-BSYA-11 exposed at 950 °C
(Figure 5.9). After 4500 hours oxidation, damage was observed at regions A, D and E.
There were also cracks on the right hand side of region C. Cracks were always located
on the edges of the sample (Figure 5.9(a)). After another cycle, these cracks had not
spread much but new ones had appeared in region F (Figure 5.9(b)).
The evolution of cracks at 950 °C was slower than at 975 and 1000°C. Cracks
usually initiated in regions A and B first, then in D and E.
Figure 5.10 Schematic representation of the damage evolution in sample 81-BSYA-28 oxidised at 925 °C. Sample was oxidised for (a) 740; (b) 5500; and (c) 8740 hours. Damage beneath the ceramic TC appears in grey.
At 925°C samples, against expectations, some small damage could be observed
on the concave side of the blade at region a after 740 hours of oxidation (Figure
5.10(a)). After further oxidation, this damage did not propagate and was therefore
considered not to be high temperature exposure/cycling induced cracking. As for a
similar feature observed at 975 °C, it was supposed to be damage caused during the
manufacturing of the sample. The first signs of exposure induced cracking appeared
after 5500 hours of exposure and were located on the left hand edge at location B
(Figure 5.10(b)). After 8740 hours, this crack propagated and another one appeared on

Influence of curvature on failure, diffusion and oxide growth mechanisms ____________________________________________________________________________
87 ______________________________________________________________________
the right hand edge of the sample at location B (Figure 5.10(c)). After 18,000h of
oxidation, no damage could be seen on samples oxidised at 900 °C.
The presence of cracks identified by flash thermography was partly verified by
optical microscopy on the edges of samples, as shown in Figure 5.11 which shows
microcracks at location B and location E of the sample. Cracking away from the edges
was later confirmed by the observation of polished cross-sections through the samples.
Figure 5.11 Optical microscope image of cracks in a modified aerofoil shaped sample exposed at 950 °C for 3000 hours with flash thermography data.
5.1.3 Observations of crack development using SEM
A range of crack profiles were observed, around the samples’ cross sections
using a SEM (Figure 5.12). The coatings’ oxidation temperature, exposure time and
curvature did not seem to induce a particular pattern of failure. Cracks ran through the
TGO (Figure 5.12(a)), at the TGO/BC interface (Figure 5.12(b)) or at the TBC/TGO
interface (Figure 5.12(c)) and in some cases cracks ran through spinels (Figure 5.12(e)).
When a lot of TGO surface undulation was present, cracks ran through the TBC (Figure
5.12(d)). Echsler et al. [98] observed similar crack profiles. The only apparently
consistently observed crack feature influenced by curvature was the vertical cracking
through the TC at the trailing edge (Figure 5.12(f)) [126].

Influence of curvature on failure, diffusion and oxide growth mechanisms___________________________________
______________________________________________________________________
Figure 5.12 SEM image of a crack running the TGO/TC interface (d) through the TC
5.1.4 Summary
To summarise, the use of flash thermography showed that at high temperatures
cracks initiated first at the leading edge and at the “bump” (region D) and then
Influence of curvature on failure, diffusion and oxide growth mechanisms____________________________________________________________________________
88 ______________________________________________________________________
SEM image of a crack running (a) through the TGO (b) at the TGO/BC interface d) through the TC (e) through spinel and (f) vertically through the TC.
To summarise, the use of flash thermography showed that at high temperatures
cracks initiated first at the leading edge and at the “bump” (region D) and then
Influence of curvature on failure, diffusion and oxide growth mechanisms _________________________________________
______________________________________________________________________
b) at the TGO/BC interface (c) at f) vertically through the TC.
To summarise, the use of flash thermography showed that at high temperatures
cracks initiated first at the leading edge and at the “bump” (region D) and then

Influence of curvature on failure, diffusion and oxide growth mechanisms ____________________________________________________________________________
89 ______________________________________________________________________
propagated along the edges and across the samples. Damage also propagated at the
trailing edge and finally on the flat convex surface of the sample (Figures 5.13 and
5.14). This indicates that the sample shape has an influence on crack initiation and
propagation. The amount of damage varied between samples with the same exposure
times/temperatures [126].
Figure 5.13 Flash thermography data showing damage evolution in a sample isothermally oxidised at 1000 °C for exposure times of (a) 1050; (b) 1350; and (c) 1500 hours. Light contrast indicates sub-surface damage.
Figure 5.14 Flash thermography data showing damage evolution in a sample isothermally oxidised at 950 °C for exposure times of (a) 4000; (b) 4500; and (c) 4760 hours. Light contrast indicates sub-surface damage.
81-BSYA-15
950°C – 4000 h
81-BSYA-15
950°C – 4500 h81-BSYA-15
950°C – 4760 h

Influence of curvature on failure, diffusion and oxide growth mechanisms ____________________________________________________________________________
90 ______________________________________________________________________
5.2 Influence of the curvature on the evolution of the BC microstructure
5.2.1 Understanding the effect of exposure time on the oxidation behaviour
of an APS/TBC system
All TBC coating systems exposed to high temperature have a common oxidation
behaviour which is well established in literature (Chapter II). In this section, the basic
diffusion/inter-diffusion mechanisms occurring in the modified aerofoil-shaped
samples, such as the BC depletion of the β-NiAl phase, the TGO growth and the SRZ
formation, are characterised, described and explained. The first stage of observation
ensures that samples have behaved as expected from previously reported research
carried out on similar materials, in order to allow a comparison of the results.
Furthermore, testing the modified aerofoil-shaped samples at a range of temperatures
(900-1000 °C) enabled the comparison of oxidation mechanisms under different
exposure conditions.
5.2.1.1 Depletion of the β-NiAl phase and the growth of the protective Al2O3 layer with exposure
Within the MCrAlY BC, the β-NiAl phase constitutes the Al reservoir which is
used to grow the protective Al2O3 during exposure at high temperatures [12]. As the
TGO thickens, the amount of Al in the BC reduces causing the gradual depletion of the
β-phase. Figure 5.15 depicts the evolution of BCs at location C (with this region chosen
as an example because of its relatively flat curvature) in samples oxidised at 925 °C for
up to 7000 hours. Before exposure, the β-phase grains, in dark grey contrast within the
BC (Figure 5.15(a)), were fine and evenly distributed in the layer. At this stage, the
TGO was non-existent (or very thin) and the SRZ, which was formed during

Influence of curvature on failure, diffusion and oxide growth mechanisms ____________________________________________________________________________
91 ______________________________________________________________________
manufacturing, smaller than 10 µm. After 100 hours exposure (Figure 5.15(b)), the β-
NiAl grains present in the BC increased in size and a zone free of β-phase, of 15 µm
thickness at the outer edge of the BC, accompanied by the growth of the TGO layer, in
dark grey contrast, at the TC/BC interface. The oxide layer (TGO) at this stage was 1.5
µm thick.
Figure 5.15 Evolution of the APS/TBC system under oxidation at 925 °C. SEM images of the BC and TGO in location C of (a) an as-deposited sample; and samples exposed for (b) 100 hours; (c) 4000 hours; and (d) 7000 hours. Dotted white arrows indicated β-depletion zones.
This β-depleted zone, called the outward depletion zone, has a γ-Ni matrix
(confirmed by EDX analysis), and is created by the diffusion of Al from the BC to the
TGO. Beneath the BC, the SRZ remained the same size and no inward β-depletion,
from the BC to the substrate, could be observed. After 4000 hours (Figure 5.15(c)), β-
NiAl grains continued to increase in size and appear more scattered than on as-
20 µm
TBCa)
BC
β-NiAl
20 µm
b)TGO
β-NiAl
Substrate
β-depletion zone
20 µm
c)
TGO
β-NiAl
20 µm
d)
TGO

Influence of curvature on failure, diffusion and oxide growth mechanisms ____________________________________________________________________________
92 ______________________________________________________________________
deposited coatings. The outward β-depletion zone progressed deeper into the BC, 22 µm
thick, as the TGO thickened up to 3.7 µm. Close to the BC/substrate interface, an
inward β-depletion zone, characterising the diffusion of Al to the substrate, appeared
and measured 35 µm. This zone has a γ-Ni/γ’-Ni 3Al matrix (confirmed by EDX
analysis). Finally, after 7000 hours (Figure 5.15(d)), the outward and inward β-depletion
zone joined together, leaving the BC totally depleted in β-NiAl. The TGO was 5.3 µm
thick.
Figure 5.16 Median TGO thickness at different location around samples oxidised at 925 °C against time. Plain, dotted and dashed lines respectively correspond to convex, flat and concave curvatures.
The growth of the TGO, which was measured at every location around the
modified aerofoil-shaped samples (Appendix D), was divided in two stages, as seen on
Figure 5.16. In the graph, the trend appears as a sub-parabolic curve which is composed
of a first part with a higher slope and a second part that was less steep. The fast
oxidation rate described by the high slope, the transient stage, correspond to the rapid
growth of transient θ-Al 2O3 and it is followed by the steady-state stage, second part of
the curve, during which stable slow growing α-Al 2O3 replaces totally or partially
0
1
2
3
4
5
6
0 1000 2000 3000 4000 5000 6000 7000 8000 9000 10000
TG
O t
hick
ness
(µ
m)
Time (hours)
A
B
C
D
E
F
a
b
c
Average

Influence of curvature on failure, diffusion and oxide growth mechanisms ____________________________________________________________________________
93 ______________________________________________________________________
(depending on temperature) the transient oxides. The trend is the same at every location
around the sample meaning that growth mechanisms remain identical regardless of
geometry. This aspect will be investigated in greater details later in this chapter.
5.2.1.2 Identifying the less protective mixed oxides/spinels in the TGO layer
The depletion of Al from the BC, as a result of selective oxidation to maintain
the protective Al2O3 layer, causes a compositional change in the TGO from α-Al 2O3 to
include a mixture of chromia and spinels ((Cr,Al)2O3) and (Ni(Cr,Al)2O4)). Under the
SEM those less protective oxides appear in a lighter contrast than the Al2O3
layer (Figure 5.17). Usually located close to the TGO/TC interface as isolated clusters
or more rarely a continuous layer, they are made of one single phase
((Co,Ni)(Cr,Al)2O4) (Figure 5.17(a)) or of two phases ((Co,Ni)(Cr,Al)2O4 and
(Co,Ni)O) (Figure 5.17(b)). In the Al2O3 layer, Ti associates with Al to form Ti
aluminate precipitates which appear as white phases in the dark TGO layer. These
different phases were identified using EDX analysis (Figures 5.18 and 5.19).
Figure 5.17 SEM images of TGO layer in sample oxidised at 950 °C for 4000 hours. Pictures of spinels/mixed oxides at (a) location D and (b) location c.
10 µm
a)
TGO
Spinel/mixed oxide
Al2O3
10 µm
b)
(Co,Ni)(Cr,Al)2O4
(Co,Ni)O
Ti Aluminate

Influence of curvature on failure, diffusion and oxide growth mechanisms ____________________________________________________________________________
94 ______________________________________________________________________
EDX mapping highlighted the concentration of Co and Cr in the spinel/mixed
oxide. Spinels/mixed oxides contain very small amounts of Al and Ni concentrated at
their cores (Figure 5.18). The compositions of each phase are given in Figure 5.19. The
compositions of these mixed oxides are consistent with observations made by Chen et
al. [36] who found levels of Ni+Co up to 5-16 at% and Al+Cr of 28-43 at%.
These less protective oxides have a detrimental effect on the coating’s life as
they are believed to help the initiation and propagation of cracks [36,50,78,79].
However, their presence highlights a change of diffusion behaviour in the coating and
can be used to understand oxidation mechanisms. Indeed, they require different oxygen
partial pressure to grow compare to Al2O3 [12], they need more space between the TC
and the oxide due to their larger volume change and their location seems to be dictated
by the TC microstructure as well as the TC/TGO interface profile [36,56,80]. Even
though they are extensively described in literature, their effect on the coating system’s
lifetime still needs to be clarified. This will be discussed later in Chapter VI.
Figure 5.18 EDX mapping of spinel/mixed oxides in TGO from location a in sample oxidised at 925 °C for 7000 hours. Spinel/mixed oxide is circled in red.
Co Ka1 Ni Ka1
Electron image O Ka1 Al Ka1
Cr Ka1
10 µm
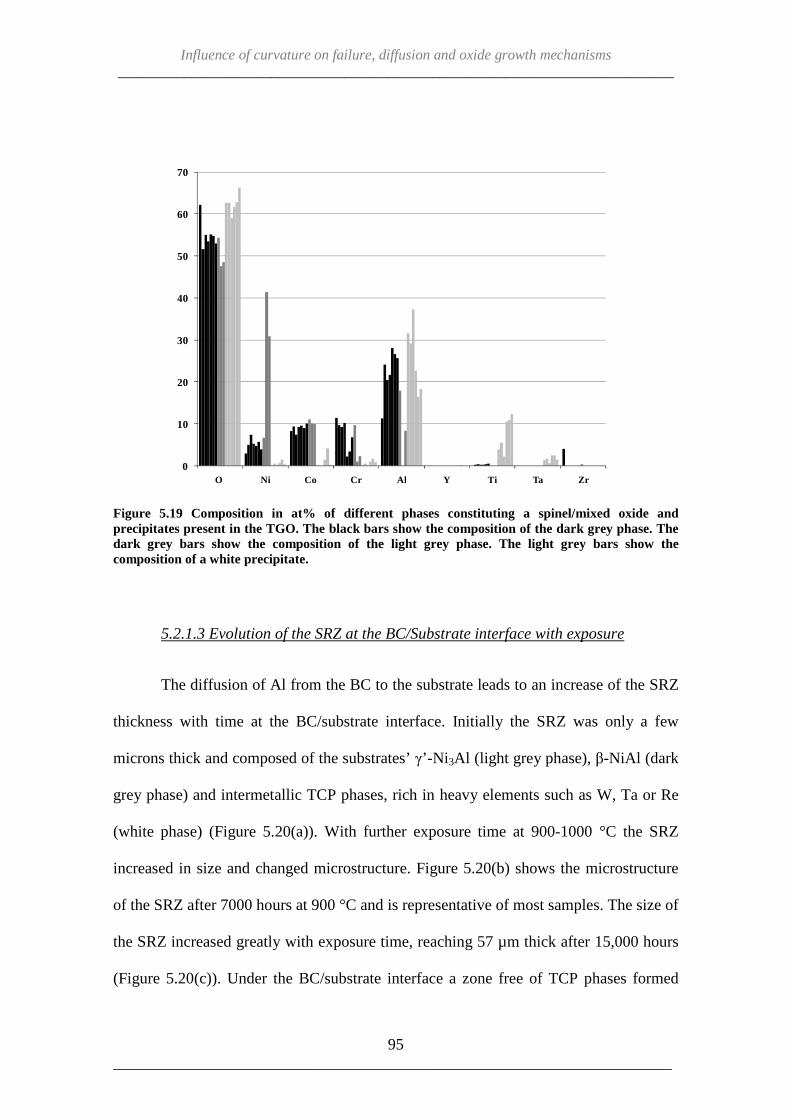
Influence of curvature on failure, diffusion and oxide growth mechanisms ____________________________________________________________________________
95 ______________________________________________________________________
Figure 5.19 Composition in at% of different phases constituting a spinel/mixed oxide and precipitates present in the TGO. The black bars show the composition of the dark grey phase. The dark grey bars show the composition of the light grey phase. The light grey bars show the composition of a white precipitate.
5.2.1.3 Evolution of the SRZ at the BC/Substrate interface with exposure
The diffusion of Al from the BC to the substrate leads to an increase of the SRZ
thickness with time at the BC/substrate interface. Initially the SRZ was only a few
microns thick and composed of the substrates’ γ’-Ni 3Al (light grey phase), β-NiAl (dark
grey phase) and intermetallic TCP phases, rich in heavy elements such as W, Ta or Re
(white phase) (Figure 5.20(a)). With further exposure time at 900-1000 °C the SRZ
increased in size and changed microstructure. Figure 5.20(b) shows the microstructure
of the SRZ after 7000 hours at 900 °C and is representative of most samples. The size of
the SRZ increased greatly with exposure time, reaching 57 µm thick after 15,000 hours
(Figure 5.20(c)). Under the BC/substrate interface a zone free of TCP phases formed
0
10
20
30
40
50
60
70
O Ni Co Cr Al Y Ti Ta Zr

Influence of curvature on failure, diffusion and oxide growth mechanisms ____________________________________________________________________________
96 ______________________________________________________________________
and in the rest of the SRZ light grey precipitates appeared and the white precipitates
increased in size.
Figure 5.20 Evolution of SRZ with time. SEM images of BC/Substrate interface in location C on as-deposited sample (a) and samples exposed at 900 °C for 7000 hours (b); and 15,000 hours (c).
Figure 5.21 shows the results of EDX mapping done on the SRZ at location F on
the same sample. The sample was etched in order to see the phase structure of the BC
and the SRZ. The analysis showed the SRZ was composed of a Ni and Al-rich matrix
(γ’ phase, which was etched away leaving raised phases marking grain boundaries).
Indeed accordingly to the composition of the CMSX-4 substrate and the AMDRY 995
BC (which can be found in Table 4.1), more Ni was counted in the SRZ and more Cr
was present in the BC. However, more Al should be observed in the BC rather than in
20 µm
BC
Substrate
SRZ
γ'-Ni3Al (matrix)
γ-Ni (matrix)
β-NiAl
TCP phases
a)
BC
20 µm
SRZ
Substrate TCP phase
Cr rich phase
b)
50 µm
SRZ
BC
Substrate
c)
TCP phase
Cr rich phase

Influence of curvature on failure, diffusion and oxide growth mechanisms ____________________________________________________________________________
97 ______________________________________________________________________
the SRZ, confirming that Al had diffused from one layer to the other and that the SRZ is
partly made of γ’-Ni 3Al.
A phase rich in Cr and low in Al and Ni (α-Cr) gathers at the grain boundaries.
EDX analysis showed that the white phases appearing on Figure 5.21(f) were
intermetallic TCP phases, rich in W and Ta. Later during exposure, the SRZ was still
made of two zones and increased in size, reaching 81 µm after 15,000 hours (Figure
5.20(c)). The grain size of the precipitates also seemed bigger but this was not the case
for every sample and quantifying their size to confirm the trend could not be achieved
accurately enough.
Figure 5.21 EDX mapping of the SRZ. Image of location F on an etched sample exposed for 7000 hours at 900 °C. (a) and (b) are SEM images of an etched sample. (c),(d) and (e) are the scans of (a) and (b). (f) is a SEM image of the SRZ at location F before etching. Dotted lines represent the limit between the SRZ and the BC. Red circles correspond to a Cr rich precipitate in the SRZ.
The thickness of the SRZ in samples exposed at 900 °C was measured at every
location around the sample (Appendix H) and plotted against time in Figure 5.22 (the
10 µm
20 µm
Etched SRZ Al Ka1
Cr Ka1 Ni Ka1 SRZ (no etching)
SRZ
a) b) c)
d) e) f)

Influence of curvature on failure, diffusion and oxide growth mechanisms ____________________________________________________________________________
98 ______________________________________________________________________
SRZ thickness of the samples exposed at higher temperatures can be found in Figure
5.29). While the TGO growth followed a sub-parabolic behaviour, the SRZ’s evolution
was described by parabolic trend composed of a fast and a steady state. The fast growth
rate in the first stages of oxidation might be exaggerated by the heat treatment processes
carried out before deposition of the TC. This increase of the SRZ with time is common
to each modified aerofoil shaped sample regardless of the exposure temperature. Even
though TGO and SRZ follow a different growth trend, if we suppose that they both
grow parabolically (as described by equation (1)), the growth rate k(TGO) of the TGO
would average around 1.5x10⁻⁶ µm2/s while the SRZ growth rate k(SRZ) would average
around 4.0x10⁻⁴ µm2/s.
Figure 5.22 SRZ thickness as a function of time in samples oxidised at 900 °C. Plain, dotted and dashed lines respectively correspond to convex, flat and concave curvatures. See nomenclature on reference sheet at end of thesis.
0
20
40
60
80
100
120
0 5000 10000 15000 20000
SR
Z th
ickn
ess
(µm
)
Time (hours)
A
B
C
D
E
F
a
b
c
average

Influence of curvature on failure, diffusion and oxide growth mechanisms ____________________________________________________________________________
99 ______________________________________________________________________
5.2.2 Understanding the effect of exposure temperature on the oxidation
behaviour of an APS/TBC system
5.2.2.1 The effect of exposure temperature on the TGO growth
Modified aerofoil-shaped samples were exposed at temperatures between 900
and 1000 °C to allow the investigation of the effect of temperature on the oxidation
behaviour of the APS/TBC system.
The samples were weighed regularly between each oxidation cycle (Appendix
B) to give an indication of the extent of oxide growth for each sample. The average
mass gain of the samples at each temperature, between 900 and 1000 °C, is plotted
against time in Figure 5.23. For each temperature in the graph, the trends appeared as a
combination of parabolic and linear curves which were composed of a first part with a
higher slope and a second part that was less steep. For the first hundred hours of
oxidation, the mass gain was quick, correlating with the fast growth of the θ-Al 2O3
oxide during the transient stage of oxidation. Then the mass gain slowed down in
accordance to the formation of the slow growing α-Al 2O3. As the temperature increased,
the mass gain rate increased as well which can be explained by looking at the TGO
growth equation found in literature [1]:
h² = 2kpt+C (1) where h is the thickness, t time and kp the parabolic rate constant. Since kp follows the
Arrhenius law, the increase of temperature will greatly influence the rate at which the
TGO grows and so, the mass gain of the samples. The Arrhenius equation for kp is [1]:
+, = +E exp6− Q 1�B 7 (12)
where k0 is the standard rate constant, T is the temperature, E the activation energy
(J/mol) and R the gas constant (J/mol/K). The actual TGO thickness of the modified

Influence of curvature on failure, diffusion and oxide growth mechanisms ____________________________________________________________________________
100 ______________________________________________________________________
aerofoil-shaped samples can be seen in Figure 5.24. The similar trend of the curves
confirms the relation between mass gain and TGO growth. Modelling of the TGO
growth is described in more detail in Chapter VII.
Figure 5.23 Average mass change of samples exposed to temperatures between 900 and 1000 °C as a function of time.
Figure 5.24 Average TGO thicknesses of samples exposed to temperatures between 900 and 1000 °C as a function of time. Errors bars represent the standard deviation.
0.0
0.2
0.4
0.6
0.8
1.0
1.2
1.4
1.6
1.8
0 2000 4000 6000 8000 10000 12000 14000 16000 18000
Mas
s ch
ang
e (m
g/c
m2)
Time (h)
900 °C
925 °C
950 °C
975 °C
1000 °C
0
1
2
3
4
5
6
0 5000 10000 15000 20000
TG
O th
ickn
ess
(µm
)
Time (hours)
900 °C
925 °C
950 °C
975 °C
1000 °C

Influence of curvature on failure, diffusion and oxide growth mechanisms ____________________________________________________________________________
101 ______________________________________________________________________
5.2.2.2 The effect of exposure temperature on the β-depletion and the SRZ
The accelerated growth of the TGO with temperature which was shown by the
accelerated mass gain (Figure 5.23) and TGO thickness (Figure 5.24) was accompanied
by an accelerated depletion of the β-NiAl phase from the BC (Appendix F). Figure 5.25
plots the amount of β-phase remaining in the BC at location C as a function of time for
temperatures between 900 and 950 °C. The time for the samples’ BC to be depleted
decreased as the temperature increased. Samples oxidised at 950 °C were completely
depleted after 4000 hours of exposure while the ones oxidised at 900 °C were
completely depleted after 15,000 hours. The percentage of β-NiAl remaining in the BC
of samples oxidised over 950 °C could not be plotted because at the time the samples
were taken out to be observed under the SEM, in most cases the BC was already totally
depleted.
Figure 5.25 β-NiAl depletion in location C on samples oxidised at temperatures between 900 and 950°C. The dotted line is an estimation of the β-depletion trend.
0
5
10
15
20
25
30
35
40
45
0 5000 10000 15000 20000
% β
-NiA
l rem
ain
ing
Time (hours)
900 °C
925 °C
950 °C

Influence of curvature on failure, diffusion and oxide growth mechanisms ____________________________________________________________________________
102 ______________________________________________________________________
As well as accelerating the depletion of β-NiAl from the BC, the oxidation
temperature seemed to modify the diffusion mechanisms of Al from phases other than β
in the BC. It is important to note that according to the Ni-Al binary phase diagram
(Figure 5.26), as the fraction of Al diminishes in the Ni-Al system at constant
temperature, starting from the β-NiAl phase, it gradually transforms into γ’-Ni 3Al and
then into γ-Ni.
Figure 5.26 Al-Ni binary phase diagram [127]. Added dashed lines represent the temperatures of 900 and 1000 °C. Grey arrow represents the phase change when the amount of Al decreases.
In Figure 5.27 SEM images with enhanced contrast BCs are shown with similar
thickness at location C in samples oxidised at 900, 975 and 1000 °C. The exposure
times of 15,000, 2700 and 1050 hours, respectively, were chosen because they were
close to the end of samples’ life or the start of failure. Also, the TGO thickness, around
5 µm thick, was similar on each of them meaning that a similar amount of Al diffused
from the BC to form the oxide layer. Below 950 °C, the β-NiAl depleted BC was
1800
1600
1400
1200
1000
800
600
4000 0.1 0.2 0.3 0.4 0.5 0.6 0.7 0.8 0.9 1.0
Al Nix(Ni)
Tem
pera
ture
(°C
)
Al 3
Ni
Al 3
Ni 2
AlNiβ
Al 2
Ni 3
γ’
Niγ
Al 3
Ni 5
Liquid
Al

Influence of curvature on failure, diffusion and oxide growth mechanisms ____________________________________________________________________________
103 ______________________________________________________________________
divided into two different zones (Figure 5.27(a)). First, a zone close to the BC surface
contained only the γ-Ni matrix, whose Al level is the lowest in the BC (around 10 at%),
as Al had been used to grow the TGO. This zone can be associated with the outward β-
NiAl depletion zone and measured around 35 µm. Then, the second zone, beneath the
Al-depleted one, was made of a mix of γ-Ni and γ’Ni 3Al, appearing as a light grey
phase on the SEM image. Because this zone’s boundary coincided with the boundary of
the outward Al depletion zone on a large majority of the SEM pictures, it was
considered to correspond to the inward β-depletion zone (in case of a totally depleted
BC).
Figure 5.27 SEM images of phases present in the BC in location C on samples exposed at (a) 900 °C; (b) 975 °C; and (c) 1000 °C for 15,000, 3000 and 1050 hours respectively (samples are close to failure). Black arrows correspond to the outward and inward depletion zones.
50 µm
a)
γ'-Ni3Al
SRZ
γ-Ni (matrix)
50 µm
γ-Ni (matrix)
γ'-Ni3Al
b)
20 µm
β-NiAl
γ-Ni (matrix)
c)

Influence of curvature on failure, diffusion and oxide growth mechanisms ____________________________________________________________________________
104 ______________________________________________________________________
In parallel with the change of diffusion behaviour in the BC with increasing
temperature, made obvious by the re-precipitation of the β-phase from the substrate to
the BC, a modification of the microstructure in the SRZ at the BC/substrate interface
was observed.
Figure 5.28 Effect of the temperature on the microstructure of the SRZ. SEM images (enhanced contrast) of the BC/substrate interface in location C on (a) samples exposed at 950 °C for 4000 hours (b) exposed at 975 °C for 2700 hours; (c) and exposed at 1000 °C for 1050 hours. The black dotted lines represent the BC/Substrate interface. The white arrows represent the SRZ.
Figure 5.28 shows the SEM images, with enhanced contrast, of SRZ at location
C, at increasing temperature in samples close to the end of their lifetime. With
increasing temperature, the amount of TCP close to the BC/Substrate interface rose,
indicating a more pronounced diffusion of heavy elements towards the BC. The
precipitation of the white phase could be caused by an increase in Al content since Al
50 µm
Substrate
BC
SRZ
a)
TCP phase
Cr rich phase
50 µm
Substrate
BC
SRZ
TCP phase
Cr rich phase
b)
20 µm
BC
SRZ
Substrate
TCP phase
c)

Influence of curvature on failure, diffusion and oxide growth mechanisms ____________________________________________________________________________
105 ______________________________________________________________________
reduces the solubility of some heavy elements, such as Ta [47]. At the same time, TCP
close to the SRZ/substrate interface possessed a dot-like microstructure and seemed
evenly scattered unlike at lower temperatures (Figure 5.20) suggesting a change of
lattice orientation. Moreover the progression from the BC to the SRZ of the γ-Ni phase,
characterised by the dark grey matrix, accompanied by the disappearance of the light
grey γ'-Ni3Al, confirms the diffusion of Al (mechanisms will be explained in
section 6.1). Finally, as a remark, the absence of Cr-rich phase in Figure 5.28(c), is not
representative of other samples. As for the TGO, the growth rate of the SRZ increases
with temperature (Figure 5.29). The growth rate calculated from the SRZ thickness data,
considering the behaviour parabolic (as described by equation (1) and shown in Figure
5.29), the growth rate k(SRZ) increased from 7.7x10⁻⁵ µm2/s at 900 °C to 9.8x10⁻⁴ µm2/s at
1000 °C (Table 5.1).
Figure 5.29 Average SRZ thicknesses of samples exposed to temperatures between 900 and 1000 °C compared to a model derived from a parabolic behaviour (Equation (1)) as a function of time. Error bars represent standard error.
0
20
40
60
80
100
120
0 5000 10000 15000 20000
SR
Z th
ickn
ess
(µm
)
Time (hours)
900 °C data
900 °C model
925 °C data
925 °C model
950 °C data
950 °C model
975 °C data
975 °C model
1000 °C data
1000 °C model

Influence of curvature on failure, diffusion and oxide growth mechanisms ____________________________________________________________________________
106 ______________________________________________________________________
Temperature (°C) 900 925 950 975 1000 k(SRZ) (µm2/s) 7.7E-05 1.2E-04 2.2E-04 5.7E-04 9.8E-04
Table 5.1 Table 1 Value of SRZ Growth rate with temperature.
The measured inward and outward β-depletion zone thicknesses are plotted
against time in Figure 30. Important scatter in the data was caused by the rough
TGO/BC and SRZ/BC interfaces. However, generally the trend described by the
outward β-depletion zone thickness as a function of time was similar to the trends
obtain from the TGO thickness data in Figure 5.24 while the trend described by the
inward β-depletion zone thickness as a function of time is similar to the SRZ growth
trend shown in Figure 5.29. This is in accordance with known TGO and SRZ growth
mechanisms which rely respectively on the outward and inward Al diffusion from the
BC.
Figure 5.30 Inward (plain line) and outward (dashed line) β-depletion zone thickness at 900 (black), 925 (red) and 950 (grey) as a function of time.
0
10
20
30
40
50
60
70
0 5000 10000 15000 20000
Dep
letio
n zo
ne t
hick
ness
(µ
m)
Time (hours)

Influence of curvature on failure, diffusion and oxide growth mechanisms ____________________________________________________________________________
107 ______________________________________________________________________
5.2.3 Discussion
Most of the observations made in section 5.2 were in accordance with previous
results found scattered across the literature. The growth of the TGO was sustained by
the diffusion of Al from the β-NiAl phase [44,45] which caused the creation of an Al
outward diffusion zone close to the TGO/BC interface [12,48]. In parallel, Al also
diffused to the substrate, creating the SRZ, composed of γ/γ', α-Cr and TCP phases
[17,19,21,44,46]. An Al inward diffusion zone close to the substrate resulted from this
diffusion. After longer exposure, the β-phase disappeared completely from the BC [48].
The effect of temperature was in accordance with modelling equations found in
literature [12,21,57,58]. Higher temperatures accelerated the diffusion mechanisms
resulting into faster depletion of the β-NiAl phase and faster growth of the TGO and
SRZ (more detail in section 7.2).
The depletion of Al and the growth of the TGO are considered as important
factors leading to the failure of APS/TBC systems [68]. Indeed the lack of Al in the BC,
augments the risks of growing less protective oxides (spinels/mixed oxides) in the TGO,
and prevents the oxide layer re-healing in case of cracking; while the growth of the
TGO increases the stresses between the different layers of the coating system. As a
consequence, with increasing temperature, the failure of samples occurred earlier
(Figure 5.31). The first sign of damage in samples exposed at 1000 °C were noticed
after 1050 hours whereas samples exposed at 900 °C started cracking after 15,000
hours. Moreover, the extent of damage was greater at higher temperatures. At 1000 °C,
the first cracks were spotted after 900 hours of exposure and samples were then
removed after 1500 hours due to significant ceramic TC delamination;, meaning that
critical failure was reached within 600 hours of initial cracking. At 975 °C this

Influence of curvature on failure, diffusion and oxide growth mechanisms ____________________________________________________________________________
108 ______________________________________________________________________
happened between 1950 and 4000 hours, and at 950 °C between 2780 and 5000 hours.
At those temperatures, critical failure was reached within 2050 and 2220 hours of first
cracking observation respectively. Under 950 °C, samples still haven’t experienced
critical failure.
Figure 5.31 Time of exposure after which damage was observed for the first time (by eye, under SEM or using pulsed flash thermography) for samples oxidised at temperatures between 900 and 1000 °C.
5.2.4 Summary
To summarise, when an APS/TBC system is exposed to high temperature
oxidation, the amount of β-NiAl phase, whose purpose is to provide Al for the growth
of the protective Al2O3 layer, reduces with exposure. This produces two β-depletion
zones: one close to the TGO/BC interface (outward depletion of Al) and another close
to the BC/substrate interfaces (inward depletion of Al). Lack of Al leads to the
formation of spinels/mixed oxides in the TGO which are believed to promote the
coating system’s failure. Moreover, in parallel to the TGO growth at the TC/BC
0
2000
4000
6000
8000
10000
12000
14000
16000
900 925 950 975 1000
Tim
e (h
our
s)
Temperature (°C)

Influence of curvature on failure, diffusion and oxide growth mechanisms ____________________________________________________________________________
109 ______________________________________________________________________
interface, a SRZ is produced at the BC/Substrate interface. The difference in Al activity
between the coating and the substrate cause the Al to deplete from the BC toward the
substrate. It was also found that, increasing the oxidation temperature increased the
oxidation rate of the coated system. This is a direct consequence of the accelerated
diffusion of Al and other elements with temperature. The mechanisms of oxidation
change with increasing temperature. This was suggested by different microstructure
observed in the BC and SRZ.
Knowing the basic behaviour of the modified aerofoil-shaped samples, it is now
possible to investigate the effect of the samples’ geometry on the integrity of the coating
system.
5.3 Quantification of APS/TBC features as a function of curvature
The curvature of nine different locations around the samples (Table 4.2 or
Appendix I) was calculated to investigate their influence on the TC and BC thicknesses,
β-NiAl phase depletion and TGO and spinel growth. Curvature was defined as the
inverse of the radius. Many of the results have been published in a journal paper (see
[126]).
5.3.1 Influence of curvature on TC and BC thicknesses
Plotting TC and BC thicknesses against sample curvature showed that at any
temperature, the more convex the surface, the thinner the TC and BC (Figures 5.32 to
5.36). Only the BC in location B with a curvature of 0.14 mm-1, did not follow this
tendency and appeared thinner (regardless of exposure time and temperature).

Influence of curvature on failure, diffusion and oxide growth mechanisms ____________________________________________________________________________
110 ______________________________________________________________________
These results reflect the nature of the coating application processes used in the
manufacture of these samples. The decreasing trends approximated in Figures 5.32 to
5.36 seem almost parallel and are similar for each temperature confirming that the
thickness reduction with curvature was a result of the reproducibility of manufacture
and how the coating thickness varied with angle of incidence and deposition efficiency.
More details about the manufacturing process in section 6.2.
Figure 5.32 Thickness of the TC (black symbols) and the BC (grey symbols) as a function of sample curvature. As deposited sample (diamond) and samples oxidised at 900 °C for 2780 (squares), 4000 (triangles), 7000 (circles), 10,000 (crosses), 15,000 (stars) and 20,000 hours (empty diamonds). Red circles highlight location B and red dashed line is a trend estimation, excluding the data at location B.
0
50
100
150
200
250
300
-0.5 0 0.5 1 1.5 2 2.5 3 3.5
Thi
ckne
ss (
µm
)
Curvature (mm -1)

Influence of curvature on failure, diffusion and oxide growth mechanisms ____________________________________________________________________________
111 ______________________________________________________________________
Figure 5.33 Thickness of the TC (black symbols) and the BC (grey symbols) as a function of sample curvature. As deposited sample (diamond) and samples oxidised at 925 °C for 100 (cross,) 2740 (squares), 4000 (triangles), 7000 (circles) and 10,000 hours (stars). Red circles highlight location B and red dashed line is a trend estimation, excluding the data at location B.
Figure 5.34 Thickness of the TC (black symbols) and the BC (grey symbols) as a function of sample curvature. As deposited sample (diamond) and samples oxidised at 950 °C for 2780(squares), 4000 (triangles) and 5000 hours (circles). Red circles highlight location B and red dashed line is a trend estimation, excluding the data at location B.
0
50
100
150
200
250
300
-0.5 0 0.5 1 1.5 2 2.5 3 3.5
Thi
ckne
ss (
µm
)
Curvature (mm -1)
0
50
100
150
200
250
300
-0.5 0 0.5 1 1.5 2 2.5 3 3.5
Th
ickn
ess
(µm
)
Curvature (mm -1)

Influence of curvature on failure, diffusion and oxide growth mechanisms ____________________________________________________________________________
112 ______________________________________________________________________
Figure 5.35 Thickness of the TC (black symbols) and the BC (grey symbols) as a function of sample curvature. As deposited sample (diamond) and samples oxidised at 975 °C for 2700 (squares) and 4000 hours (triangles). Red circles highlight location B and red dashed line is a trend estimation, excluding the data at location B.
Figure 5.36 Thickness of the TC (black symbols) and the BC (grey symbols) as a function of sample curvature. As deposited sample (diamond) and samples oxidised at 1000°C for 1050 (squares) and 1500 hours (triangles). Red circles highlight location B and red dashed line is a trend estimation, excluding the data at location B.
0
50
100
150
200
250
300
-0.5 0 0.5 1 1.5 2 2.5 3 3.5
Thi
ckne
ss (
µm
)
Curvature (mm -1)
0
50
100
150
200
250
300
-0.5 0 0.5 1 1.5 2 2.5 3 3.5
Thi
ckne
ss (
µm
)
Curvature (mm -1)

Influence of curvature on failure, diffusion and oxide growth mechanisms ____________________________________________________________________________
113 ______________________________________________________________________
5.3.2 Influence of curvature on the β-phase
The amount of β-NiAl remaining in the BC was quantified using an image
analysis software (Image J) (Appendix F), where different phases were distinguished by
their different gray scale values, and was linked to the BC thickness as well as exposure
time/temperature (Figures 5.37 to 5.39). β-NiAl remaining in the BC was measured at
900, 925 and 950 °C, i.e. in samples where β-phase was not completely depleted, after
various exposure times.
Figure 5.37 Comparison of the β-NiAl concentration with the BC thickness (black symbols) and the β-NiAl concentration with the sample curvature (grey symbols). Samples oxidised at 900 °C for 2780 (squares), 4000 (triangles), 7000 (circles), 10,000 (diamonds), 15,000 (stars) and 20,000 hours (crosses). Dashed lines are trend estimations.
20 40 60 80 100 120 140 160
BC thickness (µm)0-0.5 0 0.5 1 1.5 2 2.5 3
Curvature (mm-1)
β-p
hase
(%)
20 40 60 80 100 120 140
Curvature (mm -1)
0
5
10
15
20
25
30
β-p
hase
(%
)

Influence of curvature on failure, diffusion and oxide growth mechanisms ____________________________________________________________________________
114 ______________________________________________________________________
Figure 5.38 Comparison of the β-NiAl concentration with the BC thickness (black symbols) and the β-NiAl concentration with the sample curvature (grey symbols). Samples oxidised at 925 °C for 100 (cross), 2740 (squares), 4000 (triangles), 7000 (circles) and 10,000 hours (diamonds). Dashed lines are trend estimations.
Figure 5.39 Comparison of the β-NiAl concentration with the BC thickness (black symbols) and the β-NiAl concentration with the sample curvature (grey symbols). Samples oxidised at 950°C for 2780 (squares), 4000 (triangles), and 5000 hours (circles). Dashed lines are trend estimations.
20 40 60 80 100 120 140 160
Thickness (µm)
0
5
10
15
20
25
30
35
40
-0.5 0 0.5 1 1.5 2 2.5 3
β-ph
ase
(%)
0-0.5 0 0.5 1 1.5 2 2.5 3
Curvature (mm-1)
β-ph
ase
(%)
(mm-1)Curvature (mm -1)
50 100 150
Thickness (µm)
0
1
2
3
4
5
6
7
8
9
10
β-p
has
e (%
)
0-0.5 0 0.5 1 1.5 2 2.5 3 3.5
Curvature (mm -1)
β-p
hase
(%)
(mm-1)Curvature (mm -1)
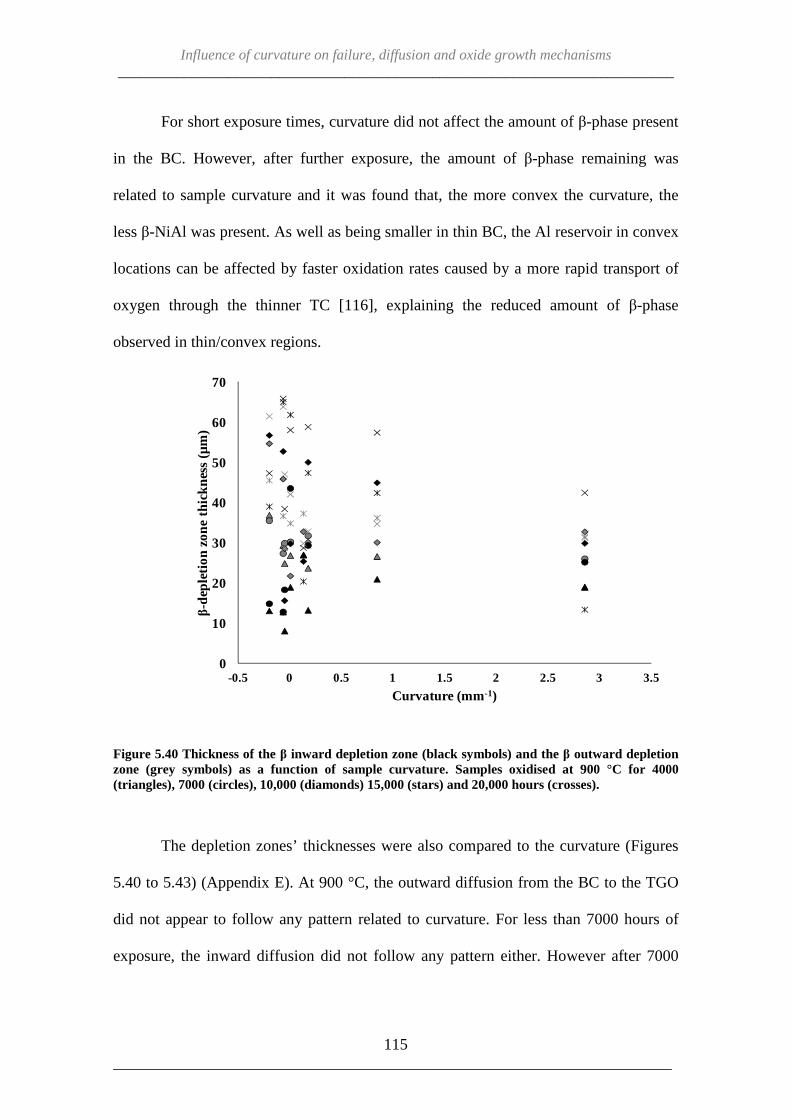
Influence of curvature on failure, diffusion and oxide growth mechanisms ____________________________________________________________________________
115 ______________________________________________________________________
For short exposure times, curvature did not affect the amount of β-phase present
in the BC. However, after further exposure, the amount of β-phase remaining was
related to sample curvature and it was found that, the more convex the curvature, the
less β-NiAl was present. As well as being smaller in thin BC, the Al reservoir in convex
locations can be affected by faster oxidation rates caused by a more rapid transport of
oxygen through the thinner TC [116], explaining the reduced amount of β-phase
observed in thin/convex regions.
Figure 5.40 Thickness of the β inward depletion zone (black symbols) and the β outward depletion zone (grey symbols) as a function of sample curvature. Samples oxidised at 900 °C for 4000 (triangles), 7000 (circles), 10,000 (diamonds) 15,000 (stars) and 20,000 hours (crosses).
The depletion zones’ thicknesses were also compared to the curvature (Figures
5.40 to 5.43) (Appendix E). At 900 °C, the outward diffusion from the BC to the TGO
did not appear to follow any pattern related to curvature. For less than 7000 hours of
exposure, the inward diffusion did not follow any pattern either. However after 7000
0
10
20
30
40
50
60
70
-0.5 0 0.5 1 1.5 2 2.5 3 3.5
β-d
eple
tion
zone
thi
ckne
ss (
µm
)
Curvature (mm -1)

Influence of curvature on failure, diffusion and oxide growth mechanisms ____________________________________________________________________________
116 ______________________________________________________________________
hours, the inward diffusion of Al from the BC to the substrate reduced for more convex
curvatures (Figure 5.40).
Similarly at 925 °C, the outward diffusion from the BC to the TGO did not
follow any obvious pattern with respect to curvature. Under 4000 hours of exposure, the
inward diffusion did not follow any obvious pattern either. However after 7,000 hours,
the inward diffusion of aluminium from the BC to the substrate reduced for more
convex curvatures (Figure 5.41). At 100 hours of exposure, the data does not follow any
trend and this may be explained by the system being in the transient stage of oxidation
rather than the steady-state stage. The abnormally thin microstructure of the β-phase
grains might also have lead to inaccuracy in the measurements.
At 950 °C, there was a clear trend for the inward diffusion of Al from the BC to
the substrate, which reduced for more convex curvatures, whereas the outward diffusion
from the BC to the TGO did not follow any obvious pattern related to curvature as
shown in Figure 5.42. Due to the high oxidation rate of the coating over 950 °C, only a
few data could be measured for samples oxidised at 975 °C and 1000 °C. In Figure 5.43
it can be seen that the outward and inward diffusion of Al from the BC to the substrate
reduced for more convex curvatures.
Generally, the diffusion of Al did not seem to follow any obvious pattern as a
function of curvature. Diffusion is expected to be influenced by the micro-geometry
(roughness) of the interfaces between the different layers of the TBC systems rather
than the macro-geometry (curvature) of the samples.
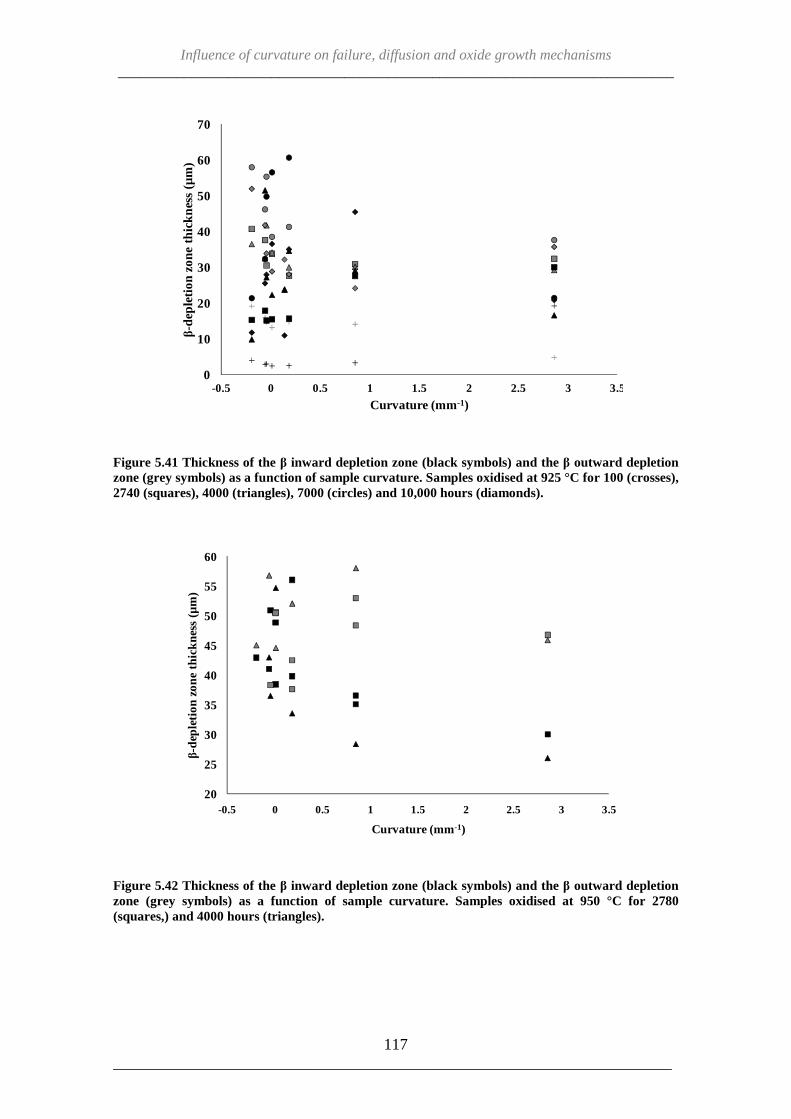
Influence of curvature on failure, diffusion and oxide growth mechanisms ____________________________________________________________________________
117 ______________________________________________________________________
Figure 5.41 Thickness of the β inward depletion zone (black symbols) and the β outward depletion zone (grey symbols) as a function of sample curvature. Samples oxidised at 925 °C for 100 (crosses), 2740 (squares), 4000 (triangles), 7000 (circles) and 10,000 hours (diamonds).
Figure 5.42 Thickness of the β inward depletion zone (black symbols) and the β outward depletion zone (grey symbols) as a function of sample curvature. Samples oxidised at 950 °C for 2780 (squares,) and 4000 hours (triangles).
0
10
20
30
40
50
60
70
-0.5 0 0.5 1 1.5 2 2.5 3 3.5
β-d
eple
tion
zone
thi
ckne
ss (
µm
)
Curvature (mm -1)
20
25
30
35
40
45
50
55
60
-0.5 0 0.5 1 1.5 2 2.5 3 3.5
β-d
eple
tion
zon
e th
ickn
ess
(µm
)
Curvature (mm -1)
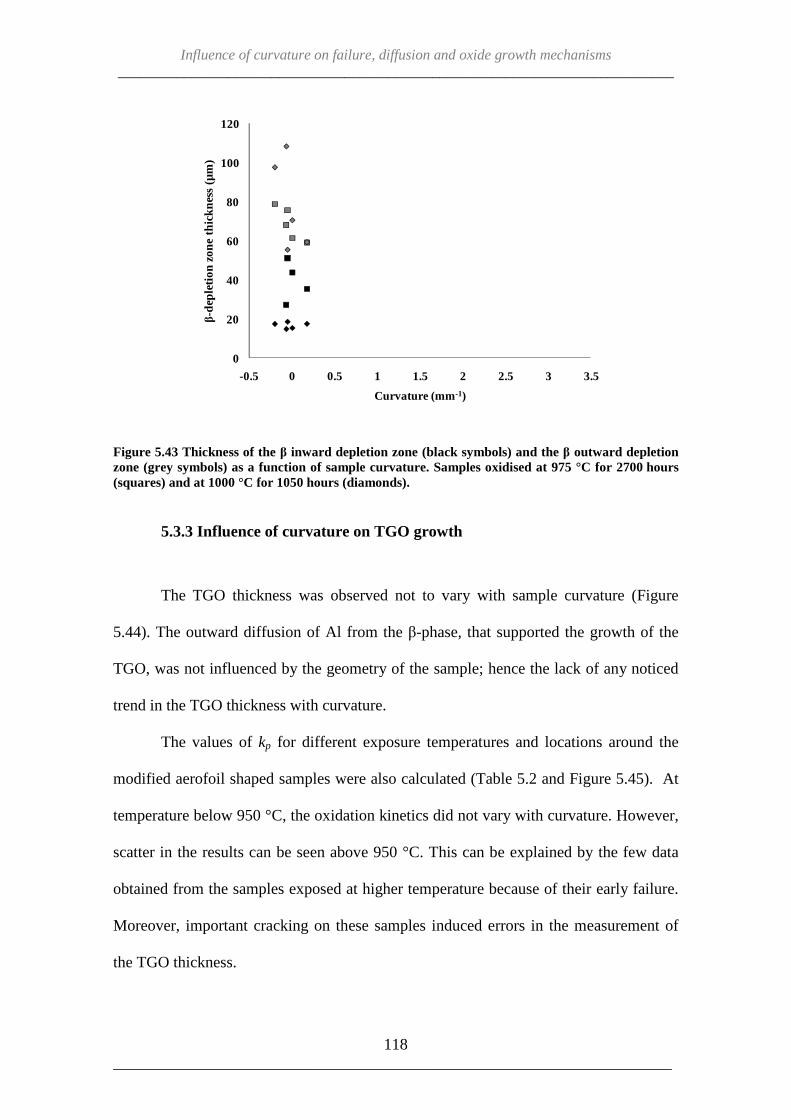
Influence of curvature on failure, diffusion and oxide growth mechanisms ____________________________________________________________________________
118 ______________________________________________________________________
Figure 5.43 Thickness of the β inward depletion zone (black symbols) and the β outward depletion zone (grey symbols) as a function of sample curvature. Samples oxidised at 975 °C for 2700 hours (squares) and at 1000 °C for 1050 hours (diamonds).
5.3.3 Influence of curvature on TGO growth
The TGO thickness was observed not to vary with sample curvature (Figure
5.44). The outward diffusion of Al from the β-phase, that supported the growth of the
TGO, was not influenced by the geometry of the sample; hence the lack of any noticed
trend in the TGO thickness with curvature.
The values of kp for different exposure temperatures and locations around the
modified aerofoil shaped samples were also calculated (Table 5.2 and Figure 5.45). At
temperature below 950 °C, the oxidation kinetics did not vary with curvature. However,
scatter in the results can be seen above 950 °C. This can be explained by the few data
obtained from the samples exposed at higher temperature because of their early failure.
Moreover, important cracking on these samples induced errors in the measurement of
the TGO thickness.
0
20
40
60
80
100
120
-0.5 0 0.5 1 1.5 2 2.5 3 3.5
β-d
eple
tion
zon
e th
ickn
ess
(µm
)
Curvature (mm -1)

Influence of curvature on failure, diffusion and oxide growth mechanisms ____________________________________________________________________________
119 ______________________________________________________________________
At each temperature, the values of kp seemed to decrease slightly for curvatures
close to 0 (Table 5.2). Higher TGO/BC roughness of increasingly concave locations and
the extreme convex geometry of location F explain why the oxidation kinetics increased
in these regions (see Chapter VI for further explanation).
Figure 5.44 Thickness of the TGO thickness as a function of sample curvature. Samples oxidised at 900 (black symbols), 925 (dark grey symbols), 950 (mid grey symbols), 975 (light grey symbols) and 1000 °C (empty symbols) for 1500 (diamond), ~ 2700 (squares), 4000 (triangles) and 5000 hours (circles).
Location Curvature (mm-1) kp (µm/s2) Exposure temperature (°C)
900 925 950 975 1000 A 0.85 4.1E-07 7.2E-07 1.5E-06 3.6E-06 4.3E-06 B 0.14 3.2E-07 7.8E-07 1.6E-06 3.5E-06 4.3E-06 C 0.01 5.7E-07 5.7E-07 1.6E-06 2.8E-06 5.6E-06 D 0.18 3.9E-07 6.5E-07 1.8E-06 3.1E-06 5.0E-06 E Theoretical 0 3.3E-07 7.6E-07 1.3E-06 3.4E-06 3.9E-06 F 2.86 4.9E-07 7.4E-07 1.7E-06 2.7E-06 5.2E-06 a -0.06 3.5E-07 7.1E-07 1.5E-06 2.6E-06 5.6E-06 b -0.05 2.6E-07 6.5E-07 1.7E-06 2.3E-06 4.7E-06 c -0.20 4.8E-07 8.0E-07 1.7E-06 2.5E-06 6.0E-06
Table 5.2 Oxidation kinetics (values of kp) at different locations and exposure temperatures of the BCs on the modified aerofoil-shaped samples.
0
1
2
3
4
5
6
7
-0.5 0 0.5 1 1.5 2 2.5 3
TG
O T
hick
ness
(µ
m)
Curvature (mm -1)

Influence of curvature on failure, diffusion and oxide growth mechanisms ____________________________________________________________________________
120 ______________________________________________________________________
Figure 5.45 Values of kp at 900 (black symbols), 925 (dark grey symbols), 950 (mid grey symbolss), 975 (light grey symbols) and 1000 °C (empty symbols) as a function of curvature.
It was observed that the amount of spinel at 900 and 950 °C reduced
significantly for more convex curvatures (Figure 5.46) (Appendix G). The high fraction
of spinels in location F, with a curvature of 2.86, can be explained by the relatively
sharp trailing edge geometry. Al depletion in this region occurred more rapidly because
of diffusion in multiple directions to support TGO growth resulting in more rapid β-
phase depletion, spinels form earlier and are at higher concentration than in other areas
of the samples.
0.E+00
1.E-06
2.E-06
3.E-06
4.E-06
5.E-06
6.E-06
7.E-06
-0.5 0 0.5 1 1.5 2 2.5 3 3.5
Kp
(µ
²/s)
Curvature (mm -1)

Influence of curvature on failure, diffusion and oxide growth mechanisms ____________________________________________________________________________
121 ______________________________________________________________________
Figure 5.46 Fraction of spinel as a function of sample curvature. Samples oxidised at 900 (black symbols), 925 (red symbols), 950 (mid grey symbols), 975 (light grey symbols) and 1000 °C (empty symbols) for 1500 (diamond), ~ 2700 (squares), 4000 (triangles) and 5000 hours (circles). Red arrow points to the curvature of location F.
5.3.4 Distinction between effect of BC thickness and effect of curvature
The graphs in Figures 5.32 to 5.46 indicate that for more convex curvatures, the
BC and TC thicknesses, β-NiAl fraction and spinel fraction all decrease. However,
because of the relationship between the BC thickness and the β-NiAl fraction it is not
possible to separate geometry effects from BC microstructure and BC thickness itself.
To investigate the actual influence of geometry, two regions on the samples, which have
approximately the same BC thickness but a different curvature (Figure 5.47), were
compared. In this comparison, the temperature and time of exposure were not taken into
account but rather the relative behaviour at locations C and D. It was found that
irrespective of exposure conditions (Table 5.3) the curvature did not influence the
inward Al diffusion (Figure 5.48), the outward Al diffusion (Figure 5.49) or the TGO
0.0
0.1
0.2
0.3
0.4
0.5
0.6
-0.5 0 0.5 1 1.5 2 2.5 3 3.5
Fra
ctio
n o
f spi
nel
Curvature (mm -1)

Influence of curvature on failure, diffusion and oxide growth mechanisms ____________________________________________________________________________
122 ______________________________________________________________________
thickness (Figure 5.50). However, the fraction of spinels appeared to be greater in
location C, in most cases (Figure 5.51).
Figure 5.47 Relative comparison of the BC thickness in region C (diamonds) and D (squares).
Sample Temperature (°C) Time of exposure (hours) 1 900 2780 2 900 2780 3 900 4000 4 900 7000 5 900 10,000 6 900 15,000 7 900 20,000 8 925 100 9 925 2740 10 925 4000 11 925 7000 12 925 10,000 13 950 2780 14 950 4000 15 950 5000 16 975 300 17 975 2700 18 1000 1050 19 1000 1500
Table 5.3 Oxidation conditions of data used in Figures 5.45 to 5.49.
0
20
40
60
80
100
120
140
160
0 2 4 6 8 10 12 14 16 18 20
BC
thic
knes
s (µ
m)
Samples
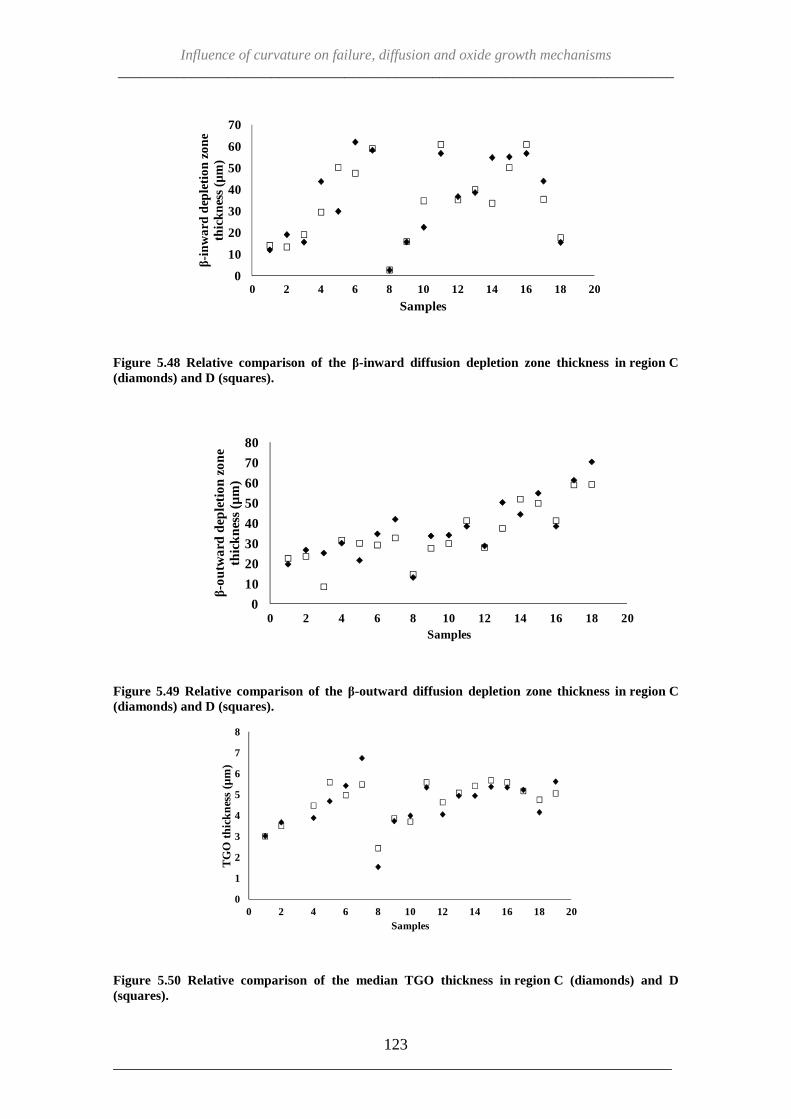
Influence of curvature on failure, diffusion and oxide growth mechanisms ____________________________________________________________________________
123 ______________________________________________________________________
Figure 5.48 Relative comparison of the β-inward diffusion depletion zone thickness in region C (diamonds) and D (squares).
Figure 5.49 Relative comparison of the β-outward diffusion depletion zone thickness in region C (diamonds) and D (squares).
Figure 5.50 Relative comparison of the median TGO thickness in region C (diamonds) and D (squares).
0
10
20
30
40
50
60
70
0 2 4 6 8 10 12 14 16 18 20
β-in
wa
rd d
eple
tion
zone
th
ickn
ess
(µm
)
Samples
0
10
20
30
40
50
60
70
80
0 2 4 6 8 10 12 14 16 18 20
β-o
utw
ard
dep
letio
n z
on
e th
ickn
ess
(µm
)
Samples
0
1
2
3
4
5
6
7
8
0 2 4 6 8 10 12 14 16 18 20
TG
O t
hick
ness
(µ
m)
Samples

Influence of curvature on failure, diffusion and oxide growth mechanisms ____________________________________________________________________________
124 ______________________________________________________________________
Figure 5.51 Relative comparison of the amount of spinel in the TGO in region C (diamonds) and D (squares).
In Figures 5.47 to 5.51, samples have been arranged by severity of oxidation,
plotting the data by increasing exposure temperatures and exposure times. Oxidation
conditions of each set of data were summarised earlier in Table 5.3. By considering this
table of exposures, further remarks to the effect of temperature and time on the
behaviour of the coatings may be made. For example, looking at Figure 5.49, the
outward diffusion of Al for the formation of the TGO seemed to be depended of the
severity of oxidation. Increasing oxidation temperature and time increased, almost
linearly, the depletion in the BC of β-NiAl phase. However, this trend was not followed
by the inward diffusion of Al to the substrate which seemed rather parabolic with time
for each temperature examined, as seen in Figure 5.48 (ignoring point 8 because of the
low exposure time). Finally, the TGO growth reached a plateau when thickness
exceeded 5 µm (Figure 5.50). This did not coincide with the linear growth of the
outward β-depletion zone in the BC suggesting that an excess of Al was used for other
purposes than growing Al2O3.
0.0
0.1
0.2
0.3
0.4
0.5
0.6
0 2 4 6 8 10 12 14 16 18 20
Fra
ctio
n o
f spi
nel
Samples

Influence of curvature on failure, diffusion and oxide growth mechanisms___________________________________
______________________________________________________________________
5.3.5 Discussion - Why is
curvature?
Figure 5.52 shows the state of the TGO around the “bump” (location D/E/c) of
the modified aerofoil shaped
from region D (Figure 5.5
curvature becomes gradually more concave
essentially unchanged, its undulation
Figure 5.52 SEM images of a TGO and spinels in samples exposed at 925 °C for 2740 hours at location D, (b) location E and (c) location c
Spinels and/or mixed, less protective, oxides in the form of clusters, were more
frequently identified in concave regions. These spinels were observed to form at the
Influence of curvature on failure, diffusion and oxide growth mechanisms____________________________________________________________________________
125 ______________________________________________________________________
Why is spinel and mixed oxide formation influenced by
the state of the TGO around the “bump” (location D/E/c) of
the modified aerofoil shaped samples after 2740 hours of exposure at 925 °C
5.52(a)), to E (Figure 5.52(b)) and to c (Figure 5.5
gradually more concave; while the TGO thickness
unchanged, its undulations and irregularities were observed to increase
SEM images of a TGO and spinels in samples exposed at 925 °C for 2740 hours at (c) location c.
Spinels and/or mixed, less protective, oxides in the form of clusters, were more
frequently identified in concave regions. These spinels were observed to form at the
Influence of curvature on failure, diffusion and oxide growth mechanisms _________________________________________
______________________________________________________________________
formation influenced by
the state of the TGO around the “bump” (location D/E/c) of
after 2740 hours of exposure at 925 °C. Travelling
ure 5.52(c)), the
the TGO thickness remained
s and irregularities were observed to increase.
SEM images of a TGO and spinels in samples exposed at 925 °C for 2740 hours at (a)
Spinels and/or mixed, less protective, oxides in the form of clusters, were more
frequently identified in concave regions. These spinels were observed to form at the

Influence of curvature on failure, diffusion and oxide growth mechanisms ____________________________________________________________________________
126 ______________________________________________________________________
TC/TGO interface as well as within the TGO itself. EDX analysis showed that spinels
and mixed oxides growing at the interface contained Ni and Cr as well as Al i.e.
(Cr,Al)2O3 and Ni(Cr,Al)2O4 while the phase formed within the alumina layer was Ti
rich (Figure 5.19). Unlike the TGO, the β-phase outward diffusion zone border did not
undulate which could be explained by Taylor et al.’s [74] theory of an accelerated Al
depletion in asperities. Naumenko et al. [68] highlighted the influence of TGO
roughness on the growth behaviour of various oxides. They found that TGO “peaks”
consisted mainly of pure Al2O3 occasionally covered with spinel nodules and they
associated it with a faster depletion of Y and Al under those regions compared with
TGO “valleys”. The influence of the geometry of the modified aerofoil shaped samples
on the observed fraction of spinels may be associated with the increased undulation of
the TGO in the concave locations.
5.3.6 Summary
To summarise, decreasing TC and BC thicknesses as a function of curvature
indicated that geometry of the modified aerofoil-shaped samples had an impact on the
deposition process of the coating, which in turn also influenced the depletion of the β-
phase. However, further investigation showed that this phenomenon was related to
thickness of the BC rather than the curvature of the substrate. Concave geometries
around the sample (and the sharp trailing edge) seemed to be more prone to spinel
formation. The influence of the geometry of the modified aerofoil shaped samples on
the concentration of spinels could be associated with an increased undulation of the
TGO in the concave locations. This statement however leads to further questions:

Influence of curvature on failure, diffusion and oxide growth mechanisms ____________________________________________________________________________
127 ______________________________________________________________________
- How does BC thickness and TC/BC interface roughness interact with each
other?
- Why do spinels/mixed oxides grow more easily in concave region where the Al
reservoir in the BC is more important?
- Cracking of the coating system does not appear to happen in concave regions.
What factor, more important that the spinel/mixed oxide concentration, reduces
the lifetime of the samples as a function of geometry?
Focus needs to be drawn on the mechanisms occurring in different regions of the
samples in order to identify the intricate effects of curvature, thickness and roughness
on the behaviour of the different layers of the APS/TBC coating system and finally
understand why failure location seems dictated by geometry. In parallel, the change of
TC structure, and consequent effect on the coating integrity, with curvature needs to be
identified. The following sections explore the results and corresponding discussions on
a more detailed study of the influence of the roughness of the TC/BC interface and the
BC thickness on the behaviour of the TBC system.

Influence of BC, TC/BC interface and TC microstructure on the behaviour of APS/TBC _____________________________________________________________________________
128 ______________________________________________________________________

Influence of BC, TC/BC interface and TC microstructure on the behaviour of APS/TBC _____________________________________________________________________________
129 ______________________________________________________________________
CHAPTER VI – INFLUENCE OF BC, TC/BC INTERFACE AND TC MICROSTRUCTURE ON THE BEHAVIOUR
AND FAILURE OF APS/TBC
6.1 Influence of Roughness of the TBC/BC interface and BC thickness
This chapter shows how blade curvature influences BC thickness and TC/BC
roughness during manufacture and how this affects the behaviour of the system during
oxidation. In an attempt to separate the effect of thickness and roughness, thin and thick
BCs with various TC/BC interface roughness were characterised. Ultimately, the
purpose of this investigation is to show whether BC thickness affects the failure
mechanisms of the TBC system and in what way. Samples oxidised at 900 °C were
chosen to study the influence of interface roughness and BC thickness, since all
mechanisms happened more slowly at 900 °C than at higher temperatures. Also, these
samples were exposed for up to 20,000 hours, allowing the collection of more pictures
and data to support this analysis.
6.1.1 Roughness as a function of curvature
HVOF thermal spraying has been found to deposit relatively smooth coatings
compared to plasma spray techniques (e.g. LPPS or shrouded air plasma spraying) [31].
The TC/BC interface at most locations around the modified aerofoil-shaped samples
had small undulations and was relatively smooth as shown in Figure 6.1(a). However,
roughness increased greatly on concave sample features (Figure 6.1(b)) (Chapter V).
Generally, during manufacture, the spraying gun is programmed to travel around the
sample and deposit an equal amount of molten powder in every location. As a molten

Influence of BC, TC/BC interface and TC microstructure on the behaviour of APS/TBC _____________________________________________________________________________
130 ______________________________________________________________________
particle hits the sample surface, it creates a splat. Around convex sample features, a
small part of the splat might spatter the adjacent concave side. That could explain the
greater BC thickness as well as greater interface roughness on such concave features.
The two SEM images in Figure 6.1 were taken from a convex and a concave region of
the same sample. In location c, a concave region, the TGO undulated more and was also
highly uneven in thickness. On the contrary, in location D, a convex region, the TGO
was relatively smooth and even in thickness.
As the geometry of the sample is the main parameter influencing BC thickness
and roughness, the TGO microstructure at locations with different curvatures was
characterised in order to investigate the influence of thickness and/or roughness on the
diffusion behaviour of the coating system. The volume fraction and size of
spinels/mixed oxides in the scale increased the more concave the location (section 5.3).
Even early during exposure (4000 hours), their microstructures were more complex than
those found at more convex locations (microstructure similar to an example at 950 °C is
illustrated in Figure 5.17).
Figure 6.1 SEM images of the TGO and spinels in a sample exposed at 900 °C for 4000 hours. (a) 110 µm thick BC at convex region D and (b) 125 µm thick BC at concave region c.
50 µm
a)
200 µm
b)
SpinelsSpinels

Influence of BC, TC/BC interface and TC microstructure on the behaviour of APS/TBC _____________________________________________________________________________
131 ______________________________________________________________________
Thick BCs seemed to be associated with greater roughness and greater
roughness was accompanied by the formation of less protective oxides. The high
fraction of spinels/mixed oxides suggested that the Al diffusion was also influenced by
the roughness of the TC/BC interface.
The growth of Al2O3, with large fractions of spinels/mixed oxides in the TGO of
thicker BC, was a strong indication that the coating layer was either critically depleted
in Al or physically defective. Two phases of spinel/mixed oxides started to appear in the
TGO at locations with thicker BC on exposed samples after 4000 hours, when the β-
NiAl outward depletion zone measured around 30 µm. On locations with slightly
thinner and smoother BCs, two spinel phases were observed after 7000 hours of
exposure. In that case, the depletion zone was around 30 µm thick, as well and for these
reasons, 30 µm was considered the critical outward depletion width of β-NiAl
promoting the chemical failure for this study.
6.1.2 The influence of BC thickness: the case of thin BCs
6.1.2.1 Can β-depleted thin BCs grow an Al2O3 scale?
In location B, the BC was only 50 µm thick on average and the absence of the
dark grey phase in SEM pictures showed that it was depleted of β-phase after only 2780
hours of exposure at 900°C (Figure 6.2(a)). Critical Al depletion was assumed to have
been reached in an early stage of exposure. Because the depletion of the β-NiAl phase is
often associated to the formation of less protective oxide according to literature [68-71],
it was expected that a high fraction of spinels/mixed oxides would grow in this region of
the sample and that chemical failure would ultimately occur very rapidly. However, not
only did the sample continue to resist oxidation up to 20,000 hours at 900 °C without

Influence of BC, TC/BC interface and TC microstructure on the behaviour of APS/TBC _____________________________________________________________________________
132 ______________________________________________________________________
major failure, but from examination of cross-sections, the TGO was found to grow
steadily and mostly formed a protective Al2O3 scale (Figure 6.2).
Figure 6.3 is a plot of the TGO thickness in the nine locations around the sample
as a function of exposure time. The TGO at location B was as thick as the TGO at any
other region of the sample, within measurement error. This suggested that the TGO
grew at the same rate at location B as around the rest of the modified aerofoil-shaped
sample, indicating that the TGO fed on a source of Al other than solely the β-NiAl
phase. This source could be the γ-Ni rich phase of the BC and/or the γ’- Ni 3Al phase of
the substrate as they both contain Al.
Figure 6.2 SEM images of location B’s BC in samples exposed at 900 °C for (a) 2780 hours; (b) 7000 hours; (c) 10,000 hours and (d) 15,000 hours. The BC is respectively 54, 45, 64, and 54 µm thick on average.
20 µm
BC/Substrate
interface
a)
BC/Substrate
interface
50 µm
b)
20 µm
BC/Substrate
interface
c)
50 µm
BC/Substrate
interface
d)

Influence of BC, TC/BC interface and TC microstructure on the behaviour of APS/TBC _____________________________________________________________________________
133 ______________________________________________________________________
Figure 6.3 TGO thicknesses against exposure time at 900 °C for different locations around the modified aerofoil-shaped samples. Plain, dotted and dashed lines respectively correspond to convex, flat and concave curvatures.
In location F, where the BC was found to measure as little as 20 µm for some
samples, the TGO growth followed the same tendency as the other regions. The
particular geometry of the trailing edge suggested that Al could diffuse laterally as well
as inward and outward. Added to the hypothesis of secondary Al reservoirs, this can
explain how the thin coating (20 µm) could maintain its oxide and integrity.
6.1.2.2 In thin BCs, where does the additional Al diffuse from?
The Al concentration EDX line traces recorded across location B’s depleted BC
are presented in Figure 6.4. Between 7 and 10 points were measured across the BC from
the TGO/BC interface to the BC/substrate interface in order to record the amount of Al
present in the BC. The amount of Al in the middle of the BC decreased from ~12 at%
after 2780 hours of exposure to ~4 at% after 7000 hours of exposure. This tendency was
confirmed after further exposure to 15,000 hours. The Al concentration was observed to
increase again close to the substrate as a result of the inward diffusion which occurred
0
1
2
3
4
5
6
7
8
0 5000 10000 15000 20000
Th
ickn
ess
(µm
)
Time (hours)
A
C
D
E
F
a
b
c
B

Influence of BC, TC/BC interface and TC microstructure on the behaviour of APS/TBC _____________________________________________________________________________
134 ______________________________________________________________________
in the first stages of high temperature exposure leading to the formation of the SRZ. The
continued TGO growth observed in Figure 6.3, despite the low levels of Al in the centre
of the BC means that some Al from the γ-phase must have been used to sustain TGO
growth and repair it when damaged. EDX analysis performed on other depleted
locations around the modified aerofoil-shaped samples indicated that the amount of Al
remaining in these depleted areas had generally fallen to around 8 to 10 at%. After
20,000 hours of exposure, no significant reduction of the amount of Al in the BC was
found. This implied that the source of Al was not the γ-phase in the BC and that this
was also being replenished with the Al from another phase.
Figure 6.4 Amount of Al (at%) in depleted BCs at location B from the TGO/BC to the BC/substrate interface after exposure at 900 °C for 2780 to 20,000 hours.
The possible source of Al to sustain the TGO growth could be the substrate
itself. In section 5.2.2.2, evolution of the SRZ with time and temperature highlighted the
existence of a zone rich in γ'- Ni3Al close to the BC/SRZ interface. Etching of BCs
helped identify 3 different phases present in the different layers. β-NiAl left deep pores
(appearing black in contrast) in the BC, while γ'- Ni3Al, in the SRZ and BC could be
seen as light grey cavities (Figure 5.21). The presence of the γ’-phase in the BC close to
0
4
8
12
16
20
0 10 20 30 40 50 60
Al (
at%
)
Distance from TGO (µm)
2780h
7000h
10,000h
15,000h
20,000h

Influence of BC, TC/BC interface and TC microstructure on the behaviour of APS/TBC _____________________________________________________________________________
135 ______________________________________________________________________
the BC/SRZ interface (Figure 5.27(a)) indicated either that less Al diffused,
transforming β- into γ’- instead of the γ-phase, or that the Al could diffuse from the SRZ
back into the BC.
The evolution of the BC in location B with time is shown in Figure 6.5. Before
oxidation (Figure 6.5(a)), location B had the same microstructure as other locations
around the sample. The BC was made of a γ matrix with β-NiAl precipitates (no γ'-
Ni3Al observed) and the SRZ was composed of a mix of γ, γ', β and TCP phases.
Black inclusions at the BC/substrate interface, caused by grit-blasting before
deposition of the MCrAlY, are an indication of the interface between the BC and the
SRZ, which is delimited by the red dashed line. After 4000 hours at 900 °C, the BC was
depleted of β-NiAl and left a γ/γ’ mix, as explained in section 5.2.2.2. In the SRZ, the
TCP phase was observed to form further into the CMSX-4 substrate, and this element
diffusion left a zone composed of γ’ and γ only close to the BC (Figure 6.5(b)). In the
BC, the γ’-Ni 3Al phase disappeared after 7000 hours of exposure, due to the inward
diffusion of Al into the SRZ (Figure 6.5(c)). Also, the amount of dark grey phase in the
γ'/γ zone of the SRZ seemed to increase, suggesting a transformation of γ' into γ. At this
point, the BC was only composed of the γ phase, therefore containing very low levels of
Al. However, pictures of the BC in location B after 15,000 hours showed that only
Al 2O3 was growing on the BC. At the BC/SRZ interface, propagation of γ’-phase back
into the BC could be seen, and this is more evidence for the hypothesis of reversed
diffusion of Al back into the BC (Figure 6.5(d)).
To summarise, the TGO grew in locations B and F of the BC for 20,000 hours
without critical crack formation, despite complete β-depletion after 2780 hours. As the
oxide layer only had a low fraction of less-protective oxides, the low amounts of Al (~4

Influence of BC, TC/BC interface and TC microstructure on the behaviour of APS/TBC _____________________________________________________________________________
136 ______________________________________________________________________
at%), coming from the γ’-Ni 3Al in the substrate, in the BC/substrate were sufficient
enough to grow and heal the Al2O3 TGO.
Figure 6.5 SEM images of BC and SRZ at Location B on (a) as-deposited sample and on samples exposed at 900 °C for (b) 4000, (c) 7000 and (d) 15,000 hours. Red dashed line delimits the BC/SRZ interface. White arrows represent the propagation of the γ’-Ni 3Al phase. White circle indicate intrusion of SRZ into BC.
6.1.3 The influence of BC thickness: the case of thick BCs
Thicker BCs were shown to be located in concave areas of samples (section 5.3)
and their interfaces with the TC had a high probability of being rougher than other
interfaces around the sample. This is why the diffusion behaviour of Al in thicker BCs
differs from that observed in thinner BC [126].
20 µm
a)
γ'
50 µm
b)
50 µm
c)
50 µm
d)

Influence of BC, TC/BC interface and TC microstructure on the behaviour of APS/TBC _____________________________________________________________________________
137 ______________________________________________________________________
Cross-sectional images from samples around areas with thick BCs showed that
the inner interface of the outward β-depletion zone did not follow the undulations of the
TGO. In Figure 6.6 it can be seen that more Al was consumed under the TGO “peak”
(2) than in a place where the TGO did not undulate (1). The TGO “peak” grew
protective Al2O3 as well as less protective spinel/mixed oxides (circled). Also, while the
Al consumed in (1) was used to grow Al2O3 only, the Al provided by the same amount
of β-depletion allowed a much thicker TGO with spinel/mixed oxides to be grown at (3)
and a thinner TGO with spinel/mixed oxides at (4). From a 3D point of view, this
difference in Al diffusion might be explained by the 3D roughness of the TBC/BC
interface, which increases the surface-to-volume ratio in contact with the supply of
oxygen locally. This changes the local Al activity forcing the Al to diffuse in all
directions down activity gradients. A lack of Al would result in the growth of less-
protective oxides.
Figure 6.6 SEM image of location C’s BC in a sample exposed at 900 °C for 7000 hours. Dashed line indicates limits of outward β-depletion. Dashed circles indicate spinels/mixed oxides. White arrows are used as reference to show the distance between the TGO and the limit of the β-depletion zone.
50 µm
1
2 3 4

Influence of BC, TC/BC interface and TC microstructure on the behaviour of APS/TBC _____________________________________________________________________________
138 ______________________________________________________________________
Grains of the γ- and β-phases in the BC could be observed on etched samples
(Figures 6.7 and 6.8). On as-coated samples (Figure 6.7), the γ- and β- phase grains are
fine and evenly distributed in the BC but etching with phosphoric acid did not allow the
two phases to be distinguished easily.
Figure 6.7 SEM image of (a) the BC and (b) the TC/BC interface at location A on as-coated sample etched with phosphoric acid.
At the TC/BC interface, before the formation of the TGO, the grains looked
deformed and elongated as if they were following the rough geometry of the interface.
This was caused by the HVOF deposition of the MCrAlY, during which the molten
particle travels with enough energy to deform the microstructure of the alloy upon
impact. After oxidation, as shown in Figure 6.8, the grains generally measured between
1 and 6 µm in diameter. In most cases, smaller grains (all γ-Ni) were present close to the
TGO (Figure 6.8(a)) and BC asperities usually contained very fine grains (Figure
6.8(b)).
20 µm
a)
β-NiAl
64
5 µm
b)

Influence of BC, TC/BC interface and TC microstructure on the behaviour of APS/TBC _____________________________________________________________________________
139 ______________________________________________________________________
Figure 6.8 SEM image of the BC in (a) location D and (c) location c in an etched sample oxidised at 900 °C for 2780 hours (cracking caused by etching with hydrochloric acid).
6.1.4 FIB results and study of TGO/BC interface grain boundaries.
To look at grain microstructure in more detail a cross-sectional TEM sample of a
sample oxidised at 900 °C 15,000 hours taken from location B, was prepared using
focused ion beam (FIB) thinning. The location and orientation was chosen so that the
FIB lift-outs would comprise three different layers of the TBC system: BC, TGO and
TC, enabling both interfaces to be examined on the same sample (Figure 6.9).
In Figure 6.10, the TC appears in dark grey contrast at the top of the image.
Beneath it, in light grey contrast, is the TGO whose two microstructures can be seen
clearly. Close to the BC, appearing in dark grey contrast at the bottom of the picture, the
TGO scale has the typical columnar α-Al 2O3 microstructure [29,30,68,134] with an
overlying fine-grained layer which has been identified in literature as a mixed θ-Al 2O3-
ZrO2 zone (confirmed by EDX analysis) [128]. EDX analysis of this zone detected ~ 45
at% of Al, ~ 45at% of O, ~ 1 at% of Zr and traces of Cr, Co and Ni. Pores at the
TGO/BC interface appeared in a very light contrast in TEM imaging (Figures 6.10 and
6.11). They can also be seen on the SEM image in Figure 6.15.
10 µm
a)
5 µm
b)

Influence of BC, TC/BC interface and TC microstructure on the behaviour of APS/TBC _____________________________________________________________________________
140 ______________________________________________________________________
Figure 6.9 FIB image of a lift-out being cut.
Figure 6.10 TEM image of a FIB lift-out from sample 81-BSYA-8 exposed for 15,000 hours at 900 °C. Light grey contrast corresponds to α-Al 2O3, dark grey at the top of the image to the ceramic TC and at the bottom of the image to the BC.
5 µm
BC TGO TC

Influence of BC, TC/BC interface and TC microstructure on the behaviour of APS/TBC _____________________________________________________________________________
141 ______________________________________________________________________
Figure 6.11 TEM image of a FIB lift-out from sample 81-BSYA-8 exposed for 15,000 hours at 900 °C. (a) Light grey contrast corresponds to α-Al 2O3 and dark grey to γ-Ni. Areas analysed by EDX appear in red in (b).
As well as revealing the TGO’s microstructure, TEM imaging enabled the
observation of the grains inside the BC (Figure 6.11(a)). These were fine grains
measuring around 1 µm. To verify if grain boundaries have a direct effect on an
accelerated diffusion of Al, EDX analysis was performed along these grain boundaries
as shown in Figure 6.11(b). The aim of these measurements was to check the variation
of the Al amount between the grains and their boundaries. Results are summarised in
Table 6.1.
Analysis of area 1 in the TGO, confirmed the presence of pure Al2O3, containing
only traces of Cr and Ni. Moving on to the BC, the amount of Al drastically diminished
from 54.2 at% in the Al2O3 TGO to 2.6 at%, representative of the γ-Ni phase. The
difference in Al values detected using the EDX in the SEM, where around 8 at% of Al
was found (Figure 6.4), and the EDX system in the TEM, can be explained by the
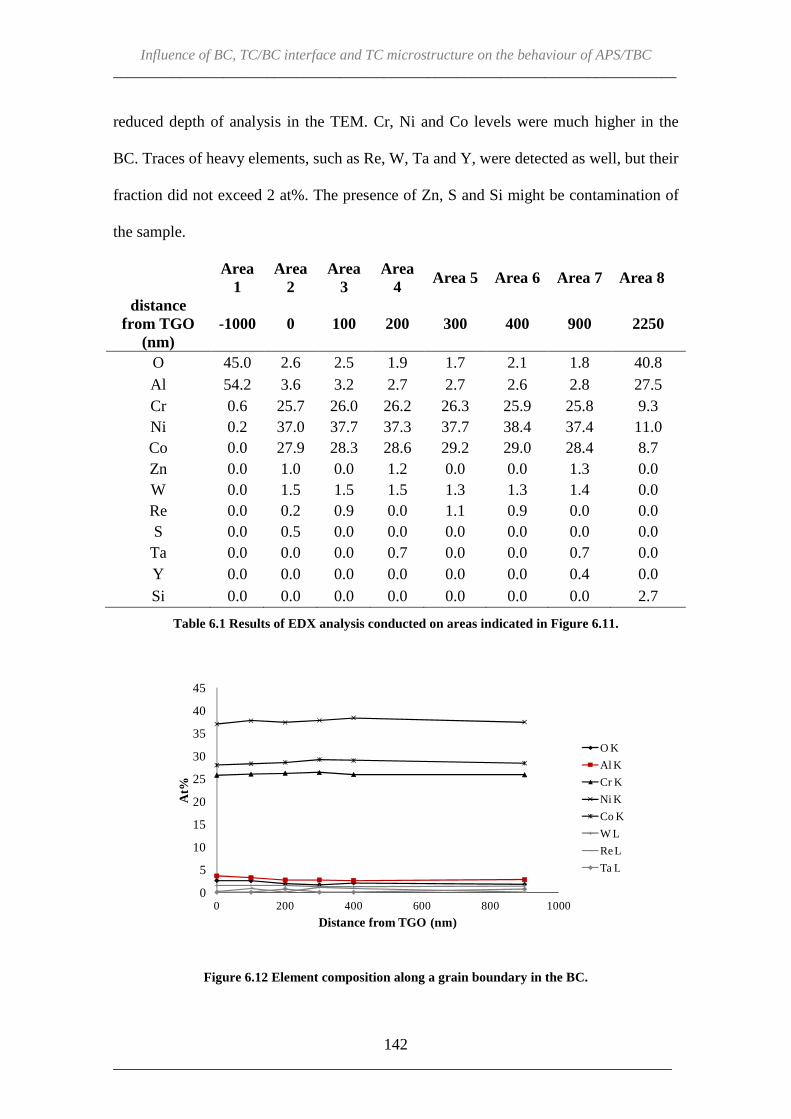
Influence of BC, TC/BC interface and TC microstructure on the behaviour of APS/TBC _____________________________________________________________________________
142 ______________________________________________________________________
reduced depth of analysis in the TEM. Cr, Ni and Co levels were much higher in the
BC. Traces of heavy elements, such as Re, W, Ta and Y, were detected as well, but their
fraction did not exceed 2 at%. The presence of Zn, S and Si might be contamination of
the sample.
Area
1 Area
2 Area
3 Area
4 Area 5 Area 6 Area 7 Area 8
distance from TGO
(nm) -1000 0 100 200 300 400 900 2250
O 45.0 2.6 2.5 1.9 1.7 2.1 1.8 40.8 Al 54.2 3.6 3.2 2.7 2.7 2.6 2.8 27.5 Cr 0.6 25.7 26.0 26.2 26.3 25.9 25.8 9.3 Ni 0.2 37.0 37.7 37.3 37.7 38.4 37.4 11.0 Co 0.0 27.9 28.3 28.6 29.2 29.0 28.4 8.7 Zn 0.0 1.0 0.0 1.2 0.0 0.0 1.3 0.0 W 0.0 1.5 1.5 1.5 1.3 1.3 1.4 0.0 Re 0.0 0.2 0.9 0.0 1.1 0.9 0.0 0.0 S 0.0 0.5 0.0 0.0 0.0 0.0 0.0 0.0 Ta 0.0 0.0 0.0 0.7 0.0 0.0 0.7 0.0 Y 0.0 0.0 0.0 0.0 0.0 0.0 0.4 0.0 Si 0.0 0.0 0.0 0.0 0.0 0.0 0.0 2.7
Table 6.1 Results of EDX analysis conducted on areas indicated in Figure 6.11.
Figure 6.12 Element composition along a grain boundary in the BC.
0
5
10
15
20
25
30
35
40
45
0 200 400 600 800 1000
At%
Distance from TGO (nm)
O K
Al K
Cr K
Ni K
Co K
W L
Re L
Ta L

Influence of BC, TC/BC interface and TC microstructure on the behaviour of APS/TBC _____________________________________________________________________________
143 ______________________________________________________________________
The graph in Figure 6.12 plots the change of the elemental concentration along
the grain boundary, moving away from the TGO and compares it to the composition of
a grain (area 7). The horizontal lines show that there was no difference between
boundaries and centre of grains, in terms of elemental composition.
6.1.5 Discussion – Difference in Al diffusion behaviour depending on BC
thickness.
In section 6.1.2, the study of thin locations around the modified aerofoil-shaped
samples, showed that, despite a smaller Al reservoir and the reported possibility of
accelerated oxidation because of thinner TCs [116], the TGO grew as quickly as at any
other location around the samples. Observation of SEM images at location B, led to the
conclusion that after long exposure times Al diffusion from the substrate to the BC
could be maintaining the Al flux and thus the integrity of the TGO. Following these
observations, a mechanism for Al diffusion in thin BCs is proposed in Figure 6.13. In
as-coated samples, the system starts with a BC composed of β-NiAl and γ-Ni phases
and a thin SRZ made of β-NiAl, γ'-Ni3Al, γ-Ni and TCP phases. The substrate is
characterised by a dendritic γ + γ' structure (Figure 6.13). Pictures (Figure 6.14) of BCs
taken in the transient stage of oxidation showed that in the first stages of oxidation
(Figure 6.13(b)), Al from the β-phase diffused outwardly to form the TGO and
inwardly towards the SRZ with precipitation of the γ'-Ni3Al phase being observed
towards the BC/SRZ interface. Figure 6.13(b) also shows the γ+γ'+TCP layer being
thicker. The microstructure of the SRZ itself did not change much but an increase in
thickness (~10 µm +/- 5) was observed. During the steady-state stage of oxidation,
corresponding to the growth of stable α-Al 2O3 above the BC, two β-depletion zones

Influence of BC, TC/BC interface and TC microstructure on the behaviour of APS/TBC _____________________________________________________________________________
144 ______________________________________________________________________
were observed: one close to the TGO and the other close to the SRZ (Figure 6.13(c)).
The outward depletion zone thickened with time and consisted of γ phase, while the
inward depletion zone, whose thickness also increased, had a γ/γ' mix. At this point, in
the SRZ, the TCP were found to be located further into the substrate, rather than close
to the BC interface and α-Cr started to appear. The TCP phase free zone, close to the
BC interface, was composed of the γ'/γ phases (Figure 6.13(c)). Steps (b) and (c) were
only observed in thick BCs but may have happened in thin BCs too rapidly to be
detected within the time steps used. Figure 6.13(d) represents the completely β- phase
depleted BC, at which point the outward and inward depletion zones join in the BC. The
size of the BC’s γ/γ' zone decreased with time as the outward and inward diffusion of Al
continued. In the SRZ, the amount of γ phase in the TCP phase free zone increased.
Finally, in the case of thin BCs, the diffusion of Al from the BC to the SRZ reversed
and the γ'-Ni3Al phase was observed to form back into the BC (Figure 6.13(e)).
Reduction in Al concentration in the SRZ was also highlighted by the increase in γ
phase (Ni rich) in the TCP phase free zone. This new source of Al to the BC maintains
the growth of the TGO on thin BCs and, therefore, the integrity of thin coating systems.
If we consider that the concentration gradient between the BC and the substrate
provides a driving force for Al diffusion [128], then the diffusion of Al back into the
depleted BC appears likely.
It is believed that TBC systems with larger Al reservoirs have longer lifetimes
[129,130]. Al Badairy et al. [129] studied the breakaway oxidation of FeCrAlY wedge
samples and observed that an increased Al concentration led to an increase in alloy life.
Chemical failure along with crack initiation would always occur at the thinnest part of
their samples. They associated an increase of surface-to-volume ratio with an increase

Influence of BC, TC/BC interface and TC microstructure on the behaviour of APS/TBC _____________________________________________________________________________
145 ______________________________________________________________________
of Al depletion during exposure [129]. Renusch et al. [130] developed a model
confirming the effect of the Al reservoir on the system’s lifetime. They also proposed a
hypothesis that the substrate could provide the TGO with Al. Results shown in section
6.1.2 and Figure 6.13 confirm that, when considering the Al depletion, the BC’s γ-phase
and the substrate’s γ’-phase must also be taken into account.
Figure 6.13 Schematic mechanism of the evolution of phases caused by the diffusion of Al in thin BC. (a) Represents the coating system as-deposited, (b) to (d) show the evolution of phases with exposure and (e) illustrates the hypothesis of reverse diffusion of Al after Al depletion of the BC reduces levels to below those in the substrate.

Influence of BC, TC/BC interface and TC microstructure on the behaviour of APS/TBC _____________________________________________________________________________
146 ______________________________________________________________________
Diffusion of Al from the substrate to the BC does not prevent failure of the
system, but only delays its onset. Indeed, cracking of the modified aerofoil-shaped
samples oxidised at 900 °C was first spotted on the trailing edge, after 15,000 hours of
exposure. It probably initiated at the tip of the trailing edge where the BC and TC were
the thinnest. The crack then propagated along the TGO/BC interface by the coalition of
microcracks (Figure 6.15).
Figure 6.14 SEM image of BC at location C after oxidation at 925 °C for 100 hours. Arrows represent the Al outward diffusion depletion zone and the zone containing γ’ close to the BC/SRZ interface.
Figure 6.15 SEM image of the tip of a crack propagating at the TGO/BC interface at location F in a sample oxidised at 900 °C for 15,000 hours.
20 µm
Outward depletion zone
Presence of γ'
2 µm
Microcracks
Influence of BC, TC/BC interface and TC microstructure on the behaviour of APS/TBC _____________________________________________________________________________
147 ______________________________________________________________________
In section 6.1.3, the greater roughness of the BC/TGO interface on the thicker
coatings, corresponding to concave locations, was found to locally affect the diffusion
of Al. Taylor et al. [74] proposed a model to explain the rapid depletion of Al and the
formation of less protective oxides around TGO peaks. They assumed that “the Al
concentration was determined by the balance between the flux of Al entering the oxide
layer and that arriving at the asperity from the bulk of the coating”. The high surface-to-
volume ratio at TGO peaks would accelerate Al depletion, resulting in a steeper gradient
of Al concentration. Their model predicted the bulk of the asperity could only contain
1 at% Al.
Figure 6.16 shows that this model needs to be reconsidered and that the
mechanisms of Al diffusion in rough coatings are more complex than for those with a
smooth interface. EDX line scans performed through two BC asperities and into the BC
show that the level of Al was constant, within the resolution of the scan, from the
TGO/BC interface to the middle of the BC (at around 10 at%). No or very little Al
gradient could be observed. Another explanation for the rapid β-phase depletion in BC
asperities must be found and the answer may well be held by the grain microstructure of
the BC near the TGO/BC interface.
SEM images of etched samples revealed the presence of finer grains close to the
TGO (Figure 6.7 and 6.8). Diffusion of elements happens faster when grain boundaries
are more numerous. Indeed, the expected bulk diffusion of elements, switches to short-
circuit diffusion at the grain boundaries as the size of the grains is reduced. This could
explain why Al depletion happened faster in asperities and thus when the TGO/BC
interface was rough. Moreover, as Pint et al. [128] observed while studying the
relationship between the adhesion of Al2O3 and substrate composition, spallation

Influence of BC, TC/BC interface and TC microstructure on the behaviour of APS/TBC _____________________________________________________________________________
148 ______________________________________________________________________
resistance was affected by the BC grain size. Their results showed that finer grains in
the BC were more likely to lead to spallation of the TGO at 1150 °C than similar BCs
with larger grains [128].
TEM coupled with EDX analysis did not give any indication on how boundaries
affected the diffusion of elements such as Al and Cr only demonstrating that the
composition was constant and consistent both within the grains and at the grain
boundary. However, it enabled a better view of the TC/TGO (discussed later in section
6.2.3) and TGO/BC interfaces. For this coating system, the chemical bonding of Al2O3
seemed stronger with the ZrO2 than with the MCrAlY and this might explain why
cracks appeared first at the TGO/BC interface.
Figure 6.16 SEM image of BC asperities in location D on a sample oxidised at 900 °C for 7000 hours (a) and measurements of Al concentration along Line 1 and Line 2 (b). Line 1 was repeated at higher magnification in (c).
23.1 µm
Line1
22.4 µm
Line 2
a)
20 µm
b) c)

Influence of BC, TC/BC interface and TC microstructure on the behaviour of APS/TBC _____________________________________________________________________________
149 ______________________________________________________________________
6.1.6 Summary
Thick BCs were observed to be more likely to have spinel/mixed oxide
formation, but the BC roughness and TGO undulations in this region were believed to
aid the growth of those less-protective oxides. Thin BCs were able to maintain the
integrity of their TGO by using Al from other sources after the β-phase depletion (Al
from γ-phase in BC and then Al from the substrate).
The depletion of Al at rough interfaces is believed to be eased by the abundance
of fine grains in BC asperities. However, this assumption could not be verified using the
SEM and the TEM. In general, γ-phase grains were smaller close to the TGO. However,
in thick BCs, larger grains were found away from the TGO whereas in thin BCs, grains
had the same size from the TGO/BC interface to the BC/substrate interface. This
probably explains why Al diffuses more easily across thin plasma or thermally sprayed
BC to sustain the TGO layer (Figure 6.8).
Finally, it is important to consider the BC thickness when assessing the lifetime
of an APS/TBC system. Thin and thick BCs give rise to different mechanisms of failure
(Chapter V). It is essential to study the oxidation of BCs to identify failure mechanisms
since the TGO growth and change in microstructure is known to promote interfacial
debonding. However, to understand fully the APS/TBC system, it is also important to
study the ceramic TC as well.
Influence of BC, TC/BC interface and TC microstructure on the behaviour of APS/TBC _____________________________________________________________________________
150 ______________________________________________________________________
6.2 Effect of the modified aerofoil-shaped sample’s geometry on the behaviour of the TC and the TC/BC interface.
TCs’ particular microstructure, composed of deposition splats, inter-splat
boundaries, microcracks and pores (Figure 6.17(a)), makes the APS YSZ a delicate
material to study. Indeed, the presence of those defects affects local residual stresses,
oxygen diffusion and as a consequence, failure mechanisms (as well as heat transfer
through the coating). Moreover, the porous microstructure makes mechanistic
experimentation difficult and induces a large scatter in results.
Section 6.2 presents the results of the observations of modified aerofoil-shaped
samples’ TCs and the impact of geometry on their microstructure and behaviour. The
main focus is on the ceramic layer as a whole and also on the region close to the
TC/TGO interface. As for the work on BCs, the effect of TC thickness and interface
roughness is looked at and failure mechanisms (via the propagation of cracks) taking
those parameters into account are suggested.
Samples oxidised at 925 °C were used as a representative example because the
kinetics of the mechanisms were slow at this temperature and data on the transient stage
of oxidation was available (from a sample taken out after 100 hours of exposure). The
fast growth of the oxide during the transient stage of oxidation and the large volume
change that this involved, between the BC and TC, might result in a particular TC
behaviour, and so is worth considering. For this purpose, additional samples provided
by Rolls-Royce (section 4.1.3) were exposed at 925 °C for up to 200 hours and the TGO
growth behaviour as a function of roughness was investigated (section 6.2.3).

Influence of BC, TC/BC interface and TC microstructure on the behaviour of APS/TBC _____________________________________________________________________________
151 ______________________________________________________________________
6.2.1 Influence of the geometry on TC microstructure
6.2.1.1 Flat locations
Because of its flat curvature, TC’s microstructure at location C was taken as a
reference. Figure 6.17 shows the evolution of the TC between 0 and 7000 hours.
Features common to plasma sprayed coatings, such as horizontal splat boundaries,
microcracks into the splats and pores could be observed (Figure 6.17(a)). 6 deposition
layers separated by thick splat boundaries were counted (Figure 6.17(b)). They were
created as the powder particles cooled down between each passage of the spray gun
during manufacturing. In early stages of exposure (Figure 6.17(c)), a lot of short splat
boundaries, microcracks and pores were present in the TC.
Figure 6.17 SEM image of TC in location C in (a) as-deposited sample and (b) its schematical representation as well as SEM images of samples oxidised at 925 °C for (c) 100 hours and (d) 7000 hours. White arrows on left hand side represent deposition layers.
100 µm
Splat boundariesMicrocracks
Pores
a) b)
100 µm
c)
100 µm
d)

Influence of BC, TC/BC interface and TC microstructure on the behaviour of APS/TBC _____________________________________________________________________________
152 ______________________________________________________________________
After 7000 hours (Figure 6.17(d)), the number of splat boundaries decreased but
their length increased suggesting the coalescence of those splats, or the formation of
cracks linking them together. Also, fewer microcracks and fewer pores indicated a
reduction of porosity (slight sintering).
6.2.1.2 Convex locations
The ceramic microstructure in convex areas of the modified aerofoil-shaped
sample was different to that found on flat regions, as highlighted by images taken at
location A, representative of a sample’s convex feature (Figure 6.18). As for areas of
flat curvature, 6 deposition layers could be counted. In the early stages of exposure, the
ceramic TC contained numerous short inter-splat boundaries that seemed to link
together with exposure. Simultaneously, the pores and microcracks, very present in
Figure 6.18(a), disappeared with further oxidation. However, unlike flat regions, splat
boundaries were not all parallel to the BC surface but present in a more random
organisation.
After 7000 hours, cracks started to propagate along the TGO/BC interface of the
sample’s convex regions. At the same time, the ceramic started to crack vertically,
driving inter-splat boundaries of different deposition layers to link together (Figure
6.18(c)). The widening of these vertical cracks, from the BC to the surface, associated
with cracking in the TGO, promoted delamination and then the coating system’s failure.
Wide vertical cracks through the TC were only observed on convex regions.

Influence of BC, TC/BC interface and TC microstructure on the behaviour of APS/TBC _____________________________________________________________________________
153 ______________________________________________________________________
Figure 6.18 SEM image of TC in location A in sample oxidised at 925 °C for (a) 100, (b) 4000 and (c) 7000 hours. White arrows on left hand side (a) represent deposition layers. Red arrows (c) point at vertical cracking.
Figure 6.19 (a) SEM image of TC in location F in sample oxidised at 925 °C for 4000 hours and (b) its schematic representation.
Moving on to the trailing edge (location F), where the curvature is extremely
convex, the deposition layers, which amount reduced to 5 rather than 6, did not follow
50 µm
a)
50 µm
b)
50 µmCrack at TGO/BC
c)
100 µm
a) b)

Influence of BC, TC/BC interface and TC microstructure on the behaviour of APS/TBC _____________________________________________________________________________
154 ______________________________________________________________________
the thin geometry of the blade (Figure 6.19). Instead, inter-splat boundaries linked with
the surface. This feature of the manufacturing process was not observed at less convex
curvatures (presumably as a result of the motion of the spray gun around the sample).
Large inter-splat boundaries or microcracks open to the surface would be expected to
ease the propagation of cracks trough the TC at that location and the eventual spallation
of the TC during the course of the exposure.
6.2.1.3 Concave locations
Concave curvatures, as explained in section 6.1, have the potential to be rougher
than other areas (because of the spraying process).
Figure 6.20 SEM image of TC in location a in (a) an as-deposited sample and samples oxidised at 925 °C for (b) 2740 and (c) 7000 hours. Red arrows point at vertical micro cracks.
100 µm
a)
100 µm
b)
100 µm
c)

Influence of BC, TC/BC interface and TC microstructure on the behaviour of APS/TBC _____________________________________________________________________________
155 ______________________________________________________________________
Counting deposition layers was more difficult because of this roughness, but
seemed to be around 6 in most cases. The TC surface roughness amplitude can be seen
in Figure 6.20. Roughness seemed to be related to the formation of vertical cracks at the
surface of the TC (red arrows on Figure 6.20). During the first 2740 hours of exposure,
these vertical cracks grew open (Figure 6.20(b)). After 7000 hours, it was more difficult
to observe these cracks, suggesting that a combination of compressive stresses and the
concave curvature had forced their closure. The vertical cracks did not propagate to the
lower region of the TC. It is not clear if these cracks have a detrimental effect on the
lifetime of the coating.
The particular microstructures observed on samples exposed at 925 °C were also
spotted on the modified aerofoil-shaped samples oxidised at other temperatures, as is
summarised in Table 6.2. Vertical microcracks in concave TCs were present on all the
concave locations of every modified aerofoil-shaped sample used for experimentation.
The manufacturing features found at the trailing edges were more difficult to observe
but were present in most cases. Concerning the vertical macro- cracking of the TC in
convex locations; these could not be observed on samples oxidised at 900 °C and most
of the ones exposed at 925 °C because they had not reached the end of their life at the
time of observation. These preliminary results tend to show that convex features
promote the development of critical cracks in the TCs, which eventually lead to failure
(section 6.2.4).

Influence of BC, TC/BC interface and TC microstructure on the behaviour of APS/TBC _____________________________________________________________________________
156 ______________________________________________________________________
Temperature (°C)
Time (hours)
Vertical microcracks in
concave TC Abnormal deposition layers in convex TC
Vertical crack through convex
TC 0 0 + + +
900 2780 + + 4000 + 7000 +
10,000 + + 15,000 + +
20,000 + + 925 100 + +
2740 + + 4000 + + 7000 + + +
10,000 + + 950 2780 + + +
4000 + + 5000 + +
975 300 + 2700 + + +
3000 + + + 1000 1050 + + +
1500 + + +
Table 6.2 Summary of observations of particular features observed in ceramic TCs depending on curvature, made in samples oxidised from 900 °C to 1000 °C.
6.2.2 The TC/TGO interface’s microstructure
6.2.2.1 YSZ splats configuration at the TC/TGO interface
In APS/TBC systems, the roughness of the TC/BC interface is one of many
factors promoting the failure of the whole coating system. One explanation is that rough
surfaces produce convoluted scales with higher out-of-plane stress, contributing to
spallation [128] (section 2.3.3.2). To investigate the effect of roughness at the TC/BC
interfaces, SEM images at every location around the samples oxidised at 925 °C were
compared.

Influence of BC, TC/BC interface and TC microstructure on the behaviour of APS/TBC _____________________________________________________________________________
157 ______________________________________________________________________
As a result, four types of TC protrusion into the BC were observed. Their
microstructures depended on the splat particles layout (Figure 6.21).
Figure 6.21 SEM image of TC/BC interface from (a) location B, (b) location D, (c) location F and (d) location A, in sample oxidised at 925 °C for 100 hours. Highlighted areas represent YSZ powder particles.
Type 1, in Figure 6.21(a), occurred on deep and broad undulations filled by a
single splat particle. This type of protrusion appeared during manufacture when a single
molten TC powder particle was deposited on the bare BC. After exposure, the TGO
contoured that protrusion. Type 2 protrusions, in Figure 6.21(b), were also filled by a
single splat particle but unlike Type 1, the protrusion was convoluted and small. This
configuration was the result of an initial rough BC surface on which the YSZ molten
particle landed, coupled to TGO growth stresses created during oxidation causing the
protrusion to deform and the ceramic to be trapped by Al2O3. Type 3 in Figure 6.21(c)
20 µm
a)
20 µm
b)
10 µm
c)
20 µm
d)

Influence of BC, TC/BC interface and TC microstructure on the behaviour of APS/TBC _____________________________________________________________________________
158 ______________________________________________________________________
occurred when the protrusion was deep and broad with splats particles following the
shape of the BC surface. Unlike Type 1, the particle did not keep a round shape but
flattened and elongated. Type 4 protrusions, Figure 6.21(d), were observed to be
shallow and narrow undulations filled with one or several small splat particles; with the
upper boundary of the splat usually being aligned with the edges of the protrusion.
These four types, (and their combinations), describe almost all the kinds of TC
asperities encountered at the TC/BC interface. The stresses gradient generated between
the TC and the TGO is most likely to differ around various kinds of protrusions, leading
to different crack profiles as shown in Figure 6.22.
Figure 6.22 SEM image of cracks running into the TGO at TC/TGO in the case of (a) Type 2, (b) Type 3 and (c) Type 4 microstructures. (d) Without TGO undulation cracks were located at TGO/BC interface.
10 µm
a)
10 µm
b)
10 µm
c)
20 µm
d)

Influence of BC, TC/BC interface and TC microstructure on the behaviour of APS/TBC _____________________________________________________________________________
159 ______________________________________________________________________
In Figure 6.22(a), Type 2 protrusions caused a crack initially propagating in the
TGO (or at the TGO/BC interface, depending on propagation direction), to travel
through the TC and caused the ceramic to crack. In the presence of a Type 3 asperity
(Figure 6.22(b)), the crack followed the inter-splat boundary and travelled through the
TC instead of propagating in the TGO. For Type 4 (Figure 6.22(c)), undulation of the
TGO was wider than a Type 2 layout, but acted in the same way. No examples were
found of cracks encountering a Type 1 asperity, suggesting that they do not promote the
formation and/or propagation of cracks. When the TGO was less rough, cracks would
propagate along the TGO/BC interface as seen in Figure 6.22(d).
6.2.2.2 Presence of spinels at the TC/TGO interface
Spinel/mixed oxides change the mechanical properties of the TC and the TGO
and reduce the TC/TGO and TGO/BC adhesion [36,50,51,78,79]. Added to the large
volume change of those particles at the TC/BC interface, recognised to induce stresses,
the Ni, Co and Cr contained in the spinels (especially large ones in concave locations of
samples) grew into the TC (infiltrating micro-cracks) and created oxides in the cracks
and/or splat boundaries (Figures 6.23(a) and 6.24). It locally increased the amount of
stress in the TC eventually leading to cracking into the TC (Figure 6.23(b)).
It was interesting to notice that in almost all of cases, spinels/mixed oxides were
connected to a crack/splat boundary in the TC (Figure 6.25). The isolated islands of
spinel present into the TC suggested that spinels diffused along such cracks. The
oxygen partial pressure was higher in these areas, which could help the growth of
spinels instead of Al2O3 (Al2O3 needs a lower minimum oxygen partial pressure to form

Influence of BC, TC/BC interface and TC microstructure on the behaviour of APS/TBC _____________________________________________________________________________
160 ______________________________________________________________________
[12]). Although, spinels were associated with cracks, cracks did not always lead to
spinel formation.
Figure 6.23 SEM image of (a) spinel/mixed oxides in TGO at location b in sample oxidised at 925 °C for 7000 hours and (b) crack propagating through infiltrated TC at location c in sample oxidised at 975 °C for 2700 hours. Black dashed arrows point to diffusion of oxide into the ceramic TC.
Figure 6.24 EDX mapping of oxide showed in Figure 6.23(a).
20 µm
(Cr,Al)2(Ni,Co)O4
Al 2O3 (Ni,Co)O
a)
20 µm
Crack through TC with infiltrated spinel/mixed oxide
b)
Electron image O Ka1 Al Ka1
Cr Ka1 Co Ka1 Ni Ka1

Influence of BC, TC/BC interface and TC microstructure on the behaviour of APS/TBC _____________________________________________________________________________
161 ______________________________________________________________________
Figure 6.25 SEM image of spinel/mixed oxides in TGO from location a in sample oxidised at 925 °C for 7000 hours. (a) Original image. (b) Red dashed lines are cracks/splat boundaries linked to spinels.
The same features were observed on samples oxidised at other temperatures as
summarised in Table 6.3. The different types of TC asperities were not observed at
every temperature or exposure time which might suggest that stress states and/or
oxidation mechanisms change with exposure conditions (Type 2 asperities) and that
some Types of asperities have lower probability to be formed during manufacture (Type
1 and Type 3). Lower temperature oxidation (e.g. at 900 °C) involves longer exposure
times which could leave enough time for the TC/TGO and TGO/BC interfaces to
accommodate stresses. Also, ceramic TCs oxidised at high temperatures (1000 °C) are
more likely to sinter, making it more difficult to observe micro-cracks and pores in the
YSZ.
20 µm
a)
20 µm
Spinels linked to a crack/splat boundary
Spinels into TC
b)

Influence of BC, TC/BC interface and TC microstructure on the behaviour of APS/TBC _____________________________________________________________________________
162 ______________________________________________________________________
Temp. (°C)
Time (hours)
Type 1 TC
asperity
Type 2 TC
asperity
Type 3 TC
asperity
Type 4 TC
asperity
Spinel into TC
Spinel linked to TC crack
0 0 + + + +
900 2780 + + + + +
4000 + + + + + +
7000 + + + + + +
10,000 + + + + + +
15,000 + + + + +
20,000 + + + + + +
925 100 + + + + + +
2740 + + + + + +
4000 + + + + + +
7000 + + + + + +
10,000 + + + + + +
950 2780 + + + +
4000 + + + +
5000 + + + + + +
975 300 + + + +
2700 + + + + +
3000 + + + +
1000 1050 + + + +
1500 + + + +
Table 6.3 Summary of observation, made in samples oxidised from 900 °C to 1000 °C, of particular features observed at the TC/BC interface.
6.2.3 Study of the initial stages of oxidation (Rolls-Royce samples)
6.2.3.1 Evolution of TC/BC interface and TGO on Rolls-Royce samples
Additional APS/TBC samples were provided by Rolls-Royce in order to gather
more information on the initial stages of oxidation. The areas of main interest were
around the interface between the YSZ TC and MCrAlY BC, and the adhesion between
the two layers. Moreover, the evolution of the TGO in the first hours of oxidation would
provide information on how the microstructures of the TC and the BC influence the

Influence of BC, TC/BC interface and TC microstructure on the behaviour of APS/TBC _____________________________________________________________________________
163 ______________________________________________________________________
nature of the TGO and could promote the growth of less-protective oxides. These
samples were exposed at 925 °C for up to 200 hours (section 4.1.3).
SEM observations of an as-coated sample showed that before exposure a TGO
was already present between the TC and BC. This 0.3 to 0.5 µm thick layer was mostly
continuous (Figure 6.26(a)), but could become discontinuous in some places (Figure
6.26(b)). This was due to a significant difference between the manufacturing of the
Rolls-Royce and modified aerofoil-shaped samples (heat treatment before deposition of
TBC). EDX analysis detected the presence of Al (7 to 28 at%), Zr (2 to 20 at%), Co (1
to 13 at%), Ni (1.5 to 14.5 at%) and Cr (2.5 to 13 at%) oxides suggesting that the TGO
was a mix of Al2O3, ZrO2 and spinels in various places. Similar mixed oxide layers
were observed in the literature between EBPVD/TBCs and MCrAlYs and were found to
be caused by the BC heat treatment before deposition of the ceramic [134-137].
Figure 6.26 SEM images of as-received RR sample, taken at a flat location, showing a (a) continuous and (b) discontinuous TGO between the APS/TBC and BC.
According to Murphy et al. [135], the formation of the Al2O3+ZrO2 mixed zone
is promoted by the presence of transient Al2O3 (γ or θ). This was confirmed by Levi et
al. [135], as well as Jarayam et al. [138], who stated that ZrO2 is much more soluble in
metastable Al2O3 than in stable α-Al 2O3. Indeed, an initial layer of γ-Al 2O3 could
5 µm
TBC
BC
TGO
a)
2 µm
TBC
BC
TGO
b)

Influence of BC, TC/BC interface and TC microstructure on the behaviour of APS/TBC _____________________________________________________________________________
164 ______________________________________________________________________
dissolve and contain up to 17 mol% YSZ; and θ-Al 2O3 up to 40 mol%. Levi et al. [135]
made the hypothesis that Zr and Y were able to slow down the conversion from γ- to α-
phases and thus delay the transition between TGO growth mechanisms by Al outward
diffusion and O inward diffusion [134]. Exposures in these studies were usually over
1000 °C [134-137], making the solid state diffusion of elements easier between the two
layers. However, the Rolls-Royce samples in this thesis were exposed at 925 °C,
suggesting that the initial mixed zone was created during a short heat treatment at
1100 °C (carried out during the manufacturing process) and further growth of the mixed
zone would be more a physical phenomena (growth of oxides in TC micro-cracks) than
a chemical one (interdiffusion of Zr and Al). The thermodynamically stable θ-Al 2O3
phase present in the TGO at this temperature grew between the micro-cracks in the TC,
this creating a fine network of Al2O3 and ZrO2.
In concave areas of the RR samples, what initially appeared to be TGO in some
places was just in fact an absence of cohesion between the BC and TC (no TGO)
(Figure 6.27). Also, the high roughness of the TC/BC promoted the presence of pores in
the BC and at the interface (Figure 6.28(a)).
Figure 6.27 SEM image of as-received RR sample, taken at a concave location, showing the absence of TGO between the TBC and BC.
10 µm
TBC
BC
No TGO

Influence of BC, TC/BC interface and TC microstructure on the behaviour of APS/TBC _____________________________________________________________________________
165 ______________________________________________________________________
Upon further oxidation, the gradual growth of TGO into big pores at the TC/BC
interface caused splats of MCrAlY to be stuck between oxides and ceramic
(Figure 6.28(b)). These islands were good candidates to grow spinels with further
oxidation. After 150 hours of exposure, they were almost completely depleted of β-NiAl
(Figure 6.28(c)).
At the same time, the TGO layer at the TBC/BC interface became more
continuous and it reached thicknesses of between 1.5 and 4 µm after 200 hours at
925 °C. SEM images of the oxide layer showed that it was not composed of pure Al2O3.
Indeed, diffusion of elements from the TBC into the TGO and/or diffusion of elements
from the BC into the TGO seem to be occurring according to the network of light
contrast into the dark Al2O3 (Figures 6.29).
Figure 6.28 SEM images of (a) as-received RR sample and samples exposed for (b) 50 and (c) 150 hours at 925 °C, showing the presence of pores in the BC close to the TBC/BC interface.
10 µm
TBC
BC
Pore in BC
a)
TBC
BCPore in BC
Isolated BC
b)
10 µm
TBC
BC
Pore in BC
Isolated BC
c)
20 µm

Influence of BC, TC/BC interface and TC microstructure on the behaviour of APS/TBC _____________________________________________________________________________
166 ______________________________________________________________________
Figure 6.29 SEM images of RR sample exposed for 50 hours, taken at a flat location, of the TGO (a). Image is magnified in (b). Red numbers indicate location of EDX analysis.
Figure 6.30 SEM images of samples exposed for (a) 150 and (b) 200 hours, taken at a flat location, of the interdiffusion between TC and TGO.
The local roughness of the interface between the TC and the TGO was found to
influence greatly the interdiffusion between the TC and the TGO. Indeed, in the
presence of fine protrusions of ceramic into the TGO, the Al2O3 seemed to infiltrate
deeper into the YZS than around areas of lesser roughness or bigger undulations by
filling physical holes present in the TC. In some cases, it led to the isolation of TC
islands into the TGO as in Figure 6.30(a), or to a protrusion of TC laced with channels
5 µm
TBC
BC
Al2O3+ZrO2
Spinel
1
2
34
5
a)
2 µm
TBCBC
Al2O3+ZrO2
Spinel
b)
2 µm
TBC
BC
Al2O3+ZrO2
a)
2 µm
TBC
BC
Al2O3+ZrO2
b)

Influence of BC, TC/BC interface and TC microstructure on the behaviour of APS/TBC _____________________________________________________________________________
167 ______________________________________________________________________
of Al2O3 as shown in Figure 6.30(b). The question is: has this mixed zone a detrimental
effect on the coating’s adhesion and integrity or not? (section 6.2.4)
6.2.3.2 Comparison with the modified aerofoil-shaped samples
The observations made on the Rolls Royce APS/TBC samples were compared to
the modified aerofoil-shaped samples, concentrating on features such as the mixed
zones, the presence of pores caused by the roughness of the TC/BC interface and the
growth of spinels. Some TGO was present on the modified aerofoil shaped samples
before exposure at 925 °C. However, it was not continuous (Figure 6.31(a) and (b)) and
internal oxidation seemed to prevail (Figure 6.31(c) and (d)) regardless of the location
around the sample.
Figure 6.31 SEM images of as-coated modified aerofoil-shaped samples’ TC/BC interface at locations (a) B, (b) C, (c) c and (d) F. Sample shown in (d) was etched using phosphoric acid.
5 µm
TBC
BC
TGO
Internal oxidation
a)
5 µm
TBC
BC
TGO
b)
5 µm
TBC
BC
Internal oxidation
c)
5 µm
TBC
BC
Internal oxidation
TGO
d)

Influence of BC, TC/BC interface and TC microstructure on the behaviour of APS/TBC _____________________________________________________________________________
168 ______________________________________________________________________
This level internal oxidation causes some islands of BC to be isolated from the
rest of the MCrAlY with exposure, as seen in Figure 6.32. In the case of the Rolls-
Royce samples, the isolation of these islands seemed to be as a consequence of the
roughness of the TC/BC interface (Figure 6.28), whereas for the modified aerofoil-
shaped samples, it happened around relatively flat interfaces.
The Al2O3-ZrO2 mixed zone was observed on the 925 °C modified aerofoil-
shaped sample exposed for 100 hours indicating the presence of transient Al2O3 in the
first stages of oxidation. Figure 6.33(a) shows that most of the TGO layer was made of
the Al2O3-ZrO2 mixed zone. The infiltration of Al2O3 into Zr is characterised by its
lighter contrast. After longer exposure at 900 °C (comparable to 925 °C), the thickness
of the Al2O3-ZrO2 mixed zone was equal or smaller than the one of α-Al 2O3 and not
present all around the samples suggesting that some of it was converted into the most
stable form of Al2O3. However, some particles of Zr could still be observed in the TGO
as well as some diffusion of Al2O3 into the TC as shown in Figures 6.33(b) and 6.34.
Figure 6.32 SEM image of internal oxidation isolating islands of BC on a modified aerofoil-shaped sample exposed for 100 at 925 °C.
5 µm
TBC
BC
Isolated BC

Influence of BC, TC/BC interface and TC microstructure on the behaviour of APS/TBC__________________________________
______________________________________________________________________
Figure 6.33 SEM images of the interdiffusion between TC and TGOsamples exposed (a) for 100 hours at 925 °C
Figure 6.34 TEM image of the TC/TGO interface taken on sample exposed for 15,00900 °C.
A series of EDX analysis were carried out along a line through the interdiffusion
zone observed on the TEM sample shown
in Figure 6.35 and show
Influence of BC, TC/BC interface and TC microstructure on the behaviour of APS/TBC_____________________________________________________________________________
169 ______________________________________________________________________
of the interdiffusion between TC and TGO on modified aerofoil100 hours at 925 °C and (b) for 7000 hours at 900 °C.
of the TC/TGO interface taken on sample exposed for 15,00
A series of EDX analysis were carried out along a line through the interdiffusion
zone observed on the TEM sample shown in Figure 6.34. These results are summarized
5 and show that the amount of Zr, which initially reached ~45at%,
BC
5 µm
b)
Influence of BC, TC/BC interface and TC microstructure on the behaviour of APS/TBC ___________________________________________
______________________________________________________________________
modified aerofoil-shaped
of the TC/TGO interface taken on sample exposed for 15,000 hours at
A series of EDX analysis were carried out along a line through the interdiffusion
lts are summarized
that the amount of Zr, which initially reached ~45at%,
TBC
Al2O3+ZrO2
5 µm

Influence of BC, TC/BC interface and TC microstructure on the behaviour of APS/TBC _____________________________________________________________________________
170 ______________________________________________________________________
gradually diminished until disappearing in the α-Al 2O3. At the same time the fraction of
Al gradually increased on going from the TC to the TGO (increasing from ~1 at% to
~45at%). Only traces of Cr, Co and Ni were detected, confirming the absence of spinel
in the area investigated.
Figure 6. 35 EDX measurements along a line through the TBC, mixed zone and Al2O3.
Another feature shared by the Rolls-Royce and modified aerofoil-shaped
samples was that pores at the TC/BC interface were filled by the growing TGO (Figure
6.36). After short exposure times big pores were found at the TC/BC interface, as
shown in Figure 6.36(a) taken on a sample oxidised for 100 hours at 925 °C. The BC
surface around these pores grew Al2O3 more or less thick depending on the roughness
of the surface. Depletion of the β-NiAl from the BC around these pores was believed to
be more important. Also, the pores can be filled with particles of ceramic which become
embedded into the growing Al2O3. As the exposure continued, these pores were
completely filled by a mixed of Al2O3 and spinel/mixed oxide, as shown in Figure
6.36(b) taken on a sample exposed at 925 °C for 4000 hours.
0
10
20
30
40
50
1 2 3 4 5 6 7 8
At%
Points of EDX analysis
O
Al
Cr
Co
Ni
Y
Zr
TBC Al 2O3+ZrO2 θ-Al 2O3 α-Al 2O3

Influence of BC, TC/BC interface and TC microstructure on the behaviour of APS/TBC _____________________________________________________________________________
171 ______________________________________________________________________
Figure 6.36 SEM images of modified aerofoil-shaped samples exposed for (a) 100 and (b) 4000 hours at 925 °C, of pores between TC and BC being filled by the growth of the TGO.
Comparison of the Rolls Royce and modified aerofoil-shaped samples showed
that although they were initially different due to manufacturing processes (a heat
treatment growing an initial TGO on the RR samples), similarities were found on
samples after exposure for a few hours. These similarities comprised the presence of an
Al 2O3-ZrO2 mixed zone in the TGO close to the TC, the formation of isolated islands of
spinels and the formation of thick clusters of TGO because of the growth of the TGO
into large pores between the BC and the TC.
6.2.4 Discussion – The effect of micro and macro geometry on the TC/BC
interface behaviour.
Observation of the TC in flat locations on the modified aerofoil shaped samples
in section 6.2.1, showed that the amount of small cracks in the ceramic reduced with
exposure at 925 °C. Residual stress measurements, on the modified aerofoil-shaped
samples, done using Raman Spectroscopy in Bristol University [131], showed that the
ceramic was becoming more and more compressive with oxidation. Tensile stresses in
20 µm
TBC
BC
Pore in BC filled with TGO
a)
TBC
BC
Pore in BC filled with TGO
Isolated BC
20 µm
b)

Influence of BC, TC/BC interface and TC microstructure on the behaviour of APS/TBC _____________________________________________________________________________
172 ______________________________________________________________________
the first stages of oxidation could promote the appearance of pores and the creation of
microcracks while compressive stresses (caused by the growth of TGO and thermal
cooling) later during exposure explained the closure of microcracks and pores. The
linking together of TC splats indicated stress relaxation. Thompson and Clyne [132]
also observed an increase of stiffness with exposure to temperatures higher than
1000 °C, divided in two stages: a rapid initial increase followed by a more progressive
rise. This change in mechanical properties was associated with sintering of the ceramic
[75]. Generally expected at temperatures above 1400 °C, sintering was detected at
temperatures as low as 800 °C [133].
The macro-geometry of the substrate seemed to greatly affect the microstructure
of the TC which in turn affected parameters such as stress generation and relaxation,
crack initiation and propagation, as well as the transport of oxygen. Irregularities in
manufacture, caused by the different curvatures around the modified aerofoil shaped
samples, produced ceramic coatings with varying thickness and roughness which
eventually promoted the localised generation of vertical and life limiting cracks.
Moreover in literature, thin TCs were found to enhance the gas permeation of oxygen
because of a greater density of interconnected microcracks shortening diffusion paths
[116] which would eventually affect the oxidation rate of the system. Spallation of the
ceramic did not happen on concave regions of the samples (observed through pulse
flash thermography in section 5.1). Failure happened first on the convex features of the
sample, and then propagated along the flat curvature (suction side). Propagation through
the concave locations was more difficult and always happened last. To understand fully
how cracks were created in the coating system, it was necessary to study the TC/BC

Influence of BC, TC/BC interface and TC microstructure on the behaviour of APS/TBC _____________________________________________________________________________
173 ______________________________________________________________________
interface which micro-scale topology is now well known to affect the way cracks
initiate and propagate.
On the effect of local TC/BC interface roughness, Singh et al. [90] observed the
damage evolution at the TC/BC interface of a similar TBC system and found that
damage was preferentially initiated in areas where the ZrO2 protruded into the BC
because of the different stress state of the ceramic and Al2O3 layer. Combination of the
compressive stress in the TGO and the tensile stress in TC protrusion (because of
shrinkage caused by sintering), made the convoluted interfaces preferred damage
initiation sites. They added that spallation occurred through the linkage of micro-cracks
rather than because of the rapid propagation of a single crack [90].
In line with the findings of Singh et al. [90], the investigation of the BC/TC
interface was focussed on TC asperities into the BC. In section 6.2.2, 4 recurrent TC
asperity types were found to affect the crack propagation at the TC/TGO interface
(Figure 6.22). Figure 6.37 is a schematic representation of the 4 asperity types. The red
arrows represent the crack paths observed on SEM pictures. Type 1 did not allow cracks
to propagate through the TC. The large asperity, the absence of short splat boundaries,
and the unlikely formation of micro-cracks, made the propagation of a crack difficult
into this asperity. In that case, the crack would be expected to travel around through the
TGO. It is highly likely that Type 2 allowed a lot of stress to concentrate in a small area
of the TC. Micro-cracks often developed in the asperity’s convoluted space and cracks
propagating in the TGO continued their path at the splat boundary as well as across the
fine strip of ceramic. The large undulation encountered in Type 3 did not stop cracks
from propagating at the splat boundary. However, if that splat boundary was too far
away from the TGO/TC interface (bringing them closer to Type 1), cracking occurred in

Influence of BC, TC/BC interface and TC microstructure on the behaviour of APS/TBC _____________________________________________________________________________
174 ______________________________________________________________________
the TGO. In Type 4, again a lot of stresses were gathered within the asperity causing the
formation of micro-cracks. A propagating crack from the TGO would travel along the
splat boundary at the edge of the asperity. The linkage of microcracks with the asperity
was also observed. Finally, in the absence of undulation, the cracks propagated mainly
at the TGO/BC interface or in the middle of the TGO (Figure 6.22).
Figure 6.37 Schematic representation of YSZ splats configurations found in TC protrusions into the BC. Red arrows and lines are potential cracks paths.
The residual stresses around the different types of protrusions were measured by
D. Liu as part of a collaborative work done between Bristol University and Cranfield
University on the modified aerofoil-shaped samples. It was found that the local
geometry had a large effect on the stress interaction between the TGO and the TC
resulting in large stress mismatches and leading to a physical stress accommodation
(closure or opening of micro-cracks in the TC) or to debonding of the two layer and
crack imitation. The nature of the TC/TGO interface (pure Al2O3 or a mix of Al2O3-
ZrO2) greatly affected the stress accumulated in the two layers. In a general manner, it
was found that the protrusion of TC into the TGO resulted in a large residual stress
difference between the two layers which, when reaching a high value, led to cracking,
either in the TC or at the TC/TGO interface depending on the local geometry.
Work done by Karadge et al. [139] can help explain how cracks propagating at
either the TC/TGO or the TGO/BC interface manage to link when they encounter highly
4321

Influence of BC, TC/BC interface and TC microstructure on the behaviour of APS/TBC _____________________________________________________________________________
175 ______________________________________________________________________
convoluted features in the oxide layer (Figure 6.22 (a) and (c)). Karadge et al. [139]
studied the microstructure of the oxides growing in EB-PVD and APS/TBC systems
and found that cracks nucleated either at the TC/TGO or at the TGO/BC interfaces, but
were able to traverse inter-granularly across the TGO thickness around severely
rumpled geometries (in the case of EB-PVD/TBCs). Also, their research showed that
the texture of the TGOs in APS/TBC systems led to large inter-granular stresses that
could explain micro-cracking in the oxide layer [139].
Added to the local undulation of the interface, the presence of an Al2O3-ZrO2
mixed zone in the TGO, affected the integrity of the APS/TBC system. At temperatures
over 1000 °C, because of the rapid transformation of the γ-Al 2O3 and θ-Al 2O3 into α-
Al 2O3 [53], the mixed zone is only formed during the early stages of oxidation and is
therefore very thin [134-137]. However, between 900 and 1000 °C, transient and stable
forms of Al2O3 can thermodynamically co-exist [53], thus enabling ZrO2 to stay
dissolved into the TGO. The TEM images of a sample exposed at 900 °C for 15,000
hours in Figures 6.10 and 6.34 showed the large fraction of mixed zone present in the
TGO. Moreover, the mixed zone was found to form more easily around fine protrusions
of TC into the TGO (Type 2) which would be expected to have a large affect on the
stress states at the TGO/TC interface and therefore act as potential decohesion points.
Tuan et al. [140] studied the mechanical properties of Al2O3-ZrO2 composites
and reported that the toughness of Al2O3 was enhanced by adding t-ZrO2 or m-ZrO2 but
at the same time, reduced its strength. They found that increasing the ZrO2 content led
to a reduced densification of the Al2O3, a reduction in its elastic modulus and refined its
grain microstructure [140]. Moreover, Leyens et al. [136] reported some spinel
formation between the mixed oxide and the TC, as well as some pronounced pore

Influence of BC, TC/BC interface and TC microstructure on the behaviour of APS/TBC _____________________________________________________________________________
176 ______________________________________________________________________
formation within the mixed oxide helping crack propagation. This has led to the
suggestion that the Al2O3-ZrO2 can in some cases promote the diffusion of species such
as Cr, Co and Ni which will eventually convert into spinels at the interface between the
TGO and TC.
The effect of the TC/BC interface geometry on the formation of spinels/mixed
oxides was also investigated. The islands of BC created in the early stages of oxidation,
by the internal growth of Al2O3 around BC protrusions into the TC (Figure 6.38(c))
were believed to be one route for the formation of spinels/mixed oxides. To explain this
hypothesis, it is important to go back to thermodynamics of oxide formation. The
stability of oxide product for the Ni-Al-O system is presented in Figure 6.38.
Figure 6.38 Thermodynamic stability diagram of the Ni-Al-O system [21].
The diagram represents the equilibrium between the Al 2O3, NiAl2O4, NiO and Ni-Al
phases with the oxygen activity, ao and the Al activity aAl. In the diagram, the important
equilibria are as follow:
- (1) represents Al2O3 in equilibrium with Ni-Al by the reaction: 2Al + 3O = Al2O3;

Influence of BC, TC/BC interface and TC microstructure on the behaviour of APS/TBC _____________________________________________________________________________
177 ______________________________________________________________________
- (2) refers to NiAl2O4 in equilibrium with the alloy by the reaction: Ni + 2Al + 4O
= NiAl 2O4;
- (3) involves NiO in equilibrium with the alloy by the reaction: Ni + O = NiO;
- (4) is defined by the reaction: 3Ni + 4 Al2O3 = 3 NiAl2O4 + 2Al;
- and (5) is defined by the reaction: 3 Ni + NiAl2O4 = 4 NiO + 2Al [21].
In the BC islands at the beginning of exposure, the parameters assure that
reaction (1) (Figure 6.38) is occurring. The oxygen activity is too low at the interface to
form oxides other than Al2O3. However, as the amount of Al in the BC reduces, the
oxygen activity increases along line 1 in Figure 6.38. At the intersection of lines 1 and 2
the Al2O3 converts into NiAl2O4. Thermodynamics might explain as well the presence of
spinels/mixed oxides close to microcracks and pores at the TC/TGO interface in the
modified aerofoil-shaped samples. Indeed Fox and Clyne [116] found that the
permeation of oxygen through the TC was enhanced by the presence of these flaws in
the ceramic, as they act as discrete oxygen delivery sites and shorten the diffusion path.
This would increase pO2 locally and promote the growth of spinels/mixed oxides.
The diffusion of Al out of these BC islands to grow Al2O3 changed the initial
composition of the MCrAlY which may eventually mean that the mixed (Al,Cr)2O3
become the more stable oxide to grow. Referring back to the Ni-Cr-Al oxidation
diagram in Figure 2.9 (Wallwork et al. [12,65]), at temperatures of over 1000 °C, the
amount of Ni, Cr and Al present in the BC influence the nature of the growing oxide.
Figure 6.39 is a schematic representation of the formation of spinel/mixed
oxides in the particular case of BC islands. After a short exposure time, the TGO
(mainly transient oxides) is thin and follows the undulations of the TC/BC interface,

Influence of BC, TC/BC interface and TC microstructure on the behaviour of APS/TBC _____________________________________________________________________________
178 ______________________________________________________________________
with the BC being rich in β-NiAl phase (Figure 6.39 (a)). After longer exposures, the
TGO thickens as a result of the outward diffusion of Al from the β-NiAl phase reacting
with the oxygen to form transient Al2O3. As observed on the Rolls-Royce samples,
internal oxidation occurred in the BC close to the TGO, narrowing the asperity’s neck
(Figure 6.39 (c)). Further exposure caused the complete isolation of the upper part of the
undulation, creating a BC island still rich in Al (Figure 6.39(d)).
Figure 6.39 Schematic representation of spinels/mixed oxides growth in isolated BC islands with exposure at high temperatures (chronologically from (a) the initial stage of oxidation to (f) the final form of the spinel/mixed oxide).
The increasing thickness of the TGO eventually led to the depletion of the β-
phase from the BC island (Figure 6.39(d)), thus reducing the Al activity and promoting
the formation of MCrAlY increasingly rich in Cr growing (Al,Cr)2O3 (Figure 6.39(e))
a) b)
c) d)
e) f)
TC
TGO (Al 2O3)
BC
Internal oxides
Outward β-NiAldepletion zone boundary
Al2O3 oxides join
Island of BC with remaining β-NiAl
Depleted BC island
Assumption : growth of mixed (Al,Cr) 2O3
As amount of Al and Cr decreases, BC island is replaced by mixed oxides/ spinels

Influence of BC, TC/BC interface and TC microstructure on the behaviour of APS/TBC _____________________________________________________________________________
179 ______________________________________________________________________
and then the formation of spinels in a second time until the whole coating is converted
(Figure 6.39(f)).
Liang et al [142], studied the grow mechanisms of Cr2O3 and NiCr2O4 on
NiCoCrAlYs at the lattice scale and found that the lattice mismatch between the γ-Ni/γ'-
Ni3Al phases and Cr2O3 was less than for the γ-Ni/γ'-Ni3Al phases and Al2O3 [142].
This meant that, Cr2O3 would grow more easily on a depleted BC, giving another reason
why (added to the fact that the BC is running out of Al) the creation of Al2O3 is replaced
by the creation of mixed (Al,Cr)2O3. As the BC is further depleted in Al and Cr, the
growth of (Co,Ni)O becomes possible and the reaction between (Ni,Co)O and
(Al,Cr)2O3 forms the spinels. Going back to the EDX mapping of a spinel/mixed oxide
in Figure 6.24, this would explain the presence of (Al,Cr)2O3 oxides with changing Al
contents on the outer region of the spinel/mixed oxide, and the core of the spinel/mixed
oxide being rich in Ni. The study of model BC deposited by magnetron sputtering in
Part II of this thesis will show the influence of BC composition on the nature of the
oxide and that the Cr/Al ratio dictates the fraction of (Al,Cr)2O3 created on the surface.
6.2.5 Summary
On the effect of the substrate macro-geometry, it was found that life limiting
vertical cracking happened more easily on convex features. The initiation of these
vertical macro-cracks happened after cracking of the TC/TGO and TGO/BC interfaces.
In the case of extreme convex curvature (trailing edge), a particular TC microstructure
could be observed; the deposition layers did not follow the geometry of the blade
around the trailing edge. Concave curvatures were very rough and as a consequence,
vertical micro-cracking was located at the surface of the ceramic. These cracks,
Influence of BC, TC/BC interface and TC microstructure on the behaviour of APS/TBC _____________________________________________________________________________
180 ______________________________________________________________________
however, did not seem to propagate towards the BC. With exposure, pores and micro-
cracks present in the coating closed and inter-splat boundaries grew in size, suggesting
stress accommodation and maybe sintering.
Looking at the TC/BC interface, 4 types of TC asperities into the BC could be
recognised, caused by the interface roughness. These different configurations are
believed to change crack propagation paths and eventually to promote the formation of
vertical macro-cracks into the ceramic layer. Spinels/mixed oxides were found to form
by diffusion into the ceramic coating, changing the mechanical properties of the
interface and also giving an indication of the diffusion mechanisms occurring around
the TC/TGO and TGO/BC interfaces. The high oxygen partial pressure at the TC micro-
cracks and splat boundaries promoted the formation of spinels. The roughness of the
TC/BC interface in concave curvatures was also found to be important in promoting the
formation of thick TGO and spinels/mixed oxides. An extension on the study of spinels
at lower exposure temperatures is presented in Part II.
Finally, the fraction of Al2O3-ZrO2 mixed zone in the TGO is expected to have
an effect on the adhesion of the coating, the residual stress concentration and on the
formation the spinels/mixed oxides by helping the diffusion of species such as Cr, Ni
and Co toward the TC/TGO interface.

General discussion (Part I) _____________________________________________________________________________
181 ______________________________________________________________________
CHAPTER VII – GENERAL DISCUSSION (PART I)
7.1 Why does failure of the modified aerofoil-shaped samples occur in convex locations?
In section 5.1, Flash Thermography showed that the modified aerofoil-shaped
samples delaminated (and cracked) at the leading and trailing edges and at the “bump”,
i.e. around convex features. Then the comparison of features such as TC and BC
thicknesses, Al diffusion and TGO growth (section 5.2) against curvature, highlighted
the role of geometry on the physical quality of the coating (section 5.3). Indeed, the
thicknesses of the TC and BC were highly dependent on curvature, and TGOs in convex
areas grew less spinels/mixed oxides than concave regions of the samples.
7.1.1 Thickness of BC influences the type of failure
The results in sections 5.3 and 6.1 led to the following conclusions:
- Substrate curvature, TC/BC interface roughness and BC thickness are factors
that affect each other and influence the behaviour of the TBC coating system.
- In thin BCs, more likely to be found around convex curvatures, inward Al
diffusion mechanisms eventually reverse in order to maintain the growth of the
TGO.
- In thick BCs, more likely to be found around concave curvatures, the high
roughness of the TC/BC interface seems to increase the amount of mixed
oxides/spinels in the TGO despite a larger Al reservoir. More rapid depletion of

General discussion (Part I) _____________________________________________________________________________
182 ______________________________________________________________________
Al in BC asperities was explained by short-circuit diffusion promoted by finer
grains close to the TGO.
One question is: how does BC thickness (and indirectly the substrate’s
curvature) influences the failure of the TBC system?
In the case of thin BCs, where the supply in Al depends on phases other than β-
NiAl, the diffusion rate from the γ and γ' phases might be too slow to grow Al2O3 in
case of cracking. Indeed when the partial pressure of oxygen increases i.e. formation of
crack, a minimum amount of Al is needed to repair the oxide layer. This critical amount
is likely to be in the range of 4 to 5 at% Al [74]. For that reason, thin BCs are more
vulnerable to the formation of cracks which would cause the rapid growth of less
protective oxide and eventually the failure of the coating system, i.e. mechanically
induced chemical failure (MICF).
MICF and intrinsic chemical failures (InCF) are the two types of failure
associated with the depletion of Al from the BC. Eschler et al. [75] affirmed that those
two types of failure, when leading to spallation, had different mechanisms with different
temperature dependences. InCF was based on BC properties while MICF depends
mostly on the TC properties. Evans et al. [73] suggested that MICF happened before
intrinsic chemical failure if the Al2O3 layer cracked. If the integrity of the Al2O3 layer
was maintained, MICF could not be initiated and the system lifetime would depend on
InCF. They also wrote that chemical failure would occur at different times around a
sample because of different deposition splat sizes, formed during manufacturing of the
BC.
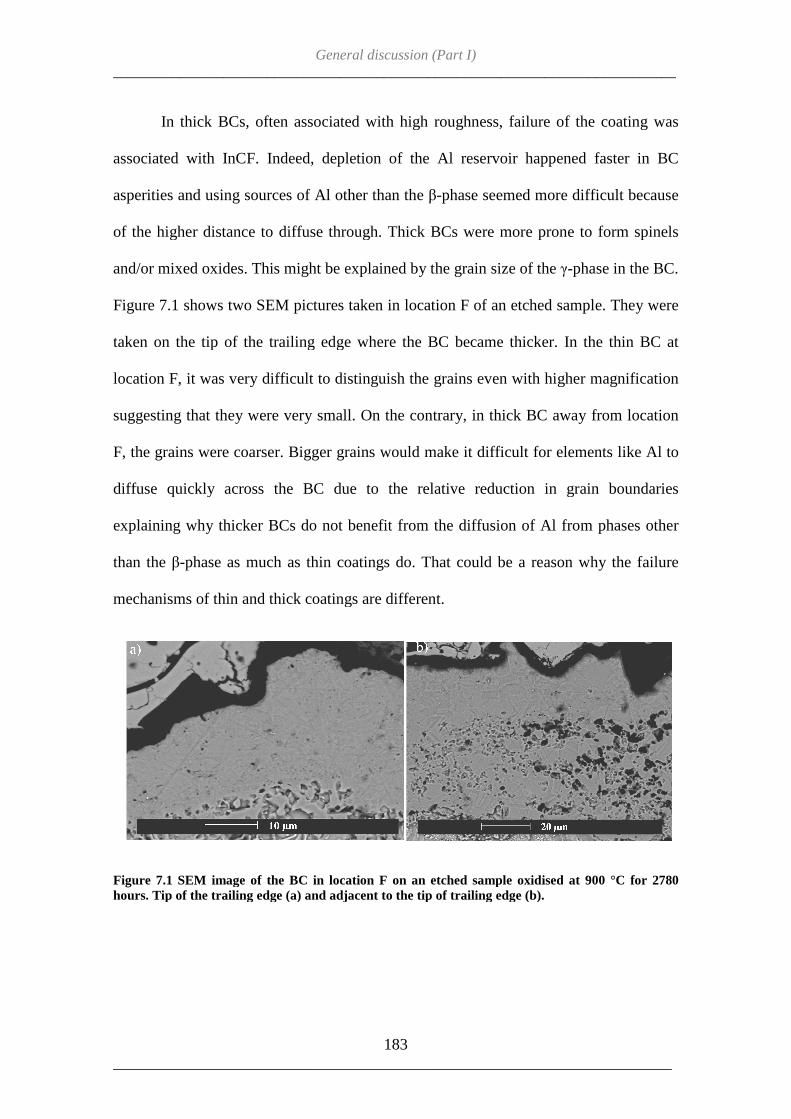
_____________________________________________________________________________
______________________________________________________________________
In thick BCs, often associated with high roughness, failure of the coating was
associated with InCF. Indeed, depletion of the Al reservoir happened faster in BC
asperities and using sources of Al other than the
of the higher distance to diffuse through. Thick BCs were more prone to form spinels
and/or mixed oxides. This might be explained by the grain size of the
Figure 7.1 shows two SEM pictures taken in location F of an etched sample. The
taken on the tip of the trailing edge where the BC became thicker. In the thin BC at
location F, it was very difficult to distinguish the grains even with higher magnif
suggesting that they were very small. On the contrary, in thick BC away f
F, the grains were coarser. Bigger grains would make it difficult for elements like Al to
diffuse quickly across the BC due to the relative reduction in grain boundaries
explaining why thicker BCs do not benefit
than the β-phase as much as thin coatings do. That could be a reason why the failure
mechanisms of thin and thick coatings are different.
Figure 7.1 SEM image of the BC in location F on an etched sample oxidisedhours. Tip of the trailing edge (a) and adjacent to the tip of trailing edge (b).
General discussion (Part I) _____________________________________________________________________________
183 ______________________________________________________________________
, often associated with high roughness, failure of the coating was
. Indeed, depletion of the Al reservoir happened faster in BC
asperities and using sources of Al other than the β-phase seemed more difficult beca
of the higher distance to diffuse through. Thick BCs were more prone to form spinels
and/or mixed oxides. This might be explained by the grain size of the γ-
Figure 7.1 shows two SEM pictures taken in location F of an etched sample. The
taken on the tip of the trailing edge where the BC became thicker. In the thin BC at
location F, it was very difficult to distinguish the grains even with higher magnif
that they were very small. On the contrary, in thick BC away f
F, the grains were coarser. Bigger grains would make it difficult for elements like Al to
diffuse quickly across the BC due to the relative reduction in grain boundaries
y thicker BCs do not benefit from the diffusion of Al from p
phase as much as thin coatings do. That could be a reason why the failure
mechanisms of thin and thick coatings are different.
SEM image of the BC in location F on an etched sample oxidised at 900 °C for 2780 hours. Tip of the trailing edge (a) and adjacent to the tip of trailing edge (b).
_____________________________________________________________________________
______________________________________________________________________
, often associated with high roughness, failure of the coating was
. Indeed, depletion of the Al reservoir happened faster in BC
phase seemed more difficult because
of the higher distance to diffuse through. Thick BCs were more prone to form spinels
-phase in the BC.
Figure 7.1 shows two SEM pictures taken in location F of an etched sample. They were
taken on the tip of the trailing edge where the BC became thicker. In the thin BC at
location F, it was very difficult to distinguish the grains even with higher magnification
that they were very small. On the contrary, in thick BC away from location
F, the grains were coarser. Bigger grains would make it difficult for elements like Al to
diffuse quickly across the BC due to the relative reduction in grain boundaries
from the diffusion of Al from phases other
phase as much as thin coatings do. That could be a reason why the failure
at 900 °C for 2780

General discussion (Part I) _____________________________________________________________________________
184 ______________________________________________________________________
7.1.2 Higher probability of failure in convex areas
The results in section 6.2 led to the following conclusions:
- TCs in convex curvatures were more likely to cracks vertically through their
thickness.
- TCs in concave curvature did not promote the propagation of vertical cracks
through the ceramic.
- Undulation of the TC/BC interface and different TC asperity microstructures
influence the propagation of cracks. Cracks into the TC promote the critical
failure of the TBC system by initiation life limiting vertical macro-cracks into
the ceramic.
- High roughness of the TC/BC interface promotes the presence of large pores
which in turn promote the growth of large Al2O3 clusters mixed with
spinels/mixed oxides.
Crack initiation and propagation mechanisms are complex as they depend on
several parameters, such as: the stress state of the 3 different layers of the system, their
microstructure and the local geometry. Those factors are in turn influenced by oxidation
temperature and time. Mechanisms suggested in literature [21,68,94,98] (section 2.3.4)
agree that the stress caused by the growth of the TGO could cause the initiation of
cracks in the TC and/or the TGO, and that undulation of the interface create out-of
plane and shear stresses causing micro-cracks to link and propagate. It was also agreed
that cracks preferentially propagated at the TC/TGO, TGO/BC interface, through the
TGO and in the TC depending on the local roughness [67,98]. Researchers understand
the importance of roughness on failure mechanisms. However, little research, if any, has

General discussion (Part I) _____________________________________________________________________________
185 ______________________________________________________________________
been carried out into the effect of the layout of discrete splats in the TC at the TC/TGO
interface on the residual stress state of the APS/TBC system. In this study, the particular
layout of the YSZ splats and the TGO were found to have a great effect on crack
propagation. This, in turn, was dependent on the macroscopic geometry of the turbine
blade.
Indeed, in regions of concave curvature, the roughness of the TC/BC interface
was more important and the amplitude of the TGO undulation between the two layers
was higher than in regions of convex curvature. Larger amplitudes were more likely to
promote Type 1 and Type 3 ceramic microstructures (Figure 6.37), configurations
making cracks formation and propagation more difficult. The flash thermography
experiments confirmed this hypothesis by showing that damage at concave locations of
the samples did not propagate as quickly as in convex areas. Moreover, when critical
failure happens, the TBC coatings in concave regions usually stayed attached to the BC
(Figure 7.2).
On the other hand, the TC/BC interfaces at convex curvatures were more likely
to promote Type 2 and Type 4 (Figure 6.37) TC asperities because of the smaller
amplitude of the TGO undulations dictated by a smaller roughness. These two types of
TC microstructure at the TC/BC interface were found to promote cracking into the TC,
the creation of an Al2O3-ZrO2 mixed zone and high residual stress gradient between
both sides of the interface. The probability of crack propagation inside the ceramic
when the curvature of the coating was convex was therefore higher. Figure 7.3 is an
SEM image of a cross-section through the trailing edge of a modified aerofoil shaped
samples (location F) and shows how a crack propagating inside the TGO continued its
path in the ceramic when encountering a Type 4 protrusion. The 3 concave undulations

General discussion (Part I) _____________________________________________________________________________
186 ______________________________________________________________________
highlighted in red demonstrate the fact that around these protrusions, the cracks do not
always continue propagating into the TC but only increase the probability of creating a
critical crack into the ceramic.
Figure 7.2 Thermographs of sample 81-BSYA-37, oxidised at 975 °C for 4000 hours. Light grey contrast corresponds to detached ceramic.
The higher probability of cracks generating critical damage close to the TC/TGO
interface at convex features of the modified aerofoil-shaped sample, combined with the
poorer physical state of the whole TC caused by the spray deposition in these areas
(thinner coating not following the geometry of the blade), make it a preferential location
for critical cracking which will dictate the lifetime of the entire system.
81-BSYA-37
975°C – 900 h
81-BSYA-37
975°C – 1950 h
No propagation
81-BSYA-37
975°C – 2700 h
d)
81-BSYA-34
975°C – 4000 h
Suction sidecompletely detached
Suction sidecompletely detached
No propagation Still
attached

General discussion (Part I) _____________________________________________________________________________
187 ______________________________________________________________________
Figure 7.3 SEM image taken at location F of samples oxidised for 2780 hours at 950 °C showing cracks propagating at TGO/BC interface and through the TC. Red circles highlight TC protrusions into the TGO.
7.2 TGO thickness development model
7.2.1 Modelling the TGO growth on the modified aerofoil-shaped samples
The oxidation at 5 different temperatures between 900 and 1000 °C for times up
to 20,000 hours on modified aerofoil-shaped samples has enabled the collection of
significant data to improve the modelling of TGO development in industrial gas turbine
conditions (Chapter 5).
In the literature [1,58,110-113,115], modelling the oxidation behaviour was
conducted by considering that the ideally parabolic trend was actually composed of two
stages: a transient stage, which had a higher rate and corresponded to the formation of
θ-Al 2O3, followed by a steady state stage corresponding to the α-Al 2O3 formation. The
entire process deriving from the transition of one stage to the other can be described by
the following equations [1]:
50 µm
Critical vertical crack through TC
Crack entering TC at concave undulation of TGO
12
3

General discussion (Part I) _____________________________________________________________________________
188 ______________________________________________________________________
�∆�S5 �) = 6+,4. �7 + � �8 � < �: (8)
�∆�<5 �) = T�4:5 U) + +,< (� − �:) �8 � > �: (9)
Where, ∆w is the mass change (mg); A the material surface (cm2); kpθ the rate
constant for θ-Al 2O3 (mg2/(cm4 h)); kpα the rate constant for α-Al 2O3 (mg2/(cm4 h)); wθc
the critical weight for θ-Al 2O3 (mg/cm2); t the time; and tc the critical time for the θ- to
α-Al 2O3 transformation to happen. The first equation describes the growth of θ-Al 2O3
and the second, the growth of α-Al 2O3.
In this simple initial model, the influence of temperature on wθc (critical weight
at which θ-Al 2O3 starts transforming into α-Al 2O3) was not taken into account. It meant
that the mass of the grown oxide at the transition point between formation of θ- and α-
Al 2O3 was the same at every temperature. However, it is well known, that the stability
of metastable Al2O3 and their rate of transformation is highly dependent on temperature
[53]. This assumption led to an inaccurate description of growth behaviour as it can be
seen in Figure 7.4. In this first trial, the experimental data was well represented by the
model for the first stages of the oxidation but was not for the second stage especially for
temperatures above 925 °C.

General discussion (Part I) _____________________________________________________________________________
189 ______________________________________________________________________
Figure 7.4 Inaccurate comparison of experimental mass change data and model.
Figure 7.5 shows the model after temperature specific values of wθc were
calculated. The new model describes the mass change of samples oxidised at 900, 925
and 1000 °C much better. The new values of wθc are plotted against temperature in
Figure 7.6.
The critical mass of the oxides, at which the transition between θ-Al 2O3 and α-
Al 2O3 happened, reduced when the exposure temperatures were higher. The inaccuracy
remaining at temperatures 950 and 975 °C could be explained by a change of oxidation
mechanism and means that further adjustments of the model are needed. Changes could
include the rate constant kpα in function of the temperature or even transposing the
parabolic trend to a cubic one.
0.0
0.2
0.4
0.6
0.8
1.0
1.2
1.4
1.6
1.8
0 2000 4000 6000 8000 10000 12000 14000 16000 18000 20000
Ma
ss c
hang
e (m
g/c
m2)
Time (hrs)
900C data
900C mod
925C data
925C mod
950C data
950C mod
975C data
975C model
1000C data
1000C mod

General discussion (Part I) _____________________________________________________________________________
190 ______________________________________________________________________
Figure 7.5 Comparison of experimental mass change data and corrected model.
Figure 7.6 wθc as a function of temperature.
0.0
0.2
0.4
0.6
0.8
1.0
1.2
1.4
1.6
1.8
0 2000 4000 6000 8000 10000 12000 14000 16000 18000 20000
Ma
ss c
ha
nge
(mg
/cm2 )
Time (hrs)
900C data
900C mod
925C data
925C mod
950C data
950C mod
975C data
975C model
1000C data
1000C mod
0.3
0.4
0.5
0.6
0.7
0.8
875 900 925 950 975 1000
wθc(m
g/cm
2 )
Temperature (°C)
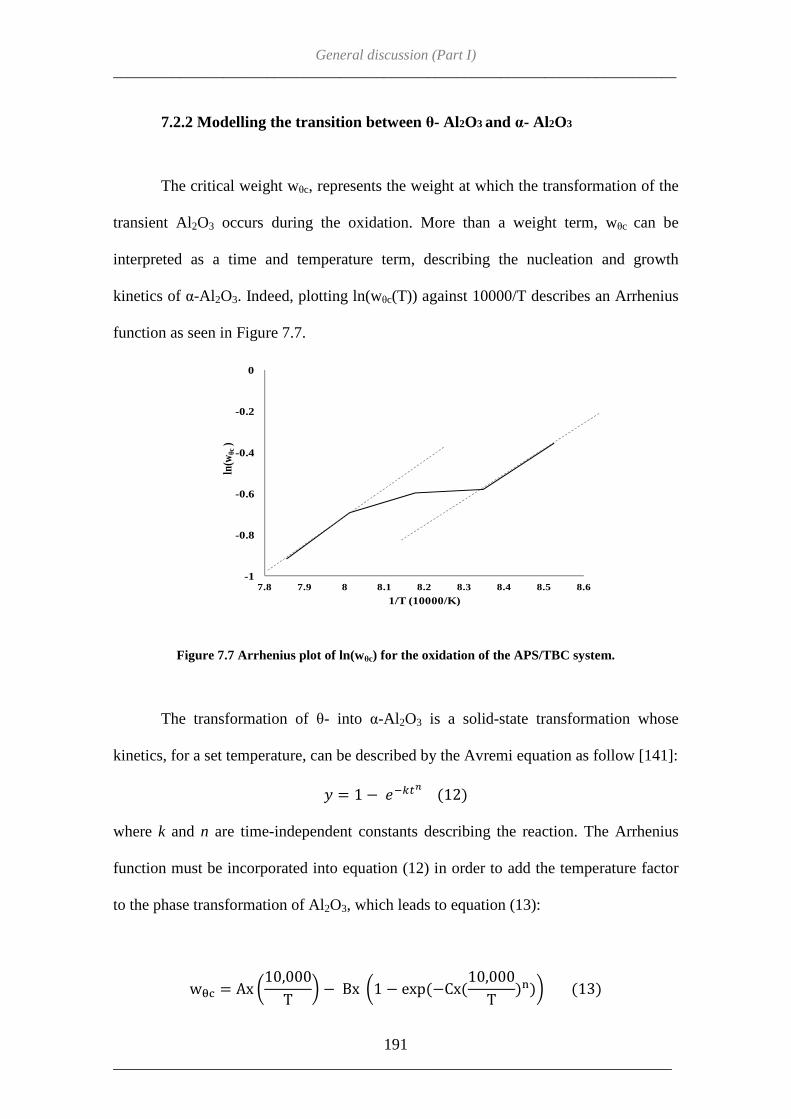
General discussion (Part I) _____________________________________________________________________________
191 ______________________________________________________________________
7.2.2 Modelling the transition between θ- Al2O3 and α- Al2O3
The critical weight wθc, represents the weight at which the transformation of the
transient Al2O3 occurs during the oxidation. More than a weight term, wθc can be
interpreted as a time and temperature term, describing the nucleation and growth
kinetics of α-Al 2O3. Indeed, plotting ln(wθc(T)) against 10000/T describes an Arrhenius
function as seen in Figure 7.7.
Figure 7.7 Arrhenius plot of ln(wθc) for the oxidation of the APS/TBC system.
The transformation of θ- into α-Al 2O3 is a solid-state transformation whose
kinetics, for a set temperature, can be described by the Avremi equation as follow [141]:
V = 1 − �WXYZ (12)
where k and n are time-independent constants describing the reaction. The Arrhenius
function must be incorporated into equation (12) in order to add the temperature factor
to the phase transformation of Al2O3, which leads to equation (13):
w\] = Ax �10,000T � − Bx �1 − exp(−Cx(10,000
T )b)� (13)
-1
-0.8
-0.6
-0.4
-0.2
0
7.8 7.9 8 8.1 8.2 8.3 8.4 8.5 8.6
ln(w
θc)
1/T (10000/K)

General discussion (Part I) _____________________________________________________________________________
192 ______________________________________________________________________
where, according to the data, A = 0.7267, B = 6.5744, C = 0.05 and n = 6.
7.3 Conclusion (Part I)
An advanced approach was developed for the understanding of complex coating
systems, taking into account metallurgical, microstructural and mechanical evolutions.
It is now possible to predict where failure will occur first around an aerofoil shape,
potentially making gas turbines overhaul quicker and more efficient. The effect of
different coating shapes on as-deposited coatings, showing the dependence on
curvature, highlighted the importance of having a well controlled manufacturing route.
Despite the high level of interest in TBCs, there has been relatively little work on the
TC/TGO interface geometry of APS/TBC systems and its effect on mechanisms of
crack initiation and propagation [90,91]. This present work highlighted the effect of
local TC/BC interface geometry on the state of the ceramic layer and the propagation of
cracks in and around the TGO.
The improvement of NDE techniques and their possible application in industry
will save time during gas turbine maintenance, and thus reduce costs, by quickly
indicating which blades are still serviceable or need to be changed. Shorter shut-downs
and better estimation of damage on the blades will reduce the downtime and increase
the availability of industrial gas turbines.
Plasma spraying imperfections, causing a scatter in the TC and BC thicknesses
of the TBC systems were found to cause preferential and then critical failure on convex
features of modified aerofoil-shaped samples, i.e. leading and trailing edges. During
operation, the temperature experienced by a single turbine blade can vary from 600 to a
maximum of 1100 °C around the different geometries because hot streaks from the

General discussion (Part I) _____________________________________________________________________________
193 ______________________________________________________________________
combustor flow into the turbine making the temperature field highly heterogeneous
[1,18,99,143]. Furthermore, modelling of the aerodynamics of turbine blades, carried
out by researchers specialised in Computational Fluids Dynamics (CFD) [143,144],
showed that hot spots were generally concentrated on the leading edge of turbine blades
(Figure 7.8).
Figure 7.8 CFD simulation of hot spots in a high pressure turbine stage [143].
Past studies on the coating failure on turbine blades also indicated that
compressive stresses states were modified by aerofoil geometry, explaining the
spallation of the protective ceramic generally being found on convex and flat surfaces as
well as on sharp edges [100,101,103,104].
The combination of higher temperatures and higher stress gradients on the
leading edge of blades make such locations highly vulnerable. It is therefore crucial to
improve the spraying process of the BC and TBC in order to avoid the deposition of
thin coatings in areas likely to experience the most severe conditions during service.
Hot spot

_____________________________________________________________________________
194 ______________________________________________________________________

_____________________________________________________________________________
195 ______________________________________________________________________
PART II - OPTIMISING BOND COATINGS FOR GAS TURBINE APPLICATION
Overlay coatings, or BCs in the presence of a TBC, provide different protection
properties depending on their composition because of the nature of the oxides growing
on them. The time and temperature of their exposure also greatly influences the oxide
layers created. Ni-Cr-Al and Co-Cr-Al ternary systems undergoing oxidation have been
the subject of extensive studies. Since researchers usually operate at high temperatures
in order to accelerate the oxidation of samples, and because of the important support
and interest of aeronautical industry, the behaviour of these alloys above 1000 °C is
well understood and mapped [12,40,63,65,66]. However, this is not the case for
oxidation at lower temperatures. Information on the Co-Ni-Cr-Al system is also difficult
to find.

_____________________________________________________________________________
196 ______________________________________________________________________
New coating compositions deposited by magnetron sputtering (method
described in Chapter IV) were oxidised in order to achieve a better knowledge of
MCrAlYs behaviour under oxidation in industrial gas turbine operating conditions.
Oxidation rate for the Ni-Co-Cr-Al system and determination of oxide types at 900 and
950 °C have been outputs from these experiments. Studying a range of Ni-Cr-Al and
Ni-Co-Cr-Al has also highlighted the role of each element concentration on the
preferential oxidation and the growth of protective oxides (such as Cr2O3 and Al2O3) or
less protective oxides (such as NiCr2O4).
Firstly the results of the oxidation and analysis of Ni-Cr-Al coatings exposed at
950 then 900 °C are presented: including, mass gain curves, EDX and XRD analysis.
This leads to the creation of oxide predominance Ni-Cr-Al maps at both the exposure
temperatures, and a comparison of the coatings behaviour with exposure temperature
and composition.
Secondly, the effect of Co addition to the Ni-Cr-Al system has been
investigated. Again, mass change curves, EDX analysis and XRD graphs are presented
and their analysis has led to the creation of oxide predominance maps at 900 and 950°C.
Some of the work presented in this chapter has been published in a paper in Surface and
Coating Technology [145].

Oxidation of Ni-Cr-Al coatings at 900-950 °C _____________________________________________________________________________
197 ______________________________________________________________________
CHAPTER VIII – OXIDATION OF Ni-Cr-Al COATINGS AT 900 – 950 °C
8.1 Oxidation of Ni-Cr-Al systems at 950 °C
Around 10 samples from each batch of the two target co-sputtering deposition
experiments were chosen and oxidized in air at 950 °C in a horizontal furnace for
exposure times of up to 500 hours. They were unloaded every 20 hours for weighing,
XRD and visual inspection. Samples with apparent cracking and/or significant weight
loss were taken out of the experiment. The compositions of the samples produced using
the Ni-10wt%Cr+Al, Ni-20wt%Cr+Al and Ni-50wt%Cr+Al targets are presented in
Table 8.1. A dozen samples were sufficient to represent the range of compositions
deposited by sputtering from each combination of targets.
8.1.1 Physical changes of samples with exposure
Pictures of the sapphire discs were taken regularly between exposure cycles
(Figures 8.1 to 8.3). Before oxidation all coatings had a homogeneous grey colour, the
shade of which depended on the amount of Al present. The more the Al the lighter the
grey shades. In the Figures 8.1 to 8.3, 4 to 5 samples were chosen as representative
examples of the physical changes happening during oxidation. They are described in
terms of increasing amounts of Al. Samples from the Ni-10wt%Cr+Al batch are shown
in Figure 8.1. Sample 130510B3 (10.6 at%Cr, 1.9 at% Al), rich in Ni, had an
increasingly rough surface with ongoing exposure.

Oxidation of Ni-Cr-Al coatings at 900-950 °C _____________________________________________________________________________
198 ______________________________________________________________________
Targets Sample Ni (at%) Cr (at%) Al (at%) Cr/Al Exposure (hours)
Ni-10wt%Cr
+Al 130510 B3 87.5 10.6 1.9 5.58 220 170510 d2 84.5 9.7 5.8 1.67 200 130510 E2 81.4 9.2 9.4 0.98 300 130510 e3 76.3 8.2 15.5 0.53 500 170510 F2 61.6 6.7 31.7 0.21 500 170510 f3 49.5 4.7 45.8 0.10 500 170510 G3 37.3 3.3 59.4 0.06 100 170510 g2 23.5 2.3 74.2 0.03 500 130510 H2 15.9 1.6 82.4 0.02 500 130510 h2 10.7 0.9 88.4 0.01 20
130510 i2 6.0 0.4 93.6 0.00 20 Ni-
20wt%Cr +Al 080710 B2 77.4 22.1 0.5 44.20 80
080710 D2 77.2 20.2 2.6 7.77 500 080710 F2 63.9 14.6 21.5 0.68 500 080710 f2 52.5 11.5 36.0 0.32 500 080710 G2 41.2 8.4 50.4 0.17 500 080710 g2 29.1 6.1 64.8 0.09 80 080710 H2 17.1 3.7 79.2 0.05 500 080710 h2 14.0 2.5 83.5 0.03 500
080710 i1 8.4 2.1 89.5 0.02 500 Ni-
50wt%Cr +Al 290610 C3 37.7 59.7 2.7 22.53 500
290610 D2 38.1 55.9 6.0 9.36 500 290610 d3 36.1 51.8 12.1 4.28 500 290610 E3 33.5 48.2 18.2 2.64 500 290610 F2 22.5 44.9 32.6 1.38 500 290610 f3 15.8 22.5 61.6 0.37 500 290610 G2 10.3 14.7 74.9 0.20 60 290610 H3 4.1 5.1 90.8 0.06 500
290610 h2 2.8 2.8 84.4 0.03 500
Table 8.1 Compositions of Ni-Cr-Al coatings resulting from 2 target co-sputtering and oxidised at 950 °C.

Oxidation of Ni-Cr-Al coatings at 900-950 °C _____________________________________________________________________________
199 ______________________________________________________________________
Detachment of the coating happened after 200 hours at 950 °C as indicated by
the red arrow. Sample 130510e3 (8.2 at% Cr, 15.5 at% Al), obtained a green coloration
after 20 hours of oxidation which became more pronounced after 500 hours. 170510 F2
(6.7 at% Cr, 31.7 at% Al), kept a grey colour throughout its exposure. Finally,
130510h2 (0.9 at% Cr, 88.4 at% Al), composed mainly of Al, was cracked and seemed
to have melted at high temperature and solidified during cooling. Overall, samples
changed colour during the first stages of oxidation and then stayed unchanged during
the reminder of the 500 hours exposure (or until failure).
Samples from the Ni-20wt%Cr+Al batch are shown in Figure 8.2. Similarly to
130510B2, 080710B2 (22.1 at% Cr, 0.5 at% Al), became rougher with exposure.
However before cracking at 80 hours, green crystals precipitated on the surface of the
coating and then disappeared. This could be explained by the higher amount of Cr in
this sample. With increasing amount of Al, in sample 080710D2 (20.2 at% Cr, 2.6 at%
Al), the green coloration was not observed anymore. Instead the progressive growth of a
light grey oxide occurred, and after 500 hours, covered the entire surface of the coating.
Like 170510F2, 080710F2, composed of 21.5 at% Al and 14.6 at% Cr, kept the same
grey colour throughout its exposure at 950 °C. Also similar to the Ni-10wt%Cr+Al
batch, samples with a high amount of Al, represented by 080710h2 (2.5 at% Cr, 83.5
at% Al), showed a molten then solidified surface. However, its higher amount of Cr
seemed to have avoided cracking and failure. Again no difference could be spotted
between the transient stage and the steady-state stage of oxidation at 950 °C.
The samples from the Ni-50wt%Cr+Al batch showed that high amounts of Cr
(above 45 at%) resulted in a green surface coloration (Figure 8.3). Indeed on sample
290610d3, containing 51.8 at% of Cr and 12.1 at% Al, a green oxide grew progressively

Oxidation of Ni_____________________________________________________________________________
______________________________________________________________________
toward the edges of the sapphire d
290610E3, with 48.2 at% of Cr
green. As previously, higher amount of Al
surfaces, as seen on sample 260910F2
Al (above 75 at%) lead to molten coatings (290610H3
Al). Most of the samples from the Ni
that higher amounts of Cr in
oxidation protection.
Figure 8.1 Pictures showing evolution of 130510BCr, 15.5 at% Al), 170510F2 (6.7 at% Cr, 31.7 at% Al) 10wt%Cr+Al) with exposure time
Oxidation of Ni-Cr-Al coatings at 900-950 °C _____________________________________________________________________________
200 ______________________________________________________________________
toward the edges of the sapphire disc between 300 and 500 hours, while on
at% of Cr and 18.2 at% Al, the edge of the disc also beca
, higher amount of Al (above 30 at%) lead to grey
, as seen on sample 260910F2 (44.9 at% Cr, 32.6 at% Al) and very high level of
lead to molten coatings (290610H3 with 5.1 at% Cr and 90.8 at%
from the Ni-50wt%Cr+Al batch lasted 500 hours,
that higher amounts of Cr in the coating provided better adhesion properties and
Pictures showing evolution of 130510B3 (10.6 at%Cr, 1.9 at% Al), 130510e3(6.7 at% Cr, 31.7 at% Al) and 130510h2 (0.9 at% Cr, 88.4 at% Al)
time at 950 °C. Red arrows point at damage in coatings.
_____________________________________________________________________________
______________________________________________________________________
while on sample
and 18.2 at% Al, the edge of the disc also became
lead to grey coloured
and very high level of
with 5.1 at% Cr and 90.8 at%
Cr+Al batch lasted 500 hours, indicating
r adhesion properties and /or
, 130510e3 (8.2 at% Cr, 88.4 at% Al) (Ni-
at 950 °C. Red arrows point at damage in coatings.

Oxidation of Ni-Cr-Al coatings at 900-950 °C _____________________________________________________________________________
201 ______________________________________________________________________
Figure 8.2 Pictures showing evolution of the oxides on 080710B2 (22.1 at% Cr, 0.5 at% Al), 080710D2 (20.2 at% Cr, 2.6 at% Al), 080710F2 (14.6 at% Cr, 21.5 at% Al) and 080710h2 (2.5 at% Cr, 83.5 at% Al) (Ni-20wt%Cr+Al) with exposure time at 950 °C. Red arrows point at damage in coatings.
Figure 8.3 Pictures showing evolution of the oxides on 290610d3 (51.8 at% Cr, 12.1 at% Al), 290610E3 (48.2 at% Cr, 18.2 at% Al), 290610F2 (44.9 at% Cr, 32.6 at% Al) and 290610H3 (5.1 at% Cr, 90.8 at% Al ) (Ni50Cr+Al) with exposure time at 950 °C.

Oxidation of Ni-Cr-Al coatings at 900-950 °C _____________________________________________________________________________
202 ______________________________________________________________________
8.1.2 Mass change of samples
Weighing the coated sapphire discs allowed calculation of the sample mass
changes, which are representative of oxide growth. Different types of oxides have
different oxidation rates. Therefore, mass change graphs plotted against time can be
correlated with the nature of the oxide growing on the coating.
Figure 8.4 presents the mass changes as a function of time for the Ni-
10wt%Cr+Al coatings. Two types of behaviour could be observed. Oxides on samples
containing large amounts of nickel, 130510B3 (10.6 at%Cr, 1.9 at% Al) for example,
grew very quickly, while oxides on samples with a large amount of Al, 170510F2 (6.7
at% Cr, 31.7 at% Al), grew slowly. Slow growing oxide curves were divided in two
parts: an initial fast growing part followed by a steady growth part. This describes the
two stages of Al2O3 growth well (transient oxide growth, e.g. θ-Al 2O3 or possibly NiO,
followed by α-Al 2O3). An abrupt reduction of a sample’s mass corresponded to the
spallation of part of the oxide or coating. Sample 130510e3 (8.2 at% Cr, 15.5 at% Al)
is believed to have had a particularly unusual behaviour. Indeed, XRD analysis (which
will be presented later in this chapter), showed that a mix of NiO and transient θ-Al 2O3
grew on the coating’s surface. The presence of NiO would suggest a quick mass gain,
however, this sample behaved like a slow growing Al2O3 former.
The mass change of the Ni-20wt%Cr+Al coatings, represented in Figure 8.5,
showed the same behaviour apart from sample 080710H2 (3.7 at% Cr, 79.2 at% Al)
which did not appear to follow the trend. 080710H2 falls into the composition range
that is expected to be molten at the 950 °C test temperature and this is believed to
account for the high observed oxidation rate for this sample [61,147]. In Figure 8.5,
080710h2 (2.5 at% Cr, 83.5 at% Al) does not follow this trend, even if it contains a

Oxidation of Ni-Cr-Al coatings at 900-950 °C _____________________________________________________________________________
203 ______________________________________________________________________
large concentration of Al. At 950 °C, it might form a different liquid or partially liquid
phase which behaves differently than the other phases formed by the rest of the batch.
Figure 8.4 Mass change of Ni-10wt%Cr+Al coatings against time of exposure at 950 °C. Red curves represent samples growing protective oxides.
Figure 8.5 Mass change of Ni-20wt%Cr+Al coating against time of exposure at 950 °C. Red curves represent samples growing protective oxides.
0
0.2
0.4
0.6
0.8
1
1.2
1.4
0 50 100 150 200 250 300 350 400 450 500
Mas
s ch
ange
(m
g/c
m2)
Time (hours)
B3
d2
E2
e3
F2
f3
G3
g2
H2
0
0.2
0.4
0.6
0.8
1
1.2
1.4
0 50 100 150 200 250 300 350 400 450 500
Ma
ss c
hang
es (
mg/
cm2 )
Time (hours)
B2
D3
F2
f2
G2
g2
H2
h2
i1
Oxidation of Ni-Cr-Al coatings at 900-950 °C _____________________________________________________________________________
204 ______________________________________________________________________
The addition of Cr to the alloy system reduced the extent of oxidation. Indeed, in
Figure 8.4 (Ni-10wt%Cr + Al), the mass change of samples mainly growing Al2O3
reached 0.2 to 0.4 mg/cm2 after 500 hours of exposure while in Figure 8.5 (Ni-
20wt%Cr + Al) their masses only went up by 0.1 mg/cm2. Cr-rich coatings from the Ni-
50wt%Cr+Al batch produced slow growing oxides with a maximum weight gain of 0.35
mg/cm2 after 200 hours of exposure (Figure 8.6), presumably as a result of these
compositions favoring the growth of Cr2O3 and Al2O3 scales over faster growing NiO.
Samples 290610C3 (59.7 at% Cr, 2.7 at% Al) and 290610D2 (55.9 at% Cr, 6.0 at% Al)
produced Cr2O3; sample 290610d3 (51.8 at% Cr, 12.1 at% Al) produced a mix of Cr2O3
and Al2O3; the rest of the Ni-50wt%Cr+Al batch tested, grew Al 2O3. In Figure 8.6 it
can be seen that Cr2O3, even if protective, grows slightly faster than Al2O3 over 500
hours. The Ni-50wt%Cr + Al samples growing Al2O3 (and not melting) only reached a
maximum gain weight of 0.1 mg/cm2, comparable to the mass change seen in Figure
8.6.
Although plotting the mass changes against time identified coating compositions
that produced slow growing oxides, it did not show which samples had the lowest extent
of oxidation. To this end, mass changes were plotted against the Cr/Al fractions in the
coatings (Figure 8.7). Low levels of Al led to higher levels of oxidation, as did high
levels of Al. From the three graphs, the optimum Cr/Al fraction (at%) producing the
least oxidation was between 0.1 and 0.5. The corresponding samples are listed in Table
8.2 [145].

Oxidation of Ni-Cr-Al coatings at 900-950 °C _____________________________________________________________________________
205 ______________________________________________________________________
Figure 8.6 Mass change of Ni-50wt%Cr+Al coating against time of exposure at 950 °C. Red curves represent samples growing protective oxides.
Targets Sample Ni (at%) Cr (at%) Al (at%) Cr/Al
Ni-10wt%Cr+Al F2 61.60 6.70 31.70 0.21 f3 49.50 4.70 45.80 0.10
Ni-20wt%Cr+Al f2 52.50 11.50 36.00 0.32 G2 41.20 8.40 50.40 0.17
Ni-50wt%Cr+Al F2 22.45 44.93 32.61 1.38 f3 15.83 22.54 61.63 0.37
Table 8.2 Ni-Cr-Al samples producing slow lowest oxidation levels.
0
0.2
0.4
0.6
0.8
1
1.2
1.4
0 50 100 150 200 250 300 350 400 450 500
Ma
ss c
han
ge (
mg
/cm2
)
Time (hours)
C3
D2
d3
E3
F2
f3
G2
H3
h2

Oxidation of Ni-Cr-Al coatings at 900-950 °C _____________________________________________________________________________
206 ______________________________________________________________________
Figure 8.7 Mass change of (a) Ni-10wt%Cr+Al, (b) Ni-20wt%Cr+Al and (c) Ni-50wt%Cr+Al coatings against Cr/Al content (in at %). Gaps in the curve correspond to sample failure (absence of data).
0
0.2
0.4
0.6
0.8
1
1.2
1.4
0.001 0.01 0.1 1 10
Ma
ss c
hang
e (m
g/c
m2 )
Cr/Al
20h
100h
180h
260h
340h
420h
500h
Alloys that are molten at test temperature
a)
0
0.1
0.2
0.3
0.4
0.5
0.6
0.7
0.01 0.1 1 10 100
Mas
s ch
ange
(mg/
cm2 )
Cr/Al
40h
160h
220h
340h
400h
500h
Alloys that are molten at test temperature
b)
0
0.1
0.2
0.3
0.4
0.5
0.01 0.1 1 10
Mas
s ch
ange
(mg/
cm2 )
Cr/Al
20h
100h
180h
260h
340h
500h
Alloys that are molten at test temperature
c)

Oxidation of Ni-Cr-Al coatings at 900-950 °C _____________________________________________________________________________
207 ______________________________________________________________________
8.1.3 Identification of oxides
XRD was used to identify the oxides present on the coatings after exposure.
High concentrations of Ni in the samples led to the growth of NiO oxides (Figure 8.8).
High concentrations of Cr were needed in order to form Cr2O3 instead (Figure 8.9). No
Cr2O3 was formed on samples containing less than 20 at% Cr. The first traces of Al2O3
were observed on sample 130510e3 (8.2 at% Cr, 15.5 at% Al) (Figure 8.10). However,
the high amount of Ni in the composition of this coating led to the formation of NiO as
well, which reduced the oxidation protection properties of the coating. Pure and
protective Al2O3 was observed on samples F2 (from the Ni-10wt%Cr+Al and Ni-
20wt%Cr+Al batches) as shown in Figures 8.11 and 8.12. When the amount of Cr was
low (6.7 at%) , 32 at% Al was needed to form Al2O3. However, higher amounts of Cr
(14.6 at%) reduced the required Al to 21.5 at%. At high Cr levels (56 at%), Al2O3
oxides were found when the alloy contained 6 at% Al (Figure 8.13). This tendency is
described in literature, where it is called the “third element effect” [63] and is consistent
with current understanding of the oxidation performance of Ni aluminide coatings and
MCrAlY overlay coatings used in industrial gas turbines. XRD analysis of samples
170510F2 (6.7 at% Cr, 31.7 at% Al) and 080710F2 (14.6 at% Cr, 21.5 at% Al) detected
the presence Al2O3 with two different microstructures, hexagonal and monoclinic. A
study from Levin and Brandon [147] identified the hexagonal Al2O3 as α-Al 2O3 and the
cubic one as θ-Al 2O3. This confirms that, at temperatures below a 1000°C, the oxide
layer is constituted of two different forms of Al2O3. Higher amounts of Al led to α-
Al 2O3 forming coatings [145].

Oxidation of Ni-Cr-Al coatings at 900-950 °C _____________________________________________________________________________
208 ______________________________________________________________________
Figure 8.8 XRD spectrum from the surface of sample 130510B3 (10.6 at% Cr, 1.9 at% Al)(Ni-10wt%Cr + Al) after 220 hours exposure showing the presence of NiO.
Figure 8.9 XRD spectrum from the surface of sample 290610D2 (55.9 at% Cr, 6.0 at% Al)(Ni-50wt%Cr + Al) after 500 hours exposure showing the presence of NiO and Cr2O3.
130510B3Li
n (C
ount
s)
0
1000
2000
3000
4000
5000
6000
7000
8000
9000
10000
11000
12000
2-Theta - Scale
5 10 20 30 40 50 60 70 80 90
NiO
2θ-scale5 20 40 60 80
Co
unt
sC
oun
ts
290610D2
Lin
(Cou
nts)
0
100
200
300
400
500
600
700
800
5 10 20 30 40 50 60 70 80 90
2θ-scale5 20 40 60 80
Cr 2O3
NiO
Ni

Oxidation of Ni-Cr-Al coatings at 900-950 °C _____________________________________________________________________________
209 ______________________________________________________________________
Figure 8.10 XRD spectrum from the surface of sample 130510e3 (8.2 at% Cr, 15.5 at% Al)(Ni-10wt%Cr + Al) after 500 hours exposure showing the first traces of Al2O3.
Figure 8.11 XRD spectrum from the surface of sample 170510F2 (6.7 at% Cr, 31.7 at% Al)(Ni-10wt%Cr + Al) after 500 hours exposure showing Al2O3.
Co
un
ts130510e3
Lin
(Cou
nts)
0
100
200
300
400
500
600
700
800
900
1000
1100
1200
1300
1400
1500
1600
1700
1800
1900
2000
2100
2200
2300
2400
2500
2600
2700
2800
2900
3000
3100
3200
3300
3400
3500
3600
3700
3800
2-Theta - Scale
5 10 20 30 40 50 60 70 80 90
2θ-scale5 20 40 60 80
NiO
θ-Al 2O3
Ni
Co
un
ts
170510F2
Lin
(Cou
nts)
0
100
200
300
400
500
600
700
800
900
1000
1100
1200
1300
1400
2-Theta - Scale
5 10 20 30 40 50 60 70 80 90
2θ-scale5 20 40 60 80
α-Al 2O3
θ-Al 2O3
Ni

Oxidation of Ni-Cr-Al coatings at 900-950 °C _____________________________________________________________________________
210 ______________________________________________________________________
Figure 8.12 XRD spectrum from the surface of sample 080710F2 (14.6 at% Cr, 21.5 at% Al) (Ni-20wt%Cr + Al) after 500 hours exposure showing Al2O3.
Figure 8.13 XRD spectrum from the surface of sample 290610E3 (48.2 at% Cr, 18.2 at% Al)(Ni-50wt%Cr + Al) after 500 hours exposure showing the first traces of Al2O3 growing with Cr 2O3.
Co
unts
08010F2Li
n (C
ount
s)
0
100
200
300
400
500
600
700
800
900
1000
1100
1200
1300
1400
1500
1600
2-Theta - Scale
5 10 20 30 40 50 60 70 80
2θ-scale5 20 40 60 80
α-Al 2O3
θ-Al 2O3
Ni
Co
un
ts
290610E3
Lin
(Cou
nts)
0
10
20
30
40
50
60
70
80
90
100
110
120
130
140
150
160
170
180
190
200
210
220
230
240
250
260
270
280
290
300
310
320
330
340
350
360
370
380
390
400
410
420
430
440
5 10 20 30 40 50 60 70 80 90
2θ-scale5 20 40 60 80
α-Al 2O3
Cr 2O3
NiAl

Oxidation of Ni-Cr-Al coatings at 900-950 °C _____________________________________________________________________________
211 ______________________________________________________________________
A few samples grew less protective oxides, such as NiCr2O4 and NiAl2O4 spinels
or NiO.Cr2O3 oxides. Spinels observed on samples having failed prematurely may be a
result of transient oxidation, such as sample 080710B2 (22.1 at% Cr, 0.5 at% Al)(Figure
8.14). However, after longer exposure, the formation of spinel between the coating and
the substrate may well reflect Al exhaustion after 500 hours of oxidation testing at 950
°C (Figure 8.15). At 950 °C, less protective oxides were observed on a few samples
with Cr contents higher than 5 at% (in the absence of NiO). Samples oxidised at 950 °C
indicate either that these oxidation conditions do not promote the formation of spinels,
or that exposure at this temperature might help the transformation of transient spinels
and mixed oxides into protective Al2O3 or Cr2O3 [145].
The XRD results for all the samples oxidised at 950 °C are summarised in
Table 8.3.
Figure 8.14 XRD spectrum from the surface of sample 080710B2 (22.1 at% Cr, 0.5 at% Al)(Ni-20wt%Cr + Al) after 80 hours exposure showing the presence of Cr2O3 as well as spinels.
Cou
nts
080710B2
Lin
(Cou
nts)
0
10
20
30
40
50
60
70
80
90
100
110
120
130
140
150
160
170
180
190
200
210
220
230
240
250
260
270
280
290
300
310
320
330
340
350
360
2-Theta - Scale
5 10 20 30 40 50 60 70 80
2θ-scale5 20 40 60 80
Cr 2O3
NiO
Ni
NiCr 2O4

Oxidation of Ni-Cr-Al coatings at 900-950 °C _____________________________________________________________________________
212 ______________________________________________________________________
Figure 8.15 XRD spectrum from the surface of sample 290610d3 (51.8 at% Cr, 12.1 at% Al)(Ni-50wt%Cr + Al) after 500 hours exposure showing the presence of Cr2O3 , as well as spinels and mixed oxides.
The cross-sections through samples from the Ni-10wt%Cr+Al, Ni-20wt%Cr+Al
and Ni-50wt%Cr+Al batch were mounted and observed under the SEM (Figures 8.16 to
8.18). According to literature [63], the magnetron sputtering had deposited coatings
with a columnar microstructure because of the roughness of the sapphire substrates.
Even if the deposition rate was dependant on the target, all the coatings were between
~30 and ~50 µm thick. As Figure 8.17(a) shows, adhesion between the Ni-Cr-Al and the
sapphire disc was more or less adequate depending on composition, which might
explain why some coatings detached earlier than others during exposure.
Co
unts
290610d3Li
n (C
ount
s)
0
100
200
300
400
500
600
5 10 20 30 40 50 60 70 80 90
2θ-scale5 20 40 60 80
Cr 2O3
Ni
NiCr 2O4
NiO.Cr 2O3

Oxidation of Ni-Cr-Al coatings at 900-950 °C _____________________________________________________________________________
213 ______________________________________________________________________
Targets Sample NiO Cr 2O3 Al 2O3 Mixed oxides Spinels Ni- 130510 B3 +
10wt%Cr+Al 170510 d2 +
130510 E2 +
130510 e3 +
170510 F2 α-,θ- 170510 f3 α-,θ- 170510 G3 α- 170510 g2 α- 130510 H2 α- 130510 h2 α-
130510 i2 α-
Ni- 080710 B2 + + NiCr2O4
20wt%Cr+Al 080710 D3 + +
080710 F2 α-,θ- 080710 f2 α- 080710 G2 α- 080710 g2 α- 080710 H2 α-,θ- 080710 h2 α-
080710 i1 α-
Ni- 290610 C3 +
50wt%Cr+Al 290610 D2 + +
290610 d3 + + NiO.Cr2O3 NiCr2O4
290610 E3 + α- 290610 F2 α-,θ- NiCr2O4
290610 f3 α-,θ- 290610 G2 α- 290610 H3 α- NiCr2O4
290610 h2 α-
Table 8.3 Different oxide phases identified using XRD on the samples exposed at 950 °C.
Figure 8.16(a) shows a cross-section through sample 170510d2, from the Ni-
10wt%Cr+Al batch which was initially rich in Ni (85 at% Ni, 9.7 at% Cr, 5.8 at% Al).
The oxide scale that grew on the coating surface was composed of an external NiO layer
above a mixed Cr2O3+Al2O3 layer. An external NiO layer above a Cr2O3 layer is
consistent with the literature [40,43,59]. Indeed, the establishment of the Cr2O3 would
have happened when the partial pressure of O2 was reduced by the growth of NiO.

Oxidation of Ni-Cr-Al coatings at 900-950 °C _____________________________________________________________________________
214 ______________________________________________________________________
Figure 8.16(b) highlights the fact that oxide could also grow between the columns
constituting the coating and at the coating/substrate interface. The high oxidation rate of
the oxide could be an explanation for the formation of pores inside the Ni-Cr-Al overlay
coating. Decreasing the amount of Ni to 81 at % in sample 170510E2 (9.2 at% Cr,
9.4at%Al) still led to the formation of a NiO layer. The (Al,Cr)2O3 was thicker on this
sample and failure occurred between the two different oxide layers. Gradual increase of
the Al content caused the external NiO layer to disappear, being replaced by a two
layered (Al,Cr)2O3 oxide with different Cr contents (Figure 8.16(c)). With still more Al
(31.7 at%), a pure Al2O3 layer formed (Figure 8.16(d)).
Sample 080710D3 (20.2 at% Cr, 2.6 at% Al), from the Ni-20wt%Cr+Al batch,
is shown in Figure 8.17(b). (Cr,Al)2O3 and NiO were identified on this sample by XRD
analysis and this was confirmed with EDX analysis. The oxide layer typically measured
around 20 µm. Figure 8.17(c), presents an image from a cross-section through sample
080710G2 (8.4 at% Cr, 50.4 at% Al), which was found to grow Al2O3 and traces of
spinels. The oxides were typically very thin, < ~ 5µm thick, and grew on top on the Ni-
Cr-Al, between the columns and at the interface with the sapphire substrate. The
spinels were usually found close to the substrate which indicated that the Al
concentration was very low in this region of the coating. Finally, Figure 8.17(d) shows
the picture of a sample containing a high amount of Al, 080710H2 (3.7 at% Cr, 79.2
at% Al). In this case the growth of the oxide consumed most of the Ni-Cr-Al to create
an Al2O3 which did not survive sample preparation. The growth of this oxide was
promoted by the melting of the coating.

Oxidation of Ni-Cr-Al coatings at 900-950 °C _____________________________________________________________________________
215 ______________________________________________________________________
Figure 8.16 Cross sections SEM images of (a) 170510d2, (b) 130510E2, (c) 130510e3 and (d) 170510F2.
Cross-sections of samples chosen from the Ni-50wt%Cr+Al batch are shown in
Figure 8.18. High amounts of Cr avoided the formation of an external NiO layer and led
to the growth of a mixed (Al,Cr)2O3 layer (Figure 8.18(a)). Increasing the initial fraction
of Al up to 32.61 at%, enabled the growth of a pure Al2O3 layer as seen on the cross-
section through sample 290610F2 (44.9 at% Cr, 32.6 at% Al) in Figure 8.18(b).
The use of analytical techniques, to identify the nature of the oxides growing on
the Ni-Cr-Al coatings, confirmed the hypothesises from the weight change data. Indeed,
the various extents of oxidation shown by the different mass gain curves, reflected well
the oxides formed. The only feature that mass change measurements did not show was
the presence of spinels or mixed oxides beneath an outer oxide layer.
20 µm
Mixed (Al,Cr) 2O3
NiCrAl
Sapphire
NiO
Pores
a)
10 µm
Mixed (Al,Cr) 2O3
NiCrAl
Sapphire
Remaining NiOb)
10 µm
Mixed (Al,Cr) 2O3
rich in Al
NiCrAl
Sapphire
Mixed (Al,Cr) 2O3
rich in Cr
c)
10 µm
NiCrAl
Sapphire
Al2O3
d)

Oxidation of Ni-Cr-Al coatings at 900-950 °C _____________________________________________________________________________
216 ______________________________________________________________________
Figure 8.17 Cross sections SEM images of as deposited (a) 080710A2, (b) 080710D3, (c) 080710G2 and (d) 080710H2.
Figure 8.18 Cross sections SEM images of (a) 290610d3, and (b) 290610 F2.
The chemical composition obtained by EDX analysis of the oxide layers
observed on example samples are summarised in Table 8.4.
50 µm
NiCrAl
Sapphire
a)
20 µm
NiO
NiCrAl
Sapphire
b)
Mixed (Al,Cr) 2O3
20 µm
Al2O3
NiCrAl
Spinel
Sapphire
c)
50 µm
NiCrAl
Al2O3
Sapphire
d)
20 µm
Mixed (Al,Cr) 2O3
NiCrAl
Sapphire
a)
10 µm
NiCrAl
Sapphire
Al 2O3
b)

Oxidation of Ni-Cr-Al coatings at 900-950 °C _____________________________________________________________________________
217 ______________________________________________________________________
Sample Oxide O (at%) Ni (at%) Cr (at%) Al (at%) 130510 B3 outer layer 52.5 32.9 1.1 13.5
inner layer 57.2 14.9 13.9 14.0 170510 d2 outer layer 52.8 25.7 1.9 19.7
inner layer 56.2 16.2 8.3 19.3 130510 E2 outer layer 52.3 33.0 2.3 12.5
inner layer 50.4 17.0 8.9 23.7 130510 e3 outer layer 52.9 23.9 2.1 21.2
inner layer 53.2 12.6 8.4 25.9 170510 F2 single layer 61.2 3.9 1.2 33.7 170510 f3 single layer 62.0 1.8 0.9 35.2 170510 g2 single layer 61.6 1.8 0.0 36.6 080710 D3 outer layer 53.2 25.6 1.5 19.4
inner layer 62.0 8.5 14.1 15.5 080710 F2 single layer 60.3 3.2 1.6 35.0 080710 f2 single layer 56.0 4.8 2.6 36.7 080710 G2 single layer 58.5 2.4 2.0 37.1 080710 H2 single layer 60.3 1.7 0.4 37.6 290610 d3 single layer 62.1 1.5 18.7 17.7 290610 E3 single layer 54.4 3.4 10.8 31.4 290610 F2 single layer 54.0 2.1 8.4 35.5
Table 8.4 Composition (obtained by EDX analysis) of the oxide layers observed on the cross-sections of selected Ni-Cr-Al samples exposed at 950°C.
Table 8.4, indicated that, all the oxide layers contained variable levels of Ni.
Comparison with Table 8.1 shows that this depended on the initial amount of Ni in the
deposited coating. Lower levels of Ni could be from the beam spread in the EDX. High
initial amounts of Ni (130510B3) led to the formation of a two layered oxide scale,
whose outer layer was composed of 32.9 at% Ni and 13.5 at% Al (mixed NiO.Al2O3)
and inner layer was composed of 14.9 at% Ni, 14 at% Al and 13.9 at% Cr (NiO +
(Al,Cr)2O3). The reduced amount of Ni in samples from the Ni-50wt%Cr+Al batch
coupled with the high fraction of Cr, avoided the formation of a double layered oxide.

Oxidation of Ni-Cr-Al coatings at 900-950 °C _____________________________________________________________________________
218 ______________________________________________________________________
Increasing the initial amount of Al in the coatings led to mixed (Cr,Al)2O3 layers
increasingly richer in Al until the layer formed was mainly pure Al2O3 (Figure 8.19).
SEM and EDX did not allow identifying different forms of Al2O3.
Figure 8.19 Effect of the initial Ni-Cr-Al coating composition on the (Cr,Al)2O3 oxides formed at 950°C.
8.1.4 Oxidation of the coatings obtained from 3 target co-sputtering
To complete the information provided by these 29 samples, 9 additional samples
from the Ni-10wt%Cr+Ni-50wt%Cr+Al 3 targets co-sputtering batch were also exposed
at 950 °C. The composition of the coatings selected for the oxidation at 950 °C, are in
Table 8.5.
0
10
20
30
40
50
0 1 2 3 4 5 6 7 8 9
Co
mpo
sitio
n o
f oxi
de la
yer
(at%
)
Initial Cr/Al
at% Cr
at% Al

Oxidation of Ni-Cr-Al coatings at 900-950 °C _____________________________________________________________________________
219 ______________________________________________________________________
Sample Ni (at%) Cr (at%) Al (at%) 251111_02 46.3 20.7 33.1 251111_06 32.4 28.9 38.7 251111_07 55.2 16.3 28.5 251111_08 30.7 38.0 31.3 251111_16 44.8 28.4 26.8 251111_20 57.6 26.0 16.4 251111_24 48.9 37.8 13.3 251111_25 45.4 33.7 21.0 251111_27 44.2 39.4 16.4
Table 8.5 Ni-Cr-Al compositions of coatings resulting from 3 targets co-sputtering and oxidised at 950 °C
After verification under the SEM, it was found that prior to oxidation, the
coatings were only 10 µm thick, despite modifying deposition parameters. Therefore, to
avoid their complete destruction, the samples were oxidised for 40 hours instead of 500.
They were then analysed using XRD. A summary of the oxides detected in the samples
is shown in Table 8.6. A majority of the transient Al 2O3 present consisted of δ- Al2O3
instead of the θ-Al 2O3 obtained on the previous samples after 500 hours exposure
suggesting that the θ- phase appears later during oxidation. Also, few spinels were
observed. Few spinels were detected on the samples’ surface.
Sample NiO Cr2O3 α-Al 2O3 transient Al2O3 spinels 251111_02
+ + θ-Al 2O3
251111_06
+ δ-Al 2O3 251111_07 + + + δ-Al 2O3 251111_08
+ + δ-Al 2O3 Ni(Cr,Al)2O4
251111_16
+ + δ-Al 2O3 251111_20 + +
NiCr2O4
251111_24
+ +
251111_25
+ + δ-Al 2O3 251111_27
+ + δ-Al 2O3
Table 8.6 Different oxide species identified using XRD on the samples exposed at 950 °C for 40 hours.

Oxidation of Ni-Cr-Al coatings at 900-950 °C _____________________________________________________________________________
220 ______________________________________________________________________
8.1.5 Discussion - Ni-Cr-Al ternary oxidation map at 950 °C
Figure 8.20 summarises the oxides found on the coatings after oxidation at
950 °C for 500 hours of exposure. It shows that the higher the amounts of Al, the more
likely Al 2O3 will grow on the coating. Samples 170510g2 (2.3 at% Cr, 74.2 at% Al) and
130510H2 (1.6 at% Cr, 82.4 at% Al) from the Ni-10wt%Cr + Al batch differ from this
tendency, but both of these coatings are expected to be molten when tested at
950 °C [61,146]. Superimposed on Figure 8.20 is a proposed boundary defining the
limiting coating composition for Al2O3 scale formation at 950 °C. It should noted that at
high concentrations and temperature’s Al tends to react with the Ni to form
intermetallics and that this will modify the Al2O3 activity and therefore the propensity
of the coating to form Al2O3 scales. XRD showed the presence of Ni3Al or NiAl phases
in the coatings initially containing more than 60 at% Al. Oxidation of Ni3Al at 950 °C
does not encourage the growth of Al2O3 [148] and this could explain the presence of
spinels in some of the samples. An Al depletion, caused by either the formation of
Al 2O3 in the first stages of oxidation or the formation of intermetallics, may have led to
the growth of Ni oxides and mixed oxides towards the end of the oxidation tests.
Moreover, because of the columnar microstructure of the sputtered coating, in some
cases oxides grew between the substrate and the BC, between columns and on top of the
BC. The higher oxygen partial pressure at the bottom of the BC caused by the growth of
Al 2O3 between columns, could contribute the growth of Ni oxides, and therefore the
formation of NiAl2O4, instead of Al oxides as the Al reservoir in the coating is depleted
as the oxidation progresses [145].
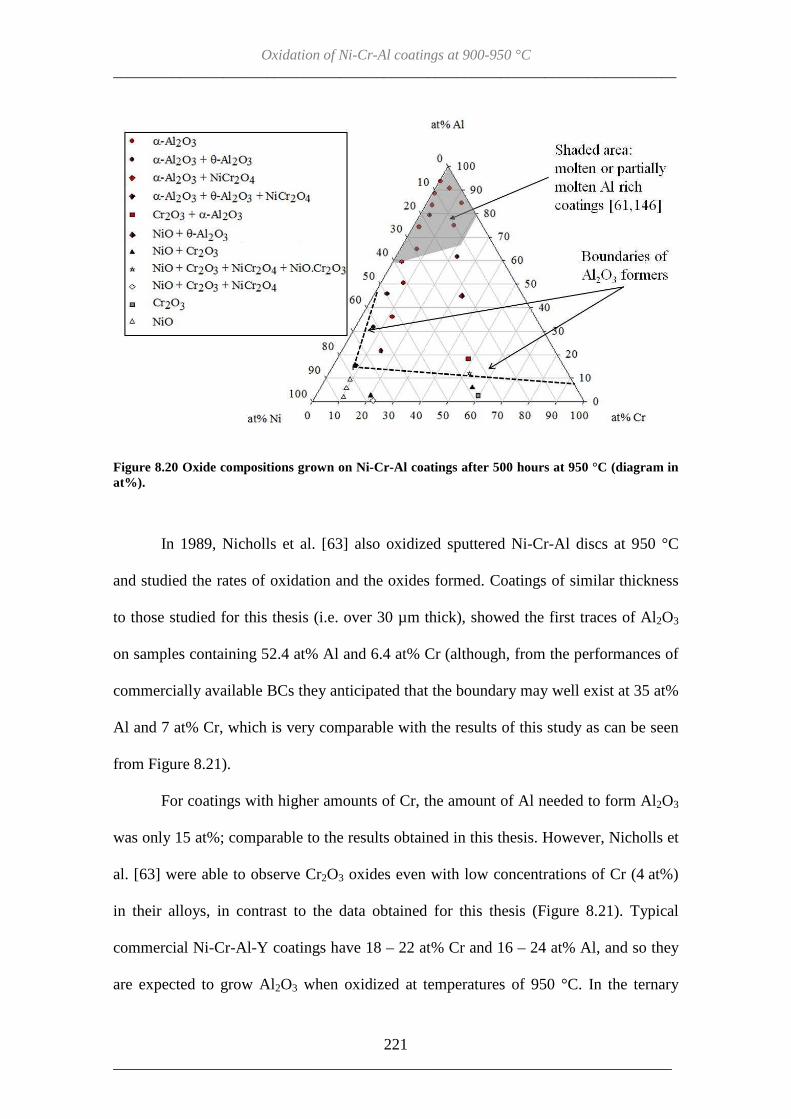
Oxidation of Ni-Cr-Al coatings at 900-950 °C _____________________________________________________________________________
221 ______________________________________________________________________
Figure 8.20 Oxide compositions grown on Ni-Cr-Al coatings after 500 hours at 950 °C (diagram in at%).
In 1989, Nicholls et al. [63] also oxidized sputtered Ni-Cr-Al discs at 950 °C
and studied the rates of oxidation and the oxides formed. Coatings of similar thickness
to those studied for this thesis (i.e. over 30 µm thick), showed the first traces of Al2O3
on samples containing 52.4 at% Al and 6.4 at% Cr (although, from the performances of
commercially available BCs they anticipated that the boundary may well exist at 35 at%
Al and 7 at% Cr, which is very comparable with the results of this study as can be seen
from Figure 8.21).
For coatings with higher amounts of Cr, the amount of Al needed to form Al2O3
was only 15 at%; comparable to the results obtained in this thesis. However, Nicholls et
al. [63] were able to observe Cr2O3 oxides even with low concentrations of Cr (4 at%)
in their alloys, in contrast to the data obtained for this thesis (Figure 8.21). Typical
commercial Ni-Cr-Al-Y coatings have 18 – 22 at% Cr and 16 – 24 at% Al, and so they
are expected to grow Al2O3 when oxidized at temperatures of 950 °C. In the ternary

Oxidation of Ni-Cr-Al coatings at 900-950 °C _____________________________________________________________________________
222 ______________________________________________________________________
diagram (Figure 8.21), these coatings would be located above and right of the two
hypothetical Al2O3 boundaries. In addition, the high amount of Cr in the most oxidation
protective compositions found in this study might signify that such coatings would be
capable of both oxidation and hot corrosion protection. This would be very useful for an
industrial gas turbine application [145].
Figure 8.21 Oxide compositions grown on Ni-Cr-Al coatings after 500 hours at 950 °C compared to data obtained by Nicholls et al. [63](diagram in at%).
Data obtained from the oxidation of the coatings deposited with 3 targets was
added to the previous ternary map and are shown in Figure 8.22. Apart from the
exception circled in red, samples confirm the Al2O3 former domain boundaries drawn in
Figure 8.20.

Oxidation of Ni-Cr-Al coatings at 900-950 °C _____________________________________________________________________________
223 ______________________________________________________________________
Figure 8.22 Oxide compositions grown on Ni-Cr-Al coatings after 500 hours at 950 °C completed with the data obtained from 3 target co-sputtering and compared to data obtained by Nicholls et al. [63](diagram in at%).
8.2 Oxidation of Ni-Cr-Al systems at 900 °C
As for the experiments carried out at 950 °C, around 10 samples from each batch
of the 2 target co-sputtering deposition experiments were chosen and oxidized in air at
900 °C in a horizontal furnace for exposure times of up to 500 hours. They were
unloaded every 20 hours for the same inspections as previously. Samples with apparent
cracking and/or significant weight loss were taken out of the experiment. The
compositions of the samples from the Ni-10wt%Cr+Al, Ni-20wt%Cr+Al and Ni-
50wt%Cr+Al targets are presented in Table 8.7. Compositions as close to the ones
chosen previously were taken for exposure in order to compare the behaviour of the
coatings at different temperatures.

Oxidation of Ni-Cr-Al coatings at 900-950 °C _____________________________________________________________________________
224 ______________________________________________________________________
Targets Sample Ni
(at%) Cr
(at%) Al
(at%) Cr/Al Exposure (hours)
Ni- 130510 D2 86.1 9.9 4.0 2.49 100 10wt%Cr+Al 130510 d2 84.5 9.7 5.8 1.67 120
170510 E3 81.4 9.2 9.4 0.98 60 170510 E2 81.4 9.2 9.4 0.98 460 130510 e2 76.3 8.2 15.5 0.53 60 170510 e2 76.3 8.2 15.5 0.53 100 170510 F3 61.6 6.7 31.7 0.21 500 170510 f2 49.5 4.7 45.8 0.10 500
130510 i3 6.0 0.4 93.6 0.00 500 Ni- 080710 c2 77.2 20.9 1.9 11.00 100
20wt%Cr+Al 080710 d3 77.0 18.5 4.5 4.11 500 080710 E3 74.3 17.9 7.8 2.31 220 080710 e2 69.1 16.3 14.6 1.11 500 080710 F3 63.9 14.6 21.5 0.68 500 080710 f3 52.5 11.5 36.0 0.32 500 080710 G3 41.2 8.4 50.4 0.17 500 080710 h3 14.0 2.5 83.5 0.03 500
080710 i4 10.2 2.1 87.7 0.02 100 Ni- 290610 C2 37.7 59.7 2.7 22.53 500
50wt%Cr+Al 290610 c3 37.9 57.8 4.3 13.41 500 290610 D3 38.1 55.9 6.0 9.36 500 290610 E2 33.5 48.2 18.2 2.64 500 290610 e3 29.7 41.6 29.1 1.43 500 290610 F3 22.5 32.6 44.9 0.73 500 290610 G3 10.3 14.7 74.9 0.20 60 290610 g3 6.8 9.0 84.2 0.11 500
290610 H2 4.1 5.1 90.8 0.06 500
Table 8.7 Compositions of Ni-Cr-Al coatings resulting from 2 target co-sputtering and oxidised at 900 °C. Numbers in italic correspond to samples removed prematurely for observation purposes.

Oxidation of Ni-Cr-Al coatings at 900-950 °C _____________________________________________________________________________
225 ______________________________________________________________________
8.2.1 Physical changes of samples with exposure
Lowering the exposure temperature from 950 to 900 °C caused the oxidation
mechanisms to slow down, leading to particular physical changes of the coatings
surfaces. Pictures of the samples at different exposure times are shown in Figures 8.23
to 8.25.
Samples from the Ni-10wt%Cr+Al batch are presented in Figure 8.23. As at 950
°C, light grey crystals grew on the surface of coatings containing over 85 at% Ni
(130510 D2 (9.9 at% Cr, 4 at% Al)). Increasing the Al concentration led to a spectacular
change of colour during the first stages of oxidation. The surfaces of samples 170510E2
(9.2 at% Cr, 9.4 at% Al) and 170510 e2 (8.2 at% Cr, 15.5 at% Al) evolved from grey to
iridescent pinks and greens. These colourful shades disappeared with further exposure
to leave a light grey colour. On the other hand, samples with higher amounts of Al (over
30 at%), like 170510F3 (6.7 at% Cr, 31.7 at% Al ), became black in the first stages of
oxidation. Finally, as for samples oxidised at 950 °C, the samples essentially composed
of Al such as 130510i3 (0.4 at% Cr, 93.6 at% Al), showed a molten/re-solidified profile.
The early detachment of most of the coatings from the Ni-10wt%Cr+Al batch at 900 °C
confirm that low amounts of Cr are life limiting.
Only pictures of the transient stage of oxidation were taken for the samples from
the batches of Ni-20wt%Cr+Al (Figure 8.24) and Ni-50wt%Cr+Al (Figure 8.25). They
show the unchanged coloration of 080710d3 (18.5 at% Cr, 4.5 at% Al), the slightly
iridescent edge of 080710E3 (17.9 at% Cr, 7.8 at% Al) and the black shade of 080710e2
(16.3 at% Cr, 14.6 at% Al) which confirmed the different nature of the oxides growing
on those three samples. The iridescent shade on 080710E3 disappeared with oxidation

Oxidation of Ni-Cr-Al coatings at 900-950 °C _____________________________________________________________________________
226 ______________________________________________________________________
as it was observed on sample 130510E2. As for samples from the Ni-10wt%Cr+Al
batch, 080710h3 (2.5 at% Cr, 83.5 at% Al) showed a molten/re-solidified profile.
The same observations were made for samples taken from the Ni-50wt%Cr+Al
batch (Figure 8.25). As the amount of Al in the coating increased, samples went from a
grey (290610D3 (55.9 at% Cr, 6.0 at% Al)), to an iridescent (290610 E2 (48.2 at% Cr,
18.2 at% Al)), to a dark colour (290610F3 (32.6 at% Cr, 44.9 at%Al). Again, the
iridescent colour, faded with exposure. This is an effect of oxide thicknesses when they
are approximately the same as the wavelength of light. Finally high amounts of Al (91
at%) lead to the same molten/re-solidified coatings (290610 H2 (5.1 at% Cr, 90.8 at5
Al).
Figure 8.23 Pictures showing the evolution of the oxides on 130510D2 (9.9 at% Cr, 4 at% Al), 170510E2 (9.2 at% Cr, 9.4 at% Al), 170510e2 (8.2 at% Cr, 15.5 at% Al), 170510F3 (6.7 at% Cr, 31.7 at% Al ) and 130510i3 (0.4 at% Cr, 93.6 at% Al)(Ni-10wt%Cr+Al) with exposure at 900 °C. Red arrows point at damage in coatings.

Oxidation of Ni-Cr-Al coatings at 900-950 °C _____________________________________________________________________________
227 ______________________________________________________________________
Figure 8.24 Pictures showing the evolution of the oxides, during the first stage of oxidation, on 080710d3 (18.5 at% Cr, 4.5 at% Al), 080710E3 (17.9 at% Cr, 7.8 at% Al), 080710e2 (16.3 at% Cr, 14.6 at% Al) and 080710h3 (2.5 at% Cr, 83.5 at% Al)(Ni-20wt%Cr+Al) with exposure at 900 °C.
Figure 8.25 Pictures showing the evolution of the oxides, during the first stage of oxidation, on 290610D3 (55.9 at% Cr, 6.0 at% Al), 290610E2 (48.2 at% Cr, 18.2 at% Al), 290610F3 (32.6 at% Cr, 44.9 at%Al) and 290610H2 (5.1 at% Cr, 90.8 at5 Al) (Ni-50wt%Cr+Al) with exposure at 900 °C.
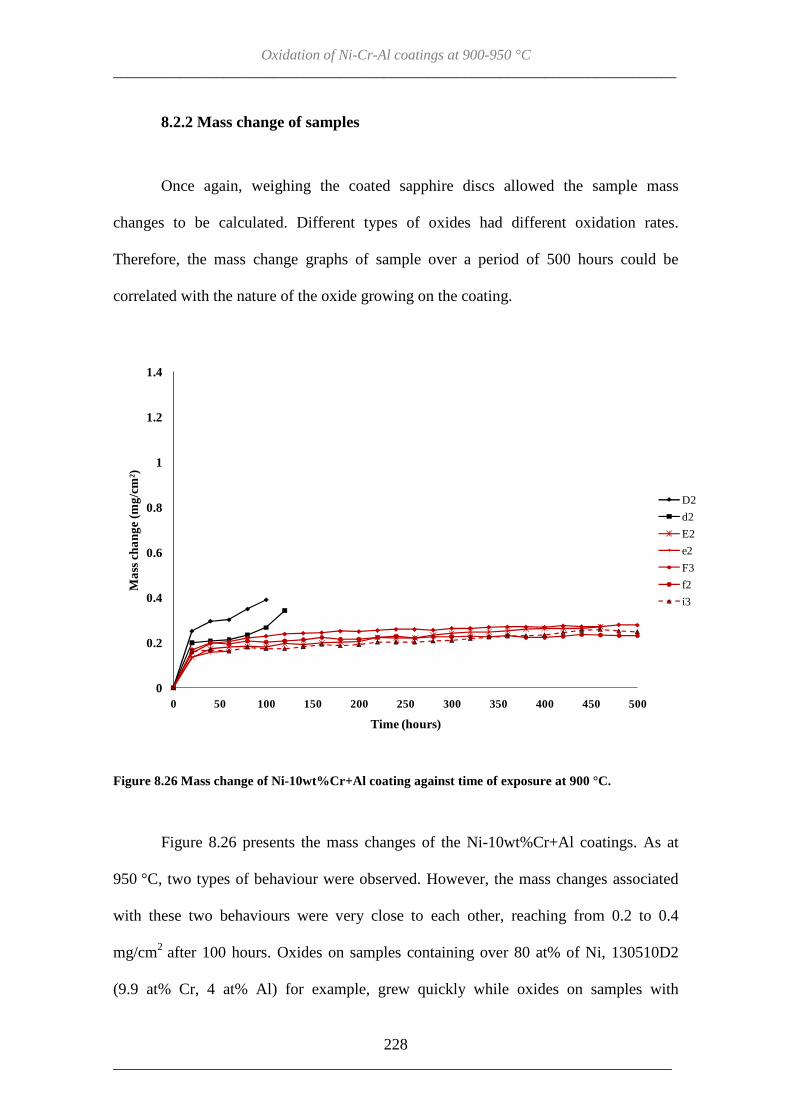
Oxidation of Ni-Cr-Al coatings at 900-950 °C _____________________________________________________________________________
228 ______________________________________________________________________
8.2.2 Mass change of samples
Once again, weighing the coated sapphire discs allowed the sample mass
changes to be calculated. Different types of oxides had different oxidation rates.
Therefore, the mass change graphs of sample over a period of 500 hours could be
correlated with the nature of the oxide growing on the coating.
Figure 8.26 Mass change of Ni-10wt%Cr+Al coating against time of exposure at 900 °C.
Figure 8.26 presents the mass changes of the Ni-10wt%Cr+Al coatings. As at
950 °C, two types of behaviour were observed. However, the mass changes associated
with these two behaviours were very close to each other, reaching from 0.2 to 0.4
mg/cm2 after 100 hours. Oxides on samples containing over 80 at% of Ni, 130510D2
(9.9 at% Cr, 4 at% Al) for example, grew quickly while oxides on samples with
0
0.2
0.4
0.6
0.8
1
1.2
1.4
0 50 100 150 200 250 300 350 400 450 500
Mas
s ch
ang
e (m
g/cm
²)
Time (hours)
D2
d2
E2
e2
F3
f2
i3

Oxidation of Ni-Cr-Al coatings at 900-950 °C _____________________________________________________________________________
229 ______________________________________________________________________
contents around and above 9 at% Al, 170510E2 (9.2 at% Cr, 9.4 at% Al), grew more
slowly. The mass change curves were once again divided in two parts: an initial fast
growing part followed by and a steady growth part. This describes the two stages of
Al 2O3 growth (transient oxide growth, e.g. θ-Al 2O3 or possibly NiO, followed by α-
Al 2O3). The particular behaviour of 130510d2 (9.7 at% Cr, 5.8 at% Al) can be explained
by a late appearance of NiO oxides which changed the oxidation mechanisms after 80
hours of exposure until failure of the sample at 120 hours. Reducing the oxidation
temperature did not reduce the mass gain of the coatings. The average mass change
remained around 0.2 mg/cm2 after 500 hours.
Figure 8.27 Mass change of Ni-20wt%Cr+Al coating against time of exposure at 900 °C.
The mass change of the Ni-20wt%Cr+Al coatings, represented in Figure 8.27,
showed a similar behaviour to the Ni-10wt%Cr+Al ones apart from samples 080710d3
0
0.2
0.4
0.6
0.8
1
1.2
1.4
0 50 100 150 200 250 300 350 400 450 500
Ma
ss c
hang
e (m
g/c
m²)
Time (hours)
c2
d3
E2
e2
F3
f3
G3
h3
i4

Oxidation of Ni-Cr-Al coatings at 900-950 °C _____________________________________________________________________________
230 ______________________________________________________________________
(18.5 at% Cr 4.5 at% Al) and 080710E2 (17.9 at% Cr, 7.8 at% Al) which, even if they
were later found not to grow pure Al2O3 (XRD analysis), still had a very slow growing
oxide. Samples falling into the composition range that were expected to be molten at
the 950 °C test temperature (red and black data points on graph) did not show a high
oxidation rate at 900 °C. However, pictures of these coatings confirmed that they had
melted during exposure indicating that it might form a different liquid or partially liquid
phase which behaves differently compared to the other phases.
Figure 8.28 Mass change of Ni-50wt%Cr+Al coating against time of exposure at 900 °C.
The addition of up to 50 at% Cr to the alloy system reduced the extent of
oxidation at 900 °C in a less dramatic manner than for samples exposed at 950 °C.
Indeed, in Figure 8.26 (Ni-wt%10Cr+Al), the mass change of samples mainly growing
Al 2O3 reached 0.2 mg/cm2 after 500 hours of exposure while in Figure 8.27 (Ni-
0
0.2
0.4
0.6
0.8
1
1.2
1.4
0 50 100 150 200 250 300 350 400 450 500
Ma
ss c
hang
e (m
g/c
m²)
Time (hours)
C2
c3
D3
E2
e3
F3
G3
g3
H2

Oxidation of Ni-Cr-Al coatings at 900-950 °C _____________________________________________________________________________
231 ______________________________________________________________________
20wt%Cr+Al) their masses only increased by 0.1-0.2 mg/cm2. Cr-rich coatings from the
Ni-50wt%Cr+Al batch produced slow growing oxides with a maximum weight gain of
0.35 mg/cm2 after 500 hours of exposure (Figure 8.28), presumably as a result of these
compositions favoring the growth of Cr2O3 and Al2O3 scales over faster growing NiO.
The Ni-50wt%Cr+Al samples growing Al2O3 (and not melting), such as 290610F3
(32.6 at% Cr, 44.9 at%Al) only reached a maximum gain weight of 0.1 mg/cm2,
comparable to the mass change seen in Figure 8.28, and similarly to samples exposed at
950 °C (Figure 8.6).
8.2.3 Identification of oxides
XRD analysis was used to identify the oxide phases present on the coatings after
exposure. On samples from the Ni-10wt%Cr+Al batch, high concentrations of Ni (over
80 at%) in the samples led to the growth of NiO oxides and Cr2O3 (Figures 8.29 and
8.30). A peak typical of γ-Al 2O3 was even observed on sample 130510d2’s (9.7 at%Cr,
5.8 at% Al) spectrum but the presence of this oxide could not be confirmed (Figure
8.29). Increasing the concentration of Al up to ~9 at% led to the formation of
NiO.Al2O3 and a further increase, to 15.5 at% Al, to the formation of α-Al 2O3 (Figure
8.31). The composition of the Al2O3 oxide layer seemed more diverse when the initial
amount of Al in the coating was around 32 at% as various transient forms of the Al
oxide were observed on 170510 F3 (6.7 at% Cr, 31.7 at% Al)(Figure 8.32).

Oxidation of Ni-Cr-Al coatings at 900-950 °C _____________________________________________________________________________
232 ______________________________________________________________________
Figure 8.29 XRD spectrum from the surface of sample 130510d2 (9.7 at% Cr, 5.8 at% Al) (Ni-10wt%Cr+Al) after 120 hours exposure, showing the presence of Cr2O3, NiO and presumably transient γ-Al 2O3.
Figure 8.30 XRD spectrum from the surface of sample 170510E2 (9.2 at% Cr, 9.4 at% Al) (Ni-10wt%Cr+Al) after 500 hours exposure, showing the presence of Cr2O3, NiO and mixed oxides.
130510d2Li
n (C
ount
s)
0
100
200
300
400
500
600
700
800
900
1000
1100
1200
5 10 20 30 40 50 60 70 80 90
2θ-scale5 20 40 60 80
Cr 2O3
NiO
Ni
γ-Al 2O3
Cou
nts
Co
unts
170510E2
Lin
(Cou
nts)
0
100
200
300
400
500
600
700
800
900
1000
1100
1200
1300
2-Theta - Scale
5 10 20 30 40 50 60 70 80 90
2θ-scale5 20 40 60 80
Cr 2O3
NiNiONiO.Al 2O3

Oxidation of Ni-Cr-Al coatings at 900-950 °C _____________________________________________________________________________
233 ______________________________________________________________________
Figure 8.31 XRD spectrum from the surface of sample 130510e2 (8.2 at% Cr, 15.5 at% Al)(Ni-10wt%Cr+Al) after 100 hours observation, showing the presence of NiO and α-Al 2O3.
Figure 8.32 XRD spectrum from the surface of sample 170510F3 (6.7 at% Cr, 31.7 at% Al) (Ni-10wt%Cr+Al) after 500 hours oxidation, showing the presence of transient γ- and θ-Al 2O3 as well as α-Al 2O3.
Co
unts
170510e2Li
n (C
ount
s)
0
100
200
300
400
500
600
700
800
900
1000
1100
1200
1300
1400
1500
1600
1700
2-Theta - Scale
5 10 20 30 40 50 60 70 80 90
2θ-scale5 20 40 60 80
NiO
Ni
α-Al 2O3
Co
un
ts
130510F3
Lin
(Cou
nts)
0
100
200
300
400
500
600
700
800
900
1000
5 10 20 30 40 50 60 70 80 90
2θ-scale5 20 40 60 80
Ni
θ-Al 2O3
γ-Al 2O3
α-Al 2O3

Oxidation of Ni-Cr-Al coatings at 900-950 °C _____________________________________________________________________________
234 ______________________________________________________________________
Figure 8.33 XRD spectrum from the surface of sample 080710d3 (18.5 at% Cr, 4.5 at% Al) (Ni-20wt%Cr+Al) after 500 hours exposure, showing the presence of Cr2O3, NiO and spinels.
Figure 8.34 XRD spectrum from the surface of sample 080710e2 (16.3 at5 Cr, 14.6 at% Al) (Ni-20wt%Cr+Al) after 500 hours exposure, showing the presence of Cr2O3 and α-Al 2O3.
Co
unts
080710d3Li
n (C
ount
s)
0
100
200
300
400
500
600
700
800
900
1000
1100
1200
2-Theta - Scale
5 10 20 30 40 50 60 70 80 90
Cr 2O3
NiNiCr 2O4
NiO
2θ-scale5 20 40 60 80
Co
unts
080710e2
Lin
(Cou
nts)
0
100
200
300
400
500
600
700
800
900
1000
1100
1200
1300
1400
2-Theta - Scale
5 10 20 30 40 50 60 70 80 90
2θ-scale5 20 40 60 80
Cr 2O3
Ni
α-Al 2O3

Oxidation of Ni-Cr-Al coatings at 900-950 °C _____________________________________________________________________________
235 ______________________________________________________________________
Figure 8.35 XRD spectrum from the surface of sample 080710F3 (14.6 at% Cr, 21.5 at% Cr) after 140 and 500 hours exposure (Ni-20wt%Cr+Al) showing the presence of transient θ-Al 2O3 as well as α-Al 2O3.
Figure 8.36 XRD spectrum from the surface of sample 290610D3 (55.9 at% Cr, 6.0 at% Al) (Ni-50wt%Cr+Al) after 500 hours exposure, showing the presence of Cr2O3, transient δ-Al 2O3 and spinels.
080710F3Li
n (C
ount
s)
0
100
200
300
400
500
600
700
800
900
1000
1100
1200
2-Theta - Scale
5 10 20 30 40 50 60 70 80 90
2θ-scale5 20 40 60 80
500 hours
140 hours
Ni
θ-Al 2O3
α-Al 2O3
Co
unts
Co
unt
s
290610 D3
Lin
(Cou
nts)
0
100
200
300
400
500
600
700
800
2-Theta - Scale
5 10 20 30 40 50 60 70 80 90
Cr 2O3
Ni
NiCr 2O4
δ-Al 2O3
2θ-scale5 20 40 60 80

Oxidation of Ni-Cr-Al coatings at 900-950 °C _____________________________________________________________________________
236 ______________________________________________________________________
Figure 8.37 XRD spectrum from the surface of sample 290610E2 (48.2 at% Cr, 18.2 at% Al) (Ni-50wt%Cr + Al) after 500 hours exposure, showing the presence of Cr2O3, transient δ-Al 2O3, α-Al 2O3 and spinels.
Low concentrations of Cr (minimum of 5 at%) were needed in order to form Cr2O3
(Figures 8.29, 8.30, 8.31, 8.32, 8.36 and 8.37). On the Ni-20wt%Cr+Al batch, the first
evidence of Al2O3 was observed on sample 080710e2 (16.3 at% Cr, 14.6 at% Al) as
shown in Figure 8.34. Once again, increasing the amount of Al up to 21.5 at%, lead to
the growth of the transient θ-Al 2O3 along with α-Al 2O3 (Figure 8.35). Figure 8.35 also
highlights the growth of the Al2O3 oxides with time. Between 140 and 500 hours, the
transient phases seemed to grow as much as the stable α-phase which confirms that at
the lower temperature different forms of Al2O3 can co-exist.
Finally on the samples from the Ni-50wt%Cr+Al batch, Al2O3 was first spotted
on 290610D3 (55.9 at%Cr, 6.0 at% Al) (Figure 8.36). Generally, a higher initial amount
of Cr reduced the amount of Al necessary to form Al2O3, as was observed at 950 °C, but
Co
un
ts290610E2
Lin
(Cou
nts)
0
10
20
30
40
50
60
70
80
90
100
110
120
130
140
150
160
170
180
190
200
210
220
230
240
250
260
270
280
290
300
310
320
330
340
350
360
370
380
390
400
410
5 10 20 30 40 50 60 70 80 90
Cr 2O3
NiAl
NiCr 2O4
δ-Al 2O3
α-Al 2O3
2θ-scale5 20 40 60 80

Oxidation of Ni-Cr-Al coatings at 900-950 °C _____________________________________________________________________________
237 ______________________________________________________________________
also seemed to increase the probability of forming spinels/mixed oxides. Indeed, most
of the samples for this batch grew NiCr2O4 or NiO.Al2O3 (Figures 8.30, 8.33, 8.36 and
8.37).
The XRD results for all the samples oxidised at 900 °C are summarised in
Table 8.8.
Targets Sample NiO Cr 2O3 α-Al 2O3 Mixed oxides Spinels Ni- 130510 D2 + +
10wt%Cr+Al 130510 d2 + + 170510 E3 + + 170510 E2 + + Al 2O3.NiO 130510 e2 + α- 170510 e2 + α- 170510 F3 α,γ,θ- 170510 f2 α,δ,θ-
130510 i3 α-
Ni- 80710 c2 + + NiCr2O4
20wt%Cr+Al 80710 d3 + + NiCr2O4 80710 E2 + Al 2O3.NiO 80710 e2 α- 80710 F3 α,θ- 80710 f3 α,θ- 80710 G3 α,γ- 80710 h3 α-
80710 i4 α- Ni- 290610 C2 + +
50wt%Cr+Al 290610 c3 + 290610 D3 + δ- NiCr2O4 290610 E2 + α,γ- NiCr2O4 290610 e3 α- Al 2O3.NiO NiCr2O4 290610 F3 α- NiCr2O4 290610 g3 α,θ- Al 2O3.NiO
290610 H2 α,γ-
Table 8.8 Different oxide phases identified using XRD on the samples exposed at 900 °C.
The first traces of Al2O3 were observed on samples 130510e2 (8.2 at% Cr, 15.5
at% Al), 080710e2 (16.3 at%Cr, 14.6 at% Al) and 290610D3 (55.9 at%Cr, 6.0 at% Al),
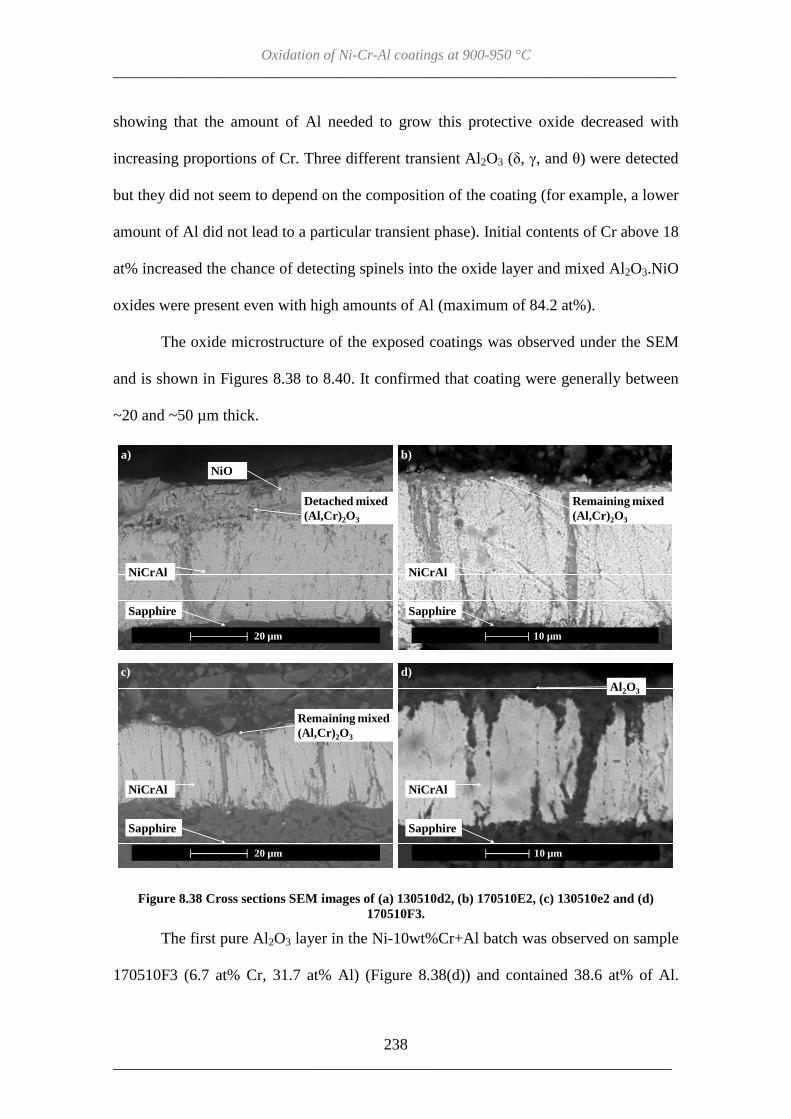
Oxidation of Ni-Cr-Al coatings at 900-950 °C _____________________________________________________________________________
238 ______________________________________________________________________
showing that the amount of Al needed to grow this protective oxide decreased with
increasing proportions of Cr. Three different transient Al2O3 (δ, γ, and θ) were detected
but they did not seem to depend on the composition of the coating (for example, a lower
amount of Al did not lead to a particular transient phase). Initial contents of Cr above 18
at% increased the chance of detecting spinels into the oxide layer and mixed Al2O3.NiO
oxides were present even with high amounts of Al (maximum of 84.2 at%).
The oxide microstructure of the exposed coatings was observed under the SEM
and is shown in Figures 8.38 to 8.40. It confirmed that coating were generally between
~20 and ~50 µm thick.
Figure 8.38 Cross sections SEM images of (a) 130510d2, (b) 170510E2, (c) 130510e2 and (d) 170510F3.
The first pure Al2O3 layer in the Ni-10wt%Cr+Al batch was observed on sample
170510F3 (6.7 at% Cr, 31.7 at% Al) (Figure 8.38(d)) and contained 38.6 at% of Al.
20 µm
Detached mixed (Al,Cr) 2O3
NiCrAl
Sapphire
a)NiO
10 µm
Remaining mixed (Al,Cr) 2O3
NiCrAl
Sapphire
b)
20 µm
Remaining mixed (Al,Cr) 2O3
NiCrAl
Sapphire
c)
10 µm
Al 2O3
NiCrAl
Sapphire
d)

Oxidation of Ni-Cr-Al coatings at 900-950 °C _____________________________________________________________________________
239 ______________________________________________________________________
Samples containing high amounts of Ni (over 84 at%) grew a two layered TGO
composed of an outer mixed NiO.Al2O3 layer and an inner mixed (Al,Cr)2O3 layer
(Figure 8.38(a)). Increasing the initial Al contents from 5.8 to 9.4 at% in the coating led
to the growth a mixed (Al,Cr)2O3 layer (Figure 8.38(b) and (c)). Samples 170510E2
(9.2 at% Cr, 9.4 at% Al) and 130510e2 (8.2 at% Cr, 15.5 at% Al) respectively failed
after 460 and 100 hours of exposure, explaining the very thin remaining oxide layer.
This indicates either that failure occurred within the oxide layer or at the oxide/coating
interface and was followed by re-growth of the oxide.
From the Ni-20wt%Cr+Al batch, a pure Al2O3 layer could not be seen at
compositions lower than sample 080710F3 (14.6 at% Cr, 21.5 at% Al) (Figure 8.39(d)).
Lower amounts of Al (14.6 at%) led to the formation of a mixed Cr2O3.Al2O3 layer, the
composition of which was dependent on the initial composition of the coating (Figures
8.39(b) and 8.39(c)). Even with high amount of Ni in 080710d3 (18.5 at% Cr, 4.5 at%
Al), the double oxide layer system made of NiO and Cr2O3 could not be found as easily
as on samples oxidised at 950 °C (Figure 8.39(a)). Also, spinels were largely present on
the coatings and usually had two sorts of microstructures. They could appear as very
voluminous oxides consuming most of the overlay coating as in Figures 8.39(a) and
8.39(d), or be very small and located in the oxide layer next to the overlay coating as in
Figure 8.39(b) and 8.39(c).

Oxidation of Ni-Cr-Al coatings at 900-950 °C _____________________________________________________________________________
240 ______________________________________________________________________
Figure 8.39 Cross sections SEM images of (a) 080710d3, (b) 080710E2, (c) 080710e2 and (d) 080710F3.
Figure 8.40 Cross sections SEM images of (a) 290610D3 and (b) 290610E2.
Cross-sections through samples from the Ni-50wt%Cr+Al batch showed that a
pure Al2O3 layer could not be observed on samples with an amount of Al smaller than
10 µm10 µm
Mixed (Al,Cr) 2O3
NiCrAl
Sapphire
Spinel NiOa)
10 µm
Mixed (Al,Cr) 2O3
NiCrAl
Sapphire
Spinelb)
Mixed (Al,Cr) 2O3
NiCrAl
Sapphire
c)
10 µm
Al2O3
NiCrAl
Sapphire
10 µm
d)
Spinel
20 µm
Mixed (Al,Cr) 2O3
NiCrAl
Sapphire
Spinel
a)
Al 2O3
NiCrAl
Sapphire
10 µm
b)

Oxidation of Ni-Cr-Al coatings at 900-950 °C _____________________________________________________________________________
241 ______________________________________________________________________
18 at% as in 290610 E2 (48.2 at% Cr, 18.2 at% Al) (Figure 8.40(b)). Even if traces of
Al 2O3 were found on 080710D3 (55.9 at% Cr, 6.0 at% Al) using XRD analysis, SEM
coupled with EDX analysis showed that the oxide layer was rich in Cr and Al instead
(mix of Cr2O3 and Al2O3) (Figure 8.40(a)). The size of spinels in the oxide layer
increased and they also seem to be present more inside the overlay coating.
Sample Oxide O (at%) Ni (at%) Cr (at%) Al (at%) 130510 d2 outer layer 50.2 30.9 1.4 17.5
inner layer 54.7 19.2 9.2 16.9 170510 E2 outer layer 46.4 21.5 8.4 23.7 130510 e2 outer layer 54.4 9.2 2.7 33.6 170510 F3 outer layer 56.2 4.2 1.2 38.4
080710 d3 outer layer 55.3 5.0 20.7 19.0
080710 E2 outer layer 57.1 4.0 22.8 16.2
080710 e2 outer layer 58.9 5.5 13.9 21.8
080710 F3 outer layer 52.6 3.8 2.6 41.
290610 D3 outer layer 59.4 1.8 18.8 20.1 290610 E2 outer layer 59.2 2.6 6.8 31.5
290610 e2 outer layer 43.8 8.6 14.5 33.1 290610 F3 outer layer 57.9 1.7 4.0 36.4
Table 8.9 Composition (obtained by EDX analysis) of the oxide layers observed on the cross-sections of selected Ni-Cr-Al samples exposed at 900°C.
The compositions of the oxide layers were determined using EDX analysis and
the results are summarised in Table 8.9. As for the results in Table 8.4, all the oxide
layers contained a fraction of Ni (probably because of the resolution of the EDX which
is around 3-5 µm). High initial amounts of Ni (130510d2 with 9.7 at% Cr and 5.8 at%
Al) led to the formation of a two layered oxide scale, whose outer layer was composed
of 30.9 at% Ni and 17.5 at% Al (mixed NiO.Al2O3) and inner layer was composed of
19.2 at% Ni, the same amount of Al and 9.2 at% Cr (mixed (Cr,Al)2O3 enriched in Ni).

Oxidation of Ni-Cr-Al coatings at 900-950 °C _____________________________________________________________________________
242 ______________________________________________________________________
The amount of Ni present in the oxides layers reduced with the lesser amounts of Ni in
the coating before oxidation.
At the same time, as for coatings exposed at 950 °C (Figure 8.19), increasing the
initial amount of Al in the coatings led to mixed (Cr,Al)2O3 layers increasingly richer in
Al until the layer formed was mainly pure Al2O3 (Figure 8.41). SEM and EDX did not
allow identifying different forms of Al2O3.
Figure 8.41 Effect on the initial composition on the oxides formed at 900°C.
8.2.4 Oxidation of the coatings obtained from 3 target co-sputtering
To complete the information provided by these 27 samples, 8 additional samples
from the Ni-10wt%Cr+Ni-50wt%Cr+Al 3 target co-sputtering batch were also exposed
at 900 °C. The compositions of the coatings selected for the oxidation at 900 °C are
given in Table 8.10.
0
10
20
30
40
50
0 2 4 6 8 10
Co
mpo
sitio
n o
f oxi
de la
yer
(at%
)
Initial Cr/Al
at% Cr
at% Al

Oxidation of Ni-Cr-Al coatings at 900-950 °C _____________________________________________________________________________
243 ______________________________________________________________________
Sample Ni (at%) Cr (at%) Al (at%) 251111_01 41.1 39.8 19.1 251111_04 39.3 36.3 24.5 251111_09 52.3 23.2 24.6 251111_10 39.4 45.3 15.3 251111_12 35.9 39.9 24.2 251111_15 30.5 33 36.5 251111_17 60.9 15.2 23.9 251111_23 44.1 42.8 13.1
Table 8.10 Ni-Cr-Al compositions of coatings resulting from 3 targets co-sputtering and oxidised at 900 °C.
After verification under the SEM, it was found that prior to oxidation the
coatings were only 10 µm thick, despite modifying deposition parameters. Therefore, to
avoid their complete destruction, these samples were oxidised for 40 hours instead of
500 hours. They were then analysed using XRD. A summary of the oxides detected in
the samples is shown in Table 8.11. The majority of the transient Al2O3 present
consisted of δ-Al 2O3 instead of the θ-Al 2O3 obtained on the previous samples after 500
hours exposure, suggesting that this phase appears later during oxidation at this
temperature. Also, spinels were detected on most of the samples.
Sample NiO Cr2O3 a-Al2O3 transient Al2O3 spinels 251111_01 + + δ-Al 2O3 NiCr2O4 251111_04 + + δ-Al 2O3 NiCr2O4 251111_09 + + δ-Al 2O3 NiCr2O4 251111_10 + + δ-Al 2O3 NiCr2O4 251111_12 + + δ-Al 2O3 NiCr2O4 251111_15 + + δ-Al 2O3 NiCr2O4 251111_17 + + + 251111_23 + + θ-Al 2O3
Table 8.11 Different oxide species identified using XRD on the samples exposed at 900 °C for 40 hours.

Oxidation of Ni-Cr-Al coatings at 900-950 °C _____________________________________________________________________________
244 ______________________________________________________________________
8.2.5 Discussion- Ni-Cr-Al ternary oxidation map at 900 °C.
Superimposed on Figure 8.42 is a proposed boundary defining the limiting
composition for Al2O3 scale formation at 900 °C. Samples identified to grow any form
of Al2O3 are represented in red in the diagram. As for the oxidation at 950 °C, an
increase in the Cr fraction in the initial coating reduced the amount of Al needed to
grow Al2O3, extending the Al2O3 domain toward the Cr rich corner.
Figure 8.42 Oxide compositions grown on Ni-Cr-Al coatings after 500 hours at 900 °C (diagram in at%).
Less melting of the Al rich samples was noticed at 900 °C suggesting that the
melting domain in the Al rich corner is smaller compared to the one at 950 °C (Figure
8.42 compared to Figure 8.20). Spinels were present more in coatings with a high initial
Cr content while transient Al2O3 seemed to form more easily with lower amounts of Cr
and Al (Figure 8.42).

Oxidation of Ni-Cr-Al coatings at 900-950 °C _____________________________________________________________________________
245 ______________________________________________________________________
Data obtained from the oxidation of the coatings deposited with 3 targets was
added to the previous ternary map and are shown in Figure 8.43. These data confirm the
boundaries drawn by the results from the coatings deposited by 2 target co-sputtering.
The presence of Cr2O3 in the Al2O3 domain could be explained by the fact that the
coatings were only exposed for 40 hours. At low temperatures such as 900 °C, the
conversion of the Cr2O3, spinels and transient Al2O3 might be too slow to disappear
after short exposure times [12,149]. It can be assumed that the Cr2O3 will cause the O2
partial pressure at the surface of the BC to reduce thus promoting the formation of
Al 2O3. This needs to be confirmed by depositing thicker coatings and oxidizing them
for longer periods of time.
Figure 8.43 Oxide compositions grown on Ni-Cr-Al coatings after 500 hours at 900 °C including the data obtained from 3 target co-sputtering(diagram in at%).

Oxidation of Ni-Cr-Al coatings at 900-950 °C _____________________________________________________________________________
246 ______________________________________________________________________
8.3 Discussion - Influence of Ni-Cr-Al compositions and exposure temperature on the nature and growth of oxides.
Both domains for the samples oxidised at 900 and 950 °C are drawn on the Ni-
Cr-Al diagram in Figure 8.44. Reducing the oxidation temperature expanded the Al2O3
formers domain a little, promoted formation of transient Al2O3 and reduced the
transition to stable Al2O3. The difference of oxidation behaviour increased with an
increasing amount of Cr in the initial coating. Indeed, less Al was needed at 900 °C to
grow Al2O3 than at 950 °C for the same amount of Cr. However, going back to the mass
gain graphs in Figures 8.6 and 8.28 showing the evolution of the oxide layer for the Ni-
50wt%Cr+Al batch of samples, at both temperatures the behaviour was almost identical,
unlike the Ni-10wt%Cr+Al and Ni-20wt%Cr+Al samples (Figure 8.4, 8.5, 8.26 and
8.27).
Figure 8.44 Oxide compositions grown on Ni-Cr-Al coatings after 500 hours at 900 °C Boundaries of Al2O3 formers are compared to those obtained at 950 °C in this work and by Nicholls et al. [63](diagram in at%).

Oxidation of Ni-Cr-Al coatings at 900-950 °C _____________________________________________________________________________
247 ______________________________________________________________________
This leads to the idea that at high Cr contents, the same quantity of oxygen had
reacted at both temperatures, but the slower oxidation mechanisms allowed the growth
of different oxides. Or, the slower oxidation mechanisms enabled transient Al2O3 to
remain in the oxide layer, instead of being replaced by a continuous layer of Cr2O3, as at
950°C. For lower amounts of Cr, reducing the oxidation temperature reduced the overall
mass gain of the samples and did not affect the nature of oxide grown on the surface.
Unlike Brumm and Grabke [52], the beneficial effect of Cr on the transformation of
transient Al2O3 into stable Al2O3 was not observed here.
At the lower temperature, more forms of transient Al 2O3 were observed (Table
8.8). This is consistent with research carried out on the oxidation of NiAl which showed
that with decreasing temperature transient forms of Al2O3 could co-exist with α-Al 2O3
because of their slower oxidation kinetics (Figure 2.7) [52]. Lowering the temperature
from 950 to 900 °C, increased the probability of the system being in the transient
domain of this diagram (Figure 2.7) and thus the likelihood of forming different phases
of Al2O3.
Reducing the oxidation temperature from 950 to 900 °C also reduced the extent
of the melting samples domain in the ternary diagram. This enables higher amounts of
Al to be included in coatings if a very pure Al2O3 layer is needed for protection
purposes at lower temperatures. However, in real life operation, these coatings are
exposed to the risk of overheating and too high a content of Al will lead to melting and
premature failing of the system.
At both temperatures, the domain of protective oxide formers (Cr2O3, Al2O3 or a
mix of the two), comprises the usual Ni-Cr-Al-Y composition found commercially (18-
22 wt%Cr, 8-12 at% Al) which suggests that even if they are not the most efficient

Oxidation of Ni-Cr-Al coatings at 900-950 °C _____________________________________________________________________________
248 ______________________________________________________________________
composition available for overlay and BCs at lower temperature, they will still grow
protective oxides and extend the lifetime of the substrate they are supposed to protect.
Lowering the temperature from 950 to 900 °C also affected the formation of
spinels and mixed oxides. More NiCr2O4 and Al2O3.NiO were detected using XRD
(comparing Tables 8.3 and 8.8) at 900 °C. This could be caused by the lower oxidation
kinetics at 900 °C delaying the formation of continuous and protective Al2O3 and/or
Cr2O3 layer(s) and thus promoting the formation of spinels [12]. Or it could be caused
by the higher amounts of transient Al2O3 at 900 °C, helping the diffusion of Ni and Cr
species to form less protective oxides [136].
The data gathered from the samples with the Ni-10wt%Cr+Al, Ni-20wt%Cr+Al
and Ni-50wt%Cr+Al coatings were also compared to the work reported by Wallwork et
al. [65] on samples oxidised at 1000 °C and over (Figure 2.9). In this case, instead of
just taking into account the growth of Al2O3, the Ni-Cr-Al compositions were divided
into 3 categories: (I) the NiO formers; (II) the Cr2O3 formers; and, (III) the Al2O3
formers. The diagram for the samples exposed at 950 °C is shown in Figure 8.45:
boundaries between the 3 different domains at 1000 °C are in black, while the ones at
950 °C are traced in red. Domain sizes changed greatly with the reduction of
temperature from 1000 to 950 °C. Indeed, the external NiO domain was much bigger at
the lower temperature and more Al was needed to grow an external layer of Al2O3.
Reducing the exposure temperature to 900 °C (Figure 8.46) altered the domain
boundaries in a similar way as for 950 °C. Another difference is that at 1000 °C, it was
stated that the oxides were composed of two layers, even in domain II, which was found
in the literature [40] to grow an external layer of Cr2O3 and an internal layer of Al2O3.
At lower temperatures, only the coatings containing a high amount of Ni grow an outer

Oxidation of Ni-Cr-Al coatings at 900-950 °C _____________________________________________________________________________
249 ______________________________________________________________________
layer of NiO above a layer of mixed (Cr,Al)2O3. In other cases, only one mixed oxide
layer was created at the lower temperatures and its composition varied with the initial
Cr/Al ratio.
Figure 8.45 Compositional effects on the oxidation of Ni-Cr-Al ternary alloys, at over 1000 °C [65], cited in reference [12] and [63], compared to the data gathered at 950 °C on the coated sapphire discs. Black doted lines represent the boundaries at 1000 °C and the red ones, the boundaries at 950 °C. I) NiO + internal oxidation of Al and Cr ; II) Cr 2O3 + internal oxidation of Al ; III) an Al 2O3 external scale.
Boundaries between domains II and III in Figure 8.45 and 8.46 were established
according to the data obtained from the 3 target co-sputtered coatings. Because these
samples were only exposed 40 hours, the oxide layer was essentially composed of
transient oxides (NiO, spinels, Cr2O3 and transient Al2O3). Therefore, the red dotter
boundaries on the ternary diagrams might shift toward lower Al concentrations with
longer exposure. Indeed, research carried out on Ni-Cr-Al samples at 1000 °C in the
III
III

Oxidation of Ni-Cr-Al coatings at 900-950 °C _____________________________________________________________________________
250 ______________________________________________________________________
literature [12, 149] showed that the initial formation of NiO, spinels and Cr2O3 was
gradually replaced by stable α-Al 2O3 because of the reduction of the O2 partial pressure.
This transformation is expected to take place more slowly at lower temperatures.
Figure 8.46 Compositional effects on the oxidation of Ni-Cr-Al ternary alloys, at over 1000 °C [65], cited in reference [12] and [63], compared to the data gathered at 950 °C on the coated sapphire discs. Black doted lines represent the boundaries at 1000 °C and the red ones, the boundaries at 950 °C. I) NiO + internal oxidation of Al and Cr ; II) Cr 2O3 + internal oxidation of Al ; III) an Al 2O3 external scale.
8.4 Summary
The physical vapour deposition technique, magnetron sputtering, has been used
successfully to deposit a range of Ni-Cr-Al coatings on 10 mm diameter sapphire
substrates. This was achieved through co-sputtering from two targets: a Ni10Cr,
Ni20Cr, Ni50Cr target (changed between deposition runs) and a pure Al target. X-ray
diffraction (XRD) was used to identify the oxides formed during exposures at 900 and
950 °C. The selective growth of protective Cr2O3 or Al2O3 oxides (depending on the
III
III

Oxidation of Ni-Cr-Al coatings at 900-950 °C _____________________________________________________________________________
251 ______________________________________________________________________
initial coating composition) was observed. At 950 °C, the first traces of Al2O3 were
observed on samples containing 32 at% Al (at a low Cr concentration, 6.7 at%) and 21.5
at% Al (at a higher Cr concentration, 14.6 at%). Increasing the Cr content to 56 at%
confirmed that for all high Cr alloys the critical Al level to form Al2O3 was below 6
at%. Decreasing the exposure temperature to 900 °C decreased the amount of Al needed
to form Al2O3.The first traces of Al2O3 were observed on samples containing 15.5 at%
Al (at a low Cr concentration, 8.2 at%), 16.3 at% Al (at a medium Cr concentration,
14.6 at%) and 6 at% Al (at a high Cr concentration, 56 at%). Decreasing the oxidation
temperature promoted the formation of transient Al2O3 and spinels.

Oxidation of Co-Ni-Cr-Al coatings at 900-950 °C _____________________________________________________________________________
252 ______________________________________________________________________

Oxidation of Co-Ni-Cr-Al coatings at 900-950 °C _____________________________________________________________________________
253 ______________________________________________________________________
CHAPTER IX – OXIDATION OF THE Co-Ni-Cr-Al COATINGS AT 900-950 °C
9.1 Study of the Co-Ni-Cr-Al system – oxidation at 950 °C
The addition of Co, with the use of the Ni-20wt%Co-40wt%Cr or Ni-40wt%Co-
20wt%Cr targets, was intended to extend these studies to quaternary systems in order to
deposit coatings with compositions closer to commercial MCrAlYs. Similar oxidation
experiments were conducted on the Ni-40wt%Co-20wt%Cr+Al and Ni-20wt%Co-
40wt%Cr+Al samples. The names, compositions and exposure times of the coated
sapphire discs are collated in Table 9.1.
Targets Sample Co(at%) Ni(at%) Cr(at%) Al(at%) Cr/Al Co/Ni Ni- 130910 d3 18.3 31.3 41.6 8.8 4.75 0.58 20wt%Co- 130910 E2 18.0 30.9 40.6 10.5 3.88 0.58 40wt%Cr 130910 e2 16.4 28.8 38.1 16.7 2.28 0.57 +Al 130910 F2 12.3 21.9 29.2 36.6 0.80 0.56
130910 f3 11.8 20.2 27.8 40.2 0.69 0.58 130910 G2 7.9 14.0 18.3 59.8 0.31 0.57 130910 g3 4.2 7.5 9.0 79.3 0.11 0.56 130910 H2 2.7 5.2 5.8 86.3 0.07 0.53
130910 i4 1.7 2.8 3.1 92.4 0.03 0.57 Ni- 160810 d2 36.6 34.4 21.6 7.4 2.93 1.06 40wt%Co- 160810 E4 31.4 30.3 18.2 20.1 0.91 1.03 20wt%Cr 160810 e3 26.0 25.1 15.4 33.5 0.46 1.04 +Al 160810 F4 24.0 21.7 13.4 40.9 0.33 1.16
160810 f2 16.3 15.8 8.9 59.0 0.15 1.03 160810 G4 10.7 10.5 5.8 73.0 0.06 1.02 160810 g1 8.5 8.5 4.5 78.5 0.06 1.00 160810 H1 4.4 4.4 2.4 88.8 0.03 1.01
160810 h1 3.5 3.6 1.9 91.0 0.02 0.99
Table 9.1 Compositions of Co- Ni-Cr-Al coatings resulting from 2 target co-sputtering and oxidised at 950 °C.

Oxidation of Co-Ni-Cr-Al coatings at 900-950 °C _____________________________________________________________________________
254 ______________________________________________________________________
9.1.1 Physical changes of samples with exposure
Pictures of the Ni-40wt%Co-20wt%Cr+Al and Ni-20wt%Co-40wt%Cr+Al
samples were taken regularly between exposure cycles and are shown respectively in
Figures 9.1 and 9.2.
Fractions of Co above 30 at% in the initial coating, led to very specific coating
morphology. Indeed on samples 160810d2 (21.6 at% Cr, 7.4 at% Al) and 160810E4
(18.2 at% Cr, 20.1 at% Al) in Figure 9.1, after 20 and 40 hours of exposure, features
looking like crystals started to nucleate on the coatings’ surface and grow with time.
These crystals eventually covered the whole sample surface. Increasing the initial
amount of Al to 16.7 at% created a grey surface which did not change during exposure.
Failure on sample 160810e3 (15.4 at% Cr, 33.5 at% Al) started on the edges of the
sapphire disc after 280 hours at 950 °C. As for the Ni-Cr-Al system (section 8.1.1),
coatings containing a very high content of Al (above 75 at%) melted at 950 °C. Sample
160810H1 (2.35 at% Cr, 88.8 at% Al) has got a molten and re-crystallised layer (as
previously observed on Ni-Cr-Al samples).
Physical changes on the coatings from the Ni-20wt%Co-40wt%Cr+Al batch,
shown in Figure 9.2, were not as spectacular as the ones presented above (Figure 9.1)
but still depended on their initial compositions. High levels of Cr (around 40 at%) grew
green oxidation products whose colour became more intense with exposure, indicating a
thickening of the oxide layer (e.g. 130910 d3 with 41.6 at% Cr and 8.8 at% Al).

Oxidation of Co-Ni-Cr-Al coatings at 900-950 °C _____________________________________________________________________________
255 ______________________________________________________________________
Figure 9.1 Pictures showing the evolution of oxides on 160810d2 (21.6 at% Cr, 7.4 at% Al), 160810E4 (18.2 at% Cr, 20.1 at% Al), 160810e3 (15.4 at% Cr, 33.5 at% Al) and 160810H1(2.35 at% Cr, 88.8 at% Al) (Ni-40wt%Co-20wt%Cr+Al) with e xposure at 950 °C. Red arrows point at damage in coatings.
Figure 9.2 Pictures showing the evolution of oxides on 130910d3 (41.6 at% Cr, 8.8 at% Al), 130910e2 (38.1 at% Cr, 16.7 at% Al), 130910f3 (27.8 at% Cr and 40.2 at% Al) and 130910H2 (5.8 at% Cr and 86.3 at% Al) (Ni-20wt%Co-40wt%Cr+Al) wi th exposure at 950 °C. Red arrows point at damage in coatings.

Oxidation of Co-Ni-Cr-Al coatings at 900-950 °C _____________________________________________________________________________
256 ______________________________________________________________________
Sample 130910e2 (38.1 at% Cr, 16.7 at% Al) became slightly iridescent in the
first stages of exposure and then turned green, which suggests a thickening oxide
(interference colours). Again, increasing the amount of Al led to the formation of grey
surface oxide layers (130910f3 with 27.8 at% Cr and 40.2 at% Al)) and melting
occurred on samples with the fraction of Al exceeding 80 at% (130910H2 with 5.8 at%
Cr and 86.3 at% Al)).
9.1.2 Mass change of samples
As carried out previously for the Ni-Cr-Al system (sections 8.1.2 and 8.2.2), the
samples mass changes were plotted against time. For samples coated with the Ni-
20wt%Co-40wt%Cr and Al targets, no obvious trend in behavior could be deduced
(Figure 9.3), except that samples 130910f3 (27.8 at% Cr and 40.2 at% Al) and
130910G2 (18.3 at% Cr, 59.8 at% Al) which resulted in the slowest oxidation and
corresponded to a Cr/Al atomic ratio between 0.31 and 0.69. It should be noted that all
the samples had alternatively high Cr and/or Al contents, thus all would be expected to
produce relatively slow growing oxides.
As previously reported, the high Al concentration coatings may well be molten
at the test temperature of 950 °C. Indeed, while 130910i4 (3.1 at% Cr, 92.4 at% Al) was
the sample with the most Al, its mass increased by 0.15 mg/cm2 after 500 hours of
exposure while sample 130910f3, with less Al, only increased by 0.1 mg/cm2.

Oxidation of Co-Ni-Cr-Al coatings at 900-950 °C _____________________________________________________________________________
257 ______________________________________________________________________
Figure 9.3 Mass change of Ni-20wt%Co-40wt%Cr+Al coating against time of exposure at 950 °C.
Figure 9.4 Mass change of Ni-40wt%Co-20wt%Cr+Al coating against time of exposure at 950 °C.
0
0.2
0.4
0.6
0.8
1
1.2
1.4
0 50 100 150 200 250 300 350 400 450 500
Mas
s ch
ange
s (m
g/cm
2 )
Time (hours)
d3
E2
e2
F2
f3
G2
g3
H2
I4
0
0.2
0.4
0.6
0.8
1
1.2
1.4
0 50 100 150 200 250 300 350 400 450 500
Ma
ss c
hang
es (
mg/
cm2 )
Time (hours)
d2
E4
e3
F4
f2
G4
g1
H1
h1

Oxidation of Co-Ni-Cr-Al coatings at 900-950 °C _____________________________________________________________________________
258 ______________________________________________________________________
In systems containing more Co, two rates of oxidation could be observed
(Figure 9.4). The faster growing oxides on sample 160810d2 (21.6 at% Cr, 7.4 at% Al)
were believed to be the result of a mix of CoO and NiO. The lowest level of oxidation
was obtained with sample 160810G4 (5.8 at% Cr, 73.0 at% Al), a coating which
contained a very high amount of Al and on Cr/Al atomic ratio of 0.06. The sample with
the second lowest oxidation, 160810e3, contained 33.5 at% Al and 15.4 at% Cr, giving
a Cr/Al atomic ratio of 0.45. Both of these high Al coatings would be expected to be
brittle [146].
9.1.3 Identification of oxides
XRD was used to identify the oxides present on the coatings after exposure. On
samples from the Ni-20wt%Co-40wt%Cr+Al batch, high concentrations of Cr in the
samples led to the growth of Cr2O3. In sample 130910d3 (41.6 at% Cr, 8.8 at% Al)
(Figure 9.5), 31 at% Ni and 18 at% Co were enough to grow NiO and CoO. The spinel
NiCr2O4 was also detected. Against expectations, 8.8 at% Al led to the formation of
transient δ-Al 2O3. It was surprising because in the Ni-50wt%Cr+Al system (section
8.1.3) a minimum of 18 at% Al was needed to grow Al2O3 at 950 °C. Increasing the
fraction of Al, as shown in the spectrum of sample 130910F2 (29.2 at% Cr, 36.6 at%
Al) in Figure 9.6, decreased the strength of the Cr2O3 peaks while increasing the
strength of the Al2O3 peaks (both α- and transient δ-phases). Although no Co and Ni
oxides could be detected on 130910F2, a further increase of Al in sample 130910f3
(27.8 at% Cr, 40.2 at% Al) (Figure 9.7) created mixed (Co,Ni)O oxides and CoO.
Finally, coatings containing a very high levels of Al (above 80 at%) grew Al2O3.

Oxidation of Co-Ni-Cr-Al coatings at 900-950 °C _____________________________________________________________________________
259 ______________________________________________________________________
Depending on the sample, both transient and stable phases could be detected, or only α-
Al 2O3 was present. The composition of spinels changed from NiCr2O4 to NiAl2O4
because of the low amount of Cr in coatings such as 130910H2 (5.8 at% Cr, 86.3 at%
Al) (Figure 9.8).
Figure 9.5 XRD spectrum from surface of sample 130910d3 (41.6 at% Cr, 8.8 at% Al) (Ni-20wt%Co-40wt%Cr+Al) after 500 hours exposure, showing the presence of Cr2O3, transient δ-Al 2O3, spinels, NiO and CoO.
Co
un
ts
130910d3
Lin
(Cou
nts)
0
10
20
30
40
50
60
70
80
90
100
110
120
130
140
150
160
170
180
190
200
210
220
230
240
250
260
270
280
290
300
310
320
330
340
350
360
370
380
390
400
410
420
430
440
450
460
470
5 10 20 30 40 50 60 70 80 90
2θ-scale5 20 40 60 80
Cr 2O3
CoO
NiCr 2O4
δ-Al 2O3
NiO
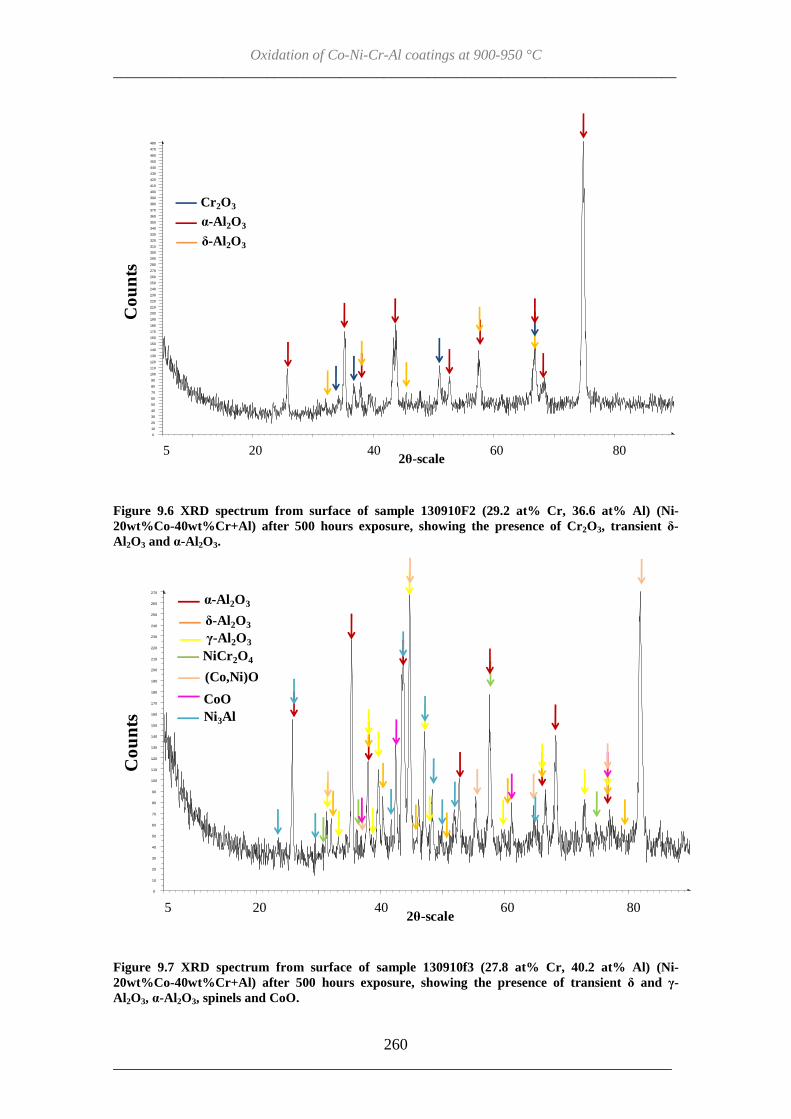
Oxidation of Co-Ni-Cr-Al coatings at 900-950 °C _____________________________________________________________________________
260 ______________________________________________________________________
Figure 9.6 XRD spectrum from surface of sample 130910F2 (29.2 at% Cr, 36.6 at% Al) (Ni-20wt%Co-40wt%Cr+Al) after 500 hours exposure, showing the presence of Cr2O3, transient δ-Al 2O3 and α-Al 2O3.
Figure 9.7 XRD spectrum from surface of sample 130910f3 (27.8 at% Cr, 40.2 at% Al) (Ni-20wt%Co-40wt%Cr+Al) after 500 hours exposure, showing the presence of transient δ and γ-Al 2O3, α-Al 2O3, spinels and CoO.
130910F2Li
n (C
ount
s)
0
10
20
30
40
50
60
70
80
90
100
110
120
130
140
150
160
170
180
190
200
210
220
230
240
250
260
270
280
290
300
310
320
330
340
350
360
370
380
390
400
410
420
430
440
450
460
470
480
5 10 20 30 40 50 60 70 80 90
2θ-scale5 20 40 60 80
Cr 2O3
δ-Al 2O3
α-Al 2O3
Co
un
tsC
ou
nts
130911f3
Lin
(Cou
nts)
0
10
20
30
40
50
60
70
80
90
100
110
120
130
140
150
160
170
180
190
200
210
220
230
240
250
260
270
2-Theta - Scale
5 10 20 30 40 50 60 70 80 90
2θ-scale5 20 40 60 80
CoO
NiCr 2O4
α-Al 2O3
Ni3Al
(Co,Ni)O
δ-Al 2O3
γ-Al 2O3
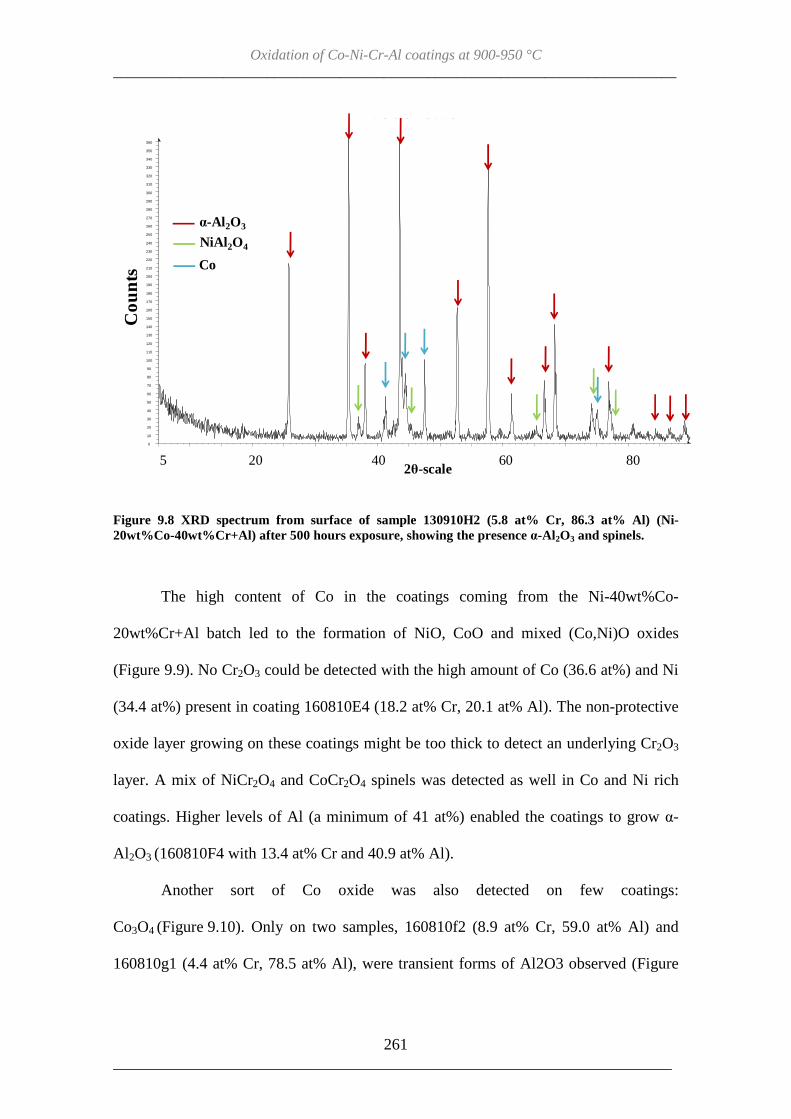
Oxidation of Co-Ni-Cr-Al coatings at 900-950 °C _____________________________________________________________________________
261 ______________________________________________________________________
Figure 9.8 XRD spectrum from surface of sample 130910H2 (5.8 at% Cr, 86.3 at% Al) (Ni-20wt%Co-40wt%Cr+Al) after 500 hours exposure, showing the presence α-Al 2O3 and spinels.
The high content of Co in the coatings coming from the Ni-40wt%Co-
20wt%Cr+Al batch led to the formation of NiO, CoO and mixed (Co,Ni)O oxides
(Figure 9.9). No Cr2O3 could be detected with the high amount of Co (36.6 at%) and Ni
(34.4 at%) present in coating 160810E4 (18.2 at% Cr, 20.1 at% Al). The non-protective
oxide layer growing on these coatings might be too thick to detect an underlying Cr2O3
layer. A mix of NiCr2O4 and CoCr2O4 spinels was detected as well in Co and Ni rich
coatings. Higher levels of Al (a minimum of 41 at%) enabled the coatings to grow α-
Al 2O3 (160810F4 with 13.4 at% Cr and 40.9 at% Al).
Another sort of Co oxide was also detected on few coatings:
Co3O4 (Figure 9.10). Only on two samples, 160810f2 (8.9 at% Cr, 59.0 at% Al) and
160810g1 (4.4 at% Cr, 78.5 at% Al), were transient forms of Al2O3 observed (Figure
130910H2Li
n (C
ount
s)
0
10
20
30
40
50
60
70
80
90
100
110
120
130
140
150
160
170
180
190
200
210
220
230
240
250
260
270
280
290
300
310
320
330
340
350
360
5 10 20 30 40 50 60 70 80 90
2θ-scale5 20 40 60 80
Co
NiAl 2O4
α-Al 2O3
Co
un
ts

Oxidation of Co-Ni-Cr-Al coatings at 900-950 °C _____________________________________________________________________________
262 ______________________________________________________________________
9.11). In both case, their crystal structure was monoclinic, characteristic of the θ-phase,
according to Levi and Brandon [147]. On sample 160810g1, containing 4.4 at% Cr,
peaks of tetragonal Cr2O3 were detected. These are different from the usual hexagonal
form present in oxidised coatings (Figure 9.11).
All the oxides observed on the Ni-20wt%Co-40wt%Cr+Al and Ni-40wt%Co-
20wt%Cr+Al samples using XRD analysis are summarised in Table 9.2.
Figure 9.9 XRD spectrum from surface of sample 160810E4 (18.2 at% Cr, 20.1 at% Al) (Ni-40wt%Co-20wt%Cr+Al) after 500 hours exposure, showing the presence of NiO, mixed (Co,Ni)O and spinels.
Co
un
ts
160810E4
Lin
(Cou
nts)
0
100
200
300
400
500
600
700
800
900
2-Theta - Scale
5 10 20 30 40 50 60 70 80 90
2θ-scale5 20 40 60 80
NiO
NiCr 2O4
CoO.NiO
CoCr2O4

Oxidation of Co-Ni-Cr-Al coatings at 900-950 °C _____________________________________________________________________________
263 ______________________________________________________________________
Figure 9.10 XRD spectrum from surface of sample 160810F4 (13.4 at% Cr, 40.9 at% Al) (Ni-40wt%-Cowt%20Cr+Al) after 500 hours exposure, showing the presence of α-Al 2O3 and Co3O4.
Figure 9.11 XRD spectrum from surface of sample 160810g1(4.4 at% Cr, 78.5 at5 Al) (Ni-40wt%Co-20wt%Cr + Al) after 500 hours exposure, showing the presence of α-Al 2O3 , transient θ-Al 2O3 CoO and Cr2O3.
Co
un
ts160810F4
Lin
(Cou
nts)
0
10
20
30
40
50
60
70
80
90
100
110
120
130
140
150
160
170
180
190
200
210
220
230
240
250
260
270
280
290
300
310
320
330
340
350
360
370
380
390
400
410
420
5 10 20 30 40 50 60 70 80 90
2θ-scale5 20 40 60 80
Co3O4
Co
α-Al 2O3
Co
un
ts
160810G1
Lin
(Cou
nts)
0
10
20
30
40
50
60
70
80
90
100
110
120
130
140
150
160
170
180
190
200
210
220
230
240
250
260
270
280
290
2-Theta - Scale
5 10 20 30 40 50 60 70 80 90
2θ-scale5 20 40 60 80
CoO
θ-Al 2O3
NiAl
α-Al 2O3
Cr 2O3 (tetra) ?

Oxidation of Co-Ni-Cr-Al coatings at 900-950 °C _____________________________________________________________________________
264 ______________________________________________________________________
Targets Sample NiO/CoO NiO.CoO Cr 2O3 Al 2O3 Spinels Ni- 130910 d3 + + δ- NiCr2O4 20wt%Co- 130910 E2 + θ- NiCr2O4 40wt%Cr 130910 e2 + α- +Al 130910 F2 α,γ,θ-
130910 f3 + α,γ,θ- NiCr2O4 130910 G2 α- 130910 g3 α- 130910 H2 α- NiAl 2O4
130910 I4 α-
Ni- 160810 d2 NiO + NiCr2O4 40wt%Co- 160810 E4 + (Ni,Co)Cr2O4 20wt%Cr 160810 e3 α- +Al 160810 F4 Co3O4 α-
160810 f2 CoO α- 160810 G4 + α,θ- 160810 g1 α-
160810 H1 α,θ- 160810 h1 α-
Table 9.2 Different oxide species identified using XRD on the surface of samples exposed at 950 °C.
The oxide microstructures in cross-sectioned Co-Ni-Cr-Al coatings after
exposure at 950 °C were observed under the SEM and are shown in Figures 9.12 and
9.13. These confirmed that coating were generally between 20 and 30 µm thick.
In the Ni-20wt%Co-40wt%Cr+Al batch of samples, the oxides had formed in a single
mixed layer. High initial amounts of Cr (41.6 at%) led to the growth of a mixed
(Al,Cr)2O3 layer whose thickness varied between 3 and 12 µm due to the presence of
oxide “lumps” (Figure 9.12(a)). Increasing the initial Al fraction to 16 at% still created
a layer of mixed (Al,Cr)2O3. However, the Cr content in this layer reduced to an average
of 5 at%, with the amount of Al increasing up to 35 at%. Also, the thickness of the
oxide layer was thinner (1.5 µm) and more homogeneous (Figure 9.12(b)).A further
increase in Al (36.6 at%) led to similar results (Figure 9.12(c)).

Oxidation of Co-Ni-Cr-Al coatings at 900-950 °C _____________________________________________________________________________
265 ______________________________________________________________________
Figure 9.12 Cross sections SEM images of (a) 130910d3, (b) 130910e2 and (c) 130910F2.
High fractions of Co in the initial composition of coatings from the Ni-
40wt%Co-20wt%Cr+Al batch led to different oxide microstructures. Above 26 at% Co,
a two-layered oxide grew on the surface (Figure 9.13(a)). EDX analysis identified the
upper layer as a mix of (Co,Ni)O while the lower one was mixed (Al,Cr)2O3. The upper
layer corresponded to the coloured crystals appearing on the surface of the sample, as
shown in Figure 9.1, but was not continuous. Their high porosity indicated that they
were fast growing oxides and therefore not protective against oxidation. With increasing
initial amounts of Cr (15.4 at%) and Al (33.5 at%), and decreasing amounts of Ni (25.1
at%), the upper oxide layer disappeared and only a mixed (Al,Cr)2O3 oxide was formed.
On sample 160810e3 (15.4 at% Cr, 33.5 at% Al), which was identified as the first
10 µm
NiCoCrAl
Sapphire
Mixed (Al,Cr) 2O3a)
10 µm
NiCoCrAl
Sapphire
Mixed (Al,Cr) 2O3b)
10 µm
NiCoCrAl
Sapphire
Mixed (Al,Cr) 2O3c)
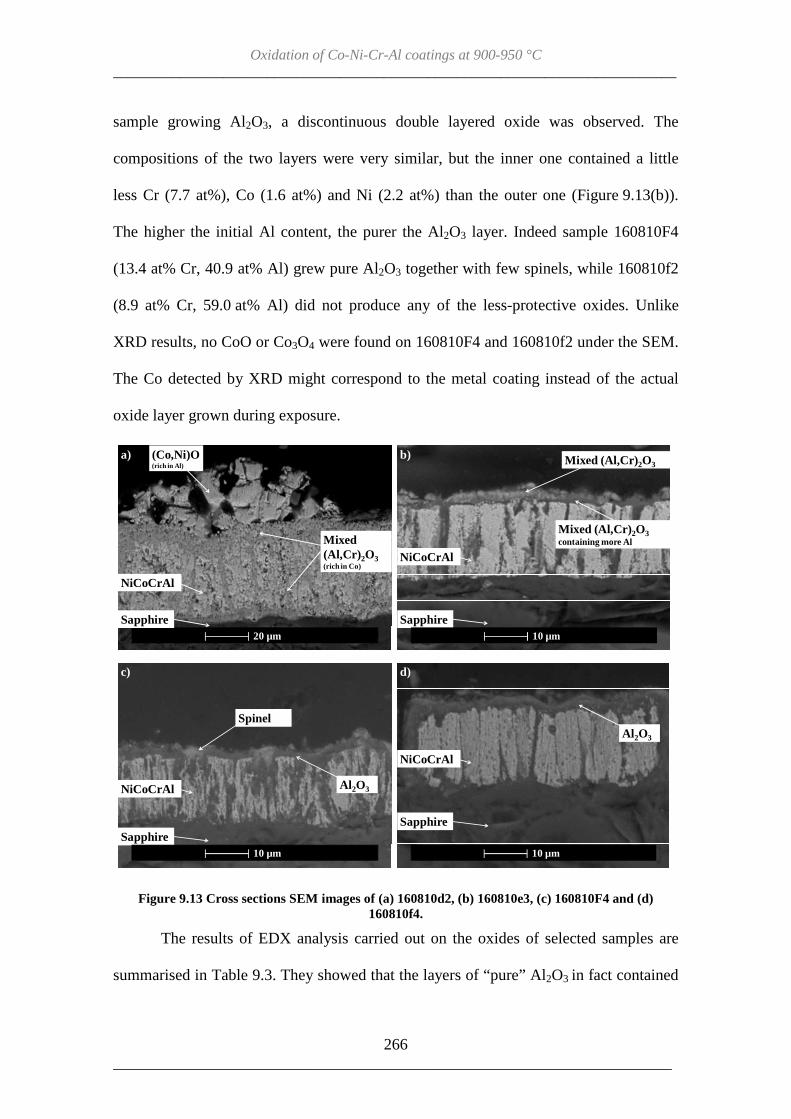
Oxidation of Co-Ni-Cr-Al coatings at 900-950 °C _____________________________________________________________________________
266 ______________________________________________________________________
sample growing Al2O3, a discontinuous double layered oxide was observed. The
compositions of the two layers were very similar, but the inner one contained a little
less Cr (7.7 at%), Co (1.6 at%) and Ni (2.2 at%) than the outer one (Figure 9.13(b)).
The higher the initial Al content, the purer the Al2O3 layer. Indeed sample 160810F4
(13.4 at% Cr, 40.9 at% Al) grew pure Al2O3 together with few spinels, while 160810f2
(8.9 at% Cr, 59.0 at% Al) did not produce any of the less-protective oxides. Unlike
XRD results, no CoO or Co3O4 were found on 160810F4 and 160810f2 under the SEM.
The Co detected by XRD might correspond to the metal coating instead of the actual
oxide layer grown during exposure.
Figure 9.13 Cross sections SEM images of (a) 160810d2, (b) 160810e3, (c) 160810F4 and (d) 160810f4.
The results of EDX analysis carried out on the oxides of selected samples are
summarised in Table 9.3. They showed that the layers of “pure” Al2O3 in fact contained
20 µm
NiCoCrAl
Sapphire
Mixed (Al,Cr) 2O3(rich in Co)
(Co,Ni)O (rich in Al)
a)
NiCoCrAl
Sapphire
Mixed (Al,Cr) 2O3b)
10 µm
Mixed (Al,Cr) 2O3 containing more Al
NiCoCrAl
Sapphire
Spinel
c)
10 µm
Al 2O3
NiCoCrAl
Sapphire
d)
10 µm
Al 2O3

Oxidation of Co-Ni-Cr-Al coatings at 900-950 °C _____________________________________________________________________________
267 ______________________________________________________________________
small amounts of Cr (~2 to 6 at%). Samples containing less initial amounts of Cr (from
the Ni-40wt%Co-20wt%Cr+Al batch) formed purer Al2O3. The double oxide layers
formed on samples with high initial amounts of Co (above 30 at%) were composed of
an outer layer containing equal contents of Co and Ni. However, the inner oxide layer
contained around 10 at% Co and no Ni amongst ~ 15at% of Cr and Al. Co had a better
affinity with the mixed (Al,Cr)2O3 oxide than Ni.
Sample Oxide O (at%) Co (at%) Ni (at%) Cr (at%) Al (at%) 130910 d3 single layer 57.7 4.9 2.5 17.2 17.8 130910 e2 single layer 57.6 1.1 2.4 5.5 33.5 130910 F2 single layer 57.0 1.6 3.1 6.4 31.8 160810 d2 outer layer 50.1 12.9 18.2 2.2 16.7
inner layer 56.6 10.1 3.1 15.8 14.5 160810 e3 single layer 58.8 1.6 2.2 7.7 29.7 160810 F3 single layer 63.0 0.8 0.8 1.3 34.2 160810 f4 single layer 61.7 1.5 0.6 2.5 33.4
Table 9.3 Composition (obtained by EDX analysis) of the oxide layers observed on the cross-sections of selected Co-Ni-Cr-Al samples at 950°C.
9.1.4 Discussion - An attempt to map the oxide composition as a function of the Ni-Co-Cr-Al content at 950 °C.
The identification of the oxide layers grown on the Co-Ni-Cr-Al coatings at 950
°C are summarised in Figure 9.14, in a graph plotting Cr/Al against Co/Ni atomic ratios.
The domain under the red dotted line on the graph represents the Co-Ni-Cr-Al
compositions capable of forming α-Al 2O3 after 500 hours when exposed at 950 °C. The
black dotted line delimits the samples capable of forming transient forms of Al2O3.
Samples needed a ratio of Cr/Al (in at%) under 5 with Co/Ni equal to 0.5 to grow a pure
α-Al 2O3 layer at 950 °C. Without Co present this Cr/Al ratio did not change much and
was still around 5. Increasing the amount of Co increased the amount of Al needed to
grow Al2O3 and no Cr2O3 could be produced. Ni and Co oxides were more likely to be

Oxidation of Co-Ni-Cr-Al coatings at 900-950 °C _____________________________________________________________________________
268 ______________________________________________________________________
formed with a higher initial Co level and some of these non protective oxides could be
found in the Al2O3 domain. Not appearing in the graph, mixed oxides and spinels were
observed in a lot of samples (more details in Figure 9.28(a)). Adding Co to the Ni-Cr-Al
increased the likelihood for the formation of spinels/mixed oxides (see Figure 9.28(a)).
Figure 9.14 Effect of Cr/Al and Co/Ni ratios (at%) on oxide compositions observed after 500 hours at 950 °C. Red diamonds correspond to α-Al 2O3, black squares to transient Al2O3, green dots to Cr 2O3 and grey crosses to Ni or Co oxides. Beneath black dotted line are samples capable of forming transient Al 2O3. Beneath red dotted line are samples capable of forming α-Al 2O3.
0.01
0.1
1
10
0 0.2 0.4 0.6 0.8 1 1.2
Cr/
Al
Co/Ni

Oxidation of Co-Ni-Cr-Al coatings at 900-950 °C _____________________________________________________________________________
269 ______________________________________________________________________
9.2 Study of the Co-Ni-Cr-Al system – oxidation at 900 °C
Two other sets of Ni-20wt%Co-40wt%Cr+Al and Ni-40wt%Co-20wt%Cr+Al
samples were exposed at 900 °C for up to 500 hours. Their denominations and
compositions are given in Table 9.4.
Targets Sample Co (at%) Ni(at%) Cr(at%) Al(at%) Cr/Al Co/Ni Ni 130910 c2 19.1 33.0 44.3 3.6 12.46 0.58 -20wt%Co 130910 d2 18.3 31.3 41.6 8.8 4.75 0.58 -40wt% Cr 130910 E1 18.0 30.9 40.6 10.5 3.88 0.58 +Al 130910 e3 16.4 28.8 38.1 16.7 2.28 0.57
130910 F3 12.3 21.9 29.2 36.6 0.80 0.56 130910 f2 11.8 20.2 27.8 40.2 0.69 0.58 130910 G1 7.9 14.0 18.3 59.8 0.31 0.57 130910 g1 4.2 7.5 9.0 79.3 0.11 0.56
130910 H1 2.7 5.2 5.8 86.3 0.07 0.53 Ni 160810 c2 38.7 35.4 22.9 3.0 7.69 1.09 -40wt%Co 160810 D3 38.0 35.1 22.4 4.5 5.02 1.08 -20wt%Cr 160810 E2 31.2 30.3 18.2 20.1 0.91 1.03 +Al 160810 E3 31.2 30.3 18.2 20.1 0.91 1.03
160810 e2 26.0 25.1 15.4 33.5 0.46 1.04 160810 F1 23.2 22.5 13.4 40.9 0.33 1.16 160810 f3 16.5 15.8 8.9 59.0 0.15 1.03 160810 G2 7.9 14.0 18.3 59.8 0.06 1.02
160810 g3 4.2 7.5 9.0 79.3 0.06 1.00
Table 9.4 Compositions of Co-Ni-Cr-Al coatings resulting from 2 target co-sputtering and oxidised at 900 °C.
9.2.1 Physical changes of samples with exposure
Pictures of the Ni-40wt%Co-20wt%Cr+Al and Ni-20wt%Co-40wt%Cr+Al
samples exposed at 900 °C are shown in Figures 9.15 and 9.16.
Initial levels of Co above 30 at% in the Ni-40wt%Co-20wt%Cr+Al samples
(Figure 9.15) led to the formation of shiny crystals on the coatings surface. In sample
160810c2 (22.9 at% Cr, 3.0 at% Al) these crystals started to appear after 100 hours

Oxidation of Co-Ni-Cr-Al coatings at 900-950 °C _____________________________________________________________________________
270 ______________________________________________________________________
exposure while in sample 160810D3 (22.4 at% Cr, 4.5 at% Al) they nucleated after only
40 hours exposure. The coverage increased with further exposure until the samples’
surface was fully covered. Sample 160810E2 (18.2 at% Cr, 20.1 at% Al) grew two
distinct types of oxides, because of an initial composition gradient across its surface.
The half of the coating with a higher Co and Cr content grew a green oxide which was
later covered by the same sort of shiny crystals, while the part of the coating with an
higher Al content grew a grey oxide. After 300 hours exposure, failure was located on
the grey half of 160810E2.
Figure 9.15 Pictures showing the evolution of oxides on 160810c2 (22.9 at% Cr, 3.0 at% Al), 160810D3 (22.4 at% Cr, 4.5 at% Al), 160810E2 (18.2 at% Cr, 20.1 at% Al) and 160810e2 (15.4 at% Cr, 33.5 at% Al) (Ni-40wt%Co-20wt%Cr+Al) with exposure at 900 °C. Red arrows point at damage in coatings.
Similarly 160810e2 (15.4 at% Cr, 33.5 at% Al), even if it could not be seen on
the as-deposited coating, had a gradient of composition which led to the growth of
different oxides in different areas. The oxide formed went from light grey to a mix of

Oxidation of Co-Ni-Cr-Al coatings at 900-950 °C _____________________________________________________________________________
271 ______________________________________________________________________
pink, dark grey and light grey depending on the amount of Al present initially. Failure at
the sapphire/coating interface occurred after 180 hours in the dark grey area in the
coating while other parts stayed attached to the sapphire substrate.
Figure 9.16 Pictures showing the evolution of oxides on 130910c2 (44.3 at% Cr, 3.6 at% Al), 130910e3 (38 at% of Cr, 16.7 at% of Al), 130910f2 (27.8 at% Cr, 40.2 at% Al) and 130910H1 (5.8 at% Cr, 86.3 at% Al) (Ni-20wt%Co-40wt%Cr+Al) with e xposure at 900 °C. Red arrows point at damage in coatings.
Increasing the amount of Cr in all coatings up to 44 at% led to the growth of
homogeneous grey oxides (e.g. 130910c2 with 44.3 at% Cr and 3.6 at% Al in Figure
9.16). 130910e3, containing 38 at% of Cr and 16.7 at% of Al, grew a very vivid blue
oxide during the first 20 hours of exposure at 900 °C. The colour faded with further
exposure, to be replaced by an iridescent coloured oxide. Higher amounts of Al (over 30
at%) created grey to black surface colours, e.g. on 130910f2 (27.8 at% Cr, 40.2 at%
Al). Finally, excessive amounts of Al (over 80 at%), limited the lifetime of the coatings

Oxidation of Co-Ni-Cr-Al coatings at 900-950 °C _____________________________________________________________________________
272 ______________________________________________________________________
to a few cycles. 130910H1 (5.8 at% Cr, 86.3 at% Al), only lasted 60 hours. The coating
did not have the molten profile that could be observed on samples from the Ni-Cr-Al
system, suggesting that the Co had changed its melting point, however, the short
lifetime of the coating still indicated that the high level of Al had limited its mechanical
properties.
9.2.2 Mass change of samples
The mass change data from the Co-Ni-Cr-Al coatings exposed at 900 °C were
plotted against time. Figure 9.17 shows the results obtained with samples deposited with
the Ni-20wt%Co-40wt%Cr and Al targets. Most of the samples lasted until 500 hours,
apart from 130910H1 (5.8 at% Cr, 86.3 at% Al) which initially contained a high
fraction of Al. The oxides grew slowly and could be split into two categories. Oxides
from the coatings with a higher amount of Cr (above 40 at%) reached a maximum
growth of 0.3 mg/cm2 after 500 hours while the ones grown on coating with a higher
amount of Al (above 16 at% Al) did not exceed 0.1 mg/cm2. This indicated that
coatings 130910c2 (44.3 at% Cr, 3.6 at% Al) to 130910E1(40.6 at% Cr, 10.5 at% Al)
grew oxides with compositions dominated by Cr2O3 and coatings 130910e3 (38.1 at%
Cr, 16.7 at% Al) to 130910g1 (9 at% Cr, 79.3 at % Al) grew purer Al2O3.
The batch of samples resulting from sputter deposition using the Ni-40wt%Co-
20wt%Cr and Al targets showed a range of diverse behaviours (Figure 9.18). The most
peculiar was observed on sample 160810c2 (22.9 at% Cr, 3.0 at% Al), which initially
contained 38 at% Co. Starting at a slow rate until 20 hours exposure, the mass of the
oxide increased almost exponentially until 200 hours when it slowed down again. At
that point the curve showed a parabolic trend, corresponding to the growth of protective

Oxidation of Co-Ni-Cr-Al coatings at 900-950 °C _____________________________________________________________________________
273 ______________________________________________________________________
oxides. This radical change of behaviour could be explained by the appearance and
propagation of the crystals on the surface of the coatings as seen in Figure 9.15. The
growth rate of the oxide slowed down when those crystals covered the whole surface of
the sample. However, sample 160810D3 (22.4 at %Cr, 4.5 at% Al) also grew these
crystals but the mass gain curve described a parabolic behaviour divided into an initial
rapid growth (up to 100 hours) and a second part where the sample didn’t gain much
weight. After 500 hours, the mass gain of the sample with the most Co reached 1.3
mg/cm2 while the other one reached 0.8 mg/cm2.
Figure 9.17 Mass change of Ni-20wt%Co-40wt%Cr+Al coating against time of exposure at 900 °C.
Increasing the amount of Al (over 20 at%) changed the nature of the
oxides growing on the coatings and therefore reduced the extent of oxidation. Samples
0
0.2
0.4
0.6
0.8
1
1.2
1.4
0 50 100 150 200 250 300 350 400 450 500
Ma
ss c
hang
e (m
g/c
m²)
Time (hours)
c2
d2
E1
e3
F3
f2
G1
g1
H1

Oxidation of Co-Ni-Cr-Al coatings at 900-950 °C _____________________________________________________________________________
274 ______________________________________________________________________
160810E2 and E3 (18.2 at% Cr, 20.1 at% Al), which had the same composition grew
oxides at a different rate. Samples that were expected to grow Al2O3, red curves in the
graph, reached an average growth of 0.2 mg/cm2 after 500 hours.
Figure 9.18 Mass change of Ni-20wt%Co-40wt%Cr+Al coating against time of exposure at 900 °C.
9.2.3 Identification of oxides
XRD spectra of selected Ni-20wt%Co-40wt%Cr+Al samples exposed at 900°C
are shown in Figures 9.19 to 9.21. High amounts of Cr (44.3 at%) added to the presence
of Co (19.2 at%) enabled the formation of transient Al2O3 with very low initial contents
of Al (3.6 at%). Indeed XRD analysis of sample 130910c2 (Figure 9.19) detected the
presence of δ-Al 2O3 as well as Cr2O3 and spinels. No fast growing oxides such as NiO
or CoO were detected on the coating’s surface. The first traces of α-Al 2O3 were
observed on sample 130910e3 (38.1 at% Cr, 16.7 at% Al), as seen in Figure 9.20. At the
0
0.2
0.4
0.6
0.8
1
1.2
1.4
0 50 100 150 200 250 300 350 400 450 500
Ma
ss c
hang
e (m
g/c
m2 )
Time (hours)
c2
D3
E2
E3
e2
F1
f3
G2
g3

Oxidation of Co-Ni-Cr-Al coatings at 900-950 °C _____________________________________________________________________________
275 ______________________________________________________________________
same time, the peaks corresponding to transient Al2O3 lose intensity compared to Figure
9.20. Coating that were possibly molten during exposure, because of their high level of
Al (over 80 at%), grew a mix of stable and transient Al2O3. NiCr2O4 spinels could also
be detected (Figure 9.21). No Cr2O3 was observed with such low levels of Cr (below 10
at%) in these coatings.
Figure 9.19 XRD spectrum from surface of sample 130910c2 (44.3 at% Cr, 3.6 at% Al) (Ni-20wt%Co-40wt%Cr + Al) after 500 hours exposure, showing the presence of δ-Al 2O3, Cr2O3 and NiCr 2O4.
Co
un
ts
130910c2
Lin
(Cou
nts)
0
100
200
300
400
500
600
700
5 10 20 30 40 50 60 70 80 90
2θ-scale5 20 40 60 80
NiCr 2O4
Co
δ-Al 2O3
Cr 2O3

Oxidation of Co-Ni-Cr-Al coatings at 900-950 °C _____________________________________________________________________________
276 ______________________________________________________________________
Figure 9.20 XRD spectrum from surface of sample 130910e3 (38.1 at% Cr, 16.7 at% Al) (Ni-20wt%Co-40wt%Cr + Al) after 500 hours exposure, showing the presence of α-Al 2O3 δ-Al 2O3, Cr 2O3 and NiCr2O4.
Figure 9.21 XRD spectrum from surface of sample 130910H1 (5.8 at%Cr, 86.3 at% Al) (Ni-20wt%Co-40wt%Cr + Al) after 500 hours exposure, showing the presence of γ-Al 2O3, α-Al 2O3 and NiCr 2O4.
Co
un
ts130910e3
Lin
(Cou
nts)
0
100
200
300
400
500
600
2-Theta - Scale
5 10 20 30 40 50 60 70 80 90
2θ-scale5 20 40 60 80
NiCr 2O4
Ni3Al
δ-Al 2O3
Cr 2O3
α-Al 2O3
Co
unts
130910H1
Lin
(Cou
nts)
0
10
20
30
40
50
60
70
80
90
100
110
120
130
140
150
160
170
180
190
200
210
220
230
240
250
260
270
280
290
300
310
320
330
340
350
360
370
5 10 20 30 40 50 60 70 80 90
2θ-scale5 20 40 60 80
NiCr 2O4
α-Al 2O3
γ-Al 2O3

Oxidation of Co-Ni-Cr-Al coatings at 900-950 °C _____________________________________________________________________________
277 ______________________________________________________________________
XRD spectra of selected samples from the Ni-40wt%Co-20wt%Cr+Al batch are
shown in Figures 9.22 to 9.24. High amounts of Co (38.7 at%) in sample 160810c2
(22.9 at% Cr, 3.0 at% Al) enabled the formation of a range of Co oxides, including
CoO, mixed (Ni,Co)O and Co2O3 (Figure 9.22). Peaks of Cr2O3 were weak compared to
the Co oxides ones, suggesting that the Cr oxides form an inner layer beneath a thick
(Ni,Co)O outer layer. The first traces of Al2O3 were detected on sample 160810E2 (18.2
at% Cr, 20.1 at% Al), as shown in Figure 9.23. At these levels of Co, Cr and Al, the
coating still grew an outer layer of non-protective CoO, this time above an inner layer of
mixed (Cr,Al)2O3. Spinels were detected as well. Initial levels of Co needed to be
reduced to 26.1 at%, e.g. in sample 160810e2 (15.4 at% Cr, 33.5 at% Al) (Figure 9.24),
to avoid formation of the fast growing external layer. At the same time, the increased
amount of Al enabled the formation of stable α-Al 2O3 as well as transient γ-Al 2O3. The
absence of Cr2O3 suggests that the oxide layer is essentially made of pure Al2O3.
Figure 9.22 XRD spectrum from surface of sample 160810c2 (22.9 at% Cr, 3.0 at% Al) (Ni-40wt%Co-20wt%Cr + Al) after 500 hours exposure, showing the presence of Cr2O3, CoO, (Co,Ni)O and Co2O3.
Co
unt
s
160810c2
Lin
(Cou
nts)
0
100
200
300
400
2-Theta - Scale
5 10 20 30 40 50 60 70 80 90
2θ-scale5 20 40 60 80
CoO
Cr 2O3
CoO.NiO
Co2O3
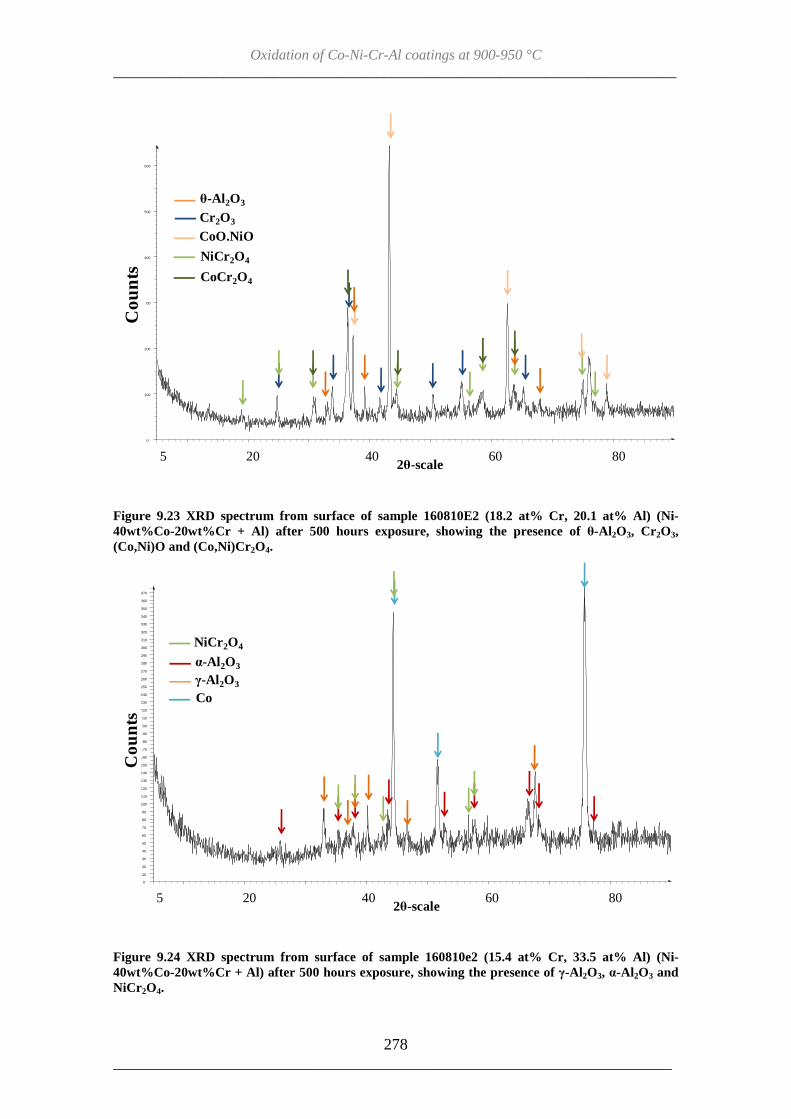
Oxidation of Co-Ni-Cr-Al coatings at 900-950 °C _____________________________________________________________________________
278 ______________________________________________________________________
Figure 9.23 XRD spectrum from surface of sample 160810E2 (18.2 at% Cr, 20.1 at% Al) (Ni-40wt%Co-20wt%Cr + Al) after 500 hours exposure, showing the presence of θ-Al 2O3, Cr2O3, (Co,Ni)O and (Co,Ni)Cr2O4.
Figure 9.24 XRD spectrum from surface of sample 160810e2 (15.4 at% Cr, 33.5 at% Al) (Ni-40wt%Co-20wt%Cr + Al) after 500 hours exposure, showing the presence of γ-Al 2O3, α-Al 2O3 and NiCr 2O4.
160810E2Li
n (C
ount
s)
0
100
200
300
400
500
600
2-Theta - Scale
5 10 20 30 40 50 60 70 80 90
2θ-scale5 20 40 60 80
NiCr 2O4
θ-Al 2O3
Cr 2O3
CoO.NiO
CoCr2O4
Co
unts
160810e2
Lin
(Cou
nts)
0
10
20
30
40
50
60
70
80
90
100
110
120
130
140
150
160
170
180
190
200
210
220
230
240
250
260
270
280
290
300
310
320
330
340
350
360
370
2-Theta - Scale
5 10 20 30 40 50 60 70 80 90
2θ-scale5 20 40 60 80
NiCr 2O4
α-Al 2O3
γ-Al 2O3
Co
Co
un
ts
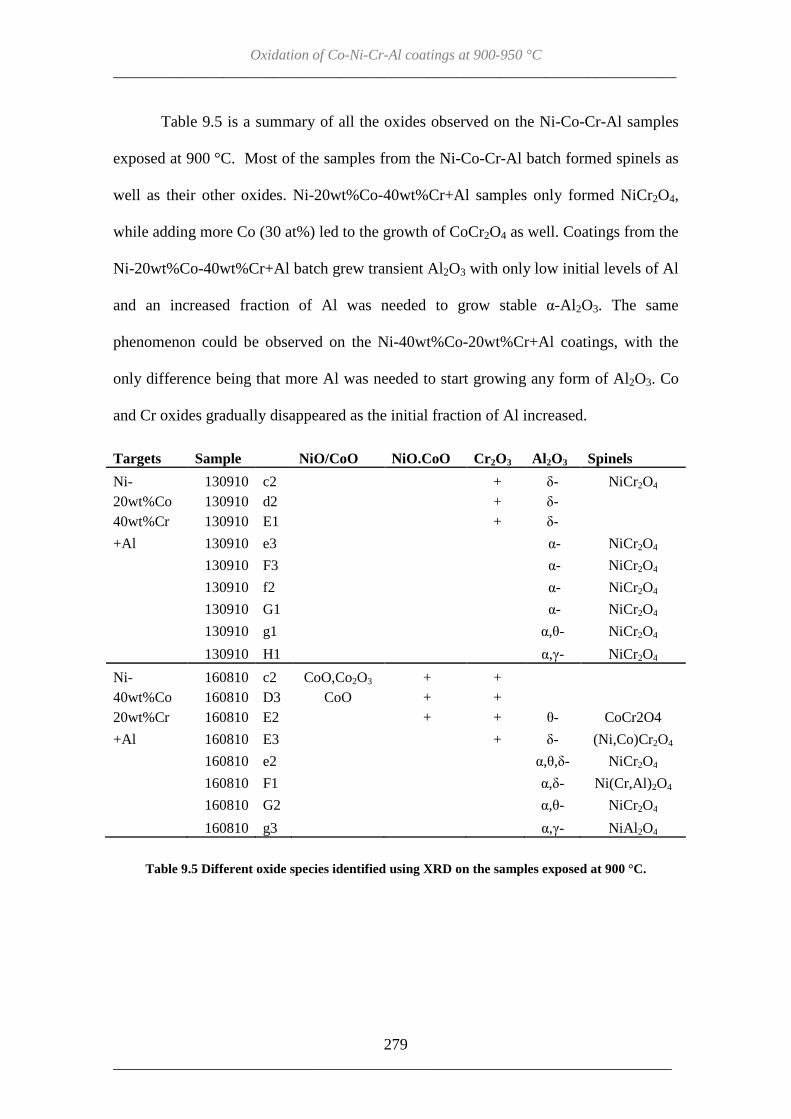
Oxidation of Co-Ni-Cr-Al coatings at 900-950 °C _____________________________________________________________________________
279 ______________________________________________________________________
Table 9.5 is a summary of all the oxides observed on the Ni-Co-Cr-Al samples
exposed at 900 °C. Most of the samples from the Ni-Co-Cr-Al batch formed spinels as
well as their other oxides. Ni-20wt%Co-40wt%Cr+Al samples only formed NiCr2O4,
while adding more Co (30 at%) led to the growth of CoCr2O4 as well. Coatings from the
Ni-20wt%Co-40wt%Cr+Al batch grew transient Al2O3 with only low initial levels of Al
and an increased fraction of Al was needed to grow stable α-Al 2O3. The same
phenomenon could be observed on the Ni-40wt%Co-20wt%Cr+Al coatings, with the
only difference being that more Al was needed to start growing any form of Al2O3. Co
and Cr oxides gradually disappeared as the initial fraction of Al increased.
Targets Sample NiO/CoO NiO.CoO Cr 2O3 Al 2O3 Spinels Ni- 130910 c2 + δ- NiCr2O4 20wt%Co 130910 d2 + δ- 40wt%Cr 130910 E1 + δ- +Al 130910 e3 α- NiCr2O4
130910 F3 α- NiCr2O4 130910 f2 α- NiCr2O4 130910 G1 α- NiCr2O4 130910 g1 α,θ- NiCr2O4
130910 H1 α,γ- NiCr2O4
Ni- 160810 c2 CoO,Co2O3 + + 40wt%Co 160810 D3 CoO + + 20wt%Cr 160810 E2 + + θ- CoCr2O4 +Al 160810 E3 + δ- (Ni,Co)Cr2O4
160810 e2 α,θ,δ- NiCr2O4 160810 F1 α,δ- Ni(Cr,Al)2O4 160810 G2 α,θ- NiCr2O4
160810 g3 α,γ- NiAl 2O4
Table 9.5 Different oxide species identified using XRD on the samples exposed at 900 °C.

Oxidation of Co-Ni-Cr-Al coatings at 900-950 °C _____________________________________________________________________________
280 ______________________________________________________________________
The oxide microstructures of the exposed Ni-Co-Cr-Al coatings at 900 °C were
observed under the SEM and are shown in Figures 9.25 and 9.26. These images
confirmed that coatings were generally between 20 and 30 µm thick.
Cross-sections of samples from the Ni-20wt%Co-40wt%Cr+Al batch are shown
in Figure 9.25. High initial amounts of Cr in sample 130910d2 (41.64 at% Cr, 8.8 at%
Al) led to the formation of a single layer of mixed (Al,Cr)2O3. The presence of spinel
was also identified (Figure 9.25(a)). Decreasing the initial amount of Cr down to 40.6
at% in the coating and increasing Al to 10.5 at%, gave similar results. The mixed
(Al,Cr)2O3 contained a small fraction of Co (~ 2at%) and Ni (~ 3 at%) (Figure 9.25(b)).
The first layer of Al2O3 was observed on sample 130910e3 (38.1 at% Cr, 16.7 at% Al)
(Figure 9.25(c)). A further increase in the initial level of Al in the coating, reduced the
amount of Cr in the Al2O3 layer, as shown for example on sample 130910F3 which
contained only ~ 6 at% of Cr in its Al2O3 layer (Figure 9.25(d) and Table 9.6).
The microstructures of the oxides grown on samples from the Ni-40wt%Co-
20wt%Cr+Al batch are shown in Figure 9.26. As for the samples exposed at 950 °C,
high amounts of Co in the initial composition (over 32 at% Co) of samples exposed at
900 °C led to the formation of double layered oxides. On the top, a porous mixed
(Co,Ni)O containing ~10 at% Al. Beneath this layer was a mixed (Al,Cr)2O3 (Figure
9.26(a)). Amongst the range of composition across the coating on sample 160810E2
(average of 18.2 at% Cr and 20.1 at% Al), is the threshold over which a double layer is
no longer formed and is replaced by a single layer of mixed (Al,Cr)2O3. Clusters of
mixed oxides rich in Co are still present (Figure 9.26(b)). A further increase in the
initial Al content enables the growth of an Al2O3 layer, as observed on sample
160810e2 (15.4 at% Cr, 33.5 at% Al). Although small spinels precipitated within the

Oxidation of Co-Ni-Cr-Al coatings at 900-950 °C _____________________________________________________________________________
281 ______________________________________________________________________
Al 2O3 layer, the latter was almost pure, containing only 2 at% or less of Co,Ni and Cr
(Figure 9.26(c)).
Figure 9.25 Cross sections SEM images of (a) 130910d2, (b) 130910E1, (c) 130910e3 and (d) 130910F3.
The results of EDX analyses carried out on the oxides of the selected samples
are summarised in Table 9.6. Oxides growing at the surface of the Ni-20wt%Co-
40wt%Cr+Al batch samples always contained very small amounts of Co (> 2 at%) and
Ni ( > 4 at%) and as the Cr/Al atomic ratio decreased, the amount of Al present in the
oxide increased, making the Al2O3 layer purer. The two layers of oxide growing on
samples from the Ni-40wt%Co-20wt%Cr+Al batch contained a significant amount of
Al which increased with the increasing initial fraction of Al in the coating. Ultimately,
when reaching an initial fraction of Al of ~33.5 at%, the oxide layer becomes almost
20 µm
Mixed (Al,Cr) 2O3
NiCoCrAl
Sapphire
Spinel
a)
20 µm
Mixed (Al,Cr) 2O3
NiCoCrAl
Sapphire
Spinelb)
10 µm
NiCoCrAl
Sapphire
Al 2O3
Spinelc)
10 µm
Al 2O3
NiCoCrAl
Sapphire
Spinel
d)

Oxidation of Co-Ni-Cr-Al coatings at 900-950 °C _____________________________________________________________________________
282 ______________________________________________________________________
pure Al2O3. Also, at equal initial fractions of Co and Ni, upon exposure, the outer oxide
layer formed was always richer in Ni.
Figure 9.26 BSE SEM images of cross-sections through (a) and (b) 160810E2, and (c) 160810e2.
Sample Oxide O (at%) Co (at%) Ni (at%) Cr (at%) Al (at%) 130910 d2 single layer 60.9 0.6 1.2 19.2 18.1 130910 E1 single layer 55.8 1.9 3.9 20.1 18.3 130910 e3 single layer 53.3 1.4 4.0 10.0 31.3 130910 F3 single layer 55.8 1.0 1.9 4.6 36.9 160810 D3 outer layer 54.1 11.6 17.8 1.6 14.9
inner layer 58.6 10.7 3.8 13.8 13.2 160810 E2 outer layer 53.6 10.6 12.0 1.5 22.3
inner layer 58.7 2.6 2.4 15.5 20.9 160810 e2 single layer 59.9 1.6 1.6 1.9 34.9
Table 9.6 Composition (obtained by EDX analysis) of the oxide layers observed on the cross-sections through selected Co-Ni-Cr-Al samples at 900°C.
20 µm
Mixed (Al,Cr) 2O3(rich in Co)
NiCoCrAl
Sapphire
(Co,Ni)O (rich in Al)
a)
20 µm
Mixed (Al,Cr) 2O3(rich in Co)
NiCoCrAl
Sapphire
Mixed (Al,Cr) 2O3
Mixed NiO.Al 2O3
b)
10 µm
Al2O3
NiCoCrAl
Sapphire
Spinelc)

Oxidation of Co-Ni-Cr-Al coatings at 900-950 °C _____________________________________________________________________________
283 ______________________________________________________________________
9.2.4 Discussion-An attempt to map the oxide composition as a function of
the Ni-Co-Cr-Al content at 900 °C.
The results concerning the analysis of the Co-Ni-Cr-Al samples exposed at 900
°C are summarised in Figure 9.27. The domain under the red dotted line on the graph
represents the Co-Ni-Cr-Al compositions capable of forming α-Al 2O3 after 500 hours
when exposed at 900 °C. The black dotted line delimits the sample capable of forming
transient forms of Al2O3. Samples needed a ratio of Cr/Al (in at%) under 5 with Co/Ni
equal to 0.5 to grow a pure α-Al 2O3 layer at 950 °C. Without Co present this Cr/Al ratio
did not change much and was still around 5. The growth of transient Al2O3 as 900°C
seems to be promoted by the addition of Co, increasing the Cr/Al ratio up to around 7.
Figure 9.27 Effect of Cr/Al and Co/Ni ratios (at%) on oxide compositions observed after 500 hours at 900 °C. Red diamonds correspond to α-Al 2O3, black squares to transient Al2O3, green dots to Cr 2O3 and grey crosses to Ni or Co oxides. Beneath black dotted line are samples capable of forming transient Al 2O3. Beneath red dotted line are samples capable of forming α-Al 2O3.
However this tendency reverses with further increases of the initial Co
concentration. More Co also increased the amount of Al needed to grow α-Al 2O3. Not
appearing in the graph, mixed oxides and spinels were observed in a lot of samples
0.01
0.1
1
10
0 0.2 0.4 0.6 0.8 1 1.2
Cr/
Al
Co/Ni

Oxidation of Co-Ni-Cr-Al coatings at 900-950 °C _____________________________________________________________________________
284 ______________________________________________________________________
(more details in Figure 9.28 (b)). Adding Co to the Ni-Cr-Al increased the likelihood
for the formation of mixed oxides (see Figure 9.28(b)).
9.3 Discussion - Effect of Co-Ni-Cr-Al compositions and temperature on the coating behaviour
9.3.1 The effect of temperature on the Co-Ni-Cr-Al system
Comparison of Tables 9.2 and 9.5, summarising the peaks identified using the
XRD, shows that the nature of the oxides changed with exposure temperature.
The coatings from the Ni-20wt%Co-40wt%Cr+Al batch grew more (Co,Ni)O
oxides when exposed at 950 °C than at 900 °C. For example, sample 130910d3 (18.3
at% Co, 41.6 at% Cr, and 8.8 at% Al) grew an external layer of mixed (Al,Cr)2O3
containing less Co (5 at% less) than the similar 130910d2 that was oxidised at 900 °C
(Tables 9.3 and 9.6). Similarly, samples from the Ni-40wt%Co-20wt%Cr+Al which
were more likely to grow NiO and/or CoO, did not form as much of these fast growing
oxides when oxidised at lower temperatures. Indeed at 900 °C, samples initially
containing below 30 at% Co, did not grow CoO oxides while they were detected on
samples initially containing as little as 8 at% Co at 950 °C. More Cr2O3 oxides were
observed on samples oxidised at 900 °C. They grew on samples from the Ni-40wt%Co-
20wt%Cr+Al with an initial Cr content above 18 at%, unlike at 950 °C.
Changing the exposure temperature did not affect the formation of α-Al 2O3
(Tables 9.2 and 9.5). The first traces of the stable oxide where observed on samples
130910e2 and 130910e3 (38.1 at% Cr, 16.7 at% Al) for the Ni-20wt%Co-40wt%Cr+Al
batch, and on samples 160810e3 and 160810e2 (15.41 at% Cr, 33.5 at% Al) for the Ni-
40wt%Co-20wt%Cr+Al batch. However, at the lower temperature, transient Al2O3 were
Oxidation of Co-Ni-Cr-Al coatings at 900-950 °C _____________________________________________________________________________
285 ______________________________________________________________________
detected earlier on samples containing less initial Al and Cr (e.g. 160810E2 with 18.22
at% Cr and 20.1 at% Al).
Finally, a lot more spinels were detected at 900 °C than at 950 °C (Tables 9.2
and 9.5). This phenomenon is more pronounced in samples from the Ni-40wt%Co-
20wt%Cr+Al coating batch. The coatings only formed NiCr2O4 and (Ni,Co)Cr2O4 on
the samples containing the most initial Co at 950 °C (160810d2 (36.6 at% Co) and
160810E4 (31.3 at% Co)) while at 900 °C, spinels grew on most of the samples. Also
the nature of the spinels varied depending on the initial amounts of Al and Cr.
Gradually, more initial Al led to the formation of NiAl 2O4, and more Cr to NiCr2O4.
This is discussed further in Chapter X.
An alternative method of comparing the oxidation data obtained from the
sputtered coatings is presented in Figure 9.28. Instead of plotting the Cr/Al ratio over
the Co/Ni ratio as in Figures 9.14 and 9.27, data was organised in a ternary diagram
similar to the ones used for the study of the Ni-Cr-Al system. To simplify the
quaternary system into a ternary one, the atomic Co and Ni contents were added
together. Also, the experimental data were compared to commercial Co-Ni-Cr-Al-(Y)
compositions found in literature and summarised in Table 9.7 [60,150,151]. The ternary
diagrams show that decreasing the oxidation temperature increased the Al2O3 formers
domain for coatings containing less Cr in their initial composition. It could be assumed
that the domain is also larger for coatings containing around 50 at% Cr, but more data is
needed to confirm this assumption.

Oxidation of Co-Ni-Cr-Al coatings at 900-950 °C _____________________________________________________________________________
286 ______________________________________________________________________
Figure 9.28 Compositional effects on the oxidation gathered at (a) 950 °C and (b) 900 °C on the coated sapphire discs. Black doted lines represent the Al2O3 formers boundaries and the circles highlight commercial coatings out of Al2O3 formers domain at 950 °C.
Boundaries of Al2O3
formers
a)
Boundaries of Al2O3
formers
b)

Oxidation of Co-Ni-Cr-Al coatings at 900-950 °C _____________________________________________________________________________
287 ______________________________________________________________________
At 950 °C, commercial Co-Ni-Cr-Al-Y caotings that are expected to grow Al2O3
upon exposure, did not coincide with the results found with the coated sapphire discs
exposed at 950 °C (circled in red on Figure 9.28(a)). Indeed, three compositions
corresponding to AMDRY 995/LC022, LN21 and LC029 are out of the Al2O3 formers
domain at 950 °C. This could indicate that those coatings are not ideal for exposure at
950°C or that they behave differently when used as BCs instead of overlay coatings.
Covered by a YSZ TC, these coatings might grow protective oxides because of the
reduced oxygen partial pressure. This could also indicate that the real BC surface
temperature are lower than 950 °C, as at 900 °C, the compositions are well within the
Al 2O3 domain.
Co(at%) Ni (at%) Cr (at%) Al (at%) Reference AMDRY 995 34.7 28.6 21.2 15.5 - LN11 20.0 40.3 16.4 23.3 [150] LN21 21.3 42.9 20.2 15.6 [150] LN33 0.0 59.7 19.5 20.7 [150] LN46 13.7 45.5 18.4 22.4 [150] LN49 12.7 45.1 18.2 24.0 [150] LC07 54.5 0.0 23.2 22.3 [150] LC022 34.7 28.6 21.2 15.5 [150,151] LC022Al 33.6 25.1 20.5 20.7 [150] LC029 67.7 0.0 18.4 13.8 [150] LC040 55.5 0.0 25.6 18.9 [150] LC049 24.4 35.5 14.3 25.7 [150] TM309 21.7 36.7 22.7 19.0 [150] Talboom et al. 50.9 0.0 23.6 25.5 [60] ATD2B 53.6 0.0 24.1 22.3 [151] ATD5B 61.5 0.0 17.7 20.8 [151] ATD10 0.0 59.7 19.5 20.7 [151]
Table 9.7 Commercial overlay coatings used as commercial reference in ternary diagrams in Figure [60,150,151]. Y (at%) is not taken into account.

Oxidation of Co-Ni-Cr-Al coatings at 900-950 °C _____________________________________________________________________________
288 ______________________________________________________________________
9.4 Summary
As for the Ni-Cr-Al system, magnetron sputtering has been used successfully to
deposit a range of Co-Ni-Cr-Al coatings onto 10 mm diameter sapphire substrates. This
was achieved through co-sputtering from two targets: a Ni-20wt%Co-40wt%Cr or Ni-
40wt%Co-20wt%Cr target (changed between deposition runs) and a pure Al target.
XRD was used to identify the oxides formed during oxidation exposure at 900 or 950
°C for 500 hours. High levels of Co in the coatings promoted the formation of (Co,Ni)O
oxides at both temperatures. At 950 °C, the first traces of Al were observed on samples
containing 33.5 at% Al (at low Cr concentration, 15.4 at%) and 9 at% Al (at high Cr
concentration, 41.6 at%). At 900 °C, the first traces of Al were observed on samples
containing 33.5 at% Al (at low Cr concentration, 15.4 at%) and 20 at% Al (at high Cr
concentration, 18 at%). Lowering the oxidation temperature increase the size of the
Al 2O3 formers domain (larger composition range for Al2O3 formers) and prevented the
formation of (Co,Ni)O oxides (with high concentrations of Cr). Adding Co to the Ni-Cr-
Al systems promoted the formation of diverse spinel phases the compositions of which
depended on the initial compositions of the coatings.

General discussion (Part II) _____________________________________________________________________________
289 ______________________________________________________________________
CHAPTER X – GENERAL DISCUSSION (PART II)
10.1 How does composition and temperature affect spinel/mixed oxide formation?
Looking at Figures 9.14 and 9.27 (from sections 9.1.4 and 9.2.4), adding Co to
the Ni-Cr-Al gradually required more initial Al concentration (at lower Cr contents) to
enable the exposed coating to grow a protective Al2O3 layer. While the system was not
affected by up to 20 at% Co, increasing the amount up to 40 at% led to a diminution of
the Al2O3 formers domain area. This is confirmed by the ternary diagrams in Figure
9.28 (section 9.3) which shows that as the Ni+Co content increases, the amount of Al
needed to grow Al2O3 is higher (the effect of Co and Ni are separated by comparing
Figure 9.28 to Figure 8.44). Thermodynamic studies of the effect of Co in MCrAlY,
carried out by several groups of researchers (such as Ma and Schoenung [152] and
Liang et al. [153]), led to the conclusion that increasing the amount of Co in the Co-Ni-
Cr-Al system reduced the formation of γ'-Ni3Al phase and increased the fraction of β-
NiAl and γ-Ni. As a consequence, Co additions increased the oxidation resistance of the
different alloys studied. These conclusions contradict the result found in this chapter
and could be explained by the fact that it is not possible, using the data generated in this
thesis, to separate the effect of the increase of the Co fraction and the decrease of the Cr
fraction. Indeed in Chapter VIII, it was found that increasing the amount of Cr in the
coating, was reducing the amount of Al needed to grow Al2O3. Reciprocally, by
decreasing the amount of Cr, a higher amount of Al should be required to grow the
protective oxide layer.

General discussion (Part II) _____________________________________________________________________________
290 ______________________________________________________________________
In order to investigate the effect of Co additions on the growth of the oxide,
samples with similar Cr and Al initial contents from the Ni-Cr-Al and Co-Ni-Cr-Al
batches were compared. The samples chosen are summarised in Table 10.1.
Temperature (°C) Sample
Co (at%)
Ni (at%)
Cr (at%)
Al (at%)
Oxides formed (XRD)
950 080710 B2 0.0 77.4 22.1 0.5 NiO, Cr2O3, NiCr2O4 080710 D3 0.0 77.2 20.2 2.6 NiO, Cr2O3 160810 d2 36.6 34.4 21.6 7.4 NiO, (Co,Ni)O,
NiCr2O4 080710 F2 0.0 63.9 14.6 21.5 α-Al 2O3, θ- Al2O3 160810 e3 26.1 25.1 15.4 33.5 α- Al2O3 080710 h2 0.0 14.0 2.5 83.5 α- Al2O3
160810 H1 4.5 4.4 2.4 88.8 α- Al2O3, θ- Al2O3 900 080710 c2 0.0 77.2 20.9 1.9 NiO, Cr2O3, NiCr2O4
080710 d3 0.0 77.0 18.5 4.5 NiO, Cr2O3, NiCr2O4 160810 c2 38.7 35.4 22.9 3.0 NiO, (Co,Ni)O,
Co2O3, Cr2O3 160810 D3 38.0 35.1 22.4 4.5 NiO, (Co,Ni)O,
Cr2O3 080710 F3 0.0 63.9 14.6 21.5 α- Al2O3, θ- Al2O3 160810 e2 26.1 25.1 15.4 33.5 α- Al2O3, δ,θ- Al2O3,
NiCr2O4 290610 g3 0.0 6.8 9.0 84.2 α- Al2O3, θ- Al2O3,
Al 2O3.NiO
130910 g1 4.2 7.5 9.0 79.3 α-Al 2O3, θ- Al2O3,
NiAl 2O4
Table 10.1 Chosen samples for comparisons between the Ni-Cr-Al and Co-Ni-Cr-Al systems, their compositions and oxide formed.
At 950 °C, the comparison of sample with a high Co and/or Ni content, medium
Cr content and low Al content (samples 080710B2 (22.1 at% Cr, 0.5 at% Al),
080710D3 (20.2 at% Cr, 2.6 at% Al) and 160810d2 (21.6 at% Cr, 7.4 at5 Al)) showed
that XRD could not detect Cr2O3 in the sample containing Co (Tables 8.3 and 9.2 from
sections 8.1.3 and 9.1.3). However, SEM cross-sections confirmed the presence of a
mixed (Cr,Al)2O3 layer beneath the (Co,Ni)O outer layer (Figures 8.17(b) and 9.13(a) in
section 8.1.3 and 9.1.3). In the three cases, the Cr content of the mixed layer was around

General discussion (Part II) _____________________________________________________________________________
291 ______________________________________________________________________
15 at% (Tables 8.4 and 9.3 from sections 8.1.3 and 9.1.3) suggesting that the effect of
Co addition here is to grow a thicker outer oxide layer. A comparison of the images of
the outer oxide layers in both systems revealed that addition of Co create a more porous
and discontinuous outer oxidelayer (Figures 8.17 (b) and 9.13 (a)).
At 950 °C, samples with medium initial contents of Cr and Al (080710F2 (14.6
at% Cr, 21.5 at% Al) and 160810 e3 (15.4 at% Cr, 33.5 at% Al)) both grew Al2O3
(Figure 8.12 and Table 9.2). In the sample with no Co (080710F2), XRD detected the
presence of transient Al2O3. More Al was needed to grow the Al2O3 on the coating
containing Co and microstructure of the oxide layer observed under the SEM revealed
that the layer contained Cr, unlike the layer grown on the Ni-Cr-Al coating (Tables 8.4
and 9.3). Also, the sample containing Co failed early, after only 260 hours of exposure
(Figure 9.4 in section 9.1.2), suggesting weaker oxide adhesion properties.
At 950 °C, samples containing high levels of Al (080710h2 (2.5 at% Cr,
83.5 at% Al) and 160810H1 (2.4 at% Cr, 88.8 at% Al) grew similar α-Al 2O3 layers.
Transient θ-Al 2O3 was detected on the surface of the Co-Ni-Cr-Al coating (Table 8.3
and 9.2).
At 900 °C, medium Cr contents and low Al content (080710 c2 (20.9 at% Cr,
1.9 at% Al), 080710d3 (18.5 at% Cr, 4.5 at% Al) and 160810 d2 (22.9 at% Cr, 3.0 at%
Al) led to the growth of a double layered oxide on both Ni-Cr-Al and Co-Ni-Cr-Al
coatings (Tables 8.8 and 9.5 and Figure 8.39(a) in sections 8.2.3 and 9.2.3). XRD
detected Cr2O3 on each samples suggesting that the outer layers have similar
thicknesses, and EDX quantified the content of Cr in the mixed (Al,Cr)2O3 layer to be
around 18 at% in the case of 080710d3 and 14 at% in the case of 160810d2 (Tables 8.9

General discussion (Part II) _____________________________________________________________________________
292 ______________________________________________________________________
and 9.6 in sections 8.2.3 and 9.2.3). The external non-protective oxide layer was
continuous in both cases.
At 900 °C, for samples with an higher level of Al (080710F3 and 160810e2), the
oxide layers present in both cases were mixes of transient and stable Al2O3 coupled with
some NiCr2O4 spinels (as detected by the XRD and confirmed by SEM). Both layers
were very similar (Figures 8.39(d) and 9.26(b) in section 9.2.3). As for the samples
containing very high amounts of Al exposed at 900 °C (290610g3 and 130910g1), XRD
detected similar Al2O3 oxides layers and NiAl2O4 on both the Ni-Cr-Al and Co-Ni-Cr-
Al sample (Tables 8.9 and 9.5).
In a general manner, comparing the Al2O3 domains (in ternary phase diagrams)
drawn from the data obtain from the sputtered coatings (Figure 10.1), adding Co to the
Ni-Cr-Al system promoted the formation of protective Al2O3. Indeed, for higher Cr
concentrations, at 900 and 950 °C, the amount of Al needed to grow Al2O3 was reduced
by adding Co to the coatings.
In Chapter VIII, the oxidation of the Ni-Cr-Al coating systems showed that the
spinels/mixed oxides grown (and identified using XRD) were essentially NiCr2O4
(Tables 8.3 and 8.8). Lowering the oxidation temperature promoted their formation, as
did increasing the initial amount of Cr in the coating (Figures 8.22 and 8.43). The Ni-
Cr-Al coatings with enough Al to start growing Al2O3, formed a mixed (Al,Cr)2O3 layer
instead of pure Al2O3 (at Cr levels of 6.7, 14.6 and 56 at% at 950 °C and 8.2, 14.6 and
56 at% at 900 °C). The initial Cr/Al ratio needed to achieve a pure protective Al2O3
layer needed to be below 1, meaning that the initial amount of Al had to be quite high
(Figures 8.19 and 8.41).
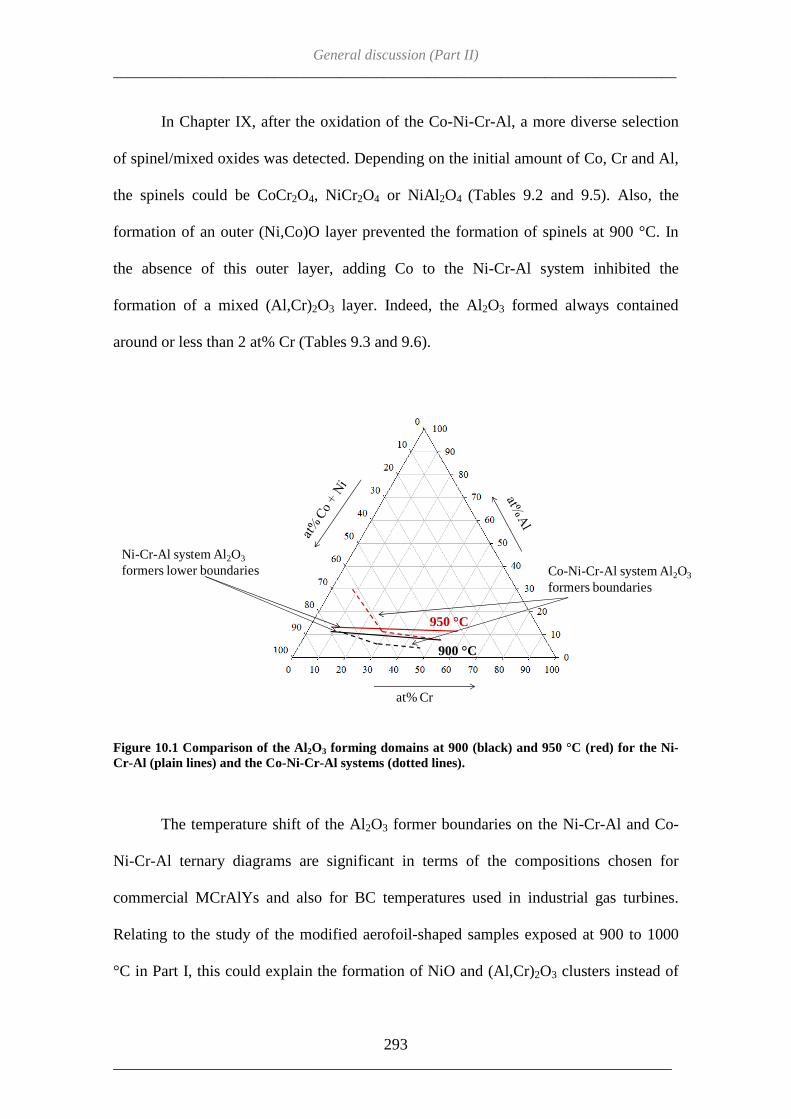
General discussion (Part II) _____________________________________________________________________________
293 ______________________________________________________________________
In Chapter IX, after the oxidation of the Co-Ni-Cr-Al, a more diverse selection
of spinel/mixed oxides was detected. Depending on the initial amount of Co, Cr and Al,
the spinels could be CoCr2O4, NiCr2O4 or NiAl2O4 (Tables 9.2 and 9.5). Also, the
formation of an outer (Ni,Co)O layer prevented the formation of spinels at 900 °C. In
the absence of this outer layer, adding Co to the Ni-Cr-Al system inhibited the
formation of a mixed (Al,Cr)2O3 layer. Indeed, the Al2O3 formed always contained
around or less than 2 at% Cr (Tables 9.3 and 9.6).
Figure 10.1 Comparison of the Al2O3 forming domains at 900 (black) and 950 °C (red) for the Ni-Cr-Al (plain lines) and the Co-Ni-Cr-Al systems (dotted lines).
The temperature shift of the Al2O3 former boundaries on the Ni-Cr-Al and Co-
Ni-Cr-Al ternary diagrams are significant in terms of the compositions chosen for
commercial MCrAlYs and also for BC temperatures used in industrial gas turbines.
Relating to the study of the modified aerofoil-shaped samples exposed at 900 to 1000
°C in Part I, this could explain the formation of NiO and (Al,Cr)2O3 clusters instead of
950 °C
900 °C
Ni-Cr-Al system Al2O3
formers lower boundaries Co-Ni-Cr-Al system Al2O3
formers boundaries
at% Cr

General discussion (Part II) _____________________________________________________________________________
294 ______________________________________________________________________
the expected protective Al2O3. For Ni-Cr-Al and Co-Ni-Cr-Al systems, as oxidation
goes on and the Al depletes from the coating, the local fraction of Cr increases and
promotes the localised growth of mixed oxides.
In the literature, various types of commercial overlay and bond coatings have
been exposed at temperatures above 1000 °C [36,48,50,51,77-81]. The results
concerning spinels and mixed oxides that were reported, whether they were obtained
from EXD, XRD analysis or SEM imaging, were more or less precise. However, they
showed that Ni-Cr-Al-Y coatings promoted the formation of a double layer of mixed
(Al,Cr)2O3 over α-Al 2O3 with small amounts of NiO and NiAl2O4 [51,80]. Observation
of oxidised Ni-Co-Cr-Al-Y highlighted the presence (or not) of a mixed (Al,Cr)2O3
layer above a protective α-Al 2O3 as well, but no spinels were mentioned [77,79]. More
research carried out on Co-Ni-Cr-Al-Y coatings at 1000 °C and above, and describes
the TGO as a mix of α-Al 2O3, and clusters of mixed (Al,Cr)2O3, spinels and (Ni,Co)O
[77,78]. Different types of spinels were detected and reported as (Co,Ni)(Al,Cr)2O4
[36], and the mixed oxides/spinels seemed to form more easily as clusters rather than
continuous layers [36,48,77,78,81]. It was also found that depositing YSZ on top of the
overlay coatings promoted the formation of spinels and mixed/oxides [51,81].
Thickness measurements of the TGOs grown on different types of BCs did not show
which was more inclined to form more spinels/mixed oxides [50]. The results found in
literature showed that above 1000 °C, adding Co to the Ni-Cr-Al system promoted the
formation of spinels and correlate with the behaviour observed on the coatings
deposited on the sapphire discs using magnetron sputtering and exposed at lower
temperature in this study.

General discussion (Part II) _____________________________________________________________________________
295 ______________________________________________________________________
The amount of spinels/mixed oxides, growing on modified aerofoil shaped
samples used in Part I (Figure 5.44) after exposure at 900 to 1000 °C, was measured in
9 different locations on 26 samples. The fraction of spinels/mixed oxides in the TGO
decreased from ~21 to ~16% as the temperature increased. This would help confirm the
effect of temperature on the formation of spinels found with the coated sapphire discs,
but the scatter in the measured data (error of +/- 5%) were too important to take this
result into account.
10.2 What would be the best coating?
The coatings compositions growing the slowest oxides (minimum mass gain
after 500 hours) and without NiO and/or CoO oxides are summarised in Table 10.2 for
950 °C, and Table 10.3for 900 °C. From an oxidation point of view, these coatings are
considered to have the most suitable compositions for a use in industrial gas turbines.
In order to eliminate more candidates, mechanical, thermal stability
(interdiffusion) and corrosion properties must be taken into account as well as oxidation
properties. High levels of Al are expected to produce a high volume fraction of β-NiAl
which is a desirable phase to form a protective oxide but could also be detrimental by
making the coating too brittle. At high operating temperatures, high brittleness is
avoided due to the brittle to ductile transition, but in gas turbines, the coatings have to
survive thermal cycling (start up and shut downs) which would expose them to lower
temperatures. Moreover, at high temperatures, Co-Ni-Cr-Al coatings containing
contents of Al that are too high will melt (Figure 8.44) [151]. Achar et al. [154],
modelled the phase equilibria in different MCrAlY alloys at 950, 1000 and 1050 °C.

General discussion (Part II) _____________________________________________________________________________
296 ______________________________________________________________________
Their work proved that the phase constitution of these alloys changed with temperature,
which could partly explain why in Part II of this thesis, the oxides formed differed
somewhat with temperature. From their study of Ni-Cr-Al alloys [154] it can be
deduced that 170510F2 microstructure would be of a mix of β-NiAl + γ'-Ni3Al phases,
170510f3 and 080710G2 would be made of β-NiAl phase and 080710f2 of α-Cr + β-
NiAl + γ'-Ni3Al (Table 10.2). It is not possible to determine the phases present in
290610F2 and 290610f3 from their work, but it can be estimated that they would
contain α-Cr and β-NiAl.
Along with Ma and Schoenung [152] and Liang et al. [153], Achar et al. [154]
found that Co additions stabilised the γ and β phases, explaining why lower levels of Al
are needed to grow Al2O3. They also added that levels of Co around 10 at% promoted
the formation of α-Cr [154]. Mechanical testing of Ni-Cr-Al-Y and Co-Ni-Cr-Al-Y
alloys proved that the former crept faster at low stress than the latter, but that the
tendency reversed in the case of high stresses [155], showing that either type of BC
could be desirable from a mechanical point of view.
Sample Co
(at%) Ni
(at%) Cr
(at%) Al
(at%) Spinels Weight gain
(mg/cm2) 170510F2 0.0 61.6 6.7 31.7 0.31 170510f3 0.0 49.5 4.7 45.8 0.22 080710f2 0.0 52.5 11.5 36.0 0.05 080710G2 0.0 41.2 8.4 50.4 0.07 290610F2 0.0 22.5 44.9 32.6 0.11 290610f3 0.0 15.8 22.5 61.6 + 0.15 130910G2 7.9 14.0 18.3 59.8 + 0.13
Table 10.2 Coating compositions forming Al2O3, with the lower final mass gain after 500 hours at 950 °C.

General discussion (Part II) _____________________________________________________________________________
297 ______________________________________________________________________
Sample Co
(at%) Ni
(at%) Cr
(at%) Al
(at%) Spinels Weight gain
(mg/cm2) 170510f2 0.0 49.5 4.7 45.8 0.23 080710e2 0.0 69.1 16.3 14.6 0.16 080710F3 0.0 63.9 14.6 21.5 0.17 080710f3 0.0 52.5 11.5 36 0.14 290610e3 0.0 29.7 41.6 29.1 0.12 290610F3 0.0 22.5 44.9 32.6 + 0.13 160810E3 31.2 30.3 18.2 20.1 + 0.33 160810f3 16.5 15.8 8.9 59.0 + 0.23 130910e3 16.4 28.8 38.1 16.7 + 0.13 130910F3 12.3 21.9 29.2 36.6 + 0.13
Table 10.3 Coating compositions forming Al2O3, with the lower final mass gain after 500 hours at 900 °C.
Adding in this information, at 950 °C, the best BC compositions for industrial
gas turbine use are, in terms of high temperature protection properties, Ni-11.5Cr-36Al
and Ni-6.7Cr-31.7Al (in at%).
At 900 °C, higher levels of Cr are preferable because such low temperature
could induced corrosion attacks (in the presence of deposits and corrosive gas) as well
as oxidation one. Contents of Co above 10 at% are also needed in order to stabilize the
β-NiAl phase. This is why, the best BC composition, in order of oxidation protection
efficiency is, Ni-12.3Co-29.2Cr-36.6Al (at%).
10.3 Conclusion (part II)
In Part II, the oxidation of a range of MCrAl compositions at 900 and 950 °C
confirmed the effect of temperature on the high temperature protection of these coatings
and the potential to use alternative alloys in industrial gas turbines where the exposure
temperatures are lower than those for which commercial BCs are designed. The new
BC, needs to contain more Cr and Al than the ones exposed at 1000 °C or over.

General discussion (Part II) _____________________________________________________________________________
298 ______________________________________________________________________
On an (Ni+Co)-Cr-Al ternary diagram, commercial BC are located near to the
boundaries (at 900 °C) or out of the Al2O3 former domain (at 950 °C) meaning that they
would be susceptible to forming species less protective than the desired Al2O3 during
exposure (mixed (Cr,Al)2O3 or spinels).
Magnetron co-sputtering was found to be an efficient method to deposit a large
quantity of small samples with different compositions. However, it was not a good
technique for the deposition of Ni alone, because of the paramagnetic nature of this
metal. Films containing contents of Cr higher than 40wt% were also less adhesive.
Targets of any chosen composition can be used in magnetron sputtering, making this
technique very flexible to coat small parts. It is limited by the deposition rate of the
coatings, which is quite slow (20 hours to deposit ~20 µm) and by the size of the
substrate (dependant on the size of the deposition chamber).

Conclusions _____________________________________________________________________________
299 ______________________________________________________________________
CHAPTER XI – CONCLUSIONS
TBCs are a key part of the high temperature protection of industrial gas turbines
parts. Although they are extensively used in industry, many challenges still remain in
understanding their failure mechanisms and in developing better performing materials.
This PhD project was divided in two parts. Firstly, the effect of the bulk
geometry of the components on the microstructural evolution of APS/TBC systems and
their failure was studied. Secondly, new BC compositions, which could be used as
coatings for high temperature protection of industrial gas turbines, were manufactured
and investigated.
In part I, 40 modified aerofoil-shaped samples were exposed in air at 900, 925,
950, 975 and 1000 °C for up to 20,000, 15,000, 5000, 3000, and 1500 hours
respectively. Pulsed (flash) thermography has been successfully used to detect cracked
and delaminated areas below APS/TBCs on modified aerofoil shaped samples. Multiple
samples cracked at the leading edge and on a convex feature on the “pressure side”,
suggesting an impact of geometry on coating failure. SEM and EDX characterisation
enabled to gather data at 9 different locations of varying curvature around the sample on
the different layers of the TBC system. Concave geometries around the sample
promoted the formation of less protective oxides; spinels and mixed oxides. BC
roughness and TGO undulations were found to cause the growth of those less-protective
oxides. The overall sample curvature also affected the quality of manufacturing
explaining the higher thicknesses and higher roughnesses on concave features. In the
case of extremely convex geometry, TBC deposition layers did not follow the substrate
curvature resulting in uneven coatings which could ease crack formation and

Conclusions _____________________________________________________________________________
300 ______________________________________________________________________
propagation. Thinner BCs at convex locations were able to grow Al2O3 at the same rate
as thicker BCs by using the Al from the γ'-Ni3Al instead of the β-NiAl phase. They were
however found to be more sensitive to mechanically induced failure which made convex
locations more likely to crack first. Additionally, the investigation of the TC/TGO
interface highlighted the significant effect of the splat layout on the residual stress state
at the interface and therefore the initiation and propagation of cracks.
The oxidation of samples at 900 to 1000 °C for up to 20,000 hours, enabled the
collection of an important amount of data, which in turn, allowed the optimisation of an
existing oxidation prediction model. It highlighted the dependence of the transition to
stable Al2O3 growth on temperature and the importance of this in the model.
Premature failure of the APS/TBC at the leading and trailing edge of a blade,
which are locations subject to higher temperatures and stresses in the gas turbine, could
be reduced by monitoring the manufacture of the coating more effectively. Roughness
of the TC/BC interface is compulsory for the adhesion properties of the APS/TBC so
cannot be avoided. However, the difference of TC and BC thicknesses around the
blades should be reduced to prevent preferential cracking at the thinner locations.
In part II of this thesis, the PVD technique, magnetron sputtering, has been used
successfully to deposit a range of potential Co-Ni-Cr-Al coatings on sapphire substrates.
Around 200 samples were created using this technique and half of them were exposed
in air at 900 and 950 °C for up the 500 hours. The selective growth of protective Cr2O3
or Al2O3 oxides or other non-protective oxides (depending on the initial coating
composition) was observed. The oxidation temperature was found to have great effect
on the nature of the oxides formed on the coating surfaces. It increased the domain (on
ternary phase diagrams) of NiO formers for coatings containing low levels of Cr while

Conclusions _____________________________________________________________________________
301 ______________________________________________________________________
increasing the Al2O3 formers domain for higher initial levels of Cr. Lowering the
oxidation temperature from 950 to 900 °C promoted the formation of transient Al2O3
and spinels. At the same time, adding Co to the Ni-Cr-Al system allowed coatings to
form Al2O3 with lower Al levels (at 900 °C) and also encouraged spinels growth.
At 900 °C, the composition with the lowest extent of oxidation and therefore the
best oxidation protection properties was (in at%) Ni-12.3Co-29.2Cr-36.6Al. This
coating contained less Al and more Cr than the most efficient coatings at 950°C which
were Ni-11.5Cr-36Al and Ni-6.7Cr-31.7Al. All these compositions have high levels of
Al suggesting that the most oxidation resistant coatings at 950 and 900°C contain high
volume fractions of nickel/cobalt aluminides.
Recommendations for further work:
The work presented in this thesis opens many directions for further
investigations:
• The deposition and oxidation of APS/TBC systems with equal thicknesses all
around aerofoil-like samples will verify whether the preferential cracking on convex
locations is caused by geometry or by the thickness of the coating.
• Further investigations of the transient stage of oxidation at 900-950 °C using FIB
and TEM techniques would generate detailed information about the growth
mechanisms of γ- and θ-Al 2O3 and spinel/mixed oxides, as well as their chemical
interaction with the YSZ TC and the resulting creation of the Al2O3-ZrO2. More
studies are needed to understand the effect of the Al 2O3-ZrO2 mixed zone on the
integrity of the TBC coating systems at lower temperatures.

Conclusions _____________________________________________________________________________
302 ______________________________________________________________________
• Nano-indentation should be used to evaluate the mechanical properties of the
TC/BC interface and verify the effect of the TC splat size/shape on the toughness of
the TC material. Also, the elastic moduli of YSZ reported in literature are not
representative of the TC material due to the defects present in the TC ceramic.
• New BC compositions should be deposited onto a metallic substrate to study the
effect of interdiffusion on the nature of the oxide(s) grown on the overlay coating
during exposure. A variety of CoCr targets should be used in magnetron co-
sputtering to investigate further the effect of Co on the oxidation protection
properties of CoNiCrAl systems. They should then be coated with an APS/TBC in
order to verify their efficiency under conditions closer to the ones encountered in
practise.

References _____________________________________________________________________________
303 ______________________________________________________________________
REFERENCES
[1] Nalin L., Degradation of environmental protection coatings for gas turbine
materials (2008 MPhil Thesis), Cranfield University, Bedfordshire, UK.
[2] Enerdata, electricity domestic consumption data by region in 2010,
http://yearbook.enerdata.net/world-electricity-production-map-graph-and-data-in-
2010.html#/electricity-domestic-consumption-data-by-region-in-2010.html.
[3] International Energy Agency, Key World Energy Statistics 2010.
[4] Commission of the European Communities (2007), Communication from the
commission to the European council and the European parliament – An energy policy
for Europe, Report SEC(2007)12, Brussel.
[5] Keenan R. (2010), “Statistical aspects of the energy economy in 2009”, Eurostat.
[6] Oakey J.E., Simms N.J., Allen D.H. (2004), “Environmental degradation issues in
gas turbines and their relevance to plant life extension – R&D initiatives”,
Environmental
degradation in gas turbine, OMMI 3, Issue 1.
[7] Boyce M.P. (2008), Gas turbine engineering handbook (third edition), Gulf
professional publishing, Boston.
[8] Simms N.J., Oakey J.E., Stephenson D.J., Smith P.J., Nicholls J.R. (1995),”Erosion-
corrosion modelling of gas turbine materials for coal-fired combined cycle power
generation”, Wear, vols. 186-187, pp. 247-255.

References _____________________________________________________________________________
304 ______________________________________________________________________
[9] Driver D., Hall D.W., Meetham G.W. in Meetham G.W. (ed.) (1981), The
development of gas turbine materials, Applied Science Publishers Ltd., London, pp.1-
30.
[10] Stringer J. (2002), “High temperature corrosion in energy-related systems”,
Materials Research, vol. 7, pp. 1-9.
[11] Eon Course – Introduction to the options for power generation.
[12] Birks N., Meier G.H., Pettit F.S.(2006), Introduction to the high-temperature
oxidation of metals (Second edition), Cambridge University Press, Cambridge.
[13] Nicholls J.R., Lawson K.J., Rickerby D.S., Morell P. (1997), “Advanced
processing of TBC’s for reduced thermal conductivity”, AGARP REPORT R-823,
Aalborg, Denmark.
[14] Taylor R., Brandon J.R., Morell P. (1991), “Microstructure, composition and
property relationship of plasma-sprayed thermal barrier coatings”, Surface and Coatings
Technology, vol. 50, pp. 141-149.
[15] Nicholls J.R. (2000), “Design of oxidation-resistant coatings”, Journal of the
Minerals, Metals and Materials Society, vol. 52, pp. 28-35.
[16] Okazaki M. (2001), “High-temperature strength of Ni-base superalloy coatings”,
Science and Technology of Advanced Materials, vol. 2, pp. 357-366.
[17] Donachie M.J. and Donachie S.J. (2002) Superalloys: a technical guide (Second
edition), ASM international, Ohio.
[18] Betteridge W. (1959), The nimonic alloys, Edward Arnold Ltd., London.
[19] White C.H. in Meetham G.W. (ed.) (1981), The development of gas turbine
materials, Applied Science Publishers Ltd., London, pp.89-120.
References _____________________________________________________________________________
305 ______________________________________________________________________
[20] Smith W.F (1981) Structure and properties of engineering alloys, McGraw-Hill,
New York, p. 458.
[21] Evans A.G., Mumm D.R., Hutchinson J.W., Meier G.H., Pettit F.S.(2001),
“Mechanisms controlling the durability of thermal barrier coatings”, Progress in
Materials Science, vol. 46, pp. 505-553.
[22] Kingery W.D., Bowen H.K., Ulhmann D.R. (1976), Introduction to ceramics
(Second edition), Wiley-Interscience, New York. Cited in [6]
[23] Gleeson B. (2005), “Thermal barrier coatings for aeroengine applications”, Journal
of Propulsion and Power, vol. 22, pp. 375-383.
[24] Nicholls J.R, Simms N.J. (2010), “Gas turbine oxidation and corrosion”, Shreir’s
Corrosion, vol. 1, pp. 518-540.
[25] Weisenburger A., Rizzi G., Scrivani, Mueller G., Nicholls J.R.(2007), “Pulsed
electron beam treatment of MCrAlY bondcoats for EB-PVD TBC systems part 1 of 2:
Coating production”, Surface and Coatings Technology, vol. 202, pp. 704-708.
[26] Smeggil J.G. (1987), “Some comments on the role of yttrium in protective oxide
scale adherence”, Materials Science and Engineering, vol. 87, pp. 261-265. Cited in [6].
[27] Smialek J.L., Jayne D.T., Schaeffer J.C., Murphy W.H. (1994), “Effect of
hydrogen
annealing, sulphur segregation and diffusion on the cyclic oxidation of superalloys – a
review”, Thin Solid Films, vol. 253, pp. 285-292. Cited in [6].
[28] Saunders S.R.J., Nicholls J.R. (1989), “Coatings and surface treatments for high
temperature oxidation resistance”, Materials Science and Technology, vol. 5, pp. 780-
798.

References _____________________________________________________________________________
306 ______________________________________________________________________
[29] Christensen R.J., Tolpygo V.K., Clarke D.R. (1996), “The influence of the reactive
element yttrium on the stress in alumina scales formed by oxidation”, Acta Materialia,
vol.45, pp. 1761-1766.
[30] Jedlinski J. (2005), “Local and microstructure-related effects affecting the high
temperature oxidation of alumina formers: a brief survey”, Materials at High
Temperature, vol.22, pp. 485-495.
[31] Ding Z., Knight R., Smith R.W. (2002), “Effect of bond coat processes and surface
characteristics on the failure mechanism of thermal barrier coatings” in Berndt C.C.
(ed.), Thermal spray 2001 : New Surface for a New Millennium, ASM international,
Ohio, pp.173-177.
[32] Mom A.J.A. (1981), “High Temperature Coatings for Gas Turbines, an overview”,
NLR report MP 81003U, Amsterdam.
[33] Prescott R., Graham M.J. (1991) “The formation of aluminum oxide scales on
high-temperature alloys”, Oxidation of Metals, vol. 38, pp. 233-253.
[34] Wright P.K., Evans A.G. (1999), “Mechanisms governing the performance of
thermal barrier coatings”, Current Opinion in solid State and Materials Science, vol. 4,
pp. 255-265.
[35] Evans A.G., Clarke D.R., Levi C.G. (2008), “The influence of oxides on the
performance of advanced gas turbines”, Journal of the European Ceramic Society, vol.
28, pp. 1405-1419.
[36] Chen W.R., Wu X., Marple B.R., Patnaik P.C. (2006), “ The growth and influence
of thermally grown oxide in a thermal barrier coating”, Surface and Coatings
Technology, vol. 201, pp 1074-1079.
[37] Armijo J.S. The kinetics and mechanism of solid-state spinel formation – A review
and critique. Oxidation of metals 1, 171- 198 (1969).

References _____________________________________________________________________________
307 ______________________________________________________________________
[38] Zhao X., Shapiro I.P., Xiao P (2007), “Spinel formation in thermal barrier systems
with a Pt-enriched γ-Ni + γ’-Ni 3Al bond coat”, Surface and Coatings Technology, vol.
202, pp. 2905-2916 (2007).
[39] Pieraggi B. (1997), “Fundamental aspects of reactions at the metal/scale interface
during scaling”, Materials Science Forum, vols. 251-254, pp. 299-312.
[40] Kvernes I.A., Kofstad P. (1972), “The oxidation behaviour of some Ni-Cr-Al
alloys at high temperatures”, Metallurgical Transactions, vol. 3, pp. 1511-1519.
[41] Gesmundo F. (1997), “Mathematical modeling of alloy oxidation”, Material
Science Forum, vols. 251-254, pp. 3-18.
[42] Rahmel A., Wood G.C., Kofstad P., Douglas D.L. (1985), “International Workshop
on 'Critical issues concerning the mechanisms of high-temperature corrosion'”,
Oxidation of Metals, vol. 23, pp. 251-338.
[43] Wood G.C. (1970), “High-temperature oxidation of alloys”, Oxidation of Metals,
vol. 2, pp. 11- 57.
[44] Karuaratne M.S.A, Ogden S.L, Kenny S.D., Thomson R.C. (2009), “ A
multicomponent diffusion model for prediction of microstructural evolution in coated
Ni based superalloy”, Materials Science and Technology, vol. 25, pp. 287-299.
[45] Taylor M.P (2005), “An oxidation study of an MCrAlY overlay coating”,
Materials at high temperatures, vol. 22, pp. 433-436.
[46] Li M., Sun X., Zhang Z., Hu W., Hou G., Guan H., Hu Z. (2004), “Element
diffusion and interface characteristics between NiCrAlY coating and Ni-based single
crystal superalloy”, Rare Metal Materials and Engineering, vol. 33, pp. 55-58.

References _____________________________________________________________________________
308 ______________________________________________________________________
[47] Taylor M.P., Pragnell W.M., Evans H.E. (2004), “Evidence for the formation of
Al-rich reservoir phase resulting from the interdiffusion between MCrAlY coating and
Ni-based substrate”, Materials Science Forum, vol. 461-464, pp. 239-246.
[48] Rabiei A., Evans A.G. (2000), “Failure mechanisms associated with the thermally
grown oxide in plasma-sprayed thermal barrier coatings”, Acta materialia, vol. 48, pp.
3963-3976.
[49] Okada M., Hisamatsu T., Kitamura T. (2008), “Temperature estimation and Al
content prediction focusing on microstructural change in a thermal barrier coating”,
Journal of Thermal Spray Technology, vol. 18, pp. 90-95.
[50] Wu F., Jordan E.H., Ma X., Gell M. (2008), “Thermally grown oxide growth
behaviour and spallation lives of solution precursor plasma spray thermal barrier
coatings”, Surface and Coatings Technology, vol. 202, pp 1628-1635.
[51] Haynes J.A., Rigney E.D. (1996), “Oxidation and degradation of plasma-sprayed
thermal barrier coating system”, Surface and Coatings Technology, vol. 86, pp. 102-
108.
[52] Brumm M.W., Grabke H.J. (1992), “The oxidation behaviour of NiAl-I. Phase
transformations in the alumina scale during oxidation of NiAl and NiAl-Cr alloys”,
Corrosion Science, vol.33, pp. 1677-1690.
[53] Grabke H.J. (1999), “Oxidation of NiAl and FeAl”, Intermatallics, vol. 7, pp.
1153-1158.
[54] Jedlinski J. (2009), “Growth mechanism vs matter transport in thermally growing
oxides on high temperature materials: a brief survey based on the case study of alumina
formers”, Defect and Diffusion Forum, vols. 289-292, pp. 385-395.

References _____________________________________________________________________________
309 ______________________________________________________________________
[55] Rybicki G.C. and Smialek J.L. (1989), Effect of the θ-α-Al 2O3 transformation on
the oxidation behaviour of β-NiAl + Zr”, Oxidation of Metals, vol. 31, pp. 275-304.
[56] Klumpes R., Marée C.H.M., Schramm E., de Wit J.H.W. (1997), “The influence of
chromium on the oxidation of β-NiAl at 1000 °C”, in H.J Grabke and M. Schütze (ed.),
Oxidation of Intermetallics, Wiley-VCH,Weinheim, pp. 99-107.
[57] Niranatlumpong P., Ponton C.B., Evans H.E. (2000), “The failure of protective
oxides on plasma-sprayed NiCrAlY overlay coatings”, Oxidation of Metals, vol. 53, pp.
241-258.
[58] Beck T., Herzog R., Trunova O., Offermann M., Steinbrech R.W., Singheiser L.
(2008), “Damage mechanisms and lifetime behavior of plasma sprayed thermal barrier
coating systems for gas turbines-Part II: Modeling”, Surface and Coatings Technology,
vol. 202, pp 5901-5908.
[59] Li M.H., Zhang Z.Y., Sun X.F., Li J.G., Yin F.S., Hu W.Y., Guan H.R., Hu Z.Q.
(2003), “Oxidation behavior of sputter-deposited NiCrAlY coating”, Surface and
Coatings Technology, vol. 165, pp. 241-247.
[60] F.T Talboom, R.C. Elam, L.W. Wilson, Evaluation of advanced superalloy
protection systems, Report CR7813, NASA, Houston, TX (1970).
[61] Grainger S. (1989) Engineering coatings – design and application, Abington
Publishing, Cambridge, p.79.
[62] Hou P.Y. (2010), “Oxidation of metals and alloys”, in T.S.A Richardson (ed.),
Shreir’s corrosion, vol. 1, 1st ed., Elsevier, Manchester, 2010, pp. 215-224.
[63] Nicholls J.R., Hancock P., Al Yasiri L.H. (1989), “Optimising oxidation resistance
of MCrAl coating systems using vapour phase alloy design”, Materials Science and
Technology, vol. 5, pp. 799-805.

References _____________________________________________________________________________
310 ______________________________________________________________________
[64] P.F. Tortorelli and M.P. Brady (2010), “Design of high temperature alloys”,in
T.S.A. Richardson (ed.), Shreir’s Corrosion, vol.1,Elsevier, Manchester, p. 541-557.
[65] Wallwork G.R., Hed A.Z. (1971),” Mapping of oxidation products in ternary Co-
Cr-Al system”, Oxidation of Metals, vol. 3, pp. 213.
[66] Rhouta B., Hajjaji M., Oquab D., Pieraggi B. (1997), “ Oxydation à haute
température de poudres d’alliages MCrAlY (M=Co,Ni) à différentes teneurs en
aluminium”, Materials Science Forum, vols 251-254, pp. 49-56.
[67] Trunova O., Beck T., Herzog R., Steinbrech R.W., Singheiser L. (2008), “Damage
mechanisms and lifetime behavior of plasma sprayed thermal barrier coating systems
for gas turbines-Part I: Experiments”, Surface and Coatings Technology, vol. 202, pp
5027-5032.
[68] Naumenko D., Shemet V., Singheiser L., Quadakkers W.J. (2009), “ Failure
mechanisms of thermal barrier coatings on MCrAlY-type bondcoats associated with the
formation of the thermally grown oxide”, Journal of Materials Science, vol. 44, pp.
1687-1703.
[69] Schlichting K.W., Padture N.P., Jordan E.H., Gell M. (2003), “Failure modes in
plasma-sprayed thermal barrier coatings”, Material Science and Engineering, vol.
A342, pp. 120-130.
[70] Shillington E.A.G. and Clarke D.R. (1998), “Spalling failure of a thermal barrier
coating associated with aluminum depletion in the bond-coat”, Acta Materialia, vol. 47,
pp. 1297-1305.
[71] Yi H.C., Smeltzer W.W., Petric A. (1996), “Oxidation of γ’-Ni 3Al and γ’-Ni 3Al(Si)
intermetallic compounds at low-oxygen pressures”, Oxidation of Metals, vol.45, pp.
281-299.

References _____________________________________________________________________________
311 ______________________________________________________________________
[72] Renusch D., M., Schütze M. (2008), “The role that bond coat depletion of
aluminium has on the lifetime of APS=TBC under oxidizing conditions”, Materials and
Corrosion, vol. 59, pp.547-555.
[73] Evans H.E. and Taylor M.P. (2001), “Diffusion cells and chemical failure of
MCrAlY bond coats in thermal-barrier coating systems”, Oxidation of Metals, vol. 55,
pp. 17-34.
[74] Taylor M.P., Pragnell W.M., Evans H.E. (2008), “The influence of bond coat
surface roughness on chemical failure and delamination in TBC systems”, Materials
and Corrosion, vol 59, pp. 508-513.
[75] Eschler H., Renusch D. and Schütze M. (2004), “Bond coat oxidation and its
significance for life expectancy of thermal barrier coating systems”, Materials Science
and Technology, vol.20, pp. 307-317.
[76] Taylor M.P. and Evans H.E. (2003), “Formation of diffusion cells in LPPS
MCrAlY coatings”, Materials at High Temperatures, vol. 20, pp. 461-465
[77] Brandl W., Grabke H.J., Toma D., Krüger J. (1996), “The oxidation behaviour of
sprayed MCrAlY coatings”, Surface and Coatings Technology, vol. 86-87, pp 41-47.
[78] Chen W.R., Wu X., Marple B.R., Lima R.S., Patnaik P.C. (2008), “ Pre-oxidation
and TGO growth behaviour of an air-plasma-sprayed thermal barrier coating”, Surface
and Coating Technology, vol. 202, pp. 3787-3796.
[79] Moskal G., Swadźba L., Mendala B., Góral M., Hetmańczyk M. (2009),
“Degradation of the TBC system during the static oxidation test”, Journal of
Microscopy, vol. 237, pp. 450-455.
References _____________________________________________________________________________
312 ______________________________________________________________________
[80] Ajdelsztajn L., Picas J.A., Kim G.E., Bastian F.L., Schoenung J., Provenzano V.
(2002), “Oxidation behaviour of HVOF spryed nanocrystalline NiCrAlY powder”,
Materials Science and Engineering A, vol. A338, pp. 33-34.
[81] Ogawa K., Masuda T., Shoji T. (2001), “Kinetics of thermally grown oxide at
interface between thermal barrier coatings and MCrAlY bond coatings”, in Berndt C.C.,
Khor K.A. and Lugscheider E.F. (eds.), Thermal Spray 2001 : New Surfaces for a New
Millennium, ASM international, Ohio, pp. 187-194.
[82] Gil A., Shemet R., Subanovic M., Toscano J., Naumenko D., Singheiser L.,
Quadakkers W.J. (2006), “Effect of surface condition on the oxidation behaviour of
MCrAlY coatings”, Surface and Coatings Technology, vol. 201, pp 3824-3828.
[83] Che C., Wu G.Q., Qi H.Y., Huang Z., Yang X.G. (2009), “Uneven growth of
thermally grown oxide and stress distribution in plasma-sprayed barrier coatings”,
Surface and Coatings Technology, vol. 203, pp. 3088-3091.
[84] Tang F. and Schoenung J. (2004), “Local accumulation of thermally grown oxide
in plasma-sprayed thermal barrier coatings with rough top-coat/bond-coat interfaces”,
Scripta Materialia, vol. 52, pp. 905-909.
[85] Gong X.Y and Clarke D.R. (1998), “On the measurement of strain in coatings
formed on a wrinkled elastic substrate”, Oxidation of Metals, vol.50, pp.355-376.
[86] Tolpygo V.K. and Clarke D.R. (1997), “ Competition between stress generation
and relaxation during oxidation of an Fe-Cr-Al-Y alloy”, Oxidation of Metals, vol.49,
pp.187-212.
[87] Bull S.J. (1997), “Modeling of residual stress in oxide scales”, Oxidation of Metals,
vol. 49, pp. 1-17.

References _____________________________________________________________________________
313 ______________________________________________________________________
[88] DeMasi-Marcin J.T., Sheffler K.D., Bose S. (1990), “Mechanisms of degradation
and failure in plasma-deposited thermal barrier coating”, Journal of Engineering for
Gas Turbines and Power, vol. 112, pp. 521-526.
[89] Bäker M., Rösler J., Heinze G. (2004), “A parametric study of the stress of thermal
barrier coatings Part II: cooling stresses”, Acta Materialia, vol. 53, pp. 469-476.
[90] Singh J.P., B.G. Nair, D.P. Renusch, M.P. Sutaria, M.H Grimsditch (2001), “
Damage evolution and stress analysis in Zirconia thermal barrier coatings during cyclic
and isothermal oxidation”, Journal of American Ceramic Society, vol. 84, pp. 2385-
2393.
[91] Hsueh C-H., Haynes J.A., Lance M.J., Becher P.F., Ferber M.K, Fuller E.R.,
Langer S.A., Carter W.C., Cannon W.R. (1999), “Effects of interface roughness on
residual stresses in thermal barrier coatings”, Journal of the American Ceramic Society,
vol. 82, pp. 1073-1075.
[92] Miller R.A. and Lowell C.E. (1982), “Failure mechanisms of thermal barrier
coatings exposed to elevated temperatures”, Thin Solid Films, vol. 95, pp. 471-482.
[93] Goswani G., Ray A.K., Sahay S.K. (2003), “Thermal barrier coating system for gas
turbine application – A review”, High Temperature Materials and Processes, vol. 23,
pp. 73-92.
[94] Sohn Y.H., Biederman R.R., R.D Sisson Jr. (1994), “Isothermal oxidation of
physical vapour deposited partially stabilized zirconia thermal barrier coatings”, Journal
of Materials Engineering and Performance, vol. 3, pp. 55-60.
[95] Teixeira V., Andritschky M., Buchkremer H.P., Stöver D. (1998), “Failure
mechanisms in thermal cycled TBC’s” in Lecomte-Beckers J., Schubert F. and Ennis
P.J. (eds.), Materials for advanced power engineering 1998 Part III, Forschungszentrum
Jülich, Jülich, pp. 1601-1610.

References _____________________________________________________________________________
314 ______________________________________________________________________
[96] Bäker M., Rösler J., Heinze G. (2004), “A parametric study of the stress state of
thermal barrier coatings part II: cooling stresses”, Acta Materialia, vol. 53, pp. 469-476.
[97] Eschler H., Renusch D., Schütze M. (2004), “Mechanical behaviour of as sprayed
and sintered air plasma sprayed partially stabilised zirconia”, Materials Science and
Technology, vol. 20, pp. 869-876.
[98] Echsler H., Shemet V., Schütze M., Singheiser L., Quadakkers W.J. (2006),
“Cracking in and around the thermally grown oxide in thermal barrier coatings: A
comparison of isothermal and cyclic oxidation”, Journal of Materials Science, vol. 41,
pp. 1047-1058.
[99] Mezzedimi V., Giorni E., Tognarelli L., Pratesi F., Zonfrillo G., Giannozzi M.,
Innocenti M. (1998), “Assessment of turbine hot gas path components”, ” in Lecomte-
Beckers J., Schubert F. and Ennis P.J. (eds.), Materials for advanced power engineering
1998 Part III, Forschungszentrum Jülich, Jülich, pp. 1601-1610.
[100] Sjöström S. and Brodin H. (2010), “Influence of TBC end geometry on the TMF
of an APS TBC”, Procedia Engineering, vol. 2, pp. 1363-1371.
[101] Sohn Y.H., Lee E.Y., Nagaraj B.A., Biederman R.R, Sisson Jr. R.D. (2001),
“Microstructural characterization of thermal barrier coatings on high pressure turbine
blades”, Surface and Coatings Technology, vol. 147-147, pp. 132-139.
[102] Altuncu E., Karaali E.I., Erdogan G., Ustel F., Turk A. (2009), “ The effect of
samples geometry and thermal cycling on the thermal shock behaviour of plasma
sprayed TBCs”, Plasma Processes and Polymers, vol. 6, pp. S711- S715.
[103] Demasi J.T. & Sheffler K.D. Thermal barrier coating life prediction model
development. In: NASA Contract Rep. 175087, National Aeronautics and Space
Administration (1986).

References _____________________________________________________________________________
315 ______________________________________________________________________
[104] Koomparkping T., Damrongrat S., Niranatlumpong P. (2004), “Al-rich
precipitation in CoNiCrAlY bondcaot at high temperature”, Journal of Thermal Spray
Technology, vol. 14, pp. 264-267.
[105] Busso E.P., Wright L., Evans H.E., McCartney L.N, Saunders S.R.J, Osgerby S.,
Nunn J. (2007), “A physics-based life prediction methodology for thermal barrier
coating systems”, Acta Materialia, vol. 55, pp. 1491-1503.
[106] Martena M., Botto D., Fino P., Sabbadini S., Gola M.M., Badini C. (2005),
“Modelling of TBC system failure: Stress distribution as a function of TGO thickness
and thermal expansion mismatch”, Engineering Failure Analysis, vol. 13, pp. 409-426.
[107] Renusch D., Eschler H., Schütze M. (2001), “New approach to the understanding
of failure and lifetime prediction of thermal barrier coating systems”, in Schütze, M.,
Quadakkers, W.J., Nicholls, J.R.(eds), Lifetime Modelling of High Temperature
Corrosion Processes 34, Proceedings of an EFC Workshop, Maney, pp. 324-336.
[108] Nesbitt J.A. (1995), “Numerical modeling of high-temperature corrosion
processes”, Oxidation of Metals, vol. 44, pp. 309-338.
[109] Krukovski P., Kolarik V., Tadlya K., Rybnikov A., Kryukov I., Juez-Lorenzo M.
(2001), “ Theoretical and experimental approach for long term modeling of oxidation
and diffusion processes in MCrAlY coatings”, in Schütze, M., Quadakkers, W.J.,
Nicholls, J.R.(eds), Lifetime Modelling of High Temperature Corrosion Processes 34,
Proceedings of an EFC Workshop, Maney, pp. 231-245.
[110] Gurrappa I., Weibruch S., Naumenko D., Quaddakers W.J. (2000), “ Factors
governing breakaway oxidation of FeCrAl-based alloys”, Materials and Corrosion, vol.
51, pp. 224-235.
[111] Monceau D. and Pieraggi B. (1998), “Determination of parabolic rate constants
from a local analysis of mass-gain curves”, Oxidation of Metals, vol. 50, pp. 477-493.

References _____________________________________________________________________________
316 ______________________________________________________________________
[112] Strehl G., Guttmann V., Naumenko D., Kolb-Telieps A., Borchardt G,
Quaddakers W.J., Klöwer J., Beaven P.A., Nicholls J.R. (2001), “The influence of
sample geometry on the oxidation and chemical failure of FeCrAl(RE) alloys”, in
Schütze, M., Quadakkers, W.J., Nicholls, J.R.(eds), Lifetime Modelling of High
Temperature Corrosion Processes 34, Proceedings of an EFC Workshop, Maney, pp.
107-122.
[113] Gurrappa I., Weibruch S., Naumenko D., Quaddakers W.J. (2000), “Factors
governing breakaway oxidation of FeCrAl-based alloys”, Materials and Corrosion, vol.
51, pp. 224-235.
[114] Nesbitt J.A. and Heckel R.W. (1984), “Modeling degradation and failure of Ni-
Cr-Al overlay coatings”, Thin solid Films, vol. 119, pp. 281-290.
[115] Nicholls J.R., Newton R., Bennett M.J., Evans H.E., Al-Badairy H., Tatlock G.J.,
Naumenko D., Quadakkers W.J., Strehl G, Borchardt G. (2001), “Development of a life
prediction model for the chemical failure of FeCrAl(RE) alloys in oxidizing
environments”, in Schütze, M., Quadakkers, W.J., Nicholls, J.R.(eds), Lifetime
Modelling of High Temperature Corrosion Processes 34, Proceedings of an EFC
Workshop, Maney, pp. 83-106.
[116] Fox A.C. and Clyne T.W. (2004), “Oxygen transport by gas prmeationthrough the
zirconia layer in plasma sprayed thermal barrier coatings”, Surface and Coatings
Technology, vol. 184, pp. 311-321.
[117] Ingo G.M., Paparazzo E., Bagnarelli N., Zaccheti N. (1990), “ XPS studies on
cerirum, zirconium and yttrium valence states in plasma-sprayed coating”, Surface and
Interface Analysis, vol. 16, pp. 515-519 cited in [149].
[118] Ingo G. (1991), “Origin of sarkening in 8wt% yttria-zirconium plasma-sprayed
thermal barrier coatings”, Journal of the American Ceramic Society, vol. 74, pp. 381-
386.

References _____________________________________________________________________________
317 ______________________________________________________________________
[119] Kidd G., Nunn J. (2011), “Application of pulsed thermography to quality
assurance of thermal barrier coatings”, to be published in Journal of Aerospace
Engineering.
[120] Sun J.G. Thermal Imaging Characterization of Thermal Barrier Coatings.
American Ceramic Society’s 31st International Cocoa Beach Conference & Exposition
on Advanced Ceramics & Composites, Daytona Beach, FL, Jan. 21-26 (2007).
[121] Nunn J, Saunders S., Banks J. (2005), Application of thermography in the
evaluation of early signs of failure of thermal barrier coating systems. Materials at High
Temperatures, vol. 22, 385-392.
[122] Thermal Wave Imaging Inc. (2009), thermography basics at
http://www.thermalwave.com/technology.php
[123] Chang C.Y & Sze S.M. (1996), “ULSI technology”, New York: McGraw-Hill
[124] Danson N., Safi I., Hall G.W., Howson R.P. (1997), “Techniques for the
sputtering of optimum indium-tin oxide films on to room-temperature substrates”,
Surface & Coatings Technology, vol. 99. pp. 147-160.
[125] Carlin M., Design, manufacture, and high temperature behaviour of α-phase
bondcoat for thermal barrier coating (2007 PhD Thesis), Cranfield University,
Bedfordshire, UK.
[126] Seraffon M., Simms N., Sumner J., Nicholls J. (2011) ,“Performance of thermal
barrier coatings in industrial gas turbine conditions”, Materials at High Temperatures,
vol. 28, pp.309-314.
[127] Okamoto H., Desk handbook phase diagrams for binary alloys, ASM, Ohio, 2000,
p.38.

References _____________________________________________________________________________
318 ______________________________________________________________________
[128] Pint B.A., Wright I.G., Lee W.Y., Zhang Y., Prüβner K., Alexander K.B. (1998),
“Substrate and bond coat compositions: factors affecting alumina scale adhesion”,
Materials Science and Engineering A, vol. 245, pp. 201-211.
[129] Al-Badairy H., Tatlock G.J., Bennett J. (2000), “A comparison of breakaway
oxidation in wedge-shaped and parallel sided coupons of FeCrAl alloys”, Materials at
high temperature, vol. 17, pp. 101-107.
[130]Renusch D., Schorr M., Schütze M. (2008), “The role that bond coat depletion of
aluminium has on the lifetime of APS-TBC under oxidizing conditions”, Materials and
Corrosion, vol 59, pp 547-555.
[131] Liu D., Flewitt P.E.J., Hallam K.R. (2011), “The measurement of residual stresses
in thermal barrier coated model aerofoils”, Key Engineering Materials, vols 488-499,
pp. 9-12.
[132] Thompson J.A., Clyne T.W. (2001), “The effect of heat treatment on the stiffness
of zirconia top coats in plasma-sprayed TBCs”, Acta Materialia, vol. 49, pp. 1565-
1575.
[133] Wesling K.F, Darrell F.S., Beardsley B. (1994), “Fatigue of thick thermal barrier
coatings”, Journal of the American Ceramic Society, vol. 77, pp. 1863-1868.
[134] Murphy K.S., More K.L., Lance M.J. (2001), “As-deposited mixed zone in
thermally grown oxides beneath a thermal barrier coating”, Surface and Coatings
Technology, vol.146-147, pp. 152-161.
[135] Levi C.G., Sommer E., Terry S.G., Catanoiu A., Rühle M. (2003), “Alumina
grown during deposition of thermal barrier coatings on NiCrAlY”, Journal of the
American Ceramic Society, vol. 86, pp. 676-685.

References _____________________________________________________________________________
319 ______________________________________________________________________
[136] Leyens C., Schulz U., Fritscher K. (2003), “Oxidation and lifetime of PYSZ and
CeSZ coated Ni-based substrates with MCrAlY bond layers”, Materials at High
Temperature, vol. 20, pp. 475-480.
[137] Yang Y.Q., Leyens C., Schuls U., Dudek H.J., Kaysser W.A. (2000), Proc.
Materials Week, Munich, Germany.
[138] Jayaram V., Levi C.G., Whitney T., Mehrabian R. (1990), “Charaterisation of
Al 2O3-ZrO2 powders produces by electrohydrodynamic atomization”, Materials Science
and Engineering A, vol. 124, pp. 65-81.
[139] Karadge M., Zhao X., Preuss M., Xiao P. (2006), “Microtexture of the thermally
grown alumina in commercial thermal barrier coatings”, Scripta Materialia, vol. 54, pp.
639-644.
[140] Tuan W.H., Chen R.Z., Wang T.C., Cheng C.H., Kuo P.S. (2002), “Mechanical
properties of Al2O3/ZrO2 composites”, Journal of the European Ceramic Society, vol.
22, pp. 2827-2833.
[141] Callister W.D. (ed.), (2007), Materials Science and Enginerring – An introduction
(7th edition), John Wiley & Sons, USA.
[142] Liang G.Y, Zhu C., Wu X.Y, Wu Y. (2010), “The formation model of Ni-Cr
oxides on NiCoCrAlY-sprayed coating”, Applied Surface Science, vol. 257, pp. 6468-
6473.
[143] Wlassow F., Leonard T., Duchaine F., Gourdain N., CERFACS (2010),
http://www.cerfacs.fr/8-26772-Aerothermie-des-turbines.php.
[144] Shyam V., 3-D unsteady simulation of a modern high pressure turbine blade :
analysis of heat transfer and flow, (2010 PhD thesis), Ohio State University, Ohio,
USA.

References _____________________________________________________________________________
320 ______________________________________________________________________
[145] Seraffon M., Simms N.J., Sumner J., Nicholls J.R. (2011), “The development of
new bond coat compositions for thermal barrier coating systems operating under gas
turbine conditions”, Surface and Coatings Technology, vol. 207, pp. 1529-1537.
[146] Rosell-Laclau E., Durand-Charre M., Audier M. (1996), “Liquid-solid equilibria
in the aluminium-rich corner of the Al-Cr-Ni system”, Journal of Alloys and
Compounds, vol. 233, pp. 246-263.
[147] Levin I., Brandon D. (1998), “Metastable alumina polymorphs: crystal structures
and
transition sequences”, Journal of the American Ceramic Society, vol. 81, pp. 1995-
2012.
[148] Sauthoff G. (1995), “Intermetallics”, 1st Ed., VCH, Weinheim, p.38 .
[149] Kear B.H., Pettit F.S., Forwalt D.E, Lemaire L.P. (1971), “On the transient
oxidation of a Ni-15Cr-6Al alloy”, Oxidation of Metals, vol.3, pp.557-569.
[150] Taylor T.A., Walsh P.N. (2004), “Thermal expansion of MCrAlY alloys”, Surface
and Coatings Technology, vol. 177-178, pp. 24-31.
[151] Nicholls J.R., Lawson K.J, Al Yasiri L.H., Hancock P. (1993), “Vapour phase
alloy design of corrosion resistant overlay coatings”, Corrosion Science, vol. 35, pp.
1209-1223.
[152] Ma K., Schoenung J.M. (2010), “Thermodynamic investigation into the
equilibrium phases in the NiCoCrAl system at elevated temperatures”, Surface and
Coatings Technology, vol. 205, pp. 2273-2280.
[153] Liang J.J., Wei H., Zhu Y.L., Sun X.F., Jin T., Hu Z.Q., Dargusch M.S., Yao X.
(2011), “Influence of Co addition on constituent phases and performance of a
NiCrAlYRe alloy system”, Surface and Coatings Technology, vol. 205, pp. 4968-4979.

References _____________________________________________________________________________
321 ______________________________________________________________________
[154] Achar D.R.G, Munoz-Arroyo R., Singheiser L., Quadakkers W.J. (2004),
“Modelling of phase equilibria in MCrAlY coating systems”, Surface and Coatings
Technology, vol. 187, pp. 272-283.
[155] Thompson J.A., Tsui Y.C., Reed R.C., Rickerby D.S., Clyne T.W.(2000), “Creep
of plasma sprayed CoNiCrAlY and NiCrAlY bond coats and its effect on residual
atresses during thermal cycling of thermal barrier coating systems”, High Temperature
Surface Engineering, Proceedings of 6th International Conference on Engineering the
Surface, Edinburgh, UK.

References _____________________________________________________________________________
322 ______________________________________________________________________

Appendices __________________________________________________________________________________
323 ______________________________________________________________________
APPENDIX A – MOUNTING MOULD (DESIGN)

Appendices __________________________________________________________________________________
324 ______________________________________________________________________

Appendices __________________________________________________________________________________
325 ______________________________________________________________________
APPENDIX B – MASS CHANGE CURVES OF MODIFIED AEROFOIL-SHAPED SAMPLES
Data at 900 °C:
Data at 925 °C:
0.0
0.2
0.4
0.6
0.8
1.0
1.2
1.4
1.6
1.8
0 2000 4000 6000 8000 10000 12000 14000 16000 18000 20000
Ma
ss c
hang
e (m
g/c
m2)
Time (hours)
81-BSYA-1
81-BSYA-2
81-BSYA-3
81-BSYA-5
81-BSYA-6
81-BSYA-7
81-BSYA-8
0.0
0.2
0.4
0.6
0.8
1.0
1.2
1.4
1.6
1.8
0 2000 4000 6000 8000 10000 12000 14000 16000 18000 20000
Mas
s ch
ange
(m
g/c
m2 )
Time (hours)
81-BSYA-25
81-BSYA-26
81-BSYA-27
81-BSYA-28
81-BSYA-29
81-BSYA-30
81-BSYA-31
81-BSYA-32

Appendices __________________________________________________________________________________
326 ______________________________________________________________________
Data at 950 °C:
Data at 975 °C:
0.0
0.2
0.4
0.6
0.8
1.0
1.2
1.4
1.6
1.8
0 2000 4000 6000 8000 10000 12000 14000 16000 18000 20000
Mas
s ch
ange
(m
g/cm
2 )
Time (hours)
81-BSYA-9
81-BSYA-10
81-BSYA-11
81-BSYA-12
81-BSYA-13
81-BSYA-14
81-BSYA-15
81-BSYA-16
0.0
0.2
0.4
0.6
0.8
1.0
1.2
1.4
1.6
1.8
0 2000 4000 6000 8000 10000 12000 14000 16000 18000 20000
Mas
s ch
ang
e (m
g/c
m2)
Time (hours)
81-BSYA-33
81-BSYA-34
81-BSYA-35
81-BSYA-36
81-BSYA-37

Appendices __________________________________________________________________________________
327 ______________________________________________________________________
Data at 1000 °C:
0.0
0.2
0.4
0.6
0.8
1.0
1.2
1.4
1.6
1.8
0 2000 4000 6000 8000 10000 12000 14000 16000 18000 20000
Ma
ss c
hang
e (m
g/cm
2 )
Time (hours)
81-BSYA-17
81-BSYA-18
81-BSYA-19
81-BSYA-20
81-BSYA-21
81-BSYA-22
81-BSYA-23
81-BSYA-24

Appendices __________________________________________________________________________________
328 ______________________________________________________________________

Appendices __________________________________________________________________________________
329 ______________________________________________________________________
APPENDIX C – MEASURED BOND COAT AND TOP COAT THICKNESSES ON MODIFIED AEROFOIL-SHAPED
SAMPLES (µm)
na: data non available
BOND COAT:
Sample (81-BSYA) ref 1 2 3 4 5 6 7 8 Temperature (°C) 0 900 900 900 900 900 900 900 900
Exposure time (hours) 0 4000 10,000 2780 2780 20,000 4000 7000 15,000 A 105 91.3 85.6 112.7 96.2 88.7 97.1 79.2 70.1
B 40 54.3 64.2 49.3 34.8 59.2 58.5 45.4 53.8
C 108 113.3 104.4 108.7 112.3 104.1 101.0 100.7 95.8
D 105.6 116.1 95.0 108.9 115.4 93.8 113.7 114.1 76.4
E 48.6 61.2 60.5 117.9 48.0 67.6 112.0 84.1 71.7
F 27 38.5 63.0 68.3 44.0 45.7 88.6 57.3 37.9
a 120 141.9 98.7 na 135.9 136.4 na 132.9 106.0
b 141 127.7 136.3 na 146.8 117.9 na 118.9 115.7
c 111.6 122.2 106.0 na 105.1 115.0 na 138.0 91.3
Sample (81-BSYA) 12 13 14 15 18 19 Temperature (°C) 950 950 950 950 1000 1000
Exposure time (hours) 2780 4000.0 2780.0 5000 1050 1500 A 99.8 90.7 92.7 80 69.1 88.7
B 53.5 56.1 58.5 50 104.4 68.7
C 109.9 106.3 106.8 110 120.9 122.2
D 113.7 94.3 97.2 100 111.1 105.6
E 61.1 104.7 79.3 75 84.6 82.0
F 45.6 50.8 50.4 50 60.8 52.0
a 117.5 145.0 na 140 140.4 143.2
b 147.2 98.5 na 140 133.7 152.4
c 122.5 152.5 139.3 145 131.6 147.7

Appendices __________________________________________________________________________________
330 ______________________________________________________________________
Sample (81-BSYA) 25 26 27 29 31 35 36 37 Temperature (°C) 925 925 925 925 925 975 975 975
Exposure time (hours) 10,000 100 4000 2740 7000 300 3000 2700 A 105.4 100.6 92.9 103.0 101.2 104.6 106.8 116.1
B 41.2 40.0 62.0 37.3 42.3 58.8 49.0 52.2
C 112.4 108.2 102.5 120.0 120.0 121.3 120.0 131.1
D 107.3 106.6 98.6 123.5 97.4 100.0 129.4 134.7
E 54.3 104.7 107.6 91.5 91.9 108.5 60.5 105.6
F 29.2 47.2 40.7 51.7 49.3 50.0 45.9 52.4
a 124.7 138.2 146.5 150.1 140.1 153.6 157.1 160.1
b 161.9 124.6 127.4 145.1 106.6 146.0 165.7 135.6
c 99.3 147.7 146.9 145.9 136.4 154.1 96.7 142.1
TOP COAT:
Sample (81-BSYA) ref 1 2 4 5 7 8 Temperature (°C) 0 900 900 900 900 900 900
Exposure time (hours) 0 4000 10,000 2780 20,000 7000 15,000 A 188 160 211 200 201 180 206
B 202 190 201 180 234 150 208
C 245 210 232 210 232 250 231
D 216 220 216 200 236 200 212
E 202 190 172 170 166 210 201
F 152 150 139 150 148 130 115
a 240 270 270 230 234 220 237
b 250 250 257 230 252 200 245
c 225 250 252 250 229 220 192
Sample (81-BSYA) 12 13 16 18 19 Temperature (°C) 950 950 950 1000 1000
Exposure time (hours) 2780 4000 5000 1050 1500 A 205 200 205 200 240
B 200 170 160 180 160
C 250 240 235 250 270
D 205 250 230 240 220
E 170 210 180 180 180
F 120 170 180 180 150
a 190 230 240 250 300
b 230 235 240 260 250
c 245 290 300 300 260

Appendices __________________________________________________________________________________
331 ______________________________________________________________________
Sample (81-BSYA) 25 26 27 29 31 35 36 37 Temperature (°C) 925 925 925 925 925 975 975 975
Exposure time (hours) 10,000 100 4000 2740 7000 300 3000 2700 A 198 218 216 200 199 235 196 196
B 169 192 171 172 161 250 175 159
C 279 258 287 257 245 270 255 254
D 259 198 247 210 212 220 204 218
E 204 193 216 218 184 170 212 213
F 204 165 204 155 160 198 148 161
a 272 247 258 260 253 256 235 258
b 261 220 253 260 209 258 226 224
c 290 284 307 251 278 246 97 228

Appendices __________________________________________________________________________________
332 ______________________________________________________________________

Appendices __________________________________________________________________________________
333 ______________________________________________________________________
APPENDIX D – TGO THICKNESSES MEASURED ON MODIFIED AEROFOIL-SHAPED SAMPLES (µm)
Data in red: presence of cracks
na: data non available
Sample ID Thickness at location (µm) 81-BSYA-1 A B C D E F a b c
900°C 2.51 3.11 3.21 2.6 2.8 2.86 3.09 2.43 3.16 4000 hours 2.53 3.23 3.28 3.23 2.96 2.96 3.28 3.38 3.52
3.09 3.36 3.29 3.34 3.04 3.15 3.47 3.45 3.53
3.58 3.4 3.6 3.34 3.21 3.34 3.57 3.67 3.61
3.62 3.51 3.68 3.51 3.42 3.35 3.62 3.77 3.74
3.65 3.53 3.72 3.56 3.59 3.48 3.76 3.96 3.79
3.8 3.64 3.8 3.6 3.63 3.5 3.76 4.18 3.83
3.81 3.84 4.14 3.88 3.76 3.66 3.88 4.2 3.83
4.15 3.87 4.44 4.07 3.77 3.71 3.96 4.29 4.51
4.51 3.98 4.93 4.16 3.91 3.83 4.6 5.43 4.55
Sample ID Thickness at location (µm) 81-BSYA-2 A B C D E F a b c
900°C 3.82 3.96 2.7 4.38 3.09 3.75 3.94 3.49 4.46 10,000 hours 3.91 4 3.43 5.11 4.2 3.92 4.41 3.76 4.61
3.98 4.04 3.92 5.11 4.42 4.1 4.62 3.92 4.76
4.03 4.54 4.16 5.11 4.64 4.29 4.87 4.06 4.76
4.29 4.89 4.69 5.6 4.65 4.42 5.1 4.42 5.06
4.53 5.22 4.78 5.84 4.86 4.65 5.66 5.03 5.21
4.96 5.22 5.23 6.57 4.87 4.78 5.68 5.82 5.36
5.25 5.22 5.39 7.3 5.08 4.95 6.39 5.94 5.8
5.51 5.41 5.88 7.54 5.08 5.5 6.49 6.33 5.95
5.77 5.45 6.01 8.03 5.52 5.79 7.66 7.34 6.55

Appendices __________________________________________________________________________________
334 ______________________________________________________________________
Sample ID Thickness at location (µm) 81-BSYA-3 A B C D E F a b c
900°C 2.82 2.27 2.69 2.83 2.62 3 na na na 2780 hours 3.1 2.61 2.93 3.03 2.68 3.06 na na na
3.14 2.66 2.97 3.19 2.69 3.07 na na na
3.2 2.83 3.02 3.41 3.01 3.27 na na na
3.47 2.9 3.12 3.42 3.09 3.32 na na na
3.53 3.22 3.28 3.5 3.21 3.36 na na na
3.56 3.34 3.45 3.55 3.29 3.95 na na na
3.69 3.41 3.51 3.56 3.43 3.96 na na na
3.79 3.7 3.69 3.58 3.61 4.53 na na na
4.38 3.99 3.78 3.82 3.75 4.61 na na na
Sample ID Thickness at location (µm) 81-BSYA-4 A B C D E F a b c
900°C 2.68 2.53 2.25 2.49 2.72 2.65 2.01 2.65 2.68 2780 hours 2.75 3.07 2.48 2.57 3.01 2.78 2.13 2.9 3.38
3.09 3.2 2.61 2.57 3.2 2.83 2.69 3.07 3.39 3.39 3.51 2.98 2.62 3.36 2.88 2.74 3.18 3.61 3.48 3.52 3.03 3.01 3.54 2.92 2.78 3.21 3.67
3.67 3.57 3.04 3.14 3.64 3.01 2.86 3.31 3.97
3.79 3.62 3.09 3.14 3.74 3.13 3.14 3.82 4.22
4.16 3.73 3.38 3.31 3.78 3.2 3.44 3.83 4.51
4.24 3.84 3.49 3.79 4.04 3.36 3.46 3.85 4.73 4.98 3.9 3.54 3.8 4.76 3.37 3.64 4.3 5.23
Sample ID Thickness at location (µm) 81-BSYA-5 A B C D E F a b c
900°C 4.94 4.52 5.81 4.53 4.81 4.75 4.05 3.09 4.44 20,000 hours 5.02 4.98 6.09 4.53 4.83 4.87 4.18 4.23 5.74
5.28 5.08 6.15 4.63 5.02 5.27 4.76 4.31 5.91
5.73 5.21 6.3 4.64 5.21 5.92 5.28 4.4 5.99
5.85 5.32 6.75 5.49 5.23 6.12 5.3 4.63 6.37
5.99 5.85 6.82 5.79 5.62 6.52 5.86 4.73 7.12
6.1 5.94 6.92 6.2 5.91 6.87 6 6.4 7.27
7.96 6.04 7.38 6.45 6.75 7.02 6.43 6.77 7.35
8.3 6.16 8.2 6.75 7.1 7.27 6.75 7.2 7.97
9.72 6.48 8.37 6.97 9.74 8.13 8.39 8.75 8.88

Appendices __________________________________________________________________________________
335 ______________________________________________________________________
Sample ID Thickness at location (µm) 81-BSYA-6 A B C D E F a b c
900°C 2.71 2.41 3.26 2.49 2.07 3.19 na na na 4000 hours 3.02 3.06 3.38 2.75 2.7 3.21 na na na
3.13 3.26 3.48 2.86 2.71 3.34 na na na 3.25 3.32 3.7 2.95 2.78 3.42 na na na 3.36 3.45 3.88 2.99 2.88 3.58 na na na 3.42 3.49 3.98 3.04 2.94 3.59 na na na 3.44 3.52 4.12 3.45 2.99 3.77 na na na 3.55 3.69 4.13 3.64 3.05 3.8 na na na 3.77 3.74 4.3 3.67 3.52 3.84 na na na 3.88 3.81 5.2 4.01 3.68 4.02 na na na
Sample ID Thickness at location (µm) 81-BSYA-7 A B C D E F a b c
900°C 3.55 4.15 3.34 3.28 3.04 3.18 3.38 4.01 3.71 7000 hours 3.79 4.22 3.39 3.66 3.65 3.19 3.88 4.02 3.81
3.98 4.25 3.64 3.68 4.29 3.59 4.18 4.24 3.84
4.29 4.41 3.66 3.8 4.31 3.95 4.53 4.59 3.93
4.31 4.48 3.89 4.48 4.39 4 4.74 4.71 4.25
4.41 4.98 3.96 4.77 4.49 4.16 4.87 4.92 4.44
4.58 5.07 4.08 4.89 4.5 4.29 4.96 4.93 4.53
4.63 5.14 4.28 5 4.56 4.7 5.18 5.01 5.41
4.9 5.79 4.31 5.09 4.83 5.21 5.68 5.44 5.44
5.39 5.92 4.66 5.63 4.94 5.22 6.08 5.82 6.14
Sample ID Thickness at location (µm) 81-BSYA-8 A B C D E F a b c
900°C 4.18 3.11 4.52 3.09 3.52 3.98 3.49 3.68 4.44 15,000 hours 4.28 3.5 4.56 4.44 3.67 4.3 3.64 4.25 4.66
4.66 4.07 4.73 4.45 4.22 4.63 4.71 4.41 4.75
5.14 4.47 5.22 4.53 4.56 4.65 4.73 4.66 5.02
5.15 4.47 5.43 4.98 4.82 5.34 4.79 4.84 5.23
5.56 4.52 5.5 5.13 4.84 5.75 4.89 4.84 5.35
5.58 4.71 5.92 5.41 5.02 5.79 5.72 5.39 5.38
6.04 5.21 6.48 5.75 5.44 6.28 6.17 5.54 5.57
6.34 6.17 6.76 5.98 5.5 6.7 6.65 5.81 5.61
6.41 6.56 7.48 6.29 6.18 6.71 7.33 7.38 5.95

Appendices __________________________________________________________________________________
336 ______________________________________________________________________
Sample ID Thickness at location (µm) 81-BSYA-9 A B C D E F a b c
950°C 4.14 3.99 3.64 3.98 3.42 3.65 na na na 4000 hours 4.21 4.06 3.81 4.39 4.13 3.76 na na na
4.38 4.13 3.87 4.46 4.26 4.14 na na na
4.64 4.24 3.9 4.54 4.77 4.22 na na na
4.66 4.26 4.06 4.54 4.8 4.34 na na na
4.72 4.31 4.12 4.72 4.83 4.78 na na na
4.93 4.41 4.27 4.81 4.9 4.85 na na na
4.97 4.46 4.5 5.26 4.92 4.87 na na na
5.07 4.71 5 5.37 5.15 5.17 na na na
5.14 4.72 5.17 5.77 5.36 5.76 na na na
Sample ID Thickness at location (µm) 81-BSYA-11 A B C D E F a b c
950°C 4.37 4.12 4.38 4.26 4.78 4.46 na na na 5000 hours 5.41 4.16 4.56 4.29 4.84 4.51 na na na
5.42 4.34 4.67 4.75 4.86 4.7 na na na
5.72 4.74 5.05 5.48 5.01 5.02 na na na
5.84 4.78 5.27 5.99 5.06 5.05 na na na
6.53 5.75 5.28 6.25 5.14 5.17 na na na
6.67 5.91 5.55 6.42 5.26 5.38 na na na
6.72 5.92 5.76 6.44 5.33 5.39 na na na
6.87 6.35 5.79 6.46 5.37 5.76 na na na
6.89 6.65 5.84 6.64 5.81 5.99 na na na
Sample ID Thickness at location (µm) 81-BSYA-12 A B C D E F a b c
950°C 4.02 3.8 3.98 4.23 4.06 3.86 4.65 4.02 4.44 2780 hours 4.42 4.04 4.63 4.27 4.59 3.88 4.69 4.52 4.77
4.69 4.11 4.76 4.91 4.73 4.26 4.69 4.78 4.84
4.88 4.16 4.78 4.92 5.46 4.41 4.89 4.87 4.92
4.95 4.17 4.95 5.09 5.58 4.55 4.99 4.88 5.49
4.97 4.24 5.01 5.09 5.72 4.99 5.31 5.13 5.8
4.98 4.28 5.01 5.45 5.76 5.16 5.47 5.34 5.98
5.06 4.37 5.08 5.56 5.79 5.19 5.71 5.4 6.17
5.51 4.76 5.2 5.76 5.81 5.43 5.8 6.03 6.18
5.8 4.84 5.86 5.97 6.28 5.44 6.43 6.27 7
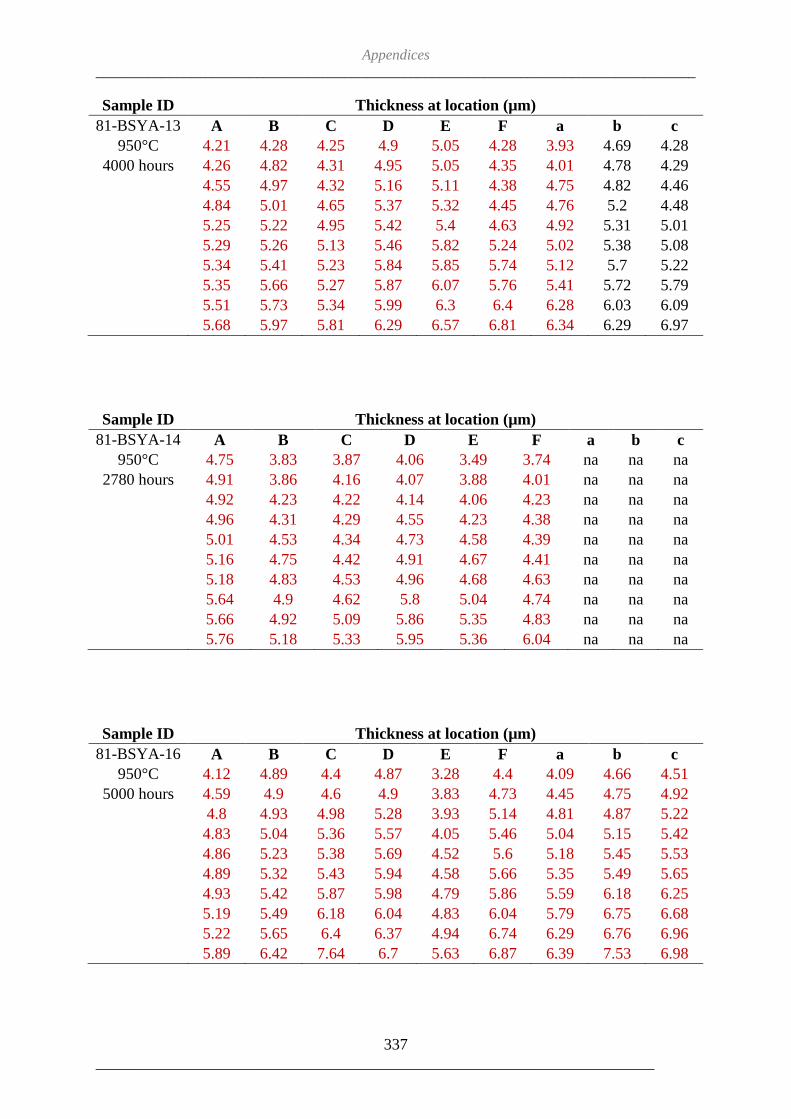
Appendices __________________________________________________________________________________
337 ______________________________________________________________________
Sample ID Thickness at location (µm) 81-BSYA-13 A B C D E F a b c
950°C 4.21 4.28 4.25 4.9 5.05 4.28 3.93 4.69 4.28 4000 hours 4.26 4.82 4.31 4.95 5.05 4.35 4.01 4.78 4.29
4.55 4.97 4.32 5.16 5.11 4.38 4.75 4.82 4.46
4.84 5.01 4.65 5.37 5.32 4.45 4.76 5.2 4.48
5.25 5.22 4.95 5.42 5.4 4.63 4.92 5.31 5.01
5.29 5.26 5.13 5.46 5.82 5.24 5.02 5.38 5.08
5.34 5.41 5.23 5.84 5.85 5.74 5.12 5.7 5.22
5.35 5.66 5.27 5.87 6.07 5.76 5.41 5.72 5.79
5.51 5.73 5.34 5.99 6.3 6.4 6.28 6.03 6.09
5.68 5.97 5.81 6.29 6.57 6.81 6.34 6.29 6.97
Sample ID Thickness at location (µm) 81-BSYA-14 A B C D E F a b c
950°C 4.75 3.83 3.87 4.06 3.49 3.74 na na na 2780 hours 4.91 3.86 4.16 4.07 3.88 4.01 na na na
4.92 4.23 4.22 4.14 4.06 4.23 na na na
4.96 4.31 4.29 4.55 4.23 4.38 na na na
5.01 4.53 4.34 4.73 4.58 4.39 na na na
5.16 4.75 4.42 4.91 4.67 4.41 na na na
5.18 4.83 4.53 4.96 4.68 4.63 na na na
5.64 4.9 4.62 5.8 5.04 4.74 na na na
5.66 4.92 5.09 5.86 5.35 4.83 na na na
5.76 5.18 5.33 5.95 5.36 6.04 na na na
Sample ID Thickness at location (µm) 81-BSYA-16 A B C D E F a b c
950°C 4.12 4.89 4.4 4.87 3.28 4.4 4.09 4.66 4.51 5000 hours 4.59 4.9 4.6 4.9 3.83 4.73 4.45 4.75 4.92
4.8 4.93 4.98 5.28 3.93 5.14 4.81 4.87 5.22
4.83 5.04 5.36 5.57 4.05 5.46 5.04 5.15 5.42
4.86 5.23 5.38 5.69 4.52 5.6 5.18 5.45 5.53
4.89 5.32 5.43 5.94 4.58 5.66 5.35 5.49 5.65
4.93 5.42 5.87 5.98 4.79 5.86 5.59 6.18 6.25
5.19 5.49 6.18 6.04 4.83 6.04 5.79 6.75 6.68
5.22 5.65 6.4 6.37 4.94 6.74 6.29 6.76 6.96
5.89 6.42 7.64 6.7 5.63 6.87 6.39 7.53 6.98
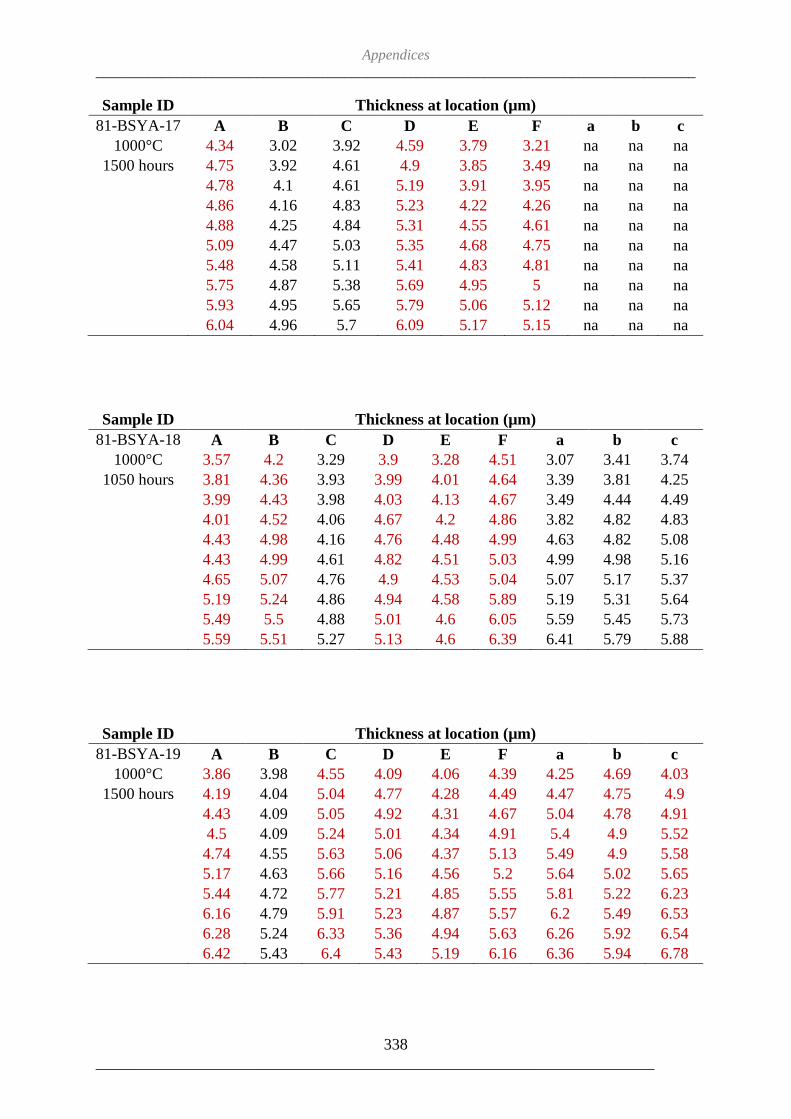
Appendices __________________________________________________________________________________
338 ______________________________________________________________________
Sample ID Thickness at location (µm) 81-BSYA-17 A B C D E F a b c
1000°C 4.34 3.02 3.92 4.59 3.79 3.21 na na na 1500 hours 4.75 3.92 4.61 4.9 3.85 3.49 na na na
4.78 4.1 4.61 5.19 3.91 3.95 na na na
4.86 4.16 4.83 5.23 4.22 4.26 na na na
4.88 4.25 4.84 5.31 4.55 4.61 na na na
5.09 4.47 5.03 5.35 4.68 4.75 na na na
5.48 4.58 5.11 5.41 4.83 4.81 na na na
5.75 4.87 5.38 5.69 4.95 5 na na na
5.93 4.95 5.65 5.79 5.06 5.12 na na na
6.04 4.96 5.7 6.09 5.17 5.15 na na na
Sample ID Thickness at location (µm) 81-BSYA-18 A B C D E F a b c
1000°C 3.57 4.2 3.29 3.9 3.28 4.51 3.07 3.41 3.74 1050 hours 3.81 4.36 3.93 3.99 4.01 4.64 3.39 3.81 4.25
3.99 4.43 3.98 4.03 4.13 4.67 3.49 4.44 4.49
4.01 4.52 4.06 4.67 4.2 4.86 3.82 4.82 4.83
4.43 4.98 4.16 4.76 4.48 4.99 4.63 4.82 5.08
4.43 4.99 4.61 4.82 4.51 5.03 4.99 4.98 5.16
4.65 5.07 4.76 4.9 4.53 5.04 5.07 5.17 5.37
5.19 5.24 4.86 4.94 4.58 5.89 5.19 5.31 5.64
5.49 5.5 4.88 5.01 4.6 6.05 5.59 5.45 5.73
5.59 5.51 5.27 5.13 4.6 6.39 6.41 5.79 5.88
Sample ID Thickness at location (µm) 81-BSYA-19 A B C D E F a b c
1000°C 3.86 3.98 4.55 4.09 4.06 4.39 4.25 4.69 4.03 1500 hours 4.19 4.04 5.04 4.77 4.28 4.49 4.47 4.75 4.9
4.43 4.09 5.05 4.92 4.31 4.67 5.04 4.78 4.91
4.5 4.09 5.24 5.01 4.34 4.91 5.4 4.9 5.52
4.74 4.55 5.63 5.06 4.37 5.13 5.49 4.9 5.58
5.17 4.63 5.66 5.16 4.56 5.2 5.64 5.02 5.65
5.44 4.72 5.77 5.21 4.85 5.55 5.81 5.22 6.23
6.16 4.79 5.91 5.23 4.87 5.57 6.2 5.49 6.53
6.28 5.24 6.33 5.36 4.94 5.63 6.26 5.92 6.54
6.42 5.43 6.4 5.43 5.19 6.16 6.36 5.94 6.78

Appendices __________________________________________________________________________________
339 ______________________________________________________________________
Sample ID Thickness at location (µm) 81-BSYA-20 A B C D E F a b c
1000°C 4.07 3.35 4.05 4.12 3.67 3.91 na na na 1050 hours 4.19 3.51 4.17 4.2 3.71 4.07 na na na
4.53 3.74 4.18 4.23 3.91 4.13 na na na
4.71 3.88 4.24 4.69 4.01 4.23 na na na
4.81 4.39 4.31 4.73 4.12 4.49 na na na
4.94 4.51 4.81 4.81 4.15 4.57 na na na
4.99 4.6 4.83 5.07 4.31 4.75 na na na
5.21 4.67 4.91 5.11 4.42 4.85 na na na
5.66 4.69 5.03 5.18 4.49 4.88 na na na
5.86 4.78 5.17 5.49 5.49 5.07 na na na
Sample ID Thickness at location (µm) 81-BSYA-22 A B C D E F a b c
1000°C 3.58 3.22 3.94 4.03 4.52 3.48 na na na 1050 hours 3.66 3.87 4.42 4.93 4.54 3.93 na na na
3.87 4.2 4.53 5.02 4.62 4.18 na na na
4.17 4.38 4.6 5.07 4.78 4.4 na na na
4.18 4.6 4.69 5.12 4.98 4.89 na na na
4.38 4.72 4.83 5.24 5.04 4.94 na na na
4.75 4.73 4.86 5.29 5.21 4.95 na na na
5.27 4.76 4.9 5.57 5.55 5.25 na na na
5.38 4.91 4.97 5.58 5.61 5.52 na na na
5.71 5.03 5.25 6.98 5.69 5.68 na na na
Sample ID Thickness at location (µm) 81-BSYA-23 A B C D E F a b c
1000°C 5.11 4.44 4.3 4.15 4.75 4.29 na na na 1500 hours 5.13 4.8 4.51 4.93 4.83 5.18 na na na
5.32 4.83 4.71 4.96 4.97 5.38 na na na
5.39 5.74 4.92 5.41 4.99 5.95 na na na
5.77 5.95 5.05 5.6 5.4 6.42 na na na
5.88 5.98 5.08 5.61 5.45 6.44 na na na
5.91 6.28 5.43 5.7 5.59 6.75 na na na
5.92 6.29 5.51 5.81 5.8 6.84 na na na
5.93 6.42 5.77 6.46 5.82 7.42 na na na
6.37 6.9 6.18 6.67 6.1 8.01 na na na

Appendices __________________________________________________________________________________
340 ______________________________________________________________________
Sample ID Thickness at location (µm) 81-BSYA-24 A B C D E F a b c
1000°C 4.14 4.02 3.83 4.04 3.77 3.88 na na na 1050 hours 4.4 4.19 4.15 4.07 3.9 4.13 na na na
4.58 4.3 4.34 4.12 4.04 4.41 na na na
4.84 4.39 4.41 4.18 4.2 4.48 na na na
5.03 4.41 4.43 4.3 4.27 4.59 na na na
5.26 4.58 5 4.31 4.8 4.9 na na na
5.61 4.76 5.09 4.69 4.9 4.93 na na na
5.65 4.9 5.35 5.3 5.14 4.96 na na na
5.67 5.39 5.8 6.08 5.16 5.53 na na na
5.95 5.4 6.53 6.09 5.52 5.62 na na na
Sample ID Thickness at location (µm) 81-BSYA-25 A B C D E F a b c
925°C 3.54 2.64 3.32 3.11 3.28 3.99 2.84 3.56 3.96 10,000 hours 3.81 4.06 3.77 3.77 3.32 4.16 4.1 3.86 4.77
4.14 4.1 3.77 4.06 3.99 4.18 4.64 4.1 5.21
4.47 4.77 3.77 4.28 4.1 4.28 4.71 4.5 5.37
4.71 5.22 3.81 4.37 4.71 4.47 4.87 4.59 5.43
4.84 5.24 4.06 4.64 5.3 4.64 5.23 5.01 5.6
4.95 5.26 4.06 4.65 5.99 4.65 5.4 5.12 5.6
4.97 5.57 4.47 4.71 6.17 4.81 5.58 5.15 5.79
5.95 5.97 4.95 5.15 6.52 4.89 6.23 6.18 6.1
6.42 6.14 5.08 5.26 7.46 6.1 6.58 7.1 6.6
Sample ID Thickness at location (µm) 81-BSYA-26 A B C D E F a b c
925°C 0.71 1.43 0.9 1.93 0.9 1.29 0.9 1.55 0.8 100 hours 1.01 1.47 1.3 2.06 1.66 1.43 1.77 1.77 1.18
1.55 1.51 1.35 2.09 1.8 1.53 1.77 1.95 1.48
1.64 1.58 1.53 2.19 1.82 1.55 1.82 1.98 1.61
1.82 1.69 1.55 2.44 1.91 1.57 1.93 2.14 1.77
1.88 1.84 1.66 2.58 2.14 1.83 2.25 2.17 1.8
2.08 1.89 1.74 2.59 2.32 1.84 2.37 2.68 2.26
2.23 1.89 1.96 2.59 2.6 1.86 2.64 2.74 2.42
2.39 2.03 1.97 2.94 2.89 2.17 2.77 2.75 2.58
2.96 2.38 2.66 3.5 3.12 2.3 3.23 3.13 2.7

Appendices __________________________________________________________________________________
341 ______________________________________________________________________
Sample ID Thickness at location (µm) 81-BSYA-27 A B C D E F a b c
925°C 3.36 3 3.11 2.53 2.89 3.04 3.26 4.05 4.25 4000 hours 3.42 3.24 3.12 3.12 3.18 3.34 3.5 4.35 2.91
3.69 3.34 3.14 3.4 3.7 3.53 4.19 4.71 3.11
4.11 3.35 3.31 3.6 3.73 3.98 4.23 4.84 3.45
4.41 3.38 3.98 3.71 3.77 3.99 4.65 4.84 4.17
4.61 3.65 4.02 4.1 3.77 3.99 4.95 5.02 4.44
4.83 3.86 4.18 4.14 4.36 3.99 4.97 5.08 4.79
4.88 4.46 4.23 5.14 5.47 4.42 5.79 5.21 4.9
5.21 4.91 4.3 5.58 5.53 4.44 6.04 5.22 4.94
5.31 5.43 4.41 5.66 5.96 4.58 6.18 5.92 4.94
Sample ID Thickness at location (µm) 81-BSYA-29 A B C D E F a b c
925°C 2.94 3.34 2.65 2.93 3.7 2.64 3.02 3.73 2.44 2740 hours 3.32 3.47 2.72 3.08 3.81 2.66 3.27 3.86 3.49
3.46 3.56 3.38 3.18 3.91 2.77 3.43 4.06 3.53
3.55 3.6 3.6 3.25 3.95 2.84 3.47 4.19 3.77
3.55 3.8 3.74 3.87 4.01 2.93 3.56 4.21 3.8
3.78 4.07 3.81 3.89 4.04 2.98 3.6 4.28 3.97
3.8 4.44 4.25 3.96 4.1 3.35 3.86 4.29 4.07
3.99 4.56 4.55 4.08 4.22 3.44 3.86 4.52 4.77
4.06 4.68 5.04 4.3 4.55 3.76 4.36 4.87 4.77
5.36 4.92 5.06 4.51 5 4.68 4.49 5 4.98
Sample ID Thickness at location (µm) 81-BSYA-31 A B C D E F a b c
925°C 4.84 4.07 5.55 4.94 3.25 2.84 3.94 3.94 4.51 7000 hours 5.21 4.41 5.83 5.06 4.48 4.11 3.96 4.39 2.72
5.33 4.85 5.79 5.44 4.73 4.72 4.07 4.55 4.43
5.41 4.94 6.04 5.54 4.81 5.48 4.54 4.73 4.53
5.41 5.15 5.35 5.59 5.02 5.64 4.61 4.78 4.59
5.8 5.26 5.49 5.98 5.4 5.69 4.85 4.99 4.72
5.91 5.6 5 6.08 5.41 5.83 5.24 5.25 5.68
6.32 5.62 4.92 6.52 5.41 5.87 5.49 6.05 6.48
6.53 6.01 4.36 7.94 6.39 6.24 5.51 6.07 6.78
7.21 7.73 4.83 8.59 6.95 6.68 6.08 6.78 7.25
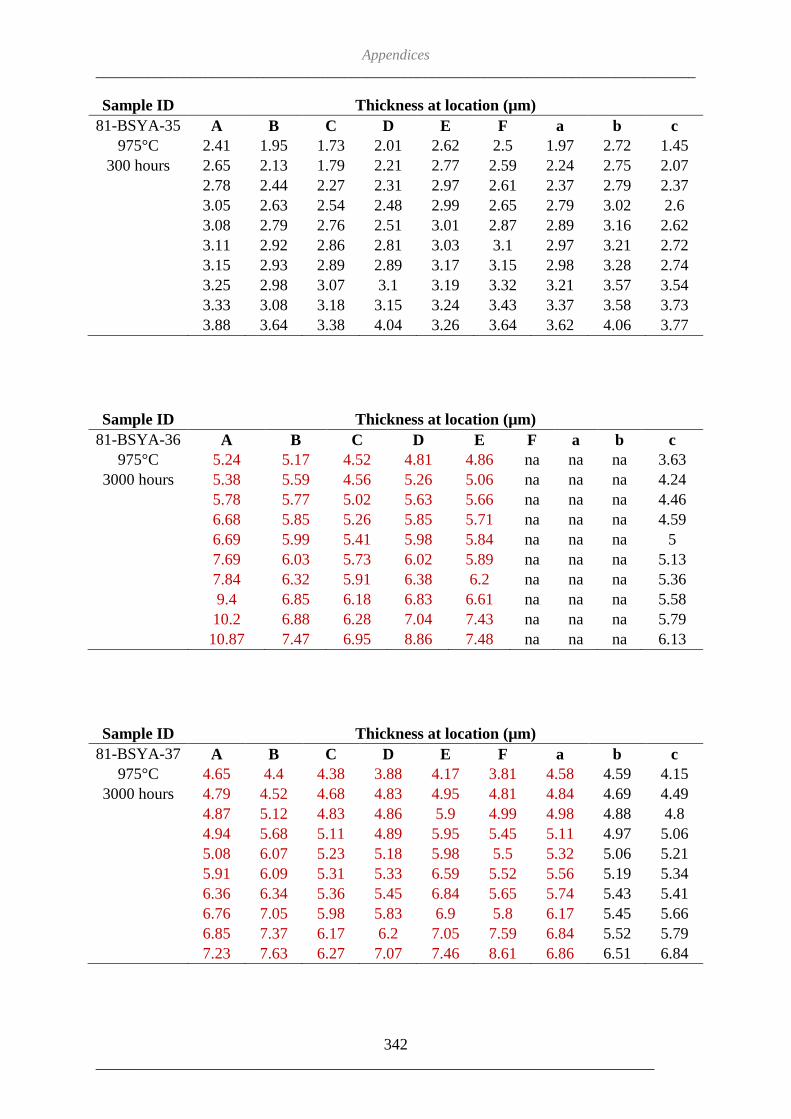
Appendices __________________________________________________________________________________
342 ______________________________________________________________________
Sample ID Thickness at location (µm) 81-BSYA-35 A B C D E F a b c
975°C 2.41 1.95 1.73 2.01 2.62 2.5 1.97 2.72 1.45 300 hours 2.65 2.13 1.79 2.21 2.77 2.59 2.24 2.75 2.07
2.78 2.44 2.27 2.31 2.97 2.61 2.37 2.79 2.37
3.05 2.63 2.54 2.48 2.99 2.65 2.79 3.02 2.6
3.08 2.79 2.76 2.51 3.01 2.87 2.89 3.16 2.62
3.11 2.92 2.86 2.81 3.03 3.1 2.97 3.21 2.72
3.15 2.93 2.89 2.89 3.17 3.15 2.98 3.28 2.74
3.25 2.98 3.07 3.1 3.19 3.32 3.21 3.57 3.54
3.33 3.08 3.18 3.15 3.24 3.43 3.37 3.58 3.73
3.88 3.64 3.38 4.04 3.26 3.64 3.62 4.06 3.77
Sample ID Thickness at location (µm) 81-BSYA-36 A B C D E F a b c
975°C 5.24 5.17 4.52 4.81 4.86 na na na 3.63 3000 hours 5.38 5.59 4.56 5.26 5.06 na na na 4.24
5.78 5.77 5.02 5.63 5.66 na na na 4.46
6.68 5.85 5.26 5.85 5.71 na na na 4.59
6.69 5.99 5.41 5.98 5.84 na na na 5
7.69 6.03 5.73 6.02 5.89 na na na 5.13
7.84 6.32 5.91 6.38 6.2 na na na 5.36
9.4 6.85 6.18 6.83 6.61 na na na 5.58
10.2 6.88 6.28 7.04 7.43 na na na 5.79
10.87 7.47 6.95 8.86 7.48 na na na 6.13
Sample ID Thickness at location (µm) 81-BSYA-37 A B C D E F a b c
975°C 4.65 4.4 4.38 3.88 4.17 3.81 4.58 4.59 4.15 3000 hours 4.79 4.52 4.68 4.83 4.95 4.81 4.84 4.69 4.49
4.87 5.12 4.83 4.86 5.9 4.99 4.98 4.88 4.8
4.94 5.68 5.11 4.89 5.95 5.45 5.11 4.97 5.06
5.08 6.07 5.23 5.18 5.98 5.5 5.32 5.06 5.21
5.91 6.09 5.31 5.33 6.59 5.52 5.56 5.19 5.34
6.36 6.34 5.36 5.45 6.84 5.65 5.74 5.43 5.41
6.76 7.05 5.98 5.83 6.9 5.8 6.17 5.45 5.66
6.85 7.37 6.17 6.2 7.05 7.59 6.84 5.52 5.79
7.23 7.63 6.27 7.07 7.46 8.61 6.86 6.51 6.84
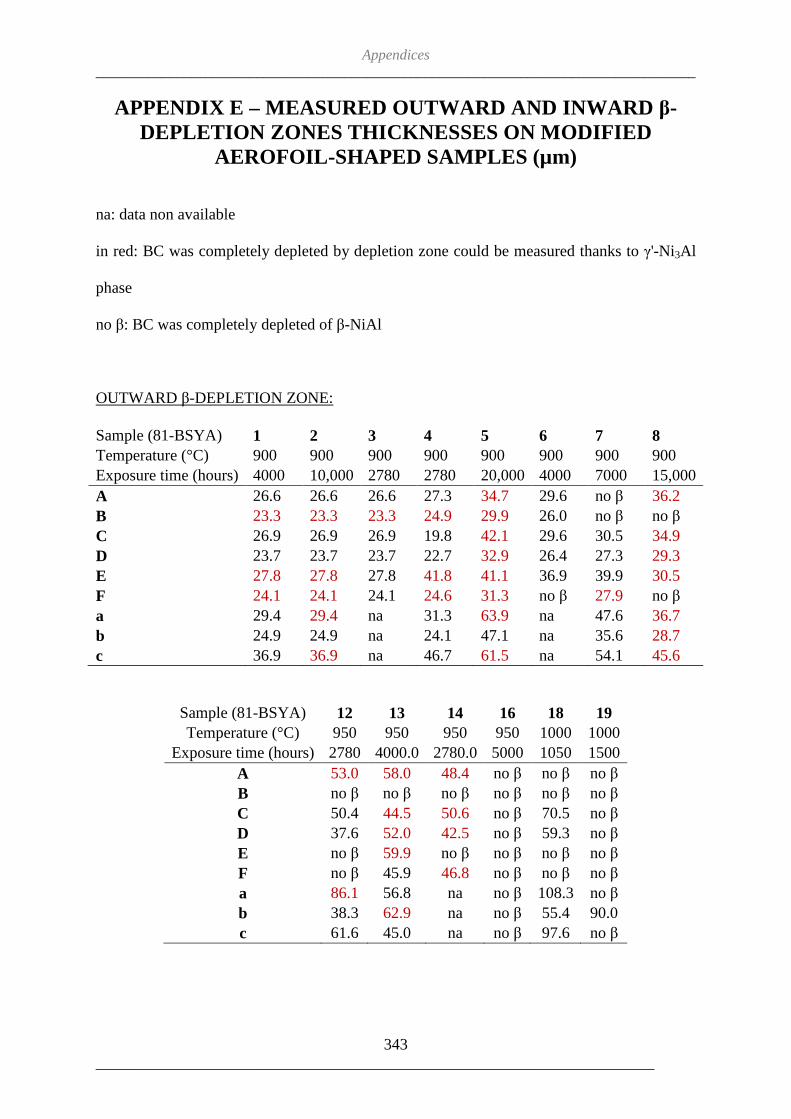
Appendices __________________________________________________________________________________
343 ______________________________________________________________________
APPENDIX E – MEASURED OUTWARD AND INWARD β-DEPLETION ZONES THICKNESSES ON MODIFIED
AEROFOIL-SHAPED SAMPLES (µm)
na: data non available
in red: BC was completely depleted by depletion zone could be measured thanks to γ'-Ni3Al
phase
no β: BC was completely depleted of β-NiAl
OUTWARD β-DEPLETION ZONE:
Sample (81-BSYA) 1 2 3 4 5 6 7 8 Temperature (°C) 900 900 900 900 900 900 900 900 Exposure time (hours) 4000 10,000 2780 2780 20,000 4000 7000 15,000 A 26.6 26.6 26.6 27.3 34.7 29.6 no β 36.2 B 23.3 23.3 23.3 24.9 29.9 26.0 no β no β C 26.9 26.9 26.9 19.8 42.1 29.6 30.5 34.9 D 23.7 23.7 23.7 22.7 32.9 26.4 27.3 29.3 E 27.8 27.8 27.8 41.8 41.1 36.9 39.9 30.5 F 24.1 24.1 24.1 24.6 31.3 no β 27.9 no β a 29.4 29.4 na 31.3 63.9 na 47.6 36.7 b 24.9 24.9 na 24.1 47.1 na 35.6 28.7 c 36.9 36.9 na 46.7 61.5 na 54.1 45.6
Sample (81-BSYA) 12 13 14 16 18 19 Temperature (°C) 950 950 950 950 1000 1000
Exposure time (hours) 2780 4000.0 2780.0 5000 1050 1500 A 53.0 58.0 48.4 no β no β no β B no β no β no β no β no β no β C 50.4 44.5 50.6 no β 70.5 no β D 37.6 52.0 42.5 no β 59.3 no β E no β 59.9 no β no β no β no β F no β 45.9 46.8 no β no β no β a 86.1 56.8 na no β 108.3 no β b 38.3 62.9 na no β 55.4 90.0 c 61.6 45.0 na no β 97.6 no β

Appendices __________________________________________________________________________________
344 ______________________________________________________________________
Sample (81-BSYA) 25 26 27 29 31 35 36 37 Temperature (°C) 925 925 925 925 925 975 975 975
Exposure time (hours) 10,000 100 4000 2740 7000 300 3000 2700 A 45.5 14.2 30.2 30.9 no β 34.3 no β no β B 11.0 no β 23.9 no β no β 42.3 no β no β C 36.6 13.3 34.2 33.9 38.6 28.8 no β 61.5 D 35.1 14.8 30.1 27.7 41.4 35.0 no β 59.1 E 34.4 18.8 30.6 36.2 40.3 29.9 no β no β F 20.9 4.9 29.3 32.5 37.7 46.0 no β no β a 25.6 16.0 32.5 37.7 46.3 25.0 83.4 68.2 b 28.0 14.8 41.8 30.6 55.4 30.0 69.3 75.7 c 11.8 19.2 36.6 40.8 58.0 35.0 no β 78.7
INWARD β-DEPLETION ZONE:
Sample (81-BSYA) 1 2 3 4 5 6 7 8 Temperature (°C) 900 900 900 900 900 900 900 900
Exposure time (hours) 4000 10,000 2780 2780 20,000 4000 7000 15,000 A 21.0 45.0 9.1 14.0 57.4 15.4 no β 42.4 B 27.3 25.4 10.5 12.0 28.8 29.7 no β no β C 19.0 29.8 7.8 11.9 58.1 15.5 43.6 61.9 D 13.2 50.1 16.4 13.9 58.9 18.9 29.4 47.4 E 23.9 38.2 6.4 26.2 16.5 29.9 29.9 38.6 F 17.7 29.9 32.8 19.3 42.5 no β 25.2 no β a 12.8 52.8 na 10.5 65.9 na 12.8 65.0 b 8.1 15.6 na 6.6 38.4 na 18.3 78.2 c 13.1 56.8 na 20.5 47.3 na 14.9 39.0
Sample (81-BSYA) 12 13 14 16 18 19 Temperature (°C) 950 950 950 950 1000 1000
Exposure time (hours) 2780 4000.0 2780.0 5000 1050 1500 A 46.2 28.3 36.5 no β no β no β B no β no β no β no β no β no β C 49.5 54.7 48.8 no β 15.4 no β D 55.4 33.5 56.0 no β 17.5 no β E no β 47.9 no β no β no β no β F no β 26.0 30.0 no β no β no β a 24.7 42.9 na no β 14.9 no β b 30.6 36.4 na no β 18.6 24.8 c 66.2 19.7 na no β 17.5 no β

Appendices __________________________________________________________________________________
345 ______________________________________________________________________
Sample (81-BSYA) 25 26 27 29 31 35 36 37 Temperature (°C) 925 925 925 925 925 975 975 975
Exposure time (hours) 10,000 100 4000 2740 7000 300 3000 2700 A 45.5 3.4 29.2 27.6 no β 0.0 no β no β B 11.0 no β 23.8 no β no β 8.3 no β no β C 36.6 2.5 22.4 15.6 38.6 13.7 no β 43.8 D 35.1 2.6 34.6 15.7 41.4 5.0 no β 35.3 E 34.4 2.6 11.0 32.6 40.3 4.9 no β no β F 20.9 19.3 16.7 30.1 37.7 7.0 no β no β a 25.6 3.0 51.6 17.9 46.3 5.0 28.3 27.2 b 28.0 3.1 27.3 15.2 55.4 5.0 19.4 51.1 c 11.8 4.1 9.9 15.4 58.0 0.0 no β 33.3

Appendices __________________________________________________________________________________
346 ______________________________________________________________________
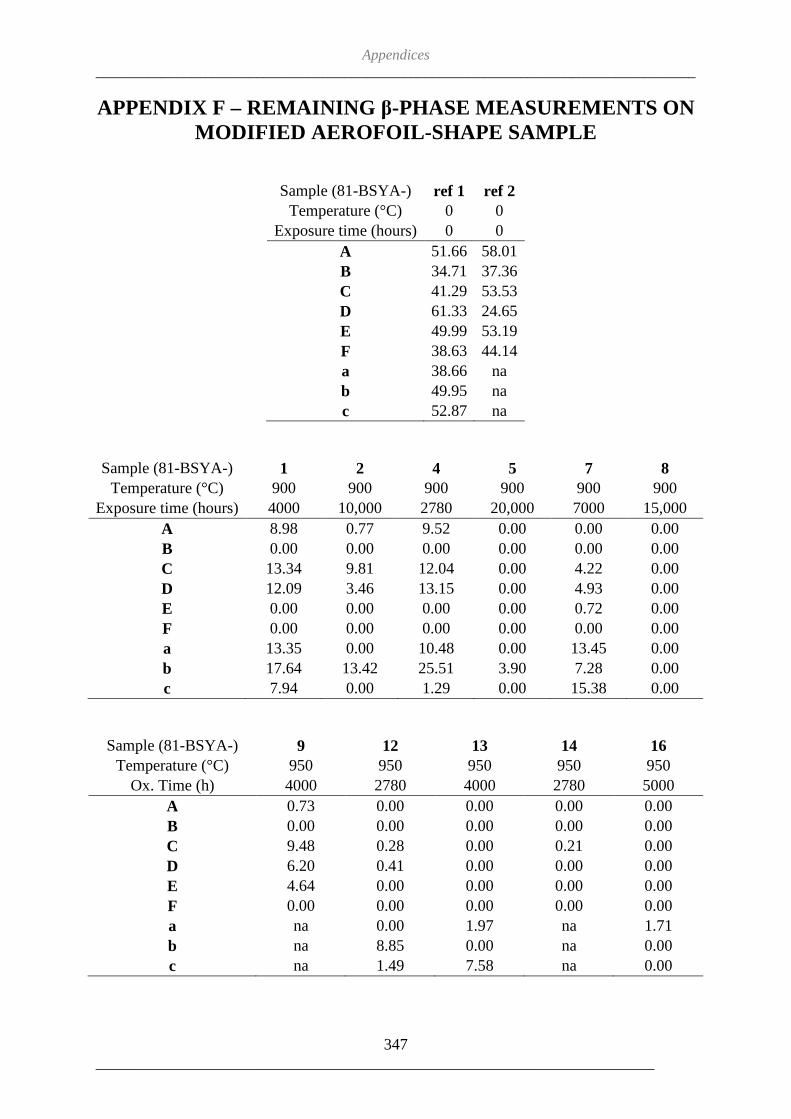
Appendices __________________________________________________________________________________
347 ______________________________________________________________________
APPENDIX F – REMAINING β-PHASE MEASUREMENTS ON MODIFIED AEROFOIL-SHAPE SAMPLE
Sample (81-BSYA-) ref 1 ref 2 Temperature (°C) 0 0
Exposure time (hours) 0 0 A 51.66 58.01 B 34.71 37.36 C 41.29 53.53 D 61.33 24.65 E 49.99 53.19 F 38.63 44.14 a 38.66 na b 49.95 na c 52.87 na
Sample (81-BSYA-) 1 2 4 5 7 8 Temperature (°C) 900 900 900 900 900 900
Exposure time (hours) 4000 10,000 2780 20,000 7000 15,000 A 8.98 0.77 9.52 0.00 0.00 0.00 B 0.00 0.00 0.00 0.00 0.00 0.00 C 13.34 9.81 12.04 0.00 4.22 0.00 D 12.09 3.46 13.15 0.00 4.93 0.00 E 0.00 0.00 0.00 0.00 0.72 0.00 F 0.00 0.00 0.00 0.00 0.00 0.00 a 13.35 0.00 10.48 0.00 13.45 0.00 b 17.64 13.42 25.51 3.90 7.28 0.00 c 7.94 0.00 1.29 0.00 15.38 0.00
Sample (81-BSYA-) 9 12 13 14 16 Temperature (°C) 950 950 950 950 950
Ox. Time (h) 4000 2780 4000 2780 5000 A 0.73 0.00 0.00 0.00 0.00 B 0.00 0.00 0.00 0.00 0.00 C 9.48 0.28 0.00 0.21 0.00 D 6.20 0.41 0.00 0.00 0.00 E 4.64 0.00 0.00 0.00 0.00 F 0.00 0.00 0.00 0.00 0.00 a na 0.00 1.97 na 1.71 b na 8.85 0.00 na 0.00 c na 1.49 7.58 na 0.00

Appendices __________________________________________________________________________________
348 ______________________________________________________________________
Sample (81-BSYA-) 17 18 19 20 22 23 24 Temperature (°C) 1000 1000 1000 1000 1000 1000 1000
Ox. Time (h) 1500 1050 1500 1050 1050 1500 1500 A 0.00 0.00 0.00 0.00 0.00 0.00 0.00 B 0.00 0.00 0.00 0.00 0.00 0.00 0.00 C 0.21 4.33 0.00 2.63 4.00 0.00 0.00 D 0.00 2.54 0.00 1.11 2.65 0.00 0.00 E 0.00 0.00 0.00 0.00 0.00 0.00 0.00 F 0.00 0.00 0.00 0.00 0.00 0.00 0.00 a na 1.19 0.00 na na na na b na 9.93 1.49 na na na na c na 1.51 0.00 na na na na
Sample (81-BSYA-) 25 26 27 29 31 Temperature (°C) 925 925 925 925 925
Ox. Time (h) 10,000 100 4000 2740 7000 A 1.03 33.35 3.72 4.78 0.00 B 0.00 0.00 0.00 0.00 0.00 C 5.55 24.26 6.85 7.10 0.00 D 7.24 22.69 4.73 10.89 0.00 E 2.57 15.68 9.09 3.17 0.00 F 0.00 0.00 0.00 0.00 0.00 a 9.04 18.78 12.00 13.65 7.79 b 9.36 24.21 6.04 11.85 0.00 c 7.62 29.99 5.89 14.26 5.53
Sample (81-BSYA-) 35 36 37 Temperature (°C) 975 975 975
Ox. Time (h) 300 3000 2700 A 8.98 0.00 0.00 B 1.78 0.00 0.00 C 13.96 0.00 0.00
D 9.11 0.00 0.00
E 8.54 0.00 0.00 F 4.16 0.00 0.00 a 0.00 3.17 0.00 b 0.00 6.53 2.24 c 0.00 0.00 0.00

Appendices __________________________________________________________________________________
349 ______________________________________________________________________
APPENDIX G – FRACTION OF SPINELS/MIXED OXIDES IN TGO ON MODIFIED AEROFOIL-SHAPE SAMPLE
Sample (81-BSYA) 1 2 4 5 7 8 Temperature (°C) 900 900 900 900 900 900
Exposure time (hours) 4000 10,000 2780 20,000 7000 15,000 A 0.15 0.10 na 0.02 0.11 0.02 B 0.17 0.38 0.45 0.12 0.27 0.12 C 0.12 0.26 0.19 0.19 0.31 0.13 D 0.18 0.23 0.20 0.27 0.21 0.08 E 0.38 0.44 0.29 0.29 0.24 0.20 F 0.08 0.10 0.27 0.04 0.17 0.23 a 0.20 0.36 0.14 0.28 0.34 0.15 b 0.16 0.25 0.11 0.22 0.28 0.05 c 0.19 0.49 0.38 0.40 0.31 0.26
Sample (81-BSYA) 9 12 13 14 16 Temperature (°C) 950 950 950 950 950
Exposure time (hours) 4000 2780 4000 2780 5000 A 0.06 0.16 0.11 0.15 0.02 B 0.23 0.29 0.25 0.18 0.19 C 0.04 0.48 0.16 0.29 0.21 D 0.02 0.04 0.03 0.09 0.12 E 0.28 0.26 0.19 0.35 0.45 F 0.17 0.06 0.30 0.12 0.18 a na 0.35 0.41 na 0.20 b na 0.26 0.23 na 0.32 c na 0.27 0.32 na 0.28
Sample (81-BSYA) 17 18 19 20 22 23 24 Temperature (°C) 1000 1000 1000 1000 1000 1000 1000
Exposure time (hours) 1500 1050 1500 1050 1050 1500 1500 A 0.02 0.04 0.14 0.02 0.18 0.11 0.03 B 0.09 0.14 0.10 0.13 0.06 0.17 0.11 C 0.25 0.23 0.23 0.09 0.07 0.38 0.29 D 0.26 0.04 0.09 0.14 0.06 0.18 0.02 E 0.40 0.19 0.46 0.43 0.38 0.27 0.35 F 0.26 0.04 0.13 0.37 na 0.22 0.02 a na 0.24 0.27 na na na na b na 0.35 0.34 na na na na c na 0.29 0.39 na na na na

Appendices __________________________________________________________________________________
350 ______________________________________________________________________
Sample (81-BSYA) 25 26 27 29 31 Temperature (°C) 925 925 925 925 925
Exposure time (hours) 10,000 100 4000 2740 7000 A 0.06 0.13 0.03 0.16 0.04 B 0.09 0.17 0.08 0.11 0.18 C 0.20 0.28 0.25 0.19 0.30 D 0.19 0.12 0.17 0.05 0.14 E 0.25 0.14 0.18 0.28 0.40 F 0.21 0.25 0.22 0.22 0.34 a 0.20 0.08 0.25 0.26 0.26 b 0.27 0.04 0.43 0.19 0.21 c 0.30 0.11 0.31 0.37 0.41
Sample (81-BSYA) 35 36 37 Temperature (°C) 975 975 975
Exposure time (hours) 300 3000 2700 A 0.25 0.02 0.07 B 0.04 0.14 0.08 C 0.26 0.16 0.12 D 0.05 0.04 0.14 E 0.23 0.12 0.18 F 0.14 0.16 0.02 a 0.33 0.27 0.20 b 0.23 0.18 0.00 c 0.43 0.40 0.09

Appendices __________________________________________________________________________________
351 ______________________________________________________________________
APPENDIX H – MEASURED SECONDARY REACTION ZONE THICKNESSES ON MODIFIED AEROFOIL-SHAPED
SAMPLES (µm)
na: data non available
Sample (81-BSYA) 1 2 4 5 6 7 8 Temperature (°C) 900 900 900 900 900 900 900 Exposure time (hours) 4000 10,000 2780 20,000 4000 7000 15,000 A 53.2 64.2 50.7 97.5 63.8 67.3 87.7 B 50.8 67.9 43.4 61.9 44.4 44.5 72.5 C 58.1 69.1 50.7 97.5 57.6 57.1 81.4 D 57.1 83.1 46.5 100.3 62.4 36.8 83.1 E 50.7 43.0 42.0 61.6 42.3 62.6 83.6 F 44.7 44.4 34.5 53.5 49.4 65.0 61.1 a 64.4 na 57.0 72.8 na 67.9 61.9 b 47.3 66.8 34.2 67.6 na 48.4 80.7 c 57.3 66.1 47.0 76.3 na 70.9 85.2
Sample (81-BSYA) 9 12 13 14 16 18 19 Temperature (°C) 950 950 950 950 950 1000 1000
Exposure time (hours) 4000 2780 4000.0 2780.0 5000 1050 1500 A 68.7 71.6 82.7 67.7 80.0 54.0 87.3 B 38.4 242.8 51.1 51.7 75.0 52.6 25.7 C 81.5 78.6 84.4 71.6 90.0 51.3 84.8 D 76.1 82.9 78.8 71.6 90.0 62.5 80.0 E 74.1 49.8 76.7 54.6 60.0 34.7 79.4 F 58.6 51.7 84.7 68.9 65.0 43.4 75.6 a na 74.8 77.2 na 75.0 59.6 91.6 b na 77.0 65.8 na 90.0 67.1 79.4 c na 89.3 67.2 na 80.0 49.5 89.7

Appendices __________________________________________________________________________________
352 ______________________________________________________________________
Sample (81-BSYA) 25 26 27 29 31 35 36 37 Temperature (°C) 925 925 925 925 925 975 975 975
Exposure time (hours) 10,000 100 4000 2740 7000 300 3000 2700 A 75.9 34.4 54.4 56.9 85.2 45.2 103.0 98.5 B 47.7 29.2 69.1 45.3 52.4 34.7 46.3 32.4 C 71.5 15.0 68.5 67.5 94.6 43.1 116.5 92.6 D 74.8 31.5 69.2 46.5 101.0 65.0 112.7 78.0 E 50.0 10.1 39.1 49.6 75.1 47.8 80.8 82.2 F 38.2 20.8 55.7 53.2 60.8 50.0 61.4 57.1 a 75.3 11.5 62.5 65.8 74.0 59.3 82.5 80.4 b 77.1 16.0 65.8 63.7 95.1 48.3 89.3 87.0 c 66.2 26.2 83.1 52.9 69.4 48.3 83.7 79.7
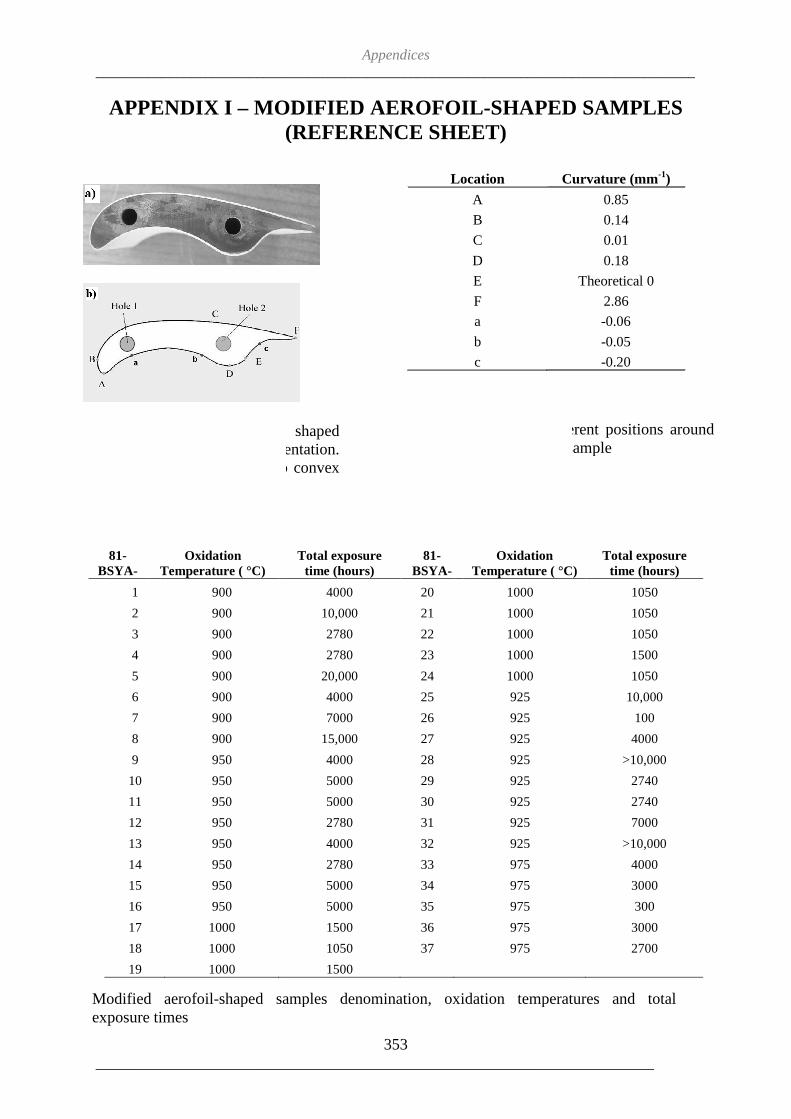
__________________________________________________________________________________
______________________________________________________________________
APPENDIX I – MODIFIED AEROFOIL(REFERENCE SHEE
#
P
81-BSYA-
Oxidation Temperature ( °C)
1 900
2 900
3 900
4 900
5 900
6 900
7 900
8 900
9 950
10 950
11 950
12 950
13 950
14 950
15 950
16 950
17 1000
18 1000
19 1000
Modified aerofoil-shaped samples denomination, oxidation temperatures and total exposure times
Picture of a modified aerofoil shaped sample and its schematic representation. Upper case letters correspond to convex areas, lower case to concave.
Appendices __________________________________________________________________________________
353 ______________________________________________________________________
MODIFIED AEROFOIL -SHAPED SAMPLES (REFERENCE SHEET)
Total exposure time (hours)
81-BSYA-
Oxidation Temperature ( °C)
4000 20 1000
10,000 21 1000
2780 22 1000
2780 23 1000
20,000 24 1000
4000 25 925
7000 26 925
15,000 27 925
4000 28 925
5000 29 925
5000 30 925
2780 31 925
4000 32 925
2780 33 975
5000 34 975
5000 35 975
1500 36 975
1050 37 975
1500
shaped samples denomination, oxidation temperatures and total
Location Curvature (mm
A
B
C
D
E
F
a
b
c
Picture of a modified aerofoil shaped sample and its schematic representation. Upper case letters correspond to convex
Radius and curvature at different positions around the modified aerofoil-shaped sample
__________________________________________________________________________________
______________________________________________________________________
SHAPED SAMPLES
Temperature ( °C) Total exposure time (hours)
1050
1050
1050
1500
1050
10,000
100
4000
>10,000
2740
2740
7000
>10,000
4000
3000
300
3000
2700
shaped samples denomination, oxidation temperatures and total
Curvature (mm -1)
0.85
0.14
0.01
0.18
Theoretical 0
2.86
-0.06
-0.05
-0.20
different positions around shaped sample

Notes __________________________________________________________________________________
354 ______________________________________________________________________