university of london - CORE
410
UNIVERSITY OF LONDON INSTITUTE OF EDUCATION, Thesis submitted for the degree of Doctor of Fhilosopby in Education. "An investigation into the relationship between children's cognitive style and their perception of the environment". Colin Conner 1982
-
Upload
khangminh22 -
Category
Documents
-
view
2 -
download
0
Transcript of university of london - CORE

UNIVERSITY OF LONDON
INSTITUTE OF EDUCATION,
Thesis submitted for the degree of Doctor of Fhilosopby in
Education.
"An investigation into the relationship between children's
cognitive style and their perception of the environment".
Colin Conner
1982

ABSTRACT OF THESIS
This study considers relationships between the cognitive style
identified by Witkin et al (1964) (ie analytic/field independence,
as opposed to global/field dependence) and children's perceptions of
their environment. Arising from a review of the literature, a Nariety
of hypotheses were examined through an empirical investigation with
481 children aged between 10 and 13 and drawn from a rural and an
urban environment.
The results of the study raise questions about the conceptual
inadequacy and empirical validity of the style identified by Witkin
and further whether the tests used to identify the style can explain
performance on map and environmental exercises. The inter correlations
between the three measures of cognitive .style used in the study were
comparatively low (Embedded Figures Test (E2T) with Rod and Frame Test
(RFT) 0.4290 p< 0.01, Pnbedded Figures Test with Articulation of Body
Concept Scale (ABC) 0.4392 p <0.01, RFT with ABC 0.3448 D <0.01) and
the most regularly used measure of this particular cognitive style in
previous research (FT) correlated more highly with intelligence
(0.5982 p <0.01) particularly perceptual reasoning (0.5616 p-<0.01)
and spatial ability (0.7333 p<0.01) than with RFT and ABC. In the
investigation of 25 specific research hypotheses, a more positive
relationship was demonstrated with the result of the Embedded Figures
Test than with those of the RFT and ABC and it is suggested that this
can be explained in terms of general intellectual ability. Sintlarly
performance on the measures of environmental perception and mapping
skill employed in the study appeared to be considerably influenced by
general intelligence and more especially perceptual reasoning. The
strong spatial/intellectual bias of the relationships identified in
the research were confirmed in a principal components and multiple
regression analysis of the results.
In a follow up study of a representative group of extreme analytic/
field independent individuals and extreme global/field dependent
individuals it was possible to identify children who demonstrated
capacitieS as described by Witkin, which were not dependent upon
ability. In general however, intelligence was the major differentia—
ting factor betwee'n the two groups.

Specific findings related to each of the research hypotheses
are discuesed in detail in the text. The main findings of the study
however appear to question the existence of the cognitive style
identified by Witkin and the expectation of an association be tween
cognitive style and environmental perception was not confirmed.

T i.
I should like to offer my grateful thanks to the following
people for all the help they have given in the undertaking of this
study.
To the headmasters/and headmis+ress, the teachers and the
children of the schools involved in the empirical research go my
sincere thanks for their time and invaluable aid.
I would like to offer my thanks to Homerton College for support
during the period of study and also my colleagues who so unselfishly
gave up their time to act as judges on some of the exercises.
I would especially like to thank my tutors at the University
of London institute of Education in this undertaking,
Professor Norman Graves and Dr John Versey for their patience, guidance
and most constructive criticism.
I am also grateful to Mrs G James for typing the study and
finally, I wish to thank my wife for her support during the duration
of the project.
Colin Conner
1982

LIST OF TABLES, MATRICES AND FIGURES (By Chapter)
Ch. 3 Page
Fig. 1 Sensual Sources in the Urban Environment 61
2 The Relationship of Emotion and Behaviour 68
3 Attitudes and the Environment 09
4 Models of Environmental Knowing 70
5 A Composite ModeJ of Man Environment Interactions 73
6 The Behavioural Environment of a Decision maker 82
7 The Study of Environmental Perception 89/90
8 A Typology of Methods of Stimulus presentation 94
9 Methods of Extracting Environmental Cognition 97/98
Information
10 The Criteria for Map Analysis adopted by Klett and 113
Alpaugh (1976) ■
11 A Graphic summary of Hart and Moore's findings and 117
hypotheses about the development of the fundamental
concept of space and macro spatial cognition
12 Developing Stages of Cognitive Map Representation 124
TABLE 3 1 A Tabulated Comparison of 4 Models of Environmental r1
Knowing

I N D X
Page Chapter 1. Introduction 1-2
Chapter 2.
Chapter 3.
Chapter 4.
Chapter 5.
Chapter 6.
A Review of the literature
associated with Cognitive
Styles
A Review of the literature
associated with Environmental
Perception
An Outline of the Empirical
Study
Statement and Discussion of
Results
Summary of Conclusions
3-49
-133
137 -158
159 - 262
263 -273
Bibliography 274 -307
Appendices 1. Tests and Standardised Instructions 308-330
2. Questionnaire and Analysis 331-353
3. Map analysis and criteria used 354--382
4. Follow up Study: Interview schedule383 -391 Standardised Instructions
Examples of Maps
Analysis of results of Stage 1 exercises completed by the Follow up sample .
5. Rear Folder: Matrix of the main elements
of the study.

Ch.4 TABLE 4 1 The Sample 138
4 2 Measures Employed in Stage 1 of the Study 148
4 3 The Follow Up Study Sample 155
Ch. 5 TABLE 5 A The Overall Characteristics of the Sample
160
B Charactercistics by Age 1. Girls 161
2. Boys 162
C Characteristics of the sample by 163
Residential Location
D Characteristics of the Sauple by Reeeidential
164
Location and Sex
E Characteristics of the Sample by k;e/Sox/
Residential Location 1. 10 - 165
2. 11 - 12's 166
3. 12 - 13's 167
Ch.5 TABLE 5 1 Correlations between the measures of cognitive 169
style (Sample, Boys and Girls)
5 2 Correlations between the measures of cognitive 170
style (Residence/Sex)
5 3 Correlations between the measures of cognitive 171
style and intelligence (Samide,Boys and Girls)
5 4 Correlations between the measures of cognitive 172
style and intelligence (Residence/Sex)
5 5 Correlations between the EMbedded Figures Test 174
results and aspects of Intelligence (Sample,
Boys and Girls)
5 6 Correlations between the Embedded Figures Test 174
Results and asp acts of intelligence
(Residence/Sex)

TABLE 5 7 Correlations between Rod and Franc Teat results
and aspects of intelligence (SamplelFoys and Girls)
175
5 3 Correlations between. Rod and Frame Test Results
and aspects of intelligence (Residence and Sex)
175
5 9 Correlations between Articulation of Body Concept 176
Scale and aspects of intelligence (Sample'Boys and
Girls)
5 10 Correlations between Articulation of Body Concept 176
Scale and aspects of intelligence (Residence/Sex)
5 11 Correlations between Draw•-A-Man Test and 177
Lntelligence
5 12 Correlations between the Draw-A-Man Teat and the
measures of cognitive style
178
5 13 Correlation between the measures of cognitive
style and spatial ability (Sample Boys and Girls)
180
5 14 Correlations between the measures of cognitive
style and spatial ability (Residence/Sex)
180
5 15 Correlation between orientation exercises 1 and 2 181
and EVT
5 16 Correlation between orientation exercises 1 and 2
and RFT
181
5 17 Correlation between orientation exercises 1 and 2
and ABC
181
5 18 Correlations between the measures of cognitive
style and orientation exercise 5
183
5 19 Correlations between the mea.AA.res of cognitive 184
style and the Draw-A-Plan Test

MATRICES IETEIM2CaBELATIONS AMONGST ThE OTIER MEASURES 185/186
USED IN THE STUDY
MATRIX 1 Correlations for the Sample as a whole 185
2 Correlations for the Boys of the Sample . 1g5
3 Correlations for the Girls of the Sample 185
4 Correlations for the Urban Boys 186
5 Correlations for the Rural Boys 186
6 Correlations for the Urban Girls 186
7 Correlations for the Rural Girls 186
TABLE 5 20 Correlation between the cognitive map analysis and 192
the measures of cognitive style
5 21 Correlation between the cognitive map analysis 195
and intelligence
5 22 Correlation between the cognitive map analysis 196
and spatial ability
5 23 Correlation between the cognitive map analysis
198
and results of the orientation exercises
5 24 Correlations between the cognitive map analysis 200
and the results of the Draw-A-Plan Test
5 25 Comparison of results of the Klett and Alpaugh
201
analysis (1)
5 26 Comparison of results of the Klett and Alpaugh
201
analysis (2)
5 27 Correlations between Maps 1 and 2 as composite 203
scores and the other measures used in the
study
5 28 Correlations between Naps 1 and 2 204
5 29 Correlations with the results of the 206
Richmond analysis (Rural Group only)

TABLE 5 30 Mean Scores on EFT, RFT aad ABC 207
209 5 31 Correlations with Age
5 32 The Principal Components Analysis 212
5 33 Regression Analysis 216
5 34 Types of Reliability Cocfficient 221
5 35 Reliability Coefficients 222
5 36 Correlation Matrix 223
5 37 (a) Correlation Matrix after attenuation 223
(b) Attenuated Matrix submitted to 224
Multiple Regression
5 38 Correlations between the measures of cognitive style
and composite scores for personality
227
5 39 Correlations between the measures of cognitive
style and individual personality characteristics
229
5 40 Correlations between Intelligence and Personality 230
5 41 Correlations between Composite Map Scores and 230
Personality
5 42 Correlations between the measures of cognitive
style and feature analysis
233
5 43 Correlations between intelligence and
feature analysis
233
5 44 Correlations between Age and feature analysis 234
5 45 Labelling of Maps 235/236
5 46 Comparison of Labelling for Maps 1 and 2 238
5 47 Correlations between degree of labelling and
intelligence
236
5 48 Correlation between labelling on Maps 1 and 2
with EFT
237
5 49 Comparison of Maps 1 and 2 for Lynch type
elements
238

TABLE 5 50 Correlation of Maps 1 and 2 in Lynch's terms with 240
Intelligence and tha Measures of Cognitive Style
THE FOLLOW DP STUDY
TABLE 5 51 The follow up sample. Scores on the measures
242
of cognitive style used to identify the sub groups
5 52 Comparative mean scores for the follow up sample 243
5 53 Follow Up Sample - comparison of results 245
5 54 (a) Follow Up Sample - comparison of map analysis 246
54 (0 Comparative histrogram analysis of the map 248
elements for the Follow Up Study
5 55 An analysis of the number of features included on 248
the area map, the route map and the various sections
of the questionnaire
5 56 Features referred to by sub groups only on the Maps 249
and in their questionnaire responses
5 57 Interests of the Follow Up Sample 252
5 58 School Subject Preferences/Dislikes of the 252
Follow Up Sample
5 59 Solitary/gregarious Activities 253
5 60 Freedom of Movement 253
5 61 Changes Noted and Desired 255
5 62 Number of features Noted 258
5 63 An analysis of the follow up study maps in the 260
terms used for the previous cognitive map analysis
5 64 Estimation of distance 261

CHAPTER ONE -- Introduction
Geographers have regularly demonstrated considerable interest
in keeping pace with current trends in educational thinking and
have derived benefit especially from psychological contributions
to our understanding of children's development. This is demonstrated
particularly in attempts to explain the problems experienced by
children with map skills and interpretation (Satterly 1965) and with
the development of map understanding. (Catling 1978, 1979, Sandford
1972).
More recently, the relationships between the disciplines of
geography and psychology have been reinforced by the emergence of
'Behavioural Geography' (Gold 1980) Environmental Psychology (Craik
1972, Ittelson,Rivlin and Proshansky 1974) and in the plethora of new
books on the 'Psychology of Place' (Canter 1976) and investigations
into individual's perceptions of their environments. (Lynch 1965,
1979, Pocock and Hudson 1978, Moore and Golledge 1976).
This study attempts to investigate the contribution of psychology
to geographical understanding in an additional direction.
Psychology of Education has focussed attention upon the investigation
of individual differences for some considerable time and recently this
has been represented by consideration of 'Cognitive Styles' or
individual preferences for study and learning. (Pask and Scott 1972),
Messick 1976, Kogan 1971, Goldstein and Blackman 1978). One particular
cognitive style which has been extensively researched by Witkin and
his colleagues in the United States is that which distinguishes
between an 'analytic' as opposed to a more 'global' and less specific
approach to the solution of problems. The foundations of Witkin's
research lie in the study of perception and has strong spatial associa
tions. Similarly, when one considers how children might come to
perceive, know and understand their environment, spatial skills must
influence the process considerably. If the cognitive style identified
by Witkin exists, it may help in explaining differences amongst and
between children in the way they come to perceive, know and understand
their environment.
1

The following two chapters present a review of research into
cognitive styles and environmental perception. Then an outline of the
empirical research devised for this study is presented which attempts
to investigate the relationship between cognitive style and children's
perception of their environment. Chapter Five discusses the results
of the empirical research in the light of previous investigations
and this is followed by a summary of the conclusions reached. A
series of Appendices contain examples of the tests and exercises
used in the study, as well as a representative selection of the child-
ren's responses.
2

CHAPTER TWO - A review of the :Literature associated
.with the study of cognitive styles
introduction
This section opens with an analysis of the background and
definition of 'cognitive style' which is then considered in terms
of relationships with other variables of individual differences.
A review of cognitive styles research is then undertaken with
reference to their specific nature and any educational applications
which have been derived for them. The focus of attention is then
directed at a detailed analysis of one particular cognitive style,
that formulated by Witkin and others of an analytic/global conceptua-
lisation. The relationships between Witkids findings are then
discussed in terms of individual's understanding of their environ-
ment; and the section concludes with a review of issues pertinent
to Research into Environmental Perception which arise throughout
the discussion.
(i) Coenitive fly:1.2p - Bac' round and. Definition
Probably no two people approach a given learning situation in
exactly the same way, whether it be studying a research article,
learning to type or understanding a problem in mathematics. Each of
us, as individuals are unique. We each have preferred problem solving
strategies and ways of organising all that we see, remember and think
about. Recent years have seen a revival of interest amongStpsycholo-
gists and others in individual differences in problem solving.
This interest is no new phenomenon Tyler (1965) notes that
differences between individuals was recognised as of importance in
understanding development at the turn of this century. The lack of
immediate practical application, coupled with the rise of Gestalt
Psychology and its search for universal laws of perception led to
a decline in interest in individual differences.
A return to individual differences as the focus of studies in
psychology has been commented upon by various authors. Mahoney
(1977) for example noted that one common characteristic is the
attention paid in recent research to the cognitive leanlig psrspeotive
3

and that individuals respond to their own cognitive construction of
the environment rather than to objective reality. In other words
we each have our own unique individual interpretation of the world
and it is to this that we respond and refer in our everyday environ-
mental encounters. In his overview of the status of Psychology,
McKeachie (1976) indicated a return amongst psychologists to an
interest in the 'psyche', mental processes and cognition. Similarly,
in a recent lecture by Nisbet (1979) reviewing the status of Edu-
cational Psychology, he saw the future of psychological study as
centred essentially within the cognitive-learning framework and its
association with individual differences and applications which might
be derived for educational practice.
One manifestation of this increased interest in cognition and
its association with individual differences is the attention which
has been paid to the idea of 'Cognitive Styles'. This interest is
demonstrated in Brody's (1972) review of the common characteristics
of research in to the cognitive approaches to personality over the
last twenty years. He isolated four main features:
(1) There is an emphasis on individual differences in styles of
thinking as a starting point.
(2) The emphasis is on style to the neglect of content.
(3) The assumption is that styles of thinking are related to other
personality characterises of an individual.
(4) The treatment of preferred ways of thinking, acting or feeling
as individual traits. (The characteristics are independent of
situational influences, and the emphasis is on the consistency
of style).
Cognitive styles have been defined in a variety of ways.
Kogan (1971) for example describes them as,
"Individual variations in modes of perceiving, remembering and
thinking or as distinctive ways of apprehending, storing,
transforming and utilising knowledge"
Goodenough (1976) refers to cognitive styles as,
"Dimensions of individual difference involving the form of
cognitive functioning, with expression in a wide array of
content areas including perceptual,intellectual, social-inter-
personal and personality defence processes".
4

Messick (1976) regards cognitive style's as,
"consistent individual differences in the ways of organising
and processing information and experience."
One group of investigators, the Witkin group, defines cognitive
style in the following way,
"... manifestations in the cognitive sphere of still broader
dimensions of personal functioning which cut across diverse
psychological areas ... and represent different ways of cutting
the personality 'pie' from those traditionally used" (Witkin
1977 et al)
Others have defined cognitive styles as,
"... the characteristic ways in which individuals conceptually
organise the environment." (Goldstein and Blackman 1978 p 2)
t; ... the way anindividualfilters and Processes stimuli so that
the environment takes on psychological meaning." (Harvey 1961)
17 a term that refers to stable individual preferences in
mode of perceptual organisation and conceptual categorisation
of the external environment." (Kcgm et al 1963 p 74)
Each of these definitions specifies fundamental aspects of the
way in which individuals experience, interact with, and lea:Ls from
their environment. Common to all of them is an emphasis of - stability
of style and a concern for the structure of thought processes as
opposed to the content of thought. Cognitive styles seem to be
concerned with how cognition is organised rather than with what
knowledge an individual has acquired. They, might be conceptualised
therefore as,
stable attitudes, preferences or habitual strategies
determining a person's typical modes of perceiving, thinking
and problem solving." (Messick 1976)
There is an important distinction which needs to be made between
cognitive styles and cognitive strategies. Cognitive styles as
represented in the various interpretations described previously,
refer to high level heuristics, which organise and control an
individual's behaviour in the majority of situations that, he finds
himself in. Strategies on the other hand are seen as decision making

regularities in information processing which result as a function of
the conditions of a particular situation. This distinction is
clearly made by Messick (1976) and Goodenough (1976) and is demon-
strated in the work of Pask and Scott (1972) where they distinguish
between 'learning styles', which are relatively stable personal
preferences or characteristic ways of learning; and 'learning strate-
gies' which are seen as the immediate response to the requirements
of a particular task. Pask (1976) recognises that an individual's
response to a task will depend on both his cognitive (or learning)
preference and on the perceived characteristics of the task.
Messick (1976 p 6) sums up the differences between cognitive styles
and cognitive strategies when he says,
"Cognitive strategies are selected, organised and controlled
in part as a function of larger-scale, more general cognitive
styles and ability patterns, but they are also determined in
part as a function of task requirements, problem content and
situational constraints; hence in comparison to styles,
strategies are likely to be more amenable to change through
training under varied conditions of learning. It may thus be
possible for individuals to learn to use optimal problem solving
and learning strategies consonant with their cognitive styles
and even to learn to shift to less congenial strategies that
are more effective for a particular task than are their preferred
ones."
(ii) Cognitive Styles and relationships with other variables of
individual difference
In that cognitive styles are seen to encompass diverse aspects
of an individual's behaviour, it is not surprising that advocates
of the existence of such styles recognise strong relationships
between an individual's cognitive style and his personality. As
such,cognitive styles are thought to be intimately associated with
affective, temperamental and motivational features of the whole
personality. In this view, a core personality represents itself
in the various domains of psychological functioning, both intellec-
tual and affective. (Witkin et al 1971)
6

In a review of the concept of cognitive style, it would seem
important to examine the distinction between cognitive style and
general intellectual abilities. The concept of ability implies the
measurement of capacities in terms of maximum performance, with an
emphasis on level of achievement. The concept of cognitive style
implies the measurement of characteristic modes of operation in
terms of typical performance and the emphasis is on process.
Similarly, abilities are concerned with the level of skill, the
more or less of a performance, whereas cognitive style considers the
manner or form of cognition, the preferred way of doing something.
Cognitive styles are certainly not habits in the technical sense of
learning theory, for they are not directly responsive to the princi-
ples of acquisition and extinction. They are seen to develop
slowly and experientially and are not easily modified by specific
training or tuition.. (Kogan 1971). It is also the case that
abilities are unipolar,' whereas cognitive styles are bipolar.
Abilities therefore, vary from zero, or very little, to a great
deal, with an increased score implying more and more of the same
facility. High spatial ability for example predisposes a person to
achieve in certain areas but its absence only implies that' in those.
areas associated with spatial ability might an individual experience
difficulty. Cognitive styles are described in the form of a continuum
which ranges from one extreme to another extreme, with each end of the
continuum having different implications for cognitive functioning.
Cognitive styles are therefore a more advantageous way of categorising
people in that each of the extremes have differentiated values, whereas
abilities are seen as being possessed or not. Each end of a cogni-.
tive style continuum is seen as possessing both positive and negative
features and because of this, Witkin (1976) believes that cognitive
style becomffia less threatening concept to people than are abilities
or intelligence. Information about an individual's cognitive style
is therefore more easily communicated to him. There are disadvan-
tages to conceptualising styles in this way however, since the various
extremes axe often described as if they were stereotypes, when in
reality individuals are distributed continuously between the extremes
with considerable variations. A further problem is isolated by
7

Vernon (1972) and Satterly (1976) who point oat that one end of a
cognitive style continuum can quickly assume superiority over its
opposite and is then viewed by recipients in the same way as measures
of intelligence.
A measurement of ability also differs from a cognitive style in
terms of the range of competence with which it is associated. An
ability usually delineates a fairly discrete area of human behaviour
and is specific to a particular domain of content or function.
Cognitive styles, in contrast, cut across domains and as described
earlier are conceptualised as high level heuristics that organise
lower level strategies, operations and propensities, including
abilities.
There is also an important historical distinction which can be
made between ability and cognitive style, in that they differ in
the methods by which they are ordinarily measured. Abilities are
rooted in mental test theory and dating from the beginning of this
century have a close association with Education. Psychologists
associated with the identification and measurement of abilities have
tended to develop pencil and paper measuring instruments for use in
school settings, either with individuals or groups. One consequence
of this is that ability measures tend to emphasise accuracy of res-
ponse and level of achievement. Cognitive styles, in contrast, have
their roots in the study of perception and personality mainly derived
from laboratory and clinical studies and employing individually
administered measuring devices (for example, Rorschach or word
association procedures). One natural consequence which has already
become apparent in the discussion, is that cognitive style measures,
at least at the level of interpretation, emphasise process of res-
ponding. These differences in measurement are not intrinsic to the
variables measured however and a considerable range of pencil and
paper tests of cognitive style have been developed which are suitable
both for individual and group adsomistration. (Messick and Fritzky
1963, Messick_and Kogan 1966, Oltman, Raskin and Karp 1971).
8

(iii) A review of 0 mitive St2ltp Research their nature and
Educationallalications
In an attempt to review cognitive style research up until 1975,
Messick distinguishes current studies in terms of nine categories.
The first four derive from the wcrk on cognitive controls by Gardner
and Klein (Gardner, Holzman, Klein, Linton and Spence, 1959) and
are those of scanning, levelling-sharpening, constricted as opposed
to flexible control and tolerance for incongruous or unrealistic
experience. A fifth approach was originated by Witkin and his
colleagues (Witkin, Lewis, Hertzman, Machover, Meissner and Wapner
1954) who use the categories of field dependence - field independence. Workers in the area of cognitive controls also investigated this
variable, terming it 'field articulation'. Messick's sixth category
of 'cognitive complexity' included the work of Kelly (1955) Bieri,
Atkins, Briar, Leaman, Miller and Tripodi (1966) and Harvey, Hunt
and Schroder (1961). The final three categories in this list were reflection - impulsivity (Kagan, Rosman, Day, Albert and Phillips
1964) Pettigrew's (1958) styles of categorisation and Kagan, Moss and Sigel's (1963) styles of conceptualisation, Recently Messick (1976) has modified these nine categories and added new ones to produce a list of 19 American approaches to the study of cognitive -
style which reflects both increasing research interest in cognitive
styles as well as Messick's continuing attempt to organise and
integrate a wide variety of research efforts. To the list produced
by Messick, could be added Pask and Scott's (1972) styles of Holists and Serialists and Satterly's (1970) Analytic-Synthetic categorisa7 tion.
Kogan (1973, 1976) distinguishes between three types of cogni-tive style. The first type refer to an ability to perform, with
performance judged against a standard. He cites Witkin's category
of field dependence - independence as an example. In type II
Cognitive Styles, greater value is placed on one of the stylistic
categories by the investigator. For example, Kelly (1955) and Bieri et al (1966) view the cognitively complex person as having an advan-tage over the cognitively simple person in processing information
9

about his environment. This particular category appears to contradict
the point made earlier about the *continuum nature and value free
status of cognitive style categories. The third type of cognitive
style described by Kogan does not relate to ability. Further, the
investigator does not attribute superiority in performance to an
individual at any particular pole or in any particular situation.
Kogan (1976) cited Pettigrew's (1958) investigation into 'category
width' as an example of this type of style, as are Bruner's (1956)
focussing and scanning strategies of concept attainment. Perera's
(1974) review of cognitive style adopts a similar interpretation to
that, of Kogan. Working under the guidance of Satterly at Bristol,
Perera distinguished between cognitive styli as ability and cognitive
style as preferences. The former are identified where subjects are
set to determine a single correct response (for example in Witkin et
al's (1971) Embedded figures test) and the latter where situations
are presented which are potentially capable of a number of equally
valid solutions (as in Satterly and Brimer's (1971) style of thinking
test).
As can be seen, numerous approaches have been made to the study
of cognitive-style, often from diverse theoretical standpoints and
employing various research techniques. This variation of approach
has resulted in obvious problems of definition. Such conceptual
distinctions as arise are, more often than not, a matter of the
differences in theoretical orientation than in the phenomena isolated.
Yet the conceptual differences are important, for the psychological
processes underlying individual variation in cognitive functioning
will be relevant to the way individual differences are articulated
and the suggestions for application and further experiment. It would
seem therefore essential to consider various styles within the frame-
work of their heritage before appropriate comparisons might be derived.
The problems associated with comparison across cognitive style research
is demonstrated in a recent study by Goldstein and Blackman (1978)
in which they question some of the basic assumptions of cognitive
styles. Despite the elements of common interest in the study of
cognitive style, the variations in approach and the use of varying
measuring instruments, has produced a body of literature from which
10

it is difficult to extract general principles. Kagan and Honker
pointed out the need for systematisation at the levels of theory and
research in 1966. The Goldstein and Blackman study (1978) attempted
to invesbigate the inter-relationships which exist between five
established and well researched cognitive styles and found that each
of them do relate to identifiable behaviour of one sort or another.
They concluded by emphasising the need for more specific, yet generally
applicable measuring instruments, as well as research directed towards
the ex=amination of the interactions between the various cognitive
styles and the relationship between cognitive styles and environ-
mental experience.
The discussion so fax has considered cognitive styles in general
terms and there are apparent inconsistencies between the claims made
for cognitive styles and the criticisms which have been suggested
about these claims. Despite these comments, it is the case that
some argue strongly about the potential educational applications
which might be derived from cognitive styles research. (Lritkin at al
1977, Kogan 1971, Doebler and Eicke 1979). For the teacher, the
diversity of individual differences is an everyday fact of life.
There are obvious differences which distinguish pupils, such as age,
sex, race, ethnic background and social class. Pupils also differ
in abilities (general and specific), their motivation to achieve, their
interests, attitudes, values and personality characteristics. Teachers
are accustomed to describing children in terms of all of these factors.
Unlike ability, personality and value constructs, all of which have
been intimately linked to Education for many years, the concept of
cognitive styles has penetrated the scene to only a minor extent.
Yet, much that has been discussed so far has an immediate attraction
in the educational context. A measurable feature of individual
difference, which is stable and consistent over time and which is
thought to cut across levels of intelligence would be a valuable
addition to the teachers' armoury. A further important feature of
cognitive styles, the relationship to- process rather than content,
would also seem to be closely associated with current emphases in
modern educational thinking. Information derived from cognitive
styles research would therefore appear to offer important potential
11

applications to education, some of which might call for radical re-
thinking and restructuring of educational experiences. For example,
does the way in which a child or student is taught suit his cog-
nitive style, his preferred way of.learning? If not, is this an
important factor in his failure to grasp or understand certain
situations or experiences? Is there anything that can be done to
match teachers and learners cognitive styles and more importantly,
ought we to do this? There are obviously a whole range of important
educational questions here and Witkin (1965) claims that whilst
educational decisions have traditionally been taken in relation to
a child's age, intelligence and interests,
... knowledge of a child's cognitive style is potentially
capable of suggesting effective ways by which he may best be
taught."
As one might expect however, in the light of earlier comments
of the poor inter-correlations between cognitive styles research
and the resulting lack of generalisability, suggestions such as those
made by Witkin are treated skeptically by some. Satterly's (1976)
response to Witkin's assertion is that,
"Although research into stable and consistent individual differ-
ences in cognition has been extensive over the last twenty
years there are few, if any, convincing data to demonstrate
the relevance cf cognitive styles to school learning and
achievement.'! (page 36)
(iv) The field dependence field inde endence conce tualisation
The above comments and previous questions about potential edu-
cational applications will be considered in relation to one parti-
cular cognitive style. Amongst the styles identified to date, the
most widely known, and most extensively researched, is the Field
dependence/Field independence dimension identified by Witkin and
his colleagues in the United States. For something over twenty
five years now, the Witkin group have been the source of and stimulus
for a considerable body of research into this dimension. A biblio-
graphy dated up until 1976 lists something over 2,500 pieces of
research associated with this cognitive style.
12

Witkin's earliest work was concerned with how people locate
the upright in space (Witkin 1949, 1950, 1952; Witkin and Asch 1948).
Most individuals.might be expected to be clear about which way is
up, on the basis of information received from the visual environment
as well as reference to bodily sensation and to adjustment to
gravity in maintaining upright posture and balance. In Witkin's
initial experiments in this field, the complex visual world was
eliminated and replaced by a simpler and more manipulable visual
world, in which it was possible to separate visual and bodily standards.
(1) Measuring Instruments
The Body Adjustment Test (BAT) was the first test designed to do this. The test consists of a tilting chair within a tilting room.
The seated subject is required to adjust the chair to the vertical
and the subject's score is represented by the deviation of the
chair's adjusted position from the true upright. The room is tilted
by the experimenter whilst the subject is blindfolded and the subject
is also moved such that the chair's position, the dimensions of the
tilted room and the outside environment are all in contradiction.
The aim of the experiment is to differentiate between the subjects'
reliance on visual impression or bodily sensation. Some subjects
choose to align themselves almost completely with the wallS of the •
room in front of them and are entirely influenced by the tilted
walls. All other bodily sensation seems to be overridden by the
contradictory visual information. Such subjects were described by
Witkin as 'field dependent'. Other subjects manage to achieve a
good approximation of the true upright and are able to ignore the
dominant visual impression. These subjects were termed 'field
independent' by Witkin. It is important to remember that these
categorieS represent the extremes of performance on the BAT and that
other subjects place themselves somewhere between these two extremes,
emphasising this distinction in behaviour as a continuum, one of the
characteristic features of cognitive style descriptions of behaviour.
The BAT consists of six trials. In half of these the room and chair
are tilted in the same direction and in the other half they are tilted
in opposite directions. _An alternative procedure which required
subjects to adjust the room rather than their bodies to the true
upright has also been developed. Scores derived from this test,
13

the room adjustment test, showed little relation to other tests of
the field dependent/independence conceptualisation and was sub-
sequently dropped from Witkin's studies.
A second test to investigate the style of field dependence/
independence is conducted in a completely darkened room. The
apparatus consists of a square frame and rod which pivot at the
same centre, both of which have been coated with luminous paint.
This is all the subject can see, Rod and Frame can be tilted clock-
wise or anticlockwise, together or separately. In a typical trial,
the subject on having his blindfold removed, finds the rod and frame
in tilted positions. He is asked to adjust the rod to the upright
whilst the frame remains in its tilted position. As with the BAT
some subjects align the rod with the tilted frame whilst others
approximate it to the true vertical. Handel (1972) cites a number
of studies which use variations of the original Rod and Frame Test
(EFT) all of which correlate well with performance on the original
instrument. One of the most widely used modifications of this test
is Oltman's portable apparatus. In a standardisation study with
163 college students, Oltman (1966) reported a correlation of 0.89
between performance on the standard RFT and his portable apparatus.
A further test of this particular style has subsequently been
developed. The Embedded Figures test is a pencil and paper test
which, since it does not require elaborate equipment, features in
most research associated with Field dependence/independence. The
test itself is an adaptation of that originally developed by Gottschaldt
(1926) and requires the subject to identify a simple figure which is
embedded within a more complex geometric pattern. The mean time
taken to locate all 24 figures in the test is the subject's score.
A version of this test is available for administration to groups
(GEFT). This version Witkin et al (1971) suggests requires additional
validity studies which is consistent with the findings of Renna and
Zenhausen (1976). In this study a sample of 337 undergraduates were found to be more field dependent than- expected on the basis of the
norms suggested in the handbook for administration (Witkin et al
1971).
14

The original version of the EFT is thoaght suitable for children
aged ten years and above. A children's version was developed by
Goodenough and Eagle (1963) the Clado. They administered this test,
the RFT, BAT and EFT to a group of thirty ten year old boys and
achieved statistically significant correlations of 0.70, 0.46
and 0.63 respectively. This test has subsequently been modified
by Kemp and Konstadt (1971) and is now known as tie Children's
EMbedded figures test (CEFT). This test is regarded as suitable
for children aged from five years old and instead of the geometric
designs used in the standard Embedded figures test employs meaning-
ful complex figures (eg a man, a car, a dog - each of which resembles
a large jig-saw).
(2) Test reliability
Witkin et al (1962) reported the results of their own research
and that of others on the reliability of the RFT, BAT and EFT. In
all studies reported, the reliabilities were high, clustering between
0.80 and 0.90 when tested with a one week interval. Test-retest
reliabilities over a longer period are lower, yet still satisfactory
(Goldstein and Blackman 1978).
Some question has been raised about the reliability of the RFT
(Sigman, Goodenough, Flannagan 1979). Small (1973) summarises the
research related to these complaints and suggests that performance
can be improved with practice. Goodenough and Witkin (1977) also
noted that EthT and RFT performance shows greater field independence
with practice and training, which suggests that research should be
undertaken with naive subjects to avoid any bias in subjects scores.
It also raises an important question of the stability of this
cognitive style. This point will be discussed later when develop-
ment of field independence is considered.
(3) Test Intercorrelations
It has already been indicated that scores on various versions
of the RFT are highly correlated, (Handel 1972), and it would seem
essential to discuss the evidence related to intercorrelations between
the various tests. In a study with 150 male undergraduates, Karp
(1963) administered the BAT, EFT and. RFT with a variety of other
measures. A factor analysis of the inter-correlations revealed a
15

common loading for the three tests of field independence. Karp
concluded that they were measuring th3 same ability, to separate
figure from context, the ability to overcome embeddness.
In a further long itudual study of developmental differences in
field dependence, Witkin, Goodenough and Karp (1967) found statisti-
cally significant correlations between the EFT, RFT and BAT at
various ages (8, 10, 11, 12, 13, 15, 17 and 20 years). Goldstein
and Blackman (1978) reviewed 16 reports representative of the re-
search on the relationships between versions of the RFT and EFT and
concluded that almost all correlations were siEnificant and were
generally in the range 0.30 - 0.65.
An immediate question arising from the discussion so far,
centres on the psychological basis for coherence amongst the measures
of field dependence. Witkin et al (1962) rules out such explanation
as perceptual accuracy or bodily sensitivity. Performance on the
BAT with eyes closed is not significantly related to performance
with eyes open and such a finding cannot be explained by bodily
sensitivity alone. (Kogan 1971). The currently accepted inter-
pretation is that each of these criterial measures entails the over-
coming of an 'embedding context'. The body, the rod and the geometric
design represent the elements in the BAT, RFT and EFT respectively
which must be separated from the embedding field. Further evidence
for the 'embeddedness' interpretation is offered by Karp (1963)
in the study previously referred to, he found that Witkin's criterial
measures generated a factor different from that yielded by a series
of tasks with distracting as opposed to embedding contexts.
(4) 13.2ILUalishiswithAeayRaLga
In 1954 Witkin and his colleagues presented data on the relation-
ship between field dependence and age. In this research a parti-
cularly interesting finding which emerged was that field indepen-
dence was seen to increase sharply during the middle years from
10-13. As a result one might have expected research to consider
why this might be so and more especially that a considerable volume
of research in to this style to have been investigated with this age
group, where the greatest changes were taking place. In fact, the
great majority of research has been undertaken with adults and more
18

especially college students.
From 13 - 17 years of age there was only a slight further in-
crease in field independence and there was no significant difference
in field dependence between 17 year olds and an adult group with a
mean age of 24 years.
Correlational data on two longitudual groups, one tested at 8
and 13 and the other at ages 10, 14, 17 and 24 indicate high levels
of stability of cognitive style. (Witkin, Goodenough and Karp 1967).
This data emphasised the stability of relative position on the
continuum. Both cross sectional and longitud studies have shown
a progressive increase in field independence up to the age of 17 in
males. and 15 in females, with no additional increase between 17 and
24. "The stability of field independence therefore appears to be
inter-individual rather than intra-individual. Individuals
maintain their position relative to others but at the same time
progressively increase in field independence through mid to
late adolescence." (Kogan 1971)
Canavan (1969) reported on a developmental study of field in-
dependence involving 1,510 children aged 6 to 12. Field indepen-
dence was measured with a modified RFT in which the rod was replace&
by a silhouette of a man. An analysis of variance indicated age,
sex and ethnic group differences. White subjects were found to be
more field independent than Mexican-American children, who in turn
were in general more field independent than black children. The
same results occured even when the effect of IQ measured by a full.
scale WISC was eliminated by analysis of covariance.
There has also been interest within the research into this
style in the levels of field independence demonstrated by older
people. Studies reveal a decrease in field independence with age,
and indicate that advanced age and infirmity are associated with
field dependence. (Schwartz and Karp 1967). Although in another
study (Karp 1967) of a group of elderly males who were still employed
and compared with a similar group of unemployed elderly males, per-
formance of the employed males were significantly more field in-
dependent than those who were unemployed.
17

In their earlier studies (Witkin, Lewis, Hertzman, Machover,
Meissner and Wapner 1954) small but persistent sex differences in
field dependence/independence were identified. Beginning in adoles-
cence, women tend on average to be more field dependent than males. Since this early report, it has often been maintained that females
are more field dependent. This is in fact a misrepresentation, as
emphasised by Witkin et al (1977)
it should be stressed, however, that the difference in
the means between the sexes is quite small compared to the range
of scores within each sex; in other words, the distribution
for the two sexes shows considerable overlap" (witkin et al
1977 P 7) Goldstein and Blackman (1978) cite a number of studies in which
there were no statistically significant differences between scores
of males and females, for both children and college students. In
fact one study with children (Coates 1974) and one with undergraduates
(Constantinople 1974) found females to be more field independent.
(5) Relationships with 22.2.
A number of studies have identified a positive relationship
between field independence and intelligence (Woerner and Levine
1950). Witkin et al (1962) reported positive and high correlations
on the BAT, RFT and EFT and total IQ scores derived from the Stamford
Binet for children aged 10 and 12. (0.57 for boys and 0.76 for girls).
In a follow up study comparing scores on the criterial measures of
field independence and the WISC (Witkin et al 1962) indicated a
positive correlation in which performance scores on the WISC were
higher than verbal scores. In a factor analytic study with a small
number of children Goodenough and Karp (1961) discovered an 'analytic •
field factor' which indicated substantial loadings (0.66) between
measures of field independence and the Picture Completion, Object
Assembly and Block Design components of WISC. They interpreted
these findings as providing evidence that these tests share with the
measures of field dependence/independence the requirement of over-
coming an 'embedding context'.
18

In addition to the 'analytic field factor' this study identified
two other factors, a verbal/comprehension factor which was represented
by the vocabulary, information and comprehension .subtests; and an
Attention/Concentration factor represented by the Digit Span, arith-
metic and digit symbol subtests of WISC. These three elements are
similar to those identified in previous factor analytic studies of
WISC by Cohen (1957, 1959). In a later study with 150 male under-
graduates Karp (1963) found similar confirmatory results. In the
EFT test manual, Witkin et al (1971) sums up the implications of these
findings for the field dependence/independence dimension.
"If separate factor. IQ is computed for each of the three
Weschler factors, EFT scores correlate at a high and signifi-
cant level with the analytic factor IQ's but only at a low and
usually non-significant level with both the verbal/comprehension
and attention/comprehension factors". (p 6)
The important word in this statement would seem to be 'usually'
the implication being that verbal intelligence is not or very rarely
related to the perceptual measures of field dependence, since only
those WISC performance subtests that have been loaded together with
the perceptual subtests have been interpreted as involving extraction
of an item from an embedding context. In a review of 20 studies,
Goldstein and Blackman (1978) p 186 - found conistent indications
that the measures of field independence/dependence are related to
various measures of both verbal and performance intelligence. The
correlations between field dependence/independence and intelligence
were mostly in the range 0.40 - 0.60 and correlations between field
dependence/independence and academic achievement and aptitude tests
somewhat lower.-
Whilst Within et al (1971, 1977) accept that moderate corre-
lations have been found between full IQ scores and EFT scores,they
believe that the factor analytic studies offers conclusive evidence
that these correlations are in the main part due to success on the
analytic elements of such tests. It is still felt by some researchers
however, (Satterly 1976) that the distinction between intelligence and
field dependence/independence has not been completely established.
19

Further research appears to be required to satisfy this dilemma.
It would be interesting, for example, to apply the technique deve-
loped by Wallach and Kogan (1965) to investigate modes of thinking
in young children (ie to consider the differences between High field
independent/High IQ, High field independent/Low IQ. Field dependent/
High IQ, Field dependent/Low IQ individuals). Witkin concluded
however, that one cannot therefore assert that persons who are field
independent on the Etbedded figures test are necessarily superior in
general intelligence, as reflected in the Weschler, since such
individuals might show wide variations in the other two factors
revealed in the factor analytic study.
(6) Heal-tic/Global
The individual differences first identified in Perceptual tasks
Within et al (1971) argue clearly extend therefore in to in-
tellectual functioning and are an important feature of an
individual's problem - solving propensities. Witkin et el (1954) commented,
"Intellectual problems that call for a high degree of creativity
but do not involve perception directly, often also require that
'parts'- be separated from the context in which they are embedded
and brought in to new relationships. It is likely - and this
is of course subject to experimental test - that if a person
has this basic ability to 'break-up/ a configuration it will
be manifested not only in straight forward perceptual situations
but in problem solving situations as well." (p 477) In fact one might argue that if the assertions made here are
correct, the existence of such stylistic tendencies are likely to
influence an individual in all of his environmental encounters.
However, following the interpretation by the Witkin group, of the
factor analytic studies, Witkin designated the field dependent/
independent dimension as a 'cognitive style'. Yet, he also argued
that the description of field dependence and independence was
primarily associated with a specifically perceptual ability and as
such was felt to be too limited a label for the broader realm of
cognitive functioning that had been revealed. What was basic to
this cognitive style was a measurement of the extent to which an
20

individual is able to overcome an embedding context. This ability,
when developed, makes possible an 'analytical' way of viewing ex-
periences and demonstrates contrasting ways of approaching a stimulus
field, whether immediately present, or presented symbolically. (As
in a map for example). On the basis of the correspondence across
perceptual and intellectual fields the construct was redefined as
an 'Analytic' as opposed to a 'Global' dimension of cognitive
functioning. Field dependence/independence is currently treated by
Within and his colleages as the perceptual aspect of a more pervasive
analytic/global cognitive style. Witkin et al (1954) argued there-
fore that,
"The dimension of individual difference with which we are dealing
thus represents, at its extremes, contrasting ways of approaching
a field, whether the field is immediately present or represented
symbolically. It may therefore best be described as an analytic
vs. global field approach. What we have been calling 'field
dependence' is in effect the perceptual component of this more
general cognitive style". (pp 70 - 71)
(7) Relationshi s with Personality
As a result of this reconceptualisation, Witkin went on to con-
sider the association of this style to other personality and behavioural
characteristics. In an investigation using Rorschach inkblots
(Witkin et al 1962) field dependent individuals were found to leave
such material as it is, rather than attempting to impose any structure
on it. As a result, percepts tend to be rather vague and indefinite.
In contrast, field independent individuals are likely to impose a
structure on the inkblots which lack it, with the result that their
percepts are organised and definite. Such individuals are able to
perceive items as discrete from their backgrounds, or re-organise a
field when the field is already organised, or impose some structure
on a field and so perceive it as organised, when the field itself has
relatively little inherent structure. Perera (1974) comments, however,
that the validity and reliability of the Rorschach is often questioned
and have been reported as near zero. (Evon, 1965; Guilford 1959; Harris 1960). Witkin interprets the research employing the Rorschach
as indicative of the ability to structure experience, which in turn
was seen to be part of an increasing tendency towards 'articulation'.
21

At the global end of the continuum when the field is structured,
there is a tendency for its organisation as given to dictate the manner
in which both the field as a whole and its parts are experienced.
When the field lacks structure, experience tends to be global and
diffuse. At the articulated extreme, there is a tendency for
experience to be delineated and structured even when the material
lacks inherent organisation. Parts of the stimulus field are ex-
perienced as discrete and the field, as a whole, as organised. As
with the original dimension of perceptual field dependence, Witkin
et al (1971) confirm that there was no intention that the world should be viewed as peopled by two distinct kinds of human beings,
scores for any large group of subjects show a continuous distribution.
More recently, Witkin and his colleagues have argued that the
global/articulated style is part of a still broader psychological
dimension and it has been found for example that individual differences
in cognitive style are also related to individilal differences in body
concept (Witkin et al 1962, 1965) in the nature of the self and the
controls and defences typically used.
Whereas study of performance on the embedded figures test
focusses on externalised experiences, study of the body concept has
its primary source within the individual. Witkin suggests that there
is now considerable evidence that children and adults who show an
articulated cognitive style are also likely to have an articulated
body concept (that is they experience their body as a whole and as
having definite limits or boundaries and the parts within as discrete,
yet unrelated and joined in a definite structure). To assess this,
figure drawings have been used. Originally referred to as the .
'sophistication of body concept scale' (Witkin et al 1962 and re-
printed in 1974) it has subsequently been redefined as the Arti-
culation of Body Concept Scale in the 1974 reprint and can be used with both children and adults. Studies using the scale have shown
that figure drawings made by field dependent subjects tend to be
global in character. Their drawings include very little detail and
tend towards unrealistic representation and proportioning of body
parts. Sexual characteristics are indicated minimally or not at all.
In many cases there is no attempt at role representation and it is
difficult to distinguish what sex has been represented. In field
independent subjects' drawings, proportion is more realistic and
22

the representation of body parts detailed and accurate and sexual
distinctions are clearly and often aaasingly portrayed. Measure-
ments on a scale of articulation of body concept applied to figure
drawings for both children and adults have repeatedly been shown to
relate significantly to measures of field dependence. (Corah 1965,
Karp,Silberman and Winters 1969, Winestine 1969, Witkin at al 1962).
One immediate question however relates to the association of the
distinction described here to general intelligence. Is what is
demonstrated merely evidence of intellectual maturity? This point
has been tested by relating the scale scores to a full scale WISC IQ
and to the intellectual and verbal indices within the Weschler.
Though a significant relationship was established between IQ score
and level of articulation of body concept (0.55), the fact that the
intellectual index achieved a higher association than the verbal
index (0.54, as opposed to 0.33) has been interpreted by Witkin to
indicate that the differences in nature of the drawing is primarily
a reflection of the differences in mode of field approach rather than
a reflection of general intelligence. It would be interesting to
investigate whether it was more an indication of drawing skill,
which seems to be an important element of representing features
realistically, there are clear relationships between the Articulation
of body concept test and the Draw-a-man-test.
Individuals with a more global or more articulated cognitive
style have also been found to differ in their sense of separate identity.
Thus more articulated individuals have a greater awareness of the needs
feelings and attributes which they recognise as their own and which
they identify as distinct from those of others. This sense of separate
identify implies experience of the self as segregated from the non-
self, it also implies experience of the self as structured. Internal
frames of reference have been adopted and developed and are available
as guides for self definition. The less developed sense of separate
identity associated with individuals with a more global cognitive
style demonstrate a reliance on external sources for definition of
their attitudes, judgements, sentiments and their view of themselves.
Studies to support these claims for a separate sense of identity have
shown that field dependent individuals are more attentive to faces of
people around them, they literally look more at faces and are better
23

at remembering faces. (Crutchfield, Woodworth and Albrecht 1958,
Konstadt and Forman 1965, Messick and Damarin 1964) Witkin et al
argue (1971 p 9) that the extent to which a face is the major
source of cues as to anothers feelings and thinking, it is not un-
reasonable to define their views of themselves by other's reactions to
them in terms of facial cues.
Another type of study used to assess a sense of separate identity
is exemplified by Dell (1955) who obtained from a group of students
their views, in writing, on the use of antihistaines. At a later date
they were presented with a made up, apparently authoritative analysis
of the use of antihistamines which contradicted their previously
expressed viewpoint. Relatively field dependent subjects were more
likely to char€e their original viewpoint to the position attributed
to the authority, whereas field independent individuals were more
likely to take up their previously expressed view. Witkin et al (1971)
suggest that this and similar studies demonstrate that the person for
whom the context strongly determines perception of an element within
it, will be strongly influenced by the immediate social context in
his experience of attributes of the self.
It has further been demonstrated that persons who experience in
an articulated fashion tend to use specialised defences such as
isolation. More global individuals are strongly influenced by feelings,
which is congruent with their perceptual abilities where they do not
keep things separate (ie body separate from field, rod separate from
frame or simple figure separate from organised ground). Persons with
an articulated style, in using isolation, maintain the discreteness
of feelings and ideas. - This is demonstrated in a study by Millard and
Mooney (1969) where field dependent subjects speed of perception of
tachistoscopically presented words was markedly effected by whether
or not the word carried an emotional connotation. Percepts and
feelings were not kept separate. Field independent persons showed
no difference in speed of perception of neutral and charged words,
suggesting an ability to separate percept and feeling.
In commenting on such studies Perera 1974 states (p 54) "It appears that though certain cognitive-style-personality
relationships have been observed, the interpretation of the
results obtained in this regard is not an easy matter. The
24

difficulty of interpretation is due to employment of pro-
jective techniques in the assessing of certain personality
measures as well as due to the uncertainty as to whether these
findings were due to general intelligence or to the cognitive
style as claimed by Witkin et al".
'Atkin et al (1971) however, sum the evidence up as an indication
of an individual's "psychological differentiation". An individual who
demonstrates a greater degree of differentiation will have a perception
of the world in which parts of the field are perceived as discrete and
the fields-truct=ed. His body concept will have a definite sense of
bounneny and a clear understanding of the inter-relation among its
parts, he will see himself as distinct from others and has developed
internalised standards to guide his view of the world and of himself.
Witkin et al argues (1971) in this context,
"It is reasonable to believe that these various characteristics
are not the end product of development in separate channels, but
are diverse expressions of an underlying process of development
towards greater psychological complexity". (p 10)
The relationships discussed here are derived originally from
Werner's (1948) orthogenetic principle of differentiation. This
principle states that development proceeds from a state of relative
globality and lack of differentiation to increased articulation and
hierarchical integration. Werner intended this as an abstract,
untestable theoretical construct, yet it has been taken by Witkin to
represent the ability to extract an item from an embedding context
(Witkin et al 1962, p 13) and as has been discussed he attempts to
demonstrate the permeation of this ability in diverse areas of psycho-
logical functioning.
(8) Determinants of the dimension
Many studies have sought to identify the determinants of the
characteristics under discussion. One group of such research has
investigated early socialisation experiences as a possible source,
(Dyk and Witkin 1965, Witkin et al 1962) and have established a
relationship between the extent of a child's field dependence and the
degree to which his early socialisation effected the achievement of
a separate autonomous functioning. In particular, the op, crtunity
25

and encouragement of separation from the mother, the manner of dealing
with the child's expression of impulse, have been found to be of
importance. Also the parental characteristics and their influence in
the separation process and the regulation of their children's impul-
sive behavour. More field independent children appear to have in-.
teracted with their parents in ways that foster separate autonomous
functioning. (Barclay and Casumans 1967, Berry 1966, Dawson 1967).
Further, it has been hypothesised (Witkin et al 1962) that- the
classification of mothers as 'fostering' or 'inhibiting' differentia-
tion would reflect their own level of differentiation, that less
differentiated children are likely to have less differentiated
mothers. But the results obtained by administering Lie2 and the
Figure drawing test to mothers have not proved conclusive in the
main (pp 318 - 319). Parent child relations as demonstrated in TAT
stories appear to suggest that relatively less differentiated children
tend to have relatively non-supportive parents in contrast to the more
differentiated children. Zigler (1963) points out however, that much
of the data which was collected by interview could be questioned,
since the interviewers were aware of the characteristics associated
with the cognitive style they were investigating and would thus find
it difficult to remain objective in their interpretations.
In a further study which attempted to identify the socialisation
experiences which contribute to the development of a more field
dependent or more field independent style, cross-cultural studies
have been undertaken. Recently (Witkin, Price-Williams, Bertini,
Christiansen, Oltman, Ramirez and Van Meel 1974) have completed a
study of children from two relatively self-contained villages in each
of three 'countries, Italy, Holland and Mexico. These villages were
chosen because of the merked difference between them in the child
rearing practices earlier found relevant to the development of field
dependence and independence. Similar studies have investigated
varying cultural settings for example the Temne of Sierra Ieone, the
Eskimo of Baffin Bay, the Arunta of Australia and the Boat People
and Hakka of Hong Kong (Berry 1966, Dawson 1967 a. b. 1971). The
evidence of these pieces of research demonstrate that the develop-
ment of the various extremes of the style identified by Witkin is
26

indeed related to processes of socialisation - and primarily those
referred to earlier. Yet socialisation experiences are not felt to
be the only influence. Witkin and Oltman (1967) suggest that differences
in the central nervous system and autonomic nervous system also effect
the development of field independence. This evidence is based on .
studies with adults, and it is therefore difficult to distinguish
cause from effect. Studies with infants suggest that some of the
somatic differences found later in life may be present in the neonate
and constitute the foundations for the development of more or less
differentiated functioning. (Dyk 1969)
The possibility that genetic factors may be an important variable
has also been considered. Three kinds of study are currently investi-
gating this and are discussed by Witkin in Messick (1976 I.= 46 - 47).
In the first study a check is being made about predictions of the
extent of resemblance of son and daughter to each parent. The
predictions derive from the hypothesis that a recessive gene on the
X chromosome plays a role in the development of individual differences
in field dependence. The second study investigates the cognitive
style of men with an extra Y chromosome (XYY's) or an extra X
chromosome (XXY's) in addition to the usual XY sex chromosome comple-
ment. This study has been undertaken in Denmark because of their
excellent social records. The third study has identified three son
families, in which two of the sons share onaof the mother's two
X chromosomes and the third son has received her other X chromosome.
To make these distinctions such X-linked chnracteristics as
colour blindness and blood features have been used. If there is a
genetic influence on the X chromosome which contributes to differences
in field dependence/independence, the two brothers with the same X
chromosome should be significantly more similar on this dimension
than either is to the third brother. Messick (1976) concludes this
discussion on determinants of field dependence/independence,
"In overview, it seems fair to say from the evidence now on
hand that socialisation factors are undoubtedly of overwhelming
importance in the development of individual differences in field
dependence versus field independence. At the same time, it may
be that genetic factors are implicated as well, although probably
27

to a much smeller degree. If they are implicated, we should
know about the role they play in interaction with social factors."
(P 47)
(9) Conclusions
To conclude this discussion therefore, the conceptualisation
that has been proposed by Witkin attempts to bring together within
'cognitive experience', experience of stimulus configuations, experience
in the domain of symbolic representations, experience of one's own
body, of the self, and experience which is the produce of defence
mechanisms as they mediate between an individual's environmental
encounters. This conceptualisation also proposes that there is a
consistency in quality or type of experience - whether more global
or more articulated - across all of these domains. Witkin et al
(1971) believe that investigationcfan ind4.vidual's experience in
any domain such as in perception through the Embedded figures test,
is likely to reveal his general tendency to function at a more or
less differentiated level. In the figure below, 'psychological
differentiation' is the highest order construct and field dependence-
independence the lowest order construct of Witkin's conceptualisation.
Psychological differentiation,
I Articulated Articulated perceptual and body concept intellectual functioning
Structured, specialized defences
Sense of separate identity
Analysis
in perception (field inde-pendence, as reflected in EFT per-formance)
Structuring
in Intel- in perception lectual function- ing
Figure 1
in intellectual functioning
(Witkin et al 1971 p 14)
28

(v) Educational_Aulications derivethz_tlie 'Atkin Grout
More recently the attention of the Witkin group has been turned
towards educational applications which might be derived from their
studies. In 1977 Witkin suggested that the concepts and methods
derived from studies of cognitive style are being increasingly applied
to the study of educational problems. In particular it is argued
that the research undertaken by Witkin and his colleagues has impli-
cations for how children and students learn, how teachers teach, and
how students and teachers interact. (Witkin et al 1977, Doebler and
Bloke 1979).
In relation to learning, students with a field dependent, cr
more global cognitive style have been shown to be better at learning
and remembering incidental social material (Ruble and Nakamura 1972,
Crutchfield et al 1958, ). It is also the case that an indivi-
dual's cognitive style may influence his learning in terms of the
effects of different kinds of reinforcement. Field dependent indivi-
duals have been seen to be more effected by external reinforcement
through praise or criticism. (Ferrell 1970, Konstadt and Forman
1965). The evidence suggests that field independent persons tend to
learn more than field dependent persons under conditions of intrinsic
motivation, although these differences are seen to disappear when
external rewards for learning are introduced. In a study by Steinfeld
(1973) a group of 11 year old children played an experimental marble
game in which three types of reinforcement were compared. In the
first reinforcement condition an abstract technique was used, a
flashing light, and field independent children learned more success-
fully. In the second condition token rewards were given. These -
were exchangeable for small toys and all children learned equally
successfully, as was the case in the final condition, where social
reinforcement in the form of praise by the experimenter was employed.
In another study of the effects of social reinforcement, the evidence
suggests that field dependent individuals are more effected by criticism.
Whether the criticism has a positive or negative effect on learning
depends on the manner in which it is administered. (Ferrell 1971,
Konstadt and Forman 1965). A final point on the implications of
cognitive style on learning relates to the skills of analysis em-
ployed by individuals. Because of their weaker analytic abilities
field dependent individuals have been found to prefer greater struc-
29

tore in their learning and to experience difficulty with relatively
unstructured learning experiences. (Renzi 1974, Nebelkopf and Dreyer
1973). The relationship between field dependence and independence and
concept attainment would seem to be of significance in relation to
current educational emphasis.on the fundamental features of a dis-
cipline as opposed to acquisition of factual information. (Blythe
et al 1976). Goodenough (1976) and Witkin et al (1977) consider this
in detail and cite a number of studies which suggest that field
dependent persons tend to favour a 'spectator approach' to concept
formation and attainment, whereas more field-independent individuals
employ an hypothesis testing approach. When required to employ an
hypothesis testing strategy, field dependent individuals may be more
strongly guided by the salient features of a stimulus array. Field
Independent individuals are less easily influenced and tend to sample
the array more extensively and selectively. (There seem obvious
simularities here with Bruner et al's (1956) focusing or scanning
approaches to concept formation and with Pask and Scott's (1972)
investigation into learning strategies). However, one main implica-
tion for learning, is the importance for field dependent individual's,
of ensuring that the main features of a piece of learning are clearly
and unambiguously displayed.
In a recent study which questions some of the above assertions
Grieve and Davis (1971) compared field dependent and field independent
students learning capacities when studying geography in two different
learning modes. (ie A discovery learning approach and a more directive
expository approach). They concluded that neither cognitive style,
nor the method of instruction had an overall effect on the acquisition
of knowledge. However, extremely field dependent males experienced
difficulty in acquiring knowledge through an expository mode and were
also limited in their ability to apply any of the knowledge that they
had gained in a new situation. Field independent students., both male
and femele, on the other hand, were better able to apply their geo-
graphic knowledge and coped equally well with both instruction modes.
Witkin et al (1977) emphasise that the approaches favoured by
one kind of person do not necessarily make for better achievement.
3.0

Whether learning is successful or Pet seems to depend on the specific
characteristics of the learning task and the circumstances under
which it is taking place. They go on to argue, however, that the
available evidence suggests that,
"Tt is not unreasonable to expect that as teachers become more
aware of the ways in which relatively field dependent and field
independent students learn ..., they may become more effective
in adapting instructional procedures to the needs of different
kinds of students." (Witkin et al 1977 p 27)
Evidence in support of Witkints second educational application
of cognitive styles research comes fnem. studies of teachers preferences
and behaviour in simulated conditions and has demonstrated important
differences in characteristics between field dependent and independent
teachers. The characteristics which result from a more social or a
more impersonal orientation has an effect on the level of inter-
action with others, as well as a preference for the more social or
more abstract features of a curriculum. Similarly the degree of
separateness of identity has been demonstrated as effecting the extent
to which the teacher is likely to assume responsibility for directing
the teaching situation or sharing this responsibility with his students.
(Within 1977). Thus, field dependent teachers seem to prefer teaching
situations which allow for interaction with their students, whereas-
more field independent teachers prefer more impersonal teaching •
situations, oriented towards the more cognitive aspects of teaching.
Wu (1968) for example, found that field dependent student teachers •
ranked discussion as more important than lecture or guided discovery
approaches, which tended to be preferred by field-independent student
teachers, Both lecture and guided discovery leave much of the organi-
sation of the learning to the teacher. Similarly Moore (1973) found
that more field independent teachers tended to use questions as
instructional tools more often than field dependent teachers,
preferring to use questions to check on student learning. The more
field dependent teachers tend to use questions to introduce en idea,
and to follow up on students' answers.
Emmerich (Witkin 1977 p 29) found that field independent teachers
employed the use of feedback more extensively in their teaching and
31

regarded that telling a student if he was right or wrong, and why,
as an effective way of enhancing student learning. As such, Emmerich
took this as an indication of the field independent teacher's pre-
ference for organisation of the learning experiences themselves,
rather than involving the students in their own learning. Probably
also reflecting the preference of field independent individuals for
analytic and abstract situations, students of field independent teachers
perceived them as encouraging students to apply principles. In contrast,
field dependent teachers were often seen as emphasising facts.
Despite such differences, there seems to be no evidence for
differences in teaching competence, any differences that do exist
appear to lie in the ureferred approach to a teaching/learning situation.
If teachers have preferred approaches, an important question would seem
to be, how far are teachers able to adapt their teaching to meet the
needs and preferences of a particular student and an obvious corollary
to this, should they? Di Stefano (1970) found that teachers and
students matched to each other for cognitive style tended to view
each other positively, whereas when mismatched the tendency was towards
a negative appraisal. In another study using a very small sample,
James (1973 - Witkin et al 1977 p 33) obtained similar results and
also found that teachers gave students matched to them in style higher
grades, Teachers also stated that students matched to them in style
understood the material better. It would appear therefore that there
are positive advantages to matching students and teachers for cognitive
style. Students matched for style are seen as having superior perfor-
mance than those who are not matched, even when no real differences
exist.
There are also disadvantages to matching however. For some kinds
of learning it would seem important that a contrast in styles was
established, since this could be more stimulating. Wapner (1976)
advocates this viewpoint and believes that mismatching is more
appropriate when the aim is to promote flexible and creative thinking,
obstacles, opposition and conflict are necessary to
stimulate development and creativity." (Wapner 1976)
Wapner does accept, however, that matching may be more approp-
riate when the aim is the promote subject matter achievement.
32

A Zexthar noint about the diee.dvartages of matching relates to
subject matter content. It is certainly the case that some subjects
in the curriculum reauire particular strategies to cope with them.
The more analytic subjects for example (erg maths) may be more success-
fully undertaken by those with an independent cognitive style. Further,
there axe some advantages to mismatching relating to the features
Witkin identifies for the field dependent/ independent dimension. The
feedback provided by field independent teachers could be advantageous
to the field dependent student, by providing the structure which he
appears to need in his learning. Similarly the preference of more
open 'discussion' in learning adopted by field dependent teachers,
would appear to suit more field independent students and their pre-
ference for imposing their own structure on their learning. It would
seem that there are positive advantages and as Witkin comments (1977)
a classroom which contains representatives from the full continuum of
the style he has identified is more typical and leads to more diverse
viewpoints which could enliven the classroom.
Witkin believes however that it is possible to obtain the positive
effects of matching, whilst avoiding the negative. Witkin, Lewis and
Weil (1968) found that therapists, regardless of their own cognitive
style, took -a systematic and more directive role with field dependent
clients, and a more flexible approach with field independent clients.
By using more directed questions with the one group and more open
questions with the other, they seemed to be adjusting to the need for
structuring experiences based on cues they had picked up about their
clients cognitive style. On this basis one might ask that if this is
achieved naturally and intuitively as seembere, isn't this also
likely to happen within the teaching-learning situation. Goodenough
(1976) suggests that,
by sensitising teachers to the implications of their own cog-
nitive style and the styles of their students for the teaching
learning process, we might increase the adaptability of teachers."
(p 50)
A recent study by Doebler and Eicke (1979) attempted to investi-
gate this. The cognitive styles of three classes of 11 and 12 year
olds and of their teachers were assessed. Teachers in two of the
33

schools were told of the results an;i. were given some instruction on
the educational implications of cognitive styles research with reference
to the evidence from the Witkin group. The teachers were followed up
over a period of six weeks, when they were invited to raise questions
in relation to the children in their own class. Measures of the
children's self concept and attitude to school were taken at the
beginning and end of the experiment and the evidence seems to indicate
that it is possible to create a more educationally conducive atmos-
phere in the classroom by making teachers more aware of the educational
implications of a knowledge of field dependence and independence.
There was also evidence to suggest that teachers could show adapta-
tions in their own teaching style to accommodate differing cognitive
styles in their children. They concluded that,
"This study lends further credence to the value of cognitive
style data as a means of conveying information about individual
students to the teacher. Cognitive style relates to processes
involved in how a student perceives, thinks, learns, solves
problems and relates to others, as well as other personality
dimensions. The bi-polar nature gives cognitive style a neutral
character and eliminates the value judgements associated with t(.
This study indicates that cognitive style information can be used
to bring about significant and beneficial changes in the student."
(p 231)
It is obviously important to consider the results in the light
of likely experimental effect.
(vi) 'N-Space and Co tive Style
The description of the development of field-independence provided
by Witkin and his supporters (Witkin et al 1954) raises an important
question about the relationship of the field-dependence/independence
continuum to maturation of cognitive processes in general. As
Saarni (1973) suggests.
"The sorts of strategies an individual uses in a problem solving
situation can be understood in terms of the developmental
capacities he brings with him into that situation. These strate-
gies that he is capable of dictate his approach to the problem
34

and to a considerable extent, what he is capable of finding
out. They reflect the cognitive structure underlying his
problem solving performance." (p 338)
Pascual-Leone (1969, 1970) has attempted to investigate the inter-
relationships between an established theoretical description of the
development of cognitive processes, that of Piaget and the work of
Witkin. A major purpose of the study by Pascual Leone was to attempt
to make Piaget's theory a 'functional' theory, for as Flaveil and
Wohlwill (1969) point out, Piaget's theory is predominantly 'structural'
aiming at a formal description of an individual's knowledge or com-
petence at different points in his development.
According to Piaget (1964, 70 and 78) the most influential
factor in cognitive development is the child's auto-regulative or
equilibrative activity. In problems of conservation, for example,
where objects or substances are made to look different by some kind
of transformation, the immediate impression is often perceptually
confusing, especially for the non-conserver. The child's develop-
ment leads him to recognise inconsistencies in his on thinking and
in his response to such perceptually confusing situations. As he
matures, he attempts to remedy these inadequacies, to eliminate the
conflicting picture based on one particular type of cue. By con-
servation, reversibility and logic, such paradoxes are overcome as
a normal part of development. A further important variable in the
Piagetian framework is the part played by maturational processes, but,
"The maturation of the central nervous system can do no more
than determine the possibilities and impossibilities at a given
stage of development. A particular social environment remains
indispensable for the realisation of these possibilities. It
follows that their realisation can be accelerated or retarded
as a function of cultural and educational conditions." (Piaget
1970)
Piaget (1969) also believes that problem solving is influenced
by the existence of 'field-effects', is for example in the percep-
tually confusing conservation exercises.
Pascual Leone has attempted to incorporate these features of
Piaget's ideas into his discussions of the inter-relation between
35

the development of thought and the development of field independence.
Pascual-Leone (1969) hypothesises that a child or adult's 'M-Sse:
is an important feature of an individual's developing cognitive
structure. M-space is regarded by Pascual-Leone as the maximum
number of schemes (patterns of activity which are co-ordinated and
act as integrated wholes), that can be co-ordinated simultaneously -
that is, the number of variables present in a problem solving situa-
tion that can be attended to and co-ordinated in an attempt to solve
the problem. According to Piagetian theory, in the course of an
individual's everyday environmental interactions, he is assumed to
be constantly modifying his basic repertoire of schemes. The total
set of schemes activated at any moment is held to constitute the fora
of thought (Case 1974). Pascual-Leone believes that an essential
feature of problem-solving is the ability of an individual to utilise
the full 'M--power' that he has available, to call on all necessary
available schemes to solve a problem. Some people are especially
low 'MI processors, they prefer to look at or respond to a problem
in the simplest manner possible, involving the least mental effort
and relying on a limited number of schemes. The mretimum mental effort -
or M-power-activated in response to any situation is thought by
Pascual-Leone to vary both within and across age groups. Within age
group differences are assumed to result largely from biological factors
and across age group differences from maturation. For normal indi-
viduals 'Mpowert'is assumed to increase linearly with age.
Like Piaget, Pascl3e1-Leone accepts the influence of 'field effects'
on problem solving ability. Amongst adults and children the ability
to solve problems is often dependent on the relative weight an indivi-
dual gives to cues from the perceptual field, as opposed to cues
obtained from other sources such as task instructions. Pascual-
Leone suggests that individuals differ in their tendency to give
weight to salient but often misleading cues and that individual
differences in this tendency are stable across tasks and across
time. As a result of this Pascul-Leone assumes that the full utili-
sation of qg power' and the differential effects of perceptual cues
are highly correlated with the field dependance/independence dimension.
In his 1969 study for example, he found high correlations emerged
36

between tests of conservation involving the use of 'field effects'
and the Rod and Frame Apparatus. (0.52). He suggests therefore, that
field-dependent subjects are likely to be low Vii-processors, who assign
a higher weight to perceptual cues than to those provided by the task
instructions and that field independent individuals tend to be.high
M-processors who assign a higher weight to the task instructions
than to perceptual cues. (Pascual-Leone 1969, Case and Globerson
1974)
As has been described earlier, tests of field independence are
thought to rely heavily on a 'disembedding' or analytic capacity.
The fact that low, but still significant correlations are obtained
with cognitive measures not containing such a requirement, has been
explained by the suggestion that these tests are factorially impure.
That is, they contain elements unrelated to disembedding. (Vernon 1972,
Dubois and Cohen 1970). Pascual-Leone however suggests that the weak
correlations with non-analytic items may result from the psychologi-
cal nature of disembedding itself. (Pascual-Leone 1969, Case 1974).
According to Pascual-Leone a subject confronted with a disembedding
problem can respond to it in one of two ways. He can either answer
in terms of the perceptual display itself, through learned reaction
to similar displays previously experienced. Responses of this kind
rely on the salience of the perceptual cues on which the response is
based, as well as its structural simplicity. Alternatively the sub-
ject can respond in relation to the problem as it is stated, which
requires consideration of cues which at first may seem hidden, as
well as the structural complexity of that situation, La such a sub-
ject recognises that there are more variables in the problem which
might well be associated with the solution to that problem.
In the Rod and Frame Test for example a subject can respond
primarily in terms of the salient perceptual cues provided by the
tilted frame and create a simple understanding in which the rod is
squarely aligned with the frame, or a response can consider the less
salient cues provided by his body and"create a more complex mental
Pattern in which the rod lies at an angle to the frame, but on the
imaginary line which can be formed by mentally connecting true up
and down.
37

"The Ro& and Frame Test the1efor,-7 differentiates between those
who adopt an incorrect response which is simple and perceptually
compellino and a correct response which is more complicated
and less perceptually compelling." (Case ens Gioberson 1974) The- generation of a more complex response is assumed to place
a greater burden on a subject's He-Space, since it requires that a
greater nuMher of items of infamation and/Or transformational
processes be activated simnitaneously.
Studies by Saarni (1973), Case (1974, 1977) and Case and
Globersan (1974) are amongst these who have attempted to empirically
investigate the hypotheses proposed by Fascnal-Leone. Saarni (1973)
investigated the ability of young adolescents according to their
level of field independence and their level of cognitive functioning.
Her results did not appear to yield. any significant differences in
problem solving ability as a result of level of field independence.
This she believes challenges Witkin's claim for his construct as a
cognitive style which shows some kind of consistency across various
sorts of intellectual functioning. Saarni comments,
"The construct Field-Independence appears to have doubtful
implications for complex problem-solving performance. The
analyses inaicate that Field Independence within each Piagetiaa
level does not affect complex multistep problem-solving per-
fonmance as maeffested in the productive thinking problems.
This does not invalidate the role Field Independence might
have in determinino. performance on problems which are more
perceptually bound. and/or relatively non-verbal.. The results
obtained, here, however, cast doubt on the generality of the
field inaependence construct as a cognitive style or as a con-
sistent characteristic of the individual in his intellectual
functioning." (p 543) Three immediate questions arise in response to Saarni. Again,
In contradiction to comments made earlier, she relies on one criterial
measure far the assessment of Field independence. It is also the
case that she concentrates solely on field independence in her dis-
cussion and the emnirical investigation. So one might comment
reciprocally on her criticism of Witkin's construct as a cognitive
38

style, which should supposedly consider individuals in terms of a
continuum, ie Field dependence and Field Independence, with various
gradations between these extremes. Finally it is also the case that
Field Independence is merely another variable in the research and
not the focus of the investigation (ic 'In addition, it was hypothe-
sised that individual differences in field independence ... might
be a second variable relevant to explore in studying problem solving
behaviour." p 338)
Case and Globerson (1974) attempted to assess Pascual-Leone's
proposition that there would be a correlation between tests of Field
Independence and implicit demand on the use of FM-space'. They con-
cluded that tests of field independence share a substantial degree
of common variance with structurally similar IQ tests but also that
in agreement with Pascual-Leone, a disembedding situation is one
where a relatively large amount of central computing space must be
used in the process of generating a complex perceptual response. It
would be interesting to speculate whether the ability to interpret a
map makes similar demands, in that it presents a complex embedded
picture. Case and Globerson also concluded that one of the reasons
that a subject fails in disembedding situations is that he uses
insufficient of his central computing space.
In their discussion of their results Case and Globerson raise.
a number of important issues. The first concerns the nature of the
developmental increase in field independence, as described by Witkin
et al (1954) and discussed earlier. This could result they suggest,
from the developmental increase in 'M-power'(Pascual-Leone 1969,
Case 1972) or a change in the way information is processed or co-
ordinated', or a developmental decrease in sensitivity to perceptually
misleading information. Whilst the last point would seem to be parti-
cularly pertinent, it is important to remember that the age range
during which Field-Independence shows the greatest increase (ie 10 -
13 years) is not one during which sensitivity to primary perceptual
illusion shows much change. (Piaget 1969). Pascal-Leone suggests
that sensitivity to perceptual features actually increases with deve-
lopment and that the decrease in field dependence is exclusively a
result of developmental changes in 'M-space' and the improved co-
ordination and processing of experience within that 'M-Space'.
39

A second important point relates to the nature of the Educational
Environment most suitable for field-dependent subjects. Case (1974)
suggests that there are different types of field dependent subject
and that this needs to be considered in any educational programme.
A field dependent subject so classified because he uses limited 'N-
space' may respond differently to someone who is especially sensitive
to misleading perceptual cues, eg someone whose spatial ability is
limited. There is now considerable evidence to suggest that there
are cerebral functions equated with particular cerebral areas, for
example that the right brain is largely responsible for performing
spatial functions. (Milner 1971, Downs and Sten 1977, Blakemore
1977). Given the spatial character of tests of field independence
it could be hypothesised that the analytic function of disembedding
is located in the right hemisphere. This does not explain the
correlation of Fiela Independence with tests of M-Space, since they
contain no element of spatial transformation. The Backward Digit
Span test, for example, does not even involve visually presented
material. Case and Globerson (1974) suggest that the spatial elements
of a disembedding problem draws on right hemisphere and the processes
required to overcome the 'perceptual pull' of such problems is
located in the left hemisphere, which is usually associated with
linguistic and logical capacities. Although speculative, they believe
this may explain why patients receiving a shock to the right hemis-
phere of their brain show improved RFT performance, although per-
formance on other spatial tasks decreases and why patients receiving
shocks to the left hemisphere show a decrease in RFT scores but not
in other spatially oriented tests. (Cohen, Berent and Silverman 1973)
In a study in (1977) Case attempted to investigate whether a
subject's cognitive style continues to affect performance on con-
servation tasks after some instruction had been given on that task.
His analysis was based on an investigation with 54 non-conserving
children aged between 5 and 8 years. He concluded that before a child
can be expected to ignore his current perceptual judgement, he must
acquire an understanding that some perceptual judgements are more
reliable than others. This is similar to comments made by Braine
and Shanks (1965). Within the context of Pascual-Leone's theory
" Brophy (1982) suggests that success on the Rod and Frame test
may be associated with 'Hemispheric Specialisation'.
40

before a child can co-ordinate the specific schemes relevant to a
conservation problem, he must ace re an apnropriate 'executive
scheme' - a general plan for evaluating the relative quantity or
difference between the objects presented. Both Case and Pascual-
Leone believe that field dependence results from an unusually strong
tendency to apply global, perceptually facilitated executive schemes
and that limitations in reasoning may result from failure to fully
comprehend and overcome perceptual influence at earlier stages of
development.
(vii) Criticisms
There have been many studies associated with the work of Witkin
and his colleagues. In a bibliography dated to 1976 something over
2,500 different papers are included. It is not surprising therefore
to find that the research has not gone uncriticised. The number of
such critics are by no means numerous however. Perera (1974) comments,
"While most investigators appear to have adopted Witkin et al's
procedures and interpretations without criticism, Gruen (1957),
Sigler (1963), Lester (1968), Vernon (1972) and Satterly (1970,
71, 76) are amongst those few who have pointed out various
errors of commission and omission that appear to question the
validity of the superstructure built up by the Witkin group".
This section proposes to consider some of these criticisms.
Goldstein and Blackman (1978) criticises much of the research
related to the dimension for its lack of consistency in the various
measurement instruments employed. The earlier reliance on BAT, RFT
and EFT now seems to have been superceded by either RFT or. EFT alone,
sometimes a combination of both of these measures, but mainly the
use of the EFT in a variety of forms. Although it is clear that a
short form, a group form and a children's form serve useful functions,
it is not clear that the many variations of each of these serve a
useful purpose. The relationships among these many variations and
the standard measures are often unclear, which makes the task of
comparison somewhat difficult. This is a point stressed by Satterly
and Brinier (1971) who argue that any investigation designed to assess
an individual's cognitive style ought to attempt to employ some
standardised procedure, yet be sufficiently flexible. They suggest
that there are three important factors which ought to be considered
in any such investigation:
41

(i) The tests used should allow freedom to the subject to
determine what is significant for him - so that the material can be
organised in a variety of ways.
(ii) Highly fozmalised diagrammatic material should be avoided,
since these demandtoo specific an orientation - and exerts a strong
influence on the modes of solution.
(iii) That the results should be analysed by a technique which
does not seek to impose a number of preconceived categories by which
to classify the styles elicited by the task.
Despite these comments however, Satterly's subsequent research
(Satterly 1976, Satterly and Telfer 1979) investigating the association
between field dependence/independence and spatial ability and school
leaguing, employs the use of only one test from the Witkin criterial
measures, the imbedded Figures Test. This falls short of Vernon's
(1972) recommendation that a version of the Rod and Frame Test and
the Draw-a--person test, together with the Embedded figures test
constitute a reasonable minimum battery for the measurement of field
dependence. Satterly argues however that the RFT and DAP tests were
shown by Vernon to have low, but admittedly positive correlations
with the Embedded Figures test, which Satterly believes causes
investigators to question the necessity of deriving a pooled index of
field dependence from such disparate measures. In a recent
study (1982) Brophy reported positive correlations betweenEFT and
DAP in a sample of 147 14 year olds, but no correlation with RFT.
In a factor analysis of his results, RFT scores emerged as an in-
dependent factor unrelated to other measures of field independence
which clustered with tests of spatial ability. It seems likely
however that, the various versions of the EFT do measure substantially
similar functions amongst adults (Jackson et al 1964) and ten year
old children (Perera 1974). It is also the case that Witkin et al
(1971) accept the EFT as an acceptable base measure of field indepen-
dence. It is interesting to note that the Body Adjustment.Test
now features rarely in experimental investigations, probably because
of the size and costs involved and also to a lesser degree the Rod
and Frame test is less extensively used. As a result many assertions
are made for the style identified by Witkin based primarily on one
test, which appears to have a very strong association with spatial ,
ability. (Gardner,Jackson and Messick 1960, Kogan 1971, Vernon 1972, .
Satterly 1976).
Another difficulty associated with comparability of results 42

obtained in different studies arises from the various ways in which
the extremes of field dependence/independence are delineated. Vaught
(1968) commenting on an exchange between Immergluck (1968) and
Pressey (1968) showed that when an average deviation on the RFT of 10 degrees or more is used as the criterion for defining field
dependence, only about 17% of the undergraduate population is
defined as field dependent. Many investigators who do not have
access to large pools from which to draw samples simply divide
their subjects on the basis of median or quartile scores and there-
fore likely to fail to include in the field dependent group subjects
who are clearly field dependent.
Perera (1974) introduced two interesting criteria associated with delineation of style. To investigate this dimension he used
a version of Thurstone's concealed figures test, the score of which
is usually the number of correct responses. In Perera's investi-
gation a 'correction for guessing' was included, by substracting each
persons incorrect marks from his correct scores. After correcting,
a constant was added to each subjects score to convert all scores to
positive ones. He then differentiated Field Independent and Field
dependent subjects as one standard deviation above and below the mean
of the scores for his group sample. A further intermediate group
was designated as those falling immediately above and below the mean.
Similarly, in a study by Case (1974) which employed the Wesohler Blocks as the test of Field independence, subjects who scored one
standard deviation above the mean for 'national averafees' were
classified as Field Independent and those scoring one standard devia-
tion below the mean was classified as field dependent.
A similar technique was adopted by Doebler and Eicke (1979) who having administered the EFT to each of the children in a large
sample (296 children). The mean and standard deviation of the scores
were computed. Only students falling more than one half of a standard
deviation from the mean were retained in the sample. Field dependence was defined as an EFT score of 1,812 or above (n =.108), field
independence was defined as an EFT score of 1,454 or below (n = 78). In the discussion on intelligence and field dependence some
critics find it difficult to accept Witkin's assertion that the
43

cognitive style of field dependence/independence cuts across general
levels of intelligence. Correlations between field dependence and
measures of intelligence have been shown to be positive and in the
range between 0.40 and 0.60, and are not taken by Witkin as indicative
of a single dimension underlying both intelligence and field depen-
dence. Similar correlations of 0.30 - 0.60 are accepted by Witkin
as demonstrating positive and significant relationships between the
Rod and Frame Test and the Embedded Figures test. (Goldstein and
Blackman 1978). In a detailed and comprehensive study of the corre-
lations between RFT and EFT Arbuthnott (1972) concluded that while
the measures of field dependence/independence do share some variances
the amount is generally quite low.
Witkin acknowledges the existence of high correlations with
intelligence, but as explained earlier, these are interpreted in the
factor analytic terms identified by Karp (1963). Following an ex-
tensive review of the literature, and an enquiry designed to assess
the distinctiveness of Field independence, Vernon (1972) concluded
that the group versions of the pencil and Paper tests of field
dependence/independence do not measure a factor distinct from
general intelligence. Not all studies agree with Vernon however, Busse
(1965) was able to extract a factor of cognitive style distinct from
general intelligence. Further criticisms associated with field .
dependence and intelligence relates to the low correlation with verbal
ability. Contrary to latkints claims, Crandell and Sinkeldam (1964)
and Wachtel (1972) report significant correlations between EFT scores
and verbal ability in pre-adolescents and young adults respectively.
Similarly, Bieri, Bradburn and Galinsky (1958) found significant
correlatibns between mathematical ability and field independence
amongst college students.
All of the above research suggests that the analytical/global
cluster identified by Witkin rya be linked empirically with verbal,
numerical, and as was mentioned earlier, spatial ability. - It would
seem essential therefore to attempt to control for these abilities
when comparing field dependence/independence to other variables.
If it is the case that field dependence/independence is not
separable from general intelligence, Sattorly (1976) argues that the
44

criterial measures of this particular cognitive style are unlikely
to further our understanding or knowledge of an individual, nor are
they likely to suggest potential for achievement beyond that which
is predicatable from standardised tests of intelligence. Entwistle
(1979) adopts a similar point of view and is wary of over emphasis on the attributes of describing individuals in terms of styles of
thinking. He is particularly critical of accepting individual differences
as indicative of preference for this implies that both capabilities
exist within an individual. He says,
"Throughout childhood, styles as preferences are impossible to
separate from the limitations imposed by differential develop-
ment in reasoning ability."
and with reference to the cognitive style identified by Witkin,
Entwistle (1981) has commented, more recently that, "The problem in Witkin's description is that field dependence
is an inability to impose structure. If it is to be a style
a rather more positive description of 'global' thinking should
be expected." (Entwistle 1981 p 207) Kogan (1971) however refutes assertions such as those of
Satterly and Entwistle. He believes that Witkin's research has
identified important individual differences which are reflected in
each individual's behaviour patterns. In 1965 Catteli commented that the capacities isolated by Witkin had a strong association with one
factor of personality embodied within his personality theory, that
of an 'independence factor' (QIV within his 16PF measuring instru-
ment). Ohnmacht (1968) correlated scores on two versions of the EFT with the QIV scores derived from Cattell's 16PF. He found non—
significant relationships which led him to reject Cattel's claim of
an association between QIV and field independence. This finding was
later supported by Johnson et al (1969). Cattell's comments on these
studies suggested that these relationships needed further investigation,
and hypothesised that tests of field dependence, QIV and a further
'general temperamental factor' of the 16 PF-(U1 19) would all load together (Cattell 1969). Thomy's (1972) study threw doubt on this assertion, as does Brophy's(198) more recent investigation.
A further point of criticism associated with research in to
this area is discussed by Goldstein and Blackman (1978) and that is the relative lack of direct systematic research on specific issues.
They commend Witkin and his colleagues for their continuing and de-
tailed studies but are critical of the lack of coherence in the work 45

of other researchers. The suggestion is made that field dependence/
independence is often not the central concern in many studies but
is employed as one further variable, primarily because of the ease
of administration of the EFT, even in spite of comments made earlier
about reliance on one criterial measure. Arbuthnot (1972) makes
similar comments and criticises research for indeterminate use of
tests which 'resemble' Witkin's original measures, which he argues is
unwarrented and 'conceputally dangerous'. Future studies he believes
should be based upon at least two measures, preferably the RFT and
EFT. Arbuthnot concludes however that within the samples he studied
there are clearly subgroups for whom the measures under consideration
relate and identify describable individual characteristics, which
suggests research into this area is valuable. Kogan supports these
assertions when he comments, -
"Witkin's analytic/global dimension would appear to be ideally
suited for research on the interaction between cognitive style
and instruction. Both ends of Witkin's dimension have adaptive
properties, though of a distinctly different kind and it is
feasible that educational programmes could be devised to profit
each of these polar types." (Kogan 1971 p 253)
Despite many of his earlier criticisms, recent research by
Satterly (1979) seems to offer some support to the assertions made
by Kogan. Satterly identified some factors which lead him to now
accept that the cognitive style measured by performance on the EFT
is an educationally relevant measure of individual difference.
Satterly and Telfer (1979) found that, in agreement with Witkin,
field independent pupils favour school subjects where greater cogt.
nitive activity is necessary, rather than those subjects which merely
required reproduction of what had been seen or heard. It was also
found that in complex information processing tasks gains may be made
when the children are made consciously aware of the inherent organi-
sational structure of a piece of learning, especially for those field
dependent pupils who lack the facility of analysis associated with
the articulated end of the dimension.
In a further study of the co-variance of cognitive styles, in-
telligence and achievement Satterly (1979) identified factors of
46

general ability, field independence and levelling-sharpening. One
of the highest factorial loadings were found between the EFT and
tests in Mathematics and Geography. The geographical tasks selected
were of a spatial nature associated with children's understanding
of maps and plans. (0.386 for Test 1 and 0.398 for Test 2) The
results lend further support to the association of this style to
spatial abilities and more especially to mapping abilities. Yet the
analysis of this piece of research Satterly concluded "provides
some support for the independence of cognitive style from general
intelligence."
If it is possible to separate cognitive style indices_ from the
usually accepted indices of ability and aptitude, Kogan believes this
is of considerable educational significanee. It demonstrates, for
example, that standardised tests of intelligence do not begin to tap
the many forms of cognitive variation present in the repertoire of
all children. It was this conclusion that led Piaget to search for
an alternative investigatory technique and to adopt the clinical
method as a means of revealing more information about childrens'
reasoning than is obtained from standardised test results. It is per-
haps important therefore to consider information derived from tests
of cognitive style in the same way that Vernon (1979) suggests In-
telligence test scores should be interpreted,that is as one further
part of the complex jig-saw of individual differences, which help
us to understand that individual a little better.
A further implication is that educators cannot afford an ex-
clusive pre-occupation with mastery of subject matter, but rather, must
give due consideration to the child's mode of thinking. Bruner (1966)
aptly describes the interplay of recognising individual differences
and determining the strategies and goals of instruction when he says,
"Individual differences exist in massive degree - in the
extent to which children have problem-solving predispositions,
in the degree of their interest, in the skills that they bring
to any concrete task, in their preferred mode of learning and
representing things, in-their ability to move easily through
any particular sequence and in the degree to which they are
initially dependent upon extrinsic reinforcement from the
teacher. The- fact of individual differences argues for pluralism
47

and for an enlightened opportunism in the materials and methods
of instruction no single ideal sequence exists for any
group of children. The conclusion to be drawn from that asser-
tion is .... that if a curriculum is to be effective in the
classroom, it must contain different ways of presenting sequences,
different opportunities for some children to 'skip' parts while
others work their way through, different ways of putting things.
A curriculum, in short, must contain many tracks leading to the
same general goal". (p 71)
(viii) Relationshi s with Ehvironmental Understandkas
Faced with the complexity of reality man attempts to identify
significant features and relationships and searches for order.
Bryant (1971) regards the way man understands his environment as
the central problem of cognitive psychology. The development of this
understanding, which is always incomplete and approximate, is the
result of a long and complex process throughout childhood.
It is a complex one because it involves not only the way
children manage to learn the rules that govern their world but
also the effects of this learning on subsequent behaviour.
The way a child understands his environment probably effects
his behaviour in it and his behaviour probably determines the
experiences on which further development is based." (p 22)
(Bryant 1971)
The association of ideas within the mind provides a conceptual
framework for handling sense perceptions and enables us to go beyond
an immediate experience. If Witkin's suggestions are in any way
correct, the conceptualisation that he proposes would seem to be of
fundamental importance in helping us to understand the way in which
an individual comes to terms with his environment and learns and
interprets his environmental experiences. In Witkin's terms,
investigation of experience in any domain is likely to reveal a
general tendency to function at a more or less 'differentiated'
level. Witkin (1976) believes that with growing knowledge about
salient cognitive styles, in time it will be possible to identify
each individual's cognitive pattern. This cognitive pattern he
refers to as "an individual's Cognitive Map" - which he suggests is
a comprehensive classification of an individual's cognitive and
48

broader psychological functioning.
The term 'Cognitive Map' has been used in an entirely different
way by those interested in man's perception of his environment,
here the term is used as a construct to provide an explanation of
how people come to know the environment about them. As Kaplan
(1976) explains,
"The Cognitive Map is a construct that has been proposed to
explain how individuals know their environment. It assumes
that people store information about their environment in simpli-
fied form and in relation to other information they already
have. It further assumes that the information is coded in a
structure which people carry around in their head and that this
structure corresponds, at least to a reasonable degree, to
the environment it represents. It is as if an individual
carried around a map or model of the environment in his head.
The map is far from a cartographer's map, however. It is
schematic, sketchy, incomplete, distorted and otherwise simpli-
fied and idiosyncratic. It is after all, a product of experience
not precise measurement." (Kaplan, Preiser Vol 1 pps 275 - 6
1974) In that one's cognitive map as represented in these terms is
built up on the basis of experience, one might expect a preferential
learning set, as identified by cognitive style research, to influence
the way in which an individual's image of his environment is con-
structed and developed. It is interesting therefore, that Witkin
chose to adopt the term 'Cognitive Map', for the potential inter-
relationships between cognitive styles and cognitive maps seem
worthy of further investigation. The next section of this study
reviews the growing interest amongst psychologists and geographers
into the field of Environmental Perception and particularly the
various interpretations and uses of 'cognitive map' before prodeeding
to a discussion of the relationships which might exist between an
individual's cognitive style and his perception of his environment,
but before doing so it would seem pertinent to indicate issues in the
previous discussion which are thought to be pertinent to the proposed
study.
49

(ix) Areas of otential staly
Within the text, the followin factors would seem to be 9112B2Etpnss. for the proposed study:
1. Cognitive styles appear to be closely associated with environ-
mental experience' (p1M
2. Cognitive styles develop slowly and experientially - as does
an individual's perception of his environment (p7 and Bryant's
comments p413)
3. A suggestion has been made that research is needed which relates
cognitive styles to environmental experience (p11 )
4. The middle years is seen as a period of important changes in the
style identified by Witkin - and the study proposes to focus
attention on this age group (p 16)
5. The relationship between ICI and cognitive style is still not
really very clear - and this is perhaps worthy of further re-
search.( p 18/19)as are the relationships with personality.
(p 20 on.)
6. It would be possible to test Witkin's assertions on p 20, that
an individual's ability to break up a configuration will be
manifested in problem solving activities - especially in terms.
of environmental encounters.
7. There appear obvious relationships with mapping abilities. A
map requires the ability of an individual to 'disembed' from a
symbolically presented stimulus array. (comments on page 20)
Map understanding could also be described as an 'analytic' skill -
and is likely to be more successfully undertaken by field in-
dependent individuals. (pps 21 and 42)
Maps might also be described in terms of the articulated -
global dimension, as demonstrated in the Articulation of Body
Concept Scale (p 22). As with the Articulation of Body Concept Scale there is an
important and often ignored element of drawing ability in maps
which merits further consideration in the analysis of individuals
mental representations of their environments. (p23 )
49a

The associations suggested here have been demonstrated by
Satterly's research (1976, 1979) (p47)
8. The educational applications of cognitive styles research for
learning and teaching about the environment, as well as for the C
structuring of environmental experience would seem to be an
important area of potential research. (pps 20
9. Although many of the criticisms discussed are justifiable and
raise doubt about the existence of the style identified by
Witkin, it appears that the majority of the criticisms are levelled
at research other than that undertaken by Witkin and his colleagues.
(PPs 41 -48)
49b

CHAPTER THREE - A review of the literature associated
with the study of Environmental Perception
Introduction
This section opens with an attempt to delineate the field of
study which has come to be known as 'Environmental Perception'.
An analysis of this kind necessarily leads to an examination of
terminology which arises in the literature and in particular, terms
such as 'perception', cognition' and 'images' are considered as are
the factors which contribute to their formation. x selection of the
resultant models of 'environmental knowing' are then
compared and contrasted. The historical and philosophical roots of
this area are also discussed and particular reference is made to
the contribution of geography to perception studies. A review of
the various kinds of research undertaken to date are considered in
relation to the problems of measurement and the measurement techniques
which have been employed in the research. One particular technique,
'cognitive mapping', which has been extensively used by researchers
in this area, is critically evaluated. The final section examines
how it is believed an individual's knowledge and understanding of
his environment develops, and concludes with a review of the investi-
gations which have been undertaken into children's perceptions of
their environment.
(i) The Studi of Environmental. Perce Lion
"There is an environment in the m4nds of men. It encompasses
the environment of sun and rain, bricks and mortar, people and
things. For the human concerned, it is no less real than the
external ambience despite its existence solely in the form of
perceptions, cognitions, attitudes, beliefs and behaviour,
It is the environment which men both respond to and seek to
fashion." (Kates 1970 p 648)
Saarinen (1970) referred to a list of over thirty disciplines
of knowledge concerned in some way with the relationship which exists
between man and his environment. Of this range, he suggests that
the two main contributors in this field are those of geography and
50

psychology. The geographer attempts to understand man's use of or
behaviour in the environment, whilst the psychologist focusses upon
man's psychological processes in order, to explain how the environ-
ment is known.
During the 1960's there was considerable inter-disciplinary
interest in the interaction between man and his environment, which
has culminated in a wide range of studies which collectively have
been referred to in various ways. For example, the fields- of
Environmental Cognition (Golledge 1975), Environmental Perception
(Goodey 1971, 1974), Environmental Psychology (Craik 1969, 1970)
ittelson, Proshansky, Ruhn and Winkel 1974), The Psychology of Place
(Canter 1977) and more recently, Environmental Knowing (Moore and
Golledge 1976).
The range of titles listed here demonstrate clearly the potential
from both geography •and psychology to studies which attempt,
*v. to understand the relations among human experience and
behaviour and the large scale socio-physical environments in
which we carry out our daily lives." (Moore and Golledge 1976
p xi)
Environmental Perception, Cognition or Knowing are collective•
terms therefore for any of the ways in which we apprehend our
surroundings. The environment we experience and the way we make .
sense of that experience is a cognitive or mental process in which
environmental reality is thought to be simplified in to environmental
images which we all carry around with us in our heads. Pocock
(1978, 1979) conceptualises such environmental images as,
"... learned and stable mental conceptions .... mental models ...
which can be thought of as summarising an individual's environ-
mental knowledge, evaluations and preferences and as having
implications for their behaviour." (Pocock and Hudson 1978 p 3)
Studies investigating into this area work from the premise that
an individual's understanding of the world is built up through direct
sensory experience which is ordered in significant ways through the
processes of perception and cognition. These processes are also
thought to be subject to social and cultural influences.
51.

Downs (1970) for example argues that,
"Perception studies concentrate on the cognitive understanding
that man has of his environment and the way in which this
knowledge is stored and organised in the mind: that is, they
are concerned with the image of the real world. One of the
principal under-pinnings of the perception approach is that
spatial behaviour is a function of the image, where the image
represents man's link with his environment. The focus is on
such problems as the nature of the image, its relationship to
the real world, the processes which influence the transformation
of the real world into the image and the precise effect of images
on decisions. In addition, these problems have a dynamic aspect
through time and vary across different groups of people." (p 70)
The similarity, or commonality which runs through the various
defined fields, as listed earlier, is demonstrated by comparing
Downs discussion of 'perception studies' with that of Moore and
Golledge (1976) below, who state that,
"Environmental Cognition is the study of the subjective information,
image impressions and beliefs that people have of-their environment;
the ways in which these conceptions arise from experience and
the ways in which they affect subsequent behaviour with respect
to the environment." (p 3)
It is possible to isolate similar definitions for each of the
fields of study already suggested and it is clear therefore that
these terms should be regarded as synonymous.
It is the case however, that many psycholgists are critical of
the use of the terms 'perception' and 'cognition' in the context to
which they are referred here. Goodey (1974) for example suggests
that 'conception' or 'un_ders•tanding' might in fact be better terms
to use, IT ... and at times the rather free use of terms like 'perception'
or 'cognition' must disturb psychologists and others who recog-
nise a very precise meaning for these terms." (p 8)
It is just this lack of.precision that leads Burgess (1979)
to suggest that the supposed relationships between psychology and
geography in this area are somewhat tenuous. She suegests that not
52

only might psychologists be critical of use of terminolgy, but also
of research methodology and measurement techniques employed in studies
within this field. It is clear from.Goodey's comments above however,
that geographers are conscious of these criticisms and it was this
that led Moore and Golledge to refer to their recent edition of
collected papers as essays on 'Environmental Knowing'. Similarly
it is possible for geographers to be critical of psychological use
of terminology, for the term 'environment' is psychologically conceptua-
lised as micro-scale laboratory settings, (Burgess 1979), or refers
to social and interpersonal influences on an individual with little
or no reference to the characteristics and attributes of the physical
environment. (Wohiwill 1970)
While on; should not underestimate the contribution made by
laboratory experimentation, research that isolates man in an artifi-
cial environment runs the risk of sterility and irrelevance and
phenomena studied may never occur outside that setting. As Proshansky
(1976 p 63) comments,
"Since at a very minimum the person's awareness of his being in
a given physical setting is a requirement for his behaving and
coming to terms with that setting, no laboratory or other
artificial setting, no matter how contrived can serve as a sub-
stitute for such a reality. No matter how well a research
setting duplicates the real physical world of the individual,
hie knowledge that it is not the actual setting immediately
invalidates the integrity of any person - environment phenomenon
being studied in relation to that real world setting ... "
Geographers adopt a different interpretation of 'environment'
to that of the psychologist. The Gersons (1976) for example suggests
the term environment is taken to mean,
"...places and the characteristics of those places."
It is clear therefore, that geographical conceptions of an
environment are on a much larger scale and concerned with the environ-
ment as it is, rather than an abstraction of a limited aspect of
reality, whatever reality might be.
The difficulties of definition raised here, lead Burgess (1979)
to suggest that the fusion of ideas evident during the late 1960's is
now fading "... as researchers return to their parent disciplines
and a more traditional pre-occupation about appropriate research
topics and methodologies." (p 321). If this is true, some might
regard it as unfortunate. In 1970 Wood suggested that studies 53

linking geography and psychology may have a unifying value for the
realm of the social sciences and in a geographical context, Burton
(1963) commented that,
"Perception may soon come to merit a place alongside the
quantitative revolution in terms of significant viewpoints."
(p 157) In his review of the status of perception studies until 1970
Downs commented however, that even the most fervent proponent of
the view that human spatial behaviour patterns can be partially
explained by a study of perception would admit that the resultant
investigations have not yet made a significant contribution to our
understanding. More recently Pocock and Hudson (1978), Canter (1977)
and Spencer (1973) would refute this claim. Similarly, as Moore
and Golledge point out (1976 p 22) the exchange across disciplines
has facilitated the development of theoretical constructs which are
comprehensive and not discipline bound.
Despite the criticisms mentioned here, the range of studies
stimulated by the field of man-environment interactions is vast
and is still growing. In a review of research revised-until 1975,
Goodey, Spencer and Daniels listed over 1,250 pieces of research
based on this theme and this collection they recognised as represen-
ting only a partial selection of the available research.
(ii) 'Perception' and 'Cognition' in the study of Environmental
Knowina
It is clear from the discussion so far that perceptual and
conceptual development are central to the processes underlying how
we come to know and understand an environment. In the light of
criticisms levelled earlier it would seem important to clarify the
meanings associated with these terms. Whilst conceptual develop-
ment will be dealt with in a later section, the role of 'perception'
and 'cognition' in the development of 'Environmental Knowing' will
be discussed here.
Dictionary definitions of 'perception' trace the root of the
term to the latin 1 percipere4,to take hold of, feel or comprehend.
Goodey (1971) refers to Webster's (1962) dictionary which lists the
following interpretations (p 1,085)
54

1. Consciousness, awareness.
2. The awareness of objects or other data through the medium
of the senses.
3. The process or faculty of perceiving.
4. The result of this; knowledge, etc gained by perceiving.
5. Insight or intuition, as an abstract quality.
Perception might be regarded therefore as the process of being
aware. It is true to say that most work on perception has been
undertaken by psychologists, yet, as a process it is still one about
which psychologists are not totally agreed. This is reflected in
Saarinen's (1969) reference to the International Encyclopaedia of the
Social Sciences, in which the definition and discussion of 'perception'
is allocated some 50 pages. Bartley for example commented,
"Nowhere in the literature can we find in concise and adequate
form a well rounded account of what perception is, what its
characteristics are and or how it relates to other aspects of
behaviour." (1958 p 449) and more recently in discussing perceptual development, Bryant (1971)
commented,
"The central problem in perceptual development is whether there
is such a process at all." (p 200)
In the study of perception, psychologists have considered a
variety of topics, the perception of shape, depth, form, movement
and perceptual illusion, as well as that of time, race and other
variables. (Vernon 1969, Wohlwill 1960). To the psychologist, it
is clear that perception is not only a process of seeing, but also
of hearing, tasting, touching and smelling and empirical research.
has led to the construction of general theories of perception and
the role of perceptual processes in behaviour. The particular inter-
pretation adopted, often reflecting the psychological perspective of
the researchers involved (eg Behaviourist, Psycho-analytic, cognitive
or humanistic).
Moore and Golledge(1976) in theif discussion of 'perception'
recognise a variety of contexts in which the term is used, by
psychologists, and other behavioural and social scientists. To
the experimental psychologist they recognise a very limited definition,
55

that is the reception of external stimuli through the 'psychological
excitation of periftral sense receptors." (p 6) Whereas to social
and personality psychologists, perception refers both to the sensory
awareness of people as social objects and more broadly to the overall
impressions that people form of each other. To behavioural psycho.
logists, social geographers, sociologists and political scientists,
the term has become an all encompassing one, referring to perceptions,
images, memories, preferences and attitudes. In fact to all the
psychological factors assumed to affect large scale spatial behaviour.
This range of interpretations is reflected in the available
literature. Allport (1958) for example argued that perception has,
... Something to do with our awareness of the objects or
conditions around us. ,It is dependent to a large extent on the
impression these make on our senses. It is the way things look
to us, or the way they sound, feel, taste or smell. But perception
also involves, to some degree, an understanding.awareness, a
'meaning' or 'recognition' of these objects ... We can include
all senses and interpret perception as covering the awareness of
complex environmental situations as well as single objects ...
things can and do look differently from the way they 'are' •
and when we realise this fact and begin to explore the reasons
for it we shall have gained some light of the meaning of perception
and the problem it presents." (p 14 - 15)
Probably the foremost psychologists studying the nature of perception
are the Gibsons. Eleanor Gibson (1969) for example describes perception
in functional terms, as the process by which we obtain firsthand
information about the world. As a process it has a phenomenal aspect,
that is, the awareness of events presently occurring in the immediate
surroundings and a responsive element, which entails discrimination, a
selective response to the stimuli in the immediate environment. The
stimulation potential is considerably more than the individual's
ability to register, as a result of which perception is seen by
Gibson to be selective. Progressively the individual learns to
selectively discriminate from the available information in an en-
vironment and this is a direct result of experience and maturation.
This implies therefore that some recognition of the processes involved
56

and the individual differences that exist in perceptual learning,
would appear to be of importance in developing an understanding
of how individuals come to 'know' their world. It would also seem
essential that teachers are informed of the varying perceptual
influences and levels of perceptual functioning that one might expect
of children of varying ages.
It now seems clear from the work of Bower (1964, 1966) Fantz
(1964) Saayman, Ames and Moffett (1964) and Salapatok and Kessen
(1966) that the human infant is born with the ability to distinguish
shape, distance and colour. If these basic perceptual mechanisms
are innate, it is very tempting to suggest that they are also fixed
and unchangeable. The most convincing attempt to show that this is
not so comes from the Gibsons (Gibson and Gibson, 1955; Gibson, 1966;
Gibson, 1969 and more recently Bryant, 1971, 1974). Their hypothesis
suggests that what a person perceives is the end product of considerable
selection and this selection changes with age. They claim that a
person's perceptual world differs along several stimulus dimensions
and that some of these are likely to be relevant to his On-going
behaviour while others are not. He attends primarily to those that
are relevant. and ignores those that are not. The child's major
perceptual task, according to this hypothesis is to detect the relevant
distinctive features. As he grows older, his knowledge of the
significance of different dimensions increases and the actual signi-
ficance of some dimensions may change, so that dimensions that were
previously irrelevant become relevant. What an individual perceives
therefore, is dependent upon his understanding of what is significant
for him in his environment. Whilst the research of the Gibsons and
Bryant focusses upon simple contexts such as the orientation of lines
and figures, it is an easy task to translate the hypotheses outlined
to more complex environmental situations and envisage a similar
developmental process at work. In part this is what studies of
Environmental Knowing have attempted to do.
The most recent developments in perception research is that
being undertaken by physiological psychologists and neurophysiologists
(Blakemore 1978, Oatley 1972, Hubel and Weisel 1965). The main focus
of attention in these studies is an attempt to explain behaviour in
terms of the workings of the central nervous system and the brain's
functioning mechanisms. This research is clearly on a micro-scale
57

and investigates the functioning of inaividual and/or groups of nerve
cells, but as Oatley (1972) comments,
"Individual nerve cells carry out only quite simple logical
operations; it is rather their inter-connections that give
rise to the complexity of behaviour and enable the brain to
represent symbol ically and to represent situations and events
in the outside world. It is upon this capacity that we depend
for perception, purposive behaviour, learning, memory, thought
and language,"
in fact, to our coming to terms with the environment around us.
In these neurophysiological investigations, perception is regarded as
the interpretation of information sensed through our various receptors.
Oatley (1972) suggests that man's development has been influenced
by his environment and that in this context, perception must be
associated with the ability to interpret patterns of receptor stimu-
lation as objects within this environment, the attributes of these
objects and their relationships with each other. EXperience then
creates in the mind of the perceiver a model of the world to which
he responds. To this extent the world is created in the minds of
man out of the mass of impinging sensory stimulation. Thus as well
as classifying and grouping the patterns we perceive, perception
is regarded as an interpretive process. Perception in a neurophysio-
logical sense is not just a problem of pattern recognition, but also
....Uncludes being able to describe visual scenes, to first see a
wall then the rows of bricks and to see a world full of objects
and people with which to interact in an indefinite number of
ways." (Oatley 1972)
Research in to the workings of individual nerve cells, especially
the influence of different orientations of light on different parts
of the retina has provided an important stimulus in the field of
artificial intelligence. Computer programmes have been developed
which have helped further the understanding of the perceptual process.
Patterns of light impinging on the retina, it seems are decomposed into
their constituent elements, and this begins to demonstrate the importance
of being able to describe and interpret the relationships between
these parts. The faculties of decomposition, description and inter-
pretation are pre-requisites for adequate classification of objects
58

within a scene. Since we do not respond directly to patterns in the
retinal image, we need to decompose and interpret these patterns
into the domain of real things in the real world. It is only then
are we able to identify features and regularities within our environ-
ment and respond to them appropriately. As Bruner (1957) suggests,
in naturally attempts to order the perceptual chaos he meets and
learns to order his various percepts in an established and accepted
framework. This framework is built up and elaborated upon as the
child develops. Perceiving the environment through all of his senses,
man is required to interpret the various components that he meets
(ie colour, movement, form etc etc) He forms hypotheses on the basis
of these perceptions and accepts or rejects them as a result of
previous experience.
From the previous discussion therefore, perception is more than
the immediate sensory stimulation of our various receiving mechanisms.
Ittelson (1973 pps 1 - 19) suggests that perception should be viewed
as a middle stage in the process of sensory awareness between 'Sensation',
the initial unorganised response to a stimulus and 'Cognition' a
general awareness, or a simmary of all previous stimuli. The close
association of perception and cognition is recognised by meny researchers
in this field and as such perception is regarded as a function of
cognition (eg Allport 1955, Bruner 1957, Brunswick 1956, Gibson 1969,
Ittelson 1951, 1960, 1973, Neisser 1967, Piaget 1969, Pick and Pick
1970, Vernon 1962, Wapner and Werner 1957 Wohlwill 1960).
Wapner and Werner (1957) for example treat perception as a
subsystem of cognition, where knowledge about the world may be con-
structed by many means, of which perceptual judgements are but one.
As development proceeds Wapner and Werner argue that perception
becomes of less importance, subordinated to higher mental processes.
Piaget (1969) makes an important distinction between two - types
of knowing. Figurative Knowledge, which is related to the 'percepts'
or 'images' of successive states of the world by direct or immediate
contact. This is immediate experiencd and momentary configurations.
Visual perception is regarded by Piaget as an example of Figurative
Knowing. • Operative knowledge on the other hand relates to the operations
that intervene between successive states and are the means by which a
59

person transforms perceived parts of the world in to recognised
schemata (patterns of activity which are co-ordinated and act as
integrated wholes, as distinct from strings of separate responses)
and mental structures. Piaget argues that intelligence or cognition
is based upon the operative mode. Like Piaget, Epstein (1967)
suggests that the standard criteria for perception are 'immediacy'
and 'stimulus dependency'. Immediacy implies that a behavioural
response, whether overt or covert immediately follows or accompanies
'energistic impingements' on the sense organs. Stimulus dependency
implies that a great proportion of the variance of perceptual
response can be accounted for by the physical properties of stimuli.
Some stimuli are more complicated than others. There are some percep-
tual responses that do not accompany or immediately follow stimulation,
and others that are not totally dependent on the immediate stimulus,
but considered and explained as a result of past experience, as for
example in perceptual illusion. Furthermore, most perceptual tasks
require an interval between stimulus presentation and an individual's
response. It may be questioned therefore, if pure perception ever
exists and as suggested it is probably better to regard perception
as a facet of 'Cognition' which refers to,
... the various means of awareness or knowing that intervene
between external energy impingements in the present and the •
past and the entire gamut of human behavioural responses present
and future ... thus subsumes the more specific concepts and
substages of perception, imagery, retention and recall, reasoning
and problem solving and judgement and evaluation. As such it.
includes the various processes by which visual, linguistic,
semantic and behavioural information is selected, encoded, reduced
and elaborated, stored, retrieved, decoded and used." (Moore
and. Golledge 1976 p 6)
(iii) The Senses
The experience upon which perception and cognition focus is
registered through the senses and although it is conventional to
consider the senses as those of taste, touch, smell, sight and hearing,
Gold (1980, p 50) reminds us of the four tactile or skin senses of
pressure, pain, cold and warmth and the two body senses of balance
60

and Kinesthesis. Gold believes that spatial information is derived
from all the senses, as is demonstrated in Banz's (1975) analysis
of the sources of information in the urban environment, which is
described in terms of those features which might be regarded as
sensually stimulating, as opposed to those which might be repulsive
to an individual.
Fig. 1 bENSUAL SOURCES IN THE URBAN ENVIRONMENT
[ Positive: Stimulation (beauty, excitement)
Negative: Repulsion (ugliness, chaos)
-I_ -Positive: Negative: Stimulation
drills, car horns) Confusion (pneumatic
(wind rustles leaves)
Positive:
--Negative:
-Positive:
Olfactory —Negative:
rVisual
-Direct Experiencei
Aural
Kinetic
Stimulation (solar radiation, textures)
Abrasion
Stimulation (agreeable smells)
Revulsion (offensive smells
rInterpersonal 1:Positive: Face-to-face
Negative: Confrontation
Mass
Positive: [ Stimulation through mass media
Distraction
Communication
Negative:
(After Benz 1975 p 165)
Further Skurnik and George (1967) suggest that the detection
range of individual senses varies enormously with only the 'distance'
senses of sight, hearing and smell able to receive stimuli from parts
of the environment beyond the tactile zone. Of these, sight is
probably the most important source of spatial information. Dodwell
(1966) points out that over ninety per cent of human knowledge
61

about the external world is received through our eyes. Visual
information is recognised as precise and more detailed than that
derived from the other senses, yet it is important to recognise that
on some occasions smell, hearing or even tactile experience can extend
the range beyond that of the immediate visual field. In an urban
environment for example the sounds of moving traffic, smells from
local factories, or the vibrations experienced from an uneven road
surface can provide important additional information and probably
of greater significance, can stimulate affective aspects of our
spatial understanding and knowledge.
(iv) Ima&es of the Environment
To the psychologist, the objective environment that we as
individuals all see is unknowable, because as has been suggested
earlier, it is a personal construction. In our interpretation of any
individual's understanding or knowledge of his world we are forced
to rely heavily on inference, which is one of the major problems
of cognitive psychology.
As Neisser suggests.
"We have no direct immediate access to the world, nor to any
of its properties ... Whatever we know about reality has been
mediated." (Neisser 1967 p 3)
It is obviously of importance to consider the information pro-
cessing capacities of the human brain, for at. any one moment the
individual can absorb only a tiny fraction of the potential stimuli
in an environment. For the viseal sense alone, it has been estimated
that the environment supplies some ten million units ('bits') of
information every second. In the same period of time, Held and
Richards (1972) suggest that the brain can only absorb around twenty •
five units. Similary, Lowenthal comments that other research has
suggested that an individual is able to monitor some eighteen separate
images or sense impressions every second, (Lowenthal 1961 p 78)
and further Miller indicated that the processing of such information
is limited to consideration of up to seven pieces at any one time.
(Miller 1956 pp 81 - 97). This supposed limitation of the processing
facility of the brain reveals another difficulty of investigating
62

individual's environmental understanding but it further explains
the natural filtering system which human beings possess. This
system limits the variety of environmental information that it is
possible for any individual to consider. Without such a filter, the
condition of information overload would result in confusion and
mental imbalance. (Oatley 1972) Pocock and Hudson (1978) suggest
therefore, that,
” .... familiarity holds the Key"
or as in Boulding's (1956) words,
".. part of the image is the history of the image." (p 174)
The idea of the 'image' standing as a 'representation' of an
individual's environmental knowledge is a theme which consistently
appears in the available literature. In one sense this 'representa-
tion" may be taken to refer to the re-presentation of something by
symbolising the absent thing, as for example when a painting represents
a landscape. Alternatively representation can be taken to mean
'Knowledge' or 'thought' itself. It is in this context that the term
is used when various writers talk of the 'images' people have of their
environment (eg Lynch 1960, Strauss 1961, 1968) or of the personal
constructs by which one organises knowledge of the environment (eg'
Harrison and. Sarre 1971) or of the ways in which one 'construes'
the environment (eg Wapner et al 1973).
Piaget (1951 pps 67 - 72) for example distinguishes between two
interpretations similar to those described. For the first he suggests
that 'symbolisation' might be a more appropriate term, but where
representation is taken to refer to knowledge or thought itself,
Piaget suggests a more appropriate description would be 'conceptual'
or 'cognitive' representations, which are internal and refer to
knowledge which is not directly observable. As a result such internal
representations have to be inferred. Noore and Golledge (1976 p 8)
raise important questions in relation to the non-observable nature
of 'cognitive representations' in terms of their logical status.
They suggest there are three possible interpretations. Firstly, the
term is used as a 'hypothetical construct' as a proposition about
hypothetical entities, processes or events which are not directly
observable. The second possible interpretation is as an 'interventas
63

variable' where the term 'representation' is seen as a summary of
the variables in a statement of the relationships which exist within
an environmental framework. The third interpretation they suggest
is a more metaphorical use which is an las-ift or 'unreal' usage,
as for example when Tolman (1948) describes men and rats as having
'cognitive maps'. This interpretation is one that has raised problems
in the study of environmental understanding and produced a proliferation
of commonly used, and often misused terms, eg mental maps or cognitive
maps (which will be discussed in more detail in a later section).
The first attempt to demonstrate environmental images in this concrete
form has been attributed to Lynch (1965) who suggested that when
attention is turned to the content of the individual's mental image,
one of the major components is the basic physical structure, what is
contained within the image. Lynch (1960 pp 46 - 90) hypothesised
that art individual simplified the physical characteristics of his
environment by organising it in terms of five main elements. Paths
are channels along which the individual moves, Edges are linear
elements which provide the outlines to areas, and often a form of
barrier, Districts are distinctive areas of an environment, Nodes
are the strategic points within an environment, often converging
points of paths and finally Landmarks are single prominent elements
within an environment. Although Lynch recognised that an individmT's
image of his environment was a result of both physical form and meaning,
he concentrated deliberately on the importance of form, developing
the central hypothesis that an individual's knowledge of an environ-
ment (Lynch was primarily concerned with city environments) was a
function of its limageability', which he defined as,
"... that quality in a physical object which gives it a high
probability of evoking a strong image in any given observer.
It is that shape, colour or arrangement which facilitates the
making of vividly identified, powerfully structured, highly
useful mental images of the environment." (Lynch 1960 p 9)
Lynch empirically tested his hypotheses and demonstrated how
the images of the central areas of Boston, Jersey City and Los Angeles
were constructed. HiE research methods have been replicated in
various cultural settings. More recently, Lynch (1977) has co-
ordinated a 'UNESCO investigation based on these ideas, which monitors
children's perceptions of city environments in varying cultures,
Research teams in Argentina, Australia, Mexico and Poland investigated
the way groups of adolescents use and value their spatial environment. 64

All lived in low-income areas in homes that were limited in space
and often lacking basic amenities. It was clear from this study
that the immediate social environment, parents, neighbours and
friends all had their impact on the development of spatial under-
standing and the children's image of their environment and were all
part of an important socialisation process.
More recently, Lynch's ideas have been subject to criticism
and modification. Gold (1980) identifies four major deficiencies
in Lynch's approach. The first concerns methodology, particularly
the use of freehand sketch maps as a means of eliciting an individual's
knowledge of his environment. As has been stated, this particular
process will be discussed in more detail in a later section, but in
principle, the validity of the technique depends upon the map being
a true representation of a person's cognition of the environment.
Spencer (1973) found the technique both difficult to administer and
suspect in its results when studying a working class community in
Birmingham and concluded that Lynch's sample were obviously more
familiar with maps and had the requisite skills to draw them.
Similarly Graham (1976) finds the whole concept of 'mental maps'
conceptually dangerous, and lacking in coherence.
A second criticism is the emphasis on visual components of
environmental knowledge. Lynch has himself moved away from visual
information towards considering additional forms of sensory information,
drawing attention to the important affective properties of the non-
visual senses. Southworth (1969) for example, studied the sonic
environment of Boston and demonstrated the contrasting environmental
experiences derived from different senses and more especially the-
close relationship between hearing and emotion. For example, the
Boston water front was described as monotonous by a person deprived
of hearing, but thought of as delightful by one who was blindfolded.
A third point argues that Lynch ought to have considered the
functional and symbolic use of space in urban environments. Steinitz
(1968) who re-examined the area of central Boston that had been
studied by Lynch considered functional meaning to be fundamental to
urban life, simply because it is of importance to know what is happening
and where. In support with a previous study by Gulick (1963),
65

Steinitz argued that the imageability of a city was determined by
visual differentiation of physical form as suggested by Lynch but
in combination with significant social or behavioural associations.
Individuals and groups can and do impose their own meaning on their
environments, as was demonstrated in Lynch's (1977) UNESCO study.
The validity of Lynch's five environmental elements has also
been questioned. Sarre (1972) for example added 'function' in his
study of Bath. Goodey et al(1971)altered the typology more radically
in the 'City—Scene' Project, which had obtained sketch maps from
individuals in response to articles in a regional newspaper. In
their analysis Goodey et al found difficulty in differentiating
between some of Lynch's elements without the respondents there
to explain to them. They condensed Lynch's typology to paths,
nods/landmarks and edges. Similarly Pocock (1975) in his study of
Durham classified the elements that appeared on sketch maps into
point features, linear features and areas, which is comparable with
Gold's (1980) sub division of environmental elements into buildings,
(monuments and landmarks), paths and areas. Gold also criticises
Lynch for ignoring the influence of emotion and attitudes in his
early studies of individual'sperceptionsi for our expectations,intentions
and feelings about places are certain to influence how they are
conceived or 'imaged' as well as how an individual might behave or
react in them.
(v) Motivation Emotion and Attitudes
Theories of motivation can be classified in one of two ways, those
that suggest man is motivated by a desire to overcome the stresses
imposed by his environment and to the reduction of tension (Evans
1976) and those that suggest human beings desire novelty, excitement
and stimulation and thus actively seek to increase tension (Berlyne
1950, Wohlwill 1968, White 1959). Underlying such interpretations is
the concept of needs. Some needs require satisfaction for continued
survival, as in the case of food and shelter. Other needs are more
social and personal and incorporate the importance of acceptance and
recognition by one's peer group, as opposed to those which drive
individuals to fulfil their own self image. Emotion is an area of
66

psychology which is associated with research in to human motivation.
Some emotions accompany motivation, as for example when an individual
strongly desires something, the accompanying emotional state increases
the strength of desire to achieve the goal. Other emotions result
from motivated behaviour, such as the feelings experienced when a
course of action succeeds against all odds.
Although little research has attempted to identify affective
aspects of the physical environment and their relationship to be—
haviour, some interesting exploratory studies have been undertaken.
Rapoport and Kantor (1967) analysed people's affective responses to
the built environment and have suggested possible design implications
from their results. Mehrabian and Russell (1974) suggest that the
information load of different environments coupled with the tcheracteri—
stic emotions associated with personality' stimulate primary emotional
responses which they sub divide into three types (Pleasure, Arousal
and Dominance). These three dimensions of emotion then mediate
the behavioural response to the environment, either positively
(approach) or negatively (avoidance). This means that an environment
that an individual feels is arousing, unpleasant and in which he
feels submissive is to be avoided, whereas one that gives a feeling
of low arousal,mild pleasure and in which he feels dominant,is likely
to be comfortable and attractive to him. Although an important advance
in studying the association of emotion and environmental knowing,
Moore (1977) suggests that the ideas described by Mehrabian and
Russell are only concerned with a limited range of variables and
leaves much behaviour unaccounted for.
67

PRIMARY EMOTIONAL RESPONSES
BEHAVIOURAL RESPONSES
Approach-avoidance
(which includes physical approach, exploration affiliation, performance or other verbal and non-1 verbal communications of preference)
Sense modality variables (eg colour and temperature)
Information rate (characterizing the spatial and temporal relationships among the stimulus com-ponents of an environment)
Pleasure
Arousal
Dominance
[--
Characteristic emotions associated with PERSONALITY
••■■•■•101116
Fig. 2 'The Relationshi of Emotion and Behaviour'
(After Mehrabian and Russell 1974 p 8)
The concept of attitude would also seem of importance in any
behavioural study for it brings together both internal mental life
(including cognition, motivation and emotion) and overt 'behavioural
responses within one framework. Fishbein and Ajzen (1975) suggest
that an attitude can best be described as a, "... learned predisposition to respond in a consistently favourable or unfavourable manner with respect to a given
object," (In Gold 1980 p 23)
In this context, an attitude would appear to contain three basic
elements. Firstly, it is learned, secondly it effects behaviour and
predisposes an individual to certain forms of action and finally it
is relatively stable over time. These points are aptly demonstrated
in Chaplin and Krawec's (1974) interpretation of attitudes,
"Attitudes may be considered to be enduring cognitive states
which are motivational in the sense that, where strongly held,
they predispose the individual to react in a certain way."
Triandis (1971) conceived of attitudes as possessing three main
elements, a cognitive element where the individual was regarded as having thought about his beliefs, although often he need have no
coherent reason for believing in the way he does; an affective
68

STIMULI (individuals, situation, social issues, social groups and other "attitude" objects)
element related to his feelings ascociated with a particular attitude
and a behavioural element which consists of actual overt actions
associated with expressions of attitude. The inter-relationship
between these elements is demonstrated in the following diagram.
Measurable Intervening Measurable independent variables dependent variables variables
AFFECT
--ATTITUDES— COGNI-TION
BEHAVIOUR
Sympathetic nervous system responses Verbal statements of affect
Perceptual responses Verbal statements of belief
Overt actions Verbal statements concerning behaviour
Fig. 3 ATTiTuDES and the Environment
(After Triandis 1971 p 3)
Gold (1980) suggests that an attitude also incorporates a variety
of other concepts such as bias, belief, doctrine, faith, ideology,
opinion, judgement, stereotype and value. Many of these concepts
share the common characteristic of supplying a rapid, if frequently
erroneous, interpretation of environments and environmental experiences. .
They are all ways by which individuals arrange and order their ex-
periences within a particular environment. Attitudes it seems are
mostly learned in childhood and, once formed axe pervasive and
evidence exists to show that attitudes can withstand extensive
presentation of contrary evidence. (Tunstall 1970, McQuaii 1972).
Of obvious interest is the question of attitude change, in knowing
whether attitudes can be altered and whether this effects behaviour.
O'Riorden (1973) demonstrates that if attitudes were changed in some
way, a change in behaviour need not result, for there is frequently
69

111111IMillamomMimbimpm.•
SC,C40-ECC.ROM C
Tenel •
Home
PIRCIPTIOti OF ?HO Prehnencoo
(newton
URBAN ENVIROMMEntf
lanytto of Res.!onto at lotobon
ACTION
SPACE
14R PLACEs,
Rvs,
\,(-)
RAerco.,on Pelotion rov■cl. >
'FAR PLACES'
Goodey (1973)
_, 1 •SO:re't.hontato
MS Ob,oenm
--11;Himenenoo
omtbach
ET-E;h1 IVE PR )(ASSES SeRunna Perces,. tRon.9
t KIER f
INeOR:AAIKIN DECItOis
11
t X.'aTIThIATIONS
t :oNAorr V10.1.81.15
1.,01, En
GAMPAW CU urtm, .A: OAS
a gap between stated attitude and actual behaviour. It is still
the case, however, that attitudes are a further influence on an
individual's perception of his environment and need to be considered
in any analysis of an individual's perceptions.
(vi) Models of Environmental Knowing
The variety of factors mentioned to date as influencing an
individual's perception of his environment are reflected in the
various models of 'Environmental Knowing' which have been constructed.
Figure 4 presents a representative selection of such models, those developed by Horton and Reynolds (1969) Goodey (1973) Pocock and
Hudson (1978) and Gold(1980.) When the constituent elements are
analysed considerable similarities are demonstrated as can be seen
in the tabulated analysis which follows Fig. 4, as well as progression
and elaboration as the models become more recent, it is possible to
identify an increased emphasis on psychological explanation.
Horton and Reynolds (1969)
ENVI
RON
MEN
T
fi ta
U fY
o.
tu
L
Gold (1980)
Pocock and Hudson (1978)
Figure 1.. Models of Environmental Knowing. 70

.......,-..-.. 'ION end ROPIOLDS (1969) GOODIE' (1973) f POCOCK and HUDSON (1978)
1 GOLD (1980)
'Joss 'urban experiences' tnat help to explain why 1Mividuals perceptions differ
1. Conceptualises the various environments within which man operates •
•
1. Distirgyishas between 'the EnvironmentYthe Perceiver' and 'the Image'
1. Focusses on the 'Behavioural and Objective Environment' neeeanistic, reflecting influence of behavioural psychology. and models developed in cognitive psychology
The influence of Lewin is seen in 'Action Space'
2. Lewin influence is seen in 'Life/Personal Space'
,
•
3. Demonstrates a progres-sion of the Immediate and Inicem to the distant and less well known (but about which we held perceptions)
Major Influences: Travel, Sccio Economic Attitude length of residence, structure of the Environment .(Ia t. imagoeble is Lynch's
terms)
Major influences: Previous Experience of people and events group; Culture; Media, printed, spoken and photographic. Differ- emcee will depend on an individual's movements, peroeptual abilities and stimuli received.
Q. Major Influences: ' Previous Experience and Information; present situation; Individual phycho-logical characteri- atlas; cultural and social influences.
. Major Influences: Personality Variables: Group and Cultural Factors; Cognitive Processes
5. Man is located in a Dynamic - constantly interacting Spatial framework
5. A continually expanding cycle of .
learning and development
5. The no-lel demoestrates a Ideleseie process' of ma n enveeonecnt inter-actioac eed streovee the relation:haps vhich eeist
Feedback 13 seen as an important feature of the model
6. Feedback is seen as an important feature of the model
6. Feedback is seen as an important feature of the model
-------....
6. Feedback is seen as an important feature of the model
----
7. 7. Perception: an Inter- vening filter between man and the environ- meat
7. An information sus decielon filterire: .1.:TC,C112 operates ehich infleenc.eu the final image
Delineates Man's 'Action Space' in an Urban Setting
8. Results in 'Manta Perceptual Map'
. .
8. The resultant 'Im-.eel. ee.see......-. 8. Recults in an individual'a 'Cognitive eepreseetatienal Images or Spatial schemata -wnica have a direct influence on the Indieldualle BEHAVIOUR
•
•
of the environment possesses 3 Lain elements (1) Desirsative: describes and claasifies the elements upon which the image is based. (2) rnprainiv- : Evalua- tiverireferential. and reflects personal aesecia tiona of value end worth about the environment (3) Proaceiotive: Reflecting the influences of the previous two. This gives the image depth and continuity and incorporates previous experiences.
Table 3.1 J Tabulated comparison of 4 models of Environmental Knowing.
71

Each of the models analysed in the previous tabulation emphasise
the main elements with which this fie3d is concerned, namely how
does an individual come to know his environment, how is it conceived,
what are the major influences on this conception and how does this
relate to behaviour? Although individual differences are represented,
the importance and influence of the social and cultural setting is
recognised in them all, for as Goulding (1956)argues, the sharing
of similar needs, ideals and loyalties induces common or group
images. In this context, the term 'public image' is used and defined
as being a,
"... basic bond of any society, culture, sub-culture or organi-
sation." (Boulding 1956)
A similar theme is pursued in one of the seminal works in this
area, that of Lynch (1960) which was discussed earlier. Lynch talks
in terms of 'collective images'. Pocock and Hudson suggest that
there is an obvious overlap between an individual's perception and
the common image derived from group norms. The extent of overlap
could in fact be regarded as a measure of an individual's sociali-
sation or even indoctrination into a particular culture or sub-
culture.
The extent to which an individual's experience of, and inter-
pretation of his environment is unique is a factor recognised by
Sonnenfeld (1969) who suggested the concept of an 'Environmental
Personality' which he defined as the
"... predisposition to behaviour in the non-interacting
geographical environment."
Sonnenfeld argued that each of us are selectively sensitive
to environmental cues, quite apart from that resulting from social
cultural influences. He suggests that this might be a fruitful
avenue for research, that is,the identification of factors influen-
cing these degrees of sensitivity.
As a conclusion therefore, it seems possible to conceive the
varying influences and perceptions an individual might hold in the
form of a series of continua which incorporates the Individual as
opposed to the Group and the Known as opposed to the Unknown
72

B
INFLUENCES
V A
H E
0 U
R
C
A N M
A L
> 1 'F S
CULTURAL
SOC I0- ECONOMIC
rEDIA
r
Y D \ 21
IMAGE
PHY3 IOLOG ICA
PSYCHOIAGICA
' MEDIA
RIVIRON-
ME L
STRUCTURE
SCHEMA
p 11 \
R S 0 E
C
S PERSONAL
2,XPER TENCH
SOC I0-
EC ONOMIC
R E
S N P 0
E S
GROU IV1DUAL
Environment. The individual exists in a continually expanding and
changing milieu, as he responds to the varying influences impinging
upon him. Figure 5 attempts to depict this diagrammatically, where
it can be seen that an individual's schema or image is undergoing
constant modification as a result of the influences listed below. it
is a dynamic process in which the individual modifies what he experiences
by being selective in what he attends to and in turn is modified by
the experience. As Bryant (1971) suggests for cognitive development,
the way an individual conceives his environment probably effects his
behaviour in it and this determines the experiences upon which the
the further development of the image is based. Any individual image
would therefore contain considerable similarities to that of the
prevailing group conception, which of course would vary in relation
to who the 'Group' might be, but it would still be the case that an
individual's personal experience would ensure that there were elements
that differentiated his image from that of others. The similarity of
his image with that of others would then depend on the closeness of
his association with the other members of the group, hence the suggest-
ion of this dimension being,viewed in the form of a continuum.
WN
UNK tIOWN
Fig. 5 A CMEAS ITE MODEL OF :a N FNVIROMENT INTERACTIONS
73

The image a person might possess would also vary across the dimension
Known-Unknown. The image of the known environment would be clearer and
more specific than that of the unknown,and limited knowledge or
experience of some places would not prevent someone from possessing an
image of an unknown place, and often an erroneous one at that. In this
conception the image is seen as multi-faceted, expanding with experience
and providing a broadening basis for the future experience of new places.'
(vii) The e istemolo ical Basis of the Study of Environmental
Koltim
Having discussed the fundamental elements of the field of en-
vironmental knowing, it would seem pertinent to at least consider
the epistemological bases of this growing area of knowledge. Moore
and Golledge (1976 p 11) identify three fundamentally different
stances from which the relationship between the environment and
behaviour have been conceptnalised; Empiricism and Environmental
Determinism; Rationalism and Nativism; and interactionalism ,and
Constructivism.. Each of these perspectives rests on different
assumptions about what influences behaviour, the nature of reality
and the way in which knowledge is acquired. Each has therefore
adopted different questions, research methodologies and modes of
interpretation and explanation. Moore and Golledge suggest they
represent a continuum where on the one hand behaviour and experience
are treated as determined entirely by external environmental influences
and at the other extreme experience and behaviour are the direct
result of heriditary and biological influence.
'Empiricism' can be traced to the writings of Locke, Berkley
and Hume, the eighteenth century British philosophers. This parti-
cular viewpoint argues that behaviour in general and knowledge in
particular are strictly under environmental control. Reality in
this view can only be contained in sensation and knowledge of reality
is built up from successions of sensations impressed upon a 'tabula
rasa', a blank slate. This was an idea which was continued by late
19th and early 20th century philosophers of the positivist' school
(eg Compte, Mill, Wittgenstein) who saw sensation as the one source
of knowledge.
Any ideas of an 'image' in the mind in this context would be
regarded as a copy or reflection of matter, an accumulation of sensed
74

data. Despite this, the role of thought in the organisation of this
data is accepted by some neopositivists (Bochenski 1966).
The extension of this perspective came with the Environmental
determinists who define behaviour in terms of patterns of responses
which result from the environment impinging on a passive organism.
The world therefore acts on people and we are the products of forces
outside ourselves, and therefore the world is regarded as a 'reality'
with an objective existence independent of the observer. Within
this framework, three main interpretations can be identified.
(1) Stimulus - Response Theories
(2) Mediational Stimulus Response Theories
(3) Cognitive - Behaviourist Theories
In the extreme versions of environmental determinism such as
those of classical conditioning (Pavlov 1941) and operant conditioning
(Skinner 1938), behaviour is treated as determined directly by the
environment, therefore no form of representational activity is assumed
on the part of the individual. In more moderate versions such as
Osgood's (1953) 'Mediational' S - R theory or Watson's (1914) inter-
pretation, or Tolman's (1948) cognitive-behaviourist-theory, some form
of 'mediational reaction', 'intervening variable' or 'cognitive map'
is assumed to mediate between the stimuli of the environment and overt
behavioural responses.
Representation from this perspective, which has obvious associa-
tions with behaviourist psychology, are built up throagh sensation
arising from experience and they are learned and strengthened or
weakened and eliminated according to the behaviourist principles of
learning and reinforcement.
An alternative to the Empiricist, Positivist, Environmental
Determinist viewpoint is that of 'Rationalism' - which is the second
phisophical root identified by Moore and College. Rationalism starts
from the contention that knowledge is immediate, innate and exists
for us before experience. It is this 'pure' thought that opens
reality to us. All of our environmental experience in this viewpoint,
therefore unravels our own innate ideas about the environment.
Sensation creates individual images which are innate, and which arise
from our own powers of intellect. Innate concepts precede and
75

determine the data we sense and behaviour is assumed to be determined
primarily by genetic and biological factors. We are born with pre-
dispositions to react to the world in predetermined ways. In short
therefore an individual acts upon the world and the world is formed
and structured from human consciousness existing before the world is
experienced. Innate ideas thus precede and determine the form of
data to be sensed and experience in the environment simply allows
for the manifestation of these ideas in particular instances. This
particular viewpoint Moore and Golledge suggest-can be traced from
17th Century Philosophers such as Descartes, Spinoza and Leibniz,
through to Chomsky's (1965) discussion of innate linguistic capacities
and Jung's (1953) manifestation of archetypes.
An attempt to synthesise the two extremes discussed so far can
be grouped under the 'interactionist',1constructionist' or 'transa-
ctionalist' philosphy initiated by the nineteenth century German
philosopher, Kant.
Kant argued from a totally different position to either the
empiricists or rationalists. Instead he distinguished between the
'matter' or 'content' of knowledge as that which corresponds to
sensation and the 'form' of knowledge as that which causes the matter
to be organised in a particular way. As with empiricism, Kant saw
'matter' as arising through experience and as with the rationalists
he believed the 'form' of knowledge is given 'a priori'. Knowledge
of the world therefore, is seen as a synthesis, that the subject,
"constructs out of the formless stuff of experience."
(Bochenski 1966 p 4)
The importance of 'construction' is further seen in Kant's
view that'instead of ever being able to represent reality, what we
take to be real is a product of the act of knowing, that is a
'construction of thought'. Kant identified two ways of knowing, the
scientific method and an exploration of the processes by which
reality is formed in the mind. (As for example in the field of
'genetic epistemology' developed by Piaget). Two of the main
approaches to philosophy during the 19th Century were extensions of
these sub divisions. Moore and Golledge distinguish between the
constructionist position and the two previous interpretations,
76

"The position is taken, therefore, that knowledge, or cognitive
representations, as a particular form of behaviour, far from
being simply given through sensation and reinforcement leading
to covert responses and far from being given by innate ideas
before experience, are formed through an active construction
of thought influenced by both the person and the environment
and by the transaction between the two" (p 15)
The main differences between the constructionist position and
that of the 'rationalists' and 'empiricists' therefore are firstly
that there is a distinction between 'reacting to' and 'knowing
about' an object or environment. Secondly, rather thsibeing formed
throngh the reinforcement of response to stimuli, knowledge is
intentionally constructed by an individual. An important consequence
therefore is that in the constructionist approach rather than
distinguishing between an individual and his environment, what is
taken to be the environment is not a reality defined independently
of the observer, but a world established and constructed by persons
in the context of ongoing transactions in environments.
Moore and Golledge conclude their discussion of the epistemolo-
gical roots of studies of environmental knowing by emphasising the•
importance of recognising, "... the underlying assumptions about the
nature of knowledge, the nature of human beings, the nature of the •
organism-environment - relation and the implicit models of 'man' on
which we base our specific ideas and investigations. But whether
or not acknowledged outright, assumptions on these issues are implied
in all research on the, human condition". (p 16)
(viii) The Historical Roots of the Studlr of Environmental Knowing
The more recent historical antecedents of this area are wide-
ranging. The first systematic experimental investigation into human
knowledge of the large scale environment appears to have been con-
ducted by Trowbridge (1913), who investigated peoples methods of
orientation and their limaginery maps'. Trowbridge identified two
fundamental methods of orientation, a domicentric method closely
related to the immediate known environment and features within it,
and orientation in terms of cardinal directions.
77

The earliest reported study with c.nildren appears to have been
undertaken in 1908 by Gulliver, who found that young children just
starting school could not use cardinal directions for orientation,
but relied consistently on their own body position and idiosyncratic
orientation. Generally, an interest amongst psychologists in the
physical environment as a focus for research, as opposed to micro-
scale laboratory settings, is comparatively recent. In 1947 MacLeod,
an American psychologist suggested that studies of perception should .
focus on 'what is actually there for the individual' and he proposed
a branch of psychology which he referred to as 'psychological
geography'. Geographical interest in how individuals conceived of
and related to their environment have been traced by Saarinen (1970)
to the writings of Von Humboldt, who over 100 years' ago asserted,
... in order to comprehend nature in all its vast sublimity,
it would be necessary to present it under a twofold aspect,
first objectively, as an actual phenomenon and next subjectively
as it is reflected on the feelings of mankind." (p 62)
Von Humboldt felt that early impressions exercised a powerful
and lasting effect and that such impressions are derived from a
variety of sources such as, literary description, landscape painting
and direct contact with the environment. Humboldt advocated the
opening in large cities of panoramic buildings containing pictures
of landscapes from different cultures and different zones of ele-
vation so that the public might enhance their understanding of their
world.
Wood (1970) suggests that as a result of psychological investi-
gation into perception and the philosophical questioning about the
nature of reality, an awareness of the value of perception in the
study of man-environment relations began to filter in to the behavioural
sciences in the 1940's. In 1947 for example, Wright, an American
geographer proposed the discipline of 'geosophy' which was supposed
to concern itself with 'man's sense of space', especially in terms
of the individual differences across cultures. The importance of
such study was demonstrated by Fonaroff in his (1930) analysis of
the Federal government's attempts to rationalise the economy of the
Navajo Indians. The attempt failed, and Fonaroff attributed this to,
78

... their lack of understanding of the Navajo's view of his
environment; the Navajo ideas about nature being markedly
different from those of European-descended administrators."
(Wood 1970 p 130)
Similar attempts to focus attention upon cultural and individual
differences in perceptions of environments are found in the writings
of Hall (1959) who described the concept of 'proxemics' as,
11 ... the study of man's use of space as a specialised elabora-
tion of culture."
Boulding (1956) advanced the discipline of 'Bionics', which would
focus upon the study of the images and perceptions held by people.
Boulding argued that humans do not apprehend the nature of reality
directly, but through a highly learned interpretive process. As
such, he suggests that there are no such things as facts, only
messages filtered through a complex of images. These images rep-
resent an individual's impressions of different aspects of the world,
and are a major influence underlying behaviour.
In 1948, Tolman discussed the 'cognitive maps' of rats and men
and referred explicitly to individual's cognitive representations of
spatial environments. In 1952, he elaborated upon his ideas of the
ways in which environments, scenes and routes are mentally represented
by proposing the concepts of 'behaviour spaces' and 'belief value
matrices'. Behaviour Spaces were conceptualised as,
” ... a psychological space of objects with distance and direction,
as perceived by a person at any given moment." (Pocock and
Hudson 1978 p 5)
and belief value matrices as,
11 ... learned differentiations and categorisations related to
objects and behaviour in space." (Pocock and Hudson 1978 p 5)
Thus Tolman sees people as possessing mental images of environ-
ments and environmental situations which result from previous learning
and are of central importance in influencing behaviour. Thus in order
to understand an individual's behaviour one needs to know something
of how he conceptualises his environment. A similar notion is ad-
vocated by Simon (1957) who argued that people construct simplified
mental models of their world in order that,
79

"... they might successfully chart a course through life's
complexities."
The roots of the ideas proposed by Tolman and Simon are to be
found in the writings of Lewin. Using gestalt psychology and with
reference to topological geometry, Lewin (1935) developed the concept
of psychological 'life space'. This space consists of the individual
and the psychological environment that exists for him, together with
unconscious states which have effects upon him. Lewin saw the indi—
vidual personality as being broken in to 'regions' separated by
'boundaries' which become less permeable with increasing age. Lewin
used his concept of life space to consider the sum of all the facts
that determine a person's behaviour at a given time and conceived
of his task as that ofanalyng and explaining behaviour as a des—
cription of the life space at any given moment.
"Lewin's theory predicts how a psychological structure
spontaneously changes under the pressure of its own internal
dynamics." (Baldwin 1967)
Canter (1977) an Environmental Psychologist, traces the origin
of this area to the work of Bartlett (1932) and his studies of per—
ception. Bartlett believed that,
"... an examination of normal perceptual processes leads
directly and inevitably to an investigation of mental processes
and in particular to the study of imagery and recall." (Canter
1977 p 13)
Bartlett's main idea was that there are internal representations
which each individual calls upon as a reference when attempting to
reconstruct an image or scene. Bartlett referred to these images,
as 'schema' and saw inter relations between these mental re7)resen—
tations as a growing and elaborating system which structured the
ways we approach and deal with our surroundings. These schema he
believed were actively constructed. Some twenty years after Bartlett's
publication, Lee (1954) one of his students, applied the notion of
schema to the context of the physical environments where he described
the way in which our daily interactions contribute to the develop—
ment of these schema.
SO

"There is a continuous input of sensory information from the
physical and social objects in the urban locality, arising from
our repeated transactions with neighbours, tradesmen, buildings,
bicycles, parks, walls, children, shops, pubs, bus-conductors
and so on. These impressions are not alloted an equal sized
pigeon hole and stored ad infinitum or until such time as they
may be called upon. Many are rejected at once, either because
they don't fit in with what is there or because they don't
contribute anything new. The rest make their mark and leave
their impress. They modify the schema that is building up and
then they are finished in their original pristine form, living
on only in so far as the schema is different because they
happened." (Lee 1973 p 95)
(viii) Geaphy and Perception Studies
Geographical attempts to fit perception studies into a geographic
framework date from the 1950's. In 1952, Kirk, as an historical
geographer, was interested in the way that societies in different
places and times interpreted and responded to their environments.
He suggested that people acted according to their 'environmental
perceptions'; views of the world that might differ from reality
but were heavily influenced by the particular culture of which an
individual was a part. Kirk attempted to introduce conceptions
derived from Gestalt Psychology in to geographical thinking, the
central feature of which was the importance of perception as an
intervening variable between stimulus and response. Gestalt Psycho-
logists argued that perception proceeded as a result of innate
capacities and arranged environmental stimuli into coherently
organised forms or patterns which were referred to as 'Gestalten'.
Behaviour was mediated by the perceptual process and was a result of
the way a stimulus was perceived rather than the particular stimulus
properties of any environment. A central element of Gestaltist
doctrine was the belief that, 'the whole was greater than the sum
of its parts', and the subdivision of 'Gestalten' in to component
parts would be rejected because this would not produce an understanding
of the operation of the perceptual process as a whole. In keeping with
81

Gestalt Psychology, Kirk (1963 p 366), distinguished between the
objective or phenomenal environment and the behavioural environment.
The former was the physical environment coupled with any changes made
by man and the latter was a 'psycho-physical field' in which pheno-
menal facts are arranged into patterns or structures (Gestalten)
and acquire values as a result of their particular cultural context.
Kirk did not discuss how the behavioural environment evolved, but
once formed he regarded it as the basis of rational human behaviour.
One way in which the behavioural environment was represented by Kirk
is seen in the following diagram,
Fig 6. "The behavioural environment of a decision maker"
(After Gold 1977 p 41)
The social and physical facts of the objective environment
only become part of the behavioural environment when they have
penetrated a highly sensitive filter of cultural values. Such
values vary tremendously, so one would expect that the same infor-
mation would have different meanings for people of different cultures
or even for the same society at different times.
8T
Image redacted due to third party rights or other legal issues

Kirk's behavioural environment corresponds to the 'psycho-
milieu' proposed by H and M Sprout (1965) which consists of an in-
dividual's images and. ideas which are derived from the interaction
between what an individual selectively receives via his senses and
his own values, memories and information which is subconsciously
stored.
Downs (1970) expresses the same ideas as an inter-related system,
between People, Their Environment and the images they produce, which
in turn effects their behaviour. In order to break into this system,
one must study images Downs suggests, which are the points of contact
between individeals and their environments. Whilst Downs stresses
the need for investigations into the relationship of peoples Images
to their environments, Wood (1970) also emphasises the importance of
the relationship between images and human behaviour.
Morley (1968) believes that images individual's hold of their
environment should be studied within
the framework of the personal interpretation of space,"
which emphasises the uniqueness of individual experience and inter-
pretation. Morley's concept of 'personal space' is clearly derived
from Lewin's concept of 'life space' and underlines the suggestion
that the level of knowledge available about an environment is related
to level of experience within that environment.
Gold. (1980) associates the development of geographers' interests
in environmental knowing with 'behavioural' geography. The aim of
which is to,
"... replace the simplistic and mechanistic conceptions that
previously characterised much man-environment theory with new
versions that explicitly recognise the complexities of behaviour."
(p 3)
For Gold, behavioural geography seeks to explain patterns of
spatial behaviour in terms of the cognitive processes underlying
such behaviour and he identifies four major characteristics. Firstly,
that the 'environmental cognitions' upon which people act may well
differ from the nature of the true world, that is we are selective
in our perceptions. Secondly, that research must recognise that the
individual shapes, as well as responds, to his physical and social
83

environment. Thirdly that behavioural geography focuses upon the
individual rather than the group and, finally that it is a multi
disciplinary study.
Gold further suggests that during the 1960's and 70's the
relevance of geographical study was under discussion. (Berry 1972)
Such discussion crystallized around three main issues, firstly that
more should be done to study issues of contemporary social concern
such as pollution, poverty and welfare. Secondly that geography
should have a more direct influence and contribution to public plan-
ning and policy making. Thirdly that geographers should be conscious
of the value laden nature of their enquiries. Each of these Cold
(1980 p 34) believes acted as a stimulus for the development of
behavioural geography.
"It is a branch of inquiry that is inflmately concerned with
environmental and social issues, it is strongly policy oriented
and recognises that geographers, as well as thehunan subjects
of their research, are individuals with a distinct outlook on
the world rather than detached value free observers."
Further, Gold (1977) examined the current state of behavioural
geography' by surveying courses of geography in British Institutions
of Higher Education. He found that behavioural geography appeared
in two main forms, as a component of wider human geography courses
and in a small but growing number of departments as a specialist
subject in its own right. It was also clear that such teaching was
research-led, where advanced research developments were actively
being diffused into student courses. Despite the best endeavours
of course organisers however, Gold (1980 p 40) comments,
” ... teaching programmes reflected the somewhat disparate state
of the research literature, with confused terminology, conflic-
ting aims and objectives and poorly integrated conceptual and
empirical material."
84

(x) Environmental Coenition - Research
In a review of Environmental cognition research, Hart and Moore
(1973) distinguished two main sub groups studying fundamentally
the same problems. Developmental Psychologists, they argued, were
undertaking investigations into environmental understanding as a
means of further understanding the development of spatial concepts,
whilst geographers, urban planners and others are concerned to develop
knowledge of how large scale environments come to be known. Moore
and Colledge (76) identify five main contributory disciplines,
although as with Saarinen (1970) recognise a passing interest from
others.
... such as the work on personal space by the anthropoligist
Hall and the psychologist Sommer, the sociological studies of
neighbourhoods in England by Lee and in France by Bardet, the
work of pschologists,archlects and others on the perception of
space; the ideas of Barker and his colleagues on ecological
psychology, Craik on Environmental Psychology and the pioneer
perception study of city planner, Kevin Lynch." (Sarrinen
1970 p 66)
Of the contributory disciplines, Moore and College identify
Urban Planning, Anthropology, Sociology, Psychology and Geography,
as the major participants in the on-going debate. Urban Planning is
typified by the work of Lynch (1960) which was discussed earlier,
that is an interest in the 'imageability' of an environment, how
well different cities or parts of cities stand out and can be recog-
nised and organised in to coherent patterns or systems in people's
minds. Anthropologists on the other hand are more interested in -
cross-cultural comparisons of different cognitive systems, (Tyler
1969) which seeks through inverview, observation and where possible
experimentation, to discover some part of the system of meanings by
which different people organise their world. From Sociology, Strauss
(1961) for example works from the premise that it is not possible to
fully understand social behaviour in cities, or other processes of
urbanisation, without at the.same time learning something about, what
people think of the places where they live. He and other sociolo-
gists therefore are interested in the 'total holistic fabric' of
85

the structure, function and moaning of urban and non-urban environ-
ments. Psychological interest, apart from conceptual understanding,
is somewhat different. Rather than a concern for specific conceptions
of the environment, or even of specified environments, Moore and
Golledge (1976) suggest that psychology has been more interested in the construction of overall general explanatory theories, however
as Kaplan (1973) has argued, t? ... the structure underlying the spatial map of the world ...
is not different from the structure that underlies all cognitive
processes."
Attempts have been made to relate current major theories of
psychology to certain aspects of the available data, as for example
Moore's (1972) discussion of Piaget's developmental theory, and Harrison and Sarre's (1971, 74) and Donnelly and Menzie's (1973) consideration of the role of personal construct theory in the measure-
ment of environmental images. Other psychological studies have
focussed on the development of children's knowledge of the spatial layout of their home areas, Blaut and Stea (1971, 74) and these will be discussed later. Moore and Golledge (1976 p 20) list a variety of other studies in which psychologists have shown interest, for '
example Bycroft's (1974) study of the relationship between cognitive.
mapping and spatial ability, the work of Pick and his students on . children's knowledge of spatial layout (Pick et al 1973, Kosslyn et al 1973) and the recent work of Wapner and others on age and value differences in reaction to different large scale environments.
(Wapner, Kaplan, and Cohen 1975) The contribution of geographers to the study of environmental
knowing have been classified in various ways. Moore and Golledge
(1976) identify four main lines of research: (1) Studies of contemporary conceptions of aspects of the
spatial environment
(2) Studies of conceptions of the environment over historical
time
(3) Studies of cognitions of the environment across different
cultures and
(4) Studies of cognitions of the environment of various social
groups.
86

Downs (1970) identifies three main elements within the research,
the analysis of structure, or what is the nature of the perceived
world; the analysis of evaluation, what are the major features of
the perceived world that affect decisions; and the analysis of
preference, how are objects and features of the environment evaluated
with respect to each other. Goodey (1970) distinguishes between
studies of Environmental Perception, which consider man's awareness
of features in the immediate environment, Extra-Environmental
Perception which concentrate upon man's awareness of features out-
side the immediate environment and studies of 'Preferential. Perception,
which consider man's preferences for movement toward particular
places. A similar division of the research can be identified within
Bordessa's (1969) analysis which distinguished between studies of
Environmental Perception, Attitudes and Responses, Preference and
Behaviour. It is clear therefore that research to date can be classi-
fied in terms of those which focus on the individual, where group
perceptions are assumed to be the sum of individual images (Kates
1967) and those which focus on the social unit and assume that in-
dividual conceptions are not independent from each other, but are
derived from the prevailing group conception. (Buttimer 1972)
Moore and Golledge also identify a sharper distinction between two
essentially different research methodologies. A quantitative approach,
based upon interviews and questionnaire scales, (as for example in
Kates 1967, and Shafer 1969) and a more qualitative analysis of
literature and other introspective materials (Lowenthal 1961, Tuan
1977) Moore and Golledge (1976) argue that both methods have a
place but recognise that,
survey research methods, although 'objectively quantifiable,'
may prevent the investigator from appreciating the richness and
multiple interconmectedness of phenomena ... those who are
concerned that content analyses, while rich, may be overfashioned
by the eyes and biases of the investigator and may, therefore,
be non reliable and non-repeatable." (p 19)
Viewed as a whole, most geographical studies have focussed on
conceptions of different specific geographic environments and almost
no attention has been given to systematisation of individual differences
87

which might exist, or the reasons why and how such individual
differences might be accounted for.
In their analysis of geographic perception studies, wood. (1970)
Saarinen (1970) and Pocock and Hudson (1978), rather than differen-
tiate in terms of underlying trends, concentrate on the particular
focus of study. Saarinen (1970) for example, differentiates between
studies at a world level, the level of 'the country', of larger
conceptual regions and of the city and smaller areas. Wood (1970)
and Pocock and Hudson (1978) discuss the studies in terms of specific
topics. Wood (1970) identifies Landscape studies, Hazard studies,
Recreation studies, Urban studies, Movement studies and Space
Preference studies. To these Pocock and Hudson add the more specific
elements of Industrial Location, Urban Territoriality, Neighbourhood
and City Images both xegionally and nationally, retailers images of
their operating environments and Urban and regional historical geo-
graphy studies. They cite examples for each of these types of study.
(Wood 1970 pp 132 - 136, Pocock and Hudson 1978 pp 7 — 15) In an attempt to analyse the range of studies undertaken to
1974, in terms of the contributing disciplines, Goodey -(1974) pro-duced the following list, within which he distinguishes those areas
that are well developed, developing and neglected and as can be seen,
geography makes a significant contribution to many of them. It is limited
also noticeable that A reference is made to individual differences
which might exist in perception of the environment.
88

Theme I Di:',-,.ilProfessions -I
1. 'Pairly Well. Developed'
- Perception of Environment,/ Personal Space
- Perception of Environment,/ The City
- Perception of the Visual Environment
- Perception of Environment/ Aesthetics of Large Archi- tectural Space
- Perception of Environmental Hazards
- Anthropology: Architecture (especially medical and institu- tional): Medicine: Psychiatry: Psychology (including Social Psychology)
- Architecture: Building Tech- nologies: Civic Design: Geography: Landscape Archi- tecture: Planning: Psychology: Sociology
- Various branches of Medicine and Psychology
- Architecture: Civic Design: Geography: Landscape Archi- tecture: Planning: Psychology: Sociology
- Chemistry: Engineering (various branches): Geography: Life Sciences: Physics: Public Health
2. 'Developing'
- Effects of Sensory Stimuli on Urban Populations
- Perception of Landscape (Aesthetic/Historic)
- Perception of Environment,/ Roads and Pathways
- Perception of Acoustic Surroundings
- Highway Engineering: Planning: Psychology: Public Health
- Aesthetics: Archaelogy: Architecture: Art Criticism: Geography: History: Landscape Architecture: Tourism and Recreation Planning
- Architecture: Highway Engineering: Landscape Architecture: Planning: Psychology: Public Health:: Safety
- Acoustic Engineering: Acoustic Architecture: Planning: Public Health
continued
89

Theme Disciplines Professions
3. tNeglectedt • - Perception of Environment/ - Agricultural Sciences: Geography:
Larger Conceptual Regions Lito Sciences: Tourism and (Natural Beauty and Open Recreation Planning Space)
- Cross- Cultural Perception - Anthropology: Geography: Psychology
- Indicators of Perceptual - Geography: Recreation Planning: Quality and other Quantita- Regional Planning: Resource tive Measures Planning
- Perception of Environment/ - Geography: Journalism: Peace Countries and Conflict Studies: Political
Science: Psychology: Sociology: • Social Psychology
Fig. 7 The Study of Environmental Perception
(After Goodey 1974 p 32)
(xi) The Problems of Measurement
As has been suggested earlier in this discussion, one of the
major problems facing the researcher interested in determining the
extent, organisation and characteristic features of an individualts
knowledge of the environment, is that of 'Measurement'. In studying.
Environmental Knowing, one is concerned with attitudes, opinions and
impressions, all of which are aspects of the individual and therefore
extremely difficult to- measure. They cannot be observed, and have
to be approached through a variety of measurement techniques, all of
which are open to misunderstanding on the part of the respondent and
misinterpretation by the researcher. The confusion that exists in
the problem of measurement is not helped by the inter-disciplinery
nature of this field, each contribution tending to have its own
methodological and philosophical perspectives. As Pocock and Hudson
(1978) comment,
"A corollary of this theoretical diversity is the wide range
of methodologies used to measure environmental images, methodo-
logies that are often at variance or even contradictory in the
assumptions on which they are based and the evidence which they
produce." (p 36) 90

Although each individual necessarily has his own unique cognitive
understanding of environmental information, Golledge (1976) argues
that there is abundant evidence to indicate that many people are
aware of the existence of the same things,
"Awareness can be generated by any of our senses and differences
of opinion as to what is in the environment may occur when
different senses are used in the information extraction process,
when physiological qualities of the senses differ among observers,
when different transactional modes are used to elicit information
and when socio-cultural values of individual observers differ.
It is quite critical therefore, to become aware of the range
of methods that utilise different skills to extract information
from the environment." (p 300)
Before considering the various techniques employed in research
of this kind, it would seem pertinent to make some reference to the
purpose of measurement, in order to relate the methods to be dis-
cussed to some kind of measurement rationale.
Kaplan (1964 p 177) argues that,
"Measurement in the most general terms can be regarded as the
assignment of numbers to objects (or events or situations)
in accordance with some rule."
It is important to recognise however, that measurement is not.
an end in itself, but a means to an end. Measurements are made such
that hypotheses can be tested more objectively. Downs (1970)
suggests that there are three important factors to be considered in
any discussion of the purpose of measurement. Firstly, that measure-
ment procedures are defined for a specified task. The observer or
researcher develops a technique to provide data for testing a parti-
cular hypothesis or series of hypotheses. Secondly, the whole
procedure of measurement and the subsequent analysis of the resultant
data, are inter-related. It is important to consider the nature of
measurement techniques in association with techniques of analysis.
Thirdly, as Kaplan (1964 p 176)suggests,
"Whether we can measure something depends .. on how we have
conceptualised it, on our knowledge of it and above all on the
skill and ingeniuty which we bring to bear on the process of
measurement which our enquiry can put to use."
91

The role of measurement can be expressed as the translation of
ideas in to concrete informa;;Lon or data which can be used for later
testing and analysis of hypotheses. Downs (1970) suggests that
measurement can be seen therefore as the link between the imagined, or
conceptual world and the real world (p 93). In relation to the
measurement of Environmental Images and understanding, Downs discusses
some of the problems facing the researcher. The major difficulty
is the distinction between an 'individual' and 'group image of an
environment. Can they be isolated and do they actually exist?
The question of the nature of such images is crucial and will require
extremely sensitive measuring devices which have to beware of imposing
upon people ways of thought and conceptualisation which are not their
own. Lynch (1976) remains convinced that this is possible and argues
for the use of a variety of techniques to fully capture an individual's
beliefs, feeling and ideas, and that,
"... the graphic language is just as central as the verbal
one. Not just maps incidentally ... but allltnds of graphic
expressions: eye level sketches, photographs, video tapes,
diagrams, models." (p vi)
Downs 0970) suggests that the most appropriate measurement
technique for coping with the complexities of this field of study
are to be derived from psychology. In particular he recommends the
use of multi dimensional scaling techniques which Guilford (1954
p 146) suggests should be used with complicated stimuli, whose physical
dimensions are not well known and where there are no recognised
physical dimensions for judging psychological qsalities. Downs
argues that this set of criteria relate exactly to the study of en—
vironmental knowing, Images both individual and group are complex
and multifaceted, relationships to the physical real world uncertain
and with no clear means of physical expression. Downs (1970 p 100 —
101) attempts to apply the technique using two examples which demon—
strate the very complexity of applying methods derived from other
fields of the social sciences. •
Pocock and Hudson (1978) following Harrison and Saare (1971)
consider the measurement process in terms of three central features,
92

those of Specification, Scaling and Generalisation, and Inference.
Specification refers to the conceptualisation of what is to
measured in a measurable form. Thus, as an example, there has been
a strong tendency in the literature to link the development of an
'environmental image' to the development of spatial concepts. (Hart
and Moore 1973, Kaplan 1976) Scaling is a process of assigning
numbers to objects to represent attributes of those objects and is a
common technique used by researchers. While a comparatively straight—
forward process in the case of physical objects, it is more compli—
cated when one is dealing with 'unobservable' images people purport
to possess, or which researchers suggest they possess. Finally the
type of inferences one might be able to derive and the degree of
generalisability of the results is directly dependent upon .the
quality of the data obtained, that is the basis upon which data is
collected and the technique employed for the collection of data.
Pocock and Hudson conclude their discussion however by stating,
"Perhaps the most important point to establish is that despite
the numerous problems encountered, environmental images can
be measured, if not always as precisely as might be wished.
(1978 p 46)
(xii) Measurement Techni ues
Craik (1968) recognises four main issues in investigations in
this area. How to present the situation to an individual, which
behavioural reaction to elicit and record, which are the relevant
attributes of the situation and whose comprehension to study.
Thus an individual's actual ability to comprehend a given method
becomes crucial. Evidence exists that biases between people in terms
of socio—economic group or level of education are possible.
Reiser (1972) attempted to analyse the methods of measurement
techniques which had been adopted in terms of the type of stimulus
presentation.
93

Fig. 8 A TYPOLOGY OF METHODS OF STIMULUS PRESENTATION
Form in which presented to respondent
Type of stimulus
__presentation 'Reality' A
Structured* or Constrained less Structured* or Open
Take respodent through actual route or area. Record required reactions at go and at return. Or measure sensory reaction, ie eye movement camera.
Unguided and undirected trip or exposure in actual area. Controlled for groups, ie experience/knowledge of area.
Iconic (B) Series of photographs: describe what is in between recognised ones, or fit in order. Motion film of area: stop projection, ask what comes next.
Show a large selection of photos of area; respondent picks out those recognised
Iconic (C) Discontinuous L
Recognition of a series of photos taken at regular intervals; may also state if in/out of area.
As above. Spatial continuity will emerge, especially with probing.
Graphic (D) continuous I/
Present with street map, draw a line around - specified area, ie central city or home area.
Sketch area on blank sheet of paper. Little control of respondent's interpretation of requirements.
Graphic (E) discontinuous
Identify individual streets and elements directed on map.
As above. Extent of continuity will emerge from the sketch.
Verbal (F) Object or place named or described. Respondent explains how to get there if recognised. Repeat until composite image.
Describe.requested area ie name or describe streets, places etc and their locations •
Verbal discontinuous L
Names or descriptions of places on individual cards. Pick out those of specified area recognised.
As above, Will depend on description and extent of probing.
* Structured/less structured refers to how specific the stimuli are and so how constrained are the responses.
IL Continuous/discontinuous applies to the spatial form inherent in the different kinds of stimuli presentation. This will depend on secondary controls and the amount of inference made from responses.
(After Reisser 1972)
94

As can be seen in the diagram, Reiser distinguishes between
'Real' experiences,'Iconic' images, 'Graphic' images and 'Verbal
experiences', which were either structured or open and then discusses
each of them in terms of what might be expe3ienced by the subject.
Again it becomes very clear that different types of stimulus situation
require different skills and clearly the way in which the respondent
interprets the stimulus is crucial.
Ittelson, Proshansky,Rivlin and Winkel (1974) remind researchers
that all research is simply the gathering of information. It is
the objectives of the study that determines the most suitable procedure.
In their discussion of the techniques used in Environmental Psychology,
they identify five categories of research technique. 'Experimental
research' is usually conducted in a laboratory setting with some
formal control over the setting and the variables to be investigated.
'Holistic' research on the other hand concentrates on the relation—
ships which exist amongst a range of variables rather than the study
of selected features. Broadly speaking research of this type is
qualitative seeking underlying themes of a situation rather than the
relationships existing between isolated Variables. As Weiss (1968)
suggests,
"Holistic research takes as its problem the nature of the
total system rather than a particular process within the
situation." (p 343)
'Survey Research' employs questionnaires, interviews, tests and
simulations. This procedure is widely used in finding out how people
think and feel about certain specific issues, and in general explore
attitudes rather than behaviour. The 'field study' uses existing
data, such as demographic information and the investigator has no
control over the raw material.
"Field studies correlate the social, physical, and psychological
data in an effort to find relevant associations that may indicate
a causal relationship among specific variables ... "
(Ittelson,Proshansky et al 1974 p 210)
Finally, 'exploratory research' like the holistic model, can
be used to study complex environments. The material collected
however, is more likely to be quantified and correlated in to possible
95

sets of significant relationships. In effect exploratory research
is frequently a preliminary to a more precisely formulated and narrowly
focused design in which an attempt is made to investigate certain
causal relationships.
Additional techniques which Proshansky (et al) regard as
especially pertinent to environmental research include 'simulation',
in which one attempts to create 'mock environments' in order to
predict behaviour in a comparable real environment. Similarly,
'Gaming', uses simulated situations or processes in an effort to
elicit behavioural traits which the individual may not always be
aware of. Games create 'dramatic representations of the real problem
being studied.' (Abt 1970 p 13)
A more recent analysis of the methods employed in the investi-
gation of Environmental Knowing by Golledge (1976) has attempted to
analyse each technique in terms of the skills required by the
respondent. Not only does it provide a detailed breakdown of ex-
perimental procedures and required skills, but also describes the
form of representation that the subject is expected to produce as
well as examples of research employing that particular technique.
Golledge suggests that most of the research undertaken to date can
be classified in three main ways. Firstly, there is a reliance on
inference based on naturalistic as opposed to experimenter controlled
behaviour. Secondly, there is a distinction between those inferences
made from directly observed behaviour as opposed to that taken from
the past. Finally, he makes a distinction between those responses
elicited directly from individuals using participatory or self report
procedures, as opposed to second hand inferences from a variety of
indirect 'judgemental tasks.
96

Fig. 9 MIT'IT HODS Olo EXTRACTING ENVIROIThTI.i'i111AL COGNITION I NFORYIA '2 ION
. Pe thod Procedure
.S.thicc t Sell!
External -...".
Rep resen fa Eonal refit) F x ample
Experimenter observation Experimenter observes or t arks mowements tnrough actual environments ie g ,
crawl patterns, search be. (Iowa,. overt spatiai ectivity, ectual way-finding, etc.)
Experimenter infers degrees of cognitive knowledge from behavior in unstruc- lured -clinical- situations
Subjects reveal environmental knowledge in the process of sorting or grouping elements of actual or simulated environments
Subjects adopt roles or per- form acts in simulated and/or reel environments
- -
Subjects arrange toys or ob- jects represenring environ- mental elements or model environments, and expert. 'renter observes the sequence of acts in position. mg elements and/or using the environment
Experiment, deduces cog- naive information from nonhuman activities leg , animal acts, machine simulation)
Cognitive Concrete Psycho.
motoric
Cognitive Concrete Motoric
Cognitive Abstract Relational
Cognitive Abstract Relational
Cognmve Concrete Motoric
Cognitive Psycho-
motor
Observations Reports Maps Tables
Charts Profiles
Lists Tables Composite maps
•
Photographs Tables •
A, 'log models
Observaiional schedules
Tables
'
Lynch (1960)
Marble (1957)
Ladd (19701
Jones 1;9721
Devlin (1973)
Tannaras (1973)
R Kaplan, Chap. 3
Werner
in naiuralistic or con•
trolled situ soon'
(1948) Preget and Inhelder
(1956) Hart
(1974) Downs
11970a) Wish
(1072) Zannarat
(1973) Golledge at if.
11975) Ittelson
(1951) Mitgrarn
11970) &wort
(1973) Aerectolo,
Chap. 13 Plage, et if.
(1960) ((taut and Steil
(1559) Leurendrau end
Pinard (1970)
Mark 11972)
Hart . (1974)
Tolman (1048)
Peters (1973)
Histories' Experimenter deduces environmental knowledge
from written descriptions
(novels, poems, etc.) and/or past pictorial representations of environ• 'rents, usually from hors- contal or oblique perspectives
Affective Psycho.
motor Linguistic
Novels Poems Paintings Philosophies Sketches Diaries Cnntent
analysis
Lowenthal and Prince (1964)
Heathcote (1565)
reconstructions
Gleason (19721
Cowden (197b)
Tuan. Chap. 23
Shin; Chap. 24
Lloyd, ' , •. 2
Analysis of external —representations—
Subjects are asked to wine descriptions of whet they are aware of in enwron• meats
•
.
Subjects are asked to de- scribe orally a given environment
.
Subjects draw sketches or sketch maps representing environments
Af rective Psycho-
motor Linguistic
Affective Linguistic
Al fective Graphic Relational
Written reports Contact analysis Item analysis
Oral reports Type TranscriptionsInterview Protocols
Pictorial sketches -
Sketch mans Quantitative and
structural enalyses
Lynch and Rivkin (19b9)
Ca, and Schissler (1169)
Appleyard (1969a)
Winkel et el. llSG91
Lynch (1960)
Corr and Schissler 11069)
Gimes (1969)
Cork (1970a)
Moore (1973o)
Zannaras (1973)
Lynch 119601
Shernyakin (1962)
Stea (196901 •
Apple lard 11970b)
Ladd (1970)
Moore (1973b)
Wood (1973h)
participatory activities
-
97

Fig. 9 (continued)
Subject
..--.......----,—.
(eternal Representational
*Mod Procedure Skill Fein? Example
Subjects arrange toys or Affective Models Piaget et et. make models representing Cognitive Arrangements (1960) environments Concrete of toys Blaut and Stea
Motonc (1969) Relational Mark and Silverman
(197)) Steel
• (1973) Hart
(19741 Stea.
Chap. 9 Subjects show existence,
location, proximity, or Cognitive Graphic
Base maps with overlays
Lynch (1960)
other spatial relators of Abstract Notation Thiel environmental elements; use of symbols to repre- sent such elements.
Relational systems (1961) Appleyaid
(1969a) • Wood and Beck.
Chap. 32 Subjects asked to identify Affective Verbal Piaget and Inhatder
photographs. models, etc. Motoric Abstract
Protocols 11956/ leurendeau and
' " Relational Pinard 119701
Stea and Blaut (1973b)
Zenner as
J1213J..._.— Indirect judgmental tasks Selection of constructs which Cognitive) Word rests Kelly '
reveal environmental infor• Abstract Tables 119501 'nation, adjective check- Relational Graphs Downs lists, semantic differentials, repetory grid test, etc.
Grids 0973) Honikman,
Chap. 7 Harrison and Sarre.
Chap 34 Golant and Burson
Chap. 33 Paired proximity judgments Cognitive Maps Briggs
and other scaling devices Abstract Tables (1973a) that al:ow specifica•ion of latent structure in environ. mental information
Relational LOveAy
(1973) Golledc,e et al.
(1975) Cadwallader
(1973) Gula-it Lad Burton,
Chop. 33 Projective tests (e 9 . T A.T.) effective. Verbal Burton et al.
Abstract stones (1969) Relational Saarmen
(1973b)
After Golledge (1976) (pps 303 - 305)
98

In his discussion of the various techniques, Golledge offers
examples representing the range of studies within each of his sub-
divisions of the available research. Research based on observation
in Naturalistic and Controlled situations ranges from tracking people
through known and unknown environments and observing their responses
to different features cf the environment, to making inferences from
behaviour in various 'clinical' situations. 'Way finding' is typical
of this kind of study, Zannaras (1976) for example, took individuals
to a particular place in an urban environment and asked them to make
their own way to a specific destination. She then considered the
factors which influenced subject's decisions about appropriate routes.
Golledge identifies four different strategies that have been
employed for observing behaviour in controlled or partly controlled
experimental situations. Firstly, what he calls 'subject controlled
classification procedures' which requires subjects to sort environ-
mental occurences or experiences into classes. These can be speci-
fied by the experimenter, or left to the discretion of the respondent.
In the latter situation though, it is much more difficult to establish
how the sorting procedure is decided upon. Wish (1972) has adopted
this approach in his investigation of peoples cognitive configura-
tions of world nations and Rivizzigno and Golledge (1973) have also-
used this method to discover which parts of a city are thought to be
near to each other. The second strategy identified by Golledge for
behavioural observation is when subjects are placed in role playing
situations. This technique is a standard tool of clinical psychology,
and little used outside psychology itself. A great deal of the work
on perceptual illusion has used this technique, as have investigations
into the interaction of people to different environments. (Proshansky,
Ittelson and Rivlin 1970)
Another category of observational techniques involves the use of
constructive toy play and model building activities. Mark (1972)
for example used an artificial environment to examine chilcirens toy
play patterns and then attempted to reconstruct environmental information
by observing both the locational patterns or positional arrangements of
toys and the action patterns of the children with respect to these
arrangements. (Similar studies have been undertaken by Siegel and
99

Schadler 1977, Hagen, Lockman and Pick 1978, Stea and Taphanel
1975, Kaplan 1976, Acredolo 1976 and Hart 1979).
The fourth observationalmebhodidentified by Golledge involves
making inferences about environmental knowledge and understanding
after observing varying forms of animal behaviour. Again this approach
has largely been confined to psychology and is demonsh.ated in
Tolman's (1948) study, which has already been discussed.
The second major category of research described in Golledge's
table concentrates on those studies which are based upon reports
written by individuals about different environments. These can be
whilst actually undergoing an experience, or based upon memory.
In such studies, there appears to be a mixture of direct experience
and recall and as such are open to criticism in terms of objectivity
and accuracy. Shin (1976) for example, comments on the day to day
written experiences of travellers in the South Western United States
of America and analyses impressions of the physical environment.
Lloyd (1976) has used novels as his source for the investigation of
urban experience at the turn of the century. Tuan (1976; 78) is
much more general in his approach and draws on various written sources,
fictional, factual and philosophic. In each case however, he focusses
on the cognitive structure of the knowledge that the writers have
about the external environments with which they are concerned. Much
of the research in this vein falls under the umbrella of Environmental
Perception and in geography can be attributed to the stimulus of
Lowenthal. In his 1961 paper on 'geographical experience and imagina-
tion' it is possible to identify the bases for many studies of this
type. In 1964 Lowenthal and Prince attempted to reconstruct what
people observed_ in the landscape in the present and past. A funda-
mental aim of which was to show how perception of and attitudes
towards different environments influenced the course of history. In
this context, Golledge also comments on the potential usefulness of
paintings and other art forms as a scurce of environmental knowledge.
This area he suggests is virtually untapped by social and behavioural
scientists and it may well become as fertile a source as literature.
100

The third major category of research involves the analysis of
external representations. Investigators ask subjects to produce
information about an environment by such means as self report methods,
verbal and written, free-flowing conversations and map and model-
making techniques. In the early stages of environmental cognition
research one of the most widely used techniques was a sketch map upon
which respondents recorded information which he or she thought signi-
ficant. These maps could be drawn from memory, or whilst in the
actual environment to be mapped. This particular technique will be
discussed in more detail in a later section but in most early research
no control was attempted for cartographic knowledge or skills and
one example of a map was often taken as representative of an indivi-
dual's knowledge. Similarly it is often inferred that either what
is not said is not known, or that what is not pointed out is of
relative insignificance for the individual. As a result, Gulledge
1976 comments,
"The resulting analyses were frequently invalidated by investi-
gators trying to compile information from such sketches at a
data level that was highly inappopriate in terms of each
individual's graphic representational abilities." (p 308)
The implication of Golledge's comments are that an individual
with limited graphic representational capabilities will find diffi-
culting in demonstrating the extent of his or her knowledge and the
inferences that can be drawn from the results must be questionable.
Appleyard (1970) argues that this problem is not so important at an
adult level, because as adults we are more able to structure our
thoughts and produce external representations which more truly reflect
levels of knowledge and understanding. The extent to which this is
true is obviously open tc debate. (Kuhn 1970)
More recently, Bycroft (1974) has suggested that measurement of
environmental images by this technique is methodologically unreliable
and he suggests a range of means by which a greater degree of relia-
bility can be achieved.
A more innovative use of sketch maps has been developed by'
Moore (1973) who attempted to distinguish between levels of representa-
tion, which he then associated with developmental theories of
101

cognition. In this case, no attempt was made to consider what was
mapped, instead the information was used to
"draw conclusions about the comparative internal structurali-
sation and representational abilities of the subjects, rather
than to provide information on how much information subjects
had about a place." (Gulledge 1976 p 308)
Another alternative approach comes from the work of Ley (1972)
who asked youths to define the places within their home area that
they would not venture in to and then asked them to show where they
were on a map. He found that many of the places so described had
never been visited, which reveals important gaps in an individual's
spatial knowledge and also some explanation of individual bias in
spatial preferences.
The final category of study represented in Golledge's diagram
are described as 'indirect judgemental tasks'. In using such
techniques, subjects may be asked to select adjectives that best
describe their feelings about places and the experimenter then deduces
an individual's or group's knowledge about a place from their responses.
Typical of these techniques are the Semantic Differential technique
first developed by Osgood, Suci and Tannenbaum (1957) and demonstrated
in the study by Golant and Burton (1976). Osgood (et al) describe
this method as follows,
"We provide the subject with a concept to be differentiated
and a set of bipolar adjectival scales against which to do it,
his only task being to indicate for each term the direction of
his association and its intensity on a seven point scale. The
crux of the method, of course, lies in selecting the sample of
bi-polar terms. Ideally, the sample should be as representative
as possible of all the ways in which meaningful judgements can
vary and yet be small enough in size to be efficient."
(Osgood et al 1957 p 20)
This is an example of a 'multi dimensional' scaling technique
which was referred to earlier. Such an approach attempts to impose
a structure on the information obtained by examining paired comparison
judgements made by individuals about places in an environment.
(Golledge et al 1975). In this method, individuals are asked to scale
the degree of separation of all possible places in an environment.
The responses are then put in to a variety of multi-dimensional
102

scaling algorithms and the configurations of these places then
obtained in diagrammatic form. For example, Golant and Buxton (1976)
attempted to assess how much knowledge individuals have about en-
vironmental hazards such as storms and floods. What was revealed
was the individual variation that exists in the interpretation of
such concepts. Many subjects had different views of what constituted
a 'flood' or 'serious derange' and emphasises the multi-dimsnsionnl
nature of such terms. Factors such as frequency of exposure to the
hazard proved to be critical to an individual's assessment. Rooney
(1967) for example demonstrates this. In the North West United
States snowfalls of 4 - 6 inches are generally accepted as typical
winter occurences by individuals and local government. Residents
in Eastern cities however, regard similar levels of snow as extremely
hazardous and city governments spend a considerable part of their
budgets to overcome what they regard as a hazardous situation.
Similar responses can be identified in British reactions to recent
severe weather conditions. It is also the case that increasing use
is being made of Personal Construct Theory as a means of eliciting
environmental images (Bannister and Mair 1968, Harrison and Sarre
1971, Donnelly and Menzies 1973, Harpham 1979). Personal construct
theory is derived from the work of the psychologist Kelly (1955) who
believed that individuals created conceptual models of the world
which they used in deciding on future action. Kelly operationalised
his model of the mind via the Repertory Grid methodology, which many
researchers have used in their in1estigations into this area.
Constructs which supposedly represent an individual's perception
of his environment are elicited from subjects by asking them to name
places to fit an interviewer's definition, as for example in Sarre's
(1973) study of Bath when he asked for 15 to 20 places important to .
them in their everyday life. In another study, Sarre (1974),reported in.
Harrison & Sarre (1976),subjects were asked to supply speeific
places to fit experi menter definitions like: your local pub, your
children's school, the best building in town, the worst eyesore in
the city. The 'constructs' are then arrived at by asking subjects
to discriminate amongst the elements by 'triad' sorting, where they
are asked to consider three elements at a time and to state an
103

important way in which two were similar and the other different.
This produces a difference in adjectival terms and after some reworking
one arrives at adjectival pairs (which are opposites) and taken as
verbal representations of personal constructs. For example, in the
Bath study, one respondent compared 3 areas, one as Georgian and two
as modern. Sarre elected to change Georgian to old and modern to
new to produce the construct dimension 'old - new'.
(xiii) Cognitive Maps and Cognitive Na
On a number of occasions in the discussion so far, reference has
been made to one particular technique which has been extensively
employed in the research, but about which many questions have been
raised. The use of sketch maps in one form or another is a major
way in which research undertaken to date has attempted to articulate
individual's representations of their environments. The concept of
a 'cognitive map' the product and 'cognitive mappings the process has
been a direct result of the application of this technique, and can be
traced back to Tolman (1948) who as explained earlier, in his experi-
ments with rats suggested that they constructed 'mental images' of
the maze routes they were forced to follow in the experimental situation.
Tolman in fact likened the rat's brain to the central office of a map-
making agency.
"The stimuli, which are allowed in, are net connected by just
simple one-to-one switches to the out-going responses. Rather,.
the incoming impulses are usually worked over and elaborated
in the central control room into a tentative, cognitive-like
map of the environment. And it is this tentative map, indicating
routes and paths and environmental relationships, which finally
determines what response, if any, the animal will finally
release." (Tolman 1973 p 31)
As defined by Downs and Stea (1973 p 9), cognitive mapping
refers to the process by which people acquire code, store, recall and
decode information about the relative locations and attributes of
phenomena in the everyday spatial environment and Sarre (1973) for
example describes a cognitive map as,
... a model of the environment which is built up over time in
the individual's brain." (p 16)
104

As a research technique, the collection of some element of an
individual's cognitive map has tended to require individuals to draw
recall maps often of their immediate environment. Within the litera-
ture it is possible to identify two major sources of criticism of
this approach. Firstly, many assumed that TolmPn's map analogy
meant that people actually carry cartographic representations of their
environments in their heads. Psychology in general has been rather
confusing on this point. The inner representation of external reality
ranges from an image in the real sense of a tvisual duplicate' to an
abstract transformation of the event or scene. Gibson (1970) suggests
that this might be seen as a continuum, which represents a series of
related multi channelled storage-recall systems which are available
to the individual depending upon the demands of the situation.
Kaplan (1976) is adopting this interpretation, when he envisages the
brain as a series of layers. The first layer receives information
about features in the environment from the sensory analysers and
constructs a model closely tied to this sensory experience. The
second layer receives input from the previous layer and would come
to contain a model of the model of the environment and -in this way we
develop representations of classes of objects and regions. Layers
then become progressively more abstract, less tied to sensory ex-
perience, with an organisational structure weaker than the previous
one. Higher layer representations will tend to develop later argues
Kaplan, since their input is largely from lower layer representations
than from feature analysers. The proposed mechanism, which derives
from studies of information processing, Kaplan suggests achieves
considerable economy of storage. Neisser (1968) regards seeing and
visual imagery as employing the same mechanists which are integrally
linked to short and long term memory. Initially a scene is retained
in image form as part of short term memory but then decoded and
abstractly transformed into neural connections to become part of the
long term memory. To some extent therefore it is possible to conceive
of individuals as carrying pictures in_' the mind, as Gregory (1966)
suggests,
105

"We do have 'mental pictures', but this should not suggest that
there are corresponding electrical pictures in the brain. It
is possible to represent things in symbols (Gibson's abstract
transformation, Bruner's iconic representations) but symbols
will generally be very different from the things represented.
The notion of brain pictures is conceptually dangerous. "
The extent to which the visual system is able to hold pictures
is to some extent plausible therefore, but the extension ofthis
facility to retain complex systems of cartographic connections in
space is more difficult to accept. Graham (1976) questions where
such maps are likely to be stored and suggests that it is ridiculous
to suppose that it is possible to find such patterns imprinted on the
brain. Maps are not the kind of things, she says, that one finds
during a surgical operation. As a result Graham, like Gregory,
considers the concept of a mental map as conceptually limited.
Research undertaken so far has not produced an acceptable theoretical
basis and this she suggests is a direct result of the basic incoherence
of the central concept. It does seem however, that Graham's criticisms
are aimed at a more metaphorical interpretation of 'mental maps' as
was suggested earlier, (p64) rather than a consideration .of the .
concept as a useful descriptive tool in the investigation of individual's
environmental perceptions, and the sketch map technique as one
method by which it is possible to collect some information about
individual's environmental knowledge.
A second major criticism of the recall map technique, is the
assumption that an individual's understanding, knowledge or feelings
about an environment can be realistically portrayed in representative
detail within a sketch map. Ability to draw or respond to carto—
graphic maps depends to a great deal on education and thus a response
to cognitive mapping exercises may be an imperfect representation of
spatial cognition.
Gold comments (1980) (p 112 and 224) that if researchers are
not careful such exercises become a test of map comprehension rather
than a true measure of aspects of individual's environmental knowledge,
106

"In the case of freehand sketch maps, the finished product
may tell more about cartographic skills than externalise the
cognitive representations of space that are in the respondents
mind." (p 244) Catling (1979 p 7) sums up the various :Limitations that have been
described for children's cognitive maps
1. The child may not be able to display his understanding in a
conventional fashion. (Siegel, Kirasic and Keil 1978)
2. He may be constrained by the act of trying to represent a large
scale space on a smaller sheet of paper. (Herman and Siegel
1978) 3. He may lack the manipulative ability to draw well. (Webley 1976)
4. Detail may be excluded which would have been noted in an alterna-
tive method of eliciting recall information. (Spencer and Lloyd
1974, Spencer 1973) 5. The way the child constructs the drawing may influence its final
form. (Biel and Torreil 1977)
6. He may have limited experience of the particular environment and
therefore find it difficult to depict the spatial layout accurately.
(Siegel and Schadler 1977)
Murray and Spencer (1979) reiterate many of the comments critical
of the use of sketch maps as a research technique and attempted to
test the hypothesis that differences in cognitive maps result from
two factors. Firstly, that drawing skill is an important variable
and secondly, geographical mobility is of importance. They suggest
that individuals who have experience of a considerable number of
places develop an approach to both novel and familiar areas which
allows for a rapid, structured and efficient 'imaging' of such places
and as a result they are able to produce better cognitive maps than •
those people who live predominantly in cne location. It was also
argued that the map task is likely to influence the resulting product
and since most research has employed only one mapping task, Murray
and Spencer elected to use a range of tasks, in an attempt to tap
individual's abilities rather than 'sub-sets of information that
subjects possessed.' Respondents were therefore asked to produce
five maps of vastly differing environmental scales, as well as a
drawing of their own homes with which to compare the maps for drawing
107

ability. The five maps requested were of the immediate locality,
the town, a route map, a regional map, and a world map. The sample
studied were representative of highly mobile, of medium mobility and low mobility individuals. The results confirmed that geographical
mobility was a significant influence on the maps produced when analysed in terms of Organisation, Features displayed and Complexity of inter-
relationships displayed. As expected, basic drawing ability was also
found to be significantly related to mapping ability, but whilst
drawing ability is related to performance on the mapping tasks it
only accounted for between 10 and 25% of the variance between in-
dividuals which suggests that the importance of this relationship
should not be overstated. They concluded,
"The use of mental mapping techniques to examine the individualls
environmental cognition has already received much criticism
and the present paper, in showing that basic drawing ability is
an important intervening variable in mapping, could be taken
simply as another such criticism. We believe, however, that for
most subjects in our study, even if the tasks proved difficult, they also involved and did indicate something of the considerable
differences that exist between high - , medium - and low -
mobility individuals in their construing of the local and (more
particularly) more distant environments. Mental mapping
techniques may be flawed, but they do reflect differences in
the skill of cognising the environment which could only other-
wise be brought out by laborious interview or questionnaire
technique." (p 391) Like Murray and Spencer, Wood and Beck (1976) questioned whether
sketch maps are capable of generating data reflective of anything
but the ability of the mapper to cope with a set task and comment
that in the light of criticisms described, it is surprising that the
technique has survived. They accept, however, that a sketch map can
be used to convey a considerable amount of information and could
reveal much of a respondent's knowledie if he was able to communicate
with confidence through this medium. Wood and Beck believe that the
reason why communication through sketch maps is not as successful as
it might be is because of a lack of clarity over the symbolisation to
108

be used. As a result they have developed a mapping language des-
cribed as 'Environmental A' which they employed in studies of American
teenager's perceptions of cities visited for the first time. (Wood
and Beck 1976 b). The 'language' consists of a vocabulary of signs,
marks and name labels for points, lines and areas within a city, as
well as a set of rules for manipulating these symbols. They comment,
... there is no way for the group or most subjects in most
cognitive mapping exercises to communicate what they know;
not only of the connective structures of which they must at
some level been aware in order to navigate the city in question,
but of anything more elemental or symbolic at all. Before a
sketch mapper may be expected to communicate something to a
researcher he or she must be taught a language that both under-
stand. Any work investigating reported cognition of large
scale environments employing sketch maps as primary data must
bear this in mind." (Wood and Beck 1976)
Lynch (1976) however, commenting on this technique argues for
instructionless mapping, since it produces maps of lesser compara-
bility but without any imposition from the researcher. The researcher's
language obviously changes the way a mapper might see the environ-
ment. Prince (1976) makes similar comments,
"Your approach to the techniques of mapping are, it seems to me,
heavily authoritarian. It is simply not true to assert that
maps are unintelligible unless they obey a set of grammatical .
rules (like a language) or theorems (as in maths). Pictograms
of very idiosyncratic construction may be read by all sorts of
people without too much formal teaching. How much of what is
represented in the maps is Wood and Beck directed and how much
is spontaneously kid-directed? Would the kids in Lord of the
Flies have set about mapping their island in the way you re-
commend? Can you say what the kids discovered for themselves
from the experience?." (In Moore and Golledge 1976 p 352)
Lynch (1976) suggests that a map however naively drawn indicates
many things. It can be looked at he says for the sequence in which
it is made, its connections and its gaps, its style, the particular
things grap hically emphasised and those left out, the evidence of
109

indifference or emotion, the variance in detail, the confidence or
timidity with which different parts are drawn, the total structure
and even to some extent the scale distortions (although the purpose-
ful communication of distance and direction in a map is a special
skill, which usually requires special teaching). A disconnected or
distorted map does not necessarily indicate an unco-ordinated image,
instead Lynch (1976) believes that the very unfamiliarity of the task,
like the unexpected question, releases impressions that might other-
wise have been surpressed. It is also the case that it is often
ignored that verbal communication is also difficult for some people.
Sketch maps offer an alternative and are usually only one means by
which information is obtained.
Criticisms such as those described can be made of all methods
of recall map reconstruction, whether drawn, verbalised, modelled or
enacted in the original environment. As Catling (1979) suggests,
such comments are valid if care is not taken to assess any recall
sketch map in the light of such criticism and more recent research
has attempted to do just that. (Nagy and Baird 1978, Biel and Torrell
1977, Bycroft 1974). Bycroft's (1974) major criticism of the use of sketch maps, is
the lack of objectivity in the analysis of the finished articles.
To overcome this problem Bycroft incorporated five major ways of
assessing the maps, which were undertaken by a panel of judges.
The first technique was a 'wholistic' sorting to differentiate
generally amongst the maps. The judges were provided with standardised
criteria by which to undertake this analysis. A second technique was
based on a Goodenough L Barris (1963) type checklist of children's'
drawings'and for the area studied three detailed accuracy checklists
were constructed. The remaining three forms of analysis had their
origins in the cognitive mapping literature. The first, after Apply-
yard (1970), involved the sorting of drawings based on their content,
and the second, again after Appleyard was based on the structure of
the drawings. The final technique was based on Ladd's (1970) represen-
tational criteria, of 'pictorical', 'symbolic' or 'abstract' (map
like) categories. Again for each of these the judges were provided
with standardised criteria by which to categorise the maps. The
110

ratings given by the four judges on each sorting task were inter-
correlated, both to provide credence to the objectivity of the
sorting procedures and also as a means of establishing a single
score on each measure for each sketch map based on the pattern of
sorting of the four judges used. Factor analyses of Bycroft's study,
which attempted to relate cognitive mapping ability to spatial and
general ability, revealed three major factors. Firstly, that general
ability was of considerable importance for the types of map produced
and secondly factors of environmental familiarity were of importance.
(eg Residential location and length of exposure) which could be taken
to contradict the results of Murray and Spencer 1979. The final
point, and probably of most significance for 'cognitive mapping' was
the discovery of an Urban Spatial Ability factor, which Bycroft
suggests gives impetus to the contention that previous cognitive
mapping measures have confused process with product,
"They have tended to treat elicited sketch maps as typologies
reflecting inner representations rather than protocols resulting
from inner processes." (Bycroft 1974 p 75) Downs (1976) makes a similar distinction and argues that it is
essential to recognise a separation between cognitive mapping as a.
process and the cognitive map as the product. He also warns geo-
graphers of the tendency of their background in cartography to alloW
the metaphoric nature of cognitive maps to dominate thinking about
the form and function of the cognitive map. Downs believes that by
emphasising the process, and concentrating on the way aspects of the
spatial environment are learned and come to be understood, will
reduce the need to conceive of cognitive maps as actual maps in the
mind. Cognitive maps are generated to serve a purpose and do not
necessarily exist in a given structured form. What does exist are
sets of information and sets of rules for generating maps and it is
to this that Downs suggests we should turn our attention. tf ... we should treat much of the conventional wisdom of cogni-
tive mapping with a healthy degree of scepticism, since it lacks
supporting data of other than a personal, introspective nature.
It is especially true that we lack solid evidence as to the
unfolding of the cognitive mapping process in a temporal context."
(Downs 1976 p 69)
111

Catling (1978) however, argues that asking children to draw
'cognitive maps' can serve three important purposes. Firstly, as
a diagnostic instrument, which provides insights into the child's
perceptions, representations and levels of learning. Secondly, as
an instructional activity which can be utilised by the teacher to
develop children's cartographic abilities and their spatial and
environmental perception. Finally as an Informative guide as to
the focal points of the local environment. What are the features
and places of importance for the child? Catling also points out that
the type of question asked will influence the type of map which is
produced. For example 'Draw a map of the way you come to school'
as opposed totdraw a map of the way you come to school and the areas
you pass through, putting on and -naming all those features you can
remember or you think are important'
Blaut and Stea (1971) suggest that children are able to engage
in many of the fundamental processes of map making and map reading
such as rotation from horizontal to vertical views, reduction in
scale and abstraction to semi-iconic signs long before they are
exposed to traditional maps. Purther,Hart (1979) demonstrated that
children can use maps to solve simple navigational problems. With
very young children, their limited graphic and linguistic skills, it
is accepted by Blaut and Stea, does raise considerable difficulties
for the research, but Bruner'A comments seem particularly apposite
here,
"We begin with the hypothesis that any subject can be taught
effectively in some intellectually honest form to any child at
any stage of development." (Bruner 1963 p 33)
More recently Catling(1979) has argued that it is perfectly
feasible for young children to understand and use maps, provided you
approach any mapwork with the children's developmental stage in mind.
Blaut and Stea (Blaut, McClearly and Blaut 1970, Stea and Taphanel
1975) have proposed two hypotheses about the development of cognitive
mapping abilities in young children. They argue that the construction
of any cognitive representation is based upon a set of three cognitive
transformationcale, Perspective and Abstraction each of which can
be hierarchically described as seen overpage.
112

Fig. 10 The Criteria of Anal sis adopted by _let-LandZpLa
Five Point Rating Scales of Developmental Transformation of Scale,
Perspective and Abstraction
1. Scale
i Subfocal: own immediate personal space (point--like)
ii Focal: what an individual could see about him
iii Local: area experienced over time (not all elements
could be seen at once)
iv Valliudinal: displays concept of valley as whole (surrounded
by mountains, valley lower than surroundings, shape)
✓ Macro: valley represented as part of some larger system
2. Perspective
i Ground level: view as seen from ground (line of sight parallel
to ground)
ii Mixed: some elements viewed as from ground, some viewed as
from a point above ground
iii Downward oblique: view is consistently from a point above
the ground (line of sight at acute angle with ground)
iv Partially overhead: some elements viewed from overhead and
some viewed in downward oblique mode
✓ Mainly overhead: almost all elements viewed from overhead
(line of sight perpendicular to ground plane)
. Abstraction
i Realistic: attention paid to detail (much effort made to make
things look like they are); for example, windows in buildings
are put in regular rows
ii A: intermediate class between realism and abstraction
(combination of both)
iii Schematic: still some attention to detail but things are
more represented; for example, buildings still look like
buildings but windows are randomly distributed
iv B: intermediate between schematic and symbolic
✓ Symbolic: very little attention to detail, things are •
highly represented; for example, buildings are just squares
with no windows.
(Klett and Alpaugh 1976) 113

Bleut (1970) further hypothesised that the abilities required
to achieve each of these transformations are all associated, so that
they will be approximately the same at any given point in a child's
developmental sequence, but accepts that in the early years one would
expect the developmentally 'primitive' transformations of scale and
perspective to develop earlier than abstraction. Klett and Alpaugh
(1976) attempted to test these hypotheses with children aged 6i years,
9i years and 102 years. The resulting drawings of the San Fernando
Valley were estimated by a jury on each of the three ratings. If
there was a majority opinion a 'drawing was assigned that rating. If
there was no majority opinion the drawing was discussed by the jurors
until a majority opinion was achieved. Using these scores it was
possible to test Blaut and Stea's hypotheses that the ability re-
lated to each of these transformations shouJd be about the same at
any given point in a child's development and that the younger chil-
dren's drawings would be found to be developmentally primitive and
rated higher on the scale and perspective ratings than the abstract
rating.
Each of these hypotheses were confirmed at the 1% level, more
detailed analysis showed that a greater proportion of the younger
children achieved higher levels on the abstraction scale than the
scale and perspective categories. There were also more 9 year olds in the upper levels of all categories than classic development theory
would lead one to anticipate. One possible explanation offered by
Klett and Alpaugh is that development is achieved and stabilises
earlier since in a mobile society travel is emphasised and even young .
children are exposed to considerable spatial experience. Interestingly-
in a follow up study, Klett and Alpaugh identified a decline in level
of achievement beyond the age of 9 which they attribute to a variety of reasons. Firstly, as argued strongly by Balchin and Coleman (1965) •
the school pays relatively little attention to the development of the
skills of 'graphicacy'. Secondly the request for a sketch map could
result in the child emphasising features in their environment as a
description of perceptual space rather than a representation of their
understanding of conceptual space. Thirdly they also find drawing a
difficult medium of expression and finally for young children, space
114

is primarily understood in terms of personal activity. At about the
age of 8 or 9 there is a move away from egocentrism, from a concrete
and personal space, towards one that is more static, abstract and
impersonal. The decline in achievement identified by Klett and Alpaugh
may have arisen as a result of these changes, as the child re-orientates
his spatial understanding.
(xiv) The Development of Environmental Knowleck and Underaiz,7211.414
Within the research of Blaut and Stea and Klett and Alpaugh it
is possible to begin to detect the influence of general theories of
cognitive development, which has been another approach to environ-
mental cognition which has shown considerable promise (Gold 1980).
In particular such theoretical frameworks have been used to explain
the process by which cognitive maps are produced.
The theories of Piaget and Werner for example are based on the
evidence of extensive empirical study and systematic observation of
children and suggest that as the child grows he will have a view of
the world and have developed levels of spatial understanding that are
qualitatively different from when he was younger. Spatial learning
therefore is not merely a question of acquiring more spatial information
but also of developing and expanding sophisticated schema within which
to organise this information.
Hart and Moore (1973) and more recently Moore (1976) proposed
a framework within which the various ideas of Piaget and Werner
might be applied to large scale spatial contexts. Within the litera-
ture on developmental psychology, Moore identifies six fundamental
principles for an environmental theory of development. Firstly,
spatial knowledge is neither innate, nor a result of passive copying
of reality, but in line with Kant's philosophy results from an indi-
vidual actively constructing his view of reality through direct contact
and active involvement in the world. Secondly, spatial cognition
itself develops as a result of the dynamic interaction between the
internal mental characteristics brought by an individual to a situation
and the demands that the situation makes upon that individual. Third,
Moore emphasised the importance of the child's active exploration of
his environment in the learning process, with cognition arising out
of the transactions between the child and his environment.
115

Fourthly, spatial knowledge builds upon existing cognitive structures,
suggesting that cognition is likely to be influenced and interpreted
in terms of past experience. A fifth important feature is that
there are likely to be qualitative as well as quantitative changes in
a child's spatial cognition over-time, with more complex structures
replacing, or expanding the simpler ones of earlier years. Finally,
our understanding of the more advanced levels of spatial knowledge,
will only result from a comprehension of the process of development.
Moore, it seems is suggesting that process is of greater importance
than product; a tenet which was discussed earlier in terms of cog-
nitive styles and also made earlier in terms of cognitive maps.
Central to Moore's interpretation is the Piagetian concept of
adaptation and the overall 'equilibration process'. This process
monitors and aids the development of intellectual functioning from
the lower modes of biological and reflexive functioning, through
action oriented and perceptual functioning, to higher modes of con-
ceptual and symbolic functioning.
The key to learning in Piagetian terms is adaptation and al-
though intrinsic to all human beings, it is not intelligence itself
that is inherited but a mode of intellectual functioning composed of
two functional invariates assimilation, the process by which the
individual forms schemata of the outside world and accommodation,
the readjustment of schemata to cope with assimilation. The balance
between them is called equilibrium.
Hart and. Moore (1973) offer the following framework within which
to understand the growing development of spatial processes. As can
be seen in the diagram overpage they rely heavily on the Piagetian
stages of development generally and the concept of space in parti-
cular. During the sensorimotor period from 0 - 2 years on average,
the child can visualise things only in terms of actions that are
performed on them. Space is viewed egocentrically and although
there are the rudiments of understanding distance and direction,
the child lacks the ability to represent space conceptually. In
the next major stage that of pre-operations lasting from 2 - 7 years, the child's image of space is un-cordinated, based on memory of
previously manipulated, or perceived objects.
116

C 0
.0 C
0
C a !
il < l- .0 IV Ire. Formai operational Formal operational
--
period space
tc,;raitfier of
c.c.s and Euclidian MIMS
C ! 2 - 13
.o — — — — C-OO7c1. 1-n-iti-J; of — Euclid la n — 0- — ? perspectives ,L,t31 2 i o o 8 system of
f3IIIBI- Concrete Concrete a reference '7,., i - I operational operational
space
0
! r period
E SI -2 13 "g 1;: f 2'. ,'", .° E E.
E -, o cia t.'d illIAIL
Fa V, g 8
—R '
(0 j 8 c ,,, — -- — 1,.-, ,5. — E z,- 0
_6 IlBi_ Preoperational 0 6. -o (S',
11
`L'
o 1 Ppereroiopderational
space 713. Q Et -S.' cr ,; '0 73 .
0 - ,
.0 1.0 ... ,,, C ri.
X 0 2 '''
C2 O - ,... ,
E O. IIA -
o S841
)2 :'.!
i'i ,i," c c I period—
i 1 Sensonmotor Formation of the image ?.., s z. space .., Ociect permanence :.:*.i• al L3 11
E - . Lu CL 0
GENERAL LEVELS OF SPATIAL RELAnoNs TYPES OF REFERENCE INTELLECTUAL SPATIAL TO BE CONSTRUCTED SYSTEMS AND DEVELOPMENT ORGANIZATION TOPOGRAPHICAL
REPRESENTATIONS
z
n. 3 wIL0
0.
CO
NC
RET
E
AB
S TR
AC
T'
DIF
FE
RE
NTIA
TIO
N
PE
RS
PE
CT
IVIS
M
Fig II. A DIAGRANNATIC REPRESENTATION OF 21.12 DEVELOPNUNTAL NATURE OF ENTEONNENTAL COGNITION. (Part and Moore 1973.)
(After Moore 1976 p 149)
By Concrete Operations, the child is able to conceive of space
apart from his actions in it, but his thinking is still tied to
real or represented objects. In the final stage it is possible to
conceive of space entirely in the abstract, without representations
being dependent upon real actions, objects or spaces.
There is also a developmental sequence for the way in which
the child learns to construct spatial relations (Piaget 1956);
From the age of two the child gradually learns to master topological
principles which are concerned with relationships such as order,
proximity and separation and whether Mines are open or closed.
Later, projective space introduces perspective and the inter—
relationship of objects as seen from different viewpoints. This
develops in general from about the age of three and evolves alongside
117

the understanding of topological principles, although it is not until
about the age of twelve that the child fully learns to co-ordinate
perspectives. Euclidean principles emerge from about the age of four
and progressively develop towards a culmination in early adolescence.
The child gradually recognises the metric properties of space in-
cluding co.-ordinates, accuracy of distance and proportional reduction
to scale. By the end of the formal operational period the child will
have attained a co-ordinated system which incorporates Euclidean
principles alongside those of topological and projective. Moore
(1976) has subsequently extended his conceptualisation, incorporating
the Piagetian description of development, to the way adults learn
about new spatial environments. (Moore 1976)
The relationship between micro-spatial understanding and that
of larger scale environments of course is of questionable validity, as
is the application of a description of the development of children's
spatial understanding to adult conceptualisations. As Gold (1980)
suggests, adult cognition has a much greater inferential capacity
than is found in children, which may well produce qualitative differences
in the developmental process. It is also important to recognise that
Piagetb research is not without its critics and recently many of his
basic premises have come under considerable scrutiny. (Kuhn. 1979,
Boden 1979, Smedslund 1978, Brown and Deforges 1979, Anthony 1978,
Sigel and Brainerd 1978). Piagetb ideas have been criticised for
being too mechanistic and for indicating what the child is unable to.
do, rather than what he is capable of. This is nicely summed up in
the title of a recent article by Duckworth (1979)
"Either we're too early and they can't learn it or we're too
late' and they already know it: The dilemma of applying Piaget."
(p 297) Bryant (1974) and Donaldson (1978) are particularly critical of
Piagetb discussion of the egocentric nature of children's thinking,
especially during the late pre-operational period. In terms of the
development of spatial understanding, Donaldson raises questions
about the validity of the results of one of the classic experiments
employed by Piaget. In the three mountains experiment, children are
118

presented with a model of three mountains of differing sizes and
including varying features for distinguishing between them. The
child is seated at one side of the model display and a doll is
placed opposite him, the child's task is to select a picture which
represents the viewpoint of the doll from a range of available
Photographs. The child therefore needs to decentre his own thinking
and consider the perspective of someone else. Piaget discovered that
in general, children up to the age of eight or nine find this difficult,
and that there is a strong tendency of children aged 6 and below to
select the picture which represents what they themselves see.
Donaldson (1978 p 20) cites an experiment by Hughes (1975) which is
much simpler than that of Piaget, but which demonstrates that children
as young as 5-,1' years were able to distinguish the viewpoints of others.
Donaldson suggests that the main difference between the two experi-
ments is that whilst the Hughes experiment is clearly understood by
the children, the Piagetian one is obviously not. The mountains
task she argues is too abstract and the instructions too difficult
for them to comprehend. Comments on experiments such as these by
Piaget and Inhelder (1972 and 1978 respectively) suggest that there
are always likely to be individual differences when compared with a
general description of the form of thought and that such advances
are a direct result of the testing experience, where the training
was the necessary stimulus for such advance to be made or simply
that they had developed the cognitive capacities to cope with the
demands of such a situation earlier than the majority.
Other research into mapping skills and abilities also suggest
that children are able to cope with and co-ordinate perspectives,
earlier than Piaget's ideas might suggest. As described earlier,
the research of Blaut and Stea (1971) suggests that mapping can be
achieved in a rudimentary form at the age of three. This was demon-
strated when the children were engaged in toy-Play activities, building
town scenes and then comparing them with aerial photographs.
Fishbein,Lewis and Keiffer (1972 p 32) offer an important critical
comment on the research of both Piaget and Hughes,
' 119

"... that one should be extremely cautious in applying age
designations to any stage of thinking ... (methodologically)
we have always asked the child to identify the viewpoint of
another human being, whereas the other researchers have asked
the child to identify the viewpoint of a doll. The latter is
in the realm of the hypothetical: 'If a doll could see' or
'if a doll could take a photograph'. Dolls cannot see or
take photographs, yet the child is asked to assume that they can.
If young children have difficulties in dealing with the abstract
or hypothetical, but can readily deal with the concrete ... then
methods which employ dolls instead of people should prove to be
more difficult for these children."
Despite the criticisms levelled at Piaget's ideas, it is still
the case that his contribution to child development is unparalleled.
He has provided a very detailed framework, of spatial understanding
in this instance for researchers to work from. As Bruner (1972)
and Brown and Desforges (1979) comment, Piaget's major contribution is likely to be in the direction of questions which he has raised
for others to study, rather than his description of the developmental
process. It is the case that a number of researchers have followed
Moore's lead in using Piaget's ideas. Acredolo (1976) Wood and Beck
(1976) and Kates and Katz (1977) have adopted developmental theory
to examine large scale spatial environments and Catling (1978, 1979)
has attempted to relate the development of cognitive mapping ability
(the process) and cognitive maps, (the product) to a similar model
as that produced by Moore.
Catling (1979) suggests that whatever the context, the process of cognitive mapping is the same. The extent to which a child can
acquire information about a given place or area and his ability to
use this knowledge appropriately depends on his level of cognitive
mapping ability. Catling attempts to construct a framework to
describe the development of this ability; he bases his suggestions
on a variety of sources. (Piaget and Inhelder 1956, Shemyakin 1962,
Rart and Moore 1975, Siegel and White 1975, Moore 1976, Siegel, Kirasic and Kail 1978 and Hart 1979). From this evidence it seems
that there are four main stages through which cognitive mapping
120

ability evolves. Adopting a Piagetian descripticn, Catling refers
to the initial stage as that of Senscri-motor spatial action, which
occurs during the early months of life and is characterised by the
infants' exploratory movements around his environment. It is the
stage of initial physical and perceptual interaction with the spatial
world. As yet the child is unable to internalise his experiences
and his spatial awareness is momentary and his movements haphazard
and unto-ordinated. Once he can walk he can explore for himself
and begins to initiate interaction. At this stage, the child has
not yet begun to draw, but with the development of the ability to
internalise his acticns through representational thinking, he attempts
to draw. His initial efforts gradually evolve into intelligible
representations during the next stage of Egocentric Spatial Perception,
when he is able to retain an image of a feature, or event and an idea
of its location in its absence. (Bruner (1972) describes this as
iconic representation). This stage is characterised by the develop-
ment of a frame of spatial reference which is based upon the child
himself. He sees features in terms of a direct link to himself, or
a self--substitute such as his home, room or toys. The essence of this
stage is a sequential ordering, which originates from within the child,
topological structures dominate and specific location and direction
are unimportant (Moore 1976, Shemyakin 1962, Siegel and White 1975,
Hazen, Lockman and Pick 1978). The child's earliest attempts at
depicting environmental relations in recall sketch maps reflect these
capacities. They are topological, with the home often as the focal
point. Maps tend to be highly personalised and relationships such
as relative location, distance and direction unimportant. Features
are often drawn as pictures and those features shown are usually those
of most immediate pertinence to the child. Those without meaning, or
of limited experience, are ignored, but it doesn't mean they are not
known.
Increased experience of the immediate environment and indirect
contact with a wider world moves the child towards the third stage
of pObjectiveSa-tia1 , when the child comes to realise that
relationships between features exist without his presence. The child
121

at this stage has a well developed knowledge of areas with which he
is familiar, but is poor at co-ordinating relationships which might
exist between these areas. As such he possesses a reference system
which is only partly co-ordinated because as yet he is unable to
relate parts to the whole. As suggested earlier, Moore (1976)
argues that the individual's 'thought space' can be conceived of as
containing 'objective clusters', in that he has an objective idea of
their internal relationships even though his understanding does not
extend to 'cluster co-ordination'. Maps produced by children at this
stage include more sophisticated patterns of relationships and are
more clearly portrayed, although pictorial representation still tends
to dominate. There is still an element of egocentricity, but the
child demonstrates a realisation that features exist outside and
beyond himself. Known places are connected and some parts of the
map are well co-ordinated. It is still the case however, that
personally significant features can be over-exaggerated. This stage
of map drawing ability comes at a point when the child's cognitive
mapping ability, that is the process, is entering the final stage of
Abstract aatial reasonina, when the child realises that the map concept involves the representation of patterns and content from a
vertical perspective. Initially, however, he may still be acquiring
standardised map conventions. Generally the co-ordination of
relationships is sound and proportional and distance relationships
are more accurate, but with some over-and-under- estimation. There -
can often be a mixture of elevated and vertical viewpoints, with more
complex features presented pictorially. Many researchers have
commented on the use of pictorial representation as opposed to con-
ventionalsymbols (Conner 1969, Spencer 1974). Goodnow (1977)
suggests that in drawing a recall map, the child or adult is attemp-
ting to portray the spatial layout of an area, as if seen from above.
To do this successfully three problems have to be overcome. Firstly,
the individunl has to recognise that the environment will look
different. He has to also work out how it looks different and finally
must decide how to show this on paper, in a way that communicates
this viewpoint acceptably. As Catling (1979) suggests,
122

"In effect, the child has to present an equivalent view of the
environment. This may well be one that he has never considered
before. He finds himself challenged to depict relationships
he has not, perhaps, consciously realised. So, he may well
fall back on what he can do and employ equivalents he may. have
developed earlier such as drawing stereotype elevation views
of building to show what and where they are." (p 8)
Often when questioned, the child is clear that you can only
see roofs from above, but since he has no alternative way of portray-
ing this view he utilises what he knows and includes mixed elevations.
This is a transition stage, the ability to correctlz; represent symbols
and plan form emerges after this in the period of Abstract Spatial
reasoning when the reference system is abstractly co-ordinated and
hierarchically integrated. He is able to visualise an area and
successfully relates each of its constituent parts to the uhole.
At this stage the individual can analyse and assess spatial situations
without the necessity of direct experience. His thinking therefore
demonstrates the ability to apply abstract reasoning (Piaget's Formal
Operations) in a spatial context. The recall maps at this level tend
to employ conventional techniques to display information. The indi-
vidual is aware of the selective and purposeful nature of maps and
can locate features accurately and show size and distance in correct
proportion. Although, perhaps not entirely conventional as in O.S.
or Atlas maps the resultant product may be described as a 'true map'.
A recall map at this level shows that the individual concerned is
able to rationalise content in terms of the instructions given, can
abstract himself to produce an aerial map correct in terms of
structure and features, and is able to communicate this information
in a meaningful and conventional form. In an earlier piece of re-
search, Catling (1978) presented a diagrammatic representation of
the process and the stages of map representation. As can be seen in
the diagram below, he bases his analysis here on the Piagetian des-
cription of the stages in the development of the concept of space and
attributes typical map types to the varying levels of Topological
Projective andEuclideanunderstanding. Empirical Research has
revealed that each of these map types are distinguishable within a
123

Stago Map style)
Stage and comments
Topological [Egocentric]
Projective 1 [Quasi-egocentric]
Projective 2 (Quasi-abstract]
Euclidean [Abstract]
1. Link-picture map Highly egocentric Known places connacted to home. Solely iconic. Direction oriantat.on, distance, scale non-existant. Unco-ordinated map.
2. Picture map Still egocentric Partial co-ordina-tion and connection, of known places, direction more accurate. Road in plan form, but Luddings iconic Scale and distance inaccur-ate Little development of pers-pective.
3. Quasi-map More detailed and differentiated. Bette, co-ordination; continuity of toe,tes. Soire build ngs in p'an form Direction, or entetion, Ms-lance and scale tmptoved. Bettor perspeLtive.
4. True map Abstractly co urdinated and heir-eichical'y integrated map. Accurate and detailed Direction, orientation. distance, shape, size, scale all roughly accurate Map in plan form No symbols highly iconic, so key necessary.
Ke. V pp AD 3
""" • SIAM, LA74.1
°.:1""'" • INF irrr gja S .5„
On res
sample (Conner 1969) and albh.7fugh meatal age is of considerable
importance in terms of level achieved, experience with maps and
range of environmental interaction are also of considerable importance.
(Piaget 1956, Uzzel 1976).
Fig. 12 Stages in the Development of Cognitive Kap Representation
(Catling1978 p 121)
124

Catling (1979) also argues for the importance of careful
assessment of recall maps. Much previous research he believes has
tended to confuse the different representational elements in their
evaluation. As suggested earlier he identifies three main elements
to a recall map, each of which needs to be evaluated separately.
Firstly, he suggests, recall maps can be assessed in terms of
their aphic the extent to which they conform
to cartographic norms. This however, should not be confused with
questions about the extent of an individual's spatial understanding
which would be evaluated in the second category Spatial Representation.
This considers to extent to which an individual is capable of
communicating his understanding of the structure of spatial relation-
ships in a graphic context either topologically, projectively or by
displaying a .Euclidean understanding showing location distance and
direction accurately. Finally, Catling argues that recall type sketch
maps are also statements of Place Representation, since they display
knowledge of, and reaction to an area. Idhat is included will probably
depend on familiarity and how it is noted may provide some indic ation
of feelings associated. It is also important to consider why things
are excluded. Does it mean they are not known, unintentionally
excluded, or thought to be unimportant for the specific task in hand,.
Or as Ladd (1970) suggests, is it because of fear of entering a
particular area, or that one is prevented from doing so? Of course
one needs to be careful in distinguishing between these elements and
a map which is conventionally drawn may be assessed to be of a higher
level in all categories than is actually the case. Similarly someone
unfamiliar with an area may produce a map which would be assessed
at a lower level than greater experience would indicate. It would
appear that 'talking' to the mapper is essential.
Despite many of the reservations discussed here the problems
should not be over-emphasised. Recall map drawings are important
ways of representing knowledge and understanding and provided they
are carefully assessed, in conjunction with other techniques, they
can provide considerable information about an individual's knowledge
of his environment and what is important to him, as well as some
evidence of his abilities to reconstruct and communicate his view
125

of the world at a given time. As Pocock (1979) comments,
"The elicited mental map tells us something about the environ-
ment, the respondent and the underlying cognitive processes ...
within the context and constraints of the actual elicitive
technique used." (p 282) Goodey (1971) supports this assertion and comments that once
we can accept the idea that the map which does not conform to standardi-
sed conventions is not 'wrong' and once we can discuss maps and plans
produced by the 'untrained' in the same way that many parents view
their children's paintings and drawings (as an interesting personal
expression rather than an accurate representation), then we have at
our disposal a most promising technique.
One final element which requires discussion, is the means of
scoring cognitive maps, Bycroft (1974) in his review of research
associated with the analysis of children's drawings, refers to the
work of Martin and Damarin (1951) which isolated three main types of analysis which Bycroft argues are consistently demonstrated throughout
the cognitive napping literature. They are:
1. The analytic or quantitative analysis of detail which correlates
with chronological age, and most highly of these three factors, with
intellectual ability.
2. The comparative or qualitative method which measures the symmetry
and proportion of the drawings as a whole and most probably correlates
highly with spatial ability.
3. The presentation of the drawing in terms of stroke and repre-
sentation.
Bycroft comments,
"All have parallels in sketch map scoring methods currently
used in Environmental Psychology, to such an extent that it
seems redundant to reiterate the highly probable relationship
between cognitive abilities and what have been traditionally
termed cognitive mapping measures. Ladd's (1970) measure is
essentially representational (3,.above), Appleyeard's (1970)
and Moore's (1973) is qualitative (2) and most of the cognitive
mapping studies since Lynch (1960) have included some measure
of accuracy or detail (1 above)." (p 29)
126

(xv) Children's Perceptions and Understandin of their environment
Uzzell (1976) argues that it is perfectly justifiable to consider
children's perception of the environment as a topic in its own right
as there do seem to be important differences between adult and children's
conceptions. Maurer and Baxter (1972) for example comment,
... although children's imagery bears some relationship to
adults, there are impressive differences. There is a
quality of intricacy and attention to detail not found in
similar adult tasks ... the individuality of houses, interest
in animals, the unnerving confrontation with huge streets and
bothersome trains ... gives an interest and vitality lacking
amongst adults."
Lynch (1960) demonstrated that adults tend to concentrate on the
larger details of their environment, with little or no mention of
colour, sky, wall materials and items above ground level, probably
because such detail is irrelevant in their eyes for the task in hand.
Streets often appear as barriers in adult maps. Bishop and Foulsham
(1973) demonstrated that landmarks for children are those that are of
the greatest significance to them and that architectural elements
have very little importance. Bishop and Foulsham also found that the
maps of primary school children tended to be rather pictorial and not
very comprehensive. Consideration of scale was limited, but direc-
tional sense was clearly demonstrated. In their study of two primary
schools an interesting factor which emerged was associated with the
complexity of the environment in which the children lived. The one
school environment produced maps which contained a high level of
'connectivity' between the elements of the children's maps. The
particular area was one which was physically more, consistent, with
a very clear organisation of road and path networks. This is obviously
more 'imageable' in Lynch's terms. On the other hand, the low
'connectivity' of the elements of the children's maps in the second to
school Bishop attributesAthe complexity of that particular area with
a great deal of isolated environmental cues and often meandering
routes.
Bishop followed up this study with a similar experiment in
London with 9 year olds, who produced considerably less pictorial

maps, which were more-comprehensive. Bishop suggests this might be
attributed to the greater sophistication of London children, or more
probably to the contextual situation in which the children live, a
tightly ordered lay out of streets. This study also included a
consideration of secondary school children, whose maps demonstrated
a definite move away from pictorial representation, which demonstrates
a developmental growth of skills in association with age. It was
still the case however, that some of these children were neither
consistent nor comprehensive. The most marked differences were
those between the sexes. Boys were generally less consistent, but
less pictorial and more diagrammatic. Girls tended to include considera-
bly more detail. Bishop suggests that the girls were able to produce
better maps than the boys in general, but with less use of diagrammatic detail
and conventional mapping techniques.
Bishop also noticed that the primary school children have a clear
image of routes and are clearly conscious of staging posts, of im-
portant features and objects along these routes. With age, the number
of objects decreased. Bishop suggests that it is unlikely that the
older children forget these. What is more likely is that they are
responding to the demands of the task, providing what they think is
required, whereas primnry children he suggests are too egocentric for
that. Sieverts (1967) and Hart (1971) found that secondary school
children employ 'categories' to a greater extent than younger children.
That is, with increasing knowledge categories become more inclusive,
away from .an egocentric descriptive to a more abstract classification
system.
In his study of Harwich, Bishop (1973) found that for secondary
school children large landmarks emerged to be of minimal importance
and again in association with practical use. Thus the toilets in
front of the lighthouse assume more importance than the lighthouse
itself in the children's maps. The telephone boxes were mentioned
by many, as were the pubs, yet the school and church got a low response.
As one might expect, the sweet shop attains a high score. Several
children named all the shops in the High Street and the roads leading
off in the right order, where the system became more complex, some
are omitted, or the system is simplified. as is demonstrated in the
recent study by Byrne (1979).
128

Bishop raises an interesting point about the maps of 11 - 13
year old children in his sample whose Paps tended to include a high
level of conformity to group norms. They are told what is acceptable
and what is not, and 'art and the picturesque' in maps is certainly
to be avoided. Uzzell comments,
"Our whole system is geared to perceive and interpret in terms
of stereotypes and any move away from this is condemned as being
incorrect. Development is required to proceed towards the perfect
stereotype that is culturally and educationally acceptable."
(1976 p 17)
Another example of the differing perceptions of adults and
children was demonstrated in an undated study by Wood. The children
in the study were required to locate an hotel on a fictitious island.
The physical constraints had been organised such that, in adult terms,
there was only one obvious place to locate the hotel which was in a
sheltered sandy bay. The vast majority of children however, sited it
on a cliff top, facing strong winds and overlooking a rugged coast with
a shark infested sea.
It is interesting to consider when a child's means of inter-
pretation moves away from such idiosyncratic, often personalised
interpretations towards more adult-like abstract interpretation?
Children's usage of the environment tends to be functional and multi-
purposed, taking on a variety of diverse roles, rather than clear cut
and specific as is the case for many adults. In another part of the
study by Wood, two slides were shown to a sample of 40, 9 year old
children. One was of an alley in a New town with two girls walking
and another child cycling; the other was of a lakeside scene with
two boys playing. The children were simply asked which scene they
preferred. The result was an equal choice twenty for slide 1 and 20
for slide 2. Sex analysis however, revealed clear sex differences.
80% of the boys selected the alleyway, because they could cycle on
the pavements and climb on the walls. A second series of slides
were also shown to this group, of a sand dune beach, a mountain snow
scene, a forest, a rural area and an area of terraced houses in a
state of decay. Wood then asked the children to rank them in order
of preference. The children were from an area which most resembled
129

the final slide, and Wood hypothesised that areas of familiarity
are not favoured or preferred and this was not demonstrated by the
results. Many of the children ranking the picture like their own
environment highly. Bayliss and Renwick (1966) asked children to
describe what they saw in a photograph of the area where they lived,
which was in an Industrial city. The children aged between 7 and 11
showed that they had little difficulty in naming the main elements
in the photograph, though the emphasis was on particular features
with no attempt at generalisation about the area as a whole. For
example, only five of the sample of 95 children thought the hill,
which dominated the picturel worth mentioning.
Calland (1973) investigated which features a small sample (24)
of children could recognise on a photograph of the area around their
school and which features they marked on a map of their route from
home to school which was within one mile of the school. A distance
decay principle seemed to operate. Most features recognised, lay
within a radius of *miles from the school. Their maps showed a
clearer idea of the ends of journeys than the middle and certain
distinguishable features were identified. (For example the hospital,
shops, road features and the motorway, which acted as an edge to the
perceptual field of the children). On the whole, ten year olds
included more information than 9 year olds and in an analysis of the
maps in terms of Lynch's elements, the children seemed conscious of
Landmarks, Edges, Nodes and Paths, but not of particular districts
or areas within their environment.
Maurer and Baxter's (1972) study of Black, Mexican and Anglo-
American children's perception of their neighbourhood revealed that
Anglo-American children possess a life-style and an imagery more
complex than the other two groups. The reasons they suggest were,
more varied transport experiences, there was more likely to be more
home stimulation because mothers tended to be at home, there was also
a higher degree of mobility amongst this group with shorter periods of
residence in a particular place, and finally friends and relations of
this group tended to live further away, resulting in greater travel
and awareness of other areas. As a result they produced more complex
maps which included a high degree of regularity and order and
130

neighbourhoods were subsumed within a larger geographic area, suggesting
both a familiarity with and a clear image of the inter-relationships
of their environment. The other groups' maps were marked by a more
restricted view of their environment, yet the black children's maps
contained more elaborate detail than for the other two groups combined.
Maurer and Baxter suggested a Complexity - Constriction hypothesis,
as a result of this study, whereby life style and the image of an
environment which results places one somewhere on a position between
these bi-polar attributes. In terms of ability to cope with differing
environments, and environmental complexity, Carr and Lynch (1968) maintain
that most environments become boring with repeated experience, which
is particularly true for children who during summer vacations are
often limited in the extent of travel and movement possibilities.
Lynch suggests that environments need to change continually, or the
individual must be motivated to search for new levels of experience
and meaning in an environment that offers successive, levels of complexity.
This was demonstrated in Lynch's (1976) UMW study which was referred
to in an earlier section.
Ladd (1970) in his investigation into black youths view of their
environment suggested that the organisation and complexity of children's
maps reflected their sense of coherence and understanding of the area
where they lived. At the lowest level of organisation in cities he
suggested that the street is usea ly the central organising factor,
which tends to reflect a highly personalised view of the neighbourhood
revealing a narrow egocentric viewpoint. At a more sophisticated
level, the organising factor goes beyond the street where the subject
lives, towards some more abstract factor such as an intersection or
main comMercial thoroughfare which is obviously less personal, more
abstract and objective. One interesting feature to emerge from Ladd's
study was that 15 year old children's maps contained fewer landmarks
than 13 year olds, which Uzzell (1976) suggests might imply a greater
ability to select and consider the demands of the task more abstractly,
but surprisingly the most sophisticated 'mappers' in the study in-
cluded more landmarks than any other group which one would imagine
would not suggest superior selection skills. In Ladd's study only
one child made reference to the external features of his house when
131

asked what was liked or disliked about present housing. Uzzell
(1976) suggests that facades seem to have little significance for
children.
In the study by Maurer and Baxter, items mentioned most frequen-
tly by children included houses, streets, traffic, other children,
fences and grass play areas. Nearly all the children began by
naming the streets and then described the sights, sounds and smells
associated with their environment, but in two case studies cited by
Maurer and Baxter of a description of the route taken to school by
two white American children, a 13 year old boy and a 12 year
old girl. Both children mentioned roads and buildings far more
frequently than other perceptual cues, including people,olfactory
and auditory features.
In the UNESCO studies (1973, 1977) children were questioned about
the nature, extent and frequency of their journeys out of their own
areas. The visiting of friends and relatives was the most common
response, followed by shopping, drives with friends and attendance
at social and sporting functions. School is one of the least
mentioned and presumably least memorable travelling experiences.
In response to questions about, where children feel most cCmfortable,
or feel like an outsider, most children it seems feel most relaxed
in their own homes, especially their own bedrooms, whereas they are
unhappy in areas unknown to them or excessively overcrowded places.
Downton (1973) and later Lynch (1977) asked questions concerning
dangerous, beautiful, ugly and holy places. Roads are seen as the
most dangerous, along with heavy or fast traffic. The river also is
often regarded by children as a hazard. Certain areas are feared
because of the potential for gang fights in them. (Ladd 1970).
As far as beauty is concerned, the natural environment, gardens,
parks and anywhere with trees tend to be mentioned, especially by
children living in cities. It would be interesting to consider how
far this view is supported by children living in environments, other
than those described here, as for example in rural village communities.
Factories are most frequently referred to as being ugly, along
with poor housing, pollution and dumped rubbish. City buildings are
disliked because they are cold, tall and concrete and churches are
132

obviously the most frequently mentioned holy place.
Downton (1973) also comments that planners often see the use
of open space in terms of sporting facilities, whereas most fourteen
year olds tend to look for a more adventurous use of space. The
primary use of space by this age group is a social one, the meeting
of one's peer group and raises the important question as to whether
the social use of the environment is more important for children than
the physical? It was also found that children find streets more
interesting than open play spaces, because they are more dynamic and
lively, with plenty going on.
Lukashok and Lynch (1956) carried out a study of adults' child-
hood memories of a city and despite the problems of studies of this
kind, the results confirmed many of the findings of studies with
children. Adults it seems remember the importance of not only play
spaces often citing the generic term of Play Places, but the whole
of the environment, including streets as a central meeting and play-
space. Many of their recollections included important emotional
elements. What was remembered, being closely associated with why
it was remembered.
Uzzell comments that one aspect of urban imagery not covered in
previous adult perception studies is that of means of transport and
its effect on knowledge. In studies of children however, the use of
transport is quite well documented and the effect of travelling by
car, bus, bicycle'and on foot have been considered. Maurer and
Baxter (1972) maintain for example, that mode of transport effects
the quality of the imagery and that for those travelling by forms of
transport, other than by foot, there is a high incidence of structure
in their maps. Those who walk, tend to rely more heavily on natural
environmental objects and prominent landmarks. Downton (1973) suggests
that some transport forms result in limited route knowledge. -In a
car, for example, only limited attention is paid to the route and
the surroundings passed through. Bishop (1973) also found that the
information obtained and remembered can often be highly specialised,
often dominated by one side of the street, depending on an individual's
seat in the car. Similarly bus travellers, who produce prodigious
amounts of information tend to concentrate on one side of the street.
133

Tindall's (1971) study demonstrated that the environmental range,
the extent of the area experienced, was different for urban and
sub-urban children. He found that urban children's range was
smaller than that of sub-urban children and as a result they tended to
have a more constricted view of their environment. Boys tended to
have a more extensive environmental range than girls at all age levels
and the strongest single relationship was found to exist between home
range and school grade level. Home range increased progressively
with grade level, which Uzzell takes to suggest a clear indication
that home range is a developmental process.
Sieverts (1967) study of Berlin demonstrated that for children
there is not just one perceptual image of the environment, but
several, depending upon the problems raised. Maps of a navigational
route through the city produced considerable differences when compared
with maps of the city as a whole. Sievertsalso found that the
centre of Berlin was over dimonsionalised, perhaps expressing its
subjective importance.
Sieverts maintains that the growth of a perceptual image of an
environment (ie a town) is parallel to the development -of personality.
In childhood he suggests, the image consists of a series of dis-
connected districts in which one's own residential district is the
centre. This he referred to as a 'domicentric' viewpoint. By the end
of adolescence the perception of a town as a whole emerges, with the
town centre at its heart, an 'exocentric viewpoint'. Although some-
what simplistic, this suggests that perceptual images are develop-
mental, which has been demonstrated in Bishop's (1973) study, and
Appleyard's (1970) classification of the development of networks and
is referred to diagrammatically by Catling (1979). Gulick (1963)
however questions whether the placing of a location as a central
focus on a map indicates its overwhelming imageability, or that it
merely demonstrates an inability to draw a well proportioned map.
Gould (1973) also demonstrates a developmental progression in
children's preferences within their environment. Gould showed children
aged 72 - 13 a map of Sweden with 70 functional regions demarcated.
The children were asked to rank them in order of preference. As
one might expect the youngest children found this virtually impossible,
134

but by 912 a collective image was beginning to emerge which appeared
to have been fully developed by 13 where preferences were assigned
with considerable care and subtle differentiation (eg between pre-
ference for permanent residence and a holiday).
Probably the most detailed analysis of children's perceptions
of their environment is that undertaken by Hart (1979). In this
study, Hart had considered making reference to the work of Witkin,
but in the end elected to actually involve himself in the activities
of his sample of children. He spent a year living and working with
the children of a small compact rapidly expanding and urbanising
town in the United States, sharing as fully as possible with them
in their direct experience of the environment. He adopted a largely
descriptive and naturalistic approach in this study which attempted,
"to discover the landscape as it exists for children"
He employed a variety of techniaues to investigate the spatial activity
of his sample, their place knowledge, place use and the value and
feelings they attach to these places. Hart concluded that an im-
portant quality demanded of environments for children is its suitability
for modification by them, (Hart 1979 p 349) "The children of this research demonstrated ... how much they
value paths which they have 'found' or made themselves ...
They also showed how important the freedom to make other
environmental modifications is, particularly the opportunity
to make places for themselves".
Conclusion
The previous discussion clearly argues that the process of environ-
mental pei.ception is an interactive one in which each individual
shapes as well as responds to his environment. Each of us is sele-
ctive in what we perceive and it appears that there are a variety
of ways in which this information is stored and retrieved. The
selection process can be explained in part by social and cultural
pressures, but such pressures do not explain individual differences
135

in the process of perception, which appears to be a developmental
phenomena. There are apparently considerable differences which exist
between the child and the adult in their perception of the environ-
ment for example.
Goodey (1971) suggests that perception studies offers a rich,
but largely untapped resource for education at all levels. It reveals
to teachers important distinctions about the ways in which children's
views and interpretations of the environment can differ from that of
the adult. As Graves (1975) suggests, the teacher has to start from
the images held by the children, and Uzzell who comments:
"... in many aspects of our daily encounters with the environment,
the child's world is often significantly different from our own.
The question now arises as to what use is this information for
those involved in environmental education. One conclusion
immediately springs to mind. The courses which we teach are
based on our own set of values as to what is important and sig-
nificant in the environment. Perhaps it would be more constructive ,
and creative if we were now to try and base environmental edu-
cation on the value system of those we are teaching. That is,
to build upon the perceptions of, and the meanings that the
child invests in his own environment." (1976 p 18)
Wohlwill (1976) however, believes that what emerges from most
studies is a total lack of consideration of the 'individual', his
own preferences and abilities and ways that might distinguish between
individual's perceptions of their environment. It is the central
thesis of this study that cognitive styles may offer one useful
avenue for such individual differentiation. More particularly, the
distinction between an analytic and global cognitive style as identi-
fied by Witkin and discussed earlier would seem to offer the
potentially most useful avenue for investigation as a result of the
perceptual roots of both this cognitive style and an individual's
Environmental Image. Further, there seem to be important changes
taking place in children's environmental images during the middle
years from 10 - 13, at a time when Witkin et al, have suggested the
development of field independence is increasing at its maximum rate.
The next section describes the organisation of the empirical
investigation in to the relationships between children's cognitive
style and their perception of the environment. 136

CHAPTER 4 Outline of the Empirical Study
In order to investigate the relationships which exist between
children's cognitive styles and their perception of the environment,
the following research was devised. It was proposed that the study
should focus on children in the middle years of schooling,
primarily from 10 - 13 years, for a number of reasons. As was suggested
at the end of the last section, Witkin has demonstrated that the
greatest changes that take place in the development of Field Indepen-
dence occur during this period. This is also a time at which Piaget's
researches suggest considerable development is manifesting itself in
children's thinking capacities and the inter-relationships between
Field Independence and such developments have been recognised and
investigated by Pascual - Leone (1969, 1970) Case (1974, 1977) and
Case and Globerson (1974) and were discussed earlier. Finally this
is the age range with which the author has most experience.
The research was conducted in two stages. Firstly, an inter-
correlational exercise which concentrated upon the inter-relation-
ships between the following elements:
(i) measures of Witkins analytic/global dimension
(ii) measures of ability
(iii) measures of environmental perception
(iv) aspects of personality associated with Field dependence/
independence
This was followed by individual interviews and a further field
exercise with a representative sample of children. The focus of .
this second stage was derived from the results of the analysis of
stage one of the project.
The sample for the inter-correlational exercise was drawn from
3 schools, one middle school in a rural environment, and an urban
secondary school and one of its feeder primary schools. The number
of children participating in this part of the study is as follows:
137

TABLT1 4. 1 The Sample
10-11 yr olds 11-12 yr olds 12-13 yr olds
School Type Boys Girls Boys Girls Boys Girls TOTAL
Rural Middle 31 45 42 37 55 36 . 246
Urban Primary
Urban Secondary
33 -
26 -
44
-
45
- 36
- 51
235
TOTAL 64 71 86 82 91 87 481
TOTAL BOYS: 241 TOTAL GIRLS: 240
The various measuring techniques employed in stage one of the
study were as detailed below:
1. Measures of Coiitive St *le:
As suggested by Vernon (1972), three measures were adopted to
investigate the cognitive style of the sample in terms of Witkin's
analytic/global dimension; the Embedded Figures Test, the Rod and
Frame Test and the Articulation of Body Concept Scale. To counteract
previous criticism (Vernon 1972) the procedure for each of them
followed those prescribed by Witkin et al. The first measure was
the Group Version of the Embedded Figures Test developed by Witkin,
Oltman and Raskin (1971) and is divided in to three sections each
of which is timed. The norms are based on standardised testing
times of five minutes each for the second and third sections and two
minutes for the first section. In a small pilot study (Witkin 1971),
the test was found to differentiate among 9 and 10 year old children
when the time limit was extended to 10 minutes each for the second
and third sections, so for the younger children in the sample an
extended time period was observed. As was explained in Chapter 2 ,
the Group test revives subjects to identify a simple figure in a
more complex shape, to tdisembedt in Witkin's terms. A sample of
simple and complex figures found in the test can be seen in Appendix 1,
along with the standardised procedure for undertaking the test.
138

The second measure of cognitive style was the Rod and Frame
Test. For this, a portable apparatus was obtained. * The procedure
for this exercise, which is undertaken individually in a semi-
darkened room, was kindly provided by Dr Philip Oltman, a colleague
of Witkin, who developed the first portable rod and frame apparatus.
The procedure was adapted slightly to suit the age range under study.
A copy of the standardised instructions can be seen in. Appendix 1.
The apparatus measuresAubject'sability to overcome the perceptual
effects of another shape when attempting to align a rod to the vertical,
again demonstrating the ability to 'disembed'. A successful (field
independent) subject will achieve a low deviation score over the
eight trials of the test, whereas a less successful subject (field
dependent) will achieve high deviation scores and is distracted by
the surrounding visual field.
The final measure of cognitive style, the Articulation of Body
Concept Scale requires subjects to produce two drawings, one of a man
and one of a woman. These are then assessed on a five point scale
representing the degree of differentiation within and between the
drawings, in terms of the form of the figures, sex differentiation,
the level of detailing and the articulation of features. Because of
the highly subjective nature of such analysis three judges were used
to assess the drawings. The details of inter-judge reliability will
be discussed in a later section and a copy of the directions and
criteria for analysis can be seen in Appendix 1 (The details for this
exercise were again kindly provided by Dr Oltman of the Educational
Testing Service at Princeton ).
*Grateful thanks to Peter Jobbins at the Institute of Education's
Technical Resources Centre.
139

2. Measures of Ability
(i) In Chapter two it was suggested that the relationship
between field dependence/independence and aspects of intelligence
is still not very clear, with considerable question as to whether
the style identified by Witkin is in fact merely a representation
of general ability and more particularly of spatial ability. (Vernon
1972, Satterly 1976, 1979). To further investigate these questions
it was proposed to include various measures of ability in the study.
AH3, devised by Heim, Watts and Simmonds (1978) was adopted as the
measure of general ability. It is divided into three sections and
provides an assessment of Verbal, Numerical and Perceptual Reasoning,
(in this test 'perceptual' denotes material which is either diagram-
matic or pictorial) as well as a measure of 'general ability' in the
final score. The test can be used successfully with children aged
from 9+ and consists of a series of 40 questions for each section.
Each section is timed and requires 15 minutes, 15 minutes and 12
minutes for the respective sections. Norms are provided for children
aged 9+ to 15+ who attend Comprehensive schools throughout England
and Wales, which is probably a more appropriate comparison for the
children of the sample schools. The results of this test Would alsO
allow the study to identify any particular loading which might exist.
between aspects of intelligence and the three measures described in
the previous section. (As was discussed earlier Karp (1963) had
identified an association between measures of Field Independence and-
an 'analytic' sub factor in the Weschler Intelligence Scale)
(ii) To investigate the relationship between the measures of
Field Independence and Spatial Ability, NFER Spatial Test 2 was used.
Previous research (Bycroft 1974) had identified a relationship
between elements of the test and cognitive maps produced by a small
sample of English Secondary schoolboys. This test was adopted to
serve a dual purpose therefore, as a comparison with performance on
the tests of Field dependence/independence, as well as a measure of
the association of spatial ability with the maps produced by the
sample. The test itself consists of a series of five sub-tests and
is designed to investigate children's ability to deal with three
dimensional material. Each sub-test is preceded by a short practice
140

test and requires a total of 45 minutes for administration. Extracts of the test and the standardised instructions employed can be seen
in Appendix 1.
(iii) In the discussion of the Articulation of Body Concept Scale,
(Ch 2 and earlier in this chapter), drawings of a man and a woman
are used to indicate subjects ability to demonstrate clear identity
and sex differentiation of the figures, which Witkin et al (1974) suggests is closely associated with the ability to Idisembedt, hence
its use as a measure of psychological differentiation. If Witkin's
distinction is to be accepted as a 'cognitive style' it is to be
expected that all associated measures satisfy the requirements
presented in Chapter two, in particular that performance on any
exercise is not a direct result of intellectual maturity or ability.
The work of Goodenough (1926)- and more recently Harris (1963) suggests
that detailed analysis of drawings of a man and a woman provides
evidence of a close association between quality and detail in the
drawings produced and increasing intellectual maturity. It was
felt that by analysing the drawings resulting from the Articulation
of Body Concept Scale in the terms described by Harris (1963), it
might be possible to examine the relationship between Articulation of
Body Concept and Intellectual maturity, a factor which seems to have
been ignored in discussions of the Articulation of Body Concept Scale.
The Goodenough-Harris Draw-a-man test (1963) examines individual
elements included on the drawings of a man on a 0 - 72 point scale
and the woman on a 0 - 69 point scale. Detailed information is given
for each item considered. A breakdown of the elements considered
for each of the drawings can be seen in Appendix 1.
3. Measures of Environmental Perce tion
(i) To date only one study has examined the relationship between
Field Independence, as measured by the Embedded Figures Test and
aspects of Environmental Knowing. This is the study by Satterly
(1979) which was discussed earlier, in.which a positive correlation
was identified between performance on the Embedded Figures Test and
two tests of 'geographical ability'. (0.386 and 0.398), These'tests
for a group of 10 - 11 year olds consisted of a series of exercises
of orientational ability, ie.left, right and cardinal direction when
141

using simple plans. For this study the exercises were modified as
a series of straight orientational problems, the first involving a
series of small plans and the second based on a more detailed street
plan, to these exercises was added a further orientational exercise
developed by Conner (1969) which required subjects to match small
map extracts with an appropriate picture of the information contained
on the map. Details of each of these exercises can be found in
Appendix 1 with the standardised instructions for their execution.
(ii) As a further measure of Spatial Ability, but with potential
implications for children's perception of the environment, the Draw-a-
Plan test, devised by Thorstad (1974) was undertaken by the children
in the sample. The test requires subjects to draw a plan of the lower
floor of their house. An ability to draw a plan horizontally,
Thorstad (1974) suggests, implies that a child understands space as
a Euclidean grid of intersecting horizontal and vertical planes.
Before drawing the plan, the child has to imaginatively put together
the spaces that he lives in and take a point of view from above, which
is not possible in reality and then the information has to be trans-
posed from 3 into 2 dimensions, which is employing similar skills
to map drawing. The ability to draw a plan Thorstad argues is an
outward manifestation of the child's stage of conceptual development,
the development of which occurs mainly in the stage defined by Piaget
as the Concrete Operational Stage. The scoring of the plans is
undertaken on a 0 - 40 point scale and the scores are standardised,
elements such as proportion, structure, and connectedness are considered.
A copy of the test with the standardised instructions are included in
Appendix 1.
(iii) The rosin technique that has been used extensively in
Environmental Perception research is the 'Cognitive Map'. As was
discussed in Chapter 3, this is a technique which has been the
subject of considerable criticism, yet despite such criticism, re-
search employing this technique has revealed valuable information
concerning peoples knowledge and understanding of place. Bearing
such criticism constantly in•mind, with a view to further constructive
criticism of the technique, the 'cognitive map' was adopted as one of
the measures for this investigation. Rather than rely on one map,
142

however, as much of the previous research has done, subjects in the
sample were requested, to produce two maps, one of the area where
they lived and one of the route from home to school. These were
undertaken as separate exercises a week apart. Following Catling's
(1979) comments that what subjects are asked to do influences their
response, the instructions for each of the mapping exercises were
standardised and printed at the top of the response format. (Copies
of these can be seen in Appendix 1).
To allow further opportunity for the children in the sample to
reveal their knowledge and preferences about the area where they
lived, they were asked to complete a questionnaire. The questions
included were based on previous environmental perception research
and asked about favourite places, disliked places, beautiful and ugly
places etc. (A copy of the questionnaire, which had been tested
prior to the study with a small sample of primary school children
to ensure clarity and lack of ambiguity, can be seen in Appendix 2).
Although criticism might be levelled at the highly linguistic nature
of this exercise, it was intended as flexible a medium as possible
for obtaining farther information. During the completion of the
questionnaire the author was always present, as was the class or
geography teacher . Questions were invited and farther explanation
was given wherever necessary. There was no time limit set for the
exercise and all subjects were allowed as much time as they reauired.
Children with reading or language difficulties were identified prior
to each session and the class or geography teacher attempted to ensure
that they were clear about what was intended of them and offered help
on the completion of questions if it was required. On such occasions
it was arranged that reference would first be made to the researcher
to attempt to achieve some level of consistency across the sample.
(in actual fact the exercise caused little difficulty and the sample
completed the questionnaire with very few problems encountered).
Whilst completing the questionnaire, the map that they had drawn of
their home area was returned to them for reference. They were invited
to add to it or amend it if necessary, in order to obtain as complete
a picture of their 'perceptions' as possible. Throughout the exercise
the children were asked not to consult with each other.
143

The resulting maps drawn by the pupils were analysed in a variety
of ways, based to a great extent on criteria developed in previous
research, but modified for this particular undertaking *1. The
criteria for the first stage of the map analysis was tested on a
cross-sectional sample of the maps by two judges *2 who analysed the
maps in the terms specified. (The details of the criteria and the
instructions for this analysis can be seen in Appendix 3). Once
satisfied that the criteria were clear and that it was possible to
analyse the maps in such terms, each map was considered in the
following way. (Correlations between the judges on the scales used
will be discussed later in this chapter).
Map 1
(The Area where subjects lived)
1. The Extent of the Area depicted
Map 2
(The Route from Home to School)
2. The degree of Abstraction demonstrated
1. The degree of Abstraction demonstrated
3. The Perspective Adopted 2. The perspective adopted
4. Accuracy or Quality 3. Accuracy or Quality
5. Map structure or Style 4. Map structure or Style
Each of these elements were scored separately on a 0 - -5 point scale (and 0 - 4 scale in the case of Map Style). The scores for the
degree of abstraction demonstrated, the perspective adopted, the
accuracy or quality of the map, and the map style were then combined
to produce a Total Map score for each of the maps, as can be seen in
the following example.
Abstraction Perspective Quality Structure CompoSite --- Score
14
.----14ai Map 1 5 4 3 2
Map 2 3 3 3 1 10
*1 The breakdown of the criteria and the research upon which they are
based is discussed in Appendix 3.
-).(-2 The researcher and Mr Michael Younger of the Geography Dept at
Homerton College, to whom I am most grateful for this lengthy
undertaking.
eg
144

The individual scores for each cat:Li-lent and the final scores for
each map were included in the statistical analysis, for as can be
seen later in this section, it is hypothesised that there are likely
to be close associations between success on each of the scales and
performance on the tests of Field dependence/independence. It could
be argued, as Gold (1980) has suggested, that these forms of analysis
will provide more information about the cartographic skills of the
children involved rather than their perceptions of the environment.
so the maps were also analysed in the following terms:
1. Labelling. A recent study by Mathews (1980) had demonstrated
an association of the degree of labelling and the quality of maps
produced by a sample of 11 - 18 year olds. Simple percentage com-
parison of his results revealed that all maps of children aged 14
and above contained some form of labelling whilst 17% of eleven year
olds and 11 per cent of 12 year olds did not differentiate features
semantically. This study would serve as a comparison for the 11 and
12 year olds, and offer additional information for those children
aged 10.
2. LlaS-_u_o,etur: Lynch's classification of the structure of mans,
although criticised (Pocock 1977, 1979) has been employed in a wide
range of studies. Mathews (1980) suggests that there is a preference
for the inclusion of a wider array of features as age increases. In,
his study, paths, nodes and landmarks were included by large propor-
tions of his sample and for the youngest children individual buildings
rather than routes were emphasised, stressing the functional signi-
ficance of the environment for them. Each of the maps in this study
were analysed for inclusion or absence of each of Lynch's characteri-
stics and results could again serve as a comparison with studies
such as those of Mathews (1980) and Calland (1976) and the detailed
review of such studies by Moore and Young (1978).
3. Elemental Content. As suggested above (Mathews 1980) previous
research has identified an association between age and the number and
type of features included on cognitive maps. Similarly, other
studies (Bishop and Fousham 1973) have noted young children's concern
with the minute and incidental as compared with adults. Each of the
maps in this study were examined for type and range of features
145

included, with the possibility of an association between them and
tests of Field dependence and independence.
The Questionnaire was analysed separately, then compared with
the information portrayed on the Area maps. The organisation and
results of this analysis will be discussed in a later section.
As a final element of stage 1, it was proposed that some measure
of Personality and its association with the factors under study should
be included. As was discussed earlier, certain personality characteris-
tics have been associated with each of the extremes identified by
Witkin. These are discussed in Witkin and Goodenough (1976) and
Witkin, Moore, Goodenough and Cox (1977). Similarly Cattell (1969)
had suggested that the Q4 'Independence' factor of his 16 PP Personality
Inventory was likely to load significantly with tests of Field Inde-
pendence. The only known association of Personality and Environmental
Perception is Sonnenfeld's (1969) suggestion of the existence of an
'environmental personality' which predisposes one to behave in certain
ways in any environmental setting. As was mentioned earlier,Sonnenfeld
suggested that each of us are selectively sensitive to cues from the
environment and that the identification of factors influencing these
degrees of sensitivity might be a useful avenue for research. In
this context it might be argued that a bias for field dependence or
independence might predispose an individual to behave in certain ways
in any environmental setting and as such influence what he perceives
to be of importance in that environment.
The major difficulty of including a consideration of personality
however, was that of finding an appropriate research instrument.
Despite obvious problems of reliability, it was decided to adapt a
scale which had been devised by the Open University for their course
E 201. (Floyd 1976). In this course, it was suggested that research
evidence exists to support the association of the following persona-
lity characteristics with the Field dependence - independence
continuum.
146

• • • 0 • • • • • • • 0
• • • 0 • • • • •
• • • • • I, • • •
• • • • • • • 0 •
• • • • • • • • •
• 0 • • 0 • • • • • • •
Factors associated with
Field Independence
Leader ...
Solitariness ...
Introvert
Individualistic
Perseveres
Independent
Factors associated with
Field dependence
Follower
Gregariousness
Extravert
Conformist
Gives up Easily
Dependent
In the examples presented in the Open University course each
of these pairs were seen as opposites with an individual tending
towards one extreme or the other. Thus a predominantly field in-
dependent individual would tend towards the left hand side of the
diagram and a predominantly field dependent subject towards the
right hand side. It was felt however, that scores on continua scales
hide more than is revealed, so-the characteristics listed above were
treated as separate personality features and presented in random
order. The children's year tutors were then asked to make an
assessment for all of the children in their year gToup, when compared
with their peers, for each of the characteristics listed on a 5
point scale, from it not being a feature of their personality, to it
being a dominant feature of their personality. Year tutors were
selected to reduce the number of teachers making an assessment for
each child and because of their close pastoral care and personal
knowledge of the children. The instructions for the exercise were
standardised and printed on each response format, a copy of which can
be seen in Appendix 1. The results would therefore produce separate
scores for each child for each of the characteristics and scores "
could be combined in the terms described by the Open University to
produce scores for those factors which research had suggested were
associated with Field dependence and Field Independence. The major
problem with analysis of this kind however is consistency and inter-
judge reliability. This is accepted and recognised. It was to some
extent overcome in that the year tutors undertook the task and in the
rural school it was taken as a very serious exercise indeed, with the
teachers of the various year groups participating in the an,nlysis
over several year group meetings. In the urban schools it relied on
147

LADLE 4. 2 a'•ASLRES =MO= IN STAGE 1 OF TEE STUDY
1. Cognitive Detail Style
Simple Figures hidden in more complex shapes
RFT Degree of deviation from upright over 8 trials
ADC Degree of differentiation of drawings
DAN
Drawing of a Ilan ant a Woman
3. MOCSUTOO of. Environmental Perception
Orientation Exercise 1 Simple Pleas '
Etercise 2 Street Plan
EXercise 3 Relating Map Ettraot to Pictures
DA Plan Drawing of Lowei. Floor of Mouse
Naps 1 and 2 Areal Extent (Nap 1 only)
Degree of Abstraction
Ferspeotive Adopted
Accuracy
Style
Labelling
Structure (Paths, Lanmarks, Nodes, Edges, Districts)
No and Type of Features Included
Score
0-25
5.50 — 223.5
1 — 5
Total 120
Total 100
0 — 72 Standardised
0 — 69 Scores for Each
0 — 9
0-22 Total 0 — 43
0-12
0 — 40 Standardised Scores
1 — 5 1 — 5 Combined to
1 — 5 produce a score for each
1 R map out of 19
1-4
1, 2 or 3
Presence or Absence
Tndividually analysed and for the sample
3. Measure of Environmental Perception (Contd.)
Questionnaire Favourite Places (and aspens)
Disliked Places ("
I/
Comfortable Places
Uncomfortable Places
Dangerous Places
Beautiful Places
Moises
Smells
A series of Guide Photographs
Sights shown to Child, Relation and OtLer Adult
Personality Leader 0 — 4 Follower 0 — 4 Characteristics Solitary 0— 4 Gregarious 0— 4
Introvert 0 — 4 Extravert 0 — 4 Tn.i1vid•xs1istio 0 — 4 Conformist 0 — 4 Perseveres 0 — 4 Gives up easily 0 — 4 Tnd.pendent 0 — 4 Dependent
on others 0 — 4 Field Ind. Score Field Dep. Score
2. Measures of Ability
AR 3 Verbal Numerical and Perceptual Reasoning 0 — 40
ST 2 5 sub tests of ability to deal with 3 dimensional material 0 — 20
four different teachers, the two primary class teachers and the first
and second year year tutors in the Secondary school. Consistency
was attempted by stannardising the instructions and the researcher
constantly being available for advice whilst the forms were being
completed. Despite the potentially low level of reliability, it
was felt to be a worthwhile inclusion to give at least some indication
of the relationship which might exist between style, personality and
environmental perception.
This concludes a review of the measuring techniques employed in
the first stage of the empirical research. The next section presents
data on the reliability of these techniques and the following diagram
describes the techniques in tabulated form.
148

Scori -erJude aLr Id the Reliabi241yofthe
lausurinstruments
Two of the measuring techniques employed in the study were more
open to criticism because they involved less objective scoring.
These are the Articulation of Body Concept Scale and the analysis
of the maps for Areal dent, Abstraction, Perspective, Accuracy
and Style. In an attempt to achieve a greater degree of objectivity,
panels of judges were used in the marking of these tests.
As was discussed earlier, the Articulation of Body Concept
Scale considers the degree of 'psychological differentiation'
(Witkin et al 1971), demonstrated in children's drawings of a man
and a woman. These drawings are scored on a 1 to 5 point scale, a score of 1 representing the most 'articulated' drawings and a score
of 5 representing the least 'articulated' drawings. The detailed criteria for this analysis can be seen in Appendix 1 along with
examples of drawings for each of the five categories. A panel of
three judges * scored the drawings collected for this study using the
criteria provided by Dr Oltman. The correlations between the judges
were as follows:
J 1 with J 2 : 0.3306 p.(.01 J 1 with J 3 : 0.9087 P.C.01 J 2 with J 3 : 0.7609 P1:.01
(These compare most favourably with previously reported measures
of reliability by Witkin et al 1974).
Final grades for each child were assigned by comparing the grades
of the three judges. If two judges scored an individual in a
particular category, it was assigned to that category. Any drawings
where this did not apply were discussed and assigned to an agreed
category. As can be seen by the correlations above, these occasions
were rare and the degree of correspondence between the judges highly -
significant. However, each of the judges questioned how carefully MI■IIMONII04.11.■••■•
* 1. Mr John Ball of the Psychology department of Homerton College Cambridge, who has a particular interest in psychological aspects of children's drawing.
2. Mr David Spence of the Art department of Homerton College Cambridge
3. The Researcher. My grateful thanks to my colleagues.
149

they were following the stated criteria, as opposed to looking at
the drawings in terms of progressive development of drawing skill.
This was a question raised earlier.and it was proposed to further
investigate this by analysing the drawings in the terms specified
by the Goodenough-Harris Draw-a-man test, the results of which will
be discussed in the next section.
As has been explained, a major element of the map analysis
considered each of the maps produced by the sample in the following
terms:
1. The Extent of the Area depicted (Area Map only)
2. The degree of Abstraction demonstrated (Both Maps)
3. The Perspective adopted. (Both Maps)
4. The Quality/Accuracy of the Map (Both Maps)
5. The Map Style employed (Both Maps)
Each of these categories are derived from previous research
into the analysis of cognitive maps and the derivation of each of
them is explained in detail in Appendix 3. These categories were
also selected as elements likely to demonstrate close association with
the measures of field independence. As can be seen in Appendix 3
each of the categories were presented as a progressive Scale repre-
senting successive improvement in the maps, (Thus the first four
categories listed above were scored on a scale from 1 to 5 and the
last category, of map style on a scale of 1 to 4) the lower scores
representing maps of poorer quality. This technique of scoring
cognitive maps is one which is regularly demonstrated throughout
the research (eg Appleyard 1970, Klett and Alpaugh 1976) but it
is open to considerable criticism as Bycroft (1974) has demonstrated.
In an attempt to achieve greater objectivity in the analysis
of the maps, it was proposed to follow Bycroft's example and use a
panel of judges. However, the demands of scoring nearly 1,000 maps
for each of these categories was an overwhelming burden to place on
others, so as a compromise, a random sample of 100 different maps
were analysed for each of the categories by a panel of two judges*
.1.1111i*MA110.1
.1■•■•■•••••••••■■■•■•V
* 1. Mr Michael Younger of the geography department at Homerton College, to whom I am most grateful.
2. The Researcher.
150

which meant 500 of the maps were considered by them for at least
one of the categories. The correlations between the two judges
for this exercise were as follows:
Areal Extent : J 1 with J 2 0.83 p<.01
Degree of Abstraction J 1 with J 2 0.94 p4t.01
Perspective J 1 with J 2 0.93 pe4.01
Accuracy or Quality J 1 with J 2 0.97 p4.4.01
Style or Structure J 1 with J 2 0.94 p4:4.01
This proved to be a most useful exercise and after minor refine—
ment to the scales each of the maps were then graded by the researcher
following the final guidelines which can be seen in Appendix 3.
Other reported measures of reliability for the tests employed
in the study were as follows:
bedded Figures Test. Witkin et al (1971) confirmed the reliability
of this test for various age groups in the following table
Age Level Sex N Reliability
10 M 51 .86
F 52 .81
11 M 21 .84 F 24 .74
12 M 25 .78
F 26 .74 13 m 26 .61
F 25 .85
15 M 25 .92
F 25 .74 17 14 23 .84
F 25 .61
College Students M 51 .82
F 51 .79
(The reliability coefficients cited here were computed by the Spearman
Brown Method)
151

2. Rod and Frame Test. Oltman (1968) reported Spearman-Brown
split half reliabilities of 0.95 for the portable rod and frame
apparatus.
3. Articulation of Body Concept Scale. Witkin et al (1962, 1974)
reported reliability correlations of 0.84 between two judges' ratings
of drawings of 30 ten year old boys. They also cited an unpublished
study of 20, 12 - 15 year old Israeli children whose drawings were
rated by three judges. The correlation between the judges were
0.99, 0.98 and 0.84. In another study by Fuller and Lumney (1965)
the drawings made by 104 children aged between 7 and 17 (66 males and 38 females) were rated by two judges and found to correlate at 0.91.
4. An. Heim et al (1974) report test-retest correlations over a 10 month gap of 176 eleven year olds as follows:
Verbal : 0.81
Numerical : 0.83
Perceptual : 0.76
AH3 : 0.91
Split half correlations of 100 technical college students (40
females - 60 males) revealed the following results:
Verbal : 0.84
Numerical : 0.86
Perceptual : 0.70
AH3 : 0.92
5. Draw-A-Man. In a dated, but detailed study of the reliability
of the Draw-a-Man, McCarthy (1944) reported inter-scorer correlations.
of 0.81, 0.90 and 0.92 between three scorers when considering the,
drawings of 386 children aged 7 - 13. Similar correlations are
reported by Harris & Goodenough (1963) who comment that examiner
effect and art training were found to be a negligible influence on
test results.
6. Draw-A-Plan. Thorstad (1974) reports split half reliability
coefficients of between 0.82 and 0.98 for her sample of 1,900,7 -
14 year olds, scorers reliability coefficients were all above 0.90.
152

7. familtajlITILsElauclaa. Bycroft (1974) reported detailed
measures of inter-judge reliability for each of his analyses. In
the wholistic sorting of maps inter judge reliability was high,
ranging from 0.64 to 0.76, similarly analysis of map content produced
high measures of agreement ranging from 0.62 to 0.79. The comparison
of the structural analysis of the maps were not as positive however
and revealed correlationsbetween 0.096 and 0.486 for his five judges,
nor were the results of the 'presentation measure' a consideration
of the maps in terms of pictorial, symbolic and abstract representa-
tion. Correlations for this section ranged from 0.017 to 0.533. Klett and Alpaugh (1976) although not reporting measures of reliability,
compared the successful rating of maps within their categories.
(Scale, Perspective, Abstraction) and reported the results as per-
centages. Approximately 786 of the drawings were successfully rated.
In cases where no initial majority opinion amongst their three judges
emerged, the drawings were discussed and a majority opinion achieved.
In only 6% of cases was no majority opinion reached.
Unfortunately no reliability details were available for the
measures of orientational ability or for Spatial Test 2. The
reliability of these tests with the sample used in the present study
and all of the techniques described above are discussed in a later
chapter. The next section considers the organisation of stage two
of the empirical study, the follow up study with representatives
of the extremes of field dependence and field independence.
153

The Follow tp Shady
For the second element of the empirical study, two subgroups
were selected to represent the extremes of the sample in terms of
field dependence and field independence. As was discussed earlier,
previous research has tended to rely on the results of one test,
usually a version of the Embedded Figures Test and has designated
those at either - a standard deviation from the mean (as in the case
of Doebler and Eicke, 1979) or one full standard deviation from the
mean (eg Case 1974)as representing the extremes of field dependence
and field independence. For the purposes of this study it was
proposed to include all children in a follow up study who demonstrated
consistency across the three measures of cognitive style (eg EPT,
RFT and ABC) but at 1-i standard deviations from the mean for their
age groups. This'is was felt provides a clearer indication of true
field dependence and independence in Witkin's terms and goes some
way to satisfying the criticisms of Vernon 1972, Satterly and Brinier
1971, Goldstein and Blackman 1978 and Arbuthnot 1972, It was also
hypothesised that any differences which exist between field dependent
and field independent individuals in their perception of the environ-
ment is more likely to be demonstrated by such extreme groups.
Analysis of the full sample in these terms produced a possible
group of 19 extreme field independent individuals and 23 extreme
field dependent individuals which were spread across age groups,
sexes and schools. Of the 23 field dependents, six were classified
by their respective schools as remedial* so they were withdrawn from
the subgroups leaving a possible 19 Field Independents and 17 Field
Dependents. It was proposed that each of these children be inter--
viewed individually and that as small groups they would participate
in a further practical field exercise. When this was undertaken,
for various reasons three children were absent leaving a final
subgroup sample of 17 field independent and 16 field dependent
subjects made up in the following way: (Although for parts of the
follow up study analysis there were 17 in each group).
*Offering further evidence about the relationship between Field dependence and intelligence
154

Rural Child- ren
Urban Child- ren
Rural Child- ren
Urban Child- ren
RuralChild,. ren
Urban-- Child- ren
TOTALS
10+ 10+ 11+ 11+ 12+ 12+
BOYS 2 2 - 2 2 - 8 FI GIRLS - 3 2 1 3 9
17
BOYS 2 2 1 1 2 - 8
GIRLS 3 - 2 - 1 2 8 1
TABLE 4. 3 The Follow up Study Sample
The interview was based upon further questions, associated with
Field dependence/independence research and children's perceptions
of their environment. It also allowed follow up questions based on
the children's maps and questionnaires completed earlier in the study.
The field exercise was the same for all of the children and consisted
of a short walk around an area unknown to them. They were asked to
note features of importance for them and then required to draw a map
of the route they had walked and estimate the distance involved.
(More comprehensive details of these undertakings and the standardised
instructions employed can be seen in Appendix 4). The maps and
interviews were then analysed as described for the other maps and
questionnaires.
This chapter outlining the empirical study concludes with a
breakdown of the hypotheses investigated in the first part of the
empirical research.
155

HYPOTHESES TO BE INVESTIGATED IN THE FIRST STAGE OF THE STUDY
The following hypotheses are seen as contributory to investi-
gating the underlying purpose of the research, which is a considera-
tion of the relationships which exist between children's perceptions
of their environment and cognitive style as defined by Witkin's
analytic/global dimension. The following specific research hypotheses
were identified with regard to the measures employed and they can be
divided into four main categories.
1. Those which investigate further the notion of cognitive
style;
2. Intercorrelations between some of the measures themselves;
3. Those which consider relationships with the cognitive map
analysis;
4. That which investigates personality and cognitive style.
1. Those h otheses which further invesiialeCaoitive Style
1. Research suggests that there will be a positive and significant style
correlation between the three measures of cognitiveAo_e between the
Embedded Figures Test, the Rod and Frame Test and the Articulation
of Body Concept Scale).
2. Since 'cognitive styles' purport to cut across general levels
of ability, one would not necessarily expect high correlations with
intelligence (as measured by AH3) and the measures of cognitive style.
3. There are likely to be higher correlations with the perceptual
reasoning component of AH3 and the measures of cognitive style than
with verbal or numerical reasoning.
4. The Draw-A-Man Test will correlate positively and significantly
with AH3 and in particular with perceptual reasoning.
5. The correlation between Draw-A-Man test and the Articulation
of Body Concept Scale will prove to be both positive and significant.
6. Research suggests that correlations between Spatial ability and
cognitive style will prove to be positive and significant. (This
will apply especially to the Embedded Figures Test)
7. There will be a positive and significant correlation between the
measures of orientational ability (01 and 02) and the measures of
cognitive style. (This was expected to be particularly true of the
156

EIT and RFT because of the 'orientational' skills required in them).
8. The disembeddirg skills required in orientation test 3 will correlate positively and significantly with those demonstrated by
the tests of cognitive style.
9. Scores on the Draw-A-Plan Test will correlate positively and
significantly with the measures of cognitive style.
2. Inter-Correlations amongst the other measures used in the study.
10. There will be a positive and significant correlation between ST2 and
intelligence but particularly with perceptual reasoning.
11. Orientation soores will correlate positively and significantly
with intelligence, but with perceptual reasoning in particular.
12. Orientation scores will correlate positively and significantly
with spatial ability.
13. Scores on the Draw-A7Plan Test will correlate positively and
significantly with the measures of intelligence and with perceptual
reasoning in particular.
14. Scores on the Draw-A-Plan Test will correlate positively and
significantly with the measure of spatial ability.
15. Scores on the Draw-A-Plan Test will correlate positively and
significantly with scores on the orientation exercises.
16. Scores on the Draw-A-Plan Test will correlate positively and
significantly with those of the Draw-A-Man Test.
3. Hypotheses investicrating associations with the cognitive maps
produced by sample
17. Each of the Elements for which the maps were analysed will
correlate positively and significantly with the tests of cognitive
style with the analytic (field independent) subjects producing better
maps.
18. Each of the elements for which the maps were analysed will
correlate positively and significantly with the measures of intelligence
and with perceptual reasoning in particular.
19. There will be a positive and significant relationship between
the elements for which the maps were analysed and spatial ability.
20. There will be a positive and significant relationship demon-
strated between the measures of orientation and the elements for which
the maps were analysed.
ST2 refers to Spatial Test 2 which was described earlier.
157

21. There will be a positive and significant correlation between the
elements for which the maps werearalysedand the results of the Draw-
A-Plan analysis.
22. There will be a positive and significant correlation between
the composite map scores for Map 1 and Map 2. (Thus demonstrating
consistency across the maps, and offering evidence to support cog-
nitive mapping as a consistent means of obtaining data).
23. The influence of Age will be reflected across the results of the
study and will be demonstrated in particular in the correlations
of the Tests of Cognitive Style and those of the map analysis.
4. Correlations between the measurual22gni:tive stzleadjampla of uersonalitz
24. Composite scores for personality characteristics associated with
field independence will correlate positive and significantly with
the measures of cognitive style and conversely there will be a
significant negative correlation demonstrated between the measures
of cognitive style and the composite scores for Personality Characteri-
stics associated with Field dependence.
Each of these hypotheses will be considered for Age and Sex
differences and for any differences which exist between those children
living in a more 'urban' as opposed to a more 'rural' environment.
The next section presents a statement and discussion of the
results of the analysis and investigation of these hypotheses.
158

CHAPTER FIVE - A Statement and discussion of the Results
The central focus of this research has been an investi-
gation into the relationship between cognitive style, as represented
by Witkin's analytic/global dimension and children's perceptions of
their environment. This section attempts to co-ordinate and discuss
the results of the study and to relate their significance to the pre-
vious research which was reviewed in chapters two and three. This
chapter will be organised in the following way:
1. The overall results produced by the sample
2. An analysis of Intercorrelations between the various
elements of the study
3. Feature Analysis of 1) The Questionnaire
2) The Maps
4. Additional Map Analysis 1) Labelling
2) Structure
5. The Follow up study
1. The overall results produced b the sample
The following five tables provide a detailed description of the
overall characteristics of the sample on the measures of cognitive
style, ability, mapping exercises and aspects of personality. Each
table includes details of mean scores, standard deviations and the
range of scores for the sub groups,of the sample, ie
TABLE A The overall characterstics of the sample (includirig
comparison by sex)
TABLE B Characteristics of the sample by Age and Sex (including
sub divisions for 10 - 11, 11 - 12, and 12 - 13 year old
boys and girls)
TIMM C Characteristics of the Sample by Residence (ie 'Urban' and 'Rural' groupings)
TABLE D Characteristics of the sample by residence and sex
(ie Urban Boys, Rural Boys, Urban Girls, Rural Girls)
TABLE E Characteristics of the sample by Age, Sex and residence
(ie 10 - 11 Urban boys, Rural Boys, Urban girls, Rural girls;
11 - 12 Urban boys, Rural boys, Urban girls, Rural girls;
12 - 13 Urban boys, Rural boys, Urban girls, Rural girls)
In the text which follows, Tables Are labelled 5.1, 5.2 etc, indicating
that they are to be found in Chapter 5. The discussion of results refers only to the Table number, and excludes the chapter reference, i.e. Table
5 indicates 159

17; 0 • N CD
O M cF
CD O 0
W O c+ O 0.
CD
CD
0 rj
5 ■-•
K
0
.-.....-,....,... Mean :3.D. RaA,,,‘e, Mean S.L. Beare ':ean S.D. Ran -e
COG EFT 16.574 5.854 0-25 16.900 5.912 0-25 16,250 5.791 1-25 STYLE RFT 43.003 55.818 3.5-223.0 38.295 51.509 3.5-223.5 47.731 59.567 5-222.5
ABC 3.143 0.947 1-5 3.325 0.988 1-5 2.961 0.868 1-5
AH3 51.747 16.452 9-100 50.729 16.079 9-100 52.773 16.793 14-91 VERBAL 17.632 6.446 • 1-34 16.949 6.187 1-33 18.321 6.639 3-34
.44 NUMERICAL 12.606 6.237 0-55 12.992 6.343 2-35 12.218 6.117 0-33 1-,..1 P_1ICETTUAL 21.541 6.232 1-35 20.862 6.115 5-35 22.228 6.287 1-35
SPATIAL TEST,2 59.017 20.306 11-99 60.440 20.604 11-94 57.607 19.950 15-99 DRAW-A-NAN 103.095 13.105 58-139 103.143 13.920 58-139 103.048 12.262 67-132
DRAW-A-PLAN 100.095 13.544 70-131 97.545 14.016 70-131 102.622 12.587 75-129 ORIENTATION 1 7.028 1.819 0-9 6.893 1.885 1-9 7.163 1.744 0-9 ORIENTATION 2 13.212 4.333 1-22 13.068 4.333 1-22 13.356 4.338 2-22 ORIENTATION 3 7.053 3.316 1-12 7.685 3..325 1-12 6.416 3.190 1-12
M tr) 1
ExrErr ' ABSTRACTION 1
2.553 3.564
0.959 1.272
1-5 1-5
2.665 3.717
1.035 1.123
1-5 . 1-5
2.438 3.407
0.863 1.393
1-5 1-5
PERSPECTIVE 1 4.116 1.207 1-5 4.287 1.064 1-5 3.942 1.317 1-5 co ACCURACY 1 2.390 0.902 1-5 2.404 0.956 1-5 2.376 0.846 1-5 STYLE 1 2.711 0.600 1-4 2.709 0.632 1-5 2.712 0.567 . 1-5
C-5 MAP 1 (COM3ITE) 12.735 3.049 4-19 13.117 2.816 5-19 12.447 3.240 4-18 RI. ABSTRACTION 2 3.904 1.163 1-5 4.058 1.029 1-5 3.760 1.262 ' 1-5
PERSPECTIVE 2 4.361 1.003 1-5 4.577 0.795 1-5 4.156 1.131 1-5 ACCURACY 2 2.349 0.977 1-5 2.426 1.012 1-5 2.276 0.939 1-5 STYLE 2 2.601 0.801 1-4 2.529 0.792 1-5 2.670 0.806 1-5 MAP 2 (CODT0SITE) 13.217 2.858 4-19 13.591 2.473 5-19 12.664 3.143 4-19
LEADERSI1E> 1.543 1.236 0-4 1.398 1.235 0-4 1.688 1.223 0-4 SOLITARINESS 1.227 1.054 0-4 1.274 1.076 0-4 1.179 1.029 0-4 INTROVERT 1.410 1.122 0-4 1.394 1.117 0-4 1.425 1.129 0-4
›-■ E-1 .-1 a
INDIVIDUALISTIC PERSEVERES INDEPENDENT
1.998 2.252 2.056
1.073 1.021 1.074
0-4 0-4 0-4
1.942 2.079 1.938.
1.063 1.003 1.080
0-4 0-4 0-4
2.054 2.425 2.175
1.083 1.012 1.056
0-4 0-4 0-4
6 COMP0SI7rE SCORE . FOR FI
r., 0 rn E-,
CHARACTERISTICS
FOLLOW:11 GREGARIOUS EXr,RAVT_RT
10.478
1.825 1.906 1.690
3.495 1.070 1.085 1.208
0-21
. 0-4 0-4 0-4
10.025
1.921 1.954 1.734
3.622
1.102 1.054 1.176
0-21
0-4 0-4 0-4
10.933
1.729 1.858 1.6416
3.308
1.030 1.115 1.239
1-17
0-4 0-4 0-4
M CONrORli:IST 2.039 0.930 0-4 2.033 0.894 0-4 2.146 0.964 0-4 GIVES UP 1.428 1.097 . 0-4 1.585 1.100 0-4 1.271 1.073 0-4 D.r.,PENDENT 1.125 1.060 . 6-4 .1.759 1.092 0-4 1.563 1.021 0-4 CONPOSITE SCORE FOR FD CHARACTERISTICS 10.638 3.466 1-21 11.017 3.433 1-19 10.258 3.464 3-21

VARIABLES N ean -
S.D. - -- Ran e Mean S.D. Ranee Mem S.D. Ramie
COG EFT 15.190 5.794 4-25 16.885 5.961 0-25 18.010 5.739 2-25 STYLE RFT 58.567 68.578 5.5-223.5 33.526 46.101 6-212 29.230 38.349 3.5-214
ABC 3.661 0.940 1-5 3.355 0.989 1-5 3.075 0.953 1-5
AE3 41.492 13.984 12-91 53.115 15.131 20-95 54.895 15.822 9-100 VERBAL 13.444 5.432 3-30 18.244 5.825 7-32 18.211 6.100 1-.33
P NUTIMICAL 9.984 5.160 2-26 13.564 6.115 3-31 14.516 6.612 2-35
rl PERCEPTUAL SPATIAL TEST 2
18.095 53.049
6.337 19.947
5-35 16-88
21.179 59.553
5.709 20.175
9-35 11-94
22.374 65.895
5.733 19.959
6-34 14-94
DRAW-A-MAN TEST 101.952 15.518 58-159 102.829 13.150 79-137 104.194 13.477 74-135
DRAW-A-PLAN TEST 00.065 13.843 75-131 95.507 13.864 70-130 97.469 14.126 73-127 ORIENTATION 1 6.444 1.830 1-9 6.895 2.004 1-9 7.189 1.282 2-9 OREENTATION 2 11.524 3.860 3-19 13.132 3.890 1-21 14.042 4.699 1-22 ORIEIATATION 3 7.063 3.068 2-12 6.987 3.657 1-12 8.646 2.991 2-12
EXTENT 2.459 0.941 1-5 2.487 0.959 1-5 2.946 1.097 1-5 Q ABSTRACTION 1 3.410 1.086 1-5 3.566 1.289 1-5 4.043 0.908 1-5
PERSPECTIVE 1 4.082 1.053 1-5 4.105 1.260 1-5 4.570 0.813 1-5 ACCURACY 1 2.279 0.819 1-4 2.224 0.961 1-5 2.634 0.998 1-5
0 STYLE 1 2.656 0.544 2-4 2.579 0.548 1-4 2.849 0.722 1-4 M MAP 1 (COMPOSITE) 12.426 2.513 6-18 12.474 3.066 6-19 14.097 2.515 5-19
ABSTRACTION 2 3.610 1.246 1-5 3.955 0.983 1-5 4.456 0.704 2-5 PERSPECTIVE 2 4.424 0.969 1-5 4.470 0.881 2-5 4.771 0.502 3-5
• . ACCURACY 2 2.119 0.930 1-4 2.343 0.962 1-5 2.711 1.042 1-5 STYLE 2 2.407 0.833 1-4 •2.515 0.769 1-4 2.627 0.776 1-4 NAP 2 (CONTOSI2T.E) 12.559 2.699 5-17 13.318 2.413 7-19 14.542 1.983 10-19
_ LEALFRSHIP 1.825 1.264 0-4 1.321 1.211 0-4 1.190 1.178 0-4 SOLITARINESS 1.286 • 1.023 0-4 1.000 1.044 0-4 1.480 1.096 0-4 INTROVERT 1.317 1.075 0-4 1.385 1.119 0-4 1.450 1.149 0-4 INDIVIDUALISTIC 2.190 0.993 0-4 1.962 1.025 0-4 1.770 1.109 0-4
1.905 1.043 0-4 2.321 0.987 1-4 • 2.000 0.964 0-4 PELSEVERES P, rim:Pima-72
COMPOSITE SCORE 2.143 1.162 0-4 2.179 0.977 0-4 1.620 1.033 0-4
4 FOR FI o
d
CHARACTERISTICS
FO
CHARACTERISTICS 10.667
2.000
3.137
1.063
4-17
0-4
10.167
1.654
3.645
1.103
1-21
0-4
9.510
2.080
3.842
1.093
0-20
0-4
GGRE('I‘RIOUS 1.249 1.118 0-4 1.937 1.038 0-4 1.750 0.989 0-4
o EXTRAVLRT 2.111 1.179 0-4 1.795 1.155 0-4 1.450 1.132 0-4 E9 cop7masT . 2.000 0.861 0-3 2.000 0.926. 0-4 2.080 0.895 0-4
M GIVES UP 1.857 1.090 0-4 1.295 1.070 0-3 1.640 1.087 0-4 m DEPENDERT 1.714 1.211 0-4 1.564 1.064 0-4 1.940 1.013 0-4 "4 Ca.LPOSITE SCORE
l'OR FI CHARACiULISTICS 11.921 2.497 5-17 10.423 3.923 3-19 10.910 3.447 .1-19
%J1
acv S
q s
aTq_
ezae
q.oez
euo

ed
‘.n tzi ro
a
p0
H. ry ci-H. 0
a' e-4
1
10 - 11 Year Olds 11 - 12 Year Olds 12 - 1, Year Olas Mean S.D. Range VARIABLES Mean S.D. Range Mean S.D. Range
COG ITT 13.319 5.465 1-24 16.341 5.126 1-25 18.438 5.677 3-25 STYLE EFT 50.659 59.520 7-218 51.762 61.160 7-222.5 41.747 58.294 5-222
ABC 3.391 0.669 2-5 2.937 0.822 1-5 2.622 0.911 1-4
AH3 43.000 12.52 18-73 50.219 16.387 14-90 62.941 14.592 27-91 VERBAL - 14.254 5.136 3-27 18.049 6.132 7-33 21.788 6.313 6-34 NUMZRICAL 9.119 4.252 0-26 11.390 6.586 0-33 15.459 5.366 3-27 PERCLPTUAL 19.627 6.159 1-30 20.756 6.195 1-35 25.580 4.908 12-35
p'14 SPATIAL TEST 2 51.478 18.706 19-96 53.247 18.160 22-95 66.845 19.405 15-99 DRAW-A-MAN TEST 102.435 1g.025 75-132 102.562 13.206 67-129 104.012 11.587 73-126
DRAW-A-PLAN TEST 104.217 12.141 60-129 98.793 12.099. 75-128 105.110 12.665 79-129 0RT-NTATI0N 1 .6.159 1.746 3-9 7.481 1.678 1-9 7.682 1.457 0-9 ORIENTATION 2 11.739 3.261 2-19 12.684 4.454 . 3-22 15.294 4.309 3-22 ORIENTATION 3 6.188 3.074 1-12 5.911 2.927 2-12 7.071 3.432 1-12
cid EXTENT 2.344 0.895 1-4 2.075 0.671 1-4 2.866 0.628 . 1-5
01-1 ABSTRACTION 1 2.984 1.507 1-5 3.350 1.468 1-5 3.793 1.108 1-5 n PERSPECTIVE 1 3.484 1.425 1-5 3.837 1.326 1-5 4.402 1.064 1-5 ACCURACY 1 2.266 0.802 1-3 2.087 0.830 1-3 2.744 0.767 -1-5
0 STILE 1 2.594 0.526 2-4 2.688 0.518 1-4 2.829 0.625 1-4 r..i MAP 1 (COMPoSlit) 11.328 3.423 6-16 11.962 3.239 4-16 13.793 2.600 6-18
ABSTRACTION 2 2.984 1.314 1-5 3.709 1.189 1-5 4.430 0.872 2-5 - PMSPECTIVE 2 3.429 1.341 1-5 4.291 0.922 1-5 4.680 0.823 1-5
ACCURACY 2 1.984 0.793 1-3 1.962 0.854 1-5 2.823 0.888 1-5 STYLE 2 2.381 0.750 1-4 2.506 0.732 1-4 3.063 0.774 1-4 NAP 2 (COMPOSITE) 10.794 .3.118 4-17 12.456 2.731 4-19 14.924 2.099 9-19
LEADERSHIP 2.087 1.160 0-4 1.463 1.249 0-4 1.584 1.185 0-4 SOLITARINESS 1.159 1.066 0-4 0.963 0.922 0-4 1.393 1.062 0-4 INTROVERT 1.536 1.119 0-4 1.402 1.142 0-4 1.360 1.131 0-4 INDIVIDUALISTIC 2.406 0.960 0-4 1.963 1.071 0-4 1.865 1.130 0-4
>4 2.449 0.978 . 1-4 2.573 0.930 0-4 2.270 1.095 0-4 iutSEVMES IND=DENT 2.551 0.948 1-4 2.073 1.131 0-4 1.978 1.000 0-4 COMPOSITE SCORE
C-ci fO FI CiARACTERISTICS 12.183 2.277 6-17 ' 10.439 3.356 3-17 10.416 3.639 1-17
FOLLOWER 1.670 . 1.028 0-4 1.780 1.031 0-3 1.573 1.021 0-4 ° GREGARIOUS 1.925 1.155 0-4 1.793 1.141 0-4 1.865 1.068 0-4 2 EXTRAVERT 1.855 1.240 0-4 1.605 1.309 0-4 1.337 1.117 0-4 Pr 34 cONFOPdaST •2.493 1.024 . 0-4 2.146 0.803 0-4 1.876 0.975 0-4 0-1 GIVES UP 1.348 0.997 0-4 1.207 1.074 0-3 1.270 1.136 0-4
4̀ DEPEME\IT 1.623 1.099 0-4 1.451 1.044 * 0-3 1.618 0.935 0-4 COMPOSITE SCORE FOR ED • CHALRACTERISTICS 11.261 2.501 5-16 10.195 3.808 3-17 9.539 3.618 3-21
----

TABT.F C Characteristics of the Sample by Residential Location
RURAL URBA,N ---------- VARIABLES Mean S.D. Range Mean S.D. Ran-Te
COG- EFT 15.228 5.970 0-25 17.996 5.388 1-25 STYLE RFT 48.976 60.607 3.5-223.5 36.751 49.683 4-217
ABC 3.208 0.937 1-5 3.069 0.955 1-5
AH3 49.047 14.631 14-93 54.633 17.802 9-100
E-1 r--1 -q -1
VERBAL NUMERICAL PERCEPTUAL
16.803 11.795 20.426
5.757 5.642 5.779
3-32 2-31 1-34
18.527 13.482 22.708
7.019 6.725 6.483
1-34 0-35 5-35
Q SPATIAL TEST 2 56.988 18.902 11-96 61.210 21.549 14-99 DRAW-A-MAN 101.445 12.751 67-132 104.968 13.277 58-139
DRAW-A-PLAN 101.909 13.483 70-131 98.117 13.361 70-129 ORIENTATION 1 6.927 1.735 1-9 7.140 1.906 0-9 ORIENTATION 2 12.882 3.847 1-22 13.577 4.795 1-22
1- ORIENTATION 3 7.061 3.401 1-12 7.045 3.228 1-12
c? fii EXTENT 2.381 0.997 1-5 2.729 0.888 1-5 f-ist, ABSTRACTION 1 3.706 1.442 1-5 3.418 1.054 1-5 L' PERSPECTIVE 1 3.926 1.328 1-5 4.311 1.036 1-5
ACCURACY 1 2.134 0.953 1-5 2.653 0.765 1-5 STYLE 1 2.749 0.602 1-4 2.671 0.596 1-4
G MAP 1 (COMPOSITE) 12.515 3.424 4-19 13.062 2.587 5-19
ABSTRACTION 3.694 1.169 1-5 4.117 1.120 1-5 Z.4 PERSPECTIVE 2 4.213 1.129 1-5 4.512 0.833 1-5
ACCURACY 2 2.184 1.038 1-5 2.516 0.883 1-5
...... STYLE 2 MAP 2 (COMPOSITE}
2.537 12.634
0.904 3.136
1-4 4-19
2.667 13.808
0.678 2.414
1-4 5-19
IPADEitbEIP 1.703 1.131 0-4 1 1.374 1.319 0-4 SOLITARINESS 1.220 1.042 0-4 1.234 1.066 0-4 IBTROVERT 1.500 1.102 0-4 1.315 1.137 0-4
,,...) E-1 t-i
LNDIVIDUALISTIC PERSEVERES
i 2.004 2.150
1.020 0.997
0-4 0-4
1.991 2.357
1.128 1.038
0-4 0-4
-DEPENDENT 1.980 1.012 0-4 2.128 1.133 0-4 o DI COMPOSITE SCORE
2 FOR FI cL CHARAC2E2,ISTICS 10.565 3.172 1-17 10.387 3.808 0-21
8 FOLLOWER 2.049 1.064 0-4 1.591 1.027 0-4 tr) GREGARIOUS 2.163 0.972 0-4 1.638 1.133 0-4 61 EXTRAVERT 1.825 1.221 0-4 1.549 1.181 0-4
CONPORMIST 2.374 0.907 0-4 1.791 0.859 0-4 .c4 GIVES UP 1.581 1.117 0-4 1.268 1.054 0-4
DEPENDENT 1.890 1.092 0-4 1.421 0.972 0-4 COMPOSITE SCORE FOR FD CHARACT[qiiSTICS 11.915 2.927 3-21 9.302 3.487 1-16
163

VARIABLES Urban Boys Riral 13ovs Urban Girls 6.Lra1 Girls Mean S.D. Ran IIc S.D. Ronne Me .n S.D. Ran,e Mean S.D. R2n,,e
COG- LTT STYLE RFT
ABC
18.108 37.345 3.288
5.767 52.061 0.952
1-25 4-208-.5 1-5
15.852 39.133 3.354
5.857 51.207 1.020
0-25 3.5-223.5
1-5
17.893 36.201 2.866
5.040 47.584 0.915
3-25 6-217 1-5
14.551 59.653 3.051
6.042 68.003 0.851
1-25 5-222.5
1-5
AB3 VERBAL
H N=ICAL .4 H .1.,E2.0cpTUAL Q SPATIAL TEST 2
DR/V.1-A-MAN
52.139 17.056 13.648 21.661 61.383 105.192
18.379 6.944 6.939 6.944 22.631 14.048
9-100 1-33 2-35 5-35 14-94 58-139
49.539 16.859 12.483 20.164 59,632 101.465
13.808 5.494 5.763 5.212
18.751 13.640
20-93 3-31 2-31 6-33 11-94 74-132
56.915 19.873 13.331 23.673 61.051 104.759
17.016 6.842 6.548 5.888 20.606 12.578
18-91 3-34 0-33 7-35 15-99 73-152
48.560 16.741 11.086 20.716 54.162 101.424
15.533 6.058 5.443 6.357 18.732 11.778
14-59 4-32 2.27 1-34 19-96 67-129
DR.V.T-A-PIA1'I ORIIIITATION 1 oRTENTATIoN 2 ORIENTATION 3 m
1.1 Er) =IT H o ABSTRACTION 1
nPERSPECTIVE 1 ACCURACY 1
,c,.? STYLE 1 PI NAP 1 (COMPOSITE)
ABSTRACTION 2 - PERSPECTIVE 2
ACCURACY 2 STYLE 2 MAP 2 (COMPOSITE)
94.889 6.963 12.944 7.972
2.877 3.613 4.519 2.632 2.660
13.425
4.286 4.612 2.571 2.633
14.082
13.175 1.976 4.912 3.161
0.973 • 0.879 0.875 0.832 0.631 2.272
1.045 0.820 0.942 0.632 2.260
70-121' 1-9 1-21 2-12
1-5 1-5 1-5 1-5 1-4 5-19
1-5 1-5 1-5 1-4 5-19
99.839 6.833 13.173 7.441
2.484 3.806 4.089 2.210 2.70
12.855
3.855 4.545 2.297 2.436
13.155
14,363 1.812 3.795 3.452
1.055 1.292 1.169 1.014 0.633 3.195
0.975 0.774 1.058 0.904 2.581
74-131 1-9 1-22 1-12
1-5 1-5 1-5 1-5 1-4 6-19
1-5 2-5 0-5 1--4 7-19
101.122 7.304 14.165 6:174
2.597 3.244 4.126 2.672 2.681 12.739
3.974 4.426 2.470 2.696
13.574
12.875 1.831 4.628 3.056
* 0.785 1.164 1.132 0.702 0.566 2.809
1.166 0.838 0.831 0.715 2.524
75-129 0-9 3-22 1-12
1-4 1-5 1-5 1-5 1-4 6-17
1-5 2-5 1-5 1-4 7-19
104.085 7.025 12.568 6.653
2.262 3.589 3.738 2.047 2.748
12.121
3.528 3.868 2.066 2.642 12.094
12.177 1.651 3.895 3.311
0.915 1.596 1.475 0.873 0.568 3.646 •
1.325 1.324 1.007 0.896 3.555
75-129 1-9 2-22 1-12
1-5 1-5 1-5 1-4 1-4 4-18
1-5 1-5 1-5 1-4 4-19
LF"1..DERSHIP SOLITARINESS INTR0VERT INDIVIDUALISTIC
.-.1, PERSEVERES Hi DID=TDENT ,_.1
..-. COMPOSEE SCORE
c:) FOR FI CHARACTERISTICS
FOIL= p. o GRE.;LRI0US gi =TEO= o C0117OR,':1ST N GIVES UP .4: DEPMDENT
COMPOSITE SCORES
CHARACTERISTICS r...........■...
1.292 1.274 1.265 1.965 2.230 2.035
10.062
1.681 1.699 1.673 1.805 1.398 1.522
9.779
1.367 1.104 1.110 1.093 1.027 1.149
4.014 1.080 1.125 1.168 0.766 1.065 . 1.001
3.443 FOR FD
0-4 0-4 0-4 0-4 0-4 0-4
0-21
0-4 0-4 0-4 0-4 0-4 0-3
1-16
1.492 1.273 1.508 1.922 1.945 1.852
.
9.992
2.133 2.180 1.739 2.234 1.750 1.969 ,
12.109
1.101 1.055 1.115 1.039 0.966 1.012
3.252
1.052 0.934 1.188 0.951 1.108 1.129
3.041
0-4 0-4 0-4 0-4 0-4 0-4 .
2-17
0-4 0-4 0-4 0-4 0-4 0-4
3-19
1.451 1.197 1.361 2.016 2.475 2.213
10.689
1.508 1.582 1.434 1.779 1.148 1.328
8.861
1.273 1.034 1.165 1.164 1.038 1.115
3.598
0.973 1.142 1.185 0.940 1.034 0.940
3.484
0-4 0-4 0-4 0-4 0-4 0-4
3-17
0-4 0-4 0-4 0-4 0-4 0-4
3-16
1.932 1.161 1.492 2.093
1 2.373 2.136
11.186
1.958 2.144 1.864 2.525 1.398 1.805
11.703
1.123 1.029 1.092 0.996 0.985 0.995
2.973
1.041 1.015 1.260 0.834 1.103 1.048
2.796
0-4 0-4 0-4 0-4 0-4 0-4
1-17
0-4 0-4 0-4 0-4 0-4 0-4
4-21
Characteristics of the Sample by Resid enti al L ocation

VALLLJDUP,0 Mean S.D. Range Mean S.D. Reno.e NcEn S.D. Ran e iv'en. S.D. Range
COG EFT 15.469 5.702 5-25 16.520 3.980 8-22 14.903 5.969 4-25 11.500 5.389 1-24 STYLE RFT 62.016 73.802 5.5-205.5 41.400 52.673 8-217 55.048 63.763 9-223.5 55.920 63.053 7-218
ABC 3.531 0.983 1-5 3.320 0.748 2-5 3.800 0.887 2-5 3,432 0.625 2-5
AH3 42.031 15.568 12-91 46.400 13.360 18-73 40.935 12.372 23-65 40.976 11.688 19-71 11=3AL . 13.31 3 6.151 4-30 15.800 5.657 3-27 13.581 4.675 3-22 13.333 4.626 4-25
E-i NUMERICAL 10.219 5.517 2-26 9.520 5.292 0-26 9.742 4.844 2-20 8.681 3.542 3-17
;1 a -4.
PERCLVTUAL SPATIAL TEST 2 DRAW-A-MAN
18.563 50.438
103.438
7.066 21.626 15.854
5-35 16-88 58-139
21.080 55.120 106.200
5.560 19.934 11.822
7-29 22-87 85-132
17.613 55.931
100.367
5.560 17.844 15.258
6-27 21-82 74-132
10.762 49.409 100.295
6.397 17.875. 11.737
1-30 19-96 75-129
DRA1-A-PLAN 96.188 12.805 75-421 105.240 11.945 80-129 104.200 13,912 81-131 103.636 12.350 80-125 ORIENTATION 1 6.000 2.095 1-9 6.120 1.965 3-9 6.903 1.399 4-9 6.182 1.632 3-9 oRIEflTATION 2 10.750 4.579 3-19 12.960 3.323 3-19 12.323 2.797 7-18 11.045 3.050 2-19 OPIENTATION 3 6.438 2.552 2-12 6.520 3.190 1-12 7.710 3.447 2-12 6.000 3.027 1-12
EXTEI1T 2.833 0.950 1-5 2.840 0.800 1-4 2.097 0.790 1-4 2.026 0.811 1-4 ti3 ABSTRACTION 1 3.167 0.874 .1-5 3.000 1.077 1-5 3.645 1.226 1-4 2.923 1.738 1-5 0 F-4 PliaSPECTIVE 1 4.200 0.961 1-5 4.000 0.957 2-5 3.968 1.140 1-5 3.154 1.582 1-5
VI ACCURACY 1 2.667 0.606 1-4 2.040 0.374 2-3 1.903 0.831 1-4 1.897 0.788 1-3 ki STYLE 1 2.333 0.571 2-4 2.480 0.586 2-4 2.774 0.497 2-4 2.667 0.478 . 2-3
0 COMPOSITE SCORE M 114 MP 1 12.567 2.176 7-16 12.400 2.309 8-15 12.290 2.831 6-18 10.641 3.849 6-16
ABSTRACTION 2 3.933 1.230 1-5 3.125 1.393 1-5 3.276 1.192 1-5 2.897 1.273 1-5 PERSPECTIVE 2 4.267 1.112 1-5 3.875 1.035 2-5 4.586 0.780 2-5 3.154 1.443 1-5 ACCURACY 2 2.633 0.765 1-4 2.542 0.509 2-3 1.586 0.780 1-.3 1.641 0.743 1-3 STYLE 2 2.733 0.583 2-4 2.708 0.550 2-4 2.069 0.923 1-3 2.179 0.790 1-4 COI TOSIT:J SCORE
FLAP 2 13.567 2.622 5-17 12.292 2.493 7-15 11.517 2.400 7-16 9.872 3.246 4-17
LEADERSHIP 1.656 1.473 0-4 1.72o 1.242 0-4 2.000 1,000 0-3 2.295 1.069 0-4 SOLITARD1ESS 1.156 0.920 0-3 1.320 0.802 0-3 1.419 1.119 0-4 1.068 1.189 0-4 INTR01IE2: 1.156 1.019 0-3 1.520 1.005 0-3 1.484 1.122 0-4 1.545 1.190 0-4
r, IUDIV"IDuALISTIC 2.094 0.963 1-4 2.400 1.000 1..4 2.290 1.039 0-4 2.409. 0.948 0-4 P PERSNTEaES 1.969 0.999 1-4 2.640 0.907 1-4 1.039 1.098 0-3 2.341 1.010 1-4
IlDLTE5DEM 2.250 1.218 0-4 2.660 0.945 1-4 2.032 1.110 0-4 2.477 0.952 1-4
P 0 COMPOSITE SCORE
FOR FI CHARACTERISTICS 10.231 3.612 4-17 12.230 2.685 6-17 11.065 2.555 5-16 12.136 2.041 7-15
P---,. ° FOLLOVER 1.875 .0.976 0-3 1.640 0.952 0-3 2.129 1.147 0-4 2.000 1.057 0-4 E+ CRLCARIOUS 1.344 1.096 0-4 1.960 0.978 1-4 2.129 1.147 0-4 1.909 1.254 0-4 cci3 EXTRAVMT 2.094 1.254 0-4 1.880 1.013 0-4 2.129 1.118 0-4 1.641 1.363 0-4 rt C LcFORT LIST 1.844 0.574 1-3 2.120, 0.881 0-.3 2.161 1.068 0-3 2.705 1.047 0-4 4̀ GIVES UP 1.750 1.016 0-3 1.280 .0.843 0-3 1.968 1.169 0-4 1.386 1.083 0-4
DEP=DENT 1.656 1.125 0-3 1.640 0.952 0-3 1.774 1.309 0-4 1.614 1.185 0-4 COMPOSITE SCORE FOR PD CHARACTERISTS 11.563 2.488 6-16 10.920 2.482 6-15 12.250 2.493 5-17 11.455 2.519 5-16
i-3
C)
0
0
c+
1-h
1-1 CD
Clq
U1
X
CD r. m -1 o p, I c+
CD 0 0
o c-1- 1--1 Pi 0

(s-p
to
—
0
to
0
0
C/2
2 48 M
Ce
to X
cf
rJ N 0 0
0 0
.,...----- Vean S.D. IbliFe E,,an S.D. Ran e Herin S.D. 1191- 70 dean S.U. Range
COG EbT 19.333 5.324 1-25 17.386 4.463 5-25 14.786 5.723 0-24 I 15.132 5.619 1-25 STYLE P&T 27.986 43.136 6-208.5 32.705 37.402 7-162.5 38.274 49.253 6.5-212 73.829 75.029 7.5-222.,
ADC 3.147 1.019 1-5 2.629 0.892 1-5 3.524 0.943 1-5 3.053 0.733 2-4
AE3 57.083 15.834 29-95 54.523 17.123 22-90 49.714 13.795 20-93 45.237 14.130 14-77 VERBAL 19.278 6.327 8-32 19.159 6.523 8-33 17.357 5.272 7-31 16.763 5.450 7-28
r_, NICUMICAL 14.661 6.020 4-28 13.205 7.470 0-33 12.452 6.045 3-31 9.289 4.655 2-24 PERCEPTUAL 22.944 6.150 12-35 22.159 5.051 10-35 19.667 4.882 9-33 19.132 6.261 1-34 SPATIAL TEST 2 63.332 20.188 25-91 57.253 18.126 25-95 56.452 19.863 11-94 48.737 17.342 22-90 DRAW-A-MPN 107.735 13.772 82-137 104.219 13.062 80-125 98.857 11.293 79-124 100.816 13.305 67-129
DRAW-A-PLAN 94.471 12.809 70-117 97.909 15.212 75-127 96.410 14.828 70-130 99.816 [0.752 75-128 ORIENTATION 1 7.529 1.911 3-9 7.829 1.564 1-9 6.381 1.950 1-9 7.105 1.737 1-9 ORIENTATION 2 14.441 3.799 3-20 14.195 4.781 3-22 12.071 3.672 1-21 11.053 3.440 5-18 ORIENTATION 3 7.647 3.634 2-12 5.317 2.514 2-12 6.452 3.631 1-12 6.553 3.227 2-12
EXTFM 2.861 0.931 1-5 2.093 0.479 1-3 2.150 0.864 1-4 2.054 0.848 1-4 ABSTRACTION 1 3.694 0.056 1-5 2.953 1.327 1-5 3.450 1.584 1-5 3.311 1.506 1-5 PERSPECTIVE 1 4.528 0.845 2-5 3.860 1.320 1-5 3.725 1.450 1-5 3.811 1.351 1-5 ACCURACY 1 2.639 0.899 1-5 2.372 0.757 1-3 1.550 0.844 1-4 1.757 0.796 1-3 STYLE 1 2.667 0.586 1-4 2.674 0.522 2-4 2.500 0.506 2-3 2.703 0.520 1-3
0 CO::POSITE SCORE MAP 1 13.528 2.063 8-19 11.860 3.197 6-16 11.525 3.508 6-17 12.081 3.323 4-16
ATISACTION 2 4.194 1.078 1-5 3.381 1.087 2-5 3.743 0.852 2-5 3.514 1.283 1-5 PERSPECTIVE 2 4.613 0.761 2-5 4.405 0.857 2-5 4.343 0.968 2-5 4.162 0.986 1-5 ACCURACY 2 2.387 0.919 1-5 2.048 0.731 1-3 2.3u6 1.009 1-5 1.865 0.976 • 1-5 STYLE 2 2.645 0.551 1-3 2.476 0.707 1-4 2,400 0.914 1-4 2.541 0.747 1-4 CO1OSITE SCORE EAP 2 13.639 2.146 7-17 12.810 2.540 7-16 12.657 2.566 7-19 12.054 2.915 4-19
LELDEZSIIIP 1.111 1.369 0-4 1.159 1.275 0-4 1.500 1.018 0-4 1.816 1.136 0-4 • SOLITARINESS 1.083 1.131 0-4 1.045 1.011 0-3 0.920 0.973 0-3 0.868 0.811 0-3 INTR0V=T 1.306 1.167 0-4 1.477 1.311 0-4 1.452 1.007 0-4 1,316 1.165 0-4 INDIVIDUALISTIC 1.669 1.141 0-4 1.909 1.217 0-4 2.024 0.924 1-4 2.026 0.885 0-3 PSEIVE,17S 2.639 1.018 1-4 2.864 0.905 1-4 2.048 0.862 1-4 2.237 0.852 1-3 IND2PENDENT 2.222 1.098 0-4 2.159 1.238 0-4 2.143 0.872 0-4 1.974 1.000 0-4 COMPOSITE SCORE
'5' FOR FI E. CHARACTERISTICS 10.250 4.265 1-21 10.614 3.743 3-17 10.095 3.067 2-16 10.237 2.680 3-15
r., FOLLOT,r.,H 1.389 1.178 0-4 . 1,568 1.043 0-3 1.681 0.993 0-4 2.026 0.912 0-3 ° GREaARIOUS 1.444 0.998 0-3 1.295 1.0(.9 0-3 2.452 0.832 1-A. 2.3(3 . 0.942 1-4 p, EN.TRAVI7T 1.528 1.108 0-4 1.409 1.282 0-4 2.024 1.158 0-4 2.263 1.201 0-4
CONaalIST 1.889 0.854 0-4 1.955 0.834 0-4 2.095 0.983 0-4 2.368 0.714 1-3 P4 m 11.7,8 UP 0 - 0.972 1.000 0-3 0.841 1.010 0-3 1.571 1.063 0-3 1.632 0.998 0-3
DEPENDENT 1.250 0.967 0-3 1.068 0.950 0-3 1.033' 1.080 0-4 1.895 0.981 0-3 COMPOSITE SCORE FOR FD . CHARACTMISTICS 8.472 3.368 3-16 8.136 3.521 '3-16 12.095 3.600 5-19 2.579 2.543 5-17
1-=1 tt-1

VARIABLES uroan LONG -_,..-_-_-__-- tiLoc.a la'11.1.1 t.,,a_c.J_ , _
Meats S.D.
5.657 32.117 0.843
Renoe
2-25 4-186.5 1-5
Mean
18.962 36.651 2.632
S.D.
5.743 52.979 0.948
Iimo-e
3-25 7.5-208
1-4
Mean
17.200 30.818 2.982
S.D.
5.723 43.011 1.027
Range
4-25 35-214 1-5
Moan
17.667 49.25o 2.583
S.D.
5.560 65.396 0.874
Ranrre
4-25 5-222 1-4
COG EFT STYLE RFT
ABC
19.047 27.289 3.211
AH3 55.775 19.727 9-100 64.429 15.278 27-91 54.255 12.398 32-79 60.917 13.551 29-89 VERBAL 18.050 7.016 1-33 22.592 6.583 6-34 18.327 5.403 8-30 20.694 5.840 11-32 ri NII=CAL 15.300 7.849 2-35 15.388 5.35o 3-25 13.945 5.552 4-29 15.556 5.464 6-27
I--1 PERCEPTUAL 22.864 6.907 6-34 26.212 5.131 16-35 21.982 4.617 9-32 24.667 4.479 12-32 SPATIAL TEST 2 68.268 22.600 14-94 67.429 21.611 15-99 64.093 17.703 29-94 66.029 16.033 33-94 DRAW-A-MAN 104.395 12.665 74-135 104.457 12.748 73-126 104.055 14.124 80-130 103.444 10.058 74-125
. DRA1.-A-PLAN 94.219 13.935 73-121 101.957 12.524 79-127 99.691 13.863 75-127 109.139 11.823 86-129 ORIENTATION 1 7.244 1.685 3-9 7.469 1.733 0-9. 7.148 1.867 2-9 7.972 0.910 5-9 ORIEATATION 2 13.415 5.459 1-21 14.755 5.019 3-22 14.519 4.018 4-22 16.028 3.009 9-22 ORLELITATION 3 9.405 2.58 4-12 6.714 3.291 1-12 8.056 3.194 2-12 7.556 3.605 2-12
m =1'ETT 2.925 1.047 1-5 2.902 0.781 1-4 2.962 1.143 1-5 2.806 0.910 1-5
H ABSTRACTION 1 3.875 0.791 1-5 3.569 0.965 1-5 4.170 0.975 2-5 4.161 1.214 1-5 o =3PECTIVE 1 4.750 0.776 1-5 4.412 0.983 1-5 4.434 2-5 4.387 1.202 1-5
ACCURACY 1 2.600 0.928 1-5 2.843 0.703 1-5 2 ?:g15 1-5 2.581 0.848 1-4 STYLE 1 • 2.750 0.112 1-4 2.784 0.577 1-4 2.925 0.730 1-4 2.903 0.700 2-4
.c.?, PI fa,
COMPOSITE SCORE MAP 1 13.975 2.330 5-19 13.647 2.432 7-17 14.189 2.632 9-19 14.032 2.881 6-18
ABSTRACTION-2 4.649 0.716 2-5 4.469 0.819 , 2-5 4.304 0.662 3-5 4.367 0.964 2-5 - PERSPECTITE 2 4.892 0.393 3-5 4.714 0.540 3-5 4.674 0.560 3-5 4.433 1.135 1-5
ACCURACY 2 . 2.676 1.082 1-5 2.796 0.889 1-5 2.739 1.021 1-5 2.867 0.900 1-5 STYLE 2 2.541 0.730 1-4 2.878 0.754 1-4 2.696 0.813 1-4 3.367 0.718 1-4 COMPOSITE SCORE MAP 2 14.703 1.927 10-19 14.857 1.904 11-19 14.413 2.039 10-19 15.033 2.414 9-19
LEADERSHIP 1.178 1.248 0-4 1.566 1.264 0-4 1.200 1.129 0-4 1.611 1.076 0-4 S0LIT:\RTNESS 1.511 1.180 0-4 1.264 1.146 0-4 1.455 1.033 0-4 1.583 0.906 . 0-3 INTROVERT 1.311 1.145 0-4 1.189 1.257 0-4 1.564 1.151 0-4 1.611 0.671 0-3 INDIVIDUALISTIC 1.933 1.156 0-4 1.925 1.174 0-4 1.636 1.060 0-4 1.778 1.972 0-4
P_I PERSEVERES 2.089 0.973 0-4 2.075 1.071 0-4 1.927 0.959 0-4 2.556 1.081 0-4 ' IEDEP=TDU1T 1.733 1.095 0-4 2.038 1.037 0-4 1.527 0.979 0-4 1.889 0.950 0-3
COMPOSITE SCORE 3 FOR FI
P.. CHARACTF-RISTICS 9.756 4.146 0-20 10.000 3.674 3-17 9.309 3.600 2-17 11.028 3.676 1-17
PA o FOILMEU GREGARIOUS
1.778, 1.444
1.042 1.078
0-4 , 0-4
1.396 1.642
0.927 1.222
0-4 0-4
2.327 2.000
1.090 0.839
0-4 0-4
1.833 2.194
1.108 0.568
0-4 1-4
C1 r.-f EXTR1VERT 1.489 1.100 0-4 1.245 1.142 0-4 1.418 1.166 0-4 1.472 1.082 0-4 Rei CO:TFORI.ST 1.711 0.815 0-3 1.472 0.973 0-4 2.382 0.850 0-4 2.472 0.609 1-3 n DEPENDENT 1.644 0.930 0-3 1.396 0.634 0-4 2.182 1.038 0-4 1.944 0.924 0-4
GIVES UP 1.489 1.058 0-4 1.340 1.091 0-4 1.7C4 ' 1.105 0-4 1.157 1.207 0-4 SCORE FOR F 0
CHARACT-I1iISTICS 9,556 3.609 1-16 8.491 3.539 3-16 12.018 2.896 3-19 11.063 3.193 4-21
0
0 0
0 P.
0 h.)
r/2
(113
CD
r-<1
o P.
! P,
t-1 0
o p 0
W 0 H
L.. 0

hisnotproposed to discuss differences which emerge from the analysis
of the overall characteristics, for it is felt that any differences
which exist will emerge as the next stage of the discussion continues.
2. 212 121-7.__ItE2221aIlmallagula As was explained in the previous chapter, the inter-correlational
analysis attempted to examine the inter-relationships between four
ma in elements, ie
1. Measures of cognitive style
2. Measures of ability
3. Measures of environmental Perception
4. Aspects of personality associated with Witkin's analytic/
global dimension
The inter-relationships between these elements will now be
discussed in lerms of the hypotheses outlined in the last chapter,
where the hypotheses were seen to be organised in to four main sub
groups.
A Those which further investigate the analytic/global dimension
and consider the correlations between the tests of cognitive
style and other measures used in the study (Hypotheses 1 - 9 and 25)
B Those which consider the strength of relationships amongst -
the ability and various 'mapping' measures. (Hypotheses
10 - 16)
C Those which consider the inter-correlations with the scores
on the children's cognitive maps. (Hypotheses 17 — 23) D That which considers the relationship between cognitive
style and aspects of personality. (Hypothesis 24)
A. Correlations with the measures of coarnitive st le
Hypothesis 1. Research suggests that there will be a positive and
significant correlation between the three measures of cognitive
style (ie Between scores on the Etbedded Figures Test (EFT), the
Rod and Frame Test (RFT) and the Articulation of Body Concept Scale
(ABC) ).
168

The first hypothesis is probably the most crucial of the research,
for the existence of the analytic/global style described by Witkin is
dependent upon a positive correlation between the three measures being
demonstrated for the sample. As was discussed in Chapter 2, where
previous research was reviewed, correlations between the measures of
cognitive style vary in their levels of significance. For example,
the review of research by Goldstein and Blackman (1978) demonstrated
that correlations between EIT and RFT were significant and generally
within the range of 0.30 - 0.65. Similarly Arbuthnot's (1972) more
comprehensive study of relationships between EFT and RFT concluded
that whilst the measures do share some variance the amount of
generality is often auite low. Correlations between the Articulation
of Body Concept Scale and the other measures of cognitive style have
been shown to be significant (Corah 1965, Karp, Silberman and Winters
1969, Witkin et al 1974) and generally in the range 0.4 - 0.5.
Machover for example (Witkin et al 1962 p 117) is reported to have
achieved a correlation of 0.41 (p<0.05) between figure drawings
and the measures of field independence. The results of the inter-
correlations between the measures of cognitive style for this study
were as follows:
TABLE 5. 1 Flail Sample -..-k§.9-.----
Boys (241) Girls (240)
EFT with RFT 0.4290 ** 0.4956 XX 0.3683 X
EFT with ABC 0.4392 xx 0.4654 xx 0.4529 ** -----
RFT with ABC 0.2338 ** 0.2975 XX 0.2165 **
Levels of significance * p < .05
XX p <.01
TABLE 5.1 Correlations between the measures of. Cognitive Style
(Sample, Boys, Girls)

As can be seen in these results, the EFT/RFT correlations
fall within the limits described by Goldstein and Blackman. All
of the results are significant at the 1% level and would probably
be taken by Witkin to support his assertions. However, the low
correlations between the Articulation of Body Concept Scale and the
Rod and Frame Test raises questions about the ABC and RFT as reliable
measures of cognitive style. Similar low correlations were identified
by 'Vernon (1972) and this led Satterly (1976, 1979) to question the
necessity of deriving a pooled index of field independence from such
disparate measures and he preferred to rely solely on the results of
the Embedded Figures Test as his measure of cognitive style, or
more particularly field dependence/independence.
The results above also suggest slightly stronger associations
between these measures for the boys of the sample. Analysis of the
results in terms of the urban/rural distinction indicates that
differences between the sexes for EFT/RFT correlations derive primarily
from the high correlations, of the urban boys and the lower correla-
tions of the rural girls. The slightly higher correlations of EFT/ABC
for the boys is a result of the lower correlations of the Urban Girls,
although that of the rural girls was the highest.
TABT,T1 5. 2 Urban Boys (113) -
Rural Boys --112U3.------LL122
Urban Girls —
Rural Girls 021.-----
EFT with RFT 0.6098 ** 0.4097 XX 0.4136 ** 0.2841 X
12dT with ABC 0.4605 XX 0.4689 XX 0.3830 ** 0.5074 **
RFT with ABC 0.2899 ** 0.3045 ** 0.1697 0.2330 *
(Levels of significance * p < .05, ** p4:.01)
TABLE 5. 2. Correlations between the measures of Cognitive Style
(By Residence/Sex)
The lower correlations between RFT/ABC are further demonstrated
by the urban/rural categorisation with the results of the girls
especially. The rural girls correlations were at the 5% level and
those of the Urban girls proved not to be significant. Age differences
in the correlations between these measures are discussed in a later
section.
The results described here are similar to those reported by Brophy
(1982, p.II6) who concluded that the criterion measures of Field depend-
ence/independence do not correlate ata significantly high enough level
to meet even modest 'equivalence' conditions which Arbuthnot (1972)
argued was necessary if they were to be regarded as measuring a similar
capacity. 170

Hypotheses 2 and 3 were concerned with the relationships between
the measures of cognitive style and intelligence.
Hypotheses 2. Since 'cognitive styles' uurport, to out across general
levels of ability, one would not necessarily expect high correlations
between intelligence (as measured by AH3) and measures of cognitive
style.
Hypotheses 3. 'There are likely to be higher correlations between perceptual reasoning and the measures of cognitive style than with
verbal or numerical reasoning.'
The relationship of intelligence with the measurement of Witkin's
analytic/global dimension has been a central issue in the literature
reviewed in Chapter Two. Witkin et al (1962) have reported high
positive correlations between RFT and EFT and intelligence and as
was mentioned earlier Witkin et al (1971) argue that if separate factor
IQ scores are computed for the three factors of the Weschler In-
telligence Scale, EFT scores correlate at a high and significant
level with the analytic factor, but only at a low and usually non-
significant level with the verbal and comprehension factors. Goldstein
and Blackman (1978) however, report consistent indications that the
measures of cognitive-style are related to various measures of verbal
and performance intelligence. The results of the analysis of this
study seem to support these assertions.
TABLE 5.3 Sample Boys Girls ---]
AH3 with EFT 0.5982 0.5353 0.6729 AH3 with RFT 0.2991 0.2822 0.3269
AH3 with ABC 0.3290 0.3623 0.3623
(All significant at the 1% level)
TABLE 5.3 Correlations between the measures of Cognitive Style and
Intelligence (Sample, Boys, Girls)
171

Comparison of these correlations with those described in
Table 1 reveal that EFT correlations are higher with intelligence
than they are with the other measures of cognitive style, whereas
RFT and ABC correlations are generally higher with EFT than they
are with intelligence. This is a further indication of the differences
that exist between these measures and seems to offer further support
to the views of Satterly cited earlier of taking the Embedded Figures
Test as the most appropriate measure of cognitive style. However, in
terms of Hypothesis 2, the association between ABC and RFT and
intelligence was as had been hypothesised, whereas this proves not
to be the case for the Embedded Figures Test. As a result one
might question whether RFT and ABC are therefore more appropriate
indicators of the analytic/global dimension. (It is important to
remember however that all of the inter-correlations with intelligence
(as measured by full AH3 score), proved to be significant at the 1% level and that EFT correlations were much the strongest).
When the inter-correlations between intelligence and cognitive
style were considered in terms of the rural/urban distinction,limited
differences emerged and in general the results confirm the comments
already made.
TABLE 5.4 Correlations between the measures of Cognitive Style and
Intelligence (By Residence/Sex)
TABLE 5.4 Urban Boys Rural Boys' Urban Girls Rural Girls
AH3 with EFT 0.6408 0.4230 0.6410 0.6671
AH3 with RFT 0.3390 0.2220* 0.3132 0.2896
AH3 with ABC 0.2913 0.3018 0.3021 0.4054
(All Results significant at the 1% level except * p <
A further interesting point about the relationship of these-
measures to intelligence is the relatively low level correlations
between ABC and AH3 for the sample (Table 3) although there are
exceptions (see the rural girls in Table 4). It has been argued
earlier that the analysis of the ABC raised some difficulty for the
!This was also confirmed in Brophy's (1982) study.
172

judges of this sample who felt that they were measuring increasing
drawing sophistication which Goodenough-Harris (1972) argue is a
demonstration of increasing intellectual maturity. The lower
correlations described in Tables 3 and 4 do not support the associa-
tion between intelligence and ABC particularly strongly. Witkin et
al (1971) had earlier identified a clear relationship between the
intellectual index of the Weschler Intelligence Scale and the level
of Articulation of Body Concept (0.55 significant at the 1Y0 level)
and the fact that this correlation was higher than with that of the
verbal index (0.33) was taken by Witkin to indicate that differences
in the nature of drawings is primarily a reflection of the differences
in mode of field approach rather than a reflection of general in-
telligence. It is interesting however that this was not considered
merely as a reflection of drawing ability, although the Goodenough-
Harris Draw-a-Man Test which is usually taken as an indicator cf
intellectual maturity, is also recognised as a measure of the level
of drawing skill.
The third hypothesis, which has already been stated, derives
directly from the factor analytic studies undertaken by Witkin and
his colleagues (Karp 1965). The measure of intelligence employed
in this study provided scores for verbal, numerical and perceptual
reasoning and it was hypothesised that the Spatial bias of the
measures of cognitive style (Vernon 1972, Satterly 1976) would be
reflected in the correlations especially with perceptual reasoning.
Similarly, the comments previously referred to about associations
with verbal indices, would lead one to anticipate low and possibly
non-significant correlations with verbal reasoning. As can be seen
in Table 5 below, the association between EFT and perceptual reasoning
confirms the hypothesis when the sample is taken as a whole and when
the boys are considered separately, but the correlations with verbal
reasoning are slightly higher for the girls.
173

TABLE 5.5 Sample Boys Girls
EFT with Verbal 0.5111 0.4199 24.6122 EFT with Numerical 0.4890 0.4359 0.5425
EFT with Perceptual 022616 2-.a.-.1° 0.6128
(All results significant at the 1% level)
TABLE 5.5 Correlations between EFT results and aspects of intelligence
(Sample,Boys/Girls)
When the results are considered for the urban/rural categori-
sation it becomes clear that the correlations of the rural girls
influenced the association between EFT and verbal reasoning for the
girls as a whole.
TABLE 5.6 Urban Bo *s
Rural Bo s
Urban Girls
Rural Girls
EFT with Verbal 0.5797 0.2678 0.5920 0.6081 Numerical 0.4843 0.3755 0.4825 0.5763
Perceptual 0.6275 0.4125 0.6260 0.5531
(All Results significant at the 1% level)
TABLE 5.6 Correlations between EFT Results and aspects of intelligence
(By Redidence/Sex)
It is important to recognise the high correlations which are
demonstrated here between the three elements of ability and En!.
The only relatively low correlations are for those of the Rural Boys
sub-group and in general these results appear to confirm the suggestions
of Goldstein and Blackman about associations between EFT and other
elements of intelligence and which in turn are contradictory to
those reported by Witkin.
174

The correlations between RFT and ABC and the subdivisions of
ability were not as high as those with the Embedded Figares Test
but in general confirmed the hypothesised relationship with
perceptual reasoning being stronger than with verbal or numerical
reasoning. As can be seen in Table 7, RFT correlates most highly with perceptual reasoning in all cases described here and although
correlations with the other elements of numerical and verbal reasoning
are significant, the level of shared variance is extremely low and
especially in the case of the association between RFT and Numerical
Reasoning for the boys of the sample. The strength of the
TABLE 5.7 Sample Boys Girls
RFT with Verbal 0.2373 0.2222 0.2706
RFT with Numerical 0.2223 0.1864 0.2487
RFT with Perceptual 0.3202 glaai 20122
All correlations are significant at the 1% level)
TABLE 5.7 Correlations between RFT and aspects of intelligence
(Sample, Boys, Girls)
relationship with perceptual reasoning was further demonstrated
by the results of the analysis by urban and rural sub—grouping, as
was the much lower associations with verbal and numerical reasoning.
TABLE 5.8 Urban Bovs
Rural Bo s
Urban Girls
Rural Girls .....
RFT with Verbal 0.3194 XX 0.1173 0.2933 • 0.2005 -1'
RFT with Numerical 0.1984 * 0.1755 0.2254 * 0.2313 *
RFT with Perceptual 0.3782 ** 0t2612 ** 2422a ** 242161 **
(Levels of significance: * p <:.05, p < .01
TABLE 5.8 Correlations between RFT and aspects of intelligence
(By Residence/Sex)
175

The correlations for the Rural Boys were particularly low and those
of RFT with verbal and numerical reasoning proved not to be signifi-
cant for the rural boys.
The correlations between the Articulation of Body Concept Scale
and verbal, numerical and perceptual reasoning were similar to those
for the Rod and Frame Test, except that, as with the Embedded Figures
Test, correlations for the girls were higher with Verbal than Per-
ceptual Reasoning. As with the Embedded Figures Test, this was a
result of the correlations achieved by the Rural Girls. (The
difference in correlation between verbal and perceptual reasoning
was extremely small, however: 0.0010).
TABLE 5.9 Sample Boys Girls
ABC with Verbal 0.3127 0.2705 0.5372
ABC with Numerical 0.2151 0.1934 0.2797
ABC with Perceptual 241122 0.3040 0.3362
signi-.
ficant at
the 1% level)
TABLE 5.9 Correlations between ABC and aspects of intelligence
(Sample, Boys, Girls)
TABLE 5.10 Urban Bois
Rural Bo s
Urban Girls
Rural Girls
ABC with Verbal 0.2918 x x 0.2553 ** 0.2770 ** 24182/ **
ABC with Numerical 0.1776 * 0.2080 * 0.2013 * 0.3508 **
ABC with Perceptual 2.1122 ** 0.2951 ** 2,1u2 xx 0.3240 **
(Levels of significance: * p <;.05, ** p 4=.01)
TABLE 5.10 Correlations between ABC and aspects of intelligence
(By Residence/Sex)
176

It seems thereforethat with the exception of the Rural girls
of the sample, the association between perceptual reasoning and
the measures of cognitive style is the strongest and that in general
the association of all of the ability measures with ABC and RFT is
much smaller than with the Embedded Figures Test. It is the case
however that the results do confirm an association with intelligence
and this is further investigated in the factor analysis of the
results which will be discussed in a later section of this chapter.
azithepeslaLI5. attempted to investigate the validity of
the Articulation of Body Concept Scale as a measure of cognitive
style by comparing the results of the Draw-a-Man analysis with
intelligence and with those of the Articulation of Body Concept
Houtheses 4. The Draw-a-Man Test will correlate positively and
significantly with AH3 and in particular with perceptual reasoning.
apotheses c. The correlation between the Draw-a-Man test and
the Articulation of Body Concept Scale will prove to be both positive
and significant.
The results of this analysis produced lower correlations than
might have been anticipated for the relationship between Draw-a,
Man and ability, especially since the test is supposed to be an
indicator of increasing intellectual maturity (Goodenough-Harris 1963)
but as anticipated in Hypothesis 4, the most positive relationship
was with perceptual reasoning for all sub groups.
TABLE 5.11 Sample 1 Boys Girls Urban
Bo s Rural Bo s
Urban Girls
Rural Girls
DAM with:
AH3 10.2587**
Ver.
Num.
4 Per.
0.2366XX
0.1509**
0.2920**
0.2349X X 0.2123xx
0.1226
062868**
0.2874** 0.2667*-x
0.1655**
241212 X X
0.2595xxp.1925*
0.2613xx0.1597
0.1429
2412111241V... 1
0.0812
0.2377*
0.2055x
0.1545
24212!'
0.2928**
0.2882**
0.1756
2422.72!*
(Levels of Significance: * p < .05, *E p < .01)
TABLE 5.11 Correlations between Draw-a-Man Test Results and
intelligence
177

Again there appears to be a considerable degree of similarity
between all sub groupings from these results. Low, but significant
correlations between Draw-a-Man and AH3 and Verbal and Perceptual
Reasoning, but much weaker correlations between Draw-a-Man and
numerical reasoning. The results do however, raise ouestions about
the Draw-a-Man test as a reliable indicator of intellectual maturity
for this sub group.
When the results of the Draw-a-Man analysis were compared with
those of the tests of Cognitive Style, as anticipated in Hypothesis 5,
the correlations between ABC and D-a-Man proved to be highly signi-
ficant for all sub groups. When this result is taken in conjunction
with those reporting associations with intelligence and with cog-
nitive style (ie Table 11 for Draw-a-Man and Tables 2, 4 and 9 for
ABC), it appears that the high positive variance between these tests
is something other than 'intellectual maturity' or the ability to
'disembed'. As was discussed earlier and in Chapter 4 the judges who
scored the Articulation of Body Concept Scale found it difficult to
decide whether they were in fact following the criteria for the ABC
analysis and felt that they were more likely to have considered the
drawings in terms of their quality, and even perhaps the level of
drawing skill demonstrated, which is obviously an important element
of the Goodenough-Harris analysis.
TABLE 5.12 Correlations between Draw-a-Man Test Results and the
measures of Cognitive Style
TABLE 5.12 amp Sle Boys Girls Urban
Bo s Rural Boys
Urban Girls
Rural Girls
DAM with: ** x x ** ** ** x x
EFT 0.4379 0.4632 0.4112 0.4832 0.4229 0.3661 0.4194* -,,* **
RFT 0.2558 0.29'6 0.2257 x x
0.3415 0.2512 0.1705 0.2364 xx 4.-x XY * ** **
ABC 0.7594 0.8112 0.7270 0.8357 0.8357 0.7369 0.7084
(Levels of Significance, * p< .05, xx p <.01)
178

As with the results discussed so far, the correlations with
EFT were positive and significant, the results here are probably
associated with the perceptual skills required in solving EFT
problems and drawing high scoring figures on the Draw-a-Man Test.
The correlations with RFT scores are interesting in that they
demonstrate slight sex differences, with the scores of the girls
of the sample achieving lower levels of correlation than the boys.
The different levels of correlation for the three measures of
cognitive style raises further question about their inter-relation-
ships.
Hypothesis 6 attempted to follow up the relationship between
Spatial ability and the measures of cognitive style.
Hypothesis 6. Research suggests that correlations between tests of spatial ability and the measures of cognitive style will prove to
be positive and significant. This will amply especially to the
Embedded Figures Test. Positive correlations have been reported
between aspects of spatial ability and the Witkin measures by Vernon
(1972), Kogan (1973) Perera (1974) and Satterly (1976) and since
the original basis of the analytic/global dimension identified by
Witkin was of a strongly perceptual nature, this is not surprising.
(It will be remembered that in Chapter Two it was commented that
Witkin now sees Field dependence/Independence as the perceptual
element of the analytic/global dimension).
Results of this study clearly confirm this relationship and
again raises questions about the existence of the style as an
independent definable characteristic, or merely as a representation
of spatial ability as demonstrated by the results of Spatial Test 2
(ST2) which has a bias towards the mental manipulation of three
dimensional shapes.
As can be seen in Table 13 all of the results reported here
are highly significant, all at the 1% level and are the highest
correlations reported so far. Again the correlations for the
Embedded Figures Test are higher than those for RFT and ABC, yet
the RFT/ABC correlations with Spatial Ability are amongst the
strongest for these tests to be demonstrated in this study.
Brophy's (1982) study of 14 year olds confirm these findings for
the hiq and ABC, but achieved lower correlations for the RFT (0.33),
when scores on the criterion measures were compared with the results
of N.F.E.R. Spatial Test I. 179

TABLE 5.13 Sample Boys Girls
EIT with ST2 0.7333 0.7354 0.7295
RFT with ST2 0.4179 0.4777 0.3611
ABC with ST2 0.4205 0.4349 0.4495
(All significant at the 1% level)
TABLE 5.13 Correlations between the measures of cognitive style and
spatial ability. (Sample Boys, Girls)
These results were confirmed by the analysis of the urban and
rural subgroups.
r---- TABLE 5.14 Urban
Bovs Rural Bo r-
Urban Girls
Rural Girls
EFT with ST2 0.7747 0.7150 0.7667 0.6903
RFT with ST2 0.4828 0.4755 0.4287 '0.2841
ABC with ST2 0.4555 0.4210 0.4317 0.4487
(All results significant at the 1% level)
TABLE 5.14 Correlations between the measures of cognitive. style and
spatial ability. (By Residence/Sex)
There appears to be very little difference between the subgroups
or the sexes for this analysis, except perhaps for slightly stronger .
associations for EFT/ST2 for the Urban 'Subgroup and the somewhat
lower correlation between RFT/ST2 for the Rural Girls which has
obviously influenced the lower 'girls' correlation described in
Table 13., .
Within the fdisembeddingt ability isolated by Within is an
element of orientational ability, positioning oneself appropriately
to separate figure from field, or rod from the surroundingframe, or
identification of self. The particular skills required to.solve EFT
and RFT problems especially, it was felt, contained obvious similarities
to skills required to solve mapping problems, eg separate a shape from
the complexity of an Ordnance survey map, orientation of a map with
the ground. Thus, measures which explored some of these abilities
were included in the study. Satterly (1979) had previously identified
180

a positive correlation between TIPT scores and the exercises used in
this study as Orientation 1 (01 .-0.563,p<1% level) and Orientation
2 (02- 0.398,p<1% level). These tests made use of small plans for
01* and a street map for 02* and presented the children with problems
of left, right, orientation and of cardinal directions. The results
" of this study confirm the findings of Satterly and at an increased
level of significance particularly in the case of Orientation Exercise
Two, which required the children to solve directional problems on
the fictitious stmt plan. (* 01/02 - shorthand for Orientation 1 and 2)
TAMPS 5.15, 16, 17 Correlations between the measures of cognitive
style and Orientation Exercises 1 and 2.
TABLE 5.15 Sample Boys Girls Urban 23o,ysZoys
Rural Rural
Urban Girls Girls
01 with .b..T 0.4333 0.4330 0.4371 0.5637 0.3479 0.3997 0.4733 02 with EFT 0.5242 0.5398 0.5148 0.6355 0.4889 0.5227 0.4740
TABU', 5.16 Sample Boys Girls Urban Boys
Rural Bors
Urban Girls
Rural Girls
01 with RFT
02 with RFT
0.2637 0.3334
0.3447 0.3702
0.2189 0.3125
0.4077 0.4639
0.2638 0.2605
0.3889
0.4226
0.0772ns
0.1913ns
TABLE 5.17 Sample Boys Girls Urban-Rural Boys Boys
Urban Girls
Rural Girls
01 with ABC 0.2806 0.2607 0.2875 0.3095 0.2202* 0.2570 0.5125
02 with ABC 0.3072 0.3105 0.3053 0.3867 0.2477 0.2323 0.3700
Levels of Significance: All significant at 1% level except
*p <5%, ns - not significant)
and thus to some extent confirmed Hypothesis 7 for this study. Hypothesis 7. There will be a positive and significant correlation between the measures of orientational ability (01 and 02) and the
measures of cognitive style. (This was felt to be more likely in the
case of EFT and RFT because of the 'orientational' skills required in
them).
181

As can be seen in Tables 15, 16 and 17 the strongest correlations
between Orientation and cognitive style are with the Embedded Figures
Test, producing fairly consistent results for all subgroups.
Correlations with EFT and ABC were again much lower, but still
significant (At the 1% level except for the Rural Girls with RFT,
and at level for the Rural Boys on the ABC). It was also the
case that correlations with orientation 2 were higher than those of
orientation 1 for the ABC/Itn! and there appears to be a slightly
higher correlation between RFT and orientation for the Urban children
of the sample. Why this might be so can only be speculated upon, The
much more 'angular' environment of the urban children may be an
influence and this could be an avenue for further investigation.
As a further measure of orientational ability and its association
with cognitive style a third measure,0 3,had been included in the
study. This exercise presented children with a variety of map extracts
of increasing complexity and a series of pictures. The children's
task was to match the map extract to its appropriate picture and it
was hypothesised that this would require considerable 'disembedding'
skills in Witkins terms since children would have to separate elements
from the visual field of the pictures and the map extracts in order
to compare them,and that with increased detail this would place
greater demands on the disembedding ability that the measures of
cognitive style are supposed to reveal.
Hypothesis 8, The disembedding skills required in orientation 3 will
correlate positively and significantly with those demonstrated by
the tests of cognitive style.
As can be seen in Table 18 below, the results do not confira-
Hypothesis 8 with any real strength. The correlations with the
Embedded Figures test are again the highest and all at the 1% level
except for the Rural Girls, but the level of shared variance between
EFT and 03 is quite low. It is also the case that as with previous
results, the correlations with RFT and ABC are considerably lower,
particularly in the case of RFT and 0 3, where all results of those
other than the sample as a whole proved not to be significant and
even then the shared variance is extremely low. When the results
182

are considered in terms of the urban rural distinction, they again
demonstrate stronger correlations for the urban children of the
sample and reinforce the suggestions of the need for further re-
search to examine this difference.
TABLE 5.18 Correlations between the measures of cognitive style
and Orientation exercise 3
TABLE, 5.18 Sample Boys Girls Urban Bo -s
Rural Bcrs
Rural Urban Girls Girls
03 with EFT 0.2849*k 0.3234** 0.2340 0.347 0.2931 0.3489 0.2087* 03 with RFT 0.1038* 0.0934 0.0836 0.1811 0.0271 0.1499 0.0687
** xx xx 03 with ABC 0.1642** 0.2205** 0.1892 0.3197 0.1486 0.3533 0.0504
(Levels of Significance: * p <.05, x x p < .01)
The final analysis which further investigated the analytic/global
continuum, considered the possible associations with. map/plan
drawing. The Draw-a-Plan Test was included as an additional measure
for comparison with the cognitive map analysis. As with the hypotheses
associated with orientation, it was felt that the disemhedding skills
described by Witkin might have a considerable influence cn the
drawing of maps and plans, thus it was hypothesised that,
Huothesis_2. Scores on the Draw-a-Plan Test will correlate posi-
tively and significantly with the measures of cognitive style,
especially the EVT and RFT.
The results set out in Table 19 again demonstrate stronger
associations with the Embedded Figures Test and it appears that
these tests do share a fairly high level of variance. Correlations
with RFT are much lower than anticipated and although significant do
not appear to support the hypothesis outlined above, in fact corre-
lations with ABC are generally higher than those with RFT, perhaps
relating the 'drawing' element of both exercises. Comparison of
the results for the various sub-groupings do not appear to.reveal
any major differences, except that when the boys and girls are con-
sidered as total groups there appears to be a slightly increased
correlation between Draw-a-Plan and all measures of cognitive style
183

TABLE 5.19 Correlations between the measures of Cognitive Style
and the Draw-a-Plan Test.
TABLE 5.19 Sample Boys Girls Urban Bo s
Rural Bo- s
Urban Girls
Rural Girls
DAP with ElIT 0.4381 0.4711 0.4425 0.5292 0.5131 0.4620 0.5440
DAP with RFT 0.2475 0.3308 0.2108 0.3936 0.2939 0.2692 0.2287*
DAP with ABC 0.3413 0.3225 0.3078 0.4324 0.2635 0.3245 0.3217
(All significant at 1% level except * p < 5%)
in favour of the boys of the sample. When these results are con-
sidered for urban and rural sub-groups however, this distinction is
not confirmed for the Embedded Figures Test where the Rural girls
achieved the highest correlation, or the Articulation of Body Concept
Scale where the Rural Boys was the lowest.
B. Inter-correlations Amongst the other Measures used in the Study
As an additional element of the analysis, it was thought im-
portant to investigate the strength of relationships between the other
measures used in this study. This would then serve as a comparison
for the results, just discussed, relating these measures to those
of cognitive style. The following matrices 1 - 7 present the results of the intercorrelations and Hypotheses 10 - 16 focussed upon relation-
ships within them which were regarded as pertinent to the study as a
whole.
Hypothesis 10, anticipated that the association between Spatial
Ability and Intelligence would be strongest for the perceptual -
element of AH3.
The results of the analysis confirmed this hypothesis with all
correlations between Spatial Ability and AH3 and Verbal,Numerical
and Perceptual Reasoning being significant at the 1% level. Corre-
lations with perceptual reasoning proved to be the highest
amongst the three sub-divisions of intelligence for all sub groups.
Of particular interest within this analysis were the results of the
girls of the sample, who have achieved the highest correlations
between all elements of ability and Spatial Test 2. Previous research
(Watts 1963) had revealed clear sex differences on correlations of
184

INTERCORRELATIONS AMONGST OiliEti MEASURES USED IN THE STUDY
MATRIX 1 Correlations for the Sample as a whole
Alij VER NUM PER ST2 01 02 03 DAM
AH3 -- ( •
--
NUM "" 0.6 21** • PER - 0.6 88 0.602 "
0.6 82** 0.52 ** O. 122* 0.6183** 01 O. 220** O. 088** O. 142** O. 8 ** 0.'410**
02 0.6146** O. -*'', O. 06•*-* O. 680** O. A X-- o. or** 0 kgaraitarootatraaak.4, - ., 1 It S. o, .1-13,111M I DAM ViiiiligndanalLealo -, I. S 0 . .- O., Ao 0.264 ,-- 0 DAP 0.3241** 0.2599** 0.2436** 0.3464** 0.4804** 0.2413** 0.3441** 0.1350** 0.3624**
TRIX 2 Correlations for the Boys of the Sample
AH3 VER NUM PER ST2 01 02 03 DAM
VER -- -- -
NUM -. 0.6624** . - 0.6117** 0.6084**
ST2 O. 1** O. 4 2** C.'•,12** 0. 8• ** kiiiplarnms, 6 - 0.-o Alas,•0 . 2
02 e.6. ' 0.T4 0. •-- •. aUliitIMIS2, 03 0.21 ** 0.16 * 0.1 -9* 0.210•*-* 0.2 87** 0.169•* 0.1964**
0.2349*4 0.2123** 0.1226 0.2868** 0.40 1 0.2 894-* 0. 206** 0.21 *-* DAP 0.2900 0.1974** 0.2415** 0.32674'4 0.5322 0.2795** 0.3693** 0.1655* 0.35164°1-
MATRIX 3 Correlations for the Girls of the Sample -
AH3 VER NUM PER ST2 01 02 03 DAM
AH- -- VER -- -- •
NUM -- 0.66 0** - . PER -- O. 1** 0.620 ** ST2 0.'1 4-* 0.629 ** 0. 82 '-* 0.6 06** 01 - . 0.4 - •. a .Ey 02 0.6201** O. • 2 - • . - -14- .'I, I • ligaill111111111111111111111111111111
0.2 ** 0.20 8** 0.2628** O. 0• ** O. 0 0** 0.1690* 0.2101** • DAN abitia '"•. o. S. 5 •.116ANOME- - •.262 0._0 o- * •. DAP 0.3573** 0.3039** 0.2905** 0.3456** 0.4748** 0.1764** 0.3189** 0.2102** 0.3929**
Levels of Significance * p < .05 . .
** P <.01 -.....,
185

MATRIX 4 Correlations for the Urban Boys only
AHj VER NUM PER ST2 01 02 03 DAM
AHD --
VER , -- ...
TTIT -- 0. 33 ** • ---- PER -- 0.6241** 0.6402** ST2 0.6470** 0.5526** 0.5105,-* 0.6296**
01 0.f294**Th-6944** 0.4239* 0.5856-* 0.5201** 02 0.6410** 0.5961*- 0.4341** 0.6410** 0.5 92,* 0.7029** .
03 0.3199** 0.3296** 0.2615** 0.2457* 0.3418'* 0.0801 0.2399 DAM 0.2595** 0.2613)......,- .14.220.01- 0.2"0.218*-34E- 0.2326** LAP 0.4711** 0.4183** 0.3729** 0.4890** 0.5751** 0.3594** 0.4459',* 0.2139' 0.4609)-*
MATRIX 5 Correlations for the Fural Boys only
VER MUM 22111 ST2 01 02 03 DAM
AH3 -- . .
VER -- -
'7 -- O. 7 9**
PER -- 0.9010** 0.55734*
ST2 0.4810'=*- 0.3125** 0.3531** 0.5375**
01 0.4342** 0.3158w* 0.3939** 0.40/15** 0.3780**
02 0.5724*4 0., 32** 0. 7115** 0.5292" 0.5109** 0.4147** 03 0.1092 0.0163 0.0958 0.1666 0.2-96** 0.2377'^* 10.1650 ' D2,.1.: 0.1225L2,122112212 0.2449'*, 0. 38 ** 0.2187* 0.2340** 0.1A8' DAP 0.1650 0.0138 0.1722 0.231 ,4* 0.5337** 0.2284** 0.5024h* 0.1573 0.3234**
MATRIX 6 Correlations for the Urban Girls only
A23 VER NUM PER ST2 01 . 02 03 DAM
/R3
VER -- -- 7 r" -- 0.6 2 * PER -" 0.7233** 0.5E61** ST2 0.6891- - 0.6-27** 0.5187** 0.66 2**
01 0.4526-* 0.4834'4* 0.400344' 0:32184-* 0.4608**
02 0.5603** 0-5221:L 0Z559`L 0.211:1 0.5695" 0.5177** 03 0.2312** 0.1666 0.2351** 0.3422** 0.2785** 0.1676 043285** 211L.....1";:237 2763.-* 0. 17 0.260 ** 0.1634 0.44 4-* LAP 0.3515**,0.2882** 0.2592** 0.5834** 0.4398** 0.0943 0.2823**.0.3636** 0.4217**
_ . Mk 7 Correlations for the Rural Girls only
AH3 VER NUM PER ST2 01 02 03 DAM
P.1 -
LL. -- --
0.6260** • PEN -- 0.43 9** 0.6 68.Y* ST2 0.7241-'-'0.59 ** 0.6 8 • ** 0.6918**
0.5'87** 0. 538** 0.4619** 0. 894* 0.4207** 02 ktifter •. I. ,- S. ": .21** . 1QG • o • ' %MI rsialisalkla • s. s i
M 0.2'23** 0.2881** 0.1756 0.2872** 0.3911** 0,2500* 0.129* 0.068 DAP ! 0.4495** 0.3932** 0.3914* 0.3808** 0.5756** 0.2843** 0.4192-- 0.0654 0.4087**
Levels of Significance: -* p (:.05 -
" P < .01
186

this test with intelligence in favour of the boys, although reference
to Fig. 1 (The overall characteristics of the Sample) still confirms
a higher mean score on this test for the boys. A further point of
importance was that differences between the correlations of Spatial
Test Two with Verbal, Numerical and Perceptual reasoning were com-
paratively smell.
It was also anticipated that a similar relationship to that
described for spatial ability would be demonstrated between intelli-
gence and the measures of orientational ability. As Hypothesis 11
stated,
Hypothesis 11. Orientation scores will correlate positively and
significantly with the measures of intelligence, especially percep-
tual reasoning.
Conner (1969) had established a positive and significant relation-
ship between intelligence and Orientation Exercise 3 (of 0.46 for boys and 0.39 for girls) with a sample of 9 — 14 year old children and Satterly found correlations of 0.481 and 0.457 between intelligence
and orientation Exercises 1 and 2 respectively and in the range 0.33 -0.
37 with tests of English and 0.39 - 0.57 with tests of Mathematics. The findings of this study are somewhat contradictory however. Corre-
lations of 01 and 02 with Intelligence (AH3) are generally higher than
those established by Satterly for this sample, with much more positive
relationships demonstrated by the Urban children. Similarly, higher
correlations (0.50 and 0.544) are demonstrated in these results for
correlations with verbal reasoning when compared with Satterly's
'English Test' results. whereas slightly lower correlations are demon-
strated for numerical reasoning (0.41 for Orientation 1 and 0.51 for
Orientation 2). The assumption that these orientation exercises would
correlate most strongly with perceptual reasoning was not confirmed.
The results of correlations with orientation Exercise 3 are not as positive as those reported by Conner and the somewhat lower correla-
tions when compared with orientation 1 and 2, seem to be a direct
influence of the non-significant results of the Rural Boys for all
aspects of the intelligence measures. It is also the case that.corre-
lations between 03 and AH3, Verbal and Numerical reasoning are the
187

most positive for the Urban Boys and Rural Girls sub-groups, whereas
correlations with perceptual reasoning are strongest for the girls
of the sample.
When the Orientation Exercises were compared with Spatial
Ability, similar results to those for Intelligence were demonstrated,
with Orientation 2 producing the most consistent and strongest positive
correlations and Orientation 3 achieving generally much lower corre-
lations than the other two tests and thus confirming Hypothesis 12.
21212112pis 12. Orientation scores will correlate positively and
significantly with the measure of Spatial Ability.
As can be seen in the matrices of results, correlations between
01 and 02 and Spatial Ability are slightly lower than those described
for intelligence, whereas those for Orientation 3 are slightly higher.
It has already been explained that the Draw-a-Plan Exercise had
been included in this study, because of anticipated associations with
map drawing. Hypotheses 13 to 16 investigated correlations between
scores achieved on this test and the elements discussed so far, ie
Hypothesis 13 with measures of intelligence
14 with measure of spatial ability
15 with the measures of orientational, ability
16 with aspects of drawing (Draw-a-Man)
Hypothesis 12. Scores on the Draw-a-Plan Test will correlate
positively and significantly with measures of ability and in particular
with perceptual reasoning.
Correlations with intelligence proved to be rather lower than
anticipated, especially since Thorstad (1974) sees this test as a
good indicator of intellectual maturity, but with a strong Spatial
bias. As was anticipated however, scores for perceptual reasoning
were most strongly correlated in all cases, except the rural girls
whose correlation with verbal reasoning was only slightly stronger
(0.3982 for verbal and 0.3808 for perceptual). Although hypothesis 13
is confirmed the level of shared variance between the tests is quite
low. One interesting factor to emerge from this analysis was the
results of the Rural Boys, which as with the Orientation 3 scores
188

just reported, proved not to be significant for all elements of
the analysis of intelligence except perceptual reasoning.
Ralationshipsbetween this test and spatial ability were confirmed by
the results of this study and in turn confirmed Hypothesis 14.
Hypothesis 14. Scores on the Draw-a-Plan Test will correlate posi-
tively and significantly with the results of Spatial Test 2.
Thorstad (1974) had previously reported positive correlations
between the Draw-a-Plan and two spatial sub-tests drawn from the
Weschler Intelligence Scale for Children (ie the Object Assembly
Test produced correlations of 0.32 for girls and 0.39 for boys and
the Block Design achieved a correlation of 0.54 for both sexes).
The results of this analysis produced consistent results in the range
0.44 - 0.58, with limited intergroup differences. The only obvious
difference was the somewhat lower correlation of the rural boys
subgroup.
When the Draw-a-Plan results were compared with those of the
Orientation Exercises, the correlations were rather varied and less
consistent or positive than was anticipated. Orientation. 1 and 2
were concerned with plans and the low correlations between them and
Draw-a-Plan results are perhaps an indication of the differences
between 'reading' and 'drawing' plans. The demands of drawing a
plan of one's house requires mental transformations which it was
felt demanded a high degree of orientational ability and thus it
was hypothesised that,
Hypothesis 15. Scores on the Draw-a-Plan Test will correlate posi-
tively and significantly with scores on the Orientation Exercises.
As can be seen, the results do not consistently support this
assertion. The correlations with Orientation 2 are the strongest
and significant at the 1% level in all cases, with the most positive
results achieved by the Urban Boys and Rural Girls.Orientation 2
involved the use of the street plan and there appears to be a relatively
high degree of shared variance here. Orientation 1 demonstrated more
positive results for the boys of the sample, but this is due to the
very low and non significant correlation of the Urban Girls, who in
turn were the only sub-group to achieve a positive correlation
between D-a-Plan and Orientation 3.
189

Hypothesis 16 attempted to investigate a point made earlier about
the differences between map/plan drawing and map/plan reading.
The Draw-a-Man test is not only a useful indicator of intellectual
maturity according to Goodenough-Harris (1963) but also demonstrates
something of an individual's concern for detail in his drawing. The
Draw-a-Plan Test also demands concern for detail. Thorstad (1974) has
reported positive correlations (of 0.32 for girls and 0.28 for boys)
between D.A.Man and Draw-a-Plan, and Thompson (1977) reported sig-
nificant (at the 1% level) but unspecified correlations between
Draw-a-Man and Draw-a-Plan;and Draw-a-Plan and a Map Drawing Exercise.
The results of this study produced higher correlations than those
reported by Thorstad and to some extent confirmed Hypotheiis 16,
that
Hypothesis 16. Scores on the Draw-a-Plan test will correlate positively and significantly with those of the Draw-a-Man test.
However, the level of shared variance is still low and it is
open to question as to whether this is a direct result of general
intelligence, since both tests purport to measure this.
This concludes the review of inter-test correlatiOns, the next
section goes on to consider the cognitive-man analyses.-
C. Intercorrelations with the Cognitive Maps produced by the
Children of the Sample
Hypotheses 17 to 21 considered the inter-relationships demon-
strated by the results of this study when the two maps produced by the
children were compared with the various measurement techniques.
Strong and positive correlations were anticipated between the maps
and the following elements.
Hypothesis 17, with the measures of Cognitive Style ft 18, with the measures of Intelligence te 19, with the measure of Spatial Ability
20, with the measures of Orientational Ability
21, with the Draw-a-Plan Test
It will be remembered that the maps were analysed in a variety
of ways, for The Extent of the Area Map and for the degree of
Abstraction,Perspective adopted, Accuracy and Map Style, for both
'so

the Area Map and the Route Map. Hypothesis 17 anticipated that the
results of the analysis of the maps in terms of these elements would
correlate positively and significantly with the three measures of
cognitive style and this had been a significant factor in the selection
of these particular elements for analysis. (See Appendix 3 for a
detailed explanation).
apo-theasal. Each of the elements for which the maps were analysed
will correlate positively and significantly with the tests of cog-
nitive style, with field independent subjects producing better maps.
If this hypothesis proved to be confirmed, this would support
the major hypothesis of the study that there is an association
between children's perceptions of their environment, (as demonstrated
in their cognitive maps) and cognitive style (as demonstrated by
Witkin's analytic/global dimentsion). The previous discussion about
the inter-relationsb.ips between the measures of cognitive style would
lead one to anticipate a varied inter-correlational matrix in terms
of the three measures of cognitive style, which is the case as can
be seen on Table 20.
The results demonstrate a reasonable degree of similarity in
the correlations between the Extent of the Area revealed in Map 1 .
and the Embedded Figures Test, confirming the hypothesis anticipated
in Appendix 3 of a positive relationship between these two elements:
All results are significant at the 1% level, but not at as high a
level as had been anticipated. Thus, although statistically it is
possible to argue that field independent subjects are more likely to
produce more 'extensive' maps than those produced by field dependent
individuals the difference is smaller than expected. (This is
followed up later in terms of the actual detail included on the maps).
Comparison of the correlations between Extent and the RFT and ABC are
less supportive however, and as has been demonstrated previously the
correlations are much lower than with the Embedded Figures Test.
Although correlations for the sample are significant at the 1% level,
there are indications of lower and non-significant correlations for
the sub-groups. This raises further questions about the comparability
of the measures of field dependence/independence and their use as a
reliable indicator of children's cognitive style for this study. If
191

TABLE 5.20 Map Elements and the Measures of. Cognitive Style
Map 1 (Area) iNSINIIININIk
Sample Boys Girls Urban Bo
Rural Bo - _ '.x
Rural Urban ,;s , Girls
Extent with EFT 0.3419** 0.2966** 0.3959** 0.3018** 0.2480:<-* 0.3443** 0.3745** Abstraction with EFT 0.2942** 0.2546** 0.3265* 0.1454* 0.3546** 0.5351(* 0.2327** Perspective with EFT 0.3555** 0.2827** 0.4173** 0.1461* 0.3377** 0.4429** 0.3272*h. Accuracy with EFT 0.4055** 0.3584** 0.4160** 0.3280** 0.3329** 0.3598** 0.4227** Style with EFT 0.1411** 0.1711* 0.1082 0.2669** 0.1321 0.1921 0.0779
Extent with RFT 0.1951** 0.1674** 0.1960** 0.2441* 0.1409 0.2123* 0.1324 Abstraction with RFT 0.1091** 0.1143 0.0946 0.0726 0.1457 0.3067** 0.0223 Perspective with RFT 0.1611** 0.1191 0.1816** 0.1170 0.1183 0.3023** 0.0723
with RFT 0.2423** ' 0.1837** 0.3057** 0.1695 0.1937** 0.2665** 0.2462*
I
Accuracy Style with RFT 0.1622** 0.1163 0.2103** 0.1254 0.1161 0.1892 0.2638**
Extent with ABC 0.2060** 0.2617** 0.1972** 0.2120* 0.2957** 0.2153** 0.1410 Abstraction with ABC 0.1368** 0.1678* 0.1623* 0.0824 0.2187* 0.2375** 0.1352 Perspective with ABC 0.1632** 0.2094** 0.1860** 0.1506 0.2421** 0.1668 0.1739 Accuracy with ABC 0.1946** 0.1717* 0.2363** 0.1465 0.1848* 0.2601** 0.1682 Style with ABC 0.1742** 0.1379 0.2254** 0.2161* 0.0851 0.3600-** 0.0388
Map 2 (Route) Sample Boys Girls Urban Bo s
Rural Boars
Urban Girls
Rural Girds
' Abstraction with EFT 0.2967** 0.2055** 0.3665** 0.1218 0.2381** 0.3307** 0.3551** Perspective with EFT 0.3149** 0.2685** 0,3472** 0.0983 0.4194** 0.3555** 0.2624** Accuracy with EFT 0.3597** 0.3606** 0.3541** 0.3870** 0.3195** 0.2961** 0.3195** Style with EFT 0.1168* 0.0421 0.1973** 0.0649 0.0023 0.1271 0.2503*
Abstraction with RFT 0.1652** 0.2684** 0.0822 0.2447* 0.3072** 0.0615 0.0382 Perspective with RFT 0.1810** 0.2573** 0.1221 0.1773 0.3395** 0.0807 0.0710 Accuracy with RFT 0.1853** 0.1917** 0.1726** 0.1425 0.2401** 0.0561 0.1808 Style with RFT 0.0341 0.0103 ' 0.0824 0.0663 0.0612 0.1284 0.0479
Abstraction with ABC 0.1497** 0.1707* 0.1856** 0.1281 0.2140* 0.1849 0.1507 Perspective with ABC 0.0901 0.1335 k 0.1428* 0.0077 0.2550** 0.0825 0.1543 Accuracy with ABC 0.2634** 0.3060** 0.2617** 0.3189** 0.3024** 0.2227* 0.2 68** Style with ABC 0.1908** 0.0240 0.3457** 0.0367 0.0589 0.3470** 0.3535**
Significance Levels: * p < .05 ck p < .01

the only measure used as an indicator of 'style' had been the EFT,
as much of the previous research has done, the relationships are
much more positive. This assertion is also demonstrated when the
other elements of the map anlysis are considered in terms of their
correlations with EFT, RFT and ABC. When the results for both maps
are compared, the EFT achieves the greatest degree of consistency.
Correlations with Abstraction, Perspective and Accuracy are at the
1% level for all groups except the Urban Boys and the only irregular
results are the associations with Map Style which included non
significant results for the Girls and the Rural Boys.
Thus, if the EFT is taken as the measure of cognitive style,
the hypothesis relating the map analysis to cognitive style is also
confirmed for the degree of abstraction, the perspective adopted and
the accuracy of the maps. In each case field independent individuals
are more likely to achieve higher scores for these elements. The
association of a particular map style and field independence is not
proved however and it must also be recognised that the correlations
for the other elements are comparatively low and that the strongest
association links Accuracy with the Embedded Figures Test. Witkin
would probably have expected this to be the case, since as was dis—
cussed earlier, accuracy is an associated characteristic of field
independent individuals. Similarly Satterly (1964) had suggested,
tt ... that the best single predictor of mapwork skill was
provided by performance in the test of the perception of em—
bedded shapes." (p 262)
The results of this study seem to confirm Satterly's suggestion.
As with the analysis of the Extent of the Maps, when the Abstrac—
tion, Perspective, Accuracy and Style of the maps are considered in
terms of their relationship with RFT and ABC, the results are less
clear and contain a large number of non significant results.
When the results are compared for sex and residential group
differences there are very few Differences and there is a considerable
degree of similarity between the results for the two maps, with only
the Urban Boys achieving consistly low correlations for both of them.
The association of cognitive style and cognitive maps is also
considered in a later section when the scores for Abstraction, Pers—
pective, Accuracy and Style are combined to produce composite scores
193

for each map and then compared with results of LeY, RFT and ARC.
When each of the elements for which the maps had been analysed
were compared with intelligence, Hypothesis 18 anticipated that a
higher correlation would emerge with perceptual reasoning.
apothesis 18. Each of the elements for which the maps were analysed
will correlate positively and significantly with the measures of
intelligence and with perceptual reasoning in particular.
Table 21 provides a breakdown of the analysis, where it can be
seen that the expected dominant association with perceptual reasonint3
is not confirmed. It is the case however that for the sample as a
whole perceptual reasoning is the strongest correlating element, but
it is also true that there are clear associations for verbal and
numerical reasoning. It is also the case that correlations with
intelligence are about the same as for the Embedded Figures Test
and higher than for Rod and Frame and ABC. Previous research has
demonstrated a close relationship between cognitive maps and intelli-
gence. Bycroft (1974) for example identified a general ability factor
in his analysis, Satterly (1964) demonstrated an association between
intelligence and Map drawing and interpretation and Thompson (1977)
reported significant correlations between map drawing and ability (0.611).
In terms of the elements considered in this study, the most
positive association appears to be between Accuracy and Intelligence
for n11 groups and there is a positive relationship demonstrated
between the Extent of Map 1 and Intelligence. The remaining categories
are less clear however, except that the perspective adopted and the
degree of abstraction demonstrated are more closely associated with
perceptual reasoning. The Style element again has produced extremely
varied correlations with distinct sex differences. The boys demon-
strate negative associations (Rural Boys on Map 1 and Urban Boys on
Map 2) between Style and Intelligence, whereas the girl's correlations
are more positive, but still demonstrate non-significant results. In
general however, the girls correlations are significantly higher than
those of the boys. This is especially' true of the Rural Girls, whose
results correlate with AH3, verbal, numerical and perceptual reasoning
at the 1% level in all instances except the Style element on. Map 1.
194

TABLE 5.21 Map 1 and 2 Elements/Intelligence
NAP 1 with Intellipence
Sample Boys Girls Urban Boys
Rural Boys
Urban Girls
Rural Gir s
{ia.T with: Verbal 0.34894-* 0.3724** 0.3610,-* 0.3739** 0.3849** 0.2572** 0.4126** Numerical 0.3426** 0.3484** 0.3203** 0.3066** 0.3751** 0.1328 0.4996** Perceptual 0.35.60** 0.3000** 0.4629,-* 0.2675** 0.3068** 0.4749** 0.4031** AH3 0.3975** 0.3890** 0.4343** 0.3524** 0.4218** 0.3162** 0.5012**
ABSTRACTION with: • Verbal 0.3049** 0.2308** 0.3909** 0.2686** 0.2246** 0.4946** 0.4100** Numerical 0.2456** 0.1768* 0.2933** 0.2629xx 0.1465 0.2786** 0.3937" Perspectual . 0.3156** 0.1678* 0.4380" 0.1459 0.2256** 0.56/5** 0.4862** AH3 0.3343" 0.2255** 0.4377** 0.2544** 0.2408** 0.5095** 0.5005**
PERSUECTIVE with: Verbal 0.2935** 0.1607* 0.4299** 0.1570 0.1721 0.4025** 0.4365** Numerical 0.2521** 0.1558* 0.3262** 0.1517 0.1413 0.2103* 0.4226** Perceptual 0.3549** 0.2050** 0.5122** 0.1658 0.2111* 0.4787** 0.5150** AH3 0.3456** 0.1996** 0.4824** 0.1745 0.2114* 0.4134** 0.5296**
ACCURACY with: Verbal .0.4163x-* 0.3947** 0.4544" 0.4772** 0.3540** 0.3535** 0.4579* Numerical 0.3948** 0.3782** 0.4152** 0.3798** 0.3727** 0.2283* 0.5432** Perceptual 0.4235**- 0.3118** 0.5584** 0.2356** 0.3585** 0.5210A* 0.5136** AH3 0.4753" 0.4254** 0.5400** 0.4309** 0.4295** 0.4112** 0.5799**
STYLE with: • Verbal 0.1407** 0.1078 0.1731* 0.2685** -0.0434 0.2056* 0.1686 Numerical 0.0997* 0.1167 0.0841 0.1469** 0.1090 0.0735 0.1194 Perceptual 0.1332** 0.0982 0.1692* 0.2277** -0.0141 0.2155* 0.1616 AH3 0.1497** 0.1317 0.1679* 0.2573** 0.0247 0.1957 0.1739 NAP 2 with
Sample Intelligence Boys Girls Urban Boyq
Rural Boys
Urban Girls
Rural Girls
ABSZIV,CTION with: • Verbal 0.2966** 0.0909 0.4718** -0.0244 0.2378** 0.4959** 0.40164'-* Numerical 0.2671** 0.0998 0.3910** -0.0734 0,2773" 0.333,-* 0.4132** Perceptual 0.3534** 0.2033** 0.4980** -6.0708 0.3302** 0.4829** .0.4703x* 1113 0.3565** 0.1526* 0.5222** -0.0075 0.3381** 0.5097** 0.4966*
PERSPECTIVE with: Verbal 0.2734** 0.1219 0.4214** 0.0871 0.1649 0.3408** 0.4454** Numerical 0.2480** 0.1234 0.3228** 0.1021 0.1452 0.2273* 0.3693** Perceptual 0.2794** 0.1276 0.4323x* 0.0832 0.1755* 0.3425** 0.4366*- * AH3 0.3672** 0.1432* .0.4473** 0.0934 0.1973* 0.3458** 0.4844**
ACCURACY with: Verbal • 0.3692** 0.3388** 0.4200" 0.4055** 0.2954** 0.2906x-* 0.4953** Numerical 0.3723** .0.3768** 0.3603** 0.3738** 0.3836** ' 0.1889 . 0.5023** Perceptual 0.4029** 0.3142** 0.5141** 0.2528** 0.3676* 0.3840** 0.5725** 1113 0.4386** 0.3986** 0.4894** 0.3868** 0.4232*+ 0.3193** 0.6072**
STYLE with: Verbal 0.1532** 0.0050 0.2660** -0.0145 0.0235 0.2231* 0.3288** Numerical 0.1576** 0.0928 0.2365 0.0679 0.1072 0.1099 0.3058** Perceptual 0.1578** 0.0013 0.2828** -0.0275 -0.0005 0.2999** 0.2763** 1113 0.1772** 0.0356 0.2945** 0.0087 0.0505 0.2303* 0.3779**
Significance Levels: * p < .05
** P < .01 .
-...k................,
195

When the correlations between Maps 1 and 2 are compared there
is a considerable degree of consistency demonstrated with a limited
number of exceptions. (eg The Boys and especially the Urban Boys
when Abstraction is compared for Maps 1 and 2 and the Style of Maps
1 and 2 for the Girls, Rural Girls especially and the Urban Boys).
This offers some support to the argument that cognitive maps are a
consistent and reliable technique.
Previous research has suggested that a fundamental relationship
exists between spatial ability and the skills involved in using and
producing maps, Rushdoony (1968), Satterly (1964), By-croft (1974).
This has been further demonstrated by the results of this study,
confirming Hypothesis 19, that,
Hypothesis 12. There will be a positive and significant relationship
between the elements for which the maps were analysed and those of
spatial ability (ST 2)
TABLE 5. 22 Correlations between the map analyses and spatial
ability
MAP 1 with ST 2 Sample Boys Girls Urban
Boys Rural Bo
Urban Girls
Rural Girls
Extent 0.3759 0.3160 0.4433 0.3619 0.2721 0.4130 0.4318*
Abstraction 0.329?* 0.268g* 0.375K 0.2500 0.3263' 0.530r 0.3293:
Perspective 0.3691 0.2845' 0.453r 0.2821 0.2902x 0.465 x 0.3891* Accuracy 0.3962 0.3078 0.499gx 0.2791 0.3323 0.4579 0.4823
Style 0.1668 0.2317 0.0931 0.3391' 0.1387 0.1736 0.0356
MAP 2 with ST 2 Sample Boys Girls Urban
Boys Rural Boys
Urban Girls
:Rural Girls
-x-* ,* -xei- Abstraction 0.3398 0.2345 0.4158 0.254g* 0.2697 0.4065 0.4341
** X* ** Perspective 0.3189 0.2632 0.3542 * 0.252 0.3316 0.3483 0.380r
** ** *4( ** ** ** Accuracy * 0.3841 0.3838 0.3779 0.4115 0.3734 0.3141 0.3147
xx ** ** )..x, XX XX Style 0.1724 0.0708 0.2791 0.124C 0.0379 0.2688 0.3815
(Levels of significance * p < .05, ** p < .01)
196

As the results in Table 22 demonstrate, all elements are corre-
lated significantly at the TK, level with Spatial Ability, except
for the Style category, which again has produced inconclusive results.
The levels of correlation are still comparatively low however. The
Extent category seems to be most highly correlated with Spatial Ability
for the girls of the sample and the correlations described here are
higher than those between Extent and EFT, suggesting that Spatial
Ability is of more influence in the 'extent' demonstrated on the maps
of the sample. The other categories are not so consistent however.
In the Abstraction analysis the correlations were higher with EFT for
the Rural Boys and the Urban Girls and in the Accuracy analysis EFT
correlations were also higher for the girls on Map 1 and the Rural
girls only on Map 2. For the remaining correlations Spatial Ability
correlated higher than EFT and questions the considerable influence
of Spatial ability on the results produced by the sample. In general,
the correlations for the girls between the map analysis and spatial
ability are higher. One might conclude however, that Hypothesis 19
is confirmed, with all elements except the style category correlated
significantly at the 1% level, but with the slight reservation that
the levels of correlation are lower than expected, especially for the
boys.
Hypothesis 20 anticipated a positive and significant correlation
to be demonstrated between the map analysis and the measures of
orientational ability.
Hypothesis 20. There will be a positive and significant corre-
lation between the elements for which the maps were analysed and the
measures of orientation. It is anticipated that Orientation 2 will
correlate most highly.
The results of this analysis, which can be seen in Table 23,
are similar to those for orientation already discussed, that is
clear differences between the correlations of Orientation 1 and 2,
and those of Orientation 3. The results described here do not confirm
Hypothesis 20, except that correlations with Orientation 2 are higher
than those for Orientation 1'and 3. Again, the style category •
produces the only consistently non-significant results, with the
Rural Girls being the only positive correlation with Orientation 2
197

NAP 1 with 01 S3nole -Boys Girls Urban Boys Rural Boys Urban Girls Rural Girls nv,TIlliT 0.2616** 0.2989* 0.2372x* 0,3491** 0.2539x* 0.1509 0.3054** ABSTRACTION 0.2606** 0.23674(4 0.3033** 0.2468** 0.2482** 0.3257** 0.3209** tl PERSPECTIVE 0.2336** 0.2042** 0.2047** 0.2099** 0.1984** 0.2480** 0.3108** ACCURACY 0.2469** 0.2657** 0.2272** 0.2002** 0.3129** 0.1167 0.3047* STYLE 0.0713 0.0693 0.0726 0.0991 0.0497 0.0144 0.1457
7.:Ar 2 with 01
ABSTRACTION 0.1935** 0.1195 0.2811** 0.0726 0.1737 0.2319* 0.3139** PERSPECTIVE 0.1317** 0.0998 0.1841** 0.0618 0.1387 0.1066 0.2206* ACCURACY 0.1955** 0.2397** 0.1609* 0.2128A 0.2700** -0.0272 0.3074** STYLE 0.0119 -0.1081 0.1221 -0.2217* -0.0385 -0,0318 0.2585**
NAP 1 with 02 Spmnla Boys Girls Urban boys Rural Buy-s Urban Girls
0.3494** 0.4586** 0.4244** 0.3615** 0.0069
Rural Girls
0.3843** 0.3439" 0.4183** 0.4204** 0.1361
EXL211T ABSTRACTION PERSPECTIVE ACCURACY STYLE
0.3507** 0.3019** 0.3433** 0.3561** 0.1018*
0.3321** 0.2588** 0.2518** 0.2962** 0.1450*
0.3897** 0.3479" 0.4317** 0.4300** 0.0534
0.3674** 0.2187* 0.2594* 0.2658** 0.2053*
0.3225** 0.3051** 0.2705** 0.3539** 0.0851
MAP 2 with 02
ABSTRACTION 0.3034A-* 0.1937** 0.3968** 0.1090 0.3300** 0.3055** 0.4432** PERSPECTIVE 0.2378** 0.2032** 0.2810** 0.1368 0.2859** 0.2107* 0.2806** ACCURACY 0.3643** 0.3398** 0.3975** 0.3630** 0.3581** 0.3005** 0.4467** STYLE 0.1319** 0.0146 0.2396** -0.1147 0.1277 0.1072 0.3776**
YAP 1 with 0 Sar r Bus_ Girls Urban Bo r Rural BaysLrban Girls Rural Girl
XTIT.IT 0.1855-x-,, 0.0903 0.2632** 0.0971 0.0733 0.3565** 0.2170* ABSTRACTION 0.1917** 0.1256 0.2177* 0.0807 0.1591 • 0.2275* 0.2061 PERSPECTIVE 0.1788** 0.1292 0.1823** 0.0588 0.1589 0.1383 0.2369* ACCURACY 0.1883** 0.1499* 0.2372** 0.1609 0.1314 0.3878** 0.2035* STYLE 0.0272 -0.0545 0.1300 0.1151 0.1743 0.1572 0.0999
1%TAP 2 with 03
'OSTRACTI0N 0.1709** 0.1186 0.1727* 0.0482 0.1681 0.0899 0.2652** PERSPECTIVE 0.1072* 0.0301 0.0915 -0.0004 0.0545 -0.0032 •0.1755 ACCURACY 0.2523** 0.2301** 0.2501** 0.2491* 0.2115* 0.3584** 0.2004* STYLE 0.0758 0.0236 0.2132** 0.0347 -0.0636, 0.2575** 0.1847
..-----4-----
(Levels of Significance p .05 • • p .01 )

(at the 1% level, which in turn influences the correlation for the
girls and the sample as a whole). Factors of interest which emerge
from this analysis are the generally more positive correlations of
the girls and the rural girls in particular. The much lower corre-
lations of the urban boys, especially on Orientation 1 and 3 and the
somewhat inconsistent results when the two maps are compared. As
was mentioned for Orientation 2, the Style category produced con-
sistently non-correlating results, which perhaps raises questions
about the validity of this particular measure as a means of analysing
cognitive maps. The differences between the urban and rural sub-
groups demonstrated in other aspects of the orientational analysis
were not demonstrated here however.
It has been explained earlier that map and. plan drawing were
felt to depend on similar skills and in order to measure this, the
Draw-a-Plan Test had been included in the Study where it was hypothe-
sised that,
Hvp2Ilazia1111 There will be a positive and significant correlation
between the elements for which the maps were analysed, and the
results of the Draw-a-Plan Test. Thompson (1977) had identified a
positive correlation between map drawing and the Draw-a-Plan Test
(r = 0.429 sigmificant at the 1% level) for a sample of 125 11 - 12
year olds. She also identified sex differences in favour of the boys
but did not report the differences in levels of significance. The
results of this study are described below in Table 24, where it can
be seen that there are distinctly different results demonstrated
between the maps themselves, perhaps questioning the statement made
earlier about cognitive maps as a consistent measure of environmental
perception. The low correlations may however be because the Draw-a-
Plan score is a composite score and inter-relationships between MAD
and Plan Drawing might be more clearly portrayed by the analysis when
the map scores are combined to produce a s;milar composite score.
This will be discussed in a later section. The correlations des-
cribed here are generally lower than that reported by Thompson and
contrary to her findings, the correlations for the girls are generally
higher than for the boys. Although it was commented that there appears
* Bycroft reported similarly conflicting results for the analysis of map
structure by his panel of judges.
199

TABLE 5.24 Correlations between the map analysis and the Draw-a--Plan
exercise
MAP 1 with DAP Sample Boys Girls Urban
Do Rural Bo s
Urban Girls
Rural Girls
EXtent 0.2257 0.1976 0.33 4 0.3172A 0.1807* 0.3222A 0.4076*
Abstraction 0.2197 0.1891 0.3081 0.0115 0.2799x-
0.3059 0.2999
Perspective 0.1786* 0.1639* 0.2575 0.1393 0.240r 0.2178* 0.336*
Accuracy 0.2902 0.271r 0.3314 0.3658 0.2912* 0.3136 0.4931X
*
Style 0.1871* 0.2095X 0.1644 0.1006 0.2712x 0.2444* 0.0745
MAP 2- with DAP
Abstraction
Perspective
Accuracy
Style
** 0.1214
** 0.2261
0.1167**
0.0241 *
0.1391 *
0.2176
0.0148
0.2383 **
0.1925 XX
0.2808
0.2270**
0.110g4
* 0.0103
0.0715 XX
0.4272
0.1273
0.1287 *
0.2180 *
0.1794
0.0604
1 0.2207
* 0.2280
0.3491 0.3055
**
10.295g* ,
0.2283 **
0.2771
0,1716
(Levels of significance: * pe4.05, -x* p ‹:.01)
inconsistency between the maps themselves, it is the case that the
correlations between Draw-a-Plan and the Accuracy of the Maps is at
the 1% level in all cases (except the Rural Boys on Map 2 which is
significant at the 5% level), which is not surprising since considerable
weight is layed upon Accuracy of detail in the Draw-a-Plan Test.
This concludes the analysis of the maps in terms of the elements
of extent, abstraction, perspective, accuracy and style, but before
moving on it is possible to re-investigate a hypothesis referred to
earlier. The analysis of Klett and Alpaugh (1976) had provided three
of the categories used in this study, those of Extent (Scale in
Klett's terms), Abstraction and Perspective. Derived from the work
of Blaut and Stea, Klett and Alpaugh hypothesised that children's
abilities for these three cognitive transformations will be approxi-
mately at the same level at any given point in a child's develop-
mental sequence. As can be seen below the results of this study
confirm those of Klett and Alpaugh at the 1% level when the sample
is seen in terms of sex and residential groupings, but there are minor
inconsistencies demonstrated when the results are considered in terms
200
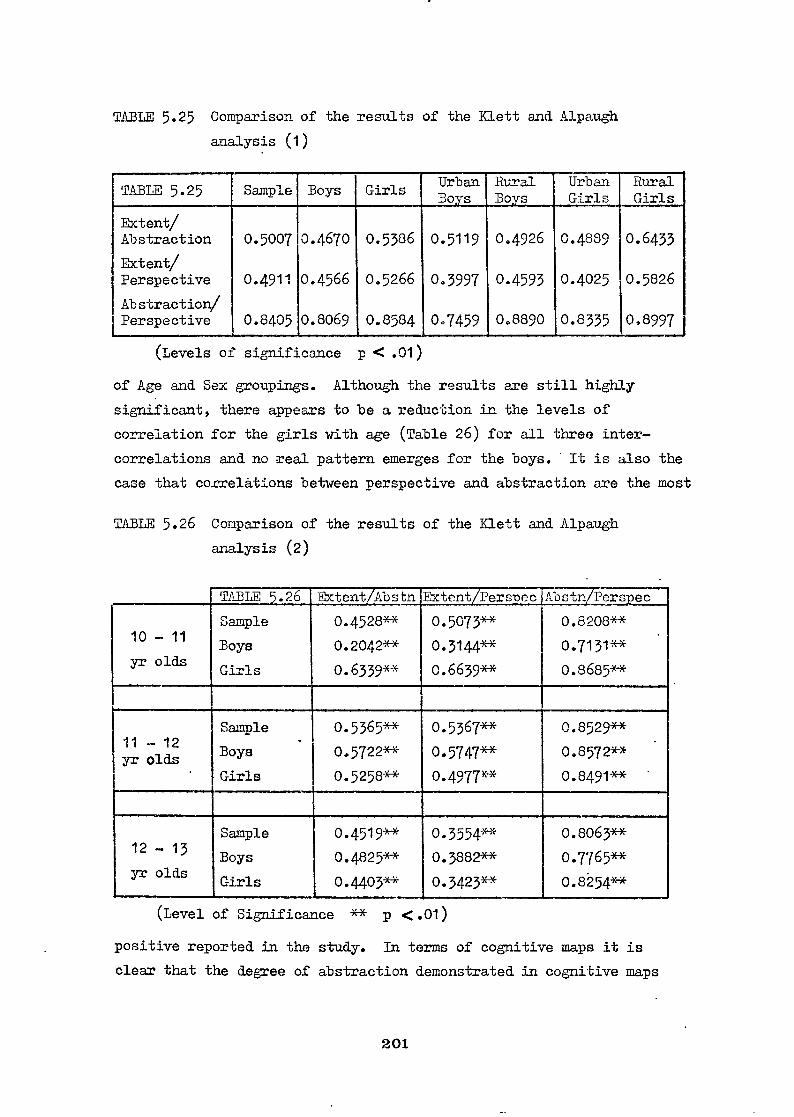
TABLE 5.25 Comparison of the results of the Klett and Alpaugh
analysis (1)
TABLE 5.25 Sample Boys Girls Urban Boo-s
Rural Bo s
Urban Girls
Rural Girls
Extent/ Abstraction 0.5007 0.4670 0.5386 0.5119 0.4926 0.4889 0.6433
Extent/ Perspective 0.4911 0.4566 0.5266 0.3997 0.4593 0.4025 0.5826 Abstraction/ Perspective 0.8405 0.8069 0.8584 0.7459 0.8890 0.8335 0.8997J
(Levels of significance p < .01)
of Age and Sex groupings. Although the results are still highly
significant, there appears to be a reduction in the levels of
correlation for the girls with age (Table 26) for all three inter-
correlations and no real pattern emerges for the boys. It is also the
case that correlations between perspective and abstraction are the most
TABLE 5.26 Comparison of the results of the Klett and Alpaugh
analysis (2)
TABLE 5.26 Abstn Extent PersDec Abstn Perspec
10 - 11
yr olds
Sample
Boys
Girls
0.4528**
0.2042**
0.6339**
0.5073**
0.3144** 0.6639xx
0.8208xx
0.7131**
0.8685**
11 - 12 yr olds
Sample
Boys
Girls
0.5365xx
0.5722*w
0.5258*w
0.5367**
0.5747 0.4977"E
0.8529**
0.8572**
0.8491**
12 - 13
yr olds
Sample
Boys
Girls
0.4519ww
0.4825**
0.4403**
0.3554xx 0.3882**
0.3423**
0.8063**
0.7765**
0.8254**
(Level of Significance p <.01)
positive reported in the study. In terms of cognitive maps it is
clear that the degree of abstraction demonstrated in cognitive maps
201

is dependent upon the perspective adopted by the mapper.
Each of the categories for which the maps were analysed demon—
strated a progressive improvement in that particular element in the
map. (This is discussed in Appendix 3). It was therefore argued
that by combining the scores for the degree of abstraction, perspective
adopted, accuracy and style for each of the maps it was possible to
produce composite scores which reflected the overall quality of the
maps. Thus maps with higher composite scores for Map 1 and Map 2
were the 'better' maps. The results of these composite scores were
then correlated with the other measures used in the study and the results
can be seen in Table 27 where many of the assertions made for the
analysis of the maps as separate elements are confirmed when the maps
are considered in terms of their composite scores, ie
1. The Embedded Figures Test correlates more highly than RFT/ABC
with the composite nap scores and that the correlations for thagirls
are more positive than those of the boys. (This is primarily as
a result of the Urban Girls on Map 1 and the Rural Girls for Map 2).
There does appear to be some consistency between the maps for these
correlations for all sub groups of the sample.
2. Comparison between composite map scores and intelligence (A113) -
indicates, with the exception of the Urban Boys, a strong positive
correlation. This is particularly true of the girl's results.
3. When the intelligence scores are separated out for Verbal,
Numerical and Perceptual reasoning, perceptual reasoning is most
highly correlated with the composite map scores in all cases except
for the Urban Boys on Map 1 (where a high loading with verbal reasoning
influences the result 0.4124) and for the Boys as a whole on Ma. .2. ,correrations
(It is interesting to note that for •the Urban Boys on Map 2/are only
significant for EFT and ST2 at the 1% level and RFT and 02 at the
5% level). 4. There is a strong positive association demonstrated between
Spatial Ability as measured by Spatial Test 2 and the composite
nap scores, which is again consistent across both maps and with the
girls of the sample achieving the higher correlations.
202

TABLE 5.27 Correlations between Maps 1 and 2 Composite Scores
and other measures used in the study
TABLE Sample . Boys Girls Urban Urban
..._&_. Rural Bol,s
Urban Girls
Rural Girls
Map 1 with:
h1?T 0.4103* 0.3686** 0.4772** 0.2956** 0.59:8** 0.5418** 0.3694**
RFT 0.2135** 0.1795* 0.2323** 0.1700 0.1867* 0.3555** 0.1390
ABC 0.2135** 0.2354 K 0.2465** 0.2038* 0.2526%":-:" 0.3032** 0.1856
AH3 0.4448** 0.3394+k 0.5504** 0.3938x* 0.3160** 0.5131** 0.5983**
VER • 0.3929** 0.3111** 0.4880** 0.4124** 0.2576÷* 0.4912*k 0.4986**
NUM 0.3367** 0.2839** 0.3788*x 0.3400*-* 0.2509** 0.2687** 0.4912"
PER 0.4231" 0.2725** 0.5814** 0.2699** 0.2795** 0.5989** 0.5682**
ST2 0.4318** 0.3691** 0.4837** 0.3865** 0.3704** 0.5520** 0.4228X
DAM 0.2172xx 0;2094* 0.2324xx 0.2214* 0.1924* 0.2216* 0.2227*
01 0.2880** 0.2776** 0.3177" 0.2769** 0.2820** 0.2675** 0.3621**
02 0.3872** 0.3317** 0.4457** 0.3384** 0.3544** 0.4515** 0.4416**
03 0.2118+k 0.1379 0.2514** 0.1449 0.1296 0.2742** 0.2503*
DAP 0.2837" 0.2745** 0.3531** 0.2114** 0.3458"* 0.3394** 0.3955**
Sample Boys Girls Urban Boirs
Rural Boars
Urban Girls
Rural Girls
Map 2 with:
EFT 0.3853** 0.3274xx 0.4280** 0.2645** 0.3450** 0.3999*-' 0.5343** RFT 0.2049** 0.2689** 0.1521* 0.2506* 0.2975*x 0.1121 0.3757** ABC 0.2343*=' 0.2441** 0.2916** 0.1790 0.2968** 0.2776** 0.1059 A113 0.45104,-* 0.2806xx 0.5915** 0.1873 0.3786** 0.5109** 0.6369**.
VER 0.3862%sx 0.2153xx 0.5362** 0.1788 0.2692** 0.4950" 0.5443** NUM 0.3663** 0.2639xx 0.4402 0.1702 0.3469** 0.3170** 0.5346**
PER 0.4207** 0.2485** 0.5802 0.1526 0.3252** 0.5385** 0.5714** ST2 0.4246" 0.3539** 0.4761** 0.3644*-x 0.3656xx 0.4744" 0 44163
DAM 0.2116** 0.1923** 0.2348** 0.1955 0.1675 0.1782 0.2391*
01 0.1952** 0.1363 0.2622** 0.0731 0.1964* 0.1332 0.3551**
02 0.3693** 0.2887x 0.4428** 0.2093* 0.4084** 0.3475 x 0.4926**
03 0.2090** 0.1338 0.2292xx 0.1295 0.1302 0.2299* 0.2631**
DAP 0.2837** 0.1423 0.3096xx 0.2281** 0.1505 0.38264- 0.3194**
(Levels of Significance * p < 0.05, ** p <0.01) 203

5. Orientation 2 produced significantly more positive correlations
with the composite map scores than orientation tests 1 and 3, and in general correlations are higher for the girls (The only exception
to this is that of 02 for the Rural Boys on Map 2)
6. When the composite scores for Maps 1 and 2 are compared the
results shown in Table 28 demonstrate that a considerable degree of
consistency is represented for all subgroups of the sample and
confirmed Hypothesis 22, that,
Hvnothesis 22e There will be a positive and significant correlation
between the composite scores for Maps 1 and 2. (Thus demonstrating
consistency across the maps and offering evidence to support cog-
nitive mapping as a consistent means of obtaining data).
TABLE 28 Correlations between Maps 1 and 2 (composite scores)
MAP 1 with
Ln22.2.—
Sample Boys Girls Urban Boys
Rural Boys '
Urban Girls
Rural Girls
0.5868 0.5287 0.6118 0.5730 0.5068 0.5563 0.6397]
(p < .01)
As can be seen, the correlations between Map 1 and Map 2
composite scores are highly significant confirming Hypothesis 22
at the 1% level and again the correlations for the girls are higher than those of the boys.
7. When the Draw-a-Plan scores are considered in terms of the
composite map scores, the correlations are much lower than was
expected. The results on Map 1 are more consistent, but correlatiOns
with Map 2 demonstrate non-significant correlations for the boys,
particularly the Rural Boys. The correlations for the girls are
again higher than the boys which is contrary to the findings of
Thorstad (1974) and Thompson (1977) which were discussed earlier.
As a final comment about associations between the composite
map scores and the other measures used in the study, it appears that
AH3 and the Embedded Figures Test achieve the most positive relation-
ships. In order to investigate this tri-partite relationship,
correlations for the three scores were submitted to analysis by
204

partial correlation which provides a single measure of association
between two variables while adjusting or controlling for the effects
of one or more variables.
When the effects of Intelligence were partialled out from the
relationship between Map 1 and theEhabedded Figures Test the corre-
lation reduced from 0.4103 to 0.2009 and that of Map 2 and the EFT
from 0.3853 to 0.202 which suggests a strong influence of intelli-
gence on the relationship between Map 1 and EHST (of 0.2094) and Map
2/i 'T (0.1833). These results were also confirmed by the correla-
tions between EFT and intelligence which were discussed earlier.
Although not part of the original study, it was possible to
compare the map results with another form of map analysis. Following
the collection of the empirical data the children of the Rural School
undertook the Richmond Test of Basic Cognitive Skills as part of the
Authority's monitoring of progress. Included in this battery of
tests is a section testing map reading skills. The school concerned
very kindly loaned the computer print out of these results which
were then correlated with the results of this study and can be seen
on Table 29 below, where associations for the Richmond- Test are
similar to those described for the analysis of Map 1 and Map 2
composite scores. Intelligence and Embedded Figures Test achieve
high positive correlations, although verbal reasoning correlates
more highly for the girls. The Draw-a-Plan produces slightly higher
but similar results, with the Girls Draw-a-Plan results correlating
more highly with the Richmond Scores than do the boys, which was the
case for correlations with Map 1 and Map 2.
Throughout the analysis so far, no mention has been made of the
effects of age on the results described. Much previous research into
both environmental perception and cognitive style has demonstrated
that age is an important variable in the development of the capacities
associated with each of these, some of which was discussed in
Chapters Two and Three. It was hypothesised that age would prove
to be an important variable for the results of this study.
205

TABLP 5.29 Correlations with the results of the Richmond Test
analysis (Rural Group only)
TAME222 Rural Sam le Rural Boys Rural Girls
Richmond Test with Mq'T 0.4909 0.5015 0.4689
RFT 0.3196 0.3215 0.3059
ABC 0.2222 0.1895 0.3173
A113 0.5416 0.5098 0.5753
VER 0.4717 0.3995 0.5499
Nan 0.4479 0.4489 0.4325
pat 0.4546 0.4159 0.5102
ST 2 0.4896 0.4968 0.4679
DAM 0.2547 0.2052 0.3215
01 0.3367 0.3486 0.3403
02 0.4482 0.4549 0.4323
03 0.1613 0.0953 0.2156
DAP 0.3552 0.3099 0.4629
Extent 0.2763 0.2322 0.3167
Abstraction 0.3224 0.2626 0.3735
Perspective 1 0.3220 0.2774 0.3498
Accuracy 1 0.3539 0.3144 0.3958
Style 1 9.42251 2:2751 -2.2.421.
Abstraction 2 0.3901 0.3444 0.4117
Perspective 2 0.3556 0.3398 0.3435
Accuracy 2 0.3470 0.2896 0.3883
Style 2 -0.0257 722122 0.0720
Map 1 0.3637 0.3225 0.3934
Map 2 0.3837 0.3241 0.41T0
Those under-lined -not significant
(Results all significant at the 1y0 level except correlations
with Style 1 and 2 and Orientation Exercise 3 for the Rural
Boys which were not significant)
206

HoothpAsal. The influence of age will be reflected across the
results of the study and will be demonstrated in particular in the
correlations of the tests of cognitive style and those of the map
analysis.
Table 30 is taken from the 'overall characteristics of the
sample' which were presented earlier as Tables A -• E. In this
tabulation it is possible to identify a general and progressive
improvement on all of the exercises with age. If for example, scores
TABLE 5.30 Mean scores on EFT, RFT, ABC
- TABLE 5.30 Sample Boys Girls Urban
Bo -s Rural Bo s
Urban Girls
Rural Girls
Mean EFT
10 - 11's 14.212 15.190 13.319 15.469 14.903 16.520 11.500
11 - 12's 16.606 16.855 16.341 19.333 14.786 17.386 15.132
12 - 13's 18.214 18.010 18.438 19.047 17.200 18.962 17.667
Mean RFT
10 - 11's 54.443 58.587 50.659 62.016 55.048 41.400 55.920
11 - 12's 42.872 33.526 51.762 27.986 38.274 E.322 7lt822 12 - 13's 35.124 29.230 41.747 27.289 30.818 36.651 49.250
Mean ABC
10 - 11's 3.519 3.661 3.391 3.531 3.800 3.320 3.436
11 - 12's 3.142 3.355 2.937 Ii4.1. 3.524 2.829 3.053
12 - 13's 2.863 3.075 2.622 3.211 2.982 2.652 2.580
(1. Higher EFT scores indicate Field Independence)
2. Lower ABC/RFT scores indicate increasing Field independence)
for the sample, the Boys and the Girls are reviewed,Witkin's
assertions are confirmed with the exception of the higher EFT score
for 12 - 13 year old girls. Age certainly appears a dominant factor.
Yet when the results are considered for urban and rural sub-groups,
sex and age differences are less clearly progressive, which raises
questions about the supposed age related characteristics of Witkin's
analytic/global dimension. In order to compare the influence of age
207

within the study, age was treated as an independent variable and
scored in months, thus the older an individual, the higher his
age score. The ages of the sample were then correlated with the
measures employed to provide an indication of the effect of age on
the results, a breakdown of which can be seen in the table below
(Table 31).
The correlations between Age and the measures of cognitive
style are varied, suggesting that something more than age is influen-
cing success on these tests. In general, correlations between EFT
and age are low with the exception of the Rural Girls, where age
appears to be a dominant influence. Correlations with RFT and ABC
suggest that age is more influential on the drawings produced by the
children, yet when the Draw-a-Man scores are considered, correlations
with age are extremely low. This contradicts comments made earlier
about similarities between these tests (DAM/ABC) or at least points
to one major difference between them, ie Age is more influential
when drawings are scored for Articulation of Body Concept than for
the Draw-a-Man Scale.
As might have been expected, correlations between age and the
tests of intellectual ability are comparatively high, with that of
the girls being higher on all counts. Correlations with Spatial
ability are lower and age seems to be less influential, reinforcing
spatial ability as a separate element of ability not an age related
factor. The measures of orientation produced mixed results with
Orientation Exercises 1 and 2 demonstrating a stronger influence
of -age than Orientation 3. In general however, the influence of
age is comparatively small, but its effect is greater for the girls
for all three exercises. This is particularly true on Orientation
1 and 2 for the Rural Girls.
The most interesting results of the analysis of the influence
of age on the results are those associated with the composite
scores for Map 1 (The Area where the children live) and Map 2
(The Route from Home to School). In all cases except the Urban
Boys, the influence of age is considerably stronger on Map 2, the
Route from Home to School. This suggests an important avenue for
further study which has not been mentioned in the research literature
that the appropriateness of a test to the particular age group
undertaking that task needs to be more carefully considered in
cognitive mapping studies. 208

6O
( LW> d xx go*; d * aouPOTJTtt TS JO ST9A9a)
AVCS'o
etec*o **
zeet*o -X-X-
)( CV.Ct
ot/Lc*o
ZCOV°0 xx
176gro 1 xx f 901-CT x-*
a955•0
63ec'o x-* toc*o
-X-X.
91.'10
Mwo
oatT
*66517to
aecro
.x _ittc*o
L3tC•o, ** .
AVO .0
xcoLt•o
ot.(A•eo ** 9L-61-o
aoro
1.5517'o **
.x zoct*o
tgro *
ctzro
Zai,r0
x69LC'T x 142,1,-V•o
earo
c690'0
.666L'o
oLl-F,'o * c6zro
CLWO
Ltkro
9c17ro
kairo
01.90'0
xpLz*o
56/S'o 4,,*
xp0c.0
61,17'o
zert/T xx VSz*o
z9LO.O
6oero
1LWo
zero xx
6egro -X*
;t81/10-o
L9gw o
e9Ltro
maro
zi.cc*o xx Wro
pt.'cl
ag_eo -30E-
alLwo-
cogo'o
Aotivo
Leoro
CC60•o
Lo9ro
L6cc*o X X
ifp-C.0
J_Lcc*o
oca•o xx x906z*o
Vc9ro
zaro
6ezro
-eScro *
Stcro
95aro
N OC*0 x o6ero
XX
L6gro
Leocro
6z6ro
x6z6ro
Otwo X X
e9c0r0-
go9c*o -x-x- VC3'o
2Ltro
1.6evo
Aotc•o
eaz'o X X
Acc.0
*VocT
L9CCT ** LL6vo
6czo
utz*o *
J96t*o
eLLC•c) xx
gocT X X
ipzc*o
L86c°0
Aggiro
. zSro
gtro xx I.56ro
171.12vo xx el.gro
i(---X-
Lgoo*o
9001.'0
, g11.'o
6z55T
oozwo
*pc°o
ecec'T -X-X-
A9OV*0
7?Lgt-o
sat-o ** )(95cc*o
L95oro
555c*o xx
xzwc*o
ZO53'0 **
69wo
x555z%)
*V9r0
ccc*(3, XX
9zi.'o
ti.Lro * _(.eLro
t.Ctro *-x 1.96ro
-X-X-
6Ltwo-
Zc6r0 xx ‘0,Cro
ieLro
agwo
J.9Sro
og6ro (-3E
gLI.C*0
jacT
5C5c*o xx xt6cz*o
CC6r0
°Lev° xx
445zt-o
L69r0 **
eLz'o -X-X-
.vpro
890C'0 x x LtWo
XX
iciero *X- ,
z9ozT .x.* )(pro
6ctro xx 95Z*0 *-<k
Lzcwo-
tCgrO xx ltaro
„E.Vz•c)
59c0'0
4V6F,*o
acc'o -X--*
6c9c*o
oecao
ict.t-o, xx x6e9z'o
il.WO
cl,Lro **
■—
• r r
— N
N
N
N
r
CV
—
4,
••
4-3
0
• • r
.)
OC) CE14
4.• gr.)
P.
c cr
) ••
••
tap
cp E
-1
v—
N ts
r\E...3
8
mg
° 0
M
fo
Ci2
sTaTD TuanU
sTaTD mcla ft
agog an Tv u
agog =Lan sTaTD agog aTdmuS 1..c'g =VI
oRV LI1TM suoTlviaaaop 1.*5 =VI

When the effects of age are considered for the elements of
the map analysis further interesting results emerge.
1. There is a closer association between the 'Extent' of the Area
maps and age for the girls of the sample, which perhaps suggests
that it is only as the girls get older that they are given greater
freedom and hence acauire greater knowledge of their home area
which is then reflected in their maps.
2. The degree of abstraction demonstrated and the perspective adopted
demonstrate a stronger association with age in Map 2 for all groups
except the Urban Boys.
3. The Accuracy of the maps seems to be more strongly associated
with age for the Rural children of the sample.
4. Similarly, the Style of the maps, appears to improve with age
for the Rural group on the second map, which again reinforces the
suggestions made above about the influence of the task andits
association with age.
Generally however, the influence of age on the results of the
study are less significant than one might have expected and that
we are concerned more with differences in capacity rather than with
developmental changes. This conclusion seems to be supported when"
a partialling analysis (as undertaken with intelligence and discussed
earlier) is performed to investigate the influence of Age on the
association between Embedded Figures and the Composite Map Scores.
When this analysis was undertaken, correlations between EFTMap.1
were reduced from 0.4103 to 0.3741, an influence of 0.0362 of age,
and on EFT/Map 2 from 0.3853 to 0.3558 an influence of 0.0293. The limited influence of age on the results of the analysis were further
confirmed' when the major elements of the study were submitted to a
Principal Components Analysis in order to determine the structure of
their relationships.
Ezi.E.21. 2Anaga (Several of the variables which were included in the principal
components analysis have not been mentioned in the discussion so far.
These will be discussed in more detail in later sections: SCORE 1
and SCORE 2 refer to composite scores for personality characteristics
associated with Field dependence/independence and NOF 1, 2, 3 and
210

NODF refers to the Number of Features included on Map 1 (1) Map 2 (2),
the Questionnaire (3) and the number of different features mentioned
by individuals (NODF) ).
In a principal components analysis, Badger (1978) cites Kaiser
(Cooley and Lohnes 1971 p 104), who suggest that components with
Eigen values larger than unity may be considered significant. In
this study,four components satisfied this criterion and two fell
slightly short of it, as can be seen in Table 32. The first, with
an eigen value of 8.002, accounts for 53.5% of the variance and reflects the common intellectual component of the variables, but
with a particularly strong bias towards the spatial/perceptual
elements. (Spatial Test 2, EFT and the perceptual element of AH3
demonstrating the highest loadings). Loadings for the tests of
cognitive style again reflect the differences demonstrated in the
earlier part of the analysis, with EFT higher than RFT/ABC.
Similarly,comparison with the scores for verbal, numerical and per-
ceptual reasoning reinforce the comments made about the influence
of intelligence. The various elements of the map analysis also
demonstrate comparatively high loadings, suggesting the influence
of spatial/perceptual/intellectual abilities in them. As has been
shown in the earlier analysis however, the Style component is clearly
differentiated from the other forms of map analysis when compared
with this factor.
The second component has an eigen value of 2.15984 and accounts
for a further 14.4% of the common variance. This component seems to
be defined by the degree of abstraction and perspective adopted in
the maps produced by the children of the sample. It is inversely
related to a variety of other variables, but particularly the number
of features referred to by the sample. This component seems to
reflect important elements of environmental perception, ie The view-
point adopted and the resulting perception in terms of the features
felt to be significant. Of the measures of cognitive style, only
the Articulation of Body Concept appears to demonstrate any associa-
tion with this component.
The third component, with an eigen value of 1.5403 accounts for
a further 10.3% of the variance and appears to represent a bi-polar
211

TABLE 5.32 The Principal Components Analysis
VARIABINS j. COT aJONIIHS
vi vii ii iii iv V
AGE 0.461 0.049 0.217 0.196 0.388 0.095 0.108
EFT 0.74 -0.033 -0.303 -0.036 -0.035 0.026 0.103
RFT 0.43 -0.091 -0.247 -0.024 0.039 0.042 -0.100
ABC 0.53 -0.327 -0.150 -0.474 -0.200 -0.110 -0.031
VER 0.73 -0.083 -0.172 0.286 -0.057 -0.012 -0.014
NUM 0.65 -0.065 -0.078 0.355 -0.064 0.064 -0.035
PER 0.74 -0.048 -0.203 0.290 -0.324 0.057 0.049
ST 2 0.77 -0.058 -0.222 0.012 -0.025 0.006 0.154
D A Man 0.48 -0.243 -0.271 -0.595 -0.095 -0.077 -0.132
01 0.55 -0.139 -0.179 0.205 0.072 -0.214 0.076
02 0.69 -0.077 -0.158 0.194 0.056 -0.056 0.039
03 0.32 0.017 0.019 -0.062 -0.084 0.007 0.213
D A Plan 0.46 -0.114 -0.185 -0.209 0.195 0.075 0.013
Extent 0.59 0.209 0.225 -0.066 0.286 0.202 -0.080
Abst. 1 0.54 0.584 0.127 -0.133 0.267. -0.195 0.167
Pers. 1 0.57 0.593 0.076 -0.162 0.194 -0.181 0.125
Accuracy 1 0.66 0.139 0.152 -0.024 0.272 0.389 0.107
Style 0.23 -0.007 0.080 -0.118 -0.010 0.164 0.144
Abst. 2 0.52 0.520 0.117 -0.006 -0.295 -0.099 0.223
Pers. 2 0.46 0.569 0.042 -0.033 -0.223 -0.149 -0.207
Accuracy 2 0.59 0.048 0.242 -0.043 -0.163 0.311 -0.011
Style 2 0.26 -0.059 0.246 -0.114 -0.208 0.273 -0.001
NOF 1 0.47 -0.297 0.332 0.090 0.162 -0.058 - 0.101
NOF 2 0.39 -0.269 0.334 -0.079 -0.136 0.141 0.211
NOF 3 0.32 -0.370 0.300 0.004 0.157 -0.287 -0.290
NODF 0.56 -0.481 0.605 -0.011 0.071 -0.249 -0.032
SCORE 1 0.24 -0.156 -0.285 0.073 0.262 0.023 -0.162
SCORE 2 -0.44 0.109 0.176 •-0.133 0.099 -0.021 0.203
EIGEN- VALUE 8.00186 2.15984 1.54033 1.10796 0.88940 0.75308 0.49617
PERCENTAGE OF VARIANCE 53.5% 14.4% 10.3% 7.4% 5.9% 5.0%
3.3%
212

component of Embedded Figures, Rod and Frame and the more spatially
biased measures of intelligence against the Number of Features
referred to by the sample. Again there is an inverse relationship
demonstrated here, which is contrary to expectations, for as will
be discussed later it was hypothesised that there would be a strong
positive association demonstrated between cognitive style and
perception of the environment as represented by the range of features
referred to by individuals on their maps and in the questionnaire.
This factor is the only one that demonstrates an influence of cog-
nitive style and for the first time associations between EFT/RFT
are demonstrated comparatively strongly, when compared with the
other relationships associated with this factor.
Fourthly, a drawing component seems to have emerged as a sig-
nificant factor, with an eigen value just above unity of 1.1079
and accounting for a further 7.4% of the variance. This factor associates the results of Draw-a-Man and the Articulation of Body
Concept Scale and lends further support to Hypothesis 5 which
argued for a close relationship between these tests.
Eighty-five point seven per cent of the variance of the measures
is accounted for by these four components. A fifth component which:
almost reaches unity (0.889) accounts for a further 5.9% of the variance and appears to be defined by age. This further confirms -
the limited influence of age on the results of the study. A sixth
factor which also almost approaches unity (0.75%) and accounts for a-
further 5% of the variance is defined by an Accuracy factor. In all,
the factors discussed here account for 96.7% of the common variance,
but it is clear that the most significant one is that reflecting the
influence of spatial/perceptual/intellectual ability required in the
solution of the measures used in the study.
Multiple Regression Analysis
In a final attempt to investigate this last assertion and in
an attempt to interpret the results achieved so far, the major elements
of the study were submitted to analysis by Stepwise Multiple Regression.
As Nie et al (1974 p 321) explain, multiple regression is a general
statistical technique through which one can analyse the relationships
213

between a dependent or criterion variable and a set of independent
or predictor variables. It can be used as a 'descriptive' or 'in-
ferential' tool. In a stepwise multiple regression, independent
variables are entered if they meet certain statistical criteria,
thus the variable that explains the greatest amount of variance in
the dependent variable is entered first and then the variable that
explains the greatest amount of unexplained variance is entered next
and so on, which produces a hierarchy of influences on the dependent
variable.
Since the maps were regarded as an indicator of children's
perceptions of their environments for this study, it was decided to
investigate the influence of other factors on the production of.
the maps as represented by their composite scores. As argued earlier
higher 'composite map scores' reflected maps of increasing quality
and demonstrate significant differences in environmental perception.
Composite scores on Maps 1 and Map 2 were submitted as the dependent
or criterion variable and were regressed upon the variables achieving
the highest correlations in the inter-correlational analysis. (ie
Age, Verbal/ erical and Perceptual Reasoning, Etbedded Figures,
Spatial Test 2 and Orientation 1 and 2). As Badger (1978) comments,
the independent variables are entered into the analysis in order of
the size of their unique variance when compared with the other
variables in the eauation. The size of correlation with the dependent
variable is not necessarily the important factor influencing the order
in which variables are entered. A variable which is highly correlated
with the dependent variable may not be selected because it is too
highly correlated with a variable already in the equation and con—
sequently contributes little unique variance.
When all of the variables had been entered in to the regression
analysis, the resulting multiple regression coefficient for Map 1
was 0.51 accounting for only 26.5% of the variance. The order by
which the variables emerged and the corresponding degree of variance
was interesting and confirmed the findings of the factor analysis
of a strong spatial/perceptual influence in the production of Map 1
but accounting for a relatively small proportion of the variance.
214

Order of Emergence
of the variables
with Map 1
Spatial Test 2 19.4% of variance
Perceptual -6easoning 3.8% 4' n
Embedded Figures 1.2% " "
Age 0.99% ►► n
Orientation 2 0.73% " ”
Verbal Reasoning 0.24% " n
Orientation 1 0.084% n
Numerical Reasoning 24.20.(2 n
26.457'
The regression equation which defined this relationship was:
Y1 = 4.21 + 0.214 + 0.643 + 0.692 + 0.252 4- 0.782 + 0.404 - 0.608 - 0.563
(ST2) (PER) (EFT) (AGE) (02) (UR) (01) (NUM)
When Map 2 was regressed with the sane variables the order of
the emergence of the variables was altered and age was seen to increase
in importance, as had been demonstrated in the Factor analysis and
offers further evidence of the association of age to certain types
of cognitive mapping task. Spatial and Perceptual influences were
still of importance. However, as was demonstrated with Map 1, the
variance accounted for is still quite low,
Order of the emergence Spatial Test 2 17.2% of variance
of the variables Age 8.9% u
with Map 2 Perceptual Reasoning 1.8% "
Orientation 2 0.97%
Orientation 1 0.58/6
EFT 0.5% " Numerical Reasoning 0.3% " Verbal Reasoning 0.057%
30.39% at 30.39%, but slightly higher than for Map 1.
A further interesting factor was that Verbal Reasoning and Numerical
Reasoning reverse their contributions in the two equations. The
resulting multiple regression coefficient for Map 2 was 0.55 and was
defined by the following regression equation.
y1= 0.137 0.189 + 0.706 + 0.495 + 0.786 — 0.218 + 0.495 + 0.292 + 0.169 (ST2) (AGE) (PER) (0.2) (0.1) (EbT) (NUM) (VER)
215

Since neither of these analyses explained a large enough per—
centage of the variance, further regression analyses were performed
on the results. The strongest positive influences demonstrated
in the correlation matrix were Intelligence as represented by AH3,
Spatial Ability and the results of the Pmbedded Figures Test and
although age has been shown to be of limited importance it was also
included.
The results of this analysis, although confirming the influence
of intelligence on the production of both maps and at an equivalent
level, as well as the emergence of features in the same order, the
amount of variance accounted for is still low. (25.4% for Map 1,
and 28.7% for Map 2).
TABT•F, 5.33 Regression analysis
Regression of AH3, ST 2, EFT and AGE on Maps 1 and 2
Order of mergence MAP 1 r = 0.504 MAP 2 r = 0.54
AH3 20.2% of variance 20.3% of variance
ST 2 3.6% " n 5.0 " " EFT 0.9% " tr 2.2•% " • " • AGE 0.6% " 11 0.4% " "
_ ----- •••■■••••••••■••■ •=1
Percentage of Variance 25.4% 28.7%
It seems therefore, that the low variance accounted for is
attributable to the colinearity of the variables, a phenomenon in
which some, or all of the independent variables are very highly
correlated. As was explained earlier, one of the uses of multiple
regression as an interpretive tool is to evaluate the relative
importance of the independent variables and in order to do this
certain levels of statistical significance are required. Nie et al
(1974) p 340) comment,
"The situation is somewhat parodoxical The more strongly
correlated the independent variables are ... the greater the
need for controlling the confounding effects."
216

A number of possible solutions are offered in the literature.
Nie et al (1974) suggest that one alternative is to use only one of
the variables in the highly correlated set to represent the under-
lying dimension, which in this case would appear to be the SpatiaV
intellectual ability identified in the principal components analysis.
Alternatively, Cohen and Cohen (1975) suggest a Stepwise Regression
with cross validation should be undertaken. A more appropriate
solution argued for by Cohen and Cohen however, is to employ a
hierarchical multiple regression analysis in which the order that
the variables are entered into the equation is determined by the logic
of the research. It may be for example that one or more of the
Independent Variables are suppressing the resultant regression
analysis. Cohen and Cohen are critical of the use of stepwise reg,-
ression since this relieves the investigatai: of the responsibility
of making decisions about the logical or causal priority of variables.
They believe that advances in the behavioural sciences are more likely
to occur when researchers provide a hierarchical ordering of the
Independent variables which reflect causal hypotheses rather than
when computers order independent variables, 'post and ad hoc for
a given sample' (p 103) .
To investigate these suggestions in relation to the current
Study a variety of further analyses were undertaken, none of which
appeared to solve the problem of the multtolinearity of the variables
involved. One final possibility lay in the reliability of the
variables employed in the study.
Reliability and Disattematinn
An important factor in the interpretation of the conclusions
of any research programme is the reliability of the measures upon
which conclusions are based. Reliability theory originated in
Spearman's desire to interpret correlations between operationally
distinct variables, yet he realised that no matter how carefully one
tries to assess an aspect of ability or particular trait of behaviour,
assessments will never have the precision or accuracy that attends
the measurement of physical characteristics such as weight or height.
To help remedy this, Spearman (1904) recommended obtaining a measure
217

of the reliability of the tests used and correcting for attenua—
tion (unreliability) in their measurement. Cohen and Cohen (1975)
(p 369) and Maxwell (1977.) (p 79) argue that part of the reason for
the weak relationship which characterises studies in the social and
behavioural sciences lies in the attenuation phenomena. It is not
surprising they suggest, that multiple regression coefficients of
above 0.50 are rare, when perhaps as much as half of the variance
can be accounted for by random error and by definition is inaccessible
to correlation with the Independent variables.
Although there are no conditions under which perfect reliability
can be expected, Anastasi (1969 p 106) suggests, that
... test reliability indicates the extent to which individual
differences in test scores are attributable to chance errors
of measurement and the extent to which they are attributable
to true differences in the characteristics under consideration."
The reliability of a variable may be defined as the correlation
between the variable as measured and another equivalent measure of
the same variable. In standard psychometric theory, the square root
of the reliability coefficient may be interpreted as the correlation
between the variable as measured by the test and the 'true' error—
free score. (Maxwell 1977). Since 'true' scores are not themselves
observable, a series of techniques have been developed to estimate
the correlation between the obtained scores and these 'hypothetical'
true scores. To estimate the correlation between two constructs
from the correlations obtained between the 'imperfect' observed
measures of these constructs, one corrects for attenuation by applying
the following formula:
r x r x* y* rxx ryy
where r x* y* = Corrected correlation
rxy = Uncorrected correlation
rxx, ryy = Reliabilities of the two tests involved
Thus, for example, if two variables, each with a reliability
of 0.80 were found to correlate 0.44, the attenuated correlation
would be calculated as follows:
218

r x* y* __It:11___ = 0.80
_ x 0.80 - 0.55
Cronbach (1972, 1976), Maxwell (1977), Cohen and Cohen (1975)
amongst others have long argued for the need for disattenuation and
they offer evidence that correcting for error can at times change
an ordinary partial correlation from negative to positive. For
example a re-examination by Cronbach (cited in Cohen and Cohen 1975)
of a study by Bloom revealed that Bloom's findings that IQ change
from age to age had a slightly negative correlation with intial IQ
(-0.05) was changed to a positive correlation when error in measure-
ment was taken into account. Similarly Cohen and Cohen (1975) cite
the conclusions of Campbell and Erlebacher (1970) that failure to
correct for the faili bility of partial variables in the analysis
of the 'Headstart' programme may have led to mistaken conclusions.
(Further examples supporting disattenuation are given in Cronbach et
al 1972, p 294 - 301).
One further advantage of disattenuation is that this technique
makes it possible to consider the relative contribution of less
easily measured variables, which despite the unreliability of their
assessment may be of greater importance than those which can be
measured more precisely. Similarly when such corrections are not
made it is the more precisely measured variables which tend to
explain the greatest proportion of variance in a prediction equation.
Also, as Cronbach (1976) suggests, in a complex model aimed at
ultimate prediction, neglect of the unreliability of measures may
well lead to totally incorrect predictions. "An uncorrected model
presumes a non-existent reliability."
Correction for attenuation is not without its critics however..
As Cohen and Cohen (1975) comment (p 62) as for all estimated
coefficients, extreme caution must be used in interpreting attenua-
tion corrected coefficients, since each of the coefficients used
in the equation is subject to sampling error. Indeed it is even
possible to obtain attenuation corrected coefficients larger than
1, primarily when the reliability of variables is under-estimated.
Similarly (Barker 1982) suggests, there may be an understandable
hesitance about increasing a set of correlations on the basis of
219

error in the measurement of the contributory variables when a
natural but incorrect inclination to. the effect of error would be
to decrease correlations based on the 'error-contaminated' measures.
It is also the case that the difficulty of obtaining reliability
coefficients for all of the variables in a complex model may be a
further obstacle to researchers electing to correct matrices.
On the basis of the previous discussion, it was decided that
it would be appropriate to attempt a disattenuating analysis to
complete the investigation of the factors associated with the production
of the maps used in this study. In order to do this, it was therefore
necessary to calculate levels of reliability of the measures used
with this particular sample. (It will be remembered that previously
reported levels of reliability for the tests were indicated in
Chapter 3).
Thorndike and Hagan (1969) define reliability in terms of how
accurately a test, or equivalent test, will produce the same results
on an alternative occasion. In order that this might be achieved
there are important factors which could influence results, namely
variations in the individuals concerned, as well as various factors
within the test instruments themselves. Thorndike and Hagan (1969)
suggest that there are three main sources of variation in performance,
each of which could effect reliability coefficients:
1. Variation in response to the test at a particular moment
in time.
2. Variation in the individual from time to time
3. Variation arising out of the particular sample of tasks
chosen to represent an area of behaviour.
Brown (1976) suggests that a major factor effecting the
reliability of a measuring device is related to the range of scores
which the test produces. As the variability of the scores decreases,
reliability decreases. Thus a small score range tends to achieve a
lower measure of reliability. The difficiatysfatest for example,
can either increase or decrease score range, which in turn effects
the resultant coefficient.
220

It would appear important to consider reliability levels with
such factors in mind. Some of the measures employed in this study
encompassed limited ranges and were therefore subject to low levels
of reliability, which need not imply that they were invalid test
instruments for this particular undertaking but could certainly
suppress their contribution to a final analysis.
Anastasi (1969) has tabulated the various types of reliability
that are available to researchers, in the evaluation of their
research techniques.
TABLE 5.34 Types of Reliability Coefficients
Procedure Conventional Desi• ation Error Variance
— 1. Retest with same Coefficient of Temporal Fluctuation
form on different
occasion
Stability
2. Retest with Coefficient of Temporal Fluctuation
parallel form on stability and and item specificity.
different
occasion
Equivalence
3. Retest with Coefficient of Item Specificity
parallel form on
same occasion
Equivalence
4. Split-Half (Odd- Coefficient of Item Specificity
Even or other Internal con-
parallel splits sistency
5. Kuder-Richardson Coefficient of Item Specificity
(and other Internal
measures of inter-
item consistency
Consistency
(After Anastasi 1969 p 123)
221

The question of the most appropriate method of determining
reliability seems of considerable importance and it is likely that
more than one technique might need to be used as a result of varia-
tions in the testing techniques. The following table provides a
breakdown of the Particular reliability technique employed for each
of the tests used in the study, with the resulting reliability coefficient.
Test Procedure Coefficient
EFT Kuder -Richardson 0.87
RFT Parallel Form (RFT 2 repetitions) 0.39
ABC . Inter Judge reliability 0.80
AH3 Kuder Richardson 0.90
Verbal Kuder Richardson 0.77
Numerical Kuder-Richardson 0.80
Perceptual Kuder -Richardson 0.76
Spatial Test 2 Kuder -Richardson 0.95
Draw-a-Man Kuder -Richardson 0.84
Draw-a-Plan Kuder -Richardson _ 0.85
Orientation 1 Kuder -Richardson 0.60
Orientation 2 Kuder-Richardson 0.75
Orientation 3 Kuder-Richardson 0.80
Map 1 Parallel Form 0.59
Map 2 Parallel Form 0.59
TABLE 5.35 Reliability Coefficients
Once the measures of reliability had been calculated, it was
possible to undertake the disattenuation analysis. The following
two tables present the correlation matrix prior to disattenuation
and when disattenuated, where it can be seen that accounting for
error considerably influences the correlations obtained. It is also
interesting to note the comparability Of correlations with Maps 1 and
2.
222

TABLE 5.36 Correlation Matrix Before Attenuation (Corrected to 2 d.p)
EFT RFT ABC AH3 Vra NUN YEN ST2 DAM DAP 01 02 03 NAP 1 MAP 2
hki
RFT 0.43 ABC 0.44 0.24 • AH3 0.60 0.30 0.33
VER 0.51 0.24 0.31 - . NUM 0.49 0.22 0.21 - 0.65
PER 0.56 0.32 0.33 - 0.66 0.60
ST2 0.73 0.42 0.42 0.64 0.53 0.51 0.62
DAM 0.44 0.26 0.76 0.26 0.24 0.15 0.29 0.41
DAP 0.44 0.25 0.34 0.32 0.26 0.24 0.35 0.48 0.36
01 0.43 0.27 0.23 0.52 ' 0.51 0.41 0.45 0.44 0.25 0.24 02 0.52 0.53 0.31 0.62 0.55 0.51 0.57 0.55 0.27 0.34 0.53 03 0.29 0.11 0.16 0.24 0.16 0.22 0.23 0.31 0.22 0.14 0.15 0.19
MAP 1 0.41 0.21 0.21 0.45 0.39 0.34 0.42 0.43 0.22 0.28 0.29 0.39 0.21
MAP 2 C.39 0.21 0.23 0.45 0.39 0.37 0.42 0.43 0.21 0.28 0.20 0.37 0.21 0.59
ACE 0.27 0.12 0.27 0.41 0.39 0.36 0.33 0.29 0.04 -0.03 0.26 0.27 0.15 0.29 0.43
TABLE 5.37 Correlation Matrix after Attenuation (Corrected to 2 d.p)
E/1 RFT ABC AH3 VER NUM PER ST2 DAM DAP 01 02 03 MAP 1 NAP 2
;;;--
RFT 0.49 ABC 0.53 0.27
AH3 0.68 0.33 0.39 VER 0.63 0.29 0.40 -
NUM 0.59 0.26 0.27 - '0.83
FM 0.69 0.39 .0.42 - 0.86 0.77
ST2 0.81 0.46 0.48 0.69 0.62 0.59 0.73
DAM 0.51 0.30 0.93 0.30 0.29 0.18 0.37 0.46
DAP 0.51 0.29 0.41 0.37 0.32 0.29 0.43 0.53 0.43
01 0.60 0.37 0.40 0.71 0.75 0.60 0.66 0.58 0.35 0.34
02 0.64 0.41 0.40 0.75 0.72 0.66 0.75 0.66 0.33 0.43 0.79
03 0.34 0.12 0.21 0.28 0.21 0.30 0.30 0.36 0.27 0.17 0.22 0.25
up 1 0.57 0.29 0.31 0.62 0.58 0.50 0.63 0.57 0.31 0.40 0.49 0.59 0.31
ti? 2 0.56 0.30 0.35 0.65 0.61 0.56 0.66 0.60 0.31 0.41 0.35 0.58 0.32 1.00
Age 0.29 0.13 0.30 0.44 044 0.41 0.38 0.30 0.04 -0.04 0.34 0.32 0.17 0.38 0.55
223

(psq.s/exaoo ssmq.i tloyclm tn.Tm q.S94. arqq. uo epsta STuo ssm awe ao; uo.moexmoo sum) •
0000°1. 6555°0 ZLLC°0 503'0 L51.5*0 1555°0 5550'0-9650°0 8405*0 0585*() 69017*() ooWo 5g0-0 9005*0 cezro 6o6ro
6555*0 0000'4 0000'1. 3t05*0 3555'0 4835'0 90017°0 9005*0 I.L95e0 59Z9°0 zcc•c) 8L9'O Caro 01.175°0 L383°0 ei.Co
zac*o 0000'1. 0000'1. 5e05°0 4385e0 vfret-o woiro GeoC'o 99L5eo cnCro 1o6teo 6385'0 17019"0 9045°0 9i63"0 LZLg'0
CLL1e0 Zt05°0 CeoC•c) 0000.4 58ti3'0 L8L3'0 9894e0 t.oLro 4555•0 9963.0 t/L6ro 6toro bazeo coo oCwo 51i7CT
L5KT 35*0 4395°0 88t3"0 0000'1. StaT 010-0 zcaT 2959'0 352,6c) tKiro 990,%) LOLT 9965eo Lgoti-o 68t9•o
L555*0 4835"0 vtletT L913°0 5t6L•() 0000'1. zeaT c6tceo 0705T 31799.0 eLg'o tLVLeo toLLT ogt*o LL95'T L665eo
5550.0 -90otT 90017-0 9e9ro enCtee 3855°0 0000'4 6ezt•0 9tc5•cl. 045t%) 17563'o c25'0 9oLc*0 654t-o 9ter0 5605%0
9650e0 9005*o 58oc•o LoLro cozC° c6tcso 693t*o 0000'4 809t7'0 5595°0 3-1763°0 SL63°0 V9Z6e0 856ro zzLgeo
noC*o 1L95*o 89LC*0 4555*0 8 59'0 11785*0 9t7c5•0 eoWo 0000'1. LL3L*0 SD:4*o 8919.0 zo69 60 tartIT SKt•o 99086 0
0585*0 cezro eLcro 9963.0 535L'o zp99'o c15-fro 5595*10 1.12LT 0000'1. VZLL'O 3198e0 0000'0 Zt3t,'0 56e5T Lo69•o
690t-o zagT LoWo t7L6ro 17 59'0 EIL6g•o V56ro ftwo GLetT tal•o cmcwi. Goan waro 6e9ro 5593.0 1995*0
oott-o eL4so 63e5'o 617o3'0 891L•c) t7LtIL*0 cLzc'o 31763'0 8919'0 uwo 6oce*o ommt. oamo Ve65T L9e3°o gizro
5517-0 Caro V019°0 6aro LetLT tot./A) 90a°0 5L6ro zo69'o 000TT'000cro 0000'0 0000'1. LLGC'T 37c '0 o9L910
9005*0 cmKT e015*0 Cgoro 9965T o5o'ro 6c1.17*() 17936T tget-o 3z4u-ID 6993.0 te6C°0 LLeCbo 0000'1 aLro 593*0
gewo L393°0 9t6ro ()cue() Leutro LL95T 917e3.0 863°0 5-1717%) 569*() g59vo L98Z°0 z7 '0 aLvo 0000'1. gLet*o
6o6ro eag'o 22L5*() 517c°0 6et9'o L665%) 56o5*o 3315°0 9908'o L069°0 1985`0 51739°0 09L9'0 93*() gL8-17°O 0000'1.
aDV
Z dV14
dVIAT
CO
ZO
1.0
ava v(
NVI
ZIS
llad
uats.
CHV
DEV
Sael
Ida
aov 3 dVIAT 4 EVIAI CO
ZO 40 avr uaa NRN uaA
CHV
0a-V
1L I Sad
simalmv missamau aaaiarmi os NOISSIKEaS U0d

The disattenuated matrix was then submitted to multiple re-
gression analysis and the results revealed a variety of factors,
in particular a considerable increase in the percentage of explained
variance. These results of course have to be considered in terms
of the comments of Cohen and Cohen cited earlier, of the problems
of interpreting attenuation corrected matrices. However, it
appears that Spatial Test 2 was acting as a suppressing variable
and that in the disattenuated matrix the influence of ST 2 is not
so strong and that Perceptual Ability becomes the dominant factor
in the production of both Maps 1 and 2.
The resulting multiple regression coefficient for Map 1 was
increased from 0.51 to 0.69 and the explained variance increased
from 26.5% to 48%. The order in which the variables emerged was
altered slightly once the influence of Spat4.al Test 2 was reduced,
Perceptual Ability then becomes the most important factor, followed
by the Embedded Figures Test, Age and Orientation 2, as had emerged
prior to disattenuation. Spatial Test 2 then assumes a much reduced_
influence and the order of the remaining variables, Verbal Ability,
Numerical Ability and Orientation 1 are reversed.
Order of emergence of the variables Perceptual Ability 39.9%of variance
with Map 1 after disattenuation Embedded Figures 3.5% " Age 1.9% "
It
Orientation 2 1.2% "
It
Numerical Reasoning 0.4% "
It
Spatial Test 2 0.3% 1,
Verbal Reasoning 00,4
It
Orientation 1 0.5% " It
48.0%
The regression equation defining the relationship was:
y' = 0.23 + 0.17 + 0.15 + 0.25 - 0.17 + 0.12 + 0.21 - 0.14
(Per) (EFT) (Age) (02) (Num) (ST2) (Ver) (01)

When Map 2 was regressed with the same variables, the multiple
regression coefficient increased from 0.55 to 0.80 and the explained
variance from 30.39% to 64.9%. Ls with Map 1 the order of emergence
of the variables was altered and Perceptual ability is again seen
as the dominant influence, accounting for 39.5)/0 of the variance in
maps of the route from Home to School. Age is still seen to be
considerably more influential on the production of these maps than
of those of the home area and apart from the influence of Spatial
Ability and the order of Verbal and Numerical Ability the results
are similar to those achieved prior to disattenuation. The reg-
ression equation defining the relationships was:
yt = 0.09 + 0.37 - 0.63 + 0.47 + 0.13 + 0.40 + 0.17 - 0.13
(Per) (Age) (01) (02) (EFT) (Ver) (ST2) (Num)
Order of emergence of the Perceptual Ability 39.5% of variance variables with Map 2 after Age 11.5% "
disattenuation 01 2.6% "
02 6.6% " Embedded Figures
Verbal Reasoning
1.9%
1.6%
"
" ft.
Spatial Test 2 0.7% "
Numerical Reasoning 0.% " 64.9%
When the results for Maps 1 and 2 are compared the dominance
of Perceptual reasoning becomes most apparent and demonstrates the
significance of Perceptual reasoning skills for map production.
As had already been suggested, Age was more influential on the
production of the Route maps and as might have been anticipated,
greater demands are made on orientational abilities in the production
of Route as opposed to Area maps. (When explained variance percen-
tages are combined for orientation exercises 1 and 2 for each of the
maps 9.2% of variance of the Route Maps is explained, whereas only.
1.7% is explained for the Area Maps). Finally, as was suggested
earlier, the influence of verbal and numerical reasoning remains
reversed for the two maps, although the differences in explained
variance are comparatively quite small.
226

This concludes the detailed statistical analysis of the maps.
produced for the study. A later section considers the maps in
terms of their content and detail. The next section considers
the association of personality characteristics and cognitive style
for the children of the sample.
D. Correlations between the measures of Co itive St le and As ects
of Personality
As was explained in Chapter 4, it was proposed to consider the
relationship of personality characteristics supposedly associated
with field dependence/independence with the three measures of cog-
nitive style derived from this study. It was anticipated that,
aptollasis 2i. Composite scores for personality characteristics
associated with Field independence will correlate positively and
significantly with the measures of cognitive style and conversely
there will be a significant negative correlation with the composite
scores for personality characteristics associated with Field dependence.
The results of the analysis confirm these expectations parti-
cularly for the negative correlations with personality characteristics
associated with Field dependence. (Table 38). The only major
exception is that of the Rural Boys when Score 1*is not significantly
correlated with EFT/RFT/ABC
TABLE 5.38 Correlations between the measures of cognitive style and
the composite scores for personality
SCORE 1* Field Inde•endent
Sample Boys Girls Urban Boys
Rural Boys
Urban Girls
Rural Girls
with EFT
RFT
ABC
0.1882
0.2080
0.1318*
0.1864
0.1993x
0.1711
0.1974*
0.2460
0.0956
0.3526x
0.2551
0.2249
0.0148
0.1392
0.0158
0.2479
0.2557
0.0514
0.2198
0.2950
0.1662
SCORE 2* Field Dependent
Sample Boys Girls Urban Boys
Rural Boys
Urban Girls
_
Rural Girls
with EYT
RFT
ABC
t* -0.3395
-0.2485* if*
-0.2680
"* -0.3551 -0.2514
xx -0.1840
' x -0.3411
-x-x- -0.2690
-0.3183
xx -0.3672
-0.2030
-0.2309
-0.2643
0.3208* *
-0.1438
-0.310r
-0.1387
-0.3205
-0.2053
-0.2915x
-0.280;x
(Levels of significance * p < .05, ** p < .01) *SCORE I : Composite score for characteristics associated with Field
Independence SCORE 2 : it ft ft it 9 If Field
227 Dependence

When the personality characteristics are considered as individual
elements, rather than as part of a composite score, several emerge
as more dominant. As can be seen in Table 39 there are considerable
variations which lead one to question the supposed association of
personality and style for the children of this sample, despite the
reservations discussed in Chapter 4 about the technique used to . investigate personality. As far as characteristics associated with
field independence are concerned, the two with the strongest and most
positive association are Perseverance and Independence, which appears
to support Catell's belief in a possible association between 'field
independence' and the independence factor of his 16 PF.
Similarly of the personality characteristics supposedly associated
with Field dependence, two emerge as the most positively associated,
those at the opposite poles of the two already mentioned, ie Gives
Up Easily, and is Dependent on Others, and Follower for the Urban
boys and Rural Girls.
For both sets of characteristics, associations are more clearly
and consistently demonstrated in correlations with the Embedded
Figures Test. In general therefore this study seems to suggest that
cognitive style and personality can be linked particularly in terms
of the continua: Gives up Easily - Perseveres, Dependent on Others -
Independent, and for the category 'Follower' of the characteristics
associated with Field dependence.
How far this might also be seen as representative of the behaviour
of more intelligent as opposed to less intelligent individuals is
obviously an important factor. Analysis of the correlations between
composite scores for personality and Intelligence suggests that it
may well be the case, as (Table 40) reveals. This appears to be
especially true for the Urban boys on both and for the Rural Boys
for correlations between intelligence and characteristics associated
with Field dependence.
The results described here are similar to those reported by
Brophy (1982, p. 130), who in addition to rejecting the claims of
Catell, as was mentioned earlier, reported few significant correlations
between the personality measures used in his study and the criterion
measures of the Field dependence-independence continuum.
228

TABLE 5.39 Correlations between the measures of cognitive style and individual personality characteristics
FIELD BIPJ=INDENT CHAPACTERISTICS Sample Boys
NM Urban Boys
Rural Bo- s
Urtan Girls •
Rural Girls
LEADERSRTP with EFT 0.0753 0.1091 0.0548 0.2517* -0.0057* 0.1768 0.0635 RFT 0.0890 0.1534* 0.0536 0.2626* 0.0376* 0.0180 0.1656 ABC 0.0960 0.1586* 0.0227 0.2532* 0.0753 0.0269 -0.0412
SOLITARINESS with i21 -0.0262 -0.0899 0.0360 -0.0291 -0.1501 0.0834 -0.0116 RFT 0.0440 0.0038 0.0740 -0.0193 -0.0254 0.1829 -0.0067 ABC 0.0651 -0.1072 0.0024 -0.0378 -0.1587 0.C631 0.0608
INTROVERT with i'2 -0.0919 -0.0835 -0.0995 -0.0104 -0.1125 -0.0553 -0.1165 RFT 0.0002 0.0194 -0.0142 -0.0560 0.0905 0.0983 -0.0809 ABC -0.0816 -0.1019 -0.0665 -0.1007 -0.0972 -0.0864 -0.0293
INDiviDUALISTIC with: EFT 0.1198* 0.1266 0.1193 0.2642** -0.0019 0.1116 0.1633 RFT ' 0.1039* 0.0860 0.1288 0.1645 0.0114 0.1998* 0.0953 ABC 0.0658 0.0791 0.0299 0.2306* -0.0442 0.0371 0.0270
PERSMEAES with EFT 0.3135** 0.3271** 0.3281** 0.4415** 0.1664" 0.5067* 0.3514" RFT 0.2118** 0.1954** 0.2613** 0.2330* 0.1589 0.1426 0.3530** ABC 0.2991** 0.2261** 0.3278** 0.2516* 0.2057' 0.3001** 0.3432**
INDEPENDENT with EFT 0.2188** 0.2490** 0.2090** 0.3050** 0.1563 0.2055* 0.2135* RFT 0.2282** 0.2029** 0.2742** 0.2869'* 0.1167 0.1972* 0.3471** ABC 0.1264* 0.1351 0.0775 0.1784 0.0939 0.0110 0.1456
FIELD DE-2E-NDEliT CHARACTERISTICS Sample Boys Girls
Urban Boys
Eural Boys
Url,an Girls
Rural Girls
FOLLOWER with ITT -0.2831** -0.2650** -0.3163** -0.5628** -0.1261 -0.2468k -0.2911** RFT -0.2171** -0.2128** -0.2417** -0.2765** -0.1559 -0.0617 -0.3097** ABC 0.170** -0.1454* -0.1841** -0.2687** -0.0455 -0.1285 -0.2041*
GREGARIOUS with EFT -0.0683 -0.0747 -0.0677 -0.1022 0.0380 -0.1400 0.1472 RFT -0.0880 --0.0431 -0.1326 0.0102 -0.0949 -0.0753 -0.1015 ABC -0.0548 -0.0054 -0.0863 0.0134 -0.0100 -0.1734 0.0709
EXTRAVERT with EFT -0.0440 -0.0748. -0.0185 -0.0001 -0.1233 -0.0973 0.1401 RFT 0.0014 -0.0080 0.0035 0.1629 -0.1570 -0.0629 0.1093 ABC -0.0826 -0.0252 -0.1382 0.0215 -0.0257 -0.1991* -0.0484
CONFORMIST with EFT -0.1111* -0.0597 -0.1543* 0.0415 -0.0559 -0.0695 -0.0274 RFT -0.0807 -0.0701 -0.0807 -0.0255 -0.0992 -0.0301 0.0160 ABC -0.0309 -0.0295 -0.1171 -0.0125 -0.0695 -0.0597 -0.1112
GIVES UP EASILY with
...FT -0.3345** -0.3603** -0.03313** -0.4537" -0.2459** -0.30464'w -0.3206** RFT -0.2706** -0.1839** -0.2589 -0.2202* -0.1521 -0.1433 -0.3136** ABC -0.2556** -0.1737* -0.3055** -0.2898** -0.0822 -0.2906** -0.3006t*
DEPENDENT with EFT -0.2765** -0.2999** -0.2652** -0.3175** -0.2365** -0.2002" -0.2218* RFT -0.2308** -0.2949** -0.1926** -0.3454** -0.2611-** -0.1291 -0.1715 ABC -0.2031** -0.1720* -0.2116** -0.1939 -0.1519 -0.2288* -0.1618
(Levels of significance * p 4: .05, ** p 4:.01)
229

TABLE 5.40 Correlations between intelligence and personality
AH3 Personality
AH3 with SCORE 1
AH3 with SCORE 2
S ample Boys Girls Urban Boys
0.4123
-0.4273
Rural
0.2658
-0.5122
Booms Urban Rural
^ Girls
0.3118
-0.4232
0.3502
-0.4621
0.2621
-0.3792
0.2743
-0.2901
0.3044
-0.3486
(All significant at the 1% level)
In an attempt to follow up SonnenfeId's suggestions about an
'environmental personality' the correlations between personality
characteristics and cognitive maps were computed and as can be seen,
very little of significance emerged. This was also the case when
Maps 1 and 2 were compared with the individual personality elements.
TABLE 5.41 Cr,rrelations between composite map scores and personality
TABLE 5.41 Sample Boys Girls Urban Boys
Rural boys
Urban Girls
Rural Girls
Map 1 with: Score 1 0.0796 0.0535 0.1414 0.0435 0.0634 0.1854 0.1195
Score 2 x c
-0.187 -0.2239x -0.1872 -0.2370 -01883 -0.1562 -0.1800
Map 2 with: Score 1 -0.0152 -0.0226 0.0237 0.0157 0.0601 0.0363 0.0465
Score 2 -0.224r -0.2163 0.263)e -0.0796 -0.2540x -0.1927- -0.2021
(Levels of significance * p <.05, ** p < .01)
The main differences demonstrated here are the stronger negative
associations with factors associated with field dependence, but even
then some of the correlations are non-significant.
3. The Feature Analysis
Earlier in the discussion it was hypothesised that Field IndependenV
analytic subjects would demonstrate a more detailed perception of
their environment and that this would be reflected in their response
to measures of environmental perception. This has been investigated
so far by comparing the 'extent' of the 'area' maps produced by the
children in the sample with their scores on the measures of cognitive
style. As an additional attempt to follow this association, it was
230

further hypothesised that a more extensive perception would be
reflected in the detail referred to about their environment. In
particular this refers to the detail demonstrated on Maps 1 and 2,
and for this purpose each map was considered for the elements
included and given a Score for the Number of Features (NOF 1 for
Map 1, NOF 2 for Map 2). In the course of this analysis a considerable
amount of information pertinent to environmental perception research
was accumulated and this has been placed in Appendix 2, where the
results are discussed.
It was also suggested earlier in the discussion that it was
proposed to include a questionnaire to attempt to reveal more detail
of the sample's knowledge of their environment. By concentrating
on elements referred to in previous environmental perception research
it was possible to obtain considerable detail about the children's
perceptions in terms of:
1. Favourite Places and Reasons for. Liking
2. Disliked Places and Reasons for Disliking
3. Comfortable/Uncomfortable Places
4. Dangerous Places
5. Beautiful Places
6. Noises/Smells associated with their environment
7. Two tasks 1) Choose a series of Guide photographs of
their area
2) Distinguish between features shown to a
child, a relation, and a stranger, who you
have been asked to show round
The results of the children's responses were analysed and -
compared across the questions to produce a score for the number of
Features referred to in the questionnaire (NOF 3). Again this
culminated in a considerable body of information pertinent to environ—
mental perception research. This is included with a copy of the
Questionnaire, in Appendix 2, where it is discussed. (Differences in
terms of the Features referred to by more Field Dependent/Field
Independent subjects are discussed in the section which considers the
Follow Up Study).
231

The features referred to in Maps 1 and 2 and the Questionnaire
were then compared for each individual to produce a final category
for the number of different features referred to by the sample
(NODF).
Having undertaken this elemental analysis, it was possible to
investigate Hypothesis 25, with the scores for NOF1, NOF2, NOF31
and NODF.
Hypothesis 25. There will be a positive and significant relationship between the measures of cognitive style and the features referred to
by the children of the sample on their maps (N0F 1, 2) in the question-
naire (NOF 3) and as a total number of different features (NODF).
This will demonstrate that Field Independent individuals possess
a more 'detailed' knowledge of their environment.
As can be seen in Table 42, the results of correlations between
scores for the number of features and the measures of cognitive
style are varied and provide no conclusive evidence to support
hypothesis 25. Correlations with the three measures of cognitive
style again demonstrate non-comparable results, with the RFT achieving
the weakest and consistently non-significant correlations. Contrary
to expectations the Articulation of Body Concept Scale achieves more
consistently positive associations than does the Embedded Figures
Test. When the various sub-divisions of the Number of Features
analysis are considered there are considerable variations demonstrated
between Map 1 and Map 2 for the three measures of cognitive style,
which raises another question about consistency across cognitive maps.
The most reliable measure, producing the most positive correlations
with the EFT and ABC, but not the Rod and Frame Test, is that which
is derived from an analysis of the maps and the questionnaire (PDF).
This is the most comprehensive of the Number of Features measures
used, since it is based upon both the naps and the questionnaire, and
thus allowed children more opportunity to reveal their perceptions of
the environment.
232

TABIR 5.42 Correlations between the measures of cognitive style
and the feature analysis
TABU" 5.42 Sample Boys Girls Urban Boys
Rural Boys
Urban Girls
Rural Girls
EFT with:
NOF 1 0.222?x 0.1813 0.2698 0.3436* 0.1687 0.2319 0.3315
NOF 2 0.2136x 0.1891 0.2407 0.2443 0.1097 0.1883 0.1839
NOF 3 0.1094 0.1313 0.0890, 0.1263, 0.1748 0.1422 0.0904
NODF 0.2529 0.256g* 0.2558x 0.3064* 0.265g* 0.2411 0.2843x
EFT with:
EDF 1
NOF 2
NOF 3
NODF
** 0.1403
0.1067
0.0670
0.1484x
0.2008**
0.0313
0.0167
0.1483
xx 0.0889
0.1761
0.1168
0.1553
0.1957 0.0007
0.0285
0.1136
0.2275 0.0630
0.0099
0.1658 .....t
x-0.2295 0.1841
0.1665
0.1879
--,------___
0.0028
0.1040
0.1182
0.1369
ABC with: NOF 1
NOF 2
3
NODF
xNOF
0.1974 Xx
0.2628
0.2539x
0.360r
0.1986 x x
0.2167
0.2627
0.3495
0.1861 *
0.3090
0.3718*
.2472" 0.258r
0.1847 -X-X-
0.2945
0.3059'
0.2293
0.1588 0.2717
-r*
0.3928*
0.1287 **
0.3168
0.3470
0.4092X.
0.2545 *
0.2548 0.1458
0.3268*
(Levels of significance * p <.05, ** p <.01)
Since results discussed so far have demonstrated an association
with intelligence it was proposed to consider the number of features
referred to in terms of intelligence. The results of this Pnelysis
are below (Table 5.43) where it can be seen that the associations'
TABLE 5.43- Correlations between Intelligence and the feature
analysis
TABLE 5.43 Sample Boys Girls Urban Bo s
Rural Bo s
Urban Girls
Rural Girls
AH3 with: EDF 1 0.3311 0.4053 0.2566' 0.5522 0.3478 0.1517 0.4041
EDF 2 0.258r 0.2175-* 0.2908x .1609 0.278g* 0.1592 0.3458
NOF 3 0.2022 0.1630 X
0.2361 0.055 X*
0.2667 0.2970x 0.15'
NODF 0.324ix 0.299r 0.3438* 0.3048* 0.3269* 0.2905 0.4289aHc
(* p <.o5, ** p < .01)
233

between AH3 and NODF are as strong as those reported between EFT
and NODF, but not quite as strong as those between NODF and ABC.
The correlations for the Urban Boys and the Rural Girls between
NOF1 and AH3 and between NODF and AH3 for the rural girls are the
most positive and there appears to be a stronger association between
intelligence and the number of features included for the rural
children of the sample. In general however, the correlations are
comparatively low when one considers associations with intelligence
discussed earlier, so it was felt that age might be an influential
factor effecting the number of features referred to. The analysis
described in Table 44 suggests that this probably is not the case. If anything, the most positive association between age and the number
TABLE 5.44 Correlations between Age and the feature analysis
TABTP 5.44 Sampld Boys Girls Urban Boys
Rural Boys
Urban Girls
Rural Girls
Age with: NOF 1 0.2725 0.2814x )x 0.2689 0.2614' 0.3031x 0.239g 0.3157
NOF 2 0.2417x 0.199g* 0.2820x 0.1058 0.3156x 0.200] 0.3205
NOF 3 0.0824 -0.0447 0.2043 -0.0978 -0.0036 0.283V 0.1328 NOM' 0.2714 0.1765 0.3671x 0.1201 0.2257 0.3998 0.32r
(Levels of significance * p .05, XX p .01)
of features is demonstrated by the girls of the sample, especially
for the maps and total number of different features. The reverse
appears to be the case for the boys on the auestionnaire, however,
where there is a slightly negative correlation suggesting perhaps,
that the younger boys are likely to provide more detail in response
to the questionnaire.
4. Additional Map Analysis
Whilst analysing the maps in the terms describea for this study,
it was felt that it would be an opportunity to repeat types of analysis
used in previous environmental perception research. MatheWs (1980)
for example found a close association between the amount of labelling
included on the maps of his sample and the 'quality' of the maps. He
also found that the amount of labelling increased with age within his
234

sample of 11 - 17 year olds. For this study three categories of
labelling were described, those of None, where nothing was actually
written on the map, Incidental, where labelling was incidentally
written over the map and Detailed, where the labelling was clearly
seen as an important element of the map. On such maps, features '
would be named, as would roads and directions might also be included.
As can be seen on Table 45, confirming the findings of Mathews, there
is a progressive increase with age of the numbers of this sample
including detailed labelling and that this progression seems to be
true for both sexes and is demonstrated on both of the maps drawn
for this study.
TABLE 5.45 Labelling of maps
MAP 1 AREA
TABLE 5.45 Sample Boys Girls Urban Boys Rural Boys
J Urban Girls
Bur Girls
10 - 11's None 8 3 5 - .3 - 5 Inci-dental 106 50 56 25 25 21 35 Detailed 16 7 9 6 1 4 5
MAP 2 ROJ1E)
None 3 3 - - 3 - Inci-dental 104 50 54 25 25 19 35 Detailed 16 7 9 6 1 6 3
MAP 1 (AREA
11 - 12's None .8 4 4 3 1 -
Inci- ' dental 122 58 64 26 32 36 28
Detailed 30 18 12 13 5 8 4
MAP 2 Ranh ----------- None 7 4 3 3 1 - 3 Inci- dental 112 53 59 28 25 35 24 Detailed 24 12 12 5 7 7 5
continued
235

MAP AREA
TABLE.5. --ULI
.45 UpN
Sample Boys Girls Urban Bo s
Urban Bo s
Rural Girls
Rural Girls
12 - 13's None 3 3 - 1 2 - -
Inci- • dental 105 55 50 23 32 27 23
Detailed 58 28 30 9 19 22 8
0 TE
None 4 4 - 3 1 - - Inci- dental 111 57 54 19 38 34 20
Detailee 41 18 23 9 9 14 9
When the labelling analysis was compared with composite scores
for Maps 1 and 2 to consider the association of increased labelling
with higher 'quality' maps the results of Mathews were further con-
firmed, with all correlations significant at the Vo level as can be
seen in Table 46. This was particularly true of the Rural Girls on
TABU', 5.46 Comparison of labelling for maps 1 and 2
,----- TABLE 5.46 - Sample Boys Girls Urban
Bo .s Rural Boys
Urban Girls
Rural Girls
Labelling with MAP 1
** 0.3592 0.3466
xx 0.3759
** 0.3979
* 0.3200
* 0.3107
** 0.4124
Labelling with MAP 2
x x 0.3585
4 0.4327 0.3334
3E-* 0.3867 0.4687 0.306r
-X-X- 0.3320
TABLE 5.47 Correlation between degree of labelling and intellegence
TABLP 5.47 Sample Boys Girls Urban Bo s
Rural Be s
Urban Girls
Rural. l Girls
AH3 with labelling
Map 1
Map 2
** 0.3368
*-x- 0.2450
** 0.3192
x x 0.2372
* 0.3564 **
0.2478
X X 0.3909
*-X- 0.1690
** 0.2431
-)(- 0.3181
0.2220 0.2280
xx 0.4184
* 0.2119
(Levels of significance * p <:.05, ** p <:.01)

Map 1 and the Rural Boys on Map 2. The association of Intelligence
with these results, however, suggests that ability may be a definite
influence for the Rural Girls on Map 1 and similarly the Rural Boys
correlation with intelligence was the highest on Map 2. In general,
however, correlations between intelligence and the amount of
labelling demonstrated is auite low. (Table 47) In order to compare the extent to which the maps of the more
'analytic' individuals included more labelling,the results of the
labelling analysis were correlated with the measures of cognitive
style. As can be seen below in Table 5.48 no real picture emerges
TABLE 5.48 Correlations between labelling on Maps 1 and 2 and FYT
scores
TABLE 5.48 Sample Boys Girls Urban Bo s
Rural Buys
Urban Girls
Rural Girls
Labelling on:
EFT Map 1 0.2322 0.1498 0.3192 0.2457 0.0660 0.1954 0.3376* Map 2 0.1892 0.1901 0.2007x 0.2418 0.1269 0.2331 0.1193
* * RFT Map 1 0.1057 0.0629 0.1465 0.0909 0.0370 0.2114 0.0321
Map 2 0.0779 0.0953 0.0730 0.0685 0.1253 0.1238 0.0047 *X- * ** x *
ABC Map 1 0.1772 0.1491 0.2237 0.1705 0.1315 0.1999 0.2073 Map 2 0.1982 0.1627 0.2215" 0.1762 0.1540 0.2408 0.1705
(Levels of significance * p < .05, ** p < .01)
and the most positive correlations are for the Rural Girls and IbT
which as was pointed out in the previous analysis is probably strongly
associated with intelligence.
As a final element of the map analysis, each of the maps were
considered for the structural elements described by Lynch, ie
Paths, Landmarks, Nodes, Edges and Districts. As can be seen -in
Table 49 below, younger children's maps tended to consist primarily
of Paths, Nodes and Landmarks and stressed individl'al elements rather
than the connections between them. There was increased reference
to Edges in the maps of children aged between 12 and 13, as well as
the beginnings of a recognition of the composition of an area into
237

TABLE 5.49 Comparison of Maps 1 and 2 for 'Lynch' Type elements
TABLE 5.49 Sample Boys Girls Urban Boys Rural Boys Urban Girls Rural Girls
AGE GROUPS P L N ED P - LNED PLNED PLNED PLNED PLNED PLNED MAP 1
10-11 yr olds 125 94 114 41 3 60 42 55 20 1 65 52 59 21 2 31 27 30 13 1 29 15 25 7 0 25 24 24 16 2 40 28 35 5 0
11-12 yr olds 160 136 149 55 15 80 65 78 29 9 80 71 71 26 6 42 37 41 21 8 38 28 37 8 1 44 41 41 20 6 36 30 30 6 0
12-13 yr olds 165 144 159 99 26 36 68 86 45 10 79 76 73 44 16 33 27 33 19 7 53'41 53 26 3 49 49 46 30 12 30 27 27 14 4
MAP 2 (21°1112...MS.)--
Sample Boys Girls Urban Boys Rural Boys Urban Girls Rural Girls
AGE GROUPS P LN ED PLNED PLNE D P L N E :J PLNED PLNED PLNED
10-11 yr olds 122 97 107 29 0 59 47 54 13 0 63 50 53 16 0 31 31 30 13 0 28 16 24 0 0 25 25 24 16 0 38 35 29 0 0
11-12 yr olds 133 128 140 20 2 69 62 71 12 2 64 66 69 8 0 36 34 36 7 0 33 28 35 5 2 42 39 40 6 0 32 27 29 2 0
12-13 yr olds 148 143 153 50 8 78 71 77 24 4 77 72 76 26 4 31 30 31 13 2 47 41 46 11 2 48 47 47 17 2 29 25 29 9 2
(P = Paths, L = Landninrks, N = Nodes, E = Edges, D = Districts)

specific districts. There were also clear differences demonstrated
within this sample between the Urban and Rural sub-groups for
reference to Edges and Districts. This was definitely to the
advantage of the Urban group, which is not surprising since the
analysis devised by Lynch is primarily intended to describe the
structural organisation of the city, ie. a more Urban environmental
setting, and goes some way to supporting the suggestions of Bishop
(1973) who argues that some environments are more fimageablel to
children, using Lynch's terminology. Interestingly however, it
was still possible to identify Edges and some Districts in the Rural
maps. As with other studies however (Spencer and Lloyd 1974, Pocock 1975, Gold 1980) some difficulty was experienced in differen-tiating between the elements described by Lynch. It is also the
case that the nature of the task is often ignored when analyses of
this kind are applied. How far do exercises such as those used in
this study, and others, allow an individual to demonstrate a know-
ledge of Districts and Edges? For example, the way in which the
request for 'the map of an area' is interpreted influences the
opportunity for inclusion of such features. Similarly, how far
you live away from school, on a map which depicts a route from home
to school, can certainly influence whether you actually pass through
any districts and therefore include them on a map. In general,
however, the results described here support the findings of Matthews
(1980) and Calland (1973) which were discussed earlier.
when the results of this analysis were compared with the measures
of cognitive style and that of intelligence by a point-biserial
analysis, no clear associations emerged. The most positive associa-
tions demonstrated were between the Embedded Figures Test and the
Edges included on Area Maps of the sample, but in all cases associa-
tions with AH 3 were higher, suggesting that if anything, it would be the more intelligent individuals who would include reference to
the Edges and Boundaries of the area where they lived. In general
the correlations were very low and feW significant relationships are
demonstrated (Table 50). .
239

• siAls eAT17.11200 Jo semsvox
eqq. play uoweouTsstio gotaq uuam.sq aoTmeaao3 oc • S
•
' ( 10*
f:JO'
> d „
> d * GotrunJ1122To Jo optuol)
L46LT OCWO OL5ZT 09V0T p1*0 5OLLT 4/.51'0
L660'0 44OZT ZaLT Lotwo Scgvo 9414'0 *Savo (ezo'o 65L0ro zetwo -eowo 6410'o ztto*o o6z0'o 136L0'0 SOLLT teLL'O 95.'74'0 Lc14'O kg9LT intLT
CM(
ou
ma
1 E7 :111-Tm SIOINISIC
,L8L2'O Li.Lro 9920'0 Voro 5954T V901T *5Z44'O
494.34'0 69:2-LT Logy() EiLzvo 96zz*0 LzCvo uLvo
L9eoT 4N0'0 °PELT 1.00*0 c660'o' 0z60T 9960.0
Lfrzro 9cowo CcZVO L941.'0 -0Z94'0 4664'0 0494'0 * * * ** **
4Hv
oav
ma
ma :111-TA same
,..6fzLCT 1.1.Lvo 9560'o 5V52'0 *pro Lo8vo *623r0
50Z4'0 6654'0 99L0'0 t164'0 9L4'O p54'0 i944'0
66zoT K90'0 419Z*0 93S0'0 6Livo oCzvo Lawo
542.O.0 getroT 1.(Q*0 6uvo 966wo LLgro =iv° * * *
qiIr
09Y
L wq
rra.pt sepox
54L4'O
6Z94'0
09Z0'0
6924T
ZOZOT
920'0
5490'0
5'41'0
4500'0
L551'0
060'0
46L0'0
202'0 41.L4'0 6524'0 j6t4'0
LOCOT 0914'0 9490'0 L900'0 16L0T 9LLOT zoo 0100'0- 922O'0 MLT ZOL0'0 0.60'0
5.97
oav
aii
Wg alWASTINNCINVI
Z dliIi siaTo sTaiD
rtvexa ir ectan sAoa
=clan skog
sTaTO sX09 eidaeS reanu 05'5 MaysMays
(4o' 50'
d ** d * epuRomu9T8 Jo eisAaq)
6t7ro *6o44'o icgro
eeLo'o Loy() 51750.o
9ozV0 LOUT 'VOLT i33'0 *OOLZT 904T
L641'o j6z4'o 417zvo *vero
eL“T ctLLT 6590T Lt.ovo
6t7ecro 6991.'0 991.4'0 *44174'0
Ler° 4,69Lro *Vero 4(lo4ro
4HV
oav
IdU
ma NI-TA magma
999$'0 */45L2'o *itLvo czevo LcWo *56c2'o 66z4'o
tOZ'O Ltiovo et.CoT ti.Lro L6vo 6cwo tecro * . 8L90'0 *6z9iro 9e94'0 LZSLT *162'0 T494T *506LT
59L4T 5t5ZT O44Z*0 c9evo *ti.L4'o *vcro LCOCT
cHV
0EV
Idtt
Ida :111TA =X
*V93'0 &WO 5944'0 4L43'0 44LtZ'O tL94'0 9O2*0
4840*0 Z9L4'0 4424'0 9990'0 L6ovo 5900'o z640ro
6940'0 9094'O tVOLT L9Z0T 176W0 /650T pOLT
oKvo gel%) L/20'0 9504T iLL'O V95wo invo
M
OST
ma J...47 :T TA mon
t,33-0 taw() aszz'o ectivo *poro *ti.vvo *2664'0
6/94'0 ZU0'0 2902'0 66L0'0 4914'0 0450'07 9060'0
17064'0 cz•so 546vo tgovo *totz'o p,Ltivo oLvo
4oero 6oGro “Lvo LI.Evo *61_6vo (.617cro 4407vo
CHI'
010
ma
ma • N.ITA amwativl
L dY1,1 sTaTD slam s OE
usgan us TES clan s og
sTaTD sAcq eidoreS iv anu. 05'5 EMI

This concludes the statement and discussion of the results
of the main part of the empirical research. The next section
goes on to consider the results of the Follow up study on two small
sub-groups representing the extremes of the analytic/global cognitive
style.
5. The Follow Ur Stud z
The follow up study was an attempt to investigate further a
possible relationship between cognitive style and environmental
perception and to consider some of the factors that had emerged
from the previous discussion in terms of sub-groups representing
the extremes of the analytic/global dimension identified by Witkin.
In order to achieve this, the criteria adopted for selection of the
follow up study groups was 11--- standard deviations from the mean for
the childrenls age groups, across all three measures of cognitive-
style. This was easily satisfied for the EMbedded Figures Test
and the Articulation of Body Concept Scale, but as can be seen in
Figure 1 presented earlier in this chapter, Rod and Frame Test
standard deviations were larger than the mean score. In order to
achieve a standardised score on the Rod and Frame Test for selection
purposes for those at the Analytic/field independent extreme an
average of the numbers achieving this standard for E2TABC was taken
and that number was assumed to have achieved the standard for the
RFT. The eventual standard for all three tests can be seen in
Table 51. As was explained in the previous chapter this produced an
eventual follow up sample of 17 extreme field independent/analytic
individuals (8 boys, 9 girls) and 17 extreme field dependent/global individPals, although only 16 of the Field dependent individuals -
participated in the field exercise. The group was drawn from
children right across the sample and from all schools used in the
study (as was shown in Table 4.3) in the previous chapter).
241

TABLE 5.51 The follow up sample. Scores on the measures of
cognitive style used to identify the follow up sub-
groups-
FT7LD INDEPENDENT'S FIPLJD DEPENDENTS TAMP, 5.51 --------
EeT RFT ABC EFT RFT ABC
Boys 10+ 24 11.5 2 6 153.0 5 Girls 10+ 22 12.5 2 5 140.5 4/5 Boys 11+ 25 8 1/2 8 65.5 4/5
Girls 11+ 24 15 1/2 9 141.0 5 Boys 12+ 25 6.5 1/2 9 65.5 4/5
Girls 12+ 25 9.0 1/2 10 40.5 4
(EFT Scores 0 - 25, RFT represents degrees of deviation over
8 trials, ABC Grades 1 - 5 with higher scores representing
more analytic individuals (ie 1/2) whereas lower scores (4/5)
represent more global individuals)
It is proposed to discuss the analysis of the Follow-Up Study
as follows:
1. Comparative analysis of Part I Results
2. Individual Interview
3. Field Exercise
1. Comparative Analysis of Part I Results
(1) Table 5.52 provides a breakdown of the mean scores for
each of the sub-groups and the sample on all of the exercises
included in the empirical study. It can be seen that the mean
scores for the Field Independent group are higher than the mean
score for all results (except the composite score for personality
characteristics associated with field dependence) and that mean
scores for the Field dependent sub-group are lower than mean scores
on all exercises (except for the composite scores for personality
characteristics associated with Field dependence). Reference to
the scores for the various measures of ability used in the study
242

TABLE 5.52 Comparative mean scores (The sample and the two
sub-groups)
TABU', 5.52 Sample F ield
Ind.e 1,_clent Field
De pendent
EFT 16.574 24.18 5.12
RFT 43.003 9.74 172.97
ABC 3.143 1.8 4.53 VER 17.632 22.06 13
NUM 12.606 16.71 8.06
PER 21.541 27.3 14.9 AH3 51.747 66.06 36.9
ST 2 59.017 79.94 31.2
D-a-Man 103.095 118.29 92.2
D-a-Plan 100.095 108.76 84.2
0 1 7.028 8.26 5.24 0 2 13.212 16.5 9.88 0 3 7.053 9.9 5.71 EXTENT 1 2.553 3.26 1.88 ABSTN 3.564 4.12 2.53
PERSPECTIVE 1 4.116 4.41 3.12
ACCURACY 1 2.390 3.0 1.59 STYLE 1 2.711 2.77 2.59 ABSTRACTION 2 3.904 4.19 3.0 PROSPECTIVE 2 4.361 4.625 3.2 ACCURACY 2 2.349 3.0 1.6 STYLE 2 2.601 2.81 2.27 MAP 1 12.785 14.29 9.8 MAP 2 13.217 14.625 10.6 NOF 1 7.534 10.41 6 NOF 2 6.914 8.38 6.6 EDF 3 10.122 11.76 9.65 NODF 17.028 20.3 15.24 SCORE 1 10.478 11.65 9.53 SCORE 2 10.638 9.59 12.12
243

leads one to believe that it is ability that is the over-riding
influence on these results and reinforces comments made earlier
negating Witkins assertions about the influence of intellioence
on cognitive style. When the results are inspected for individuals
however, there are definite exceptions, as can be seen by reference
to Table 53. Consider, for example, Case number 110, an extremely
field independent individual aged 13 years, with an AH3 score of
53, just above the mean for his age group. Similarly case number 86, an extremely field dependent 13 year old with an AH 3 score of
68, which is well above the mean for his age group. Generally,
however, the analysis of the comparative scores in these terms
indicates better performance for the field independent individuals
and strongly reinforces the conclusion of the factor analysis, referred
to earlier, of an underlying intellectuslApatial/Perceptual ability
of which performance on the tests of cognitive style is one part.
This suggests that intelligence iskLextricably linked with the ability
to cope with exercises such as the EFT, RFT, and ABC and therefore
further questions the notion of a cognitive style dominated by the
ability to tdisembed'a However it is important to recognise that
at an individual level it is possible to find individuals that
clearly substantiate the claims of Witkin and his colleagues. The
extent to which this is generalisable, however, is open to considerable
question.
(2) When the results of the map analysis are abstracted from
Table 5.3 , definite differences are demonstrated in them for the
two sub-groups. The maps produced by the field independent sub-
group are generally more extensive, more abstract, more accurate,-
and adopt the most conventional perspectives. (See Tables 54(a) and
(b)D. There appears to be little difference demonstrated in the map
style adopted however. To this extent the results certainly Confirm
hypotheses anticipating differences for these various categories,
yet the extent to which they derive from differences in cognitive
style as opposed to differences in ability is questionable.
Similarly, when the two sub-groups are compared for composite map
scores, the field independent scores demonstrate that their maps
are generally 'better' than those produced by the field dependent
sub-group.
244
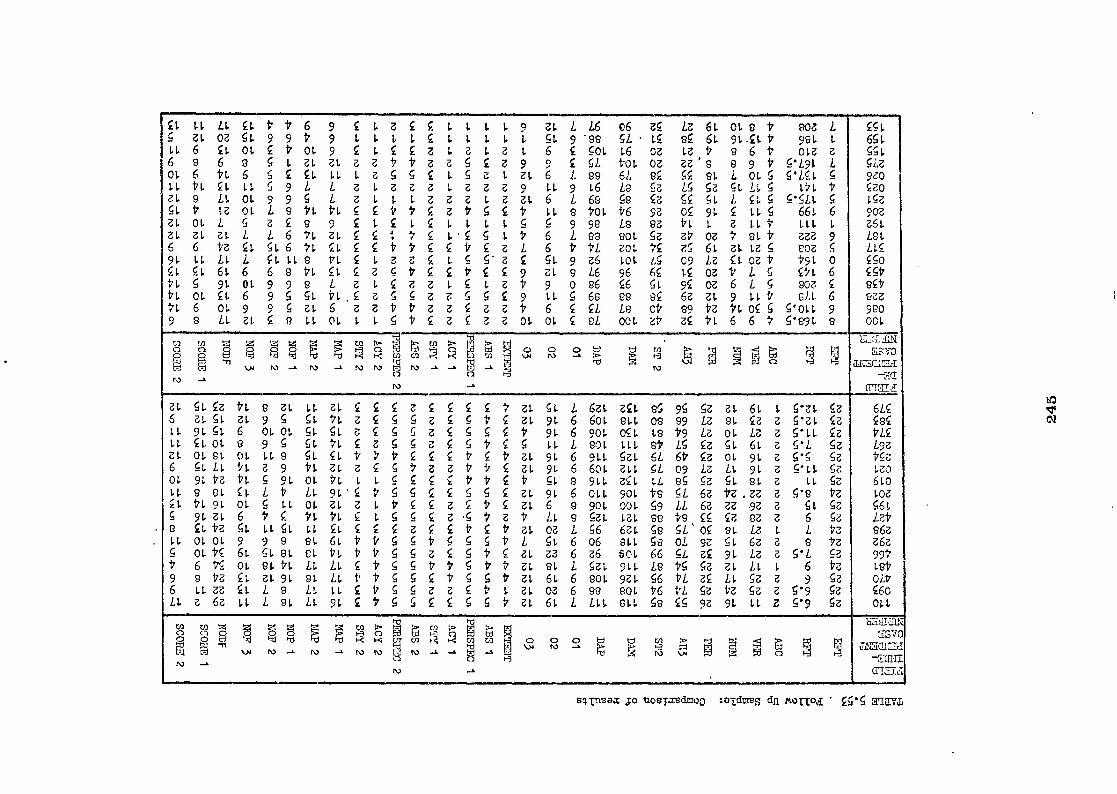
CL LI. Lt. C1. 5 EL 03 St. Lt. 6 CL oL 6 8 6 3 ol. 6 'pl. 6 LL it. 41. LL eL 8 LL 01. SLV tz 01. Z1. 01. L 5 61. 31. ZL L 6 6 t'6 Ct. 91. 1.1. LLL CL CL 61. 6 VL 5 91. 01. VL OL CL 6 Vt. 6 IN. 9 9 8 LL 31.
tt6 9 I. C 1.1.1.1.9 31./..L6 9 9 .179 1.1.1.1.51.1.1.1. L 51. 9 'ee Ctot. 9 41.4431.31.31. 64 401. gLZL 31.33ttzz5439 9 4 51. 5 4 CL LLLz55 4 LSzLeL 6 Lee 5 9L L 3Lzeet.3339 Li. 9 L6 9 95 L ZL4L3ZZLZZL 6 L 68 L8tL 'Vt. S. 4tt4et5 4 V LLetoL 3C 8 9 41.445LLL1.5 5 9 94 L 6 In a C C t V C t.. C C I. V 6 L ee 51. 6 ti. CL C C V V C C V C 3 L 6 t VL cl LL 8 VL 4LZZ4L5 5.3C SL 9 Z6 6 e Vt. Ct. C E 5 t C C t C C 9 34 e L6 9 9 8 L at.Cg3LC Lzt 9 0 86 9 5 St. in • C 3 5 5 z e 5 5 C 9 LL 5 64 9 5 zt. 6 zzttzzCzzt 6 4 CI. Cet. 01.4L5t4343301. ot. C el.
06 CL . 1.6 tot. 61 L9 Se t'6 L9 eot. cot. LOL 96 46 e9 Le own
3C LC oz oz eC ge S3 9z 83 53 V4 L5 64 51. 04 CV t.,
Lz 61. 01. et POZA. eC 61. 91..0.17 9e1. L Lz t e6t oLz z z6'8 8 9175q91L 54 eLLot. 5 g•LCL g L5 Sz 5L LL 5 LVLV SS CLLC1. C 5•5L4 5 04 91. 4 LL 5 661. 6 VI. 4 ZLLV LLL 4 35 oz t el. 't 633 9 35 61. zt. Lz 5 coz 5 09 LZ “ 03V 1791. 0 L4 oz t L g CtL 6 9C OZ 6L5 806 S 6Z ZL 9 LL V sa 6 89 V3 VI. OC 5 5*OLL 9 zC in 6 6V5'891. 8
C51. 651. 551. gLZ 9eo CZO 1.52 9az 661. Lei. LC SSO CSt 841' 863 9e0 001.
FA 0 0 N rs)
rn 0 . ta1 N 4" -1
It .,..
'21 r4 0 0 '._1 ft NI ...s. N,
it N tj; -- ,-;, cf., .,,- rd tl- o „ t..., 1-4 1-4 cri 0 ■-< t rn 0 \A NI •-•
"1:1 ..... NJ (%) tcli N.) -./ '''' 0" .e-1 /-7
N.) --L
.
s, r„
,.., 1-3 Z
il V1 ' 7'i 0 t-1 N IILL:ilLaN
asim ma c=
'.111T
3
31. 6 14 Lt. Ct. 6 01. LL CL 5 e LL 5 V 9 6 L1.
SL Cz tlezt. Lt. zt. St. ZL 9 5 Si. 9t. St. 6 OL OL 54 Ct. me 9 5 51. OL St. OL LL 8 54 5L LL VLZ9 VT. 91. to V4 5 91. 04 8 el 41. L V LL VI. 91. OLgLL OL 91. zt. 6 V 4 In CL tz 51. LL St. LL OL OL 9 9 8 et. OL VC 61. 54 et. el. 6 V4 01. eL VL LL 8 V3 CL Z4 9i. 91. LL ZZ 44L8 1.4 26z 41.L81. LL
31. 44434 4 4 Ctu 51.L621. V4ZC55ZC5VC UL 91. 6 601. 54 3 C5 52C 55Ct 91. 6 901. in 4 -65534 5t4S LI.Leol. CLVVVC C CVCVZL 91. 6 91.4 ELZC5VZZVV C ZL 9L 6 601. VLLL5 CCCVVCV 51. 2 91.4 N.' C V 5 g 4 4 5 5 4 ZL 91. 6 01.1. ZLZ4VCCZCVC zt. 6 9 901. Vt. C. L 5 g C z .5 V z V LL e 531. CI. 4 C. CaC 4t41'31. 06156 61.t1/55t555tL 51. 6 06 VLVV55zC 5 V 4 et. zz 6 z6 LL 45 5tt517tz1. e1.1531. LLVV55 CV5gVZL 61. 6 en 44 4t5 SzzCtLzi. 03 6 99 91. 4t55 4 4 55t ZL 61.LL44
641. 941. OCL I.I.I. SZL ZLL EC'. 901. OOL LZL 6eL elL 6ot. 914 96L ROL el:
eS 08 L9 et 6L SL LL V8 59 99 Se 59 66 L8 56 V6 58
95 5z 31. 61.1.5•31. 89 LZ et. ZZG'ZI. t9 /.3 OL LZ,Z5'LL LS Ce SL 61.35'L 6t S3 OL 9L3S'S 09 Lz LL 9Leg'LL 95 5Z 51. 91.Z U.. CL 6z VZ .33 Z 5'8 LL 6z zz 9zz 5L te CC 43 93 3 6 5L' oC et. LzL L 01. 96 5L 633 8 Si. 6C 91. Lzzgq t5 53 31. LLL 6 tL ZC LL 5zz 9 VL gz tz 5335'9 45 93 91. 1.1.Z5'9
43 CZ CZ 53 SZ 53 53 VZ 53 53 V3 VZ C3 V3 S6 53 5Z
6L4 £84 VL4 L93 VS6 L60 61.0 L03 564 Lzt 863 Z66 991' Let oLt 46o 013
Cl) CO 0 0 H
N N -1
NI -
8 . .i ....
8 8 't .1:1 NJ •-.• N)
'4 2 8 M g2 8 )-4 1-4 US 0 r, i-4 0 Ea
-% t \ ) N, NI ..-% -a N _. ...., 8
, ._3 5 2 ' : 1 `2 : ,1 yy
'0, 0 N uanah asvo arzta. --,.ru
sqinsas jo uosTavdmoo midaes dn. Aorrod aaau

TABLE 54 (a) TAMERS A C MEV LNG FA CR SC ORE ON TEE MAP ANALYSIS
TABLE 54 a EXTENT ABSn I PERSPEC ACY I STY I ABS 2 ERSPEC ACY 2 STY 2 1 2 3 4 5 1 2 3 4 5 1 2 3 4 5 1 2 3 4 5 1 2 5 4 1 2 3 4 5 1 2 3 4 5 1 2 3 4 5 1 2 3 4
F.I. SUB GROUP
1 1 I 6 7 --- "
3 9 5 -- 3 410 - 410 2'1 - 6.9 2 -'2'3 11 - 2 212 32 4 7- f i
1'418
F.D. SUBGROUP
6 9 I
2!-,- .
; i i
64.31 4 , ,
3 3 4 3 4 ; ; ;
9 [ 61:2i-
I ' I -X7 10 - 3:2 26 2
1 22 3 4 4 84'3 -
. ; 3 3 -
`TABLE 54 (b) COLTA RA T1VE ANALYSIS OF THE MA P SC ORES BY HISTOGRAM, ,...
FIELD DEPENDENT SUB GROUP l' FIELD INDFPENDENT SUB_gROUP MAP I--AREA ROUT .....11AL2- M – A P 9 –R
EXTENT EXTENT 9- 8,
N6—, 94-
2-
- 9 8
Ns
94 2
-1 1 1 2
SCORE_ 3 4 5 1 2 3 4 5
SCORE ABSTRACTION I ABSTRACTION 2 ABSTRACTION I A BS TRA C T ION 2
8
6 -
4 --"••P
6
4
9- 8- 6-
4-
2-
10-
8 6
4
-
2- 2
_J 2 r-1 -
1 2 3 4 5 1 2 3 4 5 1 2 3 4 5 ' 1 2 3 4 5
PERSPECTIVE I PERSPECTIVE 2 P7,:RSPEC rf lITI I PER S13-7C T FIE 2 10
8
6'
4-
----1 12 10-
6-
4-
8 •
--
1 2 3 4 5 1 2 3 4 .5 2 3 4 5 1 2 3 4 5
ACCURACY I ACCURACY 2 T ACCURACY I ACCURACY 2
9 10 .
8
6
4
2
6
2 ,
8
8
4
2
-,
6
4
1 2 3 4 5 1 2 3 4 5 1 2 3 4 5 1 2 3 4 5
STYLE I STY LE 2 STYLE I STYLE 2
8
6
4-
8
6
4
. 9- 8-
6-
4
-
8
6
4 -
•
--
-1
2- 2 2-
-1
2,--
1 2 3 4 1 2 3 4 1 2 3 4 1 2 3 4
C OMPOS ITE SCOPE I C 01 ILPOS ITE SC ORE 2 C M 'OS ITE SC ORE I COLP OS ITE SC ORE 2
6
4-
2
111213141516171819- 1 11
4-1
2-111J—,11. 1011 12 1314 15 15 17 13
--.
6 7 8 9 10 11 1213 14 4 5 6 7 8 9 1011 12131415
246

The analysis of the questionnaire and the maps for the features
mentioned by each of the sub groups revealed further information
about differences between field dependent and field independent
individuals. (The detailed results of this analysis, which considered
the items listed in Table 55 can be seen in Appendix 4). When•the
various elements listed in Table 55 were analysed, previous suggestions
about the seemingly more extensive knowledge of their environment was
confirmed for the Field Independent sub groups. On nearly every
section, Field independent individuals included reference to more
features (with the exception of Disliked, Dangerous and Comforttie
places) when the overall total number of different references are
considered the Field independent sub group mentioned significantly
more features. A further interesting factor to emerge was that girls
in both sub groups mentioned more features than the boys. When the
analysis is considered for differences in type of features perceived
it is difficult to discern any trends, yet when the overall responses
are considered for features mentioned by the field dependent sub
group alone and those referred to only by the field independent
individuals it is possible to identify characteristic differences.
As can be seen in Table 56 Field dependent subjects demonstrate a
concern for incidental environmental features, with a positive
influence of more social situations (eg Leisure Centre, Youth Clubs,
Tennis Courts etc) there also appears greater specificity including
personalised detail and often seemingly unimportant environmental
elements, (eg Traffic bollards, Park benches, Chip shops and 'my
old primary school'). Field Independent individuals on the other
hand appear to consider more landmark type cIenents, the key features
by which they move around their area and demonstrate a concern for
the functional elements of the landscape. They also appear to be
able to generalise better when it comes to a specific task. For
example, in response to the request for features they might show
to a cousin, a relation or a stranger, Field independent individuals
said they would 'ask them', 'show them a map', 'take them on a
general tour' and similarly when asked to select five features to be
photographed for inclusion in a guide book of their area, Field

TABTR 5.55 An analysis of the number of features included
on the area map, the route map and the various
sections of the questionnaire
PI BOYS
FI GIRLS
PI TOTAL
FD BOYS
FD GIRLS
FD TOTAL
SAMPLE TOTAL
Features noted on Maps 48 59 73 35 43 43 83
Favourate places 14 17 24 14 12 22 34
Disliked places 4 9 12 6 10 14 21
Features to Cousin
------- 10 22 28 13 12 18 37
Features to Adult relation 10 21 25 10 11 16 31
Features to visitor 11 25 27 8 14 17 35
Dangerous places 3 8 8 5 9 12 16
Beautiful places 9 9 16 4 6 8 21
Uncomfortable places 2 8 9 5 7 7 13
Comfortable places 4 2 4 4 6 7 7
Associated with their environment — Noises I 7 13 6 8 13 19
Associated with their environment — smells 7 5 10 4 4 7 14
Guide photographs selected to rep—, resent their area 24 26 36 16 22 30 48
TOTAL NO. OF DIFFERENT FEATURES INCLUDED 64 86 98 41 57 64 106
248

TABU'. 5.56 Features referred to by Sub groups only on Maps and
in Questionnaire
1.4■■•••■■■■=T
FD sub group only FI Sub group only
Personalised detail
My Toys
Leisure Centre
Tennis Courts
Youth Club
Jockey Club
Football Ground
Sand Pit
Woods
Farms/Sheds
Grass
Level Crossing
Electricity Sub Station
Traffic Islands
Road Signs
Park Bench
Chip Shop
Hairdresser
Restaurant
Old Primary School
Railway
Doctors
Health Centre
Post Box
Telephone Box
Telephone Exchange
Subway
Shopping Centre
Community Centre
Playground
Rec
Sports Ground
Pond
Loch
Lake
River/Brook
Nursery
Old People's Home
Museums
Colleges
Kings Chapel
Monument
Mill
Church/ Village Hall
Church
Churchyard/ Cemetry
Factory
Offices
Tech
Police Station
Maternity Hosp.
Flats-
Bus Station
Car Park
Garages
Waste Area
Council Yard
Allotments
Animals
Paddock
Orchard
Riverside Facilities
249

independent individuals generalised by suggesting 'general' or
'aeriel' views be taken. One might conclude that such responses
suggest that Field independent subjects demonstrate a greater
ability to analyse the situation and reflect on more appropriate
solutions to tasks, as Witkin argues of field independence. It
needs to be remembered however, that differences described here
still tend to be reflective of the responses of individuals rather
than typical of the sub groups as a whole.
2. Individual Interview
The character of the study described so far is very much of an
objective scientific nature with the researcher distanced from the
subjects of study. It was criticism of this approach that led Hart
(1979) to opt for, a more naturalistic approach, which he accepted
as more subjective in interpretation, but which he believed was
likely to reveal pertinent information. In attempting to produce
a balanced study it was intended to include an interview with the
children in the follow—up study, in which their responses to the
maps and questionnaire could be reviewed with them and where other
questions associated with research into Field Dependence/Independence
and children's perceptions of their environment could be considered.
It was intended that the interview should be as relaxed as possible,
with key questions to provide a basic structure, but adopting
Piagets 'Method Clinique' where anything of interest was pursued
with the individnal concerned. As can be seen from the copy the
Interview Schedule in Appendix 4, the following areas were considered. 1. Children's Interests
2. School subject preferences and reasons
3. School subject dislikes and reasons
4. Preferences for Gregarious/Solitary activities
5. Freedom of Movement in the Environment
6. Changes noted in their own area
7. Changes desired in their own area
8. Follow up questions on the maps and questionnaire
Of these topics, the first four were attempting to consider
suggestions made by Witkin (1976) and discussed in Chapter 2, that
250

there are differences between analytdc/global individuals for their
interest and study preferences and for solitary or gregarious
activities. The following tabulated results (Tables 57 - 59) do not support Witkin's suggestions that more analytic field inde—
pendent individuals demonstrate a preference for more analytic
subjects, although specific comments by Field Independent children
were more supportive. For example, comments of the following type
were made by 7 of the children in the Field Independent Sub group.
I like such and such a subject because
"... It makes me think." 11... I like it when you've got a problem and you can figure
it out ..."
"... I try to work things out for myself rather than ask the
teacher..."
When preferences for more solitary or more gregarious activities
were raised, the results presented in Table 59 do not demonstrate as positive an association between Field Independence and solitary
activities as Witkin would expect. There is however, a clear
preference demonstrated for gregarious activities by the field de—
pendent sub group. It is also the case that field independent
subjects indicate some interest in more solitary activities (eg
Dog Walking, modelling, stamp collecting, reading) and the comments
of one Field independent girl (Case Number 466) seemed to sum up
the views of a number of them.
"... I like being with other people, but don't mind being on
my own. If I get involved in something I don't like being
disturbed though ..."
An important point to emerge from the interviews was the
importance of the teacher and comments of the sort (Case Number 470) H... the teacher influences my liking it a lot ..."
were common.
Question 5 in the interview considered the freedom of movement
allowed to the children in the sub group. It was felt that this
might be a factor closely associated with the analytic/global
dimension and environmental perception. Witkin's assertions of
parental influence on the development of field dependence were
251

TABLE 5.57 Interests of the Follow Up Sample
TABLE 5.57 - Interests .
F.1 Boys
F.I Girls
P.I Total
F.D Boys
P.O Girls
F.D. Total
Sporting Activities 2 1 3 9' 2 Rounders 1 1 Football 4 . 4 6 6 Cricket 2 2 1 1 Golf 1 1 Swimming 2 2 1 3 4 Horse Riding 2 2 Cycling 1 1 2 2 . Playing 1 2 3 1 1 2 Fishing 2 . 2 Drawi ainting 1 5 6 1 1 2 Modelling 3 3 Speedway 1 1 Motor Bikes 1 1 Watching TV 2 2 2 2 School Club 1 1 1 1 Music 3 3 Reading 2 2 Cinema 1 1 Chess 1 1 Space Invaders Ballet 1 1 Stamp Collecting 1 1 Drama Club 1 1 Guides 1 1 • Walking 1 1 Dog Walking 1 1
TABLE 5.58 School Subject Prefered/Disliked by the Follow up sample
TABLE 5.58 F.I F.T. F.I F.D F.D F.D
LIKES Boys Girls Total B - Girls Total DISLIKES Boys Girls ToTal Boys Girls Total
Ehglish
I
cq ka
re% M
r- *I
' I-- CV
N I-- M
I N ,s—
CV
-4
r— English
Maths 5 1 2 3 5 Maths 1 2 3 2 2 4 Science 1 2 1 1 2 Science 3 3 ench • 1 1 French 2 2 2 1 3
History 1 2 1 1 History 1 2 3 1 1
Geography 2 4 6 Geography 1- 1 2 2
R.E. 1 1 R.E 1 1 1 1
Classics giology . 1
1 1 Classics Biology 1
1 1 1
Games 4 3 1 4 Games 1
Writing 1 1 1 Writing 1 1
Design 1 1 1 1 2 Music 1
Gym/P.E 1 1 2 1 3 Spelling 1 1
Drama 1 1 1 2 Table Teats 1 1
Woorketalwork Art Craft
2 1
1 1 2 2 None
. . 1 1 2 2 2
Reading 1 Most Things .2
---
252

TABLE 5.59 Preferences for Solitary/Gregarious Activities
TABLE 5.59 Solitary Gregarious
F.I Boys
F.I Girls
F.I Total
F.D Boys
F.D Girls
F.D Total
Gregarious 1 1 7 6 13
Solitary 3 3 1 1
Both 8 5 13 1 1 2
TOTALS 8 9 17 8 8 16
TABLE 5.60 Freedom of Movement of the Children in the
Follow up sample
TABLE 5.60 Freedom of Movement FI Bo s
FI Girls
FI Total
FD FD Bo s
FD Girls Total
Total Freedom (no restrictions) 1 1 1 1
Total Freedom (only time restriction) 1 1 1 1
Total Freedom (if parents informed 2 3 5 5 3 8 Freedom within defined Geo- graphical Limits (ie The Estate, MY Area, The Village) 4 3 7 1 1
Limited Freedom (with permission) 2 2
Definite Restrictions 3 3
Preference for them to be with others
2 5 7 2 4 6
No difference if alone, or with others 3 3 2 2
Increased freedom if with others (old children, adults)
Increased freedom if with others (friends) 1 2 3 1 1
Time restriction (stated hour) 1 1 1 1 2
Time restriction (Time of year) 1 1 1 1 ...,
Source of Permission: Mother 3 7 10 7 7 14 Father 1 1
Both 5 1 6 2 2
Noted Restrictions:
None ("Places they wouldn't want me to go to, I probably wouldn't want to go to anyway" (Case No 110)
Cafe (to play Space Invaders) 3 3 Main Rbads 1 1 2 1 2 3 Building Site 1 1 1 1
River 1 1 1 1
Specific Areas 1 1
Cinema 1
Park at Night 1 1 2
Out Alone 3 3
253

discussed earlier and the effect of parental control on children's
'environmental range' has been a subject of study in previous
environmental perception research. (Hart 1979, Moore and Young
1978).
The results of the analysis of the responses to this question
demonstrate that differences, rather than being the result of an
analytic or global style, tends to be dependent upon age, especially
for the girls. The older girls were given considerably more freedom
than younger girls and the boys appear to be granted greater freedom
earlier than the girls. These results are supported by the findings
of previous research, (as reviewed by Moore and Young 1978) (pp 91 —
106). It would have been interesting to have followed up questions
of this kind with the parents of the children in the sub groups,
however this proved impossible. The kind of restrictions imposed
upon the children's freedom are demonstrated in Table 60, where it
can be seen that generally parents are happy for children in this
age group to decide for themselves where they go and what they do,
provided their parents are informed. There is some preference for
them to be with others and the usual source of permissibn is the
children's mother.
When the children were asked to comment on the changes noted
and the changes they would like to see in the area where they lived,
the differences between the sub groups were minor, yet the detail
of the changes noted and the vehemence with which desired changes
were argued demonstrated considerable differences. The field inde—
pendent children were more thoughtful, more reflective and more
analytic in their responses and several of them spoke at considerable
length about changes that had taken place, or that they wished to
see. This difference in linguistic skill is probably a direct result
of ability as can be seen by reference to the comparative scores for
verbal reasoning on Table 52. The types of features that were
commented upon in response to these questions are tabulated below,
where it can be seen that most of the Changes noted were associated
with building and that most of the changes desired associated with
improving. leisure activity facilities.
254

TABLE 5,61 Changes noted and desired in their home area by
Children in the follow up sample
Cha nges N oted FI Boys
FI Girls
FI Total
ID Boys
FD Girls
1) Total
No obvious changes 2 4 6 3 1 4
Limited Building 3 3 6 1 1
Building Sites 1 1 3 1 4
Demolition 1 1 2 1 1 2
Factory Ektension 1 1
Shopping Precinct 1 1 1 1
Change of shop type 1 1
Infilling 1 1
Increased Noise 1 1
Increased Violence 2 2
Changes Desired
None 3 2 5 1 3 4
Improved play facilities 1 1 3 1 4 More play spaces 1 2 3 Sports Centre 1 1 1 1
Adv. Playground 1 1 1 1
Ice Skating Rink 1 1
Swimming Pool 1 1
Cinema 2 2
More Clubs and Activities 2 2 1 1 2
As Under 18's Bar 1 1
Improved Shopping facilities 1 1 1
Change area into Pedestrian Precinct 1 1 1 1
Stop Alterations to Named Area 1 1
255

The final questions in the interview were concerned with clarifying
individual responses to the maps and the questionnaire, primarily for
the purpose of analysis. However, when the sub groups were asked to
look again at their maps the Field Independent individuals were more
readily prepared to suggest amendments or additions to ther maps.
They were also prepared to constructively criticise their efforts
and were quick to see any limitations or omissions in them.
When asked how they went about the task of drawing maps such as
those undertaken for the study, the field independent individuals
were much clearer about the process they would adopt. For example,
I would plan it out in my rough book first .... I would
start from where I'm going from and think out things in stages ..
I like to plan it out first ..." (Case number 019)
whereas the Field dependent individuals seemed to be less clear
about the process involved,
tt ... I start where I live and put things on as I think of them
like the school and then the round-about (and then referring to
his own map) ... and then that3a shop and thats the youth
club..." (Case number 317)
or "... I'd put the church on and then a few roads and then I might
put my house on and then the river I suppose ..." (Case number 228)
The lack of process in the drawing of maps between the two
groups was clearly demonstrated in the next stage of the Follow up
study which involved the children in a practical exercise.
3. The Field Exercise
It was felt that the exercises used in the study and discussed
so far were somewhat static and since the focus of attention was
the environment there ought to be the opportunity to investigate
the ways in which children perceive the environment in a more
direct way. To have undertaken this with the full sample would
have been extremely difficult so it was proposed that it be under-
taken with the children in the two sub groups representing the ex-
tremes of the analytic/global dimension*
256

As groups of 10 - 12, the children were taken by mini bus to
an area unknown to them where they then went on a short walk.
Whilst on the walk they were asked to imagine that they were ex-
ploring the area for the first time and to note down a list of any
features they thought would help them to find their way back to the
mini bus. (Paper and Clip-boards were provided and the Standardised
Instructions used for the introduction can be seen in Appendix 4)
Once back at the minibus the children were taken to a room in a
local college and asked to draw a map of the route that they had
just walked and to estimate how far they had walked. The list of
features they had noted down were available to them for reference
and the children had been asked to undertake the whole exercise
without discussing it with the other members of the group. Whilst
the various groups were drawing their maps, it was possible to focus
on one or two individuals to monitor the process employed in drawing
the maps.
- This exercise produced four further elements for analysis,
1. The mapping process
2. The features noted
3. The Maps (analysed as for the full study and compared with
results of their earlier maps)
4. The estimation of distance
1. The Mapping Process
It was suggested earlier that distinct differences were demon-
strated in the interview in the way in which field dependent and
independent individuals said they would set about the task of drawing
maps. To see how far this was true in practice, it was decided to
monitor the process of mapping employed by some of the children in
the follow up sample. Six children were selected for this purpose,
two from each of the field exercise excursions, representing the
extremes of field dependence and independence. Although highly
subjective in interpretation, definite differences were demonstrated
by these children. In all cases monitored, the field dependent
children hesitated before commencing the task and were very tenta-
tive in the drawing which tended to be rather sketchy (as can be
seen by the examples in Appendix 4). They made very little reference
257

to their notes, although it had been suggested that it might help.
Comparison between notes and completed maps demonstrated that the
three field dependent children ignored features that they had noted
when it came to drawing their maps. The field independent children
on the other hand, appeared to tackle the task more confidently.
One of them had actually kept a rough map-type record of the walk,
perhaps anticipating the proposed exercise. The maps produced were
more carefully organised, and included more detail and as a result
the comparison between features noted and features represented on
the maps were much closer. One final point of interest was concerned
with the accuracy of the maps. Two of the field dependent children's
maps contained orientational errors, in fact, one of these was 180a
out, producing virtually a mirror image of the actual route walked.
Although speculative and subjective it is felt that the findings
described here suggest further avenues for research. It may of
course be that the differences noted here are again representative
of differences in general ability rather than style.
2. Features noted on the field exercise
As with the results of the full study and the sub group analysis
discussed earlier, there were clear differences in the number of
features noted by the two sub groups. Field independent children
generally noted many more features when compared by age, sex and
as full groups (Table 62). There were also definite differences
TABLT1 5.62 Number of features noted on the field exercise by
children in the follow up study
TABLE 5.62 Fl Boys
FI Girls
— FI
Total FD
Bo's FD
Girls ED -
Total
10 - 11 yr olds 12.25 18.3 14 9 14.6 12
11 - 12 yr olds 24.5 22.6 23.4 15.5 20.3 14.75 12 - 13 yr olds 17 27.3 23.1 10 16.6 16.2
TOTAL 16.4 22.1 21.3 11.3 16.6 14.1
(Average Number of Features noted)
between the sexes, with the girls again tending to note more features
than the boys.
258

When the features themselves were analysed for difference of
inclusion, similar differences to those described earlier were
revealed. Field dependent individuals tended to include very
specific incidental and even ephemeral features (eg Log Piles,
Bicycles, Ducks), whereas Field Independent individuals recorded
more specific landmark type elements with a very detailed catalogue
of stred names by FI girls especially. As can be seen in Section 4 of Appendix 4 it was also the case that 13 out of the 17 field independent children recorded directional details, (left, right,
straight on etc) whereas only 2 of the field dependent group
included any such information.
When the maps were analysed for features noted, as has been
suggested for the individuals monitored for the mapping process,
field independent subjects made more reference to their notes.
Thus there is greater correspondence between the number of features
noted and the number of features mapped for the field independent
group. One miner/point about this analysis was that two field dependent
children included details on their maps, which they hadn't noted and
which were not in the area that they had walked. (See Section 4 Appendix 4). There was also evidence of each of the sub groups
referring to their own memory of the walk, as well as to their notes,
since features appeared on maps that had not been noted, but that
they had certainly seen whilst on the walk.
3. Mau Analysis
Analysis of the maps in terms of the elemental characteristics
of Abstraction, Perspective, Accuracy and Style produced probably
the most interesting results, with the Field Independent sub group
producing the most detailed and accurate maps of the route with
scores which reflect this, as can be seen on Table 63. In general
field independent scores are much higher, but there are exceptions
to the lower scores for the field dependent group. See Case number
453 for example, similarly not all field independent individuals achieve high scores. See Case number 427 as an example of this. When average scores for each of the sub groups are considered however,
there are obvious and definite differences demonstrated between the
259

TABLE 5.63 An analysis of Individual's maps from the field exercise in the terms used to analyse the Route and Area Maps.
NAP ANALYSIS GIRLS
Age Group
Case Yo.
._
Perspec. Acy. Style Score AV.
Score 1 Age I Group
Case No.
Abstn. Perspec. Acy. Style Score Av. Score ocore
FIELD DFZUIDEP FIELD SUB GROUP 10-11 251 1 2 1 2 6 10-11 155 2 3 1 2 8
.023 1 1 i 1 4 5.75 159 2 2 1 1 6 7
026 2 2 1 2 7 153 2 3 1 1 7
275 1 2 1 2 6
11-12 053 2 3 1 2 8 10 11-12 187 3 3 1 2 9 9
317 4 3 2 3 12 206 3 3 ... 1 2
12-13 086 3 3 2 2 10 9 12-13 228 4 3 2 2 11
100 3 3 1 1 8 438 2 2 2 2 8 11.6
453 5 5 3 3 16 ----
Average Scores — FT Boys FD Girls FD TOTALS
7.6 9.25 8.4 •
e rou.
Case No.
Abstn. Perspec. Acy. Style Score Av. , Score
A P'a Case ;-- I - It.roupo.
Abstn. Perspec. Acy. Style Score ,'!" v. Score
FIELD IND1J)=-72 SUB GROUP D-11 267 5 5 2 2 14 10-11 379 5 - 5 5 4 19
254 5 5 3 3 16 15.5 383 5 5 . 4 3 17 17.6
019 5 5 3 3 16 379 4 4 5 4 17
021 5 5 3 3 16
1-12 292 5 5 4 4 18 11-12 195 t 5 5 3 3 16
298 4 4 4 4 16 17.0 201 5 5 3 3 16 14.3
427 3 3 2 3 11
2-13 093 - 5 5 4 3 17 12-13 466 4 4 4 4 16
110 5 • 5 4 3 17 17.0 481 5 5 4 4 18 17.0
470 4 5 4 4 • 17
Average Scores — Fl Boys FT Girls FT TOTAL
16.5 16.3 16.3
260

groups. (Table 62) Examples of the maps produced for this exercise
can be seen in Appendix 4.
4. The Estimation of Distance
There have been an increasing number of studies which focus on
the estimation of distance as a part of environmental perception
research, (Pocock and Hudson 1978 pps 52 - 59, Canter 1975, 1976;
Canter and Tagg 1975) which suggests an association exists between
experience and accurate distance perception. Since accuracy had
been a feature focussed upon in the analysis of the maps for this
study it was decided that it would be interesting to see if the
differences between field dependent and field independent subjects
tendency towards greater or lesser accuracy was reflected in their
ability to estimate how far they had walked whilst on the Field
Exercise. They were told that reference to their maps might help.
The results which can be seen on the diagram below suggests that
Field independent subjects generally estimate distances more
accurately and that there is a progressive improvement with age for
both subgroups and for both sexes. Again, how far these differences
are a reflection of general ability, as opposed to cognitive style,
is highly questionnable. It is also the case that such an area
deserves such more detailed investigation.
TABLE 5.64. DISTANCE ESTIMATION FOR THE FIELD EXERCISE.
Field- Field Dependent Range
4
I"
Dependent
Field
I0-II Boys " Girls
II-I2 Boys " Girls
12-13 Boys " Girls
11.•••■••••■•4
+
1,C)
0.1 +
C-----4======4> Field Independent Range rA w
C5
wo
Independent I0-II Boys " Girls
11-12 Boys " Girls
12-13 Boys " Girls
00
• 41;1 t51
4' + 1
tjl
2 I 2 4 Estimated Distance in Miles.
3
261

This concludes the discussion of the follow up study and the
statement and discussion of the overall results. The next chapter
presents a summary of the conclusions reached.
262
C • tH. SIX Summary of Conclusions
The following points present a résumé of the conclusions
discussed in the previous chapter.
1. The irregularity of correlations between the three measures of
cognitive style used in the study (FIT, RFT, ABC) raise questions
about their consistency and reliability as true indicators of style.
If the Embedded Figures Test is used as the indicator of cognitive
style, as is the case in many previous studies, a much clearer and
more regular series of results emerges than when all three measures
are used. It also questions the existence of the cognitive style
described by Witkin, if the level of consistency between the three
measures are as low as those described in this investigation.
2. When the measures of cognitive style are considered in relation
to intelligence, there is a very positive association between EFT
and intelligence, whereas RFT and ABC correlations are generally
higher with EFT than they are with intelligence. It is suggested
that in terms of a cognitive style which cuts across levels of
intelligence, the RFT and ABC may be better indicators - of style than.
the Embedded Figures Test, which clearly requires an intellectual
ability in its solution.
3. When considered for the sub divisions of intelligence (ie Verbal,
numerical and perceptual reasoning) the most positive association
with EFT is with perceptual reasoning as was anticipated, although
contrary to Witkin's findings and in accordance with the suggestions
of Goldstein and Blackman (1978) positive correlations were found
with both verbal and numerical reasoning. RFT and ABC also demon,.
strated more positive relationships with perceptual reasoning, but
in general correlations with verbal, numerical and perceptual reasoning
were low when compared with those of the Embedded Figures Test.
4. When the measures of cognitive style were compared with the
results of the Draw-a-Man analysis, as expected, correlations between
ABC and Draw-a,-Man were particularly strong, whereas both had demon-
strated relatively low correlations with intelligence, It is suggested
that the high positive variance demonstrated between these tests is
based upon something other than the ability to disembed (in the case
263

of the ABC) or intellectual maturity (as is the case in the D-a-M)
but represents the 'quality' of the drawings analysed in terms of
the children's level of drawing skill.
5. A clear and positive association was demonstrated between all
measures of cognitive style and spatial ability and when taken in .
conjunction with the results describing correlations with intelli-
gence, again questions the analytic/global dimension as an indepen-
dent definable characteristic. The correlations between EFT, RFT
and ABC and Spatial ability again demonstrated stronger associations
for EFT, yet correlations for RFT/ABC and Spatial Test 2 are amongst
the strongest reported for these two tests. These results provide
further evidence of the Embedded Figures Test in particular as a
measure of something other than cognitive style and since many
investigations have relied upon results of this test as their indi-
cator of style it must raise questions about the reliability of
their conclusions.
6. When aspects of orientational ability were compared with the
measures of cognitive style and with intelligence, previous findings
were confirmed (Satterly 1979) and generally at increased levels of
significance. One factor of interest which emerged from this analysis
was that the Urban children of the sample demonstrated a stronger
association between RFT and orientation and it is hypothesised that
this might be due to their greater experience of a more 'angular'
and regular environment. It was suggested that this might be an
interesting avenue for further research.
7. A relationship was demonstrated between Plan drawing and EFT
and ABC. It was suggested that ABC/Draw-a-Plan correlations may be
highlighting the drawing component of both exercises and that the
EFT/Draw-a-Plan results demonstrating the 'disembedding' skills
required to solve them both.
8. The analysis of the cognitive maps produced by the children of
the sample demonstrated that those individuals achieving higher
Embedded Figures Test scores produced maps which were more extensive,
more abstract, were more likely to adopt an overhead pas222tive
and were more accurate. Comparisons with ABC and RFT were less clear
however and the results contained a number of non-significant results.
264

The lack of consistency amongst the correlations of the measures of
cognitive style questions the hypothesised association between cog—
nitive style and environmental perception as measured by cognitive
maps, although the EMbedded Figures Test is revealed as a reliable
indicator of potential cognitive mapping ability.
9. When the results of the cognitive map analysis were compared
with the measures of intellectual ability (AH3, verbal, numerical and
perceptual reasoning) correlations were similar to those achieved
with the Etbedded Figures Test, but more positive with intelligence
than they were with RFT and ABC. The most positive associations
demonstrated were between the Extent of Map 1 (The Area where the
children lived) and Intelligence and the accuracy element of both
maps (The Area where the children lived and their Route from home
to school) and intelligence. This suggests that the association
described in point 8 above, may in fact be more a result of intelli—
gence than they are of cognitive style.
Correlations between intelligence, verbal, numerical and per—
ceptual reasoning with the map analysis were stronger for the girls
in all cases.
10. Comparison of the analysis of the two maps produced by the
children in the sample in terms of the degree of abstraction demon—
strated, perspective adopted, accuracy and style of the maps revealed
a considerable degree of consistency in the scores which offers soma
support to the argument that cognitive maps are a reliable and con—
sistent technique.
11. Previous research had identified a positive relationship between
spatial ability and the skills involved in using and producing maps.
The results of this study confirmed these findings, although
correlations were lower than anticipated. The 'Extent' of the area
map was the element that correlated most highly with spatial ability
and at a higher level than it had correlated with the Etbedded Figures
Test, suggesting that spatial ability is a greater influence than
'cognitive style' on the extent of an area depicted in a cognitive
map of an individual's locality.
265

12. The findings of Klett and Alpaugh (1976) of a developmental
association between the three cognitive transformations of cognitive
mapping of Extent (Scale in their terms), Abstraction and Perspective
were confirmed by the results of this study. The correlations between
the perspective adopted and the degree of abstraction were the. most
positive reported in the analysis and in terms of cognitive maps, it
is clear that the degree of abstraction demonstrated is dependent
upon the mental perspective adopted by the mapper.
13. The expectation of a positive correlation between map and plan
drawing were not confirmed when the maps were considered in terms of
the constituent elements of extent, abstraction, perspective,
accuracy and style, although when Draw-a-Plan scores were compared
with composite map scores (combination of scores for abstraction,
perspective, accuracy and style) a more positive relationship was
revealed, although this was still lower than expected.
14. Composite map scores, which reflected the overal talqlityt of
the maps as a whole also produced the following results,
(i) EFT scores correlated most positively of the tests of
cognitive style.
(ii) Correlations with intelligence and Spatial ability were
highly positive, especially for the girls of the sample.
(iii) Correlations with verbal, numerical and perceptual
reasoning were strongest with perceptual reasoning in
all cases except the Urban boys.
(iv) Consistency was clearly demonstrated between composite
map scores, further reinforcing the belief in cognitive
maps as a reliable measure.
15. A partialing analysis between the elements most highly corre-
lated with the composite map scores revealed that intelligence was
a significant influence on the relationship between EFT and the
production of both Maps 1 and 2 which confirms suggestions made
earlier of the underlying influence of intelligence rather than
cognitive style on the results of the study.
266

16. A similar analysis to assess the effects of age on the relation-
ship between EFT and Intelligence on the production of the Maps
suggests that the children's age Eid not appear to be a significant
influence. In terms of the inter correlational analysis however,
(i) Correlations between age and EFT are generally low,
except for Rural girls of the sample, where age appears
to be a dominant influence. Correlations with RFT/ABC
suggest that age is more influential on the drawings
produced by the children, yet when Draw-a-Man scores
are considered correlations are extremely low. (This
contradicts comments made earlier about similarities
between the ABC and Draw-a-Man exercises, or at least
points to one major difference between them, ie Age is more
influential when drawings are scored for articulation of
body concept than in the terms provided by the Draw-a-Man
analysis. This might be an interesting area for further
study). When the mean scores for the tests of cognitive
style were considered, as Witkin suggests, there is a
progressive movement towards an analytic/field independent
mode demonstrated with age, although contrary to the
findings of Witkin, the 12 - 13 year old girls mean score
was higher than that of the boys, and when more specific
sub group analysis is undertaken association with age is
not so clearly demonstrated.
(ii) Correlations between intelligence and age were, as one
might expect, comparatively high, with those of the girls
being the highest for all sub groups of the study. (ie
Age and Residence).
(iii) Success on the test of spatial ability used in the study
(Spatial Test 2) does not appear to be significantly
influenced by age.
(iv) In all cases except the Urban Boys (and in particular
the 12 - 13 year old Urban Boys) age was a considerably
stronger influence on the production of the second map
the children were asked to produce, (The Route from Home
to School) and it is suggested that more attention needs to
267

(iv) be directed in cognitive mapping studies towards the contd. relationship between age and activity. This is another
avenue for potential research. The association of age
and differences between the two map tasks were also
confirmed when the effects of age were considered for the
elements of the map analysis.
(1) The degree of abstraction demonstrated and the
perspective adopted demonstrated a more positive
association with age on Map 2 for all groups except
the Urban Boys.
(2) The accuracy of the maps seems to be more dependent
upon age for the Rural Children of the sample.
(3) The style of Map 2 appears to improve with age for
the Rural children of the sample.
(4) A closer association was identified between the
Extent of the Area maps and Age for the girls of
the sample, suggesting perhaps that it is only as
girls get older that they are given greater freedom
and hence acquire greater knowledge of their home
area which is then reflected in their cognitive
maps. This might also be worthy of further research.
17. A principal components analysis identified four significant
components which accounted for 85.V0 of the variance of the measures
used in the study. The most significant of these reflected the
common intellectual/spatial/perceptual bias of the exercises and
accounted for 53.5% of the variance. A second component, accounting
for a further 14.4% of the variance was based upon the perspective,/ abstraction demonstrated in the cognitive maps of the sample and
appears to reflect important elements of environmental perception.
Thirdly, a cognitive style factor emerged and was identified by EFT
and RFT associations and accounted for a further 10.3% of the variance.
Finally, a drawing component emerged, linking the Draw-a-Man and Articulation of Body Concept Scale and accounting for a further 7.4%
of variance.
268

18. A stepwise multiple regression analysis confirmed the under-
lying intellectual/spatial bias of the investigation and demonstrated
the multi colinearity of the variables involved. A variety of analyses
were undertaken to overcome the problems of multicolinearity.
Eventually, when the inter-correlation matrix was disattenuated to
account for error in the variables themselves, Perceptual Reasoning
emerged as the most dominant influence on the production of both maps.
The effect of age on the production of the Route Map was also con-
firmed.
19. A relationship was established between personality and cog-
nitive style. Personality characteristics associated with an analytic/
field independent style correlated positively with the measures of
cognitive style and much stronger negative correlations were estab-
lished between the measures of cognitive style and personality
characteristics associated with a more global/field dependent style.
In particular the bi-polar dimensions of 'Gives up Easily - Perseveres'
and 'Dependent - Independent' were identified by this study as being
closely associated with the analytic/global extremes. As with other
results reported, correlations with the 1'mbedded Figures Test were
the most consistent of the three measures of cognitive style. How
far the results merely demonstrate personality characteristics
associated with more or less able children was considered and
comparison of individual and composite personality scores with in-
telligence suggests that this may be true.
20. Analysis of the maps and the questionnaire for the number of
features referred to by individuals in the sample revealed little of
significance, which was particularly disconcerting considering the
length of time taken to score this analysis. The number of features
mentioned by an individual does not appear to be influenced in any
dramatic way by Age, Intelligence or Cognitive Style, although the
girls of the sample generally made reference to more features than
the boys in all activities, supporting the findings of Bishop (1973).
21. The additional analysis of the maps for the level of labelling included and the structure of the maps in the terms described by
Lynch (1960) confirmed the findings of previous research. Older
269

children tended to include more detailed labelling on their maps,
and only in the case of the Rural children was the influence of
intelligence seen to be particularly important. No clear association
emerged between cognitive style and the amount of labelling included
on the cognitive maps however.
Analysis of the maps for map structure demonstrated that younger
children's maps tended to consist primarily of Paths, Nodes and
Landmarks and there was an increased reference to Edges and Districts
in the maps of children aged 12 - 13. There were clear differences
between the Urban and Rural sub groups on this analysis, as might be
expected, since Lynch's original investigation reflected structural
organisation of Urban Environments, thus there were more Urban
children making reference to Edges and Districts. It was commented
that the nature of the task set is an important consideration in
analyses of this kind. Some tasks may not allow an individual the
opportunity to demonstrate a knowledge of districts or boundaries in
particular. Comparison of the results with intelligence and cogni-
tive style revealed that it is the more intellectually able children
who are more likely to include reference to Edges or Districts in
their cognitive maps. In general however, correlations were low.
22. The follow up study of two sub groups representing extremely
analytic/field independent individuals and extremely field dependent/
global individuals revealed the following information.
1. Analysis of mean scores on all of the exercises demonstrated the
superiority of the Field Independent subjects, which appeared to
reflect the extremes of intelligence in the sample, i.e. the
analytic field independent individuals were also the most intelli-
gent and the global/field dependent sub group consisted of the
less able children in the sample. Comparison of the sub groups
at an individual level however, revealed that there were indi-
viduals within each of the sub groups for whom cognitive style
was not a reflection of general intellectual ability.
2. Comparison of the map analysis for the two sub groups revealed
consistent differences. As had been stated for the full sample,
the more analytic/field independent individuals produced maps
which scored higher for the Extent, Abstraction, Perspective and
270

Accuracy categories, whereas the Style of the maps demonstrated
results similar to the sample as a whole, with no significant
differences emerging between the• sub groups.
3. When the map scores were combined to produce composite map
scores, Field Independent/analytic subjects' maps achieved
markedly higher scores reflecting the superior quality of their
maps as a whole.
4. Comparative analysis of the two sub groups for the number of
features they made reference to in the cognitive mapping tasks
and in their responses to the questionnaire revealed that analytic/
field independent subjects mentioned more features and therefore
a wider range of features, for all activities, which it is
suggested is representative of a more detailed and perceptive
knowledge of the features which constitute their environment.
How far this is a reflection of general ability is of considerable
importance.
5. Analysis of the different kinds of features mentioned by the two
sub groups suggests that global/field dependent children seemed
more concerned with incidental environmental features and more
socially oriented places, whereas children representing the
opposite extreme accentuated more landmark type elements. Field
independent subjects were also able to generalise better when
it came to tasks associated with environmental perception.
6. When the two sub groups were individually interviewed, Witkin's
suggestions that Field Independent/analytic individuals will
demonstrate a preference for more analytic subjects were not
supported for children in this 10 - 13 age group, whereas, as
Witkin had also asserted, Field dependent/global children demon-
strated a stronger preference than the Field independent sub
group for more gregarious activities. Although the analysis
did not fully confirm Witkin's suggestions of an association
between Field independence and more solitary activities, there
was certainly evidence of a stronger bias in this direction for
the children in the extreme analytic/field independent sub group.
In response to questions about freedom of movement in their
environment, rather than being associated with cognitive style,
271

differences in this study seem to be dependent upon age, es-
pecially for the girls. As was suggested earlier (16,iv,4)
older girls appear to be given considerably more freedom than
younger girls and boys seem to be granted freedom earlier
than girls.
When the children were asked to comment upon changes they
had seen, or that they would wish to see in the area where they
lived, the major differences appeared to be in relation to the
articulacy of the field independent sub group, which adds
further evidence of the underlying intellectual element of the
analytic/global dimension. Reference to the differences in
Verbal reasoning scores confirmed this for the majority of the children, but as stated before, there were exceptions.
Finally, the interview appeared to reveal a more constructively
critical approach to the problems of cognitive mapping by the
analytic/field independent sub group. This was confirmed in
the Field exercise which the two sub groups participated in.
This raises another area of potential research.
7. The field exercise required the noting of features. felt to be of
importance whilst on a short walk. As reported previously field
independent individuals noted more features, when compared by
age, sex and as full sub groups. There were also definite sex
differences hodever, with the girls tending to note more features
than the boys. When the features were analysed for differences,
as suggested earlier, the analytic/field independent children
included more specific landmark type elements, especially the
girls who included a very detailed catalogue of street names.
Field dependent's on the other hand included incidental and often
ephemeral environmental features. More field independent indi-
viduals included orientational and directional detail and.several
field dependent subjects made orientational errors in their maps
of the walk undertaken whilst on the field exercise.
Analysis of the maps of the field exercise revealed similar
results to those previously discussed, with analytic field
independent individuals scoring more highly on all elementS of
the map analysis. Comparison of the three maps produced by the
272
children in the follow up study demonstrated a high degree of
consistency in the scores for all exercises and further confirms
the cognitive map as a consistent means of measuring an individual's
perception of his environment.
8. A final element of the Follow up study revealed that Field Independ-
ent individual's tended to be more accurate in their estimation of
the distance walked whilst on the field exercise, although all groups
improved in accuracy with age. This is an area which could be
explored in greater detail.
The original intention of this undertaking was to examine the
relationships between children's cognitive style and their perception of the
environment. The potential of this area for exploration and explanation for
both geographers and psychologists has been recognised and commented on by
others (Hart 1979, p 18) and especially in terms of the cognitive style
dimensicn identified and so thoroughly researched by Witkin and his
colleagues. The main findings of this study, however, appear to raise
doubt about the existence of a cognitive style, in the terms described by
Witkin, which is independent of the level of intellectual ability of the
majority of individuals. What has emerged seems to reinforce the comment
of Bruner mentioned in the text (p 47), that in any group,'individual
differences exist in massive degree'. The conceptualisation suggested by
Witkin, however attractive, appears somewhat simplistic in the face of
the wide variations of individual difference that exist within the population.
One important point however, is that it is too easy when considering a
cognitive style dimensicn which describes differences in extremes, to
view the world as if it is populated by the extremes,rather than the
range between the two extremes. As has been demonstrated, the numbers of
this sample falling at the ends of the continuum is extremely small.
One final point questions why someone as eminent as Witkin bos
devoted so much time and effort to an area which recent research has
raised doubts about? One of the most recent articles from the Witkin group
(Witkin et al 1977) contains an extensive array of supportive evidence,
but makes little reference to criticisms levelled at their findings. In
any area of research the time and effort demanded involves considerable
career investment and one often feels impelled to justify and substantiate
a perspective with which one is closely associated, as has been demonstrated
by supporters of the work of Piaget in the light of recent critical
comment. As has been indicated however, it is possible to identify
individuals who demonstrate the capacities identified by Witkin, but which
do not reflect levels of general ability. In this study the numbers were
extremely small, and by implication it appears that sampling is a crucial 273

factor in the investigation of cognitive styles. It is also the case that
any discernable differences, not dependent upon intelligence, are more
likely to be identified when the original testing instruments of the Body
adjustment Test and the Rod and Frame Test are used. Most recent research
has relied on the Embedded Figures Test as its measure of cognitive style,
and the results of this study suggests that by doing so researchers have
probably distinguished between their sample in terms of general intelligence
rather than by cognitive style.
Brophy (1982), in the conclusion to his study refers to Cronbach (1971),
"Theories are intellectual tools conceptual frameworks
deliberately devised for effectively directing experimental enquiry
and for exhibiting connections between matters of observation that
would otherwise—be regarded as unrelated."
Witkin's researches have attempted to connect that which had previously
been regarded as unconnected, and in doing so has crossed boundaries between
diverse psychological areas which were previously treated separately, in
particular those of cognition, intelligence, personality and social behaviour.
Studies of Environmental Knowing have attempted a similar cross fertilisation
of ideas between the social and behavioural sciences, and this study was an
attempt to extend that process. The results of the study, however, do not
confirm the anticipated association between cognitive style and environmental
perception. Despite this, it is hoped that much of interest has been revealed
and as has been indicated in the text,that it has raised potentially useful
questions for further research.
273a

-

BIBLIOGRAPHY.
Abercrombie,M.L., 1960. The Anatomy of Judgement, Hutchinson.
Abse,D.W., 1966. "Sone Psychological end Psycho-analytic
aspects of Perception", Perception end
Environment-Foundations of Urban Design,
Stripe,R.E.,(Ed), Chapel N.C., Institute
of Government, University of North
Carolina, p. 11-16.
Abt,C.C., 1970. Serious Games, New York,Viking.
Acredolo,L•P • 1976. "Frames of Reference used by children for
Orientation in unfamiliar spaces", Ch. 13,
in Moore,G.T.and Golledge,R.G.,(eds)
Environmental Knowing, Dowden, Hutchinson
and. Ross, p. 165-172. Aoredolo,L.P., 1977. "Developmental Changes in the ability to
co-ordinate perspectives of large-scale
space", Developmental Psychology, Vol. 13,
No. I, p.
Allport,F.H., 1955. Theories of Perception end the concept cf Structure, New York, Wiley, p. 14-15.
Anastasi,A., 1963. paychological Testing, McMillan.
Andrews,H.F., 1973. "Home-range and the Urban knowledge of
school-age children", Environment end
Behaviour, Vol. 5, March, p. 73-81. Anthony,W.S., 1977. "Activity in the learning of Piagetian
Operational Thinking", British J. Ed. Psych.,
Vol. 47, p.18-24. Appleyardp., 1970. "Styles and methods of structuring a city",
Environment and Behaviour, Vol.2, Jan,
Arbuthnot,J., 1972. "Cautionary note on the measurement of
Field Independence", Perceptual and Motor Skills, Vol. 35, p.479-488.
Ausubel,D.P., 1967. "A cognitive structure theory of school
learning", in Siegel,L., (Ed), Instruction: some contemporary viewpoints, San Francisco,
Chandler.
Badger,M., 1979. "The construct validity end reliability of
the Matching Familiar Figires Test as a
measure of Reflection-Impulsivity", Unpub.,
PhD., University of London. 274

Bibliomply cont.
Balchin,W.G.V., and 1965.
ColemankA.M.,
BaldwinpA.L., . 1967.
Bale,J., Graves,N., 1973. and Walford,R., Bannisterp., and 1968.
Banz,G., 1975.
BarclayA. end 1967.
Cusumano,XR.,
Bartlett glio 1932.
Bart ley,S .H. 1958.
Bayliss,D.G. and 1966.
Renwick,M.,
Bell,E.G., 1955.
Berry,J.W., 1966.
Berry,J.W., 1967.
Bieri,J., Bradburn,W. 1958.
end Galinsky,M.D.,
Biel,A. and Torrent 1977. G•9
Bieri,J.,Atkins,A.L., 1966.
Briar,S.,Leaman,R.L.,
Miller,H. and
Tripodi,T.,
Bishop,J. and Foulsham,J.,
"Graphicacy should be the Fourth Ace in
the pack", Times Ed. Supp., 5th Nov.
Theories of Child Development, New York,
Wiley.
Perspectives in Geogmphical Education,
Oliver and Boyd. The Evaluation of Personal Constructs,
Academic Press. Elements of Urban Form, Mc grave Hill, 2nd
Edition.
"Father absence, cross-sex identity and
Field Dependent behaviour in male adolesc-
ents", Child Development, Vol. 38, p.243-250.
Remembering, C.U.P.
Principles of Perception, New York, Harper
and Row, p.449. "Photograph Study in a Junior School",
Vol. 51, p.322-329.
"Inner -directedness and other directed
attitudes", Unpub. Doctoral Dissertation,
Yale, discussed in Witkin,H.A.,et al (1971) ,
A Manual for the Embedded Figures Test,
P.9. "Temne end Eskimo Perceptual skills",
International Journal of Psych., Vol.I,
p.207-229.
"Independence and conformity in subsistence level societies", Journal of Personality
and Soc. Psych., 7b1.79 p.415-418. "Sex differences in Perceptual behaviour",
Journal of Personality, Vb1.26, p.I-I2;
"The mapped environment: Cognitive aspects
of children's drawings", Goteborg Psych -
°logical Reports, Vol.7, .
Clinical end Social Judgement: The
discrimination of Behavioural Information.
New York, Wiley.
1973. "Children's Images of Harwich", Working ,per No.3, Arch. Psvchol. Res. Unit,
Kingston Polytechnic. 275

Bibliog:s.ity cont.
Bishop,J.,
Blakemore,C., • Blakemore,C.,
Blaut,J.M.,
Blaut,J.M.,
McGlearey,G.S.,
and Blaut,J.S.,
Blaut,J.M., and Stea,D.,
Blaut,J.M., and
Stea,D.,
Blythe,W.A.L., and
Derricott,R.,
Bochenski,I.M.,
Boden,M.A.,
Bordessa,R.,
Boulding,K.E.,
Bower ,T. G.R.
Brody,N.
Brodzinsky,D.M.,
Brookfield,H.C.,
Brown,G., and
DesforgeS,C.,
Brown,W.,
1977. "Routes to school", Athene, 65, Summer, p.20-22.
1976. "An Image of truth", The Listner, 25th Nov.
1977. Mechanics of the mind, Cambridge, C.U.P. 1979. "The Dissenting Tradition", A.A.A.G.,
March, p.157 164.
1'970. "Environmental Mapping in young children",
Environment and Behaviour, Vol.2, p.335- 349.
1974. "Mapping at the age of three", Journal of.
Geogra.17, No.7, October.
1971. "Studies of Geographic Learning" , A .A .A .G.
Vol.61, p.387-393.
1977. The Social Significance of Middle Schools, London, Batsford.
1966. Contemporary European Philosophy, University
of California Press.
1979. Piavt, Glasgow, Fontana/Collins. 1969. "Perception Research in Geography: An
appraisal and contribution to Urban
Perception",12pt. of Ceogu_Selnillar.P_a_per
No.8, University of liewCastle.
1956. The Image: Knowledge in Life and Society,
Ann Arbor, Mich., University of Michigan
Press.
1974. Development in Infancy, San Francisco,
Freeman.
1972. Personality Research end Theory, New York,
Academic Books. 1980. "Cognitive Style differences in children's
Spatial Perspective Takind', Developmental
Psychology, Vol.16, p.I51-152.
1969. "On the Environment as perceived", Progress
in Geography: International reviews of
Current Research, London, Arnold, p.52-80.
1979. Piaget's Theory. A Psychological Critique, London, R.K.P.
1932. "Spatial Integration in a Human Maze",
University of California publications in
Psychology, Vol.5, Part 6, p.123-134.
276

Bibliography cont.
Bruner,J.S.,
Goodnow,J. and
Bruner,J.S.,
Bruner,J.S.,
Bruner,J.S.,
Bruner,J.S.,
Brunswick,E.,
Bryant,P.E.,
Bryant,P.E.,
Burgess,J.A.,
Burton, I.,
Busse,T.V.,
Buttimer,A.,
BycroftiP.,
Byrne,R.W.,
CallandtA.R.,
1956. A Study of Thinking, New York, Wiley.
1957• "On Perceptual readiness", Psychological Review, Vol.64, p.184-I92.
1963. The Process of Education, New York, Vintage
Books.
1966. Toward a Theory of Instruction, Cambridge,
Mass., Harvard University Press.
1974. Beyond the Information Given, London, George ellen and Unwin.
1956. Perception and the representative desie
of Psychological experiments,Berkley,
Calif., University of California Press.
1971. "Cognitive Development", British Ledical
Bulletin, Vol.27, No.3, p.200-205.
• 1974. Perception and Understandingin Young Children, London, Methuen.
1979. "Place-making: The contribution of Environmental Perception studies in
planning", Geography, Vol.64, Part 4,
Nov. p.317-326.
1963. "The Quantitative Revolution and
Theoretical Geography", Canadian Geog.,
p.15I-162.
1968. "Establishment of the flexible thinking
factor in fifth grade boys", Journal of
Psychology, Vo169, p.93-100.
1972. "Social space and the planning of
residential areas" Environment and
Behaviour, Vol. 4, p.279-310. 1974. Environmental Representation and Cognitive
Spatial Ability: The case for Cognitive
Mapping as a process. Unpublished M.Sc.,
Dept. of Psychology, University of Surrey.
1979. "Memory for Urban Geography", Quarterly Journal of Experimental Psychology, Vol. 31,
p.147-I54.
1973. An Investigation of the Images held by a small sample of primary school children
of their local environment, Unpublished Masters Thesis, University of London.
277

Bibliography cont.
Canavan,D., 1969. "Field Dependence in children as a
function of grade, sex end ethnic group
• membership", Paper presented to the
American Psychological Association,
Washington D.C., discussed in Goldstein,K.M., and Blackman,S.,(Eds), Cognitive Style-
Five Approaches and Relevant Research,
Wiley, 1978, p.I86-187.
Canter,D., and 1974. Zsycholopv and the Built Environment,
Lee,T., Tonbridge, Kent, Architectural Press.
Canter,D., 1977. The Psychology of Place, London, Architectural Press.
Carr,S.land 1968. "Where Learning Happens", Daedalus, Vol.
Lynch,K., 97, p.1277-I291. Case,R., 1974. "Structures and Strictures-Some functional
limitations on the course of cognitive
growth", Comitilepsycl, Vol. 6, P.544-573.
Case,R., 1977. "Responsiveness to conservation training as a function of induced subjective
uncertainty in space and cognitive style",
Canadian Journal of Behavioural Science, Vol. 9, p.I2-25.
Case,R., and 1974. "Field Independence and Central Computing
Globerson,T., Space", Child Developmentjol. 45, p.772— 778.
Cashden,A., and 1971. Learning Styles, Open University Press,
Lee,V., Units I and 2 of O.U. Course, E.281.
Catling,S.J., 1978. "The child's spatial conception and
Geographic Education", Journal of Gem.,
Jan., p.24-28. Catling,S.J., 1978. ncoEslitive mapping as a Primary Geograph-
ical Experience", Teaching Geography,Jan.
Catling,S.J., 1979. "Children's maps of Place", Paper presented to the International Conference on
Environmental Psychology, University of Surrey, July.
Cattell,R.B., 1965. The Scientific Analysis of Personality,
Harmondsworth, England, Penguin Books.
278

Bibliography cont.
Cattell,R.B., 1969.
Chomsky,N., 1965.
Coates,S., 1974.
Cohen,J., 1957.
Cohen,J., 1959.
Cohen,B.D., 1973. Berent,S., and
Silverman,S.J.,
Conner,C., 1969.
Constantinople,A., 1974.
Corah,N.L., 1965.
Craik,K.H., 1968.
Craik,K.H. 1970.
"Is Field Dependence an expression of
the general Personality source trait of
U.I.19?", Perceptual and Motor Skills,
Vol. 28, p.865-866. Aspects of the Theory of Syntax, Cambridge,
Mass., M.I.T. Press.
"Sex differences in Field Dependence-
Independence between the ages of 3 and 6", Perceptual and Motor Skills, Vol. 39, p.1307-1310.
"The factorial structure of the
between early adulthood and old age",
Journal of Consultiu•Psycholmr, Vol. 21, p.283-290.
"The factorial structure of the \V.I.S.C.
at ages 7.6, 10.6, and 13.6", Journal of
Consulting Psycholor, Vol. 23, p.235-299.
"Field Dependence end lateralisation of function in the human brain", Archives of General Psychiatry, Vol. 23, p.165-167. "The development of 'Graphicacy' in
children between the ages of 9 and I4", Unpublished Dissertation of the University
of Sussex.
"Analytic ability and perceived similarity to parents", Psychological Reports, Vol. 35, p.1335-1345. "Differentiation in children end their .
parents", Journal of Personality, Vol. 33, p.300-308.
"The ComDrehension of the everyday phys'ical environment",Jouraal of the American
Institute of Planners; Vol. 34, p.29-37.
Cohen,J. and
Cohen,P.,
"Environmental Psychology", Ch.L, in New Directions in Psychology, Vol.4,
p.I-121, New York, Holt, Rinehart and Winston.
1975. Applied Multiple RegrAion Correlation Analysis for the Behavioural Sciences, L.B.A.
279

Bibliography cont.
Crandell,V.J., and 1964. Sinkeldam,C.,
Cronbach,L.J., • 1972. Gleser,G.C.,Nanda,H.,
and Rajaratnam,N.,
Crutchfield,R.S., T958. Woodworth,D.G.,and
Albrecht,R.E.,
Dawson,J.L.M., 1971.
"Children's dependent and achievement
behaviours in social situations and
their perceptual field dependence", Journal of Personality, Vol.32, p.I-22.
The dependability of Behavioural
Measures, New York, Wiley.
"Perceptual performance and the effective person", Lackland Air Force Base, Texas,
Personnel Laboratory, Wright Air-Develop-
ment Centre, TN-58-60, Astia document
No.151 039.
"Cultural and Physiological influences
upon spatial perceptual processes in
W. Africa", Part One: International Journal of Psychology, Vol.2, Part 2,
p.I15 -128, Part Two: International
Journal of Psychology, Vol.2, Part 3, p.171-185.
"Theory and Research in cross-cultural
Psychology", Bulletin of the British
Psychological society, Vol.2, 85, p.291-306.
Dewson,J.L.M., 1967.
DiStefano.J.J.,
Dodwell ,P,.0
Doebler,L.K. and
Donaldson,M.,
1969. "Interpersonal perceptions of Field-
Independent and Field Dependent teachers
and students", Doctoral Dissertation,
Cornell University. (Dissertation abstracts International, 1970, 31, 465t
464A. University Microfilms No.70-11,225.) 1972, "Studies of the Visual System", in Foss,
B.M. (Ed.), New Horizons in Psychology
Harmondsworth, Penguin Books.
1979. "Effects of Teacher awareness of the
Educational Implications of Field depend-
ence/Field independence Cognitive styles
on selected classroom variables", Journal
of Educational Psychology, Vol.71, No.2,
p.226-232.
1978. Children's Minds, London, Fontana..
280

Bibliography cont.
Donnelly,D. and 1973. "Meaning in Imagery / The role of
Menzies,M., Personal Construct Theory", Working Paper
No.2, UniversitycIllsgashELLEtmliss
Urban and Regional Studies, October.
Donnelly,D., 1973. "Perception Related survey for Local
Goodey,B. and Authorities -A pilot study in Sunderland",
Menzies,M., Research Memorandum No.20, University of
Birmingham Centre for Urban and Regional
Studies, April.
Downs,R.M., 1970. "Geographic Space Perception: Past Approaches and iture Prospects", in
Board,C. et al, (Eds.), Progress in
Geography: International Reviews of Current
Research, London, Arnold9 p.67-108. Downs,R.M. and 1973. Image and Environment: Cognitive mapping
Stea,D. (Ede.), and Spatial Behaviour, London, Arnold.
Downs,R.M., 1976. "Cognitive mapping and Information Processing: A commentary", Ch.5, in
Moore,G.T. and Golledge,11.R.,(Eds.), Environmental Knowing, Stroudsburg, Penns-
ylvania, Dowden, Hutchinson and Ross, p.67 - 70.
Downs,R.M. and 1977. Res in Mind: Reflections on Cognitive
Stea,D., Mapping, New York, Earner and Row.
Downtcn,P.J., 1973. "Children's Perception of Space Project:
Melbourne study, preliminary draft", School
of Architecture end Building, U.N.E.S.C.O., (Also in Lynch,K.,(Ed.), 1977, Growinkup
in Cities, Unesco Paris, MIT Press.
Dubois,T.E. and 1970. "Relationship between measures of
Cohen,W., Psychological differentiation and Intellectual ability", Perceptual and
Motor Skills, Vol.34 p.411-416. Duckworth,E., 1979. "Either we're too early and they can't
learn it or we're too late and they know
it already: The dilemma of applying Piaget", Harvard Ed. Rev., Vol.49, No.3, August,
p.297-312. Dyk,R.B., 1969. "An exploratory study of mother-child
interaction in infancy as related to the
development of differentiation", Journal of
AM. Ac. Child Devel.,Vol.8„ p.657-691. 281

BiblAo Is cont.
Dyk,R.B. and
Eagle,M.,
Goldberger,L. and
Breitman,M.,
Entwistle,N.,
Fntwistle,N.,
Entwistle,N.,
Epstein,W.,
Evans,F.J. end
Schmeidler,D.,
Evon,L.D.,
Fant z ,R *I. ,
Ferrel.J.G.,
Lewis,S. and
Keiffer,K.,
Flavell,J.W.
and Wohlval,J.F.,
1965. "Family experiences related to the
development of differentiation in
children", Child Development, Vol.30, p.21-55.
1969. "Field dependence and memory for social
versus neutral and relevant versus
irrelevant incidental stimuli", Perceptual
and Motor Skills, Vol.29, p. 903-910.
1977. "Strategies of Learning and Studying - Recent research findings", B.J.Ed.Studies,
Vb1.25, No.3, Oct., p.225-238.
1979. "Stages, Levels, Styles or Strategies- dilemmas in the description of thinking",
Ed. Review, Vo1,31, No.2.
1981. :Lyles of learning and Teaching: An
integrated outline of Educational psychology
for students, teachers, and lecturers,
Chichester, Wiley.
1967. Varieties of Perceptual Learning, New york, McGraw Hill.
1966. "Interjudge reliability of human-figure drawing meacures of Field Dependence",
Perceptual and Motor Skills, Vol.22, p.630.
1965, "Review of Rorschach Test", in Buros,O.K.,
(ed.), Sixth Mental Measurement Yearbook,
New York, Gryphon press, p.495-501.
1964. "The Origins of Form Perception", Science, Vol.146, p.668.
1970. "The differential performance of lower class pre-school negro children as a
function of E, sex of SI reinforcement
condition and level of Field dependence",
Unpublished Doctoral Dissertation, Univ.
of 0. Mississippi, (University Microfilms
1970 No. 71-28-831.).
1972. "Children's understanding of spatial
relations: Co-ordination of perspectives",
Developmental Psychology, Vol.?, p.21-33.
1969. "Formal and Functional aspects of cognitive
development", in Elkind,D. and Flavell,J.H.,
(Eds,), Studies in Cognitive Development,
New York, O.U.P., p.67-120. 282

Biblioanhy cont.
1976.
Fonaroff,L.S., 1963.
Forbes,J., 1974.
Gardner,R.W., 19 59. Holzman,P.S.,Rlein,H.,
and Spence,D.P.,
Gardner,R.W., 1960.
Jackson,D.N.,and
Messick,S.J.,
Gerson,E.M. and - 1976.
Gerson,ILS.,
Cognitive Styles,Block 5, O.U. Course
E 201, Personality and the Growth of
Learning, Milton Keynes, Open University
Press.
"Conservation and stock reduction on the
Navajo Tribal Range", Geouaphical Review, Vol.53, p.200-223.
"Towards a Co-ordi noting Framework for
Environmental Education: A Planners View",
B.E.E., Vol.35, March, N9-18.
"Cognitive control: A Study of individual consistencies in cognitive behaviour", Psychological Issue, Vol.', No.4. "Personality organisation in cognitive controls and intellectual ability",
Psychological Issues, Vol.2, Part 4, No.8. "The Social Framework of Place perspectives",
Ch.16 in Moore,G.T. .and Golledge,R.S., (Eds.) Environmental Knowing, Stroudsburg,
Pennsylvania, Dowden, Hutchinson and Ross, p.196-205.
Gibson,J.J. and
Gibson,E.J.,
Gibson,J.J.,
Gibson,E.J.,
Golant,S., and. Burton,I.,
Gold,J.R.,
Gold,J.R.
1955. "Aspects of Perception",Psychological Review, Vol.62, p.32.
1966. The Senses viewed as PerceptualSystems,
Boston, Houghton Mifflin.
1969. Principles of Perceptual Leerning,and
Development, New York, Appleton-Century. Crofts.
1976. "A Semantic Differential Experiment in the interpretation and grouping of
environmental hazards", Ch.33, in
Moore,G.T. and Golledge,G.R. (Eds.), Environmental Knowing, Stroudsburg, Pennsylvania, Dowden, Hutchinson and Ross,
p.364-374.
1977. "Teaching Behavioural Geography" Journal
of Geography in Higher Education, Vol.1„ No.I, p.37-46.
1980. An Introduction to Behavioural Geoesphy, New York, Oxford University Press. 283

Bibliogvphy cont.
Golledge ,R G. ,
Coodenough,D.R.,
Goodenoughp.R. and
Eagle,C.J.,
GoodenoughiD.R. and
Karp,S.A.,
Goodenough,D.R. and
Witkin,H.A.,
Coodenouh,F.L.
Goodey,B.,
Goodey,B.
1978. Cognitive Style -Five Approaches end
Relevant Research, New York, Wiley.
1975. "Learning about a city: analysis by
multi-dimensional scaling"
Golledge,R.G. and Rushton,G., (Eds.), Spatial choice and Spatial Preference,
Ohio, Ohio State University Press.,
1976. "Methods and methodological issues in
Environmental Cognition Research", Ch.28,
in Moore,G.T. and Golledge.R.G.,(Eds.),
Environmental Knowing, Stroudsburg,
Pennsylvania, Dowden, Hutchinson and
Ross, p. 300-313.
1976. "The role of Individual differences in
Field dependence as a factor in learning
and memory",Psychological Bulletin.% Vol.
83, p.675-694.
1963. "A modification of the Edbedded Figures
Test for use with young children",
Journal of Genetic Psychology, Vol.103,
p.67-74.
1961. "Field Dependence and Intellectual- .
functioning", Journal of Abnormal and,
Sccial Psychology, Vol.63, p.241-246.
1977. "Origins of the Field dependent and
Field independent cognitive style", . ETS-RB-77-9, Educational Testing
Service abstracts, Educational Testing
Service, Princeton.
1926. Measurement of Intelligence by drawingg,
New York, Harcourt Brace end World.
1973. "Perception of the Environment", 0cc.
Paper No.17, University of Birmingham
Centre for Urban and Regional Studies.
1974. "Images of Place", Occ. Paver No.50,
University of Birmingham Centre for
Urban and. Regional Studies.
"The last Environmental Perception
Checklist", Res. Memo No.22, University
of Birmingham Centre for Urban and
Regional Studies, March.
Goldstein,K.M[. and
Blackmen,S.,
Golledge,R.G.,.
Rivizzingo,V.L. and
Spector,A.,
Goodey,B., Spencer,D., 1975.
and. Manie1s$R.$
284

Bibliogrlphy cont.
Goodnow,J., 1977.
Gottschaldt,K., 1926.
Gould,P.R., 1973.
Gould,P. and 1974. White,R.,
Graham,E., 1976.
Graves ,N.J. 1975.
Gregory,R.L.; 1966.
Grieve,T.D. and 1971.
Davis,J.K.,
Gruen,A., 1957.
Cuilford,J.P., 1959. Gulick,J., 1963.
Calliver,F.P., 1908.
Hall,E.T., 1959.
Handel,R., 1972.
Children's Drawing2„ London, Fontana/
Open Books.
"bber den EiniLms der Ehrfahrung auf
die wahrnehmung vin figuren I, uber den
einfluss gehaufter eingragung von
figuren auf ibre sichtbarkeit in
umfassenden konfigurationen", psycho'.
Forsch., Vol.8.,p.261-317. (Discussed
in Witkin et al, 1971, A manual for the
Embedded Figures Test, Palo Alto, Calif.,
Consulting Psychologists Press.
"The Black boxes of Jdnk6ping: Spatial
information and Process", in Downes,R.M.
and Stea9D., (Eds.), Man and Environment:
22.&nitive ;,Mapping and Behaviour,
Chicago, Aldine*
Mental Maps, Harmondsworth, Penguin
Books.
"Criticism of Cognitive Yaps", A.R.E.A.,
No.4, p.259-262.
Geogopty in Education,London, Heinemann
Educational Books.
Eye and Brain: The Psychology of Seeing,
New York, McGraw Hill.
"The relationship of cognitive style
and method of instruction to performance
in ninth grade geography", Journal of
Educational Research, Vol.65, p.135-141.
"A Critique and re-evaluation of Witkints
perception and perception-personality
work", Journal of Genetic Psychology,.
vol.56, p.73-93.
Personality, New York, McGraw Hill.
"Images of an Arab city", Journal of
the American Institute of Planners,
Vol.29, p.179 198.
"Orientation of Maps", Journal of Geog.
Vol.7, p.55-58.
The Silent Lane lm, New York, Doubleday.
"Perception of verticality of a modified
portable Rod and Frame Test", Perceptual
and Motor Skills, Vol.34, P.459-468. 285

Bibliography cont.
Harpham,T.,
Harris,D.B.,
Harris,J.G.,
Harrison,J. and
Sarre,P.,
Harrison,J. and
Sarre,P.,
Harrison,J. and
Sarre,P.,
Hart,R.A. and Moore,G.T.,
Hart,R.,
Harvey,O.J.,
1979. "Psychology into Geography: Personal Construct Theory on the measurement of
Etvironmental Images of Portsmouth",
South Hampshire Geographer, Vol.II.
1963. Children's drawings as measures of
intellectual maturity,New York, Harsup.
1960. "Validity: A Search for a constant in a universe of variables", in Rickers-
Ovsiankia, (Ed.), Rorschach Psychology, New York, Wiley.
1971. "Personal Construct Theory in the
measurement of Environmental Images:
One: Problems and Methods", Environment
and Behaviour, vol.3, p.351-374.
1974. "Personal Construct Theory in the measurement of Environmental Images:
Two: Applications", Environment and
Behaviour, Vol.6,
1976. "Personal Construct Theory, the
Repertory Grid, and Environmental
Cognition", Ch.34., in Moore,G.T. and Golledge,G.R., (Eds.), Environmental Knowing, Stroudsburg, Pennsylvania,
Dowden, Hutchinson and Rosa, p.375-384.
1973. "The Development of Spatial Cognition: A Review", in Downs,R. and Steap., (Eds.), Imagrand Environment: Cognitive mapping
and Spatial Behaviour Chicago, Aldine,
p.246-288.
1979. Children's Experience of Place, New York, Irvington.
1963. "Authoritarianism and conceptual
functioning in varied conditions", Journ.
olyerscrtylelit, Vol.31, p.462-470. Conceptual Systems and Personality
Orgnallatimj New York, Wiley.
"The Development of children's represent-
ations of Large-Scale Environments",
Child Development, vol.49, p.623-636. AH2/AH3 rianuell Windsor, N.F.E.R.
Publishing Co., Second Edition. 286
Harvey,O.J.,Bunt,D.E., 1961. and Schroder,H.M.,
Hazen,N.L., 1978. Lockman,J.J.and
Pick,H.L.,
Heim,A.W., Watts,K.P. 1978.
and Simmonds,V*.,

BibliogIaphy cont.
Holloway,C.,
Horton,F. and
Reynolds,D.R.,
Ittelson,W.H.,
Ittelson,W.H.,
Ittelson,W.H.,
Johnsen,D.T., Neville,C.W. and
Workman,S..N•
JurkG,C .G.
1972. Perception. ntchanisms and Models,
San Francisco, Freeman.
1978. "The Development of Cognitive Mapping in
the Large-Scale Environment", Journal of
Experimental Child Psychology, Vol.26.
1978. Cognitive Psychology, Units 22-23, Open
University Course D.303, Milton Keynes,
Open University Press.
1969. "An Investigation of Individual Action Space: A Progress Report", ProceedineB
of the Association of American Ceogrphers,
Vol.1, p.70-75.
2968. "Comment on, 'Figural after-effects,
illusions and the dimension of Field
dependence", Perceptual and Motor Skills,
Vol.II, p.367.
195I. "The constancies in Perceptual Theory",
Psychological Review, Vol.58, p.285-294.
1960. Visual Space Perception, New York,
Springer.
1973. "Environmental Perception and contempory
perceptual theory", in Ittelson,W.H., (Ed.),
Environment and Cognition, New York,
Seminar Press, p.I-19.
An Introduction to Environmental Psychology,
New York, Holt, Rinehart and ffinston.
Human Spatial Behavior-A Social Geogrzty,
New York, Duxbury Press.
"Evaluation of Group and Individual forms
of the Embedded Figures measure of Field
Independence", Educ. Psychol., Vol.24,
p.177-1920
1969. "Field Independence and the Sixteen
Personality Factor Questionnaire: A
Further note", Perceptual end kotor Skills,
Vol.28, p.670.
1953. Two Essays on Anelytic Psycjloy,London,
Held,R. and
Richards,W.,
Hermen,J.F. and
Siegel ,A .W.
Ittelson,W.H., 1974. Proshansky,H.M.,
Rivlin,L.G. and
Winkel,G.H.,
Jackle,J.A.,Brunn,S., 1976.
end Rosemen,O.C.,
Jackson,D.N., 1964.
Messick,S. and
Myers,C.T.,
287

Bibliography cont.
Kagan,J., Moss,H.A. 1963. "Psychological significance of styles of
and SigellIX., conceptualisation", in Wright,J.C. and
Kagan,J., (Eds.), Basic Cognitive Processes • in children, Monographs of the Society for
Research in Child Develo went, Vol.28, No)20
Kagan,J.,Roseman,B., 1964. "Information Processing in the Child:
Day,D.,Albert,J, Significance of analytic and reflective
and PhillipsiU., attitudes", Psychological Monogvph2j Vol.78,
No.'.
Kagan,J. and 1966. "Annuel Review of Psychology", Developmental
Henker,B., Psychology, Vol.17, p.1-50.
Kagan,S. 1974. "Field Dependence and conformity of Rural
Kaiser,P.,
Kaplan,A.,
Kaplan,S.,
Kaplan,S.,
Eaplan,S.,
Karp ,S .A
Karp,S.A
Karp,S.A.,
Silbermen,L. and Vanters,S.,
Mexican and Urban Anglo-american children",
Child Development, V0145, P.765-771.
1971. Principal Components Analysis, in Cooley,W.
and Lohnes,P.R., Multivariete Data Analysis,
New York, Wiley.
1964. The Conduct of Inquiry, San Francisco,
Chandler.
1973. "Cognitive Naps in Perception and Thought",
in Downs,R.M. and Steap. (Eds.), Imam
end Environment: Cognitive Mapping and
patisl Behaviour Chicago, Aldine, p.63-78.
1974. "Cognitive Naps, Human needs and the
designed environment", Ch. 5.4, in Preiser,W.F.E., (Ed.), Environmental
Design Research Vol.I, Stroudsburg,
Pennsylvania, p.275-283.
1976. "Adaption, Structure and Knowledge", Ch.2, in Iloore,G,T. and Golledge,R.G., (Eds.),
Environmental Knowing, Stroudsburg,
Pennsylvania, Dowden, Hutchinson and Ross,
p•32-45.
1967. "Field Dependence and occupational activity
in the aged", Perceptual and Motor Skills,
V01.249'13.603-609.
1963. "Field Dependence and overcoming embedded-
noes", Journal of Consulting Psychology,
Vol.27, p.294-302.
1969. "Psychological differentiation and socio- economic status.", Perceptual and Motor
Skills, Vol.28, p.55-60. 288

Bibliography cont.
Kelly,G.,
Kerlinger,F.J. and.
Pedhazur,E.J.
Kirk,W.,
KLett,F.R. and
Alpaugh,D.
Kogan,N.,
Kogsn,N.,
Kogan,N.,
Konst a dt ,11. and
Foremen,E.,
1967, "The Perception of storm hazard on the
shores of megalopolis", in Lowenthal,D.,
(Ed.), Environmental Perception and
Behaviour, University of Chicago Dept. of
Geography, Research Paper No. 109, p. 60- '
69.
1970. "Human Perception of the Environment",
International Social Science Journal,
Vol.221 No.4, p.648-660.
1955. The Psychology of Personal Constructs,
(Volumes I and II), New York, Norton.
1973. Thltiple Regression in Behavioural
Research, New York, Wiley.
1952. "Historical Geography and the concept of
the Behavioural Environment" , Indian
Geographical Journal, Jubilee Issue,
p.152-160. (Discussed in Wood,L.J.,
"Perception Studies in Geography",
I.B.G.Transactions, No.50, July 1970,
p.129-I41.)
1963. "Problems in Geography", Geography,
P•357-371.
1976. "Environmental Learning and Ierge-
Scale Environments", Ch.I0, in Moore,G.T.,
and Golledge,R.G,, Environmental
Knowing, Stroudsburg, Pennsylvania,
Dowden, Hutchinson and Ross, p.I21-130.
1971. "Educational Implications of Cognitive
Styles", Ch.I0, in Lesser,G.S., Psycholog7
and Educational Practice ,Glenview,
Illinois, Scott, Foresman.
1973. "Creativity and Cognitive Style: A Life-
span perspective", in Battes and. Schaie,
(Eds.), Life Span Developmental Psychology,
New York, Academic Press.
1976. Cognitive Styles in Infancy and Early
Childhood, New York, Academia Press.
1965. "Field Dependence and. External directed-
ness", Journal of Personality end Social
Psychology, Vol.1, p.490-493. "Cognitive Tilaps in children and men", Child. Developmert t Vol.45, p.707-716. 289
Kates ,R.W.
Kates ,R.7.
Kosslyn,S.M. L. 11974. and Feriello,G.R.,

Bibliography cont.
Kuhn,D.,
KUhn,M.,
Kuhn,T.,
Ladd,F.C.,
Lee ,T.R.
Leet tEop
Lee ,S .A
Lester,G.,
Lewin,K.,
Iey,D.,
Lord,F.,
1979. "Tho application of Piaget's Theory of
Cognitive Development to Education",
Harvard Educational Review, Vol.49, No.3,
p.341-360. 1968. "Researches in Human Space", Ekistics,
Vol.25, June, p.395-398. 1970. The Structure of Scientific Revolutions,
Chicago, University of Chicago Press.
1970. "Black youths view of their environment-
neighbourhood maps",Environment and
Behaviour, vol.2. p.74-99. 1954 A study of urban neighbourhood, Unpub.
PhD. Thesis, University of Cambridge.
1976. Psychology end the Environment,London,
Methuen.
1973. "Environmental perception, preferences
and the Designer", in Killer,R., (Ed.),
Proceedings of the Lund Conference on
Architectural Psychology.
1968. "The Rod and Frame Test; Some comments
on methodology", Perceptual and Motor
Skills, Vol.26, p.1307-1314.
1936. Principles of Topolaicalpsychology,
New York, McGraw Hill.
1972. "The Black inner-city as a frontier
outpost and behaviour of a North
Pennsylvania Neighbourhood", Unpub.
PhD Thesis, University of Pennsylvania.
(Discussed in Moore,G.T. and Golledge,R.G.,
Eds., Environmental Knowing, Stroudsburg,
Pennsylvania, Dowden, Hutchinson and Ross,
1976, p.308.)
1976. "Landscape Imagery in the urban novel. A
source of Geographic evidenoe", Ch.25,in
Moore,G.T. and Golledge,R.G., (Eds.),
Environmental Knowing, Stroudsburg,
Pennsylvania, Dowden, Hutchinson and Ross,
p.279-285. 1941. "A Study of spatial orientation in children",
Journal of Educational Research, Vol.34,
p.481-505. 290

Bibliography cont.
Lowenthalp.,
Lowenthalp.,
Lowenthal,D. and
Prince,H.C.,
Lukashok,A.K. and
Lynch,K.,
Lynch, K.
Lynch
Lynch,K. (Ed).,
MacLeo4R.B.,
Mahoney, M. J.,
Mark ,L.S • ,
Mathews,M.H.,
Ue:urer,R. end
Baxter,J.C.
Maxwell ,A .E.
1961. "Geography, Experience and Imagination:
Towards a Geographical Epistemology",
A.A.A.G., Vol.51, Sept., p.241-260. 1967. "Environmental Perception end behaviour",
Research paper number 109, University of
Chicago Dept. of Geography.
1964. "The English Landscape", Geographical
Review, Vol.549 p.309-346. 1956. "Some childhood memories of the city",
Journal.of the American Institute of
Planners, Vol.22, p.142-152.
1960. The Image of the City, Cambridge Mass.,
M.I.T. Press.
1976. Foreward to Moore,G.T. and Golledge,R.G.,
(Eds.), Environmental Knowing, Stroudsburg,
Pennsylvania, Dowden, Hutchinson and Ross,
p.v-viii.
1977. Growing...jun in Cities, Paris, Unesoo./ M.I.T. Press.
1947. "The Phenomenological approach to social
Psychology", Psychological Review, Vol.
54, P.193-210. 1977. "Reflections on the cognitive-learning
trend in Psychothera]py", American
Psychologist, Vol.32, p.5-13.
1972. "Modeling through toy play: A Methodology
for eliciting topographical representations
in children", In Mitchell,W.J., (Ed.),
Environmentel Design: Research and
Practice, University of California School
of Architecture and Urban Planning,
p.I -3 -1 to 1-3-9.
1980. "The Mental Ltps of children", Geography
Vol.65, Part 3, July, p.169-179. 1372. "Images of the neighbourhood and city
among black anglo / and mexican
American children", Environment and Be
Behaviour, Vol.4, Part 4, p.351-388. 1977. Multivariato enElysis in Behavioural
Research, New York, Chapman and Hall,
291

Bibliogrady cont.
McKeachie,W.J.,
Menzies
Goodey,B. end
Donnelly,D.M.,
Messick,S. and
Damarin ,F.
Messick,S. and
Fritzky,F.J.,
Messick,S. and
Kogen,N.,
Messick,S.(Ed.),
Miller,G.,
Milner,B.,
Mooney 'W. ,
Moore,C.A.,
Moore,G.T. and
Golledge,R.G.,
1976. "Psychology in .America's Bicentennial
Year", American Psycholodst, Vol.31,
p.819-833.
1973. "The place of meaning in Perception -
related studies in planning", Proceedings
of the Lund Conference.
1964. "Cognitive styles and memory for Faces", Journal of Abnormaland Social Psychology,
Vol.69, p.313-318.
1963. "Dimensions of Analytic attitude in
cognition and Personality", Journal of
Personality, Vol.31, p.346-370.
1966. "Personality consistencies in Judgement:
Dimensions of role constructs", in.
Multivariate Behavioural Research,
p.165-175.
1976. Individuality in Learning, New York,
Josey-Bass.
1956. "The magical number seven, plus four
or minus two; Some limits on our capacity.
for processing information", Psycholcdcs1
Review, Vo1.63, p.8I -97.
1971. "Interhemispheric differences in the
localisation of Psychological processes
in man", British Medical Bulletin,
Vol.27, p.272-277.
1969. "Psychological differentiation and
perceptual defence studies of the
separation of perception from emotion",
Journal of Abnormal and Social Psychology,
Vol.74,
p.I31 -139.
1973. Styles of Teacher Behaviour under
simulated learning conditions, Unpub.
Doctoral Dissertation, University of
Stanford, Dissertations Abstracts
International No. 34 3149A 3150a,
University Microfilms No. 73-30,449.
1976. Environmental Knowing, Stroudsburg,
Pennsylvania, Bowden, Hutchinson and
Ross.
292

Bibliography cont.
Moore,G.T., 1976. "Theory and Research on the Development
of Environmental Knowing', Ch. 12, in
Moore,G.T. and Golledge,R.G., (Eds.),
1976, op. ciIi, p.138-164.
Moore,G.T., 1972. "Development/differences in Environmental
Cognition", in Preiser (Ed.), Environmental
Design Research, Vol.2„ Stroudsburg,
Pennsylvania, Dowden, Hutchinson and Ross,
p.221-231.
Moore,R. and 1978. "Childhood Outdoors: Towards a social
Young,D., ecology of the Landscape", Ch.3, in
Altman,I. and Wohlwill,J. (Eds.),
Children and the Environment. Human
Behaviour and Environment, Advances in
Theory and Research, Vol.3, New York,
Plenum, p.83-130.
Moran,P., 1972. "The Cognitive Structure of Spatial
Knowledge", in Preiser,W.P.E. (Ed.),
Environmental Design Research, Vol.2,
Stroudsburg, Pennsylvania, Dowden,
Hutchinson and Ross, p.366-373.
Morley,C.D., 19680 "Perception, space behaviour and urban
models; a discussion paper", (Unpublished
Paper presented to the Urban Studies
Group, Institute of British Geographers,
Salford, 1968.) In, Wood,L.J., "Perception
Studies in Geo rap I.B.G.Trans.,
No.50, July 1970, p.129-141.
Murray,D. and 1979. "Individual differences in the drawing Spencer,C., of Cognitive Maps: The effect of
Geographical mobility, strength of mental
imagery and basic graphic ability",
I.B.G.Transactions x Vol.4, N0.3, Nagy,J.N., and 1978. "Children as Environmental Planners", in
Baird,J.C., Altman,I. and Wohlwill,J.F., (Eds.),
Children and the Environment: Human
Behaviour and Environment, Advances in
Theory and Research, Vol.3,New York,
Plenum, p.259-294. Nebelkopf,E.B. and 1973. "Continuous and discontinuous concept DreyertA.S., attainment as a function of individual
differences in cognitive style", 293

BibliogTp,phy cont.
Perceptual and rotor Skills Vol.36,
p.655-662.
Neisser,U., 1967. Cognitive Psychology, New York, Appleton-
Century-Crofts.
Nisbet ,J.D., 1979. University of Cambridge Faculty of Education Centenary Lecture, Delivered
at Cambridge, 13th Nov.
Nie,N.H.,et al, 1975. "S.P.S.S."Statistical Package for the Social Sciences, New York, McGraw Hill.
Oatley,K., 1972. Brain Mechanisms and Mind, London,
Thomas and Hudson,
Ohnmacht,F.W., 1968. "Note on the validity of the 16 P.F.
Questionnaire measure of Field
Independence", Perceptual and Motor Skills,
Vol.27, p.564.
Oltman,P.K., 1968. "A Portable Rod and Frame Apparatus",
Perceptual and Motor Skills, Vol.26,
p.503-506.
Osgood,C.E., 1953. Method and Theory in Experimental
Psychology, Oxford, O.U.R.
Osgood,C.E.,Suci,G.J.,I975. The Measurement of Meaning, Urbana,
and Tannenbaum,P.H., University of Illinois Press.
Parr,A.E., • 1967. "The Child in the City: Urbanity and
the Urban Scene", Landscape,Vol.16,
p.3-6.
Pascual-Leone,J., 1969. Cognitive Style and Cognitive
Development: A General Psychological
Integration, Unpublished Doctoral
Dissertation, University of Geneva.
(Discussed in Case,R., 1974, 1977, op.cit., and Brown,G. and Desforges,G.,
1979, op.cit.) Pascual-Leone,J., 1970. "A Mathematical model for the transition
rule in Pia gets developmental stages",
Acta Psychologica, Vol.63, 301-345.
Pask,G., 1976. "Styles and Strategies of Learning",
B..T.E.P., Vol. 46, Part 2, June,
p.128-148.
Pask,G. and Scott, 1972. "Learning Strategies and Individual
B.C.E., Competence", Int. Journ. Man Machine
Studies, Vol.4, p.217-253. 294
Bibliography cont.
Pavlov,I.V., 1955. Selected Works, Moscow, Foreign Languages Publishing House.
Perera,S.J., 1973. Cognitive Styles among Primary school children, Unpublished Masters Thesis,
University of Bristol.
Pettigrew,T.F., 1958. "The measurements of correlates of category width as a cognitive variable",
Journal of Personality, Vol.26, p.532-
544. Piaget,J., 1951. Plays, Dreams and Imitation in
Childhood, New York, Norton.
Piaget,J. and 1956. The Child's conception of Space, London,
Inhelder,B., R.K.P.
Piaget,J., 1964. "Development and Learning", in Ripple,R.,
and Rockcastle,V.N., (Eds.), PiagEt
Rediscovered, Ithaca,N.Y., School of
Education, Cornell University Press.
Piaget,J., 1969. The Mechanisms of Perception, New York,
Basic Books.
Piaget,J., 1969. The Science of Education and the
Psychology of the child, London,
Longman.
Piaget,J., 1970. "Piaget's Theory", in MUssen,P. (Ed.),
Carmichael's Manual of child Psycho,
Vol.I, New York, Wiley, p.709-733. Piaget,J., 1978. "Intellectual Evolution from. Adolescence
to Adulthood", Ch.I0 in Johnson-Laird,P.N.,
and Wason,P.C., Thinking: Readings in
Cognitive Science,Cambridge, C.U.P.,
p.158-165.(Originally appeared in
Human Development, Vol.15, 1972, p.1-12.)
Piaget,J., 1978. Equilibration, London, R.K.P..
Pick,H.L. and Pick, 1970. "Sensory and Perceptual Development",in
A.D. 9 Mussen,P.H. (Ed.), Carmichael's manual
of child puchology, Vol.1, New York,
Wiley, p.773-843. Pick,B. and Beer,E., 1978. "Children's perceptions of their
Etvixonment-A slide-tape sequence",
B.E.E., No.86, June.
295

PresseyA.,
Prince,H.,
1976. "Children's knowledge of the spatial
layout of their homes", paper presented
to the Society for research in Child Development, (Discussed in Moore,G.T.
and Golledge,R.G., (Edo.), 1976, op.cit.,
1976. "Some characteristics of mental maps;
An empirical study", I.B.G.Transactions,
Nov. p.493-512.
1978. 'mazes of the Urban Environment, London, Na6Millan.
1979. "The contribution of mental maps in
perception studies", Geography, Vol.64,
Part 4, p.279-287.
Environmental Design Research, Vol.I, Stroudsburg, Pennsylvania, Dowden,
Hutchinson& Ross.
Environmental Desig Research, Vol.2,
Stroudsburg, Pennsylvania, Dowden,
Hutchinson and Ross.
1968. "A Reply to comments on figural after
effects, illusions and the dimension of field dependence", Psychonomic Science,
Vo1.11, p.364.
1976. Personal communication to Wood,D. and
Beck,R., in Moore,G.T. and Golledge,R.G.,
(Eds.), 1976, op.cit., p.352.
Environmental Psychology, New York,
Holt, Rinehart & Winston.
"Analysis of the development of
children's spatial reference systems",
Cognitive Psychology, VO1.5, p.151-175.
Bibliography cont.
Pick,H.L.,
Acredolo,L.P. and
Gronseth,M.,
Pocock,D.C.D.,
Pocock,D.C.D. and
Hudson,R.,
Pocock,D.C.D.,
Preiser,W.F.E. (Ed.), 1973.
Preiser,W.F.E. (Ed.), 1973.
Proshansky,H.M., 1970.
Ittelson,W.H. and
Rivlin, L.G. (Eds.),
Pufall,P.B. and 1973.
Shaw,R.E.,
Reiser,R. g
Reinking,R.H.
Renna,M. and
Zenhausern,R.,
1972. "Urban spatial images: An appraisal of
the choice of respondents and
measurement situations", London School
of Economics, Discussion Paper No.42.
1977. "Cognitive set influences on Witkin's
Rod and Frame Test", Perceptual and
Motor Skills, vol.44, P.439-444.
1976. "The Group Embedded Figares Test:
Normative data", Perceptual and Motor Skills, vo1.43, p.1176-1178.
296

Bibliography cont.
Renzi IN .B • ,
Rooney,J.S.,
Ruble,D.N. and.
Nakamurra,C.Y.,
Rushdoony,H.A.,
Sarre ,P
Saarinen,T.F.,
Saarinen,T.F.,
Saarni ,C . I. ,
Salapatek,P. and-
Kessen,W.
1974. A Study of some effects of Field
dependence-independence and feedback
on performance achievement, Doctoral
Dissertation, Hofstra University,
Dissertation Abstracts International,
1974, 35 2059A, University Microfilms
No. 74-21,861.
"A method of recovering cognitive
information about a city", in
Carson,D.H. (Ed.), Man Environment
Interactions, Part 2, University of
Wisconsin, p.9-18.
1967. "The Urban Snow Hazard in the United
States", Geographical Review, Vol.67,
P.538-559.
1972. "Task orientation versus social
orientation in young children and their
attention to social cues", Child Devel.,
Vol .43 p.471-480.
1968. "A Child's ability to read maps: Summary
of the research", Journal of Geoaphy,
Vol.67, April, p.215.
1972. New Trends in Geography-Perception,
Block5, Milton Keynes, Open University.
Press, p.I0-42.
1970. "Environmental Perception", Ch.3 in
Bacon,P. (Ed.), Focus on Georrimphy: Key
Concepts and Teaching Strategies, New
York, N.C.S.S.,p.63-99.
1976. Environmental Planning: Perception and.
Behaviour, Boston, Houghton Mifflin.
1973. "Piagetian Operations and Field Independ-
ence as factors in children's problem
solving performance", Child Development ,
Vol.44, P.338-345. "Aspects of Perception", Journal of
.E_Derimental Child Psychology, Vol.I,
p.189.
1966. "Perceptual processes", Journal of
Experimental Child Psychology, V01.3,
p.155• 297
Rivizzigno,V.L, and 1974. Golledge,R.G.
Saayman, G. , Ames ,E.W. , 1964..
and. Moffett ,A.,

Bibliography cont.
Saloman,G., 1968.
Sandford,H.A., 1972.
Satterly,D.J., 1964.
Satterly,D.J. and 1971.
Satterly,D.J., 1976.
Satterly,D.J. and 1979.
Telfer,I.G.,
Satterly,D.J., 1979.
Schwartz,D.W. and 1967.
Karp,S.A.,
Shafer,E.L., 1969.
Shemyakin,F.N., 1962.
Shin ,M. 1976..
Shouksmith,G., 1970.
Siegel ,1 .W. 1977.
"Cultural differences in reading and
understanding maps", Paper presented
to the American Educational Research
Association, Annual Meeting.
"Perceptual Problems", Ch.7, in Graves,
N.J., (Ed.), New Movements in the study
and Teaching of Geography. London,
Temple Smith, p.83-92.
"Skills and Concepts involved in map
drawing and interpretation", New Era,
Vol.45, p.260-263.
"Cognitive Styles and School Learning",
B.J.Ed.Psych., Vol.41, p.294-303.
"Cognitive Styles, Spatial ability and
School achievement", Journal of Ed.
Psych., Vol.68, No. I, p.36-42.
"Cognitive Style and Advance organisers
in Learning and Retention", B.J.Ed.Psych.,
Vol.49, p.169-178.
"Covariation of Cognitive Styles,
Intelligence and Achievement", B.J.Ed.
Psych., Vol.49, p.179-181.
"Field dependence in a geriatric
population", Perceptual and Motor skills,
V01.24, p.495-504.
"Perception of the natural environment",
Environment and Behaviour, Vol.I1 p71-82.
"Orientation inSpace", in Anan'yev,B.G.,
(Ed.), Psychological Sciences in the
U.S.S.R., Vol.T, Office of Technical
Services, Report number 62-11083,
Washington, U.S.A.
"Geographical Knowledge in three south-
western novels", Ch.24, in Moore,G.T. and
Golledge,R.G. (Eds.), 1976, op.cit.,
p.273-278.
Intelligence, Creativity and Cognitive
6tyle, London, Batsford.
"Finding one's way around the large-scale
environment: The development of spatial
representations", Ch.8, in McGurk,H.,(Ed.), 298

Bibliography cont.
Siegel,A.W. and
Schadler,M.,
Siegel,A.W.,
Kirasic,K.C. and
Kail,R.V.,
Siegel,A.W. and
White,S.H.,
Sieverts,T.,
Sigman,E.,
Goodenoughp.R. and
Flannagan,D.,
Small ,M.M.
Smedslund,J.,
Ecological factors in Human Development,
New York, North-Holland,p.93-109.
1977. "The development of young children's spatial representation of their classroom",
Child Development, Vol.48, p.388-394.
1978. "Stalking the elusive cognitive map: The
development of children's representations
of Geographic Space", in Altman,I. and
Wohlwill,J.F., (Eds.), Children and
Environment; Human behaviour and
Environment, Advances in Theory and
Research, Vol.3., New York, Plenum,
p.223-253.
1975. "The Development of spatial represent- ations of large-scale environments",
Advances in Child Development and
Behaviour, Vol.10.
"Alternatives to Pia get. Critical
essays on the Theory", New York,
Academic Press
1967. "Perceptual Tmqges of the city of Berlin",
in Brill,E.J.,(Ed.), Urban core and
innsrcity, University of Leiden.,
p.282-285.
1979. "Instructions, illusory self tilt; and the Rod and Frame Test",
Ouarterly Journal of Experimental
-chology, Vol.31, p.155-I65.
1957. 112221sofivijjzi New York, Wiley. •
1938. The Behaviour of Organisms, New York,
Appleton-Century-Crofts.
1967. psychology for Everyman, Harmondsworth,
Pelican Books.
1977. "Spin off from the concept of perception
for the Geography Teacher", B.E.E.,
Vol.69, Jan., p.14-18.
1973. "Modification of performance on the
Rod and Frame Apparatus", Perceptual and Motor Skills, Vol.36, p.715-720.
1977. "Piaget's Psychology in practice", B.J.Fduc.Psychol., Vol.47, p.1-6.
299
Skinner,B.F.,
Skurnik,L.S. and
George,F.,
Slater,F.,
Siegel,L.S. and 1978.
Brainerd,C.J.,(Eds.),

Bibliography cont.
Smith,G.C. 1976. "The spatial information field of
urban consumers", I.B.C.Transactions,
Vol.1, No.2, p.175-I86.
Soloman,L., 1978. "Mental mapping - A classroom strategy", .
Journal of GeograpLy, Vol.77, No.2, Feb.
Sonnenfeld,J., 1969. "Equivalence and distortion of the
Perceptual Environment", Environment and
Behaviour, Vol.I, p.83-99.
Southworth,M., 1969. "The sonic environment of cities",
Environment and Behaviour, Vol.1, June,
P.49-70.
Spearman,C., 1904. "The proof and measurement of
association between two things",
American Journal of Psychology, Vol.15,
p.88-1o3.
Spencer,D., 1973. "An evaluation of cognitive mapping in
neighbourhood studies", University of
Birmingham Centre for Urban and Regional
Studies, Research Memorandum No.23, Dec.
Spencer,D. and 1974. "A Child's Eye view of Small Heath
Lloyd,J., Birmingham - Perception studies for
Environmental Education", University of
Birmingham Centre for Urban and Regional
Studies, Research Memorandum No.34, Aug. Sprout,H. and 1965. "The ecological perspective on human
Sprout,M., affairs with special reference to
international politics", (Discussed in
Wood,L.J., "Perception Studies in
Geography" I.B.G.Transactions No.50,
July 1970, p.129-141.
Stea,D. and 1975. Theory and Experiment in the relation
Taphanel.S.A., between environmental modelling (toy
play) and environmental cognition, in
Canterp. and Lee,T.R. (Eds.), 1975,
op.cit., p.170-178.
Steinfeld,S.L., 1973. Level of differentiation and age as
predictors of reinforcer effectiveness,
Doctoral Dissertation, Hofstra University,
(Dissertation Abstracts International
1973. 34. 2912E-29 13B. University Microfilms No. 73-25,324.) 300

Bibliophy cont.
Steinitz,C., 1968. "Meaning and congruence of urban
form", Am. Inst. Planners, V01.349
p.233-248.
Strauss,A.L., 1961. Imares of the American City, New York,
Free Press.
StrausstA.L., 1968. The American City: A sourcebook of
urban ima_Ey, Chicago, Aldine.
Thompson,K., 1977. "Sex differences in Geography", Dissertation submitted as part of the
Certificate of the Child Guidance
Training Centre, Tavistock Centre,
London.
Thomy,V.A.„ 1971. Relationship among three factors
reflecting independence. Witkin's
Field Independence and Cattell's
Objective Test and Questionnaire
Independence. Dissertation Abstracts
International, 1971.
Thorndike,R.L., 1969. Measurement and Evaluation in
and Tingen,E.P., Psychology and Education, New York,
Wiley.
1974. Thorstad,M.G., The construction of the plan of.a
house test and an investigation into
some of its developmental and clinical
implications in children, Unpublished
PhD. Thesis, University of London.
1971. "The Home-range of Black elementary
school children: An exploratory study
in the measurement and comparisbn of
Home-range", Place Perception Report
No.8, Clark University.
Tolman,E.C., 1948. "Cognitive Maps in rats and Nen",
Psychological Review, Vol.55, p.189-
208.
Tuan,Y.F., 1975. "images and Mental Naps", A.A.A .G., Vol.65, No.2, June, p.205-213.
Tuan,Y•F• 1976. "Literature, Experience and
Environmental Knowing', Ch.23, in
Moore,G.T. and Golledge,R.G. (Eds.),
1976, op.cit., p.260-272.
301

Bibliography cont.
Tuan,Y.F.,
Trowbridge,C.C.,
Tyler„R.W.,
Tyler,S.A.,
Uzzel,D.L.,
/ '
Vaught,G.,
Vernon,P.E.,
Vernon,P.E.
Vernon,P .E.
Wachtel IP .L.
Wachtel ,P.L,
Wallach,M.A. and
Kogan,N.,
Wapner,S.,Kaplan,B.,
and Cohen,S.B.,
Wapner,S.,
1977. Space and Place-The perspective of Experience, London Arnold.
1913. "Fundamental methodsof Orientation
and Imaginary maps", Science, Vo1.38,
1949.
p.888-897.
Basic Principles of Curriculum
Instruction, Chicago, University of
Chicago Press.
1969. Cognitive Anthropology, New York,
Holt, Rinehart and Winston.
1976. "Children's perception and under-
standing of their environment",
B.E.E., Vol.66, Oct., p.9-I8.
1968. "Expected scores in the Rod and
Frame Test: Fuel for the Immergluck-
Pressey fire", Psychonomic Science,
Vol.13, p.248.
1969. The Psychology of
Harmondsworth, Penguin Books.
1972. "The distinctiveness of Field
Independence", Journal of
Personality, Vol.40„ p.366-391.
1979. "Intelligence testing and the nature- nurture debate, 1928-1978: What next?",
B.J.Ed.Psych., Vol.49, p.1-I4.
1971. "Cognitive Style, attention and
Learning", Perceptual and Motor Skills,
Vol.32, p.315-32I,
1972. "Field dependence and Psychological
differentiation: Re-examination",
Perceptual and Motor Skills, Vo1.359
p.179-189.
1965. Modes of Thinking in Young Children,.
New York, Holt, Rinehart and Winston.
1973. "An organismic-developmental perspective for understanding
transactions of men and environments",
Environment and Behaviour, Vol.5,
p.255-289.
1976. "Commentary on Process and context in
the conception of Cognitive styles",
Ch.4, in Messick,S.et al I976r op.cit. 302

Bibliog_ply cont.
Wapner,S.,
and Werner,H.,
Ward,C.,
Warr,P.B. and
Knapper,C.,
Watson,J.B.,
Watts,A.F.,
Webley,P.,
Weiss,R.S.,
Wells,B.,
Werner,H.,
Werner,H.,
White,R.,
White,R.W.,
Whitfield,R.C. and
Kerr,J.F.,
1957. Perceptual Development, Clark University Press.
1979. The Child in the City, Harmondsworth, Penguin Books.
1968. The Perception of People and Events,
New York, Wiley.
1924. Behaviourism, Chicago, University of
Chicago Press.
1965. Manual of Instructions for Spatial
Test Two,Windsor, N.F.E.R, Publishing
Company.
1976. "Children's Cognitive maps", Paper presented to the British Psychological
Society, Social Psychology Conference, York.
1968. "Issues in Holistic Research", in
Becker,E.S., Geer,B., Reisman,D. and
Weiss,R.S., (Eds.), Institutions and
the Person, Chicago, Aldine.
1965. "Towards a definition of Environmental
Studies. A Psychologists contribution",
The Architects Journal Information
Library, Sept.22nd, ref. Sfb Abl: UIC,61.
1948. 22mparative Psychology of Mental
Development, New York, International
Universities Press.
1957. "The concept of Development from a comparative and organismic point of
view", in Harris,D.B., (Ed.), The
Concept of Development. An issue in
the study of amen Behaviour, University
of Minnesota Press, p.125-148.
1967. "The measurement of Spatial Perception", Seminar Paper Series A, No.8, University
of Bristol, Nov.
1959. "Motivation reconsidered: The concept of competence", Psychological Review,
Vo1.661 p.297-333.
1970. "Some problems in course evaluation: A British View", Teachers College Record,
Vol.72, No.2. 303

Bibliogm& cont.
Wish,M., 1972. Notes on the variety, appropriateness
and choice of proximity measures.
Unpublished paper, Bell Laboratories
Workshop on multi-dimensional scaling,
Murray Hill, New York. (Discussed in
Moore,G.T. and Golledge,R.G., (Eds.),
1976, op.cit., p.303-306. Wilton,R.N., 1979. "Knowledge of Spatial Relations. The
,specification of the information used
in making inferences", Quarterly
Journal of Experimental Psychology,
Vol.31, p.133-146. Winestine,M.C., 1969. "Winship and Psychological
differentiation", Journal of the
American Academy of Child Psychiatry,
Vol.8, p.436-455. Witkin,H.A., 1949. "Perception of body position and the
position of the visual field",
Psychological Monographs, Vol.63, p.I-46.
Witkin,H.A., 1950 "Individual differehces in ease of
perception of Embedded Figures", Journal of Personalit, , Vol.19,
p.I-15. 1952. "Further studies of perception of the
upright when the direction of the
force acting on the body is changed",
Journal of Experimental Psychology,
Vol.43, p.9-20. 1965. "Psychological Differentiation and
forms of Pathology", Journal of
Abnormal Psychology, Vol.70, p.317-336. Witkin,H.A., 1976. "Cognitive Style in Academic
Performance & Teacher- Student
Relations", Ch.3, in Messick,S. et al, (Eds.), 1976, op.cit., p.38-72.
Witkin,H.A. and 1948. "Studies in space orientation, IV: Asch,S.E., Further experiments on perception of
the upright with displaced visual
fields", Journal of Experimental
Psychology, Vol.38, p.762-782. 304

Bibliowphy cont.
Witkin,H.A., Lewis,H.B.,I954. Hertzman,M.,Machover,K.,
Meissner,P.B. and
Wapner,S., Witkin,H.A., Dyk,R.B., 1962. Faterson,H.F.,
Goodenough,D.R. and
Karp,S.A.,
Witkin,H.A. and
Oltman,P.K., 1967.
1967. Goodenough,D.R. and
Karp,S.A.,
Witkin,H.A.,Tewis,H.B. 1968.
and Weil,E.,
Witkin,H.A., and 1970.
Faterson,H.F.,
Witkin,H.A ,Oltman,P.K. 1971,
and Karp,S.A.,
Witkin,H.A., Price- 1974.
Williams,D.,Bertini,M.,
Christiansen,B.,
Oltman,P.K.,Ramirez,11.
and Van Meel,J.,
Personality through Perception,
New York, Harper.
Psychological Differentiation,
New York, Wiley. (Reprinted 1974.)
"Cognitive Style", Int. Journal of
Neurology, Vol.6, p.I19-137.
"Stability of Cognitive Style from
childhood to young adulthood",
Journal of Personality and Social
Psychology, Vol.7, p.291-300.
"Affective reactions and Patient-Therapist interactions among
differentiated and less differentiated patients early in therapy", Journal
of Nervous and ?Dental Disease",
Vol.146, p.I93-208. "Longitudinal study of the
development of the body concept",.
Developmental Psychology, Vol.2,-
p.429-438. A manual for the Embedded Figures
Test, Palo Alto, Calif., Consulting
Psychologists Press. "Social conformity and Psychological
differentiation", Int, Journal of
Psychology, Vol.9, p.II-29.
Witkin,H.A. and
Goodenough,D.R.,
1975. "Some Implications of Research on
Cognitive Style for Problems of
Education", Ch.2I, in Whitehead,J.M.,
(Ed.), Personality and Learning,
London, Hodder and Stoughton.
1976. "Field dependence and inter-personal
behaviour", E.T.S., R.B.-76-12,
Princeton, Educational Testing Service. 305

Bibliography cont.
Witkin,H.A.,Moore,C.A., 1977. Goodenough,D.R. and
Cox,P •W•
Woerner, and
Levine.,
Wohlwill,J.F.,
Wohlwill,J.F.,
Wohlwill,J.F.,
Wood,D. and Beck,R.,
Wood,D. and Bec4R.,
Wood,L.J„
WU.J.J.,
Zannaras,G.,
Zigler,E.,
"Field Dependent and Field Independent
Cognitive styles and their Educational
Implications", Review of Educational
Research, Vol.47, No.I, Winter, p.1-64.
1950. "A preliminary study of the relation-
ship between perception and thinking",
Discussed in Witkin,H.A. et al, (1962),
op.cit.
1960. ,"Developmental studies of Perception",
Psychological Bulletin, Vol.57., No.4.,
July, p.249-288.
1970. "The emerging discipline of Environ-
mental Psychology", American Psychol.,
Vol.25, p.303-312.
1976. "Searching for the Environment in
Environmental Cognition Research: A
commentary on Research strategy", Ch.35.,
in Moore,G.T. and Golledge,R.G., (Eds.),
1976, op.cit., p.385-392.
1976. "Talking with Environmental'A', an
experimental mapping language", Ch.32,
in Moore,G.T. and Golledge,R.G.,. (Eds.),
1976, op.cit., p.35I-36I.
1976.b "Comparative Developmental Analysis of
individual and aggregated cognitive
maps of London", Ch.14, in Moore,G.T.
and Golledge,G.R., (Eds.), 1976, op.cit.,
p.173-188.
1970. "Perception Studies in Geography",
I.B.G.Transactions, No.50, July,
p.129-141.
1968. Cognitive Style and Task performance:
A study of Student Teachers. Doctoral
Dissertation, University of Minnesota,
University Microfilms 1968, No.68-7408.
1976. "The relation between cognitive
Structure and Urban Form", Ch.31, in
Moore,G.T. and Golledge,R.G., (Eds.),
1976, op.cit., p.336-350.
1963. "A Measure in search cf a theory",.
Contemporary Psychology, Vol.8,
p.133-135. 306

Bibliography cont.
Zigler,E. 1963. "Reply to Witkin", Contempor
Psychology, vo1.8, p.459-461.
_._._._._.-._
Addendum.
Brophy,J. 1982. "An empirical investigation of
the construct validity of the
Field dependence/independence
Dimension of Cognitive Styles",
Unpublished PhD., University of
London.
RapoporttA. and 1967. "Complexity and Ambiguity in
Kantor,R.E., Environmental Design", Journal
of the American Instit. of Planners,
Vol. 33, p.210-22I.
307

APPENDICES.
I. TESTS AND STANDARDISED INSTRUCTIONS.
II. QUESTIONNAIRE AND INSTRUCTIONS FOR COMPLETION.
QUESTIONNAIRE FEATURTEANALYSIS.
MAP FEATURE ANALYSIS.
III. CRITERIA FOR THE ANALYSIS OF TUE MAPS.
IV. THE FOLLOW UP S1UDY.

APPENDIX I.
Examples of the tests used in the
empirical study, with respective
standardised instructions.

N/217777N7:,71, This is the correct solution, with the simple form traced over the lines of the complex figure*
Solution.
GROUP EMBEDDED
FIGURES TEST , ..
1 ... 1
By Philip K °glean. Evelyn Raskin. & Herman A Within
/ Akt Name Sex -
• y
raft
..:r
Today's date Birth date
INSTRUCTIONS This is a test of ,our ability to find a simple form when it is hidden within a complex pattern Note that the lop right-hand ',panel° is the correct ore It e top left-hand In it.., following paoes problems 'trite the ones above will appear On
Margie is sirnirar, but faces in the opposite direction and is theretve not each will site arum{-lox 'gun, and tinder it will be a letter pane you "X" Here es a simple form which we have laoeled
X
correct corresponding to the senule form who..11 is hidden in it For each proolem look ai the BACK COVE, f this booxlet ta see which simple form to
Now try another praVice problem Find and trace the simple form named "Y" in the complex figure below d:
in find Then try to trace it pencil over the *Web of tne complex figure
Y • Note Ihcso points
Tins simple form. named "X . s hidden within tne more complex figure
1 Look back at the s nple forms as often as necessary
2. ERASE ALL MISTAKES oelOw:
3. Do the problems in order Don t skip a problem unless you are al.so-
• .11111, lowly "stuck t on it
4 Trace ONLY ONE SIMPLE FORM IN EACH PROBLEM You may see • . more than one but trace one of them just
•
. 5 The simple form is always present in the complex figure in the SAME
A V
SIZE. the SAME PROPORTIONS, and FACING IN THE SAME DIREC.
....■..........„11
TION as it appears on the hack cover of this booklet
Look at the next page to check your solution Try to hind the simple form in the complex filure and trace it in pone 1 directly c%er the tines of the complex licure It is the SAME SIZE in the SAME PROPORTIONS and FACES IN THE SAME DIRECTION within the .. CI:17,09m MI by Centefung burg nolo. Is Fr,. Inc fr Ord re the UnOed blales
• I Soren" Al ugh,. reserved Mu ...I or pas Ibereol Irlity I101 DO seprOthKed COMPICX figure as when d anpecred alone In soy Witt edrubol yerveauen el tee bunt... Do not turn the page until the signal is given
When you finish. turn the page to check your solution 2 3
I. THE EMBEDDED FIGURES TEST. (Standardised Instructions)

Go on to the next page
13 Go on to the next page
5
SIMPLE FORMS THIRD SECTION
CONSULTING PSYCHOLOGISTS PRESS 17? Coll.p• I slo Alto Cettototita eases
Go on to the next page
FIRST SECTION SECOND SECTION
Find Simple Form "B"
Find Simple Form "A"
Find Simple Form "F"
ElUEDDED FIGURES TEST—SAMPLE ITEMS. (Reduced in Size.) 309

SUBJECT SEATED AND LOOKING THROUGH EYE PIECE.
Fowl
THE PORTABLE ROD AND FRAME APPARATUS.
INSIDE VIEW
II.THE ROD AND FRAME TEST. (Oltman,P.K.)
As was explained in the text, a portable apparatus was obtained for this
exercise, and the children in the sample were all seen individually to
undertake the test. The apparatus is as described in the diagram below, and
the exercise is undertaken in a semi-darkened room. The purpose of the test
is to determine how well an individual can establish the upright under
various conditions.
Standardised Instructions: (Adapted from those provided by Dr, Phillip Oitman.)
"In this exercise T want to find out how wellyou can decide whether something
is upright and straight..
In this box you will see a square frame and a rod just like this. (A small
model of the rod and frame was shown to the child.)
I can tilt the frame to the left or to the right. I can also tilt the rod to
the left or to the right. I can tilt the frame on its own, or the rod on its
own or I can tilt them both together.
At the beginning of each exercise I want you to tell me if the rod and frame
are straight or tilted, and if they are tilted which way they are tilted
Are there any questions?
You will be asked to turn this handle, which moves the rod until you think
the rod is straight up and down like a flagpole or a telegraph pole."
TRIAL I. Frame 28 L and Rod 28 L.
"Please tell me the position of the rod and the frame.
Now will you turn the handle to move the rod until you think it is straight
up and down like a flagpole or a telegraph pole."(When the subject is
finished he/she is asked if he/she is sure.)
TRIAL 2. Frame 28 L and Rod 28 R.
"Please tell me the position of the rod and the position of the frame.
Will you no% turn the handle to move the rod so that it is straight up and
down like a flagpole or a telegraph pole."(The subject is again asked to
confirm that he/she believes the rod to be straight.)
Then the remaining trials are proceeded with:
TRIAL 3. Frame 28 R and Rod 28 R. TRIAL 4. Frame 28 R and Rod 28L.
TRIAL 5. " 28 L and " 28 L. TRIAL 6. " 28 L and " 28 R.
TRIAL 7. " 28 R and " 28 R. TRIAL 8. " 28 R and " 28 L. 310

The degrees of deviation from the upright over the 8 trials then constitute
the Rod and Frame score. A high deviation score is said to represent
extreme Field Dependence and a low deviation score to represent extreme
Field Independence.
III. ARTICULATION OF BODY CONCEPT SCALE.
In the version of this test, which was very kindly supplied by Dr. Oltman
of the Educational Testing Service at Princeton, the following criteria
were used to distinguish between the drawings produced by the children
of the sample. Examples of the drawings representing each of these
categories are also included. The children were simply asked to produce
two drawings, one of a man and one of a woman, using instructions adapted
from the Goodenough-Harris Draw-a-Nan-Test.
Criteria for distinguishing between the drawings.
1. Most articulated drawings: These manifest high form level (e.g.,
waistline, hips, shoulders, chest or breasts, shaped or clothed limbs,
etc.); appendages and details represented in proper relation to body
outline, with some articulation in mode of presentation; appropriate,
even imaginative, detailing (e.g., young girl in evening clothes, well-
dressed man with cigarette, etc.)
2. Moderately articulated drawings: Drawings which show a definite
attempt at role assignment (with regard to age, activity, occupation,
etc.) through adequate detailing, shaping, clothing; with continuity
of outline (i.e., integration of parts) attempted.
3. Drawings intermediate in level of articulation: Drawings in which
identification of sex is evident, attempts at shaping and a fair level
of integration of parts are manifest and a minimum of detailing is
present.
4. Moderately primitive drawings: Drawings which essentially lack
features of differentiation through form, integration, identity, or
detailing; however, these drawings show slightly more complexity in
some respect (e.g., presence of one body part that is unusual in most
primitive drawings, such as the neck) than drawings rated 1.
5. Most primitive and infantile drawings: These manifest a very low
level of form (ovals, rectangles, sticks, stuck on to each other); no
311

312
Which one of the six lower pictures is like the top two but unlike the other five ?
evidence of role or sex identity (same treatment of male and female
with, at most, difference in hair treatment, no facial expression,
little shaping or clothing).
(Drawings representing each of these categories can be seen in the follow-
ing pages. Each of these drawings were drawn by children in the sample.)
IV. 3. The standardised instructions for this test are as provided in the
manual. ( 1AB2/AH3-1Ahnual', devised by Heim IA.W., Watts,K.P. and
Simmonds,V., published by the National Foundation for Educational
Research.)
Examples drawn from the three categories of Verbal, Numerical and
Perceptual Reasoning can be seen below. There are 40 questions in each
section, and 15, 15, and 12 minutes are allowed for the respective
sections. VERBAL
AMIN/ 41MIStilia■ Which one of the six lower words means either the same.or the opposite of the top
word ? softly
hesitatingly whispering quietly quickly - silently unheard 1 2 3 4 5 ' 6
The two top words are alike in some way. Only one of the six lower words is unlike the top two. Which is it?
adder python
serpent grass-snake lizard cobra asp boa-constrictor 1 2 3 4 5 6
NUMERICAL
38 A square floor is covered with 121 tiles All the outer ones are blue, the rest are grey. How many grey ores are there?
none of 81 80 79 77 100 these A
39 3 is to 4 as 12 is to
16 36 11 40 24 18 A 13 E F
411111111===1WIEVOINIMIllek PERCEPTUAL

ARTICULATION OF BODY CONCEPT SCA LE: RA TING I.
BOY I2years
GIRL 12 years
313

RATING 2.
BOY II years.
BOY 10 years.
314

RA TL4G 3.
BOY I0 years.
BOY 10 years.
315

RATING 4.
GIRL-llyears.
GIRL-I0 years.
. 316

RATLIO 5.
BOY-II years.
GIRL-I0 years.
317

Put a spot on the boxes so that all five boxes in each row have their spots on the same corner.
318
27
THESE ARE THE MODELS WHICH CAN BE MADE FROM THE SHAPES.
V. SPATIAL TEST TWO.(Watts,A.F., Pigeon,D.A. and Richards,M.K.B.)
The instructions for this exercise were as presented in the manual.
(Manual of Instructions for Spatial Test II, published by the National
Foundation for Educational Research.)
The Test consists of 5 subtests, and examples of each of these can be
seen below:
TEST I. MATCH BOX CORNERS (Time allowed-32 mins.)
There are 20 items of the following kind in the full test.
TEST 2. SHAPES AND MODELS (Time allowed-I0 mins.)
There are 20 items of the following kind in the full test.-
PUT A LETTER ON EACH SHAPE TO SHOW THE MODEL THAT CAN BE MADE FROM IT.

4111211111MR01124
=n1- 1-P411D1
=En+-17-1 [J'EA =A+17
TEST 3. SQLMRE C07,12TPTION (Time allowed-61- mins.) There are 20 items of the following kind in the full test.
UNDERLINE THE FIGURE UNDER 'C' WHICH WHEN ADDFD TO 'B' WILL MAKE TIE
SQUARE IA .
TEST4. PAPER FOLDING (Time allowed-3i mins.)
There are 20 items of the following kind in the full test.
UNDERLINE THE SQUARE ON THE RIGHT THAT LOOKS LIFE TEE SMALL SQUARE WHEN
IT IS UNFOLDED.
TESTS. BLOCK BUILDING (Time allowed-3 mins.)
There are 5 items of the following kind on the full test.
HOW =LOP THE SMALLER BLOCKS IN TEE ROWS BELOW ARE HEEDED TO BUILD THE
LARGER BLOCK ON THe. LEFT?
For each of the exercises described, the children undertake a series of
practice items to ensure that they are clear about what is expected of them. 319

1. Head present 2. Neck present 3. Neck, two dimen-
sions • 4. Eyes present 5. Eve detail: brow or
lashes 6. Eye detail: pupil 7. E)e detail: propor-
tion 8. Eye detail: glance 9. Nose present
10. Nose, two dimen-sions
11. Mouth present 12. Lips, two dimen-
sions 13. Both nose and lips
in two dimensions 14. Both chin and fore-
head shown 15. Projection of chin
shown; chin clearly d•Iferentia ted from lower lip
16. Line of jaw indi-cated
17. Bridge of nose 18. Hair I 19. Hair H 20.'Hair HI 21. Hair IV 22. Ears present 23. Ears present: propor-
tion and position
MAN POINT SCALE
24. Fingers present 25. Correct number of
fingers shown 26. Detail of fingers cor-
rect 27. Opposition of
thumb shown 28. Hands present 29. Wrist or ankle
shown 30. Arms present 31. Shoulders I 32. Shoulders II 33. Arms at side or en-
gaged in activity 34. Elbow joint shown 35. Legs present 36. Hip I (crotch) 37. Hip II 38. Knee joint shown 39. Feet I: any indica-
tion 40. Feet H: proportion 41. Feet III: heel 42. Feet IV: 'perspective 43. Feet V: detail 44. Attachment of arms
and legs I 45. Attachment of arms
and legs II 46. Trunk present 47. Trunk in propor-
tion, two dimen-sions
48. Proportion: he:id I
49. Proportion: head II 50. Proportion: face 51. Proportion: arms I 52. Proportion: arms II 53. Proportion: legs 54. Proportion: limbs in
two dimensions 55. Clothing I 56. Clothing II 57. Clothing III 5S. Clothing IV 59. Clothing V 60. Profile I 61. Profile II 62. Full face 63. Motor coordination:
lines 64. Motor coordination:
junctures 65. Superior motor co-
ordination 66. Directed lines and
form: head outline 67. Directed lines and
form: trunk outline 68. Directed lines and
form: anns and legs 59. Directed lines and
form: facial features 70. -"Sketching" tech-
nique 71. "Modeling" tech-
nique 72. Arm movement 73. Leg movement
4/111/INORMEleirREVOZIONENSIP
VI. THE DRAW A MAN TEST.(Harris,D.B., 1963.)
The test was administered according to the instructions presented in
Harris's book, 'Children's Drawings as measures of Intellectual maturity',
and the resultant drawings of a 11.1an and a Woman were considered for the
ed.stence of the following criteria:
320

nc rl
1. Head present 2. Neck present 3. Neck, two dimen-
sions 4. Eyes present 5. Eve detail: brow or
lashes 6. ENC detail: pupil 7. Eve detail: propor-
tion 8. Checks 9. Nose present
10. Nose, two. dimen-sions
11. Bridge of nose 12. Nostrils shown 13. Mouth present 14. Lips, two dimen-
sions 15. "Cosmetic lips" 16 Both nose and lips
in two dimensions 17. Both chin and fore-
head shown 18. Line of jaw indi-
cated 19. Hair I 20. 1 lair II 21. Hair HI 2. !fair IV 23. Necklace or earrings 24. Arms present 25. Shoulders 26. Arm's at side (or en-
gaged in activity or behind back)
WOMAN POINT SCALE
27. Elbow joint shown 28. Fingers present 29. Correct number ' of
fingers shown 30. Detail of fingers cor-
rect 31. Opposition of thumb
shown 32. Hands prcscnt 33. Legs present 34. Hip 35. Feet I: any indica-
tion 36. Feet H: proportion 37. Feet III: detail 38. Shoe 1: "feminine" 39. Shoe II: style 40. Placement of feet
appropriate to figure 41. Attachment of arms
and legs I 42. Attachment of arms
and legs H 43. Clothing indicated 44. Slec.e I 45. Sleeve II 46. Neckline I 47. Neckline II: collar 48. Waist I 49. Waist II 50. Skirt "modeled" to
indicate pleats or draping
51. No transparencies in the figure
•
52. Garb feminine 53. Garb complete,
without incongrui-ties
54. Garb a definite "type"
55. Trunk present 56. Trunk in propor-
tion, two dimensions 57. Head-trunk propor-
tion 58. Head: proportion 59. Limbs: proportion 60. Arms in proportion
to trunk 61. Location of waist 62. Dress area 63. Motor coordination:
junctures 64. Motor coordination.
lines 6",". Superior motor co-
o rd ma tion 66. Dircctcd lines and
form: head outline 67. Directed lines and
form: breast 68. Directed lines and
form: hip contour 69. Directed lines and
form- arms taper 70. Directed lines and
form: calf of leg 71. Directed lines and
form: facial features
(Detailed explanations are included in the test manual for
the scoring of each of the items listed for both the Man
and the Woman.)
VII. THE ORIENTATION EXERCISES.
Exercises I and 2 were undertaken as group exercises with children
working individually within each class group. Exercise 3 was
administered individually.
In Exercise I, it was explained that the task was to follow a series
of instructions, (Nine in all), and that each instruction related to
a small plan. Direction I therefore related to Plan I, and Direction 2
related to Plan 2 etc. etc. (This is seen by reference to the copies
of the test sheets overpage.)
For Exercise 2, it was explained that the questions related to a more
detailed street plan, to which they were refered. Answers to these
questions were Written on the space provided on the question sheet. (Again this can be seen by reference to the sheets overpage.)
322

DIRECTIONS.
OR TENTA T ION EXERC ISE I.
Direction 1. (Use Plan 1 ) Starting from the place marked with an 'X', walk along Lena Avenue,
turn right at the junction, and put a tick in the circle at the end
of this road.
Direction 2. (Use Plan 2 ) Starting from the place marked with an 'X', walk along Lewis Street,
then turn left at the road junction, and put a tick in the circle at
the end of this road.
Direction 3. (Use Plan 3 ) Starting from the place marked with to the junction with Arley Hill. At along to the next junction and then circle at the end of this road.
an 'X', walk along Laurel Street this junction turn left and walk turn right, and put a tick in the
Direction 4. (Use Plan 4 ) Starting at the place marked with an 'X', walk up Fry's Hill to the junction and then turn west, and put a tick in the circle at the end
of this road.
Direction 5. (Use Plan 5 ) Starting at the place marked with an 'X', walk south along Evans Road to the cross-roads and then turn west and put a tick in the circle at
the end of this road.
Direction 6. (Use Plan 6 ) Starting from the place marked with an 'X', walk along Downs Road to
the junction with Elm Road. At this junction turn south.Walk to the next set of cross-roads and here turn East and put a tick in the circle
at the end of this road.
Direction 7. (Use Plan 7 ) You are at the place marked with an 'X' and wish to make a telephone
call. In what road is the nearest Post Office Telephone?
Direction 8. (Use Plan 8 )
John lives in Fox Road and goes to the nearest school. On his way to
school he passes a building which is NOT another house. what is this building?
Direction 9. (Use Plan 9)
Your car has broken down in Harrow Road and you need to telephone
for help. Go to the cross-roads. In what road is the R.A.C. telephone box that you could use?
323

' I a
s' m
axa
NOI 1
\Ul la ZIO
N.
E
S.
. W.
t Means Church.
Sch. lens School.
P. Means Post OFFS ee-.
T. Means Post OFF;ce Telephone.
R. Means R• A. C. Telephone.
0 *D.
PLAN 2.
0
X N
4, z 1
Ai et
7 Z W J a
0
PLAN 3
10
J J i
V 0 I
ti.,,............, 1.-----------... 4
s
0
II I L. L. ST.
ci

DIRECTIONS 2.
ORIENTATION EXERCISE 2.
NAME SCHOOL
START AT POINT 'A'. ?rom point 'A', walk along Wood Road and
turn left into Blake Road. What is the milding on your left? ialk on along Blake Road until you meet a .oad junction. What is the name of the road
rhich faces you?
• 0 . 0 . 0 • • 0 OOOOOOOOO
TART AT POINT 'B'.
'rom point 'B', walk along Digby Street o the junction with Shamrock Road and
oman Avenue. Turn left into Roman Avenue, hat is the building on your right a little ay up Roman Avenue?
urn left opposite the church. waat is the ame of this road?
TART AT POINT 'C'.
rom point 'C', walk due East across the Park.
lat is the name of this Park?
len you come to the first road there is a lilding opposite you. What is this building?
trn left now and walk along the road to the
rst set of cross-roads. At these cross-ads what is the name of the road which
.ces you?
'ART AT POINT 'D'.
lk :Jest along Hampton Road. At the first set of
cross-roads, what is the name of the road your left?
little way along the road you have named,
at is the building on your right? 325

41, gc4\1". •51-01:ze
E
KAMP 1". 0 14 0 AZ
SA 61.-AKe IW IU.
z
j1 A LI iW LA1\14.1.,
cRE 661V r
NEV L. 9t.
STOKE PARK
c.f.245 T
14 t LC- • ■••••■
,•••■■■ 1- td( tct 326
2 0

For Orientation Exercise 3, the standardised procedure described below was adopted:
"I am going to show you a small map extract and three pictures of
landscape views. One of these pictures is a picture of the area that
is shown on the map. I want you to look very carefully at each picture
and decide which picture matches what is shown on the map."
For this exercise, there were 5 different sets of a map extract and pictures. A copy of one of the sets can be seen below, these have been
reduced in size, and in.-the original are coloured appropriately.
Example of one of the Exercises used in Orientation Exercise 3. yap Extract Number 4:
327

VIII. THE DRAW A PLAN TEST.(Thorstad 1974.)
The procedure adopted was as described in the Test Manual:
"I want you to draw a plan of your house. I only want the ground floor.
Imagine that you are a bird and are looking straight down on top of it.
Imagine that you have taken away the roof and the bedrooms so that you.
can see the ground floor. I want you to show me where the Kitchen is,
the Hall, the Stairs, the Dining Room, the Sitting Room (Lounge,
Living Room, Front Room) and any other rooms you may have. Show where
the doors and the windows are. Put the names of the rooms on your plan.
(It is permissible to remind individuals once about the omission of
an item.)
The Plans are then scored for the following items: (Each of which is clearly explained in the test manual.)
I. Roof .Absent.
2. Chimney Absent.
3. Upstairs Absent.
4. Plane of outside wall Absent.
5. Floor.
6. Depth.
7. Horizontal Structure.
8. Connectedness.
9. Commanality. IO.Outside Wall I.
II.Outer Wall 2.
I2•Rooms Proportion.
INHall I.
14.Hall 2.
15.Hafl Proportions.
I6.Horizontal Stairs.
17.Staircase I. IB.Staircase 2.
19.Staircese Proportion.
20.Treads I.
2I.Treads 2.
22.Doors I.
230Doors 2.
24.Doors Type I.
25.Doors Type 2.
26.Doors Type 3. 27.Doors Proportion
28.Windows I.
29.Windows 2.
30.Windows Type I. 31.Windows Type 2.
32.Windcws Type 3. 33.No unaccounted space. 34.N9 vertical walls.
35.Proportions I. 36.Proportions 2.
37.Proportions 3. 38.Proportions 4. 39.Quality I.
40.Quality 2.
One mafior problem of applying this test is that some children live in
Flats or Bungalows, where no stairs exist. This effected the plans of
34 children in the sample. To account for this in the analysis of the results and so as not to exclude these children from the analysis, the
average score on the 'Stairs' section of the test was calculated for
those who had completed this section of the test. The average score
was then added to the results of those whose plans were of Flats or 328

Bungalows:
431 completed plans, Total score on the Stairs section: 1599, Therefore Average Score= 3.7099,
A score of 4 was added to the results of those living in Flats or
Bungalows to make their results comparable with the rest of the sample.
IX. NAPS: STANDARDISED INSTRUCTIONS.
Map I.
"This morning/afternoon, I would like you to draw a map for me.
On this piece of paper I would like you to draw me a map of the
Area where you live, on it could you show me your favourite places,
the places that you like to go to. Include anything that you think
is important or interesting. If this area has a name, for example
'Chesterton' or the 'Estate', write this as a title at the top of
your map."
Map 2.
"Today I would like you to draw me another map, not of the area where
you live this time, but of your route from Home to School. Show me all
the places that you pass, and put on all the things that you can remember,
or think are important. Remember to name the things you include on your
map."
X. PERSONALITY TiEsamm.
A copy of the personality questionnaire given to the Teachers is
included overpage. There was a copy of this for each child in the
sample. As was explained in the text, the investigator was available
for consultation whilst the forms were being completed. (This was
undertaken as a Year Group exercise in the Rural School.)
329

For each of the following Personality characteristics, could you
please assess the 'relative' capacity that
behaviour has demonstrated to you, when compared to his/her peers.
The five boxes represent an increasing capacity for each of the
characteristics listed, from no such behaviour having been
demonstrated to you to it's being a very strong feature of his/
her personality.
LEADER.
SOLITARY.
INTROVERT.
INDIVIDUALISTIC.
FOLLOWER.
GIVES UP EASILY.
EXTRAVERT.
CONFORMIST.
PERSEVERES.
INDEPENDENT.
GREGARIOUS.
DEPENDENT ON OTHERS.
330

APPENDIX 2.
I. Questionnaire and Instructions for
completion.
2. Questionnaire Feature analysis.
3. Map Feature analysis.

I. QUESTIONNAIRE. (Undertaken after the completion of the AREA Nap.)
INTHODUCTION.(Standardised Instructions.)
"On the set of papers in front of you, you will see that there are a
series of questions with spaces underneath them for you to write your
answer. There is nothing to worry about, this is not a test. I am
trying to find out about the different ways that children of different
ages think and feel about where they live.
There are 12 questions for you to answer, and you will see that they
are all about the area where you live. You can use your map to help
you if you like.
If there are any questions, please put your hand up."
QUESTIONS ON THE QUESTIOMUERE.(These were read through to each group
before they began to fill in their answers.)
I. What are your favourite places in the area where you live?
2. Why do you like these places? What do you do in these places?
3.Are there any places that you do not like in the area where you live?
4. Why don't you like these places?
5. There are 3 visitors coming to see the area where you live. They
will be coming at different times and have never visited you
before. What do you think you would show them, where would you
take them?
(i) Imagine that the first visitor is your cousin who is
about your age.
(ii) Imagine that the second visitor is an adult that you
know well, perhaps an Aunt or an Uncle that has come
to visit you for the first time.
(iii) Imagine that the last visitor is somebody that you do
not know, and that you have been asked to show them
around the area where you live. What would you show
this person?
6. Do you think that there are any Dangerous places in the area where
you live? If so, where are they, and why do you think that they
are dangerous?
7. Do you think that there are any Beautiful places in the area where
you live? If so, what are they, and why do you think that they
are beautiful?
8. Are there any places where you feel Uncomfortable or at all
frightened in the area where you live? If so, where are these
places, and what is it that worries you about them?
331

9. Where do you feel the safest and most Comfortable in the area where
you Live?
IC. Are there any Sounds that come to your mind when you think about the
area where you live?
II. Are there any Smells that come to your mind when you think about the
area where you live?
12. I would like you to imagine that you are making a Guide Book of the
area where you live. To make this more interesting, you can include
some photographs. If I asked you to imagine that you were going to
take 5 photographs, what would you have photographed to make the
Guide a more interesting description of the area where you live?
For Questions I0 and II further help was given.
After the children had been working through the questions for some time
and some of them were nearing questions 10 and II, they were all asked
to listen again.
"When you come to answer questions I0 and II I want you to think care-
fully before you answer. Question number I0 asks about the sounds you
might think of which you often hear in the area where you live. For
example, near where I live there is a Railway line, so I often hear the
sound of trains when I go home. Some of you might hear the noise of
Factories, and others the sound of animals. So think carefully before
you answer, don't just repeat the examples that I have just given you.
Try to think of your own ideas. It might help if you close your eyes
to help you picture your home area.
You could also do,this when you think about Question II, which asks
about Smells that come to yoUr mind when you think of your home area.
This might sound strange, and I expect the usual answers come to your
mind, but could you please think carefully and sensibly before you
answer. To give you an example which might help, a friend of mine'lives
near a sweet factory, and whenever I go to see him , the first thing I
always notice is a very strong smell of sugar in the air. Can you think
of anything like this when you close your eyes and think of your own
area? If not, don't worry, perhaps you can think of something later
and will tell me about it at one of our future meetings."
332

2. ,UESTIONNAIRE ANALYSIS.
As has been explained earlier, (Chapter 5.) the analysis of the
questionnaire for the whole sample revealed further information about
children's perceptions of their environment, which was difficult to
analyse on the basis of cognitive style. This section presents a
resum6e of the findings of this analysis in terms of the various sub-
groups employed in the study. (i.e. By Residence, Sex and Age.)
The questions selected for the Questionnaire are typical of those found
in Environmental Perception research, and the work of Lynch(1977),
Hart(1979), Uzzell(1976) and Moore and Young(1978), were especially
useful in the formulation of topics for consideration. As can be seen
in the Questionnaire, the topics selected were as follows:-
I. Favourite places and reasons for liking
2. Disliked places and reasons for dislikin
3. Comfortable as opposed to Uncomfortable
4. Dangerous places.
5. Beautiful places.
6. Noises associated with the environment.
7. Smells associated with the environment.
8. Two Tasks: (i) Selection of features to related child, a related other Adults.
(ii) Selection of a series of of the home area.
them.
g• places.
be shown to a Adult, and to
Guide Photographs
The discussion of the results of this analysis of responses will follow
the above order.
I. Favourite places and reasons for liking.
As can be seen from Table i., there is a progressive increase in the
number of Favourite places mentioned as the children get older, with
the girls tending to mention more features, a factor which occurs with
all age groups in the sample and as has been found by other researchers,
(Bishop, 1973, Mthews, 1980.) The types of features mentioned compare
favourably with other studies of this kind, although the number of
mentions per feature are lower than those described for example in the
CDULS study undertaken in the United States, (reported in Moore and
Young 1978, p.I06-III) which was based upon the analysis of features
shown in maps of 8-12 year old American children's favourite places.
There were however, a larger number of features mentioned by the
children in this study. (This was also the case for the two maps
produced for this project, the results of which will be discussed later.)
When the various favourite elements are considered as 'Composites', 333

► BOYS GIRLS SAMPLE I. SAMP E 2
TOPIC R lofT
1-'
ii+ U ° RU"T RU -̀eril
T, 12+1" BT
's
1047, U -̀'-r R
Ii4 U
T, 124 wRUO'h
T 0
a BO S
RURURU
GIRLS, Tait. - LA L
Favourite Places 22 19 34 36 27 47 43 30 50:66
I
• 22 48 41 32 56 31 35
s 49 AI 54 49 62 57 72 65 88
Disliked Places I0 21 14 12 20 20 10 25 42 12 25 16 17 26 19 20 22 50 33 23 35 34 50 41 68 C omfortabl. z Places 1 8 8 12 8 12 II 21 25 • 5 II 13 IC 17 II 14 18 22 19 18 19 19 26 25 33 Uncomfortable Places I0 6 15 7 II 13 7 19 34 4 15 II 15 21 II 16 25 37 24 19 23 27 31 32 45 Dangerous Places I 8 17 9 7 15 14 7 8 27 6 15 12 II 17 10 12 21 32 18 17 21 20.2.4 30 40 Beautiful Places TO 7 14 8 12 18 16 II 19 15 9 19 15 13 23 15 II 20
1 28 20 15 25 20 28 22 32
Noises 12 12 I• I0 I 20 21 8 26 12 J. II 12 IS 20 17 29 33 26- 19 25 21 34 27 43 Smells 9 14 23 9 9 16 16 8 18 29 7 8 IC II 14 21 7 15 20 29 23 19 16 25 27 30 39 TASKS: I. Cousin.
Adult. Visitor
25 20 24
IS 18 20
33 27 34
25 20 23
32 24 24
43 33 36
33 34 32
31 23 30
49 45 47
67 55 58
29 25 29
20 19 20
39 36 40
29 26 29
33 46 28 37 33 48
28 29 30
31 29 29
50 43 43
66 62 64
48 39 45
47 40 43
44 46 49
46 46
51'55 54 53
60 53 51
76 73 68
2. Guide - Photos. 38 39 35 46 62 48 39 64 88 45 26 56 45 35 60 39 46 64 83 58 60 60 57 70 78 103
1 R =RURAL , U=URBAN
TABLE I. A COMPOSITE TABULATION OF THE NUMBER OF DIFFERENT FEATURES It NTIONED
FOR EACH OF THE QUESTIONS ON THE QUESTIONNAIRE. (Details given for
each age group and. in their Rural and Urban sub-groups.)

Table ii. Favourite Places
Common Features
Total Reference,
Mention Rate
Own House 131 0.29 Green 50 0.11 Park 46 0.I0 Shops 40 0.09 N'd Roads 35 0.08 Own Road 33 0.07 Rec. 32 0.07 Sweet Shop 27 0.06 Own Garden 26 0.06 Fields 26 0.06 Playing Fields 26 0.06 Named Stores 24 0.05 River/Brook4 Stream 22 0.05 Public House 21 0.05 N'd Places ' 19 0.04 Woods 17 0.04 Trees 17 0.04 Swimming Pool 16 0.04 Tracks/Alleys 15 0.03 Playground 15 0.03 'Chippy' 12 0.03 Church 12 0.03 Post Office II 0.02 Friend's House II 0.02 Common 1 II 0.02 Garage 9 0.02 Church/Village Hall 0.02 Own Camp/DeJ : 0.02 N'd Buildings 8 0.02 Car Parks 1 7 0.02 Football Gnd. 7 0.02 Library 7 0.02 Youth Club 6 0.01 Swings 6 • 0.01 My !Areal 6 0.01 Own Room 6 0.01 Council. Dump 6 0.0I School
I 5 0.01
Station 5 0.01 Building Site 5 0.01 NONE 5 0.01 Flats 4 0.0I Old School 4 0.01 Garages (en bloc4 0.0I Factories 4 0.0I Waste/Derelict Areas 3 0.01 Orchards 3 0.0I Relation's House 2 0.0I Meadows 2 0.0I
On Urban Naps only
Total ReferenceE
Mention Rate
Cemetry 8 0.04 N'd B'dings 4 0.02 Market I 3
0.0I Sports Hall 2 0.0I Commy Centre 2 0.0I Hospital 2 0.0I Subway 2 0.01. . T.A.Centre I 0.004 Airport I 0.004 Bus stop I 0.004 Monastery I 0.004 Adventure Playground I 0.004 Bingo Hall. I 0.004 Dancing Sch. I 0.004 Cycle Track I , 0.004 , On Rural Maps
____fnlY I Heath 19 0.08 Stud IO 0.04 Stables 7 0.03 Farms 4 0.02 Cafe 4 0.02 Yard 4 0.02 Paddock 3 0.01 Police Station2 G.OI Water Tower 2 0.01 Windmill 2 0.0I Market I 0.004 Physical Features I 0.004 'The Village' I 0.004 Rides I 1 0.004 'The view's 1 0.004 Bus shelter I 0.004 Hotel 1 0.004 Restaurant I 0.004 Cinema I 0.004 Town Centr I 0.004 MAJOR
COMPOSITES PLAY PLACES 268 0.59
PERSONAL or HOMITE 229 0.50
SHOPS 104 0.23
HORSES etc. 40 0.20 (Rural only
335

TABLE iii. Reasons for Liking particular places. (Mention rate.)
COMMON REASONS TOTAL REFS. MENTION RATE
Playing 330 0.67 Sweets 71 0.2 Quiet 67 0.2 Friend's 45 0.1 Shopping 39 0.I Warmth/Family
Associations 33 0.I Cycling 28 0.1 Climbing 28 0.I Swimming 25 0.I Food 23 0.I Swings 21 0.I Football 20 0.05 Animals 18 0.04 Walking 15 0.03 Lots to do 13 0.03 Watch Sport II . 0.02 Fishing IO 0.02 Reading IO 0.02 Space Invaders 10 0.02 Drinking 7 , 0.02 Ridin Motor Bikes) 7 0.02 Conkers 7 0.02 Scouts/Guides etc 6 0.01 Youth Club 6 0.0I Away from Adults 5 0.01 Hobbies 3 0.0I Boating/Canoeing 2 0.004 Skating 2 0.004 Trains 2 0.004 Choir 2 0.004 Bingo 2 0.004
URBAN CHILDREN ONLY
Dancing 3
0.01 Judo 2 0.004
RURAL CHILDREN ONLY
Riding 15 0.03 Watching others 3 0.0I Places of Interest 3 0.01 Television 3 0.0I Carting 2 0.0I Kite Flying 2 0.0I Scrumping 2 0.01 Tennis I 0.004 Birdwatching I 0.004 Picnics I 0.004
336

Play-places, Personal and 'Home-site' elements and Shops emerge as the
most positively regarded features of the environment. These results are
similar to those identified in the CDULS project and to Lynch's study
of 'Growing up in Cities', although the adolescents in Lynch's research
did not consider shops as important as the younger children of this and
the CDULS study. As has also been suggested by Bishop, (1973) it appears
that young children make considerable use of the shops in their environ-
ment, especially the 'sweet shops'. It is also interesting to note the
very specific distinctions made by children between the various play -
places that exist in their environment. To some extent this supports
comments by Bishop, (1973) and others,„Uzzell (1976), about the
differences between adult and child perceptions. Lynch had previously
commented, (Lukashok and Lynch 1956.) that adult memories of childhood
play places were often labelled quite simply as the Park, or the Play-
Area, whereas the results cited here offers the Green, Rec, Park, Fields,
Playing Fields, Meadows, Heath, Playground etc. In addition to these,
Car-parks, Garages, Building sites and Council Dumps were mentioned
with play as the main reascn for liking. The enthusiasm for play places
is contrary to the low rating described in Maurer and Baxter's (1972)
study.
Evidence offered as reasons for liking a particular place or
feature revealed information of further interest. Clearly,playing is the
major influence, but again the variety of activities associated with a
particular place are extensive and clearly delineated by the children,
as can be seen in Table iii. As has already been indicated, shops were
often cited primarily for the purchase of sweets, food or drinks and a
surprising variety of places served this purpose i.e. sweet shops,
fish and chip shops, post offices, garages and even the local Hospital
shop.
The girls of the sample appeared to prefer places that offered
peace, quiet and privacy and one also begins to identify the emergence
of more adolescent pastimes especially with the older girls, who cited
'meeting friends' and 'away from adults' as major reasons for liking
somewhere. There are also other sex differences demonstrated between
the types of activity associated with favourite places, with the boys
appearing to refer to more active pastimes in general. One final
distinction was between the urban and rural sub-groups. The urban girls
in particular seemed to enjoy the shopping facility offered by.a large
city centre, whereas the rural boys appeared to be becoming 'Hooked' on
the space invaders game.
2. Disliked Places and reasons for Disliking.
The majority of disliked features and places have a clear association
with the preservation and,security of self. Evident in Tables iv and.v , "337

TABLE iv. Disliked Features / Table v. Reasons for Disliking
COMMON NUMBER OF FEATURES REFS
MENTION RATE RURAL FEAT RES (Cont)
No. of Refs.
Mention Rate.
NONE
1
183 0.4
N'd Roads 58 0.13 Common I 0.004 Specific Houses3I 0.07 Swings I 0.004 School 20 0.04 Sports Hal. I 0.004 N'd Shops 15 0.03 Pit/Dump I I 0.004 Passages/ Railway Line I 0.004 Alleyways II 0.02 Toilets 0.004 Churchyard IO 0.02 Lorry Park
I
I I 0.004
Garage 9 0.02 Car Park I 0.004 Brook/Fond/ Carrot Wash I 0.004 River 9 0.02 Station I I 0-.004 At Night 8 0.02 Underpass I I 0.004 Play Area 7 0.02 Road System I 0.004 Factory 7 0.q.:2 Telephone Ex.I 0.004 Flats 6 0.0I Other ChildrenI 0.004 Public Houses 6 0.0I Paddock I I 0.004 N'd Areas 6 0.01 Woods 6 0.01 REASONS FOR DISLIKING-TABLE v.
Park Football Pita
6 3
0.01 0.0I
COTZ1ON REASONS
No. of Refs,
Mention Rate
Bridge Allotments
2,- 2
0.004 0.004
Traffic I Smell
38 37
0.08 0.08
New Houses Green
2 2
0.004 0.004
Complaining • Adults 34
Fields 2 0.004 Frightening Bullying
31 23
URBAN CHILDREN Noise 18
0.07
0.04 ON.' Untidy 16 0.04
Hospital I 4 0.02 Personal ExpI6 .
Community Centre4 C.02 At Night/DarkI5 0.03 Building Site 3 0.0I Dislike it 14 0.03 Subway 2 0.0I Ugly/Dull 7 0.02• Rec 2 0.01 Excluded 7 0.02 Restaurant 2 0.0I Neighbours 6 0.0I Orchard I 0.004 Glass 7
i 0.01 Church Hall I 0.004 Strangers 2 0.004
'Funeral Parlour I 0.004 Boring 2 0.004_ 0.A.P'S Home I I 0.004 URBAN ONLY Fire Station ' I ' 0.004 Tramps 3 0.01 Derelict Site I 0.004 Derelict I 0.004 Airport' I 0.004 No Friends I 0.004 Garden Centre I 0.004 Muddy I 0.004 Market I 0.004 Cold I 0.004 Roundabout I 0.004 Expensive I 0.004 Telephone Box I 0.004 RURAL ONLY
RURAL CHILDREN Dangerous IO 0.04
ONLY Animals 9 ' 0.04
Stable 4 0.02 Nothing to do7 0.03
Stud 3 0.01 Nowhere to
Own Area 3 0.01 play 6 0.03
Trees 0.0I Poor Facilit..-
Police Station 3 0.01 ies 0.03
Sewer 3 0.01 Polluted 2 0.0I
Paddock 2 0.0I Police 2 0.0I
Bus Shelter 2 0.01 Schoolwork 2 0.0I
Own House 2 0.0I Farms 2 0.0I Heath 2 0.0I Water Tower 2 0.0I
338

is a conscious association between disliking and dangerous elements in
the children's environment. (It needs to be recognised that many of the
comments made refer only to a small proportion of the sample and that
the most positive response to the question of disliked elements was that
there were NO disliked features.) As with the previous section, there is
an age association demonstrated in the results, but one that works in the
opposite direction i.e. the younger children tending to refer to more
disliked places than the older ones. This is interesting in that one
might have anticipated more to dislike from children with a more
extended Home-rangek..e. Older children are likely to be given more
freedom in their environment.) There is evidence from a few responses
of individual's social perception of the environment, (e.g. Glass,
poor road surfaces, pollution etc.). There are also indications of
sex differences, with more girls mentioning 'At night', the 'Dark',
and 'Tramps and Drunks' as reasons for disliking a particular place.
It is the case however, that both sexes describe features as
'Frightening'. More boys commented about 'Adults who complain' as a
reason for disliking somewhere, and the girls appeared-to be more
conscious of the immediate physical appearance of places, describing
them as 'DullyDreary', 'Ugly' or 'Untidy'. It was also interesting
that both boys and girls commented on irritating noises end smells
as factors contributing to their disliking somewhere, prior to their
having to comment on such factors in the Questionnaire, which seems to
suggest that they do naturally consider auditory and olfactory
information in their interpretation of places.
3. Comfortable, Uncomfortable and Dangerous Places. When these characteristics are considered, similar results to those
already discussed begin to emerge. It is evident that most children are
happiest and confident in their immediate locality. There is evidence
of a limited number of older children beginning to go beyond the immediate
locality,(to swimming pools and the various Parks and Recreation grounds.)
Girls again make significantly more references to the'Dark', 'Night' and
'Unlit Places', and the 'Woods' as areas where they are uncomfortable.
More boys seem to have no such fears, commenting that they are happy
and confident everywhere, and that there wasn't anywhere where they
felt uncomfortable. These results are similar to those described by
Lynch (1977), and it was interesting that no reference was made to
disliked areas in the terms described by Ladd (1970). Any major differ-
ences between the urban and rural sub groups arise primarily from the
environment in which the children live, and in fact the similarity
between the features described by both sub group:: is remarkably high..
For example, 'Traffic' is clearly seen as an important environmental 339

TABLE vi. COMFORTABLE PLACES. TABLE vii .UNCOMFORTABLE PLACES.
COMMON FEATURES
NO. OF REFS.
MENTION RATE
Own House Own Garden Own Road
353 29 29 .
0.8 0.06 0.06
Near my 'Area' 20 0.05 In Bed 18 0.04 The Green II 0.04 Own Room 9 0.02 Friend's 8 0.02 Own Den 7 0.02 Park 6 0.0I Other N'd Roads 5 0.0I Swimming Pool 5 0.0I Fields 5 0.0I With Others 5 0.0I Rec 4 0.01 School 2 0.004 Police Station 2 0.004 River. 2 0.004
URBAN CHILDREN ONLY NONE 4 0.02 Everywhere 3 0.0I Other Rooms 3 0.0I Shops 2 0.01 Neighbour's I 0.004 Church Hall I 0.004 Cemetery I 0.004 Daylight I 0.004 RURAL CHILDREN ONLY Church 0.0I Heath 3 2 0.0I Relation's I 0.004 Swings I 0.004 Public Houses I 0.004 Cafe I 0.004 Stable I 0.004 Ma rket I 0.004
i
COMMON FEATURES
NO. OF REFS.
MENTION RATE
NONE 256 0.6 At Night 62 0.14 Woods/Trees 31 0.07 N'd Roads 27 0.06 Passages/
Alleys 18 0.04 Cemetery 16 0.04 . Church IO 0.02 N'd Buildings 8 0.02 Empty Buildings6 0.0I Park 5 0.0I Bridge 5 0.0I N'd Houses 4 0.0I Fields 4 0.0I Building Site 2 0.004 Playground 2 0.004 River 2 0.004 Bullying 2 0.004 Factory 2 0.004 Dump 2 0.004
URBAN CHILDREN . ONLY Unlit Roads 8. 0.04 Greens 7 0.03 Common 5 0.02 Garages 4 0.02 N'd Areas 3 0.0I Public Houses 3 0.01 Video Cameras 2 - 0.0I • Subway 2 0.0I Crowds I 0.004 Lorry Park I 0.004 . Swimming Pool I 0.004 Football Gnd. I 0.004 Flats I I 0.004 RURAL CHILDREN Onl Alone 7 0.03 Farms 4 0.02 . Heath 4 0.02 Police Station 3 0.0I Personal 1
Experience 3 0.0I Railway 1 2 0.0I Elec.Sub Stat. 2 0.0I Paddock 2 0.0I Animals I • 0.004 Scho'bl I 0.004 Garden Centre I 0.004 Coal Yard I I 0.004 Out of My Area I 0.004
340

TABLE viii. DANGMOUS PLACES. TABLE ix. BEAUTIFUL PLACES/FEATURES.
COLSTON FEATURES
NO. of Refs.
MENTION RATE
COMMON FEATURES
No. of Refs.
MENTION RATE
NONE 155 0.3 NONE 208 0.46 Roads/Traffic 139 0.3 Woods/Trees 30 0.07 Rivor(s)/Water 22 0.05 N'd Buildings 23 0.05 Railway 21 0.05 River/Stream 21 0.05 Woods/Trees 17 0.04 Own House 18 0.04 Building Site 16 0.04 Fields 18 0.04 A ileys/Tracks II 0.02 Church 17 0.04 Gas/Electricity Gardens 13 0.03 Installations 9 0.02 N'd Roads 12 0.03
Derelict B'dings 8 0.02 Green(s) II 0.02 At Night 6 0.0I Own Area 9 0.02 Lorry Park 5 0.01 Own Garden 8 0.02 Park/Green 4 0.01 Park 7 0.01 Rec 2 0.004 Churchyard 7 0.0I Sand Pit 2 0.004 Rec 6 0.01 Car Park 2 0.004_ Specific Houses 5 0.01 URBAN CHILDREN Public Houses 5 0.01
ONLY Flowers 4 0.01 Wherehouse Factory 7 0.03 School 3 0.0I Playground 6 0.03 URBAN CHILDREN Play Equipment I 4 0.02 ONLY Strangers/Drunks 4 0.02 Common 6 0.03 Public Houses 3 0.01 Shops 5 0.02 Quarry/Pits 2 0.01 Bowling Green 2 0.0I Subway/Tunnel 2 0.01 Playing Fields I 0.004 Market 0.004 RURAL CHILDREN Meadow 0.004 ONLY Fields 0.004 Heath 17 - 0.07 Lock 0.004 Stables/Stud 9 0.03 Airport 0.004 Horses 7 0.03 Fire Station 0.004 Views 5 0.02 RURAL CHILDREN Footpaths/Walks 5 0.02 ONLY Bridge 2 0.0I
Farms/Barns 6 0.03 Race Course I 0.01 Stud/Stables , 6 0.03 Paddocks 1 I 0.004 Garages 4 0.02 Own Den I 0.004 Junkyard/Dump 4 0.02 Thatched Garage I 0.004 Horses 4 0.02 Sewer 3 0.01 Heath 0.004 Water Tower 0.004 Other Animals(Bull)I 0.004
This tabulation demonstrates a feature which emerges throughout the questionnaire responses, that what is beautiful, comfortable and attractive for some is dangerous and uncomfortable for others. This reinforces the belief that the circumstances in which a place is experienced or the context in which it is considered is fundamental to one's perception of it.
341

hazard by many children, as are the woods and the river. It is of note
that more rural children commented on the 'Railway' as dangerous,
probably as a result of the open nature of Railway systems in the country.
As a result Railway lines are more accessible and there is less likli-
hood of being observed. A further interesting difference in the features
described as dangerous, was reference to 'Strangers' or 'Drunks',
especially at night, which was particularly noted by the Urban girls.
(Each of the references to this category was supported by descriptions
of personal experience or local knowledge which categorised them as
dangerous.) were As with the last section, there/many children who felt that there was
no danger in the area where they lived, and this was true of both boys
and girls and urban and rural sub-groups.
4. Beautiful Places.
The analysis of responses in this section revealed that in general the
girls of the sample described more features of their environment as
beautiful, and this was confirmed for all age groups in both rural
and urban sub-groups. The differences between the sexes were relatively
small, but it was evident that the girls were able to identify something
of beauty where they lived. Similarly there were fewer girls who said
there was nothing that could be thought.of in this way in the area where
they lived. In general the type of features included by both sexes tended
to be similar, with minor exceptions. (For example, only the girls
described 'Fields' as things of Beauty.) Comparison between the rural
and urban sub-groups revealed that the rural group tended to refer to a
slightly wider range of beautiful elements, perhaps indicating the
difficulties of identifying beauty in an urban setting for children of
this age. Other studies by Lynch (1977) and Uzzell (1976) have
identified a similar range of responses to questions about beauty in
the environment of children.
5. Noises and Smells associated with the Environment.
Despite the fact that researchers suggest that an environmental image
will contain associated noises and smells, there is little evidence of
attempts to identify what these might be. The results of the analysis
for this study revealed how perceptive some children are when the
senses of sound and sight are called upon. (As can be seen in Tables x
and xi)
Although many children failed to respond to this section of the Question-
naire, or merely suggested that no sounds or smells came to their mind
when they thought of the area where they lived, those who did respond
produced a most interesting range of answers. As was suggested in 342

TABLE X. NOISES ASSOCIATED WITH TABLE Xi. SMELLS ASSOCIATED WITH TEE ENVIRONMENT
THE ENVIRONMENT
COMMON FEATURES
NO. OF REFS.
MENTION RATE
Traffic 126 0.28 NONE 125 0.28 Animals 61 0.13 Children's
Voices 32 0.07 Trains 28 0.06 Adult Voices 20 0.05 Birds 14 0.03 Building/Road
Works 12 0.03 Football Crowd II 0.02 Wind II 0.02 Trees II 0.02 Music 6 0.0I Church Bells 6 0.0I Factory 5 0.0I River 4 0.0I Garage 3 0.0I Neighbour's '3 0.0I Tree Cutting . 0.004 Lucks 2 0.004 URBAN CHILDREN ONLY Aircraft 17 0.04 Pub Noises 5 0.02 Ambulances 3 0.02 Footsteps 2 0.0i Tennis Courts 2 0.01 School Bell 2 0.0I Rain I 0.004 Ice Cream Vans 1 0.004 Fire Bell I 0.004 RURAL CHILDREN ONLY Horses 35 0.07 Farm Machinery 14 0.03 Dogs 4 0.02 Chickens 3 ' 0.01 Pigeons 2 0.0I Cows 2 0.01 Heating System 2 0.0I Quiet 2 0.0I Motorway 2 0.01 Dry Leaves I 0.004 Church Clock I 0.004 Telephone I 0.004 Choir I 0.004 Swings I 0.004 Geese I 0.004 Pheasants I 0.004 Turkeys I 0.004
COMMON FEATURES
NO. OF REFS
----- MENTION RATE
NONE 211 0.46 Horses 67 0.15 Fish & Chips 23 0.05 Smoke/Bonfires 21 0.05 Petrol/Diesel 19 0.04 Cooking 17 0.04 Exhaust Fumes 16 0.03 Animals 13 0.03 Rubbish/Refuse IO 0.02 Cut Grass 9 0.02 Flowers 9 0.02 Farm Smells 8 0.02 Sewage 6 0.01 Cafe/Restaurant 4 0.0I Gasworks 4 0.01 River 4 0.0I Pubs/Beer 3 0.01 Drains 3 0.0I Paint 2 0.004 URBAN CHILDREN ONLY Baking 6 0.03 Tar 3 0.02 Laundry 2 0.01 Swimming Pool 2 0.0I Dogs I 0.004 Glue 1 0.004 Cut Wood I 0.004. Builders I 0.004 Tobacco I 0.004 - Fresh Air I 0.004- Crops Allotment I 0.00, RURAL CHILDREN ONLY Pigs
HH
HH
HH
-Y4-•
V) 0.02 Factory 0.02 Garage 0.01 Paraffin 0.004 Apples 0.004 Chickens 0.004 Coal Yard 0.004 Toilets 0.004 Fertiliser 0.004
343

in response to dangerous environmental features, 'Traffic' was the most
regularly identified noise, folowedby the noises of animals. Of
particular interest here was the tendency of urban children to use the
generic term 'animals' or just Dogs and Cats, whereas the rural children
distinguished a considerable variety of animal noises. This was also
demonstrated when the smells associated with an environment are considered.
Horses were mentioned by a fairly large section of the sample, especially
the rural children. It is also possible to identify the influence of
immediate or reasonably recent experience in the responses. (e.g. Bonfires,
Paint.) It is also possible to reinforce earlier comments about the
importance of food in the minds of many children with references to
'Fish and Chips','Cooking', and 'Baking'. Finally the effects of
'Traffic' in a nasal sense is demonstrated in references to 'Petrol/
Diesel' smells and to 'Exhaust Fumes'.
6. Two Tasks.
As a final element of the Questionnaire, the children were presented
with two tasks which required them to consider their knowledge and
environmental preferences in terms of others. The first task asked
them to select what features or places they might show to a related
child, (probably of the same age as themselves) a related adult and an
unknown adult. The analysis of the detail of these results can be seen
in Tables XII and XIII)
A progressive increase in the number of features mentioned is demonstrated
as the children get older, thus the children 12+ suggested more features
for each category, and as has previously been indicated, the girls tended
to offer more suggestions than the boys. It was also the case that more
features were listed for showing to a related child than to either adult,
and that generally more features were suggested for the related adult
than for the visitor, as might have been expected.
When the,features themselves are considered, the appropriateness of
selection becomes apparent, thus a related child is more likely to be
shown the House , Bedroom or Road, Local Play places or secret places.
Similarly a related adult is more likely to be shown 'Our House' or
'the same as a related child', although the sim ilarity of features
selected for a known and unknown adult is comparatively high, suggesting
that children find it easier to consider such selection in their own
terms. The features identified as appealing to adults seems to bear this
out to some extent, for example there is a high incidence of 'Landmark'
type elements in Lynch's terminology.Thus shops, Pubs, Churches, Schools
and Named Buildings receive support. Some of the features listed do not
immediately appear appropriate for example, 'The Bus StationyThe Post
344

TABLE XII. COMMON FEATURES TO BE SHOWN TO A COUSIN, A RELATED ADULT AND A VISITOR.
COMMON FEATURES TO COUSIN.
NO. OF REFS
YENTION RATE.
COMMONFEATURES TO REL'N.
NO. OF REFS.
MENTION RATE.
COMMONFEATURES TO VISITOR
NO. OF REFS.
MENTION RATE.
Own House Shops All Round Green Schools Park Secret Tlaces Church Playing Fields River Swimming Pool Rec. Other Roads Pub Own Garden N'd Buildings Own Road Friend's House Common Alleys/Tracks Fields Woods Town Centre Ask/Show a Play Areas N'd Places Village/Church
Hall Animals/Pets Own Room Garages Sites/landmarks Flats Sports Centre Station Trees Factories Post Office Relation's House
Cafe Garden Centre Farms 1 Police Station
12_ 116 60 44 39 38 36
1 34 30
I 30 29 26 21 20 19 19
I 17 17
I 17 15 15 14 14
map 13 12
1 II
1 9 8
1 8 1 8
6 1 5
5 5 4 4 2
2 2 2 2 2
0.27 0.25 0.13 0.I 0.I 0.I 0.I 0.1 0.I 0.I 0.I 0.06 0.05 0.05 0.04 0.04 0.04 0.04 0.04 0.03 0.03 0.03 0.03 0.03 0.03 0.02
0.02 0.02 0.02 0.02 0.01 0.0I 0.0I 0.01 0.01 0.0I 0.004
0.004
0.004 0.004 0.004
0.004.Alleys/Short
Shops All Round Own House Church Pub Schools Same as
Cousin Other Roads Town/Shopl
Centre. Offer a map/ Ask them
Own Garden N'd Bldings River N'd Places Green Park Library Fields Playing F'ds Woods Own Road Sites/Land-
marks
Post Office Animals/Pets Station Hospital Cemetry Factories Play Areas Post Box Friend's
House Common Church Hall Bowls Club
Cuts Own Room,
1
95 83 77 48 48 44
37 25
22
19 IS 17
I 17 15 14 14 IQ IO 8
7 7
7 1
6 6 5 5 5 5 5 4
4 4 3 3 3 3 3
0.2 .0.18 0.17 0.II 0.II 0.I
0.1 0.05
0.05
0.04 0.04 0.04 0.04 0.03 0.03 0.03 0.02 0.02 0.02 0.02 0.02
0.02
0.01 0.01 0.0I 0.0I 0.0I 0.0I 0.0I 0.01
0.0I 0.01 0.01 0.0I
0.0I 0.01
Shops All Round Own House N'd Roads Same as ReA.46 Schools i Church N'd B'dings Pubs
Town Centre Park River Sites/Land-marks
Own Garden Playing F'ds Ask/Show Map Other Houses Swimming Poo= Play Areas Common Own Area Green Post Office
IStation
1 1Hospital Graveyard Own Road Garages Alleys/Short-
cuts Fields Police Station5 Car Park 1 Building Site N'd Places Post Box
0.01
96 93 55 48
44 44 35
I 31
30 I 30
22
1 18 13 13 13 12
II 10 9 9 9 8
8 7
7 - 7
6 1 6
4 4 3 2
0.2 0.2 0.12 0.I 0.I 0.I 0.I 0.I 0.1
0.I 0.I 0.05
0.04 0.03 0.03 0.03 0.03 0.02 0.02 0.02 0.02 0.02 0.02 0.02
0.02 0.02 0.02 0.02
0.0I 0.01 0.0I 0.0I 0.0I 0.0I 0.004

TABLE XII (cont.) FEATURES SHOWN TO A COUSIN, A RELATED ADULT AND A VISITOR. URBAN CHILDREN ONLY.
COUSIN NO OF REFS
MENTION RATE
ADULT RELATION
NO. OF REFS
MENTION RATE
VISITOR NO. CF REFS
MENTION RATE
IIONIMINI
N'd Buildings 12 0.05 N'd Buildings 14 0.06 N'd Buildings 21 0.09 Football Gnd. 9 0.04 Museums 1 10 • 0.04 Rec II 0.05 Library 7 0.03 Football Gnd. 5 0.02 Post Box 7 0.03 Youth Club 6 0.03 Youth Centre 4 0.0I Library 7 0.03 Hospital 4 0.01 Swimming Pool 3 0.01 Bus Stop 6 0.03 Graveyard 4 0.01 Stables 3 0.0I Museum 6. 0.03 Museums 4 0.0I Rec 2 0.0I Bowls Club 4 0.0I Swings 3 0.0I Police Station 2 0.0I ,irport 3 0.0I Building Site 3 0.0I Toilets 2 0.0I Factories 3 0.01 Post Box 2 0.0I Doctor 2 0.01 Doctors 2 0.01 Toilets 2 0.0I Bus Stop 2 0.0I Youth Centre 2 0.0I Market Place 2 0.0I Phone Box 2 0.0I Toilets 2 0.01 Cinema 2 0.0I Swings I 0.004 wings I 0.004 Airport I 0.004 Market Place I 0.004 .,ports Centre I 0.004 Subway I 0.004 Community Community Community Centre I 0.004 Centre I 0.004
Centre I 0.004 Cinema I 0.004 Bowls Club I 0.004 Garden Centre I 0.004 Adventure Garage I 0.004 Playground 1 0.004 Dentist I 0.004
Meadows I 0.004 T.A.Centre I 0.004 Bus Stop I 0.004 Phone Box I 0.004
TABLE XII (cont.) FEATURES SHOWN TO A CCUSINI A RELATED ADULT AND A VISITOR. RURAL CHILDREN ONLY.
COUSIN NO. OF MENTION ADULT NO. OF MENTION VISITOR NO. OF MENTION REFS. RATE RELATION REFS RA TE REFS RATE
Heath 20 0.09 Heath 18 0.08 Heath 18 0.08 Stud/Stables 20 0.09 Stud II 0.05 Stud/Stablesl8 0.08 Horses 12 0.05 Horses II 0,05 Horses 1 7 0.03 Own Area IO 0.04 Race Course 4 0.02 Race Course 4 0.02 Trains 6 0.03 Meadows 4 0.02 Hotel 1 4 0.02 Paddock 3 0.0I Farms 1 3 0.0I Village 11 4 0.02 Yard 2 0.0I Relation's Paddock 3 0.0I Fish & Chip House 2 0.01 Woods 3 0.0I
Shop 2 0.0I Hotel 2 0.0I Farms 3 0.0I Court House I 0.004 Paddock 2 0.0I Garden Centre2 0.0I. Bridge I 0.004 Yard 2 0.01 Trees 1 2 0.01 Hotel I 0.004 Trees I 0.004 Fish & Chip Caravan I 0.004 Orchard I 0.004 Shopl 2 0.0I Car Park I 0.004 Trains I 0.004 Friend's Hse,2 0.0I Race Course I 0.004 Bridge I 0.004 Cinema I 0.004
Fish & Chip Bridge I 0.004 Shop 1 I 0.004 Yard I 0.004
BuildingSitel 0.004 Bus Station I 0.004
1
346

RURAL FEATURES ONLY
NO. OF REFS
MENTION RATE
Stables/Stud 47 Heath I 42 Clock Tower 40 Race Course 31 Horses 25 Farms 1 IO N'd Buildings 8 Physical 1
Features 8 Brook 1 6 Water Tower 6 Paddock I 5 Old Station 5 Windmill I 4 Jockey Club 4 Ford
Memorial Motorway Own Den Orchard Meadows Bank Fish & Chip
Shop Yard
1 3 Other Animals 2 Farm Machinery2
2
2 I I
I 0.004 I 0.004
0.21 0.18 0.17 0.14 0.11 0.04 0.04
0.04 0.03 0.03 0.02 0.02 0.02 0.02 0.0I 0.01 0.01 0.0I 0.0I 0.004 0.004 0.004 0.004
TABLE XIII. PHOTOGRAPHS SPLECTED FOR INCLUSION IN A GUIDE BOOK OF THE CHILDREN'S HOME AREA.
COMMON FEATURES
NO. OF REFS
MENT ION RATE
URBAN FEATURES ONLY
NO. OF REFS
MENTION RATE
Church 122 0,27 N'd Buildi Es 46 0.21 Shops 102 0.22 Common 23 0.I Own House 99 0.21 Rec 15 0.06 School 84 0.2 Museums 7 0.03 Public Houses 68 0.2 Library 6 0.03 N'd Roads 68 0.2 N'd Areas 6 0.03 Town/Shopping Swings/ 6 0.03
Centre 56 0.13 Play Areas Park 55 0.12 Airport 3 0.01 Other Houses 48 0.II Lake 3 10.01 Green 43 0.I Youth Centre 3 0.01 River 41 0.I Woods 31 0.I
T.A.Centrel 2 0.0I Boat Yard 2
0.01 Playing Fields 30 0.I Flats 2 0.0I N'd Buildings) 29 0.I Health Centre 2 0.01 Station/Railway28 0.I Community Cntr.2 0.0I Fields 27 0.06 Youth Centre 2 0.01 Swimming Pool 26 0.06 Y.M.C.A. I 2 0.01 General/Aerial Sports Hall 2 0.0I
Views 26 0.06 Tech. 2 0.0I N'd Areas 24 0.05 Subway 0.004 Own Road 21 0.05 Market I 0.004 Gardens 21 0.05 Galleries(Art) I 0.004 Pond 19 0.04 Monestry I 0.004 Own Garden 15 0.03 Fen 1 I 0.004 Football Groundl4 0.03 Bus Shelter I 0.004 Footpaths/TrackI3 0.03 Lock I 0.004 Church/Village Nursery I 0.004
Hall 13 0.03 Doctors I 0.004 Churchyard II 0.02 Garden Centre 0.004 Factories 0.02 Bath House 0.004 Bridges II 0.02 Playground IO 0.02 Post Office 9 0.02 Hospital. 9 0.02 Trees 8 0.02 Garage(s) 7 0.02 N'd Places 6 0.01
•
Old Primary School 6' 0.0I
Police Station 5 0,01 Hotel/Restaurant5 0.0I Cinema/,.heatre 4 0.0I Allotments 4 0.0I Council Dump 4 0.0I Fire Station 3 0.0I Building Sites 2 0.004 N'd People 2 0.004 Tennis Courts) 2 0.004
347

Office', or 'The Post-Box'. Follow up questions, either whilst completing
the Questionnaire, or in the follow up interview always provided an
extremely logical explanation for their inclusion.
Any differences that emerged between the urban and rural sub-groups
can be attributed to the availability of certain features in each environ-
ment, and the number of features commonly mentioned was quite high.
Similar findings emerged in the analysis of Task 2, which required the
children to select 5 features or places for inclusion in a Guide-Book
of the area where they lived. Again many of the children were most thought-
ful in their responses to this task and reference was made to all of the
features previously included in the Questionnaire responses. In a11,103
different features were mentioned as can be seen in Table AA end it was again the case that urban and rural differences arose from
the different natures of each of those environments. As with Task I, a
progressive increase with _asp in the number of features included is
demonstrated, with considerable similarities in the number and type of
feature mentioned by boys and girls. When the features are considered
in rank order of mentions there is further evidence of the emphasis
placed by children of this age on 'Landmarks'. Churches was the most
popular inclusion. 'My House' also emerged as a strongly supported
Guide-Book inclusion, confirming yet again the importance of the
immediate locality and personal homespace for these children. Shops
were also confirmed in their importance, especially for the girls, -
(The urban girls particularly).
Many of the comments made here were further demonstrated when the two
maps , (of the Area where the children lived and of their route from
Home to School) were analysed for the type of features which were
included.
3. Map Analysis.(Feature Inclusion) ( TABLE XIV) When the mops are considered for the number of features- mentioned by the
children, an increase in the number is again demonstrated with age,
although the differences between the II+ and 12+ age groups are small.
The differences between these two groups and the results of the younger
children provides some evidence of the developmental nature of
Environmental knowledge discussed in the text of the thesis, or
alternatively may be associated with changes in parental attitude at about
the time of traditional primary/secondary transfer. (It needs to be
remembered that the children in the rural school were in a middle shool
and therefore did not physically change schools, yet their results
indicate a trend similar to that of the urban children who had changed
school, and who now had to travel further distances to get to school.)
348

The Table below also identifies a factor of importance by which to
compare the two mapping tasks. In all cases the Area maps included more
detail, particularly when you consider the maps of the girls of the sample
BOYS GIRLS DI+ II+ 12+ IC+ 11+ 12+
ROUTE NAPS 51 62 62 41 59 63
AREA MPS 55 70 81 63 77 89
Number of Features mentioned on the Naps.
The greater detail included on the area maps and indicated in the above
table is probably associated with the importance of the immediate environ-
ment to the children which was mentioned earlier,1 The Home Site Princplel
described by Moore and Young (1978) and Bart (1979). The differences
between the maps may also be a direct result of the nature of the two
tasks, a factor which was raised in Chapter 5 and was previously- hinted
at by Sieverts (1967) in his study of children's perception of Berlin.
During the route from home to school either comparatively little
attention is paid to the environmental detail which is passed, or
alternatively and probably more likely, that there is so much detail
that individuals are more selective about what they attend to, an
example of Calland'S (1973) Distance-Decay principle.
When the number of features are considered in terms of differences
between the urban and rural sub-groups another interesting factor emerges
especially when the Route Maps are considered. The Rural children appear
to include more detail on their maps as can be seen in the tabulated
results below
BOYS GIRLS
10+ II+ 12+ 10+ II+ 12*
URBAN NAPS 25 39 41 25 34 43
RURAL NAPS 36 44 42 29 42 50
Number of Different features included on the Route Naps
by the Urban and Rural Sub-groups.
The results of this analysis suggest that the longer route undertaken
by many of the rural children, many of whom have to travel in to school
from some distance, allows the possibility of more environmental detail
to be considered and seems to contradict the points made above and the
comments of Downton (1973) who suggested that the length of route to
school could effect attention to detail.
When the features themselves are considered there are considerable simil-
arities demonstrated between the groups in the kinds of features attended 349

COMMON FEATURES
VENTION RATE
ROADS 0.8 Own House 0.6 School 0.5 Other Houses 0.3 Shops 0.3 Roundabouts 0.3 Parks/Greens 0.2 Public Houses 0.I Named Areas 0.I Bus Stops 0.I Church 0.I Garages/Petrol 0.I Trees 0.I Footpaths I 0.I Bridges 0.I Zebra Crossing 0.I Fields 0.04 Car Parks River Post Office N'd Buildings swimming Pool Gardens Factories Sports Field 0.03 Friend's House 0.03 ailway Line 0.03 Personal Detail0.03 Telephone Box 0.03 Swings 0.02 Other Towns/
Villages 0.02 Traffic Lights 0.02 Post Box 0.02 Hoods 0.02 Flats 0.02 Police Station 0.02 Own Garden 0.02
commoN FEATURES (cont.)
MENTION RATE
Town/Market Centre 0.02
Playground 0.02 Library 0.02 Hotel 0.02
I
Fire Steti n 0.02 Pond/Lake 0.02 Churchyard 0.0I Subway/Under-
Pass 0.0I Hospital 1 0.0I Building Site0.0i Own Camp/Den 0.0I Station 0.0T Allotments 0.0I Old Peoples
Home 0.0I Sports Hail 0.0I Youth/A ctivity
Centre 0.01 Own Garages Parking Space0.01 Bowls Club 0.0I Offices Animals Vehicles Mill 0.0I Bus Station 0.0I Toilets 0.0I Bench I 0.0I Nurses Home 0.0I Derelict/
Waste Bank Vets Lorry Park 0.0I Council Yard 0.0I Lamp Posts 0.01" Orchard 0.0I Garages 0.0I Villa ge/Church
Hall 0.01 Sewer/Sewage
Works 0.0I Electricity Sub Station 0.0I Cinema I 0.0I
URBAN
MENTION FEATURES
RATE ONLY Colleges 0.03 School.Hall 0.03 Nursery 0.0I Youth Hostel 0.0I Technical
College 0.0I Community
Centre 0.0I Football Gnd.O.OI Named Garden 0.0I Gas Works 10.01 Tennis Courts0.0i Off Licensel 0.0I Pits/Quarry 0.0I Science Labs 0.0i Workshop 1 0.0I G.P.O.Sorting
Office 0.0I Bingo Hall 0.0I Launderette 0.01 Nature Reser-
ve 10.0I Lock 1 0.0I Market Place 0.0I Dentist 1 0.01 Doctor I 0.0I Multi-Storey
Car Park 0.0I Bath House 0.004 Theatre 0.004 Pavillion 0.004 Dog's Home 0.004 Wood Yard 0.004 Golf Club 0.004 Signal Box 0.004 Airport 0.004 Traffic
Bollards 0.004
0.04 0.04 0.04 0.04 0.04 0.04 0.03 0.0I
0.01 0.0I
0.0I 0.0I 0.01
RURAL FEATURES ONLY
MENTION RATE
Clock Tower Heath Stud Stables Farms Old Station Grain Silos Paddock
0.2 0.I 0.I 0.I 0.03 0.03 0.03 0.02
Caravan Centre 0.0I Gas/Electricity
Installations0.0I Cafe 0.0I Moat 0.0I Car Wash 0.01 Animal Research
Centre I 0.0I Ancient Monument 0.0I Horse Crossing 0.0I Ford 0.0I Telephone Ex. Bus Shelter Greenhouses Private Road
0.0I 0.004 0.004 0.004
Physical Features0.02 Street Signs 0.02 Water Tower Yard Barns/sheds Men's Club One Way System By Pass Memorial Garden Centre
0.02 0.0I 0.01 0.0I 0.0i 0.0I 0.0I 0.0I
TABLE XIV. A COMPOSITE ANALYSIS OF THE FEATURES SHOWN ON THE ROUTE AND AREA MAPS.
TOTAL NUMBER OF DIFFERENT FEATURES SHOWN ON EACH OF THE MAPS
Total number of Features
Common Features
Urban Only
Rural Only
AREA MAPS 129 67 31 31
R(DTE MAPS 99 48 32 19
COMBINED 139 76 32 31
350

to by children of this age. Roads emerge as the most regularly included
map element in both maps confirming the importance of 'paths' in
children's perceptions of the structure of their environment, as Ladd
(1970) found. The children's own house also achieves a high mention
rate offering further evidence in support of the 'home-site principle'
mentioned earlier, and as was, demonstrated in the questionnaire, shops
and play places were also regularly included in the maps. Many of the
features listed could be categorised in Lynch's terms as Landmarks and
as Bishop (1973) comments they tend to be those of the greatest significance
to them rather than because of architectural significance. It seems
therefore that paths,nodes and landmarks are the dominant structural
elements of the maps , and this finding is similar to that discussed
in other similar research analysing recall sketch maps for children
within this age range.
When the results are compared with similar studies, notably the CUULS
study mentioned earlier, comparison with Table xxviv indicates that
more features were included in the maps of this sample, and that there
are some obvious cultural differences. It is still the case however
that the dominance of Home-site, playplaces end the shops is apparent
for both samples despite the different cultural backgrounds.
The rural children's inclusion of vegetative/farming elements seems
to compare with the findings of Maurer and Baxter (1972), where their
sample of multi-ethnic 7-14 year olds ranked Grass, Trees and Flowers
highly (by 425, 525 and 225 of their sample respectively), whereas
their results of 90i; reference to Houses, 70% references to Homes -
and 69% references to Streets compares favourably with the results'of the
full sample. One obvious difference is similar to that identified by
Moore and Young (1978) when they compared Maurer and Baxter's findings
with those of the CUU1S study, and that was the low ranking of'play-
places' in the Maurer and Baxter sample, although thell% reference to
streets could well be included within the purvue-of PPlacer. if other
studies are anything to go by. However the Berkley Park Use Study
(Mason et al 1975.) presents evidence that children and adolescents are
the predominant users of parks. In 5 out of 6 parks they monitored,
under 19's represented more than 755 of the user population. In half
of these, 6-12 year olds were the most dominant users. The results of
this study would seem to suggest that 10-13 year old British children
also make considerable use of such places.
The number of references made by children in this study to many of the
elements listed is often small, beyond the features already discussed.
This may perhaps suggest that individuals vary more than has previously
been suggested in the features that they perceive to be of importance-
351

•
Place elements ,ars.
Number of mentions
Mention rate
1 Child's own house 210 .79
2 Through streets 209 .79
3 Child's mention of self 174 .66
4 Friends/relatives home 127 .48
5 Child's school 105 .40
6 Child's friend(s) 94 .35
7 Store(s) 93 .35
S Community park 90 .34
9 Single trees 82 .31
10 Lawns 82 .31
11 Fences 70 .26
12 Playgroundischoolyard/equipment 70 .26
13 Traffic 69 .26
14 Community buildings 69 26
15 Dv. ell trigs/apartments 61 .23
16 Neighbors/sitter's house 57 22
17 Yo!..1 for play/stoop 57 .22
13 Dirtisand/gravelltanbark 56 .21
19 Creek/stream 55 .21
20 rrailsishortiuts/paths/alley 53 .20
21 Sidewalks 51 .19
22 Child's parents 51 .19
- 23 Swimming pool 47 .18
24 Sports field 47 .18
25 F1,11 mountains 46 .17
26 De-ad-ends/driveways ' 45 .17
27 Child's siblings 44 .17
28 Building interiors 43 .16
29 Sports playing court 41 .15
30 Topo,_zraphy 38 .14
31 Shrubs 38 .14
32 li,i5esTAR1 /stops 37 .14
33 Tall grass/weeds/leaves 37 .14
34 Climbing trees 36 .14
35 Free clusters 32 .12
35 Child's relatives/other adults 31 .12
37 Cats:dogs 30 .11 38 Climatic conditions 29 .11
39 Agricultural land 27 .10
40 Forts/clubhouses 25 .09
• 41 Water Play 25 .09
42 Fruiting trees/vines 25 .09
43 Rocks 25 .09
44 P •);ional r•ark/fairvoundlcampground 24 .09
45 Vacant lot/land under development 24 .09 46 Railroad 23 .09 47 Parking lut 23 .09 45_ Misc buildings!structures for playing 23 .09 49 Shopping/comMercial strip 22 .08 50 Pondilakeiles2rvoir/ocean 22 .08 51 Gas station 19 .07 52 Fishtaquitic life 19 07 53 Fridges/tunnels 113 .07 51 Dot toads 18 .07 55 Flowers 18 .07 56 Treehouse 18 .07 57 Garden 16 .06 58 Skating rinkJbowling alley 16 .06 59 Church 16 06 60 Wild animals 16 .06 61 Shopping center/plaza 15 06 62 horses 14 .05 63 Abandoned buildings/structures 14 .05 64 Farm animals 13 .05 65 Wild birds/insects 13 .05 66 MoviP theater/drive-in 10 .04 67 Tree-swing 10 .04 68 Other domestic animals 8 .03 69 SecreChiding places 7 .03 70 Asphalt/concrete 6 .02 71 Woodland 5 .02 72 Culvert or stream 2 .01
THE 'CUULS'STUDY AMERICAN 8-12 YEAR OLDS N=265 352

in their environment. Although, as found by Bishop (1973), regular
reference was made to such features as pubs, post boxes and offices and
to telephone boxes, whereas contrary to the findings of Bishop, churches
and schools were regularly included.
One final factor concerned the differences between the rural and urban
sub-groups. As might be expected, the rural group made more reference on their maps to features like woods, trees and fields. On the other
hand, the urban group included more detail about the street furniture
and especially to features like traffic lights and zebra crossings,
which again reinforces the experiential nature of environmental
knowing and the subsequent influence on a representation of that
knowledge in a recall sketch map.
MIMI• MOND • ■•■•• •••••••
353

APPENDIX 3.
Criteria adopted for the analysis of the
Maps produced by the Sample.

The following criteria were adopted for the main analysis of the recall
sketch maps produced by the children in the sample. There were 5 elements in this analysis, each of which was derived from the literature and
adapted for the purposes of this study.
The five elements of the analysis were as follows:
I. An analysis of the area depicted on the map in terms of
its EXTENT. (This section was only considered in relation
to the map of the area where the children lived.)
2. An analysis of the degree of ABSTRACTION demonstrated in the
maps. (i.e. How far they considered conventional mapping
techniques in terms of symbolisation particularly. All of
the children in the sample had had some experience of
maps as part of the school curriculum, although obviously
some had had more than others.)
5. An analysis of the PERSPECTIVE adopted by the mapper,
(i.e. How far were they able to separate themselves from the
activity t'disembed' in Witkin's terminology, and adopt
the overhead perspective associated with conventional
mapping.)
4. An analysis of the ACCURACY or Quality of the map.
5. An analysis of the STYLE adopted in the map.
(Categories 2 to 5 were applied to both of the maps produced by the children, whereas as has already been
indicated, Category I applied only to the map of the
Area where the children lived.)
AREAL EXTENT.
A small pilot study undertaken prior to the full study had demonstrated
differences between relatively Field Dependent and Field Independent
individuals in their responses to drawing a map of the area where they
lived, especially with respect to the dimensions of that area. In the
discussion of the derivatives and associated characteristics of the
dimension identified by Witkin it has been suggested that Field
Independent subjects demonstrate greater independence, and are more likely
to be given greater freedom by their parents to develop this independence.
If this is so, it might be hypothesised that this would be demonstrated
in their more extensive exploration and knowledge of their locality,
which would be reflected in any representation of their 'home area' as,
for example in a recall sketch man. Such individuals would see their
home area as more extensive therefore than those who might be classified
at the opposite pole of the Field Dependence/Independence dimension.
This hypothesis was investigated by analysing the maps in the terns• 354

described below. It was also investigated in the Questionnaire completed
by the whole sample, and in the Interview with the Follow up sample
who represented the extremes of the Witkin dimension within the sample.
The sub divisions of this category are similar to those employed by
Klett and Alpaugh (1976) in their analysis of the 'Scale' of maps
of the San Fernando Valley drawn by children aged 6j years, 92years and IO2 years. Their sub-divisions of cognitive map analysis into the
dimensions of SCALE, PERSPECTIVE and ABSTRACTION is derived from the
work of Blaut and Stea, (Blaut, McCleary and Blaut (1970) and Stea and
Taphanel (1975) ) who argue that any cognitive representation of the
environment is based upon these three important cognitive transformations.
THE EXTENT OF THE AREA MAPS.
The following instructions were given to the judges for the preliminary
analysis of this category.
Could you please consider the EXTENT of the area represented in these
Maps by sorting them into 5 categories based on the following guide-lines:
I. Own Immediate Personal Space. (The road where the child lives,
his own house and houses nearby, his most immediate environment.
Klett and Alpaugh refer to this as 'Sub-Focal')
2. The Immediate Locality.(This category represents an extension
of category I, to include the square and local network of
streets, which are likely still to be limited in number. It "
really represents what the child can see about him when outside
his house. Klett and Alpaugh describe this as 'Focal'.)
3. The Local Area. (This will now include parts of the environment
which have been experienced over time and therefore goes
beyond the 'immediate locality' as described above. Maps in•this
group demonstrate an improved representation of the street network
and local environmental features. 'Local' in Klett and Alpaughla
terms.)
4. A clear concept of the Area. (The area is now seen as an entity
in its own right . Inter-connections are extensive and clearly
represented. This category demonstrates an improvement on the
previous one. 'Valliudinal' in the analysis by Klett and Alpaugh.)
5. The Village or Town or Area is now seen as part of a larger system.
(Inter-connections and directions elsewhere are included, roads
are seen to continue beyond the immediately described space.
Klett and Alpaugh categorise this as 'Macro'.)
355

Example maps for each of the 'Extent' categories are included in the
following pages. These have been reduced in size. The tables below
indicate the percentages of the sample achieving the various categories
previously described, by sex and by age group.
SAMPLE. I 2 3 4 5
I0 - II year olds 16% 40.8% 31.2% 11.2% 0.bp
II - 12 " " 16.6% 47.4% 28.2% 7.1% 0.7% . T2 - 13 " " 4.6% 32% 38.3% 18.3% 6.0%
TOTAL 11.8% 39.7% 32.9G/0 12.58,
BOYS. I 2 3 4 5 10 - II year olds I3.I% 44.3% 27.9% I3.It/o 1.6%
11 - 12 " " 15.8% 35.5% 34.2% 13.2% 1.3%
12 - 13 " " 5.4% 34.4% 32.3% 16.1% 11.8%
TOTAL 10.9% 37.4% 31.7% 14.4ro 5.6%
GIRLS. I 2 3 4
10 - .II year olds 18.8% 37.5% 34.4% 9.3'/0 -
II - 12 " " 17.5% 58.84 22.5r0 1.2% -
12 - 13 " " 3.6% 29.3% 45.1‹ 20.7% 1.3%
TOTAL 12.8% 42% 34% 10.6,7A, o.60
356

[ u';
- ij 113 '04 _ hofce.t.,4 • ■•■• ..... .....
41=111anirge, IIIINIENIIII•011•11111111110.
CATEGORY I... IO Year old Girl
ct.r
77 • .11 , — 8.. 1 A.. • ; -V•e:
MO.M.■■•■•■■■•■•••
EXTENT OF THE AREA MA PS : SAMPLE MAPS
CATEGORY 2... TO Year old Boi
CATEGORY 3...12 Year old Girl. 357

sgt; 'log P10 ageA • *5 AUOIXIIVO
Q't nitiv;

2.The Degree of ABSTRACTION demonstrated.
A major element of conventional mapping is the use of symbolisation. To
a great extent the use of symbols is dependent upon experience and know-
ledge of maps, as well as education about maps and their various purposes.
It is the case however that the quality of a map and the ability to
represent detail on that map is dependent upon selecting appropriately
from the considerable environmental detail contained within an
environment, and the representation of that detail in a common form
interpretable by others. Children find great difficulty in selecting
appropriately and often attempt to include everything on their maps.
Bishop (1973), would argue that what children regard as appropriate is
likely not to be seen so by adults. However, the stage at which an
individual recognises that it is not possible to include everything on
the map, and that one has to engage in some form of selection, is an
important one inthe development of map understanding. Similarly, the
recognition that a map does not and cannot convey all of the detail of
an environmental setting is another landmark in the development of map
understanding, (Sandford 1972). The use of symbols is also an important
aspect of the development of map understanding, particularly that of
recognising potential use by others and that maps are often 'Social'
documents requiring common, accepted and usually abstract forms of
representation. It is important to remember that the fact that a map
is not symbollically portrayed does not detract from its potential
value, as many historical maps demonstrate. Yet, analysis of maps
in terms of the mode of presentation it is argued, is an important
indicator of the child's level of mapping ability. As a child gets older,
gains more experience of maps and is educated into conventional mapping
wisdom, one would expect an increasing level of abstract representation.
That this need not be so has been demonstrated elsewhere, (Catling 1978,
Conner 1969). The ability to represent things symbollically requiises
an individual to abstract oneself from the situation and an. analysis
of the situation in the terms described earlier, (i.e. recognise that
it is not possible to include everything, and therefore it is
necessary to engage in a process of selection.) It is hypothesised that
this equates with Witkin's 'Disembedding' ability, and that more Field/ Independent
Individuals are likely to achieve greater success than Field Dependent
individuals in such aspects of mapping.
For the analysis of the degree of abstraction demonstrated, the following
criteria were adopted, which demonstrate an increasing degree of
abstraction in the representation. They are similar to those of
Catling (1979), who distinguished between'Egocentric', 'Objective'
359

and 'Abstract' representations based on a Genevan description of develop-
ment, and to Ladd's criteria of 'Pictorial', 'Symbolic' and 'Abstract'
maps, which clearly reflects Bruner's levels of representation, and
Klett and Alpaugh's sub-category, 'Abstraction'.
THE DEGREE OF ABSTRACTION DEMONSTRATED.
The following Instructions were given to the judges for the preliminary
analysis of this category.
Could you please consider the degree of ABSTRACTION demonstrated in these
maps. This implies a progression from a pictorial representation through
to a cartographically, symbol dcally portrayed map. Could .you sort the
maps into 5 piles representing a progressive development from one end of
the continues to another and place them in the appropriate folders,
(numbered from I to 5). The following categories are offered as a
guide, you may of course find no maps to represent one or more of the
categories.
I. PICTORIAL. (Maps in this group will be totally pictorial.
Often of a very limited area, an individual house for example,
which may be drawn in three dimensions.
2. MENDED PICTORIAL. ( Maps in this group will still be in
the form of a picture, but of a more extensive area and will
probably include more features represented as drawings, some
of which will be flat and two dimensional.)
3. PICTURE MAP. ( The beginnings of symbolisation are demonstrated
in the maps in this category. Some elements will therefore be
in symbolic form, but some pictures remain, often as if in an
overhead form.)
4. APPROACHING A CONVENTIONAL MAP. (Some maps will be in an
lAs if from an aaroplane perspective: so true symbolisation
and abstraction is not yet fully developed.)
5. A TRUE MAP. (Abstact symbolisation is now complete.)
Example maps for each of the 'Abstraction' categories are presented in the following pages, again they have been reduced in size. A
tabulated analysis of the proportions of the sample (by Percentage)
achieving each of the above categories is presented overpage with
differences by age and sex.
360

THE DEGREE OF ABSTRACTION DIEMONSTT.qA TED IN TIE AREA AND ROUTE MAPS.
MAP I. THE AREA MAP
SAMPLE 10 - II year olds II - 12 " " 12 - 13 " "
TOTAL
1 16.8% 17.9%
2.9% 11.8%
2 I2% 5.1% 7.4% 7.9%
3 24% 14.1% 15.4% 17.3%
4 29.6% 39.1% 42.5% 37.9%
5 17.6% 23.8% 31.4% 25.1%
BOYS. I0 - II year olds 8.2% 8.2% 31.1% 39% 13.5% II - 12 " " 13.2% 5.3% 18.4% 38.2% 24.9% 12 - 13 " " I.1% 5.4% 16.1% 43% 34.4%
TOTALS 6.9% 6.1% 20.9% 40.4% 2 5.7%
GIRLS.
10 - II year .olds 25% 15.6% 17.2% 20.3% 21.9% II - 12 " " 22.5% 5% 10% 40% 22. g% 12 - 13 " " 4.9% 9.8% 14.6% 42.7% 28%
TOTAL 16.8% 9.7% 13.7% 35.4% 24.4%
MAP 2 THE ROUTE MAP.
SAMPLE. 10 - II year olds II - 12 " " 12 - 13 " "
TOTAL
I 8.2% 2.8%
- 3.3%
2 26.2% 11.7%
2 .5% 12.4%
3 18.9% 19.3% II. I% 16.1%
4 22.1% 33.1% 2 5.9% 27.7A
5 24.6% 33.1% 60 .5% 40.9%
BOYS I0 - II year olds 5.1% 18.6% 16.9% 28.8% 30.6% II - 12 " " 1.5% 7.6% 18.2% 39.4% 33.3% 12 - 13 " " - 1.2% 8.4% 33.7% 56.7%
TOTAL 1.9% 8.2% 13.9% 34.1% 41.9%
GIRLS I0 - II year olds II.I% 33.3% 20.6% 15.9% 19.1% II - 12 " " 3.8% 15.2% 20.3% 27.8% 32.9% 12 - 13 " " 3.8% 13.9% 17.7% 64.6%
TOTAL 4.5% 16.3% m . V. 20.8% 40.3%
361

CATEGORY I. II Year old Boy
CATEGORY 2...10 Year old Girl flA9.

.1\1
N.lev:marvcr-%:—.11.u1-1-Tam,
ax•Nr-ioavt:ST • -
‘tstc4 C.NAE:** \JE.L=Nt
INAc VD cmtnIz.Eximt,,xe
\ ejiAs9k N Loe4- as-rA-;
1
1 i t rd __1
-1 734. al
CATEGORY 3...12 Year old r! •
1
\
36 3 r-r - AINIMONIMENIW
her
J\Li ,1V _JP b
r
•••111e...m.,■■
I.Nq • 4•NN c„tvi s'T
kw.) 174,v3
••■••••••■-
Zrt
1—_
CATEGORY 4 . 12 Year old Boy.

.---- 0 IfeeNt' '' NW • !% __.! -. -i',:
cilt.,..T0'.1"Get Ro4D 1
4.‘01 fe• - Atzi" ,.,,,,,o• ,,tv,.: ‘. ,N.,,,, , .
II
AWE tr ' .. ROO ocya: ■••_-PL rr. . ',H --.- -- - - -
_ lkily 61i 1.. , .7_ _ : ROAD ea
/ \ frCIA) 75..CSU S 1
,p • _
MDSUZIPAG t / I 62C Mr10
ROAD --,_ t_ ESA
---- •:---- 0,e 40 A 4,..- --, --3 .,..,
apAc- ---:;:"..-----a-e.v. )
f' u-
. ■ 4 rl ••..,„.. o,,,.... ‘` ••:,"..../ ,
-71
V0
i t Pant : , . (U! < - - -fl 1 1=e4711 & TAB ,,f (
( tils.Sit.r,-, 1 -(1014.0
SCHoot_ t pAin (
1/270 ik.A T15urov■Aft, 11-1E teltTt
'TAKE -To savor- t CAmk-.eA) I • Nue^ YcILS
• it
U) 0,4 CSIEtklo
CATEGORY 5...13 Year old Boy.
364

3. The PERSPECTIVE adopted.
Klett and Alpaugh (1976), in applying the ideas first suggested by
Blaut and Stea (1970, 1975 op.cit.), argue that the ability to represent things in symbolic and abstract form on a map is dependent on the
perspective adopted by the mapper. It is clear that if an individual
views a map as an overhead view of the landscape, the resulting document
will be less pictorial and more typical of the conventional map. The
mental transformations required to adopt such a perspective has obvious
associations with spatial ability,as well as requiring the 'disembedding'
ability discussed for the earlier categorisations. As such it is
hypothesised that the greater spatial ability of field independent
individuals allied with their ability to separate elements from the
surrounding visual field will lead them to adopt an overhead perspective
when drawing their maps, whereas field dependent subjects are less
likely to do so.
Klett and Alpaugh (1976) identify three main perspectives, those of
Ground Level, as.if an individual is drawing what he sees or is thinking
about with his line of sight parallel to the ground; a Downward Oblique
viewpoint, where the line of sight is at an acute angle with the ground
producing maps which include features displayed at some very odd angles;
and finally an Overhead viewpoint, where the line of sight is perpendicular
to the ground and the resulting maps more symbolic. Maps in this final
category can often take the overhead view almost literally, as for
example one 12 year old in the study who commented, "I tried to think
about my map as if I was in an aeroplane looking down." As a result,
such maps might include roof tops, chimneys, the tops of trees, and on
one occasion, even the heads of people walking in the street.
The analysis employed in this study adopted and slightly modified
those of Klett and Alpaugh, with the inclusion of 'mixed ' categories
between I and 2, and 2 and 3, as Klett and Alpaugh had also done in
their analysis. The following diagram was also included to help in the
analysis, and it can be seen that the progression represents a move
from a more egocentric towards a more abstract perspective
TEE PERSPECTIVE ADOPTED.
The following instructions were given to the judges for the preliminary
analysis of this category.
Could you pleasa consider the Perspective from which you think these
maps have been drawn by sorting them into 5 piles using the guide lines
described here. There may of course be categories for which there are
no maps. It is hoped that the diagram will be of some help in your
deliberations: 365

3.
2.
I. Ground Level
5.
I.An Egocentric Viewpoint. (Maps of this category adopt a
Ground level viewpoint, as if the mapper is face on to
the features mapped, Position I in the above diagram.)
2.Intermediate.(A mixed category which contains some
elements at stage I, (face on) and some as described
for category 3, at an Oblique angle to the ground)
3.Downward Oblieue.(Line of sight for this category
is in position 3.in the diagram, and as a result
features are often 'splayed' out at odd angles. The
vantage point may therefore vary from feature to
feature.)
4.Intermediatee(A mixed category between stages 3 and 5.
Maps in this category are therefore likely to contain
some elements drawn from an oblique perspective and the
beginnings of an overhead viewpoint.)
5.An Overhead Viewpcint.(All elements are presented as if the
viewpoint adopted is perpendicular to the ground, some
elements may not yet be symbolised, for example some
houses may be portrayed with the roof or chimney indicated.)
Example maps for each of the 'Perspectivel oategories are presented in
the following pages, which have again been reduced in size. A
tabulated analysis of the percentages of the sample who achieved the
above categories is presented overpage with differences by age and
by sex.
366

THE PERSECTIVE ADOPTED IN THE AREA AND ROUTE MAPS.
Ni4P I .THE AIM MAP.
SAMPLE. I 2 3 4 5 10 - II year olds 8.8% 9.6% 14.4% 29.6% 37.6% II - 12 " " 7.1% 10.9% 10.2% 21.8% 50% 12 - 13 " " 2.3% 2.9. 9.1% 14.8% 70.9%
TOTAL 5.7% 7.5% 10.9% 21.3% 54.6%
BOYS. I0 - II year olds 3.4% 8.2% 6.6% 40.9% 40.9% II - 12 " " 6.6% 9.2% 6.6% 22.4% 55.2% 12 - 13 " " 1.1% 1.1% I0.8% 13.9% 73.1%
TOTAL 3.5% 5.7% 8.3% 23.8% 58.7%
GIRLS 10 - II year olds 14.1% 10.9% 2I.9% 18.8% 34.3% II - 12 " " 7.5% 12.5% 13.8% 21.2% 45% 12 - 13 " • " 3.7% 4.9% 7.3% 15.8% 68.%
TOTAL 7.9% 9.3% 13.7% 18.6% • 50.5%
MAP 2.
SAMPLE I 2 3 4 5 10 - II year olds 5.7% II.% 16.4% 18.8% 47.5% II - 12 " " 0.7% 4.1% 12.4% 22.8% 60% 12 - 13 " " 1.2% - 4.9% 16.1% 77.8%
TOTAL 2.3% 4.7% 10.-W 19.1% 63.2%
BOYS. IO - II year alas 1.7% 5.1% 8.5% 18.6% 66.1% II - 12 " " - 6.1% 7.6% 19.6% 66.7% 12 - 13 " " - 3.6% 15.7% 80.7%
TOTAL 0.5% 3.4% 6.2% 17.8% 72.1%
GIRLS. I0 - II year olds 9.5% 17.5% 23.8% 19.1% 30.1% II - 12 " " 1.3% 2.5% 16.5% 25.3% 54.4% 12 - 13 " " 2.5% - 6.3% 16.5% 74.7%
TOTAL 4.1% 5.9% 14.9(.7 20.4% 54.7%
367
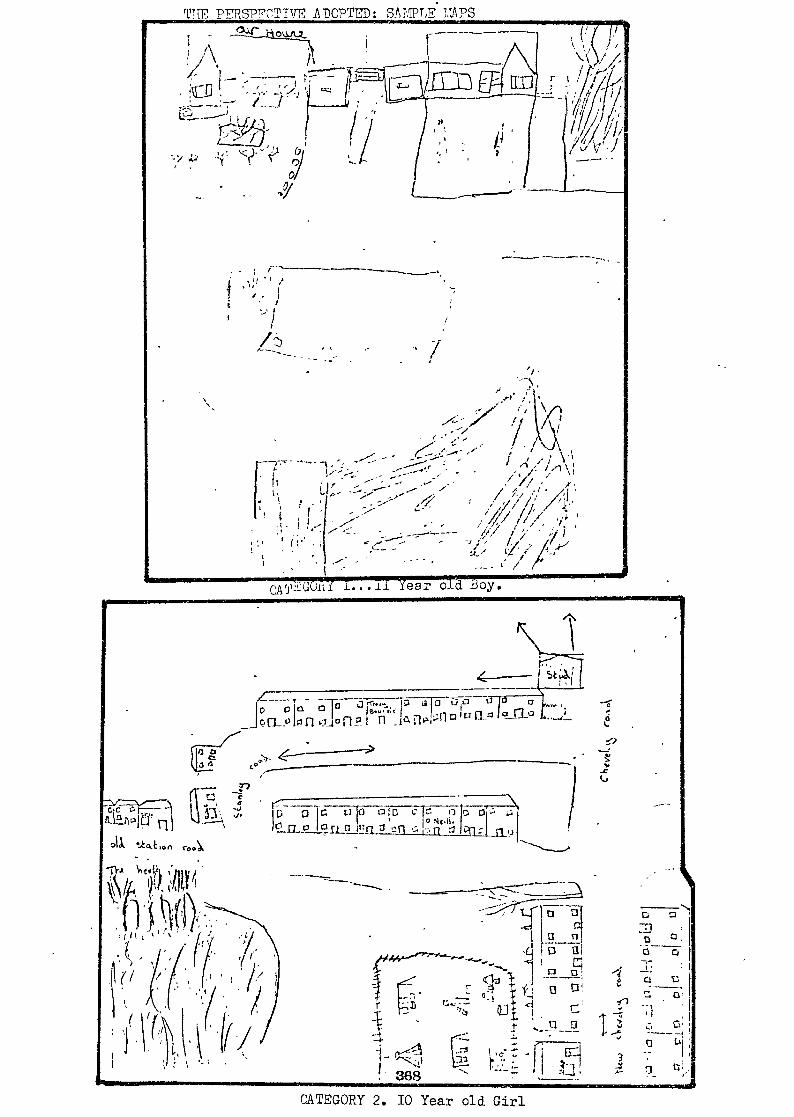
64' WL7,_
In
)Q „.„
„, , \J , •
11 - :///• \
- ,
• • I _ -
' e .#0 / I
+1/, > •
I cA TEGOR ± ear o _d .doy.
Fc\\
Jo la 016 Jri.La o of] -13 io
PIL.oio 11 o_io 11? I n n,>11.n ;
a a
ILI ciIC In olD fr!, 0 c- lo Natlit
11- ILSI c cn Cr1:1 _fl.,1
a n
3 -;
- . 368
,1 ti ci 2 r74 t
TUE', P ,9P7CT DTI?, .ADOPTED: SPMPTF I:APS
CATEGORY 2. 10 Year old Girl

TiraORY . . TO Year old Boy.
to • we.. .•••• • e
• r r. , / .1
f ( I
d3:31.4ri'
€48AL
ShCii. .47 ,,. , i I '■
i , .1 1:0,,c4 :LI ,, I- ., -.r :4_ 1:".--1 0 , , 4-11.l.as. ... , 4" _ r ', ,-- ----- i „„.....,. , , i , ._ , kic_
4. A i frit:A ....fi_i_l_P 1 i
1.::, I ti_ .... -I..,:■ • • L-.14 I
Tg- 1 fl). -In- 1 1 la 0 V ''---L- i,_
1 5.- le 0-10-■ 4!t3 i:1 tg ii;,,9,1 ou I'''.'
1
I CLOSte) j c.a.
I I
c:1 - - • 7, ; ) \
• 't
CATEGORY 4... I2 Year old Girl 369

afimmx/e/5/
I Sk.).„,,,,44. p ocal-
rq Cr) 2y m
~ss ri• Jo rr
CATEGORY 5...I2 Year old Boy.
370

4. The Accuracy or Quality of the Map.
A central question one needs to ask about any map is, could it serve
the true purposes of a map? Is it possible to use it as a directional or
locational document? This raises important questions about the map's
quality, its accuracy and its inclusion of relevant detail with respect
to its intended purpose. The fourth means of analysis attempted to
consider these factors, to assess the organisation of the map as a
complete and integrated whole. It was a central hypothesis of this study
that there would be a relationship between elements of the map analysis
and measures of Field dependence/independence, and in terms of this
particular element there is en obvious use of the 'analytic ability'
associated by Witkin with Field Independence. Field Independent subjects
are said to be more analytic and precise, and it is suggested that this
will be demonstrated in the quality of the maps produced by the sample.
As in the previous categoriesla 5 point scale was adopted to represent
a progressive improvement in the quality of the maps. The criteria
for this analysis was derived from previous analyses of this kind.
Appleyard (1969)included a consideration of accuracy in his study of
Ciudad Guayana, by comFaring the recall maps of his sample with the
local city map. Bycroft (1974), included a focus of this kind when he
asked his judges to undertake an 'wholistic' sorting of his maps, and
as Bycroft comments (p.29), the analysis of some measure of the quality
or accuracy has been included in most cognitive mapping studies since
Lynch.
The Accuracy of the Maps.
The following instructions were given to the judges for the preliminary
analysis of this category.
Could you please consider the organisation of these maps in terms of their
quality. Could the map serve the true purposes of a map, is it accurate
in terms of its representation of scale, orientation and detail? The
Ordnance Survey map and local maps of the area are available for
comparison. Again, could you sort the maps in to 5 categories along the
lines suggested below. Of course there may be no maps for some of the
categories described.
I. Unco-ordinated Representation. (An inaccurate map, poor
co-ordination of detail, or placing of information; the
detail itself is very limited and there is an omission
of important features or informatics. e.g. road names, •
directions, and elements not correctly positioned. As
a map it will serve no useful purpose.) 371

2. Intermediate. (Some improvement on category I, but still
poorly co-ordinated. Increased detail, but this is still
lacking in organisation. e.g. some useful locational
detail included, but still involves difficulty in
orienting to reality. Not easy to interpret or use.
3. Reasonable degree of Organisation. (Increased detail,
now more carefully arranged, it might include the local
road network appropriately named and increased locational
information. Some consideration is given to the scale of
the map, but it is still not fully accurate and as a
result orientation of the map to the local map proves
difficult.)
4.Intermediate. (Now a much more carefully co-ordinated and
detailed document which is clearly presented and well
organised, but contains some minor errors of omission,
orientation or scale.)
5.An Accurate and well Or.,nised Map. (Yaps in this category
will demonstrate a clear consideration of distance,
direction,location and scale. Elements are located with
a good degree of precision and there is a close
correspondence with reality.)
Example maps for each of the above categories are included in the
following pages. The tabulation below provides details of the percent-
ages of the sample achieving each of the categorisations, by age and
sex.
THE ACCURACY OF THE MAPS.
MAP I. THE AREA MAP
SAMPLE.
IO - II year olds 200 35.2% 42.4% 2.4% -
II - 12 " " 28.2% 32.1% 37.1% 1.3% 1.3% 12 - 13 " " 9.7% 28% 49.7% 9.2% 3.4%
TOTAL 18.9% 31.4% 43.4% 4.6% 1.7% BOYS
IO - 11 year olds 18.1% 40.9% 36.1% 449% -
II - 12 " " 26.4% 32.9% 35.5% 2.6% 2.6%
12 - 13 il " 12.9% 30.1% 43% 8.6% 5.4% TOTAL 18.7% 33.9% 38.7% 5.6% 3.1%
372

TUE AREA MAP cont.
GMLS. 2 3 4 5 I0 - II year olds 21.9% 29.7% 48.4% -
II - 12 30% 31.3% 38.7% - 11 U 12 - 13 6.1% 25.6% 57.3% 9.8% 1.2%
TOTAL 19% 28.8% 48.2% 3.5g 0.5g
MAP 2. TUE ROUTE MAP.
SAIPLE. I 2 3 4 5 I() - II year olds 31.9% 33.6% 31.9% 2.6% - II - 12 " " 26.9% 37.8% 31.1% 2.1% 2.1% 12 - 13 " " 8.1% 32.1% 40.T% 14.8% 4.9%
TOTAL 21.2% 34.5% 34.7% 6.0% 2.6%
BOYS 10 - II year olds 32.2% 28.8% 33.9% 5.1% - II - 12 " " 19.6% 33.$ 40.9% 3.1% 3.1% 12 - 13 " " 13.3% 27.7% 38.5% 15.7% 4.8%
TOTAL 20.7% 29.8% 37.9% 8.7% 2.9%
GIRLS I0 - II year olds 31.7% 38.1% 30.2% - II - 12 " " 32.9% 41.7% 22.8% I.3% 1.3% 12 - 13 " " 2.6% 36.7% 41.7% 13.9% 5.1%
TOTAL 21.7% 38.9% 31.7% 5.4% 2.3%
373

CATEGORY 1.- 11Year Old BOY CATEGORY 2.- II Year Old GIRL
• '•!`-, __Bstokz r 1
,. „ LJ
11 -0
cz
:514. -2- V1
THE QUALITY OR ACCURACY OF THE MAPS.

CATEGORY - 12 Year Old GIRL
CATEGORY 4 - 12 Year Old GIRL i AO vTt.., _ V?,0"1 vicicnr.:
re0 ,
1/ / ' , • - et ,' r' , Si re> ---
', <AV ---- — - -
e- , e- ' k ■ v j, . ../i,,...• 0.: ' , \ ■ ' , 4° ...P al , 1 •■•\ -,./ e
/
o
1 . 44
1:'"*.,,,...-;'‘,,,\
,..;...„,... ,., . N .. 've .. , .... `,.. s."... • ,qk
''..■ ,,. ",..„,..
' S \'■, 0
la fri % V I
It 1‘ 0 SA13 2.. CA. WALE...I. I
LA'
TO ckl, StIra tl eg \ ON 'V. ArnK*ArC •
*.-. 1
ll i
."..".-- --..-.- Ca.s rou'rt,. : VIN. PAA.c. 1..\4.-1?\Nolvt..
1:1
.g.11.:t... „--
If•
. Co..
t L --""••••
I '
Di ,' -, I P41. c.
#1 ,.. I ', .:91.2.../
%-..
/5 1 ......,:.,:------
k I
li d) 1
g
,..e ! ,...
375

CAr,, tx.fkr
•••
tf FITZ
‘-‘1 %ckT>;L.
Attxqr .b, PA 51
r.„1
_ ■ s. C.ATA.. - • -
aft tleiG, •
piQ4vrinot -6/77.mtin 0 '
rfrAri,A L./
-/61320J r ervl:fr A7-15 N)1 4 schat fry% wtf, Al f-43 Adat.
CATEGORY 5.-13 Year Old GIRL
376

Netted
Branch and loop
SEQUENTIAL Fragmented
Chain
SPATIAL Scattered
0 0
0 a a 0 a
O
a
Linked
Patterned
TOPOLOGICAL
POSITIONAL
5. The Map Structure or Style.
The final element of the map analysis to be discussed here attempted to
consider the style cnd structure of the maps produced by the children
in the sample. Similar analyses have been undertaken by other cognitive
mapping studies (e.g. Bycroft 1974 and Pocock 1975) and tend to be
derived from the original work of Appleyard (1969). In his study of
Ciudad Guayana, Appleyard considered the structure of his samples maps
in terms of the type of element included and the level of accuracy. As
can be seen in the diagram below he distinguishes between 'Spatially'
and 'Sequentially' organised maps. In sequential maps the parts are more
obviously connected and the connections are dominant. In spatial maps
connections appear to be incidental between the parts, which as a
result are scattered over the map. These criteria are then sub-divided
in to four categories according to the level of accuracy or sophistication
of the map. This particular form of analysis was employed by Spencer
and Lloyd (1974) in their study of Small Heath in Birmingham, by
Goodchild(1974) in his study of Market Drayton and by Pocock (1975),
in his study of Durham.
MAP STYLES TYPOLOGY, BASED ON TYPE OF
ELEMENT AND LEVEL OF ACCURACY. (Appleyard 1969.) 377

Appleyard's criteria were modified by Bycroft (1974) and reduced to
a series of 4 continua which represented varying degrees of structure
included in the maps of his sample : Scattered Fragmented
Schematic Mosaic
Linked Loop
Netted Map
After initial attempts at applying the techniques described here it
was found that many of the categories did not seem to fit the maps
of this study. It was also felt that these analyses were looking at more
than the structure of the maps. (Appleyard's for example included
accuracy, which had been considered separately for the maps in this
exerciseiNep structure was interpreted as the style of the map, the it
way in which/had been constructed and drawn. So an attempt was made to
simplify the categorisation and the following four categories resulted,
which represents a progressive increase in the structural organisation
of the maps in association with variations in style, suggesting that
a specific style is more suitable for the production of an effective map.
The high correlation achieved by the two judges on this task (0.94)
suggests that it is possible to analyse the maps in these terms and
seems to justify the simplification of the criteria, although the
varied results of the inter-correlational analysis do seem to raise
some questions about its appropriateness. In relation to the association
with cognitive style , it is suggested that it ructure is closely it
allied to accuracy and precision and as such/was anticipated that the
structural organisation,and thus a more appropriate map style,would be
identified in the maps of more Field Independent individuals
MAP STRUCTURE OR MAP STYLE.
The following instructions were given to the judges for the preliminary
analysis of this category.
Could you please consider the 'type' of maps produced. This form of
analysis distinguishes between the maps in terms of the structure, the
way that they have been drawn, and the four categories listed - below
represent a progressive improvement in the structure of the maps. Can
you please use the criteria listed here to differentiate between the maps.
I. Line-Link 1Ls.(These maps are composed primarily
of single lines to link all the locational
information portrayed on the map. They tend to be
very rough with little or no apparent structure.)
2: Irregular Maps.(Maps in this category tend to be
Rough sketch like maps employing a high degree of
wavy lines, bends and curves. Roads are shown as.
two likes varyingly separated, twisting haphazardly.) 378

3. Regularaps. (These maps tend to be much more
highly structured. Considerable use is made of
straight lines probably drawn with a ruler. Such
maps as a result are very angular in their
appearance. Roads tend to be shown as parallel
lines meeting at right angles. Houses are drawn
as accurate squares or rectangles.)
4. True Maps.(Nraps in this category are structurally
well organised and employ an appropriate balance
of straight and curved lines. As a result they are
more likely to approximate reality.)
Example maps for each of the categories described above are included
in the following pages. The results tabulated below indicate the
percentages of the sample achieving each of the categories by age
and by sex.
TH7 STYLE OF THE MAPS.
MAP I. THE AM YAP,
SAMPLE. I 2 3 J 4 I0 - II year olds - 40% 57.6% 2.4% II - 12 " " 1.3% 35.3% 62.2% I.21. 12 - 13 " " 1.7% 26.9% 57.1% 14.3%
TOTAL I. I% 33.3% 58.9% 6.7%
BOYS
IO - II year olds - 37.7% 59.I% 3.2% II - 12 " " I.3% 40.6% 56.6% 1.3% 12 - 13 " " 2.2% 27.9% 52.7% 17.2% TOTAL 1.3% 34.8% 55.7% 8.2%
GIRLS
Io - II year olds - 42.4% 56.3% I.
II - 12 " " 1.3r. 30,4 67.4% 1.3% 12 - 13 " " 1.3% 25.0% 62.2% 10.9%
TOTAL 0.9% 31.9%. 62.4% 4.8%

MP 2. THE ROUTE MAP.
SAMPLE I0 - II year olds II - 12 " " 12 - 13 " "
TOTAL
I 14.8% 10.3% 7.4%
1.0.5%
2
35.2% 33.1A 19.1%
28.4%
3 45.9%
51,7% 55.6%
51.5%
4 4.1%
4.9%
17.9%
9.6%
BOYS. I0 - II year olds 18.6% 2 5.4% 52.5% 3.5% II - 12 " " 10.6% 33.3% 50% 6.1% 12 - 13 " " 9.6% 26.5% 55.4% 8.5%
TOTAL 12,,53/0 28.4% 52.9% 6.2%
GIRLS. I0 - II year olds 11.1% 44.4% 39.7% 4.8%
II - 12 " " I0.1% 32.9% 53.2A 3.8% 12 - 13 " " 5.1% 11.4% 55.7% 27.0%
TOTAL 8.6% 28.5% 50.2% 12.7%

,S-E°P - CaSbe_77 \
1
TIE STYLE OR STRUCTURE OF THE MAP S
\S<il
O
/: ;.e 0 p •
CATEGORY I - 10*Year Old BOY CATEGORY2 — 1 1 Year Old GIRL

hATARF
CATEGORY 3. 12 Year Old BOY
ra
CC L.14
■...;
C Li E ;. R Y - H I_ N To, h.1 RU t''-4 --".
■ 1 c(%•ool It i 1
\ s, i //1
RN:, GI IND Roo
oo
CATEGORY 14.
13 Year Old BOY
1-1 0 8 A k T
143 4, Illt.bakf itM
x a A ae
i3 U I Ii 0
— _
i - sorroo ' w inn
1-*
"tet• f".

APPENDIX 4.
THE FOLLOW UP STUDY.
I. Interview schedule.
2. Standardised Instructions for the
Field Exercise.
3. Examples of the maps produced on
the Field Exercise.
4. Tabulated Analyses: (i) Of the Features noted
and the features mapped
whilst on the Field
Exercise.
(ii) Of the Questionnaire
responses of the Follow
up sample.
(iii) Of the Route and Area
Nhps of the Follow up
Sample.

I. The Interview Schedule.
These sessions were tape-recorded with the permission of the children
concerned. The tapes are available.
The following questions formed the basis of the interview with each of
the children in the follow up sample. As was explained in the text,
the questions were derived from 'research into both Cognitive Style and
Environmental Perception.
Key Questions.
The following questions formed the basis of the interviews, but if
anything of special interest was said, it was followed up before
returning to the prescribed questions.
I. What are your main interests, what do you most like doing in your
spare time?
2. What are your favourite school subjects and why do you especially
like them?
3. What subjects do you dislike in school, and why?
4. When you go out to play, are you allowed to play wherever you wish?
5. How far away from home are you allowed to go on your own?
Can you tellmesome of the places you go to (a) With permission,
and (b) Without permission.
6. Does it make any difference if you go with others? Who might these
others be? Where might you go then?
7. Are there any places where your parents are not happy for you to
go to ? Why don't they like you going there?
8. Who do you ask for permission to go out?
9. How has the area where you live changed during the time that you
have lived there?
IO. What changes would you like to see in the future?
The last part of the interview focussed on the Questionnaire responses
and the maps produced by the group of their home area and their route
from home to school.
(i) Specific individual questions or queries , by reference to their
completed questionnaires and maps.
(ii) "Look at your maps again, what would you have added or taken away?
What changes would you make to your map on reflection?
(iii)"When faced with a task like drawing a map, How do you start? Use
your maps to help you explain.
383

2. The Standardised Instructions used on the Field Exercise.
"We are going on a short walk. What I would like you to do is to
imagine that you are going on this walk on your own. The area is
new to you and you are not sure where you are . On the piece of
paper provided could you please note down anything that YOU think
would be helpful to you in finding your way beck to this car park.
Youa wi probably end up with a list of things. Some of you might ],otll
note/of details and some only a few. This doesn't matter. It is what
You think is important that interests me. Can you please do this
on your own, and make sure your name is in the space provided at
the top of the sheet. Perhaps it is best that you do that now
before we start."
After completing this exercise, the children were transported to
a local college where they were asked:
Distance Estimation. "We have all completed a short walk which took
us about 25-35 minutes. How far do you think we walked? Could you note the distance you think we walked on the new, sheet of paper."
Nbp of the Route Walked. "You have all produced a record of the
things that you felt were important on the walk. Could you now
please draw me a map of the route that we have just walked. You.
can use your notes to help you. Add anything else that you
remember, but that you hadn't included on your list. Do not add
anything to your list though."
(The children were well spaced out whilst they drew their maps.)
384

.2" r".ke, kV% r% k...ue.k4ve uu.:Alcea
ler
10Year old Girl
uci-
r ■ _c•
\oV1-
Zo.rn-(0 • 30r,
•
9
,-- \e'k
ecatyr,6,..„)
44•44444...1.1.10.-
12Yearold Boy

Ptt,v25-.s --rl, 1..1
\ \ 1 \ I r----i ,
clo-----1 ,Ce.,
Zanch.F4,5)10:1L_ , < I i :)
1 E?
...........fo, c....12A
13gire 1, 4 «VS' otK EET
-
1
rb
e,'",V ClIitev 1- -I-1).7 V•Vvicil
( o; Cv\rt.5-i
tiv.,* I IS SC■0 Itl,
fitaxL:\.,, 1/4" -1
it7t) I 1.1 41 d'
13 Year old Girl
1-t tr
- g
2 0
e calicr,
ROTANIC G4RDE,ii
R,074,itc GAP cyN
117
11:; 1- 7-.4 c. sr, "1 /
(}P PARK 14" I ,;•
I 1,...4AKC 1. I,
; , 4 if if
19,6 • 6errc
1111.1•11111111111 .
r>. 4 4 -4 -4 -4 -> 4 -> 9 itormIc 6A*001;STE Cl
, ! 00, I f ,A1 ,
GI -1ra :1 ? I = I 4
1 - I )1 4 it
a. I It YI
•Or• t(,.
4, 0 4, u Y PAfr,( L.GOITS
ovvo
ov 41
•
) •
-- )
... ti 7 it4rFrc e ,„ -77"
0. 4, ,
e- tA• 4.- 4- 0- gt,
10 Year old Girl

FOLLOW UP STUDY: ANALYSIS OF i,EATURES NOTED AND FEATURES MAPPED WHILST
ON THE FIELD EXFRCISE.
PPt lig NOTED : C a
in B
PP ED t' is I Tea
Cdr Coach Park 5 7 12 -
Ht. 0
r-- c o
1-1
t-.) I-1 In
I I co
(NJ
Ls-N c\I 1
"71 --1
H 1
I-4 UM
u-N H
I C
V 1
H
1-1 c
v 1
N
1-1
tr \ tr\ 1
(V
H
I-1 1-1
4 6 9 15 6 7
N'r
CO
to
•Zr •Cr t•--
1 H
I H
1
N K
\ 1 N
M 1
1 H
V:) H
H I (V
(11 •■■•• H 1
1
cv 1 -1 1
"tt •■1-
V C
V C
V C
V H
H
H Pub(2 on the routel2 15 27 8 18 6 IO 16 7 8
Road/Street Names 9 '9 38 3 20 13 24 37 - 8 Road Signs 4 T II 2 I0 5 3 8 - 5 Mini Roundabout 2 2 4 - I I 3 4 I - Post Box 2 2 4 - 6 - I I - 4 Bus Stop I 3 4 i I - I I 3 Traffic Lights 2 6 8 2 7 - 5 5 2 5 Pelican Crossing - 3 4 I 3 4 - - Telephone Box I 2 3 - I I I - Hote1(3 possible) 14 16 30 9 17 6 5 II 3 4 Gardens 5 7 12 5 9 6 8 14 3 4 Main Cate 2 7 9 I 3 2 3 5 2 3 Hot House 5 6 II 4 8 3 6 9 3 2 Pond/Lake 5 7 12 5 _10 4 7 I I 2 3 River 4 9 15 3 8 4 8 12 3 2 Rockery 2 2 4 I 2 3 - I Vegetable Gardens 2 2 - ----- Steps - 3 3 I I 2 - - Paths 6 7 13 I 3 6 7 13 I I Bridges 2 7 9 3 7 3 6 9 3 - Fences I I 2 I I - I - - Trees/Vegetion I 7 8 I 2 I 3 4 2 I Field (with Ponies)_ 1 I - - - 2 2 - - Buildings(General) - - I 2 Convent 5 6 II 6 II 5 7 12 5 6 Church 3 7 I0 5 I0 2 5 7 3 3 Masonic Hall I - I I I I 2 - I School 2 I 3 I 112 - I School Gate - 2 2 - - I I - - Church Hall I 3 4 2 4 - 3 3 1 I Laboratories 9 - 2 - - - 3 3 I I Memorial 5 5 10 4 6 3 4 7 2 2 Shop ,I I 2 I 2 -II- I Brewery I I 2 I 2 Cafe I I - Named Buildings I I 2 2 5 - I I I Hire Shop 2 2 - 2 - 3 3 - House Detail 4 4 Front Garden I I 2 I I 2 I 3 Dustbins - - 2 5 - - 2 2 Log Piles - - 2 3 - - I I Bike Sheds I 2 3 2 I I - 2 Bicycles - - 2 5 - I Benches - 5 2 Tennis Courts 2 2 4 - - Ducks - 2 4 - I Directional Detail 7 6 13 ON YAPS ONLY Houses I 2 Architects - I I Cross Keys Pub - I 1 Chemist. - I (The Last 2 did not exist inthe area) 1
A:Field Independent Boys.
B:Field Independent Girls.
C:Field Dependent Boys.
D:Field Dependent Girls.
TOTAL indicates total number of separate individuals of each sub-group refering to the category*
387

Beautiful Places
B TOT
D TOT
None Church N'd Gardens River Churchyard Stud Stables Fields Station Colleges Pllg Fields Own Garden Own Area Brook 'The Village Paths Heath Park Swings Bowling Gn. Gra 4S TOTAL 2I)
5
9 116
OS
I
3 2 2 2
I I I I I 2 I I I I
I
2 I 2 I I
I
I I I I I
•••
2
I I a
Favourite Places.
Sweet Shop Own House Own Area Own Road River/Brook Common/Green Rec Playing Field Garages Youth Centre Cemetry Stud Library Orchard N'd Places N'd Areas Colleges Other Shops Roads Trees Own Garden Friends Playground Bus Shelter Fields View Swings Pond Track Heath N'd Buildings Pub Chip Shop Primary School
Disliked Places A None Building Site Rec Church Hall Keighbuurls Subway Church Factory Flats Garages Play Area Station Pool N'd Roads Wood Sand Pit
Restaurant Hairdresser Health Centre Other Houses School TOTAL (21)
TOT
3 9
I I3 3 3 3 II
T I2 II
I I 2
I I I I
I
T.OT
7 II
I I I I I
I
12
I
I 2 2
I
IMO
I I I
B
2 6
B
I I I I
2
C
I
I I
I I
T
I 2 I
I I - I I I I
2 2 4 I
- I I I I
I I
I I
- 6 IO 14
388
D
D
TOT
TOT
I 2
I 4
2
I 2
T
I
I
I
I
IMO
3 II
I2
I
2 IMO
2
3 II
I2
I I 2 I I
FOLLOW UP STUDY: ANALYSTS OF QUESTIONNAIRE RESPONSES.
Dangerous Places
A B C D TOT
Main Roads 4 4 8 3 4- 7 N'd Area - I I StationAlwy 11 2 - I I Playground - I I - I I Swings I - Drunks I I - River - I I - - Sandpit - I Heath - - I I Sheds - - - I I Horses - - I I Pubs - - I I Level X'ing - - I - I Building Site- - I -- I Sub Station - - I I NONE 3 I 4 2 I 3 TOTAL (16) 3 8 8 5 19 12 Uncomfort-able Places
A B TOT C D TOT
NONE 7 2 9 2 1 3 .N'd Roads - 2 2 I I 2 At Night - 3 3 2 I 3 Cemetry - I I - - - Unlit Roads - I I *- - - Garages - I I - - - Shops - I I - - - Stud - I I - - - Passages I - I - - - Woods/trees - - - - 3 3 Outside Area - - - - 2 2 Park - - - I - I N'd Building- - - I -. I TOTAL (13) 2 8 9 5 7 7

FOLLOW UP STUDY: ANALYSIS OF QUFSTIONNAIRE RESPONSES (cont.)
Comfortable Places
A B TOT C D TOT
Own House Local Green Own Road Own Garden In Bed Own Area Friends
7 I I
8 I -
15 2 I I
7 I
I I
'- -
3 -
2 I 3 I
I0 I I 3 2 3 I
TOTAL (71 4 2 4 4 6 7
Smells A B TOT C D TOT NONE 2 5 7 4 3 7 Cooking I I - 2 2 Horses I I 2 - 3 3 Factories I I - Baking Bread I - Chips I - Petrol I - I - - Cut Grass I - I - Sewage I I - Toilets I - I - Fires - . Restaurant - I - I Pond - I - I Refuse - I - I TOTAL (14) 7 5 I0 4 4
Noises B TOT C D TOT
None 2 2 4 2 2 4 Ambulances - I I - Traffic I 5 6 - Voices - 3 3 - Children I - Playing Trains 2 I Horses I I I I 2 Animals 2 2 Planes I I - Wind I 1 - NeighbourlsI I - - Farm Equipment I I - Building Site I v I I- I
Football Crowd - I I 2
School Bell- - I - I Telephone - I I Dry Leaves - - I I Trees - - I I Siren (Factory - - I I
TOTAL (19) 8 7 13 6 8 13
Guide Photographs
A B TOTI D TOT Guide Photo
grapha
A B TOT C D TOT
Church(es) 3 5 8 I- I Paddock - I I - Roads 2 4 6 2 2 4 Station I I - Playing Allotments - I I - - - Fields 3 2 5 I I 2 N'd Gardens- I I - I I
Own House 2 2 4 2 4 6 Church Hall- I I - N'd Buildings 2 2 4 12 3 A View II I 2 - Schocl(s) I 3 4 1 2 3 Aerial Vie'I - 1 - Shops 1 - I 2 2 4 Pond 2 2 - - Library I 2 3 - I I Heath I - 1 - I I Own Road I 2 3 I I Town CentreI - I .- Pub 2 I 3 I I Fields I- I I River I 2 3 - - - Paths I I - Common/park _ 1 I I 2 3 Physical Horses 213 - I I Features I - Noods - - - 3 3 Own Garden - - I I Swimming Pool - - I 2 3 Railway - I I 2 N'd Areas 112 - I I Playground - - I I N'd Places I I 2 - - Tennis Cts - - I Rec 2 2 - - Aay.P'Ground I Other Houses - I I I - I Youth C'Ntre - I - I Bridge I I - - Own Area 1-- - I - I Cemetry I I - - TOTAL(46) 23 25 35 15 21 28 Airport I I - - Stud I I - I
In each of the Tables in this section, A= Field Independent Boys B= Field Independent Girls C= Field Dependent Boys
- D= Field Dependent Girls 389

FOLLOW UP STUDY: ANALYSIS OF QT.TESTIOrKis IRE RESPONSES (C ant )
Features to Cousin.
A B TOT C D TOT Features to Adult Rel'n A B TOT C D TOT
Own House Own Road Own Garden Shops Shopping Centre Swimming Pool River/Brook Green Church Church Hall Cemetry N'd Buildings Rec All Round Own Canp/Favouri2 te places Heath Horses Friends Swings Youth Centre Taiseum Library N'd Gardens Paddock Stud Pets N'd Roads Tracks Sports Hall Pub Airport Leisure Centre Own Area My Toys Football Cnd.
2
2 - I I
3 2
I I
-
CV 1-1 f-A CV CV CV
1,(N CV t-A
PA E-I N1 I I I
11
1-1 I-
I 1-1
1-1 H FA 1-1 PA I-A
IIIIIIII FA
4 I I 4 2 3 4 2 I I I 3 3 2 2
- - I I I I I I I I I I I
- - - - - I
I - I I
2 -
I
I I I I
3 I I 2
-
- 2 -
I
-
-
-
4 I 2 3
I - - - - - I 2 2 I
2 2 - -
-
-
- - I I I I I
The Same All Round Ask them Own House Own Garden Own Area N'd Roads Church Fields Sports G'nd. Bowls Club Pub Sw ' g Pool Hospital Factories Rec/Green N'd Builings Cemetry N'd Gardens Horses Shops Library A Map Friends Stud Heath Own Road Schools Railway Doctors
2 4
I
2 I
-
I
I I I - - - -. - -.
I I I I
I I 3 2 I I I I I I 3 2
I
- - - -
III-
3 5 I 2
I 3 4 2 I I I I I I 3 3 I I I 2 I I I - - - - - -
- I
4
- I
I -
I - 2 I -, T
2 I
3
I I
-
- - -
- - I I - w•
- I I I -
2 2 - 7 I - I 2 - I -2 --- - - - - I 2 - -
- I 2 I 2 I I
TOTAL(30) IO 20 I 24 IO II 16
TOTAL (37) tE,,, 22 28 13 12 19 ieptures to Visitor. A B TOT C D TOT reatures to
Visitor A B TOT C D TOT
Same as Adult Town Centre School(s) Heath Own Garden N'd Reads All Round Min House N'd Buildings Shops Museums Church Park Places of Interest
Town Centre
Fields Green
3, - 1 I
I 3
I 2
I
5 2 I I
2 I I 3 I
I
-
6 2 2 2 - 3 4 I 4 3
*1 2 I
I - - -
---c-
-;
I I I 1 2
; - 3 2 I 2 - -
I
I
3 3 2 3 I 2
I
River Pub Short Cuts Swimming Pool Sports G'nds. Maternity Hospital Marina Houses 'Bowls Club Bus Stop Paddock Horses Stud (ardens Friends Farms My Area
- - - - -
- - I - I - - - - - -
I I I
I I I
1,11
11
IIIIIIIII
II14
I- A FA 1-
1 P-1 1-1
.
I-I P-1 CV EA PA I-1.
FAII
II
I
-
I I
-
- - - - -
- - I ---- I I I I
ToTAL(34) II 22 25 6 14 17 390
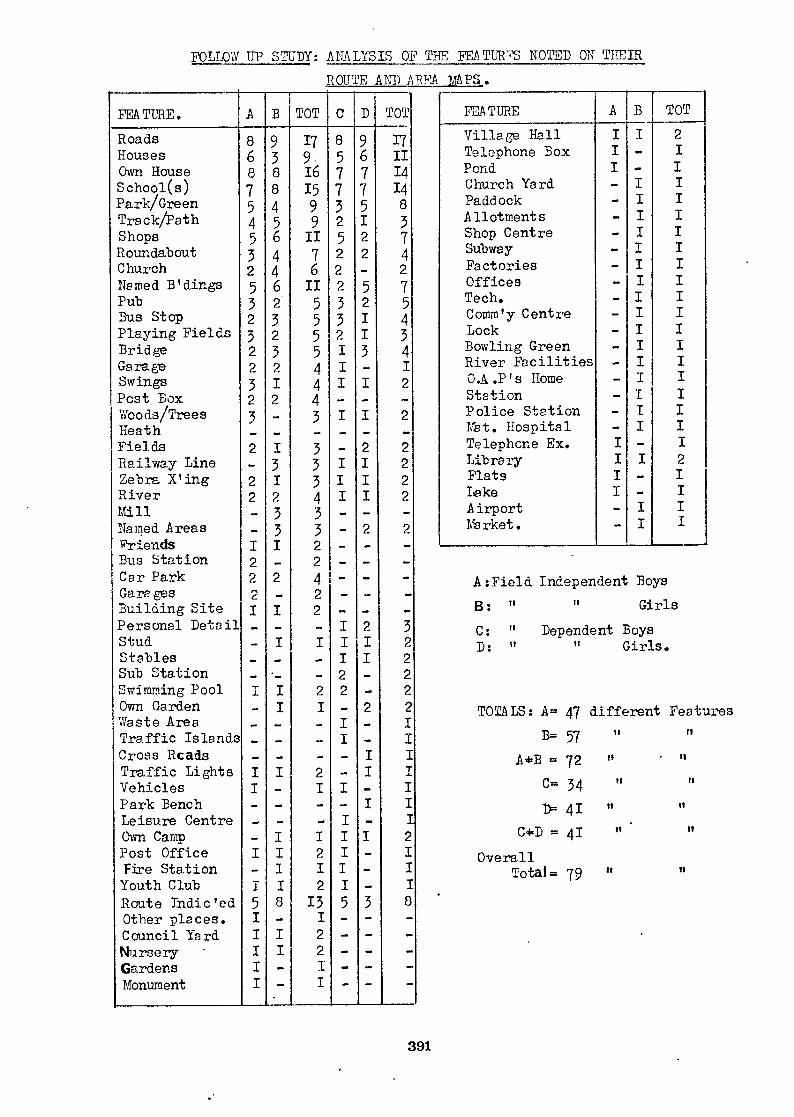
It 11
FOLLOW UP STUDY: ANALYSIS OF THE FEATURES NOTED ON THEIR
ROUTE AND AREA MAPS .
FEATURE. A B TOT C D TOT
Roads
1 E0
•0 ap c
- Ir N
"1- 1-r• reN
EN
IIN K
\ cv Fr N
cv c•1 K
■ cv tc\ I
N IN
N I I
HN
NN
I- 1
IIIIH
IIII
H 1-1 I I 1
H 1
I—I in
1--I i—
I I—I
1-1
I— I
9 17 8 9 17 Houses 3 9. 5 6 II Own House 8 16 7 7 14 School(s) 8 15 7 7 14 Park/Green 4 9 3 5 8 Track/Path 5 9 2 I 3 Shops 6 II 5 2 7 Roundabout 4 7 2 2 4 Church 4 6 2 - 2 Named B'dings 6 II 2 5 7 Pub 2 5 3 2 5 Bus Stop 3 5 3 1 4 Playing Fields 2 5 2 I 3 Bridge 3 5 1 3 4 Garage 2 4 I - I Swings I 4 I I 2 Post Box 2 4 - - - Woods/Trees - 3 • I I 2 Heath _ _ - _ - Fields I 3 - 2 2 Railway Line 3 3 I I 2 Zebra X'ing I 3 I I 2 River 2 4 I I 2 Mill 3 3 - - - Named Areas 3 3 - 2 2 Friends I 2 - - - Bus Station Car Park 2 4 - - - Garages Building Site I 2 - - - Personal Detail - - I 2 3 Stud I III 2 Stables - - I I 2 Sub Station - 2 - 2 Swimming Pool I 2 2 - 2 Own Garden I I - 2 2 Waste Area - - I - I Traffic Islands - I - I Cross Roads - - - I I Traffic Lights I 2 - I I Vehicles - I I - I Park Bench - - - I I Leisure Centre - - I - I Own Camp I 1 I I 2 Post Office I 2 I - I Fire Station I I I - I Youth Club I 2 I - I Route Indic'ed 8 13 5 3 8 Other places. - I - - - Council Yard I 2 - - - Nursery ' I 2 - - - Gardens - 1 - - - Monument
FEATURE A B TOT
Village Hall I I 2 Telephone Box I - I Pond I - I Church Yard - I I Paddock - I I Allotments - I I Shop Centre - I I Subway - I I Factories - I I Offices - I I Tech. - I I Comm'y Centre - I I Lock - I I Bowling Green - I I River Facilities - I I 0.A .P's Home - 1 I Station - I I Police Station - I I Mot. Hospital - I I Telephone Ex. I - I Library I I 2 Flats I - I Lake 1 - I Airport - I I Market. - I I
A:Field Independent Boys
Girls
Dependent Boys It Girls.
TOTALS: A= 47 different Features
B= 57 A=B = 72
C. 34
41
C*D = 41
Overall Total= 79
B:
C: D:
391