City, University of London Institutional Repository
336
City, University of London Institutional Repository Citation: Smith, G.M. (1989). Improving the decision usefulness of the corporate annual report. (Unpublished Doctoral thesis, City University London) This is the accepted version of the paper. This version of the publication may differ from the final published version. Permanent repository link: https://openaccess.city.ac.uk/id/eprint/7406/ Link to published version: Copyright: City Research Online aims to make research outputs of City, University of London available to a wider audience. Copyright and Moral Rights remain with the author(s) and/or copyright holders. URLs from City Research Online may be freely distributed and linked to. Reuse: Copies of full items can be used for personal research or study, educational, or not-for-profit purposes without prior permission or charge. Provided that the authors, title and full bibliographic details are credited, a hyperlink and/or URL is given for the original metadata page and the content is not changed in any way. City Research Online: http://openaccess.city.ac.uk/ [email protected] City Research Online
-
Upload
khangminh22 -
Category
Documents
-
view
3 -
download
0
Transcript of City, University of London Institutional Repository

City, University of London Institutional Repository
Citation: Smith, G.M. (1989). Improving the decision usefulness of the corporate annual report. (Unpublished Doctoral thesis, City University London)
This is the accepted version of the paper.
This version of the publication may differ from the final published version.
Permanent repository link: https://openaccess.city.ac.uk/id/eprint/7406/
Link to published version:
Copyright: City Research Online aims to make research outputs of City, University of London available to a wider audience. Copyright and Moral Rights remain with the author(s) and/or copyright holders. URLs from City Research Online may be freely distributed and linked to.
Reuse: Copies of full items can be used for personal research or study, educational, or not-for-profit purposes without prior permission or charge. Provided that the authors, title and full bibliographic details are credited, a hyperlink and/or URL is given for the original metadata page and the content is not changed in any way.
City Research Online: http://openaccess.city.ac.uk/ [email protected]
City Research Online

GEORGE MALCOLM SMITHSCHOOL OF ACCOUNTING
CURTIN UNIVERSITY OF TECHNOLOGYPERTH, WESTERN AUSTRALIA
IMPROVING THE DECISION USEFULNESS OF THE
CORPORATE ANNUAL REPORT
This thesis is submitted as arequirement of the degree Doctorof Philosophy at the City University
September 1989
1

PAGE5679
l011
12
12151925
- Information Processing
25- Dimensionality
26- Presentation
27Content
28- Content
29- Presentation
29
IMPROVING THE DECISION USEFULNESS OF THE CORPORATE ANNUAL REPORT
TABLE OF CONTENTS
List of TablesList of FiguresList of AppendicesAcknowledgementsUniversity declarationABSTRACT
1 INTRODUCTION
1.1 Objectives
1.2 Empirical Overview
1.3 Approach and Methodology
1.4 Specific Propositions1.4.1 Financial Information1.4.2 Financial Information1.4.3 Narrative Statements1.4.4 Narrative Statements -1.4.5 Accounting Statements1.4.6 Accounting Statements
2 OBJECTIVES OF THE CORPORATE REPORT
31
2.1 Voluntary Disclosures 372.2 The Information Needs of Users 40
3 THE QUALITATIVE CHARACTERISTICS OF FINANCIAL INFORMATION 51
3.1 The Corporate Report (1975)
513.2 Financial Accounting Standards Board (1980)
53
3.3 Australian Accounting Research Foundation (1987)
543.4 Canadian Institute of Chartered Accountants (1980)
55
3.5 The Dimensionality of Financial Information
583.5.1 An Empirical approach to Measurement
60
3.5.2 Empirical Results
643.5.3 Conclusions
67
4 BARRIERS TO AN EFFECTIVE COMMUNICATION PROCESS
69
4.1 • The Language of Accounting Disclosures
694.2 Intuitive Statistics in the Processing of Accounting
Narratives
714.3 Heuristics Experiment: Methodology
73
4.3.1 Case: Representativeness
744.3.2 Case: Integration
77
4.3.3 Case: Anchoring and Adjustment
804.3.4 Case: Availability
83
4.4 Summary of findings 85
2

5 DATA SELECTION AND SAMPLING OF COMPANIES 87
5.1 Objectives of Sampling Procedure 87
5.2 Sampling Methodology 89
5.3 Subsampling for Chairman's Narrative Experiment 92
5.4 Subsampling for the Facial Profiles Experiment 95
6 COMMUNICATION OF NARRATIVE AND ACCOUNTING INFORMATIONIN ANNUAL REPORTS 98
6.1 Shared Meaning in Accounting Narratives 98
6.2 Measures of Readability 996.2.1 Alternative Readability Formulae 1006.2.2 Experimental Procedure 1056.2.3 Experimental Results 1076.2.4 Conclusions 111
7 INFORMATION CONTENT OF NARRATIVE DISCLOSURES 114
7.1 Content Analysis applications in the AccountingEnvironment 1177.1.1 Classificatory systems for Content Analysis 1217.1.2 Experimental Procedure: Word Content 1227.1.3 Experimental Procedure: Sentence Content 1247.1.4 Experimental Procedure: Management Actions 1287.1.5 Experimental Procedure: Hypotheses 130
7.2 Content Analysis: Tests of Hypotheses 1317.2.1 Linear Discriminant Analysis Methodology 1317.2.2 Content Analysis: Word Occurrences 1357.2.3 Content Analysis: Thematic Content 1397.2.4 Content Analysis: First Sentence Message 1417.2.5 Content Analysis: Management Actions 1447.2.6 Content Analysis: Word/Theme/Strategy
Combination 1477.2.7 Content Analysis: Conclusions 149
THE COMMUNICATION OF ACCOUNTING INFORMATION IN THEANNUAL REPORT 153
8.1 Independence of Information Sources 154
8.2 Experimental Methodology 1568.2.1 Specific Propositions 157
8.3 Experimental Procedure 157
8.4 Experimental Results 1598.4.1 Conclusions 170
9 IMPROVING THE PRESENTATION OF FINANCIAL INFORMATION 173
9.1 Tabular Presentations 173
9.2 Graphical methods 175
9.3 Facial Representations 1799.3.1 Faces as a Means of Communication 1829.3.2 The Saliency of Facial Features 1849.3.3 Information Processing in Facial Examination 1859.3.4 The Assignment of Variables to Facial Features 1929.3.5 Implications for Financial Applications 194
3
10 APPLICATION OF THE FACIAL PROFILE TECHNIQUE IN A FINANCIALENVIRONMENT 197
10.1 The Classification of Failed/Non-Failed Companies 19810.2 The Detection of Performance Trends over Time 20110.3 Prediction of Failure using alternative Presentation Forms 205
10.3.1 Methodology - Experiment 1 20610.3.2 Results - Experiment 1 20810.3.3 Experiment 1 - A Reappraisal 21410.3.4 Design - Experiment 2 21610.3.5 Results - Experiment 2 21810.3.6 Facial Profiles Experiment: Conclusions 223
11 SUMMARY AND CONCLUSIONS 225
11.1 The Content of Accounting Narratives 22611.2 The Presentation of Accounting Narratives 22711.3 The Content of Accounting Statement Information 22811.4 The Presentation of Accounting Statement Information 22911.5 Directions for Future Research 23011.6 Research Implications 234
APPENDICES 235
BIBLIOGRAPHY 295
4

LIST OF TABLES PAGE
2.2.1 Shareholder Surveys of Source Rankings for DecisionUsefulness 41
2.2.2 Ranking of Information Sources for Investment Decisions 422.2.3 Shareholder Surveys of Annual Report Readership 432.2.4 Shareholder Survey of Decision Usefulness 432.2.5 Ranking of Annual Report Items for Usefulness in Investment
Decisions 443.2.1 Information Specific Qualities of Information 546.2.1 Correlation Coefficients: Statement Length/Size 1086.2.2 Correlation Coefficients: Readability/Performance 1086.2.3 Readability Comparisons: Failed/Non-Failed Companies 1086.2.4 Mean LIX Readability Scores: Alternative versions 1096.2.5 CLOZE Scores and Readability Scores 1117.1.1 Theme Components in Content Analysis 1277.2.1 Correlation coefficients between Company Status and
Word Variables 1367.2.2 Words: Discriminant Model Explanatory Power 1397.2.3 Words: Correlation Coefficient Matrix 1397.2.4 Correlation coefficients between Status and Theme variables 1407.2.5 Themes: Discriminant Model Explanatory Power 1417.2.6 Themes: Correlation coefficient matrix 1417.2.7 First-Sentence message: Distribution of Themes 1427.2.8 First-Sentence message: Correlation between Themes and Status 1437.2.9 First-Sentence message: Explanatory Power of Discriminant
Variables 1447.2.10 First-Sentence message: Correlation Coefficient Matrix 1447.2.11 Correlation Coefficients between Actions and Company Status 1457.2.12 Actions: Distribution of Occurrences 1467.2.13 Actions: Discriminant Model Explanatory Power 1477.2.14 Actions: Correlation coefficient matrix 1477.2.15 Distribution of Misclassified cases across Alternative Variables 1487.2.16 Mixed Model: Explanatory Power of Discriminant Variables 1497.2.17 Mixed Model: Correlation Coefficient Matrix 1498.4.1 Classification Errors - Incremental Financial Information 1648.4.2 % Respondents reporting changed classification performance
compared to that based on Chairman's Narrative alone 1668.4.3 Case Misclassifications compared to Narrative Performance 1668.4.4 Classifications Differences: Narrative Superior 1678.4.5 Classification Differences: Financial Statements Superior 1688.4.6 % Cases correctly classified by Alternative Sources 17010.1.1 Financial Ratios and Dimensions represented in Linear
Discriminant Model 19810.2.1 Financial Ratios and Dimensions represented 20210.3.1 Mean Error Classification for Experiment 1 20910.3.2 Mean Processing Times in Experiment 1 21010.3.3 Experiment 1: Misclassification Combinations 21210.3.4 Experimental Design: Distribution of Tasks 21710.3.5 Facial Profiles Experiment: Effects of Alternative Ordering of
Processing 21910.3.6 Facial Profiles Experiment: Distribution of Misclassifications 22010.3.7 Facial Profiles Experiment: Mean Misclassification Errors 22110.3.8 Facial Profiles Experiment: Mean Number of Misclassification
Errors per respondent 222
5

LIST OF FIGURES PAGE
1.1 Schematic Overview: The Communication of FinancialInformation 14
3.5.1 Scree Diagram in the Determination of Dimensionality 657.1 The Communication Process: Shannon and Weaver 1147.2 The Communication Process: McCroskey 11510.1.1 Failure Classification: Assignment of Financial Variables to
Facial Characteristics 19910.1.2 Facial Portraits in Failed/Non-Failed Classification 20010.2.1 Relative Performance Trends: Assignment of Financial
Variables to Facial Characteristics 20310.2.2 Berwick Timpo (31/12/78 to 31/12/81) 20410.2.3 Southern Constructions (31/12/75 to 31/12/78) 20410.2.4 Sir Joseph Causton (30/9/76 to 30/9/79) 205
6
LIST OF APPENDIQESPAGE
3.1 Qualitative Characteristics in Alternative Studies 2363.2 Abstract from the Corporate Report: ASSC ICAEW (1975) 2373.3 a) Test Material: Property Trade Offs: Desirable Properties 2383.3 b) Test Material: Experimental Task 239/2403.4 a) MDS Indscal Scores Useful/Usable v Bias/Punctuality 2413.4 b) MDS Indscal Scores Bias/Punctuality v Quantity/Quality 2423.4 c) MDS Indscal Scores Quantity/Quality v Useful/Usable 2435.1 Matched sample of companies 2445.2 CLOZE procedure: preliminary results: divisional groupings 2455.3 Chairman's Statement Analysis: preliminary results: divisional
groupings 2465.4 Experimental Design: Distribution of Cases for Narrative
Analysis 2475.5 Facial Profiles Experiment: Sample Financial Ratios 2485.6 Facial Profiles Experiment: Ratio Distribution of Sample Cases 2496.2.1 Readability scores for sample companies 2506.2.2a) The CLOZE Procedure: Instructions to Respondents 2516.2.2b) The CLOZE Procedure: Test Instrument for Case No. 2:
ACROW PLC 2526.2.3 Readability Study: Descriptive statistics for 66 companies 2536.2.4 CLOZE Procedure: Ranking of Cases by Respondents of
differing sophistication 2546.2.5 Distribution of Readability Levels for Accounting Narrative
Disclosures 2557.1.1 Content Analysis: Distribution of Pre-Sample Companies 2567.1.2 Word Distribution in Content Analysis of Narrative 257/87.2.1 Content Analysis: Alternative Discriminant Models 259/2607.2.2 Content Analysis: Descriptive Statistics 2618.1 Financial Ratio Indicators in Narrative Statements 2628.3.1a) Test Materials: Chairman's Statement Analysis 2638.3.1b) Test Materials: Case 48: Nova (Jersey) Knit 2648.3.2a) Materials for Financial Statement Analysis: Case 63 -
George Spencer 265/6178.3.2b) Materials for Financial Ratio Analysis: Case 9-George S7acer 268(98.4.1 t-statistics in the comparison of Ale no . ot izAek, .e..c.:xxons
with the no. of failed cases8.4.2 t-statistics in the comparison of Vile no. of c..\•ascaK‘011
errors with the no. of failed cases 2718.4.3 Mean classification errors in the analysis of Chairman's
Narrative 2728.4.4 Chairman's Statement Analysis: Case Misclassifications 2738.4.5 Mean No. of Classification Errors and Failed Decisions 2748.4.6 Distribution of % Misclassifications across All Cases 2759.2.1 Alternative Graphical Formats 276/79.2.2 Computer Generated Facial Portraits 27810.3.1 Experiment 1 Materials: a) Financial Statements 279
b) Financial Ratios 280c) Facial Portrait Data 280
10.3.2 Experiment 1: Sample Companies 28110.3.3 Experiment 1: Distribution of Misclassifications 28210.3.4 Experiment 1: Misclassified Cases for Alternative Processing
Strategies 28310.3.5 Experiment 1:Facial Profiles for Failed Cases 28410.3.6 Experiment 1: Facial Profiles for Non-Failed Cases 28510.3.7 Experiment 1: Assignment of Financial Variables to Facial
Features 28610.3.8 Experiment 2: Sample Guide to the Assignment of
7

Variables 28710.3.9 Experiment 2: Alternative Variable Assignments 28810.3.10 Experiment 2: Facial Profile Information 289/29010.3.11 Experiment 2: Effects of Alternative Ordering of Processing 29110.3.12 Experiment 2: Effects of Alternative Failure Base Rates 29210.3.13 Experiment 2: Misclassification with Alternative
Instruments 29310.3.14 Experiment 2: Misclassifications resulting from Alternative
Classification Strategies 294
8

ACKNOWLEDGEMENTS
The guidance and direction of my supervisor, Professor Richard Taffler, Headof Accounting Division, City University Business School, has beenfundamental in bringing this extensive research study to fruition.
The suggestions of Dr Lynda White, Department of Statistics, University ofLondon, with respect to statistical sampling and experimental design havebeen most helpful and are much appreciated.
The quality of word-processing and textual formatting of the thesis owe muchto the patience and forbearance of Ms Kylie Cugini, School of Accounting,Curtin University of Technology.
The support for this research project provided by my previous academic'institution, Cambridgeshire College of Arts and Technology, is acknowledged.
9

DECLARATION
A copy of this thesis may be lodged in the City University library, and singlecopies of particular sections abstracted for educational purposes. The authorgrants discretion to the University Librarian to allow such copies to be madewithout further reference to the author, subject to the normal conditions ofacknowledgement.
10

ABSTRACT
Shareholder surveys consistently demonstrate users' perceptions of theimportance of annual report disclosures in the decision-making process andtheir readership of the Chairman's narrative. - Yet existing empiricalevidence casts doubt on the informational content of any part of the annualreport.
This study offers a partial explanation of this anomaly by demonstrating thedecision usefulness of annual report disclosures, focusing on improvementsmade possible by a more detailed analysis of the content and its presentation.
The Chairman's narrative provides a voluntary disclosure acting as a vehiclefor signalling the intentions of the executive, but also as an opportunity toconvey information incremental to the financial statements. The absence ofa shared meaning for accounting terms between the users and preparers ofthe, accounts provides a further opportunity for miscommunication. andmisinformation. Such differences may be attributable to either thecomplexity of content or the complexity of presentation. Both are addressedin this study.
With regard to content, the study examines the environmental predictabilityof the semantic content by constructing explanatory models of the financialperformance of the enterprise.
With regard to presentation, both the readability and cognisability of thenarrative are evaluated with reference to the size and financial performanceof the enterprise.
The study concludes with an examination of alternative methods for thepresentation of financial information, focusing on the use of schematic facesas a potentially unique format with specific portrayal advantages. The facialformat is shown to be an efficient method of processing, producing decisionsof comparable quality to those with financial statement information, and in amuch shorter time. An approach is adopted which rectifies the deficienciesof earlier studies by incorporating the full force of the existingpsychological evidence and by generating an optimum feature assignmentexperimentally.
11

CHAPTER ONE
INTRODUCTION
1.1 OM=
Surveys of shareholders, financial analysts and investors consistently
demonstrate the preference of users for annual report information, together
with their perception of the relative importance of different disclosed items to
the decision-making process (Lee and Tweedie (1975); Wilton and Tabb (1978);
Winfield (1978), Anderson (1979); Chang, Most and Brain (1983)).
The Chairman's Statement has been shown to be the most read section of the
report (Lee and Tweedie (1975)), dnd the US Trueblood Committee (1973)
recognises that the achievement of an objective 'to provide information useful
for making economic decisions' cannot rely solely on quantitative accounting
data but requires the additional use of narrative disclosures for descriptive and
explanatory purposes.
The Efficient Markets Hypothesis (Fama (1970)) casts doubt on the usefulness of
the annual report on the grounds that it comprises information already in the
public domain and that its content is largely pre-empted by the preliminary
announcement of earnings. However, the decision-usefulness of financial
statement numbers has been demonstrated by a number of studies across three
distinct areas (Patton (1982)):
i) the analysis of business transactions in markets that may not be efficient;
ii) the imposition of contractual limits based on financial ratios;
iii) the prediction of performance and evaluation of risk in an efficient
market.
12

This final area is the focus of study in this thesis, following the models of Taffler
and Sudarsanam (1980), for the measurement of relative financial performance
and Taffler (1982), for the identification of financial distress. The aim of the
thesis is to improve the predictive ability of existing models by increasing the
decision usefulness of existing annual report disclosures. By focusing on
linguistic and visual means of communication it suggests a means of improving
the communicative ability of financial statement numbers, and formulates a
methodology whereby . narrative information may be used to complement
financial statement information in the measurement of performance. By
making better use of existing information, the intention is to provide the user
with the opportunity to make more informed decisions.
This study examines the incremental information that might aid a distinction
between failed and non-failed companes, focusing on improvements made
possible by a more detailed analysis of the content and presentation of narrative
disclosures. As such it provides an illustration of a typical application within a
specific task environment. Systematic research into the application of content
analysis techniques to accounting messages is long overdue both in terms of
tests of the relevance of this methodology and for the predictive insights that
might derive. This study attempts to redress the balance.
Figure 1.1 provides a schematic overview of this thesis, which focuses on the
dual aspects of content and presentation in the context of both quantitative and
narrative financial disclosures:
13

PRESENTATION
FINANCIAL INFORMATION
/\A\TIVE QUANTITATIVE
CONIENT CONIENT PRESENTATION
FIGURE 1. / : SCHEMATIC OVERVIEW: THE COMMUNICATION OF FINANCIAL
INFORMATION
This distinction between content and presentation of information allows the
predictive ability of each branch of the schematic tree to be examined. Thus the
Narrative-Content branch is concerned with the incremental information
conveyed by the structure and message of the Chairman's narrative. The
objective is to improve on the explanatory power of existing financial models
through the inclusion of qualitative variables. The Narrative-Presentation
branch is concerned with the motives and implications associated with messages
of low readability and poor levels of understandability. The objective is to
determine whether such occurrences are indicative of current performance or
predictive of future performance. The Quantitative-Content branch examines
existing predictive models comprising financial ratio combinations, with the
objective of determining their environmental predictability and the source of
case misclassifications. The Quantitative-Presentation branch is concerned with
alternative means of representing financial statement data, notably the
adoption of graphical methods. The objective is to develop a better means of
presentation to ease the communication of financial statement information and
assist in its efficient processing. This work aims to offer empirical evidence in
14

each of the above areas to demonstrate the decision usefulness of both tt--
incremental information content of narrative disclosures and graphical
representation of financial statement data.
1.2 EMPIRICAL OVERVIEW
Empirical evidence suggests a lack of information content of annual report
disclosures, in terms of their impact on share prices, largely attributable to the
lack of timeliness associated with this form of accounting data. A strong body of
evidence, notably Beaver (1968) and Ball and Brown (1968), exists to support the
notion that the release of interim and annual earnings numbers is associated
with both increased trading volume and share price effects. Even so, their
findings suggest that the information content of the income number has
already been substantially reflected in share prices, to the extent of 85 to 90 per
cent, attributable to more timely media.
Firth (1981), using weekly data, found the annual report to have information
content on a par with that of the interim report. Chambers and Penman (1984)
found that the interim report had a greater price effect than the preliminary
announcement of earnings and dividend figures. McNichols and Manegold
(1983) provide empirical evidence to support the contention that 'the marginal
information content of an annual report is greater when it has not been
preceded by interim reports'. But conflicting evidence is provided by Foster,
Jenkins and Vickrey (1986) who found the annual report to contain no useful
incremental information for the valuation of shares.
15

These findings are directly at variance with the findings of user surveys of
shareholders, by Lee and Tweedie (1981) and of professional analysts, by Chang
and Most (1977). These demonstrate the perceived importance of the Chairman's
Statement, the Profit and Loss Account and the Balance Sheet in the decision-
making process.
However, the survey study of Chang, Most and Brain (1983) demonstrates a
remarkable congruence in the perceptions of analysts and investors across
three continents. The corporate annual report occupies a prominent position
among information sources, but the narrative sections (notably the President's
Letter and the Auditor's Report) are not highly regarded.
Shareholders perceptions of the importance of the Chairman's Statement are
therefore apparently not matched by those of the professional analyst.
Accounting research typically focuses on quantitative data and either ignores,
or at most gives only passing reference to, the incremental information that
might be contained in alternative disclosures.
But research has revealed that other forms of disclosure do have informational
content in that they provide signalling devices to investors of management's
intentions. Thus, Waymire (1984) reported security price effects in response to
management's forecast of earnings and Dielman and Oppenheimer (1984)
observed dividend announcements having an effect consistent with their
representing information regarding future earnings prospects. The timeliness,
as well as the content, of disclosures was found to be important too; Chambers
and Penman (1984) observed that 'early' and 'late' re/eases were consistent with
16

expectations of 'good' and 'bad' news respectively, generating positive and
negative security price effects.
It is possible that the information conveyed in the Chairman's Statement takes
on a greater significance when there is a paucity of competing information.
Zeghal (1984) hypothesises that since less information is available about small
firms than large firms, because they are less well-researched, then a higher
risk is associated with investment therein. This argument is in accord with the
empirical findings of Banz (1981), Reinganum (1981) and Dimson and Marsh
(1986) who report an inverse relationship between size of company and the
excess stock returns earned.
This work is concerned with the potential decision usefulness of other
accounting information, notably the content and form of presentation of annual
report disclosures. To date there is little evidence to attribute importance to the
content of the annual report, other than confirmatory support for the numbers
of the prior announcement. Such evidence as exists is conflicting and
unconvincing because of the associated empirical problems of timing and
disaggregation (eg: see Stober (1986) on footnotes relating to inventory
liquidations and Bailey (1982) with regard to audit reports).
Narrative disclosures in the annual report, in particular, have been much
neglected in the accounting research literature and this work attempts to
redress the balance by examining the potential decision usefulness to the users
of accounts of the content and presentation of such releases. The second focus is
on the presentation rather than the numerical content of quantitative
accounting statements, exploring the success of alternative formats, in the
communication of financial information and their relative decision usefulness.
. 17

Since more attention is paid to accounting numbers than to non-accounting
information, the opportunity exists, in theory, for management to convey an
alternative message in its discretionary narrative disclosures (Bowman (1984)).
If this information is neglected we run the risk of overlooking incremental
information with regard to management's attitude, confidence and expectations
about the future. This work explores the potential for missed opportunities by
focusing primarily on non-accounting information, using the Chairman's
Statement as representative of such discretionary disclosures.
Few studies have attempted to evaluate the incremental content of non-
accounting over and above accounting information in annual reports.
(Exceptions include Belkaoui and Cousineau (1977), Peel, Peel and Pope (1985),
Keasey and Watson (1986) and Courtis (1986)).
Most studies of narrative disclosures, among them Buzby (1974), Firth (1978) and
Moizer and Arnold (1984), are more concerned with information disclosure and
an analysis of the perceptions of importance of different items of information to
different user-groups. The focus here is more on what has been said and the
manner in which the information has been communicated.
Just as the majority of accounting research papers have been devoted to
quantitative, rather than qualitative aspects, so the focus in the past has tended
to be on content rather than presentation. Studies by such as Ehrenberg (1977),
Moriarity (1979), and Smith and Taffler (1984) have been devoted to
presentational format, but even so, of quantitative content only.
18

1.3 APPROACH AND METHODOLOGY
The Chairman's Statement was chosen as the representative narrative disclosure
since a number of studies, notably that of Lee and Tweedie (1975), have shown it
to be the section most read by private shareholders. Lee and Tweedie (1977 and
1981) and Adelberg (1979b) have shown that both sophisticated and
unsophisticated users have difficulty in reading and correctly comprehending
the contents of annual reports. As a consequence secondary narrative sources,
such as stockbrokers circulars and financial press reports may be preferred
information sources. It may be that such sources represent a loss of
information content compared to the original narrative disclosure and this
paper investigates whether the Chairman's Statement in its original form
represents a valid source of incremental information over and above the audited
financial statements in the annual report.
The empirical evidence regarding the information content of the Chairman's
Statement is in direct conflict with its perceived importance to readers. Chapter
2 examines the alternative objectives of corporate reporting, discussing users'
perceptions of the relative importance of different sections of the report. The
emphasis is placed firmly on the potential usefulness of the Chairman's
narrative in providing evidence of strategies, attitudes and pointers for future
performance.
The information science literature, notably Larcker and Lessig (1980),
Gallagher (1974) and Zmud (1980) provides a theoretical framework for the
analysis of the dimensionality of accounting information. A Multidimensional
Scaling (MDS) approach is adopted to map users' perceptions of the desirable
characteristics of accounting communication. Chapter 3 provides empirical
evidence to support the loading of accounting characteristics onto two basic
. 19

dimensions - namely content and presentation. The experimental design
examines the trade-off which user groups, of differing sophistication, are
prepared to tolerate when desirable qualities cannot be achieved
simultaneously. The different attitudes of alternative user-groups to enforced
compromise suggests an extension of this research area in the future to examine
trade-offs associated with particular decsion-making contexts.
Barriers to effective communication are associated with failure concerning
content which is too complex and means of presentation, which are either
inadequate or inappropriate to the target audience.
Each of these aspects is discussed with reference to the communication
literature. Li (1963) and Parker (1981) provide a framework for the
consideration of problems in both the preparation and interpretation of
accounting communications. In Chapter 4 inefficiencies of information
processing are addressed regarding statistical misconceptions and the adoption
of heuristics, following Slovic (1974) and Kahnemann and Tversky (1972).
Empirical evidence is provided which is supportive of the findings of Ashton
(1984) and Joyce and Biddle (1981), regarding the use of intuitive statistics in
information processing, and of the findings of Lichtenstein and Slovic (1971),
regarding uncertainty. This work highlights the errors in the decision-making
process associated with prior probabilities and the quantification of uncertainty
in accounting narratives.
20

The major thrust of this thesis concerns a number of empirical studies
involving the comparison of financial messages communicated through
narrative and quantitative means across a large sample of companies. The
concerns of prior probabilities and the interpretation of narrative are central
to the experimental results generated. Chapter 5 details the selection of sample
companies in order to provide a common base for studies related to readability,
cognizability, content analysis, failure prediction and pictorial representation.
A consistent approach is adopted in the selection of companies in failed and
non-failed groups, with each pair of companies matched on financial status,
size, industrial sector, and financial year-end. Pilot testing of the experimental
materials using student respondents, across the whole sample of companies,
allows judicious sub-sampling to take place in experimental designs which
optimise the discriminatory power of the tests when applied to more
sophisticated audiences.
Chapter 6 addresses issues of shared meaning and user expectations following
Haried (1973) and Houghton (1987), and considers alternative measures of
readability, and the implications of particular levels of readability of narrative
disclosures for predicting Company performance. Several studies have assessed
various readability techniques, Pashalian and Crissy (1950), Soper and Dolphin
(1964), Smith and Smith (1971), Still (1972), Adelberg (1979a), Parker (1982),
Lewis, Parker, Pound and Sutcliffe (1986) and Courtis (1986), among them.
Although several alternative measures have been used, few studies have paid
sufficient attention to the LIX and CLOZE procedures, potentially the most
appropriate to the accounting environment. This work explores the utility of
these procedures.
21

Most studies to date have been content to measure the readability of narrative
accounting disclosures in comparison to that of more traditional reading
materials. They have employed fixed readability indices (notably the FLESCH
and FOG formulae) which are based on word and sentence complexity, but whose
formulation is independent of the meaning of the message or the target
audience. This work highlights the use of techniques to measure the
cognizability of accounting narrative and demonstrates significant differences
in perceptions associated with the sophistication of the user.
Few studies (eg: Courtis (1986)) have attempted to relate the derived readability
scores to current financial performance, none to use such scores as a basis for
predicting performance. This work tests whether the readability of Chairman's
Statements of companies prior to failure is predictive of their financial status.
This direction of argument is extended in Chapter 7 by a consideration of the
message conveyed by the narrative as a whole. Evidence is presented which
compares the perceptions of respondents as to the financial performance of
groups of companies when provided with narrative and/or accounting
information. Of particular interest are those companies who convey conflicting
messages to users from their alternative information sources. The information
content of narrative disclosures is then explored by directing attention
specifically to the words and phrases employed and the future strategies
identified. Only Ingram and Frazier (1983), Bowman (1984) and Frazier, Ingram
and Tennyson (1984) have explored the significance of particular word
occurrences in narrative disclosures, mainly to examine potential economic
determinants. The present study tests whether the informational content of the
narrative disclosures of failed and surviving companies is predictive of their
future prospects.
22

Ogilvie (1966) and Oliver (1974) provide a theoretical framework on which to
base the construction of linear discriminant models to distinguish between
failed and non-failed companies on the bases of specific aspects of the content of
their narrative, notably, word patterns, thematic structure, initial messages and
management strategies conveyed.
The environmental predictability of models based on narrative content is
compared, in Chapter' 8, with those based on financial ratio combinations. The
relative power of the models is discussed together with an analysis of alternative
model and respondent misclassifications. Empirical evidence is presented which
examines the decision-making models of respondents when confronted with
incremental, potentially conflicting, information sources.
Chapter 9 commences by considering Financial Ratios as just one of the
alternative formats available for the representation of accounting information.
Various numerical alternatives are considered, referring to Ehrenberg (1977),
in order to establish formats which improve the effective communication of the
intended message, and provide an appropriate comparative base. An extensive
review of the psychological literature identifies the nature and testing of
alternative graphical forms of representation. Powerful evidence, Yin (1969),
Goldstein and Chance (1971) and Cuceloglu (1970), is provided to support the use
of a schematic human face in the representation of information. The work of
hard (1971) and Ekman (1973) provides a theoretical framework to allow the
matching of facial characteristics with financial variables on the basis of
perceived importance, while Chernoff (1973) and Bruckner (1978) have
provided the means of generating computer-constructed schematic faces.
Empirical evidence is presented in Chapter 10 which compares the ability of
, 23

respondents to make failed/non failed decisions on the basis of information
presented in the form of accounting statements, financial ratios and facial
profiles. Experiments have been designed to vary, the order of processing, to
evaluate learning and fatigue effects; the number of failed cases, to evaluate the
effect of prior probabilities; the assignment of financial variables to facial
features, to evaluate optimal assignment strategies, and the sophistication of the
user, to evaluate experiential and educational differences.
The work concludes with pointers for future research, most notably the testing
and development of the empirical models to evaluate their efficiency over time,
and an extension of the methodology employed to provide incremental
information, complementary to the quantitative financial type, in order to assist
performance appraisal and predictive ability of future status. A summary of the
findings of this work emphasises the decision usefulness of the procedures
adopted thus far, both in the analysis of narrative content to determine
predictors of future performance, and in the presentation of information to
facilitate a more efficient decision-making process.
Reference to the aforementioned literature allows the development of a number
of specific propositions for testing, and these are detailed in the following
section.
24

1.4 SPECIFIC PROPOSITIONS
Much of the literature already referenced originates in psychological and
information science journals; in most instances they identify sources and
methodologies which have received scant attention in the accounting literature.
Application of these arguments to the domain of financial information allows
the development of a number of specific propositions. These are formulated and
tested in each of the empirical areas of this thesis providing results which
represent substantially original findings.
The propositions are best grouped in terms of the schematic diagram in Figurc,
1.1 presented above and follow the continuity of argument of the complete work.,
1.4.1 FINANCIAL INFORMATION - INFORMATION PROCESSING
Chapters 4, 6 and 8 examine the interpretation of accounting narrative in
experimental settings. Two propositions are tested:
P1: Following on from the work of Bell (1984 a and b), Kahnemann and
Tversky (1972), Joyce and Biddle (1981), Ashton (1984) and Dupree (1985),
we would expect representative users to demonstrate an ignorance of
prior probabilities in an experimental setting, with a preference for
narrative rather than numerical information.
Such findings would have potentially serious implications for the
processing of narrative and quantitative disclosures, especially when the
two sources are conveying apparently conflicting messages. Chapters 4
and 8 examine these implications in an experimental setting.
25

P2: Following the work of Cohen, Dearnley and Hansel (1958) and
Lichtenstein and Newman (1967), we would expect representative users to
demonstrate significant differences in their perceptions of the
quantification of narrative uncertainties. We expect such differences to
be associated with educational and experiential differences and with the
contextual framework of the narrative.
Such findings would have implications for the manner in which
accounting narratives are processed and interpreted. The effect on the
resultant decisions may have economic consequences.
1.4.2 FINANCIAL INFORMATION - DIMENSIONALITY
An experiment is designed and conducted in Chapter 3 to examine and quantify
the extent of property trade-offs and test the following propositions:
P3: Following the work of Larcker and Lessig (1980) and Zmud (1978) we
would expect that user perception of the relative desirability of the
qualitative characteristics of accounting statements will be consistent
with a trade-off between two major dimensions, namely Content and
Presentation. If supported, this proposition would suggest that more
attention be paid to the manner in which accounting information is
structured and presented, as well as to its content and quality. Such
findings would be consistent with those of Bettman and Kakkar (1977), for
consumers, and Iselin (1989) for accounting statement users.
26

P4: Different user groups will have different perceptions of this compromise
dependent upon education and experiential differences and the
contextual framework of the decision task. Such findings would support
the argument for differential reporting, with disclosures destined for
different target audiences.
1.4.3 NARRATIVE STATEMENTS - PRESENTATION
Chapter 6 addresses the issues of readability and cognizability in accounting
narratives, using both accounting students and practitioners as experimental
subjects. The following propositions are tested:
P5: Following the work of Taylor (1953), Miller and Coleman (1967) and
Adelberg and Razek (1984), we would expect that the readability of
narrative statements, as measured by formulae based on word and
sentence complexity, is related to, but not identical with, user
understandability of the message. Reading ease will not necessarily
correspond with the successful communication of a message, such that
the receiver confers on it the same meaning as the sender. Accounting
communications thus deemed 'acceptable' in terms of reading formulae
may require further adjustment if they are to provide effective
communication.
P6: The length of the Chairman's Statement is a function of the size of the
enterprise.
P7: Following the work of Morton (1974) we would expect that the readability
of the Chairman's Statement is a function of the financial health of the
enterprise. If supported, this proposition would provide us with an
additional explanatory variable which might improve the predictive
power of existing performance based models.
27

P8: The readability and cognizability of the statements of failed companies
are significantly lower than those of surviving matched enterprises.
P9: The cognizability of narrative statements will differ significantly among
user groups, variances being associated with educational and experiential
differences. Such findings would support those of Adelberg and Farrelly
(1989) who evidence a serious communication problem in the
transferring of the subjective meaning of financial statement terms
between producers and users. The full significance of particular
narrative messages may, thus, only be apparent to sub-sections of users.
1.4.4 NARRATIVE
Chapter 7 examines the potential for the predictability of distress, or the
construction of a wider performance measure, based on narrative information
alone. Several propositions are tested which, if supported, would generate new
predictive models or provide additional explanatory variables to be used in
conjunction with financial variables:-
P10: Following the work of Osgood, Suci and Tannenbaum (1957), Belkaoui
(1978), Ingram and Frazier (1983) and Houghton (1987), we would expect,
a priori, that the narrative content of the Chairman's Statement provides
sufficient information to discriminate between failed and non-failed
enterprises. Such discrimination, based on word patterns, thematic
content and management strategies can form the basis of a model to
predict financial distress.
P11: The reporting of 'good news' and 'bad news' will coincide with
explanations attributable to 'superior management performance' and
'external factors beyond our control', respectively.
28

1.4.5 ACCOUNTING STATEMENTS - CONTENT
Chapter 8 examines the incremental effect of the availability of additional
financial information on the decisions made by groups of representative users.
Two propositions are tested:
P12: Following the work of Peel, Peel and Pope (1985) and Keasey and Watson
(1986) among others, we would expect that users can make improved
decisions, in a failure prediction context, when provided with both
narrative and financial statement data.
P13: Where alternative messages are conveyed by the narrative and financial
statements such conflict is consistent with attempts to lessen the impact
of 'bad news'. The incidence of such conflict might, therefore, be
evidence of poor future performance.
1.4.6 ACCOUNTING STATEMENTS - PRESENTATION
Chapters 9 and 10 examine the adoption of a facial means of representation in an
experimental setting. Its usefulness is addressed as both a screening device and
communication facilitator in management information systems, through the
testing of a number of propositions:
P14: Following the work of Chernoff (1973) and Moriarity (1979), Stock and
Watson (1984) and Smith and Taffler (1984), we would expect facial
profiles to provide an efficient means of representing financial
statement data, both in the depiction of overall performance and of
financial trends.
29

P15: In decision-making tasks facial profiles can be processed more quickly,
and with lower error rates than either accounting statements or
financial ratios conveying like information.
P16: Following the work of Chernoff and Rizvi (1975) we would expect that an
optimum allocation of financial variables to facial characteristics can be
achieved which minimises classification errors.
P17: The classificatory ability of respondents, when employing facial profiles,
is independent of their accounting sophistication.
These specific propositions in their entirety span the whole breadth of the
empirical content of the thesis. They embrace a number of original and
potentially important notions regarding the content and presentation of both
narrative and quantitative financial statements. The support of these
propositions will have potentially far-reaching implications for both the
analysis and communication of financial information which will significantly
aid the usefulness of corporate annual disclosures.
In preparation for the empirical studies of Chapters 5 to 10, Chapters 2 and 3 are
concerned with the nature and dimensionality of accounting information and
Chapter 4 with information processing strategies.
30

CHAPTER TWO
OBJECTIVES OF THE CORPORATE REPORT
In countries where the setting of accounting rules is the prerogative of
goverment legislative assemblies (e.g: France, Germany, Japan, Sweden) the
accounting profession is monitored to ensure its actions are in the public
interest and no conceptual framework projects have been undertaken.
Where standard setting is the responsibility of self-policing accounting
bodies (e.g: US, UK, Canada, Australia) with monopolistic control over some
areas of work, a process of 'accountability' is necessary to demonstrate that
the bodies are objective and consistent in their actions. Where accounting
standards are perceived as having the potential to change income
distribution and resource allocation - typically governmental roles - then
some form of legitimacy is sought in the form of a body of knowledge
demonstrating that accountability. In each of the latter four countries,
attempts have been made to develop a core body of accounting knowledge - a
conceptual framework - to provide a base against which standards and
procedures might be validated.
In the main, these research efforts have been commissioned in response to
mounting public and professional pressure with regard to the nature of
corporate reporting and deficiencies in the accounting standard setting
process. Peasnell (1982) with respect to the FASB conceptual framework
observes: 'it perceives a need to show that its heart and mind are in the right
place: to demonstrate that it is trying by logical means to develop accounting
standards based on principles of general appeal.' If accounting standards,
and the resulting disclosures, are to meet the varying and potentially
conflicting, needs of all user groups, then such standards should be adaptive
to the changing requirements of interested parties.
31

Stamp (1982) identifies three elements that he perceives to be essential
components of a conceptual framework:
1 General agreement on the overall objectives of
financial reporting;
2 General agreement as to the nature and needs of the
various groups of users of financial reports;
3 Identification of a set of criteria to be used in
choosing between alternative solutions to standard-
setting problems and in assessing the quality and utility
of financial reports.
These elements provide the basis for discussion in this Chapter, and might be
considered an aggregation of the eight areas identified, in the US by the
Financial Accounting Standards Board (FASB) (1980) within which formal
propositions might be developed:
1) objectives
ii) qualitative characteristics
Hi) . elements of financial statements
iv) criteria for accounting recognition
v) accounting measurement
vi) means of reporting
vii) reporting of income
viii) reporting of flows and liquidity
Of central concern in this study is the content of the report ( 0, ii) and iii)
above) and its means of presentation (vi). This section of the thesis is
concerned with the objectives of disclosure and the information
requirements of users. The qualitative characteristics viewed essential for
32

the fulfilment of these objectives and the achievement of user requirements,
are considered in Chapter 3.
In the US the AICPA, Trueblood Committee (1973) have specified the basic
objective of financial statements as being "to provide information useful for
making economic decisions." They recognise that the achievement of such
an objective cannot rely solely on quantitative accounting data and
recommend the additional use of narrative disclosures for descriptive and
explanatory purposes. They see such statements as serving primarily the
needs of those users from whom the financial report offers the major,
perhaps only, sources of relevant information, and accordingly suggest
three principal sub-objectives:-
i ) "to provide information useful to investors and creditors for
predicting, comparing and evaluating potential cash flows to them in
terms of amount, timing and related uncertainty."
ii) "to supply information useful in judging management's ability
to utilise enterprise resources effectively in achieving the
primary enterprise goal."
iii) "to provide factual and interpretive information about transactions
and other events which is useful for predicting, comparing and
evaluating enterprise earning power. Basic underlying assumptions
with respect to matters subject to interpretation, evaluation, prediction
or estimation should be disclosed."
The underlying recommendation is, therefore, that the shareholder and
other interested parties should be provided with sufficient information to be
able to assess the company's performance and to estimate the likely risk of
their future involvement. In the UK the ICAEW Corporate Report (1975)
reiterates the fundamental objective as "to communicate economic
33

measurements of and information about the resources and performance of
the reporting entity useful to those having reasonable rights to such
information." The content is much the same as that of the Trueblood
Committee but the emphasis has shifted away from mere 'provision' towards
'communication'.
More recently the Australian Accounting Research Foundation (AARF) (1987)
proposed that 'general purpose financial reporting shall provide
information useful to users for making and evaluating decisions on the
allocation of scarce resources.' They identified three categories of user,
deemed 'primary users' of general purpose financial reports.
a) Resource Providers - including employees, lenders, creditors,
suppliers, investors and contributors.
b) Recipients of Goods and Services - including customers,
beneficiaries, ratepayers, taxpayers and members of professional
associations.
c) Parties performing a review or oversight function - including
government and regulatory agencies, analysts, labour unions,
employer groups, media and special interest community groups.
They proposed that the common information needs of these groups should
dictate the nature of the information to be disclosed, but this may imply a
lack of awareness of the potential usefulness of some undisclosed items to the
decision-making process.
Firth (1979) criticises the woeful level of information reporting,
ft ... disclosure levels are very low and there is a big demand by some users of
accounts for greater amounts of information to be released in annual
reports." However, it is difficult not to be of the opinion that some user
34

groups will always demand more information, however much is disclosed,
even when full and efficient use is not being made of that information
already provided.
The arguments favouring expanded data disclosure tend to overlook economic
consequences: the increased costs of data collection and communication, and
the cost of less effective decision making. Lee (1976) recognises that
communication may already have been reduced by the extension of
disclosure, through successive companies acts and professional body
requirements, such that the increased complexity of technical documents has
exceeded the information limitations of users. Revsine (1970) emphasises the
complexity and multidimensionality of the information contained in
financial reports, necessitating the simultaneous analysis of many variables
in order to establish future expectations and a user who is capable of the
complex differentiation and integration of data. He considers expanded
reports to be dimensionally richer only if new data increases their
complexity by providing information regarding previously ignored elements
of the financial environment.
It is well established that there is an upper limit to the amount of information
that the human observer can process. Bieri (1970), in an experiment
utilising musical tones, identifies between 5 and 9 aural stimuli as being the
maximum number that can successfully be discriminated. If information
overload can be shown to exist in the accounting environment and that data
expansion might lower users' conceptual levels and reduce the effectiveness
of decisions, then the implicaions for broadening the scope of existing
reports are serious.
35

Schroder, Driver and Streufert (1967) note the importance of the task
environment and user skill levels in the incidence of information overload,
and demonstrate empirically that increases in the information processor's
environment beyond an optimal point results in a lowering of the processor's
ability to make judgements. Such findings question the advisability of the
expansion of existing financial reports. Schroder (1970) notes that "... the
flexibility of integration involved in information processing will increase as
the environment becomes richer (presents more diverse information) until
an optimal level of functioning is reached. If the complexity of the
environment is increased beyond this point, the level of integration involved
in performance begins to decrease." This model suggest that at first
increases in information evoke increases in the complexity of the
information processing from concrete to abstract, with more stimuli being
detected. But when the cognitive structure becomes overtaxed by the number
of stimuli it must combine, resources previously committed to the perception
of stimuli are now deployed in their integration, so that new stimuli are less
well perceived.
Evidence in support of the implications of information overload, rare in the
financial environment, is provided by Casey (1980), Jacoby (1977) and
Jacoby, Speller and Kohn (1974), but it is reasonable to expect firms to extend
their voluntary disclosures while they feel such disclosures to be of benefit
to the company.
More attention needs to be devoted to the content and presentation of these
disclosures if the additional content is to be communicated effectively, and its
usefulness reflected in a decision-making context.
> 36
2. 1 VOLUNTARY DISCLOSURES
Minimum levels of corporate disclosure are determined by the provisions of
the Companies Acts, by Stock Exchange listing requirements and by the
pressures exerted by the professional accounting bodies. Historically, this
level of disclosure is designed to protect investors and creditors (fulfilling a
stewardship role), but is not necessarily sufficient to ensure the
communication of a true and fair view (and the fulfilment of a decision-
usefulness objective).
There is no legal requirement in the UK for the Chairman to report
separately from his directors. Nevertheless it is now rare among publicly
quoted companies for the Chairman not to take this opportunity of
communicating with shareholders, when it is clear that the Chairman's
Statement is the most widely read portion of the report.
The motives for voluntary disclosure are rooted firmly in agency theory with
disclosure agreements in an unregulated environment designed to reduce
agency costs. The interests of the manager (AGENT) may not coincide with
those of shareholders or bondholders (PRINCIPALS) so that the incentive
exists for the agent to act in a self-interested manner to the detriment of
shareholders. Disclosure practices will vary between firms, and within firms
over time, in accord with the degree of bonding perceived necessary to
control the worst of managerial excesses. Thus Chow (1982) reports on the
provision of voluntary audit reports, Watts (1977) on external financial
reporting and Leftwich, Watts and Zimmerman (1981) on the provision of
interim reports, their frequency and frequency-switches.
The nature of voluntary disclosures is likely to be company specific. Anton
(1954) found the provision of voluntary funds statements to be positively
37

correlated with size. Salamon and Dhaliwal (1980) found a similar size
relation in the disclosure of segmented sales data.
Ruland (1979) and Waymire (1985) separately reported findings of greater
stability of earnings in instances where earnings forecasts were provided
voluntarily.
On the downside, voluntary disclosure (eg: of earnings forecasts) may turn
out to be overly optimistic or may be used to their own advantage by
competitors (eg: research and development expenditure, or advertising
budgets). The disclosure of short-term objectives may also unduly constrain
management to ensure that they are satisfied, while consequently sacrificing
longer-term objectives of greater benefit to the organisation.
On the other hand, voluntary disclosures provide an opportunity for creating
a beneficial public perception of a company and its shares through, at best,
biased or, at worst, misleading reports.
Signalling theory suggests that firms will provide financial statements as a
guarantee of the high quality of their securities. However, Gonedes (1978)
identifies the opportunities for dishonest suppliers of financial statements to
report in circumstances in which users are unable to distinguish between
honest and dishonest financial reports.
Both Chambers and Penman (1984) and Kross and Schroeder (1984) report
that 'good news' and 'bad news' releases are not symmetrically distributed
around announcement dates. Firms with 'good news' are more likely to
announce it earlier than the expected reporting date, while those with 'bad
news' are more likely to announce it after the expected reporting date.
38

Similar findings are associated with the timing of announcements within the
day. Pate11 and Wolfson (1982) found only 10.7% of earnings increases to be
released after trading, while 34.6% of earnings decreases were released after
trading hours.
Although there are incentives to provide voluntary disclosures, incentives
exist for the suppression of 'bad news' information. Risk averse individuals
will wish to buy time in order to hedge themselves against the impact of the
information and potential losses.
Voluntary disclosures increase the opportunities for conveying misleading
financial messages. But Foster (1986:32) identifies four mechanisms which
exist to reduce the likelihood of misrepresentations in financial statements:
i) the reputation of the firm: any short-term gain from financial
misrepresentation may subsequently damage the credibility of the
company and prove costly in the long-term. Firms might be prompted
into making further voluntary disclosures in order to correct the
misleading, and potentially damaging, allegations of external analysts;
ii) the reputation of the management: individual managers have a vested
interest in maintaining their credibility since misrepresentations may
irreparably damage their career paths;
iii) third-party certification: monitoring by external auditors, non-
executive directors, investment bankers and underwriters should
reduce the opportunities for misrepresentation;
iv) legal penalties: the fraudulent provision of false or misleading
financial representations may result in corporate financial loss
and personal loss of freedom.
39

Where information (eg: earnings forecasts, future outlook, management
strategies) is not disclosed elsewhere in the annual report, the Chairman's
statement performs a vital function in satisfying the user-needs of report
readers.
2.2 THE INFORMATION NEEDS OF USERS
Just as different people require different information for different purposes,
it is reasonable to expect that they will have different perceptions of
usefulness of individual items.
For the purposes of determining the usefulness of the annual report, the
definition of immediate share-market reaction is too simplistic. Hines (1982)
suggests three major reasons why immediate market responses might not be
generated:
i ) the interpretation of annual report disclosures may take place over a
period of time, generating longer time price reactions, overlooked by
research studies. This suggestion is consistent with timeliness being
assigned a lesser role than the interpretability of information.
i i ) the nature of the new information contained in the annual report will
not be so critical as to overcome the transactions cost deterrent and
cause immediate substantial trading.
iii) much of the annual report disclosures (eg: auditors report) will be
confirmatory in nature, fulfilling a validatory role without
engendering changed decisions. The findings of Firth (1978) and Ball,
Walker and Whittred (1979) are consistent with the auditors report
providing confirmatory information validating the message
communicated in the prior earnings announcement.
40

Ball, Brown and Finn (1977) corrected a common misconception with regard
to market efficiency in that security prices are based only on expectations o f
future returns and while new information is reflected in price in an
unbiased manner, superior fundamental analysis can yield abnormal
returns. This perception was reinforced by the survey results of US
financial analysts by Mayer-Sommer (1979), finding that over 86% of them
rejected the proposition that fundamental analysis of public domain
information cannot yield abnormal returns.
The apparent usefulness of the annual report is doubly damned by the
Efficient Markets Hypothesis in that i) it comprises information already in
the public domain and ii) its content is largely pre-empted by the
preliminary announcement of earnings.
However, these suggestions are in conflict with the findings of various
shareholder surveys, which show annual reports to rank prominently, along
with press and stockbroker sources, as decision-useful information media:
PERCENTAGE OF SHAREHOLDERS VIEWING SOURCE AS VERY/MOST IMPORTANTFOR INVESTMENT DECISION-MAKING
BAKER &HASLEM(1973):US
CHANG &MOST(1977):US
CHENHALL& JUCHAU(1977):AUS
ANDERSON
(1979):AUS
Stockbrokers 46.8 . 33.3 27.5 46.4Annual Reports 7.9 46.8 30.0 38.6Newspapers/
Magazines 14.8 38.0 16.6 38.1Advisory Services 15.6 32.1 7.6 10.7Advice of Friends 9.7 13.1 3.2 6.9Company Visits 6.9Bank Manager 4.2Government.
Publications 4.1Tips & Rumours 5.2 7.8 15.1 2.5Proxy Statements 16.6
TABLE 2.2.1 SHAREHOLDER SURVEYS OF SOURCE RANKINGS FOR,DECISION USEFULNESS
(Source: RD Hines (1982) * - Not reported separately)
41

A similar perception emerges in surveys of investors, with the annual reporthighly regarded as an information source for investment purposes:
IndividualInvestors
InstitutionalInvestors
FinancialAnalysts
US UK NZ US UK NZ US UK NZ
,Corporate annual reports 1 3 3 1 1 2 1 2 1Corporate interim reports - - - - - 4 4 2Stockbroker's advice 4 2 2 4 2 1 - - -Advisory services 3 5 5 2 5 3 5 8 8Newspapers and Magazines 2 1 1 3 4 5 8 5 7Proxy statements 5 4 4 5 3 4 7 7 6Corporate press releases 6 6 4Prospectuses 2 3 5Communications withmanagement 3 1 3Advice of Friends 6 6 6 6 6 6Tips and rumours 7 7 7 7 7 7
TABLE 2.2.2 RANKING OF INFORMATION SOURCES FORINVESTMENT DECISIONS
(Source: Chang, Most and Brain (1983))
A similar view emerges with the examination of the corporate report to
determine those sections which are i) the most widely read and ii) considered
the most decision useful. Although the results of individual surveys may be
subject to bias in various forms, the results of many such shareholder
surveys (Lee and Tweedie (1975); Wilton and Tabb (1978); Winfield (1978);
Anderson (1979)) are remarkably consistent. The Chairman's Statement is
the most read section of the report, with almost all respondents indicating at
least a casual study, and over half a thorough reading.
,. 42

Table 2.2.3 illustrates the consistency of findings.
PERCENTAGE OF RESPONDENTS INDICATING THOROUGH READING
I FE & 'TWEEDIE WILTON & TABB ANDERSON(1975) (UK) (1978) (NZ) (1979) (AUS)
Chairman's Report 51.6 51.0 52.8Profit & Loss Statement 46.5 48.5 48.8Directors' Report 35.0 37.0 40.1Balance Sheet 34.0 40.6 36.0Statistical summary 26.5 29.7 33.0Funds statement * * 24.6Notes to Accounts 29.4 22.4 21.6Auditor's Report 17.4 11.5 17.0Statement of AccountingPolicies * * 14.5
TABLE 2.2.3: SHAREHOLDER SURVEYS OF ANNUAL REPORTREADERSHIP
(Adapted from RD Hines (1982) * - Items not reported)
A similar consistency results in the findings of surveys of section
preference, with the profit and loss account consistently ranked by
shareholders as the most important part of the report for decision making
purposes. Table 2.2.4 demonstrates the variations in rankings.
RANKING OF ANNUAL REPORT SECTIONS FORPERCEIVED IMPORTANCE IN DECISION-MAKING
LEE & TWEEDIE(1975) (UK)
WILTON & TABB ANDERSON(1978) (NZ) (1979) (AUS)
Profit & Loss Statement 1 1 1Balance Sheet 3 2 2Chairman's Statement 2 3 3Statistical Summary * 6 4Directors Report * 4 5Funds Statement * * 6Notes to Accounts * 5 7Auditor's Report * 7 8Statement of Accounting
Policies * * 9
TABLE 2.2.4: 5HAREHOLDER SURVEYS OF DECISION USEFULNESS
(Source: RD Hines (1982) * Items not reported)
43

More variation is apparent in the results of the Chang, Most and Brain (1983)
survey of individual and institutional investors and financial analysts. Non-
response bias is a potential problem here, with a UK response rate of only
21.3%, and the results are subject to the usual survey-based deficiency of
cost-free provision of information in a hypothetical study. Nevertheless, the
income statement and the balance sheet are, respectively, consistently the
most highly ranked items.
INDIVIDUAL INSTITUTIONALINVESTORS INVESTORS
FINANCIALANALYSTS
US UK NZ US UK NZ US UK NZ
Balance Sheet 3 3 3 2 1.5 3 2 2 2Income Statement 1 2 2 1 1.5 1 1 1 1Statement of changes in
financial position 4 4 4 3 3 2 3 3 5Summary of operations:
5-10 years 2 1 1 5 8 4 6 93Management's discussionof operations 6 5 5 9 6 5 8 5 4Sales and income by
product line 5 6 6 7 7 6 4.5 4 7President's letter 10 7 7 10 9 7 10 8 6Auditor's report 9 9 10 8 10 10 9 10 10Accounting policies 8 8 8 6 4 8 4.5 6 9other footnotes 7 10 9 4 5 9 7 7 8
TABLE 2.2.5: RANKING OF ANNUAL REPORT ITEMS FORUSEFULNESS IN INVESTMENT DECISIONS
(Source: Chang, Most and Brain (1983))
Differences in the perceptions of shareholders and investors are to be
expected. There will be no unanimous agreement on the ranking of
disclosures for importance because different user-groups will each have a
diverse focus of interest. Nevertheless, Spearman's Coefficient of Rank
Correlation reveals measures in excess of 0.9 within and between user groups
in all cases.
44

Despite any reservations regarding the reliability of survey findings,
empirical evidence consistently suggests that i) the corporate report is
perceived as an important information source . for decision-making, and that
ii) financial and narrative disclosures are regarded as useful.
However, the disclosure of financial information is set against the context of
the almost total absence of detailed knowledge of the needs of users of
financial statements. Lee and Tweedie's (1977) study found that information
relating to profitability, future prospects and dividends were the most sought
after items, and Chambers (1979) views evidence of this nature as sufficient
to ignore further the users of information. He argues for a generalised
report since accountants cannot estimate the degree of relevance of
particular items of information to specific user groups: "... any party
interested in the financial affairs of an enterprise is interested in its
solvency, debt-dependence, its asset composition and its rate of return."
However, the distinction between the provision and communication of
accounting information is succinctly recognised by Craswell (1969): "... the
ability of accounting reports to communicate will depend, to a large extent,
upon the identification of the users of reports and the types of decisions
these users are likely to make. It is not only imperative that users of
accounting reports be identified but they must also be specified so as to avoid
unintended use."
45

Stamp (1980) considers user needs to be determined by studying users'
decision models and reports a list of thirteen such needs, though without
making reference to the research on users' decision processes. He
recognises the difficulty of the task, associated with the diversity of users,
their decision-making models and the degrees of rationality with which
these models are employed.
The Corporate Report (1975) casts doubt on the ability of general purpose
reports to satisfy the needs of all user groups since if financial statements
are to satisfy the information nededs of all those with a reasonable right to
information, then a single entity would be required which simultaneously
satisfied shareholders, creditors, employees, customers, competitors, analysts,
advisers, government and the public. The Corporate Report identifies
fourteen ways in which financial statements can contribute to user
information needs, by providing data in three important areas: i)
organisational performance; ii) organisational background and iii)
indicators of likely future performance.
The authors of the Corporate Report consider profit and loss accounts,
balance sheets and statements of sources and application of funds alone as
insufficient to meet the total needs of users. When it was published, this
aspect of the Corporate Report caused great controversy within both business
and the accounting profession, so much so that its findings have been
largely ignored in the setting of subsequent standards.
46

The objectives of corporate reporting and the needs of information users can
only be satisfied by employing appropriate means of transmission. The
Corporate Report (1975) notes that "... an important aspect of communication
is that the means of transmission and the form and presentation of the
information transmitted must be selected as being relevant to the receiver.
In particular the information transmitted must be understandable." The
implications are the provision of financial measurements and explanatory
statements avoiding technical jargon but paying ,appropriate attention to
design and layout in order to achieve clarity and visual impact.
An understanding of the varied impact of alternative transmission means on
different individuals is essential if the nature of accounting disclosures is to
be appropriate to the communication methods used. Bedford (1973) identifies
two determinants of the effectiveness of accounting disclosures - the means
of transmission employed and the comprehension capacity of receivers
where the interpretation of disclosures may be influenced both by the means
of transmission and the terminology used, and where comprehension
capacity is influenced by the needs of the recipient and the noise in the
reception process. Within the transmission process Smith and Smith (1971)
identify three essential elements of communication: i) Communication only
takes place when the receiver of the information assigns the same meaning
to it as intended by the preparer; ii) effective communication when the
information is useful to the receiver, and iii) influential communication
when the receiver responds as intended by the preparer of the accounts. In
this respect Craswell (1969) provides a useful differentiation between
information and data; "effective communication can only be appreciated
when it contains useful information rather than merely data; information
relevant to one particular decision may be irrelevant data for another
decision."
47

The work of Bedford (1973), Hammill (1979), Hilton (1978), Stevens (1977/78),
and Ehrenberg (1977) establishes a useful consensus for improvements in
the presentation and effective communication of financial inforation.
Effective reporting requires firstly the technical ability to assemble the
appropriate information, and secondly the ability to identify and
communicate that information to users. The report should attract the
attention of the user by making a clear visual impact and by creating a clear
set of objectives to be achieved. It should relate information relevant to the
needs of the user, disclosing significant relationships without resorting to
the use of complex technical jargon. The report should maintain the interest
of the user by emphasising a few basic points and maintaining a common
theme throughout. Wherever possible the information should be
personalised and relate to the environment. A uniform practice should be
adopted with respect to quantitative information, using averages to reduce
the number and size of figures. Finally, the report should stimulate action on
the part of the user which may or may not be that intended by the preparers
of the accounts. If the report produced is to be both readable and
unambiguous then uniform accounting standards and practices are essential.
Without these any communication taking place would not be effective
communication. As Chambers (1964) notes, "... accounting statements are
exercises in communication, whose objective is to transfer information from
one group of people to another. Totally effective communication would be
achieved only if the language system in use gave to those who received
signals exactly the same information as would direct perception of the objects
which the signals represent."
The evidence of Lee and Tweedie (1977) suggests that the existing corporate
report is not fulfilling its communication objectives: "... the chairman's
report was the most widely read section of the corporate financial report,
with 52% of the respondents reading it thoroughly, 39% paid the same degree
. 48

of attention to the profit and loss account but the other sections of the report
(including the auditor's report) typically were poorly used, most being read
only briefly for interest." The findings establish the importance of
narrative disclosures, but even so no section of the corporate report was as
widely read as the financial press reports.
Lee and Tweedie recognise that "... reporting accountants are failing to
communicate adequately with a very large number of individuals, and that
existing financial reports have become documents which are prepared by
"accountants for accountants" and suggesting a four-pronged attack:
i ) simplification of existing financial statements
ii) accurate definition of the accounting terminology employed
iii) the provision of explanations and comments on reported results
iv) the continuing search for alternative systems of reporting which are
more meaningful to the unsophisticated user.
This final point seems to cast doubt on whether simplified financial
statements are really the answer after all, and Lee and Tweedie express
concern at the apparent lack of interest in financial reporting exhibited by
shareholders, since were this to be confirmed "... neither user education nor
report simplification will increase the number of readers and the
understanding of financial statements." Bedford (1973) sees the provision of
redundant information as a possible means of increasing the success of
simplified statements. Repeated disclosure should reduce or eliminate the
noise associated with accounting statements, aiding comprehension and
reducing confusion. He suggests four alternative ways of introducing
redundancy into reports:
49

i) through the addition of a 'highlights' or 'summary' section
ii) through pictorial and graphical supplements
iii) by the use of frequent summaries
i v) through verbal reports and comments on the content of quantitative
disclosures.
Lothian (1976) notes that "... redundancy guards against misinterpretation"
and Lee and Tweedie support the idea as a means of achieving their
communication objectives by "... reinforcement and guarantee."
Hammill (1979) on the other hand, is more sceptical, considering the use of
redundant information as an invalid technique which contributes to
information overload - though he includes no empirical evidence to
substantiate such a contention.
The inability of the corporate report either to attract or maintain the interest
of the majority of its potential users highlights the problems faced by the
preparers of accounts in attempting to communicate financial information to
unsophisticated users. The situation is made even worse by the inability of
all but the most sophisticated of users to comprehend the content of financial
statements. Clearly a revised approach is required to communication
through the financial report in order for its decision-usefulness to be fully
exploited.
50

CHAPTER THREE
THE OUALITATIVE CHARACTERISTICS OF FINANCIAL INFORMATION
A number of studies have addressed the criteria for the evaluation of the
usefulness of accounting information. These include, in the US (AICPA (1962
and 1973), AAA (1966) and FASB (1980)) in the UK (ASSC (1975)) in Australia
(AARF (1972) and (1987)) and in Canada (CICA (1980)). Details of the
characteristics deemed desirable in each of these research studies are
provided in Appendix 3.
Notable among these studies are those that raised the ire of the accounting
profession by calling for disclosure deemed 'inappropriate' - Sprouse and
Moonitz (1962), whose study for the AICPA, sought stable measuring units
and the Corporate Report (1975), for the ASSC of the ICAEW, by
recommending the provision of earnings forecasts. Of the more successful
early studies, the Trueblood Report (1973) for the AICPA formed the basis of
the FASB (1980) documentation. The most recent developments across four
countries (UK, US, Australia and Canada) are worthy of more detailed
consideration in order to demonstrate significant similarities and
differences.
3.1 THE CORPORATE REPORT (1975)
This report of the Accounting Standards Steering Committee of the ICAEW
identifies seven qualitative characteristics viewed as desirable for the
fulfilment of their fundamental objective:
i ) relevance
ii) understandability
iii) reliability
iv) completeness
v) objectivity
vi) comparability
vii) timeliness
That these characteristics are desirable is not in doubt, rather the problem is
that they are not simultaneously achievable (and may, in any case, be
ambiguous in meaning). Their very nature makes a conflict of objectives
inevitable.
51

According to The Corporate Report disclosed financial statement information
should be relevant in that it satisfies users' information needs and is
appropriate to their decision-making requirements. In practice the
information conveyed tends to be directed towards a standardised decision-
making model associated with the rational, utility-maximising, consistent
user. Thus while some sophisticated users are provided with insufficient
relevant information, others receive information irrelevant to their
decision-making needs. Craswell (1969) and Lee (1976) argue for multiple
specialist reports, in addition to a simpler generalised report, as a potential
solution, though this will necessarily increase complexity and reduce
understandability.
The reverse argument emphasises understandability achieved through
improvements in readability and comprehension by simplifying both
content and format and improving presentation. Several authors take this
approach in the search for improved understanding (eg: Adelberg (1979a),
Lothian (1978), Hammill (1979), Lee and Tweedie (1977), Ehrenberg (1977),
Moriarity (1979) and Smith and Taffler (1984)). Inevitably such a line might
reduce the quality and extent of information provided and, in addition,
reduce comparability.
The credibility of financial information is vital to users and confidence in
accuracy and reliability of accounting statement information is of
paramount importance. If this credibility is to be backed by audit, and the
provision of statistical measures of probability, then both relevance and
timeliness may need to be sacrificed because of the increased lag before
publication (McDonald et al (1975)). Such improvements will also increase
complexity and reduce the understandability of the accounts for all but the
most sophisticated of users (Wright (1980)).
Attempts to provide more information, in search of completeness, are likely
further to increase complexity. Jensen (1976) expresses doubt about the
reliability of some of the aggregation methods involved in providing a
rounded picture, while Chambers (1979) identifies a potential conflict with
objectivity, through the provision of partial or mis-information where
subjective judgements are made regarding items for inclusion.
Bedford (1973) argues for greater standardisation in the provision ' of
information to improve objectivity, while Adelberg (1979a) provides
empirical evidence supporting the existence of reporting which is
, 52

management rather than user-orientated. Both Morton (1974) and Salamon
and Smith (1979) provide evidence for potential manipulation of the
financial messages conveyed. Once again, less ambiguity is likely to mean
more complexity and greater potential for confusion. Parker (1981) argues
that 'standardisation does not really help the lay investor, since it is not a
substitute for clarity or effective communication'. Similar arguments apply
for improvements in comparability through standardised accounting
concepts and measurement methods, with similar consequences.
Several authors (notably Gilling (1977), Courtis (1976), Dyer and McHugh
(1975) and Whittred (1980)) provide compelling evidence for the
improvement of timeliness in the provision of disclosures in order to ensure
relevance, though prompt reporting might reduce both the reliability and
completeness of disclosures.
The Corporate Report provides no indication of perceived importance of the
desirable attributes. Importantly, recognition is evident that all may not
necessarily be capable of simultaneous achievement.
Clearly some compromise position is necessary in order to satisfy this
inevitable conflict in objectives. The desirable compromise position, and the
permitted trade-off between properties, will likely depend on both the user-
group and the decision-making context.
3.2 FASB - STATEMENT OF FINANCIA ACCOUNTING CONCEPT 2 (1980)
The FASB (1980) concept statement offers an alternative approach, providing
a hierarchy of accounting qualities which recognises both potential conflict
and relative decision usefulness. The statement makes a clear distinction
between those qualities viewed as user-specific and those inherent in the
information. Table 3.2.1 provides a graphic illustration of the perceived
relationships:
53

2 Reliability
Timeliness
1 Relevance
Predictive/Feedback Value
Representational Faithfulness (Validity)
Verifiability
Neutrality
Consistency
3 Comparabilit
Usefulness
TABLE 3.2.1: INFORMATION SPECIFIC OUALITIES OF INFORMATION
Relevance, reliability and comparability are viewed as the key attributes,
with other characteristics viewed as sub-attributes contributing to the
fulfilment of the key properties. A 'materiality threshold' is suggested such
that the benefits provided by the disclosure of information should exceed its
cost.
FASB admits that there may be a trade-off between relevance and reliability:
'Though, ideally the choice of an accounting alternative should produce
information that is both more reliable and more relevant, it may be
necessary to sacrifice some of one quality for a gain in another.'
Understandability is viewed as a user-specific property, desirable, but one
whose importance is played down: 'The understandability of the information
is related to both the characteristics of the information and of the
information-user making it difficult to evaluate without reference to a
particular set of decision makers.'
Given that information can only be useful if it can be understood, even
though it may be reliable and relevant to the decision-making context, this
lack of emphasis may not be wholly appropriate.
3.3 AUSTRALIAN ACCOUNTING RESEARCH FOUNDATION (1987)
The AARF (1987) takes a similar line but makes a different distinction,
between
i ) selection of information
i i ) presentation of information
54

In i) above, two primary characteristics, relevance and reliability are
identified. The statement recognises that the one may need to be balanced
against the other, but makes no ranking decision between the two. Again
the concept of materiality is employed to gauge the importance of any
omission or misstatement, and again timeliness and cost-benefit are viewed
as constraints on the achievement of relevance and reliability.
In ii) comparability (embracing both consistency and uniformity) and
understandability are identified as desirable presentational properties. But
the statement recognises that complex transactions may be incapable of
simple reporting without the sacrifice of relevance and/or reliability.
Understandability is, therefore, clearly considered subservient to the
'primary' characteristics.
3.4 CANADIAN INSTITUTE OF CHARTERED ACCOUNTANTS (198Q)
The Accounting Standards Committee of the Canadian Institute produced a
much more voluminous set of desirable characteristics, ranking 20 criteria
in accordance with the perceived preferences of its nineteen members:
1 Relevance
2 Clarity
3 Substance over Form
4 Timeliness
5 Comparability
6 Materiality
7 Freedom from Bias
8 Objectivity
9 Rationality
10 Full disclosure (Completeness)
11 Consistency
12 Isomorphism
13 Verifiability
14 Cost/Benefit effectiveness
15 Non-arbitrariness
16 Data availability
17 Flexibility
18 Uniformity
19 Precision
20 Conservatism
55

The list of attributes is deliberately long to avoid any omissions, even though
this introduces obvious overlaps, notably: verifiability/data availability,
rationality/non-arbitrariness, relevance/comparability and
objectivity/verifiability/precision.
Of particular interest is the wide agreement on the criteria at the extreme
ends of the distribution. All members of the committee viewed 'relevance' as
the most important single criterion, and 'conservatism' was almost uniformly
viewed to be the least desirable. These findings are consistent with the AARF
pronouncements in that while 'relevance' assumes adherence to a 'substance
over form' reporting of transactions, and 'reliability' assumes the adoption of
'prudence' in dealing with uncertainties in the measurement process, such
assumptions are at odds with a 'conservatism' principle which would lead to
deliberate bias and the consistent understatement of assets.
An analysis of the standard deviations of the rankings is revealing and
illustrative of the dangers of this kind of analysis. The term 'isomorphism'
recorded a ranking variability far in excess of any other attribute possibly
indicating differences in the perceived meaning, as well as the perceived
importance, of the attribute.
Stamp (1981) recognises this as a key area of difficulty for accountants:
'Although accounting deals with figures, many of its most important
problems arise because of accountants' uncertainty about the
meaning of the words they use. ... we shall never attain the empyrean
where everyone is at all times agreed on precisely what is meant by
the criteria being applied but this is no reason why we should
continue to ignore semantics.'
Stamp (1982), operating within a Canadian context, emphasises that not only
is 'understandability' user-specific, but so is 'relevance', since any
judgement of relevance must be made relative to user needs and the decision-
making context. He identifies several pairs of criteria that might be
perceived to be in conflict, so much so that a trade-off is necessitated in their
fulfilment:
56

1 Relevance Objectivity
2 Comparability Verifiability
3 Timeliness Precision
4 Clarity Completeness
5 Conservatism Freedom from Bias
6 Uniformity Flexibility
7 Materiality Precision
However, he makes no attempt to quantify the nature and extent of such
trade-offs, preferring to develop absolute weighting scores for each of the
criteria. He identifies several areas of difficulty associated with such an
approach:
i) there are no generally accepted definitions of the criteria
employed and semantic differences may influence user
preferences;
ii) the criteria employed are neither mutually exclusive nor
collectively exhaustive. Their meanings clearly overlap and it is
possible that all desirable aspects have not been completely
covered;
iii) it may be unrealistic to expect a consistent assignment of
numerical weightings to qualitative criteria, so the ranking
system generated may rest on shaky foundations. Such
assignments are investigated empirically in Chapter 4.
This final point is particularly problematical, since any absolute weighting
assigned to a particular attribute is likely to be decision specific. In such
circumstances it may be more appropriate to evaluate relative weightings by
examing the trade-off between conflicting characteristics.
An empirical evaluation of this trade-off is examined in section 3.5, using the
seven criteria of the Corporate Report as representative. Despite the
improvements likely in a relative-weighting approach, some reservations
must still remain regarding the decision specificity of the attributes.
Of even greater consequence is the weighting attributed to the qualitative
characteristics, in toto, by the standard setting bodies. At best they seem to
be regarded as peripheral, with their conflict with accounting standards,
and the standard setting procedure, (Hines (1989)), remaining unaddressed.
57

3.5 THE DIMENSIONALITY OF FINANCIAL INFORMATION
The concept of 'usefulness' of information is not one which is confined
solely to accounting information.
The empirical findings of information scientists can be generalized to the
accounting information environment. Swanson (1974) developed a 16 item
instrument to measure the relative value of management information
systems to users. Eight of these related to an evaluation of information and
were seen as components of perceived usefulness:
i) timely/untimely ii) relevant/irrelevant
iii) unique/redundant iv) accurate/inaccurate
v) instructive/misinstructive vi) concise/diffuse
vii) clear/ambiguous viii) readable/unreadable
The first six of these might be thought to relate to the quality of
informational content, the last two to the quality of presentation.
Gallagher (1974) developed a very similar measurement scale, but with a
more extensive list of semantic adjectives. Zmud (1978) argues that user
perception of information has four basic dimensions:
i) significance, usefulness or helpfulness
ii) accuracy, factualness and timeliness
iii) quality of format, physical presentation Or readability
iv) meaningfulness or reasonableness of the information
Again this classification might be split between informational content [(i),
. (ii) and (iv)] and presentation of content [(iii)]. Larcker and Lessig (1980)
saw the perceived usefulness of information to be a function of two factors:
i ) Perceived importance information is thought to be relevant,
informative, meaningful, important,
helpful and significant
i i ) Perceived usableness - information is thought to be
unambiguous, clear and readable.
They admitted that information accuracy and timeliness might provide
additional dimensions of perceived usefulness that had possibly been
ignored. Even so their important/usable split might be thought to
58

Relevance
Completeness ]
Understandability ] QUALITY OFPRESENTATION
Accuracy
Validity
Usefulness
]]I QUALITY OF CONTENT]]]
]]]]]
]i
correspond to one concerned with quality of informational content/quality
of presentation.
Such divisions are consistent with the approaches of the accounting
standard setting bodies. Thus FASB (1980) adopted a division of
i) information-specific
ii) user-specific
Similarly AARF (1987) proposes:
i) information selection
ii) information presentation
relevance, reliability, comparability
understandability.
relevance, reliability
understandability,
comparability.
The 20 characterisitics of the Canadian ASC (1980) might, a priori, be
aggregated as follows:
Relevance ]Substance over Form ]Timeliness ]Materiality ]Cost-Benefit ]
Isomorphism ]Precision ]Non-arbitrariness ]Verifiability ]Freedom from Bias ]Data availability ]
Objectivity ]Rationality ]ConsistencyUniformityConservatism
]]]
Comparability ]Flexibility ]
Full disclosure ]
Clarity ]
59

Similarly, the sevenfold classification of the Corporate Report (1975) mightbe aggregated as follows:
Relevance I ]Comparability ] Usefulness ]
Reliability ] ]Timeliness ] Accuracy ] QUALYFY OF CONTENT
Completeness l lObjectivity l Validity l
Understandability l Readability ] QUALITY OFPRESENTATION
Each of these analyses identifies content and presentation as the
fundamental features of information, so it appears reasonable to carry out a
further empirical investigation, to determine the underlying dimensionality
of information, within the accounting environment. A mapping procedure
was employed involving the use of a multidimensional scaling technique to
convert perceived preferences, in the form of measurable trade-offs
between potentially conflicting characteristics, to a multidimensional
graphical output.
3.5.1 AN EMPIRICAL APPROACH TO MEASUREMENT
The Multidimensional Scaling (MDS) technique provides the solution to an
inverse mapping problem; given the distances between a set of points the
procedure establishes the relative positions of the points in
muiltidimensional space.
The data distances input are measures of similarity or dissimilarity between
all combinations of points and provide a correlation matrix of the variables
under consideration. A map can then be constructed in such a way that high
correlations produce points which are close together, and vice-versa.
The MDS approach is very similar to that of factor analysis, but whereas MDS
is based on the distances between points the latter is based on the angles
between vectors. In addition, by imposing an assumption of linear
relationships factor analysis often produces an unmanageably large number
of dimensions. MDS makes no such assumption and normally provides more
readily interpretable solutions of lower dimensionality.
We use MDS to form homogenous groupings of decision-makers with common
perceptions of the meanings of accounting information items. By evaluating
similarity judgements 'perceptual spaces' are generated which provide
spacial representations of the structure and dimensions of the stimuli
60

(judgements) being studied. The geometric position of these points
corresponds to their relative ranking by respondents.
The pioneering application of MDS to a financial environment is provided by
Green and Maheshwari: (1969) in gauging the perception of respondents to
the similarity of shares, based on financial ratio variables. Belkaoui and
Cousineau (1977) adopt a behavioural accounting approach to respondents'
perceptions in the same area. In each case a two-dimensional plot was
suggested, labelled as 'perceived growth' and 'perceived risk'.
Libby (1979) used the INDSCAL routine of MDS, due to Carroll and Chang
(1970), to examine the perceptions of auditors and bankers to the message
communicated by the audit report. This study was repeated by Bailey,
Bylinski and Shields (1983) using CPA candidates and final-year accounting
undergraduates as subjects. In each case a two-dimensional solution was
generated attributable to 'information content' , and 'user judgement'.
In this INDSCAL application of this present study the dissimilarity scores are
generated by the trade-off measurements, perceived by respondents,
between the property variables.
The major difficulty in the solution of the mapping problem is the
determination of the number of dimensions in which the map should be
drawn. Kruskal and Carroll (1969) introduce the concept of 'stress' as a
measure of 'badness of fit' being a normalised residual sum of squares which
should be minimised. Stress is thus analogous to the R2 of regression
analysis, with a stress factor of zero corresponding to a perfect fit, of one
corresponding to no material relationship. Kruskal (1970) advances the use
of the 'scree' diagram to determine the most appropriate number of
dimensions : a plot of '% stress' on the vertical against the 'number of
dimensions' on the horizontal will often display a kink at the optimum
number of dimensions. If the diagram is constructed in too few dimensions
the diagram will be uninterpretable because too many variables will
simultaneously be competing for expression. However, Watkins (1984) is
critical of researchers who rely solely on stress to determine dimensionality,
recommending the use of alternative diagnostic measures to evaluate the
interpretability of the derived configuration. Shepard (1974) is similarly
concerned that by using 'stress' alone, researchers extract too many
dimensions and ignore the more important contributions of statistical
stability and substantive interpretability.
> 61

Davies and Coxon (1981) provide the MDS (X) series of programs in which the
INDSCAL routine generates solutions in each of the possible dimensions from
the highest specified to the lowest. Each of these alternative solutions may
then be examined to identify other diagnostic measures:
i) large negative weights in the subject-weights matrix for each
dimension cannot be interpreted,
and are indicative of a dimensionality that is too high;
ii) the sums of squares of subject-weights on the main diagonal of
the matrix for each dimension
show the relative importance of each dimension to the final
solution;
iii) the sums of products of off-diagonal elements show the degree of
correlation between dimensions. Large values again suggest
that dimensionality is too high.
Like the Libby (1979) and Bailey et al (1983) studies, this work is concerned
with similarity measurements in the perception of meaning of accounting
terminology. Likewise, therefore, the INDSCAL routine is used here.
Compared to alternative routines, INDSCAL has the further advantage of
developing sensible and meaningful solutions of low dimensionality,
provided that the data set is reasonably reliable.
This application is concerned with 21 similarity judgements (i.e. 7 C2 being
all combinations of two qualitative properties from the seven (stimuli)
deemed desirable by the Corporate Report). Schiffman, Reynolds and Young
(1981) recommend the recording of respondents' similarity judgements by
using a 5 inch scale. They suggest that a 4 inch line will compress results,
while a 6 inch line will encourage the non-use of the right- hand scale. The
line used is not differentiated in any way (i.e. no boxes, numbers, synonyms
or verbal descriptors) to avoid the potential for bias. Accordingly these
suggestions are incorporated into the test instrument detailed in Appendix
3.3(b).
. 62

Hypotheses: HO i Null Hypothesis - no clear dimensions determinable.
111
User perception of the relative desirability of the
properties of accounting statements will load onto two
major dimensions concerned, respectively with Content
and Presentation.
H02 Null Hypothesis - no difference in the perceptions of
different user groups.
H2 Different user groups will have different perceptions of
this relative desirability breakdown for the use of
accounting statement information in different contexts.
To explore the potential of the research approach in a preliminary manner a
respondent group of 30 MBA Finance students at the City University Business
School was used who were already familiar with those properties deemed
desirable in accounting communications. They were supplied, as a reminder,
with an abstract from 'The Corporate Report' by the Accounting Standards
Steering Committee of the ICAEW (1975) in which the properties are
designated (Appendix 3.2). As an initial exercise, respondents were asked to
rank the seven properties into the order they perceived to be most
appropriate, using a system which designated 1 - most important, 2 - next
etc., so that the property ranked 7 was perceived as the least desirable.
Respondents were then presented with the test material proper (Appendix
3.3) which comprises a brief reinforcement of each of the seven properties,
and their meaning, and a statement of the task requirements. Respondents
were required to quantify their relative ordering by indicating their
preference between pairs of properties. This preference was to be stated in a
measurable way by showing the trade-off that each respondent thought
permissible; that compromise position whereby a degree of one property
might be sacrificed for part of the other. The 21 pairs of properties (all
combinations of 2 from 7) were distributed randomly, for order and for
left/right handedness, to ensure, as far as possible, that 21 separate decisions
were made.
63

No of Dimensions Power (%) Stress (%)Explanatory
1 29.4 70.0
2 44.4 54.9
3 60.6 38.2
4 69.7 27.2
The result and responses represented the satisfaction of inter-property
conflict on an individual basis and provided the basis for the generation of
dissimilarity matrices and the mapping of perceptual preferences using the
INDS CAL routine of the MDS (X) set of programs.
A forty point measurement scale was used. A score of 20 represented
indifference between the two properties, 0 of absolute preference for the
second, and 40 absolute preference for the first of the properties. The
resulting scores were used as an INDSCAL data set.
The experiment was later repeated with a further group of thirty final year
UK business undergraduates, to determine the effect of educational
attainment.
In this respect we follow Ashton (1976) who justifies the use of students as
surrogates for accounting professionals in the use of accounting statements.
3.5.2 EMPIRICAL RESULTS
Hi: The INDSCAL routine generates solutions in alternative dimensions
from 1 to 4:
Maximisation of explanatory power suggests the adoption of a four-
dimensional solution (R2 =0.697), as does the minimisation of the stress
criterion (% stress = 27.2). Such a preference is not surprising since stress
will decrease and correlations increase as the number of dimensions
increases. The danger is of extracting too many dimensions and generating
a statistically unstable solution. Further diagnostics are therefore sought.
The 'Scree' Test depicted in Figure 3.5.1 reveals the hint of a Kink, or elbow,
centred on three dimensions, though the diagram is not of sufficient clarity
to be totally convincing.
64

80
STRESS (%)
60
40
20
1 2 3 4
No of Dimensions
FIGURE 3.5.1: SCREE TEST FOR THE DETERMINATION OF DIMENSIONALITY
Further consideration of the output from the INDSCAL routine helps to
clarify the configuration:
i ) examination of • the normalised subject spaces reveals very few negative
subject weightings in any of the alternative configurations. Little
evidence is provided to suggest the adoption of a level of dimensionality
which is too high.
ii) examination of the group space product sums reveals the angle between
the dimensions in each of the alternative solutions. Orthogonality
between the axes is sought, with an optimum 90 degree angle
indicated by an intercorrelation measure of r=0. The closer to zero is
the correlation coefficient the better the configuration.
NUMBER OF DIMENSIONS
2 3 4
ri • 2 -0.145 (98.3°) -0.145 (98.3°) -0.145 (98.3°)
r l . 3 0.101 (82.2°) 0.101 (84.2°)
r2.3 0.059 (86.7°) 0.059 (86.7°)
r1.4 -0.217 (102.4°)
r2.4 0.153 (81.2°)
r3.4 -0.117 (96.7°)
The four-dimensional solution clearly demonstrates large divergences from
the optimum, and is rejected accordingly. The three-dimensional solution
offers a configuration close to orthogonality.
65

iii) examination of the subject space product sums identifies the relative
importance of the dimensions, while the graphical plots of the group
space configurations allows an interpretation of the dimensions to be
made.
TWO-DIMENSIONAL SOLUTION
VARIATION
EXPLAINED(%)
DIM 1 25.7 Completeness
DIM 2 18,6 Timeliness
Sum : 44.3
PROPERTIES
TRADE-OFF
- Reliability
Quantity - Quality
- Objectivity
Punctuality - Bias
THREE-DIMENSIONAL SOLUTION
VARIATION
EXPLAINED (%) PROPERTIES
DIM1 25.4 Completeness - Reliability
DIM 2 18.5 Timeliness - Objectivity
DIM 3 16.7 Relevance - Understandability
Sum : 60.6
TRADE-OFF
Quantity - Quality
Punctuality - Bias
Useful - Usable
The diagnostic measures ingest a preference for a three-dimensional
configuration which maximises explanatory power at 60.6% while
generating acceptably orthogonal axes. The first two of these dimensions
focus attention on the informational content of the communication, the third
on the manner of its presentation. The specification of a Content-
Presentation split therefore emerges.
Appendix 3.4 illustrates each •of the two-dimensional maps generated by
plotting the respondents (numbered 1 to 30) and the qualitative properties
(numbered 1 to 7) on common axes. The properties at the extreme end of
each axis allow an interpretation of the dimensions as above. The subjects
lying closest to a 45 degree line in the north-east quadrant represent, in
each case, the respondents with perceptions closest to the mean.
Results from a repeat of the experiment with a less sophisticated audience of
accounting undergraduates were very similar and are not reported
separately here. This might suggest that both groups may have taken
attributes at their face value without a full appreciation of their accounting
implications. It is possible that a more sophisticated audience of accounting
66

practitioners might generate alternative responses, but this remains to be
tested. However, Bailey et al (1983) report that subject groups with differing
levels of audit report knowledge (CPA candidates and undergraduate
accounting students) showed a high level of interstudy statistical similarity,
with no significant difference in their perception of audit report messages.
Libby (1979) similarly reports little difference in the perceptions of auditors
and commercial lending officers in the same decision-making environment.
Watkins (1984) expresses the hope that the MDS technique might be applied
more widely in the accounting and finance environment, but reports of such
applications remain scarce in the accounting literature.
H2: The rank ordering exercise reveals a strong preference for reliability
and relevance among the thirty respondents in their perceived importance
of the different properties:
MEAN RANK STANDARD
RANK PROPERTY SCORE DEVIATION
1 Reliability 2.3 1.5
2 Relevance 3.2 1.9
3 Timeliness 4.0 1.9
4 Objectivity 4.1 1.7
5 Understandability 4.6 2.1
6 Comparability 4.8 1.9
7 Completeness 5.0 1.4
These results are significantly at variance with those of Stamp (1982) as
considered in Section 3.4. The latter reported a clear preference for
'relevance' among accounting professionals. This conflict suggests that
differences attributable to education and experience may be important and
that such issues need to be further explored.
3.5.3 CONCLUSIONS
The empirical findings for MBA Finance students demonstrate preferences
which suggest that these users are prepared to sacrifice completeness,
objectivity and understandability of disclosures in return for, respectively,
reliability, timeliness and relevance. This preference for reliability and
relevance (with timeliness a contributory factor) is consistent with the
proposals of both FASB (1980) and AARF (1987). Respondents perception of
the importance of understandability is apparently consistent with the
subservience attached to it by the accounting standard setters. It is difficult
67

to reconcile such a stance with the overriding objective of 'Communicating
decision-useful information', since:
i) if a message is not understood effective communication has not
taken place
ii) without understanding, relevant and reliable information will
not impact appropriately.
Given the apparent acceptance of the complexity of content, more attention
needs to be paid to appropriate means of presentation, if the current
imbalance is to be repaired. Chapter 4 extends this argument by exploring
respondents' perceptions of content alternatively presented, in narrative or
numerical form.
> 68

CHAPTER FOUR
BARRIERS TO AN EH-ECTIVE COMMUNICATION PROCESS
4.1 THE LANGUAGE OF ACCOUNTING DISCLOSURES
and a set of rules for
mathematics and music have
too must qualify with its
s, conventions and
A language system has a set of symbols (the lexicon)
relating these symbols (syntax). On this basis both
been regarded as language systems, and accountancy
symbols (words and numerals) and rules (procedure
standards).
Cherry (1966) distinguishes between factual information - 'semantic
information conveyed by sentences in the language' - and useful information
information conveyed for the benefit of a particular user.
Li (1963) argues that, at the semantic level, accountancy is not concerned with
the usefulness of information but rather with its factual content. This
distinction is consistent with a general-purpose annual report in which
information is stated, rather than communicated, to an unspecified audience.
The effectiveness of any communication that takes place is dependent on the
satisfaction of three conditions (Smith (1971)):
i ) the message transmitter successfully encodes the required meaning into
language.
ii) the message is transmitted through a channel of communication (e.g.,
written report)
iii) the receiver decodes the language and confers on it the meaning
intended by the transmitter.
The breakdown of the communication process may be attributable to problems of
content and presentation:
i ) the content of the communication is perceived as being too complex to be
understood by unsophisticated users. The suggestion is that there exists a
need for more education (Lee and Tweedie (1977) ) or for simplified
accounts (Hammill (1979)).
69

ii) the means of presentation is perceived as being inadequate to meet the
needs of the target audience. The suggestion is that the communication
fails to meet the information needs of the sophisticated user and that
specialist user-based reports (Bedford (1973)) are required.
Such fundamental problems are consequent upon the production of a general
purpose annual report, whose objectives and target audience are largely
unspecified.
The stated objectives of financial reports are essentially non-specific, especially
with regard to the potential audience. The Trueblood Committee (1973) specified
the basic objective as being 'to provide information useful for making economic
decisions' for an audience comprising 'the shareholder and other interested
parties'. The Corporate Report (1975), in a similar fashion, specified the
fundamental objective of communicating 'economic measurements of and
information about the resources and performance of the reporting entity' to an
audience comprising 'those having reasonable rights to such information'.
In each instance the generalisation of the user-group designation presupposes
the production of a single all-purpose report, which may fail to satisfy the
information requirements of any of its potential user-groups. At least the latter
specifies the need for communication, but provides little guidance of the
patterns to be adopted if this is to be effective over a diverse audience. Parker
(1982) correctly observes that 'some company managements may be quite
unconcerned about their annual report readership levels'.
Dupree (1985) argues 'the impossibility of communicating to all shareholders,
regardless of literacy or ability' and apparently abandons any idea of
communicating with the 27.2% of US shareholders without a college education.
Instead he explores the simplification route, replacing technical accounting
terms with descriptive alternatives . Such an approach appears fraught with
danger while the two accounting terminology problems identified by Haried
(1972) still persist:
i ) technical meanings are assigned to words with other meanings in every
day use,
70

i i ) there is insufficient standardisation of the terms used in financial reports.
The empirical work of Haried (1973), Oliver (1974) and Belkaoui and Cousineau
(1976), evaluating the semantic meaning of accounting concepts, reveal a
startling lack of conformity between different user-groups in terms of
perceptions of their meaning.
Chapter 6 is concerned with the complexity of presentation of narrative
disclosures and the potential consequences of obfuscation. The remainder of
this chapter is concerned with the problems consequent upon the perceived
complexity of narrative disclosures.
Where complexity distorts the decision-making process, because the information
processing mechanism is impaired, the potential exists for damaging economic
consequences. While damaging results following on from distorting complexity
are intuitively appropriate, the empirical evidence providing support for such
economic effects is sadly lacking. What is not in doubt is the effect on
information processing methods consequent upon information which is
complex in volume and nature. Simplifying procedures will be adopted to
integrate alternative information cues and to accommodate the uncertainty
associated with different messages from alternative sources.
4.2 INTUITIVE STATISTICS IN THE PROCESSING OF ACCOUNTING
NARRATIVES
Decisions in the accounting environment require an information processing
capability which allows the accommodation of uncertainty. Too often inference,
prediction and diagnosis of events result in biased judgements following the
adoption of subjective statistical inaccuracies. Inappropriate heuristic devices
and guidelines to simplify the decision-making process may lead to sub-optimal
judgements and the inefficient use of the available information.
The nature of decision rules and their potential implications for the processing
of information under conditions of uncertainty in a psychological environment
has been researched and documented by Slovic (1974) and Kahnemann and
Tversky (1974). This analysis was extended to the accounting environment by
Swieringa et al (1976) and in particular to the audit environment by Joyce and
71
Biddle (1981). In the main these studies are devised to demonstrate the
inadequacies of common statistical heuristics, though Thorngate (1980) has
shown that in some circumstances such heuristics can lead to optimal responses.
This section adopts an empirical approach to the investigation of the
relationship between quantitative and qualitative information sources, focusing
on the manner in which numerical and narrative information is employed in a
decision-making context. Three issues are addressed:
i) the reaction of respondents to the provision of numeric base rates as an
indication of the likelihood of outcomes. This issue is of particular
relevance to the empirical studies conducted in Chapters 8 and 10 where
respondents are required to process test materials involving sets of
companies, in which the base-rate for failed companies is a controlled
variable.
ii) the nature and extent of the integration of narrative and numerical
information when both are available, especially when the message
conveyed is to some extent conflicting and information preferences are
apparent. This issue is of particular relevance to the empirical study
reported in Chapter 8, where respondents are required to combine numeric
and narrative information from alternative sources in determining a
failed-non-failed decision.
iii) the consistency with which respondents attempt to attach numerical
rankings to qualitative measures of uncertainty. This issue is of particular
relevance to the interpretation of the Chairman's narrative reflected in
the empirical studies of readability (in Chapter 6) and. of disclosed message
(in Chapter 8).
Ashton (1984) documented a variety of cases employed in the earlier sources in
order to extend the evaluation of auditing judgements into the classroom, using
students as surrogate decision-makers.
In order to illustrate the three issues above, four simple cases have been selected
which demonstrate the adoption of heuristic devices to facilitate processing. In
particular:
72

i ) representativeness - the making of decisions on flimsy evidence which
ignores prior probabilities. Case 1 is designed to examine the emphasis
placed on questionable narrative sources compared to impeccable
numerical information relating to base rates.
i i ) integration - the adoption of inconsistent simplification to combine
information from alternative sources. Case 2 examines the manner in
which numerical indicators of size, and qualitative indicators of reliability
are combined with an existing body of information.
iii) anchoring and adjustment - overconfidence in estimates resulting from
adjustments, made with additional information, to unreliable initial
guesses. Case 3 seeks to appraise the reaction of respondents to the
availability of new (numerical) information complementary to the existing
narrative.
iv) availability - judgemental bias resulting from undue emphasis on recent or
imaginable instances. Case 4 demonstrates how respondents attitudes to
risk and uncertainty might impair the consistency of their estimates.
Ashton and Kramer (1980) observed sizeable discrepancies in the opinions of
students in behavioural accounting research, when compared to practitioners,
in questions of attitudes and attitude changes. When decision making studies
were examined, however, the information processing abilities of students
suggest that they are reasonable surrogates for practitioners. This study
attempts to evaluate differences in the performance of accounting
undergraduates and practitioners in questions devoted to both attitude
measurements and information processing.
4.3 HEURISTICS EXPERIMENT: METHODOLOGY
A test was conducted using 250 final year Australian undergraduate accounting
students, who were asked •to complete a test instrument independently within a
one-hour time constraint. No case completion order was specified and some
individuals failed to complete the entire test instrument.
73

Thirty-two different versions of the test instrument were prepared to reflect the
8 alternative versions of Case 2 and the 4 alternative versions of Case 3. Both
Cases 1 and 4 comprised single versions without variations. The test instrument
was administered randomly to the subject group to ensure that each version was
considered approximately eight times by different individuals. This treatment
allowed the assessment of the effects, if any, of subtle numerical and narrative
changes within the text of the four cases.
4.3.1 CASE 1: REPRESENTATIVENESS
SOURCE: D KAHNEMANN and A TVERSKY
'Subjective Probability: A Judgement of Representativeness'
COGNITIVE PSYCHOLOGY (July 1972) pp 430-454
Case adapted by the author to an Australian tertiary
environment.
In 1987 the number of equivalent full-time students enrolled at this University,
totalled 6,720. They were distributed as follows:
Accounting 532
Architecture 308
Art & Design 375
Biology 138
Business & Administration 1429
Chemistry 201
Communication Studies 583
Computer Science 379
Education 552
Engineering . 634
Library Studies 147
Physics 240
Social Studies 1120
Surveying 82
One such student, Tom W, is in the final year of an undergraduate course. The
following description of him was made by a psychologist, resulting from a
projective test prior to the commencement of his undergraduate studies:
74

'Tom is highly intelligent, although lacking in true creativity.
He has a need for order and clarity, and for neat and tidy
systems in which every detail finds its appropriate place. His
writing is rather dull and mechanical, occasionally enlivened
by somewhat corny puns and by flashes of imagination of the
sci-fi type. He has a strong drive for competence. He seems to
have little feel and little sympathy for other people, and does
not enjoy interacting with others. Self-centred, he
nonetheless has a deep moral sense.'
The Task
Please rank the above fourteen fields of study in order . to identify that field in
which you consider the likelihood of Tom being a student is the highest.
Place your ranks in the grid above, with a Rank = 1 indicating the most probable
choice.
75

RESULTS
A total of 244 usable replies were generated:
Prior Probabilities suggest the following rank order:
Rank Field of Study No. of Students
Observed Incidence
of Rank = 1
No. of Students
Actual (%) Actual (%)
1 Business Admin 1429 21.3 23 9.4
2 Social Studies 1120 16.7 1 ' 0.4
3 Engineering 634 9.4 48 19.7
4 Communications 583 8.7 2 0.8
5 Education 552 8.2 2 0.8
6 Accounting 532 7.9 14 5.7
7 Computer Science 379 5.6 76 31.2
8 Art & Design 375 5.9 5 2.1
9 Architecture 308 4.6 4 1.6
10 Physics 240 3.6 32 13.1
11 Chemistry 201 3.0 15 6.2
12 Library Studies 147 2.2 10 4.1
13 Biology 138 2.0 2 0.8
14 Surveying 82 1.2 10 4.1
TOTAL 6720 100% 244 100%
Significant differences between observed and expected frequencies are
apparent, particularly with regard to Business Administration, Social Studies,
Engineering, Computer Science and Physics. Respondent preferences in the
first three ranked positions shared just four fields: Computer Science (140),
Physics (129), Engineering (127) and Chemistry (91) to occupy over 66% of the
top ranks.
On prior probabilities their expected proportion of the student body represents
only 21%. A chi-squared test confirmed a highly significant difference between
actual and expected subject rankings, at the 5% test level.
> 76

These results are consistent with Ashton's observation that base-rate
information is consistently underutilised - except in instances where it is the
only form of information available.
In this decision framework the base-rate information is paramount but subjects
were apparently unable to integrate this information with their
'representativeness' perceptions - the similarity between the brief description
and a typical student on each of the courses.
The implications of this result are potentially significant to the outcome of the
study in Chapter 8. Where different messages are being conveyed by the
Chairman's Report and the Financial Accounts, the emphasis accorded to the
narrative/numerical messages, when both are available, might suggest an
inappropriately high weighting being accorded the narrative because of its
warmth and apparent saliency.
Further, the apparent ignorance of base rates, even when explicitly stated in
numerical form is disturbing. It suggests potential difficulties in changing
respondents' perceptions of base rates in instances where the base rate may
vary widely. Such difficulties are apparent in the findings reported in Chapters
8 and 10.
4.3.2 CASE 2: INTEGRATION
SOURCE: E.J. JOYCE and G.C. BIDDLE
'Are Auditors' Judgements sufficiently regressive?'
JOURNAL OF ACCOUNTING RESEARCH (Autumn 1981b) pp 323-
349
As part of the regular year-end audit of a client - a consumer electronics
wholesaler - you are reviewing the adequacy of the allowance for uncollectable
receivables.
You prepare an ageing schedule of accounts receivable and note a very large
account is six months past due. The customer has returned you positive
confirmation verifying the client's balance as correct. You know from your
experience with this client that approximately 70 per cent of account balances
77

six months past due, are unrecoverable. Assume this single account balance is a
material item. It is the controller's opinion that the entire amount will be
recovered and that there is no need to provide for the loss.
A further investigation of the customer by the client's credit manager, yields
the following description:
The customer is a rapidly expanding merchandiser of television, radio,
stereo, and other consumer electronics equipment. It began as a single-
store operation in 1974 and now operates a total of 12 stores across four
States. Further expansion is planned in the near future. Earnings
growth has been strong since 1974. As the firm expanded, its average
payment time on accounts receivable has steadily increased. This is due to
an inadequate accounting system rather than to cash difficulties. A new
computerised accounting system is presently being installed and is
expected to remedy the firm's payment problems.
Given the above information, what is your estimate of the probability that the
accounts receivable will be collected in full next year?
.00 .10 .20 .30 .40 .50 .60 .70 .80 .90
1.00
TICK ONE BOX
The italics of '70 percent' are used for illustration only. This figure was varied
so that each of four groups of respondents received a different estimate - 50%,
60%, 70% and 80% respectively.
Similarly the description 'the client's credit manager' was changed so that the
source of the credit information - and perception of its reliability might be
varied - through the use of an alternative description 'an independent credit
agency'.
Prior probabilities suggest expectations of complete recovery of account
balances to regress towards the base rates, 0.50, 0.40, 0.30 and 0.20 respectively.
The extent of this regression will be dependent upon the importance
attributable to the description of the customer, and the reliability of the latter.
78

STATED
PROBABILITY 80%
Such differences may be considerable in this case, because of the extent of the
potential conflict between the messages conveyed by narrative and numbers.
Despite the weakness of the narrative information we might expect it to be
predominant in an integration of two independent sources. Assignment of
independence for the source of credit information might be expected to reduce
the variability associated with the outcome of the narrative.
RESULTS
PRIOR PROBABILITIES OF % ACCOUNT BALANCES RECOVERABLE
0.0 0
0.1 2
0.2 2
0.3 3
0.4 7
0.5 14
0.6 8
0.7 8
0.8 9
0.9 6
1.0 _aTOTAL 62
MEAN 0.602
STD DEVN 0.219
pISTRIBUTION
50% Overall
SOURCE
70% 60% 'Client' 'Independent'
1 0 0 1 1 0
1 0 1 4 2 2
1 4 2 9 5 4
5 6 3 17 10 7
6 7 6 26 12 14
8 4 7 33 18 15
10 6 6 30 14 16
9 16 14 47 25 22
12 9 14 44 20 24
3 3 5 17 10 7
_11 _1 __Q 4 __a _.1.
56 56 58 232 120 112
0.586 0.591 0.623 0.602 0.599 0.604
0.206 . 0.209 0.197 0.209 0.217 0.199
There is insufficient difference between the group means to suggest that they are
other than samples from the overall distribution, at a 5% level of significance.
Such evidence is consistent with judgements made with disregard for the
importance of prior probabilities, and total reliance on the narrative passage.
The overall mean prObability of 0.602 (Standard deviation = 0.209) compares with
the Joyce and Biddle finding of a mean probability of 0.705 in their corresponding
79

experiment with a group of 50 practicing auditors (standard deviation = 0.210). A t-
test suggests that this difference in overall means is significant at the 5% level,
and that the samples of students and auditors are drawn from different populations
- possibly attributable to experience levels.
Of some concern in the auditor study, means of 0.704 and 0.706 were generated by
the groups with narrative statements based on 'client's credit manager' and
'independent credit agency' respectively, suggesting that auditors may not be
sensitive to the reliability of the data. Such a finding is consistent with that from a
student audience, above, with corresponding means of 0.599 and 0.604.
Such findings have Clear implications for the weighting-models employed by
respondents when faced with conflicting narrative and numerical information.
They also suggest that the relative reliability of the messages conveyed by such
sources may be misjudged in the decision-making context.
4.3.3 CASE 3: ANCHORING AND ADJUSTMENT
SOURCE: E.J. JOYCE and G.C. BIDDLE
'Anchoring and Adjustment in Probabilistic Inference in Auditing'
JOURNAL OF ACCOUNTING RESEARCH Vol. 19 No. 1 (Spring 1981a)
It is probably true that many cases of management fraud go undetected, even when
competent annual audits are performed. The reason is that generally accepted
auditing standards are not designed specifically to detect executive-level
management fraud.
Please give your own estimate of the prevalence of executive-level management
fraud in the following circumstances:
1 Based on your audit experience, is the incidence of significant executive-
level management fraud more than twenty in each 1,000 clients (ie, 2 per
cent) audited by Big Eight accounting Firms?
Circle one of these: a) YES, more than twenty in each 1,000.
b) NO, fewer than twenty in each 1,000.
80

2 In the square below, put your estimate of the number of Big Eight clients
per 1,000 that experience significant executive-level management fraud.
Italics are added for illustration of the variable items within the case. Four
different anchors were provided to different groups of students as a 'guide' to the
number of executive-level management frauds:
ten (ie, one percent)
twenty (ie, two percent)
fifty (ie, five percent)
one hundred (ie, ten percent)
The 'guide' number provides no new information relevant to the judgement
process but, nevertheless, might be expected to influence the quantification of
expectations.
RESULTS
Total of 244 usable replies were generated:
Specified No. of
Executive Level Coefficient
Respondent Sample Management Observed Standard of
Group Size Frauds Mean Deviation Median Skewness
1 65 10 64.46 111.53 20 1.196
2 59 20 45.58 68.45 15 1.340
3 61 50 71.30 64.69 40 1.452
4 59 100 91.19 108.45 50 1.139
OVERALL 244 68.07 92.71 40 0.908
The mean scores for respondents in Groups 2 and 4 differ significantly from the
overall mean at a 5% level, but the overriding features are the very high
degrees of variation together with the significant positive distribution skews.
81

The linear correlation coefficient between the No. of specified Frauds and actual
estimates, r=0.1489 is significant at a 5% level, but observations are more
consistent with an adjusting upwards from the extreme low anchor, and
downwards from the extreme high anchor. Such results are consistent with the
existence of non-monotonic anchoring effects observed in psychophysics
research (Helson and Masters [1966]).
Joyce and Biddle's corresponding experiment with auditors produced the
following results:
Specified No. of
Executive Level
Respondent Sample Management Observed Standard
Group Size Frauds Mean Deviation
1 25 10 16.52 22.41
2 25 200 43.11 36.97
OVERALL 50 29.81 33.33
These results are consistent with the 'anchoring and adjustment' principle and
the increased variability at the upper anchor is amplified in the present study
by the high standard deviations corresponding with the extreme anchor points,
though the precise effect of such a measure is dependent on the symmetry of
the distribution. Prior probabilities in terms of an expected base-rate for
executive level management fraud are likely to be beyond the experience of
accounting undergraduates, contributing to the wide difference in mean
incidence expectations.
These results are important in indicating the manner in which variations in
base rates might be processed by respondents. They foreshadow difficulties in
Chapters 8 and 10 concerned with changing users' perceptions of likely failed-
non-failed combinations in material sets of ten companies; they suggest
processing around an expectation of 'about 5' failed companies, together with
adjustments based on the actual characteristics of the cases.
82

4.3.4 CASE 4: AVAILABILITY
Examination of the semantic differential by Haried (1973) and Houghton (1987)
has identified and quantified changes in users perceptions of the meaning of
accounting terms. Perceived differences in meaning may have economic
consequences via their effect on decision processes.
Attempts to quantify narrative terms in order to accommodate measures of
uncertainty are currently an area of concern for Accounting Standard - Setting
bodies worldwide.
SOURCE: S. LICHTENSTEIN and J.R. NEWMAN
'Empirical Scaling of Common Verbal Phrases associated with
Numerical Probabilities'
PSYCHONOMIC SCIENCE (1967) Vol. 9(10) pp 563-4
Listed below are 5 common words or phrases that are used to express degrees of
certainty or uncertainty. Beside each item please write the probability
(numbered 0.01 to 0.99) which most clearly reflects the degree of probability
implied by each word or phrase.
Unlikely
Likely
Minimal Likelihood
Very Unlikely
Very Likely
RESULTS
A total of 230 usable responses generated revealed the following:
Perceived Probabilities
Mean Std Devn Median
Very Unlikely 0.12 0.12 0.10
Minimal Likelihood 0.20 0.15 0.15
Unlikely 0.24 0.15 0.20
Likely 0.66 0.13 0.70
Very Likely 0.81 0.12 0.80
83

All mean values are significantly different at a 5% level of significance.
Interestingly there is no 'mirror image' of corresponding descriptions.
ie , Likely (0.66) + Unlikely (0.24) < 1.00
Very Likely (0.81) + Very Unlikely (0.12) < 1.00
This skewness is consistent with the earlier results of Lichtenstein and Newman,
who found a similar lack of correspondence in 8 of 11 matched pairs.
Reference to earlier studies does, however, highlight two factors contributing to
differences in perceptions of the quantification of uncertainty:
i) educational and experiential differences of the respondents;
ii) the contextual framework of the quantification exercise.
Thus, this study with n=230 accounting undergraduates generated a mean
probability of 0.66 for 'Likely', whereas the corresponding score of 0.72
documented by Lichtenstein and Newman was based on the n=188 scorable replies
from a postal survey of male employees of a U.S. corporation; a highly significant
level of difference in mean scores.
The earlier study by Cohen et al (1958) used n=125 adults attending evening
classes to generate scores of 0.56 and 0.63 in two different forecasting contexts,
attributable respectively to meteorological (weather forecast) and political
(election forecast) probabilities.
These marked differences suggest that the contextual environment is of
paramount importance, a critical factor in the examination of accounting
communications, and in particular the evaluation of shared meaning between the
preparers and users of accounting narrative.
Such results suggest that non-formula based measures of readability, including
content-dependent measures of cognizability like the CLOZE score considered in
Chapter 6, will be experience dependent. The degree of accounting sophistication
of respondents may therefore be expected to have a positive effect on recorded
scores, though not necessarily rank ordering, in the results of that chapter.
84

Similar effects might be expected in the interpretation of narrative messages and
the emphasis accorded them relative to financial statements when both
information sources are combined in the results of Chapter 8.
4.4 SUMMARY OF FINDINGS
The experimental results of this paper are largely consistent with the
psychological literature in lending support to the adoption of intuitive statistics
in the decision-making process.
Cases 1 and 2 illustrate the ignorance of prior probabilities and the preference of
respondents for 'soft' information - narrative providing only flimsy evidence -
rather than the 'hard' information available in the form of numeric frequencies
where both are available. This preference is consistent with the information
selection processes suggested by Bell (1984a) when the information sources are
respectively numeric and narrative.
Case 3 demonstrates the opportunities for influencing the decision-making
process with irrelevant, or at best obscure, information.
However, whereas the pattern of results is generally similar to those generated
by accounting practitioners, the differences in means and the variability of
responses suggests that the use of student surrogates is hampered by an
ignorance of population base rates that may be attributable to experience, and a
lack of complexity in the information processing task. Such findings are
consistent with the suggestions of Ashton and Kramer (1980) and Bouwman
(1984).
Einhom and Hogarth (1981) suggest that the nature of the judgemental task
largely determines the decision strategies employed, and a concern for task
structure suggests the development of a more realistic contextual framework in
order to generate more reliable results from information processing.
The findings of these short narrative pieces point to potential difficulties in the
operation of the respondent-based experiments in the latter part of this study.
Expectations might include:
85

i ) a difficulty in changing the perceptions of respondents as to the base
rates for failed proportions in sets of companies. Despite explicit
information regarding the possible range of base rates, decision-makers
will rely on central expectations and adjust around this anchor in accord
with the characteristics of particular observations. The resultant
distribution of outcomes might be expected to be curvilinear in shape,
reflecting an undue proportion of errors when the materials set
comprises an extreme number of failed cases.
ii) a difficulty on the part of respondents in developing a consistent •
additive model through which to integrate findings from narrative and
numeric sources. An undue emphasis on the qualitative information,
where both sources are available, may lead to a marginal positive or
negative effect on decision-making capabilities when apparently
complementary information is provided.
iii) measures of narrative message might be expected to be both context and
experience dependent. It is therefore reasonable to expect improved
performance from accounting practitioners, especially those seasoned
in narrative financial statement analysis, in questions of
comprehension and interpretation of narrative disclosures.
In order to test the findings of this chapter in an accounting environment, a
sample of companies was selected for which both narrative and quantitative
information sources were available. Chapter 5 details the selection of such a
sample together with the objectives of each of the intended experiments.
86

CHAPTER FIVE
DATA SELECTION AND SAMPLING OF COMPANIES
5.1 OBJECTIVES OF SAMPLING PROCEDURE
Each of the foregoing chapters, 6 through to 10, is concerned with extensive
empirical exercises making use of a common set of companies. Details of the
administration of the individual experiments are contained in the
corresponding chapter, but here we describe the basis of construction of the
common dataset and of selection of the subsequent samples.
Experiments in the next five chapters are conducted to examine the content
and presentation of both narrative and accounting statement information,
utilising as far as Possible the same companies, in order to facilitate
comparisons both between companies and between alternative analytical
procedures.
Throughout we use the failed/non-failed decision as an initial task
environment since there is already a wealth of literature in this area. If the
techniques employed can be shown to be applicable to this task environment
they may then be extended elsewhere.
i ) Chapter 6 is concerned with the presentation of narrative and reports
on the administration of a CLOZE experiment, to determine how well
subjects of varying degrees of sophistication, can interpret narrative
financial messages. The intention is to demonstrate a difference
between 'readability' (as measured by standard formulae) and
'understandability' (as measured by target respondent) and to examine
their implications for the prediction of future company performance.
ii) Chapter 7 is concerned with the content of narrative and reports on
the administration of a content analysis, to determine the nature and
extent of the information conveyed in the chairman's narrative
statement.
iii) Chapter 8 is concerned with the content of accounting statements and
reports on the administration of an experiment in which the decision-
making capabilities of respondents are compared in situations where
their information sources are varied, comprising either/both
narrative or/and accounting statements. The intention is to determine
the incremental information content of the chairman's narrative over
and above that contained in the quantitative financial statements.
87

iv) Chapter 9 and 10 are concerned with the piesentatism_o_f_ausautiLgt
statements and report on the administration of an experiment to
determine the relative facility of respondents when making decisions
using traditional information sources (accounting statements and
financial ratios) and non-traditional sources (facial profiles). Here we
seek to explore the potential for improving the decision-usefulness of
financial information by varying the format in which it is presented.
A set of companies is required which is large enough to encompass the Whole
range of performance possibilities, but small enough to allow the generation
of efficient experimental designs consistent with the realistic administration
of empirical work.
A matching principle was therefore envisaged in order to sample pairs of
companies with many matching attributes, but differing significantly in
aspects of their financial performance. A number of essential
characterisitics of the matched pair was specified.
i) the two companies will comprise a failed/non-failed combination. One
company will have failed and ceased trading the other will be
apparently healthy and still trading;
ii) the two companies must display Z-scores of opposite signs. The failed
company is predictable as 'distressed' on the basis of its final published
annual disclosure prior to failure, recording a negative Z-score based
on Taller and Tisshaw (1977), while the non-failed enterprise records
a positive sign. The environmental predictability of the sampled pair
is therefore high, with both distinguishable on the basis of their past
financial profiles. Ideally the two companies will represent extremes
of relative financial performance, exhibiting a clear distinction,
rather than a combination of marginal-negative with marginal-
positive Z-score;
iii) the Chairman must report separately from his directors, in order to
provide a sample narrative suitable for analysis;
iv) the length of the narrative must satisfy certain minimum
requirements in order to facilitate the efficient administration of tests
of the content and presentation of narrative statements;
88

v) the two firms will be members of a common industrial sector, and
ideally have common product areas;
v i ) the firms must be of the same 'order' of size; ideally they will have
sales turnover figures which do not differ significantly;
vii) the firms should have common financial year ends to facilitate
comparison and minimise the effects of external economic factors.
No constraints on the size of the sample were imposed at this stage; the
objective was to generate as large a sample as possible of matched companies,
each match to include a recent failure. It was anticipated that further
subsampling might be necessary to generate efficient designs for the
respondent-based experiments.
In the only comparative accounting based study of narrative disclosures in
the literature Ingram and Frazier (1983) confine their attention to companies
within a particular industrial sector in order to avoid potential intra-
industry complications, such as those associated with specific technical
processes. However, this study, in attempting to discriminate between failed
and solvent companies, would have been intolerably constrained by such an
imposition - restricting the sample to maximum of about five companies
within a particular sector. We therefore seek as large a sample of companies
as possible, to facilitate statistical analysis of the results, consistent with a
requirement to overcome difficulties associated with technical language.
5.2 SAMPLING METHODOLOGY
To avoid industrial specific peculiarities companies were matched by
industry and then a further matching procedure was carried out in order to
pair-off these sector based companies. By matching simultaneously on sales
turnover and financial year end, both size and time differences should be
eliminated, or at least alleviated.
The initial selection of companies to form part of the narrative analysis,
therefore, followed the procedure below:
i ) Failed manufacturing companies were identified with a final year-end
prior to failure not earlier than 31 December 1978. Receivership,
89

voluntary liquidation and compulsory liquidation were taken to be
evidence of failure.
ii) Failed companies which were not exhibiting signs of financial
distress at the time of failure, were eliminated from the sample. A
negative Z-score based on the PAS formula (Taffler (1984)) was used as
evidence of financial distress. No companies were eliminated from
consideration on this condition.
iii) For each of the above companies narratives were sought in which the
Chairman reported separately from the Directors in the final Report
and Accounts. Norvic Shoe failed to satisfy this condition and was
eliminated from the sample. Scotcros was allowed to remain, even
though it was the Managing Director who reported separately, in the
place of a newly incumbent Chairman.
iv) The Chairman's Statement was considered of sufficient length to
facilitate the use of the Cloze procedure in measuring cognizability of
text. A minimum length of about 150 words is suggested by Taylor
(1953) and Miller and Coleman (1967) to allow between 30 and 50
deletions in text mutilation. Melody Mills, with only 51 words in the
Chairman's narrative was eliminated on this condition, but Woodrow
Wyatt, with only 147 words, allowed to remain.
v) For each remaining failed company a surviving enterprise was
identified which provided a close match on each of the following
conditions. Where no suitable matching company could be identified,
the corresponding failed company was removed from the sample:
a) a common industrial sector, wherever possible based on major
product area, otherwise on Stock Exchange Classification. Where
companies were widely diversified matching was attempted on
their chief area of activity. •
b) equivalent size, as measured by sales turnover, external to the
organisation and net of sales taxes. Wherever possible this
matching was completed on the basis of a direct numerical
comparison, but in difficult cases some matching was completed
on the basis of 'small' (turnover <E 10m) or 'very large' (turnover
>f 100m).
c) a common financial year end. Where month differences
varied a 3-month difference was sought, but a 6-month
difference tolerated where there was no suitable alternative.
.. 90

d) an indication of financial well-being to demonstrate a status
diametrically opposed to the distress of the failed set. Again the
PAS Z-score formula was employed, with a positive score being
sought. A significantly higher relative performance score,
compared to the corresponding failed company, was considered
essential. The relative performance (or PAS) score is
constructed by ranking firms in a particular year by their Z-
score in order to provide a measure on a scale from 0 to 100. The
PAS Score then indicates, on a holistic basis, the percentage of
companies doing less well in any year and provides an
intertemporal measure of relative performance in the
manufacturing and construction sector. A PAS-score difference
in excess of 20 points was employed as the acceptability
criterion.
Two of the surviving companies failed to satisfy this
condition. M Y Dart (Z-score = -0.82) was eliminated
along with Mettoy (Z-score = -8.25), its matched failure
in the toy sector. Similarly, Smith Whitworth (Z-score =
-2.57) and Wilshaw Securities (Z-score = -6.22) were
eliminated on the grounds of a common distressed profile.
e) Chairman reporting separately from his Directors.
Hence, Tomkinsons, Early's of Witney and Sumrie could
not be considered as potential matches for failed
companies within their respective sectors.
Chairman's narrative satisfying the 150 word minimum
length condition. Forminster (81 words) failed to satisfy
this criterion. •
A match was sought which simultaneously satisfied each of these
conditions.
91

Where potential matching companies failed to meet a critical criterion re-
matching was carried out on a next-best basis. Where no suitable matching
company could be identified, the corresponding failed company was removed
from the sample. This inability to identify a suitably close matching pair of
companies drastically reduced the number of companies under consideration.
The original database comprised the 54 failed companies from the quoted
manufacturing sector with last published accounts within the period
December 1978 to June 1985, but the resulting sample was reduced to 33
matched pairs (ie 66 companies). The companies, and matching criteria, are
to be found in Appendix 5.1.
5.3 SUBSAMPLING FOR CHAIRMAN'S NARRATIVE EXPERIMENT
(Ref: Chapters 6 and 8)
The above sample of 66 companies was used at the pre-test stage with student
respondents to establish two aspects with regard to the communication of
narrative:
i) an indication of the range of difficulty experienced in
understanding the narrative message, as a prelude to the
generation of a main test instrument employed in Chapter 6 to
measure cognizability.
ii) the extent to which the identity of failed and non-failed companies
might be misjudged on the basis of the Chairman's Statement alone.
The ease with which the message was comprehended, and the
interpretation placed on that understanding in terms of the financial
message conveyed, formed the basis of the test instrument employed in
Chapter 8.
A large sample of responses from 146 final year undergraduate finance
students from CCAT (Cambridge), with a limited exposure to the content of
voluntary narrative disclosures, allowed the generation of ranked groupings
based on degree of difficulty.
92

i) Each student processed five CLOZE manipulations to ensure that each
case had been completed at least nine times. The systematic
manipulation of text tests its comprehension by allowing content to be
predicted on the base of its adjacent context. Appendix 6.2.2 provides
an example of the test instrument.
Three groupings, of 22 companies each, emerged based on average
CLOZE score, as a measure of the ease with which a narrative message
was conveyed. These were recorded and termed:
DIFFICULT for scores in the range of 0% to 45%
MEDIUM for scores in the range of 45% to 52%
EASY for scores in the range of 52% to 60%
The percentage score indicates the success with which respondents can
'predict' words in a mutilated message. The actual range of scores, overall,
was from 33.2% to 64.2%. Although the numerical division between the
groupings was somewhat arbitrary, classification on the basis of equal
proportions allowed the identification of cases at extreme ends of the
cognizability scale, and facilitated further sub-sampling.
ii) Each student processed ten examples of the Chairman's narrative in
order to make a failed/non-failed decision on the basis of this source
alone. Each case was examined at least 15 times.
Three groupings, of 22 companies each, emerged based on the extent to
which a particular company was misclassified (ie: classified as failed
when actually non-failed, or classified as non-failed when actually
failed), based entirely on the interpretation of the content of the
Chairman's narrative. Appendix 8.3.1 a) provides an example of the
test instrument.
The % Misclassification score was recorded for each of the 66
companies and termed:
DIFFICULT for scores in the range of 100% to 37%
MEDIUM for scores in the range of 37% to 18%
EASY for scores in the range of 18% to 0%
93

The actual range of scores recorded was actually from 0% (case never
misclassified) to 100% (case always misclassified).
Again, an arbitrary numerical division between the groupings resulted, but
one which highlighted the degree of divergence between cases and provided
a classification on the basis of equal proportions.
Appendix 5.2 and Appendix 5.3 contain, respectively, details of the
preliminary company groupings based on the CLOZE Procedure, and the
Chairman's Statement Analysis. This dual three-fold split formed the basis of
a more elaborate experimental design, where the intention was to carry out
an in-depth study of a smaller number of cases selected from across the
whole range of narrative difficulty. The revised sample set ideally had
several desirable properties:
i) an equal number of failed and non-failed companies, to facilitate
variations in the proportions of each in the test materials;
ii) an equal number of Difficult/Medium/Easy cases from each of the
classification in order to generate an efficient experimental design;
iii) a relatively small number of cases overall to reduce the number of
sophisticated users required to repeat the test;
iv) a number of cases which would permit the randomising of the order of
processing for cases of different degrees of difficulty in order to
improve the internal validity of the test instrument;
v) a design permitting respondents to be tested on both aspects of the
analysis (ie CLOZE and Chairman's Statement) without identical cases
reappearing, and without exceeding a time constraint of about two
hours.
These conditions could not be satisfied simultaneously using a random means
of selection. The unevenness of distribution of the failed cases made
systematic methods difficult, and it proved impossible to produce a suitable set
of CLOZE procedures all of which comprised a mixture of failed and non-failed
cases. A 'next-best' approach was employed to devise a scheme which
employed only 36 companies in all (of which half were failed). The
94

distribution of companies allowed the generation of 18 sets of eleven
companies each.
This number allowed:
i) the running of a CLOZE procedure of 3 companies simultaneously with
one based on the analysis of 8 Chairman's Statements. None of the
companies from each part of the test were coincident;
ii) the number of failed cases in each of the Statement sets could
be varied from zero up to eight, in order to test for the effects of
varying base-rate probabilities;
iii) the CLOZE tests employed comprised one of each from the
Difficult/Medium/Easy groupings for each material set based on %
CLOZE Score, with ordering of processing varied to cover all
possibilities;
iv) the Chairman's Statement analysis comprised representatives from
each of the Difficult/Medium/Easy groupings based on %
Misclassifications, with the 3:3:2 distribution of cases varied to cover
all possibilities;
v) the 36 companies selected comprised 12 each from the three %
Misclassification groups. Of these, 18 companies (of which 11 failed)
were used in the CLOZE test, 6 each from the three difficulty groups.
The resulting experimental design for the major test instrument is detailed in
Appendix 5.4. The administration of the experiment and the results
generated are discussed in Chapters 6 and 7.
5.4 SUB-SAMPLING FOR THE FACIAL PROFILE5 EXPERIMENT
(Ref: Chapter 10)
As well as the linguistic aspects of communication, examined in Chapters 6 to
8, this study also investigates visual aspects of presentation. Initial
impressions and perceptions of information are important to the manner
with which it is used and the degree of reliability placed upon it. Bell
(1984a), among others, examines differences in perceptions between
narrative and numerical sources; Wright (1968) and Ehrenberg (1977),
95

among others, comment on the relative advantages of tabular-numerical and
graphical displays. Cleveland and McGill (1987) suggest that graphical
perception, the visual decoding process, is a controlling factor in the ability
of a graph to convey information.
Chapters 9 and 10 look at graphical methods of presenting accounting
information, culminating in an empirical study involving the use of
computer-generated graphics, in the form of facial portraits (termed 'picitcs'
by Harrison (1964)). The objective is to examine the relative advantages that
such a visual display might have over more traditional methods of presenting
financial statements.
The first experiment with the use of facial profiles in the representation of
financial information identified potential deficiencies in the procedures
adopted in the initial experimental study of Section 10.2. The test was,
therefore, repeated using a revised sample design employing a sub-sample of
the 66 companies identified above, and in Appendix 5.1.
Sample companies were selected on the bases of the values of three financial
ratios and their corresponding PAS (relative performance percentile) scores.
The ratios, indicating respectively profitability, financial risk and liquidity,
together provide a measure of overall performance. These ratios represent
the three most important dimensions identified by Sudarsanam and Taffler
(1980) in a principal components analysis of the relative financial
performance of companies in the manufacturing and construction sector.
The following criteria were sought:
i) a diverse set of financial profiles based on the use of only
three ratios, in order to • allow all possible variations of
assignment to be employed within a viable materials set;
ii) a sub-sample representative of the whole matched sample,
containing equal numbers of failed and non-failed companies
and ideally a series of matched pairs;
iii) a lack of duplication of ratio profiles, in order to avoid
identical facial portraits;
iv) avoidance of multicollinearity between the ratio sets.
96

A sub-sample of 30 companies was selected which largely satisfied the above
conditions. Appendix 5.5 details the financial ratios and PAS profiles of the
chosen set. Appendix 5.6 details the distribution of ratio values compared
with the complete matched sample, demonstrating the choice of a
representative group of companies with ratio values spread across the whole
of the percentile range.
In the eventuality only seven matched pairs (14 companies) were able to
satisfy the criteria for inclusion in the sub-sample.
The pooled within-groups correlation coefficient Matrix of financial ratio
values reveals relationships, not statistically significant at the 5% level,
between RISK (11-11•1W) and LIQUIDITY (Q A/CL) with r = -0.23, between RISK(PBITtr A) ,and PROFIT where r = -0.29, and between PROFIT and LIQUIDITY
where r = 0.2. The analysis by Sudarsanam and Taffler (1980) suggests that
for a large sample of companies (n = 547) these dimensions are orthogonal.
Random sampling was employed within the 30 company sets to generate
materials comprising ten companies each, with the number of failed cases
varying between zero and ten. This sample design then provided a
framework for the test instrument employed in Chapter 10 to evaluate the
decision usefulness of a facial profiles format.
Chapters 1 and 5 together establish, respectively, the experimental objectives
and sampling base fundamental to the empirical work of this thesis. Chapters
6 to 10 detail the methodologies employed and the investigative procedures
undertaken in the administration of the experiments.
97

CHAPTER SIX
COMMUNICATION OF NARRATIVE AND ACCOUNTING INFORMATION IN ANNUAL
ACCOUNTS
6.1 SHARED MEANING IN ACCOUNTING NARRATIVES
The measurement of meaning is an important research area in accounting,
not least since the absence of a shared meaning between producer and user
may have damaging decision-useful consequences. This chapter focuses on
the potential misinformation that might be conveyed by the Chairman's
narrative, and the different levels of understanding attributable to users of
varying degrees of sophistication.
The pioneering work of Haried (1972 and 1973) and Houghton (1987a, 1987b
and 1988) has largely been word based and restricted to financial statement
vocabulary. Thus Haried (1972) used the antecedent-consequent technique to
measure the denotative meaning of accounting terminology, ie perceptions
of an objective definition of events, and used the semantic-differential to
measure connotative meaning, ie subjective attitudes . towards the same -
events. Houghton (1987a) used the semantic differential technique to
measure inter-temporal changes in connotative meaning and Houghton
(1987b) demonstrates a lack of shared meaning for the concept 'true and fair
view' between accountants and shareholders.
Oliver (1974) extended the scope of Haried's studies from accounting
statement terminology to the concepts underlying their construction,
demonstrating a lack of communication between producers and users, and
marked differences in interpretation between accounting academics and
other groups.
This thesis develops this initial work in two directions:
i ) by extending word-based research from accounting concepts and
accounting statement terminology to the narrative content of
accounting disclosures
ii) by moving from a purely word-based approach to one that is
concerned with the message conveyed by phrases, sentences and
thematic content of the narrative.
98

Chapter 7 is concerned with the analysis of the content of the narrative. The
remainder of this chapter is concerned with the manner in which that
message is presented and in particular its degree of difficulty.
If the message intended by the preparers of accounting disclosures is to be
successfully conveyed the receiver must be able to both read and understand
it. Adelberg and Razek (1984) incorrectly make no distinction between the
terms 'readable' and 'understandable'. This work will demonstrate that the
differences between the two are both measurable and significant.
6.2 MEASURES OF READABILITY
Studies of readability of narrative accounting statements have focused on two
aspects:
i ) the understandability of the text and success in the communication of
accounting messages
i i ) the implications of particular levels of readability for other aspects of
financial performance.
The majority of research effort has thus far been directed towards the
former. Both Smith and Smith (1971) in the US and Healy (1977) in New
Zealand have raised serious doubts about the comprehensibility of footnotes
appearing in accounting disclosures. Smith and Smith found that less than
20% of the US adult population had achieved an educational level sufficient to
comprehend the messages appearing in 86% of the notes to financial
statements. On the basis of similar findings Healy noted: 'the majority of
footnotes to financial statements are of low readability, and this prevents
many investors from gaining the information which may be necessary for
rational economic decision making'.
Still (1972) used the Flesch reading ease formula to assess the readability of a
systematic sample of 50 UK Chairman's Statements, finding that 77% of the
reports required a level of reading ability which was beyond that of 80.7% of
US adults.
Stevens, Stevens and Raabe (1983) used the CLOZE procedure to measure the
readability of FASB statements, identifying two potential user groups who
found them unreadable. They emphasised the reliability of their procedure
in comparison to those based on sentence length and word difficulty and
99

recommended improvements to readability through the minimisation of
obscure technical jargon and a reduction in lengthy sentence patterns.
Adelberg (1979b) also used the CLOZE procedure on narrative disclosures,
finding that accounting policies, footnotes, managements' analysis of
operations and other narrative disclosures were not well understood by a
group of trainee bank loan officers. He further suggested the use of CLOZE to
replicate the study by Morton (1974), to determine whether message
manipulation was a function of understandability and operating
performance. The latter had established a positive correlation between the
understandability of disclosures in financial statement footnotes and
favourable nature of the content of these footnotes. His findings suggested
that negative disclosures may be shrouded in unnecessary complexity by the
preparers of accounts quite intentionally.
The Morton study is one of few which have attempted to relate readability and
financial performance. Another more recent one by Courtis (1986) reviewed
the limitations of readability formulae and applied the FLESCH (1974) and FOG
(1968) formulae to the Chairman's address and footnotes in a sample of
Canadian annual reports. He found no evidence to suggest that low
readability was related to either low profitability or high risk. This latter
study is notable for the manner in which it fails to give detailed
consideration to the LIX (Anderson (1983) and Bjornsson (1983)) and CLOZE
(Taylor (1953)) procedures, arguably preferable as readability measures in
an accounting environment. This prompts a discussion of the relative
advantages of the alternatives.
6.2.1 ALTERNATIVE READABILITY FORMULAE
Readability formulae have been widely adopted as alternatives to reader-
feedback and comprehension tests in assessing the difficulty of narrative
passages. They are all based on two features:
i ) word length (w) - related to speed of recognition, and
ii) sentence length (s) - related to a recall of words in the
immediate memory.
Word and sentence complexity cause the greatest difficulty, but mere length
is much easier to measure. Several authors, notably Klare (1974-75) and
Davison and Kantor (1982) have argued that reducing sentence length will
100

not necessarily improve matters, since the addition of subordinate clauses
often aids comprehension.
The following abstracts are illustrative of the differences in complexity of
Chairman's Statements attributable to sentence length:
The Annual Report for George Spencer PLC at 31 December 1983, the last
prior to failure, includes the following within the Chairman's Statement:
"In the Dyeing and Finishing area we have found it necessary to
establish and fund an operation alternative to that previously
conducted by Saxby in order to reduce a potentially extremely large
claim for damages in respect of the three year agreement with Nova
which would fall on Saxby to the detriment of creditors of the company
and would also have led to a claim against George Spencer PLC by
reason of its guarantee of Saxby's obligations under the agreement".
A sentence of 80 words in length, without any punctuation whatsoever.
In contrast the Report of Ruberiod PLC (a financially sound company) at 31
December 1981, has the following paragraph in the Chairman's Statement:
"Contracting
This Division is mainly concerned with roofing and cladding. Contrary
to popular experience our level of completed contracts and profits
shows a marked improvement. The incidence of completed contracts
has a noticeable effect on profits. This year was particularly good".
Four short sentences in all in a simple paragraph of only 40 words, and an
average of only 10 words per sentence. A paragraph typical of the style of
the statement as a whole.
It is interesting to note that statements disclosed by other companies under
the common chairmanship of Thomas Kenny are written with a similar style
and clarity to that of Ruberoid. Thus Grimshawe Holdings (30 April 1981) a
failed company, exhibits similar low levels of both word and sentence
complexity. Words per sentence of 16.27 (Ruberoid 14.38) and syllables per
word of 1.61 (Ruberoid 1.66). Jones (1988) details the results of a case study
devoted to the examination of the readability of the narrative of one company
(H-P Bulmer) over a period of time. His findings suggest that readability is a
101

function of company size and personality of chairman, as well as declining
over time. In these instances the chairman clearly has close control over the
content and presentation of the narrative, but there is no authoritative
literature to confirm that this is a widespread phenomenon.
Different readability formulae arise because of different measures of 'word
length' and different weightings applied to the component parts. Three
representatives of the infinite possible alternatives are worthy of detailed
consideration:
i) FLESCH = 206.385 - 0.846W - 1.015S
whereW = Word length = no of syllables per 100 words and
S = sentence length = total no of words/total no
of sentences
The formula is simple to compute apart from the tedious necessity of counting
all of the syllables and determining the number of syllables in certain
problem words (eg, stopped, USA and 1987).
The calculation represents a deduction from the base constant for both word
and sentence complexity, so that the higher the score the easier the
readability (ie, 80+ for comic journals, but less than 50 for academic
literature, and less than 30 for technical and scientific articles. Most
accounting communications would be expected to coincide with the academic
literature category since they do not contain the same level of technical
jargon as academic journals).
i i ) FOG INDEX = 0.4 (W S)
where S = average number of words per sentence
and W = % of 'hard' words in the passage
The definition of a 'hard' word is most ambiguous and is a considerable
weakness in the use of this formula (Kwolek (1973)) Such words include
abbreviations, words having three or more syllables and symbols. But these
exclude arithmetic operator symbols, capitalised words, combinations of easy
words and verb forms ending -es, -ed or -ing. Thus 'profitable' might be a
hard word but not 'profiting' or 'bookkeeper'.
102

The calculation is incremental with increased complexity so that the higher
the score the more difficult the readability (ie, less than 14 for newspapers
and comics, but greater than 17 for scientific and technical literature).
i i i ) LIX FORMULA = S + W
where S = average number of words per sentence
and W = % of words of seven or more letters
The advantage of using a particular word length is great both for speed and
reliability of calculation, Harrison (1980) and Anderson (1983) found the
application of LIX both reliable and consistent for ' passages over five
languages, so, since we have defined accounting as a language in Section 4.1,
it would appear reasonable to extend this consideration to narrative
statements in the annual report. The choice of seven letters as the cut-off
point identifying difficult words seems somewhat arbitrary and it may be
that a higher cut-off is more appropriate for complex technical literature in
the accounting environment. This possibility is tested in Section 6.2.3. •
Whereas these three measures predict readability without reference to
context, the CLOZE procedure, importantly, differs in predicting the
understandability of a complete passage based on a measure of
comprehension of the contents of a sample of text. The procedure is a simple
one and involves the mutilation of narrative passages by the deletion of
every nth word and its replacement by a blank space. Respondents are then
required to predict the correct insertion for the blank based on the
surrounding context.
Taylor (1953) has shown that deletion of every fifth word gives optimum
results and that a variety of subjects will provide near identical rankings of
different passages. For passages containing unusual content he found CLOZE
more reliable than standard formulae like FLESCH and FOG. Bormuth (1968)
found CLOZE test scores of 44% and 57% on English comprehension passages
to be comparable to multiple-choice test results of 75% and 95% respectively.
The percentage of correct replies is so low because only exact responses are
treated as valid.
Miller and Coleman (1967) appear to have conducted the most extensive
validation of the CLOZE procedure to date finding cross-correlation . results of
greater than 0.9 for:
103

i ) Five versions of the fifth word deletion to cover every word in each
position in the sentence.
ii) Multiple versions with only one word deleted from the passage.
iii) An every-word deletion system with incremental information provided
by revealing succeeding words one at a time.
They also experimented with alternative scoring systems comparing the
traditional method, allowing only exact insertions, with a weighted version
scoring 3 for exact word; 2 for synonym; 1 for correct word form. Since the
systems correlated at 0.99 they concluded that the simpler, traditional method
of measurement was preferable.
Follow up studies by Erickson and Hansen (1974) and by Bartoo (1975) have
found no significant difference in CLOZE scores when either 'buffer zones' of
unmultilated text are inserted, or when the amount of unmutilated text
preceding the first CLOZE blank is varied.
Nestvold (1972) and Aquino (1969) have found that CLOZE procedure scores
correlate highly with readers perceptions of the degree of difficulty of
narrative. These studies would thus appear to go some way in alleviating
Adelberg's (1979b) concern that CLOZE procedures must be shown empirically
to be valid measures of reading comprehension if they are to be used to
measure readability in the accounting environment. But Haried (1972)
warns that 'reliance on empirical evidence generated by researchers in
fields such as psychology, sociology and economics may be inappropriate
when used to support hypotheses in accounting research'. Such a concern
might suggest that further research is necessary to confirm that the 57%
CLOZE criterion level is appropriate to technical accounting communications.
Adelberg and Razek (1984) applied the CLOZE procedure to discriminate
between accounting textbooks and recommend its further validation with
accounting communications.
This study recognises the relative neglect of LIX and CLOZE procedures for
assessing readability/understandability in the accounting environment and
addresses the situation by testing the hypotheses below.
104

Hypotheses:
1101: Null Hypothesis: no relationship between company size and
length of narrative.
HI: The length of the Chairman's Statement is a positive function of
the size of the enterprise.
H02: Null Hypothesis: no relationship between readability and
financial performance.
H2: The readability of the Chairman's Statement is a function of the
financial health of the enterprise, as measured by its Z-score.
H3: Null Hypothesis: no relationship between readability and
company status.
H3: The readability of the statements of failed companies is
significantly lower than that of surviving matched enterprises.
6.2.2 EXPERIMENTAL PROCEDURE
A sample of 66 companies was selected in accordance with the matching
procedure detailed in Chapter 5. The Chairman's Statements for each of these
companies were entered onto computer file and the Oxford Concordance
Program (OCP) (Hockey and Martin (1988)) developed by Oxford University's
Quantitative Linguistics School, used to generate a series of indicators:
i ) the total number of words in each statement;
i ) a keyword sort based on word length, to identify the
incidence and distribution of long words;
i i i) the total number of sentences;
iv) an alphabetical sort of words, to allow the compilation
of a statement dictionary;
v) a concordance of the context of the incidence of all
potential keywords.
105

This information allowed the calculation of:
i) LIX scores as measures of readability
ii) measures of correlation between turnover, readability,
Z-score and length of statement
iii) tests of significance for readability differences
between matched pairs of companies.
The following normal conventions were adopted:
i) Year dates (eg, 1987) treated as one word
ii) Numerical product names treated as words (eg, S10 = one
word, Dragon 32 = two words)
iii) Initials (eg, PLC, UK, USA, EEC, ECGD) treated as one
word
iv) Non-date numbers not counted as words
v) Hyphenated words treated separately except when they are
unable to stand alone in the text:
(eg, long-term = two words, co-operate = one word)
vi) Apostrophes discounted except where meaning is affected
(eg, company's treated as a 7-letter word; but care
exercised in distinguishing we'll from well).
Appendix 6.2.1 details the calculated values of LIX and FLESCH readability
scores for each of the 33 failed and 33 non-failed companies. The
development of the research instrument, to conduct the CLOZE experiment,
followed the application of the mutilation procedure to each of the
Chairman's Statements, or to a sample of text from the statement, where its
length precluded the use of the statement in its entirety.
Taylor (1953) suggests the use of 'about 50' deletions in the CLOZE test, while
Miller and Coleman (1967) used 30 deletions in each of their validation
studies. Pilot runs of the CLOZE procedure with a group of 20 business
undergraduates suggested that deletions in excess of 100 took too long to
process and caused respondent fatigue.
106

Accordingly the whole statement is used only when it is short enough to
provide around 30 to 50 deletions (ie, word length of 150 to 250 words). In all
other cases, the divisional review is eliminated from the statement and CLOZE
fifth-word deletions carried out on the remainder. The common core of
narrative therefore comprises an overall review of operations, strategy and
future performance projections. In some cases this results in more than 50
deletions, and overall variations in the number of deletions range between 30
to 80.
The resulting statements are retyped and mutilated so that every fifth word is
replaced by a line ' ' in each case of fifteen-character width. The
deletions commence at the fifth word in the passage and continue at equal
intervals throughout except for the incidence of proper names, dates and
numbers.
The revised passages were pre-tested on a group of 146 undergraduate
finance students, with each CLOZE statement measured on at least nine
separate occasions by different respondents. Each respondent completed five
such statements. Appendix 6.2.2 provides an example of the research
instrument, together with the instructions issued to respondents.
6.2.3 EXPERIMENTAL RESULTS
The computation of LIX and FLESCH scores and the administration of the CLOZE
procedure on a student audience allowed the testing of the Hypotheses of
Section 6.2.1:
Table 6.2.1 demonstrates that the length of statement, measured in
terms of both Number of Words and Number of Sentences was found to
be significantly related to the size of the company, as measured by
Sales Turnover. The numerical content of the statements too was
significantly related to size.
The Null Hypothesis Hi therefore rejected at the 5% level of
significance and the alternative H1 accepted.
107

SALES TURNOVER
FAILEDCOMPANIES
NON-FAILEDCOMPANIES
ALLCOMPANIES
No of Words 0.483 0.594 0.439
No of Sentences 0.490 0.613 0.484
No of Numbers 0.382 0.643 0.434
TABLE 6.2.1: CORRELATION COEFFICIENTS: STATEMENT LENGTH/SIZE
H2: Table 6.2.2 shows that Readahility, measured in terms of word and
sentence complexity by the LIX and FLESCH scores, was found to be
significantly related to financial performance. The level of
intercorrelation between the two scores was significantly high
(r = -0.78). The Null Hypothesis H02 is rejected at the 5% level of
significance and the alternative H2 accepted.
FINANCIAL PERFORMANCE (Z-SCORE)
FAILED NON-FAILED ALL COMPANIES CQMEAHLES. COMPANIES (Z-score ) STATUS (0.1)
LDC SCORE 0.055 -0.253 -0.317 -0.278FLESCH SCORE -0.181 0.406 0.410 0.344
TABLE 6.2.2: CORRELATION COEFFICIENTS : READABILITY/PERFORMANCE
H3: A comparison of the readability of the statements of failed and non-
failed companies in Table 6.2.3 on the basis of overall groupings, and
on the basis of a matched pair-wise comparison, reveals significant
differences. The statements of failed companies exhibit significantly
lower readability. The Null Hypothesis F103 is therefore rejected at the
5% level of significance and the alternative H3 accepted.
FAILEDCOMPANIES
NON-FAILEDCOMPANIES
PAIRWISEDIFFERENCE
LDC SCORE Mean: 56.71 53.68 3.03SD: 4.33 5.87 (t=2.67) 6.37 (t=2.32)
FLESCH Mean: 33.11 38.32 5.21SCORE SD: 6.09 7.98 (t=3.16) 9.17 (t=2.89)
TABLE 6.2.3 READABILITY COMPARISONS: FAILED/NON-FAILED COMPANIES
108

A further analysis of the LIX formula was undertaken to examine its
operation in an accounting environment. Alternative versions of the LIX
score were calculated to test the arbitrary nature of its traditional definition
ux SCORE = WORDS + % Hard Words
SENTENCES
where Hard Word = one with 7 or more letters.
Alternative definitions were examined for 8, 9, 10, 11 and 12 or more letters
and the corresponding LIX scores computed. The significance of the
difference in scores, on each basis, was tested between Failed and Non-failed
companies and the results displayed in Table 6.2.4. The score calculated on
the basis of the traditional definition of 'hard word' proved the most
significant.
Difficult Word =7 or more letters
Difficult Word =8 or more letters
Difficult Word =9 or more letters
Difficult Word =10 or more letters
Difficult Word =11 or more letters
Difficult Word =12 or more letters
FAILED NON-FAILEDCOMPANIES COMPANIES
56.71 53.68
47.06 45.64
39.92 38.53
34.43 33.45
31.05 29.92
28.77 27.66
•
t-STATISTICS
2.42
2.25
2.39
1.96
1.79
1.68
TABLE 6.2.4: MEAN LIX READABILITY SCORES: ALTERNATIVE VERSIONS
CLOZE scores computed for the complete sample of companies using student
respondents generated the results reproduced in Appendix 5.2. A comparison
of readability scores (LIX, FLESCH) with understandability scores (CLOZE)
revealed a low but significant level of correlation between the two.
109

However, while the two formula based scores (LIX and FLESCH) are highly
correlated (r=-0.78), their correlation with the CLOZE score is relatively low,
respectively (r=-0.23) and (r=0.30). This marked difference suggests that
'readability' and 'understandability' are indeed different concepts.
Appendix 6.2.3 details descriptive statistics for the entire readability study.
Student respondents were also asked to rank their CLOZE statements in
accordance with their perceived difficulty in completion. The rankings of
Perception of difficulty and actual CLOZE score were significantly positively
correlated (r=0.303 with t=2.545) but the level of correlation lower than that
attributable to the findings of Nestvold (1972).
The CLOZE score computations above allowed divisions according to degree of
difficulty to be made in accordance with Section 5.3 and Appendix 5.2
facilitating the selection of a subsample of companies for testing on a more
sophisticated audience. An experimental design (detailed in Appendix 5.4)
was formulated which specified 18 separate sets of test materials. Each of
these sets comprised 3 CLOZE cases - one designated 'easy', one 'medium' and
one 'difficult' - corresponding to one, two or three failed companies. Failure
base rates were incorporated into the experimental design by varying the
proportion of failed cases in the set. Of the 18 material sets 6 contained 1
failure, 9 contained 2 failures and 3 comprised 3 failures.
The design of the experiment allowed for a repeat of the cases so that only 18
companies were included. The administration of the complete experiment, of
18 material sets to 18 respondents therefore allowed each of the 18 companies
to be processed three times.
The experiment was administered to a group of (n=18) accounting
practitioners from the London Office of a Big 8 company and comprising 3
partners, 6 managers, 6 seniors and 3 assistants. Appendix 6.2.4 details the
mean CLOZE scores recorded for each of the 18 cases, together with a
comparison of the associated student-based scores. Table 6.2.5 displays the
overall mean scores for accounting practitioners together with mean CLOZE
scores for accounting undergraduates, and associated readability scores for
110

the same cases. Ranked order of difficulty is similar throughout, but absolute
differences in scores are statistically significant (t=3.04), with the
practitioners outperforming the students. There is no suggestion in this size
of sample (n=18) that failure base rates influence the scores, but this needs to
be tested on a larger audience.
CLOZE SCORES (%) LIX FLESCHACCOUNTANTS STUDENTS SCORES SCORES(n=18) (n=146)
MEAN 57.7 48.5 56.5 34.2
STANDARDDEVIATION 8.8 8.8 4.2 6.2
TABLE 6.2.5: CLOZE SCORES AND READABILTTY SCORES
Interestingly the practitioners recorded higher CLOZE scores than did the
students on every single case. The correspondence of the Accountant's mean
CLOZE score with the 57% readability criterion suggested by Bormuth (1968)
is notable.
Out of the 7 non-failed cases in the sample of 18 companies, 4 of these were
considered the easiest to process, with CLOZE scores in excess of 66%; Of the 8
cases with scores less than 55%, 6 of these were failed companies.
Appendix 6.2.5 details the distribution of Readability and Cognizability
(understandability) scores, establishing a reference for degree of difficulty
related to the sophistication of the user. This distribution adds CLOZE scores to
those of Anderson (1983) for LIX scores and Courtis (1986) for FLESCH scores.
6.2.4 CONCLUSIONS
The experimental results provide empirical support for the hypotheses
advanced above.
i ) the length of the Chairman's Statement (measured in terms of the
number of words, sentences and numerical references) is positively
related to the size of the enterprise (measured by its sales turnover).
This may be attributable to the complexity of the organisation and
diversity of functions.
111

ii) the readability of the Chairman's Statement, in terms of word and
sentence complexity, as measured by the LIX and FLESCH indicators is
significantly correlated with the financial performance of the
enterprise, as measured by the Z-score. Low readability is associated
with poor financial performance, and in some instances may be
consistent with deliberate obfuscation in order to conceal poor results.
This conclusion is in direct conflict with that of Courtis (1986), who
found no systematic relationship between low readability, and high
risk.
iii) a matched comparison of failed and surviving enterprises revealed a
significant difference in the level of readability. Readability scores
among the failed group were significantly lower than among the
survivors, suggesting that the readability index has potential
predictive power in the identification of failure candidates.
iv) the understandability of the Chairman's Statement, as measured by the
CLOZE score, was not highly correlated with associated measures of
readability, suggesting that different concepts are being measured by
these indicators. These results, in an accounting environment, differ
from those detailed by Bormuth (1968) with other narrative sources.
The absolute level of CLOZE score differed significantly according to
the level of accounting sophistication of the user. This suggests that
understandability is related to context and to education and experience,
and constitutes a different measure to readability indices calculated
independently of either context or user. Any attempt to measure the
understandability of accounting narrative messages should be related
to the target audience, suggesting a preference for the CLOZE
procedure.
The findings of this chapter suggest that the readability of the Chairman's
narrative is performance related and that complexity of presentation is
associated with the communication of 'bad news'. This relationship suggests
that a measure of readability might constitute a useful explanatory variable
in the construction of models classifying potentially failed companies.
112

Chapter 7 goes beyond merely a consideration of the presentation of
narrative, to a detailed analysis of the content of that narrative. The
potential implications are correspondingly decision useful in that narrative-
based variables might be identified which improve on the predictive ability
of existing performance related models.
113

Message Message
CHAPTER SEVEN
INFORMATION CONTENT OF NARRATIVE DISCLOSURES
Shannon and Weaver (1949) modelled the communication process in a
manner suitable to describe the effect of accounting disclosures:
Informationsource Transmitter Receiver Destination
----obi 1--4.-
Signal L Receivedsignal
Noisesource
FIGURE 7.1: THE COMMUNICATION PROCESS (SHANNON AND WEAVER)
, 114

(InvestigationProcess)
Conception ofIdea
(EncodingProceu)
Creation of
Message
(DecodingProcess)
Hearing-Seeing
Interpretation
Evaluation
Response
NOISE
(CommunicationEffects)
SubsequentThought and
Action
NOISE
Determination Adaptation ofof Intent
Message
Selection of I TransmissionMeaning I of Message
I r - Feedbock•
Induc.Adooation I
I
NOISE I NOISE
'Noise' can be any disturbance in the channels of communication that
interferes with the signal transmitted and causes a different signal to be
received than the one intended. The source of 'noise' may be attributable to
the potential conflict arising from the simultaneous disclosure of several
pieces of accounting information, or to educational and experiential
differences which cause a breakdown in the communication process. Laswell
(1948) emphasises the importance of 'Effect' to the right hand side of such a
diagram, an appropriate addition for accounting communications in which
the decision-usefulness of information is of central consideration.
McCroskey (1968) provides a more detailed version of the process in which a
feedback channel is added, with the potential to influence future
communications, and alternative sources of 'noise' identified in the
'encoding' and 'decoding' processes.
Prior to AfterRHETORICAL COMMUNICATION PROCESSCommunication I I Communication
SOURCE
CHANNEL RECEIVER
NOISE NOISEMessage
I
L_NoisF EEEDBACK CHANNEL 1 1
L-76.Feedback
NOISE I.1
FIGURE 7.2: THE COMMUNICATION PROCESS (McCROSKEY)
115

Noise in the encoding process may be attributable to the adoption of language
or tone inappropriate to the target audience. It may arise as a result of
misunderstanding of the message to be conveyed.
Noise in the decoding process may be attributable to educational, experiential
or differences apparent between the user and the preparer of the
communication. Where general purpose annual accounting disclosures
predominate, with no specific audience targetted, misunderstandings
resulting from noise are inevitable.
If the intended message conveyed by the preparers of narrative statements
differs from that received by users, two alternatives are possible:
i) the receipt of misinformation, or at least only partial
information,
ii) the receipt of incremental information unintentionally
disclosed.
A systematic analysis of the application of content analysis to accounting
messages is long overdue, particularly in terms of our objective of improving
their decision usefulness. This study attempts to redress the balance by
conducting a content analysis of Chairman's Statements to determine
whether they convey information which is different to that apparent from
the financial statements.
Krippendorff (1980) has defined content analysis as 'a research technique
for making replicable and valid inferences from data to their context'. In
using narrative passages the basic unit of data is the word, and most
inferences in content analysis studies have been made on the incidence of
individual words and of collocations of one or more words.
Content analysis has received only fleeting reference in the accounting
literature to date, with principal applications elsewhere. Statistical studies of
literary style to solve disputes about the authenticity of writings began as far
back as 1851 (Kenny (1982)) but without great success until the 1940's, by
which time they were being applied in the psychological field. In this
respect Moskovich (1977) cites the use of the co-occurence of words in letters
as indicators of the corresponding connections in the minds of mental
patients.
,. 116

Morton (1978) makes the following word classification:
nouns - indicative of the subject matter of the text without indicating
anything of the author;
verbs, adjectives, adverbs - influenced by textual content, but also likely
to be author dependent, since 'though used a variable number of
times by different authors, [they] seem to be drawn by each
author from a constant stock and so be typical of an author'.
function words - particles (eg, a, an) and connectives (eg, and, but)
not influenced by textual content, but reflective of style
and authorship.
Authorship studies have therefore been massed around non-noun words.
Mosteller and Wallace (1963) constructed a linear discriminant model
allowing them to distinguish the disputed authorship of Federalist papers
based on the incidence of the words 'whilst', 'upon' and 'enough'. Stone and
Hunt (1963) adopted a similar approach in following the pioneering work of
Osgood and Walker (1959), by distinguishing between fake and genuine
suicide notes on the basis of the use of concrete references to things and
persons, the word 'love', and reference to thoughts and decisions.
Though successful in the analysis of word patterns and sequences, fewer
studies have been devoted to an analysis of meaning, and the hidden
messages conveyed in narratives. Berelson (1952) discusses the use of
content analysis to expose propoganda techniques in political speeches, and
in a similar context Ertel (1976) developed a 'dogmatism quotient' based on the
choice of dogmatic and tentative alternatives in the works of philosophers
and politicians, to measure the tone of the communication. Of perhaps wider
application, Janis and Fadner (1965) produced a 'coefficient of imbalance' to
measure the degree to which favourable statements outnumber unfavourable
ones, when attempting to determine future intentions from political
statements.
7.1 CONTENT ANALYSIS APPLICATIONS IN THE ACCOUNTING ENVIRONMENT
As indicated above there have been few applications to accounting
narratives. This might be considered surprising in that annual reports
might variously be viewed as 'an undisguised advertisement' or 'platforms for
preaching [management's] philosophies and [for] touting themselves and
their companies' (Ingram (1983)), and the hypothesised misrepresentation of
firms performance by management (Salamon and Smith (1979)). Bowman
(1984) used the number of occurrences of the word 'new' in the Chairman's
117

firms performance by management (Salamon and Smith (1979)). Bowman
(1984) used the number of occurrences of the word 'new' in the Chairman's
Statement as a measure of managerial risk, and emphasised the advantages of
content analysis as an unobtrusive measurement, since the statements are
written for purposes and audiences different from those constituted by
content analysts.
Several attempts have been made, notably by Peel et al (1985) and Keasey and
Watson (1986), following Argenti (1976), to include non-quantitative
variables in bankruptcy prediction models as proxies for financial ratios.
These have included the shareholding and resignations of directors and the
introduction of share capital but this approach strays from a content analysis
based on word-meanings and occurrences.
We are all familiar with references in the Chairman's Statement to 'being
poised to take advantage of any upturn' and of expressing 'appreciation of
the support and understanding of our bankers'. This study is concerned with
the significance that might attach to such references.
More specifically, we are faced with Mettoy's (1982) admission:
'the much greater improvement in performance which was
anticipated did not arise since the foreseen increase in turnover did
not occur'.
And that of Cocksedge (1984):
'Recovery is taking longer than we had hoped but I believe there are
now grounds for cautious optimism'.
Both companies subsequently failed.
Although damning in isolation such remarks should be considered within the
context of the remainder of the Chairman's Statement in a systematic analysis
of content. Rather than emphasising anecdotal instances, this study conducts
such a formal analysis.
118

Krippendorff (1980) identifies the major components of content analysis
methodology, using the 'word' as the basic 'unit' of measurement:
i ) Data making - the counting of all separate units, or sampling
where the number of- units is unmanageably large.
The measurement of units may be in absolute terms,
or relative to the total number of units.
i i ) Data reduction - contextual classification of units either through a
factor analysis or by allocation to investigator-
specified categories. This process may be eased
through predetermined or synonym dictionaries.
i i i ) Statistical Inference -test of difference of number of occurrences
between subjects or comparison of the observed
number of occurrences with that expected if
occurrences were to be distributed proportionally
over all observations.
iv) Analysis - identification of the key discriminatory features.
v) Validation - test of qualitative standards and reliability.
The type of approach recommended has been used by Frazier et al (1984) with
a program call WORDS, originally developed by Iker (1974) for use in a
psychoanalytic environment. The program employs objective procedures in
its analysis of narrative accounting disclosures and is not restricted by the
need to preassign semantic tags.
WORDS isolates the most frequent content words, deleting function words, and
tags and lemmatises them into their root forms. Intercorrelations between
words are obtained, the assumption being that high correlations correspond
with particular content references. A factor analysis then determines the
dimensions which account for the obtained correlations, and these are
subjectively interpreted. The technique therefore relies on frequency of
occurrence and redundancy of language: repeated words and phrases are
conveying the important messages in the communication.
Lothian (1976) addressed the question of redundant information in the
annual report and regarded it as a factor which guarded against
misinterpretation, while Lee and Tweedie (1977) thought it reinforced their
communication objectives. Luhn (1957) thought that redundancy and
thematic repetition be characterised by what he described as the 'major
notion':
119

'a notion occurring at least twice in the same paragraph ... [or] which
occurs also in the immediately preceding or succeeding paragraph ...
even though it appears only once in the paragraph under
consideration'.
This continuing repetition of a common theme and persistence in returning
to a particular topic is common among Chairman's Statements. Witness, for
example, the report of subsequently failing Berwick Timpo PLC for year
ending 31 December 1981. A complete paragraph is devoted to a detailed
examination of falsification of accounting records, but these irregularities
are also mentioned in four other paragraphs of the statement, three
preceding and one succeeding. Such exposure ensures that 'major notion'
status be devoted to their theme.
Similarly, the five-paragraph statement of failing Nova (Jersey) Knit PLC for
year ending 31 March 1984 contains four with detailed reference to the
relocation of the Dyeing and Finishing plant.
There are, however, potential difficulties in several aspects of the application
of content analysis. Hockey (1980) has recommended the use of prose text of
at least 100 consecutive sentences - thankfully, a rare occurrence among UK
Chairman's Statements. Oakman (1984) has stressed that although the
instances of words and phrases in text can be identified systematically, they
must usually be channelled into categories which are investigator-specified.
Baker (1962) observes that discrimination between documents based on
keywords is highly dependent on the choice of keywords, which in the face
of an overwhelming variety of potential word-variables, must be investigator
Specified.
Such difficulties are recognised and addressed in this study:
i) a copy of the WORDS package was secured, but discarded on the grounds
of complexity and rigidity. A combination of text analysis with the
Oxford Concordance Program (OCP) (Hockey and Martin (1988))
together with a comprehensive statistical package (SPSS-X) (Nie and
Hull (1984)) was preferred on the grounds of flexibility and ease of
operation.
- 120

i i ) the need for investigator-specification of keywords was recognised
and a literature search performed in order to establish a suitable
classificatory framework.
7.1.1 CLASSIFICATORY SYSTEMS FOR CONTENT ANALYSIS
Osgood, Suci and Tannenbaum (1957) identify two classification systems
worthy of consideration, each designed to analyse group differences and
allow content characteristics to be related to quantifiable variables outside of
the text analysis:
i ) The semantic analysis of content. The semantic differential offers a
method of mapping certain aspects of a passage so that objects can be
represented in multidimensional factor space. Experiments reveal
roughly the same three dimensions:
EVALUATIVE: Positive evaluation - Negative evaluation
POTENCY: Strong - Weak
ACTIVITY: Active - Passive
Houghton (1988) provides results which are substantially supportive of those
of Osgood et al. In an intertemporal study of meaning in accounting he
identifies a four-factor cognitive structure:
EVALUATIVE: Beneficial - Adverse
POTENCY: Tangible - Intangible
ACTIVITY: Dynamic - Static
MANAGEABILITY: Expected - Unexpected
* 121

ii) A structural analysis of language using the Need - Achievement (N-
Ach) scoring system.
following achievement
category):
NEED
TO-BE
COMPETE
VERB-POSITIVE
ADVERB-POSITIVE
ADJECTIVE POSITIVE
VALUE-POSITIVE
ROLE-POSITIVE
BLOCK
SUCCESS
FAILURE
AFFECT-POSITIVE
AFFECT-NEGATIVE
TIME
This suggests a classification under the
tags (with sample words to illustrate each
(wants, desires, hopes)
(become, becoming)
(win, gain, surpass)
(doing, making, working)
(carefully, cautiously, thoroughly)
(great, powerful, promising)
(discovery, creation, intelligence)
(lawyer, executive, professor)
(broken, damage, crisis)
(fame, glory, honour)
(error, incorrect, mistake)
(happy, cheerful, delighted)
(sad, anxious, sorry)
(lifetime, life, years)
Some of these categories are clearly more applicable to narrative accounting
statements than others, so a pilot study was carried out using a combination
of the two approaches suggested above.
7.1.2 EXPERIMENTAL PROCEDURE: WORD CONTENT
A pre-sample of 12 companies (not part of the final sample of 66 companies)
was used to develop rules for the identification of content within narrative
statements. Data had been collected on these companies with the original
intention of their being included in the study, but they had been eliminated
for failure to comply with the constraints of Chapter 5.
Six 'distressed' and six 'healthy' companies were selected reporting over the
period 1981 to 1984. The two sets were drawn from diverse sectors of
manufacturing industry (including engineering, construction, industrial
plant, motor components, electrical and textiles) in an attempt to replicate
the technical and environmental language to be expected in the major
sample.
122

These companies, detailed in Appendix 7.1.1, comprised two sets:
i ) a financially distressed set of companies, all having negative Z-scores,
but comprising 2 failed companies (Mettoy, Wilshaw), one taken over
as an alternative to failure (Dunlop) and 3 companies who continue to
trade (BSR, Smith Whitworth and MY Dart).
ii) a relatively healthy set of successfully trading companies.
The Chairman's narrative for each of these companies was subjected to the
Oxford Concordance Program to provide an alphabetic sort and concordance
for each of the words occurring.
Using the concordance to verify coincidence of meaning, words were
lemmatised to allow counts of those words with common roots (eg, profit,
profits, profitable, profitability), and then allocated to message categories.
Function words, not influenced by textual context, were eliminated from
consideration and the remaining keywords allocated to appropriate meaning
categories. Independent verification was carried out independently by two
other accounting academics, with a substantially similar categorisation.
The resulting classification provides eight categories to form the basis of an
analysis of keyword content:
1 Uncertaintly regarding the future
2 Vagueness about the past/present
3 Emphasis on maintaining the status quo
4 Reluctant need to take action
5 Dependence on external economic factors
6 Reference to measures of past performance
7 Detailing of Positive achievements
8 Detailing of Negative occurrences
These categories are consistent with the classifications of Osgood and
Houghton, above:
EVALUATIVE:
Beneficial (Positive Achievement) - Adverse (Negative Occurrence)POTENCY:
Tangible (Degree of Certainty) - Intangible (Vagueness)
ACTIVITY:
Dynamic (Measure of Performance) - Stati_e (Reluctant Action)
MANAGEABILITY:
Expected (Status Quo) - Unexpected (External Factors)
123

Appendix 7.1.2 details the keywords (168 in all) identified under each of the
classification categories.
7.1.3 EXPERIMENTAL PROCEDURE: SENTENCE CONTENT
A similar procedure was conducted on the pre-sample in order to establish
the thematic content of each sentence in the narrative. This procedure is
common to that adopted with the main sample and is therefore presented
here is some detail.
Each sentence registered a theme score of 1 unit. Where a sentence
comprised several separable themes then this unit was subdivided to register
the relative importance of that theme in the narrative. No distinction was
made between the length of sub-classes in any sentence, so that if a sentence
comprised four themes, each was accorded a theme-score of 0.25. The overall
score accorded any particular theme was perceived to be indicative of its
importance within the narrative. Thus the narrative for Acrow PLC
(31/3/83) comprised seven sentences thematically sub-divided as follows:
Declining markets 0.5
Weak engineering industry 0.5
Intensity of competition 0.25
Maintenance of sales 0.25
Reduction in margins 0.25
Substantial losses incurred 0.25
Dividend payment 1.0
Uncertainty in markets 0.5
Product leadership 0.5
Strength of sales force 2.0
Return to prosperity 1,11
TOTAL 7.0
Trading conditions and future uncertainty predominate, without the
development of company specific themes.
Independent verification of the themes again produced a close
correspondence. An alternative approach to the measurement of themes was
also examined, according each theme mentioned a score of 1.0 on its
appearance. This methodology produced no significant difference in the
resulting proportion of good/bad/neutral themes, so the initial methodology
was retained.
. 124

Kelly-Newton (1980) adopts an identical procedure, to the measure of themes
adopted here, in her content analysis of the general comments section of a
sample of replacement cost footnotes, examining management's reaction to
disclosure requirements.
Nova Jersey Knit PLC (31/3/84) provides a stark contrast in the thematic
breakdown of its 12 sentence narrative:
Plant Relocation 3.0
Joint Venture agreement 1.0
Profitability 0.5
Overheads 0.5
Diversification 2.0
Losses 0.5
Extraordinary costs 0.5
Damage claims 2.0
Loan Finance 1.0
Dividends _i...4
TOTAL 12.0
Eight of the twelve sentences revolve around common central themes - plant
relocation to achieve a product diversification, with disastrous consequences.
This case is clearly exceptional, but so is the extremely negative message
conveyed by the narrative. Krippendorff (1980: 130) warns against the
potential unreliability of self-applied investigator-developed recording
instructions. He emphasises three aspects of the process:
i ) stability - intertemporal coding differences in the same
observer should be insignificant.
ii) reproducibility coding rules should be such as to allow different
coders in different locations to agree substantially
on their assignments.
iii) accuracy - the performance of coders should largely comply
with a known 'right' answer.
There is no generally agreed level of correlation in performances which
may be deemed satisfactory, but the pre-sample cases were tested for their
conformity to the above aspects, as follows:
125

i) the investigator replicated the original coding at an interval of
approximately one month, with no discernible difference;
ii) the coding exercise was replicated with a group of 15 UK final
year undergraduate business students, but confined to only four
of the original pre-test sample (Dunlop, Mettoy, Jarvis and Sound
Diffusion). A substantial coincidence of thematic recognition
resulted. Such differences as occurred were attributable to
varying degrees of collectivism (i.e. factors like interest rate,
exchange rate and inflationary effects were accorded separate
theme status, rather than being attributed to 'external economic
factors'), and to the use of a variety Of semantic descriptions
attributable to common themes;
iii) the investigator-generated thematic structure was perceived as
an 'ideal' except in instances where external coders identified a
preferable degree of aggregation. This categorisation does not
provide a judgement-free 'right' answer in terms of
Krippendorffs definition, since this study is concerned with
achieving a level of aggregation which will generate an
optimum explanatory model of company financial performance.
Any level of validation may be subject to criticism. It might be argued that
the content analysis performed here should be replicated over a longer
period of time and with larger groups of coders. Such replications should
take place to guarantee the internal validity of the test instrument, but
results thus far are sufficiently encouraging to suggest that the content
analysis of the complete sample should proceed
Accordingly, a general thematic framework was developed and applied to
reduce the opportunities for variation within cases and to highlight the
themes common between cases.
The major thrust of this framework was within Osgood's Evaluative
dimension, identifying different components of the beneficial - adverse
factor.
Five components were identified providing themes contributing to an overall
balance between Positive (Good News) and Negative (Bad News). Table 7.1.1
below identifies the components, together with typical explanatory . factors:
126

POSITIVE NEGATIVE
PERFORMANCE Profits, Turnover, Losses,
Productivity, Dividends Debt,
Borrowings,
Banker's
Support, No
Dividend
TRADING CONDITIONS Demand, Orders Recession,
Downturn,
Competition,
Margins
EXTERNAL FACTORS Economic recovery Strikes, Weather,
Interest Rates,
Exchange Rates
GROWTH Expansion, Acquisitions, Contractions,
Investment, Development, Closure,
Progress Disposal,
Redundancy,
Rationalisation
CHANGE Innovations, Major
New products, difficulties,
New technology, Litigation,
Diversification, Failed product
New Markets or acquisition,
Damage claims,
Technical
problems, Lack
of financial
control, With-
drawal of support,
Partners sought
TABLE 7.1.1 THEME COMPONENTS IN CONTENT ANALYSIS
This framework made compatible alternative descriptions of common themes
while reducing the impact of technical factors, complexities of process and
other industry specific and company specific factors. While welcoming the
guidance provided, it was not considered desirable to generalise the analysis
127

at this stage when unnecessary. Accordingly the major sample was analysed
using a wide-ranging set of themes in order not to obscure the potential
explanatory power of quite specific aspects. The framework provided the
possibility of alternative dimensions in the analytic process, both a five
component split and the 'good news - bad news' fall back position.
7.1.4 EXPERIMENTAL PROCEDURE: MANAGEMENT ACTIONS
The approach outlined above generates conclusions on the basis of a
summation of a sentence-by-sentence thematic analysis. An alternative
approach is to identify predominant themes within paragraphs or even from
the whole narrative. This approach seeks to identify indications of attitude,
confidence, future intentions and forward strategies.
The study by Bowman (1984) suggested the coding and counting of lines of
prose on issues of: corporate social responsibility
acquisitions
international activities
price control
foreign joint ventures
strategic planning
A similar US study by Ingram and Frazier (1983) across three industries,
metal manufacturing and fabricating, oil, and chemicals, identified the
following predominant themes in the President's Letter:
, 128
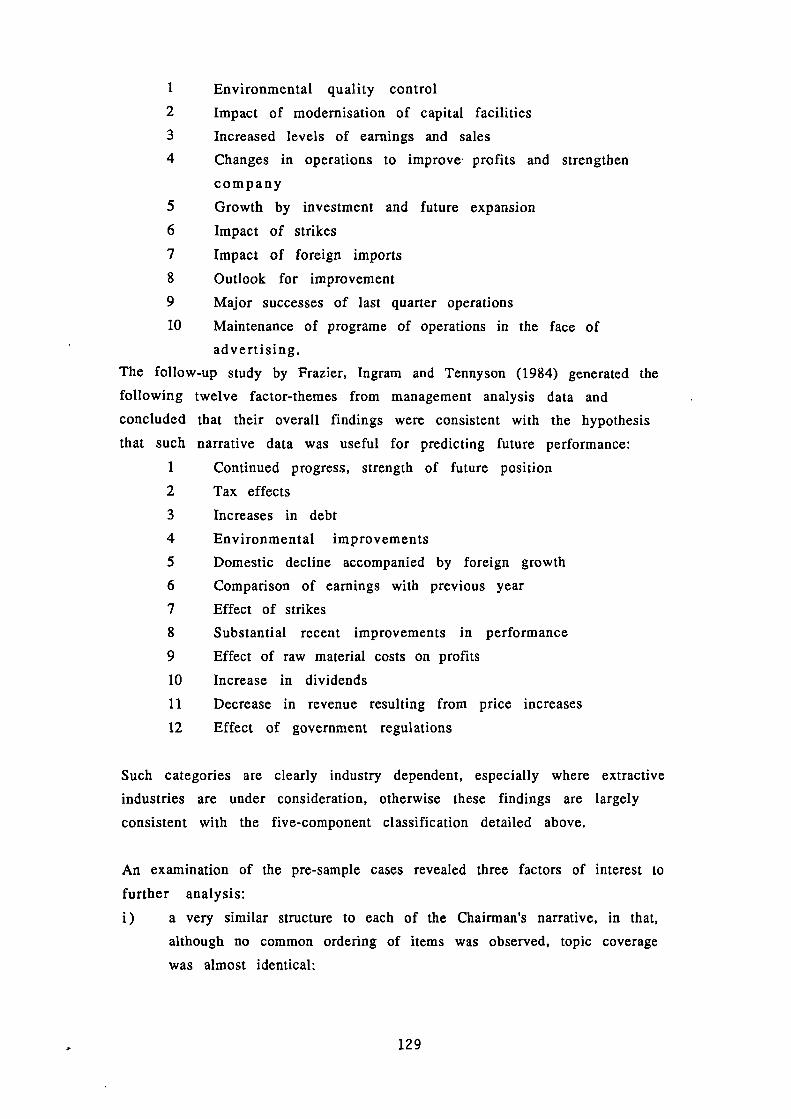
1 Environmental quality control
2 Impact of modernisation of capital facilities
3 Increased levels of earnings and sales
4 Changes in operations to improve profits and strengthen
company
5 Growth by investment and future expansion
6 Impact of strikes
7 Impact of foreign imports
8 Outlook for improvement
9 Major successes of last quarter operations
10 Maintenance of programe of operations in the face of
advertising.
The follow-up study by Frazier, Ingram and Tennyson (1984) generated the
following twelve factor-themes from management analysis data and
concluded that their overall findings were consistent with the hypothesis
that such narrative data was useful for predicting future performance:
1 Continued progress, strength of future position
2 Tax effects
3 Increases in debt
4 Environmental improvements
5 Domestic decline accompanied by foreign growth
6 Comparison of earnings with previous year
7 Effect of strikes
8 Substantial recent improvements in performance
9 Effect of raw material costs on profits
10 Increase in dividends
11 Decrease in revenue resulting from price increases
12 Effect of government regulations
Such categories are clearly industry dependent, especially where extractive
industries are under consideration, otherwise these findings are largely
consistent with the five-component classification detailed above.
An examination of the pre-sample cases revealed three factors of interest to
further analysis:
i) a very similar structure to each of the Chairman's narrative, in that,
although no common ordering of items was observed, topic coverage
was almost identical:
129

1
Trading Activities
2 Dividends
3 Finance
4 Accounting Changes
5 Economic Climate
6 Divisional Review
7 Personnel -
8 Future Prospects
- sales turnover; profits;
acquisitions/investments;
disposals/closures; exports/overseas
ventures; new
products/diversification;
rationalisation/restructuring
- capital expenditure; modernisation
costs; liquidity; borrowings/overdrafts;
extraordinary costs
- Competition; recession; inflation;
interest rates; exchange rate
Board changes
These categories provide a framework for the analysis of management
strategies and specific action in particular areas.
) the paucity of identified future strategies did not bode well for further
analysis. Instances where a well argued case for future directions
supplanted blind rhetoric were notable by their almost total absence.
This suggested that attitudes to change and confidence in the future
(justified or otherwise) might be a more fruitful direction for
research.
iii) in the great majority of cases the first impressions created by the
opening paragraph were extreme in their wording or tone. Where
these conveyed good or bad news there was little in the remainder of
the narrative to alter the impression created. It was therefore
determined to extend the thematic analysis to an examination of
common features in the initial statement, using the framework of
Table 7.1.1 as a recognition guide.
7.1.5 EXPERIMENTAL PROCEDURE: HYPOTHESES
H1: Failed and non-failed companies cannot be discriminated on the basis
of their narrative content.
Hl: A combination of key words and phrases will exist which allow
discrimination between failed and non-failed companies based on the
content of the Chairman's Statement.
130

H02: Potential failures cannot be identified on the basis of management
actions conveyed in the Chairman's Narrative.
H2: The management actions outlined in Chairman's Statements differ
sufficiently to allow the identification of likely subsequent failures.
1-103: The financial status of the enterprise is independent of the initial
impression conveyed by the Chairman's Narrative.
H3: The initial impression created by the narrative is indicative of the
message conveyed by the whole, and the financial status of the
enterprise.
H4: Reference to external factors in the Chairman's Narrative will not be
performance related.
H4: Poor performance will be attributed to external factors, with an
emphasis on features thought to be 'beyond our control'.
Ho: Successful performance will not be attributed more to management
action than it is trading conditions.
H5: Successful performance will be attributed to appropriate management
action, with an emphasis on sales turnover and profitability.
7.2 CONTENT ANALYSIS: TESTS OF HYPOTHESES
The guidelines established above for the pre-sample were employed in the
analysis of the matched sample of 66 companies. Each of the content areas
identified: words, sentence themes, first-sentence message and managerial
actions were examined to determine any significant relationships. Appendix
6.2.1 details the distribution of words and sentences; Appendix 7.2.2 details the
distribution of themes, over each of the company cases.
7.2.1 LINEAR DISCRIMINANT ANALYSIS METHODOLOGY
The classification of failed and non-failed companies, on the basis of their
narrative content, is considered within the context of a two-group case of the
linear discriminant model. Alternative methods, notably probit and logit, are
detailed in the literature, but neither has been shown to be significantly
superior to discriminant analysis (Teller and Abassi (1984)). Several studies
report no material difference in the classifications generated by
discriminant and logistic analysis for either continuous or binary variables
(e.g. Saini and Bates (1978), Ball and Tscheogl (1982), Press and Wilson
(1977)). Efron (1975) and O'Neill (1980) even go so far as to suggest that a
logistic approach might induce a loss in efficiency, particularly where the
131

groups are well separated and normality and covariance assumptions
satisfied. In these circumstances, and with the potential importance of
binary variables for the models of this chapter, the linear discriminant
model was retained throughout.
We seek to transform the n-dimensional company narrative data into a single
discriminant score which efficiently distinguishes between failed and non-
failed cases. The discriminant function is of the form:
Z = Co + divi + d2v2 + d3v3 +
where Z is the discriminant score, the vi are the variables selected for
inclusion in the analysis, the di are the optimal variable weightings and Co,
the constant term, is the cut-off criterion between groups. A stepwise
discriminant routine of the SPSS-X group of packages (Nie et al (1984)) is used
to determine that vector of discriminant coefficients (di) which best separate
the two company groups. The optimum condition is the maximisation of
Wilks' Lambda, where
Lambda = between-group variation,
within-group variation
and its maximisation will minimise the probability of a company
being classified in the wrong group.
The Fisher classification function coefficients are given by the subtraction
of separate group coefficients, with the constant term (Co) adjusted for the
pre-set prior probabilities. Where prior probabilities of 1:10 are considered
appropriate for the population proportions of failed:non-failed companies
this suggests an adjustment to the constant term of Loge ( 1 /10) = -2.3. A cut-
off point of Z=-2.3 (rather than Z=0) between the two groups would therefore
reflect the expected incidence of such companies in the population. Such
prior probabilities are employed here to reflect the status of the population
of companies over the time period considered.
Altman, Haldeman and Narayanan (1977), in the context of the loan decision,
argue that the cost of a Type II error, predicting that a loan applicant will not
pay when it subsequently could, is extremely small. They estimate that the
cost of a Type I error, predicting a loan applicant will repay, when it
subsequently does not, is 35 times more costly than the opportunity cost of a
Type II error.
Zmijewski (1983) extended this approach to error analysis to the prediction of
bankruptcy. He analysed how predictive ability varied with different
132

assumptions on the relative cost of Type I (a healthy decision in a failed case)
and Type II (a failed decision in a healthy case) errors, demonstrating the
efficiency of alternative models using weightings of 1:1, 2:1, 20:1 and 38:1.
The effect of such differential misclassification costs suggests a further
adjustment of the cut-off point, to distinguish between Type I and Type II
errors. i.e. an overall adjustment of loge (P*C)
where P = the prior probability ratio = 1/ 1 0
and C = the misclassification cost ratio = ciaLsg_Zypt aTs=cost of Type II error
= 40/i (Approximately)
This produces an adjustment of loge ( 1 /10 • 40/1) = loge (4) = lin and would
have the effect of moving the population towards the smaller group in order
to minimise the costs of misclassifying failed companies. This adjustment is
employed in each of the models constructed in this chapter.
The application of the Linear Discriminant technique is based on a number
of underlying assumptions:
i ) the two groups to be distinguished are distinct. Our definition of
'failed' and 'non-failed' and selection of group cases ensures the
validity of this assumption.
i i ) separate multivariate normality should exist in each of the two
groups. This is difficult to test for in practice, since separate
univariate normality, though a necessary condition, is an
insufficient one. Separate univariate normality is sought
through variable transformation and data winsorisation. It is
generally accepted that constituent model variables will be
bounded and transformed to normality (Lachenbruch,
Sneeringer and Revo (1973)), suggesting the use of
transformations to reduce skewness and Kurtosis and the
replacement of outliers with points at 2.5 standard deviations
from the mean of the remaining observations. The distributions
of discriminant variables in this study are detailed in Appendix
7.2.2. No transformations were undertaken in the final analysis
because of the high incidence of zero values.
iii) dispersion matrices should be equal. Any inequality covariance
matrices would suggest a likely preference for a quadratic
discriminant function, but since none of the literature has
133

demonstrated the superiority of the latter, the linear
discriminant function is retained here.
i v) Multicollinearity constitutes a potentially serious problem in the
practical application of discriminant analysis (Pinches (1980);
Taffler (1982)) suggesting a detailed investigation of variable
intercorrelations. When it exists, multicollinearity can
influence both the signs and stability of discriminant
coefficients. A factor analysis was performed, but loadings of
greater than 0.5 accounted for less than 35% of the total
variation and were loaded into 15 dimensions, most of which
were unexplainable. Accordingly the emphasis here was placed
on an examination of the correlation coefficient matrix
appropriate to each model.
The fitted model is tested in several different aspects:
i) Wilks Lambda is used in the testing of the overall goodness of fit
of the model, through a chi-squared measure of statistical
significance.
ii) Box's M-statistic provides a test for the equality of dispersion
matrices, though in practice it is more sensitive to departures
from multivariate normality.
iii) The classificatory ability of the model provides a measure of its
explanatory power. The concept of an 'overall correct'
classification rate is meaningless when the cost of Type I and
Type II errors differs significantly. Morrison (1969) and Joy
and Tollefson (1975) suggest that the errors be considered
separately and this is how they have been presented here.
iv) The explanatory power of each of the variables in the model is
measured using the Mosteller-Wallace method. By dividing up
the Mahalanobis distance (D2 ) - the distance between the two
group centroids - the percentage contribution of each variable
to the model is computed. Since explanatory power is a function
of both the size of the discriminant coefficient (di) and the
relative size of the variables, as measured by the difference
between within-groups centroids, (xi j - x2j), the method
represents a compromise between the two by computing
dj(2Tdj._:12j) * 100%
E - )72j)
134

v) The Lachenbruch Holdout Test (Lachenbruch (1967)) is used to
permit the computation of almost unbiased estimates of the true
misclassification proportions of the discriminant model. By
computing (Iii + n2) discriminant functions from the (n 1 + n2 -
1) company cases, leaving out a different case each time, the
held-out case is classified by that discriminant function
estimated without the use of that case in the dataset.
vi) The stability of variable coefficients is assessed by deriving
discriminant functions for a number of random subsets of the
cases. In this section groups of 60 of the 66 cases were used to
establish a substantial degree of coefficient stability.
7.2.2 CONTENT ANALYSIS: WORD OCCURRENCES
The Oxford Concordance Program provides a total word count, and a count of
individual occurrences within each of the narratives. This allowed the
construction of ratio variables for each of the keywords of Appendix 7.1.2 on
the basis of
number of common meaning occurrences
total number of words in narrative.
The resulting data set was used as source material with the SPSS-X statistical
package. A factor analysis of the words variables was carried out, with
loadings in excess of 0.5 revealing six factors. However, together they
explained less than 40% of the total variation, and no meaningful
relationships were discernible. More revealing was a correlation coefficient
matrix, and in particular the association between certain words, and word
combinations, and the STATUS variable (a 0,1 dummy identifying companies
as failed or non-failed respectively).
Table 7.2.1 shows the most prominent variable groupings for the strongest
measures of association.
135

CORRELATIONSYMBOL WORD
COEFFICIENTWITH STATUS (0.1)
PROFITABILITY PR PROFIT 0.407RP REDUCED PROFIT 0.216FP FUTURE PROFIT -0.171FL FUTURE LOSS -0.248LO LOSS -0.498UNP UNPROFITABLE -0.279
HXW = (PR + RP + FP) - (UNP + LO + FL) ]PRW = (PR +RP) - (UNP +LO) ]RPW = PR - (RP + UNP + LO) ]
0.612RELATIVE 0.645PROFITABILITY 0.629
BORROWINGS HF OVERDRAFT -0.299HH LOANS -0.305HG BORROWING -0.330
HQW = (HF + HH + HG) ] BORROWING -0.436
CLOSURES BA CLOSURE -0.489BB DISPOSAL -0.323BP SALE -0.309
BZW = (BA + BB + BP) ] CLOSURES -0.573
GROWTH
DA GROWTH
0.170DB EXPANSION
0.186
DZW = (DA + DB) ] GROWTH
0.223CEW ECONOMY
0.276CCW RECESSION -0.219
TABLE 7.2.1: CORRELATION COF,PHCIENTS BETWEEN COMPANY STATUS AND WORD VARIABLES
The generalisability of the symbols identified in Table 7.2.1 need to be tested
over a wider variety of companies and over a longer period of time. It is
conceivable that other themes might be prominent outside the parameters set
in this study.
Linear combinations of symbols are used throughout to generate composite
variables (e.g. HQW = BF + HH + HG for Borrowings, above). It is possible that
such a simple linear additive model may not be statistically optimum, and that
regression methods might generate improved relationships, with differential
weightings and a non-linear mathematical form. However, Ashton (1976)
advances the benefits of linear additive models, in terms of their simplicity
and robustness, and they are retained here.
The three alternative measures of relative profitability, each contrasting the
occurrence of 'profit' with 'loss' and 'unprofitable', recorded the highest
136

correlation coefficients. The word combinations conveying messages
relating to borrowings and closures recorded the highest negative
coefficients. An intuitive correspondence between profit, on the one hand,
and borrowings and closures, on the other, therefore exists.
Two further word occurrences were accorded special treatment because of
their perceived importance: (i) The word 'banker' occurred with regard to
the 'provision of support' and 'continued confidence'. The word never
appeared more than once in any statement, but of the 17 statements
containing the reference, 16 were of companies which subsequently failed.
Consequently both the 'Banker Support' (BF) and 'Dividend' (NOMDIV)
variables were treated as (0,1) variates representing their presence, or
otherwise, in the narrative.
Because of its singular occurrence deflation of the variable by the normal
word count was considered inappropriate, since this would merely have
reduced the variable to a reciprocal of length of narrative. (ii) Similarly,
dividend declarations for the current year were one-off references confined
to a specific portion of the narrative, most notably when a negative message
was being conveyed in the form of 'no dividend' or 'nominal dividend'. Of the
17 statements containing these singular references all were of companies
which subsequently failed.
An initial linear discriminant model was formulated using variables
reflecting the information content of the profit and loss account (i.e. PRW
(profit) NOMDIV (dividends)).
A conventional stepwise Fisher approach was used, employing prior
probabilities which reflected both population groupings and relative
misclassification costs. The following function was generated:
Z = -1.29 + 302.12 (PRW) - 3.492 (NOMDIV)
and produced 14 misclassifications: 1 Type I error (3%) and 13 Type II errors
(39.4%), the only failure misclassification being Case 55: RIVINGTON REED.
Wilks Lambda at 0.474 gives a chi-square of 47.06 with two degrees of
freedom, which when compared with the critical value of 2c 20.05, 2 LT-. 5.99
suggests the existence of a highly significant relationship.
137

A second model was generated to gauge the incremental effect of the
inclusion of balance sheet information (i.e. HQW (borrowings)). The three-
variable function was:
Z = 0.619 + 322.4 (PRW) - 6.0 (NOMDIV) - 1006.7 (HQW)
and produced only 5 misclassifications, but 4 of these were Type I errors
(12.1%) and one Type II error (3%). The non-failed misclassification was Case
32: HAWTIN, the missed failures Cases 44 (MIDLAND), 46 (MOSS), 55 (REED),
and 58 (SCOTCROS). Wilks Lambda at 0.196 gives a chi-square of 98.9 with nine
degrees of freedom again confirming the significance of the overall
relationship.
A third linear Discriminant model was fitted to explain company status in
terms of word-based variables, by submitting the five other variables of
Table 7.2.1 reflecting non-financial statement information: closures, growth,
economy, recession and banker support. Of the eight variables submitted in
total seven entered the model:.
Z = 1.22 + 364.64 (PRW) + 1005.04 (CEW) - 557.80 (BZW) - 6.35 (NOMDIV)
- 1004.97 (HQW) - 2.77 (BF) - 718.94 (CCW)
This model produces only one misclassification, again the non-failed
company Case 32: HAWTIN. (i.e. Type I error (0%), Type II error (3%)). Wilks
Lambda at 0.240 gives a chi-square of 86.28 with seven degrees of freedom,
which when compared with the critical value of x 2 0.05,7 = 14.07 confirms the
significance of the overall relationship. The Lachenbruch U-test reveals an
identical classification.
Interestingly the one misclassification is of the only non-failed case in
which the Chairman's narrative conveys support from its bankers.
Table 7.2.2 shows the results of a Mosteller-Wallace test to determine the
explanatory power of the discriminatory variables.
138

% EXPLANATORY
VARIABLES
POWER
NOMDIV = (NO DIVIDEND + NOMINAL DIVIDEND) 26.7
PRW = PROFIT 24.7
HQW = BORROWINGS 15.9
BZW = CLOSURES 13.3
BF = BANKERS' SUPPORT 10.3
CEW = ECONOMY 6.3
CCW = RECESSION 2.9
100.0%
TABLE 7.2.2: WORDS: DISCRIMINANT MODEL EXPLANATORY POWER
The signs and weightings of the explanatory variables are largely consistent
with expectations suggested by Table 7.2.1. The presence of the CEW
(economy) variable as a positive influence may be attributable to a long-term
outlook, rather than a future confined to overcoming short-term crises.
The pooled within groups correlation coefficient matrix of Table 7.2.3 reveals
the potential multicollinearity problems concerning the
dividend/profit/closures/bankers variables. Coefficients in excess of 0.26
are statistically significant at the 5% level and therefore potentially
hazardous, but none of the interrelationships appear dangerously high.
PRW
CEW
BZW
NOMDIV
HQW
BF
CEW
-0.205
BZW
0.056
-0.136
NOMDIV
-0.121
0.087
-0.002
HQW
0.102
-0.007
0.178
-0.438
BF
-0.087
-0.152
0.085
-0.028
-0.043
CCW
-0.031
0.129
0.034
-0.018
-0.090
-0.040
TABLE 7.2.3: WORDS: CORRELATION COE-HCIENT MATRIX
7.2.3 CONTENT ANALYSIS: THEMATIC CONTENT
Theme-scores per sentence were computed for all 66 companies following the
procedure of 7.1.3. Ratio variables were then computed for each theme on
the basis of
139

Sum of Theme Scores
Total Number of Sentences,
to provide an indicator of the perceived importance of that theme to the
narrative.
Correlation of the theme variables with company STATUS are presented in
Table 7.2.4 within the matrix of observed themes:
POSITIVE NEGATIVEPERFORMANCE SPS (positive) 0.571 SMS (negative) -0.638
SDE (dividend) *0.252 SDES (no dividend)**-0.309
TRADING CONDMONS OPT(optimism) 0.124POI (poised totake advantage) 0.049
EXTERNAL FACTORS SES (externals) 0.055
GROWTH SGS (growth) 0.274 SCS (contraction) -0.537
CHANGE DIV (diversif-ication) 0.172SNS (newproducts) 0.213
TABLE 7.2.4: CORRELATION COEI-HCTEN'TS BEWTEEN STATUS AND THEME
VARIABLES
* dividend increased or maintained
** dividend reduced, not declared, or a nominal declaration.
The strongest relationships are consistent with previous findings,
identifying
GOOD NEWS = (positive performance and beneficial dividend news),
BAD NEWS = (negative performance and adverse dividend news), and the
negative growth of the enterprise (contraction).
A Linear Discriminant Model was fitted to explain company status in terms of
theme-based variables, and the following equation generated:
Z = 0.407 + 10.375 (GOOD) - 17.012 (BAD) - 14.538 (SCS)
140

Wilks Lambda at 0.351 gives a chi-square of 65.4 with three degrees of
freedom compared with a critical value of x 2 0.05,3 = 7.81, confirming the
significance of the overall relationship. Box's M-statistic at 75.3 gives an
approximate F-test of 11.9, confirming the equality of group variances.
The Lachenbruch test provides 3 Type I errors (9.1%) and no Type II errors
(0%). The three misclassifications were all failed cases: (44) MIDLAND, (53)
PULLMAN and (55) RIVINGTON REED. In each case the company reported pre-
tax profits together with a maintenance of dividends, 'good news' regarding
past profit performance which overshadowed balance sheet difficulties.
Table 7.2.5 shows the results of a Mosteller-Wallace test to determine the
explanatory power of the discriminatory variables.
% EXPLANATORY
VARIABLES POWER
BAD = Adverse themes + bad dividend news 38.4
GOOD= Beneficial themes + good dividend news 35.5
SCS = Contraction _al100.0%
TABLE 7.2.5 THEMES: DISCRIMINANT MODEL EXPLANATORY POWER
The signs and weightings of the explanatory variables are intuitively
acceptable. The within-groups correlation coefficient matrix of Table 7.2.6
illustrates the absence of multicollinearity problems arising from these
relationships.
BAD SCS
GOOD -0.061 -0.081
BAD -0.216
TABLE 7.2.6 THEMES: CORRELATION MATRIX
7.2.4 CONTENT ANALYSIS: FIRST SENTENCE MESSAGE
Analysis of the themes conveyed in the first sentence of the Chairman's
narrative of the 66 companies revealed the distribution shown in Table 7.2.7.
141

FAILED NON-FAILED
FAILED NON-FAILED
PERFORMANCE PROFIT 4 17 LOSS 10
PLEASURE 1 4 DISPLEASURE 1 1
PRODUCTION 1
OBJECTIVES 1 1
ACHIEVED
TRADING 11vIPROVED 1 DIFFICULT TC 8 6
CONDMONS TC WORST TCREGRETS
55
EXTERNAL ECONOMIC 2
FACTORS OUTLOOK
GROWTH
CHANGE DISCLOSURE 1 NEW CHAIRMAN 1FORMAT RATIONAL'S- 1
ATIONRECONSTRUCT- 1IONRELOCATION 1
TABLE 7.2.7: FIRST-SENTENCE MESSAGE: DISTRIBUTION OF THEMES
(The 66 cases generate 73 initial themes since they include:
1 case combining 'worst' and 'loss'
1 case combining 'reconstruction' and 'profit'
2 cases expressing 'regret' and 'loss'
3 cases expressing 'pleasure' and 'profit')
Considerations of past performance and trading conditions predominate, but
relatively few themes appear to discriminate well between failed and non-
failed companies. With the exception of 'profit' and 'loss' the most promising
themes (worst ..., regrets, economic outlook and reorganisation =
(rationalisation + reconstruction + relocation)) have relatively few
occurrences. Measures of correlation between these themes and company
STATUS show profit and loss to have the greatest potential explanatory power:
142

PLE Pleased -0.218
REG Regrettably -0.286
LOS Loss -0.423
PRO Profit 0.477
WOR Worst ... -0.286
REO Reorganisation -0.218
TABLE 7.2.8 FIRST-SENTENCE MESSAGE: CORRELATION BETWEEN THEMES AND
STATUS
The construction of a linear discriminant model produced five significant
explanatory variables in an equation which generated 3 Type I errors (9.1%)
and 14 Type II errors (42.4%):
Z = 0.91 - 3.72 (LOS) + 2.09 (PRO) - 3.72 (WOR) - 4.79 (REO) - 1.86 (REG)
The three failure misclassifications, Cases 6 (BLACKMAN), 29 (FODENS) and 55
(RIVINGTON REED) are all initially concerned with profits.
The blandness of the opening remarks with reference to recent trading
conditions, common among both failed and non-failed companies, remains
the greatest single source of misclassification. Such non-failed cases,
numbered: 1, 9, 12, 13, 18, 23, 30, 32, 37, 38, 57, 64, 65 and 70. Wilks Lambda at
0.536 generates a chi-square of 38.4 with 5 degrees of freedom, a highly
significant overall relationship, when compared with the critical value of
X2 0.05,5 = 11.07.
The Mosteller-Wallace test of Table 7.2.9 reveals the predominance of
profit/loss in the explanatory power of the variables, and the within-groups
correlation coefficient matrix of Table 7.2.10 the absence of relationships
which might be a potential source of multicollinearity.
143

LOS
PRO
WOR
REO
REG
% EXPLANATORY
VARIABLES POWER
Losses 33.5
Profits 28.3
Worst ... 16.8
Reorganisation 13.0
Regrettably _SA
100.0%
TABLE 7.2.9: FIRST-SENTENCE MESSAGE: EXPLANATORY POWER OF
DISCRIMINANT VARIABLES
LOS WOR REO REG
PRO -0.135 -0.086 0.113 -0.086.
LOS -0.279 -0.209 0.089
WOR -0.134 0.057
REO -0.134
TABLE 7.2.10: FIRST-SENTENCE MESSAGE: CORRELATION COEFFICIENT
MATRIX
7.2.5 CONTENT ANALYSIS: MANAGEMENT ACTIONS
As foreshadowed in 7.1.3 the identification of distinct strategies is obscured
by the lack of information provided in the narrative. In terms of 'attitudes'
there are many expressions of confidence, but few substantiated. In terms of
'direction' there are few which provide a clear indication of proposed action.
Case 8 (BODYCOTE) is exceptional in providing a well-argued case for its
diversification intentions. Actions could be identified within five broad
areas:
i ) Board movements
i i ) Dividend policy
iii) Investment
iv) Contraction
v) Problem solving
Accordingly variables were constructed in each of these areas, scoring on
the basis of their inclusion in the narrative on a one-off basis. Calculation of
correlation coefficients between these variables and company STATUS
reveals the following distribution.
144

BOARD MOVEMENTS
CIIRES Chairman Resigns -0.316CHRET Chairman Retires -0.105MDR Managing Director Resigns -0.218NMD New MD Appointed -0.285
CHAIR =
(CHRES + CHRET) Chairman -0.286CHMD = (CHRES + MDR) Resignations -0.323
DIVIDEND POLICY
ND No dividend -0.471NOMD Nominal dividend -0.286NDM No dividend mention -0.108REDD Reduced dividend 0.246INCD Increased dividend 0.495M2kIND Dividend maintained 0.041
NOMDIV =
(ND + NOMD) -0.580NOMINDIV =
(ND + NOMD + NDM) -0.598
INVESTMENT
INV Manufacturing investment 0.242NEW New product launch 0.336
CONI'RACTION
CLO Closures -0.541DIS Disposals -0.413RED Redundancies -0.441
PROBLEM SOLVING
OUT Outside help sought -0.344LAC Lack of financial control -0.371LIT Litigation -0.254BF Bankers support -0.520
TABLE 7.2.11: CORRELATION COEFFICIENTS BETWEEN ACTIONS AND
COMPANY STATUS
, 145

A linear discriminant model constructed using this variable set generated a
five variable model which produced ten misclassifications: Only one Type I
error (3%) but 9 Type II errors (27.3%).
Z = 3.53 - 3.79 (NOMINDIV) - 4.03 (CLO) - 2.67 (BF) - 5.11 (OUT) - 3.66 (LAC)
Wilks Lambda at 0.339 gives a chi-square statistic of 66.5 with 5 degrees of
freedom confirming the goodness of the overall fit of the relationship, when
compared with the critical value of x 2 0.05,5 = 11.07.
The most prominent variable concerned with Board Movements, that
concerning resignations of Chairman and Managing Director (CHMD), was
not sufficiently significant statistically to enter the model. The ten
misclassifications comprise one failed case, (29) FODENS, and 9 non-failed
cases: 1, 3, 12, 18, 25, 32, 64 and 65. The reasons underlying these
misclassifications are revealed by an examination of the incidence of
occurrence of the five key variables:
FAILED
NON
FAILED
NOMINDIV 26 6
CLO 20 3
OUT 7 0
LAC 14 0
BF 16 1
TABLE 7.2.12 ACTIONS: DISTRIBUTION OF OCCURRENCES
As noted in Section 7.2.1 HAWTIN is the only non-failed case in the sample to
express support from its bankers. The other misclassifications illustrate the
inadequacy of models comprising only action indicators, with no inclusion of
the profit/loss variables so prominent in the preceding models.
The Mosteller-Wallace test reveals the importance of dividend policy to the
explanatory power of the model.
146

% EXPLANATORY
VARIABLES POWER
NOMINDIV = Dividend Policy 30.4
CLO = Closures 27.5
BF = Bankers' Support 16.1
OUT = Outside Help Sought 14.3
LAC = Lack of Control _11...1
100.0%
TABLE 7.2.13 ACTIONS : DISCRIMINANT MODEL EXPLANATORY POWER
The within-groups correlation coefficient matrix of Table 7.2.14 reveals
potential multicollinearity problems associated with the relationship
between dividend policy and growth. All of the coefficients in excess of 0.3
are statistically significant at the 5% level.
an OUT LAC BF
NOMINDIV -0.029 -0.068 0.088 0.022
CO -0.293 -0.106 0.224
BF -0.121 -0.055
OUF -0.118
TABLE 7.2.14 ACTIONS: CORRELATION COEFFICIENT MATRIX
7.2.6 CONTENT ANALYSIS: WORD/THEME/STRATEGY COMBINATION
Table 7.2.15 below reveals the cases misclassified by each of the foregoing
models. A close examination shows there to be no misclassifications common
throughout, though case 32: Hawtin is misclassified 3 times and failed cases
29: Fodens and 55: Reed twice by alternative models. Non-failed companies 1,
12, 18, 64 and 65 are too each twice misclassified. The potential therefore
exists to improve on the performance of Model 1 (WORDS) through the
incremental consideration of themes and strategies.
147

MODEL:
1 WORDS 2 THEMES 3 FIRST-SENTENCE 4 STRATEGIESMESSAGE
FAILED NON- FAILED NON- FAILED NON- FAILED NON-FAILED FAILED FAILED FAILED
32 44 6, 29, 55 1, 9, 12, 29 1,3, 12,53 13, 18, 23 18, 25, 3255 30, 32, 37 36, 64, 65
38, 57, 6465, 70
TABLE 7.2.15 DISTRIBUTION OF MISCLASSIFTED CASES ACROSS
ALTERNATIVE MODELS
A new linear discriminant model was therefore constructed on the basis of
the seven variables of the Words Model together with variants from other
models which involved alternative calculation methods for variables of
similar meaning. A nine variable model was generated but did not improve
on the WORDS model. One misclassification was apparent, this time a Type I
error with Case 55 a missed failure.
Z= 3.86 + 418.4 (PRW) - 5.69 (NOMDIV) - 4.91 (CLO) - 1171.1 (HQW)
- 5.84 (OUT) - 2.49 (BF) - 3.94 (LAC) + 1012.8 (CEW) - 1148.5 (CCW)
Six of these variables were common to the Words Model, the seventh BZW
(Closures) was replaced by CLO, an alternative closures variable computed on
the basis of strategy mention rather than word weighting. Wilks Lambda at
0.196 gives a chi-square of 96.9 with nine degrees of freedom, confirming a
significant overall fit when compared to the critical value of X 2 0.05,9 = 16.9.
The Lachenbruch U-test revealed the same classification matrix.
The Mosteller-Wallace test reveals that the explanatory power attributable to
the Closures variable has improved from 13.3% to 15.9% as a result of the
switch, but this is not a material change.
148

% EXPLANATORY
VARIABLES POWER
PRW = Profit 21.9
NOMDIV = No Dividend 18.5
CLO = Closures 15.9
HQW = Borrowings 14.4
OUT= Outside Help Sought 7.8
BF = Bankers' Support 7.1
LAC = Lack of control evident 6.0
CEVV = Economy 4.9
CCW = Recession
100.0%
TABLE 7.2.16 MATRIX MODEL: EXPLANATORY POWER OF DISCRIMINANT
VARIABLES
The within-groups correlation coefficient matrix reveals potential
multicollinearity difficulties associated with the relationship between
profit/dividends/closures/control. The coefficients in excess of 0.3 are all
statistically significant.
CEW NOMDIV CLO CCW LAC OUT HQW BF
PRW -0.205 -0.121 0.168 -0.031 -0.156 0.075 0.102 -0.087
CEW 0.087 0.100 0.129 -0.014 -0.066 0.007 -0.052
NOMDIV -0.032 -0.018 0.266 0.058 -0.438 -0.028
CLO -0.012 -0.106 -0.293 0.108 0.224
CL'W 0.002 -0.229 -0.090 -0.040
LAC -0.121 -0.328 -0.118
OUT 0.008 -0.055
HQW -0.043
TABLE 7.2.17 MIXED MODEL: CORRELATION COEFFICIENT MATRIX
7.2.7 CONTENT ANALYSIS: CONCLUSIONS
Appendix 7.2.1 provides a summary of the discriminant models computed,
together with variable definitions.
Hypothesis 1: A combination of key words and phrases will exist which
allow discrimination between failed and non-failed companies based
on the content of the Chairman's Statement.
149

The linear discriminant models constructed provide weighty evidence to
substantiate this hypothesis. Model 3 shows that 49 of the cases (30 failed, 19
non-failed) can be correctly classified on the basis of the thematic content of
the first sentence of the chairman's narrative alone. This proportion
improves enormously when more sophisticated measures of the complete
narrative are applied. Model 2, founded on a sentence-based measure of
themes, correctly classifies 63 cases 90.9% of failed and 100% of non-failed
cases, and Model 1 based on the weight of word patterns correctly classifies
all but one non-failed case.
In each model the signs and variable weightings are intuitively appropriate.
Therefore we reject the Null Hypothesis 1101 at the 5% level of significance.
Hypothesis 2: The management actions outlined in Chairman's
Statements differ sufficiently to allow the identification of likely
subsequent failures.
Model 4 substantially supports this proposition by providing a model based on
strategies which correctly classifies 92.42% of cases 97% of failed and 72.7%
of nn-failed cases. The Null Hypotheses H02 may therefore be rejected at the
5% level. However, in doing so it identifies the inadequacies of such a
simplistic model. Three of the misclassifications were not made by any of the
other models - models which included as central explanatory variables those
concerning profitability. The message is a clear one, variables based on
management strategies do have useful discriminant ability, especially when
employed in conjunction with financial measures of performance, either
qualitative or quantitative.
The exploratory version of Model 1 (WORDS) is a clear reflection of this,
showing 61 cases correctly classified on the basis of narrative references to
balance sheet and profit and loss references alone.
Model 5 shows that this can be done, providing a mixed narrative model
which correctly classifies all but one case. It is conceivable that a model
including financial ratio variables as well as strategy indicators, may operate
more efficiently. Such a model remains an area for future research.
Hypothesis 3: The initial impression created by the narrative is
indicative of the message conveyed by the whole, and the financial
status of the enterprise.
150

As noted above, Model 3 shows that the great majority of enterprises can be
correctly classified on the basis of the first sentence of the chairman's
narrative and the Null Hypothesis Ho is consequently rejected at the 5%
level. Those instances of extreme performance, good or poor, are most easily
recognised. However, the frequent presence of a bland introductory
paragraph devoted to external factors, makes this discriminatory method
relatively unreliable. Style of narrative often dictates an opening statement
bemoaning the 'severe' or 'deteriorating trading conditions' over which the
company has triumphed, or alternatively, which have contributed to its
downfall. The use of this device is common to failed and non-failed
companies, making discrimination much more difficult.
Hypothesis 4: Poor performance will be attributed to external factors,
with an emphasis on features thought to be beyond our control.
There is a wealth of anecdotal evidence within the sample linking poor
performance with external factors, most notably to trading conditions,
competition, interest and exchange rates, strikes and the weather. However,
a systematic analysis of these statements was unable to provide any
conclusive evidence to suggest that such references were closely linked with
future financial status; the Null Hypothesis 1104 could not therefore be
rejected at the 5% level of significance. Variables concerned with the need
to take reluctant action had low correlation measures of association with
status (Forced (-0.117); Had to ... (-0.116)), similarly those above, concerned
with short-term problems attributable to external factors. Neither of these
variables entered any of the discriminant models, despite having intuitively
appropriate signs.
Those external variables which were found to be significant were those
consistent with a more long-term view of performance. Thus 'the
economy'(r = 0.276) and 'recession' (r = -0.219) both exhibited sufficiently
strong relationships for them to enter MODEL 1, based on word patterns.
Where used, references to the 'economy' were consistently expressed by non-
failed companies looking beyond short-term crises, apparently not perceived
to be terminal. References to 'recession' and its debilitating effects were
largely confined to the failed group of companies, hence the negative
correlation coefficient. This variable must be considered the only one which
offers any consistent support for the hypothesis above.
151

Hypothesis 5: Successful performance will be attributable to
appropriate management action, with an emphasis on sales turnover
and profitability.
Models 1, 2, 3 and 5 all support the contention of a strong relationship
between positive performance and profitability. The attribution of this
success to positive management action is less strong, but still highly
significant. The analysis of management strategies in Model 4 reveals
positive correlations between expansionist management policies and non-
failed status:
Acquisitions strategy (0.186); Investment strategy (0.242); New product
launch (0.336).
The signs of these variables are all intuitively appropriate and provide
support for the above hypothesis. However, none of these variables is
sufficiently strong to enter Model 4 as a significant discriminator, since the
model is dominated by negative strategies consistent with management
incompetence, rather than achievement. The Null Hypothesis 1105 cannot
therefore be rejected at the 5% level of significance.
This analysis strongly supports the notion that narrative information alone
is an excellent means of classifying companies by performance. The
suggestion is that such information might be incremental to that provided by
the financial statements. This remains to be investigated, and an experiment
is detailed in Chapter 8 to allow such an investigation to take place.
152

CHAPTER EIGHT
THE COMMUNICATION OF ACCOUNTING INFORMATION IN THE ANNUAL REPORT
Fama (1970:416) concludes that 'the evidence in support of the efficient
markets model is extensive, and contrary evidence is sparse'; but since that
date a large number of studies have provided evidence which is inconsistent
with the efficient markets model. Publicly observable variables have been
used, in models of varying degrees of sophistication, to discriminate between
securities with subsequent differential abnormal returns. Basu (1983)
demonstrates a significant relationship between P/E ratios and risk-adjusted
returns, with securities on a low P/E rating outperforming those on high
ratings. Foster (1985) reports on the use of accounting information, already
in the public domain, by an analyst, Abraham Briloff, whose criticism
resulted in immediate and permanent reductions in the prices of the
securities concerned.
Altman (1968) in the US and Taffler (1982) in the UK, among others, provide
evidence of the ability of financial ratio combinations to predict future
failure. Such studies report that as early as three to five years prior to
failure, the financial ratios of failed firms exhibit behaviour different to
those of non-failed firms. Research on financial distress has documented
empirical regularities in the profiles of financially-distressed and non-
distressed firms, but economic theory has played a minor role in the
development of such models. The absence of a substantive theoretical
underpinning has generated much criticism of the work in this area, but the
results are demonstrably decision-useful for creditors, investors and
managers alike. The variable combinations included in most linear
discriminant bankruptcy models are almost entirely firm oriented, and
largely derived from quantitative financial statements and stockmarket price
data. Rose, Andrews and Giroux (1982) provide evidence that macroeconomic
variables (eg, interest rates and employment rate changes) are influential
factors in determining the timing of failures; Foster (1986) suggests that
microeconomic variables (eg, firm size and industry) are important
variables, which paired-sample designs matching on these same variables
effectively preclude as financial distress indicators. There may, therefore,
be scope for improving the predictive power of existing models through the
inclusion of other economic indicators.
153

Information, often in a non-numerical form, on the firm's perception of the
importance of economic and industry-specific factors is frequently
contained in the Chairman's narrative. This chapter examines the nature of
this additional information and provides an experimental methodology to
determine its incremental effect in a decision-making context.
8.1 INDEPENDENCE OF INFORMATION SOURCES
Cherry (1966) and Oliver (1972) argue that numbers imply measurement, so
that for many users numerical messages must be assumed to be both more
precise and more authoritative than non-numerical messages. Bell (19g4b),
on the other hand, found that users expressed more confidence in non-
numerically presented information because it had been placed in a
contextual frame of reference.
The present study is confined to the information content of the Chairman's
narrative, the accounting information in the financial statements, and to
financial ratios derived from the financial statements. These sources are not
independent, since some narratives will inevitably comment on the content
of the financial statements. A preliminary examination of the content of the
sample narratives was therefore conducted to determine the extent of this
information overlap.
Reference to profitability, or lack of it, is common among Chairman's
narratives; in the current study, all 66 companies under detailed
consideration included such instances.
However, reference to balance sheet measures is extremely rare; only ten
instances, six of them among failed companies. This lack of emphasis reflects
the weighting placed on profit and loss account items in decision-making
compared to the content of the balance sheet. Of these ten instances seven
refer to liquidity issues and three to gearing. Only one case, Case 13:
BURGESS, a healthy enterprise, provides a numerical measure within the
narrative:
'The gearing adjustment reveals that less than 30% of the Group's
average fixed assets and working capital during the year was financed
by borrowing'
Different perceptions of the seriousness of liquidity ratios in the lowest 20%
of all companies are revealed by two references:
154

CASE 5: BERWICK TIMPO 'there is no restriction on product development, andliquidity is not a problem'
CASE 14: BURRELL 'During a period of formidable trading losses suchas has been experienced during 1979, it isunsurprising that the Company's liquidity positionhas come under considerable strain from time totime'
Both companies subsequently failed, and it is difficult to conclude other than
that liquidity difficulties contributed significantly to each failure. Appendix
8.1 provides abstracts from the narratives of these ten companies, classifying
them according to whether the references are liquidity or gearing based and
by the failed/non-failed status of the companies. Supporting ratio
calculations are also provided together with PAS-scores through which to
gauge the relative performance of the companies. (Refer to Section 5.2 for
an explanation of the PAS-score methodology). A statistical analysis of the
usefulness of balance sheet references in the prediction of financial
performance was thought desirable, but the incidence of occurrence was
viewed to be too low to justify such an analysis. In a more extensive study
Williamson (1984) examined the financial ratios cited in the annual report
and found three (return on equity; current ratio; return on sales) which
were higher when cited than when they were not disclosed. He concluded
that 'selective reporting by Fortune 500 companies does occur for some
ratios'.
The implication would appear to be that the narrative statements are
providing a significantly different source, compared to the numerical
financial statements, especially with regard to balance sheet information.
The prominence of profit and dividend references suggest that the
difference is not so marked with respect to the profit and loss account.
References to current action, future strategies and intended policies are
totally divorced from those to be found in the financial statements.
Financial ratio information is derived from the accounting statements,
though not explicitly stated in the latter. Processing differences between
these two sources will arise and may be attributable to experiential or
educational differences, or to the adoption of heuristics using only stated
information rather than its implication.
155

An experimental methodology was devised to compare processing differences
between alternative information sources, and the resultant effects of
information integration.
8.2 EXPERIMENTAL METHODOLOGY
The environmental predictability of financial ratio data is well established.
The linear discriminant models of Altman (1968) and Taffler (1982) have
demonstrated that such models can achieve almost 100% classificatory ability
of failed and non-failed cases. Even simple additive linear models can be
surprisingly robust in differentiation exercises and help to overcome the
undue emphasis that may otherwise be placed on the profit variable.
The environmental predictability of narrative statement information is
much less clear. The empirical evidence provided in Chapter 6 suggests that
the readability of narrative is performance related, and the linear
discriminant models of Chapter 7 that the semantic content of narrative may
be used to identify potential failed cases. The misclassification of cases based
on narrative information, needs to be examined and the attributes of the
misclassified cases identified. Where cases are consistently misclassified
under experimental conditions, contrary to the expectations of a predictive
model, the explanatory variables which are being underemphasised might be
identified. Where these misclassifications conflict with those associated with
alternative information sources the nature of the difference in perceptions
needs to be examined to determine whether processing difficulties exist or
whether there is deliberate obfuscation in the communication of the
message.
In realistic decision-making circumstances all financial statement
information will be available simultaneously, in addition to outside sources.
The initial experiments of Chapter 4 provide some reservations regarding the
nature of the integration of this information, notably regarding the
emphasis placed on segments of dubious reliability and the consistency with
which information conflicts are overcome. The place of the narrative in this
overall decision-making context, and the nature of the information
processing need to be determined.
156

Accordingly a series of experiments was devised to gauge the facility of
respondents with narrative materials; to compare this facility with that
apparent with numerical materials, and to observe the manner in which
numerical and narrative sources were integrated.
8.2.1 SPECIFIC PROPOSITIONS
P1: The classification of Chairman's statements will support the notion
that the narrative provides an excellent discriminator between failed
and non-failed cases.
P2: The information provided by the narrative will be incremental to that
provided by the financial statements, so that improved decisions result
from the employment of both sources in an integrated manner.
P3: Experimental results will be highly dependent on the prior probability
of failure within the material sets. Results will likely demonstrate an
inability to influence the base rate expectations of respondents,
following the results of Chapter 4 and supporting the findings of
Houghton (1986), though conflicting with those of Casey (1983).
P4: Experimental results will follow those of Chapter 4 by demonstrating
an inappropriate emphasis accorded to narrative information of a
flimsy nature, when more reliable financial statement data is also
available.
P5: The misclassification of cases resulting from an apparent conflict in
the message being conveyed by narrative and financial statements
will be attributable to:
i ) the presentation of the narrative - its length and readability -
so that insufficient information is conveyed;
i i ) the content of the narrative - the creation of a mistaken
impression, possibly deliberately, by adopting an overly
optimistic or pessimistic posture.
8.3 EXPERIMENTAL PROCEDURE
A sample of n=146 final year UK undergraduate business students, familiar
with the format of the Chairman's narrative, was employed in the
classification of cases. The intention was to appraise the clarity with which
the financial message was conveyed. Each respondent received a set of
materials comprising the Chairman's narrative of ten companies, with the
requirement that they classify the companies as failed or non-failed. Each
157

set of materials included a combination of failed: non-failed cases varying in
proportion from 0:10 to 10:0.
In each case the statement provided was complete and unabridged except that
the names of the company, its major subsidiaries, trading partners, key
personnel and branded products had been deleted so as not to divulge the
identity of the company in question.
An analysis of classification errors allowed the cases to be grouped into a
three-way classification of difficulty in accordance with the regularity with
which a case was misclassified. This grouping formed the basis of a revised
sampling frame destined for a more sophisticated audience. Twelve
companies were chosen from each of the 22-strong groupings to provide an
approximately equal mix of failed and non-failed companies.
The selection of companies for the main test instrument was made in accord
with the experimental design detailed in Appendix 5.4 and clarified in
Section 5.3. The requirement was of an efficient sample design to allow the
simultaneous processing of CLOZE experiments and chairman's narratives
without duplication of companies. This was accomplished by using 36
companies in all, 18 of which were used in the CLOZE experiment.
The new set of materials was prepared each comprising the Chairman's
narrative of eight companies, so that the set included representatives of
'easy', 'medium' and 'difficult' cases. In addition the materials sets were
varied so that combinations of failed and non-failed cases ranged from 0:8 to
8:0. These 18 different sets of materials were administered to groups of i)
n=234 final year UK accounting undergraduates and ii) n=18 professional
accountants with the London office of a Big 8 company, in order to compare
outcomes and gauge the importance of experiential affects. Appendix 8.3.1
provides an abstract of the materials.
For each set of narrative materials corresponding sets of numerical materials
were prepared comprising i) profit and loss account and balance sheet and
ii) a set of financial ratios, together with industry averages, for each of the
companies. Financial statement information was supplied for one year only
so that it corresponded exactly with the period of the narrative. In the case
of failed companies, these materials were all provided by the annual
disclosure immediately prior to failure. Appendix 8.3.2 provides a Sample of
the experimental materials employed. These new sets of materials were
158

administered separately to a sample of n=234 accounting undergraduates
immediately after they had processed their sets of narratives. Different
numerical codings were employed to prevent comparisons, and students were
informed that they were appraising 3*8=24 different companies.
All respondents processed the materials in the same order:
i) Chairman's narratives ii) financial statements iii) financial ratios.
No attempt was made to vary the order since the intention was to assess the
effect of the additional information provided by the financial statements on
decisions already made on the basis of the narrative information alone.
Replication of this experiment should include order of processing as a
potential explanatory variable.
On completion of the decision-making task involving separate materials,
students were informed of the coding system employed so that they were able
to reconcile narrative-statements-ratios for each of their eight companies.
They were then asked to review their original decisions and make a new set
of decisions based on the expanded information base. This final part of the
experiment was not undertaken with the accounting practitioners and
replication is required to gauge further experiential effects.
8.4 EXPERIMENTAL RESULTS
The preliminary sample allowed each of the 66 company cases to be assessed
approximately twenty times by different respondents. The resulting
classifications based on narrative disclosures showed one case (Case 53: R & I
PULLMAN: Failed) always to be misclassified. Six other cases (five of them
failed companies) were misclassified on over 70% of the occasions they were
processed. At the other extreme, six cases were never misclassified.
A case classification was designated 'difficult' if misclassified in over 37% of
cases; as 'easy' if misclassified in fewer than 18% of cases. The remaining
cases wcre designated an 'intermediate' status. The percentage figures used
here are arbitrary, but allow the company cases to be split on the basis of
equal proportions. A complete distribution of the percentage
misclassifications is detailed in Appendix 5.3.
Examination of these results revealed that the Number of Failed Decisions was
only marginally significantly related to the Number of Failed Cases in the
sample (r=0.280) t=2.33 and to the Number of Misclassification Errors (r=0.208)
159

t=2.29. The only significant variation in the number of classification errors,
relative to the number of failed cases in the sample set, occurred when 9 or
10 of the ten cases were failed. These results are consistent with those
anticipated from our tests in Chapter 4, where prior probabilities were vastly
different from expectations, and explicit instructions had failed to change
perceptions of expectations. Respondents apparently perceived a 'mixture' of
failed and non-failed cases to mean a combination comprising at least two
cases of each description, since the number of failed decisions was
significantly different when the materials comprised eight or more cases of
common status. Appendix 8.4.1. details the t-statistics in the comparison of
the Number of Failed Cases with those of the Number of Failed Decisions, and
Appendix 8.4.2 those in the comparison of the Number of Failed Cases with
the Number of Type I and Type II Classification Errors.
The mean number of classification errors was 3.56 (Type 1:2.18, Type 11:1.38)
but the distribution of errors non-linear. Appendix 8.4.3 details the
classification error pattern, identifying a deterioration in processing
capability at the extremes of the distribution.
A repeat of this narrative part of the experiment with groups of final-year
accounting undergraduates and accounting practitioners revealed very
similar classification patterns. The eight most-misclassified cases were
common to accounting undergraduates and business students, and the five
most misclassified common to all groups. Any test of the experiential factors
affecting this error pattern is limited by the extremely small number (n=18)
of accounting practitioners in the sample. Appendix 8.4.4 details the case
misclassification percentages across the three participating groups.
An examination of the most commonly misclassified cases, those consistently
misclassified more than 70% of the time, is illuminating, providing indicators
of potential problem cases, even when complementary financial statement
data is available. All the narrative cases are correctly predictable using the
sophisticiated content-models of Chapter 7. Some elements of these will be
unavailable to experimental respondents who are more likely to process on
the basis of keywords or on an impression conveyed by future strategies and
the positive balance of the content. Within this context some of the
consistent misclassifications are revealing:
160

CASE 53: R & J PULLMAN (Failed) - consistently the most misclassifiedcase, attributable to a lengthy positive narrative indicating anexpansive and acquisitive approach leading to healthy profitmargins. Levels of gearing are not mentioned, but anexpression of confidence in their bankers provides a clue thatall is not well.
CASE 12: A F BULGIN (Non-Failed) - a very short narrative (only 324words) conveying a mixed impression message of loss-makingsubsidiaries balanced by a profitable manufacturing division.Justification of the 'mild optimism' experienced is clearlydependent on the success of new product launches.
CASE 46: MOSS ENGINEERING (Failed) - similar to Case 53 in that anexpansive and acquisitive posture has been rewarded withprofits. But this has taken place against a background ofreconstruction and redundancies in which lack of tightfinancial control is evident and gearing levels extremely high,and expected to remain so.
CASE 39: FAIRBAIRN LAWSON (Failed) - again an acquisitive postureproducing increased profits, though reduced margins, and asubstantial increase in dividends. But a major shareholder hasdisposed of significant holdings and the company is activelypursuing merger opportunities to provide a sounder base.
CASE 44: MIDLAND INDUSTRIES (Failed) - profits reduced but dividendsmaintained, with acquisitions and investments both to extendthe product range and to seek new technology to replacetraditional markets.
The common feature is that profitability, or lack of it, is allowed to dominate
all other aspects of the information conveyed.
The accounting undergraduates recorded a mean number of classification
errors of 2.49 (Type 1:1.64; Type 11:0.85) significantly lower than that
recorded by the business students, suggesting experiential improvement.
However, the pattern of errors was very similar, with the largest number of
misclassifications registered in material sets comprising the largest and
fewest number of failed cases respectively; evidence again consistent with
an inability to influence the respondents' perceptions of failure base rate.
The number of failed decisions recorded was positively correlated (r=0.51)
with the number of failed cases in the set. Details of these distributions are
included in Appendix 8.4.5.
When the same cases were administered to the accounting undergraduates, in
the form of alternative information media, significantly fewer errors were
recorded:
161

accounting statements, mean 1.89 (Type I:1.37;Type 11:0.52)
financial ratios, mean 2.00 (Type I:1.25;Type 11:0.75)
But the pattern of error distribution persisted, consistent with anchoring
around 50% (4 failures) expected and adjustments around this figure.
When respondents were made aware of the coincidence of cases in the three
material sets they were asked to reconsider their original decisions. The vast
majority of respondents did not attempt a fundamental analysis of the revised
materials, but instead attempted to combine their original decisions in some
way. Several alternative means of integration are available in order to
overcome conflict at the individual level.
Schroder (1970) has identified some of the major characteristics of
information processing at the lowest levels that are dependent upon single
rule structures:
"a greater tendency toward bifurcated thinking; absolutistic standards
and an apparent dependence on these fixed standards as the only
authority; a great inability to generate conflict or ambiguity and an
habitual avoidance of ambiguity - an orientation in which the world is
bent to fit the rule; a greater tendency to standardise judgements in a
novel situation; a great inability to interrelate perspectives; a poorer
delineation between means and ends; the availability of fewer
pathways for achieving ends; a poorer capacity to act "as if' and to
understand the other's perspectives; and less potential to perceive the
self as a causal agent in interacting with the environment."
Anderson & Shanteau (1970), among others, have shown that the use of
simple decision rules, notably the linear additive model in which users
compute a weighted sum of relevant items, can produce surprisingly
accurate predictions when the relevant components are known.
Jensen (1976) has suggested that it may be unrealistic to think only in terms
of a linear additive model and that configural models, where the weights
vary with the configuration of other factors, should gain greater
prominence.
Studies by Bowman (1963), Kunreuther (1969) and Goldberg (1970) have
shown that configural models can lead to decisions which are better than
162

those of the individuals being modelled. By filtering out the error in human
judgemental processes the model can outperform its human originator in
decision making ability.
Behling, Gifford and Tolliver (1980) have established that simplification of
data-handling through the categorisation of data is a commonly used
technique in the context of information processing limitations. Although
the grouping of data on a subjective basis might be considered as error, it has
been shown to be an important means of coping with the complexity in
overload situations, especially where greater precision is not required.
The decision making process might then be considered to be a combination of
four rules: (i) manipulation of category labels rather than exact values, (ii)
problemistic rather than opportunistic search, (iii) sequential rather than
parallel consideration of alternatives, and (iv) satisficing rather than
maximising.
The experiments and references of Chapter 4 provide strong evidence to
suggest that human judges actually "satisfice" rather than optimise in their
decision making processes, employing heuristic rules and simple linear
models on a subset of the available information, and introducing errors and
bias into the process as a result.
Montgomery and Svenson (1976) identify four major components to be
considered in studies of congitive processes leading to single decisions:
i) subjective representation of the decision alternatives
ii) decision rules for finding the best alternative
iii) procedures for processing the information about the alternatives
iv) principles for the order of application of particular decision rules.
Where 'satisficing' is apparent we might expect that decision rules will be
applied to a subset of the information, after an incomplete data search. This
is consistent with the action of respondents in integrating their original
findings rather than indulging in further fundamental analysis.
Svenson (1979) provides a framework of processing strategies for choosing
between alternatives which allows the consistency of respondent behaviour
to be examined:
163

i) 'attractiveness of most important aspect': only those cases considered
failed by one particular method (perceived by the respondent to be the
most reliable) are designated failed overall. Slovic (1975) observes that
the majority of subjects in empirical studies consistently select this
'most important' approach.
ii) 'single attribute dominance': a lowest common denominator approach,
in that a case considered failed on any one individual source is
designated failed overall.
iii) 'greatest attractive difference': a highest common factor approach, in
that only those cases considered failed on every source separately are
designated failed overall.
iv) 'maximum number of aspects': a classification reached by aggregating
the decisions based on alternative sources - commonly failure on any
two of three sources considered sufficient for designation as failure
overall.
v) 'weighted algebraic model':decisions reached on alternative sources
are weighted in accordance with their perceived relative importance
to generate an overall outcome.
The resulting mean number of misclassification errors, 1.99 (Type 1:1.47;
Type 11:0.52) is significantly fewer than for the Chairman's narrative alone
(2.49) but not significantly different from the accounting statements (1.89)
or financial ratios (2.00) alone.
Table 8.4.1 below summarises the error types across the alternative
information sources recorded by the accounting undergraduates:
Mean No of Type I (Healthy Type II (Failed
Classification When Failed When Healthy
Errors Error) Error)
Chairman's Narrative 2.49 1.64 0.85
Accounting Statements 1.89 1.37 0.52
Financial Ratios 2.00 1.25 0.75
Integrated Sources 1.99 1.47 0.52
TABLE 8.4.1: aAlanCALIDE ERRORS - INCREMENTAL FINANCIAL
INFORMATION
164

An examination of the processing decisions employed by respondents when
able to reconcile the alternative information sources is largely consistent
with the framework outlined above:
i ) 47% of responses were consistent with focus on a single processing
media - in three-quarters of these cases this was the accounting
statements.
ii) 10% of responses were consistent with the operation of a lowest
common denominator across all sources - a failure anywhere was
deemed a failure in the overall reckoning.
i i i) 15% of responses were consistent with a search for the highest
common factor - overall recognition of a failure only followed from
separate corresponding recognition on each of the processing media.
iv) 15% of responses were consistent with the operation of a simple
decision-making model designating a case as failed if any two of the
three media sources provided supporting evidence.
v) 13% of responses were consistent with the use of some form of
weighting - most commonly anchoring on one source together with
adjustments made for variations elsewhere.
Studies by Altman et al (1977) and Zmijewski (1983), referred to in Section
7.2.1, argue that the cost of a Type I error is much greater than a Type II
error. They suggest the relative importance of the Type I error to the
decision-making context, without quantifying its precise superiority. On this
basis the financial ratios provide the preferable information source, overall,
and the results on the integrated materials represent a compromise which
places undue emphasis on the, less reliable, narrative. The results are
consistent with those presented in Chapter 4, where respondents relied
inappropriately on 'soft' qualitative information even when 'hard'
numerical information was available.
Since no attempt had been made to vary the order of processing of materials
in the experimental procedure, ordering effects may have influenced the
reliability of misclassification scores for separate processing media. Even so
a comparison of respondent performance across the three processes is
illuminating, showing a greater improvement in performance when all
information sources have been employed. Comparisons are based on the
number of errors made, with no distinction between Type I and Type II
errors.
165

Accounting
Statements
Financial
Ratios
Integrated
Sources
Improved Performance 53 .57 62
(%) (ie fewer errors)
Worse Performance (%)
(ie more errors)
22 27 23
No Change (%) 25 16 15
TABLE 8.4.2: % RESPONDENTS REPORTING CHANGED CLASSIFICATION
PERFORMANCE COMPARED TO THAT BASED ON CHAIRMAN'S
NARRATIVE ALONE
An analysis of the individual cases reveals a similar pattern of improvement
in performance over the 36 cases.
Accounting Financial Integrated
Statements Ratios Sources
Improved Classification
23
20
25
Worse
10
15
7
No Change
3
1
4
Mean % Improvement 7.9
2.0 6.5
TABLE 8.4.3: CASE MISCLASSIFICATIONS COMPARED TO NARRATIVE
PERFORMANCE
Appendix 8.4.6 details the distribution of case misclassifications on the basis
of alternative information sources. It is interesting to note those instances
of major differences in the classificatory ability of alternative media, since
this suggests conflicting media messages.
There were only two instances, both failed companies, in which %
misclassification was higher for all sources than for the Chairman's
Statement alone:
166
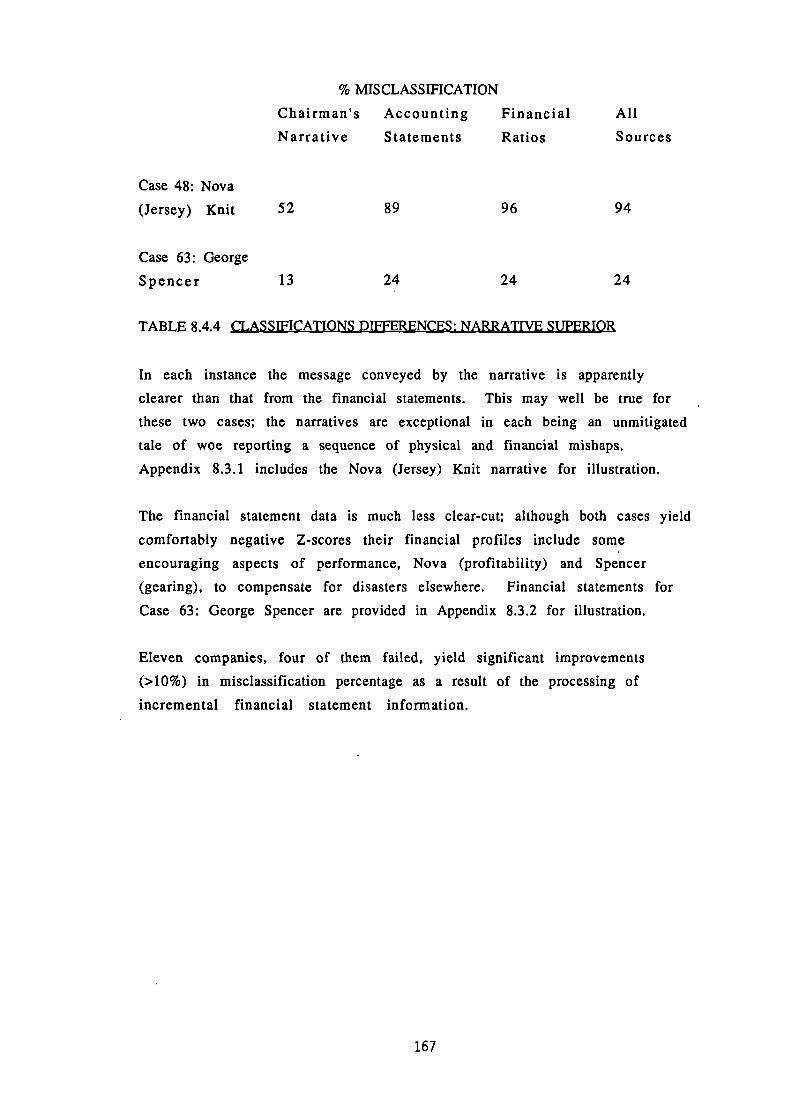
% MISCLASSIFICATION
Chairman's
Narrative
Accounting
Statements
Financial
Ratios
All
Sources
Case 48: Nova
(Jersey) Knit 52 89 96 94
Case 63: George
Spencer 13 24 24 24
TABLE 8.4.4 CLASSIFICATIONS DIFFERENCES: NARRATIVE SUPERIOR
In each instance the message conveyed by the narrative is apparently
clearer than that from the financial statements. This may well be true for
these two cases; the narratives are exceptional in each being an unmitigated
tale of woe reporting a sequence of physical and financial mishaps.
Appendix 8.3.1 includes the Nova (Jersey) Knit narrative for illustration.
The financial statement data is much less clear-cut; although both cases yield
comfortably negative Z-scores their financial profiles include some
encouraging aspects of performance, Nova (profitability) and Spencer
(gearing), to compensate for disasters elsewhere. Financial statements for
Case 63: George Spencer are provided in Appendix 8.3.2 for illustration.
Eleven companies, four of them failed, yield significant improvements
(>10%) in misclassification percentage as a result of the processing of
incremental financial statement information.
167

% MISCLASSIFICATIONS
CHAIRMAN'S
NARRATIVE
ACCOUNTING
STATEMENTS
FINANCIAL
RATIOS
ALL INTEGRATED
SOURCES IMPROVEMENT
(%)
CASE 39: 80 10 0 29 51
CASE 12: 82 44 21 43 39
CASE 4: 33 4 8 4 29
CASE 57: 36 11 30 15 20
CASE 35: 46 24 38 29 17
CASE 18: 52 20 48 37
15
CASE 28: 30 11 30 15 15
CASE 53: 94 69 58 80 14
CASE 34: 25 6 2 12 13
CASE 1: 22 4 19 9 13
CASE 66: 22 14 9 10 12
TABLE 8.4.5: CLASSIFICATION DIFFERENCES: FINANCIAL STATEMENTS
SUPERIOR,
Integration of accounting statement and financial ratio information
consistently classifies correctly cases 39, 4, 57, 28, 34, 1 and 66. Cases 12, 35
and 18 are regularly classified failed in error, attributable to poor
profitability, though more than adequately compensated by low gearing and
high liquidity. Case 53 is regularly classified non-failed, despite extreme
high gearing, because of its high profitability.
The misinterpretation of the narrative may be attributable to several factors:
i ) length of narrative statement: Cases 1, 57, 12 at respectively 203,
291 and 324 words are among the 20% of shortest narratives, all
more than one standard deviation below the mean number of
words. Case 4 at 346 words lies just outside this bound, and Case
19 with only 203 words lies just outside the group of eleven cases
of highest misclassification improvement.
. 168

The suggestion appears to be that these narrative statements are
too short to convey a clear message. On the other hand,
statements of a similar length were able to demonstrate failure
(Case 69:147 words; Case 48:274 words) or non-failure (Case
33:273 words; Case 59:294 words) within the same constraint.
i i ) readability of narrative statement: Cases 57,35 and 28 were
among the highest quartile of 'difficult' cases based on
cognizability and the CLOZE scores recorded. But cases 63, 46 and
33 were all considered more difficult without demonstrating the
same kind of conflict. Cases 57, 39 and 4 were among the highest
quartile of 'difficult' cases based on the LIX readability measure.
But cases 15 and 63 demonstrated a similar order of score without
posing significant classification difficulties. Cases 4 and 57 are
notable in that they combine brevity with difficulty, making
them doubly problematical.
i i i ) tone of narrative content: Cases 53, 39 and 12 have been
considered in detail earlier in Section 8.4, providing examples of
cases in which undue emphasis on profitability will produce
misclassifications.
The remaining failed cases (4 and 34) both convey news of
enormous losses together with an absence of dividends. Case 34
also refers to balance sheet difficulties: 'The losses placed a
severe strain on the company's liquidity'. The only redeeming
feature in either narrative to convey optimism is that
attributable to new products launched and new orders won.
The remaining non-failed cases (57, 35, 18, 28, 1 and 66) all
convey news of profits earned and dividends declared, but are
depressingly pessimistic about the future. The narrative for
Case 57 is technically and structurally the most complex,
obscuring a message of balance sheet strength: 'the group's
improved liquidity reduced net interest costs for the year to
under 7000 on the higher turnover'. Case 1 reports profits
doubled on a slightly lower turnover, but is not encouraging
regarding future market conditions. Cases 35, 18, 28 and 66 all
report reduced profits and are decidedly pessimistic about
169

prospects for recovery in the UK market. Such remarks
apparently contributed to the misclassification of these cases,
even though, as detailed in Chapter 7, references to difficult
trading conditions are commonplace across all companies, and
do not provide a useful discriminatory variable.
i v) perceptions of actual failure rates: although the identity of each
company was obscured by the emasculation of the report, in
order to maintain the readability of the narrative, often
sufficient information remained for an assessment to be made of
the industry sector, the size of company and the length of its
existence. Increases in ate experience and sagttisticateact at'
respondents would be expected to coincide with a realisation
that small, young companies in vulnerable sectors are more
likely to fail. The sample matching procedure adopted in this
study makes an assessment of these factors difficult and none
was attempted. Perceptions of industry vulnerability is a
particularly interesting and potentially important factor, but
would require the examination of a large number of failed and
non-failed cases of equivalent product-ranges.
8.4.1 CONCLUSIONS
1 The empirical evidence from groups of varying accounting
sophistication substantiate the claim that the narrative provides an
excellent discriminator between failed and non-failed cases, though
inferior to financial statement information and to • integrated
information sources. Third year accounting undergraduates correctly
classified 69% of cases based on the narratives alone. Table 8.4.6
compares this performance with that corresponding to the alternative
sources:
FAILED NON-FAILED ALL
CASES CASES CASES
CHAIRMAN'S NARRATIVE 62.1 77.1 69.0
ACCOUNTING STATEMENTS 68.3 85.9 76.4
FINANCIAL RATIOS 71.6 80.1 75.6
INTEGRATED SOURCES 66.0 85.9 75.2
TABLE 8.4.6: % CASES CORRECTLY CLASSIFIED BY ALTERNATIVE SOURCES
170

2 The number of misclassification errors recorded, per respondent and
per case, by the simultaneous processing of the financial statement
information together with the Chairman's narrative, provided a
significant improvement over those recorded with the narrative
alone.
Results thus far are based entirely on a student audience. The
experiment needs to be replicated with professionals who process
accounting information, perhaps bank lending officers. An
experimental design has been formulated corresponding to a
simplified version of that referenced in Section 5.4. Such a design
would allow the order of processing of narrative, ratio and accounting
statements to be varied, and experiential effects to be gauged, but this
remains to be tested and will form part of a future research project.
3 Misclassification patterns are consistent with an inability to change
respondents perceptions of failure base rates. This is well illustrated
by the low correlation coefficient (r=0.28) for business students
between the number of failed decisions and the number of failed cases
in the sample. The number of failed decisions therefore remains
relatively constant, consistent with processing on the basis of
adjustments around an anchor of 50% failures expected. The effects on
the distribution of classification errors is to produce a non-linear
pattern with more errors occurring at the extremes of the distribution.
This conclusion coincides with that of Houghton (1984) but conflicts
with that of Casey (1983). The latter observed loan officers'
judgements to be unaffected by disclosure of the objective prior
probability of failure, an observation which may be specific to the
particular circumstances of the experiment.
4 Where an apparent conflict exists between the message conveyed by
the narrative and the financial statements, attempts to reconcile the
conflict do frequently result in undue emphasis being placed on the
less reliable source. Thus for Case 53 (R & J Pullman), only 59% of
respondents misclassified the case on the basis of the financial ratios
compared to 94% using the Chairman's narrative. However, when
integrated, the positive message from the narrative source was over-
weighted compared to an extraordinarily high gearing ratio, so that an
80% misclassification rate still persisted.
171

Similarly for Case 39 (Fairbaim Lawson), no one misclassified this case
on the basis of a clearly failed financial ratio profile, but 80% of
respondents misinterpreted an overly optimistic narrative. A 20%
misclassification rate still persisted as a result of the use of integrated
sources.
5 There is some evidence that the brevity and complexity of the
narrative contributes to misclassification as does a narrative tone
which is optimistic/pessimistic when viewed in conjunction with the
financial profiles. But such evidence is largely anecdotal, and
statistically unconvincing.
Gestalt psychologists (eg: Yin (1969), Smith and Nielsen (1970) and Reed
(1972)) argue that decision-makers acquisition and organisation of
information within dimensions is perceived in terms of an overall
impression and that stimuli are processed in a holistic manner. Such
conclusions have serious implications for the communication of multi-
dimensional financial information, suggesting the need for comprehensible
non-conflicting sources.
* 172

CHAPTER NINE
IMPROVING THE PRESENTATION OE FINANCIAL INFORMATION
Chapter 8 has highlighted difficulties associated with the processing of
information when presented in the form of narrative and numerical
statements. The relative complexity of the content of alternative sources
generates misleading messages which lead to decision-making errors. This
chapter extends the study by considering the manner in which the financial
information is presented and in so doing completes the final branch of the
schematic overview detailed in Figure 1.1.
Difficulties in the complexity of both content and presentation of annual
accounting statements pose problems for users of all levels of sophistication.
The particular problems associated with format (Adelberg - 1979), footnotes
(Smith and Smith - 1971), jargon (Morton - 1974) and difficult language (Lee
and Tweedie - 1977) are all well documented.
Very little attention has been paid by accounting academics to the question of
improving the communicative ability of financial statements. Consequently
it is hardly surprising that the user pays most attention to the least complex
portions of the annual statement - the Chairman's Review and the profit
figure. Comparatively little attention is therefore devoted to the information
that might be conveyed by the Balance Sheet and other supporting
statements. Accounting data is essentially multivariate and its assessment
depends on the simultaneous effect of several variables in different spheres
of activity. The complex tabular presentation currently employed does not
facilitate an integration of the key features of the accounts. The segmented
multi-column format leaves an indication of separate performance areas
rather than overall success. An alternative means of presentation is needed
to provide a clear and efficient representation, either through new methods
or through improvements in existing methods. The remaining sections of
this chapter examines alternative methods.
9.1 TABULAR PRESENTATIONS
In this section we explore one particular representational method, that has
been advocated in other task environments and areas, that may overcome
some of the problems associated with traditional methods of representing
accounting information. Most recently, Iselin (1989) has addressed this issue,
but this chapter takes an alternative, though related, approach.
173

The patterns of data in a table should be clear in order to highlight
exceptions and discrepancies. Most multi-column formats fail to meet this
requirement by providing opportunities for obfuscation. On the other hand,
the simplest of tables may not be necessary at all since their message can be
conveyed efficiently in narrative form. However, the evidence (eg Lothian -
1976) suggests that some deliberate redundancy in the disclosure process may
aid communication. Ehrenberg (1977) suggests six general procedures for
improving the format of tabular presentations, which might be applied to
accounting disclosures:
i ) rounding of all numbers to two significant figures;
i i ) the use of row and column means, where applicable, to
provide both a visual focus and a summary;
i i i ) arranging figures in columns to facilitate their
comparison;
iv) ordering of rows and columns by size to ease the
comparison of small and large numbers;
v) placing of figures which are meant to be compared
adjacent to each other, to facilitate the process;
vi) the use of spacing and layout to guide the reader
through the table.
The adoption of some of these principles could significantly improve the
readability of profit and loss statements and balance sheets, though the
rounding condition suggests some conflict between our 'accuracy' and
'understandability' properties.
Wright (1968), in the information systems field, found that different tabular
formats influenced the ability to extract information. In an accounting
environment, Iselin (1989) demonstrates a preference among accounting
undergraduates for a report format (rather than account format) for the
quantitative accounting statements, with the former associated with a higher
extraction performance in terms of both speed and accuracy.
Ehrenberg has little to say in favour of graphs as a means of communicating
the quantitative aspects of data, preferring a well-designed table. He
highlights instances where many variables are involved, the ranges of data
are extensive and detailed numerical analysis required as being beyond the
scope of graphical methods. What he may imply is that new graphical
174

methods are required, more sophisticated than traditional means, in order to
overcome these problems.
Tukey (1977) argues that 'a good graph forces us to notice what we never
expected to see'. Wainer and Thissen (1981), while accepting the usefulness
of properly prepared tables, emphasise the need for more experimentation to
test the perceptual efficiency of the alternative representational techniques.
The search for an enhanced means of reporting focuses naturally on the use
of visual methods for representing relationships, making them both easier to
grasp and retain. Currently numerical and narrative exposition is employed
in circumstances where graphical or pictorial methods might be more
appropriate.
9.2 GRAPHICAL METHODS
In situations where information overload limits successful extensions of
accounting disclosures Bedford (1973) recognises that new methods of
disclosure will have to be developed. He identifies moving-picture
presentations, charts, graphs and trend lines as possible alternatives.
Similarly different methods of presentation will be necessary to deal with
different decision-making models and this may require a distinction being
made between those for which a graphical exposition is preferred and those
for which a numerical exposition is more appropriate. The existing
transmission of financial information is a one-way communication and
therefore corporate reports must be self-explanatory and couched in precise
language.
Jensen (1976) is enthusiastic about the advantages of visual displays of
different kinds in communicating financial information: an advantage of
visual display is the tremendous ability and flexibility of humans for
detecting spatially and temporally distributed features in data. Mathematical
models, though often an aid in discovering relationships, have much less
flexibility and adaptive innovation ability."
Lothian (1976) recognises that "... more research is required to establish the
potential value of reports presented to users in different styles. The novelty
of such notions may be exceeded only by their effectiveness in
communicating with users of financial statements."
175

Clearly alternative means of communicating multivariate financial data are
still sought. Pictorial methods, especially those able to represent several
dimensions simultaneously in a form that may be perceived as a Gestalt, may
potentially be useful. Gestalt psychologists, among them Yin (1969), Smith
and Nielsen (1970) and Reed (1972), have argued that the acquisition and
organisation of information within dimensions, by decision makers, is
perceived in terms of an overall impression so that stimuli are processed in a
holistic manner. The implications of this work are central to the
communication of multidimensional financial information, where simplified
and comprehensible means of presentation are needed. These methods may
appear trivial and even frivolous to existing users, but the test of their
usefulness will be in the successful communication of financial information.
Conventional pictorial methods are extremely limited in their application.
Traditional graphs and charts work well in only 2 or 3 dimensions and
quickly become overcomplicated when multivariate information if employed.
Working within three dimensions is extremely advantageous from a
communications point of view, but in many practical instances this is rarely
possible if more than a superficial overview is to be conveyed. Many
alternative pictorial methods have been employed in an attempt to facilitate
the communication of information - ranging from the familiar bar and pie
charts and pictograms to more obscure forms. The pie-chart, bar chart and
trend graph have become familiar and acceptable in the financial report as
alternatives to the narrative and numerical form. However, they have not
been entirely satisfactory in their representation of financial data. Chernoff
(1978) emphasises that 'while everyone ought to know what a pie chart is,
there are many intelligent people who do not tend naturally to think in
terms of graphs and who find it relatively difficult to be innovative in the
use of graphs and charts.'
A further difficulty arises in that existing graphs and charts are limited to
describing the relationship between only two variables, whereas financial
information is both complex and multidimensional. If a complete picture is to
emerge, rather than a series of financial relationships, then additional
graphical methods are required which will adequately represent the
multivariate nature of financial data. Chernoff (1971) provides a suitable
definition of the methods sought to represent adequately multivariate data:
'the purpose for graphical representation of multivariate data is to enhance
the ability of the analyst to detect and comprehend important phenomena,
serve as a mnemonic device for remembering major conclusions,
176

communicate major conclusions to others, and provide a means for doing
complex and relatively accurate calculations informally.' Several alternative
figures have been suggested as means of representation of multivariate
cases. Appendix 9.2.1 provides illustrations:
i ) 'profiles' are the simplest of the alternatives since they
allow a bar chart representation for each of the variables
in a single diagram. As such it is difficult to interpret
the resulting figure as any more than the sum of several
two-dimensional representations.
i i ) Anderson's (1960) 'glyphs' provide a simple figure
comprising a circle of fixed radius from whose boundary
emanate rays of various lengths and directions,
representing the values of the variables.
i i i) Siegel, Farrell, Goldwyn and Friedman (1972) adapted
the simple glyph by ignoring the rays, but joining up
their extreme points to produce a 'polygon' figure, more
recognisable than either profiles or glyphs. The Pickett
and White (1966) triangles are a special case of this
general approach.
iv) A further adaptation of the glyph has the rays
emanating from the centre of the circle to produce a
'star' with a number of vertices equal to the number of
variables under consideration.
v) Andrews (1972) has incorporated variable values into a
Fourier series allowing the construction of distinct
'curves' which facilitate the grouping of variables on the
basis of their similarity.
vi) Chemoff (1971) has initiated the idea of 'faces' whose
features can be made to vary in size and shape according
to the value of the assigned variable. The original form
of portrait has been adapted by Bruckner (1978) to
provide greater variation and by Frith (1978) and by
Flury and Riedwyl (1981) to provide greater realism.
vii) Kleiner and Hartigan (1981) have examined the use of
'trees' and 'castles', producing figures reminiscent of the
dendrogram of hierarchical cluster analysis.
177

Appendix 9.2.2 shows the extreme cases for facial presentations. Profiles,
glyphs, trees and castles create very little impact and the Andrews curves are
very difficult to interpret but the stars, polygons and faces seem potentially
useful in the analysis of multivariate data. The latter group are able to
produce a gestalt whose effect may be more than the sum of the individual
variables.
Schmid (1954) has identified five advantages of using charts and graphs
rather than tabular or purely verbal presentations, and a consideration of
these allows a more educated choice from among the alternatives outlined
above as to the most appropriate form of representation:
i) well-designed charts can be more effective both in
creating interest and by demanding the attention of the
reader through their visual impact.
ii) visual relationships are more easily comprehended and
more clearly retained.
iii) large quantities of statistical data can be condensed to a
form whose essential meaning can easily be visualised.
iv) the provision of a picture makes a complete and
improved understanding of the problem possible.
v) the disclosure of apparently hidden relationships
through graphical methods can stimulate further
investigation.
The impact of graphical representation is an important attribute since a •
forceful picture must be produced which allows new stimuli from a complex
data set to be perceived while existing stimuli are being integrated. The
characteristic shape of stars, polygons and faces suggest that they can
demand attention, while in addition faces are able to trigger an emotional
reaction which enhances their overall impact. However, we may speculate
that the impact associated with an uncomplicated and attractive format may
generate negative reactions in that emotional barriers may be raised to the
use of novel means of communication.
Most graphical and pictorial methods sacrifice some degree of accuracy in
the cause of visual impact but this is only satisfactory if the resulting
distortion does not impair the decision usefulness of the data. The data should
be communicated precisely through an appropriate graphical form without
opportunities for the manipulation of scales and axes leading to
178

misrepresentations such as those identified by Huff (1954). The use of
cartoon and schematic faces in data representation is one format where a
precise mapping of data might cause disfigurement of the overall portrait.
Bounds have to be created in order to preserve a familiar human facial form,
by the introduction of constraints to prevent facial features (e.g. eyes,
mouth) from being mapped outside the confines of the facial outline.
While graphical representations should be comprehensive they must not be
so complicated as to impair efficient and effective processing. Ideally they
will be simple, familiar and easily integrated.
9.3 FACIAL REPRESENTATIONS
Attempts to communicate too much information may detract from the
important facts and reduce the overall appeal of the chart. Of the
alternatives so far considered, facial representation seems to offer the best
opportunity of conveying simultaneously information about many variables,
but there may • be an optimum number of facial features which can usefully
be varied. Bruckner (1978) considers the use of many varying features a
plus point in facial representation since it makes the creation of a total
impression, rather than a composition of many separate stimuli, more likely.
However, he recognises the possible dangers of overexpanding the
dimensions of the face, considering fifteen variables to be a practical
maximum.
The self-explanatory nature of many. graphical methods is an important
attribute which poses difficulties for some of the newer graphical methods,
like the Andrews' functions and the Chernoff faces. The latter may only
provide speedier means of communication if users are trained in their
application and interpretation. Certainly Chernoff emphasises the
importance of user education in the use of faces to communicate information,
but Jacob (1978) has produced experimental evidence to show that faces may
be used successfully to transmit data without prior training, and Moriarity
(1979) has produced experimental results which suggest 'even persons
unfamiliar with the faces can use them more efficiently than account
balances or financial ratios'.
It is essential to identify the underlying dimensionality of the data in any
analysis since standard graphical methods are quite effective for two
dimensions or where the data may conveniently be reduced to two
dimensions. The handling of high degrees of dimensionality is eased when
179

the chart can be viewed as a whole rather than as the sum of its component
parts, and in this respect faces and stars seem to offer a much more efficient
method of presentation than do profiles or Andrews curves.
Very little work has been directed towards a comparison of the power of
alternative graphical methods. Mezzich and Worthington (1978) examined
multidimensional scaling, factor analysis and Chernoff faces in a clustering
environment and attributed the differences in the perceptions of
respondents to the potential for reduction to a traditional two-dimensional
picture.
Experiments by Yin (1969) with faces, houses, airplanes and men-in-motion
found that the recognition of difference was much the best for normally
presented faces. Jacob's (1978) work with digits, glyphs, polygons and faces
confirmed these findings which he attributed to simple decision-making
strategies that were made possible by facial familiarity: 'humans look at and
process faces constantly. They have become well adapted to this task and are
extremely good at performing it. Hence humans would be expected to
perform visual processing on faces better than on otherwise comparable
visual stimuli'.
The informational content of facial familiarity was further emphasised by
Yin (1969) in his experiments with photographic negatives and inverted
faces, each with the same geometric characteristics as normal faces. Upside-
down faces produced a much wotse performance in difference recognition
than other objects, suggesting that 'while all upside-down faces are
disproportionately affected. These findings suggest that the difficulty in
looking at upside-down faces involves two factors: a) a general factor of
familiarity with mono-oriented objects; and b) a special factor related only to
faces'.
The familiarity of faces and their ease of recognition and description makes
them superior to other pictorial forms of representation. Morton and
Johnson (1989) note that faces are special more than by virtue of their being
visible parts of the human form since they can signal their intentions. This
is so even though there is no convincing evidence that they are processed
any differently from other objects which we require to discriminate
amongst.
180

These conclusions are summarised by Chemoff (1973), 'we perceive the face
as a Gestalt and our built-in computer is quick to pick out the relevant
information and to filter out the noise' and the conclusion of Jacob (1978)
'the overall value of one multidimensional datum would be represented by a
single face. Its overall expression - the observer's own synthesis of the
various individual features - would contribute a single image depicting the
overall position of the point in its multidimensional space'.
However the facial information is perceived and interpreted it is clear that
the variation in a set of numerical data could be represented by a variety of
facial expressions. The variation of the dimensions and features of the
human face offers a very special means of presenting information, as
recognised by Bradshaw (1969) 'the human face is largely unique in its dual
role of communication and identification'.
The importance of the face as a source of visual stimuli derives from
developmental changes in infants, whereby they quickly . learn to respond to
more differentiated forms. Schaffer (1971) observes that with increasing age
the overriding importance of the eyes as a source of recognition and
attraction is complemented by increasing attention to other facial features,
facilitating the differentiation between various expressions. The similar
reaction of infants to real faces, photographic representations and schematic
line drawings, forms the basis. of their reaction as adults to the messages
provided by cartoon faces.
Although graphic data displays using charts, histograms or scatter diagrams
can provide simple and effective means of communicating information they
are severely limited in the extent to which they can convey relationships.
Huff and Black (1978) emphasise the usefulness of faces as a special stimulus
category in displaying multidimensional data.
The unique nature of faces as conveyors of information has received much
attention in the psychological literature with extensive implications for
their future use. Ellis (1975) notes that 'faces obviously constitute a rather
special class of visual input because of their complexity, the familiarity with
which we experience them, the motivation which we have to remember
them, and the ways in which they can convey non-verbal information'.
181

Ekman (1973) too is concerned with the use of the face as a complex
information source though he warns of the inherent difficulties 'the very
richness of the face, the number of different facial behaviours, the number
of different kinds of information we may derive from observing the face, and
the uncertainty about whether we are obtaining correct, incorrect, or even
purposefully misleading information, can give rise to confusion'. These
doubts are echoed by Bruckner (1978) in highlighting the facial abuse that
might allow misinterpretation and the 'built-in dependencies among facial
features may distort the data representation enough to cause erroneous
impressions'.
9.3.1 FACES AS A MEANS OF COMMUNICATION
Ekman (1973) concludes that 'such agreement (about interpretation of a
particular facial expression) must mean that these judges had common
experiences with this particular facial appearance, so that they could agree
about what it means without hearing the person's voice or words, without
any knowledge of the content, and without knowledge of what went before or
came after this facial expression'. The implications of such conclusions are
extremely encouraging for the use of facial representations to communicate
information without additional support literature and without the extensive
training envisaged by Chemoff. Cuceloglu (1970) reached similar
conclusions after tests using line drawings as a means of overcoming the
problems associated with the different facial expressions of a single person
'the results of the present study indicate clearly that some static facial
features are regarded as distinctive in the expression of a given emotion and
some are not. Some of these distinctive features are shown across cultures
reflecting what seems to be universals in facial communication... . There
seems to be a facial code employed in the communication of effective
meaning which is to a great extent, although not wholly, common to
different cultures'. Cuceloglu's findings emphasised the importance of using
schematic faces which show appearances which observers have encountered
before, and which avoid expressions that might be interpreted as being a
blend of different emotions.
These findings suggest that the successful communication of information
through facial representation should be concentrated on realistic
expressions, which means the elimination of those combinations of
components which produce impossible or unlikely facial portraits. In the
construction of schematic faces resulting from a mapping of numerical data,
182

this implies the imposition of constraints to prevent the generation of faces
which are either difficult to interpret or divorced from reality.
Jacob (1978) suggests that 'reducing the range of variation on most
parameters gave a more realistic set of faces; these were preferred because
people are especially attuned to very small variations in realistic faces'.
Chernoff (1978) provides a firm viewpoint, although providing no specific
evidence in support of his conjecture: 'experience with caricatures and
cartoons would seem to indicate that the need for realistic faces on pictures is
not great and that lack of realism is compensated for, at least in part, by the
ability to caricature'. Supporting evidence is supplied by Diamond and Carey
(1986) who find respondents to prefer schematic cartoon faces to real faces
in recognition exercises.
Experimental investigations employing the Frith-Everitt (1978) version of
the face to depict financial trends does suggest that there may be limitations
on the extent to which useful realism may be introduced into facial portraits.
Exploratory comparisons of the Chernoff and Frith faces in the
representation of financial information were undertaken with a group of 40
undergraduate business students. The two facial methods were each
employed in a decision-making context involving a failed/non-failed
classification based on the facial profiles of 20 companies, ten of each status,
and seven financial variables.
The results generated a clear preference for the Chernoff faces in this
experiment. The distinction between the two formats is analagous to that
evidenced by Johnson (forthcoming), who finds that young children
initially recognise faces on the basis of outline and hair, and can only
distinguish faces on the basis of individual features in subsequent
development.
The Frith emphasis on hair-line and chin-curve, as opposed to internal facial
features, appears to be counterproductive. Galper and Hochberg (1971)
allude to this problem: 'faces are not remembered and recognised solely by
the combination of those characteristics which survive in negative (eg face
shape, hair style)'.
Bruckner (1978) identifies a further advantage in that facial characteristics
can be linked to the physical meaning of the variables, in a way that other
forms of pictorial representation would find impossible. Thus the degree of
183
success or failure might be represented by the extent of the smile produced
through the variation of mouth curvature.
9.3.2 THE SALIENCY OF FACIAL FEATURES
In his cross-cultural analysis using simple line drawings Cuceloglu (1970)
employed 60 possible facial combinations made up of 4 eye-brow types, 3 eye
types and 5 mouth types. Principal components analysis on the emotions
associated with particular facial expressions revealed that 80.9% of the total
variation was accounted for by six factors, of which 72.4% was accounted for
by just three, which he labelled: pleasantness (32.3%), irritation (29.8%) and
non-receptivity (10.3%). Among these mouth curvature proved to be the
most important 'pleasantness' feature, while a combination of mouth
curvature with eyebrow slant appeared to be the most important 'irritation'
feature. The 'non-receptivity' feature was best characterised by a
combination of eye-closure with eyebrow slant.
Even this simple study highlights some of the difficulties associated with the
saliency of particular facial features: saliency seems to depend upon the
particular emotion being displayed, the dimensionality of variation within
the information source and the information medium itself.
Bradshaw's (1969) experiments based on very simple schematic faces
produced comparable results; where the nose and mouth were represented
only by straight lines, and without mouth curvature or eyebrow slant, he
identified a descending order of importance from eye height (and hence
length of forehead) through nose length and mouth width, down to eye
width. The experiments of Friedman, Reed and Carterette (1970) with
similarly simple faces showed the eyes to be the most important
discriminatory feature, followed by the nose and the forehead with roughly
the same degree of saliency. However, their findings seem to offer some
evidence in support of the 'composite' effect since differences between two
faces were often detected without recognition of the actual feature that was
different.
Further support for the eyes as the most salient feature has been provided by
Goldstein and Mackenberg (1966), Laughery, Alexander and Lane (1971) and
by Grant (1970). The latter identifies three main expressive areas, the eyes
(especially direction of gaze), the eyebrows and forehead and the mouth in
order of importance and links movements with particular emotions.
184

Laughery et al (1971) emphasise the importance of the eyes, and the relative
insignificance of the ears in their study: 'Certain areas, namely the eye and
mouth regions, are more mobile than others and so convey more information
about an individual's mood which can assist us in comprehending what they
are trying to communicate to us. Therefore we might pay more attention to,
and learn to differentiate, those features more effectively'.
Against this formidable display of evidence favouring the saliency of
forehead and eye areas can be ranged a corresponding array of apparently
conflicting findings (e.g. Dunlop in Izard (1971) offered evidence for the
superiority of the mouth area specifically in conveying 'happy' emotions).
Frois-Wittman (1930) found certain muscle groups that were typically
involved in particular facial expressions, but could find no consistent
dominance of either eyes (and the upper face generally) or mouth (and
lower face) in the interpretation of expression. He emphasises the
consideration of patterns of components across facial areas rather than each
component separately and argues against a simple division of the face into
top-and-bottom on the grounds of a more extensive dependence of facial
features.
Ekman, Friesen and Ellsworth (1972) express no surprise at the contradictory
nature of the findings of other investigators because of the implied use of the
unwarranted assumption of the independence of facial areas. In the absence
of a generalised procedure for measuring the changes in facial components
they developed a Facial Affect Scoring Technique concentrating on
movement in three areas of the face: i) brows, forehead area ii) eyes, eyelids
iii) lower face, including cheeks, nose, mouth and chin. More recent
evidence from Bruce (1988) suggests that more attention be paid to the
spacing of facial characteristics (e.g. inter-ocular distance) since this
provides a major facial recognition cue in adults.
9.3.3 INFORMATION PROCESSING IN FACIAL EXAMINATION
Chemoff (1978) seems convinced of the face being regarded as a total
portrait rather than the sum of a number of components, and
correspondingly views the scanning process as being template-based: 'our
ability to distinguish between very similar faces involves a mechanism
where the brain converts the face to a mental caricature on which it
operates. Hence the cartoon caricatures of faces which resemble our mental
caricature will probably be more effective as a graphical representation
185

than either more realistic drawings or freakish caricatures far moved from
our mental ones'. However, he offers no empirical support for his views and
much of the psychological literature is in direct conflict.
Braine (1965) found that 'adults appeared to scan by starting at the top of the
figures (regardless of the position of the focal part) and then continued
downwards', and Smith and Nielsen (1970) suggest a top-to-bottom sequential
scanning of facial features.
Ellis, Shepherd and Davies (1975) working with more realistic photo-fit
drawings suggest a link between saliency of feature and scanning procedure:
'it is evident that the characteristic strategy among most subjects is to
reconstruct the face from forehead, through eyes, nose, mouth and chin'.
Egeth (1966) expresses concern about the state of knowledge regarding
scanning for pertinent data cues in the absence of theories for filtering out
the 'noise' of unwanted or unimportant cues: 'until more. is known about the
processing of irrelevant information it will be difficult, if not impossible, to
achieve a good understanding of the processing of relevant information'. He
identifies the alternative scanning procedures that might be used:
i) Serial Models: serial/self-terminating involving the
scanning of features one by one in
either a fixed (top-to-bottom) or
random order until sufficient cues have
been established to make a decision.
ii) Parallel Models: involving a simultaneous feature
comparison, either exhaustive if all such
comparisons are made, or self-
terminating when sufficient
comparisons have been made.
iii) Template Models: based on a stored notion of an ideal
picture used for comparison purposes
and therefore very similar to the
parallel/exhaustive model.
An experimental examination by Smith and Nielsen (1970) of the alternatives
suggested that the template model was a reasonable one for judgements of
whether two faces were the same, but that a parallel model was more likely
for judgements of the nature of such differences. They found the use of
186

serial models to be characterised by long reaction times and a tendency for
stored features of the original face to be converted into a verbal description
prior to comparison. Empirical evidence from Bradshaw and Wallace (1971),
using identikit comparison, found no evidence to support the hypothesis that
faces were treated in a holistic fashion, nor that features were processed to
any significant extent in parallel. They found a serial self-terminating
process to be the most applicable with task difficulty, as determined by the
number of critical features present: 'processing time will tend toward a line
or function of the number of features to be encoded, one after the other,
before a decision can be reached; at this point processing stops'.
Despite the apparent importance of individual facial cues in the scanning
process much of the empirical evidence supports the hypothesis that a Gestalt
effect is important as a classification strategy since it enables the use of a
simple decision-making rule.
Yin (1969) found the dominant strategy used for the classification of faces
was an attempt 'to get a general impression of the whole picture' while for
houses, airplanes and men-in-motion respondents were 'searching for some
distinguishing feature'.
Tversky and Krantz (1969) found that the differences in face shape, eyes and
mouth which determine similar features in schematic faces 'lends some
support to the thesis that formation of overall impressions can be analysed
into the formation of a priori specifiable subimpressions and the
combination of these independent . subimpressions'.
Jacob (1978) considers that 'synthesis by the observer himself of the various
graphical elements of the facial display into a single gestalt is one of the
principal advantages of this type of iconic display'.
Reed (1972) in experiments designed to determine how subjects make
categorical classifications without logical decision rules found that 'the
predominant strategy, as revealed by successful models, was to abstract a
prototype representing each category and to compare the distance of novel
patterns to each prototype, emphasising those features which best
discriminated the two categories'.
The dominance of the 'holistic' approach is apparent from Reed's results. The
adoption of such an integrative weighted-feature approach parallels that
187

where company performance is judged by weighting key financial ratio
indicators. Messick and Damarin (1964) highlight the effects of user
differences in the adoption of alternative classification strategies influenced
by education and training.
Another important aspect of the classification procedure is how users will
react to different levels of information when provided with data in a facial
form. This information might be of a verbal or textual nature and could
introduce conflicting stimuli.
Moriarity (1979), working with financial statement data, examines the use of
multidimensional graphics as a technique for describing the financial status
of the firm. He suggests that unsupported faces may provide an excellent
framework for decision-making when produced as an alternative to
information conveyed in more traditional fashion. Moriarity asked
respondents to classify 22 retail companies as failed or non-failed, without
knowledge of prior probabilities, when presented with appropriate financial
information in each of four alternative formats:
i ) schematic faces with no explanation of the assignment of
financial variables to facial features;
i i ) schematic faces with a brief explanation of the
representations;
i) selected Key Dun and Bradstreet business • ratios relating
to each of the companies, together with, in each case, an
indication of industry averages for a six-year period;
iv) the actual financial statement balances required to
calculate the ratios.
Each of the alternative forms reflected the same changes in the financial
statement information but Moriarity's respondents found the changes most
easily detected in the faces. 'Faces without explanation' were classified faster
and more accurately than either the raw accounting numbers or the derived
ratios by both accounting students and practising accountants. In addition,
errors of classification were significantly higher for both students and
accounting professionals for data presented in a ratio format, which was
attributed to a lack of understanding of what the ratios really represented.
The Lee and Tweedie (1981) survey tends to confirm this view, suggesting
that financial 'experts' have a less than clear understanding of the meaning
of some of the most familiar financial ratios.
188

Moriarity also claimed that his schematic faces outperformed Altman's 1968
Z-model (1968) for the discrimination between bankrupt and solvent
companies. But it should be pointed out that Altman's model was derived from
small manufacturing companies, and erroneously applied (Altman (1980)) by
Moriarity to a sample of large retail firms.
Libby (1981) suggests that the use of such multidimensional graphics in the
audit environment might facilitate auditor detection of inconsistencies
during routine analytic reviews.
The psychological literature emphasises the relative importance of facial
information compared to contextual information, especially when there is
apparent ambiguity. Ekman (1973) examines the empirical evidence to
support the alternative propositions of Femberger (1954) and Bruner and
Tagiari (1954).
Femberger proposes that 'if a stimulus situation is indicated, the emotional
state will be judged in accordance with that situation rather than in
accordance with the facial expression' while the additive hypothesis of
Bruner and Tagiari suggests that judgements based on the face alone can
only be improved by additional contextual information. Ekman finds that the
additive hypothesis is not supported and questions Femberger's proposition
since there is no evidence to suggest that face judgements were more
important than contextual information: 'no consistent pattern to suggest that
the combination of face and context is always better than the source which is
superior when observed alone'.
Bugenthal (1976) notes that when facial expression contradicts informational
content, of a verbal or contextual nature, respondents made no attempt to
resolve the discrepancy. When exposed to conflict subjects were always
influenced by the least pleasant channel whichever it was. Such findings
have a potentially serious impact on the manner in which multiple features
and multiple media sources are processed.
Clearly facial information alone appears to be a powerful tool even when
used in the absence of detailed explanation. The evidence would seem to
question the need for extensive training in the use of schematic faces for
interpretative or discriminatory purposes, other than a familiarisation
exercise in order to overcome excessive emphasis on individual features.
189

Chernoff (1973) hypothesises that 'small and barely measurable differences
are easily detected and evoke emotional reactions from a long catalogue
buried in the memory. Relatively large differences go unnoticed in
circumstances where they are not important'. Jacob (1978) supports the view
that people are capable of detecting very small variations in facial form, but
does not supply any quantifiable evidence of the nature of that which might
be derived from using a measuring and scoring technique for facial
components like Ekman's (1973). This assumption is critical to the successful
operation of a system of schematic faces in clustering and trend detection,
since as Crouch, Brindle and Frye (1978) point out 'the graphical analysis of
mulitvariable data using Chernoff faces relies on an analyst's ability to
recognise changes in facial expressions'.
Clustering experiments of this type would represent a further development
of the studies detailed in Chapter 10 and provide a potentially useful area for
future research. An exploratory exercise based on the perceived similarity
of performance of 20 retail outlets using facial representation of seven
financial variables showed both Chemoff and Frith formats to be useful in
this context.
It is difficult to support Chernoff's views about large unnoticed differences
in view of the comments of Egeth (1966) regarding irrelevant information
and the possibility that the 'noise' created by the presence of many minor
variables in an analysis may tend to disrupt the filtering process and reduce
the discriminatory ability of faces;
The computer-based construction of schematic faces using a graph plotter
was initiated by Chemoff (1971) and adjustments to this basic program have
beers made through the addition of ears and the replacement of the line nose
with a triangular nose, and by the variation of the facial ellipses,
respectively by Davis (1974) and Bruckner (1978).
The original Chemoff face made possible the variation of 18 facial features
and the additions made this up to 20 (face width, ear level, face height, upper
and lower face eccentricities, nose length, mouth centre, mouth length,
mouth curvature, eye height, eye separation, eye slant, eye eccentricity, eye
length, position of pupils, eyebrow height, brow angle, brow length, radius
of ear and nose width). Others could be included but the empirical evidence
indicated by Smith and Taffler (1984) suggests that the dimensionality of the
190

data could be substantially reduced without a significant loss of explanatory
ability.
Bruckner feels that 15 is a practical maximum to the number of features that
may be varied, while Huff and Black (1978) found only seven to be
significant in their experiments. Savich (1977) found only five financial
variables to be significant in his experiments with accounting students
examining their hold-buy-sell decision making process. Such findings, if
confirmed by further investigation could have significant implications both
for facial representations and for financial statement disclosure.
The major difficulty with the construction remains the question of
interdependence of facial features - necessary in order to ensure the
production of a human face. Some features (face height, the three facial
eccentricities, eye slant, ear level and ear size) depend only on the input data
for the corresponding facial variable value, but others are highly
interdependent:
i ) pupil position is dependent in order to ensure that it
remains in the eye.
i i ) mouth structure is a function of face height, face width,
ear level, lower face eccentricity, nose length and the
three mouth parameters.
i i i) eye height is a function of nose length and face height.
iv) eye separation is a function of wiper face eccentricity
and face height.
Because of these interdependent relationships some faces will exhibit
different sensitivities to changes in features, and strenuous efforts to
produce orthogonal variables will be partly neutralised by the imposition of
a forced dependence. The existence of such problems questions the need for
precision in the necessary financial information employed when a precise
mapping of this information may not be possible. If the facial profiles are to
be processed as Gestalts then the interactions between the different
characteristics may be as important as the size and shape of individual
features. In the assignment of ratio values to features an appreciation of the
overall effect of a combination of ratios may be more important than the
precision of the individual ratios.
191

Chernoff (1978) suggests a normalisation of the faces to keep face height and
width constant in order to reduce, though not eliminate interdependence.
Deakin (1976) has shown the normal assumption to be incorrect in most
cases, of the eleven major ratios he considered only Total Debt/Total Assets
was not significantly differently distributed from the normal. The use of a
log transformation on Current Assets/Current Liabilities and a square root
transformation on Net Income/Total Assets renders them very close to a
normal distribution but other simple transformations were of no assistance
with the remaining ratios.
The Frith version of the schematic face, with minor amendments by Everitt
(1978), produces more of a cartoon face. As such the pictorial representation
is much more realistic (although Chemoff among others considers this a
disadvantage) and pays more attention to hairline and forehead height,
which the psychological literature suggest are important in recognition and
clustering exercises. Only nine facial features are variable (upper hair, chin
curve, lower hair, eye size, mouth size, eye space, eye slant, mouth curve and
face size). While more visually appealing than the Chemoff faces, these
cartoons suffer from similar problems of feature interdependence and
identical problems of data input.
Even where the input data has been amended to a satisfactory form the
problem of the most appropriate assignment of variables to facial features
remains.
9.3.4 THE ASSIGNMENT OF VARIABLES TO FACIAL FEATURES
Empirical evidence on the detection of facial cues and the interpretation of
faces suggest that the assignment of appropriate variables to facial
componenti is important. The studies of Moriarity (1979) and Bruckner
(1978) involve random and author-selected assignment of variables to facial
features. Stock and Watson (1984) also pay insufficient attention to the
relevant psychological literature on feature saliency. Smith and Taffler
(1984) reference the appropriate literature but fail to suggest an optimal
feature assignment.
Everitt (1978) justifies a random assignment procedure as a means of
reducing the problem of subjectivity caused by different observers using
different features of the face to judge their similarity 'a possible procedure
for attempting to overcome such problems is to produce several sets of faces
192

for the data, each set involving a different permutation of variables to
features'.
Similarly, McDonald and Ayers (1978) suggest that an appropriate strategy
would be 'to permute the variables which do control the individual features
and monitor the invariance (or lack of invariance) in the resulting visual
clusters'. The possibility of introducing a subjective bias by the arbitrary
assignment of variables to features is also noted by Newton (1978), who
considers that all the consequences might not necessarily be
disadvantageous: 'in fact some distortions might attract attention to
relationships that should be studied further'.
Experimental evidence from Chernoff and Rizvi (1975) reveals that 'random
permutation in the assignment of (facial) parameters may effect the error
rate in a classification task using these faces by a factor of about 25 per cent'.
Their results established that certain facial features carry little significant
information under certain conditions without permitting a clear indication
of the relative efficiency of different facial features.
Although the significance of the dimensionality of the data in influencing
discriminatory ability remains in doubt, the need for a clear decision on the
assignment of features is well established, and the psychological literature
on saliency should be of great assistance here.
Experiments by Huff and Black (1978) involved the arbitrary assignment of
facial features to variables but rankings by the forty students involved of the
features perceived to be the most important revealed an order much as would
be expected from a reading of the psychological literature; in declining order
of importance: length of eyes, eccentricity of eyes, angle of eyebrow,
curvature of mouth, length of nose, width of nose, and diameter of ears. They
assigned variables to features on the basis of relative importance as
determined by an analysis of variance. The discriminatory power of their
faces improved significantly as a result.
Andrews (1972) has suggested the use of principal components analysis to
determine the relative importance of variables and has assigned terms in his
sine function accordingly. This procedure might easily be adapted to the
faces problem by assigning those variables, revealed as most important by
principal components analysis, to those features suggested by relevant
psychological literature as being most pertinent.
193

9.3.5 IMPLICATIONS FOR FINANCIAL APPLICATIONS
Graphical techniques generally should be particularly sensitive to small
changes so that they can emphasise differences and identify outlying
observations. Psychological evidence from Ekman (1973) and Izard (1971)
suggests extreme sensitivity in facial representations in that the slightest
changes may be detected.
The literature discussed above provides convincing evidence of the
superiority of the facial portrait over other pictorial formats. It also provides
guidance in three areas of critical importance for the application of the
facial technique in the financial environment:
i) alternative facial media
ii) task dependency
iii) feature assignments.
The literature considers empirical evidence regarding several forms of facial
representation, of increasing order of sophistication:
i) schematic faces - straight lines only - Bradshaw (1969)
ii) schematic faces - with mouth curvature - Cuceloglu
(1970)
iii) computer-constructed schematic faces with multiple
features-Chernoff (197.1)
iv) artist constructed cartoon faces - Smith and Nielsen
(1970)
v) computer-constucted cartoon faces - Frith (1978)
vi) identikit drawings of facial components - Ellis et al
(1975)
vii) photofit based depictions - Bradshaw and Wallace
(1971).
The choice of a particular facial format is task dependent and the empirical
evidence covers experiments associated with recognition, recall,
discrimination and clustering as well as the communication of meaning.
Observation of facial processing in a Gestalt manner by Friedman, Reed and
Carterette (1970) suggests that the simplest of line drawings will suffice in
questions of recognition, recall and similarity. McDonald and Ayers (1978)
194

suggest emphasis on facial outline (hairline and chin curve) rather than
eyes/mouth might prove advantageous in clustering exercises.
But where the facial portrait is required to communicate a message the
emphasis must be placed on the mobile features. Thus Grant (1970) and
Laughery et al (1971) emphasise the expressive areas associated with the
mouth, eyes, eyebrows and direction of gaze. These features can be varied
efficiently with the Chernoff-Bruckner (1978) formulation to facilitate the
interpretation of the overall portrait. The difficulty of interpretation of the
Frith-Everitt (1978) faces precludes their further consideration in the
context of financial variables. The lack of emphasis on internal facial
features in the latter means that the only suggestion of financial well-being
in these representations is the fleshy-faced appearance that might be
associated with health and nourishment.
Although the Chernoff faces offer the facility to vary simultaneously over
• twenty facial features, strong evidence suggests that this is too many for
efficient processing. Savich's (1977) suggestion that as few as five features
may be more realistic, is a view strongly supported by this work.
The influence of relatively few financial variables, representing the key
performance areas, can therefore be concentrated on the three key
'expressive' areas identified above.
The question of an optimum assignment of financial variables to facial
features remains unclear at this stage. Conflicting evidence has been
presented favouring the eyes (Laughery et al - 1971) and the mouth (Dunlop
- 1971) as the most important single feature at work in conveying emotion. A
similar problem exists with respect to the financial variables, in that the
priority accorded them may vary depending on the task at hand. Thus Taffler
and Tisshaw (1977) and Taffler and Sudarsanam (1980) use different ratio
combinations when explaining, respectively, i) financial distress and
impending failure, and ii) relative financial performance.
The suggestion is that different financial variables and alternative facial
assignments might be appropriate for different decision-making tasks. This
issue is addressed with respect to the two financial environments above, in
Chapter 10.1.
195

What is clear from preliminary experimental findings is the danger that the
mouth may so completely dominate the face, when profitability is assigned to
it, that the other features/variables may be considered insignificant in
comparison. Where profit is the key financial area it may be more
appropriate to assign it to a less dominant feature in order to prevent it from
obscuring other relevant influences. This issue is examined empirically in
Chapter 10.2.
McKelvie (1973) conducted a study in which respondents compared schematic
faces comprising systematic variations of eyebrow slant, mouth curvature,
nose length, eye height and eye shape. The perceived meaningfulness of the
face was found to be at its greatest when both the eyebrows and mouth
curvature varied from an average position. The suggestion is that the
interaction of eyebrow slant and mouth curvature provides an effective
force in the communication of meaning in facial expressions.
These findings are consistent with the psychological • evidence provided •by
Laughery et at (1971) and have been employed in the facial constructions in
this study. Strangely in the accounting applications published thus far,
Moriarity (1979) did not attempt to manipulate eyebrow slant and Stock and
Watson (1984) employed feature direction the inverse of that suggested by
the literature. Further, Stock and Watson (1984) accorded the nose a
prominent position in the assignment of financial variables to facial
features. In these respects and in the provision of an extensive sampling
design, the present study represents a distinct • improvement over its
predecessors.
196

CHAPTER TEN
APPLICATION OF THE FACIAL PROFILE TECHNIQUE IN A FINANCIAL
MalEDISMElaThe application of the psychological literature of Chapter 9 to a financial
environment suggests that facial extremes can be used to depict overall
performance without the need to comment on the individual features. This
chapter explores the opportunity that this presents for alternative, and
potentially improved, means of representing financial information. In the
context of the thesis as a whole, a methodology is suggested for representing
complex financial content in a manner which facilitates its use for decision
making.
The implications for the Gestalt processing of facial information are that the
single image representing multidimensional data is an entity in which the
whole is worth more than merely the sum of the parts, just as the overall
informational content of a set of accounts is greater than the sum of its
constituent elements.
Interpretation problems may, however, potentially arise because of the
overriding prominence of one or two facial characteristics. Nonetheless,
similar problems can also arise in financial analysis from an overemphasis
on an individual accounting variable, such as the profit number.
A further advantage lies in the fact that the facial representation may not be
restricted only to identifying change, but may also communicate the effect
through changes in expression in •a . manner impossible for other pictorial
methods.
The question of the assignment of financial variables to facial features is a
problematic one, but less critical in depicting differences than in
communicating absolute meaning. Where we are concerned with identifying
trends over time, the detection of even slight differences in .a series of
portraits is facilitated by adjacent comparison references. The assignment of
variables may be less critical in this context than in a failed/non failed
classification task, where no corresponding classificatory template is readily
available.
Our familiarity with faces makes an interpretation of the portraits possible
without a detailed knowledge of the information used or the facial
assignments employed. Provided that due attention is paid to the combination
of facial features, without overemphasis on dominant features, it is possible
197

that an integrative picture might emerge to give a clear indication of overall
performance. If we wish to attribute aspects of this performance to
particular financial attributes then we might do so by referring to the
feature assignment key.
To illustrate the potential benefits for the financial analyst from the use of
schematic faces, two examples are provided:
i ) as a screening device to facilitate the examination of large
amounts of financial information and allow the classification of
observations. Here the bankrupt/solvent decision is employed;
i i ) the detection of change in performance over time, in which the
faces act as gauges measuring financial position, facilitating the
detection of abnormal performance and highlighting areas for
action. Three examples are provided here, two of companies in
decline, culminating in eventual failure, and one of a company
effecting a recovery from a distressed state.
Like those of Moriarity, the preliminary results presented suggest that the
facial format may have a useful part to play in the detection, control and
communication of financial performance.
10.1 THE CLASSIFICATION OF FAILED/NON-FAMED COMPANIES
Taffler and Tisshaw (1977) used a linear discriminant model with a sample of
92 companies in order to distinguish between solvent and bankrupt
manufacturing companies on the basis of their Z-scores. The constituent
variables of their model are listed in Table 10.1.1
RATIO REPRESENTING DIMENSION OF
ACCOUNTING INFORMATION .
Profit Before Tax (PBT)
Current Liabilities (CL)
Current Assets (CA)
Total Liabilities (TL)
Current Liabilities_ (CL)
Total Assets (TA)
No Credit Interval (days)
Profitability
Working Capital Position
Financial Leverage
Liquidity
TABLE 10.1.1: FINANCIAL RATIOS AND DIMENSIONS REPRESENTED IN
LINEAR DISCRIMINANT MODEL
198

The Taffler and Tisshaw Z-model ratios were assigned to facial features in
accordance with Figure 10.1.1 below to provide extremes of Chernoff portraits
as shown. The aim was to produce faces which reflected the financial
performance of the company and which could be interpreted without the
need for a detailed explanation of the variables employed or the feature
assignments.
FIGURE 10.1.1: FAILURE CLASSIFICATION - ASSIGNMENT OF FINANCIAL
VARIABLES TO FACIAL CHARACTERISTICS
199

SOLVENT COMPANIES
HAWKER SIDDELEY (31/12/80)
BLUE CIRCLE (31/12/80)
FAILED COMPANIES
FODENS (31/3/79)
AIRFIX (31/3/80)
FIGURE 10.1.2 FACIAL PORTRAITS IN FAILED/NON-FAILED
CLASSIFICATION
200

Figure 10.1.2 illustrates the use of the technique by showing pictics for four
companies, two solvent and two failed. Thus Hawker Sidde/ey and Blue Circle
exhibit large smiling faces with long noses and large rightward-looking
eyes, features consistent with highly profitable concerns with strong no-
credit intervals and respectable working capital positions. The larger mouth
of the former, however, indicates greater relative profitability, while the
larger eyes and flying eyebrows of the latter indicate the longer no-credit
interval and lower leverage figure of a stronger balance sheet.
The failed pair on the other hand, based on their last accounts prior to
failure, exhibit a similarly forlorn appearance. Fodens and Airfix both have
down-turned mouths, perplexed eyebrows and small backward-glancing eyes,
indicative of extremely poor profitability, poor asset positions and weak no-
credit intervals within a high-risk situation. However, Fodens provides some
marginal respite in the longer face and nose of a slightly better current asset
position.
These examples are interesting in that they suggest that pictics may
potentially provide a clearer indication of the financial state of an enterprise
than is apparent from its accounting ratios alone.
The ease of detection of facial differences appears to facilitate the distinction
between failed and solvent companies within a large data set. An
experimental examination, to test this hypothesis, is detailed in Section 10.3
below.
10.2 THE DETECTION OF PERFORMANCE TRENDS OVER TIME
Taffler and Sudarsanam (1980) applied factor analysis to identify the
underlying dimensionality within a set of 80 financial ratios calculated for
547 manufacturing companies. Six ratios, loaded on independent factors,
were selected for the purposes of further analysis. These are listed in Table
10.2.1. Tallier and Sudarsanam argue that performance in any year is a
relative, not an absolute, concept, and emphasise the importance of using a
ranked position measure compared to other companies rather than the more
conventional raw ratio approach. In this way first order effects of changes
in the economic environment may be removed, allowing valid inter-temporal
comparisons.
201

REPRESENTING DIMENSION
MADaaallan
INFORMATION.
Profitability
Financial Leverage
Working Capital Position
Liquidity
Asset Turnover
Value Added
RATIO
earnings before Interest and Tax (EBITI
Average Total Assets (ATA)
Total Liabilities (TL)
Total Net Worth (TNW)
Working Capital (WC)
Net Capital Employed (NCE)
Quick Assets (OA)
Current Liabilities (CL)
Average Current Assets (ACM
Sales (S)
Value Added (VM
Average Total Assets (ATA)
TABLE 10.2.1 FINANCIAL RATIOS AND DIMENSIONS REPRESENTED
To illustrate the manner in which inter-temporal performance comparison
may be made using 'pictics', two deteriorating companies, Berwick Timpo
(receivership) and Southern Constructions (receivership) are considered
along with one which effects a recovery from a distressed state, Sir Joseph
Causton.
For each concern the financial ratios of Table 10.2.1 are calculated and
converted into percentile scores to reflect relative company performance on
each measure, in each year separately, compared to manufacturing industry
as a whole.
The resulting variables are assigned to particular features of the face, so that
'better than average' performance is matched with a pleasant facial
appearance.
Figure 10.2.1 below indicates the assignment of variables to facial features
that is used to match those variables highlighted by the factor analysis with
the facial features identified as prominent by Laughery et al (1971).
202

FIGURE 10.2.1: RELATIVE PERFORMANCE TRENDS - ASSIGNMENT OF
FINANCIAL VARIABLES TO FACIAL CHARACTERISTICS
The feature assignment also illustrates the way in which changes in the
variable values can produce extremes in the overall Chernoff portrait. In
this way a visual impression of the personality of each company is created
which may even allow some speculation as to its corporate identity and
attributes. This visual representation of performance, based on accounting
numbers, complements the idea of 'corporate personality' developed in a
numerical sense by Sorter, Becker, Archibald and Beaver (1966).
A healthy, profitable and secure company might be expected to have a round
smiling face with large, bright, forward-looking eyes, while a company in
financial distress might wear a worried frown on a long face, with a low-
slung, down-turned mouth. The eyes would be small and close together,
exhibiting furtive backward-looking glances. The addition of a small
pinched nose might also add to the overall message by creating the
impression of the empty, washed-out face of an impoverished enterprise.
Figures 10.2.2/3/4 show the resulting trends in relative performance for the
three companies using the Chernoff program, and facilitate the detection of
change over the four-year time period under consideration.
203

FIGURE 10.2.2 . BERWICK TIMPO (31/12178 TO 31/12/1981)
The facial profiles of Berwick Timpo in the year prior to receivership are
typical of companies in the toy sector (Lines Bros., Dunbee Combex Marx,
Airfix, and Lesney Products all had almost identical pictics prior to their
demise). Despite the smile of profitability, the warning signs are apparent in
1978; the eyes are small and the brows perplexed, indicating respectively debt
and liquidity difficulties. These worsen further over the , next two years but
profitability is maintained. The collapse of profits in 1981 compounds
balance sheet difficulties; the mouth becomes down-turned and all facial
features are consistent with a distressed financial performance.
FIGURE 10 2 3 . SOUTHERN CONSTRUCTIONS (31/12/1975 TO 31/12/1978)
Again the warning signs are apparent in the portrait for 1975. Despite the
smile of profitability the perplexed eyebrows convey a poor liquidity
position. Profitability has disappeared by 1976, but the eyes and nose remain
large so neither the debt position nor the working capital position is yet
critical. The portraits for 1977 and 1978 convey unrelieved misery, very poor
performance in all key financial aspects. Receivership in 1977, one year
prior to actuality, might not have been surprising in the circumstances.
204

FIGURE 10.2.4: SIR JOSEPH CAUSTON (30/9/1976 TO 30/9/1979)
Causton depicts the classic recovery profile, from the distressed state of 1976,
with all features depressed, to 1979 where a happy picture is conveyed. The
transformation is gradual, with improvements in profits yielding a smile by
1978, but the balance sheet remains poor. The correction in liquidity, debt
position and working capital does not arise until 1979 with a reversal of brow
angle and increases in eye and nose size.
A scanning of these figures indicates how the profiles allow the detection of
even the smallest changes. When allied to the feature assignment these
facial expressions clearly convey changes in financial performance.
10.3 PREDICTION OF FAILURE USING ALi ERNATIVE PRESENTATION
FORMS
The clarity with which the foregoing figures. convey their financial
messages, in the absence of a detailed narrative explanation, provides the
impetus for a detailed analysis of the relative explanatory power of
alternative presentation formats. A substantial literature, summarised by
Foster (1986), highlights the prediction of performance on the basis of the
trends supplied by financial ratios and accounting statements. The ease of,
processing facial profiles suggests that they might provide a more efficient
means of making the same analysis.
205

10.3.1 EXPERIMENTAL METHODOLOGY - EXPERIMENT 1
While the simplicity of the facial technique is a positive feature in
communicating financial information - especially to the less sophisticated of
users of accounting information - it can be a barrier preventing its
widespread use. It has to be demonstrated that, apart from the novelty of
approach, this method can improve on or complement existing methods. To
test the hypothesis that facial profiles might provide an efficient means of
representing financial variables, an experiment was devised to test the
reactions of respondents to financial information expressed in alternative
forms -
i ) accounting statements
ii) financial ratios derived from these statements and
iii) 'faces' constructed by the application of financial ratios to
particular facial features.
A pilot experiment was conducted with the co-operation of academics from
City University Business School and the Universities of Leeds, Lancaster and
Birmingham and that of accounting professionals through Dun and
Bradstreet and First Co-operative Finance over a period of three months
during 1982. Together they provided a sample size of 121, comprising 52
accounting academics, 23 practitioners and 46 MBA Finance Majors.
The respondents consisted of skilled users, who employed accounting
information and financial statement data regularly, and users who, though
not practitioners, had an extensive knowledge of accounting terminology and
format. Respondents 'who were unfamiliar with accounting information
were excluded from the sample, since prior experiments had shown that, for
them the faces were the only medium to convey any meaning. A sample of 20
companies was chosen, with the intention of providing a majority that were
still trading and a minority of failures. Since a random sample of a company
database would be unlikely to give many (if any) failures, a 14:6 split was
chosen to avoid an even distribution of companies while providing enough
variety in the sample to illustrate the performance range. Companies were
therefore chosen to reflect the clearly healthy/clearly failed extremes as
well as several marginal cases, but at no time were the respondents aware of
the 14:6 division.
206

Previous experiments have shown that respondents tend to assume an equal
division of failed and healthy companies unless told that this is not
necessarily the case. Where specific prior probabilities have been indicated
in previous studies (Libby (1975)) respondents may fail to treat each case on
its individuals merits, preferring to rank cases on a best-to-worst basis and
then group on the basis of the given failure base rate. The importance, or
otherwise, of knowledge of prior probabilities to the experimental process
has been the source of much disagreement in the accounting literature.
Casey (1983) and Houghton (1984) are illustrative of the diversity of opinion.
Accounting statements and financial ratios were prepared and faces
constructed for each of the 20 companies over five year periods and a random
numbering systems used to separate the statements/ratios/faces information
bases. The statements related to financial information over accounting years
28/12/74 to 31/3/80, and in the case of failed companies information for the
final year was based on the last accounts published prior to failure. Prior to
the commencement of the experiment respondents were issued with sample
information sheets to illustrate the manner in which the statements and
ratios would be depicted and with an illustration of the assignment of ratios to
features in the facial representations. Appendix 10.3.1 provides examples of
the experimental materials.
Each respondent was provided with a set of accounting statements and asked
to make failed/healthy decisions for each of the 20 cases, together with the
total time spent in processing the statements.
On completion, respondents were provided with 20 sets of company financial
ratios They were informed that the companies were different from the
original set, and asked to repeat the exercise with the ratios.
On completion, respondents were asked to complete a third test, this time with
the faces, again on what was apparently a completely new set of companies.
There was some suspicion among the respondents that the companies had, in
fact, been identical on each occasion, but the different numbering systems
made comparisons odious and helped to allay such fears.
Different processing orders were used on a sub-sample of audiences so that
all six possible orderings of statements-ratios-faces, statements-faces-ratios,
etc., were included. This mechanism was employed to test for any effect that
207

order might have on processing times and decisions made. In particular,
processing of the accounts might occupy a shorter time period when in
position 3, compared to that in position 1, for a variety of reasons, including
peer pressure and task familiarity. On completion of the experiment
respondents were informed of the identity of the companies, of the white lies
regarding three unique sets of 20, and of the correct failed/healthy decisions.
Appendix 10.3.2 reveals the identities of the 20 companies employed in the
test. Respondent classifications on each of the three different bases were
analysed to determine the extent of the errors made and of the time
differences involved. The two possible types of error were distinguished:
errors of healthy classification when actually failed (Type I), and a failed
classification when actually healthy (Type II). Interestingly, conducting the
experiment with credit managers revealed that many believed only the
former (Type I) to be an error (ie failure to observe a potential bad debt was
an error, but a missed lending opportunity that proved to be safe was not!).
Any analysis of errors of classification should take into account weightings•
for relative importance of errors made and the associated misclassification
costs.
An analysis of the misclassified cases was carried out, with two aims:
i) to identify those cases which had proved to be the most
difficult
ii) to determine an information processing model consistent with
the misclassifications made.
10.3.2 EXPERIMENTAL RESULTS - EXPERIMENT 1
Tests conducted to determine the homogeneity of the sample respondents
showed that performance levels did not differ significantly within the
sophisticated user group.
Classificatory results for the complete sample of 121 respondents are detailed
below in Table 10.3.1 together with an indication of the performance of each
of the separate user groups:
208

Mean No of Classification Errors Classification Time (Mins)
TYPE I TYPE II
(Healthy when Failed) (Failed when Healthy)
Academics
(n = 52) 1.88 1.90 0.65 2.17 2.84 2.32 11.84 8.77 4.18
Accountants
(n = 23) 2.00 2.11 0.63 2.09 2.69 2.04 11.24 8.21 3.80
MBA Students
(n = 46) 1.74 2.00 0.57 1.96 2.91 2.17 11.78 8.43 3.96
Total (n=121) 1.9 2.0 0.6 2.1 2.8 2.2 11.6 8.5 4.0
TABLE 10.3.1: MEAN ERROR CLASSIFICATION FOR EXPERIMENT 1
Since 20 cases had been employed throughout, split 14 healthy to 6 failed, the
nature of possible errors made reduced to:
classifying a company as failed when actually healthy
,there being 14 opportunities for such an error
classifying a company as healthy when actually failed
there being 6 opportunities for such an error
This 14:6 (i.e. 70%:30%) split between non-failed and failed companies in the
sample was felt justified because it conformed closely with the 75%:25% split
at the time between healthy and distressed companies in the population,
based on their computed Z-scores.
In percentage terms, showing the proportion of potential errors that were
made, the final lines of Table 10.3.1 would show:
Classified as Healthy Classified as Failed
when Failed (Type I Errors) when Healthy (Type II errors)
Acctg Ratios Faces Acctg Ratios Faces
Stats Stats
31.8% 33.1% 10.9% 14.7% 19.6% 16.4%
An analysis of these results highlights two differences, each statistically
significant at the 5% level:
i ) the proportion of failed cases misclassified is very much higher
than that of the non-failed cases . This is a potentially important
209

feature of the results if, as suspected, the 'missed failure' is a
relatively more important misclassification.
ii) the time spent processing the facial profiles is less than half
that spent on either accounting statements or financial profiles.
The attempt to vary the order of processing of the test materials, by adjusting
the experimental procedure was made largely as an afterthought, and the
great majority (97) of useful responses were based on an Accounts-Ratios-
Faces ordering. The results generated, below in Table 10.3.2, suggest that
order of processing is not important, but the strength of conclusions is
restricted by the size of sample employed.
Mean Processing Time (Minutes)
Processed Processed Processed
First Second Third
Accounting Statements 12.09 11.25 11.23
Financial Ratios 11.79 8.02 7.54
Faces 5.40 4.53 3.61
TABLE 10.3.2: MEAN PROCESSING TIMES IN EXPERIMENT 1
Paired-case t-tests were employed to compare the performance of individual
respondents for each of the means of presentation, with the following
results:
i ) respondents exhibited significantly more Type II errors when
using ratios than for either faces (t= 2.33) or accounting
statements (t= 3.45)
ii) no significant difference existed even at the 10% level in the
number of Type II errors made using accounts or faces (t=1.02)
iii) significantly fewer Type I errors were made with the faces than
with either the accounts (t= 11.6) or ratios (t= 11.8)
iv) no significant difference existed even at the 10% level in the
Type I errors resulting from the use of either accounts or ratios
(t= 0.35)
210

v) faces were processed significantly more quickly than either the
accounts (t= 21.1) or the ratios (t= 15.0)
vi) ratios were processed significantly more quickly than the
accounts (t= 7.41)
Faces were, therefore, processed significantly quicker and produced
significantly fewer Type I errors, than either the accounting statements or
the financial ratios. The faces produced fewer Type II errors than the ratios,
but not the statements.
The facial profiles have therefore generated decisions at least as good, and
often better, than using other sources, and much quicker.
Appendix 10.3.3 provides a detailed analysis of the percentage
misclassification of each of the cases employed. Of the failed cases 3,4 and 16
caused the most errors in each of the methods of classification, but the
improvement in performance when faces are employed is startling. Of the
healthy cases, 15 and 17 are consistently misclassified by all three methods,
but case 1 is notable in that the faces exhibit far more errors than either the
accounting statements or the financial ratios.
An analysis of misclassification combinations among respondents reveals . the
likely decision-making models being employed. Table 10.3.3 below shows all
of the common misclassification patterns (ie those exhibited by 15% or more
of respondents).
211

CASE:
COMBINATIONS
% MISCLASSIFICATIONS
ACCOUNTING RATIOS FACTS
STATEMENTS
3,4 22 25 5
3,16 34 44 4
4,16 29 27 1
3,4,16 18 20 1
15,17 29 22 36
1,15 7 7 48
1,17 6 12 34
13,15 12 8 24
13,15,17 6 5 17
1,15,17 5 5 28
1,13,15,17 2 1 15
TABLE 10.3.3 EXPERIMENT 1: MISCLASSIFICATION COMBINATIONS
,
The pattern of misclassifications for accounts and ratio processing methods is
remarkably similar with a preponderance of misclassified failed companies.
However, for facial classifications it is rare for any respondents to produce as
many as two failed misclassifications and accordingly the figures at the top of
the table are extremely low.
This distinction in error patterns can be explained by looking more closely at
the manner of information processing in order to deduce the decision-
making models that might have produced the observed pattern of errors.
Alternative linear models were constructed for combinations of accounting
statement items and financial ratios in order to generate the above
misclassification patterns. Ashton (1976) demonstrates the robustness of
simple linear models of the type used here, even though more precise
weightings might be generated by regression procedures. A similar process
was employed with the qualitative facial information. The variable
combinations identified are detailed in Appendix 10.3.4.
A simultaneous consideration of profitability, short term debt and balance
sheet strength is sufficient to avoid any errors of classification. Over-
emphasis on the profit item produces the familiar error pattern: 3,4,16 of the
. 212

failed cases; 15,17 from the non-failed set. The simultaneous consideration of
leverage leaves only Case 4 misclassified.
Alternative classification models using individual facial features and
combinations of features reveals a very different error pattern.
Concentration on the profitability feature (mouth) produces the (1,13,15,17)
error combination - but correctly identifies all the failed cases. Classification
on the eyes (leverage) alone or the eyebrows (liquidity) alone produce error
patterns of (1, 6, 11, 19, 20) and (5, 14, 20) respectively, which never occurred
in practice among respondents, suggesting that they were never considered
separately from the mouth.
The combination of all three features - mouth, eyes, eyebrows -
corresponding to profitability, leverage, and liquidity ratios, produces a
perfect classification.
Appendix 10.3.5 shows the faces for the six failed companies and reveals the
reasons for so few misclassifications. Only in Case 4: (Brocks Group) is there
an element of compensation in the eye size, otherwise the combination of
eyes, mouth and eyebrows is consistent with the extreme of financial distress.
Among the non-failed group, the most common misclassifications, cases:
1,13,15,17 all required a more complex processing than the remaining ten
cases to illicit a correct response. •Some compromise was required to balance
the message conveyed by the different facial features. These cases are
illustrated in Appendix 10.3.6.
For Case 1: (Associated Fisheries), the down-turned mouth and smallish eyes
of poor profitability and high debt are compensated by the flying eyebrows
of an excellent liquidity position. Both Case 13: (LRC) and Case 15: (Petbow)
exhibit poor profitability, but have large eyes, large noses and flying
eyebrows consistent with good debt, working capital, and liquidity positions.
Case 17: (Sanderson, Murray and Elder) compensates for poor liquidity and
profitability with respectable debt and working capital positions.
This remarkable difference in error patterns when the same financial
information is processed through different media suggests that potential
improvements in the decision-usefulness of the information might be made
by varying the format of the presentation.
213

10.3.3 EXPERIMENT 1: A REAPPRAISAL
During the execution of the experimental procedures and subsequent
workshopping of results several areas of concern emerged. Questions were
raised both with respect to the experimental design employed and with the
nature of the comparison being attempted. One fundamental issue, raised by
Barron (1984), related to the equivalence of the information sources. The
construction of the facial profiles is dependent upon the use of mean and
standard deviation values for the ratios employed in order to map the features
appropriately. This information did not accompany either the accounting
statement or financial ratio sources, so that it might be argued that a
comparison is being made between 'absolute' and 'relative' financial
measures. It was therefore determined to redesign the experiment and repeat
the procedure in a manner which overcame the principal points at issue,
notably:
1) the accounting statement information was perceived as being
too complex; it was therefore revised and simplified in both
content and format to comply more with the principles
advocated by Ehrenberg (1977). A similar procedure was adopted
for the financial ratios, reducing the number computed and
clarifying their presentation.
i i ) respondent feedback revealed that the 5-year data provided was
not being used in the decision-making process. Only one (the
most recent) or at most two years' data were being considered.
The volume of information was therefore reduced fivefold with
the provision of only one years' data, for failed companies that
being the last disclosure prior to failure.
iii) the means and standard deviations of financial ratio variables
were provided, since they had already implicitly been employed
in the construction of facial profiles. The aim here was to
ensure that equivalent information was conveyed by each of the
three media sources.
iv )
the number of financial variables used for facial mapping,
along with the number of variable facial characteristics were
both reduced to reduce the complexity of the overall impression.
214

v) a single assignment of financial variables-to-facial features had
been used throughout the initial study, as detailed in Appendix
10.3.7. This presumed advance knowledge of an optimum
assignment, where such knowledge did not exist. Chemoff and
Rizvi (1975) commented on the likely variation in results from
alternative assignments; it was therefore determined to examine
all of the alternative multiple combinations under experimental
conditions. The reduction in variables outlined in iv) above
allowed this all embracing process to take place without the need
to extend the scope of the experiment unduly.
vi) the testing of the effects on processing of varying the order of
materials had been inadequately examined at this initialstage,
because of sample difficulties. The revised experimental design
envisaged a systematic procedure whereby all alternative
processing orders would be analysed thoroughly.
vii) the initial test materials comprised 20 companies resulting in
extensive experimental periods (in excess of an hour for many
respondents). In an effort to reduce the potential effects of
subject fatigue, and of peer group pressure, inducing the
hurried completion of the final tasks, the number of companies
was reduced to ten.
viii) the proportion of failed companies .(6 of 20) in the first
experiment was arbitarily determined. In view of the potential
effects of alternative failure probabilities the revised
experimental design incorporated sets of test materials
containing, respectively, 1,3,5,7 and 9 failed cases.
ix) concerns were voiced regarding the non-random selection of
case samples in order to generate what were perceived to be a
preponderance of deliberately difficult cases. A complex
matching procedure, detailed in Chapter 5, was therefore
employed in order to provide a sample from which a complete
range of profiles could be selected.
A sub-sample of 30 companies was selected from a matched major sample of 66
companies (33 failed and 33 non-failed). These companies provided a diverse
set of financial profiles, based on only three financial ratios, to allow a test
215

instrument comprising all possible variations of feature assignment,
together with the opportunity of varying the base rate for failed companies.
As a consequence of the results of Experiment 1, together with the
appropriate psychological literature, a series of propositions was developed
for further testing:
P1: Facial profiles will be processed significantly quicker than either
financial ratios or accounting statements.
P2: The number of misclassification errors resulting will be dependent
upon the assignment of financial variables to facial characteristics.
P3: The classification decisions made using the facial profiles will be as
good as, or better than, those made with either the financial ratios or
accounting statements.
P4: The order of processing of the alternative information sources will not
significantly influence the classification decisions made.
P5: The number of misclassification errors recorded will be a function of
the failure base rate in the sample set.
10.3.4 EXPERIMENT 2- EXPERIMENTAL DESIGN
A group of 100 MBA students nearing the end of their introductory
accounting course at the City University Business School comprised the
revised sample. This group was divided into 10 sub-groups of equal size.
A total of nine experimental tasks was to be considered simultaneously:
A: analysis of accounting statements
R: analysis of financial ratios
Fl to F6: the six assignments possible of 3 financial variables to 3
facial variables.
Each participant had 5 tasks in all (A, R and 3 of the F's in some order) and
generated three responses for each task:
a) the time taken
b) the number of failed companies correctly detected
216

c) the number of non-failed companies correctly detected.
Table 10.3.4 below shows the assignment of tasks for each of the ten members
of any one sub-group:
SUB-GROUP
1 2 3 4 5 6 7 8 9 10
1 A A F3 F4 F2 R R F6 F5 Fi
2 Fl F2 A A F4 F5 F6 R R F3
Order
3 R F6 F5 F3 A A F2 Fi F4 R
Presentation
4 F2 R R F6 F5 F3 A A Fi F4
5 F3 F4 F6 R R F2 Fi F5 A A
TABLE 10.3.4: EXPERIMENTAL DESIGN: DISTRIBUTION OF TASKS
Thus in any sub-group of ten persons:
i ) each respondent processes the accounting statements;
i i ) each respondent processes the financial ratios;
iii) each respondent processes three sets of faces, so that each set
of faces is processed five times;
iv) the accounting statements and the financial ratios each appear
twice in every position of the processing order. Each set of
faces appears once in every position.
v) each sub-group's experimental materials comprise the same
companies with, therefore, a common number of failed
companies. The potential exists for the variation of this
proportion between sub-groups. In practice, two sub-groups
each tackled sets of cases with common numbers of failed
companies.
This revised design therefore allows processing time and misclassification
errors to be considered as a function of:
217

i ) the number of failed cases
ii) the order of processing
iii) the variable-feature assignment
iv) the alternative information source employed.
The second experiment was administered in accordance with the above
design, in order to test the earlier propositions. Appendix 8.3.2 gives an
illustration of the test materials for the accounting statement and financial
ratio exercises. The six alternative assignments of financial variables to
facial characteristics (F1 to F6 in the experimental design) were denoted A to
F for the purpose of labelling the test instrument. Respondents were
provided with pictorial guidance (along the lines of Appendix 10.3.8) as to
which feature assignments had been employed in each set of faces with
which they had been provided. Appendix 10.3.9 details the six alternatives
together with their effect on one particular case. Sample materials for the
facial profile exercise are provided in Appendix 10.3.10. In each part of the
exercise respondents were requested to process the financial information
relating to ten companies sequentially with each case presented on a separate
sheet of A4 paper. Respondents were informed that the ten companies were
different in each section, and random numbering systems ensured that cases
could not be compared meaningfully. They were further informed that any
number of their cases could be those of failed companies, but that it was most
likely that the set comprised a mixture of failed and non-failed companies.
10.3.5 EXPERIMENT 2- RESULTS •
Reduction in the size and complexity of the experimental task reduced the
mean overall processing time to around 40 minutes, minimising the potential
for student fatigue and reducing the opportunities for peer group pressure.
Table 10.3.5 shows the mean processing times for each information source
over the five alternative processing orders.
218

1
2
3
4
5
OVERALL
MEAN PROCESSING TIME (MINUTES)
ORDER OF ACCOUNTING FINANCIAL ALTERNATIVE FACIAL
PROCESSING STATEMENTS RATIOS ASSIGNMENTS
A B C DEF
16.5 10.8 5.9 5.5 5.2 7.4 7.6 5.7
19.1 8.6 5.7 6.4 5.2 5.9 7.5 5.1
18.5 6.4 4.6 4.4 4.1 5.7 4.8 5.2
12.6 7.6 6.5 4.5 5.2 4.3 4.7 4.3
15.6 8.2 3.9 5.5 3.8 5.4 3.3 3.7
16.5 8.3 5.3 5.3 4.7 5.7 5.6 4.8
TABLE 10.3.5: FACIAL PROFILES EXPERIMENT - EFFECTS OF
ALTERNATIVE ORDERING OF PROCESSING
The testing of Propositions highlights several important features:
i ) no significant processing time differences at . the 5% level
between the alternative facial assignments as measured with a
t-test;
) no significant difference at the 5% level in processing times at
any position in the ordering process
iii) a significant reduction in the processing time as we progress
from the accounting statements through to the financial ratios
and facial profiles.
All of these results are confirmatory of the tentative conclusions drawn at
the initial study stage, providing evidence supporting the validity of these
preliminary results.
Table 10.3.6 provides a summary of the misclassifications that were generated.
219

MISCLASSIFICATIONS ACCOUNTING
STATEMENTS
FINANCIAL
RATIOS
ALTERNAIVE
FACIAL ASSIGNMENTS
A B CDE F
FAILED WHEN HEALTHY
ERRORS (Type II) 94 92 46 46 42 25 44 30
HEALTHY WHEN FAILED
ERRORS (Type I) 157 18 4 76 80 67 75 71 89
TOTAL MISCLASSIFICATIONS 251 276 122 126 109 100 115 119
No OF CASES 1000 1000 500 500 500 500 500 500
% MISCLASSIFICATION 25.1 27.6 24.4 25.2 21.8 20 23 23.8
TABLE 10.3.6:FACIAL PROFILES EXPERIMENT - DISTRIBUTION OF
MISCLASSIFICATIONS
These results highlight several features with respect to the second
proposition:
P2: i) where the opportunities for each type of misclassification error
were equal, the number of failed-company misclassifications
was significantly higher for all forms of processing.
ii) Assignment D recorded a lower proportion of misclassifications
than did any of the other facial assignments - largely
attributable to significantly fewer failed-when-healthy (Type
II) errors.
iii) Assignment C produced the fewest failed-company
misclassifications, suggesting that any assignment preference
must be dependent on the relative weighting accorded to each
of these errors. Where relative misclassification costs accord a
40:1 weighting in favour of Type I errors (following Altman et
al (1977)) this suggests that Assignment C is optimal.
A consideration of the mean number of processing errors per respondent per
10 companies reveals the following:
220

ACCOUNTING FINANCIAL FACIAL
STATEMENTS RATIOS PROFILES
FAILED WHEN HEALTHY
ERRORS (Type H) 0.94(1.40)
0.92(1.15) 0.78(1.33)
HEALTHY WHEN FAILED
ERRORS (Type I) 1.57(1.81) 1.84(2.02) 1.52(1.84)
OVERALL MEAN 2.51(1.65) 2.76(1.71) 2.30(1.56)
TABLE 10.3.7: FACIAL PROFILE EXPERIMENT: MEAN MISCLASSIFICATION
ERRORS
(Standard Deviations in parentheses)
The results highlight several features with respect to the third proposition:
P3: i) there were fewer errors overall made in processing the faces
than with the financial ratios, a difference significant at the 5%
level (t= 2.38); the difference compared to the accounting
statements, though fewer, was not statistically significant
(t= 1.12).
ii) similarly the reduced number of errors made with the
statements was not statistically significant compared to that
made with the ratios (t= 1.05).
i) although fewer misclassifications were made with the faces in
both the Failed when Healthy, and Healthy when Failed aspects
the extent of these differences was not statistically significant
at the 5% level (t= 1.02 and t= 1.40).
With respect to the fourth proposition (P4) Appendix 10.3.11 details the
distribution of classification errors according to the order in which the
alternative information sources were processed. There are no significant
differences in performance attributable to the order of processing.
With respect to the fifth proposition (P5) Appendix 10.3.12 details the
distribution of classification errors according to the number of failed cases in
the material set. Table 10.3.8 provides a brief summary of this appendix and
highlights the differences that are attributable to base rates.
221

NO OF ACCOUNTING FINANCIAL FACIAL
FAILED CASES STATEMENTS RATIOS PROFILES
1
1.80 1.45 1.67
3
2.40 1.85 1.50
5
1.90 2.75 1.45
7
2.50 2.95 2.85
9
3.95 4.80 4.05
OVERALL 2.51 2.76 2.30
TABLE 10.3.8: FACIAL PROFILES EXPERIMENT - MEAN NUMBER OF
MISCLASSIFICATION ERRORS PER RESPONDENT
The non-linear relationship is consistent with a failure to adjust the prior
probabilities of the respondents. For each format the mean number of
misclassification errors is at its highest where the set of cases includes 7 or 9
failures. Despite the instruction that the materials set might contain any
number up to ten failed cases respondents clearly expect some number below
this figure. The relative increase in misclassifications for low and high base
rates, apparent for accounts and faces, is consistent with the anchoring and
adjustment heuristic (Kahnemann and Tversky (1972)). The pattern of
results is largely consistent with the existence of the non-monotonic
anchoring effects as observed in psychophysics research by Helson and
Masters (1966).
An analysis of the misclassification of particular cases, when processed by
alternative means, is detailed in Appendix 10.3.13.
Appendix 10.3.14 shows the misclassifications that would result from the
adoption of particular processing strategies. The repeated misclassification
of the , failed cases 6,44,46,48,50 and 53 is consistent with overemphasis on the
profit figure; so too is the misclassification of the non-failed cases 18, 35 and
57.
Where the facial profiles produce misclassifications not apparent with the
other processing media, this is consistent with undue overemphasis on the
mouth as a facial characteristic. Where profitability is assigned to the mouth
such overemphasis is further amplified.
222

10.3.6 FACIAL PROFILES EXPERIMENT: CONCLUSIONS
The results of the retest are largely supportive of the prior experimental
work. Observed differences appear in the same directions as earlier, but the
tighter experimental design at this stage provides greater credence to the
statistical testing. Several aspects are worthy of re-emphasis:
i ) facial profiles provide an efficient means of processing
financial information, allowing decisions of at least comparable
quality to be made more quickly. The validity of the results of
the first experiment suggests that such findings are
generalisable to respondents of varying degrees of
sophistication. The common processing time between students
and practitioners is consistent with the results of Stock and
Watson (1984).
i i ) the order of processing of materials proves to be unimportant.
i ) the base rate of failed cases per set is a highly significant
determinant of the extent of misclassification, supporting the
conclusions of Houghton (1984). The pattern of errors is
consistent with the adoption of an 'anchoring and adjustment'
heuristic around an expected failure rate.
iv ) evidence is generated towards the provision of an Optimum
Assignment of Financial variables to Facial characteristics,
though the preference between assignments C and D is
ultimately dependent on the cost of a wrong decision in each
alternative direction. If the cost of a missed-failure error is
more than twice as much as that of a misclassified healthy
company preference switches from D to C. Such a switch would
be consistent with the findings of Altman et al (1977) as
employed by Zmijewski (1983) suggesting differential
misclassification costs of the order of 38 times greater. Most
notably, both alternatives C and D assign the liquidity ratio to the
most prominent facial feature, the mouth.
v) feedback from respondents suggests that knowledge of the
actual feature assignments was unimportant, most decisions
being made independent of the reference guide provided. This
finding is consistent with that of Moriarity (1979), suggesting
that the facial profile is processed as a compromise between
features within a facial context, without the necessity of
referring to financial meaning. The use of faces, rather than
223

the choice of a particular feature assignment, appears to be of
paramount importance.
vi) feedback also suggests that very little use is made of the means
and standard deviations of the financial ratios provided. This
may be attributable to a lack of statistical education or a lack of
facility with matters statistical. Either way a potentially
powerful piece of information with which to gauge relative
financial performance is largely ignored. This may
contribute to faces outperforming financial ratios as an
information source. The former implicitly include mean and
standard deviation measures in their construction. They thus
ensure that potentially important items of information cannot
be ignored entirely.
The empirical findings detailed in this chapter substantiate the propositions
generated by the earlier psychological literature. Respondents of varying
degrees of accounting sophistication are able to process . facial profiles
efficiently and to make speedy decisions of a quality comparable with, if not
better than, those associated with alternative financial formats in this
particular simplified analytical task. Whether such results are generalisable
to other, more complex tasks, is subject to further testing. The suggestion
here is that opportunities exist for improving the decision-usefulness of
financial statement information by experimenting with alternative
presentation forms. By highlighting the specific advantages of a facial
profiles approach, this chapter directs further work towards the
accommodation of this new methodology into the financial environment.
224

CHAPTER FLEVEN
SUMMARY AND CONCLUSIONS
Shareholder surveys, like those of Lee and Tweedie (1981) and Chang and
Most (1981), consistently demonstrate users' perceptions of the importance of
annual report disclosures in the decision-making process. Lee and Tweedie
(1975) identify the Chairman's narrative statement as the single most read
portion of the disclosure. Yet existing empirical evidence casts doubt on the
informational content of any part of the annual report.
Hines (1982) attributes this anomaly to the longer time effects required in
order for lengthy fundamental analysis to take place, suggesting that
existing empirical evidence has not digested the full import of the annual
disclosure. This study substantiates such a suggestion by demonstrating the
improvements in decision-usefulness that are possible through a more
detailed analysis of the content and presentation of annual report
disclosures.
Conceptual Framework studies in the US, UK, Canada and Australia have
emerged as part of the process of 'accountability' sought by professional
bodies and standard setters. These studies have largely agreed on the
objectives of corporate reporting and the qiialitative characteristics of
information viewed essential for the fulfilment of the objectives and the
satisfaction of users' perceived information requirements.
The Chairman's narrative provides a vehicle for the perpetuation of
'accountability' at the company level, providing a voluntary disclosure
signalling the intentions of the executive to act in the interests of
shareholders and the community. Opportunities for misleading the public
exist by conveying inappropriate 'good news', but Foster (1986) suggests that
such misrepresentation is unlikely to persist into the long-term because of
potential damage to personal and corporate credibility.
If such misrepresentation is to be avoided disclosures must convey their
message in a meaningful way. To be useful they must possess certain
desirable qualities. The desirable qualities of accounting information are by
no means mutually exclusive, and Stamp (1982) identifies a number of likely
trade-offs that would be necessary in practice. He makes no attempt to
quantify the nature and extent of any trade-off, but this study conducts such
an evaluation, investigating the dimensionality of financial information, and
presenting original empirical findings. A Multidimensional Scaling
225

approach to the analysis of respondents' perceptions is adopted, revealing
two major dimensions:
i) the quality of content and
ii) the quality of presentation.
This distinction provides the framework for a dual analysis of the narrative
and quantitative aspects of the corporate report, focusing respectively on
content and presentation.
11.1 ItMC,Q==EAfalsJMQ1AIMM (Ref: Chapter Seven)
The stated objectives of financial reports are largely non-specific with
regard to a target audience. The consequent generalisation of user-group
designation pre-supposes all-purpose reporting which may neither satisfy
the information needs nor the communication potential of users.
This thesis provides experimental evidence to illustrate different
interpretations and the alternative processing methods adopted with
narrative sources. The use of heuristics is highlighted as leading to
potentially dysfunctional decision-making in an accounting environment
associated with:
i) inefficient integration of narrative and quantitative information, with
inappropriate emphasis where both sources are available, and
ii) inconsistency in the attachment of numerical rankings to qualitative
measures of uncertainty.
The first of these points is further addressed by comparing the information
conveyed in the Chairman's narrative with that contained in the financial
statements. The incremental effect of the provision of narrative information
is evaluated and the conflict investigated. The brevity, complexity and low
levels of readability of narrative are all apparently contributory factors in
their misinterpretation. The placing of undue emphasis on a less reliable
source, in an attempt to reconcile any conflict is entirely consistent with
Kahnemann and Tversky (1972), Joyce and Biddle (1981b) and Ashton (1984),
and the adoption of simplifying heuristics.
226

In order to demonstrate the environmental predictability of models
employing qualitative information, a content analysis of Chairman's
Statements was carried out.
Oliver and Walker (1959), Stone and Hunt (1963), Mosteller and Wallace
(1963), Morton (1978) and Burrows (1986) have all demonstrated the
discriminatory ability of textual information in non-accounting
environments.
This study extends the content methodology into the financial environment
by ascertaining the significance of the terminology employed. A
classificatory system is employed, consistent with those of Osgood et al (1957)
and Houghton (1988), to identify the nature of semantic content. This then
forms the basis for the construction of a number of discriminant models
distinguishing between failed and non-failed companies through
combinations of, respectively, words, sentences, themes and perceived
strategies. The application of such a methodology to accounting narratives is
new to the literature, and the findings original. The resulting models are
most successful when identifying the key aspects of a 'good news'/'bad news'
split, most notably the positive perception of profit, dividends and growth,
and the negative perception of losses, borrowings, closures, the support of
bankers and failure to mention a dividend. Such disclolsures may, however,
be time specific and further research needs to be undertaken to determine
the effects of time trends on the usefulness of the models.
11.2 THE PRESENTATION OF ACCOUNTING NARRATIVES (Ref: Chapter Six)
Haried (1972, 1973), Oliver (1974) and Houghton (1987a, 1987b, 1988) have
each demonstrated a lack of shared meaning existing between the users and
preparers of accounting information which might be a potential source of
information. Haried (1972) identifies semantic difficulties associated with
i) conflict between technical and layman's interpretation of terminology
and
ii) insufficient levels of standardisation of financial terms,
either of which may distort the communication of narrative.
,. 227

This study extends the existing research, confined to an understanding of
concepts and terminology, to the message conveyed by the totality of words
employed. Difficulties of readability and understanding are associated partly
with word complexity, but also with sentence • structure and presentation.
Several studies, including Smith and Smith (1971), Still (1972), Healy (1977),
Adelberg (1979b), Stevens et al (1983) and Courtis (1986) have addressed the
readability of accounting literature. This study examines readability on a
relative basis in order to determine whether it is predictive of present or
future performance and measures understandability by reference to the
target audience rather than through standard formulae. Such a distinction
between 'readability' and 'understandability' is new to the accounting
literature and the findings with respect to the predictive power of narrative
complexity, original.
The Ingram and Frazier (1983) study of narrative disclosures was confined to
a particular industrial sector, whereas this study attempts to overcome inter-
industry complications through a careful matching procedure based on size,
industrial sector, performance and financial year-end. An additional
constraint is supplied by the requirement of a disclosure in which a
Chairman reports separately from his directors in sufficient depth for
cognisability measures to be reliable.
The length of Chairman's narrative was found to be positively dependent on
company size. Readability is significantly related to financial performance,
a result consistent with, but not causally related to, obfuscation in order to
conceal deficiencies.
11.3 CONTENTT_QE ACCOUNTING
(Ref: Chapter Eight)
The disclosure of the annual report apparently has no information content
in terms of its effect on share prices, and Foster et al (1986) use its lack of
timeliness to attribute no useful incremental information to the report for
the purposes of share valuation.
However, the decision-usefulness of predictive numerical models, making use
of accounting information already in the public domain, cast doubt on, at
least, the weak-form version of the efficient markets hypothesis. Altman
(1968) and Taffler (1984), among others, demonstrate the environmental
predictability of the failed/non-failed decision on the basis of financial ratio
combinations. Belkaoui and Cousineau (1977), Peel et al (1985), Keasey and
228

Watson (1986) and Courtis (1986) have all speculated on the potential for
improvement of existing models through the incremental effects of non-
accounting information. The latter addressed the issue of risk-relatedness to
the complexity of narratives, the remainder addressed the usefulness of non-
accounting variables in making a failed/non-failed classification.
This study accepts the decision-usefulness of existing models, while
recognising the frailty of the underlying theoretical framework, and
demonstrates the efficiency of similar models constructed around narrative
aspects.
The study then proceeds to address the issue of the information content of the
sum of annual disclosures, quantitative and narrative, by conducting an
experiment to investigate the incremental nature of additional information
sources. Evidence is presented which demonstrates that representative users
can make improved decisions, in a failure prediction context, when provided
with both narrative and financial statement data. The issue of conflict
between the messages conveyed by narrative and financial statements is
addressed, and alternative processing strategies suggested for the
reconciliation of conflict.
11.4 THE PRESENTATION OF ACCOUNTING INFORMATION
(Ref: Chapters Nine, Ten)
The study examines alternative tabular, graphical and pictorial methods for
the presentation of financial inforamtion. It concludes that the schematic
face has a potentially unique format with specific advantages for the
portrayal of company performance and personality.
Cuceloglu (1970) and McKelive (1973) demonstrate the power of simple line
drawings in conveying facial messages which are cross-culturally
consistent. Goldstein and Mackenberg (1966), Grant (1970) and Laughery et
al (1971) provide supporting psychological evidence detailing the saliency of
facial features.
Financial information is multidimensional and the face provides an efficient
means of integrating diverse aspects in order to generate a unified message.
Previous studies, Moriarity (1979), Stock and Watson (1984) and Smith and
Taffler (1984) have intimated the potential for facial applications in the
financial area. Thus far they have failed to incorporate the full force of the
> 229

existing psychological evidence into the choice of either feature saliency or
variable assignments. This study rectifies these deficiencies while allowing
an optimum feature assignment to be generated experimentally.
The use of schematic faces is demonstrated in two decision-making contexts:
i ) as a screening device to distinguish between failed and non-
failed companies;
ii) as a means of detecting performance trends over time.
In an experimental procedure comparing the use of accounting statements,
financial ratios and schematic faces, the facial format is shown to be an
efficient method of processing, producing decisions of at least comparable
quality much more quickly.
An optimum feature assignment is suggested which minimises the number of
failed company misclassifications. This assignment balances the relative
saliency of facial features and financial variables by attaching Liquidity-
Mouth, Profitability-Eyes and Financial Risk-Eyebrows. A slightly different
assignment (though still with Liquidity-Mouth) minimises the total number
of case misclassifications made, but Altman et al (1977) and Zjmewski (1983)
suggest that the missed failed-case represents a much more costly omission.
11.5 DIRECTIONS FOR FUTURE RESEARCH
i ) The great majority of the empirical evidence presented in this study
has relied on students, of varying degrees of sophistication, acting as
subjects. In order to appraise the generality of conclusions to
accounting practitioners, and to gauge experiential effects, the studies
must be repeated on a professional audience.
Where accounting practitioners have been used, the results have been
most encouraging, providing similar results but with improvements
consistent with education and experience. However, increased sample
sizes are advisable to verify the statistical validity.
i i ) The evaluation of similarity judgements in Chapter 3 allowed the
generation of a three-dimensional solution to the issue of information
230

preferences, concerned with the Content and Presentation of
accounting information.
Similar results were generated by student audiences of varying
degrees of sophistication, but the experiment should be repeated with a
group of accounting practitioners in order to gauge reliable
educational and experiential effects;
UK student rankings of the perceived importance of informational
properties were notably at odds with those of practitioners in Canada
and US. A repeated experiment with UK practitioners would identify
any apparent cultural differences.
iii) There have still been remarkably few applications of the
Multidimensional Scaling methodology in the accounting literature.
The presentational aspects of MDS are potentially most rewarding and
it is to be hoped that the application of Chapter 3 might generate
renewed interest in the technique among accounting academics.
i v) The experiments of Chapter 4 reveal the adoption of heuristics by
accounting students to ease information processing complexity.
Further experiments with accounting practitioners are required to
gauge the comparable educational and experiential effects.
The potential economic consequences of the adoption of alternative
processing rules in decision-making remains unaddressed and an area
for futher development.
v) Chapter 4 also highlights the potential problems associated with
inconsistent quantitative rankings being attached to qualitative
indicators of uncertainty. Where probabilistic efforts are to be made to
introduce expected values into financial disclosures, the economic
consequences may be significant indeed. Further research is justified
in this area in order to specify quantitative ranges associated with
accounting terminology conveying uncertainty.
vi) Measures of readability and understandability in Chapter 6 have been
confined to the Chairman's narrative in this study. They might
usefully be extended to a consideration of the Directors Statement and
> 231

the Auditors' Report to determine any performance related aspects of
complexity.
vii) This present study has addressed the complexity of the narrative, for
any one company, in one particular year. An examination of time
trends for a group of companies might confirm the generalisability of
such results.
viii) The Chairman's Statement bears the unmistakeable stamp of the
chairman, though the detailed content may owe much to the finance
director and the legal and public relations departments. A further
study directed towards companies under common chairmanship might
remove one variable from the complex narrative-performance
relationship, and ease its evaluation.
ix) The CLOZE scores attributable to accounting professionals demonstrated
a common ranking of companies for difficulty, but a marked
superiority in performance. This experiment needs to be repeated
with a larger audience of professionals in order to gauge the precise
educational and/or experiential factors leading to an improved ability
to predict the content of narrative.
x) The readability of the Chairman's Statement was significantly
correlated with financial performance, where the subject companies
were clearly distinguishable in terms of their financial status (i.e.
failed and non-failed). This experiment needs to be repeated with
companies of similar financial profiles (e.g. distressed and
failed/distressed but recovered) to determine whether similar
differences are discernible.
xi) Models constructed to identify distress on the basis of content and
readability need to be post-tested on new data in order to validate the
generality of these conclusions. They might then be applied in several
distinct areas:
a) as indicators of performance over time
b) as measures of relative performance
232

c as possible indicators of recovery potential among firms
designated as distressed.
xii) The discriminant models of Chapter 7 demonstrate that key words,
phrases, themes and actions can be used successfully to distinguish
between failed and non-failed companies. This area of research should
be extended:
i) with a new sample of data;
ii) across a revised time frame, to confirm that the results are
generalisable and the models robust to technical and temporal
changes.
xiii) The content analysis methodology of Chapter 7 might usefully be
extended to determine whether it can be used to detect differences
between companies whose financial profiles are substantially similar.
Narrative differences may exist between companies that are 'distressed
and failed', and those 'distressed but recovering'. Further research is
required in this area to determine whether new content-based models
might be able to make such a distinction.
x iv) In each of the experiments of Chapters 8 and 10 where failed/non-
failed decisions were made, misclassification patterns were consistent
with an inability to change respondents' perceptions of failure base
rates. In view of the controversy in this area of recent accounting
literature, further research may be appropriate.
x v) The experimental design of Chapter 8, evaluating the incremental
effect of new information on decision-making needs to be applied to an
audience of accounting professionals, or possibly bank lending
officers. The results generated by student audiences suggest an
improvement in decision-making performance when qualitative and
quantitative information is integrated, but such findings may not be
generalisable to respondents of greater accounting sophistication.
Protocol analysis might provide a useful means of determining
precisely how the information is being processed and how the
integration of separate, potentially conflicting, sources is being
accomplished. Such an analysis might aid an understanding of the
233

factors contributing to apparently conflicting messages conveyed by
narrative and quantitative statements.
xv i) Experimental work with facial profiles reveals a technique with
potentially rewarding applications in several financial areas. The
usefulness of the profiles as a clustering device is referred to in the
text but not addressed in detail. This area is one which requires
further development, so that the results of the audience-dependent
facial profiles technique might be compared systematically with those
which are algorithm based.
11.6 RESEARCH IMPLICATIONS
By examining some of the alternative methodologies available for the
fundamental analysis of content and the effect of alternative presentation
formats, this thesis highlights the opportunities that exist for improving the
decision usefulness of financial information. The CLOZE procedure for
measuring understandability of narrative and the facial portraits
methodology for displaying quantitative financial information are both
concerned with presentation. In each case they are user-specific and make
suggestions for changes in format which will allow easier and more effective
analysis by decision makers dependent upon the corporate report. The use of
content analysis in the examination of the Chairman's narrative highlights
the neglect of non-quantitative information in financial analysis.
Recognition of the important role of the narrative and its incremental value
when considered alongside the quantitative statements should further
enhance the decision usefulness of the corporate annual report.
The underlying conclusion drawn must be that better decisions do not
necessarily require more information. Improved use of the existing
information base, through the superior fundamental analysis of Chapters 6
and 7 and the potentially superior presentational methods of Chapters 9 and
10 provide ample evidence of the opportunities for such improvements.
This thesis provides a first step in illustrating the applicability of the new
methodologies to the simplistic failed/non-failed classification, and in so
doing demonstrates the potential of further extension to less narrow aspects
of performance appraisal.
234

APPENDICES

AICPA (19621:Sprouse & Moonitz
ContinuityObjectivityConsistencyStable Measuring UnitDisclosure
AICPA (1973):Trueblood
RelevanceReliabilityMaterialitySubstance/FormUnderstandabilityFreedom from BiasConsistencyComparability
AAA (1966):ASOBAT
RelevanceVerifiabilityFreedom from BiasQuantifiabilityUniformityConsistency
ASSC (1975):Corporate Report
RelevanceObjectivityReliabilityTimelinessComparabilityCompletenessUnderstandability
AARF (1972):Staubus & Kenley
RelevanceReliabilityComparabilityNeutralityTimelinessUnderstandabilityOptimal DisclosureFormat
FASB (1980):SFAC2
RelevanceReliabilityMaterialityRepresentationalFaithfulnessUnderstandabilityNeutralityConsistencyComparabilityVerifiabilityCost/BenefitTimelinessPredictive ValueFeedback Value
CICA (1980): AARF (1987)
Canadian Institute (Stamp)
RelevanceClaritySubstance over FormComparabilityTimelinessMaterialityFrredom from BiasObjectivityConsistency
Full disclosureIsomorphismVerifiabilityCost/Benefit
effectivenessNon-arbitrarinessFlexibilityData availabilityPrecisionConservatism
RelevanceReliabilityMaterialityTimelinessCost-BenefitComparabilityConsistencyUnderstandability
APPENDIX 3.1
Qualitative Characteristics in Alternative Studies
236

17 .112,. c a 730 • TOU*-5 C ID .- 0 0 .Eo ..°Ete '0 .., 'E 0 e 2 • 13 e- • .c - .5." - .o• c a) ... 5 le f_.003 m
Cm0... 61,mEz...c-...,..,m. .... .. ... t
c. a) in 0 e 9.. ex e >. 0 a 0 a 2 • m • ... U
6,14 in W a 1 .. . 2 iii2c= .c. 42. i a „_:15 i :6" E° 2.wv-ae,,,,Dince - Es in 0 0 • ..) • 1 - e J:,c V, t lo > ei 0 8 ,.. ..a.„ot . • • e ri io t. le 0 ,- 0
(1210E EVIB'S C4t,j Cm-....O430. M4wm0410-..e .sg c .04i m-et
0 - c - - c >....-1. • - 003. l. oc-.c 2 c0 2'e Vg2i i5.420 4.i I F 2 t e 0 . g 8 i.- '5- Ph
10
WI >. T_I 'a f.) ...4e 4-,,, >. a et.c e "05;-cn• .. *c .., >C
OICMBSISOVMOCZ ...., .., OU %Pao
s_
•
b c.TIEEL lit E3i2rile ...1- = .. g 1 c .0c.....,,,
VC@v.
5 2 8 k 8 -n- ,-. g ,82443 62 •
E • Est 5 i m 9 0 8 3‘jr.i... -Totiot, az-c.-080 ....a....0()....1---
„k .5 0 1 ,_,,,,e Ct.!! 1-......
1 0 e CA.411-3 a : ai-E e e s E 0 .0
,,, t: s 611 ca 0 ..5 ; aes .-.= 2 -., E m4'.'alt e-8 - 01 212:, •-5-EE.x 3o8v, Me of; zcE,Eo o , .r. x
e loce.a t4 1, "E30 c 0 • 2n /ta =i2o&e.cu-0c f,clizxe .2-1,2E -mu.... '0015.1"c0.0.=0,...532
4Og5i .- em o . c 0III 0 • t .. .r..- T1 in go 70 40 • c 4n
.4,2 • Ts ot 11....8 1V310 • -_-- 0 ec'' ..." ..5. o) v-, 0: .- 0 0 0c ;12 C 13 O. 4., C • ... IS
C....Et° E 8 2 c :C .2 ," .8 Z 2 2 2 . a 5 . E c) -.. .0 ... 0 O. 0 ''' 0 e/ a
ft El) 2 2 .?.E v $ ..-: 0 Vtil :3-621 ilU..0. * 0 ° *"
to .. s 3. 0 ° 0 '.- E • P. " c.2_ i N.." 011) ZU 0C2 pi .e2. 8 C
•
.',COO 4HIS°2z.v.,m.2.
c4 0 31... .6.: c to 1 $ 'a m8,32.22 8." •- et" *à' .c -8 v .F., . .?... iii. 9 3 "C .7;.. E 0 i 0 c COZ....mOr1. 0 . 0. 0 Cgig8 Cergo.O.r.ICre; to • 0 3 0 ..7.a a
'- ke i=i x T! 21,st 0 = -.,...5 2 .• 4.• , 0 = n , co Li
2 0 § et 2 0- k- . • e ... on ... g ._ , 2 .5 i t e ...0 E .. g ., „, ,,.6.... o II 0 E ••• e . :E gI 03 o & 8 B .0 ,„., ...erg .15 „ c..- ....
7g aitZ 212 1- c BPO ... . a , i,. •,.. ,s... s foci :c alc-,- egi c gic z 5 ° .2ic...2.14.;:at gab: 23.,gg .„ ...p.a ..% I; .e- IDoc.S..2 ,„° Vi; g to
3 as L U - • .0 ' Z 0
o 2: .... .= .• i :si, 6 re t- 2 2 c. s g .s .0 . I- E t xi "L) .1 u e 62 u
qp.0 4 .79. 8 : r. 1 i 1 .01 ‘i i I al i 33: Z.: 1‘4%, NI try. a 4.4
CID . J%-. e a u 0 41) • a
t S It • c 2• 2o
c 7, _ c 8 S4 o e ...0
get2tie,c c 5: ••• ;.... - •-es 0 .••' 0 e r,
c ‘,„ (3 a
Ili!! Tr Bg .409
e CE 4 I 7-..
Es; 0 0 • 2 .-
..- ,,, ....
-Ect c a .... .... a 0 E fa IS, re :471 r) 15 g
flit0 11 "0O:"Se.F.V
1 2" i .c12 ti 25 f.! . ,..c 20 c 0
- 5 ..?. zr, 8 1; 2 8• .0 • 0
T-,:•,1V2.2
, mi ... Cc = ... `-' V° ii a C .00-E 2 p .2 E ..c. e2's
a.... al.0 20 a
a C m 47--• 11. ,O., *a
•
ag 'owe'a5'. .i. IP • 11 g 'a ,,i C 70 ,..02gc s K .- .i. .0 . .7. ...c.
O i. 0 ,... is 9 --e, 2iSgtil e e 0. ,52 ye ..- cb,Pi el V 0 11) ' 5 E •
C 0E 'I .° 2 v .S E ,,.. E Za. EC. 0 al 0 ...
O CI. or i. ica. 0 e 0 - e S •ScE •-.c 2. • 0 . = a) a) a)
u C I. .0 ag .0 • .CI (3 • - 4.4 V - 0 al .c .0 .- ...jo" C ...- 0 •-• C ..• U O. RI
O 0•E ..n11. ,La V ai
224,SE9Ew. 12E"C't6.2'g°:;31,(2, . el.' .0 0 3ie is. • •
2 0 "jelit/6;2.2;iI;CT3.-.E... a) • 3 a In •O > •,' : 2 c .a U 40 .12 M Olg,,00_000'Z ....0 ...- - > C c ,,z.• r, . 0 IX - 0. 0e f). i • 4 2.0 _
E la. a In2 0 '.-.c0-=0. o u ‘pcv ,.." 0 'n' ° - - 5 gl o *-- ''' u .-O . 43 ••n• . (.) 3
0 13 .0 o i3 ,. .4= 52 E tV2;•"° . 5 4:1E°> i= 8
▪
8ts: " ga. : : Fz> co. : : CO :
IP 0 ° E i c• .te , . • r :,-, a Es.- .0o$•611,00s,Egaso To « 2 r t • t E f., •
.. 1 2 ,1 2 _ vett..- ID 6 V . - 2 e t, c • ,. , .7)
.0el 0 g241 1 :1! Eli!Iiii;e11• .•-• C 0 0. u a. • .-
. E ••2 0 2 . T, . .. 4 ..28,0a4:>.:i .87„...s.;c2-0-0,c
. 03 .0 . a a r, • CS *. .8 2 e > e•.. •a 8,,,,, cI3 .0 f. % .... 5, •
, 13 C • I. .0 •-• ..- . e gis 0 - I' - )„. (1) Qi.U.04,.. s go E • , v -: e . .1 S ,,?. 26 2 ". ga..,.., / .05 1:02 Ea 1 (i) ea Fo> , : E -, , ; . c 20 E.. g !.. : 1 • -. a 6 !2 .c. i
......-m..
... • 2••••003q)C150.0._,0 01.C..05 .1.2 .-' 151....-,CE•OlesuinO ii, .0 E 4, .5 022 .,,I. E cc 3 cc (...)0,-C) 6), .E .?.. 7, 1 2.- C I 0 .4 io, R 8 12 zi p2•C Z l'. el ;I 'a -
V ,.. '..ec .E 115 "E .c TD-e 21 0 .1 •08 .1 3 t . te Zo a 3 0
a) •-.. e
lt Z 02E2itU 012...1°' P- 0 417 IP
C \I• ° •-• 2 is E 8. 2'. A0 1.-• C 3 0 .... y 3
APPENDIX 3.2
Abstract from the Corporate Report:
ASSC ICAEW (1975)
237

DESIRABLE PROPERTIES OF CORPORATE REPORTS
The Accounting Standards Steering Committee (ASSC) of the Institute ofChartered Accountants in England and Wales (ICAEW) define the fundamentalobjective of the Corporate Report as:
'to communicate economic measurements of andinformation about the resources and performance of thereporting entity useful to those having reasonablerights to such information'.
They identify seven characteristics which they feel should be apparent infinancial statements if their fundamental objective is to be satisfied:
1. RELEVANCE - financial statement information satisfies theinformation needs of users and is appropriate andsufficient to their decision making requirements.
2. UNDERSTANDABILITY - financial statements are readable and avoid suchcomplexity as is likely to induce confusion andreduce comprehensibility.
3. RELIABILITY - the credibility of financial information is suchthat its accuracy is verified by an outsideagency.
4. COMPLETENESS - the corporate report provides a rounded picture ofall of the activities . of the reportingorganisation.
5. OBJECTIVITY - financial reports should neutrally reflect themeasurement of economic and accounting items, andshould not be subject to preparer bias nor seek tomisinform or mislead users.
6. TIMELINESS - the publication of financial reports shouldquickly follow year-ends in order to provide userswith up-to-date information. This delay shouldcertainly be less than six months for satisfactoryreporting.
7. COMPARABILITY - accounting concepts and measurement methods shouldbe employed consistently, to allow comparisonswith the company itself on a time series basis andwith other companies on a cross-section basis.
The conflicting nature of.several of these criteria make it impossible tosatisfy each absolutely. (e.g. the provision of a totally COMPLETE andRELIABLE report will inevitably conflict with the TIMELINESS requirement).
Some compromise must be reached through a trade-off between 'desirableproperties' so that an acceptable balance of characteristics is reached.
APPENDIX 3.3 a) Test Material: Property Trade Offs:Desirable Properties
238

RELIABILITY
•TIMELINESS
)</RELIABILITY . TIMELINESS
PERCEPTION OF AN 'ACCEPTABLE' TRADE —OFF BETWEEN PROPERTIES FOR DIFFERENT
USER—GROUPS: AN EXPERIMENTAL TASK
The seven desirable properties of the Corporate Report together providetwenty-one pairs of properties.
You are asked to consider each of these pairs of properties and to decidewhere you believe the balance of trade-off between the two should lie.
In each case you will be faced with a five-inch line separating the twoattributes and be asked to mark with a 'X' your view of the appropriatetrade off between the two:
e.g.
If you believe that all reliability rust be sacrificed for immediateinformation then you would produce a judgement:
•RELIABILITY
TIMELINESS
01 the other hand, if you believe that information must be totally accurateand reliable to be credible, no matter how long it takes to produce, thefollowing will result:
You may, however, approve some compromise between the two attributes byregistering your perception of the relative importance of the twoattributes. The closer the 'X' is marked to a particular property, themore important is that property perceived to be.
Now adopt this procedure for the pairs of properties on the followingsheet.
239

CC13LETDESS e
COVARPBILITY •
• CCNPORPSILITY
• TDELItESS
DTERIFENTPL US(: FROPERTY TRAE-CFFS
RELIABILITY
CONPLETENESS •
RELEVANCE
T WEL I NESS
UNCERSTANDA8 IL ITY
REL IAB IL ITY
OBJECT IVITY
REL IABILITY
TINELINESS
CCMDLEIENESS
OBJECTIVITY
RELEVANCE
RELIABILITY
RELEVANCE
COWARABILITY
RELEVANCE
OBJECTIVITY
TINELDESS
UNJERSTANIABILITY •
• RELEVANCE
• C&ECTIVITY
• UnCERSTANYBILIrt,
• RELIABILITY•
• OBJECTIVITY. .
• UtERSTANYBILITY
• TDELINESS•
C&ECTIVITY
• CCKLETDESS•
• LNCERSTNO38ILITYf•
• 03PPRABILITY
• COMPLETDESS
• CDCLETEWSS•
• CDPARABILITY
•
•
RELIABILITYf•
• TIFELDESS...
• RELEVANCE
• LICERSTANYBILITY
• CDR** ILITY
APPENDIX 3.3 b) Test Material: Experimental Task
240

00 •••
0+.Ps •
• •• 0
•• n',6• ••o• 0
• LC)
• •• 0
4.
+ •0
0 • •0
•0+ .0M. •0
• • •• .0• •
0 + • 0•Ca• ••0
.0•
a
•••
0+‘00•••
04
•
%11.4
.4
iiele
c., AN
g n 71 MP*
• 444o.•
woe*
rt) •
•
C4 •e
4v., exell rs N
NIn 1...44
C)4
•0••:i•• ••13
•0• CY)• •.0. 0
o
•
.
.0
.
•
0
•
▪
•. 0
4.• I*
•.0
.041
oC4• •.0▪ I•0
.1• 0
4.I•0o Not
••0
• I• 0•V1•0I• 0•4)•.o▪ I.0
:464.1.0•es• •.0•0• •.0
I• 0
W ei 01•1
.4 a . „ivC.4
--------_-_-_-_-_-_-_-___ -----------
...
04Dc40. 4. 0W(4 0. 404) 0440 4042 N4. 4.04:1.400 4 .1.0.N42o<0.04.0041.00N<0<wc4<0a.coroao 1Z OMMWWWP- 14. 44.0 .0MC4C4N.-... 00C0° —.....4c4.4.4m44.0430.WW0Ch00 • • • • • • • • • • • • • • • • • • • • • • • • •0 • • • • • • • • • • • • • 1 • • • • • • • • • • •m m000000000000000000000000M000000000000000000000000mN •IIIIIIiiiiiIIIIIIIIISIIII7 2W W2 Xm MA A
APPENDIX 3.4 a) MDS Indscal Scores: USEFUL/USABLE y BIAS/PUNCTUALITY
241

O 0 •z nEs •00
r-tu1+
.ctZ n:zo 1+0 •
•
•0• cr,• •00
Re I.. 0
•
•
•
4••
047so •
v.411
NONM
4010
alM
•. •
• ••0
•0•4;1• ••41
.0
. 0
• •
•0•0•(•)• •.0.
▪
0•cm• •• 0.0•
• •
.0
.*
•0••n1• •.0+• 0•N• •
• 0+ I
.0• M• •• 0
+ I• 0
•0
O•0
•• In• .
1+ +1• •0• •111
• •
•0• ••0
▪ 1•0•
▪
•
•0•co.0
9.I•0• 01• •
.0+ 1• O
44 0•
us
0
2
1.4
se. i I I IIue
0 socqsacs. co-* o No* 4 nocsi cost 0 •oce co 4- •J•co cu .90 4. eo e.t.a° coos secs 440 css see o eo ce solo• omacotocor-r-,ovsoulul.*44mmcvcvoc..4.40oz00•-.-40eceNcom*4-4-tAggsv4:Por.-/ n 03c0cpcAmo• • • • • • • • • • • • • • • • • • • • • • • • •cs • • • • . • • • • • • • • • • • • • • • • • • • •▪ .-600000000000000000000000004000000000000000000000000.4
IesI,'II
APPENDIX 3.4 b) MDS Indscal Scores: /PUNCTUALITY v
OUANTITY/OUALITY
242

Os.0 •
•0• •
• 1•11
. 0
00
in
gt (faOf 61
fir
•0
4.• 0• M• •D O
• 0
• •
• 04.
DOeis• •
.0
• 0••0• ••0
4.• 0
.o
4‘) eq1
we
▪
m
e* 11.
0*
I', ••••
04.
#00010 0Cl Cl Cl
*4 04
0
• 0
-0
• •
00
•
▪
10.N• •• 0
4.•0• ••••• •
010 .04.• oi•••.
•
0•••n•
• •
•0
.
▪
0
▪C•4• •
.0+ I.0• CO
•0
•0. *
0 • • •
•1 lt1 • .0la +4
z • •0.10
0 0 • • •zm .0 • •0
Ow i r +1
H Z• •0
H W • -'0aC 0 • • •
4 N. •0
oci fa + I0 i• 0
1.4 1.• • • pft•
IL In O • • •
ZZ b• • .0
0... ii. +4
I...I•C• .0w • .03
Ja 0• • •
a m • •0ZO i* +I
us• •0
*. .E-D
•0)
,.. 0 • ••
o o • .0
1
w -.... al
4. l • .0 0
M 44 •...I
Oakaw40.004m40wc.4w404,N04 . 0.0No04 4.0N0o40004004 6wmwo4mM0o40M00 1
z Ommwwww..1.44mweve,m......00z00...-.NNeveim4y4inaro ...... met010
0 • • • • • • • • • • • • • • • • • • • • • • • • • CIP• • • • • • • • • • • • • • • • • • • • • • • • • •m m000000000000o00o00000000440000000000001000000000000-,
w wIIIIIIIIIIIIIIIIIIIiiiiii
z 2toZ S
•4 M0 a
APPENDIX 3.4 c) MDS Indscal Scores: OUANTITY/OUALITY v
USEFUL/USABLE
243

w3 .n M m a- 141 r.FR 0- CA g 01 a- M r. SR G3 SG 313 8 3S R1 FS R= GO 0. 3S 0 0- 0, GO
gi ci et; 4 06 4 ui ei 4 00 qi of; ei 4 ei ui 4 a.: ti; ,; e4 ,6 „c; ri ci cr; ui ui0••• 11n,.
2CI 03 CA CA N o — 60 .n 04 03 CM CO 47 U1 00 0T r% 0 00 CY °' gr CD 0,7 ..1 04 0 gr .0 QD U1 01
3• • • • • • • • • • • • • • • • • 0
R a) C) M 23 a) C‘; N; 92 92 R r. :: 92 gl RR " " S4 R3 g4 " gR 4 'A 22 22 S2 " '' S2 R3 -..-E
cocomweAm 8SSGGE,S 01. E. G. Y2G g a g 2 g 2 gg 2Ma g aMa o0, 0, „ cp 6.; .. v.; .4 qi ,..: cri oi es; cr; qi Ni Up M c.; 4 3..d. ca a: • •
CY 00 04 n• 04 CU .- 01 .- 04
("; ,, :i N; sg ;. gi 7., gg gg g6 gi .; .; igi E• . • • •
a
gR ' on nn on on on m m m — on co 01 cl.
•.=.4...
I. 0 0 0 I. 04 ,* 2.
71 DI0 0 44 .— 0 etn g vi >, col ... 5T ..1 0 1/,'. illiEbli:241:.=131
2 rk/221 , 8T gli t2 80u ,T
•
e—sk stikami—:4_
,,,T0.... t5 us
EIli
."2 1 "4 1 IM AI P0, 4 0 1: 24p0,= E
.411 2?2. _r y ..,.g. en VI
01,...0 2 .i! 3_ . L. CUL 40 4.. I.
.....'
C LLI L. 71.1"F '`-2, i8— 0 . —
TA 0—a= ... rr
e3 i 2 .4.2..-1 MX 0
'4, 02 4! 1
1 >'..el
i A
a .;4.
;,7, 52 4 A Sr,' SB RR 2; 4 : A 8 SI M R3 5i G3 53 22 Si R= M SR G; S 74 g; 5! G3 6 RS G; 22 01 0? 1 .7 ry oli ei o4 mi
1 ill ''' 4 '' ui; -f -f -f (i -f ci '? rY .4 .f ci 1 cl "i -f c' -f c' c. Eik4.I0
Cy th N 04 .- 04 Ul cm .41 1.... 01 .n 01. 4 en 1.n 41 Vy VD p. 4, m.. I... wit 4... cD er) ... cm cD um re) ,. 0..: . • . . • • • • • • • • • •......ONMI—mn.—m
R, Pi A `13 .7: " "411 3 f=2 c° WI XS gi "" 4 2 e7.1 °I c° ' ° "' ° ' li—
ewwwwo, 'ASSIS.8303.olcocommcommalgg222222Xaa3 0.04,.;0;040i0;.;Nm0i0:000404040,0,0,qi 4 • • 6 • •
4DNM014iN N_---- — _ —
....... gi,.- •••• •••• • •• •••• .LTi on PS l'i; ;71 " 0, 0, CM 01 04 gR 00 01 en m m AA,7,07,71A07, 2
.
vq-alszrsit7;3 3, — .g4- 0 1......m.,...se g S. a- .., Ag 11 ""' ''' •- g i 8 ill E! W" g5 1. Z4... 44 . C C j..n,..n 7.2fti.ma.. 4.4 i g10.CUM 1132),==.7r7.,—Uy .C..-1..C1.4.,••n• ,—.1a.—.....404.11...1.7 .e 2 ....4, ti15 ... 1 gl .s pt,ws A.„1.s.—
2.— ,_, a
. 7, r..,, ....•, C a j .!=a13 72 2- w.) 'dIlt, 21a
is g :i at gF W4i 2; 50192 <
111;.TEmcli 3
aWi210 '
1.1.i 2
3 0 ig '8
n13 ..-
lja
s..SC L
S.
a 0)C...44C
CO-sxr2trs8
C Z' °' IA EC cj 010 3 ortrevsE ...........r.,_ .... —___........ —.—..4....a5-71.
. s ..... i .,2, 2 „is......--. ......„_. E3 6.27.-it .,:z . .Ett 2C-1Z77, 7; 44 1.n Z. C) -9 t E 3 1- 7:18
1142t32'.......
E ...., o..1
m I— u °- '-- 2 .; a se .' -ir, 8 67) 4 2 3.,....0 o,n, 0 U tf,
13 1A II:L... o
.2>, 7j e sq," Li. al
i 11 42 ii 1 .821'
AM nfL
Ci qw.0,0>g
.-N01.71.141.41s0M 0^NIM4f0Wil, a) C" R ;7, PJ R3 x R3 RS M R M $R 7,,.; g4 gR 4,
APPENDIX 5.1 Matched sample of companies
244

DIFFICULT CASES
CLOZE
MEDIUM CASES
CLOZE
EASY CASES
CLOZERANK CASE RANK CASE RANK CASEORDER NUMBER SCORE CS) ORDER NUMBER SCORE (5) ORDER NUMBER SCORE (%)
1. 49 33.2 23. 1 45.2 45. 53 52.0
2. 63 33.2 24. 8 46.0 46. 3 52.0
3. 46 34.8 25. 29 46.0 47. 70 52.2
4. 32 35.0 26. 23 46.2 48. 30 53.0
5. 33 37.4 27. 69 46.8 49. 6 53.2
6. 57 38.6 28. 27 47.0 50. 40 53.5
7. 11 38.7 29. 10 47.2 51. 42 54.0
8. 15 39.3 30. 45 47.4 52. 21 54.0
9. 52 39.4 31. 25 47.8 53. 16 54.0
10. 54 39.4 32. 36 47.8 54. 22 54.3
11. 9 40.8 33. 44 48.6 55. 39 54.4
12. 61 41.4 34. 64 48.6 56. 51 55.5
13. 26 42.0 35. 13 48.8 57. 5 55.6
14. 12 42.0 36. 17 49.6 5e. 4 56.2
15. 28 42.5 37. 18 49.7 59. 58 56.6
16. •20. 43.0 38. 2 50.5 60. 65 56.8
17. 35 43.2 39. 56 50.8 61. 37 57.7
18. 31 43.2 40. 55 51.0 62. 7 58.2
19. 48 43.5 41. 34 51.0 63. 24 58.8
20. 38 44.0 42. 50 51.2 64. 19 61.8
21. 62 44.2 43. 66 51.5 65. 59 62.7
22. 14 44.9 44. 67 51.5 66. 41 64.2
(Failed Cases emboldened)
APPENDIX 5.2 CLOZE procedure: preliminary results:
divisional groupings.
245

DIFFICULT CASES
MISCLASSIFICATION
MEDIUM CASES
CLOZE
EASY CASES
MISCLASSIFICATIONRANK CASE RANK CASE RANK CASE
ORDER NUMBER SCORE 04 ORDER NUMBER SCORE (%) ORDER NUMBER SCORE (%)
1. 53 100.0 23. 32 36.3 45. 21 17.9
2. 44 89.3 24. 36 36.4 46. 54 16.7
3. 6 86.2 25. 10 34.8 47. 7 15.8
4. 46 83.9 26. 14 33.3 48. 5 15.8
5. 39 77.4 27. 51 33.3 49. 20 14.3
6. 48 71.4 28. 28 31.6 50. 50 14.3
7. 12 70.6 29. 29 31.3 51. 3 13.3
8. 61 64.5 30. 57 31.0 52. 25 12.5
9. 18 64.3 31. 19 30.0 53. 56 10.7
10. 22 60.0 32. 42 29.4 54. 24 8.3
11. 62 58.3 33. 59 27.8 55. 23 8.3
12. 64 58.3 34. 16 25.0 56. 11 8.0
13. 35 55.0 35. 1 24.0 57. 9 7.7
14. 66 48.0 36. 8 23.1 58. 15 7.1
15. 41 47.4 37. 34 22.9 59. 63 6.7
.16. 38 47.1 38.. 65 22.6 60. 4 5.6
17. 58 42.9 39. 49 22.6 61. 31 0.0
18. 55 42.9 40. 27 22.6 62. 26 0.0
19. 2 41.2 41. 13 19.4 63. 33 0.0
20. 30 40.0 42. 67 19.2 64. 17 0.0
21. 52 40.0 43. 70 18.9 65. 37 0.0
22. 45 37.5 44. 40 18.8 66. 69 0.0
(Failed Cases emboldened)
APPENDIX 5.3 Chairman's Statement Analysis: preliminary results:divisional groupings
246

TEST
MATERIALS
NO
CLOZEPRCCECURE
MEDIUM DIFFICULT
CHAIRMAN'S STATEMENT ANALYSIS
DIFFICULT
NO OF
FAILED
CASES 'EASY
NO OF
FAILED
CASES EASY MEDIUM
1 2 4 44 57 0 33, 37 8, 28, 65 18, 62, 66
2 3 39 17 46 0 31, 33 1, 28, 59 12, 35, 62
3 2 37 34 63 1 9, 31 1, 8, 29 12, 35, 64
4 3 19 50 15 1 11, 26, 33 34, 59, 65 18, 64
5 1 59 17 33 2 4, 15, 37 1, 8, 57 12, 64
6 2 39 44 28 2 4, 11, 17 57, 59 18, 62, 66
7 2 4 17 57 3 15, 26, 50 42, 59, 65 35, 64
a 2 59 44 46 3 9, 26, 50 34,51 6, 35, 66
9 2 59 34 15 4 9, 26,63 29, 51 12, 53, 62
10 3 4 50 63 4 15, 17, 31 8, 28 44, 46, 66
11 1 37 64 46 5 11, 50 69 34, 65 18, 48, 53
12 2 51 34 28 5 9, 37, 50 1, 16, 19 39, 48
13 2 51 18 63 6 15, 33, 37 16, 51 6, 39, 46
14 1 37 50 57 6 11, 31, 69 16, 19, 42 39, 46
15 1 51 18 33 7 4, 63 19, 28, 42 44, 46, 48
16 2 19. 64 15 7 17, 63, 61 16, 29, 57 39, 44
17 1 19 18 28 8 11,69 29, 34, 51 6, 44, 53
18 1 39 64 33 8 4, 63 19, 42, 51 6, 48, 53
(Failed cases emboldened)
APPENDIX 5.4 Experimental Design: Distribution of Cases
for Narrative Analysis.11nnn••
247

FAILED COMPANIES
NO PROFITABILITYFINANCIALRISK LIQUIDITY PAS-SCORE PROFILE (S)
QA/CL(P8IT/TA) (TL/NU) (QA/CL) P8IT/TA TL/AV5 0.03 1.46 0.48 8 79 17
6 0.06 2.84 0.18 13 96 3
7 -0.05 0.80 0.49, 2 33 18
21 -0.06 0.90 0.69 2 44 45
27 -0.09 1.95 0.88 1 91 76
29 0.02 2.17 0.36 7 92 7
41 -0.30 5.50 0.38 0 99 a
44 0.06 1.14 0.58 13 62 29
46 0.08 1.81 0.68 29 88 42
48 0.08 1.21 0.80 25 68 65
49 -0.08 3.90 0.65 1 98 89
50 0.08 2.83 0.55 25 96 25
51 -0.04 1.01 0.58 2 51 31
53 0.18 2.65 0.37 89 96 7
69 0.06 3.59 0.37 16 98 8
NON-FAILED COMPANIES
1 0.08 0.81 0.78 23 33 62
9 0.09 0.92 0.91 32 43 79
18 0.03 0.28 1.31 9 2 95
24 0.15 ,0.51 1.15 78 11 93
25 0.09 0.64 0.95 37 21 82
26 0.14 1.16 0.48 73 63 17
28 0.11 1.91 0.80 57 90 64
35 0.06 0.65 0.71 14 22. 49
37 0.10 0.69 1.19 43 25 93
40 0.08 1.49 0.79 24 81 63
45 0.11 0.76 0.85 52 29 72
56 0.12 0.84 1.13 61 36 92
57 0.04 0.33 0.72 11 3 50
62 0.09 0.65 0.75 33 22 56
66 0.13 0.91 0.73 72 44 52
APPENDIX 5.5
Facial Profiles Experiment: Sample Financial Ratios
248

4.1
1111
•
II - tel lan 03% F. 41
a
1 i 'It..c — —
0 r.. N V we 0 0 ,10
0
IL 1/...... 1....I Y4C.I r 0
...0 1 tr,g4.,_,
co . m va en 0 WM F. •••• 0Y.
1 0
. 1
Y. 00
3.. —a IC 0
. bo.
81 0 0 - m m N... 1.61
LIJ i .".
4.
...I
, ,qC In N N •n• NO •n• PM ,i• 0
411
..I
6n0
No
,...0
I- i
•
.111. in 10
4— a
• er,
.m1
• 0 0
•
M M
f.• ifleIMNR1
▪
N
N N 0
0 0 0 gm, gm,N N
▪ 41 WI' MO/N*0 MO'
a
61..1C'j
▪
NM." •INMN.ONO
A MN 0000
4,1 CPI
0
▪ N NM
•
N MOO
N N 0 0 0
APPENDIX 5 . 6 Facial Profiles Exneriment:
Ratio Distribution of Sample Cases
MN MM•PMN
249

CASE
FAILED COMPANIES
LIX
SCORE
FLESCH CASENON-FAILED COMPANIES
FLESCH
WORDS SENTENCES WORDS
LIX
SENTENCES SCORENO. SCORE NO. SCORE
2 241 8 61.25 33.03 1 203 7 56.59 31.54
4 346 12 58.60 31.35 3 1346 57 51.79 30.515 1017 39 55.87 35.21 8 1309 51 55.08 35.17
6 376 13 56.05 34.60 9 . 740 28 55.21 36.65
7 960 31 61.49 26.82 10 1056 42 56.49 33.91
14 1668 43 67.93 20.53 11 823 27 54.54 41.44
15 1088 33 62.57 27.19 12 324 17 46.22 46.49
16 1335 53 50.43 48.00 13 1137 41 59.75 30.84
17 822 31 55.47 37.89 18 2295 81 56.22 38.18
19 203 6 61.42 34.97 23 944 38 53.23 44.95
20 1379 42 65.83 38.05 24 1021 48 48.79 47.61
21 1158 46 54.10 37.87 25 385 19 45.46 47.83
22 949 47 48.64 45.22 26 1236 49 53.78 33.80
27 516 23 51.31 40.93 28 1953 80 57.34 30.27
29 743 28 57.36 33.13 30 411 15 55.87 39.05
34 797 30 57.56 34.77 31 390 14 57.34 35.39
39 1268 50 58.72 30.51 32 1140 28 72.21 21.10
41 304 11 53.95 32.40 33 273 14 47.71 38.92
42 613 26 55.22 30.68 35 :.:.: 31 55.33 38.09
44 680 24 57.75 34.63 36 545 17 61.05 28.07
46 1313 51 56.44 34.12 37 671 27 51.98 42.54
48 274 13 52.46 26.74 38 312 13 52.21 40.93
49 1318 48 58.72 31.14 40 940 35 53.35 38.91
50 399 16 55.01 26.74 45 406 22 45.55 45.99
51 .815 31 55.86 28.70 56 1107 77 42.74 51.70
52 3164 121 56.21 28.87 57 291 9 63.26 28.95
53 982 32 55.23 41.12 59 294 12 48.31 49.31
54 1313 51 53.54 35.92 62 525 24 51.21 32.67
55 550 23 55.37 32.90 64 344 13 53.50 41.03
58 1384 47 58.93 33.48 65 509 21 43.10 54.92
61 498 21 56.24 20.53 66 805 30 57.39 30.16
63 986 33 59.49 24.81 67 227 10 46.93 50.37
69 147 8 46.27 39.70 70 765 14 61.06 27.15
APPENDIX 6.2.1 Readability scores for sample companies
250
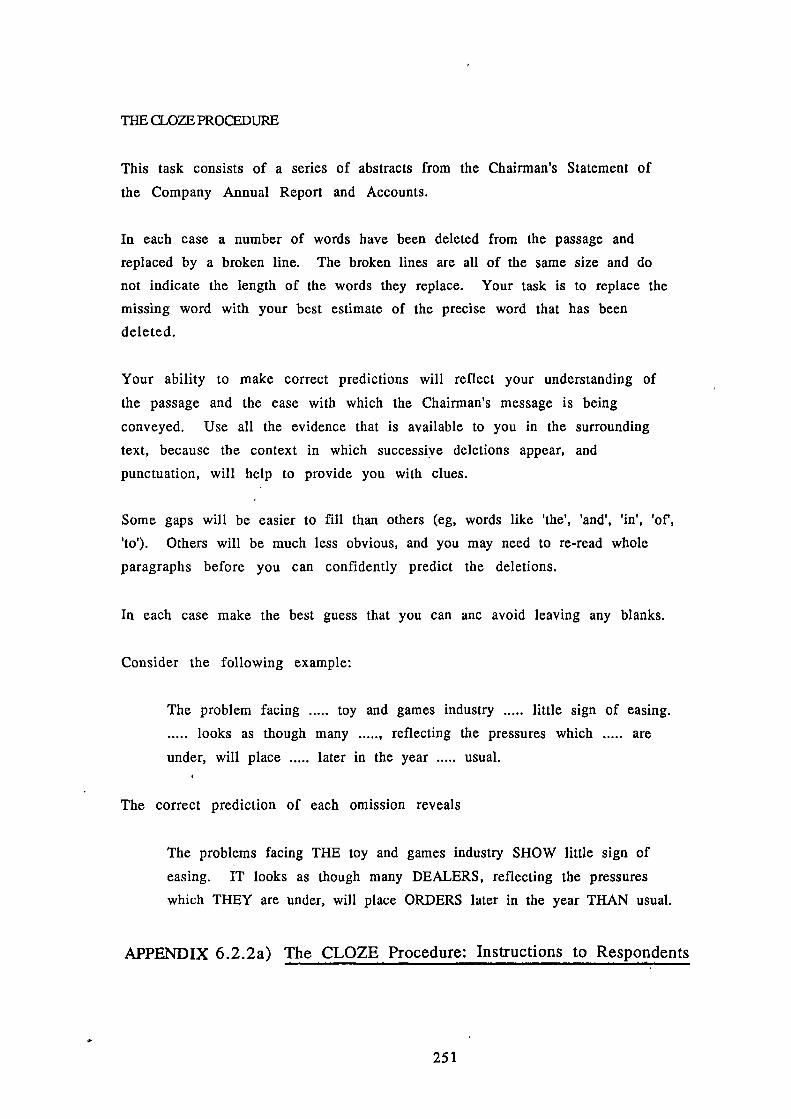
THE CLOZE PROCEDURE
This task consists of a series of abstracts from the Chairman's Statement of
the Company Annual Report and Accounts.
In each case a number of words have been deleted from the passage and
replaced by a broken line. The broken lines are all of the same size and do
not indicate the length of the words they replace. Your task is to replace the
missing word with your best estimate of the precise word that has been
deleted.
Your ability to make correct predictions will reflect your understanding of
the passage and the ease with which the Chairman's message is being
conveyed. Use all the evidence that is available to you in the surrounding
text, because the context in which successive deletions appear, and
punctuation, will help to provide you with clues.
Some gaps will be easier to fill than others (eg, words like 'the', 'and', 'in', 'of,
'to'). Others will be much less obvious, and you may need to re-read whole
paragraphs before you can confidently predict the deletions.
In each case make the best guess that you can anc avoid leaving any blanks.
Consider the following example:
The problem facing toy and games industry little sign of easing.
looks as though many , reflecting the pressures which are
under, will place later in the year usual.
The correct prediction of each omission reveals
The problems facing THE toy and games industry SHOW little sign of
easing. IT looks as though many DEALERS, reflecting the pressures
which THEY are under, will place ORDERS later in the year THAN usual.
APPENDIX 6.2.2a) The CLOZE Procedure: Instructions to Respondents

During 1982 Acrow companies to be affected by problem of
declining markets continued weakness in the and heavy
construction industry.
our sales at -E.163 were close to the year's record of £167
million, competition in these declining has had its serious
on margins resulting in substantial loss for the
Retrenchment through factory closures cost savings, together with
rationalisation and efficiency improvements been achieved
since the of Norman Cunningham as Managing Director and
Chief in December 1981.
The Board Directors recommends that no on the Ordinary Share
be paid for the financial year.
The climate uncertainty in world markets - so much a lack
need, but a lack funds - should not, however, the fact that many
the Acrow Group products leaders in their respective and
our export achievement rewarded by winning the Award for the
sixth Acrow is proud of quality of its sales throughout the
world. Priority being given by top to give maximum support
their efforts.
Both management employees are working together a concerted
manner to a return to prosperity the Group, and I like to
extend my to all members of Acrow team throughout the
for their efforts loyalty during this difficult .
APPENDIX 6.2.2b) The CLOZE Procedure: Test Instrument for Case No. 2: ACROW PLC

SALES TURNOVER: MEAN
(EM.) S.D.
Z-SCORE: MEAN
S.D.
LIX SCORE: MEAN
S.D.
FLFS CH SCORE: MEAN
S.D.
MOM SCORE: MEAN
S.D.
No OF WORDS: MEAN
S.D.
No OF SENTENCES: MEAN
S.D.
FAILED
COMPANIES
NON-FAILED
COMPANIES
ALL
COMPANIES
28.52 31.80 30.16
40.49 50.77 45.95
- 3.94 6.27 1.16
1.93 3.63 5.88
56.71 53.68 55.20
4.33 5.87 5.32
33.11 38.32 35.71
6.09 7.98 7.59
49.01 47.47 48.24
7.77 8.66 8.26
897 776 836
572 505 539
33 31 32
21 20 21
APPENDIX 6.2.3 Readability Study: Descriptive statistics
for 66 companies

CASE
No.
COGNIZABILITY SCORES
STUDENTS
CLOZE
SCORE (%) RANK
READABILITY SCORES
FLESCH
SCORE RANK
ACCOUNTANTS
CLOZE
SCORE (1.) RANK
LIX
SCORE RANK
59 72.9 1 62.7 1 48.31 2 49.31 1
37 71.6 2 57.7 3 51.98 3 42.54 2
64 71.0 3 48.8 11 53.50 4 41.03 3
33 67.3 4 37.4 16 47.71 1 38.92 4
19 65.8 5 61.8 2 61.42 16 34.97 7
51 61.3 6 55.5 5 55.86 7 28.70 15
39 61.2 7 54.4 6 58.72 14 30.51 12
4 57.5 8 56.2 4 58.60 13 31.35 11
34 55.9 9 51.0 8 57.56 11 34.77 8
18 55.6 10 49.7 9 56.22 8 38.18 5
17 54•9 11 49.6 10 55.47 6 37.89 6
15 53.2 12 39.3 14 62.57 17 27.19 16
44 52.9 13 48.6 12 57.75 12 34.63 9
50 51.9 14 51.2 7 55.01 5 26.74 17
28 51.4 15 42.5 13 57.34 10 30.27 13
46 45.8 16 34.8 17 56.44 9 34.12 10
57 45.2 17 38.6 15 63.26 18 28.95 14
63 43.5 18 33.2 18 59.49 15 24.81 18
(Scores corresponding to Failed Cases are emboldened)
APPENDIX 6.2.4 CLOZE Procedure: Ranking of Cases by
Respondents of differing sophistication
254

Readability Level
FLESCH LIX CLOZE SCORE
SCORE (%) SCORE (L) ACCOUNTING ACCOUNTING
STUDENTS (L) PRACTITIONERS (%)
Very Difficult 0- 30 19 60-80 15 30-40 15 40-50 16
Difficult 30- 50 77 45-60 82 40-60 80 50-70 67
Fairly Difficult 50- 60 4 40-45 3 60-65 5 70-75 17
Standard 60- 70 35-40
Fairly Easy 70- 80 30-35
Easy 80- 90 25-30
Very Easy 90-100 0-25
APPENDIX 6.2.5 Distribution of Readability Levels for
Accounting Narrative Disclosures

'Distressed Group' 'Healthy Group'
DUNLOP HOLDINGS MOTOR TACE (30/9/81)
(31/12/81) COMPONENTS ENGINEERING
METTOY (31/12/82) TOYS STEINBERG GROUP (28/3/81)
CLOTHING
MY DART (31/12/82) SPORTS AND
SOUND DIFFUSION
LEISURE
(31/12/81) ELECTRICAL
WILSHAW SECURITIES INDUSTRIAL
BBA GROUP (31/12/82)
(31/7/82) PLANT
MOTOR COMPONENTS
SMITH WHITWORTH INDUSTRIAL J JARVIS (31/3/83)
(31/3/82) PLANT CONSTRUCTION
BSR (31/12/82) ELECTRONICS T MARSHALL (LOXLEY)
(31/12/84) INDUSTRIAL
PLANT
APPENDIX 7.1.1 Content Analysis:
Distribution of Pre-Sample Companies
256

1 UNCERTAINTY REGARDING THE FUTUREAnticipated If ... PotentialCould Might PossibilityExpectations May ProspectsFuture New. ResearchForecast Opportunity Should ...Hopeful Optimistic UncertaintyIntroduction Proposal
2 VAGUENESS ABOUT THE PAST/PRESENTAssumed Encouraging ObscureChange A number of ... Something
3 EMPHASIS ON MAINTAINING THE STATUS QUOAdjustment Continue RemainCircumstances Maintain
4 RELUCTANT NEED TO TAKE ACTIONBankers support Involvement RelocationHad to ... Must ReluctanceIncurred Necessity UnavoidableInescapable Obliged TurnroundInevitable Requirement Unfortunately
5 DEPENDENCE ON EXTERNAL ECONOMIC FACTORSCompetition Interest Rates UnusuallyDownturn Recession UnexpectedEconomy Strike UpturnExternal Unemployment WeatherGovernment Unprecedented WinterInflation Unforeseen
6 REFERENCE TO MEASURES OF PAST PERFORMANCEAssets Liabilities PerformanceBorrowing Liquidity ProfitabilityDebt Loans ProductivityEarnings Margins ResultsGearing Overdraft Sales
7 DETAILING OF POSITIVE ACHIEVEMENTSAchievement Expansion LaunchAcquisition Extension PenetrationAdditional Favourable PleasedAdvance Gain ProfitBenefits Good ProgressBetter Great RecoveryBest Growth RecordCan Increase ResurgenceDevelopment Investment SuccessDiversification Improvement Strength

8 DETAILING OF NEGATIVE ACHIEVEMENTSAdverse Disposal Problem ReductionDisastrous Deficit Pressure RestrictedBad Difficult Provision SaleBurden Distress Poor SeriousClosure Damages Resignation SevereCrisis Depressed Retirement Set-backCollapse Excess Reorganisation UnfavourableCosts Extraordinary Reconstruction UnpalatableCannot Exceptional Restructure UnsatisfactoryDisappointing Failure Refinancing UnprofitableDamaging Fall Rationalisation WeaknessDrastic Imprudent Realignment WorstDecline Impossible RedundancyDecrease Low RetrenchmentDeteriorate Loss RegrettablyDisruption Not ... Reversal
APPENDIX 7.1.2 Word Distribution in Content Analysis of Narrative
258

MODEL 1 (WORDS)
Z= 1.22 - 6.35 (NOMDIV) + 364.64 (PRW) - 1004.97 (HQW)
- 557.80 (BZW) - 2.77 (BF) + 1005.04 (CEW) - 718.94 (CCW)
where NOMDIV= No dividend + Nominal dividend
PRW= (Profit - Loss - Unprofitable)/WORDS
HQW= (Overdraft + Loans + Borrowings)/WORDS
BZW= (Closure + Disposals + Sale)/WORDS
BF= Bankers Support
CEW= Economy/WORDS
CCW= Recession/WORDS
MODEL 2 (THEMES)
Z= 0.407 - 17.012 (BAD) + 10.375 (GOOD) - 14.538 (SCS)
where BAD = (Adverse themes + Bad dividend)
SENTENCES
GOOD = (Beneficial themes + Good dividend)
SENTENCES
SCS = Contractions/SENTENCES
MODEL 3 (FIRST SENTENCE)
Z= -0.911 - 3.723 (LOS) + 2.094 (PRO) - 3.273 (WOR) -4.794 (REO)
- 1.862 (REG)
where LOS= Loss
PRO= Profit
WOR = Worst ...
REO = Reorganisation
REG= Regrettably
MODEL 4 (STRATEGIES)
Z= 3.531 - 3.791 (NOMINDIV) - 4.033 (CLO) - 2.670 (BF) - 5.109 (OUT)
- 3.663 (LAC)
where NOMINDIV= No dividend or Nominal dividend or No
dividend mention
CLO= Closures
BF= Bankers Support
OUT= Outside Help Sought
LAC= Lack of control evident
259

MODEL 5 (MIXED)
Z= 3.861 + 418.41 (PRW) - 5.690 (NOMDIV) - 4.906 (CLO)
- 1171.11 (HQW) - 5.836 (OUT) - 2.491 (BF) - 3.937 (LAC)
+ 1012.76 ( CEW) -1148.51 (CCW)
where PRW = (Profit - Loss -Unprofitable)/WORDS
NOMDIV= No dividend + Nominal dividend
Closures
CLO= Closures
HQW= (Overdraft + Loans + Borrowings)/WORDS
OUT= Outside Help Sought
BF= Bankers Support
LAC= Lack of control evident
CEW= Economy/WORDS
CCW= Recession/WORDS
APPENDIX . 7.2.1 Content Analysis: Alternative Discriminant Models

yloau
FAILED COMPANTEsOF
Kum
NON-FAILED COMPANIESOF
KURT-WAN 5j2,COEFFICIENTSSKEW- ktEm La,
COEFFICIENTSSKEW-
ri OSISMODEL 1 WORDS
PRW -0.00 0.00 -0.49 1.43 0.01 0.01 1.51 2.61CEW 0.00 0.00 3.10 9.99 0.00 0.00 1.29 0.75BZVV 0.00 0.00 0.30 -0.94 0.00 0.00 4.35 21.31NOMDIV 0.52 0.51 -0.06 -2.13 0.00 0.00 0.00 0.00HQW 0.00 0.00 2.21 7.11 0.00 0.00 2.13 3.98BF 0.48 0.51 0.06 -2.13 0.03 0.17 5.74 33.00CCW 0.00 0.00 0.80 -0.96 0.00 0.00 2.74 7.10
MODEL 2 THEMESGOOD 0.10 0.09 2.29 8.23 0.27 0.14 0.95 0.43BAD 0.24 0.16 0.89 1.54 0.04 0.04 1.97 4.11SCS 0.18 0.14 1.38 2.27 0.04 0.05 1.64 2.65
MODEL '3 FIRST-SENTENCE MESSAGEPRO 0.12 0.33 2.43 4.17 0.58 0.50 0.32 -2.02LOS 0.30 0.47 0.90 -1.27 0.00 0.00 0.00 0.00WOR 0.15 0.36 2.04 2.29 0.00 0.00 0.00 0.00REO 0.09 0.29 2.98 7.34 0.00 0.00 0.00 0.00REG 0.15 0.36 2.04 2.29 0.00 0.00 0.00 0.00
• MODEL 4 STRATEGIESNOMDIV 0.78 0.42 -1.48 0.19 0.18 0.39 1.73 1.05CLO 0.61 0.50 -0.46 -1.91 0.09 0.29 2.98 7.34OUT 0.21 0.42 1.48 0.19 0.00 0.00 0.00 0.00LAC 0.24 0.44 1.26 -0.44 0.00 0.00 0.00 0.00BF 0.48 0.51 0.06 -2.13 0.03 0.17 5.74 33.00
MODEL 5 MIXED NARRATIVEPRW -0.00 0.00 -0.49 1.43 0.01 0.01 1.51 2.61CEW 0.00 0.00 3.10 9.99 0.00 0.00 1.29 0.75NOMDIV 0.52 0.51 -0.06 -2.13 0.00 0.00 0.00 0.00CLO 0.61 0.50 -0..46 -1.91 0.09 0.29 2.98 7.34CCW 0.00 0.00 0.80 -0.96 0.00 0.00 2.74 7.10LAC 0.24 0.44 1.26 -0.44 0.00 0.00 0.00 0.00OUT 0.21 0.42 1.48 0.19 0.00 0.00 0.00 0.00HQW 0.00 0.00 2.21 7.11 0.00 0.00 2.13 3.98BF 0.48 0.51 0.06 -2.13 0.03 0.17 5.74 33.00
APPENDIX 7.2.2 Content Analysis: Descriptive Statistics

CASE 8: BODYCOTE'In recent years we have pursued an activepolicy pf de-gearing in the optimistichope that the level of inflation wouldcontinue to fall'.11, = 0.876 (P=41)
NW
CASE 13: BURGESSThe gearing adjustment reveals that lessless than 30% of the Group's average fixedassets and working capital during the yearwas financed by borrowing'.11., =0.812 (P=33)
NW
Ratio Indicators in Narrative Statements
FAILED COMPANIES
LIQUIDITY MEASURESCASE 5: BERWICK TIMPO'There is no restriction onproduct development, and liquidityis not a problem'QA = 0.478 (P=17)CL
NON-FAILED COMPANIES
CASE 36: HUNSLET'Whilst such (tax)deferment makes a helpfulcontribution to thecompany's liquidity,deferment is dependentupon the annual level ofstock' Q.A. = 0.951 (P=82)
CLCASE 14: BURRELL'During a period of formidable
CASE 57: SANDERSON,
trading losses such as has MURRAY & ELDERbeen experienced during 1979, it is 'The group's improvedunsurprising that the Company's liquidity reduced netliquidity position has come under
interest costs for the
considerable strain from time to year' Q.A. = 0.717 (P=50)time' QA = 0.453 (P=14)
CL
CL
CASE 19: COCKSEDGE'we have recently taken stepswhich improve our long term liquidity'OA = 0.423 (P=11)CL
CASE 34: HERMAN SMITH'The losses placed a severestrain on the company's liquidity'QA = (P=15)CL
CASE 21: DANKS GOWERTON'In the light of the need ...to preserve Group liquidity your .Directors are not seeking powers topurchase any more shares for the timebeing'OA = 0.686 (P=45)CL
(1FARThMRASflRES CASE 46: MOSS ENGINEERING'Our gearing will remain high, untilthe second half of 1982 when ourprojections indicate a return tomore comfortable levels'ii = 1.807 (P=88)NW
APPENDIX 8.1 Financial
262

NUMBER FAMED COMPANY
119 ,163739509
48
.1.
HEALTHY COMPANY
CHAIRMAN'S STATEMENT ANALYSIS TEST MATERIALS 5
The attached package includes copies of the Chairman's Statement taken fromEIGHT Annual Company Reports and Accounts.
These eight statements have been selected randomly from a sample ofSEVENTY such statements, comprising a mixture of statements from healthycompanies, together with those which proved to be the final Chairman'sstatement prior to the failure of that particular company.
It is possible that your sample could contain the statements of eight failuresand none from healthy companies, or vice versa, but it is much more likelythat you will have a mixture of healthy and failed enterprises, although theproportions of failed/healthy will vary among respondents.
In each instance the names of the company, its major subsidiaries andtrading partners, have been deleted so as not to divulge the identity of thecompany in question. In some instances, the names of key personnel andproducts have been similarly treated.
THE TASKUse your skill and experience to assess the information provided and decidewhich, if any, of your statements have been made by failed companies. Thenfill in the following table to record your decision.
In each case the statement provided is complete and unabridged, so that someare quite lengthy. You may decide that some sections (eg, those dealing withpersonnel or divisional reviews) are less relevant to your decision thanothers. Just use as much of the information as you feel appropriate in themaking of a reliable decision.
Name:Full-Time StudentPart-Time StudentNo. of months of Business WorkExperience (excluding holiday jobs)
APPENDIX 8.3.1a) Test Materials: Chairman's Statement Analysis
* 263

48In August 1983 your company's dyeing and finishing operations were
transferred from South Wales to Nottingham amidst considerable
controversy. This move was made following a combined management and
production agreement with
and its Subsidiary,
subsequently ceased trading but a new contract between another
subsidiary of1111111== and ourselves, although less favourable to us than theoriginal agreement, enabled us to continue profitable operations.
As a result of the move, your company's overheads have been pruned to a
level where it can operate profitably on a more flexible level of
turnover than heretofor.
Your group has also diversified into consumer textiles, the products of
which compete successfully for a share of the market both at home and
abroad. This area of activity will become increasingly important in the
future.
During the move to Nottingham certain key machinery was seriously
damaged resulting in a loss of turnover for the year estimated ati 2.7m.
This machinery was insured for both material damage and consequential
loss covering a maximum indemnity period of 2 1/2 years from the date of
damage. Our advisors have assessed the claim to 31st March, 1984 in the
sum of f1.2m., respresenting the loss of gross (not net) profit for the
period. A further claim will be made in respect of 1984/85.
The move to Nottingham caused your group to incur considerable
extraordinary costs including the repayment of regional development
grants. In addition a term loan granted as selective assistance was
repaid in full during the year and required refinancing. In consequence
the Board can recommend only a nominal final dividend of 1/2p per share
on this occasion.
APPENDIX 8.3.11)) Test Materials: Case 48: Nova Jersey Knit

20FINANCJAl_SJAIFMFNT ANALYSIS
The attached package contains abstracts from the Profit + Loss Accountand Balance Sheet taken from EIGHT Annual Company Report and Accounts.
These eight sets of accounts have been selected randomly from a sample ofSEVENTY such statements, comprising a mixture of accounting statementsfrom healthy companies together with those which proved to be the finalaccounts prior to the failure of that particular company.
It is possible that your sample could contain the accounts of eightfailures and none from healthy companies, or vice versa. But it is muchmore likely that you will have a mixture of healthy and failedenterprises, although the proportions of failed/healthy will vary amongrespondents.
THE TASK
Use your skill and experience to assess the financial profile providedand decide which if any, of your accounting statements have been made byfailed companies. Then fill in the following table to record yourdecision.
Number FailedCompany
HealthyCompany
4
19
28
42
44
46
48
63

4 19 28 42
PROFIT AND LOSS ACCOUNT (f000) (f000) (f000) (000)
Sales Turnover 7,292 3,526 144,167 9,338
Trading Profit -1,471 402 15,839 -398
Depreciation 196 418 3,313 408
Pre-Interest Profit -1,667 -16 12,526 -806
Interest 198 128 4,385 272
Pre-Tax Profit -1,865 -145 8,108 -1,078
Tax -482 0 3,784 0
Profit after Tax 1,384 -145 4,324 -1,078
Dividends 0 0 2,789 1
Extraordinary Items -163 0 -288 0
Retained Profits -1,547 -145 3,434 -1,079
Earnings per Share -11.53p -10.3p 12.03p -11.98p
BALANCE SHEET
Stocks 1,413 176 45,993 2,210
Debtors 1,331 857 31,657 1,422
Cash 3 1 2.536 14
Current Assets 2.147 • 1.035 80,186 3.132
Creditors 1,434 1,032 23,560 1,001
Overdraft and Short-Term Loans 1,708 865 14,275 1,979
Tax 0 0 2,139 0
Dividends 0 0 2.769
Current Liabilities 3.142 2.029 42.143 3.437
Net Current Assets -395 -994 37,443 295
Fixed Assets 3,057 1,844 29,398 3,002
Share Capital and Reserves 2,626 807 26,904 3,081
Long Term Loans 0 23 20,253 216
Minority Interests 0 0 2,810 0
Deferred Tax 0 0 3,335 0
266

44 46 48 63
PROFIT AND LOSS ACCOUNT (f000) (1000) (f000) (f000)
Sales Turnover 24,746 16,740 7,978 9,894
Trading Profit 2,871 1,640 719 1,106
Depreciation 1,127 251 182 2,013
Pre-Interest Profit 1,744 1,389 537 -907
Interest 1,193 788 92 105
Pre-Tax Profit 551 601 445 -1,013
Tax 99 -39 181 23
Profit after Tax 452 640 264 -1,036
Dividends 231 333 44 18
Extraordinary Items -187 -1164 -437 -1,139
Retained Profits 34 -857 -217 -2,183
Earnings per Share 3.49p 10.41p 8.69p -17.2p
BALANCE SHEET
. .
Stocks 3,922 5,309 1,518 1,724
Debtors 6,121 7,101 2,939 945
Cash 760 22 2 43
Current Assets 10.803 12.613 4.460 2.113
Creditors 3,673 5,623 1,356 711
Overdraft and Short-Term Loans 4,482 2,344 1,068 693
Tax 0 313 466 107
Dividends 132 236 46 0
Current Liabilities 11.998 10,517 3.656 1.516
Net Current Assets -1,195 2,096 804 1,197
Fixed Assets 20,387 3,726 2,206 2,524
Share Capital and Reserves 14,573 5,999 2,940 2,624
Long Term Leans 4,676 389 o o
Minority Interests o o o o
Deferred Tax o 35 75 o
APPENDIX 8.3.2a) Materials for Financial Statement Analysis:
Case 63 - George Spencer
267

7FINANCIAL RATIO ANALYSIS
The attached package contains financial ratios calculated frominformation in the Profit + Loss Account and Balance Sheet taken fromEIGHT Annual Company Report and Accounts.
These eight sets of ratios have been selected randomly from a sample ofSEVENTY such statements, comprising a mixture of accounting statementsfrom healthy companies together with those which proved to be the finalaccounts prior to the failure of that particular company.
In each instance three ratios have been calculated representingrespectively, profitability, financial risk and liquidity:
PROFITABILITY PBIT . Profit before Interest and Tax
TA Total Assets
FINANCIAL RISK TL . Total Liabilities
NW Net Worth
. Current Liabilities + Long Term Loans
Shareholders Funds + Deferred Tax+ Minority Interests
LIQUIDITY QA . Quick Assets . Current Assets - Stocks
CL Current Liabilities Current Liabilities
For each ratio the corresponding mean value and standard deviation aresupplied, for companies in the manufacturing and construction sectors ofIndustry.
It is possible that your sample could contain the ratios of eightfailures and none from healthy companies, or vice versa. But it is muchmore likely that you will have a mixture of healthy and failedenterprises, although he proportions of failed/healthy will vary amongrespondents.
THE TASK
Use your skill and experience to assess the financial profile providedand decide which, if any, of your ratios are those of failed companies.
Number FailedCompany
HealthyCompany
9
10
16
27
30
32
33
38
* 268

PROFITABILITY LEVERAGE LIQUIDITY
PBIT/TA TL/NW QA/CL
-0.173 0.578 0.652
-0.006 2.543 0.423
-0.287 1.196 0.425
0.114 1.906 0.800
-0.120 1.186 0.418
0.056 1.144 0.574
0.081 1.213 0.804
0.085 1.807 0.677
0.07
0.06
1.12
1.28
0.82
0.11
9
10
16
27
30
32
33
38
Mean
StandardDeviation
Case
FINANCIAL RATIOS
APPENDIX 8.3.2b) Materials for Financial Ratio Analysis:
Case 9 - George Spencer
269

el 10 V3 r. rA Cs el VD CD03 Cs VD 01 VD H O VD co 01
C) • • • • • • • • • •H H •-I
Lc)
0000H000
c000Ul TP CD CI
o
el•
N
N
el•
N
CV VD V 03 cn 01 H• • • • • • •
r4 r4 r4 CD ri C) C)
el CD CV CD CI riN H CV Ul CI 03 VD Tr
• • • • • • • •CO N N H ri 0 H 0
tn r4 C) CV Ul VD ,c).
C•••
(NI
•CV
•N
ri cg r,• • • • •
r-1 ri 0 F-1
c) co VD H co cPCV C) CV CV CV
• • • • • •H 0 0 0 0 5-1
tn 10 In 10 001 CO C's 0 CO
• • • • •(C1 H H 0 r-I 0
N N .11 01-1 e-I '
• • • •Tr ri ri C) C)
0
Cs Cl r403 V3 CV
• • •0 0 0
H0 03
• •
A
1-1
•c)
co
44 4.1U0 00
41 0) 0)A
0 i-1 N 1' LC) 10 Cs CO 01
APPENDIX 8.4.1 t-statistics in the comparison of the no. of failed
decisions with the no. of failed cases
270

2 2 [.: 2 ig z; ce.:1 L,g; gCD •ri 01 el ri rl cr cr Tr Tr el ri
(J), 12 IQ 11199
r-1 UD cr Ul 01 C) Cn crri el MD ri C) 0 ri r-1
• • • • • • • •
CO 0 0 1-1 (-1 0 0 0 0
mr CO el el CN CO 0101 01 r4 cr 01 r4 cr
• • • • • • •CsCD CD C11 ri C) CD C)
01 el el 01 Tr clC) 10 Ch 01 ri 01
• • • • • •MD C) C) r4 ri C) CD
En41cn
44 4O 0
g 0
cpx1 NE ' 4P4 C) ri 01 el cl, Ul MD IN. 03 CN
APPENDIX 8.4.2 t-statistics in the comparison of the no. of
classification errors with the no. of failed case
C M ri C11 C) CD el 01 01 el C4
271
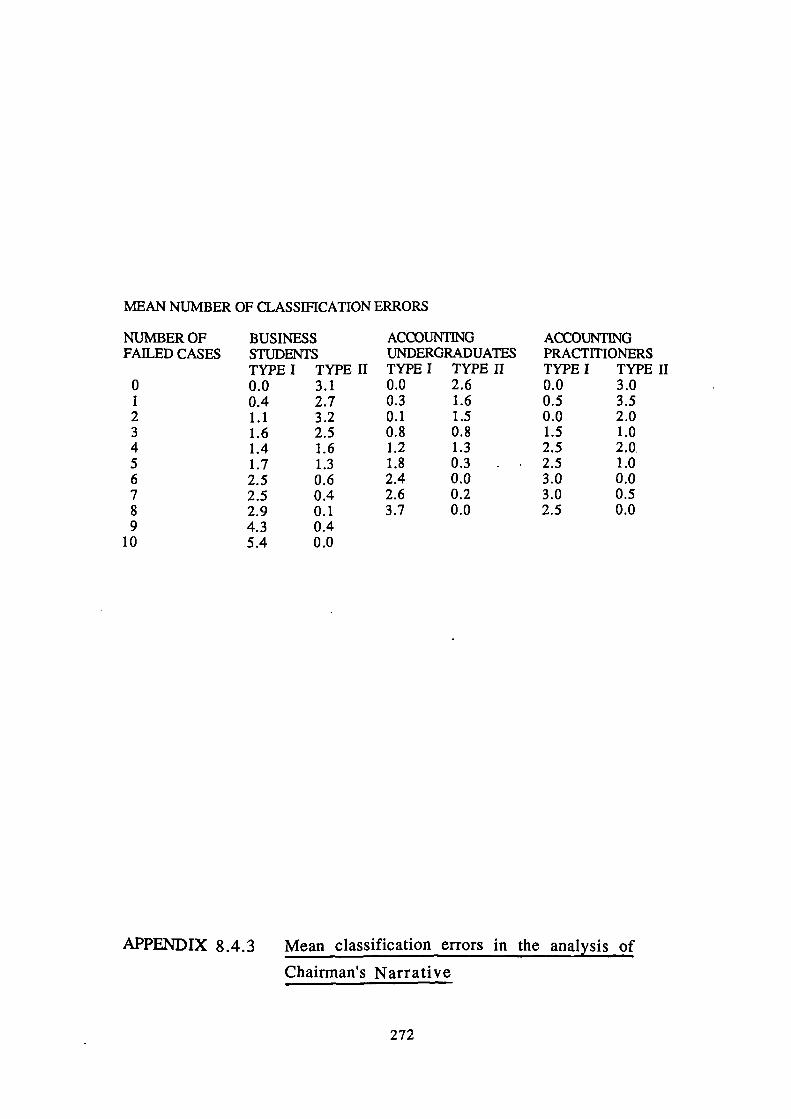
MEAN NUMBER OF CLASSIFICATION ERRORS
NUMBER OFFAILED CASES
BUSINESSSTUDENTSTYPE I TYPE II
ACCOUNTINGUNDERGRADUATESTYPE I TYPE II
ACCOUNTINGPRACTITIONERSTYPE I TYPE II
0 0.0 3.1 0.0 2.6 0.0 3.01 0.4 2.7 0.3 1.6 0.5 3.52 1.1 3.2 0.1 1.5 0.0 2.03 1.6 2.5 0.8 0.8 1.5 1.04 1.4 1.6 1.2 1.3 2.5 2.05 1.7 1.3 1.8 0.3 2.5 1.06 2.5 0.6 2.4 0.0 3.0 0.07 2.5 0.4 2.6 0.2 3.0 0.58 2.9 0.1 3.7 0.0 2.5 0.09 4.3 0.4
10 5.4 0.0
APPENDIX 8.4.3 Mean classification errors in the analysis of
Chairman's Narrative
272

ACCOUNTING
BUSINESS
ACCOUNTINGUNDERGRADUATES
STUDENTS
PRACTITIONERS
CASE MISCLASSIFIED
(n-237) (n146)
MISCLASSIFIED
(n=18)
MISCLASSIFIEDNUMBER (%) RANK (%) RANK (%) RANK
53 2A 1 121 1 1(22 1.546 12 2 IA 4 _21 5.512 82 3 71 7 75 5.539 22 4 77 5 _21 5.544 /a 5 22 2 122 1.56 67 6 86 3 _2A 23.5
48 /a 7 21 6 _11 1318 52 8 64 8 50 1335 46 9 55 11 50 1357 36 10 31 16 25 23.529 21 11 21 15 _21 23.54 21 12 6 30 _21 23.5
62 33 13 58 9 50 1328 30 14 32 14 50 1350 21 15 lA 25 _A2 1334 21 16 22 23 _al 23.519 21 17 lg 17 -2/ 5.542 22 18 a 18 0 3464 23 19 58 10 25 23.565 23 20 23 24 50 1366 22 21 48 12 75 5.51 22 22 24 21 50 138 17 23 23 22 50 13
16 11 24 2A 20 _21 23.515 11 25 7 28 _al 23.563 12 26 7 29 —21 5.531 10 27 0 31 25 23.569 _2 28 _2 36 2 3451 _2 29 22 13 __2 3459 7 30 28 19 0 3417 _a 31 •2 34 _21 23.537 4 32 0 35 25 23.59 4 33 8 27 25 23.5
26 2 34 0 32 0 3433 0 35 0 33 0 3411 0 36 8 26 0 34
(Scores for Failed Cases Underlined)
(Percentage scores rounded to whole numbers, but decimaldifferences considered in the assignment of ranks)
APPENDIX 8.4.4 Chairman's Statement Analysis: Case Misclassifications
273

VI
- CO 0 LC) MD Tr cm cn CDC) C.) el cy cy 01 el r4 UI C) r4PI 4 41 • • • • • • • • •El GLo CI Tr Tr Tr 0, el en CV CV CV
gCl)
p4 CV In r-I %.0 in If) VDri...n
•
% 0 tt) CO CO ON el al CA el HEl • • • • • • • • •Z 0 elcsii-IHHooHozH
u)
0 - r- Tr ri CV CD CV cnC.) r4 CD V) Ul r, C) Ch el0 Kg 41 • • • • • • • • •
$4 fI4 g) ul Tr 01 el el el C4 C9
Cl)0 g4 el c) 4)) C) CI el Ch
iH C) CO CI Tr c) cy r, CV r4 elE4 V4 • • • • • • • lb •
CVCV1-1011-11,-11-INCVi
f4rir;41 g
Ea
CD 01 0 - ul Tr 4) Ul r4 r4 CI r- %JD
E4 C.) Ls) cy r- Tr CA Cel Ch
Z4 41 • • • • • • • • •
E4 41 G4 CI Tr cr Tr 01 el CV CV CV r4
0 41 CO
CD E-4 1:4 u) u) cy cy u) ry el u) u)
C.) 4 CD Tr ul CA Tr LflcOr)NOl
C.) E4 pg • • • • • • • • •
0) a r-i o of4
ul- 4121 ul ry CV V) r4 ch r- CV
C...) CI ID Ul Tr o3 CD r4 141 UlH0 '1 • • • • • • • • •
E-4 124 C) Tr Tr 01 cn 01 el el CV CV
1-1 g co
g Ir, C40ul cn 03 03 m, r% Tr F4 CVtO r's V 0 LC) LC) L.0 at tn
O Z N • • • • • • • • •g4 el C4 CV CV CV r4 rq r4 C'41
C)t4
04
P4
G4O (1)
41.
o ggZ C.) co r- VD ul Tr el cy ri C)
APPENDIX 8.4.5 Mean No. of Classification Errors and Failed Decisions

0/ r% CM VD cr U1 CV CN CD Ch r% r% r% cr VD C)cr el CV ri rl 01 ri r4
rA CO CO Ul rl CD UD Ul CN cn VD rs Tr CA r% r% 01 0301 Tr el cs1 CV el Tr eq ri ri ri ri r4
▪ C) H el rq 01 01 cr r% to C) 03 cr C) CD.0 CV 01 rA el r-1 el ri N H
N N ‘C) V) el 0 el enCO if) ,c1, el el csi
CV CV 0% CD Cs .0 cr 01 CD CDC4 CV ri
c°,11 c.11LoN1 r.ic°1 rol M) 01 U) el 01 el riWI COI 1-11 r-1 err'
CD 01 CN U) .0 03 Tr 03 01 11) C) CV r% cr 03 CV CVCO 03 01 03 VD cn CV ri ri ri CV N ri
CO cr CD CV Ul MD cr COUl r% 24% 01 Ch
cn CO CD el cr CN r4 erV) CO ri Cs Cs CO CI
C) CV r% CN el ri H VD 01Tr H 1-4 N N H
ClUD CV VI ri C) in Ul TV3i N CV 01
Tr 02 CD Ul r% Ul el r% Ul .0 01 10 el el CM CM UlCN OD CO r% u) ti) el el 01 C4 01 CV H H rl
rill '41 g41 "I;1 (ci,11`"1 741 21 '1'31 ';'41
APPENDIX 8.4.6 . Distribution of % Misclassifications
across All Cases

0.5
0 2
05
0.}
a) PROFILES
b) ANDERSON'S GLYPH
C) POLYGON
d) STARS
APPENDIX 9.2.1 Graphical Representations
276

-100-2.50 -200 -1.50 -1.00-0.50 0.00 0.50 1.00 1.50200250
e) ANDREWS CURVES f) WERNOFF'S SCHEMATIC FACES
I LH L4
I C
5.315.e
191
60.5
112.5
20.00
15.00
10.00
U. 5.00
000
-5.00
-10.00
g) TREES h) CASTLES
APPENDIX 9.2.1 Alternative Graphical Formats

WORST
AVERAGE
BEST
a) CHERNOFF FACES (with additions by Bruckner)
WORST
AVERAGE
BEST
b) FRITH FACES (with additions by Everitt)
APPENDIX 9.2.2 Computer Generated Facial Portraits
278

CASE 5: MATTHEW BROWN PLC - PROFIT AND LOSS ACCOUNT31/12/X1 31/12/X2 31/12/X3 31/12/X4 31/12/X5
Sales/Turnover 11428 15657 17218 20012 22851
Operating Expenses 9011 12514 13750 16020 18234
Operating Income 2417 3143 3528 3992 4647
Depreciation 263 375 496 547 694
Trading Profit 2149 2768 3032 3445 3953
Associated Co. Profits 0 0 0 0 0
Other Income 11 1 35 49 146
Pre-Interest Profit 2160 2769 3067 3494 4099
Interest 67 195 44 30 28
Pre-Tax Profit 2093 2574 3023 3464 4071
Tax 1101 1343 1576 1615 1444
Profit after Tax 992 1231" 1447 1845 2627
Minority Interest 3 -2 1 4 5
Dividends 396 568 663 740 860
Retained Profits 593 665 783 1102 1762
-- -----
Value Added
3985 5298 5852 6931 . 8273
Wages & Salaries
1568 2155 2324 2939 3626
CASE 5: MATTHEW BROWN PLC - BALANCE SHEET
31/12/X1 31/12/X2 31/12/X3 31/121X4 31/12/X5
Current Assets
Stocks & WIP 875 891 1193 1474 1804
Debtors 1486 1427 1636 1743 2035
Cash & Equivalent 163 24 51 53 124
Other 0 1409 400 1615 1485
2524 3751 3280 4885 5448
Current Liabilities
Creditors 2497 1647 1566 1956 3466
0/0 & Short Term Loans 1101 813 355 669 179
Tax 920 1414 1398 1830 2313
Dividends & Other 279 440 494 554 649
4797 4314 3813 5009 6607
Net Current Assets -2273 -563 -533 -124 -11.59
Fixed Assets 15281 15875 17149 17826 19704
Assocs. & Other 953 950 1118 • 1257 2189
Goodwill 0 0 0 o ' • oNET CAPITAL EMPLOYED 13961 16262 17734 18959 20734
----- -----
Financed By -
Share Capital & Res 12160 14213 15078 17026 18853
Minority Interest 49 40 39 42 0
Long Term Loans 262 258 253 249 244
Deferred Tax Acc 1490 1751 2364 1642 1637
NET CAPITAL EMPLOYED 13961 16262 17734 18959 20734
APPENDIX 10.3.1 Experiment 1 Materials: a) Financial Statements
279

CASE 5: MATTHEW BROWN PLC - FINANCIAL RATIOSii=== =============
31/12/X1 31/12/X2 31/12/X3 31/12/X4 31/12/X5
PROFIT BEFOREINTEREST & TAX 0.1152 0.1346 0.1423 0.1453 0.1499TOTAL ASSETS
TOTALLIABILITIES 0.3693 0.2857 0.2326 0.2810 0.3344NET WORTH
WORKINGCAPITAL -0.1628 -0.0346 -0.0301 -0.0065 -0.0559
NET CAPITALEMPLOYED
ACID TEST 0.3438 0.3363 0.4424 0.3586 0.3268
CURRENT ASSETTURNOVER 4.5277 4.1741 5.2677 4.0966 4.1999
VALUE ADDED 0.2124 0.2575 0.2716 0.2892 0.3026TOTAL ASSETS
APPENDIX 10.3.1 Experiment 1: b) Financial Ratios
AITENDIX 10.3.1 Experiment 1: c) Facial Portrait Data
280

IDENTITY NUMBER COMPANY NAME STATUS
1 Associated Fisheries Solvent
2 Beatson, Clark & Co Solvent
3 Blackman and Conrad Failed
4 Brocks Group Failed
5 Matthew Brown Solvent
6 Sir Joseph Causton Solvent
7 Elson and Robbins Solvent
8 Fairbaim Lawson Failed
9 Thomas French Solvent
10 General Engineering Co.(Radcliffe) Failed
11 James Halstead Solvent
12 Low and Bonar Group Solvent
13 LRC International Solvent
14 Bernard Matthews Solvent
15 Petbow Solvent
16 Rivington Reed Failed
17 Sanderson, Murray and Elder Solvent
18 Southern Constructions Failed
19 Tecalemit Solvent
20 United Engineering Industries Solvent
APPENDIX 10.3.2 Experiment 1: Sample Companies
281

CASE NUMBER At MISCLASSIFICATION
ACCOUNTING FINANCIAL FACIALFAILED CASES STATEMENTS RATIOS PROFILES
3 55 57 164 36 38 238 13 15 6
10 9 6 116 64 68 1318 14 15 5
NON-FAILED CASES
1 10 16 652 8 11 15 21 21 26 13 14 27 3 23 19 4 8 0
11 5 5 612 4 8 1413 14 14 2614 7 16 115 59 38 6717 44 52 4119 5 17 120 8 28 4
APPENDIX 10.3.3 Experiment 1: Distribution of Misclassifications
, 282

a) ACCOUNTING VARIABLES
VARIABLES
pROCESSING STRATEGY ERRORS OF CLASSIFICATIONFAILED CASE IF: No.FAILED WHEN HEALTHY WHEN
HEALTHY FAILED(CASES) (CASES)
< Mean (0.108) 4TL/NW > 7Mean (0.985)QA/CL < Mean(0.715) 5
ProfitabilityRisk
Liquidity(Profit - Risk
ProfitabilityPBIT/TA
Risk
Liquidity
PBIT/TA < 0TL/NW > 1
QA/CL < 0.5+ Liquid)< 0
5 15,17 3,4,166 1,6,11,19, 4
203 5,14 165 1,6,11,19, -
20
1,13,15,17 -1,6,9,11, 419,205,11,14,17, -20
(Profit - Risk + Liquid)< Mean (-0.162) 4 1,11,19,20 -
b) FACIAL PROFILES
VARIABLES PROCESSING STRATEGY ERRORS OF CLASSIFICATIONFAILED CASE IF: No FAILED WHEN HEALTHY WHEN
HEALTHY FAILED(CASES) (CASES)
PROFITABILITY DOWN-TURNED MOUTH 4 1,13,15,17
LEVERAGE SMALL EYES 5 1,6,11,19,20
LIQUIDITY PEPLEXED EYEBROWS 3 5,14,20
PROFITABILITY DOWN-TURNED MOUTHLEVERAGE AND
1 1SMALL EYES
LEVERAGE
SMALL EYESLIQUIDITY
AND 1 20PERPLEXED EYEBROWS
PROFITABILITY DOWN-TURNED MOUTHLEVERAGE ANDLIQUIDITY SMALL EYES
0AND
PERPLEXED EYEBROWS
APPENDIX 10.3.4 Experiment 1: Misclassified Cases for Alternative
Processing Strategies
283

3. BLACKMAN AND CONRAD (31/1/80)
8. BROCKS GROUP (31/12/79)
8. FAIRBAIRN LAWSON (31/12/78)
10. GENERAL ENGINEERING (RADCLIFFE)
(31/12/78)
16. RIVINGTON REED (31/3/79)
18. SOUTHERN CONSTRUCTIONS
(31/12/78)
APPENDIX 10.3.5 Experiment 1:Facial Profiles for Failed Cases
284

I. ASSOCIATED FISHERIES (30/9/79)
13. LRC INTERNATIONAL (31/3/79)
15. PETBOW HOLDINGS (31/3/80)
17. SANDERSON, MURRAY ELDER (31/6/79)
APPENDIX 10.3.6 Experiment 1: Facial Profiles forNon-Failed Cases
285

RATIO
REPRESENTING
FACIALDIMENSION OF
ASSIGNMENTACCOUNTINGINFORMATION
Profit before Interest & Tax Mouth CurvatureTotal Assets CPBIT/TA) Profitability Mouth Length
Pupil Position
Total Liabilities Eye SizeNet Worth (TL/NW) Financial Leverage Eyebrow Length
Working Capital Working Nose LengthNet Capital Employed (WC/NCE) Capital Position Nose Width
Quick AssetsCurrent Liabilities (QA/CL) Liquidity Eyebrow Angle
Current Assets Sales (CA/S) Asset Turnover Face Size
Value AddedTotal Assets (VA/TA) Value Added Ear Level
APPENDIX 10.3.7 Experiment 1: Assignment of Financial Variables
to Facial Features
286

gz
<
APPENDIX 10.3.8 Experiment 2: Sample Guide to the Assignment ofVariables
287

FACIAL FEATURE
ALTERNATIVE ASSIGNMENTS
A
MOUTHCURVATURE
PROFIT- PROFIT- LIQUID- LIQUID- FINANCIAL FINANCIALMOUTH LENGTH ABILITY ABILITY ITY ITY RISK RISK
LIQUID-ITY
EYE SIZEPUPILPOSITION
EYEBROWANGLENOSE LENGTH
FINAN- LIQUID- PROFIT- FINAN- PROFIT-CIAL ITY ABILITY CIAL ABILITYRISK RISK
LIQUID- FINAN- FINAN- PROFIT- LIQUID-ITY CIAL CIAL ABILITY ITY
RISK RISK
PROFIT-ABILITY
a) FACIAL FEATURE - FINANCIAL VARIABLE COMBINATIONS
b) Effect of Alternative Assignments on a Single Case: Case 24 - DEWHIRST
APPENDIX 10.3.9 Experiment 2: Alternative Variable Assignments
288

TEST MATERIALS 85CDFINANCIAL GRAPHICS ANALYSIS
The attached package contains facial portraits computer-generated fromfinancial ratios extracted from the Profit and Loss Account and Balance Sheettaken from TEN Annual Company Report and Accounts.
These ten portraits (or 'pictics') have been constructed and selected from asample of SEVENTY such portraits, comprising a mixture of healthycompanies and failed companies.
In each instance, three ratios have been calculated:-
Profit Before Interest and Tax to represent ProfitabilityTotal Assets
Total Liabilities to represent Financial LeverageNet Worth
Quick Assets to represent LiquidityCurrent Liabilities
Each ratio value has been mapped onto facial characteristics in accordancewith the attached assignment, using the mean and standard deviation of theratio values to provide the range for the shape and length of features.
It is possible that your sample could contain the facial portraits of tenfailures and none from healthy companies, or vice versa. But it is much morelikely that you will have a mixture of healthy and failed enterprises,although the proportions of failed/healthy will vary among respondents.
THE TASK
Use your skill and experience to assess the financial profile provided anddecide which, if any, of your facial portraits are those of failed companies.
•NUMBER FAILED
COMPANYHEALTHYCOMPANY
9D22D26D27D30D .31D34D38D49D .51D
289

9D 300
510380
APPENDIX 10.3.10 Experiment 2: Facial Profile Information
290

in en1.1
6. N.
ld
ies
01
01
CCI
0
Mo
0
tit
4.14 I.
UI j .11`
0
h.. 41RI CPn
0
01 41
C 0
0 0 0
eft ill
Cr)
4111` in
•n••,.
N 0 0Cl 41 1.1.16 4s 11U. I.
VI 1.0,
111 ?1P..
f...) LI
0
1,1
tlt N •if
•••• 1
APPENDIX 10.3.11 Experiment 2: Effects of AlternativeOrdering of Processing
291

LLI
I.Li.1 WI L.4
.-1
..aoi s- 21
'1
°4
0
N P. 10 eri.— 0 0
al
0
0)
0 0 o N
10. 'Cf CR0
eno
02 1 f ‘'.1N
N rft
o 0 o
:1 21 :I :I
. ,. et0 .— N
01 er) o0 0 0
e..11
o ft!
0N a
01
•.n 0 0
4.)
D0 I0 I (7i1 "j1
cel I
•0k
1.1
sa l
ell
qr•„-
N 3
-
o
g m"‘LI
0 0 0
IDLLI ims
-8 -
k -1—
— N VI
rm 0 0 0
I. ,..,10 1,...
al
I..
VI P.
O
ws.
Cr$ N
—00
—
•. I 9 'Pe:21 c!CI
N '2 !'42 3 A 3 20 © c.;
8 3 3 A,.. •n 0, O
!I !I ?I5 !Is s
es:s
S S 2 8•-• 0 0
.5 .
1.LLI L.t
42O
••• 01 1,1
APPENDIX 10.3.12 Experiment 2: Effects of AlternativeFailure Base Rates
292

CASE ACCOUNTINGNo STATEMENTS
FINANCIALRAT/OS
A B
ALTERNATIVE FACIALASSIGNMENTS
c D E F(%) (%) (%) (%) (%) (%) (%) (%)
48 83 83 67 80 80 100 20 3344 80 75 60 40 30 50 40 5046 65 65 o 25 35 20 40 506 47 73 44 14 73 60 40 20
28 42 17 15 15 15 30 30 550 41 41 o 7 13 o 43 3051 40 25 70 50 25 20 20 6053 40 40 60 80 60 40 80 o35 40 30 7 34 44 7 40 o26 35 40 20 30 50 20 50 8021 28 30 65 60 15 40 65 6557 28 42 48 20 40 28 28 161 24 16 28 20 20 a 8 12
18 20 17 20 28 40 7 28 2066 17 10 o 6 o 6 o o9 15 5 10 30 10 o 10 o
62 13 30 7 26 7 7 7 o7 12 18 50 40 5 15 45 60
29 10 o o o o o 0 105 10 8 12 o o 4 o 8
56 10 7 o o o o o o27 8 32 40 70 60 60 15 5541 8 10 o o 5 5 5 o25 8 8 5 10 o o o 540 8 25 65 35 15 20 45 4549 7 13 14 49 35 35 14 4237 7 3 14 6 6 o 6 645 5 10 o o o o 10 o24 5 5 o o o o o o69 0 10 o o o o o 0
APPENDIX 10.3.13 Experiment 2: Misclassification with AlternativeInstruments
293

u61
WI
UI
cal
si N ' 74.
zi q fl .7414 r,r,
41 A
".; $
'Ai
g A D;
is,Cs, o
i s ,7,i i 7.
7.11.̀..2 A.,r; ,,ers LA
A 7, A i A
R. 2. 4.! 7'. 74
A ri; 511 SI A
m
rA. Ns.
SI A 7; A
$.1 •
*1 74 R. A
4 &II
i
4
ZifA 117,1 7,1 $
4 di
'nil 92 A A
gci
IV.-.i.-.I- = 11I 1...z
LaJI
•
•
▪ .22 I.
- E"
U. I &
....
•
,..;
▪
..e; r- oi a+
APPENDIX 10.3.14 Experiment 2: Misclassifications resulting from
Alternative Classification Strategies
294

BIBLIOGRAPHY

AMERICAN ACCOUNTING
ASSOCIATION (AAA)
AUSTRALIAN ACCOUNTING
RESEARCH FOUNDATION (AARF)
AARF
ADELBERG A H
"A Statement of Basic Accounting
Theory"
COMMITTEE TO PREPARE A STATEMENT
OF ACCOUNTING THEORY (1966)
"Objectives and Concepts of Financial
Statements"
ARS No 3 MELBOURNE (1972)
"Proposed Statements of Accounting
Concepts: Qualitative Characteristics of
Financial Information" Exposure Draft
42B (December 1987)
"Narrative disclosures contained in
Financial Reports: Means of
communication or manipulation"
ACCOUNTING AND BUSINESS RESEARCH
(Summer 1979) (a):179-90
ADELBERG A H "A methodology for Measuring the
Understandability of Financial Report
Messages"
JOURNAL OF ACCOUNTING RESEARCH
(Autumn 1979) (b):565-592
ADELBERG AH & FARRELLY GE "Measuring the Meaning of Financial
Statement Terminology: A
Psycholinguistics Approach"
ACCOUNTING AND FINANCE Vol.29 (May
1989):33-59
ADELBERG A H & RAZEK J R "The Cloze Procedure: A Methodology
for Determining the Understandability
of Accounting Textbooks"
THE ACCOUNTING REVIEW VOL. 59 NO. 1
(January 1984):109-122
296

AMERICAN INSTITUTE OF "A Tentative Set of Broad Accounting
CERTIFIED PUBLIC ACCOUNTANTS Principles for Business Enterprises"
(AICPA) (1962)
AICPA
ALTMAN E I, HALDEMAN RG
& NARAYANAN P
ALTMAN E I
ANDERSON E
"Objectives of Financial Statements"
REPORT OF THE ACCOUNTING OBJECTIVES
STUDY GROUP (CHAIRMAN R M
TRUEBLOOD) (1973)
"Zeta Analysis: A New Model to
Identify Bankruptcy Risk of
Corporations"
JOURNAL OF BANKING AND FINANCE
(June 1977):29-54
"Financial Ratios, discriminant
analysis and the prediction of
corporation bankruptcy"
JOURNAL OF FINANCE 23 (1968):589-609
"A Semigraphical Method for the
Analysis of Complex Problems"
TECHNOMETRICS 2 No 3 (August
1960):387-91
ANDERSON J
ANDERSON N H & SHANTEAU J C
ANDERSON R H
"Lix & Rix: Variations on a Little-
known Readability Index"
JOURNAL OF READING (March
1983):490-496
"Information integration in Risky
Decision Making"
JOURNAL OF EXPERIMENTAL
PSYCHOLOGY Vol 84 No 3 (1970):441-451
"The Usefulness of Annual Reports to
Australian Investors"
PAPER PRESENTED TO AAANZ
CONFERENCE, UNIVERSITY OF
MELBOURNE (1979)
297

ANDREWS D F "Plots of High Dimensional Data"
BIOMETRICS 28 (1972):125-136
ANTON HR
AQUINO M R
ARGENTI J
ASHTON R H
ASHTON R H
ASHTON R H & KRAMER S S
"Funds Statement Practices in the
United States and Canada"
THE ACCOUNTING REVIEW (October
1954):620-27
"The Validity of the Miller-Coleman
Readability Scale"
READING RESEARCH QUARTERLY
(Spring 1969) Vol. 4:342-357
"Corporate Collapse; The Causes and
Symptoms"
(MCGRAW-HILL) LONDON (1976)
"The Robustness of Linear Models for
Decision-Making"
OMEGA Vol 4 No 5 (1976):609-615
"Integrating Research and Teaching
in Auditing: Fifteen Cases on
Judgement and Decision Making"
THE ACCOUNTING REVIEW Vol LIX No 1
(January 1984):78-97
"Students as Surrogates in Behavioural
Accounting Research: Some Evidence"
JOURNAL OF ACCOUNTING RESEARCH
Vol 18 No 1 (Spring 1980):1-15
BAILEY W T "An Appraisal of Research Designs
used to Investigate the Information
Content of Audit Reports"
VOL LVII No 1 (January 1982):141-146
298

BAILEY K E HI, BYLINSKI J H &
SHIELDS MD
BAKER F B
BALL R & BROWN P
"Effects of Audit Report Wording
Changes on the Perceived Message"
JOURNAL OF ACCOUNTING RESEARCH
(Autumn 1983):355-370
"Information Retrieval based upon
Latent Class Analysis"
JOURNAL OF THE ASSOCIATION OF
COMPUTER MACHINERY (1962) Vol 9 No
4:512-521
"An Empirical Evaluation of
Accounting Income Numbers"
JOURNAL OF ACCOUNTING RESEARCH
(Autumn 1968):159-178
BALL R, BROWN P & FINN F J "Published Investment
Recommendations and Share Market
Efficiency"
AUSTRALIAN GRADUATE SCHOOL OF
MANAGEMENT, UNIVERSITY OF NSW
(NOVEMBER 1977)
BALL C A & TSCHOEGL A E "The • decision to establish a foreign
branch bank or subsidiary: and
appliation of binary classification
procedures"
JOURNAL OF FINANCIAL AND
QUANTITATIVE ANALYSIS 17
(1982):411-424
BALL R, WALKER R G & "Audit Qualifications and Share
WHTITRED G P Prices"
ABACUS (June 1979):23-34
BANZ R W
"The Relationship between return and
Market Value of Common Stock"
JOURNAL OF FINANCIAL ECONOMICS 9
(1981):3-18
299

BAR1FF M L & LUSK E J
"Cognitive and personality tests for the
Design of Management Information
Systems"
MANAGEMENT SCIENCE Vol 23 No 8
(1977):820-9
BARRON M J
BARTOO R K
"What we know about Schematic Faces"
WORKING PAPER, LONDON BUSINESS
SCHOOL (1984)
"The Effect of Cumulative Context upon
Cloze Task Performance of Tenth
Graders" JOURNAL OF EDUCATIONAL
MEASUREMENT (1975):229-255
BASU S "The Relationship between Earnings'
Yield, Market Value and Return fOr
NYSE Common Stocks: Further
Evidence"
JOURNAL OF FINANCIAL ECONOMICS
(June 1983):129-156
BEAVER W H "The Information Content of Annual
Earnings Announcements"
EMPIRICAL RESEARCH IN ACCOUNTING:
SELECTED STUDIES Supplement to
JOURNAL OF ACCOUNTING RESEARCH
(1968):67-92
BEDFORD NM "Extension in Accounting Disclosure"
NEW YORK (1973)
BEHLING 0, GIFFORD WE &
"Effects of Grouping Information on
TOLLIVER J M
Decision Making under Risk"
DECISION SCIENCES Vol 11 No 2 (April
1980):272-283
300

BELICAOUI A
"Linguistic Relativity in Accounting"
ACCOUNTING ORGANISATIONS AND
SOCIETY Vol 3 No 2 (1978):97-104
BELICAOUI A & COUSINEAU A "Accounting Information,
Nonaccounting Information and
Common Stock Perception"
JOURNAL OF BUSINESS (July 1977):334-
343
BELL J "The Effect of Presentation form on
the use of Information in Annual
Reports"
MANAGEMENT SCIENCE Vol 30 No 2
February (1984a):169-185
BELL J "The Effect of Presentation Form on
Judgement Confidence in Performance
Evaluation"
JOURNAL OF BUSINESS FINANCE AND
ACCOUNTING 11(3) Autumn
(1984b):327-346
BERELS ON B "Content Analysis in Communications
Researc.h"
(FREE PRESS), LONDON (1952)
BETTMAN J R & KAKKAR P "Effects of Information Presentation
Format on Consumer Information
Acquisition"
JOURNAL OF CONSUMER RESEARCH
(March 1977):233-40
BIER! J "Cognitive Structures in Personality"
in H M SCHRODER AND P SUEDFELD (ed)
"Personality Theory and Information
Processing"
NEW YORK (1970)
301

BJORNSSON C H
BORMUTH J R
BOUWMAN M J
BOVVMAN E H
BOWMAN E H
BRADSHAW J L
BRADSHAW J L & WALLACE G
"Readability of Newspapers in 11
Languages"
READING RESEARCH QUARTERLY
(Summer 1983):480-497
"Cloze Test Readability: Criterion
Reference Scores"
JOURNAL OF EDUCATIONAL
MEASUREMENT Vol 5 No 3 (Fall
1968):189-196
"Expert v Novice Decision Making in
Accounting: A Summary"
ACCOUNTING, ORGANISATIONS AND
SOCIETY Vol 9 No 3 (1984):325-27
"Consistency and Optimality in
Managerial Decision-making"
MANAGEMENT SCIENCE 9 (January
1963):310-321
"Content Analysis of Annual Reports
for Corporate Strategy and Risk"
INTERFACES 14 . (Jan-Feb 1984):61-71
"The Information conveyed by .
varying the dimensions of features in
human outline faces"
PERCEPTION AND PS YCHOPHYSICS 6
(1969):5-9
"Models for the processing and
identification of faces"
PERCEPTION AND PSYCHOPHYSICS Vol 9
(5) (1971):443-8
BRAINE L G "Age Changes in the mode of
perceiving geometric forms"
PSYCHONOMIC SCIENCE 2 (1965):155-6
302

BRUCE V "Recognising Faces"
(LAWRENCE ERLBAUM) LONDON (1988)
BRUCICNER L A
BRUNER J S & TAGIURI R
BUGENTAL D B, HENICER B
& WHALEN C K
"On Chernoff Faces" in P C C WANG (ed)
"Graphical Representation of
Multivariate Data" (1978)
"The Perception of People" in G
LINDZEY (ed.) "Handbook of Social
Psychology" Vol II (Addison-Wesley)
Cambridge, Mass. (1954)
"Attributional antecedents of verbal
and vocal assertiveness"
JOURNAL OF PERSONALITY AND SOCIAL
PSYCHOLOGY VOL 34 No 3 (1976):405-
411
BURROWS J F "Computation into Criticism: A Study of
Jane Austen's Novels and Experiment
in Method"
(CLARENDON PRESS) OXFORD (1986)
BUZBY S L
BLYZICY S L
"The Nature of Adequate Disclosure"
• JOURNAL OF ACCOUNTANCY April
(1974a)
"Selected Items of Information and
their Disclosure in Annual Reports"
ACCOUNTING REVIEW July (1974b):423-
435
CANADIAN INSTITUTE OF "Corporate Reporting: Its Future
CHARTERED ACCOUNTANTS (CICA) Evolution" (1980)
CARROLL I D & CHANG J I "Analysis of Individual Differences in
Multi-Dimensional Scaling via an N-
Way generalisation of 'Eckart-Young'
Decomposition"
PSYCHOMETRICA (Sept 1970):283-319
303

CASEY C J
CASEY C J
CASEY C J & SELLING T I
CHAMBERS A E & PENMAN S H
CHAMBERS R J
CHAMBERS R J
"Variations in Accounting
Information Load: The Effect on Loan
Officers' Predictions of Bankruptcy"
THE ACCOUNTING REVIEW (January
1980):36-49
"Prior probability disclosure and Loan
Officers' judgements: Some evidence of
Impact"
JOURNAL OF ACCOUNTING RESEARCH
(Spring 1983):300-307
"The Effect of Task Predictability and
Prior Probability Disclosure on
Judgement Quality and Confidence"
THE ACCOUNTING REVIEW Vol LXI No 2
(April 1986):302-317
"Timeliness of Reporting and the Stock
Price Reaction to Earnings
Announcements"
JOURNAL OF ACCOUNTING RESEARCH
(Spring 1984):21-47
"The Role of Information Systems in
Decision-Making"
MANAGEMENT TECHNOLOGY (June 1964)
"Usefulness - the Vanishing Premise
in Accounting Standard Setting"
ABACUS (December 1979):71-92
CHANG L S & MOST K S
"Investor Uses of Financial Statements:
An Empirical Study"
SINGAPORE ACCOUNTANT VOL 12
(1977):83-91
> 304

CHANG L S, MOST KS &
"The Utility of Annual Reports: An
BRAIN C W
International Study"
JOURNAL OF INTERNATIONAL BUSINESS
STUDIES (Spring/Summer 1983):63-84
CHERNOFF H
CHERNOFF H
CHERNOFF H
CHERNOFF H & RIZVI H M
"The Use of Faces to represent points
in n - dimensional space graphically"
TECHNICAL REPORT No 71, DEPT. OF
STATISTICS, STANFORD UNIVERSITY
(1971)
"Using Faces to represent points in k
dimensional space graphically"
JOURNAL OF THE AMERICAN
STATISTICAL ASSOCIATION 68
(1973):361-68
"Graphical Representations as a
Discipline" in P C C WANG (ed)
"Graphical Representation of
Multivariate Data" (1978)
"Effect on Classification Error of
Random Permutations of features in
representing multivariate data by
Faces" JOURNAL OF THE AMERICAN
STATISTICAL ASSOCIATION 70
(1975):548-54
CHERRY C "On Human Communication"
CAMBRIDGE M I T (1966)
CHOW C W
"The Demand for External Auditing:
Size, Debt and Ownership Influences"
ACCOUNTING REVIEW 57 (April
1982):272-291
305

CLEVELAND W S & McGILL R
"Graphical Perception: The Visual
Decoding of Quantitative Information
on Graphical Displays of Data"
JOURNAL OF THE ROYAL STATISTICAL
SOCIETY (Series A) 150 Part 3
(1987):192-229
COHEN J, DEARNLY E J &
HANSEL C E M
COURTIS J K
COURT'S J K
CRAS WELL A T
CROUCH W W, BRINDLE B &
FRYE J K
"A Question Study of Meaning"
BRITISH JOURNAL OF EDUCATIONAL
PSYCHOLOGY (1958) 28:141-148
"An Investigation into Annual Report
Readability and Corporate Risk-Return
relationships"
ACCOUNTING AND BUSINESS RESEARCH
(Autumn 1986):285-294
"Relationship between timeliness in
corporate reporting and corporate
attributes"
ACCOUNTING AND BUSINESS RESEARCH
6 (Winter 1976):45-46
"Accounting Reports ... Do They
Communicate?"
THE CHARTERED ACCOUNTANT IN
AUSTRALIA VOL 40 No 6 (June 1969):4-
10
"The Syracuse Person Perception Test:
A Measure of Responsiveness to Facial
and Verbal Cues" in P C C WANG (ed)
"Graphical Representation of
Multivariate Data" (1978)
CUCELOGLU D M
"Perception of facial expressions in
three cultures"
ERGONOMICS (1970):93-100
> 306

DAVIES P M & COXON A PM "The MDS (X) Series of
Multidimensional Scaling Programs"
INTER-UNIVERSITY RESEARCH
COUNCIL SERIES (January 1981) Report
No 51
DAVISON A & KANTOR R N "On the Failure of Readability Formulas
to Define Readable Texts: A Case Study
from Adaptations"
READING RESEARCH QUARTERLY No 2
(1982):187 -209
DEAKIN E B "Distribution of Financial Ratios: Some
empirical evidence"
ACCOUNTING REVIEW 51 (January
1976):90-96
DIAMOND R & CAREY S "Why faces are and are not special: An
effect of expertise"
JOURNAL OF EXPERIMENTAL
PSYCHOLOGY: GENERAL 115 (1986):107-
117
DIELMAN T E & "An Examination of investor
OPPENHEIMER H R Behaviour During periods of Large
Dividend Changes"
JOURNAL OF FINANCIAL AND
QUANTITATIVE ANALYSIS (June
1984):197-216
DIMSON E & MARSH P R
"Event study methodologies and the
Size Effect"
JOURNAL OF FINANCIAL ECONOMICS 17
(1986):113-142
DUPREE J M
"User's Preferences for Descriptive v.
Technical Accounting Terms"
ACCOUNTING AND BUSINESS RESEARCH
(Autumn 1985):281-290
307

DYCKMAN T R, DOWNES D H &
"Efficient Capital Markets and
MAGEE R P
Accounting: A Critical Analysis"
NEW YORK (1975)
DYER J C & MCHUGH A J
EFRON B
EGETH HE
EHRENBERG A S C
EINHORN H & HOGARTH R
EKMAN P (ed)
"The Timeliness of the Australian
Annual Report"
JOURNAL OF ACCOUNTING RESEARCH 13
(Autumn 1975):204-219
"The Efficiency of Logistic Regression
compared to normal Discriminant
Analysis"
JOURNAL OF THE AMERICAN
STATISTICAL ASSOCIATION 70
(1975):892-898
"Parallel versus serial processes in
multidimensional stimulus
discrimination"
PERCEPTION AND PSYCHOPHYSICS 1
(1966):245-52
"Rudiments of Numeracy"
JOURNAL OF THE ROYAL STATISTICAL
SOCIETY (Series A) 140 part 3
(1977):277-297
"Behavioural Decision Theory:
Processes of Judgement and Choice"
ANNUAL REVIEW OF PSYCHOLOGY
(1981):53-88
"Darwin and Facial Expression"
NEW YORK (1973)
EKMAN P. FRIESEN W V & "Emotion in the Human Face"
ELLSWORTH P (PERGAMON PRESS) NEW YORK (1972)
308

ELLIS H D
"Recognising Faces"
BRITISH JOURNAL OF PSYCHOLOGY 664
(November 1975):409-426
ELLIS H D, SHEPHERD J &
"Use of the Photofit technique for
DAVLES G
recalling faces"
BRITISH JOURNAL OF PSYCHOLOGY 66
(February 1975):29-37
ERICKSON L & HANSEN L H "Performance on Cloze passages in and
out of context"
JOURNAL OF EDUCATIONAL
MEASUREMENT (1974\
ERTEL S "Dogmatism: an approach to
personality" in A DIECHSEL AND K
HOLSENS CHECK (eds) "Maschinelle
Inhaltsanalyse, Materialien I"
HAMBURG (1976):34-44
EUSICE K J & MATTHEWS W M "The Use of the Integrative Complexity
of the President's Letter in the Annual
Report as an Indicator of Impending
Bankruptcy"
PAPER PRESENTED TO THE
INTERNATIONAL SYMPOSIUM ON
FORECASTING, LONDON BUSINESS
SCHOOL (July 1984)
EVERITT B S
"Graphical Techniques for
Multivariate Data"
(HEINEMANN) LONDON (1978)
FAMA E F
"Efficient Capital Markets: A Review of
Theory and Empirical Work"
THE JOURNAL OF FINANCE (May
1970):383-417
> 309

FINANCIAL ACCOUNTING
"Statement of Financial Accounting
STANDARDS BOARD (FASB)
Concepts No 2: Qualitative
Characteristics of Accounting
Information" (1980):
FIRTH M "A Study of the Consensus of the
Perceived Importance of Disclosure of
Individual Items in Corporate Annual
Reports"
INTERNATIONAL JOURNAL OF
ACCOUNTING (Fall 1978):57-70
FIRTH M
FIRTH M
"The Disclosure of Information by
Companies"
OMEGA Vol 7 No 2 (1979):129-135
"The Relative Information Content of
the Release of Financial Results Data
by Finns"
JOURNAL OF ACCOUNTING RESEARCH 19
(1981):521-529
FLES CH R "The Art of Readable Writing"
(HARPER & ROW) NEW YORK (1974):
FLURY B & RIEDWYL H
FOSTER G
"Graphical Representation of
Multivariate Data by Means of
Asymmetrical Faces"
JOURNAL OF THE AMERICAN
STATISTICAL ASSOCIATION Vol 76 No
376 (December 1981):757-65
"Briloff and the Capital Market:
Further Evidence"
WORKING PAPER, STANFORD
UNIVERSITY (1985):
FOSTER G "Financial Statement Analysis"
(PRENTICE HALL) NEW JERSEY (1986):
310

FOSTER III T W, JENKINS D R
"The Incremental information content
& VICKREY D W
of the annual report"
ACCOUNTING AND BUSINESS RESEARCH
(Spring 1986):91-98
FRAZIER K B, INGRAM R W &
TENNYSON B M
FRIEDMAN M P, REED S K &
CARTERETTE E C
FROIS-WITTMAN J
"A Methodology for the Analysis of
Narrative Accounting Disclosures"
JOURNAL OF ACCOUNTING RESEARCH
Vol 22 No 1 (Spring 1984):318-331
"Feature saliency and recognition
memory for schematic faces"
PERCEPTION AND PSYCHOPYSICS 10
(1971):47-50
"The Judgement of Facial Expression"
JOURNAL OF EXPERIMENTAL
PSYCHOLOGY 13 (1930):113-151
GALLAGHER C A
GALPER R E & HOCHBERG J
GILLING D M
GOLDBERG L R
"Perceptions of the Value of a
Management Information System"
ACADEMY OF MANAGEMENT JOURNAL
Vol 17 No 1 (1974):46-55
"Recognition memory •for photographs
of faces"
AMERICAN JOURNAL OF PSYCHOLOGY
Vol 84 No 3 (1971):351-4
"Timeliness in Corporate Reporting:,
Some further comment"
ACCOUNTING AND BUSINESS RESEARCH
Vol 8 (Winter 1977):34-6
"Man Versus Model of Man: A Rationale
plus some evidence, for a method of
improving on clinical inferences"
PSYCHOLOGICAL BULLETIN 73 (June
1970):422-32
311

GOLDSTEIN A G & CHANCE J "Visual recognition memory for
complex configurations"
PERCEPTION AND PSYCHOPHYSICS 9
(1971):237-41
GOLDSTEIN AG & MACKENBERG EG "Recognition of human faces from
isolated facial features: a
developmental study"
PSYCHONOM1C SCIENCE 6 (1966):149-50
GONEDES N J "Corporate Signalling, External
Accounting and Capital Market
Equilibrium: Evidence on Dividends,
Income and Extraordinary Items"
JOURNAL OF ACCOUNTING RESEARCH
(Spring 1978):26-79
GRANT E "Face to Face"
NEW SOCIETY (7 May 1970):769-771
GREEN P E & MAHESHWARI A "Common Stock Perception and
Preference: An Application of
Multidimensional Scaling" -
JOURNAL OF BUSINESS 42. (October
1969):439-57
GUNNING R "The Fog Index after Twenty Years"
JOURNAL OF BUSINESS
COMMUNICATION (Winter 1968):3-13
HAMMILL A E "Simplified Financial Statements"
ACCOUNTANT'S MAGAZINE (June
1979):241-243
HARIED A A "The Semantic Dimensions of Financial
Statements"
JOURNAL OF ACCOUNTING RESEARCH
(Autumn 1972):376-391
312

HARIED A A
"The Measurement of Meaning in
Financial Reports"
JOURNAL OF ACCOUNTING RESEARCH
(Spring 1973):117-145
HARRISON C "Readability in the Classroom"
(C U P) CAMBRIDGE, ENGLAND (1980):
HARRISON R P "Pictic Analysis: Towards a Vocabulary
and Syntax for the Pictorial Code with
Research on Facial Communication"
Unpublished PhD Thesis, Michigan
State University (1964)
HEALY P "Can you Understand the Footnotes to
Financial Statements?"
ACCOUNTANTS JOURNAL (July
1977):219-222
HELSON H & MASI ERS H "A Study of Inflection-Points in the
Locus of Adaptation-Levels as a
Function of Anchor-Stimuli"
AMERICAN JOURNAL OF PSYCHOLOGY
(1966):400-408
HILTON A "Employee Reports - How to
Communicate Financial Information to
Employees" CAMBRIDGE (1978)
HINES RD "The Usefulness of Annual Reports: the
Anomaly between the Efficient
Markets Hypothesis and Shareholder
Surveys"
ACCOUNTING AND BUSINESS RESEARCH
VOL 12 48 (Autumn 1982):296-309
313

HINES R D "Financial Accounting Knowledge,
Conceptual Framework Projects and
the Social Construction of the
Accounting Profession"
ACCOUNTING, AUDITING AND
ACCOUNTABILITY (FORTHCOMING)
(1989)
HOCKEY S
HOCKEY S & MARTIN J
HOUGHTON K A
HOUGHTON K A
HOUGHTON K A
"A Guide to Computer Applications in
the Humanities"
DUCKWORTH, LONDON (1980)
"Oxford Concordance Program: Users
Manual 2"
OXFORD UNIVERSITY COMPUTING
SERVICE (1988)
"Accounting Data and the Prediction of
Business Failure: The Setting of Priors
and the Age of Data"
JOURNAL OF ACCOUNTING RESEARCH
(Spring 1984):361-368
"The Development of Meaning in
Accounting: An Intertemporal Study"
ACCOUNTING AND FINANCE Vol 27 No 2
(November 1987a):25-40
"True and Fair View: An Empirical
Study of Connotative Meaning"
ACCOUNTING, ORGANISATIONS AND
SOCIETY VOL 12 NO 2 (1987b):143-152
HOUGHTON K A "The Measurement of Meaning in
Accounting: A Critical Analysis of the
Principal Evidence"
ACCOUNTING, ORGANISATIONS AND
SOCIETY (1988):263-280
> 314

HO WELLS T H
"A Study of the Ability to recognise
faces"
JOURNAL OF ABNORMAL SOCIAL
PSYCHOLOGY 33 (1938):124-27
HUFF D "How to Lie with Statistics"
NEW YORK (1954)
HUFF D L & BLACK W "A Multivariate Graphic Display for
Regional Analysis"
in P C C WANG (ed) "Graphical
Representation of Multivariate Data"
(1978)
INSTITUTE OF CHARTERED "The Corporate Report" ACCOUNTING
ACCOUNTANTS IN ENGLAND AND STANDARDS STEERING COMMITTEE
WALES (ICAEW) (1975) .
IICER H P & KLEIN R "Words: A Computer System for the
Analysis of Content"
BEHAVIOUR RESEARCH METHODS AND
INSTRUMENTATION 6 (1974):430-438
INGRAM R W & FRAZIER K B . "Narrative Disclosures in Annual
Reports"
JOURNAL OF BUSINESS RESEARCH 11
(1983):49-60
ISELIN E R "The Effects of Format on the
Extraction of Information from
Accounting Statements"
ACCOUNTING AND FINANCE Vol 29 (May
1989):73-94
IZARD C E "The Face of Emotion"
NEW YORK (1971)
315

JACOB R J K
"Facial Representation of Multivariate
Data"
in P C C WANG (ed) "Graphical
Representation of Multivariate Data"
(1978)
JACOBY J
JACOBY J, SPELLER DE &
KOHN CA
JANIS I L & FADNER R H
JENSEN R E
JONES M J
"Information Load and Decision
Quality: Some Contested Issues"
JOURNAL OF MARKETING RESEARCH Vol
XIV (November 1977):569-73
"Brand Choice Behaviour as a Function
of Information Load"
JOURNAL OF MARKETING RESEARCH Vol
XI (February 1974):63-9
"The Co-efficient of Imbalance"
in H D LASS WELL ed.
"Language of Politics: Studies in
Quantitative Semantics"
CAMBRIDGE M I T PRESS (1965):55-82
"Phantasmagoric Accounting"
AMERICAN ACCOUNTING ASSOCIATION
(1976) .
"A Longitudinal Study of the
Readability of the Chairman's
Narratives in the Corporate Reports of
a UK Company"
ACCOUNTING AND BUSINESS RESEARCH
Vol 18 No 72 (Autumn 1988):297-305
JOY 0 M & TOLLEFSON JO "On the Financial Applications of
Discriminant Analysis"
JOURNAL OF FINANCIAL AND
QUANTITATIVE ANALYSIS 10 No 5
(1975):723-39
316

JOYCE E J & BIDDLE G C
JOYCE E J & BIDDLE G C
KAHNEMANN D & TVERSKY A
KEANE S M
KEASEY K & WATSON R
KELLY-NEWTON L
ICENLEY W J & STAUBUS G J
"Anchoring and Adjustment in
Probabilistic Inference in Auditing"
JOURNAL OF ACCOUNTING RESEARCH
Vol 19 No 1 (Spring 1981a):120-45
"Are Auditors' Judgements Sufficiently
Regressive?"
JOURNAL OF ACCOUNTING RESEARCH
Vol 19 No 2 (Autumn 1981b):323-49
"Subjective Probability: A Judgement
of Representativeness"
COGNITIVE PSYCHOLOGY (July
1972):430-54
"Examining the Problems of
Understandability"
ACCOUNTANCY 88 (June 1977):82-4
"The Prediction of Small Company
Failure: Some Behavioural Evidence
for the UK"
ACCOUNTING AND BUSINESS RESEARCH
Vol 17 (Winter 1986):49-57 .
"A Sociological Investigation of the
USA Mandate for Replacement Cost
Disclosures"
ACCOUNTING, ORGANISATIONS AND
SOCIETY Vol 5 No 3 (1980):311-321
"Objectives and Concepts of Financial
Statements"
ARS NO 3, AARF MELBOURNE (1972)
KENNY A "The Computation of Style"
(PERGAMON PRESS) LONDON (1982)
317

KLARE G R
KLEINER B & HARTIGAN I A
ICRIPPENDORFF K
"Assessing Readability"
READING RESEARCH QUARTERLY Vol X
No 1 (1974-75):255-264
"Representing Points in many
dimensions by Trees and Castles"
JOURNAL OF THE AMERICAN
STATISTICAL ASSOCIATION 76
(1981):260-276
"Content Analysis: An Introduction to
its Methodology"
SAGE PUBLICATIONS, LONDON (1980)
KROSS W & SCHROEDER DA "An Empirical Investigation of the
Effect of Quarterly Earnings
Announcement Timing on Stock
Returns"
JOURNAL OF ACCOUNTING RESEARCH
(Spring 1984):153-176
KRUSKAL J B "Multidimensional Scaling in
Archaelogy: Time is not the only
dimension" in FR HODSON (ed)
'Mathematics in the Archaelogical and
Historical Sciences' Proceedings of the
Anglo-Romanian Conference (1970)
ICRUSICAL J B & CARROLL J D "Geometric Models and Badness of Fit
functions" in PR KRISHNAIAH
'International Symposium of
Multivariate Analysis' Dayton, Ohio
(Academic Press) New York (1969)
KUNREUTHER H "Extension of Bowman's Theory of
Managerial Decision Making"
MANAGEMENT SCIENCE (April
1969):415-439
318

KWOLEK W F "A Readability Survey of Technical
Popular Literature"
JOURNALISM QUARTERLY (Summer
1973):255-264
LACHENBRUCH P A "An almost unbiased method of
obtaining confidence intervals for the
probability of misclassification in
discriminant analysis"
BIOMETRICS 23 No 4 (1967):639-45
LACHENBRUCH PA, "Robustness of the Linear and
SNEERINGER C A & REVO L T Quadratic discriminant function to
certain types of non-normality"
COMMUN. STATISTICS 1 (1973):39-56
LARCICER D F & LESSIG VP
LASS WELL H D
LAUGHERY K R, ALEXANDER J F
& LANE A B
"Perceived usefulness of Information:
A Psychometric Examination"
DECISION SCIENCES Vol 11 No 1
(January 1980):121-134
"The Structure and Function of
Communications in Society"
in BRYSON L (ed) "The Communication
of Ideas" (Harper Row)
NEW YORK (1948)
"Recognition of Human Faces: effects
of target exposure time, target
position, pose position and type of
photograph"
JOURNAL OF APPLIED PSYCHOLOGY 51
(1971):477-83
I.FET A
"Company Financial Reporting: Issues
and Analysis"
LONDON (1976)
319

LEE T A & TWEEDIE D P
"Accounting Information: An
Investigation of Private Shareholder
Usage"
ACCOUNTING AND BUSINESS RESEARCH
(Autumn 1975):280-291
LEE T A & TWEEDIE D P
LEFTWICH R, WATTS R &
ZIMMERMAN J
LEWIS N R, PARKER L D,
POUND G D & SUTCLIFE P
LI D H
LIBBY R
"The Institutional Investor and
Financial Information"
ICAEW LONDON (1981):
"Voluntary Corporate Disclosacez
Case of Interim Regortiag
SUPPLEMENT TO VOL 19 JOURNAL OF
ACCOUNTING RESEARCH (1981):50-77
"Accounting Report Readability: The
use of Readability Techniques"
ACCOUNTING AND BUSINESS RESEARCH
(Summer 1986):199-213
"The Semantic Aspect of
Communication Theory and
Accountancy"
JOURNAL OF ACCOUNTING RESEARCH
(Spring i963) Vol 1:102-107
"Bankers and Auditors' Perceptions of
the Message Communicatied by the
Audit Report"
JOURNAL OF ACCOUNTING RESEARCH
Vol 17 No 1 (Spring 1979):99-122
LIBBY R
"Accounting Ratios and the Prediction
of Failure: Some Behavioural Evidence"
JOURNAL OF ACCOUNTING RESEARCH
(Spring 1975):150-161
320

LIBBY R
"Man versus model of man: Some
conflicting evidence"
ORGANISATIONAL BEHAVIOUR AND
HUMAN PERFORMANCE 16 (1969):1-12
LICHTENSTEIN S & NEWMAN J
LICHTENSTEIN S & SLOVIC P
LOTHIAN N
LOTHIAN N
LUHN H P
"Empirical Scaling of Common Verbal
phrases associated with Numerical
Probabilities"
PSYCHONOMIC SCIENCE (December 5
1967):563-4
"Reversals of preference between bids
and choices in gambling decisions"
JOURNAL OF EXPERIMENTAL
PSYCHOLOGY (1971) 89:46-55
"Bad Language in Financial Reports"
ACCOUNTANCY 89 (November 1978):42-
6
"The Nature of Redundancy and its Use
in Company Reports and Accounts"
ACCOUNTING AND BUSINESS RESEARCH
(Summer 1976):216-227
"A Statistical Approach to Mechanised
Encoding and Searching of Literary
Information"
IBM JOURNAL OF RESEARCH AND
DEVELOPMENT Vol 1 (1957):309-317 .
MACDONALD G, BIRD P &
"Statements of Objectives and
CLIMO T
Standard Practice in Financial
Reporting"
(PRENTICE HALL) NEW JERSEY (1975)
321

MAYER-SOMMER A P
"Understanding and Acceptance of the
Efficient Markets Hypotheses and its
Accounting Implications"
ACCOUNTING REVIEW (January
1979):100-106
MCCROSKEY J C
MCDONALD G C & AYERS J A
MCKELV1E S J
"An Introduction to Rhetorical
Communication"
(PRENTICE HALL) NEW JERSEY (1948)
"Some applications of the 'Chernoff
Faces': A Technique for Graphically
representing Multivariate Data"
in P C C WANG (ed) "Graphical
Representation of Multivariate Data"
(1978)
"The Meaningfulness and meaning of
Schematic Faces"
PERCEPTIONS AND PSYCHOPHYSICS 14
No 2 (1973):343-348
MCNICHOLS M & MANEGOLDJ G "The Effect of the Information
Environment on the Relationship
between Financial. Disclosure and
Security Price variability"
JOURNAL OF ACCOUNTING AND
ECONOMICS (April 1983):49-74
MESSICK S & DAMARIN F
"Cognitive styles and Memory for
Faces" JOURNAL OF ABNORMAL SOCIAL
PSYCHOLOGY 69 (1964):313-318
MEZZICH J E &
WORTHINGTON D R L
"A Comparison of Graphical
Respresentation of Multidimensional
Psychiatric Data"
in P C C WANG (ed) "Graphical
Representation of Multivariate Data"
(1978)
322

MILLER G R & COLEMAN E B
MILLER H
MOIZER P & ARNOLD J
MONTGOMERY H & SVENSON 0
MORIARITY S
MORRISON D G
"A Set of Thirty-Six Prose Passages
Calibrated for Complexity"
JOURNAL OF VERBAL LEARNING AND
VERBAL BEHAVIOUR 6 (1967):851-4
"Environmental Complexity and
Financial Reports"
ACCOUNTING REVIEW 47 (January
1972):31-37
"Share Appraisal by Investment
Analysts - Portfolio vs. Non-Portfolio
Managers" ACCOUNTING AND BUSINESS
RESEARCH (Autumn 1984):341-348
"On Decision Rules and Information
Processing Strategies for Choices
among Multiattribute Alternatives"
SCANDINAVIAN JOURNAL OF
PSYCHOLOGY VOL 17 (1976):283-91
"Communicating Financial
Information through
Multidimensional Graphics" JOURNAL
OF ACCOUNTING RESEARCH 17 (April
1979):205-224
"On the interpretation of discriminant
analysis"
JOURNAL OF MARKETING RESEARCH 6
No 2 (1969):156-163
MORTON A Q
"Literary Detection: How to prove
authorship and fraud in literature and
documents"
(CHARLES SCRIBNER) NEW YORK (1978)
323

MORTON J R "Qualitative Objectives of Financial
Accounting: A Comment on Relevance
and Understandability"
JOURNAL OF ACCOUNTING RESEARCH
(Autumn 1974):288-98
MORTON J & JOHNSON M "Four Ways for Faces to be Special" in
A W YOUNG & H D ELLIS (eds)
"Handbook of Research on Face
Processing" (ELSEVIER) NORTH-
HOLLAND (1989):49-56
MOSKOVICH W "QuantitatiNt. Limpisiits in atural
Language in Information Science" in
"Natural Language in Information
Science: Perspectives and Directions
for Research"
D WALKER, H KARLGREN & M KAY
(eds) STOCKHOLM (1977):57-74
MOSTELLER F & WALLACE D L
NESTVOLD K J
NEWTON C M
"Inference in an Authorship problem"
JOURNAL OF AMERICAN STATISTICAL
ASSOCIATION 58 (1963):275-309
"Cloze Procedure Correlation with
Perceived Readability"
JOURNALISM QUARTERLY (Autumn
1972) Vol 49:542-594
"Graphica: From Alpha to Omega in
Data Analysis"
in P C C WANG (ed) "Graphical
Representation of Multivariate Data"
(1978)
ME N & HULL H "SPSSX: Manual of Operations"
(McGraw Hill) NEW JERSEY (1984)
324

OAKMAN R L "Computer methods for Literary
Research" GEORGIA (1984)
OGIL VIE DM "The General Inquirer: A Computer
in STONE P J, D C DUNPHY, Approach to Content Analysis"
M S SMITH & D M OGILVIE CAMBRIDGE M I T (1966)
OLIVER B L
OLIVER B L
"A Study of Confidence Interval
Financial Statements"
JOURNAL OF ACCOUNTING RESEARCH 10
(Spring 1972):154-166
"The Semantic Differential: A Device
for Measuring the Interprofessional
Communication of Se1ected Accaucttag
Concepts"
JOURNAL OF ACCOUNTING RESEARCH
(Autumn 1974):299-316
O'NEILL T J "The General Distribution of the Error
Rate of a Classification procedure with
application to logistic regression
discrimination"
JOURNAL OF THE AMERICAN
STATISTICAL ASSOCIATION 75
(1980):154-160
OSGOOD C E, SUCI G J &
TANNENBAUM P H
OSGOOD C E & WALICER E G
"The Measurement of Meaning"
UNIVERSITY OF ILLINOIS, URBANA:
UNIVERSITY PRESS (1957)
"Motivation and Language Behviour: A
Content Analysis of Suicide Notes"
JOURNAL OF ABNORMAL AND SOCIAL
PSYCHOLOGY 59 (1959):58-67
PARKER L D
"Corporate Annual Reporting: A Mass
Communication Perspective"
ACCOUNTING AND BUSINESS RESEARCH
(Autumn 1982):279-286
325

PARKER L D "Corporate Annual Reports: A Failure
to Communicate"
INTERNATIONAL JOURNAL OF
ACCOUNTING Vol 16 No 2 (Spring
1981):35-48
PASHALIAN S & CRISSY W J E "How Readable are Corporate Annual
Reports?"
JOURNAL OF APPLIED PSYCHOLOGY
(August 1950):244-248
PATELL J M & WOLFSON M A "Good News, Bad News and the Intraday
Timing of Corporate Disclosures"
THE ACCOUNTING REVIEW (July
1982):243-256
PEASNELL K V "The Function of a Conceptual
Framework for Corporate Financial
Reporting"
ACCOUNTING AND BUSINESS RESEARCH
(Autumn 1982):243-256
PEEL MJ, PEEL DA & POPE PF "Some Evidence on Corporate Failure
and the. Behaviour of Non-Financial
Ratios"
THE INVESTMENT ANALYST 75 (January
1985):3-7
PICKET!' R & WHITE B S "Constructing Data Pictures"
PROCEEDINGS OF THE 7TH NATIONAL
SYMPOSIUM OF THE SOCIETY FOR
INFORMATION DISPLAY (October
1966):75-81
PINCHES G E "Factors influencing classification
results from multiple discriminant
an
JOURNAL OF BUSINESS RESEARCH 8
(1980):429-56
326

PRESS S J & WILSON S
REED S K
REINGANUM M R
REVS/NE L
ROSE P S, ANDREWS WT &
GIROUX G A
RULAND W
"Choosing between logistic regression
and discriminant analysis"
JOURNAL OF THE AMERICAN
STATISTICAL ASSOC/ATION 73
(1978):699-705
"Pattern recognition and
Categorisation" COGNITIVE
PSYCHOLOGY 3 (1972):382-407
"Misspecification of Capital Asset
Pricing: Empirical anomalies based on
earnings yields and market values"
JOURNAL OF FINANCIAL ECONOMICS 9
(1981):19-46
"Data Expansion and Conceptual
Structure"
ACCOUNTING REVIEW 45 (October
1970):704-711
"Predicting Business Failure: A
Macroeconomic Perspective."
JOURNAL OF ACCOUNTING, AUDITING
AND FINANCE (Fall 1982):20-31 .
"The Time Series of Earnings for
Forecast Reporting and Nonreporting
Firms"
JOURNAL OF BUSINESS FINANCE AND
ACCOUNTING (Summer 1979):187-201
SALAMON G D & DHALIWAL D S "Company Size and financial
Disclosure Requirements with
Evidence from the Segmental
Reporting Issue"
JOURNAL OF BUSINESS FINANCE AND
ACCOUNTING (Winter 1980):555-568
327

SAINT K & BATES P "Survey of the Quantitative approaches
to country risk analysis"
JOURNAL OF BANKING AND FINANCE 8
(1984):341-56
SALAMON G D & SMITH E D "Corporate Control and Management
Misrepresentation of Firm
Performance" BELL JOURNAL OF
ECONOMICS (Spring 1979):319-328
SAVICH R "Use of Accounting Information in
Decision Making"
ACCOUNTING REVIEW 52 (July
1977):642-52
SCHIFFMAN S S, REYNOLDS ML "Introduction to Multidimensional
& YOUNG F W • Scaling: Theory, Methods and
Applications"
ACADEMIC PRESS (1981)
SCHMID C F "Handbook of Graphic Presentation"
(RONALD) NEW YORK (1954)
SCHRODER H M
SCHRODER H M, DRIVER M J &
STREUFERT S
"Conceptual Complexity and
Personality Organisation"
in H M SCHRODER and P SUEDFELD (ed)
"Personality Theory and Information
Processing"
NEW YORK (1970)
"Human Information Processing"
(HOLT RINEHART & WINSTON) NEW
YORK (1967)
SHANNON C E & WEAVER W
"The Mathematical Theory of
Communication"
(PRENTICE HALL) NEW JERSEY (1968)
328

SHEPARD R N "Representation of Structure in
Similarity Data: Problems and
Prospects"
PSYCHOMETRICA (December 1974):373-
417
SIEGEL J H, FARRELL E J, "The Surgical Implication of
GOLD WYN R M & FRIEDMAN H P
SLOVIC P
SMITH E E & NIELSEN G D
SMITH F
SMITH J E & SMITH NP
Physiologic Patterns in Myocardial
Infarction shock"
SURGERY 72 (1972):126-141
"From Shakespeare to Simon:
speculations and evidence about man's
ability to process information"
OREGON RESEARCH INSTITUTE
MONOGRAPH Vol 12 No 2 (1974)
"Representations and Retrieval
Processes in STM recognition and
recall of faces" JOURNAL OF
EXPERIMENTAL PSYCHOLOGY Vol 85 No
3 (1970):397-405
"Understanding Reading"
• HOLT REINHART WINSTON (1971)
"Readability: a Measure of the
performance of the communication
function of financial reporting"
ACCOUNTING REVIEW 46 (July
1971):552-61
SMITH M & TAFFLER R J "Improving the Communication
Function of Published Accounting
Statements" ACCOUNTING AND
BUSINESS RESEARCH No 54 (Spring
1984):139-146
329

SOPER F J & DOLPHIN R
"Readability and Corporate Annual
Reports"
ACCOUNTING REVIEW (April 1964):358-
362
SORTER G H, BECKER S W,
ARCHIBALD T R & BEAVER W H
SPROUSE R T & MOONITZ M
STAMP E
STAMP E
STAMP E
"Accounting and Financial Measures
as indicators of Corporate Personality
Some Empirical Findings" in R J
JAEDICKE, Y IJURI & 0 NIELSEN (eds)
"Research in Accounting
Measurement"
AMERICAN ACCOUNTING ASSOCIATION
(1966)
"A Tentative Set of Broad Accounting
Principles for Business Enterprises"
ACCOUNTING RESEARCH STUDY NO3
AICPA: NEW YORK (1962)
"Corporate Reporting: Its Future
Evolution"
THE CANADIAN INSTITUTE OF
CHARTERED ACCOUNTANTS (1980)
"Accounting Standards and the
Conceptual Framework: A Plan for
their evolution"
THE ACCOUNTANT'S MAGAZINE (July
1981):216-222
"First Stepts Towards a British
Conceptual Framework"
ACCOUNTANCY (March 1982):123-130
STEVENS M
"Presentation of Financial
Information" ACCOUNTANTS DIGEST No
59 (Winter 1977/78)
330

STEVENS W P, STEVENS K C
"Communication in Accounting:
& RAABE W JNR
Readability of FASB Statements"
REVIEW OF BUSINESS AND ECONOMIC
RESEARCH Vol 19 No 1 (Fall 1983):l10-
118
STILL MD
STOBER T L
STOCK D & WATSON CJ
STONE P J & HUNT E B
SVENSON 0
"The Readability of Chairman's
Statements"
ACCOUNTING AND BUSINESS RESEARCH
(Winter 1972):36-39
"The Incremental Information Content
of Financial Statement Disclosults.. The
Case of LIFO Inventory Liquidations"
JOURNAL OF ACCOUNTING RESEARCH
Vol 24 Supplement 1986:138-160
"Human Judgement Accuracy,
Multidimensional Graphics and Human
versus Models"
JOURNAL OF ACCOUNTING RESEARCH 22
No 1 (SPRING 1984):192-206
"Computer approach to Content
Analysis using the general inquirer
system" in E C JOHNSON (Ed)
"Americal Federation of Information
Processing Societies"
CONFERENCE PROCEEDINGS, BALTIMORE
(1963):241-256
"Process Descriptions of Decision
Making"
ORGANISATIONAL BEHAVIOUR AND
HUMAN PERFORMANCE VOL 23
(1979):86-112
SWANSON E B
"Management Information Systems:
Appreciation and Involvement"
MANAGEMENT SCIENCE (1974):178-188
331

SWIERINGA R, GIBBINS M,
LARSSON L & SWEENEY J
TAFFLER R J
TAFFLER R J &
SUDARSANAM P S
"Experiments in the Heuristics of
Information Processing"
STUDIES ON HUMAN INFORMATION
PROCESSING IN ACCOUNTING,
Supplement to JOURNAL OF
ACCOUNTING RESEARCH (1976):150-87
"Forecasting Company Failure in the
UK using Discriminant Analysis and
Financial Ratio Data"
JOURNAL OF THE ROYAL STATISTICAL
SOCIETY (Series A) Vol 145 part 3
(1982) :342 -358
"Auditing the Board: A New Approach
to the Measurement of Company
Performance"
MANAGERIAL FINANCE (1980):127-147
TAFFLER R J & TISSHAW H "Going, Going, Gone, Four Factors
which predict"
ACCOUNTANCY 88 NO 1003 (March
1977):50-55
TAYLOR W L "Cloze Procedure: A New Tool for .
Measuring Readability"
JOURNALISM QUARTERLY (Fall
1953):415-433
THORNGATE W "Efficient Decision Heuristics"
BEHAVIOURAL SCIENCE (May 1980):219-
25
TUKEY J W
"Exploratory Data Analysis"
(ADDISON-WESLEY) READING, MASS
(1977)
332

TVERSKY A & KRANTZ D H
"Similarity of Schematic Faces: A test
of interdimensional activity"
PERCEPTION AND PSYCHOPHYSICS 5
(1969):124-128
WAINER H & THISSEN D
WANG PC C
WATKINS P R
WATTS R L
WAYMIRE G
WHITTRED G P
"Graphical Data Analysis"
ANNUAL REVIEW OF PSYCHOLOGY 32
(1981):191-241
"Graphical Representation of
Multivariate Data"
(ACADEMIC PRESS) NEW YORK (1978)
"Multidimensional Scaling
Measurement and Accounting
Research"
JOURNAL OF ACCOUNTING RESEARCH
Vol 22 No 1 (Spring 1984):406-411
"Corporate Financial Statements: A
Product of the Market and Political
Processes"
AUSTRALIAN JOURNAL OF
MANAGEMENT (April 1977):53-75
"Additional Evidence on the
Information Content of Management
Earnings Forecasts"
JOURNAL OF ACCOUNTING RESEARCH
(Autumn 1984):703-718
"The Timeliness of the Australian
Annual Report:1972-1977"
JOURNAL OF ACCOUNTING RESEARCH
Vol 18 No 2 (Autumn 1980):623-628
WILLIAMSON R W
"Evidence on the Selective Reporting
of Financial Ratios"
THE ACCOUTING REVIEW (April
1984):296-99
333

WILSON D A
"A Note on Environmental Complexity
and Financial Reports"
ACCOUNTING REVIEW 48 (July
1973):586-8
WILTON R L & TABB I B "An Investigation into Private
Shareholder Usage of Financial
Statements in New Zealand"
ACCOUNTING EDUCATION (May 1978):93-
101
WINFIELD R R "Shareholder Opinion of Published
Financial Statements"
paper presented at the AAANZ
CONFERENCE, UNIVERSITY OF OTAGO
(1978)
WRIGHT P "Using Tabulated Information"
ERGONOMICS (1968):331-43
WRIGHT W F
YIN R K
"Cognitive Information Processing
Biases: Implications for Producers and
users of Financial Information"
DECISION SCIENCES (April 1980):284-298
"Looking at Upside-Down Faces"
JOURNAL OF EXPERIMENTAL
PSYCHOLOGY 8 (1969):141-5
ZEGHAL D "Firm Size and the Informational
Content of Financial Statements"
JOURNAL OF FINANCIAL AND
QUANTITATIVE ANALYSIS (September
1984):299-310
334

ZNIIJEWSKI M E
"Predicting Corporate Bankruptcy: An
Empirical Comparison of the Extant
Financial Distress Models"
WORKING PAPER, STATE UNIVERSITY
OF NEW YORK, BUFFALO (1983)
ZMUD R W "An Empirical Investigation of the
Dimensionality of the Concept of
Information"
DECISION SCIENCES Vol 9 No 2
(1978):187-195
335