253443.pdf - London Met Repository
295
This PDF was created from the British Library’s microfilm copy of the original thesis. As such the images are greyscale and no colour was captured. Due to the scanning process, an area greater than the page area is recorded and extraneous details can be captured. This is the best available copy IMAGING SERVICES NORTH Boston Spa, Wetherby West Yorkshire, LS23 7BQ www.bl.uk
-
Upload
khangminh22 -
Category
Documents
-
view
0 -
download
0
Transcript of 253443.pdf - London Met Repository

This PDF was created from the British Library’s microfilm copy of the original thesis. As such the images are greyscale and no colour was captured. Due to the scanning process, an area greater than the page area is recorded and extraneous details can be captured. This is the best available copy
IMAGING SERVICES NORTH
Boston Spa, Wetherby
West Yorkshire, LS23 7BQ
www.bl.uk


Atféhtion is drawn to the fiict that idMfé ,copyright of this thesis rests with its audior.
.This copy of the thesis has been supplied •on condition that anyone who consults it is understood to recognise that its copyright rests with its author and that no quotation firom the thesis and no information derived from it may be published^ without the author’s prior written consent.
h Z ' ? b ' ? l I » /
iatAi


't" r / -r >• -'I
..■>
ACKNOWLEDGEMENTS
I would like to thank Dr E F I Roberts for guidance, patience and constant encouragement, and my wife.and family for their tolerance. I have had many useful discussions with Dr D Ross and Mr R Hunt. I would also like to thank the Worshipful Con5>any of Golds* miths and Intergold Corporation for provision of materials, equipment and technical assistance.
6L0SSABJ
1*3 » ^2 etc
etc
L2 (FS) -► Li
T |— “► L| +
8
Points where the hand 3 (or 2, etc) pass the reciprocal lattice point L.
Similarly for the reciprocal lattice point X.
The point where band 2 intersects the Fermi surface near L.
A transition with the initial state at the Fermi surface near to L2 » and the final state near to Li. Because of the 'necks' at L, the Fermi surface does not intersect the reciprocal lattice vector L«
Is relativistic notation for L2 Li* That is, band 2 = band 4 etc*Beaglehole and Erlbach (1972) inq>ly Lg~ isconq>arable with L2 Li*
Saturation:a subjective term; the most satiirated colours are the monochromatic radiations* Mixing of these with 'white' or achromatic light desaturates the observed colour*When the term is used quantitatively in this thesis, it is equivalent to excitation purity (eg Bouma 1972)*
Dominant wavelength: the wavelength of the monochromatic radiation which, when mixed with white light, yields a light having the same colour co-ordinates as the object under discussion*
•Relative luminance: the quantity in the CIS 1931 System which correlates with subjective brightness of an object*
Colour co-ordinates in the CIE 1931 Standard System*
Colour co-ordinates in the CIE 1960 Uniform Colour System.
Ellipsomatric analyser and polariser readings for the ellipsometric configuration and çonventions used at the City of London Polytechnic, ie* A-45-ip, P*4+2* Other ellipsometric notation and convention follows ihiller (1969), the Nebraska Convention*

*7'.-.-*i?V
CONTENTS
Acknowledgements•
Abstract.
Glossary.
1. INTRODUCTION
2; LITERATURE SURVEY
2.1 Colorimetry.
2.2 Optical and Electronic Properties of the Noble Metals.
3. EXPERIMENTAL
3.1 Instrumentation.
3.2 Sample Preparation.
3.3 Measuren^nt Procedure.
4. THEORY
4.1 Colorimetry.
4.2 The Application of Ellipsometry to the Determination of Reflectance and the Dielectric Function.
4.3 Fundamental Equations.
4.4 Optical Properties of Two^Phase Alloys.
5. COMPUTATION
5.0 General - Program Design.
5.1 Calculation of the Dielectric Function.
5.2 The Optical Functions Rj|»Rg>Rp»^»A,A,P
5.3 Intrinsic Spectral Substrate Functions f b2 *^2*e ifc ifIm V ct ImVc+lfiJ
5.4 Non-Spectral Intrinsic Substrate Ftmctions 103 u»p, e^(0), T
5.5 Colorimetry. 103

6. RESULTS
6.1 The Primary Metals: Silver, Gold and Copper.
6.2 Ag-Au Binary Alloys.
6.3 Au-Cu Binary Alloys.
6.4 Ag**Cu Binary Alloys.
7. DISCUSSION
7.1 Experimental Method.
7.2 Performance of Computer Programs.
7.3 Effects of Sample Preparation.
7.4 Effects of Alloying on the Inter-band Absorption.
7.5 Effects of Alloying on the Intra~band Absorption.
7.6 Heterogeneous Alloys.
8 . CONCLUSIONS AND SUGGESTIONS FOR FURTHER WORK.

■ •% v>'’:''-.V-i' - • ^
ABSTRACT
The method of ellipsometry if applied to the study of the optical
properties of Ag-Au, Ag-Cu and Au-Cu alloys and the results are
interpreted in terms of alloy colour and electronic properties.
Variation of colour with alloy coB^>osition is placed on a <}uantxt~
ative basis for the first time and discussed in terms of the most
fundamental properties of the materials. Use of ellipsometry in
the investigation also makes possible the assessment of the effects
of tarnish and other contaminant films. The influence of sample
preparation on the optical properties is discussed» and the
iiq>ortance of using ’real* surfaces» in order to make possible the
industrial and comnercial application of the work» is emphasised.
A survey is given of previous studies both theoretical and exper"
inental that are related to the noble metals or the es^erxmantal
technique used. Sao^le requirements are discussed and the
preparation methods adopted are described. Relevant electronic»
optical and colorimetric theory is presented and unified in a
con^utational system that takes full advantage of the great power
of modem computers. EllipsomAtric results are given and compared
with the optical results of workers using other techniques. The
effect of cuprite tarnish on the properties and on the accuracy
of their determination is presented in detail.
It is found that by far the most significant determinant of noble
alloy colours is the width of the d-FS gap near to L. Tarnishing
of copper rich alloys has a visually observable and measurable
effect only when prolonged over many hours» but a rapidly formed
film is probably responsible for an ellipsometrically observed
increase in the saturation of these red metals that borders on
the perceptible.

» f mr--
1. INTRODUCTION
The aim of the investigation was to examine the optical
properties of a ternary alloy system of commercial
significance, either Ag—Au~Cu or Al~Cu**Zn, and to relate
the observations to both the electronic properties and
technological problems, such as corrosion, annealing,
surface de-^alloying and enrichment.
The Ag-Au-Cu system was preferred for several reasons.
There is interesting structure in or near to the visible
spectrum of all the alloys, hence the colours; the system
encompasses a range of different alloy types Cfor instance,
the Ag-Au binary alloys are fully miscible solid solutions,
silver and copper are almost totally immiscible and form
two^hase alloys, whilst Au-Cu alloys form several inter-
metallic compounds showing order-*disorder transformations.
The alloy system is used as the basis of *gold* jewellery
alloys, so that optical measurements have their own intrinsic
commercial application, as they can be used to provide a
physical interpretation of jewellery alloy colours. Finally,
many of the alloys develop only thin surface films in air,
siiq>lifying the experimental procedure and the analysis of
the results.
The commercial application of the project implied the use
of what might be considered *sub>standard* metal surfaces in
the context of an investigation aimed solely at imcovering
fundamental properties of the alloys. In fact, analysis of
the results (in terms of electronic properties, surface
8
disorder and superficial camlsh formation) was hindered
by the use of mechanically polished sanóles. These can
never be truly clean, as cleaning techniques inevitably
involve altering the state of the surface in several ways.
Annealing in a reducing atmosphere would remove oxide or
sulphide tarnish and probably also adsorbed organic
layers, but would reduce the level of structural disorder
introduced in polishing, and alter alloy morphology and«
long-range order* Cleaning by ionrboinbardment would
introduce additional structural imperfections. Accordingly,
all samples were measured after a standard metallurgical
polish and measured in air, in accordance with common
industrial practice*
Ellipsometry was chosen as the method of acquiring optical
data, as this technique offers many advantages* The direct
measurement of the optical constants Cconq>lex refractive
index) of a surface enables the reflectance to be calculated,
as required for colorimetry, as well as the computation of
dielectric function to aid interpretation in terms of
electronic structure* Direct measurement of reflectance
with the same accuracy as can be furnished by ellipsometry
is difficult, but not more so than the construction of a
modem ellipsometer* In the present case an excellent
instrument was already available that needed only relatively
minor modifications to convert it into a spectral-scanning
ellipaometer* Calculation of the dielectric function from
reflectance measurements can be done using the well-known

Kramers'-Kronig relations, but these require data over
an optical range greatly exceeding the range of
interest, ie. the visible. In practice measurements
in the vacuxm ultrarviolet would be needed. The Kramers-
Kronig relations are not applicable to filmed systems,
and at short wavelengths even thin adsorbed layers could
seriously affect the results. Thus ellipsometry offered
the most useful tool for the investigation, considering
all its aims.
Three main directions of effort emerged during theI
research program:
Ci) development of computational analysis of
optical measurements to give information
on colour and electronic properties;
Cii) preparation and measurement of three binary
alloy systems, Ag-Au, Ag~Cu and AurCu;
Ciii) investigation of the effect of thermal and
mechanical treatment of the alloys and of
tarnishing.
■ *■ •
10LITEMauBE SBItVET2.1 Colorimetry
Coloured finishes have been used for human artefacts since
prehistoric times. This is true of dyes used for textiles,
pigments in paints and ceramic glazes, and of metals used
in jewellery and household utensils. There was, until very
recently, no possibility of synthesising colours or otherwise
producing colours to order, so that choice was limited to
those which occur naturally. Only when the situation was
altered by the great advance of organic chemistry during the^
nineteenth century was there any need for a science of color
imetry. This developing science was closely co-ordinated by
the International Commission on Colorimetry (the CIE or Comm
ission Internationale D*Eclairage) so that here it is not
necessary to refer to a great body of literature. An excellent
introduction to the subject and a thorough account of the
contemporary state of knowledge is given by Bouma (1971).
Measurements were made by various workers Ci^eferences are given
in Bouma, 1971) to determine the physical and psychological
mechanisms of human colour vision. The most significant finding
was that of the tristimulus nature of colour perception; that is,
that a unique set of three numbers was both necessary and suff
icient to identify any one of all possible colour sensations.
The choice of the system to be used in the determination of
these numbers is to a large extent arbitrary, and several
systems were proposed. Perceived colours evidently depend on
the nature of the illumination and the properties of the observer
as much as they do on the substance being observed. Colour is
a function of the spectral intensity of a light entering

11
the eye, and of the spectral variation of sensitivity
of the eye. Thus it is necessary to knov^ the spectral
energy distribution of the illumination, the spectral
reflectance of the subject, and something about the
eye. The tristimulus nature of perception suggests
that any three independant spectral functions could be
chosen to describe the sensitivity of the eye. In
1931 the CIE adopted a system with what was considered
a near~optimal set of properties. It was amenable to
exact calculationf the quantities coiq>uted correlated
well with visual assessments; and the colour of
additive mixtures of incoherent beams of light could
be described by the appropriate weighted average of
the three parameters for each of the two beams. The
chief disadvantages of this system (the CIE 1931
Standard System) are that Ci) it was chosen to
correlate well with visual data obtained using a
rather small field of view, naoiely, that samples
should subtend an angle of 2° at the eye of the
observer, and (ii) that no attempt was made to ensure
that the system was uniform. This means that equal
perceived colour differences do not correspond to
equal differences in the calculated parameters, except
over very small regions of the colour space*.
It is possible to compute alternative sets of para
meters from those discussed above which avoid some of
the disadvantages or which have special advantages of
their own. This process is merely a transformation

' • ‘ ■ 'V
of Cartesian co*?ordinates, for which reason the
terms colour co-ordinates^ and colour space**
are often used. One possible transformation is
to confute the dominant wavelength, X^» and
saturation» S, Billmeyer and his co-wrkers
C1961) found excellent correlation between X^
and perceived hue for yellow-'red colours, our
present region of interest, even for saturation
significantly higher than those found here.
The possibility of co-ordinate transformations
is the basis for the simple type of colorimeter.
frequently employed in quality-control labor
atories. These use three filters of known charac
teristics and measure the intensity of light ref
lected from a sample and transmitted through each
filter. The three intensity readings can then be
transformed into the corresponding CIE co-orindates
of the sample. The technique is not very accurate,
depending as it does on the stability of the light
source and on the precision of the transformation,
often performed by analogue electronics. For this
reason measxirements of reflectance are often oiade
for many monchromatic colours and numerical inte
gration used to obtain the required co-ordinates
(equations for this integration are given in
Section 6). This method has been employed by
Gardam (1966) actually in a study of metals and
alloys. He used a simple spectrophotometer which
required calibration against an external *Vhite*‘
12

standard. For this he chose electroplated silver,
which aptly illustrates the unsuitability of the
method for measuring very unsaturated colours.
Among the metals studied were sterling silver and
fine gold. Gardam was able to determine the
reflectivity at only a small number of wavelengths
in the visible (« 10), so that accurate results
could not be expected. The interval between
wavelengths of about 40nm is very much larger
than that conventionally employed in colour measure
ment. Typically, a constant wavelength interval of
5 or lOnm is used. The labour of experiment and
calculation is obviously greatly reduced by increas
ing this interval, but at the expense of accuracy.
A constant interval is preferred so that the weighted
ordinate method of integration can be used. Now that
the conq>utations are invariably performed automatic
ally, there is not particular reason to prefer this
method, although Ohta and Wysecki (1975) state that
it remains in use 'almost exclusively'. These
authors show, not unreasonably, that a large wave
length interval can cause very large errors if
the sample reflectance varies rapidly with wavelength.
The problem of adequately describing small colour
differences has also received recent attention.
The most obvious question relates to the
perceptibility of a calculated colour difference.
13

14The usual eaq^erimental arrangement is to match the colour o£
interest with a mixture of three coloured lights. Small
quantifiable variations in this mixture then enable a 'just
noticeable colour difference* (J.N.C.D) to be defined. This
has clear disadvantages vhen comparing a surface colour with
the coloured lights as the surface texture may have an effect
quite unrelated to colour. Rich and Billmeyer (1975) have
given a computational method for obtaining JNCD's by conparison
of a set of coloured samples in the visual test.
eA second problem relates to the non—uniformity of the 1931
colour space. This makes it difficult to relate the magnitude
of small con^ositional changes to the magnitude of the resulting
colour change. For example, a change of 5Z in the composition
of Ag-Au alloy may be expected to alter the colour mich more
in a gold-rich alloy than in a silver-rich one. Again, various
'uniform colour systeii»* (U.C.S) have been proposed. The CIE
adopted one in 1960 which has gained a wide acceptance. More* * *
recently a new system has also been put forward, the L a b UCS.
This, however, has not been finally settled, for example Pauli
(1976) has recently proposed a modification.
2.2 Optical and Electronic Properties of the Noble Metals
The study of light reflected at the interfaces between media was
initiated by Drude (1890). At this time it was not clear what
form these interfaces might take, and Drude is responsible for
the acceptance of Fresnel's theory describing the reflection at
a simple, plane interface between homogeneous isotropic media.
He showed the apparent failure of the theory was due to the
presence of very thin surface films, whose effects were felt even
when the thickness was only a few Angstroms. The equations he

,.£r
? Vrf.W-
15
derived for reflection when e homogeneous, isotropic film
is present have proved of great utility in many physical
systems, as has the e3q>erimental technique of ellipsometry
which is also his invention.
The singlest experiment which is adequate to define the
colour is, as has been said, to measure the spectral
reflectance. However, interpretation of the results is
made much simpler if both of the real and imaginary parts
of tb^ refractive index, n*ik, (or the dielectric function) •
are available. Early workers on metal optics did not have
available the Kramers-Kronig relations, %diich relate the real
and imaginary parts of the refractive index, and furthermore
they did not have instnanentation which covered a large enough
wavelength range to make them useful. Thus it was necessary tom
mairo two independent measurements at each wavelength in order
to determine n and k. These could be the ellipsometric
parameters of Drude, or the values of reflectivity | R l 1 R l ,
or the reflectivity at two angles of incidence, or the values
of reflectance and transmittance of a thin film. Nathanson
(1938), Heavens (1955) and Givens (1958) describe all of these
techniques. Heavens» book concerning those useful for thin films.
For the purposes of this investigation it is the values
characteristic of the bulk metals that are of interest, but this
does not preclude the use of films that have a suitable structure,
as the penetration of light into a metal is only of the order
of lOoi. Hethods which involve the reflection of polarised light
from opaque san|>les can be regarded as optically equivalent,
although they may vary considerably in complexity, suitability

16
for automatloa, useful wavelength range etc. Thra point has
been discussed in detail by Headows (1975). Early workers
who used polarimetric methods to study the optical properties
of copper include Drude (1890), Minor (1903), Tool (1910),
Porsterling and Freederickss (1913), Margenau (1929) and
Lowery (1936).
The variations between the results obtained were discussed
by Nathttson (1938). There was general agreement that the
degree of polishing had a profound effect on the measured
values of n’, k and R. Tool observed that an »incomplete*
polish led to rather low values of k; this may have been
a purely geometric effect associated with using a rough
specimen. Tool, Margenau and Lowery agreed that heavier
polishing caused an increase in n, while Drude had early
found that n decreased when surface strain was reduced by
glowing. Polishing and strain relief were held to have less
effect on k and these workers disputed the magnitude and
even the direction of such an effect. It can be seen from the
Drude equations for free electron absorption (Section 4) that
-k2— u,2/«2 go that there is no direct dependence of k
on the relaxation time (x), for wavelength regions where
«T»l and n^«k2. On the other hand, tz «nd n are (roughly)
inversely proportional to the relaxation time in the same
wavelength region, so that these early results are consistant
with polishing produ^ng surface disorder and thus reducing t.
Calculations based on the optical measurements showed x to be
much less than that expected on the basis of the direct
current (low frequency) conductivity, while the »effective
nusber of free electrons» also differed from the atomic
17valence that it was expected to equal. In an attempt to
produce surfaces more characteristic of the bulk material
Lowery turned to electropolishing, which removed the damage
caused by mechanical polishing. Beilby (1921) had proposed
that this consisted of an amorphous layer some 500^ thick
which could be reasonably expected to be qxiite unrepresent
ative of the bulk metal. French (1932) had objected that
a truly amorphous layer was unlikely (it requires only a very
small mean displacement from a random array of atoms in order
to produce an f.c.c. lattice, as has been pointed out by
Hunderi (1976). A microcrystalline surface, with grains 'vSoX
in diameter, was equally unpresentative however, and
electropolishing to remove this layer became an accepted
technique. It has frequently been pointed out that electro
polishing produces a relatively thick solid layer on the metal
surface, and that this may present greater problems than surface
disorder. Novak et al (1970) report a *6oX solid layer produced
on copper during polishing; this was reduced to less than
10-20i by careful washing and drying. The remaining film is
comparable in thickness to that formed in air at room-temperature
(Young and Gwathmey, 1951; Young and Cathcart, 1956). After
electropolishing, Lowery annealed his samples in an atmosphere
of hydrogen to reduce the amount of strain, which should also
have removed any remaining film. Thus these experiments were
for a long time the best that had been performed.
At this stage, theory appears to have lagged some way behind
experiment. Nevertheless, the next major effort was again
axperimental. Beattia and Conn (1955) and Hodgson (1955) took
advantage of new technology to extend measurements into the

18
infra-red. Again the chief aim was to test the validity
of the classical l>rude theory of free-electron absorption,
but now in a wavelength region inaccessible using the eye as
detector. Schultz (1957) also carried out experiments on
silver, gold and copper, using metal films evaporated onto
the faces of glass prisms. By using opaque (thick) films
and making the measurements at the glass/metal interface, as
well as by careful annealing of the films, he was able to
obtain reproducible results comparable to those on bulk
samples. The mechanism of conduction electron absorption
was now better understood, and theory was found to give a
good account of the results when an ’optical effective mass
(m*) and an ’optical relaxation time’ were used to replace
electron rest mass and d.c relaxation time of the Drude
theory. Following Schultz’ work Givens (1958) reviewed the
state of knowledge with particular regard to the optical
properties of the noble metals; it was now possible to
expand on the reasons for the sudden departure of these
materials from Drude-like behaviour as the wavelength was
decreased. Mott and Jones (1936) had ascribed this property,
the well-known ’absorption edge’, where k and €2 increase very
rapidly, to optically induced electronic transitions from the
d-bands of the metal to empty states near the Fermi surface.
The possibility of transitions, originating at the Fermi
surface, to empty conduction bands, was also considered. These
ideas now made their reappearance. Zhuraleva and Norskov
(1957) detailed the various scattering processes, and their
tenverature dependence, that contributed to the optical
relaxation time. This suggested the possibility of determining
the various contributions (namely electron-phonon, electron-

/o
y ..5>. ■ . i s*_ V'"'
Ü-jí«í 'rt-v*
■-s*
19
electron end electron-impurity collieione), by meaeuring
the variation of the optical constants vith temperature.
S Roberts (1960) used electropolished bulk samples of copper
in experiments at 90K, 300K and 500K. He accepted the
existence of the * amorphous* Beilby layer* stating that this
meat lead to a larger electrical resistivity, n and £2
are nossessed bv an undeformed Conner surface. The samóles
were annealed in vacuum, with a residual reducina atmosphere,
which, Roberts postulated, removed some IOÍ of adsorbed water
and 20X of cuprous oxide. It had previously been shown
(Winterbottom 1955) that annealing in hydrogen at 460K was
adequate to reduce the natural oxide formed on copper.
An expression for computing the dielectric function of
crystalline materials from an exact knowledge of their
electronic structure was given by Cohen and Ehrenreich (1959).
This provided a framework in which Ehrenreich and Phillip
(1962) were able to interpret the results of optical
experiments on silver and copper, using the electronic energy
band structure for copper that had been derived by Ham and
Segall (1961). Ehrenreich and Phillip used electropolished
bulk samples, as had Roberts, but made some of the optical
measurements in air. The near-normal incidence reflectance
was measured for photon energies from one to twenty electron-
TOlt». that i. from 12.4y in th. in£r«.d to .bout 50oi ¿
tí>. Til-"-" ultt.vlol.t. Although. n.c..»«rily, th. high «letgy
SMaiuroiait« w.r. i«d. in » good vacuun, .t thi. .tag. »>
air£onii.d film would mlraady hava b w n pr.a«it. N.vatth.la»a,
good agraramt for valuaa of m* and t waa found with th.
naulti of Schultz and of Bobarta. Ktamera-Ktonig analyaia
; ¡;. '.¿j; 'j ■ '• 'r;’C""/ ' -Mr*.
20
■* 1 i
was used to calculate the phase shift on reflection,
0(b)), from the experimental R((t>), enabling 6(u») to be
readily computed. Extrapolations of R(ti>) were made to
match the values of fi, thus obtained, to those of Schultz
and Roberts. By using the theoretical eiq>ression for fi(w),
and by examining the experimental results, Ehrenreich and
Phillipp showed that absorption E2 (w ) below the absorption
edge was entirely due to conduction electron transitions for
which the initial and final states of the excited electron
lie within the same band. Thus the low energy absorption
was labelled ’intraband*. In the nearly-free-electron limit,
intraband absorption is described by a Drude—lilce expression,
in which the constant m can be related to the shape of the
conduction band and Fend, surface. In the particular case
of the noble metals, intraband absorption is quite small near
the absorption edge and at higher energies. Thus at high
energies the absorption is almost entirely due to optically
induced transitions for which the initial and final electronic
states lie in different bands, or »interband’ transitions.
Due to the possibility of confusion between these similar
tern»,’free electron’ and ’bound electron’ absorption are
often preferred (hence t • It should be evident
from the early suggestion of Mottand Jones, previously mentioned,
that interband transitions may involve conduction electrons
as their initial states, that the ’free’electrons are involved
in both processes. Ehrenreich and Phillipp identified the
particular transitiona responsible for the near-visible absorption
in silver and copper as due to transitions from L3 -► PS(a 3.9eV
gap in silver), and also L3 FS(2.1eV) and X5 “ V (^-5 eV) in

21
copper. These were postulated to be momentum conserving
(’direct*) transitions, involving only the electron and
photon. Indirect transitions have also been postulated
in which a phonon interaction ensures conservation of
momentum. In the latter case, transitions would not
necessarily take place at a single point in the reduced
Brillotiin zone, such as X; and the final state in the
L3">FS transitions would not have to be near L. The calculation
of m* and x in Ehrenreich and Phillips paper did not proceed
in the same way as previously used by fitting the experimental
g to a Drude“like expression at low energies. If this is
done, it is essential to allow a contribution to ej from
interband transitions as and are not separated into
non-overlapping wavelength ranges as can be assumed for
62^ and 62^* wavelengths can be considered
constant, which simplifies the analysis. It has frequently
been referred to as the term due to 'polarisation of the bound
electrons'. Ehrenreich and Phillip performed a Kramers—Kronig
transformation on £2^(«) to give ei^(w) explicitly, includingf
its frequency dependence near the edge. Thus could be
separated from the experimental data as well as 62 . That the
calculated values of m* and x were similar to those of Schultz
and Boberts is not very significant, as ejCw) and C2(«) had been
deliberately matched to the earlier workers* results.
Vessel (1963) performed reflectance measurements on a series
of Ag-Au alloys, in response to the increasing understanding of
the pure noble metals. The alloys were electropolished to
remove surface damage, as before. Weasel observed that a
22
proloaged electropolish increased the reflectance from about
67% to SOX at 3.4eV, in the case of silver. The sharpness
of the reflectance edge was also greatly increased. F Stem
(1963) gave another general review of the optical properties
of metals, to follow that of Givens. The important role of
Kramers-Kronig treatment of reflectance data was highlighted
by a comprehensive description of this technique. The question
of sample preparation also received further attention.
Donovan et al (1963) compared mechanically polished, electro-
polished end polyciystelline films of getmsniun. Only the
electropolished surface shoued any fine structure in the
optical spectrum, variations of five percent in reflectivity
being fomd using the other methods. Frosiiold (1963)
investigated vacuum cleaning techniques in connection with
rmnoving the polishing layer from electropolished sanples and
the strained W e r from mechanically prepared surfaces. It
was found that vacuum annealing at eoC^C produced stirface
roughening, while argon-ion hoabardment caused simrlar
structural disorder to mechaxical polishing. Some of Fromhold’s
mechanically polished silver samples g«re an «lomalous peak in
the real part of the refractive index, at a wavelength of
SdOnm. A theory of optical reflections from rou^ surfaces
was advanced by Porteu. (1963). This was an import«»t mov«»ent
towards a complete theory of realistic surfaces, complementary
to the approach of making ideal surfaces to test the more
fund«»ent.l theory. This continued to attract a lot of attenUon;
Burge and Bennett (1964) m d » various calculations of the effect
oride film, (on silicon and aluminium) in optical measurements,
and of the inaccuracy of the computed refractive index if the
presence of oxide isyers was ignored. In the case of silicon

23
«t 546lX wavelength, a looi film of SiO^ ia enough to
increase the apparent value of k from 0*028 to 0*872* The
0i^ors in the case of an alimnnium substrate are not so large,
but would be significant because of the large thickness of
the oxide layer, either air-formed or produced during electro
polishing* These difficulties led to the re-investigation
of opaque evaporated films as possible substrates* Spencer-8and Givens (1964) used a vacuum of better than 10 Torr to
prepare films of copper* As had been noted by Heav«as (1955),
at a pressure of lo"^ Torr the vapour pressure of the residual
gas is conparable to that of the metal during evaporation*
Sanples prepared at different partial pressures of oiqrgea
(lO“^ to lo“® Torr) had different properties and also aged
differently* Using the best vacuum, copper films annealed
spontaneously at room-temperature* The fact that, under the
highest pressures used, no ageing took place was attributed
to dissolved oxygen inhibiting the annealing process* Kouard
(1965) prepared thin films of silver, gold and copper in
vacuum and observed an anomalous abruption peak for each of
these, which moved to longer wavelengths as the film thickness
was increased* This is just the behaviour expected of a non-
continuous metal film in the context of the Haxwell-Gamet
theory, assuming the fraction of metal in the film increases
with increasing thickness (see, for example. Heavens 1955)*
Electroplated bulk samples were used on several new investig
ations* Cooper et al (1965) extended the work of Ehrenreich
and Phillipp (1962) to include also gold* Similar techniquesy
were used* The fundamental absorption edge in each of the

24
noble metals was attributed to d-^FS transitions, as before,
originating on states near L 32 with final states where
the L2 band cuts the Femi surface. The sharpness of the
absorption edge was attributed to the flatness of the drband
at this point. Gold and copper have additional absorption
peaks near the visible, which were identified with transitions
X5 Zt,# as before. This transition in the band diagram used
corresponded to a critical point of the type S2 Cdescribed
by van Hove in connection with semi-conductor absorption).
A calculation of the imaginary part of the dielectric function
for copper was presented, which included only d-band excitations.
The cong>uted absorption strength was only one-third of the
experimental value. Beaglehole (1965) measured the optical
properties of copper and gold over the wavelength range 460nm
to 46nm (2 .7 to 27eV), using electropolished sanples that
had been annealed in a reducing atmosphere of 10 Torr at 400 C.
The reflectance was computed at several angles of incidence,
so that the dielectric function could be calculated without
the use of Kramers-Kronig analysis. This analysis was used rn
an original way to improve the interpretation of his results.
By extrapolating his results to the onset of intefband absorption
(only 0.7eV below where his measurements began), Beaglehole
was able to check the consistency of his results and obtain
values for m* and x (Beaglehole, 1966). The assignments of
structure in the optical spectrum by Cooper et al were strongly
disputed by Beaglehole, who felt that the data were anbiguous,
and that in particular silver and gold were so poorly
understood as to make manfciguous identification of transitions
in^ossible. He was willing to accept only that transitions
near L and X are responsible for structure below lOeV, and

25
emphasised the possibility of interband transitions involving
conduction electrons near L (Lg -► L7).
McAlister et al (1965) presented the results of more work on
Ag-*Au alloys. Using measurements of the Faraday effect, they
were able to show that the shape of the Fermi surface varied
smoothly with concentration, implying close similarity between
the electronic structures of silver and gold. Stem (1965)
took up this point, and interpreted Weasel’s (1963) results
as showing a similar effect. He plotted thej>osition of the
absorption as a function of composition, the small departure
from linearity being attributed to a transfer of d-electrons
from gold to silver ions in the alloy. In a theoretical
paper (Stem 1966b) the same author found that the known
properties of Ag-Au alloys could be correctly described using
a model in which the periodic lattice potential was some
average of the pure metal potentials (Virtual Crystal Model),
adjusted by transferring d-state charge density from gold to
silver. Fukutani and Sueoka (1966) presented new experimental
data for Ag-Au alloys, in the energy range 2.5 to 4.1eV.
Experiments were carried out using opaque films of 800-2000i
thickness, evaporated in a vacuum of about 10 ^ Torr and
annealed at 400®C for 1.5 hours. The results agreed with
those of Wessel, giving a similar curve of edge position
versus conçosition. Ehrenreich (1966) used a pseudopotential
method to calculate new energy band structures for silver, gold
and copper. He was unable to confirm the hypothesis that only

t \ r
'l'vlOí
26
direct transitions are excited in optical experixoenta, but
assigned the main absorption peaks in copper to L32
(ie. d -► FS, 2.lev) and X 5 - Xi/CA,8eV),
Workers considering the effect of oxide films on experimental
results have generally used the refractive index of the
stoichiometric bulk oxide for their hypothetical film* Thus
Roberts (1960), assuming the contamination to be cuprous
oxide, used values of n and k appropriate to cuprite. Wieder
and Czemanda (1966) produced non-^atoichiometric films of
copper oxide on dielectric substrates and found the optical
constants to be significantly different from those of cuprite.
This indicates the hazard of making unsupported assim^tions
about the properties of contaminating films.
Further work on alloys was reported by K25ster and Stahl (1967)
who studied electropoliahed sanples of silver and gold, as
well as sputtered sauries of Ag-Au and Au-f’Cu alloys. The
purpose of the investigation was to examine the effect of heat
treatment. It was found that annealing of the sputtered
samples reduced corresponding to reduced structural
disorder and increased relaxation time, while increased
on annealing. The width of the absorption edge in the Ag-Au
alloys was found to depend strongly on composition, reaching
a maximum of »leV for the AggoAugo *Hoy. Ordered AuCuj was
found to have an absorption peak which was absent in the
disordered alloy, while ordering produced two sharp peaks at
340nm and 350nm in AuCu.
Gerhardt et al (1967) measured the piezo reflectance of copper
for various strain axes, which enabled them to reduce the
aiiú)iguity, noted by Beaglehole, in interpreting the absorption

•'S'-L ► '4 -iV '-s , •. -i" ' .• ■■ ‘k ■ '■ ' f
27
spectmm in terms of the energy bands. Kramers-Kronig
analysis was used to derive the piezo“C2 spectrum. The onset
of interband absorption near 2eV was again attributed to
d -► FS transitions while the structure near 4eV was resolved
into two components, X5 - Xi,* at 3.9eV and FS(L2') *♦* hj at
A.3eV. The latter transition is very sensitive to the crystal
potential and moved rapidly under the appropriate strain.
Gerhardt (1968) reported similar results, this time giving
the energies as A.OeV (X5 “ Xi,*) and 4.15eV (FS -► L,). In
order to analyse piezo reflectance data, single crystal
specimens are used so that the strain axis can be aligned with
a particular crystal vector such as L, ie. the [llfl direction.
Using polycrystalline samples Gerhardt found a change in
reflectance on straining below the interband threshold, which
was absent from the single crystal spectra*. This immediately
.ugg.sts . gr.iii bound.ry
ttieUer and Phillip. (1967) calculated the intethand apectrum,
62(10), for copper uaing the Bandoo Phaae Approrination of Cohen
and Ehrenreich (1959). The calculation gave an improved fit
to experimental data (-v 50Z) congiared with that of Cooper et al
(1965). When broadening effect, were not included in the
calculation, atructure due to critical point, (auch a. Xs f V )
appeared aa an infinite diacontinuity. Broadening reduce, thia
to «1 abrupt atep, auggeating the uae of the point of mwimurn
«lope aa the 'edg. poaition*. The coag.ut.tion wa. compwred
with experimental date by Phillip. (1968). The exp.rim«it.l
p«dc in 6 2(0.) between 4 and 5eV wa. attributed to I.2- - »-I
««laitiona. aa found by Gerlutdt. Thi. corroapondod to

. -H, *''■;<Ni'!"' - ■T • * 'r, '7%*rinliK'■>r. >..*>'
traasitions from 4 ~ like states to 4 ~ like states inP ®
the calculation.
28
There was still no agreement concerning the need for
optically induced transitions to cmserve momentum» despite
the success of the BPA calculation (which assumes direct
transitions). Stem (1967) considered the effect of the
metal surface on the problem and concluded that» for the
noble metals» the presence of the surface permitted indirect
transitions- to take place.
Theorists had been unable» up to this moment» to treat the
electronic properties of alloys as rigorously as those of pure
metals» due to the lack of periodicity in a substitutionally
disordered lattice. Soven (1967) proposed a method based on
finding a periodic» self-consistent pseudo-potential foir the
alloy which would lead to the observed properties. This has
become known as the Coherent Potential Approximation (CPA).
Velicky et al (1968) examined the theoretical properties of
the CPA and demonstrated that in certain limited applications
it reduced to previously known forms» derived from perturbation
theory. There was thus some encouragement that the method would
be useful for more general cases that had formerly been
intractable. An important result of the theory was the prediction
that for small values of the ratio (band separation ♦ band width)
for the electronic bands of the constituent metals» a single
band would result in the alloy. Large values would lead to
split bands.
Lwl. «id U . (1968) pr..«it.d . non-fir»t-priiicipl.. clcuUtioa
of th. «»tgp b«id .tructur. of »ilvor, for which th. d-b«id

t *1*. '* ^> , •; - ; * . " wj. .' ,'»
V . i». - ' V , -j . , ’- i: , Z.*>
29energies were adjusted to fit the optical data. Even with
this adjustment» the method did not accurately reproduce the
4eV peak in £2^» authors pointed out the tentative nature
of the assumptions made in the computation of 62 (w) from the
electronic density of states. These were, that the one-electron
band structure is literally true; that structure in the
experimental was, in fact, entirely due to direct int—
erband transitions; and that the probability of an electronic
transition depends only on the density of initial states, the
density of final states and the energy gap separating them.
The calculations of the band gaps was consistent with the 4eV
edge as being due to transitions FS(L2») -► Lj as well as
d -*• FSCLj -► L2# ). Hodgson (1968) made a fresh determination
of the optical properties of gold, tising the method of Schultz
(1957). Opaque gold films were evaporated in a vacuum of better
than 10*" Torr onto one face of a glass prism, following which
the sanples were annealed for several hours at 200°C. Ir^I and
|R | were measured from the glass side of the film. The form
of C2 below the absorption edge - C2^ “ was not Drude-like
(proportional to the cube of the wavelength) but could be
described by an expressionf 2C2*(X) - oX + 8
“ T —
Th. coMtBit. (o.S) W.t. £o«d to vary, but ind.p«»dently, with
tuvl. .tructur.. H. .ugg«ft.d that a variation in th. magnitude
of the peak in waa due to the axiatmc. of void, in
the filiH> the quantity of which war. alao a fimction of
preparation. An abaorption peak (iei • 0.25) waa alao found
n u r 1.5.V at room t«g«r.tur.; at 445K th. atr«igth increaa.d
. ..v:-
■. ,' 'i ' •' r ■• v " ■• ■' r-- '.'■ '.‘tK .',
.Sr',.. ., -''A'.', (■' f 'fi ■'.. A V V
30
to 662 “ 0.75. ifyera et al C1968) measured the optical
properties of silver, gold and copper as part of a study of
noble~transition metal alloys. They found good agreement
between their own values for m and t and those of many earlier
workers, although for both silver and gold it was not clear
whether the correct value was slightly less than or rather
more than one.
Noble metal alloys attracted increasing attention. Nilsson
et al (1968) studied gold, copper and the Au-Cu alloys. It
was found that, as in Ag-Au alloys, the first interband edge
moved smoothly with composition. Ordered samples of inter-
metallic compound proportions had absorption edges approximately
O.OSeV higher in energy than the disordered samples. The
edge in gold near 3.8eV was not found to move on addition
of copper, and addition of gold to copper did not move the
structures at 3.9 and 4.8eV. Nilsson and Norris (1969) stated
that the opcial properties of disordered AuCu^ were a super
position of the spectra of gold and copper, while the ordered
alloy has an additional peak at 3.4eV. Photoendssion data
indicated an increase in the electronic density of states “3.8eV
above the Femd level. Thus they identified the new peak in
c (m ) with transitions from the Pernd surface to the conduction
bLd. Stahl et al (1969) studied the temperature dependence
of the optical properties of gold, copper and AUCU3. The main
absorption edge energy was found to be almost independent of
tein>erature in all three materials, while the second absorption
peak in each metal were found to move to lower energies as the
tenverature was increased. At high temperatures a new peak

* . S'** J
fa* -•> ’ • \giiSi.'., .■■ ,■'"■?;51*; '.■<
30
to 602 “ 0.75. Mjrera et al C1968) measured the optical
properties of silver» gold and copper as part of a study of
noble-transition metal alloys. They found good agreement
between their own values for m and x and those of many earlier
workers» although for both silver and gold it was not clear
whether the correct value was slightly less than or rather
more than one.
Noble metal alloys attracted increasing attention. Nilsson
et al (1968) studied gold» copper and the Au-Cu alloys. It
was found that» as in Ag-Au alloys» the first interband edge
moved smoothly with composition. Ordered samples of inter-
metallic compound proportions had absorption edges approximately
O.OSeV higher in energy than the disordered samples. The
edge in gold near 3.8eV was not found to move on addition
of copper» and addition of gold to copper did not move the
structures at 3.9 and 4.8eV. Nilsson and Norris (1969) stated
that the opcial properties of disordered AuCu^ were a super
position of the spectra of gold and copper» while the ordered
slloy has an additional peak at 3.4eV. Photoendssion data
indicated an increase in the electronic density of states “3.8eV
sbove the Fermi level. Thus they identified the new peak in
e U) with transitions from the Fermi surface to the conduction
bLd. Stahl et al (1969) studied the temperature dependence
of the optical properties of gold» copper and AUCU3. The main
absorption edge energy was found to be almost independent of
teiiperature in all three materials» while the second absorption
peak in each metal were found to move to lower energies as the
tein»erature was increased. At high temperatures a new peak

31
near 3.6eV was found for AuCus» due to ordering. A small
increase in absorption at about 0.7eV also took place. Pant
and Joshi (1970) calculated the energy band structure of
disordered AuCu3y and considered that the X5 Xi^«band gap
contributed optical absorption near 2.AeV. Rivory (1969)
prepared thin, continuous films of Ag-Au alloys and measured
the optical properties by reflection and transmission. She
observed a similar variation of the interband threshold as
had Wessel (1963) and Fukutani and Sueoka (1966). The
relaxation time and optical effective m u s varied parabolic-
ally with con^osition, x and m showing a minimum for
AgsoAugo. Beaglehole and Hendrickson (1969) prepared opaque
films of gold and Au-Fe alloys, annealing the samples at 600 C
for 20 minutes in vacuum. This prevented further roonr-
temperature aging of the specimens while avoiding surface
roughening due to recrystallization. The absorption, 62 . was
found to T « y w~xi»int.ly a. which U d th. author, to
pottulat. a frequ«icy dependent relaxation tine entering a
typical Drude-like expreaaion. Some abaorption below 2.3eV
»as obaerved, which could not be interpreted aa intraband or
direct interband absorption.
Horria and L^ch (1969) atudi.d silver and Ag-In alloys, using
pieso-reflectance. The interb«id absorption edge of ailwer
was found to h«re two almoat exactly superimposed peaks, one
of which moved under strain and one of which did not. Hoting
that theoretical calculations showed a strong sensitivity of
th. Li «lergy level (am »-Uk. state) to th. crystal
pot«tial. and that th. « S t2(P-Uk.) l.v.1.

32iiiBensitive, the peak waa asalgned to L3 -► L2^(PS) and
L2* (FS) -► Li. They also found atructure in the piezo-
apectrum below the interband threahold (c£. Gerhardt,
1968, on copper) which waa attributed to indirect trana-
itiona. Nilaaon and Sandell (1970) made the aame
aaaumption regarding low energy atructure which they found
for Ag9oAuio^«*i carrying out aimilar experiments on silver
ridi Ag-Au alloys, and indicated essentially the same
assignments concerning the interband transitions.
P.1U «Id Shig. (1969) i«e«ured the teiig).r.tut. dependaice
of th. optical ptoperti.» of gold and copper uaing electro-
poliahed sasplea annealed in vacuum. The fundamental edge
in both metals waa attributed to L3 L2 ( R ) , with
additional structure in the visible spectrum due to trans
itions at X, Xj - V (^5«’and L, Lg* -► hi (A.OSeV for gold and 4.78eV for copper). In
a theoretical calculation of the dielectric function for
copper, Dresselhaus (1969) assumed the optical edge near 2.2aV
to be due to transitions from the top of d-b«ids to the Fermi
surface, ie. L3 - 1-2'.accordingly. The gap from the bottom d-b«id at L(Li) to the
Fermi surface was th«i 4.2aV. accounting for th. peak near 4aV.
This procedure yielded a gcod fit to the eaperim«ital spectrum.
Krokilowski mid Spicer (1970) coaputed the dielectric function
of gold over a wide energy r«ige using photoamission data for
the electronic d«.sity of states. The results ware consistent
with the d ♦ F8 interpretation of the interband threshold, but
the authors argued that indirect electronic ««..ition. play
a large part in the optical absorption spectrum of gold.

^ \ ' -fc'-ri * ;■ .( ‘N* ■■■ ■ , *■ V* ' •■* ¿m
/ f.
r''-‘i^P
33
Llljenvall and Mathewson C1970) also foimd evidence of
the coin)08ite nature of the silver absorption edge» using
ellipsometric measurements at various high temperatures.
The l$2f hj component was found to move to lower energies
with increasing temperature, which effect was attributed
entirely to the change in lattice constant, in accordance
with theoretical eaq>ectations. Irani et al (1971)
interpreted the results of their experiments on silver rich
Xg-Al alloys in terms of a shift of the energy level
caused by the nodification of the crystal potential by
eluniniui» ispurities. Splitting of the absorption edge «as
exactly as in Liljenvall and Mathsuson's themo-nodulation
experiments.
The optical properties of gold were studied by Iheye (1970)
who used a cosfiination of reflection and trsnsnission
neasurenents on thin films, the thickness being independently
detenoined. Continuous films were obtained by rigoroua
attention to clesnliness, these having a toughness similsr
to that of the substrates used. Absorption at long wavelengths
was not Drude-like, and a small inter-band absorption 'tail'
was found below the band edge (2.4eV) extending to -v l.SeV. .
Badly crystallised samples also had an absorption band leV
broad centred at the latter energy, which was absent in well
am&uxlsd ssmpluSe
Dujardin sad Theye (1971) investigated the effect of struct
ural disorder, through varying the conditions of preparation,
on the optical properties of semi-trsnsperent silver films.
They fo«d no dependence of the position of the absorption

34
edge on grain, size, suggesting that disorder does not lead
to splitting of this edge. The optical mass was found to be
quite insensitive to structure, increasing sli^tly for
'poor*films, which could be interpreted as a decreasing
electron concentration due to the formation of pin-holes
tmA other imperfections, which is borne out by the decrease
In E2^Cw ) found in the same circumstances. The relaxatxon
time increased drastically with structural disorder. Some
sanóles, smooth enough for no surface plasmon absorption to
be excited, showed an absorption band at about l.SeV, C2
increasing by as much as 0.3.
m d t^er. (1973) «id Huad.ri (1973) pr.p«:ed pMtUlly
di.ord.r.d op«iu. film» of silver, observing e dotibls sbsorp-
tion p.sk St 2.4.V end 3.2.V. Th. peeks were very brosd (■v leV)
end, in some esses, rether strong, incresses in tj of »2.5 st
2.4eV snd «0.7 st 3.2eV being observed. These were cleerly
observsble over the Drude beckground. A qusntitstive theory
wee proposed, besed on s hypotheticsl nicrocrystslline structure
for the ssnples. It wes supposed thst the films were composed
of greins less then or shout one micron in diemeter, sepereted
by grein boundary regions only a few Í units across. The
thickness* of the grsin boundaries was supposed independent of
the grsin sise. The properties (opticel msss snd relexation
time) of the greins wss considered to be equal to those of bulk
silver, while the properties of the boundaries were modelled
by extremely oblate ellipsoids, the unique sxis normal to the
pl«,e of the boundary, m* snd t of the boundary were used as
adjustsble psr«neters, as were the exes of the ellipsoids
(equivalent to adjusting either the volume fraction of the

35botmdaries or the grain aise), the width of a distribution
of m* values, and the depolarisation factor for the ellipsoids.
With these five adjustable quantities a good fit to the exper
imental data was obtained by Hunderi and Ifyers (1973), which
was more convincing by Hunderi (1973) who showed that
any reasonable values for four of these could be used (as the
results were not sensitive to the actual choices)• The
remaining parameter was the volume fraction of grain boundaries
CV^) which scaled the magnitude of the absorption peak. Pitted
values of were reasonable but unfortunately were not
directly measured. It is possible that different values of
m* and t for the disordered boundaries would suffice to move
the absorption to 1.5eV, where it was found by Dujardin and
Th.y.. but thi. b M also not b w n invMtigatad. Oy and Wu (1971)
axtuidad the CPA to treat structural disorder but did not
discuss the inplications for th. optical properties.
Cristensen and Séraphin (1971) presented a relativistic band
structure calculation for gold. Relativistic corrections were
found to be Urge, leading to band splittings of the order of
one electron-volt. They calculated from the energy
bend diagram, finding good agreement with the erperimental
work of Pells and Shiga (1969) and Theye (1970). The
calculation accurately reproduced the absorption 'tail'
without «>y n«r assumptions (such as electron-electron inter
actions or indirect trensitions) being msde. This edge is
attributed to trmuitions from the top of the d-b«id. to the
Persd surface, around the neck at !.. -id over an extended
region of the Brillouin rone. 1« non-relativistic notation,
that is ««isitions L, - 1-2 ^ “

36
Qf »ii* sbovft Authors» this hsconss ttsnsttions from hs&d 5
to bsnd 6. Additional absotption around 2.9eV is due to
transitions from tha d-bands near X to the Fermi surfacej in
non-relativistic notation X5 * FS. At 3.2eV absotption is due
to transitions from band 4 to band 6, and at 3 .6eV to trans
itions at L. These are described as Li,- Li,* and are
anelogous to the previously discussed Lj* Lj. Further
absorption at A.leV is due to transitions near X (cf.Xs X^.)
and at 4.6eV transitions from band 3 to the Fermi surface
become possible. The role of critical points was felt to be
small, most of the absorption being due to transitions from
flat d-bands to the Fermi surface. The success of the Random
Phase Approximation in describing the results of optical
experiments was partly explained by Beeferman and Ehrenreich
(1970) who made a theoretical stu^ of tha effects of electron-
electron interactions, which are neglected in the RPA. They
showed that these effects are sm.ll when considering interb«.d
««.sitions. but noted that this doe. not rule out the possib
ility of a significant effect on the intraband relaxation time
(due to electron-electron scattering) a. discussed by Gurxhi
(1959) » d Th«ye (1970) e
Velicl^ and Levin (1970) gave some properties of the Coherent
Potential Approximation for disordered alloy, in «»other theor
etical paper. This was taken up by Brauwer. «id Brouer. (1970)
uho di.cua.ed the CPA in the context of Ag-Au all^s. They
suggested that the non-Drude-like behaviour of interpreted
a. a frequency dependant relaxation time by Rivory (1969) and
Theye (1970). was dua to a type of disorder not normally
Included in theoretical calculations. I«vin and EhrMireich

>*.
(1971) u»ed a single model of Ag-Au alloys and the CPA to
interpret the non-linearity of the shift of the absorption
edge and composition. Rivory^s (1969) results could be
fitted assuming an s-electron charge transfer from gold to
silver ions of 30Z, neglecting charge transfer of d-electrons
and assuming the absorption edge to be entirely due to
transitions from d FS. Fukutani C1971) reported nev
experimental results for Ag-Au alloys which agreed well
with those of Rivory. He assigned the structure in his
optical spectrum to the same set of transitions as had been
frequently cited for copper: L3 -► L2*». X5 -*• X«** and
L2 ->- Li . Partly on the basis of movement of structure
with alloy concentration, L3 -► L2* (FS) was assigned to the
2eV edge in gold and the 4eV edge in silver while X5
transitions were suggested at 3.5eV in gold and 5,2e7 in
silver. Structure near 4.1eV in the gold spectrum was
assigned to L2'- Li. A relativistic band structure calcul
ation for silver was presented by Chritensen C1972), He
obtained a band gap of only 3.49eV at L for the conduction
electron transition Li, -► L^+ Cequivalent to L2f *** Li in
non-relativistic notation), and 3.98eV for d-electron trans^
itions to the Fermi surface near X and L.
Wallden and Gustavsson (1972) gave a value of 4.17eV for the
silver L2' 1*1 8«P. '«^“8 photo-endssion experiments.Piezo-reflectance and electroreflectance measurements were
made by Cheyssac eta al (1972), for both silver and gold, but
no interpretation of the results was offered.
37

I **| X*
38Steel and Treheme (1972) measured the optical properties of
Ag-lti and Au-lfti alloys, observing that the behaviour of e2(“)
was not Drude-like below the absorption edge. For the purpose
of extrapolating the low frequency experimental 62 «)
assumed equal to £2^(0)) - to higher frequencies, so that it
could be subtracted from £2(0)) to give £2'*(«)» these authors
used a power law eiq>ression
£2^Cw) aXaTh. value of the co«£fici«it $ (3 in th. Drude theory when
ut»l) wee not given. Mechonicelly poliehed specinene were
used, which led to e '.iiiell'variation in the magnitude of
Cl and 62 but did not affect the epectral features. Steel(1972)
also made polarimetric naaaurenents on mechanically polished
gold sasples. finding some additionel ebsorption around«« - 2.4eV
as Hodgson (1968). Pells ¿ d Shiga (1969) m i Theye (1970) had
also reported. The identification of the 2.4eV ^.sorption edge
with d - PS trmisitions near to Lj - was accepted.
Dilute noble metal-noble metal alloys were studied by Beaglehole
and Erlbach (1972), who directly measured the change in normal
reflectance caused by alloying additions between 0.3 and 3
atomie percent. Both ends of the concentration range for each
of the three binary systems were studied. Assignments of
spectral structure to various transitions, as previously cited,
were accepted by the authors, who used their results to compute
the in the corresponding energy gaps due to alloying.
The results for Ag-Au alloys agreed with those of Bivory (1969) -
addition of gold to silver moved the edge at 4eV to lower
energies, and addition of silver to gold moved the 2.5eV edge
39
to higher energies. The shift in the silver absorption
edge was resolved into tvo coi^ponents» at 3.9 and 4.1eV.
The second absorption edge in gold (3.5eV) moved to lower
energies on addition of silver. Piezo reflectance data
show that the rate of diange of these energies with
strain is such that the effects of the very small change
in lattice constant can be neglected. In the AurCu system»
alloying additions at both ends of the concentration range
moved all structures in the visible to lower energies.
In the case of copper-rich AurCu alloys, this was explained
flU to the expansion of the copper lattice caused by
addition of gold. In thTAg-Tlu alloys, no shift of the
fundamental edges was observed, although alloying reduced
the strength of the host absorption. The 4.1eV structure
in silver moved to highar energies on addition of copper,
the 4.3eV peak in copper moved to lower energies on addition
of silver. Silver-rich Ag-Cu alloys had a contribution to
€2 ((o) between o3P«2 and uP4eV, due to copper impurity states.
Por this alloy, the optical effective mass increased from the
pure metal value on alloying; for all other five dilute alloys
m* decreased. The use of such dilute alloys, combined with
a narrow bandwidth optical system and the direct measurement
of the change in reflectance on alloying, allowed very precise
measurements to be msde. This would not be the case with
concentrated alloys ss the increased disorder introduced would
greatly broaden optical structures because of impurity scatter
ing of the electrons.
Ab.l.< (1972) revl«i«d cont«n>orMy tmd«ritanding of th. opticl
prop.rtlM of with o v b u l . on th. ptop.ttU. of pur.
1; * ^ '
p ■ .* - : ». J- , * • . ' »
metals. Intrabead properties of gold were discussed (mainly
using the results of Theye, 1970), in the context of
electron-electron interactions and the shape of the Femd
surface. The first interband transition in gold was firmly
identified as a ’parallel band* transition; that is, from a
flat d-band to the flat Fermi surface, because of the parar
bolic b.hwiour of Th. t.l.v«»ce Mid ▼.lidity of
Che Cobecent Potentiel Mid Virtual Crystal nodals of metallic alloy properties wds also discussed. A general graduate text- .
book describing the optical properties of metallic and die-
electric solids was contributed in the same year by Wooten
(1972). Again, the eophasis was on perfect crystals, but a
very useful introduction to the Drude and Lorenta theories was
given, with a lucid account of the quantum mechanical, energy
band approach. A coagirehensive review of the CPA method for
energy b«ids was given by Elliott et al (1974), showing the
usefulness of this method for calculating many diverse prop
erties of disordered alloys, such as the phonon and photo-
emission densities of states, a. well as the optical functions.
The CPA was used by Gelatt and Ehrenreich (1974) in an analysis
of the concentration dependance of the d ♦ PS band gap for
Ag-Au alloys. The earlier work of levin and Ehrenreich (1971)
was extMided to consider the effect of transfer of d-electrons
in addition to that of s-electrons. A best fit to the exper-
imMital data was now obtained with a net charge transfer
(Au Ag) of only 0.07e/a conpared with 0.3 for s-electrons
alone. The isproved theory did not offer any improvMSMit in
the description of optical data but was in accord with non-
optical experimMit. which indicate a very small net charge tr«.sfer.

"■•'i'■
41
/ ' IC.
A simple theoreticsl model of the optical absorption of silver
was used by Antonangeli et al C1974) to describe the temperature
dependence of C2 (<»>) ^ measured by Liljenvall and Mathewson
(1970). Since band structure calculations, pieso-reflectance
and photo-endssion studies had all supported the aosuni>tion
that L3 -► L2* (FS) and L2* Lj transitions are responsible for
the absorption near 4eV, these identifications were assumed.
Theoretical espressions for the dependence of €2
frequency for just these two transitions are quite tractable
if the energy gaps and oscillator strengths are treated as
adjustable parameters. Using this method, £2^ could be fitted
to within 5X of the experimental value over a wide range of
tenperatures. The energy gap obtained by this *lineshape
analysis’ is then of more use in a theoretical model of the
energy bands thaq that taken from some arbitrary spectral
feature such as the energy where the absorption reaches half
of its value. Colavita et al (1975) also used lineshape
analysis to fit the data of Pells and Shiga (1969) for the temp
erature dependence of the interband absorption of copper. Again
two transitions were assumed, L3 -► L2* (FS) (2.095eV at r.t)
X5 V (2.30eV at r.t). On this occasion the fit was
of the order of IX. The temperature dependence of the optical
properties of copper were the subject of fresh experimental
attention by Johnson and Christy (1975) who measured the
reflectance and transmittance of thin evaporated films. Janak
et al (1975) reported the results of a two-parameter band
theory of copper, in which one parameter was used to fit the
shape of the Femd surface to the results of de Haas-van Alphen
and cyclotron resonance measurements, while the other was used
r >
42
to fit the optical spectrum. Agreement to within the
eaq>erimaital variation vaa found using only these parameters.
The great improvement over the results of Mueller and Phillips
(1967) was attributed to the use of a more accurate crystal
potential and the explicit calculation of transition probab
ilities.
Weiss and Muldawer (1974) used Kramers-Kronig (K - K) analysis
of reflectance data to obtain e2(o>) for gold and A ^ Z n alloys.
They pointed out that C2 was scaled by the high frequency
extrapolation of R(u)). Veal and Pauliltas (1974) discussed the
low frequency extrapolation of reflectance data for K - K
inversion, concluding that the value ultimately obtained for
f was dominated by this choice. However, structure in the
absorption spectrum is less sensitive to these somewhat arbit
rary extrapolations, and Weiss snd Muldawer found shoulders
in t2^(w) at 3.7eV and 4.4eV as well as the edge at 2.3eV and
peaks at 3.05 and 3.9eV, in their experiments on gold.
Ellipsometry was used to study the optical properties of silver
and some dilute silver alloys by Platen and Stem (1975), who
used the alloy results to separate the two contributions to
the band edge at 4eV, extrapolating the alloy results to aero
concentration to obtain the values for pure silver. Christensen’s
(1972) relativistic band structure was used to interpret the
results, the Li»- -► Li»+ energy gap being estimated as 3.3eV.
The silver films used in these experiments were not annealed,
as no room temperature aging effects were observed. Grebennik
et al (1975) have shown that self-annealing does not take place
if silver films are coated with germanium, presumably due to

43the suppreaiion of diffueioa of dissolved oa^gen. It cannot
be assumed that room temperature stability indicates a
similar crystalline state to that obtained by annealing at
several hundred degrees. Rivory and Theye (1975) found that
a partial pressure of argon stabilised vapour quenched Ag-Cu
films.
The latter work was concerned with studying Ag-Cu alloys at
concentrations much greater than those employed by Beaglehole
and Erlbach (1972). It was found that silver added to copper
did not perturb the edge at 2.1 eV, but moved the edge near
4.5eV to lower energies. This was attributed to a perturbation
of the bottom copper d-band, by the upper silver d-band.
Copper added to silver did not perturb the edge at 4e7 despite
the sensitivity of the Li level to the potential; a new
absorption band centred at 3.1eV and 0.4eV wide was observed.
The magnitude of this, 6^ , was about 0.04 per atomic per
cent copper. These results were consistent with those of
Beaglehole and Erlbach at lower concentrations. Similar data
were reported by Eivory (1976) with the addition of direct
current resistivity measurements. Despite the macrocrystalline
(grain size 15 - 2oX) nature of the metastable samples, the
resistivity of the samples were found to increase with increasing
is^urity concentration. Rivory (1977) gave new results for
Ag-Cu alloys, including calculation of the effect of alloying
additions on the optical mass and relaxation time. The observ
ations were only qualitative, again agreeing with those of
Beaglehole and Erlbach.
Au-Cu .uoy. W.r. .tudi.d by Scott « d Mald«.r C1974) m d
BivDxy (1977). Ih. ab.otption .dg. of di.ord.t.d AuCus w m

44
fouad by Scott and Muldawer to be at a alightly lower energy
than that of pure copper Caa found by Beaglehole and Erlbach
for up to 3Z gold in copper), while on ordering the edge
moved 0.2eV to higher energies Cthia ia in a region of the
spectrum where the eye ia very sensitive) and a new absorption
peak appeared at 3.28eV. However, it was reported that
ordering produced no noticeable effect on colour. Rivory(1977)
found the absorption peak at 3.6eV for ordered AuigCusi,
in agreement with Nilsson and Norris C1969). For ordered
Aui gCusi», the peak was at a slightly higher energy (3.75eV).
The variation of the onset of interband transitions for
disordered Au-Cu alloys was found to have a negative deviation
from linear interpolation beteeen the pure metal value., a.
for alloy.. No .ignificmit .hift wa. found for »)ld
concentration, betirean 0 «id 30 at.Z, and no i«».uramant. were
made between 30 and 60 ataZ golda
The term ' themovariation' wa. coined by Winaamiu. at al
C1976) to deacriba the meaeutement of optical propartie. at
differ«it tenpatatura., with aufficiant accuracy to andila
the diffaranca .pactrum «cz - ejCTi) - ttCIf) w be calculated.
Ihi. i. obviouoly cloaaly related to the tharmomodul.tion
technique. Beattie*. (1955) poludmatric method W M uaad to
obtain tharmovariation apactra for .ilvar, gold «id copper at
tamparatura. between 40K and 8WK. It wa. concluded that for
thaaa metal., temperature induced change, in lattice conat«it
dominated the ra.ult. obtained, .o that thaaa could be
directly conparad with hydroetatic pia«)-modulation data.
Thermal broadening of the Famd .urfaca did not h«ra a large
affect. Lina .hope «lalyai. of the «eg .pactra, .imilar to
... .4
45that of Antonangeli et al C1974), was uaed to aid
interpretation. In the case of silver, transitions which
were held to contribute to the visible absorption were
Li»- (PS) -► Li»+ at 3.86eV, extended transitions d -► PS at
3.98eV and Li»- -► Li»+ at A.lleV. The importance of Pemd
surface to conduction band Li»— (PS) Li»+ and the extended
d»-PS transitions was heavily emphasised. Por gold, the
important transitions are -*• PS at 1.94eV, which is
reponsible for the absorption ’tail* noted by several authors,
L5+ + 6+ L|»- (PS)at 2.45eV, ‘►X«- at 2.87eV,
Li»- (PS) -► Li»+ at 3.57eV and L^- -► Li»+ at 4.20eV. Copper has
contributions from three transitions; L5+ + e’*’■**
2.13eV, Li»- (PS) -► Li»+ at 4.31eV and Li»--► Li»+ at 4.81eV. Clearly an accurate representation of the spectra requires
the consideration of a large nusber of band gaps for these
particular metals. Note, however, that none of these
assignments correspond to transitions from the bottom of the
d-bands to the Pemd surface, as suggested by many previous
authors for the second large absorption peaks in gold and
copper. Rather, the onset of absorption is again attributed
to transitions from the top of the d band to the Permi surface
near L (with a contribution near X for gold), and the other
transitions are all between conduction bands, including initial
states at the Pemd energy. Rivory (1977) accepts the
assignment of transitions from the top of the d-bands to the
Permi surface as responsible for the fundamental absorption
edge in each of the pure noble metals; for silver the
influence of transitions L^- - L^+ is also cited, but there
is no mention of L^-(PS) ^ L^+. Higher energy transitions
(3.5 - 5eV) in gold and copper are attributed as before to
inter-conduction band transitions and those from the bottom

r-,v M
46
d**band to the Fermi surface near L. Contributiona near to
X are ag*'«n mentioned in the case of gold, for energies near
to 4eV.
Rivory also discusses the intraband absorption of the noble
metals, giving the optical masses and relaxation times. A
freqxiency dependant component of the relaxation time was
found, which was interpreted as due to the effects of disorder.
Structural disorder in the pure metals was held to be similar
to siibstitutional disorder in alloys, which leads to a frequency
dependent impurity scattering term in the relaxation time.
Ik
. 1 - rCJr^ M ^ it . I > » •
-i vVr
'■
■■'
■ '¿S'i r %. • - .1 w l ?
47
EXFEBIHENTAL3.1 Inttrumentation
The automatic following ellipsometer described in Roberta
and Meadows (1974) and more fully in Meadows (1975) was mod
ified to allow continuous spectral operation from the near
ultra-violet to the near infra-red (250-850 nm) • The modif
ications were carried out progressively, and caused some
degradation of the instrument's performance, in.terms of
resolution and absolute accuracy. Measurements made early
during the research program were at only a few discrete
wavelengths, as a mercury arc light source was still in use,
but had a resolution of the order of 0.001®. Later, when the
Ag-Au binary alloys were first studied, a xenon arc light
source was available, which permitted continuous measurements
over the range 250-575 nm. The final experiments were made
over a range of 250-850 nm using an additional, red-sensitive
photo-multiplier.
A brief d..cription of the .llip.oni.t«r will be given, paying
pazticttler «ttwxtion to tboee aspects which differ from the
account of Meadows (1975). A diagram showing both optical and
electronic aysten. i. given in Figure 3.1, to which the nurbera
in parenthesis that follow refer.
• Ontical Path.The light source (1) originally used was a tek mercury vapour,
2 5 « type m/T> arc lamp. This provided a line spectrum of
suffiaent intensity to enable operation on 577.1, 546.1, 435.8
and 366 nm. Accorang to the manufacturers' data, the reaance of the 546.1 nm line is the greatest at 1.4V sr *. For an arc
sise of 0.5 X 3.75 nm (manufacturers' data), this implies an

' ■i' . Priiii IL' Ttfw'iWi- T t y> “' ' >'. .
48—I »2^solute radiance of about 23W ar cm . In order to
provide a continuous spectral source, this lamp was
replaced by an AE&-Osram higji pressure xenon lamp, type
XB0450W/4, rated at 450W and having a *spectrosil* window,
transparent in the ultrarviolet. The absolute spectral■ - 1 - 2 - 1radiance of this source is stated as 0.4W sr cm nm over
most of the visible, so that for a lOnm bandwidth about
45f ~ cm” iiw be expected, or about one-fifth of the value
for the original lamp« Meadows observed that the ellipsometer
operated satisfactorily, although at increased noise level,
for light of intensity down to about one-tenth; it has been
found during this work that resolution has been reduced to of
the order of 0 .0 1° in analyser and polariser values over most
of the spectral range, for an operating bandwidth of lOnm.
It is frequently suggested that smaller xenon arc lamps make
more suitable light sovgrces for this type of application, as
the reduced light intensity is compensated by reduced arc sire.
Indeed, 75W xenon lasg>s have a similar luminance to 450W lamps
C40,000 Lumens compared with 35,000), although arcs of intermediate
power (150W, 250W) are much inferior. It is difficult to judge
the relative merits of these options without a trial, but it
seen» probable that better collimation could be achieved with
a 75W arc, whilst the 450W arc may permit a larger luminous
flux in the b.«», »hould colUia«tion b. t.tber U*. good. -
Th. l«np W M operated from an 80V, 30A direct current aupply,
uaing a » filter to remove lOOH* ripple from the full-weve
regulated d.c. IWo aection. of SOOOpF cepacitor. were uaed
with a lOnfl inductor to achieve a total ripple of lee. than 25mV.
It ie ii^Kittant to reduce thie figure aa much aa poasible for
' v•./ ' ■ . / V ’V a :■ '-r ".•■V*;'ï'*>-1^
’ ■ ' ■**-.''^ r'i.'Æ iîJ.SBBœ ^3a
49
two reasons. Itii thealtemating component of the lamp
current which Is primarily responsible for erosxon of the
cathode» causing enlargement of the arc, arc wobble and
eventually lamp failure. Secondly, modulation of the lamp's
radiance at any frequency increases the possibility of over^
loading the detector aiqplifiers. An adjustable ballast
resistor was used to control the lamp current and to ensure
h i ^ stability, both this resistor and the lamp-housing«
being water-cooled to reduce fluctuations in the temperature
of the laboratory. A total of about 31di has to be dissipated.
Additionally, forced air convection is tised to cool the power
supply and lamp. Air is drawn over the lamp, keeping the
silica envelope at a uniform temperature and carrying away the
large quantities of ozone produced. This is blown through a
filter of activated charcoal before being released into the
air. The light is collimated (2) using a single plano-convex
silica lens, of focal length 75mni. This was used with both
mercury and xenon light sources, allowing operation at 366nm
with the mercury lamp. The beam is then stopped down to a
diameter of »v 2mm (3 , 4) before entering the polarising prism.
To isolate single lines from the mercury lanç, a graded inter
ference filter was placed before the.polariser; it had a
U.V transparent backing plate, and a bandwidth of 25nm. The
polariser (5) was a Glan-Poucault (air-gap) type, usable to
230nm wavelength and was mounted in a servo-goniometer. Next
in the optic train is the polarizer Faraday-modulator (6)
containing a 50mm core.. Two types of core were used: with
the mercury lamp, and for the 250-575nm range with the xenon
lamp, a silica core was used; for the range 480-850nm with
'JAÙÎ. ^ ^ i i.i* ;,''.. it' ■ r :i
50
the xenon lamp, a double-extrardense flint glass core (Chance
Pilkîngton DEDP) was used. Optimum modulation was about
±1° w h i A was achieved by the silica cores at 300nm and the
BEDF cores at ôOOnm. It is instructive to consider the
mechanism of the Faraday Effect, by which a longitudinal
magnetic field is used to modulate the plane of polarization
of the transmitted beam. Normal dispersion over the
useful wavelength range of the core materials is caused by the
presence of absorption bands in the ultra-violet region. The
effect of the magnetic field is to produce Zeemann splitting
of the absorption bands, so that at any particular wavelength
there are two different effective refractive indices. One of
these is appropriate for left-handed circularly polarized light
while the other is appropriate for right-handed, so that these
travel at different velocities through the core. If the linearly
polarized light entering the modulator is decomposed into left-
and right-hand circularly polarized components, it can be seen
that a phase-lag between the conçonents is introduced by the
Zeemann splitting. Reconbination of the components shows that
the plane of polarization has been rotated. The amount of
rotation depends on the phase lag, and hence on the difference
between the refractive indices. Because of dispersion, this
difference depends not only on the amount of splitting (and
thus the magnetic field), but also on the distance from the
absorption band. At long wavelengths, the refractive index
is decreasing only slowly with wavelength and modulation is
small. On the other hand, the short wavelength range is
necessarily restricted by the presence of the absorption band.
Clearly it is difficult to cover a wide spectral range using
a single modulator core material.

51Hftchanical Aaaenbly
The ellipsometer we* constructed on a naaalve cast-iron
marking table, the surface of which was machined flat to one-
thousandth of an inch per foot. On this the incident arm
was firmly fixed; carrying the light source, polariser
goniometer, Faraday modulator and compensator. A vertical
pXate was provided, on which samples could be fixed, which
has an axis of rotation co-incident with the optic-axis along
the incident arm. This back plate had kinematic controls
facilitating accurate adjustment of the position of the
sample and the plane of its surface. A mechanical linkage
connected the back plate to a movable post-reflection section
of optical bench, designed so that the plane of the sample
was automatically turned through half of any angle through
which the post-reflection arm was turned. This eliminated
th. n M d to r«dju»t the saii<>le when the engle of incidence
was chenged, end feciliteted edjustment of the cospensetor
end servo-systems, es the arm could easily be returned to the
'strsi^t-through' position. The post-reflection arm carried
a Faraday-modulator. «lalyser goniometer, grating-monchromator
Old photo-multiplier assenbly. This amounted to e considerable
mass, for which reason an air lubricated beering was fitted,
distributing the load over about 5cm* of the bench. This
reduced wear during movement of the arm, and simply by turning
off th. com.t.s.ed air supply, the arm could be locked rigidly
in position, vertical movement of the arm, previously caused
largely by eccentricity in the wheel on which it was supported,
has been effective;j.y eliminated.
W i
- ■
52
is,
I
After passing through the polarizer modulator, the beam goes
through a second stop (7) before entering the compensators (8).
This consists of an achromatic quarter-wave rhomb (King and\
Downs 1969), calibrated by Dr R King of the National Physical
Laboratory to be within 0.1° of 90° over the entire visible
spectrum. The position of the rhomb on the fixed incident
arm is preferred to the alternative position on the post
reflection arm, as the quarter-wave device is extremely
sensitive to vibration. Temperature control of the rhonb as
was previously employed for a mica quarter-wave plate has
been found to be unnecessary. Thus elliptically polarized
light falls on the reflecting surface (9), which restores
linear polarization. A second stage of plane-of-polarization
modulation then takes place (the analyser modulator, (1 1)) in
a Faraday-cell similar to the polarizer modulator, but operated
at 1230Hz rather than 1630Hz. The doubly modulated light then
passes through a third stop before entering the analyser
prism (12). The analyser prism and servo-goniometer are of
identical construction to the polariser components. When the
mercury-lamp was in use, the next stage was detection in a U.V-
sensitive photo-multiplier, EKI type 9656QR. Subsequently,
a grating-monochromator (13) was placed between analyser and
photo-multiplier (14). A Spex Mini Mate monochromator was used
with lOtm slits, giving an optical bandwidth of lOnm. In some
earlier experiments, a bandwidth of 20nm was used. A red-
sensitive photo-multiplier R.C.A type 8852 is used to supplement
the E.M.I tube. Normal practice was to use the EMI tube with
silica modulator cores to cover 250-540nm, and to employ the
R.C.A tube with DEDF cores for the range 480-850nm.

•h'
53
The servo-gonioneters were as described by Headows C1975)
with the exception that the sxibsidiary gear-box was replaced,
reducing resolution to 0 .001°, which was better than the
prevailing noise figure by an order of magnitude. This
provided an increase in speed to about 1° s“ , and made
possible direct readout of analyser and polariser settings
in units of 0 .0 0 1°.
Eeproducibility of angle of incidence was improved to about
0.01°, by the addition of a linear dial-gauge. The linkage
between the sample mounting plate and post-reflection arm was
via a sine arm which provided a convenient place for
monitoring angle of incidence, as there was a collar sliding
on a fixed bar, the relative positions of which uniquely
determined the angle between incident and post-reflection optic
axes. Provided the sample was accurately aligned to the
optic axes, the dial-gauge reading enabled the same angle of
incidence to be consistantly re-used.
Electronic SystemsEach of the Faraday modulators was driven from a small power-
anplifier, which in turn was driven from a Wienrbridge oscillator
(frequency fi or f2)• The resulting photo-multiplier signal
consists - at the null - of 2fi, 2fz «nd noise. Away from the
null f1 end f2 appear, the phases of which depend on the
sense of the deviation from the null. Phase-sensitive detectors
provided error signals which were psed to derive pulse trains
for operation of stepping-motors on the servo-goniometers, so
that any deviation or error was continuously minimised.
Beversible decade counters monitored the stepping pulses.
* '■ '. ■ 'í-■". . • ’ *V,{;VÍfá
... : ■ ■ ■ ■■ ' sr>*. •■ ■ , •< -!ííl . •.'- . •'■ '"fciViití'-- <«'
providing direct readoutg of the differencea between analyaer
and polariaer aettinga and their calibrated ’zeroea*.
Reaolution waa rather better than 0 .0 1° over moat of the
range 350-750nnm, deteriorating to 0.1° at the extremea
C250 and 850nmB).
54
3.2 Sample PrepatationInitially, a aet of thirty aamplea waa to be prepared. Theae
were required to be lOnm by 25nm by I m thick, to accommodate
the ellipaometer beam and for convenience in handling. Moat
aanplea were prepared by melting a billet 10mm in diameter and
a few millimetrea in height, and then working thia by a
confcination of forging and rolling into the deaired form. To
relieve internal atreaaea and prevent cracking, intermediate
anneala were performed after each atage of working, and finally
th. »««pi.« w«t. inv.ri.bly qu«ich.d. On. .«n>l., SO.Uu - 19.9Cu,
« U wroxiin.t.ly the conpo.ition of the int.xn.t.llic compound
AuCu m d proved Mctr«».ly brittU. It W M iinpo..ibl. to work
into th. r«iuir.d f o m «id w u therefor. recMt u . pl«iuette.
When homogeneity W M poor, the .«iple. were renelted. Thie
w u neeeetuy for .ever.l of the .«nple. melted in the vecuum
Old induction fum«»., which were ellowed to cool by n.tur. 1
convection-, «id .o the i M t e«ig>le. prepered were quenched
from the melt.
Mech«iie.l working of th. .mple. eerved both to homog«ii..
n d reduce them to the desired form. Th. Au-Cu .Hoy. g«i.r.lly
r«iuired more <^ck. of working «id «ineeling due to their
brittl«i..., but th. .Hoy m«ition.d •bom w m th. only on.
to c«iee reel difficulty. Subsequently, «lother .«iqile of
M m t n H 80AU-20CU W M c«t into pl«lu.tt. form «id poli.hed

, V-.,V •- .■=£ ■ ' • ’•
■ -<;
55
without any mechanical treatment.
The fine gold and Ag-Au binary alloys were annealed in air,
while the others required a protective atmosphere. Initially
a continuous flow of argon was used at just above atmospheric
pressure, and subsequently these samples were sealed into glass
anq>oules under vacuum. Quenching was normally performed by
tipping the samples into water.
MAltingSeveral different furnace arrangements were tried, and a settled
method was not achieved until all but a few of the samples had
been prepared. The first melt was carried out in a Wilde-
Barfield vacuum furnace, type 2904B, under a pressure of
50u torr dry nitrogen. The metals, in the form of small
granules (Ag-Au) and small pieces of copper rod, were intimately
mixed in alumina crucibles and placed in the furnace. Ho
stirring during the melt was possible, nor was it possible to
observe the cruables. Tenperature was monitored using a
platinum-rhodium thermo-couple. After a suitable period of
time the alloys were removed from the furnace, when it was
found that silver from two of the crucibles had evaporated,
modifying the composition of the nominal 90Ag-10Au and
the Au. Cu and 90Au-10Cu samples. The results
of the analyses performed by the Assay Office. London, support
this Vi«. Accordingly, the next melt was carried out under
dry nitrogen at 1 . 5 p.s.i above atmospheric pressure in the
s«mi furnace. The furnace was flushed by evacuation followed
by refilling with dry nitrogen. Since the billets had proved
hard to rele.se from the alumin. crucibles, a graphite block

56vac machined to accept aix charges in well-separated pockets.
Althou^ this proved successful, a suspicion that the temper
ature gauge was working incorrectly «id the operational
difficulty of the procedure meant that another method was
tried.
A Radyne high frequency induction furnace. Model C90, was
used to heat the charges. The induction coil was wrapped
around a vertical silica tube, through which a continuous
flow of dry nitrogen was maintained. The graphite block then
.ct.d u .u.c«.tor a. well a. container. A. with th. vacuun
f u m a c , no atirring waa poaaibl. and th. alloy, war. left
to cool over a period of about thirty «linutea. Teiiparatuta
was monitored using an optical pyrometer.
Again, this technique gave adequate results, but sample
homogeneity waa not alwaya good from the first malt. Sagraga-
tion of the component. ..«mad a likaly poa.ibility during the
relatively alow cooling «id aoUdification and to a quench
furnace wa. conatructed. Thia waa aunU from a graphite block,
with only one pocket ao that only on. melt could be carried
out in each operation. At the bottom of th. pocket a .mall
hole wa. drilled, through which the molt«i metal could pour.
Thi. hole wa. blocked by a graphite alip until th. appropriate
t«v.r.tur. h«i been r.«*ed. A poli.hed .teal diah filled
with oil wa. placed under th. container and thi. arr«ig«imnt
«„urod rapid ,u«iching from th. melt. The top of th. pocket
wa. looaaly ...led by a wood-charcoal plug, to reduce oxidation, a. it waa not poaaibl. to provide a protective atmoaphere.
Support waa provided by the induction coil, which waa wound

57
directly on the graphite container. This technique gave
inmroved homogeneity, and flatter billets which required less
working to produce the one millimetre thick samples needed
for the ellipsometer.
Thermo Mechanical Treatment
Typidly. two .tag.« of n e c h m i d work wer. petfomied. The
fir»t »teg. wa» cold forging, uaing a 30-ton Analer mechanical
tenting imchine in coigirention, and the nacond conniated of
cold rolling uaing a amall jeweller'a rolling mill.
The aaaplea were forged between poliahed ateel plattena to
prevent contamination. Between each atage of thia treatment
intermediate .treat-relieving «mealing waa performad. The
billata produced by vacuum furnace, and thoae induction
furnace melta which were not quenched from the melt, were
forged under different compta»»i™ load.. In each caae the
load wa. applied to the point, in the operator', judgmmmt,
whan the — degree of work hardening had been induced
in the .ample. Soma idea of the brittlenaaa of the alloy,
may be gauged from the nunher of cycle, of working/«mealing
needed to reduce the aanplea to one millimetre thickueaa.
In g«ier.l the Ag-Au alloy, needed about half the nuaher of
cycle, found neceaaary for the Ag-Cu «id Au-Cu alloy.. The
dilute alloy, ar. aoft.r th«i the concentrated one..
Sub.«iu«it atage. of forging were carried out in the .am.
manner.
Smooth, poliahed ateel rollar. were uaed in the rolling
atagea. E m * »tag« coag'rf»«'» rtiuction by .mail
amount, until the .«H»!« appeared to Imv. «ajuirod it.
7“]'
i-ii-.
•' . ' ’-M"' ■■is' .’ ■■' .T ■; , ' •-»■ / -
58mo-»4wwii hardneaa or reaiatance to deformation without cracking.
At thia point the aas^le would again be annealed. Some
aniaotropy appeara to have been introduced into the two-phaae
(Ag-Cu) alloya by rolling.
Moat aamplea underwent forging aa the final atage of mechanical
treatment, but the last aamplea prepared, thoae quenched from
the melt, were rolled.
The firat attempt to axineal any aamplea waa; made on the
nominal 10Au-90Cu and 80Au-20Cu. A horizontal tube furnace,
conatructed in the department, waa employed. Thia featured
an alumina tube, with a »kanthal» heating element, and hinged
at the centre ao that aamplea could be tipped out for a rapid
quench. Argon waa paaaed through the tube throughout the
procedure, to provide a protective atmoaphere. Due to
difficulty in aealing the enda of the tube, the protective
atmoaphere waa not auf ficient to* prevent contamination and
thia method waa not puraued.
Con.«iu«itly, . v.rtica tub. furMc. of .inil« construction
w u tried. In this, th. sasplM were suspended in « sn»U beg
of glMS-fibre, M r m g e d so th.t they could be dropped out
into w«t.r for qimehing. Agan, Argon wss pMsed up through
th. fum.ee. athough this w m m inprows-nt. some contmin-
. t i o n . g a n t o o k p l . e e . The contm dnetion f i l » , presumAlyoade, W M renoved u«lng .aphuac m d attic mid».
The. method .dopted for th. nejority of samples involved th.
•us. of m a r arculeting fum.ee, which could eccosnmdet. .
Urge nuafcer of smnples et an even temperature (Hermue type
JL200). The alloy, which r«,uir.d protection from omdation

'1'. '
' 4 A - • .1 . ¿a: riài
59ver» «Ml«d in tnall gla»* vncuoUs , nfalch w«r* flunhed
out o«ing dry nitiugon «nd evacuated uaing a rotary punp.
The usual annealtng tenperature wee 600°C, but the
vacuoles retained their integrity even for the two esses
when annealing took place at 750®C. Quenching of the
sealed samples was by tipping into water. In the rare
case when the glass failed to fracture on contact with the
water the annealing procedure was repeated. For those
alloys annealed in sir (Au, Ag-Au), it was considered that
a weter-quench was unnecessary. In their final form the
plsquettes were one millimetre thick, so that cooling would
have been extremely rapid once they were removed from the
furnace. Accordingly, they were simply withdrawn mid allowed
to cool in air. In a few cases, alloys annealed in air were
water-quenched along with some vacuum annealed ones.
Quenching of the vacuum annealed samples, althougji appearing
satiafactory. left certain of the Au-Cu alloys in a rather
brittle condition. It was felt that to achieve a more rapid
quench, the glaas vacuoles previously used would have to be
dispensed with. Accordingly, an electric salt bath furnace
waa used, »o suitable salt for SOO^C was available, ICI salt
cassai AS650 (melting point 65o‘>C) being used instead. Short
anneal times are sufficient to produce complete disordering
of Au-Cu intermstallic conpounds at this tenperature.
Mounting1 .0 methods of mounting the alloys (for polishing end optical
measurm«nt) were used. In both esses, cylindrical smunte
were produced of about 30nm diameter and 10-15» depth. The

60
munt* could h* drilled and tapped for fixing on the ellips-
oneter backrplate, and were convenient for grinding and
pollshinge
The Ag, Au, Cu, Ag-Au end Ag-Cu alloy« were mounted in bakelite
in a ’Metalo» automatic mounting preaa, manufactured by M E Lowe.
According to the manufacturers, the maximum temperature exper-o
ienced during thia operation should not exceed 140-150 C.
This was felt to be too high for mounting the Au-Cu samples, as
the intermetallic phases are very easily produced. These were
'cold-mounted' uaing Metaet alow-aetting mounting plaatic,
manufactured by Metaaerv. This involves an exothermic reaction
which for sasolea of this size should not have produced temp-
eratures in excess of 30-40 C.
and Polrshing
The samples were ground by hand, using wet silicon carbide
papers on a flat perspex base. Care was taken not to use
excessive pressure, avoiding contamination by particles of
carbide. Copious quantities of water were used to keep the
carbide papers free of loose grit during the grinding process.
Four grades of successively finer grinding paper were used:
320. MO. 500 and 600 lines per inch. The final paper was pre-
w o m using brass blanks to reduce the depth of the final
scratches, removed by poUshing. Between each grade of paper
the samples were carefully rinsed, and rotated through 90».
This procedure makes it clear wh«. the coarser scratches from
the previous paper have been cosçletely removd. and avoids
•smearing' the surface of the metal, which can result in a heavily
worked layer overlying deep scrat«die«.

61Mechanical polishing in three stages, using diamond grit
Itibricated by white spirit, was used to produce the final
surface. Grit sires of 6 , 1 and i micron were used for this
stage. Between each grit sire and following the final polish,
the samples were cleaned using »teepol* and distilled water.
It was possible to rinse the teepol from the sample surface
using a jet of distilled water, which then broke sway from the
aurface leaving it clean and dry. Ellipsometric measurements
were started within fifteen minutes and normally completed
within three hours.
AnalysisTh. «Hoys w.te a».<5red, u«ing chemical and electro-ch«nical
machoda. by the Aasey Office, Goldanith.' Hall. London.
Analyaia waa made of only one component in each alloy, the other
cotvonent being determined by difference. Thi. i. .indicated
in the Table 3.1 by the use of parentheses.
3,3 Measurement ProcedureBaaie alignment of the optical conponenta, adfetment of the
compenaatcr to 45" azimuth and adjuatment of the electronic
ayet«» wa. c « ^ a d out a. in Meado« (1975) Section 3. Th.
quarter-..« device «.d electronic, were a.t up at 500nm. a.
thia ia the middla of the overlap of the two detector, and
modulator co«a. Alignmant of th. reflecting aurfac. wa. alao
carried out by much th. -thod. A fr— wa. conatructad
to hold a .mall 1...* W-S-» He-Me. 632.8nn0 in a vertical
poaition inaaediately in front of th. 1«^. houaing. A thick
.luminium pl.t, attached to th. b... of thi. laa.r by two
large apring-loaded acr«« .Uow.a « » U «ii«tmm.t. to be mad.

6 2
■■. ^ .., . i » Ç _
to the laser's position and tilt. A small front-silvered
mirror at 45® to the vertical could be placed on the optical
bench beneath the laser, to reflect the beam along the optic
axis. Fine adjustment of the height of the beam could be made
with this mirror. Using this arrangement, with a plane mirror
xt the far end of the optical bench to return the beam, the
optical axis could routinely be defined in a matter of minutes.
However, it was found that after two passes along the axis the
beam became too faint to distinguish from reflections from the
many optical components, so that a somewhat shorter path
length was obtained. This could be increased by removing some
consonants from the bench, but replacement of these (either
delicate or massive) components caused greater errors so that
no benefit was obtained. For this reason adjustment of the
reflecting surface to only 'x. 0.01® is claimed (cf. 0.002® by
Meadows).
A conçut. .*p.rinent r»iuit.d IM. th«. 4 hour., from th.
fiiuX in dianond polUh of th. «Hoy to th. final .llip.oiii.tric
r«ding. Th. tin. b.w.«i finH poli.hing m d th. fir.t n M . u r r
n.nt vat in th. twig. 5-10 ninut.», during which th. reflecting
.orfece w m aligned, nonochronator and phai-nultiplier replaced,
po.t-r.flection « n nooed to the cho.«i « g U of indd«ic. «.d
the gonioneter. noved to the requited pooition for nulling.
A. the n d n probl«. concerning duration of « 1 .*p.ti»nt i.
with tamiahUg «.d oddation of th. netal aurf«:. th. ahort-
warelMigth ellipaonetric par— ter. were Beaaured firat. The
effect of contamination film, increa... with film thicknea.
but deer..... with wa«l«igth. .0 thi. method ahould minimi.,
the error, introduced by neglecting aurfac. filma. The inter
val betw.» auccaai». reading, wa. of th. order of on. minute.

' .— lA. -fife>'-ri?v.:i-..:: _ ■ ■
63
■ ;-
»¿* i---
aa the iinall wavelength chinge C5 or lOnin) did not normally
involve large angular displacements of the prisms. The servo
mechanism was able to follow changes of this order without a
very large settling time, although it was necessary to leave
the monochromator at each wavelength setting for about one
minute to avoid errors from the lag of the servo system.
An E.M.I photo-multiplier type 9656QR was used to cover the
wavelength range 250-540nm. When the latter wavelength was
reached, the instrument was returned to the ’straight-through
position and checked for drift. Assuming this was X 0.02 , the silica modulator cores were then replaced by those of
DEDF. A period of about 20 minutes was allowed for these to
reach thermal equilibrium, since the modulators run several
degrees above anfcient despite being water-cooled. The compen
sator and electronic systems were then reset to eliminate
error from stress in the new cores. The reflecting surface
was re-aligned, and the instrument restored to the same angle
of incidence. Measurements were then taken in the range
480-850nm using an R.C.A 8852 photo-multiplier. Finally the
ellipsometer was again returned to the straxght-through position
and checked for drift.

SP-* ' ■' '____iX., r.. ' . .' ■ * *>*i •■r " - >'■L‘l-\ " '¿ifl•>1 ■N' '»' ■ f* T?
Whp*' ■ y 1
63aa the small wavelength change C5 or lOnm) did not normally
involve large angular displacements of the prisma. The servo
mechanism was able to follow changes of this order without a
very large settling time, although it was necessary to leave
the monochromator at each wavelength setting for about one
minute to avoid errors from the lag of the servo system.
An E.M.I photo-multiplier type 9656QR was used to cover the
wavelength range 250-540nm. When the latter wavelength was
reached, the instrument was returned to the ’straight-through
position and checked for drift. Assuming this was I 0.02 ,
the silica modulator cores were then replaced by those of
DEDF. A period of about 20 minutes was allowed for these to
reach thermal equilibrium, since the modulators run several
degrees above anfcient despite being water-cooled. The compen
sator and electronic systems were then reset to eliminate
error from stress in the new cores. The reflecting surface
was re-aligned, and the instrument restored to the same angle
of incidence. Measurements were then taken in the range
480-850nm using an R.C.A 8852 photo-multiplier. Finally the
ellipsometer was again returned to the straight-through position
and checked for drift.


, . ■ i 'Si 4. -li ■ ► *—'' ■ ■ _ 'i; : -.*<l' -
ar* /* ■ -, hi . .‘.
65Table 3.1« Thermomechanical Treatment
Kay; (i) Con oaitiona in parentheaea are calculated by difference(ii) V - melted in Wilde Barfield vacuum furnace
I - iBtlted in Radyne induction furnace(ili) V - v « u » « , C - .ir d.ojyg.n.t.d with hot
N - nitrogen, S - aalt bath, A “ air, W wate
Hoteai (1) Sample 9 waa uaed aa caat(2) Sanvln* W «<1 probably contaminated by ailver

■ - T O
66
Table 3.1 Ccontd.)

'V:,- ^ f♦. t -
?~*cll_i •': 1
67
4.1 ColorimetryThe objective measurement of colour is made by combining
information about the spectral reflectance of the object
under consideration with details about the brightness of
the illumination and the responsivity of the human eye.
It is necessary to consider the illumination, as it is
the colour of the light entering the eye which is ditcctly
perceived and is subsequently translated by the brain into
a judgement of the colour of the object. The problem is
more complicated than simply noting that under blue light,
say, an object appears more blue than it does in red light,
as the observer’s expectations influence his judgement.
This is known as chromatic adaptation and cannot satisfact
orily be quantified. It is of particular significance with
regard to judgements of ’whiteness», which similarly cause
difficulty. In this study these problems have not been fully
treated, as useful results of a largely comparative nature
cur* be very readily obtained.
Thft CIE 1931 Standard Syst^It i. found th.t under restrictive experinentel conditions,
three quentities suffice to define sny colour sensetion. The
restrictions eie eined et reducing the sisount of infonsetion
„eilsble to observer end stenderdising the wey in which
it is presented. The CIE 1931 St«idsrd System hss been
chosen, which specifies thet psychologies! date be o b ^ e d by
cosvering s»i.les for equality of sensation, with e 2° field
of vi«i against e neutral grey background, Bsperiments of
this kind heve been used to define responsivity curves

■■■ * . ' 1r t-I “ ■ ■ i- ' . • V' :• -*
>yp
’W■v. ' -<>■ s
68
' f ':■
x(X), y(X) and z(X), describing the properties of a *stand-
ard observer*. It is not necessary that these functions
correspond directly to physiological properties, since they
are used to compute only the three coefficients which define
the colour sensation. Transformations may be applied to
the coefficients to yield alternative and equivalent sets,
which may be done to alter their individual significance.
For instance, the quantities derived in the 1931 system
(x, y - the chromaticity co-ordinates, Y, the Ixjminance),
are specially significant only in the separation of the
luminance (brightness) and chromaticity. In general,
objects having the same luminance are judged to be equally
bright, whilst those having the same chromaticity are
judged to have the same hue and purity (or saturation).
Objects having all three quantities in common are subject
ively indistinguishable dnder the standard viewing conditions.
The following relations are used to define x, y and Y:
S(X)y(X)dX -1
k *- k ^ R(X)S(X)x(X)dX
X .
- k ^ R(X)S(X)y(X)dX
X- k ^ R(X)S(X)z(X)dX
X + Y ♦ Z X + Y + Z
(4.1)
(4.2a)
C4.2b)
C4.2c)
(4.3)
R(X) is the spectral reflectance of the object, which may be
directly and accurately measured; S(X) is the spectral bright
ness of the illumination; x(X), ?(X) and i(X) represent

69psychophysical data. These latter quantities are all avail
able from tables, S(X) being defined for several ’Standard
Illuminants’ •
Saturation and Dominant Wavelength
A non-snalytic transformation has been applied to the (m,y)
co-ordinates to obtain alternative quantities C«,X^) -
saturation and dominant wavelength - which correlate with
subjective assessments of purity and hue. They are derived
in the following way -
(a) Obtain the co-ordinates corresponding to
a neutral object colour, ie. one which has equal
reflectance at all wavelengths in the visible.
Obtain a set of pairs of co-ordinates
which define the locus of monochromatic radiations
these define the spectral colours which arc the
purest obtainable.
Cb) Extend a straight line from the point Cx^,y^)
through the point (x,y) until it intercepts the
locus ix^.7y) at, say, (x^,y^). The wavelength
X . corresponding to the point Cx^,y^) i» called dthe dominant wavelength.
(c) The saturation is the ratio of the distances
(x^,y^) (x»y) andCx^,y^)^ <*d*^d^*
, - J U x - x^)* ♦ (y - yo)"> *Th. .ipiific«!« of thi. u.. in th. .dditiv. n.tur. of colour
•«uation. in th. CIE .yotmi, which h M b..n defined .o that
the chtonaticity of a mixtur. of two colour. A and B, hiring
(4.4)

-J Vil
C-'
t m< ^ ‘->'i.--'!'--y '^ ^ .V n -' '? - - ' ".'-<■ ■ ■» - j- '^*v>V* V' -M: ‘ ■¿r ■ \ V í**>f!'>5í, -:
70co-*ord£nate8 «“-d * «traight line
joining (x^.y^) and If A and B are of equal
luminance, then the diatance of the mixture*a co-
ordinatea along thia line ia proportional to the relative
quantitiea of A and B. Thua the aaturation ia the
relative proportiona of vhite and mono^ chromatic light
of wavelength X^> needed to match the colour Cx,y) •
Should X . be undefined aa it ia for purple coloura - then dthe complementary wavelength X^ may be obtained by
extending the line in the oppoaite direction»
IMiform Colour Spacea and the Colour Difference Formal
A uaeful property that the Standard aye tern lacka ia that it
ia not uniform; that ia, colour differencea which are in
practice judged to be equal do not yield trichromatic co-
ordinatea of equal aeparationa. Thia ia particularly
inq»ortant aa Juat-Noticeable-Colour-Differencea correapond
to quite different aeparationa in different parta of the
diagram. It ia thua not poaaible to atate directly from
Standard Syatem calculationa whether or not two alloya are
aubjectively indiatinguiahable. The CIE 1960 Uniform Colour
Syatem haa been uaed in attempt to relieve thia problem.
The alternative co-ordinatea (u,v) replace (x,yT ~
4X 6YX+15Y+S X+ISY+Jz
where the quantitiea, X,Y and Z are aa defined above. Thia
ayatem may be uaed to prepare colour diagrama in which equal
colour differencea are repreaented by equal lengtha.
However, even thia ayatem doea not enable differencea inm
(4.5a,b)

'>■ ''.Tin’s.. ■ ' ».47'. t. t . ‘' f
71
Ituninance to be included. For this purpose, the CIE
1964 Colour Difference Formula has been used -
U 25YVs - 17
V* - 13W*(v - v^)it it , VU - 13W (u - u )
wh.te (u ,v ) represents the schromstic stimulus. Then o o
4B - J((Di* - 02*)* ♦ (Vi* - V2*)^ ♦ (Wi* -
rhnir of Reflectance FunctionThe reconmcnded methods for measuring simple reflectance
involve non-specular scattering, typically by illuminating
the ssin)le at normal incidence and measuring the scattered
flux at 45°. In the traditional applications, which may for
instance concern coloured fabrics, paints or tiles, specular
r.fl.ction would result in saturation being grossly under*
estimated due to the sheen or gloss of the materials. Colour
measurement is often made at the quality control stage of
manufacture, where variations duo to sajq>le finish ate as
important at those due to coagiositional or structural
differences.
in this study of th. noble alloys, an attempt has been made
to isolate the effects of alloy com>osition from those of
surface finish. For this reason, rather than try to produce
saiigil.s that would give a strong non-speculat reflectxon
(by finishing with an abraded surface), the usual specular
reflectance has been used. Hormal reflect«ice has been cal
culated from th. optical const«it. at w»r.l«igth. throughout
the visible r«.ge, with 5nm intervals. In order to inv«tigate
72
1.1
the effect of the eagle of incidence Cor reflection) on
celculated colour co-ordinates, Fresnel's relations have
been used to calculate the angle-of-incidence dependant
reflectance.
Some consideration has also been made of the effect of
surface roughness on the computed colour co-ordinates.
Beaglehole and Hunderi (1970) have made an extensive
investigation of the effect of micro-roughness on
measured spectral reflectance, considering the effect
of surface plasmon excitations as well as the effect of
roughness period when this is of the order of a wavelength.
They have found that short range roughness reduces the-4iro
specular reflectance by an amount proportional to e — j— ,
which would make the reflected beam redder. However, when
the roughness dimensions are much larger than a wavelength,
the common observation (the "Tyndall Effect") is that
scattering is independent of wavelength. In this case,
one would still expect the scattered intensity to depend
on the absorption of the material.
If diffraction effects are neglected, then light which enters
the eye having been scattered from an (opaque) metal surface
may be considered to be composed of a mixture of beams which
have undergone different numbers of reflections at the surface.
For exasçle, some light will be directly reflected from the
plane areas between large scratches, while some light may
be reflected from each side of the scratch in turn before
escaping. For samplas observed under diffuse lighting
conditions, the fact that these beams will be scattered in
i41 "-IIV- ‘.' jV n ■ - - ' V'.*'• '■ ' UV<4“-*-'*,' V-* . jb . • *
■'4;
different directions is not important. Accordingly, an
attempt has been made to describe the properties of grossly
rough surfaces (such as those produced by abrading vith
emery paperX, by replacing the plane~surface reflectance
R(X) by a rough surface fxinction R (X);
7 3
B*(X) - R(X) “
where n is an integer.
(4.8)
The automatic ellipsometer described by Meadows (1975) and
Roberts (1974) has been used to determine the ellipsometric
parameters ^ and A for light reflected from the polished
surface of each of the noble alloys. The actual quantities
measured are angular displacements of a pair of prisms, the
Polariser and Analyser, these values being denoted P and A.
They are simply related to Y and A only if a perfect compen
sator is employed, that is, one which introduces a phase-
shift of exactly 90®. Should this not be the case, then the
coiq>en8ator error should be determined and a set of equations
given by, eg. Hunter Eaton and Sah C1970) used to correct
the readings. In this investigation the achromatic quarter-
wave rhomb described by Clapham, Downs and King (1969)
provided e phMe-shift of 90® ± 0.1® throughout th. visible
spectrum aad so no correction hes been applied. With the
compensetor on the incident arm, f and A are given by the
following eaqpressions.
y - 45eO - A P - 2A (4.9a,b)
«Id A represent, respectively, the relative amplitude change

74and relative phaae'-ahift of the p and a components of the
light. The coiq>lex quantity p is defined (on the Muller
(1969)convention) by
p ■ tan ¥ eiA - R /R p a (4.10)
where R and R are the complex amplitude reflection p acoefficients for p and a polarized light, p exactly
defines the ellipticity of the reflected light.
The .amplitude reflection coefficients for reflection of
plane waves at a mathematically sharp, plane interface between
two semi-infinite, homogeneous and isotropic media are
given by Fresnel's relations:
r*! ■ “ njcos 0x “ sin(0 x “ 0 ) (4.11)
n cos 0 + n|cos 0j sin(0x ♦ 0 )
r^X • nxcos 0^ - Q^cos 3x ■ tan(0^ “ 0x) (4.12)
nicos 0 + n cos 0x tan(0^ + 0x)
rox refers to the reflection of light passing from the
medium of (real) refractive index n^ to a material of
conq>lex refractive index nx. angle of incidence
and ii is related to the angle of refraction. It is
obtained by the use of a generalisation of Snell's Law:
n^ sin 0 o o nx «in ?x • “j (4.13)
Clean substrate equations
These e:q>ressions for r* and r^ are applicable directly
in the case of reflection from polished, bulk metal samples
provided that there is no contamination or corrosion of the
surface. They may be inverted to give an equation for nx.
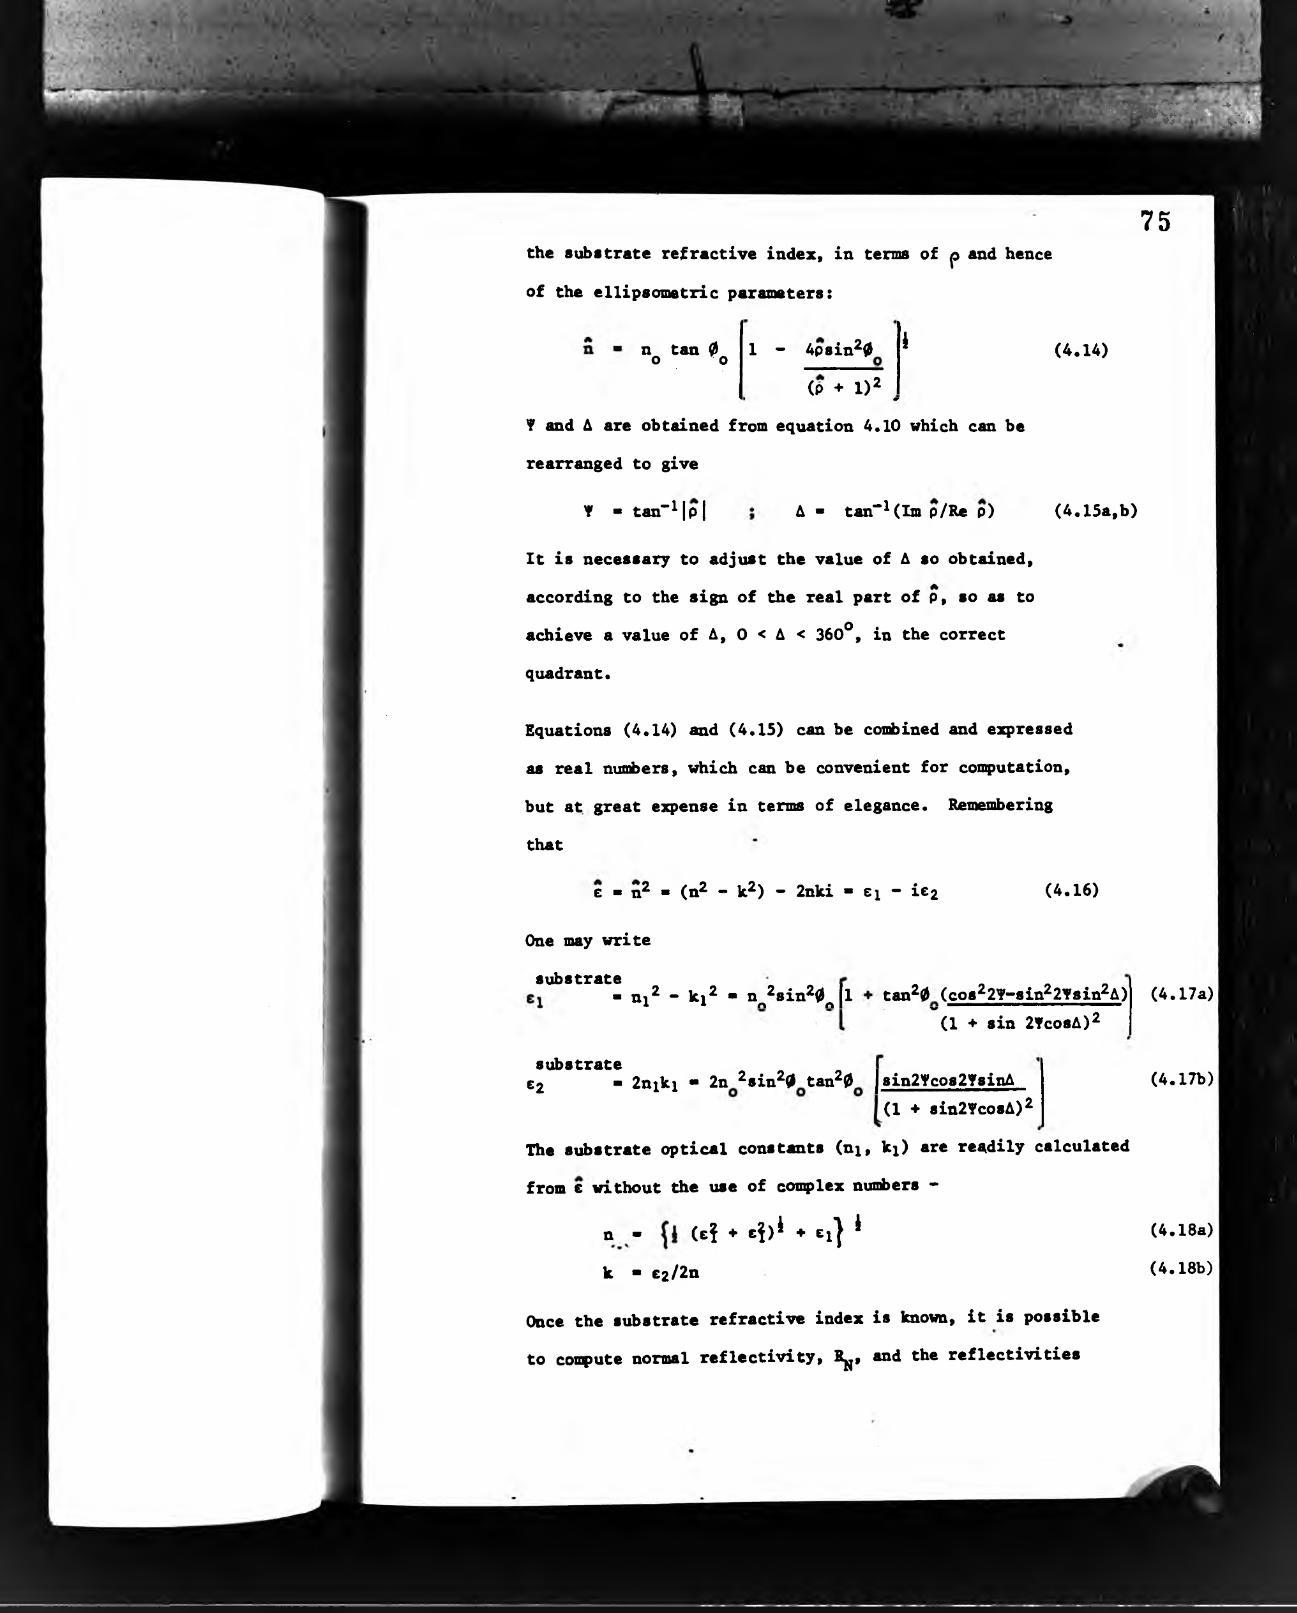
-i. f*, '-i '>'¿1K-Ci:v.Y ^ . EL*? ■ n- '
75the substrate refractive index, in tema of p and hence
of the ellipsometric parameters:
n tan 0 o • o 1 - Apsin^0 i (4.14)
(P + 1)^w
V and A are obtained from equation 4.10 which can be
rearranged to give
¥ ■ tan”^|pj A • tan~^(Im p/Re p) (4.15a,b)
It is necessary to adjust the value of A so obtained,
according to the sign of the real part of p, so as to
achieve a value of A, 0 < A < 360^, in the correct
quadrant.
Equations (4.14) and (4.15) can be combined and expressed
as real numbers, which can be convenient for confutation,
but at great expense in terms of elegance. Remembering
that
e ■ n^ - (n^ - k^) - 2nki ■ ei - ie2 (4.16)
One may write
substrate- nx^ - kx^ - n^^sin^0^|l tan^0^(cos^2Y“sin^2Ysin^A)
(1 **’ sin 2TcosA)^
substrate62 ■ 2nxkx “ 2n ^sin^0 tan^0 | sin2ycos2YsinA
(4.17a)
(4.17b)(1 + sin2YcosA)^
The substrate optical constants (nx> hi) are reedily calculated
from e without the use of coiiflex numbers -
n - (e? + €i)i ♦ ei] * (4.18a)
k ■ C2/2n (4.18b)
Once the substrate refractive index is known, it is possible
to compute normal reflectivity, Rjj, and the reflectivities

L*. '■ *
■''“^ '■ .- i" \- Etc '*
*C>-■' ••*,..
75the substrate refractive index, in terms of p and hence
of the ellipsometric parameters:
n tan 0 o o 1 - 4psin^0 ^ (4.14)
(P + 1)^
Y and A are obtained from equation 4.10 which can be
rearranged to give
Y - tan-l|p| A ■ tan”^(Im p/Re p) (4.15a,b)
It is necessary to adjtist the value of A so obtained,
according to the sign of the real part of p, so as to
achieve a value of A, 0 < A < 360^, in the correct
qtiadrant.
Eqtiations (4.14) and (4.15) can be combined and e3q>ressed
as real numbers, which can be convenient for computation,
but at. great expense in terms of elegance. Remembering
that
- n^ * (n - k^) - 2nki • ei - ie2 (4.16)
substrate , « o■ tii - ki^ - n ^sin^0 II + tan^0 (cos^2Y-sin^2Ysin^A) X 1 o o I o ——— —— — ——
(1 ♦ sin 2YcosA)^
substrate « « « .62 - 2niki - 2n ^sin^0 tan^0 |sin2Ycos2YsinA
(4.17a)
(4.17b)(1 ♦ sin2YcosA)^
The substrate optical constants (ni, ki) arc readily calculated
from 6 without the use of complex numbers -
n • (ef (4.18a)
k • 62/2n (4.18b)
Once the substrate refractive index is known, it is possible
to compute normal reflectivity, R^, and the reflectivities
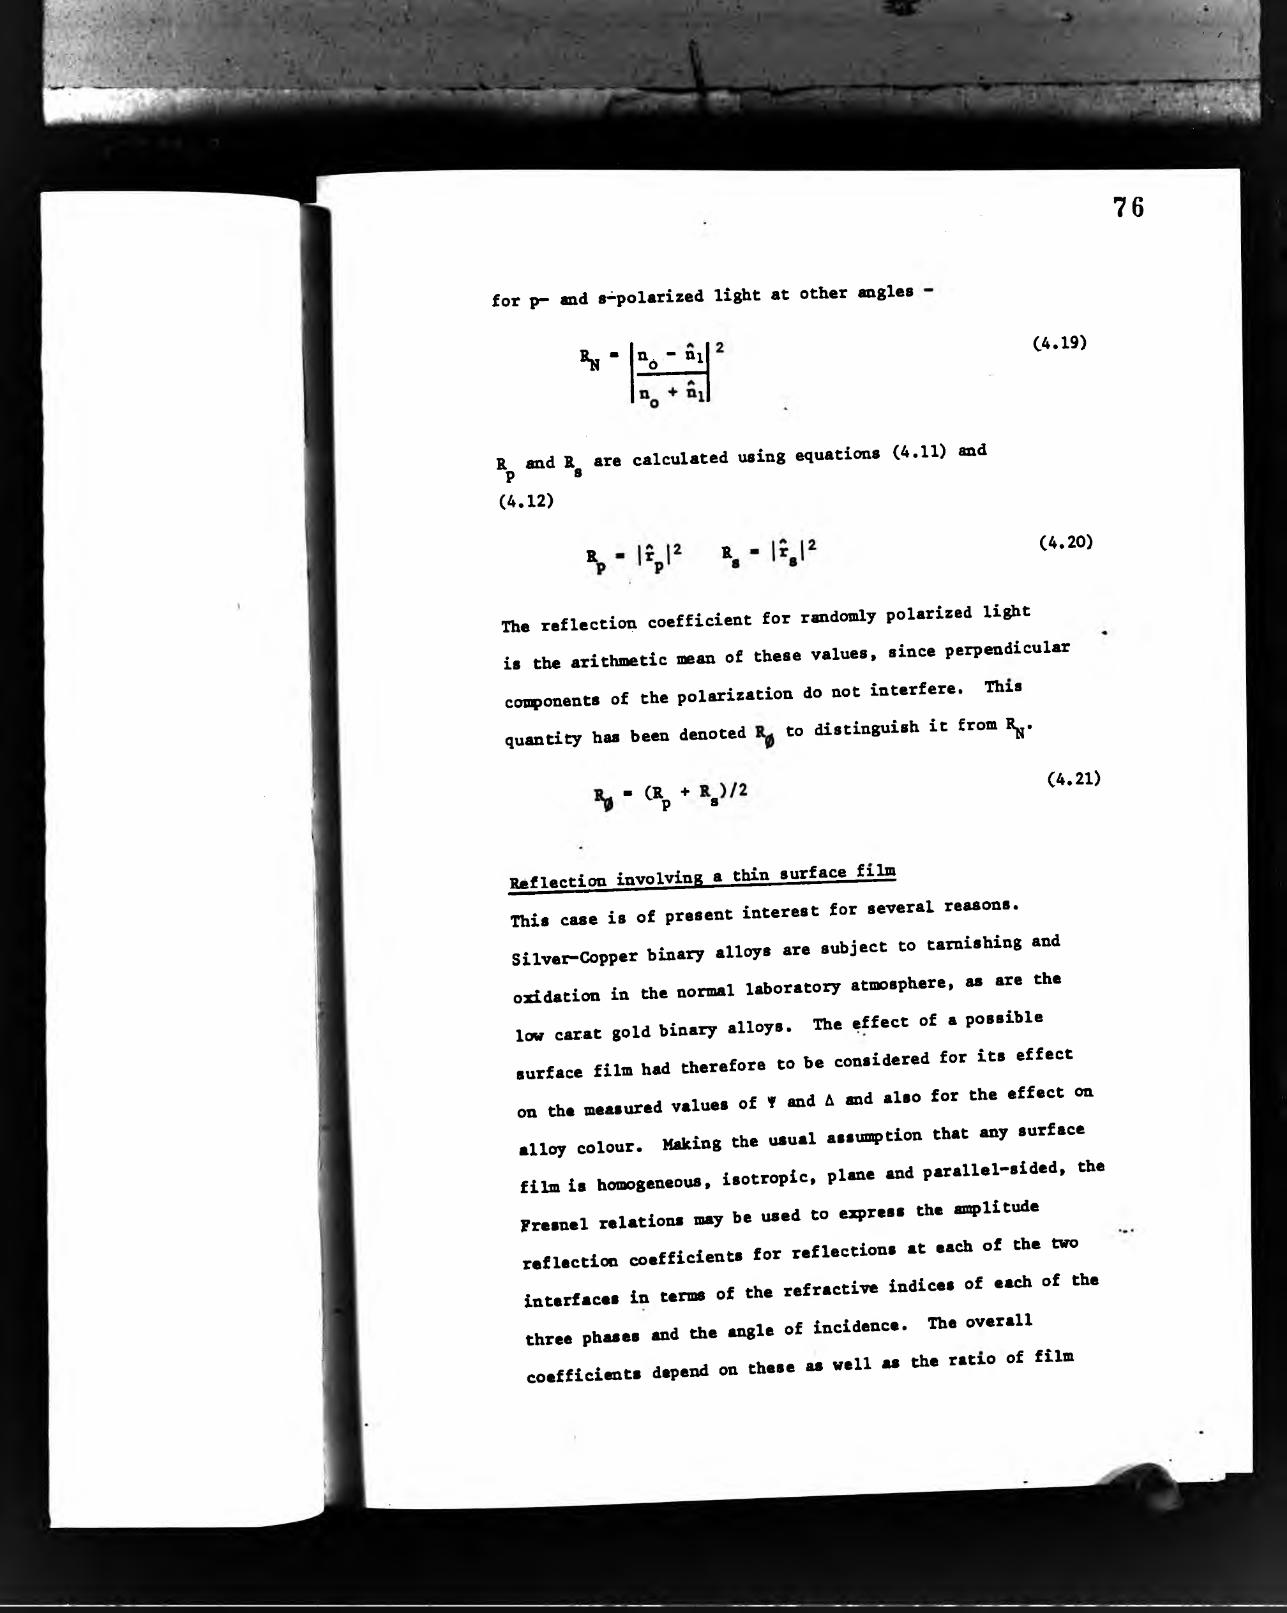
"h' /
76
for p- and a^polarized light at other angles
« N - n^ - ni C4.19)
R and R are calculated using equations (4.11) and P »(4.12)
R R (4.20)
Th. reflection coefficient for randomly polarized lijiit
is the arithmetic mean of these values, since perpendicular
cos«>onents of the polarization do not intarfere. This
quantity has been denoted to distinguish it from R^.
- CR„ +P ®(4.21)
Reflection involving a thin surface film
This case is of present interest for several reasons.
Silver-Copper binary alloys are subject to tarnishing and
oxidation in the normal laboratory atmosphere, as «ce the
10» carat gold binary alloys. The qffect of a possible
surface film had therefore to be considered for its effect
on the measured values of » «id A «.d also for the effect on
alloy colour. Mdiing the usual assumption that any surface
film is homogeneous, isotropic, pl«i. «.d parallel-sided, the
Fresnel relations may be used to express the msplitude
reflection coeffiaents for reflection, at each of th. t»o
interface, in term, of th. refractive indices of each of th.
three phase. «>d the ««!• of incidence. The overall
co.ffici«it. d«.«nd on these a. wall a. th. ratxo of film
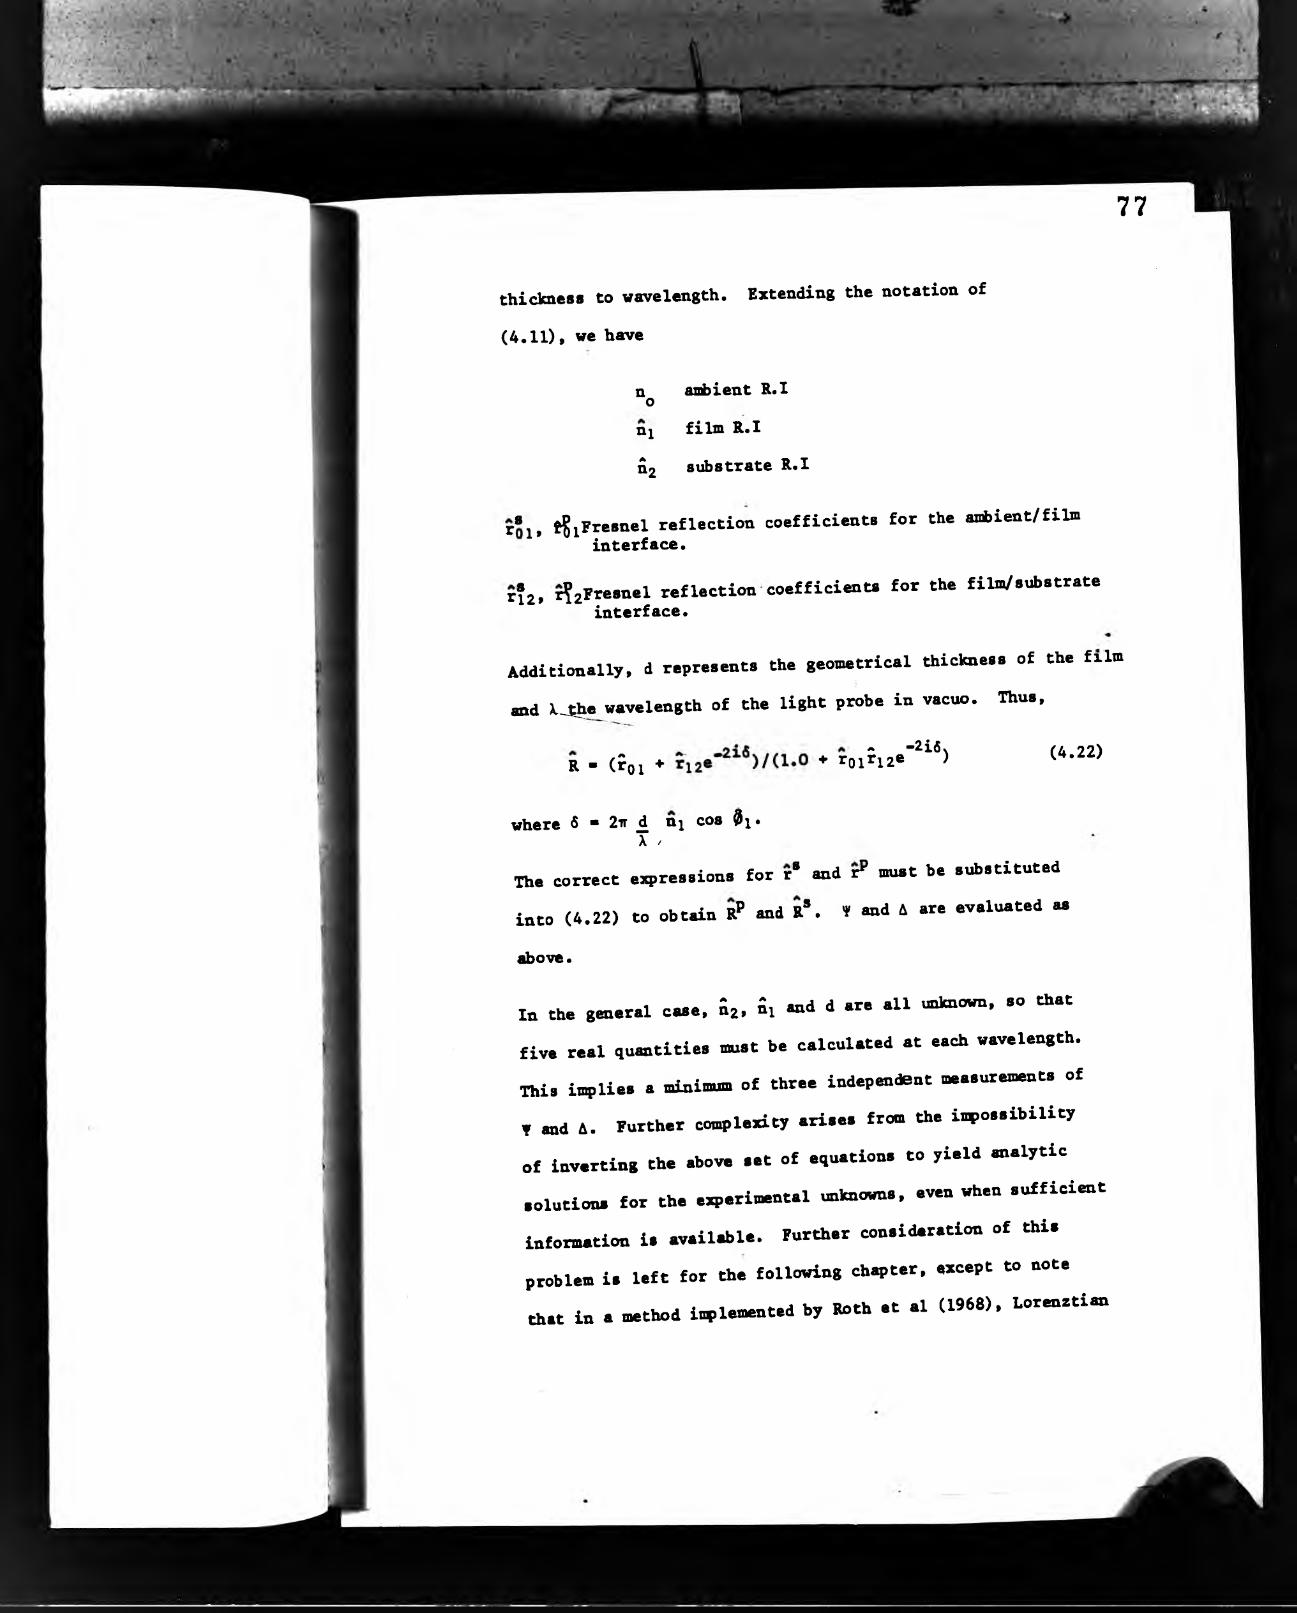
JW'■-c;. ¿“5!
77
thickness to wavelength. Extending the notation of
(4.11), we have
n ambient R,I oni film R.l
¿2 substrate R.l
r‘l. tSiFresnel reflection coefficients for the askient/film interface.
r?2» r?2F^e«^«l reflection coefficients for the film/substrate interface.
Additionelly, d represents the geometrical thickness of the film
and l ^ e wavelength of the light probe in vacuo. Thus,
K - (?01 + + '0lîl2®'“ “>-2ii, (4.22)
where 6 - 2ir ^ n^ cos 0i.X /
The correct expressions for r* and r^ muat be substituted
into (4.22) to obtain r" and r‘. » and A are evaluated ea
above.
In the general case. S2. Si «nd d ar. all unknown, so that
five real quantities must be calculated at each wavelength.
This implies a minimum of three independent measurements of
t and A. Further complexity arises from the impossibility
of inverting the above set of equations to yield analytic
solutions for the experimental unknowns, even when sufficient
information is available. Further consideration of this
problem is left for the following chapter, except to note
that in a method isplemented by Roth et el (1968). Lor«istiaa
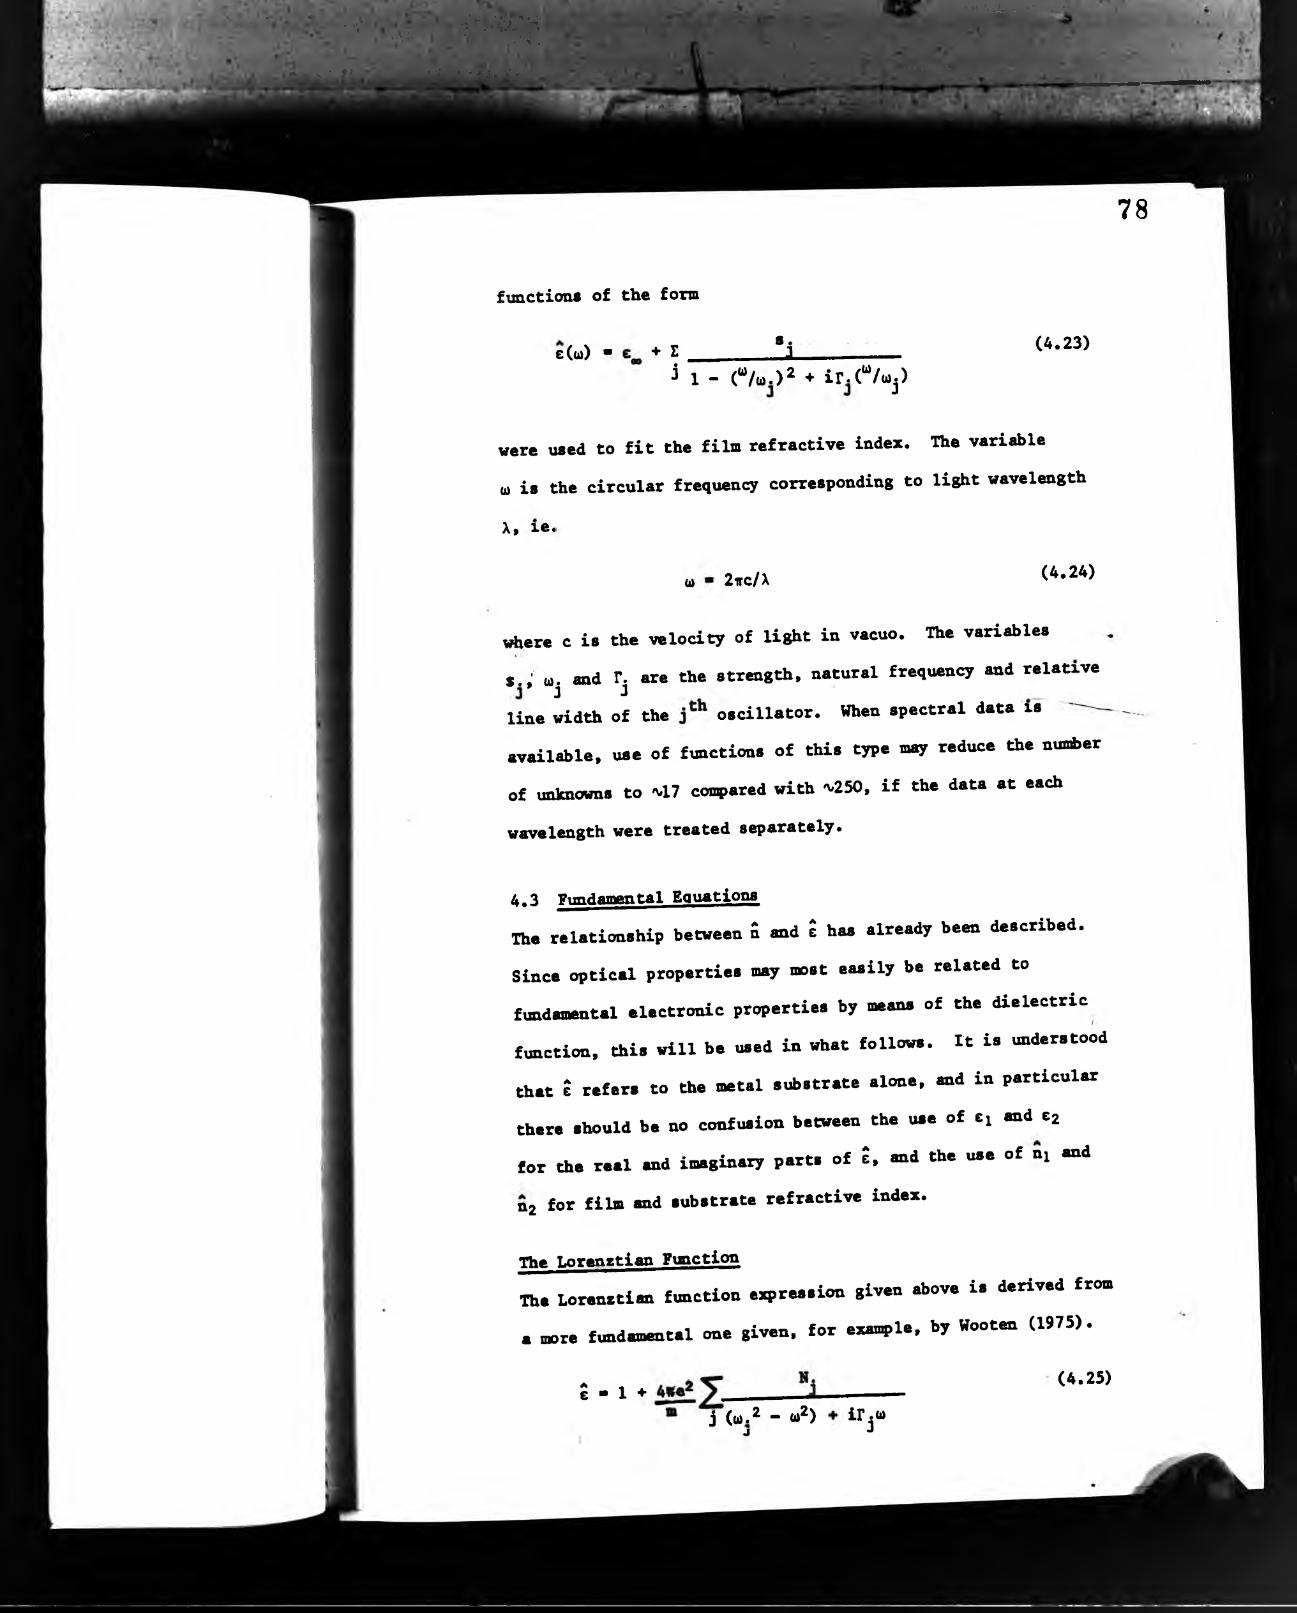
■ ■ ■ ‘ ' V i '.-'ix' S••V‘ . ..'x.1«. , s. '■ f t ’ ')'- ■ •. •■ »I. ' l l - : : - / ‘ i-2
*- p*.'*; •
. - .'ll' ’. ii*.,. T '. ■ , . ■
- t ' 4 J . •• v i- ji'-p irV ^
functions o£ the £on&
e(o)) - + Î i i (4.23)
j 1 - ( % . ) 2 + ir.(“/a,j)
were used to £it the £ilm re£ractive index. The variable
(I) is the circular £req\iency corresponding to light wavelength
X, ici
0) 2vc/X (4.24)
78
where c is the velocity o£ light in vacuo. The variables
s.,’ to»j and Tj are the strength, natural £requency and relative
line width o£ the oscillator. When spectral data is
available, use o£ £unctions o£ this type may reduce the nunfcer
o£ unknowns to ~17 compared with 'x»250, i£ the data at each
wavelength were treated separately.
4.3 Fundamental EquationsTh. r.l.tion.hip betw..n S aad Ê ha* alrwdy been deactibed.
Since opcieal propertiee nay most easily be related to
fundamental electronic properties by means of the dielectric
function, this will be used in what follows. It is understood
that ê refers to the metal substrate alone, and in particular
there should bo no confusion between the use of e; and £2
for the real and imaginary parts of ê, and the use of ni and
tt2 for film and substrate refractive index.
The Lorsnztian FunctionThe Lorenstian function expression given above is derived from
a more fundamental one given, for example, by Wooten (1975).
ê - 1 ♦ (4.25)
j (w.^ “ W^) i-fj“«J

■ .’I- v'.-t .v~: ••• . . . A ■V- ‘''-vV It ; i ;-V • v " ' . - ‘
* ■’ ■•*..■< i.' ■ ■ ■■ ■ '■ * ■ ‘ ' •'♦'»IL' '• -‘‘V. • Vj- * ' ■ • . ■
79
where a change of sign has been made to accord with
ellipsometric convention, which inqplies
e - ei - ie2
as distinct from the normal solid-state physics usage,
which has
a
c ■ ei + it2
N. is the nunber of electrons per unit volume contrib-
uting to absorption in the j*** absorption Una, is
the centre frequency, Tj « « “ absolute line width, and
m the electronic mass# Thus
S. - 4ire N. J _____1
j, relative , j. absolutey^^ C4.26)
Prude Eq.uatxon8_The long-wavelength optical absorption by noble alloys
can be approximated by a 'free electron' dielectric
function derived by Drude by considering only one
absorption process (or oscillator) with a natural
frequancy of sero. Hanipulation of the equation, and
substitution of'
(4.27)
H is now the nusber of 'free' electrons per unit volume.

-f
■’‘ . Ill
•' / ,;S
80
gives (a)
(1 + U^T^) (4.28)
62(b)
(0(1 + W^T^)
(I) is the *bulk plasnon frequency* and x the conduct- Pion electron relaxation time. In practice, absorption
due to quantuin-nechanical transitions involving electrons
not in the conduction band contribute additional absorp
tion. In contrast to the »free electron* behaviour of
conduction electrons, these are *bound electronb j b
processes and so the new terms are labelled ci and .
*f . ^b e ■ e + € (4.29)
Th. term ej’’ i" <*• values, of
u such that u~2eV, ie. for wavelengths longer than
•v650nm. On the other hand, ti’’ does not go to sero at
low energies but rather approaches a constant valua at
energies a long way below the onset of interbsnd absorp
tion. Equation (4.28(a)) should therefore be replaced
by
(4.30)
(1 + W^T^)
Where this ei is a low energy value, corresponding to
the same energy range as £2 * 0* i®* ®2 * ®2 •
Assuming - constant, then x may be calculated from
(4.28(b) and 4.30) without making any special assumptions.

■■* 's' T-d *■
r » :» ■•■.
ssFiiiiS!
mm
81
The equation
b(i»e2 ■ "lei **■
T T
indicates that x and ei'* may be taken from a graph of
ta)C2 versiis ex« In the limit 0)X>>1 »
C4.31)
C4.32)
So that, given x as above, Wp may be evaluated from a
graph of €2^ versus It is found that this
expression does not very well describe £2^ for noble
metals in the near infra-red, so that for some purposes
the cubic relation is relaxed and a power-law express
ion tised instead:
62*0 «(I) « A
Interband AbsorptionThe eoMtant of proportionality and power coefficient m y
be found from a logarithmic plot, although they do not
appear to have much physical significance. Once obtained,
they can be used to extrapolate t2* to higher energies
where €2** > 0, enabling the background £2* to be subtracted
from that experimentally determined.
C2'* • C2 " 62
This aids interpretation of the spectra.
'' ' ‘{V'.> *•• » » * • « . ' * ♦ 4
»cv- i • *.' • -- ; «^-4. *
82Plasma OscillationsThe bulk plasmon frequency u^, mentioned above, corresponds
to a frequency cb - o)p at which ei 'v 0 , as can be seen by
substitution in (4.28(a)). In practice the existence of
ei^ tends to alter the relationship a small amount, but
at this frequency it is possible to create large period
oscillations (plasmons) in the conduction electrons.
Unless C2 i* also small, these oscillations are of low
amplitude and little importance, but when they occur they
are capable of absorbing energy and by altering the
electric field inside the metal invalidate the use of
the Fresnel relations. A function of e, known as the
bulk plasmon energy loss function
Im ^/e
. can be calculated, which .hows the frequencies when this
is likely to be e problem. The position of the peak in
this function is found to vary with alloy concentration.
(4.33)
Oscillation, of the conduction electron, are also possible
in the surface of a metal. In this case the natural
frequency is that at which tj 1 . and the 'surface pla«»n
energy loss function» may be computed:
Im '/(t + 1 ) (4.34)
Electromagnetic radiation will not couple to\perfectly plane
.«spies, but may set up surface pla«»n. in rough sample, which
nedify the dielectric function. It will be seen from equation
(4.27) that <i> depends on the electronic mass.
In the quwitum mech«iic.l picture electron mass

. r. ' V-
is a function of band structure, so that an effective*
electronic mass m , where
m 4irNeU)
83
(4.35)
is applicable here. Calculation of this can yield
information about Fermi surface topology.
Optical Conductivity
Son. worker, in «tal optic, particularly thos. who
atudy conduction electron rf>»orption in the infrarred,
axpr... their reaults not in term, of a com>lex die-
electric function but aa an opticl conductivity (o)
or coin)lex optical conductivity (5 - oj - i<»2) • ^hi»
i. a consequence of the way lhawell's Equation, are
applied to the problem. If one .tarts by considering
non-absorbing, non-conducting media having real die-
electric functions, and then generalises by allowing
the dielectric function to take complex values, then
the system that has been c e d here may be derived.
Alternatively, if the conduction of the medium is con
sidered from the start, then equations analogous to those
used her. result, but in which the expression
replace, the cosplex dielectric function 1. Thu.
- c and 62 ■u
(4.36)
It is .1.0 possible to study optical properties by g«.-
eralising the direct current trmispott «luation, derivxng

i.t ¡céí*;:,-.
ífi’■■ -•' . ■'•
a complex optical conductivity (which is a free
electron conductivity)
a • cj /(I + iu)t) oC4.37)
84
4,4 Optical Properties of 2*"Phase Alloys
Host of ths Ag-Co alloys studied were not in the fairly
narrow solid solution ranges of this system. For this
reason, the assumption of homogeneity may not be made
for these alloys.
The Maxwell-Garnet TheoryPrevious workers on isotropic homogeneous systems have
esg>loyed a theory derived by Mawell-Gamet in 1904. He
treated the case of small metallic particles embedded in
a dielectric, assuming that the particles were small
cosg>ared with a wavelength, that they did not interact,
and that they are spherical. He derived the following
relation:
~ ^matrix q emAtal ~ ^matrix.(4.38)
'e££ 2ematrix ’’metal 2ematrix
where q is the volume fraction of matal. This may be
readily extended to the 2-phase alloy case by allowing
e to take cosgilex values. The equation may thenmatrixbe solved for 2,^j. if measurements are available o
the saturated solid solution dielectric functions, and
q can be independently determined. It should be noted,
howev«, that various assumptions do not seem particularly
likaly:

■jCiV'.-'i■ - Ä
•.’.'■1. -1!
85
(a) The minority phase is not in general in the
form of small spheres, although spherodisation
may take place on anneelings
(b) The particle size Cor grain size) is, in general,
rather longer than a wavelength;
(c) The dielectric functions of the two phases may
differ from those of bulk solid solutions of the
same composition due to size effects.
Interference between reflected beams
For the epeciel case where the size of the crystallites
is much greater than either one wavelength or the penet
ration depth in either phase, an alternative sis^lifyiog
asauiig>tion presents itself. Provided that the light
bean is coherent and large enough to sanple a repräsent
ativ« region of the sanple, and is focussed down to a
,™ai spot on the detector so that interference c m occur,
then the weighted «erage of the «„.litude reflection
coefficients will be measured.
/I r C4.39)i - Cl - q )r *P P
$- C i - . q ) V * ^ ^ P
Th. retio of surface areas is equal to the ratio of volunes.
as before. This hypothes;s nay be tested by coBg.aring the
,u«.tities thus calculated with those detemined by separate
erperinents on the two phases. A. the reflection coefficient,
are function, of m g U of incid«.c.. th. -effective- di
electric function Cwhich nay be cos^uted by applying th.

•■■■■' Vi
<*•>< • • » ' ■
86
ellipsometric relations with equation 4.39)> will also
depend on angle of incidence.
Addition of the Dieledtric Functions
A particularly simple way of forming an effective die-
electric constant, applicable to the extreme microscopic
case of mixed media, is simply to form a linear addition
of the dielectric constants of the 2 phases:
- Cl - q)e® + qe^
When the difference between e® and e® is small, this does
not give vastly different results from either the Maxwell-
Garnet Theory or the interference model.

' .’ ' V-V,■ ■ V * • ■• ■ \'i:
J6£*i
i «li -■♦i
kV'«
87
5. COMPUTATION
5,0 GénéralCo-putet progr»» for the « l y l . of eUlp.om.tric det. have
been detigned by ..verel author.. Perhap. that of McCracken
(1969) of the National Bureau of Standard., Va.hington, i.
the » . t con.rehen.ive «id uldely need, while thoee of
Schueler (1969) «id Both et .1 (1975) appear to be the moat
powerful. Broadly, the., program. c«i he broken down into
two type.; firatly, there i. the large group of calculation,
that can be performed «lalytically, and ..condly, the .mailer *
group that require numerical technique.. The firet group ha.
included (i) computation of aubatrate refractive index fr
film-free ellip.ometric data, (Ü) coH-utation of film thick,
n... from ellip.om.tric data and a complete a.t of known
refractive indice.; «id (iü) computation of ellip.om.tric
par««t.r. for a coH.let.ly daf««-» » y « “ - ”film-free. Until recently, ellip'.ometry ha. been performed
almoat occlu.iv.ly at .ingle .«..length, in the vi.ible,
typically 546.1nm, ao that there ha. h.«i no r«mir««nt that
apectral data, obtained at a large nuiN.er of wav.l«igth., be
conv«iiently handled. Similarly, there ha. be«i no nec.ity
to coiHut. function, «.ch a. optical conductivity, reflectance
or the dielectric function. The equation. giv«i iu Chapter 4
„able aixte«! uaeful function, to be calculated, dep«»ding
on the choice of aix indep«id«it variable.. At the beginning
of the investigation, it was not clear which of these would
B. of moat intere.t «id u.e in the «lalyaU. It w « decided
to provide a fr««ork in which choice, could be readily mad.
wh«i the coH.ut.r pxogr«. wa. run, rather th«i deaign a
.iH.le*. though rigid, progr«. which would reduce freedom of

choice at later stages. As well as a large variety of
output functions, there was a large amount of data to be
specified. This included analyser and polariser readings
at 134 wavelengths in each experiment, angle of incidence
and ambient refractive index. There was also the question
of presentation of output. Rarely is it desirable merely
to produce a large printed table of results, as often
graphical output is more readily understood; or perhaps
the spectral data may be summarised in a small number of
quantities such as relaxation time or colour co-ordinates.
Again, there is an area of selection even in the exact
way this is done. For instance, there is a choice of
illuminant to be made when performing CIE calculations,
and a choice of axes when producing graphical output.
In the program to be described, all these choices may be
made by presenting appropriate data to the program at
run—time.
IUth.r different eoneidereeion. epply to the problen of
obteining filn or eub.tr.te dielectric function, from ellip-
.ometric «..urenent. on filmed sy.ten.. The neceeeer;
det. teke longer to ecquire «id .ince the equation. h « e
to be .olT.d nunericelly. the calculation, are much more
„,en.ive and al.o take a great deal longer. It i. therefore
practical to .p«id more time preparing each calculation .0
that a eophiaticated run-time eyetem. i. not r«,uired. For
thi. reaaon, unlike the McCradeen progr»». thi. ..pect of
analyai. i. performed by entirely eeparate progr««. Once'
dielectric function, h n e been obtained which ecceptdbly

■r»
«1 r j - -■‘k •■ . m
describe the optical measurements, then further analysis
can be pursued using the analytic program.
89
' . i"-
5.1 r«i^iii.ttim of the Di.lectric Function
5.1.1 Cl.m «ubetrates
Th. coin>uter service at the City of London Polytechnic is
based on a DEC System 10 time-sharing computer manufactured
by the Digital Equipment Corporation. Terminals are provided
in the laboratories for research use, and disk storage is
available for programs and data. This storage takes the
form of disk 'files', to which the user assigns a unique
identification Cthe 'filename'). Data may be entered into
files, and corrected, using editing programs provided as
part of the system. This provides a convenient way of
t«ndling the spectral ellipsometric data, about 1,400 digits
per experiment. Thus measuremmits on a silver-gold alloy
may be stored in a file called, for example. "hG*D".
Given the experimental conditions, «»d the validity of the
Fresnel relations, knowledge of the clean substrate analyser
«.d polariser values is equivalent to knowledge of the
refractive index or dielectric constant. Also, it is
sufficient to give either the wavelength or photon energy
at which each msasurem«it was made. The program has
therefore been designed to accept various permutations of
data in the disk files, all of which are converted to
values of e(l) «henever th. data is used. Th. choice of
id) is to some ext«>t srbitr.ry, as for ex«,.le £(.) would
go iust as well,output, thus 'nn." indicates wav.lm.gth. "El" the real part
m m ^i i l i ' ■ ••, - ‘J i g 'w i? '*g I ‘V <TT J M
90
of th« subotrat« dielectric function, ti, and "B2" the
imaginary part of the dielectric function e*. Mnenonxcs
arc a U o uaed to specify the operation or operations that
are to be perform«! on the data. eg. "LIST" to print values
on the conputer terminal and "PLOT" for graphical output.
A logical syntax ha. be«i devised so that it is not necessary
to carefully format the snemonics, for example into standard
printing positions in the input data, as, instead, a syntax
scanning alogrithm can decode the data. This reduces the
choice, of error considerably, finally, mnemonic, are used
to specify data (or data file names), a. a further aid to
««.ory. A. an exaag.le. supposing the result, of «. .mperi««.t
on fine gold to have been «itered into a file called "AD",
then, after some essential preliminary dialogue with the
computer, a line of data such a.
PLOT WL, E2/SUBSTKATE:AU
will cause a graph to he produced of tid). using th. data
(A «td P value.) on gold from the fil."*«". SimUarly.
plot ENERG?, E2/substrate :AU
would cau»® ®
Although the gold data may have been taken from a cl.«,
substrate experiment, this doe. not limit th. application
of th. dielectric function so obtained. Mea.ur««nt.
« d . on bulk oxide (for ex«^U) ««» be »..d to provide
* .p«ctrum of n(X) which can than be u.ed aa »film* value®
in optical calculation®/f i l m: C020
y W . -ay .Pocity • *'**“ " *

■ '*1
K' f ' . :
91
experiment on CtaO, although it is a gross assumption that
the bulk values are applicable in the thin film ease*
nevertheless, this type of calculation can ba very useful.
As well as confuting ê at each wavelength in the data files,
interpoletions are made to match the data in different
files. This enables data to be cosçared, which may have
been obtained from different sources at different wavelengths.
Also, it mi^ not be necessary to provide as nmch data to
adequately define the film dielectric function as may be
needed to define the substrate dielectric function, since the
latter may contain more or finer structurée
A complete 'Dser's Guide' to the analytic ellipsometry has
been provided (Clarke 1978)#
A(X), P(X)
n(X), kCX)
ei(X)*62( )
f(X), d(X)
Internal Store Output
R(X)
ÿ (X1, A(X)
colorimetric quantities
electronic properties
5el .2 Filmed SystemsSeveral approaches to the calculation of substrate or film
refractive index for filmed systems have been tried. These
can be separated into techniques applicable at single wave
lengths, and one which takes advantage of the spectral nature
of the measurements made on the automatic ellipsometer.
Hessiirem^ta at a single wavelength
Initially, following the method of Shcwchun and Kowe (1970)
it was hoped to compensate for the presence of surface films

'*4 ■• ir * ~
• ••. ■ ’
and coin>ute accurate aubstrate refractive indices, while
aiiwltaueoualy deterndning film thickness end refractive
The method involved successive guesses of substrate
n and k and film n and k. At each guess, values of complex
film thickness were determined using the experimental »
and A at several angles of incidence. The guesses were
generated aiaply by incrementing the two pairs of optical
constants over a specified range. When the modulus of the
imaginary part of the computed thickness was a miniimim,
Chen a new iteration was performed using smaller increments
over a narrower range. Another criterion employed was that
the standard deviation of the computed.thickness be a
Thia procedure was followed until, at the
minimum, the real part of the thickness gave calculated
y and A within experimental error of the measured values.
The method amounts to a pattern search for the minimum of
th« error fuaction
f(n2,ni,'f,A> 1« I
eltemated with minimising s(Ke S^); s is the standard
deviation. During this search no use is mmle of the
detailed behaviour of the function f, for instance by
calculating approximations to derivatives, end, although
convargence is limited to a small set of solutions by the
limits put on nz and Si, convergence is not guarsnteed. An
att«.Vt to isg-rove the algorithm by using a gradient
following algorithm was made. This required calculation
of the partial derivatives;
92

• ri-
.r /rXi •■-■•<. \ :\.-
, vtv; .,,.s'
■ : J
3f , 3f , 9n][ dkj dxi2 9k2
These were approximated by differences, and therefore vere
not of great accuracy. Although some ing>rovement was made,
difficulties caused by this inaccuracy prevented coopletely
satisfactory convergence. As an additional step, minimis
ation of the least sqxiares error function.
Ç (,_c.lc _ ».«>pt) 2 (¿.«ic _ ¿_«ptj2J J j J J
was included. At this stage it became clear that the coiq>uter
program was evolving in the direction of those of Schueler
(1969) and Oldham (1969), which seek to minimise the error
function
£ . Î I î.“i<=-5.“PVpin order to solve simultaneously ■ tan exp (iA^), for
j Indépendant measurements. In Schueler*s work, these
involved using 3 angles of incidence, while Oldham employed
pairs of similar films of different thicknesses. Both
workers used traditional minimisation methods - Newton’s
and Gauss* - which require partial derivative calculations.
Experience showed that estimation of these by differences
could not be relied on to be of sufficient accuracy, while
analytic solutions would be of great complexity and of small
generality. In order to produce an algorithm of general
usefulness and ready adaptability a minimisation method which
did not require derivatives was sought. That of Powell (1964)
has achieved wide acceptance as an economical and reliable
technique, and was also quite readily available. Oldham’s
93

94and Schueler's ideas were combined, the new error function
being
£ calc _ y expt^tij ij f + (A.* ij
calc emptj2
where i labels the various angles of incidence and j
various films. The resulting program was tised to confirm
Schueler's result that multiple angle of incidence
measureiDents are of little use for films of gold of less
than 20nm thickness. The error fxmction given above requires
slightly more computation than that of Schueler, but it is
felt to be conceptually siiif>ler and gives equal weighting to
fhe experimental angles which are determined to similar
accuracy. Johnson and Bashara (1971), who employed Schueler's
program, indicated that minimisation of f (ac)» where (in their
case)
sometimes gave results with 0. This is not surprising»
as the method will search the vector space for a solution,
i®, for values of n, k and d over the entire field of real
nunters. Apart from the lack of physical significance of
such answers, mathematical difficulties are likely to result,m
as the equations give rise to attenpts to find square roots
of negative nunfcers. This can be avoided by minimising a
function f(w), where ^

95
With this modification, the algorithm successfully found
solutions for n2, hz d for an experimental system of
TiOz on silicon, with d ■ 65nm, X • 500nm, and employing
six angles of incidence. Since derivatives are not
needed when using Powell’s procedure, it is a simple
matter to vary the choice of adjustable parameters
according to the amount of data available. Thus in the
new program, the vector w may he selected at runrtime
from any of the elements of
(n© ni^ ki^ 03 ka d^)’ ^
*T* indicates the columa vector.
As found by Schueler, difficulty occurs if k^ is small
C'v 0.05) and \mknown, making it iin)0ssible to obtain ni
and ki to great accuracy. However, if ki - 0, and this
is known a priori, only ni and d need be found, and this
can be done quite precisely. Thus for the Ti027Si
system, a wavelength in the range 700-800nm was employed,
at which ki could safely be set to zero. The thickness
so computed was then used at shorter wavelengths to provide
e spectrum of nj, ki values. This technique was much more
robust than that of finding all three parameters simultane
ously by multiple angle measurements, giving rise to no
extra confusing solutions. As a further refinement, Oldham’s
idea of using two films of different thickness but (assumedly)
the same refractive index to reduce indeterminacy was
incorporated in a generalised way into the multi-angle program.

■ - ■ . , ' . >:,■ . ■ fc < v<' . 'h / ’
i'iV - . i
By 't ' * .; • -v r ~ V'.
The new error function was thoi
96
f(w) ? " ♦ a » “ '“-• 1—1 ^i-1 j-1
Note that aa A is a periodic function, it is necessary
to evalxxate - A**^^ modulo 2tt. No w w is selected
from
(n^....k3»d^ d2»»** d^)
It must be remenfcered that the assumption of similarity
between two or more films of differing thickness is - at
best - tentative, perhaps unlikely to be frequently
correct in practice.
Another way of reducing the possibility of finding a local
minimum in the error function (which may be far removed
from the optimal solution) is to constrain the values that
the unknown quantities may take, but this has not been
incorporated in the final algorithm. This may be done by
constant inequality constraints of the form aj<Xj<bj,
where is an element of x (ie. n, k or d) and a and
b. represent reasonable lower and upper limits the
quantity x^ may take. Use of a general purpose unconstrained
optimization algorithm may be retained by a further trans“
formation of variables (Box, 1966)•
1 ^ “ 1 ‘
so that

<T> - ** V A -. u
Beduction of film growth curve data
A conmonly used msthod (for ex&nplo» Osborne 1979» Ross 1978»
Hayfield 1961) of obtaining film optical constants involves
measurement of (^»A) pairs at many stages during growth of
the film. A family of (^»A) loci is then calculated for
VA7XOUS assumed film refractive indices» and that which most
closely corresponds to the experimental curve supposedly
indicates the correct R.I. It was hypothesised that this
tedious and inaccurate method could now be replaced by an
optimisation approach based on minimising the error function
n ^f (ni»ki) - dj I
by adjustment of n^ and kj • The conplex film thickness dj
is calculated for each pair of (t»A) measured using an
inversion of equation 4.22. In practice this approach is
fraught with pitfalls» as many values of the optical constants
satisfy the error condition. This can be understood in the
graphical picture» for suitable (very small) values of k
result in the locus of filnr-growth values passing very close
to all points in the (y»A) plane. The method can be made to
work only by applying very tight constraints to the range
of permitted values of n and k.
97

Arÿ
98
V
Spectral Ellipsometric Mèasurèments - Lorenztian function fitting«
Little interest in spectral ellipsometry seems to have been
shovn from the early work of Bartell and Churchill (1961)
until recently (Aspnes 1976, Roth et al 1975). An isolated
paper by McBee and Kruger (1969) discussed the application
of this technique to the problem of thin film characterisation,
but without the success that was hoped for. It was found that
even with an independant thickness determination, there was
still difficulty in obtaining a unique result for each film
refractive**8pectrum, using the then current techniques of
analysis. A continuity condition on ni and ki was inadequate
to resolve all the ambiguities in data interpretation. Roth
et al (1975) have since shown that the independent thickness
measurement is unnecessary, since assumption of an incorrect
film thickness leads to nonrcausally related ni and ki spectra.
Thus, by the Least-Squares (LSQ) fitting of a Lorenztian function
to describe the film, it was possible tb calculate ni(X),
ki(X) and d. Of particular interest here is their demonstration
that their method is applicable to the Ag20 on Ag system. In
the present study Roth’s method has been extended to include the
possibility of data at several angles of incidence as well as at
many wavelengths. Particular values of the Lorenztian function
at each wavelength may be xised as starting guesses in a
similar LSQ fitting of each data point, and further serve to
rule out alternative solutions.
Th. form of th. Lor«i*ti«i function u«.d i. .inilM to that
of V.tUur (1968) who o..d it in coim.ction with th. reduction

of reflection data. Unlike Roth, a tranaformation haa
been uaed to prevent the oacillator parametera from taking
\inphyaical negative valuea. Again, thia haa two effecta
aome non*”opti]nal aolutiona are eliminated and calculation
errora are avoided. For a aingle oacillator fit, the
vector of adjuatable parametera conaiata of
i
Theae acalara are of order unity except for (500nm for
viaible data) so appropriate scale factors were used.
The quantities are the oscillator strength (s), centre
wavelength (X^), relative width (r) and the high frequency
contribution to the dielectric function itj.
99
5.2 Calculation of Optical Functions
Once substrate and film dielectric functions have been
calculated by the methods of section 5.1, it is possible
to coi^ute many functions of the constants of the system
(n , ni and nz) and of the geometry (♦» y)* describe
th. .fftet of th. .y.tem on »pocoUrly t.fX«ct.d light.
ThM. include K, (noinel reflectivity), R, (inteneity
reflection coefficient for light polerieed perpendicular
to the plane of incidence), R, (ditto for parallel polar-
iaation), » and 4 (the ellipaoinetric paramatera) and A and
P (the ellipaonieter analyaer and polariaer reading.).
' M-r>:. ' it iVi '
. • * ‘ _
The calculation, \iaing the equations of Chapter 4,
is straightforward using a digital cong>uter. In the
present application, complications again rise because
of the spectral nature of the data. Since the amount
of data involved precludes a once-andrfor-all production
of comprehensive tables of these fimctions, and since
the con|>utation is now relatively cheap, a computer
program has been devised which scans loosely formatted
'command strings' — run~time data ~ and then performs
the required calculation. The same program which
reduces clean substrate ellipsometric data to a
dielectric function may be used to obtain graphical
or tabulated output of optical functions, for instance
by a command such as
LIST WAI^IENGTH, BNORMAL, PSI, DELTA
It may happen that substrate data is very much more
highly structured than the film dielectric function, or
y^ce**versa, so that while ''*1CX) data points between
X ■ 250nm and X - 850nm may be needed to accurately
define n2(X) for copper, fewer than this may be enough
for ni(X) of CU2O. Again, it may be singly that only an
inconq)lete, albeit still useful, film spectrum is avail-
able, or that the ‘available spectra have been measured
at different wavelengths. In the early part of this
study measurements were made using the several lines of
a high pressure mercury lamp, the wavelengths of which
have not been used subsequently. Monochromator recalib-
100

> V - . c . .».w
S&j'' ■■‘' V ■.,'- ' t-
StV»— ■ , ' ..i
101
rAtloQ may also cause Inconpatibilities« The
conputer progYam has been devxsed so that when a re<iue8t
is made to perform a calculation involving incompatible
sets of data, quadratic interpolation is automaticallyA A
used to furnish values of n , ni and n2 at each wave*olength. Whenever this is done, a warning message is
printed to indicate the necessarily approximate nature
of the results.
The same procedure is applied when computing an effective
dielectric function, for example using Maxwell Garnet’s
theory.
5.3 Intrinsic Spectral Substrate Functions
There are several other fxinctions related to the dielectric
function of interest to the solid state physicist. These
include ef (the ’free*, conduction electron or intra-band
contribution to €2) • (the ’bound’ or inter-band coiig)onent),
ImVe (the bulk plaamon energy loss function), Im
surface plasmon energy loss function) and a (the optical
conductivity). Cong>utation of these values may likewise be
requested of the same computer program using function
mnemonics -
«g. PLOT WAVELENGTH, E2B
S.p.r»tion of €2 i»“ «2 “ d t\ i. po».ibl. for nobX. n.t.1
alloys if the data extends to a region (X-veSOnm) where
£2 0. Simple theory indicates that in this case
£2 1/X3

In practice cubic behaviour of E2 ( ) has not been observed»
but a power law dependence has ”
e2«A
Values of N between 1 and 2.7 have been found here, while
Beaglehole and Erlbach (1972) report values ~2. Graphical
techniques have previously been tised (Steel and Treheme,
1972) to measure the constant of proportionality and N,
but in the present work the process has been automated. A
linear least squares fit, which may be performed exactly,
was used on the function
In 02 ■ a N In X
The constants so obtained were used to define
fC2 * AA
which was then extrapolated to shorter wavelengths and
subtracted from £2 to yield 62« correlation coefficient
and values of the constants were also available.
Output from the computer program was possible as functions
of hw, the photon energy, rather than wavelength. Graphical
output could thus be produced with X or hu as abscissa,
and by a change of scale results of other workers given as
functions of w could be compared. A facility was provided
so that X“ or X-^could be used, or logarithmic graphs
plotted, to establish the form of intraband absorption.
102

(• .* i, ’,,V V-i .y'* • VA .' y': __
••V-p - ■ • ■ * ^
K^V -•' ■' J'' ’ **
103
5.4 Nog-spectral intrinsic substrAte fxmctiona
Intraband electronic relaxation time and plasma freqtienc^»
T «"«1 up respectively,could be computed from the form
of the dielectric function. The Drude theory was uaed
despite the fact that its prediction of cubic dependence
of 62(X) has not been borne out. Belaxation time was
obtained from a linear least squares fit in the region
650nm >X>600nm, involving the relation of ej and C2/X-
For this it was not necessary to assume ut»1, butit was required that e^, the bound electron contribution
to 6 ]» be independent of wavelength over this region.
This is a do\ibtful assumption as the absorption's very
close, between 300 and 570nm depending on conq>osition.
A further strai^t line fit, for which ux»l was assumed,
enabled u to be computed. For such short wavelengths the P
assumption was generally justified, but computed values
of (often 'vlOO) indicated that use of a constant for
this term was not.
5.5 Colorimetry
Colours of li^t reflected by filmed or clean systems, under
\isual assuiq>tions, were computed using the C.I.E 1931
Standard System or 1960 Uniform Colour System, and one of the
reflectances as in section 5.2.
The response functions x(X), y(X) and s(X), and lamp intensity
s(X), were tabulated at 5nm intervals from 380—770nm. These
functions were confined with the computed R(X) by linear
interpolation and extrapolation, were necessary, during
integration. This facility was not required for the majority
of data as the reflectance was evaluated at all the
tabulated wavelengths in most cases.
It was arranged that the effect of angle of incidence,
film thickness (if necessary) and nuod>er of reflections
could be computed by varying these quantities as data.
104
Saturation and Dominant Wavelength
The colour co-ordinates (x™, y™) for monochromatic
light of each of the tabulated wavelengths were also
tabulated. At the extreme red end of the visible we
denoted these (x™, yj**)» whilst at the blue end they
were denoted x™g, y^g)« The curved locus joining
these points is called the 'locus of monochromatic
radiations *. The wavelength corresponding to the
point on this locus where a straight line, drawn from
the neutral ('white*, (x , y ) point), throu^ someo opoint (x,y) and extended to the locus, is called the
dominant wavelength (^^) of colour stimulus C*,y).
Using Cartesian geometry, the equation of the straight
line WX from the neutral to the experimental point
was calculated. That of the line WR from the neutral
point to (x^™, yj™) j as also computed, and the angle 0
between these lines determined. A pair of tabulated
points on the locus, say JCxj™, yj”) and
were then found such that 6 lay between the angles
- JOR and ■ J*0R formed at (x^, y^) by each of
these points and (xj”, yi™)* Next, the straight line
between this pair of points was calculated and the
position of the intercept D between J'J and the extended

■
WX obtained. Linear interpolation between the wavelengths
corresponding to J and J* finally gave the dominant
wavelength of the point X. Knowing the co-ordinates of
W, X and D the saturation WX/WD was easily found.
105

■ -• *b ’' ?‘9
1066.0 BESOLTS
6.1 The primary metals: Silver, Gold and Copper
In this section meesurements on each of the primaries
are presented. In addition to the calculated functions
(e2(hu) and R^(hu); colour co-ordinates, relaxation times
and plasma frequencies) that will form the basis of most
of the later discussion, other results are given to
illustrate the basis of the calculations or to illustrate
points that do not require reiteration for each of the
alloys measured.
The ellipsomatric results
The ellipsometric curves for pure silver, sançle No.30R,
Y(h(t))and A(hu) are shown in Figure 6.1. It will be recalled
that in Section 3, an e3q>erimental procedure requiring
two photomultipliers and ^ o core materials for the Faraday
modulators was described. One arrangement enabled the range
250-540nm ( 'v« 2 .3 - 5eV) to be studied while another was
necessary to cover the range 480 - 850nm ( 'v 1.4 — 2.6eV).
Measurements made in the region of overlap did not exactly
co-incide, the curves for Ag being typical. The difference
in 4 was 'V/ 0.1°, and that in f 'v* 0.3°. These changes are
much greater than the resolution of the instrument ( 0 .0 1 ) <
For the purpose of computing C.X.E co-ordinates and other
properties, a * correction* of half the average difference
in the centre of the overlap region (500 — 540nm) was made
to each of the measurements under the alternative systems»to bring them into line. The effect of this was always
smaller that due to sample preparation, when eiq>erxments
were repeated.

. *
- . •. '1 ?;i.,\:'t>-<9>;iV''- - •y-.-'K'. . •■•J ■-- > * '''
108
Inspection of this figure shows that the abrupt fall
in ¥ corresponds closely with the mnimum in A, at about
3.9eV.
The Dielectric function and RefleCtSnce.
Figures 6.2 and 6.4 show the confuted normal reflectance
B^Chu), along with the real and imaginary parts of the
dielectric function, e^Chm) and e2(A<t))« Comparison of
Figures 6.1 and 6.2a indicates a similarity in overall
shape between B (h(u) and and between ^
inverted 4 (fua).
The reflectance of Ag (Figure 6.2a) is high at low energies,
90Z, falling slowly through the visible to ' «70Z at 3.6eV
and Chen abrxxptly to 'vSZ at 3.9eV. The sharp drop occurs
at an energy when C2((>)) is almost constant, and when e Cco)
is passing through zero. Since normal reflectance is
uniquely determined by e ■ ~ iez» is apparent that
the change in is related to the shape of e^. Indeed,
the highly reflecting region is that where ei« 0 . ejCftm)
itself shows little structure, a single peak at 3.9eV
co-inciding with a step in £2 ( 01). Referring now to
Figure 6.2b, a rather more conq>licated behaviour can be seen.
This shows the same functions for sample No.30, confuted
from measurements made on a non*^lanar sanq>le. Although a
highly polished surface was achieved, this was superimposed
on scratches remaining from a stage of grinding on 600
grit wet carbide. There was therefore an undulation of
25ym period in the surface of the sample. This has given
rise to a double step in R^ and a broad peak in £2 ^^^®®^
2.8 and 3.5eV. Interestingly, the calculated reflectance
for the * rough** sample is generally greater than that for

V -I
Ih'
109in u
i
CO
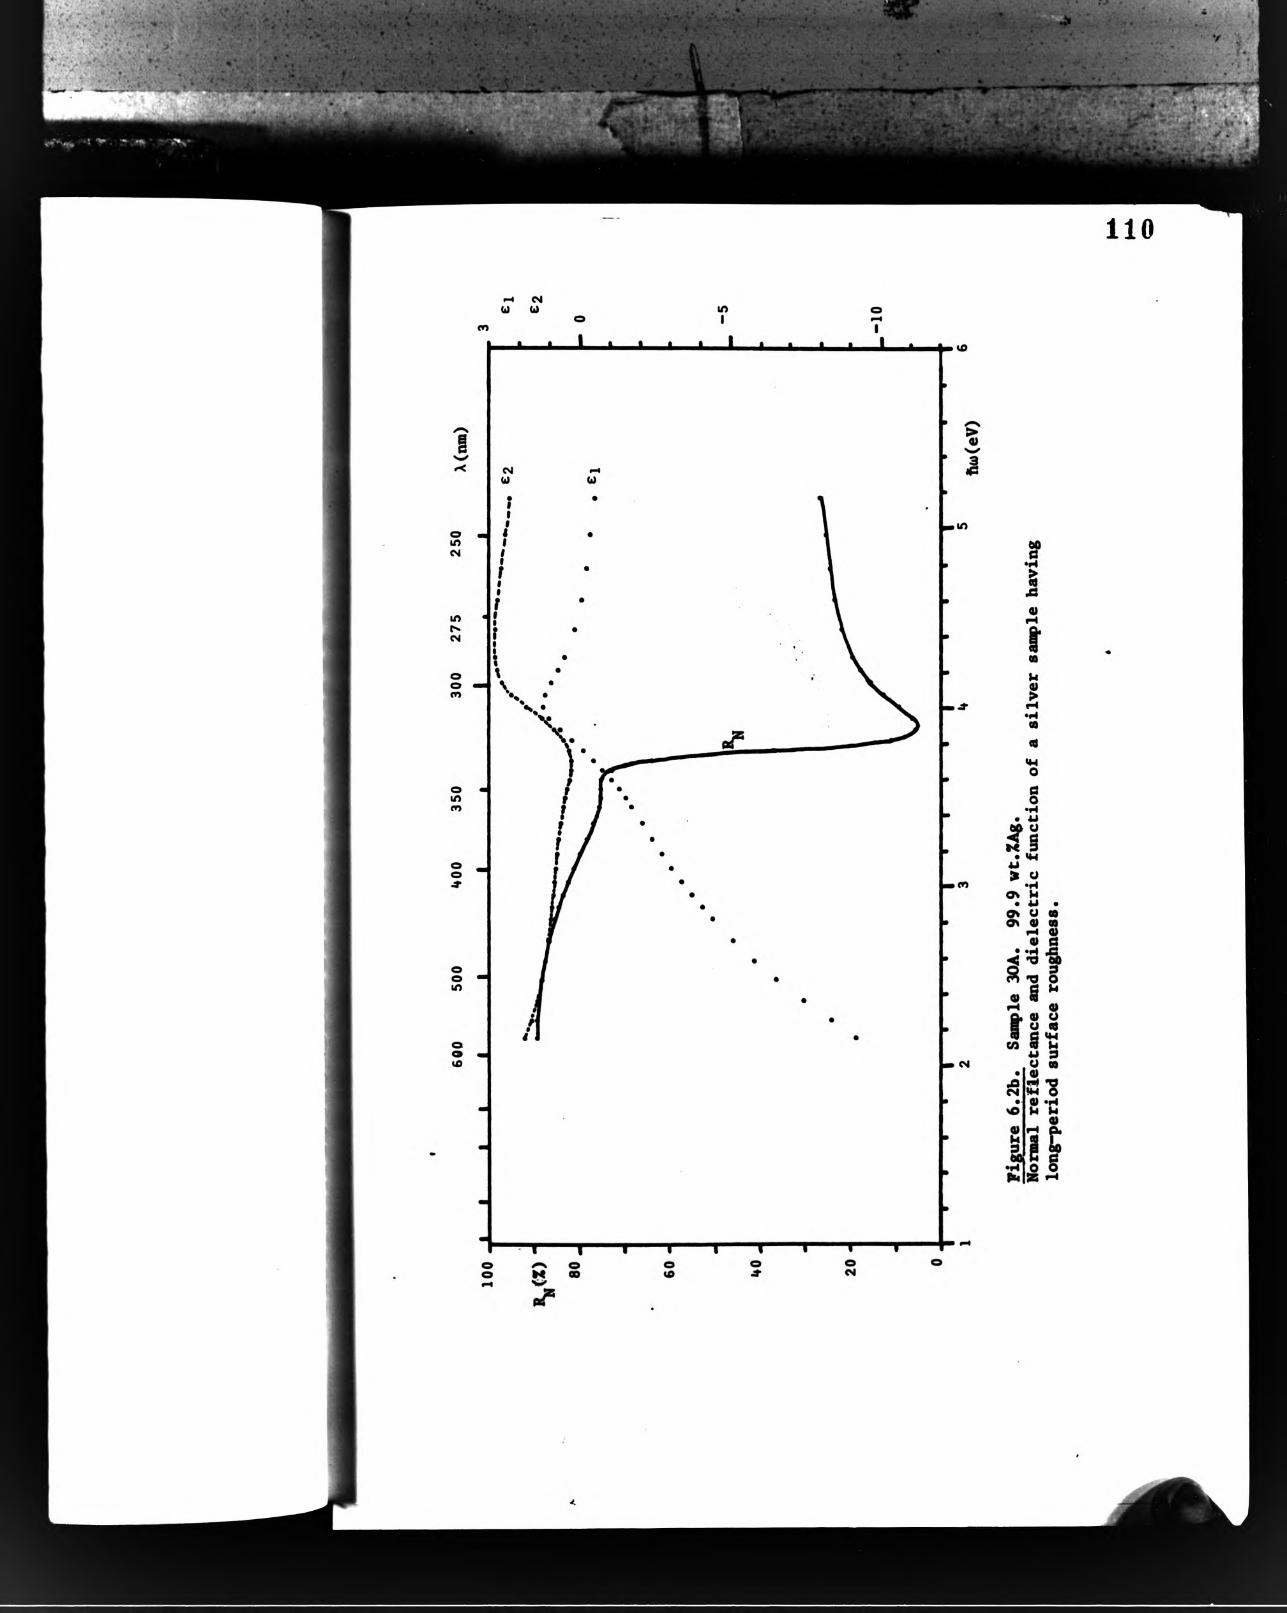

i- ..- , . . *, .......
'^p '-'y s
the * smooth^ one; although since the calculation assumes
plane surfaces, and more particularly disregards losses
due to scattering out of the specular beam, the value
of this cong)utation is doubtful.
The results for gold show a much less pronounced drop,
to only 35Z reflectance (Figure 6.3), compared with
silver. This is at about 2.3eV; before the rise in £2
(y 2.5eV, when is already near to its minimum valxie)
and when Cj ~3, Reflectance remains nearly constant
throughout the visible, indeed up to the limit of the
experiment at 5eV. All three spectral curves show weak
structure at energies greater than 2.6eV but in general
the picture is much the san» as for silver.
In Figure 6.4 a similar pattern is repeated by the curves
for copper. A very high reflectance, 95Z, at l.SeV
drops abruptly to '\<60Z at '\<2.2eV. At this energy
- 5 and £2 has alreadv besun to increase. A steady
fall in continues until a minimum of 30% is reached
at 4.3eV, after which there is a slight rise. The falling
reflectance between 2.2 and 4.3eV is associated with a
rising £i(o)). This may be contrasted with the situation
for Ag (£x decreasing, R^ increasing) and Au Ui and R^
more or less constant).
Energy-Loss Spectra
Calculated plasmon energy-loss spectra for both the bulk
plasma and surface plasma modes are given in Figures
6.5 - 6.6. These represent the magnitude of collective
oscillations of the electrons in the sauries in response
111
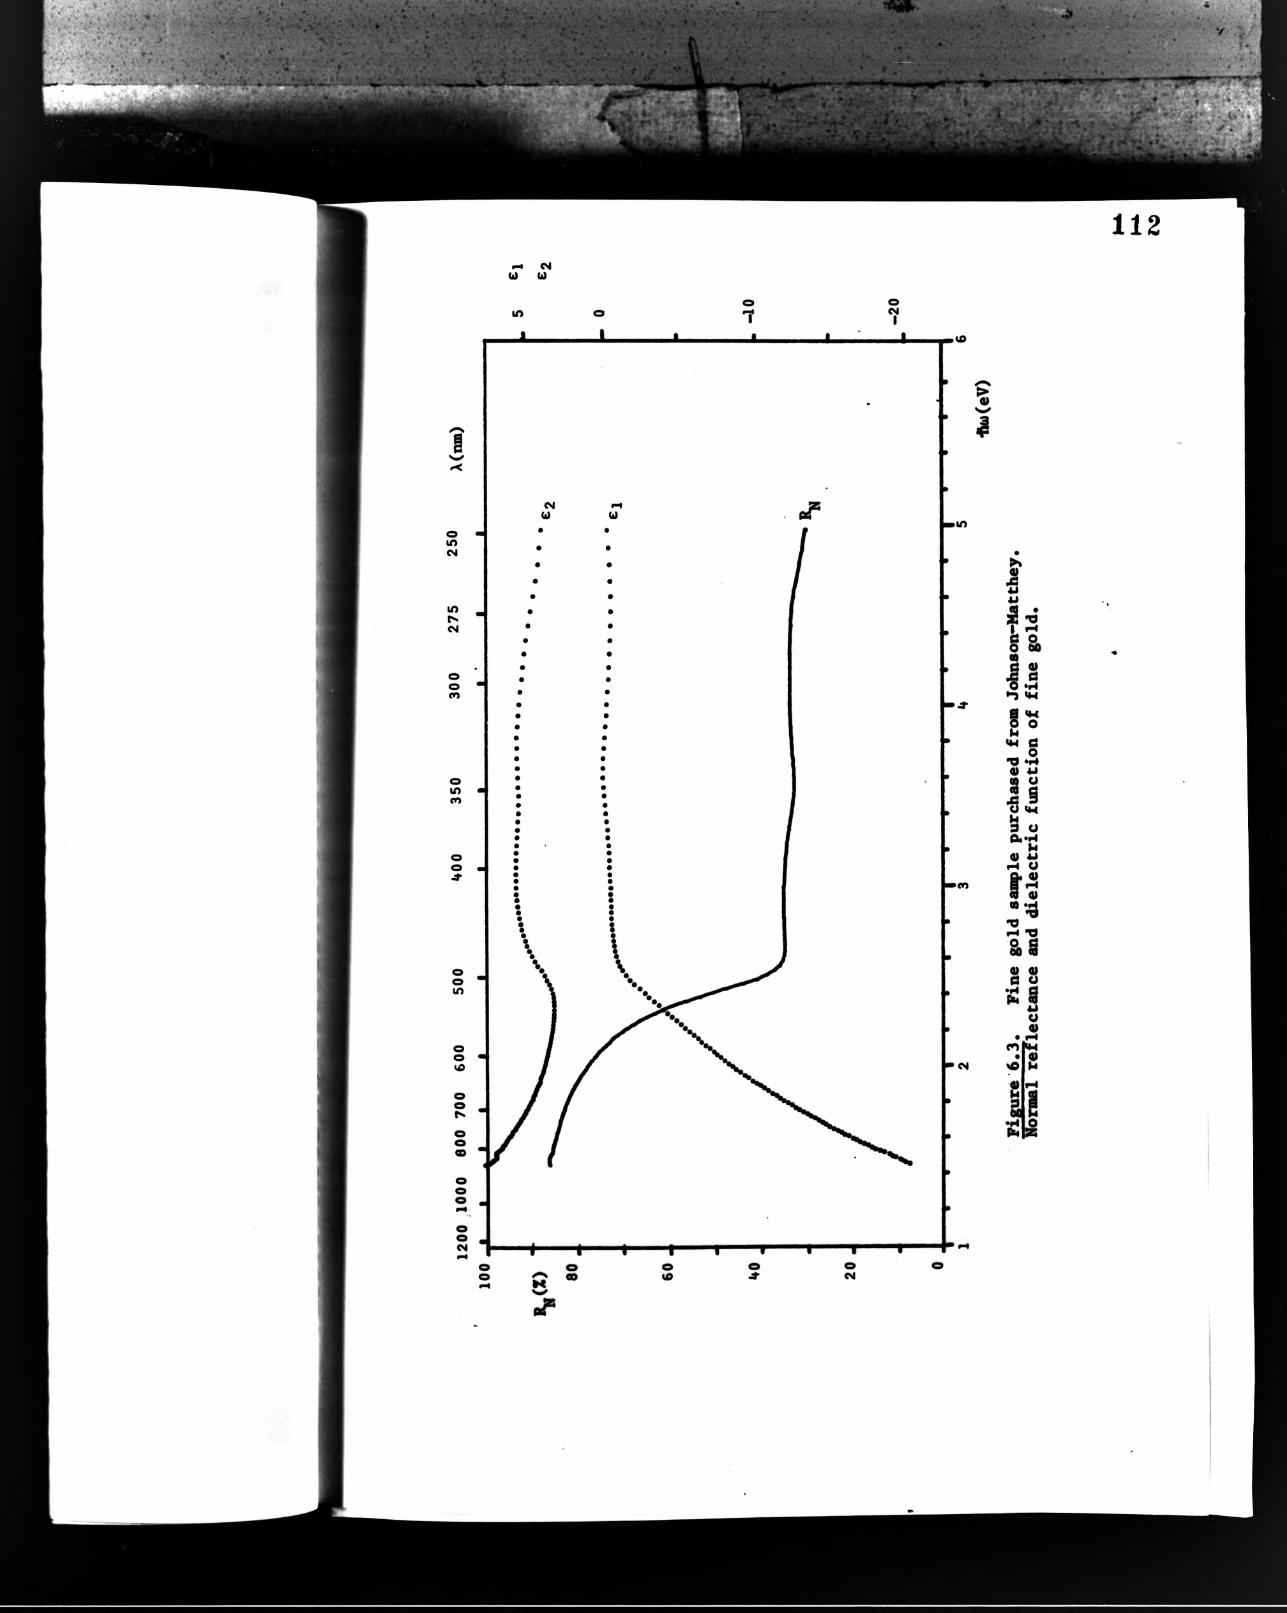
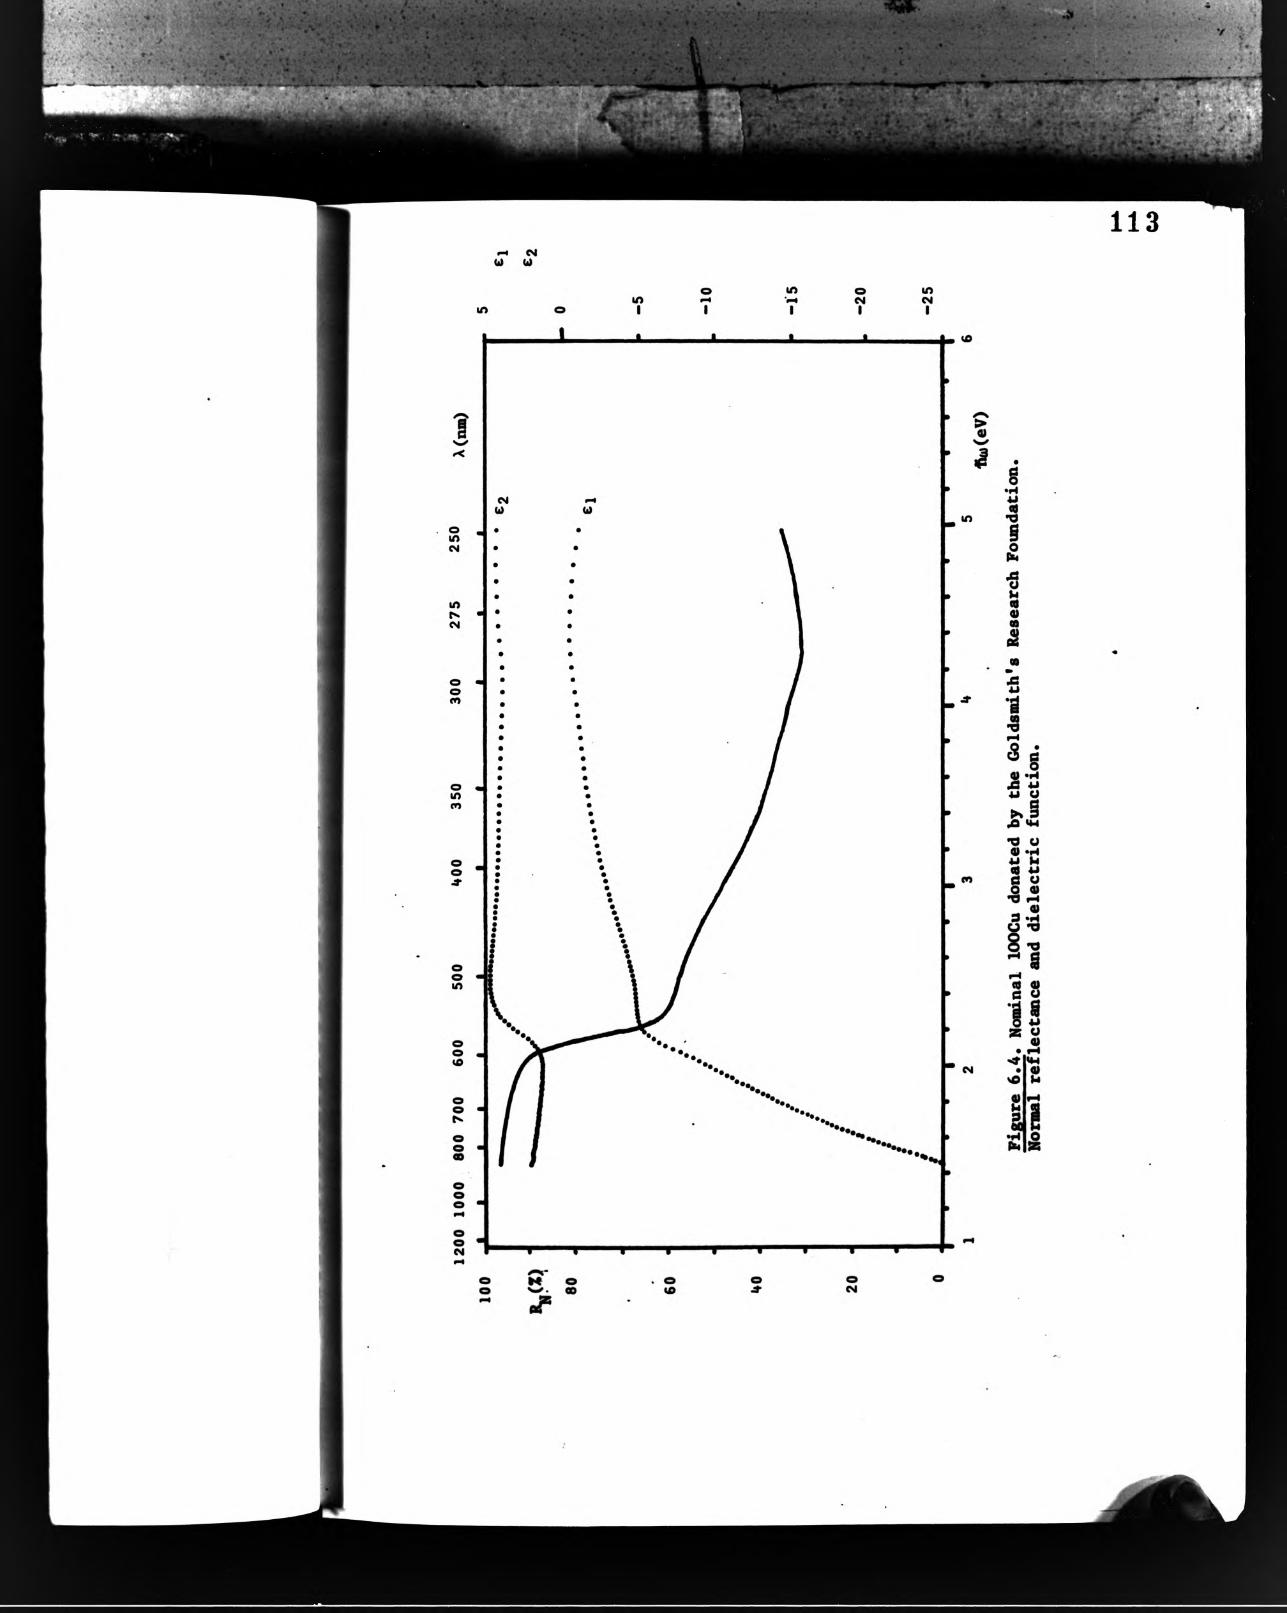
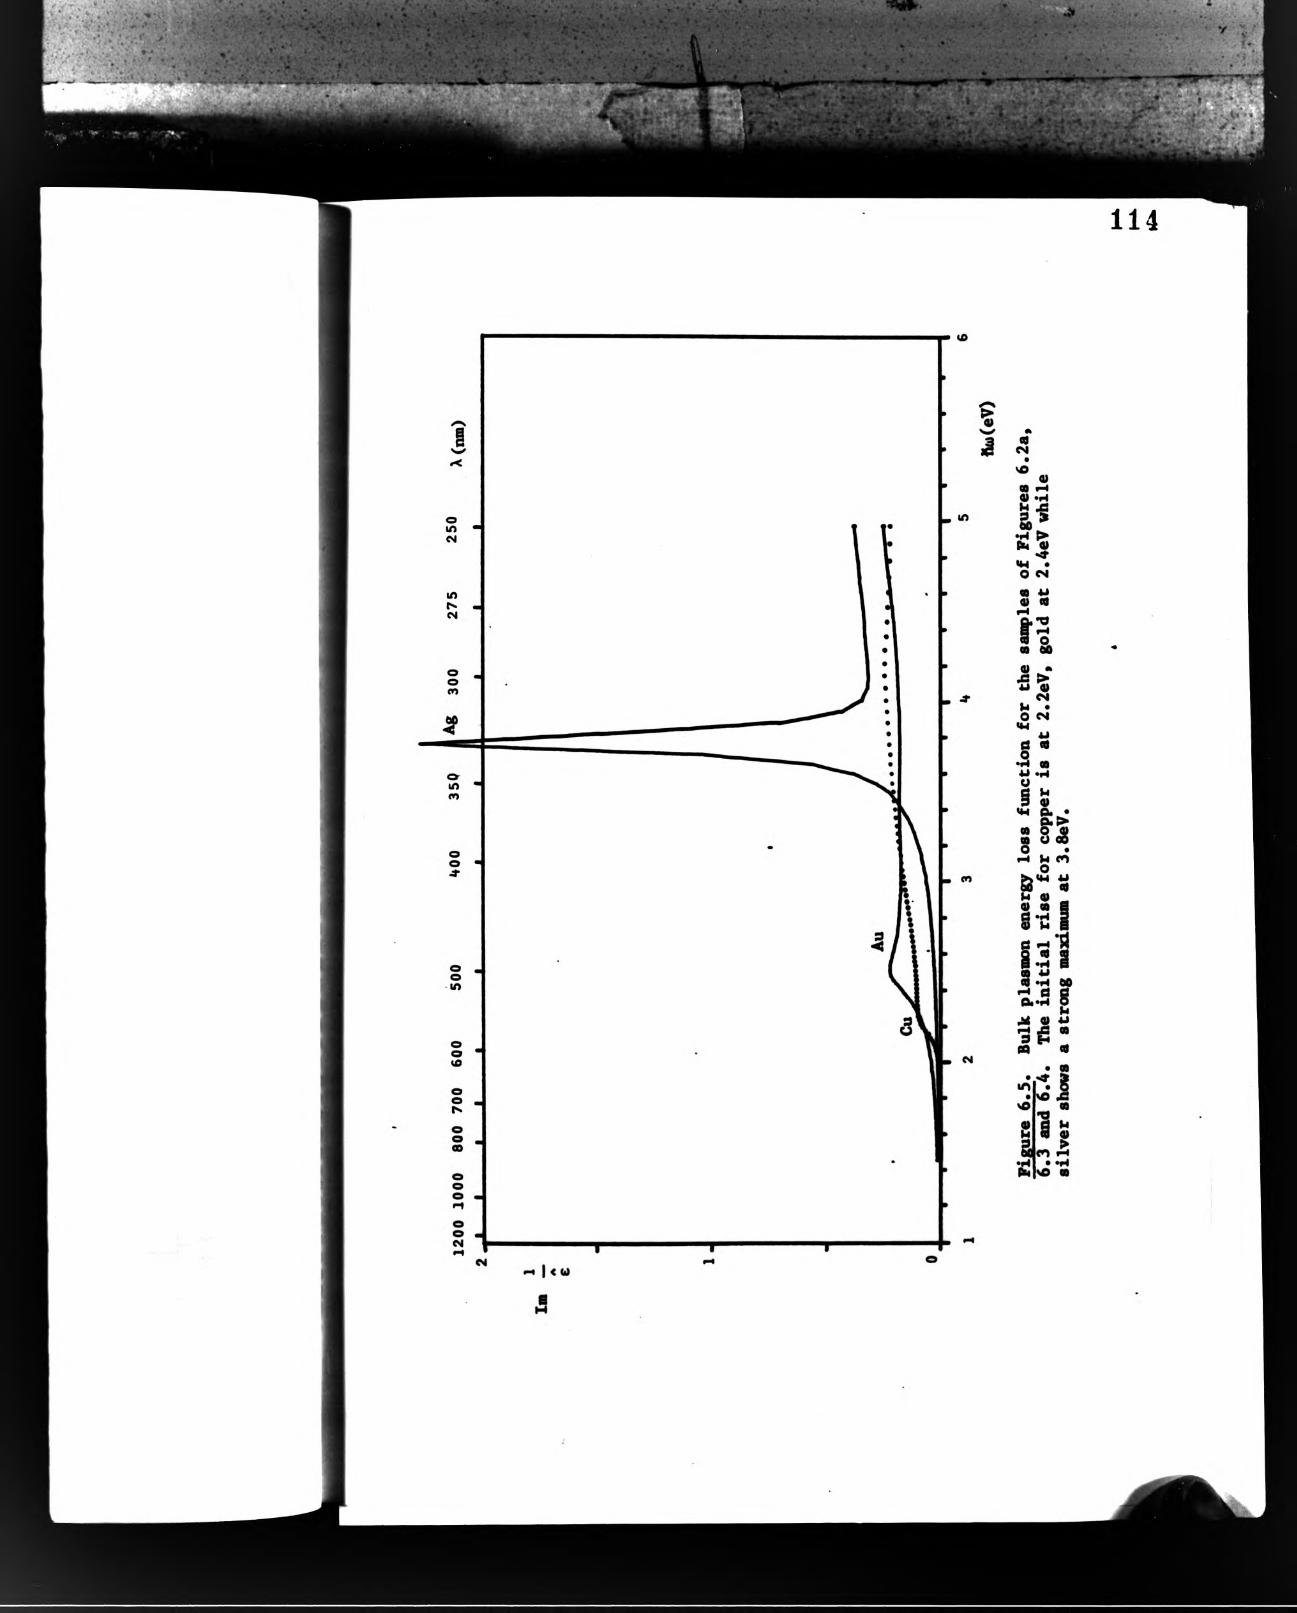

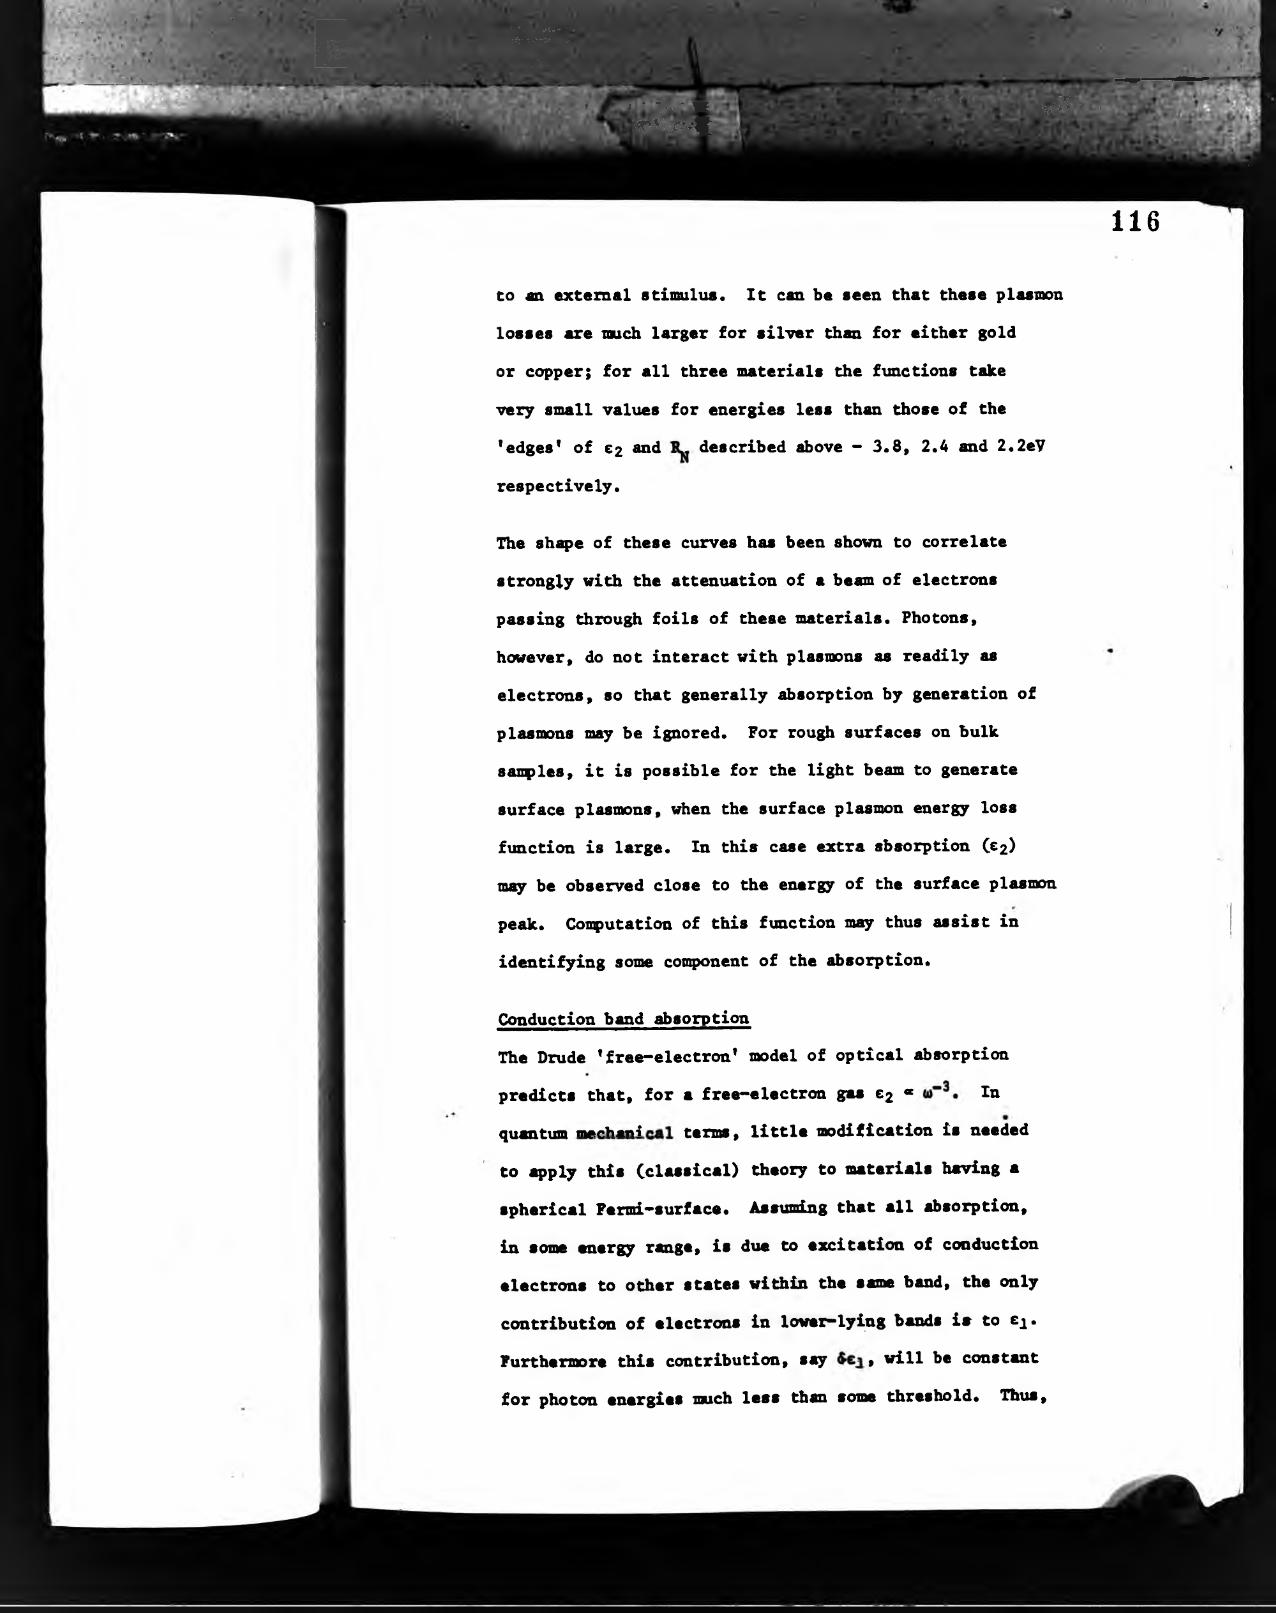
* *
■■ . . V .1 ■• • •. . V , . - • .
• i i c : ; • S ' ' > > ,
V ’i . '
» t * ".. * VPPVjT/./^
;»-t ( '* t< ,'ÎV-îîTl ■* *' ' '■
116to m. external stimulus. It can be seen that these plasmon
losses are much larger for silver than for either gold
or copper; for all three materials the fxmctions take
very small values for energies less than those of the
'edges' of £2 and described above “ 3.8, 2.4 and 2.2eV
respectively.
The shape of these curves has been shown to correlate
strongly with the attenuation of a beam of electrons
passing through foils of these materials. Photons,
however, do not interact with plasmons as readily as
electrons, so that generally absorption by generation of
plasmons may be ignored. For rough surfaces on bulk
samples, it is possible for the light beam to generate
surface plasmons, when the surface plasmon energy loss
fxmction is large. In this case extra absorption C&2)
may be observed close to the energy of the surface plasmon
peak. Computation of this function may thus assist in
identifying some cooqponent of the absorption.
Conduction band absorption
The Drude ' free**electron' model of optical absorption
predicts that, for a free-electron gas C2 • In
quantum nutchni terms, little modification is needed
to apply this Cclassical) theory to materials having a
spherical Femd-surface. Assuming that all absorption,
in some energy rangn» is due to excitation of conduction
electrons to other states within the same band, the only
contribution of electrons in lower“lying bands ia to cj.
Furthermore this contribution, say , will be constant
for photon energies much less than some threshold. Thus,

•- i-J
i»/> ''JSt -f - •
117for the purpose of extending the results to include free«*
electron, Drude or intraband absorption, it is assumed
that
(a) The Fermi surfaces of these metals are spherical;
(b) that 6ei is constant.
Also, to simplify the calculation, ve assume
(c) (i)T»l, where t is the relaxation time of the
conduction electrons.
In order to test the validity of these assximptions.
Figure 6.7 is a plot of €2 versus Chu)~^. Departure of
the curves from straight lines indicates that free-electron
behaviour cannot be asstimed. All three curves show high
energy regions where the absorption is not at all Drude-
like and a low energy region where the assumption may be
tenable. A slight curve in the graph for silver implies
some deviation from exact cubic behaviour. Accordingly,
following previous workers, the assumptions were relaxed
and a power-law dependence
02 * Chw)M
was tried. The value of N could be determined from a
plot of log 02 vs log h(i). Again, deviations from a
straight line would demonstrate the falseness of the
assumptions. The ftfiphs are given on Figure 6.8. Other
eiqperiments have yielded values for N ranging from 0.9
for one Cu sample to 2.7, compared with the predicted 3.
The value obtained strongly depends on the preparation
of the sample.


‘*5 ^
">if.
Separation of ^sorption proces^fes
The coefficients of the log-log graphs, obtained by linear£
least-squares fitting, were used to calculate £2(1 1)),
the free-electron absorption, for the full energy range.
This fimction was then subtracted from the experimental
£2 to give £2« The results of this exercise are shown in
Figures 6.9 - 6.11. For silver, the results show that
this fit is not altogether satisfactory, sometimes being
ten percent of the value of £2 (ie. 0.3) out. For gold
and copper the fit is much better, although a much smaller
interval is being considered. For gold, it appears there
is some absorption at 2.2eV, just below the edge, which
cannot be attributed to £2. However, the magnitude of
the absorption is within the observed fitting accuracy
for silver.
Silver shows only a single peak in £2 within the measure
ment raxige, at 4.4eV. Gold has two, at 3.0 and 3.8eV,
while copper has three, at 2.4, 3.6 and 4.7eV. Gold has
the largest £2» while copper has much the steepest rise in
numerical Derivatives
Numerical derivatives D^£2CHw)*r® shown in
Figures 6.12 and 6.13. These have been produced by fitting
an quadratic to £2 0ka) exactly over three adjacent
measured values -
£2(b(i>) “ a(hw)^ ♦ bClki>) c
120

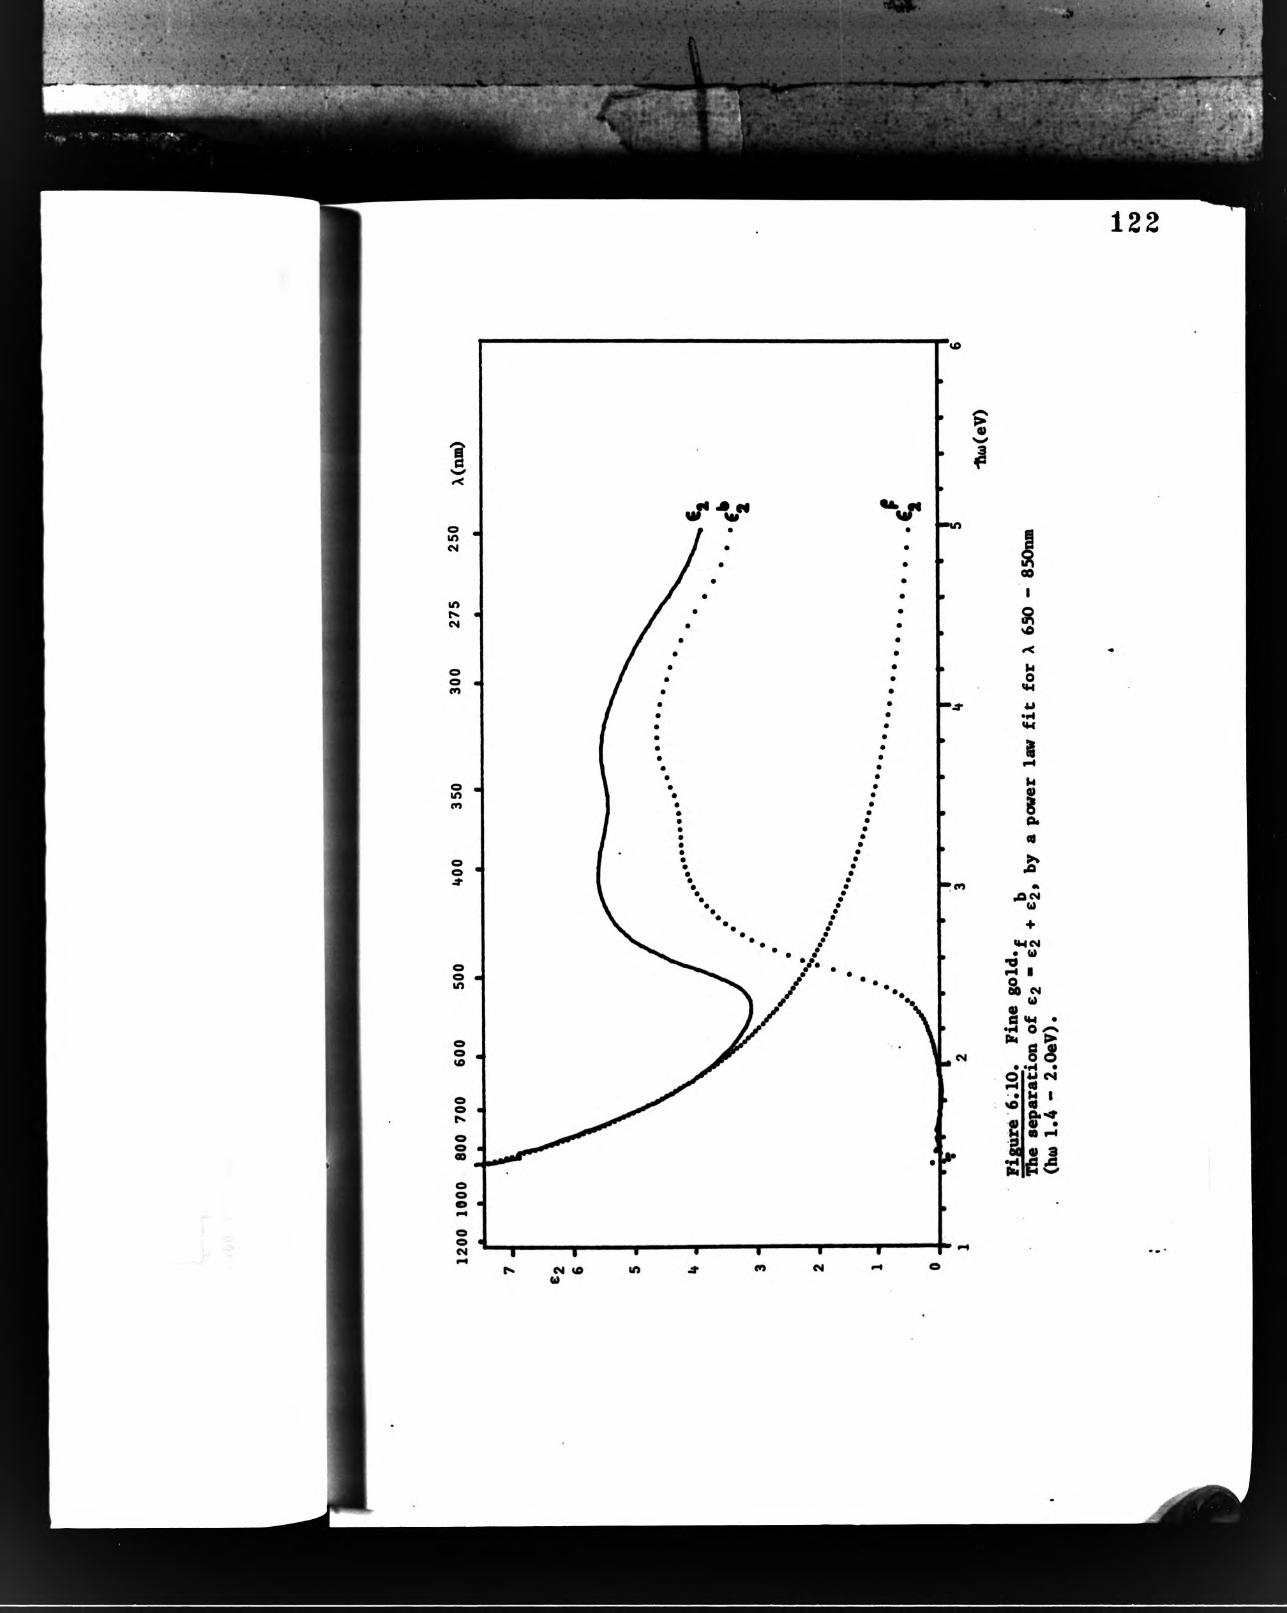


V
• »lV> i>,<
and then coiq>uting the derivative -
124
1 dc2 * 2a h(i) **> b?r
to give the gradient at the central point. Application
of this procedure recursively enabled derivatives of any
order to be btiilt iip. Thus the second derivative at any
energy was obtained from measured valiies of at five
adjacent energies.
Figure 6.12 clearly shows the positions of the main edges,
and also indicates plainly the subsidiary maxima for Au
and Cu. That for Cu at 4.7eV is resolved into two, at -
4.5 and 4.8eV. The exact position of an absorption edge
may conveniently be defined as the point of maximum slope,
which is to say one of the zeroes of the second derivative.
Thus Figure 6.13 should enable accurate values for these
positions to be interpolated. In practice, the inaccuracy
of the data can be seen to have defeated this aim for
energies less than 3.5eV. There appears to be super-
in^osed on the spectra a periodic ripple about O.leV wide.
The origin of this structure will be discussed later, but it
it possibly due to multiple reflections in one or more of
the optical elements producing interference affects, or to
spectral variation of the ellipsometer sensitivity.
Coloixr calculations
These are presented in Figures 6.14 6.18, for a variety
of schemes. The first are for the C.I.E 1931 Standard sytem,
and the second for the 1960 Uniform Colour System. Also
shown are the effects of using equal**energy distribution

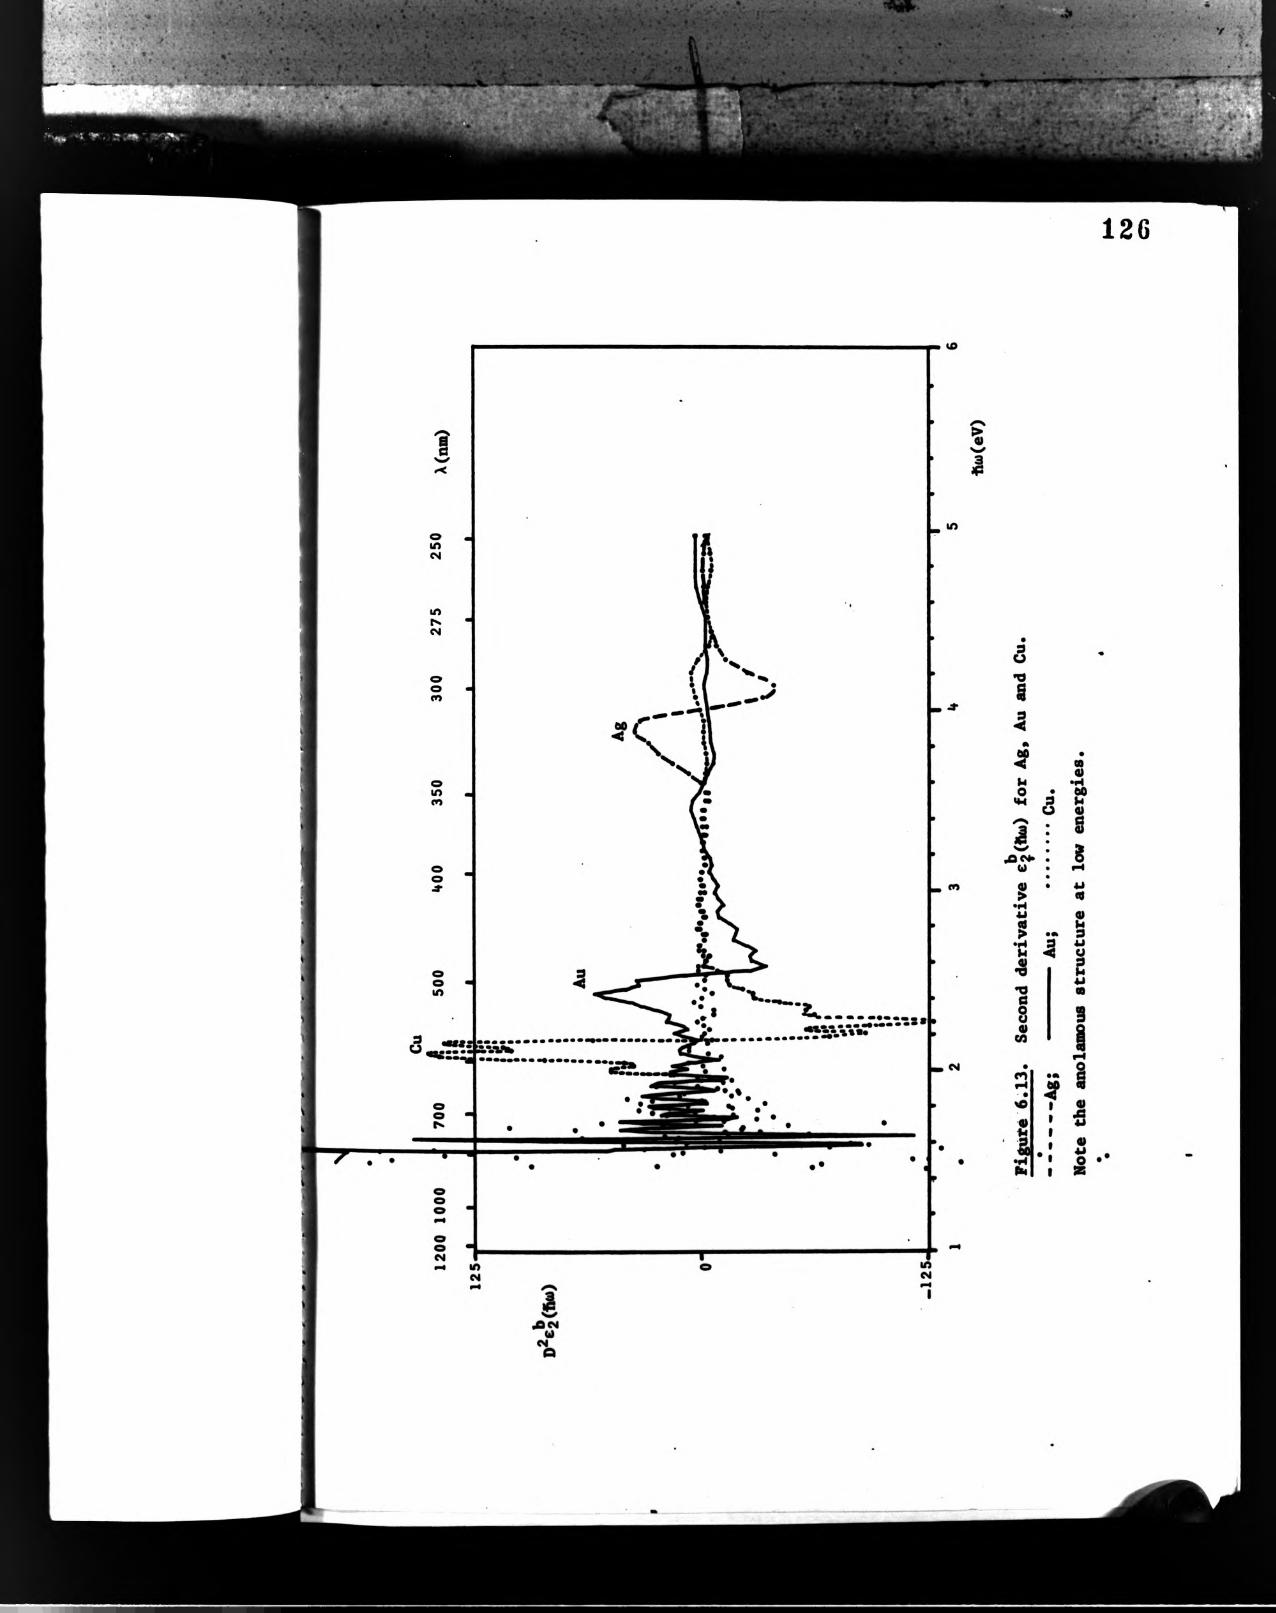

i, 'V.. A
(b) Variation of angle of incidenceFigure 6,14» C.I.E colour co-ordinates in the 1931 Standard System, equal energy illumination.(a^ for 1, 2, 3 and 4 reflections (b) reflection at 0°, 40® and 60 incidence.The 40®.points are not resolved from those at normal incidence in the cases of Ag and Cu.

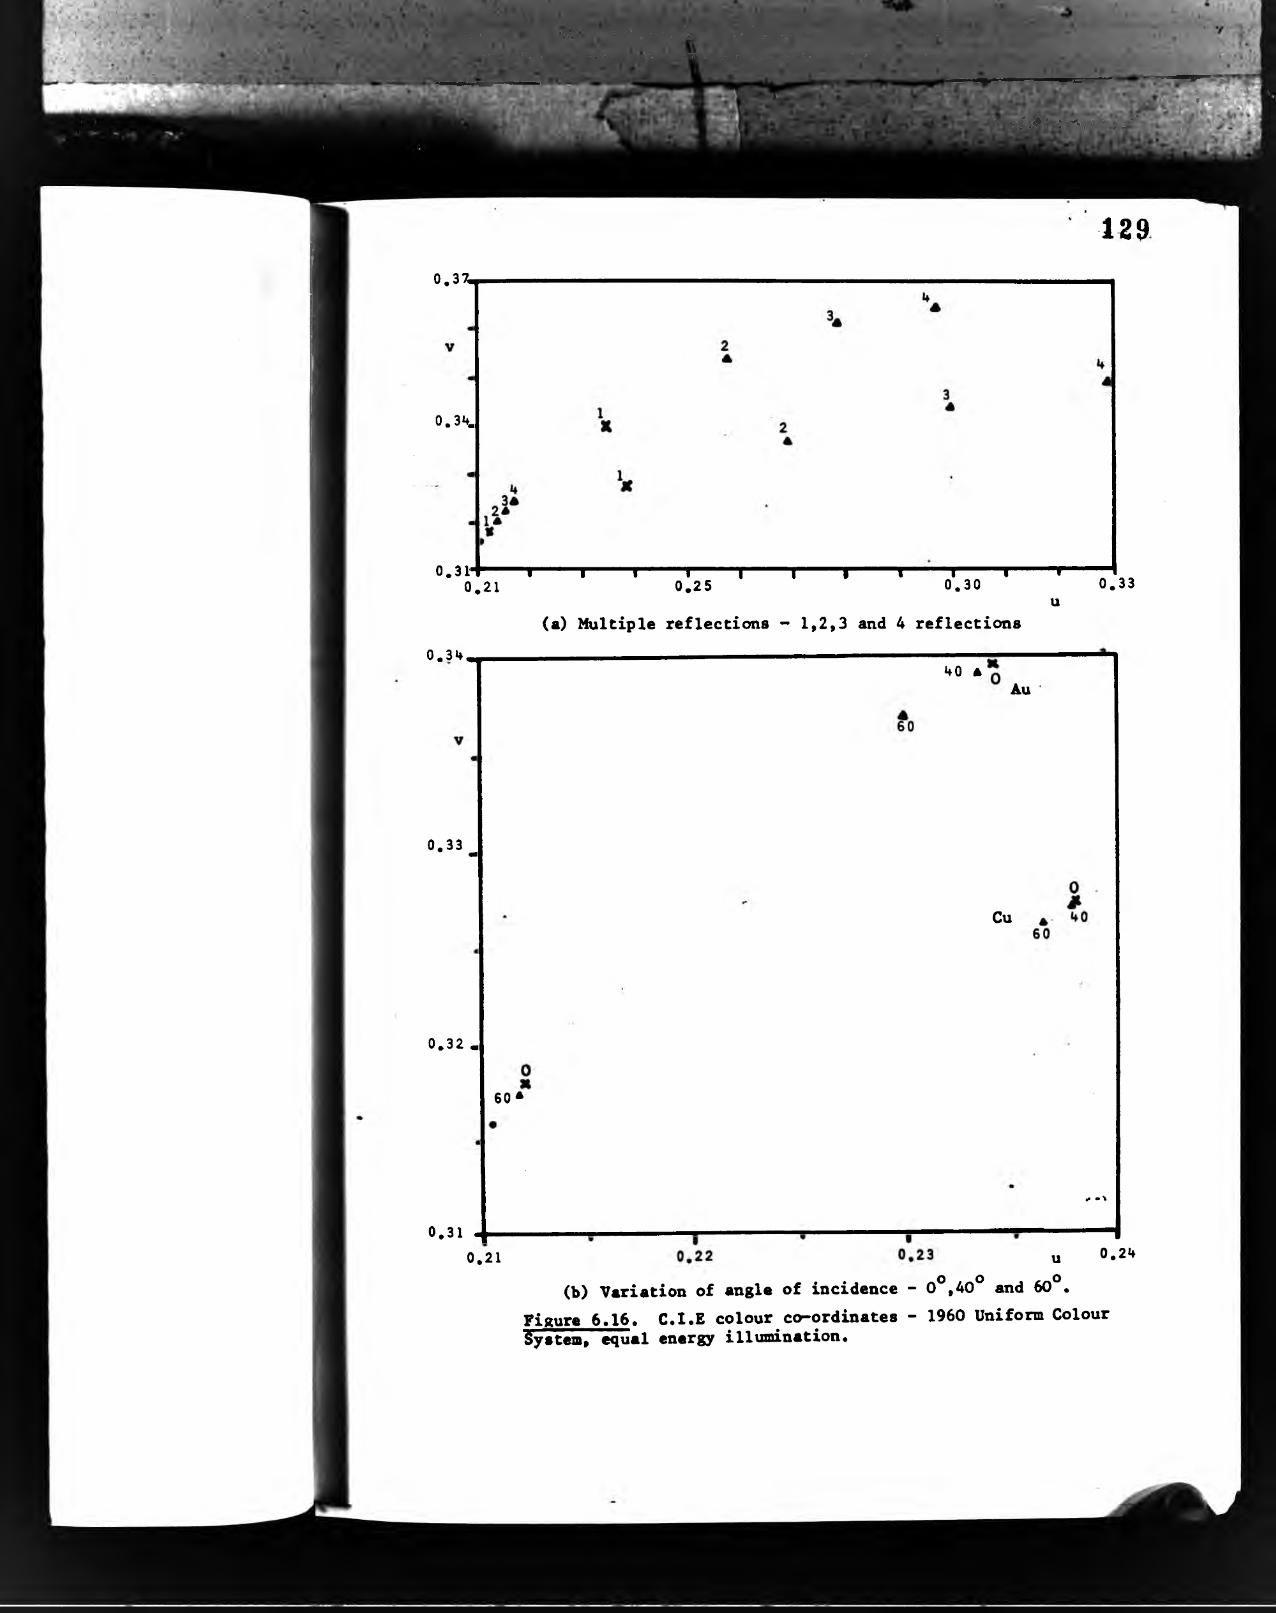
*' ' *i*V * '■t'''L '* '"'• '■-'fc' '-- * •' *• ■■ ■'>-r ■' ' T ■ i' /r-•■’ i •■ •»■*•■.■ •> ■• » * ■ •••'♦» ' . ' Ml' . » - • , -.T* . ,s-i* t’iv; '/-f . •> < , > V ■,-C' - ■ * '- r •>.■'. '.■W-' •'',. • . •.•
■9Pv W
V •: ’ >.-v ; . . '•■r* V * • ' « • •* *•
1 2 90.37i
0.3H.
0,31' I I ' l I I I I I J « « * * n i»o0 ,21 0 .2 5 0 .3 0 0 .33
u(a) Multiple reflections - 1,2,3 and 4 reflections
0.3«».
0 .33 ^
0 .32 •
0 .31
ifO aAu
Cu
60^
^ *1
0.21 u 0 .24
(b) Variation of angle of incidence - 0°,40° and 60°.Figure 6.16. C.l.E colour co-ordinates - 1960 Uniform Colour System, equal energy illumination.
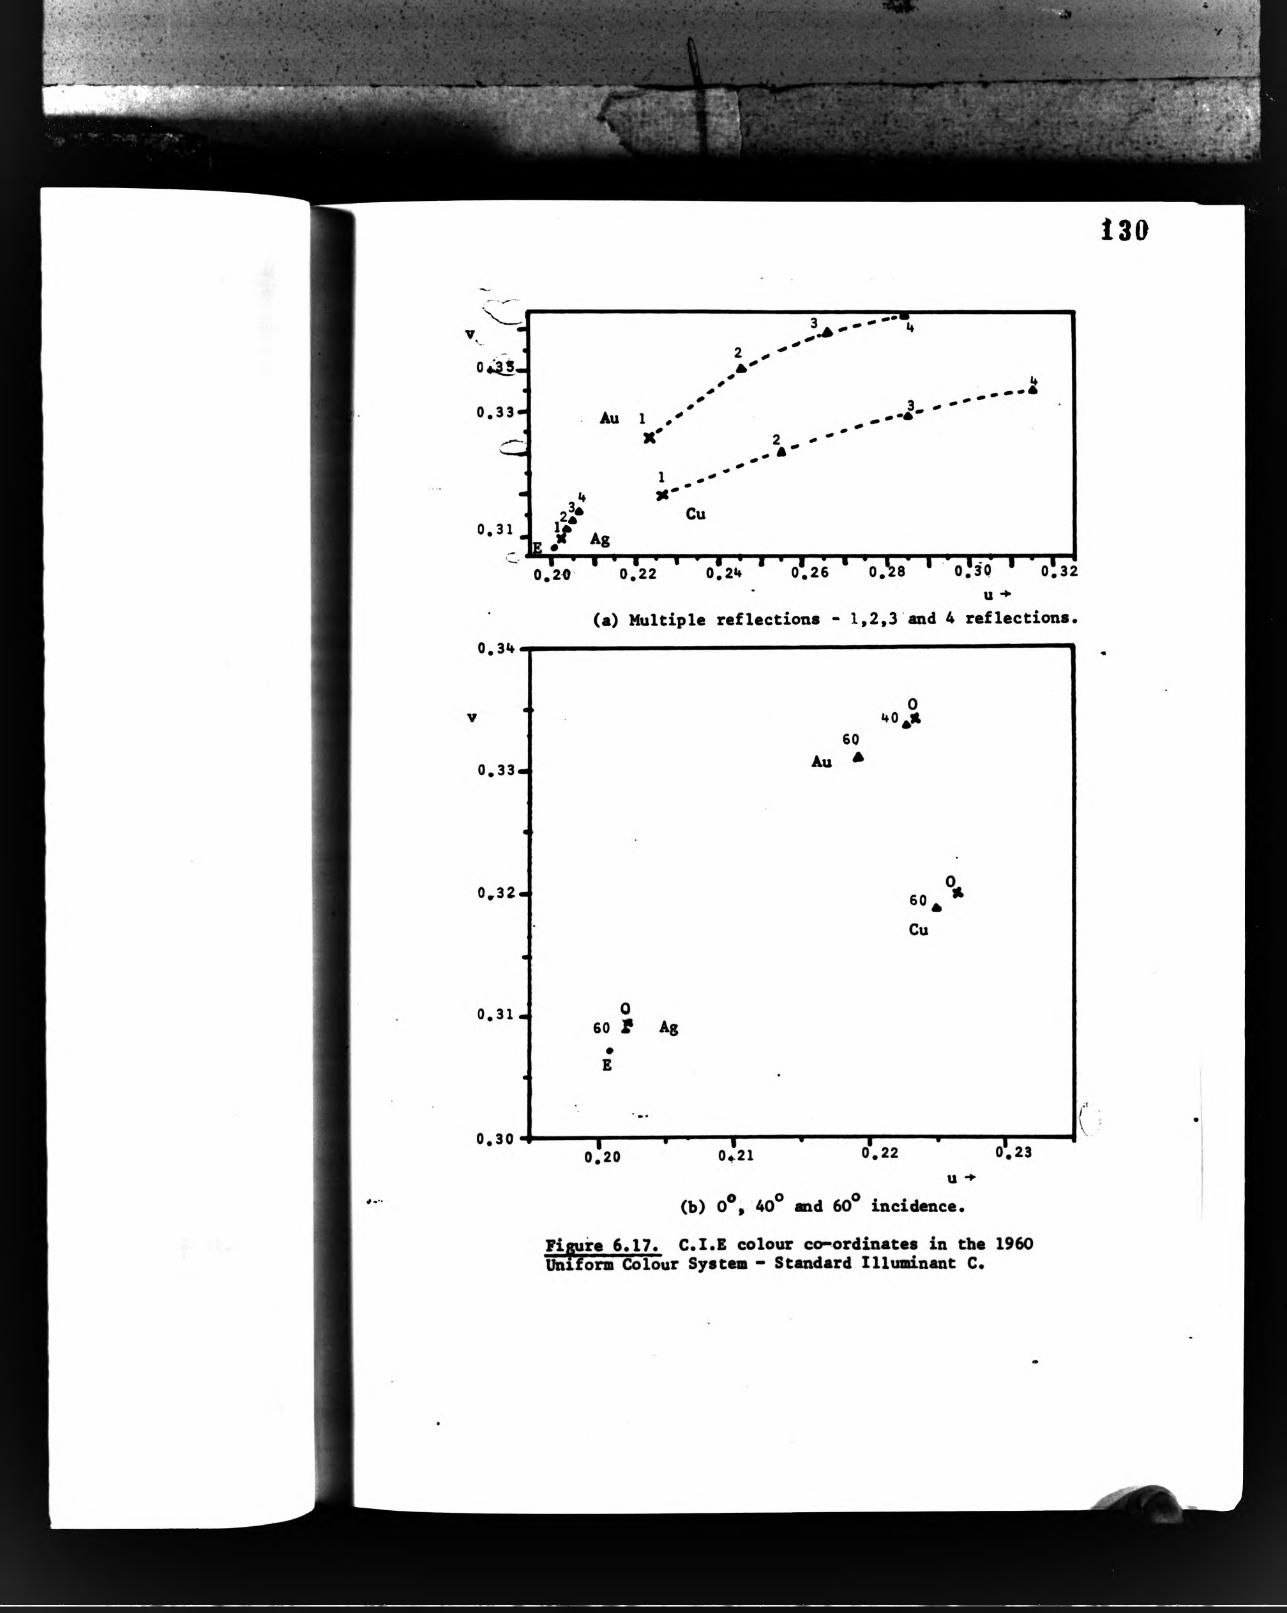

raSpWl R? "at. i ' ' 'iSsS&Mtff •. -tr
»,> > i>r»'.' .‘d . '- Jyt^..-; • S V a
131Illumination, or C.I.E Standard Illuminant C, which corr-'
esponda to dayli^t and is alightly blue. The rel
ative effect of varying the illuminant can be seen to
be small - there is certainly no danger of metamerism in
this type of lighting. The effect of varying the angle
of incidence is also shown to be small, slight decreases
in saturation being found for all three materials at
large angles of incidence (greater than 40°). Angles
within 30° of normal incidence give an insignificant
effect. Increasing the nunf>er of reflections from the
surface has the opposite effect - co-ordinates move rapidly
away from the 'white* point. For two reflections (each
at near-normal incidence) the saturation is approximately
doubled. A small increase in colour between the samples
is increased by increasing the nunber of reflections -
more so for Ag/Au and Ag/Cu than for Au/Cu.
Effect of oxidation on copper
The change in A llb)) caused by five months of oxidation in
the laboratory atmosphere can be seen in Figure 6.18. The
largest change, «y 15°, was at the longest wavelength, and
may correspond to a film 200& thick. Atteiq>ts were
made to characterise this film by fitting the -ellipsometric
data, so that the effect of film growth on colour could be
confuted. This is discussed in Section 7.3.2.
6.2 Ag-Au Binary Alloys
In this section results are presented in such a way that
the colour calculations may be interpreted from the simplest
to steadily more fundamental levels. Thus colorimetric loci


. . V..% ,
■ : 17* T . i *
133
(O)'3a\ o 00• • •M 'S" 00tH es
A»a8p9*dj08qv SJ*«9 <s
A»d(•bajj OTiTOXd) «q ------------------------------------------
aaitq uot393Cb x®8
Ot• • •a> o\ o
es r>. esm a\• • •lO en
** •!
M 00 es es \0 vo «♦ o t- es m 001 en O vo r» o es OV rS r» OVs
• •lO •m •ov •o •O • •wvo •en ••O •O»J 00 00 00 00 OV OV 00 00 OV OV
M f-i > o i H c o % o a » Q f ^ r ^ ^ S ' ? <*ï c o » ^ 0 0 ® ' ® ' ^ ' ^ ® 0 0 * ^• • • • • • • • • • •O<>i'«’ 00'a‘ <nr-ieMf-»f-i« rn es iH <n
OV vO rH en vO en 00 00 OVm es en OV es m 00 00r>» r>. f>. i>. vO r* r». p>.m m «n m m «O m «n m m m m
<0
co
«
h«M
M 4Jes en m en »0 00 r** en p^vO es vO OV •o 00 9 00 00enen
enen
esen
rSen en
rHen en S §
O H«Mf 2 00mO
esesOesesO
vO8 es8 fHqes8 OVfSOes es es es es es es es es
entH â 5 vOs
OVvO mp envO 8 in•oVO in «o en en en en OVen en en en en en en en en
envO rH OV OV vO OV •o OVm es fS es 00 px> •o fHp vO m •o en en en enen en en en en en en en
en es o\en eo en
ny X 3ilSíX»ft N o OI M oi s s s s OV o vO p>»•OVen 8
•oes•es
•o •oOVen•vom
en•m»o•o•inen
p>*•voesO•o\
•es •es00•m
en <o m vO p>* 00 OV 0<OVes es es es es es es es 00 00

- - :w -■ . .. ■ ....v:;i-^.• - 1 ' - . ' ' "
!^ - . - ^ . ¿ V ^
' » • ’■ • j .TjIT-T® ■ '*>‘/> 1
. . i “ -Hr H ', • f-ÇÏ5&‘ .'iOJ ' ■■ 4-V ■fr :rr'r‘'. V''¿,-ifc -‘ ■" ■ ■.•'■■'5 ,i' f • .. .'i‘ • -'
tiateat Vi' -
134fuactiona and finally the electronic parameters. Where
possible, spectral curves are sximmarised in terms of acalar
quantities that can be given as functions of composition.
Colorimetry
The C.l.E 1960 Uniform Colour System has been chosen to shov
the main colorimetric results, using C.l.E Standard Illum
inant C. This leads to a colour diagram in which the geom
etric separation of any pair of pointa most closely corresponds
to the perceived colour difference between the associated
stimuli, ie. observation of a pair of sajq>les in diffuse
daylight. The (u, v) locus for Ag-Au binary alloys is given
in Figure 6.19. Since this does not include a quantity
relating to perceived brightness, a graph (Figure 6.20) of
luminance versus conçosition is also given. This was computed
using the 1931 Standard System.
Saturation and Dominant Wavelength &re also presented
on this figure, calculated for equi^energy illumination. In
this system the hue is most similar to that of the mono*-
chromatic stimulus equal to X^.
Spectral Reflectance
Figure 6.21 iü a composite of the normal reflectance curves
for a representative selection of the alloys. For this
particular system it is possible to give all eleven curves
for the nominal 10% by weight intervals, without unduly
crowding the graph. In order to show more precisely the
effect of each 10% alloying addition, difference curves for
adjacent alloy compositions are presented in Figure 6.22.


. * c -*S' '► . : V. -S - T - r'
' Ù^Àwfctaï ' 'y-•T¿r •; ; ■ '”'jÍv'" "i
13&
*
o<n
■ m
o00
1
or»
oU3
1
. - 1^ O 00 ^o -»■ o 00 m00 oo t ^ t*. rv u> iOin i n i n i n m in in m l/>
• ■ É • B É •
o in o in o in<n CM CM1 i r « - l --- •
i n
CO
§ M•ä’3â §•
o\
H
§

- C *\V‘l
^¿^Mi
¡S?i'■':: ,'i|''''' ’i'
137
These will be used to provide the basis for disctission
of colour changes, and in combination with the derivative
spectra of Figure 6.22, to furnish shifts in the absorp
tion edges.
Data stsmnarising the movements of the reflectance edge are
tabulated in Table 6.2.
The dielectric functions
Figure 6.24 shows the measured values for the imaginary
part of the dielectric fijnction, e2((>)), for various comp
ositions of Ag-Au alloys. The difference between these
curves (662) for each pair of alloys of adjacent coiq>os-
ition are given in Figure 6.25. Also shown are the first
derivative spectra, dc2 (Figure 6.26). Again, shifts ind(i)
the position of the main absorption edge, 6‘Ao), have been
confuted using 5£2 ^362 , and tabulated in Table 6.3.
Data for alloys No.21 to 28 inclusive were obtained before
the RCA 8852 red-sensitive photo-multiplier ttibe became
available, and therefore do not extend below 2eV. These
samples cover the range of composition from lOZ to 80X
by weight.
Systematic variation with con^>osition for saiiq>les 21 to 28
can be seen, while the sauries measured much later (Johnson
Matthey Ag, Au; 5.8 at.Z Au (29R) and 90.7 at.Z Au (78)),
sppear also to form a distinct group.
There is a monotonic shift in the position of the edge
in e2((d) with composition (Table 6.3 and Figure 6.34), while

a.?.:*,T' V
* I t . ; . V v * ^ ‘ _--.
y-*r •' ■ •■ '
'** ■-■ BP^'- ,i' .V- •
Table 6.2. Edges of Rj Cu), Ag-Au alloys
"Z V> e &9 Wo«
<04J
b **to 4.1 OC » O —z ’ 3 c A IcO o >
X r-t- — c >•
i0)
3<&«O
ecCMO(*-o
Xg3 ®
"«O>0#o.2» J*3(0 g
»9
•1.*o1
V u N 0)
t<5
3 Ui. C8 . -
e e 4J OIO
u — > -o c e «0*4-c oo.
E<0(/> a<o1-« > N O
OC 0)a.la
d« J<■>
0 <AZ 6-1
Z IVec*o
X > <o O
J><o e
104.1 X X <0(A O U8 >
e
J-M 100 2.43 -142 47.6 2.43 55.8 -8.2 0,059 0.02 0.006 9578 90.7 2.45 -129 52.6 2.45 68.2 -15.6 0.12 0,08 0.014 8721 83. 2.53 -128 59.0 2.53 67,1 -8.1 0.06 0.08 0.005 7622 68.7 2.61 -105 61.5 2.58 72.4 -10,9 0.10 0.13 0.01 6223 56.3 2.74 -101 56.5 2.75 68.6 -12.1 0.12 0.15 0.01 502k 65.3 2,89 -94.6 57.1 2.88 70.3 -13.2 0.14 0.12 0,013 4025 35.6 3.01 -103 56.2 3.02 67.6 -11.4 0.11 0,15 0.015 3026 26.7 3.16 -105 52.0 3.18 62.5 -10.5 0,10 0.13 0.016 2327 19.0 3.29 -116 53.1 3.26 64.0 - 6.9 0.06 0,11 0.009 1628 12.4 3.40 -138 47.8 3.40 72.0 -22.2 0,16 0.20 0.024 929R 5.8 3.60 -190 43.8 3.59 C 70.6
C 82.3-26,6 0.14 0.12 0.026 ^.5**
68 0.95 3.72 -337 47.3 3.70 i 69.6 ( 71.6
- 2.3 0.0065 0.02 0,01 *»’"0.5•k-kicit
30R 0 3.76 -355 27.3 3.76JmAg 0 3.77 -502 44.7 3.77
ifc Compared with sample No.68• •
** II II II JmAg*4(4r II II II 30R
II II II JmAg


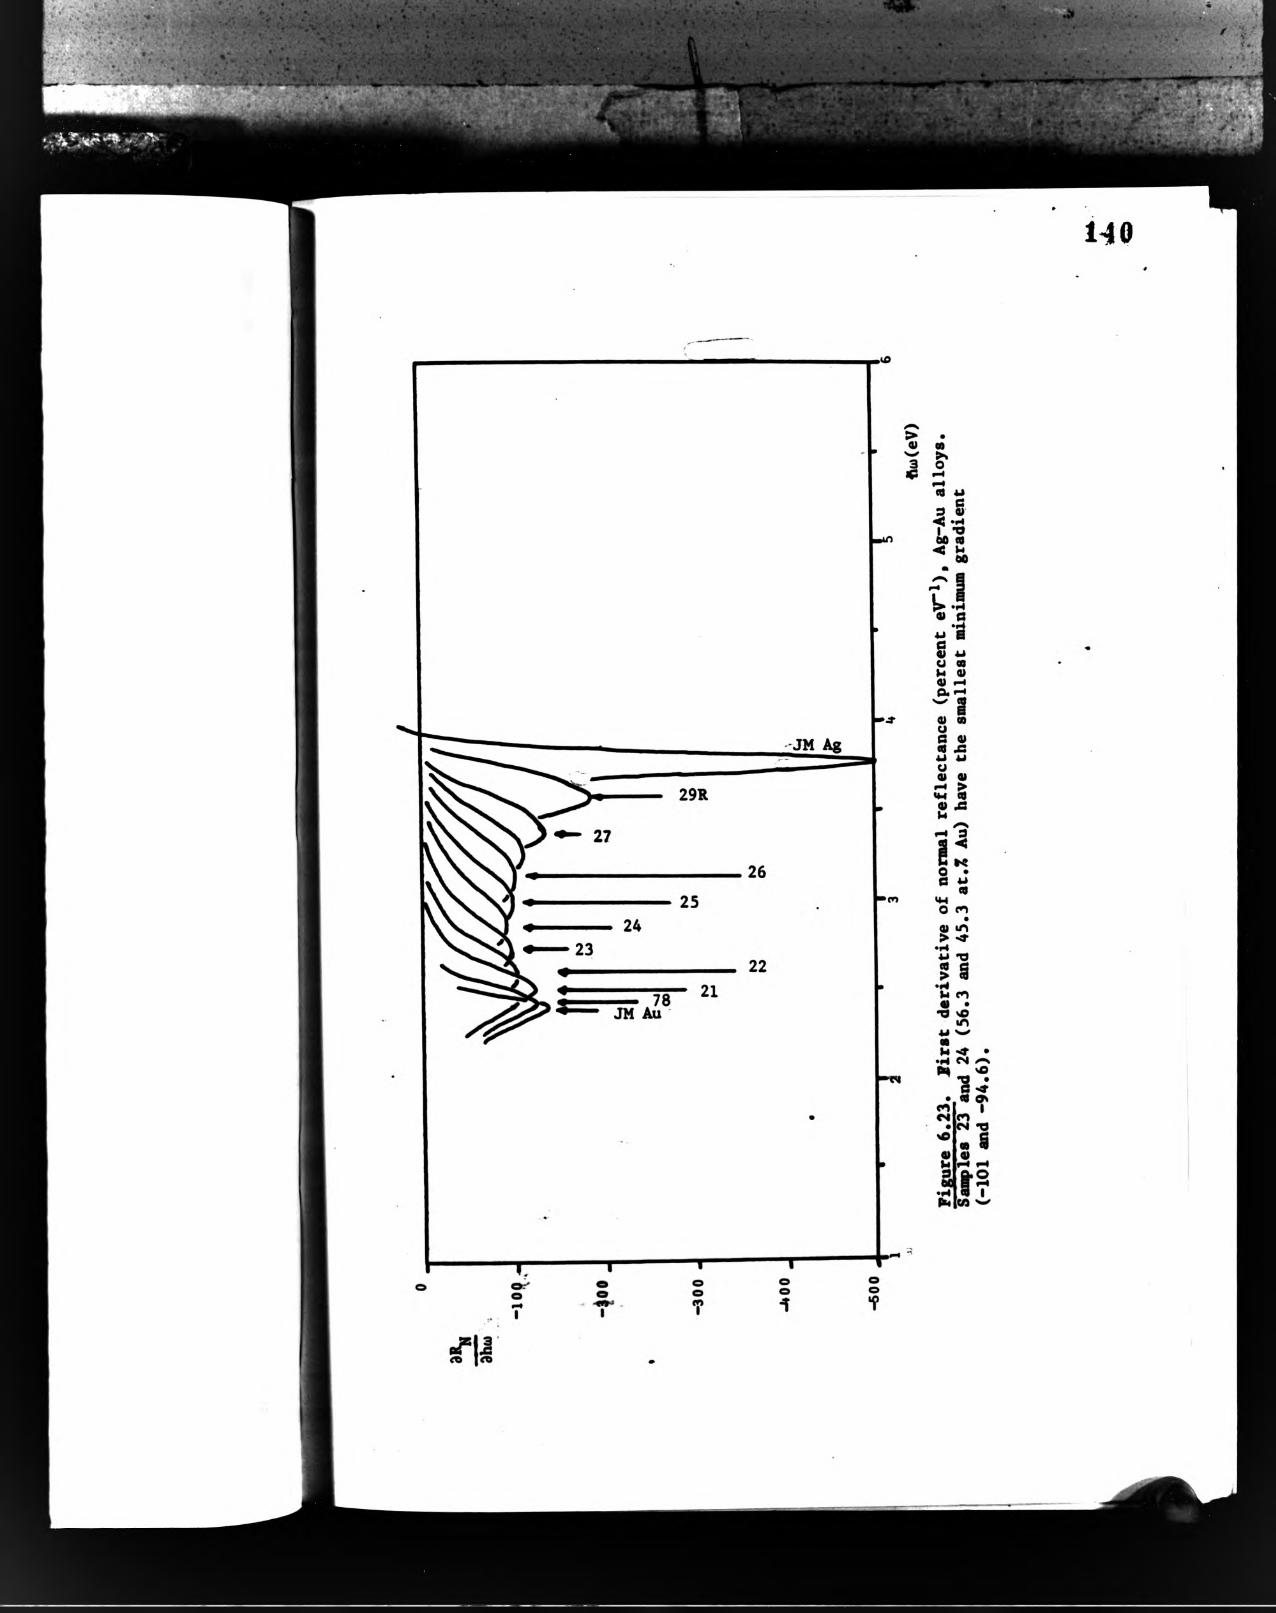
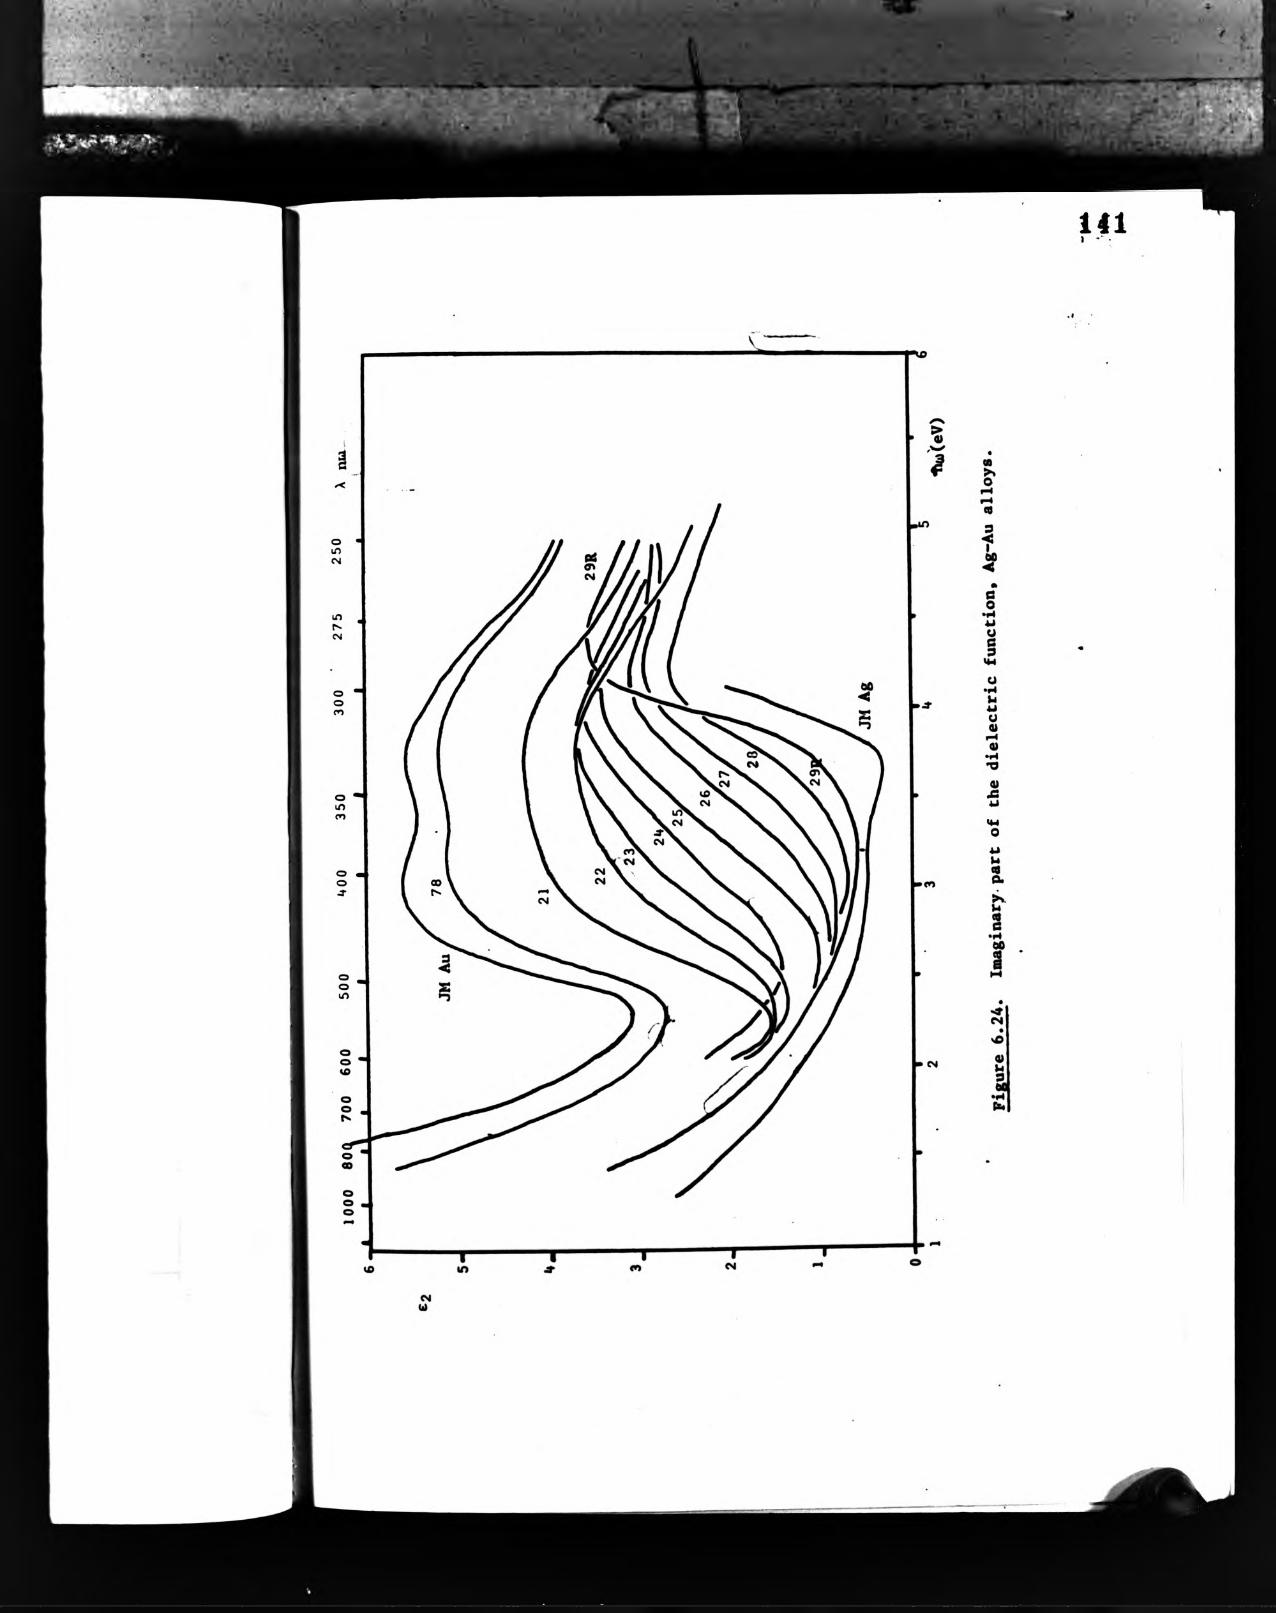

142
6g2
FiRure 6.25. Change* in £2» Ag-Au addition o? Au. Notation as in Figure 6.22.The*'Vertical bar a ahow the acale» while each graph haa its own origin.
jic.™ ^'If-.^ ' '. */4 ‘
V!***• -1 -» ■t ^ . . . , ' . a? I '
;v>- - J.
the gradient at the edge shows a well-defined minimum
at about 50 at*Z Au (Table 6*3, Figure 6.26).
The curve shown for pure Ag covers 1.4 -► A.leV, which
does not include the maximum in e2(u) at 'v« 4.5eV.
Later experiments» up to 5eV» gave a calculated normal
reflectance of 89Z con^ared with 95Z (at 2eV), and so
were not preferred to this result.
The Interband Dielectric Function
Figure 6.27 shows e2(o>)» separated as described in
Section 6.1. ’Free electron* absorption in each case
was considered to start 0.3eV below the maxi^m^in
3€2 for that alloy. Due to lack of data, these curvesdb) _ .can be presented only for fine gold and 90.7 at.Z Au at
the gold-rich end* 12.4 at.Z Au, 5.8 at.Z Au and fxne
silver at the silver-rich end. This includes only one -
No.28, 12.4 at.Z Au - of the set Nos. 21 to 28. Apart
from this san|>le, quite systematic behaviour was again
found.
Surface Plasmon Absorption
The surface plasmon energy loss functions are given in
Figure 6.30. It is clear that even at low Au concentrar
tions (»v 20 at.Z) surface plasmon effects, even for rough
saiq>les, may be safely neglected.
113

■ ■ í» i -Svi
■*■ y~ '-H
a 'fcíí':. *•'•.V ,' s *« '
* interpolated ** cf 30R
C’’’ 3r,-
Table 6.3 Edges of €2(0))» Ag-Au alloys144
J
co
ii (M|3 CO3 1ü «3
«8e « 1 elkS• 1 •Q 4J CM PC
e e U g»w. >» CM *0 iM0 0 U<0 1 ■““iMf-I(i> e J*0 J<M* 0 0
J-M 100 2.54 8.48 3.98 2.53 3.33 0.65 0.077 0.02
78 90.7 2.56 6.30 3.50 2.56 2.27*1.23 0.20 0.06
21 83.4 2.62 4.84 2.66 2.64 1.99 0.67 0.14 0.13
22 68.7 2.75 3.22 2.36 2.75 1.87 0.49 0.15 0.12
23 56.3 2.87 2.73 2.21 2.88 1.75 0.46 0.17 0.18
24 45.3 3.05 2.18 2.05 3.02 1.49 0.56 0.26 0.13
25 35.4 3.18 2.29 1.84 3.18 1.31 0.53 0.23 0.46
26 26.7 3.64 2.32 2.27 3.65 1.83 0.44 0.19 0.11
27 19.0 3.75 2.57 2.11 3.76 1.57 0.54 0.21 0.11
28 12.4 3.86 3.21 1.94 3.87 1.52 0.42 0.13 0.15
29R 5.8 4.01 7.11 2.27 4.00 1.81 0.46 0.065 0.00
68 0.95 4.01 9.06 1.81 4.00 (1.64 0.15 (1.2 0.6
0.0170.068
-0.001’ 0.08 ’
30R 0 4.00 8.82 1.64 4.00
J-M 0 4.09 7.90 1.62 4.06
**
*** cf J-M Ag

iO
o»
lA
m
04
'd
4)
I-I js eU ki « «H 0) A M OH I•o «H« 00 4J>• 2 o « e1 tC 1-4 4J «a O SSf 00< •«
> SS«0>00
u o /-s co os 3 « I-I t#(M Mu o os«M U4
g>. <« O r» 04> XsB enCd SB 4J(O <n 00« co _*a ps« a!
f ' M «M >0
CM\0
*a oBa QBI o «i o i-i I «X SB SB1 a >*
u o «Ofl «« « «H
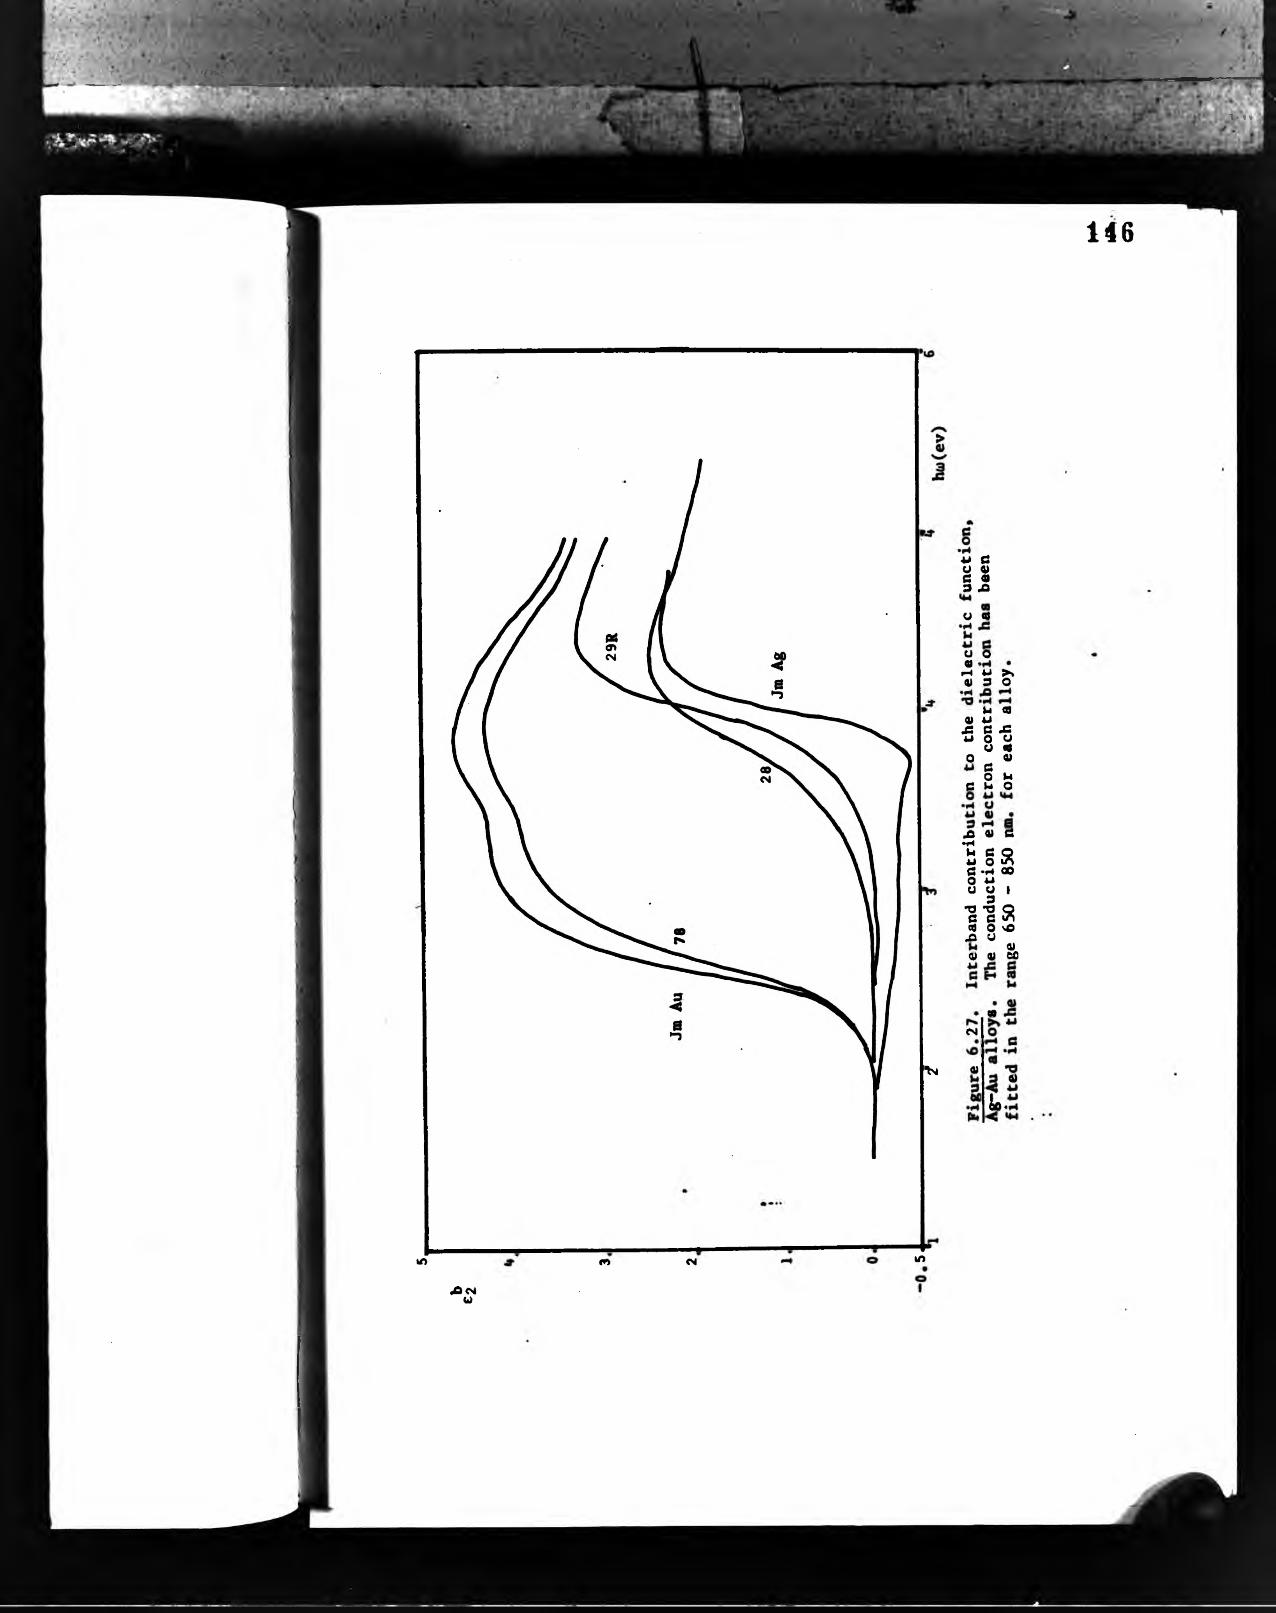
'<>»í■r»' : 1 * # % ;
146
Vi
•W 0U «e «9 .fiU «t
O O«1-1 *j >» 01 9 OM (0 « U
. f i e JS4J O CJ Ü 4 O 01fiO U fi »4 O
J3 0) fi •wh fi Q 4J O 1^ fi •<-» 00 O 4->U U I 9•9 •« Q fi fi uS cd O vo.fi U 0)01 0) 00
. (0<>1
« 0)¿0«
m en r4 tn. f i CMw


148
- 01*0
- 0
» 0
*w(eV)
Fifture 6.28. Change in €2 addition of Au; Ag-Aii alloys. The scale is shown by the bar (top right). Each graph has it own origin.

îÿ»-'t*»*
149
60
«
•âCMU<M
01
es
“1lCO im

• ■ . ■ • • - ! . ■ . * . - f ■ -, •■ . . <t * . - • ■ . j . ■ ' ■■, • .'*■'• * . >-■. , '-'j ” ' '■.. ■ /' • ■■■11 >’ '. - -I Í '-rf. , • .-i- • t..*( .ftv ■ v*t¿Í4-»*Ir*■■■-■ •

r -j «f*; * - . -
/
S ■ : -V ■ , -j- i- ■ •*
151Alloying effects
Figures 6.31 » 35 show various derived scalar quantities as
functions of alloy concentration. The conduction electron
propertoes T<Drude-like relaxation time) and hup (Drude~like
plasma frequency) show no discernible concentration effects.
As outlined in Section 4, the low frequency value of the
interband contribution to the real part of the low frequency
dielectric function, is also available from the behaviour
of e(u), provided that again Drude*-like behaviour of e^(u)
can be assumed. Apart from this, it is likely that is not
constant at 'v 1.5eV for alloys where d£2| occurs at 'x* 2eV. For3(1) max
the few samples where results were available (Figure 6.34) no
systematic behaviour was observed.
The 'position of the absorption edge' > which is eqtial
to the size of a band-gap in the electronic structure of the
material, has been defined as the value of 1 0 where 3c2 is aair
maximum. These values are given in Table 6.1 and Figure 6.35.
When C2(u) could not be evaluated - which was the case for most
of theAg-Au alloys - values of fiu deduced from have been
given instead. These might be e^qpected to be affected by ef ,
but in practice whenever both functions were available they
gave the same result to O.Ol eV.
6.3 Au-Cu binary alloys
The results for these alloys are presented in the same format
as those for the Ag-Au alloys sbove, as a similar metallurgical
system has been studied, namely, the system of disordered solid-
solutions.
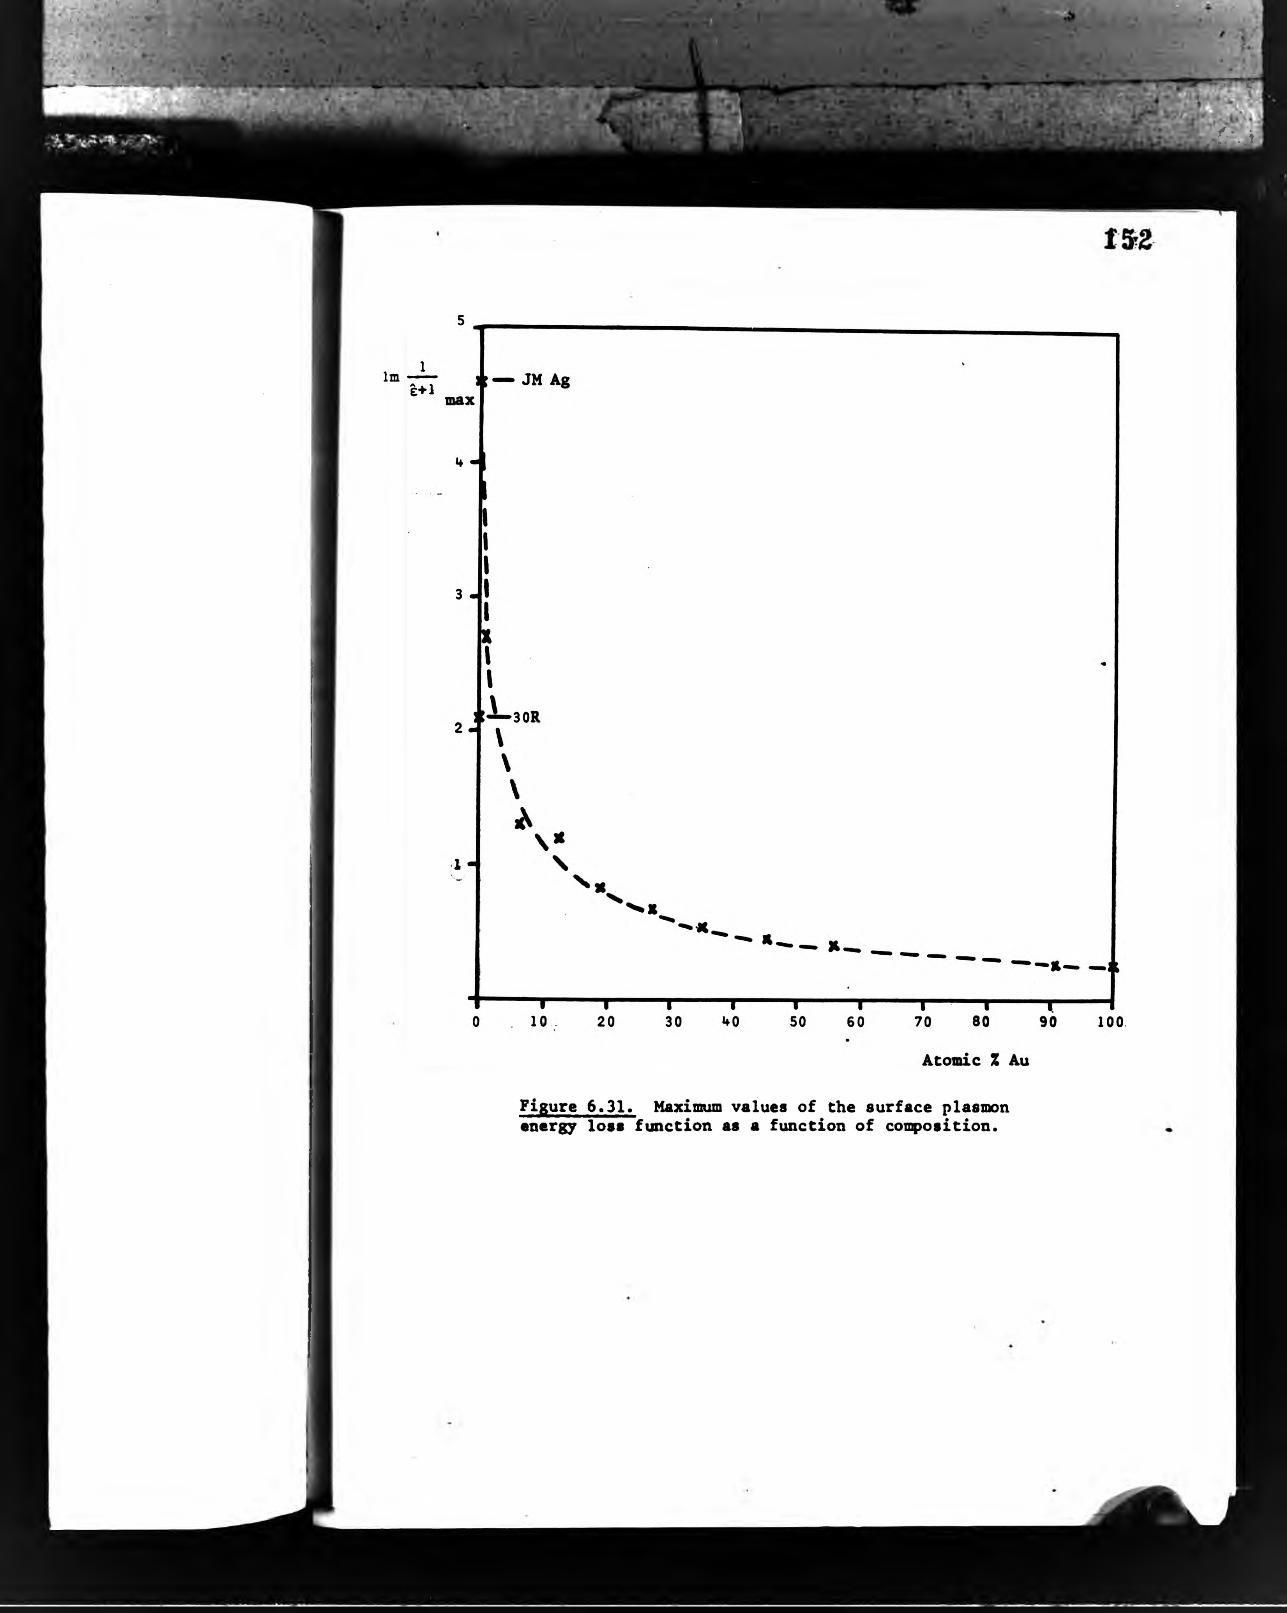
-i' C
fr.J
Im
Figure 6.31. Maximum values of the surface plasmon energy loss function as a function of composition.
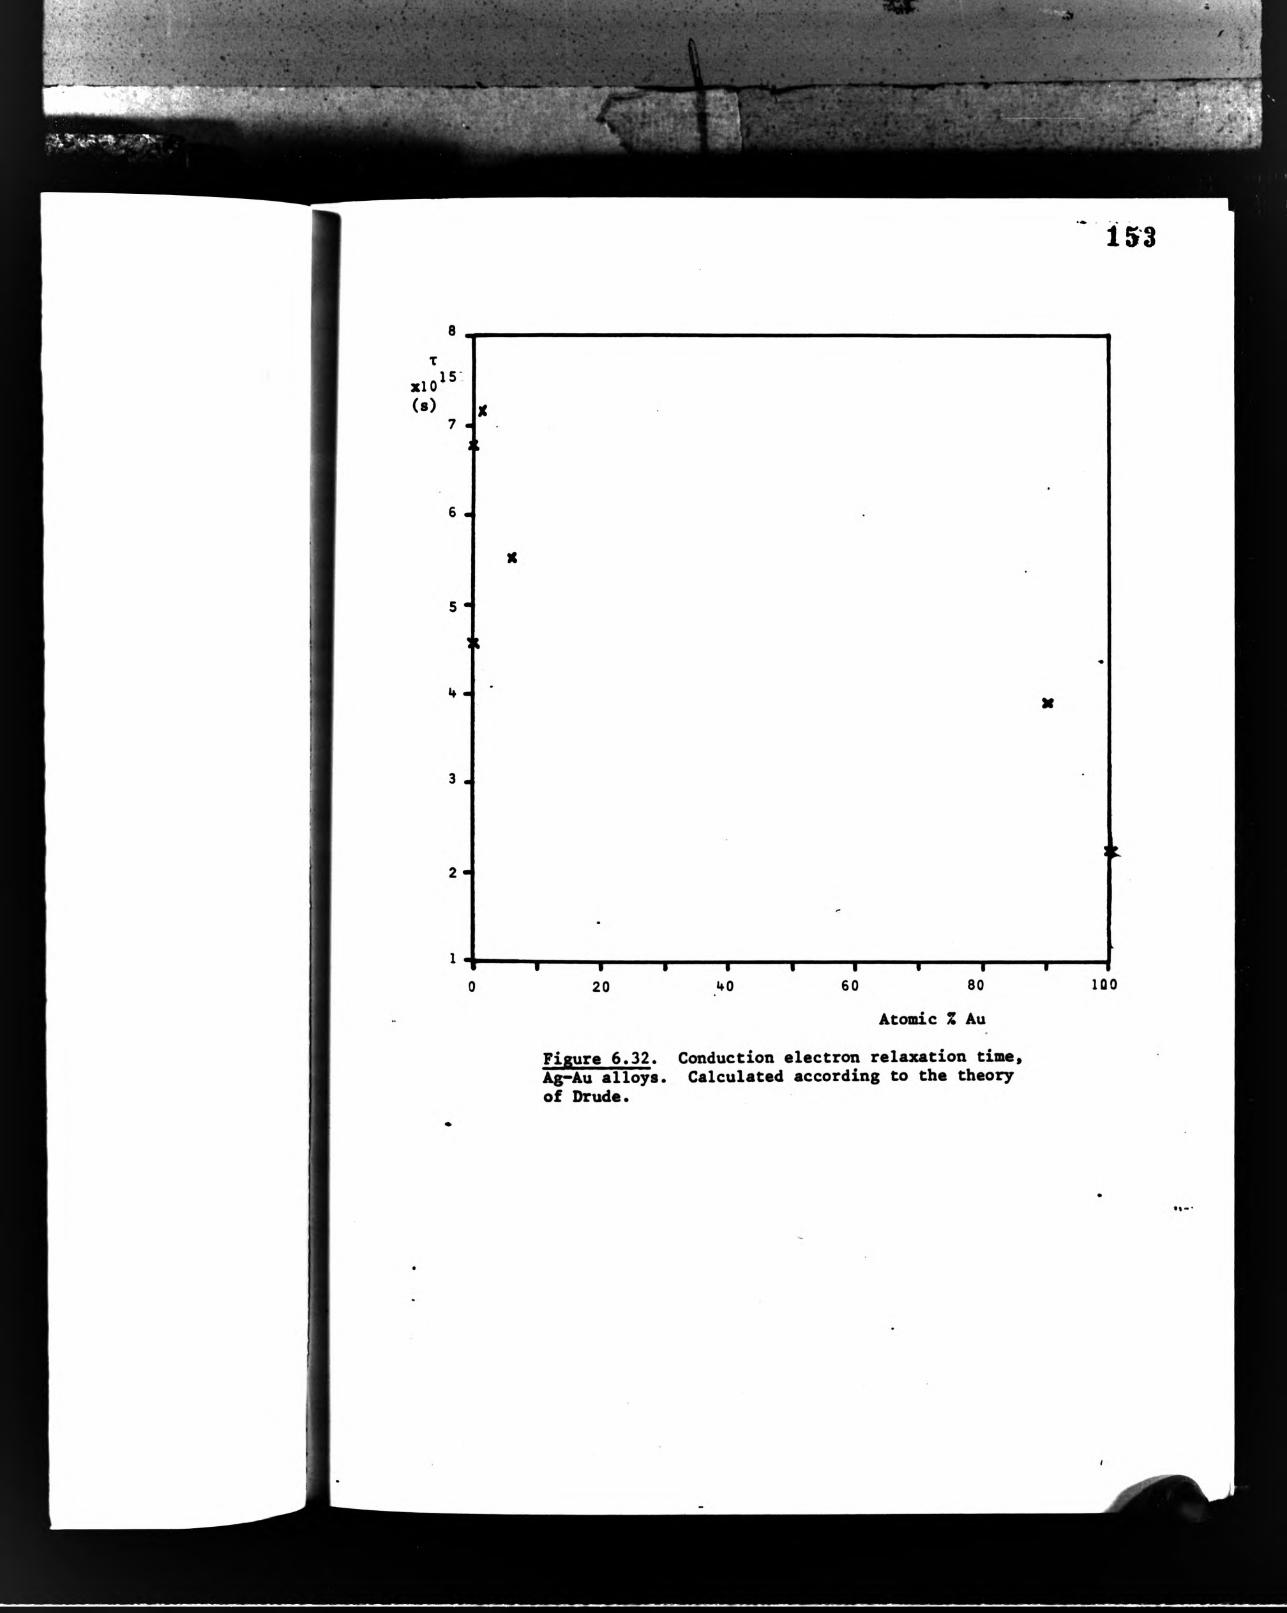


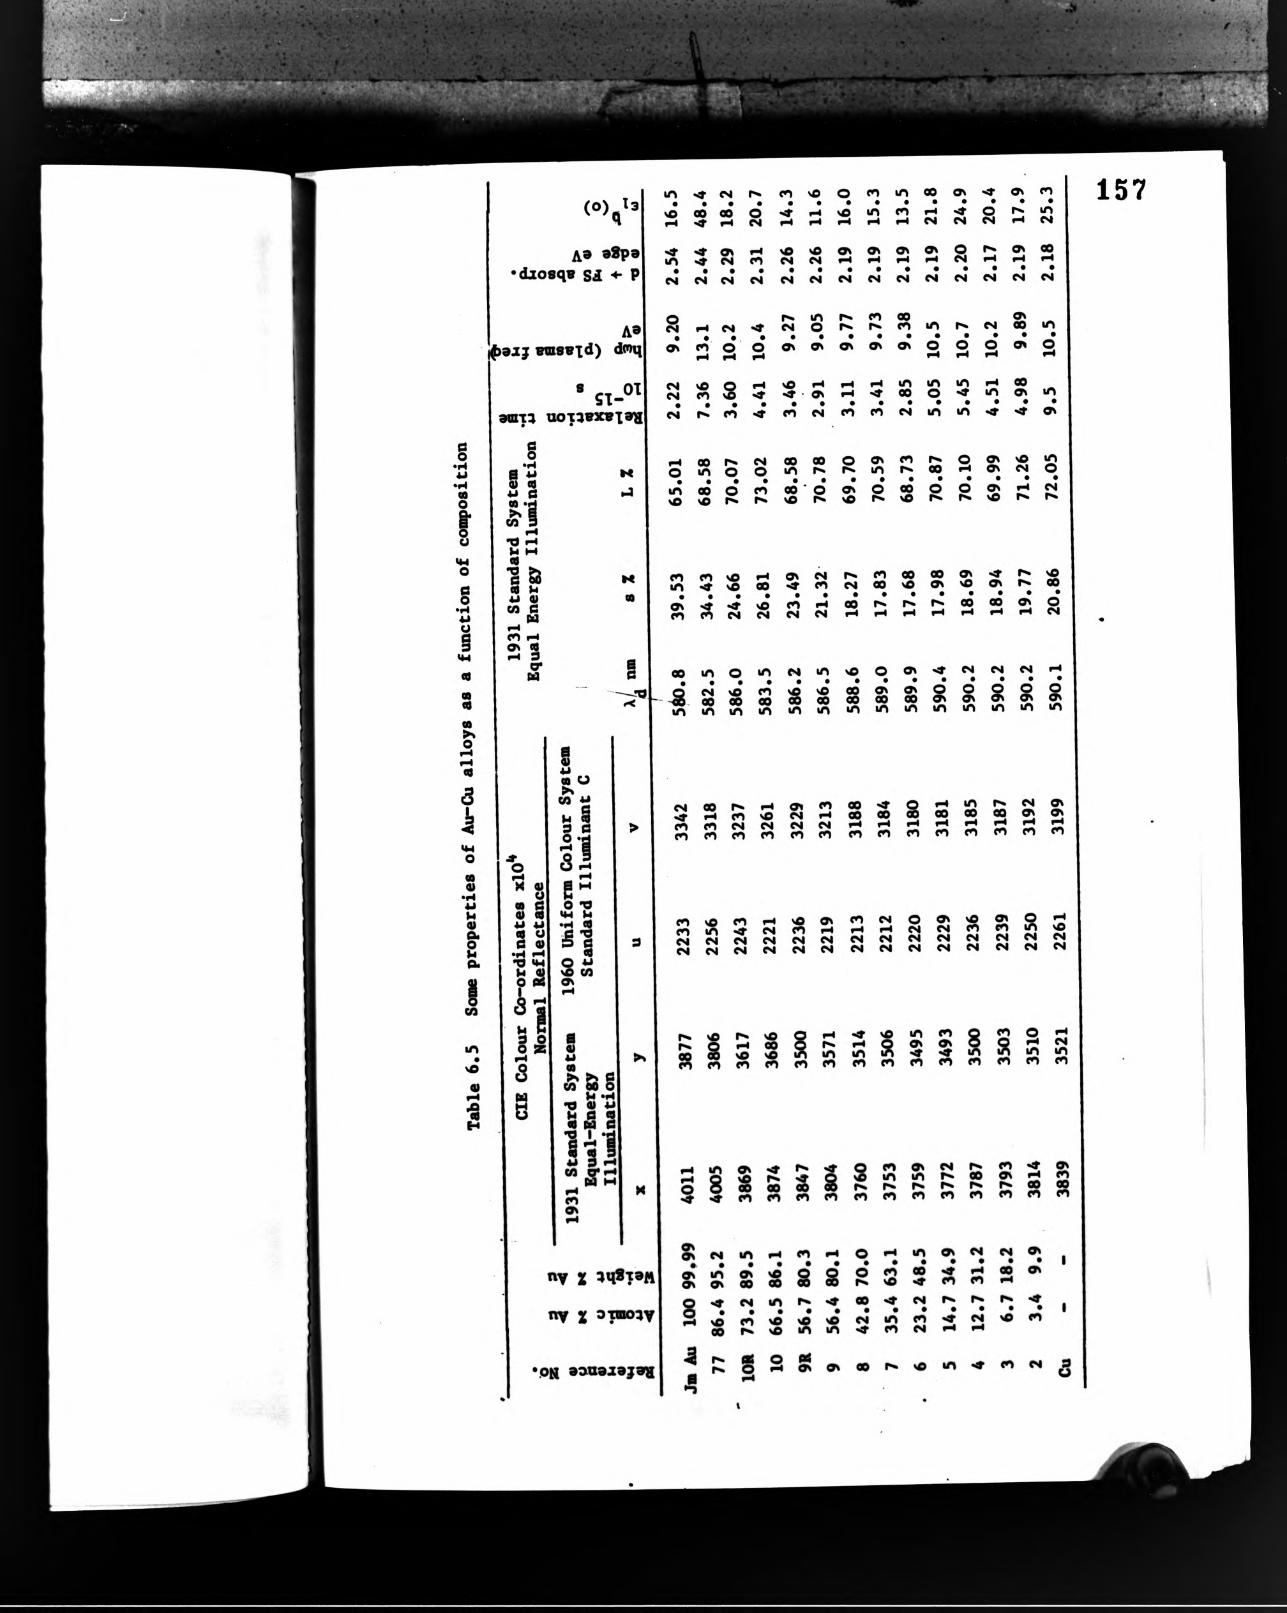

■-i’- -By ,w, V-«
L--'"---1.'*«N .S'i ''■X'V' ‘■•'j .■' ^¿)
Colorimetry
Figure 6.36 shows the locus obtained using the C.I.E
1960 Uniform Colour System to plot the chromaticity
co-ordinates of Au, Cu and several Aur-Cu alloys. The
results given in this section are for alloys 2, 3, 4,
5, 6, 7, 8, 9R, lOR and 77 of Table 3.1; in addition
certain figures show results for samples 9 and 10. It
will be seen that for these alloys curvature of the
colour locus is even more pronounced than for the Ag-Au
system. These and other colorimetric values are given
also in Table 6.5, while saturation (S), dominant wave
length (X^) and luminance (I) are plotted on Figure 6.37.
A distinct trend is noticeable in S and X^ as is
xjnplicit in the smoothness of the Cu, v) locus ^ but L,
which is not represented in the chromaticity diagram,
shows a degree of unsystematic variation.
Spectral Reflectance
Normal reflectance of these alloys is .shown in Figure 6.38.
There is but a small change in structure with conq>osition,
in order to avoid obscuring the graph it has been necessary
to plot the values of each alloy with a separate origin and
therefore with a much reduced scale. To convey better the
small shifts in edge position, a graph showing R(X) in the
visible region (Figure 6.38b) has been provided in addition
to that showing R((t>), Figure 6.38a.
158


* S'il'
160
i/> CM <n03 CO «O vo030303
03'o> 03 03 03CMCO03 03
MCA
a« >tI CO
*0«»< 'S(3«Ä U U CO 00c •4) en P
^ 0 3 O
CO H <0
saäâ • TÍ
en
t «•
J (0CO «
O 0 « •H >H 0M S «ki •-)oa
CO M

■ - * ' ■''• •■♦Ub i
r ■* . 'tif'ïflïS■V.fi2n¿ h
I"; -^ *. ’ - V
161
Table 6.6 Edges of Au-Cu alloys
U«
1U
iMO1•4Í
«60♦O«OXiU•O
•H!S
^ •3P? fi^ *a*o ^ TM 0» 0» >N 0) Û M
J
1«s « J
fi fi
&«•
«MO «O
«¿“IJA |A
>•Oh•O
«SUfi
U3 O•O
Jm Au 100 0.16 2.43 -142 47.64 2.43 48.16 -0.42«
+0.003 -0.09
77 86.4 0.22 2.34 -133 58.75 2.34 57.8<10R)
+1 -0.007 -0.11
10& 73.2 0.20 2.23 -110 67.11 2.25 65.6(9R)
♦1.5 -0.014 40.01
10 66.5 0.19 2.27 -110 71.21 2.25 66.8(lOR)
+4.41 -0.040 -0.08
9R 56.7 0.12 2.24 -112 65.64 2.25 64.59 +1.05 -0.01 -0.06
9 56.4 0.19 2.19 -105 72.83 2.19 69.95 +2.88 -0.027 -0.01
8 42.8 0.17 2.18 -112 72.15 2.18 72.73 —0.58 40.005 0
7 35.4 0.17 2.18 -114 72.73 2.18 70.41 +2.32 -0.020 -0.01
6 23.2 0.11 2.17 -122 70.41 2.18 72.56 -2.15 40.018 0
5 14.7 0.19 2.17 -145 72.56 2.18 71.89 +0.67 -0.005 0
4 12.7 0.13 2.17 -147 71.89 2.18 72.14•
-0.25 40.002 0
3 6.7 0.11 2.17 -156 72.14 2.182 3.4 0.11 2.17 -178 73.18 2.18 73.5 -0.32 40.002 -0.01
Cu 0 0.12 2.16 -193 73.80 2.18

1 & 2
Figure 6.38a. Normal reflectance of Au-Cu alloys. The nuaobers given here are the sample melt reference numbers. Au is a sasq>le of fine gold from Johnson*^ Katthey» Cu is a piece of cathode copper (4N pure)• The vertical arrows (right) indicate 0 - lOOZ,
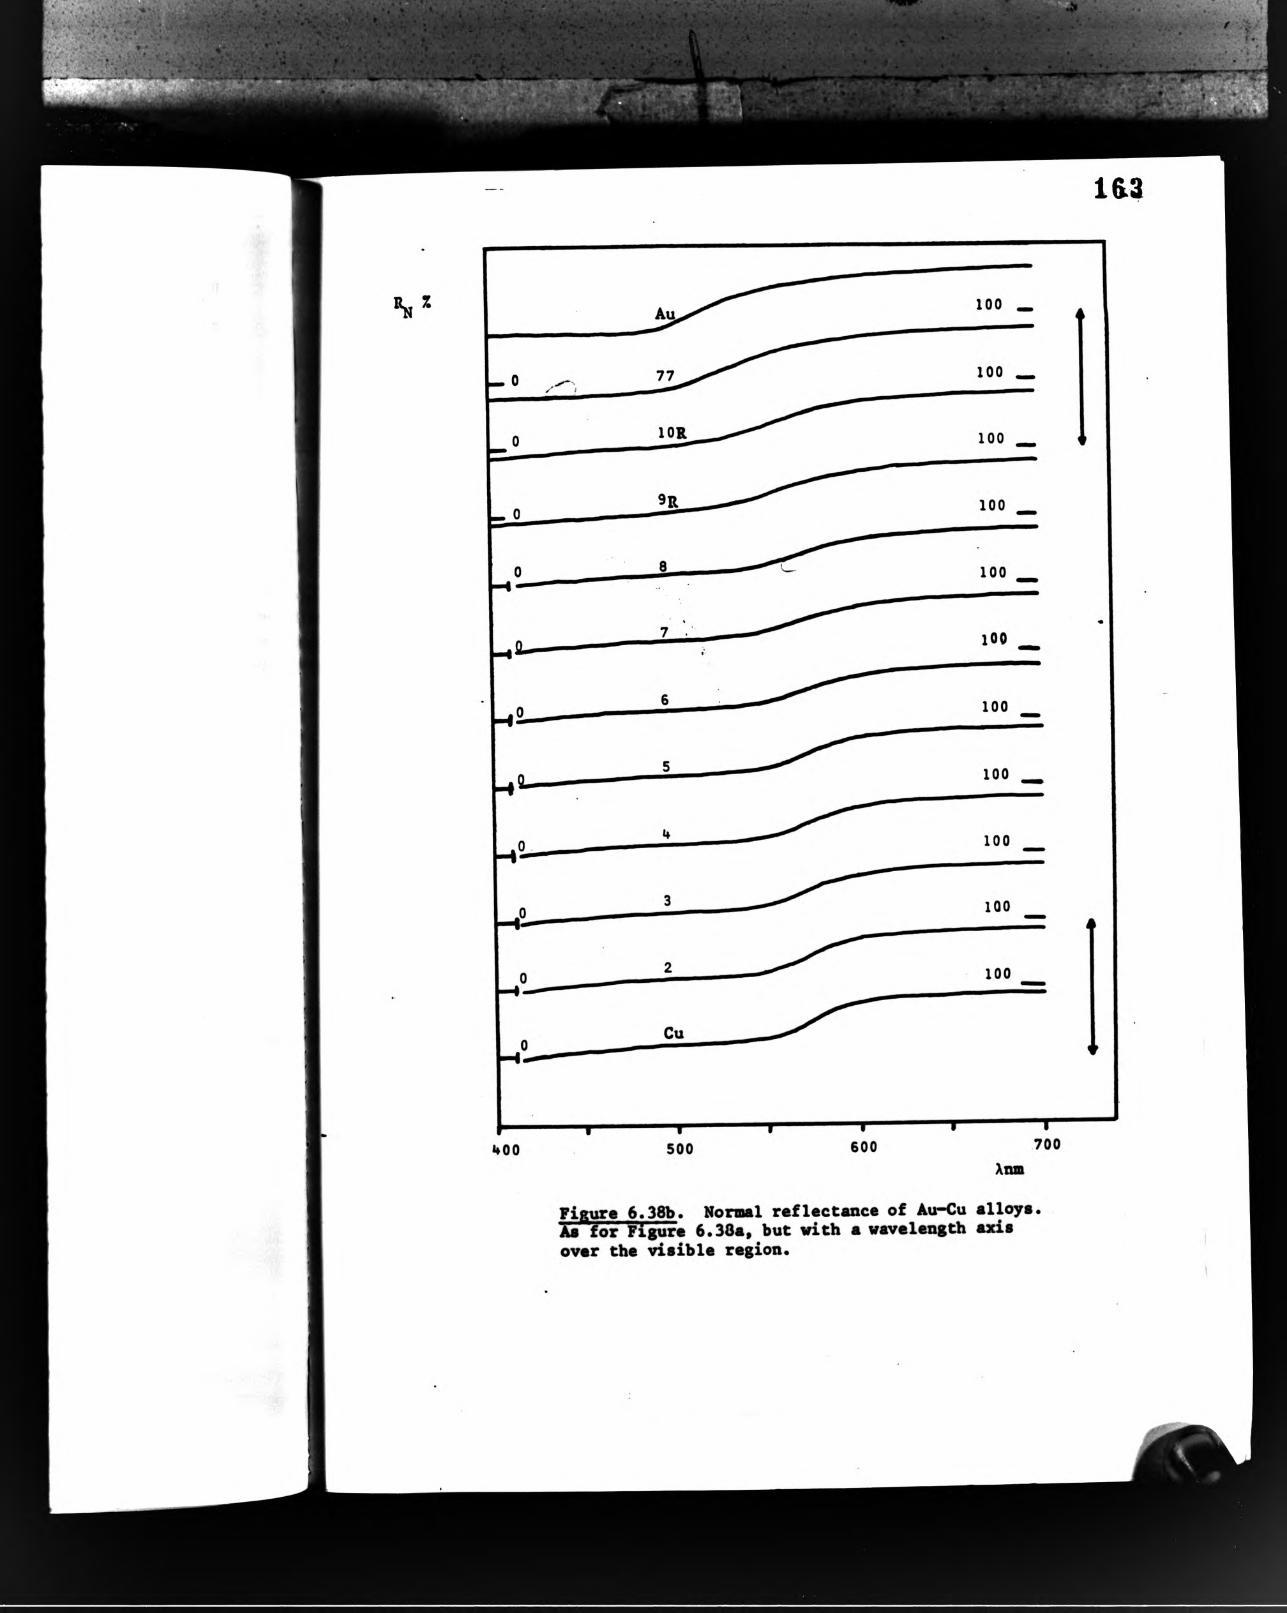

>.; ■ .îit. ' ' J'- „
r y'fi‘,s
164
Again, difference curves (dR ) are given to emphasise
the trend with composition (Figure 6.39). These enable
the colour differences to be interpreted at the level
of specific spectral features.
Xhe first derivative spectra with respect to energy,
1 ¿R , are shown in Figure 6.40. Numerical data is ft 3wpresented in Table 6.6 .
bThe Inter-band Dielectric Function, E2
Graphs of C2 («) only are given. Figure 6.41, since the
conduction electron effects can be conveniently summarised
in'^erma of a few non-spectral quantities, and sufficient
data was available for the separation to be carried out on
all the alloys.
Difference curves (6c2 (u)) ere given in Figure 6.42 and
nunerical derivative. 1 in Figure 6.43. These figures^ O C XTshow a tendency to increasing width in the peaks at 2.5eV,
with increasing gold content. This is shown more clearly
in Table 6 .8, where a column is devoted to the difference
(in eV) between the energy of the point of maximum slope on
the low-energy side of the peak in aej » energy of3(1)
the gradient minimum on the high energy side. This has
been obtained by numerically computing second derivatives
and considering their minima and maxima.
Alloying Effectsb.
The same qtaantities namely x, ik) , ci(o) ••
«are derived for certain Ag-Au alloys are given here for
all the Au-Cu alloys measured. Systenstic variation is
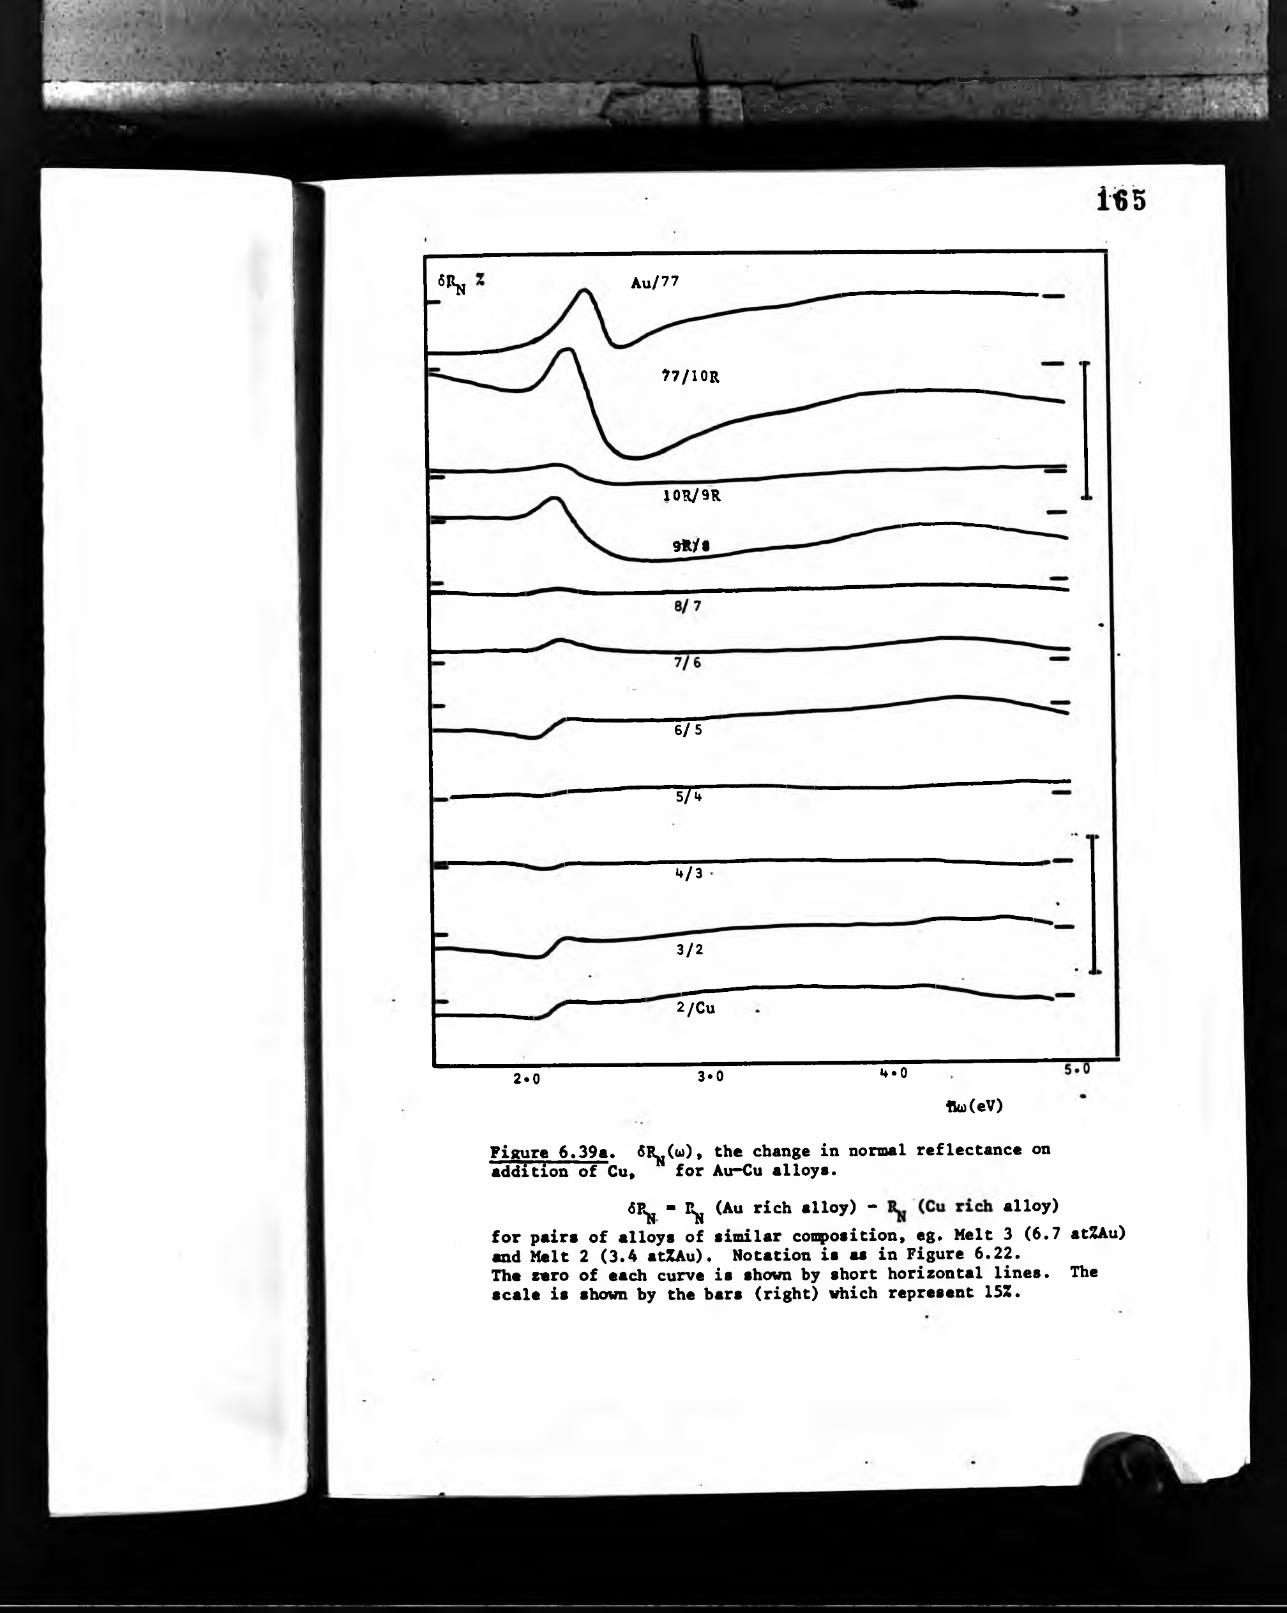
I - • ■ . ‘I ‘ . . -r 1/r' R-m ,
■' t'. Vv *•>■!'■’•- ■■■.■ ■'■
i\:< .\K ■<■•? tr
«»N Au/77
t7/10R
10R/9R
9tyt
6/5
S/T
*»/3
3/2
2/Cu
2*0 3«0 •♦•0fi(i)(eV)
Pilture 6.39a. 6R^(w), the change in normal reflectance onaddition of Cu, for Au-Cu alloys.
6Rjj - Rjj (Au rich alloy) - alloy)for pairs of alloys of similar composition» eg. Melt 3 (6.7 atZAu) and Melt 2 (3.4 atZAu). Notation is as in Figure 6.22.The sero of each curve is shown by short horizontal lines. The scale is shown by the bars (right) which represent 15Z.

; / ■, .... '.- -.r"• ■ ■ ' ,,.
■ ,. \. ,-*i ; !- ./i r •-«{■•- ’ ■' . 'i -
H 6
<g >jrigOT 6.39b. 6IL (X), the change in normal reflectanceon^addition of co^er» Au-Cu alloys. Rjj is defined by
■ rich) - rich)
for alloys of similar composition. The notation is as in Figure 6.22. The sero for each curve is marked on the left, while the arrows (right) show the scale.
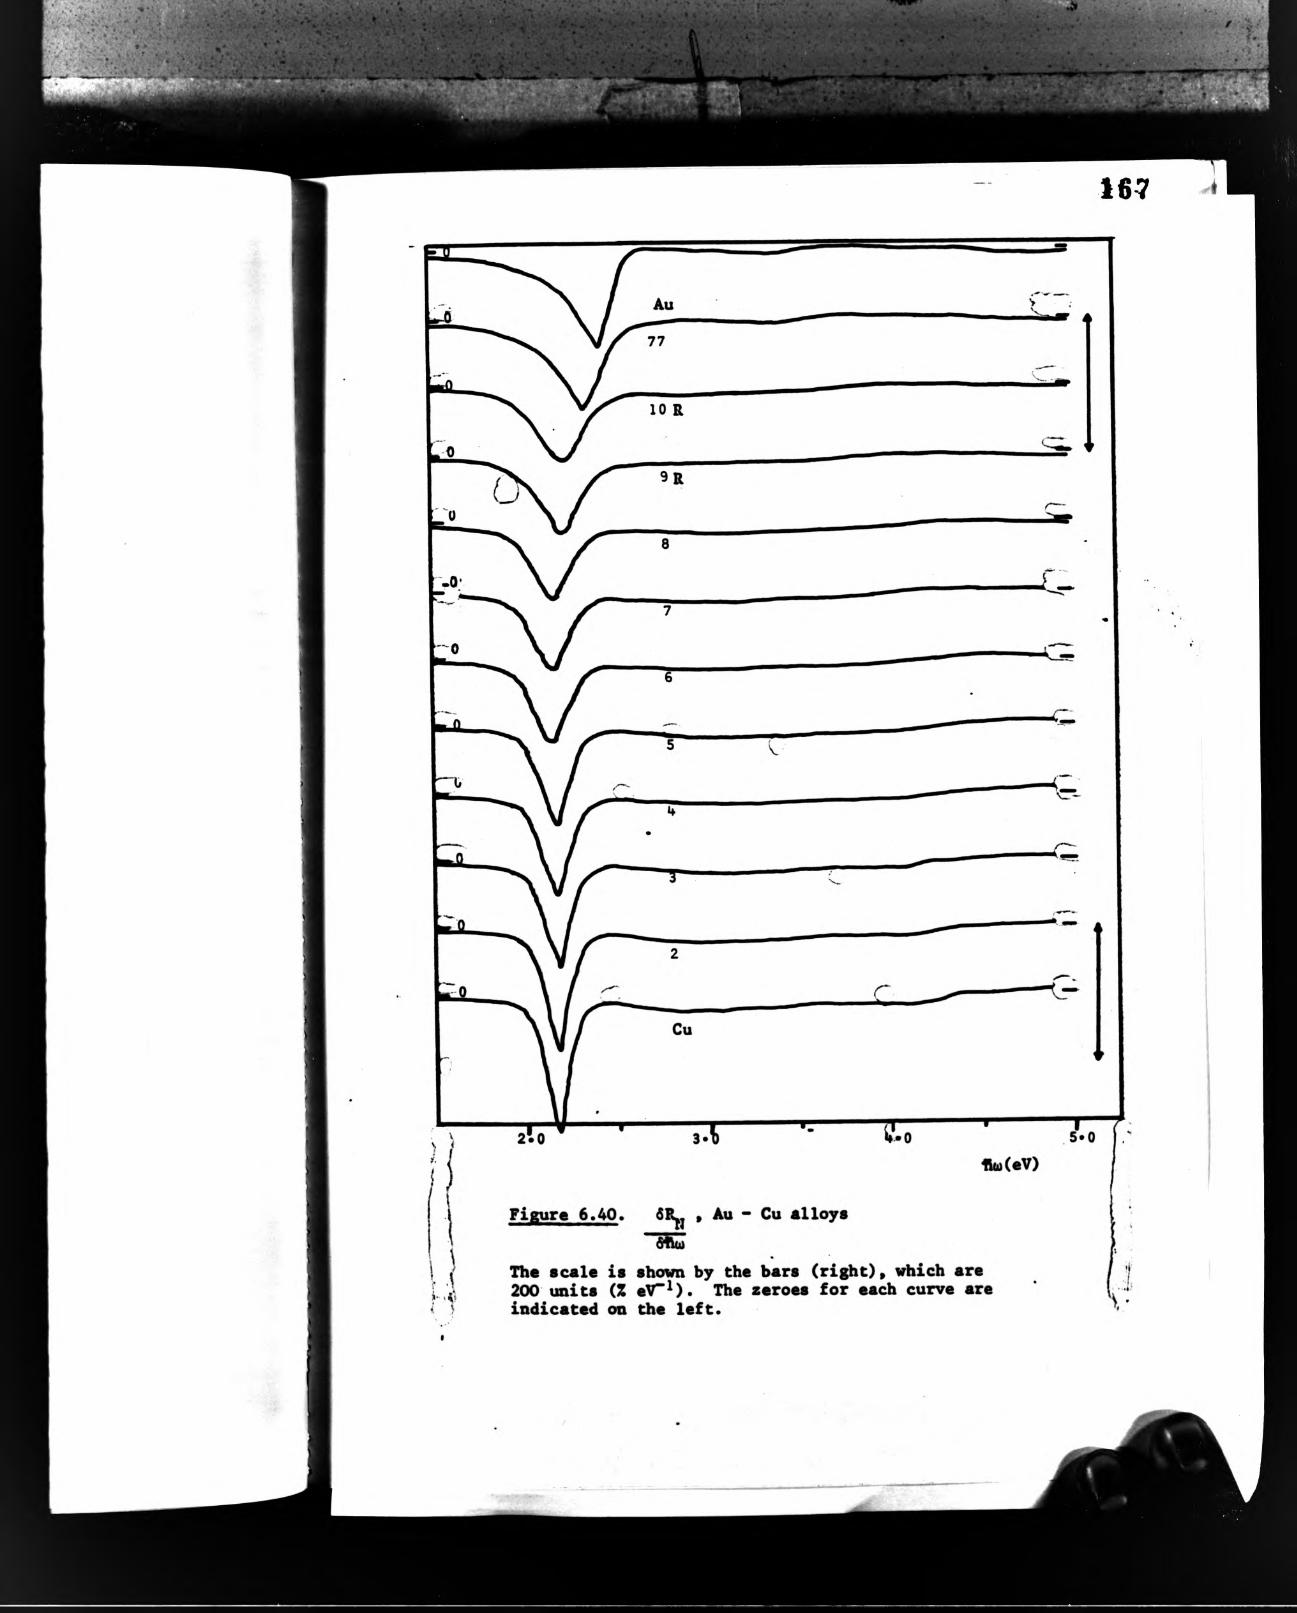

■- ■ ■-. -vVVi
- ...V-.-ii-^i
i.Vo ■ .-,
'•rLlS-' . ■ ■ -;y. ■ . .Mi»
168
Table 6.7 Edges of 62(0))» Au-Cu alloys.
The 'adjacent alloy* melt number, with respect to which the change in €2 i* calculated* is shown in parenthesis in cases where confusion could arise* eg. 4.39 (lOA).
ue
14J£
iMU14J<
&w•0««M- 0
5T3•H
3
M
<H0
se >N «
S3Si/Ot
wa .
J1•D4JeNm»CM(1)
j4Je
P-<«
««H0CMU
CMU«0
^ 8CMU
•0
k«0
CO«0ueN
J*0
Jm Au 100 0.32 2.54 8.48 3.94 2.53 4.24 -0.30 -0.03 -0.10
77 86.4 0.24 2.44 7.15 3.62 2.43 4 .3 9(lOA)
-0 .77^ 0; 11 -0.13
lOR 73.2 0.35 2.29 9.24 4.19 2.30 3.87(9»)
-0.39 -0.053 -0.03
10 66.5 0.22 2.31 7.40 3.48 2.30 4.18(9A)
-0.70 -0.095 -0.05
9R 56.7 0.20 2.26 8.53 3.52 2.25 4.57(8)
-1.05 -0.12 0
9 56.4 0.21 2.26 8.72 3.82 2.25 4.57(8)
-0.75 -0.086 -0.01
8 42.8 0.19 2.25 10.6 4.57 2.25 4.60 -0.03 -0.0028 -0.06
7 35.4 0.17 2.19 11.5 3.94 2.19 4.08 -0.14 -0.012 40.01
6 23.2 0.17 2.20 12.0 4.08 2.19 3.65 ■K).43 0.036 -0.01
5 14.7 0.17 2.19 14.2 3.37 2.18 3.20 40.17 0.012 40.01
4 12.7 0.12 2.20 14.0 3.73 2.21 3.78 -0.05 -0.0036 -0.01
3 6.7 0.12 2.19 14.6 3.50 2.19 3.19 40.31 0.021 0
2 3.4 0.12 2.19 16.3 2.87 2.18 2.50 40.37 0.023 0
Cu 0 0.17 2.18 16.2 2.43 2.18
/a

'/v:. fS;-. • • ‘
#*
'•.ft
r.-r\
¿.'•’••Ä.t; v-s.
169
Table 6.8 Edges of e2 (o>)f Air-Cu alloys
3 <Hu
âëÌ «J
• o•H»
« > t i e
M 1•H ►O 0»
«w
C4U
J oC«4U
<MU•o h<o
Ô
JS*0 N
J m Au 100 0.15 2.54 10.4 1.755 2.53 2.50 -0.74 -0.07 " -0.10
77 86.4 0.24 2.44 3.47 1.750 2.43 3.52 -1.77 -0.21 -0.15lOR 73.2 0.35 2.29 11.2 2.31 2.30 2.20 •K).ll +0.01 -0.03
(9R)lOA 66.5 0.22 2.31 9.10 1.776 2.30 2.44 -0.66 -0.06 -0.05
(9A)9R 56.7 0.21 2.26 10.5 1.74 2.25 2.46 -0.72 -0.07 -0.07
9A 56.4 0.21 2.26 10.9 1.99 2.25 2.46 -0.47 -0.04 -0.07
8 42.8 0.19 2.19 13.1 1.72 2.19 1.93 -0.21 -0.026 0
7 35.4 0.17 2.19 13.8 1.93 2.19 1.88 +0.05 +0.003 0
6 23.2 0.17 2.19 14.5 1.88 2.19 1.63 +0.15 +0.01 0
5 14.7 0.17 2.19 16.0 1.63 2.18 1.44 +0.19 +0.01 +0.01
4 12.7 0.12 2.20 15.6 2.03 2.21 2.00 +0.03 +0.002 -0.03
3 6.7 0.12 2.17 16.4 1.68 2.19 1.84 -0.16 -0.01 +0.02
2 3.4 0.12 2.19 17.8 1.44 2.18 1.45 +0.04 +0.002 -0.01
Cu 0 0.17 2.18 17.2 1.45 2.18


\ 'bU'
171
•ach curve.

ffifcu;;«;. ;i
dhuthe scale (20 eV”l). The horisontel lines show the zero for each curve.

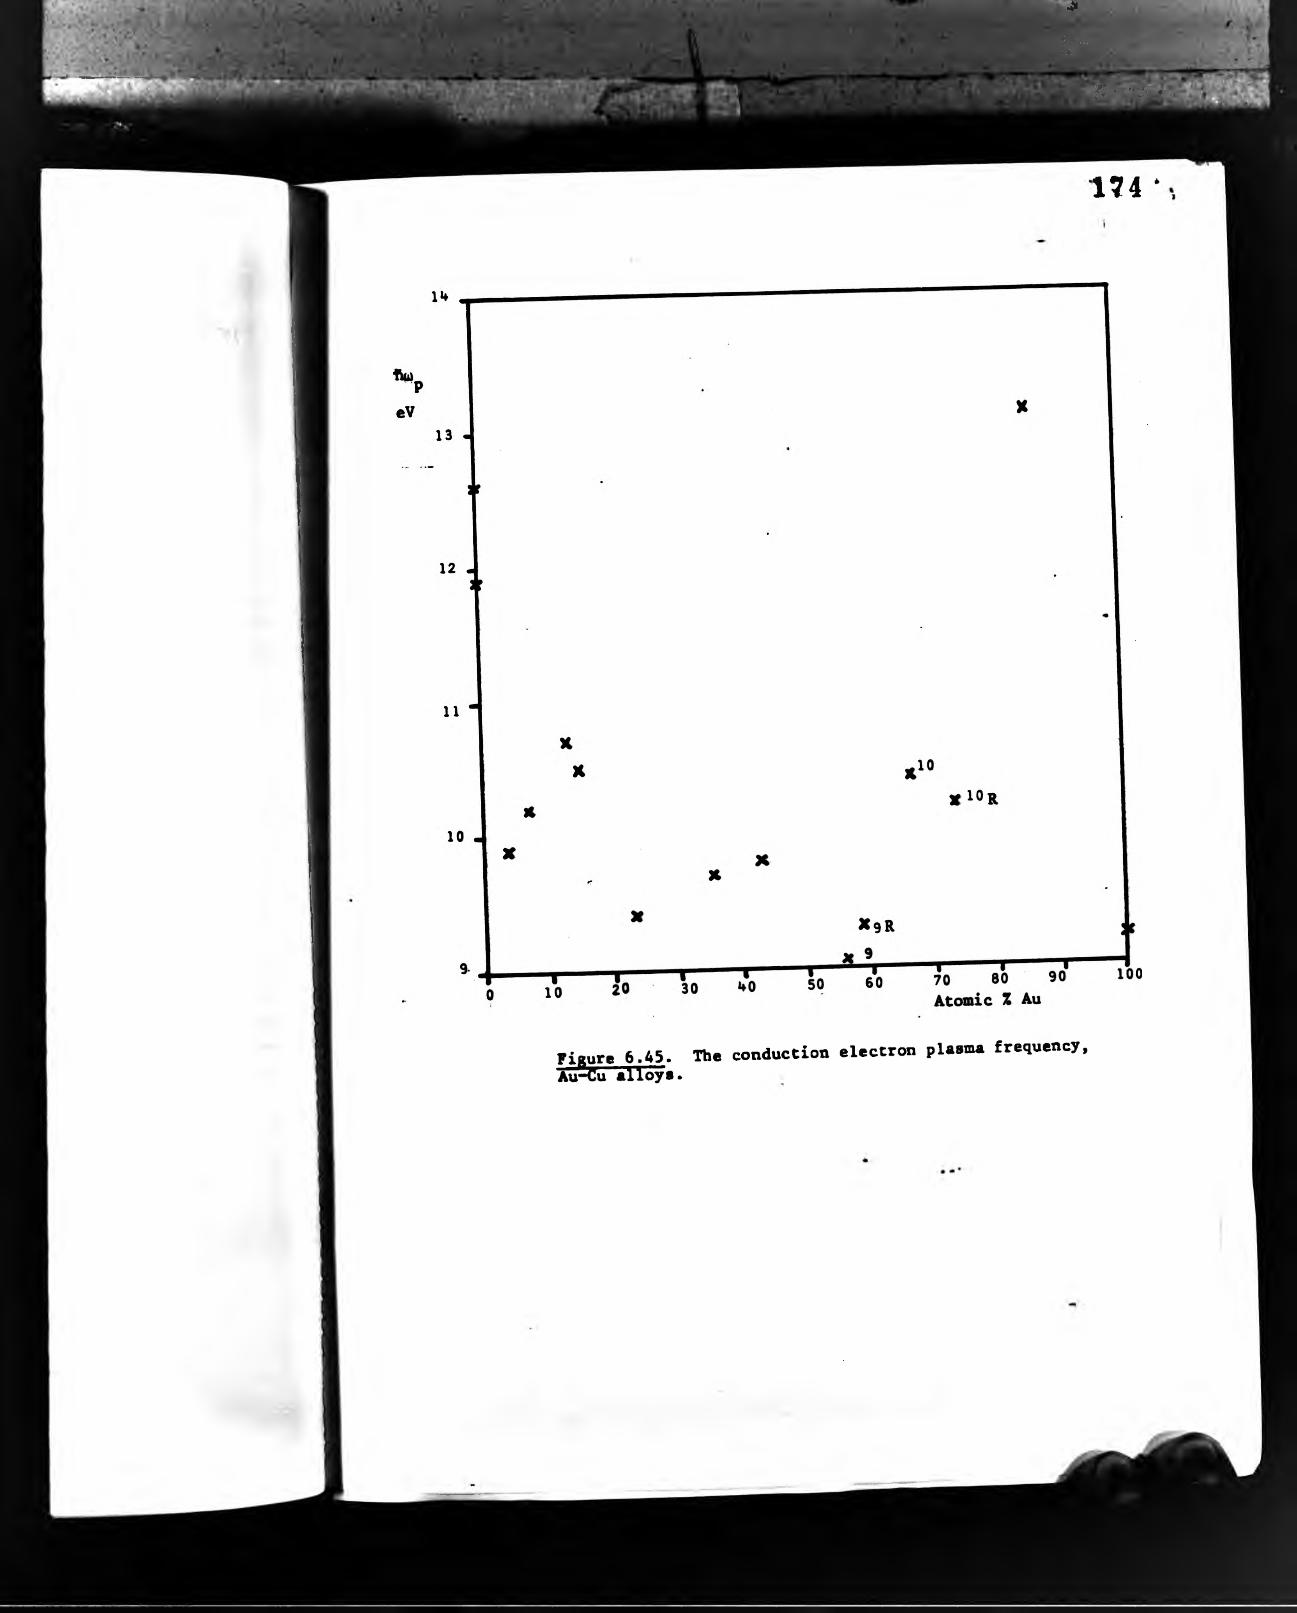
•¿I
Çs '•* Í '. i; a:
■ f t • ' •'■ . . * -
174 •
»i»ur« 6.45. The conduction electron plesme trequency, Au^u «Hoys.
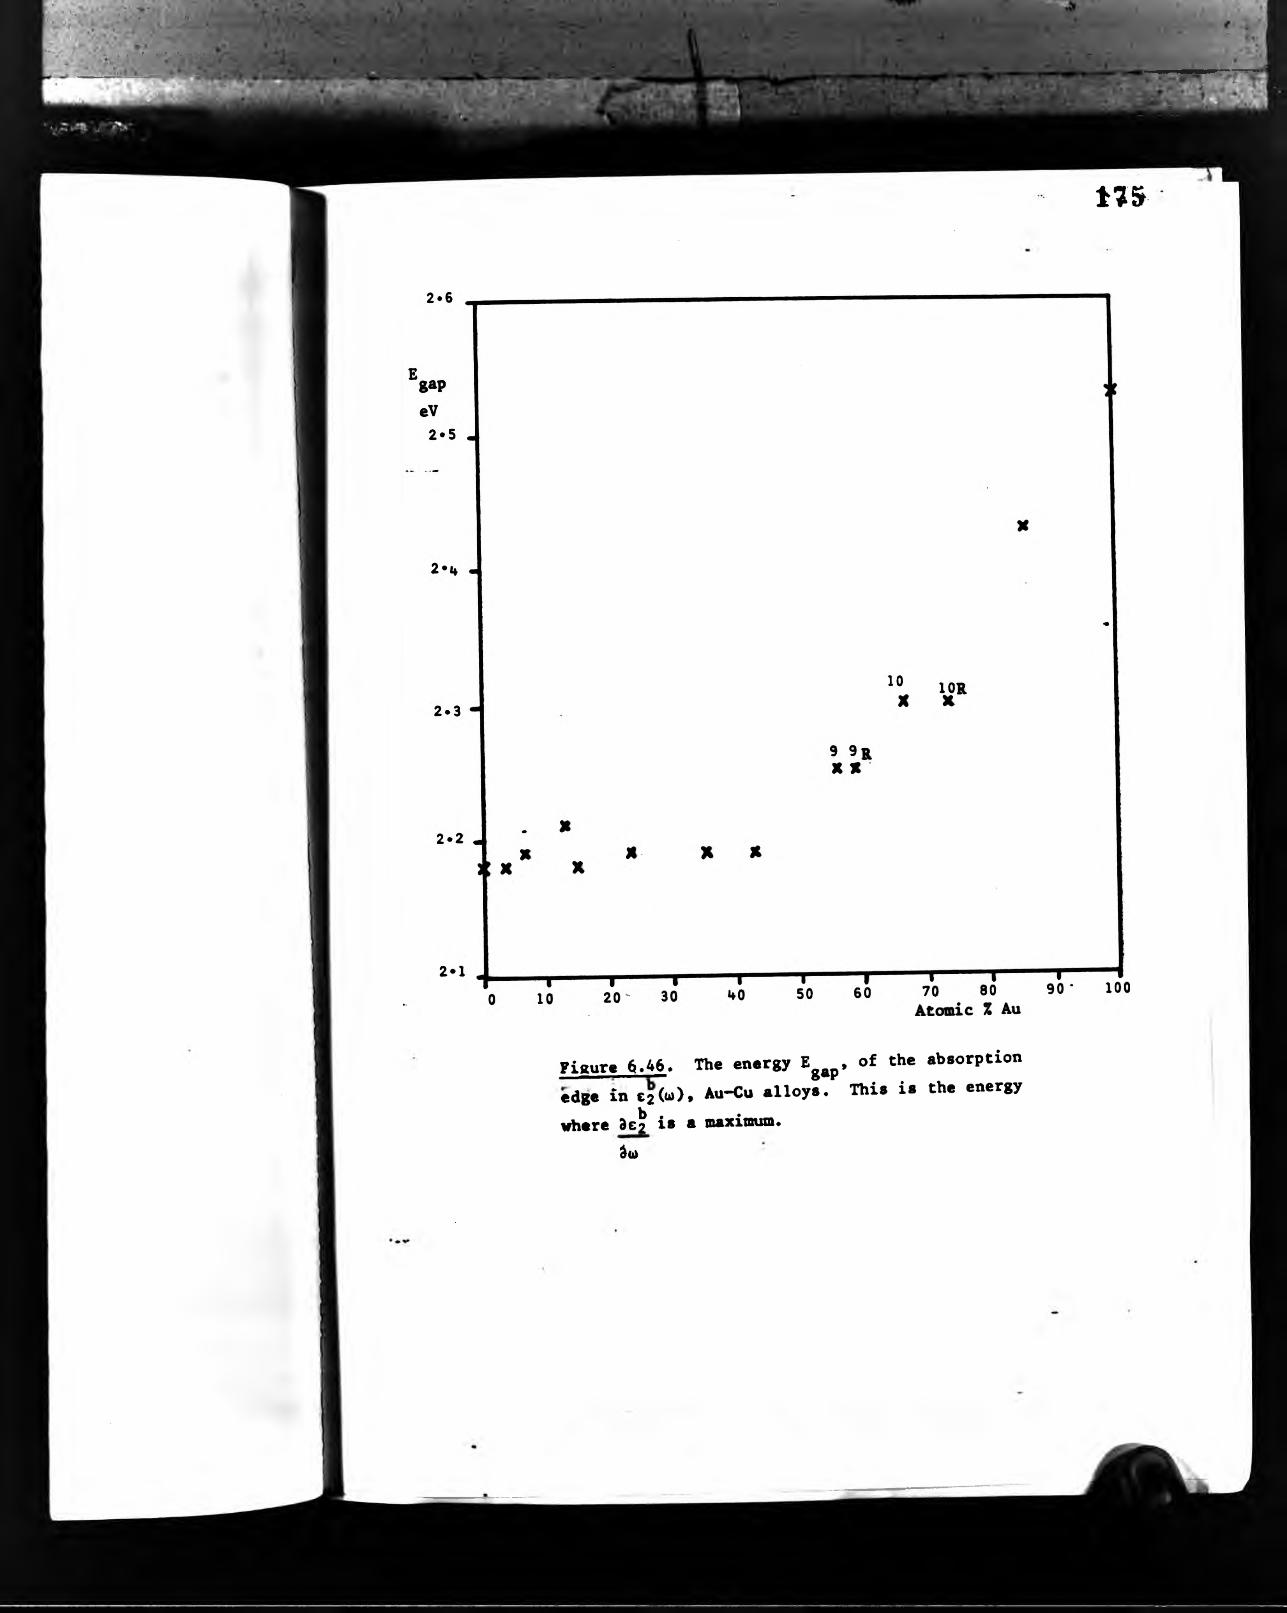
* • -.ii'
> ■ ' ' ' '-•-'i’ifciii '. •- ■ *, ■
t ? 5
Figure ^«A6. The energy E^^p,edge in C2 (<<>)» Au-Cu alloys.
b . . _where 3c2 i* *■ maximum.du
of the absorption This is the energy

V
■ ■■*:->• *?i-
i • * ►• • -A *■
176
Figure 6.47. The low frequency contribution of interbend treneitions to t\, €i(o), Au-Cu elloys.

177
absent from the plots of these as a function of Au
concentration figures 6.44 - 6.47), with the exception
of E Figure 6.46, which clearly shows littla or8»P
no variation for Au content O-'SO at.X, and rapid shift
subsequently. Analysis of the curves 5e2^^
used in the Discussion to examine these measurements more
closely.
6.4 A ^ u alloysThis alloy system has only an extremely narrow range of
solid solution at 600®C Cthe annealing temperature used for
this study) - only 5 at.X Cu dissolving in Ag, and
less than 1.5 at.X Ag dissolving in Cu. Nevertheless,
several single phase samples were prepared. Those of the
600°C saturated solid solution composition (melt numbers 75
and 76) were annealed and quenched from 750®C to ensure
that no second phase precipitated. Another alloy, melt
number 70, approximately Aggg Cu^, was made, and also a
ssmple of melt number 16 was remade by Uquid-quenching
as a metastable single phase alloy of 37.4 at,X Ag,
Some relevant properties of both the single- and duplex-
phase samples are presented together here. Sections 6.4.1
will deal with the solid solutions and Section 6,4.2 the
others. Table 6.9 lists colorimetric and electronic
properties.
ColorimetryFigure 6.46 .how, the CIE I960 Uniform Colour Syetm»
co-ordinetee, for C.I.E Stenderd Illuminent C, for ell the

■' ‘ . ' ■ Tg'./lÀ -ri '''*' i’''- • ’ *íVí>
178
(< o ÿ >
UO.T-ottava? SJ-P
A9 ‘ wq*•092} Tnu«x<
(O9tg^^01aot2V3c«Xí
CM00•>o«o-•00
00»co •mco•rM 1 m•IOpM
O'•OpMin•mNO
00•«0
O' o <M«a* •«■ r*o• 5• o• o• • pM• • pM• pM• 1sr 'S- CMCMCMCMCM\A CONO O'vO' '• CO •o
00•CMpM'O•O
O'•O'pMtná
NO•O'O'•00
00•<0pM•O'
NOr»•'Om• m•rs.
NONO•NO00•t>-NO
1m00•r>»
CMO'•00CO•COCO
mCM•
s|•2 ¿3P
S|9
0\ I-I 0« vO • • • •m 00 (*>ON 00 00 ON
r >o _\0 O' 'O
«n
S i s ^S
«*> co <n eo *n co
«o m pHCO as CO• • • • • •m r>. r*» -o asO' as 00 00 00
m m 00 O' 00 r-• • • • • •COm o O'pH f"HpHo CM00 COin as• • • • • •00 pM•o COCOpHf-* 00 00 00 s 00m m in m mo COm O' r>* r>.s CMsr pHpM pHpH fH CMCOCOCOCOCOCO«0 -o r» «0 in m<Mo O O'o CMpH-apHCMCMCMCM<MCMpMCM00 NOr». CMO' CMr- CMfHCO«0 •a- «0 m nOCOCOCOCOCOCO
g mCOvOO' pHm pHCOpHf"HCOCOsfCO inCOnOCOCO
o COm• • •CMCMCMm COCO00 O' O'CMCMCMNONO00• • •CO
00 r*• • •o r- 00msr O' sr
-a O' CO• • ••a CMmm COCMO' O' 00fHCMCMCMNO m• • •CO ofH00 s m
O' m O • • • •t-l CM£ 8 S ~
m O' *o «n O'; • • • • •\o 00 O' ^ o^ ,-1 P -t CM C>J e s
O' vO 'O ' » 'O *-•• • • • • • m 'O 00 O' oOD 00 00 OQ 00 9l o »CÌ *c' i n «0 »CÌ
lO O' 00 OOO'O' —S ^ 2¡ 2! s;COCO<0<0<OCOO'o 0>
m «o 00 'O ^In « O' 'S- >o 'S^ rM rM <M CM <MC M < M < M C M < M < M
-O «n m ¿ ¿co «A "O co CMlo m >2 ^co co co co co co
<M O' »0 ÇM 200 co m co co«A r r 00 00 Sco co co co co co
«V 1
8y X ojmovf
xmqma 2X«H
I I
<a O m as CM00 CO O'• • • sC• pH••O'O' i•O'00
•O' •O'so i s O'CO asfH s CMin
o -a •a fH O fs. •a pH• CM• • m• CM••O'O'•COO'
•CO00•Ofs.
•rsm•rssr rsCO
/■n«i00CMOCMCMNOpH
or* NOCMfH COpH «apH mfH sO sOpH pH9pH0.«SiP
rspH00 oCMmrs

;4'i> '•. ■ "J i * !‘ ‘
:::n“ "*“ sV.' ^ - ;, •5V-.-'..■ i'.
179
Fisurc 6.48. Colour Coordinates of Ag~Cu alloy. V«lu€t'citoilat«d in the C.I.E 1960 Uniform Colour Syttcm for C.I.E Standard Illuminant C.Tha nond>ert on the locus are sample melt reference ntad>ers. The point E is the equal energy point.

180
Ag-Cu alloy* measured. The colour locus takes the form of an \ipward**‘curving arc; the results which fit least well on this curve are those of, the eutectic and of the splat-cooled sample. Note that the results for the 2-phase samples have been obtained as described in Chapter 4, taking no account of any inhomogeneity.Figure 4.49 gives these results as function* of composition.
Eiectrohio Properties
The computed dielectric function* of all these alloysshow the ^Drude-like^ tail characteristic of solid
solution noble metal alloys. The optical relaxation< btime, plasma energy and low frequency part of
plotted as functions of concentration in Figures 6,50 - 6.52, Sample 13 gave a negative value for the relaxation time Ces also did one pure copper sample), so that results from this alloy, in the infra-red, have been discounted. Overall these result* do not display a marked relationship, but are similar enough to those for the Ag-Au and Au-Cu systems. It can be seen from Table 6.15 that the absorption edge position doe* not change significantly,
6.4.1 Single phsse Ag-Cu alloys lectance Curves
Figure 6,53 shows the spectral reflectance of a range of Ag**Cu solid solutions, as well a* curve* for pur* Ag and Cu, These divide into Ag rich alloys 100 95 at,f Ag, and Cu rich,37,4 0 at.f Ag. The measured absorption edge for a silver
sample from Johnson-Matthey was at a higher energy than that

F t ' -r-• •-y.-i:-':Vv r '
C4 O oo u> d- CM O 00 te J- CM O(T en O* 00 00 00 00 00 n» ts. f*» r>»
1 1 1 1 1
> .1. J— LMCO
e * CM O 00 te s-. CM O 00 te e- CM OCM CM CM
• 1 1
<o •
!" /
N«t 11 1#
' V
E«-«-
M
iO
m
ÎO
C4
O ^M an
*;s S

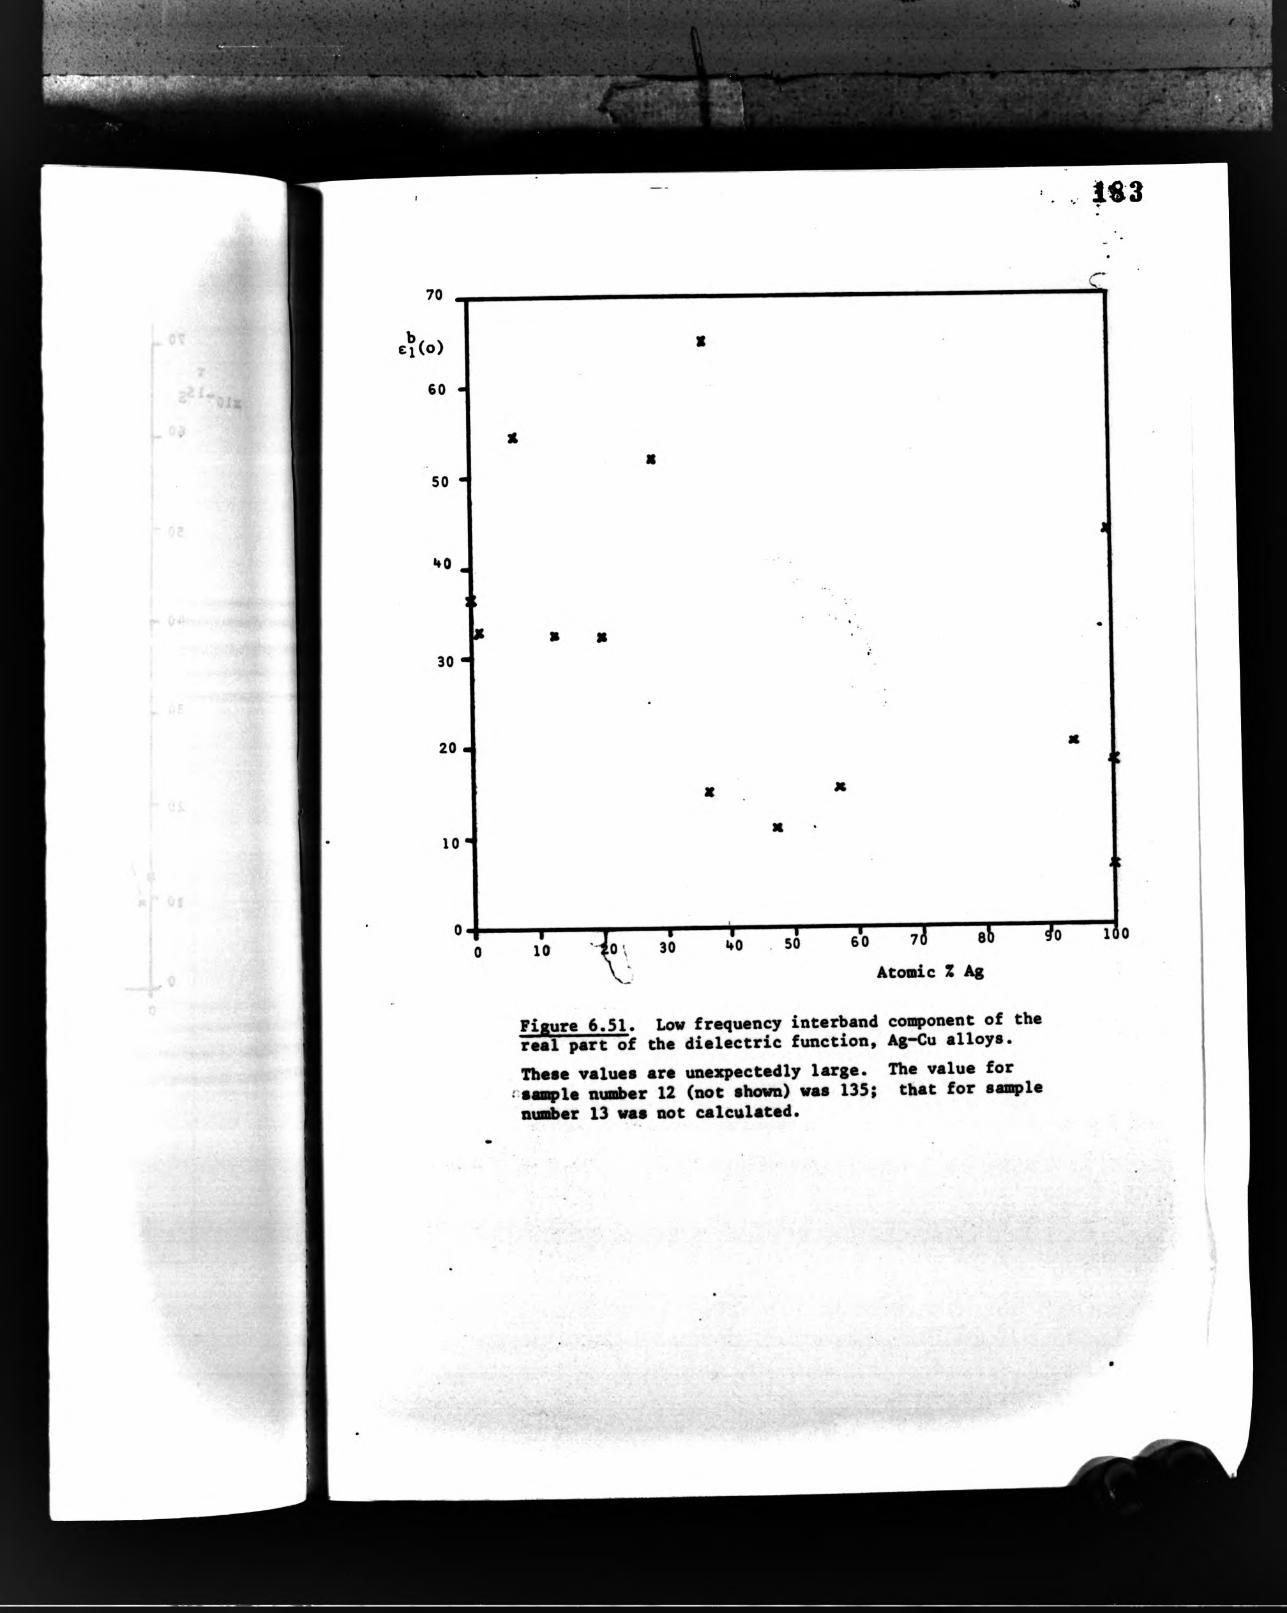

. . . >•!>- ii-
?'V *''
184
t M
Figure 6.52, The intraband plasma frequency, Ag-Cu alloys. The value computed for sample number 13 (not shovn) was 50.5.

185
Tmblft 6,10 Edges of reflectance curves (solid solutions,
«Hoo>4«N
u%
m•A
i
J•as«/=
-.j••n*o
A > • «
»44)M4J«W•s at «
*! 1
Jm Ag 100 0.12 3.77 -502 3.77 44.7 I
30R 100 0.11 3.74 -355 3.76 27.3 29.1 •K).005 0
70 99.0 0.11 3.74 ?340 3.76 29.1 31.0 +0.003_ 0■ ___^ ’ -i \
76 93.4 0.23 3.74 -218 3.76 31.0 *■■ > f.
16 37.4 0.12 2.25 -85.2 2.25 77.6 V'jH(splat)
75 1.25 0.13 2.17 -192 2.18 73.8 73.5 -0.001 0II ^
Cu 0.11 2.16 -190 2.18 73.5i J*; i
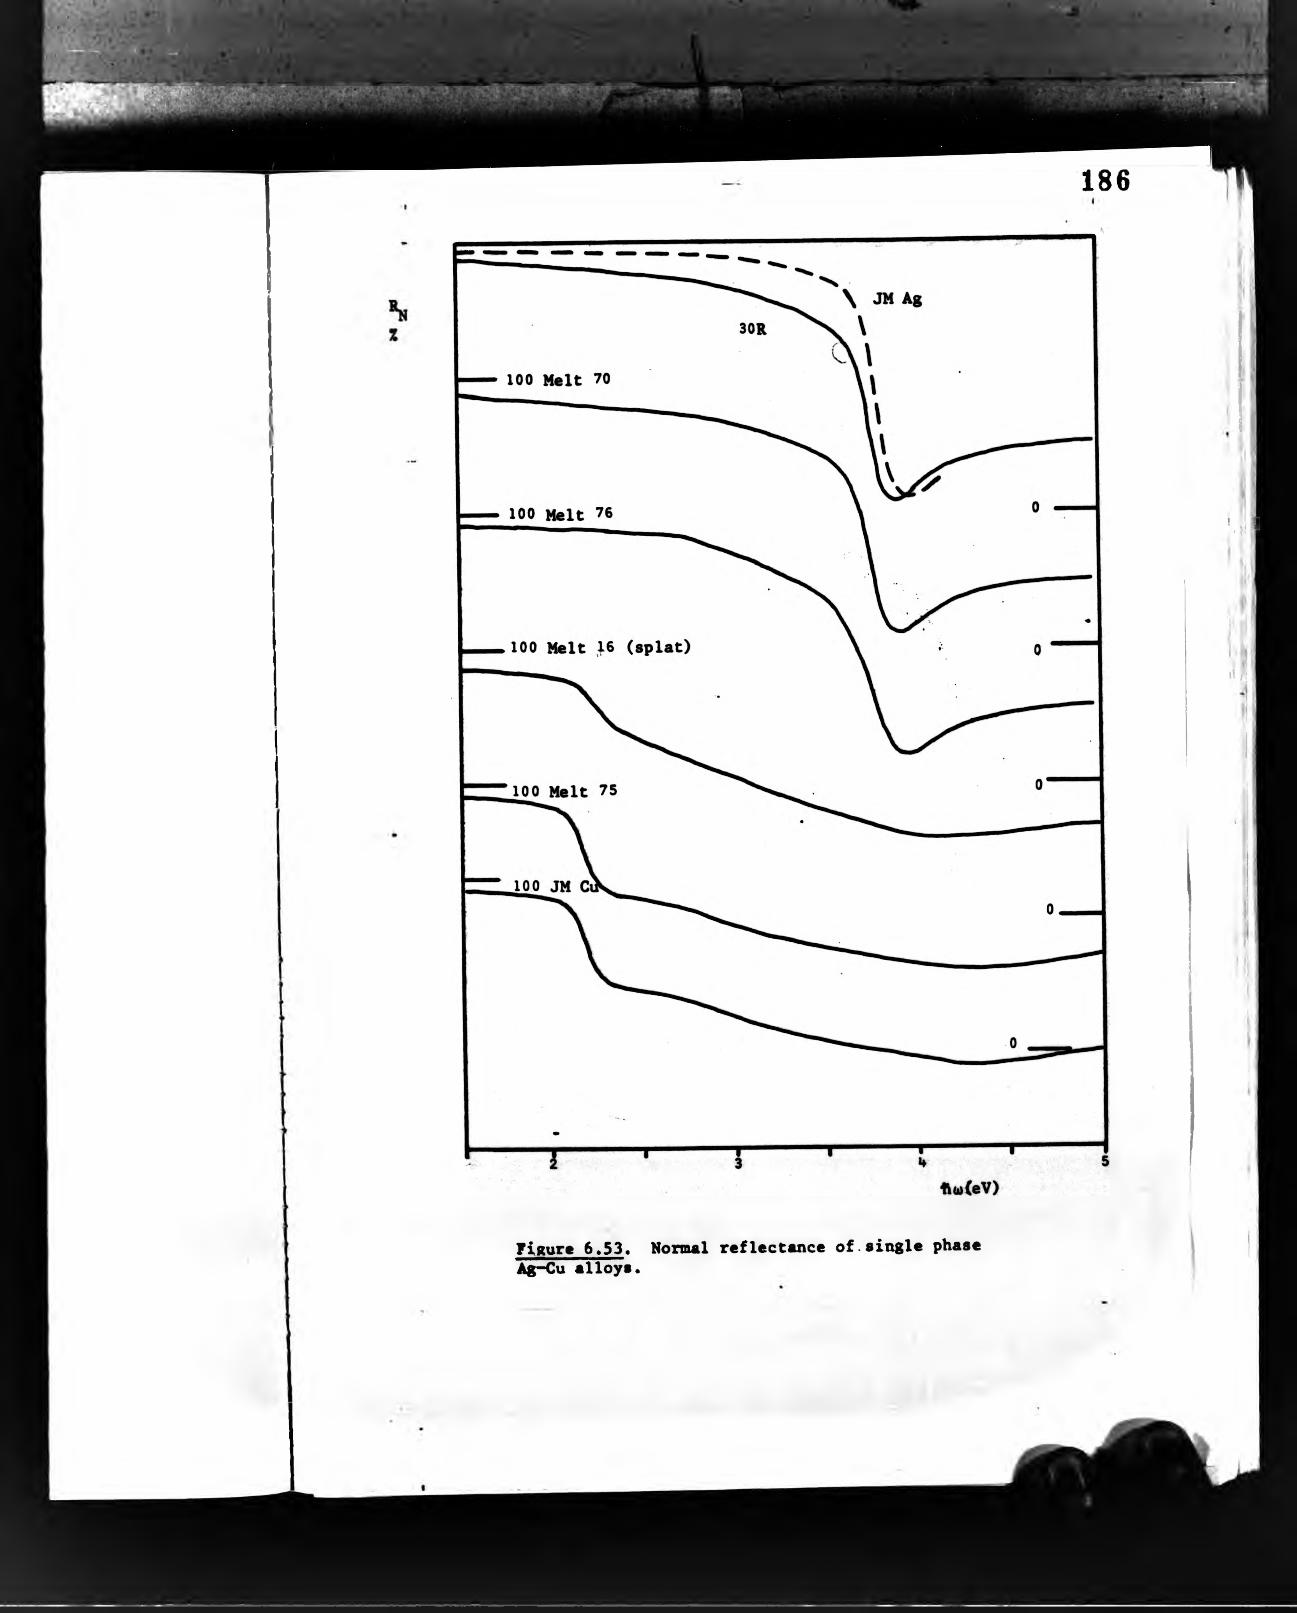
186
’,11»
n ,j:
Figur« 6.53. Mormal reflectance of.single phase Ag-Cu alloys.

— -
187
for any of the samples 30R, 70 and 76; namely, 4.09 eV to-oi«v
compared with A.OOeV. At this energy, the difference corresponds
to approximately lOnm wavelength difference. However, the optical
configuration of the ellipsometer was realigned after this result.
Also, it proved impossible to complete the experiment by making
measurements for energies 4.3 -*■ 5eV due to poor ellipsometer
performance. The possible significance of this on the validity
of these results that were obtained will be discussed again
later. The measured curves for the other Ag-rich alloys are
very similar. Difference curves (changes in reflectance with ,
alloying additions) and numerical derivatives show more
structure (Figures 6.54, 6.55). Change in reflectance is
roughly proportional to alloying concentration, near the
absorption edge, that is, 2Z for a IZ Cu addition, 8Z for a
5 at.Z Cu addition. There is also a^weak structure near 3eV.
The derivative curve shows discernible structure between 2.5 and
3eV in the case of the more concentrated alloy.
Tiiming to the Cu-rich alloys, these are characterised by an
edge at 2.17eV in the case of Cu and sample No.75 (1.25 at.Z Ag),
or at 2.25eV in the case of the metastable alloy No.16 (37.4 at.Z
Ag). A difference plot has been produced for Cu and No.75, by
subtracting the values for Cu from those for No.75. This follows
the method for the Ag-rich alloys, since alwaya the valuss for
the alloy with relatively more copper are subtracted from the
values for the alloy having less copper. Structure is clear
(IZ, compared with O.IZ scatter) at 2.17eV, at »v* 4.1eV
^ 0.3Z), and possibly at 3.3eV. The derivative curves
emphasise the lack of sharpness in the edge for the splat-cooled
i i II
t ?i
t ;i j

-I 1 'I *r^x' * '■I ■■ lv' ■
i t S 8
30 R/ 70 (xlO)
30R/76
75/JM Cu (xlO )
T Tft0(cV)
Figure 6.54. Change in reflectance on addition of Cu, singe phaae Ag**Cu alloys.
•i:
Mi'
I H
i I
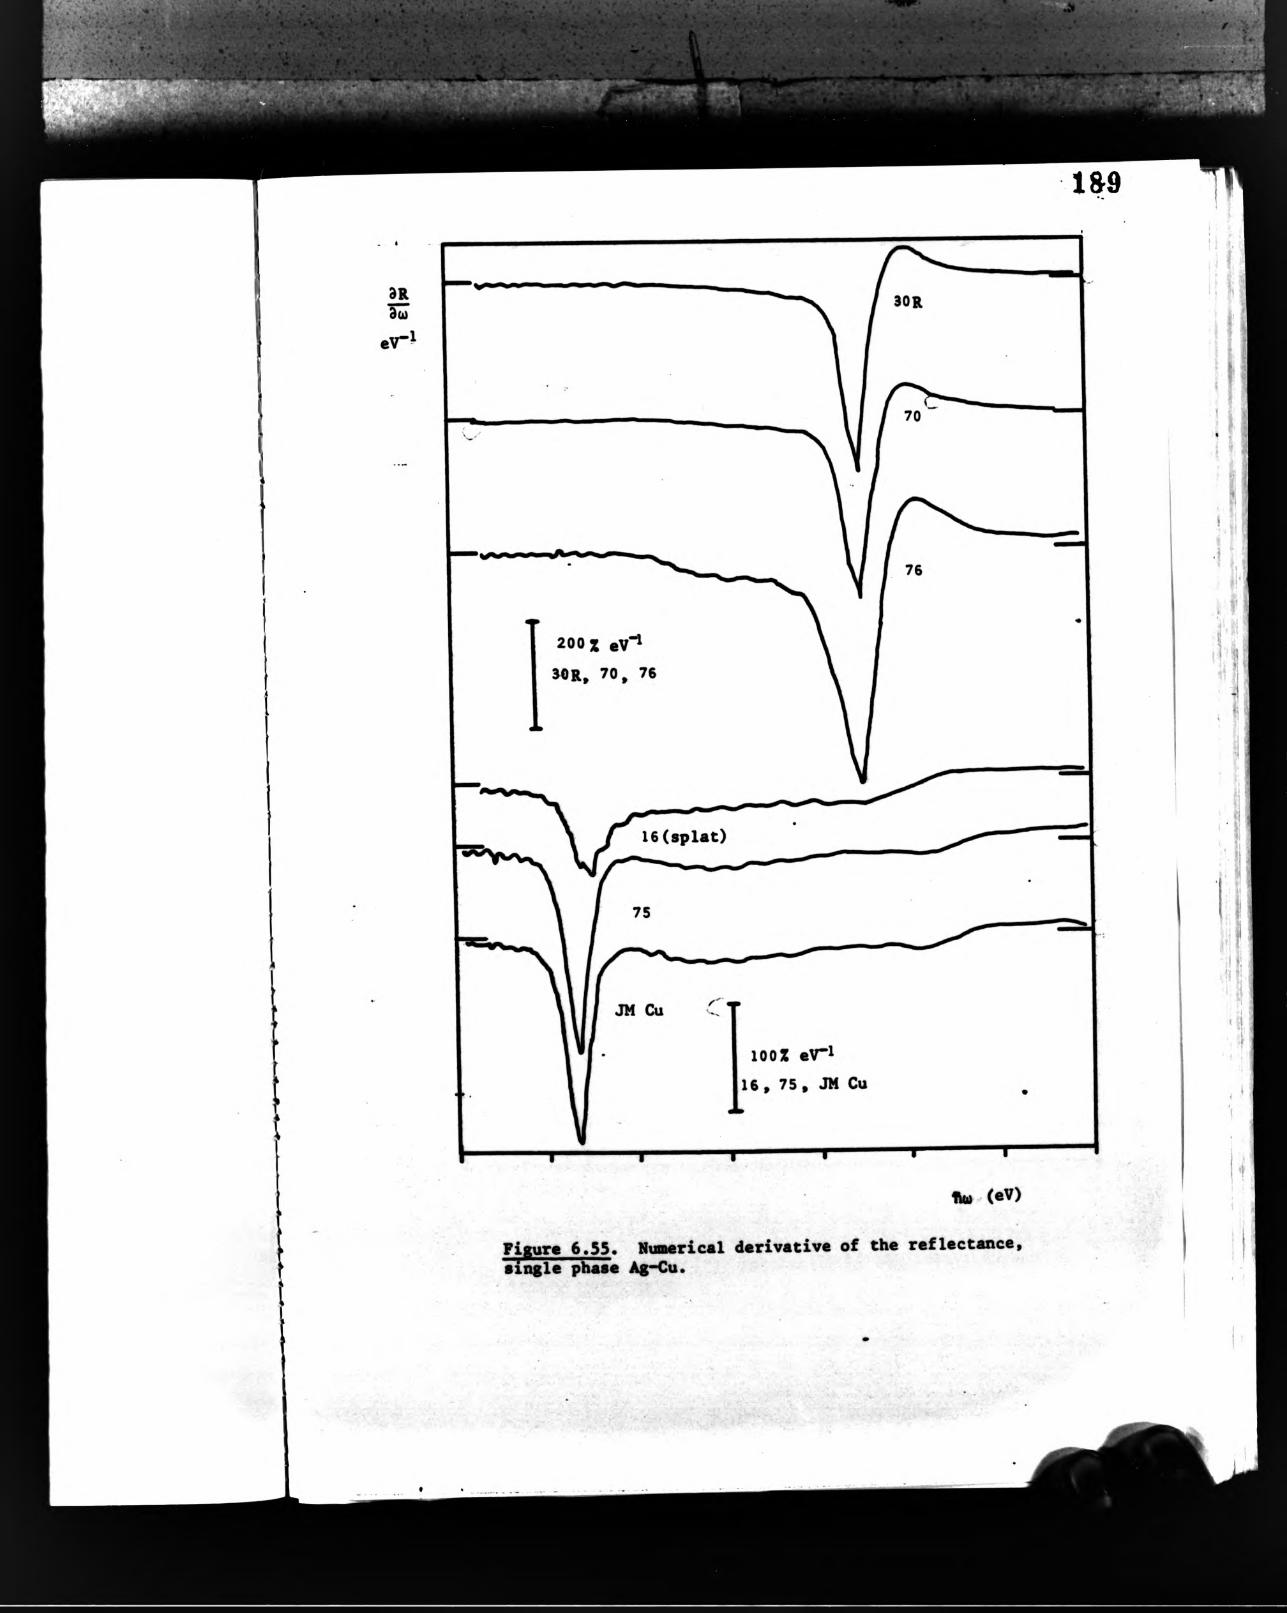
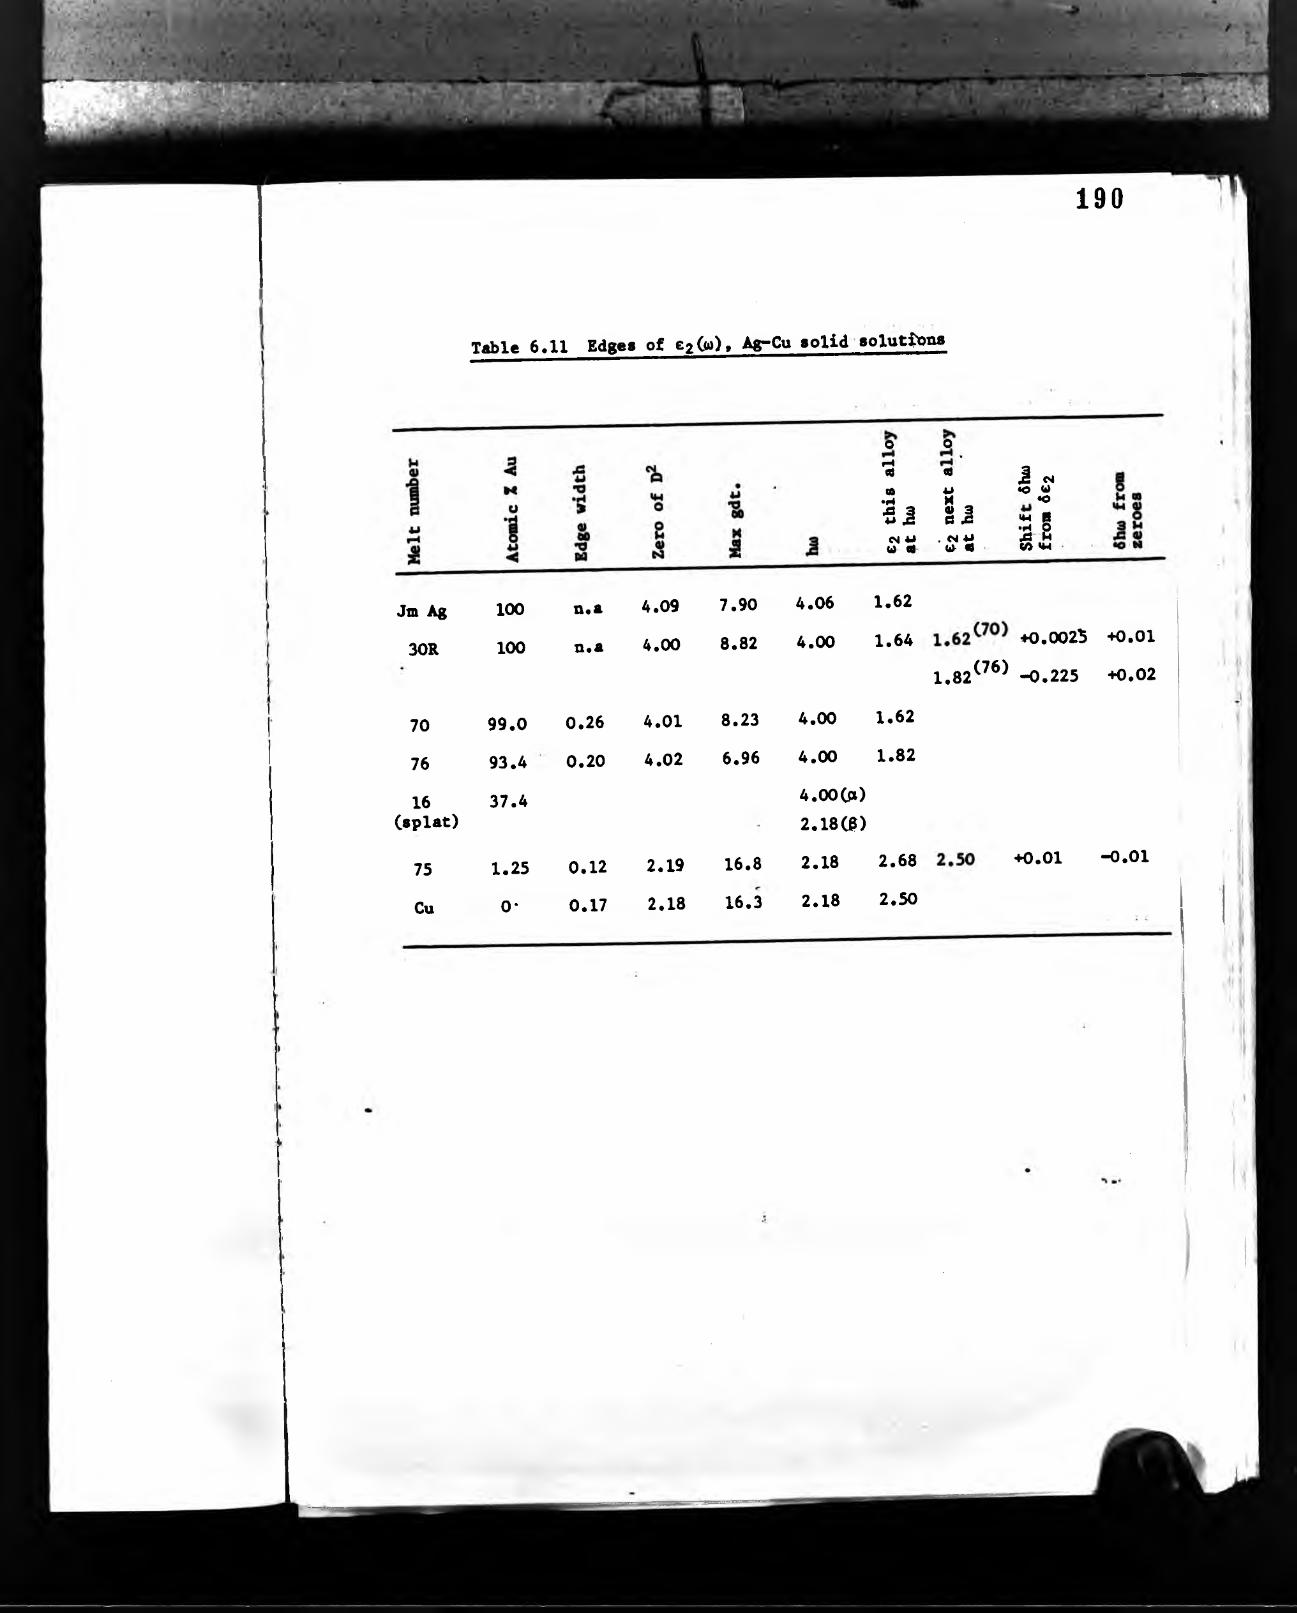
Table 6.11 Edges of e20»)f Ag-Cu solid soXatj^ons
190
o O .fH< e J wn 4J <o <•>
*.4 M «o•s J S J w gCM ** . CM 4J 2 8U ft w- e (/> IM
Jm Ag 100 n.a 4.09 7.90 4.06 1.62
30R 100 n.a 4.00 8.82 4.00 1.64
70 99.0 0.26 4.01 8.23 4.00 1.62
76 93.4 0.20 4.02 6.96 4.00 1.82
16 37.4 4.000»)Capiat) 2.18(8)
75 1.25 0.12 2.19 16.8 2.18 2.68
Cu 0* 0.17 2.18 16.3 2.18 2.50
*0.0025 *0.01
1.82^^^^ -0.225 +0.02
+0.01 - 0.01

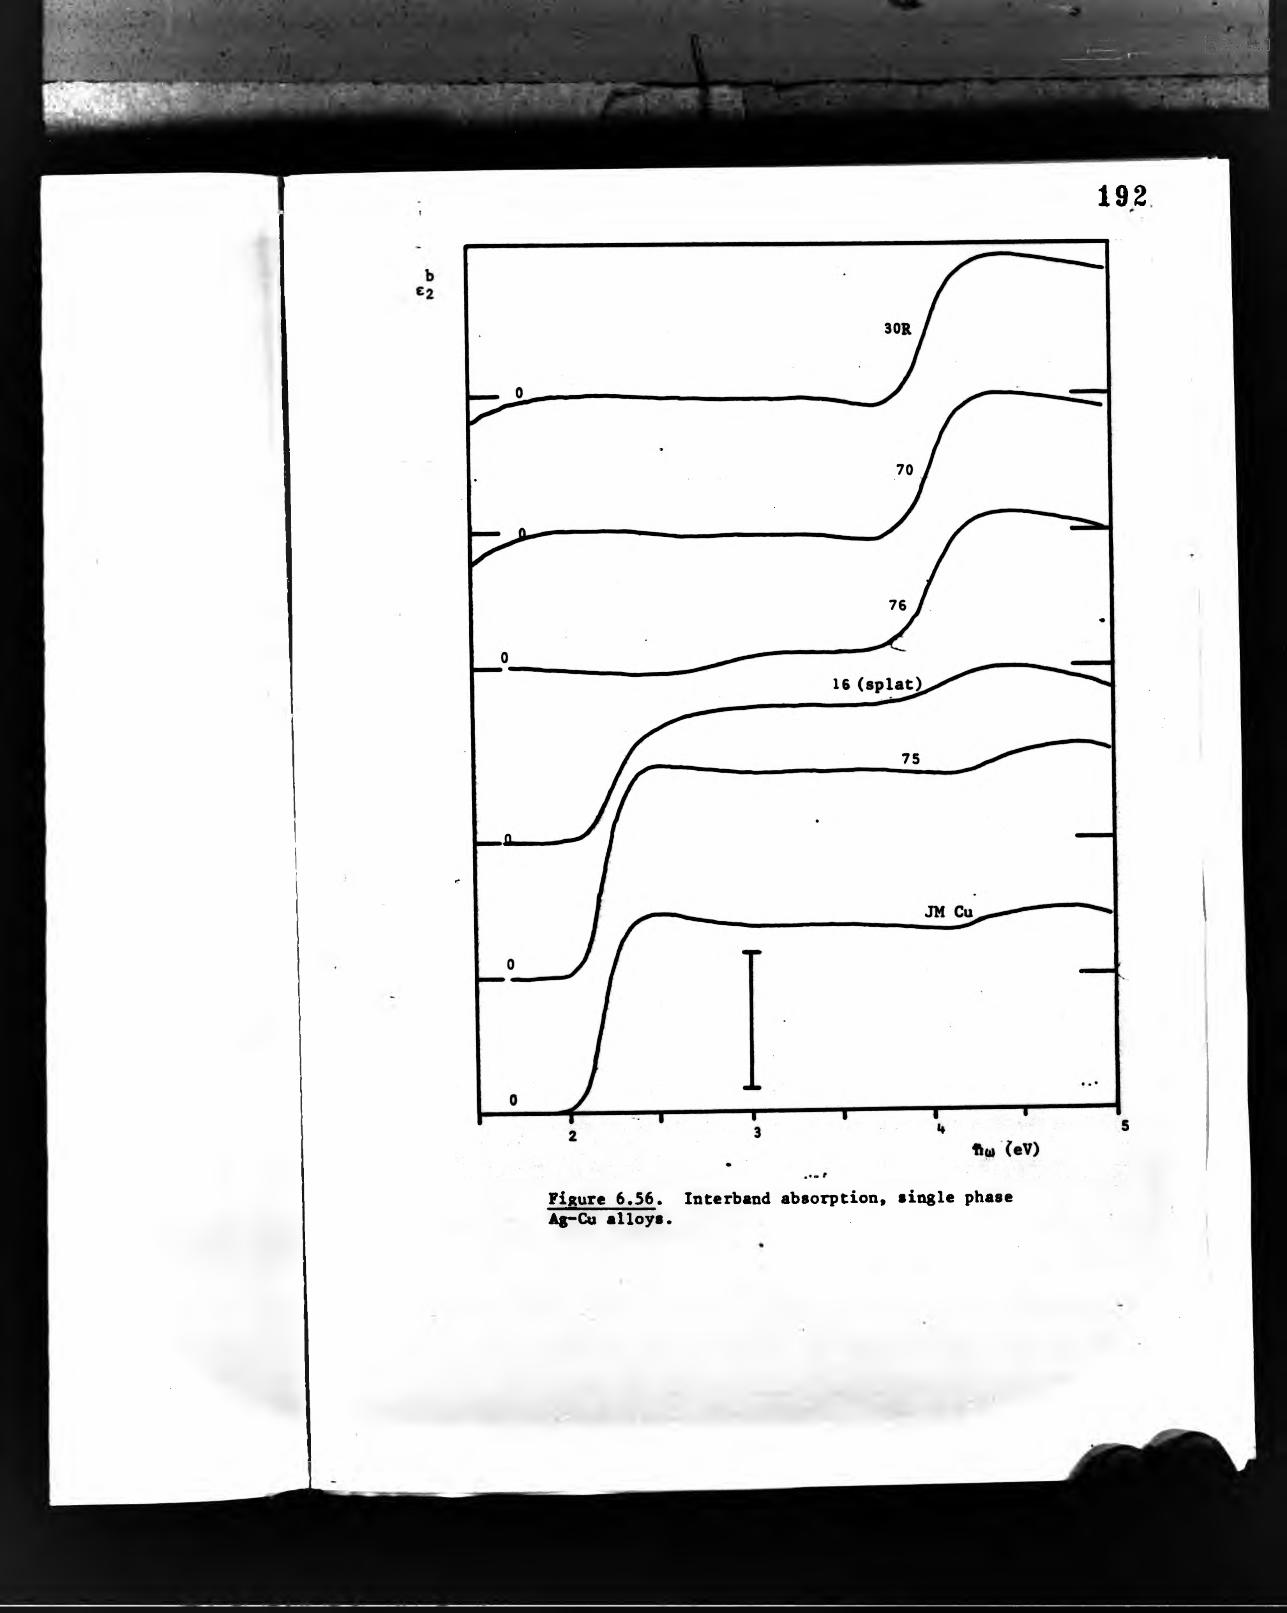
....# ;> :■ ■ «
192
Figure 6,56, Interband absorption, single phase Ag-Co alloys.

r>vr.' ' .■ \
193
sample, the latter has only half the gradient of the other
samples. The width of the peaks of the derivative seem to
be fairly constant. Structxire may also be seen at »v 4eV in
these curves.
The Interband Dielectric Function
This function is plotted as Figure 6.56 for each of the single
phase alloys. Those for Ag-rich samples are characterised
by a single, sharp rise at A.OOeV for all three compositions.
For the Johnson-Matthey Ag sample, which is not shown, an
e2<«) «¿8« position of 4.06eV was calculated. The negative
values of at low energies are the result of the inadequacy
of the expression used to fit cf over a wide range.
Interestingly, the magnitude of the absorption at the edge
varies considerably (Table 6.12). The Johnson Matthey Ag
and 93.4 at.Z Ag (No.76) samples have absorptions of 1.47
and 1.43 respectively, while samples 30R and 70 (Ag and
99.0 at at.Z Ag) have absorptions of 1.09 and 0.84
respectively. Sample 76 has broad absorption centred at
'x. 3.1eV. The difference curves show structure at 4eV and
again in proportion to the change in concentration
• (Figure 6.57). Derivative spectra in Figure 6.58 show a
little more clearly the absorption at 3a«V for those
samples containing Cu.
6.4.2 Two-Phase Alloys
Reflectance CurvesSpectral reflectance of a aet of two-phase Ag-Cu alloys, is
given in Figure 6.59, together with results for two samples
representing the terminal solid solutions o and 8.
This shows the variation of strength of the absorption edge
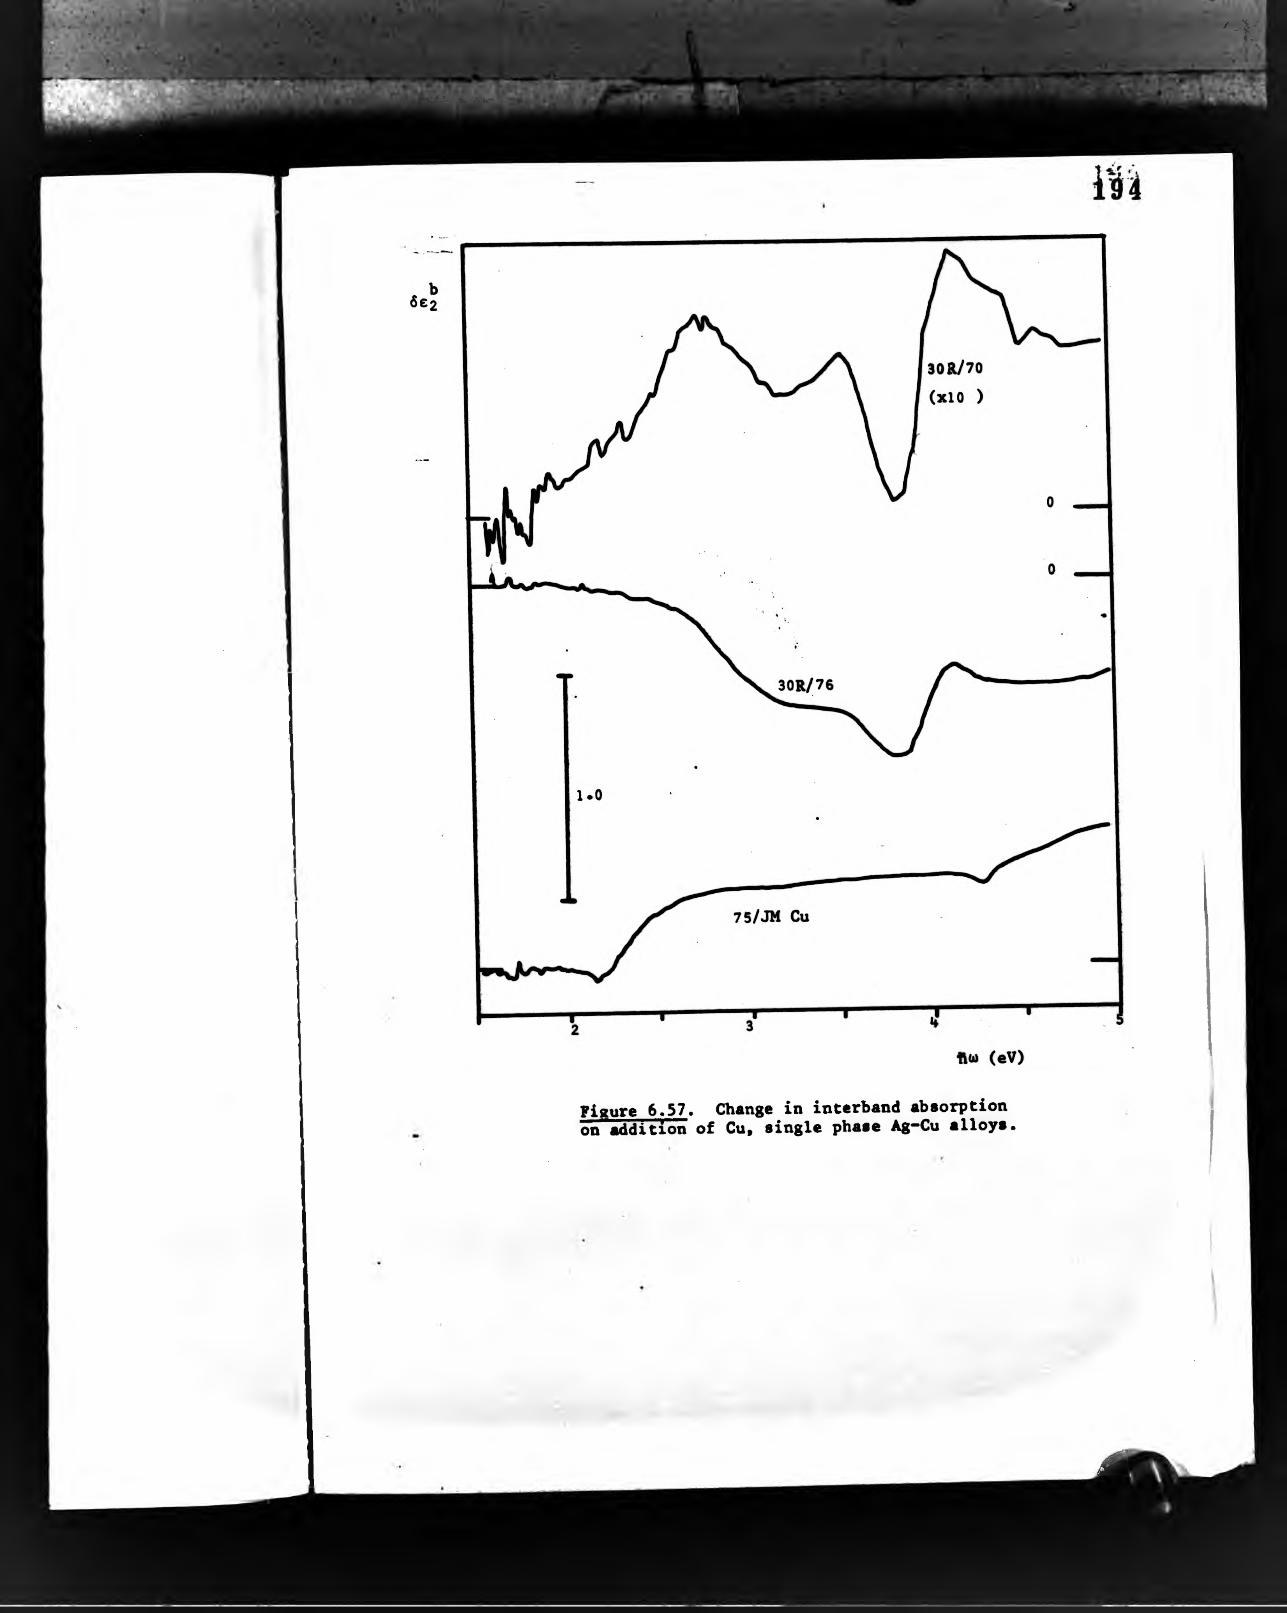
"■ ':-.y', V.k l / r L ^ - J ‘± l t^ -^ r ,:
'-‘I;:
Figure 6.57. Change in interband absorption on addition of Cu, single phase Ag-Cu alloys.
M
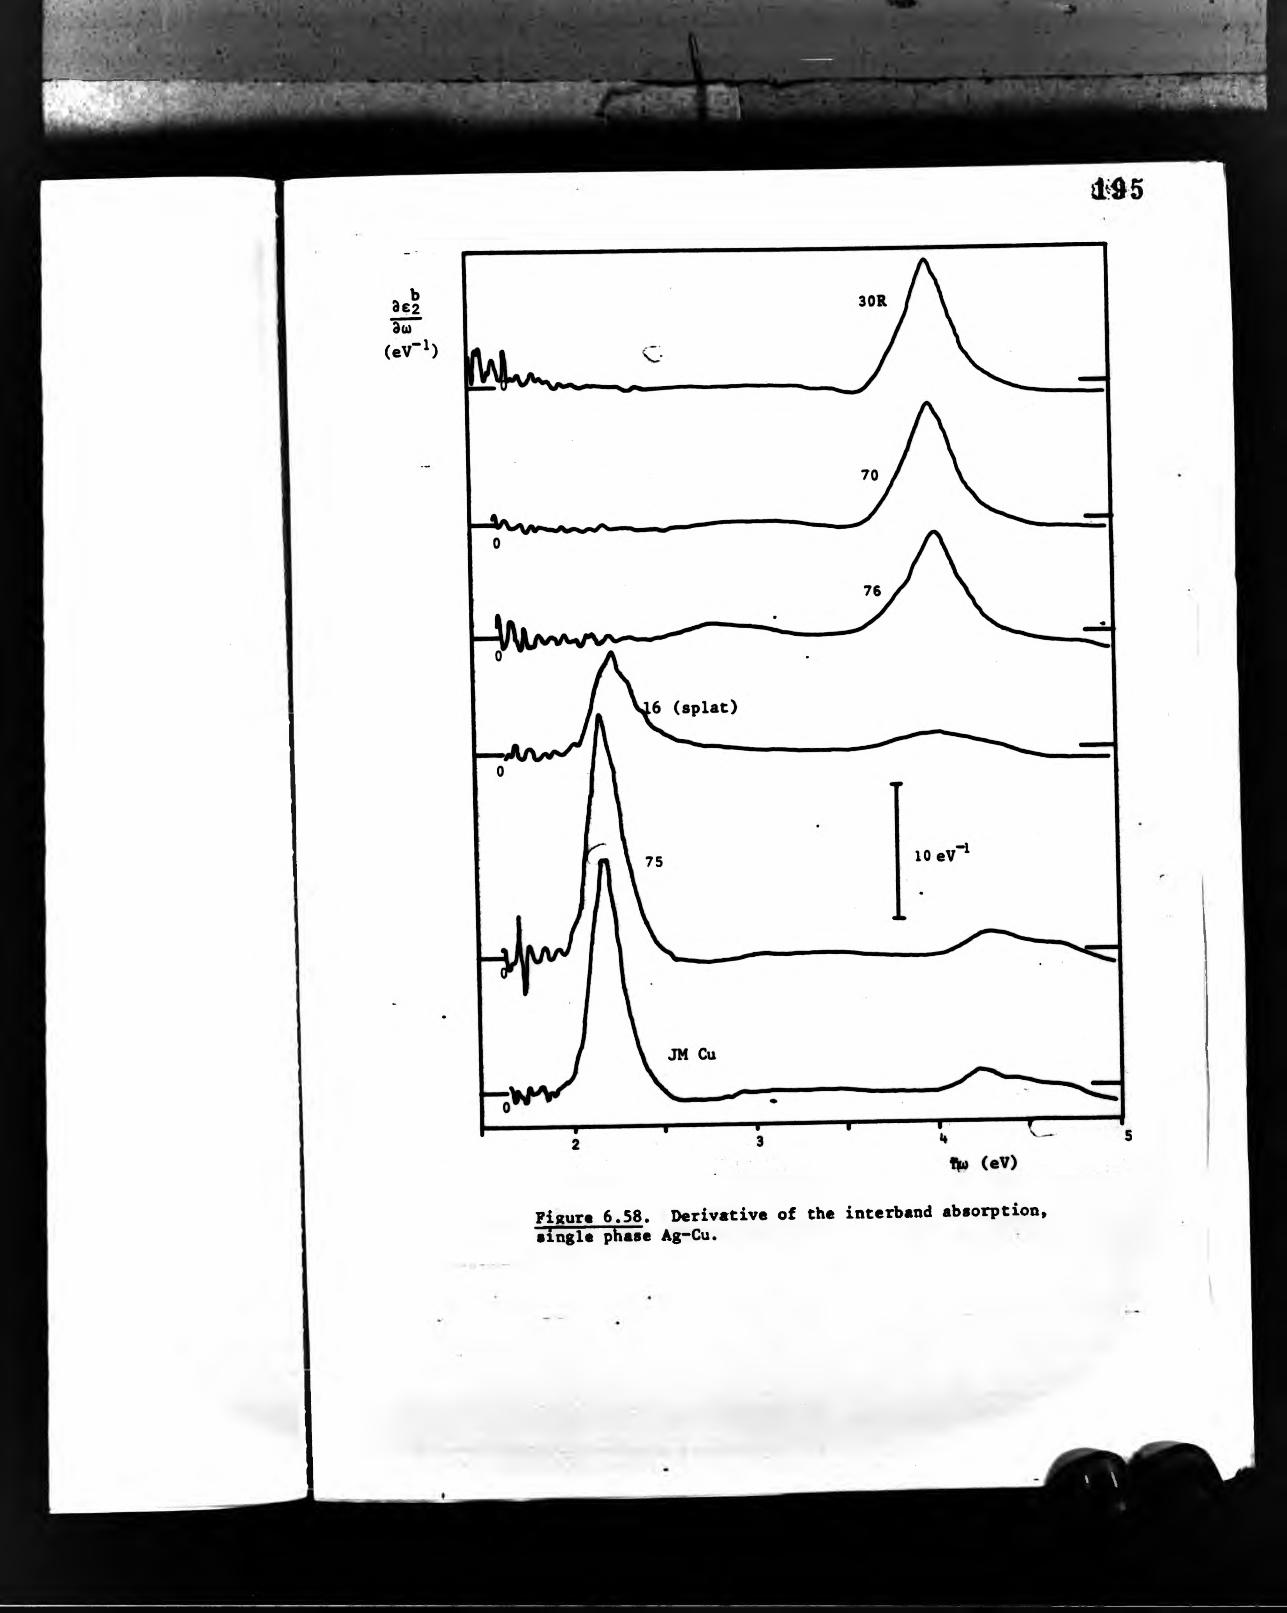
.. ‘X' ar* - ‘i-
Pigur« 6.58. Derivative of the interbend absorption» sTngIe~pKase Ag-Cu.
' \
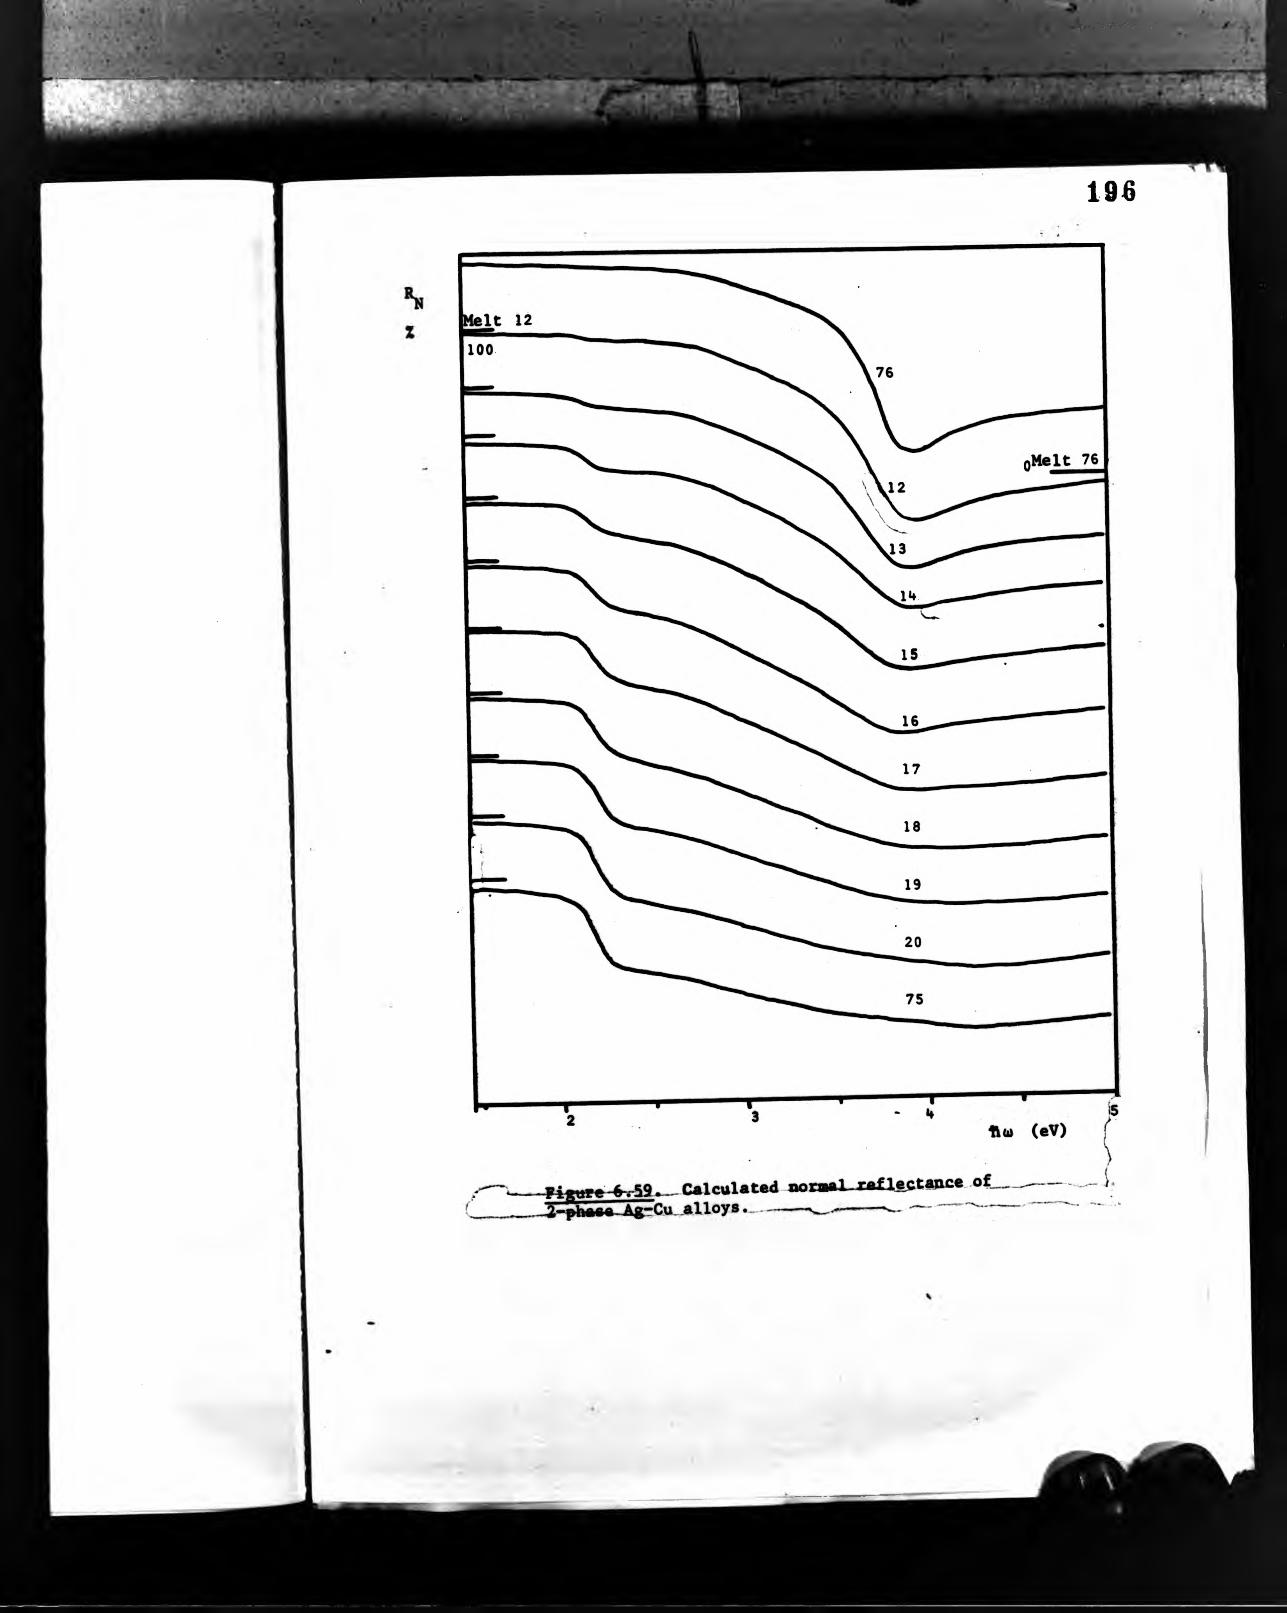
ç^ ,-/.,> v > . .■ . •■ ,, V. ^
19€

. . .
. >'*.V
L ^ » W - '.« f t ld
.1*7 ." -TvSSTi r: ■'* <*'.
Table 6,13 Edges of reflectance curves, 2-phase Ag-Cu ____________alloys. B-phase e d g e . ________________ ___
The change in edge position has not been calculated by consideration of 6E^.
197
g
•oXurHj>
aMU14J<
o«M M«H «IICU^ 0
5•o•H>eeo*oM
%IMooVteN
.u•OiH
i: j
*76 93.4 100
12 83.4 91.2 0.11 2.16 -13.3 2.18 95.6
13 70.1 79.8 0.11 2.15 -30.5 2.16 92.2
14 57.0 67.6 0.13 2.17 -65.1 2.18 87.3
15 47.7 58.3 0,13 2.17 -71.4 2.18 88.4
16 37.4 46.9 0.11 2.17 -92.0 2.18 87.0
17 28.1 36.1 0.11 2.18 -123 2.18 87.3
18 20.2 26.2 0d06 2.18 -135 2.18 84.8
. 19 12.4 15.7 0.10 2.19 -149 2.18 84.8
20 6.5 7.3 0.11 2.18 -179 2.18 78.4
75 1.25*
0 0.13 2.17 -192 2.18 73.8
* nm*«lcd «t 750®C to onnire »olid «>lotion

V 'VM. ■ '
198
with composition. In the following chapter an attempt will
be made to relate these strengths to the volume fractions of
the phases present. The difference curves (dR^, Figure 6.60)
have a wide variety of shapes. These suggest changes of edge-
width, strength and possibly position in a complicated manner.
The derivative curves OB^/du* Figure.6.61) show structure at
2.17eV and 4.00eV. In the case of the Ag-rich samples,
additional weak structure is present at 2.7eV, while in
the case of the Cu-rich samples the 4eV minimum transforms«
to a small step at 4.3eV.
The Interband Dielectric Function
These are given in Figure 6.62. Structure is present at the
same energies as in the reflectance curves, and the overall
impression is similar. The low energy edge in the pure
g-phase (bottom curve) is rather stronger than that in the
pure o-phase (top curve). The difference curves (de^.
Figure 6.63) show a negative-going step at low energies
(2.17eV) and a positive-going step at high energies (4.00eV),
with the exception of that for de2 “ 6$ 12.4 at.X Ag
6.5 at.X Ag , which has two positive steps. The shape
of all of these curves implies a composition-dependant
transition strength, with, in general, the low energy
transition increasing in strength with decreasing Ag content
while the high energy transition decreases. In the Ag-rich
alloys varying absorption between 2.5 - 4.5eV is also
apparent. The derivatives (Figure 6.64) eadiibit approximately
constant-width peaks of varying strength corresponding to the
two main edges. The 4eV peak is somewhat broader than that
at 2eV.
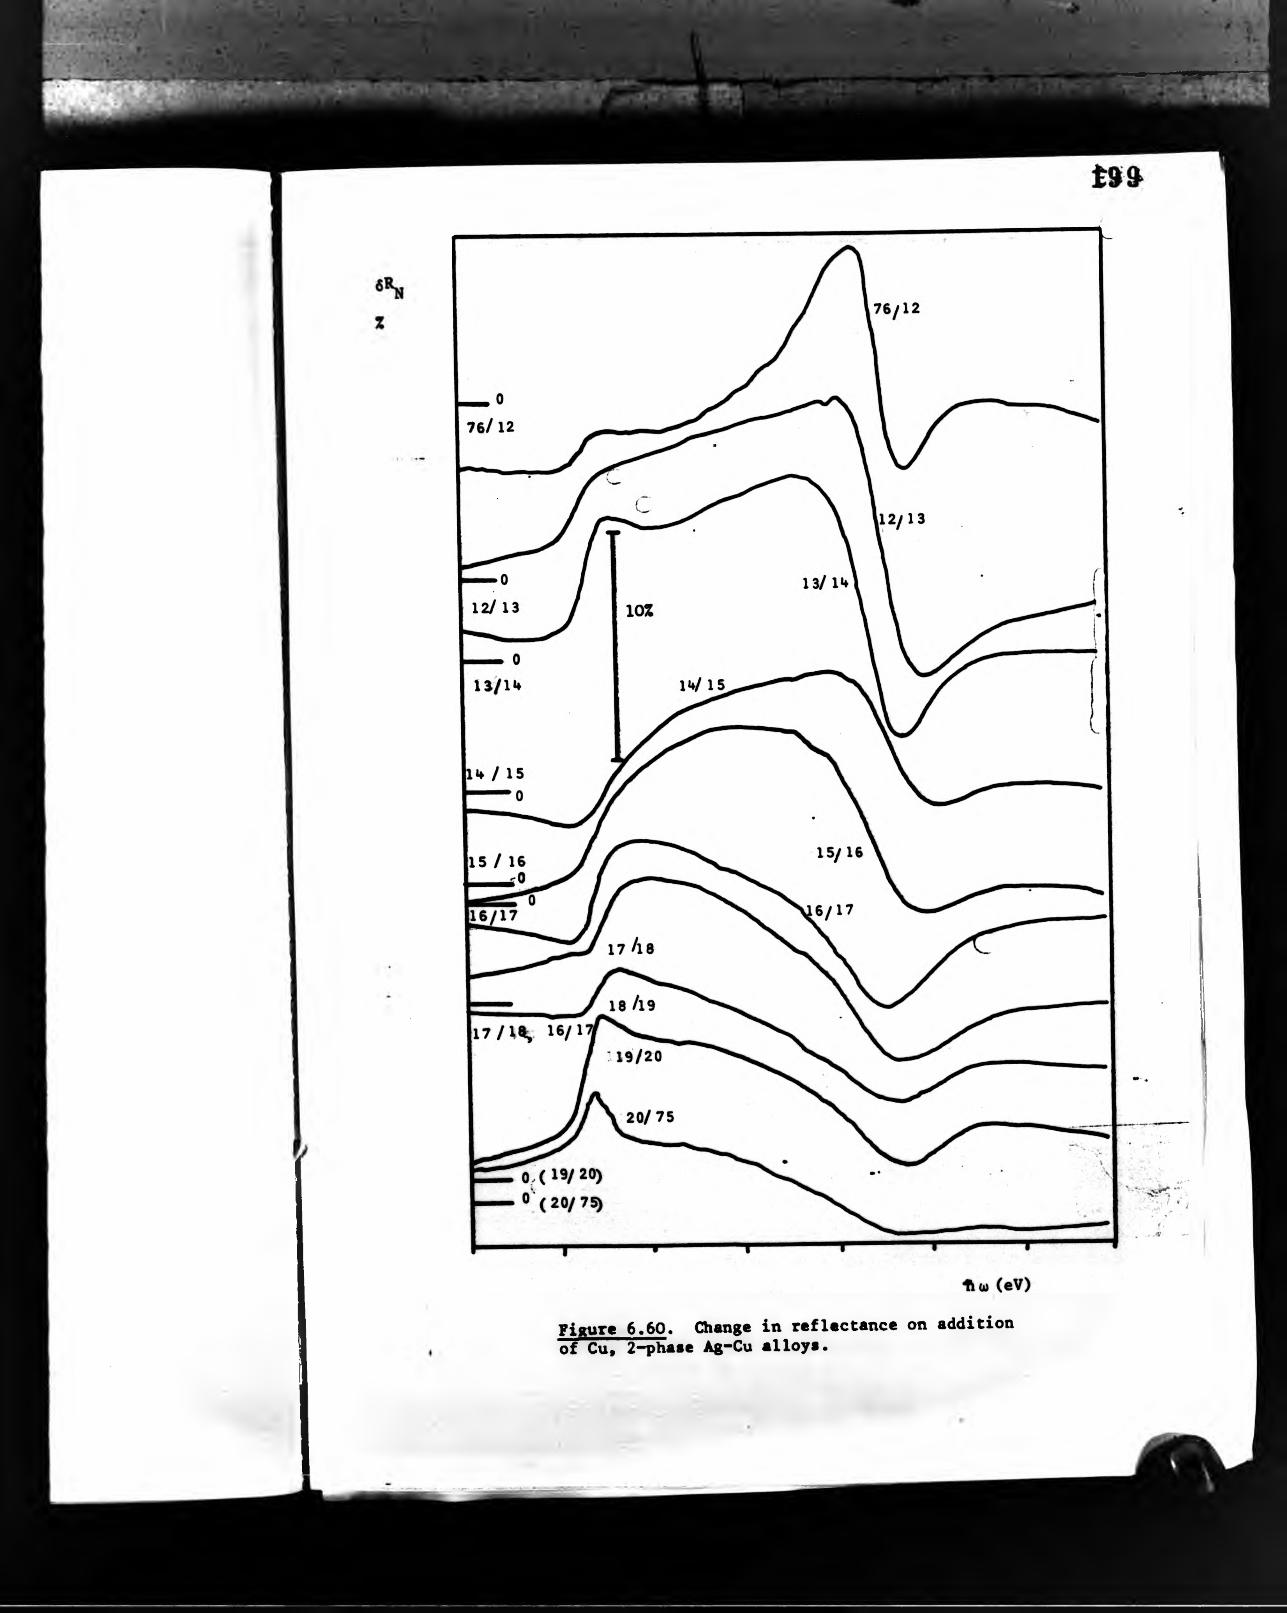
Fisure 6.60. Change in reflectance on addition of Cu, 2-phase Ag-Cu alloys.


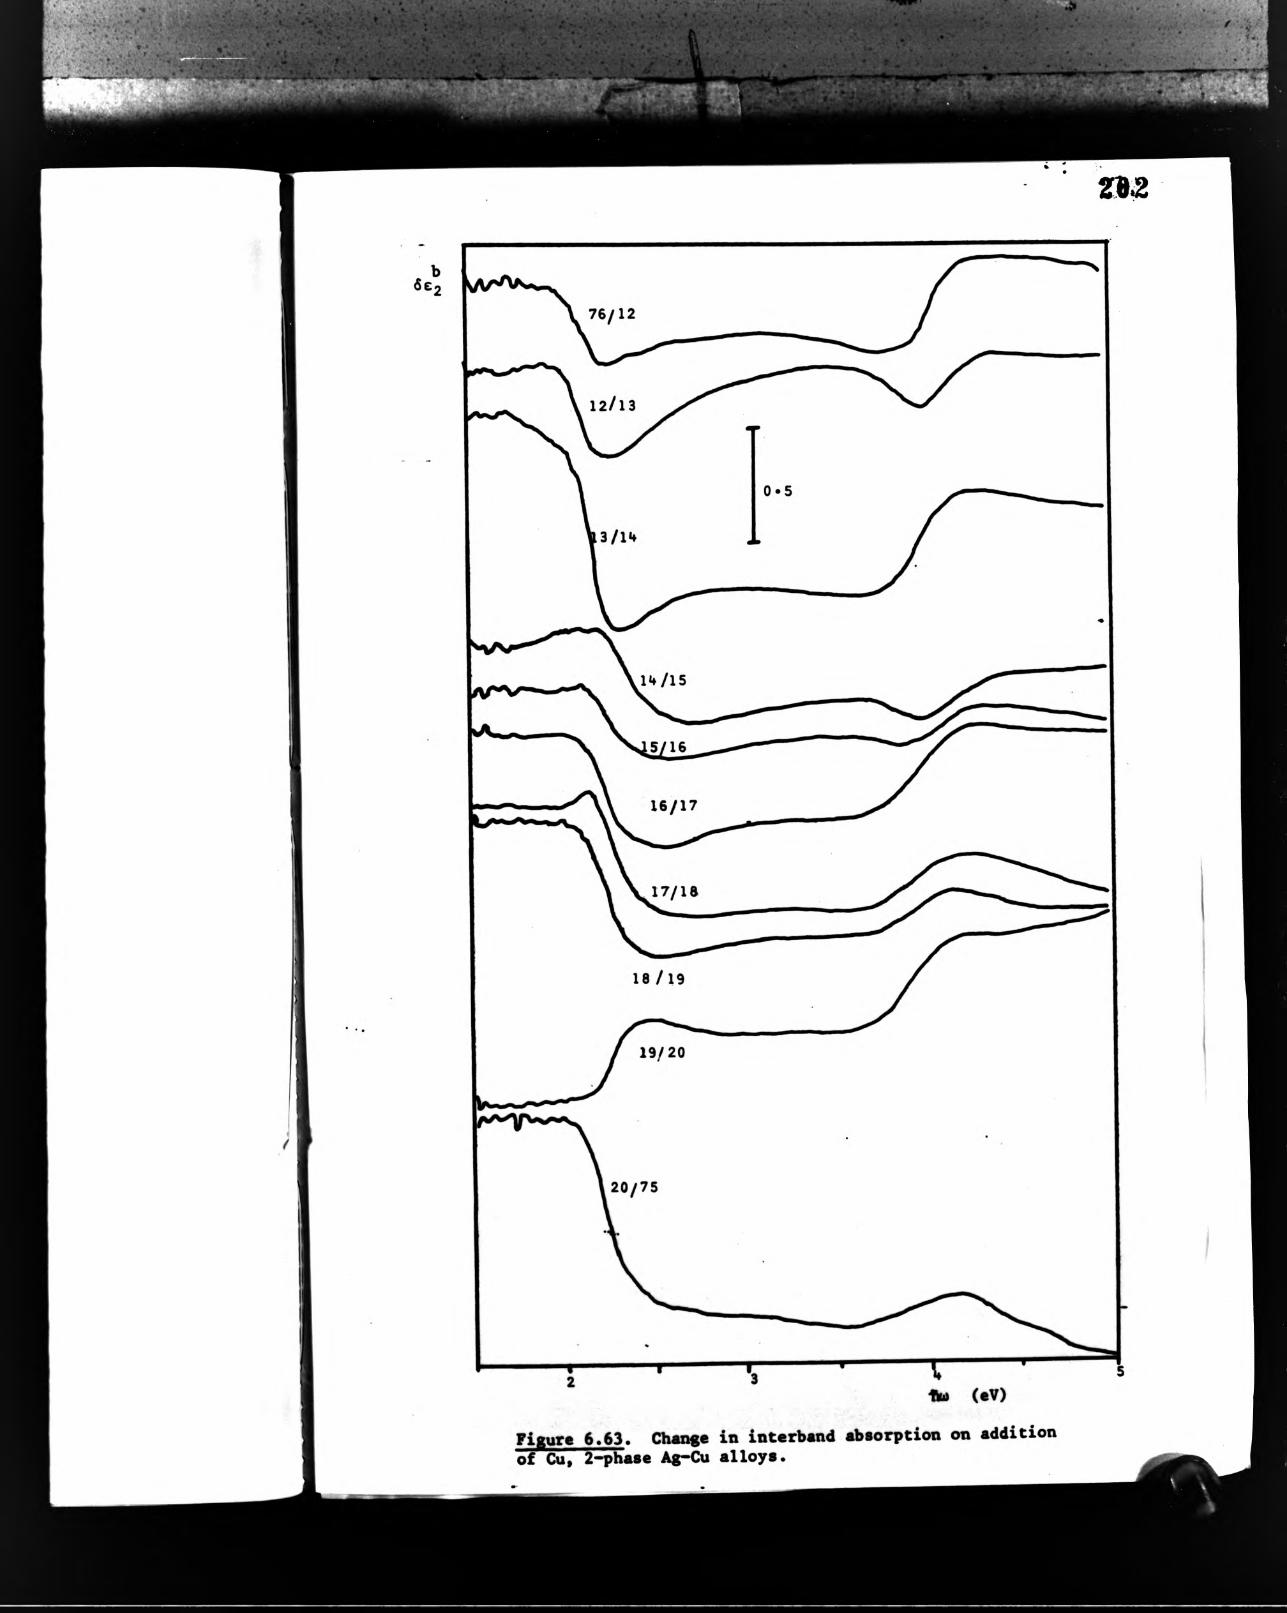
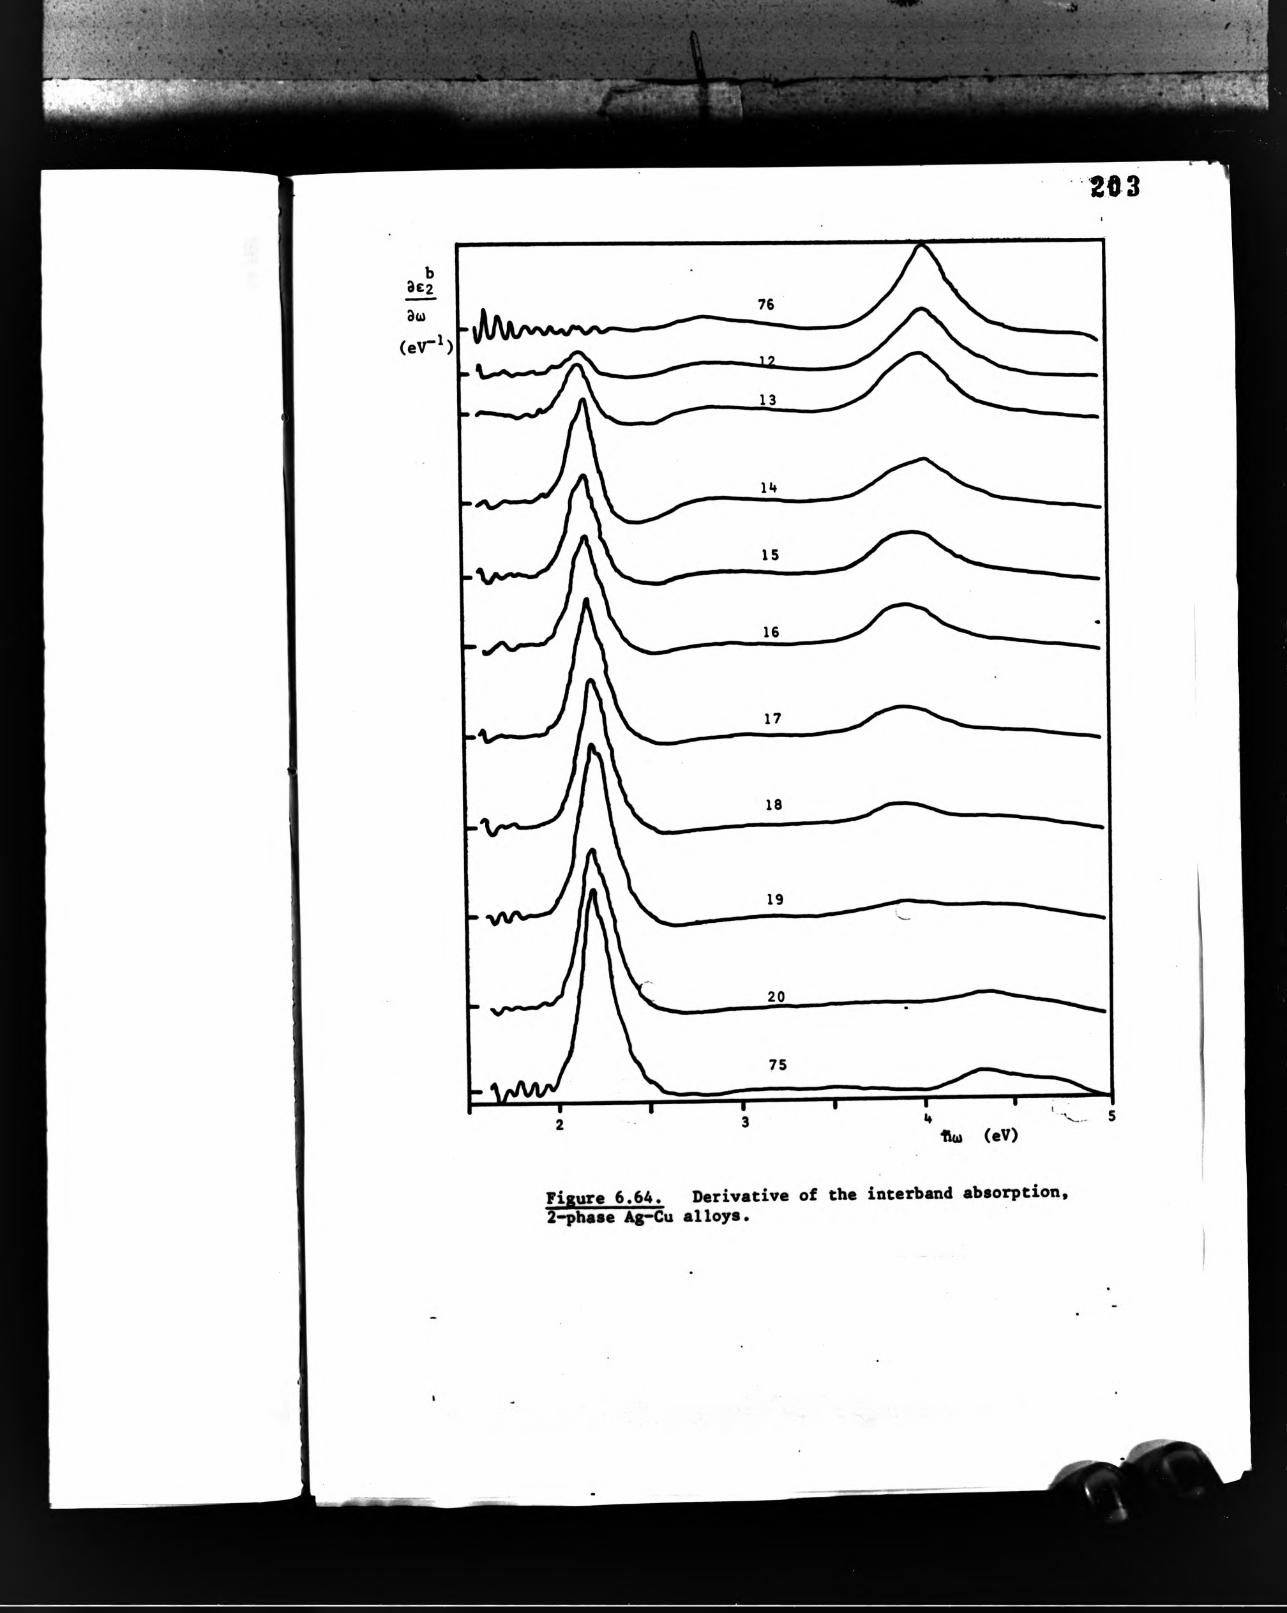

• •• ■
■'■m- . ■ •> ■
204
Table 6.14 Edges of £2(1»). 2 phase Ag-Cu alloys, g-phase edge.
s
• ca
93.4 0 (no absorpti83.4 8.8 0.23 2.1470.1 20.2 0.11 2.1557.0 32.4 0.11 2.1747.7 41.7 0.13 2.1737.4 53.1 0.11 2.17
28.1 63.9 0.11 2.1820.2 73.8 0.14 2.1912.4 84.3 0.14 2.196.5 92.7 0.19 2.191.25 100 0.12 2.19
“0.600 -6.820.129 - 0.680.589 1.820.249 0.5970.259 0.4870.069 0.1070.589 0.7980.749 0.8880.759 0.8181.12 1.12

vx,. >- -i
$
205
Table 6.15 Edges of e^O»)* 2-phase *g-Cu alloys, 6-T>hase edge
oa
J.o o i P u >
83.4 8.8 0.23 2.14 1.84 2.14 0.128 0.0908 1.03
70.1 20.8 0.11 2.14 4.27 2.16 0.426 0.302 1.37
57.0 32.4 0.11 2.17 9.22 2.18 1.03 0.73 2.25
47.7 41.7 0.13 2.17 8.85 2.18 0.965 0.684 1.64
37.4 53.1 0.11 2.17 9.87 2.18 0.985 0.699 1.32
28.1 63.9 0.11 2.18 12.2 2.18 1.10 0.780 1.22
20.2 73.8 0.14 2.19 13.1 2.19 1.30 0.922 1.25
12.4 84.3 0.14 2.19 15.4 2.19 1.50 1.06 1.26
6.5 92.7 0.19 2.19 13.9 2.19 1.39 0.986 1.06
1.25 100 0.12 2.19 17.9 2.18 1.41 1 1
206
7. DISCUSSION
7,1 Experimental Method
The principal aim of the investigation was to provide
objective information concerning colo\irs of a commercial
alloy system along with physical measurements that would
provide background concerning the fundamental processes
giving rise to these colours. The commercial application
of the work required that mechanically polished surfaces
be studied, as these are the type of surface encountered
in the industry. For this reason bulk samples were
prepared as described in Chapter 3. The method adopted
gave sang>les that were flat and homogeneous, and that
could be accurately assayed by conventional techniques.
The expense of gold alloy samples prepared in this way
meant that only one alloy of each composition was
available, but when time allowed repolishing was possible
so that this did not necessarily limit the nunber of
surfaces studied. Hardness measurements made on some
samples after polishing indicated an unexpected degree of
hardening, which could have been quench-hardening or a
result of deformation during grinding and polishing.
X-ray diffraction measurements indicated no ordering of
the AiiCu or AuCua alloys, showing that the anneal quench
procedure satisfactorily retained the disordered structures.
It has often been suggested in the literature that mechan
ically polished surfaces are unsuitable for providing
data on electronic properties due to the existence of
the Beilby-like layer, but a great deal of published
optical work shows that only trivial differences exist
between well-prepared samples of the noble metals.

w ■ 7:, " * *
■■ ■: ' < - m»-- - ' - -’■ -
Accuracy of the optical work was sufficient to
discriminate alloying changes of the order of 5 atomic
percent. The chief sources of error in the early ellip-
sometric results were poor setting of the angle of incid
ence (which was subsequently improved) and birefringence
in the Faraday modulator cores. The main source of error
in conventional (ocular) ellipsometry is the compensator,
but use of an achromatic quarter-wave rhonb minimised
errors from this source making measurements in more than
one zone unnecessary. Since the compensator was rarely
disturbed, small errors will have affected similar alloys
in the sam^ wàyv--Birefringence of the silica modulator
cores was MJ.OS® and was neglected, as was the birefring
ence of the DEDF cores (M).5°). It was necessary to
use both sets of cores during every experiment, so that
they would have required re-calibrating each time. This
was impractical. Use of a single pair of cores capable
of covering the entire spectral range of interest would
have made possible the calibration of this source of
error in the same way as biréfringent windows in electro
chemical cells or vacuum apparatus are calibrated. This
could be achieved by using longer silica cores with a
higher modulation current. Alternatively, the use of
liquid filled cores is an attractive possibility. These
would be cheap to construct in any length and would be
free of birefringence.
S«Dpl. «ligniiittt W M « .Ignificmt .cure, of .tror during th... .xp.riin.nt.. Th. .ituntion W M iinprov.d by incorp-
207
X'l
...y
208
oration of the dial-gauge described in Chapter 3, but
this did not provide an improvement in the absolute
determination of the angle of incidence« Calibration
of the dial-gauge in terms of angle of incidence could
be provided using accurately constructed prisms in the
sample position*
7*2 Performance of Computer Progtams
It is inappropriate to discuss the detailed performance
of the computer systems developed as part of this study
in terms of efficient use of computer resources Ouch**•
as data storage and processor time)» at a time when these
can be provided cheaply compared with the user^a time*
The most important criterion is the level of satisfaction
felt by users of the systems* Members of the Ellipsometry
Group at City of London Polytechnic have been able to
use the systems to analyse ellipsometric data with no
need of programning knowledge and after only minutes
rather than hours of instruction*
The most serious shortcoming of the cong>uter programs is
their lack of portability* In general, it is obviously
preferable that computer programs should be usable on
many different machines so that as wide as possible a
connunity can take advantage of the effort spent in their
production« In the present case this aim has been
sacrificed in order to provide marimum ease and security
of use by taking advantage of language facilities not
available in any of the common programming languages
available« Also, development time was greatly reduced
! rr
(< 1

209by iiting the noet suitable rather than the most
tmiversal languages.
As far as possible» techniques were used that generated
concise and relevant computer output. Thus graphical
output» particularly of spectral data» was preferred to
the printing of large tables. Least-squares methods were
used to analyse experimental data obtained on filmed
systems» as this is much more convenient than methods
which rely on visual inspection of large quantities of
theoretical results Cas in the well-known program of
NcCrackin» 1969)» and also much more reliable than
mathematically pifmitive techniques such as pattern
searches for ’best* values of film thickness and
refractive indices» used by» eg. Schewchur and Rowe
C1970). Multiple-angle-of-incidence CSchueler 1969)»
multiple-film COldham 1969) and Lorenztian function fit
ting techniques (Roth et al 197A) have all been implemented»
using the non-linear optimisation method of Powell (1964)
£0 cases. This provides excellent convergence (at
some cost in increased computer time) even when initial
guesses for the unknown parameters are as much as 50X
above or below the optimal values. Use of these programs
has been limited by the necessity of extreme absolute
accuracy in the ellipsometric data. This made it impract
ical to pursue the study of tarnishing effects as part
of this project» in view of the peripheral nature of the
problem. Initial study (Section 7.3.2) showed that room-
temperature tarnishing over periods of «v 2 hours could
9.
1«
= 1
: |i
l!!
<
1.
-
not «ffttct the colotire of these elloys to any
significant degree.
Pull docunentetion of the computer programs has been
provided elsewhere CClarke 1978)•
210
7.3 Effects of Sample Preparation
7.3.0 Comparison of results from two experimShts
The results of different eacperiments are .influenced by
various causes; notably sample preparation Cconsidered
in this section) and composition (which will be consid
ered subsequently). It is necessary only to discuss
variations in 62^01) • •• cjCw) causally related.
])£fferences in the shape of £2 (0) • 8ue to intraband
effects» can be analysed in terms of differing T and
m*, but differences in interband absorption are more
difficult to treat. The simplest analysis is in terms
of the absorption strength (magnitude of ej peaks in
e5), and the position and widths of structure, such as
peaks and edges in e^. The latter two effects are more
easily identified if the spectra which are being compared
are normalised to have the same overall strength. This
can be done by choosing a photon energy and using the
ratio of the two C2(«) at this energy to scale one of
the spectra. Alternatively, a scale factor can be chosen
to ndnimise the difference between the spectra over a *
range of energies. The least-squares optimal scale factor
s is here defined as that which minimises the sunrof-
squares residual
£(S€2i “ ^2i)^i

wher« C2i ®2i ‘I*® values of the two
spectre et energy 1Ui£. Consideration of the derivative
of this expression with respect to e leads to an
equation
EC2i 62i 1 ■
2 H
7.3.1 Effects of finish
Comparison of results for fine gold with data from J RiVOj
Rivory’s gold data were obtained using non-opaque thin
films prepared in vacuo and annealed. The films were
ndcrocrystalline but annealing will have reduced the amount
of structural disorder and deposition strains within the
grains. However annealing will also assist surface segreg
ation of in?>urities. OUr data has been obtained on a
mechanically polished gold sample, which is expected to
have resulted in a heavily deformed layer, having a large
nunber of defects within each grain (but quite possibly
room temperature recrystallixation might occur in pure
gold at room temperature).
The computed colour of an opaque sample having the same
optical constants as Rivory’s is both brighter and more
saturated than our own; also, the dominant wavelength
is shorter. In terms of reflectance, the difference in
luminance (14X) is accounted for by the much greater
reflectance of the annealed sample - 16X larger Cin
absolute terms) just below the absorption edge where the

eytt i» noit •«witive. The difference in seturetion
is e result of the increased magnitude of the step in
R(X) - a 12X greater step, despite the fact that
Rivory's sample is still reflecting 4Z more than ours
at short wavelengths. When one turns to the function
€2(w)» it appears that her s«ople has a greatly
reduced absorption in the red where free electron
effects dominate, but a larger absorption in the blue*
(interband) region. In terms of the parameters m
and T, the difference in optical mass appears negligible,
but our relaxation time is a factor of 5 shorter than
Rivory's, suggesting much increased conduction electron
scattering by defects and grain boundaries in our
sanf>les. This accounts for the reflectance differenc
for u<2.5eV (^>500nm)m
Shorter wavelengths are dominated by the term e^Cw) in
Rivory's sample has an 62(max) of 6.7 compared
%rith 4 .7 for our own, (both samples have this maxinum
at 3.87eV), explaining the larger step in R(X) and the
reflectance difference in the blue and ultrar^olet.
Also, structure in e^i«) i* marginally sharper in her
san«>le than in ours, which is also understandable in terms
of reduced disorder. It has previously been noted that
increasing disorder increases C2 * bnt this ia necessarily
true only of ’free electron’ absorption (which dominates
C2 in copper in the visible), particularly when t is
relatively large. The implication of thia work ia that
disorder reduces e2t ^nt the mechanism in this case ia
212


i
ÌA À .Ì :. i ' Í l^ í
214•Ö«
«o0.O C4 O m <N
• 0 0 •«O o O
CM
•s
«•* * ^« ?í’;íÜ Q Q .^ e > B w « *»1 o M M ^
> ® - -Íá•H «w a (0 0ri <H 0) B •f4 J3 o.>»*o » ^/«N « Ö• a ca u h « 0 «
s s s sS 4J «M Ï|l «14 <M o* * **o§ W «
• f i•H H4i > «O , H ••4 «W 3 5 O U « >«•O *j <n « Xi 4J eo 4J • o 44 *«4 B O O MS ou a ^M s s44 *0 >4 ^0 fH 9 « O.H O W ^60 . C O0) *-• •Æ ^ O44 0 9 O ^ 04 44 «M0 <44 OS 440 M • >14 02 0 O<44 • X *r*0 r*> U 44n » U >r4w 0 tt 0 ^0 M M i OO O C 0«0 9 60 O S v:4 44 ® t4 0 04 M0 *H •*0«44 .is *44 <>l 0«44 44 O *0•H * 0•O «44 0 O .CO S "¿ 44 M u a 0^ 0 0 Ä « 0 44 00 0 UfSr>.*a USs*- ü 8
8 0 0•H *44 *44g <*4 *0
f-4 0 0 w *9 0
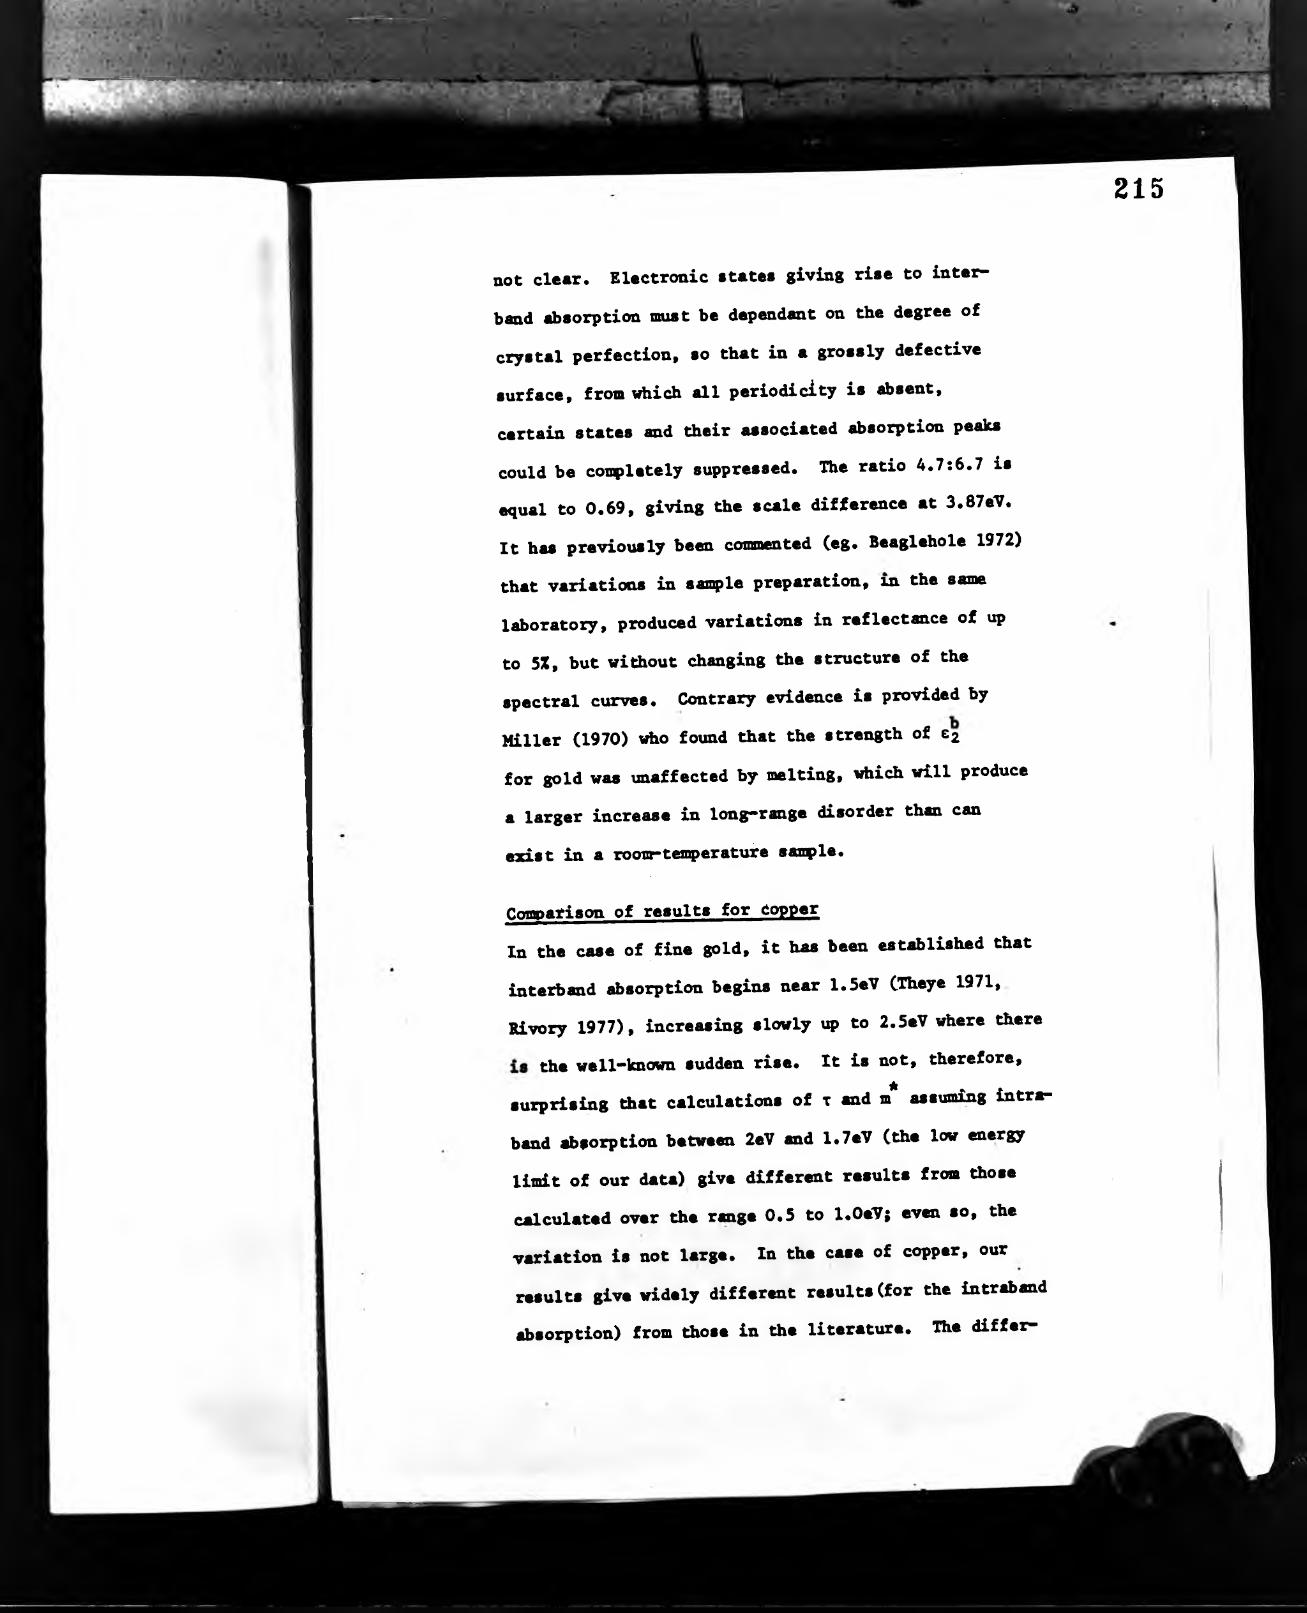
’ - ,
215
not clear. Electronic states giving rise to inter
band absorption must be dependant on the degree of
crystal perfection, so that in a grossly defective
surface, from which all periodicity is absent,
certain states and their asaociated absorption peaks
could be completely suppressed. The ratio 4.7:6.7 is
equal to 0.69, giving the scale difference at 3.87e7.
Ir has previously been commented Ceg. Beaglehole 1972)
that variations in sanqple preparation, in the same
laboratory, produced variations in reflectance of up
to 5X, but without changing the structure of the
spectral curves. Contrary evidence is provided by
Miller (1970) who found that the strength of 62
for gold was unaffected by melting, which will produce
a larger increase in long-range disorder than can
exist in a roow-tenperature sample.
Comparison of results for copper
In the case of fine gold, it has been established that
interband absorption begins near l.SeV (Theye 1971,
Kivory 1977), increasing slowly up to 2.5eV where there
the well-known sudden rise. It is not, therefore,
surprising that calculations of t and m* assuming intrar
band absorption between 2eV and 1.7eV (the low energy
limit of our data) give different results from those
calculated over the range 0.5 to 1.0e7; even so, the
variation is not large. In the case of copper, our
tnaults give widely differ«at results(for the intraband
absorption) from those in the literature. The differ-

I'' - •• '5
K r ^ ■ if c i - »•?.v •
216
Table 7.1 Compàrison of Resulti for Fine Gold
E2(2.53eV) e2(3.26eV) e2(3.87eV)
This work 1.76 4.26 4.65
Rivory (1977) 3.26 6.15 6.75
Ratio 1.6 1.5 1.3«
3e2(2.53)^^^(2)edge width 6e2(3.87eV)^^^
This work 10.2
Rivory (1977) 11.9 -
(1) per electron volt
(2) difference between the energies where the second derivative
has its iwtT>'t™iin and maxiinuip (d~FS)
(3) after subtraction of the background due to d -► FS trans
itions starting at 2.5eV.

\ •■• '*v«r-/
217
enccs cannot ba explainad in tanna o£ raaaonable variations
in tha paramatara; rathar an aiqplanation must ba sought
in tarnishing affacts landing to incorract values of
C2(w) or in tha naamass of tha absorption adga. These
points ara ançlifiad in tha following sections, but it is
appropriate to mention hare that Rivory*s data corroborates
results found in tha literature whan analysed at the lowest
energies, but gives results similar to tha present ones
in tha energy interval 1.7 -► 2aV. CSaa Table 7.2 for
values of x etc., from Bivory at »n. 2p and 0.75v).
7.3.2 Effects of Tarnishing
It is well-known that room tamparature tarnishes form
on silver- and copper-rich alloys, having a profound effect
on the surface colour of these metals. On silver (and
sterling silver) a black sulphide tarnish forms, which can
cause yellow interference effects during the early stages
of its growth. On copper a reddish cuprite phase appears,
and again interference effects are produced; in this case
the pink hue of the fresh copper surface is made more
intense, to an orange-red. Other workers have shown that
cuprite is the thernrndyn amically favoured oxide on Atr-Cu
alloys for gold concentrations up to 70 atomic percent.
Higher carat alloys tarnish so slowly that the oxide formed
is negligible.
Burge et al (1969) found an initial tarnishing rate for
air-formed Ag2S on silver of O.di hr"^, for a measured
concentration of atmospheric H2S and SO2 of 0.2 parts
per billion. Johnson and Bashara (1971) give the fil«

218thickneas of air fonnad Ag2S on silver as only
'N, 1 3 i after seven days, but do not state the laboratory atmosphere concentration of H2S and SO2. Given
this slow rate of growth, sulphide tarnishes on the
silver rich alloys have been neglected, but it is worth
pointing out that the surface plasma frequency is
expected to be shifted to lower energies, compared with
the peak in im(Ve ♦ 1), by the presence of a surface
film.
The influence of an oxide layer on copper-rich samples
has received attention from several points of view.
Firstly, the-appearsn« of these alloys when viewed in
air is strongly modified by the presence of films which
may be 15 - 2 o i after only a few hours exposure. The
limiting film thickness is about 45& at room temperature(Winterbottom 1 9 5 5 .)A* dMctib.d in Chnpt.r 3, copp.r *«t« iin».«l>.<iby poll.bing with i nicton di«nond pMt., WMhing with pux. .cap .olution C’T..pol') «id rinting with di.tilUd w«t.r. At thi. point, «» nd»otb.d lv«r ioiii. s£ thick
oi O2 «id H2O c«i b. Mcp.ct.d; during th. cour.. of th. «».rit-nt thi. will b. r.pl«.d by up to 20I of CU2O. P.ll. «d «.Murod th. opticaleon«t«it. of copper .t room t««p.r.tur., u»ing .l.ctro- polUhad *«iplM gtv«i • roduci^ «m..l *t high t«n>.r.tur.. ud low pr..«ur.« to Ttaon cont«ninAtlon. «iwory CW77) prq>.r.d continuou. thin fill» of copper in vacuum and MMured tha rafractiva indax by a coutination of raflaction „d tran««i..ion i»..ur««nt.. It wa. not .tatad, how«r.r.

219
whether the films were exposed to sir before or during
the optical work. Calculations have been made using the
numerical data of Pells and Shiga and of Rivory, for
con^arison with and interpretation of the current results.
The spectral refractive index nC«*)) for bulk cuprite obtained by Roberts and Rastall (1979) has been used to represent
the film, and Pells* and Shiga's data for the substrate,
as this is known to have been obtained on clean copper.
Table 7.3 shows the variation of colour for this system
with film thickness, and the computed colours using the
data of Rivory for an alloy AgeCugi». From our own
data, we find no significant difference between copper
and a Ag-Cu alloy of 1.25 at.X silver; nevertheless,
these results may not be directly comparable, particularly
as Rivory's sample was in a vapour-quenched metastable
form.
Luminance can be seen to fall rapidly and saturation
increases rapidly as the film thickness increases. Domin
ant wavelength decreases, but slowly. Copper samples
measured here had a luminance (computed assuming no film
to be present) corresponding to between 20% and 3oX of
Cu20 on copper. The saturation imples a film thickness
of 2oX. One sample was polished and left in the laboratory
unprotected for several months, after which time the oxide
film caused noticeable reddening of the sample. Similar
calculations gave a luminance corresponding to a film
thlckiMtf of 45X to 50i but • ••tut.tion suggesting 2oX
again. The thicket the oxide I f i , then the less eccept-I
eble is the use of the pseudo-constants to compute the
1 ,

■* t .’'4. • :• *JOk i
‘ '.• \ >\ «P .jH**!
Substrate Ag6Cu9i*(Rivory 1977) and film CU2O (Roberts and Rastall 1979). The results of the calculation depend on the energy or wavelength interval over which the fitting ia performed.
Interval -gj3t (s nm“ ) BciCO) (hbT^) Dhu CeV naT ) *5d 3d
m
220
650-850nm 0.62 x 10“^® 2.7715
ly-2v 0.22 X 10“ 0.29

• ■ »■ '. i*
221
Table 7.3a Bate óf chángé óf cónpiifd colorimattic
These were obtained by uaing cleaa auhatrate data for Ag6Cu9i»(Rivory 1977) and copper (Pella and Shiga 1969), and comparing these results with thoseobtained using the pseudo-refractive indices
7Xcorresponding to 20X of film.
CIE 1931 Standard System, Illuminant C, Hormal Reflectance
ax (nm~*) ^ (nmT 3d 3d
*' ) 3L(X nmT^) 3d
3Xd 3s(Z nm"^) 3d 3d
Rivory 0.0056 0.0038 -1.81 ' » -0.5 2.51
Pells and Shiga 0.0041 0.0026 -1.82 -0.6 1.77«
nA^A nf chance of computed absorption.calculated as above for a Ag Cu substrate.
Xnm
*
369(nm~^)34
3e£(nm“ )34
369(nmT^) 34
250 -0.073(-l.lX) -0.032(-5Z) -0.041(-0.7Z)
500 - -0.124C-6Z) -0.417(-8Z)
800 -0.40 (-9Z) •

222reflectance. The exact equation» have been uaed to
conf)ute the elllpsometric parameter» f(u) and dCw) for
»7 »tern» of CU2O on copper, which have then been uaed to
derive paeudo-conatant», reflectance and colour co
ordinate». Thia indicate» that for a 2oi film, «•« of
the paeudo-conatant» would cauae the film thickneaa to
be under-eatimated by 2-3&, from the calculated lundn-
tance and aaturation. Uaing X^, the thickneaa would be
overeatimated by 'v lol but due to the amnll change»
(6X 'v 28) thia figure could vary widely, d
The aenaitivity of chromaticity, luminance etc. to film
thickneaa ia further illuatrated by the partial derivat
ive» (w.r.t thickneaa) of theae parameter», in Table 7.3.
A juat-noticeable-colour-difference would reault from
lOnm of oxide. The variation ahown ia that found uaing
a range of different aubatrate-and filmrconatanta including thoae of Rivory (1977) for AggCue^ and Pella and Shiga
(1967) for copper.
variation comuted free-electron parameter» with fbiclp»eaa of oxide film.Copper d.t. of Rivory (1977) ni cuprit. d«t. of Rob.rt. «d Rut.ll (1979) b«. b.en u«.d to dcul.t. .lliptoiutric d.t. for .y.t«i. of cuprit. on copp.r in th. vu.l«igth rug. 2.5w to 620nn. In turn thu. hu. fumi.h.d p..udo-S v.lu.. uhich hu. b.u u.ly..d to giv. t, m* ud ei(0). Thu. th. vuiation of thu. puautar. with contudnut film thicknu. hu b.u obtUnod. Th. chug, in U P « “ « Drud.-lik. r.lu-
tim. i. .bout lOX of th. uuur.d valu. par nuom.tr.
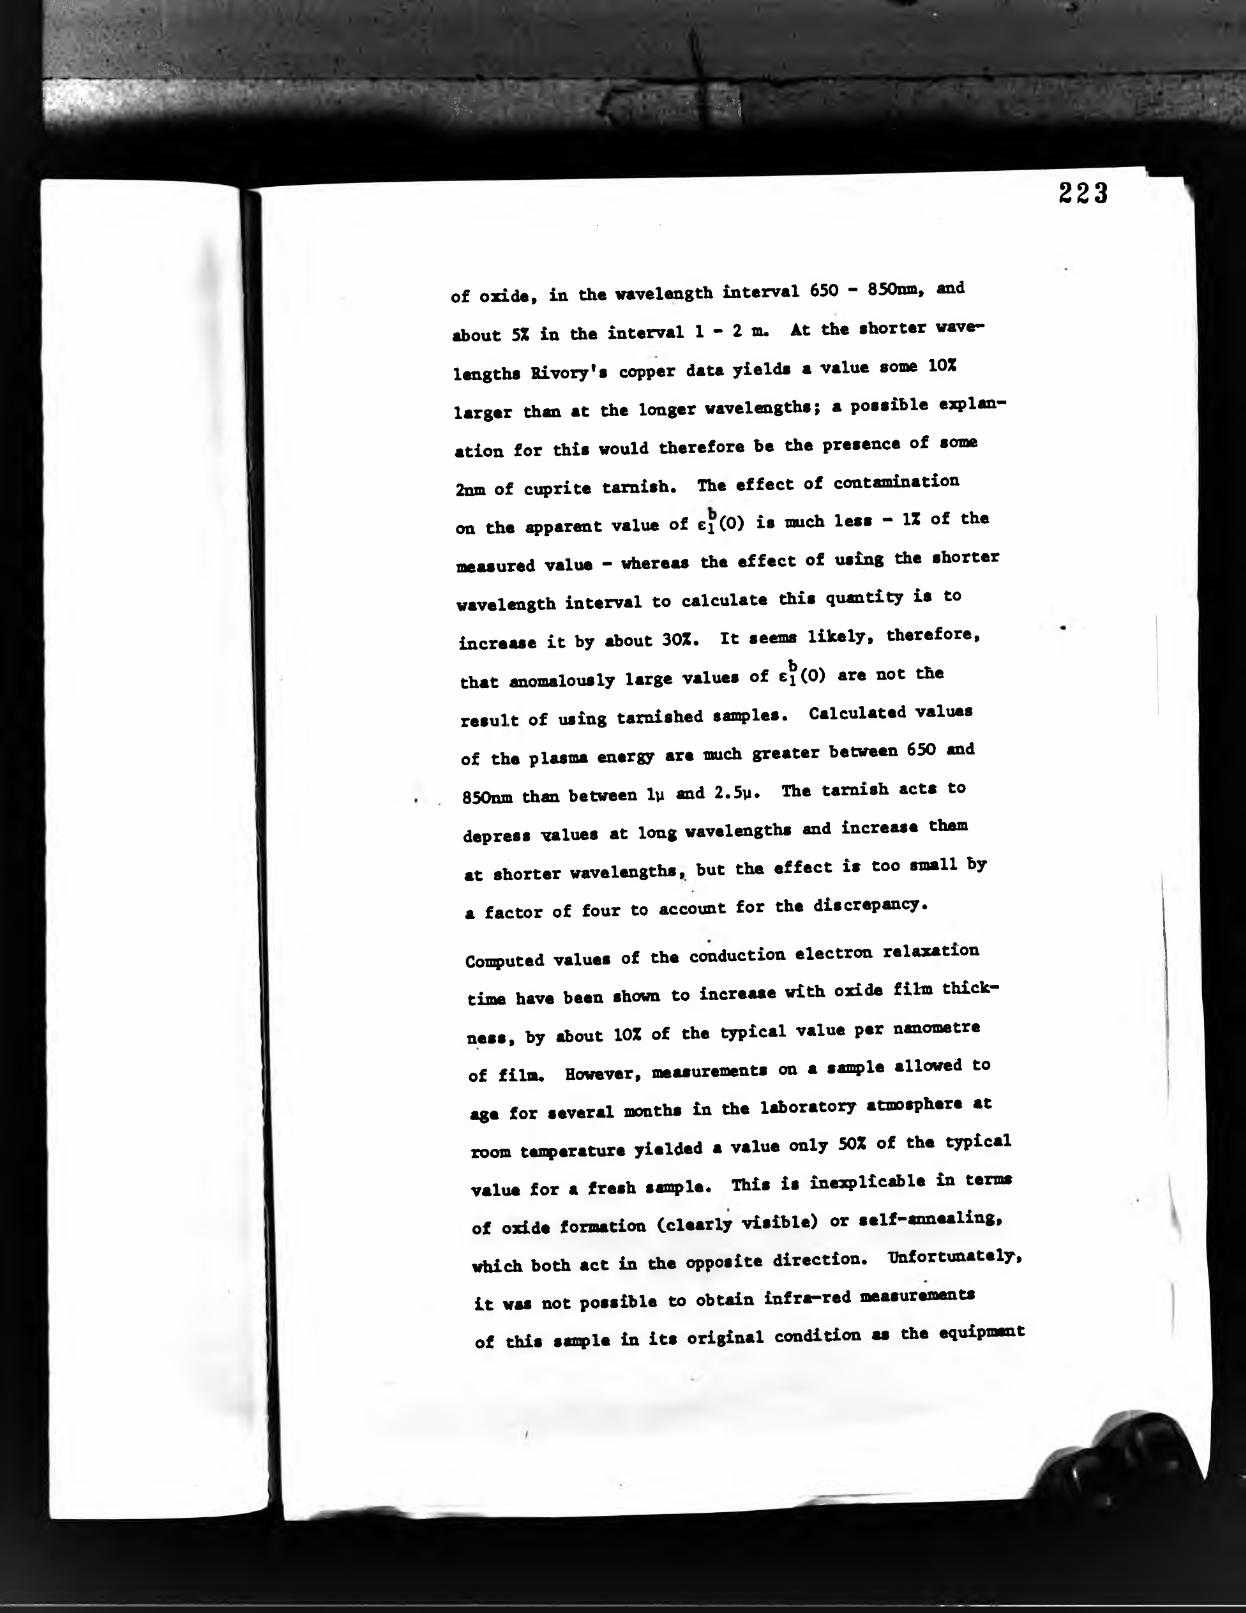
;> ns
‘•'Kv •Itoi.'V..I -;i ■' - it!« . ■i: . : ■ -'j
of oxid«» in th« wavelength interval 650 - 850nm, and
about 5X in the interval 1 - 2 m. At the shorter wave
lengths Kivory’s copper data yields a value some lOX
larger than at the longer wavelengths; a possible explan
ation for this would therefore be the presence of some
2nm of cuprite tarnish. The effect of contamination
on the apparent value of cjCO) is much less - IX of the
measured value - whereas the effect of using the shorter
wavelength interval to calculate this quantity is to
increase it by about 30X. It seems likely, therefore,bthat anomalously large values of ei(0) are not the
result of using tarnished samples. Calculated values
of the plasma energy are much greater between 650 and
850nm than between Ip and 2.5w* Ibe tarnish acta to
depress values at long wavelengths and increase them
at shorter wavelengths, but the effect is too small by
a factor of four to account for the discrepancy.
Computed values of the conduction electron relaxation
time have been shown to increase with oxide film thick
ness, by about lOX of the typical value per nanometre
of film. However, measurements on a aample allowed to
age for several months in the laboratory atmosphere at
room tein)erature yielded a value only 50X of the typical
value for a fresh sample. This is inexplicable in terms
of oxide formation Cclearly visible) or self-annealing,
which both act in the opposite direction. Unfortunately,
it was not possible to obtain infra-red measurements
of this sanq>le in its original condition as the equipment
223
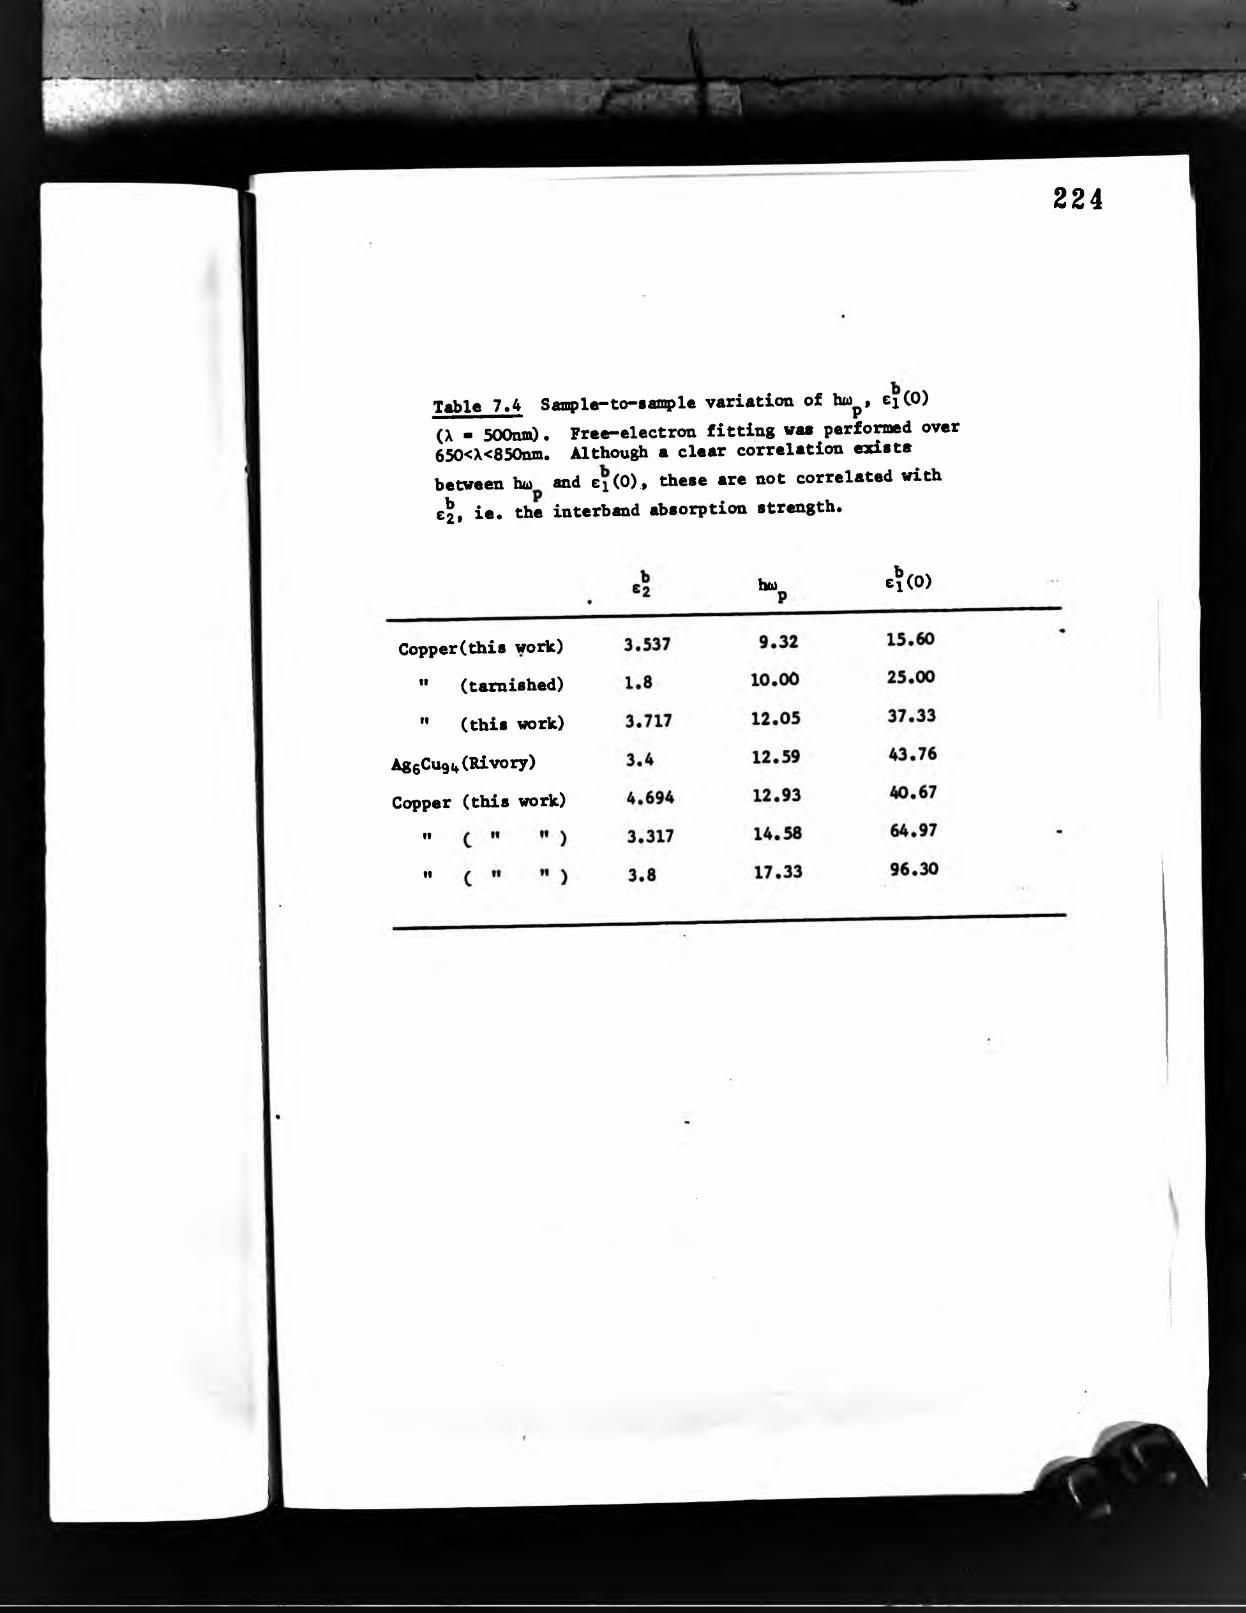
1-‘:T's ' V '. .i. ■:' . ‘”f ,
Table 7.4 Sanple-to-sample variation of hw^, cjCO)(X ■ 500nm). Free-electron fitting waa performed over 650<X<850nm. Although a clear correlation existabetireen hu and ej (0), theae are not correlated withz\, ie. the interband abaorption atrength.
224
Copper (thia work)
(tamiahed)
(thia work)
Ag6Cu9i*(Rivory) Copper (thia work)
II
II
II
hto e?(0)
II
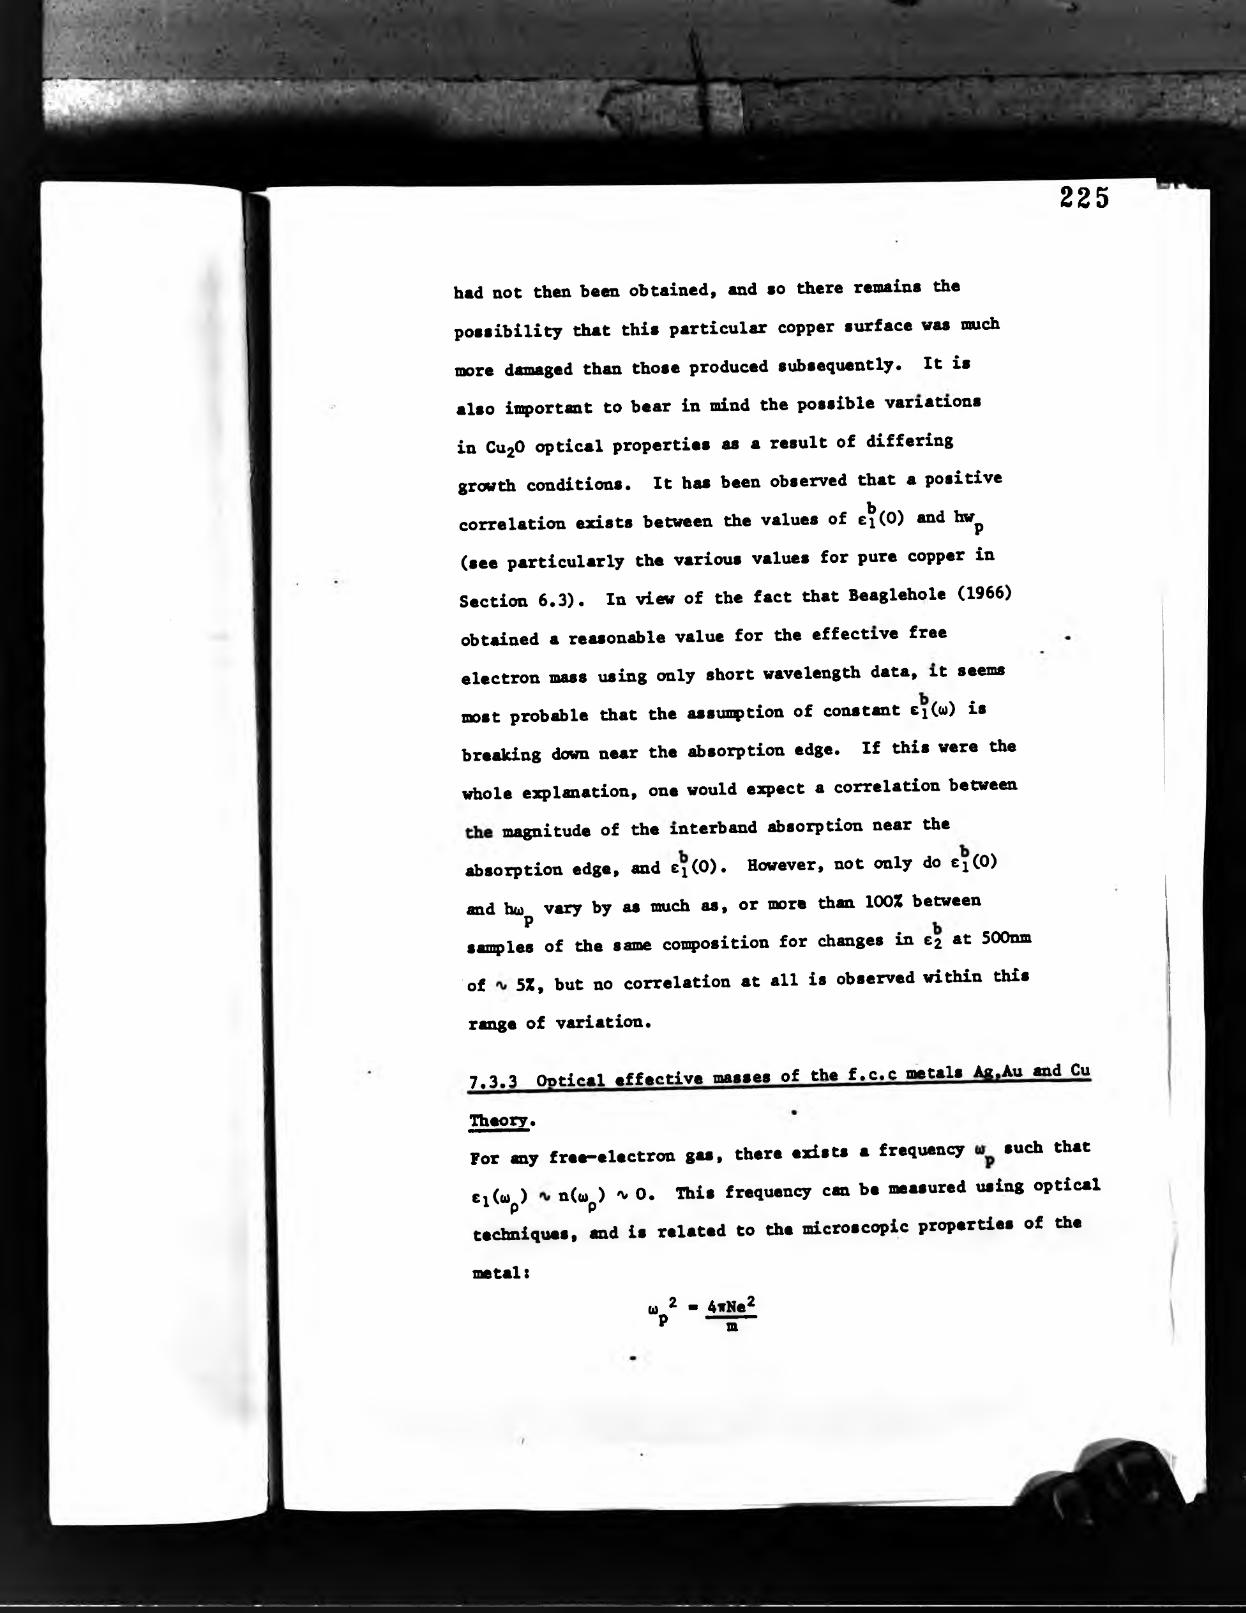
had not then been obtained, and ao there remains the
possibility that this particular copper surface was much
more damaged than those produced subsequently. It is
•Xso important to bear in mind the possible variations
in CU2O optical properties as a result of differing
growth conditions. It has been observed that a positive
correlation exists between the values of 6^(0) and hw^
(see particularly the various values for pure copper in
Section 6.3). In view of the fact that Beaglehole (1966)
obtained a reasonable value for the effective free
0^ootron mass using only short wavelength data, it seems
most probable that the assumption of constant ei(w) is
breaking down near the absorption edge. If this were the
whole esqplanation, one would expect a correlation between
magnitude of the interband absorption near the
absorption edge, and ei(0). However, not only do ei(0)
and h(i) vary by as much as, or more than lOOX between P
samples of the same composition for changes in 62 at SOOnm
of 5Z, but no correlation at all is observed within this
range of variation.
225
7,3,3 Optical effective masses of the f.c.c metals Ag.Au and Cu
Theory.For any free-electron gas, there exists a frequency such that
ei((jp) n(o»p) 'v» 0. This frequency can be measured using optical
techniques, and is related to the microscopic properties of the
metal:(0 2 . 4irNeP m

'í-" .iT-;:%’'^ á■ .ji ^ ' '' C¿â?TA T• •'’*7?ï
226
Tablé 7.5« M.m.ríe*l valu«« (from * 1 ^ ScÍÉPce D*t« Boók'1>y R M TéQüéttt
* 6.5821845 X 10⁻¹⁶ eV a
e 4.80325 X 10⁻¹⁰ e.a.n
9.10956 X 10⁻²⁸ 8
Table 7.5b Lattice parameters and electronic d e n a i t y . A„ end Cü ¿rom * Alphabetical Index óf Wórk on Métala and All<ya_.
4;0862 1.4657x10"^
4.07833 1.4742x10“
3.6147 2.1173x10-^
a-3(8-72)
0.12106
0.12142
0.14551
NC « 4a~^) (cnT^]
5.8628x10^^
5.8968x10^^
8.4692x10^^
Table 7.5c Electronic density uaing bulle valuea for" thé deáaity
At.vt.(g npl"^! At.vt. ,-3i
107.87 1.7912x10⁻²² 10.494196.97 3.2707x10⁻²² 19.32
63.55 1.0553x10⁻²² 8.95a No. 6.0222 x lo28at.inol-lvacuum annealed for 24 hra at 600®C 1
N(cnT^:
5.8586x10²²
5.9069x10228.95 8.4813x10²²
(2) Weaat (1971)(3) Scientific Encyclopaedia, Van Noatrand, 1971.

*[
where c.g.s unite are used; note that ie a circular
frequency. N ie the conduction electron concentration
Ccm“^), e the electronic charge Ce.e.u) and m the
electronic maee (g). In practice, the periodic potential
of the lattice caueee the relation bettreen energy and
momentum for the electrone to depart from the parabolic
behaviour expected for free electrones
E ^
In order to use a classical description of conduction
behaviour it is therefore essential to use an effective
E -2m m.
Thi. i» conv«iUon«lly i«a«ur.d in .Uctronic n i
not grtm, to thtt vtluai of m of ord.r unity c m be
esq>ected.
The quantity N can be calculated from crystallographic
data. For an f.c.c lattice there are four atoms per unit
cell, and the volume of a unit cell is simply equal to
the cube of the lattice spacing (a, cm).
227
Thus
N - 4a',-3 cmr 3

.. . * '/-im*•' ’.r'i
Wc therefore write
- b
228
b ■ 4he |ir
When ho) is meeeured in eV, m in electronic masees and P
4 in t <t quantity b has the value 74« 2658» Writing
u , for the plasma frequency, computed assuming unity
effective mass.
m
Using published values of the lattice constants, one
obtains values of 8*9906, 9*0174 and 10*8064 eV for the
plasma frequencies of silver, gold and copper respectively*
However, structural inq>erfactions may alter the actual
value of N by a few percent (invariably downwards) intro
ducing uncertainty into calculated values of l***p*
*Typical values given in the literature are m 1 for
g^Xver gold, m 1*45 for copper* The experimental
values of Hu are siod.lar (''» ^*8eV) for all three metals*P
Experiment
Hu is deduced from experimental data for c(u) for Hu < Hu^,P
where Hu is the energy of the onset of interband transitions* o
Using the Drude free-electron theory, the experimental
«(«) ■ ei(u) ♦ i'c2(u) can be decomposed into *free*
c^(u) and ’bound’ e' Cu) parts:

'v a
Ci(o)) • e^(u) •(1 + W^T^)
e^C«) - C2(u) ♦ «Op f0)(1 + to» T )
These ere used to deduce the re la tio n
u>e2(«>) ■ "i ci(w) ♦ gi(<«>)
229
As « -► 0, e^Cw) c o n s t., so th a t th is describes a s t ra ig h t lin e a t low freqiiencies. Also, e2 (w) -► 0 as 0. Assuming «T »l*
€2(w) ■ <«>pX(i)3
T h M u , T Mid ei(<0 0) «t. obtain.d. Th. ptobl«n» with
tbi* «»thod « • that t2(“> d“ » behaviour.
6^ (0.) doe. no t bacon. conatMit w ith in th . . x p . r i « n t a l t« ig . and fo r some m ateria ls ux ~ 1.
A. a n « . approach, i t i . .uggeated th a t th . r . l « « t i o n t i n . b . replaced by an m ^ ir ic a l «cpreaeion need by They. (1970)
1 ■ 1 ♦t (m )
And th a t a Kr««ar»-Ktoni8 W Miafomation of C2 (u) in the experinM ital rMig. ia need to conputa a ta rn 6 e i(u ) . The ~».<o<ng con tribu tion to c j . iro n C2 fo r energie* InpSeV.would indeed be constant.

br,',
' :-0
e^Cw) - A ♦ 6ejCw) t
b).max
«eiO»>) “ f.X
(1 ♦
J > A .0)^2 Ob)2 2 U) - 0)
b>
230
since b> :> b> , the integral is non-singular.
The only parameters to be determined would then be A,
T and b •0
The experimental data for silver and gold give m 0.98 ± 0.09
and approximately 0.95, respectively. In the case of copper,
values ranging from 0.8 to 1.1 have been found, compared
with values in the literature of 1.45.
The values of cCw) used in these calculations a . 6 < hw < 1.9eV)
were for higher hw than those used in most studies (0.5 < hw < leV).
In consequence the spectral variation of e5(b») will complicate
the measured spectrum. If ei is assumed to be constant (when,
in fact, it is interesting with increasing frequency), then ei(b>)
will appear to decrease less rapidly with increasing frequency
than is really the case. At these energies, despite the short
relaxation times observed, wt > 1 end therefore
b 2ei % Cl - b»
A reduction in the frequency dependence of will therefore
cause b) ^ to be underestimated, and therefore the optical
•ffcctl'V. n u s to b. ov«t.»tiin«t.d. Eht.nr.ich rad Philipp (1962),
r.-.n.ly»i«g th. d.t. of Bob.rt. (1960), .ugg.«t.d corr.cting th.
v.lu.( of m* domnrard. from 1.6* to 1.42 to .llo» fot thi. .ff.ct.
dnotlMr raplraotion nrat therafor. b. .ought for th. raoiralou.

m
231
Xo(v values oi III found In tlixs mpoxt*
Data of J Rivory for a thin film coin>oaition AgeCu^i^
has baen analyaad using tha conputar program CClarka 1978)
davalopad for this study to solva tha aquations of Chaptar A.
Paarson C1958) givas tha rata of changa of voluma oh alloying
silvar into coppar as 0.0049 at.Z"^. Thus tha plasma
fraquancy, assuming unity affactiva mass, must ba dacraasad
by 'V' 0.97 for this data. In tha wavalangth intarval 2y -► 2.5p
CO.5 -► 1.2a7) an optical mass of 1.3 is obtainad, which is
identical with that given by Rivory (1977). However, in tha
intarval 650 - 850nm (1.7 2a7), which is tha largest avail
able in tha present study, m* 0.68 is found. Clearly a
similar discrepancy exists in this data as in those for
coppar obtainad hare. Also, tha quantity 6^(0) obtainad
using Rivory’s data is 29.3 at long wavelengths, 40.7 near
tha adgaj presumably this can ba related to tha frequency
dapendance of ei as tha edge is e$ is approached.
7 ,4 Effects of Alloying on tha IntarbSnd Absorption
7.4.1 Intarband absorption of Ag-Au alloys
Data was not obtainad for all these alloys at sufficiently
long wavelengths to enable tha function €2 (w) to ba derived.
Por this reason tha movamant of tha absorption edge in e2(w)
with composition has bean studied. This is not completely
satisfactory, as tha result will depend on tha form of
c|((o) - and hence on tha relaxation time and optical affactiva
mass - as wall as on €$(«) as datarminad by tha band gap.
This can ba seen in terms of a contribution to tha second

232
f _»derivative of E2(“) the curvature of e20a) $ noviag
the zero of thiz function to higher energies (Figure 7.3).
There will therefore be a ayatematic overeatimation of
the band gap energy, and additional errors introduced by
the aample-‘to-aaiH)le differences in relaxation time,
optical effective mass and the deviation from exact
Drude^like free electron absorption. It is apparent
from the results CSection 6.2) that these quantities, at
in the samples studied here, do not show a marked
dependence on conq>osition and ao these errors can be
regarded as a random element. The most probable cause
"of this is the damaged nature of the surface, which, for
example, introduces so much electron scattering from
structural defects that impurity scattering appears to
be negligible. It is also the case that the movement of
the fundamental absorption edge in this system is ao large
Cl.SeV) that the effect of these errors is not serious,
as it would be in the Au-Cu system where the movement is
only 0.4eV. The trend of the absorption edge with
cos^oaition (Figure 6.34) is within ±2X of the energy
values reported by Rivory (1977). This is better than the
experimental bandwidth of the monochromator employed (lOnm)
in the present study; Rivory does not state the optical
bandwidth used. No significant movement of the second
absorption peak (at 3.8e7) in the gold-rich alloys occurs
on addition of silver; this is also remarked upon by
Rivory although she reports the energy of 3.9eV. A shift
to lower energies of the edge at 3.5eV was reported by
Beaglehole and Erlbach C1972). This could, however, be
catised by effects other than movement of the 3.8eV peak.

• i :.' . ' • • ! • . * ; i ' ^ ï - ^SEi . t b IIe •A^b BS/’' A i- ^ i^ - . . 1 . • ® * ■ ■■ • * • > ' • . '* ' “..'•^U-'<»-,, ____
Figur# 7.3
233
(c)
Ideml forms of the imeginery parts of the dielectric function. £Ideal forms of the first dérivâtes of (a). has been assumed to be quadratic. The actual index is typically 2.3.Ideal forms of the second dérivâtes, de^ beenassumed parabolic near the maximum. t -*-Since 32c 2 . 3^cJ ♦ and from the positions
3(1» 3(1)of the xeroes (arrowed above) it is clear that considerable of the function e^Cw) rather than normally cause•*•*’ ^ O*^ . . . » »-w*.

1£
sine« there are two coiqxmeats Cd^band to Fermi Stirfaceband Fermi Surface to conduction band) of £20») at this
energy, and they are of similar magnitude. The argument
illustrated by Figure ‘7^3 ceneeming the influence of f, vhen this cannot be sxibtracted out, is equally
applicable to the problem of separate but overlapping
contributions to e^O») from different transitions. The
exact onset energy of conduction electron transition»
cannot be calculated without first subtracting the term
due to d-*FS transitions, for which a reliable lineshape
would be required. This could be performed in a manner
similar to that used by Antonangeli et al (1974) when
analysing thermovariation data of the optical properties
of silver.
The mechanically polished samples measured here show very
similar absorption strengths at the two maxima (3.1 and
3.8eV) in the gold^rich alloys. This is in contrast to
results on evaporated and annealed films. Beaglehole and
Erlbach (1972) and Rivory (1977) both found a ratio of 1.1
for
maxiitaim at 3.8eVma-giiniiin at- 3>Q^V
As prei^otisly remarked, the present samples have values of b
4
<¿34
e2((a) smaller than those of Rivory throughout the whole waver-
length range, but evidently the conduction electron transition
^2^ Li is weakened relatively more than the d*-band trans
ition. It has already been noted (Chapter 2) that the
conduction bands are more sensitive to the crystal potential
than are the d-bands. Alloying effects do not cause a spread
of the conduction electron transitions into the visible
■ "•Av' * . .- \t •-..•*' f-». - ’ *''.f - i'A' • - ' - ’‘■i’ .Lu.-.
235
C3*5eV, 380nm) and ao It vili not ba naceaaary to
conaidar tha alloying bahaviour of the conduction banda
whan discuaalng the colours in the Ag-*Au system.
The deviation from linearity of tha d FS transition
in this sytem can ba iisad to infer tha details of
electron charge transfer between the silver and gold
atoms, when used with a suitable theoretical model.
Charge transfer in alloys is interesting, theoretically,
as it relates directly (and often sinqply) to metallurg
ical (nonroptical) properties. Unforttmately the
calculation is so sensitive to the theoretical technique
used that even qualitative results cannot be relied upon.
The first calculation was by E Stem (1966) who enq>loyed
the Virtual Crystal Model, considering only d-electrons.
A large transfer from gold to silver was found. Levin
and Ehrenreich (1971) used the CPA and conai dared only
s-electrons, finding a net charge transfer, also from
gold to silver, of 0.3 electrons per atom. This is in
the opposite sense to that expected on the basis of
electronegativity (Au 2.4; Ag and Cu 1.9), and is
also much larger than indicated by Mossbauer experiments.
When both s- and d-electrons were considered in the CPA
(Gelatt and Ehrenreich 1974) a net charge transfer of 0.07
electrons per atom from gold to silver was found; d-states
are evidently transferred from silver to gold. The latter
result is in agreement with non-optical work (net charge
transfer is small) but confusion still exists: Sivory (1977)
inq>lies that total charge transfer has the opposite sense.

236
7.4,2 Au-Cu alloys
Hagnitudc of the interband abiorption.
From th« disciission of Section 7.3, it is apparent that
sample preparation has tended to reduce the magnitude of
e2((d) from that of an tmdamaged clean surface. In the
case of fine gold, the ratio of our result for the maximum
(4.7) to that of Rivory (6.7) was 0.67; for copper the
ratio is about 0.54. Koster and Stahl (1967) using sput
tered films found a variation of the peak of C2 ((») of
4.3 ■* 6.5 for gold and 4.7 -► 5.5 for copper. As previotisly
pointed out, there may be a tendency for increasing dis
order to reduce £2 whilst increasing ef» so that a somewhat
smaller variation of £2 with surface treatment may be
e3q>ected. It is reasonable to suppose that the effect of
disorder on the magnitude of the absorption is a function
of ccmpoaition, as is the absorption strength for the
perfect crystal. It is therefore not possible to separate
these effects, using only the present data. Steele and
Treheme (1972), who also used mechanically polished sanóles
report a rather small peak value of £2((d) for fine gold,
namely 3.8.
Position of the fundamental absorption ddge
Discounting the possibility of a loi^energy 'tail' in the
absorption for gold, the presence of which cannot be con
firmed in our data because of the lack of observations
below 1.5eV, the onset of interband absorption in both
copper and gold can be accepted as due to transitions from
the top the d-bands to jthe Fermi surface over extended
regions of the Brillouin sone. It is likely that in both

f ' ' V y -Wi1 ■ *< *.' . -V* -'- •'’V * .. :■ ;.<?- ‘V • . '■ ** , f* * -Vit, ■•,
237
Figure 7.A The onset energy CKo) ) interband transitions in the Au-*Cu system.


.(i ■
> wr.3-'i ’V'i-' •' ‘ '.\ 1 ^
K - T T '' > H
loetals these take place near L, L5'*’ -f 6'*’ L^-(?S), and
that the variation of onset energy shown in Figure 6.46
represents the change of the energy of this gap with
composition. In the initial experiments on these alloys
it appeared that the onset energy decreased when moving
from pure copper to copper**rich dilute A\irCu alloys,
as reported by Beaglehole and Erlbach (1972)• but this
was not confirmed in any siibsequent e3q>eriments. The
result is now attributed to an alignment error, causing
mis-calibration of the monochromator in its position
following the sample. This would esqplain the low
sensitivity of the ellipsometer noted dtiring the partic
ular e:q>eriment. Corroboration for this view was
provided by an e3q>eriment on fine silver, in which a
similarly anomalous value for the onset energy was
combined with low sensitivity.
Bivory (1977) gives a graph of hw^ for a set of AtrCu
alloys, defining this quantity as the energy at which
ex((d) reached half its value at the first maximum.
Despite the fact that the energy at which 3c2 it a maxim-da)
um has been preferred here, these results are consistent
with the present work within the e3q>erimental scatter
(Figure 7.4). No significant movement of the fundamental
edge is found for alloys containing up to 50 atomic per
cent gold; however, the scatter is about ±0.02eV. This
is comparable with the wavelength resolution (±0.03 at 2.2eV)
For gold fractions of greater than 50 at.Z, the interband
onset energy increases rapidly (and almost linearly) to its
final value of 2.5eV. The deviation in onset energy as a
function of composition from a simple linear change can be
239

regarded as negative (that is, the curve lies entirely
belcw the straight line joining the pure gold and pure
copper values) • This is similar to the behaviour of
Ag-Au alloys. The fact that the deviation is more
marked can be attributed to the variation in lattice
constant in this system. When gold is added to copper,
n lattice expanaion takes place which, other things
being equal, would tend to depress the value of the
energy gap. This has been demonstrated by piezo—optical
experiments for Au and Cu (Gerhardt et al 1966 and 1968).
Where the rate of change of gap with lattice dilation or
compression has been measured, it is possible to correct
alloying data for lattice effects, leaving a term due
only to the ionic potential of the alloying addition.
This procedure has been followed by Beaglehole and Erlbach
(1972) who assumed that in the case of very dilute alloys
piezo data obtained on pure metals could be used. No
studies of piezo reflectance of Au~Cu alloys appear to
have been made, so that it is not possible to compare the
system directly with Ag*”Au, as it may be that the negative
deviation discussed above is caused entirely by lattice
effects, with an unknown (positive or negative)contribution
from potential effects. It is therefore not possible to
decide whether charge transfer is from gold to copper or
vice versa without additional experimental evidence.
Alternatively, theoretical calculations of the onset energy
could be performed using various values of the charge
transfer and specifically including the behaviour of the
lattice constant in this system.
240

■ vx.
'■H v'' ' *
■ • '.^ »
When presenting date on the Ag^Au systeniy calculations
were included (Chapter 6) of the change in bandgap on
alloying, derived from the gradient at the absorption
edge and the absolute change in between two samples
of slightly different composition. Similar calculations
for the Au-Cu system are complicated by the fact that
variations of the magnitude of e2(<*>) are larger. Thxs
is particularly significant when comparing sample lOR
(nominal 90Z by weight gold) with other alloys of
similar composition. This has an absorption (C2) of
'X/ 4.5 at the first maTiimim near 3.8eV, compared with
3.5 for the other samplerr— Again, sample 2 ClOAu-90Cu)
has a peak 62 of 4 coog»ared with 3.7 for the pure
copper sanples. In order to make the computation of 6hto»,
the change in bandgap, independant of simple changes
in the magnitude of the absorption, the spectra have been
scaled to the same value at the maadmum before taking
the difference (see Figure 7.2 for an example of the
effect). This greatly improves the accuracy and sensit
ivity of the technique, instrumental resolution of the
analyser and polariser values being sufficient to detect
spectral shifts of about 0.001 eV. It would be necessary
to use a monochromator of much higher precision than that
presently employed, mounted on the incident arm to avoid
resetting errors, in order to fully utilise this sensit
ivity.
The peak in for fine gold near 3.8eV can be seen to
move to higher energies (Figure 6.41) on addition of copper.
The mechanically polished samples measured here did not
show a true above the absorption edge (the structure
241

r-.4
242
it not clearly defined even for annealed tanplet, but
showt rather as a point of inflection near 3«3eV). This,
in conmon with the edge itself, moved to lower energies
upon addition of copper. Between 95Aur5Cu (Melt 77) and
10Au“90Cu (Melt lOB) the inflection develops into a true
at energies of »v 3.0ciy and 3.5eV respect
ively. The double-maximum structure persists at 80Au-20Cu,
becoming more conqplicated in the alloy 70Au-30Cu (Melt 8).
Por copper contents of 30Z by weight or greater, the
structure could be interpreted as a broad flat 'minimum
between 3.0 and 3.5eV, or eqxially (within the limits of
-experimental error) as points of inflection at these two
anargies. The range of compositions (more than 50 at.X
copper) over which this feature of the interband absorp
tion does not vary coincides with that over which the
main edge shows no significant movement. Some experiments
showed a definite near 3.5eV (Melt No.7, 3.54eV).
It seems probable that samples with undamaged surfaces
would show this more clearly, but the structure is so
weak that a precise energy cannot be assigned to it.
The h i ^ energy peak (Figure 7.5) not only moves in the
opposite sense to the low energy one, but also moves most
rapidly at the copper-rich end of the alloy system. The
deviation from linearity is again negative. These results
may compsTed with those of Beaglehole and Erlbach (1972)
and Rivory (1977), shown in the same figure. The former
authors discuss the movement of the edge at 4.3e7 rather
than the adjacent peak; this is more amenable when using
their e3q>erimsntal technique. Data from the latter

/
y r.».-r™
243
author’s work Is not given explicitly and has been ext-
tracted from Figure 3 of her paper, perhaps with some loss
of accuracy* Agreement is encouraging, with the exception
that again, the movement of the pure copper edge in the
’wrong’ direction upon addition of gold has betti observed
only by Beaglehole and Erlbach. The more rapid change
on alloying at the copper-rich end of the system is
consistent with their observation that the potential
effect Cwhich they say opposes the lattice-effect in
this system) is much weaker for these alloys than for
gold-ridi ones.
As discussed in Chapter 2, this particular peak in the
copper spectrum has been assigned by most authors to
transitions from band 2 to band 1 (the first conduction
band) near L, ie. L2 Li* A contribution at slightly
lower energies L2 (FS) -► Lj is also likely from initial
electron states on the Fermi Surface. In the case of
gold it is not possible to obtain accurate resulta using
non-relativistic theory and so the smooth shift in peak
position in the AurCu system cannot be taken as identify
ing the 3.8eV peak for gold as L2T ’► L i * Bands formed
from these by relativistic splitting are 4 and 6 , and
and 6'*’. Thus the most likely assignments are Li»- -►
and Lg- Lg ., as has frequently been suggested by many
authors, on the basis of photo emission, pieso reflectnace
data and band theory calculations.

7.4.3 Single phase AgHSu ¿Iloyi
Two iilv«r-rich alloys in thia system were prepared.
Melt No.70 contained 1 at.Z copper; while No.76, contain^-
ing 6.6 at.Z copper, corresponded to the saturated alpha-
phase alloy at 600®C equilibrium concentration. Another
(metastable) solid solution of approximately 50Ag-50Cu
coaposition (No.16 37.4 at.Z silver) was prepared by
liquid-solution quenching, and finally Melt 75 contained■»
1,25 at.Z silver, the conq>osition of the saturated beta-
phase alloy.
Samples No. 30R (fine silver) and No.70 are compared in
Figure 6.57. The difference in interband absorption, de2 ,
is nowhere greater than 'xO.l or 2Z. Structure due to
l>roadening of the absorption edge at 4eV is visible; the
centre of this coincides with the peak in 3e5 (Figure 6.58)3(1)
The broadening of the edge amounts to 0.02eV. A dip in
5e2(u) centred at *ft(«) - 3eV corresponds to an impurity
absorption band in the 1 at.Z copper alloy, also noted by
Rivory (1977). In our case, the absorption band has a
width of 'v* 0.5eV compared with leV for the vapour
quenched, 6 at.Z copper sample used by Rivory. Again,
the magnitude of this absorption is 0.02 per at.Z Cu
(Rivory) and 0.03 per at.Z Cu (this work). In the same
figure, dc2 for lOOZ Ag and Ag93,i*Cu6 .6 »I*® «hown.
Broadening of the 4eV edge is 'v 0.05eV, with no detectable
movement. A new absorption band is evident in the alloy
near 3eV, having a width of 0.7eV and a strength of
0.5, or slightly less than 0.01 per at.Z Cu.
In view of magnitude of the effect, agreement with
244

-¿J
m i M à
tv . V V 3>X:f ,■i'’ï' >>
’* t •■ '■V''- ' -i ^
Rlvor^^s data for a sangle of similar conçoaition could
be better. Possibly the discrepancy is due to differences
in the way efcu) has been fitted. It is interesting to
note that the absorption due to small amounts of copper
in silver is almost indistinguishable from surface plasmon
absorption (induced by surface roughness). However, witii
larger concentrations of copper or degrees of roughness,
the spectra are dissimilar.
Rivory assigns the peak to Virtual Bound State absorption,
first described by FriedelCl958). The implication is
that the copper d~electrons form localised states, with
the occupied states below the Fermi energy but above the
highest silver d-state. This existence of this type of
state suggests that the width of the copper d-bands is
significantly less than the difference in d FS gaps
for copper and silver. The exact formulation can be
derived as a special case of the CPA (eg. Elliott 1974).
The spectrum of the 37.4 at.Z silver alloy is remarkably
giinilar to that of pure copper. The edge is broader,
as would be e3q>ected in view of the highly defective
lattice, and shifted slightly to higher energies. There
£g • weak absorption edge at about 4eV which is apparently
intermediate between the 4eV silver edge and the copper
edge at 4.25eV. It is possible that this relates to the
£xiter*"Conduction*”band contribution to the silver absorption
edge (L^^OPS) -► and L^^) » these transitions
have also been cited as responsible for structure in copper
at 4.31eV and 4.8eV (Antonimgeli et al 1974). Superficially
245

Is' /. »•L •: •. ...•.*•»?
the reflectance and absorption spectra of the two^hase
and liqua-sol alloys of this composition are very
similar. On close examination it is apparent that the
structures near 2.2eV and 4eV are moved to higher
energies in the homogeneous alloy, with the result that
in the vicinity of 2.2eV (560nm) the reflectance is
enhanced, by about 7.52. This accounts for the larger
value of saturation (18X compared with 132) as 580nm
is also the dominant wavelength of these alloys. The
energy difference at 2.2eV is approximately O.OleV.
Rivory (1977) foxmd a shift of this absorption edge
of 0.06eV to higher energies, when comparing copper
with an alloy containing 44 at.2 silver.
Alloy nunher 74 represents the saturated solid solution
at 3-phaae boundary, with 1.25 at.2 silver. This
has an interband absorption 52 greater at 3e7 than that
of a typical copper sample, which cannot be interpreted
as an alloying effect. In order to make the experiments
more readily comparable, was scaled to have the
same value at 3eV and the difference spectrum recalculated.
Without scaling, the peak value of was 0.07 at 2.2e7,
while with scaling the value was 0.2. These results
correspond to a shift of the absorption edge of 'v 0.003 and
0.01e7, respectively, to hi^er energies, on alloying.
Even in the Ag-Au system, where large movements of the
absorption edge are well established, the effect of a
1 at.2 composition diange would be only of the order of
0.01e7. It is clear that the experimental technique was
246

unable to give useful information concerning such
dilute alloys, and so this difference ia not regarded
as significant* Sain)le™tO“sample variation of the
•dge position for pure copper ia alao of the order of
O.OleV.
247
7,5 Effects of Alloying on thè Intfabend Absorption
7.5.1 Optical Effective Haases
These have been calculated for dilute Ag*Au alloys, the
full range of Aur<!u alloys and for the single^hase
▲g-Cu alloys. In general, the experimental values of
the plasma energy hojp are higher than e3q>ected for all
the saiqples studied. Possible reasons for this have
already been discussed in Section 7.3*3$ the presence
of superficial contamination and use of energies too
close to the absorption edge have been mentioned. In
view of the likely decrease in tarnishing rate as the
gold content is increased it would be unwise to try
to identify alloying effects operating directly on the
effective mass in the low carat alloys. Addition of
elXver to gold appears to raise the plasma frequency
(reduce the effective mass) ; this has also been noted
by Beaglehole and Erlbach C1972) and Rivory (1977), but
the evidence is weak because of the large uncertainties
involved. Similarly, the trend of effective mass on
addition of copper to gold sec^ to be downwards, but
the saxaple-to-saople variation is of the same order
or greater than the alloy^g effect.

8
7.5.2 Drudft-like Relaxati6tl tine
It is well-known (eg. Mott and Jones 1936) that, for perfect
crystals, alloying tends to reduce the electronic relaap*
ation time conpared with the pure metal values, due to
iiH)urity scattering. The effect is observable optically
provided well-annealed samples are used (Rivory 1970). No
such effect has been foimd in the present study. There are
a variety of possible reasons for this, the most significant
probably being the quantity of structural defects introduced
by mechanical polishing. Scattering from defects acts to
reduce the relaxation time, masking the effect of impurities.
The effect of using pseudo-optical constants for the
relaxation time calculation has also been investigated; the
presence of likely contamination films would be to increase
the computed value C'x, 0.6 x IQ-^S .^c nmT^). Using Rivory»s
C1977) data it has been shown that values are in accord
with those in the literature only for energies of less
than IdV, at higher energies shorter relaxation times are
found. This anomalous behaviour is extremely variable,
some samples even giving negative relaxation times. Such
behaviour invariably disappeared when the sample was
repolished. Hunderi (1973) offers a model which may go
some wsy to e3q>lain these results. Work performed on
silver sang>les with a micro-crystal line structure indicated strong absorption (c2 20) at energies below the
interband threshold, which Hunderi interpreted as due to
the stimulation of plasma oscillations in grain boundaries,
which formed a large proportion of the volume of his
249
samples. It hes frequently been suggested that nechr
anical polishing produces a defective, microcrystalline
surface, as shown by electron diffraction studies. Only
a small amount of plasmon absorption at energies of about
1 - 2eV would be sufficient to explain the present
results. Interestingly, Stahl et al (1969) show an
absorption spectrum for a sputtered Au-Cu alloy which
has a nott-Drude-like tail in this energy range.
7.6 Heterogeneous Alloys
The most striking feature of the spectral curves for the
two^hase Ag-<:u alloys is that they are not (considered
one composition at a time) qualitatively different from
those for the variotis homogeneous alloys studied. This
is so despite the fact that all the optical and electronic
theory \ised to derive these functions was derived for
homogeneous media. Moat pertinently, the question that
arises is, "Do these ’effective medium* calculations offer
genuine insight into the behaviour and properties of the
metals?" In particular, does use of an effective die-
electric function give a worthwhile approximation to the
reflectance in typical viewing conditions? If not, the
CIE colour coordinates derived in Chapter 6 do not represent
tha colour variation with composition in this system.• • •
Micrographie examination of the alloys revealed the expected
mixture of eutectic and o- or 6 primary phases. Homogen
isation of the samples by mechanical working resulted in
an extremely fine mixture of the phases such that even
at the limit of resolution of optical microscopy the finest
k

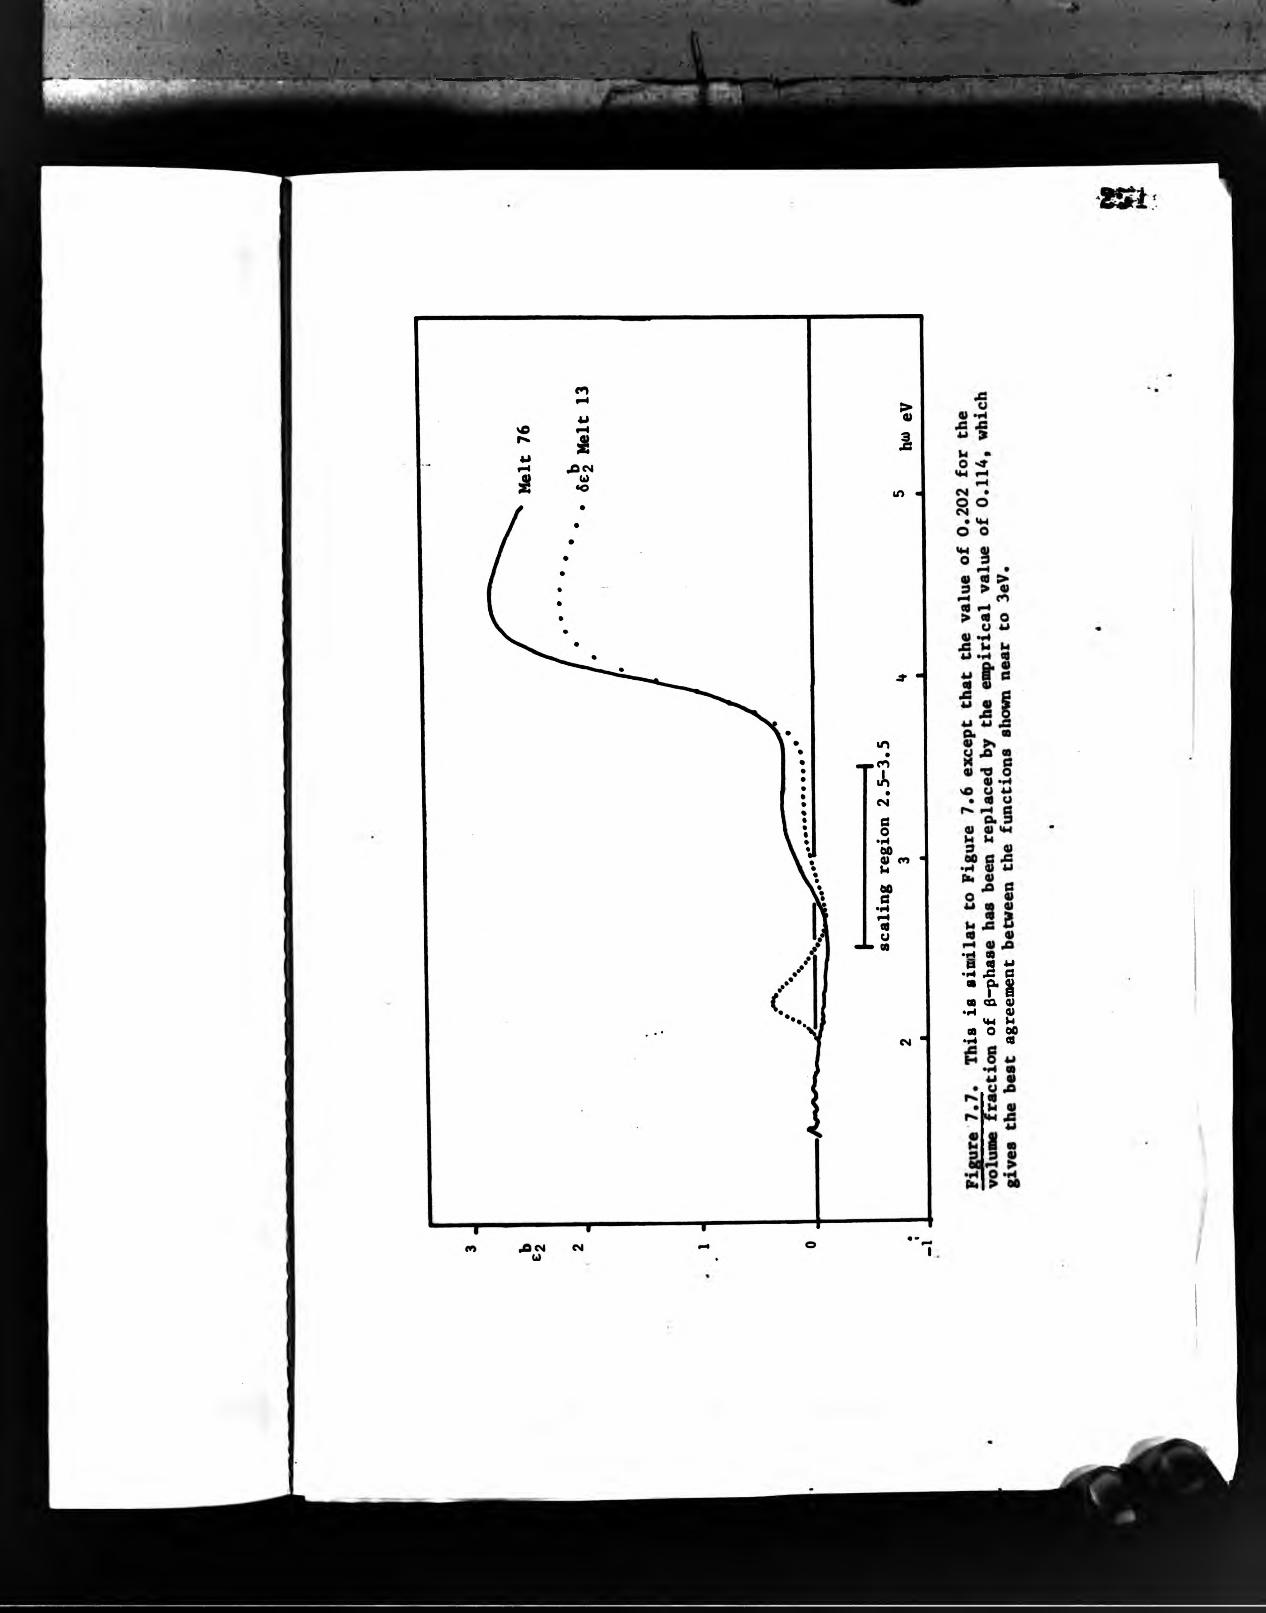
/■ J/
•H m.55 3. f.|j«B ca 01 •i-l o> «M V4 CO O 00
•r4 C8
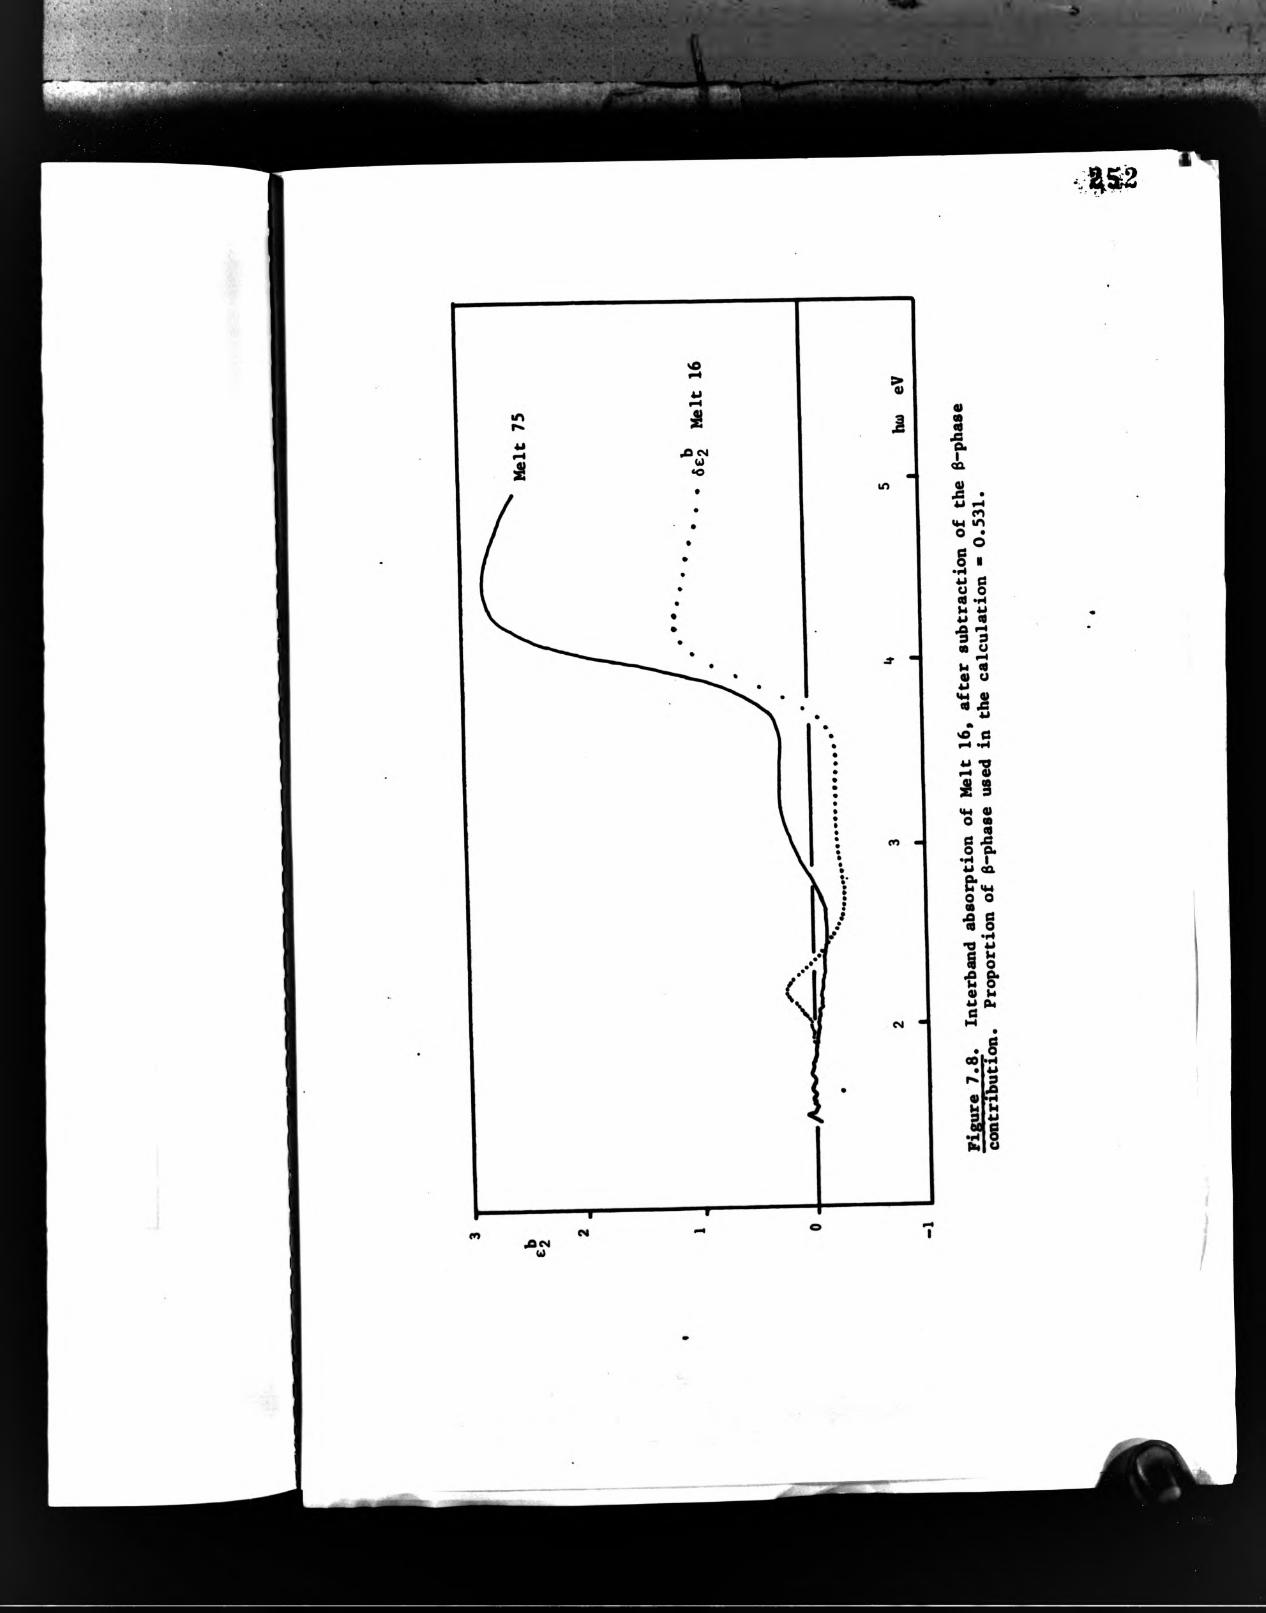


256
precipitates could not be resolved. Frequent and prolonged
annealing resulted in spherodisation of the precipitates»
preventing optical anistropy. It was not possible to
carry out micro^ellipsometric or xnicro^reflectance measure^
ments on each of the precipitates in any of the t«ro^hase
alloys» and so samples were prepared of the appropriate
conq>ositions for the 600°C <*“ and 3—phase boundary
compositions. These were quenched from 750°C to ensure
a single phase structure» since the small amount of
additional structural disorder introduced by the higher
temperature was considered less significant than the
effect of phase separation. The small amount of silver
in the 0-phase sanq>le (Kelt 75; 6.6 at.X) affect the colour
in manner similar to the effect of moderate roughening.
An attempt has been made to derive the experimental
results for the series of two-phase samples» from data
obtained on the limiting concentration single-phase alloys
ebove» combined with the volume fraction derived from the
phase diagram.
Figures 7.6 - 7.7 compare the interband absorption of
the a—phase alloy (Kelt 75) with the absorption strength
remaining in various two—phase alloys when a quantity
(proportional to the volume fraction) due to the 0-phase
has been subtracted. A notable feature of these curves is
the peak near to 2.2eV; this can be interpreted as a
shift of the absorption edge to lofier energies in the
heterogeneous alloys. This is borne out by the derivative
calculations of Table 6.15; a small» but systematic»

257
change ie evident. When the optical interference theory
(Section 4.4) ia used to derive the effective dielectric
function of the two-phaae alloya a sindlar shift with
volume fraction ia observed. It ia probable, therefore,
that the d-band energies are governed only by the local
coin)oaition and are independent of the morphology .of the
alloy.
In the energy range 2.5 - 3.5e7 the computed absorption
is too large for the interference theory, as it is for
simple additive behaviour, compared with the experimental
function. This could be explained if the volume fraction
of e-phase were larger than expected for the 600°C iso
thermal, as might happen if the quenching rate of the
samples were inadequate, and the phase structure of the
•lloy. cotr..iKmd.d to a low«r t««p.ratar.. Int.taatiiigly,
a h i ^ r aqtiillbrluiii t«n>etatur. w u l d incieaaa the
coDcentration of copper in the o-phaae. «hich would incteaee
the abaotption in thia energy range hy yirtual bound atatea.
It would be neceaaaty to atudy a range of equilibrium
tenperaturea in order to clarify thia point.
Baflectance curve, calculated from ellipaometric data on
tbeae alloy, differ by up to 5* from the value, derived
uaing the interference theory. Since thia difference ia
certainly viaually perceptible, the modelling of the
raflaction process catinot be considered adequate.

2S8
8.It ha. baen shown that ap.ctr.1 eUip.om.try i. capable
of yielding a guKititative de.cription of the colour, of the Ag-Au-Cu alloy system, and of providing enough
information to permit interpretation of these colours in
terms of the underlying physical processes. Kepeatability
of the erperiment. is such that compoaitional ch«ig.. of
the order of 5X {atomic) or greater are d.t.ctri>le,
suggesting that sources of error in sample preparation
and experiment are less significant th«, this. Source,
of instrumental error that have not been «Mmined closely
are modulator core birefringence; cosg.enaator tr«is-
miasion «id retardation error; compensator a.is«th error;
.«.pi. alignment; polari.er ellipticity »«1 monochromator
accur«:y. ImprovM-nt. in these area, should enable
colorimetry of simple specular surface, to «iced the
discrimination of the human eye. changes in the
optical comionents would be necessary, as calibration
and correction for these ««or. would be strilghtforward,
especially » in the pr..«it in.tru»«it non. of tii...
imperfection, are l«rge. Simple two-son. averaging
would significantly reduce many of the errors, but more
de.ir.bl. would be the modification of the computational
procedure, to permit correction of single-son. data. The
. « « sourca. of error also limit interpretation in term,
of electronic properties. Here, how«,.r, improv«.«it in
the theoretical model is . U o r«,uired. For in.t«.c.,
interpretation of the conduction electron adsorption in
terms of a single r.l«»tion time .has not been very «.ccessful, «Id the possibility of int.rb«id absorption

„...■-•t>3i
259
below the main ebeorption edge reqtjiree quentitetive
study. Theoreticel work of this nature could be
performed within the framework of the Coherent Potent
ial Approximation (Elliott 1974) and the Kandom
Phase Approximation (MuelUr 1967). Further experimental
work in the wavelength range In to 25n would also be
necessary to clarify the reasons for the departure from
sisvle theory in the wavelength range 650-850nm.
Sainterpretation of the present results using Kramers-
Kronig inversion of the calculated e2<ji)) would also be
possible; by explicit computation of ejos) the assump
tion of constant ej at long wavelengths could be dis
carded. so that more accurate results for the optical
effective masses could be obtained. Understanding of
the colours of heterogeneous alloys would be improved
if a joint ellipsometry and reflectance study could be
carried out. This would test the applicability of the
simple theory of Chapter 4 sad fuel further theoretical
work.
In the context of the electronic properties of solids,
the most informetive optical techniques are pierò-
iriflectance and differential reflectance Cie. directly
measuring the difference between alloys of similar
coin>osition), combined with Kramers-^Kronig inyersion.
Both these methods are in essence modulation techniques.
It is difficult to conceive of an arrangement by which
difference measurements on alloys could be performed
ellipsometrically, because of the sensitiyity of ellips
ometry to angle of incidence and therefore sample wobble.

-..,-. ■.’'.'stySS
260
However, certain types of piezo-meesureinent would he
quite poeeible, for inetauce uaing a pieio-ceramic
substrate with a thick film sanple on it. Alternatively,
the optical bandwidth could he reduced (poesihly
by the uae Of a cooled photoisoltiplier and increased
electronic integration tine) and a « r e accurate nono-
chronator. could be uaed. This would enable high order
numerical derivatives to he calculated, which are
eogq>arable to electroreflectance spectra hut rather
simpler to interpret. The only other source of error
which is difficult to conpensate for is multiple
reflections in the optical components, the air-gap
polarising prisms being particularly troublesome.
The results in terms of alloy colours can he summarised
a» follows:
Cl) The colour change yellow green white found as
silver is alloyed with gold is due to an increase
in width of the d-FS gap near L from 2.5 to 4eV.
Transitions to the first empty conduction band,
such as contribute to the absorption of silver
above 4eV, do not significantly affect the colour;
Broadening of the absorption edge upon alloying
also takes place, presumably because of substitution
al disorder, and increases the bleaching effect for
silver additionr of about 50 weight per cent. This
broadening does not affect the brightness of the
alloys, which increases monotonically from gold to
silver.

261
(2) Th. colour change y«ll« -i. .Iloyed with gold i. du. «.inly to . reduction
of th. width of th. d*FS gap hear L from 2.5 to 2.2.V. The Chang, in aaturation for the copper-rich alloy, i. due to ». incre... in the reflect«.«below the abaorption edge a. « P P « i»
i. d « to either an incre... in oxide thickneaa
Cof about 30Î ) fro« 50*n-50Cu to pur. copper, or to
. „difi«tion of the weak int.rb.nd ab.orption below
the edge..or to both the., effects.
(3) The colour change whit. - red found a. copper Î.
alloyed with ailver i. d « «.inly to th. reaulting
ch«.g. in th. proportion, of the whit, o ph... »«1
eh. red 6 ph«.. The « ph... is oUdhtly y.Uower
than fin. ailver be«ua. of the pre.enc. of ».
i..çurity abaorption band, itself d « to the l«g.
difference in the d-b.nd energies of silver and
copper. In the heterogeneous alloy, the «orphology
of th. o Ph«e i. to lead to surface pl««on
abaorption. producing a further slight yellow shift.

262
HEFEBENCES^ 1 . . F (1965) in "Qptical Prop«ttl.. and Blactionic Structure
L i AUcye", ed. F Abel.., Pubi. North-Holl«.d.
«beles, F (1969) in “Optici Propertie. of SoUds” ed. F Abeles,Pubi. North-Holland.Antonangeli, P., Colavita, E, Roaei, R and Saiusti, S E (1974)Il Nuovo Cimsnto 24B(1), 121.Atìcins, P W «id Wilson, A D (1970) , Surf. Sd., 22 , 433-458.
Aspnes, D (1976.) in “Optici Propertie. of SoUds. N«r Eev.lop-.nt.“ sd. B Serajphin, North-Holland.
A s p n e s , D (1976b) Surf. Sci. 56, 322-33.
B«tell, l S c d ChurAill, D (1961), J. Phys. O»«»- 22"-
Bassett, M c d Baegl-iole, D (1976) J. Phys. F 6(6), 1211.
B e i f l l e h o l e , D (1965) Proc. Phys. Soc., Lond. 85, 1007-20.
Be.gl.hol., D (1966) Proc. Phys. Soc., Lcd. 87 , 401.
Be.,ltì.ole, D c d Brlbach, E (1972) Phys. Rev. B 6(4), 1209.
Be.gl.hol., D c d Hendridcson, T J (1969) Phys. Rev. lett. 22(4), 133.
B.egl-K.1., D C d H e d e d , O (1970) Phys. Rev. B 2(2), 309.
Be.gl.hol., D c d Wihl (1972) J. Phy.. F 2, 43.
B..ttle, J R c d Coc, 0 K T (1955) Phil. M.g. 46 , 989.
Beefer««, L W c d Ehrenrei*, H (1970) Phys. Rev. B 2(2). 364.
Bennett c d Becett (1966) in “_ Q p d c l ^ n r ' ^ ^ U ^ i î ^ S T l i L d . Structure of MeteU œ d Alloys“, ed. F Abeles, p eBennett. H E c d PorCus. J 0 (1969) J. Cçt. Soc. A». 51. 123.
Billcyer. F W. Becley, d K » 8 Sheldc. d A (1961) d. Qpt. Soc. ». 65(7), 834.B O O C (1971) “Physicd Aspects of (»leur“, P<*1- Mec-illc
Breuers, M c d Broers. F (1970) Phys. SCt. Sol. b 75, 519. Bronsveld. P M c d Redelcr. S (1975) d. Phys. Soc. de- 38(5), 1336.
Burge. D R C d B«mett. H B. (1964) d. (*t. Soc. A-. 54(12), 1428.caban, B D (1976) Surf. Sci. 56, 354-372.a c . B C. M c t c . d P C d Broc, d D (1976), d. Vec. Sc. *.chnol. 13(4), 981.
V. /'. - •
263
Qieyssac, P, Garrigos, R, Kofman, R, Penavaire, L, Rldiard, J and Saiasy, A (1972) Dhln Solid Films 13, 275-9.caiopra, K L (1969) "Thin Film Phenomena" McGraw H ill .Chopra, K L, Thalcoor, A P, Beurthwal, S K and North, P (1977)Phys. S ta t . Sol. A 40, 247.Christensen, N E (1972) Phys. S ta t. Sol. B 54, 551.Christensen, N E and Séraphin B 0 (1971) Phys. Rev. B 4(10), 3321-44.Connolly, J W D and Johnson K H (1970) Progress Report: SoUd S ta te and Molecular Theory Groiqp, MIT No. 72.C olavlta B, ModasU, S and Roaal, R (1975) SoUd S ta te Coamiun. 17,931-34. Cooper, H, B hrenreidi and P hllU pp (1965) Phya. Rev. 138», 494-507.Crowell, J and RltdJle R H (1970) J . Opt. Soc. to . 60 , 794.Cyrot, M (1976) SoUd S ta te Conanun. 20, 467-71.Daude, A, Savary, A and R<*ln, S (1972) Uii n SoUÎl Fllna 13, 255-259. Davies, H (1953) Proc. lEEE 101, 209.Desjonqueres, M C and Çyrot-Lackmann F (1977) J . Phys, F 7 (1 ), 61.Donovan, T M, Ashley, E J and Bennett, H E (1963) J . Opt. Soc. Am. 53(12), 1403-9.Doremus, R H and Turkalo, A M (1976) J . Mat. Sci. 11(2), 638.Dresselhaus, G (1969) S o U d State Commun. 7, 419-429.Drude, P (1890) Ann. D. Physilc, 39, 514.Dujardin, M and «leye, M (1971) J . Phys. Qiem. Sol. 32, 2033.Dy, K S and Shi-Yu Wu (1971) Phys. Rev. B 3(4 ), 1173.Ehrenreidx, H (1966) in "Optical Properties and Elertronic Structure o f Metals and Alloys" Ed. F Abeles, publ. North-Holland.
E hrenreid i, H and P h ilU pp , H R (1962) Phys. Rev. 128, 1622.ElUott, R J, Kruniiansl, J A and Leath, P L (1974) Rev. Mod. Phys. 46, 465-543.Fano, 0 (1941) J . Qpt. Soc. Am. 31, 213.toK fta iv , L A, Davle, l C and S team a, M B (1977) Phye. Rev. B 15(12) ,5535, PenateniaJcer, C H and MeCradcin, F L (1969) Surf. S d . 16, 85.Flaten, C J and Stem, E A (1975) Phys. Rev. B 11(2), 638.Forsterling, K and Freederidcsz, V (1913) Ann. d. Physik. 40, 201.Frm ch, R C (1932) Nature 129, 169.

■
264Priedel, J (1969) in "Optical Properties of SoUds" ed. P Abeles, publ. North-Holland.
Fronixold, A T (1963) I I Nuovo Cimento 28, 1127-45.Fukutani, H (1971) J . Phya. Soc. Jap . 30(2), 399.pukutœl H and Suaoka, O (1966) in "Optical Properties and Electronic ^ c t u r e of Metals and Alloys" ed. F Abeles, publ. Horth-Holland.
Gardam, 0 E (1966) Trans. In s t . Metal F inishing 44, 186-8.GarfinJiel, M, Tleman, J J and Engeler, W F (1966) Phys. Rev. 148, 695.Gasvik, K (1977) Opt. Comnun. 22(1), 61.G e la tt and Eihrenreicii, H (1974) Phys. Rev. B 10, 398Gerhardt, U (1968) Phys. Rev. 172, 651.Gerhardt, Ü, Beaglehole, D and Sandrodc, R (1967) Phys. Rev. Lett. 19,309. Givens, M P (1958) S o U d State Physics 6 , 343.Golovashk^, A I , Kopeliovidi, A I and Motulevich, G P (1968) Soviet Physics J Ê ^ 26(6), 1161.Gottesfeld, S, Bahai, M and Reidunan, B (1976) Surf. Sci. 56, 373-93.Green, E I and Muldawer, L (1970) Phys. Rev. B 2 (2 ), 330.Grebennik, I P , Podus, G N and Semin'ko, I V (1975) Fiz. Metal.Metaü.loved 39(6), 1198-1204.Haas, G and Thomas, R E (1976) J . Appl. Phys. 48(1), 86.Ham, F S and S eg a ll, B (1961) Phys. Rev. 124(6), 1786.Heavens, O S (1955) "Optical Properties of Biin S o U d Films", Butterworth.
Heavens, O S (1960) Rep. Prog. Phys. (GB) 23, 2-65.Hodgson, J N (1955) Proc. Phys. Soc. B 68, 593.Hodgson (1968) J . Phys. Chem. Sol. 29, 2175-81.Hunderi, O (1973) Phys. Rev. B 1, 3418.Hunderi, O (1976A) Thin SoUd Films 37, 275-280.Hxanderi, O (1976B) S urf. S ci. 61, 515-520.Hunderi, O and B e a g l e h o l e , D (1969) Physics l e t t . 29A(6), 335.Hunderi, O and Beaglehole D (1970) Phys. Rev. B 2 (2 ), 321.Hunderi, O and Myers, H P (1973) J . Phys. F 3, 683.l r « i . G B, Hu.n, T » d Mooron. F M (1971) Phy.. R»v. B 2 . 330.
I

- • *-* ., ■• * '
. •'* >■ .*9’
1 *-. '4" • I
• - ' -i .~S .
26^j » * . J F, W i l l i « . , A R and Moruazi, V L (1975) Phya. Rev. B 11,1522.J a t t e , B R and POote, F (1935) J . Chan. Phya. 3 , 605-16.Johnaon, J A and Baahara, H M (1971) J . Opt. Soc. An. 61(4), 457.Johnaon, P B and O iria ty , R W (1972) Phya. Rav. B 6(12), 4370-9.Johnaon, P B and C hriaty , R W (1975) Phya. Rev. B 11(4), 1315.J u n ^ , G (1971) Phys.S tata S o l. b44, 239.Jun^F G (1973) Phys. S ta t . Sol.bSS, 579.Knlttl (1976) "Optics o f Thin Films" pubi. Wiley.KOilca, H, Y ana,ud .i, S » .d Hanya, T (1975) J . Phya. Soo. Jap . 38(5),1370. K oater, W and S ta h l, R (1967) Z. MetalUcda. 58(11), 768.
«Kreibig, U (1974) J . Phys. P:Mstal Physics 4, 999.KïOlUcowa)ci, W F and Spioat, W E (1970) Phya. Rav. B 1 (2 ), 478.Lanhan (1967) J . Opt. Soc. An. 57, 473-6.Levin and Ehtanraid», H (1971) Phya. Rav. B 3, 4172.Lawia, P E and Lee, P M (1968) Phya. Rav. 175(3), 795.Ufahita, V A and Starohanho, l .P (1973) a . T r ., Vaao. Hauoh-Iaalad. Proekt-Konstr. Inst. Yuvelimoi Prom. 2, 104-21.Lowery (1936) P h il . Mag. 22, 769.Malin, M and vedam, K (1976) Surf. Sci. 56, 49-63.Margenau, H (1929) Phys. Hev. 33, 1033Mathews^, A G (1970) J . Phys. C 3, 341.MoAliatar, A J , S tem , E.A ».d McGroddF, J C (1965) Phya. Rav. 1 4 0 (6A) ,2105, H cintyra, J D B and Aapnaa, D E (1971) Surf. S d . 24,M atealfé, E and Laa)», J A (1975) Acta Hat. 23, 1135.Minor (1903) Ann. d. Physi)c. 10, 581.
. _ - » Î1Q77Ï II Nuovo Cimento 39B(2), 442.Modesti, S, Rosei, R and Colavita, E (197/) xx «wvw
Mocxia, C E « id ly n d i, D W (1969) Phya. Rav. 182, 719.Hott, N F «.d Jonaa, B (1936) " » a Theory of the propartiaa of natola and Alloys", pubi. Dover, New York.H uallar, F M « d P h ilU p a , J C (1967) Phya. Rav. 157(3), 600.Mpers, H P (1976) J . PhySa F 6 (1 ), 141.
*. V, * s
-, • AÎÿ'ÎÀ.Îtpi#':r-i:i
266ItyerSÿ H P, Walldan» L and Karlsson, A (1968) Phll. Mag* 18, 725.
Naegele, K and Pliath, W J (1976) S\irf. Sci. 61, 504-14.
Nathanson, J B (1938) J. Opt. Soc. Am. 28, 300.
Neal, W E J, Fane, R W and Grimes, N W (1970) ^11. Mag. 21, 167.
Nilsson, P O (1970) Phys. Kondens. Mater. 11, 1.
Nilsson, P O and Porsell (1974) J. Phys. (Paris) 35, C4-57.
Nilsson, P O, Lindau, I and Hagstrom, S B M (1970) Phys. Rev. B 1(2) ,498.
Nilsson, P O and Norris (1969) Phys. Lett. A 29, 22.
Nilsson, P O, Persscn A and Hagstrom, S (1968) Solid State Commun.6,297.Nilsson, P O and Sandell, B (1970) Solid State Commun. 8, 721.
Novak M., Reddy, AKN and Wrdblava, H (1970) J. Electrochem. Soc: Electrochem. Sci. 117(6), 733.
O 'Handley (1974) Surf. Sci. 46_i_24-42.
O'Handley, R C (1975) Surf. Sci. 50, 407-33.
O'Handley, R C and Burge, D K (1975) Surf. Sci. 48, 214-228.
Ohlidal, I and Lukes, P (1972) Opt. Acta 19, 817.
Ohlidal, M, Ohlidal, I and Lukes, P (1976) S\irf. Sci. 55, 467-76.
Ohta, N and Wysedci, G (1975) J. Opt. Soc. Am. 65(7), 834.
Oldham, W G (1969) Surf. Sci. 16, 97-103.
Owen (1972) N A S A Report TR R-393.
Paik and Bodcris cited by YamaguAi (1972)
Pant, M M and Joshi, S K (1970) Phys. Rev. B 1 (2) , 506.
Pauli, H (1976) J. Opt. Soc. Am. 66(8), 866.
Pells, G P and Shiga, M (1969) J. Phys. C 2(2), 1835.
Peterson, C W and Knight, B W (1973) J. Qpt. Soc. Am. 63(10), 1238.
Phillips, J C (1968) J. Appl. Phys. 39(2), 755.
Porteus, J O (1973) J. Opt. Soc. Am. 53, 1394.
Raub, C (1975) Gold Bulletin 8(3), 70.RamaAandrarao, P, Banerjee, D and Anantharaman T.R. (1970) Metallurgical Transactions 1, 2655.
RiA, R M and Billmeyer, P W (1975) J. Qpt. Soc. Am. 65(8), 956.
-iir'ÏÏd
267Rivory, J (1969) Opt. Cojnmun. 1(2), 53.Rivory, J (1976) «xin Solid Films 37, 345-50.
Riyory, J U977) Phys. Rev. B 15(6), 3119.
Rivoryr J and «leye, M L (1975) Journal de Physique Lett. 36, 129.
Roberts, E P I (1973) Gold Bulletin 6(2), 42.
Roberts, S (1959) Phys. Rev. 118(6), 1509.
Robertson, A R (1972) Appi. Qpt. 11, 1936.
Roth, J, Rao, B and Dignam, M J (1975) J. Chem. Soc. Farad. Trans.2 Vol. 71, 86.
Rouard, P (1965) iq>pl. Opt. 4, 947.
Sdilosser, H (1970) Phys. Rev. B 1(2), 491.««
SdiTieler, D (1969) Surf. Soi. 16, 104-11.
Sdiultz, L G (1957) Adv. in Phys. 6, 102-144.
Scott £Uid Muldawer (1974) Phys. Rev. B 9, 1115.
Shevdiüc, N J and Goldmann, A (1974) V. Electron Spectrosc. & Related Fhenosn. (Netherlands) 5, 631-40.
Shewdiun, J and Rowe, E C (1970) J. Appi. Phys. 41(10), 4128-38.
Sivukhin (1956) Soviet Physics JETP 3, 269.
Sledita, J (1976) J. Phys. F 6(11), 2081.
Smith, T (1976) Surf. Soi. 56, 252-271.
Soven, P (1967) Phys. Rev. 156(3), 809.
Sprocr, W T and Giwia, M P (1964) J. Opt. Soc^ »n. 54(11), 1337. Stanford, J t and B«>n.tt, H E (1969) appi. Opt. 8, 2556.
Stahl, R, Sprœgar, H J and Axibauar, H P (1969) 2. MatalUcd.. 60(12) ,933,
StMl, M K (1972) J. Phy». P:Matal Phyaiea 2, 60S.
StMl, M R and Trah.rn. D.M. (1972) J. Phya. F.Matal Phyaio. 2, 199.
Stam, E A (1966) Phya. Rav. 144 , 545.
Stem, E A (1967) Phys. Rsv. 162, 565-74.Stem, F (1963) S o U d State Physics 15, eds. F Seitz and D Turnbull, p\ibl. Academie Press.Stoering, R and Conrad, H (1969) Acta Met. 17, 933.
Ibeye, M (1970) Phys. Rev. B 2(8), 3060-78.
TUii.rta.v, s F and Krykln, M A (1976) Phya. Stat. Sol. b 76 , 67.
268
Tool (1910) Phys. Rev. 31, 1.Truong, V V and Scott, G D (1976) J. Opt. Soc. JUn. 67(4), 502.
veal, B W and PaulUcas, A P (1974) Pl»ys. Pev. B 10(4), 1280.velldcy, B, Klrkpatrldc, S and Bhrenreid», H (1968) Phys. Rev. 175(3), 747.
Velieky, B and Levin, K (1970) Phys. Rev. B 2(4), 936.
Verleur (1968) J. Opt. Soc. Am. 58, 1356.verses, J A and Louis, E (1977) S o U d State (Sniniun. 22, 636-666.
Wallden, L and Gustavsson, T (1972) Phys. Scripts. 6, 73.
ward (1969) Brit. J. Appi. Phys. (J. Appi. Phys. D) 2(2), 123.weast, R C (1971) “Ban<Bx>olc of ttemistry and Physics’, The Chemical Rutiber Co., 0 S A.Weiss, D E and Muldawer, L (1974) Phys. Rev. B 10(6), 2254.
Wessel, P R (1963) Phys. Rev. 132, 2062.Wleder, H and Czemanda, A W (1966) J. Phys. 37, 184.Winterbottom (1955) Kgl. Nors)ce Videnskab. Selskabs Fosh. Skrifte 1, 95.
Winterbottom (1961) Norges tekniske hogskole, Trondheim.Wln.«^us (1973) Rljlcs Onlversitelt t. Leldan, L a i d « .,N.therlands, Ph.D. thesis.
Wlnsemlus, van Kaspan, Lengheelc and van Went (1976) J. Phys. P 6(8), 1583.
woot«», P (1972) -Optical Properties of SoUds’, pubi. Academic Press.Yamaguchl, T, Yoshlda, S and Klnbara, A (1972) J. Opt. Soc. Am. 62(5), 634-8.
young, P W and Cathcart, J V (1956) Acta Metallurgica 41, 145.Young, P W and Owathmey, A T (1951) Rev. d. Metallurgie 48, 232.Zhuravleva, L I and Nos)cov, M M (1959) Plx. metal. Metalloved. 7(3), 475-476. Zlman, 3 (1972) -Principles of the tteory of Solids’, pubi. Carf^rldge Onlv. Press.

V I
. V- * ' ^
‘ '- 'ii'i••c:
W. *1
*; >v'v=v>. - i M
'■■ ■■'^" - 4,•*- *’ jM Sa
i‘- Iv ■
M I N E R A L O O I C A L M A G A Z I N E . M A R C H I 9 8 0 , V O L . 4 3 . P P . 6 3 3 - 7
The effects of surface damage and oxide films on the optical properties of cuprite
P. Ra sta ll , K. Me. C la k k e , and E. F. I. RoaEaxs
Deputment of Metallurgy and Materiali. Qty of London Polytechnic. Whitechapel High Street, London Ei 7PF
SUMMAEY. Spectral eflipaometry in the range 240 nm to S40 am has been uaed to investigate the mlluenoe of sur&ce <t«"»«|||e induced hy mediankal periishing and surface films of CuO on the optical properties of pure synthetic cuprite. Comparison is made between bulk CuO and thin film CuO produced by low-temperature oxidation of cuprite. The effects of siram airfdisorder are discussed in rdatkm to the si ipression ofexdtonic transitions. Recently devdoped techniques have been used to simplify the analysis and take full advantage
of the qwctral data.
I t has long been known that structural defects incrystal lattkes, whether point, line, or plane, have amarked rffect on a b s o r p ^ phenomena and dec- tronic transitions. Sem iconductors arc particularly sensitive as their dectneal properties are strongly affected by those defecU. Cuprous oxide is a typical ‘defidt’ semi-conductor with a band gap of approxim atdy 2.4 eV (Roberts and R a s t^ 1978) and mudh investigation h u bem carrW Out into the exd ton k transitions in its absorption spectrum.
Exdtons are dectron hole pairs in orbit produced by photon absorption in various p am o f the tpeetp»«", and their nature and properties have been discussed at In g th (e.g. Gross, 1^ 2). Various workers have studied the d ep etu ^ ce o f the exdtopig structure on lattice perfection. Agekyan tt aL (1975) have shown that the method of production of CuiO crystals stron^y affects die sharpness of the exetton peaks, hydrotherm ally g n ^
- crystab inhibiting sharper transitions than lessperfect material prepared firom by o«id^tion. The defect structure and stoidiiom etry o f CU2O is m iukedly affected by annealing, and^»yriddes et d . (1977)aggregation in biilk samples, controlled tpf oxygenpartialpressureintbeaim ealm gprooets,isre^)on- sible for suppression or enhancenaent o f the exdton peaks. W ork carried out by H ayfid d (i96 i) <« t t o -nim CuaO obtained by k)w-tempc*atuie oxidation o f copper again suggests a rdationahip betweenlattioe defects and optical absorption.
© Copyright the Minerahgical Society
Experiments invdving reflected li^ t such as the ellipsometric measurements in this study are notonly sensitive to Inilk structural defects but are alsoaffected by the su te o f the crystal surfeoe. Surface conditions w hidi affect the dlipsom etric p « -meters arc: (i) Surface rou^mess: degree <rf polish,presence etd i pits, grain boundaries, and scratdies, e tc (2) Polish damage: disordering m- creased density the surface layers. (3) S u r ^ film presence: incidental atmospheric contamination or controlled oxidation.The purpose o f this present study is to evalimtethe effecte o f (2) and (3X «bove, on the 0 1 ^ properties o f synthetic cuprite, and to invesUf^te anom alously h i^ values o f the absorption index obtained in our previous study (Roberts andRastall, 1078X w hidi we suggested might be due tothe presence a thin absorbing surface film ofCuO . - .
Surface condition and etching ^ocedure. S e mens o f pure, polycrystalhnc cuprite were pi'^iared by a ««milar method to that desenbed previoudy. After oxidation, however, the samples were not cooled slowly in a partial vacuum, but w w given a separate annealing treatment o f 700 ®C and 10" ‘ torr for 24 hours.
Spectral scans were carried out on an automatic following dlipsom eter, the detafls o f wdescribed 1 Roberts and M eadows (1964X ^ system has since been modified by the reffiaoement tfffi-K omwlglM sFaradaY-ceil cores by water cores to reduce systematic" errors and facilitate experimental procedure (Hunt, 1979X
T o remove the poliah-damaged layer before further measuremoat, samples were etdied by immersing them in a mixture o f concentrated mtnc (20%), phosphoric (40%), and acetic (40%) a c ^ (v/v) for 20 seconds, at room temperature. Allthe specimens were washed in soap so lu ^ m tdtr^sonically dcY"**! in distilled water, and dried m pure ethanol and warm air. . . --uOxidatUm cfCujO. Oxidationand In s i» , were carried out on poBshed and etched

]}i ¡ kI - f *1 ' s,” s
lih-MIli ■
J
■!;!
■ii / /
=( 1 i» -ti4l ■;•2i
J li
■ r
'»■-:v ■
M IÏ
ts
?n
m
F ìli“••: T-«V -■ .)! fÌÌ- r!
.Ä iP;-'
- eßg¿S»?:
634 P. RASTALL ET AL.material. Batch samples were bdited in air at temperatures o f 225 ’’C and 250 °C for various times before spectral measurements were made.
For in situ measuremoita, specimens were attached by to a heating element with a variaMe resutanoe control Chrm nd-alum d thermocouple leads were spot«welded to lh ^ de> ment on eithCT side o f the specimen and the apparatus was temperature-calibrated. A spectral scan was carried out before the oxidation process was started. To foDow the oxidation process, die monochromator was set at 525 nm and the tem- poature at 250 °C. Values of the analyser and pcdarizer angles were recorded, ever few seconds during the initial period o f rapid dum ge and every 5 to 10 minutes thereafter, until no fordier changes were observed.
JUsuits and discusión. Figs, i and 2 show the normal reflectance (Jt) and n, k, qiectra for both polished and etched ctqxrite. T te r^ km 250 nm to 540 nm is one o f h i^ absorption with an edge at the long-wavdength end and peaks oorreqxmd- ing to direct allowed transitions fixMn the Cufj^) lerels to the conduction band (Gross, 1962). It can be seen that etdiing has several eflbcts on the qiectra. There is a general decrease in k except in tte region o f exdtonic transition (445 to 520 nm) and a cm reqiondm g increase in the reilues o f n and R. The most marked effects are the sharpening of the R peaks at 290 nm and 360 nm and a resolution o f the U ue and Uue-green exdton series whose maxima occur at 465 nm and 480 nm respectively. There is a s li^ t ¿ i f f to shorter wavdength o f the peak at 290 nm.
We postulate that the smearing out o f the maxima is a consequm ce o f disorder in the lattice created by diraaion of die surfsce layers. This is particularly apparent in the case o f the exdton which can only exist in lattices displaying long- range order (some have radii of about 20 nm). At room temperature the resdution o f individual members o f the exdton series is not possible due to thermal broadening and the peak heights correspond to the first member o f the series.
According to Orces, the radius o f an exdton may be ei^Mfcased as:
If So (dielecdic permittivity o f CuaO at 463 nm )« 1 1 ( X 8.8 X io~ * ) Fm~ \ ¡i (effective reduced mass o f the electron)« 0x123 (m > 9.1 x io~^* kg)N (quantum number o f the excit<m) > i,r(electron charge) * 1.6 x io~ ** C , k (Plandc’s constant) - 6.63 X io ~ ^ Js, then a value o f c. 18 A is obtained from the first cxdton member o f the blue series.
Exdtons are annihilated when they interact with
a«
ST AimmI
Flos. I and x Flo. i (to/), ¡lectral reflectanoe of poly- crystaOipe (a) Mechanically {xubed. (fc)MechankaDy polnbed and etched. Fio. 2 (bottom), wo- tral disposion of a and k for cuprite, (o) Medianically pofished. (b) Mechanically pdished uid etched.defiseti and the im plication o f these results is that the disotder induced by ptfiishing must be extensive, the mean free path o f tiie exdton being drastically reduced.
O tiier coneequences o f the pohdung process have been investigated by several authors, Vedam and Mahn (1974^ edio have made eUipsometric measumnents on poUsh-damaged vitreous sflica, suggest tiiat an increased density o f the surfisce layers occurs with a consequent increase in the value o f a; tiiough m the case o f crystalline CU3O, tiiis meohaniMn is not possible and the diange in n and k obtained here is due to disofder and an increased dislocation density in the surface w hidi, in turn, causes a decrease in the drashy.
by Demovanj gen«ral( ing,thei w hidi, they energies o f m attfiaL
TTieaccurately as the similar to reasonable cor usedin th el likd y that damaged
Figs.3<qiedm en usual various 1 comparison is evident
OPT!
lents madf (1963) suggest]
lOOQinpanyingm sntieeted inela
causes a| peaks at
the disordered I from film-fitt
; of the la I cuprite sul that it ext I 0 the tize of the (
_ flg stage (3 i ]|nterface ei
rest of th dnwtfae andk (dfrn polished mìM <mdized in
trum of I I broadenii
Bt tuccessive
. (MU) ‘
......L* •
Flo. 3 (top)- |OiO.(a)Me , 225 *C, in air,, i2jhoun. (d) Oxid , 225 "C, in ; trai dispersion the same'
/

•: ' l ÿ ^ Ê B Ê Ê ^ m: - , 'f.l_ M ^ ^ — II ¡r— - i"
I . ; V-, í T™íSfi*íaíaii¡>í- í- - -
;/
■ - ■Vi ^
- • :W
. í í í ^ T -r- íí|- ^ - : . f .:>, ■ ■ . * . . ' ■ ti•'*'
tlf .í't ni ..W - . ■ ^
t *>
r* . ' '-r *- - f‘\ ’ 7*ti I
s " * Æ
M I N E R A L O G I C A L M A G A Z I N E , M A R C H I980, V O L . 43, P P . 633-7
The effects of surface damage and oxide films on the optical properties of cuprite
P. R a s t a l l , K . M e . C l a r k e , a n d E. F. I. R o b e r t s
Department of Metallurgy and Materials, City of London Polytechnic, Whitechapel High Street, London E i 7PF
SUMMARY. Spectral ellipsometry in the range 240 nm to 540 nm has been used to investigate the influence of surface damage induced by mechanical polishing and surface films o f C uO on the optical properties of pure synthetic cuprite. Comparison is made between bulk CuO and thin film C u O produced by low- temperature oxidation of cuprite. The effects of strain and disorder are discussed in relation to the suppression of exdtonic transitions. Recently developed techniques have been used to simplify the analysis and take full advantage of the spectral data.
It has long been known that structural defects in crystal lattices, whether point, line, or plane, have a marked effect on absorption phenomena and electronic transitions. Semi-conductors are particularly sensitive as their electrical properties are strongly affected by those defects. Cuprous oxide is a typical ‘deficit' semi-conductor with a band gap of approximately 2.4 eV (Roberts and Rastall, 1978) and much investigation has been carried out into the excitonic transitions in its absorption spectrum.
Excitons are electron hole pairs in orbit produced by photon absorption in various parts o f the spectrum, and their nature and properties have been discussed at length (e.g. Gross, 1962). Various workers have studied the dépendance of the excitonic structure on lattice perfection. Agekyan et cd. (197s) have shown that Uie method of production of CU2O crystals strongly affects the sharpness of the exciton peaks, hydrothermally grown crystals exhibiting sharper transitions than less perfect material prepared from Cu metal by oxidation. The defect structure and stoidiiometry of CU2O is markedly affected by annealing, and Spyrideles et al. (1977) have indicated that vacancy aggregation in bulk samples, controlled by oxygen partial pressure in the annealing process, is responsible for suppression or enhancement of the exciton peaks. Work carried out by Hayfield(i96i) on thin- film CU2O obtained by low-temperature oxidation of copper again suggests a relationship between lattice defects and optical absorption.
© Copyright the Mineralogical Society
Experiments involving reflected light such as the ellipsometric measurements in this study are not only sensitive to bulk structural defects but are also affected by the state o f the crystal surface. Siuface conditions which affect the ellipsometric parameters are: (i) Surface roughness: degree of polish, presence of etch pits, grain boundaries, and scratches, etc. (2) Polish damage: disordering, increased density of the surface layers. (3) Surface film presence: incidental atmospheric contamination or controlled oxidation.
The purpose of this present study is to evaluate the effects of (2) and (3), above, on the optical properties o f synthetic cuprite, and to investigate anomalously high values of the absorption index obtained in our previous study (R obáis and Rastall, 1978X which we suggested might be due to the presence of a thin absorbing surface film of CuO.
Surface condition and etching procedure. Specimens of pure, polycrystalline cuprite were prepared by a similar method to that described previously. After oxidation, however, the samples were not cooled slowly in a partial vacuum, but were given a separate annealing treatment of 700 °C and 10"* torr for 24 hours.
Spectral scans were carried out on an automatic following ellipsometer, the details of which are described by Roberts and Meadows (1964). The system has since been modified by the replacement of silica and glass Faraday-cdl cores by water cores to reduce systematic errors and facilitate experimental procedure (Hunt, 1979).
To remove the polish-damaged layer before further measurement, samples were etched by immersing them in a mixture o f concentrated nitric (20%), phosphoric (40%), and acetic (40%) acids (v/v) for 20 seconds, at room temperature. All the specimens were washed in soap solution, ultra- sonically cleaned in distilled water, and dried in pure ethanol and warm air.Oxidation o f CU2O. Oxidation studies, both batch and in situ, were carried out on polished and etched
V N

\ rv - ’:ififriff
t . #; ■
¥ k ^ > A - ^ ■■ ' ■ r ,■. T%. î1
634 P. R A S T A L L E T A L .
material. Batch samples were heated in air at temperatures of 225 °C and 250 °C for various times before spectral measurements were made.
For in situ measurements, specimens were attached by clips to a heating element with a variable resistance control. Chromel-alumel thermocouple leads were spot-welded to the element on either side of the specimen and the apparatus was temperature-calibrated. A spectral scan was carried out before the oxidation process was started. To follow the oxidation process, the monochromator was set at 525 nm and the temperature at 250 °C. Values o f the analyser and polarizer angles were recorded, ever few seconds during the initial period of rapid change and every 5 to 10 minutes thereafter, until no further changes were observed.
Results and discussion. Figs, i and 2 show the normal reflectance (R) and n, k, spectra for both polished and etched cuprite. The region 250 nm to 540 nm is one of high absorption with an edge at the long-wavelength end and peaks corresponding to direct allowed transitions from the Cu(3' ) levels to the conduction band (Gross, 1962). It can be seen that etching has several effects on the spectra. There is a general decrease in k except in the region of excitonic transition (445 to 520 nm) and a corresponding increase in the values of n and R. The most marked effects are the sharpening of the R peaks at 290 nm and 360 nm and a resolution of the blue and blue-green exciton series whose maxima occur at 465 nm and 480 nm respectively. There is a slight shift to shorter wavelength of the peak at 290 nm.
We postulate that the smearing out of the maxima is a consequence of disorder in the lattice created by abrasion of the surface layers. This is particularly apparent in the case of the exciton which can only exist in lattices displaying long- range order (some have radii o f about 20 nm). At room temperature the resolution of individual members o f the exciton series is not possible due to thermal broadening and the peak heights correspond to the first member o f the series.
According to Gross, the radius of an exciton may be expressed as:
7e«c — X 1010 (A)If Co (dielectric permittivity o f CU2O at 465 nm) = 11 ( X 8.8 X 10" '^) Fm~ *, fi (effective reduced mass o f the electron) = 0.025 »He (We = 9 * x io ” ‘ kgX n (quantum number of the exciton) = i, e (electron charge) = 1.6 x 1 0 " C, h (Planck’s constant) = 6.63 X io~ Js, then a value o f c. 18 A is obtained from the first exciton member o f the blue series.
Excitons are annihilated when they interact with
*0® A(iim) «00
-Ln o aoo ^ (nm) *oo soo «00
Figs, i and 2. Fig. i (top). Spectral reflectanix of polycrystalline cuprite, (a) Mechanically polished, (b) Mechanically polished and etched. Fig. 2 (bottom). Spectral dispersion of n and k for cuprite, (a) Mechanically
polished, (b) Mechanically polished and etched.
defects and the implication o f these results is that the disorder induced by polishing must be extensive, the mean free path of the exciton being drastically reduced.
Other consequences of the polishing process have been investigated by several authors. Vedam and Malin (1974X who have made ellipsometric measurements on polish-damaged vitreous silica, suggest that an increased density o f the surface layers occurs with a consequent increase in the v^ue o f n; though in the case of crystalline CU2O, this mechanism is not possible and the change in n and k obtained here is due to disorder and an increased dislocation density in the surface which, in turn, causes a decrease in the density.

’»O A(nm) «0®
nd 2 show the ectra for both
Region 250 nm with an edge
ks correspond- 3m the Cu(3‘‘ )
1962). It can leiTects on the
in k except in I45 to 520 nm) v a lu e s o f n and 1 sharpening o f | id a resolution
series whose n respectively, ielength o f the
g out o f the r in the lattice layers. This is )f the exciton [playing long- •ut 20 nm). A t
J o f individual ^ s s ib le due to
weights corre- ■ ies.1 exciton m ay
la t 465 nm) = ¡reduced mass
X 10 -^ ' kg), I , e (electron constant) =
is obtained blue series.
I interact with
>®» A ( " I " ) «®®
Figs, i and 2. Fig. i (top). Spectral reflectance of polycrystalline cuprite, (a) Mechanically polished. (¿>) Mechanically polished and etched. Fig. 2 (bottom). Spectral dispersion of n and k for cuprite, (a) Mechanically
polished, (b) Mechanically polished and etched.
defecte and the implication o f these results is that the disorder induced by polishing must be extensive, the mean free path of the exciton being drastically reduced.
Other consequences of the polishing process have been investigated by several authors. Vedam and Malin (1974X who have made ellipsometric measurements on polish-damaged vitreous silica, suggest that an increased density of the surface layers occurs with a consequent increase in the ^ u e of n; though in the case of crystalline CujO , this mechanism is not possible and the change in n and k obtained here is due to disorder and an increased dislocation density in the surface which, in turn, causes a decrease in the density.
O P T I C A L P R O P E R T I E S O F C U P R I T E 635
Reflectance measurements made on germanium by Donovan et al. (1963) suggest that apart from general disorder accompanying mechanical polishing, the surface is subjected to inelastic tensile stress which, they postulate, causes a shift to lower energies of reflectance peaks at 600 nm in this material.
The depth o f the disordered layer cannot be accurately deduced from film-fitting calculations, as the optical properties of the layer appear very similar to the ordered cuprite substrate, but it is reasonable to assume that it extends to a depth corresponding to the size of the diamond particles used in the final polishing stage (250 nm). It is also likely that no sharp interface exists between the damaged layer and the rest of the crystal.
Figs. 3 and 4 show the n and k spectra for a bulk specimen o f cuprite, polished and etched in the usual manner and oxidized in air at 225 °C for various times. The spectrum of C uO is shown for comparison. A gradual broadening of all the peaks is evident with each successive oxidation and the
100 X ("I")
value of k increases at long wavelength, with the increasing thickness of the C uO layer. As the bulk specimen of C uO was produced by a similar, though more intense oxidation process, it is expected that the continuation of the low- temperature process will produce a C uO layer thick enough completely to obscure the influence of the substrate.
Batch experiments such as the above are subject to errors in ellipsometric alignment because the films produced do not always display uniform thickness, and it is very difficult to replace the sped- men in exactly the same position each time. Initial surface contamination also causes difficulty in accurate determination o f the oxidation-rate law, though by repeating the first measurements at the blue end of ffie spectrum after completion o f the scan, we have found that negligible room- temperature oxidation occurs during the experiments. Alignment errors can be eliminated by in situ measurements and these also facilitate monitoring of the initial stages of oxidation. The results o f such an experiment at 250 °C are shown in figs, s S shows the change in theellipsometric parameters at 525 nm as the oxidation proceeds and it is compared with the theoretical curve calculated assuming a clean substrate of cuprite (n' 3.91, k' 0.36) and films of CuO (n' 2.35, k' 0.70) o f increasing thickness. The experimental curve may be divided into three parts. Part (A)
s'a 3» s'art c.
rMnm
. — » n 'a-sr ¡i'o'«o
Figs. 3 and 4. Fig. 3 (top). Spectral dispersion of n for cuprite and CuO. (a) Medianically polished and etched, (b) Oxidiaed, 225 °C, in air, 4 hours, (c) Oxidized, 225 “C, in air, 12 hours, (d) Oxidized, 225 °C, in air, 16 hours, (e) Oxidized, 225 °C, in air, 20 hours, (f) CuO. Fig. 4 (bottom). Spectral dispersion of k for cuprite and
C u O under the same conditions.
01 u n fe « .a ®*
Fig. s- EUipsometric parameters for in situ oxidation of cuprite at 250 °C. Wavriengtii 525 nm, angle of inddence 75°. (o) Theoretical: C u jO substrate (« = 3.91, k = 0.36). CuO film (««=2.35, k -0 .7 0 ). (b) Experimental: (A) desorption; (B) n = 2.37, k « 0.60; ( Q a - 2.33, k »
0.79. [See note p. 637.]

\ J
fS'-i. ,.jj_i >, •!^ .t.' - *
636 P. R A S T A L L E T A L .
seems to indicate an initial desorption process, or a change in the surface state of the crystal prior to any oxide growth. The rest of the experimental locus corresponds to film growth. The film appears to undergo a change when it reaches a thickness of approximately 6 nm; taking the curve as two separate loci, labelled (B) and (C), it is possible to calculate the film n' and k’ for each part
B = n' 2.37, k' 0.60 (dashed with arrow)C = n' 2.23, k' 0.79.
Both these values are close to those used for the theoretical curve, though film (C) appears to be slightly more absorbing than either film (B) or the bulk CuO. Whether this change is due to reordering of the lattice on increasing thickness or other factors, possibly to do with surface contamination, is not known though further work in controlled atmosphere is planned.
It can be seen from fig. 6 that the spectrum of the oxidized system obtained from the in situ experiment at 250 °C is much closer to that of C uO than the one obtained from the batch oxidation at 225 °C but, before comparison can be made between bulk and thin film spectra, some explanation of the analytical technique is relevant.
The optical properties (n, k, £„ ej) o f bulk specimens were derived assuming these were isotropic, homogeneous, plane, and free from surface contamination. These assumptions enable film-fitting computations to be used without serious error. The calculation of the complex refractive index (n-ik) of a surface film from ellipsometric data must be done by iteration, as analytical methods cannot be used. If an independent measure of thickness is available, n-ik may be obtained directly from a knowledge o f T and A. Conversely, if n-ik is known for the film, a unique value of its thickness may be determined. Without an independent thickness measurement additional ellipsometric data are necessary. One approach is to make spectral measurements and choose the refractive index, absorption coefficient, and thickness which give calculated values o f 4* and A which most closely match the experimental data. Least-squares anidysis is then used to perform the matching automatically, fitting the film n and k for various trial thicknesses. This is done by minimizing a function of the difference between calculated and experimental parameters (Qarke, 1979). The shape of the spectra and the magnitude o f the absorption vary with the assumed thickness. The results o f this operation are shown in fig. 7, the computed film spectra giving a probaUe value of 27 nm for the CuO film, grown in situ at low temperature.
It is dear that a good match between the spectra is possible only over a limited region (300 to
\*0® A(nm) «0® 800
Figs. 6 and 7. Fig. 6 (top). Spectral dispersion of n and k for in situ oxidation of cuprite, (a) Polished and etched. (b) Oxidized in situ at 250 °C. (c) CuO. F ig . 7 (below). Spectral dispersion of e,- (a) Experimental CuO . (b) Least squares analysis thin film of C uO assumed thickness 35 nm. (c) Assumed thickness 27 nm. (d) Assumed thickness 20 nm. Crosses are for thick-film C u O (Ladelfe,
et al., 1972).
450 nm); this region in fact being dominated by just one CU2O absorption peak. The ellipsometric results for CuO films, however, depend not only on the assumed thickness but also on the assumed substrate (CU2O) spectrum which indicates caution when interpreting these results. In performing the film-fitting operation we have also assumed the filnn properties to be identical to those o f the bulk inaterial; no account has been Uken o f possiUe differences of structure between them. Structural analysis o f C uO films by other methods would be of use, but apart from measurements made by Ladelfe et al. (1972) at 4S0 nm and soo nm (fig. 7X we have been unable to find any previous work on the optical properties of C uO in this wavelength region (fig- 7).

P. RASTALL E T AL.Jn process, or a rystal prior to
experimental e film appears
I a thickness of :urve as two is possible to
[part
arrow)
used for the Appears to be
Im (B) or the due to re
thickness or 1 surface con- ther work in
spectrum of the in situ
br to that of I batch oxida- I can be made ome explana- evant.[>f bulk speci- Cre isotropic,
[surface con- : film-fitting
|us error. The |idex(n-ik)of lust be done
anot be used.> is available,
knowledge bown for the pay be deter-
ss measure- f’e necessary, easurements
korption coplated values
the experi- Jlhen used to p n g the film Phis is done ace between ers (Clarke,: magnitude ! thickness,
vn in fig. 7, Ibable value ] situ at low
1 the spectra an (300 to
O P T I C A L P R O P E R T I E S O F C U P R I T E 637
In the light of these results it is possible to offer an explanation for the anomalously high absorption index (k) obtained in previous work. Air- formed fUms of CuO on CU2O require temperatures somewhat above ambient to reach a thickness accurately determinable by the methods employed here; however, when experiments are carried out at atmospheric pressure, some adsorption of oxygen into the surface layers is inevitable. Fig. 5 demonstrates the complex nature of the initial stages of the oxidation process.
We have also demonstrated that the surface is easily disordered and strained by preparative treatments and that this disordered layer displays abnormally high absorption at long wavelengths.
R E F E R E N C E S
Agekyan (V. T.), Kuz’mina (I. P.), Lobachcv (A. N.), Predtchenski (B. S.X Starostina (L. S.), and Kaidukov (N. M.), 1975. J. Appl. Spectrosc. 22, 582. (trans. of Zh. Prikl. Spektr.)
Qarke (K. Me.), 1979. C.N.A.A. Ph.D. Thesis. City of London Polytechnic.
Ek>novan (T. M.X Ashley (E. J.), and Bennet (H. E.X 1963. J. Opt. Soc. Am. 53, 1403.
Gross (E. F.X 1962. Sov. Phys. Uspekhi, 5, 195. (trans. o f Uspekhi fiz. Sauk.)
Hayfield (P. C. S.X 1961. ist Int. Cong. Metallic Corrosion, April, p. 670.
Hunt (R.). Private communication, to be published in C.N.A.A. Ph.D. Thesis. City of London Polytechnic.
Ladelfe (P. C.X Czanderna (A. W.X and Biegen (J. R.X 1972. Thin Solid Film, 10, 403.
Roberts (E. F. I.) and Meadows (A.X 1964. J. phys. E. 7, 379-
----- and Rastall (P.X 1978. Mineral. Mag. 42, 505.Spyrideles (J.), Stoimenos (J.X and Economov (N.), 1977.
Phys. Stat. Solidi, 20, 623.Vedam (K.) and Maiin (M.), 1974. Mat. Res. Bull. 9,1503.
[Note added in proof. Fig. 5. The film thickness values on the experimental curve should be doubled, i.e. for 10 nm read 20 nm, etc.]
[^Manuscript received 19 June 1979: revised 24 September ¡979}
A(nm) 500 000Figs. 6 and 7. Fig. 6 (fop). Spectral dispersion of n and fc for in situ oxidaüon of cuprite, (a) Polished and etched. (b) Oxidized in situ at 250 °C. (c) CuO. Fig . 7 (Mow). Spectral dispersion of cj. (a) Experimental CuO. (h) Least squares analysis thin film of CuO assumed thickness 35 nm. (c) Assumed thickness 27 nm. (d) Assumed thickness 20 nm. Crosses are for thick-film CuO (Ladelfe,
et al., 1972).
450 nm); this region in fact being dominated by just one C ujO absorption peak. The eUipsometric r«ults for CuO films, however, depend not only on the assumed thickness but also on the assumed substrate (CujO) spectrum which indicates caution when interpreting these results. In perform in g the film-fitting operation we have also assumed the film properties to be identical to those of the bulk material; no account has been taken of possible differenoK of structure between them. Structural analysis of C uO films by other methods would be of use, but apart from measurements made by Ladelfe « al. (1972) at 4SO nm and 500 nm (fig. 7X we have been unable to find any previous work on the <2>tical properties of C uO in this wavelength region (fig- 7).
• ‘ - o p
Materials Science and Engineering, 42 (1980) 71 -80 © Elsevier Sequoia S.A ., Lausanne — Printed in the Netherlands
71
Optical Properties of Alloys*
E. F. I. RO BERTS, K. MC. C L A R K E and R. HUNT
Department o f Metallurgy and Materials, City o f London Polytechnic, Whitechapel, London E l (Gt. Britain)
SUM M ARY
Results are reported o f studies using an autom atic nu lling spectroellipsom eter on binary and ternary a lloys o f single- and two- phase com position. The significance o f these results is discussed in relation to the electronic structure and appearance o f such alloys.
1 . INTRODUCTION
Historically the optical properties of metals have been central to studies of the electronic structure [1 - 3]. The term “metallic lustre” is common recognition of the particular properties of opacity and high reflectance which have made possible the application and development of reflection optical microscopy. Considerable effort has been expended among mineralogists in classifying and measuring the optical characteristics of opaque minerals and not a little success can be reported for the optical discrimination of minerals by reflective photometry [4 - 6]. More recently colour characterization, standardization and quality control have featured in several metallurgical industries, e.g. the gold jewellery industry for aesthetic surface coatings [7 - 10]. Ellipso- metric studies of thin film growth kinetics during the corrosion of metallic substrates can almost without exception be considered to involve composition alterations of the substrate [11]. This is particularly so in more practical studies of alloys where de-alloying and surface enrichment have been commonly observed. Consequently the systematic application of ellipsometry to the corrosion
*Presented at the International Chalmers Sym posium on Surface Problems in Materials Science and Technology, Göteborg, Sweden, June 11 - 13 , 1979 .
of alloys demands an understanding of the optical characteristics of alloy substrates. The conventional ellipsometric models rely upon a perfectly plane homogeneous isotropic substrate [12, 13] and metallui sts will recognize the limitations of such ideal assumptions. The present programme was aimed at measuring the effects of alloying on ellipsometric measurements when both complete solid solutions and limited-range solid solutions occurred. Furthermore, the optical constants n and k of the alloys were related to their colour characteristics and a comparison was made with reflectance measurements.
2 . EXPERIM ENTAL STUDIES
Extensive optical studies of the Group Ib metals copper, silver and gold have contributed to the electron theory of metals [14 - 17]. The ternary system Au-Ag-Cu was chosen for study partly because of the theoretical framework and partly because gold jewellery alloys are based upon this system. The Au-Ag-Cu system also includes two series of solid solutions (Ag-Au and Cu-Au) and a eutectic (Ag-Cu) which extend into the ternary system. Additionally, the Cu-Au binary system possesses a series of order-disorder reactions and these also appear in the ternary system [18]. The nobility of the alloys promotes relative inertness from atmospheric attack and, apart from the copper-rich alloys, corrosion problems do not intrude.All alloys were prepared from fine gold,
fine silver and spec, pure copper. Samples were made at 10 wt.% intervals throu out the ternary diagram. Alloys were induction melted in carbon crucibles under a reducing atmosphere and bottom-cast into a polished steel dish containing oil. The cast bead was

> \
■ *'■■ KT ' *
* V ' 'V i 'V -r ’ * ’: V ■“• '
72
worked into a plaquette by cold working and annealing. The final specimen was water quenched from a 16 h anneal at 600 °C, After mounting, the specimens were carefully polished metallographically down to a 0.25 fjm diamond paste. No organic solvents were used after the final rinsing with distilled water. Within minutes of polishing the specimens were mounted on an automatic selfnulling high precision spectroellipsometer and measurements of the relative phase shift A and the relative amplitude change tan i// were made at wavelength intervals of 5 nm from 250 to 800 nm [19]. The data collected were then processed on a DEC 10 computer system to generate dispersions of the complex refractive index n(X) = n(X) — i/z(X), the complex dielectric function e(X) = ei(X) + ic2(X) and the normal reflectance R n W - It was also possible to determine standard CIE colour coordinates for each of the alloys (CIE 1970) and to analyse the dispersion curves by multiple differentiation, normalization, difference calculations etc. Some of these results will be demonstrated in the discussion.
3 . R E S U L T S
3.1. Solid solutionsBoth the gold-based binary systems Au-Ag
and Au-Cu form solid solutions (although in the latter case ordering may occur at temperatures below the final annealing temperature). Microscope and X-ray examinations of these alloys indicated that they were all single phase. The ternary diagram isothermal section for 600 °C displays an extensive two-phase region based upon the limited solid solubility regions formed in the Cu-Ag binary and its eutectic. Ternary alloys that are gold rich or contain relatively small quantities of the third component are also solid solutions. Figures 1 and 2 show the reflectance curves determined for the binary solid solution alloys Au-Ag and Au-Cu, and Fig. 3 shows similar curves for a gold-rich series of ternary alloys exhibiting only solid solutions.3.2. Duplex alloysThe two-phase alloys are based upon the
binary Cu-Ag limited-miscibility eutectic system. Two-phase ternary alloys occupy an
extensive range in the isothermal section studied here and the tie-lines for this range have been determined to lie almost parallel to the Ag-Cu composition line. Figure 4 shows the variation of reflectance for Ag-Cu and Figs. 5 and 6 show similar curves for ternary alloys with constant gold contents of 30 and 50 wt.%.An analytical examination of the quantities computed from Ci and C2 is presented in the discussion.
4 . D IS C U S S IO N
4.1. Optical properties of solidsThe reflectance of a metal at a given wave
length X is determined by its refractive index n(X) and by the surface topography. The relation is simple for an ideal plane film-free surface. Furthermore, the refractive index is equal to {e(X)} ^ where e(X) is the dielectric function [1]. The refractive index and dielectric functions are in general complex quantities since they describe the attenuation and phase change of light incident upon the metal. The dielectric function can be understood in terms of the polarization of the metal by an electromagnetic wave. For metals at optical frequencies only polarization of the electrons is significant. A causal chain exists between fundamental electronic properties and the visual appearance of a metal. Optical measurements are made at some point in the chain such that fundamental information (c.g. the electronic structure) or gross visual properties may be usefully collected and quantified. The complex dielectric function may be expressed in real and imaginary terms:e(X) = Ci(X) + ic2(X)The dielectric function of a material
wherein the electrons are classically bound to the atoms is described by a lorentzian function. Such electrons may undergo forced vibrations at a resonant frequency ojo\ this resonance corresponds to a peak in 6 2- For conduction electrons the natural frequency is zero — this gives rise to special lorentzian absorption known as Drude absorption. For a lorentzian oscillator the reflectance rises at low energies (long wavelengths) as 62 begins to rise but remains large until ej approaches zero. Therefore the highly reflecting region of

Insive range in the isothermal section ied here and the tie-lines for this range been determined to lie almost parallel to
r g-Cu composition line. Figure 4 shows ariation of reflectance for Ag-Cu and , 5 and 6 show similar curves for ternary with constant gold contents of 30 and
rt.%.n analytical examination of the quantities puted from ei and € 2 is presented in the assion.
SCUSSION
Optical properties of solids le reflectance of a metal at a given wave- ;h X is determined by its refractive index and by the surface topography. The [ion is simple for an ideal plane film-free Ice. Furthermore, the refractive index is J to {e(X)}/ where e(X) is the dielectric tion [ 1 ]. The refractive index and ctric functions are in general complex titles since they describe the attenuation 3hase change of light incident upon the il. The dielectric function can be under- i in terms of the polarization of the il by an electromagnetic wave. For metals )tical frequencies only polarization of the tons is significant. A causal chain exists [een fundamental electronic properties the visual appearance of a metal. Optical kurements are made at some point in the p such that fundamental information the electronic structure) or gross visual erties may be usefully collected and itified. The complex dielectric function be expressed in real and imaginary terms:ei(X) + ic2(X)
ie dielectric function of a material ein the electrons are classically bound to atoms is described by a lorentzian tion. Such electrons may undergo forced tions at a resonant frequency coq; this nance corresponds to a peak in ej- For uction electrons the natural frequency o — this gives rise to special lorentzian rption known as Drude absorption. For bntzian oscillator the reflectance rises at Energies (long wavelengths) as € 2 begins le but remains large until ei approaches 1 Therefore the highly reflecting region of
"X (nm)Fig. 1 . R e fle c ta n ce cu rves fo r A u - A g single-phase binary a llo y s o b ta in e d b y e llip so m etry . T h e figures o n the curves co rresp o n d to th e n o m in al gold c o n te n t (% ) o f th e a llo ys .
a solid is on the high energy (short wavelength) side of the resonance frequency wq. For metals with tjQ = 0 we have high reflectance at long wavelengths.In addition to the Drude absorption that
characterizes free-electron metals we have to consider interband transitions. If the range of such transition(s) is narrow the values of €2, 6i and R will be similar to those of a single lorentzian oscillator. The additional absorp
tion due to interband transitions reduces the reflectance. The high energy reflecting region may be completely suppressed by a succession of oscillators but structural features of the electronic bands will remain.Metals are regarded as having free electrons.
Partially filled bands or overlapping bands provide a continuum of unoccupied states adjacent to a continuum of occupied states which permits transitions at arbitrarily small
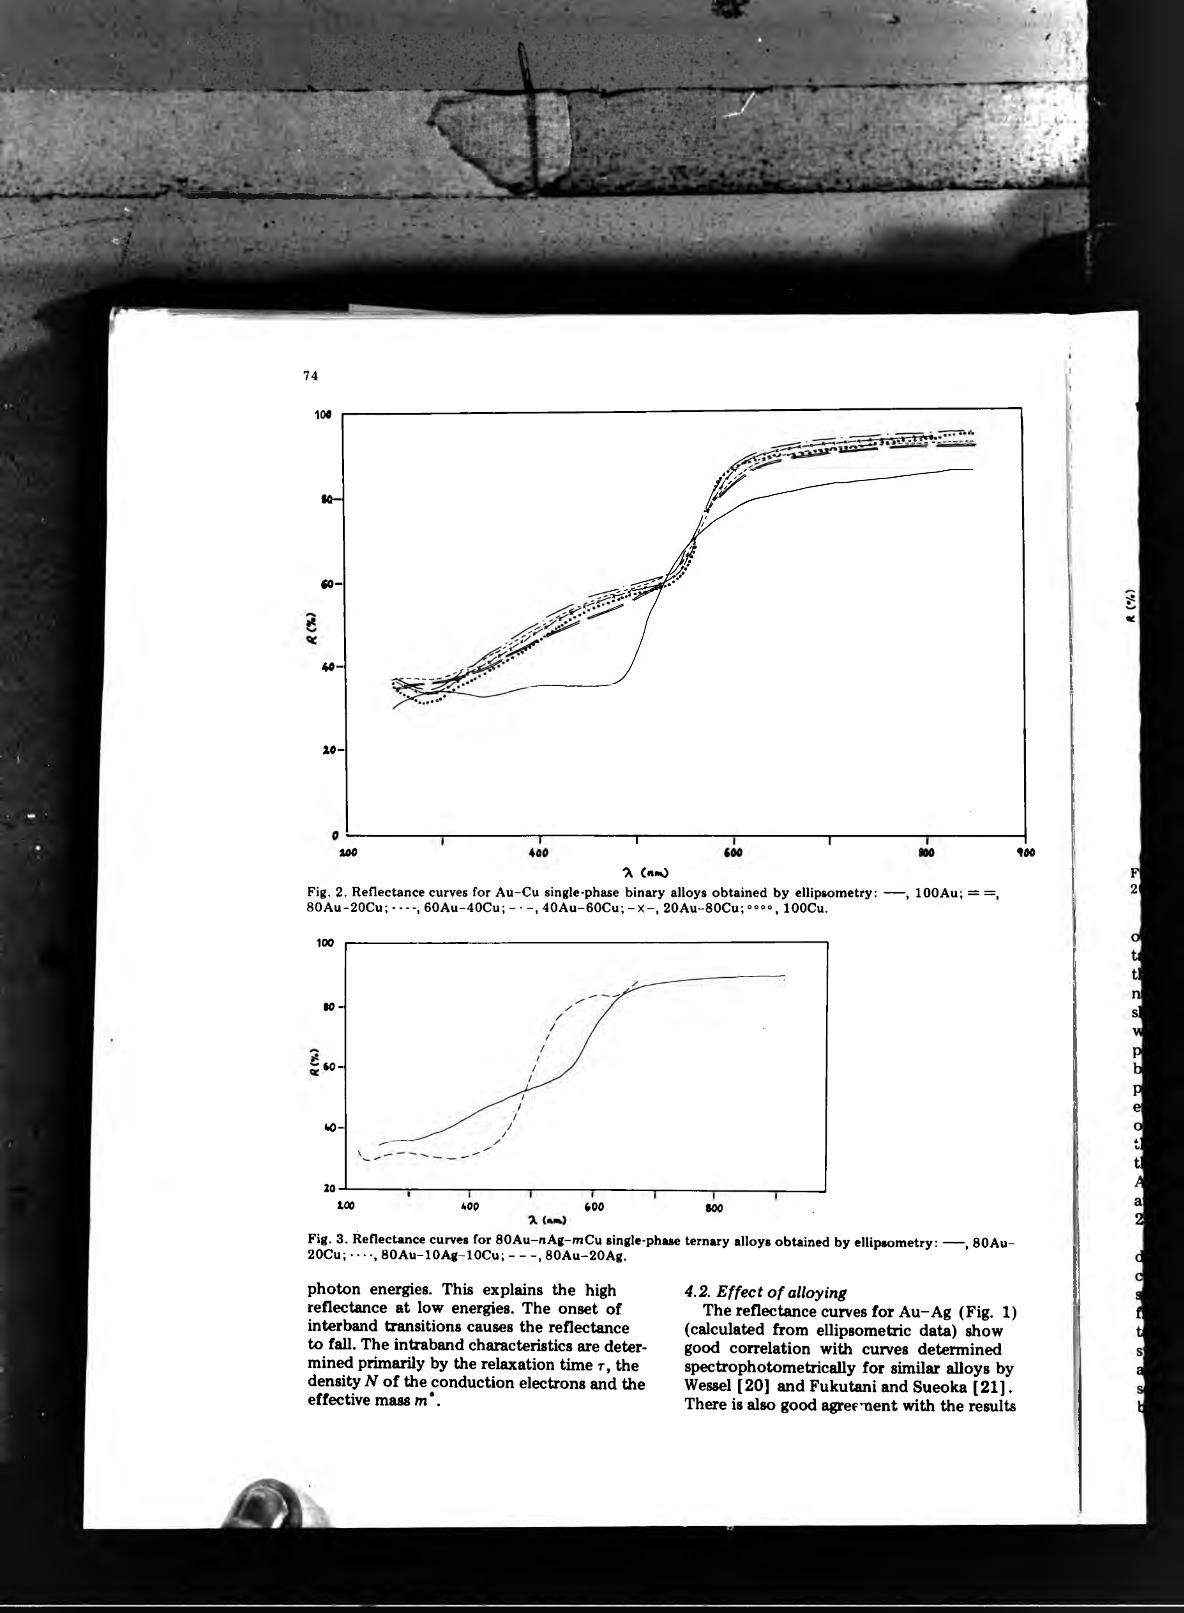
^
ij-ir .;■.*> ii74
100
•0-
«0-
«0-
10-
T T100 100
“X CnmOFig. 2 . Reflectance curves for A u -C u single-phase binary alloys obtained by ellipsom etry: ---- , lOOAu; = = ,80A u -20C u ;-----, 60A u -40C u ;----- , 40A u - 60Cu; - X - , 20A u -80Cu; °®»'>, lOOCu.
too
oo-
6 0 -
W-
20too 400 600 800
Fig. 3 . Reflectance curves for 80A u -n A g-m C u single-phase ternary alloys obtained by ellipsom etry:---- , 80A u -20Cu; • • • •, 80A u -10A g -10C u ;------, 80A u - 20Ag.
photon energies. This explains the high reflectance at low energies. The onset of interband transitions causes the reflectance to fall. The intraband characteristics are determined primarily by the relaxation time t, the density N of the conduction electrons and the effective mass m*.
4.2. Effect of alloyingThe reflectance curves for Au-Ag (Fig. 1)
(calculated from ellipsometric data) show good correlation with curves determined spectrophotometrically for similar aUoys by Wessel [20] and Fukutani and Sueoka [21]. There is also good agreement with the results
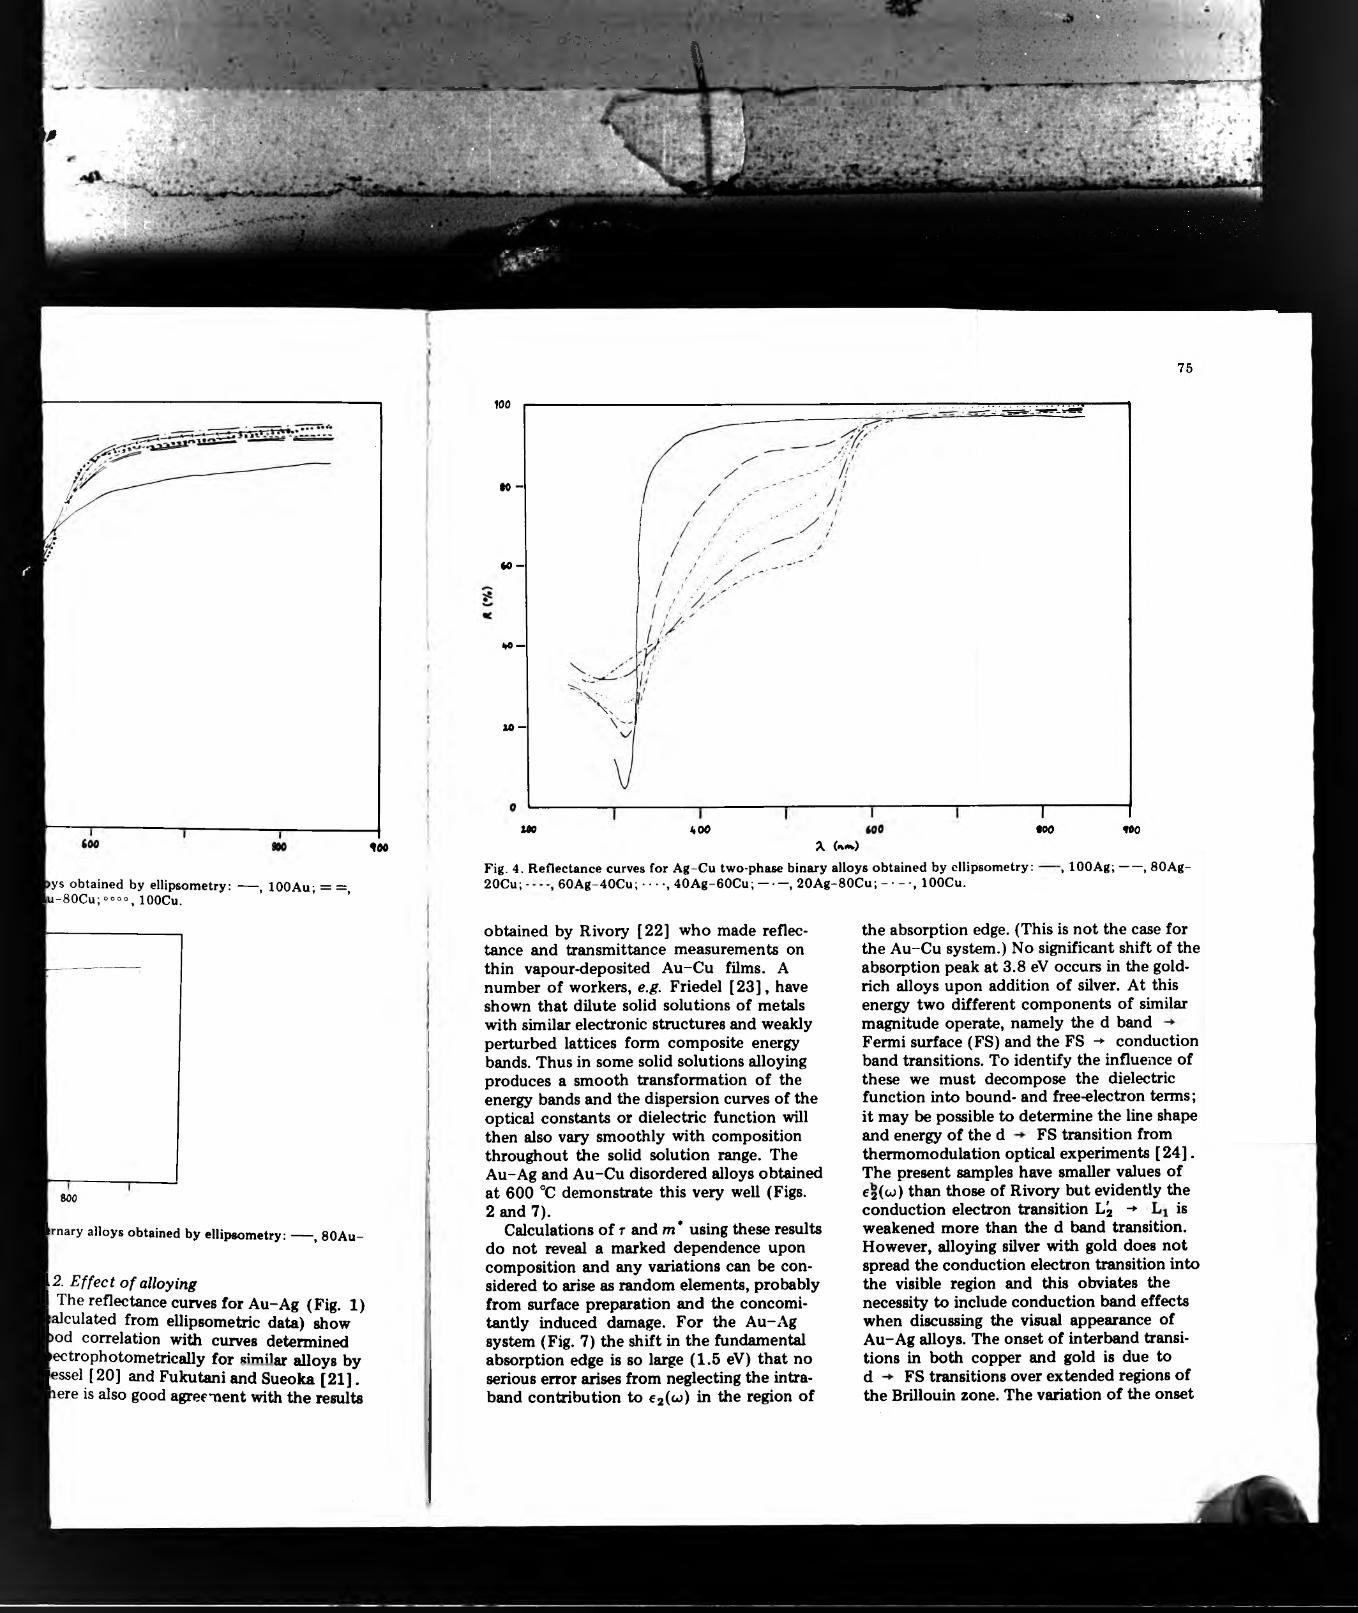
• ^ :'-i : flf-::: -..-' V- ' ■ j. ' :' ' ; '•■ ‘ 1 ' ‘V->< , ■. ••.. ’•■• ->-*• ..' ■ ‘ • l\ ' •. .-. ’•■ f- ■' ■- ■'■• ' ' - y
M
li
100
>ys obtained by ellipsometry: ---- , 100A u; = = ,l u - S O C u ; “ »®®, lOOCu.
800
krnary alloys obtained by ellipsom etry;---- , 80A u -
[2. Effect of alloyingI The reflectance curves for Au-Ag (Fig. 1) lalculated from ellipsometric data) show pod correlation with curves determined kectrophotometrically for similar alloys by Jessel [20] and Fukutani and Sueoka [21], lere is also good agreement with the results
100
0« -
* 0 -
H« —
xo-Ns
too kOOA (am.)
Fig. 4 . Reflectance curves for A g-C u two-phase binary alloys obtained by cilipsom etry: 20Cu; - 60A g -40Cu; • • • •, 40A g - 60C u ;------ , 20A g -80C u ;------ , lOOCu.
obtained by Rivory [22] who made reflectance and transmittance measurements on thin vapour-deposited Au-Cu films. A number of workers, e.g. Friedel [23], have shown that dilute solid solutions of metals with similar electronic structures and weakly perturbed lattices form composite energy bands. Thus in some solid solutions alloying produces a smooth transformation of the energy bands and the dispersion curves of the optical constants or dielectric function will then also vary smoothly with composition throughout the solid solution range. The Au-Ag and Au-Cu disordered alloys obtained at 600 °C demonstrate this very well (Figs.2 and 7).Calculations of r and m* using these results do not reveal a marked dependence upon composition and any variations can be considered to arise as random elements, probably from surface preparation and the concomitantly induced damage. For the Au-Ag system (Fig. 7) the shift in the fundamental absorption edge is so large (1.5 eV) that no serious error arises from neglecting the intraband contribution to e2(w) in the region of
-, lO OAg;-----, 80A g-
the absorption edge. (This is not the case for the Au-Cu system.) No significant shift of the absorption peak at 3.8 eV occurs in the gold- rich alloys upon addition of silver. At this energy two different components of similar magnitude operate, namely the d band Fermi surface (FS) and the FS -► conduction band transitions. To identify the influence of these we must decompose the dielectric function into bound- and free-electron terms; it may be possible to determine the line shape and energy of the d FS transition from thermomodulation optical experiments [24]. The present samples have smaller values of C2(co) than those of Rivory but evidently the conduction electron transition L '2 -*■ is weakened more than the d band transition. However, alloying silver with gold does not spread the conduction electron transition into the visible region and tiiis obviates the necessity to include conduction band effects when discussing the visual appearance of Au-Ag alloys. The onset of interband transitions in both copper and gold is due to d FS transitions over extended regions of the Brillouin zone. The variation of the onset
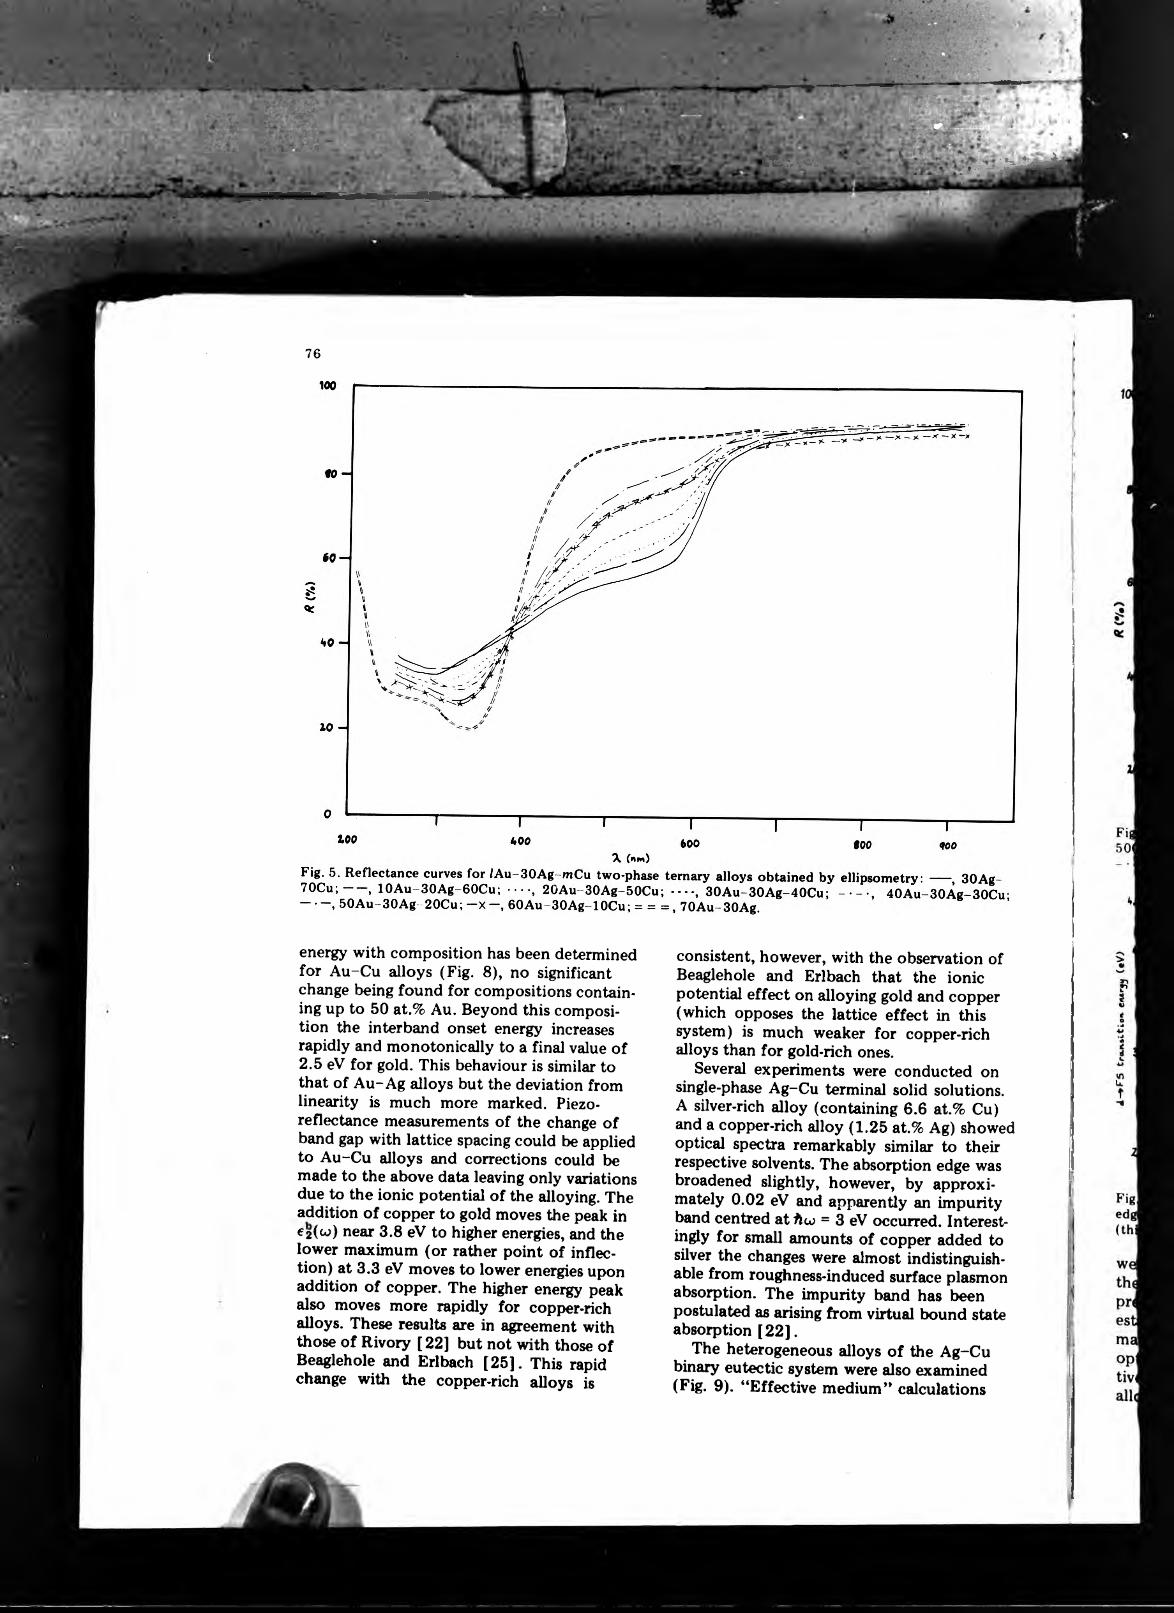
I-Vj
Ct>\',C'J'-i.. Si- f.r-_--r*5r:''
76
energy with composition has been determined for Au-Cu alloys (Fig. 8), no significant change being found for compositions containing up to 50 at.% Au. Beyond this composition the interband onset energy increases rapidly and monotonically to a final value of2.5 eV for gold. This behaviour is similar to that of Au-Ag alloys but the deviation from linearity is much more marked. Piezoreflectance measurements of the change of band gap with lattice spacing could be applied to Au-Cu alloys and corrections could be made to the above data leaving only variations due to the ionic potential of the alloying. The addition of copper to gold moves tile peak in 62(w ) near 3.8 eV to higher enei es, and the lower maximum (or rather point of inflection) at 3.3 eV moves to lower energies upon addition of copper. The higher energy peak also moves more rapidly for copper-rich alloys. These results are in agreement with those of Rivory [22] but not with those of Beaglehole and Erlbach [25]. This rapid change with the copper-rich alloys is
consistent, however, with the observation of Beaglehole and Erlbach that the ionic potential effect on alloying gold and copper (which opposes the lattice effect in this system) is much weaker for copper-rich alloys than for gold-rich ones.Several experiments were conducted on
single-phase Ag-Cu terminal solid solutions. A silver-rich alloy (containing 6 .6 at.% Cu) and a copper-rich alloy (1.25 at.% Ag) showed optical spectra remarkably similar to their respective solvents. The absorption edge was broadened slightly, however, by approximately 0.02 eV and apparentiy an impurity band centred at flw = 3 eV occurred. Interestingly for small amounts of copper added to silver the changes were almost indistinguishable from roughness-induced surface plasmon absorption. The impurity band has been postulated as arising from virtual bound state absorption [2 2].The heterogeneous alloys of the Ag-Cu
binary eutectic system were also examined (Fig. 9). “Effective medium’* calculations

t» 4 •:
r ,xi,':sS^:.'--<'^-i-:s5-.A
77
L —X - X —■*'’ ^ ^ ^
too 400
100
klloys o b ta in e d b y e llip s o m e try : -----, 30A g -|a u 30A g - 40 C u ; -------, 40A u - 30A g - 30C u ;■30Ag.
tent, however, with the observation of hole and Erl bach that the ionic tial effect on alloying gold and copper opposes the lattice effect in this ) is much weaker for copper-rich than for gold-rich ones, eral experiments were conducted on i-phase Ag-Cu terminal solid solutions, er-rich alloy (containing 6.6 at.% Cu) copper-rich alloy (1.25 at.% Ag) showed spectra remarkably similar to their
tive solvents. The absorption edge was ened slightly, however, by approxi- y 0.02 eV and apparently an impurity centred at = 3 eV occurred. Interest- for small amounts of copper added to the changes were almost indistinguish- om roughness-induced surface plasmon tion. The impurity band has been lated as arising from virtual bound state tion [22].heterogeneous alloys of the Ag-Cu eutectic system were also examined
|9). “Effective medium” calculations
«0 -
w -I . /
♦0 -
10100
X (a«)50A u -
•, 50A u - 50A g.
<>.5
k 1
I 3
I ■;— T— — T—40 60At.% Au
U
1.5 ■
Ul1.3
lA100
F ig 7 T h e p o sition o f th e lo w en ergy ab so rp tio n ^ ed ge fo r A u - A g a llo ys: X, th e en ergy fo r d eg/dw (th is w o r k ) ; o, from re f. 22.
were used, neglecting the inhomogeneity of the material. The justification for this is presented below (the nulling ellipsometer established a clear null for these alloys no matter how the null was approached). The optical spectra for these alloys are qualitatively similar to the spectra of homogeneous alloys. The alloys show various amounts of
% * *
— --> I --- -------- ---- - ^0 10 60 W W 100At%Aa
F ig . 8. T h e en ergy o f the ab so rp tio n edge in €2
fo r A u - C u a llo ys.
primary phase (a or P) and eutectic (a + /!)• The optical constants of bulk a and P were determined from separate specimens; for any of the binary alloys the respective a and 0 phases have a constant composition and thus invariant optical constants. The optical

• ,eí
'atjm
78
A (nm)F ig. 9. T h e im aginary p art €2 o f th e d ie lectric fu n ctio n fo r A g -C u a llo ys .
properties of the bulk alloy can thus be expected to be determined by the volume fractions and optical constants of each of the phases in the mixture. Since the a and phases are almost pure silver and copper it is necessary to examine the influence of mixing on the spectral characteristics of these components. Firstly the sharp interband absorption of silver at 3.8 eV does not appear to be either shifted or broadened, although in the copper-rich alloys the detail tends to be obscured by the influence of the copper. While reflectivity for copper is high for energies greater than 1.9 eV the interband transition analogous to the 3.8 eV transition for silver occurs at 2.2 eV; upon mixing this copper edge appears to be neither shifted nor broadened. However, the plateau between 2.9 and 2.3 eV in copper rises steadily with the addition of silver until it completely disappears in ttie presence of pure silver. Furthermore, the slope between 2.9 and 3.8 eV increases steadily from pure copper to pure silver. Thus the two fundamentid absorption edges in Ag-Cu do not move and only their relative strength alters with composition.
This suggests that apart from a slight terminal solubility the two components silver and copper retain their electronic and optical characteristics independently and that they will contribute to the final alloy behaviour in proportion to the volume fraction of the a and phases.The relative phase and amplitude changes
occurring in incoherently reflected light at an inhomogeneous plane surface may be determined by comparing the sum of the two Stokes vectors arising from reflection at the two types of reflecting surfaces in the inhomogeneous alloy with the column vector of a single homogeneous phase surface. This appears to be legitimate since the nulling ellipsometer provides a well-defined unambiguous null as long as tiie sampling beam width is large compared with the dimension of the inhomogeneity. The resulting equations for the relative phase change A and the relative amplitude change tan rp are
A = tan-1 i q l P M ^ P p c t l s i n (1 ~q)lpigHPpglsin Ap
19 Ip «a Ipporlcos Aa + (1 — q) Ip^UpppIcos A,

W 0 m** u
79
^
. ^
VO
hCu al loys .
p suggests that apart from a slight terminal lubility the two components silver and |pper retain their electronic and optical racteristics independently and that they 11 contribute to the final alloy behaviour in portion to the volume fraction of the a (3 phases.
|The relative phase and amplitude changes curring in incoherently reflected light at an lomogeneous plane surface may be deter- led by comparing the sum of the two )kes vectors arising from reflection at the ’ types of reflecting surfaces in the in- logeneous alloy with the column vector of
jingle homogeneous phase surface. This sears to be legitimate since the nulling Ipsometer provides a well-defined un- biguous null as long as the sampling beam 1th is large compared with the dimension jthe inhomogeneity. The resulting equations the relative phase change A and the ative amplitude change tan i|/ are
tan 1 j <?IPsaHppc»lsinAa-»-(l— q)lp^appglsinAg I
f q IPia lippalcos Aa + (1 — q) Ipj llpp lcos Ap '
F ig. 10 . E xp erim en tal (cu rv e A , 7 0 A g - 3 0 C u ) and th eoretica l (cu rve B , v o lu m e fra ctio n q « 0 .6 7 6 ) re flectan ce cu rves fo r tw o-p h ase a llo ys w ith n o m in ally th e sam e vo lu m e fra ctio n .
. , . 1 1'« i (jlp„P + (1 -9 ) IP r f l“ '
where p, and Pp are the Fresnel reflection coefficients in the s and p directions, q is the volume fraction of a, 1 — q is the volume fraction of /3, A is the relative phase change for phases a and /? and the subscript indicates the phase.Figure 10 shows a normal reflectance curve for a theoretical two-phase alloy with the same volume fractions of a (silver-rich terminal solid solution) and p (copper-rich terminal solid solution) as for the 70Ag-30Cu alloy used to obtain the experimental normal reflectance curve. If the optical spectra of two (or more) duplex alloys are available an inversion of the equations permits the determination of the optical properties of the terminal solid solutions. Furthermore this modelling explains special features of the colour identification of such duplex alloys when tile identification is made from ellipso- metrically derived normal reflectance and compared with normal spectroreflectometry. It is easy to determine the CIE [26] chromaticity coordinates for each of the specimens using the normal reflectance determined by either spectroreflectometry or spectroellipsometry. Colour theory predicts that the series of colours derived from a
mixture of two colours, e.g. white and red, will lie on a straight line in the chromaticity diagram. Such behaviour is a priori expected from the a + 0 alloy mixtures. However, the colour coordinales of such alloy mixtures determined ellipsometrically lie on a curve. Spectral reflectance (and hence the colour of metal alloys) will also vary with the angle of incidence of the probe beam. Care must therefore be exercised in comparing reflectance values, particularly those of polyphase alloys. The optical constants n and k and the dielectric functions do not suffer from this and therefore techniques to establish primarily these quantities are to be preferred for optical measurements of metals.
5 . C O N C L U S IO N
Spectroellipsometry has become accepted as a method of determining the optical characteristics of metals and alloys. Despite the extreme sensitivity of ellipsometry to surface films and surfacey)reparation the application of environment control, sample annealing and cleaning mu« .promote the application of the technique { studies of reactive metals and alloys.The optical behaviour of solid solutions is consistent with the model of extensive band mixing as the composition alters. TnV dielectric function in particular has a sii e band whose strength and peak alters progressively with composition. The behaviour of alloys which exhibit a solution limit and a separation into two (or more) phases differs in that the terminal phases retain their composition but alter their proportion (i.c. volume fraction). This effect is observed in the dispersion curves, particularly of the interband component of the dielectric function, as a separation of the constituent spectra which in turn vary in strength with volume fraction. The optical appearance and in particular the colour of the alloys can be determined objectively by computing the normal reflectivity Ra from the optical constants and calculating the CIE chromaticity coordinates. Variations in chromaticity coordinates correlate well with changes in alloying but care has to be taken in using the data for polyphase alloys. A model is introduced that permits the évalua-
80
r< _ ' .
tion of the optical characteristics of polyphase alloys. The inversion of this model also permits the quantification of volume fractions of polyphase alloys or the determination of the chromaticity of constituent phases.
ACKNOW LEDGMENTS
The authors wish to thank Dr. L. L. Shreir for providing facilities within the Department of Metallurgy and Materials, the ILEA and The International Gold Corporation for funding the work reported here, and Mr. R. Cohen and Mrs. M. Evans who prepared the materials essential for the study.
REFEREN CES
1 F . W oo ten , O p tica l P roperties o f S o lid s, A c a dem ic Press, N ew Y o r k , 1 9 7 2 .
2 D . L . G reen aw ay and G . H arbeke, O p tica l P ro p erties and Band S tru ctu re o f S em ico n d u cto rs, P ergam on , O x fo rd , 19 6 8 .
3 N . W. A s h c ro ft and N. D . M erm in, S o lid S ta te Physics, H o lt, R in eh art and W inston, N ew Y o r k , 1 9 7 6 .
4 B . D. C erve ll, C . L e v y , N. F . M. H en ry and T . N . S h ad lu n , Bu//. M ineral., 1 0 1 ( 1 9 7 8 ) 2 3 4 .
5 R . G . J. S tren s and R . F re er, Mineral. Mag., 42 ( 1 9 7 8 ) 1 9 .
6 R . G . B u rn s and D . J. V au gh an , A m . M ineral., 5 5 ( 1 9 7 0 ) 1 5 7 6 .
7 E . F . I. R o b e rts an d K. M e. C la rk e , G o ld B u ll 1 2 ( 1 9 7 9 ) 9 .
8 G . E . G ard am , Trans. Inst. M et. F inish., 41 ( 1 9 6 4 ) 1 9 0 .
9 G . E . G ard am , Trans. Inst. M et. Finish. 4 4 ( 1 9 6 6 ) 1 9 6 .
10 R . S. H un ter, T h e M easurem ent o f Appearance, In te rsc ien ce , L o n d o n , 1 9 7 5 .
1 1 D . R oss, P h .D . Thesis, U n iversity o f L on d o n , 1 9 7 8 .
12 P . D ru de, A n n . P hys. (Leipzig ), 3 9 (18 9 0 ) 5 14 .13 R . M . A . A z z a m an d N. M. B ashara, E llipsom etry
a n d P ola rized L ig ht, N orth -H ollan d , A m sterdam , 1 9 7 7 .
14 L . G . S h u ltz , A du. P hys., 6 ( 1 9 5 7 ) 10 2 .15 M . P. G iven s, S o lid S ta te P hys., 6 ( 1 9 5 8 ) 343.16 H . E h ren reich and H. R . Philips, P/iys. R ev., 128
( 1 9 6 2 ) 1 6 2 2 .17 P. O . N ilsson , S o lid S ta te P hys., 2 9 ( 1 9 7 4 ) 13 9 .18 W . S. R ap so n and T . G ro en ew ald , G o ld Usage,
A c a d e m ic Press, N e w Y o r k , 1 9 7 8 .19 E . F . I. R o b e rts and A . M ead ow s, J. Phys. E 7
( 1 9 7 4 ) 3 7 9 .20 P. R . W essel, P hys. R ev., 1 3 2 ( 1 9 6 3 ) 20 6 2.21 H. F u k u ta n i and O . S u e o k a , in F . A b eles (ed .).
O p tica l P rop erties and E lectro n ic Stru ctu re o f M etals and A llo y s , N orth -H ollan d , A m sterdam , 1 9 6 5 .
22 J. R iv o ry , P/iys. R ev ., S ect. B , 1 5 ( 1 9 7 7 ) 3 1 1 9 .23 J. F ried e l, A d v. P hy s., 3 ( 1 9 5 4 ) 4 4 6 .24 F . A n to n a n g e li, E . C o la rite , R . R o se i and S. E.
S a lu sk i, N u o u o C im en to B , 24 ( 1 9 7 4 ) 1 2 1 .25 D . B ea g leh o le and E . E rlb ach , P hys, R ev., S e ct. B,
6 ( 1 9 7 2 ) 1 2 0 9 .26 C IE In terna tional L ig h tin g V ocabulary, C IE , Paris,
3 rd ed n ., 1 9 7 0 , p . 9.

' M '•-i
■•iT'éì*'-.
r'i'j*!-'
V4 .;♦ 4
,v- ' - y’ttfj-’* •*.= ..f, - . •* i2; — —•V * ' t afire
sj •* ■ \-V^\*' »>r-T.
■ :^Sm ' ■' '■; ' '.- ■ >
■ ' ‘*ti
M, : jr. ' '■. _■ H ' '■!.•' - ' ''®—
ri- .ri ra* t' = t-\ -iJ7f
> -T.S
• ••,''• -i 'V • • ' * - ;
Attention is drawn to the fact that the copyright of this thesis rests with its author.
This copy of the thesis has been supplied on condition that anyone who consults it is understood to recognise that its copyright rests with its author and that no quotation from the thesis and no information derived from it njjiy be published without the author’s prior written consent.
■ V ..J.,V >
I I I f È È à É É ^ A r à ^ .

V
^v,.
K- tí. '..
:f.
Ï-V 1
S.0
V:.
■ K
\.f:
v,A-, V,’S».* lí-k ■■-■
D 3 7 6 7 7 Ö 1
E N D

■ Attention is to w n to the fe« ^ J * “ ^ of the the«, has been »Rph.
V • -t* anvnilC who •OHM tS It ISon coni^on that a y j „ ,coOTti^'testsunderstood to recognise that its c py ig » v ith its author and that no the thesis and no informition niay be pubUshed without the.written consent.
► mit /•
w,■ ■
r r ( 1 > <