UNIVERSITY OF LONDON THESIS
327
SHI ITEM BARCODE REFERENCE ONLY 19 1783602 X UNIVERSITY OF LONDON THESIS Degree TV? Year Name of A u t h o r 6 , rt/Sr/w/, COPYRIGHT This is a thesis accepted for a Higher Degree of the University of London It is an unpublished typescript and the copyright is held by the author All persons consulting the thesis must read and abide by the Copyright Declaration below. COPYRIGHT DECLARATION I recognise that the copyright of the above-described thesis rests with the author and that no quotation from it or information derived from it may be published without the prior written consent of the author LOAN Theses may not be lent to individuals, but the University Library may lend a copy to approved libraries within the United Kingdom, for consultation solely on the premises of those libraries Application should be made to: The Theses Section, University of London Library, Senate House. Malet Street, London WC1E 7HU. REPRODUCTION University of London theses may not be reproduced without explicit written permission from the University of London Library Enquiries should be addressed to the Theses Section of the Library. Regulations concerning reproduction vary according to the date of acceptance of the thesis and are listed below as guidelines. A. Before 1962. Permission granted only upon the prior written consent of the author. (The University Library will provide addresses where possible). B 1962- 1974 In many cases the author has agreed to permit copying upon completion of a Copyright Declaration C. 1975 - 1988 Most theses may be copied upon completion of a Copyright Declaration. D. 1989 onwards. Most theses may be copied. This copy has been deposited in the Library of ---------------------------------------- 0 This copy has been deposited in the University of London Library, Senate House, Malet Street, London WC1E 7HU.
-
Upload
khangminh22 -
Category
Documents
-
view
3 -
download
0
Transcript of UNIVERSITY OF LONDON THESIS

S H I ITEM BARCODE
REFERENCE ONLY19 1783602 X
UNIVERSITY OF LONDON THESIS
D egree T V ? Year Nam e of A u t h o r 6 , rt/Sr/w/ ,
COPYRIGHTThis is a thesis accepted for a Higher D egree of the University of London It is an unpublished typescript and the copyright is held by the author All persons consulting the thesis must read and abide by the Copyright Declaration below.
COPYRIGHT DECLARATIONI recognise that the copyright of the above-described thesis rests with the author and that no quotation from it or information derived from it may be published without the prior written consent of the author
LOANT h eses may not be lent to individuals, but the University Library may lend a copy to approved libraries within the United Kingdom, for consultation solely on the prem ises of those libraries Application should be m ade to: The T h eses Section, University of London Library, Sen ate H ouse. Malet Street, London WC1E 7HU.
REPRODUCTIONUniversity of London th e se s may not be reproduced without explicit written permission from the University of London Library Enquiries should be addressed to the T h eses Section of the Library. Regulations concerning reproduction vary according to the date of acceptance of the thesis and are listed below as guidelines.
A. Before 1962. Perm ission granted only upon the prior written consent of the author. (The University Library will provide ad d resses where possible).
B 1 9 6 2 - 1974 In many c a s e s the author has agreed to permit copying uponcompletion of a Copyright Declaration
C. 1975 - 1988 Most th eses may be copied upon completion of a CopyrightDeclaration.
D. 1989 onwards. Most th eses may be copied.
This copy has been deposited in the Library of ----------------------------------------
0 This copy has been deposited in the University of London Library, Sen ate House, Malet Street, London WC1E 7HU.


M e c h a n is m s o f c o l o r e c t a l t u m o r ig e n e s is
ASSOCIATED WITH M U T -Y (MYH) DEFICIENCY AND
IDENTIFICATION OF NOVEL PREDISPOSITION GENES
IN THE MULTIPLE ADENOMA PHENOTYPE
Christina Thirlwell
Thesis submitted for the degree o f
Doctor o f Philosophy
in the
University o f London
U.CL
Cancer Research UK
July 2008

UMI Number: U591B41
All rights reserved
INFORMATION TO ALL USERS The quality of this reproduction is dependent upon the quality of the copy submitted.
In the unlikely event that the author did not send a complete manuscript and there are missing pages, these will be noted. Also, if material had to be removed,
a note will indicate the deletion.
Dissertation Publishing
UMI U591B41Published by ProQuest LLC 2013. Copyright in the Dissertation held by the Author.
Microform Edition © ProQuest LLC.All rights reserved. This work is protected against
unauthorized copying under Title 17, United States Code.
ProQuest LLC 789 East Eisenhower Parkway
P.O. Box 1346 Ann Arbor, Ml 48106-1346

The work presented in this thesis is my own.
All collaborators are named in relevant chapters.
Christina Thirlwell 31st July 2008
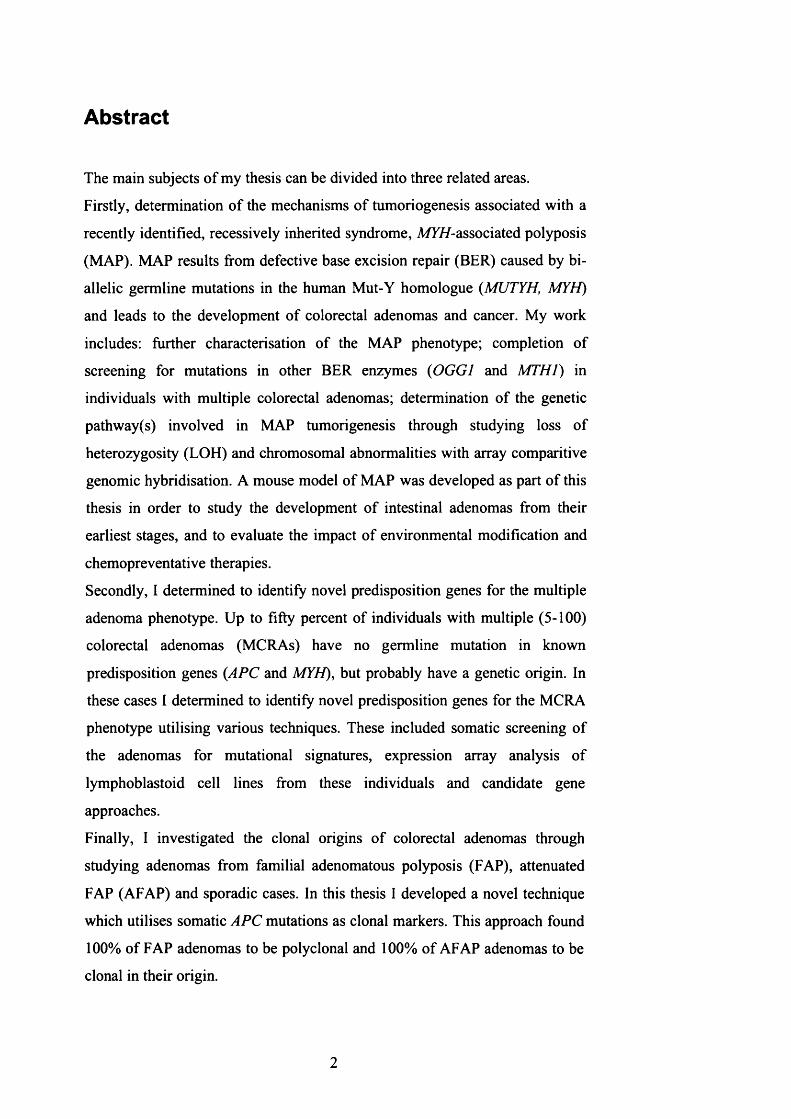
Abstract
The main subjects of my thesis can be divided into three related areas.
Firstly, determination of the mechanisms of tumoriogenesis associated with a
recently identified, recessively inherited syndrome, MK//-associated polyposis
(MAP). MAP results from defective base excision repair (BER) caused by bi-
allelic germline mutations in the human Mut-Y homologue (MUTYH, MYH)
and leads to the development of colorectal adenomas and cancer. My work
includes: further characterisation of the MAP phenotype; completion of
screening for mutations in other BER enzymes (OGGI and MTH1) in
individuals with multiple colorectal adenomas; determination of the genetic
pathway(s) involved in MAP tumorigenesis through studying loss of
heterozygosity (LOH) and chromosomal abnormalities with array comparitive
genomic hybridisation. A mouse model of MAP was developed as part of this
thesis in order to study the development of intestinal adenomas from their
earliest stages, and to evaluate the impact of environmental modification and
chemopreventative therapies.
Secondly, I determined to identify novel predisposition genes for the multiple
adenoma phenotype. Up to fifty percent of individuals with multiple (5-100)
colorectal adenomas (MCRAs) have no germline mutation in known
predisposition genes (.APC and MYH), but probably have a genetic origin. In
these cases I determined to identify novel predisposition genes for the MCRA
phenotype utilising various techniques. These included somatic screening of
the adenomas for mutational signatures, expression array analysis of
lymphoblastoid cell lines from these individuals and candidate gene
approaches.
Finally, I investigated the clonal origins of colorectal adenomas through
studying adenomas from familial adenomatous polyposis (FAP), attenuated
FAP (AFAP) and sporadic cases. In this thesis I developed a novel technique
which utilises somatic APC mutations as clonal markers. This approach found
100% of FAP adenomas to be polyclonal and 100% of AFAP adenomas to be
clonal in their origin.
2

Acknowledgements
I would like to thank my supervisor Ian Tomlinson for his enormous support,
inspiration and encouragement during the course of my thesis. Daniel
Hochhauser my second supervisor provided continuous encouragement and
stimulating discussion. My thanks also go to all o f my colleagues in the
Molecular and Population Genetics Laboratory, in particular Andrew Rowan,
Kimberley Howarth, Emma Jaeger, Angela Jones, Luis Caijaval, Zoe Kemp
and Stefania Segditsas. Also thanks to all the staff in the Equipment park at
Cancer Research UK for their support in my practical work.
I have had the pleasure of collaborating with Oliver Sieber, Simon Leedham
and Kevin Monahan and would like to thank them for their intellectual and
practical contribution to my thesis.
None of my work would be possible without the patients who agree to take
part in research studies, the support of my colleagues at the Cancer Research
UK Family Cancer Centre and Polyposis Regsitry at St Mark’s Hospital. I am
also very grateful for the funding I received from the Medical Research
Council supporting my thesis.
Finally, I would like to thank my family and friends for their unerring support
and encouragement. In particular, Paul Mulholland for introducing me to Ian
and the MPG lab, and to Rob Deakin for vociferous support in all of my
endeavours.
3

Abbreviations
aa amino acid
AAPC attenuated polyposis coli
Alb albumin
ALK3 activin receptor-like kinase 3
APC adenomatous polyposis coli
BER base excision repair
BMP bone morphogenic protein
BMPR1A bone morphogenic protein receptor type 1A
CCND1 Gl/S-specific cyclin-Dl
CDC4 cell division control protein 4
CDH1 cadherin 1
cDNA complementary DNA
CGH comparative genomic hybridisation
CHEK2 Serine/threonine-protein kinase Chk2
CIN chromosomal instability
Co-SMAD common-mediator SMAD
COX 1/2 cyclo-oxygenase-1/2
CPKl-a casein kinase 1-a
CRC colorectal cancer
CXCR4 C-X-C chemokine receptor type 4
dH20 distilled water
DI DNA index
DNA deoxyribonucleic acid
4

Dsh dishevelled
DSS dextran sodium sulphate
DUT deoxyuridine 5’-triphosphate nucleotidohydrolase
ES cell embryonic stem cell
FAP familial adenomatous polyposis
GSK3P glycogen synthase kinase 3-P
HMPS hereditary mixed polyposis syndrome
HMG-CoA hydroxymethylglutaryl-CoA
HNPCC hereditary nonpolyposis colorectal cancer
HRAS1 Ras association domain-containing protein 7
JPS juvenile polyposis syndrome
kb kilo basepairs
LOH loss of heterozygosity
LRP low density lipoprotein receptor-related protein
MAP MYH associated polyposis
mb mega base pairs
MCR mutation cluster region
MCRA multiple colorectal adenomas
Min multiple intestinal neoplasia
MLH1 human homologue of E.coli MutL
MLPA multiplex ligation-dependent probe amplification
MMR mismatch repair
Moml modifier of Min 1
MSH2 human homologue of E. coli MutS
MSI microsatellite instability
5

MTH1 human homologue of E. coli MutT
MTHF methyl tetrahydrofolate
MYH human homologue of E. coli MutY
NAT2 N-acetyltransferase 2
nm nanometer
NSAID nonsteroidal anti-inflammatory drug
nt nucleotides
OGGI human homologue of E. coli MutM
8-oxo-G 8-oxo-7,8-dihydroxy guanosine
PCR polymerase chain reaction
PJS Peutz-Jeghers syndrome
PMS2 postmeiotic segregation increased 2
POLE2 DNA polymerase epsilon subunit 2
PPAR peroxisome proliferators-activated receptor
PTEN phosphatase and tensin homologue deleted on chromosome 10
PTT protein truncation test
RNA ribonucleic acid
ROS reactive oxidative species
rpm rotations per minute
R-SMAD receptor-regulated SMAD
SMAD human homologue of Drosophila small mothers against
decapentaplegic
SSCP single strand conformation polymorphism
TCF T cell factor
TDG thymine-DNA glycosylase
6

TGF-p transforming growth factor-p
UC ulcerative colitis
UDG uracil-DNA glycosylase
Wifi Wnt inhibitory factor 1
All genes have been italicised throughout the text, whereas proteins are shown
in plain text.
7

Table of Contents1 Introduction.........................................................................................................19
1.1 Colorectal Cancer......................................................................................19
1.1.1 Incidence and Aetiology.................................................................. 19
1.1.2 CRC Risk Factors............................................................................. 20
1.1.3 Natural History, Staging, Treatment and Current CRC Outcome26
1.2 Hereditary Colorectal Cancer Syndromes.............................................42
1.2.1 Hereditary Non-Polyposis Colorectal Cancer............................... 45
1.2.2 Familial Adenomatous Polyposis....................................................47
1.2.3 Hamartomatous Polyposis Syndromes........................................... 52
1.2.4 The Hereditary Mixed Polyposis Syndrome................................. 55
1.2.5 Hyperplastic Polyposis Syndrome.................................................. 55
1.2.6 A/y//-associated Polyposis and CRC..............................................56
1.3 The Multiple Adenoma Phenotype.........................................................65
1.4 Common disease variants and CRC risk................................................ 70
1.5 Aims of this Thesis.................................................................................... 72
2 Materials and Methods.....................................................................................73
2.1 DNA Extraction.........................................................................................73
2.1.1 DNA extraction from blood.............................................................73
2.1.2 DNA extraction from cell lines.......................................................74
2.1.3 DNA extraction from fresh frozen tissue....................................... 75
2.1.4 DNA extraction from formalin fixed paraffin embedded tissue. 75
2.1.5 DNA extraction from laser micro-dissected single crypts...........76
2.1.6 DNA extraction from mouse tail and ear clips..............................77
2.2 RNA Extraction..........................................................................................77
2.2.1 RNA extraction from cell lines.......................................................77
2.2.2 RNA extraction from tissue............................................................ 78
2.3 Spectrophotometry................................................................................... 79
2.4 Polymerase Chain Reaction.................................................................... 79
2.4.1 Purification of PCR products..........................................................80
2.5 Agarose Gel Electrophoresis...................................................................81
2.6 Mutation Detection...................................................................................82
2.6.1 Single-strand Conformation Polymorphism Analysis................. 82
8

2.6.2 Denaturing High Performance Liquid Chromatography using the
WAVE platform...............................................................................................83
2.6.3 Lightscanner Analysis...................................................................... 84
2.6.4 Loss of Heterozygosity Analysis.................................................... 85
2.6.5 MLPA analysis for whole exon deletion or duplication..............86
2.7 Fluorescence cycle-sequencing of PCR products................................ 88
2.8 Cloning of PCR products.........................................................................89
2.9 Cell Culture............................................................................................... 91
2.9.1 Sterile Lymphocyte Separations......................................................91
2.9.2 Feeding Cell Lines............................................................................ 92
2.9.3 Freezing down and re-suspending cells to replace stocks...........92
2.10 Comparative Genomic Hybridisation....................................................92
2.11 Expression-Microarray Analysis........................................................... 97
2.12 Laser Capture Microdissection............................................................ 102
2.13 Immunohistochemistry..........................................................................103
2.14 Mouse husbandry...................................................................................104
2.15 Ethical Approval....................................................................................104
2.16 Solutions / Media...................................................................................104
3 Clinical MYH related studies - Determination of clinico-pathological
features and potential genotype-phenotype correlations in MYH..................110
3.1 Introduction..............................................................................................110
3.2 Methods................................................................................................... 112
3.3 Results......................................................................................................113
3.3.1 Colonic Disease...............................................................................114
3.3.2 Upper Gastro-intestinal disease................................................... 115
3.3.3 Extra-intestinal Manifestations......................................................116
3.3.4 Heterozygote carriers under follow up ........................................ 117
3.3.5 Microadenoma detection................................................................118
3.4 Discussion................................................................................................119
3.4.1 Is there genotype-phenotype correlation in MAP?....................119
3.4.2 MYH and the APC missense variant E1317Q............................. 121
3.4.3 The significance of the heterozygous state................................. 122
3.4.4 Microadenomas occur in MAP......................................................123
9

3.4.5 Current management protocols for MAP - how this study may
help to improve screening criteria...............................................................123
4 Clinical MYH related studies - Determination of presence and potential
underlying mechanisms of genomic instability in MAP...................................126
4.1 Introduction..............................................................................................126
4.1.1 Chromosomal instability (CIN) and colorectal cancer..............126
4.1.2 Methods of measuring CIN...........................................................127
4.1.3 Current understanding of CIN in sporadic colorectal adenomas
and CRC’s using aCGH................................................................................131
4.1.4 Aims of this chapter....................................................................... 133
4.2 Methods................................................................................................... 134
4.3 Results......................................................................................................135
4.3.1 Overview of aCGH analysis........................................................... 135
4.3.2 Genomic locations of aCGH changes............................................140
4.3.3 Magnitude of copy number changes and the possibility of genetic
heterogeneity..................................................................................................141
4.3.4 Conventional LOH analysis........................................................... 141
4.3.5 SNP-LOH analysis.......................................................................... 142
4.3.6 Comparison o f MAP aCGH changes with FAP and sporadic
adenomas.......................................................................................................143
4.4 Discussion................................................................................................144
4.4.1 Evidence of CIN in MAP............................................................... 144
4.4.2 Conventional LOH analysis did not replicate aCGH changes ..147
4.4.3 SNP-LOH demonstrates copy number neutral LOH in MAP... 147
4.4.4 Evidence of LOH in sub-clones within MAP adenomas 148
4.5 Conclusions............................................................................................. 148
5 Development of a mouse model of MAP.................................................... 149
5.1 Introduction............................................................................................. 149
5.1.1 Aims of this chapter.......................................................................151
5.2 Methods...................................................................................................152
5.2.1 Mouse breeding............................................................................. 152
5.2.2 Genotyping....................................................................................... 152
5.2.3 Adenoma, cystic crypt and aberrant crypt focus counts 153
5.2.4 Histology.......................................................................................... 154
10

5.2.5 Molecular analysis o f adenomas.................................................... 154
5.3 Results......................................................................................................155
5.3.1 ApcMin+/'/Myh'A mice bred on C57BL6/SV129 background 155
5.3.2 ApcM,n+/'/Myh'A mice bred on AKR background.......................... 163
5.4 Discussion................................................................................................ 167
5.4.1 ApcMm+/'IMyh'f' mice bred on C57BL6/SV129 background 167
5.4.2 ApcMn+/~/Myh'A mice bred on AKR background........................ 169
5.5 Conclusions..............................................................................................171
6 Identification of potential pathogenic mechanisms underlying the multiple
colorectal adenoma phenotype............................................................................172
6.1 Introduction.............................................................................................. 172
6.1.1 Aims of this chapter....................................................................... 175
6.2 Methods....................................................................................................175
6.3 Results......................................................................................................178
6.3.1 Germline screening o f APC and MYH prior to inclusion into this
study 178
6.3.2 Features of the MCRA patients......................................................179
6.3.3 Microadenoma detection................................................................. 180
6.3.4 Somatic mutation and LOH frequencies..................................... 181
6.3.5 Beta-catenin expression.................................................................. 184
6.4 Discussion................................................................................................ 186
6.4.1 No microadenomas were identified in MCRA cases...................186
6.4.2 No definitive mutational signature was identified in the MCRA
patients’ tumours...........................................................................................186
6.4.3 Nuclear Beta-catenin expression is increased in MCRA tumours
188
6.4.4 MCRA adenomas do not follow the “classical” pathway of
tumorigenesis................................................................................................ 189
6.4.5 Limitations of this study.................................................................190
6.5 Conclusions............................................................................................. 190
7 Lymphoblastoid cell line expression array analysis o f MCRA cases 192
7.1 Introduction............................................................................................. 192
7.1.1 Aims of this chapter....................................................................... 194
7.2 Methods...................................................................................................194
11

7.3 Results......................................................................................................196
7.3.1 Expression micro-array analysis....................................................196
7.4 Discussion................................................................................................204
7.4.1 Transcripts chosen for further study.............................................205
7.4.2 Limitations of lymphoblastoid cell line work.............................206
7.4.3 Future work......................................................................................207
7.5 Conclusions..............................................................................................208
8 Candidate gene screening in MRCA cases...................................................209
8.1 Introduction..............................................................................................209
8.1.1 Selection of candidate genes......................................................... 210
8.1.2 Aims..................................................................................................216
8.2 Methods................................................................................................... 217
8.2.1 Mutation detection...........................................................................217
8.2.2 Immunohistochemistry...................................................................217
8.3 Results..................................................................................................... 218
8.3.1 Mutation detection...........................................................................218
8.3.2 PMS2 immunohistochemistry....................................................... 219
8.4 Discussion................................................................................................219
8.4.1 DNA repair gene non-synonymous SNPs - potential candidates as
low risk alleles..............................................................................................220
8.4.2 Potential role of synonymous SNPs and non-synonymous SNPs
with the same frequency as control populations.......................................221
8.4.3 No potential pathogenic mutations identified in Wnt signalling
genes 222
8.5 Conclusions............................................................................................. 223
9 Investigation of clonal origins in FAP, AFAP and sporadic colonic
adenomas............................................................................................................... 224
9.1 Introduction............................................................................................. 224
9.1.1 The clonal origins of CRC are not fully understood..................224
9.1.2 Markers of clonality in CRC have limitations............................224
9.1.3 Aims of this chapter....................................................................... 226
9.2 Methods...................................................................................................226
9.3 Results.....................................................................................................229
9.3.1 FAP adenomas are polyclonal...................................................... 229
12

9.3.2 AFAP adenomas are clonal............................................................ 233
9.3.3 Sporadic adenomas..........................................................................236
9.3.4 Evidence for “top down” growth in sporadic adenoma
development...................................................................................................237
9.3.5 Stroma did not harbour APC mutations in FAP, AFAP or sporadic
adenomas....................................................................................................... 238
9.3.6 Polyclonal adenomas demonstrated in XO/XY FAP individual
using two different clonal markers............................................................. 239
9.4 Discussion.................................................................................................241
9.4.1 Theories of differing clonal origins of FAP, AFAP and sporadic
adenomas........................................................................................................241
9.4.2 Further work..................................................................................... 244
9.5 Conclusions...............................................................................................244
10 Discussion and Conclusions.........................................................................246
11 Publications and conference proceedings................................................... 246
12 References....................................................................................................... 255
Table of FiguresFigure 1-1 The stepwise model of CRC {Vogelstein, 1988 #642}................. 26
Figure 1-2 Anatomy of the colon, sites of CRC by incidence England 1997-
2000.................................................................................................................. 27
Figure 1-3 Schematic overview of the Wnt signalling pathway.......................33
Figure 1-4 Endoscopic view of tubular, tubulo-villous and villous adenomas
........................................................................................................................... 36
Figure 1-5 H&E stained tubuloadenoma x200 (A) and hamartomatous
juvenile polyposis polyp x200 (B) characterised by mucinous cysts 37
Figure 1-6 Staging of CRC - (National Cancer Institute, U SA )......................38
Figure 1-7 Colectomy specimen and H&E stained adnenoma (x20) from an
FAP patient..................................................................................................... 48
Figure 1-8 The APC gene with functional domains annotated.........................50
Figure 1-9 Genotype/phenotype correlation associated with germline APC
mutations.........................................................................................................51
Figure 1-10 Schematic overview of the sites of action of the BER repair genes
MYH, OGGI and A/77/7. Oxidised guanine is shown in red................... 60
13

Figure 3-1 Dye spray colonoscopy demonstrating a microadenoma
highlighted by the use of indigo-carmine dye spray................................. I l l
Figure 3-2 Colon of MYH E466X homozygous patient (48 years of age)... 114
Figure 3-3 Microadenoma in MYH E466X homozygote, 2 dysplastic crypts
(arrowed)........................................................................................................118
Figure 4-1 Loss of lp (0-46 Mb) in MAP adenoma M 12............................... 135
Figure 4—2 Gain of whole chromosome 7 in MAP adenoma M l.................... 136
Figure 4—3 Gain of whole of chromosome 13 in MAP adenoma M 5............ 136
Figure A-A Loss of 17p (0-20 Mb) and 17q (65-ter) in MAP adenoma M3 . 137
Figure 4—5 Deletion of whole of chromosome 19 in MAP adenoma M3 137
Figure 4—6 Loss of whole chromosome 22 in MAP adenoma M3..................138
Figure 4-7 Summary of aCGH changes in all MAP adenomas for
chromosomes 1 and 7 ................................................................................... 139
Figure 4—8 Summary of aCGH changes in all MAP adenomas for
chromosomes 8 and 9 ................................................................................... 139
Figure 4—9 Summary of aCGH changes for chromosomes 13, 17, 19 and 22
......................................................................................................................... 140
Figure 4—10 LOH at D1S470 in microdissected adenoma MAP 9 (upper
tracing), normal tissue (lower tracing)....................................................... 142
Figure 4—11 SNP-LOH data for MAP adenoma M10. Chromosomes 7 (upper
panel A and C) 12 (lower panel B and D). A and B = normal controls,
with no LOH. Copy number neutral LOH present in C and D ............... 143
Figure 5-1 Adenomas and cystic crypts in the small intestine of Myh deficient
m ice................................................................................................................157
Figure 5-2 Adenomas and aberrant crypt foci in the colon of Myh deficient
m ice................................................................................................................159
Figure 5-3 Mammary gland tumour in ApcMin+/7Myh'A mouse (x20) with
squamous cell differentiation arrowed.......................................................160
Figure 5-4 LOH analysis at Ape (A - wt normal, B - Min normal tissue) in
adenomas from ApcMin+A /Myh+/+ (C) and ApcMln+/' /Myh'A (D) mice. LOH
at Ape when present, occurred at the wt allele (arrowed)........................ 161
Figure 5-5 Somatic G>T transversion at nt 3919 of Ape resulting in E1307X
termination codon, A - forward sequence from adenoma DNA and B -
cloned mutant allele.....................................................................................162
14

Figure 5-6 Thymus from ApcMm+/' / Myh~A mouse, H&E sections on the right
demonstrate loss o f abnormal parenchymal architecture (x2) and
lymphocytic infiltration with high grade lymphomatous cells (x40).... 165
Figure 5-7 Mesenteric lymph nodes from ApcMm+A / MyhA mouse, H&E
sections on the right demonstrate loss of abnormal parenchymal
architecture (x2) and lymphocytic infiltration with high grade
lymphomatous cells (x40)............................................................................166
Figure 5-8 Spleen from ApcMm+A / MyhA mouse, H&E sections on the right
demonstrate loss o f abnormal parenchymal architecture (x2) and
lymphocytic infiltration with high grade lymphomatous cells (x40).... 166
Figure 5-9 Transverse H&E sections of small intestine from wt and ApcMm+A I
Myh~A mice. No adenomas are seen, lymphocytic infiltrate is evident in
the ApcMin+A / Myh Asection at x4 power..................................................... 167
Figure 6-1 LOH at microsatellite marker D5S346 in MCRA adenoma 182
Figure 6-2 Frameshift mutation in MCRA adenoma APC MCR9 del A 1472
frameshift, stop @ 1506............................................................................. 182
Figure 6-3 Somatic mutation in MCRA adeoma APC MCR5 E1379X (G>T
arrowed)..........................................................................................................183
Figure 6-4 Examples of K-ras and BRAF somatic mutations in MCRA cases
......................................................................................................................... 184
Figure 6-5 p-catenin immunohistochemistry, (A) net membrane score (B)
mean cytoplasmic score (C) mean nuclear score......................................185
Figure 6-6 p-catenin immunohistochemistry in MCRA (A) and sporadic (B)
adenoma both xlOO, crypts demonstrating increased nuclear staining
circled.............................................................................................................185
Figure 7-1 Heatmap of MCRA cases and controls demonstrating difference in
expression in MCRA cases and controls when compared to the median
201
Figure 7-2 Volcano plot of MCRA cases (p) versus controls (c), the red dots
represent the trancripts which are expressed in cases but not controls with
> 3 fold change and FDR <0.05................................................................. 202
15

Figure 7-3 Scatter plot of MCRA cases versus controls, transcripts plotted
according to fold change and associated statistical significance o f fold
change............................................................................................................. 203
Figure 1-4 Cluster dendrogram demonstrating hierarchical clustering between
MCRA cases and controls...........................................................................204
Figure 8-1 PMS2 immunohistochemistry of normal and MCRA colonic
epithelium both demonstrating normal expression of the PMS2 protein
......................................................................................................................... 219
Figure 9-1 Laser micro-dissection of FAP adenoma, H&E section (x20) on
left and serially micro-dissected crypts demonstrated on right 227
Figure 9-2 Fluorescent SSCP analysis of FAP adenoma demonstrating
aberrant bands in MCR6 and MCR9, these were sequenced and are
presented in Figure 9 -3 ............................................................................... 230
Figure 9-3 Polyclonal FAP adenoma (1), crypt in orange box wt for MCR6
and MCR9, crypt in red box truncating mutation in MCR9 and crypt in
blue box truncating mutation in MCR6......................................................231
Figure 9^4 Polyclonal FAP adenoma (2) demonstrating two different
mutations in MCR8, 3 crypts dissected within the red box harbour del A
at nt 4364 and 1 crypt dissected from within the blue box harbours ins C
at nt 4373 of APC ......................................................................................... 232
Figure 9-5 Polyclonal FAP microadenoma (3) patient, A - H&E stain x40, B
- micro-dissected crypts . 3 crypts in blue box have truncating mutation
in MCR6 and 3 crypts in red box are wt for MCR6................................. 233
Figure 9-6 Adenoma from AFAP adenoma (1), A - H&E x40, B - PALM
laser capture slide. Each crypt dissected was found to have second and
third hits at APC in MCR5 and MCR11.................................................... 235
Figure 9-7 AFAP adenomas 2 (upper panel) and 3 (lower panel). Adenoma 2
harboured G1552X nonsense mutation in all crypts studied and adenoma
3 harboured ins A at nt 4662 of APC in each crypt.................................235
Figure 9-8 Mixed crypt identified in sporadic adenoma 1, A - H&E stain x40,
B -fi-catenin immunohistochemostry demonstrating increased nuclear
staining in upper half of crypt, C - Ki-67 immunohistochemistry
demonstrating higher rate of cellular proliferation in upper half o f crypt
........................................................................................................................ 237
16

Figure 9-9 Evidence of “top down” growth in mixed crypt from sporadic
adenoma, the top (dyplastic) half of the crypt when micro-dissected
harboured a 4bp deletion at nt 4388 APC, the bottom half was wt 238
Figure 9-10 Fluorescent in-situ hybridisation for X and Y chromosomes on
adenoma of XO/XY patient with FAP, A - H&E stain x20, B - crypts
demonstrated with FISH, C - FISH demonstrating XY and XO crypts
adjacent to each other, X chromosome = green and Y chromosome = red,
DAPI = blue. D - XO crypt, E = XY crypt...............................................239
Figure 9-11 LOH analysis at codon 1309 APC in adenoma (1) from XO/XY
patient with FAP. A - H&E stain x20, B - crypt 1 has no LOH and crypts
2-4 have LOH of the somatic (wt) allele of APC demonstrating different
clonal origin.................................................................................................. 240
Table of TablesTable 1-1 TNM staging with approximate Modified Dukes staging for CRC 39
Table 1-2 Frequency of CRC diagnoses by Dukes stage with 5 year survival
........................................................................................................................... 39
Table 1-3 Summary of inherited CRC syndromes, inheritance and method of
discovery (AD - autosomal dominant; AR - autosomal recessive; BER -
base excision repair; CGH - comparative genomic hybridisation) 44
Table 1-4 Amsterdam criteria (Vasen, Watson et al. 1999)............................. 45
Table 3-1 Comparison of phenotype and extracolonic features o f FAP,
HNPCC and MAP........................................................................................ I l l
Table 3-2 Summary of bi-allelic germline MYH mutations of the 34
individuals studied....................................................................................... 113
Table 3-3 Comparison of bi-allelic E466X and Caucasian phenotypes 115
Table 3-4 Upper gastro-intestinal disease by germline MYH mutation 116
Table 3-5 Comparison of extracolonic features and extracolonic cancers
between E466X and Y 165C/G382D germline MYH mutation carriers 117
Table 4-1 aCGH fluorescence ratios with corresponding log2 ratios for diploid
and tetraploid tumours................................................................................. 128
Table 4-2 Overview of aCGH studies in CRC.................................................132
17
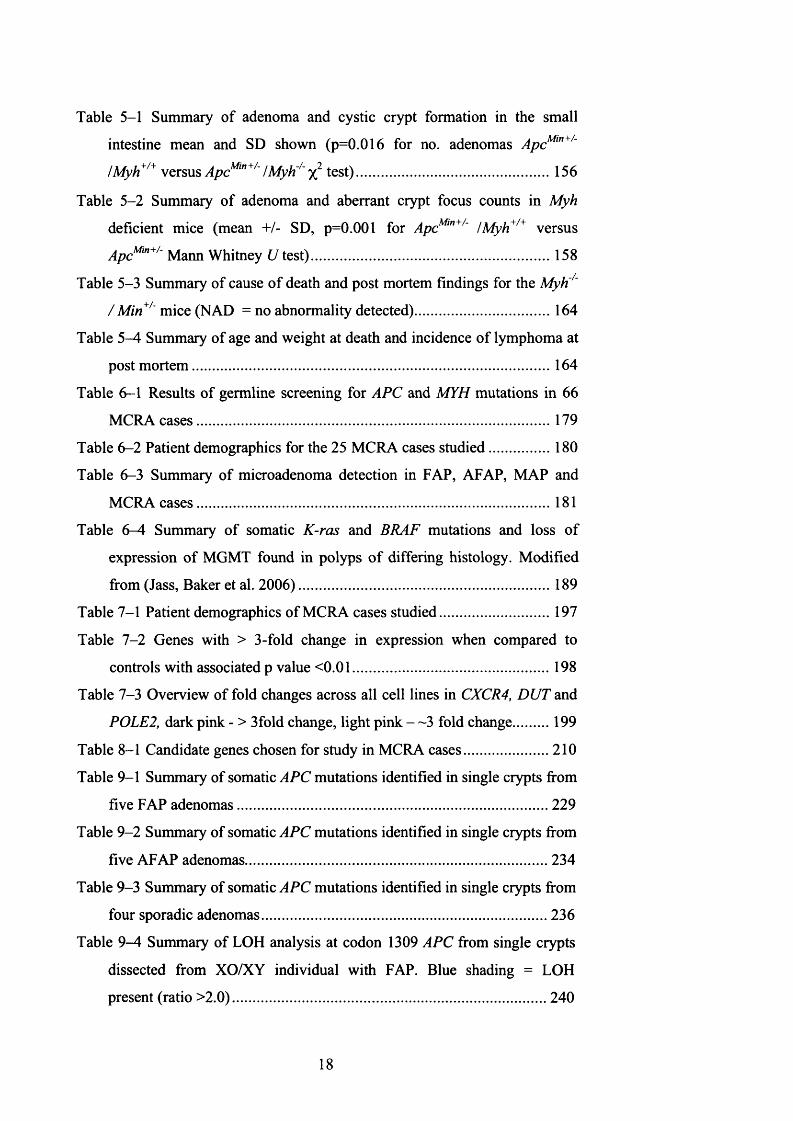
Table 5-1 Summary of adenoma and cystic crypt formation in the small
intestine mean and SD shown (p=0.016 for no. adenomas ApcMlTt+A
!Myh+/+ versus ApcM,n+/~ /Myh'A test)......................................................156
Table 5-2 Summary of adenoma and aberrant crypt focus counts in Myh
deficient mice (mean +/- SD, p=0.001 for ApcMin+/~ /Myh+/+ versus
ApcMm+/ Mann Whitney U test).................................................................. 158
Table 5-3 Summary of cause of death and post mortem findings for the MyH/'
/ Min+/~ mice (NAD = no abnormality detected)...................................... 164
Table 5-4 Summary of age and weight at death and incidence of lymphoma at
post mortem...................................................................................................164
Table 6-1 Results of germline screening for APC and MYH mutations in 66
MCRA cases..................................................................................................179
Table 6-2 Patient demographics for the 25 MCRA cases studied..................180
Table 6-3 Summary of microadenoma detection in FAP, AFAP, MAP and
MCRA cases..................................................................................................181
Table 6-4 Summary of somatic K-ras and BRAF mutations and loss of
expression of MGMT found in polyps o f differing histology. Modified
from (Jass, Baker et al. 2006).................................................................... 189
Table 7-1 Patient demographics of MCRA cases studied............................... 197
Table 7-2 Genes with > 3-fold change in expression when compared to
controls with associated p value <0.01.......................................................198
Table 7-3 Overview of fold changes across all cell lines in CXCR4, DUT and
POLE2, dark pink - > 3fold change, light pink — 3 fold change 199
Table 8-1 Candidate genes chosen for study in MCRA cases........................210
Table 9-1 Summary of somatic APC mutations identified in single crypts from
five FAP adenomas......................................................................................229
Table 9-2 Summary of somatic APC mutations identified in single crypts from
five AFAP adenomas................................................................................... 234
Table 9-3 Summary of somatic APC mutations identified in single crypts from
four sporadic adenomas...............................................................................236
Table 9—4 Summary of LOH analysis at codon 1309 APC from single crypts
dissected from XO/XY individual with FAP. Blue shading = LOH
present (ratio >2.0)...................................................................................... 240
18

Introduction
1.1 Colorectal Cancer
1.1.1 Incidence and Aetiology
Colorectal cancer (CRC) is diagnosed in 35,000 people per year
(approximately 100 people per day) in the United Kingdom. CRC is a
common form of malignancy in developed countries but is much less common
in developing countries. Worldwide, one million cases are diagnosed per
annum. In the UK it is the second most common cause of cancer-related death
with a mortality of 17,000 people per year. CRC accounts for 13% of all
cancers in the UK and is the second most commonly diagnosed cancer in
women following breast cancer and the third most common cancer in men
following prostate and lung cancer (Cancer Research UK statistics,
http://info.cancerresearchuk.org/cancerstats/).
Eighty three percent of CRC occurs in people who are 60 years of age or older
[(Office for National Statistics. Cancer statistics registrations: Registrations
for cancer diagnosed in 2002, England vol. Series MB1 no 33. London;
National Statistics, 2005), (Welsh Cancer Intelligence and Surveillance unit.
2005. www.wcisu.wales.nhs.uk) (ISD Online. Cancer incidence and mortality
data. 2005 www.isdscotland.org ) (Northern Ireland Cancer Registry. Cancer
statistics. 2005. www.qub.ac.uk/nicr ), (Cancer Research UK. Information
Resource Centre, 2006 info.cancerresearchuk.org)]. The male:female ratio is
1.2:1.0, the lifetime risk for men is 1:18 and women 1:20.
Ninety percent of CRC cases are adenocarcinomas, the vast majority of which
arise from adenomas. Adenomas are benign, relatively common lesions
occurring in approximately one third of the European and American
populations (Midgley & Kerr, 1999). It is thought that up to 10% of adenomas
progress to invasive cancer (Scholefield, 2000). Adenomas which are most
likely to progress to adenocarcinoma are o f larger size with villous histology
and exhibit severe dysplasia (Terry et al., 2002).

In general terms, there is no association between socio-economic deprivation
and CRC risk in the UK. Within the UK there is no associated geographical
distribution of CRC cases as seen with lung and stomach cancer (Quinn
MWH, 2005).
Interestingly, epidemiological studies have demonstrated a rapid increase in
CRC risk in migrants moving from low to high risk countries (Boyle &
Langman, 2000). The risk for second generation migrants is double that of the
first, most likely due to the “Westernisation of the diet” (Flood et al., 2000).
When considering these studies, other factors need to be taken into
consideration such as differences in CRC reporting between countries,
availability and provision of local heath care and variation in life expectancy
between developed and developing countries.
1.1.2 CRC Risk Factors
Over the last thirty years significant progress has been made in determining
risk factors not only for CRC but for cancer in general in terms of inherited
predisposition, lifestyle and attitudes towards health. Poor diet, obesity, lack
of physical exercise and alcohol and tobacco use are known to contribute to
many cancers (Doll, 2003). It has been predicted that two thirds of CRC could
be prevented by changes to diet and lifestyle (Doll & Peto, 1981).
I will discuss the following in relation to CRC.
Diet
The incidence of CRC is higher in populations with a “westernised diet”, who
also have higher incidence of obesity and sedentary life style.
An observation by Burkitt in 1969 (Burkitt, 1969) suggested a link between
dietary fibre intake and CRC, in that CRC appeared to have a similar
geographical distribution to diverticular disease - which is associated with low
dietary fibre intake. Since then it has been determined that it is the insoluble as
opposed to the soluble dietary fibres which promote bacterial fermentation in
the large bowel and increased stool bulk - and hence protection against CRC.
Cummings et al (Cummings & Englyst, 1987; Englyst et al., 1987)
demonstrated a role of starched resistant to digestion in the small bowel which
then promotes fermentation in the large bowel (in a similar way to fibre) with
20

production of fatty acids. Of these fatty acids it is thought butyrate confers the
most protection as it has been shown to reduce the liability of epithelial cells
to malignant change.
Specific studies in to the amount of red meat, fibre, fat, vitamin and
micronutrients have determined that a diet high in fibre, fish, dairy fat, fruit
and vegetables and low in red and processed meat is the healthiest diet in
terms of CRC prevention. The European Prospective Investigation Into Cancer
and Nutrition (EPIC) study demonstrated a significantly increased CRC risk of
55% in those with lOOg/day increased intake of red and processed meat (Norat
et al., 2005). This study also demonstrated the protective effect of a high fibre
diet - particularly if the fibre is sourced from fresh fruit and vegetables. At the
present time in the UK, 75% of the population are failing to eat the
recommended five portions of fruit and vegetables per day (National Statistics
Health Survey for England 2004 and 2005).
Obesity
It is predicted that up to 11% of CRC in developed countries is associated with
being overweight or obese. CRC risk increases by 15% in overweight and
33% in obese individuals (Bergstrom et al., 2001). This relationship is most
obvious in men and pre-menopausal women (Murphy et al., 2000). A
worrying statistic is that of the increasing incidence of obesity in both men and
women in the UK, between 1995 and 2004 the percentage of obese men rose
from 15% to 24% and women from 18% to 24% (2005) (National Statistics
Health Survey for England 2004, 2005).
Physical exercise
Few studies have specifically addressed CRC in relation to exercise. In studies
looking at risk factors in the broader context, men with higher levels of
activity throughout their lives are at lower risk of colon cancer but this risk
reduction has not been statistically associated with rectal cancer (Wei et al.,
2004); (Slattery et al., 2003); (Viano H, 2002).
Alcohol and tobacco
A meta-analysis of eight cohort studies has demonstrated an increased CRC
risk of 16% in people who drink 30-45g alcohol/day and 41% in those
21

drinking >45g alcohol/day (Cho et al., 2004). Alcohol is likely to have a
stronger effect in those with poor dietary folate in take.
Inflammatory disease o f the large bowel
Inflammatory syndromes affecting the large bowel namely Crohn’s disease
and Ulcerative colitis (UC) predispose to CRC. In UC the lifetime CRC risk is
40% (Gillen et al., 1994) (Levin, 1992) (Sugita et al., 1991). There is also
some evidence to suggest that there is a genetic element in CRC development
in UC as there is a higher sibling relative risk of CRC when compared to the
general population (Satsangi et al., 1998). A potential linkage locus on
chromosome 12 has been identified for UC (Parkes et al., 2001). UC-related
CRCs have several distinct features when compared to sporadic CRC, namely
there is a predominance of left sided, multiple, mucinous cancers which often
arise from flat adenomas rather than polypoid adenomas (Colliver et al., 2006)
(Crawford et al., 2005).
The incidence of precursor areas of dysplasia is as common in the right side of
the colon as the left - which suggests there are other factors present in the
transition from dysplasia to neoplasia. A “field effect” has been suggested by
Rutter (Rutter et al., 2004). More recently a mechanism has been suggested by
Castellone et al (Castellone et al., 2005) whereby increased levels of
inflammatory cyclooxygenases inhibit the degradation of P-catenin through
the binding o f prostaglandin E2 to its receptor. This activates a G-protein
coupled receptor (Gas) which in turn binds axin. Axin complexed with APC
and GSK3/3 phosphorylate p-catenin leading to accumulation and nuclear
entry whereby target genes are transcribed resulting in an increased rate of
cellular proliferation.
Pharmaceutical agents affecting CRC risk
Non-steroidal anti-inflammatory drugs (NSAIDs)
There is strong evidence to support a protective effect of non-steroidal anti
inflammatory drugs (NSAID) use in adenoma development and progression to
CRC. This effect was first observed in large population based studies where
NSAIDs were ingested for other medical indications and followed up as a
22

result of astute clinical observation (reviewed in(DuBois et al., 1996)). Aspirin
has been in longest use with a recent study including 10 years of follow up
data demonstrating a reduced risk of 40-50% (Chan et al., 2005). Two
randomised controlled trials have also supported the finding that aspirin use
reduces adenoma formation (Baron et al., 2003) (Sandler et al., 2003).
The protective mechanism of NSAIDs is through the inhibition o f COX-2,
which in turn slows adenoma development and growth (Ricchi et al., 2003).
COX-2 is an inducible enzyme which regulates prostaglandin synthesis.
Prostaglandins promote many varied biological effects including
immunological induction of inflammatory processes, vascular endothelial
integrity, reproductive regulation, nerve growth production and development,
bone metabolism and activation of nuclear hormone receptors (via it’s
metabolites) (Dubois et al., 1998). COX-2 is over-expressed in 50% of
adenomas and 85% of CRCs. In the same samples, COX-1 expression
remained unchanged between normal mucosa and CRC (Eberhart et al., 1994).
COX-2 has been demonstrated to promote tumour-associated angiogenesis,
although the mechanism of this remains unclear (Dormond et al., 2001).
Other members of the NSAID family, sulindac (both COX-1 and 2 inhibitor)
and celecoxib (a selective COX-2 inhibitor), have been used in the prevention
and treatment of individuals with familial adenomatous polyposis (FAP)
(Nugent et al., 1993) (Phillips et al., 2002) (Giardiello, 1994) (Debinski et al.,
1995).
The Colorectal Adenoma/carcinoma Prevention Programme (CAPP (formerly
Concerted Action Polyp Prevention)) studies set out to prospectively address
the preventative impact of NSAIDs and diet in patients with FAP (CAPP 1
study) and more recently HNPCC (CAPP 2 study). The CAPP studies are
international, multi-centre randomised controlled trials. CAPP 1 investigated
the effects of aspirin (600mg/d) and/or resistant starch (30g/d) in 206 FAP
carriers. One year follow up found that although there was not a significant
decrease in polyp number, the mean largest polyp size was reduced in the
aspirin only group. Intestinal crypt length was also affected in that those
individuals treated with starch had significantly shorter crypts, and those on
aspirin had longer crypts and 37% increased crypt cell proliferation rate. It
was suggested that both interventions have a protective effect but with
23

differing mechanisms (Bum et al., 1998) (Mathers et al., 2003). CAPP 2 is
investigating the impact of aspirin and resistant starch (at the same dose as
CAPP 1) in 1000 individuals with HNPCC. Recruitment was completed in
March 2007 and results awaited.
The impact of NSAIDs on adenoma and CRC development have been
confirmed in animal models. The ApcMtn+/ mouse, the ApcA?16 mouse (both
models of FAP), azoxymethane (AOM) treated rat and the nude mouse
xenograft assay have all demonstrated that either non-selective inhibition of
COX-1 and -2 or COX-2 inhibition alone suppress adenoma multiplicity and
CRC cell growth. Polyp multiplicity was reduced in the FAP mouse models
using celecoxib and rofecoxib respectively (Jacoby et al., 2000) (Oshima et
al., 2001). Celecoxib use led to decreased tumour incidence, multiplicity and
growth in AOM treated rats (Reddy et al., 2000); (Kawamori et al., 1998). In
the nude mouse celecoxib caused reduced colon carcinoma cell growth and
also demonstrated the absence of toxicity to normal gut mucosa whilst using
COX-2 selective inhibitors (Williams et al., 2000). This evidence is further
supported by crossing ApcMin mice with COX-2 knockout mice and mice
lacking the prostaglandin E2 receptor (Oshima & Taketo, 2002). These
animals develop fewer adenomas therefore demonstrating the significance of
both COX-2 and prostaglandin E2 and inflammatory processes per se in the
development o f adenomas.
Statins
Statin (HMG-CoA reductase inhibitor) use has been shown to reduce CRC risk
by 47% when taken over a five year period in a large case-control study
(Poynter et al., 2005). Statins are used to treat hypercholesterolaemia,
ishaemic heart disease and inflammatory bowel disease. This study included
1953 CRC cases and 2015 controls, the observed association remained
significant when other factors such as concurrent aspirin use, physical activity,
hypercholesterolaemia, family history of CRC and ethnic group were taken in
to consideration. However, a recent population-based study with 1809 CRC
cases and controls (Coogan et al., 2007) found no evidence of a decreased
incidence of CRC when statins were used for longer than 3 months - with no
24

consistent trend across dose taken or duration of use. A significant reduction
in the incidence of Stage IV disease was observed (OR 0.49, 95% Cl 0.26-
0.91) in the individuals taking statins. As it has been shown that statins have
anticancer activity in various cancer cell lines (including CRC cell lines) these
observations warrant further study.
Hormonal manipulation - HRT and OCP
Women who have ever used Hormone replacement therapy (HRT) have a 20%
reduction in CRC risk and current users have a 30% risk reduction. A large
meta-analysis found the risk of all bowel cancers to be reduced by 50% within
5-10 years o f use (Grodstein et al., 1999). However, these results were
muddied as further case-control studies demonstrated further reduced risk in
women taking oestrogen only and trans-dermal HRT preparations (Csizmadi
et al., 2004). These results are not entirely reproducible in randomised
controlled trials with a 44% reduced risk of CRC seen in women taking
combined oestrogen and progestogen preparations (Chlebowski et al., 2004),
but another further study found no reduced risk in women taking oestrogen
only HRT (Anderson et al., 2004).
In pre-menopausal women, oral contraceptive (OCP) use has been found to
result in a reduced risk of CRC of up to 18% in a meta-analysis undertaken in
2001 (Fernandez et al., 2001). A more recent case-control study in 2005 found
a non-significant CRC risk reduction of 11% for women who had ever used
OCP’s and a significant reduction in rectal cancer of 50% in women who had
taken OCP’s in the preceding 14 months (Nichols et al., 2005).
Inherited risk factors
Up to 6% of CRC is caused by known inherited genetic syndromes, although
it is likely there is a hereditary component in up to 35% (Lichtenstein et al.,
2000). Inherited genetic factors affect not only a predisposition to CRC but
also concurrent illness, handling of pharmaceutical agents and overall
outcome. The genetic make-up of any individual tumour affects the grade,
response and overall outcome for any individual with CRC. The known
inherited CRC predisposition syndromes will be dealt with in detail in a later
section of this chapter.
25

1.1.3 Natural History, Staging, Treatment and Current CRC
Outcome
1.1.3.1 The Natural history of CRC
The natural history of a cancer can be described as the histological progression
from normal tissue through tumour initiation to distant metastases. In CRC
this progression is well characterised and has been called the adenoma -
carcinoma sequence whereby adenomas form from normal colonic mucosa
and then progress to carcinoma.
Specific mutations have since been identified and associated with different
steps in the adenoma - carcinoma sequence, the “stepwise model of colorectal
carcinogenesis” was suggested by Fearon and Volgestein in 1988 (Vogelstein
et al., 1988) see Figure 1-1. This is explained in detail in section 1.1.3.3
Figure 1-1 The stepwise model of CRC (Vogelstein et al., 1988)
The study of CRC from its earliest stages is facilitated by access to tissue for
study - through colonoscopy and surgery. This can further the understanding
of sequential development of CRC from normal gut mucosa through
adenomatous polyp formation to invasive carcinoma with metastatic spread.
26

The colorectum has nine anatomical regions, the caecum, appendix, ascending
colon, transverse colon, descending colon, sigmoid colon and rectum see
Figure 1-2.
Figure 1-2 Anatomy of the colon, sites of CRC by incidence England
1997-2000 (CRUK Statistics)
The normal colonic mucosa comprises invaginated crypts lined with a single
layer of absorptive cells. These are interspersed with mucin-secreting goblet
cells, neuroepithelial and paneth cells. The mucosa rests on a basement
membrane (muscularis mucosa), lamina propria and muscularis propria. Cell
division is thought to occur in the lower third of the crypt, termed the
“proliferative compartment”. It is here that stem cells reside. As cells migrate
up the crypts the mature and develop differentiating and finally undergoing
programmed cell death - apoptosis. At this point the cells are sloughed off in
to the gut lumen.
Cell turnover in crypts takes approximately 3-6 days (Cotran R, 1999).
27

1.1.3.2 Clonal origins of colorectal tumours
Current theories o f clonality in colonic tumorigenesis
The Unitarian theory of the origin of the four epithelial cell types suggests that
differentiated cell lineages found within the intestinal epithelium arise from a
single stem population (Cheng & Leblond, 1974). Stem cells, due to their
longevity and capacity for self-renewal, are considered by some to be the
original targets for the mutation(s) required to initiate a neoplasm (Bach et al.,
2000) (Wong & Wright, 1999). The subsequent question is whether such a cell
acts alone or in co-operation with other mutated stem cells. Proponents of an
interaction theory suggest that tumours are not initially clonal and that any
later apparent clonality is the consequence of outgrowth of a dominant clone
(Alexander, 1985) (Rubin, 1985).
Clonality studies of neoplasms are therefore of great relevance to our
understanding o f tumourigenesis. To date the study of clonality in human
tissue has relied on utilising natural mutations or polymorphisms which can be
used as “markers” of clonality.
The clonality o f colonic adenomas and tumours is a source of some debate.
Early X-chromosome inactivation studies examining the status of tumours
from female patients mosaic for various X-linked genes were conflicting.
Beutler reported a polyclonal colorectal carcinoma (Beutler et al., 1967) and
Hsu described polyclonal adenomas (Hsu et al., 1983) based on gel
electrophoresis analysis o f X-inactivation mosaicism of G6PD isoenzymes.
Fearon et al used DNA rather than protein polymorphisms and examined X-
inactivation patterns of the phosphoglycerate kinase (PGK) gene, using
restriction fragment length polymorphisms. They found that adenomas and
carcinomas taken from female patients with sporadic and familial
adenomatous polyposis (FAP) associated lesions, had a consistently
monoclonal pattern of X-chromosome inactivation (Fearon et al., 1987). It
should be noted however that patch size was overlooked in these studies, and
it is possible that tumours were covertly polyclonal but appeared monotypic as
they arose within a large X linked patch. Following this, Novelli et al
(Novelli et al., 2003) studied Sardinian females heterozygous for the glucose-
28

6-phosphatase (G6PD) Mediterranean mutation (563 C—»T) and heat
deactivated the defective gene followed by enzyme histochemistry to
demonstrate glucose-6-phosphate activity. Crypts were arranged in hexagonal
arrays in large patches, with irregular patch borders, containing up to 450
individual crypts with only 8% of crypts situated on patch borders. For a
polyclonal tumour to appear heterotypic for an X-inactivated gene it has to
occur on a patch border and thus the large patch size in the colon means that
X-inactivation studies are heavily biased toward showing colorectal tumour
monoclonality.
Direct observation, rather than the indirect methods previously utilised led to
some confounding results. Novelli and colleagues (Novelli et al., 1996)
studied a highly unusual individual who had a diagnosis of FAP and was also
a sex chromosome mixoploid chimera (presumably as a consequence of a
dicentric Y chromosome). Thus his tissues were a mosaic with the majority -
some 80% of cells, being XY and the remaining 20%, XO. The detection of
the Y chromosome in the excised colonic tissues provided an excellent binary
marker for lineage analysis. Of the 263 adenomas analysed, 246 were wholly
XY, 4 were entirely XO, while 13 were o f mixed XO/XY genotype. When
considering only the tumours containing the XO lineage, 13/(13 + 4), or 76%
of all adenomas appeared to be polyclonal. A very similar result was produced
in a study using mice heterozygous for the multiple intestinal neoplasia (Min)
allele o f the adenomatous polyposis coli {Ape) gene and chimaeric for the
lineage reporter gene ROSA 26 expressing lacZ. 22 of 251 adenomas were
heterotypic for the blue (ROSA 26) and white (non-ROSA 26) lineages.
Applying the same ratio as Novelli et al, gave an adenoma polyclonal fraction
of 79% (Merritt et al., 1997).
Three hypotheses have been proposed to explain tumour polyclonality.
1. Adenoma “pseudo” mosaicism caused by focal loss of the lineage
marker in otherwise clonal dysplastic tissue.
2. Random / regional collision between independently arising neoplasms
as a consequence of high tumour multiplicity in FAP patients (Novelli et al.,
1996) and chimeric Min mice (Merritt et al., 1997).
To test this hypothesis Thliveris et al reduced tumour multiplicity in the
chimaeric mouse model described above by introducing homozygosity for the
29

tumour resistance allele of Mom 1. Overall tumour multiplicity was reduced 8-
fold but the percentage of mixed tumours ranged from 8-63%, with a mean of
22% (Thliveris et al., 2005). This is higher than would be expected if
heterotypic tumours are indeed formed through random collision.
3. Active interaction between adjacent crypts. Possible mechanisms
include microheterogeneity of tumour susceptibility where local stroma
promotes somatic mutation in adjacent crypts - the so-called landscaper effect
or stem cell interaction between neighbouring intiated crypts.
To date no firm conclusion has been drawn as to which of these theories holds
true.
Niche succession
Several theories have been put forward to suggest how a single mutated stem
cell in normal intestinal crypt can then proliferate to dominate the whole crypt
(a monocryptal clone) - this has been termed “niche succession”. Possible
mechanisms resulting in niche succession include genetic drift, selective
advantage or “hitchhiking”. Genetic drift can occur through an imbalance in
symmetric and asymmetric division (or death) of stem cells, therefore altering
the balance of the number of clones within a normal intestinal crypt. Selective
advantage or “natural selection” is only possible in a population demonstrating
three characterstics i) variation within the population ii) variation which is
heritable and iii) variation which affects the progeny. Therefore when
considering mutagenesis in the intestinal crypt, genetic instability results in the
production of many heritable genetic variants which are then selected for the
growth advantage they confer to the cell. It is equally possible that the
heritable variants confer a selective disadvantage in that they may trigger
apoptosis and cell death. A malignant cell population therefore fulfils the
criteria for natural selection - resulting in the selection of cells harbouring
mutations which confer a growth advantage (Nowell, 1976). Maley et al
suggested that certain mutations found within malignant cells are
evolutionarily “neutral” in that they confer no selective advantage or
disadvantage to the cell. When such mutations are present in cells which also
contain a selectively advantageous allele these “neutral” mutations hitch-hike
alongside the strongly selected advantageous allele (Maley et al., 2004).
30

Crypt fission and clonal expansion
Following niche succession and formation of a monocryptal clone the next
step in the development o f a microadenoma is the expansion of this clone in to
the surrounding tissue.
Studies in human and mouse tissue have demonstrated clusters of
phenotypically similar crypts found together in patches in the intestinal
mucosa (Taylor et al., 2003) (Greaves et al., 2006) (Park et al., 1995). It has
been suggested that a process of “crypt fission” whereby crypts bifurcate and
divide through longitudinal division is responsible for this. Crypt fission is
certainly the mechanism by which intestinal crypts multiply in the post-natal
period (Maskens & Dujardin-Loits, 1981) and also during regeneration of gut
mucosa following radiation (Caimie & Millen, 1975). It has been calculated
that the crypt fission cycle (the time taken for a single crypt grow and then
produce two daughter crypts by crypt fission) is 108 days in the mouse
jejunum and anything from 9-18 years in the human (Bjerknes, 1986;
Totafumo et al., 1987). In pathological conditions such as inflammatory bowel
disease, FAP, sporadic and hyperplastic adenomas, the rate of crypt fission
increases (Cheng et al., 1986) (Bjerknes et al., 1997) (Wasan et al., 1998;
Wong et al., 2002).
The mutator phenotype hypothesis is based on the observation that malignant
cells accrue genomic alterations (mutations) at a higher rate than normal
somatic cells. It is estimated that a malignant cell has up to 1012 genomic
alterations (Tomlinson et al., 2002). This hypothesis suggests that early
mutations which allow the maintenance of genetic stability result in an
increased mutation rate in that cell and overall may be one of the main
mechanisms driving tumorigenesis (Loeb, 2001). A increased mutation rate
per se may not be sufficient to initate tumourigenesis - in that individuals with
HNPCC with MMR defects develop the same number of bowel tumours as the
general population. In HNPCC however a higher number of these tumours
become malignant. Additionally, a raised mutation rate may in fact be
detrimental if it results in the activation of apoptotic mechanisms. Therefore it
may be that the mutator phenotype simply enables the progression to cancer to
occur at an increased rate (Tomlinson & Bodmer, 1999).
31

There remains much to be determined as to the mechanisms underlying the
expansion of a few dysplastic crypts (microadenoma) to an adenoma and
potentially a carcinoma and whether adenomas are truly monoclonal or
polyclonal in their origin.
1.1.3.3 The stepwise model of colorectal carcinogenesis
The adenoma-carcinoma sequence describes a series of (epi)genetic and
pathological changes which occur in stepwise progression from normal bowel
mucosa through to carcinoma (Vogelstein et al., 1988). It is thought that the
progression from adenoma to carcinoma takes anything from 10 to 40 years
(Ilyas et al., 1999).
In sporadic CRC (accounting for ~ 90% of cases), the adenoma-carcinoma
sequence is usually initiated by bi-allelic mutation of the adenomatous
polyposis coli (APC) tumour suppressor gene. It is therefore described as a
gatekeeper gene in this context as it appears APC mutation must occur before
subsequent genetic changes (Levy et al., 1994). The bi-allelic loss of APC
follows Knudsons two-hit hypothesis for tumour suppressor genes (Knudson,
1971). In normal circumstances, tumour suppressor genes inhibit cellular
turnover and growth, and therefore growth inhibition is lost when both alleles
of the tumour suppressor gene are either mutated or lost through chromosomal
changes. Oncogenes, in contrast, exert their effect through stimulation of
cellular proliferation and growth. Proto-oncogenes are the non-mutated (wild
type) version of oncogenes. Mutations in proto-oncogenes lead to
inappropriate or excessive expression of their protein resulting in accelerated
cellular proliferation. This occurs when only one allele is mutated.
Up to 80% of sporadic adenomas and CRC’s harbour somatic APC mutations
(Cottrell et al., 1992) (Powell et al., 1992) (Nakamura et al., 1992). APC
mutations have also been found in microadenoma pre-cursor lesions (Smith et
al., 1994) (Otori et al., 1998).
It therefore follows that bi-allelic APC mutations are the initiating step in
adenoma development and subsequent genetic and epigenetic changes are
required for adenoma growth and progression.
32

1.1.3.4 The Wnt signalling pathway
Bi-allelic inhibition of APC leads to Wnt signalling dysregulation. Wnt
signalling is responsible for driving epithelial proliferation in the bowel
epithelium.
Wnt-1 J dishevelled ------1 , GSK3-IFrizzled
phosphorylation
GSK3-I
APCAPCActin
■catenii iteniiAs<
b-TRCPRac
Microtubule:
APC/ Target \
C a te ^ 9enese9- Ic-myc, I(Tcf V e fe lin D1
b-catenin)EB
Figure 1-3 Schematic overview of the Wnt signalling pathway
One of the key elements of the Wnt signalling pathway is /3-catenin which is
found both cytoplasmically and in the cell nucleus where it triggers target
gene transcription and cellular proliferation. /3-catenin levels and activity are
therefore tightly controlled. Wnt signalling is initiated by extracellular binding
of the Wnt ligand to a co-receptor comprised of the transmembrane receptor
frizzled and a low density lipoprotein receptor related proten (LRP). This
triggers translocation of axin, a scaffold protein, from the cytoplasm to the
membrane, where it binds to the intracellular tail of the LRP co-receptor. This
results in destabilisation of the /3-catenin degradation complex. (Pinson et al.,
2000) (Mao et al., 2001). f3-catenin degradation is further inhibited via the
inhibition of GSK3-P through hyperphosphorylation of dishevelled (Dsh)
(Yanagawa et al., 1995). This leads to nuclear and cytoplasmic accumulation
33

of fFcatenin resulting in up-regulation of many genes, through stimulation of
transcription factors (T cell factor/lymphoid enhancer factor), resulting in over
production of the proto-oncogenes cyclin D1 and c-myc. (Parker et al., 2002)
(Thompson et al., 2002). Therefore, when the Wnt pathway is dysregulated
high levels of cytoplasmic and nuclear fi-catenin are found, leading to over
transcription of target genes and uncontrolled cellular proliferation.
Following Wnt dysregulation, mutations in the oncogenes K-ras and BRAF
appear to facilitate adenoma growth. Historically, K-ras is associated with
classical adenoma growth whereas BRAF is associated with the serrated
adenoma pathway (Jass et al., 2002). To date, it has not been reported that any
adenomas harbour mutations in both of these oncogenes. Both K-ras and
BRAF are members of the mitogen activated protein kinase (MAPK) pathway
and mutations in these oncogenes are found in adenomas undergoing
transition from early to intermediate stage. K-ras is found in approximately
50% and BRAF in 10% of these adenomas (Bos et al., 1987) (Rajagopalan et
al., 2002) (Yuen et al., 2002).
Adenoma progression from intermediate to late stage is associated with loss of
chromosome 18q, this is observed in approximately 80% of adenomas >5mm
size and 75% of CRC’s (Law et al., 1988) (Vogelstein et al., 1988)
(Vogelstein et al., 1989). There are two tumour suppressor genes SMAD2 and
SMAD4 (small mothers against decapentaplegic) which are thought to be
associated with this loss. They both belong to the transforming growth factor-
p/bone morphogenic pathway (TGF-p/BMP) signalling pathway. Point
mutations have been reported in SMAD2 and SMAD4 in CRC’s (Eppert et al.,
1996) (Thiagalingam et al., 1996).
Transition from late adenoma to carcinoma is associated with loss of
chromosome 17q - where the tumour suppressor gene p53 resides (Fearon et
al., 1987) (Vogelstein et al., 1988). Missense and truncating mutations in p53
correlating with 17q loss of heterozygosity (LOH) have been reported (Baker
et al., 1989) (Baker et al., 1990).
In addition to the adenoma-carcinoma sequence, two other genetic and
epigenetic changes are observed in CRC resulting in genomic instability
which is partly responsible for accumulation of mutations in tumour
34

suppressor genes and oncogenes. Chromosomal instability and microsatellite
instability appear to occur early in tumorigenesis (Jacoby et al., 1995) (Nowak
et al., 2002). Chromosomal instability, demonstrated by whole and partial
chromosomal losses and gains is observed in tumours of FAP patients and
although not completely understood, it is thought that mutations in APC may
be the underlying cause of chromosomal instability (Fodde et al., 2001).
Karyotypic changes namely polyploidy have been observed in in-vitro studies
of cells with mutant APC suggesting that it has a role in chromosomal
segregation. However, there is little evidence to support this finding in vivo
(Fodde et al., 2001) (Kaplan et al., 2001).
Microsatellites are numerous mono, di, tri, or tetra nucleotide repeats in DNA
sequences, both intronic and extronic. They occur throughout the genome.
During DNA replication, mutations can occur in the microsatellite regions
causing misalignment o f the daughter strands - this is termed microsatellite
instability. Therefore MSI is associated with underlying germline mutation in
mismatch repair enzymes which are the cause o f HNPCC cancers (Aaltonen et
al., 1993) (Aaltonen et al., 1994; Boland et al., 1998).
1.1.3.5 Characteristics of adenomatous polyps
Adenomatous polyps develop when the homeostatic balance between cell
proliferation and apoptosis is disrupted in the bowel epithelium. Adenomatous
polyps are discrete lesions comprising dysplastic or neoplastic tissue bounded
by an intact basement membrane. On histological examination, dysplastic
epithelium is characterised by cellular crowding, nuclear abnormalities
(enlargement, elongation and hyperchromatism) and cellular abnormalities
(loss of polarity and loss of stratification). As nuclear size increases, so the
cytoplasmic volume decreases. The proliferative compartment of dysplastic
crypts enlarges from its usual third, and in some cases extends to the crypt
surface. It is thought that adenomas arise from unicryptal lesions which
enlarge and multiply by crypt fission (Chang & Whitener, 1989) (Wasan et al.,
1998) {Wong, 1999 #647, forming microadenomas (clusters of up to 20
abnormal crypts). As the microadenoma continues to grow in, there is further
35

evidence that dysplastic epthelium may also contribute to growth in adjacent
crypts through “top down” growth (Preston et al., 2003). The clonality of
microadenoma/adenoma development and progression is addressed in the
work described in chapter 9.
Adenomatous polyps can be morphologically classified into three distinct
groups, tubular, tubulovillous and villous. Tubular adenomas have a villous
component which makes up less than 25% of the whole adenoma. Villous
components are areas of non-dyplastic fronds which are up to twice the height
of normal crypts. Villous adenomas have a villous component of 75% or
higher whereas tubulo-villous adenomas have a villous component somewhere
between 25 and 75%. As adenoma size increases, so the grade of dysplasia
generally worsens and the villous component enlarges (O’Brien et al., 1990).
Large adenomas with severe dysplasia, but with an intact basement membrane
are termed carcinoma in situ.
Tubular adenoma Tubulo-villous adenoma Villous adenoma
Figure 1-4 Endoscopic view of tubular, tubulo-villous and villous adenomas
1.1.3.6 Characteristics of hamartomatous polyps
Hamartomatous polyps arise in two inherited syndromes, juvenile polyposis
and Peutz-Jeghers syndrome. They do not normally exhibit any of the classical
signs of dysplasia, but can contain areas of adenomatous dysplasia and
invasive carcinoma. Hamartomatous polyps associated with Juvenile
Polyposis are characterised by stromal, mucin-filled cysts which are lined by
36

flattened epithelium. In Peutz-Jeghers syndrome, the polyps are characterised
by normal epithelial mucosa and a tree-like branching smooth muscle core.
Figure 1-5 H&E stained tubuloadenoma \200 (A) and hamartomatous juvenile polyposis polyp x200 (B) characterised by mucinous cysts
1.1.3.7 CRC symptoms and presentation
Symptoms and presentation of CRC may vary considerably depending on the
site and size of the primary tumour. Symptoms may in fact be absent in early
disease or non-specific such as weight loss and anaemia secondary to occult
blood loss. Tumours arising in the distal colon and rectum can present with
rectal bleeding, a change in bowel habit and in late and extreme cases show
symptoms of bowel obstruction and perforation (up to one fifth of patients
present with bowel obstruction or peritonitis secondary to bowel perforation).
37

1.1.3.8 Staging of CRC
CRC staging involves a combination of Dukes staging for CRC (introduced in
1932) and the T (tumour size), N (nodal involvement), M (presence or absence
of distant metastases) system. This combined system gives more precise
clinico/pathological information than either used alone (see Figure 1-6 and
Table 1-1 for TNM staging with the approximations of Dukes staging).
Spread to other organs
Lymph node i
Bloodvessel
SerosaMusclelayers
Submucosa
Mucosa
National C ancer Inatltuta
Figure 1-6 Staging of CRC - (National Cancer Institute, USA)
38

TNM Modified Dukes’
S tage 0 Carcinoma in situ A
S tage 1 Tumour invades subm ucosa (T1)Tumour invades m uscularis propria (T2)No nodal involvement, no distant m etastases
A
S tage II Tumour invades beyond m uscularis propria (T3) Tumour invades into other organs (T4)No nodal involvement, no distant m etastases
B
S tage III 1-3 regional lymph nodes involved - any T (N1) 4 or more regional lymph nodes involved (N2) No distant m etastases , any T
C
S ta g e IV Distant m e tas tases Any T stage, any N stag e
D
Table 1-1 TNM staging with approximate Modified Dukes staging for CRC
Ten percent o f patients at presentation are diagnosed as stage 0 or stage I. The
remaining 90% of patients at diagnosis are equally distributed between stages
II, III and IV. Up to 50% of patients are diagnosed with liver metastases either
at the time of diagnosis or as a result of disease recurrence. A small proportion
of these patients are candidates for surgical resection of the metastasis.
Dukes’ stage Freq. at diagnosis Approx. 5-year survival
A 11% 83%
B 35% 64%
C 26% 38%
D 29% 3%
Table 1-2 Frequency of CRC diagnoses by Dukes stage with 5 year survival (England and Wales 1996-1999)
At this time early diagnosis o f CRC is uncommon (unless an individual is
screened due to an affected family member(s)). This may be for many reasons
including the insidious onset, vague, non-specific symptoms and the fact that
39

the average General Practitioner in the UK will see one case of CRC per year
(Hobbs, 2000). A nation-wide screening programme is in progress involving
the use o f faecal occult blood tests and colonoscopy in individuals aged 60-69
years of age. It is expected that the whole of the UK will be actively involved
in CRC screening by 2009.
1.1.3.9 Current treatment strategies
Current treatment incorporates surgery, +/- chemotherapy, +/- radiotherapy,
+/- molecularly targeted treatments depending on the CRC stage at diagnosis.
Surgery
Standard surgical treatment for CRC patients is open resection of the primary
tumour with regional lymph node dissection. Eighty percent of CRC patients
undergo surgery with curative intent (NICE. Improving outcomes in CRC,
updated manual Sept 2003). However up to 50% of all patients with > Stage II
disease recur by two years o f follow up. Variation in recurrence rate has been
observed in different treatment centres with surgeons of varying experience
(Dorrance et al., 2000). Therefore it is vital that CRC patients are cared for
and treated in designated cancer centres with multidisciplinary team
management.
Chemotherapy and Radiotherapy
The most commonly used chemotherapy regimes use 5-fluoruracil (5-FU, a
nucleoside analogue), leucovorin and more recently oxaliplatin (a DNA
chelator) and irinotecan (a topoisomerase inhibitor).
Neo-adjuvant therapy - The role of neo-adjuvant therapy is to reduce the size
of the primary tumour before surgical resection, it would also incorporate the
“adjuvant” treatment up-front should this be required.
Adjuvant therapy - Adjuvant therapy is used following surgery - allowing
sufficient time for healing. The aim is to treat “micro-metstases” systemically
and is currently offered to patients with stage III disease where there is an
improved overall survival benefit of 12% when compared to patients who
undergo surgery alone (Laurie et al., 1989). The most commonly used
40

adjuvant treatment is the De-Gremont regime which incorporates infusional 5-
FU with leucovorin, There is some debate as to whether adjuvant
chemotherapy should be offered to patients with stage II disease, particularly
those with higher risk clinical features such as tumour adherence to adjacent
tissue or higher risk molecular features such as aneuploidy or deletion of
chromosome 18q (Lanza et al., 1998) (Jen et al., 1994). There are currently
trials addressing the use of adjuvant therapy in stage lib disease. Currently
stage II patients are candidates for clinical trials in which either surgery alone
or 5-FU-leucovorin remain the standard treatment (Poplin et al., 2005).
Post-operative radiotherapy is indicated in higher risk patients, T3 or 4
primary tumour, tumour location in immobile sites, local perforation,
obstruction and residual disease post resection.
Chemotherapy for advanced disease, recurrent disease and palliative therapy -
Treatment options at this stage include the use of oxaliplatin, irinotecan (a
topo-isomerase inhibitor) and capecitabine (an oral pre-metabolite of 5-FU)
alongside surgical resection and radio-ablation of liver metastses, should they
be amenable to that approach.
Molecularly targeted treatments
Since 2003 molecularly targeted treatments have been approved for use in
CRC following the results o f two randomised controlled trials.
Bevacizumab - a monoclonal antibody directed against vascular endothelial
growth factor (VEGF) demonstrated improved progression free survival and
overall survival in patients with advanced disease (Kabbinavar et al., 2003).
Cetuximab - a monoclonal antibody directed against epidermal growth factor
receptor, was used either alone or in combination with irinotecan in patients
with irinotecan resistant CRC. An improved response rate and progression free
survival was seen in the cetuximab treated group, but no improvement in
median survival was observed (Cunningham et al., 2004). Current studies are
assessing the use of cetuximab in higher risk patients in the adjuvant setting.
41

1.1.3.10 CRC outcome in the UK
Individuals with stage I and II disease have an 83% and 64% 5 year overall
survival rates respectively. When considering stage III patients, 50% are cured
by surgery alone, 7% are cured by surgery and adjuvant chemotherapy and
43% relapse in spite of surgery and adjuvant chemotherapy. See Table 1-2 for
survival rates per stage. One of the most important prognostic factors is lymph
node status (Berger et al., 2005). A study of predictive molecular factors with
11 years post-operative follow up in stage III patients who received adjuvant
chemotherapy found that those tumours with no chromosome 18q loss,
microsatellite stable (MSS) tumours without chromosome 18q loss compared
to MSS tumours with 18q loss, tumours with microsatellite instability (MSI)
compared to MSS tumours and MSI tumours with TGF$ 1 mutation compared
to MSI without the TGFpl mutation all had improved overall survival
(Watanabe et al., 2001). MSI status itself can be used as a predictive factor for
response to treatment with 5-FU, MSI high tumours have an increased overall
survival but do not respond as well to 5-FU treatment (Ribic et al., 2003).
Tumour markers measured in the serum - carcinoembryonic antigen (CEA)
and carbohydrate antigen 19.9 (CA 19.9) are also indicative o f poor prognosis
or recurrence of disease (Reiter et al., 2000).
Therefore it is imperative that further understanding of the CRC risk factors,
inherited genetic predisposition, molecular markers and natural history of the
disease continue alongside improved primary prevention and screening
programmes if we are to improve on the current incidence, survival and
mortality statistics.
1.2 Hereditary Colorectal Cancer Syndromes
Germline mutations can be identified in approximately 2-6% of CRC cases,
the majority of which occur in families showing Mendelian inheritance
(Kinzler & Vogelstein, 1996). Until recently, the known inherited CRC
42

syndromes were solely the result o f autosomal dominant, highly-penetrant
high risk alleles which facilitated early recognition of the underlying genetic
diagnosis (Cannon-Albright et al., 1988), (Houlston et al., 1992), (Esteller et
al., 2001). These syndromes are well characterised and include Hereditary
Non-Polyposis CRC (HNPCC) with germline mutations in MLHl, MSH2,
PMS2 and MSH6 genes, Familial Adenomatous Polyposis (FAP) with
mutations in the APC tumour suppressor gene. The most recently identified
inherited CRC predispositon syndrome is A/y//-associated polyposis (MAP)
which is caused by mutations in the base excision repair gene MYH. MAP was
first described in 2002 (Al-Tassan et al., 2002) (Crabtree et al., 2003), and is
inherited in an autosomal recessive manner. MAP will be described in more
detail in a following section of this chapter. Other inherited polyposis
syndromes include Peutz-Jeghers syndrome (LKB1 gene) and juvenile
polyposis (SMAD4 and ALK3 genes). See Table 1-3 for overview of inherited
CRC syndromes and mode o f discovery.
43

Syndrome Gene Location Inheritance Function Method of discovery
FAP APC 5q AD Inhibition of wnt signalling
Linkageanalysis
HNPCC MLH1 3p AD DNA mismatch repair
Linkageanalysis
MSH2 2p AD DNA mismatch repair
Linkageanalysis
MSH6 2p AD DNA mismatch repair Candidate gene
PMS2 7p AD DNA mismatch repair Candidate gene
MAP MYH 1P AR Base excision repair
Somaticmutation
screening
Peutz-Jeghers LKB1 19p ADSerine
threoninekinase
CGH and linkage analysis
Juvenilepolyposis SMAD4 18q AD TGF-beta
signallingCandidate
linkage analysis
ALK3 10q AD TGF-betasignalling
Linkageanalysis
Cowden’s PTEN 10q ADPhosphatase, inhibition of
AKT signalling
Somaticscreening,
Linkage
Table 1-3 Summary of inherited CRC syndromes, inheritance and
method of discovery (AD - autosomal dominant; AR - autosomal
recessive; BER - base excision repair; CGH - comparative genomic
hybridisation)
At this time defects in the known predisposition genes account for up to 6% of
all CRC. However, twin studies suggest that up to 35% of colorectal cancers
have a genetic component (Lichtenstein et al., 2000), and the relative risk in
siblings is 2-3 fold for adenomas and CRC (Cannon-Albright et al., 1988;
Houlston et al., 1992). Some of these cases may be due to as yet undiscovered
moderate or high penetrance genes, but the remainder are likely to involve
changes in genes conferring a lower level of risk and also highly probable that
they are harder to identify.
44

Hereditary colorectal cancer predisposition syndromes can be divided into two
main categories depending on the presence or absence of multiple benign
precursor lesions.
1.2.1 Hereditary Non-Polyposis Colorectal Cancer (Lynch
syndrome).
Hereditary non-polyposis colorectal cancer (HNPCC) is an autosomal
dominant disorder characterised by few colonic adenomas, early onset of
predominantly right sided CRC, and specific extra-colonic tumours including
cancer o f the ovary, endometrial, stomach, small bowel and uro-epithelial tract
(although there is a lower risk of developing these tumours than CRC). A
diagnosis of HNPCC is made if the affected individual and family members
fulfill the Amsterdam criteria (Vasen et al., 1999), see table Table 1-4 for
Amsterdam criteria. The disease accounts for approximately 1-6% of
colorectal cancer cases when the Amsterdam and Bethesda criteria are used
for diagnosis.
Table 1-4 Amsterdam criteria (Vasen et al., 1999)
Mutations in the DNA mismatch repair (MMR) genes MLH1 and MSH2
account for 90% of cases and MSH6 and PMS2 for the remaining 10% of
45

cases (Miyaki et al., 1997). Up to 29% of MLH1 and 16% of MSH2 mutations
are missense making it difficult to determine the potential pathogenicity
(Thibodeau et al., 1998) (nonsense mutations often lead to either a stop codon
or a frameshift). A database of germline mutations in HNPCC has been
developed by the International Collaborative Group on Hereditary
Nonpolyposis Colorectal Cancer and can be found at http://www.nfdht.nl. If
left without screening there is an 80% lifetime chance of developing CRC
when carrying a heterozygous mutation in one of these MMR genes. The
average age at CRC diagnosis is 45 years.
When compared to sporadic cancers HNPCC cancers are more poorly
differentiated and there is a higher incidence of synchronous cancers
(occurring within six months of diagnosis) and metachronous cancers
(occurring greater than six months from diagnosis). Histologically, an excess
of mucoid and signet cells occur along with a Crohn’s like picture of
inflammatory infiltrate.
Adenoma development in HNPCC has previously been reported to range from
between 17 and 49%, the largest study to date of 695 patients with proven
MMR mutations found 10.6% of HNPCC patients to have at least one
adenoma at first colonoscopy (Liljegren et al., 2008). Interestingly, the same
study found 5.3% of HNPCC patients to have at least one hyperplastic polyp.
When present, adenomas progress more rapidly to carcinoma in HNPCC, in 2-
3 years compared to 8-10 years in the general population (Lynch & de la
Chapelle, 2003).
Microsatellite instability occurs due to the loss of function of MMR genes and
immunohistochemistry can be performed on tumour tissue to demonstrate the
absence or weak expression of the MMR protein (Thibodeau et al., 1998).
Individuals with HNPCC (with either known germline MMR mutations or
strong clinical evidence) are screened from the age of 20-25 onwards with
annual colonoscopy. In women, screening for endometrial and ovarian cancer
is undertaken with annual trans-vaginal ultrasonography which is performed
from the age of 30 onwards. Serum Ca-125 levels are also measured as a sign
of ovarian malignancy. However the sensitivity and specificity of both of
these is limited in ovarian cancer diagnosis.
46

There is a relatively high incidence of CRC (albeit non-fatal cases) in those
patients who are screened (study of 15 year follow up of 3-year and annual
screening) due to the accelerated pathogenesis of HNPCC and in light of this,
subtotal colectomy and total abdominal hysterectomy with bilateral salpingo-
oopherectomy are offered to selective high risk patients.
1.2.2 Familial Adenomatous Polyposis.
Familial Adenomatous Polyposis (FAP) is a highly penetrant autosomal
dominant disorder accounting for -1% of CRC diagnoses. Its incidence is
approximately 1:13,500 (Bisgaard et al., 1994). Affected individuals develop
hundreds to thousands o f adenomatous polyps during the second and third
decades o f life, one or more of which progress to cancer in nearly 100% of
cases. The selective disadvantage associated with such a highly penetrant
disease (with in certain cases an extreme phenotype) is overcome by the fact
that there is a high incidence of de novo germline mutations which account for
up to 25% of cases (Bisgaard et al., 1994) (Bulow, 1986). Diagnosis is made
clinically in individuals with >100 adenomas (fewer in younger patients)
(Vasen et al., 1993).
47

Figure 1-7 Colectomy specimen and H&E stained adnenoma (x20) from an FAP patient
Each individual adenoma has a low likelihood of progressing to carcinoma but
the sheer number results in a lifetime risk of 100% with most affected
individuals developing CRC in their forties if left untreated.
Extracolonic features include desmoids, osteomas, congenital hypertrophy of
the retinal epithelium (CHRPE), sebaceous cysts and abnormal dentition
(Blair & Trempe, 1980) (Heiskanen & Jarvinen, 1996). Associated cancers
include sarcomas, papillary cancer of the thyroid, hepatoblastomas, pancreatic
cancer and medulloblastoma (Turcot’s syndrome type 1) (Hamilton et al.,
1995) (Van Meir, 1998).
1.2.2.1 The APC tumour suppressor gene.
The APC gene is located on chromosome 5q21. It consists of 15 translated
exons with its most common isoform encoding a 2843 amino acid protein
(Groden et al., 1993). Exon 9 may undergo alternative splicing which adds an
additional 18 amino acids to the transcribed protein (Sulekova & Ballhausen,
48

1995). APC is expressed in a variety of tissues including epithelial and
mesenchymal cells of both foetal and adult tissue (Midgley et al., 1997) and
has a number of functional domains.
The 5’ amino-terminal domain contains a series of heptad repeats which are
thought to be involved in APC homo-dimer formation (Groden et al., 1991)
(Joslyn et al., 1993). Amino acids 453-767 share some homology with the
central repeat region of the Drosophila segment polarity protein armadillo
which through binding Asef controls cell adhesion and motility through the
actin cytoskeleton (Kawasaki et al., 2000). The following two motifs - an
imperfect repeat of 15 amino acids occurring three times between codons 1020
and 1169 and another imperfect repeat of 20 amino acids occurring seven
times between residues 1262 and 2033 are involved in /3-catenin binding and
degradation (Rubinfeld et al., 1993) (Su et al., 1993). /3-catenin is a central
component o f the Wnt signalling pathway (see section 1.1.3.4). Each o f the 20
amino acid repeats contains an SXXXS consensus site which acts as a
substrate for GSK3/3 phosphorylation (Munemitsu et al., 1995) (Rubinfeld et
al., 1996). Three SAMP repeats occur between the 20 amino acid repeats,
these mediate the binding of axin (Kishida et al., 1998). Several signalling
motifs exist which are thought to mediate nuclear import and export o f APC
(Rosin-Arbesfeld et al., 2000). Interaction with microtubules occurs through a
region located between codons 2200 and 2400 (Deka et al., 1998) and also at
the carboxyl terminal (codons 2560 - 2843) where the microtubule associated
protein EB1 binds (Su et al., 1995). A role in chromosomal segregation has
been suggested by Fodde and Kaplan in that APC and EB1 co-localise at the
ends of microtubules attached to kinetochores at mitosis (Fodde et al., 2001)
(Kaplan et al., 2001).
49

Dimerisation (heptad repeats)
6 57
p-caten in binding (15-aa repeats)
Axin binding Microtubule binding (SAMP repeats) (basic domain)
I I M 4i r
767 1020 1169 1262 2033
Asef binding (armadillo repeats)
p-ca ten in binding, GSK3p phosphorylation (20-amino acid repeats)
2200 2400
EB1 binding
| p-catenin regulation
[~] cytoskeletal organisation
Figure 1-8 The APC gene with functional domains annotated
Due to the diversity of its function, APC has been implicated in a variety of
cellular processes including cell migration, cytoskeletal organisiation, cell
cycle control and apotosis (Sieber et al., 2000). In terms of its role as a tumour
suppressor gene in CRC, it appears that it is the impact it has on Wnt
signalling through controlling levels of P-catenin that is most important.
Mutant APC is unable to down-regulate p-catenin, therefore resulting in clonal
expansion o f mutant cells. This is supported by studies demonstrating that
colorectal tumours without APC mutations can harbour mutations in P-catenin
which prevent the degradation of the protein and resulting in similar
dysregulation of cell cycle control (Ilyas et al., 1997) (Sparks et al., 1998).
There also appears to be an “optimal level” of Wnt signalling through which
there is a relationship between the underlying germline mutation in APC and
the somatic “second hit” mutation (Lamlum et al., 1999). The role that APC
may play in chromosomal segregation suggests a mechanism by which it may
cause chromosomal instability observed in FAP tumours.
APC harbours detectable germline mutations in approximately 85% of cases
of FAP. The vast majority of these are insertions, deletions and nonsense
mutations resulting in frameshifts and premature stop codons. Ten percent of
FAP patients have a deletion of AAAAG at codon 1309. Initiation of tumour
growth occurs following a second somatic event through either mutation,
allelic loss or silencing leading to inactivation of the wild type APC allele.
There is a distinct genotype-phenotype correlation in FAP. Mutations between
50

codons 450 and 1580 are associated with classical polyposis with mutations
between codons 1250 and 1464 causing particularly severe disease. In
contrast, germline mutations in the extreme 5’ or 3’ ends of APC or in the
alternatively spliced regions of exon 9 cause attenuated adenomatous
polyposis (AAPC or AFAP) (Spirio et al., 1993). The genotype-phenotype
correlation also applies to some of the extracolonic features - desmoids are
associated with mutations between codons 1395 and 2000 (Wallis et al., 1999)
and CHRPE with mutations between codons 457 and 1444 (Caspari et al.,
1995). In a recent study of 599 index cases of “attenuated polyposis” somatic
mosaicism of the APC gene was found to be responsible in up to one fifth of
cases (Hes et al., 2007). At this time there are no other studies to support this
finding.
There is also some evidence suggesting that other environmental and genetic
factors play a role in disease severity, as some individuals with identical
germline APC mutations have differing polyp burden (Paul et al., 1993).
6 57 453 767 1020 1169 1262 2033 2200 2400
□ □ IMultiple adenom as (AAPC) Multiple adenom as (AAPC)
Classical FAP
Severe FAP
Figure 1-9 Genotype/phenotype correlation associated with germline APC mutations
1.2.2.2 Somatic mutations at APC - the mutation cluster
region
In the majority of FAP tumours the second allele of APC is disrupted through
either a truncating mutation or through allelic loss. In patients with germline
mutations at codon 1309 (5bp deletion) the second allele is lost (LOH) in up to
85% of tumours studied (Crabtree et al., 2003). Through studying tumours of
51

individuals with FAP alot has been learned to improve the understanding of
tumorigenesis in sporadic cases. In both FAP and sporadic cases the majority
of somatic mutations occur in the 5’ region o f the APC gene. There is a region
between codons 1284 and 1580 where 80% of somatic mutations occur. This
was termed the mutation cluster region by Miyoshi et al, there are three
“hotspots” at codons 1309, 1450 and 1554 which account for 20% of all
somatic mutations (Miyoshi et al., 1992).
1.2.2.3 Clinical management of FAP patients.
Following clinical and molecular diagnosis - through genetic counselling and
testing, strict surveillance is the key with annual colonoscopy and elective
sub-total colectomy when adenoma burden deems it necessary. This is usually
by the mid 20’s. Colonoscopic surveillance usually commences in the teenage
years. Regular endoscopic surveillance of the upper GI tract with endoscopy is
recommended as is screening for papillary carcinoma of the thyroid (Lynch &
de la Chapelle, 2003).
Genetic testing in classical FAP patients is usually restricted to the 5’ half of
the APC gene in the first instance, if a mutation is not found the whole gene is
then screened and MLPA analysis undertaken for whole exon deletions and
duplications.
1.2.3 Hamartomatous Polyposis Syndromes.
The hamartomatous polyposis syndromes comprise familial juvenile
polyposis, Peutz-Jehgers syndrome, Cowdens disease and Bannyan-
Ruvalcaba-Riley syndrome.
Juvenile polyposis
Juvenile polyposis syndrome (JPS) is a rare autosomal dominant syndrome
caused by germline mutations in SMAD4/DPC4 (Howe et al., 1998b),
BMPR1A/ALK3 (bone morphogenic protein receptor lA/activin receptor-like
kinase 3) (Howe et al., 2001) (Sayed et al., 2002). Both SMAD4 and BMPR1A
52

are members of the TGFp/BMP signalling pathway which is a target in CRC
carcinogenesis.
The phenotype is that of multiple colonic hamartomatous polyps and
sometimes polyps in the small intestine and stomach (Hofting et al., 1993)
(Veale et al., 1966). Associated clinical manifestations and can include mental
retardation, macrocephaly, heart defects (aortic valve malformations) and
polydactyly. Diagnosis is usually made before the age of 10 years due to rectal
bleeding, diarrhoea and abdominal pain (Heiss et al., 1993). There is an
associated CRC risk despite there being fewer benign colonic polyps
(Giardiello et al., 2000). Clinical management of JPS depends on the severity
of the polyp burden whereby prophylactic surgery is sometimes indicated
(Heiss et al., 1993) (Scott-Conner et al., 1995), or colonoscopic surveillance
(Howe et al., 1998a).
53

Peutz-Jehgers Syndrome
Peutz-Jehgers syndrome is an autosomal dominant condition characterised by
hamartomatous polyps of the small intestine and less commonly the colon.
Other clinical features include peri-oral pigmentation, pigmentation if the
fingers and sex cord tumours with annular tubules of the ovary (Giardiello et
al., 1987). The syndrome is caused by germline mutations in serine threonine
kinase LKB1/STK11 (Hemminki et al., 1998). The highest cancer risk is in the
GI tract (both small intestine and colon), but tumours also occur in the breast,
ovary, pancreas and endometrium (Boardman et al., 1998) (Giardiello et al.,
2000). Diagnosis is often made in adolescence due to gastrointestinal
bleeding, abdominal pain or intestinal obstruction. The characteristic peri-oral
and finger freckling aid clinical diagnosis. Germline mutation of LKB1 is
found in 50% of PJS families and between 30-60% of sporadic cases resulting
in truncation or loss o f the protein (Hemminki et al., 1998) (Jenne et al.,
1998).
LKB1 appears to play a role in apoptosis and foetal development. It is found in
apoptotic intestinal cells (Karuman et al., 2001) and has also been found to
regulate p53 dependent apoptosis and control of cellular proliferation (Yoo et
al., 2002).
Cowdens syndrome and Bannyan-Riley-Ruvalcaba Syndrome
Cowdens syndrome is an autosomal dominant disorder characterised by
multiple muco-cutaneous lesions including multiple trichilemmomas, acral
keratoses and oral mucosal papillomatosis (Brownstein et al., 1979) (Starink et
al., 1986). 40% of patients develop multiple hamartomatous polyps involving
the whole of the GI tract (Hizawa et al., 1994) (Waite & Eng, 2002).
Hamartomatous polyps demonstrate excessive smooth muscle in the core of
the polyps which are also often inflamed or fibrotic (Oberhuber & Stolte,
2000). In Cowdens syndrome there is an increased risk of developing thyroid,
breast and genito-urinary cancers (Salem & Steck, 1983) (Starink et al., 1986).
Bannayan-Riley-Ruvalcaba syndrome is characterised by macrocephaly,
lipomatosis, haemangiomatosis and speckling of the penis. Patients may also
develop hamartomatous polyps (Gorlin et al., 1992).
54

The presence of hamartomatous polyps in both of theses syndromes suggests
an increased risk of CRC but a firm association is yet to be made.
Germline mutations in PTEN (phosphatase and tensin homologue deleted on
chromosome 10) tumour suppressor gene cause both of these syndromes
(Liaw et al., 1997) (Marsh et al., 1997). PTEN is a dual specificity
phosphatase which has a number of pro-apoptotic functions including negative
regulation of PI3K/AKT and MAPK signalling pathways (Waite & Eng,
2002).
1.2.4 The Hereditary Mixed Polyposis Syndrome
Hereditary mixed polyposis syndrome (HMPS) is an autosomal dominant
condition characterised by the development of multiple tumours within the
colon. These include atypical juvenile polyps, hyperplastic polyps, serrated
adenomas, classical adenomas and carcinoma (Whitelaw et al., 1997). The
locus for HMPS (CRAC1) has been mapped to chromosome 15ql3-14 in
Ashkenazi families and has been found to correlate with the Ashkenazi
susceptibility locus CRAC1 (Jaeger et al., 2003). Some Asheknazi families
with the HMPS/C&4C7 locus only develop multiple classical adenomas and
CRC (Jaeger et al., 2003).
More recently, (single nucleotide polymorphism) SNP genotyping of a panel
of SNPs associated with the CRAC1 locus in CRC cases and controls found 2
SNPs associated with GREM1 and SCG5 (both found within the CRAC1
locus) to be strongly associated with CRC risk (/>=4.44xl014)(Jaeger et al.,
2008).
1.2.5 Hyperplastic Polyposis Syndrome
Hyperplastic polyps (HPPs) are common bowel tumours usually found in
individuals aged 60 and over. The great majority o f HPPs do not have
malignant potential but there is increasing evidence to suggest that some may
progress to CRC (Church et al., 1988) (Jass et al., 2002). This risk is highest
55
when polyps exhibit dysplastic features as in cases of mixed
HPP/adenomatous polyps and serrated adenomas. The age at presentation,
size, number and anatomical location (ascending colon) all contribute to the
CRC risk (Goldstein et al., 2003). The diagnostic criteria o f HPPS and the real
CRC risk associated with it are still evolving, Burt and Jass defined HPPS as
any individual with >5 HPP’s proximal to the sigmoid colon two of which
>lcm in diameter or any individual with >30 HPP’s anywhere in the colon
(Burt, 2000). Rashid et al have devised a different classification for HPPS
whereby any individual with >20 HPP’s anywhere in the colon may be
diagnosed. Further classification based on size (>lcm) or “multiple” HPP’s
(5-10) was also suggested (Rashid et al., 2000).
The proposed “serrated pathway” of colorectal neoplasia suggests HPP’s to be
the initiating lesion prior to development in to mixed polyposis
(hyperplastic/adenomatous polyps), serrated adenomas and finally CRC.
BRAF mutations are found commonly in serrated adenomas (Jass et al., 2002)
(Goldstein et al., 2003).
A recent study o f somatic mutations in 245 HPP’s found mutations in BRAF
and KRAS2 in 75% o f polyps, the frequency of BRAF mutations was higher
individuals with >10 polyps (Carvajal-Carmona et al., 2007). Patients would
have either BRAF or KRAS2 mutations in any one polyp, none were found to
have both. MSI was not observed and the epithelium of the polyps was found
to be monoclonal (which is also the case for JPS).
There is mounting evidence to suggest a genetic predispostion to HPPS in
young onset patients with multiple HPP’s but to date a locus or candidate gene
is yet to be determined (Niv et al., 2003) (Jeevaratnam et al., 1996) (Lage et
al., 2004).
1.2.6 MYH-associated Polyposis and CRC
The role of MYH as a polyposis and CRC predisposition gene was discovered
in 2002 through somatic screening of adenomas found in an interesting family
with multiple adenomas and CRC which harboured a germline APC mutation
56

E1317Q of questionable pathogenicity (Sampson et al., 2003). MYH
associated polyposis (MAP) has an autosomal recessive inheritance.
Al Tassan et al found that analysis of the somatic mutation spectrum of APC
in tumour samples from a single family who had none of the known germline
APC or MMR mutations revealed 18 somatic inactivating mutations in APC,
15 o f which were G:C -> T:A transversions - a significantly higher proportion
than that found in sporadic or FAP tumours (Sampson et al., 2003). This
mutational signature suggested faulty DNA repair of 7,8-dihydro-8-oxo-
2 ’deoxyguanosine (8 -oxo-G), which led to screening for germline mutations
in MYH and other BER enzymes, MTH1 (Mut-T Homologue) and OGGI.
Mutations in MYH were identified in both maternal and paternal alleles in
affected individuals. MYH associated polyposis (MAP) is the first human
cancer predisposition disorder to be linked to BER.
MYH is a DNA glycosylase involved in the repair o f oxidative damage of
DNA by base excision repair (BER). MYH maps to the short arm of
chromosome 1, between p32.1-p34.3. It is 7.1 kb long, and contains 16 exons.
It encodes a 535 amino acid protein with 41% identity to the shorter E coli
protein (Slupska et al., 1996).
1.2.6.1 DNA base excision repair glycosylases and the
function of MYH
Genomic integrity is maintained through several DNA repair mechanisms
which continuously identify and rectify damaged and mispaired bases. Base
excision repair involves a family o f DNA glycosylases working alongside
apyrimidine/apurine (AP) lyases, structure specific nuclease, repair
polymerase, DNA ligase and PCNA tethering complexes. The overall
mechanism is that of a simple cut and patch process removing DNA bases
which have undergone oxidative damage. Damage specific excision is
initiated by the recognition o f oxidatively damaged bases either in the mother
or daughter strand of replicating DNA or in the nucleotide pool itself. Once
the commitment to excision is made this is followed by protection of the
abasic site - in particular avoidance of deleterious double-stranded breaks in
DNA, insertion of the correct base by a repair DNA polymerase and finally
57

sealing of the nicked DNA backbone by DNA ligase. As base damage is the
most common form of cellular DNA damage, BER is one of the major
mechanisms for dealing with the majority of DNA damage (Lindahl & Wood,
1999) (Wood, 1996).
Reactive oxygen species are generated through normal cellular oxygen
metabolism and through external oxidative stress. They have been implicated
in aging and carcinogenesis (Mamett, 2000).
The mutagenic effects o f 8 -oxo-G are opposed by the synergistic action of
MYH, MTH1 and OGGI. MTH1 is a nucleotide phosphatase which catalyses
the hydrolysis o f 8 -oxoGTP to 8 -oxo-GMP, preventing its incorporation
opposite adenine during replication. OGGI detects and then removes 8 -oxo-G
mispaired with adenine. MYH acts as “belt and braces” by detecting and
removing adenine preventing it mis-pairing with thymine in subsequent
rounds of replication. See Figure 1-10 for site of action of BER enzymes.
The frequency of oxidative damage to DNA is estimated at 104
lesions/cell/day in humans (Lu et al., 2001). This is most commonly caused
endogenously as a by-product o f cellular metabolism (Demple & Harrison,
1994) (Izumi et al., 2003). External factors such as radiation and cigarette
smoke also contribute to oxidative damage. 8-oxo-7,8-
dihydro2’deoxyguanosine (8 -oxodG) is one of the most stable deleterious
products o f oxidative DNA damage. It readily mispairs with adenine (A)
residues leading to G:C > T:A transversion mutations in the daughter strand.
Levels o f 8 -oxydG are high in breast, lung and kidney cancers (Malins &
Haimanot, 1991) (Jaruga et al., 1994; Olinski et al., 1992) (Okamoto et al.,
1994). The incorporation o f 8 -oxoG into DNA is either through the direct
oxidation o f guanine (G) residues in the template strand or via the
incorporation of an 8 -oxodGTP from the nucleotide pool (Hayashi et al.,
2002). The resultant G:C > T:A transversions after the next round of DNA
replication occur because polymerases incorporate adenine opposite 8 oxodG
at a rate between 5 fold and 200 fold more frequently than they incorporate
cytosine opposite the 8 -oxoG lesions. (Shibutani et al., 1991).
58

When compared to other DNA repair mechanisms, such as nucleotide excision
repair, BER is vertically well conserved from bacteria to humans in terms of
the core components of BER machinery. This is very useful for studying the
functional implications of BER enzyme mutations in vitro. In E.coli, three
enzymes protect the cell against damage from ROS, their homologues MTH1,
OGGI and MYH have similar functions in human cells. MTH1 hydrolyses the
oxidised triphosphate 8 -oxo-dGTP to monophosphate 8 -oxo-dGMP, thus
eliminating mutagenic substrates from the cell’s nucleotide pool (Nakabeppu,
2001). OGGI provides a second level o f defence by detecting and removing 8 -
oxodG from the DNA leaving an abasic site (Slupska et al., 1996). MYH,
provides the third level of defence by scanning the daughter strand after
replication, removing A mispaired with G or 8 -oxoG (Slupska et al., 1996)
(Slupska et al., 1999) (Lu et al., 2001).
59

N N N G N N N N N N C N N N
Nucleotide pool
1st round DNA synthesis N N N G° N N N dG°TPN N N C N N N
OGG1 MTH1
N N N G N N N 2nd round DNA N N N G ° N N N N N N C N N N synthesis N N N A N N N
dG°MP
0 < N N N G° N N N N N N C N N N
IVT
N N N T N N NN N N A N N N
Figure 1-10 Schematic overview of the sites of action of the BER repair
genes MYH , OGGI and MTH1. Oxidised guanine is shown in red
MutY and it’s homologues have a catalytic core domain with an [4Fe-4S] iron
sulphur cluster in the N terminus (Guan et al., 1998) and a C-terminal MutT
like domain (Volk et al., 2000) (Fromme et al., 2004). It is the C-terminal
domain that is thought to be responsible for recognition of 8 -oxoG, as when
this domain is truncated discrimination between 8 -oxoG:A and G:A mispairs
is lost (Gogos et al., 1996) (Noll et al., 1999). In 2004, the full-length structure
of MutY interacting with DNA was determined (Fromme et al., 2004). This
has enabled further understanding of how 8 -oxoG and adenine are recognised.
The [4Fe-4S] catalytic core domain is very similar to that of Endonuclease III
which excises oxidised pyrimidines (Kuo et al., 1992) (Guan et al., 1998). The
C-terminal domain is very similar to MutT. Both the catalytic core domain and
MutT domains encircle oxidatively damaged DNA making contact with the
appropriate DNA strands. Adenine is then flipped out in to a deep pocket
(similar to other Hairpin-helix-Hairpin DNA glycosylases) the 8 -oxoG
remains in position and undergoes removal and repair by other members of the
BER family.
60

Eukaryotic BER enzymes have additional termini which elaborate the activites
and function of these enzymes in more complex organisms. These include
binding sites for enzymes from other DNA repair mechanisms for example
MSH6 in mismatch repair and the MutSa molecule. This enables co
ordination of DNA repair and also protects from potential deleterious DNA
double-strand breaks during cellular replication.
The exact mechanism(s) through which tumorigenesis occurs in MYH are yet
to be determined. Development of a faithful model o f MYH deficiency in the
mouse has been perplexing. If MYH alone is knocked out there is no apparent
phenotype, if both MYH and OGGI are knocked out mice develop lymphoma,
ovarian and thyroid tumours (Xie et al., 2004). More recently mouse fibroblast
cell lines have been developed which are deficient for MYH and deficient for
both MYH and OGGI. When these cell lines were exposed to low dosage
oxidative stress a reduction o f S phase and increase of G2/M phase in Myh
O g g lA cells was observed than in wild type cells. A similar level of cell death
was observed in both cell lines. The oxidants also induced a greater number of
multinucleated cells in Myh O ggl~/_ cells than in wild type, centrosome
amplification and multi-polar spindle formation was also seen (Xie et al.,
2008).
It was concluded from this study that when under oxidative stress, MYH and
OGGI are likely required for normal cell cycle progression and nuclear
division, suggesting multiple roles of MYH and OGGI in the maintenance of
genome stability and tumor prevention.
Despite MTH1 and OGGIs known roles in the base excision repair pathway,
numerous studies o f patients with multiple adenoma phenotype or FAP and
with no known APC mutations failed to show any definite pathogenic changes
in OGGI and MTH1. (Al-Tassan et al., 2002) (Jones et al., 2002) (Sieber et
al., 2003).
1.2.6.2 Clinico-pathological features of MAP
Common pathogenic variants occur in MYH amongst different ethnic groups.
Northern European populations have a predominance of Y165C and G382D
mutations (Jones et al., 2002). Other pathogenic variants include Y90X in
61

patients of Pakistani origin and E466X which has been found solely in patients
of Indian origin. An in frame deletion ntl395delGGA has been identified in
patients of Mediterranean origin (Gismondi et al., 2004).
The phenotype of affected individuals is that of 10's to 1000's of adenomatous
polyps and CRC. It is thought to account for approximately 1% of CRC
(Farrington et al., 2005) (Webb et al., 2006) and to also account for up to 30%
of patients with 15-100 adenomas (Sieber et al., 2003).
Affected individuals generally present in their fifth or sixth decade although
there have been exceptional cases presenting in their late teens
(Y165C/G382D) and thirties (E466X/E466X) - unpublished data. A handful
of extracolonic features have been found in the small number of patient
cohorts described to date such as congenital hypertrophy o f the retinal pigment
epithelium (CHRPE) - (4 cases), duodenal polyps - (3 cases), osteomas -(2
cases), gastric cancer - ( 1 case), desmoids - ( 1 case) and dental cysts - ( 1
case) (Enholm et al., 2003; Gismondi et al., 2004; Sampson et al., 2003;
Sieber et al., 2003). To date no definite genotype-phenotype correlation has
been identified.
The prevalence of CRC associated with MAP at presentation varies between
populations studied; one group has reported a prevalence nearing that of FAP
of 78% (Gismondi et al., 2004), whereas others have reported a lower
frequencies of 48% (Sampson et al., 2003) and 50% (Sieber et al., 2003).
MAP cancers are predominantly left sided (71%). Metachronous or
synchronous CRCs occur in a substantial number (27%) of bi-allelic mutation
carriers (Lipton et al., 2003b). In homozygous individuals, the cancer
penetrance is 100% at 60 years (Farrington et al., 2005), that is, similar to FAP
(albeit at an older age).
1.2.6.3 Mutation spectrum associated with MAP
Molecular analysis of adenomas and cancers from MAP patients has
demonstrated that APC is targeted and a higher frequency of G:C>T:A
transversions are seen at TGAA/AGAA motifs, creating nonsense mutaitons.
Somatic screening for APC mutations in adenomas and cancers did not find a
62

“mutation cluster region” as observed in FAP. Mutations in K-ras have only
been found at codon 12, all are G:C>T:A transversions. MAP cancers are near
diploid (using flow cytometry) and microsatellite stable (Lipton et al., 2003b).
A recent study examining micro-dissected MAP adenomas with comparitive
genomic hybridisation has suggested that chromosomal instability is present in
MAP adenomas (Cardoso et al., 2006).
1.2.6.4 Significance of the heterozygous state in MYH
To date there has been some debate as to the significance in terms of polyposis
and CRC risk in heterozygote MYH carriers. Farrington et al (Farrington et al.,
2005) suggested an increased relative risk of 1.68 (95% Cl 1.07-2.95) in
simple heterozygote patients with either Y165C or G382D mutations,
arbitrarily over the age o f 55 in a large population based study of 2239 cases
and 1845 controls. This compared all patients with CRC irrespective of the
presence of adenomas with age and sex matched controls in Scotland. Webb
et al (Webb et al., 2006) published a series of 2561 cases and 2695 controls
finding no significant increase in CRC risk in mono-allelic carriers of the
same common Caucasian mutations.
The first MYH mouse model described in this thesis (ApcMin+l~ / Myh+/') did
not demonstrate an increased number of intestinal adenomas in the MYH
heterozygote group when compared to wt controls (Sieber et al., 2004).
Heterozygous status in the general population has been found to be 1% in a
sample of 1845 individuals (Farrington et al., 2005). Common polymorphisms
of as yet unknown pathological significance have also been identified. In
Caucasian northern European populations Q324H is observed in 20%, V22M
in 10% and S521F in 2% of the population, predominantly as heterozygote
carriers. These polymorphisms may have implications if they form compound
heterozygotes with known pathogenic mutations or in the presence of external
or environmental factors such as cigarette smoking or radiation.
In the clinic, testing for MYH mutations is available for individuals and at risk
relatives in whom no known APC mutation has been found or who appear to
have recessively inherited multiple adenomas or CRC. For individuals who
have homozygous deletions the follow up would be identical to those who
63

have APC mutations, that is annual colonoscopy. However, to date a firm
follow up programme for heterozygous carriers is yet to be published.
64

1.3 The Multiple Adenoma Phenotype
Individuals who develop multiple colorectal adenomas (MCRAs) are a
genetically and clinically heterogeneous group who are at increased risk of
CRC. The MCRA phenotype can usefully, but arbitrarily, be defined as the
development o f 5-100 adenomas during an individual’s lifetime. Germline
mutations in the APC gene account for about 15% of cases with an MCRA
phenotype, these patients have AFAP (Spirio et al., 1999). An additional
-35% of such patients have bi-allelic germline mutations in the MYH gene and
are classified as having MAP (Sieber et al., 2003) (Sampson et al., 2003). As
mentioned previously, MYH deficiency leads to adenoma formation through
somatic hypermutation o f the APC and K-ras genes. The remaining MCRA
patients have no known underlying genetic cause for their phenotype.
To date, the most widely used strategy for identifying candidate predisposition
genes for polyposis syndromes and CRC has been through genetic linkage
analysis. This approach has been particularly successful for the dominantly
inherited syndromes FAP and HNPCC. Its ability to disclose moderate and
low penetrance genes is more questionable. No susceptibility gene for a
complex cancer has yet been identified using this approach.
The frequency of low penetrance genes may be much higher than the
frequency o f high penetrance genes in the general population due to the low
selective disadvantage associated with these changes. Identification of these
novel predisposition genes is important, enabling clinical geneticists to
identify individuals at risk and raises the possibility o f setting up reliable, cost
effective population screening.
However, detection of low penetrance genes using linkage analysis requires
prohibitively large numbers o f multi-generational families in order to yield
results. For example, a dominant model with a gene frequency of 0.1 and risk
ratio o f 6 would require 473 affected sib pairs, 205 three affected sibs, 145
four affected sibs, 545 cousin pairs or 550 avuncular pairs to give a lod score
of 3.3. (Houlston & Tomlinson, 2000). Therefore alternative approaches need
to be utilised.
65

It is likely that there may still be highly penetrant CRC predisposition genes as
yet undiscovered, but the majority of remaining are genes most likely to be of
moderate and low penetrance. The possibility of the remainder of the genetic
influence of CRC being inherited as a polygenic trait or through the
inheritance o f multiple low penetrance alleles at several genetic loci is
becoming more accepted (reviewed in (Kemp et al., 2004)).
Rodent studies have led to the identification of modifier genes loci associated
with murine FAP models. The identification of the (Modifier of Min 1) Moml
and Mom2 alleles being one such example in mice (Dietrich et al., 1993).
Moml maps to the phospholipase 2 (Plga2) gene in humans. However, to date
no mutation or evidence to suggest this is a modifier gene in humans has been
found. The search for modifier genes which affect the severity of Mendelian
cancer syndromes is of importance as these genes may act as a low-penetrance
pre-disposition genes in their own right.
In order to identify these remaining genes, different strategies need to be used
in tandem for the highest chance of success. Linkage analysis should not be
disregarded however, with the development of array technology traditional
linkage analysis can be superseded with tagged single nucleotide
polymorphism (SNP) arrays. This approach allows linkage to be undertaken
with a higher resolution across the genome. Traditional linkage analysis
utilises up to 400 microsatellite markers across the genome whereas the first
SNP arrays (Affymetrix®) contained 10 000 SNPs (Risch, 2001). This
approach led to the identification of an area of interest on chromosome 3q21-
q24 when germline DNA from 69 families (with a family history of CRC but
no mutations in the known predisposition genes) were analysed (Kemp et al.,
2006).
Array comparative genomic hybridisation (CGH) followed by linkage analysis
identified the locus (19p) and then pre-disposition gene LKB1 for Peutz-
Jegher’s syndrome in 1998 (Hemminki et al., 1998).
Mutation screening of potential candidate genes may help to identify future
pre-disposition genes and sub-polymorphic variants. Selection of candidate
genes for screening is guided by preliminary studies - such as linkage analysis
and more recently association studies and through knowledge of the
underlying pathological mechanisms involved in polyposis and CRC.
66

Therefore genes involved in the Wnt signalling pathway and DNA repair
mechanisms are obvious first line candidates, with cell cycle checkpoint genes
and modulators of apoptosis being of significance in any cancer pre
disposition syndrome.
1.3.1.1 APC Missense variants and the Multiple Colorectal
Adenoma Phenotype
The APC missense variant E1317Q
The germline missense variant APC E1317Q was first reported in 1996 by
White et al (White et al., 1996) as an incidental finding when screening for
somatic, protein-truncating APC mutations in sporadic colorectal cancers.
Further studies in a set of 164 individuals with multiple (3-100) colorectal
adenomas screened for germline APC mutations (Lamlum et al., 2000) found a
small number o f these patients carried protein-truncating mutations in exon 9
and the 3 ’ part o f exon 15 of APC, seven patients carried E1317Q, compared
with only two o f 503 UK controls. These data suggested E1317Q to be a low-
frequency (or sub-polymorphic) risk allele for colorectal adenomas (in this
sample set, odds ratio=11.2, 95%CI=2.30-54.3, p<0.001). At this time it was
not possible to provide a convincing mechanism for the effects of the 1317Q
allele, since the amino acid change (glutamine>glutamic acid) is a relatively
conserved one. It was hypothesised, however, that since the polymorphism lay
within a critical region o f the APC protein, between repeat sequences involved
in P-catenin binding and degradation, subtly increased P-catenin levels and
hence activated Wnt signalling were a plausible mechanism of increased
tumour susceptibility.
Several subsequent studies have examined the possible association between
the APC 1317Q allele and colorectal adenomas and/or carcinoma. Popat et al
(Popat et al., 2000) found E1317Q in 2 o f 364 early-onset colorectal cancer
patients and 2 o f 290 controls. Gismondi et al (Gismondi et al., 2002) found
E l317Q in 2/182 patients with single or multiple colorectal adenomas and in
2/135 controls (OR=1.29, 95% 0=0.09-18.0). Hahnloser et al (Hahnloser et
al., 2003) found no excess o f E1317Q in colorectal adenoma patients (5/231)
67

or cancer cases (9/377) compared with spouse controls (10/362), but did find
an excess compared with individuals who had had a normal screening
colonoscopy (1/317), thus providing an odds ratio of 1.164 for 1-3 adenomas,
0.523 for 4-100 adenomas and 0.838 for cancer in the latter case (95% CIs
0.28-4.78, 0.10-2.68 and 0.31-2.26 respectively). These studies involve
patients with different inclusion criteria and controls from differing sources.
Overall, they suggest that APC E1317Q has at most a small effect on the risk
of colorectal tumours and it is possible that it is simply a non-functional rare
polymorphism (Evertsson et al., 2001) (Popat et al., 2000).
How studying E1317Q led to the discovery o f MYH
Researchers were attempting to find some clues as to possible functional
effects of the 1317Q allele. One strategy was to determine whether or not
colorectal tumours from these patients had acquired an independent somatic
APC mutation on the 1317Q allele and, if so, whether that mutation lay 5’ or
3’ of codon 1317; if mutations were found which truncated the APC protein
before codon 1317, for example, a functional effect of the Q allele would be
much less likely. In colorectal adenomas from one family which carried
1317Q, not only did the somatic mutations appear to target both the 1317E
and 1317Q alleles equally, but also the mutation spectrum was grossly
atypical for APC. Allelic loss and frameshift mutations - the most common
types o f change - were almost absent and nearly all point mutations were
G:C>T:A transversions, typical of oxidative damage or defective base
excision repair. The identification of pathogenic bi-allelic mutations in the 8 -
oxo-guanine DNA glycosylase MYH followed soon afterwards (Al-Tassan et
al., 2 0 0 2 ).
The APC germline missense variant 11307K
The I1307K APC variant occurs in roughly 6-9% of Ashkenazi Jews (Redston
et al., 1998) and is very rarely found in any other ethnic groups. This variant
leads to the appearance of an Ag tract which is hypermutatble resulting in
somatic slippage and frameshift mutations (Laken et al., 1997). Similarly to
the E1317Q variant there are differing reports as to the relative risk of
developing colorectal adenomas and CRC. Frayling et al (Frayling et al.,
68

1998) and Gryfe et al (Gryfe et al., 1999) found an associated relative risk of
1.5-2.0 when studying a solely Ashkenazim population, whereas Figer and
Woodage (Figer et al., 2001) (Redston et al., 1998) found no increased risk in
unselected Israelis and Ashkenazim. Interestingly only 50% of CRC tumours
from I1307K carriers demonstrate slippage o f the Ag tract (Gryfe et al., 1998)
(Laken et al., 1997) (Zauber et al., 2003). It appears that other oligonucleotide
tracts within APC are not hypermutable. As I1307K lies within a region of
APC associated with severe FAP phenotype it may simply have a direct
functional effect as well as predisposing to hypermutability.
1.3.1.2 Non-APC related rare low risk alleles and their CRC
risk
The current situation as regards rare low-risk alleles and colorectal tumour risk
is intriguing. Whilst CHEK2 alleles are convincingly associated with
increased breast cancer risk, the evidence for an effect on colorectal cancer is
mixed. Meijers-Heijboer et al (Meijers-Heijboer et al., 2002) found no
association between CHEK2 and colorectal cancer: the llOOdelC allele was
present in 3 index cases from 107 colorectal cancer families of otherwise
unknown genetic origins, compared with 18/1620 controls of mixed origins
(OR=2.34, 95%CI=0.95-5.79). llOOdelC was, however, over-represented in
breast cancer families which also contained members with evidence of
hereditary colon cancer, compared with breast cancer families without such
evidence (OR=5.41, 95%CI=2.29-12.8). Meijers-Heijboer et al (Meijers-
Heijboer et al., 2002) have interpreted these data as showing evidence for the
hypothesised distinct hereditary breast-colon cancer phenotype, but they found
no mirroring evidence to show that colorectal cancer families with evidence of
hereditary breast cancer had an excess of the llOOdelC allele. Lipton et al
(Lipton et al., 2003a) studied 149 patients with 3-100 colorectal adenomas and
found no excess o f llOOdelC. Cybulski et al (Cybulski et al., 2004) typed
1 lOOdelC in 300 Polish colorectal cancer cases and 4,000 controls, but found
no significant excess in the former, although the missense CHEK2 I157T
variant was over-represented in cases. Kilpivaara et al (Kilpivaara et al., 2003)
69

evaluated the frequency of llOOdelC in 662 familial and sporadic colorectal
cancer cases, including some putative hereditary breast-colon cancer kindreds,
and found no increased frequency compared with population controls.
It is likely that definitive answers about alleles such as APC E1317Q and
CHEK2 1 lOOdelC will only come from large international studies and/or from
meta-analyses, which have the associated risks o f imperfect matching of cases
and controls and population-specific effects on risk.
Other variants in candidate genes conferring increased CRC risk have also
been described, these include cyclin D1 (CCND1) (Porter et al., 2002), E-
cadherin (CDH-1) (Kim et al., 2000) and a member of the transforming
growth factor p family (BMPR1A) (Lipton et al., 2003c). One study including
analysis o f beta-catenin (CTNBB1), axin (AXIN1), MLH1 and MSH2 in 124
MCRA patients and 483 controls found significant odds ratios in AXIN1 ( 6
missense variants in total) and MSH2 (3 missense variants in total) (p=0.012
and p=0.001 respectively) (Feamhead et al., 2004). In this case the AXIN1
P312T missense variant substituted a polar threonine with a neutral proline in
a region where axin binds with APC and GSK3/3
Two variants in Methylene tetrahydrofolate reductase (MTHF) (C677T and
A1298C), rapid acetylator alleles in N-acetyl transferase 2 (NAT2) and VNTR
rare alleles in Harvey rat sarcoma virus 1 (HRAS1) have also been reported as
low risk alleles (Houlston & Tomlinson, 2001) (de Jong et al., 2002).
The careful use o f strategies such the analysis o f familial cases and the study
of negative, rather than population, controls may enhance the power of
studies, but the accumulation of overwhelming evidence on variants such as
APC E l317Q, I1307K and CHEK2 1 lOOdelC may take many years.
1.4 Common disease variants and CRC risk
It is becoming increasingly apparent that many o f the remaining polyposis and
CRC pre-disposition genes may be common, less penetrant disease variants
with small effects on risk.
70

Genome-wide approaches are currently being undertaken with the hope of
identifying common, low-risk alleles but historically their discovery to date
has relied on candidate gene analysis followed by determining allele
frequencies in large case-control cohorts (Meijers-Heijboer et al., 2002).
Association studies enable an unbiased approach for searching for disease
associations without prior knowledge of function or presumptive involvement
of any gene in disease causation. This has been made possible by utilising
second generation SNP arrays (550 000 SNPs) allowing genome-wide case-
control association studies to be performed. In principle it is possible to
identify the real disease-associated variant by scanning nearby genes for
variants that could plausibly have a real effect in the pathogenesis of the
disease being studied.
This approach using 550K SNP arrays has recently led to the identification of
a series of regions o f interest in CRC development on chromosomes 8q24,
10pl4, llq23 and 18q21, (Tomlinson et al., 2007; Zanke et al., 2007),
(Haiman et al., 2007) (Tomlinson et al., 2008) (Tenesa et al., 2008).
Second stage analysis (3 replication sample sets totalling 7,473 CRC cases and
5,948 controls) o f the top 5% of polymorphic SNPs identified from Tomlinson
et als first genome wide association study of 940 CRC cases and 965 controls
(Tomlinson et al., 2007) identified 3 SNPs in SMAD7 to be significantly
associated with development o f CRC (TVend= 1.Ox 1012)(Broderick et al., 2007).
71

1.5 Aims of this Thesis
The main objectives of this thesis can be divided into three main areas -
1: Determination of the mechanisms of carcinogenesis associated with MYH-
associated polyposis (MAP).
This includes -
i) further characterisation of the MAP phenotype
ii) search for any genotype/phenotype correlation in MAP
iii) completion o f germline screening for mutations in enzymes of the same
family (OGGI and MTH1) in individuals with the multiple adenoma
phenotype
iv) looking for evidence and mechanisms of genomic instability in the
development o f MAP through comparative genomic hybridisation
v) development o f a mouse model of MAP
2: Identification of novel predisposition genes for the multiple adenoma
phenotype was undertaken utilising various techniques, including somatic
screening for mutational signatures, expression microarray analysis of
lymphoblastoid cell lines from MCRA cases and subsequent candidate gene
screening.
3: Investigation o f the clonal origins of colorectal adenomas and CRC
72

2 Materials and Methods
Solutions and media which are shown in bold have their recipes given at the
end of this chapter.
2.1 DNA Extraction
2.1.1 DNA extraction from blood
DNA extraction from fresh frozen blood taken via peripheral venesection was
performed using either the ammonium acetate method described below or
latterly with the automated Chemagen system.
The ammonium acetate method involves three key steps. Cell lysis by
hypotonic shock, nuclei lysis (and further cell lysis) by detergent action and
proteinase K digestion, and finally precipitation of DNA with ammonium
acetate and ethanol.
Nine ml of fresh frozen, EDTA preserved venous blood were thawed and
transferred in to a 50ml polypropylene tube (Coming). Cells were lysed by
adding ice-cold distilled water (dl-bO) to a final volume of 50ml. This was
mixed by inversion, and cells separated by centrifugation at 2300 rpm for 20
minutes at 4°C in a swing out rotor centrifuge (CR412 Jouan). Following
discarding of the supernatant, the cell pellet was washed in 25ml of 0.1% NP-
40 at 4°C. Nuclei were lysed by the addition of 3ml of nuclei lysis buffer,
200pl 10% SDS, and 600pl proteinase K solution. The sample was then
vortexed until the pellet was completely resuspended and incubated for 2
hours at 60°C. One ml o f saturated ammonium acetate was added to the tube
which was then vortexed for 15 seconds. The sample was then incubated at
room temperature for 10-20 minutes and centrifuged at 2300 rpm fro 20
minutes at room temperature. The supernatant was then transferred to a clean
50ml polypropylene tube and two volumes of ice-cold 100% ethanol (BDH)
were added. The DNA was precipitated by gentle inversion of the tube several
times and then spooled out using a plastic inoculating loop. The spooled DNA
73

was dipped in to an Eppendorf tube containing 70% ethanol to remove excess
salt, and transferred to a labelled screw-capped Eppendorf tube. Following air
drying, the DNA was re-suspended and stored in 1ml dFhO. Quantification of
the DNA extracted was performed with spectrophotometry at 260 and 280nm.
2.1.2 DNA extraction from cell lines
DNA extraction from lymphoblastoid or colorectal cell lines was performed
using a high salt method. This method avoids the use of toxic phenol which is
used conventionally to separate DNA from protein debris. The high salt
method involves four key steps. Cell lysis by detergent action and proteinase
K digestion, degradation o f ribonucleic acids (RNAs) as these can interfere
with downstream applications, separation of DNA from protein debris using
sodium chloride and chloroform, and precipitation of DNA with isopropanol.
Approximately 5x l0 7 cells were transferred to a 50ml polypropylene tube
(Coming) and then centrifuged for 10 minutes at 1500 rpm at room
temperature (CR412 Jouan centrifuge). The supernatant was discarded and the
remaining cell pellet washed twice in PBS before resuspending in 15ml SE
buffer. RNA’s were degraded by adding 50pi of lOmg/ml RNAseA to the
mixture followed by incubation for 1 hour at 37°C. Proteinase K (BDH) was
added to a final concentration of 2 0 0 pg/ml and cells lysed by overnight
incubation at 55°C. Separation o f DNA from protein debris was performed by
the addition of 4.5ml o f 5M sodium chloride (final concentration 1.5M) and
20ml of chloroform (BDH). The tube was mixed by rotation for 30 minutes
and then centrifuged at 2000rpm for 10 minutes at room temperature. The
DNA-containing aqueous layer was transferred to a new 50ml tube, and an
equal volume o f isopropanol (BDH) was mixed together for 5 minutes to
precipitate the DNA. Extracted DNA was spooled out using a plastic
inoculation loop and washed in 70% ethanol for 1 hour to remove excess salt.
Following air drying, the DNA was re-suspended and stored in 1ml dH2<3 .
Quantification o f the DNA extracted was performed with spectrophotometry
at 260 and 280nm.
74

2.1.3 DNA extraction from fresh frozen tissue
DNA extraction from fresh frozen tissue was performed using the QIAamp
DNA mini kit (Qiagen) according to the manufacturers instructions. This
method allows the isolation of up to 40pg of DNA from 25mg of tissue.
Tissue was cut in to small pieces and digested with proteinase K overnight.
Following digestion, RNaseA lOmg/ml was added to degrade RNAs, DNA
was precipitated by adding ethanol which was then collected by binding on a
spin column. Following a series of washes to remove protein debris, the DNA
was eluted from the column with dH20 . Quantification o f the DNA extracted
was performed with spectrophotometry at 260 and 280nm.
2.1.4 DNA extraction from formalin fixed paraffin embedded
tissue
DNA extraction from formalin fixed paraffin embedded tissue involved two
key steps - manual dissection of dewaxed tissue from unstained slides
followed by cell lysis and proteinase K digestion.
Formalin fixation o f tissue causes cross-linkage and breakage of DNA,
therefore DNA extracted with this method is generally fragmented and of
relatively poor quality. In light o f this, when using this DNA for PCR, primers
should be designed to amplify small amplicons of approximately 1 - 2 0 0 base
pairs. This method does however allow the investigation o f historical samples
which may be up to 40 years old.
Depending on the size o f the sample tissue, between 5 and 8 10pm sections
were cut from each paraffin block on to non-coated glass slides using a
microtome (Reichert-Jung). The tissue was then dewaxed in xylene (BDH) for
10 minutes, and washed twice in 100% ethanol (BDH) for 10 minutes. One
section was stained with haematoxylin and eosin (Merck) according to
manufacturers instructions, and inspected using an Eclipse 400 light
microscope (Nikon). Haematoxylin, a dye obtained from the heartwood of the
Haematoxylon campechianum tree stains cell nuclei purple whilst eosin, a
halogenated derivative o f fluoroscein, stains cell cytoplasm red. Following
75

identification of areas of interest, tissue was micro-dissected using sterile
needles under microscope guidance. Extracted tissue was digested in a small
volume (50- lOOptl) of proteinase K buffer [500pl lOx Mg2+ free PCR buffer
(Promega), 50pl 20mg/ml proteinase K (BDH), 4.45ml d H2O]. The tissue and
proteinase K buffer were transferred to a screw top Eppendorf tube and
digested for 24-48 hours at 55°C. The proteinase K was then denatured and
inactivated by heating to 95°C for 10 minutes. The sample was then
centrifuged at 1300rpm for 15 minutes in a 5415C bench-top centrifuge
(Eppendorf). The supernatant containing DNA was then removed with a
pipette and transferred into a fresh Eppendorf tube. Spectrophotometry of
DNA extracted via this method is often inaccurate due to fragmentation of the
DNA.
2.1.5 DNA extraction from laser micro-dissected single
crypts
DNA extraction from single large bowel epithelial crypts involves three key
steps. Isolation of crypts, digestion with proteinase K solution and inactivation
of proteinase K.
Up to six crypts were cut and isolated in to a 50pl capped tube (see Laser-
microdissection method for details of slide preparation and micro-dissection).
These were digested overnight in lOpl of proteinase K solution at 60°C in
PicoPure DNA extraction proteinase K (PicoPure DNA Extraction kit
(Kit:0103), Molecular Devices Corporation, CA94089-1136, USA) as per
manufacturers directions. Each tube was sealed with Parafilm (Parafilm M
sealing film, Pechiney Plastic Packaging, WI 54952, USA) to prevent sample
evaporation. Proteinase K was then denatured and inactivated by heating to
90°C for 10 minutes. Samples were then centrifuged at 13000 rpm for 10
minutes in a 5415C bench-top centrifuge (Eppendorf) before use.
76
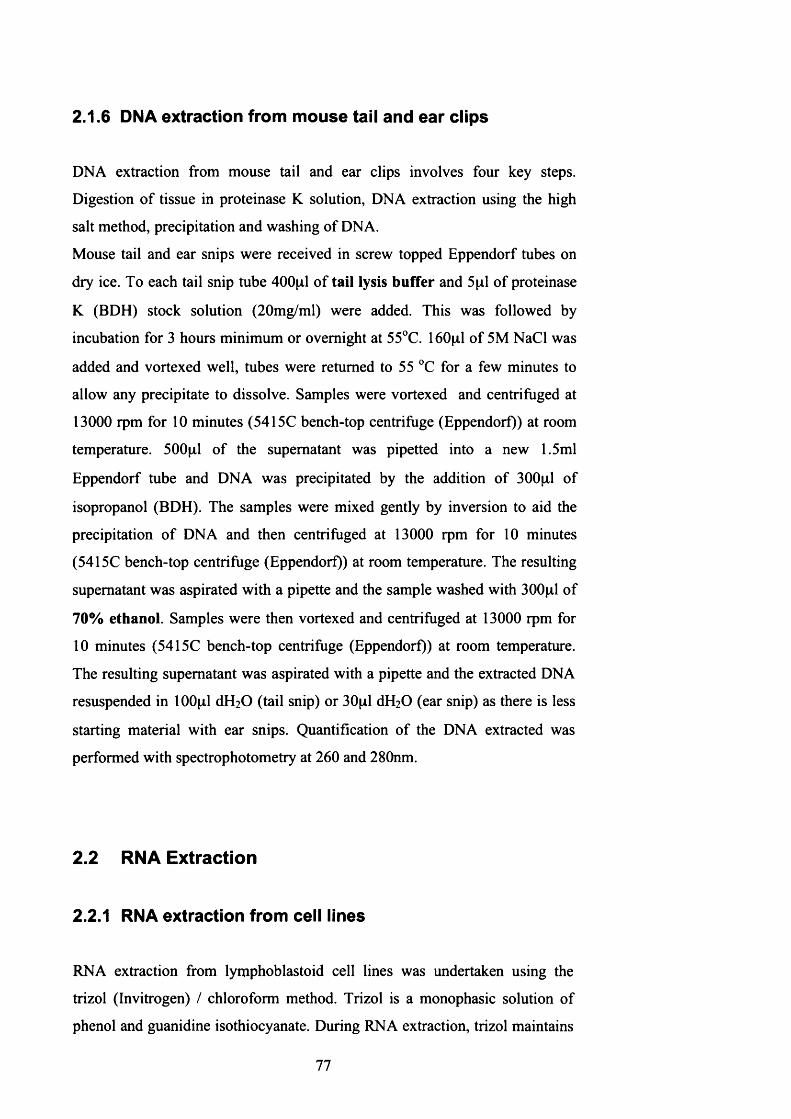
2.1.6 DNA extraction from mouse tail and ear clips
DNA extraction from mouse tail and ear clips involves four key steps.
Digestion of tissue in proteinase K solution, DNA extraction using the high
salt method, precipitation and washing of DNA.
Mouse tail and ear snips were received in screw topped Eppendorf tubes on
dry ice. To each tail snip tube 400^1 of tail lysis buffer and 5^1 of proteinase
K (BDH) stock solution (20mg/ml) were added. This was followed by
incubation for 3 hours minimum or overnight at 55°C. 160p,l of 5M NaCl was
added and vortexed well, tubes were returned to 55 °C for a few minutes to
allow any precipitate to dissolve. Samples were vortexed and centrifuged at
13000 rpm for 1 0 minutes (5415C bench-top centrifuge (Eppendorf)) at room
temperature. 500pl of the supernatant was pipetted into a new 1.5ml
Eppendorf tube and DNA was precipitated by the addition of 300p,l of
isopropanol (BDH). The samples were mixed gently by inversion to aid the
precipitation of DNA and then centrifuged at 13000 rpm for 10 minutes
(5415C bench-top centrifuge (Eppendorf)) at room temperature. The resulting
supernatant was aspirated with a pipette and the sample washed with 300pl of
70% ethanol. Samples were then vortexed and centrifuged at 13000 rpm for
10 minutes (5415C bench-top centrifuge (Eppendorf)) at room temperature.
The resulting supernatant was aspirated with a pipette and the extracted DNA
resuspended in lOOpl dH2 0 (tail snip) or 30^1 dH2 0 (ear snip) as there is less
starting material with ear snips. Quantification of the DNA extracted was
performed with spectrophotometry at 260 and 280nm.
2.2 RNA Extraction
2.2.1 RNA extraction from cell lines
RNA extraction from lymphoblastoid cell lines was undertaken using the
trizol (Invitrogen) / chloroform method. Trizol is a monophasic solution of
phenol and guanidine isothiocyanate. During RNA extraction, trizol maintains
77
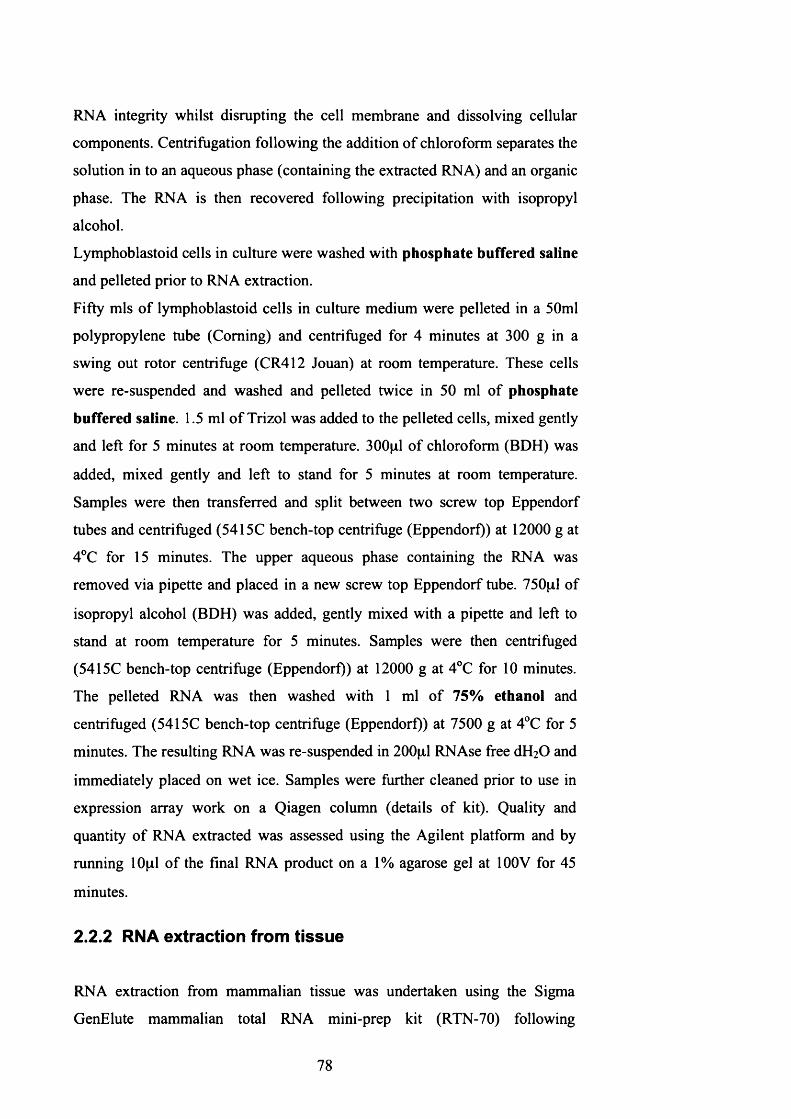
RNA integrity whilst disrupting the cell membrane and dissolving cellular
components. Centrifugation following the addition of chloroform separates the
solution in to an aqueous phase (containing the extracted RNA) and an organic
phase. The RNA is then recovered following precipitation with isopropyl
alcohol.
Lymphoblastoid cells in culture were washed with phosphate buffered saline
and pelleted prior to RNA extraction.
Fifty mis o f lymphoblastoid cells in culture medium were pelleted in a 50ml
polypropylene tube (Coming) and centrifuged for 4 minutes at 300 g in a
swing out rotor centrifuge (CR412 Jouan) at room temperature. These cells
were re-suspended and washed and pelleted twice in 50 ml of phosphate
buffered saline. 1.5 ml o f Trizol was added to the pelleted cells, mixed gently
and left for 5 minutes at room temperature. 300pl of chloroform (BDH) was
added, mixed gently and left to stand for 5 minutes at room temperature.
Samples were then transferred and split between two screw top Eppendorf
tubes and centrifuged (5415C bench-top centrifuge (Eppendorf)) at 12000 g at
4°C for 15 minutes. The upper aqueous phase containing the RNA was
removed via pipette and placed in a new screw top Eppendorf tube. 750pl of
isopropyl alcohol (BDH) was added, gently mixed with a pipette and left to
stand at room temperature for 5 minutes. Samples were then centrifuged
(5415C bench-top centrifuge (Eppendorf)) at 12000 g at 4°C for 10 minutes.
The pelleted RNA was then washed with 1 ml of 75% ethanol and
centrifuged (5415C bench-top centrifuge (Eppendorf)) at 7500 g at 4°C for 5
minutes. The resulting RNA was re-suspended in 200pl RNAse free dH2 0 and
immediately placed on wet ice. Samples were further cleaned prior to use in
expression array work on a Qiagen column (details o f kit). Quality and
quantity of RNA extracted was assessed using the Agilent platform and by
running lOpl of the final RNA product on a 1% agarose gel at 100V for 45
minutes.
2.2.2 RNA extraction from tissue
RNA extraction from mammalian tissue was undertaken using the Sigma
GenElute mammalian total RNA mini-prep kit (RTN-70) following
78

manufacturers instructions. A total of up to 150fig of total RNA can be
extracted from up to 40mg (10 cells) of starting material.
2.3 Spectrophotometry
DNA quantity and quality was assessed with spectrophotometry at 260nm and
280nm using the Nanodrop (supplier) spectrophotometer. An optical density
(OD) of 1 at 260nm corresponds to approximately 50pg/ml double stranded
DNA. Therefore DNA sample concentrations in ng/ml were calculated as
“dilution factor x 50 x OD26o”- DNA quality was assessed by calculation of
OD260/OD280 ratios with 1.8 being the ratio found in a pure sample of DNA.
Contamination with protein decreases the ratio towards 1.4 and RNA
contamination increases the ratio towards 2.0.
RNA samples (on wet ice) were assessed for quantity and quality using the
Nanodrop spectrophotometer following the same principles as outlined above
and also using the Agilent (supplier) system following manufacturers
instructions.
2.4 Polymerase Chain Reaction
The polymerase chain reaction (PCR) is an in vitro technique used for
selective amplification of a specific DNA sequence.
The DNA region of interest is amplified using two complementary
oligonucleotide primers which hybridise to the selected region of the template
DNA on opposing strands.
A typical PCR reaction consists o f 35 cycles, each made up of three steps: (i)
denaturation of the DNA template through heating to 94°C, (ii) annealing of
the primers to the separated template strands through heating to 55-60°C
(varies between primer sets) and (iii) extension of the primers by DNA
polymerase at 72°C. The reaction requires addition of the four
deoxyribonucleoside triphosphates dATP, dTTP, dGTP, dCTP and
thermostable DNA polymerase.
The first cycle produces two new strands of DNA template o f variable length,
which can then be a target for the second cycle. The third cycle results in the
79

production of double stranded DNA product which includes the target region.
The following cycles produce an exponential doubling of the target sequence
which becomes the predominant reaction product. PCR amplification can
saturate with the desired target sequence gradually failing to accumulate.
Factors affecting when this point occurs include utlisation of the reaction
substrates - dNTP’s or primers, the stability of DNA polymerases and finally
competition for substrates by non-specific products or primer dimers.
Primers for use in PCR were designed using the Primer3 programme designed
by the Whitehead institute of Biomedical Research fhttp://www-
genome.wi.mit.edu/cgi-bin/primer/primer3 www.cgiT
Typically a 25pl PCR reaction contains 30-50ng of template DNA, 0.4pmols
of each primer, 1 x Mg2+ - free PCR buffer (Promega), l-2mM MgC^
(Promega). 0.2mM of each dNTP (Amersham) and 1 unit of PIC Taq
polymerase (Cancer Research UK). PCR reactions were undertaken in 96 well
plates (ABgene). DNA samples were aliquoted in to the plate and the PCR
master mix then added after vortexing. The plate was sealed with Thermowell
sealers (Coming) and immediately run on a Tetrad PCR machine (MJ
Research). The PCR reaction programme typically consisted of initial
denaturation at 94°C for 5 minutes followed by 35 cycles of 94°C for 1
minute, 55 °C for 1 minute, 72 °C for 1 minute with a final extension at 72 °C
for 10 minutes. Various parameters were altered such as Mg2+ concentration,
annealing temperature, extension time and other additives were altered
depending on which conditions suited the selected primer pairs and target
DNA size. Primer sequence details and required PCR conditions are listed in
Appendix 1.
Resultant PCR products were analysed by agarose gel electrophoresis with
ethidium bromide staining.
2.4.1 Purification of PCR products
PCR products were cleaned up prior to sequencing using either of the two
methods below.
80

2.4.1.1 Qiagen clean up
QIAquick PCR purification kit (Qiagen) can be used to purify single or double
stranded PCR products ranging from lOObp to lOkb from primers,
polymerases and salts. All solutions were supplied by Qiagen and
manufacturer’s protocol followed.
Briefly, this method utilises a spin column with a membrane whereby the PCR
product (DNA) is first bound to the membrane, undergoes two washes whilst
bound to the membrane with buffer to remove impurities and finally eluted
with either TE buffer or dP^O.
2.4.1.2 ExoSAP-IT®
ExoSAP-IT (USB Corporation, Cleveland, Ohio, USA, product no. 78201) is
an alternative method for PCR product purification which utilises the action of
recombinant exonuclease I and shrimp alkaline phosphatase (Pandalus
borealis) in a buffered solution. Manufacturer’s instructions were followed.
Briefly, 5 pi of PCR product was mixed with 2pl of ExoSAP-IT in a PCR plate
(ABgene) and underwent the following programme on a tetrad PCR machine.
Heating to 37 °C for 15 minutes followed by heating to 80 °C for 15 minutes,
samples were then left at 8°C until used for sequencing reactions. Cleaned up
PCR products were then diluted with dH20 depending on their strength as
determined on a 2% agarose gel.
2.5 Agarose Gel Electrophoresis
Agarose gel electrophoresis is a tool which separates DNA molecules by their
size. When in solution DNA molecules carry a negative charge and therefore
migrate towards the anode of an electrical field. Agarose gel is a 3D matrix
which enables DNA to migrate according to its size, larger molecules migrate
at a slower rate than smaller ones. Ethidium bromide dye staining is used to
visualise DNA. The ethidium bromide intercalates between DNA base pairs
and fluoresces when exposed to UV light of 302nm.
81

Agarose gel electrophoresis was performed using either 1 or 2% agarose
depending on the size o f the DNA PCR products to be analysed. Either lOg
(1%) or 20g (2%) of agarose powder (Invitrogen) was dissolved in lx TBE
buffer and boiled. The molten agarose was allowed to cool to 60°C at which it
was then stored for use. Ethidium bromide was added at a final concentration
of 0.25p,g/ml. Molten agarose was poured in to a gel casting tray (Bio-rad)
with well combs in position and left to set. Following removal of the comb the
gel was covered with lx TBE buffer. For standard PCR products, lOpl of
DNA was combined with 2pl of 5 x Orange G Loading Dye (Trevigen) and
loaded in to a gel well. 10^1 of lkb ladder (Gibco BRL) - prepared as per
manufacturers instructions was added to the outermost well as a guide for the
size of the DNA products under analysis. The gel was then connected to a DC
power pack (Bio-rad PowerPac 300), and run at 120V for 20 -30 minutes.
After removal from the tank the DNA was visualised under UV light at
302nm in a White / 2UV box transilluminator (UV products). Photographs for
record keeping were taken with a UV products recording camera.
2.6 Mutation Detection
2.6.1 Single-strand Conformation Polymorphism Analysis
Single strand conformation polymorphism (SSCP) analysis enables detection
of mutations in DNA target regions amplified by PCR. This method allows the
detection of nucleotide insertions, deletions, substitutions and inversions in
DNA fragments ranging from 100-500 base pairs in size.
SSCP analysis has three main steps - amplification of the DNA target region,
denaturation of the double-stranded PCR product by heating with a denaturing
chemical and finally separation of the resultant single strands by
electrophoresis on a non-denaturing gel matrix. The conditions of the non
denaturing gel allows single stranded DNA fragments to form unique
secondary structures which are determined by their primary sequence and
stabilised by hydrogen-bonding. As the complementary strands of DNA have
different primary sequences they form different conformations in the non
denaturing gel. The same single-stranded fragment may adopt more than one
82

secondary structure. Subsequent mutation detection relies on the different
conformations of DNA migrating at differing speeds through the
electrophoresis gel than wild-type strands under analysis. The formation of
secondary structures is affected by variables such as temperature and ionic
strength, each sample is run at two temperatures as certain mutations will only
be detected under certain running conditions.
SSCP analysis PCR amplification is undertaken using fluorescently labelled
forward and reverse primers (FAM, HEX and less commonly TET). Resultant
PCR products were diluted with dH20 and multiplexed for analysis depending
on the product size and the fluorescent labelling of the PCR primers. 4pl
aliquots were transferred in to a 96 well optical reaction plate (PE-Applied
Biosystems), and 0.5pil o f 0.3M sodium hydroxide, 0.5pl TAMRA-350 size
standard (PE-Applied Biosystems), and 1 Opil formamide (BDH) were added.
Samples were then denatured at 95°C for 5 minutes, placed on ice and then run
on the ABI3100 sequencer (PE-Applied Biosystems). The ABB 100 sequencer
is a high throughput mutation analysis system which runs on a capillary based
system rather than a less sensitive gel-based systems. All samples were run at
18 °C and 24 °C on 36cm capillaries containing 5% native polymer (PE-
Applied Biosystems), 10% glycerol (BDH) and lx TBE running buffer
containing 10% glycerol. GENESCAN and GENOTYPER software (PE-
Applied Biosystems) were used for sample analysis. Mutant strands were
identified, reamplified and sequenced in both forward and reverse orientation
(see section 2.1.8 for sequencing analysis method).
2.6.2 Denaturing High Performance Liquid Chromatography
using the WAVE platform.
Denaturing High Performance Liquid Chromatography (DHPLC) is a
mutation detection tool dependent on temperature sensitive separation of DNA
containing mismatched base pairs from a pool of PCR amplified DNA
fragments. Mutation detection with DHPLC is reliant on formation and
subsequent separation on double-stranded DNA fragments which contain
83
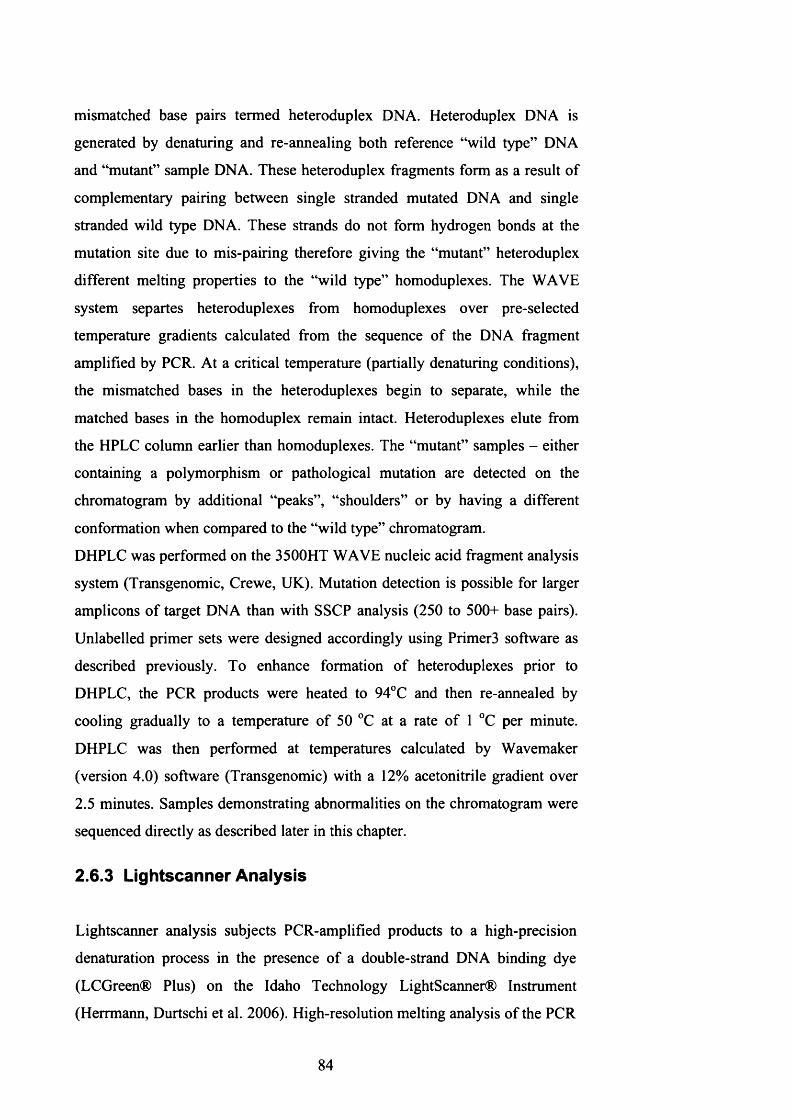
mismatched base pairs termed heteroduplex DNA. Heteroduplex DNA is
generated by denaturing and re-annealing both reference “wild type” DNA
and “mutant” sample DNA. These heteroduplex fragments form as a result of
complementary pairing between single stranded mutated DNA and single
stranded wild type DNA. These strands do not form hydrogen bonds at the
mutation site due to mis-pairing therefore giving the “mutant” heteroduplex
different melting properties to the “wild type” homoduplexes. The WAVE
system separtes heteroduplexes from homoduplexes over pre-selected
temperature gradients calculated from the sequence of the DNA fragment
amplified by PCR. At a critical temperature (partially denaturing conditions),
the mismatched bases in the heteroduplexes begin to separate, while the
matched bases in the homoduplex remain intact. Heteroduplexes elute from
the HPLC column earlier than homoduplexes. The “mutant” samples - either
containing a polymorphism or pathological mutation are detected on the
chromatogram by additional “peaks”, “shoulders” or by having a different
conformation when compared to the “wild type” chromatogram.
DHPLC was performed on the 3500HT WAVE nucleic acid fragment analysis
system (Transgenomic, Crewe, UK). Mutation detection is possible for larger
amplicons of target DNA than with SSCP analysis (250 to 500+ base pairs).
Unlabelled primer sets were designed accordingly using Primer3 software as
described previously. To enhance formation of heteroduplexes prior to
DHPLC, the PCR products were heated to 94°C and then re-annealed by
cooling gradually to a temperature of 50 °C at a rate of 1 °C per minute.
DHPLC was then performed at temperatures calculated by Wavemaker
(version 4.0) software (Transgenomic) with a 12% acetonitrile gradient over
2.5 minutes. Samples demonstrating abnormalities on the chromatogram were
sequenced directly as described later in this chapter.
2.6.3 Lightscanner Analysis
Lightscanner analysis subjects PCR-amplified products to a high-precision
denaturation process in the presence of a double-strand DNA binding dye
(LCGreen® Plus) on the Idaho Technology LightScanner® Instrument
(Herrmann, Durtschi et al. 2006). High-resolution melting analysis of the PCR
84

products amplified in the presence of LCGreen Plus can identify both
Mutation detection analysis using the LightScanner® is most successful when
analysing products of 120-220bp with a low GC content, but has been shown
to have near 100% sensitivity and specificity when used on products of up to
400 bp in length (Liew, Seipp et al. 2007).
Nucleic acid melting is tracked by monitoring the fluorescence o f the mixture
across a defined temperature range, generating melting profiles that can be
used to identify the presence o f sequence variation within the amplicon. PCR
reactions were performed in duplicate and with positive and negative sequence
controls. The reaction is optimised by testing these sequence controls with
varying concentrations o f Q® (Qiagen), MgCL and different annealing
temperatures (as described in PCR methods), lpl of the LCGreen dye is added
to the reaction mix. The total reaction volume of 12.5|il is overlaid with
mineral oil which is a necessary step for analysis by the LightScanner. Melting
curves are produced which differentiate sequence variants. The advantage of
this technique over SSCP is that it is cheaper and has a higher throughput as
up to 144 samples (288 PCR products) may be analysed per hour. Another
benefit is that following analysis on the LightScanner the PCR products may
be processed directly for sequencing.
2.6.4 Loss of Heterozygosity Analysis
Loss of heterozygosity (LOH) analysis is one method by which chromosomal
instability can be assessed in tumour samples. Tumour suppressor genes have
a negative effect on cell growth and division. If one tumour suppressor gene
allele is left intact this is generally enough to control cell growth and division.
Tumour growth occurs when both alleles are disrupted either by mutation or
epigenetic change. The first genetic change on one allele is usually a small
inactivating mutation within the tumour suppressor gene itself. The second
genetic change may be a small genetic change, an epigenetic change or allelic
loss due to partial or whole chromosomal abnormalities. It is thought that
possible mechanisms leading to loss o f heterozygosity include non-disjunction
of homologues during mitosis, mitotic recombination or de-novo interstitial
mutations.
85

For LOH analysis to be undertaken, matched germline (peripheral venous
blood) DNA and tumour tissue DNA were genotyped at a set of microsatellite
markers lying close to the tumour suppressor gene under investigation.
Microsatellite markers are short mono-, di-, tri- or tetra-nucleotides which are
frequently polymorphic in the general population. PCR was performed for
each of the microsatellite markers using a fluorescently labelled forward
primer (FAM, HEX or less commonly TET) and unlabelled reverse primer.
The resulting PCR products were run on a semi-automated ABI Prism 377XL
DNA sequncer (PE-Applied Biosystems) together with the GENESCAN-350
TAMRA size marker (PE-Applied Biosystems). Results analysis for LOH was
performed using the GENESCAN and GENOTYPER software (PE-Applied
Biosystems). Heterozygous samples could be analysed for LOH. The area
under each allele peak was calculated and the ratio of the peak areas
calculated. The LOH value was determined by dividing the allelic ration of
normal tissue by the allelic ration o f the tumour tissue. LOH values smaller or
equal to 0.5, or larger or equal to 2.0 were scored as having allelic loss on the
assumption that the tumour contained more than 50% neoplastic starting
material as confirmed by histological analysis.
2.6.5 MLPA analysis for whole exon deletion or duplication
Multiplex ligation-dependent probe amplification (MLPA) analysis was
undertaken using an MLPA kit designed specifically to screen for whole exon
deletions or duplications in the APC gene (MRC-Holland, Amsterdam, The
Netherlands. Probe kit P043 APC). Manufacturer’s instructions were
followed. This kit contains a probe mix for each of the 15 coding regions of
APC. Three probes were also included for the promoter region of the APC
gene according to Esteller et al (Esteller, Sparks et al. 2000) and Lambertz et
al (Lambertz and Ballhausen 1993). As exon 15 has a coding region o f more
than 8kb, 5 probes are used for this exon. As a control, 13 probes for other
human genes located on different chromosomes are included for each
experiment. Details of the probe ligation sites for APC used in this kit can be
found at http://www.mrc-holland.com
86

Briefly, MLPA is used to detect deletions and duplications in one or more
exons of the gene of interest. Deletions o f probe recognition sequences are
apparent by a 35-50% reduction in the relative peak area of the amplification
product of that probe. Mutations and polymorphisms occurring close to the
probe ligation site may result in a reduced relative peak area and therefore any
apparent exon deletion is always confirmed with further investigation.
MLPA analysis consists o f four main steps.
1. DNA denaturation and hybridisation of the SALSA-probes
Between 20-500ng o f starting template DNA is required and diluted with TE
buffer to 5 p i This is heated for 5 minutes at 98°C in a tetrad PCR thermal
cycler, then cooled to 25oC. 1.5pl o f the SALSA-probe mix is added along
with 1.5p,l MLPA buffer. Samples were incubated at 95°C for 1 minute and
then 60°C for 16 hours.
2. Ligation reaction
Samples were reduced from 60°C to 54°C and 32pl of Ligase-65 mix was
added to each sample and mixed with a pipette. Samples were then incubated
at 54°C for 15 minutes and then 98°C for 5 minutes.
3. PCR reaction
4pl of lOxSALSA PCR buffer was added to 26pl of dPLO and lOjxl of the
MLPA ligation reaction. The samples were placed in a thermal cycler at 60°C
and then 10pl of polymerase was added to each sample and the PCR reaction
started. PCR cycling conditions were as follows - 35 cycles of 30 seconds at
95°C, 30 seconds at 60°C, 30 seconds at 72°C followed by a final incubation at
72°C for 20 minutes.
Samples were then run on the ABI-3100 genescan (PE-Applied Biosystems)
and data analysed with Genotyper® v.2.5 software. The area under each peak
for each probe was calculated and compared with that of the control samples.
The size and peak areas are imported in to an Excel (Microsoft office) file for
further analysis. Non-specific amplification products, primer dimer peaks, and
the peaks produced by the MLPA control mix can be removed at this stage.
When only the peak areas of the expected MLPA products remain, all peak
areas are normalised by dividing each peak area by the combined peak area of
all peaks in that lane. These normalised peak areas are then compared to the
87

average results obtained on all samples. A deletion of one copy of a probe
target sequence will usually result in a reduction of the relative peak size of
35-50%. A gain in copy number for two or three copies / diploid genome
usually results in an increase in peak area o f 35-50%.
2.7 Fluorescence cycle-sequencing of PCR products
Fluorescence cycle sequencing is an automated method of DNA sequencing
which uses double stranded DNA as a template. The original technique
developed by Sanger in 1977 (Sanger, Nicklen et al. 1977) is based on the
dideoxy procedure. This procedure depends on the ability of DNA polymerase
to synthesise complementary copies of single stranded target DNA. Therefore
DNA synthesis is undertaken in the presence of one specific primer for the
target sequence, the four dNTP’s and a low concentration of their dideoxy
analogues each of which is labelled with a different fluorophore. The standard
sequencing reaction involves 34 cycles o f heat denaturation, primer annealing
and extension. As dideoxy nucleotides lack the 3 ’-hydroxyl group necessary
for extension, chain termination occurs whenever one of these nucleotides is
incorporated. As they are present at low concentration, chain termination
occurs at each nucleotide along the target DNA sequence. The resultant
strands therefore have a common 5’ end defined by the primers but vary in
length depending on their base specific 3 ’ ends. The different resultant strands
are then separated by PAGE. As the chain terminating events have a
specifically attached fluorophore identifier (one for each base) the sequence
can be read as the strands pass a fluorescence detector.
PCR products selected for DNA sequencing were first purified - removing
unincorporated primers and nucleotides using the QIAquick PCR purification
kit (Qiagen) according to manufacturer’s instructions. Proteins and
oligonucleotides smaller than lOObp’s were removed by washing through a
silica-gel membrane under different salt conditions. The resultant purified
PCR products were then sequenced in the forward and reverse orientation
using the same primer as for the original PCR reaction. Each 20pl reaction
contained 8|xl of Big Dye Terminator Ready Reaction mix (PE-Applied
Biosystems), 2pl primer (2pM; forward or reverse), 2pl of purified product
88

and 8jil of dH20 . Sequencing cycle conditions for the Tetrad PCR machine
(MJ Research) consisted of an initial denaturation at 94°C for 4 minutes, 25
cycles of 94 °C for 30 seconds, 50 °C for 10 seconds and 60 °C for 4 minutes
with a final extension step at 60 °C for 7 minutes. The resultant sequencing
products were finally purified from excess dye-labelled dideoxy nucleotides
using the QIAquick PCR purification Kit with a final elution in 8pl of
microSTOP loading buffer (PE-Applied Biosystems). Sequencing samples
were then denatured at 94 °C for 4 minutes and run on a 5% polyacrylamide
gel on a semi-automated ABI prism 377XL DNA sequencer (PE-Applied
Biosystems). Sequence analysis was perfomed using the Semi-adaptive Base
Calling option of the Sequencing Analysis Programme Version 2.1 (PE-
Applied Biosystems). The NCBI BLAST database was then searched with the
resultant sequence to ensure correct origin of the target DNA sequence
(http://www.ncbi.nlm.nih.gov/blastL All sequences were also analysed by eye
for mutations.
2.8 Cloning of PCR products
Cloning allows the amplification of a single DNA fragment such as a PCR
product. The techniques involves ligation of the DNA fragment into an
appropriate vector which, following transformation, can be propagated in a
suitable bacterial host. Recombinant clones are selected based on vector-
encoded genes, grown up to a high density, and the recombinant vector is then
purified.
Cloning of PCR products was undertaken using the pGEM®-T Easy vector
system (Promega). This system utilises a high copy number vector which
carries a gene conferring resistance to the antibiotic ampicillin. The vector is
provided ready for ligation, having been prepared by cutting with the
restriction endonuclease EcoRW. The EcoKV restriction site is located with an
open reading frame encoding the a-peptide of (3-galactosidase (lacZ'). When
intact, this enzyme can convert the colourless substrate X-gal into a blue
product upon induction with IPTG. This vector has a 3’ thymidine overhang
which allows insertion of PCR products which have a 3’ overhang of
89
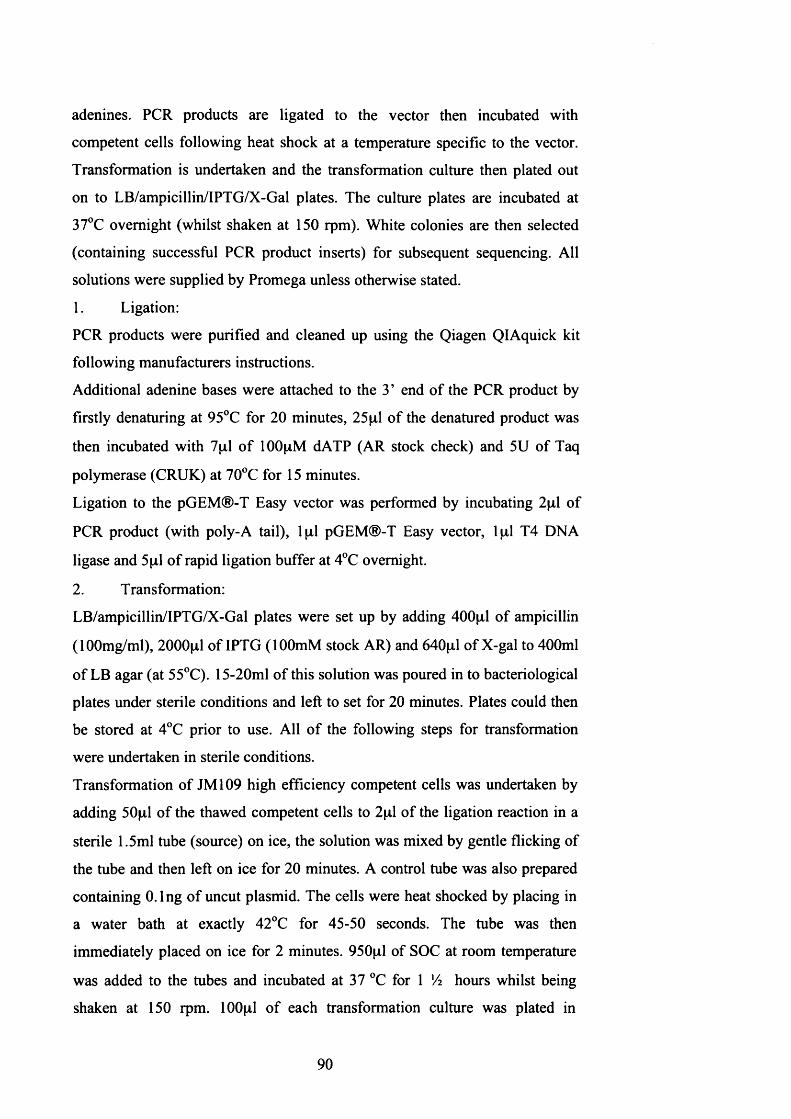
adenines. PCR products are ligated to the vector then incubated with
competent cells following heat shock at a temperature specific to the vector.
Transformation is undertaken and the transformation culture then plated out
on to LB/ampicillin/IPTG/X-Gal plates. The culture plates are incubated at
37°C overnight (whilst shaken at 150 rpm). White colonies are then selected
(containing successful PCR product inserts) for subsequent sequencing. All
solutions were supplied by Promega unless otherwise stated.
1. Ligation:
PCR products were purified and cleaned up using the Qiagen QIAquick kit
following manufacturers instructions.
Additional adenine bases were attached to the 3’ end of the PCR product by
firstly denaturing at 95°C for 20 minutes, 25pi of the denatured product was
then incubated with 7pi o f lOOpM dATP (AR stock check) and 5U of Taq
polymerase (CRUK) at 70°C for 15 minutes.
Ligation to the pGEM®-T Easy vector was performed by incubating 2pl of
PCR product (with poly-A tail), lp l pGEM®-T Easy vector, lp l T4 DNA
ligase and 5 pi o f rapid ligation buffer at 4°C overnight.
2. Transformation:
LB/ampicillin/IPTG/X-Gal plates were set up by adding 400pl of ampicillin
(lOOmg/ml), 2000pl of IPTG (lOOmM stock AR) and 640pl of X-gal to 400ml
of LB agar (at 55°C). 15-20ml o f this solution was poured in to bacteriological
plates under sterile conditions and left to set for 20 minutes. Plates could then
be stored at 4°C prior to use. All o f the following steps for transformation
were undertaken in sterile conditions.
Transformation of JM109 high efficiency competent cells was undertaken by
adding 50pl of the thawed competent cells to 2pl of the ligation reaction in a
sterile 1.5ml tube (source) on ice, the solution was mixed by gentle flicking of
the tube and then left on ice for 20 minutes. A control tube was also prepared
containing 0.1 ng o f uncut plasmid. The cells were heat shocked by placing in
a water bath at exactly 42°C for 45-50 seconds. The tube was then
immediately placed on ice for 2 minutes. 950pl of SOC at room temperature
was added to the tubes and incubated at 37 °C for 1 Vi hours whilst being
shaken at 150 rpm. lOOpl of each transformation culture was plated in
90

duplicate on to the pre-prepared LB/ampicillin/IPTG/X-gal plates and
incubated overnight at 37 °C. White cultures (indicative of successful ligation
and transformation) were then picked for further analysis and sequencing.
2.9 Cell Culture
2.9.1 Sterile Lymphocyte Separations
Sterile lymphocyte separations were performed in order to establish permanent
cell lines containing germ line DNA from patients and controls under
investigation. Cell lines were established through immortilisation of
lymphocytes with Epstein-Barr virus (CRUK cell services). All of the steps
for lymphocyte separation and cell line production were undertaken in sterile
conditions.
25ml of peripheral venous blood was collected via venesection into a Falcon
tube containing 25ml o f sodium citrate medium. The 50ml of blood and
sodium citrate medium were poured in to a 250ml flask, the tube was then
rinsed with 4ml of RPMI medium (CRUK) at room temperature. Defibrination
of the whole blood was performed by adding approximately 25 glass beads
(BDH) and 600p.l of 1M CaCh (BDH) to the flask which was then placed on
a gyratory shaker (source) at 250rpm for 15 minutes at room temperature.
20ml of RPMI was then added to the flask and the sample split between two
falcon tubes each containing 15ml o f lymphoprep (Robbins scientific). Each
sample was layered carefully over the lymphoprep solution with a pipette. The
tubes were then spun at 1800rpm for 20 minutes in a centrifuge with a swing
out rotor (with the brake off) which allowed the defibrinated sample to be
passed thorough the lymphoprep solution forming a gradient with different
cellular components being present in each layer. The interface containing the
lymphocytes was aspirated off using a pipette, transferred to a new 50ml
falcon tube and centrifuged at 2300rom for 10 minutes. The lymphocyte cell
pellets were re-suspended in 2ml o f freeze mix (90% foetal calf serum /
10% DMSO), divided equally between 2 cryotubes (Coming) and placed
immediately at -80°C overnight. The samples were then placed in liquid
nitrogen until ready for transformation.
91

2.9.2 Feeding Cell Lines
Once the lymphocytes had been successfully transformed and a growing
culture established they would require regular feeding or spinning down for
DNA or RNA extraction (as described previously). Lymphoblastoid cells lines
were cultured in RPMI/10%FCS (CRUK) medium which is used for cells in
suspension. Colon cancer cell lines (eg HCT116) were cultured in
E4/10%FCS meduim (CRUK) which is used for adherent cells.
Cells in culture were examined daily under a microscope to determine
viability and density. If cells were being deliberately left to be cultured they
would be “split” when they became confluent, 50% of the cultured medium
was removed under sterile conditions and replaced with fresh culture medium.
Culture flasks (Falcon) were incubated at 37°C in 10% CO2. Cells were then
either left for further culture or spun down for their required protocol.
2.9.3 Freezing down and re-suspending cells to replace
stocks
To ensure a permanent cell line resource an aliquot of the growing cells in
culture were frozen down and stored in liquid nitrogen. 50ml of the growing
culture was removed in to a falcon tube under sterile conditions and spun at
2000rpm for 5 minutes. The supernatant was removed and the tube in verted
to dry. The pellet was re-suspended in 2ml freeze mix (90% foetal calf
serum / 10% DMSO) and aliquoted in to 2 cryotubes (Coming) for long term
storage. Tubes were stored at -80°C overnight and then in liquid nitrogen.
2.10 Comparative Genomic Hybridisation
Comparative genomic hybridisation (CGH) enables the screening of the whole
genome for chromosomal losses and gains in a single experiment. This
technique has been used widely to study tumour karyotypes . (Kallioniemi,
Kallioniemi et al. 1992). Conventional CGH (resolution 5-10 Mb) has been
92

super-ceded by microarray CGH (aCGH) with a higher resolution of screening
across the genome. I used 1Mb resolution arrays designed by Nigel Carters
group at the Wellcome Trust Sanger Centre (Cambridge, UK). These arrays
consist o f 3125 human Bacterial Artificial Chromosome (BAC) clones,
amplified by degenerate oligonucleotide primer PCR (DOP-PCR) and printed
in duplicate on to glass slides. In addition 6 BAC clones from Drosophila
melanogaster were also printed on to the array as a control for background
hybridisation.
The BAC clones were selected from the Golden Path at a spacing of
approximately 1 Mb across the whole genome, excluding the short arms of the
acrocentric chromosomes. Clones FISH-mapped to a single location or
localised to known oncogenes and tumour suppressors were preferred, but the
selection was arbirtrary in the majority of cases (Fiegler, Carr et al. 2003).
1. Array preparation
Array printing was performed by Cordelia Langford at the Wellcome Trust
Sanger Centre (Cambridge, UK). Aminolinked PCR products were diluted
into lx printing buffer (250mM sodium phosphate pH 9.0, lx l0 ‘6 % N-
laurylsarcosine) and filtered through 0.22pm filter plates (Millipore), before
re-arraying in to 384-well plates. The DNA products were printed on to
Codelink™ activated slides (GE Healthcare) using a Microgrid II array spotter
(Biorobotics). Printed slides were transferred to a humid chamber at room
temperature for 72 hours to drive the covalent attachment of the DNA to the
slides. Slides were then immersed in 1% w/v ammonium hydroxide for 5
minutes, 0.1% sodium dodecyl sulphate for 5 minutes and then rinsed in
water. The bound DNA was denatured by immersing the slides in water at
95°C for 2 minutes before being rinsed in ice-cold water and finally the slides
were dried by centrifugation.
2. DNA labelling and purification
450ng of normal (“reference”) and tumour (“test”) DNA were labelled with
Cy3-dCTP and Cy5-dCTP (Amersham) respectively, using the Bioprime array
CGH labelling kit (Invitrogen), according to the manufacturers instructions.
Briefly, DNA was diluted to a volume of 2 lpl nuclease-free water and
combined with 20pl random octamer primers in 2.5x buffer (125mM Tris-HCl
93

(pH 6.8), 12.5mM MgCh, 25mM Ji-mercaptoethanol, 750pg/ml random
octamers). The sample was incubated at 100°C for 10 minutes and
immediately cooled on ice. 5p.l o f dNTP mix (1.2mM dATP, dGTP and
dCTP), 3pil o f Cy3- or Cy5-dCTP (lpM ) and lpl of Exo-Klenow fragment
(40U/pl) were mixed with the cooled sample. The samples were incubated
overnight at 37°C. Reactions were then stopped by the addition of 5pl of 0.5M
EDTA.
Labelled DNA was then purified using Microspin G-50 columns (Amersham)
according to the manufacturer’s protocol. DNA samples were run on a 2%
TBE-agarose gel at 120V for 20 minutes to confirm DNA labelling.
Successfully labelled samples would produce a low-molecular weight smear
(~50-200bp) when viewed under UV light.
3. DNA precipitation and hybridisation
Slides were prepared for hybridisation by first forming a seal around the
arrayed area o f the slide by applying 2 layers of adhesive PCR film (AB-gene,
AB-0558), cut to size with reference to a “dummy” printed slide.
Labelled test and reference DNA samples were combined and precipitated
with 135pg Cotl DNA (Roche) in 0.1 volumes 3M sodium acetate (pH 5.2)
and 2.5 volumes o f ice-cold ethanol at -80°C for 30 minutes. Concurrently,
lOpg of Herring sperm DNA was precipitated with 135pg Cotl DNA.
Precipitated DNA was then pelleted by centrifugation at 16,000g for 15
minutes. The resultant pellet was washed with 80% ice-cold ethanol and re
pelleted at 16,000g for 5 minutes. The supernatant was removed and the pellet
dried.
The labelled pellet was then re-suspended in 80pl hybridisation buffer (50%
deionised formamide, 10% dextran sulphate, 0.1% Tween-20, 2xSSC, lOmM
Tris (pH 7.4)) and 8pl yeast tRNA (lOOpg/^l, Invitrogen). The herring sperm
pellet was then re-suspended in 180pl hybridisation buffer. Both samples were
heated at 80°C and frequently mixed by vortex until the pellets were re
suspended. The labelled DNA sample was then placed at 37°C for 1 hour to
allow the labelled samples to compete with the Cotl DNA, blocking repetitive
sequences. The re-suspended herring sperm DNA mixture was carefully
pipetted on to the prepared slide to pre-hybridise for 1 hour at 37°C in a humid
94

chamber formed of a slide box containing 3 mm paper (Whatman) soaked in
40% formamide/2xSSC. Following competition, the labelled DNA sample
was applied to the pre-hybridised array via pipette. The humidity chamber was
sealed with electrical tape to form a firm seal. The array was then incubated at
37°C on a rocking platform for 48 hours.
4. Microarray CGH slide washing protocol
All steps were performed in the dark to preserve the fluorochromes (Cy3 and
Cy5).
Arrays were removed from the humidity chamber and placed in wash buffer 1
(2x SSC/0.1% Tween-20) in a coplin jar at room temperature. The seal was
then removed with forceps after approximately 30 seconds. The arrays were
then washed in this solution on a rocking platform for 5 minutes. Arrays were
then washed again in buffer 1 at 65 °C for 5 minutes. Arrays were then washed
in buffer 2 (0.2 x SSC) at room temperature for 5 minutes - 3 washes in buffer
2 were performed with fresh buffer for each wash (1 wash for 2 minutes, 2
washes for 20 minutes). Arrays were then transferred to wash buffer 3
(lxPBS, 0.1% Tween-20), for 5 minutes, then wash buffer 4 (lxPBS) for 5
minutes, and a final brief wash in dH20. The arrays were then dried by
centrifugation at 500g for 3 minutes in slide boxes lined with bleach-free
tissue paper. Slides were then stored in the dark at room temperature until
scanning.
5. Microarray CGH slide scanning and data analysis
A Scanarray confocal scanner and software (Perkin Elmer) was used to scan
the arrays. Every array was pre-scanned and settings adjusted to ensure even
signal detection from both Cy3 and Cy5 fluorochromes. Detailed scanning
was then performed at 10pm resolution and TIFF image files produced for
each array for further analysis.
Microarray based experiments produce very large quantities of data for
analysis which requires handling in a constant and robust manner in order to
be able to compare experimental results between research groups. There are
two important factors which need addressing. One is appropriate
normalisation o f the data - whereby raw ratios are transformed to a defined
baseline allowing for experimental artefacts such as uneven hybridisation. The
second is accurate selection of significant regions of change for further study.
95

Fielger et al addressed these issues by braking down microarray data analysis
into five steps (Fiegler, Carr et al. 2003).
i) Overlaying of image files and data-point quantification - individual output
files for each fluorescent dye channel are overlaid and the intensity of each
individual spot calculated.
ii) Data rejection - individual spots are accepted of rejected on the basis of
spot quality and the level o f “background” hybridisation. Data is then
normalised to the number of copies of test genome per copy of reference
genome. In the arrays used, this rejection was determined by the presence of 6
Drosophila melanogaster clones which are known not to hybridise to human
DNA. These were therefore controls for non-specific hybridisation.
iii) Normalisation - Accepted data values are then normalised across the array
to give a ratio of the number of test genomes per copy of the reference
genome.
iv) Duplicate rejection - variability of data for duplicated BAC clones is
compared and if excessively variable the data is rejected.
v) Identification o f significant changes - calculated log2 ratios are used to
identify regions o f altered copy number in the test DNA sample with respect
to the test sample.
Spot software (Jain, Tokuyasu et al. 2002) was used for overlaying Cy3 and
Cy5 array images. This software calculates intensity values for each spot on
the array using a local histogram method. Normalisation was performed using
a Microsoft Excel spreadsheet written by Heike Fiegler in Nigel Carter’s
group (Fiegler, Carr et al. 2003). Duplicate clone spots were then compared to
determine that both were giving an identical hybridisation ratio. This was
determined by taking the median of the normalised ratios between the test and
reference signals - and assessing for any deviation between these and the
originals. If a duplicate had greater than 10% variance when compared to the
calculated median it was rejected, if not the median was then used to calculate
the final log2 ratio for this clone.
Finally, the identification of areas of significant change was undertaken using
a file from UCSF Spot (Jain, Tokuyasu et al. 2002) using the statistical
package R (Team 2006). In theory, the log2 output for each (duplicated) clone
on the array should be representative of the number of copies of the test
96

genome per copy of the reference genome. Therefore a diploid tumour losing
one copy of a particular chromosome would result in a ratio of 0.5 - one copy
of test genome per two copies of reference genome. In practice it can be
difficult to meet these theoretical thresholds due to experimental artefacts such
as contaminating normal DNA in the test (tumour) samples which would
dilute the observed change.
The determination of copy number changes was performed using the program
DNAcopy(http://www.bioconductor.org/repository/releasel.5/package/html/D
NAcopy.html), supplemented by a formal paired t-test comparing
tumour:normal and normalinormal hybridisations to determine regions of
significant copy number change using a threshold of p<0.001. Only autosomes
were analysed.
2.11 Expression-Microarray Analysis
RNA from lymphoblastoid cell lines was extracted using the trizol method (as
described previously) and cleaned up with the Qiagen RNeasy kit following
manufacturers instructions. Quality and quantity of extracted RNA was
assessed using the Agilent 2100 bioanalyzer.
Purified total RNA (5pg) was labelled and hybridised on to Affymetrix®
U133 Plus 2.0 GeneChip oligonucleotide arrays (Affymetrix, Santa Clara,
CA). The following is a summary of the hybridisation protocol.
Full details can be found at -
https://www.affvmetrix.com/support/downloads/manuals/expression_s2_manu
al.pdf.
U133 Plus 2.0 Expression Micro-array protocol.
All reagents used were supplied by Affymetrix unless otherwise specified.
In summary, first and second round cDNA was made from the extracted
purified RNA. cRNA was then made from the cDNA. This was purified and
97

quantified then 20pg subsequently fragmented prior to hybridisation on to the
oligonucleotide arrays.
1. First Strand cDNA synthesis
Poly-A control stock was diluted with poly-A control buffer 1:20, then 1:50,
and finally 1:10 in preparation. 2pl o f the diluted poly-A control was then
added to 2pl o f T7-01igo(dT) Primer, 50 pM, and 8pl sample RNA to a total
volume of 12pl. This was incubated at 70°C for 10 mins, then cooled at 4°C
for a further 2 mins. A first strand master mix was prepared consisting of 4pl
5x 1st strand reaction mix, 2pl 0.1M DTT and lpl lOmM dNTP (total 7pl
volume). These were mixed together to make up a 19pl volume which was
then incubated immediately at 42°C x 2 min. lp l Superscript II was then
added and the mix of 20pl incubated for 1 hour at 42°C, then cooled for at
least 2 minutes at 4°C.
2. Second Strand cDNA synthesis
A master mix o f 130pl was prepared with: 91 pi RNase-free water, 30pl 5x
2nd strand reaction mix, 3pi dNTP lOmM, lpl E coli DNA ligase, 4pl E coli
DNA polymerase I, 1 pi RNase H. This was added to the 20pl from the first
strand synthesis and incubated for 2 hours at 16°C. 2pl of T4 DNA
polymerase was then added and incubated at 16°C for 5 mins. The reaction
was stopped by the addition of lOpl EDTA 0.5M.
3. Cleanup o f cDNA
600pl of the cDNA binding buffer was added to the double-stranded cDNA
preparation and mixed by vortexing. 500pl of this mixture was pipetted into a
cDNA cleanup column sitting in a collection tube then centrifuged for 1 min at
>8000g. The eluate was discarded and the spin column re-loaded with the
remaining mixture, repeating the spin as above. The collection tube was
changed and 750pl o f cDNA wash buffer was applied and the spin repeated as
above. The eluate was discarded and spun once more at maximum speed. The
collection tube was changed and 14pl o f cDNA elution buffer was applied via
pipette, it was then spun for 1 minute at maximum speed.
4. cRNA synthesis
12pl o f the eluate was mixed with lOpl RNase-free water, 4pl lOx IVT
labelling buffer, 12pl IVT labelling NTP mix and 4pl IVT labelling enzyme to
make a final volume of 40pl which was then incubated at 37°C for 16 hours.
98

5. Cleanup and quantification of cRNA
60pl RNase-free water was added to the IVT reaction and mixed by vortexing.
350pl IVT cRNA binding buffer was added to this and vortexed again. Finally
250pl ethanol (96-100%) was added and mixed with a pipette. This mix was
applied to the cRNA cleanup column placed in a collection tube. The column
was then centrifuged for 15 seconds at > 8000g. The column membrane was
washed with 500pl IVT cRNA wash buffer, then spun for 15 seconds at >
8000g. 500pl 80% ethanol was then added to the column and spun for 15
seconds at > 8000g. The eluate was discarded and the column spun for a
further 5 min at maximum speed, then transferred to a new tube, l lp l of
RNase-free water was applied to the spin column membrane and centrifuged
for 1 min at maximum speed to elute the cRNA. This step was then repeated
with a further lOpl RNase-free to maximise the quantity of eluted cRNA. The
eluate in was diluted 1:50 with dt^O to determine the final concentration and
then analysed on the ND-3100 Nanodrop.
6. Fragmentation o f cRNA
20pg of cRNA (1 to 2 lp l depending on concentration) was added to 8pl
fragmentation buffer (Affymetrix cleanup kit) and made up to 40pl with
RNase free water. This was incubated at 94°C for 35 min, then placed on ice.
The fragmentation product was then run on a 2% agarose gel at 120V for 30
mins for confirmation o f fragmentation.
7. Hybridisation
The following mix was made: 36pl fragmented cRNA, 5pi 3nM control
oligonucleotide B2, 15 pi 20x eukaryotic hybridisation controls (the 20x
eukaryotic hybridisation controls were heated to 65°C for 5 min before
aliquoting.), 3 pi herring sperm DNA, 3pi BSA (50mg/ml), 150pl 2x
hybridisation buffer, 30pl DMSO and H2O to a total volume of 300pl. This
was then heated to 99°C for 5 mins in a heat block. Meanwhile the array was
wet by filling it with lx hybridisation buffer, and incubated at 45°C in the
hybridisation oven for 10 min. The hybridisation cocktail was transferred from
the 99°C block to a 45 °C block and then spun for 5 mins at maximum speed to
remove insoluble material. The buffer solution in the array was then
exchanged for the hybridisation cocktail and placed back in the hybridisation
oven for 16 hours at 45°C.
99

8. Washing and Staining
SAPE stain solution was made by mixing 600jil 2x stain buffer, 48pl 50mg/ml
BSA, 12pl lmg/ml SAPE and 540pl ddH20 making a final volume of 1200pl.
Antibody solution was made by mixing 300pl 2x stain buffer, 24pl 50mg/ml
BSA, 6pl lOmg/ml Goat IgG stock (Sigma-Aldrich), 3.6jj.1 0.5mg/ml
biotinylated antibody and 266.4pl dfhO. The arrays are washed and stained
using the automated Affymetrix wash station using the protocol
EukGE_w52v5.450.
9. Scanning
This was performed using the Affymetrix GeneChip 3000 scanner.
Affymetrix GCOS software (vl.4) was used to obtain DAT image files which
were then converted to CEL files containing information about the expression
levels of the individual probes.
Unsupervised analysis o f microarray data aims to detect groups of samples or
outliers without knowledge o f the clinical features of each sample.
Hierarchical clustering is an unsupervised method for organizing expression
data into groups with similar signatures, which is represented by a cluster
dendrogram. A ‘volcano plot’ arranges genes along dimensions of biological
and statistical significance. The first axis indicates biological impact of the
change; the second indicates the statistical evidence, or reliability of the
change.
My data was analysed using the R statistical package (Team 2006) by the
Bioinformatics department at CRUK. The standard test statistic used for
comparing the two groups was the t-statistic:
t = (xi,l -x i,2 ) / si,
where xi,l is the mean value of gene i in group 1, xi,2 is the mean in group 2,
and si is the (non-pooled) within-groups standard error (SE) for gene i.
Usually the majority o f genes are not consistently changed between groups.
For the unchanged genes, the values of their t-statistic would follow the t-
distribution indexed by nl+n2 - 2 degrees o f freedom, in repeated trials,
provided there are no outliers in the samples. As a matter of practice, in almost
all cases, the values o f the t-statistics for all o f the unchanged genes in a single
experiment also follow a t-distribution. If the researcher expects only a small
number of genes are greatly changed, then a convenient way of assessing the
100

most likely true positives is to plot the t-scores obtained, against the t-
distribution. Usually the t-scores of the unchanged genes follow the t-
distribution; if the unchanged genes are the overwhelming majority, then this
plot will be a straight line at 45°. The t-scores for the few really significant
genes are more extreme, and stand out from the straight line, where they can
be easily seen.
Cluster dendrograms were produced to demonstrate hierarchical clustering
between the sample analysed. Dendrograms graphically present information
regarding each individual sample analysed which are then grouped together at
various levels o f similarity. At the bottom of the dendrogram each observation
is considered as having its own cluster and identity. Vertical lines extend up
for each observation, and at various similarity values these lines are connected
to the lines from other observations with a horizontal line. The observations
continue to combine until, at the top of the dendrogram, all observations are
grouped together. The height of the vertical lines and the range of the
similarity axis give visual clues about the strength of the clustering. Long
vertical lines indicate more distinct separation between the groups. Long
vertical lines at the top o f the dendrogram indicate that the groups represented
by those lines are well separated from one another. Shorter lines indicate
groups that are not as distinct.
The ‘volcano plot’ arranges genes along dimensions of biological and
statistical significance. The first (horizontal) dimension is the fold change
between the two groups (on a log scale, so that up and down regulation appear
symmetric), and the second (vertical) axis represents the p-value for a t-test of
differences between samples (most conveniently on a negative log scale - so
smaller p-values appear higher up). The first axis indicates biological impact
of the change; the second indicates the statistical evidence, or reliability of the
change.
The data presented in this thesis will include both dendrograms and volcano
plots.
101

2.12 Laser Capture Microdissection
Laser capture microdissection (LCM) is a technique used for isolation of
highly pure cell populations from a heterogeneous tissue section, cytological
preparation or a live cell culture via direct visualisation of the cells. There are
two main classes of laser microdissection, infra-red capture systems and
ultraviolet (UV) cutting systems. A UV cutting system on the P.A.L.M. laser
capture dissection microscope (P.A.L.M Microlaser Technologies, GmbH,
http://www.zeiss.com) (Micke, Ostman et al. 2005). This system allows both
UV laser cutting and catapulting of the cut tissue into a collecting cap using a
UV laser pulse.
The principle components of LCM are -
1. visualisation of the cells of interest via microscopy
2. transfer o f laser energy with photo volatisation of cells surrounding a
selected area
3. Removal of cells of interest from the heterogeneous tissue section
(with UV laser pulse)
Using LCM, both frozen and fixed tissues can be dissected and recovered cells
can be used for DNA, RNA and protein analysis.
Sections were cut from paraffin embedded archival tissue. Six 6pm section
were taken from paraffin embedded tissue on to PALM slides (PALM Laser
technologies, GmbH, 82347, Germany). The slides have a polymer membrane
and were pre-treated with UV light (302 nm) for 30 minutes. Two
haematoxylin and eosin (H&E) slides were taken for reference for each
sample - one at the beginning and one at the end. Individual crypts from
adenomas at their earliest stages were then cut in to caps (PALM Laser
technologies, GmbH, 82347, Germany. Ref 1440-0250) for extraction of
DNA. In order to obtain suitable amount of DNA for performing mutation
detection, six sequential sections of the same crypt were cut in to each
individual cap. These samples were digested overnight in proteinase K and
buffer (PicoPure DNA Extraction kit (Kit:0103), Molecular Devices
Corporation, CA94089-1136, USA). See method for extraction of DNA from
LCM dissected crypts for further details.
102

2.13 Immunohistochemistry
Immunohistochemistry was performed staining for p-catenin and PMS2.
1. Slide preparation
4 pm sections from paraffin embedded archival tissue were placed on to glass
slides. Slides were then dewaxed in xylene (BDH) for 5 minutes then 100%
ethanol (BDH) for 3 minutes, 90% ethanol for 3 minutes and 70% ethanol
for 3 minutes.
Endogenous peroxidase was blocked by incubating the slides in 3% hydrogen
peroxide (H2O2, BDH)/phosphate buffered saline (PBS) for 30 minutes.
2. Exposing antigen and applying primary antibody
Citrate buffer was heated to boiling in a pressure cooker and slides were
placed in the pressure cooker on full pressure for four minutes. Slides were
then allowed to cool in the citrate buffer and rinsed in phosphate buffered
saline (PBS) (pH 7.45).
The slides were incubated in normal rabbit serum (NGS-1:25, DAKO Ltd.)
for 10 minutes to block non-specific binding. 75pl of primary antibody (|3-
catenin, 1:100 dilution, Transduction Labs, (20pl antibody in 1980pl PBS ))
and PMS2 (purified mouse anti-PMS2 monoclonal antibody, BD Pharmingen,
1:40 concentration, (40\mu 1 in 1000ml PBS)) were added to the slides and
incubated for 45 minutes. Positive and negative control slides were included in
every run
3. Application o f secondary antibody and counterstaining
Slides were rinsed in PBS for 5 minutes and then incubated with secondary
antibody (biotinylated rabbit anti-mouse Ig, DAKO Ltd.) for 35 minutes. The
slides were incubated for 30 minutes at room temperature, washed in PBS and
then incubated with streptavidin-peroxidase conjugate (1:500, P397, DAKO
Ltd.) for 35 minutes at room temperature. The peroxidase activity was
demonstrated by activated 3,3’-diaminobenzidinetetrahydrochloride solution
(DAB) (Sigma D5637) and 0.1% H2O2 . Finally slides were dehydrated
through a series o f ethanol washes of 70%, 90% and 100%, then xylene before
being mounted using Pertex mountant (CellPath).
103

2.14 Mouse husbandry
Animals were bred at Cancer Research United Kingdom Laboratories (South
Mimms, UK). Experiments were conducted in full accordance with the United
Kingdom Animal Procedures Act 1986. All animals were sacrificed under
schedule 1 regulations. Any sick animal was reviewed by the resident Vet at
Clare Hall laboratories and either treated for its condition or sacrificed and
post mortem examination undertaken.
The C57BL/6J-/f/?cA//«+/' mice were originally a gift from A. R. Moser
(McArdle Laboratory, University of Wisconsin, Madison, WI). The
129/C51BL/6JMyh+/~ mice were a gift from J. Miller (Molecular Biology
Institute, University of California, Los Angeles, USA). AKR wild type mice
used for backcrossing were obtained from CRUK stocks in the animal unit at
Clare Hall laboratories (CRUK).
2.15 Ethical Approval
All samples and clinico-pathological data were obtained with informed
consent and local ethical review board approval in accordance with the tenets
of the Declaration o f Helsinki. All patients were recruited to the CORGI
(COloRectal Gene Identification) study, MREC 99/2/14.
2.16 Solutions I Media
Ammonium acetate (saturated)
148g NH4Ac (BDH), 50ml dH20
Ampicillin, lOOg/ml
lg ampicillin (Sigma), 10ml dH20 , stored at -20°C
104

CaCl21M
14.7g CaCl2 (BDH) in 100ml CIH2O, mixed thoroughly and filtered (0.22pm
filter)
Citrate buffer stock pH6.0
210.14g citric acid (BDH) in 1000ml dH20, adjusted to pH6.0 using NaOH
pellets (BDH)
Citrate buffer solution
20mls citrate stock (pH6.0), 1980mls dH20
DAB
5mg DAB (Sigma D5637), 10ml PBS, 20pl H2O2
Ethanol
70% - 700ml absolute ethanol (BDH) and 300ml CIH2O
75% - 750ml absolute ethanol (BDH) and 250ml (IH2O
90% - 900ml absolute ethanol (BDH) and 100ml (IH2O
95% - 950ml absolute ethanlol (BDH) and 50ml CIH2O
100% - absolute ethanol (BDH)
Ethylene-diamine-tetra-acetate (EDTA) 0.5M for 11
Na-EDTA 184.1 g, pH 8.0, autoclave
Ethidium bromide (lOmg/ml)
O.lg Ethidium bromide (Pierce) dissolved in 10ml dH20. Store in dark
Formamide wash solution (2xSSC, §0% formamide)
50ml 20xSSC, 250ml formamide (BDH), made up to 500ml with dH20
105

Freeze Mix (90% FCS/10%DMSO)
9ml foetal calf serum (GibcoBRL) mixed with 1ml dimethyl-sulphoxide
(BDH)
Growth medium E4/FCS
180ml E4 cell culture medium (CRUK), 20ml foetal calf serum (GibcoBRL)
Growth medium RPMI/FCS
180ml RPMI cell culture medium (CRUK), 20ml foetal calf serum
(GibcoBRL)
Hybridisation buffer (2xSSC, §0% formamide, 10% dextran sulphate)
lml 20xSSC, 5ml formamide (BDH), lg dextran sulphate (BDH), made up to
10ml with dH2 0
H202 0.1%
600ml methanol, 1.8ml H 202 (30%)
H202 3%
600ml methanol, 54ml H2O2 (30%)
IPTG (0.1M)
1.2g IPTG (Promega), 50ml dH20, filter-sterilised (0.22pm filter), stored at
-20°C
Luria broth (LB)
lOg sodium chloride, 5g bacto yeast extract, lOg bacto-trytone, 900ml dH20,
pH 7.0, autoclaved
106

LB agar plates
LB medium prepared as above, 15g bacto-agar added prior to autoclaving
NP-40 0.1%
200pl nonidet P40 (BDH), 200ml dH20
Nuclei lysis buffer (50ml)
lOmM Tris (500pl 1M), 400mM NaCl (4ml 5M), 2mM EDTA (200pl 0.5M
(BDH)), 45.3ml dH20
Phosphate buffered saline (lx ), for 11
NaCl 8g (137mM), KC1 0.25g (2.7mM), Na2HP04 1.43g (lOmM P 04),
KH2P 04 (0.25g), pH 7.4, autoclave
PBS/5% Tween-20
9.5ml PBS, 500pl Tween-20 (Sigma)
PBS/0.5% Tween-20
9ml PBS, 500pl Tween-20 (Sigma), 500pl BSA (NEB)
Proteinase K buffer (store 4°C)
2mg proteinase K (Merck) in lml dH20
RNAseA, lOmg/ml
lOOmg RNAseA (Advanced biotechnologies), 10ml dH20 , stored at -20°C
SE buffer
107

75mM NaCl (7.5ml 5M), 25mM EDTA pH 8.0 (2.5ml 0.5M), 1% SDS (50ml
10%) made up to 500ml with dH20, filtered 0.22pm filter.
Sodium acetate (3M)
61.52g sodium acetate (BDH), 200ml dH20, pH 6.0 made up to 250ml with
dH2 0 , autoclaved
Sodium chloride (5M)
73.lg NaCl (BDH), made up to 250ml with dH20, autoclaved
Sodium chloride (0.9%) pH 1.5
4.5g NaCl, 400ml dH20 adjusted to pH 1.5 with HC1 (BDH), made up to
500ml with dH20
Sodium dodecyl sulphate (SDS)
10% w/v volume SDS (BDH) in sterile dH20
Sodium hydroxide 0.3M
1.2g NaOH pellets (BDH), 100ml dH20
SSC buffer (20x) for 11
NaCl 175.32g (3M), Na-citrate 88.23g (0.3M), pH 7.0, autoclave
Tail lysis buffer
50mM Tris/HCl pH8.0, lOOmM EDTA, lOOmM NaCl, 1%SDS, store at room
temperature
TBE buffer (lOx) for 11
108

Tris base 108g (0.89M), boric acid 55g (0.89M), Na-EDTA 9.3g (0.02M), pH
8.3, autoclave
TE buffer (lx ) for 11
10 ml 1M Tris (pH 8.0), 2ml 0.5M EDTA (pH 8.0), filter (0.2pm) and UV
sterilise for 15 minutes
Tris 1M for 11
Tris base 121.14g, pH as required using HC1 (BDH), autoclave
Tris-HCl 0.5M pH 6.8
78.8g TRIZMA HC1 (Sigma), 400ml dH20, adjusted to pH8.0 with HC1
(BDH), made up to 500ml with dH2<3
109

3 Clinical MYH related studies - Determination of
clinico-pathological features and potential
genotype-phenotype correlations in MYH
3.1 Introduction
In this Chapter I set out to review and refine MAP in terms of its clinical and
pathological features in order to improve the understanding o f MAP
pathogenesis, selection o f individuals for genetic screening and subsequent
clinical management.
The development of the understanding o f genotype-phenotype correlation in
FAP and AFAP has improved clinical and molecular diagnosis, appropriate
surveillance and intervention. For example, in patients with severe phenotype
of 1000’s o f adenomas are more likely to have germline mutations between
codons 1250 and 1464 of APC. The presence of extracolonic features also
guides molecular screening in FAP, with CHRPE being associated with
mutations between codons 457 and 1444 and desmoids having an association
with mutations between codons 1395 and 2000. In AFAP, patients harbour
germline mutations in the 5’, 3 ’ regions o f APC or the alternatively spliced
region of exon 9.
See Table 3-1 for an overview of the phenotypes and extracolonic features of
FAP, HNPCC and MAP.
110

Upper Gl polype
Colonicpolypburden
Skin/mesodermalmanifestations
Extracoloniccancers
AverageageCRC
Heterozygoteallelefrequency
FAP Bothgastric andduodenalpolyps
Typically100’s - 1000’s
Sebaceous cysts,osteomas,CHRPE,desmoids, dental abnormalities
Duodenalcancerhepatoblastoma
40 1:10 000
HNPCC none 10’s Cafe-au-lait macules in homozygotes
Endometrium, stomach, brain,ovary, urothelium
50 1:1000
MYH Bothgastric andduodenalpolyps
10’s - >1000
As yetundetermined
As yetundetermined
50 1:100
Table 3-1 Comparison of phenotype and extracolonic features o f FAP, HNPCC and
MAP
Historically, microadenomas (a collection of less than 20 dysplastic crypts
measuring <lmm) have been associated with adenoma formation in FAP.
During colonoscopy, microadenomas can be identified using dye spray with
indigo-carmine staining of the colonic epithelium.
Figure 3-1 Dye spray colonoscopy demonstrating a microadenoma highlighted by the use of indigo-carmine dye spray.To date, there has been no hard evidence to suggest that microadenomas (see
Figure 3-1) are present in MAP. If present it would suggest that two “hits” at
APC would be required for adenoma formation to be initiated in MAP. It
therefore follows that the presence or absence of microadenomas in MAP
1 1 1

would also aid clinical diagnosis at colonoscopy and guide molecular
diagnosis.
The identification of potential genotype-phenotype correlations in MAP
whether it be for colonic or extra-colonic manifestations would be instructive
in the further understanding o f the pathogenesis of MAP and potentially lead
to clues as the why the GI tract appears to be targeted in MYH deficiency.
Furthermore, improved knowledge of any genotype-phenotype correlation and
associated ethnic correlation would further improve cost-effective genetic
mutation analysis and clinical protocols for management and surveillance of
MAP patients.
3.2 Methods
A restrospective study of MAP patients (both homozygous and heterozygous)
from St Marks Hospital was undertaken to determine whether any genotype-
phenotype correlations exist in MAP. Colonoscopy and histopathology reports
were examined and clinical examination of patients was undertaken looking
for specific extracolonic features. This cohort includes the largest collection
reported to date of individuals with the E466X mutation found in the asian
population. The colonoscopy reports o f 41 asymptomatic heterozygote carriers
were also examined.
All individuals included in this study were recruited through St Mark’s
Hospital Polyposis Registry or Family Cancer Clinic, London, UK. Every
individual had confirmed pathogenic germline mutations in MYH. The clinical
notes and pathological reports o f 41 patients were reviewed and 19 patients
were examined specifically for any extra-colonic features including skin
lesions, tooth abnormalities, and soft tissue lesions. Thirty-four patients had
bi-allelic germline mutations and four had one germline mutation, so called
“affected-carriers”. These individuals had all exons of MYH screened for a
second mutation and three had MLPA performed; in all cases these results
were negative. See table 1-2 for a summary o f bi-allelic germline mutations in
the study group.
112
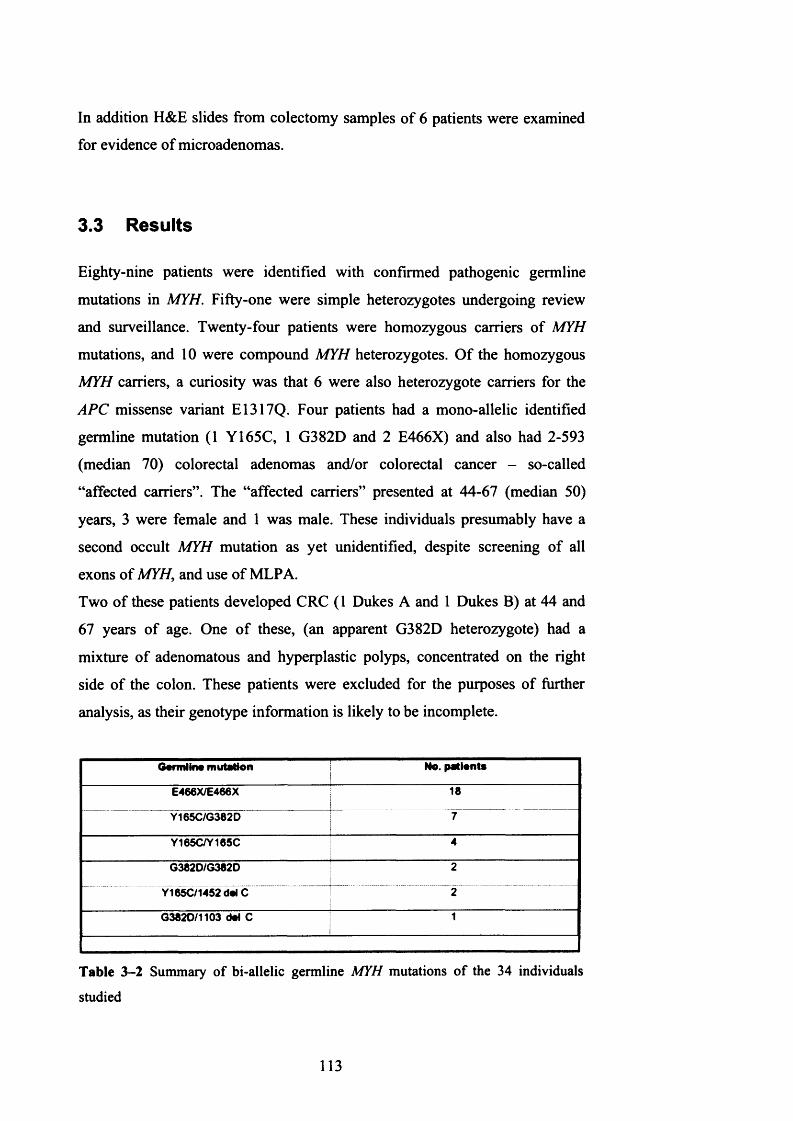
In addition H&E slides from colectomy samples of 6 patients were examined
for evidence of microadenomas.
3.3 Results
Eighty-nine patients were identified with confirmed pathogenic germline
mutations in MYH. Fifty-one were simple heterozygotes undergoing review
and surveillance. Twenty-four patients were homozygous carriers of MYH
mutations, and 10 were compound MYH heterozygotes. Of the homozygous
MYH carriers, a curiosity was that 6 were also heterozygote carriers for the
APC missense variant E1317Q. Four patients had a mono-allelic identified
germline mutation (1 Y165C, 1 G382D and 2 E466X) and also had 2-593
(median 70) colorectal adenomas and/or colorectal cancer - so-called
“affected carriers”. The “affected carriers” presented at 44-67 (median 50)
years, 3 were female and 1 was male. These individuals presumably have a
second occult MYH mutation as yet unidentified, despite screening of all
exons of MYH, and use of MLPA.
Two of these patients developed CRC (1 Dukes A and 1 Dukes B) at 44 and
67 years of age. One o f these, (an apparent G382D heterozygote) had a
mixture of adenomatous and hyperplastic polyps, concentrated on the right
side of the colon. These patients were excluded for the purposes of further
analysis, as their genotype information is likely to be incomplete.
Garmiina mutation No. pationta
E466X/E466X 18
Y165C/G382D 7
Y165C/Y165C 4
G382D/G382D 2
Y165C/1452 dal C 2
G382D/1103 dot C 1
Table 3-2 Summary of bi-allelic germline MYH mutations of the 34 individuals
studied
113

Of the relatives, 7 were affected by CRC, 8 had colorectal adenomas and 1
had pancreatic cancer and colorectal adenomas. All patients with E466X
mutation were of Indian origin, while all Y165C and G382D homozygotes
were Caucasians.
3.3.1 Colonic Disease
Colonic adenoma burden at presentation in E466X homozygotes ranged from
20 to 6250 (median 120). Two were counted at colonoscopy for surveillance
and 16 at colectomy the most common procedure being ileo-rectal
anastomosis (see Figure 3-2).
Figure 3-2 Colon o f MYH E466X homozygous patient (48 years of age)
In Caucasian Y165C and G382D homozygotes adenoma burden ranged from
25 to 265 (median 70). In compound heterozygotes adenoma burden ranged
from 18 to 300 (median 70). Of the Caucasian mutations, 3 were counted at
colonoscopy and 13 at colectomy. There was wide variation in adenoma size
ranging between 1 and 360mm. There was no statistically significant
difference in adenoma size between the asian and Caucasian patient groups
(p=0.25 for E466X versus all Caucasian mutations, t-test). The majority of
adenomas were of tubular or tubulovillous type, although 2 patients also had
hyperplastic polyps (1 individual had 1 HPP 4mm and 1 individual had 2 HPPs
3 and 5mm). Of the patients that underwent colonoscopic surveillance,
microadenomas were present in both groups (using indigo-carmine dye spray
114

colonoscopy only). The microadenomas identified by indigo-carmine spray
were not confirmed histologically as colectomy specimens were not available.
No statistically significant difference in polyp burden or CRC incidence or age
at presentation was observed on comparison by genotype (p=0.25 for adenoma
burden E466X versus Caucasian and p=0.31 for age at diagnosis E466X vs
Caucasian, t-test). However, the stage at which CRC presented was
statistically significant with a higher number of individuals with bi-allelic
E466X mutations presenting with Dukes C and D (36% vs 10% for Dukes C
and 18% vs 0% for Dukes D). A summary is shown in Table 3-3.
E466X homoaygotes (n«18)
Y165C/G382D horn and compound hate (n*16) Mann Whitney U test
AgecRagnosis rang* (median) 30-74 (45) 25-71 (55) p*0.03
Adenoma number range (median) 20-6250 (120) 18-300 (70) p=0.08
Microadenomas(dyeapray)
3/6 7/12
CRC incidence 61% 62%
Dukes A 18% 30% p=0.10
Dukes B 28% 60% p=0.001
Dukas C 36% 10% p-0.001
Dukas D 18% 0% p«0.03
Table 3-3 Comparison of bi-allelic E466X and Caucasian phenotypes
3.3.2 Upper Gastro-intestinal disease
Seventeen patients underwent upper gastrointestinal endoscopy, all were
offered endoscopy but a number of individuals declined. Table 3-4 shows a
summary o f upper gastrointestinal disease by genotype.
115

E466X/E466X horn Y1 <5063820 hom/comp hets
no. patients undergoing upper 61 endoscopy 14 11
length of follow up (years) 3.72 (SD 1.48) 4.70 (SD 0.94)
Fundal polyps 3/14 2/11median (range) 4 (2-8) all cystic 4 (2-6) all cystic
Duodenal polyps 3/14 3/11median (range) 6 (1-20) 5 (2-10)
size (mm) 1-30 mm 3-10 mm
Table 3—4 Upper gastro-intestinal disease by germline MYH mutation
Duodenal polyps were found in 5 o f 19 (26%) homozygote patients (3 E466X
and 2 Y165C), and 3 o f 10 (30%) compound heterozygotes (all
Y165C/G382D). Duodenal polyps were generally a few mm in size, but some
large polyps were found in E466X homozygotes, up to 3cm. In addition, cystic
fundal polyps were found in 5 homozygotes (4 E466X - 3 o f which also had
duodenal polyps and 1 G382D) and one compound heterozygote
(Y165C/G382D - also had duodenal polyps). There were no gastric or
duodenal cancers in this patient cohort.
3.3.3 Extra-intestinal Manifestations
Eleven E466X homozygotes and eleven Y165C/G382D homozygotes and
compound heterozygotes were retrospectively examined by a clinical nurse
specialist (J. Wright, St Marks Hospital) for specific skin, bone, dentitian and
soft tissue manifestations. On clinical examination, cafe-au-lait spots were
found in five of 11 patients with homozygous E466X mutations (46%) and
one Y165C homozygous mutation carrier. These varied in diameter from 1 -
5cm and were found on the arms, abdomen, neck and trunk. Four individuals
had one or two cafd-au-lait spots with one individual having three. There were
no cafe-au-lait spots in compound heterozygotes. Two E466X homozygotes
had sebaceous cysts and two E466X homozygotes and 2 Y165C/G382D
compound heterozygotes had abnormal dentition (supernumerary teeth).
Extracolonic cancers included sarcoma and melanoma in two E466X
116

homozygotes. No extracolonic cancer was diagnosed at an age younger or
higher frequency than that expected in the general population (see Table 3-5).
E466X/E466XY165C/G382D
horn and compound hets
No. patients examined 11 8
Caf6-au-lait spots 5 1
Sebaceous cysts 1 1
Abnormal teeth 1 3
Extracolonic CRC 1 sarcoma 1 melanoma(age diagnosis) (74 years) (66 years)
Table 3-5 Comparison of extracolonic features and extracolonic cancers between E466X and Y165C/G382D germline MYH mutation carriers
3.3.4 Heterozygote carriers under follow up
There were 51 family members of this cohort who were asymptomatic
unaffected heterozygotes under follow up. Forty one E466X heterozygotes
underwent colonoscopy (as part o f screening at St Marks Colorectal Unit), 1
individual had 1 hyperplastic polyp (1mm) at 20 years o f age and one had 2
hyperplastic polyps (both 1mm) at 21 years of age. One individual was
diagnosed with ulcerative colitis (asymptomatic) as a consequence of the
investigation. Eight Y165C heterozygotes were offered colonoscopy, 1
declined, 4 are due when reaching 25 years of age and 3 underwent
colonoscopy, all o f which were normal. Two G382D heterozygotes underwent
colonoscopy, one o f which was normal and the other found evidence of
ischaemic colitis. All individuals had one colonoscopy only with no further
colonoscopic follow up planned.
117

3.3.5 Microadenoma detection
Microadenomas were present in 3 o f 16 sections from colectomy samples
examined (by myself and confirmed by a Gastro-intestinal Histopathologist
M.Novelli, Dept. Histopathology, University College Hospital) from 6
patients included in this study (1 G382D homozygote and 2 Y165C/G382D
compound hets). The number of samples available for study was limited by
the low number of individuals undergoing colectomy. In cases where
microadenomas were present, they occurred at 0.01 microadenomas per mm2
of colonic mucosa examined. See Figure 3-3.
200 pm
Figure 3-3 Microadenoma in MYH E466X homozygote, 2 dysplastic crypts (arrowed)
Microadenomas were detected at colonoscopy using dye spray in ten
individuals (3 E466X homozygotes, 3 Y165C or G382D homozygotes and 4
Y165C/G382D compound heterozygotes). None of these were confirmed
histologically as tissue was not taken for sampling.
118

3.4 Discussion
3.4.1 Is there genotype-phenotype correlation in MAP?
As MAP is a relatively recently identified syndrome accounting for
approximately 1% of all CRC, it is difficult to draw firm conclusions from
studies involving small numbers o f individuals. Published cohorts to date
include data ranging from 4 to 25 individuals including the Y165C, G382D,
1395delGAA and rarer missense variants G175E, P391L (Sieber, Lipton et al.
2003) (Sampson, Dolwani et al. 2003) (Gismondi, Meta et al. 2004) (Enholm,
Hienonen et al. 2003) (Balaguer, Castellvi-Bel et al. 2007) (Croitoru, Cleary et
al. 2007) (Kanter-Smoler, Bjork et al. 2006) (Russell, Zhang et al. 2006). This
is the first cohort including patients with the Indian E466X mutation.
On comparison o f the E466X individuals with the Caucasian Y165C and
G382D individuals, no significant genotype-phenotype correlation was
observed in terms of adenoma number (apart from one exceptional E466X
homozygote who had 6250 adenomas), age of onset, incidence o f CRC or
presence o f extra-colonic manifestations. There was a significant difference in
the stage o f CRC at presentation in that a higher number o f E466X
homozygotes presented with Dukes C and D CRC. This finding may be due to
increased pathogenicity o f the E466X mutation if BER is more severely
impaired with this mutation rather than Y165C or G382D. To date there have
been no functional in-vitro studies o f the E466X mutation to study the ability
of repair of 8-oxoG lesions with this germline mutation. Studies of this nature
would shed some light as to whether individuals with this mutation may
progress more quickly as a result o f a higher degree of impaired BER. In-vitro
studies of site directed mutageneis in E.coli for the Y165C and G382D
equivalent mutations (Y82C and G253D) have found and 80 times reduction
in the ability to repair 8-oxoG in Y165C and 6 times reduction in G382D
(Chmiel, Livingston et al. 2003).
These findings may also be related to cultural differences between the Asian
and Caucasian population, three of the E466X homozygous patients presented
in overt bowel obstruction secondary to their underlying CRC requiring
emergency laparotomy, in comparison none o f the Caucasian patients did,
119
indicating that the Asian patients may present at a later stage than Caucasian
patients.
This finding is o f importance when considering screening and surgical
intervention in these individuals, and certainly justifies bi-annual colonoscopy.
Previously, the MAP phenotype has been described and understood as an
“attenuated” polyposis described a phenotype developing between 10-100
adenomas. In this study it was found that this is not the case as eight E466X
patients developed >100 and <1000 adenomas and one E466X patient had
several thousand (6250) adenomas. In the Caucasian group, four patients had
>100 and <1000 and none had >1000. A Portuguese case study has recently
reported two siblings with homozygous 1103delC MYH mutations one with
four synchronous adenocarcinomas (and ~30 coloreactal adenomas) and one
with severe Spiegelmans III duodenal adenomas. Their heterozygote parents
had 5 and 2 colorectal adenomas respectively (De Ferro, Lage et al. 2007).
These findings are relevant when considering which polyposis patients to
screen for MYH when making a molecular diagnosis.
This study supports previous findings that upper gastrointestinal disease is less
severe than that found in FAP - but is still present in a significant number of
patients to necessitate the need for upper GI surveillance endoscopically.
Thirty percent of compound heterozygote patients and 26% of homozygote
patients developed duodenal adenomas. Bougen et al reported gastric and
duodenal adenomas in 1 o f 11 MYH homozygotes in a recently reported study
(Bouguen, Manfredi et al. 2007). No upper gastrointestinal malignancies were
found in this patient cohort although they have been reported in MAP
(Sampson, Dolwani et al. 2003; Croitoru, Cleary et al. 2007).
When considering extra-colonic manifestations there was an increased (but not
significantly) incidence o f cafe-au-lait spots, sebaceous cysts and dental
abnormalities in E466X patients. Sebaceous adenomas have been reported in
one Italian patient (1395deIGAA) and one Indian (Gujarati) individual
(E466X) with MAP (Gismondi, Meta et al. 2004; Ajith Kumar, Gold et al.
2007). Cafe-au-lait spots have also been reported in Turcot’s syndrome
(associated with homozygous mutations in PMS2 and MLHl) (Bandipalliam
2005).
120

Bametson and colleagues screened 225 endometrial cancer patients for
germline MYH mutations. One individual was found to be a compound
heterozygote with Y165C and G382D mutations, along with endometrial
cancer she was found to have a sebaceous carcinoma (a feature of Muir-Torre
syndrome). Five heterozygote carriers were also identified (3 G382D and 2
Y165C) which is 2.2% of the cohort. This finding is not surprising as the
heterozygote carrier rate in the general population is ~ 2% (Bametson, Devlin
et al. 2007).
The extra-intestinal cancers evident in 2 patients in this cohort occurred at an
age similar to that found in the general population. It therefore appears that
homozygote MYH mutation carriers appear to develop extracolonic features
associated with other hereditary colorectal cancer syndromes including FAP,
HNPCC, and syndromes related to defective DNA repair, Turcot’s and Muir-
Torre.
It is still not understood why the GI tract is targeted by defective BER
associated with germline MYH mutations. Theoretically, other tissues with
high epithelial turnover or with high exposure to oxidative damage might also
be targeted - such as the skin or the lung in smokers. To date no firm
associations have been made, although there have been two reports benign
lesions (sebaceous adenomas). The most common form of damage to the skin
is through UV damage which is repaired by nucleotide excision repair (NER).
In one study in individuals with lung cancer, no germline mutations in MYH
(Al-Tassan, Eisen et al. 2004). A Myh/Oggl double knockout mouse has been
found to have higher levels o f 8-oxoG in the liver and the lung (Xie, Yang et
al. 2004). However, to date no germline mutations in OGGI (or MTH1) have
been found in individuals with lung cancer or multiple adenomas.
3.4.2 MYH and the APC missense variant E1317Q
It was through work on the APC missense variant E1317Q that MYH was
discovered. The association between APC E1317Q and the MAP was re
examined in this study. The original family through which MYH was
discovered are also heterozygous carriers o f the APC missense variant
E1317Q (Al-Tassan, Chmiel et al. 2002). In this study 6 of the homozygote
121

patients included in the study were also heterozygous carriers for E1317Q. In
this group there was no evidence to suggest any significant effect this has on
phenotype in terms o f either colonic adenoma burden or extra-colonic
manifestations. There doesn’t appear to be any reason for this association
except chance. It is possible that E1317Q might act as a phenotypic modifier
of MAP (perhaps by preventing nonsense G:C>T:A mutations at codon 1317),
but this was not borne out in the clinico-pathological findings of these 6
patients.
When combining these findings with those o f collaborators in the UK, Italy,
Australia, Finland and Portugal, of 96 individuals with homozygote germline
MYH mutations, 9 were found who also harboured the APC missense variant
E1317Q. Again, examination of the phenotype and extracolonic features found
no obvious genotype phenotype correlation or evidence of a modifer effect.
3.4.3 The significance of the heterozygous state
In the 48 asymptomatic heterozygote family members which underwent
screening, 3 hyperplastic polyps were found at a relatively young age (20 and
21 years respectively). However, hyperplastic polyps have previously been
found in individuals as young as 10 years o f age in a study of hyperplastic
polyposis (Carvajal-Carmona, Howarth et al. 2007). One asymptomatic
individual was diagnosed with ulcerative colitis as a result of this screening.
There has been some interest in a potential link between MYH deficiency and
inflammatory bowel disease as it is likely there would be increased levels of
oxidative damage secondary to the underlying inflammatory process. In a
small study (of 6 individuals) in our laboratory no MYH heterozygotes were
identified in screening individuals with ulcerative colitits (unpublished data).
It may be prudent to screen heterozygote carriers “once o ff’, however there is
little justification for aggressive colonoscopic screening of heterozygote
family members at this time apart from in the research setting.
122

3.4.4 Microadenomas occur in MAP
Historically, microadenomas have been thought to be pathognomonic of FAP.
They are classified as a collection of dysplastic crypts (< 20 crypts less than
1mm in diameter in total). Microadenomas were present in 3 of 16 sections
examined (by a Gastointestinal Histopathologist M. Novelli) from six patients
included in this study (see figure 1-3). The density of microadenomas was
significantly less than those detected in FAP (0.01 per mm2 of mucosa
examined in MAP and 0.22 per mm2 in FAP). Given that some FAP
microadenomas harbour somatic mutations at APC (see Chapter 9) it is likely
that they are the earliest detectable lesion which has been ‘initiated’ by ‘two
hits’ at APC (germline plus somatic mutation for (A)FAP, or two somatic
mutations for MAP).
3.4.5 Current management protocols for MAP - how this
study may help to improve screening criteria
Since its discovery in 2002, screening for the common MYH mutations is
possible in NHS molecular diagnostic laboratories. MYH screening should be
considered in patients with MCRAs - not just those with an “attenuated”
phenotype, and/or early-onset CRC (Wang, Baudhuin et al. 2004), although
APC remains a much stronger candidate in families with vertical transmission
of disease. Mutation testing should be tailored to the ethnic group, with
mutations Y165C and G382D more common in Caucasians, Y90X in
Pakistanis, E466X in Indians and ntl395delGGA in those of southern
Mediterranean origin (Gismondi, Meta et al. 2004) (Enholm, Hienonen et al.
2003) (Jones, Emmerson et al. 2002) (Halford, Rowan et al. 2003). MLPA is
now available for MYH, and it would therefore be appropriate to perform this
in “affected heterozygous” patients in whom only one germline mutation has
been found. Abnormal methylation in the germline o f MLH1 is responsible for
one genotype causing for HNPCC (Suter, Martin et al. 2004). To date
germline methylation studies have not been undertaken in MYH. This might
account for the “affected heterozygotes” identified in this study.
123

When screening a new index case, the initial germline MYH screening should
be directed towards the common mutations depending on the ethnicity of the
individual. If only one mutation is found the whole gene should then be
screened prior to MLPA analysis. Due to the recessive inheritance in MAP,
screening of the index case’s spouse for common mutations (ethnicity
specific) should be undertaken to define the risk conferred and guide
appropriate further testing and surveillance of their offspring.
The follow up of heterozygotes at this time varies from centre to centre.
Current recommendations include a one-off colonoscopy at 50 years in some
centres (Oxford) and screening starting at 35 years (St Marks Colorectal Unit)
with repeat colonoscopy five yearly thereafter, in others. In certain situations,
colonoscopies have been undertaken at the individual heterozygote’s request,
usually following a diagnosis o f MAP-associated CRC in other young family
members. The results o f my study do not support routine regular colonoscopy
in heterozygote carriers.
In the white, northern European population, the incidence o f UC is 43.6/100
000 and in the Asian population it is 5.6/100 000 (Baumgart and Carding
2007). Therefore the coincidental finding of ulcerative colitis in one individual
and a hyperplastic polyp in another individual was not significantly higher
than would be expected in the general population.
At this time, and due to the recessive nature of the disease and hence limited
family history, the majority of novel or founder bi-allelic MYH mutation
carriers are not detected at an early enough age to prevent colectomy.
In light of the finding that the E466X patients in this study presented with a
higher Dukes stage o f CRC, further studies incorporating larger patient
numbers are required to determine whether it is necessary to screen these
individuals more regularly than individuals with the Caucasian mutations is
necessary.
As the numbers of individuals diagnosed with MAP is increasing, it is vital
that collaborative studies continue to develop to facilitate the understanding of
the pathogenesis of MAP, in order to identify novel pathogenic and ethnic
mutations and subsequently to continue to improve genetic counselling,
clinical management and outcome in the future.
124


4 Clinical MYH related studies — Determination of presence and potential underlying mechanisms
of genomic instability in MAP
4.1 Introduction
4.1.1 Chromosomal instability (CIN) and colorectal cancer
The mechanism(s) underlying genomic instability in the pathogenesis of MAP
are yet to be fully determined. Genomic instability can be defined as an
increased intrinsic mutation rate and hypermutation either through
chromosomal instability (CIN) or microsatellite instability (MSI) (Lengauer,
Kinzler et al. 1998). Historically, CIN has been associated with FAP through
mutations in the tumour suppressor gene APC and MSI associated with defects
in the MMR “housekeeping” genes.
The effects o f defective BER in MAP are observed by the presence of
G:C>T:A transversions found somatically at APC and K-ras suggesting an
underlying “mutator phenotype” (Lipton, Halford et al. 2003) (van
Puijenbroek, Nielsen et al. 2008). However, the genome wide implications of
defective BER in MAP and whether it leads to chromosomal instability are not
fully understood.
The stage at which CIN occurs during tumorigenesis and indeed how to define
CIN in the first instance is a subject of ongoing debate. Some suggest that CIN
initiates colorectal tumorigenesis (Nowak, Komarova et al. 2002) whilst others
believe that it occurs early in adenoma growth (Alberici, de Pater et al. 2007).
Further groups suggest it occurs after the adenoma-carcinoma transition
(Hermsen, Postma et al. 2002; Sieber, Heinimann et al. 2002).
APC mutations occur in about 75% of human CRCs, roughly 70% of these
cases also demonstrate CIN. There is, therefore a case that APC deficiency
may be one cause o f CIN. Further evidence supporting this has been
demonstrated in mouse ES cells homozygous for the Apcx6nj mutation. The
126
v4/?c-mutant ES cells demonstrated CIN with multiple numerical and structural
chromosomal abnormalities (Fodde, Kuipers et al. 2001).
4.1.2 Methods of measuring CIN
CIN can be measured using flow cytometry, fluorescent in-situ hybridisation
(FISH), conventional CGH (resolution 5 -10Mb), array CGH (resolution 1Mb),
SNP-LOH and conventional LOH utilising microsatellite markers.
Variation in the definition o f CIN may in part be due to the different
experimental techniques used to detect it. Flow cytometry and FISH identify
changes at gross whole or part-chromosome level whereas aCGH and LOH
analysis provides information at the molecular level.
Array CGH identifies chromosomal or sub-chromosomal copy number
changes (gains and deletions) in relation to total genome dosage. Therefore
this method can detect aneuploidy but will not detect polyploidy (as this can
be copy number neutral). However in previous studies CIN+ cancers
demonstrate a higher number o f aCGH changes than CIN- cancers as
aneuploidy and polyploidy often co-exist.
Array CGH analysis is prone to intra and inter-experimental variation. It is
sensitive at detecting small regions o f chromosomal losses and gains but is
less reliable at detecting polyploidy and aneuploidy. For example, regions of
normal copy number in a diploid nucleus (2:2) and tetraploid nucleus (4:4)
have a ratio of 1 and a log2 ratio o f 0. In true aneuploidy the situation is harder
to interpret, if a tetraploid tumour has a single copy loss (3:4 ratio) the log2
ratio becomes -0.41 (Table 4—1).
127

Diploid Tetraploid Ratio log] ratio
0:2 0:4 0 -oo
- 1:4 0.25 -2
1:2 2:4 0.5 -1
- 3:4 0.75 -0.41
2:2 4:4 1 0
- 5:4 1.25 0.32
3:2 6:4 1.5 0.58
- 7:4 1.75 0.81
4:2 8:4 2 1
10:2 20:4 5 2.32
20:2 40:4 10 3.32
Table 4-1 aCGH fluorescence ratios with corresponding log2 ratios for
diploid and tetraploid tumours
In aCGH analysis thresholds are set in order identify true “signal” (copy
number change) from “noise” (region where log2 deviation from zero is due to
experimental variation). The threshold used in this study was a log2 ratio of £ -
0.5 or 2:0.5 based on work by Fiegler et al (Fiegler, Carr et al. 2003). This
threshold would not however detect tetraploid tumours with nuclear ratios of
3:4 or 5:4, particularly if normal tissue is included in the study sample (Table
4-1).Each individual clone (replicated on the aCGH slide) generates its own log2
ratio. Therefore variation in hybridisation can be observed and relative log2
values of surrounding clones can be incorporated in to the analysis (see
methods chapter for further details). In the past some groups have used
“moving thresholds” whereby the value of surrounding clones are taken into
account for each region o f loss and gain (Clark, Edwards et al. 2003) (Clark,
Edwards et al. 2002) (Pollack, Sorlie et al. 2002).
LOH analysis utilising microsatellite markers in principle measures the dosage
of the maternal allele against the paternal allele at the site o f the microsatellite
polymorphism, relative to normal. Three situations may occur in which LOH
may be detected without a change in copy number (Gaasenbeek, Howarth et
al. 2006)-
128
i) deletion of one chromosomal homologue and regain of the other homologue
through duplication, resulting in whole chromosome LOH
ii) LOH extending from a telomere involving whole or part of a chromosome
arm - “mitotic recombination”
iii) LOH in an interstitial region as a result o f mitotic recombination also
termed “mitotic gene conversion”
When using flow cytometry, sporadic and familial colorectal adenomas
(including MAP adenomas) are usually near-diploid, especially when small
and of low grade (Sieber, Heinimann et al. 2002) (Lipton, Halford et al. 2003).
These findings have been criticised on the grounds that this method is not
sufficiently sensitive to detect more subtle manifestations of CIN, such as
occasional aneusomy (Cardoso, Molenaar et al. 2006). Conventional CGH and
more recently aCGH alongside digital SNP PCR (dS-PCR) and aCGH have
also been used to demonstrate aneusomies in CRAs (Rowan, Halford et al.
2005; Cardoso, Molenaar et al. 2006).(Alberici, de Pater et al. 2007) (Shih,
Zhou et al. 2001).
Conventionally, cancers demonstrating CIN are held to be aneuploid/polyploid
with large-scale gains and deletions (Douglas, Fiegler et al. 2004; Rajagopalan
and Lengauer 2004). The majority of cancers contain cells with abnormal
numbers of chromosomes (commonly between 60-90) which commonly have
structural abnormalities very rarely seen in normal cells. These include
inversions, translocations, duplications and deletions (Rajagopalan and
Lengauer 2004).
In reality the term CIN can also be used to describe small scale changes with
gains and deletions o f a few Mb, as well as larger scale changes with
translocations and gross ploidy changes. The underlying mechanisms leading
to these changes differ in that cell cycle check point abnormalities result in
gross ploidy changes and translocations where-as smaller scale changes may
be due to defective housekeeping genes (such as MMR genes. It is therefore
likely that different types o f CIN exist with differing underlying pathogenesis
(Douglas, Fiegler et al. 2004; Jones, Douglas et al. 2005) (Gaasenbeek,
Howarth et al. 2006). CIN could therefore be described as both an initiating
element and a consequence of tumorigenesis, some believe that it is an
essential event for tumorigenesis to occur (Lengauer, Kinzler et al. 1998).
129
One theory is that CIN is caused by a two-step process whereby an initial
development o f a polyploid, (yet euploid) karyotype occurs followed by
smaller scale chromosomal gains and losses (Shackney, Smith et al. 1989).
Wang et al suggested that specific mutations or gene silencing may cause CIN
either directly or indirectly (Wang, Cummins et al. 2004). In this situation a
large number o f underlying defects may be responsible such as dysfunction of
microtubules, centromere or centrosomes, chromosome breakage and telomere
erosion.
Specific genes have been identified in vitro as causing CIN in CRC. The
tumour suppressor gene APC (Fodde, Kuipers et al. 2001), G l/S checkpoint
regulators CDC4/FBXW7 (Rajagopalan, Jallepalli et al. 2004), mitotic
checkpoint regulators BUB1/BUBR1 (Cahill, Lengauer et al. 1998) and
centrosome dysfunction through mutations in aurora kinases (Zhou, Kuang et
al. 1998). APC is the only gene in which somatic mutations are consistently
found in all CRC karyotypes in vivo (Rowan, Halford et al. 2005).
CIN is likely to confer a survival advantage in cancerous cells through
acceleration o f LOH o f tumour suppressor genes and amplification of
oncogenes through chromosomal duplication (Rajagopalan and Lengauer
2004). CRCs and adenomas can be classified on the presence of MSI or CIN
(Jass, Whitehall et al. 2002). Very rarely are CRCs found to be MSI and CIN+
when using older methods for measuring CIN.
Cancer cells which demonstrate MSI have an intrinsic mutation rate at the
nucleotide level 2-3 times higher than observed in normal cells (Boyer, Umar
et al. 1995). Using flow cytometry and FISH analysis MSI+ CRCs have been
found to be diploid or near-diploid (Lengauer, Kinzler et al. 1997). More
recently CIN has been observed in MSI cell lines using SNP-LOH and array
CGH (Gaasenbeek, Howarth et al. 2006), the underlying MSI mutator
phenotype may in these cases be responsible for the small scale changes
observed in this study.
130
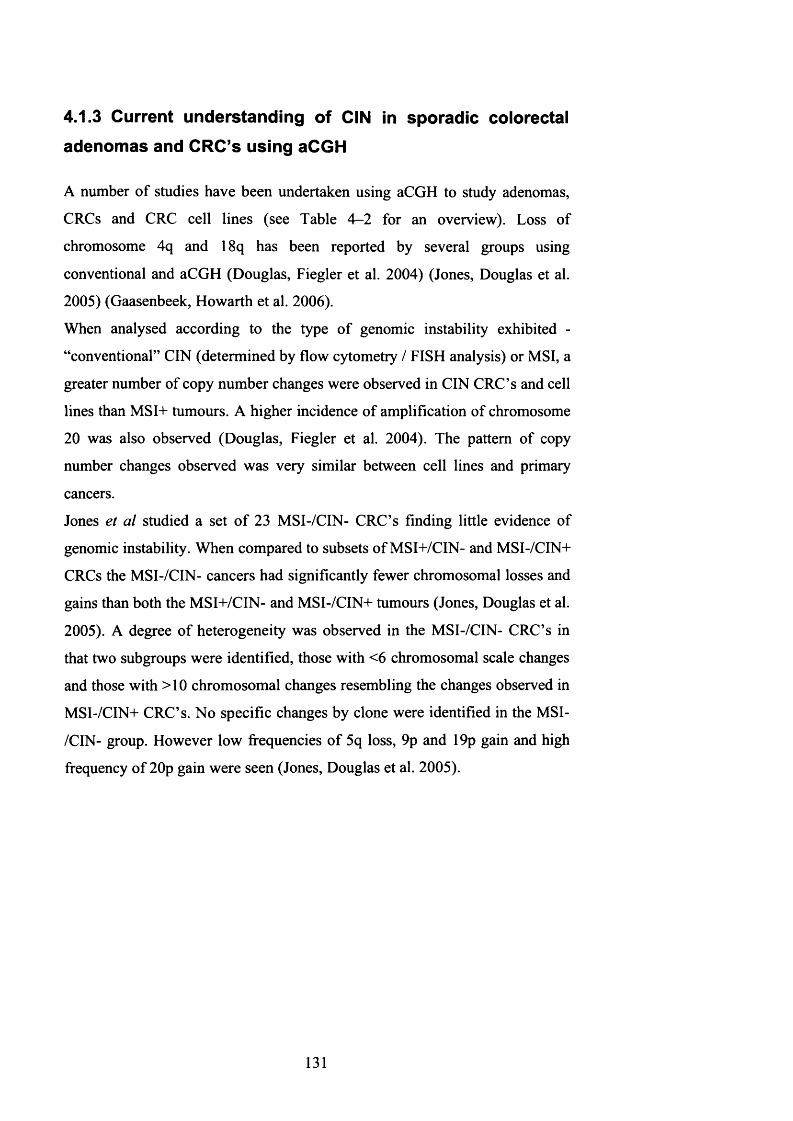
4.1.3 Current understanding of CIN in sporadic colorectal adenomas and CRC’s using aCGH
A number of studies have been undertaken using aCGH to study adenomas,
CRCs and CRC cell lines (see Table 4-2 for an overview). Loss of
chromosome 4q and 18q has been reported by several groups using
conventional and aCGH (Douglas, Fiegler et al. 2004) (Jones, Douglas et al.
2005) (Gaasenbeek, Howarth et al. 2006).
When analysed according to the type of genomic instability exhibited -
“conventional” CIN (determined by flow cytometry / FISH analysis) or MSI, a
greater number of copy number changes were observed in CIN CRC’s and cell
lines than MSI+ tumours. A higher incidence of amplification of chromosome
20 was also observed (Douglas, Fiegler et al. 2004). The pattern of copy
number changes observed was very similar between cell lines and primary
cancers.
Jones et al studied a set o f 23 MSI-/CIN- CRC’s finding little evidence of
genomic instability. When compared to subsets of MSI+/CIN- and MSI-/CIN+
CRCs the MSI-/CIN- cancers had significantly fewer chromosomal losses and
gains than both the MSI+/CIN- and MSI-/CIN+ tumours (Jones, Douglas et al.
2005). A degree of heterogeneity was observed in the MSI-/CIN- CRC’s in
that two subgroups were identified, those with <6 chromosomal scale changes
and those with >10 chromosomal changes resembling the changes observed in
MSI-/CIN+ CRC’s. No specific changes by clone were identified in the MSI-
/CIN- group. However low frequencies o f 5q loss, 9p and 19p gain and high
frequency of 20p gain were seen (Jones, Douglas et al. 2005).
131

Sample type No. samples Chromosomallosses
Chromosomalgains Methods Ref.
CRC both MSJ+ and CIN+ 37 18q,4q34-q35 8q, 13, 20 aCGH Douglas et
al
CRC call lines both MSI-*- and
CIN+48
18q, 4q34-q35, 6
8q, 13,20 12p, 15
aCGH Douglas et al
CRC MSI-/CIN- 23 5q (infrequent)9p, 19p (lowfreq)
20p (high freq)aCGH Jones et al
CRC MSI-/CIN+ cell lines 34
18q, 17p (LOH or deletion) FreqLOH
genom e wide
Freq LOH genome wide
aCGH/SNP- LOH
G aasenbeek eta1
CRC MSI+/CIN- cell lines 11 none none aCGH/SNP-
LOHGaasenbeek
eta!
Table 4-2 Overview of aCGH studies in CRC
One of the first studies to incorporate SNP-LOH alongside aCGH in analysis
in CRC cell lines found that on examination of 11 MSI-*- and 34 MSI- CRC
cell lines the array based CGH changes found were not identified by SNP-
LOH analysis (as they did not demonstrate reduction-to-homozygosity)
(Gaasenbeek, Howarth et al. 2006). Regions of SNP-LOH were also observed
without aCGH changes - the majority of cell lines demonstrating whole
chromosome LOH of 2 chromosomes, 1-2 terminal regions o f LOH (mitotic
recombination sites) and 1 interstitial region of LOH. The MSI+ cell lines
rarely demonstrated chromosomal gains and deletions or whole chromosome
LOH. However, the near-diploid karyotype o f this group concealed mitotic
recombination frequencies similar to the MSI- group. From this study the
relationships between LOH, CIN and copy number change are far from clear
and that it is possible to have LOH without copy number change.
Until recently, examination o f MAP adenomas and cancers has found these
tumours to be near diploid (using flow cytometry) and microsatellite stable
(Lipton, Halford et al. 2003). The mutational signature o f defective BER is
detected in the somatic mutation spectra o f APC and K-ras (Lipton, Halford et
al. 2003). It is thought that through hyper-mutation o f APC that MAP
tumourigenesis is driven. K-ras mutations are known to occur in adenomas
from MAP patients - targeting the mutational hotspot at codon 12 (Lipton,
132

Halford et al. 2003). In keeping with defective BER all mutations reported to
date are G:C>T:A tranversions.
Somatic mutations in BRAF have not been observed in these tumours.
Cardoso et al (Cardoso, Molenaar et al. 2006) at the same time as this study
was undertaken used array-comparative genomic hybridisation (aCGH) to
analyse approximately 0.6mm2 dissected tissue from adenomas of 5 MAP and
8 FAP patients. Tumour samples were microdissected and subsequently
amplified with whole genomic amplification prior to hybridisation. Small
copy number changes were observed in both MAP (80%) and FAP (60%)
frequently with losses at chromosomes lp, 17, 19 and 22 with gains on
chromosomes 7 and 13. It was concluded from this study that CIN is observed
in both of these syndromes. However, some caution should be used when
interpreting these results as the process of whole genome amplification is
likely to introduce artefactual losses and gains.
4.1.4 Aims of this chapter
The primary objectives o f this study were to identify underlying mechanisms
of genomic instability in MAP using a variety of experimental approaches to
address the following areas -
1: As CIN does not occur in MMR deficient cancers should it occur in BER
deficient tumours?
2: To confirm the findings o f CIN in MAP tumours described by Cardoso et al
(undertaken at the same time as my work) without using whole-genome
amplification
3: If CIN is present - what are the underlying mechanisms for this?
The results of this study are discussed alongside results obtained from aCGH
analysis performed on FAP and sporadic CRAs undertaken by other
laboratory members (A Jones and W Chambers).
133

4.2 Methods
Array CGH was performed on adenomas from 4 MAP patients with confirmed
germline MYH mutations (1 Y165C homozygote and 3 E466X homozygotes).
Fourteen adenomas and 1 carcinoma were analysed with aCGH, SNP LOH
and microsatellite analysis from 4 MAP individuals
Adenomas were snap frozen and analysed against paired blood or
morphologically normal tissue. The clinico-pathological features of these
tumours are in Table 3. Histological review was undertaken to confirm at least
65% dysplastic tissue was present in each tumour.
DNA extraction, aCGH analysis, LOH analysis (including SNP-LOH) was
undertaken as described in the Methods 2.1.10 and 2.1.6.4. Chromosome maps
and clone positions (Mb) were taken from the Sanger Centre and UCSC
websites (http://www.sanger.ac.uk. http://genome.ucsc.eduV Where copy
number changes were found, confirmation of the copy number changes was
then undertaken using microsatellite-based LOH analysis on the same DNA
extracted from the whole tumours that had been used for the aCGH analysis.
For increased genome-wide resolution and the ability to detect copy-neutral
LOH, SNP-LOH analysis was carried out on 3 MAP tumours where sufficient
DNA was available for analysis.
For microsatellite LOH analysis, whole tumours were initially analysed.
Subsequently, for analysis o f potential spatially distributed sub-clones within
the tumour, frozen sections o f MAP adenomas were cut onto slides and 12
samples of epithelium (each about the size of a white needle tip) were
removed with the aid of the dissecting microscope. Whole tumours, each of
the twelve dissected samples and paired normal tissue were genotyped at 17
microsatellite markers (D1S201, D1S2729, D1S2749, D1S470, D9S1818,
D9S1826, D9S1829, D9S1830, D17S786, D17S1832, D17S1353, D17S1844,
D19S886, D19S878, D19S215, D19S565 and D19S591) with standard
reaction conditions (see Appendix 1 for primer sequences and conditions).
134

4.3 Results
4.3.1 Overview of aCGH analysis
Of the 14 MAP adenomas analysed, eleven (78%) had changes; four
adenomas had 1 -3 changes, six had 6-7 changes and one had 17 changes
(median 3 (range 0-17) and IQR 1-7). Sixty-seven changes were observed in
total; 11 of these were of a whole chromosome. The MAP CRC analysed
identified 2 whole chromosome deletions (chromosomes 1 and 10), and a
whole chromosome gain of chromosome 7. Regions of loss were observed on
chromosome 8p and 8q and regions of gain observed on regions 5p and 9p.
(See Table 4-3 and Figures 4-1 to 4-6 for clinico-pathological features and
examples of aCGH changes).
Chrom osom e 1
2
1.5
1
o ' 0.5
Millions-1
-1.5
-2distance in bp
Figure 4-1 Loss of lp (0-46 Mb) in MAP adenoma M12
135

Chrom osom e 7
2
1.5 1
I “® . O 5 0 20 4 0 60 80 100 120 140 160 180
Millions-1
-1.5 -2
d is tan ce in bp
Figure 4-2 Gain of whole chromosome 7 in MAP adenoma Ml
C hrom osom e 13
2
1.5
1
0.5
0o*■5£CN
S -0.5 0
-1
-1.5-2
♦
20 40 60 80 100 120Millions
d istan ce in bp
Figure 4-3 Gain of whole o f chromosome 13 in MAP adenoma M5
136
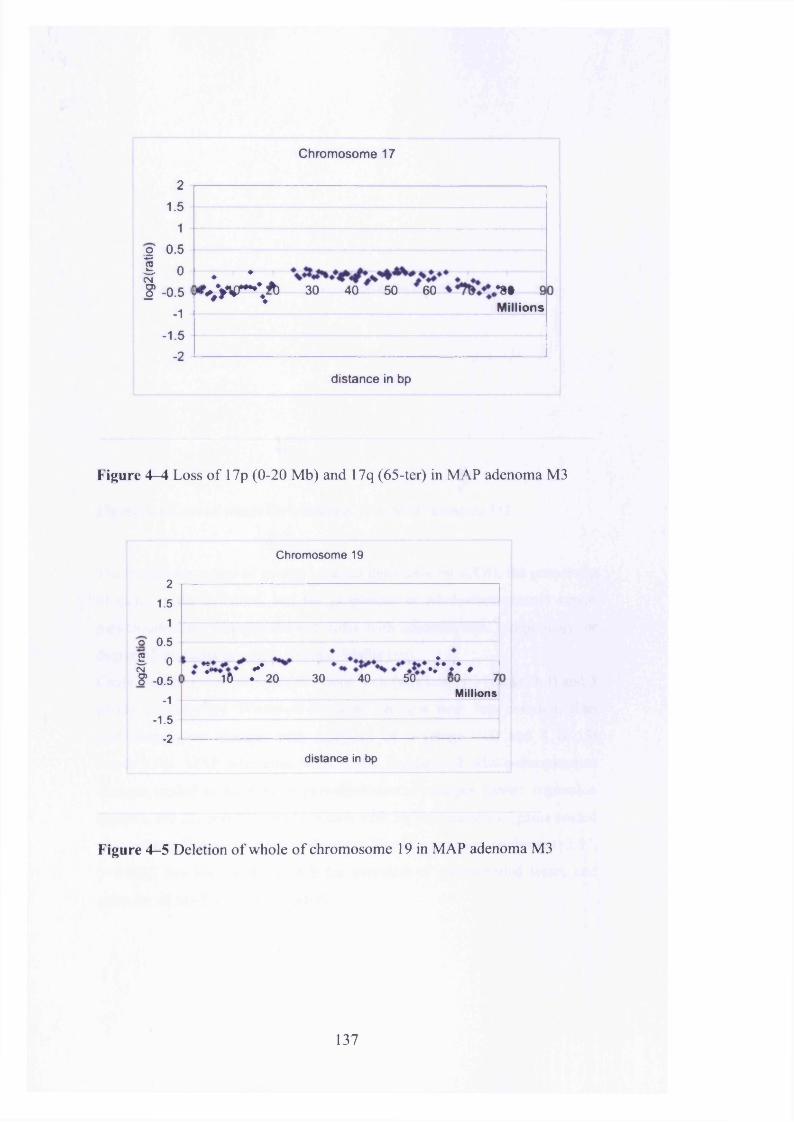
Chromosome 17
21.5
1o ' 0.5
I 0eg§ -0.5
-1
-1.5
-2
♦ *r ^ > V - V b 30 40 50 60 >•»§ 90
Millions
distance in bp
Figure 4—4 Loss of 17p (0-20 Mb) and 17q (65-ter) in MAP adenoma M3
Chromosome 19
21.5
1o' 0.5
0-0.5
-1
-1.5 -2
2I : - * ..;v ,
16 ♦ 20 30 40 50 70Millions
distance in bp
Figure 4-5 Deletion of whole o f chromosome 19 in MAP adenoma M3
137
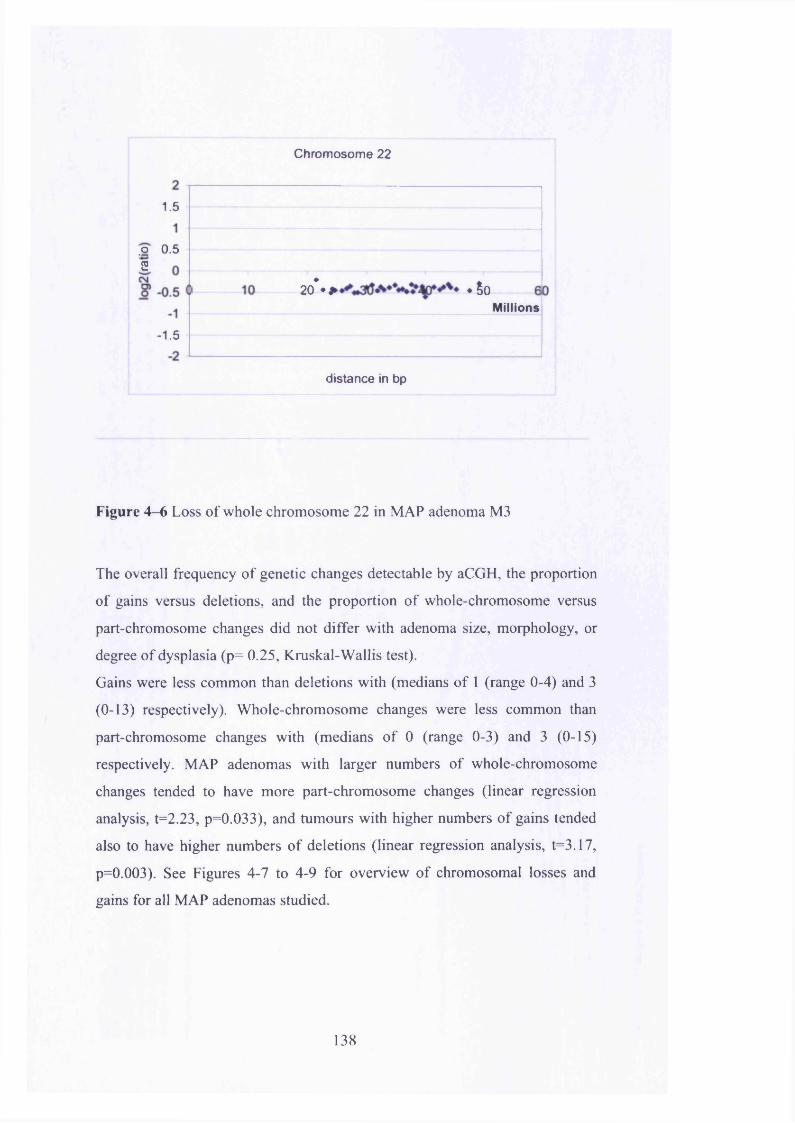
Chromosome 22
1.5
o 0.52
20* ♦ * #50Millions
-1.5
d istance in bp
Figure 4-6 Loss of whole chromosome 22 in MAP adenoma M3
The overall frequency of genetic changes detectable by aCGH, the proportion
of gains versus deletions, and the proportion of whole-chromosome versus
part-chromosome changes did not differ with adenoma size, morphology, or
degree of dysplasia (p= 0.25, Kruskal-Wallis test).
Gains were less common than deletions with (medians of 1 (range 0-4) and 3
(0-13) respectively). Whole-chromosome changes were less common than
part-chromosome changes with (medians o f 0 (range 0-3) and 3 (0-15)
respectively. MAP adenomas with larger numbers of whole-chromosome
changes tended to have more part-chromosome changes (linear regression
analysis, t=2.23, p=0.033), and tumours with higher numbers of gains tended
also to have higher numbers of deletions (linear regression analysis, t=3.17,
p=0.003). See Figures 4-7 to 4-9 for overview of chromosomal losses and
gains for all MAP adenomas studied.
138

IDG erm line m utation No. a d en o m as size ad en o m a h isto log ical g rade position in colon
ch rom osom al lo s s e s and g a in s
M1E466X hom 24235mm TA mild dysplas d esc colon
7,all, gain19, all, del20,all,gain
M2E466X hom 24212mm TVA severe dyspl rectum
17,0-10,del 19,all,del
M3 M4E466X hom Y165C hom242 26514mm TVA 8mm TAsevere dysplasia mild dysplasiarectum hep flexure
1,27-46,del 1,0-41,del8,0-31,del 1,145-162,del17,0-20,del 3,49-58,del17,65-ter,del 4,0-8, del18,all,del 4,14-ter,gain19,all,del 6,33-37,del22,all,del 7,78-127,gain
9,121-ter,del 12,111-ter,del 13,56-96,gain 14,88-ter,del 17,18-50,del 17,71-ter,del 19,all,del 20,29-ter,del 21,13-31,gain 22,all,del
No. aCGH c h a n g e s 3
c h a n g e s in bold = log2T:N ratio >0.5
17
Table 4-3 aCGH analysis of 15 MAP tumours
M5 M6 M7 M8 M9Y165C hom E466X hom E466X hom E466X hom E466X hom265 242 242 >100 >1009mm TA 29mm TA 33mm TA 6.3mm TA 4.1mm TAmild dysplasia mild dysplasia mild dysplasia m oderate dysplasia m oderate dysplasiasigmoid colon a sc colon d esc colon transverse colon ascending colon
13,all,gain 1,0-46,del 1,0-51,del 1,28-46,del9.121-ter,del 17,0-12,del 3,19-36,gain13,59-96,gain 19,0-18,del 9,121-ter,del17,0-10,del 12,111-ter,del17,35-46,del 19,all,del19,0-17,del 21,0-29, gain19,38-ter,del
1 7 3 0 6

G erm line m utation No. a d e n o m a s size ad en o m a h isto log ica l g rade p osition in colon
chro m o so m al lo s s e s an d g a in s
No. aCGH c h a n g e s 0
c h a n g e s in bold = log2T:N ratio >0.5
M10E466X hom >1006.8mm TA mild dysplasia transverse colon
M11E466X hom >1007.3mm TA moderate dysplasia sigmoid colon
Table 4-3 aCGH analysis of 15 MAP tumours
M12E466X hom 24229mm TA mild dysplasia ascending colon
1.0-46,del 9,121-ter,del 13,59-96 .gain17.0-10,del 17,35-46,del19.0-17,del 19,38-ter,del
M13E466X hom 24221mm TA mild dysplasia transverse colon
1.0-46,del9,121-ter,del13,59-96,gain17.0-10,del17,35-46,del19.0-17,del19,38-ter,del
M14E466X hom 24230mm TA mild dysplasia descending colon
1.0-46,del9,121-ter,del13,59-96,gain17.0-10,del17,35-46.del19.0-17,del19,38-ter,del
M15E466X hom >10045mm adenocarcinom a adenocarcinom a descending colon
1,all,del5.0-45,gain 7,all .gain8.0-42,del 8,48-ter,del9.0-30,gain 10,ail,del
7 7 7 7

Chromosomes 1 and 7 MAP
Ml M2 M3 M4 MS M6M7 Ml M9 MW M il M12 MY3 MM MIS
1
Figure 4-7 Summary of aCGH changes in all MAP adenomas for
chromosomes 1 and 7
C hrom osom es 8 and 9 MAP
m i i m n w u s M u i m u i u«o m u m u m u m m m u m i m j m> im m s m m i m m > m u m u m u m u m m m u
■
ii t\ n n n n
Figure 4—8 Summary of aCGH changes in all MAP adenomas for
chromosomes 8 and 9
139

Chromosomes 13, 17, 19 and 22 MAPMl M2 M3 M4 M6 IWM7 U i m i i n M11 MW H D U U UIS U1 M2 M l U* Mi U tU I U l IM MW U11 M12 MW MU MW
\ ato
3 3 3
17
12
Ml M2
1 i n j! m 0
119
Ml M2 Ml M4 US MS u ; MS MS MW UU M12 M il MU MW
22
Figure 4—9 Summary of aCGH changes for chromosomes 13, 17, 19 and 22
4.3.2 Genomic locations of aCGH changes
Particularly frequent sites of change were deletion of chromosome lp (57% of
adenomas), gain of chromosome 13 (43%), deletion of 17p (64%), deletion of
chromosome 19 (71%), gain of chromosome 21 (14%) and deletion of
chromosome 22 (14%). Comparing frequencies of change among whole
chromosomes a tendency for deletion or gain of the smaller chromosomes was
observed (linear regression analysis, t=2.25, p=0.032). This is with the
exception of chromosome 1, which showed frequent deletion involving its
short arm. A similar tendency was found for part-chromosome changes to be
more frequent on smaller chromosomes (linear regression analysis, t=-3.11,
p=0.006). In order to determine if the chromosome lp losses were artefactual
or due to poor hybridisation, dye swap experiments were performed and the 1 p
loss was still observed. Conventional LOH analysis was also performed on
whole tumours using microsatellite markers from lp (D1S201, D1S2729,
D1S2749 and D1S470) but no LOH was observed.
LOH was observed in one MAP adenoma (MAP 9) at marker D1S470 when
microdissected.
140

4.3.3 Magnitude of copy number changes and the possibility
of genetic heterogeneity
Of the 67 changes observed in the 11 MAP adenomas (with changes present),
only 7 changes in 3 adenomas demonstrated log2T:N ratios approaching ±0.5
(corresponding to a theoretical gain or loss o f approximately 25% of DNA,
allowing for the presence o f some normal cells). These changes are
highlighted in bold in adenomas M l, M3 and M5 in Table 4-3. The remainder
of adenomas demonstrated changes closer to ±0.1 - 0.2 (theoretically
corresponding to a gain or loss of between 7 and 14% of DNA in each tumour
sample). These low-magnitude changes were also found in the 3 MAP polyps
which also harboured changes with log2T:N ratios close to ±0.5. A plausible
explanation is that the copy number changes detected were present in tumour
sub-clones.
4.3.4 Conventional LOH analysis
No LOH was found on chromosomes 1, 9, 17 and 19 when microsatellite-
based LOH analysis, on the same DNA extracted from the whole tumours that
had been used for the aCGH analysis. However, when LOH analysis was then
undertaken on frozen sections using the same microsatellites in a single
adenoma (M9) that had shown small-scale deletions by aCGH, LOH was
observed in the region o f lp and 17q. Twelve different regions of tumour
epithelium were micro-dissected, no chromosome 9 or 19 LOH was found, but
LOH was observed in two o f 12 tumour regions using chromosome 1 markers
(D1S470) and in a different two regions using chromosome 17 markers
(D17S786 adjacent to p53). Neither o f these were the regions that showed
LOH contiguous within the tumour. See Figure 4-10.
141

I t I I I I I I I I I I I I I I I I I I I I I I I I I I
15 150 155 160 165 17003fsa 3 Blue
Figure 4-10 LOH at D1S470 in microdissected adenoma MAP 9 (upper
tracing), normal tissue (lower tracing)
4.3.5 SNP-LOH analysis
In order to determine whether LOH was present in copy number neutral
regions on aCGH analysis SNP-LOH was performed using the Infinium II
assay.
Three MAP adenomas (M8, M10 and M i l ) were analysed for SNP-LOH
analysis (this procedure was performed by A. Jones). None of these adenomas
had changes on aCGH analysis. One MAP polyp (M10), a tubular adenoma
with mild dysplasia measuring 6.8mm without any aCGH changes, showed
copy number-neutral LOH involving the whole of chromosomes 7 and 12
(Figure 4-11). Adenomas M8 and M13 displayed no evidence of copy neutral
LOH or gross CIN on aCGH.
142

at rr - ■■ . ' V ’--- ' T 'V,; ■ ■ I ' M’ ■ -v ' . yr i ' ■■ .1 I » v ; ^ i
m m -
Figure 4-11 SNP-LOH data for MAP adenoma M10. Chromosomes 7 (upper
panel A and C) 12 (lower panel B and D). A and B = normal controls, with no
LOH. Copy number neutral LOH present in C and D
4.3.6 Comparison of MAP aCGH changes with FAP and
sporadic adenomas
Small-scale aCGH changes were observed in 66% (6/9) of FAP adenomas and
71% (10/14) of sporadic adenomas studied (by A. Jones and W.Chambers). Of
the FAP adenomas four had 1-3 changes, one had 7 and one had 9 changes. Of
the sporadic adenomas six had 1-3 changes, two had 4 changes, one had 12
changes and one had 13 changes. Only MAP tumours had any log2T:N
changes of ^0.5 whereas all o f the FAP and sporadic changes were in the
143

region of 2:0.1. A similar distribution of changes was observed throughout the
genome in the MAP and sporadic adenomas that was not observed in the FAP
group.
See Appendix 2 for details of changes in FAP and sporadic cases.
When considering the frequency o f genetic changes detected, proportion of
gains versus losses and proportion of whole or part-chromosome gains and
losses, no statistical difference was observed between the three groups (p>0.45
in all cases, Kruskal-Wallis test). Again, no statistical significance was
detected when considering adenoma size, morphology or degree of dysplasia
(p>0.48 in all cases). Deletions were more common than gains and part-
chromosome changes were more common than whole-chromosome changes
across the three groups. Adenomas demonstrating a higher number o f whole-
chromosome changes also harboured a greater number of part-chromosome
changes (linear regression analysis t=2.23, p=0.033). Correspondingly,
adenomas with a higher number of gains also had a higher number of deletions
(linear regression analysis t=3.17, p=0.003).
Analysis o f the frequency distribution of aCGH changes found that the whole-
chromosome changes fitted a Poisson distribution well with a mean o f 0.94
(z=0.34, p=0.73). For part-chromosome changes the dataset failed to fit the
Poisson distribution (z=4.02, p<0.001) even with the exclusion o f the two
adenomas with the greatest number o f changes (Sporadic 8 and MAP 4).
When excluding the six adenomas in the dataset which harboured >5 aCGH
changes (removing non-random distribution bias) the remaining 28 adenomas
fitted the Poisson distribution well (z=0.76, p=0.45).
4.4 Discussion
4.4.1 Evidence of CIN in MAP
When considering whether CIN is present in this sample set, subtle changes
alongside large-scale chromosomal changes (observed in “true” CIN) need to
be considered. These include the tendency for individual tumours to harbour
specific changes relating to an underlying defect in cell division or DNA
144

repair, a deviation from the number o f changes observed in Poisson or normal
distribution and an excess o f changes that might be expected in “normal”
tissue.
Using these criteria, this data suggest that CIN is present in MAP.
Small amplitude copy number changes both whole and part-chromosome were
observed in both whole and part chromosomes in 78% of MAP adenomas
suggesting that CIN occurs in MAP. With the exception of one MAP adenoma
and one sporadic adenoma the number o f aCGH changes followed Poisson
distributions for whole and part-chromosome changes. The two “outlying”
adenomas (causing deviation from the Poisson distribution) had a large
number of part-chromosome changes suggesting a high level o f double DNA
strand breaks. The higher frequency of part-chromosome changes observed in
these adenomas may have been a consequence o f them having progressed
further along the adenoma-carcinoma sequence. However histologically they
did not exhibit any exceptional morphology with the MAP adenoma
displaying “mild dysplasia” and the sporadic adenoma “moderate dysplasia”.
Only a small subset o f the MAP adenomas harboured aCGH changes with
log2T:N ratios o f ^0.5, the ratio was nearer 0.1 for all the FAP and sporadic
samples.
A similar distribution o f copy number changes throughout the genome was
observed between the MAP and sporadic adenomas suggesting a similar
underlying cause o f genomic instability, this distribution was not seen in the
FAP adenomas analysed by aCGH.
Based on their size (0.6-3.5 cm), none o f the adenomas studied would be
described as “early” lesions, previous studies o f similar sized adenomas would
almost certainly find them to be diploid using flow cytometry (Sieber,
Heinimann et al. 2002) (Sieber, Tomlinson et al. 2005).
It is possible that some o f the low-magnitude changes observed in this study
were artefacts o f the aCGH technique (some studies have reported these in
gene- and GC-rich regions such as chromosome 19) (N. Carter, personal
communication). It has been previously speculated that aCGH data smoothing
algorithms might not be effective at removing regional differences in
hybridisation efficiency resulting in systematic over- or under-reporting of
Cy3:Cy5 ratios. Loss o f chromosome lp is frequently reported and it has been
145
suggested that this region is prone to erroneous reporting (N. Carter, personal
communication). It is possible that some o f the changes in this region in this
study are in fact artefactual.
Previous aCGH studies o f early CRC tumour samples have found frequent
losses at chromosomes 4q and 18q (Hermsen, Postma et al. 2002; Douglas,
Fiegler et al. 2004) (Jones, Douglas et al. 2005) (Gaasenbeek, Howarth et al.
2006). In this study loss at 4q was seen in one MAP adenoma and loss of the
whole of chromosome 18 in another. In the FAP adenomas no changes were
observed at 4q and 1 18q deletion and 1 whole chromosome 18 deletion were
seen. The sporadic adenomas demonstrated no 4q changes and one 18q loss in
a single adenoma. It is therefore likely that these changes occur later in the
pathway of progression from adenoma to carcinoma.
Bartkova et al (Bartkova, Horejsi et al. 2005) have suggested that CIN occurs
in CRA’s through an elevated rate o f chromosomal breakage at fragile sites as
a consequence o f elevated DNA damage response. Chromosomes
8p23.1/8p21.3, 9q32 and 1 lp l5.1 were cited as fragile sites in their study.
None of the changes observed in the three adenoma groups studied were
breakages at these fragile sites and therefore do not provide any evidence to
support this hypothesis.
The sites o f chromosomal loss and gain throughout the genome in the MAP
adenomas were similar to those observed by Cardoso et al (Cardoso, Molenaar
et al. 2006), with the exception that this dataset found no gains of whole-
chromosome 7. Cardoso et al studied 17 MAP tumours from 5 patients and
found aCGH changes in 6 o f these. Multiple small regions (approx 0.6mm2)
were microdissected and analysed with the aim of identifying aneusomic
subclones within the tumour. Array CGH changes were found on
chromosomes lp, 7, 13, 17p, 19 and 22. Array CGH changes were also seen in
samples from “normal” colorectal mucosa. In this study copy number changes
were scored for any smoothed data point lying outside the 15 and 85%
quantile bands. This approach may lead to high sensitivity at the cost of
specificity. In both this and Cardoso’s study a high incidence of changes in
chromosome 19 were observed. It is known that chromosome 19 is gene rich
and therefore prone to aberrant behaviour in both conventional and aCGH
146

experiments. Therefore results for this chromosome should be interpreted with
caution.
Overall, these results super-cede Cardoso et al (Cardoso, Molenaar et al.
2006) as DNA used for this studies did not undergo whole-genome
amplification prior to aCGH analysis. The process o f whole-genome
amplification can introduce artefactual changes would could be interpreted as
small-scale chromosomal losses and gains.
4.4.2 Conventional LOH analysis did not replicate aCGH
changes
Microsatellite LOH analysis on chromosomes 1, 9, 17 and 19 of whole
adenoma samples found no evidence o f LOH. This may in part be due the fact
the majority of aCGH changes detected were small scale with very small
quantitative changes in gene dosage (approx 7% for log2T:N ratio of ̂ 0.1).
Therefore it could be suggested that the non-artefactual changes observed are
from sub-clones within the tumour rather than the bulk of the tumour tissue.
The LOH analysis undertaken on microdissected samples support this theory.
4.4.3 SNP-LOH demonstrates copy number neutral LOH in
MAP
Analysis o f 3 MAP adenomas with SNP-LOH found evidence o f copy number
neutral LOH on chromosome 7 and 12 in one MAP adenoma (MAP 10) which
harboured no changes on aCGH. This suggests the presence of CIN in the
absence of aCGH changes.
The remaining MAP adenomas examined found no evidence of LOH or copy
number neutral LOH.
This study would have been improved should there have been sufficient DNA
to analyse all o f the adenomas by SNP-LOH therefore enabling comparison of
SNP-LOH data from adenomas with whole or part-chromosome changes on
aCGH.
147

4.4.4 Evidence of LOH in sub-clones within MAP adenomas
LOH was found in micro-dissected clones from one MAP adenoma (M9) in
2/12 dissected regions on chromosomes lp and 17q. In the same sample no
LOH was detected on analysis o f the whole adenoma. These findings also
support the finding of 6 small scale changes (5 part-chromosome and 1 whole-
chromosome) observed on aCGH analysis of the same sample. The adenoma
analysed was relatively small at 4.1 mm exhibiting moderate dysplasia.
This data suggest the possibility that sub-clones may develop from
hypothetical tumour stem cells leading to faster progression to carcinoma.
4.5 Conclusions
CIN occurs with both small-scale part and whole-chromosomal losses and
gains in 78% of MAP adenomas and whole chromosomal losses and gains in a
minority o f MAP adenomas. Copy number neutral LOH was observed in one
of three MAP adenomas analysed by SNP-LOH analysis.
No correlation was identified between the size or grade o f dysplasia o f the
adenoma and the number o f chromosomal losses and gains observed with
aCGH.
The majority of losses and gains were of a magnitude far below predicted
levels for single copy number loss and gain; SNP-LOH and conventional LOH
found the majority o f these subsequently to be either artefactual or occurring
in sub-clones within the adenoma.
The finding of LOH in microdissected sub-clones may represent a faster
progression towards carcinoma. It is very difficult to predict however whether
these clones would have in fact progressed to carcinoma if left in situ.
148

5 Development of a mouse model of MAP
5.1 Introduction
In humans, MAP is a rare disorder accounting for ~ 1% of CRC. Development
of a mouse model reflecting human disease is desirable in order to study the
pathogenesis of MAP from its earliest stages, to study MAP cases in numbers
which are statistically high enough and also to consider experimentally
controlled environmental factors such as oxidative stress and diet.
Once developed, a mouse model o f MAP could be used to determine the
impact of therapeutic interventions such as the use of NSAIDs and anti
oxidants both in the prophylactic setting and in the treatment of adenomas. A
MAP mouse model would be useful for studying the impact of the M Yhf1'
carrier state.
Knockout mice for the BER genes Mthl, Oggl and Myh have previously been
generated (Hirano, Tominaga et al. 2003) (Klungland, Rosewell et al. 1999)
(Minowa, Arai et al. 2000) (Sakumi, Tominaga et al. 2003). When knocked
out, none o f these mouse lines developed intestinal adenomas. Mthl'1'
deficient mice have a higher incidence of lung liver and stomach cancers
compared to M thl+/+ mice (Tsuzuki, Egashira et al. 2001). M thlv' deficient
mice when crossed with MMR deficient (Msh2+/') mice developed a higher
frequency of G:C>T:A transversions on examination of the spleens of these
animals(Egashira, Yamauchi et al. 2002). When Myh and Oggl are knocked
out together, mice develop a higher frequency of lymphoma, lung and ovarian
cancers (Russo, De Luca et al. 2004).
Two mouse models o f MAP were developed as part of this thesis. The first
model was under development (by O.Sieber) as I joined the laboratory and I
became involved as the animals were culled for analysis. The second mouse
model was developed following initial pathological and mutational findings of
the first model; this was solely my work.
The first mouse model o f MAP was determined on the basis that as Myh
mice do not develop adenomas the majority o f MAP adenomas in humans
harbour bi-allelic APC mutations (Jones, Emmerson et al. 2002) (Lipton,

Halford et al. 2003), by crossing Myh deficient mice with ApcMm+/~ mice,
tumorigenesis would be driven at a higher rate without deviating far from the
pathway of Myh'1' driven polyposis. ApcMm+/' mice harbour a germline
mutation (truncating C>T) in codon 850 of Ape. These mice develop multiple
adenomas in the small intestine, mammary tumours, desmoids and epidermoid
cysts (Shoemaker, Gould et al. 1997). As homozygosity for the Min allele is
embryonic lethal, ApcMin+/' mice were used in both models of MAP. Results of
the first MAP mouse model have since been published (Sieber, Howarth et al.
2004).
Initial results from the first MAP mouse model (described in detail in this
chapter) indicated that despite G:C>T:A transversions being present in three
adenomas of Myh deficient mice, the majority of “second hits” at Ape were
through LOH (associated with ApcMm+/' mice bred on the C57BL6
background). Shoemaker et al (Shoemaker, Moser et al. 1998) investigated the
effect of murine genetic background on tumour multiplicity in ApcMin+/' mice
demonstrating a reduction o f tumour frequency from 100% (68/68 animals) in
C57BL6 Min+/'mice to 25% (43/170 animals) in AKR Min+/' mice at 85 and
138 days respectively. Fewer adenomas developed due to a lower incidence of
LOH as the “second hit” at Ape in AKR M in'' mice. Luongo et al have also
demonstrated that the predominant somatic loss of Ape function in C57BL6
ApcMm+/' (Myh+I+) mice is through LOH (Luongo, Moser et al. 1994).
Haigis et al whilst studying mechanisms of tumour regionality in the mouse
demonstrated that when AKR Min+/' mice were crossed with Mlh knockout
mice tumour multiplicity returned on the introduction of defective MMR. The
AKR Min+/7Mlh+/+ mice developed a mean of 3.7 +/- 1.6 tumours, AKR
Min+/7Mlh+/' mice developed 4.0 +/- 3.5 tumours and AKR Min+/7Mlh~'~ mice
developed 34 +/- 6.4 tumours. The average lifespan was 149, 177 and 95 days
respectively (Haigis, Hoff et al. 2004).
AKR mice are homozygous carriers of the resistant allele o f Modifier of Min 1
(M omlR/R) locus found on chromosome 4, which is thought to confer
resistance to tumour formation (colonic>small intestine) by acting as a
modifer. The prime candidate gene for this modifer effect is the secretory
phospholipase Pla2g2a, although a locus just distal to D4mit64 has also been
identified as a complementary resistance loci for Moml resistance (Cormier,
150

Bilger et al. 2000). When M o m l^ was introduced to C57BL6 mice (which
are homozygous for the sensitive allele o f M omls/s), tumour multiplicity was
reduced by 50% in Momls/R mice and by 75% in Momlm mice (Gould,
Dietrich et al. 1996). All mice were therefore genotyped for Moml in both
MAP mouse models developed in this Chapter.
Therefore on developing the second MAP mouse model it was hypothesised
that if Apc^^VM yh ̂ were bred on the AKR genetic background fewer of
their adenomas would lose the second allele of Ape through LOH,
consequently it would be expected that a higher proportion of adenomas
would demonstrate G:C>T:A transversions somatically at Ape. By the
introduction of defective BER to AKR ApcMm+/~ mice it would be predicted
that tumour multiplicity would return in Apc^^^/Myh'^ mice bred on the
AKR background.
5.1.1 Aims of this Chapter
The aim of this Chapter was to develop a faithful mouse model of MAP in
order to study the development o f MAP from its earliest stages and in
significant numbers.
151

5.2 Methods
All animals were bred, housed and experiments carried out in accordance with
the United Kingdom Animal Procedures Act 1986. Animals were housed at
the Cancer Research United Kingdom Laboratories (South Mimms).
5.2.1 Mouse breeding
The original C57BL/6J-/fpcM"+/' mice were obtained from A.R Moser
(McArdle Laboratory, University o f Wisconsin, USA). The SV129/C57BL/6J-
Myh+/' mice were a gift from J. Miller (Molecular Biology Institute, University
of California, Los Angeles, USA).
When breeding the first MAP mouse on the C57BL/6J background, male
ApcMm+/~ mice were bred with female Myh+/ mice, from the Fi generation
male ApcMm+/~ / Myh+/~ mice were inter-crossed with Apc+/+1Myh+/~ females.
The ApcM,n+/~ mutation was carried through the male line when setting up
mating pairs and trios. The F2 generation onwards were used for analysis as
these mice would share equivalent contribution from the two genetic
backgrounds (C57BL/6J and SV129).
When breeding the second MAP mouse on the AKR genetic background, the
C57BL/6J-ApcMm+/~ and SV 129/C51BL/6S-Myh+/' were backcrossed ten times
on to the AKR genetic background before setting up inter-crosses as described
above.
The following study groups were set up for both mouse models o f MAP.
ApcMin+/' /Myh+/+, ApcMin+/~ IMyh+/~ and ApcMin+/' I Myh'A; the three comparison
groups were Apc+/+ /Myh+/+, Apc+/+ /Myh+/' and Apc+/+ IMyH1' .
5.2.2 Genotyping
DNA was extracted from tail snips as described in Methods 2.1.1.6. All mice
were genotyped for Ape, Myh and Moml (AKR resistant allele).
The original Myh knockout mouse was developed by Jeffrey Millers group
using a targeted vector pMC-neoR (neomycin cassette) in exon 6 o f Myh as
described by Xie et al (Xie, Yang et al. 2004). Myh was genotyped with a
152

three primer allele specific PCR assay across exon 6 where neomycin cassette
insertion occurs. Primers PI and P2 amplify wt Myh (262 bp product) and
primers PI and P3 amplify mutant Myh (376 bp product).
Ape and Moml(Pla2g2a) were genotyped by sequencing directly across the
Min mutation at codon 850 of Ape and the resistant allele of Moml located on
chromosome 4. AKR mice are homozygous for the resistant allele Momlm
and C57/BL6 mice are homozygous for the sensitive allele Momls/s.
All primer sequences and conditions can be found in Appendix 1.
5.2.3 Adenoma, cystic crypt and aberrant crypt focus
counts
Mice in the first MAP mouse study were sacrificed between 110 and 130 days
by CO2 asphyxiation for adenoma, cystic crypt and aberrant crypt focus
counts.
Four of the second MAP mice bred on the AKR background were sacrificed
between 110 and 130 days, but as they had no intestinal phenotype the
remainder were left, initially with the intention of analysing them at 18
months. However, the majority o f the mice developed lymphoma and
necessarily had to be sacrificed prior to this.
The intestinal tract was removed and dissected into four segments - 3 small
intestine (proximal, middle and distal) and 1 colonic. Each segment was
flushed with PBS and opened longitudinally. Bowel preparations were fixed
with Camoy’s medium for 3 hours and stored in 70% ethanol. Tissue was
stained with 0.2% methylene blue for 3 minutes and washied in PBS for 20
minutes. Adenomas and cystic crypts were counted on a dissecting microscope
at x3 magnification. Cystic crypts in the small intestine and aberrant crypt foci
in the colon were counted at x3 and x5 magnification. In the first MAP mouse
the preparations were counted by both O.Seiber and myself to confirm
accuracy of results.
153

5.2.4 Histology
Following adenoma, cystic crypt and aberrant crypt foci counts, five of
animals from each study group had their small intestine and colon rolled,
embedded in paraffin, sectioned at 4pm intervals and stained with
haematoxylin and eosin. These sections were examined by a pathologist
blinded to the genotype o f the mice (G. Stamp) to determine the number of
aberrant crypt foci in the colon. Any abnormal tissue identified at post-mortem
was also taken for histological analysis (eg mammary tumours and thymic
masses).
5.2.5 Molecular analysis of adenomas
Adenomas were dissected from whole-mount preparations using a dissection
microscope at x3 magnification. Each adenoma was sized as either <lmm, 1-
2mm or >2mm. All samples were placed directly in to coming tubes on dry
ice. A separate scalpel was used for each individual adenoma to prevent
contamination and care was taken to avoid sampling of the normal
surrounding epithelium. Tail tissue and normal bowel epithelium were also
sampled. DNA was extracted as described in Methods 2.1.1.6.
LOH analysis at Ape and Myh
Adenomas were analysed for LOH at Ape was using fluorescent SSCP
analysis distinguishing the wt and Min alleles. LOH at Myh was analysed with
the same allele specific assay as used for genotyping with the common PI
primer fluorescently labelled. See Methods 2.1.6.4 for LOH analysis and
Appendix 1 for primer details and conditions.
Mutation analysis
Exons 5-14 o f Ape, Myh exons 2-15 and K-ras exon 1 were screened to
determine the mutation frequency and mutational signature in the adenomas
dissected. Exon 15 o f Ape (codons 652 - 1648) was covered by 10
overlapping primer pairs. Ape and Myh were screened with fluorescent SSCP
analysis followed by direct sequencing o f samples with aberrant SSCP bands.
K-ras exon 1 was sequenced directly. See Methods 2.1.6.1 for details o f SSCP
154

analysis, Methods 2.1.7 for details o f fluorescent cycling sequencing and
Appendix 1 for primer details and conditions.
When somatic mutations were identified, these were confirmed by cloning the
PCR product from the tumour sample. See Methods 2.1.8.
5.3 Results
5.3.1 ApcP,n*/mIMyhm/m mice bred on C57BL6/SV129 background
In total, 134 small intestine and 6 colonic adenomas were dissected from 12
ApcMm+/' /Myh*/+mice , 147 small intestine and 21 colonic adenomas from 16
ApcMm+/' /Myh*f~ mice and 167 small intestine and 16 colonic adenomas from
13 ApcMin+/~ / Myh'A mice. Adenoma, cystic crypt and aberrant crypt foci counts
were performed in 15 ApcMin+/ /Myh*/+, 25 ApcMin+/' /Myh r/~ and 15 ApcMin+/~
/Myh'1' mice and 15 animals from each o f the three control groups Apc+/+
/Myh*/+, Apc+/* /Myh+/~ and Apc+/* !Myh'/'. The three study groups had similar
male:female ratios 8:7 for ApcMin+/~ /Myh*/+, 11:14 for ApcMin+/~ /Myh+/~ and
6:9 for ApcMin*A/My h A.
5.3.1.1 Enhanced adenoma and cystic crypt formationobserved in the small intestine of ApcP^IM yh* mice
In the small intestine tumour multiplicity was increased by 53% in the
ApcMin+/' /M yhA mice when compared to ApcMm+/~ /Myh*/+ mice (p=0.016,
Mann Whitney U test). A higher number of adenomas developed in the
proximal and middle segments o f small intestine examined than the distal
segment (p=0.01, ANOVA for interaction).
No significant increase in tumour multiplicity was seen in the ApcMm+/~ / Myh+/~
mice when compared to ApcMm+/' /Myh*/+ mice (p=0.83 Mann Whitney U
test). See Table 5-1.
155

ApcMln/+ M y h + /+ ( n = 1 5 )
ApcMln/+ M y h -/+ (n = 2 5 )
ApcMln/+ M y h -/- (n = 1 5 )
Adenom as 161 ± 58 164 ± 92228 ± 84
(p = 0 .0 1 6 )
Proximal 21 ± 8 25 ± 16 4 4 ± 21
Middle 62 ± 23 60 ± 34 85 ± 35
Distal 7 8 ± 33 79 ± 47 99 ± 36
Cystic crypts 20 ± 24 24 ± 32 46 ± 50
Table 5-1 Summary o f adenoma and cystic crypt formation in the small
intestine mean and SD shown (p=0.016 for no. adenomas ApcMm+/~ /Myh+/+
versus ApcMln+/~ IMyhv' Mann Whitney U test)
When considering adenoma size, no significant difference was seen between
the ApcMin+/' /Myh+/~ and ApcMin+/~ I Myh'1' mice when compared with ApcM,n+/~
/Myh+/+ mice (p=0.10 for ApcMm+/~ /Myh+/+ versus ApcMin+/~ !Myh+/~ mice;
p=1.0 for ApcM,n+/~ IMyh+/+ versus ApcMm+/' /Myh'A mice, %2 test)-
An increased number of cystic crypts was observed in the ApcMm+/~ /Myh'A
mice (mean = 46 in ApcMm+/~ I Myh''\ 24 in ApcMin+/' /Myh+/' and 20 in ApcM,n+/'
/Myh+/+ mice) however, this was not statistically significant (p=0.17 Mann
Whitney U test). A sub-population o f cystic crypts demonstrated dysplastic
features (see Figure 5-1 ). Animals with a higher adenoma burden also had a
higher cystic crypt count (R2=0.57, p=<0.001, linear regression analysis).
No adenomas or cystic crypts were found in the small intestine of any o f the
animals in the three control groups (Apc+/+ /Myh+/+, Apc+/+ /Myh+A and Apc+/+
/Myh'A).
156

Figure 5-1 Adenomas and cystic crypts in the small intestine of Myh deficient
mice
The above figure demonstrates adenomas and cystic crypts in the small
intestine of ApcMin+/' /Myh'A mice. Methylene blue stained adenomas and
cystic crypts are shown in (A) and (B), cystic crypts are arrowed. H&E stained
transverse sections of small intestine demonstrate cystic crypts with normal
pathology (C) and dysplasia (D).
5.3.1.2 Increased number of aberrant crypt foci observed in
the colon of ApcM/n+/7My/fA mice
ApcMinW' /Myh+/+, ApcMin+/' !Myh+/' and ApcMinW' /Myh'A mice all developed a
mean of 2 adenomas in the colon (p=0.18 for ApeMn+A /Myhw* versus
ApcMn*f' /Myh+/' mice and p=0.16 for ApcMin+/' / Myh+/+ versus ApcMinW~ /Myh~~
mice, Mann Whitney U test). No significant difference in size of adenoma was
observed between study groups with 82% (19/23) ApcMm+/' /Myh+/+, 60%
157

(28/47) ApcMm+/~ /Myh+/' and 88% (21/24) ApcMw+/ !MyH/' o f adenomas
measuring >2mm (p=0.06 for ApcMm+/' /Myh+/+ versus ApcMm+/~ /Myh+/~ and
p=0.7 for ApcM,n+/~ /Myh+/+ versus ApcMm+/~ /Myh'A, Fishers Exact test).
Myh deficient mice developed an approximately 2-fold increase in number of
aberrant crypt foci (ACF) predominantly in the distal colon. ApcMm+/~ /Myh+/+,
ApcMin+/~ /Myh+/' and ApcMln+/~ /Myh'1L mice developing a mean number of 23,
17 and 48 ACFs respectively (p=0.001 for ApcMm+/~ IMyh+/+ versus ApcMm+/'
I Myh'1' and p=0.10 for ApcMin+A /Myh+/+ versus ApcMin+/' /Myh+/' Mann
Whitney U test). The number o f ACFs did not correlate with the number of
adenomas in any one animal (R2=0.0054, p=0.61, linear regression analysis).
No adenomas of ACFs were present in any of the control groups.
A pcM,n/+ M y h + /+ ( n = 1 5 )
Apc*'n/+ M yh -/+ (n = 2 5 )
A pcM,n/+ Myh- / - (n = 1 5 )
Adenom as 2 ± 3 2 ± 2 2 ± 1
ACFs 23 ± 13 17 ± 12 48 ± 22(p = 0 .0 0 1 )
Table 5-2 Summary of adenoma and aberrant crypt focus counts in Myh
deficient mice (mean +/- SD, p=0.001 for ApcMtn+/~ IMyh+/+ versus ApcMm+/~
Mann Whitney U test)
158

c'v. '.v L /v Y f ~ < t'> v-
K <t> 7 i -V;
Figure 5-2 Adenomas and aberrant crypt foci in the colon of Myh deficient
mice, bar size = 500pm
The above figure demonstrates adenomas and ACFs in the colons of ApcMin+/'
/Myh'A mice. Methylene blue-stained adenomatous polys are shown in (A),
with ACFs demonstrated (with arrow heads) in (B). H&E transverse sections
demonstrate a monocryptal ACF (C) and polycryptal ACF (D), scale bars =
500pm.
5.3.1.3 No evidence of progression from adenoma -
carcinoma in A pc^^ 'IM yh^ ' mice
Analysis of 8 small intestine and 8 colonic adenomas from ApcM,n+/' /Myh+/+,
21 small intestine and 17 colonic adenomas from ApcMm+/' /Myh+/' and 30
small intestine and 17 colonic adenomas from ApcMin+/1 Myh'1' mice found no
evidence of progression from adenoma to carcinoma by 120 - 130 days of age.
159

5.3.1.4 An increased frequency of mammary gland tumours
was observed in ApcfUn*/‘INIyh'/' mice
Mammary gland tumours were found in 0% (0/16) ApcMin+/' /Myh+/+, 7%
(3/43) ApcMin+/- /Myh+/- and 27% (4/15) ApcMin+/' /Myh'A mice (p=0.028 when
comparing Myh'1' with both Myh+/' and Myh +/+ mice, Fishers exact test). See
Figure 5-3.
Figure 5-3 H&E stain of mammary gland tumour in ApcMin+/VMyh'A mouse
(x20) with squamous cell differentiation arrowed
5.3.1.5 Molecular analysis of adenomas from A pcMm*/' IMyh'
A mice
LOH analysis at Ape
As all mice in the study groups were ApcMin+/\ initial analysis of all adenomas
for LOH at Ape was undertaken to determine the mechanism of loss of the
second Ape allele, either through LOH or through G:C>T:A transversions
through Myh deficiency.
Ninety-three percent (118/127) adenomas from ApcMin+/' /Myh+/+, 89% (87/98)
adenomas from ApcMin+/' IMyh+/' and 81% (121/150) from ApcMin+/' /Myh'A
160

mice were found to have lost the wt allele o f Ape (p<0.001 for Myh deficient
mice versus Myh heterozygous and wt mice, Fishers Exact test).
LOH analysis o f colonic adenomas found no significant difference in the
frequency of allelic loss at Ape. One hundred percent (6/6) of adenomas from
Ape**”*'' /Myh*'*, 100% (18/18) ApcMn+/' I Myh*'- and 94% (15/16) adenomas
from Ape""*''I Myh'' mice had loss o f the wt allele (p=0.10 for
deficient versus Myh wt mice, Fishers Exact test).
ft W1 NormalA
A
B
D
• M n Normal
\
Polypi
I
Figure 5-4 LOH analysis at Ape (A - wt normal, B - Min normal tissue) in
adenomas from ApcMin+/~ /Myh+/+ (C) and ApcMin+/ I Myh'1' (D) mice. LOH at
Ape when present, occurred at the wt allele (arrowed)
G :O T:A transversions occur in adenomas o f ApcMin+/~ /Myh'f' mice
Twenty-nine adenomas from 4/?cM"+A /Myh'A, eight adenomas from ApcM,n+/'
/Myh+/' and 9 adenomas from ApcMin /' /Myh+/+ mice which had not
demonstrated LOH for the wt allele o f Ape underwent somatic mutation
analysis at Ape.
Somatic mutations were detected in 10% (3) adenomas of ApcMin+/' I Myh'1'
mice. All were G:OT:A transversions (2x G>T nt 3919 (E1307X), lx C>A nt
161

4754 (S1585X). The sequence motif around the E1307X mutation
(AAAGAGA) is the same as that identified in human MAP as a sequence
prone to hyper-mutation as a consequence of defective BER. No somatic
mutations were identified in adenomas from ApcM,n+/~ /Myh+/' and ApcMin+/'
/Myhw* mice.
A G A A
B A A A A T A G A A
Figure 5-5 Somatic G>T transversion at nt 3919 of Ape resulting in E1307X
termination codon, A - forward sequence from adenoma DNA and B - cloned
mutant allele
Adenomas from ApcM,n +/~ /Myh mice did not harbour K-ras mutations
No mutations in exon 1 of K-ras were found in 40 adenomas analysed from
ApcMn+/' /Myh~A mice and 20 adenomas from ApcMin+/' /Myh+/+ mice.
No LOH at Myh was observed in ApcMin+/' /Myh+/~ mice
In order to determine whether inactivation of the wt allele is selected in
tumour development in Myh heterozygotes, 137 adenomas from Apcmn+/'
/Myh+/' mice were screened for LOH at Myh. One percent (2/137) adenomas
harboured allelic loss at Myh, and in one of these cases the LOH targeted the
inherited mutant allele rather than the wt allele. Eighty-two adenomas were
subsequently screened for somatic mutations in exons 2-15 of Myh, but no
mutations were identified.
162

5.3.2 ApcMm+/'IMyhm/m mice bred on AKR background
Following backcrossing o f ApcMln+/’ and Myh+/~ onto AKR and inter-crossing
of and Myh+/' as described earlier in this chapter, the same study
groups were set up on the AKR genetic background. Twenty-two ApcMtn+/~
I Myh'A , 44 ApcMin+/-1 MyhfA , 20 ApcMin+/- /Myh+/+ and 30 Apc+/+ /Myh+/+ mice
were studied.
Four mice from the ApcM,n+/~ /Myh'A group were culled between 110 and 130
days, but on examination, none of these animals had developed adenomas,
cystic crypts or ACFs. In light of these findings and those of (Sakamoto,
Tominaga et al. 2007) (published whilst this experiment was in progress), it
was decided to leave these animals for up to 18 months of age in order to
determine whether they would in fact develop a gastro-intestinal phenotype.
5.3.2.1 The majority of mice across all study groupsdeveloped high grade lymphoma
Whilst waiting for the mice to mature all o f the animals became sick
necessitating culling. Full post mortems were carried out and none of the mice
in any of the study groups had developed adenomas, cyctic crypts or ACFs.
The majority o f the animals had developed high grade lymphoma and had died
as a consequence o f metastatic spread to other organs and bone marrow failure
-see Table 5-3 and Table 5-4.
163

AnimalID Genotype
Age at death
(weeks)PM find ings
Cause of deathweight
(9)LN
size thymus spleen comments
1
X>-Z
Min*'' 8 lym phom a 21.6 5-10x lOx NAD2 MYH''' Min*'- 24 no obvious cause 39.8 NAD NAD NAD subcutaneous chest wall nodule3 MYH''' Min*'- 24 no obvious cause 28.9 NAD NAD NAD stom ach distended4 Z -< X Min*'" 28 lym phom a 29.1 5x lOx NAD5 MYH7 Min*'" 36 lym phom a 30.9 2x lOx 3x6 MYH7 Min*'' 24 lym phom a 32.5 2x 5x 3x liver infiltrated7 3 -< X Min*7' 28 lym phom a 33.4 lOx NAD NAD riqht inquinal LN lOx size8
I>-z
Min*'‘ 36 lym phom a 50.2 NAD NAD NAD 2 subcutaneous ab scesses non-active9 MYH7 Min*7' 26 lym phom a 26.2 3-5x lOx 3x10 MYH7 Min*7' 26 no obvious cause 26.7 3-5x lOx 3x11 MYH7' Min*'" 21 no obvious cause 31.1 NAD NAD NAD hyperplasia of th e u terus12 MYH7' Min*'" 28 lym phom a 35.1 NAD NAD NAD culled as piloerect and rapid breathinq13 MYH7' Min*7' 16 lym phom a 34.1 2x lOx NAD14 MYH7' Min*'" 24 lym phom a 36.3 3-5x lOx 3x15 MYH7' Min*'" 38 no obvious cause 30.1 2x lOx NAD liver infiltrated16 MYH7' Min*'- 38 lym phom a 33.9 3-5x lOx 5x liver infiltrated17 MYH7' Min*7' 40 no obvious cause 44.8 NAD lOx NAD18 MYH7' Min*7' 22 lym phom a 25.9 2x lOx NAD liver infiltrated19 MYH7' Min*'" 30 no obvious cause 32.5 NAD NAD NAD20 MYH7' Min*7' 30 no obvious cause 37.1 NAD NAD NAD21
X>-z
Min*'' 32 no obvious cause 46.4 NAD 30x NAD22 MYH7' Min*'" 32 no obvious cause 51.7 NAD 30x NAD subcutanous cyst under chin
Table 5-3 Summary of cause of death and post mortem findings for the Myh'1'
/ Min+/~ mice (NAD = no abnormality detected)
GenotypeAKR
backgroundno.
age a t death (w eeks)
median (range)weight (g)
median (range) lymphoma
MYH'1' / Min +/ 22 28 (8 -4 0 ) 32 .5 (2 1 .6 -5 1 .7 ) 1 2 /2 2 (55% )MYH+I' / Min +/~ 44 26 (2 -3 2 ) 3 3 .4 (2 5 .7 -4 1 .2 ) 2 8 /4 4 (63% )MYH+/+ / M in +/' 20 28 (8 -4 4 ) 31 .4 (1 7 .9 -4 6 .6 ) 1 0 /2 0 (50% )MYH+I+ / A p c +h 30 32 (1 5 -4 5 ) 3 9 .6 (2 1 .7 -3 5 .4 ) 2 1 /3 0 (70% )
Table 5-4 Summary o f age and weight at death and incidence of lymphoma at
post mortem
No significant difference was observed in either the age or weight at death
between any o f the study groups (p=0.22 for ApcMin+/' IMyh'A versus ApcMm+/~
/Myh+/\ p=0.84 for ApcMin+/' /Afyh^ versus ApcMin+/' IMyh+A , p=0.08 for
ApcM,n+/~ IMyh'A versus Apc+/+ /Myh+/+ for age at death; p=0.68 for ApcMm+/~
IMyh'A versus ApcMm+/~ IMyh+/' , p=0.58 for ApcMn+A IMyh'1' versus ApcMln+/'
IMyh+/+ and p=0.46 for ApcMm+/' IMyh'1' versus Apc+/+ IMyh+/+ for weight at
death, t-test).
When considering the incidence of lymphoma, no significant difference was
observed across the study groups (p=0.16 for ApcM,n+/ IMyh'A versus ApcMm+/'
164

IMyhfA, p=0.23 for ApcMw+/' IMyhA versus ApcMin+A IMyh+/+ and p=0.12 for
ApcMn*/' IMyh1' versus Apc+/+ IMyh+/+ Fishers Exact test).
5.3.2.2 Histological findings at post mortem
Full post mortems were performed and gut preparations examined for
adenomas, cystic cryps and ACFs. As none were seen in any animals for all
study groups, a sub-set of 5 ApcMin+/' IMyhA and 5 Apc+/f IMyh+/+ animals had
full gut rolls prepared and were examined by a Histopathologist (G. Stamp) for
any evidence of cystic crypts ot ACFs. One ACF was identified in the colon of
one ApcMn+/' IMyh'1' animal.
The figures below show gross pathological and H&E-stained preparations of
the thymus, mesenteric lymph nodes, spleen and bowel mucosa from both
ApcMin+/' IMyh' ̂ and wt C57BL6 animals for comparison.
w t Min+'/Myh-'- w t M in * /M y h *
Figure 5-6 Thymus from ^/7cMn+A / Myh' ' mouse, H&E sections on the right
demonstrate loss of abnormal parenchymal architecture (x2) and lymphocytic
infiltration with high grade lymphomatous cells (x40)
165

Wt M in *'/M yh + w t Min*'-/Myh-'
Figure 5-7 Mesenteric lymph nodes from ApcMin*/' / Myh'1' mouse, H&E
sections on the right demonstrate loss of abnormal parenchymal architecture
(x2) and lymphocytic infiltration with high grade lymphomatous cells (x40)
x2
x40
wt M i n + ' / M y t r ' - wt M i n + ' / M y h '
Figure 5-8 Spleen from ApcMin+/' / Myh'1' mouse, H&E sections on the right
demonstrate loss of abnormal parenchymal architecture (x2 ) and lymphocytic
infiltration with high grade lymphomatous cells (x40)
166

Min+'/Myhr'-
Figure 5-9 Transverse H&E sections of small intestine from wt and Apcmn+/' I
M yh ' mice. No adenomas are seen, lymphocytic infiltrate is evident in the
ApcMin+/~ / A/y/^‘section at x4 power
5.4 Discussion
5.4.1 A p c Min*/'INIyh'/’ mice bred on C57BL6/SV129
background
The first mouse model o f MAP bred on a mixed C57B6/SV129 genetic
background demonstrated an additive effect of defective Myh when crossed
with ApcMin+/' mice both in the development of intestinal and extra-intestinal
tumour development.
A significantly increased number of adenomas developed in the small intestine
of ApcMin+/' IMyh'A mice and a higher number (not statistically significant) of
cystic crypts was also observed. Cystic crypts are lesions of unknown
neoplastic potential which occur in the small intestine of ApcM,n+/' mice and
increase in number when mice are treated with ethylnitrosourea (ENU) or are
167

bred with MMR (M lhl) deficient mice (Shoemaker, Moser et al. 1995;
Shoemaker, Haigis et al. 2000). It is possible that the addition of defective
BER alongside the ApcMm+/~ mutation may have caused the observed increased
number of cystic crypts through similar (as yet undetermined) mechanisms to
those underlying the ApcMm A7Mlh'A mice. The ApcMln+/7Mlh'A mice also
developed other extra-intestinal manifestations o f defective Ape such as
desmoids and epidermoid cysts (Shoemaker, Haigis et al. 2000), none of these
features were seen in the ApcMm+A /Myh'A mice. ApcMln+/7Mlh'A mice also
developed ~ 2 fold greater number o f ACFs which are putative pre-malignant
lesions developing in the colon o f ApcMin+A mice (Paulsen, Steffensen et al.
2001; Yamada, Hata et al. 2002) and that are following treatment with
chemical carcinogens (Wargovich, Jimenez et al. 2000). This suggests that
Myh deficiency in the mouse promotes the development of both of these pre-
malignant lesions.
The proportion o f adenomas in ApcMm+A !Myh'A mice without LOH of the wt
allele of Ape was similar to that in previous studies in other BER and MMR
deficient mice - Mbd4, Mlhl, Msh2 and Pms2 (Wong, Yang et al. 2002)
(Shoemaker, Haigis et al. 2000) (Reitmair, Cai et al. 1996) (Baker, Harris et
al. 1998).
The presence o f G:C>T:A transversions at Ape in adenomas from ApcMin+A
/MyhA mice was indicative that defective BER was promoting tumorigenesis
in these animals. As no G:C>T:A transversions at Ape were seen in adenomas
from the ApcMm+/ /Myh+/' and ApcMm+/' IMyh+/+ mice, it can be concluded that
the pathogenesis in those adenomas demonstrating G:C>T:A transversions
similar to that occurring in humans (Al-Tassan, Chmiel et al. 2002) (Jones,
Emmerson et al. 2002).
The low frequency o f somatic truncating mutations at Ape observed in the
ApcM,n+A IMyh'1' mice may be due to increasing evidence that adenomas from
ApcMin+A mice and germline APC mutation carriers in humans (FAP) are
polyclonal (Merritt, Gould et al. 1997) (Novelli, Williamson et al. 1996)
(discussed further in Chapter 9). In this situation the overall contribution to the
tumour DNA from the mutant allele may be too small to be detected (unless
samples are micro-dissected). This is supported by the finding that the somatic
168

mutation (G>T transversion at nt 3919) cited in this chapter (Figure 5-5)
could only be confirmed on cloning of the PCR product.
The distribution of adenomas within the small intestine of ApcMm+/' IMyh'1'
mice with a greater proportion developing in the proximal and middle
segments of the small intestine in part reflect the distribution of adenomas in
humans MAP (where duodenal and gastric adenomas can occur). When
ApcMmW' mice are crossed with MMR deficient {Mlhl) mice a uniform
distribution of adenomas is observed (Shoemaker, Haigis et al. 2000). This
observation in both human and murine MAP may reflect varying levels, of
oxidative stress throughout the GI tract or may relate to the level of activity or
functional redundancy o f MYH in different anatomical regions of the Gl tract.
The first MAP mouse model was very useful in determination of the
significance o f the heterozygous state in MYH. The finding that ApcMm+/'
/Myh+/~ mice did not develop a significantly higher number of adenomas than
ApcMm+/' /Myh+/+ mice indicated that being a heterozygous carrier of MYH did
not confer a higher risk o f developing adenomas and CRC. This study and its
publication (in 2004) came before subsequent population based studies
confirming this finding (Webb, Rudd et al. 2006).
The first mouse model o f MAP demonstrated elements of tumorigenesis
similar to that found in the human form of the disease, however adenomas
were found to have a much higher incidence o f LOH at Ape as the “second
hit” and lower incidence o f somatic G:C>T:A transversions at Ape.
It was on the basis o f these findings that the second MAP model was bred in
order to develop a more “faithful” model of the disease.
5.4.2 Apcmn*/~IMyh'/~ mice bred on AKR background
It is known that AKR mice are prone to developing leukaemia and lymphoma
(http://iaxmice.iax.org) with a lifetime incidence o f 60-90%. However
previous studies back-crossing ApcM,n+/' on to AKR and subsequent inter
crossing with Mlhl led to the development o f a gasto-intestinal phenotype
(Haigis, Hoff et al. 2004). In the study by Haigis et al, ApcM,n+/' /MlhrA mice
also developed thymic lymphoma at an average age o f 1 0 0 days.
169

As four AKR ApcMin +/VMyh~/~ mice in my study had not developed a gastro
intestinal phenotype or lymphoma by 1 1 0 to 130 days and following the
findings of Sakamoto et al (Sakamoto, Tominaga et al. 2007), the study and
control groups in this experiment were left for longer (ideally > 1 year) prior
to culling.
Sakamoto et al developed a Myh~ mouse bred on the C57BL6 background
whilst this study was in progress. This mouse develops both spontaneous
adenomas at > 18 months o f age and a significantly higher number of
adenomas when fed KBrCh in drinking water. At 18 months of age 109 wt and
1 2 1 Myh'f' mice were sacrificed and examined for development of adenomas
and extra-intestinal tumour development, at this time no increased mortality
was observed in the Myh A mice. Four adenomas and seven carcinomas were
found in the intestines (small intestine / colon not specified) o f 10 Myh"/‘ mice
and none were found in the wt controls. When oxidative stress was induced
with KB1O 3 in drinking water, a higher number o f adenomas was observed in
16 Myh f' and 15 wt mice (mean no. adenomas = 61.88 in Myh~A and 0.85 in
wt) when animals were culled at 12 months. The adenomas in the Myh A mice
were found predominantly in the proximal small intestine (as found in the first
MAP mouse above). None o f the wt or Myh~A animals which were not fed
KB1O 3 developed adenomas by 12 months o f age. No mutational analysis was
undertaken in these studies to determine whether the adenomas which
developed in the Myh f' mice had an excess of G:C>T:A transversions.
The main obstacle in development o f the second MAP mouse model was the
discrepancy between the length o f time required for a “simple” Myh'A
knockout mouse (on C57BL6) to develop a phenotype (18 months of age)
(Sakamoto, Tominaga et al. 2007), and even then this is found in only 8 %
(10/121) of animals and the incidence of lymphoma inherent in the AKR
genetic background. In excess o f 90% of AKR mice develop lymphoma by 18
months of age.
Interestingly, no difference was observed in either the age of death or
incidence of lymphoma in any o f the study groups or controls in the second
MAP mouse .There was a suggestion in the data that the ApcMin+/~ mice died at
a younger age and weight, but this was not significant. The presence of
170

ApcMm+/~ allele either with or without Myh deficiency did not significantly
affect the age or cause o f death when all o f the study and control groups were
compared. Mouse models o f lymphoma (with associated microsatellite
instability) include MMR deficient (Msh2 and M lhl) mice which are thought
to lead to a higher number o f errors in T-cell and B-cell gene rearrangements
of the immunoglobulin gene superfamily, but little is known of the target
genes for defective MMR in this situation. Msh2 deficent murine lymphomas
develop insertion/deletion muations in TgfjS type 2 gene (Lowsky, Magliocco
et al. 2000). Up to 75% of Mlhl deficient mice develop lymphomas which
harbour somatic mutations in the transcription factor ikaros (Kakinuma,
Kodama et al. 2007).
In the AKR Apc^^'lM yh'1' model, defective BER should not cause the same
mutation spectra in either T and B cell gene rearrangement (as BER is not
directly involved in T and B cell gene rearrangement) or Tgffi - and would not
lead to the development o f lymphoma at a faster rate than wt animals. This is
reflected in the observed results presented in this Chapter.
It seems that some other mechanism is required alongside Myh'A deficiency to
drive tumorigenesis in mouse models of MAP - either through environmental
oxidative stress or a predisposition to adenoma development through the
ApcMin+/~ allele.
5.5 Conclusions
The first mouse model o f MAP (ApcMm+/'/Myh'/ mice bred on C57BL6/SV129
genetic background) developed several features in keeping with the human
MAP syndrome - those o f intestinal adenoma development, with a proximal
distribution in the GI tract and evidence of somatic G:C>T:A transversions at
Ape.
Further studies have provided evidence that mouse models of MAP (on both
the C57B6 and AKR genetic background) appear to require a second promoter
of tumorigenesis either through external oxidative stress or inherited mutations
in Ape.
171

6 Identification of potential pathogenic
mechanisms underlying the multiple colorectal adenoma phenotype.
6.1 Introduction
The multiple colorectal adenoma (MCRA) phenotype is can be defined as any
individual who develops between 5-100 adenomas in their lifetime.
These individuals carry an increased risk o f developing CRC. Up to 35% of
MCRA individuals are homozygous carriers of MYH germline mutations
(Sieber, Lipton et al. 2003) (Sampson, Dolwani et al. 2003), and a further 15%
harbour a germline mutation in APC (“attenuated” FAP, (AFAP)) (Spirio,
Green et al. 1999). The remaining -50% of MCRA cases are likely to have
some genetic component which is as yet unidentified.
The concept o f utilising molecular profiling alongside histopathological
features in adenoma classification has continued to develop since the
introduction o f the “adenoma - carcinoma sequence” in the late 1980’s. This
paradigm describes the progression from normal colonic epithelium through
adenoma to carcinoma initiated by bi-allelic loss of APC followed by
activating K-ras mutation and culminating with inactivation of p53 resulting
in transition to carcinoma (the “classical” pathway)(Vogelstein, Fearon et al.
1988).
Activating K-ras mutations have historically been associated with advanced
adenoma and a higher degree o f “aggressiveness” of an adenoma (Maltzman,
Knoll et al. 2001). However, K-ras mutations are also found in
microadenomas and small tubular adenomas indicating a limited potential for
progression (Takayama, Ohi et al. 2001). Taking this alongside the finding
that only 30% of CRC’s harbour K-ras mutations (Jass, Whitehall et al. 2002)
172

indicates that its historical position in the adenoma — carcinoma sequence
could be questioned.
The concept o f an alternative “serrated” pathway of colorectal tumorigenesis
was introduced on the finding that serrated adenomas, hyperplastic polyps and
mixed polyps harbour mutations in BRAF (Chan, Zhao et al. 2003; Kambara,
Simms et al. 2004) (Yang, Farraye et al. 2004). They are also commonly
microsatellite unstable and demonstrate extensive DNA methylation (O’Brien,
Yang et al. 2004) (Jass 2005).
In reality it is likely that there is a molecular spectrum of (epi)genetic
mutations and histological findings which are observed in sporadic adenomas,
serrated adenomas and hyperplastic polyps. It has been suggested that
molecular “crossover” from the serrated to the classical pathway may occur
conferring enhanced aggressiveness in certain adenomas (Jass, Baker et al.
2006).
The histopathological features (the majority being tubular adenomas) of
MCRAs suggest that they would follow the classical pathway. However, prior
to this study this area not been specifically explored or studied.
In this study I utilised several approaches in tandem to identify potential
pathogenic mechanisms leading to the development o f MCRAs in a group of
patients in whom MYH and APC mutations had been excluded.
I set out to identify potential pathological mechanisms by looking for clues as
to the development o f MCRAs from their earliest stages by examination of
histological slides for the presence or absence of microadenomas, searching
for evidence o f disruption o f Wnt signalling through performing immuno-
histochemistry for P-catenin and examining adenomas for evidence of a
somatic mutation spectrum suggestive o f an underlying disruption of DNA
repair. Somatic mutation spectra in K-ras and BRAF were also determined to
further molecularly classify the MCRA phenotype .
The significance o f the presence o f microadenomas
The primary tumour predisposition in FAP and MAP is through the formation
of colorectal adenomas via APC mutation. FAP and MAP patients develop not
only macroscopic adenomatous polyps, but also microadenomas - each
comprising at most a few dysplastic crypts (Lipton, Halford et al. 2003) and
173

more recently described in the duodenum (Preston, Leedham et al. 2008). This
is consistent with an increased rate o f adenoma initiation in FAP and MAP. In
HNPCC, by contrast, the primary predisposition is probably to carcinoma (or
progression from adenoma to carcinoma) and microadenomas are generally
absent. The presence or absence o f microadenomas in the colonic mucosa of
MCRA patients would therefore provide evidence as to the origins o f the
disease.
A similar line o f reasoning can be applied to the observation that (A)FAP and
MAP patients frequently develop extra-colonic adenomas, particularly in the
duodenum. The similarity of the MAP and (A)FAP phenotypes suggests that
all individuals predisposed to inactivation o f APC may develop both colorectal
and duodenal adenomas. Interestingly, HNPCC patients are at greatly
increased relative risk - but low absolute risk - of small bowel cancer, but have
very few adenomas at this site.
Wnt signalling disruption and adenoma formation
The relationship between APC and Wnt signalling has been previously
described in Chapter 1 (1.1.3.4). A simple method with which to assess
disruption o f APC function and Wnt signalling is through cellular expression
of fi-catenin - a downstream product in the Wnt signalling pathway. FAP and
AFAP adenomas have increased nuclear and cytoplasmic expression of fi-
catenin indicative o f Wnt disruption (Seidensticker and Behrens 2000).
HNPCC tumours in contrast, have relatively low frequency o f nuclear fi-
catenin.
A previous study screening for germline mutations in the TGF-ft (SMAD4,
BMPR1A) and Wnt signalling (APC2, conductin, GSK3-fi) pathways in 47
MCRA cases found only one individual to have a putative pathogenic
mutation in BMPR1A (Lipton, Sieber et al. 2003).
Considering the complexity o f the Wnt signalling pathway (including
numerous inhibitory factors - the Wif family) this pathway warrants further
study in the MCRA setting.
Determination o f the presence o f a somatic mutation signature
Following the precedent of the discovery o f MYH, determination of a potential
mutation signature at APC may lead to the identification of an underlying
174

defect in DNA repair. This is also evident in HNPCC where the effects of
DNA mismatch repair (MMR) deficiency can be detected somatically through
the presence o f microsatellite instability (MSI) and frameshift mutations in
short repeats within genes such as BAX and TGFBR2 (Woodford-Richens,
Rowan et al. 2001). It follows that, should some of the remaining MCRA
cases be caused by a defect in DNA repair or by some other form of
hypermutation, the somatic mutation spectrum will reflect the underlying
cause of genomic instability.
6.1.1 Aims of this chapter
In order to determine the underlying pathogenesis of the MCRA phenotype I
studied a collection o f 25 MCRA cases in the following ways.
1: Examination for the presence o f microadenomas - an indication that “2-
hits” at APC have occurred initiating adenoma formation.
2: Identification o f Wnt activation through immunohistochemistry for f3-
catenin expression to identify any underlying defect in Wnt signalling and
somatic mutation screening for the two mutational hotspots found in exons 3
and 5 o f fFcatenin.
3: Examination o f adenomas for somatic mutation at APC, K-ras, and BRAF
in order to identify a potential somatic mutation signature relating to an
underlying defect in DNA repair, using the precedent o f the discovery o f MYH
as proof o f principle.
4: Molecular classification o f the MCRA phenotype through analysis for
somatic mutations at K-ras and BRAF to determine whether the “classical” or
“serrated” pathways are followed.
6.2 Methods
Sample collection and preparation
Patients were recruited through St Mark’s Hospital Colorectal Cancer Unit
and blood was routinely sampled. Informed consent was obtained prior to
175

sample collection. Inclusion criteria for the study were that patients should
have between 10 and 100 synchronous or metachronous colorectal adenomas,
irrespective o f follow-up or (prophylactic) colectomy.
Individuals had all coding exons o f APC and MYH screened for germline
mutations with fluorescent SSCP and subsequent sequencing prior to entry in
to the study. Primers and conditions for APC and MYH analysis are listed in
appendix 1, SSCP analysis and sequencing were performed as outlined in
Methods (2.6.1 and 2.7).
In addition, multiplex ligation-dependent probe amplification (MLPA)
analysis was used to screen for germline deletions or duplications o f APC
using the Salsa MLPA kit P043 APC (MRC Holland), see Methods (2.6.5).
This was undertaken in collaboration with E. Volikos at St. Marks Hospital.
A total o f 241 formalin-fixed, paraffin-embedded adenomas were collected
from the 25 patients who were eligible for the study.
Fifty-six formalin-fixed, paraffin-embedded sporadic adenomas (patients with
1 or 2 adenomas and no reported family history) were collected from 29
individuals.
Existing sets o f adenomas from AFAP and MAP patients in our laboratory
were available for comparison (Sieber, Lipton et al. 2003) (Lamlum, Al
Tassan et al. 2000) (Sieber, Segditsas et al. 2006).
For all patients, germline DNA was extracted from peripheral blood using
methods as described Methods (2.1.1.1).
Tumour and normal tissues were dissected from sections cut from archival,
paraffin-embedded specimens. It was estimated that the resulting tumour
DNAs were derived from at least 70% dysplastic cells. DNA was extracted
from these by proteinase K digestion at 55°C as described in Methods
(2.1.1.4).
Mutation detection
F-SSCP analysis was used to screen the formalin-fixed, paraffin-embedded
tumours for somatic APC mutations between codons 1220 and 1620,
corresponding to the mutation cluster region (MCR) and covering the region
between the first 20-amino acid beta-catenin binding/degradation repeat
176

(20AAR) and the first SAMP repeat. The region was sub-divided into 12
amplicons (see Appendix 1 for details o f primers and conditions). Any sample
with a bandshift was sequenced directly in both orientations from a new PCR
product. Exon 1 of K-ras, /3-catenin exon 3, and the mutational hotspot at
codon 600 of BRAF were screened by direct DNA sequencing in both
orientations. Novel mutations were identified through comparison with the
COSMIC database (http://www.sanger.ac.uk/genetics/CGP/cosmic) and the
European APC database (Laurent-Puig, Beroud et al. 1998).
LOH analysis
Loss of heterozygosity (LOH) at APC was analysed using microsatellite
markers just distal to the locus (D5S346, D5S421 and D5S656) on the ABI
3100 sequencer as described in Methods (2.1.6.1). Constitutionally
homozygous markers (and occasional PCR failures) were scored as non-
informative. In the event o f discordance between microsatellite markers,
precedence was given to the marker closest to the APC gene.
Microadenoma detection
H&E slides o f adenomas from the MCRA, sporadic and MAP groups were
examined for the presence o f absence o f microadenomas (collections of
dysplastic crypts <lm m in diameter) under the guidance of a specialist
gastroenterological histopathologist. (M.Novelli, Department of
Histopathology, University College London).
Immunohistochemistry
Immunohistochemistry for (3-catenin was performed on the multiple adenoma
group, sporadic adenomas and, for comparison, a set of patients with FAP as
described in Methods (2.1.13). Slides were then examined using a
conventional light microscope and the level o f expression of fi-catenin (1, 2 or
3) was recorded separately for the nucleus, cytoplasm and cell membrane
according to the intensity o f staining in five random high-powered fields per
slide. This was compared directly with staining in normal crypts from each
177

sample. For membranous expression, in order to normalise results across
different runs o f immunohistochemistry, the abnormal staining for each
tumour was divided by the membrane staining in surrounding normal cells.
Normal cytoplasmic and nuclear expression was so weak that such a
correction was not required. Immunohistochemistry was scored by myself and
a subset re-scored by another laboratory member (K.Howarth) to ensure
consistence, all under the guidance o f a specialist gastrointestinal
histopathologist (M.Novelli); any differences were resolved by consensus.
6.3 Results
6.3.1 Germline screening of APC and MYH prior to inclusion
into this study
Sixty-six individuals were screened for germline mutations in APC exons 1-
15 and MYH exons 1-16 using fluorescent SSCP analysis. This was followed
by direct sequencing o f a fresh PCR product if aberrant SSCP bands were
found (see Table 6-1 for summary).
One individual was found to have a 5 bp deletion in exon 150 (nt 6233) of
APC. She had 33 adenomas and no extracolonic features. Silent mutations
were found in seven individuals and missense mutations in three.
One individual had homozygous Y165C mutations in MYH, and one
individual was a compound heterozygote for G382D and 1395delGAA. These
are the known pathogenic mutations seen in northern European (Y165C,
G382D) and southern European (1395delGAA) populations. A previously
described MYH polymorphism, Q324H, was identified in 30% of individuals.
No individuals were found to have whole exon deletions or duplications at
APC using MLPA analysis. All individuals with pathogenic or missense
germline mutations were excluded from further study.
178

Gene and Exon Mutation Outcome PathogenicNo. indivudals
harbouring mutation
No. TA’s range (median)
APC5 intronic C>T no 18 8-32(15)7 intronic G>C no 1 2911 nt1458 C>T silent no 7 10-33(18)13 nt1635 A>G silent no 35 7-53(17)
15E Q1122R nt3368G>A Q->R no 1 9151 nt 4479 G>A silent no 11 9-34(19)15J nt 5034 A>G silent no 4 6-18(10)
nt4904 G>A silent no 1 2115K nt 5268 G>T silent no 3 7-26(11)15L D1822V no 1 13150 del 5bp nt6233 stop 2071 ves 1 3315Q C>T A2254V A->V no 1 1515S G>A; G2502S G->S no 1 8. 13 HPP15T silent nt7704 A>G silent no 1 33MYH
x7 Y165C hom yes 1 >30x13 G382D het het 1395delGAA yes 1 >10
x12A Q324H hom Q324H polymorphism 3 8-11 (5)X12A Q324H het Q324H het polymorphism 20 8-76(17)
Table 6-1 Results of germline screening for APC and MYH mutations in 66
MCRA cases
From the 66 individuals screened, 25 were included in the following studies.
6.3.2 Features of the MCRA patients
The clinical features o f the 25 MCRA patients included for further study are
shown in Table 2. All were o f white UK origin. The mean age at presentation
was 60 years (median=61, range=44-75). Mean adenoma number at
presentation was 24 (median=21, range= 10-76), and the great majority of
adenomas were mildly dysplastic tubular or tubulovillous adenomas less than
5mm in diameter. One patient had CRC at the time o f presentation. No patient
had upper gastrointestinal adenomas and there were no other notable or
consistent extra-colonic features. Most MCRA patients were isolated cases,
although a few patients had a single sibling affected with multiple adenomas.
In no case was there multi-generational inheritance of CRAs (except case 19).
In six patients, CRCs were present in other family members, although none of
these individuals had been reported as having adenomas.
179

Pattent no. Ago a t diagnoais Adonoma no. CRC FH MCRAs FH CRC
1 75 20 No No Mother - 83vrs2 66 25 No No3 60 25 No No4 71 14 No No5 61 10 No No6 51 26 No No7 52 27 No No M other - 60vrs8 65 10 No No9 61 19 No No10 73 10 No No Sister - 64 years11 68 23 Yes 68 years No12 69 12 No No13 67 27 No No14 73 76 No No Father - 80vrs15 55 10 No No Brother - 60vrs16 55 17 No No17 52 50 No No18 55 18 No No19 49 15 No Yes - Father 19 adenom as20 66 10 No 1st cousin "multiple polyps"21 55 30 No No22 44 33 No No23 48 32 No No24 64 50 No No25 51 21 No No M other - 85yrs, Mat GM - 70yrs
Table 6-2 Patient demographics for the 25 MCRA cases studied
The MAP patients used for comparison (Sieber, Lipton et al. 2003) presented
at a median age o f 57 (range=54-69), not significantly different from the
MCRA patients (p=0.476, Wilcoxon test).
The AFAP patients used for comparison (Lamlum, Al Tassan et al. 2000)
(Sieber, Segditsas et al. 2006) had a median age o f 43 (range=27-68) and were
significantly younger than the MCRA group (p=0.027, Wilcoxon test).
The family histories and phenotypes of the MCRA cases therefore resembled
MAP. However, no evidence o f a predisposition to extra-colonic disease was
seen in the MCRA group.
6.3.3 Microadenoma detection
Examination o f H&E-stained sections o f large bowel from FAP, AFAP, MAP
and multiple adenoma patients for the presence o f microadenomas (dysplastic
lesions <lmm diameter) was undertaken in otherwise normal large bowel
mucosa. Microadenomas were present in 16 o f 19 FAP sections examined, the
mean density being 0.22 per mm of mucosa examined (see Table 6-3). In
AFAP, microadenomas were present in 2 o f 7 sections examined from four
patients, with mean density 0.03 per mm o f mucosa examined. In MAP,
microadenomas were present in 3 of 16 sections examined from six patients at
0.01 per mm o f mucosa examined. No microadenomas were found on
examination o f 16 sections from seven MCRA patients. There was a
180

significantly higher number o f microadenomas on comparison o f FAP with
MCRA and FAP and MAP (p<0.001 (FAP versus MCRA); p=0.04 (FAP
versus MAP) Fishers Exact test). No significant difference was observed
between MCRA and MAP cases (p=0.23 Fishers Exact test). The majority of
specimens examined were from colectomies subsequently sporadic adenoma
cases could not be assessed, as it is very unusual for colectomy to be
undertaken in these patients.
Adenoma type FAP AFAP MAP MCRA
no. microadenomas detected per
number of sections examined
16/19(84%) 2/7 (29%) 3/16 (19%) 0/16 (0%)
density of microadenomas per
mm of colonic mucosa examined
0.22 per mm
0.03 per mm
0.01 per mm
0.00 per mm
Table 6-3 Summary o f microadenoma detection in FAP, AFAP, MAP and
MCRA cases
6.3.4 Somatic mutation and LOH frequencies
Truncating somatic mutations at APC were detected in 49 o f 221 (22%)
adenomas from the MCRA group (see Table 6-5). Of 190 informative
tumours, 32 (17%) showed allelic loss (LOH) see Figure 1. Two truncating
somatic APC changes were detected in 2 tumours and 11 tumours had a single
APC mutation and LOH. The APC mutation and LOH frequencies were not
significantly different from those found in the sporadic adenomas (Table 6-4);
however, the AFAP and MAP tumours had significantly higher frequencies of
truncating mutations and lower frequencies o f LOH than the MCRA tumours
(Table 6-4). No adenoma was found to have a somatic fi-catenin mutation.
181

No. ad*2 0 aa rp ts In
so m atic m u ta n t a llelca
LOH and tru n ca tin g
so m atic m u ta tio n
2 0 aa rp ts in so m atic m u ta n t alla ls
|Type of| so m a tic c h a n g e
T y p a o fso m aticc h an g e
1 tru n ca tin g so m atic
m u ta tio n
No. ad en o m as ana lysed
tru n c a tin gs o m a tic
m u ta tio n s
LOH a t APC
No. a d e n o m a s w ith LOH onlyD etails of tru n c a tin g m u ta tio n sP atien t ID t r u n c a t i n g
Ei ?79Xg>T + U>H 13S4dcfTT t + .NI)
G1312X G>T + LOH; 1573 del 5bP
noneQ1338X1472fS
Q1338X C>T +LOH; 1472FS InsT + LOH
1489FS insT; 1431FS delA; 1489FS InsC; 1489FS InsT; 1493FS delA; 1472FS delSSbp; 1488FS delTT; 1465FS del2bp; I465FS del2bp + LOH; 146SFS de!2bp; 1465FS deIG 4 LOH: 1465FS InsT________________________________
1489FS
wireIfflfS.ware...1493FS1472FSmure.
d€lA
J o t LdelA
<WTTi deIC: 1466FS de!2bp 1319FS
1465FS deIG +LOH; 1491FS delT; 1491FS delT; 1491FS delT; 1491FS delT; 1491FS delT; 1491FS delT; 1491FS delT; 1491FS delT; 1501FS detT; 1481FS delT: 1500FS del A: 1500FS delA ♦ LOH__________________________________
1486FS
1465FS
■ MCde!2bp
deIG
1431FSJ iS L F S1491FS1491FSwire.wire.wire.
J4 9 1 F § _
_asDL_dgTL.
delT<KIT
_SsEE__dsOL
Tabie S: Mutation spectrum a t APC including LOH for 25 MCRA cases

P a tie n t ID No.ad e n o m a s
No.a d en o m asanalysed
D etails of tru n c a tin g m u ta tio n s No. ad e n o m a s w ith LOH only
w ithsom atic
tru n ca tin gAPC
_m n aiflg n i_
I tru n ca tin g so m atic
m u ta tio n
Type of so m atic c h an g e
20 aa rp ts In so m atic m u ta n t alle le
2tru n ca tin g
so m aticm u ta tio n s
Type of so m atic ch an g e
2 0 aa rp ts In som atic m u tan t a lle les
LOH a t APC
LOH and tru n c a tin g
so m atic m u ta tio n
LOH only
CA -t= S B = ______Ss!A
-----2—2•j n/
1 "5
----- 1----- —lAgarS— l « l f S _ . ______t e n 2
? 5 21 13 H S5 .. 2.p(LQH * d ), S t o t o w P * to s P 5 S 3 « $ . . ----- 2 _ . . . ---------2--------14§5£S—
---------2--------2
---1-- __ - L . --- Q—
Table S: Mutation spectrum a t APC Including LOH for 25 MCRA cases

MCRA S poradic AFAP MAPTruncatinq m utation 49/221 (22%) 10/56 (18%) d=0. 59 91/242 (38%) D<0.001 25/34 (74%) p<0.001LOH 32/190(17%) 5/56 (9%) p=0.20 19/230 (8%) p=0.01 1/34 (3%) p=0.02
Table 6-4 Comparison between APC mutation frequencies and LOH in
MCRA, sporadic, AFAP and MAP cases, p values are comparisons with the
MCRA group using Fishers Exact test
See Figure 6-1 for example of LOH and Figure 6-2 for examples of somatic
APC mutations.
NormalD5S346
AdenomaD5S346
B lu e
tLOH
Figure 6-1 LOH at microsatellite marker D5S346 in MCRA adenoma
i C A G C A T T T A C T G C A G C T N G C T A A G G N C C A C N C N C N C N C
Figure 6-2 Frameshift mutation in MCRA adenoma APC MCR9 del A 1472
frameshift, stop @ 1506
1 8 2

Figure 6-3 Somatic mutation in MCRA adenoma APC MCR5 E1379X (G>T
arrowed)
When analysing the mutation spectrum on an individual patient basis none had
a specific tendency to frameshift changes, specific nonsense mutations, or to
LOH dXAPC (Table 6-5).
One patient (case 21) had acquired frameshift mutations in 13 tumours and no
nonsense changes, and another (case 23) had 5 frameshift changes and no
nonsense changes. Although apparently unusual, These frequencies were not
significantly different from those observed in sporadic adenoma (p>0.1, exact
binomial test).
Owing to the high frequency of frameshifts, these two patients (case 21 and
case 23) were then screened for germline mutations in the MMR genes MLH1,
MSH2, MSH6 and PMS2. Normal tissue was included from around the
adenomas in this screen in case these individuals were mosaics. No pathogenic
changes were found in any of the genes analysed.
A total of 12 (24%) K-ras mutations were detected in 51 MCRA tumours
analysed; 10 mutations occurred at codon 12 and two mutations, at codon 13.

All of the changes - G12A, G12D, G12V and G13D - have been previously
reported to occur frequently in sporadic adenomas and CRCs.
Nine of 85 (11%) MCRA adenomas analysed had a BRAF mutation V600E
(all T>A); this is higher that would be expected in tubular adenomas without
serrated morphology. See Figure 6-4 for examples of K-ras and BRAF
mutations.
TG G T G G C G B T G G T G G C G A C A G T G A A A D AC AG TG AAA
K -ras wt K-ras G12D G>A som atic m utation
BRAF wt
Figure 6-4 Examples o f K-ras and BRAF somatic mutations in MCRA cases
No tumour harboured both K-ras and BRAF mutations. The K-ras and BRAF
mutation frequencies in the MCRA tumours were not significantly different
from those in the sporadic adenomas (5/34 (p=0.58) and 5/40 (p=0.73)
respectively, Fisher’s exact test).
6.3.5 Beta-catenin expression
The 57 MCRA tumours analysed for ^-c a ten in expression demonstrated
increased nuclear expression when compared to the 27 sporadic adenomas
analysed (p=0.0087, Wilcoxon test) (see Figure 6-5). There was, however, no
significant difference in nuclear p-catenin expression between the MCRA
group’s tumours and a set of 33 adenomas of similar size from 6 individuals
with FAP (p=0.09, Wilcoxon test).
BRAF V600E T>C som atic m utation
184

Figure 6-5 P-catenin immunohistochemistry, (A) net membrane score (B)
mean cytoplasmic score (C) mean nuclear score
Expression was also not significantly different between MCRA and sporadic
adenomas in the cytoplasm (p=0.12, Wilcoxon test) or at the membrane
(p=0.63, Wilcoxon test). Examples o f p-catenin expression in MCRA and
sporadic adenomas can be seen in Figure 6-6.
Figure 6-6 p-catenin immunohistochemistry in MCRA (A) and sporadic (B)
adenoma both xlOO, crypts demonstrating increased nuclear staining circled
185

Logistic regression analysis incorporating the three sites of |3—catenin
expression, adenoma size, degree o f dysplasia and patient age found increased
nuclear expression to be the only significant variable which distinguished
MCRA and sporadic tumours (p=0.017, OR=0.22, 95% Cl 0.065-0.76).
6.4 Discussion
6.4.1 No microadenomas were identified in MCRA cases
Historically, microadenomas have been said to be pathognomic of FAP. This
study demonstrates that they also occur in AFAP and MAP. Given that FAP
microadenomas have been found to harbour somatic mutations at APC (see
Chapter 9), it is likely that they are the earliest detectable lesion which has
been “initiated” by “two hits” at APC (germline plus somatic mutation for
AFAP, or two somatic mutations in MAP).
The finding that the number and density o f microadenomas detected was
highest in FAP followed by AFAP and finally MAP fits the “two hit”
hypothesis o f microadenoma formation with the likelihood and speed at which
“two hits” would occur in the FAP group being highest and lowest in the MAP
group.
The absence o f microadenomas in the MCRA cases suggests that their cells
are not acquiring “two hits” at APC at an appreciably faster rate than the
general population. The mechanism of tumour predisposition in the MCRA
cases may therefore involve a stage of tumorigenesis that is post-initiation.
6.4.2 No definitive mutational signature was identified in the
MCRA patients’ tumours
In the MCRA patients’ tumours, the total o f 51 truncating APC mutations
(Table 6-5) comprised 44 frameshifts (small insertions or deletions) and 7
nonsense mutations (3 C:G>T:A transitions and 4 G:C>TA transversions).
Although the proportion o f frameshift mutations was higher than in the APC
mutation database (Laurent-Puig, Beroud et al. 1998) this may have resulted
186

from detection bias in small, archival tumours, which were the only samples
available from the patients studied. Decreased nonsense and missense
mutation detection sensitivity in such samples has previously been observed
(Groves, Lamlum et al. 2002). This is in part due to the poor quality of DNA
extracted from paraffin embedded samples. The DNA is often “sheared” into
smaller segments through the extraction process, resulting in fragments often
only ~200bp in length.
In support of this contention, the excess of frameshifts in the MCRA tumours
was very similar (p=0.44, Fisher’s exact test) to that in the sporadic adenomas,
which had acquired 8 frameshift changes, plus one A:T>T:A transition and
one G:C>T:A transversion. The APC mutation spectrum in the MCRA
tumours contrasted with the finding that all 25 truncating mutations in the
MAP tumours were G:C>T:A transversions (p<0.001, Fisher’s exact test).
If the MCRA cases had, like MAP patients, a tendency to hypermutation of
APC in the gastrointestinal tract, it might be expected that a similar spectrum
of disease to MAP or (A)FAP would occur. Therefore, it is likely that MCRA
results either from hypermutation of APC in the large bowel only, or from a
distinct pathogenic mechanism that does not involve a tendency to inactivation
of APC.
All changes in the tumours o f patients case 21 and case 23 occurred in a
particular region o f the APC gene, between the 2nd and 3rd 20-amino acid p-
catenin binding and degradation repeats. Such a spectrum of mutations might
be expected in patients with a germline APC mutation before codon 1280
(Albuquerque, Breukel et al. 2002) (Crabtree, Sieber et al. 2003) (Lamlum,
Ilyas et al. 1999) or with a deficiency in MMR that did not manifest as MSI in
adenomas (Wu, Berends et al. 1999).
In the MCRA patients, the K-ras mutations comprised 6 G:C>A:T, 5
G:C:>T:A, and 1 G:C>C:G changes. This mutation spectrum overall was
similar to that of the sporadic adenomas, which had 9 G:C>A:T, 3 G:C>T:A,
and 2 T:A>A:T mutations (p=0.31, Fisher’s exact test). As in the case of APC,
these K-ras mutation spectra contrasted with the sole change, G12C
(G:C>T:A), found in MAP tumours. As might be expected, all of the BRAF
mutations were T:A>A:T transitions resulting in the V600E change. No
187

adenoma had both K-ras and BRAF mutations. There was no association
between the presence o f APC and K-ras or BRAF mutations.
Overall, these findings strongly suggested that there is no common mutational
signature in the MCRA group o f patients, subject to the limitations of
screening large genes, such as APC, in DNA of relatively low quantity and
poor quality. Despite these difficulties, the difference from MAP was striking,
once again suggesting that there is no specific tendency to hypermutation in
this set of MCRA cases.
6.4.3 Nuclear Beta-catenin expression is increased in MCRA
tumours
Unlike the other molecular analyses described in this chapter, p-catenin
immunohistochemistry showed clear differences between MCRA and sporadic
adenomas, with expression in MCRA tumours being similar to FAP. The
greater Wnt activation in MCRA patients’ tumours was too consistent to be
readily explained by the inclusion of one or two individuals with cryptic, as
yet undetected, germline APC or MYH mutations in the MCRA group.
Allowing for the fact that colorectal microadenomas probably vary in their
progression to macroscopic lesions (Crabtree, Tomlinson et al. 2001), this
finding raises the possibility that increased Wnt activation in MCRA may lead
to microadenoma development more rapidly, or with greater probability to
progress to macroadenomas. Our studies to date (Lipton, Sieber et al. 2003)
have not identified causal germline mutations in Wnt pathway genes in
MCRA cases. However many Wnt related genes remain to be studied in
MCRA cases such as the Wnt inhibitory factors Wif, Dickkopf-1 and Snail 1
(Larriba, Valle et al. 2007).
Future work might include immunohistochemistry studies of the Wnt
inhibitory factors W ifi and Dickkopfl in MCRA cases to determine whether
their level of expression correlates with the increased nuclear expression of |3-
catenin in MCRA cases.
188

6.4.4 MCRA adenomas do not follow the “classical” pathway of tumorigenesis
All of the MCRA adenomas studied had tubular or tubulovillous morphology.
It is therefore not surprising that the prevalence o f K-ras (24%) and BRAF
(11 %) mutations detected were in keeping previous published data for these
morphologies (Jass, Baker et al. 2006). In Jass’s study (Jass, Baker et al. 2006)
comparison of K-ras and BRAF mutation rates alongside MGMT loss in a
wide variety of polyps found K-ras mutations in 18% and BRAF mutations in
5% of TAs <10mm (see Table 6-6 for summary modified from (Jass, Baker et
al. 2006)). What is surprising is the higher incidence of BRAF mutations in the
MCRA group none o f which demonstrated serrated morphology.
Table 6-6 Summary o f somatic K-ras and BRAF mutations and loss of
expression of MGMT found in polyps o f differing histology. Modified from
(Jass, Baker et al. 2006)
The absence of microadenomas in the MCRA group demonstrates that the
initiation step of bi-allelic APC mutation associated with the classical pathway
of tumorigenesis does not occur.
One explanation which fits this dataset would support the “crossover” theory
that sessile / serrated adenomas with predominantly BRAF mutations would
later develop K-ras mutations rendering them more aggressive. A very small
number of adenomas have been reported to harbour both K-ras and BRAF
mutations (2% of a series o f 189 polyps studied) (Jass, Baker et al. 2006). No
adenomas in this study harboured both mutations.
189

It was not possible to screen for mutations in other known components o f the
classical pathway of tumorigenesis (such as p53) due to limited amounts of
DNA extracted from paraffin embedded tissue.
6.4.5 Limitations of this study
One of the main limitations o f this study was the availability and access to
high quality (and quantity) o f DNA for analysis in all groups undergoing
analysis. This was because the majority of samples were paraffin embedded
tumour blocks.
Following the finding of increased nuclear expression o f p-catenin in the
MCRA group, I would have wanted to proceed to screen the MCRA cases for
other Wnt related factors such as the Wnt inhibitory factors should DNA have
been available.
Examination for loss o f MGMT expression would have helped to support /
disprove the suggestion that “crossover” may occur from the serrated to the
classical pathways in the MCRA group.
6.5 Conclusions
To date, Mendelian colorectal cancer syndromes can be categorised in two
ways. First, the primary predisposition may be to polyps or to carcinoma.
Second, the primary defect may be in either a ‘gatekeeper gene’ (such as APC,
LKB1, SMAD4/MADH4 and ALK3/BMPR1A) or a caretaker/DNA repair gene
(such as the MMR loci and MYH/MUTYH). The MCRA cases studied with no
germline APC or MYH mutations are likely a priori to have a strong genetic
predisposition, given the phenotypic similarity to MAP and AFAP.
In the MCRA cases, multi-generational inheritance o f multiple adenomas was
not found, suggesting recessive — or, perhaps, multi-locus - inheritance.
Several possible explanations for the MCRA phenotype exist, and these
patients may be a heterogeneous group.
190

The similar frequencies o f changes at APC , K-ras and BRAF in MCRA and
sporadic cases suggest that the genetic pathways o f tumorigenesis overlap, at
least with regards to these three genes.
The differences in mutation spectra observed between MAP and AFAP
reinforce the likelihood that hypermutation of APC and/or K-ras does not
drive tumorigenesis in this set o f MCRA patients, particularly as the incidence
of K-ras mutation is lower in MCRA group than both MAP and AFAP
adenomas.
The most significant finding separating the MCRA and sporadic groups in
terms of their molecular profiling was the increased nuclear expression of j3-
catenin.
Somatic mutation frequencies and spectra in MCRA adenomas were found
that are very similar to comparable sporadic lesions, and distinct from AFAP
and, especially, MAP. No microadenomas were found in the MCRA patients’
colons. These results suggest that hypermutation of APC does not cause the
MCRA patients’ disease and indeed does not initiate the disease suggesting
they do not follow the classical pathway of tumorigenesis. This strongly
suggests that MAP is not a paradigm for the remaining MCRA patients. One
possibility may be that those few microadenomas which do occur
spontaneously in MCRA cases have an increased chance o f progressing to a
macroadenoma. Another possibility is that o f “crossover” between the serrated
and classical pathways o f tumorigenesis. This model is supported by the
immunohistochemical analysis o f p-catenin expression in this study. If this is
the case, it seems unlikely that the predisposition gene is a ‘gatekeeper’ type
of tumour suppressor (since MCRA disease seems to be isolated or recessive),
or a ‘caretaker’ (since no evidence o f a specific DNA repair defect was
found). It could be suggested that these data best fit a modified ‘landscaper’
model of tumorigenesis in which the intra-cellular or extra-cellular
microenvironment o f cells is altered to favour tumour progression from
microadenoma to macroadenoma.
191

7 Lymphoblastoid cell line expression array
analysis of MCRA cases
7.1 Introduction
To date it has proven very difficult to identify novel predisposition genes in
the MRCA phenotype. This is in part due to the fact that some o f these cases
are inherited recessively making traditional linkage analysis harder, and also
due the likelihood that these cases may be due to inheritance o f mutated genes
which are o f moderate or low penetrance.
When considering “isolated” or possibly recessive cases in the MCRA group
one approach which could identify homozygous or compound heterozygous
mutations is comparison o f mRNA transcripts isolated from lymphoblastoid
cell line DNA in MCRA cases and normal controls. The differences in
expression profiles would highlight genes and biological pathways affected by
inherited germline mutations if these genes had a profound effect on transcript
levels.
During cellular replication, mutant mRNA transcripts (where an error in
replication may have occurred or a correct transcript from a mutated germline
gene has occurred) are destroyed by a process called nonsense-mediated decay
NMD, therefore maintaining the integrity cellular replication. The nonsense
RNA transcripts most commonly arise from nonsense or frameshift mutations
creating premature translation termination codons (PTC).NMD is activated
when mulit-protein exon junction complexes (EJC) assemble around aberrant
exon/exon junctions following the first round of DNA synthesis in cellular
replication (Ishigaki, Li et al. 2001). The EJCs are removed from spliced
mRNA during the translation step when mRNA passes through the ribosome.
This mechanism works for any PTC located more than 50 nucleotides
upstream if the last exon/exon junction. The unremoved EJCs found
downstream of the PTC recruit the Upf protein complex subsequently
initiating the degradation of the PTC containing transcript (Holbrook, Neu-
Yilik et al. 2004). NMD is therefore an mRNA surveillance mechanism which

prevents the production o f truncated proteins. If putative MCRA pre
disposition genes are inherited recessively, bi-allelic nonsense mutations could
trigger NMD and subsequent loss o f expression (if the gene of interest is
expressed in lymphocytes).
Analysis o f gene expression is viewed by some as the determination o f a more
refined phenotype as it is a measure o f phenotypic variance at a molecular
level (Monks, Leonardson et al. 2004). Each gene-expression phenotype can
provide annotation, pathway and genome location data. In isolated or
recessive diseases such as the MCRA phenotype this approach could
potentially identify not only quantitative trait loci, but also identify subsequent
genes, pathways and biological processes under the influence of such loci.
Jansen and Nap first described the use of expression profiling in separating
populations (Jansen and Nap 2001). Soon after, differences in expression were
observed between sexes in Drosophila melanogaster (Jin, Riley et al. 2001)
which has since been observed in the study of human lymphoblastyoid cell
lines (Zhang, Bleibel et al. 2007). In Zhang’s study, differences in expression
between the sexes were observed in pathways involving adherens junctions
and cytokine-cytokine receptor interaction (based on KEGG (Kyoto
Encyclopaedia of Genes and Genomes) analysis).
Differences in lymphoblastoid cell line mRNA expression between different
ethnic populations has also been observed. A study of lymphoblastoid cell line
expression from the full set o f European and African HapMap samples found
differing expression in biological processes such as ribosome biogenesis and
antimicrobial humeral response were found in the 383 transcript clusters found
between the two populations (Zhang, Duan et al. 2008).
Differences in expression can be also observed if culturing conditions vary - if
the cell line is “stressed” (cultured for too long or cells not split / fed at the
same time intervals).
In light of these findings, differences in expression between different
populations, sexes and culture conditions were taken in to account on design
of this study.
193

A previous study of lymphoblastoid cell lines from autistic cases (another
heterogenous condition) and control samples demonstrated differences in
expression profiling between cases and controls (Nishimura, Martin et al.
2007). Nishimura et al used expression microarray analysis to successfully
identify differences in mRNA expression profile in lymphoblastoid cells from
males with autism with known underlying germline mutations (fragile X
mutation (FMR1-FM), or a 15q 11-ql 3 duplication (dup(15q)), and non-
autistic controls. I used this data as proof of principle for this study.
For this study I chose the “best” MCRA cases from my cohort, ie those
individuals with the largest number of adenomas present at the youngest age.
7.1.1 Aims of this chapter
The aim of this study was to identify any differences in mRNA expression
profiling in MCRA “cases” and normal “controls”. These differences could
help to identify underlying genetic defects or biological pathways (as a
secondary aim) affected by an underlying mutated predisposition gene.
7.2 Methods
Patient samples
Venous blood was collected from eleven MCRA patients and 5 controls after
obtaining informed consent.
Expression array analysis
Eleven MCRA and five control lymphoblastoid cell lines were produced from
peripheral venous blood samples obtained with prior consent - see Methods
(2 . 1.2 . 1).
A total o f ~ 9 x 10⁶ lymphoblastoid cells were seeded in a 150ml falcon
culture flask (Falcon) and then incubated at 37°C in 10% CO2 for 72 hours -
194

see Methods (2.1.9.1-3). mRNA was then extracted from healthy cell lines
cultured in identical conditions - see Methods (2.1.2.1). RNA quality and
quantity was then analysed on the Agilent 2100 Bioanalyser (Agilent, Santa
Clara, CA, USA).
Complementary RNA ((cRNA) - following synthesis o f cDNA) was
hybridised to Affymetrix GeneChip® Human Genome U133 Plus 2.0
Expression Micro-arrays - see Methods (2.1.10). The U133 Plus 2.0 array
comprises 54,000 probe sets covering 47,000 transcripts from 38,000
characterised human genes. All the probe sets are duplicated across the array.
Oligonucleotide probes (25-mer) complimentary to each sequence are
synthesised in situ on the array. Eleven pairs of probes are used to measure the
level of transcription o f each sequence represented on the array. Each array
includes control sequences covering hybridisation quality, poly-A controls,
normalization (determination o f consistency of expression) and
housekeeping/control genes (GAPDH, beta-Actin, ISGF-3 (STAT1). See
Affymetrix website for further details
http:// www. affymetrix. com/products/array s/specifi c/hgu 133. affx.
Statistical analysis
Statistical analysis and identification o f genes with a significant >3-fold
change in expression was undertaken using the statistical package R with
individual programs written for data analysis by the bioinformatics department
at Cancer Research UK, London Research Institute (P. East).
Probe level intensities were quantile normalised and probeset level signal
intensity estimates calculated using RMA (Irizarry, Bolstad et al. 2003). A
linear model was fitted to the data and differential genes between the MCRA
and control groups were selected using a 0.05 FDR (false discovery rate)
threshold. T-statistics were moderated prior to differential gene identification
using an empirical Bayes method to converge probeset sample variances to a
common value (Smyth 2004). Genes were further filtered using a 5-fold
threshold. These genes are represented in a heatmap in the Results section.
The analysis was carried out using the limma package from Bioconductor 2.2.
(Gentleman, Carey et al. 2004). Reported annotation is from the hgul33plus2
Bioconductor annotation package.
195

Scatter and volcano plots were produced to confirm the quality o f the
experiment and robustness o f the data. Heirarchical clustering using
Spearman’s rank correlation with average linkage clustering was then
performed.
Finally, functional annotation clustering was then performed using DAVID
KEGG and GO analysis. DAVID (Database for Annotation Visualisation and
Integrated Discovery) is a clustering algorithm based on the hypothesis that
similar annotations should have similar gene members from different
biological pathways (Dennis, Sherman et al. 2003). KEGG is an integrated
bioinformatics resource which combines information from three databases
incorporating genomic, chemical and network information (Kaneshisa M
2004). The GO (Gene Ontology) project provides a systematic description of
attributes o f genes (and gene products) in three domains shared across all
organisms, molecular function, biological process and cellular component
(Ashbumer, Ball et al. 2000).
7.3 Results
7.3.1 Expression micro-array analysis
Patient Demographics
MCRA cases were aged between 28 and 69 years (median 52 years) Adenoma
burden ranged from 17 to 100 (median 23 adenomas) see Table 7-1. Two
cases were diagnosed with CRC (case 6 at 67 years and case 9 at 59 years).
CRC was present in 1st degree relatives o f two cases (case 8 at 85 years and
case 11 at 60 years). All cases were o f white European origin. Germline APC
and MYH mutations were excluded prior to inclusion in the study. The control
set were o f similar age range and ethnic background.
196
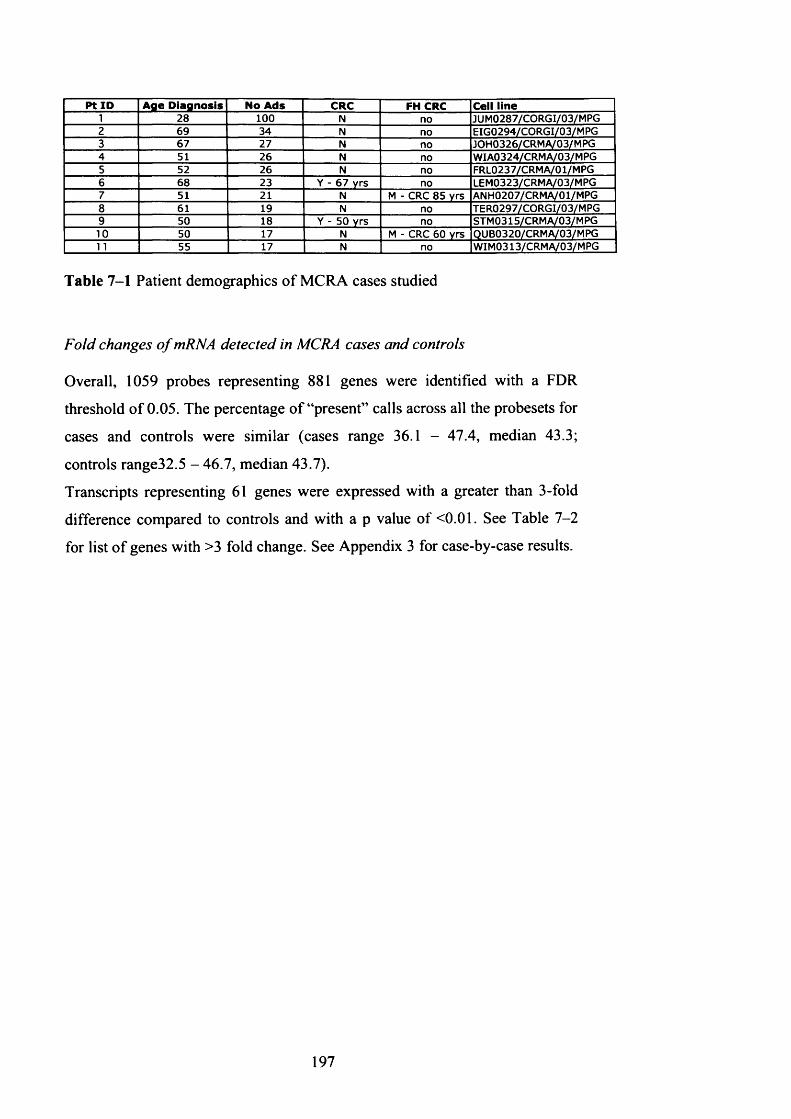
P t ID A ge D iag n o sis No A ds CRC FH CRC Cell line1 28 100 N no JUM0287/CORGI/03/MPG2 69 34 N no EIG0294/CORGI/03/MPG3 67 27 N no JOH0326/CRMA/03/MPG4 51 26 N no WIA0324/CRMA/03/MPG5 52 26 N no FRL0237/CRMA/01/MPG6 68 23 Y - 67 yrs no LEM0323/CRMA/03/MPG7 51 21 N M - CRC 85 yrs ANH0207/CRMA/01/MPG8 61 19 N no TER0297/CORGI/03/MPG9 50 18 Y - 50 Yrs no STM0315/CRM A/03/M PG10 50 17 N M - CRC 60 yrs QUB0320/CRMA/03/MPG11 55 17 N no WIM0313/CRMA/03/MPG
Table 7-1 Patient demographics o f MCRA cases studied
Fold changes o f mRNA detected in MCRA cases and controls
Overall, 1059 probes representing 881 genes were identified with a FDR
threshold o f 0.05. The percentage o f “present” calls across all the probesets for
cases and controls were similar (cases range 36.1 - 47.4, median 43.3;
controls range32.5 - 46.7, median 43.7).
Transcripts representing 61 genes were expressed with a greater than 3-fold
difference compared to controls and with a p value of <0.01. See Table 7-2
for list o f genes with >3 fold change. See Appendix 3 for case-by-case results.
197

Gene Symbol Absolute fold Map GeneRGS13 7.682 1q31.2 regulator of G-protein siqnallinq 13APP 5.752 21q21 .2;21q2 amyloid beta (A4) precursor proteinIGF2BP3 5.495 7p11 insulin-like growth factor 2 mRNA bindinq protein 3FAM111B 5.336 11 ql 2.1 family with sequence similarity 111, member BVSIG9 5.153 3q1 3.31 V-set and immunoqlobulin domain containing 9SLC39A10 4.775 2q32.3 solute carrier family 39 (zinc transporter), member 10GRK5 4.435 10q24-qter G protein-coupled receptor kinase 5DAPP1 4.421 4q25-q27 dual adaptor of phosphotyrosine and 3-phosphoinositidesNC0A6IP 4.296 8q11 nuclear receptor coactivator 6 interacting proteinLM07 4.276 1 3q22.2 LIM domain 7ZNF83 4.225 19q1 3.3 zinc finger protein 83ZWILCH 4.148 1 5q22.31 Zwilch, kinetochore associated, homoloq (Drosophila)RBM25 4.137 14q24.3 RNA binding motif protein 25TPR 4.13 1 q25 translocated promoter reqion (to activated MET oncogene)LYAR 4.106 4p16.2 NAIL6ST 4.094 5q11 interleukin 6 signal transducer (qp130, oncostatin M receptor)P0LE2 3.938 14q21-q22 polymerase (DNA directed), epsilon 2 (p59 subunit)FAM111B 3.904 11 ql 2.1 family with sequence similarity 111, member BCYCS 3.886 7p1 5.2 cytochrome c, somaticC1orf79 3.722 1 p35.3 chromosome 1 open reading frame 79NA 3.72 NA NASYNE2 3.716 14q23.2 spectrin repeat containing, nuclear envelope 2CASC5 3.702 1 5q14 cancer susceptibility candidate 5PITPNC1 3.699 17q24.2 phosphatidylinositol transfer protein, cytoplasmic 1CD74 3.695 5q32 CD74 molecule, major histocompatibility complexDUT 3.679 1 5q1 5-q21.1 dUTP pyrophosphatasePON 2 3.66 7q21.3 paraoxonase 2CCNE2 3.624 8q22.1 cyclin E2CDC42BPA 3.624 1q42.11 CDC42 binding protein kinase alpha (DMPK-like)MLF1IP 3.621 4q35.1 MLF1 interacting proteinHNRPDL 3.599 4q13-q21 heteroqeneous nuclear ribonucleoprotein D-likeCCNE2 3.596 8q22.1 cyclin E2DDX46 3.58 5q31.1 DEAD (Asp-Glu-Ala-Asp) box polypeptide 46POGK 3.534 1q24.1 poqo transposable element with KRAB domainGDAP1 3.517 8q21.11 qanqlioside-induced differentiation-associated protein 1HDGFRP3 3.458 15q11.2 NAUBD 3.432 6p21.3 ubiquitin DHELLS 3.4 10q24.2 helicase, lymphoid-specificWBP5 3.371 Xq22.1-q22.2 WW domain binding protein 5CDC6 3.37 17q21.3 CDC6 cell division cycle 6 homolog (S. cerevisiae)APP 3.366 21q21.2;21q2 amyloid beta (A4) precursor proteinRGS13 3.359 1 q31.2 requlator of G-protein signalling 13ANKRD44 3.334 2q33.1 ankyrin repeat domain 44SCML1 3.315 Xp22.2-p22.1 sex comb on midleq-like 1 (Drosophila)MCM4 3.289 8q11.2 MCM4 minichromosome maintenance deficient 4 (S. cerevisiae)C21orf71 3.281 NA chromosome 21 open reading frame 71TFAM 3.274 10q21 transcription factor A, mitochondrialFMNL2 3.258 2q23.3 formin-like 2UHRF1 3.235 19p1 3.3 ubiquitin-like, containing PHD and RING finger domains, 1RNF36 3.211 1 5q21.1 rinq finqer protein 36NASP 3.2 1 p34.1 nuclear autoantiqenic sperm protein (histone-binding)NA 3.151 NA NATNFRSF7 3.123 12p13 tumor necrosis factor receptor superfamily, member 7MCM10 3.118 10p13 MCM10 minichromosome maintenance deficient 10 (S. cerevisiae)HLA-E 3.117 6p21.3 major histocompatibility complex, class 1, EUTP20 3.101 12q23 UTP20, small subunit (SSU) processome component, homolog (yeast)PAK1IP1 3.086 6p24.2 PAK1 interactinq protein 1FUS 3.077 16p11.2 fusion (involved in t(12;16) in malignant liposarcoma)HELLS 3.071 10q24.2 helicase, lymphoid-specificGPATC4 3.046 1q22 G patch domain containing 4FUT4 3.039 11 q21 fucosyltransferase 4 (alpha (1,3) fucosyltransferase, myeloid-specific)MCM4 3.025 8q11.2 MCM4 minichromosome maintenance deficient 4 (S. cerevisiae)PCBP2 3.019 I2q13.12-q13 polv(rC) binding protein 2ZNF718 3.01 4p16.3 zinc finqer protein 718
Table 7-2 Genes with > 3-fold change in expression when compared to
controls with associated p value <0.01
198
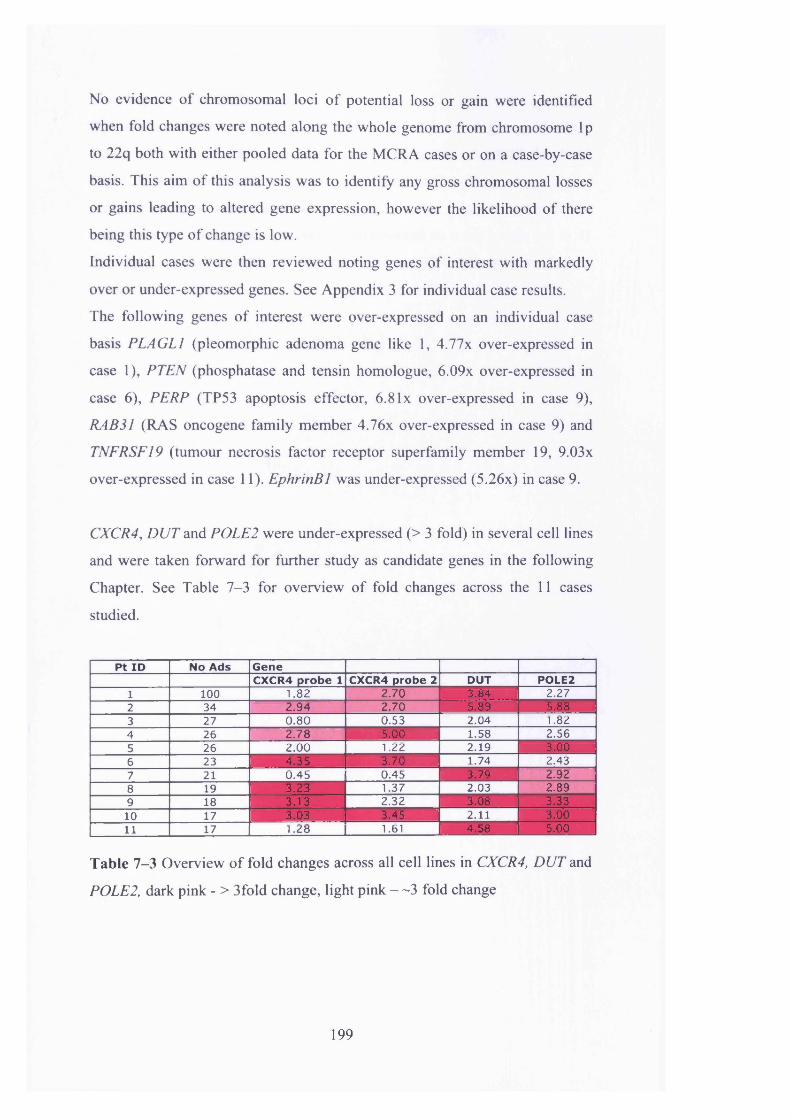
No evidence of chromosomal loci o f potential loss or gain were identified
when fold changes were noted along the whole genome from chromosome lp
to 22q both with either pooled data for the MCRA cases or on a case-by-case
basis. This aim of this analysis was to identify any gross chromosomal losses
or gains leading to altered gene expression, however the likelihood of there
being this type of change is low.
Individual cases were then reviewed noting genes of interest with markedly
over or under-expressed genes. See Appendix 3 for individual case results.
The following genes of interest were over-expressed on an individual case
basis PLAGL1 (pleomorphic adenoma gene like 1, 4.77x over-expressed in
case 1), PTEN (phosphatase and tensin homologue, 6.09x over-expressed in
case 6), PERP (TP53 apoptosis effector, 6.8lx over-expressed in case 9),
RAB31 (RAS oncogene family member 4.76x over-expressed in case 9) and
TNFRSF19 (tumour necrosis factor receptor superfamily member 19, 9.03x
over-expressed in case 11). EphrinBl was under-expressed (5.26x) in case 9.
CXCR4, DUT and POLE2 were under-expressed (> 3 fold) in several cell lines
and were taken forward for further study as candidate genes in the following
Chapter. See Table 7-3 for overview of fold changes across the 11 cases
studied.
Pt ID No Ads GeneCXCR4 probe 1 CXCR4 probe 2 DUT POLE2
1 100 1.82 2.70 3 .8 4 2.272 34 2.94 2.70 5 .8 9 5 .8 83 27 0.80 0.53 2.04 1.824 26 2.78 5 .0 0 1.58 2.565 26 2.00 1.22 2.19 3 .0 06 23 4 . 3 5 3 .7 0 1.74 2.437 21 0.45 0.45 3 .7 9 2.928 19 3 . 2 3 1.37 2.03 2.899 18 3 . 1 3 2.32 3 .0 8 3 .3310 17 3 .0 3 3 .4 5 2.11 3 .0 011 17 1.28 1.61 4 .5 8 5 .0 0
Table 7-3 Overview of fold changes across all cell lines in CXCR4, DUT and
POLE2, dark pink - > 3fold change, light pink — 3 fold change
199

Heat maps o f cases and controls
The heatmap below (Figure 7-1) shows the differential genes identified
between the multiple adenoma and control groups using a 0.1 FDR threshold.
Genes were further filtered using a >2 fold filter. Each multiple adenoma case
probeset value has seen scaled to the probeset median across all samples. The
magnitude o f differential expression is represented on a log2 scale (-4 to 4).
The cases and controls cluster separately across the heatmap when filtered
using a >2 fold filter.
200

s c a le to m edian
Figure 7-1 Heatmap of MCRA cases and controls demonstrating difference in
expression in MCRA cases and controls when compared to the median
201

Volcano plot
The Volcano plot arranges gene transcriptions studied according to their
biological and statistical significance. The x-axis (log scale) demonstrates the
fold change between the two groups The y-axis represents the p-value for each
t-test of differences between samples (on a negative log scale).
See Figure 7-2 for volcano plot of cases (p) versus controls (c) for the 11
cases and 5 controls studied. The dots in red represent the transcripts with a
statistically significant fold change (>3 with a FDR of 0.05 or smaller) when
comparing the MCRA cases (p) and controls (c).
co
Bu_|
o
Figure 7-2 Volcano plot of MCRA cases (p) versus controls (c), the red dots
represent the trancripts which are expressed in cases but not controls with > 3
fold change and FDR <0.05
Comparison PvsC
202

Scatter plot
The scatter plot (Figure 7-3) plots gene transcripts of cases against controls
according to the fold change and the associated statistical significance of the
observed change. The plot o f the MCRA cases against controls is
symmetrical- demonstrating a “good” experiment
£cOJ
T3T3
23ECMO)o
Log2 control intensity
Figure 7-3 Scatter plot o f MCRA cases versus controls, transcripts plotted
according to fold change and associated statistical significance of fold change.
Cluster dendrogram
The cluster dendrogram demonstrates unequivocal hierarchical clustering
between the MCRA cases and control samples analysed (Figure 7-4). With
the exception of one MCRA sample and one control sample (clustered
together on the right of the figure) all o f the remaining MCRA cases and
control cluster separately indicating similarities of gene expression within the
groups and differing expression between the groups.
203
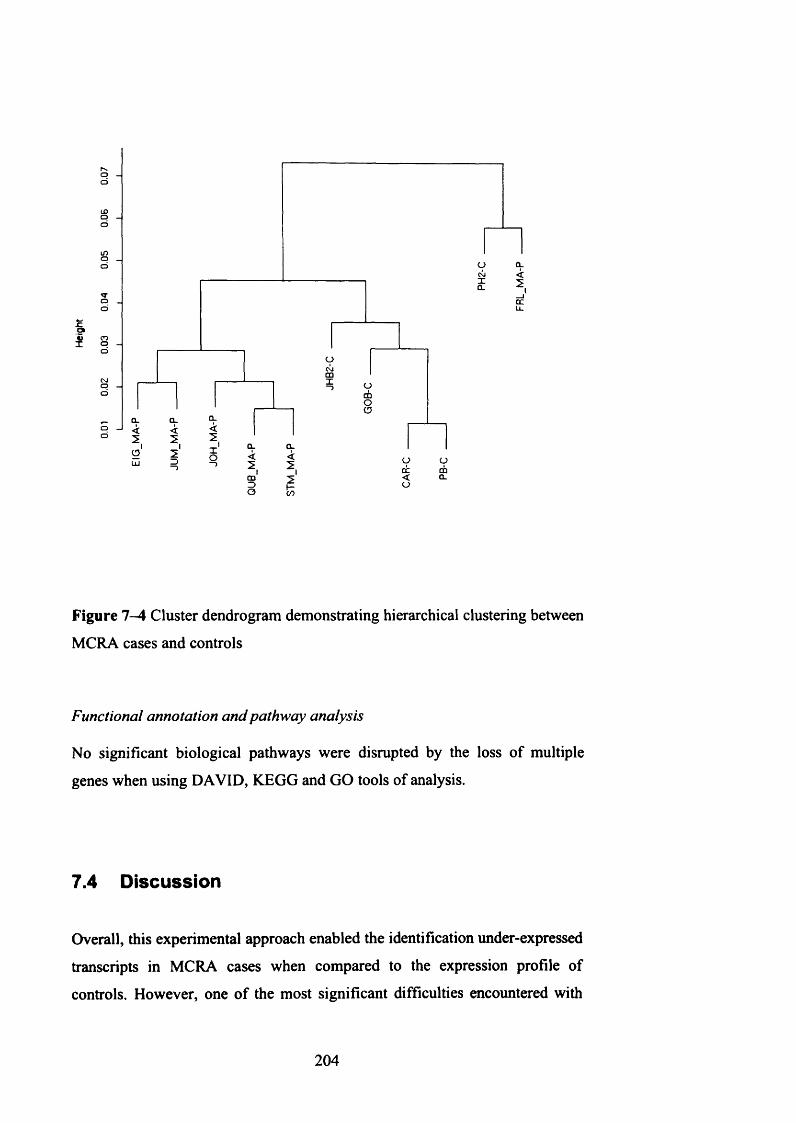
a.
u.
om
CD
CL CL
ccCD
Figure 7 -4 Cluster dendrogram demonstrating hierarchical clustering between
MCRA cases and controls
Functional annotation and pathway analysis
No significant biological pathways were disrupted by the loss o f multiple
genes when using DAVID, KEGG and GO tools of analysis.
7.4 Discussion
Overall, this experimental approach enabled the identification under-expressed
transcripts in MCRA cases when compared to the expression profile of
controls. However, one o f the most significant difficulties encountered with
204

this approach is the interpretation o f the “missed” or “absent” probe calls.
Despite the call rate across the cases and controls being equal and of a similar
standard to other groups (Nishimura, Martin et al. 2007) the fact that a probe
may have an “absent” call could indicate that the particular gene which it
represents is not expressed by lymphocytes. In this study, results from every
probe in the MCRA cases and controls (whether “absent” or not) were
included in the statistical analysis.
7.4.1 Transcripts chosen for further study
The following transcripts were chosen for further study based on their fold
change (across all cases) and relevance o f their function in tumorigenesis. All
were under expressed suggesting a loss o f function.
CXCR4 is the chemokine receptor for stromal cell-derived factor-la (SDF-
la ). It is a seven-transmembrane receptor G protein coupled receptor and is
known to be a co-receptor for HIV (Feng, Broder et al. 1996). In haemopoetic
cells, it has been demonstrated that c-kit and CXCR4 interact to provide
homing to the bone marrow. CXCR4 has also been shown to have a role in
migration and metastasis o f solid tumours such as breast, ovarian and small
cell lung cancer (Muller, Homey et al. 2001) (Scotton, Wilson et al. 2001;
Kijima, Maulik et al. 2002), reviewed in (Zlotnik 2008).
dUTP phosphatase (DUT), is a DNA repair gene which prevents mis-
incorporation o f uracil residues in to DNA during replication. In all known
organisms uracil is not a native component o f DNA. It can however become
incorporated in to DNA through spontaneous deamination o f cytosine residues
or through dUTP utilisation by DNA polymerases during replication (Lindahl
1993). As cytosine deamination can lead to G:C >A:T transversions, a BER
repair mechanism has evolved to remove and correct mis-incorporated uracil
(Lindahl 1982). To prevent dUTP utilisation during DNA replication, DUT
hydrolyses dUTP to yield dUMP and PPi. This reaction effectively removes
dUTP from the DNA biosynthetic pathway and provides a substrate (dUMP)
for de novo synthesis o f thymidylate.
POLE2 (DNA polymerase), pol e B-subunit 2 (p59 subunit) is a replicative
DNA polymerase which forms a central component in DNA replication,
205

repair, recombination and cell cycle control (Hubscher, Nasheuer et al. 2000).
The DNA polymerase family are multi-subunit enzymes which are up-
regulated by mitogenic activators. The organisation and induction of the
POLE2 promoter is similar to the promoter o f cyclin D l (Watanabe, Albanese
et al. 1998).
To date, no direct link between POLE2 mutations and mammalian
tumorigenesis have bene observed. However its role in DNA replication and
repair make it a promising candidate gene to pursue.
7.4.2 Limitations of lymphoblastoid cell line work
Despite working within strict limits to prevent differences in culturing
conditions, there will always be some differences of the exact conditions that
each cell line studied was exposed to resulting in observed differences in
expression. The analysis o f the MCRA cases, both combined and on an
individual basis, would have highlighted any gross differences in expression
between cases.
In the cell lines used in this study NMD would theoretically have removed
many o f the truncated (mutated) transcripts which may have led to the
identification o f novel germline predisposition genes. In this scenario however
a fold change (down-regulation) would have been observed. The three
candidate genes chosen for further study were all down-regulated suggesting
either an upstream inhibition of transcription or degradation of mutated
transcripts. It is possible to inhibit mRNA translation and subsequently NMD,
exploitation o f this could be a useful tool to study lymphoblastoid cell line
mRNA expression further - see future work.
When considering changes o f expression, it is difficult in this situation to
determine where in a biological pathway the initiating mutation has occurred
to cause the observed effect. It would have been expected that KEGG, DAVID
and GO analysis would identify any biological or biochemical pathways
which were grossly affected by an underlying mutation.
206

7.4.3 Future work
1: Confirmation o f fold changes observed
i) Real-time PCR analysis (qRT-PCR) is a useful tool which could be used to
determine functional levels o f proteins whose expression array levels were
altered. qRT-PCR of the candidate genes chosen and of those transcripts with
a more than >3 fold change o f expression would help to identify functional
changes in expression.
ii) Immunohistochemistry (IHC) o f the protein products o f down-regulated
transcripts in GI mucosa (if expressed there and if probes available) would
confirm any changes at a tissue level.
2: Inhibition o f NMD to identify mutated transcripts
Several research groups have utilised the inhibition of NMD to identify genes
carrying nonsense / frameshift mutations. This strategy is termed GINI (gene
identification by NMD inhibition) and to date has been used successfully in
colorectal cancer cell lines and prostate cancer cell lines (Ionov, Nowak et al.
2004) (Huusko, Ponciano-Jackson et al. 2004) (Rossi, Hawthorn et al. 2005).
A limitation o f earlier studies utilising inhibition o f NMD was that emetine
(used to inhibit translation) was a strong inducer o f a stress response in the cell
lines being studied, therefore causing many genes to be up and down
regulated. This has been overcome in part by the addition of caffeine to
culturing media (GINI2) (Ivanov, Lo et al. 2007). GINI has not yet been used
successfully in lymphoblastoid cell lines to identify mutations in constitutional
DNA.
One approach would be to culture lymphoblastoid cell lines from MCRA
cases and controls both with and without inhibition of NMD decay.
Expression array analysis o f these cell lines when compared both with and
without inhibition o f NMD would identify transcripts which are down-
regulated due to a constitutional DNA mutation rather than an error in
replication.
207

3: Whole genome sequencing o f selected MCRA cases
Whole genome sequencing has emerged as a realistic experimental approach
over the last 2 years (Bentley 2006). This approach which is now available
through Illumina (Solexa) allows analysis o f the whole genome. It is based on
parallel sequencing o f millions o f fragments using reversible terminator-based
sequencing.
See - http://www.illumina.com/sequencing/Technology.ilmn.
Whole genome (or candidate gene region) sequencing of carefully selected
MCRA cases would enable identification o f constitutional mutations (with the
caveat that they would be found in the 99% of the human genome re
sequenced with Solexa).
7.5 Conclusions
Expression array analysis o f 11 MCRA cases and 5 controls identified 3
candidate genes CXCR4, DUT and POLE2 which were all under-expressed >3
fold in the majority o f MCRA cases studied. These candidate genes were then
taken forward to study further in the following Chapter.
208

8 Candidate gene screening in MRCA cases
8.1 Introduction
Candidate gene screens are a useful tool for identification o f novel predisposition
genes. When considering the MCRA phenotype, genes involved in DNA repair
and Wnt signalling are the most obvious point at which to start. Cell cycle
checkpoint genes and regulators o f apoptosis are a priori good candidates for any
tumour type.
To date, one study has screened candidate genes from the Wnt signalling and
TGF-fi pathways in the MCRA phenotype (Lipton, Sieber et al. 2003). Lipton et
al screened 47 MCRA cases (with APC and MYH mutations excluded) for
germline mutations in APC2 , conductin and GSK3f5 from the Wnt signalling
pathway and SMAD4 and BMPR1A from the TGF-p pathway. One patient was
found to have a putative pathogenic mutation in BMPR1A (3 bp del nt 1079-81,
resulting in loss o f histidine residue) with no mutations found in the other genes
screened.
The data presented in Chapter 6 suggests that Wnt signalling is disrupted in
MCRA cases as a statistically significant increase in nuclear P-catenin was
observed. Therefore genes (including regulatory genes) in the Wnt signalling
pathway warrant further study.
A series of candidate genes was selected for further study on the basis of the
results from Chapters 6 and 7 and from evidence found in current literature.
Table 8-1 provides an overview o f the genes studied and the rationale for their
selection.
209

Candidate Gena Function Reason for selection
OGG1 DNA repair BER M ember of BER family, following discovery of MYHMTH1 DNA repair BER M ember of BER family, following discovery olM YHTDG DNA repair BER Evidence of link with BERMSH6 DNA repair MMR Known interaction with MYH, and evidence of mutations in CRCPM S2 DNA repair MMR Homozygous germline mutation identified in patient with multiple CRC primariesMGMT DNA repair Through literature searchMBD4 DNA repair Through literature searchPOLE2 DNA repair Expression array work - Chapter 5DUT DNA repair Expression array work - Chapter 5CXCR4 DNA repair Expression array work - C hapter 5
WH1 Wnt signalling Evidence of increased nuclear expression of B-cat - Chapter 4DKK1 Wnt signalling Evidence of increased nuclear expression of B-cat - Chapter 4Ephrin B2 Wnt signalling Evidence of increased nuclear expression of B-cat - Chapter 4
EphB2 germline mutation idenitifed in HPP case and selected Finnish CRC cases
CDC4 Cell cycle control Evidence of mutation in CRC
BLM DNA helicase acivity Ashkenazi CRC link, role in genomic instability
Table 8-1 Candidate genes chosen for study in MCRA cases
8.1.1 Selection of candidate genes
DNA repair genes
Base excision repair genes - OGGI, MTH1, TDG
Following the discovery o f MAP (Al-Tassan, Chmiel et al. 2002) (Sieber, Lipton
et al. 2003), it is possible that disruption o f other BER genes may predispose to
MCRA development, particularly as there is functional overlap and redundancy
within the BER system.
Somatic mutations in OGGI have previously been reported in several human
cancers including gastric, colorectal, lung, renal and leukaemia (Shinmura, Kohno
et al. 1998) (Park, Choi et al. 2001) (Audebert, Chevillard et al. 2000) (Hyun,
Choi et al. 2000). More recently the Korean germline OGGI polymorphisms
R154H and S326C have been identified in sporadic CRC patients (Kim, Ku et al.
2004) and multiple adenoma cases (Kim, Ka et al. 2007) respectively.
To date, no published polymorphisms or somatic mutations in MTH1 have been
identified in human cancers, but as a pivotal member o f the BER family it
warrants further study in MCRA and CRC cases.
Thymidine-DNA glycosylase (TDG) initiates repair o f G>T and G>U mismatches
(which are commonly associated with CpG islands) by removing thymine and
210

uracil moieties. A recent study found a novel heterozygous germline missense
mutation (ntA196G, R66G) in 1/94 familial CRC cases and 0/188 controls
(Broderick, Bagratuni et al. 2006). The variant was identified in a 66 year old
male with rectal cancer; the patient’s sister died o f CRC at 47. A previously
identified polymorphism (V367M) was identifed in 1 case and three intronic
variants were also identified (A166+12G, G167-9A and G167-19C).
Mismatch repair enzymes - MSH6, PMS2
The MMR and BER DNA repair mechanisms interact through an MSH6 binding
site present on MYH, therefore preventing deleterious double strand breaks.
Germline MSH6 mutations account for <5% o f HNPCC cases (Plaschke, Engel et
al. 2004), these cases have later onset and lower incidence of CRC when
compared to MLH1 and MSH2 mutation carriers. The MSH6 promoter
polymorphism 159C>T has also been associated with an increased risk of CRC in
a study o f 929 CRC cases and 1098 controls (Mrkonjic, Raptis et al. 2007).
Niessen et al found a higher incidence of heterozygous MYH carriers in
individuals with missense MMR mutations (4/36 also harbouring MSH6
mutations) (Niessen, Sijmons et al. 2006). This was further supported by the
observation o f both MSH6 and MYH mutations in a large branch o f a Dutch
HNPCC family where 19 family members carried either heterozygous or
compound heterozygous MYH mutations alongside MSH6 mutations the
phenotype o f these individuals was more representative o f HNPCC with evidence
of MSI and an under-representation of G>T transversions (van Puijenbroek,
Nielsen et al. 2007). In light o f this it was hypothesised that heterozygous MYH
mutations may act as phenotypical modifiers of HNPCC. The German HNPCC
consortium investigated this hypothesis further and found no real association
between MSH6 mutation carriers and MYH inheritance (Steinke, Rahner et al.
2008). This study found the MYH carrier rate to be similar to the healthy control
population when 64 MSH6 mutation carriers were screened for MYH 2/64 (3.1%)
harboured both MSH6 and heterozygous MYH mutations.
211

A Danish HNPCC family presenting with CRC and adenomas at 18 years of age
was found to have mutations in both MSH6 (S612X and R1076C) and APC
(G2502S). Immunohistochemistry for MSH6 and fi-catenin found lack of
expression of MSH6 alongside increased nuclear accumulation of fi-catemn
indicating a phenotypic influence o f both the underlying mutations (Okkels,
Sunde et al. 2006).
Therefore the role of MSH6 in both MCRA and CRC development (outside
HNPCC diagnosis) is unclear, germline mutations may play some part in the
development o f MCRAs.
Homozygous deletion o f PMS2, another MMR gene, in the germline has been
found to cause a severe CRC phenotype in an individual o f Indian descent with
parental consanguinity. This individual presented at 23 years with 10 synchronous
colorectal primaries and 35 adenomas, at 25 years he was found to have duodenal
adenocarcinoma, he also had dysmorphic features, mental retardation and cafe-au-
lait spots (Will, Carvajal-Carmona et al. 2007). As this individual harboured
multiple colorectal adenomas, PMS2 warranted further investigation as a possible
MCRA predisposition gene.
Other DNA repair enzymes - MGMT, MBD4, POLE2, DUT, CXCR4
0 6-methylguanine-DNA methyltransferase (MGMT) is a DNA repair gene which
removes deleterious 0 6-methylguanine residues from DNA. MGMT loss of
function results in increased accumulation o f 0 6-methylguanine promoting
tumorigenesis through G:C > A:T transversions in growth related genes such as
K-ras and p53 (Esteller, Toyota et al. 2000) (Esteller, Risques et al. 2001).
Methylation o f MGMT can identify a subset of CRC cases with low-level
microsatellite instability (Whitehall, Walsh et al. 2001). There is increasing
evidence to support a role o f increasing levels in MGMT methylation in
progression from normal colonic epithelia through the adenoma-carcinoma
sequence (Nagasaka, Goel et al. 2008). Somatic mutations in MGMT have also
been identified in fresh frozen CRC tissue and CRC cell lines. Six of 113 CRCs
studied by Halford et al harboured somatic mutations. These tumours
212

demonstrated defective MGMT function with G:C>A:T transversions being found
at other loci such as K-ras and p53 (Halford, Rowan et al. 2005). Furthermore,
MGMT expression was decreased or lost in over half of the CRCs studied and
may therefore have a role in MCRA development.
MBD4 is known to bind to methylated CpG and TpG sites, in particular sites
related to the transcriptional repressor MeCP2. It has a c-terminal domain
homologous to DNA repair proteins (Hendrich and Bird 1998). MBD4 has the
ability to remove thymine or uracil from mismatched CpG sites (Hendrich,
Hardeland et al. 1999). It is thought that mutations causing loss o f MBD4 function
can lead to a genome wide increase in C>T transitions and therefore have a
housekeeping role similar to MMR proteins (Liu, Nicolaides et al. 1995)
(Herman, Umar et al. 1998). A study o f MBD4 in CRC found frameshift
mutations in over 40% (9 CRC primaries and 1 cell line) of CRC cases studied
(Bader, Walker et al. 1999). More recently MBD4 has been implicated in DNA
damage response and chromosomal stability (Abdel-Rahman, Knuutila et al.
2008).
The functions o f POLE2, DUT and CXCR4 are discussed in Chapter 5. These
DNA repair genes were chosen for further study as they were down-regulated >3-
fold in the majority o f lymphoblastoid cell lines from MCRA cases studied using
expression array analysis.
Wnt signalling
Wnt signalling related genes - WIFI, DKK, EPHB2
Wnt signalling inhibitory factors include WIFI and Dickkopfl (DKK) and frizzled
related proteins. These secreted molecules have been demonstrated to bind Wnt
proteins and inhibit their activity. The secreted Wnt antagonists can be divided
based on their function, the soluble frizzled related proteins (sFRPs) includes
WIFI, sFRPl, 2, 4, 5 and Frisbee. These proteins bind directly to Wnts altering
their ability to bind the frizzled receptors. The dickkopf class comprises DKK 1-4
213

which bind to low density lipoprotein receptor proteins (LRP5 and 6) which are
contained within the Wnt receptor complex. When bound DKK proteins inhibit
Wnt signalling by preventing normal LRP-Fz-Wnt interactions (Kawano and
Kypta 2003). Byun et al found a difference in expression o f inhibitory Wnt
factors in the upper and lower GI tract. Increased zonal expression of WIFI was
observed in colonic crypt bases on in situ RNA analysis suggested a role in
colonic stem cell maintenance (Byun, Karimi et al. 2005). In this study DKK1 was
not expressed in normal colonic mucosa.
Epigenetic changes (promoter hypermethylation) of WIFI have been reported in
gastric and Barretts related oesophageal cancers suggesting a role as a putative
tumour suppressor gene (Taniguchi, Yamamoto et al. 2005) (Clement, Guilleret et
al. 2008). Similar epigenetic changes have been observed in DKK1 in CRC cases
where hypermethylation o f DKK1 was observed in 9/54 CRCs studied (Aguilera,
Fraga et al. 2006).
Ephrin receptor B2 (EPHB2) is a direct transcriptional target o f /3-catenin. Its
protein product mediates the bi-directional migration and correct positioning of
cells along the crypt axis in intestinal epithelium (Batlle, Henderson et al. 2002).
In murine studies, EPHB2 has been demonstrated to have tumour suppressor
activity. When the gene is disrupted in Apcmm/+ mice acceleration o f tumour
growth is observed in both colon and rectum (Batlle, Bacani et al. 2005).
Germline missense mutations in EPHB2 have been identified in Finnish CRC
cases (who also had a personal or family history of prostate cancer) and
individuals from the UK with hyperplastic polyposis (Kokko, Laiho et al. 2006).
Four missense mutations were identified, two in the CRC cases (1361V, R568W)
and one (D861N) in a HPP case. The fourth missense mutation (R80H) found in a
CRC case was also present in 9/281 healthy controls and is likely to be a
polymorphism. As EPHB2 has an association with serrated adenomas (Laiho,
Kokko et al. 2007) it is possible that it may also play a role in MCRA
development based on the findings o f BRAF mutations in the MCRA adenomas
studied in Chapter 6.
214

Cell cycle regulation
Cell cycle regulation CDC4
CDC4 is a highly conserved E3 ubiquitin ligase which is indirectly involved in
regulating the G l-S cell cycle checkpoint by targeting proteins for destruction by
the SCF complex (Winston, Koepp et al. 1999). Mutations in CDC4 have
previously been identified in breast and ovarian cancer cell lines (Moberg, Bell et
al. 2001) (Strohmaier, Spruck et al. 2001) and more recently in a subset o f CRCs
(Rajagopalan, Jallepalli et al. 2004) (Kemp, Rowan et al. 2005). There has been
some discussion o f a putative role o f CDC4 in chromosomal instability initially
suggested by Rajopalan et al following the observation that when CDC4 is
knocked out in CRC lines, changes occur suggestive of CIN (Rajagopalan,
Jallepalli et al. 2004). Further work by Kemp et al found no association between
CDC4 mutation and CIN in a study o f 244 colorectal tumours and 40 CRC cell
lines. Six percent o f tumours (including near-diplod CIN- lesions) harboured
CDC4 mutations. The mutation spectra included nonsense an missense mutations
with a bias towards C:G>T:A transversions (Kemp, Rowan et al. 2005).
CDC4 was chosen for further study due to its role in cell cycle regulation and the
recently identified association between somatic CDC4 mutations and CRC.
Genomic instability / other CRC Hereditary syndromes
Other CRC Hereditary Syndromes - BLM
The Ashkenazi Jewish population have a 10-15% lifetime risk of developing
CRC. There are known founder mutations in both APC (I1307K) and MSH2
(1906G>C) in this population which although prevalent do not account for the
disease burden observed (Zauber, Sabbath-Solitare et al. 2005).
Bloom syndrome is a rare autosomal recessive condition leading to
immunodeficiency, growth retardation, male sterility, breast cancer and CRC. A
founder mutation in the Bloom gene BLAfsh (frameshift mutation in exon 10) has
been identified in one third o f individuals with Bloom syndrome. Two groups
report an increased risk (2.3 - 2.8 fold) o f CRC in heterozygous carriers of the
215

B Lbfsh mutation (Gruber, Ellis et al. 2002) (Cleary, Zhang et al. 2003). Although
Baris et al reported no increased risk in heterozygous carriers over three
generations (Baris, Kedar et al. 2007).
The functions o f the BLM gene include roles in genomic stability and meiotic
recombination. It has helicase activity although its natural substrates have yet to
be identified (Neff, Ellis et al. 1999). Seven pathogenic missense mutations have
been identified which have been mapped to seven highly conserved sequence
motifs (Bernstein, Zittel et al. 2003). The BLM gene warrants further study due to
its role in genomic stability and association with CRC.
8.1.2 Aims
The aim of this chapter was to screen a selection of MCRA candidate genes
selected either through my own experimental work in Chapters 6 and 7 or based
on evidence from current literature.
216

8.2 Methods
8.2.1 Mutation detection
Following selection, the genomic sequence of each gene was downloaded from
the UCSC Genome Browser - http://www.genome.ucsc.edu/
Primers were selected using Primer 3 software - http://frodo.wi.mit.edu/cgi-
bin/primer3/primer3 www.cgi and annealing conditions determined (as described
in Methods 2.1.4).
All genes except MSH6, DUT, POLE2 and CXCR4 were screened using
fluorescent SSCP (Methods 2.1.6.1).
MSH6 was screened using dHPLC WAVE analysis (Methods 2.1.6.2).
DUT, POLE2 and CXCR4 were screened using the Lightscanner melting curve
analysis (Methods 2.1.6.3).
Following identification of aberrant bands on SSCP, demonstration of
abnormalities on the dHPLC chromatogram or abnormal melting profile on
Lightscanner analysis, samples were sequenced in forward and reverse
orientations using fluorescence cycling sequencing, see Methods 2.1.7
All non-synonymous SNPs identified were analysed using the Fred Hutchinson
SIFT analysis software to determine any potential pathogenic downstream
alterations in protein structure and function
http://blocks.fhcrc.org/sift/SIFT.html.
The following genes were screened with G. Guerra an Italian collaborator -
MSH6, Wifi, DKK, MGMT, MBD4, BLM.
POLE2 and DUT were screened with K. Monahan a fellow PhD student.
8.2.2 Immunohistochemistry
Immunohistochemostry for PMS2 was undertaken as described in Methods 2.1.13
Paraffin embedded tissue from 20 MCRA cases were studied for altered
expression of PMS2.
217

8.3 Results
In total, 15 candidate genes were screened, 14 (133 exons in total) through
germline mutation detection using SSCP, dHPLC and Lightscanner mutation
detection and 1 through immunohistochemistry to determine whether any
alteration in PMS2 expression occurs in MCRA cases.
8.3.1 Mutation detection
Overall, no obvious pathogenic germline mutations were identified in the MCRA
cases studied. See Table 8-2 for a summary of the mutations detected.
The majority of mutations detected were in the DNA repair group of candidate
genes. Of the Wnt signalling genes a single synonymous mutation in EPHB2
(Q875Q A>G nt 2625) was detected.
Five silent mutations were detected, two in MSH6, one in MBD4 and one in
EPHB2. Eight heterozygous missense mutations were detected, S326C
(previously reported in Korean population) in OGGI, V83M in MTH1, L84F,
I143V and K178R in MGMT, T515S in MBD4, V154G in DUT and V181I in
CXCR4. Three homozygous missense mutations were found, S326C in OGGI,
L84F and L88F in MGMT. Intronic SNPs were identified in OGGI and MSH6.
Three 3’UTR SNPs were identified two in exon 19 of POLE2 and one in exon 7
of DUT, all o f which may have some effect on gene expression. Of 47 controls
examined for these 3 ’UTR SNPs the two SNPs identified in exon 19 o f POLE2
were found in 15% of controls suggesting that they are not pathogenic. The
3’UTR SNP associated with exon 7 o f DUT was not found in any controls
suggesting that this SNP may alter gene expression. The non-synonymous SNP
V154G present in exon 7 o f DUT is thought to be potentially pathogenic as it
occurs in a highly conserved region of the gene coding for the UTPase region (as
predicted by the Fred Hutchinson SIFT analysis http://www.fhcrc.org).
218

8.3.2 PMS2 immunohistochemistry
A total of 21 paraffin embedded tissue blocks from 20 MCRA cases were studied
for altered PMS2 expression. Adenoma burden ranged from 5 - 3 4 (median 10)
and age of individuals studied ranged from 38 - 78 (median 60 years).
No altered expression was observed in any of the cases observed when
immunhistochemistry staining was compared with normal control slides included
in the experiment. See Figure 8-1 for example of PMS2 immunohistochemistry.
X 20
normal MCRA
Figure 8-1 PMS2 immunohistochemistry of normal and MCRA colonic
epithelium both demonstrating normal expression of the PMS2 protein
8.4 Discussion
Despite careful selection o f candidate genes, no obvious pathological germline
mutations in selected DNA repair, Wnt signalling or cell cycle control genes were
identified in this study.
mmm
219

8.4.1 DNA repair gene non-synonymous SNPs - potential candidates as low risk alleles
Three non-synonymous SNPs were identified in three DNA repair genes which
warrant further study.
Most interesting is the V154G heterozygous SNP (rsl802838) found in exon 7 of
DUT which was identified in 11% o f MCRA cases (Hardy-Weinberg x2 0.34) and
0% (0/47) o f controls screened. This SNP is predicted to alter the UTPase region
of the gene and could potentially be deleterious (SIFT analysis prediction). DUT
V154G may therefore have a role as a disease modifying SNP in the MCRA
phenotype. DUT was chosen as a candidate as decreased expression >3 fold
(range 3.08 - 5.89 fold reduction in expression) was observed in 5/11
lymphoblastoid cell lines studied (Chapter 7)
The presence o f the 3 ’UTR polymorphism in exon 7 o f DUT could result in the
observed altered expression o f the protein in Chapter 5. This could be investigated
further with quantitative real time PCR (qRT-PCR) analysis.
The MGMT K178R heterozygous SNP (rs2308327) was found in 29% of cases
(Hardy-Weinberg x2 2.88) and 17% of the control population (HapMap Eur).
Despite being “tolerated” on SIFT analysis it may still have a role as a low risk
allele.
The third non-synonymous SNP T515S found in exon 6 o f MBD4 (rs3138359)
occurred in 26% of cases (Hardy-Weinberg x2 2.23) and 0% of the control
population (HapMap Eur). There is no SIFT analysis data available for this SNP.
For all of these SNPs there is a higher frequency in the MCRA cases when
compared to controls. Unfortunately no germline DNA samples were available
from other family members o f these cases to use in co-segregation analysis of
these SNPs.
In order to confirm these findings, these SNPs should be screened in another
independent cohort o f MCRA cases and control populations.
At this time they could be considered as potential low risk alleles contributing to
the MCRA phenotype - in particular the DUT V154G SNP.
220

8.4.2 Potential role of synonymous SNPs and non-synonymous
SNPs with similar frequencies in MCRA cases and control populations
Of the BER genes studied, the OGGI missense mutation S362C was identified in
27% of individuals screened; 13% were heterozygous and 14% homozygous for
the mutation. Although not thought to be pathogenic, Goode et al (Goode, Ulrich
et al. 2002) when reviewing DNA repair gene polymorphisms and cancer risk
found an increased prevalence o f S326C homozygous mutations in lung,
oesophageal and prostate cancers. In the control groups, the genotype frequencies
were 32% for the common allele, 54% for heterozygous carriers and 14%
homozygous carriers o f the rare allele (326C). There is discrepancy as to the allele
frequencies as the European HapMap figures for these alleles (rs 1052133) differ,
citing 31% for S326C heterozygotes and 6.9% for S326C homozygotes. The
frequency o f the 326C homozygote carriers of the rare allele in my study would
therefore be double (14%) that o f the HapMap frequency (6.9%) suggesting that it
may confer increased risk for developing MCRAs.
The MGMT L84F and 1143V SNPs (rsl2917 and rs2308321) were found to have
very similar frequency as the control population (HapMap Eur) and are unlikely
to have a role as either a low risk allele or disease modifying allele.
However, the presence o f missense mutations in DNA repair genes may have a
subtle effect as modifier genes or make an individual more susceptible to
environmental exposure - such as free radicals caused by smoking or oxidative
stress in the intestinal epithelium through poor diet. A candidate gene screen of
other BER genes in CRC cases by Broderick et al (Broderick, Bagratuni et al.
2006) detected three missense mutations in NEIL2 (C367A), TDG (A196G) and
UNG2 (C262T) which were screened alongside NTHLl, NEIL2, MPG and
SMUG1 in 94 CRC cases and 188 controls. The TDG A196G mutation was not
detected in the MCRA cases in this study suggesting that if it is associated with
CRC it may play a role in tumour progression rather than development.
221

There is increasing interest in the potentially pathogenic influence o f “silent”
mutations on altered protein translation kinetics on transit through the ribosome
(Komar 2007). Kimchi-Sarfaty et al (Kimchi-Sarfaty, Oh et al. 2007) have
suggested that silent SNPs can in fact alter in vivo protein folding and ultimately
function. This finding could have an enormous impact in the interpretation of
mutation detection studies particularly if these SNPs are occurring at a higher
frequency in the disease population.
As no pathogenic mutations were found in POLE2 and CXCR4, the observed
reduced expressionin both o f these genes in Chapter 7 may be due to downstream
effects or altered expression o f these genes in lymphoblastoid cells. Both o f which
are limitations o f the experimental approach as discussed in Chapter 7. The two
3’UTR polymorphisms identified in exon 19 o f POLE2 which were present in
15% of controls screened suggest that they would not have an effect on
expression. Again, qRT-PCR would be a useful tool with which this study this
observation which is not within the scope o f this thesis.
8.4.3 No potential pathogenic mutations identified in Wnt
signalling genes
No pathogenic mutations were identified in either the Wnt signalling related
genes or the BLM gene. Futher Wnt inhibitory factors WIF2, DKK2, DKK3 and
frizzled related proteins would be appropriate candidate genes to screen in the
future.
222

8.5 Conclusions
Following the identification o f several “good quality” candidate genes either
based on my own experimental work or from published data from others no
pathogenic germline mutations were identified which might lead to the
development o f the MCRA phenotype.
Areas o f interest warranting further study include -
1: Study o f the three non-synonymous SNPs DUT V154G, MGMT K178R and
MBD4 T515S identified with higher frequency in the MCRA cases, including
confirmation studies in an independent cohort o f MCRA cases.
2: Further investigation o f the Wnt signalling pathway following the finding of
increased nuclear expression o f fi-catenin in the MCRA cases.
3: Real-time PCR to investigate the expression of DUT and POLE2 following
identification o f 3 ’UTR SNPs in a larger series of MCRA cases.
223

9 Investigation of clonal origins in FAP, AFAP
and sporadic colonic adenomas
9.1 Introduction
9.1.1 The clonal origins of CRC are not fully understood
Clonality studies in colorectal adenomas and CRC have been the source of
some debate since the early 1960s. The determination of the adenoma-
carcinoma sequence with its associated genetic changes (Vogelstein, Fearon et
al. 1988), alongside the ability to study CRC from its earliest stages through
colonoscopic sampling o f tissue, makes CRC an ideal tumour type in which to
study clonality theories o f carcinogenesis.
9.1.2 Existing markers of clonality in CRC have limitations
Early studies utilised X-chromosome inactivation in females harbouring
mosaicism of G6PD isoenzymes. Beutler described a polyclonal CRC
(Beutler, Collins et al. 1967) and Hsu reported polyclonal adenomas based on
the findings o f gel electrophoresis of X-inactivation of G6PD isoenzymes
(Hsu, Luk et al. 1983). Vogelstein and Fearon et al studied X-inactivation
patterns o f the phosphoglycerate kinase (PGK) gene in DNA (rather than the
expressed protein) using restriction fragment length polymorphisms. In female
patients with FAP they demonstrated a monoclonal pattern of X-chromosome
inactivation (Fearon, Hamilton et al. 1987) (Vogelstein, Fearon et al. 1985).
The most significant limitation of these studies is the existence of X-linked
patches in both normal and dysplastic tissue. It is possible that some covert
polyclonal tumours appeared monoclonal as they arose within an X-linked
patch of tissue. Since then, Novelli et al have demonstrated through further

analysis of X-linked patch size that X-inactivation studies have a significant
bias towards demonstrating colorectal tumour monoclonality (Novelli, Cossu
et al. 2003).
Investigation o f adenomas from an individual with FAP and XO/XY
mixoploid chromosome (as a consequence o f a dicentric Y chromosome) led
to further evidence supporting a polyclonal origin of adenoma development in
FAP (Novelli, Williamson et al. 1996). In this study, clonality was assessed
through probing for the Y chromosome in adenomas, This approach
demonstrated that 76% of FAP adenomas were polyclonal.
Mouse studies have supported this finding, Merritt et al (Merritt, Gould et al.
1997) developed an ApcMin+/~ and ROSA 26 (1 acZ expressing) chimaeric
mouse. Analysis o f adenomas from these animals found 79% of adenomas to
be polyclonal (heterotypic for ROSA and non-ROSA lineages), a figure very
similar to Novelli et al.
Thliveris (Thliveris, Halberg et al. 2005) has suggested three theories of
colorectal tumour polyclonality (discussed in Introduction). Adenoma
mosaicism; random or regional collision between independently arising
neoplasms; and active interaction between adjacent crypts. To date, none of
these theories fully fits observed experimental findings in either humans or
animal models.
Since the majority o f adenomas harbour mutations at APC and as APC
mutations are the “gatekeeper” mutations in the genesis of colorectal
tumorigenesis (Kinzler and Vogelstein 1996), identification and utilisation of
somatic APC mutations in dysplastic crypts would be a suitable clonal marker
with which to study adenoma development from its earliest stages.
I set out to analyse the mutation spectrum at APC on a crypt-by-crypt basis by
laser micro-dissecting single crypts from adenomas. The identified mutations
were then utilised as clonal markers in the following adenoma types - FAP,
AFAP and sporadic adenomas. I also re-examined tissue from Novelli’s study
of an XO/XY individual with FAP to compare two different methods of
assessing tumour clonality.
225

9.1.3 Aims of this chapter
The aim of this chapter was to identify and utilise a simple and robust marker
of clonality in CRC which could be used to study adenoma development from
its earliest stages and to investigate theories o f clonal development of
adenomas further.
9.2 Methods
Sample collection and preparation
Patients were recruited through St Mark’s Hospital Colorectal Cancer Unit,
blood was routinely sampled and paraffin embedded archival tissue was
collected. Informed consent was obtained prior to sample collection through
the CORGI study.
A total o f 5 FAP, 5 AFAP and 4 sporadic adenomas plus 3 adenomas from the
individual with XO/XY chimera and FAP were studied.
The FAP individuals chosen for the study had germline APC mutations
between codons 1040 and 1061 as it would be expected that their second hits
at APC would occur within the MCR region. In comparison, individuals with
the del 5bp deletion at codon 1309 o f APC most commonly lose the second
allele of APC through LOH rather than harbouring truncating somatic
mutations. All o f the AFAP patients had germline mutations in the
alternatively spliced region of exon 9 (R332X) o f APC.
Laser Capture Micro-dissection
For each adenoma studied, serial dysplastic crypts were laser micro-dissected
from around the circumference o f the adenoma see Figure 9-1. In order to
obtain sufficient DNA from each crypt for sequencing analysis, the same crypt
was micro-dissected from 6 serial slides. Each crypt sample was laser captured
into a separate collecting tube. To determine whether any contamination may
have occurred, a “blank” collecting tube was included in every batch analysed.
DNA was extracted using standard proteinase K digestion overnight at 60°C.
226

For each crypt, a total of lOpl starting material was available for subsequent
analysis.
For SSCP analysis several crypts were dissected into one collecting tube for
digestion in order to obtain 30pl o f starting material.
See Methods 2.1.12 for overview of technique and extraction of DNA from
dissected crypts
Figure 9-1 Laser micro-dissection o f FAP adenoma, H&E section (x20) on
left and serially micro-dissected crypts demonstrated on right
Mutation detection in single micro-dissected crypts
For each adenoma, fluorescent SSCP analysis was performed covering the
mutation cluster region of APC (MCR 1-12) to identify somatic APC
mutations which could be used as clonal markers (see Methods 2.1.6.1.).
Following identification of aberrant bands on fluorescent SSCP analysis the
corresponding MCR region was then sequenced using nested PCR. First and
second round primers were used for each MCR region (see Methods 2.1.7.).
LOH analysis at codon 1309 of APC was performed in single crypts dissected
from adenomas from XO/XY chimeric FAP patient. The germline APC
mutation for the individual was del 5bp at codon 1309. Subsequently loss of
227

the wild type allele could be determined by performing LOH analysis across
the MCR3 region containing codon 1309.
All primer sequences and conditions can be found in Appendix 1.
Immunohistochemistry
Immunohistochemistry for B-catenin, and Ki-67 was undertaken as described
in Methods 2.1.13.
Fluorescent in-situ hybridisation (FISH) analysis for X and Y chromosomes
FISH for the Y chromosome in the XO/XY patient studied was performed by
R. Jeffrey in the Histopathology Laboratory, Cancer Research UK, London
Research Institute.
The work undertaken in this Chapter was in collaboration with SJ. Leedham a
fellow PhD student in the Histopathology Laboratory, Cancer Research UK,
London Research Institute.
228

9.3 Results
With the limited amount o f DNA available for analysis from each crypt it was
not always possible to identify the “second hit” at APC. If a neighbouring
crypt to one harbouring a somatic APC mutation was found to be wild type, it
was taken that this crypt had arisen from a different clone. All crypts dissected
in the study were histologically dysplastic.
9.3.1 FAP adenomas are polyclonal
In total, 36 crypts were dissected from 5 FAP adenomas. Adenomas 1-3 were
from an individual with a germline mutation at codon 1040 of APC and
adenomas 4 and 5 were from an individual with a germline mutation at codon
1061 o f APC. The mean adenoma size was 9.5 mm2 (median 2.25 mm2, range
1 . 0 - 4 0 mm ). All o f FAP adenomas were found to be polyclonal, see Table
9-1.
FAP Polyp ID Size (mm)Total no.crypts
(analysed)Somatic A P C Mutations Clonality
1 1.5 x 2.0 15(11)
8 crypts - del 2bp nt 4219 and 2 crypts ins A nt
3925
Entrapped wild type crypt
Polyclonal
2 1 .5x 1.5 13(5)
3 crypts - del A nt 4364 1 crypt - ins C nt 43731 crypt - wild type for
above
Polyclonal
3 1 .0x 1.0 9 (6 )4 crypts - del A nt 4243 2 crypts - wild type for
abovePolyclonal
4 1.0 x 1.0 5(4)2 crypts - del A nt 41952 crypts - wild type for
abovePolyclonal
5 5.0 x 8.0 100(10)
9 crypts - del C nt 4476
1 crypt - wild type for above
Polyclonal
Table 9-1 Summary o f somatic APC mutations identified in single crypts
from five FAP adenomas
229

Figure 9-2 shows SSCP tracings demonstrating aberrant bands in both MCR6
and MCR9 of FAP adenoma 1. Subsequent crypt-by-crypt sequencing analysis
identified mutations in both of these regions, see Figure 9-3. Figure 9—4
demonstrates polyclonality in FAP adenoma 2.
©
MCR 6 wt
-400
-200
©
MCR 6 polyp
-200
-too
MCR 9 wt
-600-400-200
-400-300-200-1 0 0
©
MCR 9 polyp
Figure 9-2 Fluorescent SSCP analysis o f FAP adenoma demonstrating
aberrant bands in MCR6 and MCR9, these were sequenced and are presented
in Figure 9-3
230

MCR 6 -wild typeC C M C ■
MCR 9R -wild typeT T T»C TC C* 6 C T TO C T T • G C C C C I C : C TC TC T T_TT£,
del 1bp nt 4395. stop @ 1490 del 2bp nt 4219. stop @ 1408
MCR 9 R MCR 6
Figure 9-3 Polyclonal FAP adenoma (1), crypt in orange box wt for MCR6
and MCR9, crypt in red box truncating mutation in MCR9 and crypt in blue
box truncating mutation in MCR6
231
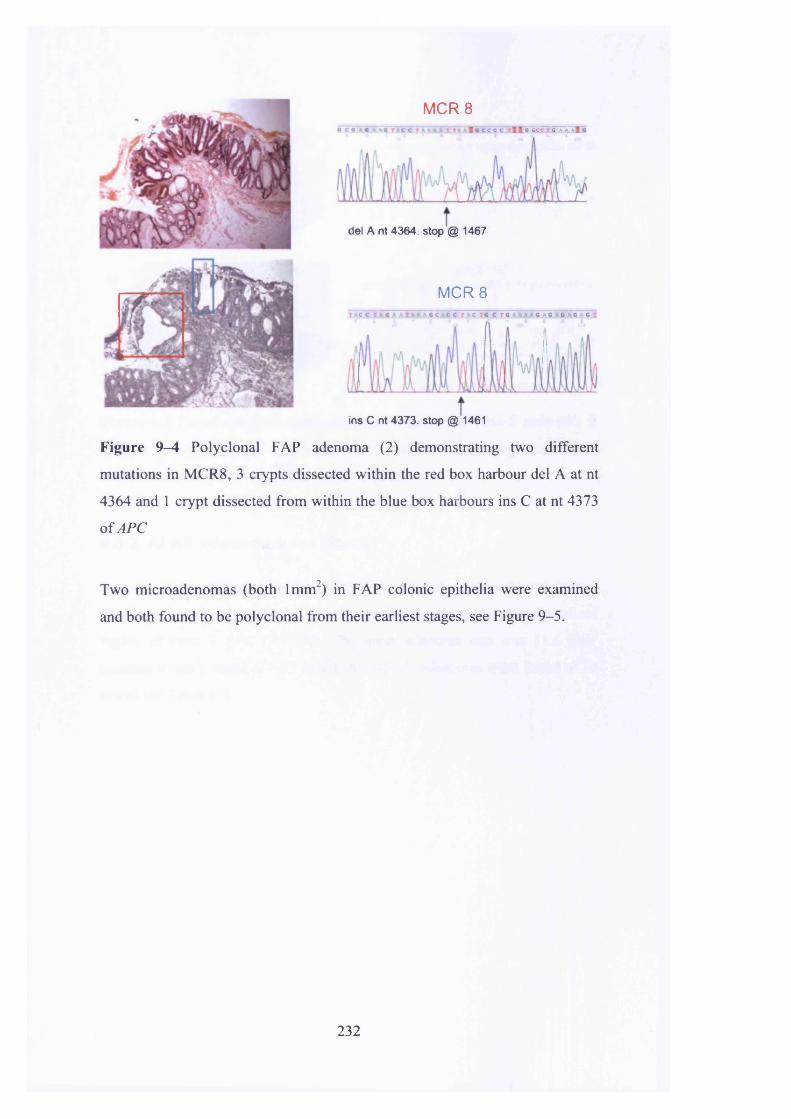
MCR 8
del A nt 4364. stop @ 1467
MCR 8
ins C nt 4373. stop @1461
Figure 9—4 Polyclonal FAP adenoma (2) demonstrating two different
mutations in MCR8, 3 crypts dissected within the red box harbour del A at nt
4364 and 1 crypt dissected from within the blue box harbours ins C at nt 4373
of APC
Two microadenomas (both 1mm2) in FAP colonic epithelia were examined
and both found to be polyclonal from their earliest stages, see Figure 9-5.
232

A
B
MCR 6F
wild type
MCR 6F
tdel A nt 4243. stop @ 1418
Figure 9-5 Polyclonal FAP microadenoma (3) patient, A - H&E stain x40, B
- micro-dissected crypts . 3 crypts in blue box have truncating mutation in
MCR6 and 3 crypts in red box are wt for MCR6
9.3.2 AFAP adenomas are clonal
In total, 36 crypts were analysed from 5 AFAP adenomas collected from 3
AFAP patients. All patients had germline mutations in the alternatively spliced
region of exon 9 APC (R332X). The mean adenoma size was 11.6 mm2
(median 9 mm2, range 4 - 2 5 mm2). All AFAP adenomas were found to be
clonal see Table 9-2.
233

AFAP Polyp ID Size (mm)
Total no.crypts
(analysed)
Somatic APC Mutations Clonality
1 3.0 x 3.0 35 (8)
All crypts
2nd hit - del C nt 4117
3rd hit - ins A nt 4662
Clonal
2 4.0 x 4.0 33 (8)
All crypts
Nonsense mutation G1552X
Clonal
3 5.0 x 5.0 60 (6)All crypts
Ins A nt 4662Clonal
4 2.0 x 2.0 25 (8)All crypts
Del 4bp nt 4386Clonal
5 2.0 x 2.0 27 (6)All crypts
SNP G to A nt 4478
Clonal
Table 9-2 Summary of somatic APC mutations identified in single crypts
from five AFAP adenomas
See Figure 9-6 and Figure 9-7 for results o f adenomas 1 - 3 . AFAP adenoma
1 is of particular interest in that it demonstrated both second and third hits at
APC in every crypt dissected.
234

2nd Hit
3rd Hit
MCR 5c 14 c< |V | b o i r e cq o m * »
del C nt4117; stop @ 1394
Figure 9-6 Adenoma from AFAP patient (1), A - H&E x40, B - PALM laser
capture slide. Each crypt dissected was found to have second and third hits at
APC in MCR5 and MCR11
'5 3 5 5 *
MCR 11
ins A n t4662; s to p @ 1558
MCR 11
Nonsense mutation G1552X
MCR 11
tIns A nt 4662; stop @ 1558
Figure 9-7 AFAP adenomas 2 (upper panel) and 3 (lower panel). Adenoma 2
harboured G1552X nonsense mutation in all crypts studied and adenoma 3
harboured ins A at nt 4662 of APC in each crypt
235

9.3.3 Sporadic adenomas
In total, 44 crypts were analysed from 4 sporadic adenomas. Each adenoma
studied was collected from a different individual (< 3 adenomas in total), none
of whom harboured germline APC or MYH mutations. The mean adenoma
size was 18.75 mm2 (median 9 mm2, range 8 - 2 5 mm2). Three “mixed” crypts
were identified in the sporadic adenomas studied whereby the top half of the
crypt demonstrated evidence o f dysplasia on H&E staining with normal crypt
appearances in the lower half o f the crypt. These crypts were studied in more
detail in the following section.
Three sporadic adenomas were found to be clonal and one polyclonal (8mm2
adenoma 1). There was no correlation between adenoma size and clonality
observed as adenoma 2 (smaller than adenoma 1) and adenoms 3, 4 (larger
than adenoma 1) are all found to be clonal. See Table 9-3 for overview.
Sporadic Polyp ID Size (mm)
Total no.crypts
(analysed)
Somatic APC Mutations Clonality
1 8.0 x 1.0 70(11)
9 crypts - del 4bp nt 4388
2 crypts - wild type for above
2 mixed crypts
Polyclonal
2 3.0 x 3.0 30(10)All crypts
Del T nt 4473Clonal
3 5.0 x 5.0 100 (12)
All crypts 1st hit - del A nt
3700 2nd hit - del 4bp
nt 4463
Clonal
4 5.0 x 5.0 50(11)
All crypts
Nonsense mutation G1312X
1 mixed crypt
Clonal
Table 9-3 Summary o f somatic APC mutations identified in single crypts
from four sporadic adenomas
236

9.3.4 Evidence for “top down” growth in sporadic adenoma
development
Figure 9-8 Mixed crypt identified in sporadic adenoma 1, A - H&E stain x40,
B -B-catenin immunohistochemostry demonstrating increased nuclear staining
in upper half o f crypt, C - Ki-67 immunohistochemistry demonstrating higher
rate of cellular proliferation in upper half of crypt
Three crypts (from 2 adenomas) were identified in the sporadic adenomas
which demonstrated mixed morphology. These were studied further by micro-
dissecting the dysplastic region of the crypt separately to the region
demonstrating normal morphology. In order to confirm progression from
normal crypt architecture to histological dysplasia B-catenin and Ki-67
immunohistochemistry was performed prior to micro-dissection see Figure 9 -
8 .
On clonal analysis o f this crypt the dyplastic top half harboured a mutation in
MCR9 and the bottom half with normal histological appearances was found to
be wt, see Figure 9-9.
237

MCR 9R
Idel 4bp nt 4388. stop @ 1472
MCR 9R
wild type
Figure 9-9 Evidence o f “top down” growth in mixed crypt from sporadic
adenoma, the top (dyplastic) half of the crypt when micro-dissected harboured
a 4bp deletion at nt 4388 APC, the bottom half was wt
9.3.5 Stroma did not harbour APC mutations in FAP, AFAP
or sporadic adenomas
When histologically normal stroma was micro-dissected from 3 FAP, 3 AFAP
and 2 sporadic adenomas, none of the tissue was found to harbour the same
APC mutations as identified through SSCP analysis and direct sequencing of
the dysplastic crypts within the adenoma.
238

9.3.6 Polyclonal adenomas demonstrated in XO/XY FAP
individual using two different clonal markers
Three informative adenomas from the XO/XY individual with FAP (del 5bp
1309 germline APC mutation) decribed by Novelli et al (Novelli, Williamson
et al. 1996) were re-examined using FISH and laser-microdissection of single
crypts for LOH analysis at codon 1309 of APC. All o f the adenomas were
found to be polyclonal using both of these techniques. Figure 9-10
demonstrates FISH analysis and Figure 9-11 demonstrates LOH analysis in
single crypts dissected from adenoma 1. LOH is considered present if the
LOH ratio of the two alleles studied is >2.0 or <0.5 (see Methods 2.1.6.4 for
summary o f LOH). Table 9 -4 summarises the LOH findings in the three
adenomas studied.
Figure 9-10 Fluorescent in-situ hybridisation for X and Y chromosomes on
adenoma of XO/XY patient with FAP, A - H&E stain x20, B - crypts
demonstrated with FISH, C - FISH demonstrating XY and XO crypts adjacent
to each other, X chromosome = green and Y chromosome = red, DAPI = blue.
D - XO crypt, E = XY crypt
239

JL- J_̂ JL
LOH analysis at codon 1309 APC
A B
Figure 9-11 LOH analysis at codon 1309 APC in adenoma (1) from XO/XY
patient with FAP. A - H&E stain x20, B - crypt 1 has no LOH and crypts 2-4
have LOH of the somatic (wt) allele o f APC demonstrating different clonal
origin
Adenoma ID Crypt no LOH ratio Clonality
1 1 0.55 polyclonal2 4.263 4.234 5.27
2 1 4.49 polyclonal2 2.193 1.384 1.33
3 1 5.32 polyclonal2 9.193 5.424 3.655 1.24
Table 9-4 Summary o f LOH analysis at codon 1309 APC from single crypts
dissected from XO/XY individual with FAP. Blue shading = LOH present
(ratio >2.0)
240

9.4 Discussion
9.4.1 Theories of differing clonal origins of FAP, AFAP and
sporadic adenomas
This is the first study to investigate colorectal adenoma clonality in
individually dissected dysplastic crypts utilising a clonal marker specific to the
underlying pathogenesis o f the disease.
The finding that 100% of FAP adenomas were polyclonal including re
examination o f XO/XY FAP tissue supports the findings of Novelli and
Merritt in both human and mouse tissue (Novelli, Williamson et al. 1996)
(Merritt, Gould et al. 1997). There are no published studies o f clonality to date
in AFAP, the finding that 100% of adenomas studied were o f single clonal
origin is intriguing and lends weight to the theories o f random collision and
field cancerisation (as a result o f the first germline APC “hit”). The finding
that 75% of sporadic adenomas are clonal and 25% polyclonal is of great
interest. Evidence o f “top down” growth as demonstrated in sporadic adenoma
“mixed” crypts suggests active interaction between crypts and raises the
possibility that an adjacent dysplastic crypt may induce proliferation in its
neighbouring crypts.
Therefore, when considering existing theories of clonal origins in adenoma
development the data presented in this chapter supports some elements of the
random / regional collision, active interaction and field cancerisation theories.
Random or regional collision between independently arising neoplasms
Previously Novelli and Merritt have suggested random / regional collision as a
mechanism underlying polyclonality in FAP as a consequence o f high tumour
burden in FAP patients (Novelli, Williamson et al. 1996) and chimeric
ApcMin+/' mice (Merritt, Gould et al. 1997).
To test this hypothesis Thliveris et al reduced tumour multiplicity in the
chimeric ApcMin+/' mouse model used by Merritt et al by introducing
homozygosity for the tumour resistance allele of Moml. Overall tumour
multiplicity was reduced 8-fold but the percentage of mixed tumours ranged
241

from 8-63%, with a mean of 22% (Thliveris, Halberg et al. 2005). This figure
is higher than would be expected if heterotypic tumours are formed by random
collision when consideration o f tumour burden is taken into account.
Therefore it was suggested that random collision is an unlikely mechanism
leading to polyclonality in the chimaeric mouse model.
The finding o f a polyclonal sporadic adenoma in this study suggests a separate
pathological process to that o f FAP adenoma development and lends more
weight to the concept o f active interaction between dysplastic crypts and
environmental impact on gastro-intestinal epithelia in different regions of the
colon.
Active interaction between adjacent crypts
Thliveris and Novelli both believe active interaction between crypts to be the
most likely cause o f polyclonality observed in human and mouse models of
FAP. The possible mechanisms underlying this include microheterogeneity of
tumour susceptibility where local stroma promotes somatic mutation in
adjacent crypts - the so-called landscaper effect, or stem cell interaction
between neighbouring initiated crypts.
These concepts are supported by the observation of polyclonality in FAP
microadenomas o f 4 crypts diameter in this study. This may be a consequence
of paracrine secretion o f mitogens or stimulatory proliferogens from
neighbouring dysplastic crypts. A different explanation could be the direct
effects of epithelial-epithelial interactions between crypts initiating loss of
control of cellular proliferation (for example through epidermal growth factor
receptor signalling).
Support of epithelial-epithelial interaction causing increased cellular
proliferation can be found in mouse studies where hyperplastic (“colossal”)
crypts found adjacent to adenomas are found to have a higher rate of
proliferation (Bjerknes and Cheng 1999). The finding of increased Ki-67
expression in the upper half o f the “mixed” crypts studied in sporadic
adenomas supports this observation.
Field cancerisation
The theory o f “field cancerisation” was first suggested in the 1950s when it
was demonstrated that multiple oral tumours could arise from a field of
242

mutated cells following exposure to a known carcinogen (Slaughter,
Southwick et al. 1953). This (albeit old) theory is easily applicable to
colorectal epithelia when considering both FAP and AFAP germline first hits
and the impact o f environmental dietary / oxidative stress in the gastro
intestinal tract.
Histologically normal crypts in individuals with FAP (harbouring the germline
A PC mutation only) have a significantly different proliferation pattern to that
of wild-type crypts - with an upwards shift (towards the top o f the crypt) of
DNA synthesising (S-phase) cells (Potten, Kellett et al. 1992). Mathematical
modelling o f stem cell kinetics in FAP crypts led to similar results where
tumor initiation in the colon was thought to be due to crypt stem cell
overproduction and increased proliferation (Boman, Fields et al. 2001).
Methylation patterns in histologically normal FAP crypts differ to wild-type
crypts, these findings were consistent with slower clonal evolution and
subsequent stem cell survival advantage (Kim and Shibata 2004).
Studies o f mitochondrial DNA have identified patches o f clonally related
crypts occuring in normal human colon (Greaves, Preston et al. 2006).
Therefore if the first “hit” at APC alters cellular proliferation and stem cell
survival as discussed above it could theoretically give rise to a
morphologically normal “patch” o f colonic epithelia harbouring an identical
first hit mutation at APC. This could result in a field of stem cells harbouring a
first hit at APC which would be more susceptible to a second hit and
subsequent initiation o f the adenoma - carcinoma sequence. This could
explain the development o f clonal adenomas observed in AFAP. Therefore in
FAP and AFAP the entire colon could represent a fertile “field” for
development o f somatic mutations. If this theory is applied to my data it could
be suggested that in FAP active interaction occurs alongside the field effect of
the germline first hit resulting in polyclonal adenomas. In AFAP the germline
first hit at APC may result in a less mutation prone “field” therefore second -
and as demonstrated in this study and Sieber et al (Sieber, Segditsas et al.
2006) - third hits are required for initiation of the adenoma-carcinoma
sequence. As this would take a longer period of time chronologically it is
more likely that the resulting adenomas would be clonal.
243

9.4.2 Further work
These results although intriguing require further confirmation through analysis
of a greater number o f FAP, AFAP and sporadic adenomas. In particular
AFAP adenomas from individuals with 5’ and 3’ germline APC mutations
should be studied to determine whether they too are clonal in origin or
whether my observations relate to AFAP cases with alternatively spliced exon
9 germline mutations only.
In order to further understand pathogenic mechanisms in MYH tumorigenesis
and explore the effects o f environmental stresses on adenoma clonality a
collection o f MAP adenomas should also be studied.
9.5 Conclusions
Somatic APC mutations can be successfully utilised as clonal markers in
crypt-by-crypt analysis o f adenomas from their earliest stages (including
microadenomas from just 4 crypts in diameter).
The finding that FAP adenomas are polyclonal and AFAP adenomas are
clonal is intriguing - this lends support to the theories of active interaction and
random collision. Evidence o f “top down” growth again supports active
interaction and suggests that the “second hit” at APC would not always have
to occur in the bottom o f the intestinal crypt where stem cells reside.
A landscaper effect was excluded by the analysis o f histologically normal
tissue within adenomas which did not harbour APC mutations.
This is the first study to investigate colorectal adenoma clonality in individual
dysplastic crypts utilising a clonal marker specific to the underlying
pathogenesis.
244


10 Discussion and Conclusions
MYH related studies
MYH associated polyposis (MAP) is a recessively inherited colorectal cancer
syndrome accounting for -1% of all CRC. MAP is caused by inheritance of
bi-allelic mutations at MYH, a base excision repair (BER) glycosylase. MAP
leads to the development of multiple colorectal adenomas and CRC. To date,
there have been reports o f extra-colonic features associated with MAP, all in
small case series. There are known common pathogenic variants which occur
in MYH amongst different ethnic groups. Northern European populations have
a predominance o f Y165C and G382D mutations (Jones, Emmerson et al.
2002). Other variants include Y90X in patients of Pakistani origin and E466X
which has been found solely in patients o f Indian origin. An in frame deletion
ntl395delGGA has been identified in patients of Mediterranean origin
(Gismondi, Meta et al. 2004).
I studied a cohort o f 34 bi-allelic carriers o f MYH mutations, 18 E466X
homozygotes, with the remainder, either Y165C, G382D homozygotes or
compound heterozygotes (Y165C/G382D) in search of any genotype-
phenotype correlation (Chapter 3). Although a similar incidence of CRC was
observed between the Y165C, G382D and E466X homozygotes (62% and
61% respectively), a significantly higher number of the E466X homozygotes
developed Dukes stage (B-D) CRC (Table 3-3) than the Northern European
mutation carriers suggesting that E466X mutation carriers develop more
aggressive disease. This finding is borne out when comparing adenoma
burden, a total o f 8 E466X homozygote carriers developed >100 and <1000
adenomas with one exceptional individual developing 6250 adenomas. This
dataset includes the largest cohort of E466X homozygotes to be studied to
date. Future studies to investigate the effectiveness of E466X mutation carriers
to repair oxidative DNA damage should include site directed mutagenesis
studies in E.coli (previously undertaken in Y165C and G382D mutations). If it
were found that the E466X mutation were less able to repair oxidative DNA
damage this would support the finding that harbouring this mutation would
lead to the development o f a more aggressive phenotype. Further clinical
246

research should include collaborative studies to investigate this finding in
larger patient cohorts.
On commencing my thesis, screening and clinical surveillance guidelines for
MAP were under development, and the significance of being a heterozygous
MYH mutation carrier was the source of some debate. Through my study of bi-
allelic MYH mutation carriers it was determined that duodenal polyps occurred
in 28% and fundal polyps in 17% of homozygote patients necessitating upper
GI endoscopy as screening in all bi-allelic mutation carriers. This is now
accepted as best practice.
The development o f a mouse model o f MAP (Chapter 5) was particularly
useful in determination o f the significance of being a heterozygous MYH
mutation carrier. In my study heterozygous Myh+/~ mice had no increased risk
of tumour development than Myh+/+ mice. This data was published in 2004
before large population based studies in humans were available (Farrington,
Tenesa et al. 2005) (Webb, Rudd et al. 2006).
Further study o f MAP adenomas and colectomy specimens from MAP
patients found the presence o f microadenomas in colonic epithelium
demonstrating that “2 hits” at APC are necessary to initiate tumourigenesis
(Chapter 3). However, it is still not understood as to why APC (and the gastro
intestinal tract) appear to be targeted in MYH deficient individuals It could be
postulated that the GI tract is more vulnerable to defective BER through
environmental exposure to oxidative damage.
Array CGH analysis o f MAP tumours (Chapter 4) demonstrated evidence of
CIN in 78% (11/14) adenomas studied, with small-scale and large-scale
chromosomal changes observed. This included copy number neutral LOH (in
one o f 3 MAP adenomas examined by SNP-LOH). The observed small-scale
changes may be as a consequence of defective BER, whereas the large-scale
changes may represent abnormal function of APC as APC is targeted in MAP.
No correlation was identified between the size or grade of dysplasia in
adenomas studied and the number of losses and gains observed on aCGH.
Previous data had suggested that MAP tumours are diploid on flow-cytometry
(Lipton, Halford et al. 2003). At the same time as my study, Cardoso et al
(Cardoso, Molenaar et al. 2006) were also undertaking aCGH analysis on
MAP tumours. The results o f Cardoso’s and mine are similar (in terms of site
247

and nature o f chromosomal changes cross the genome). However, Cardoso et
al used whole-genome amplification o f extracted DNA prior to aCGH
hybridisation. This step is likely to introduce atrefactual errors making
interpretation o f their data more difficult. Both aCGH and flow-cytometry are
limited by their lack o f sensitivity in identifying copy number neutral LOH,
the finding o f copy-number neutral LOH through SNP-LOH analysis is
particularly interesting as it may represent small-scale genome wide changes
associated with the underlying defect in BER. This data suggests that the
previous analysis o f MAP adenomas by flow cytometry should not be
dismissed as those tumours studied may have harboured copy number neutral
LOH.
The development o f the first mouse model of MAP (Apc^^'/M yh^ mice bred
on C57BL6/SV129 genetic background) (Chapter 5) was successful in that
this mouse developed several features in keeping with the human MAP
syndrome, those o f intestinal adenoma development and evidence of somatic
G:C>T:A transversions at Ape. However, due to the influence of the Min allele
on adenoma development the majority o f adenomas developed in this model
lost the second allele o f Ape through LOH rather than through truncating
mutations (as observed in human MAP). Furthermore, somatic Ape mutation
screening in these animals suggested a polyclonal origin from the ApcMin+/' /
Myh'1' mice studied. This finding was explored further in the clonal analysis of
adenoma development in Chapter 9.
It is still not understood why when Myh is knocked out alone in mice no
gastrointestinal phenotype develops. The influence of the genetic background
on which the mouse is bred appears to have a profound effect. This was borne
out in the development o f the second mouse model of MAP whereby none of
the animals developed a gastro-intestinal phenotype when bred on the AKR
genetic background. The basis of the second mouse model of MAP was to
produce a mouse model was to reduce the incidence of LOH at Ape as the
second hit in adenoma development by breeding ApcMin+/' / Myh'1' mice on
the AKR genetic background. My study, alongside the findings of Sakamoto
et al (Sakamoto, Tominaga et al. 2007), who developed a mouse model of
MAP during the course o f my thesis, have provided evidence that mouse
models o f MAP (on both the C57B6 and AKR genetic background) appear to
248

require a second promoter o f tumorigenesis either through external oxidative
stress (Sakamoto, Tominaga et al. 2007), or inherited mutations through the
ApcMin+/' allele.
Pathogenesis and identification o f potential candidate genes in the MCRA
phenotype
To date, the understanding o f the underlying pathogenesis of the multiple
colorectal adenoma phenotype (individuals who develop between 5-100
adenomas) includes the identification of a subset cases with underlying
germline APC mutations (AFAP) and bi-alleleic MYH mutation carriers,
together these account for up to 50% of cases. Previously, candidate gene
screens have included those involved in Wnt signalling (APC2, conductin and
GSK3/3) the TGF-/3 pathway {SMAD4 and BMPR1A) and DNA repair (NEIL2,
TDG, UNG2, NTHL1, NEJL2, MPG and SMUG1) (Lipton, Sieber et al. 2003)
(Broderick, Bagratuni et al. 2006). No pathogenic germline predisposition
genes were identified.
I set out to determine potential pathogenic mechanisms and candidate genes in
the MCRA phenotype utilising several approaches in tandem.
In my study o f 25 MCRA cases (with no underlying APC or MYH mutations),
I demonstrated disruption o f Wnt signalling in MCRA cases through increased
nuclear B-catenin expression on immunohistochemistry when compared to
sporadic adenomas (Chapter 6). Somatic mutation screening at APC was
undertaken in MCRA cases in order to identify any mutational signature
indicative o f an underlying defect in DNA repair. No such mutational
signature was identified. However, on lymphoblastoid cell line expression
array analysis on 11 MCRA cases and controls (Chapter 7), 3 candidate genes
(all related to DNA repair) were identified. Expression of DUT, CXCR4 and
POLE2 were all reduced >3 fold in MCRA cases when compared to controls.
These were taken forward for screening as potential candidate genes with 12
other candidates in Chapter 8. Further work of interest in utilising expression
analysis in lymphoblastoid cell lines would include the inhibition of nonsense
mediated decay (NMD) in order to identify transcripts harbouring mutations,
this would be within the remit that lymphocytes express the genes of interest.
249

On guidance o f the results from Chapters 6 and 7, and from evidence in
current literature, 15 candidate genes were screened in 95 MCRA cases in
Chapter 8. These included Wnt related genes following the discovery of
significantly increased nuclear B-catenin expression in MCRA cases in
Chapter 6 and the DNA repair genes DUT, CXCR4 and POLE2 as identified in
Chapter 7.
The most interesting and significant finding was the V154G heterozygous
SNP (rs 1802838) found in exon 7 of DUT which was identified in 11% of
MCRA cases (Hardy-Weinberg x2 0.34) and 0% (0/47) of controls screened.
This SNP is predicted to alter the UTPase region of the gene and could
potentially be deleterious. Further studies o f this SNP are warranted in an
independent MCRA cohort and a larger control population. At this time
population based data is not available for this SNP through the HapMap
consortium.
My data suggest that the remaining MCRA genes as yet to be identified would
include further candidates from the Wnt signalling pathway (including Wnt
inhibitory factors) and DNA repair genes. It is likely that the remaining genes
are o f low to moderate penetrance and multiple loci may be involved.
Therefore future strategies should incorporate a genome wide association
studies in selected cases and controls, and whole genome sequencing in
carefully selected MCRA cases.
Investigation o f clonality in adenoma development
In Chapter 9, I demonstrated that somatic APC mutations can be successfully
utilised as clonal markers in adenoma development. This is the first clonal
marker in CRC which utilises a marker relevant to the pathogenesis of the
underlying disease.
Clonality in FAP, AFAP and sporadic adenomas were studied through laser-
capture micro-dissection o f individual crypts and subsequent analysis of DNA
for somatic mutations at APC which were used as clonal markers.
The findings were intriguing, 100% of FAP adenomas were found to be
polyclonal which support previous studies in both human and mouse models
of FAP (Novelli, Williamson et al. 1996) (Merritt, Gould et al. 1997). One
hundred percent o f AFAP adenomas were clonal (with one adenoma
250

demonstrating 2nd and 3rd hits at APC in every crypt dissected). This is the first
study of clonality in AFAP and supports Sieber et a l’s findings that up to three
hits at APC are required to initiate tumorigenesis (Sieber, Segditsas et al.
2006). All AFAP adenomas studied were from individuals with a germline
mutation in the altemitvely spliced region of exon 9 (R332X) therefore further
studies should include individuals with both 5’ and 3’ germline mutations at
APC.
Interestingly, examination o f sporadic adenomas found evidence to support
“top down” growth in crypts leading weight to the theory of “active
interaction” between crypts in the colorectal epithelium suggested by
(Thliveris, Halberg et al. 2005). This finding also questions the role of stem
cells the transition from normal to dyplastic crypt architecture as stem cells
reside in the bottom o f the intestinal crypt. Therefore, my data (albeit in
limited numbers o f sporadic adenomas) supports “top down” growth as
suggested by Shih et al (Shih, Wang et al. 2001).
Future work should include the study of a greater number of adenomas from
each group including AFAP tumours from individuals with 5’ and 3’ germline
mutations.
In terms o f furthering the understanding MAP tumours particularly in light of
findings o f evidence o f polyclonality in the MAP mouse model (although it is
likely that this was driven by the Min allele), it is planned that this
experimental technique be applied to MAP adenomas. This work is planned
for the future.
In conclusion, the work in this thesis has helped to further define the clinico-
pathological features o f MAP, and through the development of a mouse
model, demonstrate that there is no increased risk o f tumour development in
heterozygous carriers. I have furthered the understanding of the pathogenesis
of MAP adenomas by demonstrating chromosomal instability (both small and
large-scale) in 78% of adenomas from MAP patients through aCGH analysis.
On studying MCRA cases, I identified and screened potential candidate genes
from the Wnt signalling signalling pathway and DNA repair. I subsequently
identified a non-synonymous SNP in exon 7 of DUT in 11% of MCRA cases
which has pathogeneic potential. Future approaches in MCRA gene
251

identification would include genome-wide association studies and whole
genome sequencing in selected MCRA cases.
Investigation of clonality in FAP, AFAP and sporadic adenomas has furthered
the understanding o f pathogenesis o f adenoma development, in particular
AFAP, and questioned some long-held beliefs in CRC pathogenesis.
252

Publications and conference proceedings
1: Colorectal cancer and inherited mutations in base excision repair.
Elizabeth Chow, Christina Thirlwell, Lara Lipton. Lancet Oncology 2004;
vol 5: iss 10, 600-606
2: An update on the genetics of colorectal cancer.
Z Kemp, C Thirlwell, O Sieber, A Silver, I Tomlinson. Human and
M olecular Genetics 2004; 13: R177-R185
3: Myh Deficiency Enhances Intestinal Tumourigenesis in Multiple Intestinal
Neoplasia (ApcM in+/') Mice.
Oliver M. Sieber, Kimberley M. Howarth, Christina Thirlwell, Nikki
Mandir, Robert A. Goodlad, Ashfaq Gilkar, Bradley Spencer-Dene, Gordon
Stamp, Victoria Johnson, Andrew Silver, Jeffrey H. Miller, Mohammad Ilyas,
and Ian P. M. Tomlinson. Cancer Research 2004 15; 64 (24): 8876-81
4: Investigation of pathogenic mechanisms in multiple colorectal adenoma
patients. C Thirlwell, KM Howarth, S Segitsas, G Guerra, HJW Thomas,
RKS Phillips, IC Talbot, M Gorman, MR Novelli, OM Sieber, IPM
Tomlinson. BJC 2007 Jun 4; 96(11): 1729-34.
5: Disease severity and genetic pathways in attenuated familial polyposis vary
greatly but depend on the site of germline mutation. O. Sieber, S.Segditsas,
A.. Knudsen, J.Zhang, J.Luz, A.Rowan, S.Spain, C.Thirlwell, K. Howarth,
E.Jaeger, J.Robinson, E.Volikos, A.Silver, G.Kelly, S.Aretz, I.Frayling,
P.Hutter, M.Dunlop, K.Neale, R.Phillips, L.Aaltonen, K.Heinimann and I.
Tomlinson. Gut 2006; 55(10); 1440-48.

6: Analysis of copy number changes suggests chromosomal instability in a
minority of large colorectal adenomas. Angela Jones, Christina Thirlwell,
Kimberley Howarth, Trevor Graham, William Chambers, Stefania Segditsas,
Karen Page, Robin Phillips, Huw Thomas, Oliver Sieber, Elinor Sawyer, Ian
Tomlinson. J Path 2007 Nov; 213(3): 249-56.
Oral Proceedings
1: The clonal origin of Human tumours - is FAP different?
British Pathological Society Centenary Meeting, July 2006.
2: Utilising somatic Adenomatous Polyposis Coli (APC) mutations as clonal
markers in colonic adenomas. International Society for Gastrointestinal
Hereditary Tumours, Yokohama, Japan. March 2007.

12 References
Abdel-Rahman, W. M., S. Knuutila, et al. (2008). "Truncation of MBD4
predisposes to reciprocal chromosomal translocations and alters the
response to therapeutic agents in colon cancer cells." DNA Repair
(Amst) 7(2): 321-8.
Aguilera, O., M. F. Fraga, et al. (2006). "Epigenetic inactivation of the Wnt
antagonist DICKKOPF-1 (DKK-1) gene in human colorectal cancer."
Oncogene 25(29): 4116-21.
Ajith Kumar, V. K., J. A. Gold, et al. (2007). "Sebaceous adenomas in an
MYH associated polyposis patient of Indian (Gujarati) origin." Fam
Cancer.
Al-Tassan, N., N. H. Chmiel, et al. (2002). "Inherited variants o f MYH
associated with somatic G:C—>T:A mutations in colorectal tumors."
Nat Genet 30(2): 227-32.
Al-Tassan, N., T. Eisen, et al. (2004). "Inherited variants in MYH are unlikely
to contribute to the risk o f lung carcinoma." Hum Genet 114(2): 207-
10.
Alberici, P., E. de Pater, et al. (2007). "Aneuploidy arises at early stages of
Ape-driven intestinal tumorigenesis and pinpoints conserved
chromosomal loci o f allelic imbalance between mouse and human."
Am J Pathol 170(1): 377-87.
Albuquerque, C., C. Breukel, et al. (2002). "The ’just-right' signaling model:
APC somatic mutations are selected based on a specific level of
activation of the beta-catenin signaling cascade." Hum Mol Genet
11(13): 1549-60.
Alexander, P. (1985). "Do cancers arise from a single transformed cell or is
monoclonality o f tumours a late event in carcinogenesis?" Br J Cancer
51(4): 453-7.
Anderson, G. L., M. Limacher, et al. (2004). "Effects of conjugated equine
estrogen in postmenopausal women with hysterectomy: the Women's
Health Initiative randomized controlled trial." Jama 291(14): 1701-12.
255

Ashbumer, M., C. A. Ball, et al. (2000). "Gene ontology: tool for the
unification of biology. The Gene Ontology Consortium." Nat Genet
25(1): 25-9.
Audebert, M., S. Chevillard, et al. (2000). "Alterations of the DNA repair gene
OGGI in human clear cell carcinomas of the kidney." Cancer Res
60(17): 4740-4.
Bach, S. P., A. G. Renehan, et al. (2000). "Stem cells: the intestinal stem cell
as a paradigm." Carcinogenesis 21(3): 469-76.
Bader, S., M. Walker, et al. (1999). "Somatic ffameshift mutations in the
MBD4 gene o f sporadic colon cancers with mismatch repair
deficiency." Oncogene 18(56): 8044-7.
Baker, S. M., A. C. Harris, et al. (1998). "Enhanced intestinal adenomatous
polyp formation in Pms2-/-;Min mice." Cancer Res 58(6): 1087-9.
Balaguer, F., S. Castellvi-Bel, et al. (2007). "Identification of MYH mutation
carriers in colorectal cancer: a multicenter, case-control, population-
based study." Clin Gastroenterol Hepatol 5(3): 379-87.
Bandipalliam, P. (2005). "Syndrome of early onset colon cancers, hematologic
malignancies & features o f neurofibromatosis in HNPCC families with
homozygous mismatch repair gene mutations." Fam Cancer 4(4): 323-
33.
Baris, H. N., I. Kedar, et al. (2007). "Prevalence of breast and colorectal
cancer in Ashkenazi Jewish carriers of Fanconi anemia and Bloom
syndrome." Isr Med Assoc J 9(12): 847-50.
Bametson, R. A., L. Devlin, et al. (2007). "Germline mutation prevalence in
the base excision repair gene, MYH, in patients with endometrial
cancer." Clin Genet.
Baron, J. A., B. F. Cole, et al. (2003). "A randomized trial of aspirin to prevent
colorectal adenomas." N Engl J Med 348(10): 891-9.
Bartkova, J., Z. Horejsi, et al. (2005). "DNA damage response as a candidate
anti-cancer barrier in early human tumorigenesis." Nature 434(7035):
864-70.
Batlle, E., J. Bacani, et al. (2005). "EphB receptor activity suppresses
colorectal cancer progression." Nature 435(7045): 1126-30.
256

Batlle, E., J. T. Henderson, et al. (2002). "Beta-catenin and TCF mediate cell
positioning in the intestinal epithelium by controlling the expression of
EphB/ephrinB." Cell 111(2): 251-63.
Baumgart, D. C. and S. R. Carding (2007). "Inflammatory bowel disease:
cause and immunobiology." Lancet 369(9573): 1627-40.
Bentley, D. R. (2006). "Whole-genome re-sequencing." Curr Opin Genet Dev
16(6): 545-52.
Bergstrom, A., P. Pisani, et al. (2001). "Overweight as an avoidable cause of
cancer in Europe." Int J Cancer 91(3): 421-30.
Bernstein, D. A., M. C. Zittel, et al. (2003). "High-resolution structure of the
E.coli RecQ helicase catalytic core." Embo J 22(19): 4910-21.
Beutler, E., Z. Collins, et al. (1967). "Value of genetic variants o f glucose-6-
phosphate dehydrogenase in tracing the origin of malignant tumors." N
Engl J Med 276(7): 389-91.
Bisgaard, M. L., K. Fenger, et al. (1994). "Familial adenomatous polyposis
(FAP): frequency, penetrance, and mutation rate." Hum Mutat 3(2):
121-5.
Bjerknes, M. (1986). "A test of the stochastic theory o f stem cell
differentiation." Biophvs J 49(6): 1223-7.
Bjerknes, M. and H. Cheng (1999). "Colossal crypts bordering colon
adenomas in Apc(Min) mice express full-length Ape." Am J Pathol
154(6): 1831-4.
Bjerknes, M., H. Cheng, et al. (1997). "APC mutation and the crypt cycle in
murine and human intestine." Am J Pathol 150(3): 833-9.
Blair, N. P. and C. L. Trempe (1980). "Hypertrophy o f the retinal pigment
epithelium associated with Gardner's syndrome." Am J Ophthalmol
90(5): 661-7.
Boardman, L. A., S. N. Thibodeau, et al. (1998). "Increased risk for cancer in
patients with the Peutz-Jeghers syndrome." Ann Intern Med 128(11):
896-9.
Boman, B. M., J. Z. Fields, et al. (2001). "Computer modeling implicates stem
cell overproduction in colon cancer initiation." Cancer Res 61(23):
8408-11.
257

Bouguen, G., S. Manfredi, et al. (2007). "Colorectal Adenomatous Polyposis
Associated with MYH Mutations: Genotype and Phenotype
Characteristics." Pis Colon Rectum 50(10): 1612-1617.
Boyer, J. C., A. Umar, et al. (1995). "Microsatellite instability, mismatch
repair deficiency, and genetic defects in human cancer cell lines."
Cancer Res 55(24): 6063-70.
Broderick, P., T. Bagratuni, et al. (2006). "Evaluation of NTHL1, NEIL1,
NEIL2, MPG, TDG, UNG and SMUG1 genes in familial colorectal
cancer predisposition." BMC Cancer 6: 243.
Broderick, P., L. Carvajal-Carmona, et al. (2007). "A genome-wide
association study shows that common alleles o f SMAD7 influence
colorectal cancer risk." Nat Genet 39(11): 1315-7.
Brownstein, M. H., A. H. Mehregan, et al. (1979). "The dermatopathology of
Cowden's syndrome." Br J Dermatol 100(6): 667-73.
Bulow, S. (1986). "Clinical features in familial polyposis coli. Results of the
Danish Polyposis Register." Pis Colon Rectum 29(2): 102-7.
Burkitt, D. P. (1969). "Related disease—related cause?" Lancet 2(7632): 1229-
31.
Bum, J., P. D. Chapman, et al. (1998). "Diet and cancer prevention: the
concerted action polyp prevention (CAPP) studies." Proc Nutr Soc
57(2): 183-6.
Burt, R. W., Jass, J.R. (2000). Hyperplastic Polyposis. Berlin, Springer-
Verlag.
Byun, T., M. Karimi, et al. (2005). "Expression of secreted Wnt antagonists in
gastrointestinal tissues: potential role in stem cell homeostasis." J Clin
Pathol 58(5): 515-9.
Cahill, D. P., C. Lengauer, et al. (1998). "Mutations of mitotic checkpoint
genes in human cancers." Nature 392(6673): 300-3.
Caimie, A. B. and B. H. Millen (1975). "Fission of crypts in the small
intestine o f the irradiated mouse." Cell Tissue Kinet 8(2): 189-96.
Cannon-Albright, L. A., M. H. Skolnick, et al. (1988). "Common inheritance
o f susceptibility to colonic adenomatous polyps and associated
colorectal cancers." N Engl J Med 319(9): 533-7.
258

Cardoso, J., L. Molenaar, et al. (2006). ’’Chromosomal instability in MYH-
and APC-mutant adenomatous polyps." Cancer Res 66(5): 2514-9.
Carvajal-Carmona, L., K. Howarth, et al. (2007). "Molecular classification and
genetic pathways in hyperplastic polyposis syndrome." J Pathol.
Caspari, R., S. Olschwang, et al. (1995). "Familial adenomatous polyposis:
desmoid tumours and lack o f ophthalmic lesions (CHRPE) associated
with APC mutations beyond codon 1444." Hum Mol Genet 4(3): 337-
40.
Castellone, M. D., H. Teramoto, et al. (2005). "Prostaglandin E2 promotes
colon cancer cell growth through a Gs-axin-beta-catenin signaling
axis." Science 310(5753): 1504-10.
Chan, A. T., E. L. Giovannucci, et al. (2005). "Long-term use of aspirin and
nonsteroidal anti-inflammatory drugs and risk of colorectal cancer."
Jama 294(8): 914-23.
Chan, T. L., W. Zhao, et al. (2003). "BRAF and KRAS mutations in colorectal
hyperplastic polyps and serrated adenomas." Cancer Res 63(16): 4878-
81.
Cheng, H., M. Bjerknes, et al. (1986). "Crypt production in normal and
diseased human colonic epithelium." Anat Rec 216(1): 44-8.
Cheng, H. and C. P. Leblond (1974). "Origin, differentiation and renewal of
the four main epithelial cell types in the mouse small intestine. V.
Unitarian Theory o f the origin o f the four epithelial cell types." Am J
Anat 141(4): 537-61.
Chlebowski, R. T., J. Wactawski-Wende, et al. (2004). "Estrogen plus
progestin and colorectal cancer in postmenopausal women." N Engl J
Med 350(10): 991-1004.
Chmiel, N. H., A. L. Livingston, et al. (2003). "Insight into the functional
consequences o f inherited variants of the hMYH adenine glycosylase
associated with colorectal cancer: complementation assays with hMYH
variants and pre-steady-state kinetics of the corresponding mutated
E.coli enzymes." J Mol Biol 327(2): 431-43.
Cho, E., S. A. Smith-Warner, et al. (2004). "Alcohol intake and colorectal
cancer: a pooled analysis o f 8 cohort studies." Ann Intern Med 140(8):
603-13.
259

Church, J. M., V. W. Fazio, et al. (1988). "Small colorectal polyps. Are they
worth treating?" Pis Colon Rectum 31(1): 50-3.
Clark, J., S. Edwards, et al. (2003). "Genome-wide screening for complete
genetic loss in prostate cancer by comparative hybridization onto
cDNA microarrays." Oncogene 22(8): 1247-52.
Clark, J., S. Edwards, et al. (2002). "Identification of amplified and expressed
genes in breast cancer by comparative hybridization onto microarrays
o f randomly selected cDNA clones." Genes Chromosomes Cancer
34(1): 104-14.
Cleary, S. P., W. Zhang, et al. (2003). "Heterozygosity for the BLM(Ash)
mutation and cancer risk." Cancer Res 63(8): 1769-71.
Clement, G., I. Guilleret, et al. (2008). "Epigenetic alteration of the Wnt
inhibitory factor-1 promoter occurs early in the carcinogenesis of
Barrett's esophagus." Cancer Sci 99(1): 46-53.
Colliver, D. W., N. P. Crawford, et al. (2006). "Molecular profiling of
ulcerative colitis-associated neoplastic progression." Exp Mol Pathol
80(1): 1-10.
Coogan, P. F., J. Smith, et al. (2007). "Statin use and risk o f colorectal
cancer." J Natl Cancer Inst 99(1): 32-40.
Cormier, R. T., A. Bilger, et al. (2000). "The Mom 1 AKR intestinal tumor
resistance region consists o f Pla2g2a and a locus distal to D4Mit64."
Oncogene 19(28): 3182-92.
Crabtree, M., O. M. Sieber, et al. (2003). "Refining the relation between 'first
hits' and 'second hits' at the APC locus: the 'loose fit' model and
evidence for differences in somatic mutation spectra among patients."
Oncogene 22(27): 4257-65.
Crabtree, M. D., I. P. Tomlinson, et al. (2001). "Variability in the severity of
colonic disease in familial adenomatous polyposis results from
differences in tumour initiation rather than progression and depends
relatively little on patient age." Gut 49(4): 540-3.
Crawford, N. P., D. W. Colliver, et al. (2005). "Characterization of genotype-
phenotype relationships and stratification by the CARD 15 variant
genotype for inflammatory bowel disease susceptibility loci using
260

multiple short tandem repeat genetic markers." Hum Mutat 25(2): 156-
66.
Croitoru, M. E., S. P. Cleary, et al. (2007). "Germline MYH mutations in a
clinic-based series o f Canadian multiple colorectal adenoma patients."
J Surg Oncol 95(6): 499-506.
Csizmadi, I., J. P. Collet, et al. (2004). "The effects of transdermal and oral
oestrogen replacement therapy on colorectal cancer risk in
postmenopausal women." Br J Cancer 90(1): 76-81.
Cummings, J. H. and H. N. Englyst (1987). "Fermentation in the human large
intestine and the available substrates." Am J Clin Nutr 45(5 Suppl):
1243-55.
Cybulski, C., B. Gorski, et al. (2004). "CHEK2 is a multiorgan cancer
susceptibility gene." Am J Hum Genet 75(6): 1131-5.
De Ferro, S. M., P. Lage, et al. (2007). "[MYH associated poliposis: severe
phenotype in the homozigoty for the 1103delC mutation]." Acta Med
Port 20(3): 243-7.
de Jong, M. M., I. M. Nolte, et al. (2002). "Low-penetrance genes and their
involvement in colorectal cancer susceptibility." Cancer Epidemiol
Biomarkers Prev 11(10: 1332-52.
Debinski, H. S., J. Trojan, et al. (1995). "Effect of sulindac on small polyps in
familial adenomatous polyposis." Lancet 345(8953): 855-6.
Deka, J., J. Kuhlmann, et al. (1998). "A domain within the tumor suppressor
protein APC shows very similar biochemical properties as the
microtubule-associated protein tau." Eur J Biochem 253(3): 591-7.
Demple, B. and L. Harrison (1994). "Repair of oxidative damage to DNA:
enzymology and biology." Annu Rev Biochem 63: 915-48.
Dennis, G., Jr., B. T. Sherman, et al. (2003). "DAVID: Database for
Annotation, Visualization, and Integrated Discovery." Genome Biol
4(5): P3.
Dietrich, W. F., E. S. Lander, et al. (1993). "Genetic identification of Mom-1,
a major modifier locus affecting Min-induced intestinal neoplasia in
the mouse." Cell 75(4): 631-9.
Doll (2003). Epidemiology of Cancer. C. T. Warrell D, Oxford University
Press.
261

Doll, R. and R. Peto (1981). "The causes o f cancer: quantitative estimates of
avoidable risks o f cancer in the United States today." J Natl Cancer
Inst 66(6): 1191-308.
Dormond, O., A. Foletti, et al. (2001). "NSAIDs inhibit alpha V beta 3
integrin-mediated and Cdc42/Rac-dependent endothelial-cell
spreading, migration and angiogenesis." Nat Med 7(9): 1041-7.
Douglas, E. J., H. Fiegler, et al. (2004). "Array comparative genomic
hybridization analysis o f colorectal cancer cell lines and primary
carcinomas." Cancer Res 64(14): 4817-25.
Dubois, R. N., S. B. Abramson, et al. (1998). "Cyclooxygenase in biology and
disease." Faseb J 12(12): 1063-73.
DuBois, R. N., F. M. Giardiello, et al. (1996). "Nonsteroidal anti
inflammatory drugs, eicosanoids, and colorectal cancer prevention."
Gastroenterol Clin North Am 25(4): 773-91.
Eberhart, C. E., R. J. Coffey, et al. (1994). "Up-regulation of cyclooxygenase
2 gene expression in human colorectal adenomas and
adenocarcinomas." Gastroenterology 107(4): 1183-8.
Egashira, A., K. Yamauchi, et al. (2002). "Mutational specificity o f mice
defective in the MTH1 and/or the MSH2 genes." DNA Repair fAmsf)
1(11): 881-93.
Englyst, H. N., H. Trowell, et al. (1987). "Dietary fiber and resistant starch."
Am J Clin Nutr 46(6): 873-4.
Enholm, S., T. Hienonen, et al. (2003). "Proportion and phenotype o f MYH-
associated colorectal neoplasia in a population-based series o f Finnish
colorectal cancer patients." Am J Pathol 163(3): 827-32.
Esteller, M., R. A. Risques, et al. (2001). "Promoter hypermethylation of the
DNA repair gene 0(6)-methylguanine-DNA methyltransferase is
associated with the presence of G:C to A:T transition mutations in p53
in human colorectal tumorigenesis." Cancer Res 61(12): 4689-92.
Esteller, M., A. Sparks, et al. (2000). "Analysis of adenomatous polyposis coli
promoter hypermethylation in human cancer." Cancer Res 60(16):
4366-71.
Esteller, M., M. Toyota, et al. (2000). "Inactivation of the DNA repair gene
06-methylguanine-DNA methyltransferase by promoter
262

hypermethylation is associated with G to A mutations in K-ras in
colorectal tumorigenesis." Cancer Res 60(9): 2368-71.
Evertsson, S., A. Lindblom, et al. (2001). "APC I1307K and E1317Q variants
are rare or do not occur in Swedish colorectal cancer patients." Eur J
Cancer 37(4): 499-502.
Farrington, S. M., A. Tenesa, et al. (2005). "Germline susceptibility to
colorectal cancer due to base-excision repair gene defects." Am J Hum
Genet 77(1): 112-9.
Feamhead, N. S., J. L. Wilding, et al. (2004). "Multiple rare variants in
different genes account for multifactorial inherited susceptibility to
colorectal adenomas." Proc Natl Acad Sci U S A 101(45): 15992-7.
Fearon, E. R., S. R. Hamilton, et al. (1987). "Clonal analysis of human
colorectal tumors." Science 238(4824): 193-7.
Feng, Y., C. C. Broder, et al. (1996). "HIV-1 entry cofactor: functional cDNA
cloning o f a seven-transmembrane, G protein-coupled receptor."
Science 272(5263): 872-7.
Fernandez, E., C. La Vecchia, et al. (2001). "Oral contraceptives and
colorectal cancer risk: a meta-analysis." Br J Cancer 84(5): 722-7.
Fiegler, H., P. Carr, et al. (2003). "DNA microarrays for comparative genomic
hybridization based on DOP-PCR amplification of BAC and PAC
clones." Genes Chromosomes Cancer 36(4): 361-74.
Figer, A., R. Shtoyerman-Chen, et al. (2001). "Phenotypic characteristics of
colo-rectal cancer in I1307K APC germline mutation carriers
compared with sporadic cases." Br J Cancer 85(9): 1368-71.
Fodde, R., J. Kuipers, et al. (2001). "Mutations in the APC tumour suppressor
gene cause chromosomal instability." Nat Cell Biol 3(4): 433-8.
Frayling, I. M., N. E. Beck, et al. (1998). "The APC variants I1307K and
E1317Q are associated with colorectal tumors, but not always with a
family history." Proc Natl Acad Sci U S A 95(18): 10722-7.
Fromme, J. C., A. Baneijee, et al. (2004). "Structural basis for removal of
adenine mispaired with 8-oxoguanine by MutY adenine DNA
glycosylase." Nature 427(6975): 652-6.
Gaasenbeek, M., K. Howarth, et al. (2006). "Combined array-comparative
genomic hybridization and single-nucleotide polymorphism-loss of
263
heterozygosity analysis reveals complex changes and multiple forms of
chromosomal instability in colorectal cancers." Cancer Res 66(7):
3471-9.
Gentleman, R. C., V. J. Carey, et al. (2004). "Bioconductor: open software
development for computational biology and bioinformatics." Genome
BM 5(10): R80.
Giardiello, F. M. (1994). "Sulindac and polyp regression." Cancer Metastasis
Rev 13(3-4): 279-83.
Giardiello, F. M., J. D. Brensinger, et al. (2000). "Very high risk of cancer in
familial Peutz-Jeghers syndrome." Gastroenterology 119(6): 1447-53.
Giardiello, F. M., S. B. Welsh, et al. (1987). "Increased risk of cancer in the
Peutz-Jeghers syndrome." N Engl J Med 316(24): 1511-4.
Gillen, C. D., R. S. Walmsley, et al. (1994). "Ulcerative colitis and Crohn’s
disease: a comparison of the colorectal cancer risk in extensive colitis."
Gut 35(11): 1590-2.
Gismondi, V., L. Bonelli, et al. (2002). "Prevalence of the E1317Q variant of
the APC gene in Italian patients with colorectal adenomas." Genet Test
6(4): 313-7.
Gismondi, V., M. Meta, et al. (2004). "Prevalence of the Y165C, G382D and
1395delGGA germline mutations o f the MYH gene in Italian patients
with adenomatous polyposis coli and colorectal adenomas." Int J
Cancer 109(5): 680-4.
Gogos, A., J. Cillo, et al. (1996). "Specific recognition of A/G and A/7,8-
dihydro-8-oxoguanine (8-oxoG) mismatches by Escherichia coli
MutY: removal o f the C-terminal domain preferentially affects A/8-
oxoG recognition." Biochemistry 35(51): 16665-71.
Goldstein, N. S., P. Bhanot, et al. (2003). "Hyperplastic-like colon polyps that
preceded microsatellite-unstable adenocarcinomas." Am J Clin Pathol
119(6): 778-96.
Goode, E. L., C. M. Ulrich, et al. (2002). "Polymorphisms in DNA repair
genes and associations with cancer risk." Cancer Epidemiol
Biomarkers Prev 11(12): 1513-30.
Gorlin, R. J., M. M. Cohen, Jr., et al. (1992). "Bannayan-Riley-Ruvalcaba
syndrome." Am J Med Genet 44(3): 307-14.
264

Gould, K. A., W. F. Dietrich, et al. (1996). "Moml is a semi-dominant
modifier o f intestinal adenoma size and multiplicity in Min/+ mice."
Genetics 144(4): 1769-76.
Greaves, L. C., S. L. Preston, et al. (2006). "Mitochondrial DNA mutations are
established in human colonic stem cells, and mutated clones expand by
crypt fission." Proc Natl Acad Sci U S A 103(3): 714-9.
Groden, J., L. Gelbert, et al. (1993). "Mutational analysis of patients with
adenomatous polyposis: identical inactivating mutations in unrelated
individuals." Am J Hum Genet 52(2): 263-72.
Groden, J., A. Thliveris, et al. (1991). "Identification and characterization of
the familial adenomatous polyposis coli gene." Cell 66(3): 589-600.
Grodstein, F., P. A. Newcomb, et al. (1999). "Postmenopausal hormone
therapy and the risk of colorectal cancer: a review and meta-analysis."
Am J Med 106(5): 574-82.
Groves, C., H. Lamlum, et al. (2002). "Mutation cluster region, association
between germline and somatic mutations and genotype-phenotype
correlation in upper gastrointestinal familial adenomatous polyposis."
Am J Pathol 160(6): 2055-61.
Gruber, S. B., N. A. Ellis, et al. (2002). "BLM heterozygosity and the risk of
colorectal cancer." Science 297(5589): 2013.
Gryfe, R., N. Di Nicola, et al. (1998). "Somatic instability of the APC I1307K
allele in colorectal neoplasia." Cancer Res 58(18): 4040-3.
Gryfe, R., N. Di Nicola, et al. (1999). "Inherited colorectal polyposis and
cancer risk o f the APC I1307K polymorphism." Am J Hum Genet
64(2): 378-84.
Guan, Y., R. C. Manuel, et al. (1998). "MutY catalytic core, mutant and bound
adenine structures define specificity for DNA repair enzyme
superfamily." Nat Struct Biol 5(12): 1058-64.
Hahnloser, D., G. M. Petersen, et al. (2003). "The APC E1317Q variant in
adenomatous polyps and colorectal cancers." Cancer Epidemiol
Biomarkers Prev 12(10): 1023-8.
Haigis, K. M., P. D. Hoff, et al. (2004). "Tumor regionality in the mouse
intestine reflects the mechanism of loss o f Ape function." Proc Natl
Acad Sci U S A 101(26): 9769-73.
265

Haiman, C. A., L. Le Marchand, et al. (2007). "A common genetic risk factor
for colorectal and prostate cancer." Nat Genet.
Halford, S., A. Rowan, et al. (2005). "0(6)-methylguanine methyltransferase
in colorectal cancers: detection of mutations, loss of expression, and
weak association with G:C>A:T transitions." Gut 54(6): 797-802.
Halford, S. E., A. J. Rowan, et al. (2003). "Germline mutations but not
somatic changes at the MYH locus contribute to the pathogenesis of
unselected colorectal cancers." Am J Pathol 162(5): 1545-8.
Hamilton, S. R., B. Liu, et al. (1995). "The molecular basis of Turcot's
syndrome." N Enel J Med 332(13): 839-47.
Hayashi, H., Y. Tominaga, et al. (2002). "Replication-associated repair of
adenine:8-oxoguanine mispairs by MYH." Curr Biol 12(4): 335-9.
Heiskanen, I. and H. J. Jarvinen (1996). "Occurrence of desmoid tumours in
familial adenomatous polyposis and results o f treatment." Int J
Colorectal Pis 11(4): 157-62.
Heiss, K. F., D. Schaffner, et al. (1993). "Malignant nsk in juvenile polyposis
coli: increasing documentation in the pediatric age group." J Pediatr
Surg 28(9): 1188-93.
Hemminki, A., D. Markie, et al. (1998). "A serine/threonine kinase gene
defective in Peutz-Jeghers syndrome." Nature 391(6663): 184-7.
Hendrich, B. and A. Bird (1998). "Identification and characterization of a
family o f mammalian methyl-CpG binding proteins." Mol Cell Biol
18(11): 6538-47.
Hendrich, B., U. Hardeland, et al. (1999). "The thymine glycosylase MBD4
can bind to the product of deamination at methylated CpG sites."
Nature 401(6750): 301-4.
Herman, J. G., A. Umar, et al. (1998). "Incidence and functional consequences
of hMLHl promoter hypermethylation in colorectal carcinoma." Proc
Natl Acad Sci U S A 95(12): 6870-5.
Hermsen, M., C. Postma, et al. (2002). "Colorectal adenoma to carcinoma
progression follows multiple pathways of chromosomal instability."
Gastroenterology 123(4): 1109-19.
266

Herrmann, M. G., J. D. Durtschi, et al. (2006). "Amplicon DNA melting
analysis for mutation scanning and genotyping: cross-platform
comparison o f instruments and dyes." Clin Chem 52(3): 494-503.
Hes, F. J., M. Nielsen, et al. (2007). "Somatic APC Mosaicism: An
Underestimated Cause Of Polyposis Coli." Gut.
Hirano, S., Y. Tominaga, et al. (2003). "Mutator phenotype of MUTYH-null
mouse embryonic stem cells." J Biol Chem 278(40): 38121-4.
Hizawa, K., M. Iida, et al. (1994). "Gastrointestinal manifestations of
Cowden's disease. Report o f four cases." J Clin Gastroenterol 18(1):
13-8.
Hofting, I., G. Pott, et al. (1993). "[Familial juvenile polyposis with
predominant stomach involvement]." Z Gastroenterol 31(9): 480-3.
Holbrook, J. A., G. Neu-Yilik, et al. (2004). "Nonsense-mediated decay
approaches the clinic." Nat Genet 36(8): 801-8.
Houlston, R. S., A. Collins, et al. (1992). "Dominant genes for colorectal
cancer are not rare." Ann Hum Genet 56 ( Pt 2): 99-103.
Houlston, R. S. and I. P. Tomlinson (2000). "Detecting low penetrance genes
in cancer: the way ahead." J Med Genet 37(3): 161-7.
Houlston, R. S. and I. P. Tomlinson (2001). "Polymorphisms and colorectal
tumor risk." Gastroenterology 121(2): 282-301.
Howe, J. R., J. L. Bair, et al. (2001). "Germline mutations of the gene
encoding bone morphogenetic protein receptor 1A in juvenile
polyposis." Nat Genet 28(2): 184-7.
Howe, J. R., F. A. Mitros, et al. (1998). "The risk o f gastrointestinal carcinoma
in familial juvenile polyposis." Ann Surg Oncol 5(8): 751-6.
Howe, J. R., S. Roth, et al. (1998). "Mutations in the SMAD4/DPC4 gene in
juvenile polyposis." Science 280(5366): 1086-8.
Hsu, S. H., G. D. Luk, et al. (1983). "Multiclonal origin of polyps in Gardner
syndrome." Science 221(4614): 951-3.
Hubscher, U., H. P. Nasheuer, et al. (2000). "Eukaryotic DNA polymerases, a
growing family." Trends Biochem Sci 25(3): 143-7.
Huusko, P., D. Ponciano-Jackson, et al. (2004). "Nonsense-mediated decay
microarray analysis identifies mutations of EPHB2 in human prostate
cancer." Nat Genet 36(9): 979-83.
267

Hyun, J. W., J. Y. Choi, et al. (2000). "Leukemic cell line, KG-1 has a
functional loss o f hOGGl enzyme due to a point mutation and 8-
hydroxydeoxyguanosine can kill KG-1." Oncogene 19(39): 4476-9.
Ilyas, M., I. P. Tomlinson, et al. (1997). "Beta-catenin mutations in cell lines
established from human colorectal cancers." Proc Natl Acad Sci U S A
94(19): 10330-4.
Ionov, Y., N. Nowak, et al. (2004). "Manipulation o f nonsense mediated decay
identifies gene mutations in colon cancer Cells with microsatellite
instability." Oncogene 23(3): 639-45.
Irizarry, R. A., B. M. Bolstad, et al. (2003). "Summaries of Affymetrix
GeneChip probe level data." Nucleic Acids Res 31(4): e l 5.
Ishigaki, Y., X. Li, et al. (2001). "Evidence for a pioneer round of mRNA
translation: mRNAs subject to nonsense-mediated decay in
mammalian cells are bound by CBP80 and CBP20." Cell 106(5): 607-
17.
Ivanov, I., K. C. Lo, et al. (2007). "Identifying candidate colon cancer tumor
suppressor genes using inhibition o f nonsense-mediated mRNA decay
in colon cancer cells." Oncogene 26(20): 2873-84.
Izumi, T., L. R. Wiederhold, et al. (2003). "Mammalian DNA base excision
repair proteins: their interactions and role in repair of oxidative DNA
damage." Toxicology 193(1-2): 43-65.
Jacoby, R. F., K. Seibert, et al. (2000). "The cyclooxygenase-2 inhibitor
celecoxib is a potent preventive and therapeutic agent in the min
mouse model o f adenomatous polyposis." Cancer Res 60(18): 5040-4.
Jaeger, E., E. Webb, et al. (2008). "Common genetic variants at the CRAC1
(HMPS) locus on chromosome 15ql3.3 influence colorectal cancer
risk." Nat Genet 40(1): 26-8.
Jaeger, E. E., K. L. Woodford-Richens, et al. (2003). "An ancestral Ashkenazi
haplotype at the HMPS/CRAC1 locus on 15ql3-ql4 is associated with
hereditary mixed polyposis syndrome." Am J Hum Genet 72(5): 1261 -
7.
Jain, A. N., T. A. Tokuyasu, et al. (2002). "Fully automatic quantification of
microarray image data." Genome Res 12(2): 325-32.
268

Jansen, R. C. and J. P. Nap (2001). "Genetical genomics: the added value from
segregation." Trends Genet 17(7): 388-91.
Jaruga, P., T. H. Zastawny, et al. (1994). "Oxidative DNA base damage and
antioxidant enzyme activities in human lung cancer." FEBS Lett
341(1): 59-64.
Jass, J. R. (2005). "Serrated adenoma of the colorectum and the DNA-
methylator phenotype." Nat Clin Pract Oncol 2(8): 398-405.
Jass, J. R., K. Baker, et al. (2006). "Advanced colorectal polyps with the
molecular and morphological features o f serrated polyps and
adenomas: concept of a 'fusion' pathway to colorectal cancer."
Histopathologv 49(2): 121-31.
Jass, J. R., V. L. Whitehall, et al. (2002). "Emerging concepts in colorectal
neoplasia." Gastroenterology 123(3): 862-76.
Jeevaratnam, P., D. S. Cottier, et al. (1996). "Familial giant hyperplastic
polyposis predisposing to colorectal cancer: a new hereditary bowel
cancer syndrome." J Pathol 179(1): 20-5.
Jenne, D. E., H. Reimann, et al. (1998). "Peutz-Jeghers syndrome is caused by
mutations in a novel serine threonine kinase." Nat Genet 18(1): 38-43.
Jin, W., R. M. Riley, et al. (2001). "The contributions of sex, genotype and
age to transcriptional variance in Drosophila melanogaster." Nat Genet
29(4): 389-95.
Jones, A. M., E. J. Douglas, et al. (2005). "Array-CGH analysis of
microsatellite-stable, near-diploid bowel cancers and comparison with
other types o f colorectal carcinoma." Oncogene 24(1): 118-29.
Jones, S., P. Emmerson, et al. (2002). "Biallelic germline mutations in MYH
predispose to multiple colorectal adenoma and somatic G:C—>T:A
mutations." Hum Mol Genet 11(23): 2961-7.
Joslyn, G., D. S. Richardson, et al. (1993). "Dimer formation by an N-terminal
coiled coil in the APC protein." Proc Natl Acad Sci U S A 90(23):
11109-13.
Kakinuma, S., Y. Kodama, et al. (2007). "Ikaros is a mutational target for
lymphomagenesis in Mlhl-deficient mice." Oncogene 26(20): 2945-9.
269

Kallioniemi, A., O. P. Kallioniemi, et al. (1992). "Comparative genomic
hybridization for molecular cytogenetic analysis of solid tumors."
Science 258(5083): 818-21.
Kambara, T., L. A. Simms, et al. (2004). "BRAF mutation is associated with
DNA methylation in serrated polyps and cancers of the colorectum."
Gut 53(8): 1137-44.
Kaneshisa M, S. G. (2004). "The KEGG resource for deciphering the
genome." Nucleic Acid Research Database Issue 32(D): 277-280.
Kanter-Smoler, G., J. Bjork, et al. (2006). "Novel findings in Swedish patients
with MYH-associated polyposis: mutation detection and clinical
characterization." Clin Gastroenterol Hepatol 4(4): 499-506.
Kaplan, K. B., A. A. Burds, et al. (2001). "A role for the Adenomatous
Polyposis Coli protein in chromosome segregation." Nat Cell Biol
3(4): 429-32.
Karuman, P., O. Gozani, et al. (2001). "The Peutz-Jegher gene product LKB1
is a mediator o f p53-dependent cell death." Mol Cell 7(6): 1307-19.
Kawamori, T., C. V. Rao, et al. (1998). "Chemopreventive activity of
celecoxib, a specific cyclooxygenase-2 inhibitor, against colon
carcinogenesis." Cancer Res 58(3): 409-12.
Kawano, Y. and R. Kypta (2003). "Secreted antagonists of the Wnt signalling
pathway." J Cell Sci 116(Pt 13): 2627-34.
Kawasaki, Y., T. Senda, et al. (2000). "Asef, a link between the tumor
suppressor APC and G-protein signaling." Science 289(5482): 1194-7.
Kemp, Z., L. Carvajal-Carmona, et al. (2006). "Evidence for a colorectal
cancer susceptibility locus on chromosome 3q21-q24 from a high-
density SNP genome-wide linkage scan." Hum Mol Genet 15(19):
2903-10.
Kemp, Z., A. Rowan, et al. (2005). "CDC4 mutations occur in a subset of
colorectal cancers but are not predicted to cause loss of function and
are not associated with chromosomal instability." Cancer Res 65(24):
11361-6.
Kemp, Z., C. Thirlwell, et al. (2004). "An update on the genetics of colorectal
cancer." Hum Mol Genet 13 Spec No 2: R177-85.
270

Kijima, T., G. Maulik, et al. (2002). "Regulation o f cellular proliferation,
cytoskeletal function, and signal transduction through CXCR4 and c-
Kit in small cell lung cancer cells." Cancer Res 62(21): 6304-11.
Kilpivaara, O., P. Laiho, et al. (2003). "CHEK2 llOOdelC and colorectal
cancer." J Med Genet 40(10): e l 10.
Kim, H. C., J. M. Wheeler, et al. (2000). "The E-cadherin gene (CDH1)
variants T340A and L599V in gastric and colorectal cancer patients in
Korea." Gut 47(2): 262-7.
Kim, I. J., J. L. Ku, et al. (2004). "Mutational analysis o f OGGI, MYH,
MTH1 in FAP, HNPCC and sporadic colorectal cancer patients:
R154H OGGI polymorphism is associated with sporadic colorectal
cancer patients." Hum Genet 115(6): 498-503.
Kim, J. C., I. H. Ka, et al. (2007). "MYH, OGGI, MTH1, and APC alterations
involved in the colorectal tumorigenesis o f Korean patients with
multiple adenomas." Virchows Arch 450(3): 311-9.
Kim, K. M. and D. Shibata (2004). "Tracing ancestry with methylation
patterns: most crypts appear distantly related in normal adult human
colon." BMC Gastroenterol 4: 8.
Kimchi-Sarfaty, C., J. M. Oh, et al. (2007). "A "silent" polymorphism in the
MDR1 gene changes substrate specificity." Science 315(5811): 525-8.
Kinzler, K. W. and B. Vogelstein (1996). "Lessons from hereditary colorectal
cancer." Ceil 87(2): 159-70.
Kishida, S., H. Yamamoto, et al. (1998). "Axin, a negative regulator of the
wnt signaling pathway, directly interacts with adenomatous polyposis
coli and regulates the stabilization o f beta-catenin." J Biol Chem
273(18): 10823-6.
Klungland, A., I. Rosewell, et al. (1999). "Accumulation of premutagenic
DNA lesions in mice defective in removal o f oxidative base damage."
Proc Natl Acad Sci U S A 96T23L 13300-5.
Kokko, A., P. Laiho, et al. (2006). "EPHB2 germline variants in patients with
colorectal cancer or hyperplastic polyposis." BMC Cancer 6: 145.
Komar, A. A. (2007). "Genetics. SNPs, silent but not invisible." Science
315(5811): 466-7.
271

Kuo, C. F., D. E. McRee, et al. (1992). "Crystallization and crystallographic
characterization o f the iron-sulfur-containing DNA-repair enzyme
endonuclease III from Escherichia coli." J Mol Biol 227(1): 347-51.
Lage, P., M. Cravo, et al. (2004). "Management of Portuguese patients with
hyperplastic polyposis and screening of at-risk first-degree relatives: a
contribution for future guidelines based on a clinical study." Am J
Gastroenterol 99(9Y. 1779-84.
Laiho, P., A. Kokko, et al. (2007). "Serrated carcinomas form a subclass of
colorectal cancer with distinct molecular basis." Oncogene 26(2): 312-
20 .
Laken, S. J., G. M. Petersen, et al. (1997). "Familial colorectal cancer in
Ashkenazim due to a hypermutable tract in APC." Nat Genet 17(1):
79-83.
Lambertz, S. and W. G. Ballhausen (1993). "Identification of an alternative 5'
untranslated region o f the adenomatous polyposis coli gene." Hum
Genet 90(6): 650-2.
Lamlum, H., N. Al Tassan, et al. (2000). "Germline APC variants in patients
with multiple colorectal adenomas, with evidence for the particular
importance o f E1317Q." Hum Mol Genet 9(15): 2215-21.
Lamlum, H., M. Ilyas, et al. (1999). "The type of somatic mutation at APC in
familial adenomatous polyposis is determined by the site of the
germline mutation: a new facet to Knudson's 'two-hit' hypothesis." Nat
Med 5(9): 1071-5.
Larriba, M. J., N. Valle, et al. (2007). "The inhibition of Wnt/beta-catenin
signalling by 1 alpha,25-dihydroxyvitamin D3 is abrogated by Snail 1 in
human colon cancer cells." Endocr Relat Cancer 14(1): 141-51.
Laurent-Puig, P., C. Beroud, et al. (1998). "APC gene: database of germline
and somatic mutations in human tumors and cell lines." Nucleic Acids
Res 26(1): 269-70.
Lengauer, C., K. W. Kinzler, et al. (1997). "Genetic instability in colorectal
cancers." Nature 386(6625): 623-7.
Lengauer, C., K. W. Kinzler, et al. (1998). "Genetic instabilities in human
cancers." Nature 396(6712): 643-9.
272

Levin, B. (1992). "Ulcerative colitis and colon cancer: biology and
surveillance." J Cell Biochem Suppl 16G: 47-50.
Liaw, D., D. J. Marsh, et al. (1997). "Germline mutations o f the PTEN gene in
Cowden disease, an inherited breast and thyroid cancer syndrome."
Nat Genet 16(1): 64-7.
Lichtenstein, P., N. V. Holm, et al. (2000). "Environmental and heritable
factors in the causation o f cancer—analyses o f cohorts of twins from
Sweden, Denmark, and Finland." N Engl J Med 343(2L 78-85.
Liew, M., M. Seipp, et al. (2007). "Closed-tube SNP genotyping without
labeled probes/a comparison between unlabeled probe and amplicon
melting." Am J Clin Pathol 127(3): 341-8.
Liljegren, A., G. Barker, et al. (2008). "Prevalence of adenomas and
hyperplastic polyps in mismatch repair mutation carriers among
CAPP2 participants: report by the colorectal adenoma/carcinoma
prevention programme 2." J Clin Oncol 26(20): 3434-9.
Lindahl, T. (1982). "DNA repair enzymes." Annu Rev Biochem 51: 61-87.
Lindahl, T. (1993). "Instability and decay o f the primary structure of DNA."
Nature 362(6422): 709-15.
Lindahl, T. and R. D. Wood (1999). "Quality control by DNA repair." Science
286(5446): 1897-905.
Lipton, L., C. Fleischmann, et al. (2003). "Contribution of the CHEK2
HOOdelC variant to risk of multiple colorectal adenoma and
carcinoma." Cancer Lett 200(2): 149-52.
Lipton, L., S. E. Halford, et al. (2003). "Carcinogenesis in MYH-associated
polyposis follows a distinct genetic pathway." Cancer Res 63(22):
7595-9.
Lipton, L., O. M. Sieber, et al. (2003). "Germline mutations in the TGF-beta
and Wnt signalling pathways are a rare cause of the "multiple"
adenoma phenotype." J Med Genet 40(4): e35.
Liu, B., N. C. Nicolaides, et al. (1995). "Mismatch repair gene defects in
sporadic colorectal cancers with microsatellite instability." Nat Genet
9(1): 48-55.
Loeb, L. A. (2001). "A mutator phenotype in cancer." Cancer Res 61(8):
3230-9.
273

Lowsky, R., A. Magliocco, et al. (2000). "MSH2-deficient murine lymphomas
harbor insertion/deletion mutations in the transforming growth factor
beta receptor type 2 gene and display low not high frequency
microsatellite instability." Blood 95(5): 1767-72.
Lu, A. L., X. Li, et al. (2001). "Repair o f oxidative DNA damage: mechanisms
and functions." Cell Biochem Biophvs 35(2): 141-70.
Luongo, C., A. R. Moser, et al. (1994). "Loss o f Apc+ in intestinal adenomas
from Min mice." Cancer Res 54(22): 5947-52.
Lynch, H. T. and A. de la Chapelle (2003). "Hereditary colorectal cancer." N
E n gU M ed 348(10): 919-32.
Maley, C. C., P. C. Galipeau, et al. (2004). "Selectively advantageous
mutations and hitchhikers in neoplasms: p i6 lesions are selected in
Barrett's esophagus." Cancer Res 64(10): 3414-27.
Malins, D. C. and R. Haimanot (1991). "Major alterations in the nucleotide
structure o f DNA in cancer of the female breast." Cancer Res 51(19):
5430-2.
Maltzman, T., K. Knoll, et al. (2001). "Ki-ras proto-oncogene mutations in
sporadic colorectal adenomas: relationship to histologic and clinical
characteristics." Gastroenterology 121(2): 302-9.
Mamett, L. J. (2000). "Oxyradicals and DNA damage." Carcinogenesis 21(3):
361-70.
Marsh, D. J., P. L. Dahia, et al. (1997). "Germline mutations in PTEN are
present in Bannayan-Zonana syndrome." Nat Genet 16(4): 333-4.
Maskens, A. P. and R. M. Dujardin-Loits (1981). "Kinetics of tissue
proliferation in colorectal mucosa during post-natal growth." Cell
Tissue Kinet 14(5): 467-77.
Mathers, J. C., I. Mickleburgh, et al. (2003). "Can resistant starch and/or
aspirin prevent the development of colonic neoplasia? The Concerted
Action Polyp Prevention (CAPP) 1 Study." Proc Nutr Soc 62(1): 51-7.
Meijers-Heijboer, H., A. van den Ouweland, et al. (2002). "Low-penetrance
susceptibility to breast cancer due to CHEK2(*)1 lOOdelC in
noncarriers o f BRCA1 or BRCA2 mutations." Nat Genet 31(1): 55-9.
274

Merritt, A. J., K. A. Gould, et al. (1997). "Polyclonal structure of intestinal
adenomas in ApcMin/+ mice with concomitant loss of Apc+ from all
tumor lineages." Proc Natl Acad Sci U S A 94(25^: 13927-31.
Micke, P., A. Ostman, et al. (2005). "Laser-assisted cell microdissection using
the PALM system." Methods Mol Biol 293: 151-66.
Midgley, C. A., S. White, et al. (1997). "APC expression in normal human
tissues." J Pathol 181(4): 426-33.
Minowa, O., T. Arai, et al. (2000). "Mmh/Oggl gene inactivation results in
accumulation o f 8-hydroxyguanine in mice." Proc Natl Acad Sci U S
A 97(8): 4156-61.
Miyaki, M., M. Konishi, et al. (1997). "Germline mutation of MSH6 as the
cause o f hereditary nonpolyposis colorectal cancer." Nat Genet 17(3):
271-2.
Miyoshi, Y., H. Nagase, et al. (1992). "Somatic mutations o f the APC gene in
colorectal tumors: mutation cluster region in the APC gene." Hum Mol
Genet 1(4): 229-33.
Moberg, K. H., D. W. Bell, et al. (2001). "Archipelago regulates Cyclin E
levels in Drosophila and is mutated in human cancer cell lines." Nature
413(6853): 311-6.
Monks, S. A., A. Leonardson, et al. (2004). "Genetic inheritance o f gene
expression in human cell lines." Am J Hum Genet 75(6): 1094-105.
Mrkonjic, M., S. Raptis, et al. (2007). "MSH2 118T>C and MSH6 159C>T
promoter polymorphisms and the risk of colorectal cancer."
Carcinogenesis 28(12): 2575-80.
Muller, A., B. Homey, et al. (2001). "Involvement of chemokine receptors in
breast cancer metastasis." Nature 410(6824): 50-6.
Munemitsu, S., I. Albert, et al. (1995). "Regulation of intracellular beta-
catenin levels by the adenomatous polyposis coli (APC) tumor-
suppressor protein." Proc Natl Acad Sci U S A 92(7): 3046-50.
Murphy, T. K., E. E. Calle, et al. (2000). "Body mass index and colon cancer
mortality in a large prospective study." Am J Epidemiol 152(9): 847-
54.
275

Nagasaka, T., A. Goel, et al. (2008). "Methylation pattern of the 06-
methylguanine-DNA methyltransferase gene in colon during
progressive colorectal tumorigenesis." Int J Cancer 122(11): 2429-36.
Nakabeppu, Y. (2001). "Regulation of intracellular localization of human
MTH1, OGGI, and MYH proteins for repair o f oxidative DNA
damage." Prog Nucleic Acid Res Mol Biol 68: 75-94.
Neff, N. F., N. A. Ellis, et al. (1999). "The DNA helicase activity of BLM is
necessary for the correction of the genomic instability o f bloom
syndrome cells." Mol Biol Cell 10(3): 665-76.
Nichols, H. B., A. Trentham-Dietz, et al. (2005). "Oral contraceptive use,
reproductive factors, and colorectal cancer risk: findings from
Wisconsin." Cancer Epidemiol Biomarkers Prev 14(5): 1212-8.
Niessen, R. C., R. H. Sijmons, et al. (2006). "MUTYH and the mismatch
repair system: partners in crime?" Hum Genet 119(1-2): 206-11.
Nishimura, Y., C. L. Martin, et al. (2007). "Genome-wide expression profiling
of lymphoblastoid cell lines distinguishes different forms of autism and
reveals shared pathways." Hum Mol Genet 16(14): 1682-98.
Niv, Y., G. Delpre, et al. (2003). "Hyperplastic gastric polyposis,
hypergastrinaemia and colorectal neoplasia: a description of four
cases." Eur J Gastroenterol Hepatol 15(12): 1361-6.
Noll, D. M., A. Gogos, et al. (1999). "The C-terminal domain of the adenine-
DNA glycosylase MutY confers specificity for 8-oxoguanine.adenine
mispairs and may have evolved from MutT, an 8-oxo-dGTPase."
Biochemistry 38(20): 6374-9.
Norat, T., S. Bingham, et al. (2005). "Meat, fish, and colorectal cancer risk:
the European Prospective Investigation into cancer and nutrition." J
Natl Cancer Inst 97(12): 906-16.
Novelli, M., A. Cossu, et al. (2003). "X-inactivation patch size in human
female tissue confounds the assessment of tumor clonality." Proc Natl
Acad Sci U S A 100(6): 3311-4.
Novelli, M. R., J. A. Williamson, et al. (1996). "Polyclonal origin of colonic
adenomas in an XO/XY patient with FAP." Science 272(5265): 1187-
90.
276

Nowak, M. A., N. L. Komarova, et al. (2002). "The role of chromosomal
instability in tumor initiation." Proc Natl Acad Sci U S A 99(25):
16226-31.
Nowell, P. C. (1976). "The clonal evolution of tumor cell populations."
Science 194(4260): 23-8.
Nugent, K. P., A. D. Spigelman, et al. (1993). "Life expectancy after
colectomy and ileorectal anastomosis for familial adenomatous
polyposis." Pis Colon Rectum 36(11L 1059-62.
O'Brien, M. J., S. J. Winawer, et al. (1990). "The National Polyp Study.
Patient and polyp characteristics associated with high-grade dysplasia
in colorectal adenomas." Gastroenterology 98(2): 371-9.
O'Brien, M. J., S. Yang, et al. (2004). "Hyperplastic (serrated) polyps of the
colorectum: relationship of CpG island methylator phenotype and K-
ras mutation to location and histologic subtype." Am J Surg Pathol
28(4): 423-34.
Oberhuber, G. and M. Stolte (2000). "Gastric polyps: an update of their
pathology and biological significance." Virchows Arch 437(6): 581 -
90.
Okamoto, K., S. Toyokuni, et al. (1994). "Formation o f 8-hydroxy-2'-
deoxyguanosine and 4-hydroxy-2-nonenal-modified proteins in human
renal-cell carcinoma." Int J Cancer 58(6): 825-9.
Okkels, H., L. Sunde, et al. (2006). "Polyposis and early cancer in a patient
with low penetrant mutations in MSH6 and APC: hereditary colorectal
cancer as a polygenic trait." Int J Colorectal Pis 21(8): 847-50.
Olinski, R., T. Zastawny, et al. (1992). "DNA base modifications in chromatin
o f human cancerous tissues." FEBS Lett 309(2): 193-8.
Oshima, M., N. Murai, et al. (2001). "Chemoprevention of intestinal polyposis
in the Apcdelta716 mouse by rofecoxib, a specific cyclooxygenase-2
inhibitor." Cancer Res 61(4): 1733-40.
Oshima, M. and M. M. Taketo (2002). "COX selectivity and animal models
for colon cancer." Curr Pharm Des 8(12): 1021-34.
Park, H. S., R. A. Goodlad, et al. (1995). "Crypt fission in the small intestine
and colon. A mechanism for the emergence of G6PD locus-mutated
crypts after treatment with mutagens." Am J Pathol 147(5): 1416-27.

Park, Y. J., E. Y. Choi, et al. (2001). "Genetic changes of hOGGl and the
activity o f oh8Gua glycosylase in colon cancer." Eur J Cancer 37(3):
340-6.
Parkes, M., J. Satsangi, et al. (2001). "Ulcerative colitis is more strongly
linked to chromosome 12 than Crohn's disease." Gut 49(2): 311.
Paul, P., T. Letteboer, et al. (1993). "Identical APC exon 15 mutations result
in a variable phenotype in familial adenomatous polyposis." Hum Mol
Genet 2(7): 925-31.
Paulsen, J. E., I. L. Steffensen, et al. (2001). "Qualitative and quantitative
relationship between dysplastic aberrant crypt foci and tumorigenesis
in the Min/+ mouse colon." Cancer Res 61(13): 5010-5.
Phillips, R. K., M. H. Wallace, et al. (2002). "A randomised, double blind,
placebo controlled study o f celecoxib, a selective cyclooxygenase 2
inhibitor, on duodenal polyposis in familial adenomatous polyposis."
Gut 50(6): 857-60.
Plaschke, J., C. Engel, et al. (2004). "Lower incidence of colorectal cancer and
later age o f disease onset in 27 families with pathogenic MSH6
germline mutations compared with families with MLH1 or MSH2
mutations: the German Hereditary Nonpolyposis Colorectal Cancer
Consortium." J Clin Oncol 22(22): 4486-94.
Pollack, J. R., T. Sorlie, et al. (2002). "Microarray analysis reveals a major
direct role o f DNA copy number alteration in the transcriptional
program of human breast tumors." Proc Natl Acad Sci U S A 99(20):
12963-8.
Popat, S., J. Stone, et al. (2000). "Prevalence o f the APC E1317Q variant in
colorectal cancer patients." Cancer Lett 149(1-2): 203-6.
Porter, T. R., F. M. Richards, et al. (2002). "Contribution of cyclin dl
(CCND1) and E-cadherin (CDH1) polymorphisms to familial and
sporadic colorectal cancer." Oncogene 21(12): 1928-33.
Potten, C. S., M. Kellett, et al. (1992). "Proliferation in human gastrointestinal
epithelium using bromodeoxyuridine in vivo: data for different sites,
proximity to a tumour, and polyposis coli." Gut 33(4): 524-9.
Poynter, J. N., S. B. Gruber, et al. (2005). "Statins and the risk of colorectal
cancer." N Enel J Med 352(21): 2184-92.
278

Preston, S. L., S. J. Leedham, et al. (2008). "The development of duodenal
microadenomas in FAP patients: the human correlate o f the Min
mouse." J Pathol 214(3): 294-301.
Preston, S. L., W. M. Wong, et al. (2003). "Bottom-up histogenesis of
colorectal adenomas: origin in the monocryptal adenoma and initial
expansion by crypt fission." Cancer Res 63(13): 3819-25.
Rajagopalan, H., P. V. Jallepalli, et al. (2004). "Inactivation of hCDC4 can
cause chromosomal instability." Nature 428(6978): 77-81.
Rajagopalan, H. and C. Lengauer (2004). "Aneuploidy and cancer." Nature
432(7015): 338-41.
Rajagopalan, H. and C. Lengauer (2004). "CIN-ful cancers." Cancer
Chemother Pharmacol 54 Suppl 1: S65-8.
Rashid, A., P. S. Houlihan, et al. (2000). "Phenotypic and molecular
characteristics o f hyperplastic polyposis." Gastroenterology 119(2):
323-32.
Reddy, B. S., Y. Hirose, et al. (2000). "Chemoprevention o f colon cancer by
specific cyclooxygenase-2 inhibitor, celecoxib, administered during
different stages o f carcinogenesis." Cancer Res 60(2): 293-7.
Redston, M., K. L. Nathanson, et al. (1998). "The APCI1307K allele and
breast cancer risk." Nat Genet 20(1): 13-4.
Reitmair, A. H., J. C. Cai, et al. (1996). "MSH2 deficiency contributes to
accelerated APC-mediated intestinal tumorigenesis." Cancer Res
56(13): 2922-6.
Ricchi, P., R. Zarrilli, et al. (2003). "Nonsteroidal anti-inflammatory drugs in
colorectal cancer: from prevention to therapy." Br J Cancer 88(6): 803-
7.
Risch, N. (2001). "Implications o f multilocus inheritance for gene-disease
association studies." Theor Popul Biol 60(3): 215-20.
Rosin-Arbesfeld, R., F. Townsley, et al. (2000). "The APC tumour suppressor
has a nuclear export function." Nature 406(6799): 1009-12.
Rossi, M. R., L. Hawthorn, et al. (2005). "Identification of inactivating
mutations in the JAK1, SYNJ2, and CLPTM1 genes in prostate cancer
cells using inhibition of nonsense-mediated decay and microarray
analysis." Cancer Genet Cvtogenet 161(2): 97-103.
279
Rowan, A., S. Halford, et al. (2005). "Refining molecular analysis in the
pathways o f colorectal carcinogenesis." Clin Gastroenterol Hepatol
3(11): 1115-23.
Rubin, H. (1985). "Cancer as a dynamic developmental disorder." Cancer Res
45(7): 2935-42.
Rubinfeld, B., I. Albert, et al. (1996). "Binding of GSK3beta to the APC-beta-
catenin complex and regulation of complex assembly." Science
272(5264): 1023-6.
Rubinfeld, B., B. Souza, et al. (1993). "Association of the APC gene product
with beta-catenin." Science 262(5140): 1731-4.
Russell, A. M., J. Zhang, et al. (2006). "Prevalence of MYH germline
mutations in Swiss APC mutation-negative polyposis patients." Int J
Cancer 118(8): 1937-40.
Russo, M. T., G. De Luca, et al. (2004). "Accumulation of the oxidative base
lesion 8-hydroxyguanine in DNA of tumor-prone mice defective in
both the Myh and Oggl DNA glycosylases." Cancer Res 64(13): 4411-
4.
Rutter, M., B. Saunders, et al. (2004). "Severity of inflammation is a risk
factor for colorectal neoplasia in ulcerative colitis." Gastroenterology
126(2): 451-9.
Sakamoto, K., Y. Tominaga, et al. (2007). "MUTYH-null mice are susceptible
to spontaneous and oxidative stress induced intestinal tumorigenesis."
Cancer Res 67(14): 6599-604.
Sakumi, K., Y. Tominaga, et al. (2003). "Oggl knockout-associated lung
tumorigenesis and its suppression by Mthl gene disruption." Cancer
Res 63(5): 902-5.
Salem, O. S. and W. D. Steck (1983). "Cowden's disease (multiple hamartoma
and neoplasia syndrome). A case report and review of the English
literature." J Am Acad Dermatol 8(5): 686-96.
Sampson, J. R., S. Dolwani, et al. (2003). "Autosomal recessive colorectal
adenomatous polyposis due to inherited mutations of MYH." Lancet
362(9377): 39-41.
280

Sandler, R. S., S. Halabi, et al. (2003). "A randomized trial of aspirin to
prevent colorectal adenomas in patients with previous colorectal
cancer.” N Engl J Med 348(10): 883-90.
Sanger, F., S. Nicklen, et al. (1977). "DNA sequencing with chain-terminating
inhibitors.” Proc Natl Acad Sci U S A 74(12): 5463-7.
Satsangi, J., M. Parkes, et al. (1998). "Genetics o f inflammatory bowel
disease.” Clin Sci fLondl 94(5): 473-8.
Sayed, M. G., A. F. Ahmed, et al. (2002). "Germline SMAD4 or BMPR1A
mutations and phenotype o f juvenile polyposis.” Ann Surp Oncol 9(9):
901-6.
Scott-Conner, C. E., M. Hausmann, et al. (1995). "Familial juvenile polyposis:
patterns o f recurrence and implications for surgical management.” J
Am Coll Surg 181(5): 407-13.
Scotton, C. J., J. L. Wilson, et al. (2001). "Epithelial cancer cell migration: a
role for chemokine receptors?” Cancer Res 61(13): 4961-5.
Seidensticker, M. J. and J. Behrens (2000). "Biochemical interactions in the
wnt pathway.” Biochim Biophvs Acta 1495(2): 168-82.
Shackney, S. E., C. A. Smith, et al. (1989). "Model for the genetic evolution
o f human solid tumors." Cancer Res 49(12): 3344-54.
Shibutani, S., M. Takeshita, et al. (1991). "Insertion of specific bases during
DNA synthesis past the oxidation-damaged base 8-oxodG." Nature
349(6308): 431-4.
Shih, I. M., T. L. Wang, et al. (2001). "Top-down morphogenesis of colorectal
tumors." Proc Natl Acad Sci U S A 98(5): 2640-5.
Shih, I. M., W. Zhou, et al. (2001). "Evidence that genetic instability occurs at
an early stage o f colorectal tumorigenesis." Cancer Res 61(3): 818-22.
Shinmura, K., T. Kohno, et al. (1998). "Infrequent mutations o f the hOGGl
gene, that is involved in the excision of 8-hydroxyguanine in damaged
DNA, in human gastric cancer." Jpn J Cancer Res 89(8): 825-8.
Shoemaker, A. R., K. A. Gould, et al. (1997). "Studies o f neoplasia in the Min
mouse." Biochim Biophvs Acta 1332(2): F25-48.
Shoemaker, A. R., K. M. Haigis, et al. (2000). "Mlhl deficiency enhances
several phenotypes of Apc(Min)/+ mice." Oncogene 19(23): 2774-9.
281

Shoemaker, A. R., A. R. Moser, et al. (1995). "N-ethyl-N-nitrosourea
treatment of multiple intestinal neoplasia (Min) mice: age-related
effects on the formation of intestinal adenomas, cystic crypts, and
epidermoid cysts." Cancer Res 55(19): 4479-85.
Shoemaker, A. R., A. R. Moser, et al. (1998). "A resistant genetic background
leading to incomplete penetrance o f intestinal neoplasia and reduced
loss o f heterozygosity in ApcMin/+ mice." Proc Natl Acad Sci U S A
95(18): 10826-31.
Sieber, O., S. Segditsas, et al. (2006). "Disease severity and genetic pathways
in attenuated familial adenomatous polyposis vary greatly, but depend
on the site o f the germline mutation." Gut.
Sieber, O. M., K. Heinimann, et al. (2002). "Analysis o f chromosomal
instability in human colorectal adenomas with two mutational hits at
APC." Proc Natl Acad Sci U S A 99(26): 16910-5.
Sieber, O. M., K. M. Howarth, et al. (2004). "Myh deficiency enhances
intestinal tumorigenesis in multiple intestinal neoplasia (ApcMin/+)
mice." Cancer Res 64(24): 8876-81.
Sieber, O. M., L. Lipton, et al. (2003). "Multiple colorectal adenomas, classic
adenomatous polyposis, and germ-line mutations in MYH." N Engl J
Med 348(9): 791-9.
Sieber, O. M., I. P. Tomlinson, et al. (2000). "The adenomatous polyposis coli
(APC) tumour suppressor—genetics, function and disease." Mol Med
Today 6(12): 462-9.
Sieber, O. M., S. R. Tomlinson, et al. (2005). "Tissue, cell and stage
specificity o f (epi)mutations in cancers." Nat Rev Cancer 5(8): 649-55.
Slattery, M. L., S. Edwards, et al. (2003). "Physical activity and colorectal
cancer." Am J Epidemiol 158(3): 214-24.
Slaughter, D. P., H. W. Southwick, et al. (1953). "Field cancerization in oral
stratified squamous epithelium; clinical implications o f multicentric
origin." Cancer 6(5): 963-8.
Slupska, M. M., C. Baikalov, et al. (1996). "Cloning and sequencing a human
homolog (hMYH) o f the Escherichia coli mutY gene whose function is
required for the repair of oxidative DNA damage." J Bacteriol 178(13):
3885-92.
282
Slupska, M. M., W. M. Luther, et al. (1999). "Functional expression of
hMYH, a human homolog of the Escherichia coli MutY protein." J
Bacteriol 181(19): 6210-3.
Smyth, G. K. (2004). "Linear models and empirical bayes methods for
assessing differential expression in microarray experiments." Stat Appl
Genet Mol Biol 3: Article3.
Sparks, A. B., P. J. Morin, et al. (1998). "Mutational analysis of the APC/beta-
catenin/Tcf pathway in colorectal cancer." Cancer Res 58(6): 1130-4.
Spirio, L., J. Green, et al. (1999). "The identical 5' splice-site acceptor
mutation in five attenuated APC families from Newfoundland
demonstrates a founder effect." Hum Genet 105(5): 388-98.
Spirio, L., S. Olschwang, et al. (1993). "Alleles of the APC gene: an
attenuated form of familial polyposis." Cell 75(5): 951-7.
Starink, T. M., J. P. van der Veen, et al. (1986). "The Cowden syndrome: a
clinical and genetic study in 21 patients." Clin Genet 29(3): 222-33.
Steinke, V., N. Rahner, et al. (2008). "No association between MUTYH and
MSH6 germline mutations in 64 HNPCC patients." Eur J Hum Genet
16(5): 587-92.
Strohmaier, H., C. H. Spruck, et al. (2001). "Human F-box protein hCdc4
targets cyclin E for proteolysis and is mutated in a breast cancer cell
line." Nature 413(6853): 316-22.
Su, L. K., M. Burrell, et al. (1995). "APC binds to the novel protein EB1."
Cancer Res 55(14): 2972-7.
Su, L. K., B. Vogelstein, et al. (1993). "Association of the APC tumor
suppressor protein with catenins." Science 262(5140): 1734-7.
Sugita, A., D. B. Sachar, et al. (1991). "Colorectal cancer in ulcerative colitis.
Influence o f anatomical extent and age at onset on colitis-cancer
interval." Gut 32(2): 167-9.
Sulekova, Z. and W. G. Ballhausen (1995). "A novel coding exon o f the
human adenomatous polyposis coli gene." Hum Genet 96(4): 469-71.
Survey, N. S. H. (2005). National Statistics Health Survey for England 2004 -
2005.
Suter, C. M., D. I. Martin, et al. (2004). "Germline epimutation of MLH1 in
individuals with multiple cancers." Nat Genet 36(5): 497-501.
283

Takayama, T., M. Ohi, et al. (2001). "Analysis of K-ras, APC, and beta-
catenin in aberrant crypt foci in sporadic adenoma, cancer, and familial
adenomatous polyposis." Gastroenterology 121(3): 599-611.
Taniguchi, H., H. Yamamoto, et al. (2005). "Frequent epigenetic inactivation
o f Wnt inhibitory factor-1 in human gastrointestinal cancers."
Oncogene 24(53): 7946-52.
Taylor, R. W., M. J. Barron, et al. (2003). "Mitochondrial DNA mutations in
human colonic crypt stem cells." J Clin Invest 112(9): 1351-60.
Tenesa, A., S. M. Farrington, et al. (2008). "Genome-wide association scan
identifies a colorectal cancer susceptibility locus on llq23 and
replicates risk loci at 8q24 and 18q21." Nat Genet 40(5): 631-7.
Thibodeau, S. N., A. J. French, et al. (1998). "Microsatellite instability in
colorectal cancer: different mutator phenotypes and the principal
involvement o f hMLHl." Cancer Res 58(8): 1713-8.
Thliveris, A. T., R. B. Halberg, et al. (2005). "Polyclonality of familial murine
adenomas: analyses o f mouse chimeras with low tumor multiplicity
suggest short-range interactions." Proc Natl Acad Sci U S A 102(19):
6960-5.
Tomlinson, I. and W. Bodmer (1999). "Selection, the mutation rate and
cancer: ensuring that the tail does not wag the dog." Nat Med 5(1): 11-
2 .
Tomlinson, I., P. Sasieni, et al. (2002). "How many mutations in a cancer?"
Am J Pathol 160(3): 755-8.
Tomlinson, I., E. Webb, et al. (2007). "A genome-wide association scan of tag
SNPs identifies a susceptibility variant for colorectal cancer at
8q24.21." Nat Genet.
Tomlinson, I. P., E. Webb, et al. (2008). "A genome-wide association study
identifies colorectal cancer susceptibility loci on chromosomes 10pl4
and 8q23.3." Nat Genet 40(5): 623-30.
Totafumo, J., M. Bjerknes, et al. (1987). "The crypt cycle. Crypt and villus
production in the adult intestinal epithelium." Biophvs J 52(2): 279-94.
Tsuzuki, T., A. Egashira, et al. (2001). "Spontaneous tumorigenesis in mice
defective in the MTH1 gene encoding 8-oxo-dGTPase." Proc Natl
Acad Sci U S A 98(20): 11456-61.
284

Van Meir, E. G. (1998). ’"'Turcot’s syndrome": phenotype of brain tumors,
survival and mode of inheritance." Int J Cancer 75(1): 162-4.
van Puijenbroek, M., M. Nielsen, et al. (2007). "The natural history of a
combined defect in MSH6 and MUTYH in a HNPCC family." Fam
Cancer 6(1): 43-51.
van Puijenbroek, M., M. Nielsen, et al. (2008). "Identification of patients with
(atypical) MUTYH-associated polyposis by KRAS2 c.34G > T
prescreening followed by MUTYH hotspot analysis in formalin-fixed
paraffin-embedded tissue." Clin Cancer Res 14(1): 139-42.
Vasen, H. F., G. Griffioen, et al. (1993). "Familial adenomatous polyposis and
its clinical surveillance." Neth J Med 42(3-4): 105-8.
Vasen, H. F., P. Watson, et al. (1999). "New clinical criteria for hereditary
nonpolyposis colorectal cancer (HNPCC, Lynch syndrome) proposed
by the International Collaborative group on HNPCC."
Gastroenterology 116(6): 1453-6.
Veale, A. M., I. McColl, et al. (1966). "Juvenile polyposis coli." J Med Genet
3(1): 5-16.
Viano H, B. F. (2002). IARC handbooks of cancer prevention: Weight control
and physical activity.. IARC Press.
Vogelstein, B., E. R. Fearon, et al. (1985). "Use o f restriction fragment length
polymorphisms to determine the clonal origin o f human tumors."
Science 227(4687): 642-5.
Vogelstein, B., E. R. Fearon, et al. (1988). "Genetic alterations during
colorectal-tumor development." N Engl J Med 319(9): 525-32.
Volk, D. E., P. G. House, et al. (2000). "Structural similarities between MutT
and the C-terminal domain of MutY." Biochemistry 39(25): 7331-6.
Waite, K. A. and C. Eng (2002). "Protean PTEN: form and function." Am J
Hum Genet 70(4): 829-44.
Wallis, Y. L., D. G. Morton, et al. (1999). "Molecular analysis of the APC
gene in 205 families: extended genotype-phenotype correlations in
FAP and evidence for the role o f APC amino acid changes in
colorectal cancer predisposition." J Med Genet 36(1): 14-20.
285

Wang, L., L. M. Baudhuin, et al. (2004). "MYH mutations in patients with
attenuated and classic polyposis and with young-onset colorectal
cancer without polyps." Gastroenterology 127(1): 9-16.
Wang, Z., J. M. Cummins, et al. (2004). "Three classes of genes mutated in
colorectal cancers with chromosomal instability." Cancer Res 64(9):
2998-3001.
Wargovich, M. J., A. Jimenez, et al. (2000). "Efficacy of potential
chemopreventive agents on rat colon aberrant crypt formation and
progression." Carcinogenesis 21(6): 1149-55.
Wasan, H. S., H. S. Park, et al. (1998). "APC in the regulation of intestinal
crypt fission." J Pathol 185(3): 246-55.
Watanabe, G., C. Albanese, et al. (1998). "Inhibition of cyclin D1 kinase
activity is associated with E2F-mediated inhibition of cyclin D1
promoter activity through E2F and Spl." Mol Cell Biol 18(6): 3212-
22 .
Webb, E. L., M. F. Rudd, et al. (2006). "Colorectal cancer risk in monoallelic
carriers o f MYH variants." Am J Hum Genet 79(4): 768-71; author
reply 771-2.
Wei, E. K., E. Giovannucci, et al. (2004). "Comparison of risk factors for
colon and rectal cancer." Int J Cancer 108(3): 433-42.
White, S., V. J. Bubb, et al. (1996). "Germline APC mutation (Glnl317) in a
cancer-prone family that does not result in familial adenomatous
polyposis." Genes Chromosomes Cancer 15(2): 122-8.
Whitehall, V. L., M. D. Walsh, et al. (2001). "Methylation of 0-6-
methylguanine DNA methyltransferase characterizes a subset of
colorectal cancer with low-level DNA microsatellite instability."
Cancer Res 61(3): 827-30.
Whitelaw, S. C., V. A. Murday, et al. (1997). "Clinical and molecular features
o f the hereditary mixed polyposis syndrome." Gastroenterology
112(2): 327-34.
Will, O., L. G. Carvajal-Carmona, et al. (2007). "Homozygous PMS2 deletion
causes a severe colorectal cancer and multiple adenoma phenotype
without extraintestinal cancer." Gastroenterology 132(2): 527-30.
286

Williams, C. S., A. J. Watson, et al. (2000). "Celecoxib prevents tumor growth
in vivo without toxicity to normal gut: lack of correlation between in
vitro and in vivo models." Cancer Res 60(21): 6045-51.
Winston, J. T., D. M. Koepp, et al. (1999). "A family of mammalian F-box
proteins." Curr Biol 9(20): 1180-2.
Wong, E., K. Yang, et al. (2002). "Mbd4 inactivation increases Cright-arrowT
transition mutations and promotes gastrointestinal tumor formation."
Proc Natl Acad Sci U S A 99(231: 14937-42.
Wong, W. M., N. Mandir, et al. (2002). "Histogenesis of human colorectal
adenomas and hyperplastic polyps: the role of cell proliferation and
crypt fission." Gut 50(2): 212-7.
Wong, W. M. and N. A. Wright (1999). "Cell proliferation in gastrointestinal
mucosa." J Clin Pathol 52(5): 321-33.
Wood, R. D. (1996). "DNA repair in eukaryotes." Annu Rev Biochem 65:
135-67.
Woodford-Richens, K. L., A. J. Rowan, et al. (2001). "SMAD4 mutations in
colorectal cancer probably occur before chromosomal instability, but
after divergence o f the microsatellite instability pathway." Proc Natl
Acad Sci U S A 98(17): 9719-23.
Wu, Y., M. J. Berends, et al. (1999). "Association of hereditary nonpolyposis
colorectal cancer-related tumors displaying low microsatellite
instability with MSH6 germline mutations." Am J Hum Genet 65(5):
1291-8.
Xie, Y., H. Yang, et al. (2004). "Deficiencies in mouse Myh and Oggl result
in tumor predisposition and G to T mutations in codon 12 of the K-ras
oncogene in lung tumors." Cancer Res 64(9): 3096-102.
Xie, Y., H. Yang, et al. (2008). "Cells deficient in oxidative DNA damage
repair genes Myh and Oggl are sensitive to oxidants with increased
G2/M arrest and multinucleation." Carcinogenesis 29(4): 722-8.
Yamada, Y., K. Hata, et al. (2002). "Microadenomatous lesions involving loss
of Ape heterozygosity in the colon of adult Apc(Min/+) mice." Cancer
Res 62(22): 6367-70.
Yang, S., F. A. Farraye, et al. (2004). "BRAF and KRAS Mutations in
hyperplastic polyps and serrated adenomas of the colorectum:
287

relationship to histology and CpG island methylation status." Am J
Surg Pathol 28(1 IV 1452-9.
Yoo, L. I., D. C. Chung, et al. (2002). "LKBl--a master tumour suppressor of
the small intestine and beyond." Nat Rev Cancer 2(7): 529-35.
Zanke, B. W., C. M. Greenwood, et al. (2007). "Genome-wide association
scan identifies a colorectal cancer susceptibility locus on chromosome
8q24." Nat Genet.
Zauber, N. P., M. Sabbath-Solitare, et al. (2005). "Clinical and genetic
findings in an Ashkenazi Jewish population with colorectal
neoplasms." Cancer 104(4): 719-29.
Zauber, N. P., M. Sabbath-Solitare, et al. (2003). "The characterization of
somatic APC mutations in colonic adenomas and carcinomas in
Ashkenazi Jews with the APC I1307K variant using linkage
disequilibrium." J Pathol 199(2): 146-51.
Zhang, W., W. K. Bleibel, et al. (2007). "Gender-specific differences in
expression in human lymphoblastoid cell lines." Pharmacogenet
Genomics 17(6): 447-50.
Zhang, W., S. Duan, et al. (2008). "Evaluation of genetic variation
contributing to differences in gene expression between populations."
Am J Hum Genet 82(3): 631-40.
Zhou, H., J. Kuang, et al. (1998). "Tumour amplified kinase STK15/BTAK
induces centrosome amplification, aneuploidy and transformation."
Nat Genet 20(2V 189-93.
Zlotnik, A. (2008). "New insights on the role o f CXCR4 in cancer metastasis." J Pathol 215(3): 211-3.
288

“Nothing grea t is easy ”
Capt. Matthew Webb
England ~ France 21 hours 45 minutes, Aug 24th 1875
Chrissie Thirlwell
England ~ France 19 hours 18 minutes, Sept 6th 2007

Gene name Primer name Primer sequence 5’ to 3’ Label Amplicon Size, bp Mg mM Q soln. (Qiagen) .A nnealing Temp °C No. CyclesAPC
Exon 1 IF ATT AAC AC A ATT CTT CTT AA ACGT C FAM 300 1.5 57 351R T GGATAAACTACAATTAAAAGTCACAG FAM
Exon 2 2F A AAT ACAG AAT CAT GT CTT G AAGT TET 200 1.5 57 352R ACACCTAAAGATGACAATTTGAG TET
Exon 3 3F T AACTTAGAT AGCAGT AATTT CCC HEX 212 2 57 353R ACCTCT CTTT CT CAAGTT CTT CTA A A HEX
Exon 4 4F AT AGGT CATTGCTTCTTGCTGAT FAM 185 1 57 354R T GAATTTT AATGGATTACCTAGGT FAM
Exon 5 5F Cl 1 1TTTTGCI TTT ACT GATT AACG TET 248 2 57 355R TGIAAI ICAI ITTATTCCTAATAGCTC TET
Exon 6 6F GGT AGCCATA GTATGATTATTT CT HEX 200 1.5 55 356R CT ACCT ATTTTT AT ACCC ACAAAC HEX
Exon 7 7F A AG A AAGCCT AC ACCATTTTT GC FAM 250 2 57 357R GAT C ATT CTT AG A ACC AT CTT GC FAM
Exon 8 8F ACCTAT AGTCT AAATTATACCATC TET 190 2 57 358R GTCATGGCATTAGTGACCAG TET
Exon 9A 9(I)F AGTCGT A ATTTT GTTT CTA A ACTC HEX 495 1.5 55 359(I)R AT GT A AA AGCT GG ATGAGGA HEX
Exon 9B 9(H)F GCTATGTCT AGCTCCCAAGA FAM 225 1.5 55 359(II)R CT CT CTT GT CAT C AGGCT GT FAM
Exon 9C 9(III)F CAACATCATTCACTCACAGC TET 185 1.5 55 359(III)R CTTT G AA AC ATGCACT ACGA TET
Exon 10 10F AAACAT CATT GCT CTT CAAAT AAC HEX 220 2 57 351 OR T ACCAT GATTT A AAAAT CCACCAG HEX
Exon 10A 10AF AAT CAT AACAGGAAGGGGAT FAM 290 2 55 3510AR CAGTCACACCCCCAGAGG FAM
Exon 11 11F GAT GATT GT CTTTTT CCT CTTGC TET 220 1.5 55 35HR CT GAGCT ATCTT AAGA A AT ACAT G TET
Exon 12 12F TTTT A A AT GAT CCT CT ATT CT GT AT HEX 180 2 60 3512R AC AG AGT CAG ACCCTGCCTCA A A G HEX
Exon 13 13F TTT CT ATTCTT ACTGCT AGCATT FAM 300 1.5 55 3513R AT ACACAGGT AAGAAATTAGGA FAM
Exon 14 14F TAGAT G ACCC AT ATT CT GTTT C HEX 325 1.5 55 3514R CAATT AGGT CTTTTT GAGAGT A HEX
Exon 15A 15AF GTT ACT GCAT ACACATTGTGAC FAM 417 1.5 55 3515AR GCTTTTTGT'ITCCiAACA 1GAAG FAM
Exon 1 5B 15BF AGTACAAGGATGCCAATATT ATG TET 346 1.5 55 3515BR ACTTCTATCTTT I ICAGAACGAG TET
A ppendix 1: P rim ers an d co n d itio n s

Exon 15C 15CF ATTT GAAT ACT ACAGT GTT ACCC HEX 399 2 59 3515CR CTT GT ATT CT A ATTT GGC ATAAGG HEX
Exon 15D 15DF CT GCCCAT ACACATT CAAACAC FAM 382 1.5 55 3515DR T GTTT GGGT CTT GCCCAT CTT FAM
Exon 15E 15EF AGTCTT AAAT ATT CAGATGAGCAG TET 420 1.5 55 3515ER G1 1 TCTCTTCATIA1A1 1 1 1ATGCTA TET
Exon 15F 15FF AAGCCT ACCAATT AT AGT GAACG HEX 428 1.5 55 3515FR AGCT GAT GACAAAGATGATAATG HEX
Exon 15G 15GF AAGAAACAAT ACAGACTT ATT GT G FAM 382 1.5 55 3515GR AT GAGT GGGGTCTCCTGAAC FAM
Exon 15H 15HF AT CT CCCT CCA AAAGT GGTGC TET 420 1.5 55 3515HR T CCAT CT GGAGT ACTTT CT GT G TET
Exon 151 15IF AGT AA ATGCTGCAGTT CAGAGG HEX 508 1 yes 60 3515IR CCGTGGCAT AT CAT CCCCC HEX
Exon 15J 15JF CCCAGACT GCTTC AAAATT ACC FAM 317 1.5 55 3515JR GAGCCT CAT CT GT ACTT CTGC FAM
Exon 15K 15KF CCCT CCA AAT GAGTTAGCTGC FAM 352 1.5 55 3515KR 1IGIGGIAIAGGI111ACTGGTG FAM
Exon 15L 15LF ACCCAAC AAA AAT CAGTT AG AT G TET 417 1.5 55 3515LR GTGGCTGGTAACTTTAGCCTC TET
Exon 15M 15MF AT GAT GTT GACCTTTCCAGGG FAM 250 1.5 55 3515MR Al IGIGI'AACI 1 1 ICATCAGTTGC FAM
Exon 15N 15NF AAAGACAT ACCAGACAGAGGG TET 338 1.5 55 3515NR Cl 1 1 11IGGCAI1GCGGAGCT TET
Exon 150 150F A AG AT GACCT GTT GCAGG AAT G FAM 291 1.5 55 351 5 OR GAAT CAG ACG AAGCTT GT CT AG AT FAM
Exon 15P 15PF CCAT AGT A AGT AGTTT AC AT CA AG TET 400 1.5 55 3515PR AAACAGG ACTT GTACTGT AGG A TET
Exon 15Q 15QF CAGCCCCTT CA AGC A AACAT G FAM 373 1.5 55 35150R GAGGACTT ATT CCATTTCT ACC FAM
Exon 15R 15RF CAGTCT CCT GGCCG AAACT C TET 361 1.5 55 3515RR GTT G ACT GGCGT ACT AATAC AG TET
Exon 15S 15SF T GGT AAT GG AGCC AAT AAAAAGG FAM 306 1.5 55 3515SR TGGGAGI11rCGCCATCCAC FAM
Exon 15T 15TF TGTCTCT ATCCACACATTCGTC TET 301 2 58 3515TR A 1G1TTTTCA1CCTCACTTTTTGC TET
Exon 15U 15UF GGAGAAGA ACTGG A AGTT CAT C FAM 401 1.5 57 3515UR TT GAAT CTTT AAT GTTTGGATTT GC FAM
Exon 15V 15VF T CT CCCACAGGT AAT ACT CCC TET 275 1.5 55 3515VR GCTAGAACTGAATGGGGTACG TET
A ppend ix 1: P rim e rs a n d c o n d itio n s

Exon 15W 15WF C AGG ACA AA ATAAT CCT GT CCC FAM 341 1.5 58 3515WR ATTTT CTT AGTTT CATT CTT CCT C FAM
APC MCR region___________ Paraffin samplesexon 15 F MCR IF CAAGCAGT GAGAATACGTCCA FAM 134 1 55 35
MCR 1R TTT CTT GGTT AAT AGAAGAAACTTTGC FAMexon 15 F-G MCR 2F GCCACTTGC AAAG1 H CTTCT FAM 144 2 yes 55 35
MCR2R TGCTTCCTGTGTCGTCTGA FAMexon 15 G MCR 3-2F CAGACGACACAGGAAGCAGA FAM 182 1 60 35
MCR 3-2F T GGA ACTT CGCT CACAGGAT FAMexon 15 G MCR 4F GAT CCTGT G AGCG AAGTT CC HEX 149 1 58 35
MCR 4R CIGAGCACCAC1 1ITGGAGG HEXexon 15 G-H MCR 5F AGAATCAGCCAGGCACAAAG FAM 173 1 55 35
MCR 5R GCAATCGAACGACTCTCAAA FAMexon 15 H MCR 6F CACTAT GTTCAGGAGACCCCA FAM 149 1 58 35
MCR 6R TGGAAGATCACTGGGGCTT A FAMexon 15 H MCR 7F GT GAACCAT GCAGTGGAATG HEX 135 1 60 35
MCR 7R ACTT CT CGCTT GGTTT GAGC HEXexon 15 H MCR 8F AA ACACCT CCACCACCTCCT HEX 145 1 58 35
MCR 8R AGCATCT GGA AGAACCTGGA HEXexon 15 l-H MCR 9F CCT AA AA AT A AAGC ACCT ACTGCTG FAM 165 3 60 35
MCR 9R CACTCAGGCTGGATGAACAA FAMexon 15 1 MCR 10F ACATTTT GCCACGG A AAGT A HEX 158 2 55 35
MCR 1 OR GGCTGCTCTGATTCTGTTTC HEXexon 15 1 MCR 11F CAGGAAAATGACAATGGGAAT FAM 168 2 55 35
MCR HR T GGCAT GGCAGAAATAATACA FAMexon 15 1 MCR 12F GGACCT ATTAGATGATTCAGATGATG HEX 148 2 55 35
MCR 12R ACTTGGTTTCCTTGCCACAG HEXAPC MCR region____________ 1st round PCRexon 15 F MCR IF GGACAAAGCAGT AAAACCGAAC 220 1 60 35
MCR 1R AACT ACAT CTT GAA AA ACAT ATT GGAexon 15 F-G MCR 2F AAGT GGT CAGCCT CA AA AGG 198 3 yes 60 35
MCR 2R GCT ATTT GCAGGGT ATT AGCAexon 15 G MCR 3F GATACTCCAATAT GTI ITTCAAGA1G 250 1 55 35
MCR 3R GCCT GGCT GATT CT G AAG ATexon 15 G-H MCR 5F CAG ACT GCAGGGTT CT AGTTT AT C 235 2 60 35
MCR 5R CATT CCACTGCAT GGTT CACexon 15 H MCR 6F CC AA AAGT GGT GCT CAG ACA 209 2 60 35
MCR 6R CAT GGTTT GT CCAGGGCT ATexon 15 H MCR 7F TTT GAGAGTCGTTCGATTGC 204 1 60 35
MCR 7R T CT CTTTT CAGCAGT AGGT GCTT
A ppend ix 1: P rim e rs a n d co n d itio n s

Exon 1 5W 15WF C AGG ACA AA AT AAT CCT GTCCC FAM 341 1.5 58 3515WR ATTTT CTT AGTTT CATT CTT CCT C FAM
APC MCR region___________ Paraffin samplesexon 15 F MCR 1F CAAGCAGT GAGAATACGTCCA FAM 134 1 55 35
MCR 1R TTT CTT GGTT AATAG AAGAA ACTTT GC FAMexon 15 F-G MCR 2F GCCACTTGCAAAG1TTCTTCT FAM 144 2 yes 55 35
MCR 2R TGCTTCCTGTGTCGTCTGA FAMexon 15 G MCR 3-2F CAGACGACACAGGAAGCAGA FAM 182 1 60 35
MCR 3-2F T GGAACTT CGCT CACAGGAT FAMexon 15 G MCR 4F GATCCTGTGAGCGAAGTTCC HEX 149 1 58 35
MCR 4R CTGAGCACCACTTTTGGAGG HEXexon 15 G-H MCR 5F AGAATCAGCCAGGCACAAAG FAM 173 1 55 35
MCR 5R GCAAT CGAACGACTCT CAAA FAMexon 15 H MCR 6F CACTAT GTT CAGGAGACCCCA FAM 149 1 58 35
MCR 6R T GGAAGAT CACTGGGGCTT A FAMexon 15 H MCR 7F GT GAACCATGCAGTGGAATG HEX 135 1 60 35
MCR 7R ACTT CT CGCTT GGTTT GAGC HEXexon 15 H MCR 8F AAACACCTCCACCACCTCCT HEX 145 1 58 35
MCR 8R AGCAT CT GGA AGA ACCT GGA HEXexon 15 l-H MCR 9F CCT AA AA AT A AAGC ACCT ACT GCT G FAM 165 3 60 35
MCR 9R CACT CAGGCTGGATGAACAA FAMexon 15 1 MCR 10F ACATTTT GCCACGGAAAGT A HEX 158 2 55 35
MCR 10R GGCTGCTCTGATTCTGTTTC HEXexon 15 1 MCR 11F CAGGAAAATGACAATGGGAAT FAM 168 2 55 35
MCR HR T GGCAT GGCAGAAATAATACA FAMexon 15 1 MCR 12F GGACCT ATTAGATGATTCAGATGATG HEX 148 2 55 35
MCR 12R ACTTGGTTTCCTTGCCACAG HEX/4PCMCR region____________ 1st round PCRexon 15 F MCR IF GGACAAAGCAGTAAAACCGAAC 220 1 60 35
MCR 1R AACT ACAT CTT G A A A A ACAT ATT GGAexon 15 F-G MCR2F AAGTGGT CAGCCT CAAA AGG 198 3 yes 60 35
P Y n n 1 CMCR 2Ru p n o r
GCT ATTT GCAGGGT ATT A GCAr* a t a r ' T r ' r ' a a nr a i i i i i /-» a a r a t oC a U i I 1 j Vj MCR oF
MCR 3RGATACT CCAAT AT GTTTTT C AAG AT G GCCT GGCT GATT CTGAAG AT
250 1 55 35
exon 15 G-H MCR 5F CAGACTGCAGGGTTCTAGTTTATC 235 2 60 35MCR 5R CATTCCACTGCATGGTTCAC
exon 15 H MCR 6F CC AA AAGT GGT GCT CAG AC A 209 2 60 35
P Y n n I S MMCR 6Ri i p n 7 c
CAT GGTTT GT CCAGGGCT ATc a u i i i o n MCR 7 F
MCR 7RI I rGAGAGTCGTTCGATTGC TCTCTTTTCAGCAGTAGGTGCTT
204 1 60 35
A ppendix 1: P rim ers an d co n d itio n s

exon 15 H MCR 8F CAT GCAGT GGAATGGTAAGT 199 2 55 35MCR 8R GCAGCATTTACTGCAGCTT
exon 15 l-H MCR 9F CAAGCGAGAAGTACCTAAAAA 210 2 55 35MCR 9R TTCTGT AT A A AT GGCT CAT CG
exon 15 I MCR 1 OF GGTT CTT CCAG AT GCT GAT A 209 2 55 35MCR 1 OR CTT GGTTTT CATTTGATT CTTT
exon 15 1 MCR 1 IF A ATT A AG A AT AAT GCCT CC AGT 209 2 55 35MCR HR TTT ACGT GAT G ACTTT GTT GG
exon 15 1 MCR 12F CCAAGAGAAAGAGGCAGAAAAA 217 1 yes 55 35MCR12R T GAT GGT AGAAGTTT GT ACACAGG
APC microsatdlite markersD5S346 346F ACT CACT CT AGTG AT A A ATCGGG FAM 125 1 55 35
346R AGC AG AT A AG AC AGT ATT ACT AGTTD5S421 42 IF T GG AA AT AG AAT CCAGGCTT FAM 170 1 55 35
421R TCT AT CGTT AACTTTATTGATTCAGD5S656 656F GCT AAGAAAATACGACAACT AA AT G FAM 187 1 55 35
656R CAT AAT AA ACT GAT GTT G ACAC AChMYH regionexon 1 IF T GAAGGCT ACCT CT GGG A AG FAM 141 1 55 35
1R AGGAGACGGACCGCAAGT FAMexon 2 2F GGCTGGGTCTTTTTGTTTCA HEX 164 1 60 35
2R GGGCCACAACCT AGTT CCTT HEXexon 3 3AF CT GT GT CCCA AGACCCT GAT HEX 187 yes 55 35
3AR TTGGTCGTACCAGCTTAGCA HEXexon 3 3BF AGCTGAAGTCACAGCCTTCC FAM 110 1 60 35
3BR CACCCACT GT CCCT GCT C FAMexon 4 4F CCT CCACCCT AACTCCTCATC FAM 110 1 55 35
4R A AAGT GGCCCT GCT CTCAG FAMexon 5 5F CAGGT CAGCAGT GT CCT CAT FAM 152 2 60 35
5R GT CT GACCCATGACCCTTCC FAMexon 6 6F GTCTCTTTCTGCCTGCCTGT FAM 125 2 60 35
6R T CACCCGT CAGT CCCT CT AT FAMexon 7 7F CGGGT GAT CT CTTT GACCTC FAM 134 2 60 35
7R GTT CCT ACCCTCCTGCCAT C FAMexon 8 8F T CTT GAGT CTTGCACTCCAATC HEX 164 1 55 35
8R AAAGTGGGGGTGGGCTGT HEXexon 9 9F GCT AACT CTTT GGCCCCT CT FAM 150 3 yes 60 35
9R CACCCTT GTT ACCCCAACAT FAMexon 10 10F CT GCTT C ACAGCAGT GTT CC HEX 208 2 yes 60 35
10R GACTTCTCACTGCCCCTT CC HEX
A ppendix 1: P rim ers a n d co n d itio n s

exon 11 11F ACACTCAACCCT GTGCCT CT FAM 147 1 60 3511R GGA AT GGGGCTT CTG ACTG FAM
exon 12A 12AF CTT GGCTT GAGT AGGGTTCG HEX 179 1 yes 60 3512AR GGCT GTT CCAGAAC ACAGGT HEX
exon 12B 12BF GAGT GGTCAACTTCCCCAGA FAM 146 1 60 3512BR CACGCCCAGT AT CCAGGT A FAM
exon 13 13F AGGGAAT CGGCAGCTGAG HEX 209 1 60 3513R GCT ATT CCGCT GCT CACTTA HEX
exon 14 14F AGGCCT ATTTGAACCCCTT G HEX 210 T 60 3514R CAACAAAGACAACAAAGGT AGTGC HEX
exon 15 15F CCCTCACCTCCCTGTCTTCT HEX 159 3 yes 55 3515R T GTT CACCCAGACATTCGTT HEX
exon 16A 16AF CT ACAAGGCCTCCCTCCTTC HEX 158 1 yes 55 3516AR GCT GCACTGTTGAGGCT GT HEX
exon 16B 16BF GCCAGCAAGT CCT GGAT AAT HEX 181 2 60 3516BR ACATAGCGAGACCCCCATCT HEX
hMTHl regionexon 2 2F GCCTT ATCGCAAGGACAGAG HEX 241 3 yes 60 35
2R T GATGGAACCAT GAGTTTGG HEXexon 3 3F TGACTCTGCCCTCTCACCTT FAM 224 1 60 35
3R CGGTT CT AT GGCCAGACCT FAMexon 4 4F TCCCTGGGCTGTGTGTAGAT HEX 270 1 60 35
4R GAGCAGGCCCTGTGAGACT HEXexon 5 5F CT CTT CCCCCATT GGT ACAG FAM 240 1 60 35
5R CT GTT CAGCAGCCACGT CT FAMhOGGI regionexon 1 IF GGGTAGGCGGGGCT ACTAC HEX 266 1 55 35
1R CCCCA AATT CCTTT GT ACCC HEXexon 2 2F AATTGAGT GCCAGGGTTGTC FAM 313 1 55 35
2R CT AACCCCAGCCCAGGT C FAMexon 3 3F CAGCAGGT ACCT CTCCT ACCC FAM 269 yes 55 35
3R T CTT GAAAGCTGATGGAAGG FAMexon 4 4F TT GA AG AT GCCT GAT GCTT G HEX 258 1 55 35
4R T AGAGAGGGCAGCT CCTACC HEXexon 5 5F T CTT CCACAAGGGCT CATT C HEX 232 1 55 35
5R T CT ACCAT CCCAGCCCACT HEXexon 6 6F T CACAGAAGGGGT CAGAT AACTT HEX 197 3 60 35
exon 76R7P
GGCTGGAGAGTCCTTTAGGG HEX( r7R
GACCCCAGT GT ACCCT CCT C AT AT CCCCCACCCCAT CTT
FAMFAM
311 1 55 35
A ppendix 1: P rim ers an d co n d itio n s

exon 8 8F ATT CT CCAT GCT GCCTT CCT FAM 346 1 55 358R GTAAGCT GGCTT GCAT CACA FAM
hMSH6 regionexon 1 IF AG AT GCGGT GCTTTT AGG AG 473 1.5 yes 60 35
1R T GCACT CATT CA AGCC AACTexon 2 2F TGCCAGAAGACTTGGAATTG 448 1.5 yes 60 35
2R CAT GCCAGAAGCTTT CACA Aexon 3 3F CT CCCAAAAT GCT GGG ATT A 486 2.5 yes 60 35
3R GGGAACTACAGAAGTATGCATGTexon 4 4AF TGAACTGTCTTACATTATGGTTTTCC 468 2.5 yes 60 35
4AR GGGC AGAG AAAGCT CT CAAAexon 4 4BF AA AGGAAAAGCT CT AGGAAGG AA 494 1.5 yes 55 35
4BR T GCACCAGGGAAT CTGAATexon 4 4CF CAGT GAACTGGGGCTGGTAT 488 1.5 . yes 55 35
4CR 1 1 1 1 AG 1 TTCCTTTGAGAGAITTCCexon 4 4DF GGACTCTAGTGGCACACTATCC 500 2.5 yes 55 35
4DR T CC ATT CAGA A AA AT CTCC A AGexon 4 4EF CAAAGCCTATCAACGAATGG 497 1.5 yes 60 35
4ER GAGAGATGACCTGCTTAAGGATTexon 4 4FF AAAATCCTTAAGCAGGTCATCTC 578 2.5 yes 60 35
4FR CAGCTGGCAAACAGCACTACexon 5 5F AAAGAAGACCTATAAAACACTTAGGC 428 2.5 yes 60 35
5R CT GT GTTT GGA A AAT G ATCACCexon 6 6F T GGATTT CAGAACAG AACCAA 391 1.5 yes 55 35
6R TGATGI 1 1 1 1AAAGTAACACCAGAAAAexon 7 7F CT CCCAA AGT GCT GGG ATT A 356 1.5 yes 55 35
7R TTTT'I AGAGCACGCAC1 CAexon 8 8F CCGATGTTGCTTTTCTGTCC 454 1.5 yes 55 35
8R CCTT GCT GCATT AA AGCCAT Aexon 9 9F T GAGAGGGC ACTT CT CTT GC 396 2.5 yes 60 35
9R CC AGGC A A ACTT CCCTT AAAexon 10 10F ACCCCAGCCAGGAGACT ATT 425 2.5 yes 60 35
10R CC ACCTTT GT CAGA AGT C AACKras regionexon 1 IF TT AACCTT AT GT GT G ACAT GTT CTA A 220 1 55 35
1R GGT CCT GCACCAGT AAT AT GCBraf regionexon 15 15F TCATAATGCTTGCTCTGATAGGA 224 1.5 55 35
15R GGCCA A A A ATTT AAT CAGT GGAB-catenin region
A ppendix 1: P rim ers an d co n d itio n s

exon 3 3F3R
ATT GAT GGAGTT GGACATGGC CCAGCTACTTGTTCTTGACTGAAGG
236 1.5 55 35
exon 5 5F GGT GGTT AAT AAGGCT GCAGTT 231 1.5 55 355R ATTTT CACC AGGGC AGGAAT
BUMexon 1 IF TT CAAGT GT CACTAGTTGT AAAT GT CA
CAGGAACCAT GCAAAGAT GA CTTT GCT CAGTT GGGAT ACAA
500 1.5 yes 60 351R
exon 2A 2AF 500 2.5 yes 60 352AR T CAT CCAT AT CAT CCCAAT CAT
exon 2B 2BF GCAGACT CCGA AGGAAGTT G 542 1.5 yes 60 352BR T CAT GACT ATT CCCAAT GGCT A
exon 3 3F AAAGGGAGAGGATCCATACAAA 486 2.5 yes 60 353R T GGG ACTT CAT CTTT AG AAT GC
exon 4 4F T GA AA AGGGCT CTTT CTGG A 494 2.5 yes 60 354R T CAGGCAAAT GCT GGCT AAC
exon 5 5F TGACAGGGTCTCACTGTGTTG 478 1.5 yes 55 355R CG AAT GTT AA AGG AGT GGTTT G
exon 6A 6AF TTTT GCT ACA ATTT CT ATTT GGT AT G A 472 2.5 yes 60 356AR CAGCAGT GCTT GT GAG A ACA
exon 6B 6BF AGT AGCAACTGGGCT GA AACA 499 2.5 yes 60 356BR AG AA ATTT GCAT AGCAAC AAT G
exon 7 7F GCAAGTTTTTGG1 GGCT 1 IG 493 1.5 yes 60 357R T GGT ACAGGAGGTTTAAGAGGTC
exon 8 8F CCTGGGCAACAGAATGAGAC 497 1.5 yes 55 358R T GCAAATTT AACTGCT GTGCTT
exon 9 9F GCCCTGCCTGAGTTATGCT 476 2.5 yes 60 359R T GCAGAGAGAGAATACAAAGCAA
exon 10 10F TGTTGGTTAGGCTGGTCACA 485 2.5 yes 60 3510R T CAGACT ACTT GGAGCTT CCTT C
exon 11 11F T CCGGAAATACCGATAAATACA 478 2.5 yes 55 3511R CT GCCATCGGGTT ACAACTT
exon 12 12F AT AT GCGGGT GGGGAGAG 488 2.5 yes 60 3512R TTT CCAGAATTGAGAGAGTTGC
exon 13 13F GCACACAT GA ATT CCTT GCTT 491 2.5 yes 60 3513R GCA ACTTT AGA AGT CT CA A AGAA AA
exon 14 14F AAT GGCATTGCAAGTTATCAG 530 2.5 yes 60 3514R TTGCCAATCTGTATAAACTCCTC
exon 15 15F AT GCCAT GTT GACAATGCTG 452 1.5 yes 60 3515R GGAAGCTGT CTTT CCCCTGT
exon 16 16F T GA A ATTT CCGT AGGTTTT GG 497 2.5 yes 55 35
A ppendix 1: P rim ers an d cond itio n s

16R TTCTTTGTATGTGAAACCATCTCAAexon 17 17F CGGGGTTT GT GAT CT ATT CC 491 2.5 yes 55 35
17R GGTT G AATTTT A AGAT CT CTTT CCAexon 18 18F AGAATGCACAGCCCCTGTT 491 1.5 yes 55 35
18R GGGT GACACAGCGAGACCexon 19 19F GTCTGCTGCCTCTGAGGTG 476 1.5 yes 60 35
19R CACAGGGGGCATAAGCACTAexon 20 20F GAATCCATATGGCAGGGAA G 472 1.5 yes 60 35
20R CT CCATT AACAACT GTCATT CCAexon 21 21F GGGTT GGT CAC AAGT CAGA A A 498 1.5 yes 60 35
21R T GGTCAG AT GCT GAC AAACACDC4exon 1 1F CAGGAGCAGGAGCTTTCACT 144 2.5 yes 55 35
1R TTTT CACT AAAAGAGGCCA AGGexon 2 2F CCAT GCT GACTC AA GATTT GAT A 164 2.5 yes 55 35
2R TT CCGGT AAT CT CAA AAT GT GTTexon 3 3F T GCCAGAT CAT CATT CTTT G 142 2.5 yes 55 35
3R GCAGCAATT AAGT GAGGCATTexon 4 4F GCCTGT AATTT GGGACATCTG 135 2.5 yes 55 35
4R C ACCC AAT G AAG AAT GT A ATT GAexon 5 5F T CAAGTAT CTCATCCTGTGGAGAA 124 2.5 yes 55 35
5R TTT CAG A AT CACT CT GCTTTT C Aexon 6 6F T GGT G A AGGC A ATTT ACT CTT G 137 2.5 yes 55 35
6R AACGGTTT CT GTT ACATT GTGCexon 7 7F AT CT GCACAT CTTTCTTATAGGTGCT 114 2.5 yes 55 35
7R G A AG AGT A A ACTT ACTTT GCCT GT G Aexon 8 8F ICACI rTTCCTTTCTACCCAAAA 182 2.5 yes 55 35
8R GGAAGAAGTCCCAACCATGAexon 9 9F I 1111CTGTTTCTCCCTCTGC 226 2.5 yes 55 35
9R TT CAT CAGGAGAGCATTTAAGGexon 10 10F T CCT CTT CCCCCTTT CCT AC 211 2.5 yes 55 35
10R TTT GT GAT GCT AAGGCTCCAMBD4exon 1 IF ATCTTACTCCGCCCCACAC 206 1.5 60 35
1R GTGAAACTGAGGCCCAAAAGexon 2 2F AAT CACTT AGACTTT G I I I TTCCAG 295 2.5 yes 55 35
2R T CATTTGGCTGTACTATCTTTACCAexon 3A 3AF ACCT AT GGC A AC ATTT GGA A 680 2.5 yes 55 35
3AR T CACACT GAGGGTCTCACCAexon 3B 3BF T GAT AGC A AA AGAG AAT CTGTGTG 496 2.5 yes 55 35
A ppendix 1: P rim ers an d co n d itio n s

exon 4 -53BR4-5F
GGCACGAAT ACAAGAT GCAG GCCT GGCAT GCTTT GT AAT A 496 2.5 yes 55 35
4-5R TCCCAGGTGACACACT CAAAexon 6 6F GCCCACCTGGAGTCTTGTAA 225 2.5 yes 55 35
6R iGirmccn igggtgtatagg
exon 7 7F CACATTTTGGGAGGGTGTCT 212 1.5 yes 55 357R GCCT CAGAGACCAAATGTGC
exon 8 8F AT GT ACT GT CCCCCAGC A AA 202 T 55 358R T GAGCTTGAAAGCTGCAGAG
MGMTexon 2 2F CGACCAGCCT CTT ACCT AT ACA 211 2 60 35
2R AGGAT CACGT GGGCT CAT ACexon 3 3F GGTGTTTGCTTTTCCGATGT 195 2 _ ves 55 35
3R ACACCGCAGATGGCTTAGTTexon 4 4F TCCTGCATTCTTCCTTTCAG 243 1 55 35
4R GAGGAAACACGTGGGATCAGexon 5 5F CGTT GT CCAGATCCCT GACT 299 t 60 35
5R T ACACGT GT GT GT CGCTCAATDGexonl IF TCTCTGGGGTTGTCTTACC 225 1.5 yes 55 35
1R GGCCGGGATTT A A A AG ACexon 2 2F AGA 1 1 1 r 1G1ACAGCTGA I'CATT 299 1.5 ves 55 35
2R A ATT C ACC AT G AA ACCCTTTexon 3 3F TTCTG C ATTT CT GGA A ATT AT 299 2.5 ves 55 35
3R AAT CCAACGAGGACAAAGATexon 4 4F T CCT CCAT AGAAACGCT AAG 222 1.5 yes 55 35
4R AACACAA1 1 GG 1 1 ITT C1 GAexon 5 5F T ACACTCT AGCCTGGGTGAC 246 1.5 yes 55 35
5R AAGGTTCCAACCCATAAAAGexon 6 6F AAGCTGTCTGAATTTAGCATATTA 208 2.5 yes 55 35
6R ACATT GCCCAT AAT GTT AGCexon 7 7F AAAT AT CAGCCACGAATAGC 250 1.5 yes 55 35
7R TTCACATTT AGCT GATTT ACAAexon 8 8F CCCAA AT A A AG ACA A AT ATT CTA A 289 1.5 yes 55 35
8R T GAAT AAAAGGAAT GAGGACAexon 9 9F TT CAT GATTT CT G A AT A AAGCT A 249 1.5 yes 55 35
9R GACCAAACCGTCTTTGAAexon 10 10F T GGGCGAT AGAGTAAGACC 288 2.5 yes 55 35
1 OR TT GTT G AC A ACT GCATT A AAA
A ppendix 1: P rim ers an d cond itions
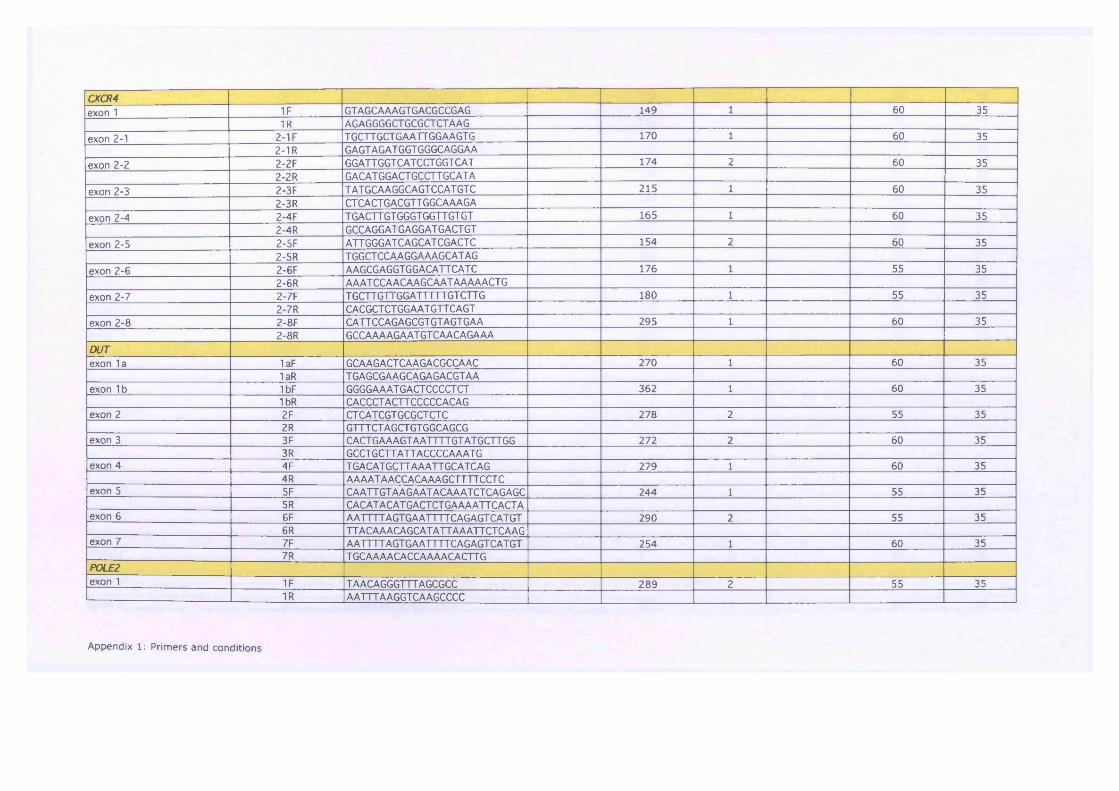
CXCR4exon 1 1F GTAGCAAAGT GACGCCGAG 149 1 60 35
exon 2-11R
2-1FA b A b b b b L 1 b b b b 1 L 1A A b
T GCTT GCT G A ATT GGA AGT G 170 1 60 352-1R GAGTAGATGGTGGGCAGGAA
exon 2-2 2-2F GGATT GGT CAT CCT GGT CAT 174 2 60 352-2R GACATGGACT GCCTTGCATA
exon 2-3 2-3F T AT GCAAGGCAGTCCATGTC 215 1 60 352-3R CT CACTGACGTT GGCAAAGA
exon 2-4 2-4F T GACTT GT GGGT GGTT GT GT 165 1 60 352-4R GCCAGGATGAGGATGACTGT
exon 2-5 2-5F ATT GGGATCAGCATCGACTC 154 2 60 352-5R T GGCT CCAAGGA AAGCAT AG
exon 2-6 2-6F AAGCGAGGTGGACATTCATC 176 1 55 352-6R AAAT CCA ACAAGCAAT AAAAACT G
exon 2-7 2-7F TGCTTG'l IGGAI 1 1 1 IGTCTTG 180 1 55 352-7R CACGCT CT GGAAT GTT CAGT
exon 2-8 2-8F CATT CCAGAGCGT GTAGTGAA 295 1 60 352-8R GCCAAA AGA AT GT CAACAGA AA
DUTexon la 1aF GCAAGACTCAAGACGCCAAC 270 1 60 35
1aR T GAGCGAAGCAGAGACGTAAexon 1b 1bF GGGG AA AT G ACT CCCCT CT 362 1 60 35
1 bR CACCCTACTTCCCCCACAGexon 2 2F CTCATCGTGCGCTCTC 278 2 55 35
2R GTTTCTAGCTGTGGCAGCGexon 3 3F CACT G A A AGT AATTTT GT AT GCTT GG 272 2 60 35
3R GCCT GCTT ATTACCCC A AAT Gexon 4 4F T GACATGCTTAAATTGCATCAG 279 1 60 35
4R AAAAT AACCACAAAGCTTTTCCT Cexon 5 5F C A ATT GT A AG A AT ACAA AT CT C AGAGC 244 1 55 35
5R CACATACATGACTCTGAAAATTCACTAexon 6 6F AA r TTTAG 1GAAT TTTCAGAG1CA1G1 290 2 55 35
6R TTACAAACAGCATATTAAATTCTCAAGexon 7 7F AA1I I 1 AG 1GAATTTT CAGAG1CA1G1 254 1 60 35
7R T GCAAAACACCAAAACACTTGP0LE2exon 1 IF TAACAGGGTTTAGCGCC 289 2 55 35
1R AATTTAAGGTCAAGCCCC
A ppendix 1: P rim ers an d co n d itio n s

exon 2 2F CCTTTCAGTGCCAGATTG 308 1 55 352R GGG ACAT CTT AAT AGT G AAGC
exon 3 3F T GGG AAA AG AGCT GT CTG 242 1 55 353R TT GAT CACT AAT AATTTT CCA AG
exon 4 4F CTT AT AAT GCAAGTT AT CAT GTT C 247 1 55 354R GT GAGCCAAAAGTGAAGC
exon 5 5F TCTCTTGCTTCACTTTTGG 246 2 55 355R CCCT GAG ATTT CCCT AA AC
exon 6 6F ACAGTGTTTCATCAGGGC 291 2 55 356R GCAGCCCATCCAGTT AG
exon 7 7F TTGT AGGACAAAATTAAACATCC 358 1 55 357R CATTCCTGTGCCCACTAC
exon 8 8F TTTT A A AAT CCACTTT CTCCC 302 1 55 358R ACATTCCTACACCAGCAAC
exon 9 9F TT AGAAGCCTT GTT GGACT C 206 1 55 359R AACAT ATTTT ACCCAAAGCAG
exon 10 10F GTTCACAGGGCATGAGAC 290 2 55 351 OR GACACAAAGCCT GACACC
exon 11 11F CT CAA AA AGAT AAAT AG AAT ACT CAAA 381 1 55 3511R C A A AG AGT ACCTTTTT ACACTGG
exon 12 12F AATTT GCAT AT AATGCCATAAA 385 2 55 3512R AAT GAAT GGCT ACT GTT ATT AGT ATT
exon 13 13F AAGCTTTGAAAGGTATTAACG 331 1 55 3513R T CCTTAGTTTT GT AAT A ATT GCTG
exon 14-15 14-15F AACTT GCTTTT A AGCT ATT GG 417 1 55 3514-15R AACTCCAAGCAACCTGC
exon 16 16F GGAATGGGGTTGTATTGTAAG 285 2 55 3516R CCCAAGGACAAATT ATT AAGT G
exon 17 17F GCAIAI I I I I AC I ICGACAAT AAT C 407 1 55 3517R TTCCT AGTTT CT CAAATTTT CT G
exon 18 18F AGCCTGGGTGATGAGAG 358 2 55 3518R CCGT GAT AAGCTCAGCC
exon 19 19F TTT GGG AGCA GAA A AGG 327 1 55 3519R ACAAATTT AAGCAGAACAT CCDKK1
exon1A 1AF GCAAGACTCAAGACGCCAAC 277 2 60 351AR TGAGCGAAGCAGAGACGTAA
exon IB 1BF GGGG AA AT GACT CCCCT CT 362 1 60 351BR CACCCT ACTT CCCCCACAG
exon 2 2F CT CAT CGTGCGCTCTCC 278 1 60 35
A ppendix 1: P rim ers a n d c o n d itio n s
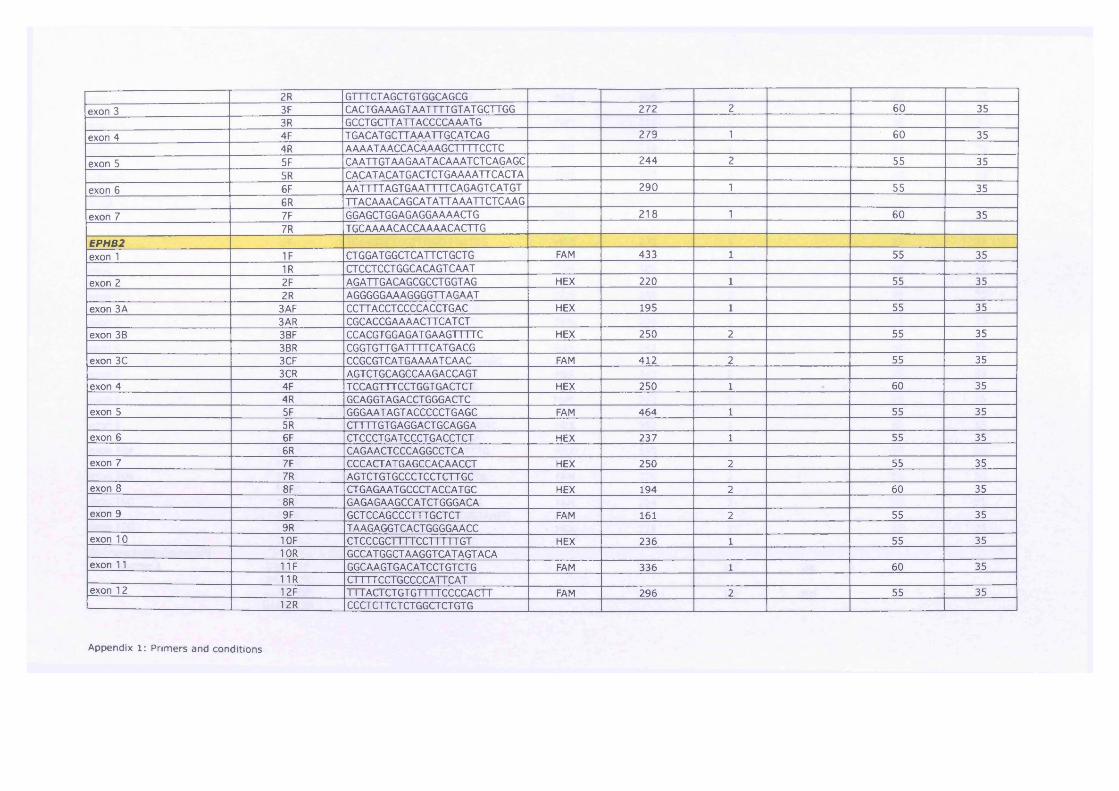
2R GTTTCT AGCTGT GGCAGCGexon 3 3F CACTGAAAGT AATTTT GT AT GCTTGG 272 2 60 35
3R GCCT GCTT ATT ACCCCA AAT Gexon 4 4F T GACAT GCTT AAATT GCATCAG 279 1 60 35
4R AAAATAACCACAAAGCTTTTCCTCexon 5 5F CAATT GT AAG AAT ACAAATCT CAGAGC 244 2 55 35
5R CACATACATGACTCTGAAAATTCACTAexon 6 6F AATTTT AGT G AATTTT CAG AGT CAT GT 290 1 55 35
6R TTACAAACAGCAT ATT A AATTCTCAAGexon 7 7F GGAGCTGGAGAGGAAAACTG 218 \ 60 35
7R T GCAAAACACCAAAACACTT GEPHB2exon 1 IF CT GGAT GGCT CATT CT GCT G FAM 433 1 55 35
1R CTCCTCCT GGC ACAGT CAATexon 2 2F AGATT GACAGCGCCTGGTAG HEX 220 1 55 35
2R AGGGGGAA AGGGGTTAGAATexon 3A 3AF CCTT ACCT CCCCACCTGAC HEX 195 1 55 35
3AR CGCACCGAAAACTTCAT CTexon 3B 3BF CCACGTGGAGATGAAGTTTTC HEX 250 2 55 35
3BR CGGT GTT GATTTTCATGACGexon 3C 3CF CCGCGT CAT G A A A AT C A AC FAM 412 2 55 35
3CR AGT CT GC AGCCA AGACC AGTexon 4 4F T CCAGTTTCCT GGT GACT CT HEX 250 1 60 35
4R GCAGGTAGACCT GGGACT Cexon 5 5F GGG A AT AGT ACCCCCT G AGC FAM 464 1 55 35
5R CTTTT GT GAGGACTGCAGGAexon 6 6F CTCCCTGATCCCTGACCTCT HEX 237 1 55 35
6R CAGAACT CCCAGGCCT CAexon 7 7F CCCACT AT GAGCCACAACCT HEX 250 2 55 35
7R AGTCTGTGCCCTCCTCTTGCexon 8 8F CT GAGA AT GCCCT ACC AT GC HEX 194 2 60 35
8R GAGAGAAGCCATCTGGGACAexon 9 9F GCT CCAGCCCTTTGCTCT FAM 161 2 55 35
9R T AAGAGGT CACTGGGGAACCexon 10 10F CTCCCGCI111CCTTTTTG1 HEX 236 1 55 35
10R GCCAT GGCT AAGGT CAT AGT ACAexon 11 11F GGC A AGTG AC ATCCTGTCTG FAM 336 1 60 35
11R Cl 111CC1GCCCCA1ICAIexon 12 12F 111 AC 1CTGTGTT11CCCCAC11 FAM 296 2 55 35
12R CCCTCTTCTCTGGCTCTGTG
A ppendix 1: P rim ers an d co n d itio n s

exon 13 13F ACCCACAAACCCTCCTCTTT HEX 206 2 55 3513R CTT GCCT AT CCCCTT GGAG
exon 14 14F AACCCCACTGCACTCCTG FAM 281 2 60 3514R AT GGGAGACGGGAAGAGG
exon 15 15F GT GCCCTGACCATCTCTGTC HEX 238 2 60 3515R AGAGGGGGTGCTAAGGTGAC
exon 16 16F CCCGCATATTT CCCT AACAC FAM 500 1 60 3516R AACTGLI1 ITCTCTCCGATTC
Wifiexon 1 IF CTCTCGCAGGCTCCTTGG FAM 356 1 55 35
1R GAGGACATAGGCAGGGGAAGexon 2 2F T CAAGTCTACCTGGTTT GATCG HEX 231 1 55 35
2R T GCCAT AAGGCAGTGGAAATexon 3 3F GCCTT CT CCCT CT CT GGTTT FAM 189 1 60 35
3R CCTTT CTT C AGGC A A AG ACCexon 4 4F CTT GGTT CCC AAGATTT CT G FAM 248 2 55 35
4R T CTT CT CTT G AAT CACC AT CGexon 5 5F GGCT GT GATT CACCCAACAT FAM 236 1 55 35
5R AC A AT AC AC AT GGGGCT CCTexon 6 6F T GGCCTT AAT CAGGGTT CT C HEX 243 2 60 35
6R CCCT AAGCCATACATTCTCAGAGCexon 7 7F GAAATGGGCAAGTAGCAAGC HEX 247 2 55 35
7R CT CCCCAAGT CAAA AGAACGexon 8 8F T GAAT GAAGCACCAGGTT CC FAM 242 1 55 35
8R CAGGCAACATGCACTAAGCAexon 9 9F CCAACTT ATGACTGGAGACTGA C HEX 350 1 55 35
9R AGCCAAGAAACCGAAGT GAAexon 10A 1 OAF GAA1C1GAAGAGCC1 GG I I T I'G HEX 195 1 55 35
10AR TCAGATGTCGGAGTTCACCAexon 1 OB 10BF GCCTTT GTT AACCTTT CAT GT G FAM 276 2 55 35
10BR GCCCCCAGACACC AT AAATexon IOC 10CF CAAT GCATTTATGGTGTCTGG FAM 224 2 60 35
10CR CT GAAT CT CT GGAAT AAT GGTA AGGexon 10D 10DF ACACTGTGGTAGTGGCATTT HEX 218 1 55 35
10DR GCAT GT GCAAAGATCACCTCMicrosatellite markerschromosome 1 D1S201F GGT AT GGAAGT CACCCAACA FAM 186 1.5 yes 55 35
D1S201R CT CAAA AT G ACT GAT GGGGTD1S2729F T ACTT GCCT AAT GCT GT GT G FAM 208 1.5 yes 55 35D1S2729R T AT C AAT CCTT GGGAG ACC
A ppendix 1: P rim ers an d co n d itio n s

D1S2749F GAT CCT GCCTTT ACT GCTT G FAM 195 1.5 ves 55 35D1S2749R GGCCAT GT GT AGCCTTT CD1S470F AAAT GGGGCT AAT AAAT CT CCT GG FAM 155 1.5 yes 55 35D1S470R CT ACACCAT AGGCAT AGGT GCAA
chromosome 9 D9S1818F GGAT CT ATGCT GGCT ACTT CATAAC FAM 133 1.5 yes 55 35D9S1818R T ATTT GGACTCTGTAGTGCTGAACD9S1826F ATGTTGATTGCCGCAGTG FAM 133 1.5 yes 55 35D9S1826R T GCAG AACCAGGT CTT ATT CGD9S1829F AGCT ACTCAGGAGGCTAAGG FAM 198 1.5 yes 55 35D9S1829R GCGA ACTT CAG A AAA AC AT CD9S1830F CAGAGT GGT GGGACTCAA FAM 107 1.5 yes 55 35D9S1830R AGCTGCAGACTGCCTTC
chromosome 17 D17S786F T ACAGGGAT AGGT AGCCGAG FAM 135 1.5 yes 55 35D17S786R GGATTTGGGCTCTTTTGTAAD17S1832F ACGCCTT GACATAGTTGC FAM 151 1.5 yes 55 35D17S1832R T GT GT GACTGTTCAGCCTCD17S1353F CT GAGGCACGAGAATTGCAC FAM 184 1.5 yes 55 35D17S1353R T ACT ATT CAGCCCGAGGTGCD17S1844F CATT CCAGCCT GGGT GA FAM 227 1.5 yes 55 35D17S1844R GGAACCAT AGGAGGCGTTTT
chromosome 19 D19S886F T GGAT CT ACACTCCGGC FAM 134 1.5 yes 55 35D19S886R A 1 1TTACTGGCTGGCACTTGD19S878F GCCT GGGCGACAGAG AAT FAM 208 1.5 yes 55 35D19S878R GGTT GCCCGCAGAGTGD19S215F CAT GC ATT A A A A AT GACAACT GT FAM 252 1.5 yes 55 35D19S215R GCT CT GCANTCCATT ACT CAD19S656F GTGATTGCACCACGGG FAM 168 1.5 yes 55 35D19S656R T CAAGT CATT GGGTT GGCD19S591F TTCCAGCCTAGGT AGCAGTG FAM 96 1.5 yes 55 35D19S591R GCAACT GAGGAAAT GCATCT
M ou se P r im e r s e q u e n c e sG ene nam e Prim er nam e Prim er se q u e n c e 5’ to 3’ Label Am plicon Size, bp Mg mM Q so ln . (Q iagen) A nnealina Temn °C No. C ycles
APCmAPC xl 5AF CTT GTT GTCACTAATCA C ATTTT C 550 2 55 35mAPC x15AR T CCAGT ATT GAAATT GT CT GACCmApc x15BF GACGCCAATCGACATGAT 547 2 55 35mApc xl 5BF CAACTGAGGGTTTCATTTGGmApc x15CF TGATGGATATGGTAAAAGAGG 544 2 55 35mApc xl 5CR TTCTTCCTCAGAATAACGTTCAC
A ppendix 1: P rim ers a n d co n d itio n s

mApc x15DF T GAAGATGATAAACCTACCA AC 545 2 55 35mApc xl 5DF CAGCTGACCGAGTTACATCAmApc x1 5EF T GCAGACAGCAGAAGTAAAAGA 504 2 60 35mApc xl 5EF GCTT AGGCCCACT CT CT CT CmApc xl 5FF AGT AA AGT CCCT GCT GCT G A 453 2 55 35mApc xl 5FR T GCCACAGGT GGAGGT AATmApc LOH 1F T ACGGT ATT GCCCAGCTCTT FAM 153 2 55 35mApc LOH 1R T GC AG ACCT CGTTTT GAT G A
mAPC xl 5 (-1 )F T GCCCCTTTACTT GTT GT CA FAM 308 1 55 35mAPC xl 5 (-1 )R T CT GTTT GCCAT GAGATT CCT FAMmAPC x1 5 (0)F CCT CATT CATT CC A AGCAC A FAM 376 1 55 35mAPC xl 5 (0)F AGAGCTGGGCAATACCGTAG FAM
mAPC xl 5 (LOH5&6)F IT 11GACGCCAATCGACAT FAM 310 2 60 35mAPC xl 5 (LOH5&6)R GTCGT CCT GGGAGGTATGAA FAM
mAPC xl 5 (1 )F GCCAAAGTTATGGAAGAAGTATCA FAM 411 1 60 35mAPCx15 (1)R TGGTGTAT CCAGTT CTCCATCA FAMmAPC xl 5 (2)F CAGT GCAAATCATATGGATGATAA HEX 372 2 55 35mAPC xl 5 (2)R TCTTCCTGACACAGAGACTGG HEXmAPC xl 5 (3)F T CGAATGGGTTCTAGTCAT GC FAM 418 1 60 35mAPC xl 5 (3)R GGGGACTTTGCAAGTAGTGC FAMmAPC xl 5 (4)F GCACAAAGAA AT GGCC AGAC HEX 391 2 55 35mAPC xl 5 (4)R CACCACTTTT GGAGGGAG AC HEX
mApc x6F CCCAT GT CAAGACACTCCAG FAM 204 1 55 35mApc x6R T GT ACCAGAAGGGGGCTTT A FAMmApc x7F TT CAT CGAGAGTTTT G AAGCA A HEX 228 2 55 35mApc x7R CAGACAGG ACTT GT C AGTTT GAA HEXmApc x8F AATTGGGAGCTTCAGAGTGG FAM 196 2 yes 55 35mApc x8R GCAAG AGGGTTT GT AAT CTGC FAMmAPC x9F TA AACT CATTT GGCCCAC AG FAM 555 1 60 35mAPC x9R CAGGGAAATGCAGATTT AAGC FAMmApc xlOF T GAGGG AT GT GT CAATAACGTC FAM 223 3 60 35mApc xlOR ATTT GTGGCGTT AGGAAAGC FAMmApc xl IF T GTTT CCTTTT GCCCTT GTT HEX 272 2 yes 55 35mApc xl 1R GTT CAACTGGGCTGCTGTG HEXmAPC xl 2F T C AGGC AGATT CCTT GAT G A FAM 208 1 55 35mAPC xl2R GCCAT ACTTT AACACAAGCCACT FAMmAPC xl 3F CCT CT AGC ATT AG A A AC A A A A AG ACA HEX 226 1 55 35mAPC x!3R CCT ATT CCAGCACCCAACAT HEXmAPC xl 4F CAGCACT GACCCAAATTTCA HEX 475 1 55 35mAPC x14F GGCCT CTTT GCTT AG AGCTT HEX
A ppend ix 1: P rim e rs a n d co n d itio n s

Mom 1MomlF GT CCAAGGGAACATTGCG 465 1 55 35MomIR AG AACAGGT GATTT GGCCC
KrasmKras x1F n i l 1 ATT G1AAGGCCTGC VGA 161 2 55 35mKras xIR GCACGCAGACT GT AGAGCAG
BRAFmBRAFxl 5F AGGCCT GGGACAGCTTAA AA 529 3 yes 65 35mBRAFxl 5R CAGCTTTCTAAGTGCTGGGATT
MYHmMYH xl F CTTTGCCCTTTTGTTTCGAG FAM 199 2 60 35mMYH xIR GAAACT GGT GAGGGACAAGC FAMmMYH x2F CT GAGTTCCCCT GGCTGTC FAM 199 2 55 35mMYH x2R CACT GTCTCTGT CCCAT CCA FAM
mMYH X3&4F ITCACCC11GGTTTTATTGACA FAM 278 2 60 35mMYH x3&4R CT CCCT CCCCAAC AT CAC FAMmMYH X5&6F 1111TGCCTGTCTTGGGTTT FAM 254 1 60 35mMYH X5&6R CACCGGGC1ATTT 1TCAGTG FAMmMYH x7&8F CT GT G AGCTT CCTGCT CCAT FAM 337 2 60 35mMYH x7&8R CCCGT CACCTCATTACCCTA FAMmMYH X9&10F AAGGGCCTTTGCTTACAGAA FAM 357 2 60 35mMYH X9&10R CT CT GAAAGGGACAGGGATG FAM
mMYH xl 1&12F GCT GGG AAT CTTT GTTT CCA FAM 466 2 yes 60 35mMYH xl 1&12R CCCT GT CACCTTTGCT AACC FAMmMYH xl 3&14F CAGACCTGGTTCGGTCT CTT FAM 460 2 60 35mMYH xl 3&14R GAAGAGGGCGGAATGCAC FAM
mMYH xl 5F GGGT AGAAGAGT CCCTGGT G FAM 201 2 60 35mMYH xl 5R TTTGGGT AGGGAAT CCCAGT FAM
MYH genotypingPI (21-mer) CAAGT GCT GGGAT CAAAGGT G 1 55 35P2 (20-mer) GCT CCTT CTT GT AGCCG ACG P1/P2 262
P3 (neo, 21-mer) TCCT CGT GCTTTACGGT ATCG P1/P3 376
A ppend ix 1: P rim ers an d c o n d itio n s

Mom 7MomlF GT CCAAGGGAACATTGCG 465 1 55 35
KrasMomlR AGAACAGGTGAT11GGCCC
mKras xlF 1111IA I1G1AAGGCCTGCTGA 161 2 55 35mKras xIR GCACGCAGACTGTAGAGCAG
BRAFmBRAFxl 5F AGGCCT GGGACAGCTT AAAA 529 3 yes 65 35mBRAFxl 5R CAGCTTT CT A AGT GCTGGGATT
MYHmMYH x1F CTTTGCCCTTTTGTTTCGAG FAM 199 2 60 35mMYH x1R GAAACT GGT GAGGGAC AAGC FAMmMYH x2F CTGAGTTCCCCTGGCTGTC FAM 199 2 55 35mMYH x2R CACTGTCTCTGTCCCATCCA FAM
mMYH x3&4F TT CACCCTT GGTTTT ATT G ACA FAM 278 2 60 35mMYH X3&4R CT CCCT CCCCA AC AT C AC FAMmMYH X5&6F 11111GCCTGTCTTGGGTTT FAM 254 1 60 35mMYH X5&6R CACCGGGC1A 11T1TCAGTG FAMmMYH X7&8F CT GT GAGCTT CCTGCTCCAT FAM 337 2 60 35mMYH X7&8R CCCGTCACCTCATTACCCTA FAMmMYH X9&10F AAGGGCCTTTGCTTACAGAA FAM 357 2 60 35mMYH X9&10R CT CT GAAAGGGACAGGGATG FAMmMYH xl 1&12F GCTGGGAATCTTTGTTTCCA FAM 466 2 yes 60 35mMYH xl 1&12R CCCT GT CACCTTT GCT A ACC FAMmMYH xl 3&14F CAGACCT GGTTCGGTCT CTT FAM 460 2 60 35mMYH X13&14R GAAGAGGGCGGAATGCAC FAM
mMYH x15F GGGT AGA AGAGTCCCT GGT G FAM 201 2 60 35mMYH xl 5R TTT GGGT AGGGAATCCCAGT FAM
MYH qenotypinqPI (21-mer) CAAGTGCTGGGATCAAAGGTG 1 55 35P2 (20-mer) GCT CCTT CTT GT AGCCGACG P1/P2 262
P3 (neo, 21-mer) T CCT CGT GCTTT ACGGTATCG P1/P3 376
A ppendix 1: P rim ers a n d co n d itio n s
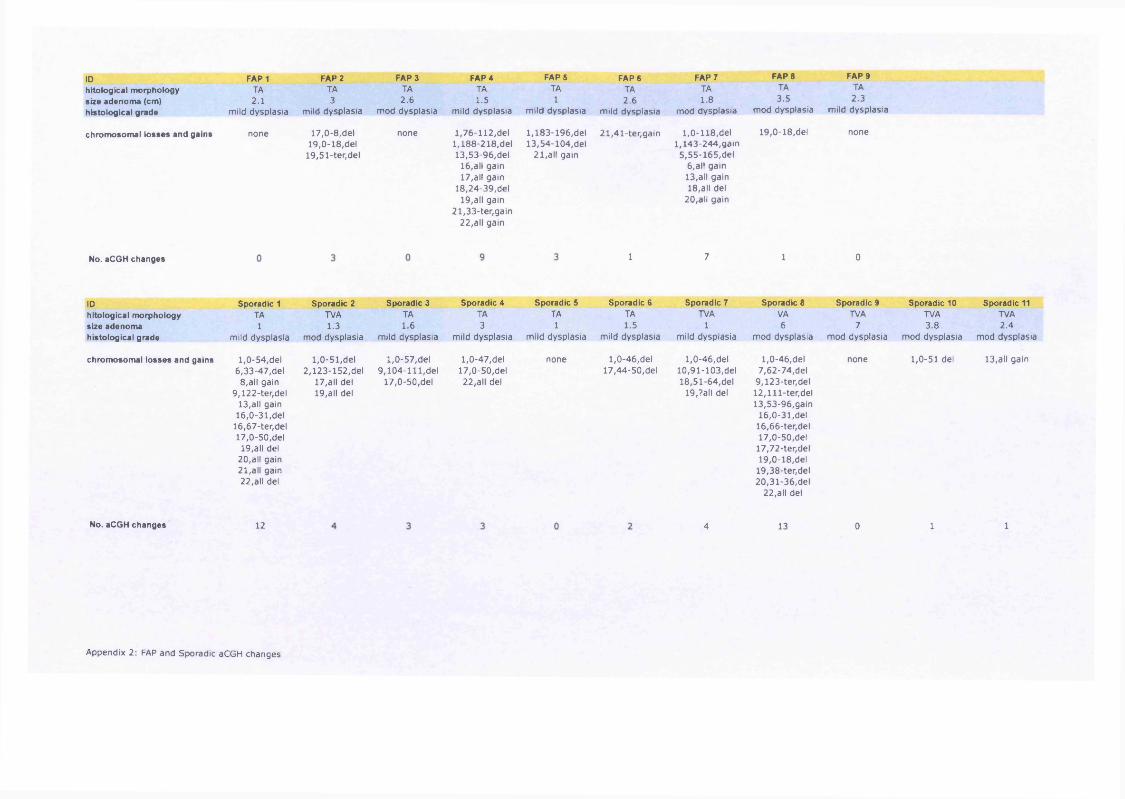
IDhitological morphology size adenom a (cm) histological grade
chrom osom al lo sses and gains
No. aCGH changes
IDhitological morphology size adenom a histological grade
chrom osom al lo sses and gains
No. aCGH changes
FAP 1TA2.1
mild dysplasia
none
FAP 2TA3
mild dysplasia
17.0-8,del19.0-18,del
19,51-ter,del
FAP 3TA2.6
mod dysplasia
none
FAP 4TA1.5
mild dysplasia
1,76-112,del 1,188-218,del 13,53-96,del
16,all gain17,all gain
18,24-39,del19,all gain
21,33-ter,gain 22,all gain
FAP 5TA1
mild dysplasia
1,183-196,del 13,54-104,del
21,all gain
Sporadic 1TA1
mild dysplasia
1.0-54,del 6,33-47,del
8,all gain 9,122-ter,del
13,all gain16.0-31,del
16,67-ter,del17.0-50,del
19,all del20,all gain21,all gain22,all del
Sporadic 2TVA1.3
mod dysplasia
1,0-51,del 2 ,123-152,del
17,all del 19,all del
Sporadic 3TA1.6
mild dysplasia
1.0-57,del 9 ,104-111,del
17.0-50,del
Sporadic 4TA3
mild dysplasia
1.0-47,del17.0-50,del 22,all del
Sporadic 5TA1
mild dysplasia
none
12
A ppendix 2: FAP and Sporadic aCGH changes
FAP 6TA2.6
mild dysplasia
21,41-ter,gain
1
Sporadic 6TA1.5
mild dysplasia
1,0-46,del 17,44-50,del
FAP 7 FAP 8 FAP 9TA TA TA1.8 3.5 2.3
mod dysplasia mod dysplasia mild dysplasia
1,0-118,del 1,143-244,gain
5,55-165,del 6 ,all gain 13,all gain 18,all del
20,all gain
19,0-18,del none
7 1 0
Sporadic 7 Sporadic 8 Sporadic 9 Sporadic 10 Sporadic 11TVA VA TVA TVA TVA
1 6 7 3.8 2.4mild dysplasia mod dysplasia mod dysplasia mod dysplasia mod dysplasia
1,0-46,del 1,0-46,del none 1,0-51 del 13,all gain10,91-103,del 7,62-74,del18,51-64,del 9,123-ter,del
19,?all del 1 2 ,lll- te r ,d e l 13,53-96,gain
16.0-31,del 16,66-ter,del17.0-50,del
17,72-ter,del19.0-18,del
19,38-ter,del 20,31-36,del
22,all del
4 13 0 1 1

IDhitological morphology size adenom a (cm) histological grade
chrom osom al lo sses and gains
No. aCGH changes
IDhitological morphology size adenom a histological grade
Sporadic 12TVA1.5
mild dysplasia
Sporadic 13TVA3.5
mod dysplasia
Sporadic 14TA1
mild dysplasia
chrom osom al lo sses and gains 17,0-14,del none
No. aCGH changes
Appendix 2: FAP and Sporadic aCGH changes

In d 1 JUM-MAP ro b e ID fo ld c h a n g e g e n e .sy m b o l m ap d e s c r ip t io n204517 at 6.97 PPIC 5q23.2 peptidylprolyl isomerase C (cvclophilin C)206366 x at 6.95 XCL1 1023 chemokine (C motif) liqand 1204983 s at 6.07 GPC4 Xo26.1 glypican 4203325 s at 6.01 COL5A1 9o34.2-034.3 collaqen, type V, alpha 11559401 a at 5.80 ZNF609 15022.31 zinc finger protein 6091569237 at 5.26 RAPGEF2 4032.1 Rap quanine nucleotide exchanqe factor (GEF) 2226665 at 5.21 AHSA2 2pl5 AHA1, activator of heat shock 90kDa protein ATPase homoloq 2 (yeast)207836 s at 5.18 RBPMS 8p l2 -p l1 RNA bindinq protein with multiple splicinq236404 at 5.10 ATXN1 6P23 ataxin 1239808 at 4.91 PITPNC1 17024.2 phosphatidylinositol transfer protein, cytoplasmic 1229026 at 4.89 CDC42SE2 5031.1 CDC42 small effector 2207002 s at 4.77 PLAGL1 6024-025 pleiomorphic adenoma qene-like 1221042 s at 4.73 CLMN 14032.13 calmin (calponin-like, transmembrane)
546 s at 4.63 APOL1 22013.1 apolipoprotein L, 1
s at 5.03 PSME3 17021 proteasome (prosome, macropain) activator subunit 3 (PA28 qamma; Ki)215001 s at 4.84 GLUL 1031 qlutamate-ammonia liqase (qlutamine synthetase)200762 at 4.51 DPYSL2 8p22-p21 dihydropyrimidinase-like 2215073 s at 4.45 NR2F2 15o26 nuclear receptor subfamily 2, qroup F, member 244783 s at 4.27 HEY1 8021 hairy/enhancer-of-split related with YRPW motif 1202613 at 4.14 CTPS 1P34.1 CTP synthase201360 at 4.09 CST3 20pl 1.21 cystatin C (amyloid anqiopathy and cerebral hemorrhaqe)20305 4 PTPRK 6022.2-23.1 protein tyrosine phosphatase, receptor type, K
In d 2 EIG - MAP ro b e ID fo ld c h a n g e g e n e .sy m b o l m ap d e s c r ip t io n213524 s at 20.91 G0S2 1032.2-Q41 GO/Glswitch 2205220 at 13.24 GPR109B 12q24.31 G protein-coupled receptor 109B219622 at 10.31 RAB20 13034 RAB20, member RAS oncoqene family202581 at 8.99 HSPA1B 6P21.3 heat shock 70kDa protein IB225803 at 8.57 FBX032 8o24.13 F-box protein 32210448 s at 8.34 P2RX5 17pl3.3 purinerqic receptor P2X, liqand-qated ion channel, 5227850 x at 7.81 CDC42EP5 19013.42 CDC42 effector protein (Rho GTPase bindinq) 5211214 s at 6.38 DAPK1 9034.1 death-associated protein kinase 1202770 s at 5.52 CCNG2 4021.1 cyclin G2
17.29 IGF2BP3 7p ll insulin-like qrowth factor 2 mRNA bindinq protein 3203820 s at 14.21 IGF2BP3 7p ll insulin-like qrowth factor 2 mRNA bindinq protein 3210138 at 10.92 RGS20 8012.1 requlator of G-protein siqnallinq 20
A ppendix 3: E xp ressio n a r ra y re su lts fo r individual p a tie n ts

| P ro b e ID fo ld c h a n g e g e n e .s y m b o l m ap d e s c r ip t io n206618 at 10.34 IL18R1 2al2 interleukin 18 receptor 1201387 s at 10.36 UCHL1 4pl4 ubiquitin carboxyl-terminal esterase LI (ubiquitin thiolesterase)204410 at 9.27 EIF1AY Yall.222 eukaryotic translation initiation factor 1A, Y-linked218589 at 8.21 P2RY5 13ql4 purinerqic receptor P2Y, G-Drotein coupled, 5205034 at 7.43 CCNE2 8q22.1 cyclin E2210279 at 6.29 GPR18 13q32 G protein-coupled receptor 18.1552680 a at 6.13 CASC5 15ql4 cancer susceptibility candidate 5
In d 3 JOH-MAP ro b e ID 207095 at
fo ld c h a n g e13.91
g e n e .sy m b o lSLC10A2
m ap13q33
d e s c r ip t io nsolute carrier family 10 (sodium/bile acid cotransporter family), member 2
205518 s at 10.22 CMAH 6P21.32 cytidine monophosphate-N-acetylneuraminic acid hydroxylase (CMP-N-acetylneuraminate monooxyqenase)201125 s at 7.53 ITGB5 3q21.2 integrin, beta 5205991 s at 6.58 PRRX1 lq24 paired related homeobox 1235349 at 6.43 FAM82A 2P22.2 family with sequence similarity 82, member A211535 s at 6.42 FGFR1 8 p ll .2 -p ll. l fibroblast qrowth factor receptor 1 (fms-related tyrosine kinase 2, Pfeiffer syndrome)1556096 s at 6.23 UNC13C 15q21.3 unc-13 homoloq C (C. elegans)225168 at 5.66 FRMD4A 10pl3 FERM domain containinq 4A210571 s at 5.64 CMAH 6p21.32 cytidine monophosphate-N-acetylneuraminic acid hydroxylase (CMP-N-acetylneuraminate monooxyqenase)227620 at 5.55 SLC44A1 9q31.2 solute carrier family 44, member 1204633 s at 5.40 RPS6KA5 14q31-q32.1 ribosomal protein S6 kinase, 90kDa, polypeptide 5208475 at 5.29 FRMD4A 10pl3 FERM domain containinq 4A222314 x at 4.95 ITPR1 3p26-p25 inositol 1,4,5-triphosphate receptor, type 1225167 at 4.69 FRMD4A 10pl3 FERM domain containinq 4A
8.45 AK3L1 1P31.3 adenylate kinase 3-like 1210643 at 8.44 TNFSF11 13ql4 tumor necrosis factor (liqand) superfamily, member 11242517 at 8.42 KISS1R 19P13.3 KISS1 receptor218094 s at 6.87 DBNDD2 20ql3.12 dysbindin (dystrobrevin bindinq protein 1) domain containinq 2225342 at 6.67 AK3L1 1P31.3 adenylate kinase 3-like 1209822 s at 5.42 VLDLR 9p24 very low density lipoprotein receptor221491 x at 4.36 HLA-DRB1 6p21.3 major histocompatibility complex, class II, DR beta 1230102 at 4.23 ETV5 3q28 ets variant qene 5 (ets-related molecule)
4.21 CYP1B1 2p21 cytochrome P450, family 1, subfamily B, polypeptide 1230967 s at 4.12 USP7 16pl3.3 ubiquitin specific peptidase 7 (herpes virus-associated)
In d 4 WA-MAP ro b e ID fo ld c h a n g e g e n e .s y m b o l m ap d e s c r ip t io n
8.30 MOXD1 6q23.1-23.3 monooxyqenase, DBH-like 12206b 8.05 TBX21 17q21.32 T-box 21
A ppendix 3: E x p ressio n a r ra y re su lts fo r individual p a tie n ts

P ro b e ID fo ld c h a n g e g e n e .s y m b o l m a p d e s c r ip t io n225728 at 5.80 SORBS2 4a35.1 sorbin and SH3 domain containinq 2203828 s at 5.02 IL32 16P13.3 interleukin 32229764 at 4.86 FAM79B 3q28 family with sequence similarity 79, member B
8 at 4.37 MOXD1 6q23.1-23.3 monooxyqenase, DBH-like 1
59644 at 5.4 BMP2K 4q21.21 BMP2 inducible kinase242903 at 4.98 IFNGR1 6q23-q24 interferon qamma receptor 1217028 at 4.9 CXCR4 2q21 chemokine (C-X-C motif) receptor 4230413 s at 4.77 AP1S2 Xp22.2 adaptor-related protein complex 1, siqma 2 subunit209604 s at 4.77 GATA3 10pl5 GATA bindinq protein 3209948 at 4.69 KCNMB1 5q34 potassium larqe conductance calcium-activated channel, subfamily M, beta member 1230921 s at 4.49 PCBP2 12ql3.12-ql3.13 poly(rC) bindinq protein 2Z J 1 4 o 4 a t 209725 at
4 . 4 /
4.37 UTP20 12q23 UTP20, small subunit (SSU) processome component, homoloq (yeast)243916 x at 4.18 UBLCP1 5q33.3 ubiquitin-like domain containinq CTD phosphatase 1229500 at 4.09 SLC30A9 4pl3-pl2 solute carrier family 30 (zinc transporter), member 9223210 at 4.08 CHURC1 14q23.3 Churchill domain containinq 1204863 s at 4.08 IL6ST 5q ll interleukin 6 siqnal transducer (qpl30, oncostatin M receptor)227740 at 4.05 UHMK1 lq23.3 U2AF homoloqy motif (UHM) kinase 122541 4.04 GPAM 10q25.2 qlycerol-3-phosphate acyltransferase, mitochondrial
In d 5 FRL-MAP ro b e ID fo ld c h a n g e g e n e .s y m b o l m ap d e s c r ip t io n
12.84 SNORA68 19pl3 small nucleolar RNA, H/ACA box 68211993 at 10.49 WNK1 12pl3.3 WNK lysine deficient protein kinase 1208151 x at 8.38 DDX17 22ql3.1 DEAD (Asp-Glu-Ala-Asp) box polypeptide 17208719 s at 7.60 DDX17 22ql3.1 DEAD (Asp-Glu-Ala-Asp) box polypeptide 17222450 at 6.76 TMEPAI 20ql3.31-ql3.33 transmembrane, prostate androqen induced RNA211082 x at 5.37 MARK2 11012-013 MAP/microtubule affinity-requlatinq kinase 2201008 , s at 5.26 TXNIP lq21.1 thioredoxin interacting protein224828 at 5.12 CPEB4 5q21 cytoplasmic polyadenylation element bindinq protein 4202205 at 4.97 VASP 19ol3.2-ol3.3 vasodilator-stimulated phosphoprotein208583 x at 4.97 HIST1H2AJ 6 d 2 2 - p 21.3 histone 1, H2aj208547 at 4.96 HIST1H2BB 6D21.3 histone 1, H2bb221092 at 4.92 ZNFN1A3 17q21 zinc finqer protein, subfamily 1A, 3 (Aiolos)2 08496 x at 4.89 HIST1H3G 6p21.3 histone 1, H3g1552263 at 4.76 MAPK1 22qll.2;22qll.21 mitoqen-activated protein kinase 1228181 at 4.73 SLC30A1 Iq32-q41 solute carrier family 30 (zinc transporter), member 1222439 s at 4.73 THRAP3 lp34.3 thyroid hormone receptor associated protein 3202082 s at 4.70 SEC14L1 17q25.1-17025.2 SEC14-like 1 (S. cerevisiae)
A ppend ix 3: E x p ressio n a r ra y re su lts fo r indiv idual p a tie n ts

P ro b e ID fo ld c h a n g e g e n e .s y m b o l m ap d e s c r ip t io n229371 ar 4.69 GPR114 I6a l3 G protein-coupled receptor 114205124 at 4.69 MEF2B 19pl2 MADS box transcription enhancer factor 2, polypeptide B (myocyte enhancer factor 2B)221881 s at 4.68 CLIC4 lp 3 6 .ll chloride intracellular channel 4223062 s at 4.65 PS ATI 9a21.2 phosphoserine aminotransferase 1200835 s at 4.63 MAP4 3p21 microtubule-associated protein 4
22884 15.41 HINT1 5q31.2 histidine triad nucleotide binding protein 12 4 1 1 63_at 14.93 NAALADL2 3q26.31 N-acetvlated alpha-linked acidic dipeptidase-like 22 2 5 0 9 2 _ a t 11.38 NUP88 17pl3.2 nucleoporin 88kDa2 1 2 1 9 5 at 11.15 IL6ST 5q ll interleukin 6 siqnal transducer (qpl30, oncostatin M receptor)24 2 5 8 6 _ a t 11.05 FSD1L 9q31 fibronectin type III and SPRY domain containinq 1-like23 0 3 8 7 _ a t 10.51 ATP2C1 3q22.1 ATPase, Ca++ transporting, type 2C, member 122 2 8 0 5 _ a t 9.98 MANEA 6ql6.1 mannosidase, endo-alpha1556121 _at 9.2 NAP1L1 12q21.2 nucleosome assembly protein 1-like 12 1 29 8 0 _ a t 8.79 USP34 2pl5 ubiquitin specific peptidase 342 1 2 0 3 7 _ a t 8.3 PNN 14q21.1 pinin, desmosome associated protein2 1 3 0 7 0 _ a t 7.96 PIK3C2A Ilp l5 .5 -p l4 phosphoinositide-3-kinase, class 2, alpha polypeptide2 2 2 6 8 5 _ a t 7.66 FAM29A 9p22.1 family with sequence similarity 29, member A2 296 9 2 _ a t 7.62 API5 Ilp l2 -q l2 apoptosis inhibitor 52 301 7 4 _ a t 7.27 LYPLAL1 lq41 lysophospholipase-like 1209902^ at 7.17 ATR 3q22-q24 ataxia telanqiectasia and Rad3 related2 2 6 9 9 8 _ a t 7.16 NARG1 4q31.1 NMDA receptor requlated 12 1 2 5 4 2 _ s_ a t 6.95 PHIP 6ql4 pleckstrin homoloqy domain interacting protein2 1 2 6 5 3 _ s_ a t 6.94 EHBP1 2pl5 EH domain binding protein 12 1 2 0 3 6 _ s_ a t 6.92 PNN 14q21.1 pinin, desmosome associated protein2 4 1 734_at 6.75 SRFBP1 5q23.1 serum response factor bindinq protein 1155 8 9 5 6 _ s_ a t 6.62 IFT80 3q26.1 intraflaqellar transport 80 homoloq (Chlamydomonas)2 3 5 3 9 0 _ a t 6.44 P18SRP 5ql2.3 NA206059_ at 6.39 ZNF91 19pl3.1-pl2 zinc finqer protein 91
In d 6 LEM-MAP ro b e ID fo ld c h a n g e g e n e .s y m b o l m ap d e s c r ip t io n213913 s at 25.39 KIAA0984 12ql4.3 NA228335 at 16.69 CLDN11 3q26.2-q26.3 claudin 11 (oliqodendrocyte transmembrane protein)213912 at 16.25 KIAA0984 12ql4.3 NA209839 at 6.79 DNM3 lq24.3 dynamin 3201427 s at 6.70 SEPP1 5q31 selenoprotein P, plasma, 1215392 at 6.27 USP3 15q22.3 ubiquitin specific peptidase 3214056 at 6.22 MCL1 lq21 myeloid cell leukemia sequence 1 (BCL2-related)233314 a t 6.09 PTEN 10q23.3 phosphatase and tensin homoloq (m utated in multiple advanced cancers 1)
A ppendix 3: E xpressio n a r ra y re su lts fo r individual p a tie n ts

P ro b e ID fo ld c h a n g e g e n e .sy m b o l m ap d e s c r ip t io n3 at 5.92 KCNMB2 3a26.2-q27.1 potassium larqe conductance calcium-activated channel, subfamily M, beta member 2
210473 s at 5.76 GPR125 4P15.31 G protein-coupled receptor 125232528 at 5.75 UBE2E3 2q32.1 ubiquitin-coniuqatinq enzyme E2E 3 (UBC4/5 homoloo. veast)209459 s at 5.55 ABAT 16P13.2 4-aminobutyrate aminotransferase205498 at 5.45 GHR 5pl3-pl2 qrowth hormone receptor1556361 s at 5.31 ANKRD13C 1P32.3-P31.3 ankyrin repeat domain 13C240594_at 5.30 CDYL 6p25.1 chromodomain protein, Y-like206032 at 5.21 DSC3 18ql2.1 desmocollin 3
223424 at 5.51 GBP3 lp22.2 quanylate bindinq protein 31558217 at 5.45 SLFN13 17ql2 schlafen family member 13201692 at 5.42 OPRS1 9P13.3 opioid receptor, sigma 11553423 a at 5.35 SLFN13 17ql2 schlafen family member 13237215 s at 5.22 TFRC 3q29 transferrin receptor (p90, CD71)201850 at 5.07 CAPG 2pll.2 cappinq protein (actin filament), qelsolin-like230543 at 4.99 USP9X Xpll.4 ubiquitin specific peptidase 9, X-linked217728. at 4.87 S100A6 lq21 S100 calcium bindinq protein A6 (calcydin)227354_at 4.57 PAG1 8q21.13 phosphoprotein associated with qlycosphinqolipid microdomains 1212999 x at 4.44 HLA-DOB1 6p21.3 major histocompatibility complex, class II, DQ beta 1211919 s at 4.41 CXCR4 2q21 chemokine (C-X-C motif) receptor 42 1 1 0 1 6 . x . at 4.02 HSPA4 5q31.1-q31.2 heat shock 70kDa protein 4
In d 7 AH-MAP ro b e ID fo ld c h a n g e g e n e .sy m b o l m a p d e s c r ip t io n226811 at 9.64 FAM46C lp l2 family with sequence similarity 46, member C232112 at 8.75 RALGPS2 lq25.2 Ral GEF with PH domain and SH3 bindinq motif 2202620 s at 8.54 PLOD2 3q23-q24 procollaqen-lysine, 2-oxoqlutarate 5-dioxygenase 2234792 x at 8.53 IGHA1 14q32.33 immunoqlobulin heavy constant alpha 1207734 at 7.16 LAX1 lq32.1 lymphocyte transmembrane adaptor 1202843 at 7.00 DNAJB9 7q31; 14q24.2-q24.3 DnaJ (Hsp40) homoloq, subfamily B, member 9
^203574 at 6.91 NFIL3 9q22 nuclear factor, interleukin 3 requlated239258_at 6.54 RHOQ 2p21 ras homoloq qene family, member Q204992 s at 6.50 PFN2 3q25.1-q25.2 profilin 2203543 s at 6.41 KLF9 9ql3 Kruppel-like factor 9210426 x at 6.38 RORA 15q21-q22 RAR-related orphan receptor A217732 s at 6.16 ITM2B 13ql4.3 inteqral membrane protein 2B213856 at 6.09 CD47 3ql3.1-ql3.2 CD47 molecule209845 at 6.06 MKRN1 7q34 makorin, rinq finqer protein, 1225464 at 6.06 FRMD6 14q22.1 FERM domain containing 624484 6.04 SEC24A 5q31.1 SEC24 related qene family, member A (S. cerevisiae)
A ppendix 3: E x p ression a rra y re su lts fo r individual p a tie n ts

P ro b e ID fo ld c h a n q e g e n e .sy m b o l m ap d e s c r ip t io n231202 at 6.01 ALDH1L2 12023.3 aldehyde dehydrogenase 1 familv. member L7239246 at 5.96 FARP1 13032.2 FERM, RhoGEF (ARHGEF) and Dleckstrin domain Drotein 1 (chondrocyte-derived)1561195 at 5.61 GPR137B 1q 4 2 - q4 3 G protein-coupled receptor 137B220377 at 5.59 FAM30A 14032.33 family with sequence similarity 30, member A233463 _at9 9 c q q q
5.565 55
RASSF6GAR1
4ql3.3 4 n 3 1 ?1
Ras association (RalGDS/AF-6) domain family 6
241844 x at 5.46 TMEM156 4pl4 transmembrane protein 156210875 S at 5.42 TCF8 lO pll.2 transcription factor 8 (represses interleukin 2 expression)2 0 7 9 0 l_ a t 5.39 IL12B 5q31.1-033.1 interleukin 12B (natural killer cell stimulatory factor 2, cytotoxic lymphocyte maturation factor 2, p40)1554462 a_at 5.37 DNAJB9 7q31; 14024.2-024.3 DnaJ (Hsp40) homoloq, subfamily B, member 9210479_s_at 5.37 RORA 15q21-q22 RAR-related orphan receptor A1557257_at 5.32 BCL10 lp22 B-cell CLL/lymphoma 10215641 at 5.31 SEC24D 4q26 SEC24 related qene family, member D (S. cerevisiae)
at 7.83 UBD 6p21.3 ubiquitin D208814 at 4.66 HSPA4 5q31.1-031.2 heat shock 70kDa protein 4208712 at 4.65 CCND1 11013 cyclin D1241403 at 4.50 CLK4 5o35 CDC-like kinase 41569025 s at 4.43 FAM13A1 4o22.1 family with sequence similarity 13, member A1241937_s_at 4.26 WDR4 21022.3 WD repeat domain 4209278 s at 4.20 TFPI2 7q22 tissue factor pathway inhibitor 2208711 s at 4.14 CCND1 11013 cyclin D12 3 1 5 7 7 s at 4.10 GBP1 1P22.2 quanylate bindinq protein 1, interferon-inducible, 67kDa222912 at 4.06 ARRB1 11013 arrestin, beta 1208920 at 4.03 SRI 7021.1 sorcin
at 4.02 PTPLAD1 15q22.2 protein tyrosine phosphatase-like A domain containinq 1
In d 8 TER-MAP ro b e ID fo ld c h a n g e g e n e .sy m b o l m ap d e sc r ip t io n205659 at 6.80 HDAC9 7p21.1 histone deacetylase 9213793 s at 2 1 3 5 7 ? 5 a t
5.544 Q 8
HOMER1C C D DTMD 1
5014.2 homer homoloq 1 (Drosophila)-L J - / / 2. j Q t
224800 at*t.yo4.39
O uKrllM DlWDFYl
op Z d 2036.1
serpin peptidase inhibitor, clade B (ovalbumin), member 1 WD repeat and FYVE domain containinq 1
229695 at 4.39 FAM107B 10pl3 family with sequence similarity 107, member B213075 at 4.18 OLFML2A 9o33.3 olfactomedin-like 2A223503 at 4.16 TMEM163 2o21.3 transmembrane protein 163227803 at 4.16 ENPP5 6p21.1-pll.2 ectonucleotide pyrophosphatase/phosphodiesterase 5 (putative function)240413 at 4.15 PYHIN1 1023.1 pyrin and HIN domain family, member 1236235 at 4.09 ITCH 2 0 q ll.2 2 -a ll.23 itchy homoloq E3 ubiquitin protein liqase (mouse)23800; 4.08 GOLPH4 3026.2 qolqi phosphoprotein 4
A ppendix 3 : E x p ression a r ra y re su lts fo r individual p a tie n ts

P ro b e ID fo ld c h a n g e g e n e .sy m b o l m ap d e s c r ip t io n
213446 5 at 213122 at
11.210.94
IOGAP1TSPYL5
15q26.18a22.1
IO motif containinq GTPase activatinq protein 1 TSPY-like 5
212257 s at 9.34 SMARCA2 9p22.3 SWI/SNF related, matrix associated, actin dependent requlator of chromatin, subfamily a, member 2242774 at 8.73 SYNE2 14023.2 spectrin repeat containina. nuclear envelope 2230058 at 8.62 SDCCAG3 9034.3 serologically defined colon cancer antiqen 3209088 s at 7.5 UBN1 16P13.3 ubinuclein 1223161 at 7.02 MULK 7034 multiple substrate lipid kinase211672 s a t 6.53 ARPC4 3p25.3 actin related protein 2/3 complex, subunit 4, 20kDa227884 at 6.49 TAF15 1 7 o ll.l-a ll .2 TAF15 RNA polymerase II, TATA box bindinq protein (TBP)-associated factor, 68kDa213286 at 6.48 ZFR 5P13.3 zinc finqer RNA binding protein206983_at 6.47 CCR6 6q27 chemokine (C-C motif) receptor 6242352 at 6.43 NIPBL 5 p 13.2 Nipped-B homoloq (Drosophila)1557100 s at 6.31 HECTD1 14012 HECT domain containinq 11563321 s at 5.86 MLL 11023 myeloid/lymphoid or mixed-lineaqe leukemia (trithorax homoloq, Drosophila)236462 at 5.77 YEATS2 3027.1 YEATS domain containing 2202855 s at 5.68 SLC16A3 17q25 solute carrier family 16, member 3 (monocarboxylic acid transporter 4)
at 5.67 BCLAF1 6022-023 BCL2-associated transcription factor 1
In d 9 STM-MAKrOD6 ID 209189 at
fo ld c h a n g e14.61
g e n e .s y m b o lFOS
m ap14024.3
d e s c r ip t io nv-fos FBJ murine osteosarcoma viral oncoqene homoloq
205931 s at 12.30 CREB5 7pl5.1 cAMP responsive element bindinq protein 5210942 s at 9.22 ST3GAL6 3012.1 ST3 beta-qalactoside alpha-2,3-sialyltransferase 6205476 at 7.76 CCL20 2033-037 chemokine (C-C motif) liqand 20237485 at 7.66 SFRS3 6p21 splicinq factor, arqinine/serine-rich 3203397 s at 7.19 GALNT3 2024-031 UDP-N-acetyl-alpha-D-qalactosamine: polypeptide N-acetylqalactosaminyltransferase 3 (GalNAc-T3)220051 at 6.82 PRSS21 16P13.3 protease, serine, 21 (testisin)222392 x at 6.81 PERP 6024 PERP, TP53 apoptosis effector218764 at 6.73 PRKCH 14q22-o23 protein kinase C, eta213355 at 5.71 ST3GAL6 3012.1 ST3 beta-qalactoside alpha-2,3-sialyltransferase 6204995 at 5.56 CDK5R1 17011.2 cyclin-dependent kinase 5, requlatory subunit 1 (p35)212715 s at 5.46 MICAL3 22011.21 microtubule associated monoxyqenase, calponin and LIM domain containinq 3235142 at 5.38 ZBTB8 1P35.1 zinc finqer and BTB domain containinq 8241843 at 5.32 EIF5 14q32.32 eukaryotic translation initiation factor 51553105 s at 5.19 DSG2 18012.1 desmoglein 2235458 at 5.17 HAVCR2 5q33.3 hepatitis A virus cellular receptor 2205270 s at 4.96 LCP2 5q33.1-oter lymphocyte cytosolic protein 2 (SH2 domain containinq leukocyte protein of 76kDa)241745 at 4.88 FBXO30 6q24 F-box protein 30217764 s at 4.76 RAB31 18pl 1.3 RAB31, member RAS oncoqene family
A ppendix 3: E xpression a rra y re su lts fo r individual p a tie n ts

P ro b e ID fo ld c h a n q e g e n e .sy m b o l m ap d e s c r ip t io n205798 at 4.72 IL7R 5pl3 interleukin 7 receptor209682 at 4.45 CBLB 3 d l3 .ll Cas-Br-M ( murine) ecotropic retroviral transforminq sequence b204614 at 4.45 SERPINB2 18q21.3 serpin peptidase inhibitor, clade B (ovalbumin), member 2225147 at 4.33 PSCD3 7P22.1 pleckstrin homoloqy, Sec7 and coiled-coil domains 3204472 at 4.30 GEM 8ql3-q21 GTP bindinq protein overexpressed in skeletal muscle218805. at 4.28 GIMAP5 7q36.1 GTPase, IMAP family member 5217763 s at 4.14 RAB31 18pl 1.3 RAB31, member RAS oncoqene family
204174 at 5.04 ALOX5AP 13ql2 arachidonate 5-lipoxyqenase-activatinq protein230425 at 5.02 EPHB1 3q21-q23 EPH recep tor B1230292 at 4.95 RCBTB2 13ql4.3 requlator of chromosome condensation (RCC1) and BTB (POZ) domain containinq protein 2230896 at 4.82 CCDC4 4pl3 coiled-coil domain containing 4238332 at 4.71 ANKRD29 18qll.2 ankyrin repeat domain 29203132 at 4.21 RBI 13ql4.2 retinoblastoma 1 (includinq osteosarcoma)242890 at 4.19 HELLS 10q24.2 helicase, lymphoid-specific227176 at 4.02 SLC2A13 12ql2 solute carrier family 2 (facilitated qlucose transporter), member 13204103 at 4.01 CCL4 17ql2 chemokine (C-C motif) liqand 4
In d 10 QUB-MAP ro b e ID fo ld c h a n g e g e n e .sy m b o l m ap d e s c r ip t io n205749 at 8.88 CYP1A1 15q22-q24 cytochrome P450, family 1, subfamily A, polypeptide 1217867 x at 8.81 BACE2 21q22.3 beta-site APP-cleavinq enzyme 2202967 at 7.97 GSTA4 6pl2.1 qlutathione S-transferase A4209793 at 6.40 GRIA1 5q33;5q31.1 qlutamate receptor, ionotropic, AMPA 158916 _at 6.21 KCTD14 llq l4 .1 potassium channel tetramerisation domain containinq 14229893 at 5.99 FRMD3 9q21.32 FERM domain containinq 3209496 at 5.61 RARRES2 7q36.1 retinoic acid receptor responder (tazarotene induced) 2204395 s at 5.58 GRK5 10q24-qter G protein-coupled receptor kinase 5219545 at 5.51 KCTD14 l la 14.1 potassium channel tetramerisation domain containinq 14221690 s at 5.48 NALP2 19ql3.42 NACHT, leucine rich repeat and PYD containinq 2206951 at 4.51 HIST1H4E 6p21.3 histone 1, H4e205660 at 4.50 OASL 12q24.2 2'-5'-oliqoadenylate synthetase-like219637 at 4.24 ARMC9 2q37.1 armadillo repeat containinq 9219667 s at 4.24 BANK1 4q24 B-cell scaffold protein with ankyrin repeats 1242600 at 4.22 FRMD3 9q21.32 FERM domain containing 3208523 x at 4.13 HIST1H2BI 6p21.3 histone 1, H2bi
< at 11.01 PDCD6 5pter-pl5.2 proqrammed cell death 6236244 at 5.20 HNRPU lq44 heteroqeneous nuclear ribonucleoprotein U (scaffold attachment factor A)
4.67 ATF5 19ql3.3 activatinq transcription factor 5
A ppendix 3: E xpression a rra y re su lts fo r individual p a tie n ts

P ro b e ID fo ld c h a n g e g e n e .sy m b o l m ap d e s c r ip t io nat
1556054 at4.ZO4.28
D c K A
RPL31lzpiz.j2a ll.2
2-deoxyribose-5-phosphate aldolase homoloq (C. elegans) ribosomal protein L31
213907 at 4.22 EEF1E1 6P24.3-D25.1 eukaryotic translation elonqation factor 1 epsilon 11558102 at 4.13 TM6SF1 15q24-q26 transmembrane 6 superfamily member 1
4.09 BMP2K 4q21.21 BMP2 inducible kinase
In d 11 WM-MAP ro b e ID fo ld c h a n g e g e n e .sy m b o l m ap d e s c r ip t io n217179 x at 33.28 IGLV1-44 22qll.2 immunoqlobulin lambda variable 1-44213245 at 11.42 ADCY1 7pl3-pl2 adenylate cyclase 1 (brain)228434 at 10.58 BTNL9 5q35.3 butyrophilin-like 9219947 at 9.53 CLEC4A 12d13 C-type lectin domain family 4, member A223827 at 9.03 TNFRSF19 13ql2.11-ql2.3 tumor necrosis factor receptor superfamily, member 19228974 at 9.01 ZNF677 19ql3.41 zinc finqer protein 677206110 at 8.82 HIST1H3H 6p22-p21.3 histone 1, H3h229985_at 8.48 BTNL9 5q35.3 butyrophilin-like 9210299 s at 8.45 FHL1 Xq26 four and a half LIM domains 1207156 at 8.24 HIST1H2AG 6p22.1 histone 1, H2aq230992 at 8.12 BTNL9 5q35.3 butyrophilin-like 9215071 s at 8.08 HIST1H2AC 6p21.3 histone 1, H2ac235953 at 7.39 ZNF610 19ql3.33 zinc finqer protein 610207120 at 6.67 ZNF667 19ql3.43 zinc finqer protein 6671560562 a at 6.67 ZNF677 19ql3.41 zinc finqer protein 6771554679 a at 6.62 LAPTM4B 8q22.1 lysosomal associated protein transmembrane 4 beta214505 s at 6.45 FHL1 Xq26 four and a half LIM domains 1206030 at 6.41 ASPA 17pter-pl3 aspartoacylase (Canavan disease)221724 s at 6.25 CLEC4A 12pl3 C-type lectin domain family 4, member A1552610 a at 6.20 JAK1 1P32.3-D31.3 Janus kinase 1 (a protein tyrosine kinase)243514 at 6.18 WDFY2 13ql4.3 WD repeat and FYVE domain containinq 2235315 at 6.15 TSC22D1 13ql4 TSC22 domain family, member 1214455 at 6.09 HIST1H2BC 6p21.3 histone 1, H2bc
2012 12.2 ATP1B1 lq24 ATPase, Na+/K+ transporting, beta 1 polypeptide204014 at 8.4 DUSP4 8p l2 -p ll dual specificity phosphatase 4213350 at 7.1 RPS11 19ql3.3 ribosomal protein S ll212097 at 7.08 CAVl 7q31.1 caveolin 1, caveolae protein, 22kDa226022 at 6.68 SASH1 6q24.3 SAM and SH3 domain containing 12Q9444 at 6.6 RAP1GDS1 4q23-q25 RAP1, GTP-GDP dissociation stimulator 1201243 s at 6.24 ATP1B1 lq24 ATPase, Na+/K+ transporting, beta 1 polypeptide
6.16 RBPMS2 15q22.31 RNA binding protein with multiple splicing 2
A ppendix 3: E xpression a r ra y re su lts fo r individual p a tie n ts

P ro b e ID fo ld c h a n g e g e n e .s y m b o l m ap d e s c r ip t io n; 204015 s at 6.15 DUSP4 8D12-P11 dual specificity phosphatase 4224209 s at 5.34 GDA 9021.13 quanine deaminase206102 at 5.11 GINS1 20011.21 GINS complex subunit 1 (Psfl homoloq)218910_.at 5.1 TMEM16K 3p22.l-p21.33 transmembrane protein 16K201890 at 5.07 RRM2 2p25-p24 ribonucleotide reductase M2 polypeptide217996 at 5.05 PHLDA1 12ql5 pleckstrin homoloqy-like domain, family A, member 1229420 at 4.85 RPL23A 17qll ribosomal protein L23a
1201426 s at 4.76 VIM 10pl3 vimentin[225660 at 4.6 SEMA6A 5q23.1 sema domain, transmembrane domain (TM), and cytoplasmic domain, (semaphorin) 6A212044 s at 4.52 RPL27A llp l5 ribosomal protein L27a205203 at 4.48 PLD1 3q26 phospholipase D l, phosphatidylcholine-specific
4.47 BIRC5 17q25 baculoviral IAP repeat-containing 5 (surviving
Appendix 3: Expression array results for individual patients