Characteristics of developing free falling films at intermediate Reynolds and high Kapitza numbers
24
Characteristics of developing free falling films at intermediate Reynolds and high Kapitza numbers q E.I.P. Drosos, S.V. Paras, A.J. Karabelas * Chemical Process Engineering Research Institute, and Department of Chemical Engineering, Aristotle University of Thessaloniki, Univ. Box 455, GR 54 124 Thessaloniki, Greece Received 7 December 2003; received in revised form 10 March 2004 Abstract Experiments on developing free falling films have been carried out in a vertical rectangular channel, using smooth inlet conditions, with three liquids characterized by high Kapitza numbers, Ka (i.e. water, 1.5% butanol and 2.5% butanol solutions with surface tension 75, 50 and 40 mN/m, respectively) at intermediate Reynolds numbers (Re L < 400). Film thickness measurements supported by visual observa- tions suggest that reduced surface tension significantly affects the inception of waves at the entrance region of the film. However, no significant qualitative difference is observed concerning developing wave patterns in the longitudinal direction, as large ‘‘tear-drop’’ type waves appear downstream in all cases, with the smaller Ka liquids being more unstable as expected. The new data show that above Re L 200, the RMS values of film thickness fluctuations, beyond the wave inception region, tend to be nearly independent of Re L . Results concerning other typical falling film characteristics also show that above Re L 200 (for the Re L range of the present experiments) the wave structure is weakly dependent on Re L beyond the wave inception region. The dominant disturbance frequencies on the wavy film surface as well as the wave celerity are in good agreement with earlier findings. Finally, results from previous linear stability analyses are compared with the new data showing in general satisfactory agreement especially with measurements corresponding to developing nearly two-dimensional waves. Ó 2004 Elsevier Ltd. All rights reserved. Keywords: Free falling film; Vertical plate; Intermediate Reynolds number; High Kapitza numbers International Journal of Multiphase Flow 30 (2004) 853–876 www.elsevier.com/locate/ijmulflow q It is our great pleasure to contribute to this Festschrift honoring Professor George Yadigaroglu, our esteemed colleague and friend. We congratulate him, on the occasion of his 65th birthday, for his scientific contributions and other achievements, and wish him all the best! * Corresponding author. Tel.: +30-2310-996201; fax: +30-2310-996209. E-mail address: [email protected] (A.J. Karabelas). 0301-9322/$ - see front matter Ó 2004 Elsevier Ltd. All rights reserved. doi:10.1016/j.ijmultiphaseflow.2004.03.003
-
Upload
independent -
Category
Documents
-
view
0 -
download
0
Transcript of Characteristics of developing free falling films at intermediate Reynolds and high Kapitza numbers

International Journal of Multiphase Flow 30 (2004) 853–876www.elsevier.com/locate/ijmulflow
Characteristics of developing free falling films atintermediate Reynolds and high Kapitza numbers q
E.I.P. Drosos, S.V. Paras, A.J. Karabelas *
Chemical Process Engineering Research Institute, and Department of Chemical Engineering,
Aristotle University of Thessaloniki, Univ. Box 455, GR 54 124 Thessaloniki, Greece
Received 7 December 2003; received in revised form 10 March 2004
Abstract
Experiments on developing free falling films have been carried out in a vertical rectangular channel,
using smooth inlet conditions, with three liquids characterized by high Kapitza numbers, Ka (i.e. water,
1.5% butanol and 2.5% butanol solutions with surface tension 75, 50 and 40 mN/m, respectively) at
intermediate Reynolds numbers (ReL < 400). Film thickness measurements supported by visual observa-
tions suggest that reduced surface tension significantly affects the inception of waves at the entrance region
of the film. However, no significant qualitative difference is observed concerning developing wave patternsin the longitudinal direction, as large ‘‘tear-drop’’ type waves appear downstream in all cases, with the
smaller Ka liquids being more unstable as expected. The new data show that above ReL � 200, the RMS
values of film thickness fluctuations, beyond the wave inception region, tend to be nearly independent of
ReL. Results concerning other typical falling film characteristics also show that above ReL � 200 (for the
ReL range of the present experiments) the wave structure is weakly dependent on ReL beyond the wave
inception region. The dominant disturbance frequencies on the wavy film surface as well as the wave
celerity are in good agreement with earlier findings. Finally, results from previous linear stability analyses
are compared with the new data showing in general satisfactory agreement especially with measurementscorresponding to developing nearly two-dimensional waves.
� 2004 Elsevier Ltd. All rights reserved.
Keywords: Free falling film; Vertical plate; Intermediate Reynolds number; High Kapitza numbers
q It is our great pleasure to contribute to this Festschrift honoring Professor George Yadigaroglu, our esteemed
colleague and friend. We congratulate him, on the occasion of his 65th birthday, for his scientific contributions and
other achievements, and wish him all the best!*Corresponding author. Tel.: +30-2310-996201; fax: +30-2310-996209.
E-mail address: [email protected] (A.J. Karabelas).
0301-9322/$ - see front matter � 2004 Elsevier Ltd. All rights reserved.
doi:10.1016/j.ijmultiphaseflow.2004.03.003

854 E.I.P. Drosos et al. / International Journal of Multiphase Flow 30 (2004) 853–876
1. Introduction
Well known is the significant role played by falling films in a wide variety of naturally occurringphenomena, as well as in the operation of industrial process equipment where heat and masstransfer take place. The quest for more efficient and compact equipment, such as reactors andcondensers usually made of vertical compartments (e.g. Paras et al., 2001), is partly responsiblefor the sustained interest in improving our understanding of falling film characteristics. Thetypical height of this type of compact equipment is of order 1 m. Controlled laboratory experi-ments (e.g. Alekseenko et al., 1994) show that, over such a length, falling films tend to evolve froman initially uniform liquid layer with smooth surface to a complex state in which two-dimensionalwaves appear first, developing downstream into three-dimensional (rather large) waves or‘‘humps’’, moving on a thin substrate. The scope of this work is to better understand the char-acteristics of such developing falling films under conditions relevant to practical applications, i.e.at intermediate Reynolds numbers, ReL, ð60 < ReL < 360Þ and high Kapitza numbers, Ka,ð1650 < Ka < 3500Þ. In this work ReL and Ka are defined as
ReL ¼ 4Cl
ð1Þ
Ka ¼ rqg1=3m4=3
ð2Þ
where C is the liquid mass flow rate per unit width of the plate, r is the surface tension, l and m thedynamic and kinematic viscosity, respectively. The particular problem motivating the presentstudy is the counter-current gas/liquid flow through vertical channels, where the role played by thegravity-induced wavy film is dominant. Understanding the latter is considered a first step beforeintroducing the complication of counter-current gas convection.A great deal of work has been published on free falling films, concerning mainly flow devel-
opment inside or outside a tube at moderate to high Reynolds numbers (ReL). The following briefliterature survey is concerned mostly with developing film flow. Tailby and Portalski (1962),Portalski (1963) and Portalski and Clegg (1972) studied experimentally the inception region andthe initial wave formation for water and several other liquids at moderate to high ReL. Statisticalfilm characteristics at long distance from liquid entry were obtained by Chu and Dukler (1974) atmoderate to high ReL where pseudo-laminar and turbulent flow is expected to occur. Salazar andMarschall (1978) measured the local thickness by using a light scattering technique. Their resultsindicated clearly the importance of measurement location on film characteristics. Takahama andKato (1980) studied the flow characteristics of longitudinally developing liquid films, includinglaminar/turbulent transition along the outer wall of a fairly long vertical tube at high ReL. Anexperimental investigation of excited periodic two-dimensional waves was carried out by Ale-kseenko et al. (1985, 1994) with water/glycerin and water/alcohol solutions as working fluids atlow to moderate ReL. They showed that solitary waves are traveling in stationary patterns withalmost constant celerity and examined the evolution of excited disturbances of various forms aswell. Nakoryakov et al. (1987) continued these experiments in order to examine the influence ofwaves on interfacial mass transfer, but they also studied the flow patterns of free falling films atlow to high ReL. Karapantsios et al. (1989) and Karapantsios and Karabelas (1995) carried out
E.I.P. Drosos et al. / International Journal of Multiphase Flow 30 (2004) 853–876 855
experiments inside a vertical pipe at moderate to high ReL, investigating also the longitudinalcharacteristics of falling films far away from the liquid entry point. An image-processing systemdeveloped by Patnaik and Perez-Blanco (1996) facilitated the identification of single frequency rollwaves in developing films. The study of Adomeit and Renz (2000) focused on the hydrodynamicsof naturally excited waves inside a vertical tube at moderate to high ReL and confirmed the three-dimensional character of the wave structure, which is strongly affected by wave interactions.Finally, a study by Ambrosini et al. (2002) deals with the statistical characteristics of the waterfilm surface at various temperatures.There is a rich literature on theoretical treatments of falling film hydrodynamics where two-
dimensional waves are considered. Aside from the pioneering study of Kapitza (1964) on film flowinstability, Benjamin (1957) and Yih (1963) concentrated on the analytical treatment of the Orr–Sommerfeld (OS) equation and showed that film flow with a smooth surface is always unstable.Their study, however, was limited to flows with small ReL and small wave numbers. Similar resultswere obtained numerically by Anshus and Goren (1966), Krantz and Goren (1971), Anshus (1972)and Pierson and Whitaker (1977), who extended the linear stability analysis to higher ReL. Thesestudies involve mainly linear stability theory, which predicts the critical conditions and the cor-responding characteristics of small amplitude sinusoidal waves near the inception line. Thus it isinadequate for describing fully developed waves at fairly large distances from the inlet, where achaotic three-dimensional wave motion is observed and improved treatments are required. Benney(1966) was the first to derive an asymptotic expansion procedure for wave disturbances of finiteamplitude that is accurate when the wavelength is large compared with the film thickness. Thismodel known in the literature as the long-wave equation (LW), is widely used predicting criticalconditions for wave inception and the characteristics of small amplitude two-dimensional wavesfor low ReL. A weakly non-linear expansion for large surface tension fluids and for amplitudes ofthe same order as wave length was first carried out by Lin (1974) and led to the Kuramoto–Sivashinsky (KS) equation that is frequently used due to its simplicity. Alekseenko et al. (1985)proposed a model to describe non-linear non-stationary waves in a wide range of ReL. Khesghiand Scriven (1987) studied numerically the evolution of finite-amplitude two-dimensional dis-turbances to a steady flow down a vertical plate, investigating the dependence of wave growth onphysical properties and plate length. A theoretical analysis of non-linear two-dimensional waveswas also made by Trifonov and Tsvelodub (1991), who studied the dependence of wave char-acteristics on ReL and Weber number (We). Hydrodynamics of wave formation on free fallingfilms has been reviewed by Chang (1994); his work (Chang, 1989; Chang et al., 1993) is focusedmainly on the LW and KS equations and the results are limited to very small ReL and highKapitza (Ka) numbers for which the amplitude is rather small (about 10% of the mean filmthickness). Chang has also derived analytical expressions relating film thickness and wave velocitywith liquid properties (Chang, 1989). A model describing the dynamics of large amplitude non-periodic waves (with peak to substrate ratios of 3–4) on laminar falling wavy films at high ReL waspresented by Yu et al. (1995). Nguyen and Balakotaiah (2000) continued this study developing anew simplified model for describing wave evolution at low ReL and a broad range of Ka. It isworth mentioning that further efforts to enrich the structure of the wave evolution process byadding a third dimension (leading to a more complex equation) did not result in a significantimprovement over simpler models such as the KS equation (Chang, 1994; Nguyen and Balako-taiah, 2000).

856 E.I.P. Drosos et al. / International Journal of Multiphase Flow 30 (2004) 853–876
The above brief review suggests that, despite progress made in recent years, significant gapsexist in understanding and modeling the evolution of falling films. To contribute in this direction,the present work aims at obtaining complete sets of detailed data on developing film flow down avertical plate for intermediate ReL, at various locations along the plate, including the region nearwave inception. Particular attention was paid to vary the Kapitza number (by varying surfacetension) without modifying the liquid viscosity. Data with such fluids are lacking.A description of the experimental equipment and procedures is presented first. Visual obser-
vations are reported next on the evolution of waves on falling films providing a qualitativedescription of flow patterns. Detailed film thickness data and their statistical analysis (for variousflow conditions and liquids employed) are reported and discussed next. Finally comparisons aremade of the new data with published theoretical and experimental results.
2. Experimental setup and procedures
An experimental facility was specifically constructed to study developing falling film charac-teristics as well as counter-current gas/liquid flow (Fig. 1). Experiments were carried out in a 70cm high by 12 cm wide vertical rectangular channel made of Plexiglas� in order to facilitate visualobservations. The spacing between the two parallel plates is 10 mm and the length of the plate onwhich the film flow develops is 38 cm. The liquid phase is introduced uniformly near the top of thechannel through a porous section, made of stainless steel, with nominal pore size 100 lm (coveringthe entire active channel width) and embedded flush with the main flat surface in order to facilitatesmooth liquid entry. Care was taken to uniformly feed the liquid and to minimize external dis-turbances upon film formation, by fixing a small liquid reservoir right behind the porous segment,which formed one of the reservoir walls. The liquid drained from the bottom of the channel andwas collected in a 50 l storage tank for re-circulation. The liquid flow rate was measured by a bankof calibrated rotameters covering the range of the present experiments (�0.1 to �0.7 l/min). Flowadjustment was achieved by a combination of valves and a by-pass. Experiments were conductedat ambient temperature and pressure conditions. Due to the sensitivity of the longitudinal flowdevelopment to geometrical imperfections, the channel was carefully aligned in the verticaldirection. It should be added that before each set of experiments the inner surface of the Plexi-glas� test section was cleaned by a dilute detergent solution and additionally its wetability wasimproved by treating it with a silica sol solution.Three liquids were used, i.e. water, 1.5% and 2.5% w/w aqueous butanol solutions, with physical
properties listed in Table 1. Tap water was used for experiments as well as for preparing thebutanol solutions after cartridge filtration. Dilute solutions of butanol were employed to obtainsignificantly smaller surface tension, with practically no effect on the density and viscosity,compared to water. The stability of the butanol solutions was checked prior to and after eachexperiment by measuring the surface tension and was found to be satisfactory (with an uncer-tainty of about 5%).The film thickness measurements reported in this work were taken along the middle of the
plate, with probes located at 5 different distances from the liquid entry; i.e. 8, 19, 22, 33 and 36 cm,using the well-known ‘‘parallel-wire conductance technique’’ described elsewhere (e.g. Paras andKarabelas, 1991). This technique relies on the fact that the conductance between two parallel

Fig. 1. Schematic diagram of experimental flow loop: (1) cross-sectional view of the test section; (2) porous sections; (3)
small reservoir for liquid feeding; (4) measurement stations-probes; (5) camera position; (6) liquid storage tank.
Table 1
Physical properties of the liquids used
Water (W) 1.5% Butanol (B1) 2.5% Butanol (B2)
q, kgm�3 1000 995 980
l, mPa s 1 1.03 1.09
r, mNm�1 75 50 40
Kað¼ r=qg1=3m4=3Þ 3500 2240 1650
E.I.P. Drosos et al. / International Journal of Multiphase Flow 30 (2004) 853–876 857
wires is uniquely related to the liquid level between them. Each conductance probe consists of apair of short parallel chromel wires spaced �2 mm apart with a diameter of 0.5 mm and a lengthof 2.5 mm. These short and rigid chromel wires are fixed in a removable plug made of Plexiglas�
in order to be withdrawn and calibrated outside the test section. It must be noted that the

858 E.I.P. Drosos et al. / International Journal of Multiphase Flow 30 (2004) 853–876
relatively large wire diameter (0.5 mm) is generally undesirable, since thick wires inside the flowtend to disturb the free falling film. However, the wires are chosen to be rigid enough to allow exsitu calibration and to remain unaffected by the high gas flow-rates that will be used in counter-current flow in future work. To compensate for temperature effects on liquid conductivity, thelatter was measured prior to and after each set of experiments and a correction factor wasincorporated in the probe calibration equation. A correction was also necessary on the measuredfilm thickness to take into account capillary rise effects (between the parallel probe wires) whichcould not be neglected in this study of relatively low ReL. Using the water data at x ¼ 8 cm fromthe entry as a reference (where the film was practically smooth and its thickness known from theNusselt expression), and considering the effect of surface tension on meniscus formation, a con-stant correction was determined for each fluid employed here.It will be pointed out that the aforementioned spacing of the probes along the plate was selected
in order to capture all possible regions of the developing film, as discussed in subsequent sections.Of particular interest here is the region of incipient wave formation, which is preceded by anentrance length, Le, of smooth film. On the basis of previous experiments (e.g. Pierson andWhitaker, 1977) the length at which waves are first visible was estimated to be in the range 5 to 10cm for water with a tendency to increase with ReL, in the ReL range of the present measurements.Another region of interest (the last one in sequence) is that of three-dimensional waves which,again for water, was roughly estimated (e.g. Chang, 1994) to be within 40 cm from the liquid entrypoint. Thus, the five probes, located between 8 and 36 cm from liquid entry, were consideredsufficient to investigate film development with the three fluids employed here.The statistical quantities and other parameters of the film thickness time records (e.g. RMS and
spectra of the fluctuations, mean wave height, wavelength, wave celerity) were calculated from10,000-point samples, obtained over a period of 80 s with a 125 Hz sampling frequency. Data setsare identified by letters (W, B1 or B2), and a number in parenthesis, designating liquid type andprobe location, respectively; e.g. W_(19), B1_(19) and B2_(19) designate water, 1.5% and 2.5%butanol solutions, respectively, at a distance 19 cm from entry.
3. Visual observations
Visual studies of the flow pattern were made using a high-speed camera (Red lake Motion ScopePCI�). Recordings were made for all liquids examined by aligning the camera normal to one ofthe channel main parallel plates (Fig. 1), at various locations along the plate in order to investigatethe evolution of waves on the falling film. A photoflood was also used with a diffuser just in frontof the light source, to improve lighting of the main channel aiming at enhancing the images ofwaves. It is rather difficult to describe the flow development along the channel using only a fewstill pictures, instead of the original video recordings, and to clearly discern differences betweenliquids with different values of surface tension. Nevertheless, using some typical images, an at-tempt is made to describe wave evolution on the falling film for two of the liquids employed in thiswork; i.e. water and 2.5% butanol solution.In Fig. 2 a general view is provided of the wave structure for water, observed in the section
between 10 and 25 cm from liquid entry, for two different values of ReL; i.e. 128 and 282. A
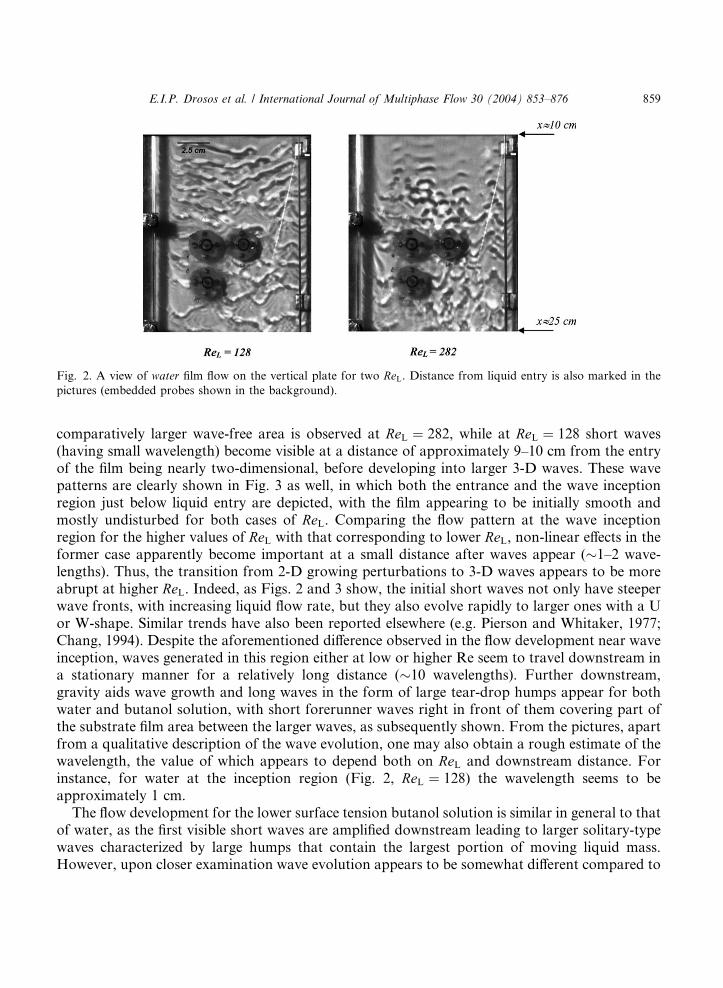
Fig. 2. A view of water film flow on the vertical plate for two ReL. Distance from liquid entry is also marked in the
pictures (embedded probes shown in the background).
E.I.P. Drosos et al. / International Journal of Multiphase Flow 30 (2004) 853–876 859
comparatively larger wave-free area is observed at ReL ¼ 282, while at ReL ¼ 128 short waves(having small wavelength) become visible at a distance of approximately 9–10 cm from the entryof the film being nearly two-dimensional, before developing into larger 3-D waves. These wavepatterns are clearly shown in Fig. 3 as well, in which both the entrance and the wave inceptionregion just below liquid entry are depicted, with the film appearing to be initially smooth andmostly undisturbed for both cases of ReL. Comparing the flow pattern at the wave inceptionregion for the higher values of ReL with that corresponding to lower ReL, non-linear effects in theformer case apparently become important at a small distance after waves appear (�1–2 wave-lengths). Thus, the transition from 2-D growing perturbations to 3-D waves appears to be moreabrupt at higher ReL. Indeed, as Figs. 2 and 3 show, the initial short waves not only have steeperwave fronts, with increasing liquid flow rate, but they also evolve rapidly to larger ones with a Uor W-shape. Similar trends have also been reported elsewhere (e.g. Pierson and Whitaker, 1977;Chang, 1994). Despite the aforementioned difference observed in the flow development near waveinception, waves generated in this region either at low or higher Re seem to travel downstream ina stationary manner for a relatively long distance (�10 wavelengths). Further downstream,gravity aids wave growth and long waves in the form of large tear-drop humps appear for bothwater and butanol solution, with short forerunner waves right in front of them covering part ofthe substrate film area between the larger waves, as subsequently shown. From the pictures, apartfrom a qualitative description of the wave evolution, one may also obtain a rough estimate of thewavelength, the value of which appears to depend both on ReL and downstream distance. Forinstance, for water at the inception region (Fig. 2, ReL ¼ 128) the wavelength seems to beapproximately 1 cm.The flow development for the lower surface tension butanol solution is similar in general to that
of water, as the first visible short waves are amplified downstream leading to larger solitary-typewaves characterized by large humps that contain the largest portion of moving liquid mass.However, upon closer examination wave evolution appears to be somewhat different compared to

Fig. 3. The entrance and wave inception region for water at two ReL: (a) 128 and (b) 282. Distance from liquid entry is
also marked.
860 E.I.P. Drosos et al. / International Journal of Multiphase Flow 30 (2004) 853–876
the water case, as can be seen in the pictures of Fig. 4 where views are included of the inceptionregion for 2.5 % butanol solution at two different values of ReL. It is evident that the waves maketheir appearance at a shorter distance, of approximately 5 cm from liquid entry at ReL ¼ 121,growing steeper in the downstream direction and having a less pronounced 2-D character. Thesame trend is observed at higher ReL values; i.e. for the higher interfacial tension water there is alonger smooth-film entry region, compared to the butanol solution, before the first wave is ob-served. Another characteristic feature of the lower surface tension butanol solution are the rel-atively larger waves evolving on the liquid film, also evident in Fig. 5 where the wave pattern isshown at ReL > 200 in a region far from the liquid entry. It may be noted that the waves (humps)for water are separated by a rather undisturbed flat film, whereas for butanol solution the filmsubstrate in-between humps, is more disturbed as a result of the more frequent interaction

Fig. 4. The entrance and wave inception region for the 2.5% butanol solution for two typical ReL. Distance from liquid
entry is also marked.
Fig. 5. Liquid film flow in the region near the end of the channel for intermediate ReL: (a) water (Ka ¼ 3500) and (b)
2.5% butanol solution (Ka ¼ 1650). Distance from liquid entry is also marked.
E.I.P. Drosos et al. / International Journal of Multiphase Flow 30 (2004) 853–876 861
between waves. This trend is better identified in video recordings of the film of butanol solution,which appears to be almost totally covered with waves having practically no undisturbed regions.The previously referred to forerunner waves are clearly visible in both pictures in Fig. 5.
862 E.I.P. Drosos et al. / International Journal of Multiphase Flow 30 (2004) 853–876
4. Interpretation of instantaneous film thickness data
4.1. Film thickness characteristics
The well-known Nusselt expressions for laminar film flow, used here as a reference, are asfollows:
hN ¼ 3Clq2g
� �1=3
¼ 3
4
l2
q2g
� �1=3
Re1=3L ð3Þ
us ¼gh2Nq2l
ð4Þ
hui ¼ gh2Nq3l
ð5Þ
where hN is the mean film thickness, us the maximum velocity of the film at the surface and hui themean film velocity; C is the liquid mass flow rate per unit width of plate and q and l are the liquiddensity and viscosity.Film thickness measurements for water were made at five different stations along the middle of
the plate, covering a ReL range from �60 to �360. In Fig. 6 the experimental mean film thickness,hmean, for water is presented for all measurement stations, exhibiting an increase with increasingReL, with the lower values of thickness corresponding to x ¼ 8 cm (near the liquid entry), wherethe film is nearly flat and undisturbed. The film seems to be thicker at x ¼ 19 and 22 cm comparedto x ¼ 33 and 36 cm especially for ReL > 200; this might be attributed to the formation of thewaves near the center region of the test plate for these ReL, as is also reported in a similar study bySalazar and Marschall (1978). The mean thickness at x ¼ 8 cm for the three liquids tested isdisplayed in Fig. 7, showing a trend similar to the Nusselt prediction, hN, as expected. Finally, inFig. 8 average film thickness data are plotted, which are obtained with all three liquids at variouslocations along the plate. No clear trend is identified in these data, related to fluid properties; thus,no particular significance can be attached to differences observed between various cases.The root-mean-square (RMS) values of film fluctuations provide a measure of ‘‘dispersion’’ of
data about their mean value. Fig. 9 shows the dependence of RMS values, hRMS, on ReL at variouslocations for all liquids examined. Throughout the ReL range, hRMS is considerably smaller inmagnitude compared to the mean thickness, with a tendency to increase displaying a strongdependence on ReL below ReL � 200. Above this limit there is a noticeable reduction of suchdependence and hRMS values seem to remain almost constant. An interesting observation concernsdata taken at x ¼ 8 cm (near liquid entry), where an increase of RMS values with increasing ReL isevident as already mentioned; however this increase is followed at higher ReL by a very pro-nounced reduction of hRMS towards very low values because of the displacement of wave inceptionregion downstream. RMS values for the low surface tension butanol solutions are clearly largercompared to those for water. This tendency is expected in view of the observed (Section 3) longerwave-free entrance region corresponding to water and the nearly flat film surface at this location(x ¼ 8 cm). A similar trend is observed at x ¼ 19 cm, where RMS values for water seem to belower compared to those for butanol solutions, except for the range above ReL � 200 in which all

0.00
0.1
0.2
0.3
0.4
0.5
50 100 150 200 250 300 350 400
W _(8)W _(19)W _(22)W _(33)W _(36)Nussel (Water)
h mea
n,
mm
Re L
Fig. 6. Mean film thickness, hmean, vs. ReL for water at various locations along the test plate. Symbols are identified by
liquid type and distance (in cm) from liquid entry.
0.0
0.1
0.2
0.3
0.4
0.5
100 150 200 250 300 350 400
W _(8)B1 _(8)B2 _(8)
h mea
n,
mm
ReL
Nusselt (Water)
0 50
Fig. 7. Mean film thickness, hmean, vs. ReL for the three liquids examined, at a distance 8 cm from liquid entry, where the
film is rather undisturbed.
E.I.P. Drosos et al. / International Journal of Multiphase Flow 30 (2004) 853–876 863
values are comparable. On the contrary, the trend encountered at x ¼ 36 cm, i.e. hRMS values forwater somewhat larger compared to those for butanol solutions (even though waves for the latterappear earlier), is more difficult to explain. Although experimental inaccuracies could play a role,

0.00
0.1
0.2
0.3
0.4
0.5
100 150 200 250 300 350 400
W _(8)W _(19)W _(36)B1 _(8)B1 _(19)B1 _(36)B2 _(8)B2 _(19)B2 _(36)Nusselt(Water)
h mea
n,
mm
ReL
50
Fig. 8. Mean film thickness, hmean, vs. ReL for the three liquids examined at various locations along the test plate.
0.00
0.03
0.06
0.09
0.12
0.15
100 150 200 250 300 350 400
W _(8)W _(19)W _(36)B1 _(8)B1 _(19)B1 _(36)B2 _(8)B2 _(19)B2 _(36)
hR
MS
, m
m
ReL
0 50
Fig. 9. RMS values of film thickness, hRMS, vs. ReL for the three liquids examined at various locations along the test
plate.
864 E.I.P. Drosos et al. / International Journal of Multiphase Flow 30 (2004) 853–876
one may offer a plausible qualitative explanation for this trend. Visual observations of the flowdevelopment (Fig. 5) show that the wave pattern for water near the end of the plate consistsmainly of large humps with small forerunner waves and a fairly flat, nearly undisturbed region

E.I.P. Drosos et al. / International Journal of Multiphase Flow 30 (2004) 853–876 865
separating them. On the contrary, the wave pattern for butanol solutions is different as the surfaceof the film seems to be more disturbed, covered to a larger extent by short waves, which seem to bepresent in-between large humps, leading to a more ‘‘uniformly’’ perturbed surface and possiblylower values for hRMS.
4.2. Power spectral density
Wave frequency is an essential parameter characterizing wave type. Typical power spectraldensity (PSD) of the film thickness fluctuations at various ReL are presented in Fig. 10 for allmeasurement stations and liquids examined. The power spectral density (PSD) of the filmthickness has been obtained by averaging modified periodograms, as reported by Paras andKarabelas (1991). The resulting standard error on the final estimate is 8%. Fig. 10a shows spectracorresponding to a location (x ¼ 8 cm) near the wave inception line. The narrow spectra for thetwo butanol solutions seem to be typical of an almost monochromatic growing disturbance,despite the fact that the system studied is naturally excited. This is in agreement with previousobservations (e.g. Chang, 1994) of growing 2-D waves. For the higher surface tension water, thewave inception line is apparently at or below x ¼ 8 cm as indicated by the very short primary peak(Fig. 10a). This is indeed confirmed by the video recordings (seen also in Fig. 3a).Fig. 10b includes spectra at x ¼ 19 cm corresponding to a region where the 2-D character of the
waves is not completely lost, but three-dimensional waves seem to dominate, in the form of tear-drop humps that tend to vary in the transverse direction and interact with their neighbors. Thiswave pattern is associated with a rather broad spectrum as clearly shown in Fig. 10b. Thedominant wave frequency in this region (somewhat below 20 Hz) is smaller than that of the initial2-D waves. The modal frequency in this section appears to be weakly dependent on ReL (slightlyincreasing with ReL) with somewhat smaller values corresponding to butanol solutions. Fur-thermore the modal frequency tends to become more pronounced for all liquids with increasingReL, as the energy conveyed by the waves-related to the peak value of the spectrum-increases.Nevertheless this energy is of roughly the same magnitude for all liquids examined. Furtherdownstream, at x ¼ 36 cm (Fig. 10c), a reduced modal frequency is observed with a value close to10 Hz as also reported elsewhere (e.g. Ambrosini et al., 2002); additionally, waves for all liquidspossess the common feature of a larger amount of energy conveyed. A secondary frequency ofapproximately 5 Hz-also noticed by Patnaik and Perez-Blanco (1996)-seems to emerge far fromliquid entry (Fig. 10c) at the higher ReL examined and may be attributed to a ‘‘distribution’’ ofwave energy to smaller waves, possibly the forerunner waves clearly shown in the pictures (Fig. 5).It is interesting to note that Karapantsios et al. (1989), for films falling inside a tube, determined amodal frequency of �5Hz for ReL ¼ 509 at a very long distance (x � 250 cm) from liquid entry;compared to the present data, this may indicate a further spatial evolution of the film structure(i.e. shifting and energy re-distribution to lower frequencies) far beyond the present plate section.
4.3. Wave celerity
Celerity, c, of the surface waves is calculated by cross-correlating two film thickness signalsrecorded simultaneously at two neighboring locations; results for all liquids at x � 19 and 36 cmare presented in Fig. 11. Waves travel with a celerity that increases with increasing ReL as expected

Fig. 10. Power spectra of film thickness for the three liquids examined and various ReL, at various locations along thetest plate: i.e. (a) x ¼ 8 cm, (b) x ¼ 19 cm and (c) x ¼ 36 cm.
866 E.I.P. Drosos et al. / International Journal of Multiphase Flow 30 (2004) 853–876
and also reported by various researchers in the literature (e.g. Jones and Whitaker, 1966; Am-brosini et al., 2002). This increase is pronounced in the ReL range below �200, in contrast with therather modest increase of celerity at higher ReL which is probably due to the traveling nearlystationary waves, with small alteration of their characteristics. A celerity increase with distancefrom the liquid entry is also evident for all liquids and may be attributed to wave interaction andto the development of larger waves that travel faster downstream. A further effort to relate themeasured wave celerity with the physical properties of liquids employed is presented in a sub-sequent section where wave evolution is considered from the viewpoint of hydrodynamic stability.

0.0
0.1
0.2
0.3
0.4
0.5
0.6
100 150 200 250 300 350 400
W _(19)W _(36)B1 _(19 )B1 _(36 )B2 _(19 )B2 _(36 )
c,m
/s
ReL
0 50
Fig. 11. Wave celerity, c, vs. ReL for three liquids at two locations along the test plate: x ¼ 19 cm and x ¼ 36 cm.
E.I.P. Drosos et al. / International Journal of Multiphase Flow 30 (2004) 853–876 867
It will be added that, as shown in Fig. 11, wave celerity attains somewhat larger values for thehigher Ka number water.
4.4. Wave amplitude
A modified procedure originally proposed by Schadel (1988), as reported by Paras and Ka-rabelas (1991), was used to determine the large wave mean amplitude, Dhmean. This quantity is themean value of the difference between a minimum in the film trace and the preceding maximum,corresponding to a large wave, for all large waves detected in a film thickness record. Thedominant frequency obtained from the spectra was used as a criterion for selecting the largewaves. In Fig. 12 mean wave amplitude, Dhmean, for two liquids is plotted versus the correspondingReL at positions x ¼ 19 and 36 cm. Three regions may be identified, marked A, B, C, exhibitingrather similar trends for the two liquids. These trends may be described by keeping in mind thevisual observations and by taking into account the review by Chang (1994), who classified waveevolution-depending on wave type-into four regions (i.e. I–IV) within the ReL range of the presentexperiments.
• Region A. This is a region of very strong dependence of wave amplitude on ReL, where the val-ues of Dhmean at x ¼ 19 cm seem to be larger compared to those at x ¼ 36 cm. This trend may beattributed to the fact that at x ¼ 19 cm strong non-linear effects dominate leading to solitaryhumps; the wave pattern at x ¼ 19 cm possibly corresponds to Chang’s region III, where wavesare still growing in amplitude. On the contrary, the observed pattern at x ¼ 36 cm may corre-spond entirely to Chang’s region IV where transverse variations develop on the solitary wavecrests. In this case the wave front tends to grow in the lateral direction, leading to someinteraction of adjacent crests and possibly to a somewhat reduced wave amplitude.

0.00
0.05
0.10
0.15
0.20
0.25
50 100 150 200 250 300 350 400
W _(19)
W _(36)
Re L
me
an,
mm
A B C
0.00
0.05
0.10
0.15
0.20
0.25
B2 _(19)B2 _(36)
Re
h∆h∆
L
mea
n,
mm
A B C
0
50 100 150 200 250 300 350 4000
(a)
(b)
Fig. 12. Mean wave amplitude, Dhmean, vs. ReL at two locations (x ¼ 19 and 36 cm) along the test plate for (a) water and
(b) 2.5% butanol solution.
868 E.I.P. Drosos et al. / International Journal of Multiphase Flow 30 (2004) 853–876
• Region B. At moderate ReL the previous trend is reversed and waves at the bottom of the plate(at x ¼ 36 cm) seem to have larger amplitude compared to that of upstream waves, as onemight have expected. This difference can be attributed to the larger wavelength of the wavescorresponding to this ReL region, that lead to an extended length of all regimes discussed byChang. Thus, waves at both measuring stations may correspond to Chang’s region III withinwhich waves are growing in wavelength, amplitude and speed. It is noted that there is no obvi-ous explanation for the very pronounced peak in the amplitude variation, for the case of water(Fig. 12a) observed in this region. It is only added in support of this trend that measurements

E.I.P. Drosos et al. / International Journal of Multiphase Flow 30 (2004) 853–876 869
(not presented here) corresponding to the immediately following region C show a rather thickfilm substrate, leading to a reduced amplitude Dhmean compared to region B.
• Region C. For ReL above �200, waves display a tendency of reaching nearly constant amplitudeindependent of liquid flow rate. Considering also Figs. 9 and 11 in which a similar trend wasobserved for RMS values as well as in measured celerities at ReL > 250, it may be argued thatthis region corresponds to traveling stationary waves that appear to dominate the film surfacestructure extending farther downstream, near the bottom of the channel, even if they are nottwo-dimensional.
It is interesting to compare the present data relatively far from liquid entry (at x ¼ 36 cm) atReL high enough that amplitude growth has been drastically reduced, i.e. in region C (Fig. 12),with similar literature measurements or correlations. For this comparison, another type of esti-mate of wave amplitude, Dhmax, is employed using the quantities hð95%Þ and hð5%Þ correspondingto thickness with probability of occurrence 95% and 5%, respectively. In Fig. 13 a generalized plotof dimensionless amplitude Dhmax=hmean is shown, depicting the trend of data for vertical film flowand various liquids with fairly well-developed waves. It is pointed out that the literature datacompared with data from this study correspond to the maximum value of wave amplitude esti-mated as the difference between the extreme minimum and maximum of the film trace. Line Irepresents a generalized empirical correlation curve presented by Alekseenko et al. (1994), whichincludes the dimensionless group ReL=Ka3=11 in order to take into account liquid physical prop-erties; the Kapitza number is used here instead of a Film number, Fi ¼ r3
q3gm4, proposed by Ale-kseenko et al. (1994). Line I seems to provide a reasonable correlation for the wave amplitude
0.1
1
5 6 7 8 9 10 20 30 40
W _(36)
B1_(36)B2_(36)
Ethylene glycol-water (Brauer, 1956)Water (Chu et al.,1975)
Water (Ganchev et al.,1970)
Alekseenko et al.,1994
max
/ hh
mea
n
ReL
/ (Ka 3/11)
I
∆
Fig. 13. Dimensionless wave amplitude Dhmax=hmean vs. ReL=Ka3=11 at two locations along the test plate and comparisonwith literature data and empirical equation proposed.

870 E.I.P. Drosos et al. / International Journal of Multiphase Flow 30 (2004) 853–876
even if flow characteristics for the liquids examined are not fully developed. Furthermore, it will
be noted that the ratio Dhmax=hmean is near unity in this section, i.e. past the rapid wave evolution.
4.5. Wave number
In Fig. 14 an attempt is presented to relate the characteristics of developing waves with theliquid physical properties by using the dimensionless wave number k and ReL, Ka. Here k is de-fined as 2phN=k, where k ¼ c=f is the wavelength, with c the wave celerity and f the corre-sponding frequency. The data are plotted in terms of the dimensionless groups kReL andReL=Ka3=11 as suggested by Alekseenko et al. (1994), for both natural and excited (forced periodic)two-dimensional waves. In the present work it is considered that only naturally excited wavesdevelop, as smooth liquid entry was provided and an effort was made to isolate the experimentalsetup from any sources of perturbations. Line I corresponds to the initially short waves ofmaximum growth rate evolving near their inception region, mainly between x ¼ 8 and 19 cm inthe present setup. This line originates from the two-wave equation that describes two types ofwaves evolving in a vertically falling film (Alekseenko et al., 1994); i.e. those which propagatefaster than the mean film velocity (and dominate in the range of large ReL) and others thatpropagate slower. It is interesting that data for the three liquids are brought together quite wellwith the data at x ¼ 19 cm being closer to line I compared to those at x ¼ 36 cm. This trend maybe attributed to the fact that waves at x ¼ 19 cm are closer to the section of maximum growth ratewhereas waves at x ¼ 36 cm are three-dimensional, located farther away from that region. Thisimplies that if measurements were made at some points near x ¼ 8 cm, in the intermediate regionbetween x ¼ 8 and 19 cm, the corresponding data would probably fall close to (or along) line I .
00
5
10
15
20
25
30
35
50
W _(19)
B1 _(19)B2 _(19)
W _(36)
B1 _(36)B2 _(36)
Alekseenko et al.,1994
Re L / (Ka 3/11)
k R
e L
I
I: Curve of maximum growth waves
x= 19 cm
x= 36 cm
10 20 30 40
Fig. 14. Dimensionless wave number (kReL) vs. ReL=Ka3=11 at two locations along the test plate, indicating the wavy
film development.

E.I.P. Drosos et al. / International Journal of Multiphase Flow 30 (2004) 853–876 871
4.6. Hydrodynamic stability considerations
It is well-known that linear stability theory predicts satisfactorily the critical conditions andcharacteristics only of small amplitude sinusoidal waves at low ReL. Even though analyticaltreatments of the Orr–Sommerfeld (OS) equation (e.g. Benjamin, 1957) have shown that the flowwithin a free falling film is always unstable or at least neutrally stable for all finite ReL, a local two-dimensional model is often considered to be adequate for describing naturally occurring waveprofiles, especially those evolving very close to wave inception region. For the present study, sincethe waves at x ¼ 19 cm retain features of two-dimensionality, it is interesting to compare therespective data with theoretical results as well as with some experimental data presented in theliterature. Farther downstream where wave interactions occur more frequently and lead to achaotic spectrum of waves, wave structures display a three-dimensional pattern and linear sta-bility theory is clearly inapplicable. Thus, in Fig. 15 data at x ¼ 19 cm of dimensionless wavecelerity, Cð¼ c=huiÞ, are plotted versus the dimensionless group ReL=Ka3=11. Stability curves fromlinear analyses are also plotted in this figure. The relatively low values of measured celerities, C,may suggest that the waves at x ¼ 19 cm are still unstable. For these values of C, periodic wavesappear and continue to exist over a rather large range of celerity values, with increasing amplitudeas C decreases (e.g. Nguyen and Balakotaiah, 2000). Additionally, it is noted that (considering thenew data) the most unstable waves appear to be those of low-Ka 2.5% butanol solution as thecorresponding dimensionless celerity C is smaller compared to that for water and 1.5% butanolsolution. This is in agreement with the results of slightly non-linear analysis of OS equation usinga first approximation with respect to e ðe ¼ hN=kÞ, as Alekseenko et al. (1994) report. Comparingthe present data with some experimental results from the literature, a reasonable agreement is
1.5
2.0
2.5
3.0
3.5
10
W _(19)B1 _(19)B2 _(19)Jones et al.,1966Kapitza et al.,1949Strobel et al.,1969Krantz et al., 1971Pierson et al.,1977Anshus et al., 1966
ReL
/ (K a 3/11)
c/ <
u>
Linear Stability Theory(Small Re and small wavelength)L
1
Fig. 15. Dimensionless wave celerity, c=hui, vs. ReL=Ka3=11 at two locations along the test plate and comparison with
some literature data and stability analysis results.
872 E.I.P. Drosos et al. / International Journal of Multiphase Flow 30 (2004) 853–876
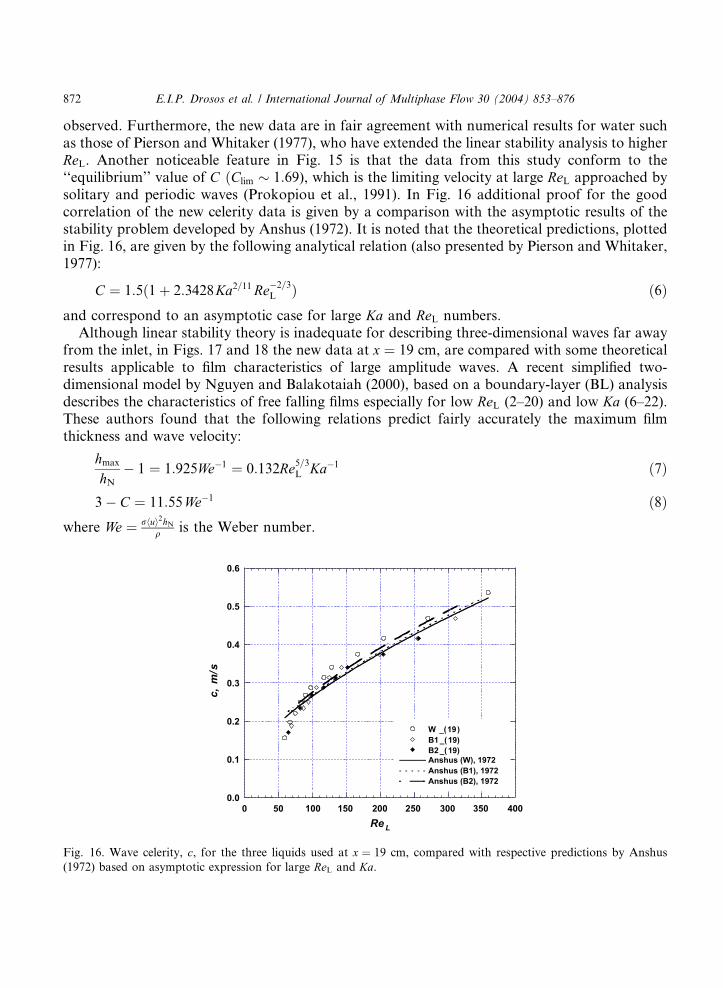
observed. Furthermore, the new data are in fair agreement with numerical results for water suchas those of Pierson and Whitaker (1977), who have extended the linear stability analysis to higherReL. Another noticeable feature in Fig. 15 is that the data from this study conform to the‘‘equilibrium’’ value of C ðClim � 1:69), which is the limiting velocity at large ReL approached bysolitary and periodic waves (Prokopiou et al., 1991). In Fig. 16 additional proof for the goodcorrelation of the new celerity data is given by a comparison with the asymptotic results of thestability problem developed by Anshus (1972). It is noted that the theoretical predictions, plottedin Fig. 16, are given by the following analytical relation (also presented by Pierson and Whitaker,1977):
Fig. 1
(1972
C ¼ 1:5ð1þ 2:3428Ka2=11Re�2=3L Þ ð6Þ
and correspond to an asymptotic case for large Ka and ReL numbers.Although linear stability theory is inadequate for describing three-dimensional waves far awayfrom the inlet, in Figs. 17 and 18 the new data at x ¼ 19 cm, are compared with some theoreticalresults applicable to film characteristics of large amplitude waves. A recent simplified two-dimensional model by Nguyen and Balakotaiah (2000), based on a boundary-layer (BL) analysisdescribes the characteristics of free falling films especially for low ReL (2–20) and low Ka (6–22).These authors found that the following relations predict fairly accurately the maximum filmthickness and wave velocity:
hmaxhN
� 1 ¼ 1:925We�1 ¼ 0:132Re5=3L Ka�1 ð7Þ
3� C ¼ 11:55We�1 ð8Þ
where We ¼ rhui2hNq is the Weber number.
0.0
0.1
0.2
0.3
0.4
0.5
0.6
100 150 200 250 300 350 400
W _(19)B1 _(19)B2 _(19)Anshus (W), 1972Anshus (B1), 1972 Anshus (B2), 1972
c, m
/s
Re L
0 50
6. Wave celerity, c, for the three liquids used at x ¼ 19 cm, compared with respective predictions by Anshus
) based on asymptotic expression for large ReL and Ka.

0.00
0.01
0.10
1.00
0.001 0.01 0.1
W _(19)B1 _(19)B2 _(19)Kapitza et el.,1949 (Alcohol) Kapitza et al.,1949 (Water) Nguyen et al., 2000 (Ka=22) Chang, 1989 Nguyen & Balakotaiah,2000
(hm
ax /
h N)
- 1
We -11
Fig. 17. Comparison of theoretical predictions of hmax with experimental data, using the dimensionless ratio hmax=hNand We.
0.1
1
10
0.001 0.01 0.1
W _(19)B1 _(19)B2 _(19)Kapitza et el.,1949 (Alcohol) Jones et al., 1966 (Water) Nguyen et al., 2000 (Ka=22) Che ng 1989Nguyen & Balakotaiah, 2000
3-C
We -1
Chang,
1
Fig. 18. Comparison of theoretical predictions on celerity with experimental data, using the dimensionless celerity 3-C
and We.
E.I.P. Drosos et al. / International Journal of Multiphase Flow 30 (2004) 853–876 873
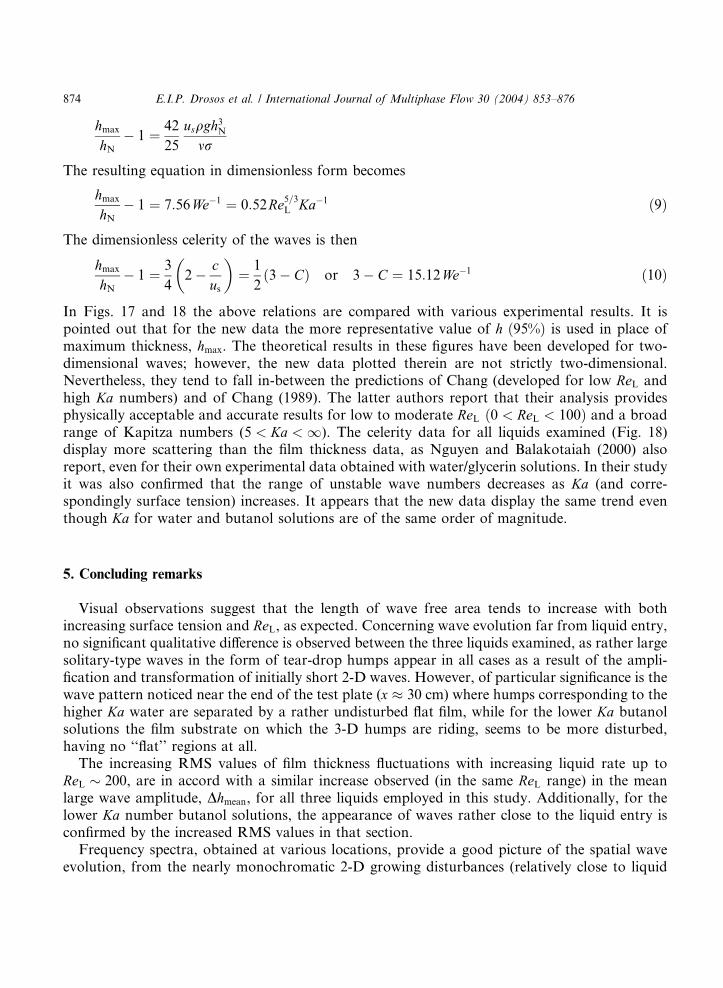
An earlier study by Chang (1989) dealt with the analysis of steady solitary waves on a filmflowing down an inclined plane near critical ReL and was based on a non-linear treatment of long-wave (LW) approximation. The following analytical expression was obtained for the maximumwave amplitude in vertical flow:
874 E.I.P. Drosos et al. / International Journal of Multiphase Flow 30 (2004) 853–876
hmaxhN
� 1 ¼ 42
25
usqgh3Nmr
The resulting equation in dimensionless form becomes
hmaxhN
� 1 ¼ 7:56We�1 ¼ 0:52Re5=3L Ka�1 ð9Þ
The dimensionless celerity of the waves is then
hmaxhN
� 1 ¼ 3
42
�� cus
�¼ 1
2ð3� CÞ or 3� C ¼ 15:12We�1 ð10Þ
In Figs. 17 and 18 the above relations are compared with various experimental results. It ispointed out that for the new data the more representative value of h ð95%Þ is used in place ofmaximum thickness, hmax. The theoretical results in these figures have been developed for two-dimensional waves; however, the new data plotted therein are not strictly two-dimensional.Nevertheless, they tend to fall in-between the predictions of Chang (developed for low ReL andhigh Ka numbers) and of Chang (1989). The latter authors report that their analysis providesphysically acceptable and accurate results for low to moderate ReL ð0 < ReL < 100Þ and a broadrange of Kapitza numbers (5 < Ka < 1). The celerity data for all liquids examined (Fig. 18)display more scattering than the film thickness data, as Nguyen and Balakotaiah (2000) alsoreport, even for their own experimental data obtained with water/glycerin solutions. In their studyit was also confirmed that the range of unstable wave numbers decreases as Ka (and corre-spondingly surface tension) increases. It appears that the new data display the same trend eventhough Ka for water and butanol solutions are of the same order of magnitude.
5. Concluding remarks
Visual observations suggest that the length of wave free area tends to increase with bothincreasing surface tension and ReL, as expected. Concerning wave evolution far from liquid entry,no significant qualitative difference is observed between the three liquids examined, as rather largesolitary-type waves in the form of tear-drop humps appear in all cases as a result of the ampli-fication and transformation of initially short 2-D waves. However, of particular significance is thewave pattern noticed near the end of the test plate (x � 30 cm) where humps corresponding to thehigher Ka water are separated by a rather undisturbed flat film, while for the lower Ka butanolsolutions the film substrate on which the 3-D humps are riding, seems to be more disturbed,having no ‘‘flat’’ regions at all.The increasing RMS values of film thickness fluctuations with increasing liquid rate up to
ReL � 200, are in accord with a similar increase observed (in the same ReL range) in the meanlarge wave amplitude, Dhmean, for all three liquids employed in this study. Additionally, for thelower Ka number butanol solutions, the appearance of waves rather close to the liquid entry isconfirmed by the increased RMS values in that section.Frequency spectra, obtained at various locations, provide a good picture of the spatial wave
evolution, from the nearly monochromatic 2-D growing disturbances (relatively close to liquid

E.I.P. Drosos et al. / International Journal of Multiphase Flow 30 (2004) 853–876 875
entry for low Ka) to the more chaotic 3-D waves downstream, represented by a broader frequencyrange. Furthermore, a very pronounced characteristic frequency is observed in all the spectra.This modal frequency remains nearly constant with increasing ReL, in the range considered here,depending mainly on the distance from liquid entry. At the same time, the energy conveyed by thewaves is increasing with both increasing ReL and downstream distance having a similar magnitudeup to ReL � 250 for the three liquids employed. In the same range of higher ReL examined here,waves of higher order corresponding to smaller frequencies seem to be amplified far downstream.By comparing measured wave celerities with results of linear stability analyses it is confirmed
that the lower Ka number fluids are associated with more unstable waves. Furthermore, anasymptotic expression for large ReL and Ka, based on such analyses (Anshus, 1972) is in fairagreement with the celerity of developing waves.Of particular interest, for applications involving counter-current gas–liquid flow, is the film
region far from liquid entry, e.g. more than �20 wavelengths or at distances of order 102 cm. Thisis the section where the most intensive gas/liquid interaction appears to take place in verticalcounter-current flow, possibly leading to flooding (e.g. Vlachos et al., 2001). The salient featuresof falling film at that section, at intermediate ReL, emerging from this work, are briefly as follows:A 3-D wave pattern (dominated by interacting tear-drop humps) prevails, with nearly constant
RMS values of film thickness fluctuations above ReL � 200. The large wave celerity and wave-length tend to increase with ReL and with distance; the characteristic wave frequency tends toremain unaffected by ReL and to decrease with distance from entry. Large wave amplitude shows adependence on ReL similar to that of RMS; however with the exception of small ReL thisamplitude normalized with the mean film thickness, hmean, appears to be nearly independent of ReLand roughly equal to unity.In general, the falling film characteristics obtained in this study provide new insights helpful in
future modelling efforts; in particular the new data are expected to help understand the mecha-nism of flooding in vertical channels.
References
Adomeit, P., Renz, U., 2000. Hydrodynamics of three-dimensional waves in laminar falling films. Int. J. Multiphase
Flow 26, 1183–1208.
Alekseenko, S.V., Nakoryakov, V.E., Pokusaev, B.G., 1985. Wave formation on vertical falling liquid films. Int. J.
Multiphase Flow 11, 607–627.
Alekseenko, S.V., Nakoryakov, V.E., Pokusaev, B.G., 1994. Wave Flow Of Liquid Films. Beggel House, New York.
Ambrosini, W., Forgione, N., Oriolo, F., 2002. Statistical characteristics of a water film falling down a flat plate at
different inclinations and temperatures. Int. J. Multiphase Flow 28, 1521–1540.
Anshus, B.E., Goren, S.L., 1966. A method of getting approximate solutions to the Orr-Sommerfeld (OS) equation for
flow on a vertical wall. A.I.Ch.E. J. 2, 1004–1008.
Anshus, B.E., 1972. On the asymptotic solution to the falling film stability problem. Ind. Eng. Chem. Fund 11, 502–508.
Benjamin, T.B., 1957. Wave formation in laminar flow down an inclined plane. J. Fluid Mech. 2, 554–574.
Benney, B.J., 1966. Long waves in liquid films. J. Math. Phys. 45, 150–155.
Chang, H.-C., 1989. Onset of nonolinear waves on falling films. Phys. Fluids A 1, 1314–1327.
Chang, H.-C., 1994. Wave evolution on a falling film. Annu. Rev. Fluid Mech. 26, 103–136.
Chang, H.-C., Demekhin, E.A., Kopelevich, D.I., 1993. Nonlinear evolution of waves on a vertically falling film. J.
Fluid Mech. 250, 433–480.

876 E.I.P. Drosos et al. / International Journal of Multiphase Flow 30 (2004) 853–876
Chu, K.J., Dukler, A.E., 1974. Statistical characteristics of thin, wavy films: part II. Studies of the substrate and its
wave structure. A.I.Ch.E. 20, 695–706.
Jones, L.O., Whitaker, S., 1966. An experimental study of falling liquid films. A.I.Ch.E. J. 12, 525–529.
Kapitza, P.L., 1964. Wave flow of thin layers of a viscous fluid. In: Collected Papers of P.L. Kapitza. Macmillan, NY.
Karapantsios, T.D., Karabelas, A.J., 1995. Longitudinal characteristics of wavy falling films. Int. J. Multiphase Flow
21, 119–127.
Karapantsios, T.D., Paras, S.V., Karabelas, A.J., 1989. Statistical characteristics of free falling films at high Reynolds
numbers. Int. J. Multiphase Flow 15, 1–21.
Khesghi, H.S., Scriven, L.E., 1987. Disturbed film flow on a vertical plate. Phys. Fluids 30, 990–997.
Krantz, W.B., Goren, S.L., 1971. Stability of thin liquid films flowing down a plane. Ind. Eng. Chem. Fund. 10, 91–101.
Lin, S.P., 1974. Finite amplitude side-band stability of a viscous film. J. Fluid Mech. 63, 417–429.
Nakoryakov, V.E., Pokusaev, B.G., Radev, K.B., 1987. Waves and their effect of convective gas diffusion in falling
liquid (in Russian). Zhum. Prikl. Mekh. Tekh. Fiz. 3, 95–104, cited by Alekseenko, S.V., Nakoryakov, V.E.,
Pokusaev, B.G., 1994. Wave Flow of Liquid Films, Beggel House, New York.
Nguyen, L.T., Balakotaiah, V., 2000. Modeling and experimental studies of wave evolution on free falling films. Phys.
Fluids 12, 2236–2256.
Paras, S.V., Karabelas, A.J., 1991. Properties of the liquid layer in horizontal annular flow. Int. J. Multiphase Flow 17,
439–454.
Paras, S.V., Drosos, E.I.P., Karabelas, A.J., Chopard, F., 2001. Counter-current gas/liquid flow through Channels with
corrugated walls – Visual observations of liquid distribution and flooding. Proceedings, 5th World Conference on
Experimental Heat Transfer, Fluid Mechanics and Thermodynamics, Thessaloniki, September 24–28, 2001 – Celate,
G.P., et al (ed’s), Edizioni ETS, Pisa.
Patnaik, V., Perez-Blanco, H., 1996. Roll waves in falling films: an approximate treatment of the velocity field. Int. J.
Heat Fluid Flow, 63–70.
Pierson, F.W., Whitaker, S., 1977. Some theoretical and experimental observations of the wave structure of falling
liquid films. Ind. Eng. Chem. Fund. 18, 401–408.
Portalski, S., 1963. Studies of falling liquid film flow: film thickness on a smooth vertical plate. Chem. Eng. Sci. 18, 787–
804.
Portalski, S., Clegg, A.J., 1972. An experimental study of wave inception on falling liquid films. Chem. Eng. Sci. 27,
1257–1265.
Prokopiou, T., Cheng, M., Chang, H.-C., 1991. Long waves on inclined films at high Reynolds number. J. Fluid Mech.
222, 665–691.
Salazar, R.P., Marschall, E., 1978. Time-average local thickness measurement in falling liquid film flow. Int. J.
Multiphase Flow 4, 405–412.
Schadel, S.A., 1988. Atomization and deposition rates in vertical annular two-phase flow. Ph.D. Thesis, University of
Illinois, Urbana.
Strobel, W.J., Whitaker, S., 1969. The effect of surfactants on the flow characteristics of falling liquid films. A.I.Ch.E. J.
15, 527–532.
Tailby, S.R., Portalski, S., 1962. Wave inception on a liquid film flowing down a hydrodynamically smooth plate.
Chem. Eng. Sci. 17, 283–290.
Takahama, H., Kato, S., 1980. Longitudinal flow characteristics of vertically falling liquid films without concurrent gas
flow. Int. J. Multiphase Flow 6, 203–215.
Trifonov, Y.Y., Tsvelodub, O.Y., 1991. Non-linear waves on the surface of a falling liquid film. Part 1. Waves of the
first family and their stability. J. Fluid Mech. 229, 531–551.
Yih, C.S., 1963. Stability of liquid flow down an inclined plane. Phys. Fluids 6, 321–334.
Yu, L.-Q., Wasden, F.K., Dukler, A.E., Balakotaiah, V., 1995. Nonlinear evolution of waves on falling films at high
Reynolds numbers. Phys. Fluids 7, 1886–1902.
Vlachos, N.A., Paras, S.V., Mouza, A.A., Karabelas, A.J., 2001. Visual observations of flooding in narrow rectangular
channels. Int. J. Multiphase Flow 27, 1415–1430.