Event-related near-infrared spectroscopy detects conflict in the motor cortex in a Stroop task
Upload
independentCategory
view
4download
0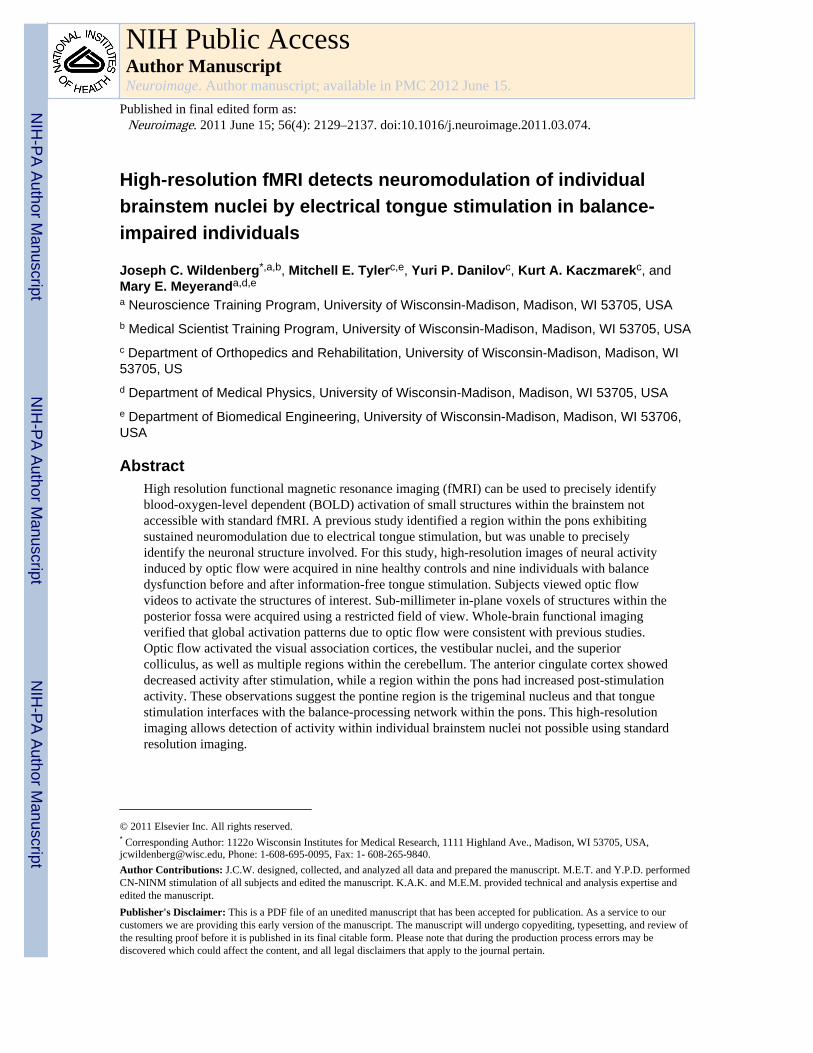
High-resolution fMRI detects neuromodulation of individualbrainstem nuclei by electrical tongue stimulation in balance-impaired individuals
Joseph C. Wildenberg*,a,b, Mitchell E. Tylerc,e, Yuri P. Danilovc, Kurt A. Kaczmarekc, andMary E. Meyeranda,d,e
a Neuroscience Training Program, University of Wisconsin-Madison, Madison, WI 53705, USAb Medical Scientist Training Program, University of Wisconsin-Madison, Madison, WI 53705, USAc Department of Orthopedics and Rehabilitation, University of Wisconsin-Madison, Madison, WI53705, USd Department of Medical Physics, University of Wisconsin-Madison, Madison, WI 53705, USAe Department of Biomedical Engineering, University of Wisconsin-Madison, Madison, WI 53706,USA
AbstractHigh resolution functional magnetic resonance imaging (fMRI) can be used to precisely identifyblood-oxygen-level dependent (BOLD) activation of small structures within the brainstem notaccessible with standard fMRI. A previous study identified a region within the pons exhibitingsustained neuromodulation due to electrical tongue stimulation, but was unable to preciselyidentify the neuronal structure involved. For this study, high-resolution images of neural activityinduced by optic flow were acquired in nine healthy controls and nine individuals with balancedysfunction before and after information-free tongue stimulation. Subjects viewed optic flowvideos to activate the structures of interest. Sub-millimeter in-plane voxels of structures within theposterior fossa were acquired using a restricted field of view. Whole-brain functional imagingverified that global activation patterns due to optic flow were consistent with previous studies.Optic flow activated the visual association cortices, the vestibular nuclei, and the superiorcolliculus, as well as multiple regions within the cerebellum. The anterior cingulate cortex showeddecreased activity after stimulation, while a region within the pons had increased post-stimulationactivity. These observations suggest the pontine region is the trigeminal nucleus and that tonguestimulation interfaces with the balance-processing network within the pons. This high-resolutionimaging allows detection of activity within individual brainstem nuclei not possible using standardresolution imaging.
© 2011 Elsevier Inc. All rights reserved.* Corresponding Author: 1122o Wisconsin Institutes for Medical Research, 1111 Highland Ave., Madison, WI 53705, USA,[email protected], Phone: 1-608-695-0095, Fax: 1- 608-265-9840.Author Contributions: J.C.W. designed, collected, and analyzed all data and prepared the manuscript. M.E.T. and Y.P.D. performedCN-NINM stimulation of all subjects and edited the manuscript. K.A.K. and M.E.M. provided technical and analysis expertise andedited the manuscript.Publisher's Disclaimer: This is a PDF file of an unedited manuscript that has been accepted for publication. As a service to ourcustomers we are providing this early version of the manuscript. The manuscript will undergo copyediting, typesetting, and review ofthe resulting proof before it is published in its final citable form. Please note that during the production process errors may bediscovered which could affect the content, and all legal disclaimers that apply to the journal pertain.
NIH Public AccessAuthor ManuscriptNeuroimage. Author manuscript; available in PMC 2012 June 15.
Published in final edited form as:Neuroimage. 2011 June 15; 56(4): 2129–2137. doi:10.1016/j.neuroimage.2011.03.074.
NIH
-PA Author Manuscript
NIH
-PA Author Manuscript
NIH
-PA Author Manuscript

KeywordsHigh-resolution; fMRI; balance; tongue; trigeminal; stimulation
1. IntroductionMany separate neuronal structures must work together to collect and process environmentalinformation pertinent to maintaining balance. These structures include components of thevisual system, the vestibular nuclei and cerebellar flocculus/nodulus (the vestibular system),and the cerebellar hemispheres (proprioception and coordination). In addition, the parieto-insular vestibular cortex (PIVC) is a multi-modal processing center that integratesinformation from all of the involved sensory systems (Brandt and Dieterich 1999). Damageto any of these structures, regardless of the exact underlying etiology, can produce deficitsof balance, posture, and gait. Unfortunately, few disorder-specific treatments exist andpermanent disability is possible depending on the severity of the disease (Brandt et al.,2010).
One dominant effect of balance dysfunction is hypersensitivity to dynamic visual stimuli.Many individuals with balance disorders complain of increased sensitivity to significantmotion within their visual field (Bronstein 2004) and the postural response to visual motionis one component of the sensory organization test (SOT) commonly used in the clinicalassessment of individuals with balance dysfunction (Furman 1994; Mirka and Black 1990;Visser et al., 2008). Optic flow, a type of visual stimulus implying relative motion betweenthe visual scene and the observer, can produce the sensation of egomotion. Optic flow canbe used to measure the sensitivity of the visual system and the ability of the balance-processing network to integrate pertinent information (Kelly, Loomis, Beall 2005; O'Connoret al., 2008; Palmisano et al., 2009). This type of stimulus is especially useful in activatingcomponents of the balance-processing network when the subject is motionless, for examplein investigations using functional magnetic resonance imaging (fMRI) (Cardin and Smith2010; Kikuchi et al., 2009; Ohlendorf et al., 2008). Several previous studies have shownincreased postural responses and hypersensitivity of the motion-sensitive visual corticeswhen balance-impaired individuals view optic flow (Dieterich et al., 2007; Mergner et al.,2005; Redfern and Furman 1994; Wildenberg et al., 2010).
Recent studies have shown that electrical stimulation of the tongue can produce behavioralimprovements in many individuals who have some sensory impairment. This route to thebrain was originally used for sensory substitution in both balance-impaired and blindindividuals (Chebat et al., 2007; Danilov et al., 2006; Robinson et al., 2009; Tyler, Danilov,Bach-Y-Rita 2003; Vuillerme et al., 2008; Vuillerme and Cuisinier 2009). Cross-modalrecruitment theories of plasticity can explain why individuals using the tongue stimulationfor sensory substitution show improvement in behavioral tasks (Collignon et al., 2009;Pietrini, Ptito, Kupers 2009; Poirier, De Volder, Scheiber 2007; Ptito et al., 2005). Oneimportant observation of some balance studies was that the beneficial effects were sustained,lasting days to weeks beyond the final stimulation session (Danilov et al., 2006; Tyler,Danilov, Bach-Y-Rita 2003).
We recently demonstrated that such beneficial effects can be generated even when thestimulation signal contains no environmental information (Wildenberg et al., 2010).Information-free stimulation of the tongue, termed Cranial Nerve Non-InvasiveNeuromodulation (CN-NINM), produced behavioral improvements that persisted after thestimulation electrodes were removed from the mouth. Imaging data collected in that studyrevealed that tongue stimulation causes sustained modulation in the processing of optic flow
Wildenberg et al. Page 2
Neuroimage. Author manuscript; available in PMC 2012 June 15.
NIH
-PA Author Manuscript
NIH
-PA Author Manuscript
NIH
-PA Author Manuscript

within some neuronal structures involved in processing balance information. Of particularinterest was modulation of a region within the pons of the brainstem. This region likelycontains the vestibular, trigeminal, and solitary nuclei. The trigeminal nuclei receivesomatosensory afferents from the tongue (cranial nerve five), while the solitary nucleireceive taste afferents from the chorda tympani nerve. Complex interactions between thesestructures (e.g. convergence and co-modulation of visual, vestibular, visceral sensory andnociceptive signals) may be involved in development and/or manifestation of varioussymptoms such as hypersensitivity to optical flow in balance and anxiety disorders, balancedysfunction in migraine disorders, and interoception (physiological sense of well-being)related homeostasic responses (Balaban and Thayer 2001; Buisseret-Delmas et al., 1999;Craig 2002; Jacob, Redfern, Furman 1995; Marano et al., 2005; Satoh, Ishizuka, Murakami2009).
Our current hypothesis is that these structures and their interconnections are modulated byelectrical stimulation applied to the tongue. Sustained changes in information processingwithin these structures could explain the behavioral and subjective improvements seen inprevious studies using this technique.
The brainstem and cerebellum present many challenges for imaging. Not only are theneuronal structures within these regions much smaller than those within the cortex, but theposterior fossa is extremely susceptible to magnetic field inhomogenities and large motionartifacts as the brainstem moves with arterial pulsation and respiration. Additional fieldinhomogenities are produced by the brainstem's proximity to the oropharynx. Multipletechniques to correct for these artifacts are effective at increasing the blood-oxygen-leveldependent (BOLD) contrast and SNR (Tracey and Iannetti 2006). Precise localization andattribution of activation to individual nuclei requires increased spatial resolution tocounteract the partial-volume effects that result when the target structure is similar (orsmaller) in size to the voxels being collected (Figure 1 A-C) (Weibull et al., 2008). Althoughvery suggestive, the standard resolution fMRI used in our previous study could notdistinguish between individual nuclei within the brainstem and it was not possible to identifywhich nuclei were modulated by the stimulation.
To precisely identify which brainstem and cerebellar structures are modulated by electricaltongue stimulation this study utilized high-resolution fMRI imaging to collect sub-millimeter axial voxels while individuals with balance-dysfunction and healthy controlsviewed optic flow (Figure 1 D-F). The stimulation techniques used are identical to thosefrom our previous study except that these subjects received an additional week ofstimulation to strengthen potential sustained neuromodulation (Wildenberg et al., 2010).
2. MethodsTo achieve sufficient statistical significance for inter-subject comparison, we used an apriori power analysis to estimate the appropriate number of study participants. Our previousstudy found mean BOLD signal changes within the brainstem of 0.2% with a standarddeviation of approximately 0.1% using identical visual stimuli to the one used in this study(Wildenberg et al., 2010). These values give a standardized effect size of (0.2/0.1)/2 = 1.0.We choose an acceptable type-I error of α = 0.05 and a power of P = 1 − β = 0.80. Using apower table for two-way ANOVAs calculated by Bausell and Yi, we find an estimatedsample size of 9 participants per group (Bausell and Li 2002). This sample size alsoprovides adequate power for intergroup comparisons using two-sample t-tests (Rosner2006).
Wildenberg et al. Page 3
Neuroimage. Author manuscript; available in PMC 2012 June 15.
NIH
-PA Author Manuscript
NIH
-PA Author Manuscript
NIH
-PA Author Manuscript

2.1 SubjectsNine subjects identified by symptoms of chronic balance dysfunction (M/F: 2/7, mean age47.0±11.5 years) and nine controls (M/F: 5/4, mean age 38.8±16.1 years) participated in thisstudy. Balance-impaired subjects were recruited primarily through referral from cliniciansaware of ongoing studies within our research group. These balance-impaired subjects werelocated throughout the United States and travelled to our facility for participation in thestudy. Controls were recruited from the general population around Madison, Wisconsin.Subject recruitment occurred from May 2009 through September 2010.
Inclusion criteria for the balance subjects were broad and included individuals with achronic, stable balance dysfunction that affected balance, posture, and gait. Exclusioncriteria, for both balance subjects and controls, were pregnancy, mental health disorders,corrected vision below 20/40, myasthenia gravis, Charcot-Marie-Tooth disease, post-poliosyndrome, Guillan-Barré, fibromyalgia, chronic fatigue syndrome, herniated disc, andosteoarthritis of the spine. Exclusion criteria for balance-impaired subjects also includedcommunicable diseases (HIV, TB, hepatitis, etc.), oral health problems (open sores in themouth or tongue), and any neurological disorder not attributed to their primary diagnosis.Subjects were also excluded if they had MRI-incompatible metallic implants. TheUniversity of Wisconsin-Madison Health Sciences Institutional Review Board approved allaspects of this study and all subjects signed the approved consent form before beginning anyportion of the study. Subjects completed consent, screening, and informational forms duringtheir first visit. Subjects were not compensated for participation in this study.
2.2 Visual stimuli and displayTwo visual stimuli were used to activate structures involved in balance processing whilesubjects remained stationary within the MRI scanner. The control stimulus (static) was astatic checkerboard of alternating white and black squares with an edge length of 230 pixels.Two-dimensional optic flow (dynamic) was presented using a video derived from the staticcheckerboard image. An apparent in/out motion arose from varying the size of the squaresusing a sinusoidal oscillation with a frequency of 0.2 Hz. Additionally, rotation about thecenter of the viewfield was produced using the superposition of two sinusoids (0.2 and 0.35Hz) to prevent prediction of the motion. These stimuli were identical to those described inour previous study (Wildenberg et al., 2010). Both stimuli had a total image size of 800×600pixels (equal to the resolution of the display goggles) and the dynamic video was displayedat 60 frames-per-second.
During the functional MRI scans, all subjects were shown the two visual stimuli in apseudo-randomized block-design paradigm. Each stimulus was displayed for twelve secondsin blocks of three to six repetitions. Within a block, the stimulus presentations wereseparated by six seconds of fixation to reduce the contamination of neural responses fromone stimulus presentation into the next (O'Connor et al., 2008). Each block was alsoseparated by six seconds of fixation. The order of stimulus presentation was the same for allsubjects.
Subjects viewed the visual stimuli on MRI-compatible head-mounted display goggles(Resonance Technology, Northridge, CA). These goggles produce an 800×600 pixel displaywith a 30° horizontal and 22° vertical field-of-view in each eye. A mask of black fabric wasplaced over the subject's head and goggles to block all remaining ambient light.
2.3 MRI data collectionMRI data was acquired with a 3T MRI scanner (GE750, GE Healthcare, Waukesha, WI).T1-weighted anatomical images were collected using a spoiled gradient recalled pulse
Wildenberg et al. Page 4
Neuroimage. Author manuscript; available in PMC 2012 June 15.
NIH
-PA Author Manuscript
NIH
-PA Author Manuscript
NIH
-PA Author Manuscript

sequence. A standard-resolution functional scan (stan-res) was acquired with a T2*-weighted gradient-echo echo-planar imaging (GE-EPI) sequence (TR = 2000 ms, echo time= 30 ms, flip angle = 75 degrees) to acquire BOLD signal over a 64×64 matrix and 42 axialslices (3.12 × 3.12 × 3.2 mm resolution). An additional high-resolution functional scan(high-res) was acquired using the same imaging parameters, but with a 256×256 matrix and23 axial slices (0.86 × 0.86 × 2.9 mm resolution) covering only the posterior fossa. Theorder of the scans was randomized to eliminate the effect of inter-scan habituation to thevisual stimuli. The first four volumes of each functional scan (152 total volumes) wereautomatically discarded to allow the longitudinal magnetization to reach equilibrium.Cardiac and respiratory waveforms were collected during the functional scans for use inphysiologic artifact removal during data analysis.
2.4 Behavioral testingThe nine balance-impaired subjects completed sensory organization testing (NeuroComInternational, Clackamas OR, USA) at the University of Wisconsin Sports Medicine facilityto measure dynamic behavioral impairment (Furman 1994). The test gives a composite scorethat combines performance on six sensory conditions and is a measure of overall posturalstability. A composite score below 70 is defined as outside the normal range.
2.5 Tongue stimulationStimulation to the tongue was delivered via a small electrode array placed on the anteriorportion of the tongue and held in place by pressure of the tongue to the roof of the mouth(Tyler, Danilov, Bach-Y-Rita 2003). The sensation produced by the array is similar todrinking a carbonated beverage.
CN-NINM stimulation consists of three square-pulse bursts delivered equally to allelectrodes with an intraburst frequency of 200Hz and an interburst frequency of 50 Hz thatdoes not vary throughout the duration of the stimulation session. Previous studies hadcoupled the array to a helmet-mounted accelerometer to give feedback on the direction ofgravity (Danilov et al., 2007; Danilov et al., 2006; Vuillerme and Cuisinier 2009). In thisstudy, the signal was not coupled to any sensor and did not provide any usefulenvironmental information to the subject.
2.6 ProcedureOn the day of the first visit (day 0), all subjects underwent an fMRI scan to collect neuralresponses to the visual stimuli. No tongue stimulation was given during the fMRI scans.Balance-impaired subjects also performed sensory organization testing (SOT). Data fromthis session will be referred to as Pre (balance-impaired subjects) or Nor (normal controls).
CN-NINM stimulation was delivered only to the balance-impaired subjects over 19stimulation sessions (two on days 1-9 and one on day 10). Days 5 and 6 were separated bytwo rest days in which the subjects did not receive any stimulation. During a stimulationsession, subjects received continuous stimulation for 20 minutes, wherein the subject stoodas still as possible with their feet together and eyes closed. A physical therapist was alwayspresent to prevent falls.
After completion of the nineteen stimulation sessions, balance-impaired subjects repeatedthe fMRI scans and SOT testing. The procedures for the tests on day 10 were identical tothose completed on day 0. This data from balance-impaired subjects (Post) were collectedbetween three and six hours after the final stimulation session.
Wildenberg et al. Page 5
Neuroimage. Author manuscript; available in PMC 2012 June 15.
NIH
-PA Author Manuscript
NIH
-PA Author Manuscript
NIH
-PA Author Manuscript
2.7 MRI data analysisfMRI data was preprocessed using the AFNI software suite (Cox 1996). This includedcorrections for slice-time acquisition errors and subject motion, temporal low-pass filteringwith a 0.15 Hz cutoff, and spatial smoothing. The stan-res data was smoothed using anisotropic Gaussian filter having a full width at half maximum (FWHM) of 8mm. The high-res data was smoothed with a 3mm filter. For input to the general linear model (GLM), thetask waveforms were combined to look at the effect of any visual stimulus (Photic: staticand dynamic) and the effect of visual motion (Motion: dynamic only). The GLM wasestimated with the SPM8 software package and included regressors for subject motion andphysiologic parameters (Johnstone et al., 2006; Lund et al., 2005). Respiratory and cardiacwaveforms collected during the functional scans were processed using a script by Kelley etal. prior to inclusion in the GLM (Kelley et al., 2008). GLM output was converted to percentsignal change by dividing each contrast image by the baseline image.
The stan-res data was normalized using the SPM8 algorithm. Normalization of the high-resdata was performed using the SUIT algorithm and atlas plugin for SPM8 as this moreaccurately aligns the brainstem and cerebellum than whole-brain normalization (Diedrichsen2006; Diedrichsen et al., 2009). The data was resampled to a resolution of 2×2×2 mm3 (stan-res) or 1×1×2 mm3 (high-res) using 7th-degree b-splines, the most accurate resamplingoption available in SPM8.
Comparison of the balance-impaired subjects before and after stimulation was performedusing a two-way repeated-measures ANOVA (separate for the stan-res and high-res data).The independent variables were the effects of optic flow (OF: Photic, Motion) and anysustained neuromodulation due to the stimulation (Stim: Pre, Post). OF data show activationattributable to visual motion by identify regions that have different activity during thedynamic stimulus compared to the static stimulus. Results for the factor Stim do notrepresent activation directly, but instead show regions whose activation pattern changedafter the week of tongue stimulation (independent of the activations due to OF). Finally, thetwo-way interaction term OF × Stim reports brain regions that have altered activity whenprocessing visual motion after stimulation compared to before. The displayed images andtables were created using t-tests to identify the directionality of the effect at each voxel.
As our study was unbalanced with respect to our two subject populations, the study designrequired group activation maps and intergroup comparisons to be performed using one- andtwo-sample t-tests. The one-sample tests show activation patterns due to optic flow in eachgroup separately. The two-sample tests determine if these patterns are different betweengroups. Tests were performed separately for the stand-res and high-res data.
Corrections for multiple comparisons was performed using AFNI's AlphaSim Monte-Carlosimulations (Forman et al., 1995). This method allows for a combination of thresholding andspatial clustering to derive a corrected p-value. Results from these simulations indicated thatonly activation clusters at the α ≤ 0.005 threshold with a volume greater than 1144 μl (stand-res) or 40 μl (high-res) would have global significance at p ≤ 0.05. While these volumes areacceptable for cortical structures, 40 μl is larger than most brainstem nuclei (Alvarez et al.,2000). Therefore, the minimum volume cutoff for the high-res clusters was 20 μl. Onlyclusters with volumes greater than these cutoffs are displayed in the figures and tables.
3. Results3.1 Behavioral results
Balance-impaired subject 3 did not receive a score on the pre-stimulation SOT due tosignificant stability impairment and was omitted from the behavioral analysis. Subject 3
Wildenberg et al. Page 6
Neuroimage. Author manuscript; available in PMC 2012 June 15.
NIH
-PA Author Manuscript
NIH
-PA Author Manuscript
NIH
-PA Author Manuscript
received a composite score of 62 on the post-stimulation test. Six of the remaining eightsubjects had impaired performance, defined as having initial SOT composite scores below70 (Figure 2). After CN-NINM stimulation, two subjects remained below this level. Theaverage improvement in SOT scores was 15.75 with a standard error of the mean of 5.59 (p= 0.026, paired student's t-test).
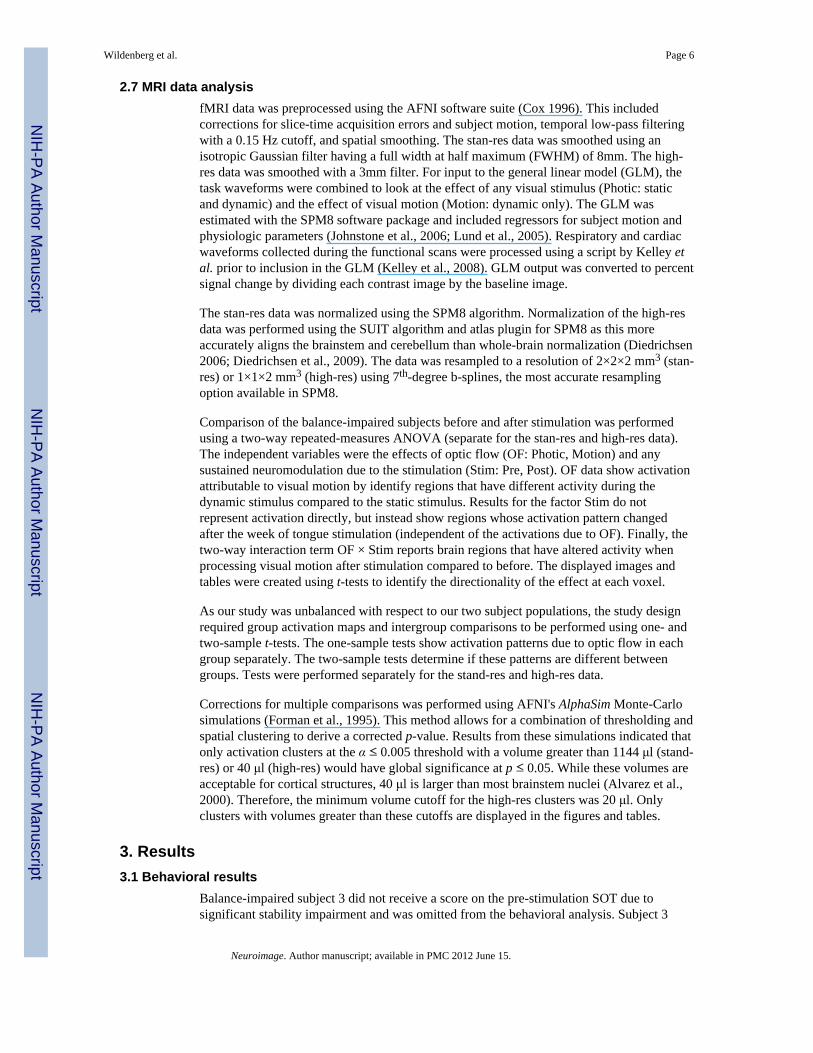
3.2 Stan-res dataANOVA suggests optic flow-related activations (OF) of multiple visual association corticesincluding hMT+/V5 and V3A (Table 1, Figure 3). No significant activation differences wereattributable to the week of CN-NINM stimulation alone (Stim). There was one area ofdecreased optic flow-related activation after CN-NINM (OF × Stim). This cluster is in themiddle of the anterior cingulate cortex bilaterally.
One- and two-sample t-tests showed each group had similar optic flow-induced activationpatterns including the lateral occipital gyrus and superior parietal lobule (Table 2, Figure 4).In addition, control individuals showed a strong bilateral activation of the superiorcolliculus. Both before and after stimulation balance subjects showed lower optic flow-related activity of the occipital poles bilaterally compared to controls.
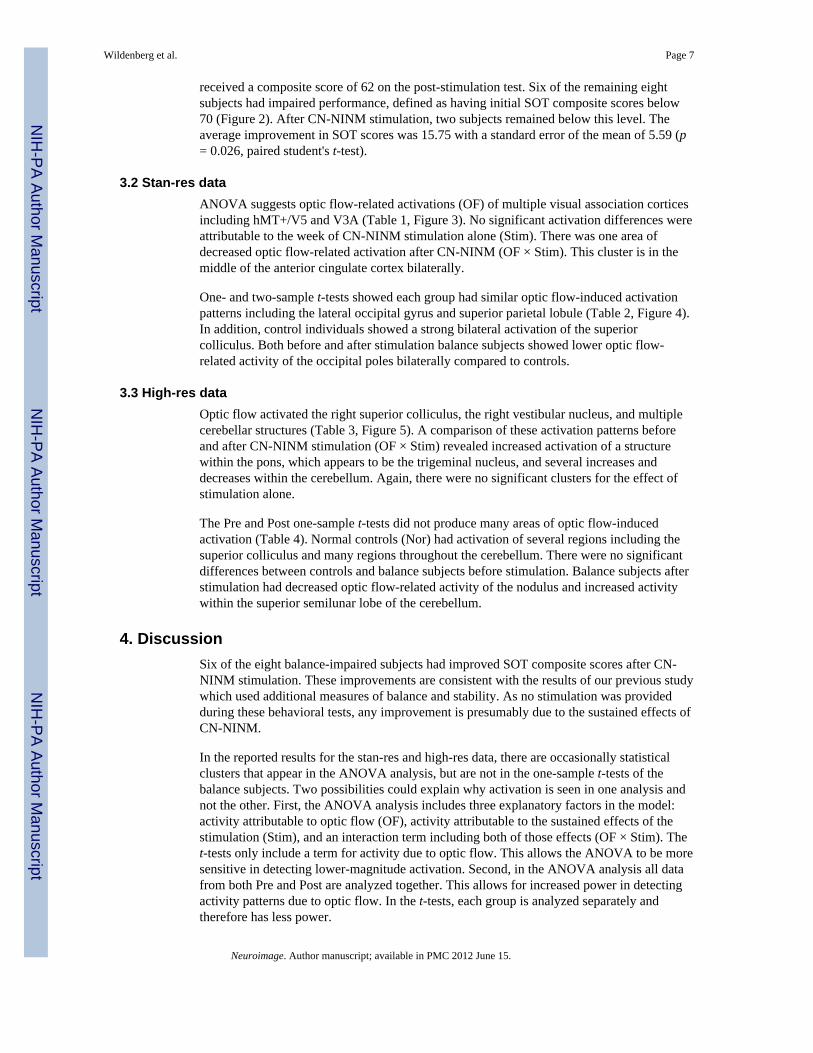
3.3 High-res dataOptic flow activated the right superior colliculus, the right vestibular nucleus, and multiplecerebellar structures (Table 3, Figure 5). A comparison of these activation patterns beforeand after CN-NINM stimulation (OF × Stim) revealed increased activation of a structurewithin the pons, which appears to be the trigeminal nucleus, and several increases anddecreases within the cerebellum. Again, there were no significant clusters for the effect ofstimulation alone.
The Pre and Post one-sample t-tests did not produce many areas of optic flow-inducedactivation (Table 4). Normal controls (Nor) had activation of several regions including thesuperior colliculus and many regions throughout the cerebellum. There were no significantdifferences between controls and balance subjects before stimulation. Balance subjects afterstimulation had decreased optic flow-related activity of the nodulus and increased activitywithin the superior semilunar lobe of the cerebellum.
4. DiscussionSix of the eight balance-impaired subjects had improved SOT composite scores after CN-NINM stimulation. These improvements are consistent with the results of our previous studywhich used additional measures of balance and stability. As no stimulation was providedduring these behavioral tests, any improvement is presumably due to the sustained effects ofCN-NINM.
In the reported results for the stan-res and high-res data, there are occasionally statisticalclusters that appear in the ANOVA analysis, but are not in the one-sample t-tests of thebalance subjects. Two possibilities could explain why activation is seen in one analysis andnot the other. First, the ANOVA analysis includes three explanatory factors in the model:activity attributable to optic flow (OF), activity attributable to the sustained effects of thestimulation (Stim), and an interaction term including both of those effects (OF × Stim). Thet-tests only include a term for activity due to optic flow. This allows the ANOVA to be moresensitive in detecting lower-magnitude activation. Second, in the ANOVA analysis all datafrom both Pre and Post are analyzed together. This allows for increased power in detectingactivity patterns due to optic flow. In the t-tests, each group is analyzed separately andtherefore has less power.
Wildenberg et al. Page 7
Neuroimage. Author manuscript; available in PMC 2012 June 15.
NIH
-PA Author Manuscript
NIH
-PA Author Manuscript
NIH
-PA Author Manuscript

The activation pattern due to optic flow is very similar to that seen in our previous studyusing a similar subject population and identical visual stimuli (Wildenberg et al., 2010).Activated cortical structures include V5/ hMT+ and V3A as well as the cingulate sulcusvisual area (CSv). These activations are consistent with many previous studies investigatingoptic flow using fMRI (Cardin and Smith 2010; Cardin and Smith 2010; Indovina et al.,2005; Kikuchi et al., 2009; Ohlendorf et al., 2008; Slobounov et al., 2006). Two previousstudies suggested that V5/hMT+ is hypersensitive to visual motion in individuals withbalance dysfunction (Dieterich et al., 2007; Wildenberg et al., 2010). Although we did notsee significant differences between balance-impaired individuals and controls in this study,our data suggest that a larger sample size may have reproduced this result.
The high-resolution scans provided a much more precise view of the activations occurringwithin the brainstem and cerebellum. Optic flow activated multiple structures involved inprocessing visual motion information including the right vestibular nucleus and the rightsuperior colliculus (Tables 3 and 4, and Figure 5). Multiple cerebellar structures were alsoactivated, again consistent with activations seen in other fMRI studies utilizing optic flow.
There were no activity differences due to the sustained effects of CN-NINM stimulation(Stim). No clusters reached significance from either the high-res data or the stan-res data.These findings are consistent with our overall hypothesis that CN-NINM modulates activitywithin the balance-processing network, but only when it is actively processing pertinentsensory information. Without being activated by optic flow, there were no overall activitydifferences between the Pre and Post scans.
There were, however, several regions in the balance subjects that showed differences inoptic-flow related activity after CN-NINM stimulation (OF × Stim). Within the cortex, theanterior cingulate area showed decreased optic flow-related activity after the week ofstimulation. Additionally, a structure within the pons that appears to be the right trigeminalnucleus had an increased response to optic flow after CN-NINM. This is the site at whichstimulation from the tongue enters the central nervous system (CNS) and may be the site oforigin for the neuromodulation leading to improvement in behavioral and subjectivemeasures. This result supports our hypothesis that the neuromodulation induced by CN-NINM is task dependent.
The anterior cingulate cortex (ACC) is involved in internal error monitoring and processing,violations of expectancy, and the resolution of discordant cognitive signals (Carter and vanVeen 2007; Holroyd et al., 2004; Oliveira, McDonald, Goodman 2007). For example,Danckert and colleagues found increased activation of the ACC when healthy subjects wereasked to point while wearing prism glasses, leading to errors between their visual and motorsystems (Danckert, Ferber, Goodale 2008). Several other imaging studies using directvestibular stimulation (caloric and galvanic) and visual stimulation have shown activationsof the ACC (Calhoun et al., 2001; Kisely et al., 2002; Miyamoto et al., 2007). We believethe decreased activation of this region after CN-NINM represents the decreased ability ofmotion in the visual field to induce the sensation of ego-motion and therefore a reduction inthe error signal processed by the ACC. This is likely due to a re-weighting of sensory inputsto the balance-processing network (Fetsch et al., 2009; Mahboobin et al., 2005).
The complexity of the cerebellum's functional structure and the intrinsic involvement ofcerebellar networks in movement control and behavior make modulations of cerebellarstructures more difficult to interpret. Other than the vermis and nodulus, which are involvedin processing balance-pertinent stimuli, the exact contributions of many cerebellar nuclei tobalance processing are still unknown (Angelaki et al., 2010). Ptito and colleagues foundincreased stimulation-induced cerebellar activation in blind individuals using PET (Matteau
Wildenberg et al. Page 8
Neuroimage. Author manuscript; available in PMC 2012 June 15.
NIH
-PA Author Manuscript
NIH
-PA Author Manuscript
NIH
-PA Author Manuscript

et al., 2010; Ptito et al., 2005). The different subject populations and tasks prevent a directcomparison of these activations.
Finally, several studies using various techniques have found connections between thetrigeminal nuclei and some components of the balance-processing network. For example,direct bi-directional connections with the vestibular nuclei may facilitate informationtransfer between these adjacent structures (Anker et al., 2003; Buisseret-Delmas et al., 1999;Herrick and Keifer 2000; Marano et al., 2005; Satoh, Ishizuka, Murakami 2009). Fujino etal. have found behavioral evidence for these connections in a study showing improvedpostural stability when subjects clenched their teeth, a movement requiring activation of themotor trigeminal system (Fujino, Takahashi, Ueno 2010). It is known that visual andvestibular information converge within the inferior olive and project to the vestibular nuclei(Barmack 2006; Gerrits, Voogd, Magras 1985). We believe CN-NINM stimulation maystrengthen connections between the trigeminal and vestibular nuclei and sensitize thetrigeminal nuclei to information present within the vestibular system. The increasedresponse of the trigeminal nuclei to optic flow after stimulation may reflect this increasedinformation transfer from the vestibular nuclei, a pathway not utilized in either balance-impaired subjects before stimulation nor healthy individuals (Figure 5). Recent studies,some using a similar tongue stimulation device, have also shown information transferbetween the tongue and hMT+/V5 without using the normal visual-processing pathways,presumably directly through the thalamus. (Bicchi et al., 2008; Fries 1990; Matteau et al.,2010; Ricciardi et al., 2007; Wall, Symonds, Kaas 1982).
The ability for information-free tongue stimulation to produce sustained improvements inobjective and subjective measures of balance is unexpected in the context of recruitmenttheories of plasticity (Collignon et al., 2009; Ptito et al., 2005). The results presented herehint at the potential for electrical stimulation to activate alternate pathways of informationtransfer not normally utilized – in this case between the balance-processing and trigeminalsystems. We postulate that the cortical changes are the result of visual-motion information,now present in the trigeminal nuclei, propagating to the motion-sensitive visual cortices(Matteau et al., 2010). An alternate information pathway could partially explain thebehavioral improvements and decrease in perceived discomfort due to visual motion afterCN-NINM stimulation (Wildenberg et al., 2010). We emphasize that the fMRImeasurements were performed without concurrent tongue stimulation. Any alteredbehavioral or fMRI measurements must therefore be the result of sustained neuroplasticchanges due to CN-NINM.
One potential source of error stemmed from the heterogeneity of our balance-impairedsubjects. Although responses to direct vestibular stimulation differ between central andperipheral vestibular disorders, responses to optic flow, which use the visual system insteadof the vestibular system as input, seems to be similar regardless of the underlying etiology(Dieterich et al., 2007; Dieterich and Brandt 2008; Wildenberg et al., 2010). It is alsopossible that the stimulation sessions taught subjects to clench their tongues to the roof oftheir mouth when performing balance tasks. Such clenching has been shown to improvepostural performance in healthy controls (Fujino, Takahashi, Ueno 2010). While some of theimprovements seen on the behavioral tests could be due to this effect, we do not believe thisexplains the altered neural responses to optic flow as there was no exposure to optic flowduring the stimulation sessions.
This study was limited by the lack of a sham stimulation subject group. The noticeablesensation of electrical stimulation of the tongue makes development of a realistic shamparadigm difficult. The intense visitation requirements would make recruitment of subjects
Wildenberg et al. Page 9
Neuroimage. Author manuscript; available in PMC 2012 June 15.
NIH
-PA Author Manuscript
NIH
-PA Author Manuscript
NIH
-PA Author Manuscript

willing to be randomized to sham stimulation difficult, and a crossover study design was notappropriate for a pilot study.
5. ConclusionThis study utilized high-resolution imaging of the brainstem and cerebellum to preciselylocalize sustained subcortical neuromodulation induced by CN-NINM. A previous studyshowed that an area within the pons had a different response to optic flow after stimulationbut was not able to identify the structure due to the small sizes of the nuclei within thebrainstem (Wildenberg et al., 2010). The results of this study suggest that this region islikely the trigeminal nucleus, the point at which tongue stimulation enters the CNS.Anatomical connections and functional interactions between the adjacent vestibular andtrigeminal nuclei may be strengthened by the stimulation, allowing visual-motioninformation present in the vestibular nuclei to activate the trigeminal. This alternate pathwayfor communication between the visual and vestibular system could partially explain themeasured improvements in postural stability. Future studies that investigate the route bywhich brainstem and cerebellar neuromodulation propagates to the cortex are needed tounderstand how local subcortical changes can yield cortical activity changes and positivebehavioral effects. The ability to non-invasively produce sustained modulation of neuralactivity holds promise as a new route for therapy in individuals with neurologicaldysfunction.
AcknowledgmentsThanks are due to Sterling Johnson for use of the goggle display system and to Laura Hogan for editorial assistance.
Disclosure Joseph Wildenberg was supported by grant numbers T90-DK070079, R90-DK071515, and T32-GM007507 from the National Institutes of Health. Authors Danilov, Kaczmarek, and Tyler have an ownershipinterest in Advanced Neurorehabilitation, LLC, which has intellectual property rights in the field of researchreported in this publication. They also receive support from the University of Wisconsin Foundation - TactileCommunication & Neurorehabilitation Laboratory Fund. Mary Meyerand reported no financial or potentialconflicts of interest Editing was supported by grant 1UL1RR025011 from the Clinical and Translational ScienceAward (CTSA) program of the National Center for Research Resources, National Institutes of Health.
ReferencesAlvarez JC, Diaz C, Suarez C, Fernandez JA, Gonzalez del Rey C, Navarro A, Tolivia J. Aging and
the human vestibular nuclei: Morphometric analysis. Mechanisms of Ageing and Development.2000; 114(3):149–172. [PubMed: 10802120]
Angelaki DE, Yakusheva TA, Green AM, Dickman JD, Blazquez PM. Computation of egomotion inthe macaque cerebellar vermis. Cerebellum (London, England). 2010; 9(2):174–182.
Anker AR, Ali A, Arendt HE, Cass SP, Cotter LA, Jian BJ, Tamrazi B, Yates BJ. Use of electricalvestibular stimulation to alter genioglossal muscle activity in awake cats. Journal of VestibularResearch. 2003; 13(1):1–8. [PubMed: 14646019]
Balaban CD, Thayer JF. Neurological bases for balance-anxiety links. Journal of Anxiety Disorders.2001; 15(1-2):53–79. [PubMed: 11388358]
Barmack NH. Inferior olive and oculomotor system. Progress in Brain Research. 2006; 151:269–291.[PubMed: 16221592]
Bausell, RB.; Li, Y. Power analysis for experimental research: A practical guide for the biological,medical and social sciences. Cambridge University Press; New York: 2002.
Bicchi A, Scilingo EP, Ricciardi E, Pietrini P. Tactile flow explains haptic counterparts of commonvisual illusions. Brain Research Bulletin. 2008; 75(6):737–741. [PubMed: 18394519]
Brandt T, Dieterich M. The vestibular cortex: Its locations, functions, and disorders. Annals of theNew York Academy of Sciences. 1999; 871(1 OTOLITH FUNCTION IN SPATIALORIENTATION AND MOVEMENT):293–312. [PubMed: 10372080]
Wildenberg et al. Page 10
Neuroimage. Author manuscript; available in PMC 2012 June 15.
NIH
-PA Author Manuscript
NIH
-PA Author Manuscript
NIH
-PA Author Manuscript

Brandt T, Huppert T, Hufner K, Zingler VC, Dieterich M, Strupp M. Long-term course and relapses ofvestibular and balance disorders. Restorative Neurology and Neuroscience. 2010; 28(1):69–82.[PubMed: 20086284]
Bronstein AM. Vision and vertigo: Some visual aspects of vestibular disorders. Journal of Neurology.2004; 251(4):381–387. [PubMed: 15083281]
Buisseret-Delmas C, Compoint C, Delfini C, Buisseret P. Organisation of reciprocal connectionsbetween trigeminal and vestibular nuclei in the rat. The Journal of Comparative Neurology. 1999;409(1):153–168. [PubMed: 10363717]
Calhoun VD, Adali T, McGinty VB, Pekar JJ, Watson TD, Pearlson GD. fMRI activation in a visual-perception task: Network of areas detected using the general linear model and independentcomponents analysis. NeuroImage. 2001; 14(5):1080–1088. [PubMed: 11697939]
Cardin V, Smith AT. Sensitivity of human visual and vestibular cortical regions to egomotion-compatible visual stimulation. Cerebral Cortex. 2010; 20(8):1964–1973. [PubMed: 20034998]
Carter CS, van Veen V. Anterior cingulate cortex and conflict detection: An update of theory and data.Cognitive, Affective & Behavioral Neuroscience. 2007; 7(4):367–379.
Chebat DR, Rainville C, Kupers R, Ptito M. Tactile-‘visual’ acuity of the tongue in early blindindividuals. Neuroreport. 2007; 18(18):1901–1904. [PubMed: 18007183]
Collignon O, Voss P, Lassonde M, Lepore F. Cross-modal plasticity for the spatial processing ofsounds in visually deprived subjects. Experimental Brain Research. 2009; 192(3):343–358.
Cox RW. AFNI: Software for analysis and visualization of functional magnetic resonanceneuroimages. Computers and Biomedical Research. 1996; 29(3):162–173. [PubMed: 8812068]
Craig AD. How do you feel? interoception: The sense of the physiological condition of the body.Nature Reviews Neuroscience. 2002; 3(8):655–666.
Danckert J, Ferber S, Goodale MA. Direct effects of prismatic lenses on visuomotor control: An event-related functional MRI study. European Journal of Neuroscience. 2008; 28(8):1696–1704.[PubMed: 18973586]
Danilov Y, Tyler M, Skinner K, Hogle R, Bach-y-Rita P. Efficacy of electrotactile vestibularsubstitution in patients with peripheral and central vestibular loss. Journal of Vestibular Research.2007; 17(2):119–130. [PubMed: 18413905]
Danilov, YP.; Tyler, ME.; Skinner, KL.; Bach-y-Rita, P. Efficacy of electrotactile vestibularsubstitution in patients with bilateral vestibular and central balance loss. Conference Proceedings :…Annual International Conference of the IEEE Engineering in Medicine and BiologySociety.IEEE Engineering in Medicine and Biology Society; 2006. p. 6605-6609.
Diedrichsen J. A spatially unbiased atlas template of the human cerebellum. NeuroImage. 2006; 33(1):127–138. [PubMed: 16904911]
Diedrichsen J, Balsters JH, Flavell J, Cussans E, Ramnani N. A probabilistic MR atlas of the humancerebellum. NeuroImage. 2009; 46(1):39–46. [PubMed: 19457380]
Dieterich M, Bauermann T, Best C, Stoeter P, Schlindwein P. Evidence for cortical visual substitutionof chronic bilateral vestibular failure (an fMRI study). Brain. 2007; 130(8):2108–2116. [PubMed:17575279]
Dieterich M, Brandt T. Functional brain imaging of peripheral and central vestibular disorders. Brain :A Journal of Neurology. 2008; 131(Pt 10):2538–2552. [PubMed: 18515323]
Duvernoy, HM. The human brain stem and cerebellum. Springer-Verlag; New York: 1995.Fetsch CR, Turner AH, DeAngelis GC, Angelaki DE. Dynamic reweighting of visual and vestibular
cues during self-motion perception. Journal of Neuroscience. 2009; 29(49):15601. [PubMed:20007484]
Forman SD, Cohen JD, Fitzgerald M, Eddy WF, Mintun MA, Noll DC. Improved assessment ofsignificant activation in functional magnetic resonance imaging (fMRI): Use of a cluster-sizethreshold. Magnetic Resonance in Medicine. 1995; 33(5):636–647. [PubMed: 7596267]
Fries W. Pontine projection from striate and prestriate visual cortex in the macaque monkey: Ananterograde study. Visual Neuroscience. 1990; 4(3):205–216. [PubMed: 2078502]
Fujino S, Takahashi T, Ueno T. Influence of voluntary teeth clenching on the stabilization of posturalstance disturbed by electrical stimulation of unilateral lower limb. Gait & Posture. 2010; 31(1):122–125. [PubMed: 19879763]
Wildenberg et al. Page 11
Neuroimage. Author manuscript; available in PMC 2012 June 15.
NIH
-PA Author Manuscript
NIH
-PA Author Manuscript
NIH
-PA Author Manuscript
Furman JM. Posturography: Uses and limitations. Bailliere's Clinical Neurology. 1994; 3(3):501–513.Gerrits NM, Voogd J, Magras IN. Vestibular afferents of the inferior olive and the vestibulo-olivo-
cerebellar climbing fiber pathway to the flocculus in the cat. Brain Research. 1985; 332(2):325–336. [PubMed: 3995273]
Herrick JL, Keifer J. Central trigeminal and posterior eighth nerve projections in the turtle< i>chrysemys picta</i> studied in vitro. Brain, Behavior and Evolution. 2000; 51(4):183–201.
Holroyd CB, Nieuwenhuis S, Yeung N, Nystrom L, Mars RB, Coles MGH, Cohen JD. Dorsal anteriorcingulate cortex shows fMRI response to internal and external error signals. Nature Neuroscience.2004; 7:497–498.
Indovina I, Maffei V, Bosco G, Zago M, Macaluso E, Lacquaniti F. Representation of visualgravitational motion in the human vestibular cortex. Science. 2005; 308(5720):416–419. [PubMed:15831760]
Jacob RG, Redfern MS, Furman JM. Optic flow-induced sway in anxiety disorders associated withspace and motion discomfort. Journal of Anxiety Disorders. 1995; 9(5):411–425.
Johnstone T, Ores Walsh KS, Greischar LL, Alexander AL, Fox AS, Davidson RJ, Oakes TR. Motioncorrection and the use of motion covariates in multiple-subject fMRI analysis. Human BrainMapping. 2006; 27(10):779–788. [PubMed: 16456818]
Kelley DJ, Oakes TR, Greischar LL, Chung MK, Ollinger JM, Greene E. Automatic physiologicalwaveform processing for fMRI noise correction and analysis. PLoS ONE. 2008; 3(3):e1751.[PubMed: 18347739]
Kelly JW, Loomis JM, Beall AC. The importance of perceived relative motion in the control ofposture. Experimental Brain Research.Experimentelle Hirnforschung.Experimentation Cerebrale.2005; 161(3):285–292. [PubMed: 15502985]
Kikuchi M, Naito Y, Senda M, Okada T, Shinohara S, Fujiwara K, Hori SY, Tona Y, Yamazaki H.Cortical activation during optokinetic stimulation - an fMRI study. Acta Oto-Laryngologica. 2009;129(4):440–443. [PubMed: 19116795]
Kisely M, Emri M, Lengyel Z, Kalvin B, Horvath G, Tron L, Miko L, Sziklai I, Toth A. Changes inbrain activation caused by caloric stimulation in the case of cochleovestibular denervation-PETstudy. Nuclear Medicine Communications. 2002; 23(10):967–973. [PubMed: 12352595]
Lund TE, Nørgaard MD, Rostrup E, Rowe JB, Paulson OB. Motion or activity: Their role in intra-andinter-subject variation in fMRI. NeuroImage. 2005; 26(3):960–964. [PubMed: 15955506]
Mahboobin A, Loughlin PJ, Redfern MS, Sparto PJ. Sensory re-weighting in human postural controlduring moving-scene perturbations. Experimental Brain Research Experimentelle HirnforschungExperimentation Cerebrale. 2005; 167(2):260–267. [PubMed: 16025292]
Marano E, Marcelli V, Stasio ED, Bonuso S, Vacca G, Manganelli F, Marciano E, Perretti A.Trigeminal stimulation elicits a peripheral vestibular imbalance in migraine patients. Headache theJournal of Head and Face Pain. 2005; 45(4):325–331.
Matteau I, Kupers R, Ricciardi E, Pietrini P, Ptito M. Beyond visual, aural and haptic movementperception: HMT+ is activated by electrotactile motion stimulation of the tongue in sighted and incongenitally blind individuals. Brain Research Bulletin. 2010; 82:264–270. [PubMed: 20466041]
Mergner T, Schweigart G, Maurer C, Blümle A. Human postural responses to motion of real andvirtual visual environments under different support base conditions. Experimental Brain Research.2005; 167(4):535–556.
Mirka A, Black FO. Clinical application of dynamic posturography for evaluating sensory integrationand vestibular dysfunction. Neurologic Clinics. 1990; 8(2):351–359. [PubMed: 2193216]
Miyamoto T, Fukushima K, Takada T, de Waele C, Vidal PP. Saccular stimulation of the humancortex: A functional magnetic resonance imaging study. Neuroscience Letters. 2007; 423(1):68–72. [PubMed: 17662530]
O'Connor KW, Loughlin PJ, Redfern MS, Sparto PJ. Postural adaptations to repeated optic flowstimulation in older adults. Gait & Posture. 2008; 28(3):385–391. [PubMed: 18329878]
Ohlendorf S, Sprenger A, Speck O, Haller S, Kimmig H. Optic flow stimuli in and near the visual fieldcentre: A group fMRI study of motion sensitive regions. PLoS ONE. 2008; 3(12):e4043.[PubMed: 19112507]
Wildenberg et al. Page 12
Neuroimage. Author manuscript; available in PMC 2012 June 15.
NIH
-PA Author Manuscript
NIH
-PA Author Manuscript
NIH
-PA Author Manuscript

Oliveira FTP, McDonald JJ, Goodman D. Performance monitoring in the anterior cingulate is not allerror related: Expectancy deviation and the representation of action-outcome associations. Journalof Cognitive Neuroscience. 2007; 19(12):1994–2004. [PubMed: 17892382]
Palmisano S, Pinniger GJ, Ash A, Steele JR. Effects of simulated viewpoint jitter on visually inducedpostural sway. Perception. 2009; 38(3):442–453. [PubMed: 19485137]
Pietrini, P.; Ptito, M.; Kupers, R. Blindness and consciousness: New light from the dark. In: Laureys,S.; Tononi, G., editors. The Neurology of Consciousness. 1st. Academic Press; 2009. p. 360-374.
Poirier C, De Volder AG, Scheiber C. What neuroimaging tells us about sensory substitution.Neuroscience and Biobehavioral Reviews. 2007; 31(7):1064–1070. [PubMed: 17688948]
Ptito M, Moesgaard SM, Gjedde A, Kupers R. Cross-modal plasticity revealed by electrotactilestimulation of the tongue in the congenitally blind. Brain. 2005; 128(3):606. [PubMed: 15634727]
Redfern MS, Furman JM. Postural sway of patients with vestibular disorders during optic flow.Journal of Vestibular Research : Equilibrium & Orientation. 1994; 4(3):221–230.
Ricciardi E, Vanello N, Sani L, Gentili C, Scilingo EP, Landini L, Guazzelli M, Bicchi A, Haxby JV,Pietrini P. The effect of visual experience on the development of functional architecture in hMT+Cerebral Cortex (New York, NY:1991). 2007; 17(12):2933–2939.
Robinson BS, Cook JL, Richburg CMC, Price SE. Use of an electrotactile vestibular substitutionsystem to facilitate balance and gait of an individual with gentamicin-induced bilateral vestibularhypofunction and bilateral transtibial amputation. Journal of Neurologic Physical Therapy. 2009;33(3):150–159. [PubMed: 19809394]
Rosner, B. Fundamentals of biostatistics. Thomson Brooks/Cole; Belmont, CA: 2006.Satoh Y, Ishizuka KI, Murakami T. Modulation of the masseteric monosynaptic reflex by stimulation
of the vestibular nuclear complex in rats. Neuroscience Letters. 2009; 466(1):16–20. [PubMed:19781598]
Slobounov S, Wu T, Hallett M, Shibasaki H, Slobounov E, Newell K. Neural underpinning of posturalresponses to visual field motion. Biological Psychology. 2006; 72(2):188–197. [PubMed:16338048]
Tracey I, Iannetti GD. Brainstem functional imaging in humans. Supplements to ClinicalNeurophysiology. 2006; 58:52–67. [PubMed: 16623322]
Tyler M, Danilov Y, Bach-Y-Rita P. Closing an open-loop control system: Vestibular substitutionthrough the tongue. Journal of Integrative Neuroscience. 2003; 2(2):159–164. [PubMed:15011268]
Visser JE, Carpenter MG, van der Kooij H, Bloem BR. The clinical utility of posturography. ClinicalNeurophysiology : Official Journal of the International Federation of Clinical Neurophysiology.2008; 119(11):2424–2436. [PubMed: 18789756]
Vuillerme N, Cuisinier R. Sensory supplementation through tongue electrotactile stimulation topreserve head stabilization in space in the absence of vision. Investigative Ophthalmology &Visual Science. 2009; 50(1):476–481. [PubMed: 18708618]
Vuillerme N, Pinsault N, Fleury A, Chenu O, Demongeot J, Payan Y, Pavan P. Effectiveness of anelectro-tactile vestibular substitution system in improving upright postural control in unilateralvestibular-defective patients. Gait & Posture. 2008; 28(4):711–715. [PubMed: 18632272]
Wall JT, Symonds LL, Kaas JH. Cortical and subcortical projections of the middle temporal area (MT)and adjacent cortex in galagos. The Journal of Comparative Neurology. 1982; 211(2):193–214.[PubMed: 7174890]
Weibull A, Gustavsson H, Mattsson S, Svensson J. Investigation of spatial resolution, partial volumeeffects and smoothing in functional MRI using artificial 3D time series. NeuroImage. 2008; 41(2):346–353. [PubMed: 18400520]
Wildenberg JC, Tyler ME, Danilov YP, Kaczmarek KA, Meyerand ME. Sustained cortical andsubcortical neuromodulation induced by electrical tongue stimulation. Brain Imaging andBehavior. 2010; 4(3-4):199–211. [PubMed: 20614202]
Wildenberg et al. Page 13
Neuroimage. Author manuscript; available in PMC 2012 June 15.
NIH
-PA Author Manuscript
NIH
-PA Author Manuscript
NIH
-PA Author Manuscript

Figure 1.A comparison of standard-resolution (A-C) and high-resolution functional MR imaging (D-F). A,D) Slice locations. B,E) Raw T2*-BOLD images. C,F) Single-subject activation of thesuperior colliculus in response to optic flow. The large voxels of the standard-resolutionimage are larger than the nuclei themselves. The voxels of the high-resolution image aremuch smaller than individual nuclei.
Wildenberg et al. Page 14
Neuroimage. Author manuscript; available in PMC 2012 June 15.
NIH
-PA Author Manuscript
NIH
-PA Author Manuscript
NIH
-PA Author Manuscript

Figure 2.Scores from the sensory organization tests (SOTs) before and after CN-NINM stimulation.The dashed line shows the cutoff for impairment as defined by the test. One subject was notable to complete the pre-stimulation testing and is therefore not included. Pre – balancesubjects before stimulation. Post – balance-impaired subjects after stimulation.
Wildenberg et al. Page 15
Neuroimage. Author manuscript; available in PMC 2012 June 15.
NIH
-PA Author Manuscript
NIH
-PA Author Manuscript
NIH
-PA Author Manuscript

Figure 3.Significant clusters in the stan-res data from the two-way ANOVA. This analysis comparedbalance-impaired subjects before stimulation (Pre) to after stimulation (Post). OF showsactivity attributable to the effects of optic flow while OF × Stim indicates regions whereoptic flow-related processing changed after stimulation. No clusters reached significance forthe effect of stimulation alone (Stim). Images are thresholded at α ≤ 0.005. Only clusterswith a volume greater than 1144 μl are displayed. All Z values are in MNI coordinates.
Wildenberg et al. Page 16
Neuroimage. Author manuscript; available in PMC 2012 June 15.
NIH
-PA Author Manuscript
NIH
-PA Author Manuscript
NIH
-PA Author Manuscript

Figure 4.Significant clusters from the one- and two-sample t-tests showing the effect of optic flow.The first three columns show activity due to optic flow in each group separately while thelast two columns show intergroup comparisons (Pre>Nor shows differences betweenbalance-impaired subjects before stimulation to healthy controls, Post>Nor showsdifferences between balance-impaired subjects after stimulation to healthy controls). Imagesare thresholded at α ≤ 0.005. Only clusters with a volume greater than 1144 μl are displayed.All Z values are in MNI coordinates.
Wildenberg et al. Page 17
Neuroimage. Author manuscript; available in PMC 2012 June 15.
NIH
-PA Author Manuscript
NIH
-PA Author Manuscript
NIH
-PA Author Manuscript
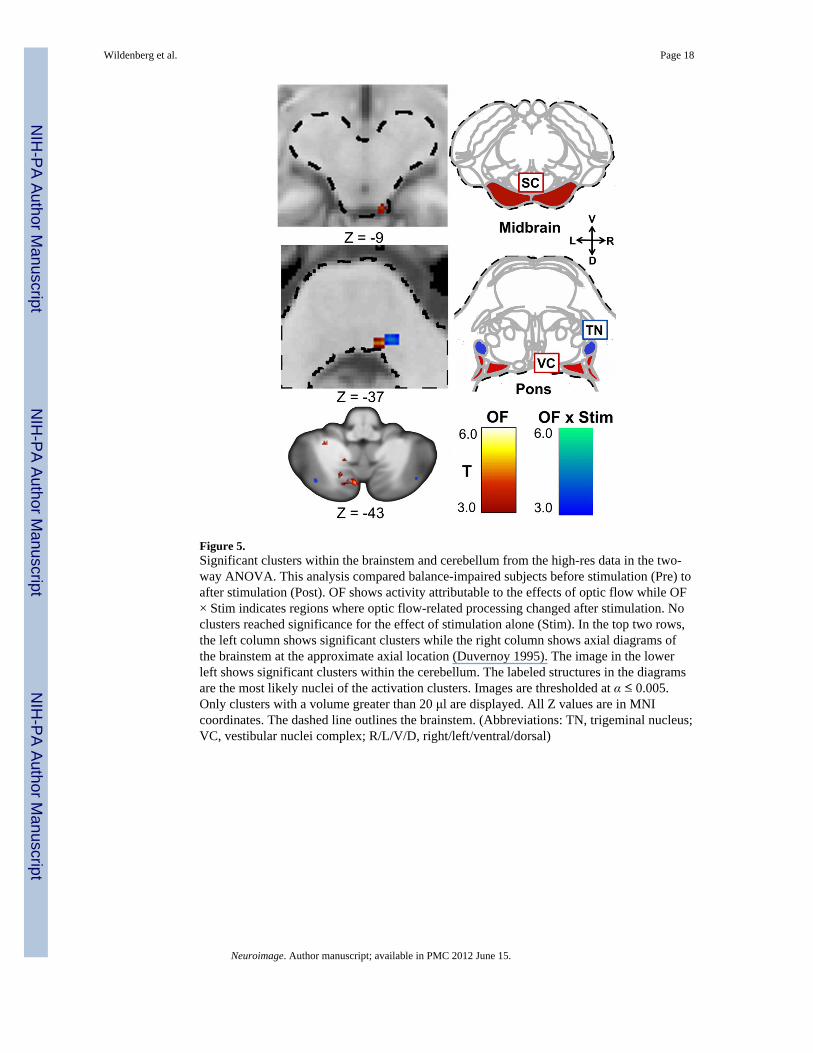
Figure 5.Significant clusters within the brainstem and cerebellum from the high-res data in the two-way ANOVA. This analysis compared balance-impaired subjects before stimulation (Pre) toafter stimulation (Post). OF shows activity attributable to the effects of optic flow while OF× Stim indicates regions where optic flow-related processing changed after stimulation. Noclusters reached significance for the effect of stimulation alone (Stim). In the top two rows,the left column shows significant clusters while the right column shows axial diagrams ofthe brainstem at the approximate axial location (Duvernoy 1995). The image in the lowerleft shows significant clusters within the cerebellum. The labeled structures in the diagramsare the most likely nuclei of the activation clusters. Images are thresholded at α ≤ 0.005.Only clusters with a volume greater than 20 μl are displayed. All Z values are in MNIcoordinates. The dashed line outlines the brainstem. (Abbreviations: TN, trigeminal nucleus;VC, vestibular nuclei complex; R/L/V/D, right/left/ventral/dorsal)
Wildenberg et al. Page 18
Neuroimage. Author manuscript; available in PMC 2012 June 15.
NIH
-PA Author Manuscript
NIH
-PA Author Manuscript
NIH
-PA Author Manuscript

NIH
-PA Author Manuscript
NIH
-PA Author Manuscript
NIH
-PA Author Manuscript
Wildenberg et al. Page 19
Tabl
e 1
Loca
tions
and
vol
umes
of t
he a
ctiv
atio
n cl
uste
rs fr
om th
e tw
o-w
ay A
NO
VA
of t
he st
an-r
es d
ata.
Opt
ic fl
ow a
ctiv
ated
seve
ral r
egio
ns k
now
n to
be
invo
lved
in p
roce
ssin
g vi
sual
-mot
ion
incl
udin
g th
e vi
sual
ass
ocia
tion
corti
ces.
This
ana
lysi
s com
pare
d ba
lanc
e-im
paire
d su
bjec
ts b
efor
e st
imul
atio
n (P
re)
to a
fter s
timul
atio
n (P
ost).
OF
show
s act
ivity
attr
ibut
able
to th
e ef
fect
s of o
ptic
flow
whi
le O
F ×
Stim
indi
cate
s reg
ions
whe
re o
ptic
flow
-rel
ated
proc
essi
ng c
hang
ed a
fter s
timul
atio
n. N
o cl
uste
rs re
ache
d si
gnifi
canc
e fo
r the
eff
ect o
f stim
ulat
ion
alon
e (S
tim) t
here
fore
that
col
umn
is o
mitt
ed. O
nly
clus
ters
with
vol
ume
grea
ter t
han
1144
mic
rolit
ers a
re in
clud
ed. C
oord
inat
es a
re th
e ce
nter
of m
ass i
n M
NI s
pace
. (A
bbre
viat
ions
: CSv
: Cin
gula
te su
lcus
visu
al a
rea;
R/L
/M: r
ight
/left/
mid
line,
#: d
ecre
ased
act
ivat
ion)
Reg
ion
R/L
OF
OF
× St
im
Coo
rdin
ates
Vol
.C
oord
inat
esV
ol.
Stan
dard
Res
olut
ion
Late
ral O
ccip
ital G
yrus
R(4
0,-7
1,5)
24,6
96
L(-
45,-7
2,7)
17,3
52
Supe
rior P
arie
tal L
obul
eR
(22,
-84,
35)
6,72
0
L(-
15,-8
5,35
)6,
700
Post
-Cen
tral G
yrus
R(2
2,-5
2,63
)3,
472
L(-
27,-5
3,62
)4,
296
CSv
R(1
3,-2
2,44
)1,
960
L(-
10,-2
2,44
)1,
824
Faci
al G
yrus
R(2
1,-6
2,-9
)2,
200
L(-
19,-6
9,-6
)1,
856
Ant
erio
r Cin
gula
teM
(2,8
,30)
#1,
800
Neuroimage. Author manuscript; available in PMC 2012 June 15.

NIH
-PA Author Manuscript
NIH
-PA Author Manuscript
NIH
-PA Author Manuscript
Wildenberg et al. Page 20
Tabl
e 2
Loca
tions
and
vol
umes
of t
he a
ctiv
atio
n cl
uste
rs fr
om o
ne- a
nd tw
o-sa
mpl
e t-t
ests
of t
he st
an-r
es d
ata.
In e
ach
grou
p, o
ptic
flow
act
ivat
ed se
vera
l vis
ual
asso
ciat
ion
corti
ces.
Nor
mal
con
trols
had
gre
ater
act
ivity
of V
1 th
an th
e ba
lanc
e su
bjec
ts b
oth
befo
re a
nd a
fter s
timul
atio
n. T
he fi
rst t
hree
col
umns
show
activ
ity d
ue to
opt
ic fl
ow in
eac
h gr
oup
sepa
rate
ly w
hile
the
last
two
colu
mns
show
inte
rgro
up c
ompa
rison
s (Pr
e>N
or sh
ows d
iffer
ence
s bet
wee
n ba
lanc
e-im
paire
d su
bjec
ts b
efor
e st
imul
atio
n to
hea
lthy
cont
rols
, Pos
t>N
or sh
ows d
iffer
ence
s bet
wee
n ba
lanc
e-im
paire
d su
bjec
ts a
fter s
timul
atio
n to
hea
lthy
cont
rols
). O
nly
clus
ters
with
vol
ume
grea
ter t
han
1144
mic
rolit
ers a
re in
clud
ed. C
oord
inat
es a
re th
e ce
nter
of m
ass i
n M
NI s
pace
. (A
bbre
viat
ions
: L,
late
ral;
S/I,
supe
rior/i
nfer
ior;
SPL,
supe
rior p
arie
tal l
obul
e; R
/L/B
, rig
ht/le
ft/bi
late
ral,
#, d
ecre
ased
act
ivat
ion)
Reg
ion
R/L
Pre
Post
Nor
Pre>
Nor
Post
>Nor
Coo
rdin
ates
Vol
.C
oord
inat
esV
ol.
Coo
rdin
ates
Vol
.C
oord
inat
esV
ol.
Coo
rdin
ates
Vol
.
Stan
dard
Res
olut
ion
L. O
ccip
ital G
yrus
R(4
2,-7
8,1)
7,93
6(3
7,-8
3,-5
)5,
960
(48,
-64,
0)8,
072
L(-
46,-7
5,1)
3,00
0(-
46,-7
6,6)
11,5
70
SPL
R(2
4,-8
8,34
)8,
848
(19,
-83,
39)
1,88
0(2
2,-7
5,38
)2,
728
L(-
10,-8
8,34
)9,
936
Post
-Cen
tral G
yrus
L(-
26,-5
8,64
)1,
504
(-27
,-54,
64)
1,20
8
Ang
ular
Gyr
usR
(51,
-42,
6)1,
224
(60,
-38,
19)
1,19
2
Faci
al G
yrus
R(2
6,-6
1,-1
4)3,
520
L(-
19,-6
7,-1
0)2,
704
Cun
eus
R(2
8,-9
3,-1
)6,
088
(25,
-94,
2)#
1,52
8(2
5,-9
8,4)
#1,
504
L(-
30,-9
1,-3
)4,
958
(-22
,-99,
1)#
1,24
8(-
24,-9
8,0)
#2,
424
Supe
rior C
ollic
ulus
B(-
1,-3
5,-1
6)3,
904
I. Se
milu
nar L
obul
eB
(5,-6
2,-4
5)5,
416
Neuroimage. Author manuscript; available in PMC 2012 June 15.

NIH
-PA Author Manuscript
NIH
-PA Author Manuscript
NIH
-PA Author Manuscript
Wildenberg et al. Page 21
Tabl
e 3
Loca
tions
and
vol
umes
of t
he a
ctiv
atio
n cl
uste
rs fr
om th
e tw
o-w
ay A
NO
VA
of t
he h
igh-
res d
ata.
Opt
ic fl
ow a
ctiv
ated
the
supe
rior c
ollic
ulus
and
the
vest
ibul
ar n
ucle
i as w
ell a
s sev
eral
regi
ons i
n th
e ce
rebe
llum
. The
trig
emin
al n
ucle
us sh
owed
incr
ease
d ac
tivity
in re
spon
se to
opt
ic fl
ow a
fter s
timul
atio
nco
mpa
red
to b
efor
e. T
his a
naly
sis c
ompa
red
bala
nce-
impa
ired
subj
ects
bef
ore
stim
ulat
ion
(Pre
) to
afte
r stim
ulat
ion
(Pos
t). O
F sh
ows a
ctiv
ity a
ttrib
utab
leto
the
effe
cts o
f opt
ic fl
ow w
hile
OF
× St
im in
dica
tes r
egio
ns w
here
opt
ic fl
ow-r
elat
ed p
roce
ssin
g ch
ange
d af
ter s
timul
atio
n. N
o cl
uste
rs re
ache
dsi
gnifi
canc
e fo
r the
eff
ect o
f stim
ulat
ion
alon
e (S
tim) t
here
fore
that
col
umn
is o
mitt
ed. O
nly
clus
ters
with
a v
olum
e gr
eate
r tha
n 20
mic
rolit
ers a
rein
clud
ed. C
oord
inat
es a
re th
e ce
nter
of m
ass i
n M
NI s
pace
. (A
bbre
viat
ions
: S/I,
supe
rior/i
nfer
ior;
R/L
/M, r
ight
/left/
mid
line,
#, d
ecre
ased
act
ivat
ion)
Reg
ion
R/L
OF
OF
× St
im
Coo
rdin
ates
Vol
.C
oord
inat
esV
ol.
Hig
h Re
solu
tion
Trig
emin
al N
ucle
usR
(12,
-34,
-38)
62
Ves
tibul
ar C
ompl
exR
(9,-3
5,-3
7)20
Supe
rior C
ollic
ulus
R(1
0,-3
4,-1
3)10
6
Pont
ine
Whi
te M
atte
rR
(2,-3
1,-3
2)20
L(-
2,-2
1,-3
0)32
Med
ial L
emni
scus
L(-
9,-3
2,-2
7)20
Cen
tral L
obul
eR
(9,-4
9,-1
8)20
S. S
emilu
nar L
obul
eR
(48,
-70,
-39)
20
L(-
41,-6
7,-3
9)34
Qua
dran
gula
r Lob
eL
(-21
,-66,
-28)
26
R(3
0,-5
9,-2
4)38
L(-
19,-6
0,-2
8)#
24
Dec
live
M(1
,-72,
-28)
52
Dee
p C
ereb
ella
r Nuc
lei
R(9
,-56,
-28)
36
Pyra
mid
of V
erm
isL
(-6,
-68,
-36)
78
I. Se
milu
nar L
oblu
eR
(40,
-72,
-47)
74
L(-
16,-6
9,-4
5)58
(-23
,-76,
-47)
64
L(-
7,-8
1,-4
7)34
(-34
,-73,
-42)
88
L(-
17,-7
6,-5
0)24
(-35
,-69,
-48)
28
L(-
7,-7
6,-4
0)33
6
Biv
ente
r Lob
eL
(-13
,-60,
-46)
40
L(-
27,-4
7,-4
3)38
Neuroimage. Author manuscript; available in PMC 2012 June 15.

NIH
-PA Author Manuscript
NIH
-PA Author Manuscript
NIH
-PA Author Manuscript
Wildenberg et al. Page 22
Tabl
e 4
Loca
tions
and
vol
umes
of t
he a
ctiv
atio
n cl
uste
rs fr
om o
ne- a
nd tw
o-sa
mpl
e t-t
ests
of t
he h
igh-
res d
ata.
The
larg
e nu
mbe
r of a
ctiv
atio
n cl
uste
rs d
etec
ted
by th
is a
naly
sis l
ikel
y re
flect
s gre
ater
con
sist
ency
in su
bcor
tical
act
ivat
ion
in th
e no
rmal
gro
up c
ompa
red
to th
e ba
lanc
e su
bjec
ts. T
he fi
rst t
hree
col
umns
show
act
ivity
due
to o
ptic
flow
in e
ach
grou
p se
para
tely
whi
le th
e la
st c
olum
n sh
ows d
iffer
ence
s bet
wee
n ba
lanc
e-im
paire
d su
bjec
ts a
fter s
timul
atio
n to
heal
thy
cont
rols
(Pos
t>N
or).
The
com
paris
on o
f bal
ance
-impa
ired
subj
ects
bef
ore
CN
-NIN
M (P
re) t
o he
alth
y co
ntro
ls (N
or) d
id n
ot p
rodu
ce a
nysi
gnifi
cant
act
ivat
ion
clus
ters
ther
efor
e th
at c
olum
n is
om
itted
. Onl
y cl
uste
rs w
ith v
olum
e gr
eate
r tha
n 20
mic
rolit
ers a
re in
clud
ed. C
oord
inat
es a
re th
ece
nter
of m
ass i
n M
NI s
pace
. (A
bbre
viat
ions
: S/I,
supe
rior/i
nfer
ior;
R/L
/M, r
ight
/left/
mid
line,
#, d
ecre
ased
act
ivat
ion)
Reg
ion
R/L
Pre
Post
Nor
Post
>Nor
Coo
rdin
ates
Vol
. (μl
)C
oord
inat
esV
ol. (μl
)C
oord
inat
esV
ol. (μl
)C
oord
inat
esV
ol. (μl
)
Hig
h Re
solu
tion
Supe
rior C
ollic
ulus
R(9
,-36,
-6)
92
L(-
6,-3
4,6)
34
Qua
dran
gula
r Lob
eR
(11,
-71,
-19)
94
L(-
5,-7
3,-1
9)13
0
L(-
24,-6
6,-2
0)28
Sim
ple
Lobu
leR
(33,
-54,
-30)
28
R(1
4,-6
7,-2
7)26
R(1
4,-6
4,-2
6)24
Nod
ulus
M(2
,-59,
-35)
42(3
,-60,
-35)
#22
Cul
men
M(3
,-70,
-31)
146
S. S
emilu
nar L
obul
eL
(-35
,-69,
-41)
34
I. Se
milu
nar L
obul
eL
(-6,
-73,
-43)
26(-
5,-7
3,-4
0)20
8
Pyra
mid
of V
erm
isM
(-2,
-63,
-43)
24
Tons
ilR
(6,-5
6,-4
3)24
Uvu
laM
(2,-5
1,-4
3)20
Den
tate
Nuc
leus
L(-
12,-5
7,-3
5)#
22
Biv
ente
r Lob
eR
(14,
-54,
-49)
40
L(-
18,-5
6,-4
7)22
(-12
,-60,
-53)
92
Neuroimage. Author manuscript; available in PMC 2012 June 15.
Copyright © 2022 FDOKUMEN