
Database of Philippine Exporters (as of 13 Sept. 2018) - DTI ...

CHAPTER TEN
Diffusion Tensor Imaging andNeuromodulation: DTI as KeyTechnology for Deep BrainStimulationVolker Arnd Coenen*,†,1, Thomas E. Schlaepfer‡,}, Niels Allert},Burkhard Mädler**Division of Stereotaxy and Functional Neurosurgery, Department of Neurosurgery, BonnUniversity MedicalCenter, Bonn, Germany†German Center for Neurodegenerative Diseases (DZNE), Bonn University Medical Center, Bonn, Germany‡Department of Psychiatry and Neurological Rehab Center “Godeshohe” Psychotherapy, Bonn UniversityMedical Center, Bonn, Germany}Departments of Psychiatry and Mental Health, The Johns Hopkins University, Baltimore, Maryland, USA}Neurological Rehab Godeshohe, Bonn, Germany1Corresponding author: e-mail address: [email protected]
Contents
1.
InternISSNhttp:/
Overview
ational Review of Neurobiology, Volume 107 # 2012 Elsevier Inc.0074-7742 All rights reserved./dx.doi.org/10.1016/B978-0-12-404706-8.00011-5
208
2. Diffusion Weighted and Diffusion Tensor Magnetic Resonance Imaging 211 3. Fiber Tractography 214 4. Deterministic and Probabilistic Fiber Tracking 215 5. Accuracy of Diffusion Tensor Imaging Fibertracking and Its Use in Neurosurgery 217 6. Electric Field Simulation 218 7. Applications 2197.1
Identification of “true” target structures 219 7.2 Tremor and the dentatorubrothalamic tract 2208.
Development of a New Target Region Utilizing the DTI Technique: A New DBSTarget to Treat Major Depression 2229.
DTI FT and the Concept of Network Balances 225 10. Summary 227 Acknowledgments 229 References 229Abstract
Diffusion tensor imaging (DTI) is more than just a useful adjunct to invasive techniqueslike optogenetics which recently have tremendously influenced our understanding ofthe mechanisms of deep brain stimulation (DBS). In combination with other technolo-gies, DTI helps us to understand which parts of the brain tissue are connected to others
207

208 Volker Arnd Coenen et al.
and which ones are truly influenced with neuromodulation. The complex interaction ofDBS with the surrounding tissues—scrutinized with DTI—allows to create testablehypotheses that can explain network interactions. Those interactions are vital for ourunderstanding of the net effects of neuromodulation. This work naturally was first donein the field of movement disorder surgery, where a lot of experience regarding therapeu-tic effects and only a short latency between initiation of neuromodulation and alleviationof symptoms exist. This chapter shows the journey over the past 10 years with firstapplications in DBS toward current research in affect regulating network balances andtheir therapeutic alterations with the neuromodulation technology.
Until the middle of the present century anatomists relied principally on fourmethods for demonstrating connections of the brain. Identified, respectively, withthe names of Gudden, Golgi, Marchi, and Nissl [. . .].
Paul MacLean 1989, The triune brain in evolution - Role in paleocerebral functions.
1. OVERVIEW
With the development of a new and sophisticated neuroscientific
method, namely, optogenetics (Deisseroth, 2012; Gradinaru, Mogri,
Thompson, Henderson, & Deisseroth, 2009; Lobo, Nestler, &
Covington, 2012), our understanding of the mechanisms underlying the
function of the brain has tremendously increased. The same increase of
insight holds true for the application of the same technique to understand
the mechanisms of altering brain function with the deep brain stimulation
(DBS) technology (Gradinaru et al., 2009) that is predominantly applied
therapeutically for chronic illnesses in the field of movement disorders
(Parkinson’s disease, dystonias, tremor) and has been used regularly for
almost 20 years (Benabid, Benazzous, & Pollak, 2002; Benabid, Deuschl,
Lang, Lyons, & Rezai, 2006). Only, recently, DBS has been approved in
Europe for the use in partial onset epilepsy (Fisher et al., 2010). As
landmark research in optogenetics has been performed also in the field of
DBS, we have now further confirmation about the mechanisms of its
action: Other than believed before DBS does not only create a functional
lesion through the proved mechanism of a depolarization block. The
mechanisms of DBS are complex, and the functional inactivation of the
target by this mechanism has been clearly demonstrated. It may,
however, not be the main mechanism of DBS under some circumstances
(Benabid et al., 2002). DBS increases the activity in axonal structures that
are reached with chronic high-frequency stimulation, and probably via
this mechanism has a larger impact on the network sum effects than the
209Diffusion Tensor Imaging and Deep Brain Stimulation
depolarization block as has been elegantly proved with optogenetics
(Gradinaru et al., 2009). The truth, however, likely is much more
complicated and the epiphenomena resulting from this activation are
complex and hard to understand. Diffusion tensor imaging (DTI)—which
in conjunction with the DBS technique is the topic of this chapter—is
more than just a useful adjunct to the developing invasive techniques. Its
totally noninvasive approach allows—in combination with other
technologies like electric field simulation (Butson, Cooper, Henderson, &
McIntyre, 2007; Butson & McIntyre, 2005; Madler & Coenen, 2012;
McIntyre & Grill, 2002; McIntyre, Mori, Sherman, Thakor, & Vitek,
2004)—to understand which parts of the individual’s brain tissue are truly
influenced with DBS. In turn, the complex interaction of DBS with
the surrounding tissues that are scrutinized with DTI in the living human
brain allows to create testable hypotheses that explain network
interactions which are vital in our understanding of the net effects of
neuromodulation. Naturally, this work had first to be done in the field of
movement disorders, where there is a lot of therapeutic experience and
only a short latency between the start of neuromodulation and alleviation
of a symptom (e.g., tremor) or the elicitation of a side effect (e.g.,
capsular effect) (Coenen, Allert, & Madler, 2011; Coenen et al., 2009;
Coenen, Madler, Schiffbauer, Urbach, & Allert, 2011). With this
experience, the identification of a neuroanatomical structure and the
allocation of a (side-) effect are much clearer than in the field of
psychiatric research where most stimulation results have to be dug out
under the dust of a patient’s individual and often distracting personality
with help of standardized neuropsychological test batteries. The rise of
new and often experimental applications in the psychiatric field
(depression, OCD, Gilles de la Tourette syndrom) mandate an
understanding of emotional networks and the identification of neuralgic
intervention points that will in the future help DBS to unfold a better
efficacy (better effects, less energy used) than at today’s target regions
(Coenen, Schlaepfer, Maedler, & Panksepp, 2010). With the results from
the movement disorder research in mind, one can now extrapolate to
even more complex interactions in emotional networks where effects of
DBS have traditionally been seen from weeks to months after initiation of
high-frequency stimulation (Lozano et al., 2008; Mayberg et al., 2005;
Neimat et al., 2008; Schlaepfer & Lieb, 2005). In a way, we and other
groups (Barkhoudarian et al., 2010; Henderson, 2012) have gaged these
instruments by testing them in the movement disorders before applying
210 Volker Arnd Coenen et al.
them to psychiatric indications. To do so, one has to assume that the brain
functions on the basis of the same neurophysiological mechanisms
regardless of the system (motor, sensory, pain, emotion, etc.) we look at
(Panksepp, 1985). Furthermore, the sophisticated use of this technology
might allow to in the future place DBS electrodes under general anesthesia
(Madler & Coenen, 2012). This chapter sums up a journey of the past
10 years with first applications of the DWI/DTI technique in DBS
(Coenen et al., 2006; Sillery et al., 2005) toward current research in the
field of emotional networks (Coenen et al., 2006, 2001; Coenen,
Schlaepfer, Maedler, & Panksepp, 2010; Gutman, Holtzheimer, Behrens,
By-passingaxons of other
circuit
DB
S
DB
S
By-passingaxons of other
circuit
Afferent neurons Afferent neurons
A B
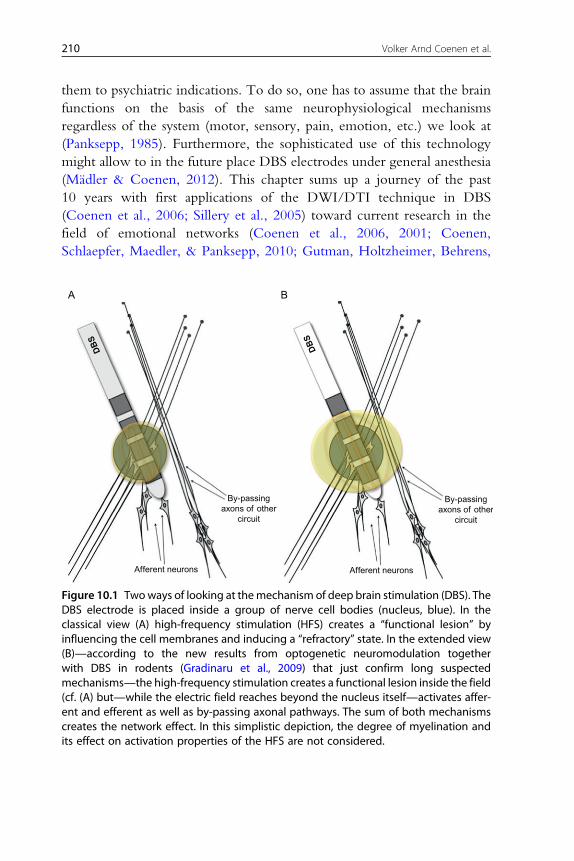
Figure 10.1 Twoways of looking at themechanism of deep brain stimulation (DBS). TheDBS electrode is placed inside a group of nerve cell bodies (nucleus, blue). In theclassical view (A) high-frequency stimulation (HFS) creates a “functional lesion” byinfluencing the cell membranes and inducing a “refractory” state. In the extended view(B)—according to the new results from optogenetic neuromodulation togetherwith DBS in rodents (Gradinaru et al., 2009) that just confirm long suspectedmechanisms—the high-frequency stimulation creates a functional lesion inside the field(cf. (A) but—while the electric field reaches beyond the nucleus itself—activates affer-ent and efferent as well as by-passing axonal pathways. The sum of both mechanismscreates the network effect. In this simplistic depiction, the degree of myelination andits effect on activation properties of the HFS are not considered.

211Diffusion Tensor Imaging and Deep Brain Stimulation
Johansen-Berg, & Mayberg, 2009; Johansen-Berg et al., 2007; Schoene-
Bake et al., 2010) and toward a better understanding of what the DBS
technique truly does: (Fig. 10.10). Influencing balanced network
interactions (Coenen, Panksepp, Hurwitz, Urbach, & Madler, 2012;
Coenen et al., 2010).
2. DIFFUSION WEIGHTED AND DIFFUSION TENSORMAGNETIC RESONANCE IMAGING
Measuring diffusion properties of molecules with nuclear magnetic
resonance (NMR) and later on spatially resolved with magnetic resonance
imaging (MRI) methods has a long tradition. They root date back to the
pioneering work of Stejskal and Tanner (1965). Compared to other methods
like chemical or radioactive tracer studies, MRI has the advantages of being
noninvasive, produces good spatial resolution, and does not adhere to a fixed
coordinate system or following specific predetermined axis or pathways, for
example, dissected slices, arbitrary volume subsamples.
Since the work from the mid-1980s of Wesbey, LeBihan, Breton,
Merboldt, Taylor, and others (Jones, 2011; Le Bihan et al., 1986;
Merboldt & Hanicke, 1985; Taylor & Bushell, 1985; Wesbey, Moseley, &
Ehmann, 1984) (Diffusion MRI, p. 58), it is possible to generate spatially
resolved in vivo diffusion maps with MRI from animals as well as from
human subjects. The first human studies produced so-called diffusion-
weighted images where the brightness of each voxel corresponds to the
inverse of the apparent diffusion coefficient (ADC) of water in the tissue,
hence dark voxels illustrating a relatively fast diffusion of water whereas
very bright regions correspond with no or very slow water diffusivity.
Followed by the reported acute reduction in ADC in ischemic tissue in
cat brain within a few hours after introduced ischemia from Moseley et al.
(1990a, 1990b), the first human clinical relevant DWI-studies focused on
acute local or global cerebral ischemia as a result of cardiac arrest, stroke,
hemorrhage, or thrombosis. Shortly after this introduction as a new MR-
image contrast mechanism, it was found that the ADC showed a
directional dependence, first on the applied gradient encoding direction
and second also on the tissue orientation (Chenevert, Brunberg, & Pipe,
1990; Doran et al., 1990; Moseley et al., 1990a, 1990b). It, therefore,
suggests treating also the cerebral tissue of animal and human as a highly
heterogeneous and hence anisotropic tissue. Since the ADC is inherently
coupled with the mean squared displacement via Einstein’s famous
212 Volker Arnd Coenen et al.
equation (hr2i prop.D*t) (Einstein, 1905), it was concluded that a structural
and/or anatomical hindrance of the water diffusion pathway in cerebral
tissue is the reason for this observation. As this effect is primarily
observed in white matter of cerebral tissue, whereas CSF and gray matter
exhibit a more or less isotropic behavior (no orientational dependence) of
water diffusion, it was initially concluded that barriers constituted by the
myelin sheaths surrounding WM-tissue, local susceptibility gradients,
axonal cytoskeleton, and fast-axonal transport are the primary causes for
this behavior (Thomsen, Henriksen, & Ring, 1987). Myelin itself,
however, seems to play only a marginal rule to cause anisotropic diffusion
behavior as studies from immature rat brains that have yet no myelin
sheath developed (Prayer et al., 1997; Wimberger et al., 1995). Later,
Beaulieu and coworkers ruled out the influence of internal susceptibility
gradients, axonal cytoskeleton, and fast-axonal transport from a series of
experiments on excised frog and giant squid nerves (Beaulieu & Allen,
1994a, b, 1996). They concluded that the main contribution of water
diffusion anisotropy in nervous tissue is the mere presence of intact cell
membranes and that myelination does only serve as a mild modulator of
anisotropy. Quantitatively this was confirmed by Madler et al. in
correlating quantitative in vivo measures for the degree of myelination in
the human brain with various anisotropy measures of water diffusion
(Madler, Drabycz, Kolind, Whittall, & MacKay, 2008).
From all the above listed phenomena, we must conclude that it is inad-
equate to describe water diffusivity specifically in nervous tissue as a single
scalar value that does not reflect any of the orientational dependencies
described above. Furthermore, different patient positions and orientations
inside aMRI-scanner would lead to different observations of the ADC. This
leads to the introduction of the diffusion tensor, a mathematical vehicle that
helps to understand and describe the three-dimensionality of the diffusion
problem. Pioneered by Basser et al. in the early 1990s, the concept of
DTI was introduced where the 3D properties of diffusion directionality
are reflected by the 3�3 matrix of the diffusion tensor D¼ (Dxx. . .Dzz).
The so-called diagonal elements Dxx, Dyy, Dzz correspond to the diffusivity
along the three orthogonal axes in a Cartesian coordinate systemwhereas the
off-diagonal elements reflect the correlation of diffusivity between those
orthogonal axes, for example, x and y. The DT is symmetric, meaning its
corresponding off-diagonal elements are the same (e.g., Dxy¼Dyx), as we
cannot distinguish directionality of diffusion along one axis (�x or þx)
by observation of the hr2i displacement only.

213Diffusion Tensor Imaging and Deep Brain Stimulation
When all three (six) off-diagonal values are zero, the tensor is aligned
with the principal axis of diffusion for the specific tissue. The diffusion tensor
transformation into the coordinate system of the principal diffusion axis of
the tissue is referred to as diagonalization. The remaining diagonal elements
Dxx, Dyy, and Dzz in the diagonalized form, the eigenvalues of the diffusion
tensor, are labeled l1, l2, and l3. The normalized directions of the orthogonal
axis in this diagonalized form are called eigenvectors. Any second rank ten-
sor (3�3 matrix elements) can be transformed into such representation of
eigenvalues and eigenvectors. If we order the eigenvalues according to their
magnitude, the three corresponding orthogonal eigenvectors v1, v2, v3
multiplied with the square root of their eigenvalues span a 3D ellipsoid with
its largest axis (sqrt(l1)) along v1. This geometric representation of the diag-
onalized diffusion tensor is also referred to as the diffusion ellipsoid. The
isosurface boundary of this ellipsoid represents the displacement of an en-
semble of molecules per measurement time—the diffusion coefficient—in
two dimensions, it could be visualized by the spread of an ink-drop on paper
with increasing observation time.
Although the idea to describe diffusion in an anisotropic medium as a
tensor property dates back to the early work of Stejskal and Tanner
(1965), it was not until 1992 when Basser and colleagues introduced a
method to measure the diffusion tensor directly from a series of DW-
measurements (Basser & Bihan, 1992) and combined this information into
what is now known as DTI (Basser, Mattiello, & Le Bihan, 1994; Basser,
Mattiello, & LeBihan, 1994).
In practice, however, the patient or tissue reference of diffusion does not
coincide with the principal or main direction of diffusion. Therefore, one
must consider the coupling of the nondiagonal elements from different gra-
dient directions (reference frame) and therefore b-matrix bij with the
nondiagonal elements of Dij. To determine the six independent elements
of D, measurements are made along at least six noncollinear gradient direc-
tions and one measurement without diffusion weighting to accommodate
the impact of various imaging gradients additionally to the diffusion weighting
gradients apparent in the sequence onto the signal equation. In general, the
measurement involves multiple b-values or gradient strength (M) along N
noncollinear gradient directions. From such an experiment, a system of linear
equations in matrix form can be created and solved for the six tensor elements
Dij as well as for the signal amplitude S(0) without diffusion weighting.
This relatively simple form becomes much more complex if one also
considers the effect of imaging and/or background gradients that are not
214 Volker Arnd Coenen et al.
considered in the Stejskal–Tanner equation. A more general formalism is
used instead to solve the Bloch–Torrey equation (Torrey, 1956) which
might become analytically very complex. Therefore, Le Bihan and co-
workers suggested early on to summarize all gradient effects over time in
the general b-matrix (Le Bihan et al., 1986).
Generally speaking, the gradients are chosen to uniformly sample the
Cartesian 3D space or at least one hemisphere (ambiguity between directions
of diffusion). For a predefined number of gradient directions, one can
employ the electrostatic repulsion model of equally charged particles on a
unit sphere (Jones, 2011). Minimizing the energy for the entire particle
assembly leads to an arrangement where all charged particles have more
or less the same distance to each other.
Nevertheless, several disagreeing results onto the optimal number and
directions of gradient encoding schemes do not leave a unique and universal
recommendation. Jones summarizes these partially diverse recommenda-
tions, as there is a benefit for improved precision in the estimated principal
eigenvectors and trace values with higher number of direction schemes,
however, with diminishing returns for more than 30 noncollinear direc-
tions. The asymptotic number of orientations for anisotropy measures is
already reached at about 20 (Jones, 2004; Papadakis, Murrills, Hall, Huang,
& Adrian Carpenter, 2000).
In practice, we almost always face the challenge to adhere to a limited
scan time for a DTI-acquisition. The total examination time is proportional
to the number of gradient encodings and has to comply with certain limi-
tations in regards to clinical patients and examinations. Nowadays, with
high-performance MRI-scanners and powerful gradient coils, a full brain
single shot EPI DWI acquisition (128�128 matrix, 60 slices, isovolumetric
voxel size 2�2�2 mm3, b-value¼1000 s/mm2) takes about 10–15 s.
Multiplying this by the number of encoding directions leads to a total acqui-
sition time, for example, for 30 directions of approximately 6 min.
3. FIBER TRACTOGRAPHY
As pointed out earlier, diffusion of water in the CNS is characterized
not only by its magnitude but also its directional variance and orientation of
the main eigenvectors. As a reasonable assumption, it is generally assumed
that the direction of the greatest eigenvalue (largest diffusivity along of
the principal tensor axis—direction of corresponding eigenvector) is parallel
to the direction of the white matter fibers in large, homogeneous regions of
A B C
P
100
50
0
robabi
ity
l
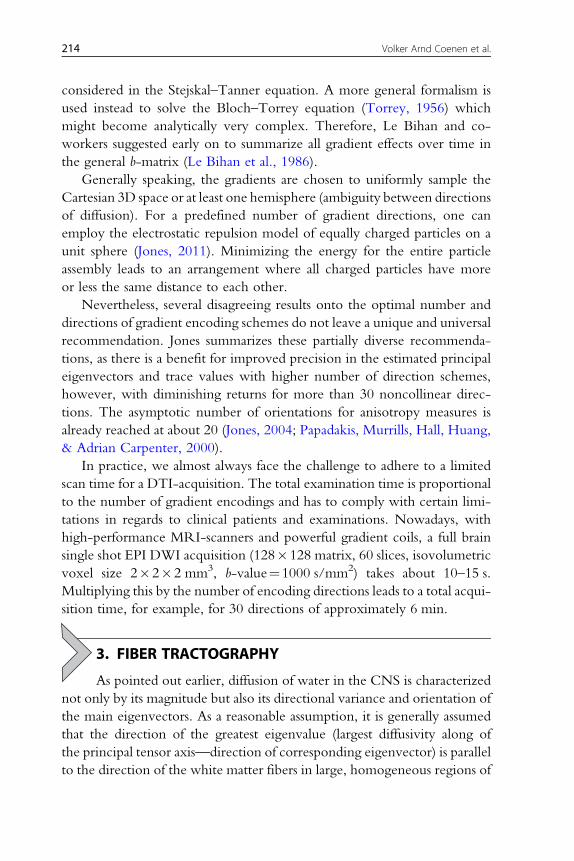
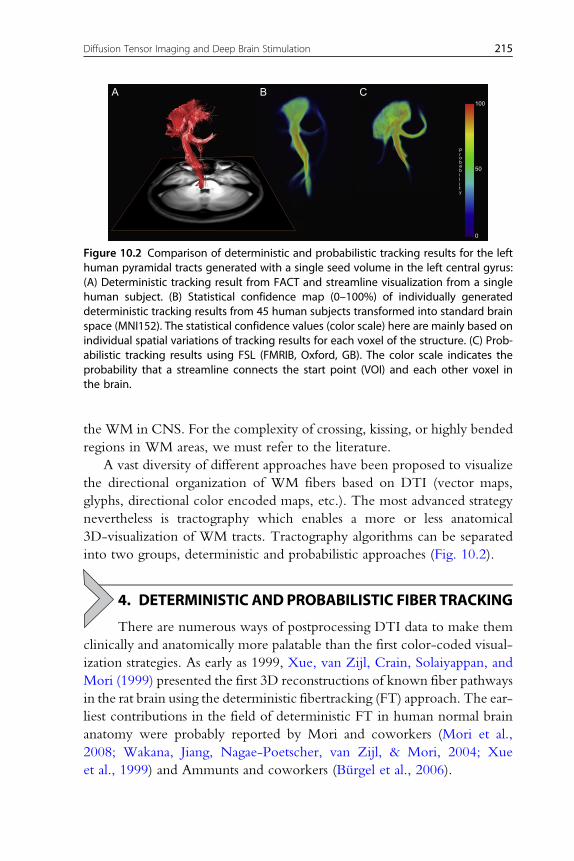
Figure 10.2 Comparison of deterministic and probabilistic tracking results for the lefthuman pyramidal tracts generated with a single seed volume in the left central gyrus:(A) Deterministic tracking result from FACT and streamline visualization from a singlehuman subject. (B) Statistical confidence map (0–100%) of individually generateddeterministic tracking results from 45 human subjects transformed into standard brainspace (MNI152). The statistical confidence values (color scale) here are mainly based onindividual spatial variations of tracking results for each voxel of the structure. (C) Prob-abilistic tracking results using FSL (FMRIB, Oxford, GB). The color scale indicates theprobability that a streamline connects the start point (VOI) and each other voxel inthe brain.
215Diffusion Tensor Imaging and Deep Brain Stimulation
the WM in CNS. For the complexity of crossing, kissing, or highly bended
regions in WM areas, we must refer to the literature.
A vast diversity of different approaches have been proposed to visualize
the directional organization of WM fibers based on DTI (vector maps,
glyphs, directional color encoded maps, etc.). The most advanced strategy
nevertheless is tractography which enables a more or less anatomical
3D-visualization of WM tracts. Tractography algorithms can be separated
into two groups, deterministic and probabilistic approaches (Fig. 10.2).
4. DETERMINISTIC AND PROBABILISTIC FIBER TRACKING
There are numerous ways of postprocessing DTI data to make them
clinically and anatomically more palatable than the first color-coded visual-
ization strategies. As early as 1999, Xue, van Zijl, Crain, Solaiyappan, and
Mori (1999) presented the first 3D reconstructions of known fiber pathways
in the rat brain using the deterministic fibertracking (FT) approach. The ear-
liest contributions in the field of deterministic FT in human normal brain
anatomy were probably reported by Mori and coworkers (Mori et al.,
2008; Wakana, Jiang, Nagae-Poetscher, van Zijl, & Mori, 2004; Xue
et al., 1999) and Ammunts and coworkers (Burgel et al., 2006).
216 Volker Arnd Coenen et al.
A deterministic tractogram is generated by starting from one or more seed
location which can be combined with logical operators AND, NOT, OR, or
XOR. The simplest and still most practical approach proposed by Basser in
1998 (Basser, Pajevic, Pierpaoli, Duda, & Aldroubi, 2000) is the streamline
algorithm that uses the eigenvector of the largest eigenvalue to define the local
trajectory direction of fiber pathways from the diffusion tensor measurements.
It involves seamless integration along the vector field either by linear step-wise
algorithms such as FACT (fiber assignment by continuous tracking—Mori
et al., 2008) or Euler integration (Conturo et al., 1999). These algorithms
create continuous wire- or tube-wise structures that can be considered as
an anatomical portrayal of major WM tracts. Using only the largest
eigenvalue–eigenvector pair for estimating the tract’s direction works well
for highly anisotropic (cigar shaped) tensors but creates higher degrees of am-
biguity in regions of less anisotropy, for example, crossing, kissing fibers. For
such cases, the exploitation of the tensor’s full properties, for example, TEND
(tensor deflection—Lazar & Alexander, 2003; Lazar et al., 2003), may yield
more realistic tractograms. With the continuous growing number of largely
as well as mildly different streamline algorithms and the need for operator
intervention when setting the tracking parameters (seed VOI’s, angular
deflection, minimum fiber length, seed density, and more), it poses one of
the biggest challenges in WM-tractography nowadays to obtain anatomical
correct as well as comparable results, for example, in clinical practice
(Burgel et al., 2009). Additionally to its potentials for pitfalls and
anatomical misinterpretation (book—Diffusion MRI, Jones 2010), the
major disadvantage of deterministic tractography is that the errors or
confidences of estimated tracts are generally unknown. This issue can be
more thoroughfully addressed using probabilistic methods.
Probabilistic methods try to overcome the limitation of deterministic
tracking methods and their lag of information regarding errors in the tracking
results by explicit characterization of the confidence with which connections
may be established through the diffusion data itself. The main sources of un-
certainty while constructing tractograms from diffusion data come from noise
in the data itself (noise generated from subject, involuntary movements, tissue
susceptibility) and from the data acquisition systems (scanner hardware,
RF-chain, gradient amplifiers, eddy currents). Further factors are imperfect
models of the diffusion process in the CNS, partial volume effects, limited spa-
tial resolution, andmultiple fiber populations per voxel. For more explicit and
detailed information, we must refer the reader to literature about this subject,
for example, Johansen-Berg and Behrens (2009), Jones (2011).

217Diffusion Tensor Imaging and Deep Brain Stimulation
The unique advantage of probabilistically tract data is that the output of
connection probability values has a specific meaning—an observed value of
probability is the statistical probability that a connection from one start point
to a specific other voxel in the brain exists on the basis of our diffusion model
of connections. Although very valuable and tempting to draw further con-
clusions, this information does not provide us with clear evidence of a gen-
uine anatomical connection existing in the CNS. Nevertheless, we can
safely assume that there is a useful and direct link between microstructural
geometry and organization with the results of tractography. Currently,
we can only provide empirical evidence that the results of tractographic
methods, deterministic or probabilistic, are closely related to true anatomical
connections. From gathering knowledge by using more sophisticated track-
ing algorithms and comparisons with histological or tracing data, we will be
more and more able to establish where such portrayals of diffusion connec-
tivity relate to true anatomical connections but also identify scenarios where
this link might be broken or unjustifiable.
5. ACCURACY OF DIFFUSION TENSOR IMAGINGFIBERTRACKING AND ITS USE IN NEUROSURGERY
With growing experience, it became clear that there might be inac-
curacies associated with the DTI FT depiction of even large robust and very
well discernible fiber tracts—like the pyramidal tract—that among other fac-
tors arise at the software level (Burgel et al., 2009). In principal, limitations
that the deterministic FT algorithm poses are the termination of tracking in
areas of reduced fractional anisotropy (because of increased intermingling of
fibers, approach of the subcortical boundaries, and partial volume effects)
and the ambiguity in following the correct connection pathways in dense
areas of crossing, kissing, or branching fibers (limitation of single diffusion
tensor model) combined with a relatively low spatial resolution (�2 mm
isotropic voxel dimension) (Pai, Soltanian-Zadeh, & Hua, 2010;
Staempfli et al., 2007; Wakana et al., 2004). We will not go into further
detail about limitations of the DTI technique.
Fiber portrayal with MRI was first introduced for planning and per-
forming neurosurgical interventions in the early 2000 utilizing diffusion-
weighted imaging and DTT to project fiber tract anatomy into the operation
field with neuronavigation systems (Coenen et al., 2001, 2003, 2005;
Holodny, Schwartz, Ollenschleger, Liu, & Schulder, 2001; Nimsky,
Ganslandt, & Fahlbusch, 2007; Nimsky, Grummich, Sorensen, Fahlbusch, &

218 Volker Arnd Coenen et al.
Ganslandt, 2005). Despite its value in glioma surgery (Wu et al., 2007), it soon
became apparent that there would be implicit errors or inaccuracies associated
with this technique (see above) which for neurosurgical applications were first
reported by Kinoshita et al. (2005) and were quantified by Nimsky and
coworkers to be as high as 5 mm in the anterior–posterior (y-) direction in
neocortical regions (Nimsky et al., 2007). In a first effort to determine the
accuracy of the DWI technique in combination with stereotactic surgery,
our own group applied visualization of the pyramidal tract in six patients
undergoing subthalamic nucleus DBS. In this experimental setup, we
determined electrophysiological distance by applying meta-analysis data
from Ranck (1975) and DWI determined distance between the electrode
position and the medial border of the internal capsule. We found an
accuracy of 3 mm in the z-direction and 1.3 mm in the “in plane”
directions (x,y), clearly better than what had been reported for the
neocortical regions, but now in the midbrain level (Coenen et al., 2006).
Hypothetically, this would allow the use of the DWI technique for
neuronavigation with its implicit localization accuracy of 3–5 mm
depending on the imaging modality (MRI, computed tomography) used.
In order to further determine the accuracy when using 3T MRI, we
utilized a similar setup but now utilizing DTI and a 12-direction encoding
sequence and extending it with a second electrophysiological approach
based on the implanted neuromodulation device and a finite element
method to simulate the electric field as reported by Butson and coworkers
(Butson et al., 2007; Butson, Cooper, Henderson & McIntyre, 2006). In
this—yet unpublished—study, we found accuracies of 1.5–2 mm for the
DTI technique when applied with stereotactic methods, 3T MRI and back
fusion of postoperative computed tomographic data (Pinsker et al., 2008)
in the midbrain level that was implicitly applied and proved correct in later
studies (Coenen et al., 2009; Coenen, Allert, & Madler, 2011; Coenen,
Madler, et al., 2011)(Madler & Coenen, 2012; Sajonz, Madler,
Herberhold, Paus, & Coenen, 2011).
6. ELECTRIC FIELD SIMULATION
DBS is a technique that delivers electrical pulses, variable in amplitude,
pulse width, and frequency, through permanently implanted electrodes,
which are connected to an implantable pulse generator (IPG). The elec-
trodes are usually placed by using stereotactic procedures based on imaging
studies (CT, MR imaging) combined with real-time intraoperative X-ray
219Diffusion Tensor Imaging and Deep Brain Stimulation
and electrophysiology. Depending on the diagnosis and patient-specific
symptoms, different anatomic targets have been proposed.
Experimental measurements of the electromagnetic field distribution gen-
erated byDBSelectrodes are still lacking.Therefore, computationalmodels are
an invaluable tool for thedescriptionof electric field patterns generatedbyDBS
electrodes and are essential to understand, optimize, and predict stimulation ef-
fects for certain DBS treatments. Substantial efforts have beenmade in design-
ing conceptional volume conductor electric field models of clinical
DBS (Butson et al., 2006; Kuncel & Grill, 2004; McIntyre et al., 2004;
McIntyre & Thakor, 2002; Yousif, Bayford, & Liu, 2008; Yousif, Bayford,
Wang, & Liu, 2008) and coupling them to multicompartmental neuronal
cable models to develop theoretical predictions of neural activation as a
function of therapeutic stimulation parameters (McIntyre et al., 2004;
Miocinovic et al., 2006, 2009). Recently, we introduced a robust and
simple numerical model based on multivariate polynomial fitting of
previously obtained data from a finite element model that provides sufficient
and practically relevant feedback as to the patient’s individual VAT
depending on specific generator-stimulation settings and patient-dependent
electrode-tissue properties. The model primarily relies on a patient’s
individual impedance measures obtained during postoperative IPG
programming with monopolar DBS electrode settings and variable voltages.
It generates VAT distance isolines around the DBS contact for specific IPG
voltages by means of a spherical model (Madler & Coenen, 2012).
7. APPLICATIONS
7.1. Identification of “true” target structures
In order to understand the merit of a new technique like DTI in conjunc-tion with DBS, one has to closely look at what has been done historically
(Hariz, Blomstedt, & Zrinzo, 2010). In the past, efforts had been made to
more precisely target regions in the brain. Spiegel and Wycis introduced
their stereotactic apparatus (Hariz et al., 2010; Spiegel, Wycis, Marks, &
Lee, 1947) in order to improve crude techniques of psychosurgery by
directly targeting small areas in the thalamus (dorsomedial thalamotomy).
Only later, these techniques were used for pain and movement disorders
and even later than this also applied for the chronic DBS techniques we
use today with implantable neurostimulators although stimulation
techniques had been used earlier to verify lesion sites. In the same way
as Spiegel and Wycis in their time applied the stereoencephalotome, new
220 Volker Arnd Coenen et al.
techniques like DTI FT can be used to identify true strategic target sites to
perform neuromodulation (Coenen, Allert, & Madler, 2011; Coenen,
Madler, et al., 2011; Henderson, 2012). Additionally, this technique helps
to understand the effect spectrum of DBS (Barkhoudarian et al., 2010;
Sillery et al., 2005) and its side effects (Coenen et al., 2009; Madler &
Coenen, 2012). We further elaborate on this in the following section,
where the DTI technique is actually used to identify a supposedly more
efficacious target region for a psychiatric intervention (Coenen et al., 2010;
Schoene-Bake et al., 2010). In this section, however, we try to explain
with an example from the movement disorders—especially Parkinson’s
disease and tremor—how the effectiveness of current established target
regions for DBS surgery can be appreciated with the DTI technique and be
attributed to the stimulation of fiber tracts.
7.2. Tremor and the dentatorubrothalamic tractFor the past 60 years, functional neurosurgeons used lesion surgery in the
ventral thalamus to achieve dramatic alleviation of tremor for patients
(Hassler, Mundinger, & Riechert, 1979). The ventralis intermedius nucleus
of the thalamus is the typical target structure among a group of previous tar-
gets for tremor surgery in the ventral thalamus (Pilitsis et al., 2008), but there
is an efficacy signal for the benefit of the posterior subthalamic region and the
caudal zona incerta as probably superior target regions for certain distinct
tremor forms (Krack, Pollak, Limousin, Benazzouz, & Benabid, 1997;
Plaha, Khan, & Gill, 2008; Plaha, Patel, & Gill, 2004). With the advent
of DBS, lesion strategies were replaced with the less invasive, adjustable,
and reproducible chronic stimulation technique (Benabid et al., 1996).
Hassler et al. (1979) had speculated that lesion techniques would involve
the fiber projections that reach up from the cerebellum to the
contralateral thalamus. This idea was later repeated by Plaha et al. (2004,
2008). With the DTI FT technique and the combination with DBS and
EFS, we were able to present clinical evidence for the identification of
the dentatorubrothalamic (DRT) (cf. Fig. 10.3) as the key target structure
for tremor suppression (Coenen, Allert, & Madler, 2011; Coenen,
Madler, et al., 2011; Sajonz et al., 2011).
To show an example for the significance of individual depiction of the
DRT with DTI, we present the case of a 73-year-old woman with essential
tremor (essential tremor rating scale (ETRS)¼63). Bilateral thalamic DBS
in the Vim target with conventional targeting methods and intraoperative

MC R LMC
A B
PTV. lat. V. lat.
iii
STR
DRTthal
CI
Vimz = 0
z = −4HDPSTNcZI
RNSNr
SCP
DN
Figure 10.3 (A) Schematic representation of the bilateral dentatorubrothalamic tracts(DRT) in coronal section. (B) Probabilistic DTI atlas depiction in the MNI152 space. Leg-end: MC, motor cortex; V.lat, lateral ventricles; iii, 3rd ventricle; PT, pyramidal tract; STR,superior thalamic peduncle; thal, thalamus; CI, internal capsule; Vim, ventralis interme-diate nucleus; HDP, hyperdirect pathway; STN, subthalamic nucleus; cZI, caudal zonaincerta; RN, red nucleus; SNr, substantia nigra; SCP, superior cerebellar peduncle; DN,dentate nucleus.
221Diffusion Tensor Imaging and Deep Brain Stimulation
test stimulation was performed for bilateral essential tremor. Immediately
after surgery stimulation was started and tremor remained well controlled
for a couple of weeks. Tremor control was lost for her left body side and
monopolar stimulation had to be increased. Because of unbearable side
effects (tingling), stimulation was changed to a bipolar stimulation mode
with 4.5 V, 90 ms, 180 Hz (cf. Figs. 10.4–10.6, red sphere). In this
situation that represented moderate tremor control, she started to develop
stimulation induced gait instability and ambulated with a walker due to a
tendency to fall. After evaluation of preoperative DTI (cf. Fig. 10.4), an
asymmetry in her DRT was seen. A second surgery was offered this time
directly aiming for the right DRT with additional electrode (R2,
Fig. 10.4). A combination of stimulation of both right-sided electrodes
(cf. Figs. 10.5 and 10.6) leads to sufficient tremor control. A follow-up
test after 1.5 years after the second additional surgery showed that in the
OFF condition she has an ETRS score of 62, in the ON condition (three
electrodes, cf. Figs. 10.3 and 10.4, blue spheres) of 22. This is an
improvement of 65%.
R1
R1
R2 L1
L1D
BSR
oblique
P
L
DB
S DB
S
DRT DRT
PC
ACR2
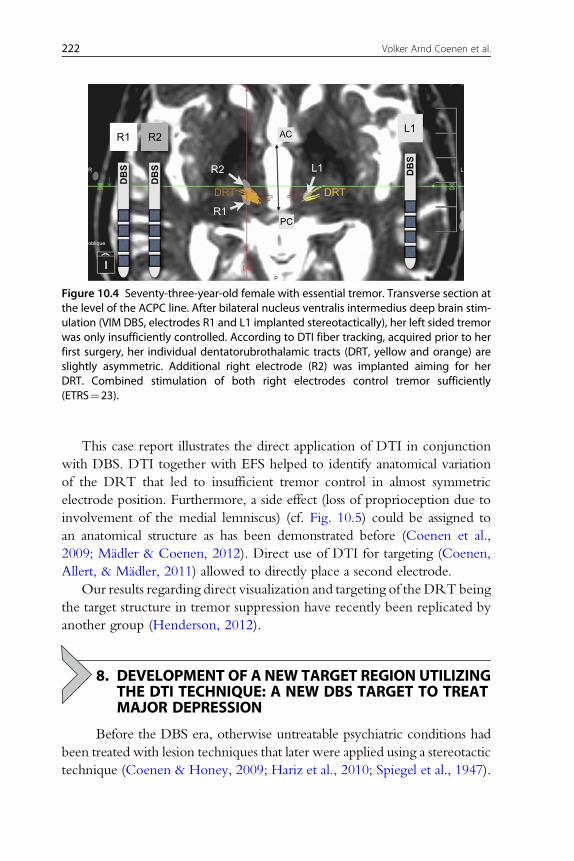
Figure 10.4 Seventy-three-year-old female with essential tremor. Transverse section atthe level of the ACPC line. After bilateral nucleus ventralis intermedius deep brain stim-ulation (VIM DBS, electrodes R1 and L1 implanted stereotactically), her left sided tremorwas only insufficiently controlled. According to DTI fiber tracking, acquired prior to herfirst surgery, her individual dentatorubrothalamic tracts (DRT, yellow and orange) areslightly asymmetric. Additional right electrode (R2) was implanted aiming for herDRT. Combined stimulation of both right electrodes control tremor sufficiently(ETRS¼23).
222 Volker Arnd Coenen et al.
This case report illustrates the direct application of DTI in conjunction
with DBS. DTI together with EFS helped to identify anatomical variation
of the DRT that led to insufficient tremor control in almost symmetric
electrode position. Furthermore, a side effect (loss of proprioception due to
involvement of the medial lemniscus) (cf. Fig. 10.5) could be assigned to
an anatomical structure as has been demonstrated before (Coenen et al.,
2009; Madler & Coenen, 2012). Direct use of DTI for targeting (Coenen,
Allert, & Madler, 2011) allowed to directly place a second electrode.
Our results regarding direct visualization and targeting of the DRT being
the target structure in tremor suppression have recently been replicated by
another group (Henderson, 2012).
8. DEVELOPMENT OF A NEW TARGET REGION UTILIZINGTHE DTI TECHNIQUE: A NEW DBS TARGET TO TREAT
MAJOR DEPRESSIONBefore the DBS era, otherwise untreatable psychiatric conditions had
been treated with lesion techniques that later were applied using a stereotactic
technique (Coenen & Honey, 2009; Hariz et al., 2010; Spiegel et al., 1947).
A B C
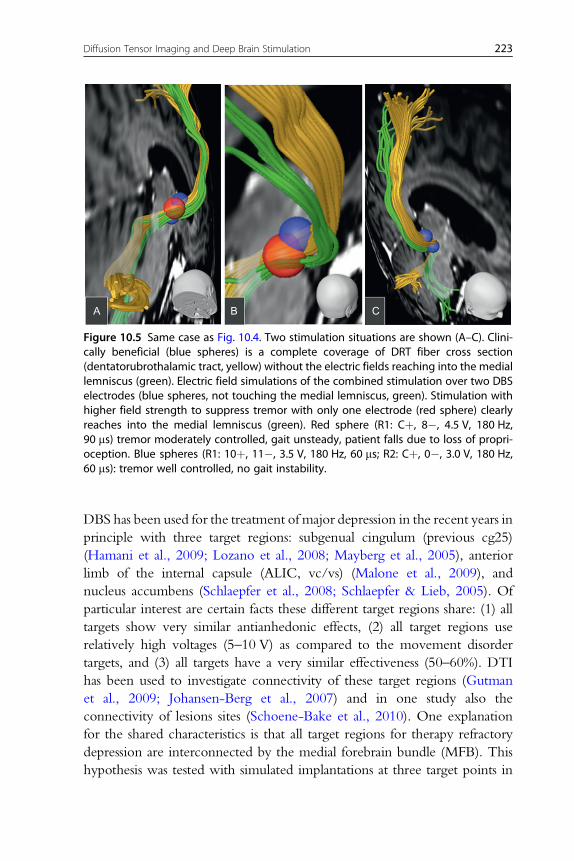
Figure 10.5 Same case as Fig. 10.4. Two stimulation situations are shown (A–C). Clini-cally beneficial (blue spheres) is a complete coverage of DRT fiber cross section(dentatorubrothalamic tract, yellow) without the electric fields reaching into the mediallemniscus (green). Electric field simulations of the combined stimulation over two DBSelectrodes (blue spheres, not touching the medial lemniscus, green). Stimulation withhigher field strength to suppress tremor with only one electrode (red sphere) clearlyreaches into the medial lemniscus (green). Red sphere (R1: Cþ, 8�, 4.5 V, 180 Hz,90 ms) tremor moderately controlled, gait unsteady, patient falls due to loss of propri-oception. Blue spheres (R1: 10þ, 11�, 3.5 V, 180 Hz, 60 ms; R2: Cþ, 0�, 3.0 V, 180 Hz,60 ms): tremor well controlled, no gait instability.
223Diffusion Tensor Imaging and Deep Brain Stimulation
DBS has been used for the treatment of major depression in the recent years in
principle with three target regions: subgenual cingulum (previous cg25)
(Hamani et al., 2009; Lozano et al., 2008; Mayberg et al., 2005), anterior
limb of the internal capsule (ALIC, vc/vs) (Malone et al., 2009), and
nucleus accumbens (Schlaepfer et al., 2008; Schlaepfer & Lieb, 2005). Of
particular interest are certain facts these different target regions share: (1) all
targets show very similar antianhedonic effects, (2) all target regions use
relatively high voltages (5–10 V) as compared to the movement disorder
targets, and (3) all targets have a very similar effectiveness (50–60%). DTI
has been used to investigate connectivity of these target regions (Gutman
et al., 2009; Johansen-Berg et al., 2007) and in one study also the
connectivity of lesions sites (Schoene-Bake et al., 2010). One explanation
for the shared characteristics is that all target regions for therapy refractory
depression are interconnected by the medial forebrain bundle (MFB). This
hypothesis was tested with simulated implantations at three target points in

R1
R1
DB
S
DB
S
DRT
DRT
dn
pg
ML
PC
MCP
1/4
1/3
R2
R2
ACthal
amus
rnrn
AB
Figure 10.6 Same case as Figs. 10.4 and 10.5. (A) CT superimposed reconstruction. (B)Schematic presentation. Right-sided deep brain stimulation electrodes R1/R2 withrespect to the patient's individual dentatorubrothalamic tract (DRT) and mediallemniscus (ML). Stimulation of both electrodes (blue spheres) covers DRT and doesnot interfere with ML. Stimulation on singel electrode (R1, red sphere) leads totremor suppression and coverage of DRT but also involvement of ML. Patientclinically is unsteady and has falls. Legend: rn, red nucleus; pg, precentral gyrus; dn,dentate nucleus; PC, posterior commissure; AC, anterior commissure; MCP,midcommissural point.
224 Volker Arnd Coenen et al.
the MNI152 brain at the same time using a probabilistic model of the MFB
(Coenen et al., 2012) together with EFS (Madler & Coenen, 2012). As a
resultant, it was shown that the MFB is partially included in the electric
field at the different depression target sites in up to 92% (Coenen et al.,
2010). Figures 10.7 and 10.8 exemplarily show the topographic
relationship of the MFB with the distinct target sites.
The humanMFBwas only recently described by our group (Coenen et al.,
2009, 2010, 2012) using the DTI technique. Obviously, there is a good
indication that the MFB represents parts of the mesolimbic dopaminergic
system and as such has an important function in the reward system. Affective
Neuroscience has conceptualized the function of the MFB as being
confluent with the SEEKING system: a system of appetitive motivation and
reward (capitalization is an affective neuroscience nomenclature convention
reflecting on the ability of primary process affective systems to directly
Hab
ALIC
NAcc
sIMFB
Accumbens
Caudate
Thalamus
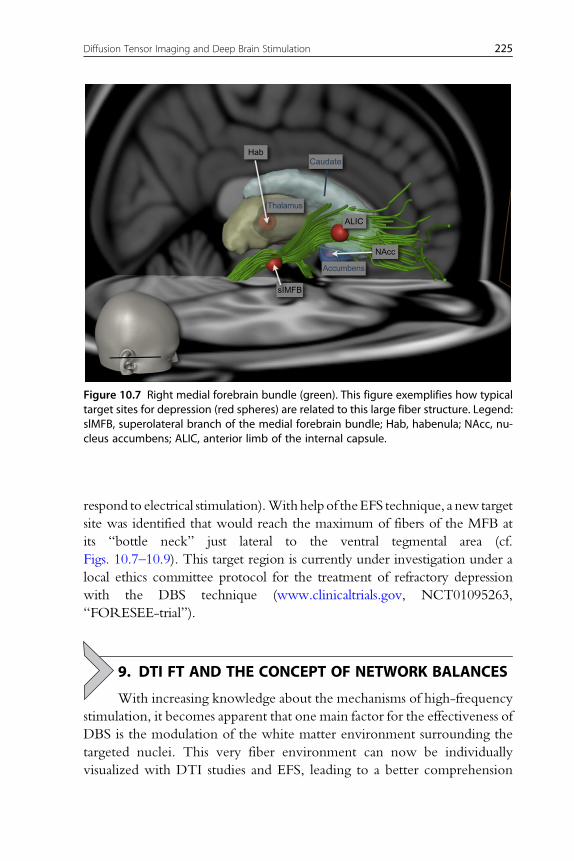
Figure 10.7 Right medial forebrain bundle (green). This figure exemplifies how typicaltarget sites for depression (red spheres) are related to this large fiber structure. Legend:slMFB, superolateral branch of the medial forebrain bundle; Hab, habenula; NAcc, nu-cleus accumbens; ALIC, anterior limb of the internal capsule.
225Diffusion Tensor Imaging and Deep Brain Stimulation
respond to electrical stimulation).Withhelpof theEFS technique, a new target
site was identified that would reach the maximum of fibers of the MFB at
its “bottle neck” just lateral to the ventral tegmental area (cf.
Figs. 10.7–10.9). This target region is currently under investigation under a
local ethics committee protocol for the treatment of refractory depression
with the DBS technique (www.clinicaltrials.gov, NCT01095263,
“FORESEE-trial”).
9. DTI FT AND THE CONCEPT OF NETWORK BALANCES
With increasing knowledge about the mechanisms of high-frequency
stimulation, it becomes apparent that one main factor for the effectiveness of
DBS is the modulation of the white matter environment surrounding the
targeted nuclei. This very fiber environment can now be individually
visualized with DTI studies and EFS, leading to a better comprehension

RN RN
x
y
VTA
LHLH
VTASNrSNr
STN
STN
mtt
VIII
fx
imMFB
SCG SCG
antidysphoric/antidepressive
antidysphoric& anti-OCD
antidysphoric/& anti-OCD
sIMFBantidysphoric/antidepressive
anti-OCD
PFC
DB
S
imMFBsIMFBsIMFB
NAcc
ALIC
NA
ALI
C
PTPT
PAG
A.
B.
C.
D.
E.
Figure 10.8 Medial forebrain bundle (green), schematic depiction. Note how DBS sitesfor depression group around this large fiber bundle (colored spheres). Legend: slMFB,superolateral branch of the medial forebrain bundle; imMFB, inferomedial branch of themedial forebrain bundle; PFC, prefrontal cortex; SCG, subgenual cingulate gyrus; fx,fornic; viii, third ventricle; mtt, mamillothalamic tract; LH, lateral hypothalamus; VTA,ventral tegmental area; SNr, substantia nigra; STN, subthalamic nucleus; PT, pyramidaltract; RN, red nucleus; NAcc, nucleus accumbens; ALIC, anterior limb of the internalcapsule.
226 Volker Arnd Coenen et al.
of the complex physiological interactions of motor control and affective and
cognitive regulation. In this respect, an appealing interpretation for psycho-
tropic effects is the inadvertent coactivation of a by-passing affective
circuitry due to an electric field that spreads beyond the electrode contact
into this fiber environment (Coenen et al., 2009, Fig. 10.1). Obviously,
DBS-induced emotional dysregulation is not reactive but merely has a neu-
roanatomical and neurophysiological substrate. This effect points toward the
true mechanism of action in DBS for OCD and depression: a (gradual) ac-
tivation of the reward circuitry. Conceptualizations of structures identified
with the DTI technique like the MFB as being confluent with the SEEK-
ING system and the anterior thalamic radiation confluent with the PANIC
system in conjunction with the DBS technique help us to understand func-
tion and connectivity (Coenen et al., 2012; Schoene-Bake et al., 2010). We
have elaborated on the idea of dynamic balances that are used to reach an
emotional equilibrium in the prefrontal cortex under physiological and
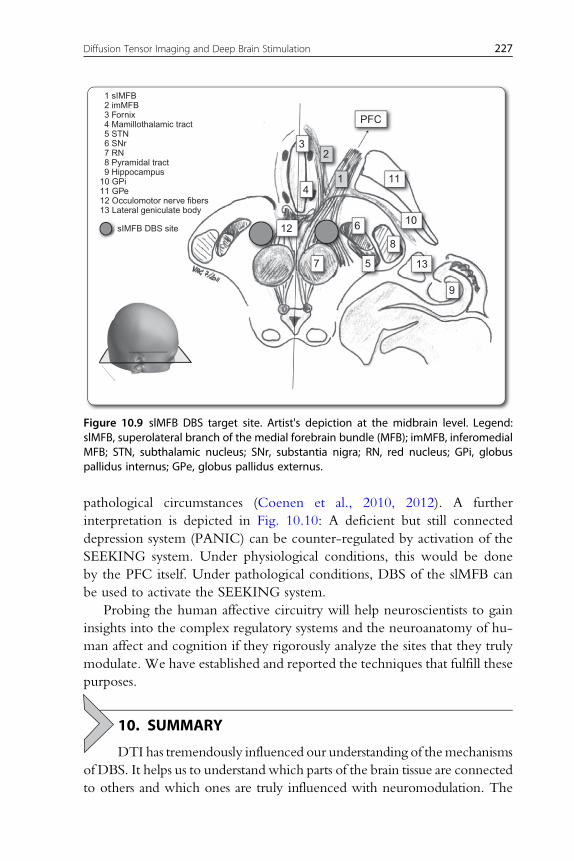
1 sIMFB
PFC
23
41 11
10
8
612
57 13
9
2 imMFB3 Fornix4 Mamillothalamic tract5 STN6 SNr7 RN8 Pyramidal tract9 Hippocampus
10 GPi11 GPe12 Occulomotor nerve fibers13 Lateral geniculate body
sIMFB DBS site
Figure 10.9 slMFB DBS target site. Artist's depiction at the midbrain level. Legend:slMFB, superolateral branch of the medial forebrain bundle (MFB); imMFB, inferomedialMFB; STN, subthalamic nucleus; SNr, substantia nigra; RN, red nucleus; GPi, globuspallidus internus; GPe, globus pallidus externus.
227Diffusion Tensor Imaging and Deep Brain Stimulation
pathological circumstances (Coenen et al., 2010, 2012). A further
interpretation is depicted in Fig. 10.10: A deficient but still connected
depression system (PANIC) can be counter-regulated by activation of the
SEEKING system. Under physiological conditions, this would be done
by the PFC itself. Under pathological conditions, DBS of the slMFB can
be used to activate the SEEKING system.
Probing the human affective circuitry will help neuroscientists to gain
insights into the complex regulatory systems and the neuroanatomy of hu-
man affect and cognition if they rigorously analyze the sites that they truly
modulate. We have established and reported the techniques that fulfill these
purposes.
10. SUMMARY
DTI has tremendously influenced our understanding of themechanisms
of DBS. It helps us to understand which parts of the brain tissue are connected
to others and which ones are truly influenced with neuromodulation. The

PFCemotionalequilibrium
PFCemotionalequilibrium
emotionalDISequilibrium
SEEKINGPANIC
Normal state
Depression
Antidepressive effect of DBS
(motivation)(loss)
SEEKING
DB
S
PANIC(motivation)
sIMFBNAccALIC
(SCG)
(loss)
SEEKINGPANIC(motivation)(loss)
depression sadness euphoria maniaeuthymiadepression sadness euphoria maniaeuthymia
depression sadness euphoria maniaeuthymia
PFC
A B
C
Figure 10.10 Dynamic network balances in affect regulation. Conceptualizationaccording to principles of affective neuroscience. In this concept, deep brain stimulationof the SEEKING system counterbalances a supposedly highly (pathologically) active PANICsystem in depression leading to euthymia as detected by the prefrontal cortex (PFC). Leg-end: slMFB, superolateral branch of the medial forebrain bundle; NAcc, nucleusaccumbens; ALIC, anterior limb of the internal capsule; scg, subgenual cingulate gyrus.
228 Volker Arnd Coenen et al.
complex interaction of DBS with the surrounding tissues—scrutinized with
DTI—allows to create testable hypotheses that can explain network interac-
tions. Those interactions are vital for our understanding of the net effects of
neuromodulation. We have shown that how the experience gained in tremor
surgery could be extrapolated to the evaluation of established target sites for
DBS in depression. This understanding together with electric field simulation
techniques might help to develop operation strategies that will allow neuro-
surgeon to place electrodes under general anesthesia without the help of the
awake patient. First results have been shown by our and other groups and are
promising. Future research in DTI FT together with DBS will focus on affect
regulating network balances and their therapeutic alterations with the
neuromodulation technology.

229Diffusion Tensor Imaging and Deep Brain Stimulation
ACKNOWLEDGMENTSDoctors Coenen and Schlapfer were sponsored with a grant from HDRS and ISAN.
Dr.Coenenoccasionally received honoraries and travel support fromMedronic (USA,Europe).
REFERENCESBarkhoudarian, G., Klochkov, T., Sedrak, M., Frew, A., Gorgulho, A., Behnke, E., et al.
(2010). A role of diffusion tensor imaging in movement disorder surgery. Acta Neu-rochirurgica, 152(12), 2089–2095.
Basser,P.,&Bihan,D.L. (1992).Fiberorientationmapping inananisotropicmediumwithNMRdiffusion spectroscopy. In: Proceedings of the 11th Annual Meeting SMRM, Berlin p. 1221.
Basser, P. J., Mattiello, J., & Le Bihan, D. (1994). MR diffusion tensor spectroscopy and im-aging. Biophysical Journal, 66(1), 259–267.
Basser, P. J., Mattiello, J., & LeBihan, D. (1994). Estimation of the effective self-diffusiontensor from the NMR spin echo. Journal of Magnetic Resonance. Series B, 103(3), 247–254.
Basser, P. J., Pajevic, S., Pierpaoli, C., Duda, J., & Aldroubi, A. (2000). In vivo fibertractography using DT-MRI data. Magnetic Resonance in Medicine, 44(4), 625–632.
Beaulieu, C., & Allen, P. S. (1994a). Determinants of anisotropic water diffusion in nerves.Magnetic Resonance in Medicine, 31(4), 394–400.
Beaulieu, C., & Allen, P. S. (1994b). Water diffusion in the giant axon of the squid: Impli-cations for diffusion-weighted MRI of the nervous system. Magnetic Resonance in Medi-cine, 32(5), 579–583.
Beaulieu, C., & Allen, P. S. (1996). An in vitro evaluation of the effects of local magnetic-susceptibility-induced gradients on anisotropic water diffusion in nerve. Magnetic Reso-nance in Medicine, 36(1), 39–44.
Benabid, A. L., Benazzous, A., & Pollak, P. (2002). Mechanisms of deep brain stimulation.Movement Disorders, 17(Suppl. 3), S73–S74.
Benabid, A. L., Deuschl, G., Lang, A. E., Lyons, K. E., & Rezai, A. R. (2006). Deep brainstimulation for Parkinson’s disease. Movement Disorders, 21(Suppl. 14), S168–S170.
Benabid, A. L., Pollak, P., Gao, D., Hoffmann, D., Limousin, P., Gay, E., et al. (1996).Chronic electrical stimulation of the ventralis intermedius nucleus of the thalamus as atreatment of movement disorders. Journal of Neurosurgery, 84, 203–214.
Bihan, D. L. (Ed.), (1995). Diffusion and perfusion magnetic resonance imaging—Applications tofunctional MRI. Raven Press: New York.
Burgel, U., Amunts, K., Hoemke, L., Mohlberg, H., Gilsbach, J. M., & Zilles, K. (2006).White matter fiber tracts of the human brain: Three-dimensional mapping at micro-scopic resolution, topography and intersubject variability. NeuroImage, 29, 1092–1105.
Burgel, U., Madler, B., Honey, C. R., Thron, A., Gilsbach, J. M., & Coenen, V. A. (2009).Fiber tracking with distinct software tools results in a clear diversity in anatomical fibertract portrayal. Central European Neurosurgery, 70, 27–35.
Butson, C. R., Cooper, S. E., Henderson, J. M., & McIntyre, C. C. (2007). Patient-specificanalysis of the volume of tissue activated during deep brain stimulation. NeuroImage, 34,661–670.
Butson, C. R., Cooper, S. E., Henderson, J. M., & McIntyre, C. C. (2006). Predicting theeffects of deep brain stimulation with diffusion tensor based electric field models.MedicalImage Computing and Computer-Assisted Intervention: MICCAI . . . International Conferenceon Medical Image Computing and Computer-Assisted Intervention, 9(Pt 2), 429–437.
Butson, C. R., Maks, C. B., & McIntyre, C. C. (2006). Sources and effects of electrode im-pedance during deep brain stimulation. Clinical Neurophysiology: Official Journal of the In-ternational Federation of Clinical Neurophysiology, 117, 447–454.

230 Volker Arnd Coenen et al.
Butson, C. R., & McIntyre, C. C. (2005). Role of electrode design on the volume of tissueactivated during deep brain stimulation. Journal of Neural Engineering, 3, 1–8.
Chenevert, T. L., Brunberg, J. A., & Pipe, J. G. (1990). Anisotropic diffusion in human whitematter: Demonstration with MR techniques in vivo. Radiology, 177(2), 401–405.
Coenen, V. A., Allert, N., &Madler, B. (2011). A role of diffusion tensor imaging fiber track-ing in deep brain stimulation surgery: DBS of the dentato-rubro-thalamic tract (drt) forthe treatment of therapy-refractory tremor. Acta Neurochirurgica, 153(8), 1579–1585 dis-cussion 1585.
Coenen, V. A., Fromm, C., Kronenburger, M., Rohde, I., Reinacher, P. C., Becker, R., et al.(2006). Electrophysiological proof of diffusion-weighted imaging-derived depiction of thedeep-seated pyramidal tract in human. Zentralblatt fur Neurochirurgie, 67, 117–122.
Coenen, V. A., & Honey, C. R. (2009). Ablative procedures for depression. In: A. M.Lozano, P. L. Gildenberg & R. R. Tasker (Eds.), Textbook of stereotactic and functional neu-rosurgery. Berlin: Springer.
Coenen, V. A., Honey, C. R., Hurwitz, T., Rahman, A. A., Mcmaster, J., Burgel, U., et al.(2009). Medial forebrain bundle stimulation as a pathophysiological mechanism for hy-pomania in subthalamic nucleus deep brain stimulation for Parkinson’s disease.Neurosur-gery, 64, 1106–1114 discussion 1114–5.
Coenen, V. A., Krings, T., Axer, H.,Weidemann, J., Kranzlein, H., Hans, F. J., et al. (2003).Intraoperative three-dimensional visualization of the pyramidal tract in a neuro-navigation system (PTV) reliably predicts true position of principal motor pathways. Sur-gical Neurology, 60, 381–390 discussion 390.
Coenen, V. A., Krings, T., Mayfrank, L., Polin, R. S., Reinges, M. H., Thron, A., et al.(2001). Three-dimensional visualization of the pyramidal tract in a neuronavigation sys-tem during brain tumor surgery: First experiences and technical note. Neurosurgery, 49,86–92 discussion 92–3.
Coenen, V. A., Krings, T., Weidemann, J., Hans, F. J., Reinacher, P., Gilsbach, J. M., et al.(2005). Sequential visualization of brain and fiber tract deformation during intracranialsurgery with three-dimensional ultrasound: An approach to evaluate the effect of brainshift. Neurosurgery, 56, 133–141 discussion 133–41.
Coenen, V. A., Madler, B., Schiffbauer, H., Urbach, H., & Allert, N. (2011). Individual fiberanatomy of the subthalamic region revealed with DTI—A concept to identify the DBStarget for tremor suppression. Neurosurgery, 68(4), 1069–1075 discussion 1075-6.
Coenen, V. A., Panksepp, J., Hurwitz, T. A., Urbach, H., &Madler, B. (2012). Human me-dial forebrain bundle (MFB) and anterior thalamic radiation (ATR): Imaging of two ma-jor subcortical pathways and the dynamic balance of opposite affects in understandingdepression. The Journal of Neuropsychiatry and Clinical Neurosciences, 24, 223–236.
Coenen, V. A., Schlaepfer, T. E., Maedler, B., & Panksepp, J. (2010). Cross-species affectivefunctions of the medial forebrain bundle—Implications for the treatment of affective painand depression in humans. Neuroscience and Biobehavioral Reviews, 35(9), 1971–1981.
Conturo, T. E., Lori, N. F., Cull, T. S., Akbudak, E., Snyder, A. Z., Shimony, J. S., et al.(1999). Tracking neuronal fiber pathways in the living human brain. Proceedings of theNational Academy of Sciences of the United States of America, 96(18), 10422–10427.
Deisseroth, K. (2012). Optogenetics and psychiatry: Applications, challenges, and opportu-nities. Biological Psychiatry, 71, 1030–1032.
Doran, M., Hajnal, J. V., Van Bruggen, N., King, M. D., Young, I. R., Bydder, G. M., et al.(1990). Normal and abnormal white matter tracts shown by MR imaging using direc-tional diffusion weighted sequences. Journal of Computer Assisted Tomography, 14(6),865–873.
Einstein, A. (1905). Uber die von der molekularkinetischen Theorie der Warme geforderteBewegung von in ruhenden Flussigkeiten suspendierten Teilchen. Annalen der Physik,322(8), 549–560.

231Diffusion Tensor Imaging and Deep Brain Stimulation
Fisher, R., Salanova, V., Witt, T., Worth, R., Henry, T., Gross, R., et al. (2010). Electricalstimulation of the anterior nucleus of thalamus for treatment of refractory epilepsy.Epilepsia, 51(5), 899–908.
Gradinaru, V., Mogri, M., Thompson, K. R., Henderson, J. M., & Deisseroth, K. (2009).Optical deconstruction of parkinsonian neural circuitry. Science, 324, 354–359.
Gutman, D. A., Holtzheimer, P. E., Behrens, T. E. J., Johansen-Berg, H., & Mayberg, H. S.(2009). A tractography analysis of two deep brain stimulation white matter targets fordepression. Biological Psychiatry, 65, 276–282.
Hamani, C., Mayberg, H., Snyder, B., Giacobbe, P., Kennedy, S., & Lozano, A. M. (2009).Deep brain stimulation of the subcallosal cingulate gyrus for depression: Anatomical lo-cation of active contacts in clinical responders and a suggested guideline for targeting.Journal of Neurosurgery, 111, 1209–1215.
Hariz, M. I., Blomstedt, P., & Zrinzo, L. (2010). Deep brain stimulation between 1947 and1987: The untold story. Neurosurgical Focus, 29, E1.
Hassler, R., Mundinger, F., & Riechert, T. (1979). Stereotaxis in Parkinson syndrome. Berlin,Germany: Springer Verlag.
Henderson, J. M. (2012). Connectomic surgery: Diffusion tensor imaging (DTI)tractography as a targeting modality for surgical modulation of neural networks. Frontiersin Integrative Neuroscience, 6, 15.
Holodny, A. I., Schwartz, T. H., Ollenschleger, M., Liu, W. C., & Schulder, M. (2001).Tumor involvement of the corticospinal tract: Diffusion magnetic resonancetractography with intraoperative correlation. Journal of Neurosurgery, 95, 1082 ff.
Johansen-Berg, H., & Behrens, T. E. J. (Eds.), (2009). Diffusion MRI: From quantitative mea-surements to in-vivo neuroanatomy. London: Elsevier Academic Press.
Johansen-Berg, H., Gutman, D., Behrens, T., Matthews, P., Rushworth, M., Katz, E., et al.(2007). Anatomical connectivity of the subgenual cingulate region targeted withdeep brain stimulation for treatment-resistant depression. Cerebral Cortex, 51(5),899–908.
Jones, D. (2011). Diffusion MRI: Theory, methods and applications. New York: Oxford Uni-versity Press.
Jones, D. K. (2004). The effect of gradient sampling schemes on measures derived fromdiffusion tensor MRI: a Monte Carlo study. Magnetic Resonance in Medicine, 51(4),897–815.
Jones, D. K., & Cercignani. (2010). Twentty-five pitfalls in the analysis of diffusion MRIdata. NMR Biomed, 23(7), 803–820.
Kinoshita, M., Yamada, K., Hashimoto, N., Kato, A., Baba, T., Maruno, M., et al. (2005).Fiber-tracking does not accurately estimate size of fiber bundle in pathological condition:Initial neurosurgical experience using neuronavigation and subcortical white matterstimulation. NeuroImage, 25(2), 424–429.
Krack, P., Pollak, P., Limousin, P., Benazzouz, A., & Benabid, A. L. (1997). Stimulation ofsubthalamic nucleus alleviates tremor in Parkinson’s disease. Lancet, 350, 1675 ff.
Kuncel, A. M., & Grill, W. M. (2004). Selection of stimulus parameters for deep brain stim-ulation. Clinical Neurophysiology, 115(11), 2431–2441.
Lazar, M., & Alexander, A. L. (2003). An error analysis of white mattertractography methods: Synthetic diffusion tensor field simulations. NeuroImage, 20(2),1140–1153.
Lazar, M., Weinstein, D. M., Tsuruda, J. S., Hasan, K. M., Arfanakis, K., Meyerand, M. E.,et al. (2003). White matter tractography using diffusion tensor deflection. Human BrainMapping, 18(4), 306–321.
Le Bihan, D., Breton, E., Lallemand, D., Grenier, P., Cabanis, E., & Laval-Jeantet, M.(1986). MR imaging of intravoxel incoherent motions: Application to diffusion and per-fusion in neurologic disorders. Radiology, 161(2), 401–407.
232 Volker Arnd Coenen et al.
Lobo, M. K., Nestler, E. J., & Covington, H. E. (2012). Potential utility of optogenetics inthe study of depression. Biological Psychiatry, 71, 1068–1074.
Lozano, A. M., Mayberg, H. S., Giacobbe, P., Hamani, C., Craddock, R. C., &Kennedy, S. H. (2008). Subcallosal cingulate gyrus deep brain stimulation fortreatment-resistant depression. Biological Psychiatry, 64, 461–467.
Madler, B., & Coenen, V. A. (2012). Explaining clinical effects of deep brain stimulationthrough simplified target-specific modeling of the volume of activated tissue. AJNR.American Journal of Neuroradiology, 33(6), 1072–1080.
Madler, B., Drabycz, S. A., Kolind, S. H., Whittall, K. P., & MacKay, A. L. (2008). Is dif-fusion anisotropy an accurate monitor of myelination? Correlation of multicomponentT2 relaxation and diffusion tensor anisotropy in human brain.Magnetic Resonance Imaging,26(7), 874–888.
Malone, D. A., Dougherty, D. D., Rezai, A. R., Carpenter, L. L., Friehs, G. M.,Eskandar, E. N., et al. (2009). Deep brain stimulation of the ventral capsule/ventral stri-atum for treatment-resistant depression. Biological Psychiatry, 65, 267–275.
Mayberg, H. S., Lozano, A. M., Voon, V., McNeely, H. E., Seminowicz, D., Hamani, C.,et al. (2005). Deep brain stimulation for treatment-resistant depression. Neuron, 45,651–660.
McIntyre, C. C., & Grill, W. M. (2002). Extracellular stimulation of central neurons: Influ-ence of stimulus waveform and frequency on neuronal output. Journal of Neurophysiology,88, 1592–1604.
McIntyre, C. C., Mori, S., Sherman, D. L., Thakor, N. V., & Vitek, J. L. (2004). Electricfield and stimulating influence generated by deep brain stimulation of the subthalamicnucleus. Clinical Neurophysiology: Official Journal of the International Federation of ClinicalNeurophysiology, 115, 589–595.
McIntyre, C. C., & Thakor, N. V. (2002). Uncovering the mechanisms of deep brain stim-ulation for Parkinson’s disease through functional imaging, neural recording, and neuralmodeling. Critical Reviews in Biomedical Engineering, 30(4–6), 249–281.
Merboldt, K.-D., &Hanicke,W. (1985). Self-diffusion NMR imaging using stimulated ech-oes. Journal of Magnetic Resonance, 64(3), 479–486.
Miocinovic, S., Lempka, S. F., Russo, G. S., Maks, C. B., Butson, C. R., Sakaie, K. E., et al.(2009). Experimental and theoretical characterization of the voltage distribution gener-ated by deep brain stimulation. Experimental Neurology, 216(1), 166–176.
Miocinovic, S., Parent, M., Butson, C. R., Hahn, P. J., Russo, G. S., Vitel, J. L., et al. (2006).Computational analysis of subthalamic nucleus and lenticular fasciculus activation duringtherapeutic deep brain stimulation. Journal of Neurophysiology, 96(3), 1569–1580.
Mori, S., & Crain, B. J. (1999). Three-dimensional tracking of axinal projections in the brainby magnetic resonance imaging. Ann Neurol, 45(2), 265–269.
Mori, S., Oishi, K., Jiang, H., Jiang, L., Li, X., Akhter, K., et al. (2008). Stereotaxic white mat-ter atlas based on diffusion tensor imaging in an ICBM template.NeuroImage, 40, 570–582.
Moseley, M. E., Cohen, Y., Mintorovitch, J., Chileuitt, L., Shimizu, H., Kucharczyk, J.,et al. (1990a). Early detection of regional cerebral ischemia in cats: Comparison ofdiffusion- and T2-weighted MRI and spectroscopy. Magnetic Resonance in Medicine, 14(2), 330–346.
Moseley, M. E., Cohen, Y., Mintorovitch, J., Chileuitt, L., Shimizu, H., Kucharczyk, J.,et al. (1990b). Diffusion-weightedMR imaging of anisotropic water diffusion in cat cen-tral nervous system. Radiology, 176(2), 439–445.
Neimat, J. S., Hamani, C., Giacobbe, P., Merskey, H., Kennedy, S. H.,Mayberg, H. S., et al.(2008). Neural stimulation successfully treats depression in patients with prior ablativecingulotomy. The American Journal of Psychiatry, 2008(165), 687–693.
Nimsky, C., Ganslandt, O., & Fahlbusch, R. (2007). Implementation of fiber tract naviga-tion. Neurosurgery, 61, 306–317 discussion 317–8.
233Diffusion Tensor Imaging and Deep Brain Stimulation
Nimsky, C., Grummich, P., Sorensen, A. G., Fahlbusch, R., & Ganslandt, O. (2005). Vi-sualization of the pyramidal tract in glioma surgery by integrating diffusion tensor imag-ing in functional neuronavigation. Zentralbl Neurochir, 66, 133–141.
Pai, D., Soltanian-Zadeh, H., & Hua, J. (2010). Evaluation of fiber bundles across subjectsthrough brain mapping and registration of diffusion tensor data. NeuroImage, 54(Suppl. 1),S165–S175.
Panksepp, J. (1985). Clinical neurology mood changes.Handbook of Clinical Neurology, 2010,1–16.
Papadakis, N. G., Murrills, C. D., Hall, L. D., Huang, C. L., & Adrian Carpenter, T. (2000).Minimal gradient encoding for robust estimation of diffusion anisotropy. Magnetic Res-onance Imaging, 18(6), 671–679.
Pilitsis, J. G., Metman, L. V., Toleikis, J. R., Hughes, L. E., Sani, S. B., & Bakay, R. A. E.(2008). Factors involved in long-term efficacy of deep brain stimulation of the thalamusfor essential tremor. Journal of Neurosurgery, 109, 640–646.
Pinsker, M. O., Herzog, J., Falk, D., Volkmann, J., Deuschl, G., & Mehdorn, M. (2008).Accuracy and distortion of deep brain stimulation electrodes on postoperative MRIand CT. Zentralblatt fur Neurochirurgie, 69, 144–147.
Plaha, P., Khan, S., & Gill, S. S. (2008). Bilateral stimulation of the caudal zona incerta nu-cleus for tremor control. Journal of Neurology, Neurosurgery, and Psychiatry, 79, 504–513.
Plaha, P., Patel, N. K., & Gill, S. S. (2004). Stimulation of the subthalamic region for essentialtremor. Journal of Neurosurgery, 101, 48–54.
Prayer, D., Roberts, T., Barkovich, A. J., Prayer, L., Kucharczyk, J., Moseley, M., et al.(1997). Diffusion-weighted MRI of myelination in the rat brain following treatmentwith gonadal hormones. Neuroradiology, 39(5), 320–325.
Ranck, J. B. (1975). Which elements are excited in electrical stimulation of mammalian cen-tral nervous system: A review. Brain Research, 98, 417–440.
Sajonz, B., Madler, B., Herberhold, S., Paus, S., & Coenen, V. A. (2011). A case of tremorreduction and almost complete ageusia under bilateral thalamic (VIM) deep brain stim-ulation in essential tremor—A therapeutic dilemma. Acta Neurochirurgica, 153(12),2361–2363.
Schlaepfer, T. E., Cohen, M. X., Frick, C., Kosel, M., Brodesser, D., Axmacher, N., et al.(2008). Deep brain stimulation to reward circuitry alleviates anhedonia in refractory ma-jor depression. Neuropsychopharmacology, 33, 368–377.
Schlaepfer, T. E., & Lieb, K. (2005). Deep brain stimulation for treatment of refractory de-pression. Lancet, 366, 1420–1422.
Schoene-Bake, J.-C., Parpaley, Y., Weber, B., Panksepp, J., Hurwitz, T. A., &Coenen, V. A. (2010). Tractographic analysis of historical lesion surgery for depression.Neuropsychopharmacology, 35, 2553–2563.
Sillery, E., Bittar, R. G., Robson, M. D., Behrens, T. E. J., Stein, J. F., Aziz, T. Z., et al.(2005). Connectivity of the human periventricular-periaqueductal gray region. Journalof Neurosurgery, 103, 1030–1034.
Spiegel, E., Wycis, H., Marks, M., & Lee, A. (1947). Stereotaxic apparatus for operations onthe human brain. Science, 106, 349–350.
Staempfli, P., Rienmueller, A., Reischauer, C., Valavanis, A., Boesiger, P., & Kollias, S.(2007). Reconstruction of the human visual system based on DTI fiber tracking. Journalof Magnetic Resonance Imaging: JMRI, 26, 886–893.
Stejskal, E. O., & Tanner, J. E. (1965). Spin diffusion measurements: Spin echoes in the pres-ence of a time-dependent field gradient. Journal of Chemical Physics, 42(1), 288–292.
Taylor, D. G., & Bushell, M. C. (1985). The spatial mapping of translational diffusion coeffi-cients by the NMR imaging technique. Physics in Medicine and Biology, 30(4), 345–349.
Thomsen, C., Henriksen, O., &Ring, P. (1987). In vivo measurement of water self diffusionin the human brain by magnetic resonance imaging. Acta Radiologica, 28(3), 353–361.
234 Volker Arnd Coenen et al.
Torrey, H. C. (1956). Bloch equations with diffusion terms. Physical Review, 104(3),563–565.
Wakana, S., Jiang, H., Nagae-Poetscher, L. M., van Zijl, P. C. M., & Mori, S. (2004). Fibertract-based atlas of human white matter anatomy. Radiology, 230, 77–87.
Wesbey, G. E., Moseley, M. E., & Ehmann, R. L. (1984). Translational molecular self-diffusion in magnetic resonance imaging. II. Measurement of the self-diffusion coeffi-cient. Investigative Radiology, 19(6), 491–498.
Wimberger, D. M., Roberts, T. P., Barkovich, A. J., Prayer, L. M., Moseley, M. E.,Kucharczyk, J., et al. (1995). Identification of “premyelination” by diffusion-weightedMRI. Journal of Computer Assisted Tomography, 19(1), 28–33.
Wu, J.-S., Zhou, L.-F., Tang, W.-J., Mao, Y., Hu, J., Song, Y.-Y., et al. (2007). Clinicalevaluation and follow-up outcome of diffusion tensor imaging-based functional neuro-navigation: A prospective, controlled study in patients with gliomas involving pyramidaltracts. Neurosurgery, 61, 935–948 discussion 948–9.
Xue, R., van Zijl, P. C., Crain, B. J., Solaiyappan, M., & Mori, S. (1999). In vivo three-dimensional reconstruction of rat brain axonal projections by diffusion tensor imaging.Magnetic Resonance in Medicine: Official Journal of the Society of Magnetic Resonance in Med-icine/Society of Magnetic Resonance in Medicine, 42, 1123–1127.
Yousif, N., Bayford, R., & Liu, X. (2008). The influence of reactivity of the electrode-braininterface on the crossing electric current in therapeutic deep brain stimulation. Neurosci-ence, 156(3), 597–606.
Yousif, N., Bayford, R.,Wang, S., & Liu, X. (2008). Quantifying the effects of the electrode-brain interface on the crossing electric currents in deep brain recording and stimulation.Neuroscience, 152(3), 683–691.
Copyright © 2022 FDOKUMEN