High-carotenoid maize as feed and food component - TDX ...
341
High-carotenoid maize as feed and food component: mycotoxin contamination, thermal processing, bioavailability and poultry meat production Joana Díaz Gómez http://hdl.handle.net/10803/405891 High-carotenoid maize as feed and food component: mycotoxin contamination, thermal processing, bioavailability and poultry meat production està subjecte a una llicència de Reconeixement-NoComercial-SenseObraDerivada 4.0 No adaptada de Creative Commons Les publicacions incloses en la tesi no estan subjectes a aquesta llicència i es mantenen sota les condicions originals. (c) 2017, Joana Díaz Gómez
-
Upload
khangminh22 -
Category
Documents
-
view
2 -
download
0
Transcript of High-carotenoid maize as feed and food component - TDX ...
High-carotenoid maize as feed and food component: mycotoxin contamination, thermal processing,
bioavailability and poultry meat production
Joana Díaz Gómez
http://hdl.handle.net/10803/405891
High-carotenoid maize as feed and food component: mycotoxin contamination, thermal processing, bioavailability and poultry meat production està subjecte a una llicència de Reconeixement-NoComercial-SenseObraDerivada 4.0 No adaptada de Creative Commons
Les publicacions incloses en la tesi no estan subjectes a aquesta llicència i es mantenen sota les condicions originals.
(c) 2017, Joana Díaz Gómez
Nom/Logotip de la Universitat on s’ha
llegit la tesi


Dissertation presented by Joana Díaz Gómez to obtain the PhD degree from
the University of Lleida. This Doctoral Thesis was supervised by Antonio J.
Ramos Girona and Carmina Nogareda Burch. The present work was carried
out in the Department of Food Technology and the Department of Animal
Science, and is included on the Agricultural and Food Science doctoral
program. The work is part of the following projects:
VitaMaize: High quality and safe food through antioxidant fortified
maize. Funding entity: RecerCaixa.
BIO2014-54426-P. Funding entity: Spanish Ministry of Economy and
Competitiveness (MINECO).
BIO2014-54441-P. Funding entity: Spanish Ministry of Economy and
Competitiveness (MINECO).
The financing of the PhD candidate was through a project contract
(RecerCaixa) and a doctoral grant from the University of Lleida.
This thesis has received a grant for its linguistic revision from the Language
Institute of the University of Lleida (2017 call).


El Dr. ANTONIO JAVIER RAMOS GIRONA, Catedrático de
Universidad del Departamento de Tecnología de Alimentos de la Universitat
de Lleida, y la Dra. CARMINA NOGAREDA BURCH, Profesora Agregada
del Departamento de Ciencia Animal de la Universitat de Lleida
HACEN CONSTAR
Que, bajo su dirección, la Sra. Joana Díaz Gómez ha realizado el trabajo de
investigación titulado “High-carotenoid maize as feed and food component:
mycotoxin contamination, thermal processing, bioavailability and poultry
meat production”, que presenta para optar al grado de Doctora por la
Universitat de Lleida. Considerando que el trabajo realizado constituye tema
de Tesis Doctoral, autorizan su exposición y defensa en la Universitat de
Lleida.
Y para que así conste, se expide el presente a 14 de junio de 2017.
Dr. Antonio J. Ramos Girona Dra. Carmina Nogareda Burch


Nothing in life is to be feared, it is only to be understood.
Marie Curie


But take your time, think a lot,
why, think of everything you've got
for you will still be here tomorrow
but your dreams may not
Father and Son, Cat Stevens
A mis padres


Las cosas podían haber sucedido de cualquier otra manera y, sin embargo, sucedieron así
(El Camino, Miguel Delibes). Antes de llegar a terra ferma, el camino ha
tenido varias etapas previas donde he trabajado con grandes investigadores y
compañeros que han contribuido a llegar a esta meta. Esta Tesis Doctoral ha
sido posible gracias a la colaboración de varios grupos de investigación
pertenecientes al Departamento de Tecnología de Alimentos, al
Departamento de Ciencia Animal y al Departamento de Producción Vegetal
y Ciencia Forestal de la Universitat de Lleida. ¡Gracias! Gràcies! Thanks!
Quisiera agradecer a mis directores de tesis, Antonio y Carmina, que
confiaran en mí para desarrollar este proyecto, que me guiaran y me
apoyaran en todo momento. Gracias Antonio por enseñarme el mundo de la
micología y por capitanear esta tesis tan multidisciplinar. Moltes gràcies
Carmina per estar sempre disponible quan et necessitava, i com no, per tots
els detalls que has tingut amb mí i pels sopars de becaris a casa teva, sempre
tindré un gran record d'aquells dies.
Un pilar fundamental de esta tesis han sido los directores del proyecto, Paul
y Teresa, many thanks for your effort and support to make this work
possible. El vostre grup d'investigació és un gran exemple a seguir, estic molt
agraïda d'haver sigut part del vostre equip. Many thanks also to Changfu
Zhu, Gerhard Sandmann and Richard Twymann for their contribution to my
research. Moltes gràcies també à la Núria per sempre ajudar-me amb els
temes burocràtics amb la millor somriure.
He tenido muchos tutores adoptivos durante este proyecto, dar las gracias a
todos ellos: a Robert Soliva, per estar sempre disposat a donar-me un cop de
mà; a Mari Paz, por adentrarme en el mundo del análisis sensorial, y a José
Antonio y Eduardo, por sus consejos veterinarios y su implicación en los
experimentos con animales. Agradecer también la participación del resto de
miembros de los equipos de investigación, en concreto, me gustaría dar las
gracias a Vicent y Sonia, por su contribución a mi investigación sobre las
micotoxinas, a Jaumes Lloveras y Antonio Michelena, por su trabajo en el
campo experimental, y a Ignasi Romagosa por ayudarme con la estadística.
Durante las largas jornadas en el laborarotio he disfrutado de la compañía de
técnicos y compañeros siempre dispuestos a comentar el día o a echarte una
mano en los momentos críticos, moltes gràcies a tots! Quisiera dar las gracias
a todos aquellos que me ayudaron de un modo u otro en los experimentos
con animales (Carmina, José Antonio, Eduardo, Mari Paz, Teresa, Robert S.,
Montse, Jordi, Robert G., Anna, Magda, los estudiantes de prácticas, etc.),
sin vosotros no hubiera sido posible.
He pasado grandes momentos dentro y fuera del laboratorio con mis
compañeras de Aluche, Burgos, Palencia, Ushuaia, Zaidín y Zaragoza, ya no
podemos seguir resolviendo el mundo en Lleida, pero siempre podemos
hacerlo tomando unos pinchos en La Laurel. El destino me había situado en
el momento y lugar exacto para que conociera a Laila, Mayka y Sandra en
etapas anteriores, pero ha sido la terra de la boira la que finalmente nos ha
unido. Gracias a todas por acompañarme en esta aventura y por todos los
momentos que hemos vivido juntas. También me gustaría recordar a todas
mis cuadrillas, como decimos en el norte, las logroñesas, las guaschinas y las
nutrias, y a Estefanía, gran investigadora y amiga, cuyo ejemplo me animó a
seguir con mi formación científica.
Por último, quisiera agradecer a mis padres y a mi hermana la paciencia y el
apoyo durante todos estos años fuera de casa y, sobre todo, el esfuerzo que
hicieron para que la pequeña de la casa siguiera formándose. Gracias a mi
madre y a mi hermana por comprender mi ausencia en los momentos
difíciles de estos últimos años, y a toda la familia y los amigos por el apoyo
que prestaron.
La música llega donde las palabras no pueden: diu que et transporta a un altre
planeta, t'inflama el cor amb mil somriures i del cel fa caure espurnes d'or per cada
moment que tornes a viure (Qui n'ha begut, Mishima). Gràcies per sempre ser-hi,
encara que sigui a 100 o 400 km de distancia.


I
High-carotenoid (HC) maize was genetically engineered to accumulate high
levels of carotenoids, including those with vitamin A activity, using as a basis
a South African white maize (M37W), which is practically devoid of
carotenoids. This biofortified maize was developed to improve the health
status of human populations that rely on maize as a staple food crop and
cannot access a diverse diet, but it is necessary to evaluate its suitability as
feed and food component before fulfilling this humanitarian objective.
During three consecutive harvest seasons (2013, 2014 and 2015), HC maize
and its near isogenic line (M37W) were cultivated in an experimental field in
Lleida (Catalonia, Northeastern Spain) and both varieties were tested for the
prevalence of fungal infection and the presence of fumonisins and aflatoxins.
There were only slight differences in fungal infection between both types of
maize. Fusarium spp. infected most maize kernels; subsequently, fumonisin
contamination was found in both maize varieties in all the years of study, but
the proportion of contaminated grains was substantially higher in the M37W
maize (1.4–fold, 2.4–fold and 2–fold more in the 2013, 2014 and 2015
harvest seasons, respectively). There was no Aspergillus spp. infection and,
accordingly, there was no contamination with aflatoxins. Maize grains
harvested each year also served as raw material to elaborate maize-based feed
and maize-derived products.
Since maize is an important cereal source in poultry nutrition, the effect of
novel traits on the growth and health of broiler chickens for meat
production and thus meat quality needs to be studied. Therefore, two animal
feeding trials were performed, including different diets: control (based on
M37W maize), HC (based on HC maize) and commercial (based on standard
yellow maize supplemented with natural color additives). Generally,
productivity and health parameters were similar among chickens fed on the
different diets. Chickens fed on the HC diet developed similar pigmentation
to those fed on the commercial diet supplemented with color additives, with
more intense yellow and red color than chickens fed on the control diet.
Thus, HC maize can be a cost-effective alternative to feed supplementation
in the poultry industry. The distribution of carotenoids and their derivatives
in the chicken was studied in more detail in an animal feeding trial in which
the bioavailability of provitamin A (PVA) carotenoids provided as intrinsic
components of HC maize compared to the same carotenoids supplied by its
near isogenic line supplemented with synthetic or natural additives was
studied. PVA carotenoids from HC maize are bioavailable, at least to the
same extent as in synthetic and natural additives, and contribute to liver
retinol levels. However, they are not metabolized in the same manner: β-
carotene is preferentially converted into retinol in the intestine whereas β-
cryptoxanthin accumulates in the liver. Zeaxanthin seems to interfere with β-
carotene absorption, since higher liver retinol levels were found in chickens
fed on low zeaxanthin diets.
A further aim was to assess the chicken meat quality and sensory shelf life,
using as raw material the meat obtained from chickens fed on the control,
HC and commercial (plus color additives) diets. Breast and leg quarters from
animals fed on the HC diet were equally or better accepted by consumers
than meat from the other two diets. Regardless of diet, meat samples were
equally accepted after 7–9 days of storage, which could be established as the
maximum storage period for this chicken meat accepted by consumers.
These results were supported by the analysis of spoilage bacteria (Pseudomonas
spp. and total aerobic mesophilic bacteria), which increased progressively
from 1 to 9 days, and the physical parameters (pH, color and texture), which
remained quite similar during storage. Thus, meat from chickens fed on a
HC maize diet has a good quality and shelf life as well as a long-lasting
golden pigmentation.
Finally, the optimal conditions for preserving carotenoids in HC maize were
analyzed, since maize and its derived products have to be cooked before
consumption. HC maize-based porridges have been shown not only to
preserve the initial carotenoid content, but also to enhance it due to the
carotenoid extractability from the food matrix. The carotenoid content was
higher when temperatures ≤ 95 °C were combined with short cooking times
(10–60 min), but longer times and low pH values can affect it. Regardless of
the type of porridge (thin or thick porridges, using unfermented or
fermented flours), HC maize-based porridges provided at least 40 µg/g (dry
weight) of total carotenoids, and therefore their consumption may contribute
to enhancing the dietary status of rural populations who depend on maize as
a staple food.
III
El maíz HC (del inglés High-carotenoid) fue modificado genéticamente para
acumular altos niveles de carotenoides, incluyendo aquellos con actividad
vitamina A, usando como base un maíz blanco sudafricano (M37W),
prácticamente carente de carotenoides. Este maíz biofortificado fue
desarrollado para mejorar el estado de salud de las poblaciones que dependen
del maíz como alimento básico y no pueden acceder a una dieta diversa, pero
es necesario evaluar su idoneidad como pienso y alimento antes de cumplir
este objetivo humanitario.
Durante tres cosechas consecutivas (2013, 2014 y 2015), se cultivó el maíz
HC y su línea isogénica (M37W) en un campo experimental en Lleida
(Cataluña, noreste de España), y se evaluó la prevalencia de infección fúngica
y la presencia de fumonisinas y aflatoxinas en ambas variedades. Sólo hubo
ligeras diferencias en la infección fúngica entre ambos tipos de maíz.
Fusarium spp. infectó la mayoría de granos de maíz de ambos tipos, lo que
originó que se diera contaminación por fumonisinas en ambas variedades de
maíz en todos los años de estudio, aunque la proporción de granos
contaminados fue sustancialmente mayor en el maíz M37W (1,4 veces, 2,4
veces y 2 veces más en 2013, 2014 y 2015, respectivamente). No hubo
infección por Aspergillus spp. y, en consecuencia, no se detectó
contaminación con aflatoxinas. El maíz cosechado cada año también sirvió
como materia prima para elaborar piensos y productos a base de maíz.
Como el maíz es una importante fuente de cereales en nutrición avícola, es
necesario estudiar el efecto de nuevas características en el crecimiento y la
salud de los pollos de engorde y, por consiguiente, en la calidad de la carne.
Se realizaron dos ensayos de alimentación animal, incluyendo diferentes
dietas: control (basada en el maíz M37W), HC (basada en el maíz HC) y
comercial (basada en el maíz amarillo estándar suplementado con pigmentos
naturales). En general, los parámetros de productividad y salud fueron
similares entre los pollos alimentados con las diferentes dietas. Los pollos
alimentados con la dieta HC desarrollaron una pigmentación similar a
aquellos alimentados con la dieta comercial con pigmentos, con un color
amarillo y rojo más intenso que los pollos alimentados con la dieta control.
Por lo tanto, el maíz HC puede ser una alternativa rentable a la
suplementación de piensos en la industria avícola. La distribución de
carotenoides y sus derivados en el pollo se estudió con más detalle en un
ensayo de alimentación animal en el que la biodisponibilidad de los

carotenoides provitamina A (PVA), proporcionados como componentes
intrínsecos del maíz HC, fue estudiada en relación a los mismos carotenoides
suministrados por el maíz M37W suplementado con pigmentos sintéticos o
naturales. Los carotenoides PVA del maíz HC son biodisponibles, al menos
en la misma medida que en los pigmentos sintéticos y naturales,
contribuyendo a los niveles hepáticos de retinol. Sin embargo, no se
metabolizan de la misma manera: el β-caroteno se convierte preferentemente
en retinol en el intestino mientras que la β-criptoxantina se acumula en el
hígado. La zeaxantina parece interferir con la absorción del β-caroteno, ya
que se encontraron mayores niveles de retinol hepático en pollos
alimentados con dietas bajas en zeaxantina.
La calidad de la carne de pollo y su vida útil sensorial fueron evaluadas
utilizando como materia prima la carne obtenida de pollos alimentados con
las dietas control, HC y comercial (con pigmentos naturales). Las pechugas y
los cuartos traseros de los animales alimentados con la dieta HC fueron
igualmente o mejor aceptados por los consumidores que la carne de las otras
dos dietas. Independientemente de la dieta, la carne fue igualmente aceptada
después de 7–9 días de almacenamiento, lo que podría establecerse como el
período máximo aceptado por los consumidores para el almacenamiento de
esta carne de pollo. Estos resultados fueron apoyados por el análisis de
bacterias alterantes (Pseudomonas spp. y bacterias aeróbicas mesófilas), que
aumentaron progresivamente del día 1 al 9, y los parámetros físicos (pH,
color y textura), que permanecieron similares durante el almacenamiento. Por
lo tanto, la carne de pollos alimentados con una dieta basada en el maíz HC
tiene una buena calidad y vida útil, así como una pigmentación amarilla-
anaranjada de larga duración.
Finalmente, se analizaron las condiciones óptimas para conservar los
carotenoides en el maíz HC, ya que el maíz y sus derivados deben ser
cocinados antes de su consumo. Los purés de maíz HC han demostrado no
sólo conservar el contenido inicial de carotenoides, sino también aumentarlo
debido a la extracción de carotenoides de la matriz alimenticia. El contenido
de carotenoides se incrementó cuando se combinaron temperaturas ≤ 95 ° C
con tiempos de cocción cortos (10–60 min), pero tiempos más largos y
valores bajos de pH pueden afectarlo. Independientemente del tipo de puré,
(fino o grueso, elaborado con harina fermentada o no), los purés de maíz HC
proporcionan al menos 40 μg/g (en peso seco) de carotenoides totales, por
lo que su consumo puede contribuir a mejorar la situación alimentaria de las
poblaciones rurales que dependen del maíz como alimento básico.

V
El panís HC (de l'anglès High-carotenoid) va ser modificat genèticament per
acumular alts nivells de carotenoides, incloent aquells amb activitat de la
vitamina A, utilitzant com a base un panís blanc sud-africà (M37W),
pràcticament sense carotenoides. Aquest panís biofortificat va ser
desenvolupat per millorar l'estat de salut de les poblacions que depenen del
panís com a aliment bàsic i no poden accedir a una dieta variada, però cal
avaluar la seva idoneïtat com a pinso i aliment abans de complir aquest
objectiu humanitari.
Durant tres collites consecutives (2013, 2014 i 2015), es van cultivar el panís
HC i la seva línia isogènica (M37W) en un camp experimental a Lleida
(Catalunya, nord-est d'Espanya), i es van avaluar la prevalença d'infecció
fúngica i la presència de fumonisines i aflatoxines en les dues varietats.
Només hi va haver lleugeres diferències en la infecció fúngica entre ambdós
tipus de panís. Fusarium spp. va infectar la majoria de grans de panís, per tant,
es va trobar contaminació per fumonisines en les dues varietats en tots els
anys d'estudi, però la proporció de grans contaminats va ser substancialment
més gran en el panís M37W (1,4 vegades, 2,4 vegades i 2 vegades més en
2013, 2014 i 2015, respectivament). No hi va haver infecció per Aspergillus
spp., i en conseqüència, no es va detectar contaminació per aflatoxines. El
panís collit cada any també va servir com a matèria primera per a elaborar
pinsos i productes a base de panís.
Com que el panís és una important font de cereals en nutrició avícola, cal
estudiar l'efecte de les noves característiques en el creixement i la salut dels
pollastres d'engreix i, per tant, la qualitat de la carn. Es van realitzar dos
assajos d'alimentació animal, incloent diferents dietes: control (basada en el
panís M37W), HC (basada en el panís HC) i comercial (basada en el panís
groc estàndard suplementat amb pigments naturals). En general, els
paràmetres de productivitat i salut van ser similars entre els pollastres
alimentats amb les diferents dietes. Els pollastres alimentats amb la dieta HC
van desenvolupar una pigmentació similar a aquells alimentats amb la dieta
comercial amb pigments, amb un color groc i vermell més intens que els
pollastres alimentats amb la dieta control. Per tant, el panís HC pot ser una
alternativa rendible a la suplementació de pinsos en la indústria avícola. La
distribució de carotenoides i els seus derivats en el pollastre es va estudiar
amb més detall en un assaig d'alimentació animal en què la biodisponibilitat
dels carotenoides provitamina A (PVA) proporcionats com a components

intrínsecs del panís HC va ser estudiada en relació als mateixos carotenoides
subministrats pel panís M37W suplementat amb pigments sintètics o
naturals. Els carotenoides PVA del panís HC són biodisponibles, almenys en
la mateixa mesura que en els pigments sintètics i naturals, contribuint als
nivells hepàtics de retinol. No obstant això, no es metabolitzen de la mateixa
manera: el β-carotè es converteix preferentment en retinol a l'intestí mentre
que la β-criptoxantina s'acumula com a tal al fetge. La zeaxantina sembla
interferir amb l'absorció del β-carotè, ja que es van trobar nivells més alts de
retinol hepàtic en pollastres alimentats amb dietes baixes en zeaxantina.
La qualitat de la carn de pollastre i la seva vida útil sensorial van ser
avaluades utilitzant com a matèria primera la carn obtinguda de pollastres
alimentats amb les dietes control, HC i comercial (amb pigments naturals).
Els pits i els quarts del darrere dels animals alimentats amb la dieta HC van
ser igualment o millor acceptats pels consumidors que la carn de les altres
dues dietes. Independentment de la dieta, la carn va ser acceptada per igual
després de 7–9 dies d'emmagatzematge, el que podria establir-se com el
període màxim d'emmagatzematge per aquesta carn de pollastre acceptat pels
consumidors. Aquests resultats van ser recolzats per l'anàlisi de bacteris
alterants (Pseudomonas spp. i bacteris aeròbics mesòfils), que van augmentar
progressivament des del dia 1 al 9, i els paràmetres físics (pH, color i textura),
que van romandre similars durant l'emmagatzematge. Per tant, la carn de
pollastres alimentats amb una dieta basada en el panís HC té una bona
qualitat i vida útil, així com una pigmentació groga-ataronjada de llarga
durada.
Finalment, les condicions òptimes per conservar els carotenoides en el panís
HC van ser analitzades ja que el panís i els seus derivats han de ser cuinats
abans del seu consum. Els purés de panís HC han demostrat no només
conservar el contingut inicial de carotenoides, sinó també augmentar-lo a
causa de l'extracció de carotenoides de la matriu alimentària. El contingut de
carotenoides es va incrementar quan es van combinar temperatures ≤ 95 °C
amb temps de cocció curts (10–60 min), però temps més llargs i valors
baixos de pH poden afectar-lo. Independentment del tipus de puré, (fi o
gruixut, elaborat amb farina fermentada o no), els purés de panís HC
proporcionen almenys 40 µg/g (en pes sec) de carotenoides totals, pel que el
seu consum pot contribuir a millorar la situació alimentària de les poblacions
rurals que depenen del panís com a aliment bàsic.


IX
ADG Average daily gain
AFs Aflatoxins
AFB1 Aflatoxin B1
AFB2 Aflatoxin B2
AFG1 Aflatoxin G1
AFG2 Aflatoxin G2
AFM1 Aflatoxin M1
AILP α-Amylase inhibidor protein
ANOVA Analysis of variance
AOAC Association of Official Analytical Chemists
aw Water activity
β-car β-Carotene
BCDO1 β-Carotene-15,15'-dioxygenase 1
BCDO2 β-Carotene-9',10'-dioxygenase 2
β-cry β-Cryptoxanthin
BCW Black cutworm
BHT Butylated hydroxytoluene
bp Base pair
Bt Bacillus thuringiensis
Bw Body weight
CaSR Calcium sensing receptor
CD36 Cluster determinant 36
CEW Corn earworm
cfu Colony-forming unit
CGIAR Consultative Group of International Agriculture Research
CIE Commission Internationale de l'Éclairage – International
Commission on Illumination
CPA Cyclopiazonic acid
CRTISO Carotenoid isomerase
CRW Corn rootworm
CSIR Council for Scientific and Industrial Research
CspB Bacterial cold shock protein B
CYP97C Carotene ε-ring hydroxylase
DG18 Dichloran 18% glycerol agar media
DMAPP Dimethylallyl diphosphate
DNA Deoxyribonucleic acid
dNTPs Deoxynucleotide triphosphates
DON Deoxynivalenol
DRBC Dichloran rose-bengal chloramphenicol agar media
dw Dry weight basis
EC European Commission
ECB European corn borer
EcfolE Bacterial GTP cyclohydrolase 1
EDTA Ethylenediaminetetraacetic acid
em Emission
EFSA European Food Safety Authority
EP European Parliament
EPA Environmental Protection Agency of the United States
EU European Union
exc Excitation
FAO Food and Agricultural Organization of the United Nations
FAOSTAT Food and Agricultural Organization of the United Nations
Statistics Division
FAW Fall armyworm
FBs Fumonisins
FB1 Fumonisin B1
FB2 Fumonisin B2
FB3 Fumonisin B3
FCR Feed conversion ratio
fd Freeze-dried
FDA Food and Drug Administration of the United States
Fig Figure
GE Genetically engineered
GGPP Geranylgeranyl diphosphate
GGPPS Geranylgeranyl diphosphate synthase
GM Genetically modified
GMO Genetically modified organism
GTP Guanosine triphosphate
HC High-carotenoid
HPLC High-performance liquid chromatography
HSD Honest significant difference
HYDB β-Carotene hydroxylase
IARC International Agency for Research on Cancer
IPP Isopentenyl diphosphate
IPPI Isopentenyl diphosphate isomerase
ISO International Organization for Standardization
IU International units
JECFA Joint FAO/WHO Expert Committee on Food Additives
LOD Limit of detection
lut Lutein
LYCB Lycopene β-cyclase
LYCE Lycopene ε-cyclase
mc Moisture content
MCRW Mexican corn rootworm
MDG Millenium development goal
MON Moniliformin
mRNA Messenger ribonucleic acid
MT Megatonne
NCRW Northern corn rootworm
nd Not detected
ne Not evaluated
NIV Nivalenol
NRC National Research Council
OPA Ortho-phthalaldehyde
Osdhar Rice dehydroascorbate reductase
OTA Ochratoxin A
PacrtI Pantoea ananatis phytoene desaturase
PAT Patulin
PBS Phosphate-buffered saline
PCA Principal component analysis
PCR Polymerase chain reaction
PDA Potato dextrose agar
PDS Phytoene desaturase
Pse Pseudomonas spp.
PSY Phytoene synthase
PVA Provitamin A
R Refrigerated
R Reproductive stages
RE Retinol equivalents
RAE Retinol activity equivalents
RASFF Rapid Alert System for Food and Feed
RDA Recommended Dietary Allowance
SCOOP Scientific Cooperation on Questions Relating to Food
SCN Standing Committee on Nutrition
SDS Sodium dodecyl sulfate
SR-BI Scavenger receptor class B type I
SCARB1 Scavenger receptor class B type I
SWCB Southwestern corn borer
T Thawed
TAMB Total aerobic mesophilic bacteria
TCC Total carotenoid content
TNAU Tamil Nadu Agricultural University
UK United Kingdom
UN United Nations
US/USA United States of America
USDA United States Department of Agriculture
V Vegetative stages
VAD Vitamin A deficiency
VE Emergenge
VT Tasseling
WB Warner-Braztler
WBC Western bean cutworm
WCRW Western corn rootworm
WHO World Health Organization
ZDS ζ-Carotene desaturase
zea Zeaxanthin
ZEA Zearalenone
ZISO ζ-Carotene isomerase
Zmpsy Zea mays phytoene synthase 1


ABSTRACT .............................................................................................................. I
RESUMEN............................................................................................................ III
RESUM ..................................................................................................................... V
LIST OF ABBREVIATIONS .......................................................................... IX
GENERAL INTRODUCTION ........................................................................ 1
1. Micronutrient malnutrition ............................................................................. 3
1.1. Vitamin A ................................................................................................... 3
1.2. Carotenoids ................................................................................................ 7
1.2.1. Carotenoid biosynthesis ................................................................ 7
1.2.2. Carotenoids: sources and health effects ................................... 10
2. Biofortification of staple crops ..................................................................... 11
2.1. Agronomic practices............................................................................... 11
2.2. Conventional breeding ........................................................................... 12
2.3. Genetic engineering ................................................................................ 12
3. Maize ................................................................................................................. 15
3.1. High-carotenoid maize ........................................................................... 19
3.2. Mycotoxins in maize ............................................................................... 20
4. Poultry production.......................................................................................... 26
4.1. Carotenoid metabolism in chickens ..................................................... 31
5. Main regulatory issues in the European Union.......................................... 32
5.1. Genetically modified food and feed ................................................... 32
5.2. Animals for scientific purposes ............................................................ 33
5.3. Additives in animal feed ........................................................................ 34
5.4. Mycotoxins in feed ................................................................................. 34
5.5. Mycotoxins in maize and maize products intended for human
consumption ................................................................................................... 35
6. References ........................................................................................................ 36
OBJECTIVES AND WORK PLAN ............................................................... 49
Objectives ............................................................................................................. 51
Work plan ............................................................................................................. 53
RESULTS AND DISCUSSION ...................................................................... 55
CHAPTER I ........................................................................................................... 57
The effect of enhanced carotenoid content of transgenic maize grain
on fungal colonization and mycotoxin content ........................................... 59
1. Introduction ..................................................................................................... 59
2. Materials and methods ................................................................................... 61
2.1. Maize ......................................................................................................... 61
2.2. Moisture and water activity measurements ......................................... 62
2.3. Meteorological data ................................................................................ 62
2.4. Mycobiota determination....................................................................... 63
2.5. DNA extraction, amplification, and identification ............................ 64
2.6. Extraction, detection, and quantification of FBs and AFs by HPLC
........................................................................................................................... 68
2.7. Statistical analysis .................................................................................... 69
3. Results ............................................................................................................... 69
3.1. Moisture and water activity ................................................................... 69
3.2. Mycobiota incidence and identification............................................... 69
3.3. Fumonisin and aflatoxin contamination ............................................. 70
4. Discussion ........................................................................................................ 71
5. References ........................................................................................................ 74
CHAPTER II ......................................................................................................... 81
High-carotenoid biofortified maize is an alternative to color additives
in poultry feed ........................................................................................................ 83
1. Introduction ..................................................................................................... 84
2. Materials and methods ................................................................................... 85
2.1. Diet preparation ...................................................................................... 85
2.2. Bird management and experimental design ........................................ 87
2.3. Growth performance ............................................................................. 88
2.4. Carotenoid analysis ................................................................................. 88
2.5. Colorimetric analysis .............................................................................. 88
2.6. Statistical analysis .................................................................................... 89
3. Results ............................................................................................................... 89
3.1. Compositional analysis ........................................................................... 89
3.2. Productivity and health parameters ..................................................... 90
3.3. Carotenoid and retinol levels ................................................................ 94
3.4. Color parameters ..................................................................................... 95
4. Discussion ........................................................................................................ 98
5. References ......................................................................................................102
CHAPTER III .....................................................................................................109
Provitamin A carotenoids from an engineered high-carotenoid maize
are bioavailable and zeaxanthin does not compromise β-carotene
absorption in poultry .........................................................................................111
1. Introduction ...................................................................................................112
2. Materials and methods .................................................................................113
2.1. Diet preparation ....................................................................................113
2.2. Experimental design and growth performance ................................116
2.3. Carotenoid analysis ...............................................................................117
2.4. Colorimetric analysis ............................................................................118
2.5. Statistical analysis ..................................................................................118
3. Results .............................................................................................................118
3.1. Compositional analysis .........................................................................118
3.2. Growth performance ...........................................................................118
3.3. Carotenoid and retinol levels ..............................................................119
3.4. Color parameters ...................................................................................121
4. Discussion ......................................................................................................123
5. References ......................................................................................................127
CHAPTER IV ......................................................................................................135
Quality and sensory shelf life of raw chicken meat obtained from
broilers fed on a diet based on carotenoid-biofortified maize ..............137
1. Introduction ...................................................................................................138
2. Materials and methods .................................................................................139
2.1. Animals and dietary treatments ..........................................................139
2.2. Sensory shelf life analyses ....................................................................142
2.2.1. Descriptive panel........................................................................142
2.2.2. Consumer panel .........................................................................143
2.2.3. Survival analysis ..........................................................................144
2.3. Microbiological analyses ......................................................................144
2.4. pH measurement ...................................................................................145
2.5. Color measurement ..............................................................................145
2.6. Texture measurement ...........................................................................145
2.7. Statistical analysis ..................................................................................146
3. Results and discussion..................................................................................146
3.1. Sensory and survival analyses ..............................................................146
3.2. Microbiological and physical analyses ...............................................150
4. References ......................................................................................................162
CHAPTER V .......................................................................................................167
Influence of cooking conditions on carotenoid content and stability in
porridges prepared from high-carotenoid maize ......................................169
1. Introduction ...................................................................................................170
2. Materials and methods .................................................................................172
2.1. Maize .......................................................................................................172
2.2. Maize porridge .......................................................................................172
2.3. Experiment 1: evaluation of temperature, time and pH during
processing ......................................................................................................172
2.4. Experiment 2: evaluation of home-cooking techniques .................173
2.5. Moisture measurement.........................................................................174
2.6. pH measurement ...................................................................................174
2.7. Carotenoid analysis ...............................................................................174
2.8. Statistical analysis ..................................................................................175
3. Results and discussion..................................................................................175
3.1. Influence of pH and temperature-time processing conditions on
carotenoid content .......................................................................................175
3.2. Effect of home-cooking techniques on carotenoid content ..........177
4. References ......................................................................................................181
4.1. Recommended reading ........................................................................185
GENERAL DISCUSSION ..............................................................................187
1. High-carotenoid maize grown under field conditions ............................189
2. High-carotenoid maize as feed ingredient ................................................195
3. High-carotenoid maize as food ingredient ...............................................204
4. References ......................................................................................................210
CONCLUSIONS ................................................................................................221
FUTURE PROSPECTS ...................................................................................227
ANNEXES ...........................................................................................................231
ANNEX I ..............................................................................................................233
Mycotoxin levels in poultry feed ....................................................................235
ANNEX II ............................................................................................................237
Biofortification of crops with nutrients: factors affecting utilization
and storage ............................................................................................................239
1. Introduction ...................................................................................................239
2. Fate of nutrients produced in plants..........................................................242
2.1. Folate ......................................................................................................242
2.2. Carotenoids ............................................................................................243
2.3. Vitamin E ...............................................................................................243
2.4. Calcium and iron ...................................................................................244
3. The role of food matrix, food processing and storage ...........................244
3.1. Food matrix ...........................................................................................244
3.2. Food processing ....................................................................................246
3.3. Storage ....................................................................................................250
4. Downstream behavior of absorbed nutrients ..........................................250
5. Conclusions ...................................................................................................252
6. References ......................................................................................................253
ANNEX III ..........................................................................................................261
The impact of Bacillus thuringiensis technology on the occurrence of
fumonisins and other mycotoxins in maize ................................................263
1. Introduction ...................................................................................................264
2. Transgenic maize and mycotoxins .............................................................265
2.1. Factors that affect mycotoxin occurrence ........................................265
2.2. Suppression of insect pests using Bt technology .............................266
2.3. Fumonisin contamination in Bt and non-Bt maize .........................268
2.4. Aflatoxin contamination in Bt and non-Bt maize ...........................269
2.5. Contamination with other mycotoxins in Bt and non-Bt maize ...271
2.6. Economic impact of mycotoxin reduction in Bt maize .................272
2.7. Alternative strategies to reduce mycotoxin levels in maize ............273
3. Concluding remarks......................................................................................274
4. References ......................................................................................................287


General introduction
3
Deficiencies in essential vitamins and minerals (micronutrients), so-called
hidden hunger, are estimated to affect 2 billion people worldwide, especially
women and preschool-age children, due to reproduction and growth
demands, respectively. As the term hidden hunger indicates, this form of
undernutrition is not readily visible in those affected by it (Muthayya et al.,
2013; Nuss and Tanumihardjo, 2010). Iron, iodine, folate, vitamin A, and
zinc deficiencies are the most widespread micronutrient deficiencies, and
often occur simultaneously, although iodine deficiency is region-specific and
is not necessarily related to countries with high hidden hunger (Bailey et al.,
2015). Sub-Saharan African countries, as well as India and Afghanistan, have
the highest level of hidden hunger, with a high prevalence of stunting, iron
deficiency anemia, and vitamin A deficiency (VAD). Micronutrient
deficiencies not only have a negative impact on health, but also affect the
economic development of those countries (Muthayya et al., 2013).
Vitamin A is an essential nutrient that plays several roles in the human body,
including normal functioning of the visual system, growth and development,
maintenance of epithelial cellular integrity, immune function, and
reproduction (UN-SCN, 2004). In many developing countries, VAD is a
public health problem that can lead to disorders, such as xerophthalmia (the
leading preventable cause of blindness in children), anemia, and weakened
host resistance to infection, which can increase the severity of infectious
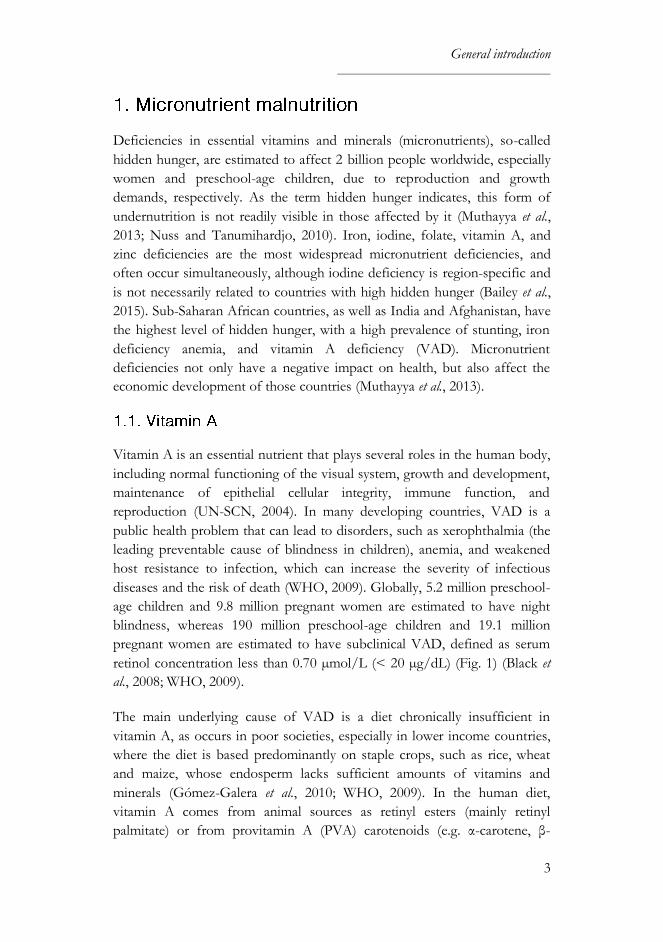
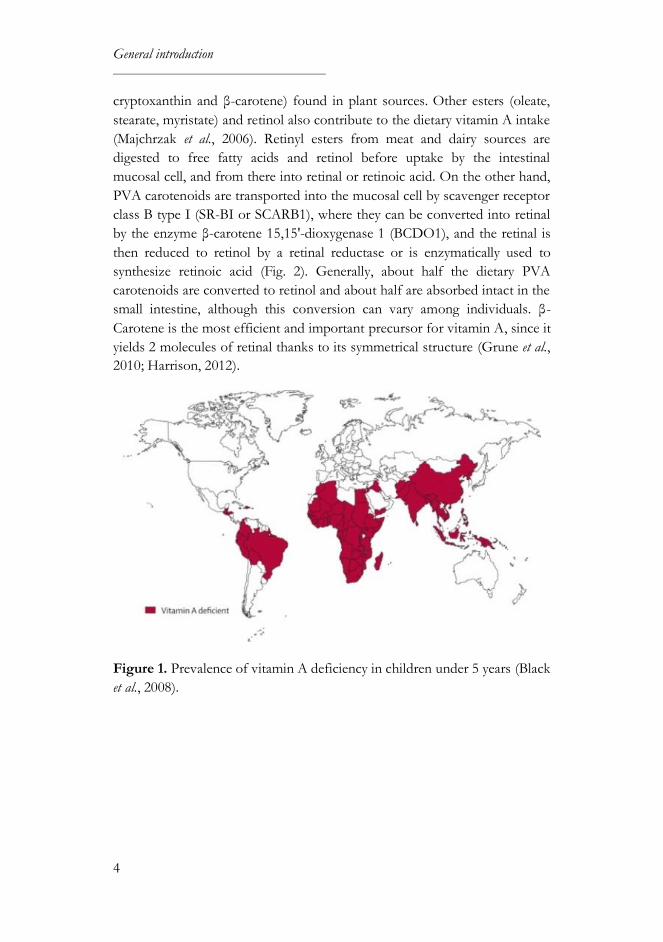
diseases and the risk of death (WHO, 2009). Globally, 5.2 million preschool-
age children and 9.8 million pregnant women are estimated to have night
blindness, whereas 190 million preschool-age children and 19.1 million
pregnant women are estimated to have subclinical VAD, defined as serum
retinol concentration less than 0.70 µmol/L (< 20 µg/dL) (Fig. 1) (Black et
al., 2008; WHO, 2009).
The main underlying cause of VAD is a diet chronically insufficient in
vitamin A, as occurs in poor societies, especially in lower income countries,
where the diet is based predominantly on staple crops, such as rice, wheat
and maize, whose endosperm lacks sufficient amounts of vitamins and
minerals (Gómez-Galera et al., 2010; WHO, 2009). In the human diet,
vitamin A comes from animal sources as retinyl esters (mainly retinyl
palmitate) or from provitamin A (PVA) carotenoids (e.g. α-carotene, β-
General introduction
4
cryptoxanthin and β-carotene) found in plant sources. Other esters (oleate,
stearate, myristate) and retinol also contribute to the dietary vitamin A intake
(Majchrzak et al., 2006). Retinyl esters from meat and dairy sources are
digested to free fatty acids and retinol before uptake by the intestinal
mucosal cell, and from there into retinal or retinoic acid. On the other hand,
PVA carotenoids are transported into the mucosal cell by scavenger receptor
class B type I (SR-BI or SCARB1), where they can be converted into retinal
by the enzyme β-carotene 15,15'-dioxygenase 1 (BCDO1), and the retinal is
then reduced to retinol by a retinal reductase or is enzymatically used to
synthesize retinoic acid (Fig. 2). Generally, about half the dietary PVA
carotenoids are converted to retinol and about half are absorbed intact in the
small intestine, although this conversion can vary among individuals. β-
Carotene is the most efficient and important precursor for vitamin A, since it
yields 2 molecules of retinal thanks to its symmetrical structure (Grune et al.,
2010; Harrison, 2012).
Figure 1. Prevalence of vitamin A deficiency in children under 5 years (Black
et al., 2008).

General introduction
5
Figure 2. Vitamin A in humans is absorbed as preformed vitamin A or as
provitamin A (PVA) carotenoids. Adapted from Bai et al. (2011).
Carotenoids are not considered essential nutrients, but it is interesting to
note that PVA carotenoids, especially β-carotene, provide more than half of
the vitamin A supply in Africa and Asia (Tanumihardjo and Yang, 2009).
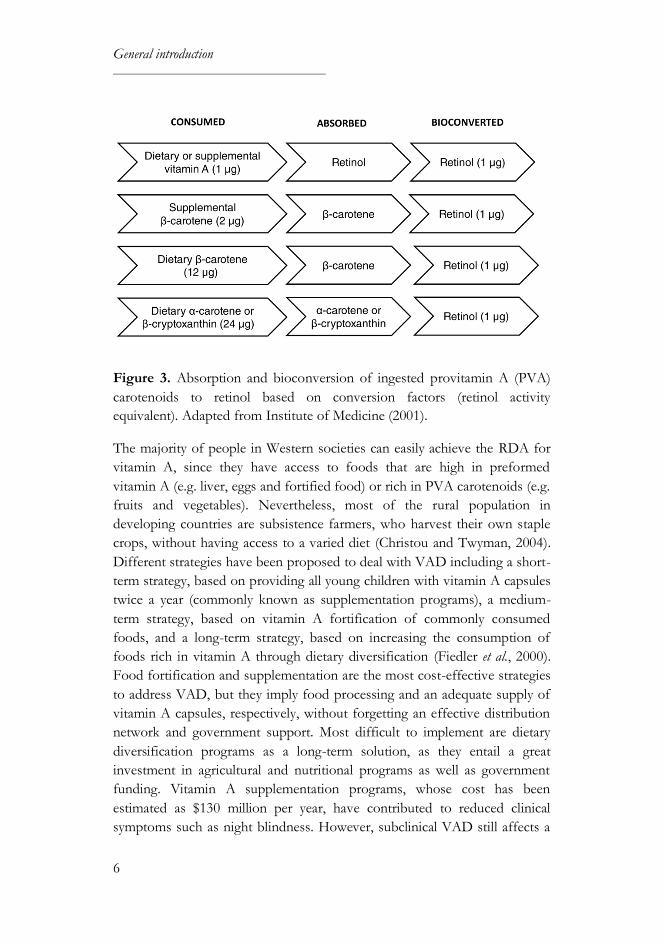
There are dietary recommendations for vitamin A intake, whereas they are
not established for carotenoids. The Recommended Dietary Allowance
(RDA) for vitamin A is 900 µg retinol activity equivalents (RAE)/day for
men, 700 µg RAE/day for women (which is increased in pregnancy and
lactation to 750–770 and 1200–1300 µg RAE/day, respectively) and 300–400
µg RAE/day for children (depending on age). Many factors affect the
assimilation of carotenoids from foods, hence the use of conversion factors:
12 µg of β-carotene or 24 µg of other PVA carotenoids are required to
obtain 1 µg of RAE (Fig. 3). Food and supplement labels usually indicate
vitamin A levels in International Units (IU): one IU of retinol is equivalent to
0.3 μg RAE (Institute of Medicine, 2001).
General introduction
6
Figure 3. Absorption and bioconversion of ingested provitamin A (PVA)
carotenoids to retinol based on conversion factors (retinol activity
equivalent). Adapted from Institute of Medicine (2001).
The majority of people in Western societies can easily achieve the RDA for
vitamin A, since they have access to foods that are high in preformed
vitamin A (e.g. liver, eggs and fortified food) or rich in PVA carotenoids (e.g.
fruits and vegetables). Nevertheless, most of the rural population in
developing countries are subsistence farmers, who harvest their own staple
crops, without having access to a varied diet (Christou and Twyman, 2004).
Different strategies have been proposed to deal with VAD including a short-
term strategy, based on providing all young children with vitamin A capsules
twice a year (commonly known as supplementation programs), a medium-
term strategy, based on vitamin A fortification of commonly consumed
foods, and a long-term strategy, based on increasing the consumption of
foods rich in vitamin A through dietary diversification (Fiedler et al., 2000).
Food fortification and supplementation are the most cost-effective strategies
to address VAD, but they imply food processing and an adequate supply of
vitamin A capsules, respectively, without forgetting an effective distribution
network and government support. Most difficult to implement are dietary
diversification programs as a long-term solution, as they entail a great
investment in agricultural and nutritional programs as well as government
funding. Vitamin A supplementation programs, whose cost has been
estimated as $130 million per year, have contributed to reduced clinical
symptoms such as night blindness. However, subclinical VAD still affects a

General introduction
7
high proportion of children in Africa and South Central Asia (Horton et al.,
2010; UN-SCN, 2010). Therefore, more efficient interventions such as
biofortification will be needed to reduce VAD in those countries.
Biofortification of staple crops with organic nutrients could cost-effectively
reduce VAD, as exemplified by Golden Rice II (Paine et al., 2005; Ye et al.,
2000), Golden Potato (Ducreux et al., 2005) and Carolight® maize (Naqvi et
al., 2009; Zhu et al., 2008).
Carotenoids are the most widespread group of pigments in nature, with over
600 different carotenoids isolated and structurally characterized, although
only about 50 are typically found in the human diet, and only about 20 are
present in human blood and tissues, including α-carotene, β-carotene,
lycopene, lutein, zeaxanthin, β-cryptoxanthin and α-cryptoxanthin (Fiedor
and Burda, 2014). Depending on their chemical structure, they are classified
into carotenes (hydrocarbons) and xanthophylls (oxygenated derivatives).
Most carotenoids are 40–carbon isoprenoid compounds, biosynthesized by
tail-to-tail linkage of two C20 geranylgeranyl diphosphate (GGPP)
molecules, from which all individual variations are derived. This C40
hydrocarbon backbone can be modified by cyclization at one or both ends of
the molecule, by changes in hydrogenation level and by addition of oxygen-
containing functional groups (Britton, 1995; Ishida and Bartley, 2009).
Carotenoids are biosynthesized by all photosynthetic bacteria, cyanobacteria,
algae, higher plants and also by some non-photosynthetic bacteria, fungi, and
yeasts. However, humans and most animals are not able to synthesize
carotenoids de novo and have to obtain them from dietary sources (Namitha
and Negi, 2010). There are two exceptions, the red pea aphid (Acyrthosiphon
pisum) and the two-spotted spider mite (Tetranychus urticae), which have
acquired the ability to produce carotenoids from fungi by horizontal gene
transfer (Altincicek et al., 2012; Moran and Jarvik, 2010).
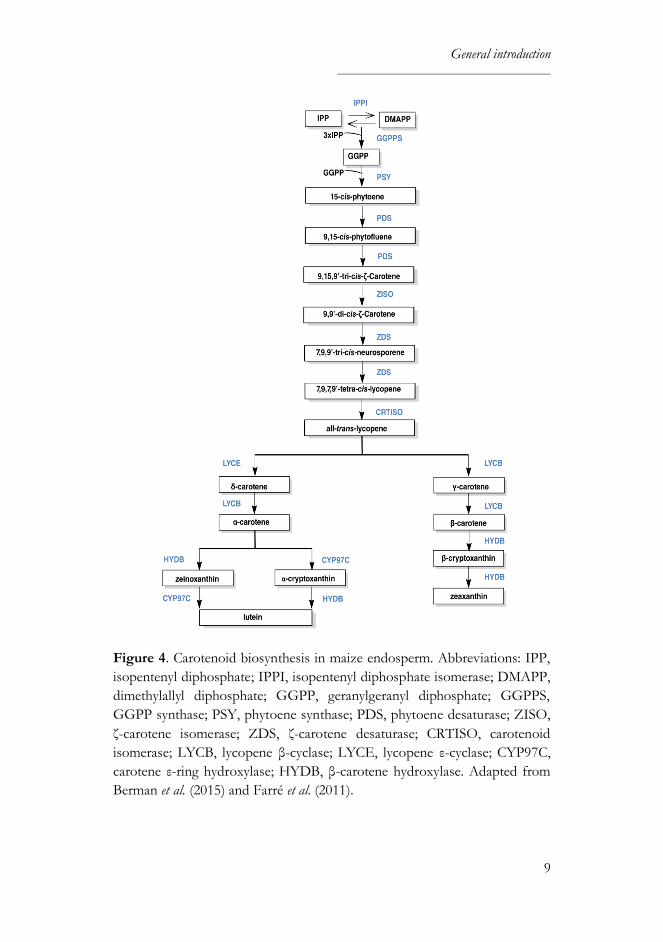
In plants, carotenoids are synthesized through the condensation of three
molecules of isopentenyl diphosphate (IPP) with one molecule of
dimethylallyl diphosphate (DMAPP) to form the 20–carbon precursor
GGPP, catalyzed by GGPP synthase (GGPPS). Two molecules of GGPP
are combined to form the first carotenoid in the biosynthetic pathway, 15-cis-
phytoene, catalyzed by phytoene synthase (PSY). This intermediate then
General introduction
8
undergoes a two-step desaturation reaction in plants to generate 9,15-cis-
phyfluene and then 9,15,9'-tri-cis-ζ-carotene, catalyzed by phytoene
desaturase (PDS). This is isomerized by light and/or ζ-carotene isomerase
(ZISO) to yield 9,9'-di-cis-ζ-carotene, which is converted by ζ-carotene
desaturase (ZDS) into 7,9,9'-tri-cis-neurosporene and then 7,9,7'9'-tetra-cis-
lycopene. The final product of desaturation reactions is converted to all-
trans-lycopene by carotenoid isomerase (CRTISO) in non-green tissue, and
by light and chlorophyll (acting as a sensitizer) in green tissue. Nearly all
other carotenoids can be derived from lycopene, which can be cyclized at
both ends by lycopene β-cyclase (LYCB) to generate the β-ionone end
groups of β-carotene, or can be cyclized at one end by lycopene ε-cyclase
(LYCE) and at the other by LYCB to introduce the non-identical ε- and β-
ionone end groups of α-carotene. Both these molecules can be oxygenated to
form xantophylls (e.g. β-cryptoxanthin, zeaxanthin or lutein) by carotene
hydroxylases, such as β-carotene hydroxylase (HYBD) (Berman et al., 2015;
Farré et al., 2011). These reactions are shown schematically in Figure 4.
General introduction
9
Figure 4. Carotenoid biosynthesis in maize endosperm. Abbreviations: IPP,
isopentenyl diphosphate; IPPI, isopentenyl diphosphate isomerase; DMAPP,
dimethylallyl diphosphate; GGPP, geranylgeranyl diphosphate; GGPPS,
GGPP synthase; PSY, phytoene synthase; PDS, phytoene desaturase; ZISO,
ζ-carotene isomerase; ZDS, ζ-carotene desaturase; CRTISO, carotenoid
isomerase; LYCB, lycopene β-cyclase; LYCE, lycopene ε-cyclase; CYP97C,
carotene ε-ring hydroxylase; HYDB, β-carotene hydroxylase. Adapted from
Berman et al. (2015) and Farré et al. (2011).
General introduction
10
Some carotenoids exhibit PVA activity (e.g. α-carotene, β-cryptoxanthin and
β-carotene), while others act as antioxidants. Apart from its contribution to
vitamin A intake, β-carotene, mainly found in carrots, squash, sweet potato,
and green leafy vegetables, is an efficient singlet oxygen quencher and also
scavenges reactive oxygen species, especially peroxyl radicals. However,
several in vitro studies have pointed out its prooxidant activity under
oxidizing conditions in high levels of oxygen (Grune et al., 2010;
Tanumihardjo and Yang, 2009). β-Cryptoxanthin, which also has PVA
activity, is primarily found in oranges, tangerines, papaya and peaches, and
has been associated with lower rates of lung cancer, whereas high amounts
of β-carotene (20–30 mg/day) were related to higher incidence of lung
cancer in smokers and asbestos-exposed workers (Krinsky and Johnson,
2005; Tanumihardjo and Yang, 2009). α-Carotene, another PVA carotenoid,
is present in high content in carrots and has been associated with lower risk
of heart disease and cancer, although few studies have directly examined its
role in human health (Tanumihardjo and Yang, 2009).
Most carotenoids efficiently scavenge singlet molecular oxygen and peroxyl
radicals, but their antioxidant potential can vary among them. Lycopene,
predominantly derived from tomatoes and tomato products, has 2–fold the
activity of β-carotene for quenching singlet oxygen. A decreased risk of
prostate cancer and cardiovascular disease has been associated with its
consumption (Tanumihardjo and Yang, 2009). The structural isomers lutein
and zeaxanthin, commonly found in maize, green leafy vegetables and egg
yolks, constitute the macular pigment of the human retina, where they
protect the photoreceptor cells against free radicals and damaging blue light.
Several studies have pointed out their role in protecting against age-related
macular degeneration and preventing cataract development (Abdel-Aal et al.,
2013).
Fruits and vegetables are good sources of carotenoids that can contribute to
human health thanks to their antioxidant properties and/or PVA activity.
Nonetheless, their bioaccessibility (i.e. the amount of an ingested nutrient
that is released from the food matrix in the gastrointestinal tract) and
bioavailability (i.e. the amount of an ingested nutrient that is available for
utilization and storage) vary depending on food matrix, dietary components,
food processing and storage, among other factors (Carbonell-Capella et al.,
2014). Carotenoids can be released from the food matrix, as well as their
General introduction
11
promoters and inhibitors, thanks to food processing. For instance,
carotenoid bioavailability is enhanced by the presence of fats, whereas it is
decreased by soluble fibers, sterols and stanols (Fernández-García et al., 2012;
Yonekura and Nagao, 2007). Most strategies developed to address vitamin
deficiencies focus on the total amount of nutrient provided rather than
nutrient bioavailability. Thus, as many factors affect the efficiency with
which nutrients are taken from food, their bioavailability must be taken into
account when selecting an appropriate strategy for combating VAD in
populations at risk (Sanahuja et al., 2013).
It is widely acknowledged that biofortification, the process by which the
nutritional quality of food crops is improved through agronomic practices,
conventional plant breeding, or modern biotechnology (WHO, 2016), is an
efficient and economical method to improve health in humans and in
domestic animals, in the latter case also increasing the value of meat and
dairy products. The benefits of added nutrients are well documented, which
is why staples such as bread and salt are artificially fortified with minerals and
vitamins, and why animal feed is supplemented with additional nutrients.
The difference with biofortification is that the plants make or accumulate the
necessary nutrients at source and artificial supplements are not necessary
(Gómez-Galera et al., 2010). Most of the population in developing countries
depends on diets mainly based on staple crops (e.g. wheat, rice or maize) that
are poor sources of some macronutrients and many essential micronutrients
(DellaPenna, 1999). Biofortification provides a sustainable, cost-effective,
long-term strategy for delivering micronutrients to rural populations in
developing countries. The three common approaches that are used to
increase the nutrient content of food crops are described below.
Agronomic practices are based on the application of mineral fertilizers and
the improvement of the solubilization and mobilization of mineral elements
in the soil, so-called soil fertilization. However, this strategy can only be used
for fortifying plants with mineral elements and not with organic nutrients
(e.g. vitamins), which must be synthesized by the plant itself (Carvalho and
Vasconcelos, 2013). Fertilization strategies targeted at improvement of
mineral content in cereal grains have been partially successful, e.g. zinc
concentration has been significantly increased in wheat endosperm, while
General introduction
12
iron appears to be difficult in this regard (Clemens, 2014). An alternative
method for applying fertilizers in situations where mineral elements are not
readily translocated to edible tissues is foliar fertilization, which achieves
higher levels of zinc accumulation in maize, rice and wheat than soil
fertilization (Carvalho and Vasconcelos, 2013; Joy et al., 2015). The success
of these methods depends on the crop species and cultivar, the mineral itself
and the soil. Furthermore, it is necessary to apply the fertilizer regularly,
which makes this strategy costly, difficult to apply and potentially negative
for the environment (Carvalho and Vasconcelos, 2013; Zhu et al., 2007). It
must be kept in mind that mineral biofortification is most efficient when
cereals are not consumed as flours, because dehulling (which removes the
outer layers from the grains) and milling (which reduces the grain size) can
affect the mineral bioaccessibility (Raes et al., 2014).
Conventional breeding is based on the identification of parent lines with
high vitamin or mineral levels that are crossed over several generations to
produce plants that have the desired nutrient and agronomic traits (Rawat et
al., 2013). It takes advantage of the plant genetic resources (i.e. the number
and quality of crop species and varieties), but it implies considerable efforts
to identify genetic variability (Johns and Eyzaguirre, 2007). This strategy is
the focus of a biofortification program within the Consultative Group on
International Agriculture Research (CGIAR), the HarvestPlus program,
which targets a multitude of crops that are a regular part of the staple-based
diets of the poor and breeds them to be rich in iron, zinc, and PVA (Pfeiffer
and McClafferty, 2007). In 2015, biofortified crops under the HarvestPlus
program were released in all eight target countries: Bangladesh (zinc rice),
Democratic Republic of Congo (iron beans, vitamin A cassava), India (iron
pearl millet), Nigeria (vitamin A cassava, vitamin A maize), Rwanda (iron
beans), Uganda (vitamin A sweet potato, iron beans), and Zambia (vitamin A
maize) (HarvestPlus, 2017). Alternatively, new traits can be introduced
directly into the commercial cultivars by mutagenesis, as exemplified by
cereals and legumes with low-phytate content, in which the bioavailability of
iron and zinc is increased (Zhu et al., 2007).
According to the definition of the Codex Alimentarius (adapted from the
Cartagena Biosafety Protocol under the Convention on Biological Diversity),
General introduction
13
modern biotechnology is defined as the application of: i) In vitro nucleic
acid techniques, including recombinant deoxyribonucleic acid (DNA) and
direct injection of nucleic acid into cells or organelles; or ii) fusion of cells
beyond the taxonomic family, that overcome natural physiological
reproductive or recombinant barriers and that are not techniques used in
traditional breeding and selection. On the other hand, a conventional
counterpart is defined as a related organism/variety, its components and/or
products for which there is experience of establishing safety based on
common use as food. In the foreseeable future, foods derived from modern
biotechnology will not be used as conventional counterparts (WHO and
FAO, 2009).
Modern biotechnology enables plants to be genetically modified (GM) with
novel traits beyond what is possible through conventional breeding (WHO,
2005; WHO and FAO, 2009). Most GM crops cultivated so far have been
developed using Agrobacterium- and particle bombardment-mediated
transformations. As a natural form of genetic engineering, the ubiquitous soil
bacterium Agrobacterium tumefaciens has the natural ability to transfer a
segment of DNA, carried on a specific plasmid, to the plant cell (Zupan and
Zambryski, 1995). Other methods were developed to avoid the dependence
on bacteria, including particle bombardment, microinjection, electroporation
and chemical transfection mediated by polyethylene glycol or calcium
phosphate transformation. Among these direct DNA transfer methods
particle bombardment, which employs high velocity DNA-coated metal
particles to deliver biologically active DNA into plant cells, is the most
widely used. This versatile and effective transformation method is not
limited by cell type, species or genotype (Altpeter et al., 2005; Christou,
1992).
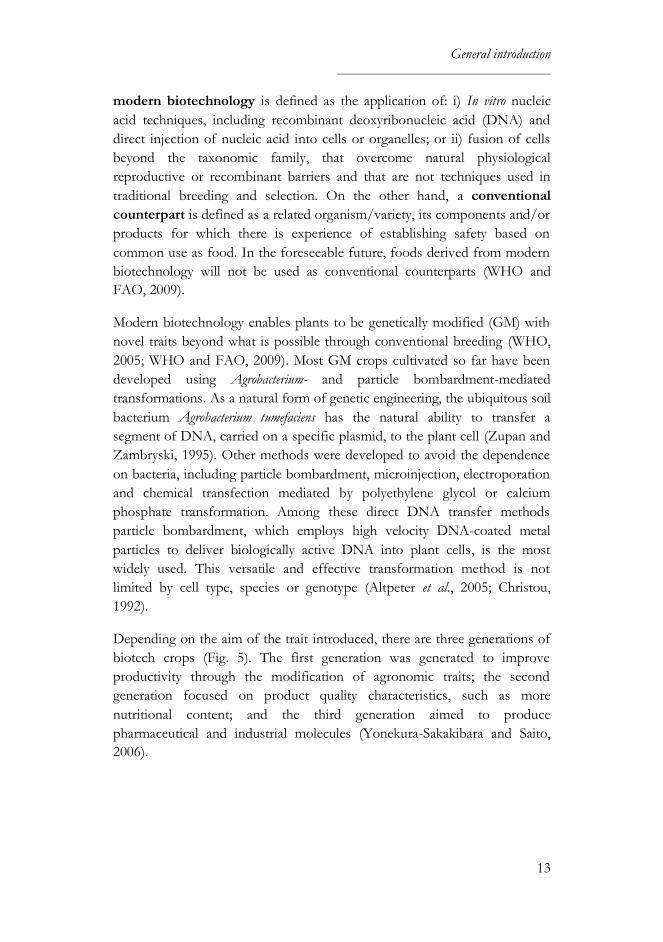
Depending on the aim of the trait introduced, there are three generations of
biotech crops (Fig. 5). The first generation was generated to improve
productivity through the modification of agronomic traits; the second
generation focused on product quality characteristics, such as more
nutritional content; and the third generation aimed to produce
pharmaceutical and industrial molecules (Yonekura-Sakakibara and Saito,
2006).
General introduction
14
Figure 5. Three generations of biotech crops. Adapted from Yonekura-
Sakakibara and Saito (2006).
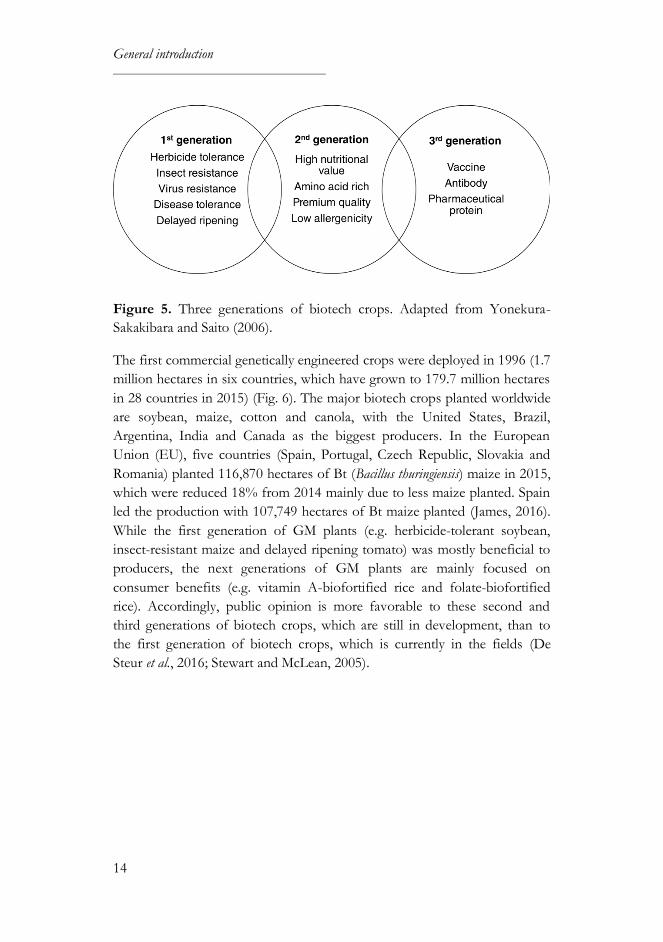
The first commercial genetically engineered crops were deployed in 1996 (1.7
million hectares in six countries, which have grown to 179.7 million hectares
in 28 countries in 2015) (Fig. 6). The major biotech crops planted worldwide
are soybean, maize, cotton and canola, with the United States, Brazil,
Argentina, India and Canada as the biggest producers. In the European
Union (EU), five countries (Spain, Portugal, Czech Republic, Slovakia and
Romania) planted 116,870 hectares of Bt (Bacillus thuringiensis) maize in 2015,
which were reduced 18% from 2014 mainly due to less maize planted. Spain
led the production with 107,749 hectares of Bt maize planted (James, 2016).
While the first generation of GM plants (e.g. herbicide-tolerant soybean,
insect-resistant maize and delayed ripening tomato) was mostly beneficial to
producers, the next generations of GM plants are mainly focused on
consumer benefits (e.g. vitamin A-biofortified rice and folate-biofortified
rice). Accordingly, public opinion is more favorable to these second and
third generations of biotech crops, which are still in development, than to
the first generation of biotech crops, which is currently in the fields (De
Steur et al., 2016; Stewart and McLean, 2005).
General introduction
15
Figure 6. Global area of biotech crops, 1996 to 2015. Adapted from James
(2016).
Genetic engineering allows the direct modulation of metabolic pathways for
the nutritional enhancement of crops, either by enriching them with novel
nutrients or increasing the content of the previously existing nutrients or
decreasing undesirable compounds (Kamthan et al., 2016). A novel strategy
based on combinatorial genetic transformation opens the door to multiplex-
transgene plants, enabling the development of nutritionally completed
cereals, which could generate substantial health effects at a relatively low cost
(De Steur et al., 2016; Zhu et al., 2008).
Maize (Zea mays L.), also known as corn, is believed to have originated in
Mesoamerica, particularly in Mexico, 7,000 years ago from a wild grass,
probably teosinte. However, this wild grass was transformed into maize by
native populations for a better source of food. After the discovery of the
American continent by early settlers, maize was introduced into Europe
through Spain, and then spread through the warmer climates of the
Mediterranean and Northern Europe, and later traders brought maize to
Africa and Asia (FAO, 1992; Ranum et al., 2014).
Botanically, maize belongs to the grass family (Gramineae) and is a tall annual
plant which reproduces via crosspollination, with the female (ear) and male
(tassel) flowers in separate places on the plant. The plant development is
divided into two physiological stages, vegetative and reproductive (Fig. 7a).
In the vegetative stages, which include from emergence (VE) to tasseling

General introduction
16
(VT), different tissues develop (e.g. leaves and reproductive organs) and
differentiate until the flower structures appear. The reproductive stages begin
with the fertilization of the female structures (which will develop into ears
and grains) and end with a rapid increase of the kernels' weight. The
reproductive stages include: silking (R1), in which any silk is visible outside
the husk; blister (R2), in which kernels are white and resemble a blister in
shape; milk (R3), in which kernels are yellow on the outside with a milky
white inner fluid; dough (R4), in which starch has a dough-like consistency;
dent (R5), in which kernels are dented; and physiological maturity (R6), in
which all kernels on the ear have reached maximum dry weight with
physiological maturity. These mature kernels are harvested for consumption
and processing (FAO, 1992; He et al., 2010).
Figure 7. a) Different growth stages of a typical maize plant, including
vegetative (V) and reproductive (R) stages. Vegetative stages: VE,
emergence; V1, first leaf collar; V3, third leaf collar; V7, seventh leaf collar;
V10, tenth leaf collar; VT, tasseling. Reproductive stages: R1, silking; R2,
blister; R3, milk; R4, dough; R5, dent; R6, maturity (He et al., 2010). b)
Structure of the maize kernel.
Each kernel is composed of four different compartments (Fig. 7b):
endosperm (mainly starch surrounded by a protein matrix) (83%); embryo or
germ (high in polyunsaturated fatty acids, enzymes and nutrients) (11%);
pericarp (a seed coat high in fiber) (5%); and tip cap (high in fiber) (1%). The
latter, the only structure not covered by the pericarp, is the connection of the
kernel to the cob, through which water and nutrients pass during
development (Gwirtz and Garcia-Casal, 2014). Maize contains approximately
74% carbohydrates, 9% protein, 5% lipid, supplying an energy density of 365
General introduction
17
kcal/100 g and providing many of the B vitamins and essential minerals as
well as fiber (7%) (USDA, 2016). However, other important micronutrients
are not present (e.g. vitamin B12, vitamin C and the essential amino acids
lysine and tryptophan) or are present at low levels (e.g. iron, calcium and
folate) (Nuss and Tanumihardjo, 2010; Ranum et al., 2014).
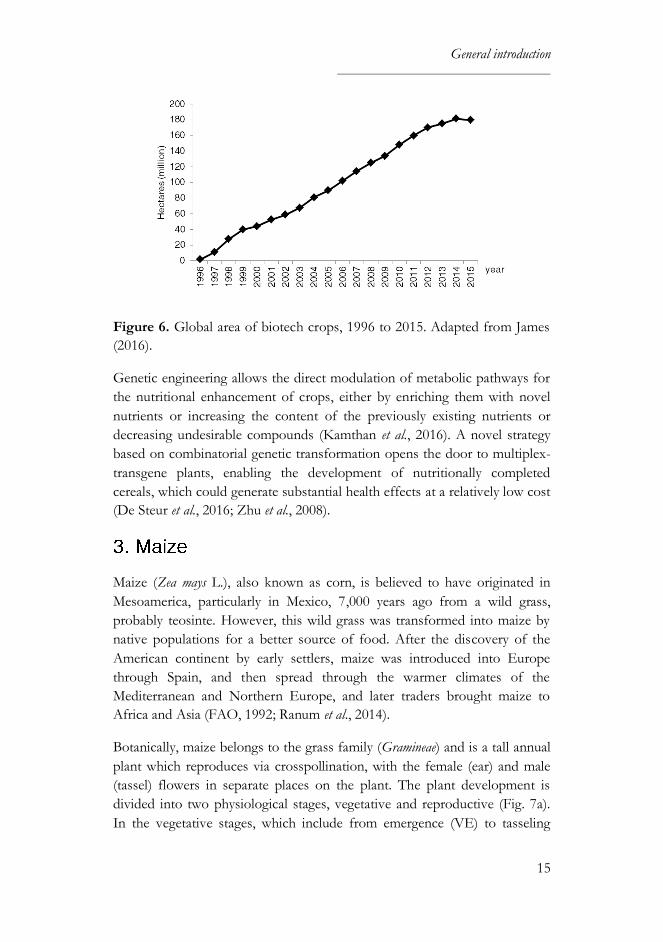
Generally, humans consume maize in different forms such as maize grits,
polenta, porridge, maize bread, popcorn and maize flakes, and it can even be
used to produce beer. Maize can be processed in the household on a small
local scale or on a larger industrial scale into different maize constituents
(Fig. 8). The initial processing (e.g. dehulling or degerming and milling)
depends on regional preferences, but can result in the loss of most vitamins
and minerals, as they are concentrated in the outer layers of the maize grain.
Some maize products can be used for commercial trade, while others have to
be consumed immediately after production. In both cases, maize products
have to be further processed to be palatable and different cooking
techniques can be applied according to regional customs. For instance, the
grain is usually fermented in African countries, whereas it is nixtamalized (i.e.
soaking maize grains in an alkaline solution) in Central America (FAO, 1992;
Gwirtz and Garcia-Casal, 2014).
Figure 8. Processing maize from raw material into food products (Gwirtz
and Garcia-Casal, 2014).
Maize is the cereal grain most produced worldwide (32%), followed by wheat
(31%) and rice (22%), with the United States, China, Brazil, Mexico and
General introduction
18
Argentina as the major producers (Table 1). Despite the continuous increase
in its production in the last two decades (Fig. 9), its human consumption
(12%) is lower compared to wheat (44%) and rice (37%), which can be
explained by its use for fuel production or as feed ingredient for livestock
(Nuss and Tanumihardjo, 2010; Ranum et al., 2014).
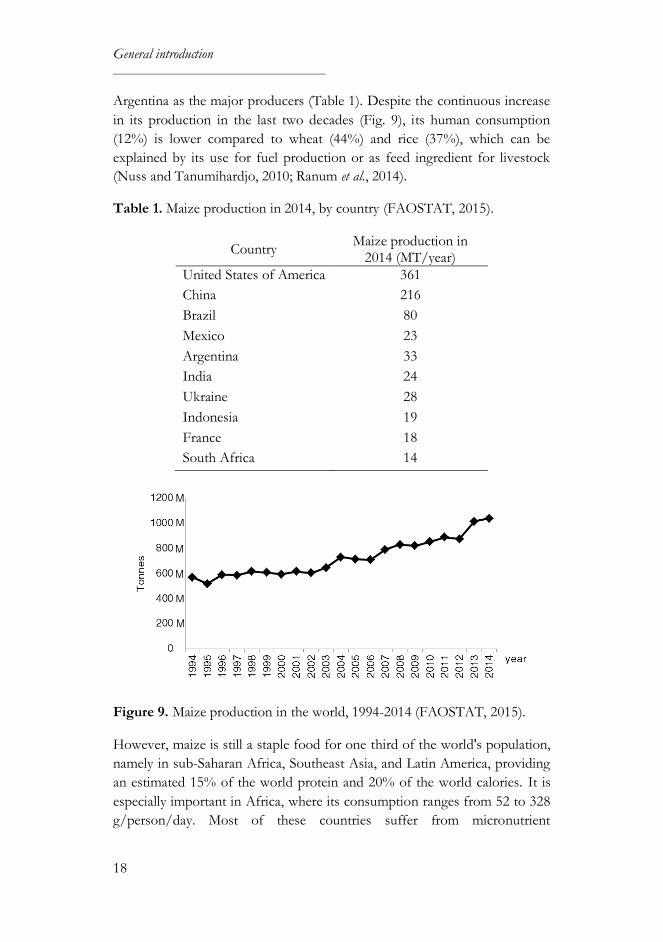
Table 1. Maize production in 2014, by country (FAOSTAT, 2015).
Country Maize production in
2014 (MT/year)
United States of America 361
China 216
Brazil 80
Mexico 23
Argentina 33
India 24
Ukraine 28
Indonesia 19
France 18
South Africa 14
Figure 9. Maize production in the world, 1994-2014 (FAOSTAT, 2015).
However, maize is still a staple food for one third of the world's population,
namely in sub-Saharan Africa, Southeast Asia, and Latin America, providing
an estimated 15% of the world protein and 20% of the world calories. It is
especially important in Africa, where its consumption ranges from 52 to 328
g/person/day. Most of these countries suffer from micronutrient
General introduction
19
deficiencies, which makes maize a target crop for nutritional programs due to
its low production costs and the high consumption of maize-derived food
products (Nuss and Tanumihardjo, 2010; Ranum et al., 2014). The nutritional
value of maize grain can be enhanced by fortification (i.e. through the
addition of multivitamin premixes to maize flour) or biofortification (i.e.
through conventional breeding or genetic engineering). Nevertheless,
fortification of maize flours is not usually possible in developing countries as
it implies food processing, packaging and a distribution network, making the
product economically inaccessible to poor people that consume most of
their daily energy requirements from maize (Gómez-Galera et al., 2010).
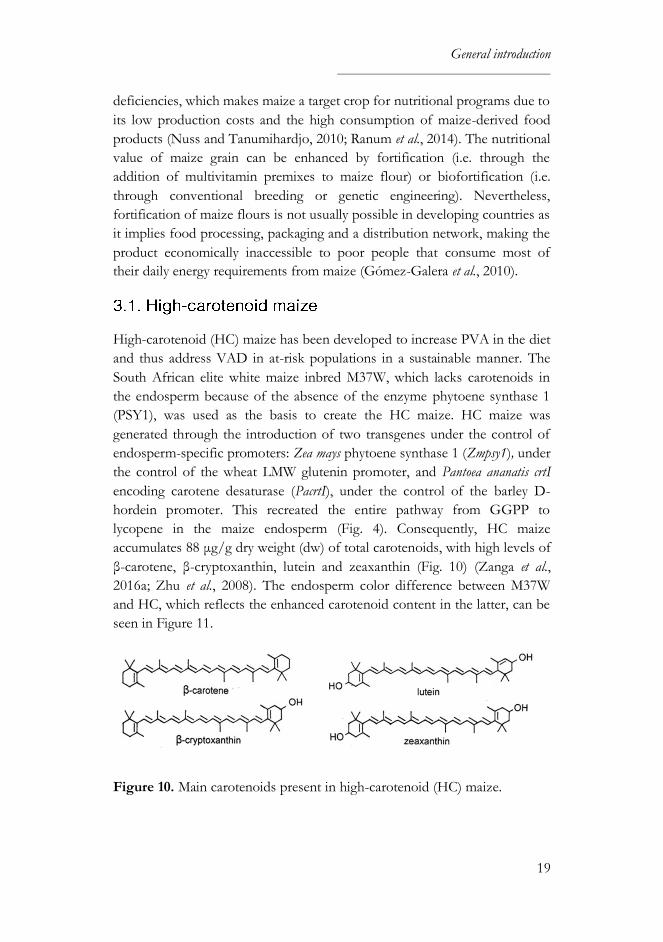
High-carotenoid (HC) maize has been developed to increase PVA in the diet
and thus address VAD in at-risk populations in a sustainable manner. The
South African elite white maize inbred M37W, which lacks carotenoids in
the endosperm because of the absence of the enzyme phytoene synthase 1
(PSY1), was used as the basis to create the HC maize. HC maize was
generated through the introduction of two transgenes under the control of
endosperm-specific promoters: Zea mays phytoene synthase 1 (Zmpsy1), under
the control of the wheat LMW glutenin promoter, and Pantoea ananatis crtI
encoding carotene desaturase (PacrtI), under the control of the barley D-
hordein promoter. This recreated the entire pathway from GGPP to
lycopene in the maize endosperm (Fig. 4). Consequently, HC maize
accumulates 88 μg/g dry weight (dw) of total carotenoids, with high levels of
β-carotene, β-cryptoxanthin, lutein and zeaxanthin (Fig. 10) (Zanga et al.,
2016a; Zhu et al., 2008). The endosperm color difference between M37W
and HC, which reflects the enhanced carotenoid content in the latter, can be
seen in Figure 11.
Figure 10. Main carotenoids present in high-carotenoid (HC) maize.
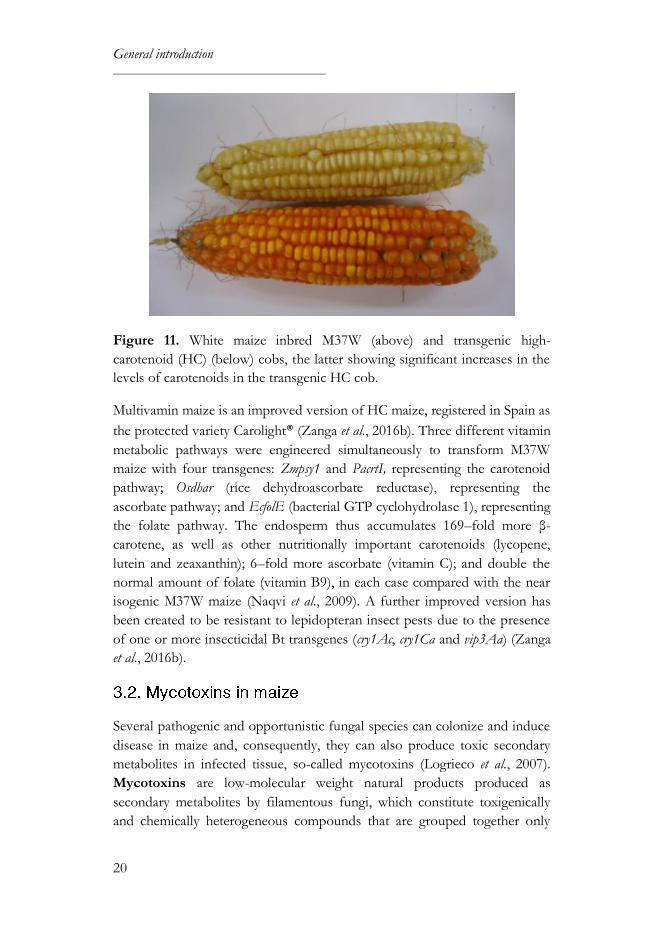
General introduction
20
Figure 11. White maize inbred M37W (above) and transgenic high-
carotenoid (HC) (below) cobs, the latter showing significant increases in the
levels of carotenoids in the transgenic HC cob.
Multivamin maize is an improved version of HC maize, registered in Spain as
the protected variety Carolight® (Zanga et al., 2016b). Three different vitamin
metabolic pathways were engineered simultaneously to transform M37W
maize with four transgenes: Zmpsy1 and PacrtI, representing the carotenoid
pathway; Osdhar (rice dehydroascorbate reductase), representing the
ascorbate pathway; and EcfolE (bacterial GTP cyclohydrolase 1), representing
the folate pathway. The endosperm thus accumulates 169–fold more β-
carotene, as well as other nutritionally important carotenoids (lycopene,
lutein and zeaxanthin); 6–fold more ascorbate (vitamin C); and double the
normal amount of folate (vitamin B9), in each case compared with the near
isogenic M37W maize (Naqvi et al., 2009). A further improved version has
been created to be resistant to lepidopteran insect pests due to the presence
of one or more insecticidal Bt transgenes (cry1Ac, cry1Ca and vip3Aa) (Zanga
et al., 2016b).
Several pathogenic and opportunistic fungal species can colonize and induce
disease in maize and, consequently, they can also produce toxic secondary
metabolites in infected tissue, so-called mycotoxins (Logrieco et al., 2007).
Mycotoxins are low-molecular weight natural products produced as
secondary metabolites by filamentous fungi, which constitute toxigenically
and chemically heterogeneous compounds that are grouped together only
General introduction
21
because they can cause disease and death in human beings and other
vertebrates (Bennett, 1987). This toxic effect on human and animal health is
known as mycotoxicosis, but toxin-producing fungus is not necessarily
involved in the diseases that it causes (Marín et al., 2013). Recently, it has
been pointed out that up to 80% of global agricultural commodities could be
contaminated with mycotoxins, although the majority of the samples
analyzed were within the maximum levels or guidance levels established by
the EU (Kovalsky et al., 2016; Streit et al., 2013).
Fungal toxins of interest are mainly produced by fungal species within the
genera Fusarium, Aspergillus, Penicillium, Alternaria and Claviceps, which can
grow on a variety of crops, including cereals, and can occur at any time along
the food chain, including pre-harvest, harvest, drying, storage and
manufactured products. Consequently, their toxins could potentially appear
in different foods and feeds. The main mycotoxins found in food are
aflatoxins (AFs), produced by Aspergillus spp.; ochratoxin A (OTA) produced
by both Aspergillus and Penicillium; trichothecenes type A (e.g. HT-2 and T-2
toxin) and trichothecenes type B (e.g. deoxynivalenol – DON –, nivalenol –
NIV –), zearalenone (ZEA), fumonisins B1 (FB1) and B2 (FB2), and some
recently-discovered Fusarium metabolites collectively known as emergent
mycotoxins, such as moniliformin (MON), beauvericin, enniatins and
fusaproliferin, produced mainly by Fusarium spp.; ergot alkaloids produced by
Claviceps; and alternariol and other toxins produced by Alternaria spp. (Marín
et al., 2013).
Maize is the most important source of fumonisin intake in human and
animal diets (Table 2), as well as its resulting milling fractions, such as grits
and flour used for further processing (Marín et al., 2013). Fumonisin
contamination in maize is directly associated with Fusarium pink ear rot or
pink fusariosis, mainly produced by F. verticilliodes (teleomorph Gibberella
moniliformis), F. proliferatum (teleomorph G. intermedia) and F. subglutinans
(teleomorph G. subglutinans). Another common disease in maize is Fusarium
red ear rot or red fusariosis, mainly produced by F. graminearum (teleomorph
G. zeae), which produces several mycotoxins, mainly trichothecenes and
zearalenones. The fungal prevalence depends primarily on environmental
conditions; Fusarium pink ear rot is related to drier and warmer climates,
whereas Fusarium red ear rot is associated with rainfall and low temperatures
during summer and early fall (Logrieco et al., 2007).
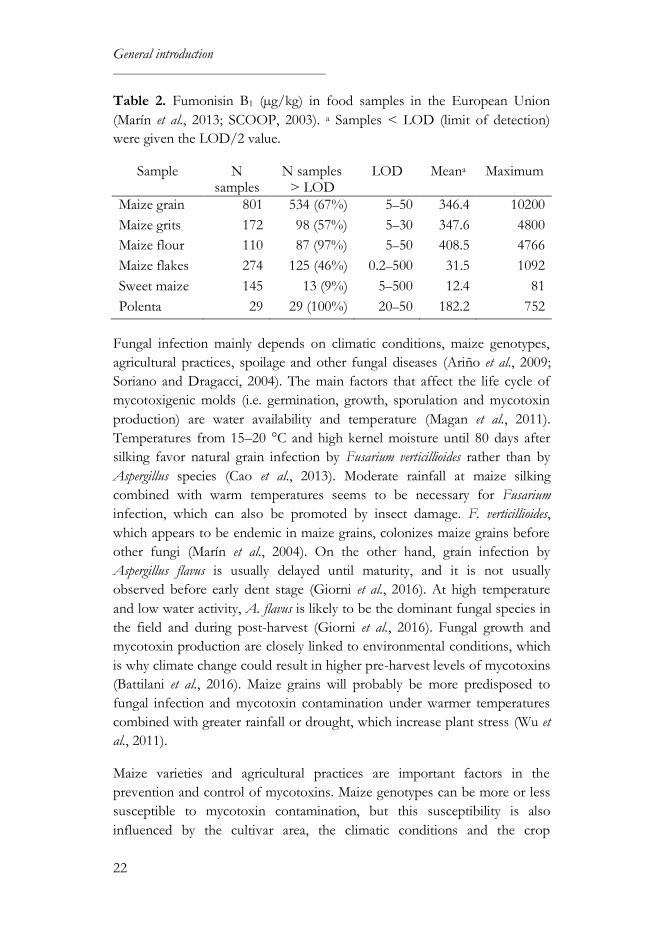
General introduction
22
Table 2. Fumonisin B1 (µg/kg) in food samples in the European Union
(Marín et al., 2013; SCOOP, 2003). a Samples < LOD (limit of detection)
were given the LOD/2 value.
Sample N samples
N samples > LOD
LOD Meana Maximum
Maize grain 801 534 (67%) 5–50 346.4 10200
Maize grits 172 98 (57%) 5–30 347.6 4800
Maize flour 110 87 (97%) 5–50 408.5 4766
Maize flakes 274 125 (46%) 0.2–500 31.5 1092
Sweet maize 145 13 (9%) 5–500 12.4 81
Polenta 29 29 (100%) 20–50 182.2 752
Fungal infection mainly depends on climatic conditions, maize genotypes,
agricultural practices, spoilage and other fungal diseases (Ariño et al., 2009;
Soriano and Dragacci, 2004). The main factors that affect the life cycle of
mycotoxigenic molds (i.e. germination, growth, sporulation and mycotoxin
production) are water availability and temperature (Magan et al., 2011).
Temperatures from 15–20 °C and high kernel moisture until 80 days after
silking favor natural grain infection by Fusarium verticillioides rather than by
Aspergillus species (Cao et al., 2013). Moderate rainfall at maize silking
combined with warm temperatures seems to be necessary for Fusarium
infection, which can also be promoted by insect damage. F. verticillioides,
which appears to be endemic in maize grains, colonizes maize grains before
other fungi (Marín et al., 2004). On the other hand, grain infection by
Aspergillus flavus is usually delayed until maturity, and it is not usually
observed before early dent stage (Giorni et al., 2016). At high temperature
and low water activity, A. flavus is likely to be the dominant fungal species in
the field and during post-harvest (Giorni et al., 2016). Fungal growth and
mycotoxin production are closely linked to environmental conditions, which
is why climate change could result in higher pre-harvest levels of mycotoxins
(Battilani et al., 2016). Maize grains will probably be more predisposed to
fungal infection and mycotoxin contamination under warmer temperatures
combined with greater rainfall or drought, which increase plant stress (Wu et
al., 2011).
Maize varieties and agricultural practices are important factors in the
prevention and control of mycotoxins. Maize genotypes can be more or less
susceptible to mycotoxin contamination, but this susceptibility is also
influenced by the cultivar area, the climatic conditions and the crop
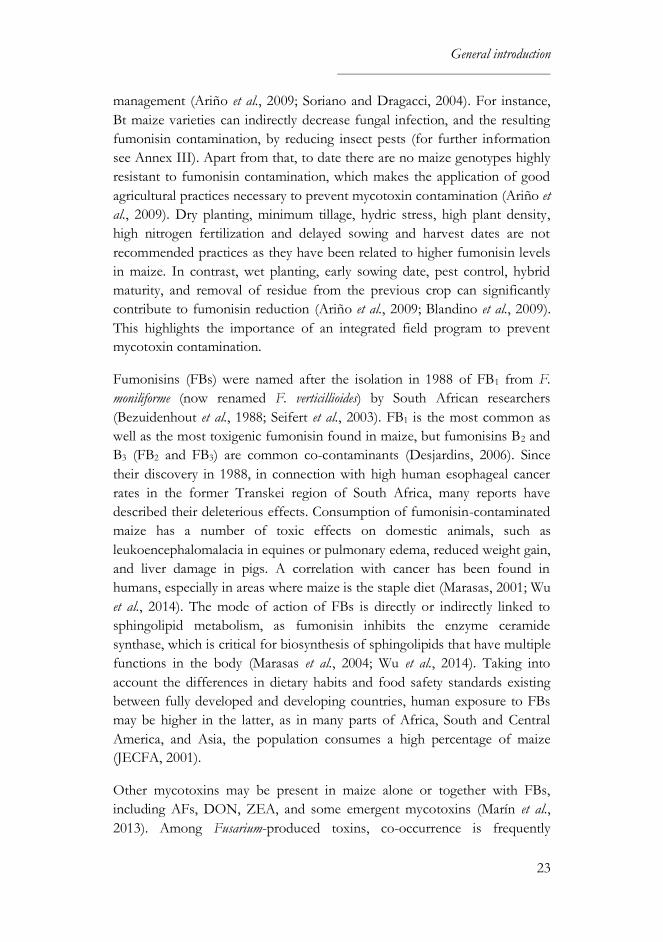
General introduction
23
management (Ariño et al., 2009; Soriano and Dragacci, 2004). For instance,
Bt maize varieties can indirectly decrease fungal infection, and the resulting
fumonisin contamination, by reducing insect pests (for further information
see Annex III). Apart from that, to date there are no maize genotypes highly
resistant to fumonisin contamination, which makes the application of good
agricultural practices necessary to prevent mycotoxin contamination (Ariño et
al., 2009). Dry planting, minimum tillage, hydric stress, high plant density,
high nitrogen fertilization and delayed sowing and harvest dates are not
recommended practices as they have been related to higher fumonisin levels
in maize. In contrast, wet planting, early sowing date, pest control, hybrid
maturity, and removal of residue from the previous crop can significantly
contribute to fumonisin reduction (Ariño et al., 2009; Blandino et al., 2009).
This highlights the importance of an integrated field program to prevent
mycotoxin contamination.
Fumonisins (FBs) were named after the isolation in 1988 of FB1 from F.
moniliforme (now renamed F. verticillioides) by South African researchers
(Bezuidenhout et al., 1988; Seifert et al., 2003). FB1 is the most common as
well as the most toxigenic fumonisin found in maize, but fumonisins B2 and
B3 (FB2 and FB3) are common co-contaminants (Desjardins, 2006). Since
their discovery in 1988, in connection with high human esophageal cancer
rates in the former Transkei region of South Africa, many reports have
described their deleterious effects. Consumption of fumonisin-contaminated
maize has a number of toxic effects on domestic animals, such as
leukoencephalomalacia in equines or pulmonary edema, reduced weight gain,
and liver damage in pigs. A correlation with cancer has been found in
humans, especially in areas where maize is the staple diet (Marasas, 2001; Wu
et al., 2014). The mode of action of FBs is directly or indirectly linked to
sphingolipid metabolism, as fumonisin inhibits the enzyme ceramide
synthase, which is critical for biosynthesis of sphingolipids that have multiple
functions in the body (Marasas et al., 2004; Wu et al., 2014). Taking into
account the differences in dietary habits and food safety standards existing
between fully developed and developing countries, human exposure to FBs
may be higher in the latter, as in many parts of Africa, South and Central
America, and Asia, the population consumes a high percentage of maize
(JECFA, 2001).
Other mycotoxins may be present in maize alone or together with FBs,
including AFs, DON, ZEA, and some emergent mycotoxins (Marín et al.,
2013). Among Fusarium-produced toxins, co-occurrence is frequently
General introduction
24
observed for compounds such as FBs, DON and ZEA, and synergistic
effects of Fusarium have been reported (Kovalsky et al., 2016). Figure 12
shows the molecular structures of the main mycotoxins found in maize.
Figure 12. Molecular structures of major mycotoxins found in maize.
AFs are hepatotoxic, carcinogenic, immunosuppressive and antinutritional
contaminants, mainly produced by Aspergillus flavus, which synthesizes type B
AFs as well as cyclopiazonic acid (CPA), depending on the strain, and by A.
parasiticus, which synthesizes both type B and type G AFs, but not CPA
(IARC, 2012; Marín et al., 2013). The ingestion of aflatoxin-contaminated
products can result in two forms of aflatoxicosis, acute and chronic. Acute
severe intoxication is produced when the food is contaminated with high
levels of AFs, resulting in direct liver damage and subsequent illness or
death. Aflatoxin-contaminated maize was related to a large number of acute
human aflatoxicosis in developing countries. As highly contaminated feed is
more frequent, acute aflatoxicosis is more common in animals, although the
susceptibility varies among species (Marín et al., 2013; Williams et al., 2004;
Wu et al., 2014). Chronic subsymptomatic exposure occurs when relatively
small amounts of AFs are consumed over an extended period. In farm and
laboratory animals, chronic exposure to AFs compromises immunity, which
results in suppression of the cell-mediated immune responses. The
nutritional status can also be compromised, with a reduction in the growth
or other productivity parameters (Marín et al., 2013; Williams et al., 2004).
General introduction
25
DON and ZEA are mainly produced by F. graminearum and F. culmorum and
are often found as co-contaminants in maize. DON is a member of the
trichothecenes family, but is not as toxic as other trichothecenes such as T-2
or HT-2 toxins. Colloquially known as vomitoxin, it presents toxic effects in
animals that range from feed refusal, vomiting and nausea, to
immunosuppression and loss of productivity, whereas in humans it can cause
acute effects related to gastrointestinal illness (Marin et al., 2013; Sobrova et
al., 2010). On the other hand, ZEA and some of its related metabolites
competitively bind to oestrogen receptors. Consequently, its toxicity is
related to reproductive problems in specific animal species (e.g. pigs and
laboratory animals) and possibly in humans. In animals, chronic exposure to
ZEA is associated with carcinogenicity, genotoxicity, reproductive toxicity,
endocrine effects, and immunotoxicity, pig being one of the most susceptible
animals (EFSA, 2011; Marín et al., 2013). Among the so-called emergent
mycotoxins, the most relevant is MON, a very strong acid produced by
several Fusarium species (F. avenaceum, F. tricinctum, F. proliferatum, F.
subglutinans, and F. verticillioides), which is an inhibitor of thiamine
pyrophosphate-dependent enzymes, pyruvate dehydrogenase being the most
studied (Marín et al., 2013; Peltonen et al., 2010).
According to the International Agency for Research on Cancer (IARC)
(Table 3), from among the mycotoxins found to occur in maize only AFs
(AFB1, AFB2, AFG1 and AFG2) and FB1 are classified as carcinogenic (group
1) and possibly carcinogenic to humans (group 2B), respectively, while the
rest are not classifiable as to carcinogenicity in humans (group 3) (IARC,
1993, 2002, 2012). AFB1 is considered the most toxic aflatoxin, and it is also
the most carcinogenic natural compound (IARC, 2012). As stated by the
annual report of the Rapid Alert System for Food and Feed (RASFF, 2016),
in 2015 mycotoxins were the main hazard in border rejection notifications in
the EU, AFs being the primarily responsible mycotoxin. Among RASFF
notifications, there were five notifications due to the presence of FBs (of
which one combined with a high level of AFs) in maize and maize products
intended for human consumption and another five notifications owing to the
presence of AFs in maize and maize products intended for feed. Natural co-
occurrence for AFs and FBs in maize has been reported in various regions of
the world, observing the highest co-occurrence rate in stored maize (Hove et
al., 2016). Therefore, given the toxicological significance of AFB1 and FB1,
and the toxicological effects caused by combined exposure, it is important to
analyze both mycotoxins in maize-derived products.
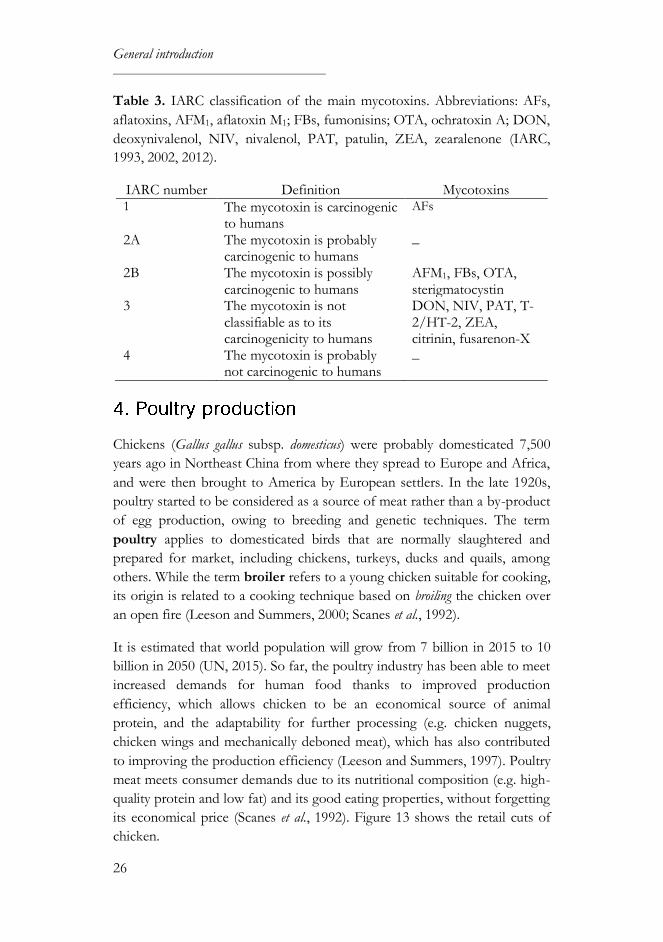
General introduction
26
Table 3. IARC classification of the main mycotoxins. Abbreviations: AFs,
aflatoxins, AFM1, aflatoxin M1; FBs, fumonisins; OTA, ochratoxin A; DON,
deoxynivalenol, NIV, nivalenol, PAT, patulin, ZEA, zearalenone (IARC,
1993, 2002, 2012).
IARC number Definition Mycotoxins 1 The mycotoxin is carcinogenic
to humans
AFs
2A The mycotoxin is probably carcinogenic to humans
_
2B The mycotoxin is possibly carcinogenic to humans
AFM1, FBs, OTA, sterigmatocystin
3 The mycotoxin is not classifiable as to its carcinogenicity to humans
DON, NIV, PAT, T-2/HT-2, ZEA, citrinin, fusarenon-X
4 The mycotoxin is probably not carcinogenic to humans
_
Chickens (Gallus gallus subsp. domesticus) were probably domesticated 7,500
years ago in Northeast China from where they spread to Europe and Africa,
and were then brought to America by European settlers. In the late 1920s,
poultry started to be considered as a source of meat rather than a by-product
of egg production, owing to breeding and genetic techniques. The term
poultry applies to domesticated birds that are normally slaughtered and
prepared for market, including chickens, turkeys, ducks and quails, among
others. While the term broiler refers to a young chicken suitable for cooking,
its origin is related to a cooking technique based on broiling the chicken over
an open fire (Leeson and Summers, 2000; Scanes et al., 1992).
It is estimated that world population will grow from 7 billion in 2015 to 10
billion in 2050 (UN, 2015). So far, the poultry industry has been able to meet
increased demands for human food thanks to improved production
efficiency, which allows chicken to be an economical source of animal
protein, and the adaptability for further processing (e.g. chicken nuggets,
chicken wings and mechanically deboned meat), which has also contributed
to improving the production efficiency (Leeson and Summers, 1997). Poultry
meat meets consumer demands due to its nutritional composition (e.g. high-
quality protein and low fat) and its good eating properties, without forgetting
its economical price (Scanes et al., 1992). Figure 13 shows the retail cuts of
chicken.
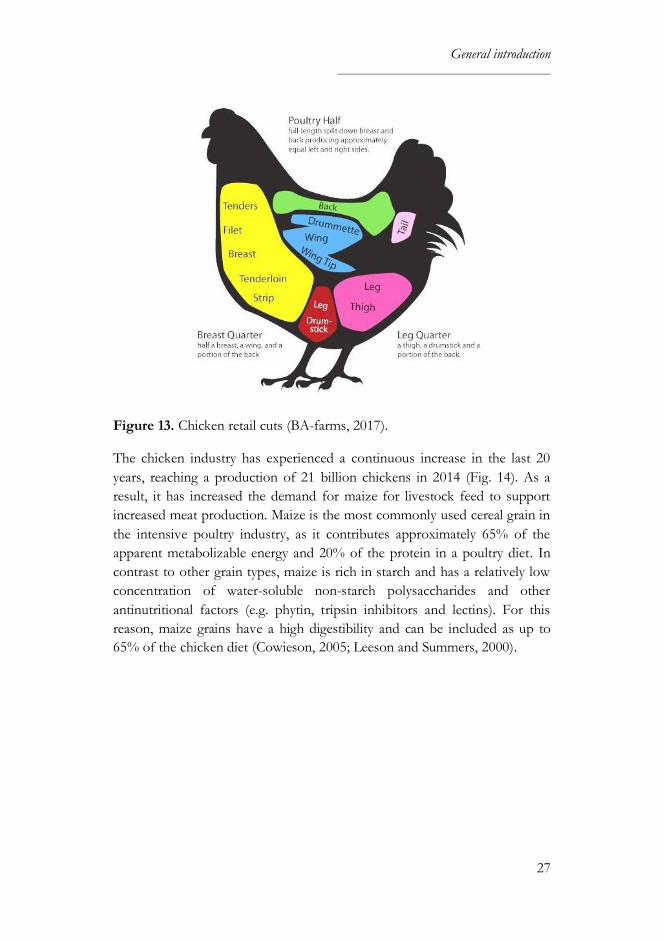
General introduction
27
Figure 13. Chicken retail cuts (BA-farms, 2017).
The chicken industry has experienced a continuous increase in the last 20
years, reaching a production of 21 billion chickens in 2014 (Fig. 14). As a
result, it has increased the demand for maize for livestock feed to support
increased meat production. Maize is the most commonly used cereal grain in
the intensive poultry industry, as it contributes approximately 65% of the
apparent metabolizable energy and 20% of the protein in a poultry diet. In
contrast to other grain types, maize is rich in starch and has a relatively low
concentration of water-soluble non-starch polysaccharides and other
antinutritional factors (e.g. phytin, tripsin inhibitors and lectins). For this
reason, maize grains have a high digestibility and can be included as up to
65% of the chicken diet (Cowieson, 2005; Leeson and Summers, 2000).
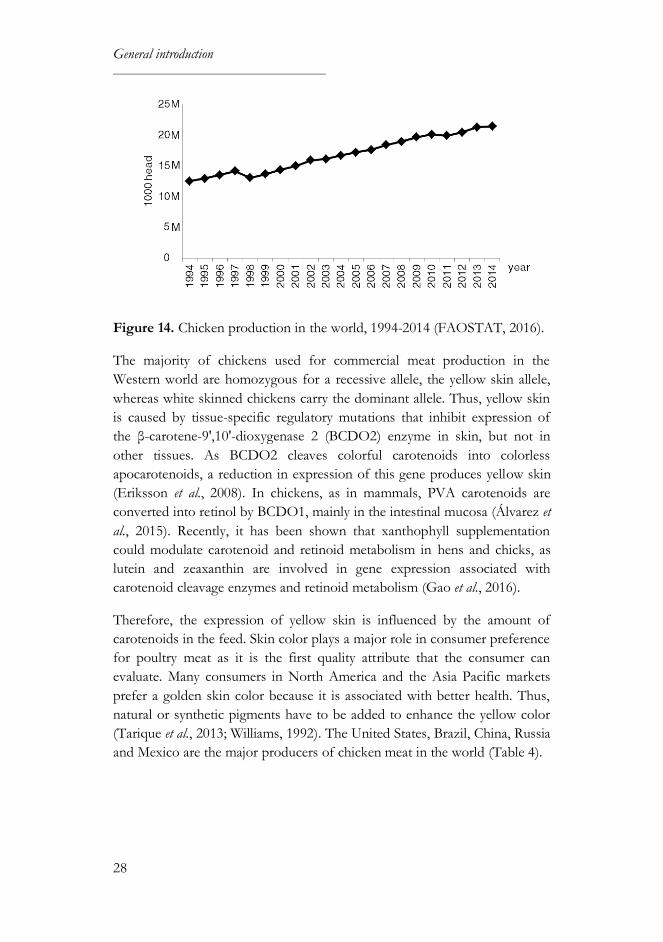
General introduction
28
Figure 14. Chicken production in the world, 1994-2014 (FAOSTAT, 2016).
The majority of chickens used for commercial meat production in the
Western world are homozygous for a recessive allele, the yellow skin allele,
whereas white skinned chickens carry the dominant allele. Thus, yellow skin
is caused by tissue-specific regulatory mutations that inhibit expression of
the β-carotene-9',10'-dioxygenase 2 (BCDO2) enzyme in skin, but not in
other tissues. As BCDO2 cleaves colorful carotenoids into colorless
apocarotenoids, a reduction in expression of this gene produces yellow skin
(Eriksson et al., 2008). In chickens, as in mammals, PVA carotenoids are
converted into retinol by BCDO1, mainly in the intestinal mucosa (Álvarez et
al., 2015). Recently, it has been shown that xanthophyll supplementation
could modulate carotenoid and retinoid metabolism in hens and chicks, as
lutein and zeaxanthin are involved in gene expression associated with
carotenoid cleavage enzymes and retinoid metabolism (Gao et al., 2016).
Therefore, the expression of yellow skin is influenced by the amount of
carotenoids in the feed. Skin color plays a major role in consumer preference
for poultry meat as it is the first quality attribute that the consumer can
evaluate. Many consumers in North America and the Asia Pacific markets
prefer a golden skin color because it is associated with better health. Thus,
natural or synthetic pigments have to be added to enhance the yellow color
(Tarique et al., 2013; Williams, 1992). The United States, Brazil, China, Russia
and Mexico are the major producers of chicken meat in the world (Table 4).
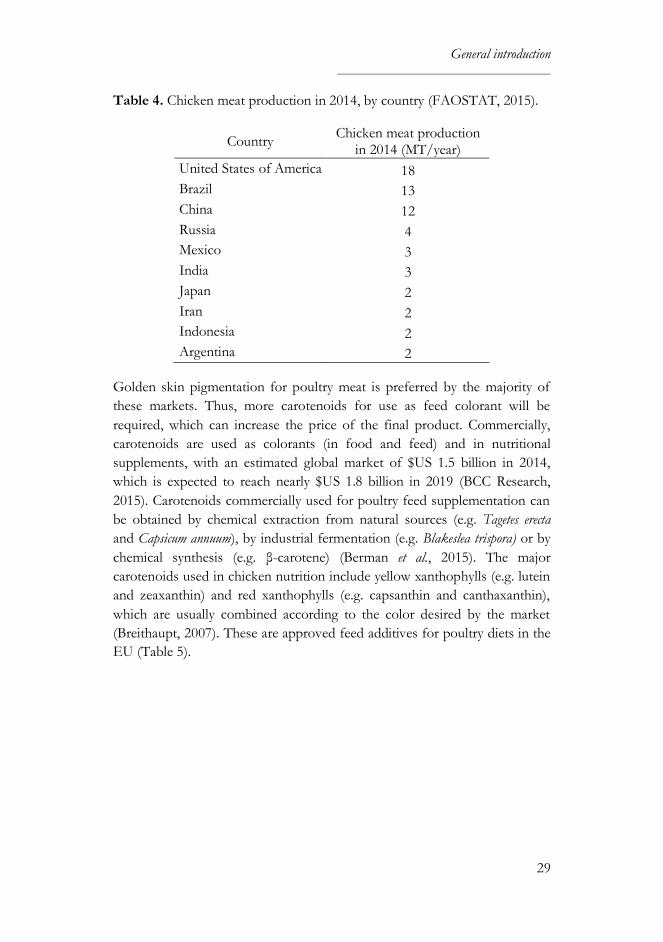
General introduction
29
Table 4. Chicken meat production in 2014, by country (FAOSTAT, 2015).
Country Chicken meat production
in 2014 (MT/year)
United States of America 18
Brazil 13
China 12
Russia 4
Mexico 3
India 3
Japan 2
Iran 2
Indonesia 2
Argentina 2
Golden skin pigmentation for poultry meat is preferred by the majority of
these markets. Thus, more carotenoids for use as feed colorant will be
required, which can increase the price of the final product. Commercially,
carotenoids are used as colorants (in food and feed) and in nutritional
supplements, with an estimated global market of $US 1.5 billion in 2014,
which is expected to reach nearly $US 1.8 billion in 2019 (BCC Research,
2015). Carotenoids commercially used for poultry feed supplementation can
be obtained by chemical extraction from natural sources (e.g. Tagetes erecta
and Capsicum annuum), by industrial fermentation (e.g. Blakeslea trispora) or by
chemical synthesis (e.g. β-carotene) (Berman et al., 2015). The major
carotenoids used in chicken nutrition include yellow xanthophylls (e.g. lutein
and zeaxanthin) and red xanthophylls (e.g. capsanthin and canthaxanthin),
which are usually combined according to the color desired by the market
(Breithaupt, 2007). These are approved feed additives for poultry diets in the
EU (Table 5).
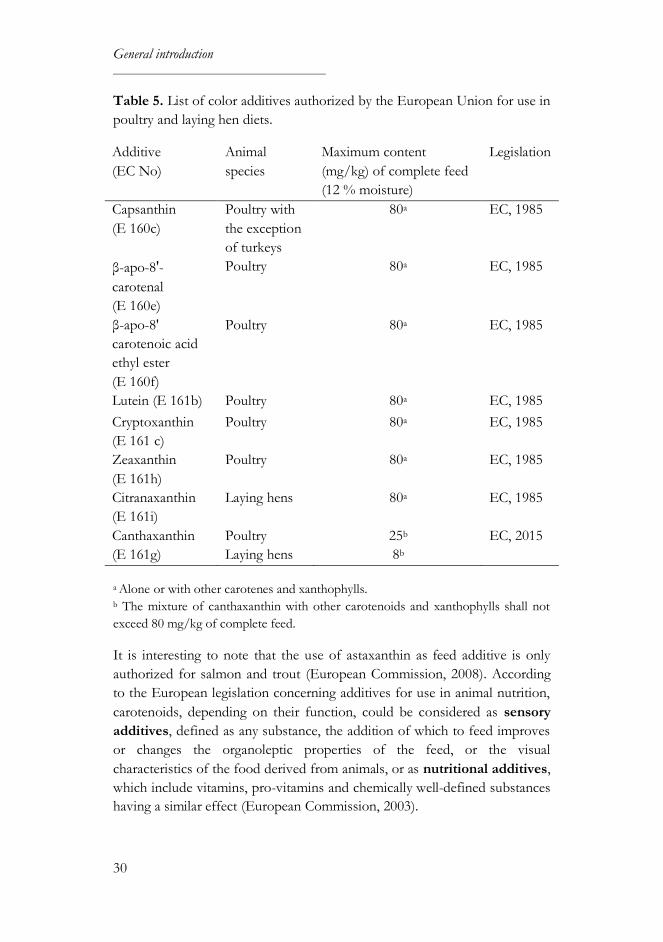
General introduction
30
Table 5. List of color additives authorized by the European Union for use in
poultry and laying hen diets.
Additive
(EC No)
Animal
species
Maximum content
(mg/kg) of complete feed
(12 % moisture)
Legislation
Capsanthin
(E 160c)
Poultry with
the exception
of turkeys
80a EC, 1985
β-apo-8'-
carotenal
(E 160e)
Poultry 80a EC, 1985
β-apo-8'
carotenoic acid
ethyl ester
(E 160f)
Poultry 80a EC, 1985
Lutein (E 161b) Poultry 80a EC, 1985
Cryptoxanthin
(E 161 c)
Poultry 80a EC, 1985
Zeaxanthin
(E 161h)
Poultry 80a EC, 1985
Citranaxanthin
(E 161i)
Laying hens 80a EC, 1985
Canthaxanthin
(E 161g)
Poultry
Laying hens
25b
8b
EC, 2015
a Alone or with other carotenes and xanthophylls. b The mixture of canthaxanthin with other carotenoids and xanthophylls shall not
exceed 80 mg/kg of complete feed.
It is interesting to note that the use of astaxanthin as feed additive is only
authorized for salmon and trout (European Commission, 2008). According
to the European legislation concerning additives for use in animal nutrition,
carotenoids, depending on their function, could be considered as sensory
additives, defined as any substance, the addition of which to feed improves
or changes the organoleptic properties of the feed, or the visual
characteristics of the food derived from animals, or as nutritional additives,
which include vitamins, pro-vitamins and chemically well-defined substances
having a similar effect (European Commission, 2003).

General introduction
31
After ingestion of feed, carotenoids are released from the matrix by digestive
enzymes and then carotenoids, as well as other feed lipids, are emulsified in
the presence of bile salts to form oil droplets. As a result of lipase action,
carotenoids are transferred from oil droplets to mixed micelles (Surai et al.,
2001). Carotenoid can be absorbed by passive diffusion across the brush
border membranes of the intestinal mucosal epithelium (Fig. 15), which
includes the migration of mixed-micelles to the membranes of intestinal
mucosal cells, incorporation into lipoprotein particles and release into the
portal vein system by portomicrons (i.e. the lipid rich lipoproteins released
from the intestinal cells), and then carotenoids can be directly delivered to
the liver and other tissues (Surai et al., 2001). In recent years, it has been
shown that carotenoid uptake is partly mediated by facilitated diffusion, as
carotenoids can be actively absorbed by membrane transporters involved in
the lipid metabolism (Fig. 15), such as SCARB1 and cluster determinant 36
(CD36) (Jlali et al., 2014; Kotake-Nara and Nagao, 2011).
Figure 15. Intestinal absorption of the dietary carotenoids in the intestinal
lumen of chickens. Adapted from Kotake-Nara and Nagao (2011).
Among the proteins involved in carotenoid metabolism, BCDO1 is mainly
responsible for the symmetrical cleavage of β-carotene into 2 retinal
molecules (and then retinal can further undergo reversible reduction to

General introduction
32
retinol or oxidation to retinoic acid), whereas BCDO2 is mainly responsible
for the asymmetric cleavage of carotenoids into apocarotenoids (Jlali et al.,
2014; Surai et al., 2001). The most important factor delimiting the efficiency
of carotenoid assimilation from the feed is carotenoid absorption in the
intestine. However, if carotenoids are presented as esterified forms instead of
free alcohol form, the carotenoid ester hydrolysis by pancreatic esterases is
also important (Surai et al., 2001).
Vitamin A plays an important role in both adult and embryo chicken
development and can be efficiently stored in the liver and yolk of chickens
thanks to its lipophilic nature (Yuan et al., 2014). Vitamin A and carotenoid
metabolism in chickens is closely related to the equivalent processes in
humans, and therefore chickens are also susceptible to VAD with similar
symptoms. Dietary VAD decreased performance, caused infertility or
impaired reproduction, and depressed the immune system in poultry (NRC,
1994; Pretorius and Schönfeldt, 2013; Yuan et al., 2014). Thus, vitamin A
supplementation could ensure immunity, growth and development. For this
reason, poultry feed formulations usually contain vitamin A at different
levels according to age (Yuan et al., 2014). In general, for maize-based feed,
broiler breeding companies recommend vitamin A supplementation up to
12,000 IU/kg in starter diets and up to 10,000 IU/kg in grower diets
(Aviagen, 2014). Synthetic retinyl esters are usually the main source of
vitamin A in the poultry industry, whereas carotenoids only provide a small
part of total vitamin A requirement (Surai et al., 2001).
Taking into account these requirements from the poultry industry, novel
sources of carotenoids in the poultry diet could contribute to enhancing both
animal appearance and health, without adding color additives and reducing
the quantity of vitamin A fortificants.
Commission Implementing Regulation (EU) No 503/2013 of 3 April
2013 on applications for authorization of genetically modified food and
feed in accordance with Regulation (EC) No 1829/2003 of the
European Parliament and of the Council and amending Commission
Regulations (EC) No 641/2004 and (EC) No 1981/2006. Official
Journal of the European Union L157: 1–48.
General introduction
33
Regulation (EC) No 1830/2003 of the European Parliament and of the
Council of 22 September 2003 concerning the traceability and labelling
of genetically modified organisms and the traceability of food and feed
products produced from genetically modified organisms and amending
Directive 2001/18/EC. Official Journal of the European Union L268:
24–28.
Regulation (EC) No 1829/2003 of the European Parliament and of the
Council of 22 September 2003 on genetically modified food and feed.
Official Journal of the European Union L268: 1–23.
Directive 2001/18/EC of the European Parliament and of the Council
of 12 March 2001 on the deliberate release into the environment of
genetically modified organisms and repealing Council Directive
90/220/EEC. Official Journal of the European Communities L106: 1–
38.
o Directive (EU) 2015/412 of the European Parliament and of the
Council of 11 March 2015 amending Directive 2001/18/EC as
regards the possibility for the Member States to restrict or prohibit
the cultivation of genetically modified organisms (GMOs) in their
territory. Official Journal of the European Union L68: 1–8.
o Directive 2008/27/EC of the European Parliament and of the
Council of 11 March 2008 amending Directive 2001/18/EC on the
deliberate release into the environment of genetically modified
organisms, as regards the implementing powers conferred on the
Commission. Official Journal of the European Union L81: 45–47.
Directive 2010/63/EU of the European Parliament and of the Council
of 22 September 2010 on the protection of animals used for scientific
purposes. Official Journal of the European Union L276: 33–79.
Commission Recommendation of 18 June 2007 on guidelines for the
accommodation and care of animals used for experimental and other
scientific purposes (2007/526/EC). Official Journal of the European
Union L197: 1–89.
Other regional and national laws which it is necessary to fulfill:
Real Decreto 53/2013, de 1 de febrero, por el que se establecen las
normas básicas aplicables para la protección de los animales utilizados en
General introduction
34
experimentación y otros fines científicos, incluyendo la docencia. Boletín
Oficial del Estado 34: 11370–11421 (Spain).
Ley 32/2007, de 7 de noviembre, para el cuidado de los animales, en su
explotación, transporte, experimentación y sacrificio. Boletín Oficial del
Estado 268: 45914-45920 (Spain).
o Ley 6/2013, de 11 de junio, de modificación de la Ley 32/2007, de 7
de noviembre, para el cuidado de los animales, en su explotación,
transporte, experimentación y sacrificio. Boletín Oficial del Estado
140: 44289–44292 (Spain).
Decreto 214/1997, de 30 de julio, por el que se regula la utilización de
animales para experimentación y para otras finalidades científicas. Diari
Oficial de la Generalitat de Catalunya 2450: 9169–9175 (Catalonia).
Ley 5/1995, de 21 de junio, de protección de los animales utilizados para
experimentación animal y para otras finalidades científicas. Diari Oficial
de la Generalitat de Catalunya 2073 (Catalonia).
Commission Regulation (EC) No 393/2008 of 30 April 2008 concerning
the authorisation of astaxanthin dimethyldisuccinate as a feed additive.
Official Journal of the European Union L117: 20–21.
Regulation (EC) No 1831/2003 of the European Parliament and of the
Council of 22 September 2003 on additives for use in animal nutrition.
Official Journal of the European Union L268: 29–43.
Commission Recommendation of 27 March 2013 on the presence of T-
2 and HT-2 toxin in cereals and cereal products (2013/165/EU).
Official Journal of the European Union L91: 12–15.
o Commission Recommendation of 4 November 2013 amending
Recommendation 2006/576/EC as regards T-2 and HT-2 toxin in
compound feed for cats (2013/637/EU). Official Journal of the
European Union L294: 44.
Commission Recommendation of 17 August 2006 on the presence of
deoxynivalenol, zearalenone, ochratoxin A, T-2 and HT-2 and
fumonisins in products intended for animal feeding (2006/576/EC).
Official Journal of the European Union L229: 7–9.
General introduction
35
Directive 2002/32/EC of the European Parliament and of the Council
of 7 May 2002 on undesirable substances in animal feed. Official Journal
of the European Union L140: 10–21.
o Commission Regulation (EU) No 574/2011 of 16 June 2011
amending Annex I to Directive 2002/32/EC of the European
Parliament and of the Council as regards maximum levels for nitrite,
melamine, Ambrosia spp. and carry-over of certain coccidiostats and
histomonostats and consolidating Annexes I and II thereto. Official
Journal of the European Union L159: 7–24.
o Commission Directive 2003/100/EC of 31 October 2003 amending
annex I to Directive 2002/32/EC of the European Parliament and
of the Council on undesirable substances in animal feed. Official
Journal of the European Union L285: 33–37.
Commission Recommendation of 27 March 2013 on the presence of T-
2 and HT-2 toxin in cereals and cereal products (2013/165/EU).
Official Journal of the European Union L91: 12–15.
Commission Regulation (EC) No 152/2009 of 27 January 2009 laying
down the methods of sampling and analysis for the official control of
feed. Official Journal of the European Union L54: 1–130.
Commission Regulation (EC) No 1881/2006, of 19 December 2006
setting maximum levels for certain contaminants in foodstuffs. Official
Journal of the European Union L364: 5–24.
o Commission Regulation (EU) No 594/2012 of 5 July 2012
amending regulation (EC) 1881/2006 as regards the maximum levels
of the contaminants ochratoxin A, non dioxin-like PCBs and
melamine in foodstuffs. Official Journal of the European Union
L176: 43–45.
o Commission Regulation (EU) No 165/2010 of 26 February 2010
amending Regulation (EC) No 1881/2006 setting maximum levels
for certain contaminants in foodstuffs as regards aflatoxins. Official
Journal of the European Union L50: 8–12.
o Commission Regulation (EC) No 1126/2007 of 28 September 2007
amending regulation (EC) No 1881/2006 setting maximum levels
for certain contaminants in foodstuffs as regards Fusarium toxins in
maize and maize products. Official Journal of the European Union
L255: 14–17.
General introduction
36
Commission Regulation (EC) No 401/2006 of 23 February 2006 laying
down the methods of sampling and analysis for the official control of
the levels of mycotoxins in foodstuffs. Official Journal of the European
Union L70: 12–34.
o Commission Regulation (EU) No 519/2014 of 16 May 2014
amending Regulation (EC) No 401/2006 as regards methods of
sampling of large lots, spices and food supplements, performance
criteria for T-2, HT-2 toxin and citrinin and screening methods of
analysis. Official Journal of the European Union L147: 29–43
Abdel-Aal, E.S.M., Akhtar, H., Zaheer, K. and Ali, R., 2013. Dietary sources of lutein and zeaxanthin carotenoids and their role in eye health. Nutrients 5: 1169–1185.
Altincicek, B., Kovacs, J.L. and Gerardo, N.M., 2012. Horizontally transferred fungal carotenoid genes in the two-spotted spider mite Tetranychus urticae. Biology letters 8: 253–257.
Altpeter, F., Baisakh, N., Beachy, R., Bock, R., Capell, T., Christou, P., Daniell, H., Datta, K., Datta, S., Dix, P.J., Fauquet, C., Huang, N., Kohli, A., Mooibroek, H., Nicholson, L., Nguyen, T.T., Nugent, G., Raemakers, K., Romano, A., Somers, D.A., Stoger, E., Taylor, N. and Visser, R., 2005. Particle bombardment and the genetic enhancement of crops: myths and realities. Molecular Breeding 15: 305–327.
Álvarez, R., Meléndez-Martínez, A.J., Vicario, I.M. and Alcalde, M.J., 2015. Carotenoid and vitamin A content in biological fluids and tissues of animals as an effect of the diet. A review. Food Reviews International 31: 319–340.
Ariño, A., Herrera, M., Juan, T., Estopañan, G., Carramiñana, J.J., Rota, C. and Herrera, A., 2009. Influence of agricultural practices on the contamination of maize by fumonisin mycotoxins. Journal of Food Protection 72: 898–902.
Aviagen, 2014. Ross 308 broiler: nutrition specifications. Available at: http://es.aviagen.com/assets/Tech_Center/Ross_Broiler/Ross308BroilerNutritionSpecs2014-EN.pdf Accessed 17 February 2017.
BA-farms, 2017. Poultry cuts made easy. Available at: http://www.ba-farms.com/poultry-cuts-made-easy/Accessed 16 February 2017.
Bai, C., Twyman, R.M., Farré, G., Sanahuja, G., Christou, P., Capell, T. and
General introduction
37
Zhu, C., 2011. A golden era – pro-vitamin A enhancement in diverse crops. In Vitro Cellular & Developmental Biology – Plant 47: 205–221.
Bailey, R.L., West, K.P. and Black, R.E., 2015. The epidemiology of global micronutrient deficiencies. Annals of Nutrition and Metabolism 66: 22–33.
Battilani, P., Toscano, P., Van der Fels-Klerx, H.J., Moretti, A., Camardo Leggieri, M., Brera, C., Rortais, A., Goumperis, T. and Robinson, T., 2016. Aflatoxin B1 contamination in maize in Europe increases due to climate change. Scientific Reports 6: 24328.
BCC Research, 2015. The global market for carotenoids. Available at: http://www.bccresearch.com/market-research/food-and-beverage/carotenoids-global-market-report-fod025e.html Accessed 16 February 2017.
Bennett, J.W., 1987. Mycotoxins, mycotoxicosis, mycotoxicology and mycopathology. Mycopathologia 100: 3–5.
Berman, J., Zorrilla-López, U., Farré, G., Zhu, C., Sandmann, G., Twyman, R.M., Capell, T. and Christou, P., 2015. Nutritionally important carotenoids as consumer products. Phytochemistry Reviews 14: 727–743.
Bezuidenhout, S.C., Gelderblom, W.C.A., Gorst-Allman, C.P., Horak, R.M., Marasas, W.F.O., Spiteller, G. and Al., E., 1988. Structure elucidation of the fumonisins, mycotoxins from Fusarium moniliforme. Journal of the Chemical Society – Chemical Communications 11: 743–745.
Black, R.E., Allen, L.H., Bhutta, Z.A., Caulfield, L.E., de Onis, M., Ezzati, M., Mathers, C. and Rivera, J., 2008. Maternal and child undernutrition: global and regional exposures and health consequences. The Lancet 371: 243–260.
Blandino, M., Reyneri, A., Colombari, G. and Pietri, A., 2009. Comparison of integrated field programmes for the reduction of fumonisin contamination in maize kernels. Field Crops Research 111: 284–289.
Breithaupt, D.E., 2007. Modern application of xanthophylls in animal feeding – a review. Trends in Food Science and Technology 18: 501–506.
Britton, G., 1995. Structure and properties of carotenoids in relation to function. The FASEB Journal 9: 1551–1558.
Cao, A., Santiago, R., Ramos, A.J., Marín, S., Reid, L.M. and Butrón, A.,
General introduction
38
2013. Environmental factors related to fungal infection and fumonisin accumulation during the development and drying of white maize kernels. International Journal of Food Microbiology 164: 15–22.
Carbonell-Capella, J.M., Buniowska, M., Barba, F.J., Esteve, M.J. and Frígola, A., 2014. Analytical methods for determining bioavailability and bioaccessibility of bioactive compounds from fruits and vegetables: a review. Comprehensive Reviews in Food Science and Food Safety 13: 155–171.
Carvalho, S.M.P. and Vasconcelos, M.W., 2013. Producing more with less: strategies and novel technologies for plant-based food biofortification. Food Research International 54: 961–971.
Christou, P., 1992. Genetic transformation of crop plants using microprojectile bombardment. The Plant Journal 2: 275–281.
Christou, P. and Twyman, R.M., 2004. The potential of genetically enhanced plants to address food insecurity. Nutrition Research Reviews 17: 23–42.
Clemens, S., 2014. Zn and Fe biofortification: the right chemical environment for human bioavailability. Plant Science 225: 52–57.
Cowieson, A.J., 2005. Factors that affect the nutritional value of maize for broilers. Animal Feed Science and Technology 119: 293–305.
De Steur, H., Wesana, J., Blancquaert, D., Van Der Straeten, D. and Gellynck, X., 2016. The socioeconomics of genetically modified biofortified crops: a systematic review and meta-analysis. Annals of the New York Academy of Sciences 1–20. doi: 10.1111/nyas.13199.
DellaPenna, D., 1999. Nutritional genomics: manipulating plant micronutrients to improve human health. Science 285: 375–379.
Desjardins, A.E., 2006. Fusarium mycotoxins: chemistry, genetics and biology. The American Phytopathological Society (APS) Press, St. Paul, MN, USA.
Ducreux, L.J.M., Morris, W.L., Taylor, M.A. and Millam, S., 2005. Agrobacterium-mediated transformation of Solanum phureja. Plant Cell Reports 24: 10–14.
Eriksson, J., Larson, G., Gunnarsson, U., Bed’hom, B., Tixier-Boichard, M., Strömstedt, L., Wright, D., Jungerius, A., Vereijken, A., Randi, E., Jensen, P. and Andersson, L., 2008. Identification of the yellow skin gene reveals a hybrid origin of the domestic chicken. PLoS Genetics 4:

General introduction
39
e1000010.
European Commission, 1985. Commission Directive of 8 July 1985 amending the Annexes to Council Directive 70/524/EEC concerning additives in feedingstuffs (85/429/EEC). Official Journal of the European Communities L245: 1–32.
European Commission, 2003. Regulation (EC) No 1831/2003 of the European Parliament and of the Council of 22 September 2003 on additives for use in animal nutrition. Official Journal of the European Union L268: 29–43.
European Commission, 2008. Commission Regulation (EC) No 393/2008 of 30 April 2008 concerning the authorisation of astaxanthin dimethyldisuccinate as a feed additive. Official Journal of the European Union L117: 20–21.
European Commission, 2015. Commission Implementing Regulation (EU) 2015/1486 of 2 September 2015 concerning the authorisation of canthaxanthin as feed additive for certain categories of poultry, ornamental fish and ornamental birds. Official Journal of the European Union L 229: 5–8.
European Food Safety Authority (EFSA), 2011. Scientific Opinion on the risks for public health related to the presence of zearalenone in food. EFSA Journal 9: 2197.
FAOSTAT, 2015. Food and Agriculture Organization of the United Nations. Statistics division. Available at: http://www.fao.org/faostat/en/ Accessed 16 February 2017.
Farré, G., Bai, C., Twyman, R.M., Capell, T., Christou, P. and Zhu, C., 2011. Nutritious crops producing multiple carotenoids – a metabolic balancing act. Trends in Plant Science 16: 532–540.
Fernández-García, E., Carvajal-Lérida, I., Jarén-Galán, M., Garrido-Fernández, J., Pérez-Gálvez, A. and Hornero-Méndez, D., 2012. Carotenoids bioavailability from foods: from plant pigments to efficient biological activities. Food Research International 46: 438–450.
Fiedler, J.L., Dado, D.R., Maglalang, H., Juban, N., Capistrano, M. and Magpantay, M.V., 2000. Cost analysis as a vitamin A program design and evaluation tool: a case study of the Philippines. Social Science & Medicine 51: 223–242.
Fiedor, J. and Burda, K., 2014. Potential role of carotenoids as antioxidants in human health and disease. Nutrients 6: 466–488.
General introduction
40
Food and Agriculture Organization of the United Nations (FAO), 1992. Maize in human nutrition. FAO, Rome, Italy.
Gao, Y.-Y., Ji, J., Jin, L., Sun, B.-L., Xu, L.-H., Wang, C.-K. and Bi, Y.-Z., 2016. Xanthophyll supplementation regulates carotenoid and retinoid metabolism in hens and chicks. Poultry Science 95: 541–549.
Giorni, P., Bertuzzi, T. and Battilani, P., 2016. Aflatoxin in maize, a multifaceted answer of Aspergillus flavus governed by weather, host-plant and competitor fungi. Journal of Cereal Science 70: 256–262.
Gómez-Galera, S., Rojas, E., Sudhakar, D., Zhu, C., Pelacho, A.M., Capell, T. and Christou, P., 2010. Critical evaluation of strategies for mineral fortification of staple food crops. Transgenic Research 19: 165–180.
Grune, T., Lietz, G., Palou, A., Ross, A.C., Stahl, W., Tang, G., Thurnham, D., Yin, S. and Biesalski, H.K., 2010. β-Carotene is an important vitamin A source for humans. The Journal of Nutrition 140: 2268S–2285S.
Gwirtz, J.A. and Garcia-Casal, M.N., 2014. Processing maize flour and corn meal food products. Annals of the New York Academy of Sciences 1312: 66–75.
Harrison, E.H., 2012. Mechanisms involved in the intestinal absorption of dietary vitamin A and provitamin A carotenoids. Biochimica et Biophysica Acta 1821: 70–77.
HarvestPlus, 2017. HarvestPlus Program. Available at: http://www.harvestplus.org/Accessed 16 February 2017.
He, Q., Berg, A., Li, Y., Vallejos, C.E. and Wu, R., 2010. Mapping genes for plant structure, development and evolution: functional mapping meets ontology. Trends in Genetics 26: 39–46.
Horton, S., Shekar, M., McDonald, C., Mahal, A. and Brooks, J.K., 2010. Scaling up nutrition. What will it cost? Imperial College, London, UK. The World Bank, Washington DC, USA.
Hove, M., Van Poucke, C., Njumbe-Ediage, E., Nyanga, L.K. and De Saeger, S., 2016. Review on the natural co-occurrence of AFB1 and FB1 in maize and the combined toxicity of AFB1 and FB1. Food Control 59: 675–682.
International Agency for Research on Cancer (IARC), 1993. IARC Monographs on the evaluation of carcinogenic risks to humans. Some naturally occurring substances: food items and constituents,

General introduction
41
heterocyclic aromatic amines and mycotoxins. Vol. 56. IARC, Lyon, France.
International Agency for Research on Cancer (IARC), 2002. IARC Monographs on the evaluation of carcinogenic risks to humans. Some traditional herbal medicines, some mycotoxins, naphthalene and styrene. Vol. 82. IARC, Lyon, France.
International Agency for Research on Cancer (IARC), 2012. IARC Monographs on the evaluation of carcinogenic risks to humans. Chemical agents and related occupations: aflatoxins. Vol. 100 F. IARC, Lyon, France.
Institute of Medicine (US), 2001. Dietary reference intakes for vitamin A, vitamin K, arsenic, boron, chromium, copper, iodine, iron, manganese, molybdenum, nickel, silicon, vanadium and zinc. National Academy Press, Washington DC, USA.
Ishida, B.K. and Bartley, G.E., 2009. Carotenoids. Chemistry, sources and physiologhy. In: Caballero, B. (ed.) Guide to nutritional supplements. Elsevier Ltd., Oxford, UK, pp. 92–101.
James, C., 2016. Brief 51: 20th anniversary (1996 to 2015) of the global commercialization of biotech crops and biotech crop highlights in 2015. ISAAA, Ithaca, NY, USA.
Jlali, M., Graulet, B., Chauveau-Duriot, B., Godet, E., Praud, C., Nunes, C.S., Le Bihan-Duval, E., Berri, C. and Duclos, M.J., 2014. Nutrigenetics of carotenoid metabolism in the chicken: a polymorphism at the β,β-carotene 15,15'-mono-oxygenase 1 (BCMO1) locus affects the response to dietary β-carotene. British Journal of Nutrition 111: 2079–2088.
Joint FAO/WHO Expert Committee on Food Additives (JECFA), 2001. Safety evaluation of certain mycotoxins in food. 56th Meeting of the JECFA, Geneva, International Programme on Chemical Safety. WHO Food Additives Series No. 47. WHO, Geneva, Switzerland.
Johns, T. and Eyzaguirre, P.B., 2007. Biofortification, biodiversity and diet: a search for complementary applications against poverty and malnutrition. Food Policy 32: 1–24.
Joy, E.J.M., Stein, A.J., Young, S.D., Ander, E.L., Watts, M.J. and Broadley, M.R., 2015. Zinc-enriched fertilisers as a potential public health intervention in Africa. Plant and Soil 389: 1–24.
Kamthan, A., Chaudhuri, A., Kamthan, M. and Datta, A., 2016. Genetically
General introduction
42
modified (GM) crops: milestones and new advances in crop improvement. Theoretical and Applied Genetics 129: 1639–1655.
Kotake-Nara, E. and Nagao, A., 2011. Absorption and metabolism of xanthophylls. Marine Drugs 9: 1024–1037.
Kovalsky, P., Kos, G., Nährer, K., Schwab, C., Jenkins, T., Schatzmayr, G., Sulyok, M. and Krska, R., 2016. Co-occurrence of regulated, masked and emerging mycotoxins and secondary metabolites in finished feed and maize – an extensive survey. Toxins 8: 1–29.
Krinsky, N.I. and Johnson, E.J., 2005. Carotenoid actions and their relation to health and disease. Molecular Aspects of Medicine 26: 459–516.
Leeson, S. and Summers, J.D., 1997. Commercial poultry nutrition. University Books, Ontario, Canada.
Leeson, S. and Summers, J.D., 2000. Broiler breeder production. University Books, Ontario, Canada.
Logrieco, A., Moretti, A., Perrone, G. and Mulè, G., 2007. Biodiversity of complexes of mycotoxigenic fungal species associated with Fusarium ear rot of maize and Aspergillus rot of grape. International Journal of Food Microbiology 119: 11–16.
Magan, N., Medina, A. and Aldred, D., 2011. Possible climate-change effects on mycotoxin contamination of food crops pre- and postharvest. Plant Pathology 60: 150–163.
Majchrzak, D., Fabian, E. and Elmadfa, I., 2006. Vitamin A content (retinol and retinyl esters) in livers of different animals. Food Chemistry 98: 704–710.
Marasas, W.F.O., 2001. Discovery and occurrence of the fumonisins: a historical perspective. Environmental Health Perspectives 109: 239–243.
Marasas, W.F.O., Riley, R.T., Hendricks, K.A., Stevens, V.L., Sadler, T.W., Gelineau-van Waes, J., Missmer, S.A., Cabrera, J., Torres, O., Gelderblom, W.C.A. and Al., E., 2004. Fumonisins disrupt sphingolipid metabolism, folate transport, and neural tube development in embryo culture and in vivo: a potencial risk factor for human neural tube defects among populations consuming fumonisin-contaminated maize. Journal of Nutrition 134: 711–716.
Marín, S., Magan, N., Ramos, A.J. and Sanchis, V., 2004. Fumonisin-producing strains of Fusarium: a review of their ecophysiology. Journal
General introduction
43
of Food Protection 67: 1792–1805.
Marín, S., Ramos, A.J. and Sanchis, V., 2013. Mycotoxins: occurrence, toxicology, and exposure assessment. Food and Chemical Toxicology 60: 218–237.
Moran, N.A. and Jarvik, T., 2010. Lateral transfer of genes from fungi underlies carotenoid production in aphids. Science 328: 624–627.
Muthayya, S., Rah, J.H., Sugimoto, J.D., Roos, F.F., Kraemer, K. and Black, R.E., 2013. The global hidden hunger indices and maps: an advocacy tool for action. PLoS ONE 8: 1–12.
Namitha, K.K. and Negi, P.S., 2010. Chemistry and biotechnology of carotenoids. Critical Reviews in Food Science and Nutrition 50: 728–760.
Naqvi, S., Zhu, C., Farré, G., Ramessar, K., Bassie, L., Breitenbach, J., Perez Conesa, D., Ros, G., Sandmann, G., Capell, T. and Christou, P., 2009. Transgenic multivitamin corn through biofortification of endosperm with three vitamins representing three distinct metabolic pathways. Proceedings of the National Academy of Sciences of the United States of America 106: 7762–7767.
National Research Council, 1994. Nutrient requeriments of poultry, ninth revised edition. National Academy Press, Washington DC, USA.
Nuss, E.T. and Tanumihardjo, S.A., 2010. Maize: a paramount staple crop in the context of global nutrition. Comprehensive Reviews in Food Science and Food Safety 9: 417–436.
Paine, J.A., Shipton, C.A., Chaggar, S., Howells, R.M., Kennedy, M.J., Vernon, G., Wright, S.Y., Hinchliffe, E., Adams, J.L., Silverstone, A.L. and Drake, R., 2005. Improving the nutritional value of Golden Rice through increased pro-vitamin A content. Nature Biotechnology 23: 482–487.
Peltonen, K., Jestoi, M. and Eriksen, G.S., 2010. Health effects of moniliformin: a poorly understood Fusarium mycotoxin. World Mycotoxin Journal 3: 403–414.
Pfeiffer, W.H. and McClafferty, B., 2007. HarvestPlus: breeding crops for better nutrition. Crop Science 47: S88–S105.
Pretorius, B. and Schönfeldt, H.C., 2013. Effect of different maize meal diets on growth and vitamin A: case-study on chickens. Food Chemistry 140: 520–525.
General introduction
44
Raes, K., Knockaert, D., Struijs, K. and Van Camp, J., 2014. Role of processing on bioaccessibility of minerals: influence of localization of minerals and anti-nutritional factors in the plant. Trends in Food Science and Technology 37: 32–41.
Ranum, P., Peña-Rosas, J.P. and Garcia-Casal, M.N., 2014. Global maize production, utilization, and consumption. Annals of the New York Academy of Sciences 1312: 105–112.
Rapid Alert System for Food and Feed (RASFF), 2016. Annual report 2015. Available at: https://ec.europa.eu/food/sites/food/files/safety/docs/rasff_annual_report_2015.pdf Accessed 24 February 2017.
Rawat, N., Neelam, K., Tiwari, V.K. and Dhaliwal, H.S., 2013. Biofortification of cereals to overcome hidden hunger. Plant Breeding 132: 437–445.
Sanahuja, G., Farré, G., Berman, J., Zorrilla-López, U., Twyman, R.M., Capell, T., Christou, P. and Zhu, C., 2013. A question of balance: achieving appropriate nutrient levels in biofortified staple crops. Nutrition Research Reviews 26: 235–245.
Scanes, C.G., Brant, G. and Ensminger, M.E., 1992. Poultry science. Pearson, Upper Saddle River, NJ, USA.
Scientific Cooperation on Questions Relating to Food (SCOOP), 2003. Reports on tasks for scientific cooperation. Collection of occurrence data of Fusarium toxins in food and assessment of dietary intake by the population of EU Member States. Available at: https://ec.europa.eu/food/sites/food/files/safety/docs/cs_contaminants_catalogue_fusarium_task3210.pdf Accessed 28 February 2017.
Seifert, K.A., Aoki, T., Baayen, R.P., Brayford, D., Burgess, L.W., Chulze, S., Gams, W., Geiser, D., de Gruyter, J., Leslie, J.F., Logrieco, A., Marasas, W.F.O., Nirenberg, H.I., O'Donnell, K., Rheeder, J., Samuels, G.J., Summerell, B.A., Thrane, U. and Waalwijk, C., 2003. The name Fusarium moniliforme should no longer be used. Mycological Research 107: 643–644.
Sobrova, P., Adam, V., Vasatkova, A., Beklova, M., Zeman, L. and Kizek, R., 2010. Deoxynivalenol and its toxicity. Interdisciplinary Toxicology 3: 94–99.
Soriano, J.M. and Dragacci, S., 2004. Occurrence of fumonisins in foods. Food Research International 37: 985–1000.
General introduction
45
Stewart, P.A. and McLean, W.P., 2005. Public opinion toward the first, second, and third generations of plant biotechnology. In Vitro Cellular & Developmental Biology – Plant 41: 718–724.
Streit, E., Naehrer, K., Rodrigues, I. and Schatzmayr, G., 2013. Mycotoxin occurrence in feed and feed raw materials worldwide: long-term analysis with special focus on Europe and Asia. Journal of the Science of Food and Agriculture 93: 2892–2899.
Surai, P.F., Speake, B.K. and Sparks, N.H.C., 2001. Carotenoids in avian nutrition and embryonic development. 1. Absorption, availability and levels in plasma and egg yolk. Journal of Poultry Science 38: 1–27.
Tanumihardjo, S.A. and Yang, Z., 2009. Carotenoids. Epidemiology of health effects. In: Caballero, B. (ed.) Guide to nutritional supplements. Elsevier Ltd., Oxford, UK, pp. 101–107.
Tarique, T., Yang, S., Mohsina, Z., Qiu, J., Zhao, Y., Gang, C. and Ailiang, C., 2013. Role of carotenoids in poultry industry in China: a review. Journal of Natural Sciences Research 3: 111–122.
United Nations (UN), 2015. World population prospects: the 2015 revision. UN, New York, NY, USA.
United Nations (UN) and Standing Committee on Nutrition (SCN), 2004. 5th report on the world nutrition situation: nutrition for improved development outcomes. UN-SCN, Geneva, Switzerland.
United Nations (UN) and Standing Committee on Nutrition (SCN), 2010. 6th report on the world nutrition situation: progress in nutrition. UN-SCN, Geneva, Switzerland.
United States Department of Agriculture (USDA), 2016 National nutrient database for standard reference. Available at: http://www.nal.usda.gov/fnic/foodcomp/search/ Accessed 28 February 2017.
Williams, J.H., Phillips, T.D., Jolly, P.E., Stiles, J.K., Jolly, C.M. and Aggarwal, D., 2004. Human aflatoxicosis in developing countries: a review of toxicology, exposure, potential health consequences, and interventions. The American Journal of Clinical Nutrition 80: 1106–1122.
Williams, W.D., 1992. Origin and impact of color on consumer preference for food. Poultry Science 71: 744–746.
World Health Organization (WHO), 2016. e-Library of evidence for
General introduction
46
nutrition actions. Available at: http://www.who.int/elena/titles/biofortification/en/ Accessed 16 February 2017.
World Health Organization (WHO), 2009. Global prevalence of vitamin A deficiency in populations at risk 1995-2005. WHO Global database on vitamin A deficiency. WHO, Geneva, Switzerland.
World Health Organization (WHO), 2005. Modern food biotechnology, human health and development: an evidence-based study. WHO, Geneva, Switzerland.
World Health Organization (WHO) and Food and Agriculture Organization of the United Nations (FAO), 2009. Foods derived from modern biotechnology. Foods derived from modern biotechnology. WHO-FAO, Rome, Italy.
Wu, F., Bhatnagar, D., Bui-Klimke, T., Carbone, I., Hellmich, R., Munkvold, G., Paul, P., Payne, G. and Takle, E., 2011. Climate change impacts on mycotoxin risks in US maize. World Mycotoxin Journal 4: 79–93.
Wu, F., Groopman, J.D. and Pestka, J.J., 2014. Public health impacts of foodborne mycotoxins. Annual Review of Food Science and Technology 5: 351–372.
Ye, X., Al-Babili, S., Klöti, A., Zhang, J., Lucca, P., Beyer, P. and Potrykus, I., 2000. Engineering the provitamin A (β-carotene) biosynthetic pathway into (carotenoid-free) rice endosperm. Science 287: 303–305.
Yonekura-Sakakibara, K. and Saito, K., 2006. Review: genetically modified plants for the promotion of human health. Biotechnology Letters 28: 1983–1991.
Yonekura, L. and Nagao, A., 2007. Intestinal absorption of dietary carotenoids. Molecular Nutrition and Food Research 51: 107–115.
Yuan, J., Roshdy, A.R., Guo, Y., Wang, Y. and Guo, S., 2014. Effect of dietary vitamin A on reproductive performance and immune response of broiler breeders. PLoS ONE 9: 1–9.
Zanga, D., Capell, T., Slafer, G.A., Christou, P. and Savin, R., 2016a. A carotenogenic mini-pathway introduced into white corn does not affect development or agronomic performance. Scientific Reports 6: 38288.
Zanga, D., Capell, T., Zhu, C., Christou, P. and Thangaraj, H., 2016b. Freedom-to-operate analysis of a transgenic multivitamin corn variety. Plant Biotechnology Journal 14: 1225–1240.
General introduction
47
Zhu, C., Naqvi, S., Breitenbach, J., Sandmann, G., Christou, P. and Capell, T., 2008. Combinatorial genetic transformation generates a library of metabolic phenotypes for the carotenoid pathway in maize. Proceedings of the National Academy of Sciences of the United States of America 105: 18232–18237.
Zhu, C., Naqvi, S., Gomez-Galera, S., Pelacho, A.M., Capell, T. and Christou, P., 2007. Transgenic strategies for the nutritional enhancement of plants. Trends in Plant Science 12: 548–555.
Zupan, J.R. and Zambryski, P., 1995. Transfer of T-DNA from Agrobacterium to the plant cell. Plant Physiology 107: 1041–1047.


Objectives and work plan
51
High-carotenoid (HC) maize was generated through genetic engineering to specifically increase the levels of carotenoids present in the maize endosperm, using as the basis a South African white maize, which is practically devoid of carotenoids. Consequently, the intake of provitamin A (PVA) carotenoids in the diet would be increased and could thus address vitamin A deficiency in at-risk populations in developing countries. The effects that its use as raw material could have on feed and food are unknown. Therefore, the main objective of this Doctoral Thesis is to evaluate its possible utilization as feed and food ingredient. The general objectives of this Doctoral Thesis are described below. To achieve each goal, it was necessary to set specific objectives.
I. Evaluate, for three consecutive harvest seasons, the susceptibility to
fungal infection and fumonisin and aflatoxin contamination of HC
maize and its near isogenic line in open field experiments (Chapter I).
i. Assess whether there are differences in fungal incidence and the
fungal species involved between HC maize and its near isogenic
line.
ii. Investigate whether the carotenoid content could play a role in
fumonisin and aflatoxin contamination.
II. Evaluate whether HC maize could be a suitable replacement for color
additives in poultry feed (Chapter II):
i. Compare the productivity and health parameters among chickens
fed on different diets, based on HC maize, its near isogenic line
and a commercial yellow maize (supplemented with natural color
additives).
ii. Investigate the color evolution among chickens fed on different
diets, based on HC maize, its near isogenic line and a commercial
yellow maize (supplemented with natural color additives), and the
levels of carotenoids and their derivatives in feed, serum and liver.
iii. A further aim was to obtain chicken meat to carry out the trial
related to objective IV.
Objectives and work plan
52
III. Assess the bioavailability of PVA carotenoids (β-carotene and β-
cryptoxanthin) provided as intrinsic components of HC maize
(Chapter III).
i. Compare the bioavailability of PVA carotenoids supplied by HC
maize or by its near isogenic line supplemented with synthetic or
natural color additives.
ii. Ascertain whether zeaxanthin, a major carotenoid in HC maize,
may play a role in carotenoid absorption.
iii. Evaluate the productivity parameters, color evolution and
distribution of carotenoids and their derivatives among chickens
fed on diets based on HC maize and its near isogenic line
supplemented with synthetic or natural color additives.
IV. Investigate the effect of HC maize on chicken meat quality and shelf
life (Chapter IV).
i. Ascertain the sensory shelf life of chicken meat obtained from
chickens fed on different diets based on HC maize, its near
isogenic line and a commercial yellow maize (supplemented with
natural color additives).
ii. Evaluate the quality of chicken meat through physical (pH, color
and texture) and microbiological analyses (Pseudomonas spp. and
total aerobic mesophilic).
V. Ascertain the optimal conditions for preserving carotenoids in HC
maize when it is cooked (Chapter V).
i. Investigate the effect of processing parameters (temperature,
cooking time and pH) on total carotenoid content of HC maize.
ii. Assess the effect of different home-cooking techniques (thin or
thick, unfermented or fermented porridges) on final carotenoid
content in maize porridges obtained from HC maize and its near
isogenic line.
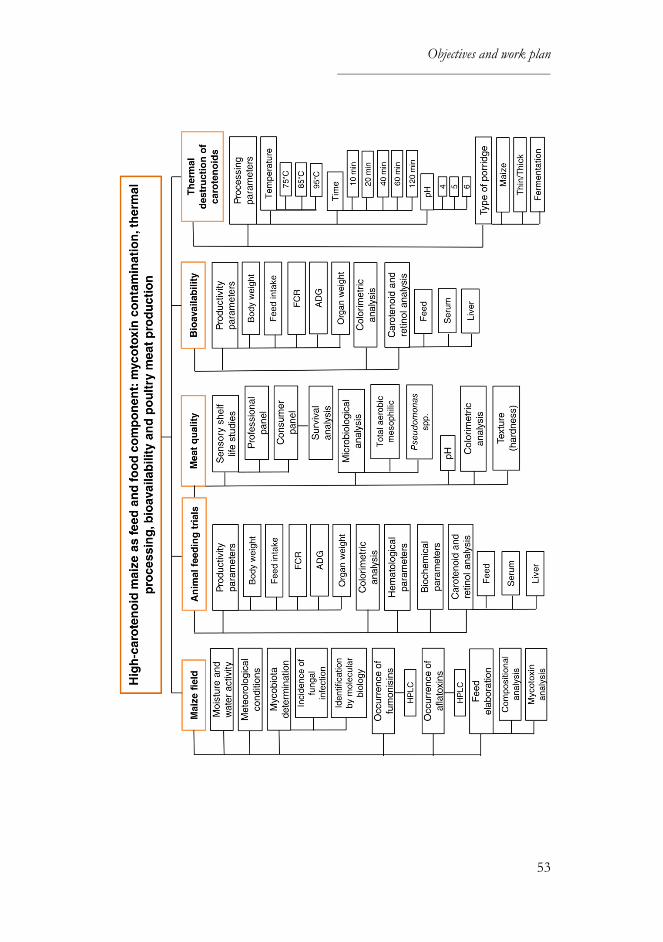
Objectives and work plan
53


–

Chapter I
59
Joana Díaz-Gómez a, Sonia Marín a, Carmina Nogareda b, Vicente Sanchis a
and Antonio J. Ramos a
a Food Technology Department, University of Lleida, UTPV-XaRTA,
Agrotecnio Center, Av. Rovira Roure 191, Lleida, 25198, Spain; b Animal Science Department, University of Lleida–Agrotecnio Center, Av.
Rovira Roure 191, Lleida, 25198, Spain
Novel strategies that address vitamin A deficiency have been developed,
such as high-carotenoid maize, a biofortified transgenic maize line rich in
carotenoids generated by genetic transformation. The South African white
maize inbred (M37W), which is devoid of carotenoids, was engineered to
accumulate high levels of β-carotene (provitamin A), lutein and zeaxanthin.
Maize seeds contaminated with fumonisins and other mycotoxins pose a
serious threat to both humans and livestock. During three consecutive
harvests, the fungal incidence and the fumonisin and aflatoxin content of
maize seeds grown in an experimental field in Catalonia (Northeastern Spain)
were evaluated. Fungal infection was similar in high-carotenoid maize and its
near isogenic line, with Fusarium verticillioides being the most prevalent fungus
in all the harvests. Neither Aspergillus spp. nor aflatoxin contamination was
found. Fumonisin levels were lower in high-carotenoid than in its near
isogenic line, but this reduction was statistically significant in only 2 of the 3
years of study. Our results suggest that high carotenoid content reduces
fumonisin levels in maize grains.
Maize, carotenoids, fumonisins, aflatoxins, Fusarium
In many developing countries, populations subsist on a cereal-dominated
diet with low levels of nutrients, including β-carotene. Chronically
Chapter I
60
insufficient vitamin A intake in the diet can lead to disorders such as
xerophthalmia, anemia and weakened resistance to infection. It has been
estimated that vitamin A deficiency (VAD) affects up to one third of the
world's pre-school-age children and up to 15% of pregnant women. VAD is
prevalent worldwide but is particularly severe in Africa and South-East Asia
(WHO, 2009).
In sub-Saharan Africa, white maize is the predominant food maize used,
while yellow maize, with a higher carotenoid content (but with no
provitamin A – PVA – carotenoids), is mainly used as animal feed (Naqvi et
al., 2009). The South African white endosperm maize inbred M37W, which
lacks carotenoids in the endosperm because of the absence of the enzyme
phytoene synthase (necessary for the biosynthesis of these metabolites), was
used as a basis to create the high-carotenoid (HC) maize through
combinatorial nuclear transformation (as described in Zhu et al., 2008).
Zmpsy1 (Zea mays phytoene synthase 1) and PacrtI (Pantoea ananatis phytoene
desaturase) controlled by endosperm-specific promoters were introduced
into M37W inbred to generate the HC maize. The maize line used in the
current experiments is able to provide the recommended daily intake of
PVA in 200 g of grain (Naqvi et al., 2009).
Mycotoxins occurring in food commodities are low-molecular-weight natural
products synthesized as secondary metabolites by filamentous fungi. The
most important toxins are produced by species in the genera Fusarium,
Aspergillus, Penicillium and Alternaria, which can grow on a variety of crops,
including cereals, and can enter the food chain during preharvest, harvest,
drying, or storage, and even in manufactured products, thus offering many
opportunities to contaminate food and feed (Shephard, 2008). Maize (Zea
mays L.) seeds are often contaminated with fumonisins (FBs), produced
primarily by Fusarium verticillioides and F. proliferatum. However, other
mycotoxins may frequently be present alone or in combination with FBs,
including aflatoxins (AFs), deoxynivalenol, zearalenone, and some recently
discovered Fusarium metabolites collectively known as emergent mycotoxins,
such as moniliformin, beauvericin, enniatins and fusaproliferin. AFs are
mainly produced by Aspergillus flavus, which synthetizes type B aflatoxins as
well as cyclopiazonic acid, depending on the strain, and by A. parasiticus,
which synthetizes both type B and type G aflatoxins but not cyclopiazonic
acid (Desjardins, 2006; Marín et al., 2013).
Chapter I
61
Fumonisin-contaminated maize is toxic, causing leukoencephalomalacia in
equines (Kellerman et al., 1990), pulmonary edema in swine (Harrison et al.,
1990) and cancer in humans, especially in areas where maize is the staple diet
(Marasas, 2001). The mode of action of FBs is directly or indirectly linked to
the effects of FBs on the sphingolipid metabolism (Wang et al., 1991).
Fumonisin B1 (FB1) is potentially carcinogenic in humans (group 2B),
according to the International Agency for Research on Cancer (IARC, 2002).
It is also the most prevalent Fusarium toxin in maize. Human exposure to
FBs in maize is common worldwide. In 2001, several countries submitted
information on the concentration of FBs in maize and maize-derived foods,
and FBs were detected in more than 60% of all food products (JECFA,
2001).
AFs are hepatotoxic, carcinogenic, immunosuppressive and anti-nutritional
contaminants found in some staple foods. Chronic exposure to AFs can
compromise the immunity and nutritional status of farm and laboratory
animals, reducing growth and productivity. AFs are potent carcinogens in all
animal species studied thus far (mice, rats, hamsters, fish, piglets and
chickens) (Williams et al., 2004; Marin et al., 2013). According to the
International Agency for Research on Cancer (IARC, 2012), there is
sufficient evidence to classify the main AFs (AFB1, AFB2, AFG1 and AFG2)
as carcinogenic in humans (group 1). Aflatoxin B1 (AFB1) is considered the
most potent aflatoxin and is also the most carcinogenic natural compound
known.
Maize is the most important source of fumonisin contamination in foods,
and infected kernels pose a serious threat to both humans and livestock,
leading to the importance of evaluating the susceptibility to contamination of
new maize varieties. It is unknown the vulnerability to fungal infection and
mycotoxin contamination of HC maize. Thus, this work aims to evaluate, for
three consecutive harvest seasons, the fungal incidence and the fumonisin
and aflatoxin presence in HC maize and its near isogenic control line in open
field experiments.
The South African white maize inbred M37W (control maize), which is
essentially devoid of carotenoids, and its engineered derivative (HC maize),
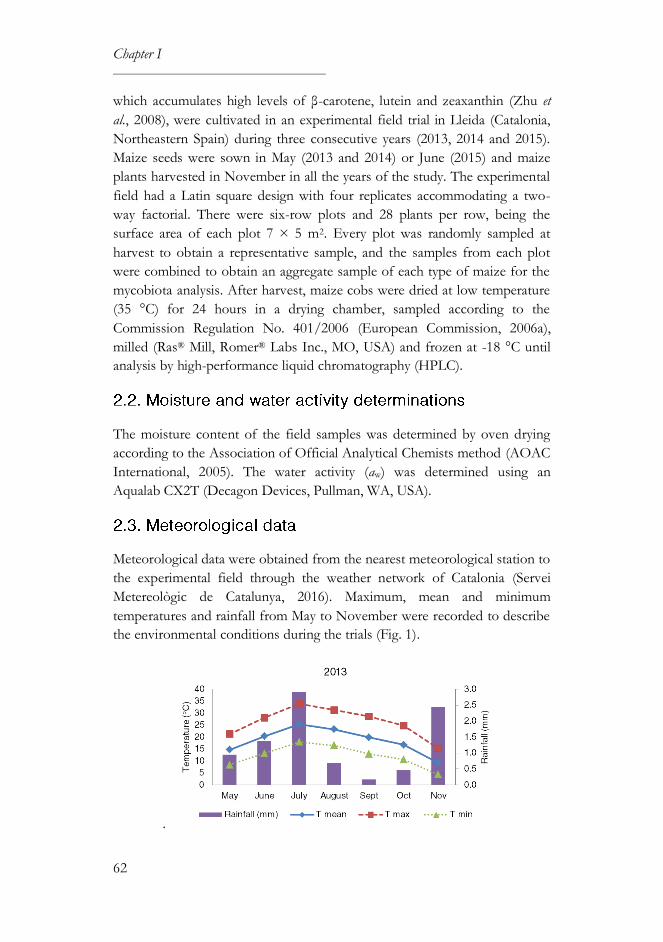
Chapter I
62
which accumulates high levels of β-carotene, lutein and zeaxanthin (Zhu et
al., 2008), were cultivated in an experimental field trial in Lleida (Catalonia,
Northeastern Spain) during three consecutive years (2013, 2014 and 2015).
Maize seeds were sown in May (2013 and 2014) or June (2015) and maize
plants harvested in November in all the years of the study. The experimental
field had a Latin square design with four replicates accommodating a two-
way factorial. There were six-row plots and 28 plants per row, being the
surface area of each plot 7 × 5 m2. Every plot was randomly sampled at
harvest to obtain a representative sample, and the samples from each plot
were combined to obtain an aggregate sample of each type of maize for the
mycobiota analysis. After harvest, maize cobs were dried at low temperature
(35 °C) for 24 hours in a drying chamber, sampled according to the
Commission Regulation No. 401/2006 (European Commission, 2006a),
milled (Ras® Mill, Romer® Labs Inc., MO, USA) and frozen at -18 °C until
analysis by high-performance liquid chromatography (HPLC).
The moisture content of the field samples was determined by oven drying
according to the Association of Official Analytical Chemists method (AOAC
International, 2005). The water activity (aw) was determined using an
Aqualab CX2T (Decagon Devices, Pullman, WA, USA).
Meteorological data were obtained from the nearest meteorological station to
the experimental field through the weather network of Catalonia (Servei
Metereològic de Catalunya, 2016). Maximum, mean and minimum
temperatures and rainfall from May to November were recorded to describe
the environmental conditions during the trials (Fig. 1).
.

Chapter I
63
Figure 1. Meteorological data (temperature and rainfall) from May to
November in the experimental field in Lleida (Catalonia, Spain) in 2013,
2014 and 2015.
One hundred grains from each of the two maize varieties were randomly
chosen immediately after harvest and decontaminated by immersion in 3%
sodium hypochlorite (NaClO) (GPR Rectapur®, VWR Chemicals, Barcelona,
Spain) followed by two rinses in sterile water. Kernels were plated in groups
of five in dichloran rose-bengal chloramphenicol agar media (DRBC) Petri
plates, which were then incubated for 7 days at 25 ºC in darkness. Colonies
of developing fungi were isolated in potato dextrose agar (PDA), and the
plates were incubated for 7 days at 25 ºC in darkness. Classification into
genera was performed according to Pitt and Hocking (2009). The species
level was identified using molecular biology techniques. The incidence of
fungal infection was calculated as percentage considering that one hundred
grains from each of the two maize varieties were isolated each harvest.
Chapter I
64
Pure cultures were grown in 500 µL malt extract broth in Eppendorf tubes
(2% w/v malt extract, 1% w/v peptone, 2% w/v glucose) for 2 days at 25 °C
in darkness. The mycelial extract was recovered by centrifugation (14,000
rpm, 10 min), and 300 µL of TNES buffer [200 mM Tris-HCl pH 8.5, 250
mM NaCl, 25 mM ethylenediaminetetraacetic acid (EDTA), 0.5% w/v
sodium dodecyl sulfate (SDS)] was added. The mycelial suspension was lysed
by vortexing with five 2.8 mm Precellys metal beads for 10 min. After
centrifugation (14,000 rpm, 10 min), 150 µL of 3 mM sodium acetate (pH
5.2) was added to the supernatant. The supernatant was stored at -20 °C for
10 min and then centrifuged (14,000 rpm, 10 min). The DNA-containing
supernatant was transferred to a new tube, and nucleic acids were
precipitated by the addition of 1 volume of isopropanol. After a 5–min
incubation at room temperature, the DNA suspension was centrifuged
(14,000 rpm, 10 min). The DNA pellet was washed with 70% ethanol. The
resulting pellet was air-dried, and the DNA was resuspended in 50 µL TE
buffer (10 mM Tris-HCl pH 8, 1 mM EDTA). After extraction, the DNA
concentrations were determined using a Nanodrop® ND-1000
spectrophotometer (Nanodrop Technologies, Wilmington, DE, USA).
Firstly, all the isolates were subjected to amplification reactions for Fusarium
identification. Secondly, amplification reactions for DNA sequencing were
carried out with the isolates whose amplification product was negative for
the specific Fusarium primers tested. Amplification reactions for Fusarium
identification were conducted in volumes of 10 µL containing 10 ng template
DNA, 0.5 µL of each primer (10 µM), 1 µl of 10x PCR buffer, 0.25 µL
dNTPs (10 mM) and 0.1 µL Taq DNA polymerase (5 U/µL) supplied by the
manufacturer (Bioron GmbH, Ludwigshafen, Germany). The PCR buffer
had the following composition 160 mM (NH4)2SO4, 670 mM Tris-HCl pH
8.8, 0.1% Tween-20, 25 mM MgCl2. To identify Fusarium isolates, specific
primers were used (Table 1). Amplification reactions for DNA sequencing
were conducted in volumes of 100 µL containing 10 ng template DNA, 4 µL
of each primer (10 µM), 10 µL of 10x PCR buffer, 2 µL dNTPs (10 mM) and
0.75 µL Taq DNA polymerase (5 U/µL). The primers used for DNA
sequencing are summarized in Table 2.
All PCR assays were performed using a GeneAmp® PCR System 2700
(Applied Biosystems, Foster City, CA, USA) under the conditions
summarized in Table 3. Amplification products were detected by

Chapter I
65
electrophoresis on 1.5% agarose ethidium-bromide gels in TAE 1x Buffer
(40 mM Tris-acetate and 1 mM EDTA). A TrackItTM 100 bp DNA ladder
(Invitrogen, Carlsbad, CA, USA) was used as molecular size marker. For
DNA sequencing, PCR products were cleaned with the GeneJet PCR
purification kit (Thermo Scientific, Waltham, MA, USA). The purified PCR
products were sequenced by the company Macrogen Europe (Amsterdam,
Netherlands). Sequences were analyzed and aligned using the Blast® search
tool (National Center for Biotechnology Information, Bethesda, MD, USA).
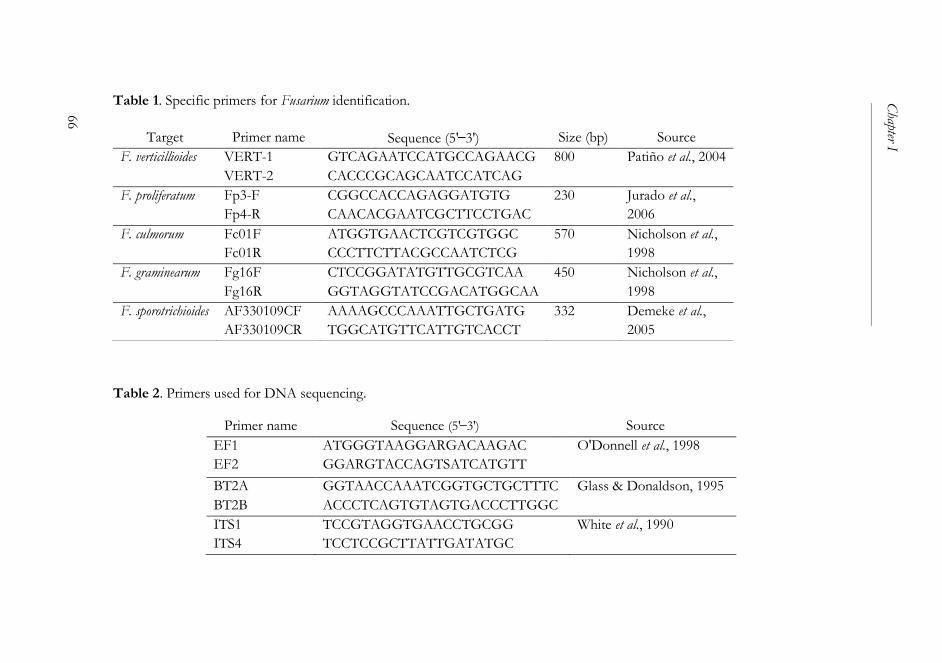
Table 1. Specific primers for Fusarium identification.
Table 2. Primers used for DNA sequencing.
Primer name Sequence (5' ̶ 3') Source
EF1
EF2
ATGGGTAAGGARGACAAGAC
GGARGTACCAGTSATCATGTT
O'Donnell et al., 1998
BT2A
BT2B
GGTAACCAAATCGGTGCTGCTTTC
ACCCTCAGTGTAGTGACCCTTGGC
Glass & Donaldson, 1995
ITS1
ITS4
TCCGTAGGTGAACCTGCGG
TCCTCCGCTTATTGATATGC
White et al., 1990
Target Primer name Sequence (5' ̶ 3') Size (bp) Source
F. verticillioides VERT-1
VERT-2
GTCAGAATCCATGCCAGAACG
CACCCGCAGCAATCCATCAG
800 Patiño et al., 2004
F. proliferatum Fp3-F
Fp4-R
CGGCCACCAGAGGATGTG
CAACACGAATCGCTTCCTGAC
230
Jurado et al.,
2006
F. culmorum
Fc01F
Fc01R
ATGGTGAACTCGTCGTGGC
CCCTTCTTACGCCAATCTCG
570 Nicholson et al.,
1998
F. graminearum Fg16F
Fg16R
CTCCGGATATGTTGCGTCAA
GGTAGGTATCCGACATGGCAA
450
Nicholson et al.,
1998
F. sporotrichioides AF330109CF
AF330109CR
AAAAGCCCAAATTGCTGATG
TGGCATGTTCATTGTCACCT
332
Demeke et al.,
2005
66
Chapter I
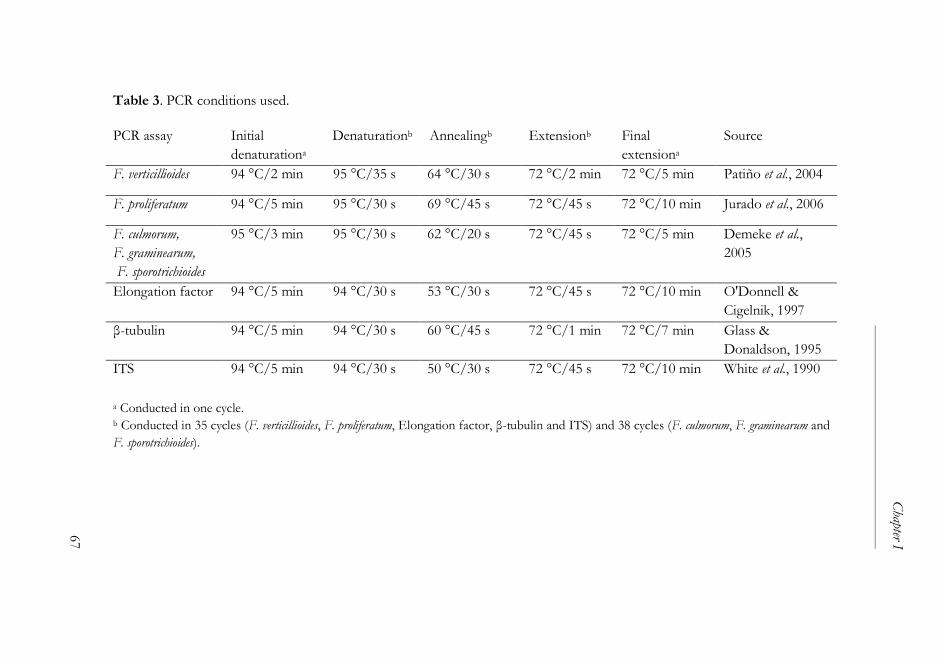
Table 3. PCR conditions used.
a Conducted in one cycle. b Conducted in 35 cycles (F. verticillioides, F. proliferatum, Elongation factor, β-tubulin and ITS) and 38 cycles (F. culmorum, F. graminearum and
F. sporotrichioides).
PCR assay Initial
denaturationa
Denaturationb Annealingb Extensionb Final
extensiona
Source
F. verticillioides 94 °C/2 min 95 °C/35 s 64 °C/30 s 72 °C/2 min 72 °C/5 min Patiño et al., 2004
F. proliferatum 94 °C/5 min 95 °C/30 s 69 °C/45 s 72 °C/45 s 72 °C/10 min Jurado et al., 2006
F. culmorum,
F. graminearum,
F. sporotrichioides
95 °C/3 min 95 °C/30 s 62 °C/20 s
72 °C/45 s
72 °C/5 min
Demeke et al.,
2005
Elongation factor 94 °C/5 min 94 °C/30 s 53 °C/30 s 72 °C/45 s 72 °C/10 min O'Donnell &
Cigelnik, 1997
β-tubulin 94 °C/5 min 94 °C/30 s 60 °C/45 s 72 °C/1 min 72 °C/7 min Glass &
Donaldson, 1995
ITS 94 °C/5 min 94 °C/30 s 50 °C/30 s 72 °C/45 s 72 °C/10 min White et al., 1990
67
Chapter I

Chapter I
68
For fumonisin analysis, each sample (10 g maize + 1 g of sodium chloride)
was extracted with 50 mL of acetonitrile: methanol: water (25: 25: 50 v/v/v)
by blending for 20 minutes. The extracts were filtered, and 10 mL of each
filtrate was diluted with 40 mL of phosphate buffered saline (PBS) solution
at pH 7.4. For aflatoxin analysis, each sample (5 g maize) was extracted with
15 mL of methanol: water (60: 40 v/v) by blending for 10 minutes. The
extracts were filtered, and 2 mL of each filtrate was diluted with 14 mL of
PBS solution. In both cases, diluted extracts were cleaned up using
immunoaffinity columns, Fumoniprep® for FBs and Easi-Extract® aflatoxin
for AFs (R-Biopharm AG, Darmstadt, Germany). The filtrates were passed
through the column at a flow rate of 2 mL/min, and the columns were then
washed by passing 20 mL of PBS through at a flow rate of 5 mL/min.
Finally, the toxins were eluted using 3 mL of methanol slowly passed
through the column, and the solvent was evaporated to dryness under a
nitrogen stream. The dried samples were re-dissolved in 500 µL methanol:
water (50: 50 v/v), and a volume of 200 µL was injected into the HPLC
system.
FBs (FB1 + FB2) and AFs (AFB1 + AFB2 + AFG1 + AFG2) were detected
and quantified separately using an HPLC system (Waters, Milford, MA,
USA) and a C18 column (5 µm Waters Spherisorb, 4.6 x 250 mm ODS2).
For fluorescence detection, a Waters 2475 module was used at the following
wavelengths: ʎexc 362 nm and ʎem 440 nm for AFs; ʎexc 335 nm and ʎem
440 nm for FBs. FBs were manually derivatized with ortho-phthalaldehyde
(OPA) (Sydenham et al., 1996), while AFs were photochemically derivatized
(UVETM, LC Tech GmbH, Dorfen, Germany). The analysis was performed
under isocratic conditions at a flow rate of 1 mL/min, and the mobile phase
used was water: acetonitrile: methanol (70: 17: 17) for AFs and methanol: 0.1
M sodium dihydrogen phosphate solution (77: 23) (adjusted to pH 3.35 with
orthophosphoric acid) for FBs. The detection limits were established based
on a signal-to-noise ratio of 3: 1 and were 0.25 ng/g for AFB1 and AFG1,
0.15 ng/g for AFB2 and AFG2, 0.02 µg/g for FB1 and 0.04 µg/g for FB2.
Quantification was performed using a software integrator (Empower,
Milford, MA, USA). The analytical methods were validated according to the
Commission Regulation No. 401/2006 (European Commission, 2006a). The
recovery percentage obtained was considered to express the results.
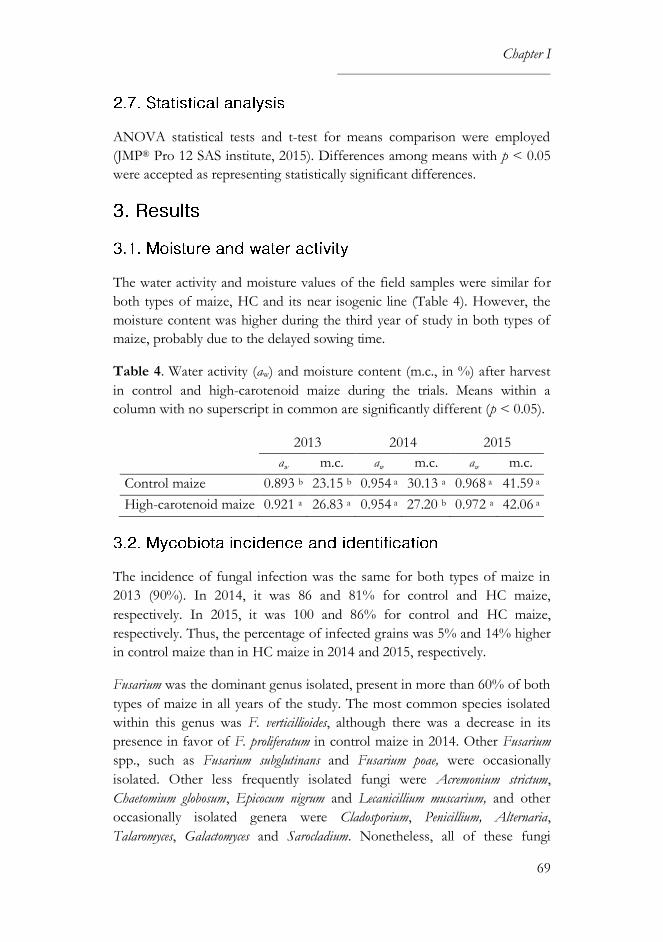
Chapter I
69
ANOVA statistical tests and t-test for means comparison were employed
(JMP® Pro 12 SAS institute, 2015). Differences among means with p < 0.05
were accepted as representing statistically significant differences.
The water activity and moisture values of the field samples were similar for
both types of maize, HC and its near isogenic line (Table 4). However, the
moisture content was higher during the third year of study in both types of
maize, probably due to the delayed sowing time.
Table 4. Water activity (aw) and moisture content (m.c., in %) after harvest
in control and high-carotenoid maize during the trials. Means within a
column with no superscript in common are significantly different (p < 0.05).
2013 2014 2015
aw m.c. aw m.c. aw m.c.
Control maize 0.893 b 23.15 b 0.954 a 30.13 a 0.968 a 41.59 a
High-carotenoid maize 0.921 a 26.83 a 0.954 a 27.20 b 0.972 a 42.06 a
The incidence of fungal infection was the same for both types of maize in
2013 (90%). In 2014, it was 86 and 81% for control and HC maize,
respectively. In 2015, it was 100 and 86% for control and HC maize,
respectively. Thus, the percentage of infected grains was 5% and 14% higher
in control maize than in HC maize in 2014 and 2015, respectively.
Fusarium was the dominant genus isolated, present in more than 60% of both
types of maize in all years of the study. The most common species isolated
within this genus was F. verticillioides, although there was a decrease in its
presence in favor of F. proliferatum in control maize in 2014. Other Fusarium
spp., such as Fusarium subglutinans and Fusarium poae, were occasionally
isolated. Other less frequently isolated fungi were Acremonium strictum,
Chaetomium globosum, Epicocum nigrum and Lecanicillium muscarium, and other
occasionally isolated genera were Cladosporium, Penicillium, Alternaria,
Talaromyces, Galactomyces and Sarocladium. Nonetheless, all of these fungi
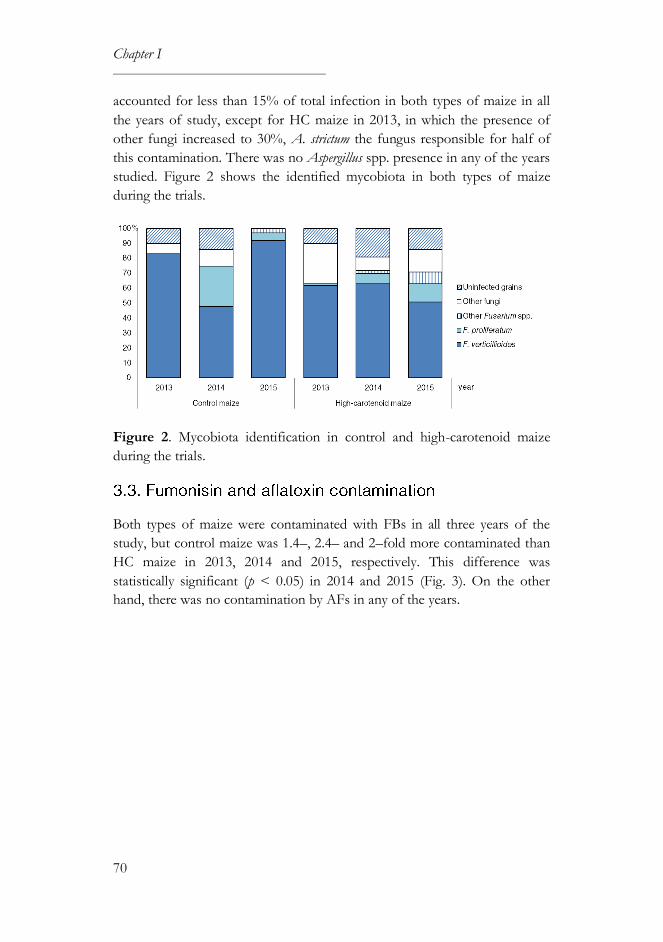
Chapter I
70
accounted for less than 15% of total infection in both types of maize in all
the years of study, except for HC maize in 2013, in which the presence of
other fungi increased to 30%, A. strictum the fungus responsible for half of
this contamination. There was no Aspergillus spp. presence in any of the years
studied. Figure 2 shows the identified mycobiota in both types of maize
during the trials.
Figure 2. Mycobiota identification in control and high-carotenoid maize
during the trials.
Both types of maize were contaminated with FBs in all three years of the
study, but control maize was 1.4–, 2.4– and 2–fold more contaminated than
HC maize in 2013, 2014 and 2015, respectively. This difference was
statistically significant (p < 0.05) in 2014 and 2015 (Fig. 3). On the other
hand, there was no contamination by AFs in any of the years.
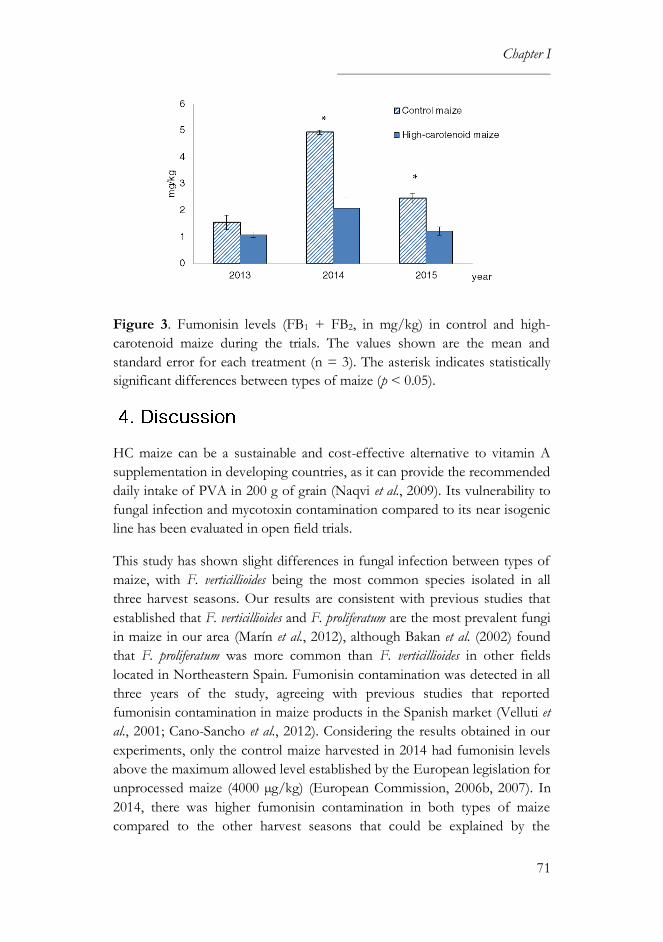
Chapter I
71
Figure 3. Fumonisin levels (FB1 + FB2, in mg/kg) in control and high-
carotenoid maize during the trials. The values shown are the mean and
standard error for each treatment (n = 3). The asterisk indicates statistically
significant differences between types of maize (p < 0.05).
HC maize can be a sustainable and cost-effective alternative to vitamin A
supplementation in developing countries, as it can provide the recommended
daily intake of PVA in 200 g of grain (Naqvi et al., 2009). Its vulnerability to
fungal infection and mycotoxin contamination compared to its near isogenic
line has been evaluated in open field trials.
This study has shown slight differences in fungal infection between types of
maize, with F. verticillioides being the most common species isolated in all
three harvest seasons. Our results are consistent with previous studies that
established that F. verticillioides and F. proliferatum are the most prevalent fungi
in maize in our area (Marín et al., 2012), although Bakan et al. (2002) found
that F. proliferatum was more common than F. verticillioides in other fields
located in Northeastern Spain. Fumonisin contamination was detected in all
three years of the study, agreeing with previous studies that reported
fumonisin contamination in maize products in the Spanish market (Velluti et
al., 2001; Cano-Sancho et al., 2012). Considering the results obtained in our
experiments, only the control maize harvested in 2014 had fumonisin levels
above the maximum allowed level established by the European legislation for
unprocessed maize (4000 µg/kg) (European Commission, 2006b, 2007). In
2014, there was higher fumonisin contamination in both types of maize
compared to the other harvest seasons that could be explained by the
Chapter I
72
environmental conditions, as high rainfall was recorded two months before
harvest in 2014, whereas the climatic conditions in 2013 and 2015 were quite
similar (Fig. 1). This observation is in accordance with Cao et al. (2014)
which pointed out that fumonisin accumulation is favored by hard rainfall
during kernel drying and Marín et al. (2004) which reviewed the
ecophysiology of fumonisin-producing Fusarium species and reported that
during the ripening and final drying in the field, there are many opportunities
for FB1 production.
The differences in fumonisin contamination between types of maize were
significant in two of the three years of the study and could be related to their
differences in carotenoid content. Both types of maize had the same genetic
background, as control maize was the basis for creating the HC maize. Thus,
the only difference between them was the carotenoid content which was 88
± 8 µg/g dw (dry weight) for HC maize and 1 ± 0.5 µg/g dw for control
maize. Zeaxanthin levels were 23 and 0.3 µg/g dw, and lutein levels were 9
and 0.6 µg/g dw for HC and control maize, respectively. PVA carotenoids
were only detected in HC maize (5.9 ± 2 and 3.7 ± 0.6 µg/g dw for β-
carotene and β-cryptoxanthin, respectively) (Zanga et al., personal
communication).
Carotenoids are well-known antioxidants (Stahl and Sies, 2003), although the
effect of carotenoids on mycotoxin biosynthesis has been scarcely studied.
Fungi are often exposed to unfavorable environmental conditions, such as
oxidative stress. It has been suggested that oxidative stress may be related to
mycotoxin production, some toxins may be produced to counteract the
excessive accumulation of reactive oxygen species (Reverberi et al., 2010).
Thus, as fumonisin biosynthesis can be stimulated by oxidative stress, the
presence of antioxidants might therefore help to disrupt toxin accumulation
(Picot et al., 2010). This is supported by a recent review which has
highlighted that antioxidant compounds such as carotenoids can quench
oxygen free radicals produced by plant cells as a defense response,
contributing to reduce oxidative stress that modulates toxin biosynthesis.
Moreover, these lipophilic secondary metabolites can scavenge lipid peroxyl
free radicals, reducing the lipid peroxidation (Atanasova-Pénichon et al.,
2016).
Regarding FBs, Picot et al. (2013) studied the potential involvement of maize
antioxidants (ferulic acid, tocopherols and carotenoids) in resistance to
Fusarium ear rot and fumonisin accumulation. Lutein (0.4 µg/mL),
Chapter I
73
zeaxanthin (0.4 µg/mL) and β-carotene (0.2 µg/mL) activity levels were
evaluated in vitro. In lutein-supplemented liquid cultures, a reduction (52%)
was observed in fumonisin production by one of the three strains of F.
verticillioides tested, but the difference was not significant compared to the
control treatments. Delgado et al. (2014) found a statistically significant
positive correlation between lutein content and Fusarium mycotoxins in
durum wheat, but FBs were not evaluated. With respect to AFs, it has been
reported that the presence of carotenoids may reduce aflatoxin biosynthesis
by A. flavus (Norton, 1997; Wicklow et al., 1998).
Many factors can modulate fumonisin biosynthesis: genes such as the FUM
gene cluster, ecophysiological factors such as water activity and temperature,
physicochemical and nutritional factors such as pH and C:N ratio, and plant
defense metabolites (Picot et al., 2010). Endogenous plant compounds, both
constitutive and induced in response to pathogen infection, may disrupt
toxin biosynthesis (Boutigny et al., 2008). It has been reported that the
physiological stages of the maize kernel play a role in the regulation of
fumonisin biosynthesis. Fungal infection can occur from the blister stage,
but fumonisin production is not initiated until the dough stage. It has been
shown that the dent stage can increase fumonisin biosynthesis (Picot et al.,
2011). Considering these previous results, the presence of carotenoids has
been demonstrated in maize kernels from the blister to the final mature
stages. Therefore, carotenoids are expected to be present when fumonisin
biosynthesis occurs (Picot et al., 2013).
The carotenoid enhancement in transgenic lines has been shown to affect
starch metabolism. In transgenic lines with a total carotenoid content similar
to the HC maize, the total starch content was found to decrease by up to 8%
compared to the isogenic maize (Berman, 2016). Many hypotheses have been
formulated regarding the role of the endosperm composition in fumonisin
biosynthesis (Santiago et al., 2015). Bluhm and Woloshuk (2005) noted that
amylopectin presence might induce fumonisin production by F. verticillioides.
Blandino and Reyneri (2007) studied waxy maize, which produces an
endosperm granule that contains almost 100% amylopectin, showing that the
waxy hybrids were more susceptible to fumonisin accumulation than the
near isogenic lines. However, Picot et al. (2011) suggested that under field
conditions, amylopectin is not the only component that favors fumonisin
biosynthesis. The increase in fumonisin production appeared three weeks
after the completion of the kernel with amylopectin, suggesting that other
mechanisms such as pH may be involved. Carotenoid-enriched maize lines
Chapter I
74
had a slight difference in starch content compared to their near isogenic line.
It would be interesting to study in detail whether starch content and
composition in carotenoid-enriched maize lines could play a role in
fumonisin reduction.
Carotenoids, as potent maize antioxidant compounds, may disrupt fumonisin
biosynthesis or accumulation in maize plants. It has been demonstrated that
the HC maize not only does not differ from its near isogenic line in fungal
infection but also has a positive effect in terms of fumonisin reduction.
Nonetheless, it is important to bear in mind that carotenoids may play a role
together or individually. Further studies are necessary to clarify the effect of
carotenoids on fumonisin production.
Association of Official Analytical Chemists (AOAC) International, 2005.
International Method 925.09B. Official Methods of Analysis, 18th
edition. AOAC, Inc., Gaithersburg, MD, USA.
Atanasova-Pénichon, V., Barreau, C. and Richard-Forget, F., 2016.
Antioxidant secondary metabolites in cereals: potential involvement in
resistance to Fusarium and mycotoxin accumulation. Frontiers in
Microbiology 7: 1–16.
Bakan, B., Melcion, D., Richard-Molard, D. and Cahagnier, B., 2002. Fungal
growth and Fusarium mycotoxin content in isogenic traditional maize
and genetically modified maize grown in France and Spain. Journal of
Agricultural and Food Chemistry 50: 728–731.
Berman, J., 2016. Unraveling the molecular bases of carotenoid biosynthesis
in maize. Doctoral Thesis, University of Lleida, Lleida, Spain, January
2016.
Blandino, M. and Reyneri, A., 2007. Comparison between normal and waxy
maize hybrids for Fusarium-toxin contamination in NW Italy. Maydica
52: 127–134.
Bluhm, B.H. and Woloshuk, C.P., 2005. Amylopectin induces fumonisin B1
production by Fusarium verticillioides during colonization of maize
kernels. Molecular Plant-Microbe Interactions Journal 18: 1333–1339.
Boutigny, A.L., Richard-Forget, F. and Barreau, C., 2008. Natural
Chapter I
75
mechanisms for cereal resistance to the accumulation of Fusarium
trichothecenes. European Journal of Plant Pathology 121: 411–423.
Cano-Sancho, G., Ramos, A.J., Marín, S. and Sanchis, V., 2012. Occurrence
of fumonisins in Catalonia (Spain) and an exposure assessment of
specific population groups. Food Additives & Contaminants. Part A,
Chemistry, Analysis, Control, Exposure and Risk Assessment 29: 799–
808.
Cao, A., Santiago, R., Ramos, A.J., Souto, X.C., Aguín, O., Malvar, R.A. and
Butrón, A., 2014. Critical environmental and genotypic factors for
Fusarium verticillioides infection, fungal growth and fumonisin
contamination in maize grown in Northwestern Spain. International
Journal of Food Microbiology 177: 63–71.
Delgado, R.M., Sulyok, M., Jirsa, O., Spitzer, T., Krska, R. and Polišenská, I.,
2014. Relationship between lutein and mycotoxin content in durum
wheat. Food Additives & Contaminants. Part A, Chemistry, Analysis,
Control, Exposure and Risk Assessment 31: 1274–1283.
Demeke, T., Clear, R.M., Patrick, S.K. and Gaba, D., 2005. Species-specific
PCR-based assays for the detection of Fusarium species and a
comparison with the whole seed agar plate method and trichothecene
analysis. International Journal of Food Microbiology 103: 271–284.
Desjardins, A.E., 2006. Fusarium mycotoxins: chemistry, genetics and
biology. The American Phytopathological Society (APS) Press, St. Paul,
MN, USA.
European Commission, 2006a. Commision Regulation (EC) No 401/2006
of 23 February 2006 laying down the methods of sampling and analysis
for the official control of the levels of mycotoxins in foodstuffs.
Official Journal of the European Union L70: 12–34.
European Commission, 2006b. Commision Regulation (EC) No 1881/2006,
of 19 December 2006, setting maximum levels for certain
contaminants in foodstuffs. Official Journal of the European Union
L364: 5–24.
European Commission, 2007. Commision Regulation (EC) No 1126/2007
of 28 September 2007, amending Regulation (EC) No 1881/2006,
setting maximum levels for certain contaminants in foodstuffs as

Chapter I
76
regards Fusarium toxins in maize and maize products. Official Journal
of the European Union L255: 14–17.
Glass, N.L. and Donaldson, G.C., 1995. Development of primer sets
designed for use with the PCR to amplify conserved genes from
filamentous ascomycetes. Applied and Environmental Microbiology
61: 1323–1330.
Harrison, L.R., Colvin, B.M., Greene, J.T., Newman, L.E. and Cole, J.R.,
1990. Pulmonary edema and hydrothorax in swine produced by
fumonisin B1, a toxic metabolite of Fusarium moniliforme. Journal of
Veterinary Diagnostic Investigation 2: 217–221.
International Agency for Research on Cancer (IARC), 2002. IARC
Monographs on the evaluation of carcinogenic risks to humans. Some
traditional herbal medicines, some mycotoxins, naphthalene and
styrene. Vol 82. IARC, Lyon, France.
International Agency for Research on Cancer (IARC), 2012. IARC
Monographs on the evaluation of carcinogenic risks to humans.
Chemical agents and related occupations: aflatoxins. Vol 100 F. IARC,
Lyon, France.
Joint FAO/WHO Expert Committee on Food Additives (JECFA), 2001.
Safety evaluation of certain mycotoxins in food. 56th meeting of the
JECFA, International Programme on Chemical Safety. WHO Food
Additives Series No. 47. WHO, Geneva, Switzerland.
Jurado, M., Vázquez, C., Marín, S., Sanchis, V. and González-Jaén, M.T.,
2006. PCR-based strategy to detect contamination with mycotoxigenic
Fusarium species in maize. Systematic and Applied Microbiology 29:
681–689.
Kellerman, T.S., Marasas, W.F.O., Thiel, P.G., Gelderblom, W.C.A.,
Cawood, M.E. and Coetzer, J.A.W., 1990. Leukoencephalomacia in
two horses induced by oral dosing of fumonisin B1. The Onderstepoort
Journal of Veterinary Research 57: 269–275.
Marasas, W.F.O., 2001. Discovery and occurrence of the fumonisins: a
historical perspective. Environmental Health Perspectives 109: 239–
243.
Chapter I
77
Marín, S., Magan, N., Ramos, A.J. and Sanchis, V., 2004. Fumonisin-
producing strains of Fusarium: a review of their ecophysiology. Journal
of Food Protection 67: 1792–1805.
Marín, S., Ramos, A.J., Cano-Sancho, G. and Sanchis, V., 2012. Reduction of
mycotoxins and toxigenic fungi in the Mediterranean basin maize
chain. Phytopathologia Mediterranea 51: 93–118.
Marín, S., Ramos, A.J. and Sanchis, V., 2013. Mycotoxins: occurrence,
toxicology, and exposure assessment. Food and Chemical Toxicology
60: 218–237.
Naqvi, S., Zhu, C., Farré, G., Ramessar, K., Bassie, L., Breitenbach, J., Perez
Conesa, D., Ros, G., Sandmann, G., Capell, T. and Christou, P., 2009.
Transgenic multivitamin corn through biofortification of endosperm
with three vitamins representing three distinct metabolic pathways.
Proceedings of the National Academy of Sciences of the United States
of America 106: 7762–7767.
Nicholson, P., Simpson, D.R., Weston, G., Rezanoor, H.N., Lees, A.K.,
Parry, D.W. and Joyce, D., 1998. Detection and quantification of
Fusarium culmorum and Fusarium graminearum in cereals using PCR assays.
Physiological and Molecular Plant Pathology 53: 17–37.
Norton, R.A., 1997. Effect of carotenoids on aflatoxin B1 synthesis by
Aspergillus flavus. Phytopathology 87: 814–821.
O'Donnell, K., Kistler, H.C., Cigelnik, E. and Ploetz, R.C., 1998. Multiple
evolutionary origins of the fungus causing Panama disease of banana:
concordant evidence from nuclear and mitochondrial gene genealogies.
Proceedings of the National Academy of Sciences of the United States
of America 95: 2044–2049.
O'Donnell, K. and Cigelnik, E., 1997. Two divergent intragenomic rDNA
ITS2 types within a monophyletic lineage of the fungus Fusarium are
nonorthologous. Molecular Phylogenetics and Evolution 7: 103-116.
Patiño, B., Mirete, S., González-Jaén, M.T., Mulé, G., Rodriguez, M.T. and
Vázquez C., 2004. PCR detection assay of fumonisin-producing
Fusarium verticillioides strains. Journal of Food Protection 67: 1278–
1283.
Chapter I
78
Picot, A., Atanasova-Pénichon, V., Pons, S., Marchegay, G., Barreau, C.,
Pinson-Gadais, L., Roucolle, J., Daveau, F., Caron, D. and Richard-
Forget, F., 2013. Maize kernel antioxidants and their potential
involvement in Fusarium ear rot resistance. Journal of Agricultural and
Food Chemistry 61: 3389–3395.
Picot, A., Barreau, C., Pinson-Gadais, L., Caron, D., Lannou, C. and
Richard-Forget, F., 2010. Factors of the Fusarium verticillioides-maize
environment modulating fumonisin production. Critical Reviews in
Microbiology 36: 221–231.
Picot, A., Barreau, C., Pinson-Gadais, L., Piraux, F., Caron, D., Lannou, C.,
Richard-Forget, F., 2011. The dent stage of maize kernels is the most
conducive for fumonisin biosynthesis under field conditions. Applied
and Environmental Microbiology 77: 8382–8390.
Pitt, J.I. and Hocking, A.D., 2009. Fungi and food spoilage. Springer, Berlin,
Germany.
Reverberi, M., Ricelli, A., Zjalic, S., Fabbri, A.A. and Fanelli, C., 2010.
Natural functions of mycotoxins and control of their biosynthesis in
fungi. Applied Microbiology and Biotechnology 87: 899–911.
Santiago, R., Cao, A. and Butrón, A., 2015. Genetic factors involved in
fumonisin accumulation in maize kernels and their implications in
maize agronomic management and breeding. Toxins 7: 3267–3296.
Servei Metereològic de Catalunya, 2016. Available at: http://www.meteo.cat
Accessed 21 June 2016.
Shephard, G.S., 2008. Determination of mycotoxins in human foods.
Chemical Society Reviews 37: 2468–2477.
Stahl, W. and Sies, H., 2003. Antioxidant activity of carotenoids. Molecular
Aspects of Medicine 24: 345–351.
Sydenham, E.W., Shephard, G.S., Thiel, P.G., Stockenström, S. and Snijman,
P., 1996. Liquid chromatographic determination of fumonisins B1, B2
and B3 in corn: AOAC-IUPAC collaborative study. Journal of AOAC
International 79: 688–696.
Velluti, A., Marín, S., Sanchis, V. and Ramos, A.J., 2001. Note. Occurrence
Chapter I
79
of fumonisin B1 in Spanish corn-based foods for animal and human
consumption. Food Science and Technology International 7: 433–437.
Wang, E., Norred, W.P., Bacon, C.W., Riley, R.T. and Merril, A.H., 1991.
Inhibition of sphingolipids biosynthesis by fumonisins. The Journal of
Biological Chemistry 266: 14486–14490.
White, T.J., Bruns, T., Lee, S. and Taylor, J., 1990. Amplification and direct
sequencing of fungal ribosomal RNA genes for phylogenetics. In:
Innis, M.A., Gelfand, D.H., Sninsky, J.J. and White, T.J. (eds) PCR
Protocols: a guide to methods and applications. Academic Press, Inc.,
New York, NY, USA, pp. 315–322.
World Health Organization (WHO), 2009. Global prevalence of vitamin A
deficiency in populations at risk 1995-2005. WHO Global database on
vitamin A deficiency. WHO, Geneva, Switzerland.
Wicklow, D.T., Norton, R.A. and McAlpin, C.E., 1998. β-Carotene
inhibition of aflatoxin biosynthesis among Aspergillus flavus genotypes
from Illinois corn. Mycoscience 39: 167–172.
Williams, J.H., Phillips, T.D., Jolly, P.E., Stiles, J.K., Jolly, C.M. and
Aggarwal, D., 2004. Human aflatoxicosis in developing countries: a
review of toxicology, exposure, potential health consequences, and
interventions. The American Journal of Clinical Nutrition 80: 1106–
1122.
Zhu, C., Naqvi, S., Breitenbach, J., Sandmann, G., Christou, P. and Capell.
T., 2008. Combinatorial genetic transformation generates a library of
metabolic phenotypes for the carotenoid pathway in maize.
Proceedings of the National Academy of Sciences of the United States
of America 105: 18232–18237.


Chapter II
83
Joana Díaz-Gómez a, b, José A. Moreno b, Eduardo Angulo b, Gerhard
Sandmann c, Changfu Zhu d, Antonio J. Ramos a, Teresa Capell d, Paul
Christou d, e and Carmina Nogareda b
a Food Technology Department, University of Lleida–Agrotecnio Center; b Animal Science Department; c Biosynthesis Group, Department of
Molecular Biosciences, J. W. Goethe University, Max von Laue Str. 9, D-
60438 Frankfurt, Germany; d Plant Production and Forestry Science
Department; a, b, d University of Lleida–Agrotecnio Center, Av. Rovira Roure
191, 25198 Lleida, Spain; e ICREA, Catalan Institute for Research and
Advanced Studies, Pg. Lluís Companys 23, 08010 Barcelona, Spain
Skin color in poultry is achieved by the addition of natural or synthetic
pigments to feed. Crops used routinely in feed formulations offer an
alternative cost-effective strategy to replace color additives if they are
biofortified with sufficient levels of carotenoids. We tested the hypothesis
that high-carotenoid (HC) maize, which was genetically engineered to
accumulate high levels of β-carotene, lutein and zeaxanthin in the
endosperm, can replace carotenoid additives in poultry feed by performing
two feeding trials using diets incorporating different maize lines with diverse
carotenoid compositions: control (wild-type M37W, the parental line), HC,
and standard yellow commercial maize supplemented with color additives
(marigold flowers and red paprika extracts). The effects of dietary treatments
on growth performance, health parameters, color evolution and carotenoid
distribution were determined. We found that chickens fed on the HC diet
grew normally and developed similar pigmentation to animals fed on a
commercial diet supplemented with color additives, although yellowness was
significantly higher in the commercial diet due to the high concentration of
yellow xanthophylls. Lightness scores in chickens fed on the control, HC and
commercial diets were 45.88 ± 1.31, 44.32 ± 1.10 and 44.29 ± 0.99,
respectively, in breast muscle, and 51.62 ± 1.33, 49.66 ± 0.96 and 50.10 ±
1.16, respectively, in thigh muscle. Redness scores in chickens fed on the
control, HC, and commercial diets were 0.36 ± 0.26, 3.25 ± 0.29 and 3.58 ±
0.29, respectively, in breast muscle, and 1.28 ± 0.37, 4.79 ± 0.39 and 4.85 ±
Chapter II
84
0.34, respectively, in thigh muscle. Yellowness scores in chickens fed on the
control, HC, and commercial diets were 2.45 ± 0.47, 7.61 ± 0.64 and 9.66 ±
0.73, respectively, in breast muscle, and 3.38 ± 0.64, 10.00 ± 1.10 and 12.64
± 0.97, respectively, in thigh muscle. High-carotenoid maize is therefore a
cost-effective alternative to feed supplementation in the poultry industry.
Chicken, biofortification, carotenoids, metabolic engineering, pigments
Skin color is the first quality attribute of poultry meat that is evaluated by
consumers. A golden skin color is preferred by consumers, especially in
North America and the Asia-Pacific markets, because this is associated with
a normal state of health (Williams, 1992). Skin pigmentation is affected by
genotype, the quantity and dietary source of pigments, and the health of the
birds, among other factors (Sirri et al., 2010). In poultry meat, skin color is
provided by carotenoid pigments present in the feed that are deposited in the
skin and subcutaneous fat (Pérez-Vendrell et al., 2001). Both natural and
synthetic pigments can be used as feed additives in the poultry industry to
achieve the level of skin pigmentation desired by consumers, but this
increases the production costs (Castañeda et al., 2005; Tarique et al., 2013).
Carotenoids are ubiquitous isoprenoid-based natural pigments that can be
classed as carotenes, which contain only hydrogen and carbon, or
xanthophylls, which also contain oxygen (Britton, 1995). Some carotenoids
have provitamin A (PVA) activity, including α-carotene, β-carotene and β-
cryptoxanthin, whereas others have no PVA activity but can act as
antioxidants (Farré et al., 2010). Carotenoids improve disease resistance in
birds and mammals (Surai, 2002) and can also modulate the immune system
(Chew and Park, 2004). Chickens, like most other animals, cannot synthesize
carotenoids de novo and must obtain them from their diet (Breithaupt, 2007;
Nogareda et al., 2016). Vitamin A and carotenoid metabolism in chickens is
closely related to the equivalent processes in humans, so chickens are also
susceptible to vitamin A deficiency with similar symptoms (NRC, 1994;
Pretorius and Schönfeldt, 2013).
The value of the global carotenoids market was an estimated $US 1.5 billion
in 2014, and is expected to reach nearly $US 1.8 billion in 2019 (BCC
Research, 2015). This increasing demand for dietary pigments in the
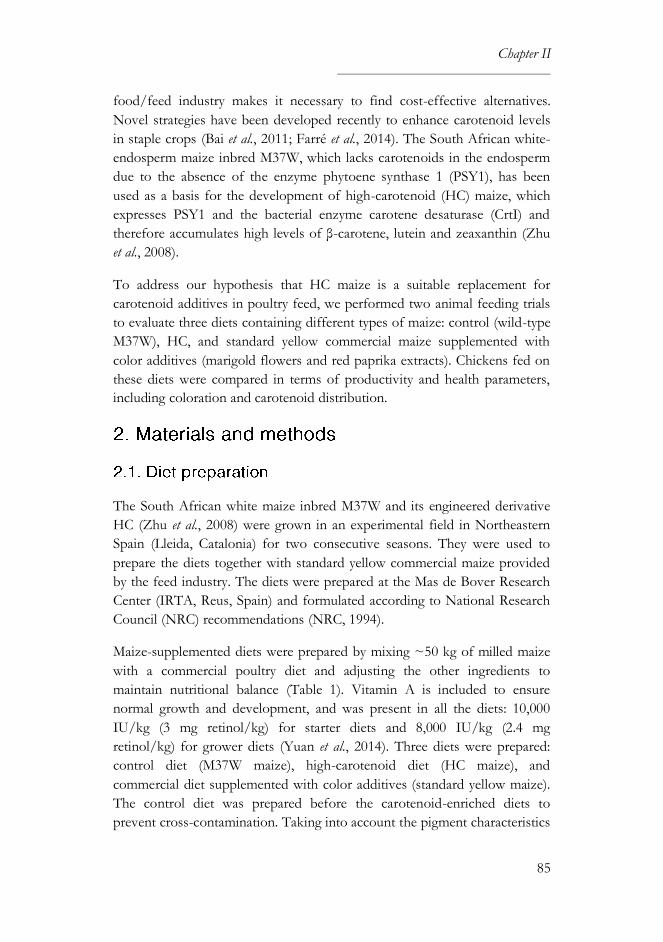
Chapter II
85
food/feed industry makes it necessary to find cost-effective alternatives.
Novel strategies have been developed recently to enhance carotenoid levels
in staple crops (Bai et al., 2011; Farré et al., 2014). The South African white-
endosperm maize inbred M37W, which lacks carotenoids in the endosperm
due to the absence of the enzyme phytoene synthase 1 (PSY1), has been
used as a basis for the development of high-carotenoid (HC) maize, which
expresses PSY1 and the bacterial enzyme carotene desaturase (CrtI) and
therefore accumulates high levels of β-carotene, lutein and zeaxanthin (Zhu
et al., 2008).
To address our hypothesis that HC maize is a suitable replacement for
carotenoid additives in poultry feed, we performed two animal feeding trials
to evaluate three diets containing different types of maize: control (wild-type
M37W), HC, and standard yellow commercial maize supplemented with
color additives (marigold flowers and red paprika extracts). Chickens fed on
these diets were compared in terms of productivity and health parameters,
including coloration and carotenoid distribution.
The South African white maize inbred M37W and its engineered derivative
HC (Zhu et al., 2008) were grown in an experimental field in Northeastern
Spain (Lleida, Catalonia) for two consecutive seasons. They were used to
prepare the diets together with standard yellow commercial maize provided
by the feed industry. The diets were prepared at the Mas de Bover Research
Center (IRTA, Reus, Spain) and formulated according to National Research
Council (NRC) recommendations (NRC, 1994).
Maize-supplemented diets were prepared by mixing ~50 kg of milled maize
with a commercial poultry diet and adjusting the other ingredients to
maintain nutritional balance (Table 1). Vitamin A is included to ensure
normal growth and development, and was present in all the diets: 10,000
IU/kg (3 mg retinol/kg) for starter diets and 8,000 IU/kg (2.4 mg
retinol/kg) for grower diets (Yuan et al., 2014). Three diets were prepared:
control diet (M37W maize), high-carotenoid diet (HC maize), and
commercial diet supplemented with color additives (standard yellow maize).
The control diet was prepared before the carotenoid-enriched diets to
prevent cross-contamination. Taking into account the pigment characteristics
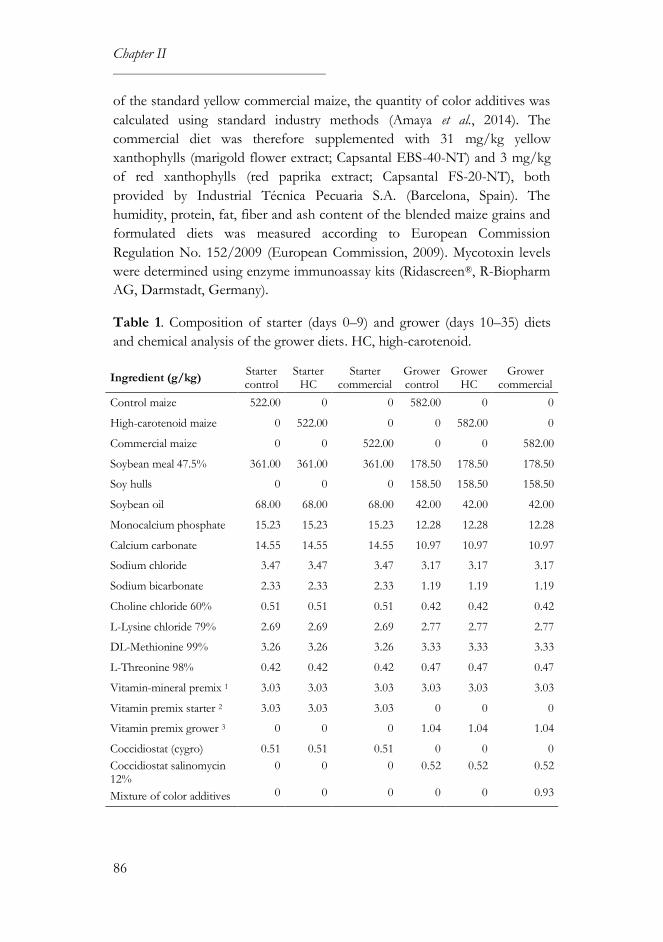
Chapter II
86
of the standard yellow commercial maize, the quantity of color additives was
calculated using standard industry methods (Amaya et al., 2014). The
commercial diet was therefore supplemented with 31 mg/kg yellow
xanthophylls (marigold flower extract; Capsantal EBS-40-NT) and 3 mg/kg
of red xanthophylls (red paprika extract; Capsantal FS-20-NT), both
provided by Industrial Técnica Pecuaria S.A. (Barcelona, Spain). The
humidity, protein, fat, fiber and ash content of the blended maize grains and
formulated diets was measured according to European Commission
Regulation No. 152/2009 (European Commission, 2009). Mycotoxin levels
were determined using enzyme immunoassay kits (Ridascreen®, R-Biopharm
AG, Darmstadt, Germany).
Table 1. Composition of starter (days 0–9) and grower (days 10–35) diets
and chemical analysis of the grower diets. HC, high-carotenoid.
Ingredient (g/kg) Starter control
Starter HC
Starter commercial
Grower control
Grower HC
Grower commercial
Control maize 522.00 0 0 582.00 0 0
High-carotenoid maize 0 522.00 0 0 582.00 0
Commercial maize 0 0 522.00 0 0 582.00
Soybean meal 47.5% 361.00 361.00 361.00 178.50 178.50 178.50
Soy hulls 0 0 0 158.50 158.50 158.50
Soybean oil 68.00 68.00 68.00 42.00 42.00 42.00
Monocalcium phosphate 15.23 15.23 15.23 12.28 12.28 12.28
Calcium carbonate 14.55 14.55 14.55 10.97 10.97 10.97
Sodium chloride 3.47 3.47 3.47 3.17 3.17 3.17
Sodium bicarbonate 2.33 2.33 2.33 1.19 1.19 1.19
Choline chloride 60% 0.51 0.51 0.51 0.42 0.42 0.42
L-Lysine chloride 79% 2.69 2.69 2.69 2.77 2.77 2.77
DL-Methionine 99% 3.26 3.26 3.26 3.33 3.33 3.33
L-Threonine 98% 0.42 0.42 0.42 0.47 0.47 0.47
Vitamin-mineral premix 1 3.03 3.03 3.03 3.03 3.03 3.03
Vitamin premix starter 2 3.03 3.03 3.03 0 0 0
Vitamin premix grower 3 0 0 0 1.04 1.04 1.04
Coccidiostat (cygro) 0.51 0.51 0.51 0 0 0
Coccidiostat salinomycin 12%
0 0 0 0.52 0.52 0.52
Mixture of color additives 0 0 0 0 0 0.93
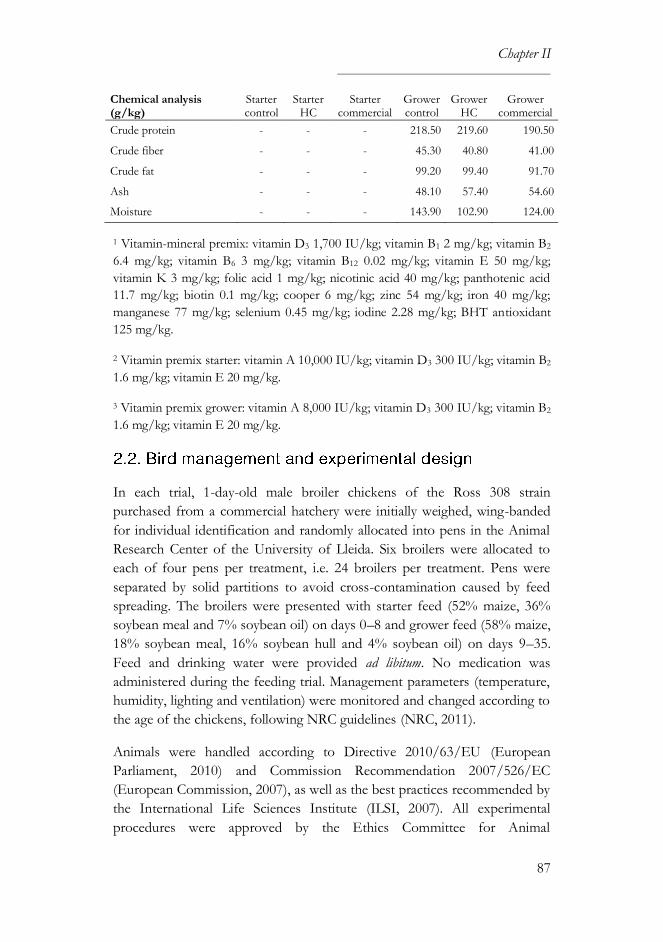
Chapter II
87
1 Vitamin-mineral premix: vitamin D3 1,700 IU/kg; vitamin B1 2 mg/kg; vitamin B2
6.4 mg/kg; vitamin B6 3 mg/kg; vitamin B12 0.02 mg/kg; vitamin E 50 mg/kg;
vitamin K 3 mg/kg; folic acid 1 mg/kg; nicotinic acid 40 mg/kg; panthotenic acid
11.7 mg/kg; biotin 0.1 mg/kg; cooper 6 mg/kg; zinc 54 mg/kg; iron 40 mg/kg;
manganese 77 mg/kg; selenium 0.45 mg/kg; iodine 2.28 mg/kg; BHT antioxidant
125 mg/kg.
2 Vitamin premix starter: vitamin A 10,000 IU/kg; vitamin D3 300 IU/kg; vitamin B2
1.6 mg/kg; vitamin E 20 mg/kg.
3 Vitamin premix grower: vitamin A 8,000 IU/kg; vitamin D3 300 IU/kg; vitamin B2
1.6 mg/kg; vitamin E 20 mg/kg.
In each trial, 1-day-old male broiler chickens of the Ross 308 strain
purchased from a commercial hatchery were initially weighed, wing-banded
for individual identification and randomly allocated into pens in the Animal
Research Center of the University of Lleida. Six broilers were allocated to
each of four pens per treatment, i.e. 24 broilers per treatment. Pens were
separated by solid partitions to avoid cross-contamination caused by feed
spreading. The broilers were presented with starter feed (52% maize, 36%
soybean meal and 7% soybean oil) on days 0–8 and grower feed (58% maize,
18% soybean meal, 16% soybean hull and 4% soybean oil) on days 9–35.
Feed and drinking water were provided ad libitum. No medication was
administered during the feeding trial. Management parameters (temperature,
humidity, lighting and ventilation) were monitored and changed according to
the age of the chickens, following NRC guidelines (NRC, 2011).
Animals were handled according to Directive 2010/63/EU (European
Parliament, 2010) and Commission Recommendation 2007/526/EC
(European Commission, 2007), as well as the best practices recommended by
the International Life Sciences Institute (ILSI, 2007). All experimental
procedures were approved by the Ethics Committee for Animal
Chemical analysis (g/kg)
Starter control
Starter HC
Starter commercial
Grower control
Grower HC
Grower commercial
Crude protein - - - 218.50 219.60 190.50
Crude fiber - - - 45.30 40.80 41.00
Crude fat - - - 99.20 99.40 91.70
Ash - - - 48.10 57.40 54.60
Moisture - - - 143.90 102.90 124.00
Chapter II
88
Experimentation of the University of Lleida and the Catalan Government
(reference numbers DAAM 7672 and DAAM 7743).
Body weight and feed weight were determined every 7 days (and on day 9,
when starter diet was changed to grower diet). Average daily gain (ADG),
body weight gain, feed intake and feed conversion ratio (FCR) were
calculated at the end of the trial. All chickens were humanely euthanized on
day 35 and gross necropsy was carried out. Blood samples were randomly
collected in three chickens of each pen for biochemical and hematological
analysis, and serum was separated and frozen for carotenoid analysis. Pre-
chilled whole liver, spleen and bursa of Fabricius were collected and
weighed. Pre-chilled samples of liver were freeze-dried (fd) for carotenoid
analysis.
Total carotenoids were extracted from freeze-dried samples in 20 mL
methanol containing 12% KOH at 65 °C for 1 h. Lipophilic compounds
were partitioned into 30% diethyl ether in petroleum ether, the upper phase
was collected and the solvent was evaporated under a stream of nitrogen gas
at 37 °C. For separation by high-performance liquid chromatography
(HPLC), samples were re-dissolved in 100 µL methanol/dichloromethane
(50: 50 v/v) and a 20-µL aliquot was injected immediately. Compounds were
separated on a 15-cm Nucleosil C18 3-µm column with an acetonitrile,
methanol and 2-propanol mobile phase (85: 15: 5 v/v/v) at 20 °C. Samples
were monitored with a Kontron 440 photodiode array detector with online
registration of the spectra and were identified by comparison against
authentic reference compounds (Sandmann, 2002).
The color was measured using the CIELab trichromatic system (CIE, 2004)
as lightness (L*), redness (a*) and yellowness (b*) with a CM-700d compact
portable colorimeter (Konica Minolta, Tokyo, Japan). Coordinate L*
represents lightness ranging from 0 (black) to 100 (white), a* indicates the
red/green component and b* indicates the yellow/blue component. The
range of both chromatic components is between −128 and 128 (Sharifzadeh
et al., 2014). The illuminant D65 and a 10° viewing angle were used for all
measurements. The measuring area was changed according to the footpad

Chapter II
89
size, using a mask of 3-mm-diameter during the first week and a mask of 8-
mm-diameter from then onward. During the feeding trial, the color was
measured weekly in the footpad with prior cleaning if necessary. After
slaughter, the color was measured in pre-chilled footpad, breast skin, and
breast and thigh muscles.
Experimental data were analyzed using JMP® Pro 12 (SAS institute, 2015)
and differences were considered significant at the 5% level of probability.
The experimental unit was the pen, except for carotenoid levels, and the
MIXED procedure was applied, including fixed effect of dietary treatments,
feeding trial (as there were only two levels) and their interaction, and random
effect of pens: Yijke = Dieti + Trialj + Dieti*Trialj + Penk + εijke. For statistical
analysis of carotenoids, analysis of variance (ANOVA) with Tukey's honest
significant difference (HSD) test was used, and for color evaluation, pairwise
correlations were used. Variables expressed in percentages were normalized
using the arcsine of the square root of the probability.
A standard compositional analysis for humidity, protein, fat, fiber and ash
content revealed that the diets were not substantially different, although
protein levels were slightly lower in the commercial diet (Table 1).
Carotenoid analysis of the grower diets (used from days 9–35) showed that
the HC diet had the highest levels of zeaxanthin (10.33 µg/g fd diet
formulation), β-carotene (3.04 µg/g fd) and β-cryptoxanthin (2.09 µg/g fd),
whereas the commercial diet supplemented with color additives had the
highest lutein levels (23.69 µg/g fd) due to the presence of marigold extract
(Table 2). Capsanthin was only detected in commercial diet supplemented
with color additives due to the presence of paprika extract.
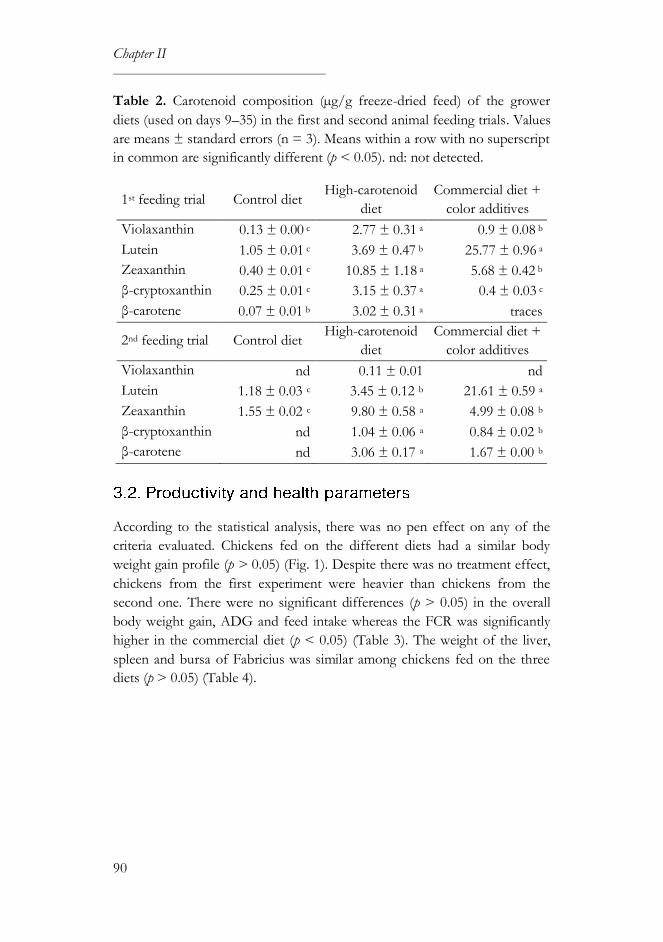
Chapter II
90
Table 2. Carotenoid composition (µg/g freeze-dried feed) of the grower
diets (used on days 9–35) in the first and second animal feeding trials. Values
are means ± standard errors (n = 3). Means within a row with no superscript
in common are significantly different (p < 0.05). nd: not detected.
1st feeding trial Control diet High-carotenoid
diet
Commercial diet +
color additives
Violaxanthin 0.13 ± 0.00 c 2.77 ± 0.31 a 0.9 ± 0.08 b
Lutein 1.05 ± 0.01 c 3.69 ± 0.47 b 25.77 ± 0.96 a
Zeaxanthin 0.40 ± 0.01 c 10.85 ± 1.18 a 5.68 ± 0.42 b
β-cryptoxanthin 0.25 ± 0.01 c 3.15 ± 0.37 a 0.4 ± 0.03 c
β-carotene 0.07 ± 0.01 b 3.02 ± 0.31 a traces
2nd feeding trial Control diet High-carotenoid
diet
Commercial diet +
color additives
Violaxanthin nd 0.11 ± 0.01 nd
Lutein 1.18 ± 0.03 c 3.45 ± 0.12 b 21.61 ± 0.59 a
Zeaxanthin 1.55 ± 0.02 c 9.80 ± 0.58 a 4.99 ± 0.08 b
β-cryptoxanthin nd 1.04 ± 0.06 a 0.84 ± 0.02 b
β-carotene nd 3.06 ± 0.17 a 1.67 ± 0.00 b
According to the statistical analysis, there was no pen effect on any of the
criteria evaluated. Chickens fed on the different diets had a similar body
weight gain profile (p > 0.05) (Fig. 1). Despite there was no treatment effect,
chickens from the first experiment were heavier than chickens from the
second one. There were no significant differences (p > 0.05) in the overall
body weight gain, ADG and feed intake whereas the FCR was significantly
higher in the commercial diet (p < 0.05) (Table 3). The weight of the liver,
spleen and bursa of Fabricius was similar among chickens fed on the three
diets (p > 0.05) (Table 4).
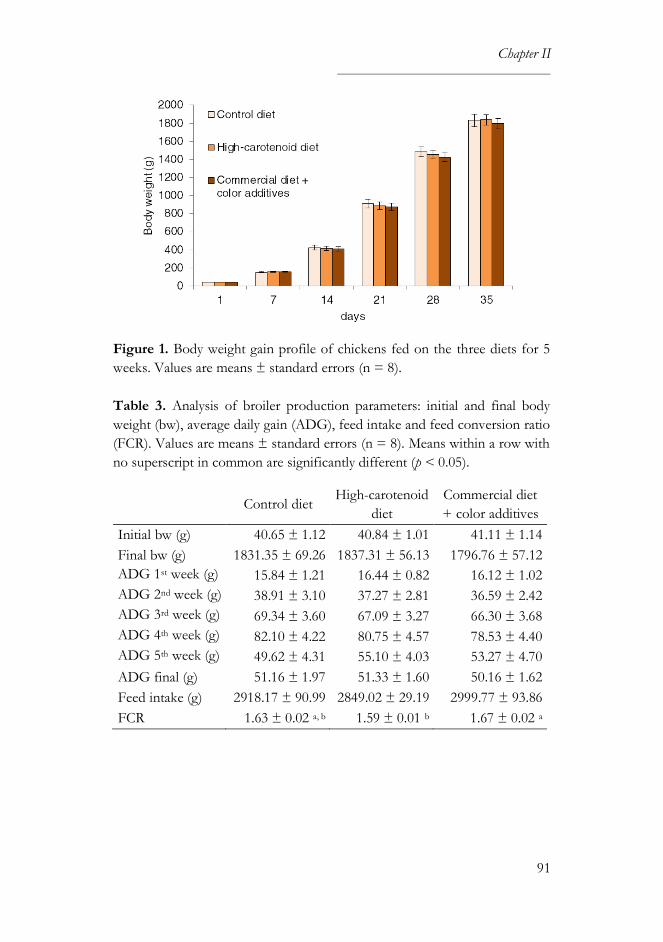
Chapter II
91
Figure 1. Body weight gain profile of chickens fed on the three diets for 5
weeks. Values are means ± standard errors (n = 8).
Table 3. Analysis of broiler production parameters: initial and final body
weight (bw), average daily gain (ADG), feed intake and feed conversion ratio
(FCR). Values are means ± standard errors (n = 8). Means within a row with
no superscript in common are significantly different (p < 0.05).
Control diet
High-carotenoid
diet
Commercial diet
+ color additives
Initial bw (g) 40.65 ± 1.12 40.84 ± 1.01 41.11 ± 1.14
Final bw (g) 1831.35 ± 69.26 1837.31 ± 56.13 1796.76 ± 57.12
ADG 1st week (g) 15.84 ± 1.21 16.44 ± 0.82 16.12 ± 1.02
ADG 2nd week (g) 38.91 ± 3.10 37.27 ± 2.81 36.59 ± 2.42
ADG 3rd week (g) 69.34 ± 3.60 67.09 ± 3.27 66.30 ± 3.68
ADG 4th week (g) 82.10 ± 4.22 80.75 ± 4.57 78.53 ± 4.40
ADG 5th week (g) 49.62 ± 4.31 55.10 ± 4.03 53.27 ± 4.70
ADG final (g) 51.16 ± 1.97 51.33 ± 1.60 50.16 ± 1.62
Feed intake (g) 2918.17 ± 90.99 2849.02 ± 29.19 2999.77 ± 93.86
FCR 1.63 ± 0.02 a, b 1.59 ± 0.01 b 1.67 ± 0.02 a
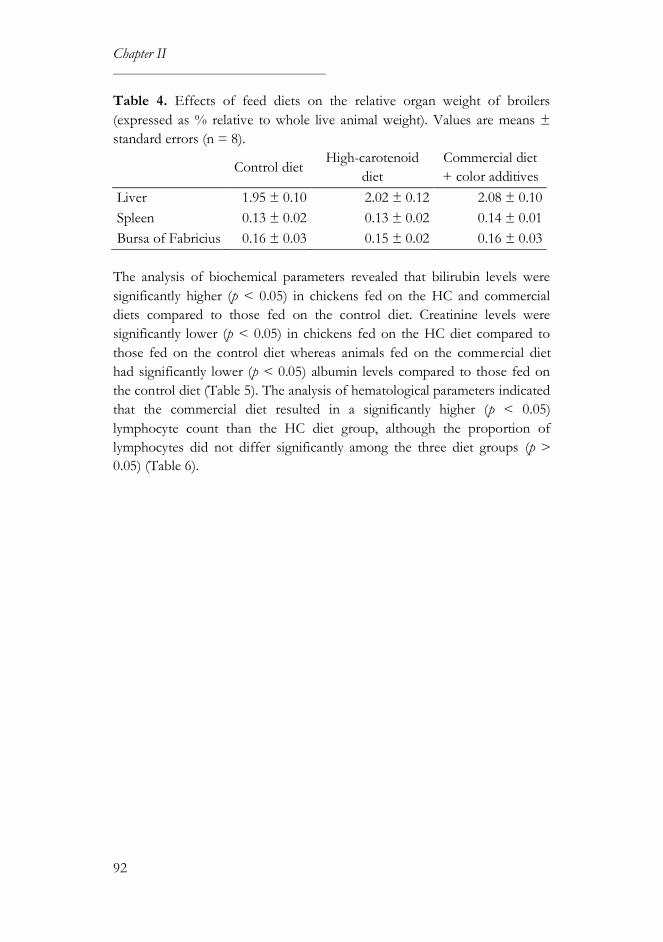
Chapter II
92
Table 4. Effects of feed diets on the relative organ weight of broilers
(expressed as % relative to whole live animal weight). Values are means ±
standard errors (n = 8).
Control diet
High-carotenoid
diet
Commercial diet
+ color additives
Liver 1.95 ± 0.10 2.02 ± 0.12 2.08 ± 0.10
Spleen 0.13 ± 0.02 0.13 ± 0.02 0.14 ± 0.01
Bursa of Fabricius 0.16 ± 0.03 0.15 ± 0.02 0.16 ± 0.03
The analysis of biochemical parameters revealed that bilirubin levels were
significantly higher (p < 0.05) in chickens fed on the HC and commercial
diets compared to those fed on the control diet. Creatinine levels were
significantly lower (p < 0.05) in chickens fed on the HC diet compared to
those fed on the control diet whereas animals fed on the commercial diet
had significantly lower (p < 0.05) albumin levels compared to those fed on
the control diet (Table 5). The analysis of hematological parameters indicated
that the commercial diet resulted in a significantly higher (p < 0.05)
lymphocyte count than the HC diet group, although the proportion of
lymphocytes did not differ significantly among the three diet groups (p >
0.05) (Table 6).
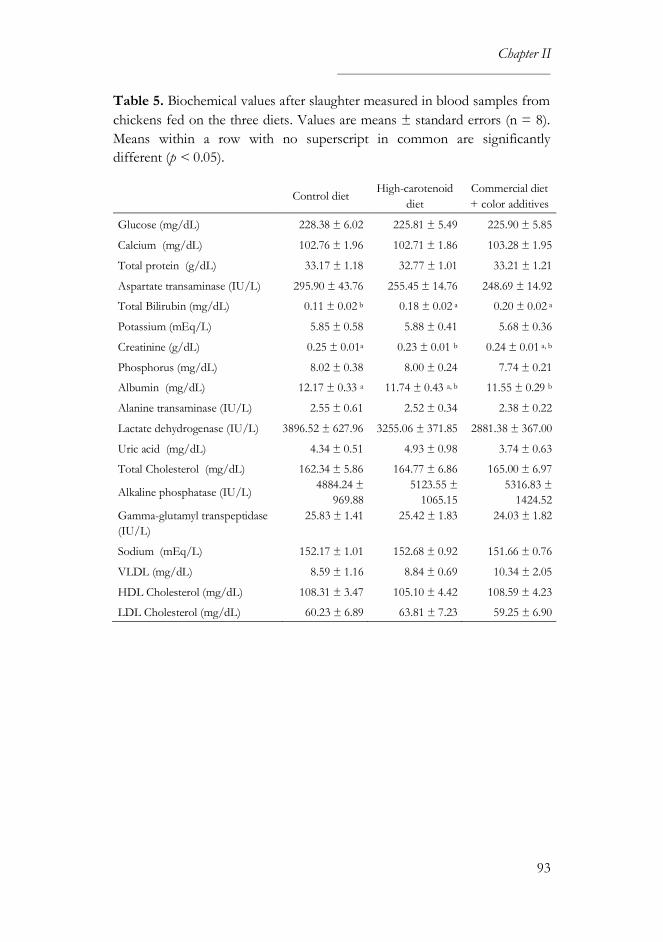
Chapter II
93
Table 5. Biochemical values after slaughter measured in blood samples from
chickens fed on the three diets. Values are means ± standard errors (n = 8).
Means within a row with no superscript in common are significantly
different (p < 0.05).
Control diet High-carotenoid
diet
Commercial diet
+ color additives
Glucose (mg/dL) 228.38 ± 6.02 225.81 ± 5.49 225.90 ± 5.85
Calcium (mg/dL) 102.76 ± 1.96 102.71 ± 1.86 103.28 ± 1.95
Total protein (g/dL) 33.17 ± 1.18 32.77 ± 1.01 33.21 ± 1.21
Aspartate transaminase (IU/L) 295.90 ± 43.76 255.45 ± 14.76 248.69 ± 14.92
Total Bilirubin (mg/dL) 0.11 ± 0.02 b 0.18 ± 0.02 a 0.20 ± 0.02 a
Potassium (mEq/L) 5.85 ± 0.58 5.88 ± 0.41 5.68 ± 0.36
Creatinine (g/dL) 0.25 ± 0.01a 0.23 ± 0.01 b 0.24 ± 0.01 a, b
Phosphorus (mg/dL) 8.02 ± 0.38 8.00 ± 0.24 7.74 ± 0.21
Albumin (mg/dL) 12.17 ± 0.33 a 11.74 ± 0.43 a, b 11.55 ± 0.29 b
Alanine transaminase (IU/L) 2.55 ± 0.61 2.52 ± 0.34 2.38 ± 0.22
Lactate dehydrogenase (IU/L) 3896.52 ± 627.96 3255.06 ± 371.85 2881.38 ± 367.00
Uric acid (mg/dL) 4.34 ± 0.51 4.93 ± 0.98 3.74 ± 0.63
Total Cholesterol (mg/dL) 162.34 ± 5.86 164.77 ± 6.86 165.00 ± 6.97
Alkaline phosphatase (IU/L) 4884.24 ±
969.88
5123.55 ±
1065.15
5316.83 ±
1424.52
Gamma-glutamyl transpeptidase
(IU/L)
25.83 ± 1.41 25.42 ± 1.83 24.03 ± 1.82
Sodium (mEq/L) 152.17 ± 1.01 152.68 ± 0.92 151.66 ± 0.76
VLDL (mg/dL) 8.59 ± 1.16 8.84 ± 0.69 10.34 ± 2.05
HDL Cholesterol (mg/dL) 108.31 ± 3.47 105.10 ± 4.42 108.59 ± 4.23
LDL Cholesterol (mg/dL) 60.23 ± 6.89 63.81 ± 7.23 59.25 ± 6.90
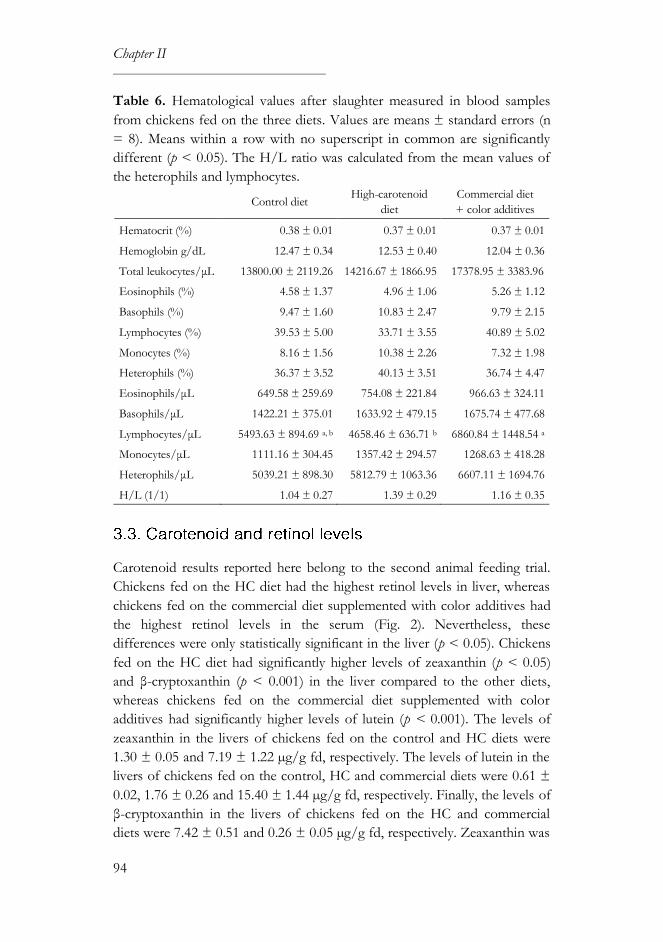
Chapter II
94
Table 6. Hematological values after slaughter measured in blood samples
from chickens fed on the three diets. Values are means ± standard errors (n
= 8). Means within a row with no superscript in common are significantly
different (p < 0.05). The H/L ratio was calculated from the mean values of
the heterophils and lymphocytes.
Control diet
High-carotenoid
diet
Commercial diet
+ color additives
Hematocrit (%) 0.38 ± 0.01 0.37 ± 0.01 0.37 ± 0.01
Hemoglobin g/dL 12.47 ± 0.34 12.53 ± 0.40 12.04 ± 0.36
Total leukocytes/μL 13800.00 ± 2119.26 14216.67 ± 1866.95 17378.95 ± 3383.96
Eosinophils (%) 4.58 ± 1.37 4.96 ± 1.06 5.26 ± 1.12
Basophils (%) 9.47 ± 1.60 10.83 ± 2.47 9.79 ± 2.15
Lymphocytes (%) 39.53 ± 5.00 33.71 ± 3.55 40.89 ± 5.02
Monocytes (%) 8.16 ± 1.56 10.38 ± 2.26 7.32 ± 1.98
Heterophils (%) 36.37 ± 3.52 40.13 ± 3.51 36.74 ± 4.47
Eosinophils/μL 649.58 ± 259.69 754.08 ± 221.84 966.63 ± 324.11
Basophils/μL 1422.21 ± 375.01 1633.92 ± 479.15 1675.74 ± 477.68
Lymphocytes/μL 5493.63 ± 894.69 a, b 4658.46 ± 636.71 b 6860.84 ± 1448.54 a
Monocytes/μL 1111.16 ± 304.45 1357.42 ± 294.57 1268.63 ± 418.28
Heterophils/μL 5039.21 ± 898.30 5812.79 ± 1063.36 6607.11 ± 1694.76
H/L (1/1) 1.04 ± 0.27 1.39 ± 0.29 1.16 ± 0.35
Carotenoid results reported here belong to the second animal feeding trial.
Chickens fed on the HC diet had the highest retinol levels in liver, whereas
chickens fed on the commercial diet supplemented with color additives had
the highest retinol levels in the serum (Fig. 2). Nevertheless, these
differences were only statistically significant in the liver (p < 0.05). Chickens
fed on the HC diet had significantly higher levels of zeaxanthin (p < 0.05)
and β-cryptoxanthin (p < 0.001) in the liver compared to the other diets,
whereas chickens fed on the commercial diet supplemented with color
additives had significantly higher levels of lutein (p < 0.001). The levels of
zeaxanthin in the livers of chickens fed on the control and HC diets were
1.30 ± 0.05 and 7.19 ± 1.22 µg/g fd, respectively. The levels of lutein in the
livers of chickens fed on the control, HC and commercial diets were 0.61 ±
0.02, 1.76 ± 0.26 and 15.40 ± 1.44 µg/g fd, respectively. Finally, the levels of
β-cryptoxanthin in the livers of chickens fed on the HC and commercial
diets were 7.42 ± 0.51 and 0.26 ± 0.05 µg/g fd, respectively. Zeaxanthin was
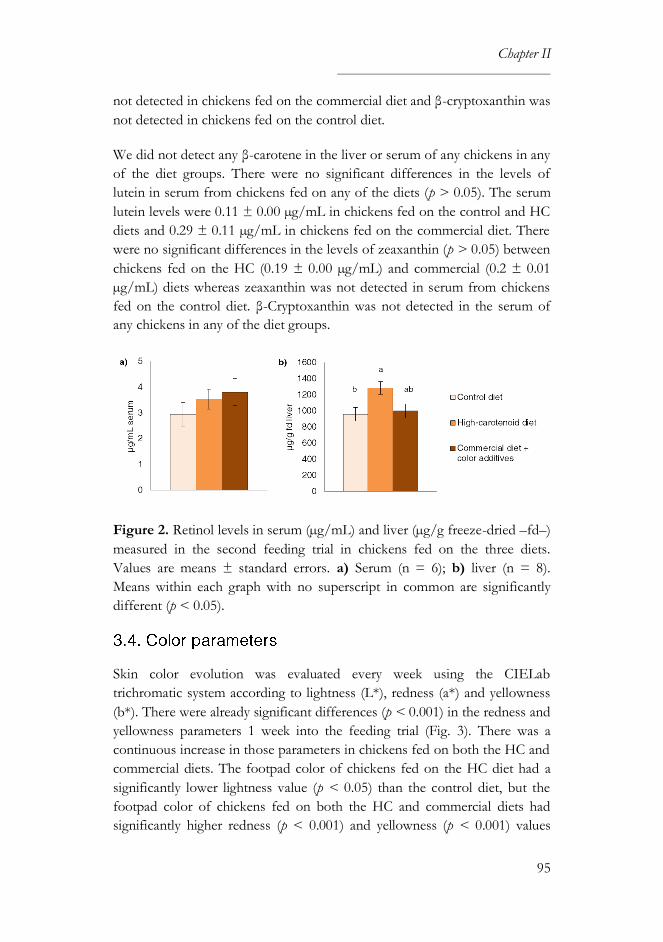
Chapter II
95
not detected in chickens fed on the commercial diet and β-cryptoxanthin was
not detected in chickens fed on the control diet.
We did not detect any β-carotene in the liver or serum of any chickens in any
of the diet groups. There were no significant differences in the levels of
lutein in serum from chickens fed on any of the diets (p > 0.05). The serum
lutein levels were 0.11 ± 0.00 µg/mL in chickens fed on the control and HC
diets and 0.29 ± 0.11 µg/mL in chickens fed on the commercial diet. There
were no significant differences in the levels of zeaxanthin (p > 0.05) between
chickens fed on the HC (0.19 ± 0.00 µg/mL) and commercial (0.2 ± 0.01
µg/mL) diets whereas zeaxanthin was not detected in serum from chickens
fed on the control diet. β-Cryptoxanthin was not detected in the serum of
any chickens in any of the diet groups.
Figure 2. Retinol levels in serum (µg/mL) and liver (µg/g freeze-dried –fd–)
measured in the second feeding trial in chickens fed on the three diets.
Values are means ± standard errors. a) Serum (n = 6); b) liver (n = 8).
Means within each graph with no superscript in common are significantly
different (p < 0.05).
Skin color evolution was evaluated every week using the CIELab
trichromatic system according to lightness (L*), redness (a*) and yellowness
(b*). There were already significant differences (p < 0.001) in the redness and
yellowness parameters 1 week into the feeding trial (Fig. 3). There was a
continuous increase in those parameters in chickens fed on both the HC and
commercial diets. The footpad color of chickens fed on the HC diet had a
significantly lower lightness value (p < 0.05) than the control diet, but the
footpad color of chickens fed on both the HC and commercial diets had
significantly higher redness (p < 0.001) and yellowness (p < 0.001) values
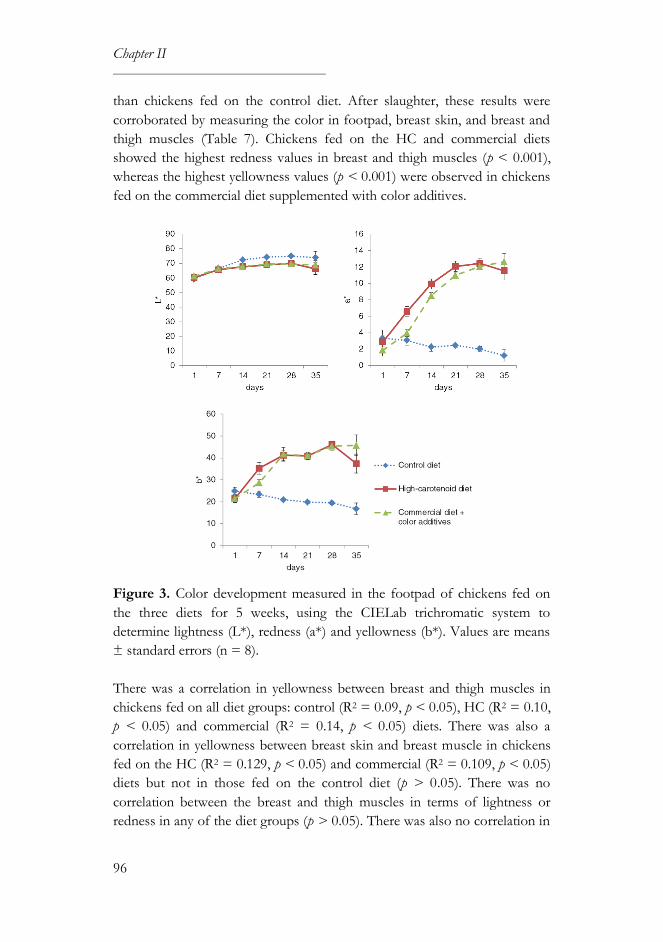
Chapter II
96
than chickens fed on the control diet. After slaughter, these results were
corroborated by measuring the color in footpad, breast skin, and breast and
thigh muscles (Table 7). Chickens fed on the HC and commercial diets
showed the highest redness values in breast and thigh muscles (p < 0.001),
whereas the highest yellowness values (p < 0.001) were observed in chickens
fed on the commercial diet supplemented with color additives.
Figure 3. Color development measured in the footpad of chickens fed on
the three diets for 5 weeks, using the CIELab trichromatic system to
determine lightness (L*), redness (a*) and yellowness (b*). Values are means
± standard errors (n = 8).
There was a correlation in yellowness between breast and thigh muscles in
chickens fed on all diet groups: control (R2 = 0.09, p < 0.05), HC (R2 = 0.10,
p < 0.05) and commercial (R2 = 0.14, p < 0.05) diets. There was also a
correlation in yellowness between breast skin and breast muscle in chickens
fed on the HC (R2 = 0.129, p < 0.05) and commercial (R2 = 0.109, p < 0.05)
diets but not in those fed on the control diet (p > 0.05). There was no
correlation between the breast and thigh muscles in terms of lightness or
redness in any of the diet groups (p > 0.05). There was also no correlation in
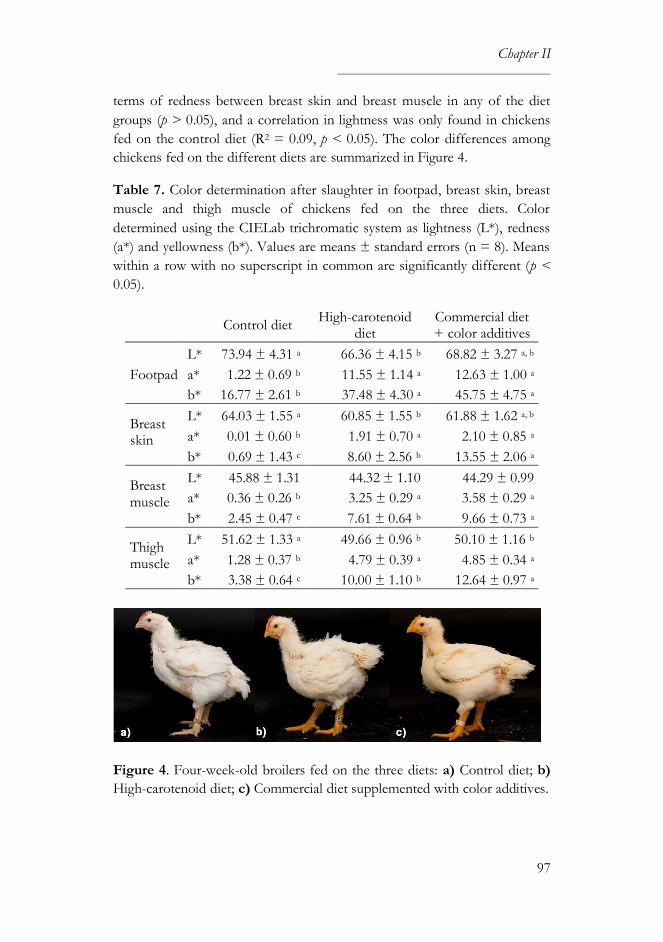
Chapter II
97
terms of redness between breast skin and breast muscle in any of the diet
groups (p > 0.05), and a correlation in lightness was only found in chickens
fed on the control diet (R2 = 0.09, p < 0.05). The color differences among
chickens fed on the different diets are summarized in Figure 4.
Table 7. Color determination after slaughter in footpad, breast skin, breast
muscle and thigh muscle of chickens fed on the three diets. Color
determined using the CIELab trichromatic system as lightness (L*), redness
(a*) and yellowness (b*). Values are means ± standard errors (n = 8). Means
within a row with no superscript in common are significantly different (p <
0.05).
Control diet
High-carotenoid diet
Commercial diet + color additives
L* 73.94 ± 4.31 a 66.36 ± 4.15 b 68.82 ± 3.27 a, b
Footpad a* 1.22 ± 0.69 b 11.55 ± 1.14 a 12.63 ± 1.00 a
b* 16.77 ± 2.61 b 37.48 ± 4.30 a 45.75 ± 4.75 a
Breast skin
L* 64.03 ± 1.55 a 60.85 ± 1.55 b 61.88 ± 1.62 a, b
a* 0.01 ± 0.60 b 1.91 ± 0.70 a 2.10 ± 0.85 a
b* 0.69 ± 1.43 c 8.60 ± 2.56 b 13.55 ± 2.06 a
Breast muscle
L* 45.88 ± 1.31 44.32 ± 1.10 44.29 ± 0.99
a* 0.36 ± 0.26 b 3.25 ± 0.29 a 3.58 ± 0.29 a
b* 2.45 ± 0.47 c 7.61 ± 0.64 b 9.66 ± 0.73 a
Thigh muscle
L* 51.62 ± 1.33 a 49.66 ± 0.96 b 50.10 ± 1.16 b
a* 1.28 ± 0.37 b 4.79 ± 0.39 a 4.85 ± 0.34 a
b* 3.38 ± 0.64 c 10.00 ± 1.10 b 12.64 ± 0.97 a
Figure 4. Four-week-old broilers fed on the three diets: a) Control diet; b)
High-carotenoid diet; c) Commercial diet supplemented with color additives.
Chapter II
98
Chickens, like most other animals, must obtain carotenoids from their diet
because they cannot synthesize them naturally (Breithaupt, 2007). However,
the crops typically used in commercial poultry feed (e.g. maize and soybean)
do not supply sufficient carotenoids to achieve the skin pigmentation desired
by many consumers in North America and the Asia-Pacific markets, and
synthetic or natural carotenoids are therefore routinely added to feed
formulations (Castañeda et al., 2005; Williams, 1992). Larger quantities of
color additives are required for today's poultry genotypes because they have
been bred to grow rapidly, and this increases the cost of feed. Novel crops
such as HC maize, which accumulates high levels of β-carotene, lutein and
zeaxanthin, could therefore provide an alternative to color additives in the
poultry industry. We tested the impact of a poultry diet based on HC maize
by measuring its impact on productivity and health parameters, color
development and the distribution of carotenoids compared to equivalent
diets based on the near isogenic wild-type maize inbred M37W (which was
used as the background to create the transgenic HC variety used in this
study) and a commercial maize diet supplemented with color additives.
There were no significant differences in productivity parameters when we
compared chickens fed on the control and HC diets. The FCR, which is
defined as the weight of feed in kg required to produce a weight gain of 1 kg
in a living animal, was significantly lower in the HC diet than in the
commercial diet supplemented with color additives. The similar performance
of the HC and control diets suggests that efficient FCR may be a property
specific to the genetic background of these lines (M37W maize, the control
maize, used as a basis for the development of HC) rather than the carotenoid
content, given that the commercial diet is based on a mixture of yellow
maize varieties and that feed supplementation with pigments does not appear
to influence feed consumption or body weight (Liu et al., 2008; Pérez-
Vendrell et al., 2001). Previous experiments have shown that broilers fed on
the HC diet had a heavier bursa of Fabricius than chickens fed on the
control diet which may reflect their better immunomodulatory response to
vaccination against infectious bursal disease (Gumboro) (Nogareda et al.,
2016). However, we observed no statistically significant difference in the
weight of this organ among chickens fed on the control, HC and commercial
diets most likely because unlike the earlier experiments, chickens were not
vaccinated in these trials. Bilirubin levels were higher in the chickens fed on
the carotenoid-enriched diets and highest in those fed on the commercial

Chapter II
99
diet, which may reflect the onset of subclinical inflammation. Both bilirubin
and carotenoids have immunomodulatory effects and this may explain the
differences in lymphocytes levels in chickens fed on the three different diets
(Koutsos et al., 2003; Y. Liu et al., 2008; Rajput et al., 2013).
Mycotoxin analysis (data not shown) indicated that mycotoxins were below
the maximum levels set for aflatoxin B1 in poultry feed (0.02 mg/kg) and the
guidance values set for other mycotoxins by the European Union (European
Commission, 2013, 2006, 2003, 2002).
Carotenoid analysis indicated that feed composition plays an important role
in the final carotenoid content of the different tissues. The HC diet
contained the highest levels of zeaxanthin, β-carotene and β-cryptoxanthin,
whereas the commercial diet supplemented with color additives contained
the highest levels of lutein. Similar proportions of these carotenoids were
found in the chicken livers, with the exception of β-carotene, which was not
detected in livers from any of the diet groups, reflecting its conversion into
retinol for storage. The levels of β-cryptoxanthin, which also has PVA
activity, remained high in livers from chickens fed on the HC diet. This
suggests the preference of the enzyme β-carotene 15,15'-dioxygenase 1, for
β-carotene as a substrate (Kim and Oh, 2010, 2009). Furthermore, β-
cryptoxanthin levels in livers from chickens fed on the HC diet were higher
than those originally present in the HC feed, suggesting that the polar nature
of this molecule may facilitate more efficient transfer from the feed to the
chicken tissues (Liu et al., 2012). A high concentration of β-cryptoxanthin
was detected in yolks from hens fed on a diet based on maize biofortified
with β-cryptoxanthin (Liu et al., 2012), and the β-cryptoxanthin
concentration in yolks and chicken livers was higher than the initial β-
cryptoxanthin content in the feed in hens fed on a biofortified orange-maize
diet (Heying et al., 2014). Even so, β-cryptoxanthin was not detected in livers
from chickens fed on the control diet or was found at low levels in livers
from chickens fed on the commercial diet (0.26 ± 0.05 µg/g fd). This
probably reflects the conversion of β-cryptoxanthin into retinol because
those diets contained less β-carotene than the HC feed. Alternatively, the
difference in bioavailability may indicate a food matrix effect, in which
carotenoids provided as intrinsic components are released more slowly and
therefore absorbed over a longer duration for more efficient assimilation.
Non-PVA carotenoids supplied to hens as biofortified maize are more
efficiently assimilated than the same carotenoids provided as a commercial
maize diet (Moreno et al., 2016). Only lutein and zeaxanthin were detected in
Chapter II
100
the serum, which may reflect the preferential transport of these carotenoids
in the circulation. Chicken serum contains more HDL than LDL, and β-
carotene is mainly carried by LDL whereas lutein and zeaxanthin are carried
by HDL (Heying et al., 2014; Parker, 1996).
Chickens fed on the HC diet accumulated more retinol in the liver, but not
in the serum. The liver is a major storage tissue for vitamin A whereas the
serum is the mobile phase for carotenoids (Jlali et al., 2012). Our results are
consistent with a previous study showing that chickens fed on the HC diet
had 1.72–fold more retinol in the liver than chickens fed on the control diet
and 1.42–fold more than those fed on the commercial diet with color
additives (Nogareda et al., 2016). Here we found that chickens fed on the HC
diet had 1.34–fold more retinol in the liver than chickens fed on the control
diet and 1.28–fold more than those fed on the commercial diet with color
additives. Despite the slightly smaller fold change, our absolute retinol levels
were higher for all treatments compared to the previous study (Nogareda et
al., 2016), which may reflect the storage conditions of the feed which may
lead to the loss of carotenoids over time (Jintasataporn and Yuangsoi, 2012).
Consumers usually reject or accept poultry meat based on its appearance,
color being one of the major contributing components to this quality
attribute. Skin color is crucial for the marketing of whole parts whereas meat
color is important for the marketing of skinless cut up pieces (Fletcher,
2002). The chicken is the only poultry species in which pigmentation of
products can be desired by consumers, although preferences vary by region
and by culture (Grashorn, 2016). Some consumers can perceive the yellow
color of chicken meat negatively because it is associated with an old bird or
rancidity while others can consider it positively because it is associated with
better health (Grashorn, 2016; Kennedy et al., 2002). The intensity of the skin
color was measured using the CIELab trichromatic system (CIE, 2004) to
provide values for lightness (L*), redness (a*) and yellowness (b*). The
redness and yellowness values were higher in chickens fed on carotenoid-
enriched diets compared to control diet, and the values in the footpad were
higher than those in the breast and thigh muscles after slaughter. Higher
pigmentation levels in shank compared to breast were previously reported in
experiments in which broilers were fed on diets supplemented with natural
and synthetic pigments (Liu et al., 2008). The color parameters vary
according to the tissue, e.g. lower yellowness was detected when the target
tissue was the fat vein (Castañeda et al., 2005), and the production conditions
Chapter II
101
(e.g. higher yellowness was found when broilers were reared under intensive
conditions) (Sirri et al., 2010).
Previous experiments have shown that the levels of lutein were 2–fold higher
in breast muscle from chickens fed on the HC diet compared to the control
whereas there were no differences in fat, breast and thigh skin, and thigh
muscle between the two diets. A more substantial difference was found in
zeaxanthin levels, which were 7–fold higher in fat and thigh muscle, 11–fold
higher in thigh skin, 20-fold higher in breast skin, and 22–fold higher in
breast muscle from chickens fed on the HC diet compared to the control. β-
Carotene levels were 11–fold higher in breast muscle from chickens fed on
the HC diet compared to the control whereas it was not detected in fat,
breast and thigh skin, and thigh muscle in any case. However, β-carotene
epoxides were found in those tissues in chickens fed on the HC diet,
suggesting that β-carotene was accumulated initially but it was metabolized
into downstream derivatives. Finally, β-cryptoxanthin was only detected in
breast muscle from chickens fed on the HC diet (Nogareda et al., 2016).
Chickens fed on the commercial diet supplemented with color additives had
higher breast and thigh yellowness compared to those fed on the HC diet,
which can be explained by the presence of the lutein-rich marigold flower
extract in this formulation (Breithaupt et al., 2003). Lutein increases the
yellowness of chicken meat, as reported for broilers fed on a diet
supplemented with 200 mg/kg lutein (Rajput et al., 2013). Yellowness is a
good indicator of yellow xanthophyll content in the feed (Pérez-Vendrell et
al., 2001). Despite the better absorption of synthetic pigments (apo-ester and
canthaxanthin), it seems that natural pigments (marigold flowers and red
paprika extracts) are more efficiently distributed into tissues, because natural
pigments increased skin yellowness more efficiently than synthetic pigments
(Castañeda et al., 2005).
A positive correlation between skin and raw breast meat yellowness was
observed when Ross 508 broilers were reared under commercial conditions
and fed on diets supplemented with xanthophylls (Bianchi et al., 2007). A
slight correlation was observed in the carotenoid-enriched diet groups under
our experimental conditions, but higher yellowness was found in breast skin
than in breast muscle in those groups. Yellowness in breast and thigh
muscles was also correlated in experiments in which Ross 308 and Ross 508
broilers were reared under intensive conditions, suggesting that a single
measurement in one tissue is adequate to assess color development (Sirri et

Chapter II
102
al., 2010). Despite there was a correlation between the yellowness values of
breast and thigh muscles in our study, the correlation values were not as high
as those reported by these authors.
The results obtained from the analysis of color parameters suggest that
breast and thigh muscles are appropriate target tissues to measure the
pigmentation of broilers intended to be processed into retail cuts. Taking
into account yellowness and redness, the meat obtained from chickens
reared on the HC diet was similar in appearance to the meat obtained from
chickens reared on the commercial diet supplemented with marigold flowers
and red paprika extracts. Thus, HC maize is a suitable feed component to
achieve the golden skin color which is desired by the consumer in some
markets, avoiding or reducing the need for supplementary pigments and thus
reducing feed costs.
High-carotenoid maize had no adverse effects on poultry, and it resulted in
similar growth and health parameters to its near isogenic wild-type line and
the commercial maize supplemented with color additives, in addition to
providing PVA carotenoids. Chickens fed on the HC diet developed similar
pigmentation to those fed on the commercial diet supplemented with color
additives, although the latter had greater yellowness values due to the high
levels of lutein in the feed. We conclude that HC maize is a suitable
alternative to color additives in the poultry production industry.
Amaya, E., Becquet, F., Carné, S., Peris, S. & Miralles, P., 2014. Carotenoids
in animal nutrition. FEFANA (EU Association of Specialty Feed
Ingredients and their Mixtures) publication, Brussels, Belgium.
Bai, C., Twyman, R.M., Farré, G., Sanahuja, G., Christou, P., Capell, T. and
Zhu, C., 2011. A golden era – pro-vitamin A enhancement in diverse
crops. In Vitro Cellular & Developmental Biology – Plant 47: 205–221.
BCC Research, 2015. The global market for carotenoids. Available at:
http://www.bccresearch.com/market-research/food-and-
beverage/carotenoids-global-market-report-fod025e.html Accessed 25
October 2016.
Bianchi, M., Petracci, M., Sirri, F., Folegatti, E., Franchini, A. and Meluzzi,
A., 2007. The influence of the season and market class of broiler
Chapter II
103
chickens on breast meat quality traits. Poultry Science 86: 959–963.
Breithaupt, D.E., 2007. Modern application of xanthophylls in animal
feeding – a review. Trends in Food Science and Technology 18: 501–
506.
Breithaupt, D.E., Weller, P. and Grashorn, M.A., 2003. Quantification of
carotenoids in chicken plasma after feeding free or esterified lutein and
capsanthin using high-performance liquid chromatography and liquid
chromatography-mass spectrometry analysis. Poultry Science 82: 395–
401.
Britton, G., 1995. Structure and properties of carotenoids in relation to
function. The FASEB Journal 9: 1551–1558.
Castañeda, M.P., Hirschler, E.M. and Sams, A.R., 2005. Skin pigmentation
evaluation in broilers fed natural and synthetic pigments. Poultry
Science 84: 143–147.
Chew, B.P. and Park, J.S., 2004. Carotenoid action on the immune response.
The Journal of Nutrition 134: 257S–261S.
Commission Internationale de l'Éclairage – International Commission on
Illumination (CIE), 2004. CIE 15: Technical Report: Colorimetry, third
edition. CIE, 552: 24.
European Commission, 2002. Directive 2002/32/EC of the European
Parliament and of the Council of 7 May 2002 on undesirable
substances in animal feed. Official Journal of the European
Communities L 269: 1–15.
European Commission, 2003. Commission Directive 2003/100/EC of 31
October 2003 amending Annex I to Directive 2002/32/EC of the
European Parliament and of the Council on undesirable substances in
animal feed. Official Journal of the European Union L285: 33–37.
European Commission, 2006. Commission Recommendation of 17 August
2006 on the presence of deoxynivalenol, zearalenone, ochratoxin A, T-
2 and HT-2 and fumonisins in products intended for animal feeding
(2006/576/EC). Official Journal of the European Union L229: 7–9.
European Commission, 2007. Commission Recommendation of 18 June

Chapter II
104
2007 on guidelines for the accommodation and care of animals used
for experimental and other scientific purposes (2007/526/EC). Official
Journal of the European Union L197: 1–89.
European Commission, 2009. Commission Regulation (EC) No. 152/2009
of 27 January 2009 laying down the methods of sampling and analysis
for the official control of feed. Official Journal of the European Union
L 54/1: 1–130.
European Commission, 2013. Commission Recommendation of 27 March
2013 on the presence of T-2 and HT-2 toxin in cereals and cereal
products (2013/165/EU). Official Journal of the European Union L91:
12–15.
European Parliament, 2010. Directive 2010/63/EU of the European
Parliament and of the Council of 22 September 2010 on the protection
of animals for scientific purposes. Official Journal of the European
Union L276: 33–79.
Farré, G., Blancquaert, D., Capell, T., Van Der Straeten, D., Christou, P. and
Zhu, C., 2014. Engineering complex metabolic pathways in plants.
Annual Review of Plant Biology 65: 187–223.
Farré, G., Sanahuja, G., Naqvi, S., Bai, C., Capell, T., Zhu, C. and Christou,
P., 2010. Travel advice on the road to carotenoids in plants. Plant
Science 179: 28–48.
Fletcher, D.L., 2002. Poultry meat quality. World's Poultry Science Journal
58: 131–145.
Grashorn, M., 2016. Feed additives for influencing chicken meat and egg
yolk color. In: Carle, R., Schweiggert, R.M. (Eds.). Handbook on
natural pigments in food and beverages: industrial applications for
improving food color. Elsevier Ltd., Duxford, UK, pp. 283–302.
Heying, E.K., Tanumihardjo, J.P., Vasic, V., Cook, M., Palacios-rojas, N. and
Tanumihardjo, S.A., 2014. Biofortified orange maize enhances β-
cryptoxanthin concentrations in egg yolks of laying hens better than
tangerine peel fortificant. Journal of Agricultural and Food Chemistry
62: 11892–11900.
International Life Sciences Institute (ILSI) International Food Biotechnology
Chapter II
105
Committee, 2007. Best practices for the conduct of animal studies to
evaluate crops genetically modified for output traits. ILSI, Washington
DC, USA.
Jintasataporn, O. and Yuangsoi, B., 2012. Stability of carotenoid diets during
feed processing and under different storage conditions. Molecules 17:
5651–5660.
Jlali, M., Graulet, B., Chauveau-Duriot, B., Chabault, M., Godet, E., Leroux,
S., Praud, C., Le, E., Le Bihan-Duval, E., Duclos, M.J. and Berri, C.,
2012. A mutation in the promoter of the chicken β,β-carotene 15,15′-
monooxygenase 1 gene alters xantophyll metabolism through a
selective effect on its mRNA abundance in the breast muscle. Journal
of Animal Science 90: 4280–4288.
Kennedy, O.B., Stewart-Knox, B.J., Mitchell, P.C., Thurnham, D.I., 2005.
Flesh colour dominates consumer preference for chicken. Appetite 44:
181–186.
Kim, Y.S. and Oh, D.-K., 2009. Substrate specificity of a recombinant
chicken β-carotene 15,15′-monooxygenase that converts β-carotene
into retinal. Biotechnology Letters 31: 403–408.
Kim, Y.S. and Oh, D.-K., 2010. Biotransformation of carotenoids to retinal
by carotenoid 15,15’-oxygenase. Applied Microbiology and
Biotechnology 88: 807–816.
Koutsos, E. A, Clifford, A.J., Calvert, C.C. and Klasing, K.C., 2003. Maternal
carotenoid status modifies the incorporation of dietary carotenoids into
immune tissues of growing chickens (Gallus gallus domesticus). The
Journal of Nutrition 133: 1132–1138.
Liu, G.-D., Hou, G.-Y., Wang, D.-J., Lv, S.-J., Zhang, X.-Y., Sun, W.-P. and
Yang, Y., 2008. Skin pigmentation evaluation in broilers fed different
levels of natural okra and synthetic pigments. The Journal of Applied
Poultry Research 17: 498–504.
Liu, Y., Li, P., Lu, J., Xiong, W., Oger, J., Tetzlaff, W. and Cynader, M.,
2008. Bilirubin possesses powerful immunomodulatory activity and
suppresses experimental autoimmune encephalomyelitis. The Journal
of Immunology 181: 1887–1897.
Chapter II
106
Liu, Y.Q., Davis, C.R., Schmaelzle, S.T., Rocheford, T., Cook, M.E. and
Tanumihardjo, S. A, 2012. β-Cryptoxanthin biofortified maize (Zea
mays) increases β-cryptoxanthin concentration and enhances the color
of chicken egg yolk. Poultry Science 91: 432–438.
Moreno, J.A., Díaz-Gómez, J., Nogareda, C., Angulo, E., Sandmann, G.,
Portero-Otin, M., Serrano, J.C.E., Twyman, R.M., Capell, T., Zhu, C.
and Christou, P., 2016. The distribution of carotenoids in hens fed on
biofortified maize is influenced by feed composition, absorption,
resource allocation and storage. Scientific Reports, 6: 35346.
National Research Council, 1994. Nutrient requeriments of poultry, ninth
revised edition. National Academy Press, Washington DC, USA.
National Research Council, 2011. Guide for the care and use of laboratory
animals, eighth edition. National Academy Press, Washington DC,
USA.
Nogareda, C., Moreno, J.A., Angulo, E., Sandmann, G., Portero, M., Capell,
T., Zhu, C. and Christou, P., 2016. Carotenoid-enriched transgenic
corn delivers bioavailable carotenoids to poultry and protects them
against coccidiosis. Plant Biotechnology Journal 14: 160–168.
Parker, R.S., 1996. Absorption, metabolism, and transport of carotenoids.
The FASEB Journal 10: 542–551.
Pérez-Vendrell, A.M., Hernández, J.M., Llauradó, L., Schierle, J. and Brufau,
J., 2001. Influence of source and ratio of xanthophyll pigments on
broiler chicken pigmentation and performance. Poultry Science 80:
320–326.
Pretorius, B. and Schönfeldt, H.C., 2013. Effect of different maize meal diets
on growth and vitamin A: case-study on chickens. Food Chemistry
140: 520–525.
Rajput, N., Naeem, M., Ali, S., Zhang, J.F., Zhang, L. and Wang, T., 2013.
The effect of dietary supplementation with the natural carotenoids
curcumin and lutein on broiler pigmentation and immunity. Poultry
Science 92: 1177–1185.
Sandmann, G., 2002. Combinatorial biosynthesis of carotenoids in a
heterologous host: a powerful approach for the biosynthesis of novel
Chapter II
107
structures. ChemBioChem 3: 629–635.
Sharifzadeh, S., Clemmensen, L.H., Borggaard, C., Stoier, S. and Ersboll,
B.K., 2014. Supervised feature selection for linear and non-linear
regression of L*a*b* color from multispectral images of meat.
Engineering Applications of Artificial Intelligence 27: 211–227.
Sirri, F., Petracci, M., Bianchi, M. and Meluzzi, A., 2010. Survey of skin
pigmentation of yellow-skinned broiler chickens. Poultry Science 89:
1556–1561.
Surai, P.F., 2002. Natural antioxidants in avian nutrition and reproduction.
Nottingham University Press, Notthingham, UK.
Tarique, T., Yang, S., Mohsina, Z., Qiu, J., Zhao, Y., Gang, C. and Ailiang,
C., 2013. Role of carotenoids in poultry industry in China: a review.
Journal of Natural Sciences Research 3: 111–122.
Williams, W.D., 1992. Origin and impact of color on consumer preference
for food. Poultry Science 71: 744–746.
Yuan, J., Roshdy, A.R., Guo, Y., Wang, Y. and Guo, S., 2014. Effect of
dietary vitamin A on reproductive performance and immune response
of broiler breeders. PLoS ONE 9: 1–9.
Zhu, C., Naqvi, S., Breitenbach, J., Sandmann, G., Christou, P. and Capell,
T., 2008. Combinatorial genetic transformation generates a library of
metabolic phenotypes for the carotenoid pathway in maize.
Proceedings of the National Academy of Sciences of the United States
of America 105: 18232–18237.

β

Chapter III
111
β
Joana Díaz-Gómez a, b, Jose A. Moreno b, Eduardo Angulo b, Gerhard
Sandmann c , Changfu Zhu d, Teresa Capell d and Carmina Nogareda b
a Food Technology Department, University of Lleida–Agrotecnio Center; b Animal Science Department; c Biosynthesis Group, Department of
Molecular Biosciences, J. W. Goethe University, Max von Laue Str. 9, D-
60438 Frankfurt, Germany; d Plant Production and Forestry Science
Department; a, b, d University of Lleida–Agrotecnio Center, Av. Rovira Roure
191, 25198 Lleida, Spain
High-carotenoid (HC) maize, a biofortified staple crop which accumulates β-
carotene, β-cryptoxanthin, lutein and zeaxanthin, was used as a feed
component in a chicken feeding trial to assess the bioavailability of
provitamin A (PVA) carotenoids in the kernel matrix compared to the
synthetic and natural color additives routinely used in the poultry industry.
We found that the PVA carotenoids in HC maize were not metabolized in
the same manner: β-carotene was preferentially converted into retinol in the
intestine whereas β-cryptoxanthin accumulated in the liver. We also
considered the effect of zeaxanthin on the absorption of PVA carotenoids
because zeaxanthin is the major carotenoid component of HC maize. We
found that chickens fed on diets with low levels of zeaxanthin accumulated
higher levels of retinol in the liver, suggesting that zeaxanthin might interfere
with the absorption of β-carotene, although this observation was not
statistically significant. Our results show that HC maize provides bioavailable
carotenoids, including PVA carotenoids, and is suitable for use as a feed
component.
Chicken, bioavailability, metabolic engineering, pigments, β-carotene
Chapter III
112
Carotenoids are isoprenoids classified as carotenes (hydrocarbons) or
xanthophylls (oxygenated derivatives) (Namitha and Negi, 2010). Some
carotenoids possess provitamin A (PVA) activity (e.g. α-carotene, β-carotene
and β-cryptoxanthin) whereas others act as antioxidants but cannot be
converted into vitamin A (e.g. zeaxanthin and lutein) (Farré et al., 2010).
Humans acquire dietary carotenoids predominantly from plant-based foods.
PVA carotenoids are important nutrients that are required to prevent vitamin
A deficiency (VAD), whereas other carotenoids provide more general health-
promoting antioxidant activity (Bramley, 2003; Institute of Medicine, 2001).
Staple crops with enhanced carotenoid levels have been developed through
conventional breeding (e.g. potato, maize, cassava and pumpkin) or genetic
engineering (e.g. rice, maize, potato and tomato) and these could help to
maintain the health of populations at risk of vitamin A deficiency (VAD)
without the need to fortify processed foods or provide supplements (Bai et
al., 2011; Gómez-Galera et al., 2010; Saltzman et al., 2013; Zhu et al., 2013).
High-carotenoid (HC) maize, which was generated through transformation
of the South African white maize inbred line M37W, accumulates large
amounts of β-carotene, β-cryptoxanthin, lutein and zeaxanthin (Zhu et al.,
2008).
In the human body, vitamin A is absorbed as preformed vitamin A from
meat and dairy products or as PVA carotenoids from plants (Sanahuja et al.,
2013). Animal models are useful to evaluate carotenoid absorption and
metabolism because target tissues such as the liver can be tested (Lee et al.,
1999). Chickens are a suitable model to study vitamin A absorption and
availability because vitamin A and carotenoid metabolism is similar to
humans, hence chickens are also susceptible to VAD (NRC, 1994; Pretorius
and Schönfeldt, 2013). Like most other animals, chickens obtain carotenoids
from their diet (Breithaupt, 2007; Moreno et al., 2016). Carotenoids
supplements are commonly used in poultry nutrition to achieve the skin
pigmentation desired by many consumers and vitamin A is added as retinyl
ester to ensure normal growth and development (Castañeda et al., 2005; Yuan
et al., 2014).
Previous studies have established HC maize as an alternative to color
additives and vitamin A fortificants in poultry feed formulations for laying
hens (Moreno et al., 2016) and broilers (Díaz-Gómez et al., 2017a; Nogareda
Chapter III
113
et al., 2016). It is important to focus on nutrient bioavailability rather than on
the total amount of nutrient provided, because the bioavailability (defined as
the amount of an ingested nutrient that is available for utilization or storage)
is influenced by dietary and physiological factors (Carbonell-Capella et al.,
2014; Sanahuja et al., 2013). Furthermore, carotenoid absorption and
metabolism are affected by interaction with other carotenoids (Furr and
Clark, 1997; Yeum and Russell, 2002). For example, in chicks, the ingestion
of more zeaxanthin inhibits the accumulation of lutein in plasma and non-
retinal tissues (and vice versa) whereas the ingestion of more β-carotene
inhibits the accumulation of zeaxanthin and lutein in plasma and most tissues
(Wang et al., 2010). The competition between lutein and β-carotene has been
widely studied, but the role of zeaxanthin has not been investigated in detail
(Mamatha and Baskaran, 2011; Yeum and Russell, 2002).
We therefore investigated the bioavailability of the PVA carotenoids β-
carotene and β-cryptoxanthin supplied as intrinsic components of the HC
maize compared to the same carotenoids provided by a near isogenic maize
line supplemented with synthetic or natural color additives. We also
considered whether the absorption of PVA carotenoids is affected by
zeaxanthin, the most abundant carotenoid in HC maize.
The South African white maize inbred M37W and HC maize (Zhu et al.,
2008) were grown in an experimental field at the University of Lleida,
Northeast Spain. After harvest, maize cobs were dried at 35 °C for 24 h in a
drying chamber before milling (Ras® Mill, Romer® Labs Inc., Union, MO,
USA). The diets were formulated and prepared at the Mas de Bover
Research Center (IRTA, Reus, Spain) according to National Research
Council recommendations (NRC, 1994). The feed composition was 58%
maize, 18% soybean meal, 16% soybean hull and 4% soybean oil (Table 1).
Vitamin A was included in the vitamin-mineral premix at a concentration of
8,000 IU/kg (2.4 mg retinol/kg) to ensure normal growth and development
(Yuan et al., 2014). The M37W control diet was prepared before the HC diet
to avoid cross-contamination. Humidity, protein, fat, fiber and ash contents
were measured following European Union (EU) regulations (European
Commission, 2009). Mycotoxin levels were determined using enzyme
immunoassay kits (Ridascreen®, R-Biopharm AG, Darmstadt, Germany).
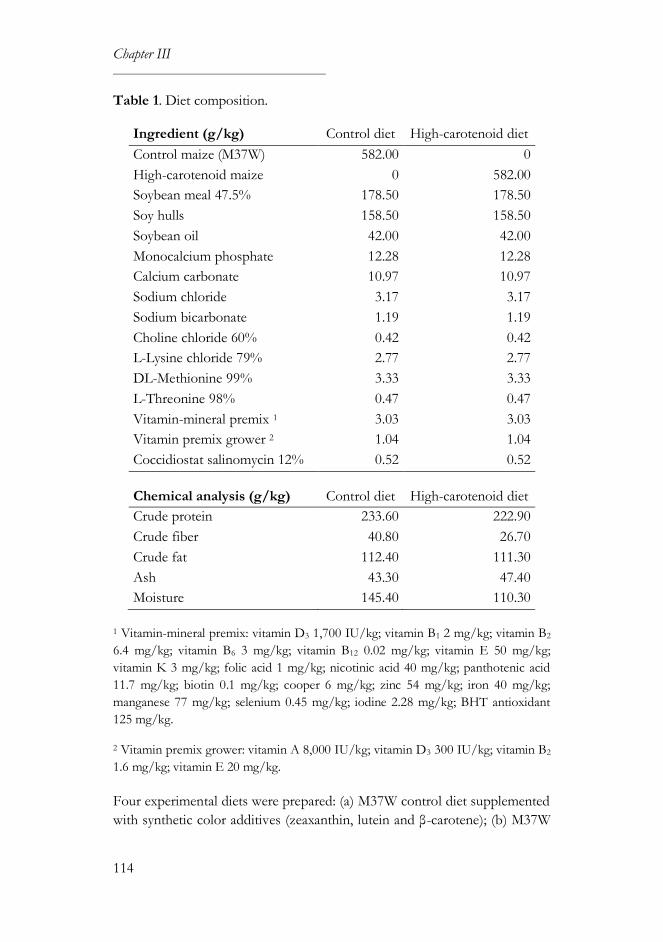
Chapter III
114
Table 1. Diet composition.
Ingredient (g/kg) Control diet High-carotenoid diet
Control maize (M37W) 582.00 0
High-carotenoid maize 0 582.00
Soybean meal 47.5% 178.50 178.50
Soy hulls 158.50 158.50
Soybean oil 42.00 42.00
Monocalcium phosphate 12.28 12.28
Calcium carbonate 10.97 10.97
Sodium chloride 3.17 3.17
Sodium bicarbonate 1.19 1.19
Choline chloride 60% 0.42 0.42
L-Lysine chloride 79% 2.77 2.77
DL-Methionine 99% 3.33 3.33
L-Threonine 98% 0.47 0.47
Vitamin-mineral premix 1 3.03 3.03
Vitamin premix grower 2 1.04 1.04
Coccidiostat salinomycin 12% 0.52 0.52
Chemical analysis (g/kg) Control diet High-carotenoid diet
Crude protein 233.60 222.90
Crude fiber 40.80 26.70
Crude fat 112.40 111.30
Ash 43.30 47.40
Moisture 145.40 110.30
1 Vitamin-mineral premix: vitamin D3 1,700 IU/kg; vitamin B1 2 mg/kg; vitamin B2
6.4 mg/kg; vitamin B6 3 mg/kg; vitamin B12 0.02 mg/kg; vitamin E 50 mg/kg;
vitamin K 3 mg/kg; folic acid 1 mg/kg; nicotinic acid 40 mg/kg; panthotenic acid
11.7 mg/kg; biotin 0.1 mg/kg; cooper 6 mg/kg; zinc 54 mg/kg; iron 40 mg/kg;
manganese 77 mg/kg; selenium 0.45 mg/kg; iodine 2.28 mg/kg; BHT antioxidant
125 mg/kg.
2 Vitamin premix grower: vitamin A 8,000 IU/kg; vitamin D3 300 IU/kg; vitamin B2
1.6 mg/kg; vitamin E 20 mg/kg.
Four experimental diets were prepared: (a) M37W control diet supplemented
with synthetic color additives (zeaxanthin, lutein and β-carotene); (b) M37W
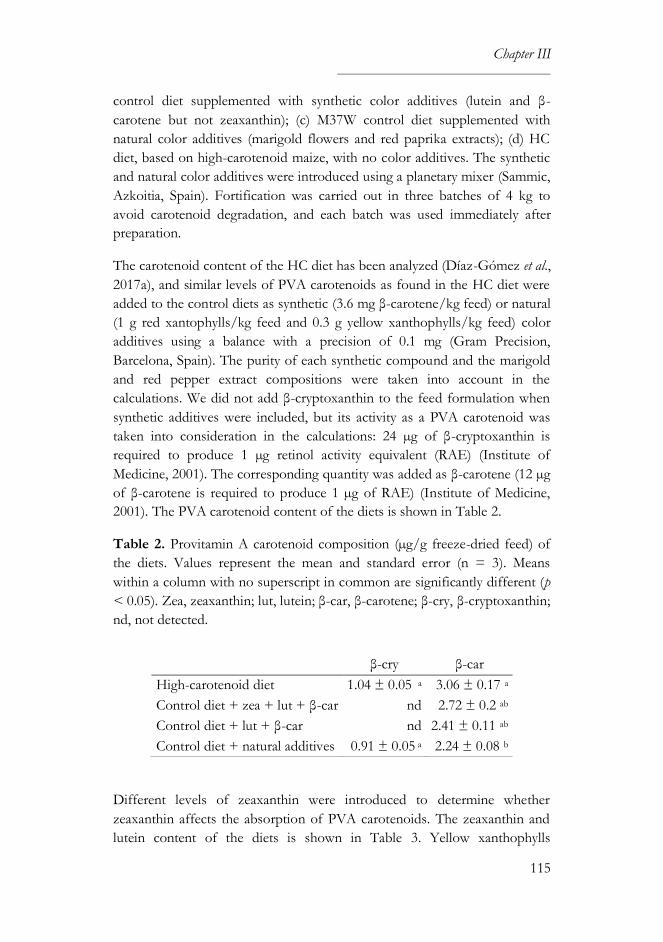
Chapter III
115
control diet supplemented with synthetic color additives (lutein and β-
carotene but not zeaxanthin); (c) M37W control diet supplemented with
natural color additives (marigold flowers and red paprika extracts); (d) HC
diet, based on high-carotenoid maize, with no color additives. The synthetic
and natural color additives were introduced using a planetary mixer (Sammic,
Azkoitia, Spain). Fortification was carried out in three batches of 4 kg to
avoid carotenoid degradation, and each batch was used immediately after
preparation.
The carotenoid content of the HC diet has been analyzed (Díaz-Gómez et al.,
2017a), and similar levels of PVA carotenoids as found in the HC diet were
added to the control diets as synthetic (3.6 mg β-carotene/kg feed) or natural
(1 g red xantophylls/kg feed and 0.3 g yellow xanthophylls/kg feed) color
additives using a balance with a precision of 0.1 mg (Gram Precision,
Barcelona, Spain). The purity of each synthetic compound and the marigold
and red pepper extract compositions were taken into account in the
calculations. We did not add β-cryptoxanthin to the feed formulation when
synthetic additives were included, but its activity as a PVA carotenoid was
taken into consideration in the calculations: 24 µg of β-cryptoxanthin is
required to produce 1 µg retinol activity equivalent (RAE) (Institute of
Medicine, 2001). The corresponding quantity was added as β-carotene (12 µg
of β-carotene is required to produce 1 µg of RAE) (Institute of Medicine,
2001). The PVA carotenoid content of the diets is shown in Table 2.
Table 2. Provitamin A carotenoid composition (µg/g freeze-dried feed) of
the diets. Values represent the mean and standard error (n = 3). Means
within a column with no superscript in common are significantly different (p
< 0.05). Zea, zeaxanthin; lut, lutein; β-car, β-carotene; β-cry, β-cryptoxanthin;
nd, not detected.
Different levels of zeaxanthin were introduced to determine whether
zeaxanthin affects the absorption of PVA carotenoids. The zeaxanthin and
lutein content of the diets is shown in Table 3. Yellow xanthophylls
β-cry β-car
High-carotenoid diet 1.04 ± 0.05 a 3.06 ± 0.17 a
Control diet + zea + lut + β-car nd 2.72 ± 0.2 ab
Control diet + lut + β-car nd 2.41 ± 0.11 ab
Control diet + natural additives 0.91 ± 0.05 a 2.24 ± 0.08 b
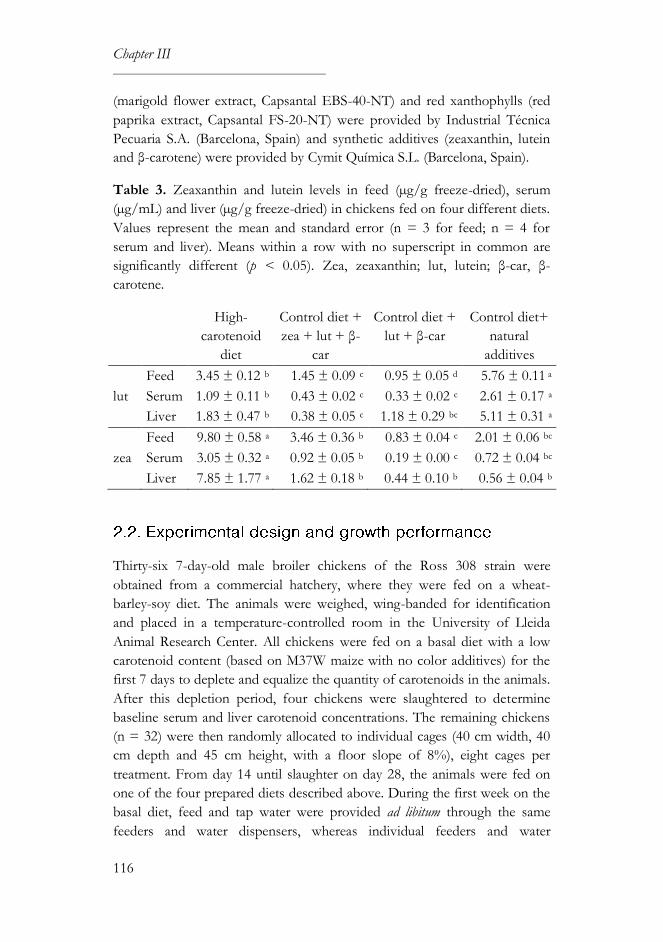
Chapter III
116
(marigold flower extract, Capsantal EBS-40-NT) and red xanthophylls (red
paprika extract, Capsantal FS-20-NT) were provided by Industrial Técnica
Pecuaria S.A. (Barcelona, Spain) and synthetic additives (zeaxanthin, lutein
and β-carotene) were provided by Cymit Química S.L. (Barcelona, Spain).
Table 3. Zeaxanthin and lutein levels in feed (µg/g freeze-dried), serum
(µg/mL) and liver (µg/g freeze-dried) in chickens fed on four different diets.
Values represent the mean and standard error (n = 3 for feed; n = 4 for
serum and liver). Means within a row with no superscript in common are
significantly different (p < 0.05). Zea, zeaxanthin; lut, lutein; β-car, β-
carotene.
High-
carotenoid
diet
Control diet +
zea + lut + β-
car
Control diet +
lut + β-car
Control diet+
natural
additives
Feed 3.45 ± 0.12 b 1.45 ± 0.09 c 0.95 ± 0.05 d 5.76 ± 0.11 a
lut Serum 1.09 ± 0.11 b 0.43 ± 0.02 c 0.33 ± 0.02 c 2.61 ± 0.17 a
Liver 1.83 ± 0.47 b 0.38 ± 0.05 c 1.18 ± 0.29 bc 5.11 ± 0.31 a
Feed 9.80 ± 0.58 a 3.46 ± 0.36 b 0.83 ± 0.04 c 2.01 ± 0.06 bc
zea Serum 3.05 ± 0.32 a 0.92 ± 0.05 b 0.19 ± 0.00 c 0.72 ± 0.04 bc
Liver 7.85 ± 1.77 a 1.62 ± 0.18 b 0.44 ± 0.10 b 0.56 ± 0.04 b
Thirty-six 7-day-old male broiler chickens of the Ross 308 strain were
obtained from a commercial hatchery, where they were fed on a wheat-
barley-soy diet. The animals were weighed, wing-banded for identification
and placed in a temperature-controlled room in the University of Lleida
Animal Research Center. All chickens were fed on a basal diet with a low
carotenoid content (based on M37W maize with no color additives) for the
first 7 days to deplete and equalize the quantity of carotenoids in the animals.
After this depletion period, four chickens were slaughtered to determine
baseline serum and liver carotenoid concentrations. The remaining chickens
(n = 32) were then randomly allocated to individual cages (40 cm width, 40
cm depth and 45 cm height, with a floor slope of 8%), eight cages per
treatment. From day 14 until slaughter on day 28, the animals were fed on
one of the four prepared diets described above. During the first week on the
basal diet, feed and tap water were provided ad libitum through the same
feeders and water dispensers, whereas individual feeders and water
Chapter III
117
dispensers were used for each experimental treatment during the remaining 2
weeks. No medication was administered during the feeding trial.
Environmental conditions (temperature, humidity, lighting and ventilation)
were monitored with a mini data logger (Testo, Lenzkirch, Germany) and
changed according to the age of the birds, following National Research
Council guidelines (NRC, 2011).
Body weights were measured each week of the experimental period and feed
intake was measured every time the feeders were filled in accordance with
standard industry methods, using a balance with a precision of 0.01 g (Kern,
Balingen, Germany). After 2 weeks on the experimental diets, all the
chickens were slaughtered on day 28 for gross necropsy. Pre-chilled whole
liver, spleen and bursa of Fabricius were collected and weighed. Serum and
freeze-dried (fd) liver samples were stored at –20 °C for carotenoid analysis.
The experimental procedure was approved by the Ethics Committee for
Animal Experimentation of the University of Lleida and the Catalan
Government (reference number DAAM 7692), following EU regulations
(European Commission, 2007; European Parliament, 2010) as well as best
practices recommended by the International Life Sciences Institute (ILSI,
2007).
The HC diet was analyzed before the feeding trial to calculate the quantities
of PVA carotenoids to be added to the control diets. Because the synthetic
and natural color additives were introduced into the control diets in three
batches, each batch was randomly sampled, and the samples from each batch
were combined to obtain an aggregate sample for carotenoid analysis. Total
carotenoids were extracted from freeze-dried samples in 20 mL methanol
containing 12% KOH at 65 °C for 1 h. Lipophilic compounds were
partitioned into 30% diethyl ether in petroleum ether, the upper phase was
collected and the solvent was evaporated under a stream of nitrogen gas at
37 °C. For HPLC separation, samples were re-dissolved in 100 µL
methanol/dichloromethane (50: 50, v/v) and a 20-µL aliquot was injected
immediately. Compounds were separated on a 15-cm Nucleosil C18 3-µm
column with an acetonitrile, methanol and 2-propanol mobile phase (85: 15:
5, v/v/v) at 20 °C. Samples were monitored with a Kontron 440 photodiode
array detector with online registration of the spectra, and were identified by
comparison with authentic reference compounds (Sandmann, 2002).
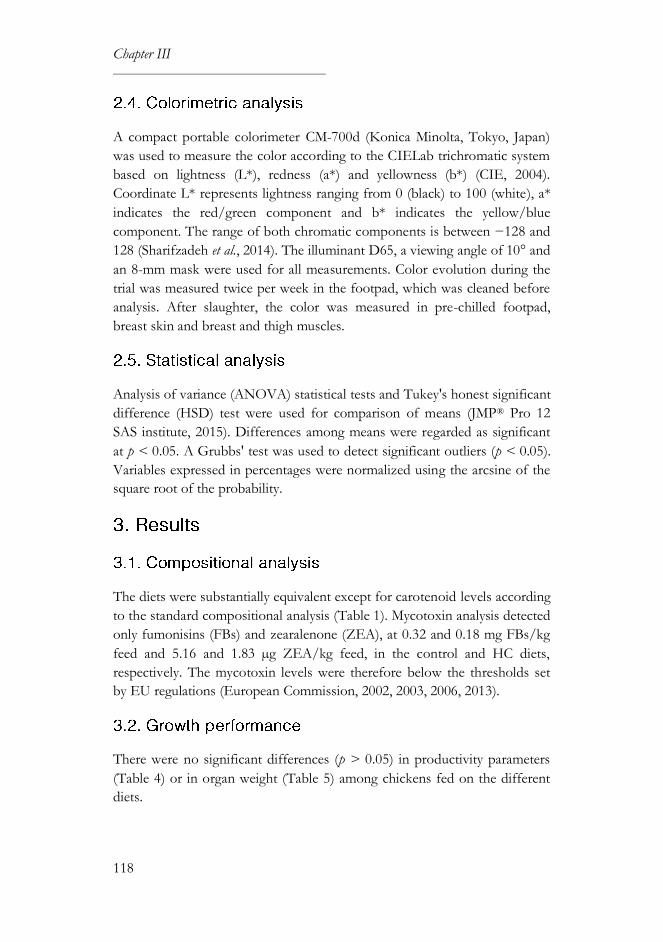
Chapter III
118
A compact portable colorimeter CM-700d (Konica Minolta, Tokyo, Japan)
was used to measure the color according to the CIELab trichromatic system
based on lightness (L*), redness (a*) and yellowness (b*) (CIE, 2004).
Coordinate L* represents lightness ranging from 0 (black) to 100 (white), a*
indicates the red/green component and b* indicates the yellow/blue
component. The range of both chromatic components is between −128 and
128 (Sharifzadeh et al., 2014). The illuminant D65, a viewing angle of 10° and
an 8-mm mask were used for all measurements. Color evolution during the
trial was measured twice per week in the footpad, which was cleaned before
analysis. After slaughter, the color was measured in pre-chilled footpad,
breast skin and breast and thigh muscles.
Analysis of variance (ANOVA) statistical tests and Tukey's honest significant
difference (HSD) test were used for comparison of means (JMP® Pro 12
SAS institute, 2015). Differences among means were regarded as significant
at p < 0.05. A Grubbs' test was used to detect significant outliers (p < 0.05).
Variables expressed in percentages were normalized using the arcsine of the
square root of the probability.
The diets were substantially equivalent except for carotenoid levels according
to the standard compositional analysis (Table 1). Mycotoxin analysis detected
only fumonisins (FBs) and zearalenone (ZEA), at 0.32 and 0.18 mg FBs/kg
feed and 5.16 and 1.83 µg ZEA/kg feed, in the control and HC diets,
respectively. The mycotoxin levels were therefore below the thresholds set
by EU regulations (European Commission, 2002, 2003, 2006, 2013).
There were no significant differences (p > 0.05) in productivity parameters
(Table 4) or in organ weight (Table 5) among chickens fed on the different
diets.
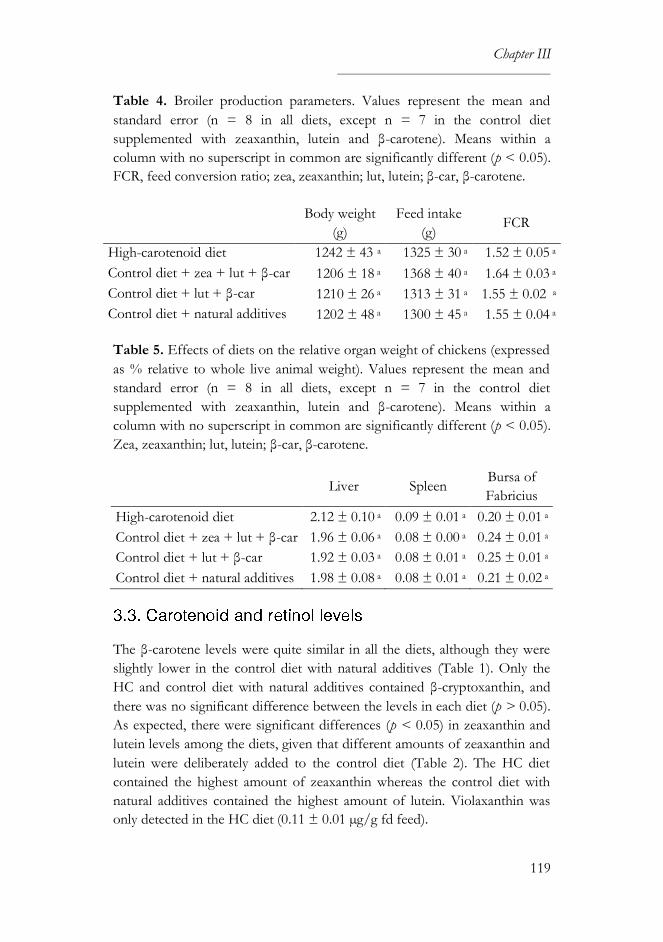
Chapter III
119
Table 4. Broiler production parameters. Values represent the mean and
standard error (n = 8 in all diets, except n = 7 in the control diet
supplemented with zeaxanthin, lutein and β-carotene). Means within a
column with no superscript in common are significantly different (p < 0.05).
FCR, feed conversion ratio; zea, zeaxanthin; lut, lutein; β-car, β-carotene.
Table 5. Effects of diets on the relative organ weight of chickens (expressed
as % relative to whole live animal weight). Values represent the mean and
standard error (n = 8 in all diets, except n = 7 in the control diet
supplemented with zeaxanthin, lutein and β-carotene). Means within a
column with no superscript in common are significantly different (p < 0.05).
Zea, zeaxanthin; lut, lutein; β-car, β-carotene.
Liver Spleen Bursa of
Fabricius
High-carotenoid diet 2.12 ± 0.10 a 0.09 ± 0.01 a 0.20 ± 0.01 a
Control diet + zea + lut + β-car 1.96 ± 0.06 a 0.08 ± 0.00 a 0.24 ± 0.01 a
Control diet + lut + β-car 1.92 ± 0.03 a 0.08 ± 0.01 a 0.25 ± 0.01 a
Control diet + natural additives 1.98 ± 0.08 a 0.08 ± 0.01 a 0.21 ± 0.02 a
The β-carotene levels were quite similar in all the diets, although they were
slightly lower in the control diet with natural additives (Table 1). Only the
HC and control diet with natural additives contained β-cryptoxanthin, and
there was no significant difference between the levels in each diet (p > 0.05).
As expected, there were significant differences (p < 0.05) in zeaxanthin and
lutein levels among the diets, given that different amounts of zeaxanthin and
lutein were deliberately added to the control diet (Table 2). The HC diet
contained the highest amount of zeaxanthin whereas the control diet with
natural additives contained the highest amount of lutein. Violaxanthin was
only detected in the HC diet (0.11 ± 0.01 µg/g fd feed).
Body weight
(g)
Feed intake
(g) FCR
High-carotenoid diet 1242 ± 43 a 1325 ± 30 a 1.52 ± 0.05 a
Control diet + zea + lut + β-car 1206 ± 18 a 1368 ± 40 a 1.64 ± 0.03 a
Control diet + lut + β-car 1210 ± 26 a 1313 ± 31 a 1.55 ± 0.02 a
Control diet + natural additives 1202 ± 48 a 1300 ± 45 a 1.55 ± 0.04 a
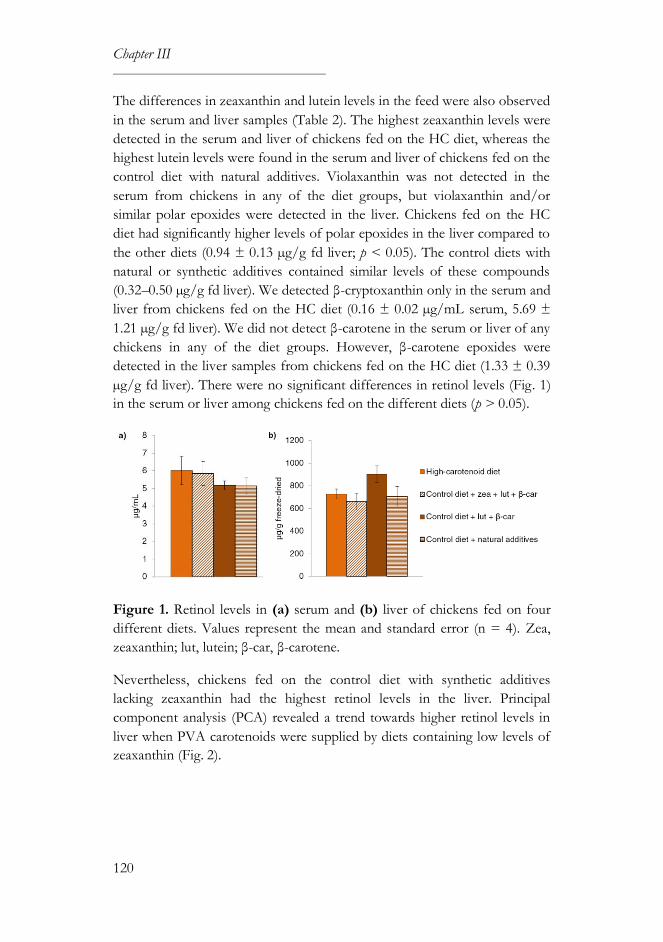
Chapter III
120
The differences in zeaxanthin and lutein levels in the feed were also observed
in the serum and liver samples (Table 2). The highest zeaxanthin levels were
detected in the serum and liver of chickens fed on the HC diet, whereas the
highest lutein levels were found in the serum and liver of chickens fed on the
control diet with natural additives. Violaxanthin was not detected in the
serum from chickens in any of the diet groups, but violaxanthin and/or
similar polar epoxides were detected in the liver. Chickens fed on the HC
diet had significantly higher levels of polar epoxides in the liver compared to
the other diets (0.94 ± 0.13 µg/g fd liver; p < 0.05). The control diets with
natural or synthetic additives contained similar levels of these compounds
(0.32–0.50 µg/g fd liver). We detected β-cryptoxanthin only in the serum and
liver from chickens fed on the HC diet (0.16 ± 0.02 µg/mL serum, 5.69 ±
1.21 µg/g fd liver). We did not detect β-carotene in the serum or liver of any
chickens in any of the diet groups. However, β-carotene epoxides were
detected in the liver samples from chickens fed on the HC diet (1.33 ± 0.39
µg/g fd liver). There were no significant differences in retinol levels (Fig. 1)
in the serum or liver among chickens fed on the different diets (p > 0.05).
Figure 1. Retinol levels in (a) serum and (b) liver of chickens fed on four
different diets. Values represent the mean and standard error (n = 4). Zea,
zeaxanthin; lut, lutein; β-car, β-carotene.
Nevertheless, chickens fed on the control diet with synthetic additives
lacking zeaxanthin had the highest retinol levels in the liver. Principal
component analysis (PCA) revealed a trend towards higher retinol levels in
liver when PVA carotenoids were supplied by diets containing low levels of
zeaxanthin (Fig. 2).
Chapter III
121
Figure 2. Principal component analysis of carotenoid and retinol levels in
the livers of chickens fed on four different diets. Zea, zeaxanthin; lut, lutein;
β-car, β-carotene; viol, violaxanthin.
Significant differences (p < 0.001) in redness and yellowness among chickens
fed on the different diets were observed 3 days into the feeding trial (day 17),
whereas significant differences (p < 0.001) in lightness were not found until a
week (day 21) (Fig. 3). The lowest redness and yellowness were found in
chickens fed on the control diet with synthetic additives lacking zeaxanthin.
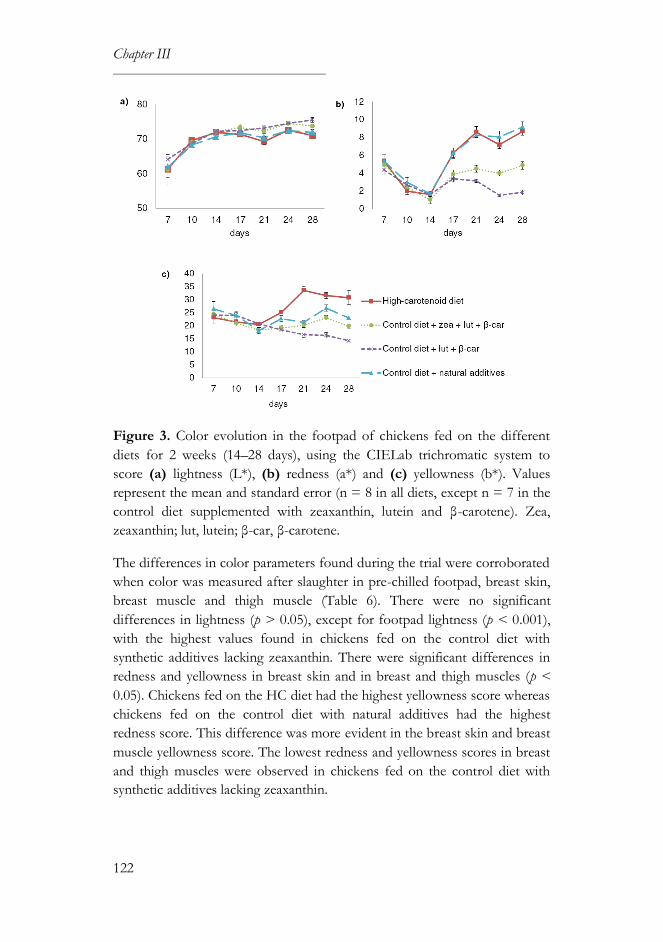
Chapter III
122
Figure 3. Color evolution in the footpad of chickens fed on the different
diets for 2 weeks (14–28 days), using the CIELab trichromatic system to
score (a) lightness (L*), (b) redness (a*) and (c) yellowness (b*). Values
represent the mean and standard error (n = 8 in all diets, except n = 7 in the
control diet supplemented with zeaxanthin, lutein and β-carotene). Zea,
zeaxanthin; lut, lutein; β-car, β-carotene.
The differences in color parameters found during the trial were corroborated
when color was measured after slaughter in pre-chilled footpad, breast skin,
breast muscle and thigh muscle (Table 6). There were no significant
differences in lightness (p > 0.05), except for footpad lightness (p < 0.001),
with the highest values found in chickens fed on the control diet with
synthetic additives lacking zeaxanthin. There were significant differences in
redness and yellowness in breast skin and in breast and thigh muscles (p <
0.05). Chickens fed on the HC diet had the highest yellowness score whereas
chickens fed on the control diet with natural additives had the highest
redness score. This difference was more evident in the breast skin and breast
muscle yellowness score. The lowest redness and yellowness scores in breast
and thigh muscles were observed in chickens fed on the control diet with
synthetic additives lacking zeaxanthin.
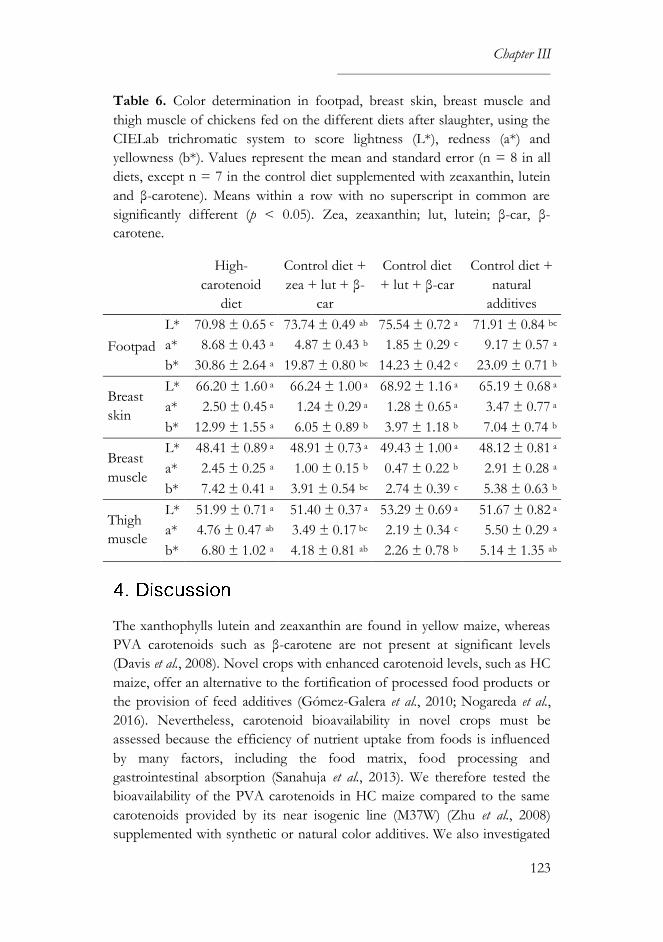
Chapter III
123
Table 6. Color determination in footpad, breast skin, breast muscle and
thigh muscle of chickens fed on the different diets after slaughter, using the
CIELab trichromatic system to score lightness (L*), redness (a*) and
yellowness (b*). Values represent the mean and standard error (n = 8 in all
diets, except n = 7 in the control diet supplemented with zeaxanthin, lutein
and β-carotene). Means within a row with no superscript in common are
significantly different (p < 0.05). Zea, zeaxanthin; lut, lutein; β-car, β-
carotene.
High-
carotenoid
diet
Control diet +
zea + lut + β-
car
Control diet
+ lut + β-car
Control diet +
natural
additives
Footpad
L* 70.98 ± 0.65 c 73.74 ± 0.49 ab 75.54 ± 0.72 a 71.91 ± 0.84 bc
a* 8.68 ± 0.43 a 4.87 ± 0.43 b 1.85 ± 0.29 c 9.17 ± 0.57 a
b* 30.86 ± 2.64 a 19.87 ± 0.80 bc 14.23 ± 0.42 c 23.09 ± 0.71 b
Breast
skin
L* 66.20 ± 1.60 a 66.24 ± 1.00 a 68.92 ± 1.16 a 65.19 ± 0.68 a
a* 2.50 ± 0.45 a 1.24 ± 0.29 a 1.28 ± 0.65 a 3.47 ± 0.77 a
b* 12.99 ± 1.55 a 6.05 ± 0.89 b 3.97 ± 1.18 b 7.04 ± 0.74 b
Breast
muscle
L* 48.41 ± 0.89 a 48.91 ± 0.73 a 49.43 ± 1.00 a 48.12 ± 0.81 a
a* 2.45 ± 0.25 a 1.00 ± 0.15 b 0.47 ± 0.22 b 2.91 ± 0.28 a
b* 7.42 ± 0.41 a 3.91 ± 0.54 bc 2.74 ± 0.39 c 5.38 ± 0.63 b
Thigh
muscle
L* 51.99 ± 0.71 a 51.40 ± 0.37 a 53.29 ± 0.69 a 51.67 ± 0.82 a
a* 4.76 ± 0.47 ab 3.49 ± 0.17 bc 2.19 ± 0.34 c 5.50 ± 0.29 a
b* 6.80 ± 1.02 a 4.18 ± 0.81 ab 2.26 ± 0.78 b 5.14 ± 1.35 ab
The xanthophylls lutein and zeaxanthin are found in yellow maize, whereas
PVA carotenoids such as β-carotene are not present at significant levels
(Davis et al., 2008). Novel crops with enhanced carotenoid levels, such as HC
maize, offer an alternative to the fortification of processed food products or
the provision of feed additives (Gómez-Galera et al., 2010; Nogareda et al.,
2016). Nevertheless, carotenoid bioavailability in novel crops must be
assessed because the efficiency of nutrient uptake from foods is influenced
by many factors, including the food matrix, food processing and
gastrointestinal absorption (Sanahuja et al., 2013). We therefore tested the
bioavailability of the PVA carotenoids in HC maize compared to the same
carotenoids provided by its near isogenic line (M37W) (Zhu et al., 2008)
supplemented with synthetic or natural color additives. We also investigated
Chapter III
124
whether zeaxanthin, a major carotenoid in HC maize, affects the absorption
of PVA carotenoids.
HC maize as a feed component did not adversely affect any of the criteria we
evaluated (e.g. production parameters and organ weight), which confirms the
results of earlier poultry nutrition experiments with this variety (Díaz-Gómez
et al., 2017a; Moreno et al., 2016; Nogareda et al., 2016). The performance of
the control diet supplemented with synthetic and natural color additives also
agree with earlier trials, confirming that the additives did not affect body
weight or feed consumption (Liu et al., 2008; Pérez-Vendrell et al., 2001). We
added synthetic β-carotene to the M37W control diets to achieve the same
levels present in the HC diet, but there was some loss during feed
preparation and storage despite the preparation of diets in three batches to
avoid carotenoid degradation (Jintasataporn and Yuangsoi, 2012). Similar
losses of vitamin A have been reported in supplemented poultry diets,
although the losses were not statistically significant (Pretorius and
Schönfeldt, 2013). As previously reported for other biofortified crops (e.g.
maize and pumpkin), the carotenoids in HC maize are likely to be protected
from degradation by interactions with the food matrix (Díaz-Gómez et al.,
2017b).
Zeaxanthin and lutein are the major carotenoids in HC maize and marigold
flowers, respectively, and this explains why those carotenoids were present at
the highest levels in the HC diet and the control diet with natural additives,
respectively (Breithaupt, 2007; Naqvi et al., 2009). The small amount of
zeaxanthin found in the control diet supplemented with synthetic
carotenoids lacking zeaxanthin came from the M37W maize, which contains
traces of carotenoids, primarily lutein and zeaxanthin (Naqvi et al., 2009). As
expected, xanthophyll levels in the serum and liver were primarily
determined by feed composition: chickens fed on the HC diet and control
diet with natural additives accumulated the highest serum/liver zeaxanthin
and lutein levels, respectively. Violaxanthin and/or similar polar epoxides
were found in livers from chickens fed on all four diets despite only being
detectable in the HC diet formulation, which may reflect the metabolic
conversion of zeaxanthin to violaxanthin. Nutrients integrated in the food
matrix are released more slowly and absorbed over a longer period for more
efficient assimilation (Moreno et al., 2016), and for that reason violaxanthin
levels in livers from chickens fed on the HC diet were 8.5–fold more
concentrated than the levels in the HC diet itself. This efficient transfer was
Chapter III
125
previously observed in eggs laid by hens fed on a diet based on BKT maize,
a biofortified maize rich in ketocarotenoids (Moreno et al., 2016).
The PVA carotenoids in HC maize (β-carotene and β-cryptoxanthin) were
bioavailable and contributed to the storage of vitamin A in the liver as retinol
(Moreno et al., 2016). Consequently, β-carotene was not detected in the
serum or liver samples from any of the diet groups because it was converted
efficiently into retinol. However, in chickens fed on the HC diet, β-carotene
epoxides were detected in liver, and these could have a protective role due to
their antioxidant activity (Gurak et al., 2014). In contrast, β-cryptoxanthin
was detected in liver samples but only from chickens fed on the HC diet, and
the concentration of this PVA carotenoid was higher than originally present
in the feed. The higher β-cryptoxanthin levels in the liver may reflect the
fact that β-carotene is a better substrate for β-carotene 15,15'-dioxygenase
(BCDO1) (Kim and Oh, 2009, 2010). These results support our earlier study
in chickens in which the food matrix was shown to play an important role in
the bioavailability of carotenoids, given that β-cryptoxanthin in HC maize is
provided as an intrinsic component (Díaz-Gómez et al., 2017a). Regarding
vitamin A absorption, it would have been ideal to study β-carotene and β-
cryptoxanthin conversion to retinol separately. However, this is not practical
as PVA carotenoids in HC maize are provided within the kernel matrix in
which zeaxanthin and lutein are also present.
The efficiency of β-carotene transfer from the feed to liver was highest in the
control diet with synthetic additives lacking zeaxanthin, followed by the
control diet with natural additives, the control diet with synthetic additives
including zeaxanthin, and finally the HC diet. Zeaxanthin appears to
attenuate the bioaccessibility of β-carotene, and the underlying mechanism
may be competition for solubilization in mixed micelles and absorption in
the intestine (Furr and Clark, 1997; Yeum and Russell, 2002). Bioaccessibility
is the amount of an ingested nutrient that is released from the food matrix in
the gastrointestinal tract and becomes available for absorption, whereas
bioavailability is the amount of an ingested nutrient that is available for
utilization or for storage (Carbonell-Capella et al., 2014; Díaz-Gómez et al.,
2017b). Carotenoids can interact with each other during absorption,
metabolism and transport (Bohn, 2008; Yeum and Russell, 2002).
Xanthophylls such as zeaxanthin and lutein are absorbed more efficiently
than β-carotene in chickens and humans because they are more polar (Furr
and Clark, 1997; Na et al., 2004). The location of carotenoids in the lipid
droplet also affects its absorption because oxygenated carotenoids
Chapter III
126
(xanthophylls) are located near the surface whereas hydrocarbon carotenoids
(carotenes) are located within the core (Borel et al., 1996; Yeum and Russell,
2002). However, the bioaccessibility of PVA carotenoids is minimally
affected by maize xanthophylls, but their uptake by cells is inhibited by lutein
in a dose-dependent manner (Thakkar and Failla, 2008). Different
concentrations of maize xanthophylls did not have any effect on the
bioefficacy (retinol/β-carotene total) (Tanumihardjo, 2002) of PVA
carotenoids in Mongolian gerbils (Davis et al., 2008), but these animals are
not a good model for xanthophyll absorption because they only absorb and
store small quantities of these molecules (Escaron and Tanumihardjo, 2006;
Molldrem and Tanumihardjo, 2004). Carotenoids may compete for specific
transporters (e.g. class B type I scavenger receptors) at the level of individual
enterocytes (Bohn, 2008; Reboul, 2013).
Interactions among carotenoids in mammals are also observed when PVA
carotenoids are cleaved by an oxygenase to produce retinal (Lietz et al.,
2010). The enzyme BCDO1 preferentially cleaves PVA carotenoids whereas
β-carotene-9',10'-dioxygenase 2 (BCDO2) also metabolizes non-PVA
carotenoids such as zeaxanthin (Palczewski et al., 2014). Zeaxanthin can
interact with the BCDO1, as shown by the limited conversion of intestinal β-
carotene to vitamin A in vitro (Grolier et al., 1997). Nevertheless, the
supplementation of poultry diets with xanthophylls (20 or 40 mg/kg) did not
have any effect on BCDO1 mRNA expression in the liver or small intestine
(Gao et al., 2016). Therefore, zeaxanthin appears to interact with β-carotene
at the levels of solubilization and absorption rather than competing for
enzymatic cleavage.
We found that higher lutein levels were present in the control diet with
natural additives compared to the other diets, but the HC diet resulted in
tissues with higher yellowness scores. This may reflect the high zeaxanthin
content of the HC diet. Higher levels of yellow rather than red xanthophylls
are routinely used in the poultry industry, but in our trial we used more red
than yellow xanthophylls to achieve PVA carotenoid levels similar to those
present in the HC maize. The higher yellowness scores in chickens fed on
the HC diet show that xanthophylls from HC maize can achieve the golden
skin color desired by many consumers, so HC maize could replace
xanthophylls commonly used in the poultry industry. Redness was slightly
higher in chickens fed on the control diet with natural additives than in
chickens fed on the HC diet due to the higher proportion of red

Chapter III
127
xanthophylls we used to achieve PVA carotenoid levels similar to those
present in the HC diet.
We established that PVA carotenoids supplied as intrinsic components of
HC maize are bioavailable at least to the same extent as synthetic
compounds and natural extracts, but the metabolism was not the same for all
types of molecules. Specifically, β-carotene was preferentially converted into
retinol in the intestine whereas β-cryptoxanthin was accumulated in the liver.
Lutein, zeaxanthin and β-carotene were bioavailable to the extent that was
predicted based on their levels in the HC feed, whereas β-cryptoxanthin and
violaxanthin were found at higher levels than originally present in the feed,
highlighting the need to evaluate individual nutrient bioavailability rather
than the total amount of nutrient provided. Despite the high zeaxanthin
content in the HC diet, which interferes with the absorption of β-carotene,
the retinol levels in chicken liver remained high. Furthermore, chickens fed
on the HC diet had higher yellowness scores for breast and thigh muscles.
We therefore conclude that HC maize provides bioavailable carotenoids,
including PVA carotenoids, and is suitable for development as a feed
component in the poultry industry.
Bai, C., Twyman, R.M., Farré, G., Sanahuja, G., Christou, P., Capell, T. and
Zhu, C., 2011. A golden era – pro-vitamin A enhancement in diverse
crops. In Vitro Cellular & Developmental Biology – Plant 47: 205–221.
Bohn, T., 2008. Bioavailability of non-provitamin A carotenoids. Current
Nutrition & Food Science 4: 240–258.
Borel, P., Grolier, P., Armand, M., Partier, A., Lafont, H., Lairon, D. and
Azais-Braesco, V., 1996. Carotenoids in biological emulsions: solubility,
surface-to-core distribution, and release from lipid droplets. Journal of
Lipid Research 37: 250–261.
Bramley, P., 2003. The genetic enhancement of phytochemicals: the case of
carotenoids. In: Johnson, I. and Williamson, G. (eds.) Phytochemical
functional foods. Woodhead Publishing Limited, Cambridge, UK, pp.
253–279.
Breithaupt, D.E., 2007. Modern application of xanthophylls in animal
feeding – a review. Trends in Food Science and Technology 18: 501–
Chapter III
128
506.
Carbonell-Capella, J.M., Buniowska, M., Barba, F.J., Esteve, M.J. and Frígola,
A., 2014. Analytical methods for determining bioavailability and
bioaccessibility of bioactive compounds from fruits and vegetables: a
review. Comprehensive Reviews in Food Science and Food Safety 13:
155–171.
Castañeda, M.P., Hirschler, E.M. and Sams, A.R., 2005. Skin pigmentation
evaluation in broilers fed natural and synthetic pigments. Poultry
Science 84: 143–147.
Commission Internationale de l'Éclairage – International Commission on
Illumination (CIE), 2004. CIE 15: Technical Report: Colorimetry, third
edition. CIE, 552: 24.
Davis, C.R., Howe, J.A., Rocheford, T.R. and Tanumihardjo, S.A., 2008. The
xanthophyll composition of biofortified maize (Zea mays sp.) does not
influence the bioefficacy of provitamin A carotenoids in Mongolian
gerbils (Meriones unguiculatus). Journal of Agricultural and Food
Chemistry 56: 6745–6750.
Díaz-Gómez, J., Moreno, J.A., Angulo, E., Sandmann, G., Zhu, C., Ramos,
A.J., Capell, T., Christou, P., Nogareda, C., 2017a. High-carotenoid
biofortified maize is an alternative to color additives in poultry feed.
Animal Feed Science and Technology 231: 38–46.
Díaz-Gómez, J., Twyman, R.M., Zhu, C., Farré, G., Serrano, J.C.E., Portero-
Otin, M., Muñoz, P., Sandmann, G., Capell, T. and Christou, P., 2017b.
Biofortification of crops with nutrients: factors affecting utilization and
storage. Current Opinion in Biotechnology 44: 1–9.
Escaron, A.L. and Tanumihardjo, S.A., 2006. Absorption and transit of
lutein and beta-carotene supplements in the Mongolian gerbil (Meriones
unguiculatus). International Journal for Vitamin and Nutrition Research
76: 315–323.
European Commission, 2002. Directive 2002/32/EC of the European
Parliament and of the Council of 7 May 2002 on undesirable
substances in animal feed. Official Journal of the European
Communities L 269: 1–15.

Chapter III
129
European Commission, 2003. Commission Directive 2003/100/EC of 31
October 2003 amending Annex I to Directive 2002/32/EC of the
European Parliament and of the Council on undesirable substances in
animal feed. Official Journal of the European Union L285: 33–37.
European Commission, 2006. Commission Recommendation of 17 August
2006 on the presence of deoxynivalenol, zearalenone, ochratoxin A, T-
2 and HT-2 and fumonisins in products intended for animal feeding
(2006/576/EC). Official Journal of the European Union L229: 7–9.
European Commission, 2007. Commission Recommendation of 18 June
2007 on guidelines for the accommodation and care of animals used
for experimental and other scientific purposes (2007/526/EC). Official
Journal of the European Union L197: 1–89.
European Commission, 2009. Commission Regulation (EC) No 152/2009 of
27 January 2009 laying down the methods of sampling and analysis for
the official control of feed. Official Journal of the European Union L
54/1: 1–130.
European Commission, 2013. Commission Recommendation of 27 March
2013 on the presence of T-2 and HT-2 toxin in cereals and cereal
products (2013/165/EU). Official Journal of the European Union L91:
12–15.
European Parliament, 2010. Directive 2010/63/EU of the European
Parliament and of the Council of 22 September 2010 on the protection
of animals for scientific purposes. Official Journal of the European
Union L276: 33–79.
Farré, G., Sanahuja, G., Naqvi, S., Bai, C., Capell, T., Zhu, C. and Christou,
P., 2010. Travel advice on the road to carotenoids in plants. Plant
Science 179: 28–48.
Furr, H.C. and Clark, R.M., 1997. Intestinal absorption and tissue
distribution of carotenoids. The Journal of Nutritional Biochemistry 8:
364–377.
Gao, Y.-Y., Ji, J., Jin, L., Sun, B.-L., Xu, L.-H., Wang, C.-K. and Bi, Y.-Z.,
2016. Xanthophyll supplementation regulates carotenoid and retinoid
metabolism in hens and chicks. Poultry Science 95: 541–549.
Chapter III
130
Gómez-Galera, S., Rojas, E., Sudhakar, D., Zhu, C., Pelacho, A.M., Capell,
T. and Christou, P., 2010. Critical evaluation of strategies for mineral
fortification of staple food crops. Transgenic Research 19: 165–180.
Grolier, P., Duszka, C., Borel, P., Alexandre-Gouabau, M.C. and Azais-
Braesco, V., 1997. In vitro and in vivo inhibition of β-carotene
dioxygenase activity by canthaxanthin in rat intestine. Archives of
Biochemistry and Biophysics 348: 233–238.
Gurak, P.D., Mercadante, A.Z., González-Miret, M.L., Heredia, F.J. and
Meléndez-Martínez, A.J., 2014. Changes in antioxidant capacity and
colour associated with the formation of β-carotene epoxides and
oxidative cleavage derivatives. Food Chemistry 147: 160–169.
International Life Sciences Institute (ILSI) International Food Biotechnology
Committee, 2007. Best practices for the conduct of animal studies to
evaluate crops genetically modified for output traits. ILSI, Washington
DC, USA.
Institute of Medicine (US), 2001. Dietary reference intakes for vitamin A,
vitamin K, arsenic, boron, chromium, copper, iodine, iron, manganese,
molybdenum, nickel, silicon, vanadium and zinc. National Academy
Press, Washington DC, USA.
Jintasataporn, O. and Yuangsoi, B., 2012. Stability of carotenoid diets during
feed processing and under different storage conditions. Molecules 17:
5651–5660.
Kim, Y.S. and Oh, D.-K., 2009. Substrate specificity of a recombinant
chicken β-carotene 15,15'-monooxygenase that converts β-carotene
into retinal. Biotechnology Letters 31: 403–408.
Kim, Y.S. and Oh, D.-K., 2010. Biotransformation of carotenoids to retinal
by carotenoid 15,15'-oxygenase. Applied Microbiology and
Biotechnology 88: 807–816.
Lee, C.M., Boileau, A.C., Boileau, T.W., Williams, A.W., Swanson, K.S.,
Heintz, K.A. and Erdman, J.W., 1999. Review of animal models in
carotenoid research. The Journal of Nutrition 129: 2271–2277.
Lietz, G., Lange, J. and Rimbach, G., 2010. Molecular and dietary regulation
of β,β-carotene 15,15'-monooxygenase 1 (BCMO1). Archives of
Chapter III
131
Biochemistry and Biophysics 502: 8–16.
Liu, G.-D., Hou, G.-Y., Wang, D.-J., Lv, S.-J., Zhang, X.-Y., Sun, W.-P. and
Yang, Y., 2008. Skin pigmentation evaluation in broilers fed different
levels of natural okra and synthetic pigments. The Journal of Applied
Poultry Research 17: 498–504.
Mamatha, B.S. and Baskaran, V., 2011. Effect of micellar lipids, dietary fiber
and β-carotene on lutein bioavailability in aged rats with lutein
deficiency. Nutrition 27: 960–966.
Molldrem, K.L. and Tanumihardjo, S.A., 2004. Lutein supplements are not
bioavailable in the Mongolian gerbil while consuming a diet with or
without cranberries. International Journal for Vitamin and Nutrition
Research 74: 153–160.
Moreno, J.A., Díaz-Gómez, J., Nogareda, C., Angulo, E., Sandmann, G.,
Portero-Otin, M., Serrano, J.C.E., Twyman, R.M., Capell, T., Zhu, C.
and Christou, P., 2016. The distribution of carotenoids in hens fed on
biofortified maize is influenced by feed composition, absorption,
resource allocation and storage. Scientific Reports 6: 35346.
Na, J.C., Song, J.Y., Lee, B.D., Lee, S.J., Lee, C.Y. and An, G.H., 2004.
Effect of polarity on absorption and accumulation of carotenoids by
laying hens. Animal Feed Science and Technology 117: 305–315.
Namitha, K.K. and Negi, P.S., 2010. Chemistry and biotechnology of
carotenoids. Critical Reviews in Food Science and Nutrition 50: 728–
760.
Naqvi, S., Zhu, C., Farré, G., Ramessar, K., Bassie, L., Breitenbach, J., Perez
Conesa, D., Ros, G., Sandmann, G., Capell, T. and Christou, P., 2009.
Transgenic multivitamin corn through biofortification of endosperm
with three vitamins representing three distinct metabolic pathways.
Proceedings of the National Academy of Sciences of the United States
of America 106: 7762–7767.
National Research Council, 1994. Nutrient requeriments of poultry, ninth
revised edition. National Academy Press, Washington DC, USA.
National Research Council, 2011. Guide for the care and use of laboratory
animals, eighth edition. National Academy Press, Washington DC,
Chapter III
132
USA.
Nogareda, C., Moreno, J.A., Angulo, E., Sandmann, G., Portero, M., Capell,
T., Zhu, C. and Christou, P., 2016. Carotenoid-enriched transgenic
corn delivers bioavailable carotenoids to poultry and protects them
against coccidiosis. Plant Biotechnology Journal 14: 160–168.
Palczewski, G., Amengual, J., Hoppel, C.L. and von Lintig, J., 2014.
Evidence for compartmentalization of mammalian carotenoid
metabolism. The FASEB Journal 28: 4457–4469.
Pérez-Vendrell, A.M., Hernández, J.M., Llauradó, L., Schierle, J. and Brufau,
J., 2001. Influence of source and ratio of xanthophyll pigments on
broiler chicken pigmentation and performance. Poultry Science 80:
320–326.
Pretorius, B. and Schönfeldt, H.C., 2013. Effect of different maize meal diets
on growth and vitamin A: case-study on chickens. Food Chemistry
140: 520–525.
Reboul, E., 2013. Absorption of vitamin A and carotenoids by the
enterocyte: focus on transport proteins. Nutrients 5: 3563–3581.
Saltzman, A., Birol, E., Bouis, H.E., Boy, E., De Moura, F.F., Islam, Y. and
Pfeiffer, W.H., 2013. Biofortification: progress toward a more
nourishing future. Global Food Security 2: 9–17.
Sanahuja, G., Farré, G., Berman, J., Zorrilla-López, U., Twyman, R.M.,
Capell, T., Christou, P. and Zhu, C., 2013. A question of balance:
achieving appropriate nutrient levels in biofortified staple crops.
Nutrition Research Reviews 26: 235–245.
Sandmann, G., 2002. Combinatorial biosynthesis of carotenoids in a
heterologous host: a powerful approach for the biosynthesis of novel
structures. ChemBioChem 3: 629–635.
Sharifzadeh, S., Clemmensen, L.H., Borggaard, C., Stoier, S. and Ersboll,
B.K., 2014. Supervised feature selection for linear and non-linear
regression of L*a*b* color from multispectral images of meat.
Engineering Applications of Artificial Intelligence 27: 211–227.
Tanumihardjo, S.A., 2002. Factors influencing the conversion of carotenoids
Chapter III
133
to retinol: bioavailability to bioconversion to bioefficacy. International
Journal for Vitamin and Nutrition Research 72: 40–45.
Thakkar, S.K. and Failla, M.L., 2008. Bioaccessibility of pro-vitamin A
carotenoids is minimally affected by non pro-vitamin A xanthophylls in
maize (Zea mays sp.). Journal of Agricultural and Food Chemistry 56:
11441–11446.
Wang, Y., Roger Illingworth, D., Connor, S.L., Barton Duell, P. and Connor,
W.E., 2010. Competitive inhibition of carotenoid transport and tissue
concentrations by high dose supplements of lutein, zeaxanthin and
beta-carotene. European Journal of Nutrition 49: 327–336.
Yeum, K.-J. and Russell, R.M., 2002. Carotenoid bioavailability and
bioconversion. Annual Review of Nutrition 22: 483–504.
Yuan, J., Roshdy, A.R., Guo, Y., Wang, Y. and Guo, S., 2014. Effect of
dietary vitamin A on reproductive performance and immune response
of broiler breeders. PLoS ONE 9: 1–9.
Zhu, C., Naqvi, S., Breitenbach, J., Sandmann, G., Christou, P. and Capell,
T., 2008. Combinatorial genetic transformation generates a library of
metabolic phenotypes for the carotenoid pathway in maize.
Proceedings of the National Academy of Sciences of the United States
of America 105: 18232–18237.
Zhu, C., Sanahuja, G., Yuan, D., Farré, G., Arjó, G., Berman, J., Zorrilla-
López, U., Banakar, R., Bai, C., Pérez-Massot, E., Bassie, L., Capell, T.
and Christou, P., 2013. Biofortification of plants with altered
antioxidant content and composition: genetic engineering strategies.
Plant Biotechnology Journal 11: 129–141.


Chapter IV
137
Joana Díaz-Gómez a, b, Maria-Paz Romero a, Carmina Nogareda b, Antonio J.
Ramos a and Robert Soliva-Fortuny a
a Food Technology Department, University of Lleida–Agrotecnio Center,
Av. Rovira Roure 191, 25198 Lleida, Spain; b Animal Science Department, University of Lleida–Agrotecnio Center, Av.
Rovira Roure 191, 25198 Lleida, Spain
Synthetic and natural color pigments are routinely used as feed components
in the poultry industry to achieve desired skin pigmentation. High carotenoid
(HC) maize, which was engineered to accumulate β-carotene, lutein and
zeaxanthin, is a cost-effective alternative to feed supplementation. The
objective of the current study was to evaluate the shelf life of raw chicken
meat through a sensory analysis and subsequent survival analysis. Meat
samples were obtained from chickens fed on three different diets: high-
carotenoid (based on HC maize), control (based on its near-isogenic line)
and commercial (based on standard yellow maize plus color additives). Breast
and leg quarters (which were previously frozen, thawed and stored under
refrigerated conditions) were olfactory tested after between 1 and 15 days of
storage by a consumer panel. Microbial counts (Pseudomonas spp. and total
aerobic mesophilic bacteria) and physical quality parameters (pH, color and
firmness) were evaluated. Considering 25% of consumers rejecting the
product, shelf lives were estimated at between 4.5 and 10 days. Breast and leg
quarters from chickens fed on the HC diet were equally accepted by the
panel than samples from the other two diets until day 9 (p > 0.05). Spoilage
bacteria increased progressively from 1 to 9 days (up to 106–107 cfu/g). Meat
from chickens fed on the carotenoid-enhanced diets exhibited more intense
red and yellow color (p < 0.05), while firmness was similar among
treatments. Considering the commercial chicken as a standard for meat
quality and shelf life, we conclude that meat from chickens fed on a
biofortified maize diet has a good quality and shelf life.
Chapter IV
138
Poultry meat, pigments, metabolic engineering, sensory analysis, survival
analysis
Consumer acceptance of poultry meat and its products is mainly related to
appearance, as color and glossiness are associated with quality parameters
such as freshness, flavor and texture (Totosaus et al., 2007). Skin color mainly
depends on dietary carotenoids present in the feed composition (Pérez-
Vendrell et al., 2001; Sirri et al., 2010). Like most other animals, chickens
cannot synthesize carotenoids. Thus, feed is supplemented with synthetic or
natural pigments, which are deposited in the skin and subcutaneous fat,
conferring the characteristic golden pigmentation (Breithaupt, 2007; Pérez-
Vendrell et al., 2001). More than 21 billion chickens were produced globally
in 2014, China being the first producer, followed by the United States
(FAOSTAT, 2015). In those markets a golden skin color is preferred by
many consumers, as it is often associated with a healthy chicken (Tarique et
al., 2013; Williams, 1992). Therefore, it makes the addition of color pigments
to poultry feed necessary, which increases production costs.
Novel crops with enhanced carotenoid content, such as high-carotenoid
(HC) maize, which accumulates β-carotene, lutein and zeaxanthin (Zhu et al.,
2008), serve as an alternative strategy to feed supplementation. HC maize has
previously been shown to provide bioavailable carotenoids and to confer a
similar skin pigmentation to color additives commonly used in the poultry
industry (Díaz-Gómez et al., 2017; Nogareda et al., 2016). However, the effect
of HC maize-based feed on chicken meat quality and shelf life is unknown.
Susceptibility of chicken meat to spoilage, commonly detected by sensory
and microbiological analyses, represents a potential health risk (Dainty,
1996). Many food products may remain microbiologically safe to eat, but
changes in their sensory characteristics could cause consumer rejection (Calle
et al., 2006; Hough et al., 2003). Consequently, sensory evaluation is an
important factor in the determination of shelf life in food products. Survival
analysis methods are applied to shelf life of foods to evaluate the probability
of a consumer accepting a product after a certain storage time (Kleinbaum,
1996). Thus, they focus on consumer rejection rather than on product
deterioration (Calle et al., 2006; Curia et al., 2005; Hough et al., 2003). Several
Chapter IV
139
shelf life studies based on survival analysis have been carried out, but chicken
meat is not usually studied. Sensory analysis can be influenced by the
conditions under which samples are obtained and stored. Freezing,
commonly used in the meat industry to preserve meat quality and safety over
longer periods, can affect meat quality due to changes in biochemical and
physical parameters (Leygonie et al., 2012; Zhuang and Savage, 2013).
Consequently, it is necessary to evaluate whether freezing, frozen storage and
subsequent thawing have some effect on quality measurements.
Therefore, the aim of this research was to estimate the sensory shelf life of
breast and leg quarter meat obtained from chickens fed on the HC diet
(based on HC maize) compared to the shelf life of chicken meat obtained
from animals fed on a control diet (based on M37W maize) and a
commercial diet (based on standard commercial yellow maize supplemented
with natural color additives) through survival analysis methodology.
Complementarily, total aerobic mesophilic bacteria and Pseudomonas spp.
were measured as indicators of microbiological shelf life, and physical
parameters (pH, color and texture) were determined to evaluate the effect of
the diets on the chicken meat quality for both refrigerated and thawed
samples. The chicken meat quality is the term used to describe the attributes
of chicken meat that affect the decision of purchase. Our study includes the
evaluation of appearance, smell and texture.
HC maize and its near isogenic line, the South African white maize inbred
M37W, were grown in an experimental field in Northeastern Spain (Lleida,
Catalonia) for two consecutive harvest seasons. Therefore, two animal
feeding trials were carried out to have experimental replicates as the number
of animals was limited by the quantity of maize harvested each year. As a
result, the number of meat samples was also restricted.
The animals, 1-day-old male broiler chickens of the Ross 308 strain, were
housed in four pens per treatment (24 broilers per treatment). They were fed
on three diets including different types of maize from 0 to 35 days: control
diet (based on M37W maize), HC diet (based on HC maize) and commercial
diet (based on standard commercial yellow maize supplemented with natural
color additives - marigold flowers and red paprika extracts -) (Díaz-Gómez et
Chapter IV
140
al., 2017). The diets were provided as starter feed (52% maize, 36% soybean
meal and 7% soybean oil) on days 0–8 and grower feed (58% maize, 18%
soybean meal, 16% soybean hull and 4% soybean oil) on days 9–35 (Table
1). The diet formulations as well as environmental conditions were in
accordance with the National Research Council recommendations (NRC
1994, 2011). The final body weight for chickens fed on the control, HC and
commercial diets was 1831 ± 69, 1837 ± 56 and 1797 ± 57 g, respectively
(Díaz-Gómez et al., 2017). At the end of the trials (at 35 days), chickens were
slaughtered in the facilities of the University of Lleida (Catalonia, Spain).
Chickens were stunned with carbon dioxide prior to killing and bleeding.
After slaughter, chickens were placed in a cold room at +12 °C where they
were manually eviscerated, removing all the organs and weighing the liver,
spleen and bursa of Fabricius. After evisceration, chicken carcasses were
placed in a cold room at +4 °C where breast and leg quarter meat was
removed, introduced in polyethylene self-sealing bags (García de Pou, Spain)
separately and stored at +4 °C or -20 °C until needed for processing. Breast
and leg quarter meat obtained was used to assess microbiological, sensory
and physical parameters. Refrigerated samples were stored during 15 days
and taken out every day (hereinafter referred to as refrigerated samples)
whereas frozen samples were taken out at different times, thawed, deboned
(if necessary) and stored under refrigerated conditions (hereinafter referred
to as thawed samples) to achieve the desired storage period (Table 2). All
analyses were performed within 1-2 months. All experimental procedures
were approved by the Ethics Committee for Animal Experimentation of the
University of Lleida and the Catalan Government (reference numbers
DAAM 7672 and DAAM 7743).
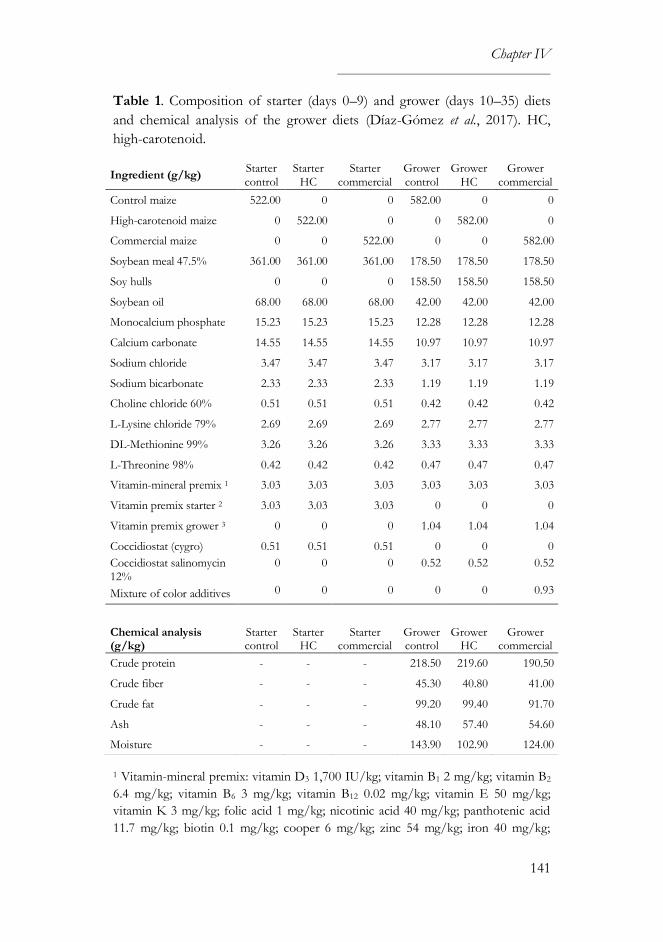
Chapter IV
141
Table 1. Composition of starter (days 0–9) and grower (days 10–35) diets
and chemical analysis of the grower diets (Díaz-Gómez et al., 2017). HC,
high-carotenoid.
1 Vitamin-mineral premix: vitamin D3 1,700 IU/kg; vitamin B1 2 mg/kg; vitamin B2
6.4 mg/kg; vitamin B6 3 mg/kg; vitamin B12 0.02 mg/kg; vitamin E 50 mg/kg;
vitamin K 3 mg/kg; folic acid 1 mg/kg; nicotinic acid 40 mg/kg; panthotenic acid
11.7 mg/kg; biotin 0.1 mg/kg; cooper 6 mg/kg; zinc 54 mg/kg; iron 40 mg/kg;
Ingredient (g/kg) Starter control
Starter HC
Starter commercial
Grower control
Grower HC
Grower commercial
Control maize 522.00 0 0 582.00 0 0
High-carotenoid maize 0 522.00 0 0 582.00 0
Commercial maize 0 0 522.00 0 0 582.00
Soybean meal 47.5% 361.00 361.00 361.00 178.50 178.50 178.50
Soy hulls 0 0 0 158.50 158.50 158.50
Soybean oil 68.00 68.00 68.00 42.00 42.00 42.00
Monocalcium phosphate 15.23 15.23 15.23 12.28 12.28 12.28
Calcium carbonate 14.55 14.55 14.55 10.97 10.97 10.97
Sodium chloride 3.47 3.47 3.47 3.17 3.17 3.17
Sodium bicarbonate 2.33 2.33 2.33 1.19 1.19 1.19
Choline chloride 60% 0.51 0.51 0.51 0.42 0.42 0.42
L-Lysine chloride 79% 2.69 2.69 2.69 2.77 2.77 2.77
DL-Methionine 99% 3.26 3.26 3.26 3.33 3.33 3.33
L-Threonine 98% 0.42 0.42 0.42 0.47 0.47 0.47
Vitamin-mineral premix 1 3.03 3.03 3.03 3.03 3.03 3.03
Vitamin premix starter 2 3.03 3.03 3.03 0 0 0
Vitamin premix grower 3 0 0 0 1.04 1.04 1.04
Coccidiostat (cygro) 0.51 0.51 0.51 0 0 0
Coccidiostat salinomycin 12%
0 0 0 0.52 0.52 0.52
Mixture of color additives 0 0 0 0 0 0.93
Chemical analysis (g/kg)
Starter control
Starter HC
Starter commercial
Grower control
Grower HC
Grower commercial
Crude protein - - - 218.50 219.60 190.50
Crude fiber - - - 45.30 40.80 41.00
Crude fat - - - 99.20 99.40 91.70
Ash - - - 48.10 57.40 54.60
Moisture - - - 143.90 102.90 124.00
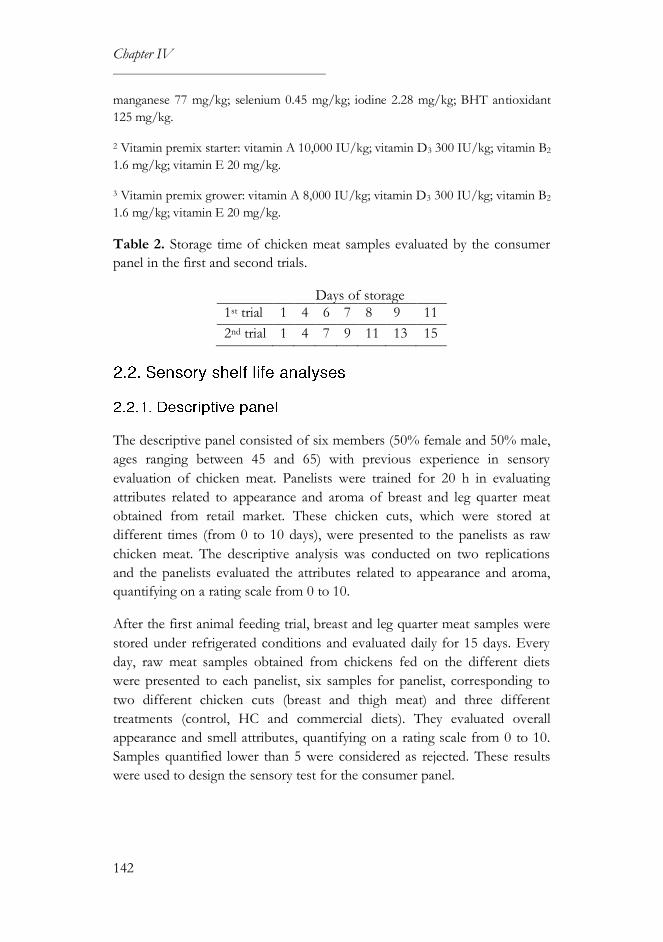
Chapter IV
142
manganese 77 mg/kg; selenium 0.45 mg/kg; iodine 2.28 mg/kg; BHT antioxidant
125 mg/kg.
2 Vitamin premix starter: vitamin A 10,000 IU/kg; vitamin D3 300 IU/kg; vitamin B2
1.6 mg/kg; vitamin E 20 mg/kg.
3 Vitamin premix grower: vitamin A 8,000 IU/kg; vitamin D3 300 IU/kg; vitamin B2
1.6 mg/kg; vitamin E 20 mg/kg.
Table 2. Storage time of chicken meat samples evaluated by the consumer
panel in the first and second trials.
Days of storage
1st trial 1 4 6 7 8 9 11
2nd trial 1 4 7 9 11 13 15
The descriptive panel consisted of six members (50% female and 50% male,
ages ranging between 45 and 65) with previous experience in sensory
evaluation of chicken meat. Panelists were trained for 20 h in evaluating
attributes related to appearance and aroma of breast and leg quarter meat
obtained from retail market. These chicken cuts, which were stored at
different times (from 0 to 10 days), were presented to the panelists as raw
chicken meat. The descriptive analysis was conducted on two replications
and the panelists evaluated the attributes related to appearance and aroma,
quantifying on a rating scale from 0 to 10.
After the first animal feeding trial, breast and leg quarter meat samples were
stored under refrigerated conditions and evaluated daily for 15 days. Every
day, raw meat samples obtained from chickens fed on the different diets
were presented to each panelist, six samples for panelist, corresponding to
two different chicken cuts (breast and thigh meat) and three different
treatments (control, HC and commercial diets). They evaluated overall
appearance and smell attributes, quantifying on a rating scale from 0 to 10.
Samples quantified lower than 5 were considered as rejected. These results
were used to design the sensory test for the consumer panel.

Chapter IV
143
The sensory shelf life study was performed using a reversed storage design
which consists of having all samples, each with a different storage time,
available on the same day. Therefore, panelists were recruited on a single day
to evaluate all samples (Hough, 2010). Samples previously thawed and
deboned (if necessary) were prepared under refrigerated and hygienic
conditions before each session and presented in black polypropylene portion
containers closed with a lid (DART container corporation, Mason, MI,
USA). A complete block design was used, randomizing both samples (which
were coded with three-digit numbers) and order of presentation (Meilgaard et
al., 2007). All sensory evaluations were conducted in a standardized sensory
testing room with individual booths under controlled conditions of light
(6500 K daylight), temperature (20 °C) and relative humidity (70%).
Consumers were recruited among students and workers from the School of
Agrifood and Forestry Science and Engineering (ETSEA, University of
Lleida, Spain). Consumers were 67% female and 33% male, ages ranging
between 18 and 65. As two animal feeding trials were performed, two
sensory shelf life studies were carried out, with two tasting sessions in each
trial, one to evaluate breast meat and the other to evaluate leg quarter meat.
In the first trial there were 69 and 45 panelists for breast and leg quarter
meat sensory analyses, respectively, while in the second trial there were 58
and 65 panelists for breast and leg quarter meat sensory analyses,
respectively. Each panelist evaluated the odor of 7 raw samples with
different storage times (Table 2), answering yes or no to whether they would
normally consider the samples suitable for cooking, waiting a minute
between sample and sample (Fig. 1). After performing the first trial, chicken
meat did not show many perceptible changes, and therefore it was decided to
extend the storage time of the samples in the second trial.
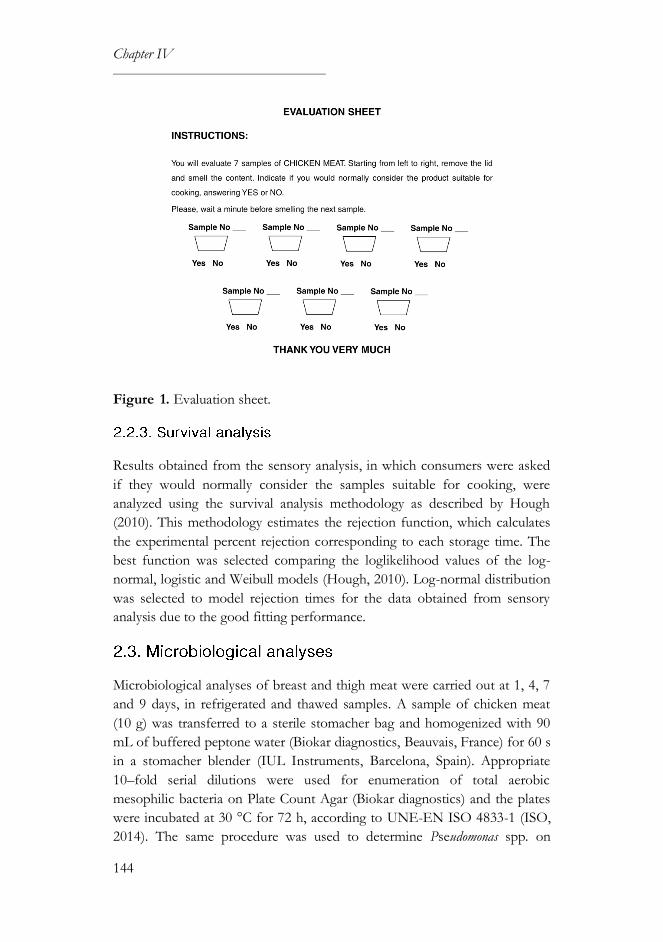
Chapter IV
144
Figure 1. Evaluation sheet.
Results obtained from the sensory analysis, in which consumers were asked
if they would normally consider the samples suitable for cooking, were
analyzed using the survival analysis methodology as described by Hough
(2010). This methodology estimates the rejection function, which calculates
the experimental percent rejection corresponding to each storage time. The
best function was selected comparing the loglikelihood values of the log-
normal, logistic and Weibull models (Hough, 2010). Log-normal distribution
was selected to model rejection times for the data obtained from sensory
analysis due to the good fitting performance.
Microbiological analyses of breast and thigh meat were carried out at 1, 4, 7
and 9 days, in refrigerated and thawed samples. A sample of chicken meat
(10 g) was transferred to a sterile stomacher bag and homogenized with 90
mL of buffered peptone water (Biokar diagnostics, Beauvais, France) for 60 s
in a stomacher blender (IUL Instruments, Barcelona, Spain). Appropriate
10–fold serial dilutions were used for enumeration of total aerobic
mesophilic bacteria on Plate Count Agar (Biokar diagnostics) and the plates
were incubated at 30 °C for 72 h, according to UNE-EN ISO 4833-1 (ISO,
2014). The same procedure was used to determine Pseudomonas spp. on

Chapter IV
145
Pseudomonas Agar Base (Oxoid, Hampshire, UK) with CFC selective
supplement (Biokar diagnostics) and the plates were incubated at 25 °C for
48 h, according to UNE-EN ISO 13720 (ISO, 2011). The presumptive
colonies of Pseudomonas spp. were then isolated in Nutritive Agar (Biokar
diagnostics), incubated at 25 °C for 24 h, and confirmed by detection of
cytochrome oxidase using Bactident® Oxidase strips (Merck Millipore,
Madrid, Spain).
The pH determination in breast and thigh meat was performed at 1, 4, 7 and
9 days, in refrigerated and thawed samples, using a Crison pH-meter
combined with an electrode 52/32 (Hach Lange Spain, Barcelona, Spain).
After slaughter, the color was measured in breast and thigh muscles in all
animals, while it was only measured in two samples (breast and thigh meat)
from each diet treatment during storage. The color determination was carried
out at 1, 4, 7, 9 and 11 days, in refrigerated and thawed samples, using a
compact portable colorimeter CM-700d (Konica Minolta, Tokyo, Japan)
according to the CIELab trichromatic system as lightness (L*), redness (a*)
and yellowness (b*) (CIE, 2004). Coordinate L* represents lightness ranging
from 0 (black) to 100 (white), a* indicates the red/green component and b*
indicates the yellow/blue component. The range of both chromatic
components is between −128 and 128 (Sharifzadeh et al., 2014). An
illuminant D65, a 10° viewing angle and an 8-mm-diameter mask were used.
The hardness was evaluated in breast meat through the Warner–Braztler
(WB) shear test using a texture analyzer (TA-XT®, Stable Micro Systems
Ltd., England, UK). This parameter was evaluated at 1, 4, 7, 9 and 11 days, in
refrigerated and thawed samples. For texture assessment, 1.9 cm-wide strips
were removed from raw breast meat (2 strips per treatment) and three shear
values were obtained for each strip (Lyon and Lyon, 1990; Zhang et al.,
2005). The samples were compressed with a V-cutting blade (guillotine),
perpendicularly to muscle fiber orientation, at a compressing speed of 5
mm/s and a down stroke distance of 30 mm. The maximum resistance of
the sample to shearing was recorded, corresponding to the highest peak of
the curve (Ruiz de Huidobro et al., 2005). The hardness of breast meat
Chapter IV
146
obtained from chickens fed on the control and HC diets was evaluated in
both trials, whereas the hardness of breast meat from chickens fed on the
commercial diet was only evaluated in the second one.
ANOVA statistical tests and Tukey's honest significant difference (HSD) test
for mean comparison were employed (JMP® Pro 12, SAS institute, 2015).
Differences among means with p < 0.05 were accepted as representing
statistically significant differences. For color analysis in breast and thigh
muscles, the MIXED procedure was applied, including fixed effect of dietary
treatments, feeding trial (as there were only two levels) and their interaction,
and random effect of pens: Yijke = Dieti + Trialj + Dieti*Trialj + Penk + εijke.
For texture analysis in breast meat, a multi-factor analysis of variance was
applied, including fixed effect of dietary treatments, type of storage, storage
time and their interaction: Yijke = Dieti + Storagej + Timek + Dieti*Storagej +
Dieti*Timek + Storagej*Timek + Dieti*Storagej*Timek + εijke. A hypothesis
test for a proportion was also performed using JMP® Pro 12 (SAS institute,
2015). Survival analysis was carried out with R statistical package (R project
for statistical computing, 2014).
According to the sensory evaluation performed by the descriptive panel, the
percentage of rejection was lower than 20% until day 10 for both breast and
leg quarter meat. From then on, there was a continuous increase in the
percentage of rejection, with a higher rejection of leg quarter meat than
breast meat (Fig. 2). Breast meat is usually preferred rather than leg quarter
meat (Elsner et al., 1997). Despite the panelists did not know what chicken
cut were evaluating, leg quarter meat was more rejected than breast meat
probably due to a higher deterioration. After analyzing the results from the
descriptive panel, it was planned the storage period for the samples analyzed
by the consumer panel. However, a longer storage period was evaluated in
the second trial (15 days) than in the first trial (11 days), as there were not
many differences among samples in the first one, maybe due to the storage
on consecutive days (6, 7, 8 and 9 days).
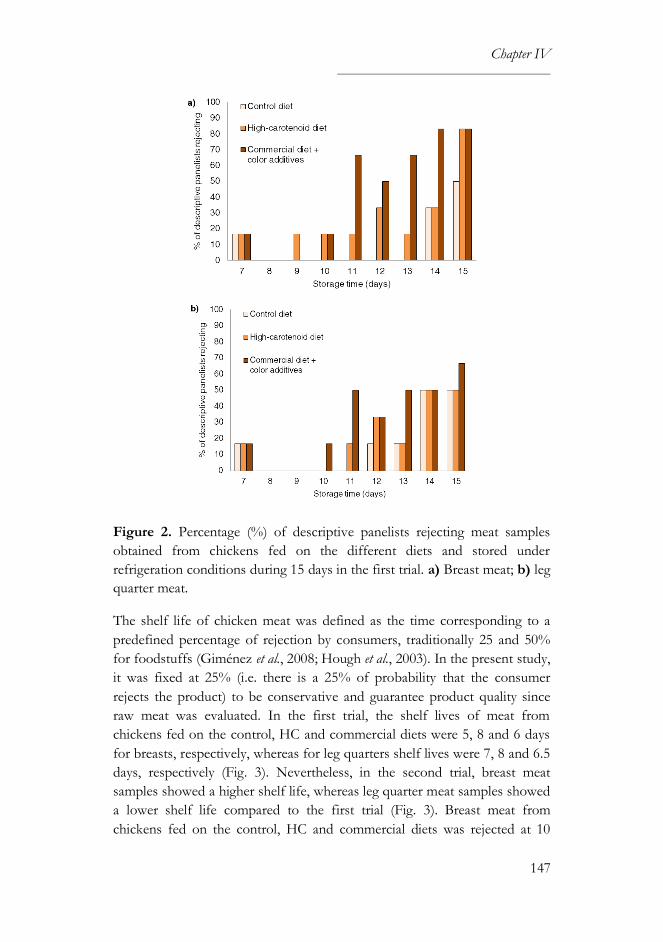
Chapter IV
147
Figure 2. Percentage (%) of descriptive panelists rejecting meat samples
obtained from chickens fed on the different diets and stored under
refrigeration conditions during 15 days in the first trial. a) Breast meat; b) leg
quarter meat.
The shelf life of chicken meat was defined as the time corresponding to a
predefined percentage of rejection by consumers, traditionally 25 and 50%
for foodstuffs (Giménez et al., 2008; Hough et al., 2003). In the present study,
it was fixed at 25% (i.e. there is a 25% of probability that the consumer
rejects the product) to be conservative and guarantee product quality since
raw meat was evaluated. In the first trial, the shelf lives of meat from
chickens fed on the control, HC and commercial diets were 5, 8 and 6 days
for breasts, respectively, whereas for leg quarters shelf lives were 7, 8 and 6.5
days, respectively (Fig. 3). Nevertheless, in the second trial, breast meat
samples showed a higher shelf life, whereas leg quarter meat samples showed
a lower shelf life compared to the first trial (Fig. 3). Breast meat from
chickens fed on the control, HC and commercial diets was rejected at 10
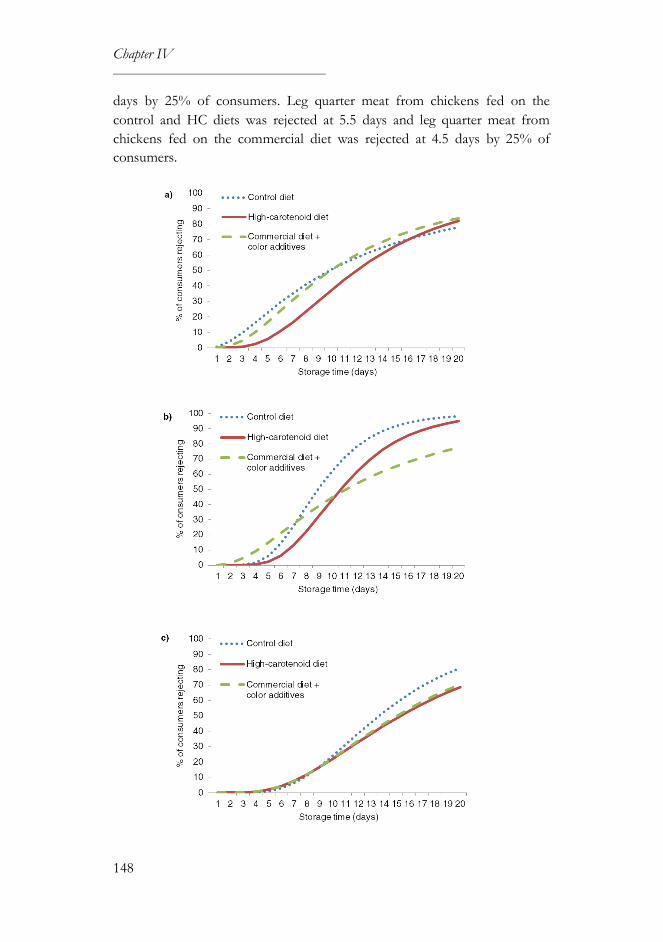
Chapter IV
148
days by 25% of consumers. Leg quarter meat from chickens fed on the
control and HC diets was rejected at 5.5 days and leg quarter meat from
chickens fed on the commercial diet was rejected at 4.5 days by 25% of
consumers.
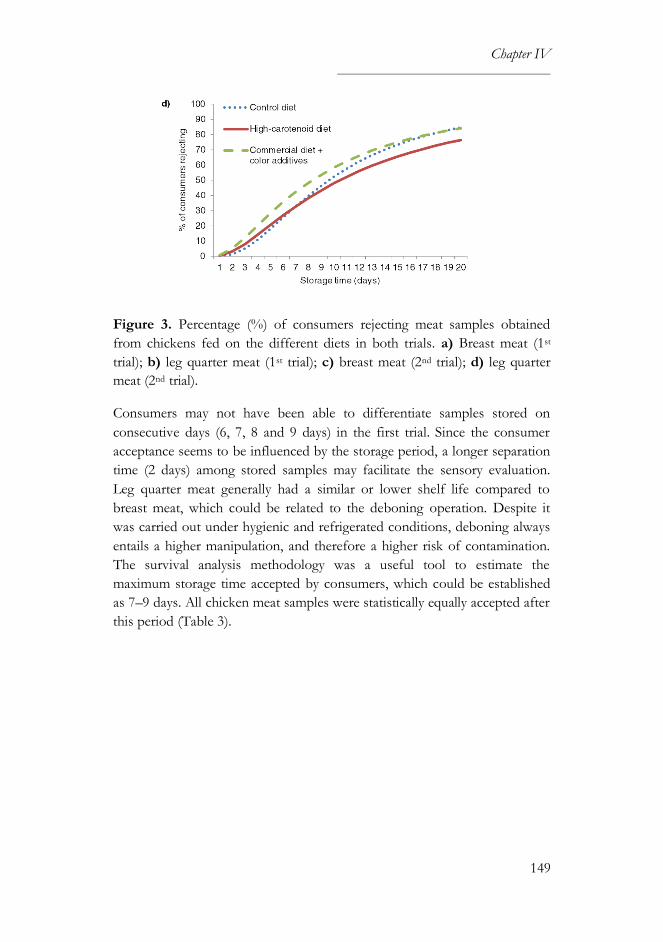
Chapter IV
149
Figure 3. Percentage (%) of consumers rejecting meat samples obtained
from chickens fed on the different diets in both trials. a) Breast meat (1st
trial); b) leg quarter meat (1st trial); c) breast meat (2nd trial); d) leg quarter
meat (2nd trial).
Consumers may not have been able to differentiate samples stored on
consecutive days (6, 7, 8 and 9 days) in the first trial. Since the consumer
acceptance seems to be influenced by the storage period, a longer separation
time (2 days) among stored samples may facilitate the sensory evaluation.
Leg quarter meat generally had a similar or lower shelf life compared to
breast meat, which could be related to the deboning operation. Despite it
was carried out under hygienic and refrigerated conditions, deboning always
entails a higher manipulation, and therefore a higher risk of contamination.
The survival analysis methodology was a useful tool to estimate the
maximum storage time accepted by consumers, which could be established
as 7–9 days. All chicken meat samples were statistically equally accepted after
this period (Table 3).
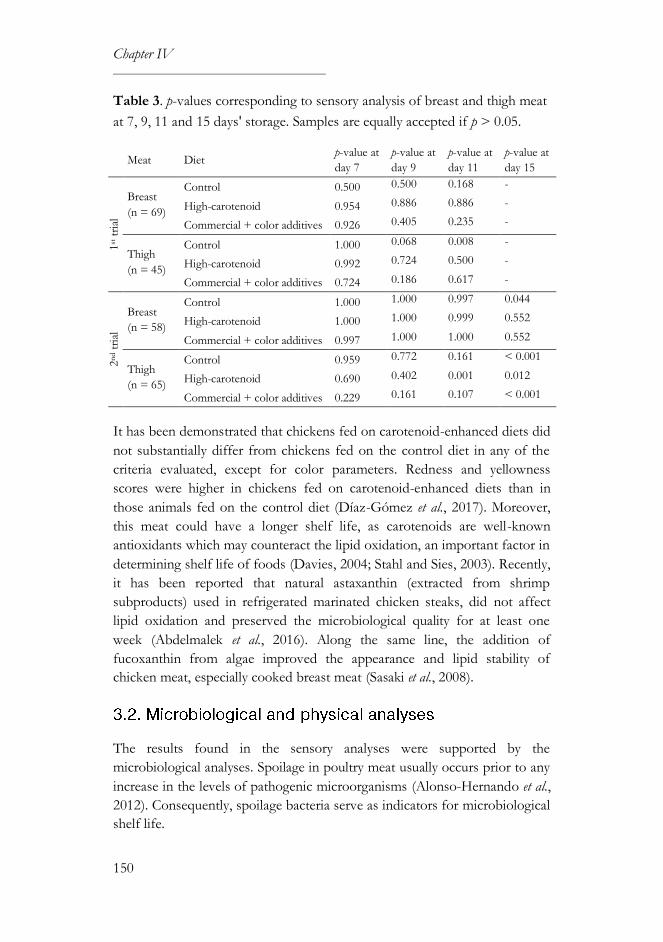
Chapter IV
150
Table 3. p-values corresponding to sensory analysis of breast and thigh meat
at 7, 9, 11 and 15 days' storage. Samples are equally accepted if p > 0.05.
Meat Diet
p-value at
day 7
p-value at
day 9
p-value at
day 11
p-value at
day 15
1st t
rial
Breast
(n = 69)
Control 0.500 0.500 0.168 -
High-carotenoid 0.954 0.886 0.886 -
Commercial + color additives 0.926 0.405 0.235 -
Thigh
(n = 45)
Control 1.000 0.068 0.008 -
High-carotenoid 0.992 0.724 0.500 -
Commercial + color additives 0.724 0.186 0.617 -
2n
d t
rial
Breast
(n = 58)
Control 1.000 1.000 0.997 0.044
High-carotenoid 1.000 1.000 0.999 0.552
Commercial + color additives 0.997 1.000 1.000 0.552
Thigh
(n = 65)
Control 0.959 0.772 0.161 < 0.001
High-carotenoid 0.690 0.402 0.001 0.012
Commercial + color additives 0.229 0.161 0.107 < 0.001
It has been demonstrated that chickens fed on carotenoid-enhanced diets did
not substantially differ from chickens fed on the control diet in any of the
criteria evaluated, except for color parameters. Redness and yellowness
scores were higher in chickens fed on carotenoid-enhanced diets than in
those animals fed on the control diet (Díaz-Gómez et al., 2017). Moreover,
this meat could have a longer shelf life, as carotenoids are well-known
antioxidants which may counteract the lipid oxidation, an important factor in
determining shelf life of foods (Davies, 2004; Stahl and Sies, 2003). Recently,
it has been reported that natural astaxanthin (extracted from shrimp
subproducts) used in refrigerated marinated chicken steaks, did not affect
lipid oxidation and preserved the microbiological quality for at least one
week (Abdelmalek et al., 2016). Along the same line, the addition of
fucoxanthin from algae improved the appearance and lipid stability of
chicken meat, especially cooked breast meat (Sasaki et al., 2008).
The results found in the sensory analyses were supported by the
microbiological analyses. Spoilage in poultry meat usually occurs prior to any
increase in the levels of pathogenic microorganisms (Alonso-Hernando et al.,
2012). Consequently, spoilage bacteria serve as indicators for microbiological
shelf life.
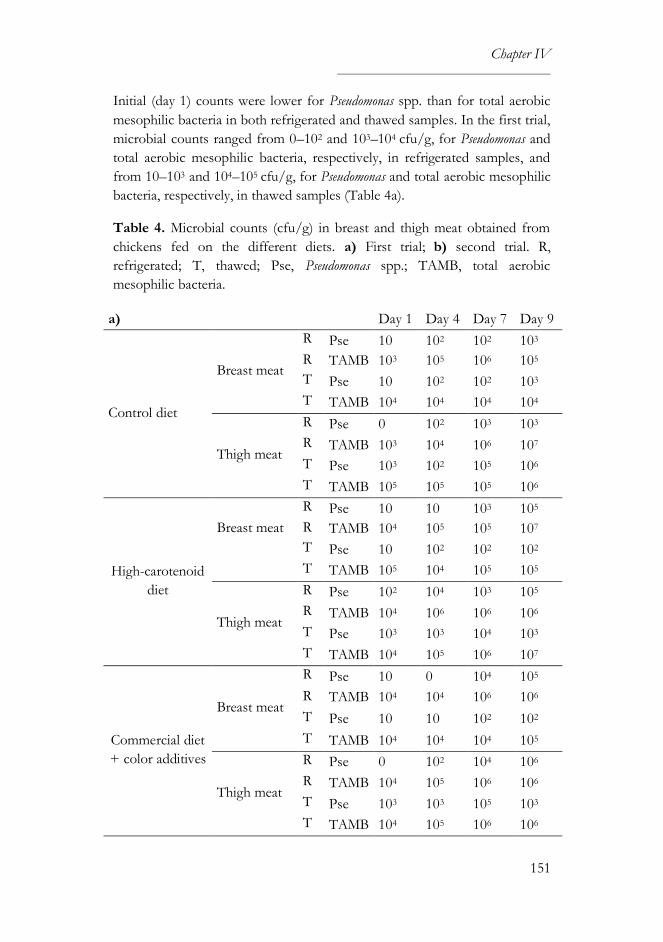
Chapter IV
151
Initial (day 1) counts were lower for Pseudomonas spp. than for total aerobic
mesophilic bacteria in both refrigerated and thawed samples. In the first trial,
microbial counts ranged from 0–102 and 103–104 cfu/g, for Pseudomonas and
total aerobic mesophilic bacteria, respectively, in refrigerated samples, and
from 10–103 and 104–105 cfu/g, for Pseudomonas and total aerobic mesophilic
bacteria, respectively, in thawed samples (Table 4a).
Table 4. Microbial counts (cfu/g) in breast and thigh meat obtained from
chickens fed on the different diets. a) First trial; b) second trial. R,
refrigerated; T, thawed; Pse, Pseudomonas spp.; TAMB, total aerobic
mesophilic bacteria.
a)
Day 1 Day 4 Day 7 Day 9
Control diet
Breast meat
R Pse 10 102 102 103
R TAMB 103 105 106 105
T Pse 10 102 102 103
T TAMB 104 104 104 104
Thigh meat
R Pse 0 102 103 103
R TAMB 103 104 106 107
T Pse 103 102 105 106
T TAMB 105 105 105 106
High-carotenoid
diet
Breast meat
R Pse 10 10 103 105
R TAMB 104 105 105 107
T Pse 10 102 102 102
T TAMB 105 104 105 105
Thigh meat
R Pse 102 104 103 105
R TAMB 104 106 106 106
T Pse 103 103 104 103
T TAMB 104 105 106 107
Commercial diet
+ color additives
Breast meat
R Pse 10 0 104 105
R TAMB 104 104 106 106
T Pse 10 10 102 102
T TAMB 104 104 104 105
Thigh meat
R Pse 0 102 104 106
R TAMB 104 105 106 106
T Pse 103 103 105 103
T TAMB 104 105 106 106
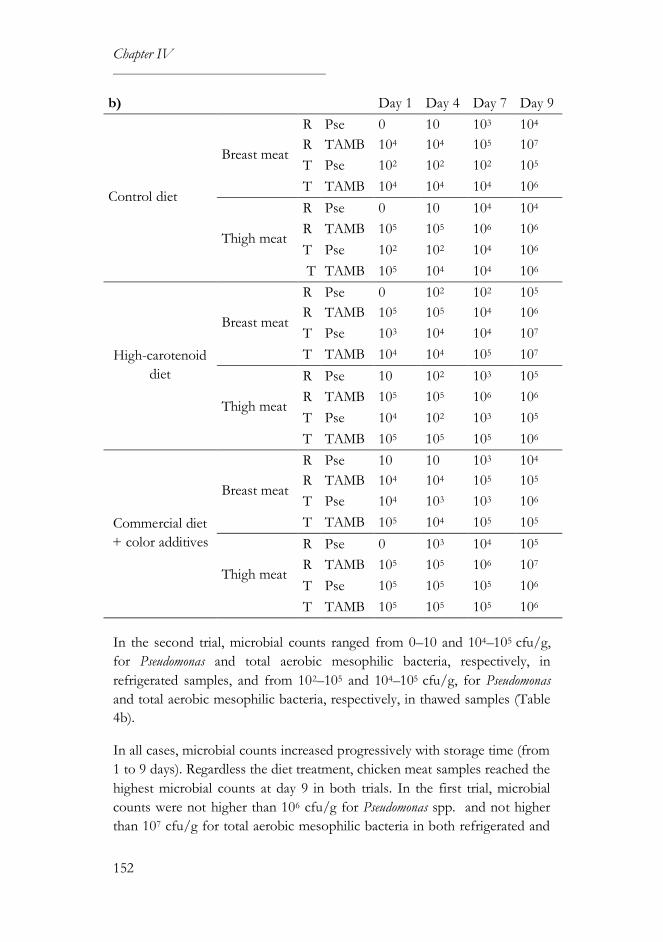
Chapter IV
152
b)
Day 1 Day 4 Day 7 Day 9
Control diet
Breast meat
R Pse 0 10 103 104
R TAMB 104 104 105 107
T Pse 102 102 102 105
T TAMB 104 104 104 106
Thigh meat
R Pse 0 10 104 104
R TAMB 105 105 106 106
T Pse 102 102 104 106
T TAMB 105 104 104 106
High-carotenoid
diet
Breast meat
R Pse 0 102 102 105
R TAMB 105 105 104 106
T Pse 103 104 104 107
T TAMB 104 104 105 107
Thigh meat
R Pse 10 102 103 105
R TAMB 105 105 106 106
T Pse 104 102 103 105
T TAMB 105 105 105 106
Commercial diet
+ color additives
Breast meat
R Pse 10 10 103 104
R TAMB 104 104 105 105
T Pse 104 103 103 106
T TAMB 105 104 105 105
Thigh meat
R Pse 0 103 104 105
R TAMB 105 105 106 107
T Pse 105 105 105 106
T TAMB 105 105 105 106
In the second trial, microbial counts ranged from 0–10 and 104–105 cfu/g,
for Pseudomonas and total aerobic mesophilic bacteria, respectively, in
refrigerated samples, and from 102–105 and 104–105 cfu/g, for Pseudomonas
and total aerobic mesophilic bacteria, respectively, in thawed samples (Table
4b).
In all cases, microbial counts increased progressively with storage time (from
1 to 9 days). Regardless the diet treatment, chicken meat samples reached the
highest microbial counts at day 9 in both trials. In the first trial, microbial
counts were not higher than 106 cfu/g for Pseudomonas spp. and not higher
than 107 cfu/g for total aerobic mesophilic bacteria in both refrigerated and
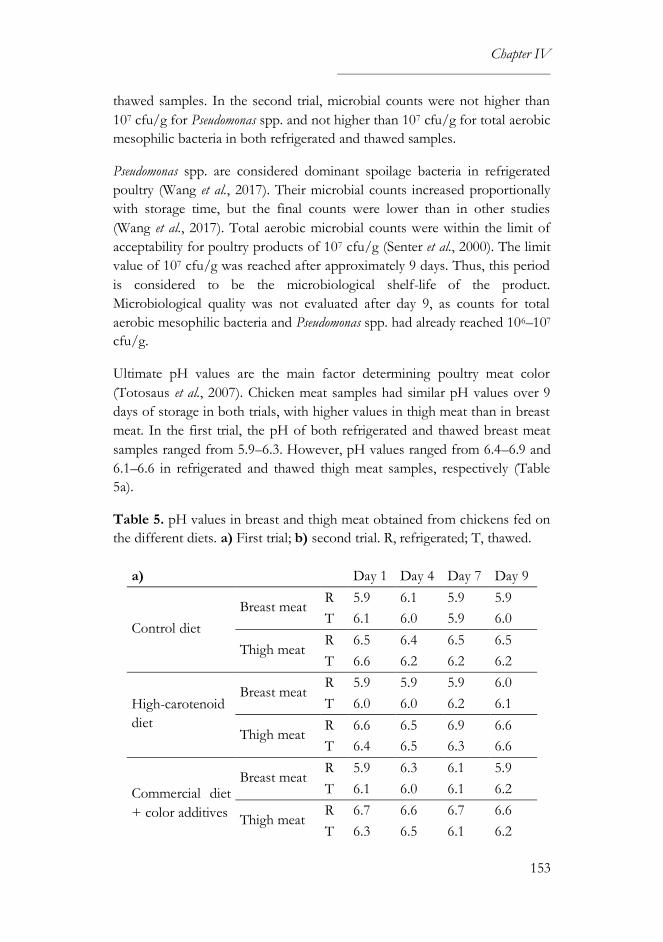
Chapter IV
153
thawed samples. In the second trial, microbial counts were not higher than
107 cfu/g for Pseudomonas spp. and not higher than 107 cfu/g for total aerobic
mesophilic bacteria in both refrigerated and thawed samples.
Pseudomonas spp. are considered dominant spoilage bacteria in refrigerated
poultry (Wang et al., 2017). Their microbial counts increased proportionally
with storage time, but the final counts were lower than in other studies
(Wang et al., 2017). Total aerobic microbial counts were within the limit of
acceptability for poultry products of 107 cfu/g (Senter et al., 2000). The limit
value of 107 cfu/g was reached after approximately 9 days. Thus, this period
is considered to be the microbiological shelf-life of the product.
Microbiological quality was not evaluated after day 9, as counts for total
aerobic mesophilic bacteria and Pseudomonas spp. had already reached 106–107
cfu/g.
Ultimate pH values are the main factor determining poultry meat color
(Totosaus et al., 2007). Chicken meat samples had similar pH values over 9
days of storage in both trials, with higher values in thigh meat than in breast
meat. In the first trial, the pH of both refrigerated and thawed breast meat
samples ranged from 5.9–6.3. However, pH values ranged from 6.4–6.9 and
6.1–6.6 in refrigerated and thawed thigh meat samples, respectively (Table
5a).
Table 5. pH values in breast and thigh meat obtained from chickens fed on
the different diets. a) First trial; b) second trial. R, refrigerated; T, thawed.
a)
Day 1 Day 4 Day 7 Day 9
Control diet
Breast meat R 5.9 6.1 5.9 5.9
T 6.1 6.0 5.9 6.0
Thigh meat R 6.5 6.4 6.5 6.5
T 6.6 6.2 6.2 6.2
High-carotenoid
diet
Breast meat R 5.9 5.9 5.9 6.0
T 6.0 6.0 6.2 6.1
Thigh meat R 6.6 6.5 6.9 6.6
T 6.4 6.5 6.3 6.6
Commercial diet
+ color additives
Breast meat R 5.9 6.3 6.1 5.9
T 6.1 6.0 6.1 6.2
Thigh meat R 6.7 6.6 6.7 6.6
T 6.3 6.5 6.1 6.2
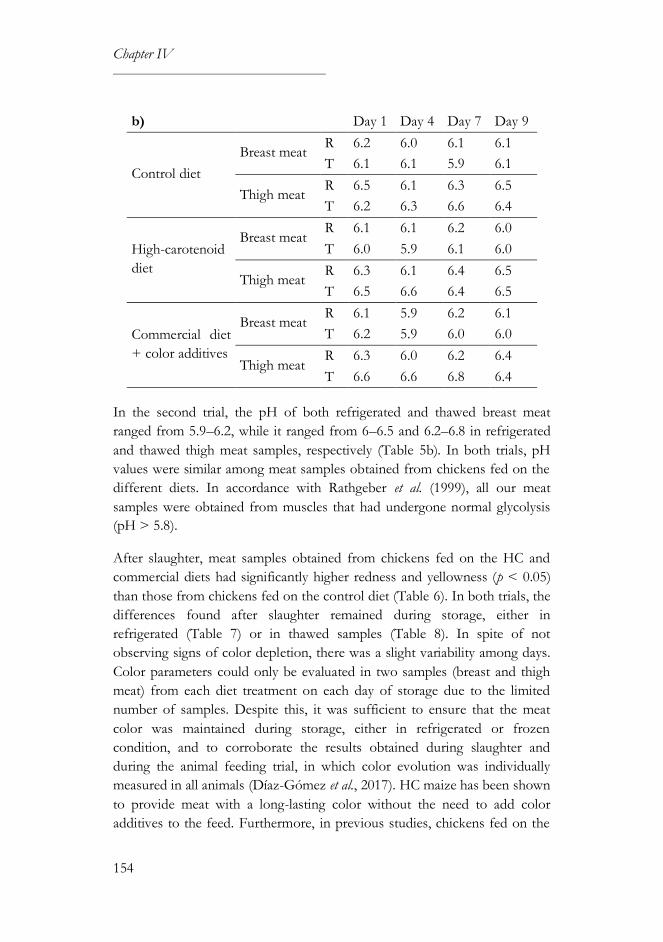
Chapter IV
154
In the second trial, the pH of both refrigerated and thawed breast meat
ranged from 5.9–6.2, while it ranged from 6–6.5 and 6.2–6.8 in refrigerated
and thawed thigh meat samples, respectively (Table 5b). In both trials, pH
values were similar among meat samples obtained from chickens fed on the
different diets. In accordance with Rathgeber et al. (1999), all our meat
samples were obtained from muscles that had undergone normal glycolysis
(pH > 5.8).
After slaughter, meat samples obtained from chickens fed on the HC and
commercial diets had significantly higher redness and yellowness (p < 0.05)
than those from chickens fed on the control diet (Table 6). In both trials, the
differences found after slaughter remained during storage, either in
refrigerated (Table 7) or in thawed samples (Table 8). In spite of not
observing signs of color depletion, there was a slight variability among days.
Color parameters could only be evaluated in two samples (breast and thigh
meat) from each diet treatment on each day of storage due to the limited
number of samples. Despite this, it was sufficient to ensure that the meat
color was maintained during storage, either in refrigerated or frozen
condition, and to corroborate the results obtained during slaughter and
during the animal feeding trial, in which color evolution was individually
measured in all animals (Díaz-Gómez et al., 2017). HC maize has been shown
to provide meat with a long-lasting color without the need to add color
additives to the feed. Furthermore, in previous studies, chickens fed on the
b)
Day 1 Day 4 Day 7 Day 9
Control diet
Breast meat R 6.2 6.0 6.1 6.1
T 6.1 6.1 5.9 6.1
Thigh meat R 6.5 6.1 6.3 6.5
T 6.2 6.3 6.6 6.4
High-carotenoid
diet
Breast meat R 6.1 6.1 6.2 6.0
T 6.0 5.9 6.1 6.0
Thigh meat R 6.3 6.1 6.4 6.5
T 6.5 6.6 6.4 6.5
Commercial diet
+ color additives
Breast meat R 6.1 5.9 6.2 6.1
T 6.2 5.9 6.0 6.0
Thigh meat R 6.3 6.0 6.2 6.4
T 6.6 6.6 6.8 6.4
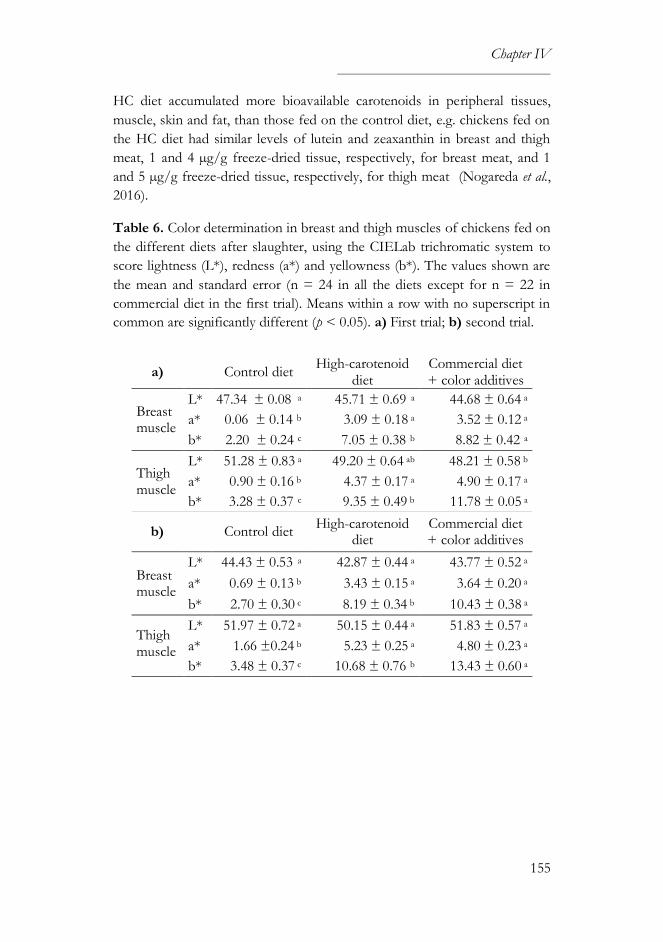
Chapter IV
155
HC diet accumulated more bioavailable carotenoids in peripheral tissues,
muscle, skin and fat, than those fed on the control diet, e.g. chickens fed on
the HC diet had similar levels of lutein and zeaxanthin in breast and thigh
meat, 1 and 4 µg/g freeze-dried tissue, respectively, for breast meat, and 1
and 5 µg/g freeze-dried tissue, respectively, for thigh meat (Nogareda et al.,
2016).
Table 6. Color determination in breast and thigh muscles of chickens fed on
the different diets after slaughter, using the CIELab trichromatic system to
score lightness (L*), redness (a*) and yellowness (b*). The values shown are
the mean and standard error (n = 24 in all the diets except for n = 22 in
commercial diet in the first trial). Means within a row with no superscript in
common are significantly different (p < 0.05). a) First trial; b) second trial.
a) Control diet High-carotenoid
diet Commercial diet + color additives
Breast muscle
L* 47.34 ± 0.08 a 45.71 ± 0.69 a 44.68 ± 0.64 a
a* 0.06 ± 0.14 b 3.09 ± 0.18 a 3.52 ± 0.12 a
b* 2.20 ± 0.24 c 7.05 ± 0.38 b 8.82 ± 0.42 a
Thigh muscle
L* 51.28 ± 0.83 a 49.20 ± 0.64 ab 48.21 ± 0.58 b
a* 0.90 ± 0.16 b 4.37 ± 0.17 a 4.90 ± 0.17 a
b* 3.28 ± 0.37 c 9.35 ± 0.49 b 11.78 ± 0.05 a
b) Control diet High-carotenoid
diet Commercial diet + color additives
Breast muscle
L* 44.43 ± 0.53 a 42.87 ± 0.44 a 43.77 ± 0.52 a
a* 0.69 ± 0.13 b 3.43 ± 0.15 a 3.64 ± 0.20 a
b* 2.70 ± 0.30 c 8.19 ± 0.34 b 10.43 ± 0.38 a
Thigh muscle
L* 51.97 ± 0.72 a 50.15 ± 0.44 a 51.83 ± 0.57 a
a* 1.66 ±0.24 b 5.23 ± 0.25 a 4.80 ± 0.23 a
b* 3.48 ± 0.37 c 10.68 ± 0.76 b 13.43 ± 0.60 a
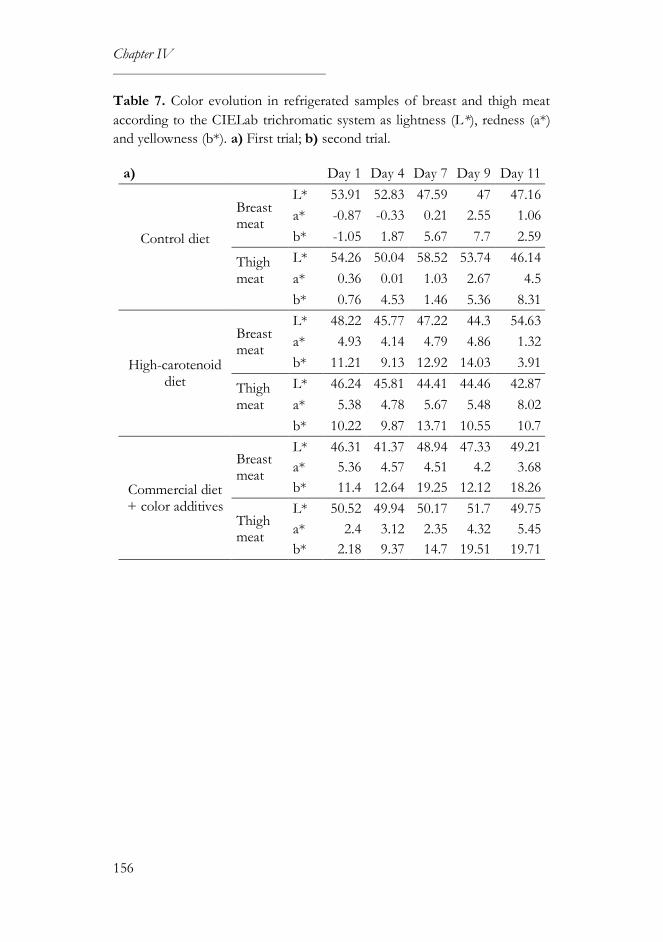
Chapter IV
156
Table 7. Color evolution in refrigerated samples of breast and thigh meat
according to the CIELab trichromatic system as lightness (L*), redness (a*)
and yellowness (b*). a) First trial; b) second trial.
a) Day 1 Day 4 Day 7 Day 9 Day 11
Control diet
Breast meat
L* 53.91 52.83 47.59 47 47.16
a* -0.87 -0.33 0.21 2.55 1.06
b* -1.05 1.87 5.67 7.7 2.59
Thigh meat
L* 54.26 50.04 58.52 53.74 46.14
a* 0.36 0.01 1.03 2.67 4.5
b* 0.76 4.53 1.46 5.36 8.31
High-carotenoid diet
Breast meat
L* 48.22 45.77 47.22 44.3 54.63
a* 4.93 4.14 4.79 4.86 1.32
b* 11.21 9.13 12.92 14.03 3.91
Thigh meat
L* 46.24 45.81 44.41 44.46 42.87
a* 5.38 4.78 5.67 5.48 8.02
b* 10.22 9.87 13.71 10.55 10.7
Commercial diet + color additives
Breast meat
L* 46.31 41.37 48.94 47.33 49.21
a* 5.36 4.57 4.51 4.2 3.68
b* 11.4 12.64 19.25 12.12 18.26
Thigh meat
L* 50.52 49.94 50.17 51.7 49.75
a* 2.4 3.12 2.35 4.32 5.45
b* 2.18 9.37 14.7 19.51 19.71
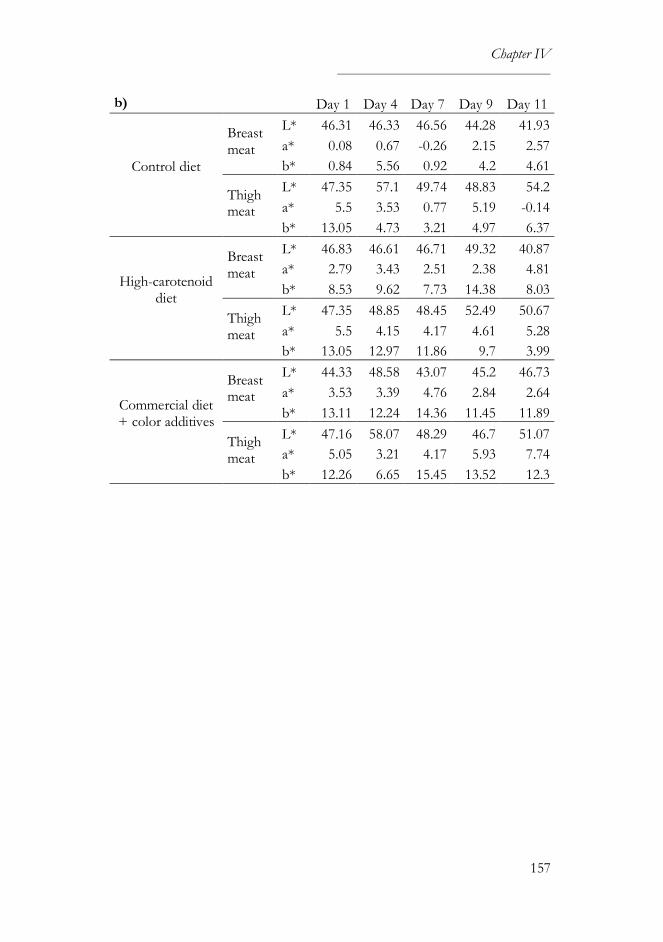
Chapter IV
157
b) Day 1 Day 4 Day 7 Day 9 Day 11
Control diet
Breast meat
L* 46.31 46.33 46.56 44.28 41.93
a* 0.08 0.67 -0.26 2.15 2.57
b* 0.84 5.56 0.92 4.2 4.61
Thigh meat
L* 47.35 57.1 49.74 48.83 54.2
a* 5.5 3.53 0.77 5.19 -0.14
b* 13.05 4.73 3.21 4.97 6.37
High-carotenoid diet
Breast meat
L* 46.83 46.61 46.71 49.32 40.87
a* 2.79 3.43 2.51 2.38 4.81
b* 8.53 9.62 7.73 14.38 8.03
Thigh meat
L* 47.35 48.85 48.45 52.49 50.67
a* 5.5 4.15 4.17 4.61 5.28
b* 13.05 12.97 11.86 9.7 3.99
Commercial diet + color additives
Breast meat
L* 44.33 48.58 43.07 45.2 46.73
a* 3.53 3.39 4.76 2.84 2.64
b* 13.11 12.24 14.36 11.45 11.89
Thigh meat
L* 47.16 58.07 48.29 46.7 51.07
a* 5.05 3.21 4.17 5.93 7.74
b* 12.26 6.65 15.45 13.52 12.3

Chapter IV
158
Table 8. Color evolution in thawed samples of breast and thigh meat
according to the CIELab trichromatic system as lightness (L*), redness (a*)
and yellowness (b*). a) First trial; b) second trial.
a) Day 1 Day 4 Day 7 Day 9 Day 11
Control diet
Breast meat
L* 41.93 49.35 48.75 45.64 47.39
a* 4.23 3.16 1.5 1.2 0.31
b* 5.28 6.27 5.13 4.19 6.59
Thigh meat
L* 52.24 53.83 52.64 50.9 49
a* 3.04 6.16 6.57 2.06 3.69
b* 3.26 12.13 15.69 1.15 8.72
High-carotenoid diet
Breast meat
L* 44.32 45.28 48.65 43.98 43.58
a* 6.03 4.03 2.26 5.13 3.96
b* 11.26 9.83 8.71 14.16 11.22
Thigh meat
L* 53.33 52.75 41.42 49.47 53.64
a* 2.78 10.45 9.07 4.89 4.51
b* 3.17 19.78 13.4 13.06 4.54
Commercial diet + color additives
Breast meat
L* 43.14 43.03 45.23 46.32 40.76
a* 5.68 4.53 3.79 4.85 5.15
b* 9.87 15.41 13.21 16.52 14.88
Thigh meat
L* 51.67 41.69 47.03 59.17 55.13
a* 7.72 9.16 7.89 3.3 5.35
b* 7.38 17.17 21.39 11.06 7.7
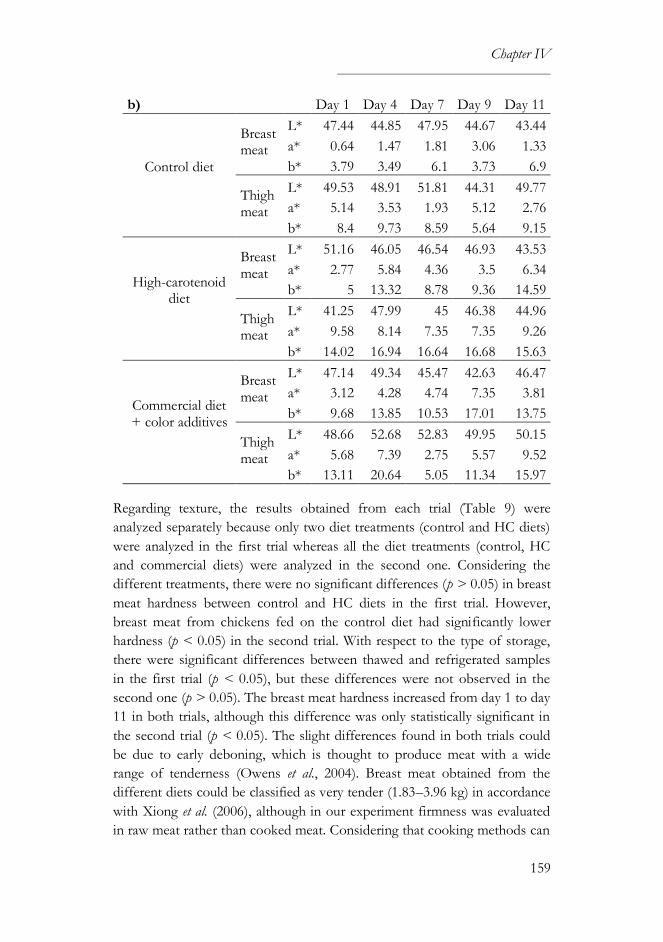
Chapter IV
159
b) Day 1 Day 4 Day 7 Day 9 Day 11
Control diet
Breast meat
L* 47.44 44.85 47.95 44.67 43.44
a* 0.64 1.47 1.81 3.06 1.33
b* 3.79 3.49 6.1 3.73 6.9
Thigh meat
L* 49.53 48.91 51.81 44.31 49.77
a* 5.14 3.53 1.93 5.12 2.76
b* 8.4 9.73 8.59 5.64 9.15
High-carotenoid diet
Breast meat
L* 51.16 46.05 46.54 46.93 43.53
a* 2.77 5.84 4.36 3.5 6.34
b* 5 13.32 8.78 9.36 14.59
Thigh meat
L* 41.25 47.99 45 46.38 44.96
a* 9.58 8.14 7.35 7.35 9.26
b* 14.02 16.94 16.64 16.68 15.63
Commercial diet + color additives
Breast meat
L* 47.14 49.34 45.47 42.63 46.47
a* 3.12 4.28 4.74 7.35 3.81
b* 9.68 13.85 10.53 17.01 13.75
Thigh meat
L* 48.66 52.68 52.83 49.95 50.15
a* 5.68 7.39 2.75 5.57 9.52
b* 13.11 20.64 5.05 11.34 15.97
Regarding texture, the results obtained from each trial (Table 9) were
analyzed separately because only two diet treatments (control and HC diets)
were analyzed in the first trial whereas all the diet treatments (control, HC
and commercial diets) were analyzed in the second one. Considering the
different treatments, there were no significant differences (p > 0.05) in breast
meat hardness between control and HC diets in the first trial. However,
breast meat from chickens fed on the control diet had significantly lower
hardness (p < 0.05) in the second trial. With respect to the type of storage,
there were significant differences between thawed and refrigerated samples
in the first trial (p < 0.05), but these differences were not observed in the
second one (p > 0.05). The breast meat hardness increased from day 1 to day
11 in both trials, although this difference was only statistically significant in
the second trial (p < 0.05). The slight differences found in both trials could
be due to early deboning, which is thought to produce meat with a wide
range of tenderness (Owens et al., 2004). Breast meat obtained from the
different diets could be classified as very tender (1.83–3.96 kg) in accordance
with Xiong et al. (2006), although in our experiment firmness was evaluated
in raw meat rather than cooked meat. Considering that cooking methods can
Chapter IV
160
affect moisture and texture of the final product, as they increase hardness in
meat (Owens et al., 2004; Ruiz de Huidobro et al., 2005), it would be
necessary to evaluate the hardness in cooked breast meat in future studies.
Generally, freezing and thawing processes did not affect quality parameters
evaluated in the present study. Regardless the type of storage, meat from
chickens fed on the HC diet was similar to meat from chickens fed on the
commercial diet supplemented with color additives in terms of sensory shelf
life, physical parameters and microbial counts. However, it must be
considered that yellowness scores were higher in chickens fed on the
commercial diet supplemented with color additives compared to chickens
fed on the HC diet due to the higher yellow xanthophyll levels from the
marigold flower extract.
HC maize used as a feed component of poultry diet did not adversely affect
any quality parameter evaluated and meat from chickens fed on the HC diet
was equally accepted than meat from the other two diets until day 9. The
shelf life of meat obtained from chickens fed on the HC diet, as measured in
an acceptability test and corresponding to a 25% rejection probability, was
approximately 8–10 and 5.5–8 days, for breast and leg quarter meat,
respectively. Taking into account the results obtained in the survival and
microbiological analyses, 7–9 days could be considered as the maximum
storage period for this chicken meat accepted by consumers. This is
supported by the physical parameters (pH, color and texture), which
remained quite stable during storage. In further studies, it would be
interesting to study the effect of carotenoids, as intrinsic compounds of HC
maize, on lipid peroxidation of chicken meat.
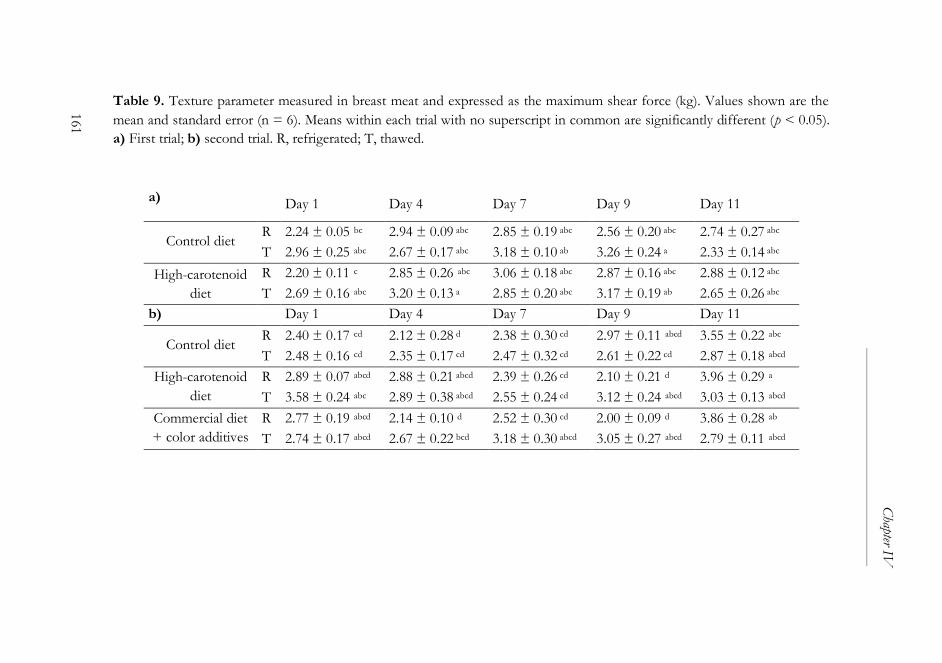
Table 9. Texture parameter measured in breast meat and expressed as the maximum shear force (kg). Values shown are the
mean and standard error (n = 6). Means within each trial with no superscript in common are significantly different (p < 0.05).
a) First trial; b) second trial. R, refrigerated; T, thawed.
a) Day 1 Day 4 Day 7 Day 9 Day 11
Control diet R 2.24 ± 0.05 bc 2.94 ± 0.09 abc 2.85 ± 0.19 abc 2.56 ± 0.20 abc 2.74 ± 0.27 abc
T 2.96 ± 0.25 abc 2.67 ± 0.17 abc 3.18 ± 0.10 ab 3.26 ± 0.24 a 2.33 ± 0.14 abc
High-carotenoid
diet
R 2.20 ± 0.11 c 2.85 ± 0.26 abc 3.06 ± 0.18 abc 2.87 ± 0.16 abc 2.88 ± 0.12 abc
T 2.69 ± 0.16 abc 3.20 ± 0.13 a 2.85 ± 0.20 abc 3.17 ± 0.19 ab 2.65 ± 0.26 abc
b) Day 1 Day 4 Day 7 Day 9 Day 11
Control diet R 2.40 ± 0.17 cd 2.12 ± 0.28 d 2.38 ± 0.30 cd 2.97 ± 0.11 abcd 3.55 ± 0.22 abc
T 2.48 ± 0.16 cd 2.35 ± 0.17 cd 2.47 ± 0.32 cd 2.61 ± 0.22 cd 2.87 ± 0.18 abcd
High-carotenoid
diet
R 2.89 ± 0.07 abcd 2.88 ± 0.21 abcd 2.39 ± 0.26 cd 2.10 ± 0.21 d 3.96 ± 0.29 a
T 3.58 ± 0.24 abc 2.89 ± 0.38 abcd 2.55 ± 0.24 cd 3.12 ± 0.24 abcd 3.03 ± 0.13 abcd
Commercial diet
+ color additives
R 2.77 ± 0.19 abcd 2.14 ± 0.10 d 2.52 ± 0.30 cd 2.00 ± 0.09 d 3.86 ± 0.28 ab
T 2.74 ± 0.17 abcd 2.67 ± 0.22 bcd 3.18 ± 0.30 abcd 3.05 ± 0.27 abcd 2.79 ± 0.11 abcd
161
Chapter IV
Chapter IV
162
Abdelmalek, B.E., Sila, A., Ghlissi, Z., Taktak, M.A., Ayadi, M.A. and
Bougatef, A., 2016. The influence of natural astaxanthin on the
formulation and storage of marinated chicken steaks. Journal of Food
Biochemistry 40: 393–403.
Alonso-Hernando, A., Capita, R. and Alonso-Calleja, C., 2012. Behaviour of
co-inoculated pathogenic and spoilage bacteria on poultry following
several decontamination treatments. International Journal of Food
Microbiology 159: 152–159.
Breithaupt, D.E., 2007. Modern application of xanthophylls in animal
feeding – a review. Trends in Food Science and Technology 18: 501–
506.
Calle, M.L., Hough, G., Curia, A. and Gómez, G., 2006. Bayesian survival
analysis modeling applied to sensory shelf life of foods. Food Quality
and Preference 17: 307–312.
Commission Internationale de l'Éclairage – International Commission on
Illumination (CIE), 2004. CIE 15: Technical Report: Colorimetry, 3rd
edition. CIE, 552: 24.
Curia, A., Aguerrido, M., Langohr, K. and Hough, G., 2005. Survival analysis
applied to sensory shelf life of yogurts – I: Argentine formulations.
Journal of Food Science 70: 442–445.
Dainty, R.H., 1996. Chemical/biochemical detection of spoilage.
International Journal of Food Microbiology 33: 19–33.
Davies, C., 2004. Lypolisis in lipid oxidation. In: Steele, R. (ed.)
Understanding and measuring the shelf-life of food. CRC Press, Boca
Raton, FL, USA, pp.142–161.
Díaz-Gómez, J., Moreno, J.A., Angulo, E., Sandmann, G., Zhu, C., Ramos,
A.J., Capell, T., Christou, P., Nogareda, C., 2017. High-carotenoid
biofortified maize is an alternative to color additives in poultry feed.
Animal Feed Science and Technology 231: 38–46.
Elsner, R.J.F., Resurreccion, A.V.A., McWatters, K.H., 1997. Consumer
acceptance of ground chicken. Journal of Muscle Foods 8: 213–235.

Chapter IV
163
FAOSTAT, 2015. Food and Agriculture Organization of the United
Nations. Statistics division. Available at:
http://faostat3.fao.org/browse/Q/QA/E Accessed 14 March 2017.
Giménez, A., Ares, G., Gámbaro, A., 2008. Survival analysis to estimate
sensory shelf life using acceptability scores. Journal of Sensory Studies
23: 571–582.
Hough, G., 2010. Sensory shelf life estimation of food products. CRC Press,
Boca Raton, FL, USA.
Hough, G., Langohr, K., Gómez, G. and Curia, A., 2003. Survival analysis
applied to sensory shelf life of foods. Journal of Food Science 68: 359–
362.
International Organization for Standardization (ISO), 2011. UNE-EN ISO
13720. Meat and meat products. Enumeration of presumptive
Pseudomonas spp. Spanish Association for Standardization and
Certification, Madrid, Spain.
International Organization for Standardization (ISO), 2014. UNE-EN ISO
4833-1. Microbiology of the food chain. Horizontal method for the
enumeration of microorganisms. Part 1: Colony count at 30 °C by the
pour plate technique. Spanish Association for Standardization and
Certification, Madrid, Spain.
Kleinbaum, D.G., 1996. Survival analysis: a self-learning text. Springer-
Verlag Inc., New York, NY, USA.
Leygonie, C., Britz, T.J. and Hoffman, L.C., 2012. Impact of freezing and
thawing on the quality of meat: review. Meat Science 91: 93–98.
Lyon, C.E. and Lyon, B.G., 1990. The relationship of objective shear values
and sensory tests to changes in tenderness of broiler breast meat.
Poultry Science 69: 1420–1427.
Meilgaard, M.C., Civille, G.V. and Carr, B.T., 2007. Sensory evaluation
techniques, fourth edition. CRC Press, Boca Raton, FL, USA.
National Research Council, 1994. Nutrient requirements of poultry, ninth
revised edition. National Academy Press, Washington DC, USA.
National Research Council, 2011. Guide for the care and use of laboratory
Chapter IV
164
animals, eighth edition. National Academy Press, Washington DC,
USA.
Nogareda, C., Moreno, J.A., Angulo, E., Sandmann, G., Portero, M., Capell,
T., Zhu, C. and Christou, P., 2016. Carotenoid-enriched transgenic
corn delivers bioavailable carotenoids to poultry and protects them
against coccidiosis. Plant Biotechnology Journal 14: 160–168.
Owens, C.M., Cavitt, L.C. and Meullenet, J.-F.C., 2004. Tenderness
evaluation in poultry meat. Proceedings ot the 57th American Meat
Science Association. American Meat Science Association, Lexington,
KY, USA, pp. 115–121.
Pérez-Vendrell, A.M., Hernández, J.M., Llauradó, L., Schierle, J. and Brufau,
J., 2001. Influence of source and ratio of xanthophyll pigments on
broiler chicken pigmentation and performance. Poultry Science 80:
320–326.
Rathgeber, B.M., Boles, J.A. and Shand, P.J., 1999. Rapid postmortem pH
decline and delayed chilling reduce quality of turkey breast meat.
Poultry Science 78: 477–484.
Ruiz de Huidobro, F., Miguel, E., Blázquez, B. and Onega, E., 2005. A
comparison between two methods (Warner-Bratzler and texture profile
analysis) for testing either raw meat or cooked meat. Meat Science 69:
527–536.
Sasaki, K., Ishihara, K., Oyamada, C., Sato, A., Fukushi, A., Arakane, T.,
Motoyama, M., Yamazaki, M. and Mitsumoto, M., 2008. Effects of
fucoxanthin addition to ground chicken breast meat on lipid and
colour stability during chilled storage, before and after cooking. Asian-
Australasian Journal of Animal Sciences 21: 1067–1072.
Senter, S.D., Arnold, J.W. and Chew, V., 2000. APC values and volatile
compounds formed in commercially processed, raw chicken parts
during storage at 4 and 13 °C and under simulated temperature abuse
conditions. Journal of the Science of Food and Agriculture 80: 1559–
1564.
Sharifzadeh, S., Clemmensen, L.H., Borggaard, C., Stoier, S. and Ersboll,
B.K., 2014. Supervised feature selection for linear and non-linear
regression of L*a*b* color from multispectral images of meat.
Chapter IV
165
Engineering Applications of Artificial Intelligence 27: 211–227.
Sirri, F., Petracci, M., Bianchi, M. and Meluzzi, A., 2010. Survey of skin
pigmentation of yellow-skinned broiler chickens. Poultry Science 89:
1556–1561.
Stahl, W. and Sies, H., 2003. Antioxidant activity of carotenoids. Molecular
Aspects of Medicine 24: 345–351.
Tarique, T., Yang, S., Mohsina, Z., Qiu, J., Zhao, Y., Gang, C. and Ailiang,
C., 2013. Role of carotenoids in poultry industry in China: a review.
Journal of Natural Sciences Research 3: 111–122.
Totosaus, A., Pérez-Chabela, M.L. and Guerrero, I., 2007. Color of fresh and
frozen poultry. In: Nollet, L.M.L. (ed.) Handbook of meat, poultry and
seafood quality. Blackwell Publishing, Ames, IA, USA, pp. 455–465.
Wang, G., Wang, H., Han, Y., Xing, T., Ye, K., Xu, X. and Zhou, G., 2017.
Evaluation of the spoilage potential of bacteria isolated from chilled
chicken in vitro and in situ. Food Microbiology 63: 139–146.
Williams, W.D., 1992. Origin and impact of color on consumer preference
for food. Poultry Science 71: 744–746.
Xiong, R., Cavitt, L.C., Meullenet, J.F. and Owens, C.M., 2006. Comparison
of Allo-Kramer, Warner-Bratzler and Razor blade shears for predicting
sensory tenderness of broiler breast meat. Journal of Texture Studies
37: 179–199.
Zhang, A.W., Lee, B.D., Lee, S.K., Lee, K.W., An, G.H., Song, K.B., Lee,
C.H., 2005. Effects of yeast (Saccharomyces cerevisiae) cell components on
growth performance, meat quality, and ileal mucosa development of
broiler chicks. Poultry Science 84: 1015–1021.
Zhu, C., Naqvi, S., Breitenbach, J., Sandmann, G., Christou, P. and Capell,
T., 2008. Combinatorial genetic transformation generates a library of
metabolic phenotypes for the carotenoid pathway in maize.
Proceedings of the National Academy of Sciences of the United States
of America 105: 18232–18237.
Zhuang, H. and Savage, E.M., 2013. Comparison of cook loss, shear force,
and sensory descriptive profiles of boneless skinless white meat cooked
Chapter IV
166
from a frozen or thawed state. Poultry Science 92: 3003–3009.

Chapter V
169
Joana Díaz-Gómez a, Antonio Javier Ramos a, Changfu Zhu b, Olga Martín-
Belloso a and Robert Soliva-Fortuny a
a Food Technology Department, University of Lleida–Agrotecnio Center,
Av. Rovira Roure 191, 25198 Lleida, Spain; b Plant and Forestry Science Department, University of Lleida–Agrotecnio
Center, Av. Rovira Roure 191, 25198 Lleida, Spain
Maize is a staple food crop in many developing countries, hence becoming
an attractive target for biofortification programs toward populations at risk
of micronutrient deficiencies. A South African white endosperm maize
inbred line was engineered with a carotenogenic mini-pathway to generate
high-carotenoid maize, which accumulates β-carotene, lutein and zeaxanthin.
As maize porridge is a traditional meal for poor populations in sub-Saharan
African countries, high-carotenoid maize was used as raw material to prepare
different maize meals. The objective of this work was to assess the impact of
popular home-cooking techniques and different cooking parameters
(temperature, time and pH) on the final carotenoid content in the cooked
product, using a spectrophotometric technique based on the mean
absorption of carotenoids at 450 nm. Carotenoid levels were not only
preserved, but also enhanced in high-carotenoid maize porridges. The
carotenoid content was increased when temperatures ≤ 95 °C were
combined with short cooking times (10–60 min). The most optimum
thermal treatment was 75 °C/10 min. When treated under those conditions
at pH 5, high-carotenoid maize porridges doubled the initial carotenoid
content up to 88 µg/g dry weight. Regarding to cooking techniques, the
highest carotenoid content was found when unfermented thin porridges
were prepared (51 µg/g dry weight of high-carotenoid maize porridge). We
conclude that high-carotenoid maize may contribute to enhance the dietary
status of rural populations who depend on maize as a staple food.

Chapter V
170
Carotenoids, processing, fermentation, biofortification, metabolic
engineering
Vitamin A deficiency (VAD) is a major public health problem worldwide,
and particularly in African and South-East Asian countries. A poor diet can
lead to chronic insufficient vitamin A intake, the main underlying cause of
VAD, which may affect vision and cellular processes. Approximately, one-
third of the world's pre-school-age children and up to 15% of pregnant
women are estimated to be affected by VAD (WHO, 2009). Vitamin A is an
essential nutrient which is converted into retinal in the retina of the eye, and
it is also necessary for embryonic development and the maintenance of
epithelial and inmune cells (Institute of Medicine, 2001). Meat and dairy
products are common dietary sources of vitamin A, whereas dietary
carotenoids (provitamin A –PVA–) are obtained from colored fruits and
vegetables (Institute of Medicine, 2001). Maize is a staple food for more than
a billion people worldwide, especially for populations in Central America and
Southern Africa where this crop provides almost one-third of their caloric
needs (Suri and Tanumihardjo, 2016). In sub-Sarahan African countries,
white maize is mainly used to prepare maize meals, but it is devoid of
carotenoids, which may contribute to the prevalence of VAD in these
populations (Nuss and Tanumihardjo, 2010).
Carotenoids are isoprenoid compounds found in fruits and vegetables, either
as hydrocarbon carotenes, or as oxygen-containing xanthophylls. Some
carotenoids (such as β-carotene, α-carotene and β-cryptoxanthin) can
contribute to human health because of their PVA activity, while others act as
antioxidants (Britton, 1995). The intracellular location of carotenoids plays
an important role in their bioavailability. In photosynthetic plant tissues, e.g.
dark-green leafy vegetables and carrots, they are bound to proteins in the
chloroplasts, whilst in non-photosynthetic plant tissues, e.g. yellow and
orange fruits, they are mainly found in chromoplasts, dissolved in oil
droplets (Ball, 2006). Maize carotenoids are also present in substantial levels
in amyloplasts, plastids specialized for storage of starch granules (Howitt and
Pogson, 2006).
Chapter V
171
Maize is usually consumed as porridge, cooked either with a thin or thick
consistency by rural populations in sub-Saharan African countries. Some
maize products are fermented to facilitate grain processing and to avoid
bacterial contamination, but the use of this technique depends on the
geographical localization (De Groote and Kimenju, 2012). The cooking
technique and cooking conditions (time and temperature) may either increase
or decrease the carotenoid concentration, e.g. stewing increases it while
frying reduces it (Murador et al., 2014). Thermal treatments inactivate
oxidative enzymes and disrupt some cellular structures. Thus, higher
carotenoid content in food products is usually reported under mild thermal
conditions. The unsaturated structure of carotenoids makes them susceptible
to degradation under high temperature, low pH, light and reactive oxygen
species. Processing and storage may favor the exposure to oxygen and
oxidative enzymes, thus causing structural modifications in carotenoids such
as geometric isomerization and oxidation (Borsarelli and Mercadante, 2010).
Biofortification of staple crops with organic nutrients is an alternative long-
term strategy to improve nutritional health of populations at risk of
micronutrient deficiencies. It can be performed at source (i.e. in the plant
itself) through agronomic interventions, plant breeding or genetic
engineering (Gómez-Galera et al., 2010). Several staple crops have been
genetically engineered to enhance carotenoid levels and composition.
Namely, high-carotenoid (HC) maize which was engineered to accumulate
high levels of β-carotene, lutein and zeaxanthin (Zhu et al., 2008). The South
African white maize inbred M37W, which lacks carotenoids in the
endosperm due to the absence of the enzyme phytoene synthase 1 (necessary
for the biosynthesis of carotenoids), was used as a basis to create the HC
maize through the introduction of two genes, Zmpsy1 (Zea mays phytoene
synthase 1) and PacrtI (Pantoea ananatis phytoene desaturase), under the
control of endosperm-specific promoters (Zhu et al., 2008). Recent studies
have demonstrated a high carotenoid retention in biofortified crops after
processing, either in transgenic biofortified crops such as sorghum and
cassava, or in conventional biofortified crops such as maize, cassava and
pumpkin (Díaz-Gómez et al., 2017).
Different processing methods lead to substantial changes in the nutritional
composition of maize products (Suri and Tanumihardjo, 2016). Thus, it is
important to assess the effect of processing on novel maize varieties. Our
objectives were: a) to investigate the effect of temperature, cooking time and
pH on carotenoid content of HC maize; b) to evaluate the effect of different
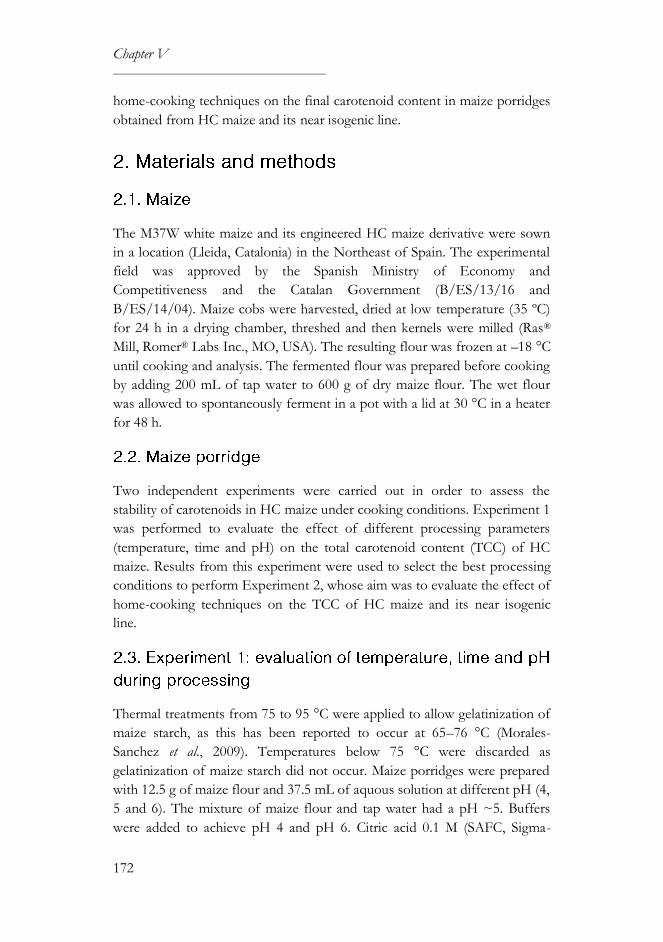
Chapter V
172
home-cooking techniques on the final carotenoid content in maize porridges
obtained from HC maize and its near isogenic line.
The M37W white maize and its engineered HC maize derivative were sown
in a location (Lleida, Catalonia) in the Northeast of Spain. The experimental
field was approved by the Spanish Ministry of Economy and
Competitiveness and the Catalan Government (B/ES/13/16 and
B/ES/14/04). Maize cobs were harvested, dried at low temperature (35 ºC)
for 24 h in a drying chamber, threshed and then kernels were milled (Ras®
Mill, Romer® Labs Inc., MO, USA). The resulting flour was frozen at –18 °C
until cooking and analysis. The fermented flour was prepared before cooking
by adding 200 mL of tap water to 600 g of dry maize flour. The wet flour
was allowed to spontaneously ferment in a pot with a lid at 30 °C in a heater
for 48 h.
Two independent experiments were carried out in order to assess the
stability of carotenoids in HC maize under cooking conditions. Experiment 1
was performed to evaluate the effect of different processing parameters
(temperature, time and pH) on the total carotenoid content (TCC) of HC
maize. Results from this experiment were used to select the best processing
conditions to perform Experiment 2, whose aim was to evaluate the effect of
home-cooking techniques on the TCC of HC maize and its near isogenic
line.
Thermal treatments from 75 to 95 °C were applied to allow gelatinization of
maize starch, as this has been reported to occur at 65–76 °C (Morales-
Sanchez et al., 2009). Temperatures below 75 °C were discarded as
gelatinization of maize starch did not occur. Maize porridges were prepared
with 12.5 g of maize flour and 37.5 mL of aquous solution at different pH (4,
5 and 6). The mixture of maize flour and tap water had a pH ~5. Buffers
were added to achieve pH 4 and pH 6. Citric acid 0.1 M (SAFC, Sigma-
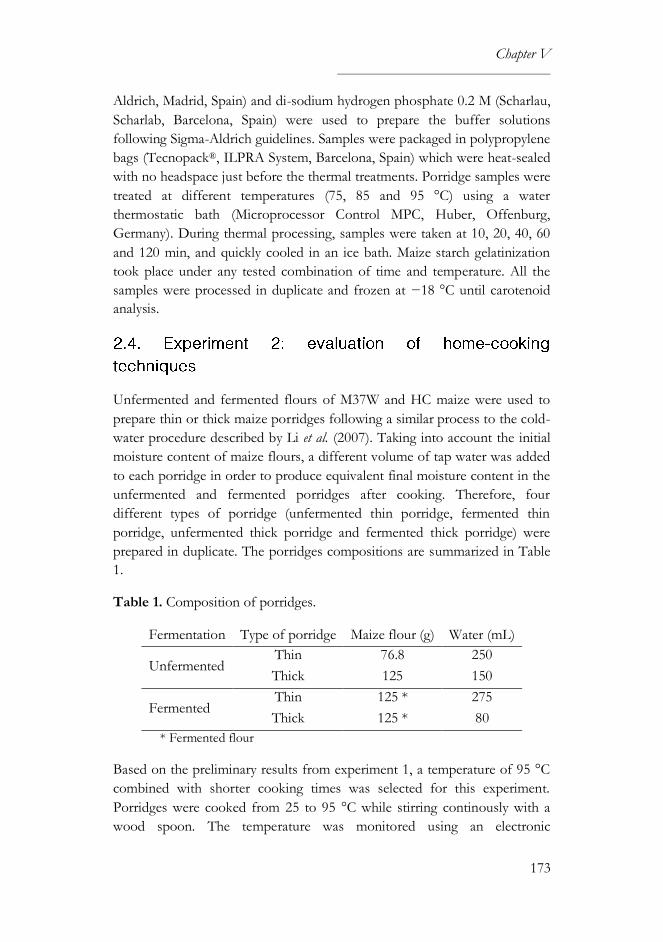
Chapter V
173
Aldrich, Madrid, Spain) and di-sodium hydrogen phosphate 0.2 M (Scharlau,
Scharlab, Barcelona, Spain) were used to prepare the buffer solutions
following Sigma-Aldrich guidelines. Samples were packaged in polypropylene
bags (Tecnopack®, ILPRA System, Barcelona, Spain) which were heat-sealed
with no headspace just before the thermal treatments. Porridge samples were
treated at different temperatures (75, 85 and 95 °C) using a water
thermostatic bath (Microprocessor Control MPC, Huber, Offenburg,
Germany). During thermal processing, samples were taken at 10, 20, 40, 60
and 120 min, and quickly cooled in an ice bath. Maize starch gelatinization
took place under any tested combination of time and temperature. All the
samples were processed in duplicate and frozen at −18 °C until carotenoid
analysis.
Unfermented and fermented flours of M37W and HC maize were used to
prepare thin or thick maize porridges following a similar process to the cold-
water procedure described by Li et al. (2007). Taking into account the initial
moisture content of maize flours, a different volume of tap water was added
to each porridge in order to produce equivalent final moisture content in the
unfermented and fermented porridges after cooking. Therefore, four
different types of porridge (unfermented thin porridge, fermented thin
porridge, unfermented thick porridge and fermented thick porridge) were
prepared in duplicate. The porridges compositions are summarized in Table
1.
Table 1. Composition of porridges.
Fermentation Type of porridge Maize flour (g) Water (mL)
Unfermented Thin 76.8 250
Thick 125 150
Fermented Thin 125 * 275
Thick 125 * 80
* Fermented flour
Based on the preliminary results from experiment 1, a temperature of 95 °C
combined with shorter cooking times was selected for this experiment.
Porridges were cooked from 25 to 95 °C while stirring continously with a
wood spoon. The temperature was monitored using an electronic
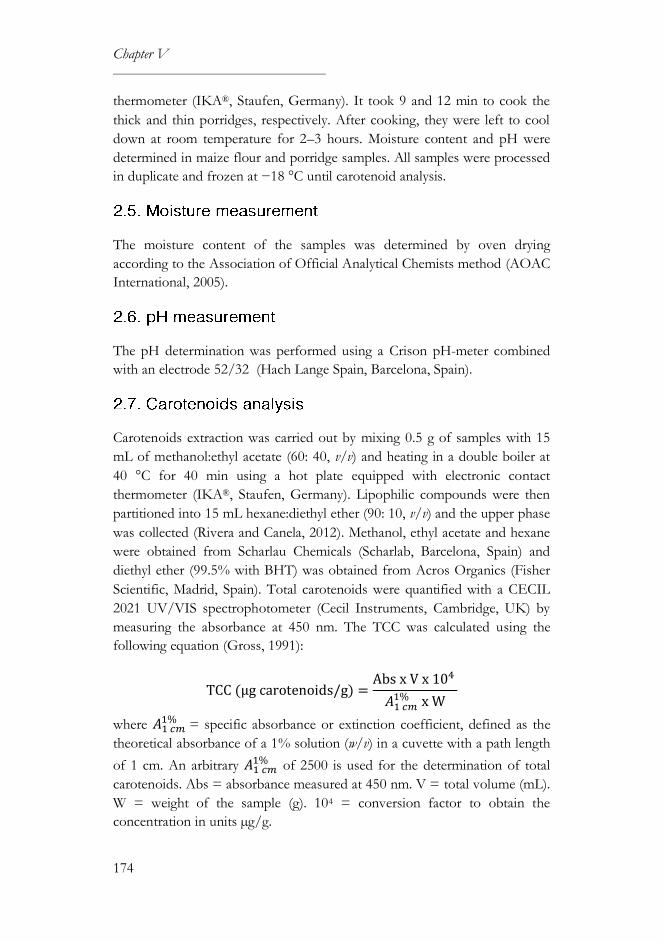
Chapter V
174
thermometer (IKA®, Staufen, Germany). It took 9 and 12 min to cook the
thick and thin porridges, respectively. After cooking, they were left to cool
down at room temperature for 2–3 hours. Moisture content and pH were
determined in maize flour and porridge samples. All samples were processed
in duplicate and frozen at −18 °C until carotenoid analysis.
The moisture content of the samples was determined by oven drying
according to the Association of Official Analytical Chemists method (AOAC
International, 2005).
The pH determination was performed using a Crison pH-meter combined
with an electrode 52/32 (Hach Lange Spain, Barcelona, Spain).
Carotenoids extraction was carried out by mixing 0.5 g of samples with 15
mL of methanol:ethyl acetate (60: 40, v/v) and heating in a double boiler at
40 °C for 40 min using a hot plate equipped with electronic contact
thermometer (IKA®, Staufen, Germany). Lipophilic compounds were then
partitioned into 15 mL hexane:diethyl ether (90: 10, v/v) and the upper phase
was collected (Rivera and Canela, 2012). Methanol, ethyl acetate and hexane
were obtained from Scharlau Chemicals (Scharlab, Barcelona, Spain) and
diethyl ether (99.5% with BHT) was obtained from Acros Organics (Fisher
Scientific, Madrid, Spain). Total carotenoids were quantified with a CECIL
2021 UV/VIS spectrophotometer (Cecil Instruments, Cambridge, UK) by
measuring the absorbance at 450 nm. The TCC was calculated using the
following equation (Gross, 1991):
TCC (µg carotenoids/g) =Abs x V x 104
𝐴1 𝑐𝑚1% x W
where 𝐴1 𝑐𝑚1% = specific absorbance or extinction coefficient, defined as the
theoretical absorbance of a 1% solution (w/v) in a cuvette with a path length
of 1 cm. An arbitrary 𝐴1 𝑐𝑚1% of 2500 is used for the determination of total
carotenoids. Abs = absorbance measured at 450 nm. V = total volume (mL).
W = weight of the sample (g). 104 = conversion factor to obtain the
concentration in units µg/g.

Chapter V
175
ANOVA and Tukey HSD test for means comparison were used (JMP® Pro
12 SAS institute, 2015). Differences among means with p ≤ 0.05 were
accepted as representing statistically significant differences.
The moisture content of HC maize porridges was 79.32% and the pH did
not change during thermal processing time. The TCC in HC untreated maize
porridges was 39 ± 1.3 µg/g dw (dry weight basis). The carotenoid content
was higher in HC maize porridges after thermal processing than in uncooked
porridges, varying according to the conditions used, although the increase
was lower when long cooking times were applied (Fig. 1). There were
statistically significant differences (p < 0.05) among treatments, as well as
among temperature-time and temperature-pH interactions. The highest TCC
was found when the lowest temperature was used (75 ºC), but there were no
significant differences among samples treated at 85 and 95 °C. At pH 5, the
carotenoid content of HC maize porridges heated at 75, 85 and 95 ºC for 10
min, was increased by 2.3–, 1.4– and 1.3–fold, respectively. At high
temperatures (> 80 °C), most maize proteins are denaturated and
unsolubilized (Sánchez del Angel et al., 2003). Under those circumstances,
carotenoids could not be easily released from the carotenoid-protein
complexes, which may explain the differences found in carotenoid content
between samples treated at 75 °C and 85−95 °C.
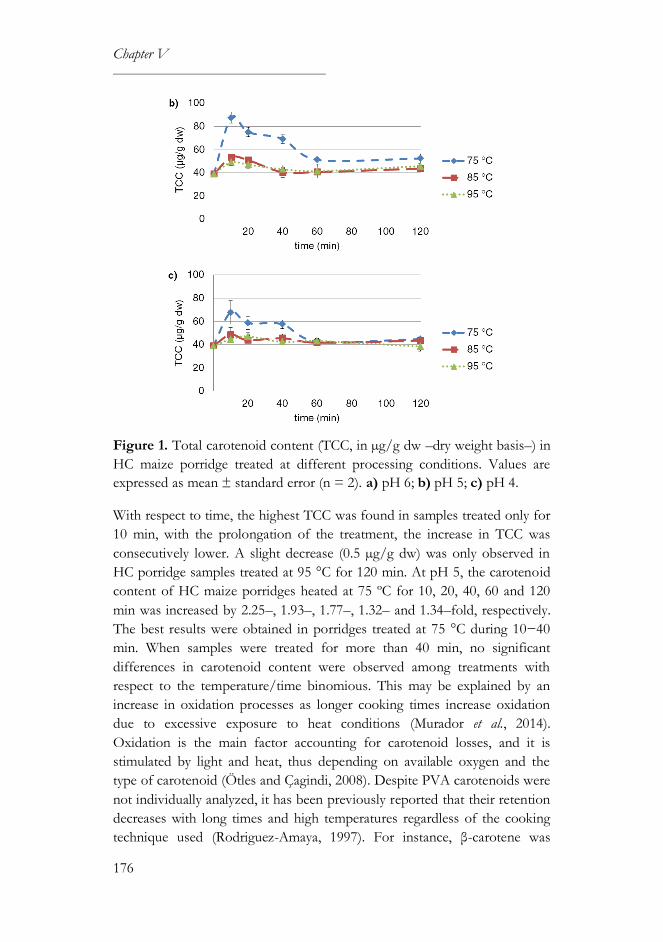
Chapter V
176
Figure 1. Total carotenoid content (TCC, in µg/g dw –dry weight basis–) in
HC maize porridge treated at different processing conditions. Values are
expressed as mean ± standard error (n = 2). a) pH 6; b) pH 5; c) pH 4.
With respect to time, the highest TCC was found in samples treated only for
10 min, with the prolongation of the treatment, the increase in TCC was
consecutively lower. A slight decrease (0.5 µg/g dw) was only observed in
HC porridge samples treated at 95 °C for 120 min. At pH 5, the carotenoid
content of HC maize porridges heated at 75 ºC for 10, 20, 40, 60 and 120
min was increased by 2.25–, 1.93–, 1.77–, 1.32– and 1.34–fold, respectively.
The best results were obtained in porridges treated at 75 °C during 10−40
min. When samples were treated for more than 40 min, no significant
differences in carotenoid content were observed among treatments with
respect to the temperature/time binomious. This may be explained by an
increase in oxidation processes as longer cooking times increase oxidation
due to excessive exposure to heat conditions (Murador et al., 2014).
Oxidation is the main factor accounting for carotenoid losses, and it is
stimulated by light and heat, thus depending on available oxygen and the
type of carotenoid (Ötles and Çagindi, 2008). Despite PVA carotenoids were
not individually analyzed, it has been previously reported that their retention
decreases with long times and high temperatures regardless of the cooking
technique used (Rodriguez-Amaya, 1997). For instance, β-carotene was

Chapter V
177
generally reduced in orange-fleshed sweet potato after thermal treatment (e.g.
boiling, frying, roasting and steaming), although there were slight differences
among cultivars (Donado-Pestana et al., 2012). As other biofortified crops,
HC maize may prevent the loss of carotenoids during cooking more
effectively than standard fortification, probably due to food matrix related
effects (Díaz-Gómez et al., 2017).
Temperature and processing time seem to be more important factors than
pH in relation to the TCC in HC maize porridges. HC maize porridges
heated at 75 ºC for 10 min had 1.3–fold higher carotenoid levels at pH 5
than at pH 6 and pH 4. This is a relevant isssue as the highest contents were
obtained when tap water was used instead of buffer solutions. The lower
TCC in samples at pH 6 may be related to a higher lipoxygenase activity
during the first minutes of heat treatment. It has been previously reported
that this enzyme exhibits its highest activity at pH 6 and it has a relatively
high thermal stability, as it is inactivated at 93 °C/4−9 min depending on the
maize cultivar (Barrett et al., 2000; Niu et al., 2015). On the other hand, the
lower TCC in samples at pH 4 could be explained by protein denaturation
and/or production of ion-pairs, as carotenoids exposed to acids are
protonated, undergoing cis–trans isomerization and additional degradation
reactions (Andrés-Bello et al., 2013).
After performing the first experiment, a temperature of 95 °C and a cooking
time below 20 min were selected for processing the maize under home
conditions. The moisture content in thin porridges was significantly higher
than in thick porridges (p < 0.05). A slightly higher moisture content was
observed in fermented porridges regardless the amount of added water (p <
0.05). The differences found among porridges obtained from M37W and HC
maize were not related to the type of maize (Table 2). The TCC was
measured in the different porridges before and after cooking (Fig. 2). The
TCC in the M37W and HC untreated maize porridges was 1.5 ± 0.5 and 39.5
± 2.6 µg/g dw, respectively, in the unfermented porridges, and 2.7 ± 0.0 and
40 ± 0.6 µg/g dw, respectively, in the fermented porridges. The great
difference in carotenoid content among M37W and HC maize porridges still
existed after processing (p < 0.001). Thus, statistical analyses were performed
separately depending on the type of maize. When unfermented flour was
used, thin and thick porridges elaborated with HC maize had 9.2– and 15.6–
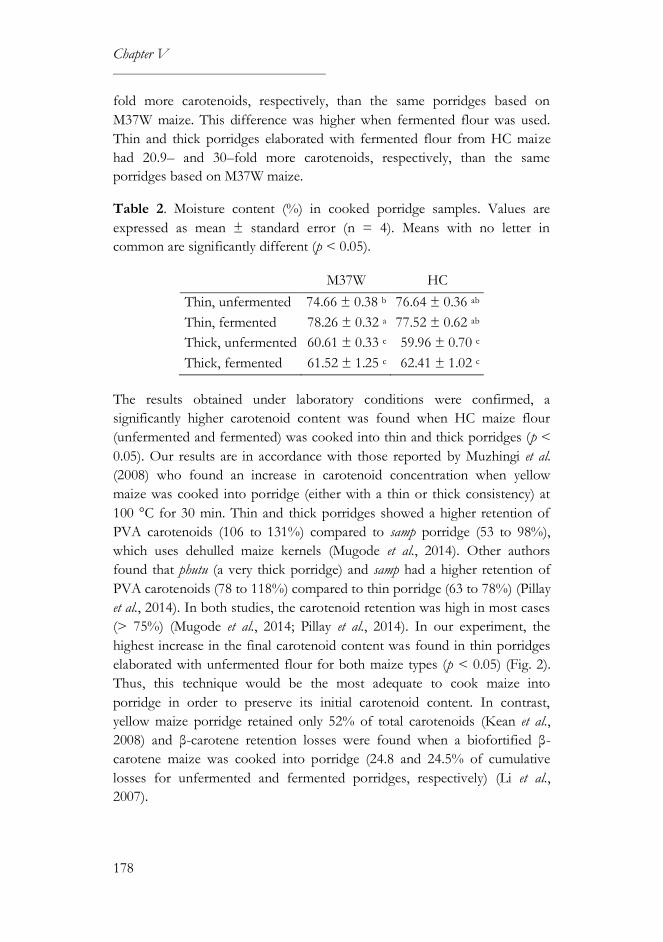
Chapter V
178
fold more carotenoids, respectively, than the same porridges based on
M37W maize. This difference was higher when fermented flour was used.
Thin and thick porridges elaborated with fermented flour from HC maize
had 20.9– and 30–fold more carotenoids, respectively, than the same
porridges based on M37W maize.
Table 2. Moisture content (%) in cooked porridge samples. Values are
expressed as mean ± standard error (n = 4). Means with no letter in
common are significantly different (p < 0.05).
M37W HC
Thin, unfermented 74.66 ± 0.38 b 76.64 ± 0.36 ab
Thin, fermented 78.26 ± 0.32 a 77.52 ± 0.62 ab
Thick, unfermented 60.61 ± 0.33 c 59.96 ± 0.70 c
Thick, fermented 61.52 ± 1.25 c 62.41 ± 1.02 c
The results obtained under laboratory conditions were confirmed, a
significantly higher carotenoid content was found when HC maize flour
(unfermented and fermented) was cooked into thin and thick porridges (p <
0.05). Our results are in accordance with those reported by Muzhingi et al.
(2008) who found an increase in carotenoid concentration when yellow
maize was cooked into porridge (either with a thin or thick consistency) at
100 °C for 30 min. Thin and thick porridges showed a higher retention of
PVA carotenoids (106 to 131%) compared to samp porridge (53 to 98%),
which uses dehulled maize kernels (Mugode et al., 2014). Other authors
found that phutu (a very thick porridge) and samp had a higher retention of
PVA carotenoids (78 to 118%) compared to thin porridge (63 to 78%) (Pillay
et al., 2014). In both studies, the carotenoid retention was high in most cases
(> 75%) (Mugode et al., 2014; Pillay et al., 2014). In our experiment, the
highest increase in the final carotenoid content was found in thin porridges
elaborated with unfermented flour for both maize types (p < 0.05) (Fig. 2).
Thus, this technique would be the most adequate to cook maize into
porridge in order to preserve its initial carotenoid content. In contrast,
yellow maize porridge retained only 52% of total carotenoids (Kean et al.,
2008) and β-carotene retention losses were found when a biofortified β-
carotene maize was cooked into porridge (24.8 and 24.5% of cumulative
losses for unfermented and fermented porridges, respectively) (Li et al.,
2007).

Chapter V
179
Figure 2. Total carotenoid content (TCC, in µg/g dw –dry weight basis–) in
M37W and HC maize porridges measured before cooking (n = 2) and after
cooking (n = 4). Thick and thin porridges were cooked at 95 °C during 9 and
12 min, respectively. Values are expressed as mean ± standard error. Means
with no letter in common (within each type of maize) are significantly
different (p < 0.05).
Fermentation did not affect carotenoid content of HC maize porridges,
whereas M37W maize porridges doubled the initial carotenoid content after
fermentation, which could be attributed to the enzimatic degradation of
subcellular compartments. However, it seems that carotenoids were more
negatively affected by heating in fermented flours, as carotenoid content was
not so much increased (HC porridge) or even reduced (M37W porridge)
when fermented flour was used. The wet flour was allowed to spontaneously
ferment, resulting in the expected reduction of pH in both thin and think
porridges, with significant differences among porridges (p < 0.05). The pH
reduction was less prominent in HC fermented porridges than in M37W
fermented porridges (Table 3), which may explain why carotenoid levels
were not decreased when HC fermented flour was used. Li et al. (2007)
showed that fermentation significantly affected the retention of β-carotene
(10.2% of losses), although they did not find differences between
unfermented and fermented porridges after cooking. The pH of their
fermented maize flour was 4, whereas the minimum pH found in our
porridge samples was ~ 5.
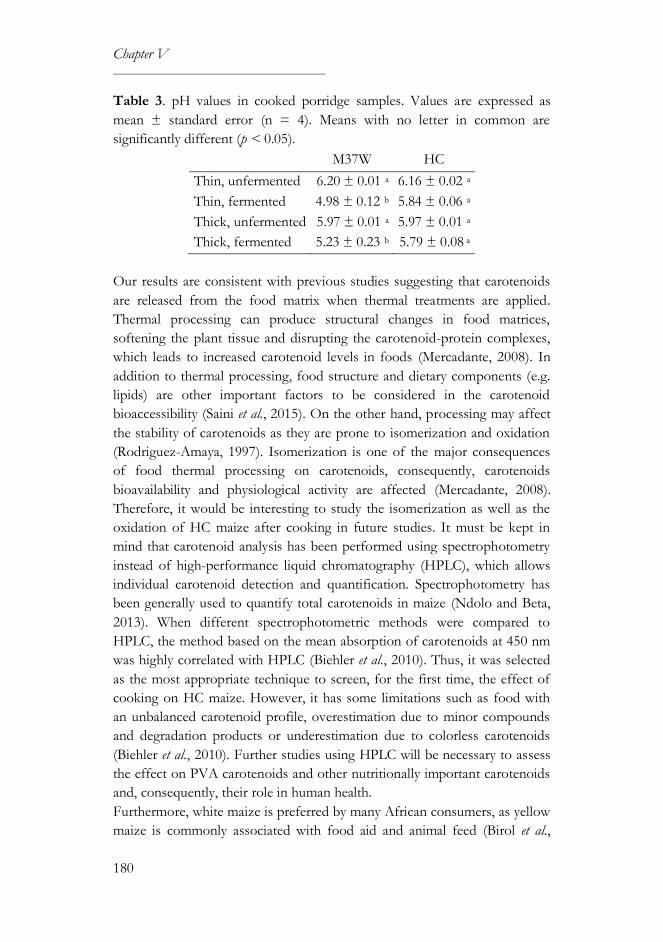
Chapter V
180
Table 3. pH values in cooked porridge samples. Values are expressed as
mean ± standard error (n = 4). Means with no letter in common are
significantly different (p < 0.05).
M37W HC
Thin, unfermented 6.20 ± 0.01 a 6.16 ± 0.02 a
Thin, fermented 4.98 ± 0.12 b 5.84 ± 0.06 a
Thick, unfermented 5.97 ± 0.01 a 5.97 ± 0.01 a
Thick, fermented 5.23 ± 0.23 b 5.79 ± 0.08 a
Our results are consistent with previous studies suggesting that carotenoids
are released from the food matrix when thermal treatments are applied.
Thermal processing can produce structural changes in food matrices,
softening the plant tissue and disrupting the carotenoid-protein complexes,
which leads to increased carotenoid levels in foods (Mercadante, 2008). In
addition to thermal processing, food structure and dietary components (e.g.
lipids) are other important factors to be considered in the carotenoid
bioaccessibility (Saini et al., 2015). On the other hand, processing may affect
the stability of carotenoids as they are prone to isomerization and oxidation
(Rodriguez-Amaya, 1997). Isomerization is one of the major consequences
of food thermal processing on carotenoids, consequently, carotenoids
bioavailability and physiological activity are affected (Mercadante, 2008).
Therefore, it would be interesting to study the isomerization as well as the
oxidation of HC maize after cooking in future studies. It must be kept in
mind that carotenoid analysis has been performed using spectrophotometry
instead of high-performance liquid chromatography (HPLC), which allows
individual carotenoid detection and quantification. Spectrophotometry has
been generally used to quantify total carotenoids in maize (Ndolo and Beta,
2013). When different spectrophotometric methods were compared to
HPLC, the method based on the mean absorption of carotenoids at 450 nm
was highly correlated with HPLC (Biehler et al., 2010). Thus, it was selected
as the most appropriate technique to screen, for the first time, the effect of
cooking on HC maize. However, it has some limitations such as food with
an unbalanced carotenoid profile, overestimation due to minor compounds
and degradation products or underestimation due to colorless carotenoids
(Biehler et al., 2010). Further studies using HPLC will be necessary to assess
the effect on PVA carotenoids and other nutritionally important carotenoids
and, consequently, their role in human health.
Furthermore, white maize is preferred by many African consumers, as yellow
maize is commonly associated with food aid and animal feed (Birol et al.,

Chapter V
181
2015). Nevertheless, it has been demonstrated that existing preferences for
white maize or negative connotations associated with yellow maize do not
adversely affect the acceptance of orange maize (PVA-biofortified maize)
(Meenakshi et al., 2012). Moreover, recent studies have shown that rural
consumers are willing to pay for biofortified crops with visible traits (e.g.
orange maize) as much as, if not more, than conventional varieties (Birol et
al., 2015). Therefore, education programs and information campaigns are
necessary to promote the nutritional qualities of biofortified maize.
High-carotenoid maize can be a cost-effective and sustainable source of
carotenoids, which may contribute to improve health status of populations
who depend on maize as a staple crop. Our results show that final
carotenoid content in maize meals varies depending on the processing
conditions and cooking method applied, even it can be enhanced due to the
increase in carotenoid extractability from the food matrix. The optimum
thermal treatment for HC maize was 75 °C/10 min, followed by 75 °C/20
min and 75 °C/40 min. Higher temperatures are used when maize is cooked
into porridge (95 °C), but they would also be acceptable, as carotenoid
content was only decreased when cooking was prolonged during 2 hours.
The carotenoid levels in maize meals may be affected by low pH values,
thus, it would be useful to control pH levels in fermented products. Further
studies are necessary to evaluate structural changes in carotenoids in HC
maize after cooking, as well as, carotenoid bioavailability after consumption
of meals based on HC maize.
Andrés-Bello, A., Barreto-Palacios, V., García-Segovia, P., Mir-Bel, J. and
Martínez-Monzó, J., 2013. Effect of pH on color and texture of food
products. Food Engineering Reviews 5: 158–170.
Association of Official Analytical Chemists (AOAC) International, 2005.
International Method 925.09B. In: Horwitz, W. (ed) Official Methods
of Analysis, 18th edition. AOAC Inc., Gaithersburg, USA, pp. 26-27.
Ball, G.F.M., 2006. Vitamins in foods. Analysis, bioavailability and stability.
CRC Press, Boca Raton, FL, USA.
Barrett, D.M., Garcia, E.L., Russell, G.F., Ramírez, E. and Shirazi, A., 2000.
Blanch time and cultivar effects on quality of frozen and stored corn
and broccoli. Journal of Food Science 65: 534–540.
Chapter V
182
Biehler, E., Mayer, F., Hoffmann, L., Krause, E. and Bohn, T., 2010.
Comparison of 3 spectrophotometric methods for carotenoid
determination in frequently consumed fruits and vegetables. Journal of
Food Science 75: C55–C61.
Birol, E., Meenakshi, J. V., Oparinde, A., Perez, S. and Tomlins, K., 2015.
Developing country consumers' acceptance of biofortified foods: a
synthesis. Food Security 7: 555–568.
Borsarelli, C. and Mercadante, A.Z., 2010. Thermal and photochemical
degradation of carotenoids. In: Landrum, J.T. (ed.) Carotenoids.
Physical, chemical and biological functions and properties. CRC Press,
Boca Raton, FL, USA, pp. 229–253.
Britton, G., 1995. Structure and properties of carotenoids in relation to
function. The FASEB Journal 9: 1551–1558.
De Groote, H. and Kimenju, S.C., 2012. Consumer preferences for maize
products in urban Kenya. Food and Nutrition Bulletin 33: 99–110.
Díaz-Gómez, J., Twyman, R.M., Zhu, C., Farré, G., Serrano, J.C.E., Portero-
Otin, M., Muñoz, P., Sandmann, G., Capell, T. and Christou, P., 2017.
Biofortification of crops with nutrients: factors affecting utilization and
storage. Current Opinion in Biotechnology 44: 1–9.
Donado-Pestana, C.M., Salgado, J.M., de Oliveira Rios, A., dos Santos, P.R.
and Jablonski, A., 2012. Stability of carotenoids, total phenolics and in
vitro antioxidant capacity in the thermal processing of orange-fleshed
sweet potato (Ipomoea batatas Lam.) cultivars grown in Brazil. Plant
Foods for Human Nutrition 67: 262–270.
Gómez-Galera, S., Rojas, E., Sudhakar, D., Zhu, C., Pelacho, A.M., Capell,
T. and Christou, P., 2010. Critical evaluation of strategies for mineral
fortification of staple food crops. Transgenic Research 19: 165–180.
Gross, J., 1991. Pigments in vegetables: chlorophylls and carotenoids.
Springer Science and Business Media, New York, NY, USA.
Howitt, C.A. and Pogson, B.J., 2006. Carotenoid accumulation and function
in seeds and non-green tissues. Plant, Cell and Environment 29: 435–
445.
Chapter V
183
Institute of Medicine (US), 2001. Dietary reference intakes for vitamin A,
vitamin K, arsenic, boron, chromium, copper, iodine, iron, manganese,
molybdenum, nickel, silicon, vanadium and zinc. National Academy
Press, Washington DC, USA.
Kean, E.G., Hamaker, B.R. and Ferruzzi, M.G., 2008. Carotenoid
bioaccessibility from whole grain and degermed maize meal products.
Journal of Agricultural and Food Chemistry 56: 9918–9926.
Li, S., Tayie, F.A.K., Young, M.F., Rocheford, T. and White, W.S., 2007.
Retention of provitamin A carotenoids in high β-carotene maize (Zea
mays) during traditional African household processing. Journal of
Agricultural and Food Chemistry 55: 10744–10750.
Meenakshi, J. V., Banerji, A., Manyong, V., Tomlins, K., Mittal, N. and
Hamukwala, P., 2012. Using a discrete choice experiment to elicit the
demand for a nutritious food: willingness-to-pay for orange maize in
rural Zambia. Journal of Health Economics 31: 62–71.
Mercadante, A.Z., 2008. Carotenoids in foods: sources and stability during
processing and storage. In: Socaciu, C. (ed.) Food colorants. Chemical
and functional properties. CRC Press, Boca Raton, FL, USA, pp. 213–
240.
Morales-Sanchez, E., Figueroa, J.D.C. and Gaytan-Martínez, M., 2009. Wet
method for measuring starch gelatinization temperature using electrical
conductivity. Journal of Food Science 74: E382–E385.
Mugode, L., Ha, B., Kaunda, A., Sikombe, T., Phiri, S., Mutale, R., Davis, C.,
Tanumihardjo, S. and De Moura, F.F., 2014. Carotenoid retention of
biofortified provitamin A maize (Zea mays L.) after Zambian traditional
methods of milling, cooking and storage. Journal of Agricultural and
Food Chemistry 62: 6317–6325.
Murador, D.C., da Cunha, D.T. and de Rosso, V.V., 2014. Effects of
cooking techniques on vegetable pigments: a meta-analytic approach to
carotenoid and anthocyanin levels. Food Research International 65:
177–183.
Muzhingi, T., Yeum, K.-J., Russell, R.M., Johnson, E.J., Jian, Q. and Tang,
G., 2008. Determination of carotenoids in yellow maize, the effects of
saponification and food preparations. International Journal for Vitamin
Chapter V
184
and Nutrition Research 78: 112–120.
Ndolo, V.U. and Beta, T., 2013. Distribution of carotenoids in endosperm,
germ, and aleurone fractions of cereal grain kernels. Food Chemistry
139: 663–671.
Niu, L., Li, D., Liu, C. and Liu, F., 2015. Comparison of lipoxygenase activity
characteristics in aqueous extracts from milk-stage sweet corn and
waxy corn. Food Science and Biotechnology 24: 867–873.
Nuss, E.T. and Tanumihardjo, S.A., 2010. Maize: a paramount staple crop in
the context of global nutrition. Comprehensive Reviews in Food
Science and Food Safety 9: 417–436.
Ötles, S. and Çagindi, Ö., 2008. Carotenoids as natural colorants. In: Socaciu,
C. (ed.) Food colorants. Chemical and functional properties. CRC
Press, Boca Raton, FL, USA, pp. 51-70.
Pillay, K., Siwela, M., Derera, J. and Veldman, F.J., 2014. Provitamin A
carotenoids in biofortified maize and their retention during processing
and preparation of South African maize foods. Journal of Food Science
and Technology 51: 634–44.
Rivera, S. and Canela, R., 2012. Influence of sample processing on the
analysis of carotenoids in maize. Molecules 17: 11255–11268.
Rodriguez-Amaya, D.B., 1997. Carotenoids and food preparation: the
retention of provitamin A carotenoids in prepared, processed and
stored foods. John Snow Inc/OMNI Project, USA.
Saini, R.K., Nile, S.H. and Park, S.W., 2015. Carotenoids from fruits and
vegetables: chemistry, analysis, occurrence, bioavailability and biological
activities. Food Research International 76: 735–750.
Sánchez del Angel, S., Moreno Martínez, E. and Valdivia López, M.A., 2003.
Study of denaturation of corn proteins during storage using differential
scanning calorimetry. Food Chemistry 83: 531–540.
Suri, D.J. and Tanumihardjo, S.A., 2016. Effects of different processing
methods on the micronutrient and phytochemical contents of maize:
from A to Z. Comprehensive Reviews in Food Science and Food
Safety 15: 912–926.
Chapter V
185
World Health Organization (WHO), 2009. Global prevalence of vitamin A
deficiency in populations at risk 1995-2005. World Health Organization
Global database on vitamin A deficiency. WHO, Geneva, Switzerland.
Zhu, C., Naqvi, S., Breitenbach, J., Sandmann, G., Christou, P. and Capell,
T., 2008. Combinatorial genetic transformation generates a library of
metabolic phenotypes for the carotenoid pathway in maize.
Proceedings of the National Academy of Sciences of the United States
of America 105: 18232–18237.
Aman, R., Biehl, J., Carle, R., Conrad, J., Beifuss, U. and Schieber, A., 2005.
Application of HPLC coupled with DAD, APcI-MS and NMR to the
analysis of lutein and zeaxanthin stereoisomers in thermally processed
vegetables. Food Chemistry 92: 753–763.
Berni, P., Chitchumroonchokchai, C., Canniatti-Brazaca, S.G., De Moura,
F.F. and Failla, M.L., 2015. Comparison of content and in vitro
bioaccessibility of provitamin A carotenoids in home cooked and
commercially processed orange fleshed sweet potato (Ipomea batatas
Lam). Plant Foods for Human Nutrition 70: 1–8.
Boon, C.S., McClements, D.J., Weiss, J. and Decker, E.A., 2010. Factors
influencing the chemical stability of carotenoids in foods. Critical
Reviews in Food Science and Nutrition 50: 515–532.
Farré, G., Sanahuja, G., Naqvi, S., Bai, C., Capell, T., Zhu, C. and Christou,
P., 2010. Travel advice on the road to carotenoids in plants. Plant
Science 179: 28–48.
Fernández-García, E., Carvajal-Lérida, I., Jarén-Galán, M., Garrido-
Fernández, J., Pérez-Gálvez, A. and Hornero-Méndez, D., 2012.
Carotenoids bioavailability from foods: from plant pigments to
efficient biological activities. Food Research International 46: 438–450.
Hotz, C. and Gibson R.S., 2007. Traditional food-processing and preparation
practices to enhance the bioavailability of micronutrients in plant-based
diets. Journal of Nutrition 137: 1097–1100.
Luterotti, S., Marković, K., Franko, M., Bicanic, D., Madzgalj, A. and Kljak,
K., 2013. Comparison of spectrophotometric and HPLC methods for
Chapter V
186
determination of carotenoids in foods. Food Chemistry 140: 390–397.
McCann, J.C., 2005. Maize and grace: Africa's encounter with a new world
crop, 1500-2000. Harvard University Press, Cambridge, MA, USA.
Rodriguez-Amaya D.B., 2016. Natural food pigments and colorants. Current
Opinion in Food Science 7: 20–26.
Stevens, R. and Winter-Nelson, A., 2008. Consumer acceptance of
provitamin A-biofortified maize in Maputo, Mozambique. Food Policy
33: 341–351.
Tanumihardjo, S.A., Palacios, N. and Pixley, K.V., 2010. Provitamin A
carotenoid bioavailability: what really matters? International Journal for
Vitamin and Nutrition Research 80: 336–350.


General discussion
189
High-carotenoid (HC) maize is a transgenic variety that accumulates high
levels of carotenoids, including those with vitamin A activity. HC maize was
developed to improve the nutritional health of human populations whose
diet predominantly relies on cereals, with little access to fresh fruit and
vegetables. However, it is necessary to evaluate its safety, agronomic
performance and nutritional sufficiency before fulfilling its humanitarian
objectives. HC maize has previously been shown to be substantially
equivalent to its near isogenic line in terms of compositional analysis (except
for the intended modification of the carotenoid content), to be safe in a 90–
day sub-chronic toxicity study in mice and to have a similar agronomic
performance to its near isogenic line (Arjó et al., 2012; Zanga et al., 2016a). A
multidisciplinary project (VitaMaize: high quality and safe food through
antioxidant fortified maize) was developed to carry out all these evaluations.
This Doctoral Thesis is framed within that project and aims to evaluate the
use of HC maize as feed and food component, through different analyses
performed from the field to the fork. An overview of the main results
obtained is presented and discussed in this section.
Novel crops created with enhanced traits should be tested against their near
isogenic lines under different environmental conditions to ensure that the
novel traits (e.g. the accumulation of carotenoids) are preserved after field
performance. Field testing is also necessary to assess the impact of abiotic
(e.g. temperature, light, humidity and weather conditions) and biotic (e.g.
pests and diseases) factors on crop performance (Zhu et al., 2017). Maize
fields are commonly colonized by several spoilage fungi and, consequently, a
large variety of mycotoxins can be found. Thus, it is necessary to evaluate the
susceptibility to fungal infection and mycotoxin contamination in novel
maize varieties.
During three consecutive harvest seasons (2013, 2014 and 2015), the HC
maize and its near isogenic line (the wild-type white endosperm variety
M37W), were cultivated in an experiment field located in the University of
Lleida (41°37'50''N, 0°35'27''E, 180 m). Both varieties were tested for the
prevalence of fungal infection and the accumulation of FBs and AFs
(Chapter I). There were only slight differences in fungal infection (expressed
as the proportion of infected grains) between both types of maize. The
dominant genus in all three harvest seasons was Fusarium. Maize kernels were
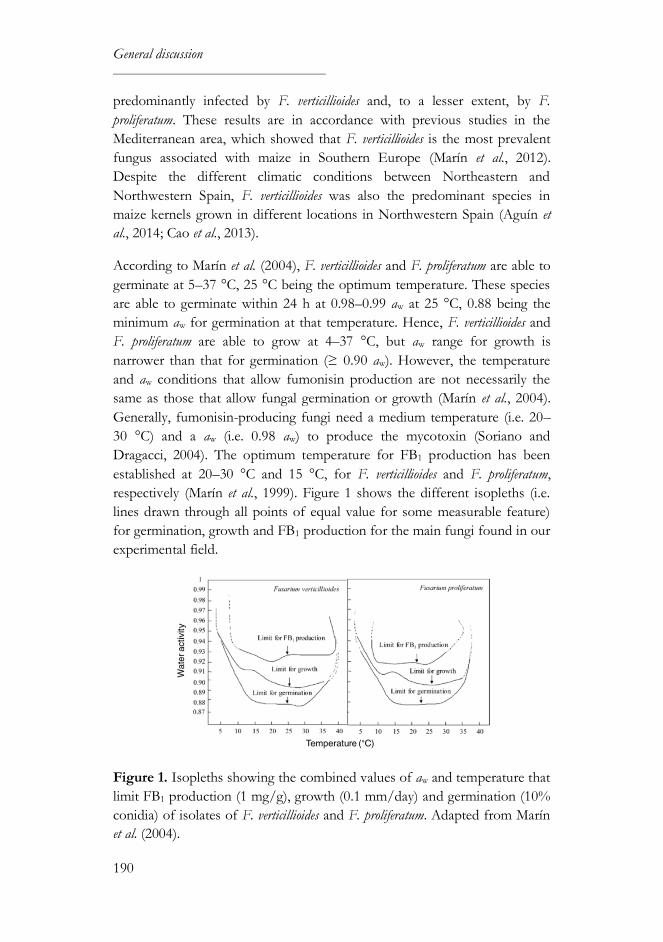
General discussion
190
predominantly infected by F. verticillioides and, to a lesser extent, by F.
proliferatum. These results are in accordance with previous studies in the
Mediterranean area, which showed that F. verticillioides is the most prevalent
fungus associated with maize in Southern Europe (Marín et al., 2012).
Despite the different climatic conditions between Northeastern and
Northwestern Spain, F. verticillioides was also the predominant species in
maize kernels grown in different locations in Northwestern Spain (Aguín et
al., 2014; Cao et al., 2013).
According to Marín et al. (2004), F. verticillioides and F. proliferatum are able to
germinate at 5–37 °C, 25 °C being the optimum temperature. These species
are able to germinate within 24 h at 0.98–0.99 aw at 25 °C, 0.88 being the
minimum aw for germination at that temperature. Hence, F. verticillioides and
F. proliferatum are able to grow at 4–37 °C, but aw range for growth is
narrower than that for germination (≥ 0.90 aw). However, the temperature
and aw conditions that allow fumonisin production are not necessarily the
same as those that allow fungal germination or growth (Marín et al., 2004).
Generally, fumonisin-producing fungi need a medium temperature (i.e. 20–
30 °C) and a aw (i.e. 0.98 aw) to produce the mycotoxin (Soriano and
Dragacci, 2004). The optimum temperature for FB1 production has been
established at 20–30 °C and 15 °C, for F. verticillioides and F. proliferatum,
respectively (Marín et al., 1999). Figure 1 shows the different isopleths (i.e.
lines drawn through all points of equal value for some measurable feature)
for germination, growth and FB1 production for the main fungi found in our
experimental field.
Figure 1. Isopleths showing the combined values of aw and temperature that
limit FB1 production (1 mg/g), growth (0.1 mm/day) and germination (10%
conidia) of isolates of F. verticillioides and F. proliferatum. Adapted from Marín
et al. (2004).
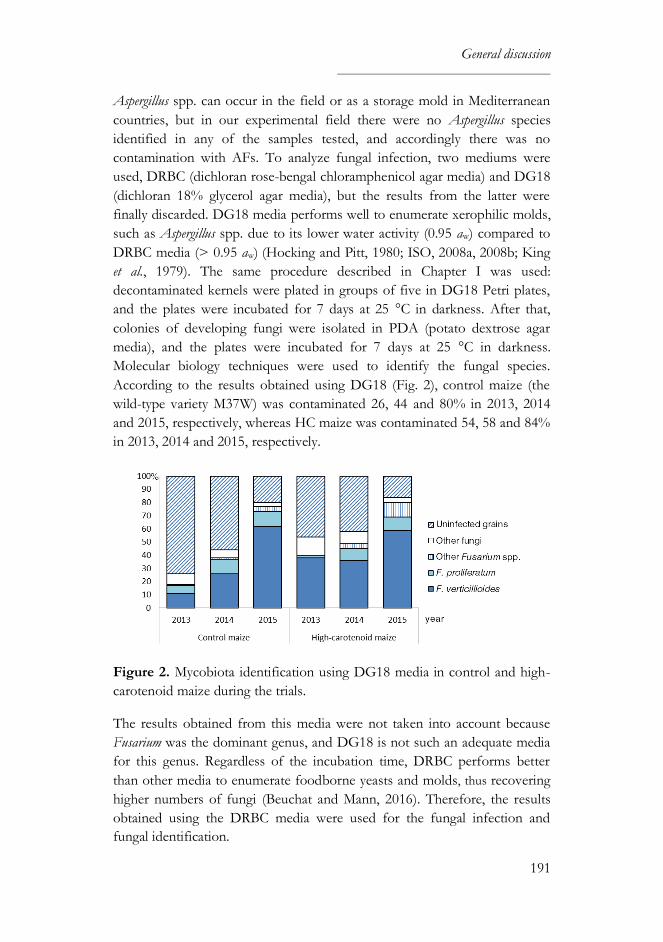
General discussion
191
Aspergillus spp. can occur in the field or as a storage mold in Mediterranean
countries, but in our experimental field there were no Aspergillus species
identified in any of the samples tested, and accordingly there was no
contamination with AFs. To analyze fungal infection, two mediums were
used, DRBC (dichloran rose-bengal chloramphenicol agar media) and DG18
(dichloran 18% glycerol agar media), but the results from the latter were
finally discarded. DG18 media performs well to enumerate xerophilic molds,
such as Aspergillus spp. due to its lower water activity (0.95 aw) compared to
DRBC media (> 0.95 aw) (Hocking and Pitt, 1980; ISO, 2008a, 2008b; King
et al., 1979). The same procedure described in Chapter I was used:
decontaminated kernels were plated in groups of five in DG18 Petri plates,
and the plates were incubated for 7 days at 25 °C in darkness. After that,
colonies of developing fungi were isolated in PDA (potato dextrose agar
media), and the plates were incubated for 7 days at 25 °C in darkness.
Molecular biology techniques were used to identify the fungal species.
According to the results obtained using DG18 (Fig. 2), control maize (the
wild-type variety M37W) was contaminated 26, 44 and 80% in 2013, 2014
and 2015, respectively, whereas HC maize was contaminated 54, 58 and 84%
in 2013, 2014 and 2015, respectively.
Figure 2. Mycobiota identification using DG18 media in control and high-
carotenoid maize during the trials.
The results obtained from this media were not taken into account because
Fusarium was the dominant genus, and DG18 is not such an adequate media
for this genus. Regardless of the incubation time, DRBC performs better
than other media to enumerate foodborne yeasts and molds, thus recovering
higher numbers of fungi (Beuchat and Mann, 2016). Therefore, the results
obtained using the DRBC media were used for the fungal infection and
fungal identification.

General discussion
192
Fusarium spp. infected most maize kernels; subsequently, fumonisin
contamination was found in both maize varieties in all the years of study
(Fig. 3), but the proportion of contaminated grains was substantially higher
in the control maize (1.4–fold, 2.4–fold and 2–fold more in the 2013, 2014
and 2015 harvest seasons, respectively). A higher fumonisin contamination
was found in both maize varieties in the second harvest, which was
associated with higher rainfall two months before harvest, corresponding
with an optimum period for fumonisin production and/or accumulation
(Marín et al., 2004).
Figure 3. Fumonisin levels (FB1 + FB2, in mg/kg) in control and high-
carotenoid maize during the trials. Values are means (n = 3).
The agronomic performance of HC maize and its near isogenic line under
field conditions was also evaluated by researchers from our university,
concluding that HC maize did not differ from its counterpart in terms of
agronomic performance, particularly grain yield and its main components.
Complementarily, two different fertilization regimes were evaluated: 0 and
200 kg N/ha, the latter applied as urea at the V6 stage (for a better
understanding of maize growth stages see pages 15–16). The response to N
was similar for both types of maize, indicating that the transgenes introduced
do not influence the manner in which maize plants respond to N availability
(Zanga et al., 2016a). The application of N fertilizers, which lead to longer
vegetative growth and higher leaf expansion, could extend the favorable
conditions (i.e. high moisture levels from silking to maturation) that promote
fungal infection (Blandino et al., 2008). High and low rates of N fertilization
have been related to higher fumonisin levels in maize fields, recommending a
balanced N fertilization (200 kg N/ha) to ensure lower fumonisin
General discussion
193
contamination (Blandino et al., 2008). Spanish researchers only found a weak
correlation between N fertilization (150–336 kg N/ha) and fumonisin levels
in maize (Ariño et al., 2009), whereas Italian researchers showed a significant
increase in fumonisin levels in fertilized maize fields (270 kg N/ha)
compared to those unfertilized in 2 of 3 years of study (Marocco et al., 2008).
However, these Italian researchers did not find significant differences in
fumonisin levels between maize fields fertilized at 300 kg N/ha or without
fertilization (Marocco et al., 2009). Thus, the effect of N fertilization on
fumonisin contamination is still controversial. Our main goal was to evaluate
whether the higher carotenoid content in HC maize could affect its
susceptibility to fungal infection and mycotoxin contamination. Therefore,
the impact of N fertilization on fumonisin levels was not considered, despite
other authors having reported a possible relation. In our experiment, the
potential role of N fertilization in fumonisin content was offset by random
sampling, i.e. all the plots were randomly sampled to obtain a representative
sample, and the samples from each plot were combined to obtain an
aggregate sample of each type of maize.
In maize fields located in Southern Europe, the fungal growth and
mycotoxin production depend on the climatic conditions during the maize
flowering period, as well as on the insect damage produced by Ostrinia
nubilalis (European corn borer, ECB) and Sesamia nonagrioides (Mediterranean
corn borer). The prevalence of Fusarium in our area is closely linked to the
activity of these insects (Marín et al., 2012). Injuries caused by insect pests
allow the colonization of maize grains by fungi, but insects can also act as
vectors (Munkvold and Desjardins, 1997). Thus, a reduction in insect pests
can result in a lower frequency and/or lower severity of fungal infections
and, consequently, a lower mycotoxin contamination, as shown by the
comparison of fumonisin concentrations in Bt and non-Bt maize hybrids in
different field locations (for further information see Annex III) (Díaz-
Gómez et al., 2016).
As part of this multidisciplinary project, other researchers from our
university evaluated whether the higher carotenoid content in HC maize
could affect the development (e.g. larval mortality, leaf consumption and
larval weight) of two maize pests: ECB, which penetrates the stalks and cobs
but also feeds on leaves, and armyworm moth (Mythimna unipuncta), which
feeds mainly on the leaves. Similar results were obtained for both species,
without significant differences in mortality rates after 14 days feeding on the
leaves. However, both species consumed fewer leaves from HC maize
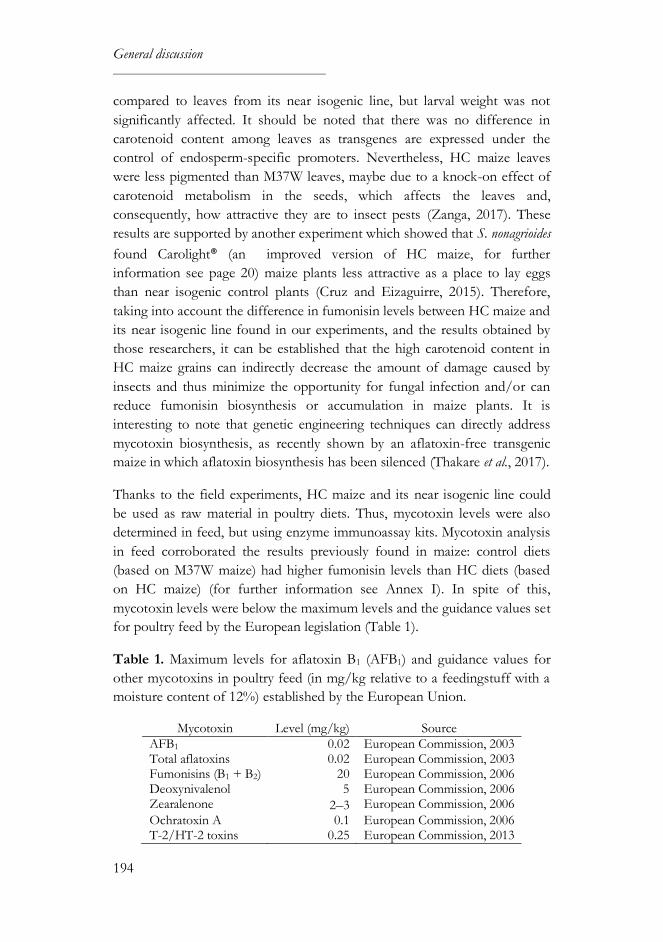
General discussion
194
compared to leaves from its near isogenic line, but larval weight was not
significantly affected. It should be noted that there was no difference in
carotenoid content among leaves as transgenes are expressed under the
control of endosperm-specific promoters. Nevertheless, HC maize leaves
were less pigmented than M37W leaves, maybe due to a knock-on effect of
carotenoid metabolism in the seeds, which affects the leaves and,
consequently, how attractive they are to insect pests (Zanga, 2017). These
results are supported by another experiment which showed that S. nonagrioides
found Carolight® (an improved version of HC maize, for further
information see page 20) maize plants less attractive as a place to lay eggs
than near isogenic control plants (Cruz and Eizaguirre, 2015). Therefore,
taking into account the difference in fumonisin levels between HC maize and
its near isogenic line found in our experiments, and the results obtained by
those researchers, it can be established that the high carotenoid content in
HC maize grains can indirectly decrease the amount of damage caused by
insects and thus minimize the opportunity for fungal infection and/or can
reduce fumonisin biosynthesis or accumulation in maize plants. It is
interesting to note that genetic engineering techniques can directly address
mycotoxin biosynthesis, as recently shown by an aflatoxin-free transgenic
maize in which aflatoxin biosynthesis has been silenced (Thakare et al., 2017).
Thanks to the field experiments, HC maize and its near isogenic line could
be used as raw material in poultry diets. Thus, mycotoxin levels were also
determined in feed, but using enzyme immunoassay kits. Mycotoxin analysis
in feed corroborated the results previously found in maize: control diets
(based on M37W maize) had higher fumonisin levels than HC diets (based
on HC maize) (for further information see Annex I). In spite of this,
mycotoxin levels were below the maximum levels and the guidance values set
for poultry feed by the European legislation (Table 1).
Table 1. Maximum levels for aflatoxin B1 (AFB1) and guidance values for
other mycotoxins in poultry feed (in mg/kg relative to a feedingstuff with a
moisture content of 12%) established by the European Union.
Mycotoxin Level (mg/kg) Source
AFB1 0.02 European Commission, 2003 Total aflatoxins 0.02 European Commission, 2003 Fumonisins (B1 + B2) 20 European Commission, 2006 Deoxynivalenol 5 European Commission, 2006 Zearalenone 2–3 European Commission, 2006
Ochratoxin A 0.1 European Commission, 2006 T-2/HT-2 toxins 0.25 European Commission, 2013
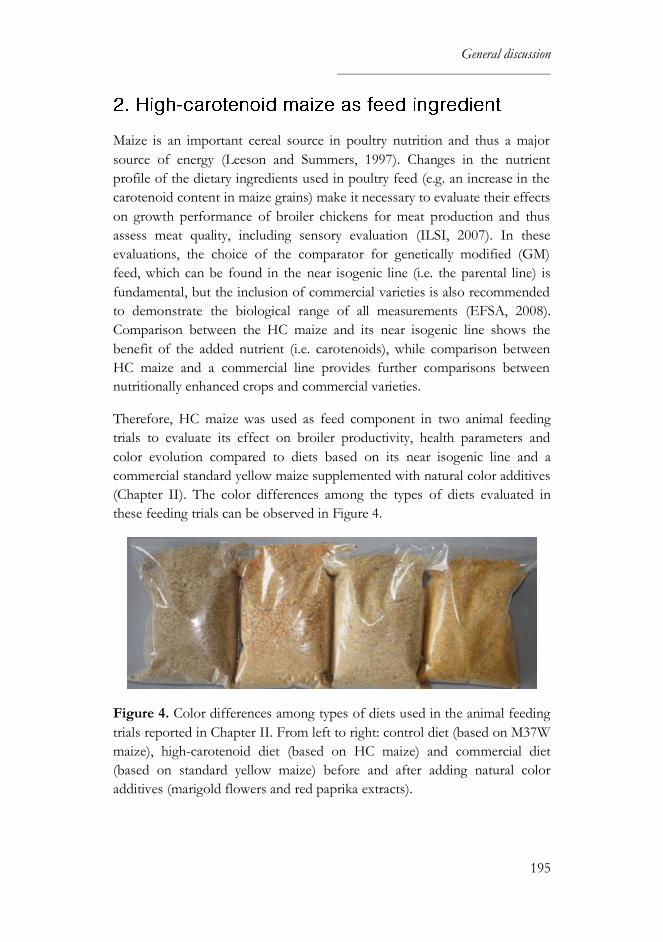
General discussion
195
Maize is an important cereal source in poultry nutrition and thus a major
source of energy (Leeson and Summers, 1997). Changes in the nutrient
profile of the dietary ingredients used in poultry feed (e.g. an increase in the
carotenoid content in maize grains) make it necessary to evaluate their effects
on growth performance of broiler chickens for meat production and thus
assess meat quality, including sensory evaluation (ILSI, 2007). In these
evaluations, the choice of the comparator for genetically modified (GM)
feed, which can be found in the near isogenic line (i.e. the parental line) is
fundamental, but the inclusion of commercial varieties is also recommended
to demonstrate the biological range of all measurements (EFSA, 2008).
Comparison between the HC maize and its near isogenic line shows the
benefit of the added nutrient (i.e. carotenoids), while comparison between
HC maize and a commercial line provides further comparisons between
nutritionally enhanced crops and commercial varieties.
Therefore, HC maize was used as feed component in two animal feeding
trials to evaluate its effect on broiler productivity, health parameters and
color evolution compared to diets based on its near isogenic line and a
commercial standard yellow maize supplemented with natural color additives
(Chapter II). The color differences among the types of diets evaluated in
these feeding trials can be observed in Figure 4.
Figure 4. Color differences among types of diets used in the animal feeding
trials reported in Chapter II. From left to right: control diet (based on M37W
maize), high-carotenoid diet (based on HC maize) and commercial diet
(based on standard yellow maize) before and after adding natural color
additives (marigold flowers and red paprika extracts).
General discussion
196
In addition to performance and animal health, the nutritional assessment of
feed derived from GM plants with an intended modification of the nutrient
content should include livestock studies to determine the bioavailability of
individual nutrients in the GM feed (EFSA, 2011; ILSI, 2007). When it is
necessary to assess the conversion of the precursors into the nutrients (e.g.
β-carotene), at least the nutritionally enhanced crop and its near isogenic line
supplemented with the nutrient under study should be included (EFSA,
2008). Generally, a bioavailability study must demonstrate that the target
nutrient is efficiently digested and assimilated and then, once absorbed, has a
positive effect (Carbonell-Capella et al., 2014). The most appropriate animal
model to study carotenoid metabolism should include the following
characteristics: 1) absorb carotenoids intact at physiological levels, similar to
humans; 2) have carotenoid distribution in serum and tissues similar to that
of humans; 3) be representative of the disease of interest; 4) be readily
available; 5) be easily manageable under laboratory conditions; and 6) be
affordable (Lee et al., 1999). Despite the fact that there is not a model that
meets all of these criteria, chickens fulfill most of them as vitamin A and
carotenoid metabolism in chickens is similar to that of humans (NRC, 1994;
Pretorius and Schönfeldt, 2013). Therefore, the bioavailability of carotenoids
supplied as intrinsic components of HC maize was evaluated in chickens in
comparison to the same carotenoids provided by its near isogenic line
supplemented with synthetic or natural color additives (Chapter III). This
comparison shows the efficiency of HC maize.
Globally, HC maize did not adversely affect chicken growth and
development, with similar values of body weight, feed intake and feed
conversion ratio (FCR) to chickens fed on the other diets. Interestingly, the
lowest FCR (i.e. kg feed per kg gain) was found in diets based on HC maize
and its near isogenic line (M37W maize), resulting in better efficiency, which
may be related to the genetic background of this maize line, although a diet
based on M37W maize was the least efficient in a laying hen feeding trial
(Moreno et al., 2016). In our animal feeding trials, 24 animals per treatment
were used, except for the bioavailability assay in which 8 animals per
treatment were used (the minimum necessary to have statistical power). A
high number of chickens is recommended to evaluate GM crops, usually 10–
12 pens per treatment with 9–12 birds per pen (EFSA, 2008). Nevertheless,
our studies were mainly limited by the production of the experimental field,
which provided raw material to perform several experiments by different
research groups, making it necessary to adapt the number of chickens to the
kg of maize available each harvest.

General discussion
197
In general terms, biochemical and hematological parameters did not
substantially differ in chickens fed on the HC diet compared to those fed on
the other diets, except for bilirubin levels which were higher in chickens fed
on carotenoid-enhanced diets. This difference did not exist in a previous
experiment in which chickens fed on the control and HC diets had total
bilirubin values of 0.05 ± 0.003 and 0.06 ± 0.003 mg/dL, respectively
(Nogareda et al., 2016). A possible explanation could be a subclinical
inflammation counteracted by an increase in bilirubin, which has
immunomodulatory effects (Liu et al., 2008). Furthermore, HC maize has
previously been shown to promote poultry health and immunity: a heavier
bursa of Fabricius was found in chickens fed on the HC diet than in those
fed on the control diet, reflecting a possible better immunomodulatory
response to vaccination against infectious bursal disease; a reduction in the
severity of coccidiosis, an important poultry disease caused by protozoan
parasites of the genus Eimeria, was found in chickens fed on the HC
compared to those fed on the control diet when animals were experimentally
challenged with 3 x 10⁴ E. tenella oocysts orally; and lower incidences of
footpad dermatitis and digital ulcers were found in chickens fed on the HC
diet than in those fed on the control diet, in the presence and also in the
absence of coccidiosis (Nogareda et al., 2016).
Yellow skin is an abundant phenotype among domestic chickens, but its
expression is influenced by the amount of carotenoids in the feed (Eriksson
et al., 2008). Like most other animals, chickens cannot synthetize carotenoids
de novo and must obtain them from their diet (Breithaupt, 2007). Carotenoids
supplied as intrinsic components of HC maize are bioavailable and confer to
chickens a long-lasting golden pigmentation similar to animals fed on a
commercial diet supplemented with natural color additives, although the
latter provided the highest yellowness scores in breast and thigh muscles due
to the marigold extract included in its composition (Breithaupt, 2007).
Yellow and red xanthophylls were added to the commercial diet at similar
levels to those commonly used in the poultry industry, approximately 10–
fold more yellow than red xanthophylls (Amaya et al., 2014). However, this
ratio was adapted in the bioavailability assay to increase the concentration of
provitamin A (PVA) carotenoids; thus, approximately 3–fold more red than
yellow xanthophylls were added and, subsequently, the yellow scores were
not as important. Xanthophylls supplied within the kernel matrix could
replace external xanthophylls usually added to the poultry feed, as shown by
HC maize.
General discussion
198
The distribution of carotenoids in chickens is mainly dependent on the feed
profile. Zeaxanthin, β-carotene, β-cryptoxanthin and violaxanthin are found
at higher levels in the HC diet, whereas lutein is found at higher levels in the
commercial diet supplemented with natural color additives. Accordingly,
chickens fed on these diets accumulated these carotenoids in liver in similar
proportions, except for β-carotene, due to its conversion into retinol. β-
Carotene was not detected in the serum or liver of any chickens in any of the
experiments, but the bioavailability study shows that β-carotene epoxides
accumulate in the livers of chickens fed on the HC diet. In previous
experiments, zeaxanthin and β-carotene epoxides were found in skin, fat and
meat samples from chickens fed on the HC diet, suggesting that high levels
of zeaxanthin and β-carotene could have accumulated initially, but then
underwent oxidation (Nogareda et al., 2016).
Nevertheless, nutrient bioavailability is a better indicator of nutritional
quality than nutrient content alone (Sanahuja et al., 2013). The levels of
lutein, zeaxanthin and β-carotene from HC maize were bioavailable to the
extent that they could be predicted based on the feed profile, whereas β-
cryptoxanthin and violaxanthin from HC maize were found at higher levels
in liver than those originally presented in the feed. The difference in nutrient
bioavailability with respect to the feed composition was more pronounced in
a laying hen feeding trial previously reported by our research group (Moreno
et al., 2016). In that trial, zeaxanthin and lutein concentration was 12.41 and
3.08 µg/g freeze-dried (fd), respectively, in the HC diet, whereas their
concentration was 14.04 and 9.2 µg/g fd, respectively, in the livers of
chickens fed on the HC diet.
PVA carotenoids (i.e. β-carotene and β-cryptoxanthin) from HC maize are
bioavailable and contribute to liver retinol levels (Tables 2 and 3), although
they are not metabolized in the same manner: β-carotene is preferentially
converted into retinol in the intestine whereas β-cryptoxanthin is
accumulated in the liver. This indicates that β-carotene is a better substrate
for β-carotene 15,15'-diooxygenase 1 (BCDO1) than β-cryptoxanthin (Kim
and Oh, 2009, 2010). The bioavailability assay showed that zeaxanthin may
interfere with β-carotene absorption, as higher retinol levels were found in
chickens fed on low zeaxanthin diets. Despite the fact that zeaxanthin is the
most abundant carotenoid in HC maize, this biofortified maize provided
bioavailable PVA carotenoids.
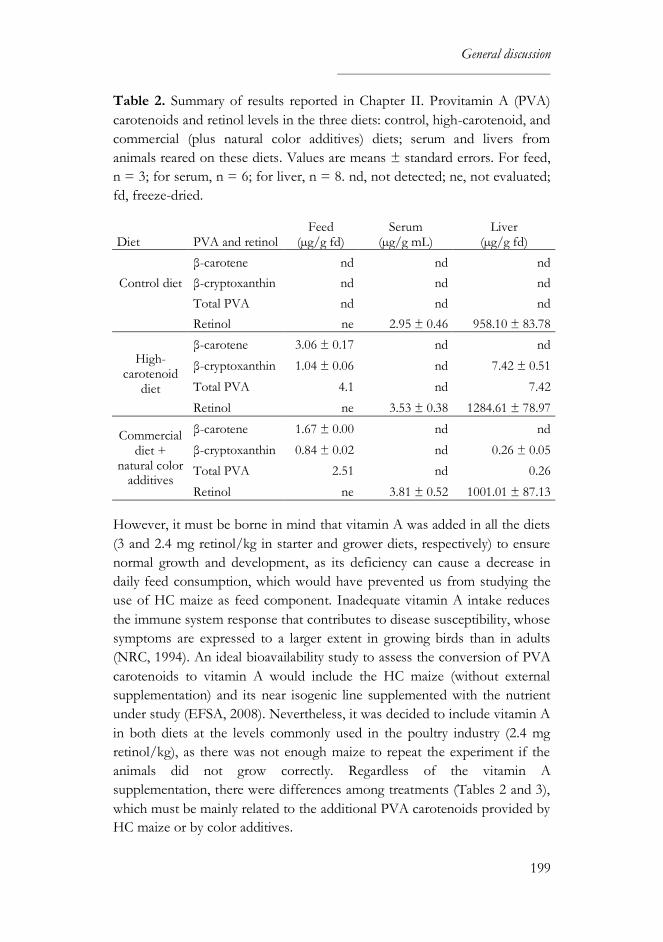
General discussion
199
Table 2. Summary of results reported in Chapter II. Provitamin A (PVA)
carotenoids and retinol levels in the three diets: control, high-carotenoid, and
commercial (plus natural color additives) diets; serum and livers from
animals reared on these diets. Values are means ± standard errors. For feed,
n = 3; for serum, n = 6; for liver, n = 8. nd, not detected; ne, not evaluated;
fd, freeze-dried.
Diet PVA and retinol Feed
(µg/g fd) Serum
(µg/g mL) Liver
(µg/g fd)
Control diet
β-carotene nd nd nd
β-cryptoxanthin nd nd nd
Total PVA nd nd nd
Retinol ne 2.95 ± 0.46 958.10 ± 83.78
High-carotenoid
diet
β-carotene 3.06 ± 0.17 nd nd
β-cryptoxanthin 1.04 ± 0.06 nd 7.42 ± 0.51
Total PVA 4.1 nd 7.42
Retinol ne 3.53 ± 0.38 1284.61 ± 78.97
Commercial diet +
natural color additives
β-carotene 1.67 ± 0.00 nd nd
β-cryptoxanthin 0.84 ± 0.02 nd 0.26 ± 0.05
Total PVA 2.51 nd 0.26
Retinol ne 3.81 ± 0.52 1001.01 ± 87.13
However, it must be borne in mind that vitamin A was added in all the diets
(3 and 2.4 mg retinol/kg in starter and grower diets, respectively) to ensure
normal growth and development, as its deficiency can cause a decrease in
daily feed consumption, which would have prevented us from studying the
use of HC maize as feed component. Inadequate vitamin A intake reduces
the immune system response that contributes to disease susceptibility, whose
symptoms are expressed to a larger extent in growing birds than in adults
(NRC, 1994). An ideal bioavailability study to assess the conversion of PVA
carotenoids to vitamin A would include the HC maize (without external
supplementation) and its near isogenic line supplemented with the nutrient
under study (EFSA, 2008). Nevertheless, it was decided to include vitamin A
in both diets at the levels commonly used in the poultry industry (2.4 mg
retinol/kg), as there was not enough maize to repeat the experiment if the
animals did not grow correctly. Regardless of the vitamin A
supplementation, there were differences among treatments (Tables 2 and 3),
which must be mainly related to the additional PVA carotenoids provided by
HC maize or by color additives.
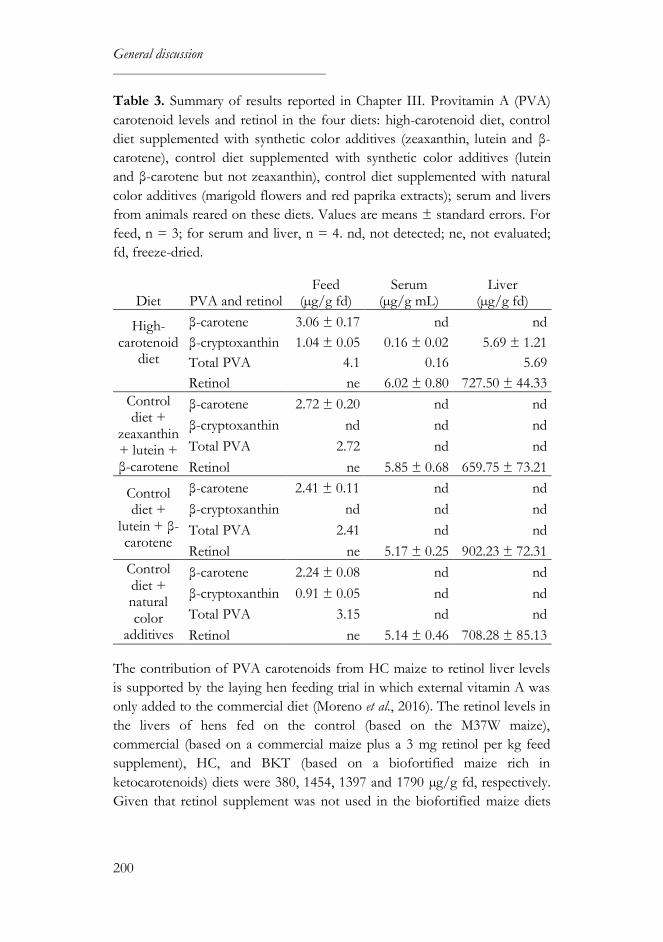
General discussion
200
Table 3. Summary of results reported in Chapter III. Provitamin A (PVA)
carotenoid levels and retinol in the four diets: high-carotenoid diet, control
diet supplemented with synthetic color additives (zeaxanthin, lutein and β-
carotene), control diet supplemented with synthetic color additives (lutein
and β-carotene but not zeaxanthin), control diet supplemented with natural
color additives (marigold flowers and red paprika extracts); serum and livers
from animals reared on these diets. Values are means ± standard errors. For
feed, n = 3; for serum and liver, n = 4. nd, not detected; ne, not evaluated;
fd, freeze-dried.
Diet PVA and retinol Feed
(µg/g fd) Serum
(µg/g mL) Liver
(µg/g fd)
High-carotenoid
diet
β-carotene 3.06 ± 0.17 nd nd
β-cryptoxanthin 1.04 ± 0.05 0.16 ± 0.02 5.69 ± 1.21
Total PVA 4.1 0.16 5.69
Retinol ne 6.02 ± 0.80 727.50 ± 44.33
Control diet +
zeaxanthin+ lutein + β-carotene
β-carotene 2.72 ± 0.20 nd nd
β-cryptoxanthin nd nd nd
Total PVA 2.72 nd nd
Retinol ne 5.85 ± 0.68 659.75 ± 73.21
Control diet +
lutein + β-carotene
β-carotene 2.41 ± 0.11 nd nd
β-cryptoxanthin nd nd nd
Total PVA 2.41 nd nd
Retinol ne 5.17 ± 0.25 902.23 ± 72.31
Control diet + natural color
additives
β-carotene 2.24 ± 0.08 nd nd
β-cryptoxanthin 0.91 ± 0.05 nd nd
Total PVA 3.15 nd nd
Retinol ne 5.14 ± 0.46 708.28 ± 85.13
The contribution of PVA carotenoids from HC maize to retinol liver levels
is supported by the laying hen feeding trial in which external vitamin A was
only added to the commercial diet (Moreno et al., 2016). The retinol levels in
the livers of hens fed on the control (based on the M37W maize),
commercial (based on a commercial maize plus a 3 mg retinol per kg feed
supplement), HC, and BKT (based on a biofortified maize rich in
ketocarotenoids) diets were 380, 1454, 1397 and 1790 µg/g fd, respectively.
Given that retinol supplement was not used in the biofortified maize diets
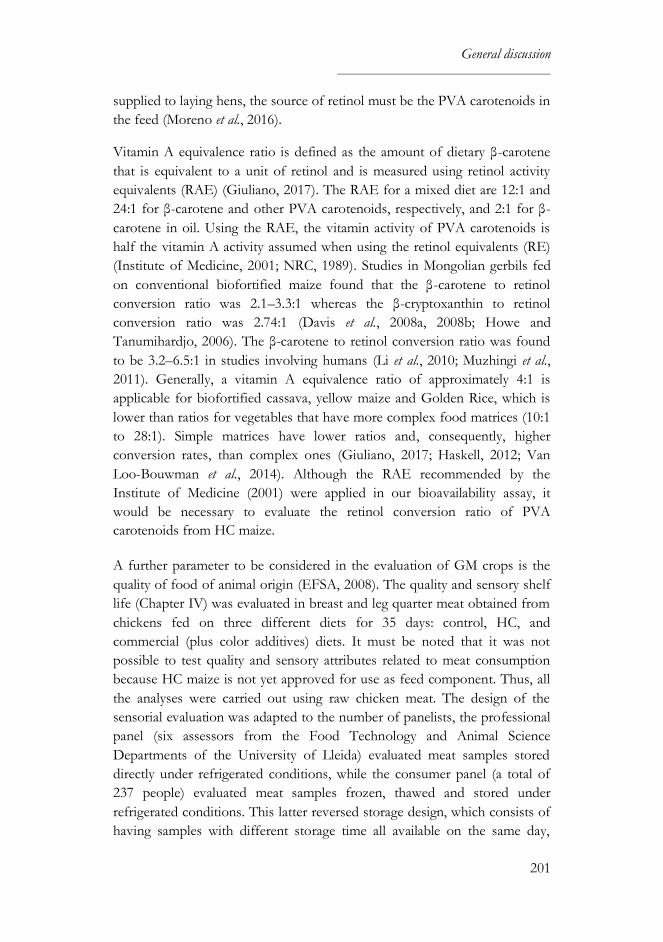
General discussion
201
supplied to laying hens, the source of retinol must be the PVA carotenoids in
the feed (Moreno et al., 2016).
Vitamin A equivalence ratio is defined as the amount of dietary β-carotene
that is equivalent to a unit of retinol and is measured using retinol activity
equivalents (RAE) (Giuliano, 2017). The RAE for a mixed diet are 12:1 and
24:1 for β-carotene and other PVA carotenoids, respectively, and 2:1 for β-
carotene in oil. Using the RAE, the vitamin activity of PVA carotenoids is
half the vitamin A activity assumed when using the retinol equivalents (RE)
(Institute of Medicine, 2001; NRC, 1989). Studies in Mongolian gerbils fed
on conventional biofortified maize found that the β-carotene to retinol
conversion ratio was 2.1–3.3:1 whereas the β-cryptoxanthin to retinol
conversion ratio was 2.74:1 (Davis et al., 2008a, 2008b; Howe and
Tanumihardjo, 2006). The β-carotene to retinol conversion ratio was found
to be 3.2–6.5:1 in studies involving humans (Li et al., 2010; Muzhingi et al.,
2011). Generally, a vitamin A equivalence ratio of approximately 4:1 is
applicable for biofortified cassava, yellow maize and Golden Rice, which is
lower than ratios for vegetables that have more complex food matrices (10:1
to 28:1). Simple matrices have lower ratios and, consequently, higher
conversion rates, than complex ones (Giuliano, 2017; Haskell, 2012; Van
Loo-Bouwman et al., 2014). Although the RAE recommended by the
Institute of Medicine (2001) were applied in our bioavailability assay, it
would be necessary to evaluate the retinol conversion ratio of PVA
carotenoids from HC maize.
A further parameter to be considered in the evaluation of GM crops is the
quality of food of animal origin (EFSA, 2008). The quality and sensory shelf
life (Chapter IV) was evaluated in breast and leg quarter meat obtained from
chickens fed on three different diets for 35 days: control, HC, and
commercial (plus color additives) diets. It must be noted that it was not
possible to test quality and sensory attributes related to meat consumption
because HC maize is not yet approved for use as feed component. Thus, all
the analyses were carried out using raw chicken meat. The design of the
sensorial evaluation was adapted to the number of panelists, the professional
panel (six assessors from the Food Technology and Animal Science
Departments of the University of Lleida) evaluated meat samples stored
directly under refrigerated conditions, while the consumer panel (a total of
237 people) evaluated meat samples frozen, thawed and stored under
refrigerated conditions. This latter reversed storage design, which consists of
having samples with different storage time all available on the same day,
General discussion
202
allowed us to call consumers only on one day instead of during two weeks,
which could have caused some bias. However, it was necessary to evaluate
whether freezing and thawing processes had some effect on the quality
measurements.
HC maize is suitable for use as feed component in poultry nutrition,
providing meat with a good quality and shelf life as well as a long-lasting
golden pigmentation. Breast and leg quarter meat obtained from chickens
fed on the HC diet did not substantially differ from meat obtained from
those fed on the other two diets in any of the criteria evaluated, except for
color parameters, which were similar among chickens fed on carotenoid-
enhanced diets. Regardless of the diet, meat samples were equally accepted
after 7–9 days of storage, which could be established as the maximum
storage period for this chicken meat accepted by consumers. These results
were supported by the analysis of spoilage bacteria (Pseudomonas spp. and
total aerobic mesophilic bacteria), which increased progressively from 1 to 9
days, and physical parameters (pH, color and texture), which remained quite
similar during storage. Thus, the storage under refrigerated and frozen
conditions did not substantially affect those parameters. The pigmentation of
chicken meat obtained from animals fed on the different diets can be
observed in Figure 5.
Figure 5. Color pigmentation of breast (above) and leg quarter (below) meat
obtained from chickens fed on control, high-carotenoid and commercial
(plus color additives) diets (from left to right).
General discussion
203
An increase in tenderness has been related to β-carotene supplementation in
poultry diets in other studies. Feed supplemented with β-carotene at 15 µg/g
modified initial juiciness, tenderness and tooth adhesion in broiler thigh meat
(Ruiz et al., 2001), whereas feed supplemented with β-carotene at 1.5 µg/g
showed the lowest hardness and tooth adhesion scores (Carreras et al., 2004).
Although the texture attributes could not be studied through a sensory
analysis in our experiments, the evaluation of the hardness using a texture
analyzer did not show considerable differences among diet treatments.
Despite the fact that the lipid oxidation was not studied, it is thought that the
antioxidant activity of some carotenoids can contribute to protecting meat
products against oxidative deterioration and thus improve the meat quality
and shelf life. The lipid oxidation of animal products seems to be more
efficiently retarded by the dietary supplementation with antioxidants rather
than the post-mortem addition of antioxidants (Simitzis and Deligeorgis,
2011). Poultry diets supplemented with xanthophylls or marigold extract
were effective in reducing lipid oxidation (Gao et al., 2013; Rajput et al., 2014;
Wang et al., 2017), whereas poultry diets supplemented with β-carotene were
not as effective (Carreras et al., 2004; Ruiz et al., 1999). Therefore, it would be
interesting to study the lipid peroxidation and to perform a sensory analysis
with meat processed under dry or moist cooking in further studies.
Animal models are necessary to study the degree to which nutrients provided
at source by biofortified crops are absorbed and to demonstrate that these
crops can improve micronutrient status (Bouis and Saltzman, 2017). In spite
of the fact that our findings are limited to broiler feeding studies, which are
considered a sensitive model for comparing the nutritional equivalence of
conventional and GM feed (EFSA, 2008), other authors have already
evaluated the efficacy of PVA biofortified crops in humans. On the one
hand, β-carotene derived from Golden Rice was shown to be effectively
converted to vitamin A in humans (Tang et al., 2009). On the other hand,
conventional PVA-biofortified maize demonstrated an improvement of
visual function among children with marginal or deficient vitamin A status
and an increase in total body vitamin A stores as effectively as
supplementation (Gannon et al., 2014; Palmer et al., 2016). Further research is
needed to show that HC maize can improve nutritional status in populations
at risk of micronutrient deficiencies as well as to fully understand the health
impact of consuming biofortified crops. In the near future, randomized
controlled efficacy trials will be necessary to confirm directly in humans the
results found in animals.
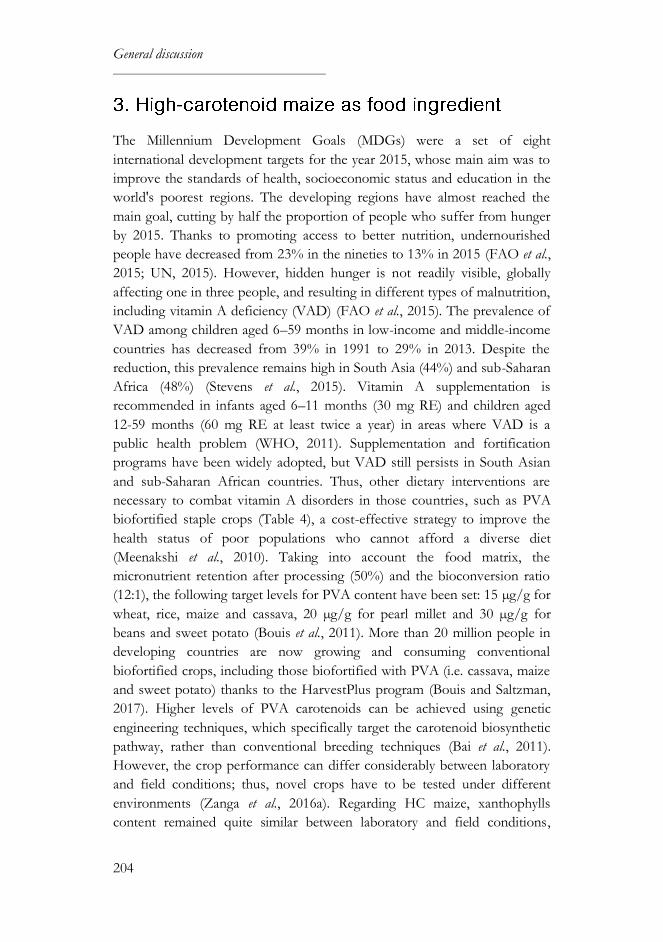
General discussion
204
The Millennium Development Goals (MDGs) were a set of eight
international development targets for the year 2015, whose main aim was to
improve the standards of health, socioeconomic status and education in the
world's poorest regions. The developing regions have almost reached the
main goal, cutting by half the proportion of people who suffer from hunger
by 2015. Thanks to promoting access to better nutrition, undernourished
people have decreased from 23% in the nineties to 13% in 2015 (FAO et al.,
2015; UN, 2015). However, hidden hunger is not readily visible, globally
affecting one in three people, and resulting in different types of malnutrition,
including vitamin A deficiency (VAD) (FAO et al., 2015). The prevalence of
VAD among children aged 6–59 months in low-income and middle-income
countries has decreased from 39% in 1991 to 29% in 2013. Despite the
reduction, this prevalence remains high in South Asia (44%) and sub-Saharan
Africa (48%) (Stevens et al., 2015). Vitamin A supplementation is
recommended in infants aged 6–11 months (30 mg RE) and children aged
12-59 months (60 mg RE at least twice a year) in areas where VAD is a
public health problem (WHO, 2011). Supplementation and fortification
programs have been widely adopted, but VAD still persists in South Asian
and sub-Saharan African countries. Thus, other dietary interventions are
necessary to combat vitamin A disorders in those countries, such as PVA
biofortified staple crops (Table 4), a cost-effective strategy to improve the
health status of poor populations who cannot afford a diverse diet
(Meenakshi et al., 2010). Taking into account the food matrix, the
micronutrient retention after processing (50%) and the bioconversion ratio
(12:1), the following target levels for PVA content have been set: 15 µg/g for
wheat, rice, maize and cassava, 20 µg/g for pearl millet and 30 µg/g for
beans and sweet potato (Bouis et al., 2011). More than 20 million people in
developing countries are now growing and consuming conventional
biofortified crops, including those biofortified with PVA (i.e. cassava, maize
and sweet potato) thanks to the HarvestPlus program (Bouis and Saltzman,
2017). Higher levels of PVA carotenoids can be achieved using genetic
engineering techniques, which specifically target the carotenoid biosynthetic
pathway, rather than conventional breeding techniques (Bai et al., 2011).
However, the crop performance can differ considerably between laboratory
and field conditions; thus, novel crops have to be tested under different
environments (Zanga et al., 2016a). Regarding HC maize, xanthophylls
content remained quite similar between laboratory and field conditions,
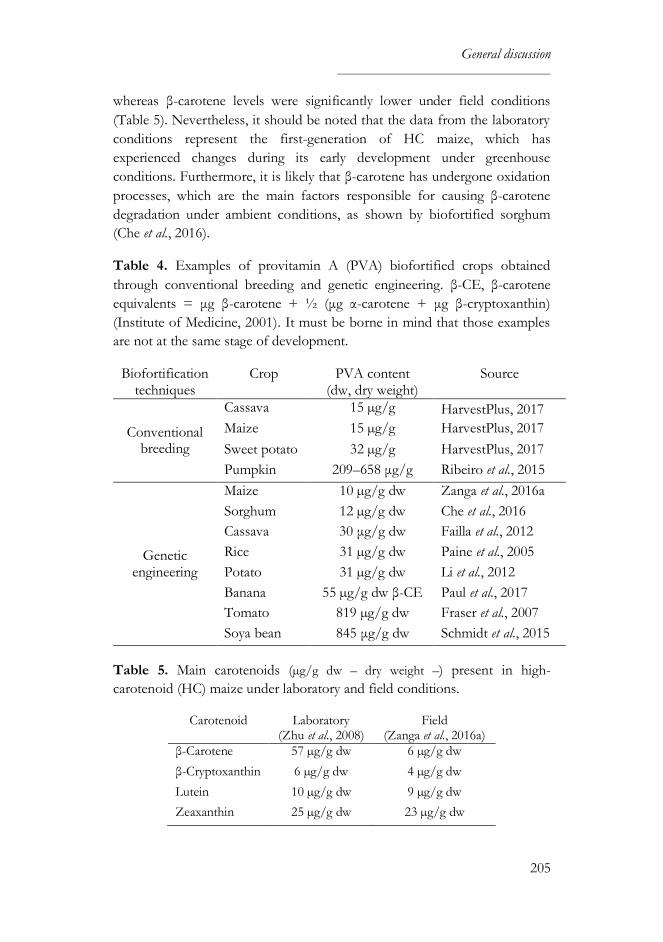
General discussion
205
whereas β-carotene levels were significantly lower under field conditions
(Table 5). Nevertheless, it should be noted that the data from the laboratory
conditions represent the first-generation of HC maize, which has
experienced changes during its early development under greenhouse
conditions. Furthermore, it is likely that β-carotene has undergone oxidation
processes, which are the main factors responsible for causing β-carotene
degradation under ambient conditions, as shown by biofortified sorghum
(Che et al., 2016).
Table 4. Examples of provitamin A (PVA) biofortified crops obtained
through conventional breeding and genetic engineering. β-CE, β-carotene
equivalents = μg β-carotene + ½ (μg α-carotene + μg β-cryptoxanthin)
(Institute of Medicine, 2001). It must be borne in mind that those examples
are not at the same stage of development.
Biofortification techniques
Crop PVA content (dw, dry weight)
Source
Conventional breeding
Cassava 15 µg/g HarvestPlus, 2017
Maize 15 µg/g HarvestPlus, 2017
Sweet potato 32 µg/g HarvestPlus, 2017
Pumpkin 209–658 μg/g Ribeiro et al., 2015
Genetic engineering
Maize 10 µg/g dw Zanga et al., 2016a
Sorghum 12 µg/g dw Che et al., 2016
Cassava 30 μg/g dw Failla et al., 2012
Rice 31 µg/g dw Paine et al., 2005
Potato 31 µg/g dw Li et al., 2012
Banana 55 µg/g dw β-CE Paul et al., 2017
Tomato 819 µg/g dw Fraser et al., 2007
Soya bean 845 μg/g dw Schmidt et al., 2015
Table 5. Main carotenoids (µg/g dw – dry weight –) present in high-
carotenoid (HC) maize under laboratory and field conditions.
Carotenoid Laboratory (Zhu et al., 2008)
Field (Zanga et al., 2016a)
β-Carotene 57 µg/g dw 6 µg/g dw
β-Cryptoxanthin 6 µg/g dw 4 µg/g dw
Lutein 10 µg/g dw 9 µg/g dw
Zeaxanthin 25 µg/g dw 23 µg/g dw
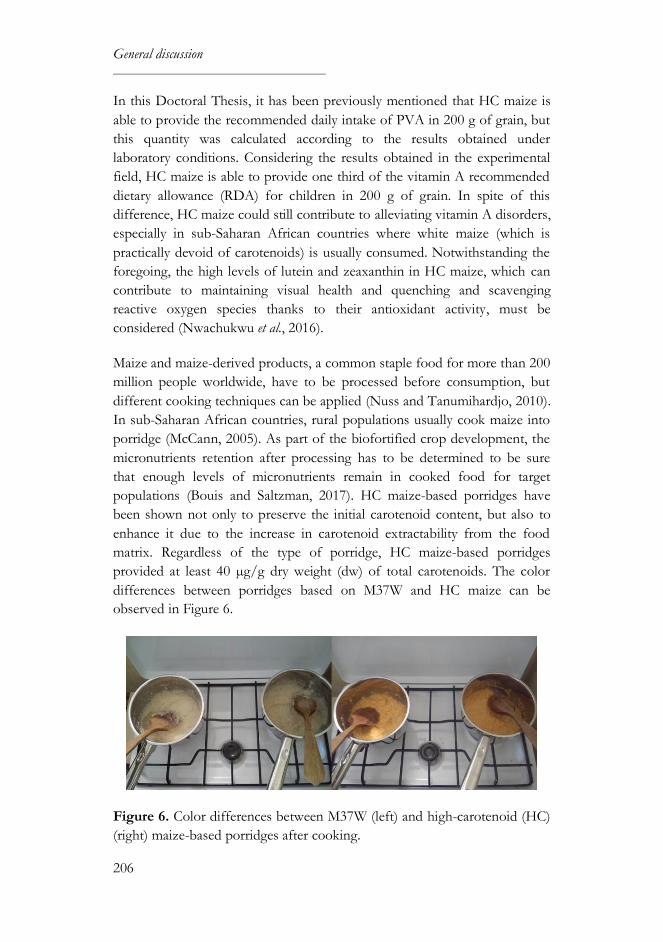
General discussion
206
In this Doctoral Thesis, it has been previously mentioned that HC maize is
able to provide the recommended daily intake of PVA in 200 g of grain, but
this quantity was calculated according to the results obtained under
laboratory conditions. Considering the results obtained in the experimental
field, HC maize is able to provide one third of the vitamin A recommended
dietary allowance (RDA) for children in 200 g of grain. In spite of this
difference, HC maize could still contribute to alleviating vitamin A disorders,
especially in sub-Saharan African countries where white maize (which is
practically devoid of carotenoids) is usually consumed. Notwithstanding the
foregoing, the high levels of lutein and zeaxanthin in HC maize, which can
contribute to maintaining visual health and quenching and scavenging
reactive oxygen species thanks to their antioxidant activity, must be
considered (Nwachukwu et al., 2016).
Maize and maize-derived products, a common staple food for more than 200
million people worldwide, have to be processed before consumption, but
different cooking techniques can be applied (Nuss and Tanumihardjo, 2010).
In sub-Saharan African countries, rural populations usually cook maize into
porridge (McCann, 2005). As part of the biofortified crop development, the
micronutrients retention after processing has to be determined to be sure
that enough levels of micronutrients remain in cooked food for target
populations (Bouis and Saltzman, 2017). HC maize-based porridges have
been shown not only to preserve the initial carotenoid content, but also to
enhance it due to the increase in carotenoid extractability from the food
matrix. Regardless of the type of porridge, HC maize-based porridges
provided at least 40 µg/g dry weight (dw) of total carotenoids. The color
differences between porridges based on M37W and HC maize can be
observed in Figure 6.
Figure 6. Color differences between M37W (left) and high-carotenoid (HC)
(right) maize-based porridges after cooking.
General discussion
207
Nonetheless, it must be taken into account that the analysis of the total
carotenoid content has not allowed us to infer the potential of HC maize-
based porridges to meet the dietary recommendations for vitamin A. It is
well known that processing can change the profile and functionality of
carotenoids (Rodriguez-Amaya, 2016). Hence, it would be necessary to apply
HPLC (high performance liquid chromatography) techniques to know the
PVA content provided by HC maize-based porridges. A good retention of
PVA carotenoids has been reported in porridges (≥ 70%) and non-alcoholic
beverages made with conventional biofortified maize (≥ 79%) (Awobusuyi et
al., 2016; Li et al., 2007). Other transgenic biofortified crops, such as cassava,
sorghum and potato, have also demonstrated a good bioaccessibility of PVA
carotenoids (Chitchumroonchokchai et al., 2016; Failla et al., 2012; Lipkie et
al., 2013). Thus, PVA carotenoids provided by HC maize are also expected
to have good retention and bioaccessibility after cooking.
Bearing in mind the results obtained in the animal feeding trials, where β-
cryptoxanthin accumulated in the liver at higher levels than those initially
presented in the feed, β-cryptoxanthin levels are likely to be higher than
those reported under field conditions. Furthermore, biofortification seems to
prevent the loss of PVA carotenoids during cooking more efficiently than
standard fortification, probably due to a food matrix effect (for further
information see Annex II) (Díaz-Gómez et al., 2017). Therefore, HC maize
can contribute to improving the health status of populations who depend on
maize as a staple crop, and could even help to alleviate VAD in populations
at risk. Different factors can affect the nutrient bioaccessibility and
bioavailability in nutritionally enhanced crops (Figure 7, for further
information see Annex II); thus, more studies are necessary to confirm the
health effects.
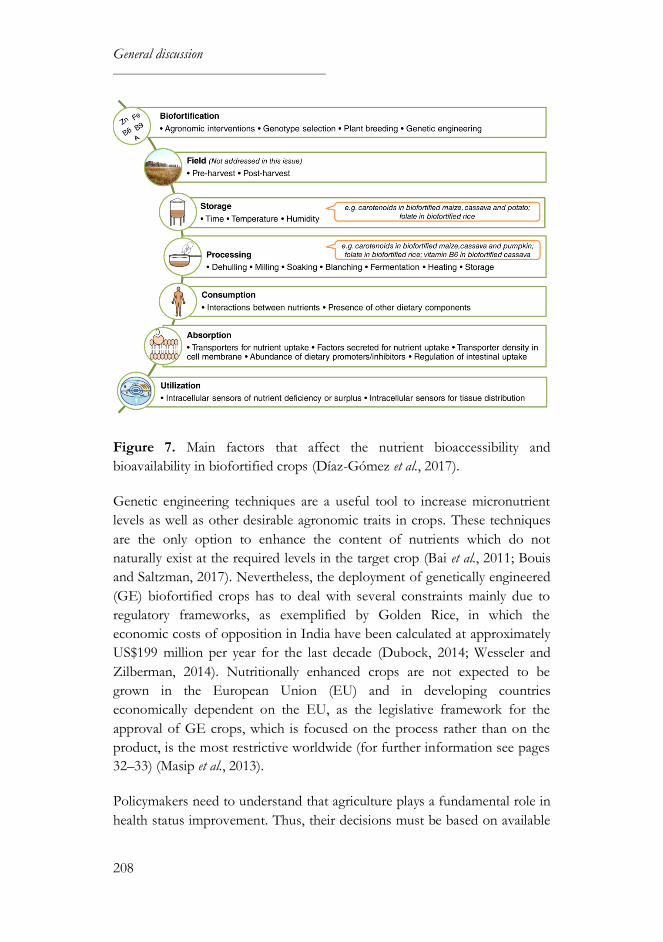
General discussion
208
Figure 7. Main factors that affect the nutrient bioaccessibility and
bioavailability in biofortified crops (Díaz-Gómez et al., 2017).
Genetic engineering techniques are a useful tool to increase micronutrient
levels as well as other desirable agronomic traits in crops. These techniques
are the only option to enhance the content of nutrients which do not
naturally exist at the required levels in the target crop (Bai et al., 2011; Bouis
and Saltzman, 2017). Nevertheless, the deployment of genetically engineered
(GE) biofortified crops has to deal with several constraints mainly due to
regulatory frameworks, as exemplified by Golden Rice, in which the
economic costs of opposition in India have been calculated at approximately
US$199 million per year for the last decade (Dubock, 2014; Wesseler and
Zilberman, 2014). Nutritionally enhanced crops are not expected to be
grown in the European Union (EU) and in developing countries
economically dependent on the EU, as the legislative framework for the
approval of GE crops, which is focused on the process rather than on the
product, is the most restrictive worldwide (for further information see pages
32–33) (Masip et al., 2013).
Policymakers need to understand that agriculture plays a fundamental role in
health status improvement. Thus, their decisions must be based on available
General discussion
209
scientific evidence rather than on beliefs (Moghissi et al., 2016). Several
independent scientific authorities in the world, including the United Nations
Food and Agriculture Organization (FAO) and the European Commission,
have concluded that GE crops are not more risky to humankind or the
environment than crops derived from any other method of production
(Dubock, 2014; European Commission, 2010; FAO, 2004). Recently, more
than 100 Nobel Prize winners supported this claim, highlighting the
importance of crops and foods improved through biotechnology, including
PVA biofortified crops (Support Precision Agriculture, 2016).
Biofortified crops could address micronutrient deficiencies if they are
adopted by farmers and consumed by target groups, which mainly depends
on their cost-effectiveness (Meenakshi et al., 2010). However, it must be
noted that GE biofortified crops need to be previously approved for
cultivation and then for human consumption. Education programs are
necessary to promote the nutritional qualities of biofortified crops to both
farmers and consumers. In fact, the adoption of biofortified crops by
producers and distributors ultimately relies on consumer preferences, which
are influenced by socioeconomic factors such as gender, education, income
and ethnic background (Bett et al., 2010; Muzhingi et al., 2008). White maize
is preferred by many African consumers due to the negative association of
yellow maize with food aid and animal feed. Despite these cultural
preferences, biofortified maize could make a difference thanks to its visual
traits (i.e. deep yellow-orange kernels), which can easily be associated with its
nutritional content (Birol et al., 2015; Meenakshi et al., 2012). Recently,
orange biofortified maize has been shown not only to improve vitamin A
status when consumed as a staple food, but also to be accepted by
consumers (Tanumihardjo et al., 2017). The HC maize technology package
has already been transferred to the Council for Scientific and Industrial
Research (CSIR), located in Pretoria (South Africa), and the Tamil Nadu
Agricultural University (TNAU), located in Coimbatore (India). These
scientific centers are expected to undertake the commercialization and
distribution of the technology (Zanga et al., 2016b). South Africa was the first
African country to allow the commercial production of engineered crops as
well as the first country worldwide to release a basic food staple, white Bt
maize (Bett et al., 2010). HC maize is likely to be well accepted by South
African producers and consumers, and could therefore address preventable
diseases, particularly those affecting children and women. Notwithstanding
the foregoing, complex national and international rules are expected to
postpone HC deployment.
General discussion
210
This Doctoral Thesis evaluated whether HC maize could be suitable as feed
and food ingredient. All the studies included here were developed in
accordance with the European Food Safety Authority recommendations
(EFSA, 2008, 2011) and other legislation (for further information see pages
32–34). HC maize and its derived food and feed were compared with their
respective comparators (i.e. M37W maize and its derived food and feed),
since traditionally cultivated crops have widely demonstrated their safe use
for consumers and/or domesticated animals. The results presented
contribute knowledge to the fight against food insecurity, especially in at-risk
populations. Complementarily, the findings reported are an advance in the
understanding of the carotenoid metabolism in animals. HC maize not only
has the potential to improve human health in populations whose diet relies
on cereals, but also its use as feed component can improve animal nutrition
and, consequently, nutritious meat and other products will be obtained. The
scientific articles obtained from this Doctoral Thesis will provide evidence
for the future approval of HC maize.
Aguín, O., Cao, A., Pintos, C., Santiago, R., Mansilla, P. and Butrón, A., 2014. Occurrence of Fusarium species in maize kernels grown in Northwestern Spain. Plant Pathology 63: 946–951.
Amaya, E., Becquet, P., Carné, S., Peris, S. and Miralles, P., 2014. Carotenoids in animal nutrition. FEFANA (EU Association of Specialty Feed Ingredients and their Mixtures) publication, Brussels, Belgium.
Ariño, A., Herrera, M., Juan, T., Estopañan, G., Carramiñana, J.J., Rota, C. and Herrera, A., 2009. Influence of agricultural practices on the contamination of maize by fumonisin mycotoxins. Journal of Food Protection 72: 898–902.
Arjó, G., Capell, T., Matias-Guiu, X., Zhu, C., Christou, P. and Piñol, C., 2012. Mice fed on a diet enriched with genetically engineered multivitamin corn show no sub-acute toxic effects and no sub-chronic toxicity. Plant Biotechnology Journal 10: 1026–1034.
Awobusuyi, T.D., Siwela, M., Kolanisi, U. and Amonsou, E.O., 2016. Provitamin A retention and sensory acceptability of amahewu, a non-alcoholic cereal-based beverage made with provitamin A-biofortified maize. Journal of the Science of Food and Agriculture 96: 1356–1361.
Bai, C., Twyman, R.M., Farré, G., Sanahuja, G., Christou, P., Capell, T. and
General discussion
211
Zhu, C., 2011. A golden era – pro-vitamin A enhancement in diverse crops. In Vitro Cellular & Developmental Biology – Plant 47: 205–221.
Bett, C., Ouma, J.O. and De Groote, H., 2010. Perspectives of gatekeepers in the Kenyan food industry towards genetically modified food. Food Policy 35: 332–340.
Beuchat, L.R. and Mann, D.A., 2016. Comparison of new and traditional culture-dependent media for enumerating foodborne yeasts and molds. Journal of Food Protection 79: 95–111.
Birol, E., Meenakshi, J. V., Oparinde, A., Perez, S. and Tomlins, K., 2015. Developing country consumers' acceptance of biofortified foods: a synthesis. Food Security 7: 555–568.
Blandino, M., Reyneri, A. and Vanara, F., 2008. Influence of nitrogen fertilization on mycotoxin contamination of maize kernels. Crop Protection 27: 222–230.
Bouis, H.E., Hotz, C., McClafferty, B., Meenakshi, J. V. and Pfeiffer, W.H., 2011. Biofortification: a new tool to reduce micronutrient malnutrition. Food and Nutrition Bulletin 32: S31–S40.
Bouis, H.E. and Saltzman, A., 2017. Improving nutrition through biofortification: a review of evidence from HarvestPlus, 2003 through 2016. Global Food Security 12: 49–58.
Breithaupt, D.E., 2007. Modern application of xanthophylls in animal feeding – a review. Trends in Food Science and Technology 18: 501–506.
Cao, A., Santiago, R., Ramos, A.J., Marín, S., Reid, L.M. and Butrón, A., 2013. Environmental factors related to fungal infection and fumonisin accumulation during the development and drying of white maize kernels. International Journal of Food Microbiology 164: 15–22.
Carbonell-Capella, J.M., Buniowska, M., Barba, F.J., Esteve, M.J. and Frígola, A., 2014. Analytical methods for determining bioavailability and bioaccessibility of bioactive compounds from fruits and vegetables: a review. Comprehensive Reviews in Food Science and Food Safety 13: 155–171.
Carreras, I., Guerrero, L., Guàrdia, M.D., Esteve-Garcia, E., García Regueiro, J.A. and Sárraga, C., 2004. Vitamin E levels, thiobarbituric acid test and sensory evaluation of breast muscles from broilers fed α-tocopheryl acetate- and β-carotene-supplemented diets. Journal of the Science of Food and Agriculture 84: 313–317.
General discussion
212
Che, P., Zhao, Z., Glassman, K., Dolde, D., Hu, T.X., Jones, T.J., Gruis, D.F., Obukosia, S., Wambugu, F. and Albersten, M.C., 2016. Elevated vitamin E content improves all-trans β-carotene accumulation and stability in biofortified sorghum. Proceedings of the National Academy of Sciences of the United States of America 113: 11040–11045.
Chitchumroonchokchai, C., Diretto, G., Giuliano, G. and Failla, M.L., 2016. Bioaccessibility and cellular uptake of carotenoids, carotenoid precursors and a-tocopherol in biofortified golden potatoes (Solanum tuberosum). The FASEB Journal 30: 914–916.
Cruz, D. and Eizaguirre, M., 2015. Do Sesamia nonagrioides (Lepidoptera; Noctuidae) gravid females discriminate between Bt or multivitamin corn varieties? Role of olfactory and visual cues. Journal of Insect Science 15: 1–5.
Davis, C., Jing, H., Howe, J.A., Rocheford, T. and Tanumihardjo, S.A., 2008a. β-Cryptoxanthin from supplements or carotenoid-enhanced maize maintains liver vitamin A in Mongolian gerbils (Meriones unguiculatus) better than or equal to β-carotene supplements. British Journal of Nutrition 100: 786–793.
Davis, C.R., Howe, J.A., Rocheford, T.R. and Tanumihardjo, S.A., 2008b. The xanthophyll composition of biofortified maize (Zea mays sp.) does not influence the bioefficacy of provitamin A carotenoids in Mongolian gerbils (Meriones unguiculatus). Journal of Agricultural and Food Chemistry 56: 6745–6750.
Díaz-Gómez, J., Marín, S., Capell, T., Sanchis, V. and Ramos, A.J., 2016. The impact of Bacillus thuringiensis technology on the occurrence of fumonisins and other mycotoxins in maize. World Mycotoxin Journal 9: 475–486.
Díaz-Gómez, J., Twyman, R.M., Zhu, C., Farré, G., Serrano, J.C.E., Portero-Otin, M., Muñoz, P., Sandmann, G., Capell, T. and Christou, P., 2017. Biofortification of crops with nutrients: factors affecting utilization and storage. Current Opinion in Biotechnology 44: 1–9.
Dubock, A., 2014. The politics of Golden Rice. GM crops & Food 5: 210–222.
Eriksson, J., Larson, G., Gunnarsson, U., Bed’hom, B., Tixier-Boichard, M., Strömstedt, L., Wright, D., Jungerius, A., Vereijken, A., Randi, E., Jensen, P. and Andersson, L., 2008. Identification of the yellow skin gene reveals a hybrid origin of the domestic chicken. PLoS Genetics 4: e1000010.
General discussion
213
European Commission, 2003. Commission Directive 2003/100/EC of 31 October 2003 amending Annex I to Directive 2002/32/EC of the European Parliament and of the Council on undesirable substances in animal feed. Official Journal of the European Union L285: 33–37.
European Commission, 2006. Commission Recommendation of 17 August 2006 on the presence of deoxynivalenol, zearalenone, ochratoxin A, T-2 and HT-2 and fumonisins in products intended for animal feeding (2006/576/EC). Official Journal of the European Union L229: 7–9.
European Commission, 2010. A decade of EU-funded GMO research (2001–2010). European Commission, Brussels, Belgium.
European Commission, 2013. Commission Recommendation of 27 March 2013 on the presence of T-2 and HT-2 toxin in cereals and cereal products (2013/165/EU). Official Journal of the European Union L91: 12–15.
European Food Safety Authority (EFSA), 2008. Safety and nutritional assessment of GM plants and derived food and feed: the role of animal feeding trials. Food and Chemical Toxicology 46: S2–S70.
European Food Safety Authority (EFSA) Panel on Genetically Modified Organisms (GMO), 2011. Guidance for risk assessment of food and feed from genetically modified plants. EFSA Journal 9: 2150.
Failla, M.L., Chitchumroonchokchai, C., Siritunga, D., De Moura, F.F., Fregene, M., Manary, M.J. and Sayre, R.T., 2012. Retention during processing and bioaccessibility of β-carotene in high β-carotene transgenic cassava root. Journal of Agricultural and Food Chemistry 60: 3861–3866.
Food and Agriculture Organization of the United Nations (FAO), 2004. The state of food and agriculture 2003-2004. Part I: agricultural biotechnology. Meeting the needs of the poor? Part II: world and Regional Review. FAO, Rome, Italy.
Food and Agriculture Organization of the United Nations (FAO), The International Fund for Agricultural Development (IFAD) and World Food Programme (WFP), 2015. The state of food insecurity in the world. Meeting the 2015 international hunger targets: taking stock of uneven progress. FAO, IFAD and WFP, Rome, Italy.
Fraser, P.D., Enfissi, E.M.A., Halket, J.M., Truesdale, M.R., Yu, D., Gerrish, C. and Bramley, P.M., 2007. Manipulation of phytoene levels in tomato fruit: effects on isoprenoids, plastids, and intermediary metabolism. The Plant Cell 19: 3194–3211.
General discussion
214
Gannon, B., Kaliwile, C., Arscott, S.A., Schmaelzle, S., Chileshe, J., Kalungwana, N., Mosonda, M., Pixley, K., Masi, C. and Tanumihardjo, S.A., 2014. Biofortified orange maize is as efficacious as a vitamin A supplement in Zambian children even in the presence of high liver reserves of vitamin A: a community-based, randomized placebo-controlled trial. The American Journal of Clinical Nutrition 100: 1541–1550.
Gao, Y.-Y., Xie, Q.-M., Ma, J.-Y., Zhang, X.-B., Zhu, J.-M., Shu, D.-M., Sun, B.-L., Jin, L. and Bi, Y.-Z., 2013. Supplementation of xanthophylls increased antioxidant capacity and decreased lipid peroxidation in hens and chicks. British Journal of Nutrition 109: 977–83.
Giuliano, G., 2017. Provitamin A biofortification of crop plants: a gold rush with many miners. Current Opinion in Biotechnology 44: 169–180.
HarvestPlus, 2017. HarvestPLus Program. Available at: http://www.harvestplus.org/Accessed 21 March 2017.
Haskell, M.J., 2012. The challenge to reach nutritional adequacy for vitamin A: β-carotene bioavailability and conversion – evidence in humans. The American Journal of Clinical Nutrition 96: 1193S–1203S.
Hocking, A.D. and Pitt, J.I., 1980. Dichloran-glycerol medium for enumeration of xerophilic fungi from low-moisture foods. Applied and Environmental Microbiology 39: 488–492.
Howe, J. A and Tanumihardjo, S. A, 2006. Carotenoid-biofortified maize maintains adequate vitamin A status in Mongolian gerbils. The Journal of Nutrition 136: 2562–2567.
International Life Sciences Institute (ILSI) International Food Biotechnology Committee, 2007. Best practices for the conduct of animal studies to evaluate crops genetically modified for output traits. ILSI, Washington, DC, USA.
Institute of Medicine (US), 2001. Dietary reference intakes for vitamin A, vitamin K, arsenic, boron, chromium, copper, iodine, iron, manganese, molybdenum, nickel, silicon, vanadium and zinc. National Academy Press, Washington DC, USA.
International Organization for Standardization (ISO), 2008a. ISO 21527-2: 2008 (E). Microbiology of food and animal feeding stuffs. Horizontal method for the enumeration of yeasts and moulds. Part 2: Colony count technique in products with water activity less than or equal to 0.95. ISO, Geneva, Switzerland.
General discussion
215
International Organization for Standardization (ISO), 2008b. ISO 21527-1: 2008 (E). Microbiology of food and animal feeding stuffs. Horizontal method for the enumeration of yeasts and moulds. Part 1: colony count technique in products with water activity greater than 0.95. ISO, Geneva, Switzerland.
Kim, Y.S. and Oh, D.-K., 2009. Substrate specificity of a recombinant chicken β-carotene 15,15'-monooxygenase that converts β-carotene into retinal. Biotechnology Letters 31: 403–408.
Kim, Y.S. and Oh, D.-K., 2010. Biotransformation of carotenoids to retinal by carotenoid 15,15'-oxygenase. Applied Microbiology and Biotechnology 88: 807–816.
King, A.D., Hocking, A.D. and Pitt, J.I., 1979. Dichloran-rose bengal medium for enumeration and isolation of molds from foods. Applied and Environmental Microbiology 37: 959–964.
Lee, C.M., Boileau, A.C., Boileau, T.W., Williams, A.W., Swanson, K.S., Heintz, K.A. and Erdman, J.W., 1999. Review of animal models in carotenoid research. The Journal of Nutrition 129: 2271–2277.
Leeson, S. and Summers, J.D., 1997. Commercial poultry nutrition. University Books, Ontario, Canada.
Li, L., Yang, Y., Xu, Q., Owsiany, K., Welsch, R., Chitchumroonchokchai, C., Lu, S., Van Eck, J., Deng, X.X., Failla, M. and Thannhauser, T.W., 2012. The Or gene enhances carotenoid accumulation and stability during post-harvest storage of potato tubers. Molecular Plant 5: 339–352.
Li, S., Nugroho, A., Rocheford, T. and White, W.S., 2010. Vitamin A equivalence of the β-carotene in β-carotene-biofortified maize porridge consumed by women. The American Journal of Clinical Nutrition 92: 1105–1112.
Li, S., Tayie, F.A.K., Young, M.F., Rocheford, T. and White, W.S., 2007. Retention of provitamin A carotenoids in high beta-carotene maize (Zea mays) during traditional African household processing. Journal of Agricultural and Food Chemistry 55: 10744–10750.
Lipkie, T.E., De Moura, F.F., Zhao, Z.Y., Albertsen, M.C., Che, P., Glassman, K. and Ferruzzi, M.G., 2013. Bioaccessibility of carotenoids from transgenic provitamin A biofortified sorghum. Journal of Agricultural and Food Chemistry 61: 5764–5771.
Liu, Y., Li, P., Lu, J., Xiong, W., Oger, J., Tetzlaff, W. and Cynader, M.,
General discussion
216
2008. Bilirubin possesses powerful immunomodulatory activity and suppresses experimental autoimmune encephalomyelitis. The Journal of Immunology 181: 1887–1897.
Marín, S., Magan, N., Bellí, N., Ramos, A.J., Canela, R. and Sanchis, V., 1999. Two-dimensional profiles of fumonisin B1 production by Fusarium moniliforme and Fusarium proliferatum in relation to environmental factors and potential for modelling toxin formation in maize grain. International Journal of Food Microbiology 51: 159–167.
Marín, S., Magan, N., Ramos, A.J. and Sanchis, V., 2004. Fumonisin-producing strains of Fusarium: a review of their ecophysiology. Journal of Food Protection 67: 1792–1805.
Marín, S., Ramos, A.J., Cano-Sancho, G. and Sanchis, V., 2012. Reduction of mycotoxins and toxigenic fungi in the Mediterranean basin maize chain. Phytopathologia Mediterranea 51: 93–118.
Marocco, A., Gavazzi, C., Pietri, A. and Tabaglio, V., 2008. On fumonisin incidence in monoculture maize under no-till, conventional tillage and two nitrogen fertilisation levels. Journal of the Science of Food and Agriculture 88: 1217–1221.
Marocco, A., Tabaglio, V., Pietri, A. and Gavazzi, C., 2009. Monoculture maize (Zea mays L.) cropped under conventional tillage, no-tillage and N fertilization: (II) fumonisin incidence on kernels. Italian Journal of Agronomy 3: 69–75.
Masip, G., Sabalza, M., Pérez-Massot, E., Banakar, R., Cebrian, D., Twyman, R.M., Capell, T., Albajes, R. and Christou, P., 2013. Paradoxical EU agricultural policies on genetically engineered crops. Trends in Plant Science 18: 312–324.
McCann, J.C., 2005. Maize and grace: Africa's encounter with a new world crop, 1500-2000. Harvard University Press, Cambridge, MA, USA.
Meenakshi, J. V., Banerji, A., Manyong, V., Tomlins, K., Mittal, N. and Hamukwala, P., 2012. Using a discrete choice experiment to elicit the demand for a nutritious food: willingness-to-pay for orange maize in rural Zambia. Journal of Health Economics 31: 62–71.
Meenakshi, J. V., Johnson, N.L., Manyong, V.M., De Groote, H., Javelosa, J., Yanggen, D.R., Naher, F., Gonzalez, C., García, J. and Meng, E., 2010. How cost-effective is biofortification in combating micronutrient malnutrition? An ex ante assessment. World Development 38: 64–75.
Moghissi, A.A., Pei, S. and Liu, Y., 2016. Golden Rice: scientific, regulatory
General discussion
217
and public information processes of a genetically modified organism. Critical Reviews in Biotechnology 36: 535–541.
Moreno, J.A., Díaz-Gómez, J., Nogareda, C., Angulo, E., Sandmann, G., Portero-Otin, M., Serrano, J.C.E., Twyman, R.M., Capell, T., Zhu, C. and Christou, P., 2016. The distribution of carotenoids in hens fed on biofortified maize is influenced by feed composition, absorption, resource allocation and storage. Scientific Reports 6: 35346.
Munkvold, G.P. and Desjardins, A.E., 1997. Fumonisins in maize. Can we reduce their occurrence? Plant Disease 81: 556–564.
Muzhingi, T., Gadaga, T.H., Siwela, A.H., Grusak, M.A., Russell, R.M. and Tang, G., 2011. Yellow maize with high β-carotene is an effective source of vitamin A in healthy Zimbabwean men. The American Journal of Clinical Nutrition 94: 510–519.
Muzhingi, T., Langyintuo, A.S., Malaba, L.C. and Banziger, M., 2008. Consumer acceptability of yellow maize products in Zimbabwe. Food Policy 33: 352–361.
National Research Council, 1989. Recommended Dietary Allowances. National Academy Press, Washington DC, USA.
National Research Council, 1994. Nutrient requeriments of poultry, ninth revised edition. National Academy Press, Washington DC, USA.
Nogareda, C., Moreno, J.A., Angulo, E., Sandmann, G., Portero, M., Capell, T., Zhu, C. and Christou, P., 2016. Carotenoid-enriched transgenic corn delivers bioavailable carotenoids to poultry and protects them against coccidiosis. Plant Biotechnology Journal 14: 160–168.
Nuss, E.T. and Tanumihardjo, S.A., 2010. Maize: a paramount staple crop in the context of global nutrition. Comprehensive Reviews in Food Science and Food Safety 9: 417–436.
Nwachukwu, I.D., Udenigwe, C.C. and Aluko, R.E., 2016. Lutein and zeaxanthin: production technology, bioavailability, mechanisms of action, visual function, and health claim status. Trends in Food Science & Technology 49: 74–84.
Paine, J.A., Shipton, C.A., Chaggar, S., Howells, R.M., Kennedy, M.J., Vernon, G., Wright, S.Y., Hinchliffe, E., Adams, J.L., Silverstone, A.L. and Drake, R., 2005. Improving the nutritional value of Golden Rice through increased pro-vitamin A content. Nature Biotechnology 23: 482–487.
General discussion
218
Palmer, A.C., Healy, K., Barffour, M.A., Siamusantu, W., Chileshe, J., Schulze, K.J., West Jr, K.P. and Labrique, A.B., 2016. Provitamin A carotenoid–biofortified maize consumption increases pupillary responsiveness among Zambian children in a randomized controlled trial. Journal of Nutrition jn239202.
Paul, J.-Y., Khanna, H., Kleidon, J., Hoang, P., Geijskes, J., Daniells, J., Zaplin, E., Rosenberg, Y., James, A., Mlalazi, B., Deo, P., Arinaitwe, G., Namanya, P., Becker, D., Tindamanyire, J., Tushemereirwe, W., Harding, R. and Dale, J., 2017. Golden bananas in the field: elevated fruit pro-vitamin A from the expression of a single banana transgene. Plant Biotechnology Journal 15: 520–532.
Pretorius, B. and Schönfeldt, H.C., 2013. Effect of different maize meal diets on growth and vitamin A: case-study on chickens. Food Chemistry 140: 520–525.
Rajput, N., Ali, S., Naeem, M., Khan, M. a and Wang, T., 2014. The effect of dietary supplementation with the natural carotenoids curcumin and lutein on pigmentation, oxidative stability and quality of meat from broiler chickens affected by a coccidiosis challenge. British Poultry Science 55: 501-509.
Ribeiro, E.M.G., Chitchumroonchokchai, C., de Carvalho, L.M.J., de Moura, F.F., de Carvalho, J.L.V. and Failla, M.L., 2015. Effect of style of home cooking on retention and bioaccessibility of pro-vitamin A carotenoids in biofortified pumpkin (Cucurbita moschata Duch.). Food Research International 77: 620–626.
Rodriguez-Amaya, D.B., 2016. Natural food pigments and colorants. Current Opinion in Food Science 7: 20–26.
Ruiz, J.A., Guerrero, L., Arnau, J., Guardia, M.D. and Esteve-García, E., 2001. Descriptive sensory analysis of meat from broilers fed diets containing vitamin E or β-carotene as antioxidants and different supplemental fats. Poultry Science 80: 976–982.
Ruiz, J.A., Pérez-Vendrell, A.M. and Esteve-García, E., 1999. Effect of β-carotene and vitamin E on oxidative stability in leg meat of broilers fed different supplemental fats. Journal of Agricultural and Food Chemistry 47: 448–454.
Sanahuja, G., Farré, G., Berman, J., Zorrilla-López, U., Twyman, R.M., Capell, T., Christou, P. and Zhu, C., 2013. A question of balance: achieving appropriate nutrient levels in biofortified staple crops. Nutrition Research Reviews 26: 235–245.
General discussion
219
Schmidt, M.A., Parrott, W.A., Hildebrand, D.F., Berg, R.H., Cooksey, A., Pendarvis, K., He, Y., Mccarthy, F. and Herman, E.M., 2015. Transgenic soya bean seeds accumulating β-carotene exhibit the collateral enhancements of oleate and protein content traits. Plant Biotechnology Journal 13: 590–600.
Simitzis, P.E. and Deligeorgis, S.G., 2011. The effects of natural antioxidants dietary supplementation on the properties of farm animal products. In: H., B.S. (ed.) Animal feed: types, nutrition and safety. Nova Science Publishers, Inc., New York, NY, USA, pp. 155–168.
Soriano, J.M. and Dragacci, S., 2004. Occurrence of fumonisins in foods. Food Research International 37: 985–1000.
Stevens, G.A., Bennett, J.E., Hennocq, Q., Lu, Y., De-Regil, L.M., Rogers, L., Danaei, G., Li, G., White, R.A., Flaxman, S.R., Oehrle, S.P., Finucane, M.M., Guerrero, R., Bhutta, Z.A., Then-Paulino, A., Fawzi, W., Black, R.E. and Ezzati, M., 2015. Trends and mortality effects of vitamin A deficiency in children in low-income and middle-income countries between 1991 and 2013: a pooled analysis of population-based surveys. The Lancet Global Health 3: e528–e536.
Support Precision Agriculture, 2016. Laureates letter supporting precision agriculture (GMOs). Available at: http://supportprecisionagriculture.org/nobel-laureate-gmo-letter_rjr.html Accessed 21 March 2017.
Tang, G., Jian, Q., Dolnikowski, G.G., Russell, R.M. and Grusak, M.A., 2009. Golden Rice is an effective source of vitamin A. The American Journal of Clinical Nutrition 89: 1776–1783.
Tanumihardjo, S.A., Ball, A.-M., Kaliwile, C. and Pixley, K. V, 2017. The research and implementation continuum of biofortified sweet potato and maize in Africa. Annals of the New York Academy of Sciences 1390: 88-103.
Thakare, D., Zhang, J., Wing, R.A., Cotty, P.J. and Schmidt, M.A., 2017. Aflatoxin-free transgenic maize using host-induced gene silencing. Science Advances 3: e16022382.
United Nations (UN), 2015. The Millennium Development Goals Report. UN, New York, NY, USA.
Van Loo-Bouwman, C. A, Naber, T.H.J. and Schaafsma, G., 2014. A review of vitamin A equivalency of β-carotene in various food matrices for human consumption. British Journal of Nutrition 111: 2153–2166.
General discussion
220
Wang, S., Zhang, L., Li, J., Cong, J., Gao, F. and Zhou, G., 2017. Effects of dietary marigold extract supplementation on growth performance, pigmentation, antioxidant capacity and meat quality in broiler chickens. Asian-Australasian Journal of Animal Sciences 30: 71–77.
Wesseler, J. and Zilberman, D., 2014. The economic power of the Golden Rice opposition. Environment and Development Economics 19: 724–742.
World Health Organization (WHO), 2011. Guideline: vitamin A supplementation in infants and children 6–59 months of age. WHO, Geneva, Switzerland.
Zanga, D., 2017. High carotenoid corn: agronomic evaluation and interactions with insect pests. Doctoral Thesis, University of Lleida, Lleida, Spain, January 2017.
Zanga, D., Capell, T., Slafer, G.A., Christou, P. and Savin, R., 2016a. A carotenogenic mini-pathway introduced into white corn does not affect development or agronomic performance. Scientific Reports 6: 38288.
Zanga, D., Capell, T., Zhu, C., Christou, P. and Thangaraj, H., 2016b. Freedom-to-operate analysis of a transgenic multivitamin corn variety. Plant Biotechnology Journal 14: 1225–1240.
Zhu, C., Farré, G., Zanga, D., Lloveras, J., Michelena, A., Ferrio, J.P., Voltas, J., Slafer, G.A., Savin, R., Albajes, R., Eizaguirre, M., Lopez, C., Cantero-Martínez, C., Díaz-Gómez, J., Nogareda, C., Moreno, J.A., Angulo, E., Estany, J., Pena, R.N., Tor, M., Portero-Otin, M., Eritja, N., Arjó, G., Serrano, J.C.E., Matias-Guiu, X., Twyman, R..M., Sandmann, G., Capell, T. and Christou P., 2017. High-carotenoid maize: development of plant biotechnology prototypes for human and animal health and nutrition. Phytochemistry Reviews DOI: 10.1007/s11101-017-9506-4.
Zhu, C., Naqvi, S., Breitenbach, J., Sandmann, G., Christou, P. and Capell, T., 2008. Combinatorial genetic transformation generates a library of metabolic phenotypes for the carotenoid pathway in maize. Proceedings of the National Academy of Sciences of the United States of America 105: 18232–18237.


Conclusions
223
The main goal of this Doctoral Thesis was to ascertain whether high-
carotenoid (HC) maize could be used as feed and food ingredient. Taking
into account the results presented in this Doctoral Thesis, as well as the
results found in other studies carried out in this university, we can conclude
that HC maize is a cost-effective and sustainable source of carotenoids
which can be used as feed and food component. Furthermore, HC maize
may contribute to improving the health status of populations who depend
on maize as a staple crop, and could even help to address vitamin A
deficiency in at-risk populations. The conclusions drawn in relation to the
objectives indicated at the beginning of this Doctoral Thesis are detailed
below.
Objective I: Evaluate, for three consecutive harvest seasons, the
susceptibility to fungal infection and fumonisin and aflatoxin contamination
of HC maize and its near isogenic line in open field experiments.
HC maize did not significantly differ from its near isogenic line (M37W
maize) in fungal infection, although the percentage of infected grains
was slightly lower in HC maize in 2 of the 3 years of study. Regarding
fungal species involved in this infection, Fusarium was the dominant
genus isolated in both types of maize in all the years of study, F.
verticillioides being the most common species isolated within this genus.
There was no fungal infection by Aspergillus spp. in any of the years of
study and, consequently, there was no aflatoxin contamination.
Fumonisin contamination was detected in both types of maize in all 3
years of study, but there were significant differences between maize
types. HC maize had lower fumonisin levels compared to its near
isogenic line, but this difference was only statistically significant in 2 of
the 3 years of study. Fumonisin levels were below the maximum level
allowed by European legislation for unprocessed maize, except for the
M37W maize in the second harvest. Accordingly, meteorological
conditions were related to a higher fumonisin contamination in both
types of maize in the second harvest, which highlights the importance of
climate in maize production, above all considering current climatic
trends in the Mediterranean area.
Bearing in mind the results found in HC maize, carotenoid content in
maize grains may disrupt fumonisin biosynthesis or accumulation, which
could be related to carotenoid antioxidant activity, as some carotenoids
Conclusions
224
can quench oxygen free radicals produced by plant cells as a defense
response, contributing to reducing oxidative stress that modulates toxin
biosynthesis.
Objective II: Evaluate whether HC maize could be a suitable replacement
for color additives in poultry feed.
HC maize can be used as feed component in poultry diets since none of
the criteria evaluated in the animal feeding trials were adversely affected.
Chickens fed on the HC maize diet grew normally and had similar
productivity and health parameters to those fed on diets based on its
near isogenic line and a commercial yellow maize (supplemented with
color additives).
HC maize has been demonstrated to be a suitable alternative to color
additives since it provides sufficient levels of xanthophylls. Chickens fed
on the HC maize diet developed similar pigmentation to those fed on a
diet based on a commercial yellow maize supplemented with natural
color additives commonly used in the poultry industry (i.e. marigold
flowers and red paprika extracts). HC maize could also contribute to
reducing the quantity of vitamin A added in the poultry diet as it
provides carotenoids with vitamin A activity.
Objective III: Assess the bioavailability of provitamin A (PVA) carotenoids
(β-carotene and β-cryptoxanthin) provided as intrinsic components of HC
maize.
PVA carotenoids supplied as intrinsic components of HC maize are
bioavailable at least to the same extent as synthetic compounds and
natural extracts. However, PVA carotenoids in HC maize are not
metabolized in the same manner: β-carotene is preferentially converted
into retinol in the intestine, whereas β-cryptoxanthin accumulates in the
liver.
The carotenoid levels found in feed, serum and liver support the need to
evaluate the nutrient bioavailability rather than the total amount of
nutrient provided. Lutein, zeaxanthin and β-carotene from HC maize
were bioavailable to the extent that this can be predicted based on their
levels in the HC feed, whereas β-cryptoxanthin and violaxanthin were
Conclusions
225
found at higher levels in the liver than originally presented in the feed,
corroborating the results found in the other two animal feeding trials.
Zeaxanthin seems to interfere with β-carotene absorption as higher
retinol levels were found in chickens fed on diets with lower zeaxanthin
levels. Despite the fact that zeaxanthin is the most abundant carotenoid
in HC maize, retinol levels remained high in livers from chickens fed on
the HC diet.
Objective IV: Investigate the effect of HC maize on chicken meat quality
and shelf life.
HC maize used as feed component in poultry diets delivers meat with a
good quality and shelf life. Breast and leg quarters obtained from
chickens fed on the HC diet were equally or better accepted by the
consumer panel than meat obtained from those fed on diets based on its
near isogenic line and a commercial yellow maize (supplemented with
color additives). Specifically, the shelf life of chicken meat (frozen,
thawed and stored under refrigerated conditions) from animals fed on
the HC diet was approximately 8–10 and 5.5–8 days, for breast and leg
quarter meat, respectively. In general, 7–9 days could be considered as
the maximum storage period for this chicken meat accepted by
consumers. These results were supported by the microbiological
analyses. Spoilage bacteria (Pseudomonas spp. and total aerobic mesophilic
bacteria) increased progressively from day 1 to 9 days in all chicken
samples, reaching similar levels to those commonly found in poultry
meat.
In accordance with the animal feeding trials, meat obtained from animals
fed on HC diet exhibited a similar pigmentation to meat obtained from
those fed on a commercial diet supplemented with color additives.
Chickens fed on carotenoid-enhanced diets exhibited a more intense red
and yellow color than those fed on a diet based on the near isogenic line,
whereas pH and firmness were not substantially different among
treatments. All the physical parameters evaluated (pH, color and
firmness) remained similar during storage; thus, refrigerated and frozen
conditions did not affect meat quality.
Conclusions
226
Objective V: Ascertain the optimal conditions for preserving carotenoids in
HC maize when it is cooked.
HC maize not only can preserve its initial carotenoid content after
thermal treatment, but also can enhance it thanks to the carotenoid
extractability from the food matrix. The optimum thermal treatment for
preserving carotenoid content in HC maize was 75 °C/10 min, followed
by 75 °C/20 min and 75 °C/40 min. However, temperatures ≤ 95 °C
combined with short cooking times (10–60 min) would also be
acceptable, as carotenoid content only decreased when cooking was
prolonged for 2 hours.
Among the home-cooking techniques tested, the best technique for
preserving carotenoid content in HC maize-based porridges is
unfermented thin porridge. It would be useful to control pH levels in
fermented products, as carotenoid levels in maize meals seem to be
affected by low pH values. The preference for thin or thick porridges
varies among regions, hence the need for nutritional programs to
encourage the use of appropriate cooking techniques to preserve
carotenoid content in biofortified staple crops at the same time as
promoting their consumption.


Future prospects
229
This Doctoral Thesis aimed to investigate whether high-carotenoid (HC)
maize could be used as feed and food component. The findings support this
hypothesis; thus, HC maize is a suitable ingredient for feed and food. As a
result, this Doctoral Thesis includes seven scientific publications, specifically
five research articles and two reviews. This research allowed us to answer
some questions and to formulate new ones, but its main contribution could
be its use in the legislative approval process for this genetically modified
(GM) crop.
From my point of view, it would be interesting to evaluate more deeply the
role of carotenoids in mycotoxin contamination, and their potential in the
inhibition of fumonisin biosynthesis and/or accumulation, which makes it
necessary to evaluate the role of each carotenoid individually. Bearing in
mind the results found by other authors, the possible effect of the carotenoid
content on insect feeding should be also considered.
Some results have a promising future, such as HC maize-based porridges,
but it would be necessary to assess their direct consumption by rural
populations to evaluate both carotenoid absorption and consumer
acceptance. Accordingly, it would be essential to keep working on the
bioavailability of provitamin A (PVA) carotenoids from HC maize meals, but
it is fundamental to move from chicken models to humans. In this way, we
will be able to make sure that PVA carotenoids from HC maize are absorbed
and assimilated by target populations.
There are other interesting lines of research, such as the structural changes in
carotenoids from HC maize after cooking and the role of these carotenoids
in meat lipid peroxidation. However, the most important future prospects
are related to the possible effects that the consumption of HC maize could
have on the health status of rural populations. Clinical trials are necessary to
ascertain whether HC maize can contribute to improving vitamin A status,
without the need for fortification and/or supplementation.
As a conclusion, the use of HC maize as a staple food crop by at-risk
populations in developing countries would be the icing on the cake, but we
all know that it will be difficult to achieve this objective, at least with the
current legislative framework. It is well-known that GM crops have some
difficulties to be deployed, as exemplified by Golden Rice. We hope that the
scientific centers in which HC maize seeds have already been released can
overcome all the constraints and that one day we will see how HC maize
helps to fight against food insecurity.


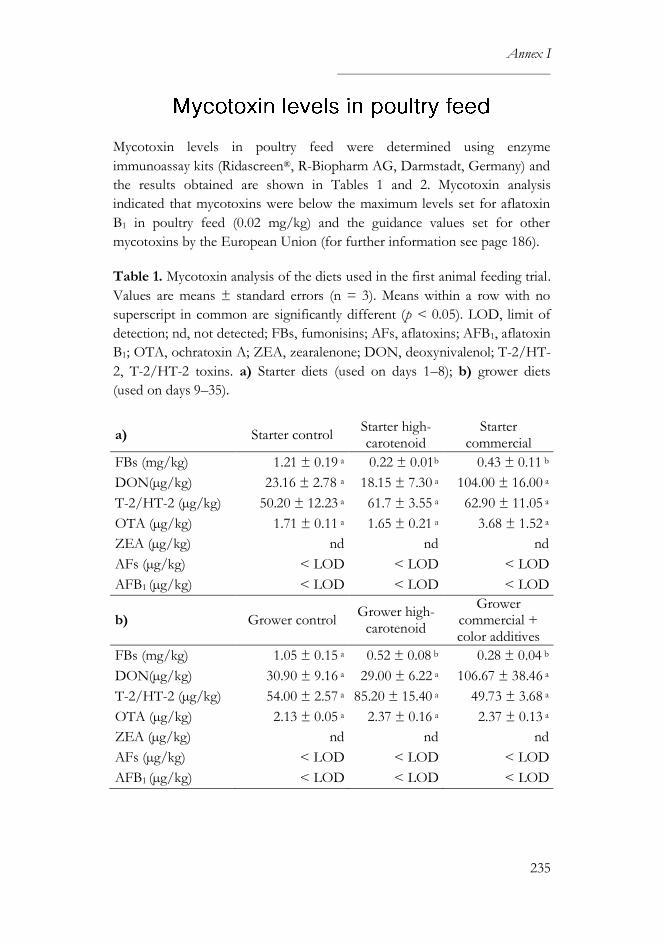
Annex I
235
Mycotoxin levels in poultry feed were determined using enzyme
immunoassay kits (Ridascreen®, R-Biopharm AG, Darmstadt, Germany) and
the results obtained are shown in Tables 1 and 2. Mycotoxin analysis
indicated that mycotoxins were below the maximum levels set for aflatoxin
B1 in poultry feed (0.02 mg/kg) and the guidance values set for other
mycotoxins by the European Union (for further information see page 186).
Table 1. Mycotoxin analysis of the diets used in the first animal feeding trial.
Values are means ± standard errors (n = 3). Means within a row with no
superscript in common are significantly different (p < 0.05). LOD, limit of
detection; nd, not detected; FBs, fumonisins; AFs, aflatoxins; AFB1, aflatoxin
B1; OTA, ochratoxin A; ZEA, zearalenone; DON, deoxynivalenol; T-2/HT-
2, T-2/HT-2 toxins. a) Starter diets (used on days 1–8); b) grower diets
(used on days 9–35).
a) Starter control Starter high-carotenoid
Starter commercial
FBs (mg/kg) 1.21 ± 0.19 a 0.22 ± 0.01b 0.43 ± 0.11 b
DON(µg/kg) 23.16 ± 2.78 a 18.15 ± 7.30 a 104.00 ± 16.00 a
T-2/HT-2 (µg/kg) 50.20 ± 12.23 a 61.7 ± 3.55 a 62.90 ± 11.05 a
OTA (µg/kg) 1.71 ± 0.11 a 1.65 ± 0.21 a 3.68 ± 1.52 a
ZEA (µg/kg) nd nd nd
AFs (µg/kg) < LOD < LOD < LOD
AFB1 (µg/kg) < LOD < LOD < LOD
b) Grower control Grower high-
carotenoid
Grower commercial + color additives
FBs (mg/kg) 1.05 ± 0.15 a 0.52 ± 0.08 b 0.28 ± 0.04 b
DON(µg/kg) 30.90 ± 9.16 a 29.00 ± 6.22 a 106.67 ± 38.46 a
T-2/HT-2 (µg/kg) 54.00 ± 2.57 a 85.20 ± 15.40 a 49.73 ± 3.68 a
OTA (µg/kg) 2.13 ± 0.05 a 2.37 ± 0.16 a 2.37 ± 0.13 a
ZEA (µg/kg) nd nd nd
AFs (µg/kg) < LOD < LOD < LOD
AFB1 (µg/kg) < LOD < LOD < LOD
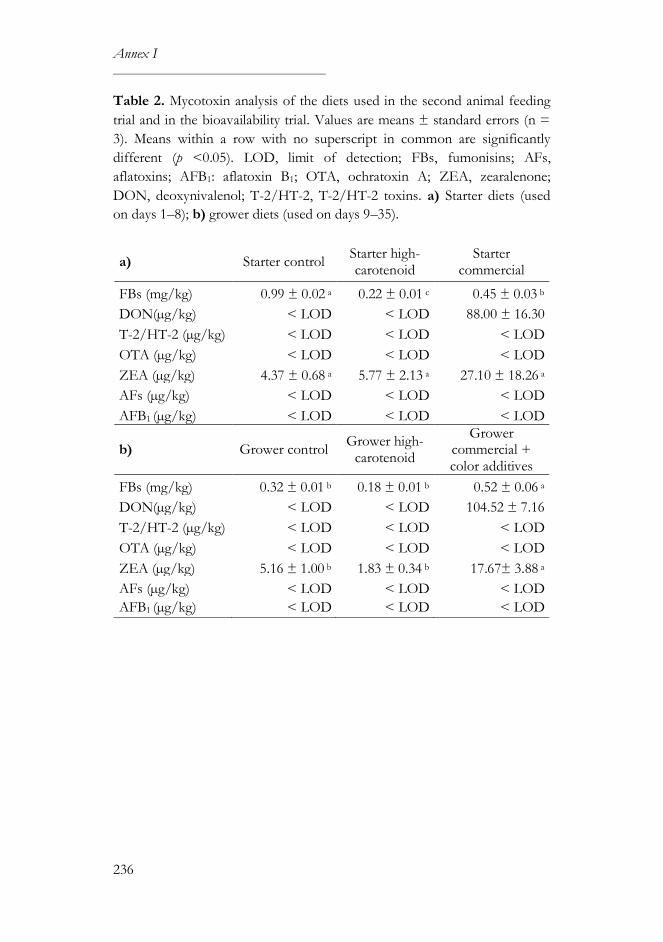
Annex I
236
Table 2. Mycotoxin analysis of the diets used in the second animal feeding
trial and in the bioavailability trial. Values are means ± standard errors (n =
3). Means within a row with no superscript in common are significantly
different (p <0.05). LOD, limit of detection; FBs, fumonisins; AFs,
aflatoxins; AFB1: aflatoxin B1; OTA, ochratoxin A; ZEA, zearalenone;
DON, deoxynivalenol; T-2/HT-2, T-2/HT-2 toxins. a) Starter diets (used
on days 1–8); b) grower diets (used on days 9–35).
a) Starter control Starter high-carotenoid
Starter commercial
FBs (mg/kg) 0.99 ± 0.02 a 0.22 ± 0.01 c 0.45 ± 0.03 b
DON(µg/kg) < LOD < LOD 88.00 ± 16.30
T-2/HT-2 (µg/kg) < LOD < LOD < LOD
OTA (µg/kg) < LOD < LOD < LOD
ZEA (µg/kg) 4.37 ± 0.68 a 5.77 ± 2.13 a 27.10 ± 18.26 a
AFs (µg/kg) < LOD < LOD < LOD
AFB1 (µg/kg) < LOD < LOD < LOD
b) Grower control Grower high-
carotenoid
Grower commercial + color additives
FBs (mg/kg) 0.32 ± 0.01 b 0.18 ± 0.01 b 0.52 ± 0.06 a
DON(µg/kg) < LOD < LOD 104.52 ± 7.16
T-2/HT-2 (µg/kg) < LOD < LOD < LOD
OTA (µg/kg) < LOD < LOD < LOD
ZEA (µg/kg) 5.16 ± 1.00 b 1.83 ± 0.34 b 17.67± 3.88 a
AFs (µg/kg) < LOD < LOD < LOD
AFB1 (µg/kg) < LOD < LOD < LOD
–

Annex II
239
Joana Díaz-Gómez a, Richard M. Twyman b, Changfu Zhu c, Gemma Farré c,
José C. E. Serrano d, Manuel Portero-Otin d, Pilar Muñoz c, Gerhard
Sandmann e, Teresa Capell c and Paul Christou c, f
a Department of Food Technology, University of Lleida – Agrotecnio
Center, Lleida, Spain; b TRM Ltd., York, UK; c Department of Plant and
Forestry Science, University of Lleida – Agrotecnio Center, Lleida, Spain; d
Department of Experimental Medicine, University of Lleida – Biomedical
Research Institute of Lleida (IRB Lleida), Lleida, Spain; e Biosynthesis group,
Department of Molecular Biosciences, J. W. Goethe University, Frankfurt,
Germany; f ICREA, Catalan Institute for Research and Advanced Studies,
Barcelona, Spain
Biofortification is an effective and economical method to improve the
micronutrient content of crops, particularly staples that sustain human
populations in developing countries. Whereas conventional fortification
requires artificial additives, biofortification involves the synthesis or
accumulation of nutrients by plants at source. Little is known about the
relative merits of biofortification and artificial fortification in terms of
nutrient bioaccessibility and bioavailability, and much depends on the
biochemical nature of the nutrient, which can promote or delay uptake, and
determine how efficiently different nutrients are transported through the
blood, stored, and utilized. Data from the first plants biofortified with
minerals and vitamins provide evidence that the way in which nutrients are
presented can affect how they are processed and utilized in the human body.
The latest studies on the effects of the food matrix, processing and storage
on nutrient transfer from biofortified crops are reviewed, as well as current
knowledge about nutrient absorption and utilization.
Nutrients in the human diet ultimately come from plants, but all our major
food crops lack certain essential micronutrients (vitamins and minerals) (Zhu
et al., 2007). The endosperm of cereal staples such as rice, wheat and maize
are the most important source of calories for humans, providing ~23%,
Annex II
240
~17% and ~10% of total global calories, respectively (Rawat et al., 2013).
However, endosperm tissue lacks sufficient amounts of vitamins (particularly
vitamins A, E, C and folate) and minerals (particularly iron, zinc and
selenium) (Gómez-Galera et al., 2010; Zhu et al., 2007). Iron and zinc
deficiencies affect more than 50% of the human population, resulting in
poor growth and development, an impaired immune system, fatigue, muscle
wasting, sterility and even death (Gómez-Galera et al., 2010; Rawat et al.,
2013). More than four million children worldwide suffer from severe vitamin
A deficiency (VAD), including 250,000–500,000 per year who become
partially or totally blind (Bai et al., 2011). Women have a higher demand for
vitamin A during pregnancy, and currently more than 20 million pregnant
women in developing countries suffer from VAD (Bai et al., 2011).
Strategies to address micronutrient deficiency include dietary diversification,
nutritional supplements, fortification and biofortification (Gómez-Galera et
al., 2010; Rawat et al., 2013; Zhu et al., 2007). A combination of approaches is
likely to provide the greatest overall benefit, but in some populations dietary
diversification is impractical and supplements are only suitable as short-term
interventions (Gómez-Galera et al., 2010; Rawat et al., 2013). Fortification
requires the addition of nutrients to food products, for example, iodine is
added to table salt, and iron, zinc and folate are added to flour to make bread
(Gómez-Galera et al., 2010; Rawat et al., 2013). One major drawback of these
approaches is the limited stability of the additives, for example, folate added
to rice becomes more soluble at higher temperatures and is lost when the
rice is boiled (Rawat et al., 2013). A second disadvantage is that additives can
also affect the quality of food, for example, iron additives are oxidized over
time and this has an impact on taste (Gómez-Galera et al., 2010). The third
and major limitation of conventional fortification is that it is mainly suited to
developed countries with the necessary technical infrastructure and
distribution networks, but is less appropriate for developing countries with
their extensive reliance on subsistence agriculture (Rawat et al., 2013).
Biofortification can address all three issues by facilitating the development of
nutrient-dense staple crops that can be grown and distributed using existing
agricultural practices (Gómez-Galera et al., 2010; Saltzman et al., 2013).
Biofortification is well established in principle but there are few practical
examples of deployment thus far. Zinc-enriched rice and wheat have recently
been deployed in Bangladesh and China, respectively; an orange sweet potato
rich in provitamin A (PVA) carotenoids has been released in Mozambique
and Uganda; and PVA rich maize has been released in Zambia and Nigeria
(Saltzman et al., 2013). Golden Rice II, the first transgenic biofortified crop
Annex II
241
engineered with PVA carotenoids in the endosperm, has incurred multiple
delays in terms of deployment. It is currently being backcrossed into locally
adapted varieties in the Philippines, Indonesia, India and Bangladesh
(Saltzman et al., 2013). Multivitamin corn (registered as the protected variety
Carolight® in Spain) was developed by transforming an elite white-
endosperm South African inbred line with four genes representing three
different vitamin biosynthesis pathways, increasing the levels of β-carotene,
other carotenoids, vitamin C and folate (Naqvi et al., 2009). Carolight® also
contains a Bacillus thuringiensis (Bt) gene making it pest resistant (Zanga et al.,
2016). Biofortification is a sustainable approach which can bring nutritious
staple crops to populations that are difficult to supply with supplements or
fortified food products, and once the crop is developed there are no
recurring costs other than those associated with normal agriculture.
However, it is necessary to consider the efficiency of nutrient delivery by
biofortified crops compared to other interventions in order to determine the
long-term benefits of this approach. Data from the first biofortified crops
are now available to allow such comparisons (Boxes 1 and 2).
Box 1. Glossary.
Supplementation is the oral delivery of micronutrients in the form of pills,
or powdered formulations that are dissolved before administration
(Gómez-Galera et al., 2010).
Fortification is the practice of deliberately increasing the content of an
essential micronutrient and thus improving the nutritional quality of
food, for example, iron and zinc added to flour, and iodine added to
table salt (Gómez-Galera et al., 2010; WHO, 2016).
Biofortification is the process by which the nutritional quality of food crops
is improved through agronomic practices, conventional plant breeding,
or modern biotechnology (WHO, 2016).
Bioaccessibility is the amount of an ingested nutrient that is released from
the food matrix in the gastrointestinal tract and becomes available for
absorption (Carbonell-Capella et al., 2014; Etcheverry et al., 2012).
Bioavailability is the amount of an ingested nutrient that is available for
utilization or for storage, including gastrointestinal digestion, absorption,
metabolism, tissue distribution, and bioactivity (Carbonell-Capella et al.,
2014; Etcheverry et al., 2012).
Annex II
242
Box 2. The measurement of bioaccessibility and bioavailability.
Nutrient bioaccessibility is usually determined in vitro, whereas nutrient
bioavailability can be assessed either in vitro or in vivo. Solubility and dialysis
assays measure bioaccessibility in vitro based on the proportional solubility of
a nutrient in a test sample, and by equilibrium dialysis, respectively
(Etcheverry et al., 2012). They only measure the basic properties of nutrients
and do not simulate the gut environment. Gastrointestinal models have been
developed for the latter purpose and can simulate parameters such as saliva
flow, peristalsis and intestinal pH (Cardoso et al., 2015; Etcheverry et al.,
2012). Samples can be collected at any time during digestion, and
bioavailability can be measured in addition to bioaccessibility when coupled
to intestinal cells. However, such models usually do not incorporate
homeostatic mechanisms, intestinal bacteria and hepatic metabolism
(Carbonell-Capella et al., 2014; Etcheverry et al., 2012). Caco-2 cells are
epithelial cells derived from a human colonic adenocarcinoma and they
behave very much like intestinal cells when grown on plastic surfaces or
Transwell inserts (Etcheverry et al., 2012). Caco-2 cells form a polarized
monolayer that accurately models the physical and biochemical barriers in
the gut, thus providing a more realistic model of absorption including the
secretion of chylomicrons, although certain aspects are missing such as other
epithelial cell types, mucin and biofilms (Carbonell-Capella et al., 2014;
Etcheverry et al., 2012).
Bioaccessibility and bioavailability can be investigated in vivo in humans or
animal models, including complete balance studies (which estimate the
bioaccessible or bioavailable fraction by comparing ingested and excreted
quantities) and tissue analysis (including plasma/serum fractions). Humans
are more appropriate for in vivo studies due to the well-documented
differences in intestinal absorption mechanisms among rats, chickens and
humans (Sanahuja et al., 2013) although such methods are laborious and
expensive and restricted by ethical constraints (Cardoso et al., 2015).
The fate of organic nutrients in plant tissues is highly dependent on their
solubility and their affinity for the constituents of the plant tissue matrix.
Folate is soluble in water and is easily released from the matrix, thus plasma
folate levels are higher following the consumption of minced/chopped
Annex II
243
spinach rather than whole leaves both as raw tissue (Castenmiller et al., 2000)
and after microwaving (van het Hof et al., 1999). Dietary fibers such as
cellulose, lignin, pectin and alginate do not appear to affect folate
bioavailability (Ristow et al., 1982). Baking causes the loss of endogenous
bread folates (~40%) as well as added synthetic folic acid (30–60%).
Furthermore, the bread matrix inhibits folate absorption (Öhrvik et al., 2010).
In contrast, the bioavailability of fat-soluble nutrients appears to be much
more dependent on associations with matrix components and other dietary
constituents, as shown for the six major dietary carotenoids (β-carotene, α-
carotene and β-cryptoxanthin with PVA activity, lycopene, lutein and
zeaxanthin without PVA activity) (Fernández-García et al., 2012).
Carotenoids are associated with proteins in many green leafy vegetables,
whereas in carrots and tomatoes they are also stored in a semi-crystalline
form (Ball, 2006; Hoffman and Gerber, 2015). Cooking, food processing,
and the enzymatic processes during digestion weaken the cell walls and
disrupt the protein-carotenoid complexes, promoting release and increasing
bioavailability (Murador et al., 2014). The bioavailability of carotenoids
appears to depend on food particle size, with more efficient absorption from
smaller food particles produced by homogenization, grinding, or milling. The
bioavailability of carotenoids after release is favored by the presence of fats
because carotenoids are incorporated into lipid droplets before entering the
micelles, whereas soluble fibers, sterols and stanols inhibit the absorption of
carotenoids (Goltz et al., 2012; Hoffman and Gerber, 2015; Lakshminarayana
and Baskaran, 2013; Yonekura and Nagao, 2007). The inhibitory effect of
fibers may reflect the higher viscosity of fibrous solutions, the formation of
gel aggregates, the incomplete hydrolysis of triacyl glycerols, or carotenoid
aggregation (Yonekura and Nagao, 2009). Carotenoids are lipophilic and may
also compete with plant sterols and stanols for solubilization in mixed
micelles (Yonekura and Nagao, 2007).
Vitamin E comprises eight fat-soluble molecules (α, β, γ and δ tocopherol
and the corresponding tocotrienols, with α-tocopherol possessing the
greatest biological activity) and like carotenoids its bioavailability is therefore
highly dependent on interactions with the food matrix (DellaPenna and
Mène-Saffrané, 2011; Nesaretnam, 2008). Accordingly, the bioaccessibility of
vitamin E varies extensively in different types of food, ranging from 0.47%
Annex II
244
in apple to almost 100% in banana, white bread and lettuce. Interestingly, the
bioaccessibility of α-tocopherol was similar to that of γ-tocopherol when
sourced from almonds, wheat germ, cheese or hazelnuts, but α-tocopherol
was more bioaccessible than γ-tocopherol when sourced from banana, bread,
lettuce and milk. This may reflect the food matrix effect, which determines
the location of tocopherols, their physicochemical state, and the
co-presentation of absorption effectors such as fibers, fats, sterols and
stanols (Reboul et al., 2006).
The bioavailability of minerals is affected by the food matrix, intrinsic
chemical properties such as the oxidation state and counter-ion, and also by
co-presented food substances, because all of these factors can affect
solubility (Etcheverry et al., 2012). Calcium must be solubilized before it can
be absorbed. The extracellular calcium concentration depends on intestinal
absorption, kidney reabsorption and bone resorption/formation, which are
regulated by the calcium sensing receptor (CaSR) located in the parathyroid
gland (Zhang et al., 2015). The absorption of calcium is highly dependent on
the abundance of phytate and oxalate, which can combine with calcium to
form insoluble complexes (La Frano et al., 2014; Liang et al., 2010). Calcium
also forms complexes with proteins, so cooking can help to release calcium
for absorption, but the cooking method is important because the soluble
calcium leaches into water used for boiling, but is retained during baking
(Repo-Carrasco-Valencia et al., 2010). Vitamin D is also required for calcium
absorption (Heaney, 2008). Similarly, iron in meat and fish is relatively easy
to absorb because of its favorable oxidation state and its storage in the form
of ferritin-iron complexes that release the mineral readily, whereas some
dietary proteins (such as albumin, casein, phosvitin and conglycinin) and
certain plant polyphenols can reduce the bioavailability of iron (Collings et
al., 2013; Etcheverry et al., 2012).
The major role of the food matrix in terms of nutrient bioaccessibility and
bioavailability is to trap the nutrients within cells or subcellular
compartments, and to provide constituents that interact chemically with
specific nutrients to either encourage or delay their release, leading to their
Annex II
245
classification as absorption promoters and inhibitors (Table 1). Lipid food
components increase the bioaccessibility of fat-soluble nutrients, so cooking
methods that preserve fats (e.g. frying) tend to outperform methods that
disperse them (e.g. boiling) in terms of promoting the bioaccessibility of
nutrients such as β-carotene, as recently shown for biofortified cassava
(Berni et al., 2014). Similarly, β-carotene bioaccessibility increased by
threefold–fivefold in a transgenic biofortified sorghum line when the lipid
content was increased from 5% to 10% (Lipkie et al., 2013). Inhibitors such
as phytate, oxalate and polyphenols reduce the bioaccessibility of iron and
zinc by forming insoluble complexes. Transgenic maize, rice and sorghum
with lower phytate levels in the seeds have been developed to address this
issue (Raes et al., 2014). Biofortification is advantageous for iron nutrition
because plants can be engineered to maximize bioaccessibility. In contrast,
standard fortification is achieved using sparingly soluble iron compounds to
avoid an undesirable metallic taste, but the bioavailability of such
compounds is low (Moretti et al., 2014). Agronomic interventions are short-
term strategies that focus on the use of soil and foliar mineral fertilizers, but
regular applications are required (Carvalho and Vasconcelos, 2013). In maize,
rice and wheat, foliar fertilization achieves higher levels of zinc accumulation
than soil fertilization (Joy et al., 2015). Mineral biofortification is most
efficient when cereals are not consumed as flours, e.g. rice grain.
Accordingly, zinc in rice grains biofortified using zinc-rich fertilizer is
absorbed to a similar extent as the same rice variety fortified artificially with
zinc immediately before consumption (Brnic et al., 2016).
Table 1. Relationship between micronutrients and the food matrix.
Carotenoids (Ball, 2006; La Frano et al., 2014)
In photosynthetic plant tissues, carotenoids are bound to proteins in the
inner chloroplast membrane, whereas in other tissues, such as fruits and
endosperm, they are mainly found in chromoplasts. Carotenoids
accumulate in the plastoglobuli of chloroplasts and chromoplasts, but in
the latter they are also deposited as crystals.
Cell walls, carotenoid-protein complexes and fibers trap carotenoids and
inhibit absorption.
The type and amount of fat can influence carotenoid absorption by
promoting the excretion of bile salts, enhancing micelle formation and
carotenoid solubilization.
Xanthophylls are more hydrophilic than carotenes and are thus easier to
absorb.
Annex II
246
Carotenoid cis isomers are more easily absorbed than trans isomers due
to their greater polarity and solubility.
Iron and zinc (Gibson, 2007; Moretti et al., 2014; Raes et al., 2014; Suri and
Tanumihardjo, 2016)
Iron and zinc are chelated by other food components for transport (e.g.
nicotianamine, peptides, proteins and organic acids). Proteins can also
enhance absorption.
Heme iron and organic zinc complexes are more readily absorbed than
non-heme iron and inorganic zinc salts. The absorption of non-heme
iron and zinc from plant-based foods can be enhanced by consuming
meat, poultry, fish or seafood in the same meal.
Phytate, oxalate, phenolic compounds and fibers form insoluble
complexes with iron and zinc. The efficiency of complex formation
depends on the chemical properties of the mineral, the pH and the
presence of other compounds. Phytate binds preferentially to calcium
and iron, limiting their bioavailability but increasing zinc bioavailability.
Organic acids (such as ascorbate and citrate) and cysteine promote iron
absorption. EDTA can promote iron and zinc absorption.
Calcium can compete with iron for intestinal absorption; its effect on
zinc has not been determined.
Water-soluble vitamins (Ball, 2006; Gibson, 2007)
Vitamins that form complexes in the food matrix are absorbed less
efficiently than free vitamins.
Vitamins B1, B3, B6 and B9 can become trapped in the insoluble part of
the food matrix in certain plant foods, reducing their bioaccessibility.
Dietary fiber does not have a significant impact on the absorption of
water-soluble vitamins.
Food processing can enhance the bioaccessibility and bioavailability of
nutrients by removing inhibitors or releasing nutrients from the food matrix
(Table 2) but it can also reduce nutritional value. For example, most cereal
grains are dehulled and milled before consumption, causing significant losses
of minerals (Raes et al., 2014) and certain vitamins (Dunn et al., 2014).
Carotenoid levels tend not to be affected by light milling, but greater losses
are caused by heavy milling (Mugode et al., 2014; Pillay et al., 2014). Genetic
engineering strategies that promote the accumulation of nutrients in the
Annex II
247
endosperm rather than the bran or husk are therefore useful to increase the
nutritional value of polished grains (De Steur et al., 2015), as shown by the
expression of enzymes that promote the synthesis of phytosiderophores in
rice, leading to the modulation of endogenous metal transporter gene
expression and the mobilization of zinc and iron from the bran to the
endosperm (Banakar et al., 2016). Cooking and thermal food processing
methods such as pasteurization can destroy heat-sensitive organic nutrients
such as folate and B6 group vitamins, and the cooking method can also
encourage leaching, but the bioaccessibility of other nutrients can increase
when they are released from the plant matrix by cooking. Transgenic
biofortified cassava provides sufficient bioavailable vitamin B6 after cooking:
the leaves and roots retain, respectively, ninefold and fourfold more non-
phosphorylated B6 than non-transgenic cassava (Li et al., 2015). Transgenic
biofortified rice meets folate requirements even after cooking losses of 45%
(100 g of rice contains 500 µg of folates) (Blancquaert et al., 2015).
Interestingly, only 43% of the original content of PVA carotenoids was
retained in fortified rice grains after cooking, whereas iron, zinc, folic acid
and vitamin B12 levels usually remained above 80% of the original value
(Wieringa et al., 2014). In contrast, β-carotene was retained when biofortified
maize (Mugode et al., 2014; Pillay et al., 2014) and biofortified pumpkin
(Ribeiro et al., 2015) were cooked (> 72% and > 78%, respectively)
suggesting that biofortification prevents the loss of PVA carotenoids during
cooking more effectively than standard fortification, probably caused by the
food matrix effect. In hens fed on transgenic biofortified maize, PVA
carotenoids are preferentially diverted to the liver, whereas non-PVA
carotenoids accumulate in the egg, in some cases doubling the initial
concentration in the feed. When non-PVA carotenoids were supplied as
intrinsic components of the transgenic biofortified maize, these nutrients
were more efficiently absorbed than carotenoid additives in the standard
commercial maize diet (Moreno et al., 2016). Transgenic biofortified cassava
also preserves the bioaccessibility of PVA carotenoids after processing, with
a greater efficiency of β-carotene transfer to micelles (30–45%) than non-
transgenic cassava (27–31%) (Failla et al., 2012). In contrast, the transfer of
β-carotene to micelles in transgenic sorghum was less efficient (1–5%) than
in non-transgenic sorghum (6–11%) (Lipkie et al., 2013). Several studies have
highlighted the importance of genotype-specific effects on the retention of
carotenoids during identical processing treatments, probably reflecting
differences in the food matrix (Berni et al., 2014; Failla et al., 2012; Mugode et
al., 2014; Ribeiro et al., 2015). The impact of cooking on the retention of β-
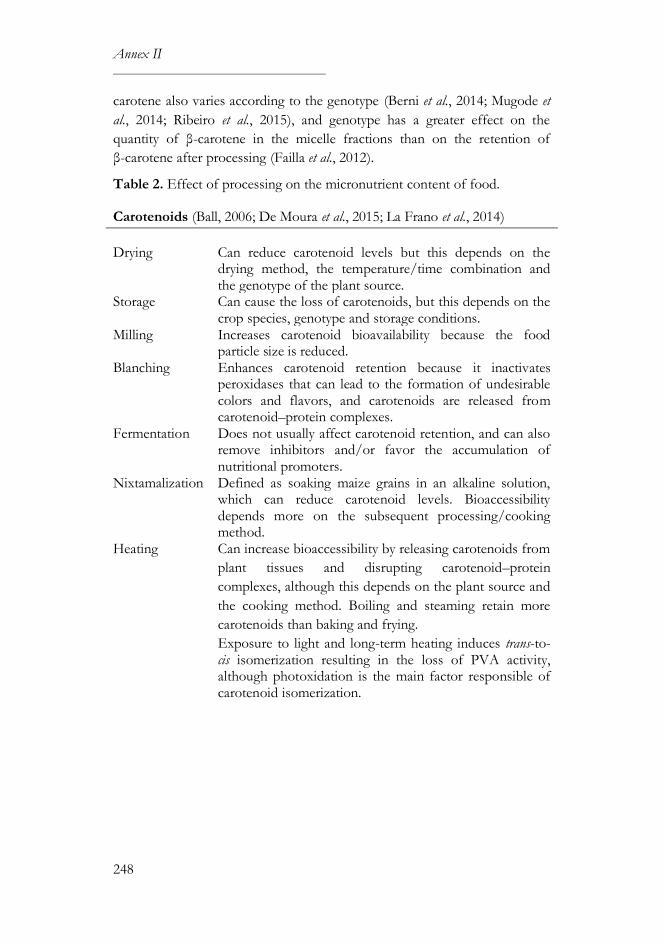
Annex II
248
carotene also varies according to the genotype (Berni et al., 2014; Mugode et
al., 2014; Ribeiro et al., 2015), and genotype has a greater effect on the
quantity of β-carotene in the micelle fractions than on the retention of
β-carotene after processing (Failla et al., 2012).
Table 2. Effect of processing on the micronutrient content of food.
Carotenoids (Ball, 2006; De Moura et al., 2015; La Frano et al., 2014)
Drying Can reduce carotenoid levels but this depends on the drying method, the temperature/time combination and the genotype of the plant source.
Storage Can cause the loss of carotenoids, but this depends on the crop species, genotype and storage conditions.
Milling Increases carotenoid bioavailability because the food particle size is reduced.
Blanching Enhances carotenoid retention because it inactivates peroxidases that can lead to the formation of undesirable colors and flavors, and carotenoids are released from carotenoid–protein complexes.
Fermentation Does not usually affect carotenoid retention, and can also remove inhibitors and/or favor the accumulation of nutritional promoters.
Nixtamalization Defined as soaking maize grains in an alkaline solution, which can reduce carotenoid levels. Bioaccessibility depends more on the subsequent processing/cooking method.
Heating Can increase bioaccessibility by releasing carotenoids from
plant tissues and disrupting carotenoid–protein
complexes, although this depends on the plant source and
the cooking method. Boiling and steaming retain more
carotenoids than baking and frying.
Exposure to light and long-term heating induces trans-to-cis isomerization resulting in the loss of PVA activity, although photoxidation is the main factor responsible of carotenoid isomerization.
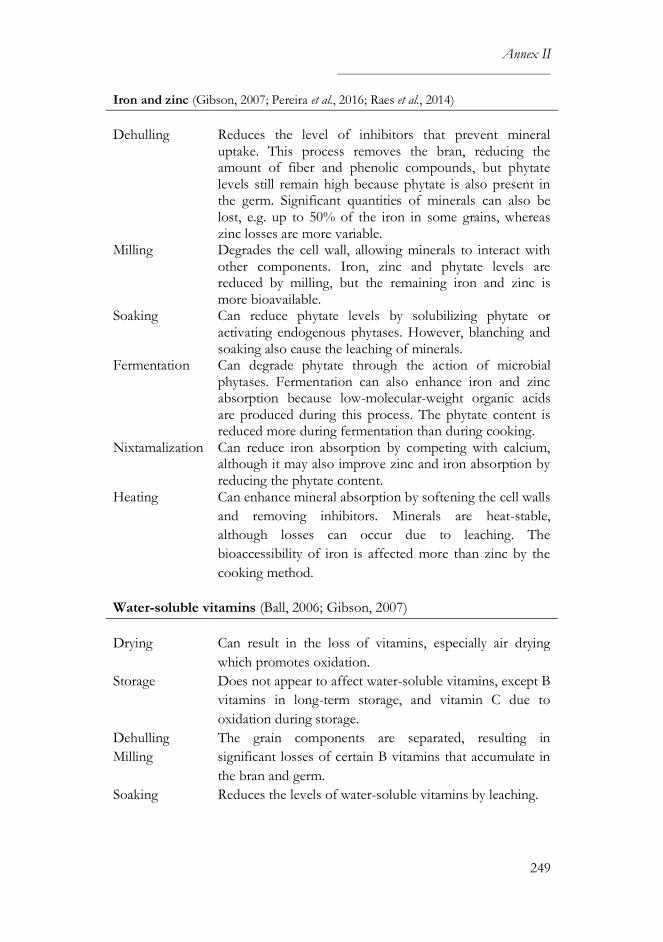
Annex II
249
Iron and zinc (Gibson, 2007; Pereira et al., 2016; Raes et al., 2014)
Dehulling Reduces the level of inhibitors that prevent mineral uptake. This process removes the bran, reducing the amount of fiber and phenolic compounds, but phytate levels still remain high because phytate is also present in the germ. Significant quantities of minerals can also be lost, e.g. up to 50% of the iron in some grains, whereas zinc losses are more variable.
Milling Degrades the cell wall, allowing minerals to interact with other components. Iron, zinc and phytate levels are reduced by milling, but the remaining iron and zinc is more bioavailable.
Soaking Can reduce phytate levels by solubilizing phytate or activating endogenous phytases. However, blanching and soaking also cause the leaching of minerals.
Fermentation Can degrade phytate through the action of microbial phytases. Fermentation can also enhance iron and zinc absorption because low-molecular-weight organic acids are produced during this process. The phytate content is reduced more during fermentation than during cooking.
Nixtamalization Can reduce iron absorption by competing with calcium, although it may also improve zinc and iron absorption by reducing the phytate content.
Heating Can enhance mineral absorption by softening the cell walls
and removing inhibitors. Minerals are heat-stable,
although losses can occur due to leaching. The
bioaccessibility of iron is affected more than zinc by the
cooking method.
Water-soluble vitamins (Ball, 2006; Gibson, 2007)
Drying Can result in the loss of vitamins, especially air drying
which promotes oxidation.
Storage Does not appear to affect water-soluble vitamins, except B
vitamins in long-term storage, and vitamin C due to
oxidation during storage.
Dehulling
Milling
The grain components are separated, resulting in
significant losses of certain B vitamins that accumulate in
the bran and germ.
Soaking Reduces the levels of water-soluble vitamins by leaching.
Annex II
250
Blanching Inactivates enzymes that oxidize vitamin C but also
encourages the loss of vitamin C by leaching.
Fermentation Can increase the bioavailability of certain B vitamins (e.g.
B2 and B3).
Nixtamalization Can reduce the content of certain B vitamins (e.g. B1 and
B3), but in some cases the remaining quantity can become
more bioavailable (e.g. B3).
Cooking Can release vitamins from the food matrix but can also
destroy heat-sensitive vitamins (B1, B2 and C), although
this depends on temperature/time combinations. The
greatest losses during cooking occur due to vitamins
leaching into the water, so steaming is preferred to boiling.
The stability of nutrients during storage is also an important consideration
because biofortified maize loses a greater quantity of carotenoids during
post-harvest storage than during cooking (Mugode et al., 2014). As discussed
above for cooking and processing, genotype has an important impact on
carotenoid stability during storage (Ortiz et al., 2016). Moreover, maize
genotypes which lose more carotenoids during drying tend to lose less during
storage (Suri and Tanumihardjo, 2016). Biofortified cassava was more
susceptible to carotenoid losses during storage than white cassava with added
red palm oil, suggesting that fatty acids can prevent carotenoid degradation
(Bechoff et al., 2015). Transgenic biofortified rice with improved folate
stability was recently reported to maintain folate levels for 4 months when
stored at 28 ºC (Blancquaert et al., 2015). The sequestration of carotenoids in
chromoplasts, which act as a metabolic sink, can enhance carotenoid levels
during storage, as recently shown for transgenic potatoes (cv. Désirée) in
cold storage for 5 months (Li et al., 2012). Nevertheless, when the Phureja
cultivar was used as the parental genotype (high carotenoid content in
tubers) instead of Désirée (low carotenoid content in tubers), there were no
significant changes in total carotenoid levels during cold storage (Campbell et
al., 2015).
Nutrient supplements and fortified foods are provided in well-controlled
doses to avoid toxicity. One concern about biofortification is that dosing
would be more difficult to control, but recent studies have shown that the
uptake of nutrients from biofortified crops is regulated at the level of
Annex II
251
absorption from the gut, and also at the cellular level and by the modulation
of storage reservoirs, based on the abundance of nutrients already in the
body and the demand for certain nutrient molecules (Jeong and Guerinot,
2008).
Each vitamin and mineral has a specific transporter that facilitates its uptake
from the gut, but some unrelated nutrients can also share the same
transporter, as shown for the sodium-dependent multivitamin transporter
that can mobilize pantothenic acid, biotin, -lipoic acid and iodine (Quick
and Shi, 2015). In this context, the transport of one nutrient can be inhibited
in a concentration-dependent manner by other compounds that share the
same transporter. Fat-soluble compounds are also mobilized by lipid
transporters that vary in specificity. For example, carotenoids are absorbed
via scavenger receptors (class B type 1 and Niemann-Pick type C1-like 1)
that are selective for particular carotenoid molecules such as lutein (Sato et
al., 2012). Some nutrients can only be absorbed as a complex with a ligand
that is secreted into the gut. For examples, intrinsic factor is secreted by
gastric parietal cells to absorb cobalamin (vitamin B12), polyglutamyl folates
must be processed by glutamate carboxypeptidase II, and the pancreatic
secretion of -glutamyl hydrolase is necessary to release folate for absorption
(Shafizadeh and Halsted, 2007).
The intestinal uptake of nutrients is adaptively regulated by the substrate
level in the diet and depends primarily on the number of transporters in the
apical and basolateral cell membranes of endothelial cells. For thiamin, this
involves the transcriptional regulation of thiamin transporter-2 (Nabokina et
al., 2013). The production of nutrient-specific transporters is regulated at the
level of transcription. High levels of nutrient bioavailability lead to the
suppression of transcription and starvation causes the transporter gene to be
induced. In some cases, specific epigenetic changes have been observed in
the promoter of the transporter gene, for example, the oversupply of
riboflavin leads to the epigenetic suppression of the riboflavin transporter
gene (Subramanian et al., 2015).
The transport of nutrients after absorption may also be regulated. For
example, fat-soluble vitamins, carotenoids and -3 fatty acids (particularly
docosahexaenoic and eicosapentaenoic acids) are transported in lipid vesicles
that require chylomicron assembly and secretion, and these processes are
inhibited when the corresponding nutrients are plentiful (Wang et al., 2014).
Similarly, iron is exported from enterocytes via ferroportin and its
distribution is limited by the availability of transferrin. Finally, specific
Annex II
252
intracellular sensors of nutrient bioavailability may regulate tissue
distribution. For example, the absorption of iron is inhibited by the
regulatory protein hepcidin which is stored in macrophages. Interestingly,
hepcidin synthesis is sensitive to both circulating iron and intracellular iron
stores because the macrophages communicate with hepatocytes to regulate
hepcidin release via multiple indicator proteins, including transferrin and
transferrin receptor-2 (Evstatiev and Gasche, 2012).
The biofortification of staple crops was envisaged as a sustainable strategy to
deliver nutritious food to populations that are unsuitable for other
intervention measures, but the bioavailability of nutrients in biofortified
crops must be confirmed before they can be widely deployed. The
bioavailability of nutrients is partly dependent on the intrinsic qualities of
each nutrient molecule and partly dependent on their presentation in the
context of the food matrix.
The major difference between biofortification and standard fortification is
that the latter involves additives that are mixed with the food, whereas
biofortification embeds the nutrients inside plant cells. The bioencapsulation
of nutrients in this manner can prevent them from leaching during cooking
and processing, as shown by the direct comparison of β-carotene levels after
cooking fortified and transgenic biofortified rice, but can also enhance the
binding of nutrients to plant proteins and fibers, as shown for iron and other
minerals. The full value of biofortified crops can therefore be realized only
by combining the adoption of biofortified varieties with the most
appropriate food preparation and cooking methods to maximize the
bioavailability of different nutrients. Moreover, cooking and storage losses
could be reduced by growing crops in which the nutrients are more stable
(e.g. transgenic folate-biofortified rice). Biofortified crops can help to
alleviate micronutrient deficiency in at-risk populations in a sustainable
manner. Some biofortified crops (e.g. rice, maize, cassava and pumpkin)
achieve better results than others (e.g. sorghum), but rural populations are
accustomed to eating staple crops commonly harvested in their area, so
biofortification strategies must be tailored for different communities to
achieve the greatest improvements in nutritional health.

Annex II
253
Bai, C., Twyman, R.M., Farré, G., Sanahuja, G., Christou, P., Capell, T. and
Zhu, C., 2011. A golden era – pro-vitamin A enhancement in diverse
crops. In Vitro Cellular & Developmental Biology – Plant 47: 205–221.
Ball, G.F.M., 2006. Vitamins in foods. Analysis, bioavailability and stability.
CRC Press, Boca Raton, FL, USA.
Banakar R., Alvarez Fernández Á., Abadía J., Capell, T., Christou, P., 2016.
The expression of heterologous Fe (III) phytosiderophore transporter
HvYS1 in rice increases Fe uptake, translocation and seed loading and
excludes heavy metals by selective Fe transport. Plant Biotechnology
Journal 15: 423–432.
Bechoff, A., Chijioke, U., Tomlins, K.I., Govinden, P., Ilona, P., Westby, A.
and Boy, E., 2015. Carotenoid stability during storage of yellow gari
made from biofortified cassava or with palm oil. Journal of Food
Composition and Analysis 44: 36–44.
Berni, P., Chitchumroonchokchai, C., Canniatti-Brazaca, S.G., De Moura,
F.F. and Failla, M.L., 2014. Impact of genotype and cooking style on
the content, retention, and bioacessibility of β-carotene in biofortified
cassava (Manihot esculenta Crantz) conventionally bred in Brazil. Journal
of Agricultural and Food Chemistry 62: 6677–6686.
Blancquaert, D., Van Daele, J., Strobbe, S., Kiekens, F., Storozhenko, S., De
Steur, H., Gellynck, X., Lambert, W., Stove, C. and Van Der Straeten,
D., 2015. Improving folate (vitamin B9) stability in biofortified rice
through metabolic engineering. Nature Biotechnology 33: 1076–1078.
Brnic, M., Wegmüller, R., Melse-Boonstra, A., Stomph, T., Zeder, C., Tay, F.
and Hurrell, R., 2016. Zinc absorption by adults is similar from
intrinsically labeled zinc-biofortified rice and from rice fortified with
labeled zinc sulfate. The Journal of Nutrition 146: 76–80.
Carbonell-Capella, J.M., Buniowska, M., Barba, F.J., Esteve, M.J. and Frígola,
A., 2014. Analytical methods for determining bioavailability and
bioaccessibility of bioactive compounds from fruits and vegetables: a
review. Comprehensive Reviews in Food Science and Food Safety 13:
155–171.

Annex II
254
Campbell, R., Morris, W.L., Mortimer, C.L., Misawa, N., Ducreux, L.J.M.,
Morris, J.A., Hedley, P.E., Fraser, P.D. and Taylor, M.A., 2015.
Optimising ketocarotenoid production in potato tubers: effect of
genetic background, transgene combinations and environment. Plant
Science 234: 27–37.
Cardoso, C., Afonso, C., Lourenço, H., Costa, S. and Nunes, M.L., 2015.
Bioaccessibility assessment methodologies and their consequences for
the risk-benefit evaluation of food. Trends in Food Science and
Technology 41: 5–23.
Carvalho, S.M.P. and Vasconcelos, M.W., 2013. Producing more with less:
strategies and novel technologies for plant-based food biofortification.
Food Research International 54: 961–971.
Castenmiller, J.J., van de Poll, C.J., West, C.E., Brouwer, I.A., Thomas, C.M.
and van Dusseldorp, M., 2000. Bioavailability of folate from processed
spinach in humans. Effect of food matrix and interaction with
carotenoids. Annals of Nutrition & Metabolism 44: 163–169.
Collings, R., Harvey, L.J., Hooper, L., Hurst, R., Brown, T.J., Ansett, J.,
King, M. and Fairweather-Tait, S.J., 2013. The absorption of iron from
whole diets: a systematic review. The American Journal of Clinical
Nutrition 98: 65–81.
De Moura, F.F., Miloff, A. and Boy, E., 2015. Retention of provitamin A
carotenoids in staple crops targeted for biofortification in Africa:
cassava, maize and sweet potato. Critical Reviews in Food Science and
Nutrition 55: 1246–1269.
De Steur, H., Blancquaert, D., Strobbe, S., Lambert, W., Gellynck, X. and
Van Der Straeten, D., 2015. Status and market potential of transgenic
biofortified crops. Nature Biotechnology 33: 25–29.
DellaPenna, D. and Mène-Saffrané, L., 2011. Vitmamin E in “Biosynthesis
of vitamins in plants.” In: Rébeillé, F. and Douces, R. (eds.) Advances
in Botanical Research. Elsevier Inc., Amsterdam, The Netherlands, pp.
179–227.
Dunn, M.L., Jain, V. and Klein, B.P., 2014. Stability of key micronutrients
added to fortified maize flours and corn meal. Annals of the New York
Academy of Sciences 1312: 15–25.
Annex II
255
Etcheverry, P., Grusak, M.A. and Fleige, L.E., 2012. Application of in vitro
bioaccessibility and bioavailability methods for calcium, carotenoids,
folate, iron, magnesium, polyphenols, zinc, and vitamins B6, B12, D,
and E. Frontiers in Physiology 3: 1–22.
Evstatiev, R. and Gasche, C., 2012. Iron sensing and signalling. Gut 61: 933–
952.
Failla, M.L., Chitchumroonchokchai, C., Siritunga, D., De Moura, F.F.,
Fregene, M., Manary, M.J. and Sayre, R.T., 2012. Retention during
processing and bioaccessibility of β-carotene in high β-carotene
transgenic cassava root. Journal of Agricultural and Food Chemistry
60: 3861–3866.
Fernández-García, E., Carvajal-Lérida, I., Jarén-Galán, M., Garrido-
Fernández, J., Pérez-Gálvez, A. and Hornero-Méndez, D., 2012.
Carotenoids bioavailability from foods: from plant pigments to
efficient biological activities. Food Research International 46: 438–450.
Gibson, R.S., 2007. The role of diet- and host- related factors in nutrient
bioavailability and thus in nutrient – based dietary requirement
estimates. Food and Nutrition Bulletin 28: S77–S100.
Goltz, S.R., Campbell, W.W., Chitchumroonchokchai, C., Failla, M.L. and
Ferruzzi, M.G., 2012. Meal triacylglycerol profile modulates
postprandial absorption of carotenoids in humans. Molecular Nutrition
and Food Research 56: 866–877.
Gómez-Galera, S., Rojas, E., Sudhakar, D., Zhu, C., Pelacho, A.M., Capell,
T. and Christou, P., 2010. Critical evaluation of strategies for mineral
fortification of staple food crops. Transgenic Research 19: 165–180.
Heaney, R., 2008. Vitamin D and calcium interactions: functional outcomes.
The American Journal of Clinical Nutrition 88: 541S–544S.
Hoffman, R. and Gerber, M., 2015. Food processing and the Mediterranean
diet. Nutrients 7: 7925–7964.
Jeong, J. and Guerinot, M. Lou, 2008. Biofortified and bioavailable: The gold
standard for plant-based diets. Proceedings of the National Academy
of Sciences of the United States of America 105: 1777–1778.
Annex II
256
Joy, E.J.M., Stein, A.J., Young, S.D., Ander, E.L., Watts, M.J. and Broadley,
M.R., 2015. Zinc-enriched fertilisers as a potential public health
intervention in Africa. Plant and Soil 389: 1–24.
La Frano, M.R., de Moura, F.F., Boy, E., Lönnerdal, B. and Burri, B.J., 2014.
Bioavailability of iron, zinc, and provitamin A carotenoids in
biofortified staple crops. Nutrition Reviews 72: 289–307.
Lakshminarayana, R. and Baskaran, V., 2013. Influence of olive oil on the
bioavailability of carotenoids. European Journal of Lipid Science and
Technology 115: 1085–1093.
Li, K.-T., Moulin, M., Mangel, N., Albersen, M., Verhoeven-Duif, N.M., Ma,
Q., Zhang, P., Fitzpatrick, T.B., Gruissem, W. and Vanderschuren, H.,
2015. Increased bioavailable vitamin B6 in field-grown transgenic
cassava for dietary sufficiency. Nature Biotechnology 33: 1029–1032.
Li, L., Yang, Y., Xu, Q., Owsiany, K., Welsch, R., Chitchumroonchokchai,
C., Lu, S., Van Eck, J., Deng, X.X., Failla, M. and Thannhauser, T.W.,
2012. The Or gene enhances carotenoid accumulation and stability
during post-harvest storage of potato tubers. Molecular Plant 5: 339–
352.
Liang, J., Han, B.-Z., Nout, M.J.R. and Hamer, R.J., 2010. In vitro solubility
of calcium, iron and zinc in relation to phytic acid levels in rice-based
consumer products in China. International Journal of Food Sciences
and Nutrition 61: 40–51.
Lipkie, T.E., De Moura, F.F., Zhao, Z.Y., Albertsen, M.C., Che, P.,
Glassman, K. and Ferruzzi, M.G., 2013. Bioaccessibility of carotenoids
from transgenic provitamin A biofortified sorghum. Journal of
Agricultural and Food Chemistry 61: 5764–5771.
Moreno, J.A., Díaz-Gómez, J., Nogareda, C., Angulo, E., Sandmann, G.,
Portero-Otin, M., Serrano, J.C.E., Twyman, R.M., Capell, T., Zhu, C.
and Christou, P., 2016. The distribution of carotenoids in hens fed on
biofortified maize is influenced by feed composition, absorption,
resource allocation and storage. Scientific Reports 6: 35346.
Moretti, D., Biebinger, R., Bruins, M.J., Hoeft, B. and Kraemer, K., 2014.
Bioavailability of iron, zinc, folic acid, and vitamin A from fortified
maize. Annals of the New York Academy of Sciences 1312: 54–65.
Annex II
257
Mugode, L., Ha, B., Kaunda, A., Sikombe, T., Phiri, S., Mutale, R., Davis, C.,
Tanumihardjo, S. and De Moura, F.F., 2014. Carotenoid retention of
biofortified provitamin A maize (Zea mays L.) after Zambian traditional
methods of milling, cooking and storage. Journal of Agricultural and
Food Chemistry 62: 6317–6325.
Murador, D.C., da Cunha, D.T. and de Rosso, V.V., 2014. Effects of
cooking techniques on vegetable pigments: a meta-analytic approach to
carotenoid and anthocyanin levels. Food Research International 65:
177–183.
Nabokina, S.M., Subramanian, V.S., Valle, J.E. and Said, H.M., 2013.
Adaptive regulation of human intestinal thiamine uptake by
extracellular substrate level: a role for THTR-2 transcriptional
regulation. American Journal of Physiology Gastrointestinal and Liver
Physiology 305: G593–G599.
Naqvi, S., Zhu, C., Farre, G., Ramessar, K., Bassie, L., Breitenbach, J., Perez
Conesa, D., Ros, G., Sandmann, G., Capell, T. and Christou, P., 2009.
Transgenic multivitamin corn through biofortification of endosperm
with three vitamins representing three distinct metabolic pathways.
Proceedings of the National Academy of Sciences of the United States
of America 106: 7762–7767.
Nesaretnam, K., 2008. Multitargeted therapy of cancer by tocotrienols.
Cancer Letters 269: 388–395.
Öhrvik, V., Öhrvik, H., Tallkvist, J. and Witthöft, C., 2010. Folates in bread:
retention during bread-making and in vitro bioaccessibility. European
Journal of Nutrition 49: 365–372.
Ortiz, D., Rocheford, T. and Ferruzzi, M.G., 2016. Influence of temperature
and humidity on the stability of carotenoids in biofortified maize (Zea
mays L.) genotypes during controlled postharvest storage. Journal of
Agricultural and Food Chemistry 64: 2727–2736.
Pereira, E.J., Carvalho, L.M.J., Dellamora-Ortiz, G.M., Cardoso, F.S.N. and
Carvalho, J.L.V., 2016. Effect of different home-cooking methods on
the bioaccesibility of zinc and iron in conventionally bred cowpea
(Vigna unguiculata L. Walp) consumed in Brazil. Food & Nutrition
Research 60: 29082.
Annex II
258
Pillay, K., Siwela, M., Derera, J. and Veldman, F.J., 2014. Provitamin A
carotenoids in biofortified maize and their retention during processing
and preparation of South African maize foods. Journal of Food Science
and Technology 51: 634–644.
Quick, M. and Shi, L., 2015. The sodium/multivitamin transporter: a
multipotent system with therapeutic implications. Vitamins and
Hormones 98: 63–100.
Raes, K., Knockaert, D., Struijs, K. and Van Camp, J., 2014. Role of
processing on bioaccessibility of minerals: influence of localization of
minerals and anti-nutritional factors in the plant. Trends in Food
Science and Technology 37: 32–41.
Rawat, N., Neelam, K., Tiwari, V.K. and Dhaliwal, H.S., 2013.
Biofortification of cereals to overcome hidden hunger. Plant Breeding
132: 437–445.
Reboul, E., Richelle, M., Perrot, E., Desmoulins-Malezet, C., Pirisi, V. and
Borel, P., 2006. Bioaccessibility of carotenoids and vitamin E from
their main dietary sources. Journal of Agricultural and Food Chemistry
54: 8749–8755.
Repo-Carrasco-Valencia, R.A.M., Encina, C.R., Binaghi, M.J., Greco, C.B.
and de Ferrer, P.A.R., 2010. Effects of roasting and boiling of quinoa,
kiwicha and kañiwa on composition and availability of minerals in
vitro. Journal of the Science of Food and Agriculture 90: 2068–2073.
Ribeiro, E.M.G., Chitchumroonchokchai, C., de Carvalho, L.M.J., de Moura,
F.F., de Carvalho, J.L.V. and Failla, M.L., 2015. Effect of style of home
cooking on retention and bioaccessibility of pro-vitamin A carotenoids
in biofortified pumpkin (Cucurbita moschata Duch.). Food Research
International 77: 620–626.
Ristow, K.A., Gregory, J. 3rd and Damron, B.L., 1982. Effects of dietary
fiber on the bioavailability of folic acid monoglutamate. The Journal of
Nutrition 112: 750–758.
Saltzman, A., Birol, E., Bouis, H.E., Boy, E., De Moura, F.F., Islam, Y. and
Pfeiffer, W.H., 2013. Biofortification: progress toward a more
nourishing future. Global Food Security 2: 9–17.
Annex II
259
Sanahuja, G., Farré, G., Berman, J., Zorrilla-López, U., Twyman, R.M.,
Capell, T., Christou, P. and Zhu, C., 2013. A question of balance:
achieving appropriate nutrient levels in biofortified staple crops.
Nutrition Research Reviews 26: 235–245.
Sato, Y., Suzuki, R., Kobayashi, M., Itagaki, S., Hirano, T., Noda, T., Mizuno,
S., Sugawara, M. and Iseki, K., 2012. Involvement of cholesterol
membrane transporter Niemann-Pick C1-like 1 in the intestinal
absorption of lutein. Journal of Pharmacy and Pharmaceutical Sciences
15: 256–264.
Shafizadeh, T.B. and Halsted, C.H., 2007. Gamma-glutamyl hydrolase, not
glutamate carboxypeptidase II, hydrolyzes dietary folate in rat small
intestine. The Journal of Nutrition 137: 1149–1153.
Subramanian, V.S., Ghosal, A., Kapadia, R., Nabokina, S.M. and Said, H.M.,
2015. Molecular mechanisms mediating the adaptive regulation of
intestinal riboflavin uptake process. PloS ONE 10: e0131698.
Suri, D.J. and Tanumihardjo, S.A., 2016. Effects of different processing
methods on the micronutrient and phytochemical contents of maize:
from A to Z. Comprehensive Reviews in Food Science and Food
Safety 15: 912–926.
van het Hof, K.H., Tijburg, L.B.M., Pietrzik, K. and Weststrate, J.A., 1999.
Influence of feeding different vegetables on plasma levels of
carotenoids, folate and vitamin C. Effect of disruption of the vegetable
matrix. British Journal of Nutrition 82: 203–212.
Wang, Y., Lin, Q., Zheng, P., Li, L., Bao, Z. and Huang, F., 2014. Effects of
eicosapentaenoic acid and docosahexaenoic acid on chylomicron and
VLDL synthesis and secretion in Caco-2 cells. BioMed Research
International 2014: 684325.
Wieringa, F.T., Laillou, A., Guyondet, C., Jallier, V., Moench-Pfanner, R. and
Berger, J., 2014. Stability and retention of micronutrients in fortified
rice prepared using different cooking methods. Annals of the New
York Academy of Sciences 1324: 40–47.
World Health Organization (WHO), 2016. e-Library of evidence for
nutrition actions. Available at:
http://www.who.int/elena/titles/biofortification/en Accessed 18
Annex II
260
October 2016.
Yonekura, L. and Nagao, A., 2007. Intestinal absorption of dietary
carotenoids. Molecular Nutrition and Food Research 51: 107–115.
Yonekura, L. and Nagao, A., 2009. Soluble fibers inhibit carotenoid
micellization in vitro and uptake by Caco-2 cells. Bioscience,
Biotechnology, and Biochemistry 73: 196–199.
Zanga, D., Capell, T., Zhu, C., Christou, P. and Thangaraj, H., 2016.
Freedom-to-operate analysis of a transgenic multivitamin corn variety.
Plant Biotechnology Journal 14: 1225–1240.
Zhang, C., Miller, C.L., Brown, E.M. and Yang, J.J., 2015. The calcium
sensing receptor: from calcium sensing to signaling. Science China Life
Sciences 58: 14–27.
Zhu, C., Naqvi, S., Gomez-Galera, S., Pelacho, A.M., Capell, T. and
Christou, P., 2007. Transgenic strategies for the nutritional
enhancement of plants. Trends in Plant Science 12: 548–55.

Annex III
263
Joana Díaz-Gómez a, Sonia Marín a, Teresa Capell b, Vicente Sanchis a,
Antonio J. Ramos a
a Food Technology Department, University of Lleida, UTPV-XaRTA,
Agrotecnio Center, Av. Rovira Roure, 191, 25198, Lleida (Spain); b Plant Production and Forestry Science Department, University of Lleida,
Agrotecnio Center, Av. Rovira Roure, 191, 25198, Lleida (Spain)
In many developing countries, maize is both a staple food crop and a widely-
used animal feed. However, adventitious colonization or damage caused by
insect pests allows fungi to penetrate the vegetative parts of the plant and the
kernels, the latter resulting in mycotoxin contamination. Maize seeds
contaminated with fumonisins and other mycotoxins pose a serious threat to
both humans and livestock. However, numerous studies have reported a
significant reduction in pest damage, disease symptoms and fumonisin levels
in maize hybrids expressing the Bacillus thuringiensis (Bt) gene cry1Ab,
particularly in areas where the European corn borer is prevalent. When other
pests are also present, the cry1Ab gene alone offers insufficient protection,
and combinations of insecticidal genes are required to reduce damage to
plants caused by insects. The combination of Cry1Ab protein with other
Cry proteins (such as Cry1F) or Vip proteins has reduced the incidence of
pests and, indirectly, mycotoxin levels. Maize hybrids expressing multiple Bt
genes, such as SmartStax®, are less susceptible to damage by insects, but
mycotoxin levels are not routinely and consistently compared in these crops.
Bt maize has a greater economic impact on Fusarium toxins than aflatoxins.
The main factors that determine the effectiveness of Bt hybrids are the type
of pest and the environmental conditions, but the different fungal infection
pathways must also be considered. An alternative strategy to reduce
mycotoxin levels in crops is the development of transgenic plants expressing
genes that protect against fungal infection or reduce mycotoxin levels by in
situ detoxification. In this review article, we summarize what is known about
the relationship between the cultivation of Bt maize hybrids and
contamination levels with different types of mycotoxins.
Annex III
264
Fumonisins, aflatoxins, deoxynivalenol, Bacillus thuringiensis, European corn
borer
Maize (Zea mays L.) is the most common source of fumonisins in human and
animal diets. Maize seeds are often contaminated with fumonisins produced
primarily by Fusarium verticillioides and F. proliferatum. These fungi can infect
the seeds, or the silks can be contaminated by airborne or waterborne
conidia, systemic infections can be caused by contamination of the roots, or
pest insects can injure the plants allowing fungal penetration (Munkvold and
Desjardins, 1997). Other mycotoxins may be present alone or together with
fumonisins, including aflatoxins, deoxynivalenol (DON), zearalenone (ZEA),
and some recently-discovered Fusarium metabolites collectively known as
emergent mycotoxins, such as moniliformin (MON), beauvericin, enniatins
and fusaproliferin (Desjardins, 2006; Marín et al., 2013). Aflatoxins are mainly
produced by Aspergillus flavus, which synthesizes type B aflatoxins as well as
cyclopiazonic acid (CPA) depending on the strain, and by A. parasiticus,
which synthesizes both type B and type G aflatoxins, but not CPA. DON
and ZEA are mainly produced by F. graminearum and F. culmorum and they are
often found as co-contaminants. Among the emergent mycotoxins, MON is
the most prevalent and can be produced by several Fusarium species,
including F. avenaceum, F. tricinctum, F. proliferatum, F. subglutinans and F.
verticillioides (Marín et al., 2013).
The consumption of mycotoxin-contaminated kernels is associated with a
range of diseases and disorders in humans and domestic animals, including
cancer, immune system dysfunction and metabolic disorders (Marasas, 2001;
Marín et al., 2013; Sobrova et al., 2010; Williams et al., 2004). Fumonisins and
aflatoxins are carcinogens (AFB1 is the most carcinogenic natural compound
known), and this creates a strong impetus to restrict the exposure of human
and animal populations as far as possible (IARC, 1993, 2002, 2012). In 2001,
several countries submitted information on the concentration of fumonisins
in maize and maize-derived foods, and fumonisins were detected in more
than 60% of all food products (JECFA, 2001). These data are supported by a
European Union (EU) report on the exposure of the EU population to
Fusarium toxins. Among samples of raw maize material, 67% were positive
for FB1 (total = 801) and a 51% were positive for FB2 (total = 544)
(SCOOP, 2003).
Annex III
265
The European Commission (EC) and European Parliament (EP) have set
maximum levels for mycotoxins in maize and maize products. When such
products are intended for human consumption, these values are currently
200–1000 µg/kg for fumonisins, 750 µg/kg for DON, 100 µg/kg for ZEA,
3 µg/kg for ochratoxin A (OTA), 5 µg/kg for AFB1, and 10 µg/kg for total
aflatoxins. Recently, indicative levels of 100 µg/kg in maize were also
established for the total content of the trichothecene mycotoxins T-2 and
HT-2 (EC, 2006b, 2007, 2010, 2012, 2013a). In animal feed, only the level of
AFB1 is currently regulated in the EU (maximum 0.005–0.02 mg/kg,
depending on the type of feed). Other important mycotoxins in feed are
limited by guidance values that vary with the species of livestock: 0.9–12
mg/kg for DON, 0.1–3.0 mg/kg for ZEA, 0.05–0.25 mg/kg for OTA and
5–60 mg/kg for fumonisins (FB1 + FB2). Recently, indicative levels of 250–
2000 µg/kg in cereal products for feed and compound feed have been
specified for the total content of T-2 and HT-2, with the exception of feed
for cats, for which the guidance value is 50 µg/kg (EC, 2002, 2003b, 2006a,
2013a,b).
In contrast, the United States Food and Drug Administration (FDA) has
proposed a guideline for total fumonisin levels in food of 2–4 mg/kg
(depending on the product), and total aflatoxin levels of 20 µg/kg in maize
and maize products for human consumption. For animal feed, the levels vary
from 5 to 100 mg/kg for fumonisins and from 20 to 300 µg/kg for
aflatoxins, depending on the animal species (FDA, 2000, 2001).
The presence of mycotoxins in maize results from the interaction of several
factors, including temperature and humidity, nutrient availability, the
presence of other fungi, stress, and physical damage caused by pest insects.
Before harvest, important factors include the weather (temperature, humidity
and rainfall), exposure to insect pests, fungi and other pathogens, planting
dates, the maize genotype and cropping system. Fumonisin contamination in
maize is directly associated with Fusarium pink ear rot (mainly produced by F.
verticilliodes) and its incidence depends on both environmental conditions and
pest damage. Kernel damage caused by insects exposes the kernels to fungal
spores, although there are several additional infection pathways. Fungal
growth and mycotoxin accumulation can also be stimulated post-harvest by
Annex III
266
poor storage conditions such as high humidity and the presence of other
pests (Marín et al., 2004; Miller, 2001).
Fungal growth and mycotoxin production are affected by multiple
ecophysiological factors. The main factors that control fumonisin production
in grain are temperature and water activity (aw). F. verticillioides and F.
proliferatum germinate at 5–37 ºC when aw exceeds 0.88, although the growth
range fluctuates in the range 7–37 ºC when aw exceeds 0.90. The optimum
conditions for fumonisin production by F. verticillioides are 30 ºC at 0.97 aw
and for F. proliferatum the corresponding values are 15 ºC at 0.97 aw.
Physicochemical and nutritional factors such as pH and carbon/nitrogen
ratio can also affect fumonisin production. The presence of other fungi, such
as A. flavus and A. niger, can affect the growth of Fusarium species, which is
most competitive at 15 ºC and 0.98 aw. At high aw values, fumonisin
production can be stimulated by A. niger and other species (Marín et al., 1999;
Picot et al., 2010; Sanchis et al., 2006).
Injuries caused by insects are common sites of fungal infection on maize ears
and stalks. The fungi can be airborne or may be suspended in water droplets
that splash the wound, but insects can also act as vectors. One of the most
prevalent examples is the European corn borer (ECB) (Ostrinia nubilalis
Hübner), a maize pest that not only injures plants and exposes them to
infection, but also vectors fungal spores, particularly F. verticillioides and F.
proliferatum. ECB therefore promotes Fusarium infection of maize kernels and
stalks, and may reduce yields by increasing the incidence of stalk rot
(Munkvold and Desjardins, 1997; Munkvold et al., 1997; Sobek and
Munkvold, 1999). F. verticillioides is the most prevalent fungal pathogen of
maize but fungicides are only partially effective, with efficacy depending on
the pathogen strain and the fungicide mechanism of action (Falcão et al.,
2011). Therefore, pest insects are more appropriate targets than fungi for the
development of strategies to reduce mycotoxin levels in maize.
In many parts of the world, the management of ECB now relies on
transgenic hybrid maize lines expressing the cry1Ab gene from the Gram-
positive soil bacterium Bacillus thuringiensis (Bt). This gene encodes a potent
pro-toxin that is activated in the alkaline environment of the insect gut and is
highly specific towards particular insect species. These insecticidal crystal
proteins are also named δ-endotoxins or Cry proteins. B. thuringiensis has
been used since 1938 to produce an insecticidal spray, but Bt transgenic
plants resistant to ECB larvae were first made available in the USA in 1996
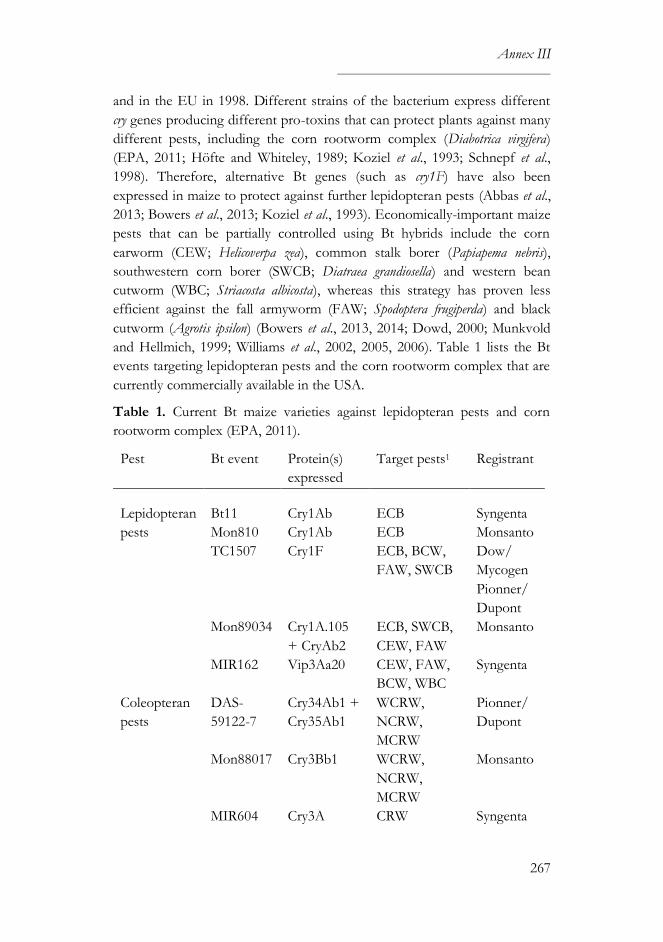
Annex III
267
and in the EU in 1998. Different strains of the bacterium express different
cry genes producing different pro-toxins that can protect plants against many
different pests, including the corn rootworm complex (Diabotrica virgifera)
(EPA, 2011; Höfte and Whiteley, 1989; Koziel et al., 1993; Schnepf et al.,
1998). Therefore, alternative Bt genes (such as cry1F) have also been
expressed in maize to protect against further lepidopteran pests (Abbas et al.,
2013; Bowers et al., 2013; Koziel et al., 1993). Economically-important maize
pests that can be partially controlled using Bt hybrids include the corn
earworm (CEW; Helicoverpa zea), common stalk borer (Papiapema nebris),
southwestern corn borer (SWCB; Diatraea grandiosella) and western bean
cutworm (WBC; Striacosta albicosta), whereas this strategy has proven less
efficient against the fall armyworm (FAW; Spodoptera frugiperda) and black
cutworm (Agrotis ipsilon) (Bowers et al., 2013, 2014; Dowd, 2000; Munkvold
and Hellmich, 1999; Williams et al., 2002, 2005, 2006). Table 1 lists the Bt
events targeting lepidopteran pests and the corn rootworm complex that are
currently commercially available in the USA.
Table 1. Current Bt maize varieties against lepidopteran pests and corn
rootworm complex (EPA, 2011).
Pest Bt event Protein(s)
expressed
Target pests1 Registrant
Lepidopteran
pests
Bt11 Cry1Ab ECB Syngenta
Mon810 Cry1Ab ECB Monsanto
TC1507 Cry1F ECB, BCW,
FAW, SWCB
Dow/
Mycogen
Pionner/
Dupont
Mon89034 Cry1A.105
+ CryAb2
ECB, SWCB,
CEW, FAW
Monsanto
MIR162 Vip3Aa20 CEW, FAW,
BCW, WBC
Syngenta
Coleopteran
pests
DAS-
59122-7
Cry34Ab1 +
Cry35Ab1
WCRW,
NCRW,
MCRW
Pionner/
Dupont
Mon88017 Cry3Bb1 WCRW,
NCRW,
MCRW
Monsanto
MIR604 Cry3A CRW Syngenta
Annex III
268
1 ECB: European corn borer; CEW: corn earworm, WBC: western bean cutworm;
BCW: black cutworm; FAW: fall armyworm; SWBC: southwestern corn borer;
CRW: corn rootworm; WCRW: western corn rootworm; NCRW: northern corn
rootworm; MCRW: Mexican corn rootworm.
Since its adoption in the USA, Bt maize has become the second most widely
cultivated GM crop worldwide, after herbicide-tolerant soybean. About 30%
of global maize production in 2014 (184 million hectares) was represented by
GM varieties (55.2 million hectares) (James, 2014). However, the EU has a
strict, complex and contradictory legislative framework for GM crops, with
only the Mon810 maize event currently authorized for cultivation (EC, 1998,
2003a, 2008).
The ability of Bt genes to protect maize against ECB and other lepidopteran
pests means that Bt maize tends to suffer a lower frequency of fungal
infections and the infections that occur are often less severe or even
symptomless. In the case of fumonisins, there is a large body of evidence to
support the benefits of Bt maize, as shown by the comparison of fumonisin
concentrations in Bt and non-Bt maize hybrids in different field locations
(Supplementary Table S1).
Munkvold et al. (1999) published a fundamental study concerning the effect
of Bt maize on disease management and concluded that transgenic hybrids
expressing cry1Ab were less susceptible to ECB, suffered less from Fusarium
ear rot and had lower fumonisin levels than their non-transgenic
counterparts. However, if other insect pests were present alone or
concurrent with ECB then the levels of fumonisins remained high (Dowd,
2000; Clements et al., 2003; Hammond et al., 2004; Papst et al., 2005).
Many studies of natural infestations confirm the significant reduction in
fumonisin levels associated with Bt hybrids (Abbas et al., 2013; Ostry et al.,
2010; Pazzi et al., 2006). These studies were carried out at different times in
different countries, including Italy (Masoero et al., 1999; Pietri and Piva,
2000), France (Bakan et al., 2002; Folcher et al., 2010; Pinson et al., 2002),
Spain (Bakan et al., 2002), Argentina (Barros et al., 2009; De la Campa et al.,
2005) and the USA (Abbas et al., 2006, 2007, 2013; Bruns and Abbas, 2006;
Dowd, 2001).
Importantly, Bowers et al. (2013) confirmed that lower levels of fumonisins
were present in Bt hybrids exposed to ECB, but found that a cry1Ab x
vip3Aa hybrid was more resistant to ECB, CEW and WBC than the cry1Ab
Annex III
269
hybrid and the non-Bt hybrid in all of the years covered by the study. The
vegetative insecticidal protein Vip3Aa can therefore be combined with other
toxins such as Cry1Ab to target additional lepidopteran pests. Unlike the cry
genes, which are expressed during sporulation, vip genes are expressed during
the B. thuringiensis vegetative growth phase and they do not share sequence
homology with cry genes (Lee et al., 2003; Schnepf et al., 1998). The cry1Ab x
vip3Aa hybrid also showed a lower level of pest damage, a lower incidence of
Fusarium ear rot and lower levels of fumonisins when infested with ECB,
whereas cry1F hybrids were better protected against WCB because cry1F
specifically targets this pest (Bowers et al., 2014). A comparison of eight
commercially available Bt hybrids expressing multiple genes found no
significant differences in the content of fumonisins among the hybrids
(Abbas et al., 2013). Recent studies of SmartStax® maize, which produces
Cry1F, Cry1A.105 + Cry2Ab2, Cry34Ab1/Cry35Ab1 and Cry3Bb1 to
protect against common lepidopteran pests and the corn rootworm complex,
reported less pest damage compared with single Bt hybrids and non-Bt
hybrids, but did not consider mycotoxin levels (Rule et al., 2014; Head et al.,
2014).
Whereas the link between Bt maize and lower fumonisin levels is clearly
established, the data for aflatoxin contamination are more contentious (Ostry
et al., 2014). Windham et al. (1999) showed a significant correlation between
fungal and insect exposure, inoculation or infestation dates and aflatoxin
contamination. They found that Bt hybrids suffered less damage from insects
and had lower aflatoxin levels than the other hybrids studied (A. flavus
resistant and A. flavus susceptible hybrids and a non-Bt isogenic hybrid)
when manually infested with SWCB. More recent studies have focused on
the inoculation technique, showing that inoculation with A. flavus by kernel
wounding, which facilitates fungal penetration, results in high-level aflatoxin
contamination regardless of the hybrids used. There were no differences
among the hybrids when infected with fungi alone because lower aflatoxin
levels in the Bt hybrids reflected the reduction in insect damage, which
indirectly reduced fungal contamination. In contrast, a non-wounding
inoculation technique combined with SWCB infestation resulted in
significantly lower levels of aflatoxin in the Bt hybrids (Williams et al., 2002,
2005; 2006). A testcross involving aflatoxin-resistant and aflatoxin-
susceptible lines crossed with Bt and non-Bt maize revealed lower aflatoxin
levels in the Bt testcrosses, but the difference for individual lines was
Annex III
270
significant in only two of 10 lines investigated. The low insect pressure
during the experiment could explain these results, because the higher the
insect pressure, the greater the differences between hybrids (Williams et al.,
2010).
In a 3–year study, Wiatrak et al. (2005) observed significantly lower aflatoxin
levels in Bt compared to non-Bt hybrids during the first year of the
experiment, but there was no difference with a tropical non-Bt hybrid. In the
second year, significantly lower levels of aflatoxins were detected in the Bt
hybrids than the tropical non-Bt hybrid, but there were no differences
compared to the non-Bt hybrids. In the final year, there were no differences
in aflatoxin contamination among the hybrids. Another 3–year study
reported lower levels of aflatoxins in Bt than non-Bt hybrids, but only in one
of the years (Abbas et al., 2006; 2007; Bruns and Abbas, 2006). Nevertheless,
a subsequent study showed that aflatoxin contamination was significantly
reduced in the Bt hybrid compared to its non-Bt isoline (Abbas et al., 2008).
The authors continued these field trials until 2009, reporting lower
mycotoxin levels in Bt maize, but the difference was not significant, perhaps
due to the continuous cultivation (Abbas et al., 2013).
In the USA, Odvody et al. (2000) observed less insect damage in Bt hybrids
but aflatoxin levels were not consistent. In a subsequent study of different Bt
hybrids, the lowest level of insect damage was observed in the Mon840 event
(cry2Ab) correlating with significantly lower aflatoxin levels compared to
non-Bt and cry1Ab hybrids in 2000, but only compared to the non-Bt hybrid
in 2001 (Odvody and Chilcutt, 2002). Different cryAb events were also
evaluated, revealing less insect damage in the Bt hybrids Mon810 and Bt11
compared to non-Bt hybrids, but aflatoxin levels were also inconsistent in
this experiment (Odvody and Chilcutt, 2003). Similarly, Maupin et al. (2001)
did not find significant differences in the levels of ear rot and aflatoxin
accumulation when comparing Bt and non-Bt hybrids inoculated with A.
flavus. Buntin et al. (2001) found no significant differences in aflatoxin levels
between Bt and non-Bt maize, but the Bt hybrids suffered less severe FAW
infestations. These data indicate that insect damage is strongly correlated
with fumonisin levels but not aflatoxin levels, suggesting that other factors
such as drought stress and individual hybrid vulnerability may play a more
dominant role than insect damage in the determination of aflatoxin levels.
The field experiments concerning aflatoxin levels in Bt and non-Bt hybrids
are summarized in Supplementary Table S2.
Annex III
271
The results obtained with other mycotoxins are also controversial.
Significantly lower levels of DON were observed in Bt compared to non-Bt
hybrids in some studies (Magg et al., 2002; Schaafsma et al., 2002; Selwet,
2011; Valenta et al., 2001), whereas in other cases the mycotoxin levels
appeared to be location-dependent (Bakan et al., 2002; Papst et al., 2005;
Pinson et al., 2002) or there was no difference between Bt and non-Bt
hybrids (Barros et al., 2009). A few studies have even found evidence for
slightly higher DON levels in Bt hybrids, although the location was an
important confounding effect (Folcher et al., 2010; Bakan et al. 2002).
Schaffsma et al. (2002) analyzed 102 commercial maize fields in Canada,
reporting a reduction in DON levels in Bt hybrids depending on the severity
of ECB infestation in each field. This was supported by a study carried out in
Germany showing a reduction in DON levels in Bt compared to non-Bt
hybrids (Valenta et al., 2001). In another study, also in Germany, Magg et al.
(2002) found significantly lower concentrations of DON in Bt maize in one
of the two years of the experiment. Pinson et al. (2002) described differences
in DON and ZEA levels between plots in two different fields in south and
central France. Lower levels were observed in two Bt hybrids, but two others
contained significantly higher levels of both DON and ZEA compared to
the corresponding non-Bt cultivars. Bakan et al. (2002) reported low ZEA
levels in their study, but significantly higher concentrations were observed in
a traditional cultivar in France. In all the studies, the Bt hybrids expressed
cry1Ab (Supplementary Table S3).
Only one study has investigated the impact of Bt on MON levels, and the Bt
hybrids showed significantly lower levels of MON than non-Bt hybrids
(isogenic and commercial hybrids) when infested with ECB. MON levels
were significantly higher following the manual infestation of unprotected
plants (296 µg/kg) compared to those treated with insecticide (66.2 µg/kg).
In the infested plots, the MON concentrations were 153.5, 336.7 and 266.1
µg/kg for the transgenic, isogenic and commercial hybrids, respectively. In
contrast, in the protected plots, the MON concentrations were 49.1, 99.3
and 42.9 µg/kg for the transgenic, isogenic and commercial hybrids,
respectively (Magg et al., 2003).
Annex III
272
The main goal of Bt technology is to reduce pest damage and promote
higher yields. However, indirect benefits such as the reduction of fumonisin
levels also increase the percentage of maize grain that meets US and/or EU
regulatory limits, which can have a significant economic impact and may also
reduce the prevalence and severity of human and animal diseases (Bowers et
al., 2013; Folcher et al., 2010; Hammond et al., 2004; Magg et al., 2002, 2003;
Munkvold et al., 1997, 1999; Pinson et al., 2002).
Estimations for the cost of crop losses due to mycotoxin contamination in
the USA range from $US 500,000 to $US 1.5 billion, reflecting variations in
contamination levels, regulatory limits, price variations and production
outputs (Vardon et al., 2003). However, in the USA most losses are
regulatory in nature (i.e. based on the rejection of grain based on quality)
rather than actual harvest losses, and maize grains rejected for food and feed
use may still be suitable for industrial processes such as biofuel production.
On the other hand, the economic benefit of Bt maize in the USA has been
specifically valued at $US 8.8 million in terms of preventing losses caused by
fumonisins, and similarly $US 8.1 million for DON and $US 14 million for
aflatoxins, even though the AF levels depend on the predominant pest
species (Wu, 2006, 2007; 2014; Wu et al., 2004). These data based on studies
carried out over a decade ago do not take into account the increased
adoption of Bt maize, which has risen from 30% in 2005 to more than 80%
in 2015 (USDA-ERS, 2015). A recent study of the Thailand maize market
estimated the economic losses due to aflatoxins. A loss of US$ ~6.9 million
per annum was estimated assuming low levels of aflatoxin contamination
(data from harvest and dried maize supplied by a pet company) but this
increased to US$ ~100 million per annum assuming higher aflatoxin levels
(data from retail markets). The rejection of aflatoxin-contaminated maize by
the livestock sector is the most influential factor contributing to economic
losses. Thus, the selection of high-quality maize (by the pet company)
reflects lower levels of aflatoxin contamination, and lower economic losses
(Lubulwa et al., 2015). Bt technology can improve the quality of maize by
reducing mycotoxin levels as an indirect consequence of preventing
infestations with insect pests. This technology also reduces the need for
chemical insecticides, resulting in lower levels of pesticide residues in food
and water and less environmental impact (Qaim, 2009; Brookes and Barfoot,
2013).
Annex III
273
Although targeting pest insects can help to reduce opportunistic fungal
infections of maize, other transgenic approaches have emerged more recently
in which the fungus itself is the target. For example, Kant et al. (2012)
reported a field study of transgenic maize expressing a modified rice Rp13
gene encoding ribosomal protein L3, a primary target of DON. They
developed two transgenic maize lines expressing the Rp13 gene, one using
the constitutive CaMV 35S promoter and the other using the silk-specific
ZmGRP5 promoter. Both plants were less susceptible to F. graminearum than
wild-type plants, and those containing the silk-specific promoter were the
most tolerant, with the mildest symptoms under field conditions (DON
levels were not evaluated). The difference in efficacy may reflect the broader
activity of the silk promoter in the seed pericarp tissue. Maize silks are the
primary route used by F. graminearum to infect the kernels. Expression of the
modified Rpl3 gene in silk tissue may therefore help to reduce Gibberella ear
rot and hence DON levels.
Maize plants expressing the α-amylase inhibitor protein from Lablab purpurea
(AILP) can also be used to reduce fungal infection. Fungal amylases liberate
fermentable sugars from kernel starch which are essential for mycotoxin
production. Kernel screening assays in AILP-transgenic maize plants
revealed aflatoxin levels 56% lower than controls. AILP expression therefore
appears to reduce both fungal growth on the kernels and aflatoxin
accumulation (Chen et al., 2015).
Another promising approach to reduce mycotoxin contamination is
enzymatic mycotoxin detoxification in situ, which converts the mycotoxins
into less toxic compounds. The ZEA lactone ring is sensitive to hydrolysis
by the fungus Clonostachys rosea, which synthesizes an alkaline
lactonohydrolase responsible for detoxification (Kimura et al., 2006;
Takahashi-Ando et al., 2002). The corresponding gene (zhd101) was able to
reduce ZEA levels in vitro and in field-grown plants compared to non-
transgenic controls, even when infected with F. graminearum. The ability of
transgenic seeds to degrade ZEA was evaluated by immersing the seeds in 50
µg/ml ZEA for 48 h. The kernel tissues were then analyzed by HPLC,
showing that wild-type seeds contained 24.6 ± 1.7 µg ZEA/g whereas the
transgenic seeds contained only 1.6 ± 0.4 µg ZEA/g. The detoxification of
ZEA in Fusarium-infected transgenic kernels was evaluated after inoculation
with F. graminearum. The wild-type seeds contained 15.4 ± 3.7 ng ZEA/g
Annex III
274
whereas the level of ZEA in non-inoculated seeds and inoculated transgenic
seeds was below the detection threshold (Igawa et al., 2007). Similarly, the
yeasts Exophiala spinifera and Rhinocladiella atrovirens, and the Gram-negative
bacterium ATCC 55552, can produce enzymes that metabolize fumonisins.
Duvick et al. (2003) patented a fumonisin esterase produced by these yeasts
which can hydrolyze the tricarballylate esters of FB1, and this is active in
transgenic maize. The esterase gene reduced fumonisin levels in Fusarium-
infected grain from 1.522 mg/kg without the enzyme to 0.379 mg/kg in
esterase positive plants. Aflatoxin detoxification in transgenic plants has yet
to be reported (Duvick, 2001; Hartinger and Moll, 2011; Jard et al., 2011).
Several transgenic strategies can be used to reduce mycotoxin contamination
in food and feed but Bt maize hybrids are widely grown and several studies
have confirmed the reduction in pest damage, disease symptoms and
fumonisin levels, particularly when ECB is the predominant pest. This is
because fumonisin levels are reduced in Bt hybrids if the Fusarium population
is dominated by species whose colonization of the plant is promoted by ECB
damage (Miller, 2001).
Among the commercial Bt hybrids, Mon810 and Bt11 (which express
cry1Ab) were associated with a reduction in the occurrence of Fusarium ear
rot and fumonisins due to the lower level of kernel damage caused by
susceptible lepidopteran pests (Dowd, 2000, 2001; Magg et al., 2001;
Munkvold and Hellmich, 1999; Papst et al., 2005). Conversely, no difference
has been reported between Bt 176 hybrids (Bt event 176 was withdrawn in
2001) and non-Bt maize (Magg et al., 2002; Schaafsma et al., 2002), and it has
even been proposed that resistance against ECB and Fusarium ear rot may be
inherited independently (Magg et al., 2002; Miller, 2001).
The pest species and its abundance are key determinants of mycotoxin levels,
particularly if the main pest is CEW which is unaffected by Cry1Ab
(Clements et al., 2003; Dowd, 2000; Hammond et al., 2004). Lower levels of
aflatoxins occur in Bt maize if the main pest is SWCB or CEW, but there is
no difference between Bt and non-Bt maize if the pest is FAW (Buntin et al.,
2001; Williams et al., 2002, 2005, 2006, 2010). When other pests are present,
hybrids expressing Cry1Ab are inefficient and must be combined with
further Cry proteins (such as Cry1F) or Vip proteins to increase the level of
protection (Bowers et al., 2013; 2014). Thus, if Bt events are not selected by
taking into account prevalent insect pests and environmental conditions in
Annex III
275
each field, Bt technology will not be effective. Hence the importance of Bt
hybrids expressing multiple genes, whose performance in the presence of
different pests and climate conditions has yet to be studied in detail.
The impact of Bt maize on the accumulation of aflatoxins, DON and ZEA
is inconclusive because the extent of contamination depends on many
interrelated factors. The different fungal infection pathways must be
considered to understand the effect of Bt hybrids. The most common route
used by F. verticillioides to infect the kernel is through the silks or through
wounds caused by insect pests, whereas F. graminearum primarily reaches the
kernels via the silks (Munkvold, 2003; Munkvold and Desjardins, 1997). A.
flavus can infect maize kernels through the silks too. This may explain why Bt
maize hybrids that are resistant to insect pests have less Fusarium ear rot and
lower fumonisin levels, whereas the relationship with DON, ZEA and
aflatoxin levels is not so clear cut. Further studies are necessary to determine
the interaction between Bt maize and the different fungal species that
produce these toxins.
Mycotoxin contamination is frequently linked with drought, heat stress and
insects. Drought favors the accumulation of fumonisins more than heat
stress (Miller, 2001). A 2-year study was carried out by Traore et al. (2000) to
characterize the effect of drought stress on Bt maize. Water deficit during
the vegetative period delayed leaf emergence, reduced the leaf area and
caused stunted growth in both Bt and non-Bt hybrids. It also reduced grain
and biomass yields and kernel number per ear during both years. However,
the Bt hybrids had greater biomass in 1997 and greater grain yields in 1998
because they were not so severely infected by second-generation ECB.
Therefore, Bt maize continues to play an important role in insect resistance
under drought stress.
The first commercially available drought-tolerant GM maize variety
(MON87460) expresses a bacterial cold shock protein B (CspB), a molecular
chaperone derived from Bacillus subtilis, which may provide a yield advantage
under limited water availability. A recent field study confirmed the higher
grain yield of MON87460 under drought conditions compared to a
conventional hybrid (Nemali et al., 2015). The combination of Bt and
drought-tolerant maize should therefore achieve even higher yields and lower
mycotoxin levels because it will be protected against two major
environmental stress factors.
Studies that considered aflatoxins and fumonisins simultaneously reported
variable results, suggesting that diverse environmental conditions may
Annex III
276
prevent the control of both mycotoxins in the same crops (Abbas et al., 2002,
2006, 2007, 2008; Bruns and Abbas, 2006). More studies are needed to
determine whether aflatoxin resistance traits can be crossed into Bt hybrids.
Aflatoxin-resistant germplasm tends to possess undesirable agronomic traits
such as tight husk coverage and late maturity. Breeding programs aiming to
achieve the introgression of aflatoxin resistance into Bt hybrids could
remove these undesirable characteristics while reducing aflatoxin
contamination (Williams et al., 2008; Williams et al., 2010). Bt maize has a
greater economic impact on Fusarium mycotoxins than aflatoxins (Wu, 2006,
2007; Wu et al., 2004). Further studies are needed to evaluate the effect of
both Bt hybrids expressing multiple genes and Bt hybrids combined with
maize lines that are resistant to the accumulation of other mycotoxins,
especially aflatoxins.
A potential risk that must be borne in mind comes in the form of mycotoxin
derivatives (modified mycotoxins) that escape routine analytical techniques
but may be digested by animals triggering toxic effects comparable to free
mycotoxins. These derivatives should be included in the total mycotoxin
allowances, and future legislation must consider their presence even though
this would increase the stringency of testing and rejection, resulting in
further economic loss. This highlights the benefits of Bt maize, which would
reduce the levels of mycotoxins and potentially their derivatives, although
the impact of Bt hybrids on the accumulation of modified mycotoxins needs
to be addressed in more detail (De Boevre et al., 2012, 2014; De Saeger and
van Egmond, 2012; Wu, 2006). Finally, the development of transgenic plants
expressing genes that protect against fungal infection (e.g. the modified Rp13
gene and the AILP transgene) or reduce mycotoxin levels by in situ
detoxification (e.g. zhd101 and fumonisin esterase) could provide an
additional strategy to control mycotoxins (Chen et al., 2015; Duvick, 2001;
Duvick et al., 2003; Igawa et al., 2007; Kant et al., 2012) and could be
combined with Bt hybrids to provide additive or even synergistic protection
against mycotoxin-producing fungal pathogens.
Annex III
277
Table S1. Summary of studies comparing fumonisin levels in Bt and non-Bt
hybrids.
Table S2. Summary of studies comparting aflatoxin levels in Bt and non-Bt
hybrids.
Table S3. Summary of studies comparing deoxynivalenol levels in Bt and
non-Bt hybrids.
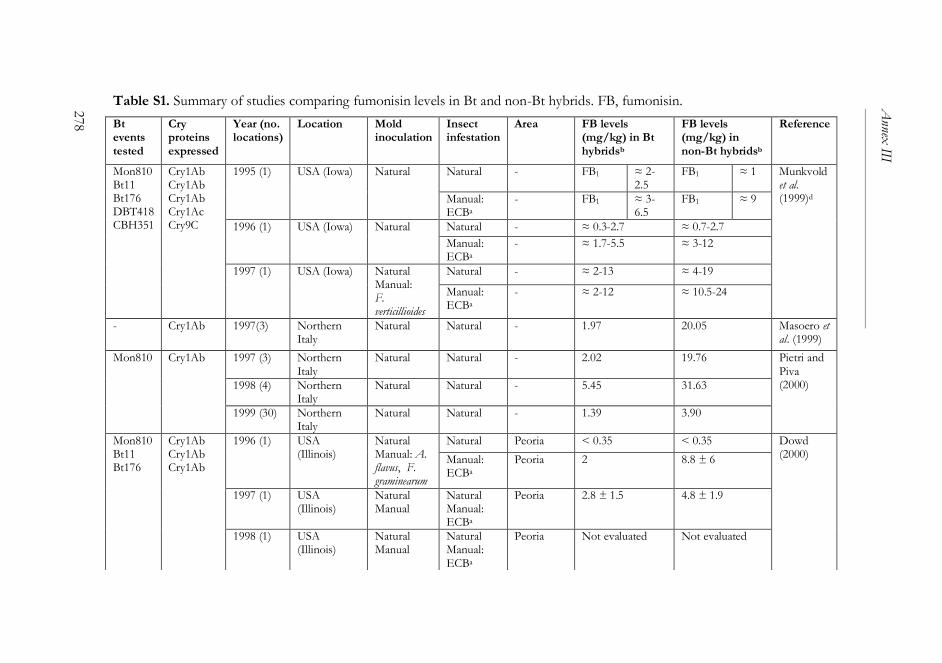
Table S1. Summary of studies comparing fumonisin levels in Bt and non-Bt hybrids. FB, fumonisin.
Bt events tested
Cry proteins expressed
Year (no. locations)
Location Mold inoculation
Insect infestation
Area FB levels (mg/kg) in Bt hybridsb
FB levels (mg/kg) in non-Bt hybridsb
Reference
Mon810 Bt11 Bt176 DBT418 CBH351
Cry1Ab Cry1Ab Cry1Ab Cry1Ac Cry9C
1995 (1) USA (Iowa) Natural Natural - FB1 ≈ 2-2.5
FB1 ≈ 1 Munkvold et al. (1999)d Manual:
ECBa - FB1 ≈ 3-
6.5 FB1 ≈ 9
1996 (1) USA (Iowa) Natural Natural - ≈ 0.3-2.7 ≈ 0.7-2.7
Manual: ECBa
- ≈ 1.7-5.5 ≈ 3-12
1997 (1)
USA (Iowa) Natural Manual: F. verticillioides
Natural - ≈ 2-13 ≈ 4-19
Manual: ECBa
- ≈ 2-12 ≈ 10.5-24
- Cry1Ab 1997(3) Northern Italy
Natural Natural - 1.97 20.05 Masoero et al. (1999)
Mon810 Cry1Ab 1997 (3) Northern Italy
Natural Natural - 2.02 19.76 Pietri and Piva (2000) 1998 (4) Northern
Italy Natural Natural - 5.45 31.63
1999 (30) Northern Italy
Natural Natural - 1.39 3.90
Mon810 Bt11 Bt176
Cry1Ab Cry1Ab Cry1Ab
1996 (1) USA (Illinois)
Natural Manual: A. flavus, F. graminearum
Natural Peoria < 0.35 < 0.35 Dowd (2000) Manual:
ECBa Peoria 2 8.8 ± 6
1997 (1) USA (Illinois)
Natural Manual
Natural Manual: ECBa
Peoria 2.8 ± 1.5 4.8 ± 1.9
1998 (1)
USA (Illinois)
Natural Manual
Natural Manual: ECBa
Peoria Not evaluated Not evaluated
278
Annex
III
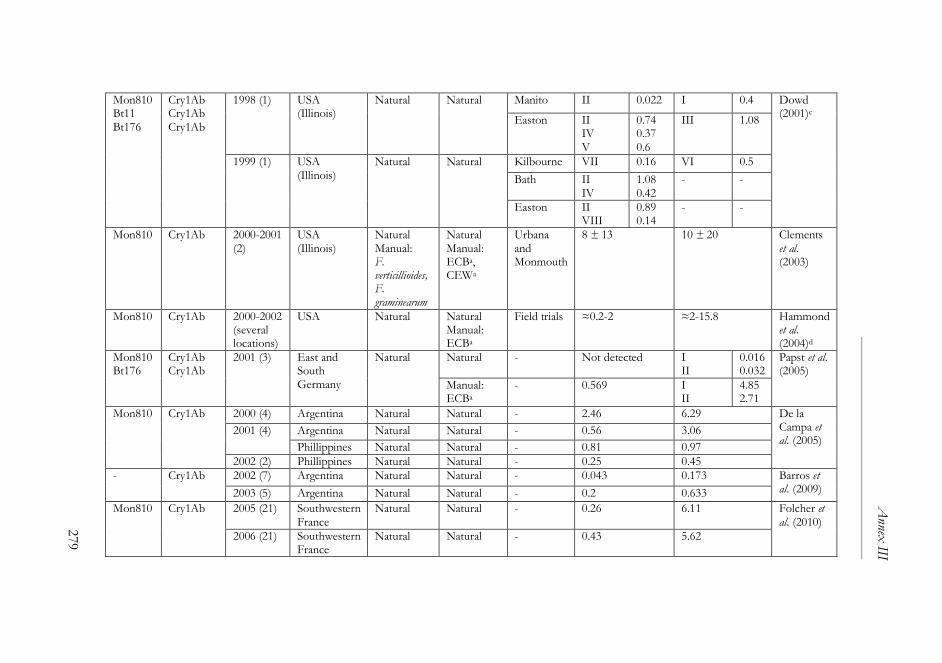
Mon810 Bt11 Bt176
Cry1Ab Cry1Ab Cry1Ab
1998 (1) USA (Illinois)
Natural Natural Manito II 0.022 I 0.4 Dowd (2001)c
Easton II IV V
0.74 0.37 0.6
III 1.08
1999 (1)
USA (Illinois)
Natural Natural Kilbourne VII 0.16 VI 0.5
Bath II IV
1.08 0.42
- -
Easton II VIII
0.89 0.14
- -
Mon810 Cry1Ab 2000-2001 (2)
USA (Illinois)
Natural Manual: F. verticillioides, F. graminearum
Natural Manual: ECBa, CEWa
Urbana and Monmouth
8 ± 13 10 ± 20 Clements et al. (2003)
Mon810 Cry1Ab 2000-2002 (several locations)
USA
Natural Natural Manual: ECBa
Field trials ≈0.2-2 ≈2-15.8 Hammond et al. (2004)d
Mon810 Bt176
Cry1Ab Cry1Ab
2001 (3)
East and South Germany
Natural Natural - Not detected I II
0.016 0.032
Papst et al. (2005)
Manual: ECBa
- 0.569 I II
4.85 2.71
Mon810 Cry1Ab 2000 (4) Argentina Natural Natural - 2.46 6.29 De la Campa et al. (2005)
2001 (4) Argentina Natural Natural - 0.56 3.06
Phillippines Natural Natural - 0.81 0.97
2002 (2) Phillippines Natural Natural - 0.25 0.45
- Cry1Ab
2002 (7) Argentina Natural Natural - 0.043 0.173 Barros et al. (2009) 2003 (5) Argentina Natural Natural - 0.2 0.633
Mon810 Cry1Ab 2005 (21) Southwestern France
Natural Natural - 0.26 6.11 Folcher et al. (2010)
2006 (21) Southwestern France
Natural Natural - 0.43 5.62
Annex
III
279
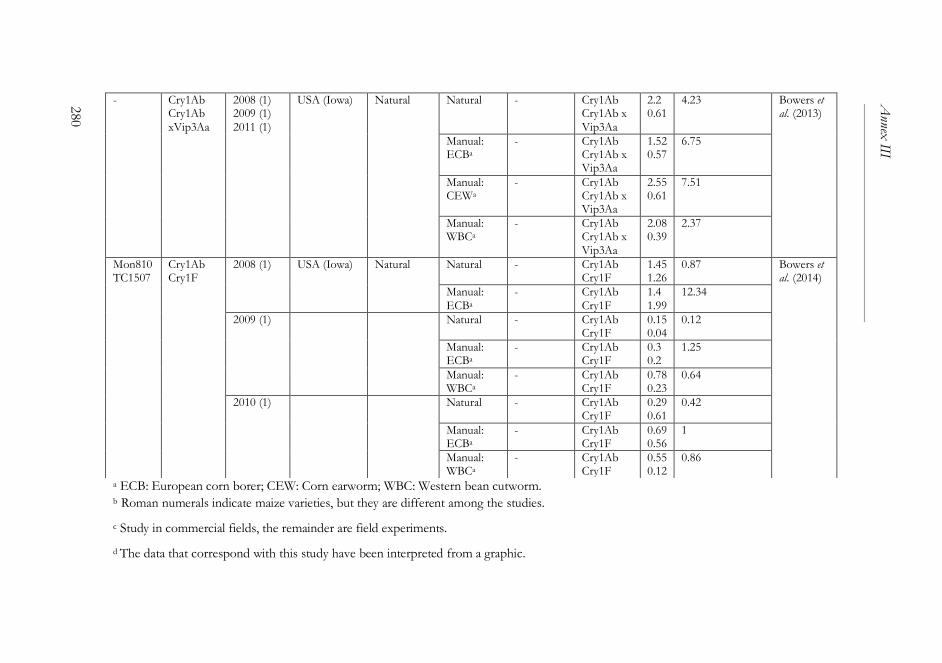
a ECB: European corn borer; CEW: Corn earworm; WBC: Western bean cutworm. b Roman numerals indicate maize varieties, but they are different among the studies.
c Study in commercial fields, the remainder are field experiments.
d The data that correspond with this study have been interpreted from a graphic.
- Cry1Ab Cry1Ab xVip3Aa
2008 (1) 2009 (1) 2011 (1)
USA (Iowa)
Natural Natural - Cry1Ab Cry1Ab x Vip3Aa
2.2 0.61
4.23 Bowers et al. (2013)
Manual: ECBa
- Cry1Ab Cry1Ab x Vip3Aa
1.52 0.57
6.75
Manual: CEWa
- Cry1Ab Cry1Ab x Vip3Aa
2.55 0.61
7.51
Manual: WBCa
- Cry1Ab Cry1Ab x Vip3Aa
2.08 0.39
2.37
Mon810 TC1507
Cry1Ab Cry1F
2008 (1) USA (Iowa) Natural Natural - Cry1Ab Cry1F
1.45 1.26
0.87 Bowers et al. (2014)
Manual: ECBa
- Cry1Ab Cry1F
1.4 1.99
12.34
2009 (1) Natural - Cry1Ab Cry1F
0.15 0.04
0.12
Manual: ECBa
- Cry1Ab Cry1F
0.3 0.2
1.25
Manual: WBCa
- Cry1Ab Cry1F
0.78 0.23
0.64
2010 (1)
Natural - Cry1Ab Cry1F
0.29 0.61
0.42
Manual: ECBa
- Cry1Ab Cry1F
0.69 0.56
1
Manual: WBCa
- Cry1Ab Cry1F
0.55 0.12
0.86
Annex
III
280

Table S2. Summary of studies comparing aflatoxin levels in Bt and non-Bt hybrids. AF, aflatoxin.
Bt events tested
Cry proteins expressed
Year (no. locations)
Location Mold inoculation
Insect infestation
Area Treatment AF levels (µg/kg) in Bt hybridsb
AF levels (µg/kg) in non-Bt hybridsb
Reference
Bt11 Cry1Ab 1995-1997 (1)
USA (Mississippi) (only Bt hybrid in 1997)
Natural Manual: A. flavus
Natural Manual: SWCBa
- Day 7
A. flavus SWCB A. flavus + SWCB
166 4 83
45 19 136
Windham et al. (1999)
- Day 21
A. flavus SWCB A. flavus + SWCB
145 5 290
45 41 650
- Control 17 6
Mon810 Cry1Ab 1999 (2) USA (South Texas)
Natural Manual: A. flavus
Natural CC Dryland 1,136 601 Odvody et al. (2000)
CC Irrigated 423 243
2000 (3)
USA (South Texas)
Natural Manual: A. flavus
Natural CC Dryland 1,399 1,166
CC Irrigated 1,078 979
BEE Dryland 187 347
- Cry1Ab 2000 (2) USA (Indiana and Ilinois)
Natural Manual: A. flavus
Natural - - Data not available
Data not available
Maupin et al. (2001)
Mon810 Cry1Ab 1998 (3) USA Natural Natural A - ≈300 ≈425 Buntin et
Annex
III
281
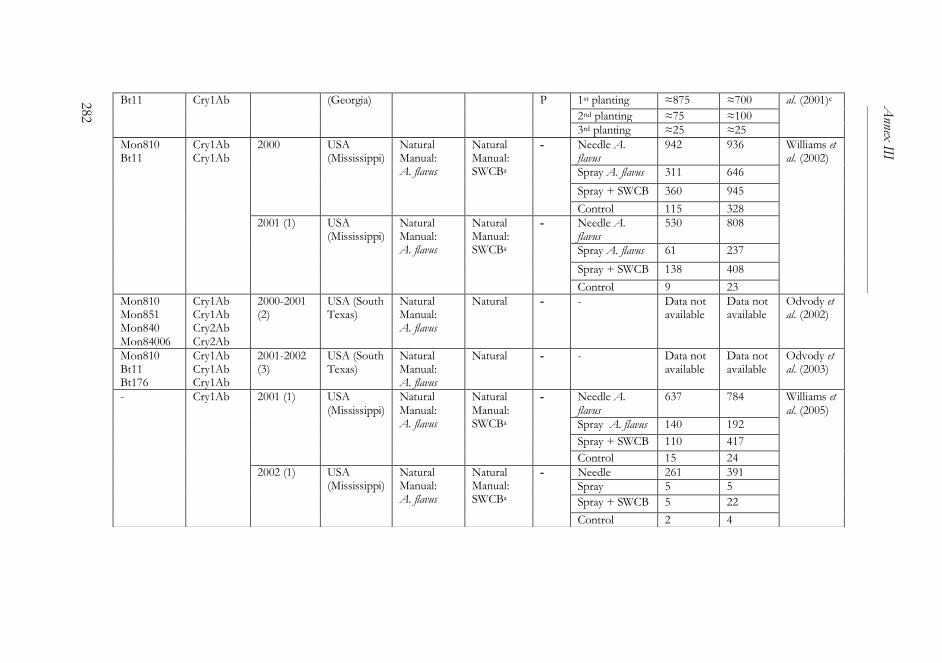
Bt11 Cry1Ab (Georgia) P 1st planting ≈875 ≈700 al. (2001)c
2nd planting ≈75 ≈100
3rd planting ≈25 ≈25
Mon810 Bt11
Cry1Ab Cry1Ab
2000
USA (Mississippi)
Natural Manual: A. flavus
Natural Manual: SWCBa
- Needle A. flavus
942 936 Williams et al. (2002)
Spray A. flavus 311 646
Spray + SWCB 360 945
Control 115 328
2001 (1) USA (Mississippi)
Natural Manual: A. flavus
Natural Manual: SWCBa
- Needle A. flavus
530 808
Spray A. flavus 61 237
Spray + SWCB 138 408
Control 9 23
Mon810 Mon851 Mon840 Mon84006
Cry1Ab Cry1Ab Cry2Ab Cry2Ab
2000-2001 (2)
USA (South Texas)
Natural Manual: A. flavus
Natural - - Data not available
Data not available
Odvody et al. (2002)
Mon810 Bt11 Bt176
Cry1Ab Cry1Ab Cry1Ab
2001-2002 (3)
USA (South Texas)
Natural Manual: A. flavus
Natural
- - Data not available
Data not available
Odvody et al. (2003)
- Cry1Ab
2001 (1)
USA (Mississippi)
Natural Manual: A. flavus
Natural Manual: SWCBa
- Needle A. flavus
637 784 Williams et al. (2005)
Spray A. flavus 140 192
Spray + SWCB 110 417
Control 15 24
2002 (1) USA (Mississippi)
Natural Manual: A. flavus
Natural Manual: SWCBa
- Needle 261 391
Spray 5 5
Spray + SWCB 5 22
Control 2 4
Annex
III
282
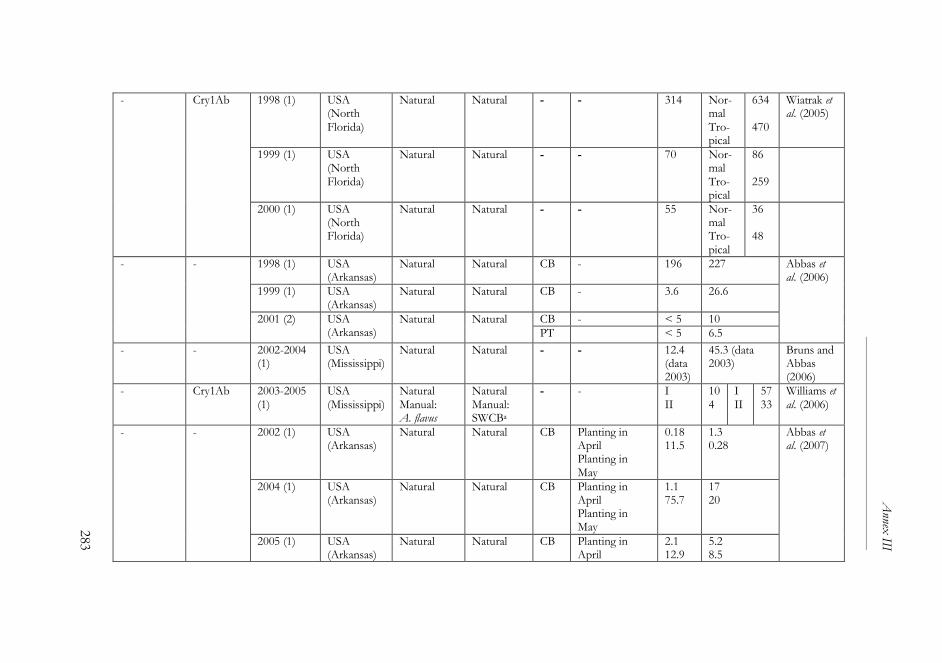
- Cry1Ab
1998 (1) USA (North Florida)
Natural Natural - - 314
Nor-mal Tro-pical
634 470
Wiatrak et al. (2005)
1999 (1) USA (North Florida)
Natural Natural - - 70
Nor-mal Tro-pical
86 259
2000 (1) USA (North Florida)
Natural Natural - - 55 Nor-mal Tro-pical
36 48
- - 1998 (1) USA (Arkansas)
Natural Natural CB - 196 227 Abbas et al. (2006)
1999 (1) USA (Arkansas)
Natural Natural CB - 3.6 26.6
2001 (2) USA (Arkansas)
Natural Natural CB - < 5 10
PT < 5 6.5
- - 2002-2004 (1)
USA (Mississippi)
Natural Natural - - 12.4 (data 2003)
45.3 (data 2003)
Bruns and Abbas (2006)
- Cry1Ab 2003-2005 (1)
USA (Mississippi)
Natural Manual: A. flavus
Natural Manual: SWCBa
- - I II
10 4
I II
57 33
Williams et al. (2006)
- - 2002 (1) USA (Arkansas)
Natural Natural CB Planting in April Planting in May
0.18 11.5
1.3 0.28
Abbas et al. (2007)
2004 (1) USA (Arkansas)
Natural Natural CB Planting in April Planting in May
1.1 75.7
17 20
2005 (1) USA (Arkansas)
Natural Natural CB Planting in April
2.1 12.9
5.2 8.5
Annex
III
283
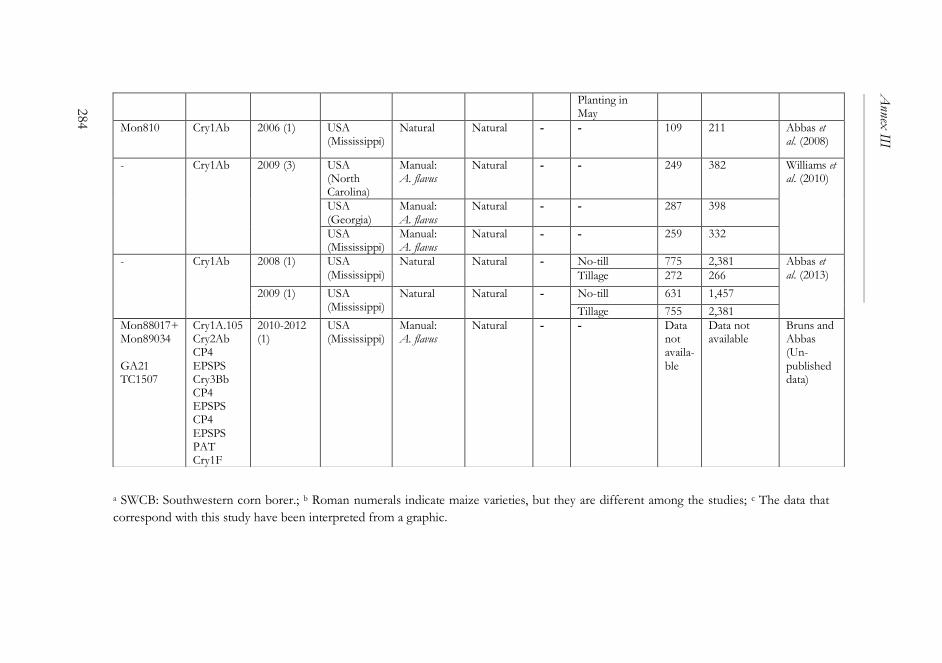
a SWCB: Southwestern corn borer.; b Roman numerals indicate maize varieties, but they are different among the studies; c The data that
correspond with this study have been interpreted from a graphic.
Planting in May
Mon810
Cry1Ab 2006 (1)
USA (Mississippi)
Natural Natural
- - 109 211 Abbas et al. (2008)
- Cry1Ab 2009 (3)
USA (North Carolina)
Manual: A. flavus
Natural - - 249 382 Williams et al. (2010)
USA (Georgia)
Manual: A. flavus
Natural - - 287 398
USA (Mississippi)
Manual: A. flavus
Natural - - 259 332
- Cry1Ab 2008 (1) USA (Mississippi)
Natural Natural - No-till 775 2,381 Abbas et al. (2013)
Tillage 272 266
2009 (1) USA (Mississippi)
Natural Natural - No-till 631 1,457
Tillage 755 2,381
Mon88017+ Mon89034 GA21 TC1507
Cry1A.105 Cry2Ab CP4 EPSPS Cry3Bb CP4 EPSPS CP4 EPSPS PAT Cry1F
2010-2012 (1)
USA (Mississippi)
Manual: A. flavus
Natural - - Data not availa-ble
Data not available
Bruns and Abbas (Un-published data)
Annex
III
284
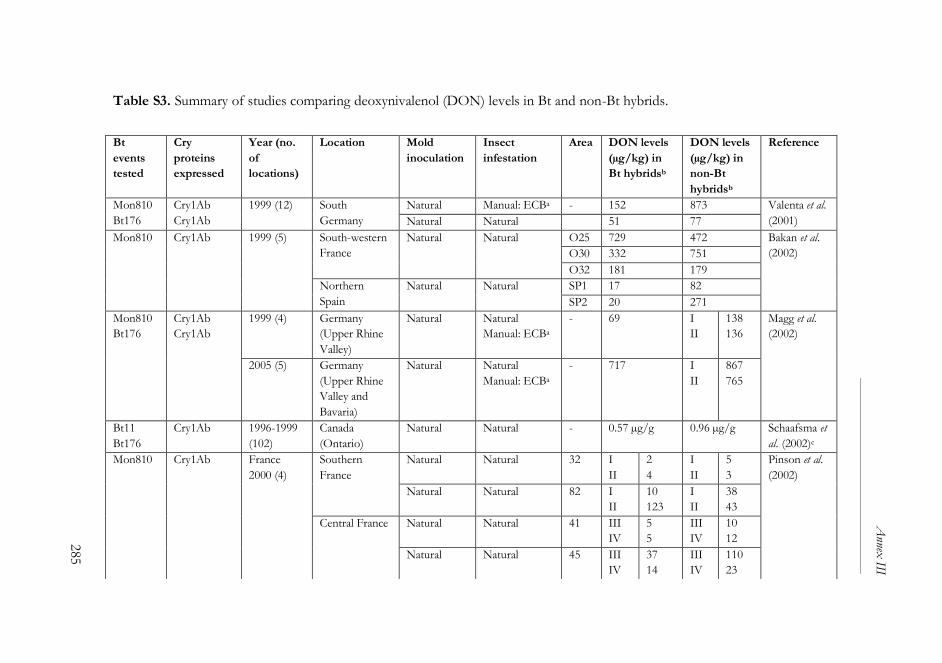
Table S3. Summary of studies comparing deoxynivalenol (DON) levels in Bt and non-Bt hybrids.
Bt
events
tested
Cry
proteins
expressed
Year (no.
of
locations)
Location Mold
inoculation
Insect
infestation
Area DON levels
(µg/kg) in
Bt hybridsb
DON levels
(µg/kg) in
non-Bt
hybridsb
Reference
Mon810
Bt176
Cry1Ab
Cry1Ab
1999 (12) South
Germany
Natural Manual: ECBa - 152 873 Valenta et al.
(2001) Natural Natural 51 77
Mon810 Cry1Ab 1999 (5) South-western
France
Natural Natural
O25 729 472 Bakan et al.
(2002)
O30 332 751
O32 181 179
Northern
Spain
Natural
Natural SP1 17 82
SP2 20 271
Mon810
Bt176
Cry1Ab
Cry1Ab
1999 (4) Germany
(Upper Rhine
Valley)
Natural Natural
Manual: ECBa
- 69 I
II
138
136
Magg et al.
(2002)
2005 (5) Germany
(Upper Rhine
Valley and
Bavaria)
Natural Natural
Manual: ECBa
- 717 I
II
867
765
Bt11
Bt176
Cry1Ab 1996-1999
(102)
Canada
(Ontario)
Natural Natural - 0.57 µg/g 0.96 µg/g Schaafsma et
al. (2002)c
Mon810
Cry1Ab France
2000 (4)
Southern
France
Natural Natural 32 I
II
2
4
I
II
5
3
Pinson et al.
(2002)
Natural Natural 82 I
II
10
123
I
II
38
43
Central France Natural Natural 41 III
IV
5
5
III
IV
10
12
Natural Natural 45 III
IV
37
14
III
IV
110
23
Annex
III
285
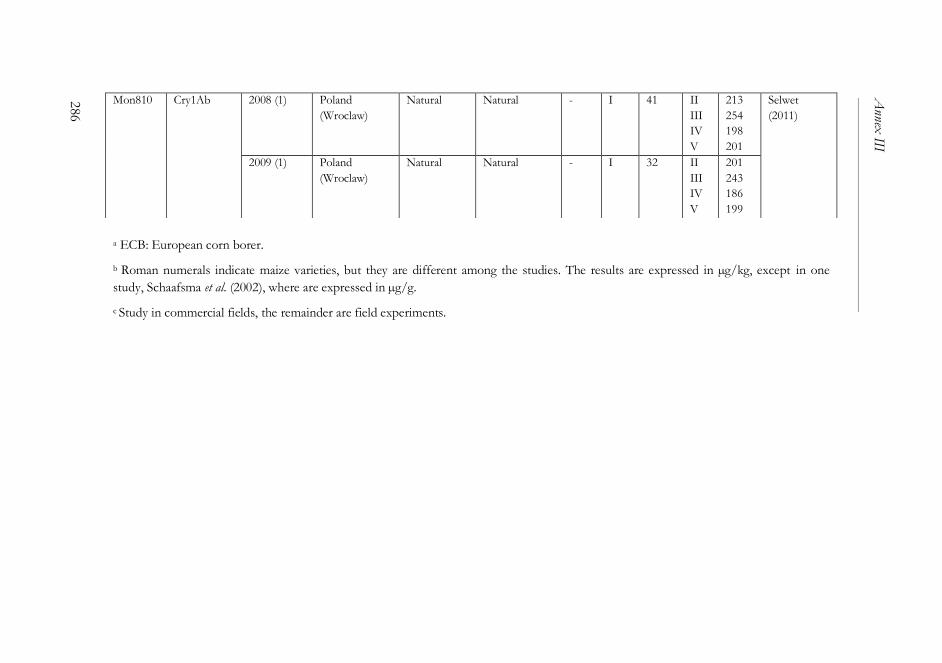
a ECB: European corn borer.
b Roman numerals indicate maize varieties, but they are different among the studies. The results are expressed in µg/kg, except in one
study, Schaafsma et al. (2002), where are expressed in µg/g.
c Study in commercial fields, the remainder are field experiments.
Mon810
Cry1Ab 2008 (1) Poland
(Wroclaw)
Natural Natural - I 41 II
III
IV
V
213
254
198
201
Selwet
(2011)
2009 (1) Poland
(Wroclaw)
Natural Natural - I 32 II
III
IV
V
201
243
186
199
Annex
III
286
Annex III
287
Abbas, H.K., Accinelli, C., Zablotowicz, R.M., Abel, C.A., Bruns, H.A.,
Dong, Y. and Shier W.T., 2008. Dynamics of mycotoxin and Aspergillus
flavus levels in aging Bt and non-Bt Corn residues under Mississippi no-
till conditions. Journal of Agricultural and Food Chemistry 56: 7578–
7585.
Abbas, H.K., Cartwright, R.D., Xie, W. and Shier, W.T., 2006. Aflatoxin and
fumonisin contamination of corn (maize, Zea mays) hybrids in
Arkansas. Crop Protection 25: 1–9.
Abbas, H.K., Shier, W.T. and Cartwright, R.D., 2007. Effect of temperature,
rainfall and planting date on aflatoxin and fumonisin contamination in
commercial Bt and non-Bt corn hybrids in Arkansas. Phytoprotection
88: 41–50.
Abbas, H.K., Williams W.P., Windham, G.L., Pringle, H.C., III, Xie, W. and
Shier, W.T., 2002. Aflatoxin and fumonisin contamination of
commercial corn (Zea mays) hybrids in Mississippi. Journal of
Agricultural and Food Chemistry 50: 5246–5254.
Abbas, H.K., Zablotowicz, R.M., Weaver, M.A., Shier, W.T., Bruns, H.A.,
Bellaloui, N., Accinelli, C. and Abel, C.A., 2013. Implications of Bt
traits on mycotoxin contamination in maize: overview and recent
experimental results in Southern United States. Journal of Agricultural
and Food Chemistry 61: 11759–11770.
Bakan, B., Melcion, D., Richard-Molard, D. and Cahagnier, B., 2002. Fungal
growth and Fusarium mycotoxin content in isogenic traditional maize
and genetically modified maize grown in France and Spain. Journal of
Agricultural and Food Chemistry 50: 728–731.
Barros, G., Magnoli, C., Reynoso, M.M., Ramirez, M.L., Farnochi, M.C.,
Torres, A., Dalcero, M., Sequeira, J., Rubinstein, C. and Chulze, S.,
2009. Fungal and mycotoxin contamination in Bt maize and non-Bt
maize grown in Argentina. World Mycotoxin Journal 2: 53–60.
Bowers, E., Hellmich, R.L. and Munkvold, G.P., 2013. Vip3Aa and Cry1Ab
proteins in maize reduce Fusarium ear rot and fumonisins by deterring
kernel injury from multiple Lepidopteran pests. World Mycotoxin
Journal 6: 127–135.

Annex III
288
Bowers, E., Hellmich, R.L. and Munkvold, G.P., 2014. Comparison of
fumonisin contamination using HPLC and ELISA methods in Bt and
near isogenic maize hybrids infested with European corn borer or
Western bean cutworm. Journal of Agricultural and Food Chemistry
62: 6463–6472.
Brookes, G. and Barfoot, P., 2013. The global income and production effects
of genetically modified (GM) crops 1996-2011. Landes Bioscience. GM
Crops and Food: Biotechnology in Agriculture and the Food Chain 4:
74–83.
Bruns, H.A. and Abbas, H.K., 2006. Planting date effects on Bt and non-Bt
corn in the Mid-South USA. Agronomy Journal 98: 100–106.
Buntin, G.D., Lee, R.D., Wilson, D.M. and McPherson, R.M., 2001.
Evaluation of Yieldgard transgenic resistance for control of Fall
armyworm and Corn earworm (Lepidoptera: Noctuidae) on corn.
Florida Entomologist 84: 37–42.
Council for Agricultural Science and Technology (CAST), 2003. Mycotoxins:
risks in plant, animal and human systems. Task force report No. 139.
Ames, IA, USA.
Chen, Z.-Y., Rajasekaran, K., Brown, R.L., Sayler, R.J. and Bhatnagar, D.,
2015. Discovery and confirmation of genes/proteins associated with
maize aflatoxin resistance. World Mycotoxin Journal 8: 211–224.
Clements, M.J., Campbell, K.W., Maragos, C.M., Pilcher, C., Headrick, J.M.,
Pataky, J.K. and White, D.G., 2003. Influence of Cry1Ab protein and
hybrid genotype on fumonisin contamination and Fusarium ear rot of
corn. Crop Science 43: 1283–1293.
De Boevre, M., Di Mavungu, J.D., Landschoot, S., Audenaert, K., Eeckhout,
M., Maene, P., Haesaert, G. and De Saeger, S., 2012. Natural
occurrence of masked mycotoxins and their masked forms in food and
feed products. World Mycotoxin Journal 5: 207–219.
De Boevre, M., Landschoot, S., Audenaert, K., Maene, P., Di Mavungu, J.D.,
Eeckhout, M., Haesaert, G. and De Saeger, S., 2014. Occurrence and
within field variability of Fusarium mycotoxins and their masked forms
in maize crops in Belgium. World Mycotoxin Journal 7: 91–102.
Annex III
289
De Saeger, S. and van Egmond, H.P., 2012. Special issue: masked
mycotoxins. World Mycotoxin Journal 5: 203–206.
De la Campa, R., Hooker, D.C., Miller, J.D., Schaafsma, A.W. and
Hammond, B.G., 2005. Modeling effects of environment, insect
damage, and Bt genotypes on fumonisin accumulation in maize in
Argentina and the Philippines. Mycopathologia 159: 539–552.
Desjardins, A.E., 2006. Fusarium mycotoxins: chemistry, genetics and
biology. The American Phytopathological Society (APS) Press, St. Paul,
MN, USA.
Dowd, P.F., 2000. Indirect reduction of ear molds and associated
mycotoxins in Bacillus thuringiensis corn under controlled and open field
conditions: utility and limitations. Journal of Economic Entomology
93: 1669–1679.
Dowd, P.F., 2001. Biotic and abiotic factors limiting efficacy of Bt corn in
indirectly reducing mycotoxin levels in commercial fields. Journal of
Economic Entomology 94: 1067–1074.
Duvick, J., 2001. Prospects for reducing fumonisin contamination of maize
through genetic modification. Environmental Health Perspectives 109:
337–342.
Duvick, J., Maddox, J.R., Rood, T.A., Wang, X., Bowen, B.A. and Gilliam,
J.T., 2003. Fumonisin detoxification composition and methods. US
Patent 6670189. Pionner Hi-Bred International, Inc, Des Moines, IA,
USA.
Environmental Protection Agency (EPA), 2011. Current & previously
registered section 3 PIP (plant incorporated protectants) registrations.
Available at:
http://www.epa.gov/oppbppd1/biopesticides/pips/pip_list.htm
Accessed 11 August 2014.
European Commission (EC), 1998. Commission Decision of 22 April 1998
concerning the placing on the market of genetically modified maize
(Zea mays L.line MON 810), pursuant to Council Directive
90/220/EEC (98/294/EC). Official Journal of the European
Communities L131: 32-33.
Annex III
290
European Commission (EC), 2002. Directive 2002/32/EC of the European
Parliament and of the Council of 7 May 2002 on undesirable
substances in animal feed. Official Journal of the European
Communities L140: 10-21.
European Commission (EC), 2003a. Regulation (EC) No 1829/2003 of the
European Parliament and of the Council of 22 September 2003 on
genetically modified food and feed. Official Journal of the European
Union L268: 1-23.
European Commission (EC), 2003b. Commission Directive 2003/100/EC
of 31 October 2003 amending annex I to Directive 2002/32/EC of the
European Parliament and of the Council on undesirable substances in
animal feed. Official Journal of the European Union L285: 33-37.
European Commission (EC), 2006a. Commission Recommendation of 17
August 2006 on the presence of deoxynivalenol, zearalenone,
ochratoxin A, T-2 and HT-2 and fumonisins in products intented for
animal feeding (2006/576/EC). Official Journal of the European
Union L229: 7-9.
European Commission (EC), 2006b. Commission Regulation (EC) No.
1881/2006, of 19 December 2006 setting maximum levels for certain
contaminants in foodstuffs. Official Journal of the European Union
L364: 5-24.
European Commission (EC), 2007. Commission Regulation (EC) No.
1126/2007 of 28 September 2007 amending Regulation (EC) No.
1881/2006 setting maximum levels for certain contaminants in
foodstuffs as regards Fusarium toxins in maize and maize products.
Official Journal of the European Union L255: 14-17.
European Commission (EC), 2008. Directive 2008/27/EC of the European
Parliament and of the Council of 11 March 2008 amending Directive
2001/18/EC on the deliberate release into the environment of
genetically modified organisms, as regards the implementing powers
conferred on the Commission. Official Journal of the European Union
L81: 45-47.
European Commission (EC), 2010. Commission Regulation (EU) No.
165/2010 of 26 February 2010 amending Regulation (EC) No.
1881/2006 setting maximum levels for certain contaminants in
Annex III
291
foodstuffs as regards aflatoxins. Official Journal of the European
Union L50: 8-12.
European Commission (EC), 2012. Commission Regulation (EU) No.
594/2012 of 5 July 2012 amending Regulation (EC) No. 1881/2006 as
regards the maximum levels of the contaminants cchratoxin A, non
dioxin-like PCBs and melamine in foodstuffs. Official Journal of the
European Union L176: 43-45.
European Commission (EC), 2013a. Commission Recommendation of 27
March 2013 on the presence of T-2 and HT-2 toxin in cereals and
cereal products (2013/165/EU). Official Journal of the European
Union L91:12-15.
European Commission (EC), 2013b. Commission Recommendation of 4
November 2013 amending Recommendation 2006/576/EC as regards
T-2 and HT-2 toxin in compound feed for cats (2013/637/EU).
Official Journal of the European Union L294: 44.
Falcão V.C.A., Ono M.A., de Ávila Miguel, T., Vizoni E., Hirooka E.Y. and
Ono E.Y.S., 2011. Fusarium verticillioides: Evaluation of fumonisin
production and effect of fungicides on in vitro inhibition of mycelial
growth. Mycopathologia 171: 77–84.
Food and Drug Administration (FDA), 2000. Guidance for industry: action
levels for poisonous or deleterious substances in human food and
animal feed. Available at:
http://www.fda.gov/Food/GuidanceRegulation/GuidanceDocuments
RegulatoryInformation/ChemicalContaminantsMetalsNaturalToxinsPe
sticides/ucm077969.htm Accessed 11 August 2014.
Food and Drug Administration (FDA), 2001. Guidance for industry:
fumonisin levels in human foods and animal feeds. Available at:
http://www.fda.gov/Food/GuidanceRegulation/GuidanceDocuments
RegulatoryInformation/ChemicalContaminantsMetalsNaturalToxinsPe
sticides/ucm109231.htm Accessed 11 August 2014.
Folcher, L., Delos, M., Marengue, E., Jarry, M., Weissenberger, A.,
Eychenne, N. and Regnault-Roger, C., 2010. Lower mycotoxin levels in
Bt maize grain. Agronomy for Sustainable Development 30: 711–719.
Annex III
292
Hammond, B.G., Campbell, K.W., Pilcher, C.D., Degooyer, T.A., Robinson,
A.E., McMillen, B.L., Spangler, S.M., Riordan, S.G., Rice, L.G. and
Richard, J.L., 2004. Lower fumonisin mycotoxin levels in the grain of
Bt corn grown in the United States in 2000-2002. Journal of
Agricultural and Food Chemistry 52: 1390–1397.
Hartinger, D. and Moll, W.-D., 2011. Fumonisin elimination and prospects
for detoxification by enzymatic transformation. World Mycotoxin
Journal 4: 271–283.
Head, G., Carroll, M., Clark, T., Galvan, T. and Huckaba, R.M., 2014.
Efficarcy of SmartStax® insect-protected corn hybrids against corn
rootworm: The value of pyramiding the Cry3Bb1 and Cry34/35Ab1
proteins. Crop Protection 57: 38–47.
Höfte, H. and Whiteley, H.R., 1989. Insecticidal crystal proteins of Bacillus
thuringiensis. Microbiological Reviews 53: 242–255.
International Agency for Research on Cancer (IARC), 1993. IARC
Monographs on the evaluation of carcinogenic risks to humans. Some
naturally occurring substances: food items and constituents,
heterocyclic aromatic amines and mycotoxins. Vol. 56. IARC, Lyon,
France.
International Agency for Research on Cancer (IARC), 2002. IARC
Monographs on the evaluation of carcinogenic risks to humans. Some
traditional herbal medicines, some mycotoxins, naphthalene and
styrene. Vol. 82. IARC, Lyon, France.
International Agency for Research on Cancer (IARC), 2012. IARC
Monographs on the evaluation of carcinogenic risks to humans.
Chemical agents and related occupations: aflatoxins.. Vol. 100 F. IARC,
Lyon, France.
Igawa, T., Takahashi-Ando, N., Ochiai, N., Ohsato, S., Shimizu, T., Kudo.
T., Yamaguchi, I. and Kimura, M., 2007. Reduced contamination by
the Fusarium mycotoxin zearalenone in maize kernels through genetic
modification with a detoxification gene. Applied and Environmental
Microbiology 73: 1622–1629.
James, C., 2014. Global status of commercialized Biotech/GM crops: 2014.
ISAAA Brief No. 49. ISAAA: Ithaca, NY, USA.
Annex III
293
Jard, G., Liboz, T., Mathieu, F., Guyonvarc'h, A. and Lebrihi, A., 2011.
Review of mycotoxin reduction in food and feed: from prevention in
fields to detoxification by adsorption or transformation. Food
Additives and Contaminants. Part A: Chemistry, Analysis, Control,
Exposure and Risk Assessment. 28: 1590–1609.
Joint FAO/WHO Expert Committee on Food Additives (JECFA), 2001.
Safety evaluation of certain mycotoxins in food. 56th Meeting of the
JECFA, Geneva, International Programme on Chemical Safety. WHO
Food Additives Series No. 47. WHO, Geneva, Switzerland.
Kant, P., Gulati, A., Harris, L., Gleddie, S., Singh, J. and Pauls, K.P., 2012.
Transgenic corn plants with modified ribosomal protein L3 show
decreased ear rot disease after inoculation with Fusarium graminearum.
Australian Journal of Crop Science 6: 1598–1605.
Kimura, M., Takahashi-Ando, N., Nishiuchi, T., Ohsato, S., Tokai, T.,
Ochiai, N., Fujimura, M., Kudo, T., Hamamoto, H. and Yamaguchi, I.,
2006. Molecular biology and biotechnology for reduction of Fusarium
mycotoxin contamination. Pesticide Biochemistry and Physiology 86:
117–123.
Koziel, M.G., Beland, G.L., Bowman, C., Carozzi, N.B., Crenshaw, R.,
Crossland, L., Dawson, J., Desai, N., Hill, M., Kadwell, S., Launis, K.,
Lewis, K., Maddox, D., McPherson, K., Meghji, M.R., Merlin, E.,
Rhodes, R., Warren, G.W., Wright, M. and Evola, S.V., 1993. Field
performance of elite transgenic maize plants expressing an insecticidal
protein derived from Bacillus thuringiensis. Nature Biotechnology 11:
194–200.
Lee, M.K., Walters, F.S., Hart, H., Palekar, N. and Chen, J-S., 2003. The
mode of action of the Bacillus thuringiensis vegetative insecticidal protein
Vip3A differs from that of Cry1Ab delta-endotoxin. Applied and
Environmental Microbiology 69: 4648–4657.
Lubulwa, G.A.S., Siriacha, P., Markwell, P.J. and Pitt, J.I., 2015. Estimating
the burden of market loss due to aflatoxins in maize: methods and
estimates for Thailand. World Mycotoxin Journal 8: 459-464.
Magg, T., Bohn, M., Klein, D., Merditaj, V. and Melchinger, A.E., 2003.
Concentration of moniliformin produced by Fusarium species in grains
of transgenic Bt maize hybrids compared to their isogenic counterparts
Annex III
294
and commercial varieties under European corn borer pressure. Plant
Breeding 122: 322–327.
Magg, T., Melchinger A.E., Klein, D. and Bohn, M., 2001. Comparison of Bt
maize hybrids with their non-transgenic counterparts and commercial
varieties for resistance to European corn borer and for agronomic
traits. Plant Breeding 120: 397–403.
Magg, T., Melchinger A.E., Klein, D. and Bohn, M., 2002. Relationship
between European corn borer resistance and concentration of
mycotoxins produced by Fusarium spp. in grains of transgenic Bt maize
hybrids, their isogenic counterparts, and commercial varieties. Plant
Breeding 121: 146–154.
Marasas, W.F.O., 2001. Discovery and occurrence of the fumonisins: a
historical perspective. Environmental Health Perspectives 109: 239–
243.
Marín, S., Magan, N., Bellí, N., Ramos, A.J., Canela R. and Sanchis, V., 1999.
Two-dimensional profiles of fumonisin B1 production by Fusarium
moniliforme and Fusarium proliferatum in relation to environmental factors
and potential for modelling toxin formation in maize grain.
International Journal of Food Microbiology 51: 159–167.
Marín, S., Magan, N., Ramos, A.J. and Sanchis, V., 2004. Fumonisin-
producing strains of Fusarium: a review of their ecophysiology. Journal
of Food Protection 67: 1792–1805.
Marín, S., Ramos, A.J., Cano-Sancho, G. and Sanchis, V., 2013. Mycotoxins:
occurrence, toxicology, and exposure assessment. Food and Chemical
Toxicology 60: 218–237.
Masoero, F., Moschini, M., Rossi, F., Prandini, A. and Pietri, A., 1999.
Nutritive value, mycotoxin contamination and in vitro rumen
fermentation of normal and genetically modified corn (Cry1Ab) grown
in Northern Italy. Maydica 44: 205–209.
Maupin, L.M., Clements, M.J., Walker, S.L. and White, D.G., 2001. Effects
of CryIA(b) on Aspergillus ear rot and aflatoxin in commercial corn
hybrids. Phytopathology 91: S59.
Annex III
295
Miller, J.D., 2001. Factors that affect the occurrence of fumonisin.
Environmental Health Perspectives 109: 321–324.
Munkvold, G.P., 2003. Epidemiology of Fusarium diseases and their
mycotoxins in maize ears. European Journal of Plant Pathology 109:
705–713.
Munkvold, G.P. and Desjardins, A.E., 1997. Fumonisins in maize: can we
reduce their occurrence? Plant Disease 81: 556–565.
Munkvold, G.P. and Hellmich, R.L., 1999. Genetically modified insect
resistant corn: implications for disease management. APSnet Features.
Available at:
http://www.apsnet.org/publications/apsnetfeatures/Pages/InsectResi
stantCorn.aspx Accessed 11 August 2014.
Munkvold, G.P., Hellmich, R.L. and Rice, L.G., 1999. Comparison of
fumonisin concentrations in kernels of transgenic Bt maize hybrids and
non-transgenic hybrids. Plant Disease 83: 130–138.
Munkvold, G.P., Hellmich, R.L., and Showers, W.B., 1997. Reduced
Fusarium ear rot and symptomless infection in kernels of maize
genetically engineered for European corn borer resistance.
Phytopathology 87: 1071–1077.
Nemali, K.S., Bonin, C., Dohleman, F.G., Stephens, M., Reeves, W.R.,
Nelson, D.E., Castiglioni, P., Whitsel, J.E., Sammons, B., Silady, R.A.,
Anstrom, D., Sharp, R.E., Patharkar, O.R., Clay, D., Coffin, M.,
Nemeth, M.A., Leibman, M.E., Luethy, M. and Lawson, M., 2015.
Physiological responses related to increased grain yield under drought
in the first biotechnology-derived drought-tolerance maize. Plant, Cell
and Environment 38: 1866–1880.
Odvody, G.N. and Chilcutt, C.F., 2002. Aflatoxin and insect response in
South Texas of near isogenic corn-hybrids with Cry1Ab and Cry2Ab
events. In: Proceedings Aflatoxin/Fumonisin elimination and fungal
genomics workshops. 23-26 October 2001, Phoenix, AZ, USA.
Mycopathologia 155: 107.
Odvody, G.N. and Chilcutt, C.F., 2003. Aflatoxin and insect response of
near isogenic non-Bt and Cry1A(b) (Mon810 and Bt11) commercial
corn hybrids in South Texas in 2001-2002. In: Robens, J.F., and
Annex III
296
Dorner, J.W., (eds.) Proceedings 3rd Fungal genomics, 4th Fumonisin
elimination, and 16th Aflatoxin elimination workshop. 13-15 October
2003, Savannah, GA, USA. USDA-ARS, Beltsville, MD, USA, p. 120.
Odvody, G.N., Chilcutt, C.F., Parker, R.D. and Benedict, J.H., 2000.
Aflatoxin and insect response of near isogenic Bt and non-Bt
commercial corn hybrids in South Texas. In: Robens, J.F., (ed.)
Proceedings 2000 Aflatoxin/Fumonisin workshop. 25-27 October
2000, Yosemite, CA, USA. USDA-ARS, Beltsville, MD, USA, p. 121.
Ostry, V., Malír F. and Pfohl-Leszkowicz, A., 2015. Comparative data
concerning aflatoxin contents in Bt maize and non-Bt isogenic maize in
relation to human and animal health-a review. Acta Veterinaria Brno
84: 47–53.
Ostry, V., Ovesna, J., Skarkova, J., Pouchova, V. and Ruprich, J., 2010. A
review on comparative data concerning Fusarium mycotoxins in Bt
maize and non-Bt isogenic maize. Mycotoxin Research 26: 141–145.
Papst, C., Utz, H.F., Melchinger, A.E., Eder, J., Magg, T., Klein, D. and
Bohn, M., 2005. Mycotoxins produced by Fusarium spp. in isogenic Bt
vs. non-Bt maize hybrids under European corn borer pressure.
Agronomy Journal 97: 219–224.
Pazzi, F., Lener, M., Colombo, L. and Monastra, G., 2006. Bt maize and
mycotoxins: the current state of research. Annals of Microbiology 56:
223–230.
Picot, A., Barreau, C., Pinson-Gadais, L., Caron, D., Lannou, C. and
Richard-Forget, F., 2010. Factors of the Fusarium verticillioides-maize
environment modulating fumonisin production. Critical Reviews in
Microbiology 36: 221–231.
Pietri, A. and Piva, G., 2000. Occurrence and control of mycotoxins in maize
grown in Italy. In: Proceedings of the 6th International Feed Production
Conference, Food Safety: Current Situation and Perspectives in the
European Community. 27-28 November 2000, Piacenza, Italy, pp.
226–236.
Pinson, L., Plancke, M.P., Richard-Forget, F. and Fleurat-Lessard, F., 2002.
Fusarium mycotoxins in isogenic and Bt maize varieties grown in
different geographic areas in France. In: Advanced in Stored Product
Annex III
297
Protection. Proceedings of the 8th International Working Conference
on Stored Product Protection. 22-26 July 2002, York, UK, pp. 511–
516.
Qaim, M., 2009. The economics of genetically modified crops. Annual
Review of Resource Economics 1: 665–693.
Rule, D.M., Nolting, S.P., Prasifka, P.L., Storer, N.P, Hopkins, B.W.,
Scherder, E.F., Siebert, M.W. and Hendrix III, W.H., 2014. Efficacy of
pyramided Bt proteins Cry1F, Cry1A.105, and Cry2Ab2 expresed in
SmartStax corn hybrids against lepidopteran insect pests in the
Northern United States. Journal of Economic Entomology 107: 403–
409.
Sanchis, V., Marín, S., Magan, N. and Ramos, A.J., 2006. Ecophysiology of
fumonisin producers in Fusarium Section Liseola. Advances in
Experimental Medicine and Biology 571: 115–122.
Schaafsma, A.W., Hooker, D.C., Baute, T.S. and Illincic-Tamburic, L., 2002.
Effect of Bt-corn hybrids on deoxynivalenol content in grain at
harvest. Plant Disease 86: 1123–1126.
Schnepf, E., Crickmore, N., Van Rie, J., Lereclus, D., Baum, J., Feitelson, J.,
Zeigler, D.R. and Dean, D.H., 1998. Bacillus thuringiensis and its
pesticidal crystal proteins. Microbiology and Molecular Biology
Reviews 62: 775–806.
Scientific Cooperation on Questions Relating to Food (SCOOP), 2003.
Reports on tasks for scientific cooperation. Collection of occurrence
data of Fusarium toxins in food and assessment of dietary intake by the
population of EU Member States. Available at:
https://ec.europa.eu/food/sites/food/files/safety/docs/cs_contamin
ants_catalogue_fusarium_task3210.pdf Accessed 11 August 2014.
Selwet, M., 2011. Maize plants infestation by Fusarium spp. and
deoxynivalenol in genetically modified corn hybrid and traditional
maize cultivars. Polish Journal of Microbiology 60: 317–321.
Sobek, E.A. and Munkvold, G.P., 1999. European corn borer (Lepidoptera:
Pyralidae) as vectors of Fusarium moniliforme, causing kernel rot and
symptomless infection of maize kernels. Journal of Economic
Entomology 92: 503–509.

Annex III
298
Sobrova, P., Adam, V., Vasatkova, A., Beklova, M., Zeman, L. and Kizek, R.,
2010. Deoxynivalenol and its toxicity. Interdisciplinary Toxicology 3:
94–99.
Takahashi-Ando, N., Kimura, M., Kakeya, H., Osada, H. and Yamaguchi, I.,
2002. A novel lactonohydrolase responsible for the detoxification of
zearalenone: enzyme purification and gene cloning. Biochemical
Journal 365: 1–6.
Traore, S.B., Carlson, R.E., Pilcher, C.D. and Rice, M.E., 2000. Bt and non-
Bt maize growth and development as affected by temperature and
drought stress. Agronomy Journal 92: 1027–1035.
United States Department of Agriculture, Economic Research Service
(USDA-ERS). Adoption of Genetically Engineered Crops in the U.S.
Overview: Recent trends in GE adoption. Available at:
http://www.ers.usda.gov/data-products/adoption-of-genetically-
engineered-crops-in-the-us/recent-trends-in-ge-adoption.aspx
Accessed 6 October 2015.
Valenta, H., Dänicke, S., Flachowsky, G. and Böhme, T., 2001. Comparative
study on concentrations of deoxynivalenol and zearalenone in kernels
of transgenic Bt maize hybrids and non-transgenic maize hybrids.
Mycotoxin Research 17: 15–18.
Wiatrak, P.J., Wright, D.L., Marois, J.J. and Wilson, D., 2005. Influence of
planting date on aflatoxin accumulation in Bt, non-Bt, and tropical
non-Bt hybrids. Agronomy Journal 97: 440–445.
Williams, J.H., Phillips, T.D., Jolly, P.E., Stiles, J.K., Jolly, C.M. and
Aggarwal, D., 2004. Human aflatoxicosis in developing countries: a
review of toxicology, exposure, potential health consequences, and
interventions. The American Journal of Clinical Nutrition 80: 1106–
1122.
Williams, W.P., Krakowsky, M., Windham, G., Balint-Kurti, P., Hawkins, L.
and Henry, W.B., 2008. Identifying maize germplasm with resistance to
aflatoxin accumulation. Toxin Reviews 27: 319–345.
Williams, W.P., Windham, G.L., Buckley, P.M. and Daves, C.A., 2002.
Aflatoxin accumulation in conventional and transgenic corn hybrids

Annex III
299
infested with Southwestern corn borer (Lepidoptera: Crambidae).
Journal of Agricultural Urban Entomology 19: 227–236.
Williams, W.P., Windham, G.L., Buckley, P.M. and Daves, C.A., 2006.
Aflatoxin accumulation in corn hybrids infested at different growth
stages with Southwestern corn borer (Lepidoptera: Crambidae ). Journal
of Agricultural Urban Entomology 23: 97–103.
Williams, W.P., Windham, G.L., Buckley, P.M. and Perkins, J.M., 2005.
Southwestern corn borer damage and aflatoxin accumulation in
conventional and transgenic corn hybrids. Field Crops Research 91:
329–336.
Williams, W.P., Windham, G.L., Krakowsky, M.D., Scully, B.T. and Ni, X.,
2010. Aflatoxin accumulation in Bt and non-Bt maize testcrosses.
Journal of Crop Improvement 24: 392–399.
Windham, G.L., Williams, W.P. and Davis, F.M., 1999. Effects of the
Southwestern corn borer on Aspergillus flavus kernel infection and
aflatoxin accumulation in maize hybrids. Plant Disease 83: 535–540.
Wu, F., 2006. Mycotoxin reduction in Bt Corn: potential economic, health,
and regulatory impacts. Transgenic Research 15: 277–289.
Wu, F., 2007. Bt corn and impact on mycotoxins. CAB Reviews 2: 1–8.
Wu, F., 2014. Global impacts of aflatoxin in maize: trade and human health.
World Mycotoxin Journal 8: 137–142.
Wu, F., Miller, J.D. and Casman E.A., 2004. The economic impact of Bt
corn resulting from mycotoxin reduction. Journal of Toxicology, Toxin
Reviews 23: 397–424.