Herschel observations of extended atomic gas in the core of the Perseus cluster
21
Mon. Not. R. Astron. Soc. 000, 000–000 (0000) Printed 23 December 2013 (MN L A T E X style file v2.2) Herschel ? observations of extended atomic gas in the core of the Perseus cluster Rupal Mittal 1 , J. B. Raymond Oonk 2 , Gary J. Ferland 3 , Alastair C. Edge 4 , Christopher P. O’Dea 5,6 , Stefi A. Baum 1,7 , John T. Whelan 8 , Roderick M. Johnstone 9 Francoise Combes 10 , Philippe Salom´ e 10 , Andy C. Fabian 9 , Grant R. Tremblay 11 , Megan Donahue 12 and Helen Russell 13 1 Chester F. Carlson Center for Imaging Science, Rochester Institute of Technology, Rochester, NY 14623, USA 2 Netherlands Institute for Radio Astronomy, Postbus 2, 7990 AA Dwingeloo, The Netherlands 3 Department of Physics, University of Kentucky, Lexington, KY 40506, USA 4 Institute for Computational Cosmology, Department of Physics, Durham University, Durham, DH1 3LE 5 Department of Physics, Rochester Institute of Technology, Rochester, NY 14623, USA 6 Harvard Smithsonian Center for Astrophysics, 60 Garden St. Cambridge, MA 02138 7 Radcliffe Institute for Advanced Study, 10 Garden St. Cambridge, MA 02138 8 School of Mathematical Sciences and Center for Computational Relativity & Gravitation, Rochester Institute of Technology, Rochester, NY 14623, USA 9 Institute of Astronomy, Madingley Road, Cambridge, CB3 0HA 10 Observatoire de Paris, LERMA, CNRS, 61 Av. de l’Observatoire, 75014 Paris, France 11 European Southern Observatory, Karl-Schwarzschild-Str. 2, 85748 Garching bei M¨ unchen, Germany 12 Michigan State University, Physics and Astronomy Dept., East Lansing, MI 48824, USA 13 Department of Physics & Astronomy, University of Waterloo, Canada, N2L 3G1 ABSTRACT We present Herschel observations of the core of the Perseus cluster of galaxies. Especially in- triguing is the network of filaments that surround the brightest cluster galaxy, NGC 1275, previously imaged extensively in Hα and CO. In this work, we report detections of far- infrared (FIR) lines, in particular, [Cii] 158 μm, [Oi] 63 μm, [Nii] 122 μm, [Oib] 145 μm and [Oiii] 88 μm, with Herschel. All lines are spatially extended, except [Oiii], with the [Cii] line emission extending up to 25 kpc from the core. [Cii] emission is found to be cospatial with Hα and CO. Furthermore, [Cii] shows a similar velocity distribution to CO, which has been shown in previous studies to display a close association with the Hα kinematics. The spatial and kinematical correlation among [Cii], Hα and CO gives us confidence to model the different components of the gas with a common heating model. With the help of FIR continuum Herschel measurements, together with a suite of coeval radio, submm and infrared data from other observatories, we performed a spectral energy distribution fitting of NGC 1275 using a model that contains contributions from dust emission as well as synchrotron AGN emission. This has allowed us to accurately estimate the dust parameters. The data indicate a low dust emissivity index, β ≈ 1, a total dust mass close to 10 7 M , a cold dust component with temperature 38 ± 2 K and a warm dust component with temperature of 116 ± 9 K. The FIR-derived star formation rate (SFR) is 24 ± 1 M yr -1 , which is in agreement with the FUV-derived SFR in the core, determined after applying corrections for both Galactic and internal reddening. The total infrared luminosity in the range 8 μm to 1000 μm is inferred to be 1.5×10 11 L , making NGC 1275 a luminous infrared galaxy (LIRG). We investigated in detail the source of the Herschel FIR and Hα emissions emerging from a core region 4 kpc in radius. Based on simulations conducted using the radiative transfer code, cloudy, a heating model comprising old and young stellar populations is sufficient to explain these observations. The optical line ratios indicate that there may be a need for a second heating component. However, stellar photoionization seems to be the dominant mechanism. We have also detected [Cii] in three well-studied regions of the filaments. Herschel, with its superior sensitivity to FIR emission, can detect far colder atomic gas than previous stud- ies. We find a [Oi]/[Cii] ratio about 1 dex smaller than predicted by the otherwise functional Ferland (2009) model. That study considered optically thin emission from a small cell of gas and by design did not consider the effects of reasonable column densities. The line ratio sug- gests that the lines are optically thick, as is typical of galactic PDRs, and implies that there is a large reservoir of cold atomic gas. This was not included in previous inventories of the filament mass and may represent a significant component. c 0000 RAS arXiv:1208.1730v1 [astro-ph.CO] 8 Aug 2012
Transcript of Herschel observations of extended atomic gas in the core of the Perseus cluster

Mon. Not. R. Astron. Soc. 000, 000–000 (0000) Printed 23 December 2013 (MN LATEX style file v2.2)
Herschel? observations of extended atomic gas in the core of thePerseus cluster
Rupal Mittal1, J. B. Raymond Oonk2, Gary J. Ferland3, Alastair C. Edge4,Christopher P. O’Dea5,6, Stefi A. Baum1,7, John T. Whelan8, Roderick M. Johnstone9
Francoise Combes10, Philippe Salome10, Andy C. Fabian9, Grant R. Tremblay11,Megan Donahue12 and Helen Russell131 Chester F. Carlson Center for Imaging Science, Rochester Institute of Technology, Rochester, NY 14623, USA2 Netherlands Institute for Radio Astronomy, Postbus 2, 7990 AA Dwingeloo, The Netherlands3 Department of Physics, University of Kentucky, Lexington, KY 40506, USA4 Institute for Computational Cosmology, Department of Physics, Durham University, Durham, DH1 3LE5 Department of Physics, Rochester Institute of Technology, Rochester, NY 14623, USA6 Harvard Smithsonian Center for Astrophysics, 60 Garden St. Cambridge, MA 021387 Radcliffe Institute for Advanced Study, 10 Garden St. Cambridge, MA 021388 School of Mathematical Sciences and Center for Computational Relativity & Gravitation, Rochester Institute of Technology, Rochester, NY 14623, USA9 Institute of Astronomy, Madingley Road, Cambridge, CB3 0HA10 Observatoire de Paris, LERMA, CNRS, 61 Av. de l’Observatoire, 75014 Paris, France11 European Southern Observatory, Karl-Schwarzschild-Str. 2, 85748 Garching bei Munchen, Germany12 Michigan State University, Physics and Astronomy Dept., East Lansing, MI 48824, USA13 Department of Physics & Astronomy, University of Waterloo, Canada, N2L 3G1
ABSTRACTWe present Herschel observations of the core of the Perseus cluster of galaxies. Especially in-triguing is the network of filaments that surround the brightest cluster galaxy, NGC 1275,previously imaged extensively in Hα and CO. In this work, we report detections of far-infrared (FIR) lines, in particular, [Cii] 158 µm, [Oi] 63 µm, [Nii] 122 µm, [Oib] 145 µmand [Oiii] 88 µm, with Herschel. All lines are spatially extended, except [Oiii], with the [Cii]line emission extending up to 25 kpc from the core. [Cii] emission is found to be cospatialwith Hα and CO. Furthermore, [Cii] shows a similar velocity distribution to CO, which hasbeen shown in previous studies to display a close association with the Hα kinematics. Thespatial and kinematical correlation among [Cii], Hα and CO gives us confidence to model thedifferent components of the gas with a common heating model.
With the help of FIR continuum Herschel measurements, together with a suite of coevalradio, submm and infrared data from other observatories, we performed a spectral energydistribution fitting of NGC 1275 using a model that contains contributions from dust emissionas well as synchrotron AGN emission. This has allowed us to accurately estimate the dustparameters. The data indicate a low dust emissivity index, β ≈ 1, a total dust mass close to107 M, a cold dust component with temperature 38 ± 2 K and a warm dust component withtemperature of 116±9 K. The FIR-derived star formation rate (SFR) is 24±1 M yr−1, whichis in agreement with the FUV-derived SFR in the core, determined after applying correctionsfor both Galactic and internal reddening. The total infrared luminosity in the range 8 µm to1000 µm is inferred to be 1.5×10¹¹ L, making NGC 1275 a luminous infrared galaxy (LIRG).
We investigated in detail the source of the Herschel FIR and Hα emissions emerging froma core region 4 kpc in radius. Based on simulations conducted using the radiative transfer code,cloudy, a heating model comprising old and young stellar populations is sufficient to explainthese observations. The optical line ratios indicate that there may be a need for a secondheating component. However, stellar photoionization seems to be the dominant mechanism.
We have also detected [Cii] in three well-studied regions of the filaments. Herschel, withits superior sensitivity to FIR emission, can detect far colder atomic gas than previous stud-ies. We find a [Oi]/[Cii] ratio about 1 dex smaller than predicted by the otherwise functionalFerland (2009) model. That study considered optically thin emission from a small cell of gasand by design did not consider the effects of reasonable column densities. The line ratio sug-gests that the lines are optically thick, as is typical of galactic PDRs, and implies that thereis a large reservoir of cold atomic gas. This was not included in previous inventories of thefilament mass and may represent a significant component.c© 0000 RAS
arX
iv:1
208.
1730
v1 [
astr
o-ph
.CO
] 8
Aug
201
2

2 Rupal Mittal et al.
1 INTRODUCTION
The Perseus cluster of galaxies is preeminent among the class ofcool-core galaxy clusters (those with gas cooling times shorter thanthe Hubble time). This is in large part due to its close proximity(z = 0.01756), allowing detailed studies to be conducted in varyingastrophysical contexts. It is the X-ray brightest galaxy cluster andhas a strongly peaked surface-brightness profile. The intraclustergas in the inner few tens of kpc has a very short radiative cool-ing time (200 Myr to 300 Myr). In the absence of heating, the ex-pected X-ray mass deposition rate is several 100 M yr−1. FUSEobservations, on the other hand, suggest an actual cooling rate of∼ 30 M yr−1 (Bregman et al. 2006) and XMM-Newton RGS obser-vations suggest an even lower residual cooling rate of 20 M yr−1
(Fabian et al. 2006, and references therein).Perseus is the prototype of cluster radio “mini-haloes” (e.g.
Pedlar et al. 1990; Gitti et al. 2002). The brightest cluster galaxyof Perseus (a giant cD galaxy), NGC 1275, is host to a powerfulradio source, 3C 84. It has a Seyfert-like spectrum and a bolo-metric radio core-luminosity of order 1043 erg s−1 (e.g Vermeulenet al. 1994). 3C 84 is inferred to undergo episodic bursts of ac-tivity, blowing out jets of plasma which interact with the intra-cluster medium. Chandra X-ray images, when compared with ra-dio emission at different wavelengths (e.g. Bohringer et al. 1993;Fabian et al. 2000, 2006; Sanders et al. 2005; Sanders & Fabian2007) reveal the extent to which the central radio source has causedhavoc in the intracluster-medium (ICM) in the form of bubbles ofvarious kinds (inner, outer, ghost), sound waves and shocks. OnVLBI/VLBA (milliarcsec) scales, the radio morphology consists ofa bright southern jet (e.g. Vermeulen et al. 1994; Taylor et al. 2006)believed to be pointed towards the observer and a dim northerncounter jet pointed away. The radio source shows a clear double-lobed morphology on smaller scales (∼ 80′′) that extends into amore amorphous one on larger scales (∼ 170′′).
One of the most intriguing aspects of Perseus is the spec-tacular network of ionized (Hα) and molecular (CO and H2) gasfilaments well beyond the optical stellar emission of the bright-est cluster galaxy (BCG). A significant number of BCGs in cool-core (CC) clusters show similarly extended filamentary structures,such as NGC 4696 (Centaurus), Abell 1795 and Hydra-A (John-stone et al. 1987; Heckman et al. 1989; Sparks et al. 1989; Craw-ford et al. 1999; McDonald et al. 2010). The source of excitation ofthe filaments is currently one of the most pertinent issues in our un-derstanding of CC galaxy clusters. In the case of NGC 1275, the fil-aments extend as far as ∼ 50 kpc out from the cluster-centric AGN,with the mean surface-brightness declining much slower than theinverse-square law. Photoionization from a central AGN thus seemsunlikely. Similarly, ionizing radiation from hot stars, such as O andB type, has been ruled out based on anomalous emission lines in thespectra of the filaments (Johnstone & Fabian 1988; Johnstone et al.2007; Ferland et al. 2008). Motivated by the observations of strongmolecular hydrogen lines in NGC 4696 and NGC 1275, Ferlandet al. (2009) showed that non-radiative heating, such as collisionalheating from ionizing particles, can produce the observed emis-sion. The importance of collisional excitation by energetic (ioniz-ing) particles was suggested more than two decades ago by John-stone & Fabian (1988). Candidate sources for these particles areeither cosmic rays or the thermal electrons of the X-ray emittingintracluster medium. Motivated by the spatial correspondence be-tween the brightest low-energy X-rays and the Hα filaments, Fabianet al. (2011) considered the penetration of cold filaments by thesurrounding hot X-ray gas through reconnection diffusion. More
recently, Sparks et al. (2012) reported a detection with the HSTACS camera and also the COS spectrograph, of [Civ]λ1549 lineemission spatially coincident with the Hα line emission in M87 inVirgo. The [Civ]λ1549 line emission is indicative of gas at ∼ 105 K.They suggest the origin of this line emission as being due to ther-mal conduction, i.e., the transport of energy by hot electrons fromthe hot ICM to the cold filament gas.
Various independent studies have provided strong evidence ofthe presence of dust in cool-core BCGs. These include dust con-tinuum observations (e.g. Edge et al. 1999; Chapman et al. 2002;Egami et al. 2006; O’Dea et al. 2008; Rawle et al. 2012) and HSTobservations of BCGs with dust absorption features in them (e.g.McNamara et al. 1996; Pinkney et al. 1996; Laine et al. 2003; Oonket al. 2011). Furthermore, observations of H2 and CO moleculargas (e.g. Donahue et al. 2000; Edge 2001; Edge et al. 2002; Sa-lome et al. 2006) suggest that there are substantial amounts of dustpresent which provide shielding. In Mittal et al. (2011), we demon-strated the need for an overabundance of dust (low gas-to-dust massratio) and metallicity to explain measurements in NGC 4696. Inmost of the cases, the gas-to-dust mass ratios are consistent withGalactic values (Sparks et al. 1989; Edge 2001), however, there isclearly an overabundance of dust in the filaments relative to the sur-rounding hot gas. The origin of the dust in the filaments is not yetclear. More recently, Voit & Donahue (2011) have suggested thatthe main source of dust in BCGs of CC clusters may be the starsof the central galaxy themselves. Thus, a stellar origin is plausi-ble although in the case of NGC 1275 that seems unlikely giventhe filaments exist out to a large radius from the galaxy core. Eventhough the sputtering timescale for dust grains is short comparedto the gas cooling time, optical observations have revealed mag-nificent dust lanes in some objects, which in many cases correlatespatially with the Hα filaments (Crawford et al. 2005; Sparks et al.1989; Donahue & Voit 1993). Fabian (1994) and Voit & Donahue(1995) have proposed that gas-phase reactions create dust in thecold clouds that cool out of the ICM, which can then lead to anincrease in dust through accretion onto existing grains. In contrast,several studies argue (e.g. Sparks et al. 1989; Farage et al. 2010)that the ionized gas and dust filaments originate from the strippingof a dust-rich neighbouring galaxy which may be in the process ofmerging with the BCG. The origin of the molecular and ionizedfilaments mixed with dust is to date an open question.
In this paper, we present Herschel observations of the core ofthe Perseus cluster. The main goal of this work is to investigate thesource of the various emissions originating from the filaments. Far-infrared data from Herschel (Pilbratt et al. 2010) have proven to beuseful diagnostics of the heating mechanisms that account for thefilaments in cool-core clusters (e.g. Rawle et al. 2012; Mittal et al.2011; Edge et al. 2010a,b; Pereira et al. 2010). This work is part of aHerschel Open Time Key Project (PI: Edge) aimed at understand-ing the origin of cold gas and dust in a representative sample of11 BCGs. We describe the data used and the analysis in section 2.We present some basic results in section 3 and move on to dis-cuss the heating mechanisms prevailing in the core of NGC 1275in section 4 and those prevailing in the filaments of NGC 1275in section 5. We finally give our conclusions in section 6. We as-sume throughout this paper the ΛCDM concordance Universe, withH0 = 71 h71 km s−1 Mpc−1, Ωm = 0.27 and ΩΛ = 0.73. Thistranslates into a physical scale of 1′′ = 0.352 kpc and a luminositydistance of 75.3 Mpc at the redshift of NGC 1275 (z = 0.01756).This distance is consistent with the independent distance inferredfrom the 2005 Type Ia supernova SN2005mz (Hicken et al. 2009).The right ascension and declination coordinates in figures are in
c© 0000 RAS, MNRAS 000, 000–000

Herschel Observations of the Perseus Cluster 3
J2000 equinox. Lastly, NGC 1275 comprises two systems – a low-velocity system (LVS) consisting of gas at 5200 km s−1 associatedwith the BCG and a high-velocity system (HVS) consisting of gasat 8200 km s−1 associated with a foreground galaxy north-west ofthe BCG. In this work, NGC 1275 refers to the LVS system onlyunless otherwise mentioned. For calculation of line velocities weassume the velocity of the LVS to be the systemic velocity.
2 DATA AND ANALYSIS
2.1 Herschel data
We used the PACS spectrometer (Poglitsch et al. 2010) to observethe [Cii] line at 157.74 µm and the [Oi] line at 63.18 µm, the twoprimary coolants of the interstellar-medium (ISM). The [Cii] and[Oi] fine-structure lines are very often the brightest emission linesin galaxy spectra. In addition, we observed [Oib] at 145.52 µm, [Sii]at 68.470 µm, [Nii] at 121.90 µm and [Oiii] at 88.36 µm. The [Oi]and [Cii] lines were observed in the raster-mapping mode, consist-ing of 5 raster lines and 5 points per line with a line step of 23.5′′,whereas the rest of the lines were observed in a single-pointingmode. The observational parameters are summarized in Table 1.The line observations were conducted in the line-spectroscopymode using the chopping and nodding technique (using a chopperthrow of 6′) to subtract the telescope background, the sky back-ground and the dark current.
The PACS photometric observations were made in large-scanmapping mode at a speed of 20′′s−1 at blue-short (BS) (70 µm),blue-long (BL) (100 µm) and red (R) (160 µm) wavelengths (PI:E. Sturm, ObsIDs: 1342204217, 1342204218, 1342216022 and1342216023). The scans consisted of 18 scan line legs of 4′ lengthand of a cross-scan step of 15′′. The “scan” and orthogonal “cross-scan” observations were individually calibrated before being com-bined into a single map of 9′ × 9′. The PACS photometer has aresolution of 5.2′′, 7.7′′ and 12′′ at 70 µm, 100 µm and 160 µm re-spectively. The PACS photometer performs observations at BS andBL simultaneously with the R band so we have two sets of scansin the R band. The SPIRE photometric observations was also madein the large-scan mapping mode and the data were recorded simul-taneously at 250 µm, 350 µm and 500 µm (PI: E. Sturm, ObsID:1342203614). The SPIRE photometer (Griffin et al. 2010) has aresolution of about 18′′, 25′′ and 36′′ at these wavelengths, respec-tively.
The basic calibration of the data (spectral and photomet-ric) was done using the Herschel Interactive Processing Environ-ment (HIPE) (Ott 2010) version 7.0 CIB 1931. For the PACS spec-tral data, the standard pipeline routines described in the PACS datareduction guideline (PDRG) were adopted to process the spectraldata from their raw to a fully-calibrated level. HIPE 7.0.1931 con-tains PACS calibration files that provide the response calibrationbased on in-orbit measurements. Hence, no ground-to-flight cor-rection factors had to be applied. The PACS cubes were rebinned inwavelength using the Nyquist-Shannon sampling, corresponding tooversample=2 and upsample=1. The spatial full-width at half max-imum (FWHM) varies from 8′′ for the [Sii] 68.47 µm line to 11′′
for the [Cii] 157.74 µm line. The line fluxes were determined us-ing the method described in Mittal et al. (2011). Briefly, the routinespecproject was used to obtain a final projection of the differentpointings and nods onto the sky plane. These maps can be read-ily used to conduct ‘aperture photometry’ and measure fluxes. ForPACS photometry, the data were reduced using the pipeline for the
ScanMap observing mode, particularly designed to detect extendedemission (> 100′′). The pipeline employs a second-level deglitch-ing algorithm, which uses the redundancy in a pixel to flag outliers,so that bright sources are not erroneously flagged as glitches. ForSPIRE photometry, the data were reduced using the pipeline for theLargeScanMap observing mode and the naıve map-maker.
2.2 Hα data
The Hα flux measurements were made using the continuum-subtracted data from Conselice et al. (2001). Based on comparisonwith our newer HST data (Fabian et al. 2008), the calibration of theWIYN data appears to over-estimate the flux by a factor of aboutthree. The source of this discrepancy is yet not clear and is underthorough investigation (Johnstone et al. 2012, in prep.). To verifythe calibration offset of the WIYN continuum-subtracted image, wecalculated the total flux in the WIYN Hα image in counts s−1 andconverted it into erg s−1 cm−2 using the conversion given in Con-selice et al. (2001). We were only able to derive the total luminosityquoted in Conselice et al. (2001), and which is in good agreementwith Heckman et al. (1989), after lowering the total flux by a fac-tor of three. Hence we have scaled down the measured WIYN Hαfluxes by a factor of three.
The HST broad band filter F625W admits light from the[Oi]λ6300, [Nii]λ6583 and [Sii]λ6731 doublets as well as Hα. Theratios of these lines to Hα are variable with position in the nebula.Such spectroscopic data are available for only a small fraction ofthe total area covered by the entire nebula. For the WIYN data thecontamination is only from the [Nii]λ6583 doublet. This is the mainreason why we prefer to use the WIYN data.
Hatch et al. (2006) found a radial gradient in the ratio[Nii]λ6583/Hα, which may be due to a spatially varying metallic-ity or excitation mechanism (see also Johnstone & Fabian 1988).They used the multi-object spectrograph instrument on Gemini andfound that the [Nii]λ6583/Hα ratio varies from 0.5 to 0.85 in theHorseshoe region. Assuming that the [Nii]λ6583/Hα ratio does notchange significantly with azimuthal angle, we subtracted the con-tribution of [Nii]λ6583 from the measured Hα flux in the Horse-shoe, southwest and Blue Loop knots, using an average ratio of[Nii]λ6583/Hα=0.65. The Gemini measurement close to the nu-cleus indicates a [Nii]λ6583/Hα ratio close to unity, therefore wehalved the measured Hα flux in the core region. Similarly, we alsocorrected for the [Nii]λ6548 line, usually a third in intensity of the[Nii]λ6583 line (Hatch et al. 2006).
Due to the uncertainties in the [Nii]λ6583/Hα ratio and thecalibration of the WIYN data, we caution the reader concerning theabsolute values of the Hα fluxes. However, the relative values of Hαflux between spatial positions should be accurate. The Hα ampli-tude plays a role in section 4, where the Herschel and Hα measure-ments are used as constraints to determine the heating mechanismsgiving rise to the various emissions. Fortunately, there are enoughFIR-derived constraints that the best-fit model parameters do notrely solely on the Hα flux measurement.
2.3 Dust Extinction
SCUBA observations of NGC 1275 have been used to infer thepresence of a large amount of dust (6×10⁷ M) present (Irwin et al.2001). The source of dust is not yet clear and understanding it is oneof the goals of this study. However, dust also presents a hindrancedue to the extinction it causes at optical and higher frequencies.
c© 0000 RAS, MNRAS 000, 000–000

4 Rupal Mittal et al.
Table 1. Herschel PACS spectroscopy observational log of NGC 1275 at a redshift of 0.01756. All the lines were observed in the line spectroscopy mode andon the same day: 30th Dec. 2009.
Line Peak Rest λ ObsID Duration Bandwidth Spectral FWHM Spatial FWHM Mode( µm) (s) ( µm) (km s−1) ( µm) (km s−1)
OI 63.184 1342189962 9600 0.266 1250 0.017 79 9.4′′ 5x5 raster, step size 23.5′′
CII 157.741 1342214362 8600 1.499 2820 0.126 237 11.1′′ 5x5 raster, step size 23.5′′
NII 121.90 1342214363 3440 1.717 4180 0.116 280 10.6′′ pointedOIb 145.525 1342202581 3440 1.576 3215 0.123 250 9.7′′ pointedOIII 88.356 1342214363 3680 0.495 1660 0.033 110 8.5′′ pointedSiI 68.473 1342202581 3840 0.218 945 0.014 62 8.3′′ pointed
Figure 1. The forbidden far-infrared line detections in the center of NGC 1275 made with the Herschel PACS instrument. The lines are spatially integrated.Top Row: [Cii] 157.74 µm (left), [Oi] 63.18 µm (middle) and [Oib] 145.52 µm (right). Bottom Row: [Nii] 121.90 µm (left) and [Oiii] 88.36 µm (right).
In this work, both the Galactic and internal extinction corrections,such as for Hα (section 2.2) and far-ultraviolet measurements (sec-tion 4.3), were calculated with the help of the mean extinction lawsgiven in Cardelli et al. (1989). We assumed the Galactic extinctionlaw, RV = 3.1, and an E(B−V) value of 0.163 from the NASA/IPACExtragalactic Database (NED1). Internal extinction was calculatedusing the observed Balmer decrements, which were compared tothe Case-B value of Hα/Hβ= 2.86. For the filaments located far outfrom the core, an internal extinction of E(B − V) = 0.38 was es-timated based on the Galactic-extinction corrected Balmer decre-ment, Hα/Hβ= 4.2, as measured in the Horseshoe knot (Ferlandet al. 2009). For the core, a similar internal extinction was esti-mated, E(B−V) = 0.37, based on the Galactic-extinction correctedBalmer decrement, Hα/Hβ=4.08, as measured 18′′ SW of the nu-cleus by Kent & Sargent (1979). Note that Kent & Sargent (1979)obtain an internal reddening of E(B−V) = 0.43 assuming a Galactic
1 http://nedwww.ipac.caltech.edu
extinction of E(B− V) = 0.1. We obtain a lower internal reddeningdue to the higher Galactic extinction adopted.
The correction factor for the internal reddening is model-dependent. If the Hα and Hβ emissions are produced by anothermechanism than case-B recombination, then the Balmer decrementwill be different from the expected value of 2.86. For example, ifparticle heating is responsible for the Hα and Hβ emissions, thenthe intrinsic Balmer decrement will be higher and consequently thededuced internal reddening lower.
3 RESULTS
Of the six lines observed, we detected all except [Sii] at 68.47 µm.Even though only [Cii] and [Oi] observations were designed to de-tect extended emission, all the detected lines except [Oiii] are spa-tially extended. The integrated line profiles are shown in Fig. 1 andtheir relative spatial extensions in Fig. 2, where the pixel thresh-old has been set to SNR>2. The SNR corresponds to the ratio of
c© 0000 RAS, MNRAS 000, 000–000

Herschel Observations of the Perseus Cluster 5
Table 2. Integrated line properties. Also given is the 3-σ upper-limit for the [Sii] line flux. The spatial extents are based on visual inspection.
Line λ (µm) Offset (km s−1) FWHM (km s−1) Line Flux Spatial Extent (Radius)zbcg zcl Obs. Intrinsic (10−18 W/m2) (′′) (kpc)
[Oi] 64.298±0.002 39±9 -61±9 383±20 375±20 2525.8±73.7 34′′ 12[Cii] 160.510±0.002 -0.6±4 -100±4 419±9 347±11 2205.3±26.5 71′′ 25[Nii] 124.031±0.004 -24±10 -124±10 558±22 482±25 125.0±2.8 28′′ 10[Oib] 148.091±0.003 32±7 -68±7 458±17 384±20 150.5±3.1 29′′ 10[Oiii] 89.900±0.005 -37±17 137±17 375±42 358±44 65.6±4.1 < 9.4′′ < 3.3[Sii] ... ... ... ... ... < 3.6 ... ...
Figure 2. A comparison of the Herschel emission lines. Overlaid on the [Cii] image (gray scale) are (starting from upper left corner and going clockwise) the[Oi] contours (green), [Nii] contours (magenta), [Oib] contours (red) and [Oiii] contours (blue). All emission lines have a pixel detection threshold of SNR> 2.
c© 0000 RAS, MNRAS 000, 000–000

6 Rupal Mittal et al.
the line peak to the standard deviation of the data about the fittedmodel. Listed in Table 2 are the integrated line properties.
The [Cii] line is detected over a spatial region of ex-tent 140′′ (50 kpc). Shown in the left panel of Fig. 3 is aHα+[Nii]λ6583, 6548 image displaying the ionized gas filamentstaken with the WIYN 3.5 m telescope (Conselice et al. 2001).Shown in the right panel of Fig. 3 is the FIR [Cii] emission with thepixel detection threshold set to SNR > 1. The middle panel displaysthe Hα emission smoothed to match the resolution of the [Cii] lineusing the ciao tool ‘aconvolve’ and the pyraf tool ‘blkavg’, with the[Cii] line contours overlaid (in red). The [Cii] emission traces theHα emission very well despite a much lower resolution. Both [Cii]and Hα reveal a central elongation, about 20 kpc in total extent,with an east-west alignment. This elongation is clearly visible alsoin the recent narrow-band imaging of a ro-vibrational transitionline of molecular hydrogen (H2) (Lim et al. 2012), which showsvery good overall morphological resemblance with Hα emission.In Mittal et al. (2011), we showed a close spatial and kinematicalcorrespondence between different emissions, such as Hα and [Cii],in NGC 4696, the BCG of the Centaurus cluster. NGC 1275 showsa similarly tight correlation, both spatial and kinematical, between[Cii], Hα and CO (section 3.1), suggesting a common heating pro-cess of the gas.
There are three well-studied regions in the Hα filaments, seenalso in the [Cii] map, which we describe briefly below: (1) TheHorseshoe is a filament to the north-west of the center of BCG(Conselice et al. 2001). The filament of gas appears to originate inthe core of the galaxy, rising a projected distance of 26 kpc throughthe ICM before looping around towards the center again. (2) Thesouthwest knots, at a projected distance of ∼ 23 kpc from the cen-ter of the BCG, are a part of the southern filaments. 3) The knotsin the southeast filament, also known as the ‘Blue Loop’, are at aprojected distance of ∼ 16 kpc. The loop is so called due to theblue optical colour of the knots this region, indicating these are starforming sites. Canning et al. (2010) studied this region in detail andfound a star formation rate of ∼ 20 M yr−1. We refer to the knotsas the ‘Blue Loop’ knots from now on. All three regions have beenstudied in detail previously at several wavelengths (Conselice et al.2001; Salome et al. 2006, 2008; Canning et al. 2010; Salome et al.2011; Hatch et al. 2005, 2006; Fabian et al. 2003, 2008; Johnstoneet al. 2007; Ferland et al. 2009).
The three regions are marked in Fig. 3. We extracted the [Cii]line spectra from them and the core region (see below). The spec-tra are shown in Fig. 4. The Horseshoe region is weaker in [Cii]emission than the SW and Blue Loop knots. This is consistent withthe study of Salome et al. (2011), where they find this region hasweaker CO emission in comparison with other filaments. There isno detection of [Oi] in any of the three regions of the filaments.The line strengths and ratios in these regions and the core providestrong constraints for studying the excitation mechanism(s) in dif-ferent parts of the BCG. This is followed-up in detail in section 5.
Brauher et al. (2008) report a flux of (2.5±0.2)×10−15 W m−2
for [Oi] and (1.2 ± 0.1) × 10−15 W m−2 for [Cii], based on obser-vations with the Long Wavelength Spectrometer (LWS) on the In-frared Space Observatory (ISO). While the [Oi] flux measurementof (2.53 ± 0.07) × 10−15 W m−2 obtained in this study compareswell with the ISO measurement, our [Cii] flux of (2.21 ± 0.03) ×10−15 W m−2 is higher by a factor of two. The reason for this dis-crepancy is that Brauher et al. (2008) obtain the [Cii] flux based onthe assumption that NGC 1275 is a point source. The FWHM ofthe LWS is 75′′. However, [Cii] emission clearly extends beyondthe FWHM of the LWS (∼ 140′′ in diameter). For this reason, we
believe that Brauher et al. (2008) underestimate the line flux in [Cii]by about a factor of two. As a rough check of this hypothesis, weconvolved our [Cii] map with a gaussian with a FWHM of 75′′ andobtained a flux of 0.97×10⁻¹⁵ W m−2 within a 75′′ aperture diame-ter. Despite the fact that this test uses a simple gaussian rather thanthe true ISO LWS beam profile, the reduction of measured flux isconsistent with the result of Brauher et al. (2008).
3.1 Kinematics
Fig. 5, the [Cii] velocity distribution shows the full extent of thecomplex kinematical structure of the filaments in NGC 1275. Thecolour scheme is such that the red shaded regions represent red-shifted gas (with positive velocities with respect to the systemicvelocity of the BCG), whereas green and blue shaded regions rep-resent blueshifted gas (with negative velocities with respect to thesystemic velocity of the BCG). The velocity pattern is likely to bethe combination of inflowing and outflowing gas, along with pro-jection and small-scale rotation effects (see below).
The dashed circle at the center marks the ‘core’ region (seeTable 7), which shows a gradient in the [Cii] line velocity. Wilmanet al. (2005) conducted near-infrared spectroscopy of the cen-tral region in NGC 1275 with the UIST IFU instrument on theUnited Kingdom Infrared Telescope. They detected ro-vibrationalH2 emission originating from a region ∼ 50 pc from the nucleus,with the results indicating a strong velocity gradient in the peakposition of the H2 line. The measured rotation curve in the centralIFU slit placed east-west along the nucleus shows a velocity changefrom 150 km s−1 east of the nucleus to -100 km s−1 west of the nu-cleus. From the sharp decrease in the magnitude of the velocity oneither side of the nucleus, they concluded that the molecular gasis distributed in a disk-like structure with the rotation axis orientednorth-south. This is also consistent with the double-horn structureseen in the CO(2-1) spectrum extracted from the same core region(Salome et al. 2011), which may be interpreted as indirect evidencefor a central rotating disk. The resolution of the [Cii] data is notgood enough to resolve any rotational structure over the scales ob-served by Wilman et al. (2005). The smallest structure in [Cii] thatcan be resolved is about 4 kpc. Similarly, the spectral resolution ofthe [Cii] data (230 km s−1) is much poorer than that of the CO(2-1) line observed with the IRAM 30 m telescope on Pico Veleta(40 km s−1). From Fig. 5, the rotational pattern claimed by Wilmanet al. (2005) and Salome et al. (2011) is not surprising. However, itis difficult to say whether the double horn feature is due to small-scale disk-like rotation or large-scale flows. If there is a rotatingdisk present in the center, it involves a relatively small gas disk of∼ 5 kpc radius. The majority of the gas distribution sampled by[Cii] does not show any regular rotation.
Also interesting is the redshifted ridge of gas passing throughthe center of the BCG with a north-south extension. The CO veloc-ity measurements made by Salome et al. (2011) in regions 4 and21 marked in Fig. 1 of their paper provide a confirmation of thepresence of this redshifted gas (also see Lim et al. 2008). This widevertical distribution of gas has a cylindrical symmetry and is sug-gestive of material being dragged upward and downward.
The upper left panel of Fig. 5 shows that there is a negative ve-locity region on either side of the center along the east-west direc-tion. The east region extends all the way along to the south, whereit merges with the Blue Loop knots. The blueshifted componentson both sides of the major axis of the emission are also visible inthe kinematics inferred from the CO spectra (Salome et al. 2006).The CO flux and velocity distribution shows a close association
c© 0000 RAS, MNRAS 000, 000–000

Herschel Observations of the Perseus Cluster 7
Figure 3. : Left The continuum-subtracted WIYN Hα line emission with a spatial resolution of 0.6′′ to 0.8′′ (Conselice et al. 2001). Middle: The Hα imagesmoothed to the resolution of [Cii], with the [Cii] line contours overlaid in red. Right: The Herschel [Cii] line emission with a spatial resolution of 11′′ (thiswork). The optical Hα emission and infrared [Cii] emission show a remarkably similar distribution. Marked are the Horseshoe knot in the northwest 20 kpcfrom the BCG, the SW1/SW2 knots in the southwest 21 kpc from the BCG and the Blue Loop knots in the southeast 16 kpc from the BCG.
with the optical filaments seen in Hα (e.g. Salome et al. 2006). InFig. 6, we show the kinematics of the gas in the inner 90′′x90′′
in three phases – optical, FIR and millimeter – as represented byHα [taken from Conselice et al. (2001)], [Cii] and CO(2-1) [takenfrom Salome et al. (2006)] line emissions. This plot shows a clearoverlap in the redshifted gas, with absolute velocities greater than5264 km s−1 (red symbols), along the ridge associated with all threeline emissions. Similarly, there is an overlap in the blueshifted gas,with absolute velocities less than 5264 km s−1 (blue symbols), westof the ridge. Especially remarkable is the curvature in the ridgeseen in both Hα (red filled squares) and [Cii] (red crosses). Fromthis we conclude a kinematical correlation among [Cii], Hα and COemissions, which further reinforces the idea that different emissionshave the same origin.
Radio observations of central radio sources often provide use-ful insights in understanding the kinematics of cool-core BCGs.Overlaid on the bottom panels of Fig. 5 are contours of the ra-dio emission associated with 3C 84 at 1.4 GHz and 74 MHz. Thebottom left panel shows 1.4 GHz radio emission at two differentresolutions – 2′′ (white contours; courtesy of VLA/NRAO2) and5′′ (yellow; kindly provided by Greg Taylor). The higher resolu-tion contours reflect a north-south radio morphology, demonstrat-ing a good alignment with the redshifted [Cii] contours. The lowerresolution contours reflect an inverted-S shaped morphology, pre-viously noted in several studies (e.g. Pedlar et al. 1990; Bohringeret al. 1993; Fabian et al. 2000). Although the southern jet shows acorrelation with the [Cii] emission, the tip of the northern jet doesnot. The 74 MHz contours (also kindly provided by Greg Taylor),shown in yellow in the bottom right panel, indicate a reversal ofthe east-west component of the jet direction on both sides of thecore, wherein the northern jet once again overlaps with the [Cii]emission. Conselice et al. (2001) noted a similar alignment betweenthe linear extension of the Hα filaments to the north and the low-brightness radio emission seen at low frequencies.
Several studies have presented scenarios wherein radio out-bursts are responsible for the dredge-up of cold, metal-rich gas
2 The National Radio Astronomy Observatory is a facility of the NationalScience Foundation operated under cooperative agreement by AssociatedUniversities, Inc.
from the core in the direction of the buoyantly rising radio plasma(e.g. Simionescu et al. 2008, 2010; Gitti et al. 2011; Revaz et al.2008; Tremblay et al. 2012a,b). Evidence for these scenarios isbased on the X-ray-derived temperature and metallicity maps,which show a spatial correlation between radio emission and coolgas extending away from the core with a metal content higher thanthat of the ambient medium. The positive correlation between theradio emission and the redshifted ridge of [Cii] gas in NGC 1275 isreminiscent of cold gas being dredged up by the radio lobes. On theother hand, this interpretation implies that both the radio jets (jetand counter-jet) are pointed away from the line-of-sight. On mil-liarcsec scale, the radio morphology comprises a one-sided jet, suchthat the southern jet is deemed to be approaching, and the north-ern jet (counter-jet) receding (e.g. Pedlar et al. 1990; Vermeulenet al. 1994; Dhawan et al. 1998; Taylor et al. 2006). Both the radiojets reveal complex kinematics in the plane of the sky. The south-ern jet is initially elongated along position angle (PA) ∼ 235 (at∼ 10 mas) but suddenly bends toward PA∼ 160 (at ∼ 20 mas) andcontinues though a series of such bends, at approximately the sameangles, out to about an arcminute (Pedlar et al. 1990; Dhawan et al.1998). The northern jet exhibits a similar complex structure. On thekiloparsec scale, it is therefore possible that, similar to the kinksobserved in the plane of the sky, the jets undergo bends along theline-of-sight, such that both the jets are receding. There are dredge-up interpretations offered for NGC 1275, suggesting that Hα gasis being dredged up by the radio source. Fabian et al. (2003) rec-ognized two filaments in the north-west, including the Horseshoe,bent on either side of the north-west ghost bubble. They showedthat the Hα emission associated with the Horseshoe is just behindthe bubble and is likely dragged out by it. Similarly, Sanders et al.(2005) discovered a high-abundance ridge using Chandra observa-tions, which they hypothesized is formed by material entrained bya fossil radio bubble.
Lastly, the [Cii] velocity structure may be related to the dis-ordered motion of gas clouds at larger radii that is not affected bythe inner radio structure. Shown in Fig. 7 is the [Cii] linewidth inkm s−1. An interesting feature of this map is that one of the re-gions the linewidth peaks is adjacent to the redshifted ridge wherethe line velocity flips from positive to negative on the eastern sideof the galaxy. This is where the CO(3-2) HARP maps shows dou-
c© 0000 RAS, MNRAS 000, 000–000

8 Rupal Mittal et al.
Figure 4. The [Cii] emission from the Horseshoe knot in the northwest (upper left panel), the SW1/SW2 knots in the southwest (upper right panel) and theBlue Loop knots in the southeast (lower left panel). These apertures are marked in Fig. 3. We also show the [Cii] spectrum for the core region (lower rightpanel), marked in the upper left panel of Fig. 5.
ble lines implying that there are multiple gas components along theline of sight (Edge et al., in prep.). However, the linewidths in thisregion may also be high due to the superposition of rapidly varyingline-of-sight velocity elements.
3.2 Spatial variation of [Oi] to [Cii] ratio
Here we briefly discuss the spatial variation of [Oi] to [Cii] ratio andwhat may be inferred from it. The resolution of [Cii] line is slightlypoorer than the [Oi] line. For compatibility, we convolved the [Oi]line map with a gaussian such that the resulting FWHM is similarto that of the [Cii] line. Fig. 8 is obtained by dividing the resultingsmeared [Oi] map by the [Cii] map (the threshold for both [Cii]and [Oi] was set to SNR>2). This figure indicates that while [Oi]is stronger than [Cii] in the core, the opposite is true at larger radii,namely, the [Cii] line emission becomes stronger at radii larger than∼4 kpc, which corresponds to the spatial resolution of [Cii].
The relative strength of [Oi] to [Cii] is an indicator of gasdensity, such that a higher [Oi]/[Cii] ratio represents a higher den-sity gas for the reasons described in section 4.1. Hence a higher[Oi]/[Cii] ratio in the center implies a relatively denser gas in thecluster core, as expected.
3.3 Dust SED
We detected emission at all three PACS wavelengths and all threeSPIRE wavelengths. The PACS images are shown in Fig. 9. Dustemission can usually be modelled as a simple modified black bodyfunction; NGC 1275, though, poses a complication. This is becauseof the strong radio source at the center of NGC 1275, with a largecontribution in the sub-millimeter and FIR range (Irwin et al. 2001).The radio source, additionally, shows a large-amplitude variabil-ity on timescales of decades (see Nagai et al. 2012, and referencestherein). Detailed monitoring at 3 mm has shown an increase in fluxfrom 3.5 Jy in 2002 to 11 Jy in 2010 (Trippe et al. 2011).
In order to obtain accurate dust parameters, it is essential to es-timate the fraction of the FIR flux originating from the synchrotronemission from 3C 84. In the following, we attempt to simultane-ously fit the dust and AGN emissions. We list in Table 3 and showin Fig. 10 the various flux measurements (black filled diamonds)that were used to obtain an optimal model. While the dust contri-bution to the SED is constrained by the PACS (blue open diamond)and SPIRE (red filled triangles) data, the synchrotron contributionis constrained by radio and sub-mm data. The two sub-sets of sub-mm flux-densities clustered around 1 mm and 3 mm (yellow filledsquares) correspond to the IRAM Plateau de Bure Interferometer(Trippe et al. 2011) observations. These measurements are from amonitoring program and chosen so as to be closest in time (span-ning days between 2010-08-21 to 2010-08-29) to the SPIRE and
c© 0000 RAS, MNRAS 000, 000–000

Herschel Observations of the Perseus Cluster 9
Figure 5. Upper Left: The detailed velocity distribution of the [Cii] gas. The colour-bar represents the velocities in km s−1. The dashed circle represents gascompatible with rotation. Upper Right: The velocity contours superimposed on the Hα image. The dashed blue contours correspond to blueshifted (negative)velocities and the solid red contours correspond to the redshifted (positive) velocities. Bottom Left: 1.4 GHz radio contours at two different resolutions,2′′ (white) and 5′′ yellow, overlaid on the Hα image. Bottom Right: 74 MHz radio contours at 25′′ resolution (yellow) overlaid on the Hα image.
PACS observations. The 5 GHz, 8 GHz and 15 GHz radio mea-surements (purple diagonal-plus symbols) correspond to the obser-vations made in 2010 with the 26-m telescope at the Universityof Michigan Radio Astronomy Observatory (UMRAO, courtesy ofM. Aller and H. Aller). We used only the 15 GHz data point for thefitting since the spectrum turns over below this frequency, indica-tive of synchrotron self-absorption. The 50 µm and 25 µm measure-ments (green filled circles) correspond to the IRAS observations(Moshir et al. 1990). To obtain a robust estimate of the tempera-ture and mass of the plausible second (warm) dust component, wealso used the 20 µm and 30 µm continuum data (red open crossed-squares) determined from the Spitzer IRS observations (Weedmanet al. 2005). We did not fit 6 µm, 10 µm and 15 µm data due toa possibly increasing contribution from a passively evolving pop-
ulation of stars at wavelengths . 15 µm. The AGN synchrotroncontribution to the total emission is expected to be small at wave-lengths shorter than 70 µm and so the variation in the flux densitydue to the different times of the IRAS/Spitzer observations fromthe rest of the fitted data can be neglected.
To model both the components - the dust emission and AGNsynchrotron emission - we used the following fitting function:
S ν = S syn,ν + S dust,ν , where (1)
S syn,ν =
S 0
(νν0
)α1 if ν < νbreak
S 0
(νbreakν0
)α1−α2(νν0
)α2 if ν ≥ νbreak(2)
S dust,ν =Ω
(1 + z)3 [Bν(Td) − Bν(Tcmb)] (1 − e−τν(Md)), (3)
c© 0000 RAS, MNRAS 000, 000–000

10 Rupal Mittal et al.
41.5
41.505
41.51
41.515
41.52
41.525
49.94 49.945 49.95 49.955 49.96 49.965
Dec
linat
ion
Right ascension
Figure 6. The kinematics of the three phases, optical, far-infrared and mil-limeter, represented by Hα, [Cii] and CO(2-1) line emissions. Show arethe redshifted (red symbols) and blueshifted (blue symbols) velocities forthe three phases. The [Cii] velocities are shown as plus (blueshifted) andcross (redshifted) symbols, the Hα velocities are shown as filled circles(blueshifted) and squares (redshifted) and CO(2-1) velocities are shown asopen down-triangles (blueshifted) and up-triangles (redshifted).
Figure 7. The [Cii] linewidth in km s−1. The dashed blue contours corre-spond to blueshifted (negative) [Cii] velocities and the solid red contourscorrespond to the redshifted (positive) [Cii] velocities (same as the upperright panel of Fig. 5).
Eqn. 2 quantifies the synchrotron emission assumed to have a bro-ken powerlaw form. S 0 denotes the normalization at ν0 =100 GHz(3 mm), α1 and α2 and the (negative) powerlaw indices on eitherside of the powerlaw break frequency, νbreak, respectively (α1 rep-resenting the powerlaw at radio frequencies and α2 representing thepowerlaw at submm/FIR frequencies). We find that for NGC 1275it is not necessary to modify the synchrotron emission with an ex-ponential term like Privon et al. (2012) did to model the spectrum ofCygnus A. The need for including an exponential term in the case
Table 3. A compilation of the fitted radio, sub-mm and IR flux-densitiesfor NGC 1275. The columns are (1) wavelength (2) instrument (3) yearof the observation (4) aperture (available only for this work) and (5) themeasured flux-density. Note that the measurements correspond to the totalflux-densities for the given instrument.
λ (µm) Instrument Year Aperture Flux (mJy)
20 SPITZER IRSd 2004 – 2410±24125 IRASc 1983 – 3539±17630 SPITZER IRSd 2004 – 3820±38260 IRASc 1983 – 7146±28670 PACS Herschela 2011 55′′ 7405±741
100 PACS Herschela 2010 55′′ 8541±854160 PACS Herschela 2010 55′′ 6979±1396250 SPIRE Herschela 2010 60′′ 3805±571350 SPIRE Herschela 2010 70′′ 3095±464500 SPIRE Herschela 2010 112′′ 2992±4491153 IRAM PdBb 2010 – 7220±10831303 IRAM PdBb 2010 – 7741±11611428 IRAM PdBb 2010 – 7299±10952710 IRAM PdBb 2010 – 10000±15002913 IRAM PdBb 2010 – 10713±16073019 IRAM PdBb 2010 – 10330±1550
20675 UMRAOe 2010 – 23230±130
a This work. The errorbars correspond to the absolute flux uncertain-ties: 10% at PACS BS and BL and 20% at R, and 15% at all SPIREwavelengths; b Trippe et al. (2011); c Moshir et al. (1990); d Weedmanet al. (2005); e University of Michigan Radio Astronomy Observatorydata for year 2010 (courtesy of M. Aller and H. Aller).
of Cygnus-A arises from the lack of synchrotron emission beyondthe submm regime. NGC 1275, on the other hand, shows evidenceof an AGN contribution all the way out to submm and, possibly,IR wavelengths (Krabbe et al. 2000). Hence, we preferred a brokenpowerlaw, such that |α2| > |α1|, to an exponential term to representthe slowly decaying synchrotron emission.
Assuming the dust to be in thermal equilibrium, Eqn. 3 quan-tifies the dust emission, which is a blackbody function modified bya term that depends on the dust optical depth, τν, defined as
τν = κνMd
D2AΩ
. (4)
The modification from a standard blackbody function is due to thefact that for typical dust temperatures, the dust grains are smallerthan the peak wavelength of the Planck function and hence do notradiate as perfectly as a blackbody. Here, Md is the dust mass, Td
is the dust temperature, κν = κν0 (ν/ν0)β is the dust absorption coef-ficient and we adopted κν0 = 1 m2 kg−1 at 1200 GHz (250 µm)(Hildebrand 1983). β is the dust emissivity index, which basedon empirical results likely lies in the range 1 to 2. Bν(T ) is thePlanck function at frequency ν, and temperature T . Bν(Tcmb) is thecontribution from the cosmic microwave background at Tcmb =
2.73(1 + z) K. Ω is the solid angle subtended by the source, hereassumed to be the total extent of the FIR emission at 70 µm.
The powerlaw indices for the AGN emission, α1 and α2, wereconstrained to have negative values, so that the synchrotron emis-sion decreases with increasing frequency. Dunne & Eales (2001)showed that a two-component dust model with β close to 2 betterfits the observed SEDs than a single-dust component. This is alsoconsistent with our findings based on the SEDs of cool-core BCGsinvestigated so far (Edge et al. 2010a,b; Mittal et al. 2011). Wetherefore fitted the data with a model comprising a cold and warm
c© 0000 RAS, MNRAS 000, 000–000

Herschel Observations of the Perseus Cluster 11
Table 4. The best-fitting model parameters of the function describing the FIR emission (Eqn 1) for the dust emissivity index, β = 1. For comparison, we alsogive the parameters for β = 1.5 and β = 2. The uncertainties correspond to the 1-σ errorbars.
Parameter β = 1.0 β = 1.5 β = 2.0
Cold dust temperature, Td,c (38.0±2.0) K (35.0±1.6) K (31.8±1.3) KCold dust mass, Md,c 106.96±0.12 M 106.91±0.12 M 106.89±0.12 M
Warm dust temperature, Td,w (115.5±8.5) K (107.0±7.4) K (95.7±6.0) KWarm dust mass, Md,w 104.71±0.17 M 104.37±0.17 M 104.60±0.18 M
Synch. powerlaw norm., S0 (10434±393) mJy (10364±393) mJy (10448±393) mJySynch. powerlaw index 1, α1 -0.41±0.02 -0.42±0.02 -0.41±0.02Synch. powerlaw index 2, α2 -1.08±0.28 -0.92±0.24 -0.83±0.21
Synch. powerlaw break frequency, νbreak (2.6±0.5)×1011 Hz ( 2.6±0.6)×1011 Hz (2.5±0.7)×1011 Hz
Derived Quantities
Dust luminosity (8 µm-1000 µm), LFIR (1.4±0.05)×1011 L (1.3±0.05)×1011 L (1.3±0.05)×1011 LStar formation rate, SFR 24±1 M yr−1 23±1 M yr−1 22±1 M yr−1
Total gas-to-dust mass ratio 4500 to 7800 5000 to 8000 5300 to 9200
Figure 8. [Oi] to [Cii] ratio. [Oi] has been convolved with a gaussian suchthat the resulting full-width at half maximum (FWHM) equals that of thePSF of the PACS spectrometer at the wavelength of [Cii]. The circle shownin the bottom left corner represents the size of the FWHM. The ratio mapshows that [Oi] is stronger than [Cii] in the core. The trend reverses at ∼4 kpc from the center.
dust component parametrized by temperature and mass (Td,c, Md,c)and (Td,w, Md,w), respectively. We used the Levenberg-Marquardtnon-linear least square fitting algorithm from Numerical Recipesto obtain the best-fit model parameters appearing in Eqn. 1: Md,c,Td,c, Md,w, Td,w, β, S 0, α1, α2 and νbreak. We explored a range ofvalues between 0.5 and 2.5 for the dust emissivity index, β. The χ2-minimization gave a best-fit value β which was < 1. Note that thereis a strong degeneracy between β and the dust temperature suchthat all values of β explored yield models, with varying tempera-tures, that are compatible with the observed SED. I.e., for any ofthe explored values of β between 0.5 and 2.5, the best-fit χ2 valuewas less than 11; for a chi-squared distribution with 17 − 8 = 9degrees of freedom (because we are not optimizing over β), thiscorresponds to a p-value (Gregory 2005) greater than 0.10, i.e., amodel consistent with the data. Based on the work of Dunne &Eales (2001), however, β is expected to lie between 1 and 2, and
so we fixed β to unity and found the best-fit values for the otherparameters subject to that choice.
The best-fit model is shown in Fig. 10 (black solid line), asare the AGN (thin-dashed line) and the dust contributions (thick-dashed lines; red representing the cold dust component and bluerepresenting the warm dust component). In addition to the fittedflux-densities, we show the supplementary Spitzer/IRAS and UM-RAO data, along with SCUBA (Irwin et al. 2001) and WMAP(Wright et al. 2009) data from around year 2000. The SCUBA (bigmagenta crosses) and WMAP data (small indigo crosses) clearlydemonstrate the strong variability in the radio source and, hence,the need for coeval flux-densities for SED fitting. Similarly, thePlanck (gray plus symbols Planck Collaboration et al. 2011) andUMRAO data (open green squares) from the year 2009 fall slightlybelow the IRAM and UMRAO data, both from the year 2010, re-spectively.
The best-fit parameter values were used to calculate the to-tal dust emissivity by integrating the emission between 8 µm and1000 µm. Assuming that young (≤ 108 yrs), hot stars dominatethe interstellar radiation field across the UV-optical band, the starformation rate can be estimated using the Kennicutt relation (Ken-nicutt 1998). In early-type galaxies, including BCGs, the cooleremissions (> 100 µm) may arise from dust heated by a passivelyevolving old stellar population, which warrants caution in the Ken-nicutt calibration. The best-fit parameters for β = 1 and the derivedquantities are given in Table 4 (we also give the best-fit parametersfor β = 1.5 and β = 2.0 for comparison) and the predicted dust andAGN flux contributions are given in Table 5. A total gas-to-dustmass ratio between 4500 and 7800 was estimated using the molec-ular gas mass ∼ 4 × 10¹⁰ M derived in Salome et al. (2006). Thetotal gas mass depends upon the conversion factor used to calculatethe atomic plus molecular mass. We used a factor of 1.36 as givenin Edge (2001). The total gas-to-duss mass ratio, although high, iswithin the range of the derived mass ratios in other cool-core BCGs(Edge 2001). At the other extreme is NGC 4696, for which a 3-σupper-limit of ∼ 450 was obtained on the total gas-to-dust massratio (Mittal et al. 2011).
While the SPIRE and PACS 100 µm observations were madeclose in time to the IRAM sub-mm observations (2010-08-24 and2010-09-09), the PACS 70 µm observations were made half a yearlater (2010-03-14), and so the underlying contribution from theAGN may have varied because of the variability in the AGN out-
c© 0000 RAS, MNRAS 000, 000–000

12 Rupal Mittal et al.
Figure 9. Dust emission. Left: PACS 100 µm image at a resolution of 7′′ showing the extended dust features. Right: PACS images convolved with a gaussianto yield a FWHM of 12′′. The 70 µm image is shown in blue, the 100 µm image in green and the 160 µm image in red.
Table 5. Dust and AGN contributions based on the best-fitting model givenin Table 4.
Wavelength µm Dust (mJy) AGN (mJy)
20 2349 ± 221 88 ± 6225 3384 ± 163 112 ± 7430 3890 ± 282 137 ± 8560 6772 ± 295 289 ± 14370 7840 ± 389 341 ± 160
100 8513 ± 775 502 ± 202160 5532 ± 746 833 ± 265250 2493 ± 369 1349 ± 323350 1175 ± 171 1939 ± 354500 485 ± 67 2850 ± 3631153 50 ± 6 7023 ± 7141303 35 ± 4 7389 ± 3981428 27 ± 3 7673 ± 4002710 4.2 ± 0.5 10008 ± 3962914 3.4 ± 0.4 10313 ± 3943019 3.1 ± 0.3 10466 ± 392
20675 0.0 ± 0.0 23231 ± 130
put. According to the best-fit model, this is not an issue of concernsince the AGN contribution to the total flux at 70 µm is small. Thiswas also verified by discarding the 70 µm data point and refittingthe data.
4 WHAT ARE THE PREVAILING HEATINGMECHANISMS IN THE INNER 4 KPC OF NGC 1275
The filamentary nebula extends out to ∼ 50 kpc from the core. Theexcitation mechanisms in the outskirts of the galaxy are very likelydifferent from those prevailing in the core. This is evident also fromthe reversal of the relative strengths of [Cii] and [Oi] line emission(section 3.2) with cluster-centric distance. The core of NGC 1275,where we expect photoionization from stars and AGN to play animportant role, needs to be modelled separately from the filaments.To this end, we conducted simulations using the radiative transfercode cloudy (Ferland et al. 1998), the main goal of which was to
Figure 10. The spectral energy distribution for NGC 1275. The dust emis-sion dominates at FIR wavelengths, whereas the AGN synchrotron emis-sion dominates at sub-mm wavelengths. The points overlaid with black di-amonds were used to find the best-fit parameters of the model.
determine whether or not an additional form of heating is requiredto reproduce some of the observed emission lines emerging fromthe core. For example, in the case of NGC 4696, the BCG of theCentaurus cluster, the [Cii]/LFIR and Hα/[Cii] ratios clearly call foranother heating component, in addition to photoionization (Mittalet al. 2011).
From the point of view of energetics of a cooling plasma, ear-lier works, such as Johnstone et al. (1987); Heckman et al. (1989);Voit et al. (1994); Jaffe & Bremer (1997); Donahue et al. (2000),have shown that the observed filamentary emissions are far too lu-minous to be just due to the recombination phase of gas coolingfrom the ICM. The observed luminosities imply far too much cool-ing, with mass deposition rates inconsistent by orders of magnitudewith the star formation rates. While such calculations have beenperformed for emissions such as Hα and molecular hydrogen lines,
c© 0000 RAS, MNRAS 000, 000–000

Herschel Observations of the Perseus Cluster 13
102
103
104
105
106
103 104 105 106 107
L FIR
(1040
erg
/s)
L100µm (1026 erg/s/Hz)
LFIR = 0.033 * L100µm1.08
Figure 11. The total far-infrared luminosity (8 µm to 1000 µm) vs. the100 µm luminosity for seven of the 11 BCGs in the Herschel cool-coreBCG sample. NGC 1275 is denoted as a black cross.
none of the current cooling calculations simulate the FIR emis-sion lines. This is because the existing cooling calculations (thatuse codes like cloudy, apec, mkcflow) usually stop when the gasreaches a temperature of ∼ 104 K, not low enough to produce theFIR lines under consideration. Hence it is presently not possible toestimate the luminosity of the FIR lines from a simple cooling-flowplasma.
We modelled a composite cloud comprising a photo-dissociation region (PDR) adjacent to an ionized (Hii) region. Forthe equation of state we assumed a constant gas pressure through-out the cloud. As input, we provided the normalization for an oldstellar population (OSP), ηOSP, the normalization for a young stellarpopulation (YSP), G0 (in Habing units), the starting hydrogen den-sity, n (in cm−3), and the hydrogen column density, NH (in cm−2).For further details on the role played by these input parameters, werefer the reader to Mittal et al. (2011). The parameters, along withthe range explored, are given in Table 8. Based on some initial in-vestigations carried out to assess the effect of an OSP componenton the output emissions, we concluded that the [Cii]/LFIR ratio canbe better reconciled if an OSP component is included. An old gen-eration of stars produces optical and UV photons that contribute tothe heating of dust but not so much to the photoelectric heating ofthe gas. In the absence of an OSP component, the [Cii]/LFIR for agiven G0 is higher. The results, however, are not very sensitive tothe presence of an OSP, except for low G0 (≤ 100 Habing) but alow G0 is not consistent with other observed ratios, as we will showbelow.
We used the starburst99 stellar synthesis library (Leithereret al. 1999) to model both the OSP and YSP. The main input pa-rameters to the starburst99 simulations are the stellar mass and age(continuous or starburst), and the initial stellar mass function. Wedid not explore the range of possible values these input parameterscan take – that is a subject of another detailed ongoing study (Mit-tal et al. 2012, in prep.). For the purpose of conducting the cloudysimulations described here, we fixed the age and mass of the OSPto ∼ 10 Gyr and 5 × 10¹¹ M, and the age and the mass of the YSPto ∼ 2 Myr and 5 × 10⁹ M. The SED corresponding to a starburst2 Myr old is indistinguishable from the one corresponding to a con-
Table 6. The default ISM gas phase chemical composition used in cloudysimulations. The abundances are given relative to H.
Element log10 abundances (ISM)
He -1.0088C -3.8222N -4.2010O -3.7171Ne -4.1319Mg -5.1215Si -5.7222S -4.7113Cl -7.2218Ar -5.7716Fe -6.4218
tinuous star formation scenario, where the oldest stars are assumedto be 2 Myr. This is because the emission in both the cases is dom-inated by young stars that are about 2 Myr old. Hence the youngpopulation of stars need not have formed at the same time.
The elemental abundances were initially set to their defaultISM values given in Table 6. However, X-ray observations madewith Chandra indicate a slight drop in the central metallicity withthe average value around 0.6 Z (Sanders & Fabian 2007). Withthis in mind, we also conducted simulations with a lower metal-licity, which, as shown below, indeed fit the observed ratios better.We did not include any polycyclic aromatic hydrocarbon (PAH)grains since the mid-infrared spectra do not contain any PAH fea-tures (Weedman et al. 2005). Although several BCGs show strongPAH features in their IR spectra indicative of star formation (Don-ahue et al. 2011), there are a few such as NGC 1275 and NGC 4696(Kaneda et al. 2005) that do not. PAH molecules are small in sizeand can easily be destroyed through physical sputtering or thermalevaporation (Dwek & Arendt 1992; Micelotta et al. 2011).
The absolute and relative strengths of the FIR and Hα linesare very important diagnostics of the various heating contributorsin cool-core BCGs. These emission lines and their ratios relativeto [Cii] are listed in Table 7. We note that there is a slight off-set of ∼ 3′′ between the peak of the [Cii] emission and the radiocore emission (the latter coincides with the peak of Hα emissionto within ∼ 0.5′′). This offset is on the order of the 1σ pointinginaccuracy of the PACS spectrometer and unlikely real. However,we estimated the FIR line fluxes for both the cases - (a) assumingthe offset is not real and (b) assuming the offset is real. These casesare referred to as “[Cii] core” and “radio core”, respectively. Thetwo cases have only marginal differences in their FIR line fluxesand are compared only for the purpose of illustrating the level ofuncertainty in the estimated line parameters. In the following, weused the “[Cii] core” as the nominal case and used the other set ofline fluxes to derive uncertainties on the line ratios.
The total FIR flux associated with the core can not be directlyestimated from fitting the SED due to insufficient resolution avail-able beyond ∼ 160 µm. We instead used the 100 µm flux as a proxyfor the total luminosity. Shown in Fig. 11 is the total FIR luminosityin the range 8 µm to 1000 µm vs the 100 µm luminosity for sevenof the 11 BCGs in the Herschel cool-core BCG sample, includingNGC 1275. We considered only those here because their FIR lu-minosity can be determined with least uncertainty. For NGC 1275we set LFIR equal to the total dust luminosity. This relation is be-ing investigated for the whole sample separately (Oonk et al. 2012,in prep.). There is a clear correlation between the total FIR lumi-
c© 0000 RAS, MNRAS 000, 000–000

14 Rupal Mittal et al.
Table 7. A comparison of FIR and optical emission lines in the core region. Given in the last column are the ratios with respect to [Cii]. The Hα flux has beencorrected for the Galactic extinction. We also give the Hα flux after correcting for the internal extinction assuming E(B-V)=0.37 in brackets.
Region RA Dec Aperture Radius Line Velocity Flux Ratio(arcsec) km s−1 (10−15 erg s−1 cm−2)
Radio Core 03h19m48.16s +41d30m42.1s 11 [Cii] 11 ± 3 665.1 ± 6.3 1.00[Oi] 27 ± 4 1310.5 ± 18.4 1.97[Oib] 50 ± 9 81.2 ± 2.1 0.12[Nii] −2 ± 7 53.7 ± 1.1 0.08[Oiii] −26 ± 15 59.0 ± 3.1 0.09Hα 1810 (4185) 2.7 (6.3)LFIR ∼ 5.9 × 10⁵ ∼ 800
CII Core 03h19m48.01s +41d30m44.9s 11 [Cii] 8 ± 3 724.8 ± 7.3 1.00[Oi] 23 ± 4 1320.2 ± 17.3 1.82[Oib] 47 ± 8 84.3 ± 2.0 0.12[Nii] −4 ± 8 58.1 ± 1.2 0.08[Oiii] −30 ± 14 66.1 ± 3.0 0.09Hα 1810 (4185) 2.5 (5.8)LFIR ∼ 5.9 × 10⁵ ∼ 700
nosity and the 100 µm luminosity, such that LFIR ∝ L1.09100µm. The
trend is also observed in the flux-flux plane (not shown) and so thecorrelation is not spuriously induced due to the common depen-dence of the two quantities on redshift. Using this correlation andthe 100 µm core flux, the total FIR flux for the core may be es-timated. The contribution from the AGN synchrotron emission at100 µm is negligible (< 6%, see Table 5) and may be ignored.
The measured 100 µm flux within the core aperture of 11′′
radius is (5608±7) mJy. Even though some of the flux may fallbeyond the chosen aperture, necessitating an aperture correction,the factor is very small for the given radius. We determined the re-quired aperture correction factor by assuming that the FIR emissioncorrelates with the Hα emission. Assuming the WIYN Hα imageto represent the true model for the FIR surface-brightness distribu-tion, we convolved the Hα image with the PACS 100 µm PSF andestimated the aperture correction from the ratio of the flux from thesmoothed to the unsmoothed image. The ratio is close to unity andtherefore we did not apply any aperture correction. The measured100 µm flux yields a FIR (8 µm to 1000 µm) flux that implies aLFIR/[Cii] ratio ∼ 700 to 800.
4.1 Best-fit energy model for the core
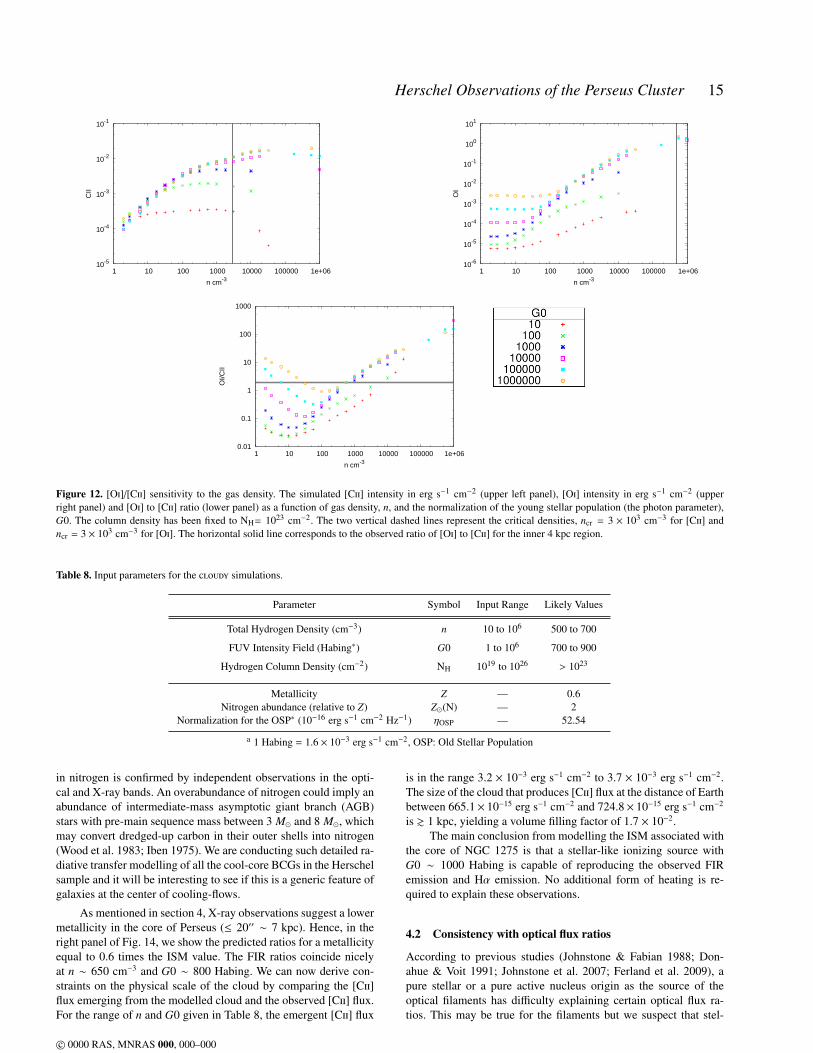
The Herschel FIR coolants serve as strong constraints for evaluat-ing the physical parameters of the ISM in the BCG. Fig. 12 shows[Oi]/[Cii] versus n for different values of the photon parameter, G0.This plot can be understood in terms of the critical densities for[Cii] and [Oi]. This is the density at which the probabilities of col-lisional de-excitation and radiative de-excitation are equal (Oster-brock & Ferland 2006). Above the critical density the level pop-ulations may be considered to be in local thermal equilibrium asthe level populations become dominated by collisions. The criti-cal density is lowered by a factor that is roughly the optical depthof the line due to photon trapping when the line is optically thick.Fig. 12 shows that, for n < ncr, the intensity of an optically thinline increases linearly with n and for n > ncr the intensity becomesindependent on n. This result is fairly insensitive to details such asthe cloud energy source, as Fig. 12 shows. While ncr for [Cii] is∼ 3 × 103 cm−3, it is substantially higher for [Oi] ∼ 5 × 105 cm−3.Therefore, at a fixed column density and photon parameter, G0, forhigh densities 3×103 cm−3 < n < 5×105 cm−3 the ratio, [Oi]/[Cii],
continues to increase with density. This makes [Oi]/[Cii] a sensitiveprobe of density if the lines are optically thin. The individual trendsdisplayed by the [Oi] and [Cii] lines in Fig. 12 are complicated bythe fact that for a given column density these lines become opticallythick for certain combinations of n and G0.
Similarly, Fig. 13 shows [Nii] and [Oiii] versus n for differentG0 and for two different column densities. [Cii] is produced in bothionized (for e.g. Hii regions) and neutral media (for e.g. PDRs),however, [Nii] and [Oiii] are produced only in ionized region dueto their higher ionization potentials. This has the effect that [Nii]and [Oiii] are produced profusely at the surface of the cloud facingthe ionization source and reduce with the depth into the cloud. Thisexplains the drop in both [Nii] and [Oiii] intensities relative to [Cii]with NH. This makes [Nii]/[Cii] and [Oiii]/[Cii] a sensitive probe ofthe cloud depth or hydrogen column density, NH.
Of the NH range investigated, the optimal cloud depth re-quired to reproduce the observed ratios is 1023 cm−2. Unless G0is high (> 10000 Habing), a higher NH does not affect the pre-dicted ratios, implying that the cloud becomes radiation bounded.In Fig. 14, we present the modelled ratios as function of n and G0for NH= 1023 cm−2, assuming stellar photoionization only. The dif-ferent sets of curves correspond to the observed lower- and upper-limits of [Cii]/LFIR (solid red), [Oi]/[Cii] (dotted blue), Hα/[Cii](dashed green), [Nii]/[Cii] (dash-dotted orange), [Oib]/[Cii] (dash-dot-dotted pink) and [Oiii]/[Cii] (long-dashed gray). Note that theobserved Hα/[Cii] ratio has a wide range due to the uncertaintiesmentioned in section 2.2. The FIR ratios, in contrast, are much bet-ter constrained. Consequently, our strategy was to first try and re-produce the FIR line and continuum ratios and then use Hα/[Cii] tocheck for consistency against the best-fit model.
The left panel of Fig. 14 assumes ISM abundances, as adoptedin Ferland et al. (2008). While [Oi]/[Cii], [Oib]/[Cii] and [Oiii]/[Cii]converge at n ∼ 1000 cm−3 and G0 ∼ 1000 Habing, the predicted[Nii]/[Cii] for this combination of n and G0 is less than the observedratio. The middle panel of Fig. 14 assumes the nitrogen abundanceis twice the ISM value, yielding a much better convergence betweenthe FIR ratios. Curiously, the best-fitting (n,G0) for NGC 4696 inthe Centaurus galaxy cluster can also be reconciled with the ob-served [Nii]/[Cii] only if the nitrogen abundance is increased bya factor of two over the assumed overall metallicity (Mittal et al.2011). In the case of NGC 4696, the need for an overabundance
c© 0000 RAS, MNRAS 000, 000–000
Herschel Observations of the Perseus Cluster 15
10-5
10-4
10-3
10-2
10-1
1 10 100 1000 10000 100000 1e+06
CII
n cm-3
10-6
10-5
10-4
10-3
10-2
10-1
100
101
1 10 100 1000 10000 100000 1e+06
OI
n cm-3
0.01
0.1
1
10
100
1000
1 10 100 1000 10000 100000 1e+06
OI/C
II
n cm-3
Figure 12. [Oi]/[Cii] sensitivity to the gas density. The simulated [Cii] intensity in erg s−1 cm−2 (upper left panel), [Oi] intensity in erg s−1 cm−2 (upperright panel) and [Oi] to [Cii] ratio (lower panel) as a function of gas density, n, and the normalization of the young stellar population (the photon parameter),G0. The column density has been fixed to NH= 1023 cm−2. The two vertical dashed lines represent the critical densities, ncr = 3 × 103 cm−3 for [Cii] andncr = 3 × 103 cm−3 for [Oi]. The horizontal solid line corresponds to the observed ratio of [Oi] to [Cii] for the inner 4 kpc region.
Table 8. Input parameters for the cloudy simulations.
Parameter Symbol Input Range Likely Values
Total Hydrogen Density (cm−3) n 10 to 106 500 to 700
FUV Intensity Field (Habing∗) G0 1 to 106 700 to 900
Hydrogen Column Density (cm−2) NH 1019 to 1026 > 1023
Metallicity Z — 0.6Nitrogen abundance (relative to Z) Z(N) — 2
Normalization for the OSP∗ (10−16 erg s−1 cm−2 Hz−1) ηOSP — 52.54
a 1 Habing = 1.6 × 10⁻³ erg s−1 cm−2, OSP: Old Stellar Population
in nitrogen is confirmed by independent observations in the opti-cal and X-ray bands. An overabundance of nitrogen could imply anabundance of intermediate-mass asymptotic giant branch (AGB)stars with pre-main sequence mass between 3 M and 8 M, whichmay convert dredged-up carbon in their outer shells into nitrogen(Wood et al. 1983; Iben 1975). We are conducting such detailed ra-diative transfer modelling of all the cool-core BCGs in the Herschelsample and it will be interesting to see if this is a generic feature ofgalaxies at the center of cooling-flows.
As mentioned in section 4, X-ray observations suggest a lowermetallicity in the core of Perseus (≤ 20′′ ∼ 7 kpc). Hence, in theright panel of Fig. 14, we show the predicted ratios for a metallicityequal to 0.6 times the ISM value. The FIR ratios coincide nicelyat n ∼ 650 cm−3 and G0 ∼ 800 Habing. We can now derive con-straints on the physical scale of the cloud by comparing the [Cii]flux emerging from the modelled cloud and the observed [Cii] flux.For the range of n and G0 given in Table 8, the emergent [Cii] flux
is in the range 3.2 × 10⁻³ erg s−1 cm−2 to 3.7 × 10⁻³ erg s−1 cm−2.The size of the cloud that produces [Cii] flux at the distance of Earthbetween 665.1× 10⁻¹⁵ erg s−1 cm−2 and 724.8× 10⁻¹⁵ erg s−1 cm−2
is & 1 kpc, yielding a volume filling factor of 1.7 × 10⁻².The main conclusion from modelling the ISM associated with
the core of NGC 1275 is that a stellar-like ionizing source withG0 ∼ 1000 Habing is capable of reproducing the observed FIRemission and Hα emission. No additional form of heating is re-quired to explain these observations.
4.2 Consistency with optical flux ratios
According to previous studies (Johnstone & Fabian 1988; Don-ahue & Voit 1991; Johnstone et al. 2007; Ferland et al. 2009), apure stellar or a pure active nucleus origin as the source of theoptical filaments has difficulty explaining certain optical flux ra-tios. This may be true for the filaments but we suspect that stel-
c© 0000 RAS, MNRAS 000, 000–000

16 Rupal Mittal et al.
0.00
0.01
0.10
1.00
10.00
1 10 100 1000 10000 100000 1e+06
NII/
CII
n cm-3
NH = 1019 cm-2
0.00
0.01
0.10
1.00
10.00
1 10 100 1000 10000 100000 1e+06
NII/
CII
n cm-3
NH = 1023 cm-2
10-8
10-6
10-4
10-2
100
102
104
106
108
1 10 100 1000 10000 100000 1e+06
OIII
/CII
n cm-3
NH = 1019 cm-2
10-8
10-6
10-4
10-2
100
102
104
106
108
1 10 100 1000 10000 100000 1e+06
OIII
/CII
n cm-3
NH = 1023 cm-2
Figure 13. [Nii]/[Cii] (upper row) and [Oiii]/[Cii] (lower row) versus density, n. Shown are the ratios for two different column densities, NH= 1019 cm−2 (left)and NH= 1023 cm−2 (right). [Nii] and [Oiii] are produced in abundance at the surface of the cloud facing the ionization source and deplete with the depth ofthe cloud and, hence, sensitive probes of NH. The different points have the same meaning as in Fig. 12. The horizontal lines represent the observed ratios inthe inner 4 kpc region.
Figure 14. Simulations based on a photoionization model containing only stars. Shown are contours corresponding to the lower and upper observed limits(given in square brackets below) for LFIR/[Cii] (solid red)→ [700:800]; [Oi]/[Cii] (dotted blue)→ [1.79:2.00]; Hα/[Cii] (dashed green)→ [2.5:6.3]; [Nii]/[Cii](dashed-dotted orange) → [0.078:0.082]; [Oib]/[Cii] (dash-dot-dotted pink) → [0.113:0.125] and [Oiii]/[Cii] (long-dashed gray) → [0.083:0.095]. For thissimple model, the regions allowed by the data, between the paired lines, would be expected to overlap at a single Habing flux (G0) and cloud density (n). Left:The element abundances are fixed to their default ISM values. Middle: Nitrogen overabundance is fixed to two. Right: The element abundances are fixed to 0.6times the ISM value and nitrogen overabundance to two. The best-measured ratio, LFIR/[Cii], overlaps for this model.
lar photoionization becomes increasingly important with decreas-ing distance to the core of the galaxy. Although fitting line andcontinuum ratios measured in different bands across the electro-magnetic spectrum (submm, IR, optical, UV) simultaneously is be-yond the scope of this paper, we compared a subset of the opti-cal ratios measured by Johnstone & Fabian (1988) to our best-fit
model predictions. This comparison is shown in Table 9. We givea range for the observed ratios since the ratios display a strongradial gradient. ‘Model I’ refers to the best-fit energy model de-scribed above. While the predicted values of the [Nii]λ6583/Hαand [Sii]λ6731/Hα ratios are consistent with the observed val-ues, [Oii]λλ3727, 3729/Hβ is lower by a factor of a few and
c© 0000 RAS, MNRAS 000, 000–000

Herschel Observations of the Perseus Cluster 17
Table 9. The optical emission line ratios in the central 4 kpc region ofNGC 1275 (Johnstone & Fabian 1988). The columns are (1) the species,(2) the measured ratios (3) the predicted ratios based on the best-fit model(4) the predicted ratios based on a slightly modified model. The observedratios are from the observations off to the south-east side of the nucleus toavoid the high-velocity system.
Ratio Value Model I Model II
[Oii]λλ3727, 3729/Hβ 3.5 – 8 1-2 1-2[Oiii]λ5007/Hβ 1.2 – 1.8 0.1-0.2 0.7-2
[Oi]λ6300/Hα+[Nii]λ6583 0.06 – 0.14 0.004-0.007 0.008-0.01[Nii]λ6583/Hα 0.8 - 1.4 0.6-0.9 0.6-0.9[Sii]λ6731/Hα 0.2 – 0.7 0.6-0.8 0.6-0.8
[Oiii]λ5007/Hβ and [Oi]λ6300/[Nii]λ6583+Hα are lower by aboutan order of magnitude than the observed values. We devised anothermodel, referred to as ‘Model II’, obtained by slightly modifying thebest-fit model by decreasing the age of the input young stellar pop-ulation by an order of magnitude. Using Model II we are able to re-produce some of the optical ratios, specifically, the ratio [Oiii]/Hβ.There is also an increase in the ratio, [Oi]λ6300/[Nii]λ6583+Hα,by a factor of two. The modified model does not impact the best-fitmodel parameters constrained by the relative strengths of FIR andHα lines (Table 7). This is due to the fact that lowering the age ofthe oldest stars in the YSP alters the SED only below 1000 Å, suchthat [Oiii]λ5007 and [Oi]λ6300 are affected. FIR lines, on the otherhand, are mainly produced by gas heated by lower-energy UV andoptical photons.
From this exercise we conclude that photoionization fromstars is the predominant source of energy in the cold gas clouds inthe core of NGC 1275. It may be that in order to obtain consistencywith the complete set of observed flux ratios at different wavebands,a composite model that includes a stellar component and one ormore additional forms of heating is required. Particle-heating mod-els are usually very hard to distinguish from slow shocks (e.g. Fer-land et al. 2008; Farage et al. 2010; Rich et al. 2011). Even thoughthe work of Ferland et al. (2009) showed that ionizing particlesare the likely heating agents in the filaments of NGC 1275, theparticle heating model was only marginally more successful thanheating by dissipative MHD wave energy. The core of NGC 1275displays large-scale motions, which may very well entail shocks(although strong shocks have been ruled out by X-ray data, Fabianet al. 2003; Sanders & Fabian 2007). Similarly, due to the proxim-ity to the AGN, particle heating (cosmic rays) may be significantas well. Hence additional heating required to explain the FIR andoptical line ratios in entirety may either manifest itself in the formof weak shocks or particle-heating or both.
4.3 Star formation
Far-ultraviolet (FUV) emission is a direct indicator of mor-phological and spatial extent of recent star-formation sites.In Fig. 15, we show the FUV emission associated with theBCG of Perseus. This image was created using two datasetsfrom the HST archive – (1) Space Telescope Imaging Spectro-graph (STIS) FUV-MAMA/F25SRF2 data (proposal ID: 8107, PI:C. O’Dea) and (2) Advance Camera of Surveys Solar Blind Chan-nel (ACS/SBC) FUV-MAMA/F140LP data (proposal ID: 11207,PI: R. O’Connell). The first dataset consisted of a single pointingonly (centered on the core). The second dataset, however, consistedof 8 different pointings, designed to map the bright UV filaments
extending NW and SE from the core. We obtained the single flat-fielded, dark-subtracted exposures from the HST archive for boththe datasets and combined them using the iraf task, multidrizzle.
The filaments NW of the core have the same spiral morphol-ogy as the HVS. This spatial correlation seems to suggest that thestar clusters in the filaments are associated with the foregroundgalaxy (e.g. Keel & White 2001). There is also evidence to thecontrary, suggesting that the star clusters belong to the LVS (e.g.Goudfrooij 1995; Brodie et al. 1998).
For the present study, we will focus only on the FUV emis-sion originating from the core region (see Fig. 16), which, dueto proximity and symmetry, is expected to be associated with theLVS. The integrated flux-density within the core is (5.3 ± 0.1) ×10−15 erg s−1 cm−2 Å−1 at 1456 Å; however the FUV emissionclose to the center is likely to be associated with the AGN. Forthe purpose of quantifying FUV emission from stars, we deter-mined the FUV emission in the annulus (0.5 kpc – 3.8 kpc) as(3.6±0.1)×10−15 erg s−1 cm−2 Å−1, and correcting for the Galacticextinction results in (1.2 ± 0.3) × 10−14 erg s−1 cm−2 Å−1. Thereis a further correction factor that needs to be applied in order toaccount for the dust internal to the ISM of NGC 1275 (see sec-tion 2.3). Assuming an internal reddening of E(B − V) = 0.37, weobtain a FUV flux-density of (1.9 ± 0.5) × 10−13 erg s−1 cm−2 Å−1.This can be directly compared to the flux density expected from asynthetic spectrum of a young stellar population, such as the oneused as input for the cloudy simulations. The expected flux densitywas determined by convolving the redshifted synthetic spectrumwith the bandpass of the FUVMAMA/F25SRF2 filter on STIS us-ing the iraf tool synphot. A synthetic spectrum corresponding toan instantaneous starburst containing 5 × 10⁹ M and 2 Myr in agepredicts a flux density of 1.7 × 10⁻¹¹ erg s−1 cm−2 Å−1. Holdingthe age constant and scaling down the mass so that the flux densityagrees with the extinction-corrected observed flux density impliesa SFR of 27 M yr−1. This is similar to the SFR ∼ 24 M yr−1 de-rived in section 3.3 (Table 4) from the FIR measurements. This isalso in very good agreement with the SFR ∼ 25 M yr−1 derivedby Norgaard-Nielsen et al. (1990) from the IUE (International Ul-traviolet Explorer) spectroscopic data.
Since the star formation rate traced via FIR data is expected tobe most accurate (due to negligible extinction at FIR wavelengths),and the FUV rate matches it, the average internal reddening overthe inner 4 kpc radius region is probably close to that suggestedby the observed Galactic-extinction corrected Balmer decrement(4.07) in a region 18′′ SW of the nucleus (section 2.3). On the otherhand, the SFR derived above using FUV data is for the core re-gion, whereas the SFR derived in Table 4 is for the whole galaxy.For example, Canning et al. (2010) obtained an optical star forma-tion rate of about 20 M yr−1 over the Blue Loop region, which isoutside the core region. Although there is hardly any FIR emissiondetected in the Blue Loop region, it is possible that it contributesto the total SFR derived from FIR measurements to some extent.This could imply that the average internal reddening over the coreis lower than assumed, making the FUV-derived star formation ratelower as well. Hence E(B − V) ∼ 0.37 is an upper-limit. Note,the above calculation is based on two assumptions: (1) the dust inNGC 1275 follows the same extinction law as the Milky Way and(2) the Balmer line ratios are close to the case-B recombinationvalues.
It is interesting that if we use the dust attenuation derived fromthe Balmer decrement and apply it at smaller (UV) wavelengths, theFIR- and UV-derived SFRs are consistent with each other. This is incontrast to studies that have indicated that the reddening values di-
c© 0000 RAS, MNRAS 000, 000–000

18 Rupal Mittal et al.
Figure 15. Combined HST SBC/F140LP and STIS/F25SRF2 FUV imageof NGC 1275. The red circle indicates the central 4 kpc core region.
verge between nebular line emission and UV continuum by a factorof two (e.g. Calzetti 1997; Buat et al. 2002), such that nebular lines,like Hα and Hβ, are more attenuated than the stellar continuumemission. This discrepancy is usually attributed to an uneven dis-tribution of dust in front of stars and ionized gas, with the latter be-ing more closely associated with the dust than the former. Calzetti(1997) suggests using the relation E(B−V)star = 0.44×E(B−V)gas.However, Garn et al. (2010) argue that the while the continuum atlonger wavelengths (optical) may be probing older stellar popula-tion residing in less dusty environments, and hence may not be co-spatial with the ionized gas, the continuum at shorter wavelengths(UV) should be more closely tied to the young stars producing ion-ized gas. Hence the correction factor (0.44) for FUV emission maybe higher than suggested by the above relation.
Using the relation suggested by Calzetti (1997), Buat et al.(2002) derived AUV(λ=2000) = 1.6 × AHα. Instead of applying the at-tenuation at FUV wavelengths by extrapolating the reddening valuecalculated from the Balmer decrement, if we apply the above cal-ibration we obtain a SFR of 6 M yr−1. This is a factor of fourlower than the FIR-derived SFR. This implies that in the case ofNGC 1275, the dust covering factor for the ionized gas resultingin the Balmer lines and the FUV emission must be rather homoge-neous, such that the attenuation tracked by the ionized gas is closelyrelated to that of the FUV emission.
5 DISCUSSION OF THE OUTER FILAMENTS
Ferland et al. (2009, F09 hereafter) conducted a thorough analysisof the Horseshoe region in NGC 1275. They used the infrared andoptical line intensities to distinguish between two types of heating:extra heating, as would be produced by passing shocks, and heatingby energetic particles such as cosmic rays. Extra heating refers toheating by dissipative MHD waves, and it is assumed that this kind
Figure 16. A zoom-in FUV image of the center of the galaxy, the red circleindicates the central 4 kpc core region.
of heating increases the thermal energy of the gas only. Hence thelocal gas kinetic temperature dictates the collisional processes thatare energetically possible. Energetic particle heating refers essen-tially to ionizing particles, and, on the other hand, is not only capa-ble of depositing thermal energy via elastic collisions with the par-ticles of the ISM but can also ionize a neutral medium via creationof a population of suprathermal secondary electrons. The physicsof molecular gas exposed to such heating sources is described byFerland (2011a) and Ferland (2011b).
The model in F09 assumes that the gas in the filaments isin pressure balance with the surrounding X-ray-emitting intraclus-ter gas. Based on the X-ray measurement of the electron pres-sure of 0.128 keV cm−3 of the hot gas surrounding the horseshoeby Sanders & Fabian (2007), F09 assumed a constant pressure ofnT = 106.5 cm−3 K. The simulations conducted in F09 are fur-ther based on the assumption that the filaments are composed ofcloudlets with a range of density, n, and temperature, T , but whichhave this single pressure, nT . This assumption is motivated by thefact ionic, atomic, and molecular emissions are all observed in thefilaments. This implies that different phases of gas occupy a tele-scope beam, even at HST resolution. In other words, there is ob-servational evidence that both dense molecular and diffuse ion-ized emission arise from spatially coincident regions. Because ofthe constant pressure assumption, low density cloudlets have hightemperature and produce emission from ionized gas, while denseclouds are cold and account for the molecular component.
The formalism adopted in F09 uses a cumulative filling factorf (n), which is a powerlaw in density, as the weighting function toco-add clouds of different densities. This factor describes the frac-tional volume filled with gas with density n or lower. The spectrafor various emission lines, in particular the infrared H2 and opti-cal H i emission lines, are determined using cloudy using a rangeof electron densities, temperatures, and non-radiative heating rates.The emission for a given line is integrated over the ensemble ofclouds and then compared to observations.
Ferland et al. (2009) found that both the forms of non-radiativeheating, extra heating and energetic particle heating, match the op-tical and infrared observations to within a factor of two for the ma-jority of the lines. There are a few discriminant lines, such as the
c© 0000 RAS, MNRAS 000, 000–000

Herschel Observations of the Perseus Cluster 19
Table 10. A comparison of [Cii], [Oi] and Hα line fluxes in the Horseshoe knot, the SW1/SW2 knots and the Blue Loop knots. Given in the last column arethe ratios with respect to [Cii]. [Oi] is not detected in any of the extended filaments – we give the 3σ upper-limits.
Region RA Dec Aperture Radius Line Velocity Flux Ratio(arcsec) km s−1 (10−15 erg s−1 cm−2)
Horseshoe knot 03h19m45.15s +41d31m33.1s 11 [Cii] 79.5 26.78 ± 0.26 1.00[Oi] < 44 < 1.64Hα 36 (88) 1.34 (3.27)
Southwest knots 03h19m45.48s +41d29m49.4s 11 [Cii] 3.3 40.67 ± 3.55 1.00(Southern Filament) [Oi] < 34 < 0.84
Hα 87 (211) 2.14 (5.19)Blue Loop knots 03h19m50.72s +41d30m07.2s 11 [Cii] -224.5 35.19 ± 1.87 1.00
(Southeast Filament) [Oi] < 30 < 0.85Hα 73 (177) 2.07 (5.03)
optical emission lines He i λ 5876 Å, [Ne iii] λ 3869 Å, and theinfrared emission line [Ne ii] λ 12.81 µm, which show a few or-ders of magnitude difference and indicate that ionizing particles areresponsible for heating and ionizing the gas. Fabian et al. (2011)argue that the surrounding hot intracluster medium is the sourceof the ionizing particles, rather than true cosmic rays as would befound in the adjoining radio lobes.
All of the predicted lines used to compare with observationswere optically thin, so their intensity relative to similar forbiddenlines has no dependence on cloud column density. The F09 modelalso made predictions for the far-infrared emission lines, such asthose observed by Herschel. In Table 10, we list the detected Her-schel emissions in the three regions of the extended filaments −the Horseshoe region, the southwest (SW) knots. We also give the3-σ upper-limits for the non-detections. These lines may be usedto distinguish between the two heating scenarios. In particular, thepredicted [Oi]/[Cii] ratio is ∼ 3 for the extra heating and ∼ 21 forthe energetic particle heating. The observed [Oi]/[Cii] ratios, on theother hand, have an upper-limit of 1.64 in the Horseshoe knot and0.85 in both the SW and Blue Loop knots. This discrepancy wasfirst pointed out by Mittal et al. (2011) in a different context.
There are two plausible explanations for why the F09 modelfails to reproduce the Herschel observations. The first reason is tiedto the critical densities, ncr, of [Cii] and [Oi] gas (see Fig. 12). Sincethe F09 model assumes a constant pressure of nT = 106.5 cm−3 K,the FIR lines which are produced at low temperatures (∼ 100 K toa few hundred K ) correspond to high densities (3×104 cm−3 > n >5× 103 cm−3). Such high densities lead to high [Oi]/[Cii] ratios dueto the reasons given in section 4.1. The model could be brought intoagreement with the observations by postulating a large componentof low density gas, which would strongly emit the Herschel lineswith the observed ratio. F09 note, in section 7, point 7, that largereservoirs of cold gas could be present yet not detected with theselection of lines they had available.
The second likely cause for the incompatibility of the F09model with the [Oi]/[Cii] ratio is that the F09 model assumes thatthe emission lines are optically thin. If the gas has high enough col-umn density, the Herschel lines become optically thick. This is nor-mally the case in galactic PDRs (Tielens & Hollenbach 1985). Theline luminosity is no longer determined simply by the product of theline emissivity and the volume of the cloud but rather the geometryof the emitting cloud, especially its column density, will affect theline intensities. F09 note that the observed surface brightness of theHα line gives the line-of-sight thickness of the cloud dl ∼ 0.3 pc.This implies a hydrogen column density of N(H) = 1022.5 cm−2.If the emission forms in a single cloud with this column density,
the Herschel lines would be strongly affected but there would belittle impact on the NIR and optical lines, other than the effects ofinternal reddening.
Clearly much remains to be learned about the geometry ofthe filaments at sub-HST resolution scales. Both scenarios outlinedhere are consistent with what is known from available observations.
6 CONCLUSIONS
We have presented far-infrared Herschel observations of the cen-ter of the Perseus galaxy cluster. The brightest cluster galaxy,NGC 1275, is surrounded by filaments, previously imaged exten-sively in Hα and CO emission. In this work, we report the presenceof coolants, such as [Cii], [Oi], [Nii], [Oib] and [Oiii], in additionto Hα and CO. All the Herschel lines except [Oiii] are spatially ex-tended, with [Cii] extending up to 25 kpc from the nucleus of thegalaxy, and cospatial with Hα and CO. Furthermore, [Cii] shows asimilar velocity distribution to CO, and the latter has been shownin previous studies to display a close association with the Hα kine-matics. The spatial and kinematical correlation among [Cii], Hαand CO gives us confidence that the different components of thegas may be modelled with a common heating model.
The velocity structure inferred from [Cii] observations revealsblueshifted components on either side of the nucleus and a ridge ofredshifted gas passing through the center in the north-south direc-tion. A combination of disk rotation on ∼ 10 kpc scales and moredisordered motion of a few distinct clouds at larger radii is oneplausible scenario consistent with [Cii] (Herschel) and CO data. Itmay also be that outflows from the radio source at the center aredredging up cold material away from the line of sight, resulting ina ridge of redshifted gas.
We have detected continuum emission at all PACS and SPIREwavelengths ranging from 70 µm to 500 µm. The Herschel con-tinuum data combined with a suite of existing radio, submm andIR data, have allowed us to perform a spectral energy distribu-tion fitting using a model comprising two modified-blackbody dustcomponents, dominant at IR wavelengths, and synchrotron AGNemission, dominant at radio and submm wavelengths. The total in-frared luminosity (8 µm to 1000 µm) is (1.5 ± 0.05)1011 L, mak-ing NGC 1275 a luminous infrared galaxy (LIRG). The infrared-inferred star formation rate is about 24 M yr−1. This is comparableto the SFR estimated in a core region (∼ 4 kpc in radius) using theHST-FUV observations, and also XMM-Newton RGS observations,which suggest a residual cooling rate of 20 M yr−1.
We have investigated in detail the source of the emissions
c© 0000 RAS, MNRAS 000, 000–000

20 Rupal Mittal et al.
emerging from a core region 4 kpc in radius. This investigationwas done by carrying out radiative transfer simulations assuminga photoionization model consisting of only old and young stellarpopulations as heating agents. We find that the Herschel and Hαemissions can be reproduced by such a model, yielding hydrogendensity between 500 cm−3 and 700 cm−3 and FUV intensity fieldbetween 700 Habings to 900 Habings. Optical flux ratios indicatethat a second heating component may be needed; however, stellarphotoionization seems to be the dominant mechanism.
We have also detected [Cii] in three previously well-studiedregions of the filaments: the Horseshoe, Blue Loop and southwestknots. The observed upper-limits of the [Oi]/[Cii] ratio are 1 dexsmaller than predicted by the best-fit model of Ferland et al. (2009),wherein two sources of ionization have been considered individu-ally: particle heating and extra-heating (the latter increases the ther-mal energy of the gas). The [Cii] line has a excitation potential of91 K and a critical density much lower than the lines considered inthat study. This suggests that the lines are optically thick, as is typ-ical of galactic PDRs, and implies that there is a large reservoir ofcold atomic gas. This has not been included in previous inventoriesof the filament mass and may represent a significant component. Itseems likely that the model used by Ferland et al. (2009) needs tobe augmented in order to reproduce the observed strengths of thevarious emissions in the filaments of NGC 1275. It can also be thata composite model, like the one used for the study of Centaurus(Mittal et al. 2011), consisting of more than one heating agent, isrequired to achieve compatibility with observations.
ACKNOWLEDGMENTS
We thank Christopher Conselice for providing the WIYN Hα im-age and Greg Taylor for the radio images. We thank the refereesincerely for a very useful feedback. This work is based (in part)on observations made with Herschel, a European Space AgencyCornerstone Mission with significant participation by NASA. Sup-port for this work was provided by NASA through an award is-sued by JPL/Caltech. We thank M. Aller for providing us withthe UMRAO data. This research has made use of data from theUniversity of Michigan Radio Astronomy Observatory which hasbeen supported by the University of Michigan and by a series ofgrants from the National Science Foundation, most recently AST-0607523. This research has made use of the NASA/IPAC Extra-galactic Database (NED) which is operated by the Jet PropulsionLaboratory, California Institute of Technology, under contract withthe National Aeronautics and Space Administration. This work issupported in part by the Radcliffe Institute for Advanced Study atHarvard University. GJF acknowledges support by NSF (0908877;1108928; and 1109061), NASA (10-ATP10-0053, 10-ADAP10-0073, and NNX12AH73G), JPL (RSA No 1430426), and STScI(HST-AR-12125.01, GO-12560, and HST-GO-12309). STSDAS isa product of the Space Telescope Science Institute, which is oper-ated by AURA for NASA. HRR thanks the Canadian Space AgencySpace Science Enhancement Program for support.
REFERENCES
Bohringer H., Voges W., Fabian A. C., Edge A. C., Neumann D. M., 1993,MNRAS, 264, L25
Brauher J. R., Dale D. A., Helou G., 2008, ApJS, 178, 280Bregman J. N., Fabian A. C., Miller E. D., Irwin J. A., 2006, ApJ, 642,
746
Brodie J. P., Schroder L. L., Huchra J. P., Phillips A. C., Kissler-Patig M.,Forbes D. A., 1998, AJ, 116, 691
Buat V., Boselli A., Gavazzi G., Bonfanti C., 2002, A&A, 383, 801Calzetti D., 1997, AJ, 113, 162Canning R. E. A., Fabian A. C., Johnstone R. M., Sanders J. S., Crawford
C. S., Hatch N. A., Ferland G. J., 2010, MNRAS, p. 1800Cardelli J. A., Clayton G. C., Mathis J. S., 1989, ApJ, 345, 245Chapman S. C., et al., 2002, MNRAS, 330, 92Conselice C. J., et al., 2001, AJ, 122, 2281Crawford C. S., et al., 1999, MNRAS, 306, 857Crawford C. S., Hatch N. A., Fabian A. C., Sanders J. S., 2005, MNRAS,
363, 216Dhawan V., Kellermann K. I., Romney J. D., 1998, ApJ, 498, L111Donahue M., de Messieres G. E., O’Connell R. W., Voit G. M., Hoffer A.,
McNamara B. R., Nulsen P. E. J., 2011, ApJ, 732, 40Donahue M., Mack J., Voit G. M., Sparks W., Elston R., Maloney P. R.,
2000, ApJ, 545, 670Donahue M., Voit G. M., 1991, ApJ, 381, 361Donahue M., Voit G. M., 1993, ApJ, 414, L17Dunne L., Eales S. A., 2001, MNRAS, 327, 697Dwek E., Arendt R. G., 1992, ARA&A, 30, 11Edge A. C., 2001, MNRAS, 328, 762Edge A. C., et al., 1999, MNRAS, 306, 599Edge A. C., et al., 2002, MNRAS, 337, 49Edge A. C., Oonk J. B. R., Mittal R., et al., 2010a, A&A, 518, L46Edge A. C., Oonk J. B. R., Mittal R., et al., 2010b, A&A, 518, L47Egami E., et al., 2006, ApJ, 652, L21Fabian A. C., 1994, ARA&A, 32, 277Fabian A. C., et al., 2003, MNRAS, 344, L43Fabian A. C., et al., 2008, Nature, 454, 968Fabian A. C., Sanders J. S., Ettori S., Taylor G. B., Allen S. W., Crawford
C. S., Iwasawa K., Johnstone R. M., Ogle P. M., 2000, MNRAS, 318,L65
Fabian A. C., Sanders J. S., Taylor G. B., Allen S. W., Crawford C. S.,Johnstone R. M., Iwasawa K., 2006, MNRAS, 366, 417
Fabian A. C., Sanders J. S., Williams R. J. R., Lazarian A., Ferland G. J.,Johnstone R. M., 2011, MNRAS, 417, 172
Farage C. L., McGregor P. J., Dopita M. A., Bicknell G. V., 2010, ApJ,724, 267
Ferland G. J., 2011a, in Narrow-Line Seyfert 1 Galaxies and their Place inthe Universe Molecular hydrogen in NLSys and its implications for theSED
Ferland G. J., 2011b, ArXiv:1109.3315v1Ferland G. J., Fabian A. C., Hatch N. A., Johnstone R. M., Porter R. L.,
van Hoof P. A. M., Williams R. J. R., 2008, MNRAS, 386, L72Ferland G. J., Fabian A. C., Hatch N. A., Johnstone R. M., Porter R. L.,
van Hoof P. A. M., Williams R. J. R., 2009, MNRAS, 392, 1475Ferland G. J., Korista K. T., Verner D. A., Ferguson J. W., Kingdon J. B.,
Verner E. M., 1998, PASP, 110, 761Garn T., Sobral D., Best P. N., Geach J. E., Smail I., Cirasuolo M., Dalton
G. B., Dunlop J. S., McLure R. J., Farrah D., 2010, MNRAS, 402, 2017Gitti M., Brunetti G., Setti G., 2002, A&A, 386, 456Gitti M., Nulsen P. E. J., David L. P., McNamara B. R., Wise M. W., 2011,
ApJ, 732, 13Goudfrooij P., 1995, PASP, 107, 502Gregory P. C., 2005, Bayesian Logical Data Analysis for the Physical Sci-
ences. Cambridge University PressGriffin M. J., Abergel A., Abreu A., Ade P. A. R., Andre P., Augueres J.,
Babbedge T., et al., 2010, A&A, 518, L3+
Hatch N. A., Crawford C. S., Fabian A. C., Johnstone R. M., 2005, MN-RAS, 358, 765
Hatch N. A., Crawford C. S., Johnstone R. M., Fabian A. C., 2006, MN-RAS, 367, 433
Heckman T. M., Baum S. A., van Breugel W. J. M., McCarthy P., 1989,ApJ, 338, 48
Hicken M., Wood-Vasey W. M., Blondin S., Challis P., Jha S., Kelly P. L.,Rest A., Kirshner R. P., 2009, ApJ, 700, 1097
Hildebrand R. H., 1983, QJRAS, 24, 267
c© 0000 RAS, MNRAS 000, 000–000

Herschel Observations of the Perseus Cluster 21
Iben Jr. I., 1975, ApJ, 196, 525Irwin J. A., Stil J. M., Bridges T. J., 2001, MNRAS, 328, 359Jaffe W., Bremer M. N., 1997, MNRAS, 284, L1Johnstone R. M., Fabian A. C., 1988, MNRAS, 233, 581Johnstone R. M., Fabian A. C., Nulsen P. E. J., 1987, MNRAS, 224, 75Johnstone R. M., Hatch N. A., Ferland G. J., Fabian A. C., Crawford C. S.,
Wilman R. J., 2007, MNRAS, 382, 1246Kaneda H., Onaka T., Sakon I., 2005, ApJ, 632, L83Keel W. C., White III R. E., 2001, AJ, 121, 1442Kennicutt Jr. R. C., 1998, ARA&A, 36, 189Kent S. M., Sargent W. L. W., 1979, ApJ, 230, 667Krabbe A., Sams III B. J., Genzel R., Thatte N., Prada F., 2000, A&A,
354, 439Laine S., van der Marel R. P., Lauer T. R., Postman M., O’Dea C. P., Owen
F. N., 2003, AJ, 125, 478Leitherer C., Schaerer D., Goldader J. D., Gonzalez Delgado R. M., Robert
C., Kune D. F., de Mello D. F., Devost D., Heckman T. M., 1999, ApJS,123, 3
Lim J., Ao Y., Dinh-V-Trung 2008, ApJ, 672, 252Lim J., Ohyama Y., Chi-Hung Y., Dinh-V-Trung Shiang-Yu W., 2012, ApJ,
744, 112McDonald M., Veilleux S., Rupke D. S. N., Mushotzky R., 2010, ApJ,
721, 1262McNamara B. R., Wise M., Sarazin C. L., Jannuzi B. T., Elston R., 1996,
ApJ, 466, L9Micelotta E. R., Jones A. P., Tielens A. G. G. M., 2011, A&A, 526, A52Mittal R., O’Dea C. P., Ferland G., Oonk J. B. R., Edge A. C., Canning
R. E. A., Russell H., Baum S. A., Bohringer H., Combes F., Donahue M.,Fabian A. C., Hatch N. A., Hoffer A., Johnstone R., McNamara B. R.,Salome P., Tremblay G., 2011, MNRAS, 418, 2386
Moshir M., Kopan G., Conrow T., McCallon H., Hacking P., GregorichD., Rohrbach G., Melnyk M., Rice W., Fullmer L., White J., ChesterT., 1990, in Bulletin of the American Astronomical Society Vol. 22 ofBulletin of the American Astronomical Society, The IRAS Faint SourceCatalog, Version 2. p. 1325
Nagai H., Orienti M., Kino M., Suzuki K., Giovannini G., Doi A., AsadaK., Giroletti M., Kataoka J., D’Ammando F., Inoue M., Lahteenmaki A.,Tornikoski M., Leon-Tavares J., Kameno S., Bach U., 2012, MNRAS,423, L122
Norgaard-Nielsen H. U., Hansen L., Jorgensen H. E., 1990, A&A, 240, 70O’Dea C. P., Baum S. A., Privon G., Noel-Storr J., Quillen A. C., Zufelt
N., Park J., Edge A., Russell H., Fabian A. C., Donahue M., SarazinC. L., McNamara B., Bregman J. N., Egami E., 2008, ApJ, 681, 1035
Oonk J. B. R., Hatch N. A., Jaffe W., Bremer M. N., van Weeren R. J.,2011, MNRAS, 414, 2309
Osterbrock D. E., Ferland G. J., 2006, Astrophysics of gaseous nebulaeand active galactic nuclei. University Science Press
Ott S., 2010, in Y. Mizumoto, K.-I. Morita, & M. Ohishi ed., Astronomi-cal Data Analysis Software and Systems XIX Vol. 434 of AstronomicalSociety of the Pacific Conference Series, The Herschel Data ProcessingSystem – HIPE and Pipelines – Up and Running Since the Start of theMission. p. 139
Pedlar A., Ghataure H. S., Davies R. D., Harrison B. A., Perley R., CraneP. C., Unger S. W., 1990, MNRAS, 246, 477
Pereira M. J., Haines C. P., Smith G. P., Egami E., Moran S. M.,Finoguenov A., Hardegree-Ullman E., Okabe N., Rawle T., Rex M.,2010, A&A, 518, L40
Pilbratt G. L., Riedinger J. R., Passvogel T., Crone G., Doyle D., GageurU., Heras A. M., Jewell C., Metcalfe L., Ott S., Schmidt M., 2010, A&A,518, L1+
Pinkney J., Holtzman J., Garasi C., Watson A. M., Gallagher III J. S., et al.,1996, ApJ, 468, L13
Planck Collaboration Ade P. A. R., Aghanim N., Arnaud M., AshdownM., Aumont J., Baccigalupi C., Balbi A., Banday A. J., Barreiro R. B.,et al. 2011, A&A, 536, A7
Poglitsch A., Waelkens C., Geis N., et al., 2010, A&A, 518, L2+
Privon G. C., Baum S. A., O’Dea C. P., Gallimore J., Noel-Storr J., AxonD. J., Robinson A., 2012, ApJ, 747, 46
Rawle T. D., Edge A. C., Egami E., Rex M., Smith G. P., Altieri B.,Fiedler A., Haines C. P., Pereira M. J., Perez-Gonzalez P. G., PortouwJ., Valtchanov I., Walth G., van der Werf P. P., Zemcov M., 2012, ApJ,747, 29
Revaz Y., Combes F., Salome P., 2008, A&A, 477, L33Rich J. A., Kewley L. J., Dopita M. A., 2011, ApJ, 734, 87Salome P., Combes F., Revaz Y., Downes D., Edge A. C., Fabian A. C.,
2011, A&A, 531, A85Salome P., Combes F., Revaz Y., Edge A. C., Hatch N. A., Fabian A. C.,
Johnstone R. M., 2008, A&A, 484, 317Salome P., et al., 2006, A&A, 454, 437Sanders J. S., Fabian A. C., 2007, MNRAS, 381, 1381Sanders J. S., Fabian A. C., Dunn R. J. H., 2005, MNRAS, 360, 133Simionescu A., Werner N., Finoguenov A., Bohringer H., Bruggen M.,
2008, A&A, 482, 97Simionescu A., Werner N., Forman W. R., Miller E. D., Takei Y.,
Bohringer H., Churazov E., Nulsen P. E. J., 2010, MNRAS, 405, 91Sparks W. B., Macchetto F., Golombek D., 1989, ApJ, 345, 153Sparks W. B., Pringle J. E., Carswell R. F., Donahue M., Martin R., Voit
M., Cracraft M., Manset N., Hough J. H., 2012, ApJ, 750, L5Taylor G. B., Sanders J. S., Fabian A. C., Allen S. W., 2006, MNRAS,
365, 705Tielens A. G. G. M., Hollenbach D., 1985, ApJ, 291, 722Tremblay G. R., O’Dea C. P., Baum S. A., Clarke T. E., Sarazin C. L.,
et al., 2012a, MNRAS, 424, 1026Tremblay G. R., O’Dea C. P., Baum S. A., Clarke T. E., Sarazin C. L.,
et al., 2012b, MNRAS, 424, 1042Trippe S., Krips M., Pietu V., Neri R., Winters J. M., Gueth F., Bremer M.,
Salome P., Moreno R., Boissier J., Fontani F., 2011, A&A, 533, A97Vermeulen R. C., Readhead A. C. S., Backer D. C., 1994, ApJ, 430, L41Voit G. M., Donahue M., 1995, ApJ, 452, 164Voit G. M., Donahue M., 2011, ApJ, 738, L24Voit G. M., Donahue M., Slavin J. D., 1994, ApJS, 95, 87Weedman D. W., Hao L., Higdon S. J. U., Devost D., Wu Y., Charmandaris
V., Brandl B., Bass E., Houck J. R., 2005, ApJ, 633, 706Wilman R. J., Edge A. C., Johnstone R. M., 2005, MNRAS, 359, 755Wood P. R., Bessell M. S., Fox M. W., 1983, ApJ, 272, 99Wright E. L., Chen X., Odegard N., Bennett C. L., Hill R. S., et al., 2009,
ApJS, 180, 283
c© 0000 RAS, MNRAS 000, 000–000