Atomic Energy Control Board
173
,';.i ... . ' .•.•...-. -.;: • . \ • • Atomic Energy Control Board p||f^ INVESTIGATION OF THE EXPLOSION HAZARDS OF HYDROGEN SULPHIDE (PHASE II) - APPENDICES by I.O. Moen Defence Research Establishment Suffield
-
Upload
khangminh22 -
Category
Documents
-
view
1 -
download
0
Transcript of Atomic Energy Control Board
,';.i ... .' .•.•...-. -.;: • . \ • •
Atomic EnergyControl Board p||f^
INVESTIGATION OF THE EXPLOSIONHAZARDS OF HYDROGEN SULPHIDE
(PHASE II) - APPENDICES
by
I.O. MoenDefence Research Establishment Suffield
I* Atomic Energy Commission de contrôleControl Board de l'énergie atomique
PO Box 1046 CP 1046Ottawa Canada Ottawa, CanadaK1P5S9 K1P5S9
Canada
INF0-0180-2A
INVESTIGATION OF THE EXPLOSIONHAZARDS OF HYDROGEN SULPHIDE
(PHASE II) - APPENDICES
by
1.0. MoenDefence Research Establishment Suffield
A research report prepared for theAtomic Energy Control Board
Ottawa, Canada
January 1986
Research report
APPENDIX A
FLAME ACCELERATION TESTS
PART I: Spherical and Hemispherical Configurations
TABLE AI - Fuel-Air Flame Acceleration Tests: Spherical and Hemispherical
Item References Configuration Fuel Flame OverpressureVelocity MaximumMaximum (bar)
(m/s)
Remarks
A l . l Dorge et a l . (1976)Wagner (1982)
Al.2 Deshaies and Leyer (1981)
Charuel and Leyer (1983)
A1.3 Lind and Whitson (1977)
Cubic containers,paper walls removedprior to ignit ion onbottom steel plate/hemispherical gridobstacles (see Fig. A l . l )(0.6 x 0.6 x 0.6 m3 max)
Hemisphericalsoap bubbles;D = 4 - 40 cmNo obstacles
C 2 H 22 <
C H 8
C,H,
1503016
534
D = 20 cm(no obstacles)
Hemispherical Balloons;5 and 10 m radiusNo obstacles(see Fig. A1.3)
C,HP3 8
CH,C 3 H 8
J oC2H-°C 2 H 2r u
20
8.912.6
22.535.417.3
3 grids1 grid1 grid
0.0024 Jet igni t ion
Plastic balloonsintact prior totests
5.5
TABLE AI Continued... il
Item References Configuration
Spherical balloons; 12 m3
{no obstacles)Homogenous mixtureStrat i f ied mixture6.3 x 6.3 x 3.15 m3cloud. No obstacles
Fuel
C2H4
C HCXc X
FlameVeloci tyMaximum
(m/s)
24
38182920
OverpressureMaximum
(bar)
0.0125
—0.0080.015
=0.001
Remarks
Balloon in tac tprior to testsBallon destroyedprior to testsEnclosuredestroyed priorto tests
A1.4 Brossard et al. (1983)Brossard et al. (1985)
Al.5 Schneider and Pfortner(1981)
Hemispherical balloons.Radii 1.53, 2.88, 5 and10 m (see Fig Al.5)No obstacles
84 0.06
Figure Al.1Dôrge et al. (1976) and Wagner (1982)
Mesh Grids60 cm x 60 cm x 60 cmC2H4, C2H2 and C3H8
Flame inside and outside gr id
Paper «rails
Oxygen
Hydrocarbon [ Nirroo»n
Gos inlet
outletMeiol-ptaiE
Fig. 1. Expérimental arrangement.
Table 1. Specification of wire screens
diameterof the grids cm
9, 14, IB
9, 14, IB
9, 18
9, 18
9
9
9
9
9
S
9
9
9 , 1«. 18. IS
mesh size 1 SOB
1 .6
2 . 8
3
6 . 3
6 . 3
3
1
£.3
10
16
S
3
1.S
v i r e dl&meter d m
0 . 8
o.e
O . 5
2
O. 8
1.5
O.2
1 .4
1 .8
1 . 8
1 .8
1 .5
O.2S
Figure Al.l Continued.
a = Velocity (outside gr1d)Velocity (inside grid)
Rew = Reynolds numberbased on laminar flamespeed and wire diameter
I5 mmto-I)
TOO BOO 900K» 2O0 SOO «OO MO «00
Fig. 2. Acceleration factor a as a function of Re for hydrocarbon-air mixtureso - / (Re . ) : • . CH^air; x. C,H«-air.
ia-\)
6.3 mm
10 mm
1000 2000 1000Re.
Fig. 3. Acceleration factor a as a function of Re. for C3Hj-air. C,H<-atr and CiH<-oxygenenriched air mixtures, a - f(.Re;O. C,H,-»ir: • . CjH^-air or dH^-oxygcn enriched air.
Figure Al .2Deshaies and Leyer (1981)Charuel and Leyer (1983)
Hemispherical soap bubbles; rad i i 2-20 cmNo obstaclesC2H4, CH4 and C3H8
.to CRO
P.P
Sparking tiec>roOes
external charge
« 200
Figure Al.3Lind and Whitson (1977)
Hemispherical balloons of rad i i 5 and 10 mNo obstacles
Sua ary of Results of Hemisphere Tests
Test
No.
57131123641110B14151817
Size,meters
55105105551010105•555
Fuel
Methane"
Propane
Ethylene Oxide"
EthyleneAcetylene
"Butadiene
Concentration,Volume X
10.010.010.04.04.05.05.05.05.07.77.76.53.57.73.5
HorizontalVelocity,
ml»
5.8... *5.2.. .b
6.1.. .*6.98.39.613.4
14.78.83.6
23.73.9
VerticalVelocity
at 3 a.
7.37.36.56.37.87.49.510.29.9
15.216.017.34.6
35.4
5.5
at 8 m.
•/•
8.9
10.6...
12.622.522.4
* Burning fuel in the instrumentation channel distorted the shape of the flame and nohorizontal velocity could be obtained.
Test performed in daylight and flame base vas insufficiently visible Cor horizontalvelocity to be obtained.
Fi gure Al.4Brossard et a l . (1983, 1985)
Spherical balloons; homogeneous and st rat i f ied mixtures of C,H -air andC2H2-air 2 *No obstacles
COMPARAISON . EXPERIENCE/ MODEUSATION D'UNE DEFLAGRATION A VITESSE CONSTANTE .
- Figure 4 _
Calculs / • E 07 o ]
V-Cte Is E10 o { Expérience
" e t rf max ' » E W » 1
fissurés
essais air • éthylène , volume * 1Z m3
m/s
E 10= T76 m/s
= 0.33
TO r ( m )
Table 2 Influence of the ch«rjt envelope
on the piessuie field
Equivalence
C j H 4 -
C 2 H 2 -
ntio of the
lir11 3
18
Miiliue
Tible 1 :
^ F
Observed Speeds
lm/>)
8.5II
2017
Vp man {mis)
II17
3238
TetlRRo
CHARLES 13(entelope destroyed bythr cxploaon lUelf)
CHARLES 14(envelope destroyed 150 nutfler i(nition)
CHARUS 1-5(envelope destroyed 100 nubefore ignition ofthe chirge!
16
6 7 ?
-
-
2 3
9 4
14
4.2
UP
74
6
9
33
4.4
4 5
6 8
2 A
mbir)
6 6
3.8
6
2 1
2 3
8 8
IS
4.5
2 2
S i
9
29
vF(-M
TK11
-
-
84
calc
87
8 2
7
<m/
me»
-
26
16
Tulc
199
23 2
15 T
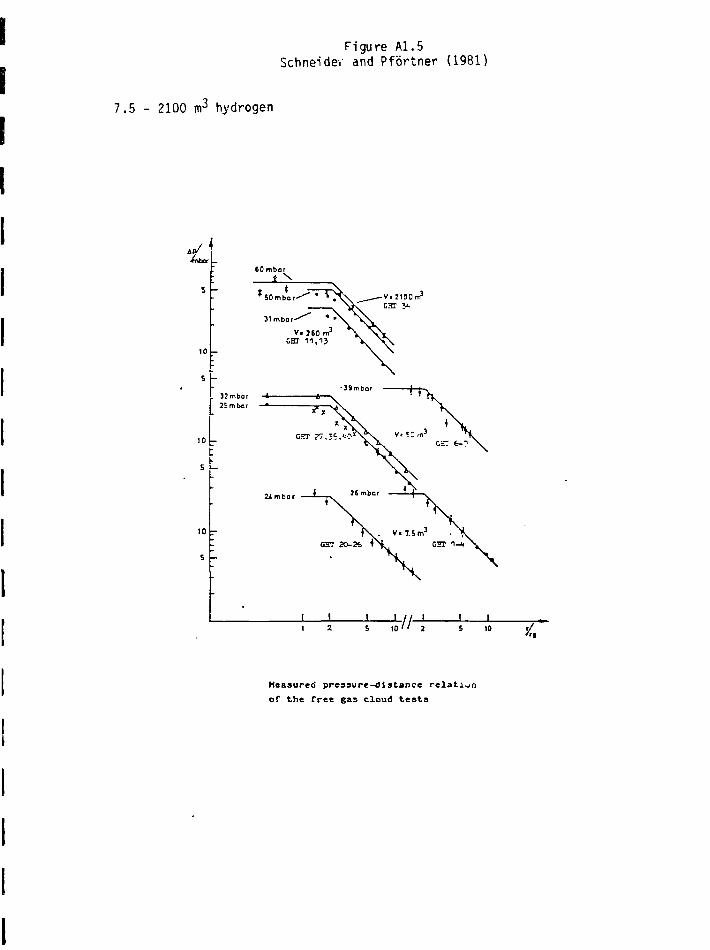
Figure Al.5Schneider and Pfortner (1981)
7.5 - 2100 m3 hydrogen
•L
10 -
10 r
5 -CHT 20-26
I \ I I1 2 5 10'
Measured pressure-distance relation
of the free gas cloud testa
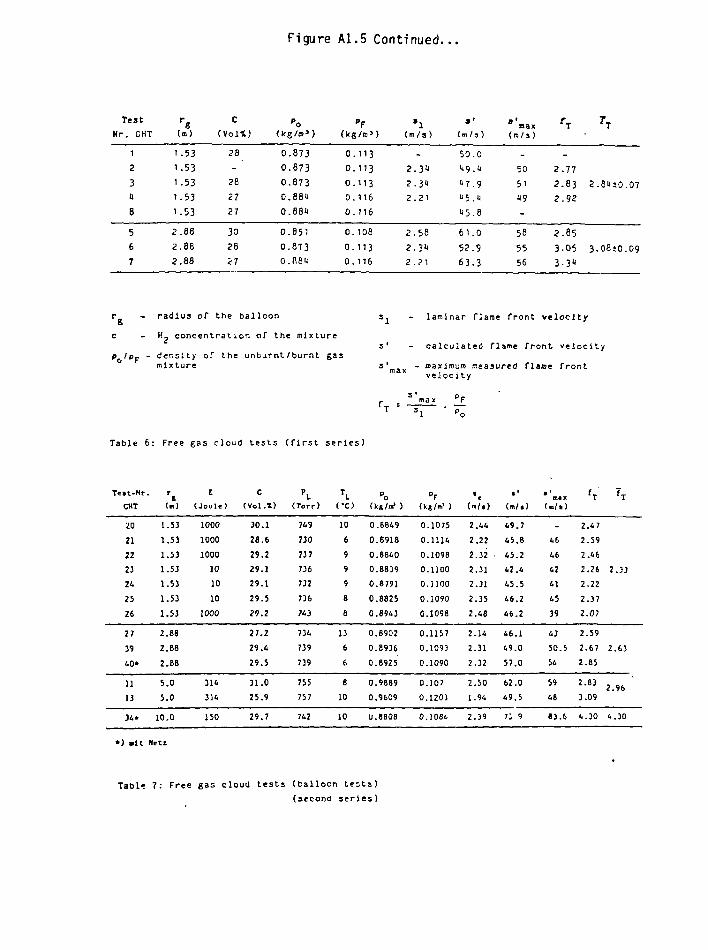
Figure Al.5 Continued...
TestNr. CHT
1
2
3ft
8
5
6
7
rg
(m)
1-53
1.53
1.53
1.53
1.53
2.88
2.8B
2.88
C
(voi<)
28
-
28
27
27
30
28
i l
"o<kg/m3)
0.873
0.873
0.873
0.881
0.881
0.851
0.87 30.(181
"F( k g / a ' )
0.113
0. 113
0.1130.116
0. 116
0. 108
0.113
0.116
• l(m/s)
-
2.31
2.3«
2.21
2.56
2.31
2 .?1
• 'C m / 3 )
50.0
i » 9 . i
" 7 . 9
U5.U
1 5 . 8
6 1 . 0
52.9
63.3
* max(m/a)
.
50
51
19
-
58
55
56
f T T T
_
2.77
2.83 2 - B1) 10.07
2.92
2.85
3-OS 3.08±0.09
3 - 3 "
r - radius of the balloon
c - H y concentrât ion of the mixture
P /pr - der-sity of the unburnt/burnt gas° mixture
laminar flame front velocity
s' - calculated flame front velocity
s1., - maximum measured flame frontaax velocity
Table 6: Free gas cloud tests (first series)
Te«t-Nr
CHT
20
21
22
23
24
25
26
27
39
4 0 *
11
13
34*
*) . I t
(ml
1.53
1.53
1.53
1.53
1.53
1.53
1.53
2.88
2.88
2.BB
5.0
5.0
10.0
Net I
E
(Joule)
1000
1000
1000
10
10
10
1000
314
314
150
c(Vol.I)
30.1
28.6
29.2
29.1
29.1
29.5
29.2
27.2
29.4
29.5
31.0
25.9
29.7
PL(Torr)
749
730
737
736
732
736
743
734
739
739
755
757
742
C O
10
6
9
9
9
8
8
13
6
6
6
10
10
po
0.8849
0.8918
0.8840
0.8839
0.8791
0.8825
0.B943
0.8902
0.8936
0.6925
0.9889
0.9609
u.eeoe
(I
0
0
0
0
0
0
0
0
0
0
0
0
0
°F'«/<"• )
.1075
.1114
.1098
.lioo
.1100
.1090
.1098
.1157
.1093
.1090
J 0 7
.1203
.1084
( * / • )
2.44
2.22
2 . 3 2 •
2.31
2.31
2.35
2.48
2.14
2.31
2.32
2.50
1.94
2.39
(m/.)
49.7
45.8
45.2
42.4
45.5
46.2
46.2
46.1
49.0
57.0
62.0
49 .5
72 9
n i x
-
46
46
42
41
45
39
43
50.5
54
59
48
83.6
'T
2.47
2.59
2.46
2.26
2.22
2.37
2.07
2.59
2.67
2.85
2.83
3.09
4.30
2.33
2.63
2.96
4.30
Table 7: Free gas cloud tests (balloon tests)
(second series)

Part I I : Cylindrical Configurations
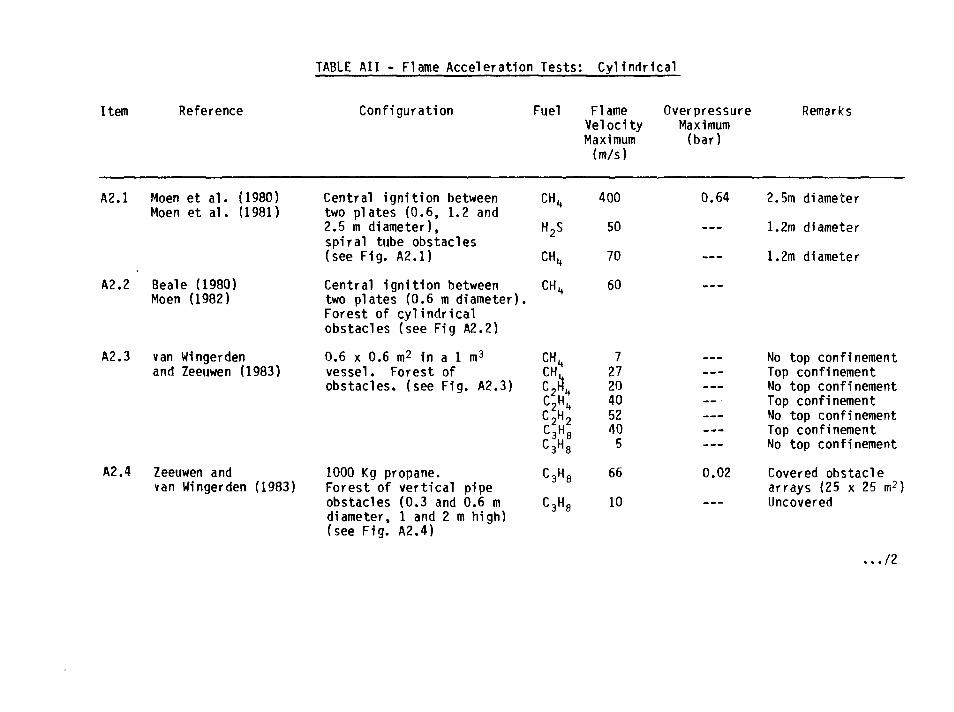
TABLE AH - Flame Acceleration Tests: Cylindrical
Item Reference Configuration Fuel Flame OverpressureVelocity MaximumMaximum (bar)(m/s)
Remarks
A2.1 Moen et al. (1980)Moen et al. (1981)
A2.2 Beale (1980)Moen (1982)
A2.3 van Wingerdenand Zeeuwen (1983)
A2.4 Zeeuwen andvan Wingerden (1983)
Central ignition betweentwo plates (0.6, 1.2 and2.5 m diameter),spiral tube obstacles(see Fig. A2.1)
Central ignition betweentwo plates (0.6 m diameter)Forest of cylindricalobstacles (see Fig A2.2)
0.6 x 0.6 m2 in a 1 m3
vessel. Forest ofobstacles, (see Fig. A2.3)
1000 Kg propane.Forest of vertical pipeobstacles (0.3 and 0.6 mdiameter, 1 and 2 m high)(see Fig. A2.4)
CH,
H2S
CH,,
CH.
CH,CHCXC H2
3H8
400
50
70
60
727204052405
66
10
0.64
0.02
2.5m diameter
1.2m diameter
1.2m diameter
No top confinementTop confinementNo top confinementTop confinementNo top confinementTop confinementNo top confinement
Covered obstaclearrays (25 x 25 m2)Uncovered
...II
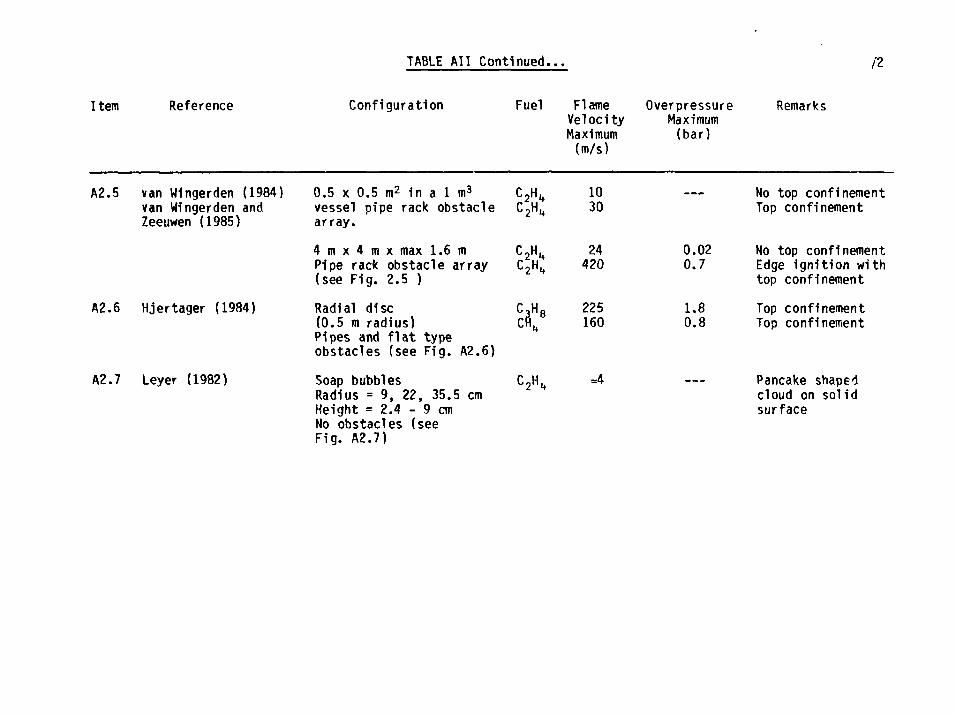
TABLE All Continued.
Item Reference Configuration Fuel FlameVelocityMaximum(m/s)
1030
24420
225160
=4
OverpressureMaximum(bar)
—
0.020.7
1.80.8
—
Remarks
No top confinementTop confinement
No top confinementEdge ignition withtop confinement
Top confinementTop confinement
Pancake shapedcloud on solidsurface
A2.5 van Wingerden (1984)van Wingerden andZeeuwen (1985)
A2.6 Hjertager (1984)
A2.7 Leyer (1982)
0.5 x 0.5 m2 in a 1 m3
vessel pipe rack obstaclearray.
4 m x 4 m x max 1.6 mPipe rack obstacle array(see Fig. 2.5 )
Radial disc(0.5 m radius)Pipes and flat typeobstacles (see Fig. A2.6)
Soap bubblesRadius = 9, 22, 35.5 cmHeight = 2 . 4 - 9 cmNo obstacles (seeFig. A2.7)
Figure A2.1Moen et al. {1980, 1981)
Central ignition between two platesShchelkin spiral obstaclesCH4 and H2S in air
îgn i tion Wi res
Gas Inlet
Spacer
Streak Camera
Schematic diagram of experimental selup for flame propagallon experimenis.
IGNITION WIRES
.\> / / / / / / / / / 1 1/ / / .- t:, I i\ \ 1 : • 1 ! I 1' ,'f\
Ui O! O Otri 11 / / / / 1 h / / / / /11 i /////////// 1 TT 1 /I m
GAS OUTLETGAS INLET
GAS OUTLET
schemtllc cross-stcllonil vltw of experimental chamber showing the obstacle con-figuration.
Figure A2.1 Continued.
ti
D = 2.54 cm,H = 1.27 cm, P = 3 cm,Rp = 70 m/sec
D = 2.54 cm,H = 1.27 cm, P = 3 cm,(H2S). RF = 50.4 m/sec
Figure A2.1 Continued...
R.m/t 6, m/t
r cm.FliTif ttlocli) Rf * i distance of propagation r for ilotchiotnrirV meihanr-alr Flimn
dolid runci carfe»p<md to Eq. (6) -llh o-O.Jt and p,~J7.$ tm, da»*td cvr»ei trc dra»nihri>UKh data puinl» (or x<60 cm): a) Plaiik lubt (pirali, i / - 4 ttn,/>- JOcm on boih top andKotiom plaiei, ////}-O.«7; b) plmiic lubt iptraf on bollom plair, M/J5-0.S7; c) plasiic tubetpirab. o l'ip plaît nnl) ,0 tup and bntlnm plaît, ti/t)-f).4; d> «lailk l«be »»lr«l on bottom
r cm.Flame *tlodt)' rf^ *• distance of proptpilom r tor ttoiehiomtuic mtlhan«.alr fiam^
(bolid c«r»« coftnpond to Eq. (7) «Hih « - 0 J 1 and p# »37J cm): a) copper lube spiral. «-1.2Scm. p •• 3-t cm «n toiiem ptalc, p(at(ic Itivc apiral; / / • 4<m, p» 10 m • • lap plate: W//>- 0.5Ï;h| c«pp«r tabc iplra] on bottom plate, HfD^Q.H, c) copper lube iplnl on bottom plat?.mD" 0.25: d) copper i»be tpfral en bottant plate. HtD »II.I3 fik» experimental point ai 30 cm ufrom the laboratory rnulUof Mocatd aJ. (1*M)].
Figure A2.2Beale (1980) and Moen (1982)
Central ignition between two plates 0.6 m diameterCylinders (125,2.5 cm diameter) as obstaclesCH4
Top p l a t e
Steel bandCeramic cap
\xi 111 n y / 1 1 i 1 1 /7t
I g n f t o r
O b s t a c l e
/ / / / / / / / is v / n i
111 n M 1111111 i/i i\\i 1111111 r m 111 n
C a s o u t l e t
B o t t o m p l a t e
Gas i n l e t
oo o
o oo
o • o
o ,
10 c
o 'o --o
o o "Oe.o
O O o'
Q o
10 cr
o -o o o
o ° ° ° o o o© °~°- © o o o
* o ° o ° o o oO o Q O O O O O
o o(~) " (" igni t ion Q (
BL O I U 1 1 'or.il °
° o o o o © © ' oO O O O e o ° C
o o o ° o o °
o o o o
oo o o
oo o o
o oo ° o
radial sful l fo , , , ,
o o o
~t" igni t ion
O full fore . r
_̂ r c d i a l &
i u I i l o r c t
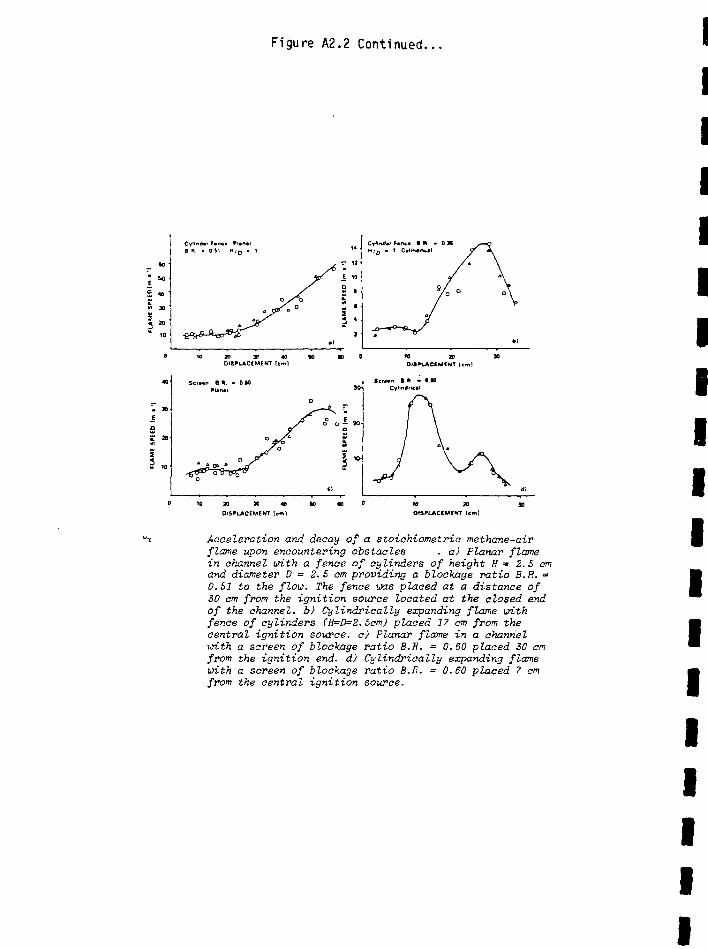
Figure A2.2 Continued...
Cyl'nriar Fane» f l»n«rI R - 0 SI H / o - 1
£
2 »
« o •
to
. 30'
OtSPLACCMCVT I c m ]
Acceleration and decay of a stoichiometric methane-airflame upon encountering obstacles . a) Planar flamein channel with a fence of cylinders of height H = 2.5 cmand diameter D = 2.5 cm providing a blockage ratio B.R. =0.S1 to the flow. The fence was placed at a distance ofSO am from the ignition source located at the closed endof the channel, b) Cylindrically expanding flame withfence of cylinders (H=D=2.5cm) placed 17 cm from thecentral ignition source, c) Planar flame in a channelwith a screen of blockage ratio B.E. = 0.60 placed 30 cmfrom the ignition end. d) Cylindrically expanding flamewith a screen of blockage ratio B.R. = 0.60 placed 7 cmfrom the central ignition source.
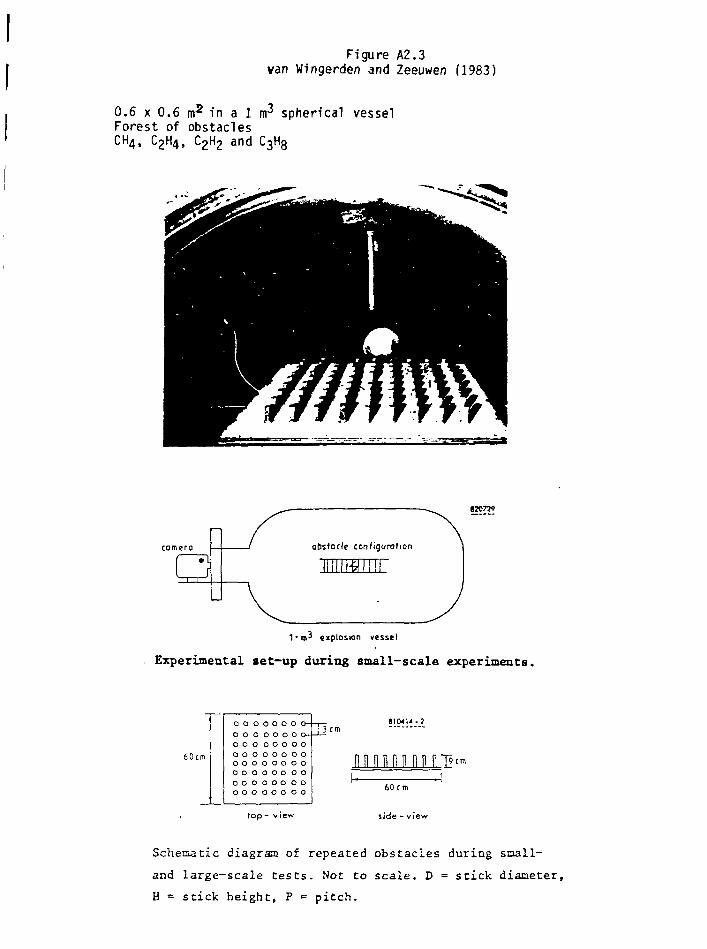
Figure A2.3van Wingerden and Zeeuwen (1983)
0.6 x 0.6 m2 in a i m 3 spherical vesselForest of obstaclesCH4, C2H4, C2H2 and C3H8
obstacle configuration
850779
miifliiir
1-m3 explosion vessel
Experimental set-up during small-scale experiments.
60cm
00000000-00000000-00000000000000000000000000000000OOOOOOOO00000000
top - v ie
6IWU-2
n n n n n n !
60 cm
side - view
Schematic diagram of repeated obstacles during sraall-
and large-scale tests. Not to scale. D = stick diameter,
H = stick height, P = pitch.
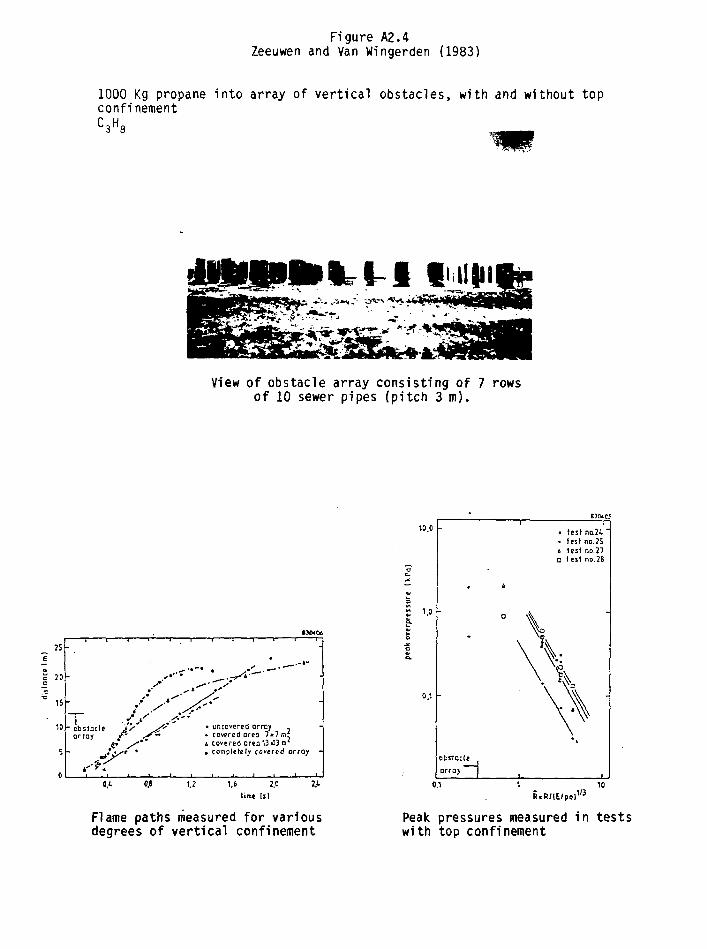
Figure A2.4Zeeuwen and Van Wingerden (1983)
1000 Kg propane into array of vertical obstacles, with and without topconfinementC3H8 .
1 - 1 tllllil
View of obstacle array consisting of 7 rowsof 10 sewer pipes (pitch 3 m).
IS -
20 -
15 -
10
5
obstacleorroy
• uncovered orroy -• covered orea 7*7 m̂i covered Oreo 13«13m'• completely covered orroy
0.' «J» 1.2 2.0time Is)
Flame paths measured for variousdegrees of vertical confinement
10.0
1.0
0.1
• A
D
obstacle
array j
a
w
\N
tes» no.2l 'test no.2Slest no.27test no.28
-
\
0.1 1 10R«R/lt/po)V3
Peak pressures measured in testswith top confinement
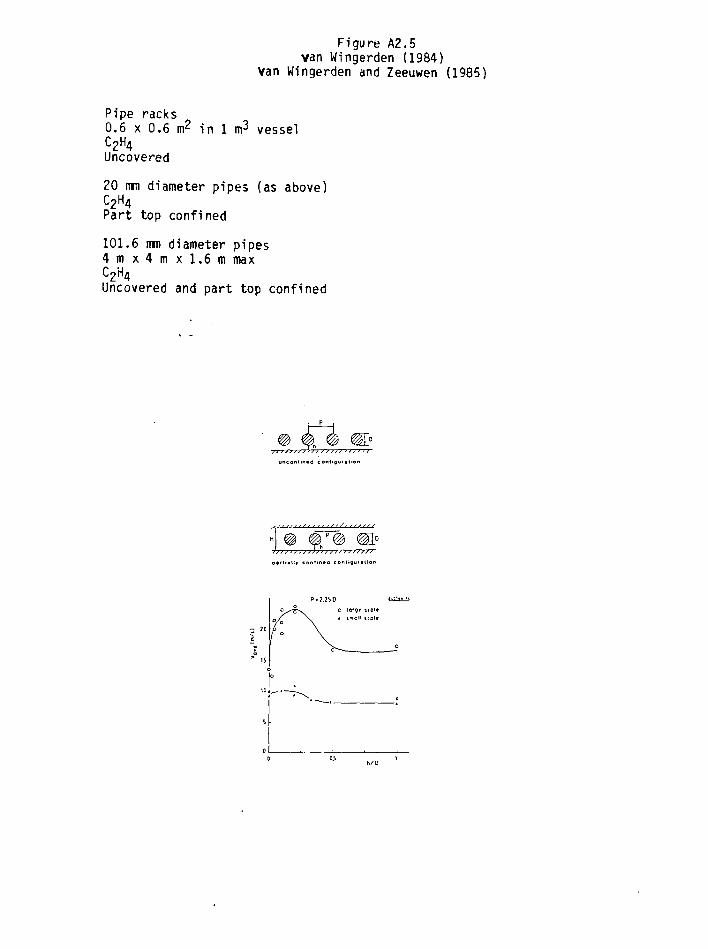
Figure A2.5van Wingerden (1984)
Van Wingerden and Zeeuwen (1985)
Pipe racks0.6 x 0.6 m^ in 1 m^ vesselC2H4
Uncovered20 mm diameter pipes (as above)C2H4
Part top confined
101.6 nm diameter pipes4 m x 4 m x l . 6 m maxC2H4
Uncovered and part top confined
Figure A2.5 (continued)
View of the small-scale obstacle array mounted in thecentre of the 1-m3 explosion vessel
View of the horizontal tubes used in the large-scale tests
Figure A2.5 Continued...
h «O.I DP-7.2S0
i loryr i
i tMolt not*
100
50
0C
t
\
UA. .' V \ / ^> -̂̂ *̂— '
1 I 3
1
i 03
0.11OU
- ^ ^
Figure A2.6Hjertager (1984)
Radial dise, 0.5 m radius with obstaclesC3H8, CH4Top confined
IGNITION
PRESSURETRANSDUCE
ION PROBES
OBSTACLES
Schematic diagram of experimental set-up.
2 Û
16
12
1O
OB
06
0 *
oa
0 1
OOB
OOS
0 0 4
0 0 2
Typr * «toi
p/n
itdf o - » « * U" F t o l
: i^mn 16oww C«*^ j » ^ ^6 ? 6 2* f V ^
/
/
/ clV-"«
/ /y*
/O//1 / "
/A/// / /
03 0* 01> Of, 07 06
Maximum prtuure in ridial di«c «xpcrimenU venus block ice ritio for variouiobsUelc (hapes. -
Figure A2.7Leyer (1982)
Pancake shaped soap bubblesRadii 9, 22, 35.5 cmHeight 2.4 - 9 cmNo obstaclesC2H4
Sketch of the cylindrical charge experimental ar-rangement.

Part I I I : Channel Configurations/Partial Confinement
TABLE AIII - Fuel Air Flame Acceleration: Channels/Partial Confinement
Item Reference Configuration Fuel Flame OverpressureVelocity Maximum(m/s) (bar)
Remarks
i ) Weak I g n i t i o n :
A3.1
A3.2
A3.3
A3.4
Chan et a l . (1983)
Urtiew et a l . (1983)
Sherman et a l . (1985)Berman (1985)
Pfôrtner et a l . (1983)Orth (1983)
Channel 1.22 m long by127 x 203 m2.Repeated b a f f l e obstacles32, 50 and 76 mm high(see F ig . A3.1)
Channel 0.9 m long0.3 m high x 0.15 m high.Repeated b a f f l e obstacles35, 92 mm high(see Fig A3.2)
Channel 30.5 m long ,2.44 m h igh , 1.83 m wide.No Obstacles(see F ig . A3.3)
Lane 10 m long,3 m x 3 m cross-sect ionMo Obstacles(see Fig A3.4)
CH.CH,,CH,C\
C3H8
H,(18.4S)H?(25, 30%)H,(12-28%)H,(15-18%)H2(24.8%)
H2(36%)
160-350 0.1530-9010-15
5
20
150 0.26Trans i t ion to detonation127 0.17115 0.1Trans i t ion to detonation
Trans i t ion to detonation
Closed top8% open top23% open top50% open top
Open top(obstacles o f f groun
Closed topClosed top50% open top13% open top13% open top
Open topwi th fan
I
.../M
TABLE A l l I - Continued...
Item Reference Configuration Fuel FlameVelocityMaximum(m/s)
OverpressureMaximum(bar)
Remarks
ii) Jet Ignition:
A3.5 Schildknecht & Geiger (1982) 0.5 m x 0.5 m driver(Schildknecht et al. (1984)
Stock and Geiger (1984)
A3.6 Schildknecht (1984)
A3.7 Stock and Geiger (1985)
A3.8 Moen et a l . (1985)
with/without turbulencegenerators into4 m x l m x l m sectionwith various degreesof confinement(see Fig. A3.5)
Into lane4 m x l m x l m lane(see Fig. A3.6)
Into lane1 2 m x 3 m x 3 m(see Fig. A3.7)
Into 4 m long plastic bag2.0 m in diameter(see Fig. A3.8)
=850 (Jet) 1.3
=850 (Jet) 3.8
Plastic only onthree sides and end
Partial confinement
Transition to detonation Lane with plastic top
Transition to detonation Lane with plastic top
600 (Jet) Transition to detonation
Figure A3.1Chan e t a l . (1983)
Channel 1.22 m long by 127 x 203 mm2 cross-sectionRepeated baf f le obstaclesCH4
~tl_i i ' i i
Gas inlet
~r
• Perforated top plate
rObstacles along central axis
I I I I I I I
Schematics of experimental apparatus.
0.4
0 3
I °2cea.CEUi
MEASURED PRESSURE
PREDICTEO PRESSURE
0.1
0 010 3 0 4 0 50 6 0
TIME , m»The pressure development in a fully confined channel.
1 6 0
140
I 120
zo
100
«IIJl' 11 ,.' 11 1
1
1 1I 1
I
1 1
E
aUJIUa.tn
UJS
8 0
6 0
4 0
7020
O h * 76 mm P= 101 mmû h=76mm PM52 mm* h =51 mm P = I52 mm• h - 51 mm P*IOI mm
ëf-
20 40 60 eo 100
OEGREE OF CONFINEMENT , %Flame speed at 1 m from ignition for various de-
trees of confinement and obstacle configurations.
Figure A3.3Sherman et a l . (1985)
Berman (1985)
30.5 m x 1.8 m x 2 . 4 m channelConf ined - 50% top open
H2
FLAME facility
Illustration of the FLAME facility(FLame Acceleration Measurements andExperiments).
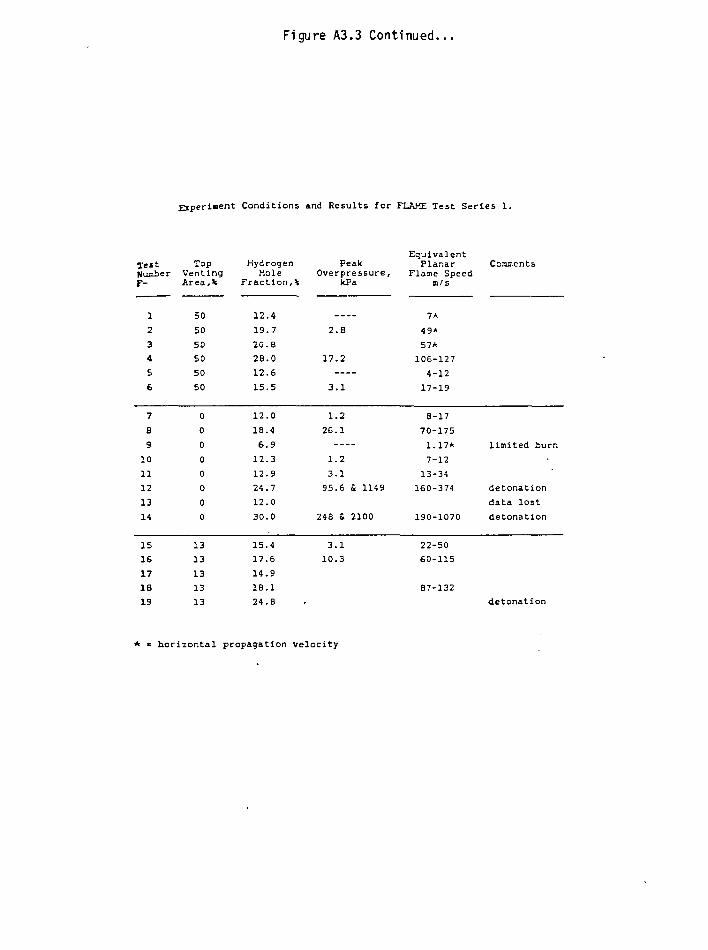
Figure A3.3 Continued...
Experiment Conditions and Results for FLAME Test Series 1.
TestNuaierF-
12
3
4
5
6
7
8
9
10
11
12
13
14
15
16
17
IB19
TopVentingArea,*
50
50
50
50
50
50
0
0
0
0
0
0
0
0
13
13
13
13
13
HydrogenHole
Fraction,*
12.4
19.7
20.8
28.0
12.6
15.5
12.0
18.4
6.9
12.3
12.9
24.7
12.0
30.0
15.4
17.6
14.9
18.1
24.B
PeakOverpressure,
kPa
2.B
17.2
3.1
1.2
26.1
1.2
3.1
95.6 & 1149
248 & 2100
3.1
10.3
EquivalentPlanar
Flame Speedm/s
7*
49*
57*
106-127
4-12
17-19
8-17
70-175
1.17*
7-12
13-34
160-374
190-1070
22-50
60-115
87-132
Coranents
limited burn
detonation
data lost
detonation
detonation
horizontal propagation velocity
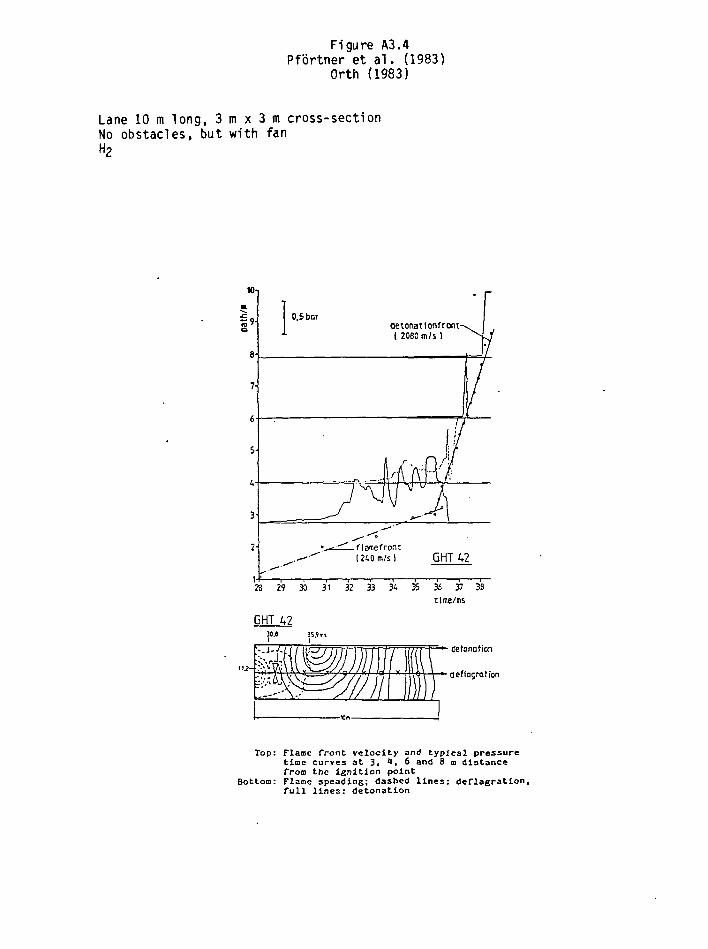
Figure A3.4Pfbrtner et a l . (1983)
Orth (1983)
Lane 10 m long, 3 m x 3 m cross-sectionNo obstacles, but with fanH2
23 29 30 31 32 33 34 35 36 37 38
Ce fonction
deflagration
Top: Flame front velocity and typical pressuretime curves at 3. "# 6 and 8 m distancefrom the ignition point
Bottom: Flame speading; dashed lines: deflagration,full lines: detonation
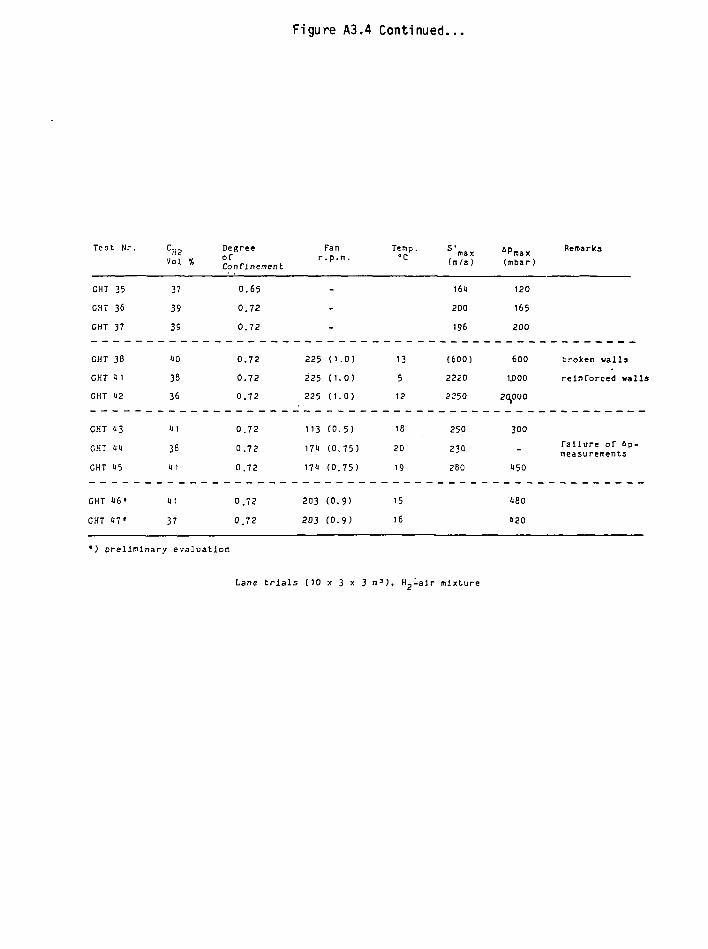
Figure A3.4 Continued...
Test Nr.
CHT 35
CHT 36
CHT 37
CHT 38
CHT m
GHT 12
GHT 13
CHT ill
CHT 15
CHT 16»
CHT <I7'
CH2Vol %
37
39
39
no
38
36
n 1
3B
ii 1
m37
DegreeofConfinement
0.65
0.72
0.72
0.72
0.72
0.72
0.72
0.72
0.72
0.72
0.72
225
225
225
113
171
171
203
203
Fan• P-
-
-
-
(1
(1.
C1.
(0.
(0.
(0.
(0.
(0.
.0)
.0)
.0)
.5)
75)
75)
9)
9)
Temp.°C
13
5
12
18
20
19
15
16
max(m/a)
161
200
196
(600)
2220
2?50
250
230
280
APnax(mbar)
120
165
200
600
1.000
20,000
300
-
1150
H80
120
Remarks
broken walla
reinforced walla
failure of ûp-measurements
*) preliminary evaluation
Lane trials (10 x 3 x 3 • ' ) , H^'-air mixture
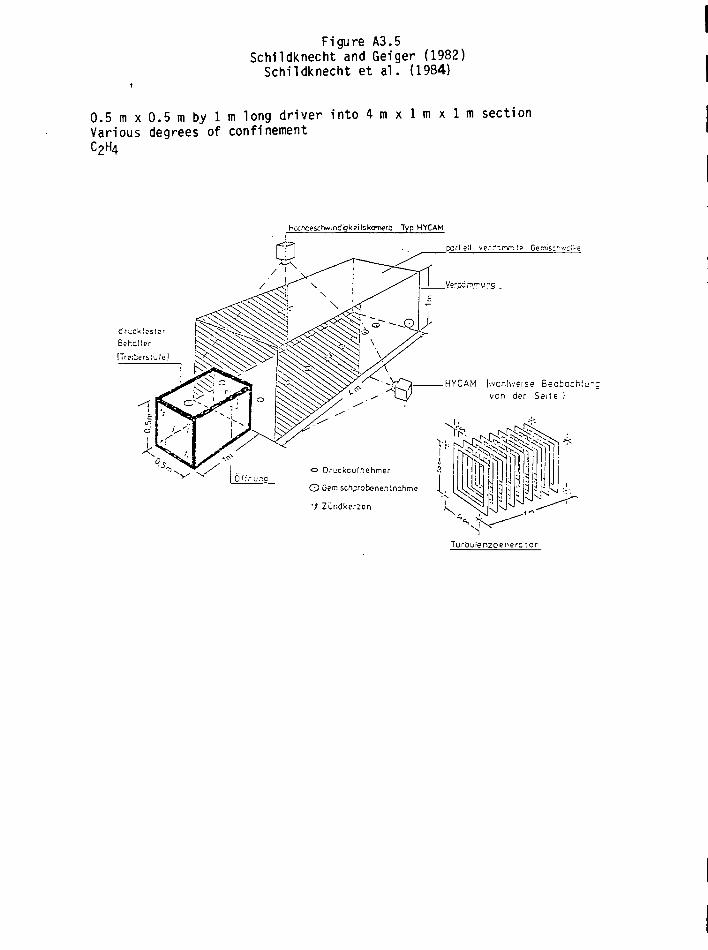
Figure A3.5Schildknecht and Geiger (1982)
Schildknecht et al. (1984)
0.5 m x 0.5 m by 1 m long driver into 4 m x 1 m x 1 m sectionVarious degrees of confinementC2H4
Hg)x:esc^indqkeilskomero Typ HYÇAM
HYCAM Iwchlv.-eise Beoboch!von der Seite !
<=• Druckcufnehmer
O Gemischprobenenlnahme
't Zùndkerzen
Turbuienzqei'erctcr
Figure A3.5 Continued...
solid wall
plastic fo i l wall
i 6
d>, \S/ /A _,
'V/JA~
r /v / / / /1
| / / ' ' ' •
y s / /s, s s /
"U
IV
VI
VII
VIII
Jet Ignition Configurations
Figure A3.5 Continued...
/////////////
/
1. /% /
V,m /
/
km iPl P2 P3 1 % P6 P 7 P 8 ,
_ ] , *<•
50
c.brc: Gûsprobeneni nohme }'Seilenansicht
F o t o - B l i t z
HYCAM
J:-\V^
i
I
i
I
I
"î Pn
Konfigurationen
I-VI
- p i10 -
•tfï P2 P3 P
s s s// IBunkerwand ]
3 P P p , «-
.5. -6. ;'. }r? L
• 2 «3 j*
•v.
; zz i
Konfiguration
VII
An.75 1.25 0.75 025 0.25 0.75 1.25 1.7s[ m
1m
*—1m —
! A Ai
Lope der Oruckan fnchmrr un cl Son rt critter HochgCBChw
Konfiguration
VIII
M 1:50
r Dlickfcld
Figure A3.5 Continued..,
Zuaammenstellung der in den einzelnen Anordnungen aufgetrctenenn.oximalen Werte fiir Oberdruck und apezi fiachen Impuls
K o n f i g u r J t ] o n
r. «* m i 3 c h -
ni 11 i 5
-
0,0025
-
ohnc
0. 1
I
0 ,07
2 . 2
ischxolkc
0 ,3
I
i . a i
olmc
0, 1
V I I
. . .
m i t
0 , 3
IV
3 ,6
7 ,7
F r n s i r . , 1 , 1
olmr n, j I
0 ,1 b , 3
VIJI VIII
2.35 1
2 , 1
fm 1
free cloud
P
0,7=
0.25
distance, m
Peak overpressure in the free cloud vs. distance fromthe opening of a room where jet ignition originates,for various orifice ratios (F area of the opening,F cross «ection of the room)G
Figure A3.5 Continued...
1.0
0,5
jet igni tionwi tb obstacles inside
jet ignition withoutobstacles inside
30 A0 50
i g n i t i o n by a spark outside the room
m = 0,006 bor
100
-0,01-
Pressure signals at the point of maximumoverpressure in the external cloud for jetignition and spark ignition
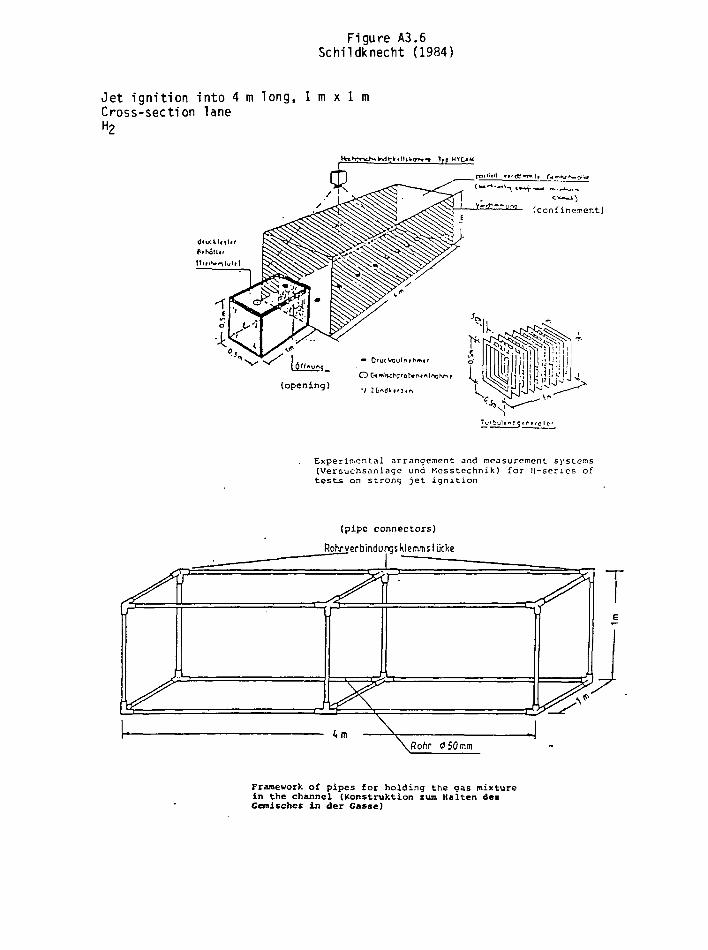
Figure A3.6Schildknecht (1984)
Jet ignition into 4 m long, 1 m x 1 mCross-section laneH2
O Cf(opening) ., :
(confinement)
Experimental arrangement and measurement systems(Versuchsjinlagc und Hesstcchnik) for ll-scrics oftest^ on strong jet ignition
(pipe connectors)
Rohrverbindungsklemmstucke
j
•
\\Rohr $50 mm
T
Framework of pipes for holding the gas mixturein the channel (Konstruktion zum Halten desGentisches In der Casse)
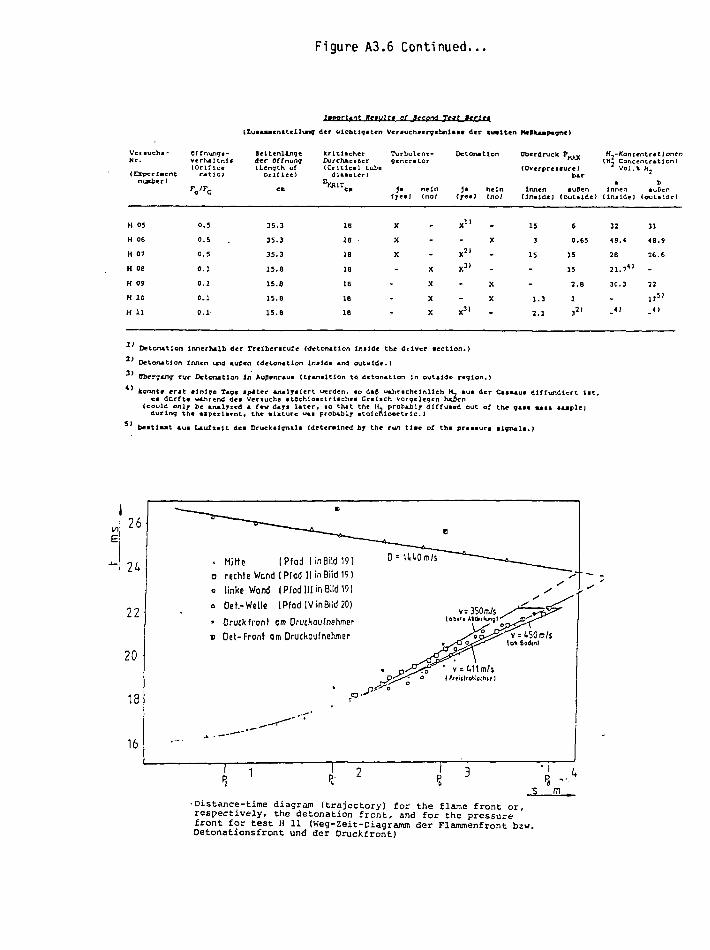
Figure A3.6 Continued...
Important Hewultw af Second T*3t Mtrlrt
(2ui*uenBtcilwi9 der vlcbclçcten Verauchverfcbnls»* dec- «wvlten
Venuchi-Nr.
(ErperlaennusberJ
Offnungi-verMJtnlf(Orifice
Seltenlljigeder Oltnuntj(Length of
orifice]
c»
kritltcher Turbulent-DurchaesBer generator(CrltU.l tubedlaaeter]
(neln
(yell (nol3»
irelb»r
K,-Konientf* 11onen(H? Concentration)
Vol.» H2
(lnaldej (outilde) (Inilce) (outsldel
H 05
H OS
H 0?
H 08
H 09
H 10
H 11
o.s
0.5
0.5
0.1
0.1
0.1
0.1
35.3
35.3
35.3
15.8
15.8
15.8
15.8
16
18
le
le
18
le
le
15
3
15
1.3
1 . 1
6
0.65
15
15
2.8
1
3 * '
31
46.9
26.6
Detonation innerh*lb der Trclbcritufe (detonation J/iiide the dr ctlon.)
Detorutlon innen und «upen (detoo*tion Inoide *nd oututde.)
Cber-jifKf tue De ton* t ion in AuP«nr*u» (tr&niltlon to deton&tton In outside region.)
•comité er*t «inJçe T*çe aplter *n«ly<iert uerden, io d»P «•hnchelnllch H- «ut der CASMUS diffundiert l i t ,ci dorft* wihrend <Sei Vertucha ctecKlosctrlichea Ccniich vorçclcgcn hoien
(could onlj be aniljied « few d«yi l*tcrr io th*t the M. prob»Lbly diffused out of the çaaa man auplejduring th« «zperlarnt, the alsture «*• probably •totcfUotietric. )
beatlutt 4ui Laufxelt del Druckaigmla (detcralned bj the run tlae of th« preaaura •lgnali. f
. Mitte (Pfod linBtld19)
o rechte Wand [Pfod HinBiId19)
o linke Wond |PfodJIJinBild19J
Oeh-Welle {Pfad IV inBiid 20)
• Oruckfront cm Oruckoufnehner
o Det- Front om Druthoufnehmer
v = Ulm/sI Fttillroh\oihnl
•Distance-time diagram (trajectory) for the flame front or,respectively, the detonation front, and for the pressurefront for test H 11 (Weg-Zeit-Diagramm der Flammenfront bxv.Detonationsfront und der Druckfront)
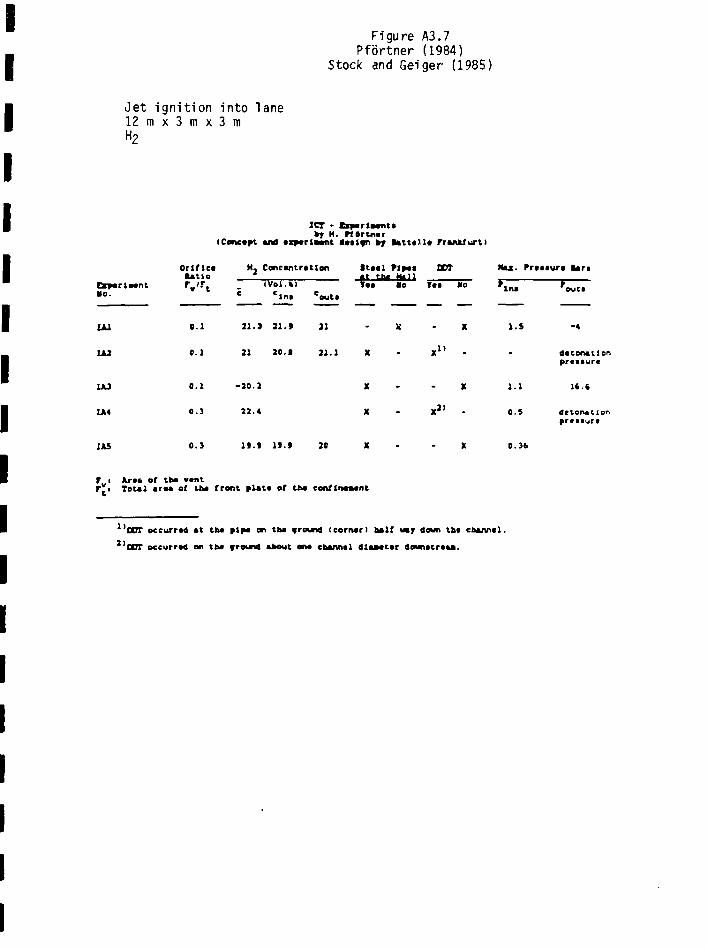
Jet ignition into lane1 2 m x 3 m x 3 mH2
Figure A3.7Pfortner (1984)
Stock and Geiger (1985)
ICT • baarlaantafry H. flOrtnar
I Concept and axparlMnt taaifn »r lattal la frankfurt)
DrpariMnt• e .
OrlfleaRatio
Concantratlon
lni vout»
• t a a l Plpaa DOT
aa Ko Taa Mo
Nu. Pratsura Ban
Lki
IÂ2
0.1
0.1
21. ) 21.»
21 20.1
21
21.1 X1»
l . S - •
tfttonatlon
1AJ
1A4
0.1
0.3
-20.2
22.4
1.1
o.s
l t . t
dttorn ilorprffisurt
IA5 0 .3 1».» I t . » 20 0.36
Ara* of tha vantTotal araa of tlta front plata of tba eonflna*ant
EOT eccurratf at tha alpa on tba fround (eornar) half lay down tha cbannal.
COT occurred on tha fround akotit ana channal dlaaatar donnât raaa.
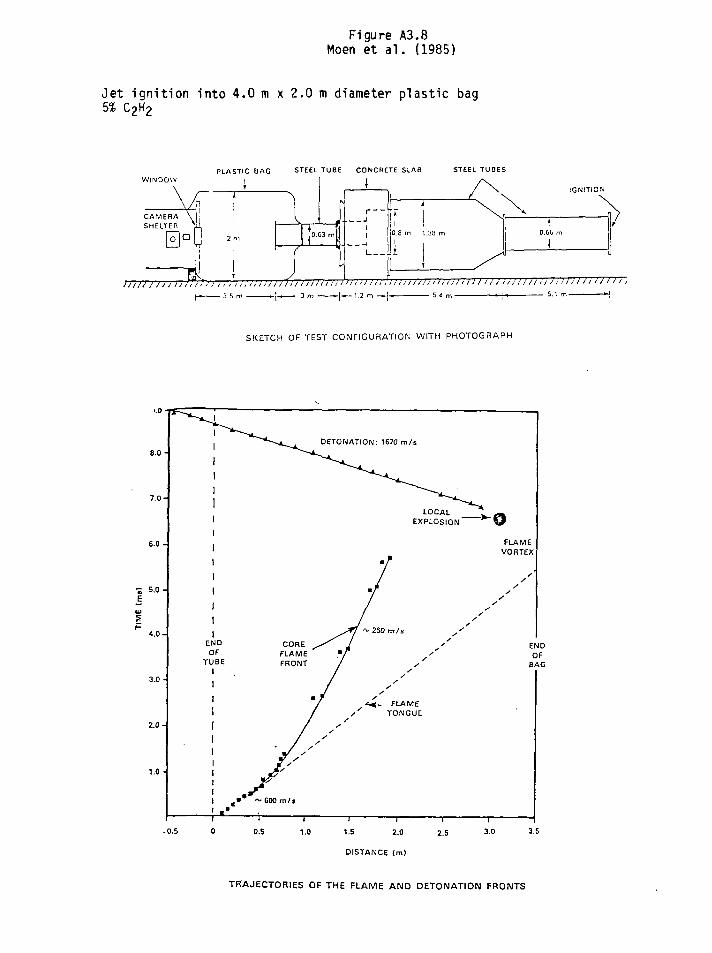
Figure A3.8Moen et a l . (1985)
Jet i g n i t i o n in to 4.0 m x 2.0 m diameter p las t ic bag5% C2H2
WINDOW\\
CAMERASHELTER
for
win u i ii
\/
\a
R
nIj
)\
PLASTIC BAG1T
k
2 m
T
STEEL
I
TUBE
1 ,0.03 m[
I)
CONCRETE SLAB
\
1111
]1
I filio.e m1
/ \
.38 m
\
i
O.0G m
1
IGNITION\
S
U
3 m H~"~ ! 2
SKETCH OF TEST CONFIGURATION WITH PHOTOGRAPH
7 0H
"S 5.0 -\B
P
i.o H
OETOMATION: 1670 m/s
0.5 1.0
DISTANCE (m)
TRAJECTORIES OF THE FLAME AND DETONATION FRONTS

Part IV: Tubes
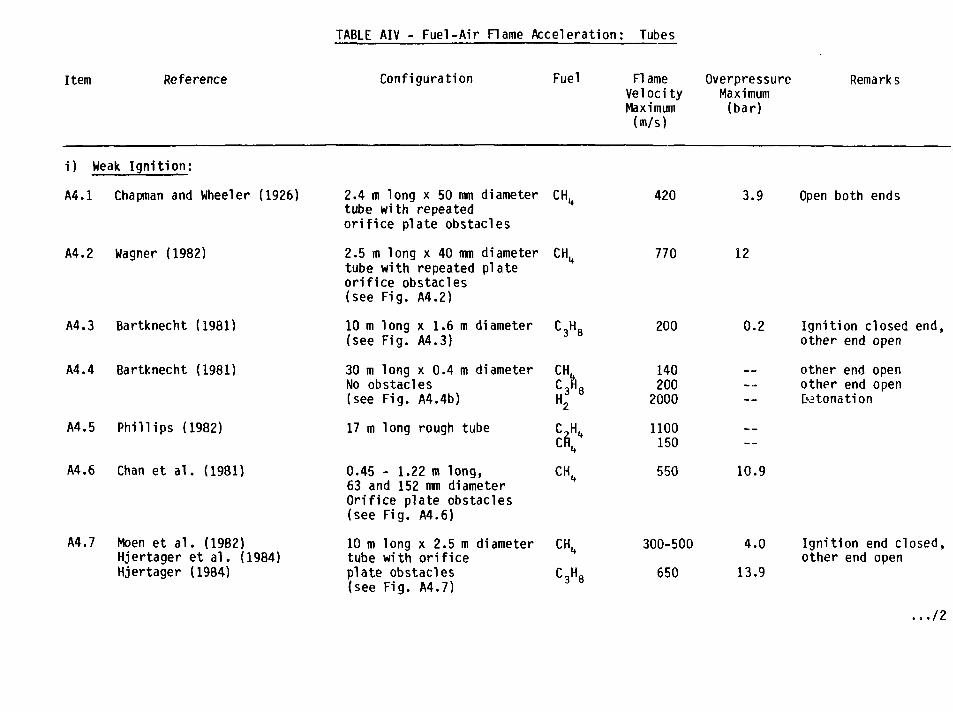
TABLE AIV - Fuel-Air Flame Accelerat ion: Tubes
Item Reference Configuration Fuel FlameVelocityMaximum(m/s)
OverpressureMaximum(bar)
Remarks
i) Weak Ignition:
A4.1 Chapman and Wheeler (1926)
A4.2 Wagner (1982)
A4.3 Bartknecht (1981)
A4.4 Bartknecht (1981)
A4.5 Phillips (1982)
A4.6 Chan et al. (1981)
A4.7 Moen et al. (1982)Hjertager et al. (1984)Hjertager (1984)
2.4 m long x 50 mm diametertube with repeatedorifice plate obstacles
0.45 - 1.22 m long, CH^63 and 152 mm diameterOrifice plate obstacles(see Fig. A4.6)
10 m long x 2.5 m diameter CHMtube with orificeplate obstacles(see Fig. A4.7)
C3 H8
420
2.5 m long x 40 mm diametertube with repeated plateorifice obstacles(see Fig. A4.2)
10 m(see
longFig.
x 1.6 m diameterA4.3)
30 m long x 0.4 m diameterNo obstacles(see Fig. A4.4b)
17 m long rough tube
C3 H8
CH
S *
770
200
1402002000
1100150
550
3.9
12
0.2
10.9
Open both ends
Ignition closed end,other end open
other end openother end openDetonation
300-500
650
4
13
.0
.9
Ignition end closed,other end open
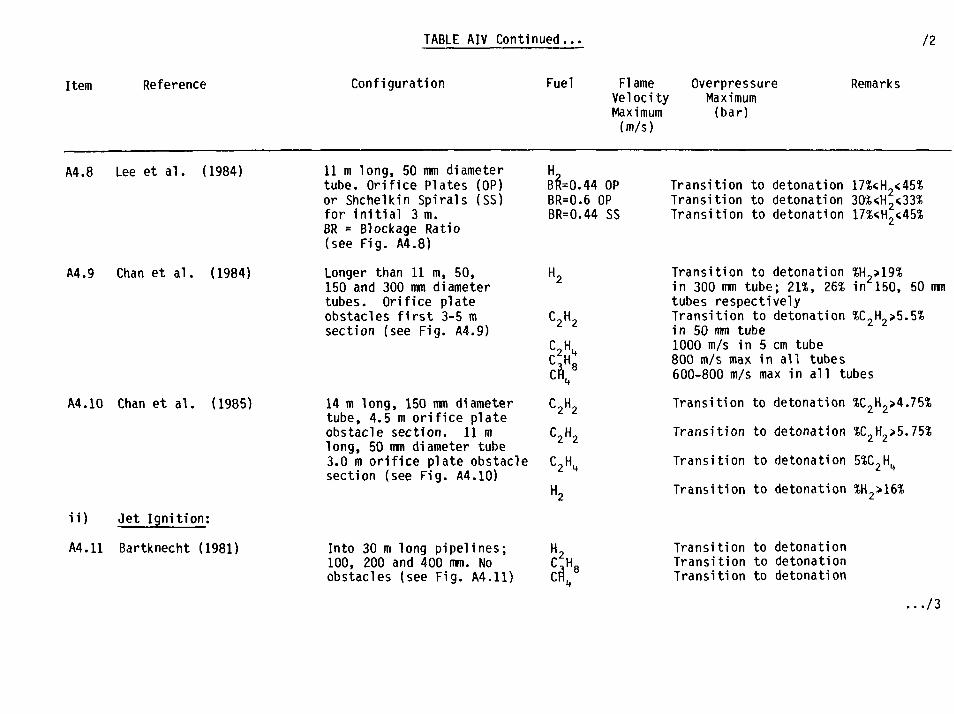
TABLE AIV Continued.., Il
Item Reference Configuration Fuel FlameVelocityMaximum(m/s)
OverpressureMaximum(bar)
Remarks
A4.8 Lee et al. (1984) 11 m long, 50 mm diameter Htube. Orifice Plates (OP) BR=0.44 0Por Shchelkin Spirals (SS) BR=0.6 OPfor initial 3 m. BR=0.44 SSBR = Blockage Ratio(see Fig. A4.8)
Transition to detonation 17ï<H2<45%Transition to detonation 30%<H2<33XTransition to detonation 17%<H2<45%
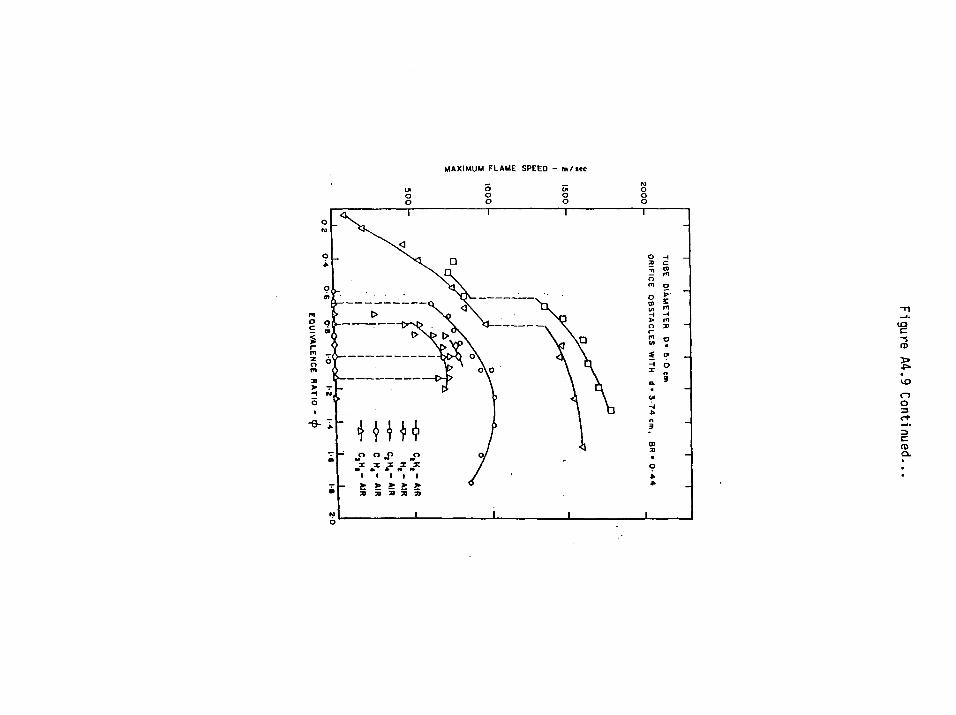
A4.9 Chan et al. (1984) Longer than 11 m, 50,150 and 300 mm diametertubes. Orifice plateobstacles first 3-5 msection (see Fig. A4.9)
C2H2
C3 H8
Transition to detonation % ?in 300 mm tube; 21%, 26% in 150, 50 mmtubes respectivelyTransition to detonation %C2H2>5.5%in 50 mm tube1000 m/s in 5 cm tube800 m/s max in al l tubes600-800 m/s max in a l l tubes
A4.10 Chan et al. (1985)
ii) Jet Ignition;
A4.11 Bartknecht (1981)
14 m long, 150 mm diametertube, 4.5 m orifice plateobstacle section. 11 mlong, 50 mm diameter tube3.0 m orifice plate obstaclesection (see Fig. A4.10)
Into 30 m long pipelines;100, 200 and 400 mm. Noobstacles (see Fig. A4.11)
C2H2
H2C 3 H
Transition to detonation XC2H2>4.75%
Transition to detonation %C2H2>5.75%
Transition to detonation
Transition to detonation %H2>16%
Transition to detonationTransition to detonationTransition to detonation
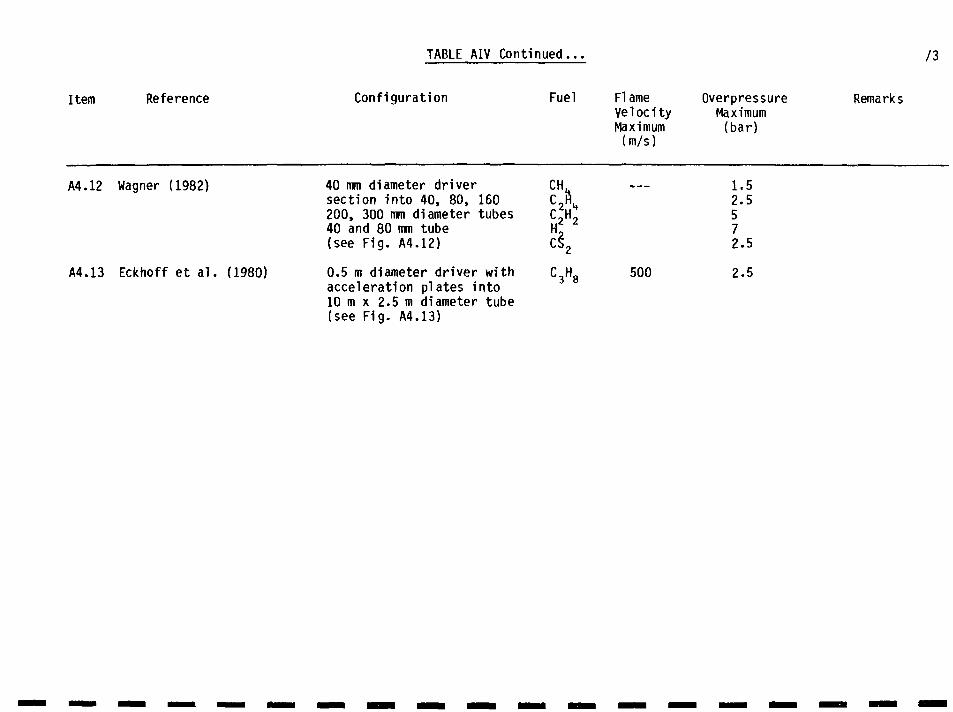
TABLE AIV Continued... /3
Item Reference Configuration Fuel Flame Overpressure RemarksVelocity MaximumMaximum (bar)(m/s)
A4.12 Wagner (1982) 40 mm diameter driver CH — 1.5section into 40, 80, 160 C2H1+ 2.5200, 300 mm diameter tubes C,H2 540 and 80 mm tube H2 7(see Fig. A4.12) CS2 2.5
A4.13 Eckhoff et al. (1980) 0.5 m diameter driver with C H8 500 2.5acceleration plates into10 m x 2.5 m diameter tube(see Fig. A4.13)
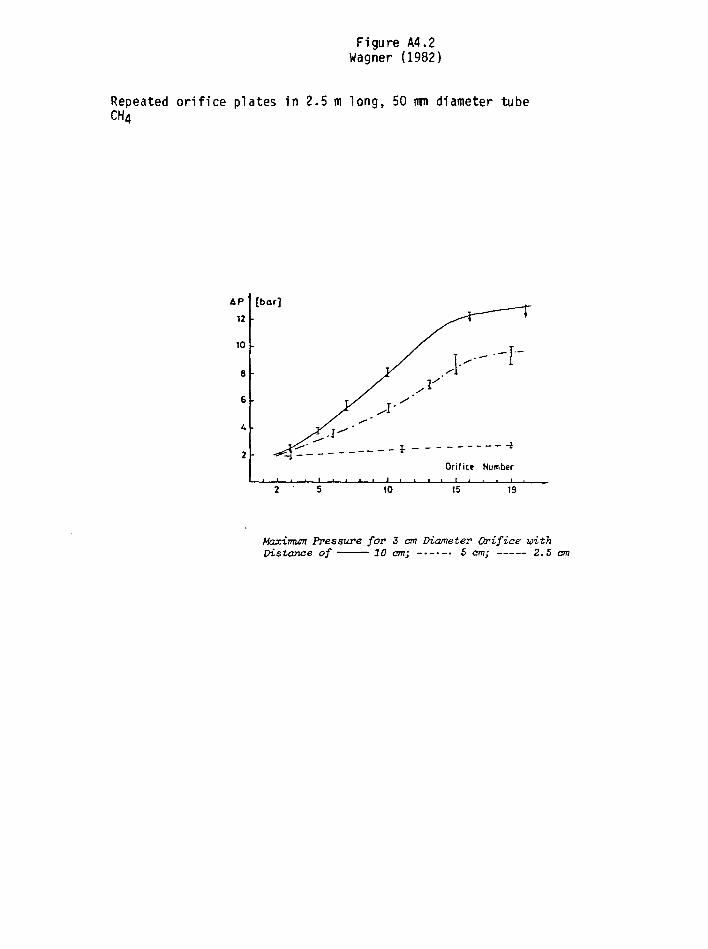
Figure A4.2Wagner (1982)
Repeated o r i f i c e plates in 2.5 m long, 50 irm diameter tubeCH4
4P
12
10
e
6
2
[bar]
/
• * • * — — — * ~
S* r
Orifice Number
10 15 19
Maximum Pressure for 3 cm Diameter Orifice withDistance of 10 cm; S cm; 2. S cm
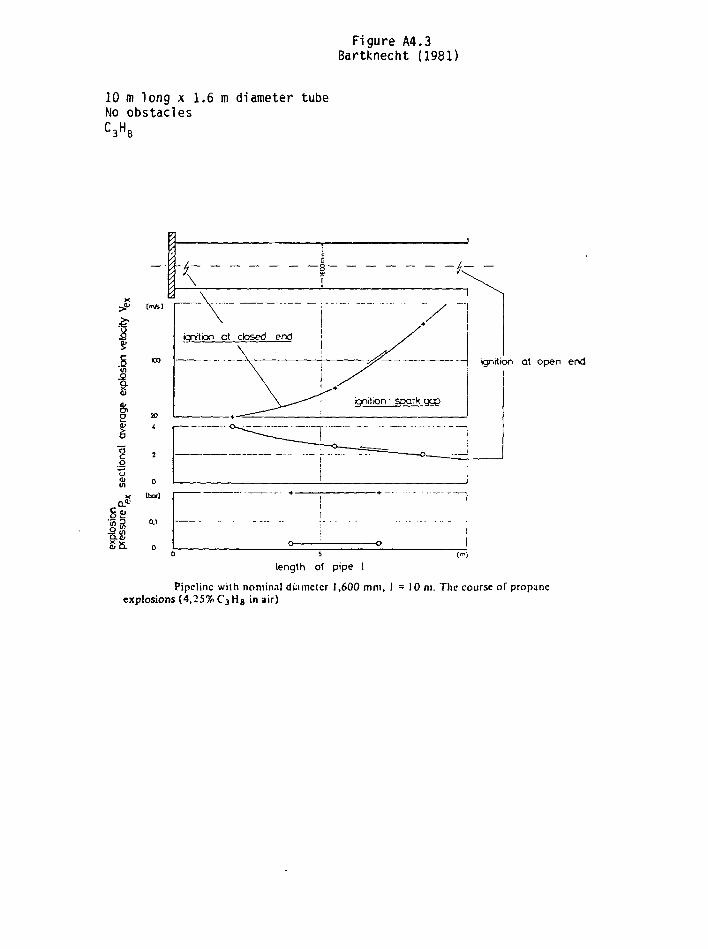
Figure A4.3Bartknecht (1981)
10 m long x 1.6 m diameter tubeNo obstacles
— ignition at open end
length of pipe I
Pipeline with nominal diameter 1,600 mm, I = 10 m. The course of propaneexplosions (4,25% CjH8 in air)
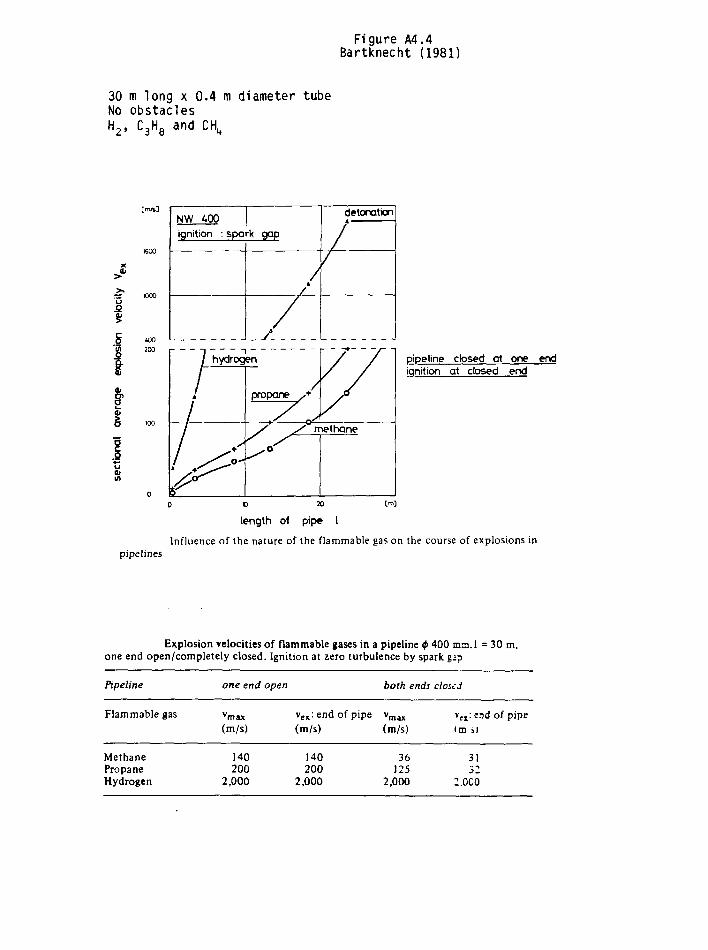
Figure A4.4Bartknecht (1981)
30 m long x 0.4 m diameter tubeNo obstaclesH2> C3H8 and CH4
S- «00
iOO
200
1.2ï/I
pipeline closed at one endignition at closed end
length of pipe I
Influence of the nature of the flammable gas on the course of explosions inpipelines
Explosion velocities of flammable gases in a pipeline <t> 400 mzi.l = 30 m,one end open/completely closed. Ignition at zero turbulence by spark gip
Pipeline
Flammable gas
MethanePropaneHydrogen
one end open
vmax(m/s)
140200
2,000
vex: end of pipe(m/s)
140200
2,000
both ends
vmax(m/s)
36125
2,000
closed
vel: end of pipeim a
313 :
2.000
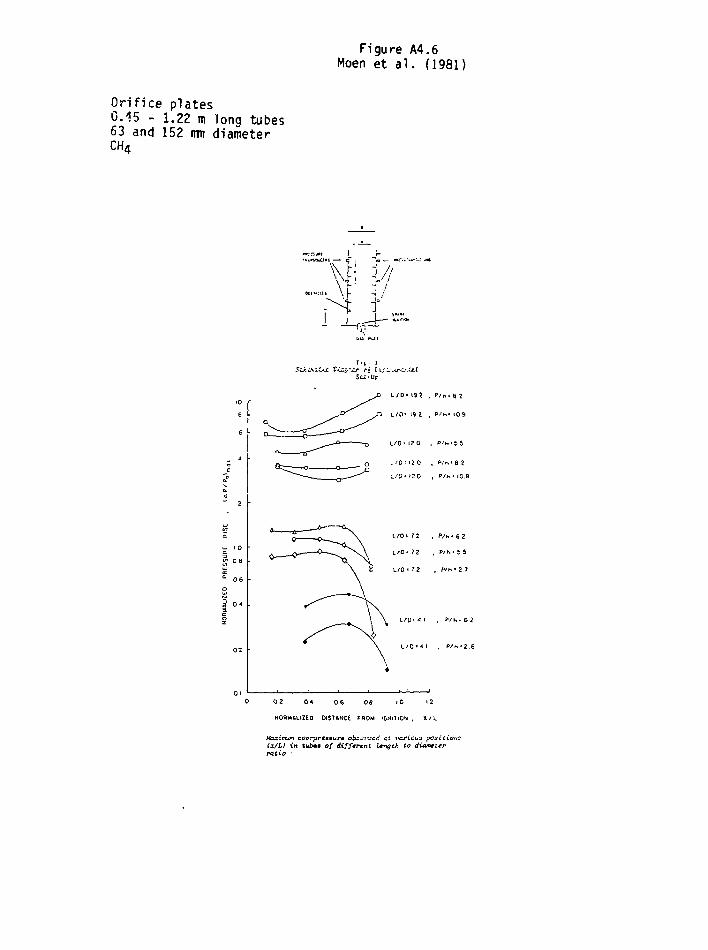
Orifice plates0.45 - 1.22 m long tubes63 and 152 mm diameterCH4
Figure A4.6Moen et a l . (1981)
• Viy
ScX-Up
L-'0 = 12 0 , P/h'8 2
1./Q' 12 0 , P/fi- 10-9
02 04 06 OS iO 12
NORMALIZED DISTANCE TRO« tCNi7)0N , x / t
ovcrpr<s»u7*« otfiw-r-ncrf at various positions(x/L! in tub*» of different length to diamattrratio •
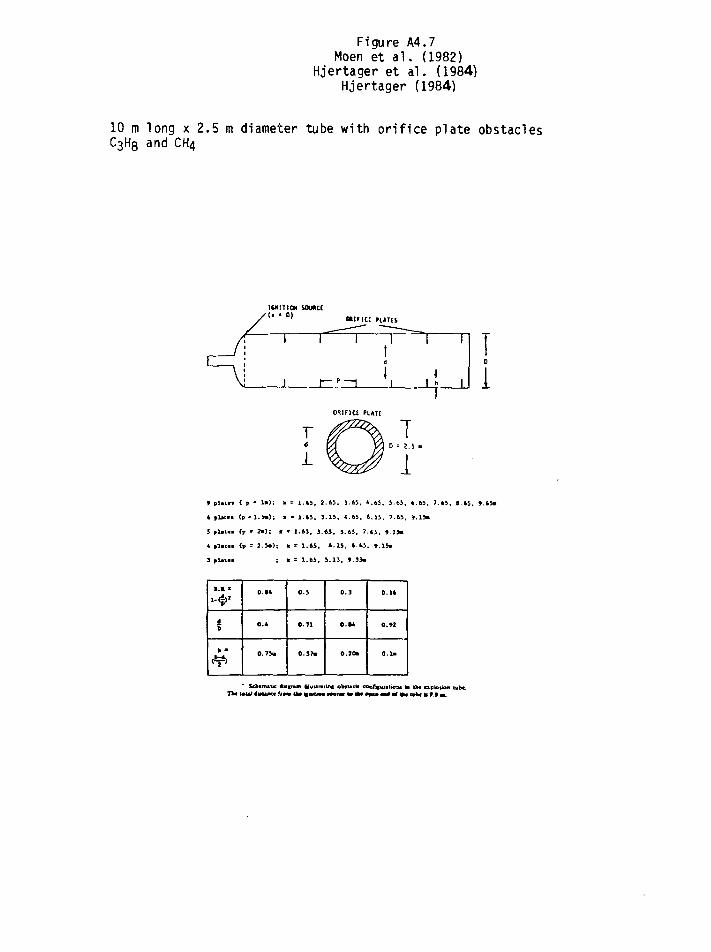
Figure A4.7Moen et a l . (1982)
Hjertager et a l . (1984)Hjertager (1984)
10 m long x 2.5 m diameter tube with o r i f i c e plate obstaclesC3H8 and CH4
1SMITI0M/ ( > • 0)
i i
SOUKLE
1
r - p
aiFICE.
1
—1
•UTEJ'
1
t1
1 1
1 Ï 1
TD
1
D • 2 . 5 i
9 plat** ( p ' l a ) ; x = 1.43. 2 . b } . 3 . (S , 4.6S. Î .65 ,
i •!<[>• <p • 1.5a): » • 1.45. 3 .15 . *-»5, 4 .15 . 7.45,
5 a l a i » (p " Ja); « « 1.45. 3 .45 . 5.45. 7.45, 9.15»
4 plaies (p = 2.5a); s e 1.45, 4 .15 , 4.45. 9.15a
3 r l i u i : » = 1 .45. 5 .13 . 1 .33-
!
h •
<¥>
o.w
0.4
0.75a
0.5
0.71
0.37a
0.3
D . U
0.30a
0.14
0.92
O.lB
Schematic *mgnm iUuiimtlng obiudt conr«urai»at ta ih* optotior tubeTW i«ul tituac* fitMH UM nnniM •*>••«• m MM «y*» M « af » • nh« ta » f M.
Figure A4.7 Continued.,.
— 500
o£3 «00
Ï 300
i
BLOCKAGE RATIO, BB i
0.1
EMPTY TUBE. POINT ICNITION
_I | |1
. Peak overprauur* inude the lube at function of nvimbei of tint» fix biocka)ntuttBR - 0 . 1 6 , 0.3 and 0.5. Proptn*—air mUturaa.
NUMBER OF RINGS
Terminal Dune ipced (between * , " 6.6l m nnd x ( • 9.61 m) versus number ofriaf» lor vanoua bktckafe ralWM. PropsiM—*ir a i t t u n i
IWUH OVERPRESSURE I b l r )
il
5 S
jr
Ir 0
AVERAGE MAXIMUM OVERPRESSURE (b»r|
s ; S3
-
1 1
szn
1 '
ï 1
î 1>
_ P
RO
PA
NE
.Q
U3a-i
>•F»
OO3
3
(T>C L
Figure A4.8Lee et a l . (1984)
11 m long, 50 mm diameter tube;Orifice plate orShchelkin spirals for initial 3 m
- I T r » _ i i i " t^ j -
IS C * « * M U C é ù p i m W u
CONSTANT VOLUME
- O - SMCMCLMIN I P I I U L , • « • 0 - 4 4
- O - oniricE HiMot, i » « a * 4- 9 - ORIFICE RtN*l, M'D.tO
10 IS 20
Variation of thr maximum iteady-iuie flamr wlociiy with compouiion of themaure for the thiac oUiack array conHfuretxHu nu4wd
Variation of ihc maximum -nw\ pi enure with compos Don of the Hj-*u mixIUIC foi the thjM OIHTKIC «ri»y conTtfuiationi nudied.
Figure A4.8 Continued...
Variai*» of fame wlodly aloof Ih* b in* tuto fat the orilk» rtnf obpuck•my "it* • UDCkap ntio BR - 0.60.
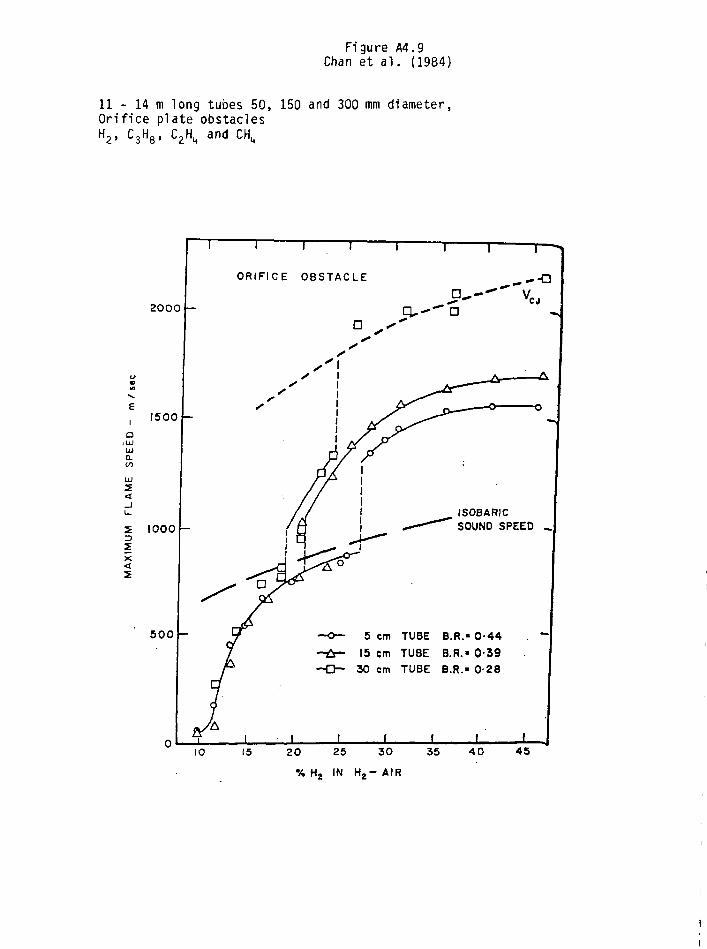
Figure A4.9Chan et a l . (1984)
11 - 14 m long tubes 50, 150 and 300 mm diameter,Or i f i ce plate obstaclesH- > C 3 H 8 ! and
2000
1500
ELCO
Id
2
U-
Z 1000sx
5 0 0
—i 1—;—i r
ORIFICE OBSTACLE
D
ISOBARICSOUND SPEED
I
5 cm TUBE B.R.-0-4415 cm TUBE B.R.- 0-39
30 cm TUBE B.R.- 0 2 8
10 15 20 25 30
% H2 IN H 2 - AIR
35 4 0 45
MAXIMUM FLAME SPEED - m/ltc
U3C
Oo
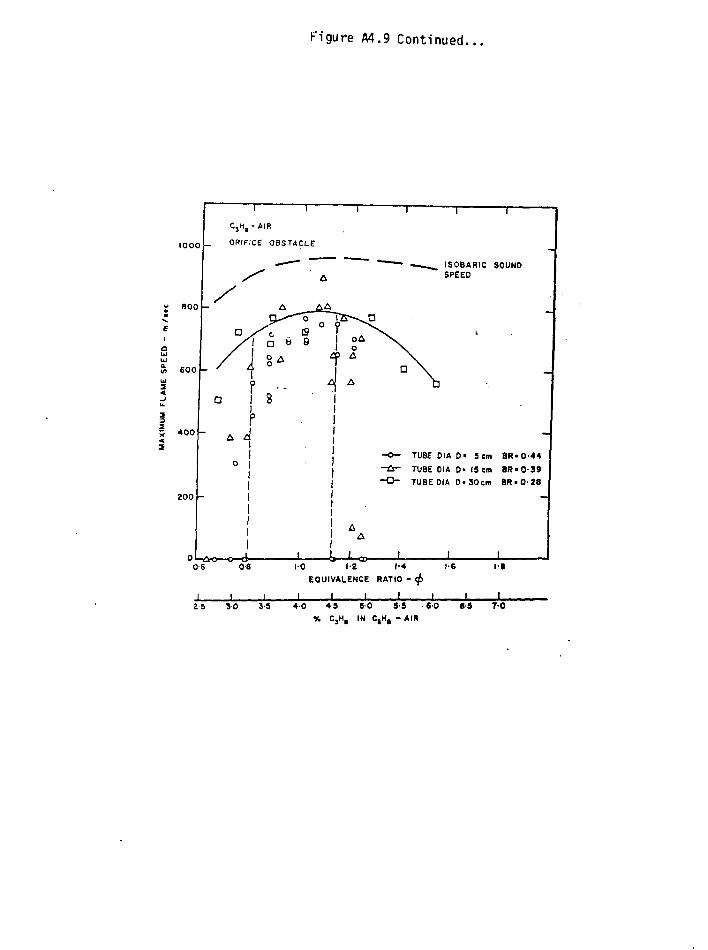
Figure A4.9 Continued...
o
24
100
flOO
6 0 0
4 0 0
200
1
C j H , - AIR
ORIFICE OBSTACLE
A
? •-D 1 8
'?4 40
* • •
• • • • "
0S9
A
A A1
0 0
1
4
— 1 —
-
OAoA
A
AA
1
• . , ^
X
- 0 — TUBE
- Û - TUBE
- O - TUBE
1
1
ISOBARICSPEED
DIA D- 5cm
DIA 0> IS cm
01A D-SOcm
1
SOUND
8R-
BR.
BR>
0-
0-
0-
-
-
44
39
28
-
0-6
2 5
08 10 I'Z 1-4 1-6
EQUIVALENCE RATIO - <f>
I I I I I I I3 0 Ï 5 4 5 5 0 9-5 -6 -0 es TO
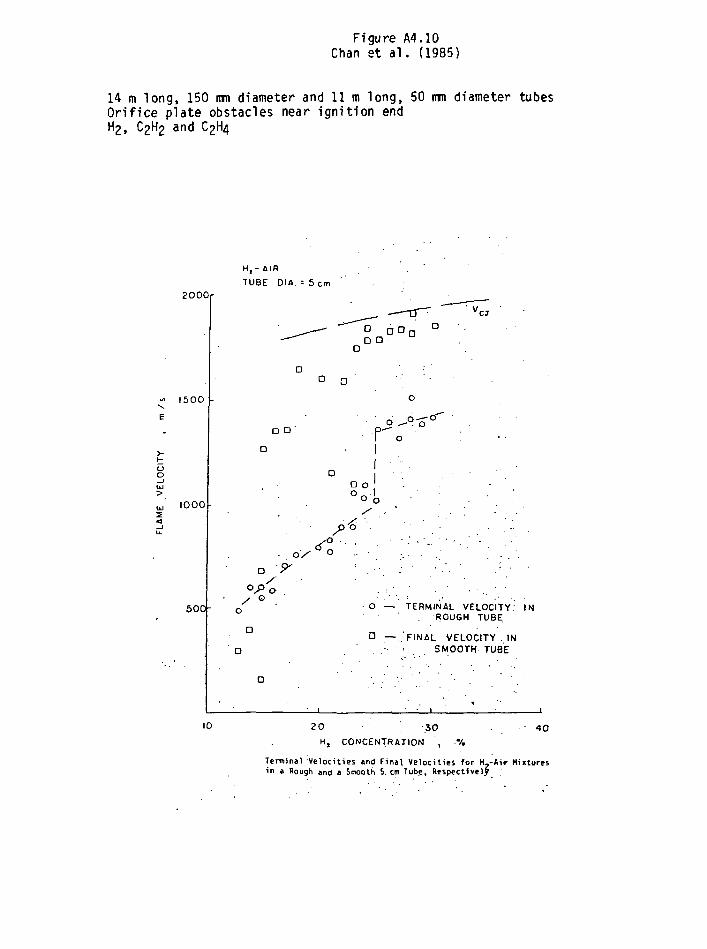
Figure A4.10Chan et al. (1985)
14 m long, 150 inn diameter and 11 m long, 50 irm diameter tubesOr i f i ce plate obstacles near i gn i t i on endH2, C2H2 and C2H4
H,-AIRTUBE DIA. -- 5 en
£UUU
5 0 0
1000
5 0 0
•
O
o
D
D
D
Dy
Po
D
O
D O '
>
°
O
° •
DD
o £
<^o '•
—DD D
>ii
o]/
o
D
O
o •
— TERMINAL VELOCITY. IN. ROUGH TUBE
— .FINAL VELOCITY . IN• ' '•- SMOOTH TUBE
1
10 20 ' -3O
H, CONCENTRATION , 7.
AO
Terminal Velocities and Final Velocities for H,-Air Mixturesin a Rough and » Snooth 5. cm Tube, Respectively ,
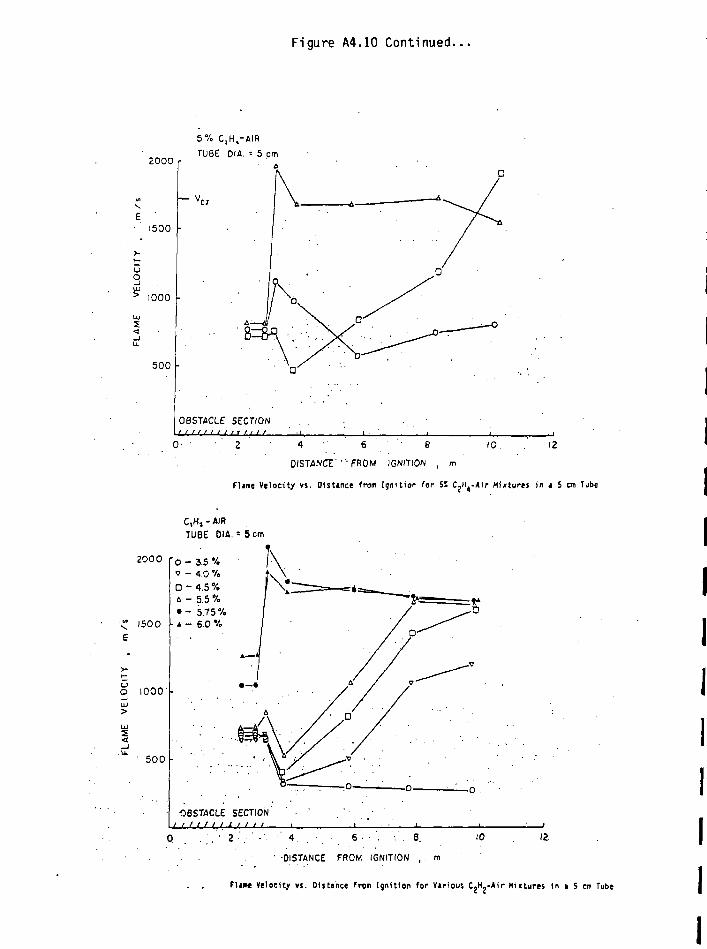
Figure A4.10 Continued.
2000 r
e '• 1500
5% CtH,-AIH
TUBE OIA. = 5 cm
2
1000
500
OBSTACLE SECTION
0: ' • 2 • 4 •' 6 • 8 10. . 12
DISTANCE'"'FROM IGNITION , m
Flame Velocity vs. OisUnce from Ignition for 51 C?l^-Air Mixtures in i 5 cm lube
C.Hj-AIRTUBE DIA. = 5 cm
2000
1500
uO
<_ J
1000'
500
•OBSTACLE SECTION
4 . . • • 6 • • : - . ' . 8 .
•DISTANCE FROM IGNITION , . m
12.
. . FUrne Velocity vi. Distance, from Ignition for Various CjH -Air Mixtures In t 5 cm Tube
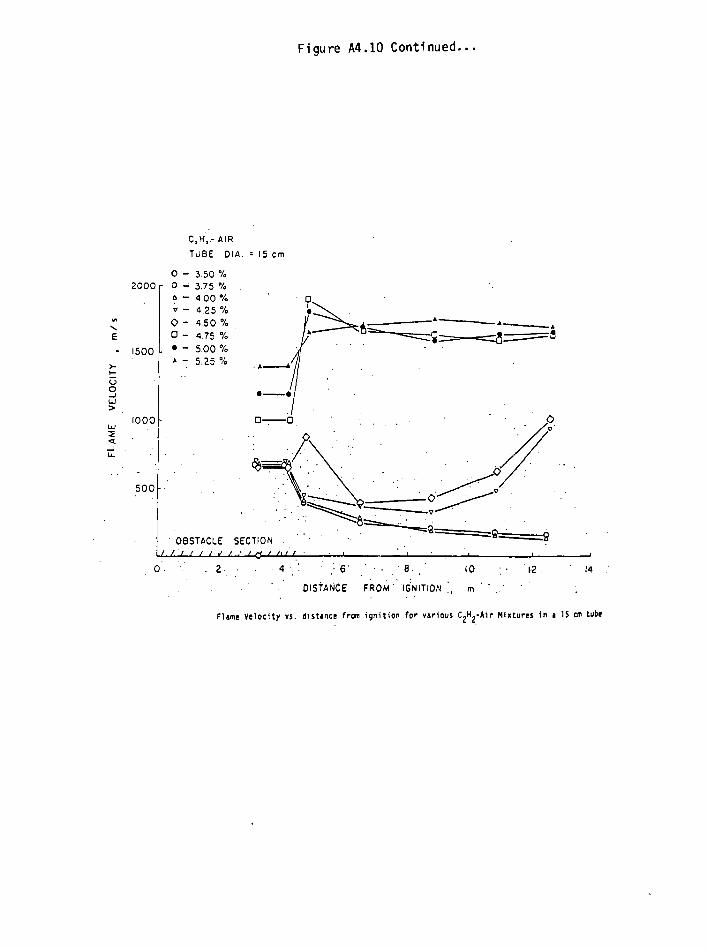
Figure A4.10 Continued.
e.
>-t—
LO
CI
>
Z
_l
2000
1500
1000
0• 0
a
V
00
. •
C.H,.- AIR
TUBE DIA. = 15 cm
- 3.50 %
- 3.75 % .
- 4.00 %
- 4.25 %
- 4.50 %
- 4.75 %
- 5.00 %
- 5 . 2 5 % . , _ _
.
_
500
' OBSTACLE SECTION/ / / / / • / • ' / M / / I
o . . ; . 2 • . 4 • : }'&• ' • • s. ' i o
' . DISTANCE F R O M ' IGNITION ', m
12
Flame Velocity vs. distance from ignition for various CjHj-Air Mixtures in i 15 en tube
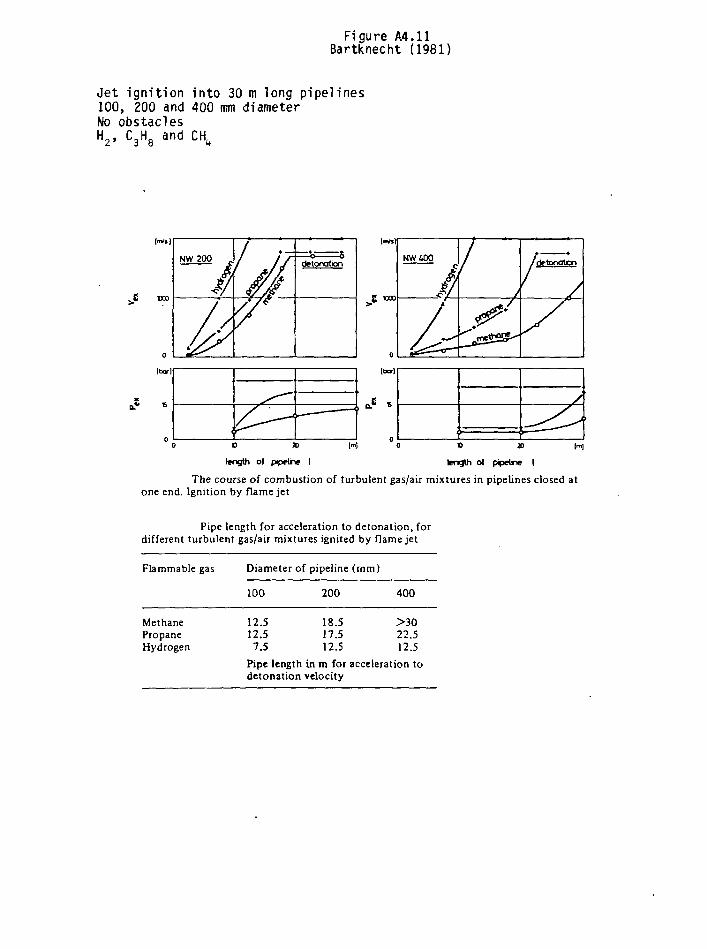
Figure A4.11Bartknecht (1981)
Jet ignition into 30 m long pipelines100, 200 and 400 mm diameterNo obstaclesH, and
("V,]
JS KD
Itar]
D 20
length of pipelne 1
M
lbo-1
01
y
O » [m]
length ot pipeline I
The course of combustion of turbulent gas/air mixtures in pipelines closed atone end. Ignition by flame jet
Pipe length for acceleration to detonation, fordifferent turbulent gas/air mixtures ignited by flame jet
Flammable gas
MethanePropaneHydrogen
Diameter of pipeline
100
12.512.57.5
Pipe lengthdetonation
200
18.517.512.5
in m forvelocity
(rnm)
400
>3022.512.5
acceleration to
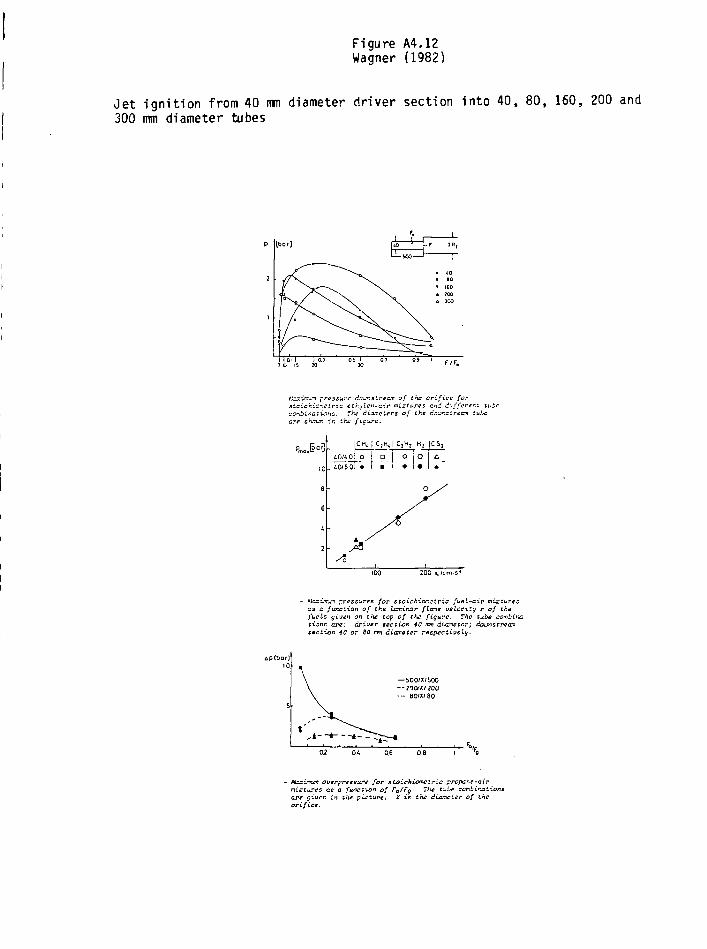
Figure A4.12Wagner (1982)
Je t ignition from 40 mm diameter driver section into 40, 80, 160, 200 and300 mm diameter tubes
r,v.
• t-^zùrun pressui-c daLf.slrean cf the orifice forstcichic-.ctric ei'rwler-air niziures end différer.: :uconbiruztions. The diameters of ihe dour.z'.reem tubeere shoun in the figure.
g
0
8
e
L
2
ICH.
iCrto! o„ Zô7é"ôT»
- X
|C
rD• 1 *
i •
H i |CS 1
O £.• 1 A "
o /
HîLzimm pressures for etoichionctric fuel-air mixtureses c function of the Lsninar flams velocity r of thefuels given on the top of the figure. The tube combinetions ere: driver gee tien 40 ran dicnclcr; dounstrear:section 40 or 80 m\ diameter respectively.
ûp(bor)10
— 500/Jt/SOO— ?QOt 1/200— eo/x/80
fkLzirruti overpressure for stoichionciric propene-eirmixtures as a fune lien of Fo/Fg. The tube combinationsere giver, in the picture. X is the diencter of theorifice.
Figure A4.13Eckhoff et a l . (1980)
Jet ignit ion from 0.5 m diameter driver with acceleration plates into10 m long by 2.5 m diameter tube
i.o i.o 1. i . o I. -i.o I i.o \ A.o i. t o
AIRJNLET
15.-sa
2 m
790750 GAS EXPLOSION TUBE
Figure A4.13 Continued...
2000
1000
500
200
•100
50
20
10
-
\ O
\
~ A
N \
- \ N
-
PRESENT
O " 12
A - 7
• - o
\
D \
EXPERIMENT,
ACCELERATION
% -
CLASSICAL
VENTING MODEL
S = a S 0
SQ= 0 , 6 0 m/s
, , ,
JET INITIATION
PLATES
-
O
—
A ^ \O
A^A
•a
0,2 0,4Area Ratio
0 , 6 0,8 1.0
Figure A4.13 Continued.,
A
0,5 -
X
0,2 .
JET INITIATION
O PRESENT" EXP. 12 ACCELERATING PLATES
A " " 1Q " 0
D
WAGNER et.al.26'27 C,H,,-AIR
0,10,2 0,4
Area Ratio
0,6 0,8 1,0
ANNEX B
FLAME ACCELERATION AND TRANSITION TO DETONATIONIN LARGE FUEL-AIR CLOUDS WITH OBSTACLES
by
I.O. Moenand
A. Sulmistras
UNCLASSIFIED
DEFENCE RESEARCH ESTABLISHMENT SUFFIELDRALSTON, ALBERTA
SUFFIELD MEMORANDUM NO. 1159
Flame Acceleration andTransition to Detonation
in Large Fuel-AirClouds with Obstacles
1.0. Moen
and
A. Sulmi stras*
PCN NO. 77C5O
February 1986
* Mechanical Engineering Department,Concordia University,
Montreal, Quebec
UNCLASSIFIED
UnlimitedDistribution
UNCLASSIFIED (i)
ABSTRACT
The results of a series of flame acceleration tests performed at the Defence
Research Establishment Suffield (DRES) are reported. These tests were performed
in order to assess the potential for flame acceleration and transition to
detonation in simulated industrial environments with repeated obstacles. The
experimental apparatus consisted of a channel 1.8 m x 1.8 m in cross-section and
15.5 m long, connected to a 0.9 m diameter tube, 8 m long. The bottom of the
channel was confined by the ground, and the sides were confined by plywood or
plexiglass sheets. The only top and end confinement was due to the plastic
envelope which was used to seal the configuration to contain the explosive
gaseous mixture. Two obstacle configurations were tested, corresponding to
500 mm or 220 mm diameter tubes mounted across the channel at regular intervals.
Tests were performed with acetylene, propane and hydrogen sulphide fuels
mixed with air. For near stoichiometric acetylene-air, the flame accelerates
from an initial speed of about 20 m/s up to speeds of about 400 m/s prior to the
occurrence of localized explosions which lead to the onset of detonation. With
the larger 500 mm obstacles, the localized explosion occurs at the end of the
channel and with 220 mm obstacles transition to detonation occurs 10.7 m down the
channel. One test with acetylene-air is very interesting in that ignition due to
a hot wire at the end of the channel leads to the explosion of the end-pocket of
turbulent unreacted gas. This explosion causes onset of detonation prior to the
arrival of the main flame front.
The behavior of flames in lean acetylene (5.17% C 2H 2)-, propane- and
hydrogen sulphide-air mixtures is much less dramatic. In fact, no significant
flame acceleration was observed in these mixtures. The flame speeds observed
range from about 25 m/s up to 200 m/s, with associated peak overpressures
typically less than 50 mbar. The continuous flame acceleration seen in more
confined situations is not observed in the present configuration with these
.../ii
UNCLASSIFIED
UNCLASSIFIED ( i i ]
ABSTRACT (cond't)
fuel-air mixtures. I t is concluded that in order for damaging explosions to
occur in propane- or hydrogen sulphide-air mixtures, the cloud must be: i) more
confined than in the present tests, i i ) ignited by a stronger ignition source
( i . e . , je t ignition from a semi-confined explosion) or i i i ) immersed in a denser
obstacle f ie ld than used in the present tests. On the other hand, for near
stoichiometric acetylene-air transition to detonation can be expected to occur in
obstacle environments similar to those used in the present tests.
UNCLASSIFIED
UNCLASSIFIED (iii)
SPONSORSHIP
The invest igat ion described in t h i s report is part of a project to
characterize the explosion hazards of hydrogen sulphide in a i r . The pro ject is
sponsored and funded by the Atomic Energy Control Board of Canada.
UNCLASSIFIED
UNCLASSIFIED ( i v )
ACKNOWLEDGEMENTS
The va luab le ass i s tance o f Gayle Hal l and Chr is Brosinsky i n p lann ing and
carrying out the f ie ld t r i a l s is gratefully acknowledged. We would also l ike to
thank the personnel of the Field Operations Section, the Electronic Design and
Instrumentation Group, and the Photo Group at DRES for their valuable assistance
during the f i e ld t r i a l s .
Finally we would l i ke to thank Dr. Paul Thibault, Dr. Stephen Murray and
Professor Jaan Saber for their input through enlightening scient i f ic and
technical discussions.
UNCLASSIFIED
UNCLASSIFIED (v)
TABLE OF CONTENTS
Page
ABSTRACT i
SPONSORSHIP i i i
ACKNOWLEDGEMENTS i v
TABLE OF CONTENTS . . . v
LIST OF TABLES vi
LIST OF FIGURES v i l
1. INTRODUCTION 1
2. FLAME PROPAGATION AND ACCELERATION 2
3. EXPERIMENTAL DETAILS 5
4. EXPERIMENTAL RESULTS 7
4.1 Summary of Results 7
4.2 Data Analyses 7
4.3 Acetyl ene-Ai r Results 8
4.4 Propane-Air Results 11
4.5 Hydrogen Sulphide-Ai r Results 12
5. DISCUSSION 13
6. CONCLUSION 15
7. REFERENCES 17
TABLESFIGURES
APPENDIX A TABULATED PRESSURE RECORD RESULTS
UNCLASSIFIED
UNCLASSIFIED ( v i !
LIST OF TABLES
TABLE I Combustion Properties of Selected Stoichiometric Fuel/Air Mixtures
TABLE I I Summary of Flame Acceleration Tests
A. 500 mm Obstacles
B. 220 mm Obstacles
UNCLASSIFIED
UNCLASSIFIED (vii)
LIST OF FIGURES
FIGURE 1 Theoretical correlation of maximum overpressure vs maximum flame
speed for constant velocity flames in spherical and planar
goemetries.
FIGURE 2 Aerial view of test site.
FIGURE 3 Selected photographs of channel with 500 mm diameter obstacles.
a) Side view of channel
b) End view of channel
c) Obstacles: end view
d) Obstacles: side view
FIGURE 4 Side view of channel with 500 mm diameter obstacles.
FIGURE 5 Selected photographs of channel with 220 mm obstacles.
a) Obstacles: end view
b) Obstacles: side view
FIGURE 6 Side view of channel with 220 mm diameter obstacles.
FIGURE 7 Flame propagation in acetylene-air 17.8% C2H2) with 500 mm diameter
obstacles and spark igni t ion.
a) Maximum pressure and flame velocity vs distance from pressure
records
b) Time of arr ival vs distance from high-speed films
c) Velocity vs distance from high-speed films
.../viii
UNCLASSIFIED
UNCLASSIFIED (viii)
LIST OF FIGURES (cond't)
FIGURE 8 Flame propagation and transit ion to detonation in acetylene-air
(7.71% C2H2) with 220 mm diameter obstacles and spark igni t ion.
a) Maximum pressure and flame velocity vs distance from pressure
records
b) Time of arrival vs distance from high-speed films
c) Velocity vs distance from high-speed films
FIGURE 9 Selected frames from the 90° wide high-speed f i lm record showing
flame acceleration and transit ion to detonation in acetylene-air
(7.71* C2H2) with 220 mm obstacles and spark ign i t ion.
FIGURE 10 Pressure-time histories at various positions down the channel for
7.71* C2H2 with 220 mm diameter obstacles and spark igni t ion.
FIGURE 11 Igni t ion, flame acceleration and transit ion to detonation with
acetylene-air in a 1.8 m x 1.8 m lane, 15.5 m long.
FIGURE 12 Flame propagation in acetylene-air (7.5% C2H2) with 500 mm diameter
obstacles and spark igni t ion.
a) Maximum pressure and flame velocity vs distance from pressurerecords
b) Time of arr ival vs distance from high-speed filmsc) Velocity vs distance from high-speed films
FIGURE 13 Selected frames from the 30° high-speed f i lm record showing the
explosion and transit ion to detonation in the turbulent end-pocket ofacetylene-air prior to the arr ival of,the main flame front.
.../ix
UNCLASSIFIED
UNCLASSIFIED ( ix )
LIST OF FIGURES (cond't)
FIGURE 14 Flame propagation in acetylene-air (5.17% C2H2) with 220 mm diameter
obstacles and spark i g n i t i o n .
a) Maximum pressure and flame ve loc i ty vs distance from pressure
records
b) Time of a r r i va l vs distance from high-speed f i lms
c) Velocity vs distance from high-speed f i lms
FIGURE 15 Two frames from the 90° t e l e high-speed f i l m record showing the flame
p r o f i l e towards the end of the channel i n lean acety lene-air (5.17%
C2H2) wi th 220 mm obstacles.
FIGURE 16 Flame propagation in propane-air (4* C3H8) wi th 500 mm diameter
obstacles and spark i g n i t i o n .
a) Maximum pressure and flame ve loc i ty vs distance from pressure
records
b) Time of a r r i va l vs distance from high-speed f i l m
c) Velocity vs distance from high-speed f i l m
FIGURE 17 Flame propagation i n propane-air (4.14% C3H8) wi th 500 mm diameter
obstacles in the center only and spark i g n i t i o n . Maximum pressure
and flame ve loc i ty from pressure records.
FIGURE 18 Flame propagation in propane-air (3.95% C3H8) with 500 mm diameter
obstacles and tube i g n i t i o n . Maximum pressure and flame ve loc i ty
from pressure records.
FIGURE 19 Flame propagation in propane-air (4.32% C3H8) wi th 220 mm diameter
obstacles and spark i g n i t i o n .
a) Time of a r r i va l vs distance from high-speed f i lms
b) Velocity vs distance from high-speed f i lms
. ../x
UNCLASSIFIED
UNCLASSIFIED (x)
LIST OF FIGURES (cond't)
FIGURE 20 Flame propagation in propane-air (4.05% C,Ha) with 220 ram diameter
obstacles and tube igni t ion. Maximum pressure and flame velocity
from pressure records.
FIGURE 21 Pressure-time histories at various positions down the channel for
4.05% C3H8 with 220 mm diameter obstacles and tube igni t ion.
FIGURE 22 Two frames from the 90° wide high-speed f i lm record showing flame
propagation in a propane-air mixture with 220 mm obstacles and spark
igni t ion.
FIGURE 23 Flame propagation in hydrogen sulphide-air (9.3% H2S) with 500 mm
obstacles and tube igni t ion. Maximum pressure and flame velocity
from pressure records.
FIGURE 24a) Flame propagation in hydrogen sulphide-air (12.9% H2S) with 500 mm
diameter obstacles and spark igni t ion. Maximum pressure and flame
velocity from pressure records.
FIGURE 24b) Pressure-time histories at various positions down the channel for
12.9% H2S with 500 mm diameter obstacles and spark igni t ion.
FIGURE 25a) Flame propagation in hydrogen sulphide a i r (10.7% H2S) with 220 mm
diameter obstacles and tube igni t ion. Maximum pressure and flame
speed from pressure records.
FIGURE 25b) Pressure-time histories at various positions down the channel for
10.7% H2S with 220 mm obstacles and tube igni t ion.
UNCLASSIFIED
UNCLASSIFIED
DEFENCE RESEARCH ESTABLISHMENT SUFFIELD
RALSTON, ALBERTA
SUFFIELD MEMORANDUM NO. 1159
Flame Acceleration and
Transition to Detonation
in Large Fuel-Air
Clouds with Obstacles
by
I.O. Moen
and
A. Sulmi stras
1. INTRODUCTION
Explosions resulting from the accidental spill of a variety of fuels have
occurred with increasing frequency over the past twenty years, sometimes with
devastating consequences. It has therefore become necessary to realistically
assess the potential explosion hazards associated with accidental spills of fuels
in chemical and industrial plant environments. Typically, the spill will occur
within the plant itself, in a complex obstacle configuration involving arrays of
pipes, conduits and pipe racks, as well as buildings and other confining
structures. It is known that such obstacles can have a dramatic influence on the
flame propagation through the fuel-air cloud which is produced by the mixing of
the spilled fuel with the surrounding air. In fact, it is the presence of these
obstacles and confining spaces which is thought to be responsible for producing
violent combustion and potentially damaging blast waves.
UNCLASSIFIED
UNCLASSIFIED 2.
A wide variety of experimental tests, both large and small scale, have been
performed so that there is now a considerable data base available on fuel-air
explosions and the blast waves produced by such explosions. The results of these
tests have recently been summarized by Moen and Saber (1985). Based on these
results, particularly hazardous obstacle configurations can be identified as
those whic( c^e heavily confined. In tubes, pipes and confined channels, for
example, high flame speeds and potentially damaging pressures are reached within
less than four diameters, even for insensitive mixtures of methane and air
(Moen et al., 1982). Similar flame acceleration is also observed in clouds which
are confined on top and bottom over a large area (Zeeuwen and van Wingerden,
1983; Moen et al., 1981; and Hjertager, 1984). Such clouds could be produced by
a release into an area within a plant which is covered by a roof. Explosions in
confined spaces can also serve as strong ignition sources for an external cloud,
thus enhancing the potential for violent explosion or even transition to
detonation in this cloud (Schildknecht et al., 1984). Weak spark ignition of
such a cloud in a relatively unobstructed environment is unlikely to result in a
damaging explosion, even for relatively sensitive fuels such as acetylene and
hydrogen (Lind and Whitson, 1977; Schneider and Pfôrtner, 1981; and
Brossard et al., 1985).
In partially confined regions with obstacles, which are more typical of
chemical plants, the flame acceleration is less dramatic than in heavily confined
regions and depends critically on the degree of confinement, the obstacle
configuration, the ignition source and the fuel-air mixture. In view of the
complexity of the coupled chemical and fluid-dynamic processes involved in the
propagation and acceleration of flames in obstacle environments, the nature of
such explosions cannot yet be predicted theoretically or numerically, so that
experimental tests in configurations which simulate the chemical plant
environment are required in order to assess the potential for hazardous
explosions.
The present paper reports on an experimental investigation of flame
propagation in a partially confined channel with repeated obstacles. The aim of
this experimental study is to assess the potential for flame acceleration in
UNCLASSIFIED
UNCLASSIFIED 3.
configurations which simulate a chemical plant environment with arrays of pipes
in the fuel air cloud. Tests were performed with repeated cylindrical obstacles
of two diameters (500 and 220 mm) for fuel-air mixtures based on acetylene,
propane and hydrogen sulphide fuels covering a wide range of mixture
sensitivity.
Some of the background on flame propagation and acceleration which provided
the more fundamental motivation for these tests is described in Section 2. The
experimental details are described in Section 3. Results, including flame
velocities and pressures at various positions along the channel, are described in
Section 4. Comparison with results from other investigations and îiscussion of
the results are given in Section 5, and the implications of the results for
explosion hazards evaluation are discussed in the conclusion.
2. FLAME PROPAGATION AND ACCELERATION
Deflagrations or flames are expansion waves in which both the pressure and
density decrease across the wave front. A combustible mixture is characterized
by its laminar burning velocity, S., which depends on the transport properties
and the reaction rate. Typical burning velocities for selected fuel/air mixtures
at stoichiometric compositions are given in Table I. Except for highly reactive
fuels (i.e., C2H2) and mixtures with high transport rates (i.e., H 2 ) , the laminar
burning velocity for fuel/air mixtures is about 0.5 m/s. The expansion across
the flame reaction-zone will generate a flow velocity, U, ahead of the flame, so
that the observed flame speed is U + S,. For flame speeds much less than the
sonic speed in the unburned mixture, the pressure drop across the flame can be
neglected. The density ratio (Pl/p2) across the flame in this approximation is
between 6 and 8.5 for the stoichiometric fuel-air mixtures included in Table I.
The corresponding laminar flame speeds, calculated assuming zero velocity of the
burned gas, is given by Pi/p2 \> These laminar flame speeds are also given in
Table I. For the test performed in the present test series the laminar flame
speeds range from 12.1 m/s for stoichiometric acetylene/air to 1.5 m/s for lean
UNCLASSIFIED
UNCLASSIFIED 4.
hydrogen sulphide/air. The pressures produced by such flames are much too smallto cause any blast damage.
The pressure produced by constant velocity flames has been calculated by
several investigators (Kuhl et al., 1973; Guirao et al., 1976; Lee et al., 1976
and Strehlow et al., 1979). Typical calculated results for fuel-air flames in
planar and spherical geometries are shown in Figure 1. From these results it can
be seen that flame velocities in excess of 120 m/s (70 m/s) are required in
spherical (planar) geometry to produce pressures above 150 mbar, which is the
approximate threshold for major structural damage (Baker et al., 1983).
Considerable flame acceleration must therefore occur, even in acetylene/air
mixtures, in order for damaging blast waves to be produced. Such flame
acceleration has been observed with repeated obstacles in tubes, in confined
channels and in clouds confined between two solid surfaces (Moen, 1982). In
these configurations, a positive feedback mechanism is established whereby the
turbulence produced by the flame-induced flow over the obstacles increases the
rate of burning, which in turn increases the flame induced flow and turbulence,
thus further enhancing the rate of burning. This feedback mechanism can lead to
the continual acceleration of the flame in a repeated obstacle environment
(Moen et al., 1981).
The strength of the positive feedback mechanism depends on the geometry, the
obstacle configuration, the degree of confinement and the fuel-air mixture.
Laboratory experiments in channels with repeated obstacles have shown that if one
of the sides of a channel is even partially open, the acceleration of the flame
is reduced dramatically (Chan et al., 1983). The present test series was
designed to study the acceleration of flames in channels open on the top with
repeated obstacles, in order to assess the potential for flame acceleration in
simulated chemical plant environments on a larger scale and for various fuel/air
mixtures. The fuel/air mixtures were chosen to cover a wide range of laminar
flame speeds as well as detonation sensitivity. The critical tube diameter of
the mixtures range from 0.115 m for stoichiometric acetylene/air to an estimated
value of 3.5 m for lean hydrogen sulphide/air mixtures. The critical tube
UNCLASSIFIED
UNCLASSIFIED 5.
diameter, the minimum detonation energy and the detonation velocity for selected
stoichiometric fuel/air mixtures are included in Table I for comparison.
3. EXPERIMENTAL DETAILS
The experimental test series was performed at the DRES fuel-air facility.
An aerial view of the facility showing the test pad, instrumentation and
fuel-flow control trailers, and high-speed camera shelters is included in
Figure 2. The facility, which is described in detail by Funk et al., (1982), is
centered around a 18.3 m x 7.6 m concrete test pad onto which the experimental
apparatus can be mounted. For the present tests, the test section consisted of a
channel, 1.8 m x 1.8 m in cross-section and 15.5 m long, constructed with a
support frame of aluminum tubing 60 mm in diameter. The sides of the channel
were confined by plywood or plexiglass sheets and the bottom was confined by the
pad itself. The plexiglass and plywood sheets were hinged to the frame in such a
manner that they would swing out prior to being destroyed by the explosion. The
only top confinement was due to the plastic envelope which enclosed the channel
and joined it at one end to a 0.9 m diameter tube, 7.6 m long. The configuration
was sealed to contain explosive gases by a plastic sheet at the end of the tube
and by wrapping the plastic around an inlet pipe at the end of the channel. Side
and end views of the channel, wrapped in the plastic envelope, are shown in
Figure 3a and b, respectively. Two obstacle configurations were tested,
corresponding to 500 mm and 220 mm diameter tubes mounted across the channel at
regular intervals. Photographs illustrating the 500 mm obstacle configuration
are shown in Figure 3c and d. A sketch illustrating this obstacle configuration
is shown in Figure 4. The corresponding photographs and sketch for the 220 mm
obstacles are shown in Figures 5 and 6, respectively. As seen in Figures 3d
and 5b, both the 500 and 220 mm obstacles were hollow pipes which were not sealed
at the ends. During the tests these obstacles therefore also contained explosive
mixture. The obstacles were mounted at regular intervals in Sections 2-11,
inclusive, with no obstacles in the first or last section of the channel, as
illustrated in Figures 4 and 6.
UNCLASSIFIED
UNCLASSIFIED 6.
Tests in each obstacle configuration were performed with acetylene (C^H2),
propane (C;jHb) and hydrogen sulphide (H2S) fuels mixed with air. The test gases
were mixed with the initial air in the test volume by a multipath recirculation
system using a high-capacity centrifugal blower. The composition and mixture
homogeneity in the test volume were monitored by continuously analyzing samples
taken from two ports in the channel and one port in the tube. The maximum
uncertainties in fuel concentrations in the test volume for the different fuels
were +0.25% H2S, +0.05% C 2H 2 and +0.05% C3Ha, respectively.
Once the desired fuel-air composition had been attained, ignition of the
flame was achieved either at the far end of the tube by one spark or by four
sparks mounted across the channel at the tube end. The latter form of ignition
was used to simulate line ignition which would produce approximate
two-dimensional flame propagation and flow down the channel. The total energy
{h CV2) supplied to the four sparks was 8.4 Joules. In selected tests, the
plastic confinement at the end of the channel was removed just prior to ignition
using a hot wire to cut the plastic envelope.
The arrival and pressure profile of the wave were monitored at up to ten
positions along the bottom of the channel by piezoelectric pressure transducers.
The positions of these transducers are shown in Figures 4 and 6. In selected
tests, two pressure transducers were also mounted in the tube. Three high-speed
cameras (~3000 frames/sec) were used to record the flame propagation down the
channel. Two cameras were placed 90° to the channel axis, one providing a view
of the whole channel (90° WIDE) and the other providing a more detailed view of
the last 8 m of flame propagation (90° TELE). The third camera was placed at a
30° angle to the channel axis giving a different view of the flame propagation.
Since hydrogen sulphide and the main product of combustion, sulphur dioxide,
are both highly toxic, the special safety procedures developed during previous
critical tube diameter tests (Su!mi stras et al., 1985) were followed in carrying
out the tests involving H2S.
UNCLASSIFIED
UNCLASSIFIED 7.
4. EXPERIMENTAL RESULTS
4.1 Summary of Results
The experimental results from the twelve tests performed are summarized
in terms of average and maximum flame speeds, and peak overpressures in Table II.
From this table it can be seen that the only potentially damaging explosions
observed were those associated with transition to detonation in near
stoichiometric acetylene-air mixtures. The behaviour of flames in lean acetylene
(5.17%. C 2H 2)-, propane- and hydrogen sulphide-air is much less dramatic. In
fact, no significant flame acceleration was observed in these mixtures. The
flame speeds ranged from about 25 m/s up to 200 m/s, with associated peak
overpressures typically less than 50 mbar. Although, the maximum flame speeds
observed were 15-20 times the laminar flame speeds, the continuous acceleration
observed in more confined situations is not observed in this configuration with
these fuels.
4.2 Data Analyses
More detailed results from each test are given in Figures 7-25. Theseresu l t include peak overpressures and velocities obtained from the pressurerecords, and time-of-arrival and velocity data obtained from the high-speedfilms. Frames from the high-speed film records and pressure-time histories arealso included for selected tests. The peak pressures, flame time-of-arrival andvelocity data obtained from the pressure records are tabulated in Appendix A.The time-of-arrival of the flame is assumed to coincide with the peak inpressure, typically observed just prior to the decay into a negative pressurephase which indicates that the main flame front has passed. The time-of-arrivaland velocities obtained in this manner are in good agreement with those obtainedfrom the high-speed film records. Unfortunately, analysis of the high-speed fi lmrecords was only possible for the tests with acetylene and for selected testswith propane. In H2S/air mixtures the flame was not visible, so that the flamedevelopment was obtained solely from the pressure records.
UNCLASSIFIED
UNCLASSIFIED 8.
The high-speed film records obtained from the two 90° cameras (90° WIDE
and 90° TELE) were analyzed by monitoring the time-of-arrival of the leading
flame front vs position along the channel, and the flame velocity was deduced
from this data. Although the flame zone was observed to be wrinkled, folded and
relatively thick, the flame was observed to propagate as a thick turbulent flame
brush extending from the bottom to the top of the channel (see Figures 9, 11, 15
and 22). Except for local variations in the velocity of the leading front as it
propagates around the obstacles, the flame velocity reported corresponds to the
velocity of this flame brush.
The venting out the top as the plastic was torn and the motion of the
plywood and plexiglass side confinement were also observed on the high-speed
films. In the acetylene/air tests with transition to detonation, the plastic top
was removed before the arrival of the flame and the sides were blown out some
distance after the flame front, thus providing complete top venting and some side
venting of the burned gases (see Figures 9 and 11). In all the other tests, the
tearing of the plastic coincided approximately with the arrival of the flame, and
the sides either remained intact or blew-out long after the flame had passed (see
Figures 15 and 22). Complete side confinement with top venting of the burned
gases can therefore be assumed in these tests.
4.3 Acetylene-Air Results
Tests with stoichiometric acetylene/air were performed in the two
obstacle configurations. In both cases, the flame continuously accelerates down
the channel and reaches a speed between 250 and 400 m/s prior to the occurrence
of a localized explosion and the onset of detonation. With the larger 500 mm
obstacles (Figure 7), the flame appears to propagate in a sporadic manner through
the obstacle field (Figure 7c). This is due to the jetting of the flame as it
propagates between the obstacles and the slow-down of the leading flame front in
the wake of the obstacles. The general trend is for the flame to accelerate.
This acceleration is particularly dramatic during the last 7 m of propagation.
The flame reaches the end of the channel with a velocity of about 400 m/s, at
which time a localized explosion near the bottom of the channel triggers
UNCLASSIFIED
UNCLASSIFIED 9.
detonation of the remaining unburned mixture. The peak pressure reaches about
150 mbar at 2 m. Similar peak pressures are recorded out to 4 m, beyond that the
records are off-scale indicating pressures larger than 150 mbar.
For stoichiometric acetylene/air with the smaller 220 mm obstacles,
transition to detonation occurs about 10.7 m down the channel, again due to a
localized explosion at ground level. The development of the flame is
characterized in Figure 8. Notice that the flame speed reaches about 250 m/s
prior to a rapid acceleration phase which starts 9 m down the channel and results
in a full-fledged detonation with a velocity close to 1800 m/s at about 13 m.
Selected frames from the 90° wide high-speed film record showing the flame
propagation and transition to detonation are included in Figure 9. The first two
frames (Frames a and b) show the flame during the rapid acceleration phase. In
Frame c, a localized explosion can be seen at ground level. The growth of this
explosion seen in the next two frames (Frames d and e) results in the detonation
shown in Frame f. The pressure-time histories at various positions are shown in
Figura 10. Prior to the rapid acceleration phase, the peak pressure is less than
2 bar. The peak pressure quickly increases to detonation pressure of almost
15 bar at 10.6 m.
The two tests described above illustrate the classic mechanism of flame
acceleration in an obstacle environment, with localized explosions somewhere in
the turbulent flame brush leading to the onset of detonation (Lee and Moen, 1981;
Urtiew and Oppenheim, 1966). The test with 7.5% C2H2 (Test #14) illustrates
another mechanism for transition to detonation. In this test, ignition of the
turbulent pocket at the end of the channel by the hot wire used to cut the end
plastic, leads to transition to detonation prior to the arrival of the main flame
front. The phenomena involved are illustrated by the sequence of photographs
shown in Figure 11. Ignition by four sparks at the tube end at 0 ms produces a
flame which propagates down the channel as shown in the next five frames
(25-125 ms). Ignition at the far end of the bag due to the hot wire occurs at
150 ms when the main flame front is about 10 m down the channel. The burning in
the turbulent end-pocket triggers an explosion which leads to the onset of
detonation at 171 ms, at which time the main flame has reached 13.3 m. By 175 ms
UNCLASSIFIED
UNCLASSIFIED 10.
this detonation has propagated through the remaining unburned mixture, partially
destroying the apparatus as shown in the last frame at 200 ms.
The development of the main flame-front prior to the onset of
detonation is characterized in terms of peak pressure, time-of-arrival and
velocity in Figure 12. The maximum flame velocity is 180 m/s with an associated
peak pressure of 132 mbar. Such pressures are much too small for shock
reflections to be responsible for the onset of detonation. However, the
flame-induced flow produces a pocket of turbulent flow at the end of the channel.
As shown by the selected frames from the 30° high-speed film record in Figure 13,
it is the ignition of this turbulent pocket which leads to a localized explosion,
with subsequent transition to detonation. The burning in this pocket, triggered
by the hot-wire, seen in the first two frames (Frames a and b) results in the
explosion near ground level seen in Frames c and d. The subsequent detonation of
the remaining unburned mixture prior to the arrival of the main flame-front can
be seen in Frames e and f. These phenomena are similar to those observed by
Moen et al., (1985) in a 5% C2H2/air mixture, except that ignition of the
turbulent pocket is due to a hot wire rather than a flame tongue as observed by
Moen et al.
The three tests described above, which were performed with sensitive,
near-stoichiometric, acetylene/air mixtures, clearly illustrate the potential for
flame acceleration and transition to detonation given the appropriate boundary
conditions and obstacle configuration. In the present configuration, the
propagation of flames in less sensitive mixtures is much less dramatic. The
results with lean 5.17% C2H2/air are shown in Figure 14. This mixture has a
critical tube diameter of 0.5 m, almost five times larger than that for
stoichiometric C2H2/air, and a laminar flame speed less than 7.4 m/s. As seen in
Figure 14, the flame in this mixture propagates down the channel with a velocity
between 60 and 100 m/s producing an overpressure less than 55 mbar. Although
there are some fluctuations in flame velocity as the flame propagates through the
obstacle field, no continuous acceleration is observed. Two frames from the 90°
tele high-speed film record showing the flame profile in the channel are included
in Figure 15.
UNCLASSIFIED
UNCLASSIFIED 11.
4.4 Propane-Air Results
Flame velocities and pressures similar to those in lean acetylene/air
are observed in stoichiometric propane/air mixtures. The results with 500 mm
obstacles and ignit ion by four sparks are given in Figure 16. In this case, the
maximum flame speed of 62 m/s is observed about half way down the channel. By
the end of the channel, the flame has slowed down to 30 m/s. The peak pressure
of 86 mbar is observed at 1.76 m prior to the tearing of the plastic envelope.
Once the envelope is torn, allowing top venting of the burned gases, the peak
pressure remains below 30 mbar. A test with only central 500 mm obstacles gave
sl ight ly higher flame velocities of 60-70 m/s, with peak pressures less than
12.4 mbar (Figure 17). As seen in Figure 18, ignit ion at the end of the tube
with a fu l l complement of 500 mm obstacles produced a relat ively high i n i t i a l
velocity of 200 m/s in the channel. However, the flame rapidly slows down to
speeds similar to those observed with spark igni t ion. The peak pressures are
also similar to those observed with spark igni t ion. I t should be pointed out
that there are no obstacles to accelerate the flame in the tube so that speed of
the flame emerging from the tube is relat ively low. With much stronger ignit ion
by a fast flame j e t , larger flame velocities and pressures would be expected, at
least near the exit from the tube.
The results in near stoichiometric propane/air with the smaller 220 mm
obstacles for spark and tube ignit ion are shown in Figures 19 and 20,
respectively. With spark ign i t ion, the flame speed fluctuates between 55 and
90 m/s over the last half of the channel, in a manner very similar to that
observed with the larger obstacles. The flame velocities and pressures obtained
with tube ignit ion (Figure 20) again show relatively tame flame propagation with
a maximum velocity of 90 m/s and peak pressures less than 52 mbar.
The flame propagation with near stoichiometric propane/air in the
channel does not di f fer dramatically in the two obstacle configurations tested,
nor does spark or tube ignit ion produce signif icantly different results. Typical
pressure-time histories from these tests are shown in Figure 21. Notice the
build-up of pressure prior to the arrival of the flame, associated with the peak
UNCLASSIFIED
UNCLASSIFIED 12.
in pressure, and the subsequent decay into a negative phase once the flame has
passed.
The two frames from the 90° wide high-speed camera record shown in
Figure 22 illustrates the typical flame propagation observed in propane-air
mixtures. As seen in this figure, the plastic envelope tears just ahead of the
flame producing essentially complete top venting of the burned gases. The
plexiglass and plywood sides remain in place long after the flame has passed, so
that the sides of the channel are essentially completely confined during the
explosion. Similar motions of the envelope and sides are also observed for flame
propagation in hydrogen sulphide-air mixtures.
4.5 Hydrogen Sulphide-Air Results
In H2S/air mixtures the flame is not visible so that no high-speed film
analysis was possible and the flame propagation is obtained solely frm the
pressure records. The results from the three tests are presented in
Figures 23-25. Figure 23 shows the pressure and flame velocity .in a lean
9.3% H2S/air mixture, with the large 500 mm obstacles, ignited from the tube.
The flame speed is less than 50 m/s and the peak pressure of 44.8 mbar is
recorded near the beginning of the channel. Both the flame speed and pressure
begin to decrease after about 8 m and at 12 m the peak pressure is less than
3 mbar. This decrease is likely due to the increased venting of burned gas out
the top as the plastic envelope is torn. The results with 12.9% H2S in the same
obstacle configuration with spark ignition are shown in Figure 24a. In this case
the flame speed is slightly higher (40-80 m/s) and the peak pressure appears to
settle down to about 10 mbar, 8 m down the channel. The pressure records at
various positions along the channel are shown in Figure 24b. As shown in
Figure 25, similar pressures are observed with tube ignition of a 10.7% H2S
mixture in the 220 mm diameter obstacle configuration. In this case the flame
velocities appear to be a little smaller, but the peak pressures and
pressure-time histories are very similar to those observed with spark ignition.
UNCLASSIFIED
UNCLASSIFIED 13.
Although the flame speeds observed in the H2S/air tests are up to 30
times the laminar flame speed, no significant flame acceleration was observed as
the flames propagated down the channel. In fact, there is some indication that
the flame slows down toward the end of the channel. The pressures and flame
velocities observed in H2S/air are typically smaller than those observed in
C3H8/air. This is likely a reflection of the smaller laminar flame speeds
characteristic of the H2S/air mixtures (see Table II).
5. DISCUSSION
The propagation of fl i in obstacle environments with partial confinement
typical of that found r & chemical plant is a >tery complex phenomenon, involving
the interaction of the flame with the turbulent flame-induced flow around
obstacles and the pressure waves reflected from nearby surfaces. The present
tests with near stoichiometric acetylene-air mixtures clearly illustrate the
potential for flame acceleration and transition to detonation in such
environments. Although stoichiometric acetylene-air is a relatively sensitive
mixture with a high laminar flame speed, the flame in large unconfined clouds of
this mixture without obstacles reaches a maximum speed of only 35.4 m/s (Lind and
Whitson, 1977). It can therefore be concluded that the flame acceleration
observed in the present tests is due to the obstacles and the partial
confinement.
The flame acceleration observed in stoichiometric acetylene-air is analogous
to that observed with less sensitive fuels in confined channels and tubes with
obstacles (Moen 1982; Moen et al., 1982; and Hjertager et al., 1984), and in
clouds confined between two solid surfaces (Moen et al., 1981; Hjertager, 1984;
and van Wingerden and Zeeuwen, 1985). The acceleration mechanisms in this
mixture is therefore strong enough to overcome the effect of top venting of the
burned gases. For the other fuel-air mixtures tested (5.171 C2H2, C3H8 and H2S
in air) the acceleration mechanisms are overcome by the top venting and no
continuous flame acceleration is observed. Similar effects of top venting on
methane-air flame acceleration in a laboratory scale channel with obstacles were
UNCLASSIFIED
UNCLASSIFIED 14.
observed by Chan et al., (1983). In their tests, the maximum flame speed
decreased from 350 m/s with a closed top to about 5 m/s with a 50% open top. A
dramatic influence of top venting on flame acceleration was also observed by
van Wingerden and Zeeuwen (1985) in their tests with ethylene-air in a 4 m x 4 m
pipe-rack obstacle array. With complete top confinement they observed flame
acceleration to flame speeds of 420 m/s, whereas maximum flame speeds of only
24 m/s were reached with the top removed.
The effect of the venting of burned gases is to decrease the flame-induced
flow ahead of the flame. It is the interaction of the flame with the turbulent
flame-induced flow over the obstacles which is responsible for the increased rate
of burning. A positive feedback mechanism leading to flame acceleration is
established only if this increase in rate of burning produces a higher
flame-induced flow velocity ahead of the flame. In the present tests, except for
those with near stoichiometric acetylene-air, a balance between the flow ahead
and that vented out the top is established such that there is no continuous flame
acceleration.
In stoichiometric acetylene-air mixtures, the high rate of burning overcomes
the effect of top venting, the flame accelerates and reaches high enough
velocities to trigger localized explosions which lead to the onset of detonation.
It is important to note that the pressure waves observed prior to the localized
explosions are relatively weak U p < 2 bar) so that shock reflections alone
cannot account for the onset of detor.ation. In one test, ignition of the
turbulent end-pocket is sufficient to trigger onset of detonation. In this case,
the pressure is less than 140 mbar prior to the explosion in the end pocket.
Similar transistion to detonation, in a less sensitive mixture (5% C2H2-air), has
been reported by Moen et al., (1985). In their test, a fast flame emerging from
a tube produced violent burning and turbulence in a cloud contained in a plastic
bag, and a flame tongue triggered the explosion in a turbulent pocket.
Transitions to detonations in hydrogen-air clouds ignitied by a flame-jet
have also been observed (Schnildknecht, 1984; and Stock and Geiger, 1985), and
Pfortner et al., (1983) reported transition to detonation in a hydrogen-air cloud
UNCLASSIFIED
UNCLASSIFIED 15.
in which a fan was used to produce turbulence. Sherman et al., (1985) havereported transition to detonation in hydrogen-air mixtures contained in an almosttotally confined channel (13$ top venting).
All of the above observations of transition to detonation are associatedwith fast flame propagation. The presence of obstacles, confinement and otherperturbations enhances the probability of detonation. However, flame speeds muchlarger than the laminar flame speeds are required to produce the conditions fortransition to detonation. Such flame speeds can be produced by strong jetignition or by the acceleration of a flame ignited by a weak energy source. Withstrong jet ignition, transition to detonation in a lean acetylene-air mixturewhich is only slightly more sensitive than propane-air mixtures has been observed(Moen et al., 1985). Transition to detonation in even less sensitive fuel-airmixtures can therefore not be ruled out. In a chemical plant, fast flames andstrong ignition sources can be produced by explosions in confined channels suchas corridors, hallways and elevator shafts or in areas covered by a roof.
6. CONCLUSIONS
The results of a series of field tests on the propagation of flames in anopen-top channel with repeated obstacles have been reported. Tests wereperformed with acetylene, propane and hydrogen sulphide fuels mixed with air. Innear stoichiometric acetylene-air, the flame accelerates as it propagates downthe channel and reaches speeds up to 400 m/s prior to the occurrence of localizedexplosions which trigger the onset of detonation.
The behaviour of flames in lean acetylene-, propane- and hydrogensulphide-air mixtures is much less dramatic. The flame speeds observed rangefrom about 25 m/s up to 200 m/s, with associated pressures typically less than50 mbar. The continuous flame acceleration seen in more confined configurationsis not observed in the present configuration with these fuel-air mixtures.
UNCLASSIFIED
UNCLASSIFIED 16.
Based on these results i t can therefore be concluded the potential for flame
acceleration and t rans i t ion to detonation in the more open areas of a chemical
plant is much smaller than in the heavily confined areas. The fac t that flames
in stoichiometric acetylene-air do accelerate and produce detonations in these
obstacle environments shows that the potential for damaging explosions does
ex i s t . However, in order for such explosions to occur in the less sensit ive
propane-air or hydrogen sulphide-air mixtures, the cloud must be: i ) more
confined than in the present t es t s , i i ) igni ted by a stronger ign i t i on source
( i . e . , j e t i g n i t i o n ) , or i i i ) in an obstacle environment with more closely spaced
obstacles.
UNCLASSIFIED
UNCLASSIFIED 17.
7. REFERENCES
- Andrews, G.E. and Bradley, D. (1972a), "Determination of Burning Ve loc i t i es :
A C r i t i c a l Review", Combustion and Flame _18_, 133.
- Andrews, G.E. and Bradley, D. (1972b), "The Burning Velocity of Methane-Air
Mixtures" , Combustion and Flame _19_, pp. 275-288.
- Baker, W.E., Cox, P.A., Westine, P.S., Kulesz, J . J . and Strehlow, R.A.
(1983), "Explosion Hazards and Evaluat ion", Fundamental Studies in
Engineering Series, Volume 5, Elsevier Sc ien t i f i c Publishing Company,
Amsterdam, Holland.
- Brossard, J . , Desbordes, D., D i fab io , N., Gamier, J . L . , Lannoy, A . ,
Leyer, J .C . , Perrot , J . and Saint-Cloud, J.P. (1985), "Truly Unconfined
Deflagrat ions of Ethylene-Air Mixtures" , presented a t the 10th Internat ional
Colloquium on Dynamics of Explosions and Reactive Systems, Berkeley,
Ca l i f o rn i a , U.S.A., August.
- Chan, C , Moen, 1.0. and Lee, J.H.S. (1983), " Inf luence of Confinement on
Flame Accelerat ion Due to Repeated Obstacles", Combustion and Flame 49,
27-39.
- Funk, J.W., Murray, S.B. , Moen, 1.0. and Ward, S.A. (1982), "A Br ie f
Descr ipt ion of the DRES Fuel-Ai r Explosives Testing F a c i l i t y and Current
Research Program", in "Fuel-Air Explosions", edi ted by Lee, J.H.S. and
Guirao, CM. Proceedings of the In ternat iona l Conference on Fuel-Ai r
Explosions, held a t McGill Univers i ty , Montreal, Quebec, 4-6 November 1981,
SM Study No. 16, Univers i ty of Waterloo Press, Waterloo, Ontario,
pp. 565-583.
- Gibbs, G.J. and Calcote, H.F. (1959), "Ef fec t of Molecular Structure on
Burning Ve loc i t y " , Journal of Chemical Engineering Data 5^, 2226.
UNCLASSIFIED
UNCLASSIFIED 18,
Guirao, CM., Bach, G.G. and Lee, J.H. (1976), "Pressure Waves Generated bySpherical Flames", Combustion and Flame 27_, 341.
Hjertager, B.H. (1984), "Influence of Turbulence on Gas Explosions", Journalof Hazardous Materials j), pp. 315-346.
Kinder, J. (1979), "The Influence of Water Sprays on H2S-Air Flames",M.Eng. Thesis, McGill University, Montreal, Quebec.
Kuhl, A.L., Kamel, M.M. and Oppenheim, A.K. (1973), "Pressure WavesGenerated by Steady Flames", 14th Symposium (International) on Combustion,The Combustion Institute, Pa., pp. 1201-1215.
Lee, J.H., Guirao, CM., Chiu, K.W. and Bach, G.G. (1976), "Blast Effectsfrom Vapor Cloud Explosions", Loss Prevention (AIChE) _U.» PP« 59-70.
Lee, J.H.S. and Moen, 1.0. (1980), "The Mechanism of Transition fromDeflagration to Detonation in Vapor Cloud Explosions", Progress in Energyand Combustion Science j>, pp. 359-389.
Lind, C D . and Whitson, J. (1977), "Explosion Hazards Associated with Spillsof Large Quantities of Hazardous Materials", Phase III, report numberCG-D-85-77, United States Department of Transportation, U.S. Coast GuardFinal Report, ADA047585.
Moen, I.O., Donato, M., Knystautas, R., Lee, J.H. and Wagner, H. Gg. (1981),"Turbulent Flame Propagation and Acceleration in the Presence of Obstacles",Gasdynamics of Detonations and Explosions, edited by Bowen, J.R.,Manson, N., Oppenheim, A.K. and Soloukhin, R.I., Volume 75 of Progress inAstronautics and Aeronautics, pp. 33-47.
UNCLASSIFIED
UNCLASSIFIED 19.
Moen, 1.0. (1982), "The Influence of Turbulence on Flame Propagation i n
Obstacle Environments", i n "Fuel-Ai r Explosions", edi ted by Lee, J.H.S. and
Guirao, C M . , Proceedings of the Internat ional Conference on Fuel-Air
Explosions, held at McGill Un ivers i ty , Montreal, Quebec, 4-6 November 1981,
SM Study No. 16, Universi ty of Waterloo Press, Waterloo, Ontario,
pp. 101-134.
Moen, I .O. , Lee, J .H.S. , Hjertager, B.H., Fuhre, K. and Eckhoff, R.K.
(1982), "Pressure Development due to Turbulent Flame Propagation in
Large-Scale Methane-Air Explosions", Combustion and Flame 4]_, 31-52.
Moen, I .O. , Bjerketvedt, D., Jenssen, A. and Th ibaul t , P.A. (1985),
"Trans i t ion to Detonation i n a Large Fuel-Ai r Cloud", Combustion and Flame
6U pp. 285-291.
Moen, 1.0. and Saber, A . J . (1985), "Explosion Hazards of Hydrogen Sulphide
Phase I I . Flame Accelerat ion and Trans i t ion to Detonation Review", contract
repor t prepared fo r the Atomic Energy Control Board of Canada,
September 1985.
Pfor tner , H., Schneider, H., Drenckhahn, W. and Koch, C. (1983), "Flame
Accelerat ion and Pressure Build-Up in P a r t i a l l y Confined Clouds", presented
at the 9th Internat ional Colloquium on Dynamics of Explosions and Reactive
Systems, P o i t i e r s , France, Ju l y .
Schildknecht, M., Geiger, W. and Stock, M. (1984), "Flame Propagation and
Pressure Buildup i n a Free Gas-Air Mixture due to Jet I g n i t i o n " , Progress i n
Astronautics and Aeronautics 94_, pp. 474-490.
Schildknecht, M. (1984), "Versuche zur Freistrahlziindung von
Wasserstoff-Luft-Gemischen im Hinbl ick auf den Ubergang
Def lagrat ion-Detonat ion", Report BIeV-R-65.769-1, Ba t te l le I n s t i t u t e e.V. ,
F rank fu r t , West Germany.
UNCLASSIFIED
UNCLASSIFIED 20.
Schneider, H. and Pfôrtner, H. (1981), "Flammen und Druckwellenausbrutung
bei der Deflagration von Wasserstoff - Luft - Gemischen", Teil I , Ju l i
1978, Teli I I , Juni 1981, Fraunhoffer - Ins t i tu te fur Treib und
Explosivestoffe (ICT), Pfinztal-Berghaven, West Germany.
Schoite, T.G. and Vaags, P.B. (1959), "The Burning Velocity of Hydrogen-Air
Mixtures and Mixtures of some Hydrocarbons with A i r " , Combustion and Flame
_3, 495.
Sherman, M.P., Tiezsen, S.R., Benedick, W.B., Fisk, J.W. and Carcassi, M.
(1985), "The Effect of Transverse Venting on Flame Acceleration and
Transit ion to Detonation in a Large Channel", presented at the 10th
International Colloquium Dynamics of Explosions and Reactive Systems,
Berkeley, Cal i forn ia , U.S.A., August.
Stock, M. and Geiger, W. (1985), Battel le I ns t i t u t e.V., Frankfurt, West
Germany, pr ivate communication.
Strehlow, R.A., Luckr i tz, R.T., Adamczyk, A.A. and Shimpi, S.A. (1979), "The
Blast Wave generated by Spherical Flames", Combustion and Flame 35,
pp. 297-310.
Suimistras, A. , Moen, 1.0. and Saber, A.J . (1985), "Detonations in Hydrogen
Sulphide-Air Clouds", Suf f ie ld Memorandum Number 1140, Defence Research
Establishment Suff i e l d , Ralston, Alberta, February.
Urtiew, P.A. and Oppenheim, A.K. (1966), "Experimental Observations of
Transit ion to Detonation in an Explosive Gas", Proc. Royal Society A 295,
pp. 13-28.
UNCLASSIFIED
UNCLASSIFIED 21.
van Wingerden, C.J.M. and Zeeuwen, J.P. (1985), " Invest iga t ion o f
Explosion-Enhancing Propert ies of a Pipe-Rack-Like Obstacle Array",
presented at the 10th Internat ional Colloquium on Dynamics of Explosions and
Reactive Systems, Berkeley, Ca l i f o rn i a , U.S.A., August.
Zeeuwen, J.P. and van Wingerden, C.J.M. (1983), "On the Scaling of Vapour
Cloud Explosion Experiments", presented a t the 9th In ternat ional Colloquium
on Dynamics of Explosions and Reactive Systems, Po i t i e r s , France, Ju ly .
UNCLASSIFIED
TABLE I - Combustion Properties of Selected Stoichiometric Fuel/Air Mixtures
Initial Conditions: 1 atm. (1.013 bar), 25°C
Fuel
Hydrogen(H2)
Acetylene(C.H,)
Methane(CHH)
Ethylene(C2H4)
Propane(CjHB)
n-Butane
HydrogenSulphide
(H.S)
Mole %in Air
29.61
7.75
9.48
6.54
4.03
3.13
12.3
LaminarBurning
Velocity(m/s)
2.70a
1.44b
0.43c
0.68b
0.46b
0.39d
0.41e
Constant PressureDensity RatioAcross Flame
6.89
8.41
7.52
8.06
7.98
7.44
6.59
LaminarFlame Speed*
(m/s)
18.6
12.1
3.2
5.5
3.7
2.9
2.7
DetonationInitiationEnergy
(g tetryl)
1.1
1.25
22 x lO"1
(estimate)
10 NO GO15 GO
50 NO GO80 GO
50 NO GO80 GO
> 80
Cri t ica lTube
Diameter(m)
0.2
0.115
3.6+
0.43
0.9
0.7+
1.3+
DetonationVelocity(m/s)
1968
1864
1801
1822
1798
1796
1647
*Assumes velocity of burned gases is zero••"Estimate based on detonation cell sizea) Andrews and Bradley (1972a)b) Gibbs and Caicote (1959)
c) Andrews and Bradley (1972b)d) Scholte and Vaags (1959)e) Kinder (1979)
TABLE II - SUMMARY OF FLAME ACCELERATION
TESTNO.
13
14
10
12
9
11
20
FUEL%
$&
C3H8I%8
C H
4%8
C3Ha4hl%H2S913%
H,S12.9%
IGNITION
4
4
4
4
4
SPARKS
SPARKS
SPARKS
TUBE
SPARKS
TUBE
SPARKS
MAXIMUMFLAME SPEED
(m/s)
435+
180+
62
200
67
45
81
A.
AVERAGEFLAME SPEED
(m/s)
124+
85+
45
55
53
18
59
500 mm DIAMETER OBSTACLES
PEAKOVERPRESSURE
(mbar)
>155+
132+
86.2
7121
12.4
44.8
25.4
LAMINARFLAME SPEED*
(m/s)
12.1
11.0
3.7
3.7
3.7
1.5
2.6
COMMENTS
TRANSITION TO DETONATION AT THE END OFCHANNEL.
IGNITION DUE TO HOT WIRE AT END LEADS TOONSET OF DETONATION.
MAXIMUM PRESSURE AND VELOCITY NEARIGNITION END.
CENTRAL OBSTACLES ONLY
APPEARS TO SLOW DOWN.
18
19
15
16
17
C2H
C2H2
7.71%
C H4?0§%
C3H
H2S10.7%
4
4
4
SPARKS
SPARKS
TUBE
SPARKS
TUBE
97
375+
90
92
36
B.
51
86+
62
70
28.5
220 mm DIAMETER
51.7
303+
51.7
—
18.3
OBSTACLES
<7.4
12.1
3.7
3.7
2.1
TRANSITION TO DETONATION 10.7 M DOWNCHANNEL.
NO PRESSURE RECORDS.
+ Pre-detonation Values* Assumes velocity of burned gas is zero
0.01
UNCLASSIFIED SM 1159
SPHERICAL
GUIRAO ETAL. (1976)STREHLOW ETAL. (1979)
100 1000
MAXIMUM FLAME SPEED (m/s)
Figure 1
THEORETICAL CORRELATION OF MAXIMUM OVERPRESSURE VS MAXIMUMFLAME SPEED FOR CONSTANT VELOCITY FLAMES IN SPHERICAL
AND PLANAR GEOMETRIES
UNCLASSIFIED
IIIIIIIIIIIIII1IIII
czorGO
mD
TEST PAD
CAMERA-SHELTER
(30°) CAMERASHELTER
(90°)
INSTRUMENTATIONTRAILER
\FUEL FLOW
CONTROL TRAILER
Czo
T1ma
Figure 2
AERIAL VIEW OF TEST SITE
c2O
C/î
on
m
a) SIDE VIEW OF CHANNEL
c) OBSTACLES: END VIEW
i
b) END VIEW OF CHANNEL
d) OBSTACLES: SIDE VIEW
Figure 3
SELECTED PHOTOGRAPHS OF CHANNEL WITH 500 mm DIAMETER OBSTACLES
cznr
mc
czn
in
zïm
"77 7777 T'tTTT'Trr 7~TTT 7 I 77 / 77V T'TT" TTT77 ! 7 rT77T7 r r / 777 7 77 rtf TTTTTJ ! / / / ? /
CHANNEL SIZE: 1.8m x 1.8m IN CROSS SECTIONx 15.5 m LONG
• PRESSURE TRANSDUCERS: SPACING = 1.27m
T7 :
OBSTACLESDIAMETER = 500 mmSPACING(S) = 1.27 mHEIGHT(H) = 0.90 m
SUPPORT FRAME: DIAMETER = 60 mm
Figure 4
SIDE VIEW OF CHANNEL WITH 500 mm DIAMETER OBSTACLES m
cznr
en
2m
C2nr->on
a I OBSTACLES : END VIEW b ) OBSTACLES: SIDE VIEW
Figure 5
SELECTED PHOTOGRAPHS OF FLAME ACCELERATION CHANNEL WITH 220 mm OBSTACLESV)
czn
C/JC/5
ma
PLASTIC BAG
12
e -<u——O ( D - O €>
j rr
CHANNEL SIZE: 1.8 m x 1.8m IN CROSS SECTIONx 15.5 m LONG
PRESSURE TRANSDUCERS: SPACING = 1.27m
0 OBSTACLES
= SUPPORT FRAME: DIAMETER = 60 mm
DIAMETER = 220 mmSPACING(S) = 0.63 m
cz
m
Figure 6
SIDE VIEW OF FLAME ACCELERATION CHANNEL WITH 220 mm OBSTACLES
UNCLASSIFIED SM 1159
• ; 012 -
UJ
0.08
004-
000
TRIAL #13 7.80% C 2 H 2
500 mm OBSTACLES : SPARK IGNITION
I VELOCITYn PRESSURE
to 12
DISTANCE (ml
a ) MAXIMUM PRESSURE AND FLAME VELOCITY VS DISTANCE.
FROM PRESSURE RECORDS
9CDEG TEU- 90DEG WIDE
3UU.UU
400 00
300 00
20000
100 00
0 00-
i........90DEG WIDE
400 8.00 1200
DISTANCE (ml
16 00 20 00 0.00 400
TIME OF ARRIVAL VS DISTANCE
b) TIME OF ARRIVAL VS DISTANCE
FROM HIGH SPEED FILMS
8 00 12 00 16.01
DISTANCE [ml
VELOCITY VS DISTANCE
c) VELOCITY VS DISTANCE
FROM HIGH-SPEED FILMS
2000
Figure 7
FLAME PROPAGATION IN ACETYLENE-AIR 17.8% C 2H 2 )WITH 500 mm DIAMETER OBSTACLES AND SPARK IGNITION
UNCLASSIFIED
UNCLASSIFIED SM 1159
2000
1750
1500
1250 <
1000 •
750-
500
2K)
0
TRIAL #19 7.220mm OBSTACLES:
1 1 1 1 1 V
71% C 2 H 2
SPARK IGNITION
' VELOCITY 1
PRE SHOCK PRESS
11
1
"̂ ^-'| 1 , • • - . ,
4 6 8DISTANCE (ml
10 12
a) MAXIMUM PRESSURE AND FLAME VELOCITY VS DISTANCE.
FROM PRESSURE RECORDS
0.20 !
0 16 '
0 08
0 04
000
/
J. ,
- - - 90 DEG TELE
1 1 1 1
000 400 800 1200
DISTANCE Iml
1600 20.00
b) TIME OF ARRIVAL VS DISTANCE
FROM HIGH-SPEED FILMS
2000
1600
_ 1200*E
400
0 0
90 DEG TEIE90 DEG WIDE
000 800 1200
DISTANCE (ml
1600
c ) VELOCITY VS DISTANCE
FROM HIGH-SPEED FILMS
Figure 8
FLAME PROPAGATION AND TRANSITION TO DETONATION INACETYLENE-AIR (7.71% C 2H 2 ) WITH 220mm DIAMETER
OBSTACLES AND SPARK IGNITION
UNCLASSIFIED
UNCLASSIFIED S M 1159
a) 117.5 ms
V/7-7
c) 119.5 ms
b) 118.5 ms
à) 119.8 ms
e ) 120.1 ms f) 120.4 ms98T-/O
Figure 9
SELECTED FRAMES FROM THE 90° WIDE HIGH-SPEED FILM RECORDSHOWING FLAME ACCELERATION AND TRANSITION TO DETONATION
IN ACETYLENE-AIR (7.71% C 2 H 2 ) WITH 220 mm OBSTACLES ANDSPARK IGNITION
UNCLASSIFIED
znr->en
3.0 m
ui
<
V)
0C
a.
zo
oa.
4.3 m
5.5 m
6.8 m
[JOO m t o r ^
] 200 m bar
1 200 m bar
""ft\
4
k
illTil,
38 58 78 98 118 138
TIME (ms)
C
znrtoon
m
3 878 98 118 138
TIME (ms)
Figure 10
PRESSURE TIME HISTORIES AT VARIOUS POSITIONS DOWN THE CHANNEL FOR7.71% C 2 H 2 WITH 220mm DIAMETER OBSTACLES AND SPARK IGNITION
UNCLASSIFIED SM 1159
0 ms 25 ms 50 ms
75 ms 100 ms 125 ms
150 ms 175 ms 200 ms
Figure 11
IGNITION, FLAME ACCELERATION AND TRANSITION TO DETONATIONWITH ACETYLENE-AIR IN A 1.8m x 1.8m LANE. 15.5m LONG
UNCLASSIFIED
UNCLASSIFIED SM 1159
•ï 200
Z_ 175
| '50
S 125
S 10°- 75lu
1 "te
a0
TRIAL #14 7.5% C 2 H 2
500mm OBSTACLES: SPARK IGNITION, VELOCITY
PRESSURE
4 6
DISTANCE I m I
10 12
a) MAXIMUM PRESSURE AND FLAME VELOCITY VS DISTANCE.
FROM PRESSURE RECORDS
016-
0 08
004- 90 DEG TELE90DEG WIDE
000H000 400 800 1200
DISTANCE Im)
TIME OF ARRIVAL VS DISTANCE
16 00 20 00
250 00
200 00-
150 00
u
u 10000>
50 00-
0 00
90 DEG TELE
90 DEG WIDE
400 8 00 12.00DISTANCE Iml
16 00 20.00
VELOCITY VS DISTANCE
b ) TIME OF ARRIVAL VS DISTANCE
FROM HIGH-SPEED FILMS
c ) VELOCITY VS DISTANCE
FROM HIGH-SPEED FILMS
Figure 12
FLAME PROPAGATION IN ACETYLENE-AIR (7.5% C 2H 2 )WITH 500 mm DIAMETER OBSTACLES AND SPARK IGNITION
UNCLASSIFIED
UNCLASSIFIED SM 1159
b) 169.2 ms
c) 170.2 ms d) 170.5 ms
e) 170.8 ms f) 171.1 ms
Figure 13
SELECTED FRAMES FROM THE 30° HIGH-SPEED FILM RECORD SHOWINGTHE EXPLOSION AND TRANSITION TO DETONATION IN THE TURBULENTEND-POCKET OF ACETYLENE-AIR PRIOR TO THE ARRIVAL OF THE MAIN
FLAME FRONT
UNCLASSIFIED
UNCLASSIFIED SM 1159
100
90
t 70O2 60> so
I «0E 30
£ 20
I 10
TRIAL #18 5.17% C 2 H 2
220 mm OBSTACLES: SPARK IGNITION' VELOCITY
" PRESSURE
4 6 8
DISTANCE (ml
10 12
a) MAXIMUM PRESSURE AND FLAME VELOCITY VS DISTANCE.
FROM PRESSURE RECORDS
i 030'2
000
I> 120 00
- 90OEG TELE
-90OEG WIDE
8 00 1200 1600 2000
DISTANCE 1ml
90DEG TELE
90DEG WIDE
800 1200
DISTANCE Iml
20 00
b ) TIME OF ARRIVAL FS DISTANCE
FROM HIGH-SPEED FILMS
c I VELOCITY VS DISTANCE
FROM HIGH SPEED FILMS
Figure 14
FLAME PROPAGATION IN ACETYLENE-AIR (5.17% C2H2 )WITH 220 mm DIAMETER OBSTACLES AND SPARK IGNITION
UNCLASSIFIED
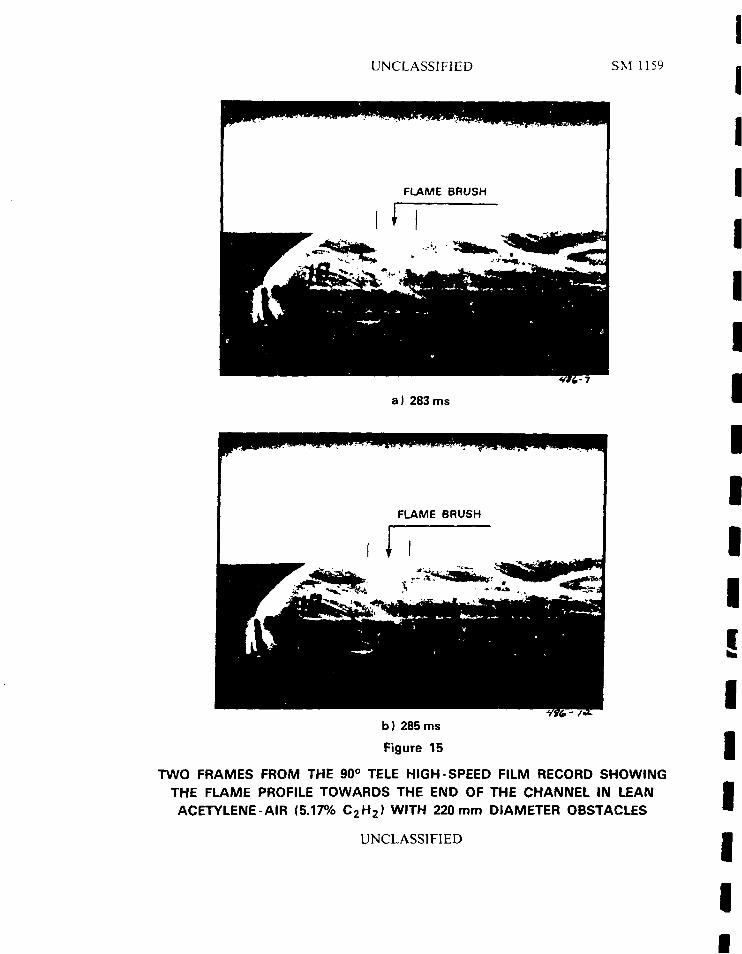
UNCLASSIFIED SM 1159
a ) 283 ms
b) 285ms
Figure 15
TWO FRAMES FROM THE 90° TELE HIGH-SPEED FILM RECORD SHOWINGTHE FLAME PROFILE TOWARDS THE END OF THE CHANNEL IN LEANACETYLENE-AIR (5.17% C 2H 2 ) WITH 220mm DIAMETER OBSTACLES
UNCLASSIFIED
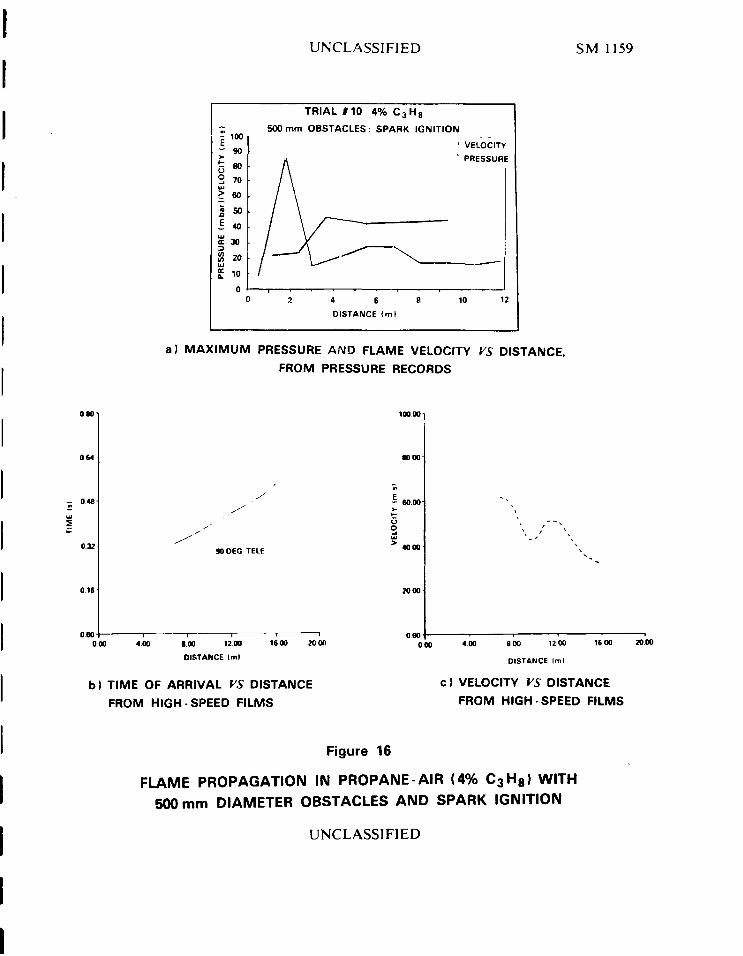
UNCLASSIFIED SM 1159
TRIAL *10 4% C 3 H 8
500 mm OBSTACLES : SPAHK IGNITION
VELOCITY
PRESSURE
4 6DISTANCE (ml
10 12
a) MAXIMUM PRESSURE AND FLAME VELOCITY YS DISTANCE,
FROM PRESSURE RECORDS
064
- 0 48
0.32
016
100 001
«0 00
- 60.00-
90OEG TELE
0 00 4 00 8.00 1200
0I5TANCE I m I
b) TIME OF ARRIVAL VS DISTANCE
FROM HIGH-SPEED FILMS
2000
800 1200
DISTANCE Iml
16 00
c ) VELOCITY VS DISTANCE
FROM HIGH SPEED FILMS
Figure 16
FLAME PROPAGATION IN PROPANE-AIR (4% C3H8> WITH500 mm DIAMETER OBSTACLES AND SPARK IGNITION
UNCLASSIFIED
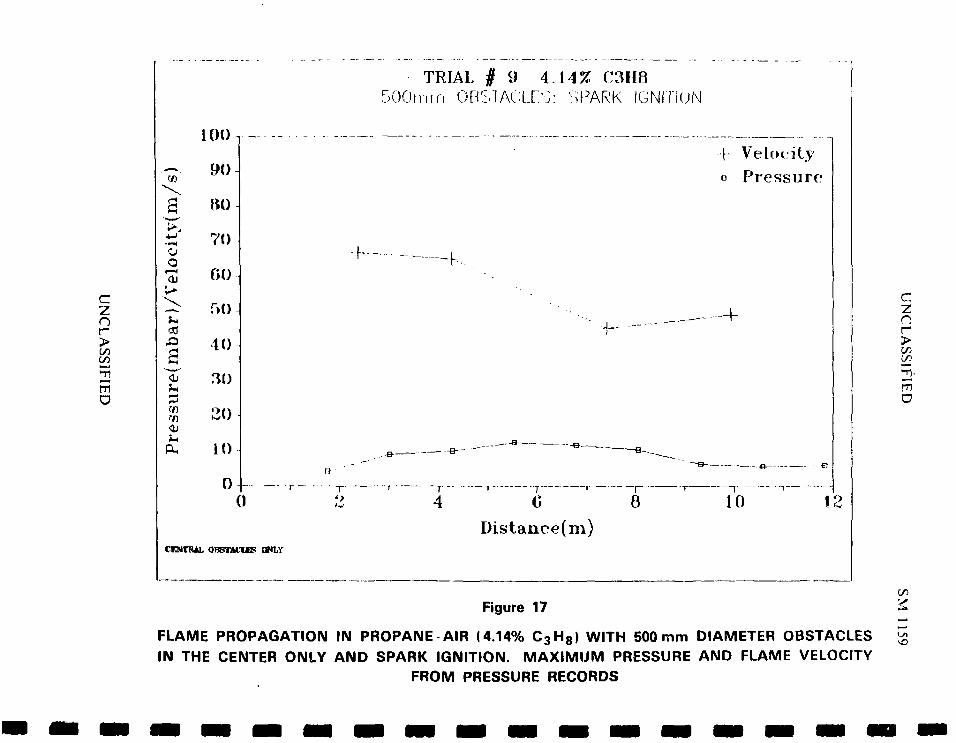
czo
>on
mD
100-,
• « • 9 < H
oI—I
3'73•71
70
f>0
r>o-|
40
30
20
10
00
TRIAL # 9 4.14% C3HB500rnin OPSlACLfS: SPARK IGNITION
CENTRitL
-f- Veloi itya Pressure
. j . f..
I _ ___-—f-
B
~r- -i-
4 7
0
_, j —
8 10
Distanoe(m)ONLY
ooFigure 17
FLAME PROPAGATION IN PROPANE AIR (4.14% C 3 H 8 ) WITH 500 mm DIAMETER OBSTACLESIN THE CENTER ONLY AND SPARK IGNITION. MAXIMUM PRESSURE AND FLAME VELOCITY
FROM PRESSURE RECORDS
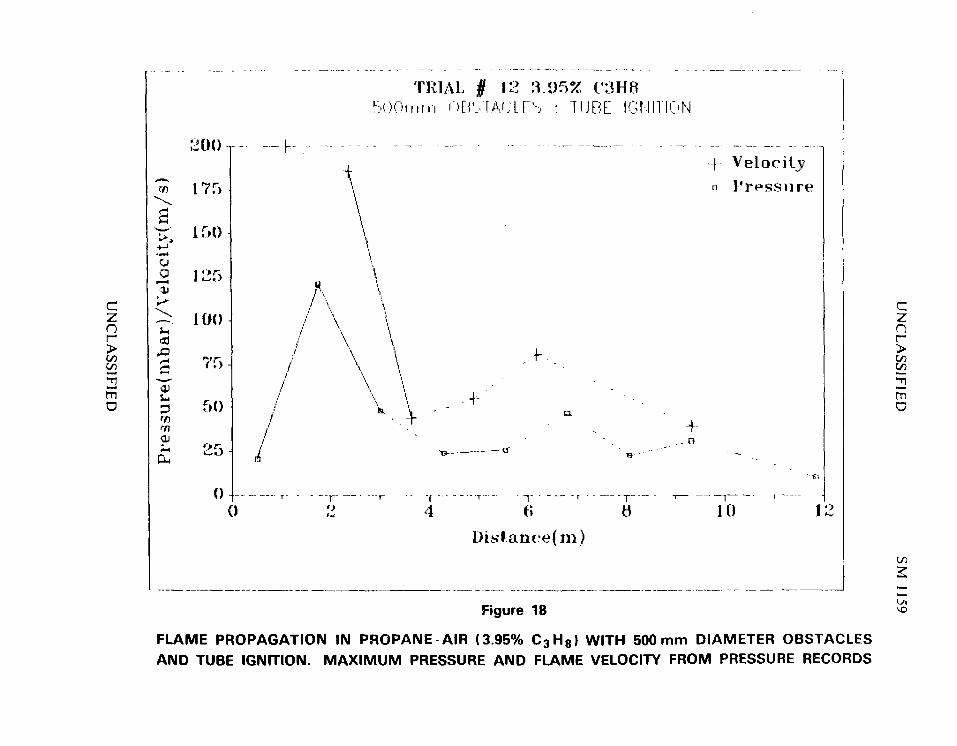
czo
to
mD
J3
m
200
175
i r»o J
?T> H
0o
TRIAL #
I .
\
A \
2 n.1)5% C3HRC i r b : 7URE1 IGNITION
4-
-u-
eDisl.anoe(m)
•-|- Velocitya Pressure
... o-
10 f o
Figure 18
FLAME PROPAGATION IN PROPANE-AIR (3.95% C 3 H 8 ) WITH 500 mm DIAMETER OBSTACLESAND TUBE IGNITION. MAXIMUM PRESSURE AND FLAME VELOCITY FROM PRESSURE RECORDS
czn
m
C/3
2
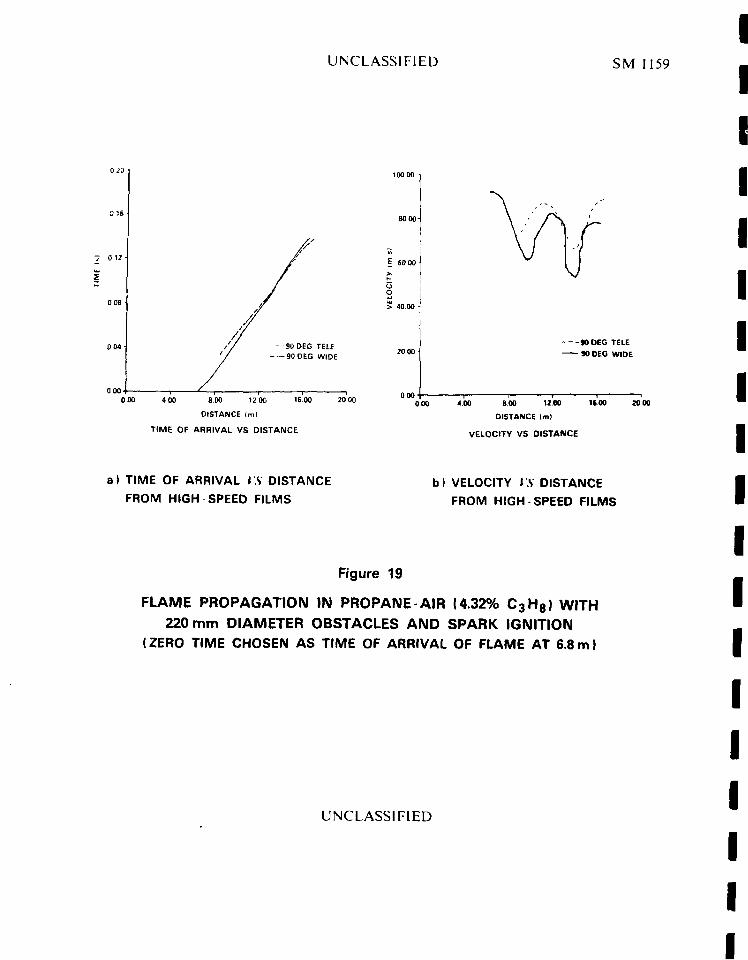
UNCLASSIFIED SM 1159
000000 4 00 8 00 12 00 16 00
DISTANCE {ml
TIME OF ARRIVAL VS DISTANCE
20 00
E 60 00
i> 40 00 -
ooo
«OOEG TELESO OEG WIDE
000 ' 0 0 SOD 12.00
OISTANCE (ml
VELOCITY VS OISTANCE
20 00
a) TIME OF ARRIVAL f.S DISTANCE
FROM HIGH SPEED FILMSb) VELOCITY >.S DISTANCE
FROM HIGH SPEED FILMS
Figure 19
FLAME PROPAGATION IN PROPANE-AIR (4.32% C 3H 8 ) WITH220 mm DIAMETER OBSTACLES AND SPARK IGNITION
(ZERO TIME CHOSEN AS TIME OF ARRIVAL OF FLAME AT 6.8m)
UNCLASSIFIED
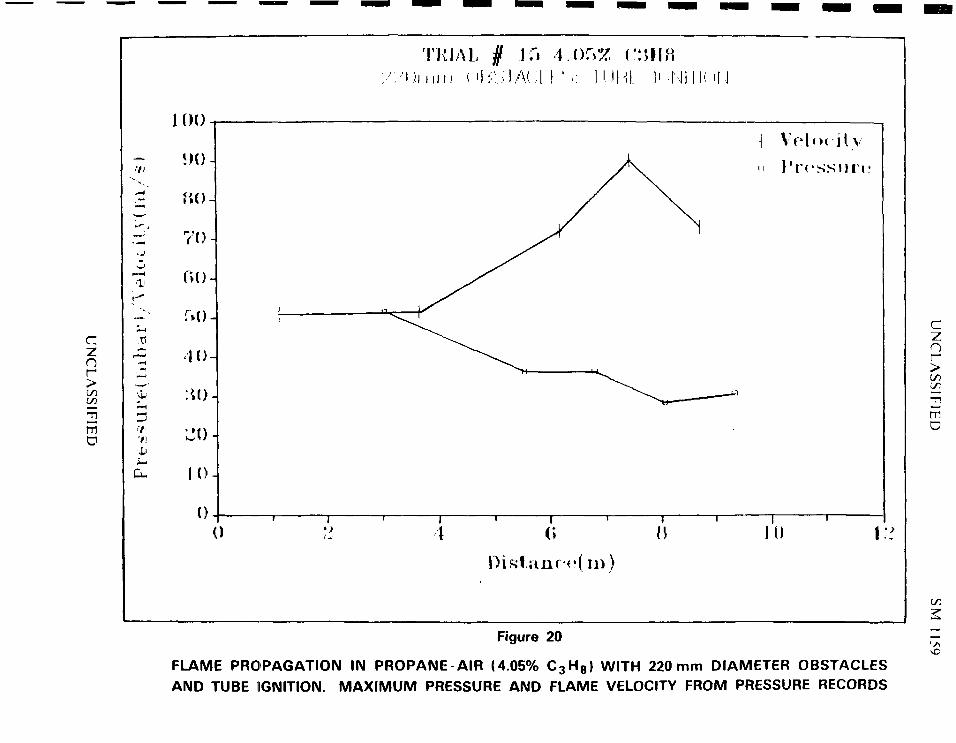
cznr-
C/3
ma
•Il
•V
77!
Du
100-j
ÎM)-
Ï ÎO-
70 -
00-
:»0-
4 0 -
:«)-
L'O -
10 -
0 -
TRIAL § If) 1.05% (
y
1 1 1 1 1 1 1
•» ! HN 1 I
\
w
] Velocily
n l'rcssuri'
I | i
10 1 • >
Figure 20
FLAME PROPAGATION IN PROPANE AIR (4.05% C 3 H 8 ) WITH 220mm DIAMETER OBSTACLESAND TUBE IGNITION. MAXIMUM PRESSURE AND FLAME VELOCITY FROM PRESSURE RECORDS
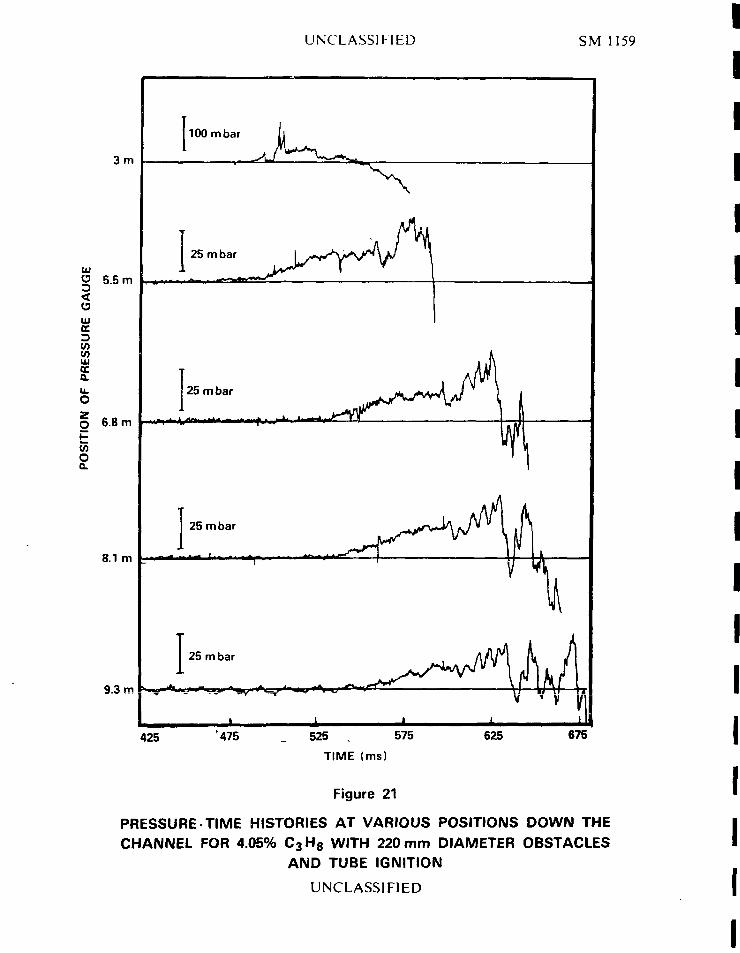
UNCLASSIFIED SM 1159
3m
5.5 m
UJ
>UJa
O 6.8 m
O0.
8.1 m
9.3 m
100 m bar
425 '475 525 . 575
TIME (ms)
625 675
Figure 21
PRESSURE TIME HISTORIES AT VARIOUS POSITIONS DOWN THECHANNEL FOR 4.05% C 3 H 8 WITH 220 mm DIAMETER OBSTACLES
AND TUBE IGNITION
UNCLASSIFIED
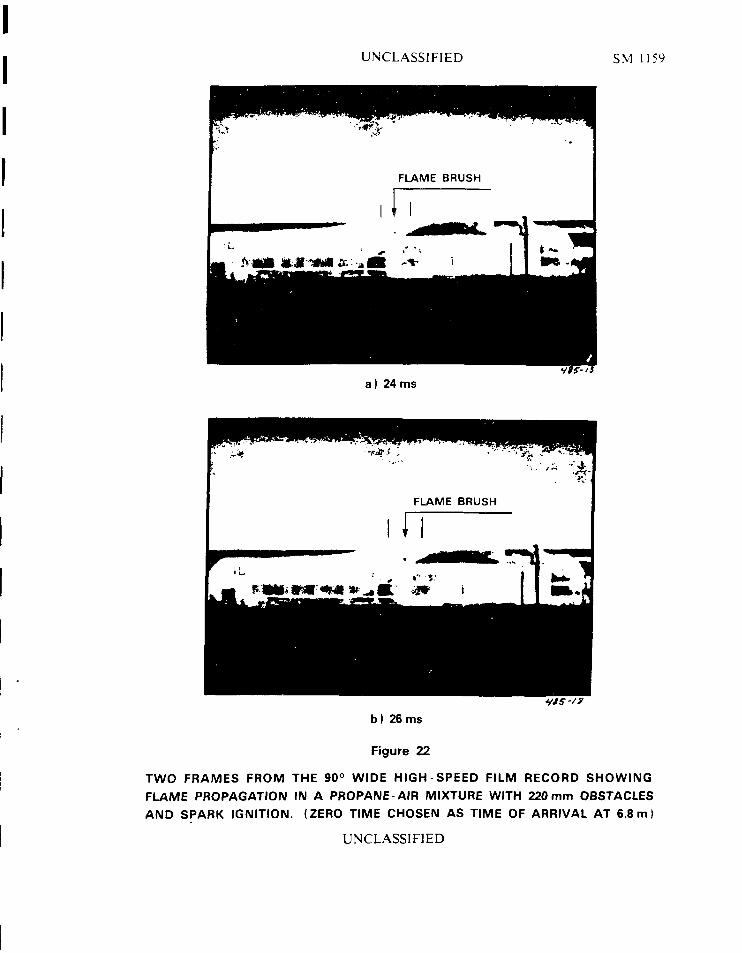
UNCLASSIFIED SM 1159
a ) 24 ms
TWO FRAMES FROM THE 90° WIDE HIGH-SPEED FILM RECORD SHOWINGFLAME PROPAGATION IN A PROPANE-AIR MIXTURE WITH 220mm OBSTACLESAND SPARK IGNITION. (ZERO TIME CHOSEN AS TIME OF ARRIVAL AT 6.8m)
UNCLASSIFIED
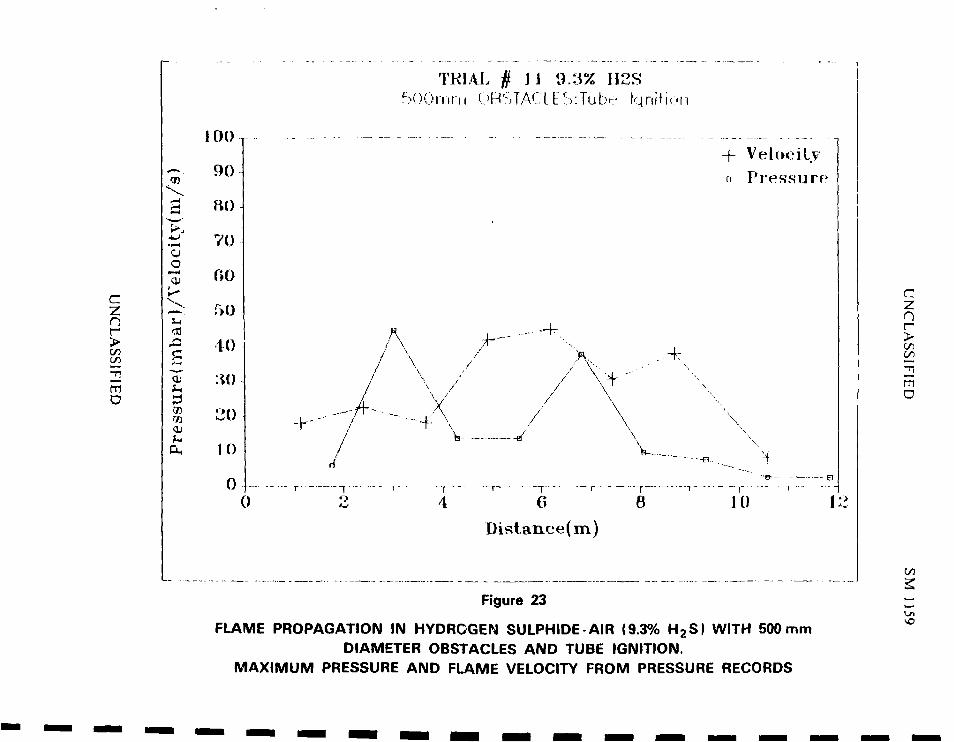
czor>in
ma
. * * > '
oi—i
ai
73•71
100
90
ftO
70
00
50
10
20
10
00
TRIAL # 11 9.3% H2SiTirn OBSTACL.E.iv.Tube Ignition
A/ \
-V'' //
X4- \
•"I
4
-4-..4:
V......
+ Velocityn Pressurp
&-• B
"T"
0T
8Distance(m)
Figure 23
FLAME PROPAGATION IN HYDROGEN SULPHIDE-AIR (9.3% H2S) WITH 500mmDIAMETER OBSTACLES AND TUBE IGNITION.
MAXIMUM PRESSURE AND FLAME VELOCITY FROM PRESSURE RECORDS
<•£>
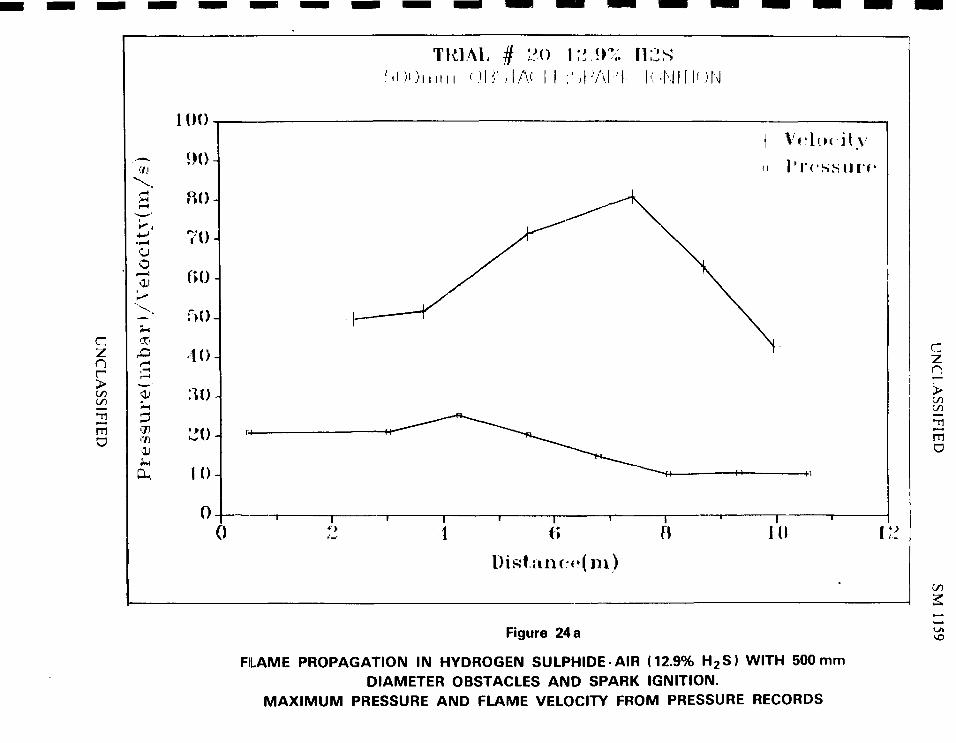
czn
mo
oi—i
ai
KM)
RI)>u -
70
KO
10-
LM)-
10-
00
TklALM ) i ) i n i i i f.J I ;'.KAI-1 I-:. ;NI f I' )N
V i ' L i K - i t y
< • > (îT r
Jl) 1 ïl
Figure 24 a
FLAME PROPAGATION IN HYDROGEN SULPHIDE-AIR (12.9% H2S> WITH 500 mmDIAMETER OBSTACLES AND SPARK IGNITION.
MAXIMUM PRESSURE AND FLAME VELOCITY FROM PRESSURE RECORDS
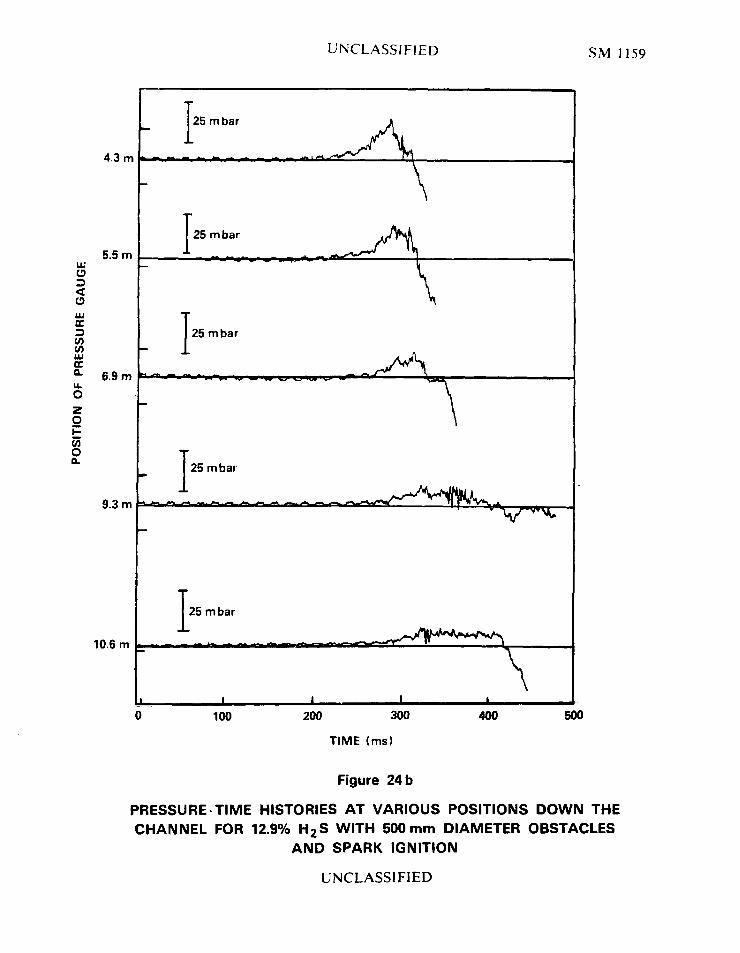
UNCLASSIFIED SM 1159
4.3 m
5.5 mLL
o
LUOC
COV)wec 6.9 m
CO
OQ.
9.3 m
10.6 m
25 m bar
25 m bar
25 m bar
25 m bar
100
\
200 300
TIME (msl
400 500
Figure 24 b
PRESSURE TIME HISTORIES AT VARIOUS POSITIONS DOWN THECHANNEL FOR 12.9% H2S WITH 500 mm DIAMETER OBSTACLES
AND SPARK IGNITION
UNCLASSIFIED
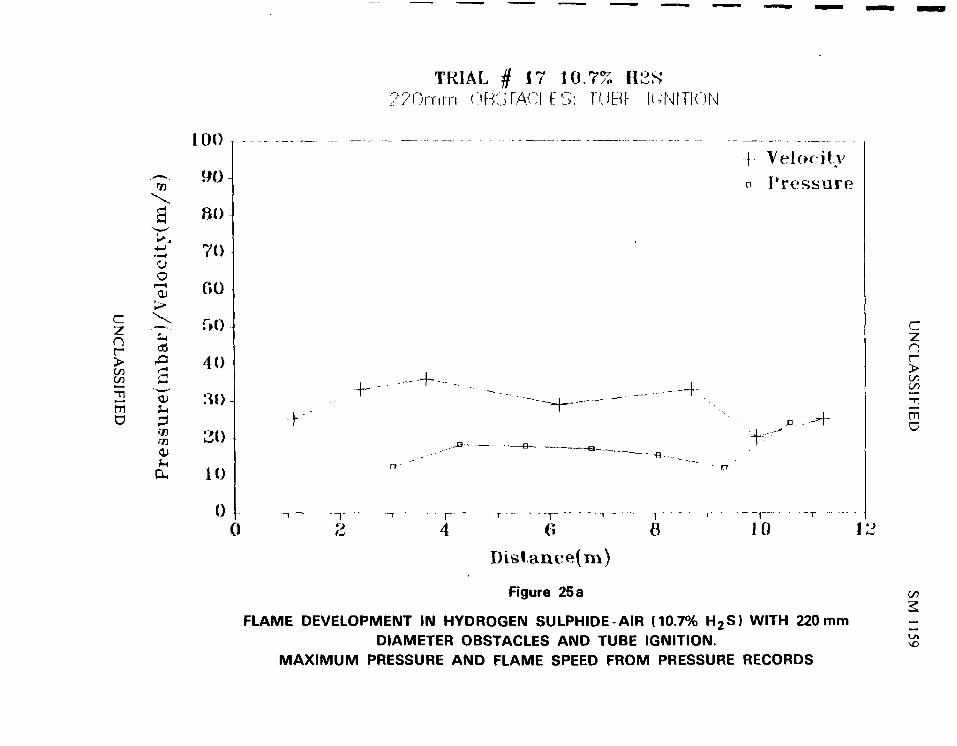
cznr
mD
o1—4
ai
*
s
0)
ai
100
90
80
70
r»o
r»o40
20
10
00
TRIAL # 17 10.7% H2S??Omm ORSTAOI ES: TUBP IGNITION
. - - • — I -
- ! • •
1 Velocityn Pressure
"t-
• r
4 106 8Dist.anee(m)
Figure 25 a
FLAME DEVELOPMENT IN HYDROGEN SULPHIDE-AIR (10.7% H2S) WITH 220mmDIAMETER OBSTACLES AND TUBE IGNITION.
MAXIMUM PRESSURE AND FLAME SPEED FROM PRESSURE RECORDS
n
t/3in
mc
co
\O
UNCLASSIFIED SM 1159
4.3 m
9.3 m
25 m bar
V
1400 1500 1600 1700 1800 1900
TIME I ms)
Figure 25 b
PRESSURE-TIME HISTORIES AT VARIOUS POSITIONS DOWN THECHANNEL FOR 10.7% H2S WITH 220 mm OBSTACLES AND TUBE IGNITION
UNCLASSIFIED
APPENDIX A
TABULATED PRESSURE RECORD RESULTS
Tarr = Time of arrival
Velocity = Flame Velocity
Pressure = Maximum pressure

PART I ACETYLENE-AIR
TRIAL NO. 13 AI-1
IGNITION: 4 SPARKS
CONCENTRATION: 7.80% C..H
OBSTACLES: 500 MM (CENTRAL and GROUND)
Channel
1O,IN11'
1
2
3
4
5
6
7
8
9
Distance(m)
TUBE
0.50
1.76
3.02
4.28
5.54
6.80
8.06
9.32
10.58
Tarr(ms)
88.7
50.7
- -
- -
- -
- -
102.9
110.9
115.9
Velocity(m/s)
- -
—
--
- -
—
--
120.7
157.5
252.0
Volts(mV)
680.0
33.0
200.0
428.0
450.0
2200.0
>2250.0
>1300.0
>2100.0
>2200.0
>2200.0
Cal(psi/V)
1.0
5.0
1.0
5.0
5.0
1.0
1.0
1.0
1.0
1.0
1.0
Pressure(mbar)
46.9
11.4
13.8
147.6
155.2
151.7
>155.2
>89.7
>144.8
>152.7
>151.7
TRIAL NO. 18 AI-4
IGNITION: 4 SPARKS
Channel
11.12J
1
2
3456
7
8910
Distance(m)
TUBE
0.501.763.024.285.546.808.069.32
10.5811.84
CONCENTRATION:OBSTACLES: 220
Tarr
(ms)
164.5304.8161.3180.0
193.3213.0
- -
248.6261.6278.1296.9
Velocity(m/s)
——
67.4
94.764.0- -
70.896.976.4
67.0
5.17% C/H/
MM
Volts(mV)
156.0
—
110.050.085.095.075.055.010.53.0
3.0
6.3
Cal
(ps1/V)
1.0
5.0
1.0
5.0
5.0
5.0
10.010.050.0
100.0100.050.0
Pressure(mbar)
10.8—
7.6
17.229.332.851.737.936.220.7
20.721.7

PART I I PROPANE-AIR
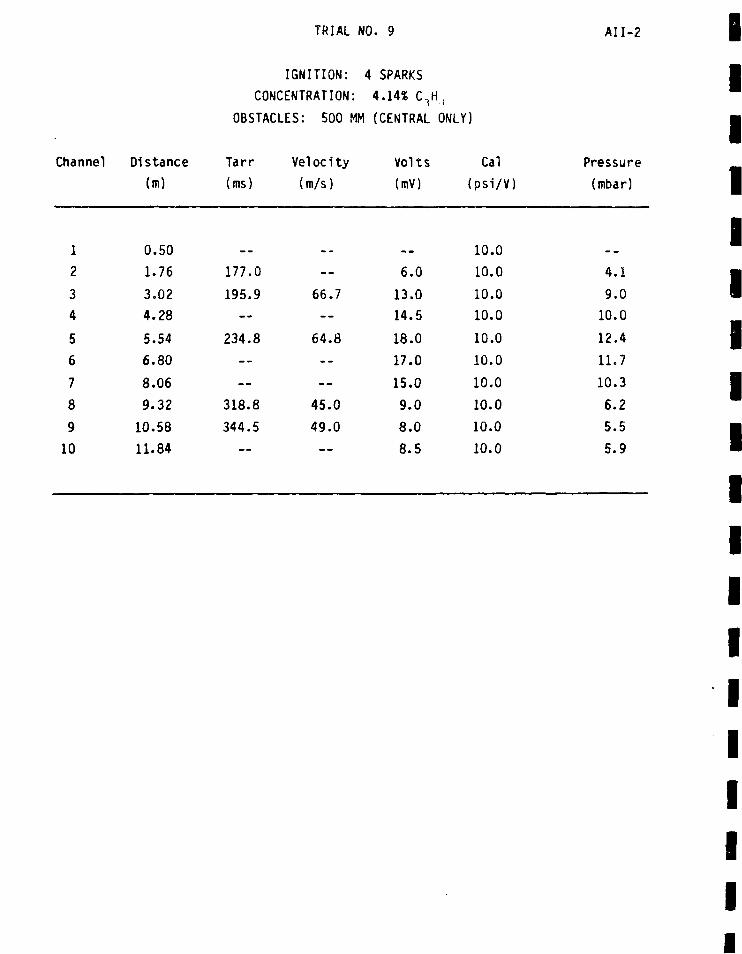
TRIAL NO. 9 AI 1-2
Channel
1
2
3
4
5
6
7
8
9
10
Distance
(m)
0.50
1.76
3.02
4.28
5.54
6.80
8.06
9.32
10.58
11.84
IGNITION:
CONCENTRATION
OBSTACLES: 500
Tarr
(ras)
177.0
195.9
—
234.8
—
—
318.8
344.5
Veloci ty
(m/s)
—
66.7
- -
64.8
- -
—
45.0
49.0
4 SPARKS
: 4.14* C,f
MM (CENTRAL
Volts
(mV)
6.0
13.0
14.5
18.0
17.0
15.0
9.0
8.0
8.5
ONLY)
Cal
(psi/V)
10.0
10.0
10.0
10.0
10.0
10.0
10.0
10.0
10.0
10.0
Pressure
(mbar)
4.1
9.0
10.0
12.4
11.7
10.3
6.2
5.5
5.9
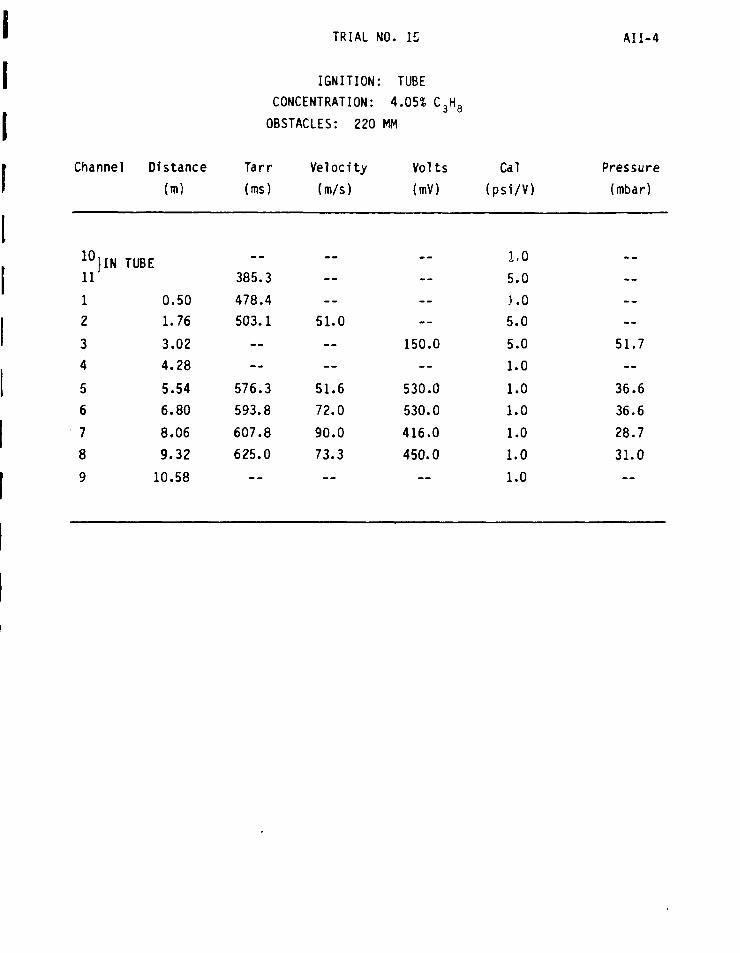
TRIAL NO. 15 AII-4
IGNITION: TUBE
CONCENTRATION: 4.05% C3H£
OBSTACLES: 220 MM
Channel
10}IN11
1
2
3
4
56789
Distance(m)
TUBE
0.501.76
3.024.28
5.546.80
8.069.32
10.58
Tarr(ins)
385.3478.4503.1
—
- -
576.3593.8
607.8625.0
Velocity(m/s)
—--
51.0—
—
51.672.0
90.073.3
Volts<mV)
—- -
- -
150.0- -
530.0530.0
416.0450.0
Cal(psi/V)
LO
5.0
KO
5.0
5.0
1.0
1.0
1.0
1.0
1.0
1.0
Pressure(mbar)
. .
- -- -
—
51.7—
36.636.628.7
31.0
PART III HYDROGEN SULPHIDE/AIR
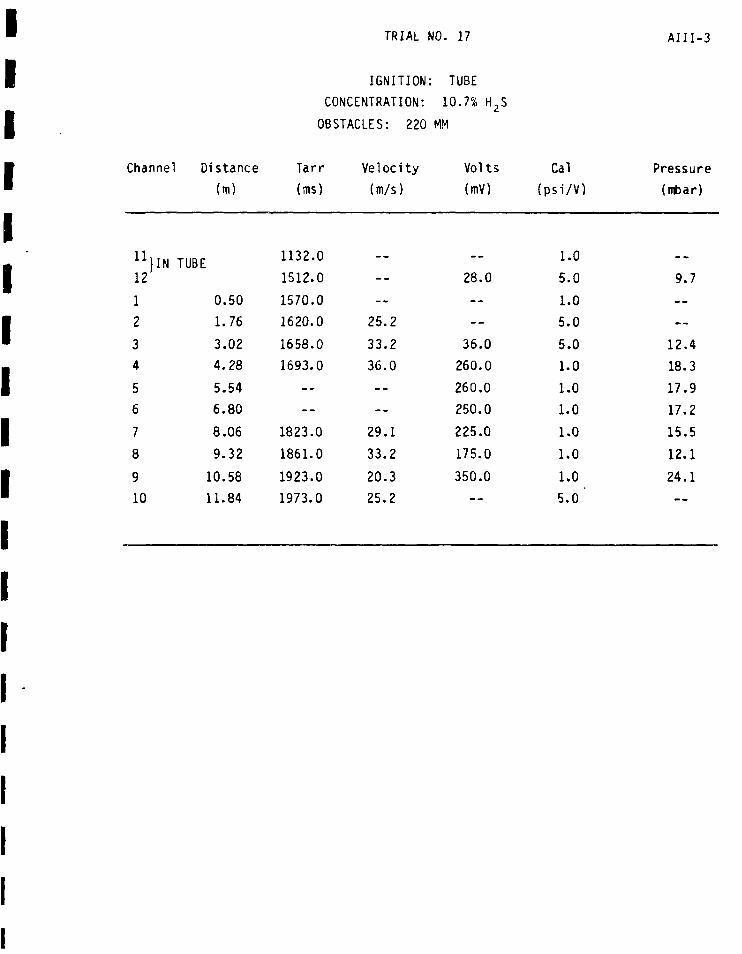
Channel
12
1
2
3
4
5
6
7
8
9
10
Distance(m)
TUBE
0.501.76
3.024.28
5.546.80
8.06
9.32
10.5811.84
TRIAL
IGNITION
CONCENTRATION:
OBSTACLES: 220
Tarr
(ms)
1132.0
1512.0
1570.0
1620.0
1658.0
1693.0
- -
- -
1823.0
1861.0
1923.0
1973.0
Velocity
(m/s)
. .
----
25.2
33.2
36.0
—
--
29.1
33.2
20.3
25.2
NO. 17
: TUBE
10.7% H2S
MM
Volts
(mV)
. .
28.0
—
—
36.0
260.0
260.0
250.0
225.0
175.0
350.0
Cal
(psi/Y)
1.0
5.0
1.0
5.0
5.0
1.0
1.0
1.0
1.0
1.0
1.0
5.0
All 1-3
Pressure(mbar)
9.7
—
—
12.418.317.917.215.5
12.1
24.1
TRIAL NO. 20 AIII-2
IGNITION: 4 SPARKSCONCENTRATION: 12.9% H2SOBSTACLES: 500 MM (CENTRAL & GROUND)
Channel Distance(m)
Tarr(tns)
Velocity(m/s)
Volts(nV)
Cal(psi/V)
Pressure(mbar)
12
1
2
3
4
5
6
7
8
9
10
N TUBE
0.50
1.76
3.02
4.28
5.54
6.90
8.06
9.32
10.58
11.84
210.3
—
260.0
285.3
309.7
- -
345.0
360.6
380.6
410.0
- -
—
—
49.8
51.6
—
71.4
80.863.0
42.9
1000.0
300.0304.0
—
61.0368.0
295.0216.0150.0155.0
150.0
1.0
5.0
1.0
5.0
5.0
1.0
1.0
1.0
1.0
1.0
1.0
1.0
69.0
103.421.0- -
21.025.4
20.314.910.310.7
10.3
ANNEX C
TURBULENT FLAME PROPAGATION AND TRANSITIONTO DETONATION IN LARGE FUEL-AIR CLOUDS
by
I.O. Moen, A. Sulmistras,B.H. Hjertager and J.R. Bakke
TURBULENT FLAME PROPAGATION AND TRANSITION TO DETONATIONIN LARGE FUEL-AIR CLOUDS*
I.O. MoenDefence Research Establishment Suffield
Ralston, Alberta, Canada TOJ 2N0
A. SulmistrasDepartment of Mechanical Engineering
Concordia University,Montreal, Quebec, Canada
B.H. Hjertager and J.R. BakkeThe Chr. Michel sen Institute
Department of Science and TechnologyBergen, Norway
* Proceedings 21st International Symposium on Combustion, Munich, West Germany,August 3-8, 1986
ABSTRACT
The results of a series of flame acceleration tests performed in atop-vented channel, 1.8 m x 1.8 m in cross-section and 15.5 m long, with repeatedobstacles are reported. The tests were performed in order to assess thepotential for flame acceleration and transition to detonation following anaccidental spill of gaseous fuel in simulated industrial environments withrepeated obstacles. Tests were performed with acetylene, propane and hydrogensulphide fuels mixed with air. For near stoichiometric acetylene-air, the flameaccelerates continuously as it propagates down the channel reaching speedsbetween 180 and 400 m/s prior to the occurrence of localized explosions whichtrigger the onset of detonation. The behavior of flames in lean acetylene (5.2%C,H 2)-, propane- and hydrogen sulphide-air mixtures is much less dramatic. Theobserved flame speeds range from about 25 m/s up to 200 m/s, with associated peakoverpressures typically less than 50 mbar. The continuous flame accelerationobserved in stoichiometric acetylene-air is not observed in these mixtures.Based on these results it is concluded that the potential for flame accelerationand transition to detonation in the more open areas of a chemical plant is muchsmaller than in the heavily confined areas. The fact that flames instoichiometric acetylene-air accelerate and produce detonations in these obstacleenvironments shows that the potential for damaging explosions does exist.However, higher levels of confinement, stronger ignition sources or denserobstacle configurations than in the present tests are required to produce suchexplosions in less sensitive mixtures. The results of numerical simulations ofthe turbulent flame propagation are also reported and compared with the observedresults. These simulations successfully describe many of the observed phenomena.In particular, the flame acceleration in acetylene-air mixtures and the absenceof similar flame acceleration in propane- and hydrogen sulphide-air mixtures arepredicted.
1. INTRODUCTION
Explosions resulting from the accidental spills of a variety of gaseousfuels continue to occur with increasing frequency, sometimes with devastatingconsequences. It has therefore become necessary to realistically assess thepotential explosion hazards associated with accidental spills in chemical andindustrial plant environments. Such spills typically occur within the plantitself, in a complex obstacle configuration involving arrays of pipes, conduitsand pipe racks, as well as buildings and other confining structures. It is thepresence of these obstacles and confining spaces which is thought to beresponsible for producing violent combustion and potentially damaging blastwaves.
The most severe type of fuel-air explosion is a detonation, which propagatesthrough the detonable parts of the fuel-air cloud producing pressures in excessof 15 bar. In view of the large energies required to directly initiatedetonation in fuel-air mixtures, this worst case scenario is typically excludedin hazard assessments. However, recent experimental tests have shown thattransition to detonation can occur under certain circumstances, even forrelatively insensitive fuel-air mixtures.1-3 Furthermore, acceleration of flamesto speeds which produce damaging blast waves has been observed in both accidentsand experimental tests. It is therefore important to determine the conditionsthat lead to violent explosions so that appropriate measures can be taken toeliminate these conditions.
A wide variety of experimental tests, both large and small scale, have beenperformed so that there is now a considerable data base available on fuel-airexplosions and the blast waves produced by such explosions. Based on theseresults, particularly hazardous obstacle configurations can be identified asthose which are heavily confined. In tubes, pipes and channels, for example,high flame speeds and potentially damaging pressures are reached within less thanfour diameters, even for insensitive mixtures of methane and air.*1 Similar flameacceleration is also observed in clouds which are confined between twosurfaces.5"7 On the other hand, weak spark ignition of an unconfined cloud in arelatively unobstructed environment is unlikely to result in a damagingexplosion, even for relatively sensitive fuels such as hydrogen andacetylene.8"10
- 2 -
In par t ia l ly confined regions with obstacles, which are more typical of
chemical plants, the acceleration of flames is less dramatic than in heavily
confined regions and depends c r i t i ca l l y on the size of the cloud, the degree of
confinement, the obstacle configuration, the ignit ion source and the fuel -a i r
mixture. The influence of top venting on methane-air flame acceleration in a
laboratory scale channel with obstacles was investigated by Chan et a l . 1 1 In
their tests, the maximum flame speed decreased from 350 m/s with a closed top to
about 5 m/s with a 50% open top. A similar influence of top venting on flame
acceleration was also observed by van Wingerden and Zeeuwen6 in their tests in a
4 m x 4 m pipe-rack obstacle array. Although qualitative descriptions of the
influence of various factors on the flame acceleration phenomena are well<• 5 6 1 1
established, ' * ' quantitative methods capable of modelling the complexcoupled chemical and fluid-dynamic processes involved are scarce. A numericalmethod which treats the coupling between flow, turbulence, heat release, mixingand pressure rise by use of submodels for each of the individual processesinvolved has been proposed by Hjertager. ' This model has been used tosimulate methane-air and propane-air explosions in tube geometries withobstacles13 and methane-air explosions in top-vented obstructed channels. ' Ofparticular importance are the scaling predictions for explosions in ventedchannels, which show that the pressure developed in partially confined obstacleconfigurations increases with the size of the cloud. With 50% top venting, forexample, the overpressure predicted for the laboratory scale channel ofChan et al.11 is very small (~10"2 bar), as observed. However, pressures inexcess of 1 bar are predicted in a similar channel scaled up linearly by a factorof 20. Since fuel-air clouds of this size and larger can easily be produced inan accidental spill, it is important to perform tests on a large scale in orderto assess the potential for hazardous explosions and to further validatenumerical predictions.
The present paper reports on an experimental and numerical investigation offlame propagation in a partially confined channel, 1.8 m x 1.8 m in cross-sectionand 15.5 m long, with repeated obstacles. The aim of this study is to assess thepotential for flame acceleration in configurations which simulate a chemicalplant environment with arrays of pipes in the fuel-air cloud. Tests wereperformed with repeated cylindrical obstacles of two diameters {500 and 220 mm)for fuel-air mixtures based on acetylene, propane and hydrogen sulphide fuels.
- 3 -
As seen in Table I, these fuels cover a wide range of laminar flame speeds anddetonation sensitivity. Experimental results obtained at stoichiometriccomposition for each fuel are compared with numerical predictions, and numericalpredictions for even larger clouds are presented.
2. EXPERIMENTAL DETAILS
2.1 Experimental Configuration and Procedure
The test section consisted of a channel, 1.8 m x 1.8 m in cross-sectionand 15.5 m long, constructed on a support frame of 60 mm diameter aluminumtubing. The sides of the channel were confined by plywood or plexiglass sheets,which were hinged in such a manner that they would swing out prior to beingdestroyed by the explosion. The bottom was confined by the test pad. The onlytop confinement was due to the plastic envelope which enclosed the channel andjoined it at one end to a 0.9 m diameter tube, 7.6 m long. Two obstacleconfigurations were tested, corresponding to 500 mm and 220 mm diameter tubesmounted across the channel at regular intervals as illustrated in Figures 1and 2.
Tests in each obstacle configuration were performed with acetylene(C 2H 2), propane (C3H8) and hydrogen sulphide (H2S) fuels. The test gases weremixed with the initial air in the test volume by a multipath recirculationsystem, and the composition and mixture homogeneity were monitored using anIR-gas analyzer. Ignition of the flame was achieved by four sparks mountedacross the channel at the tube end. This form of ignition was used to simulateline ignition which would produce approximate two-dimensional flame propagationand flow down the channel. The total energy (*s CV2) supplied to the four sparkswas 8.4 Joules. In selected tests, the plastic confinement at the far end of thechannel was removed just prior to ignition using a hot wire to cut the plasticenvelope. Selected tests were also performed with spark ignition at the far endof the tube.
- 4 -
2.2 Diagnostic Systems and Data Analyses
The arrival and pressure prof i le of the wave were monitored at up to
ten positions along the bottom of the channel by piezoelectric pressure
transducers, as i l lust rated in Figures 1 and 2. The time-of-arrival of the flame
is assumed to coincide with the peak in pressure, typical ly observed just prior
to the decay into a negative pressure phase which indicates that the main flame
front has passed. The time-of-arrival obtained in this manner is in good
agreement with that obtained from the high-speed f i lm records.
Three high-speed cameras (~3000 frames/sec) were used to record the
flame propagation. Two cameras were placed 90° to the channel axis, and the
th i rd camera was placed at a 30° angle to the channel axis. The records from the
two 90° cameras were analysed by monitoring the time-of-arrival of the leading
flame front vs posit ion, and the flame velocity was deduced from this data.
Although the flame zone was observed to be wrinkled, folded and relat ively th ick,
the flame was observed to propagate as a thick turbulent flame brush extending
from the bottom to the top of the channel. Except for local variations in the
velocity of the front as i t propagates around obstacles, the flame velocity
reported corresponds to the velocity of this flame brush.
The venting out the top as the plastic was torn and the motion of the
plywood and plexiglass side confinement were also observed on the high-speed
f i lms. In a l l tests, the tearing of the plastic coincides approximately with the
arr ival of the flame and the sides either remained intact or blew-out long after
the flame had passed. Complete side confinement with top venting of the burned
gases can therefore be assumed in a l l tests.
3. NUMERICAL SIMULATION
7 12
The numerical model has been described in detail elsewhere, ' so that onlya brief description will be given here. The governing equations for mass,momentum and energy, together with equations describing the combustion, aresolved by specifying the relevant fluxes and combustion rates, and theappropriate boundary conditions. Combustion is treated as a single-step
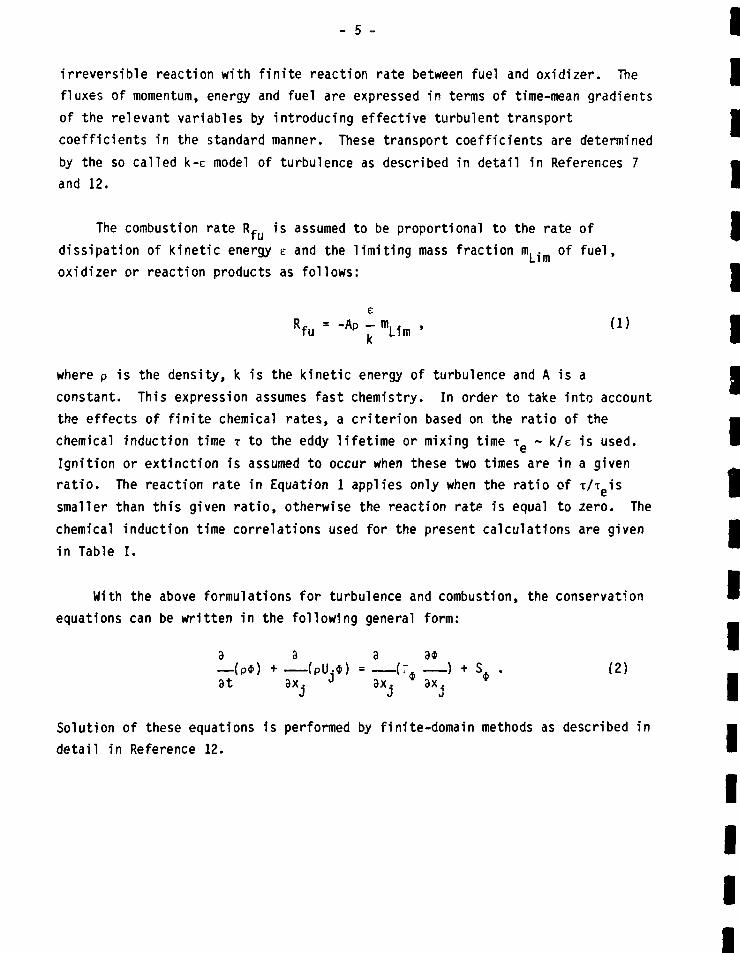
- 5 -
irreversible reaction with finite reaction rate between fuel and oxidizer. Thefluxes of momentum, energy and fuel are expressed in terms of time-mean gradientsof the relevant variables by introducing effective turbulent transportcoefficients in the standard manner. These transport coefficients are determinedby the so called k-e model of turbulence as described in detail in References 7and 12.
The combustion rate R* is assumed to be proportional to the rate ofdissipation of kinetic energy e and the limiting mass fraction m,. of fuel,oxidizer or reaction products as follows:
where p is the density, k is the kinetic energy of turbulence and A is aconstant. This expression assumes fast chemistry. In order to take into accountthe effects of finite chemical rates, a criterion based on the ratio of thechemical induction time T to the eddy lifetime or mixing time T ~ k/e is used.Ignition or extinction is assumed to occur when these two times are in a givenratio. The reaction rate in Equation 1 applies only when the ratio of T/T issmaller than this given ratio, otherwise the reaction rate is equal to zero. Thechemical induction time correlations used for the present calculations are givenin Table I.
With the above formulations for turbulence and combustion, the conservationequations can be written in the following general form:
3 3 3 8 *— ( P * ) + (PU.*) = (: ) + S . (2)at 3x. J ax. ax,.
Solution of these equations is performed by finite-domain methods as described in
detail in Reference 12.
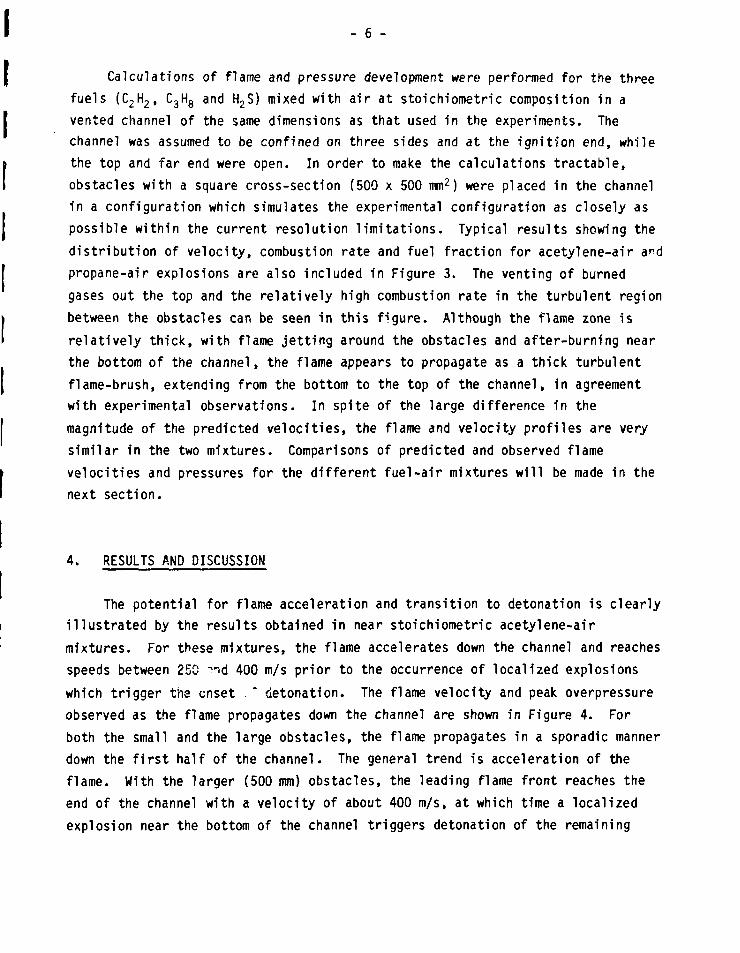
- 6 -
Calculations of flame and pressure development were performed for the three
fuels (C2H2, C3H8 and H2S) mixed with air at stoichiometric composition in a
vented channel of the same dimensions as that used in the experiments. The
channel was assumed to be confined on three sides and at the ignitïon end, while
the top and far end were open. In order to make the calculations tractable,
obstacles with a square cross-section (500 x 500 mm2) were placed in the channel
in a configuration which simulates the experimental configuration as closely as
possible within the current resolution l imi tat ions. Typical results showing the
distr ibut ion of velocity, combustion rate and fuel fraction for acetylene-air ar-d
propane-air explosions are also included in Figure 3. The venting of burned
gases out the top and the relat ively high combustion rate in the turbulent region
between the obstacles can be seen in this f igure. Although the flame zone is
relat ively th ick, with flame je t t ing around the obstacles and after-burning near
the bottom of the channel, the flame appears to propagate as a thick turbulent
flame-brush, extending from the bottom to the top of the channel, in agreement
with experimental observations. In spite of the large difference in the
magnitude of the predicted veloci t ies, the flame and velocity prof i les are very
similar in the two mixtures. Comparisons of predicted and observed flame
velocit ies and pressures for the dif ferent fuel -a i r mixtures wi l l be made in the
next section.
4. RESULTS AND DISCUSSION
The potential for flame acceleration and transition to detonation is clearlyillustrated by the results obtained in near stoichiometric acetylene-airmixtures. For these mixtures, the flame accelerates down the channel and reachesspeeds between 250 -̂«d 400 m/s prior to the occurrence of localized explosionswhich trigger the onset " detonation. The flame velocity and peak overpressureobserved as the flame propagates down the channel are shown in Figure 4. Forboth the small and the large obstacles, the flame propagates in a sporadic mannerdown the first half of the channel. The general trend is acceleration of theflame. With the larger (500 mm) obstacles, the leading flame front reaches theend of the channel with a velocity of about 400 m/s, at which time a localizedexplosion near the bottom of the channel triggers detonation of the remaining
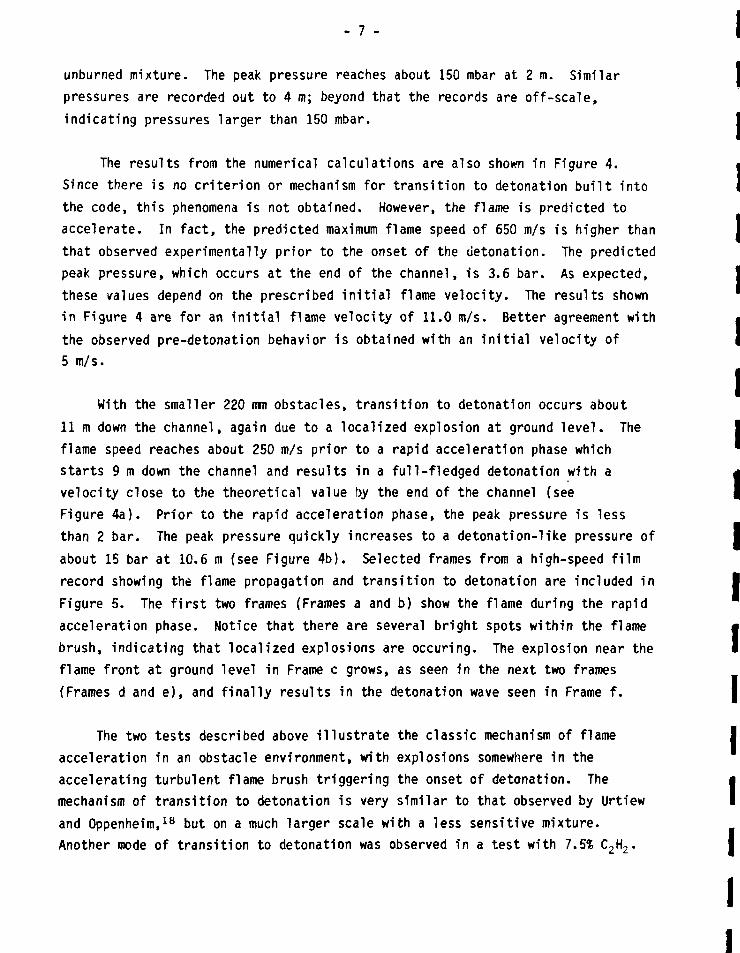
- 7 -
unburned mixture. The peak pressure reaches about 150 mbar at 2 m. Similarpressures are recorded out to 4 m; beyond that the records are off-scale,indicating pressures larger than 150 mbar.
The results from the numerical calculations are also shown in Figure 4.Since there is no criterion or mechanism for transition to detonation built intothe code, this phenomena is not obtained. However, the flame is predicted toaccelerate. In fact, the predicted maximum flame speed of 650 m/s is higher thanthat observed experimentally prior to the onset of the detonation. The predictedpeak pressure, which occurs at the end of the channel, is 3.6 bar. As expected,these values depend on the prescribed initial flame velocity. The results shownin Figure 4 are for an initial flame velocity of 11.0 m/s. Better agreement withthe observed pre-detonation behavior is obtained with an initial velocity of5 m/s.
With the smaller 220 mm obstacles, transition to detonation occurs about11 m down the channel, again due to a localized explosion at ground level. Theflame speed reaches about 250 m/s prior to a rapid acceleration phase whichstarts 9 m down the channel and results in a full-fledged detonation with avelocity close to the theoretical value by the end of the channel (seeFigure 4a). Prior to the rapid acceleration phase, the peak pressure is lessthan 2 bar. The peak pressure quickly increases to a detonation-like pressure ofabout 15 bar at 10.6 m (see Figure 4b). Selected frames from a high-speed filmrecord showing the flame propagation and transition to detonation are included inFigure 5. The first two frames (Frames a and b) show the flame during the rapidacceleration phase. Notice that there are several bright spots within the flamebrush, indicating that localized explosions are occuring. The explosion near theflame front at ground level in Frame c grows, as seen in the next two frames(Frames d and e), and finally results in the detonation wave seen in Frame f.
The two tests described above illustrate the classic mechanism of flameacceleration in an obstacle environment, with explosions somewhere in theaccelerating turbulent flame brush triggering the onset of detonation. Themechanism of transition to detonation is >/ery similar to that observed by Urtiewand Oppenheim,18 but on a much larger scale with a less sensitive mixture.Another mode of transition to detonation was observed in a test with 7.5Ï C2H2.
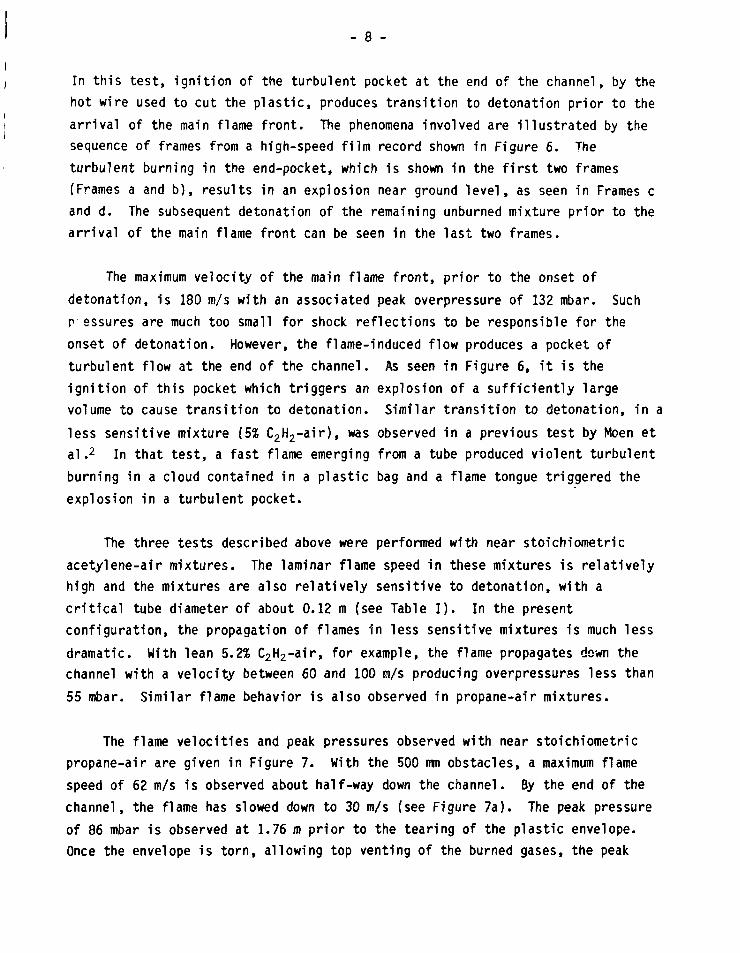
- 8 -
In this test, ignition of the turbulent pocket at the end of the channel, by thehot wire used to cut the plastic, produces transition to detonation prior to thearrival of the main flame front. The phenomena involved are illustrated by thesequence of frames from a high-speed film record shown in Figure 6. Theturbulent burning in the end-pocket, which is shown in the first two frames(Frames a and b), results in an explosion near ground level, as seen in Frames cand d. The subsequent detonation of the remaining unburned mixture prior to thearrival of the main flame front can be seen in the last two frames.
The maximum velocity of the main flame front, prior to the onset ofdetonation, is 180 m/s with an associated peak overpressure of 132 mbar. Suchr assures are much too small for shock reflections to be responsible for theonset of detonation. However, the flame-induced flow produces a pocket ofturbulent flow at the end of the channel. As seen in Figure 6, it is theignition of this pocket which triggers an explosion of a sufficiently largevolume to cause transition to detonation. Similar transition to detonation, in aless sensitive mixture 15% C2H2-air), was observed in a previous test by Moen etal.2 In that test, a fast flame emerging from a tube produced violent turbulentburning in a cloud contained in a plastic bag and a flame tongue triggered theexplosion in a turbulent pocket.
The three tests described above were performed with near stoichiometricacetylene-air mixtures. The laminar flame speed in these mixtures is relativelyhigh and the mixtures are also relatively sensitive to detonation, with acritical tube diameter of about 0.12 m (see Table I). In the presentconfiguration, the propagation of flames in less sensitive mixtures is much lessdramatic. With lean 5.2% C2H2-air, for example, the flame propagates down thechannel with a velocity between 60 and 100 m/s producing overpressures less than55 mbar. Similar flame behavior is also observed in propane-air mixtures.
The flame velocities and peak pressures observed with near stoichiometricpropane-air are given in Figure 7. With the 500 mm obstacles, a maximum flamespeed of 62 m/s is observed about half-way down the channel. By the end of thechannel, the flame has slowed down to 30 m/s (see Figure 7a). The peak pressureof 86 mbar is observed at 1.76 m prior to the tearing of the plastic envelope.Once the envelope is torn, allowing top venting of the burned gases, the peak
- 9 -
pressure remains below 30 mbar (see Figure 7b). As seen in Figure 7, the
behavior of the flame predicted by the numerical model is in excellent agreement
with that observed. Since confinement effects due to the plastic envelope are
not included in the model, the higher pressure observed prior to the tearing of
this envelope is not accounted for . However, once venting of the burned gases
occurs the predicted and observed pressures agree (see Figure 7b). The numerical
results shown in Figure 7 are for an i n i t i a l flame velocity of 9.5 m/s. Although
the numerical results depend on the choice of i n i t i a l velocity, the key
prediction is that the flame does not continuously accelerate producing higher
and higher pressure even with i n i t i a l flame speeds 2.5 times the laminar flame
speed. This should be contrasted with the results for acetylene-air where
continuous flame acceleration is predicted with an i n i t i a l speed of 5 m/s, which
is less than half the laminar flame speed for this mixture (see Table I ) .
The flame velocity observed in C3H8/air with the smaller 220 mm obstacles is
also shown in Figure 7a. Although the velocity is somewhat higher than that
observed with the larger obstacles, there is again no evfdence of continuous
flame acceleration. Tests were also performed with ignit ion at the end of the
tube. In these tests, the propane-air mixture in the channel is ignited by a
flame-jet from the tube. Although there were no obstacles in the tube to
accelerate the flame, the maximum i n i t i a l flame velocity obtained in this manner
was 200 m/s. Even with this i n i t i a l velocity, the flame in the channel rapidly
slows down to speeds similar to those observed with spark ign i t ion . The peak
pressures are also similar to those observed with spark ign i t ion . A summary of
a l l the tests results is given in Table I I .
In H2S-air mixtures, the flame is not visible so that no high-speed f i lm
analysis was possible and the flame propagation is obtained solely from the
pressure records. As seen in Figure 8, the behavior of the flame in these
mixtures is very similar to that in propane-air with maximum velocities less than
80 m/s and peak pressures less than 30 mbar. No continuous flame acceleration or
build-up of pressure is predicted or observed in any of the tests with H2S-air.
The predicted flame velocity, with an i n i t i a l flame speed of 8.5 m/s, is less
than that observed in the 500 mm obstacle configuration (see Figure 8a). The
pressures are also'underestimated (see Figure 8b).
- 10 -
The fact that the predictions of the numerical model do not agree in detailwith the experimental observations is not suprising since there are many aspectsof the experimental configuration which are not included in the numerical code.These include: the shape of the obstacles, the plastic envelope, the supportframe, the tube which is connected to the channel, ignition with four sparksrather than line ignition, and side venting. Furthermore, the numerical modelincorporates turbulent combustion through a simplified mixing model limited by asingle-step induction time. In spite of these shortcomings, the model accountsfor many of the phenomena observed. Transition to detonation cannot be describedby the model in its present form. However, the continuous flame accelerationobserved in stoichiometric acetylene-air mixtures prior to detonation ispredicted. The model also correctly predicts that flames in propane- andhydrogen sulphide-air will not continuously accelerate in the presentconfiguration. The predicted **4 maximum flame velocities and overpressures forthese mixtures also agree quite well with those observed.
In propane-air mixtures, the observed and predicted maximum flame speeds are15-25 times the laminar flame speed, and the overpressure is typically less than50 mbar. Comparison of these results with the flame speeds up to 620 m/s andpeak overpressures up to 14 bar observed in a confined tube on a similar scale(2.5 m diameter tube, 10 m long)7, clearly shows the dramatic influence ofconfinement on the development of fuel-air explosions in obstacle environments.This influence is correctly predicted by the numerical model.
The flame speeds observed in propane-air mixtures are up to four timeslarger than the maximum flame speed observed in the same mixtures in a similarlaboratory scale channel with obstacles19. However, there is no evidence toindicate that the continuous flame acceleration observed in more confinedconfigurations will occur for this mixture with this level of confinement. Asseen in Figure 9, the peak explosion pressure is predicted to increase withscale, but even in a channel scaled up linearly by a factor of 8 from the presentconfiguration, the peak pressure is predicted to be less than 150 mbar. Asimilar increase in peak pressure with scale is also predicted in hydrogensulphide-air mixtures, and the predictions for acetylene-air indicate thattransitition to detonation is also expected in larger clouds.
- 11 -
5. CONCLUSIONS
The results of a series of field tests on the propagation of flames in anopen-top channel wîth repeated obstacles have been reported. Tests wereperformed with acetylene, propane and hydrogen sulphide fuels mixed with air. Innear stoichiometric acetylene-air, the flame accelerates as it propagates downthe channel and reaches speeds up to 400 m/s prior to the occurrence of localizedexplosions which trigger the onset of detonation. The behavior of flames in leanacetylene-, propane- and hydrogen sulphide-air mixtures is much less dramatic.The flame speeds observed range from about 25 m/s up to 200 m/s, with associatedpressures typically less than 50 mbar. The continuous flame acceleration seen inmore confined configurations is not observed in the present configuration withthese fuel-air mixtures.
Based on these results it can therefore be concluded the potential for flameacceleration and transition to detonation in the more open areas of a chemicalplant is much smaller than in the heavily confined areas. The fact that flamesin stoichiometric acetylene-air accelerate and produce detonations in theseobstacle environments shows that the potential for damaging explosions doesexist. However, in order for such explosions to occur in the less sensitivepropane-air or hydrogen sulphide-air mixtures, the cloud must be: i) moreconfined than in the present tests, ii) ignited by a stronger ignition source{i.e., strong jet ignition from a confined explosion), or iii) in an obstacleenvironment with more closely spaced obstacles.
Numerical simulations of the flame propagation using a k-e turbulence model,which incorporates turbulent combustion through a mixing model limited by asingle-step induction time, describe many of the observed phenomena. Inparticular, the flame acceleration in acetylene-air mixtures and the absence ofsimilar flame acceleration in propane- and hydrogen sulphide-air mixtures arepredicted.
Future numerical and experimental research to determine the criticalconfinement, ignition and obstacle conditions for continuous acceleration andtransition to detonation in the less sensitive fuel-air mixtures are recommended.Such critieria would allow appropriate measures to be taken to eliminate theseconditions within chemical and industrial plants.
- 12 -
ACKNOWLEDGEMENTS
The experimental part of the investigation described in this report wassponsored and funded by the Atomic Energy Control Board of Canada. The numericalwork has been financially supported by BP Petroleum Development Ltd., Norway, ElfAquitaine Norge A/S, Esso Exploration and Production Norway Inc., MobilExploration Norway Inc., Norsk Hydro and Statoil, Norway.
The valuable assistance of Gayle Hall and Chris Brosinsky in planning andcarrying out the field trials is gratefully acknowledged. We would also like tothank the personnel of the Field Operations Section, the Electronic Design andInstrumentation Group, and the Photo Group at DRES for their assistance duringthe field trials.
- 13 -
REFERENCES
1. Pfortner, H., Schneider, H., Drenckhahn and Koch, C : "Flame Accelerationand Pressure Build-Up in Free and Partially Confined Clouds", presented atthe 9th International Colloquium on Dynamics of Explosions and ReactiveSystems, Poitiers, France, July 1983.
2. Moen, I.O., Bjerketvedt, D., Jenssen, A. and Thibault, P.A.: Combustion andFlame 6^, 285 (1985).
3. Sherman, M.P., Tieszen, S.R., Benedick, W.B., Fisk, J.W. and Carcassi, M.:"The Effect of Transverse Venting on Flame Acceleration and Transition toDetonation in a Large Channel", presented at the 10th InternationalColloquium on Dynamics of Explosions and Reactive Systems, Berkeley,California, U.S.A., August 1985.
4. Moen, I.O., Lee, J.H.S., Hjertager, B.H., Fuhre, K. and Eckhoff, R.K.:Combustion and Flame 47_, 31 (1982).
5. Moen, I.O., Donato, M., Knystautas, R., Lee, J.H. and Wagner, H.Gg.:Prog. Astronautics and Aeronautics jf5_, 33 (1981).
6. van Wingerden, C.J.M. and Zeeuwen, J.P.: "Investigation of Explosion -Enhancing Properties of a Pipe-Rack Like Obstacle Array", presented at the10th International Colloquium on Dynamics of Explosions and ReactiveSystems, Berkerley, California. U.S.A., August 1985.
7. Hjertager, B.H.: J. Hazardous Materials £, 315 (1984).
8. Lind, C D . and Whitson, J.: "Explosion Hazards Associated with Spills ofLarge Quantities of Hazardous Materials", Phase III, U.S. Department ofTransportation, U.S. Coast Guard Report No. CG-D-85-77, (1977).
- 14 -
REFERENCES (cont'd)
9. Schneider, H. and Pfôrtner, H.: "Flammen- und Druckweilenausbreitung bei
der Deflagration von Wasserstoff-Luft-Gemischen", Teil I , Juif 1978, Teil
I I , Juni 1981, Fraunhofer-Institut fur Trieb- und Explosivstoffe (ICT),
Pfinztal-Berghausen, West Germany.
10. Brossard, J . , Desbordes, D., Difabio, N., Gamier, J.L.» Lannoy, A.,
Leyer, J.C., Perrot, J . and Saint-Cloud, J.P.: "Truly Unconfined
Deflagrations of Ethylene-Air Mixtures", presented at the 10th International
Colloquium on Dynamics of Explosions and Reactive Systems, Berkeley,
Cali fornia, U.S.A., August 1985.
11. Chan, C , Moen, 1.0. and Lee, J.H.S.: Combustion and Flame 49, 27 (1983).
12. Hjertager, B.H.: Combustion Science Technology 2_7_. 159 (1982).
13. Hjertager, B.H., Fuhre, K., Parker, S.O. and Bakke, J.R.: Prog.
Astronautics and Aeronautics 94_, 504 (1984).
14. Bakke, J.R. and Hjertager, B.H.: "Numerical Simulation of Methane-Air
Explosions in Vented, Obstructed Channels: Scaling Characteristics", Report
CMI No 823403-5, Chr. Michel sen Inst i tu te , Bergen, 1983.
15. Kistiakowsky, G.B. and Richards, L.W.: J. Chem. Phys. 36, 1707 (1962).
16. Burcat, A., L i fsh i tz , A., Scheller, K. and Skinner, G.B.: Thirteenth
Symposium (International) on Combustion, p. 745, The Combustion Ins t i tu te ,
Pittsburgh, Pa., 1971.
17. Frenklach, M., Lee, J.H., White, J.N. and Gardiner, W.C.: Combustion and
Flame 41_, 1 (1981).
18. Urtiew, P.A. and Oppenheim, A.K.: Proc. Royal Society A295, 13 (1966).
19. Urtiew, P.A., Brandeis, J . and Hogan, W.J.: Combustion Science and
Technology 30, 103 (1983).
TABLE CAPTION
TABLE I CHARACTERISTIC COMBUSTION PARAMETERS FOR FUEL-AIR MIXTURES. Thelaminar flame speed and c r i t i ca l tube diameter are for stoichiometric
composition. The chemical induction time correlations are from
Kistiakowsky and Richards15, Burcat et a l . 1 6 and Frenklach et a l . 1 7 for
C2H2, C3H8 and H2S, respectively.
TABLE I I Summary of Flame Acceleration Tests
A. 500 mm obstacles.B. 220 mm obstacles.
FUEL LAMINAR DETONATION
FLAME SPEEDa CRITICAL TUBE
(m/s) DIAMETER (m)
CHEMICAL INDUCTION TIME (sec)
T = K [FUEL]A [OXYGEN]B exp (EA/RT)b
K A B E (KJ/mole)A
Acetylene 12.1
(C2H2)
Propane
(C3H8)
Hydrogen
Sulphide
(H2S)
3.7
2.7
0.115 2.69x10⁻¹¹ 0 -1.0
0.9
71.58
3.92x10⁻¹² 0.57 -1.22 176.65
1.3C 2.29x10⁻¹⁵ -0.45 -0.33 109.67
a) Assumes velocity of burned gas is zero.b) Units: Concentrations, [FUEL] and [OXYGEN], moles/l i ter.
c) Estimate based on detonation cel l size.
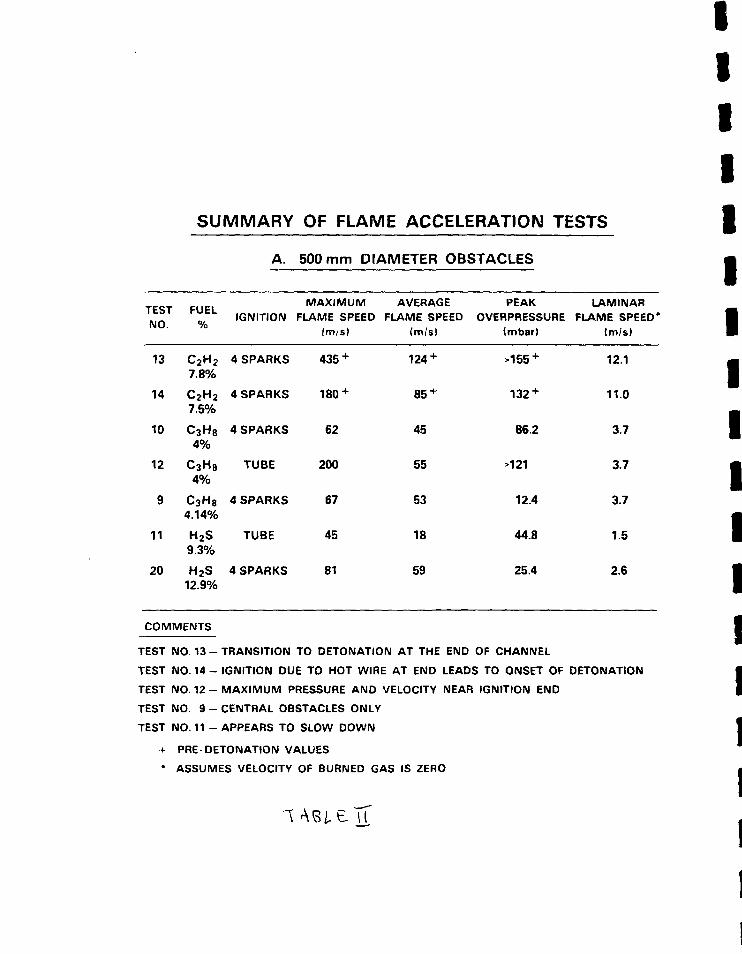
SUMMARY OF FLAME ACCELERATION TESTS
TESTNO.
13
14
10
12
9
11
20
FUEL%
C 2 H 2
7.8%
C 2 H 2
7.5%
C3H84%
C3HB
4%
C3H84.14%
H2S9.3%
H2S12.9%
COMMENTS
A.
IGNITION
4 SPARKS
4 SPARKS
4 SPARKS
TUBE
4 SPARKS
TUBE
4 SPARKS
500 mm DIAMETER OBSTACLES
MAXIMUMFLAME SPEED
(m/sl
435 +
180 +
62
200
67
45
81
AVERAGE PEAK LAMINARFLAME SPEED OVERPRESSURE FLAME SPEED*
(m/sl (mbar) (m/s)
124 +
85 +
45
55
53
18
59
>155 +
132 +
86.2
>121
12.4
44.8
25.4
12.1
11.0
3.7
3.7
3.7
1.5
2.6
TEST NO. 13 - TRANSITION TO DETONATION AT THE END OF CHANNEL
TEST NO. 14 - IGNITION DUE TO HOT WIRE AT END LEADS TO ONSET OF DETONATION
TEST NO. 12 - MAXIMUM PRESSURE AND VELOCITY NEAR IGNITION END
TEST NO. 9 - CENTRAL OBSTACLES ONLY
TEST NO. 11 - APPEARS TO SLOW DOWN
+ PRE DETONATION VALUES
* ASSUMES VELOCITY OF BURNED GAS IS ZERO
U.
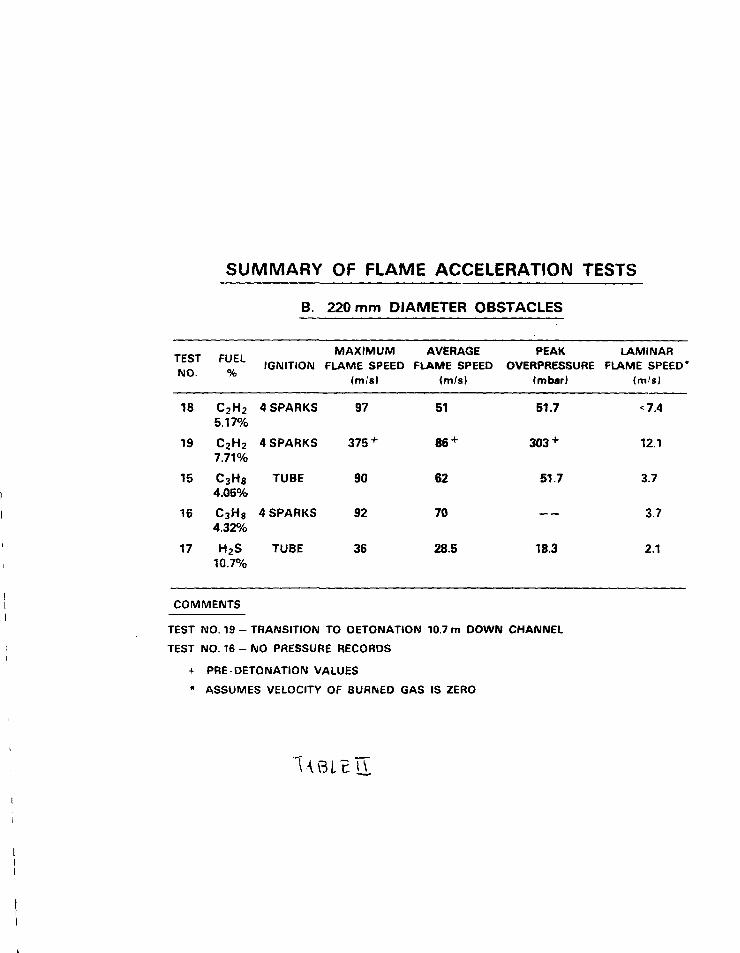
SUMMARY OF FLAME ACCELERATION TESTS
B. 220 mm DIAMETER OBSTACLES
MAXIMUM AVERAGE PEAK LAMINARNO % IGNITION FLAME SPEED FLAME SPEED OVERPRESSURE FLAME SPEED*
(mis) (m/s) (mbar) (m'sl
18
19
15
16
17
C2H25.17%
C 2H 2
7.71%
C 3 H 8
4.05%
C3H84.32%
H2S10.7%
COMMENTS
4 SPARKS
4 SPARKS
TUBE
4 SPARKS
TUBE
97
375 +
90
92
36
51
86 +
62
70
28.5
51.7
303 +
51.7
18.3
<7.4
12.1
3.7
3.7
2.1
TEST NO. 19 - TRANSITION TO DETONATION 10.7 m DOWN CHANNEL
TEST NO. 16 - NO PRESSURE RECORDS
+ PRE-DETONATION VALUES
* ASSUMES VELOCITY OF BURNED GAS IS ZERO
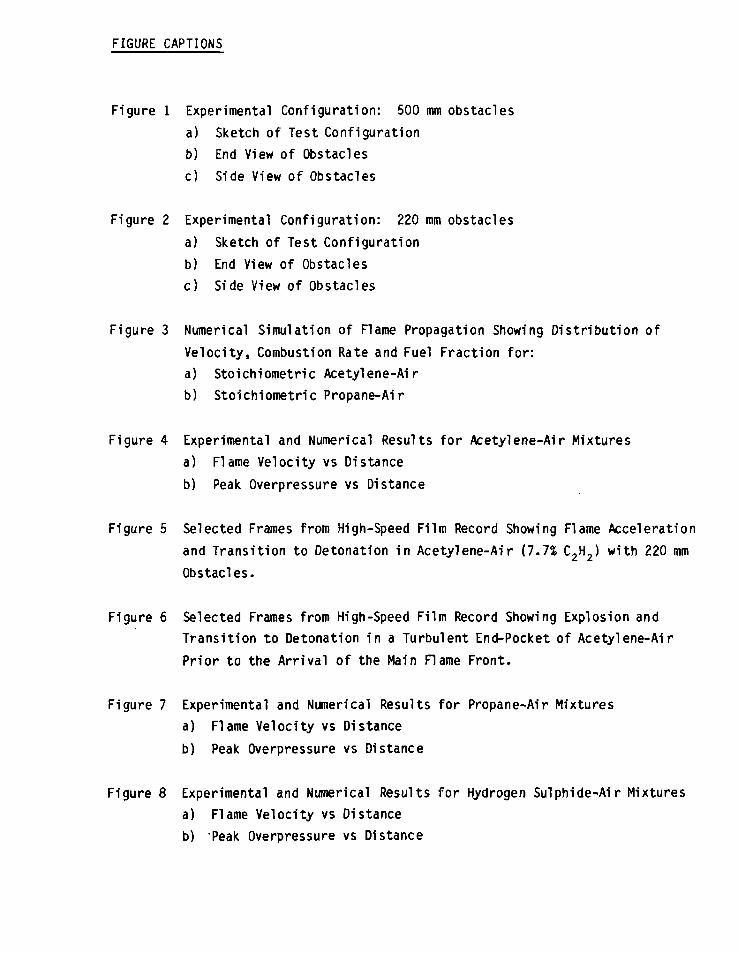
FIGURE CAPTIONS
Figure 1 Experimental Configuration: 500 mm obstacles
a) Sketch of Test Configuration
b) End View of Obstacles
c) Side View of Obstacles
Figure 2 Experimental Configuration: 220 mm obstacles
a) Sketch of Test Configuration
b) End View of Obstacles
c) Side View of Obstacles
Figure 3 Numerical Simulation of Flame Propagation Showing Distr ibut ion of
Veloci ty, Combustion Rate and Fuel Fraction for :a) Stoichiometric Acetylene-Air
b) Stoichiometric Propane-Air
Figure 4 Experimental and Numerical Results for Acetylene-Air Mixtures
a) Flame Velocity vs Distance
b) Peak Overpressure vs Distance
Figure 5 Selected Frames from High-Speed Film Record Showing Flame Acceleration
and Transit ion to Detonation in Acetylene-Air (7.7% C2H2) with 220 mm
Obstacles.
Figure 6 Selected Frames from High-Speed Film Record Showing Explosion and
Transit ion to Detonation in a Turbulent End-Pocket of Acetylene-Air
Prior to the Arr ival of the Main Flame Front.
Figure 7 Experimental and Numerical Results for Propane-Air Mixtures
a) Flame Velocity vs Distance
b) Peak Overpressure vs Distance
Figure 8 Experimental and Numerical Results for Hydrogen Sulphide-Air Mixtures
a) Flame Velocity vs Distance
b) Peak Overpressure vs Distance
Figure 9 Variation of Peak Overpressure with Scale. Scale of 1.0 Corresponds to
1.8 m x 1.8 m Cross-Section Channel, 15.5 m Long, with 500 mm
Obstacles.
77/777777//
CHANNEL SIZE: 1.8 m x 1.8 m IN CROSS SECTIONx 15.5 m LONG
PRESSURE TRANSDUCERS: SPACING = 1.27 m
OBSTACLESDIAMETER = 500 mmSPACING(S) = 1.27 mHEIGHTIHI = 0.90 m
^SUPPORT FRAME: DIAMETER = 60mm
a) SKETCH OF TEST CONFIGURATION
b) END VIEW OF OBSTACLES c) SIDE VIEW OF OBSTACLES
Figure 1
PLASTIC BAG
/ 12 11/ |
PLASTIC BAG
/ i l T /,'
CHANNEL SIZE. 1.8 m x 1.8 m IN CROSS SECTIONx 15.5 m LONG
DIAMETER = 220 mm
SPACING(S) = 0.63 m
PRESSURE TRANSDUCERS: SPACING = 1.27 m
- ^ OBSTACLES
—"SUPPORT FRAME: DIAMETER = 60 mm
al SKETCH OF TEST CONFIGURATION
b) END VIEW OF OBSTACLES c) SIDE VIEW OF OBSTACLES
Figure 2
T 248.60 MS
u diCLO I • inMAXIMUM VELOCITY. 269.90 m/s
VELOCITY
1—1 1—II—1 1—1
ur - l - rn i—\'i :'vrn
cci i i i
COMBUSTION RATE
a) ACETYLENE-AIR
FUEL FRACTION
T-421.90 MS
D •
• i—i \ ! r i ' ri ri 'ri r
MAXIMUM VELOCITY: 36.92m/s
•i—i rn i—i
VELOCITY
COMBUSTION RATE
FUEL FRACTION
b) PROPANE-AIR
Figure 3
DETONATION VELOCn220 mw OBSTACLES
(7 7% C.H..
• NUMERICAl
• ^
TRANSITION TODETONATION
a) VELOCITY VS DISTANCE
70
1 0 -
D l ;
0 0 1 -V
//
/ s
/ y
/ ~x
/ / - " '^
O500 mm OBSTACLES
' 7 B"t. C, H , F
ÙWO mm OBSTACLES
0 NUMERICAL
b) OVERPRESSURE VS DISTANCE
Figure 4
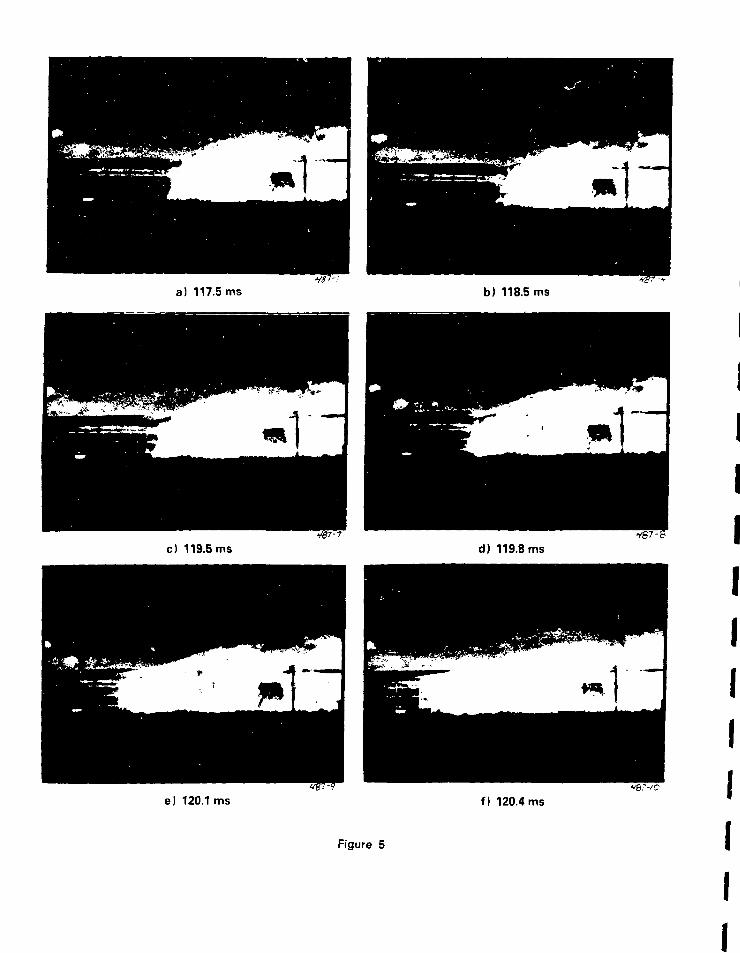
a) 117.5 ms b) 118.5 ms
c) 119.5 ms d) 119.8 ms
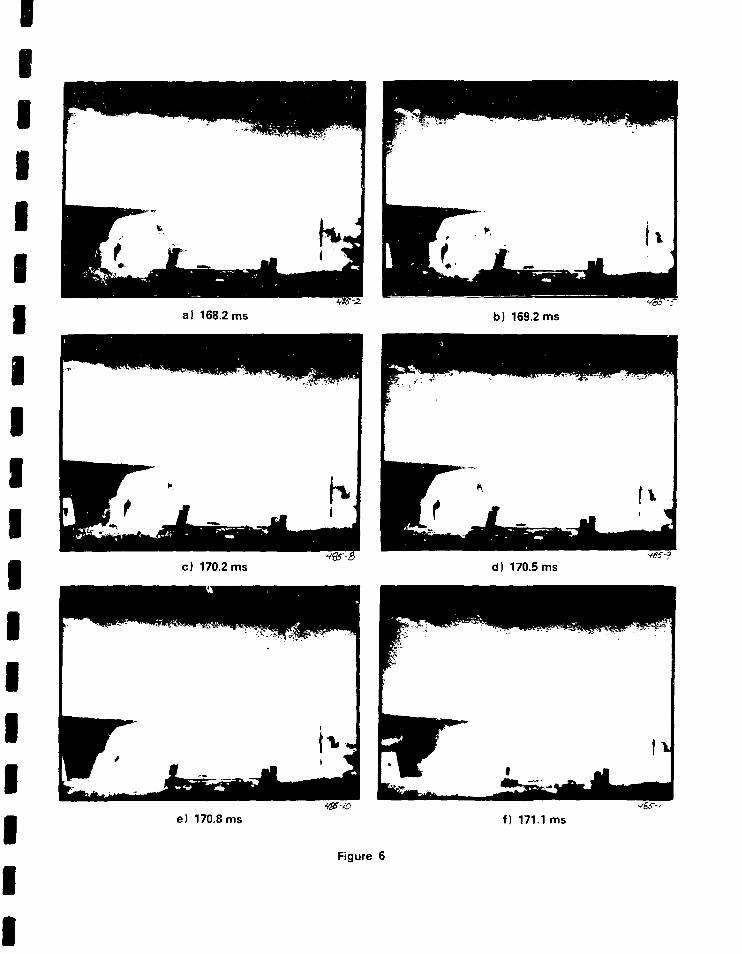
a) 168.2 ms b) 169.2 ms
vgi"-/.
e) 170.8 ms f) 171.1 ms
Figure 6
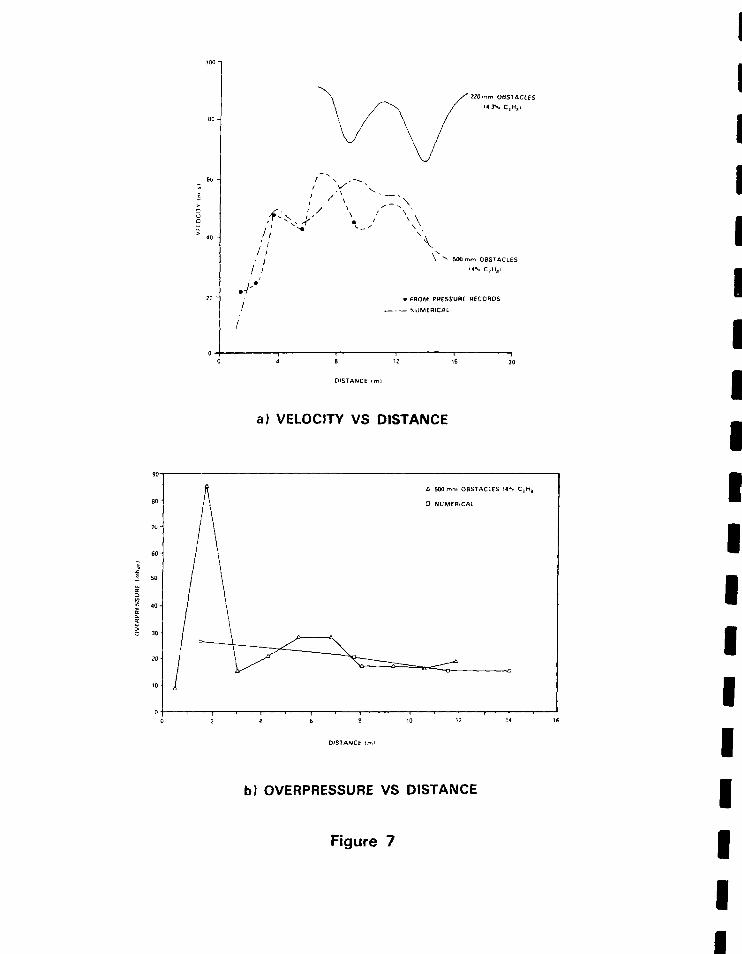
220 mm OBS7ACIES<«3% C,H,.
\ ^ 500mm OBSTACLES14% C.H.I
• fROM PRESSURE RECOUDS
— NUMERICAL
—I20
a) VELOCITY VS DISTANCE
Û 500mm OBSTACLES <«"t C3HB.
D NUMERICAL
b) OVERPRESSURE VS DISTANCE
Figure 7
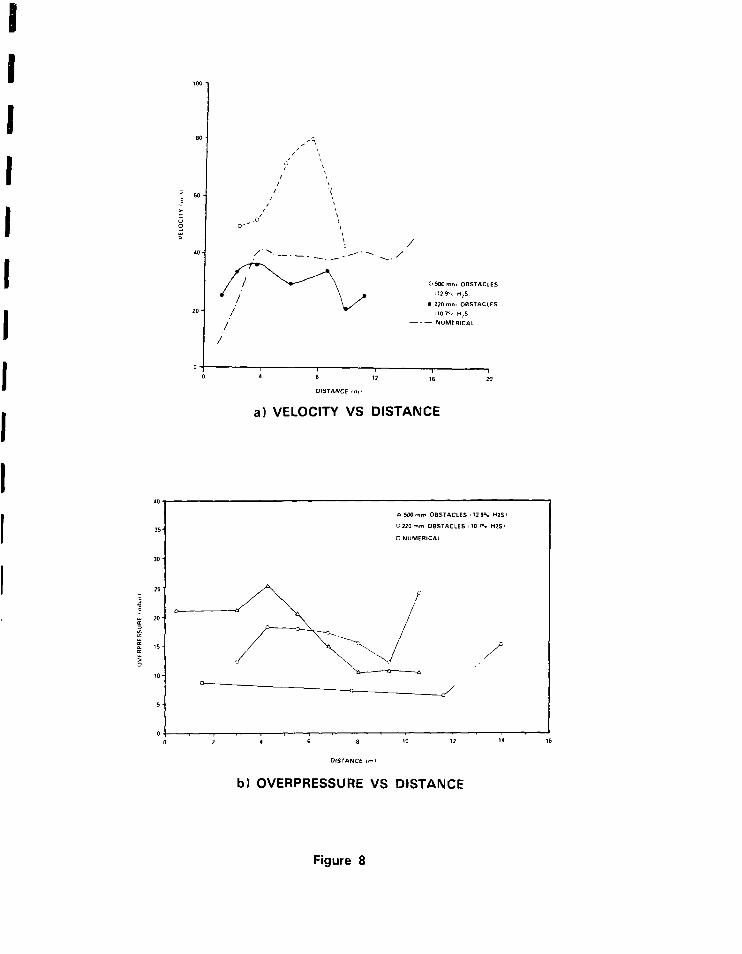
D 500 mm OBSTACLES
112 9"*, H.S.
00 7", H,S
- NUMERICAL
DISTANCE <m-
a) VELOCITY VS DISTANCE
40 •
35-
3 0 -
25 •
|
tu 2 0 -c
sï 15-
>
10-
5 •
0 •
£> 500 mm OBSTACLES '12 9% H 2 S '
O 220 m m OBSTACLES MO 7°* M2S'
D NUMERICAL
A — \ ^ // \ N/
8 >0 12
DISTANCE lm(
b) OVERPRESSURE VS DISTANCE
Figure 8
15000
10000 -
co
J 1000 •D A C E T Y L E N E
O P R O P A N E
V HYDROGEN SULPHIDEzCOCOLUcea
100 -
104 6
SCALE {-)
10
Figure 9