JP0250277i - International Atomic Energy Agency
736
1, 8 JP0250277i
-
Upload
khangminh22 -
Category
Documents
-
view
1 -
download
0
Transcript of JP0250277i - International Atomic Energy Agency

1,
8JP0250277i

4: ),, -T- ) M I 3VIAM T 319-1 195
�T i A 7r 0
(7319-1195 4F :13
This report is ssued irregularly.
Inquiries about availability of the reports should be addressed to ResearchInformation
Division. Department of Intellectual Resources, Japan Atomic Energy Research Istitute,
Tokai-mura, Naka-gun, lbaraki-ken, 319-1195, Japan.
OC Japan Atomic Energy Research Institute, 2002
Win & 1 Cliff] 9f -Mi f- )i fiff 51- in

JAERI-Conf 2002-004
Proceedings of the Intentional Symposium
NUCEF 2001
Scientific Bases for Criticality Safety, Separation Process and Waste Disposal -
October 31 - November 2 2001
Japan Atomic Energy Research nstitute (JAERI), Tokai, lbaraki, Japan
NUCEF 2001 Symposium Working Group-x-
Tokai Research Establishment
Japan Atomic Energy Research Institute
Tokai-mura, Naka-gun, baraki-ken
(Received February 8, 2002)
These proceedings contain 94 papers presented at NUCEF2001, that was held On October 31
November 2 2001, in Tokai-mura., Japan. NUCEF2001 is the international symposium of the
series, following the Ist symposium NUCEF'95 (Proceedings: JAERI-Conf 96-003) and the 2nd
symposium NUCFF'98 (Proceedings: JAERI-Conf 99-004). The subtitle of W.CEF2001 was
Scientific Bases for Criticality Safety, Separation Process and Waste Disposal". The papers were
presented in oral and poster sessions on the research fields: Criticality Safety, Separation Process,
Radioactive Waste Disposal and TRU Chemistry.
Keywords: NUCEF, Criticality Safety, Separation Process, Reprocessing, Partitioning, Radioactive
Waste Disposal, TRU Chemistry, Nuclear Fuel Cycle.
S. Fujine, S. Dojiri, T. Banba, Y. Nomura, Y. Miyoshi, G. Uchiyama, Y. Morita, H. Ogawa,
H. Kimura, S. Nakayama, K. Minato, H. Mineo, T. Tanaka, A, Yamada, T. Sato, T Kaneko,
K. Tonoike, Y, Tsubata, H. Yanagisawa, K. Kobayashi
Editor of tese poceedings are T.Banba and Y.Tsubata.
i

JAERI-Conf 2002-004
r� 4 N U C E F 2
2001 * 10 31 El 11 A 2 El
Fi *-AqT)W 3MM493M
NUCEF 2001 7 - Pr YAI -
(2002 2 A 8 Ei 'yr-31)
4: *R]k A I 2 01 4i 1 0 3 E - 2 HH * AR T)i 9 3tPOK'M ff 50fT -i�� RI t� fL f: M M
�; 1� 4 N U C E F 2 0 0 1 -C Mr-n - h � 9 4 t 0) *Ri�,Emw �-- SE & t�: �) ) -C S) zN U C E F 2
0 1 U, 1995 VA A he-$ JAERI-Conf 96-003) AiY 1998 O) 2 (M-A JAERI-Conf
99-004) MalIM-- FKOVM�kft,
FAt 75 Xt-I L r� 4 T�J:, IMA MAa yn RMA t A R
3K*RF9M � 319-1195 XJAAU5TP7MVi*# �3 t nf 2 - 4
*#-Xht, FPLU9- & fp/*, MMI fi4IZ5�, LIJEW-59, fLN lit, 4k-T.05-k,
lnitbl-�tMl *OMMI VOT9A'A'
El-Ill KfAlhH* L MOM39AN: I D mt 24 fLt�:.

JAERI-Conf 2002-004
Contents
Preface
1. Opening Session . . . . . . . . . . . . . . . . . . . . . . . . . . . . . . I
Opening Address . . . . . . . . . . . . . . . . . . . . . . . . . . . . . . . . 3
M, Maeda (JAERT)
Progress of Safety Research in NUCEF on Nuclear Fuel Cycle . . . . . . . . . . . . . 7
S. &e (JAERI)
2. Plenary Session . . . . . . . . . . . . . . . . . . . . . . . . . . . . . . . 17
*The US Nuclear Criticality Safety Experience, Needs, and Future in a Global Economy 19
C. M. Hopper (ORNL, USA)
*Overview of the Hydrometallurgical and Pyrometallurgical Processes Studied World-wide for
the Prtitioning of High Active Nuclear Wastes . . . . . . . . . . . . . . . . . . . 27
C. Madic (CEA, France)
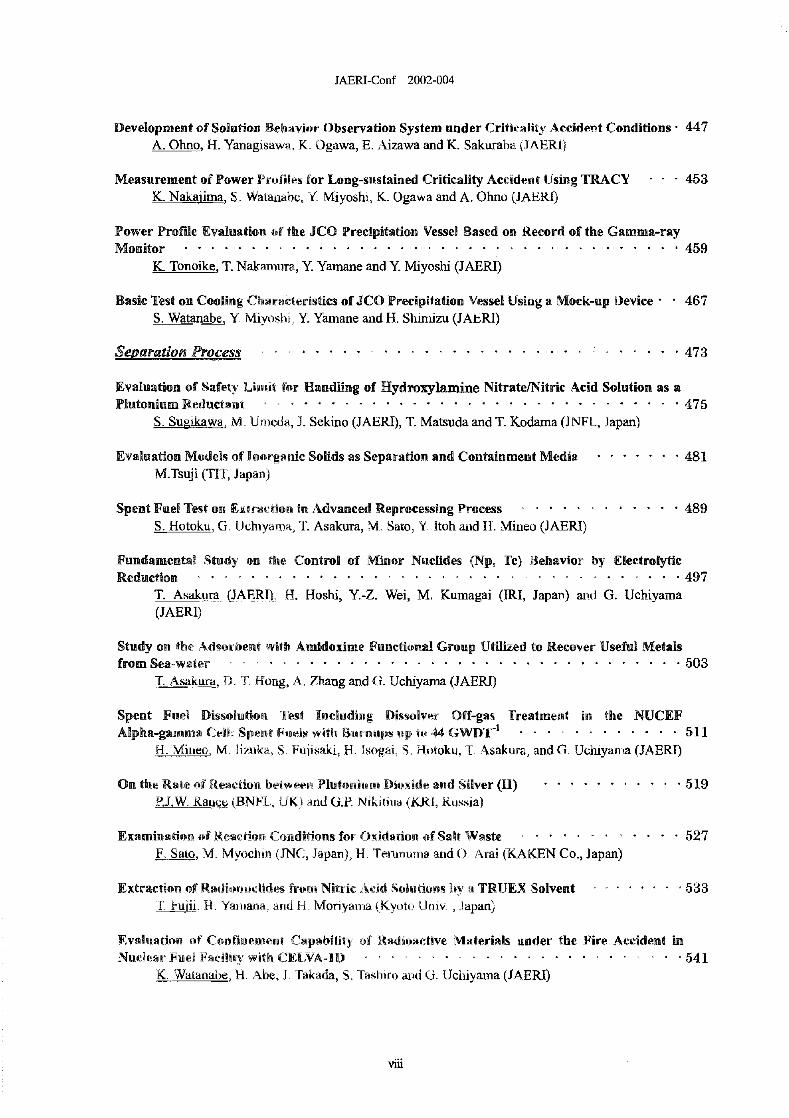
*Decision-in-principle on Final Disposal of Spent Fuel in Finland . . . . . . . . . . . . 39
J. Vira (Posiva Oy, Finland)
*Communication of Nuclear Power Concepts to Stakeholders -The se of Nature's Own
Laboratories . . . . . . . . . . . . . . . . . . . . . . . . . . . . . . . . . . . 47
J.M. West, W.R. Alexander, K. Kaku, I.G. Mckinley (NAGRA Switzerland) and
A. Simmura (Obayashi Corp., Japan)
3. Oral Session . . . . . . . . . . . . . . . . . . . . . . . . . . . . . . . . 55
CriticalLtE SSession Coordinators: Nomura and Y. Miyoshi
*Development and Application of Consensus Standards in Criticality Safety in the USA 57
T. P. McLaughlin (LANL, USA)
*Regulations for the Transport of Nuclear Fuel Material in Japan . . . . . . . . . . . . 65
S.Fukuda (CRIEPI, Japan)
*A UK Regulatory Perspective of Criticality Safety -Past, Present and Future . . . . . . . . 73
D.N. Simister (Health & Safety Executive, UK)
Development of Burnup Credit Evaluation Methods at JAERI . . . . . . . . . . . . . . 1
Y. Nomura, H. Okutio and K. Suyama (JAERI)
The REBUS Experimental Programme for Burn-up Credit . . . . . . . . . . . . . 91
P.D'hondt, K. van der Meer, P. Baeten (SCK-CEN, Belgium), D. Marloye, B. Lance and
J. Basselier (Beigonucleaire, Belgium)
Invited paper

JAERI-Conf 2002-004
Comparison of Nuclide Evolution Analyses between Japanese ad rench Codes . . . . . . 99
T. Iwasaki H. Hiralzurrii johoku University, Japan), and G. Youinou (CEA, France)
High-precision Analog Type Neutron Monitoring System . . . . . . . . . . . . . . . . 05
N.Oda, Y. Kita, and K. shizawa (Toshiba Co., Japan)
*Improving Safety in a MOX Plant by Qualification of Neutron Measurements and Criticality
Evaluation . . . . . . . . . . . . . . . . . . . . . . . . . . . . . . . . . . . . III
A. Renard, P. Kockerols, H. Libon and D. Marloye (Belgonucleaire, Belgium)
Sulicritical Limit Parameters of MOX Fuel . . . . . . . . . . . . . . . . . . . . . 125
S. Sakurai and S. Mitake (NUPEC, Japan)
Criticality Safety Control at the Plutonium Fuel Production Facility . . . . . . . . . . . 133
J. Nipagawa, S. Takahashi Y Yamamoto, S. Fujiwara, K. Kuniyasu and T. Ohtani (JNC,
Japan)
Application of Dedicated Safeguards Solution Monitoring Instrumentation towards Improved
Process Control for Criticality Safety . . . . . . . . . . . . . . . . . . . . . . . . 141
B. A. Hunt, D, Landat, L. Dechamp and M. Caviglia (EC-Joint Research Centre, Italy)
*Subcritical Measurements and Their Applications . . . . . . . . . . . . . . . . . . 147
T. E. Valentine (ORNL, USA)
Status of the FETCH Transient Criticality Code and Application to TRACY Data and
Dosimetry Applications . . . . . . . . . . . . . . . . . 155C.C. Pain', Y YarnaDe 2, CR.E.de Oliveira' and A.J.H. Goddard' (I CST, UK, 2JAERT)
Suberiticality Measurement by Source Multiplication Methodwith Higher Mode Flux 165
T, Misaw (Kyoto Univ., Japan)
Study on Neutronic and Thermal Characteristics of the Precipitation Vessel in JCO Criticality
Accident . . . . . . . . . . . . . . . . . . . . . . . . . 173
Y. Miyoshi, T, Yamamoto, K. Nakajima, Y. Yamane and S. Watanabe (JAERT)
Se nation Process . . . . . . . . . . . . . . . . . . . . . . . . . . . . . . . 181
Session Coordinators: G. Uchiyama and Y, Morita
*Present tatus of R&D on Reprocessing Process in COGEMA . . . . . . 183
M.F, Debreuille, P. Pradel (COGEMA, France) and F. Drain (SGN, France)
*SUPERPURFX as a TBP - Compatible Process for Recovery and Partitioning of Lo"g-lived
Radionuclides from NPP Spe"t uel - � � � . . . . . . . . . . . . . . . . . . 189
B. Ya. Zilbefman, Yu.S, Fedorov, E.N. Mishin, L.V. Sytrnk, .V. Smidt, WN. Kukharev,
N.D. Goletsky, RCj. Glekov, Yu.V. Palenik ad S.Yu, Sukhareva (KRI, Russia)
PARC Process as Advanced PUREX Process . . . . . . 197
QL Uchiyaina 1, Mineo, T, Asakura, S, Hotoku, M. lizuka, S. ujisaki, H. Isogal, Y, Itoh,
M. Sato and N, Hosoya (JAERI)
Invited paper
iv

JAERI-Conf 2002-004
*Recent Studies of Heterogeneous and Homogeneous Reduction Oxidation Reactions ofU(IV) Ions in Nitric Acid and TBP Phases . . . . . . 205
&-_jTqY_1_0r (BNFL, UK), V.S. Koltunov, V.1, Marchenko (Bochvar All-Russia Research
Institute of Inorganic Materials, Russia), C. Boxall and S, Xiao (University of Central
Lancashire UK)
*Study on U Crystallization for Advanced Reprocessing . . . . . . . . . 213
K. Norriura A. Shibat ad A. Aoshima (JNC, Japan)
Development of New Reprocessing Technology, FLUOREX, for WR Fuel Cycle -Hybrid
Process of Fluoride Volatility and Solvent Extraction- . . . 217
0. Amano JFPCO, Japan), L. _Kawarnura, T. Iukasawa, and A. Sasahira (Hitachi, Ltd.,Japan)
An Advanced Aueous Process for Nuclear Fuel Reprocessing 225
)L:�Z, Wei, T, Arai� H, Hoshi, M. Kumagai (IRI, Japan), A. Bruggeman, M, Gysemans (SCK-
CEN, Belgitim) and T. Sawa (Hitachi, Ltd., Japan)
*R&D of the Partitioning of the Long-lived Radionuclides in France . . . . . . . . . . . . 237
hL.Leconi.te, P. Baron, and M. Masson (CEA, France)
*Overview of the Research Activity in Partitioning at Institute of Nuclear Energy
Technology . . . . . . . . . . . . . . . . . . . . . . . . . . . . . . . . . 239
C. Song (Tsinghua Univ., China)
UNEX Process esting of the Removal of Cesium, Strontium, and Actinide Elements from
Radioactive Acidic Waste . . . . . . . . . . . . . . . . . . . . . . . . . 247
V.N. Roniappy "ki , VA. Babain, VM. Esimantovskiy, I.V Smirnov, B.N. Zaitsev (KRI,
Russia), R.S. Herbst, J.D. Law and T.A. Todd (Bechtel ArXT Idaho, USA)
Actinide Separation by TODGA Extraction . . . . . . . . . . . . . . . . . . . . . . 255
)LMonta, Y. Sasaki and S. Tachimori (JAERI)
*Systematic Characteristics of Lanthanides and Actinides in Pyrochemical and AqueousConditions . . . . . . . . . . . . . . . . . . . . . . . . . . . . . . . . . . . . 261
ff. Yaman4 (Kyoto Univ., Japan)
TRU Recover� from HT.1,W by a Pyrometallurgical Process . . . . . . . . . . . . . . . 263
N4. Kurata, K. Kinoshita and T noue (CRIEPI, Japan)
New Developments in Dicarbollide Extractions . . . . . . . . . . . . . . . . . . . . 273
J. Rais, -. Selucky N, Sistkova (NRI-Rez., Czech Republic), J. Plesek. B. Griher and B.
Casensky (Institute of Inorganic Chem. CAS, Czech Republic)
Aggregation of the Neodymium Complexes of HDEHP, Cyanex 272, Cyanex 302, and Cyanex
301 in Toluene .. . . . . . . . . . . . . . . . . . . . . . . . . . . . . . . . . . 281
M. P. Jensen, R. Chiarizia, V. Urban and K. L. Nash (ANL, USA)
Invited paper
V

JAERI-Conf 2002-004
Radioactive Waste DLeosa . . . . . . . . . . . . . . . . . . . . . . . . . . . 289Session Coordinators: H. Ogawa and H. Kimura
*Overview of the Main Results Concerning Waste Management in France . . . . . . . . 291Ph. Leconte (CEA, France)
R&D on Disposal Concept for High-level Radioactive Waste: Technical'Subject on HWDisposal at Coastal Area in Japan . . . . . . . . . . . . . . . . . . . . . . . . . . 293
M. Kawanishi, T. Hasegawa (CRIEPI, Japan), T. Igarashi (Hokkaido Univ., Japan),H. Tsuchi (NUMO, Japan) and F. Ono (TEPCO, Japan)
Separated Disposal of HW Wastes for Reducing the Total Occupational Area of theRepository . . . . . . . . . . . . . . . . . . . . . . . . . . . . . . . . . . . 301
T. Ohe, K. Nakamura, A. Tsukagoshi and T. Nishiyori (Tokai Univ., Japan)
Wastes Generated by Application of JAERI Partitioning-transmutation System to High LevelRadioactive W aste . . . . . . . . . . . . . . . . . . . . . . . . . . . . . . . . 309
S. Nakqy , Y. Morita, K_ Nishihara, H. Hayashi, and 0. Shirai (JAERI)
*Status and Future Needs in Actinide Chemistry for Performance Assessment of NuclearWaste Disposal . . . . . . . . . . . . . . . . . . . . . . . . . . . . . 315
D. Rai (PNNL, USA) and M. Yui (JNC, Japan)
*Is Thermodynamic of Actinides Applicable to Natural Dynamic Systems? . . . . . . . 323J. I. Kim (FZK, Germany)
Present Status of the Study on Radionuclide Diffusion in Barrier Materials . . . . ... . . 325T. Yamaguchi and S. Nakayama (JAERI)
Overview of Waste Form Degradation Process Models for Performance Assessment . . . . 333F. M. G_Wong (Stone & Webster, Inc., USA), C. Stockman, R. Rechard, and P. Brady (SNL,USA)
*Thermodynamic Models and Data for Assessing Radionuclide Migration in the Near FieldUses and Limitations . . . . . . . . . . . . . . . . . . . . . . . . . . . . . . . 341
M. Ochs (BMG Engineering Ltd., Switzerland)
The Role of Titanate Ceramics in Immobilisation of Wastes Arising from Partitioning andWeapons Disposition . . . . . . . . . . . . . . . . . . . . . . . . . 349
K.P. Ha Y. Zhang, B-D. Begg, Z. Aly, A. Brownscombe, R. A. Day, M.W.A, Stewart,G.R. Lwupkin, E. R. Vance and A. Jostsons (ANSTO, Australia)
Field Test of Nuclide Migration in Bentonite-based Materials at Aerated Zone - CooperativeResearch Program on Field Migration Test between CIRP and JAERI . . . . . . . . . . 355
Z, Fan A. Cul. C. Gu, Y. Zao, Q. Sun (CIR-P, China), M. Mukai, T. Maeda, J. Matsumoto, T.Tanaka, and H. Ogawa (JAERI)
Recent Activities at Underground Research Laboratories in Japan . . . . . . . . . . 361K. Aoki NC, Japan)
Invited paper
vi

JAERI-Conf 2002-004
TRU Chemis ......... 363Session Coordinators: S. Nakayama and K Minato
*Molecular Interfacial Reactions between Plutonium and Manganese Oxide Hydroxide
Surfaces . . . . . . . . . . . . . . . . . . . 365
H. Nitsche (BNL, USA)
Microbial Transformations of Radionuclides in Tansuranic Wastes . . . . . . . . . 367
A. J. Francis (BNL, USA)
Electrochemical Invesfigation of Actinide tons for Redox Flow Battery . . . . . . .. . 375
T. Yamamura N. Watanabe ad Y Shiokawa johoku Univ., Japan)
Supercritical Fluid Tech"ology for Advanced Nuclear Fuel Cycle . . . . . . . . . . . . 381
Z. Yoshida. Y Meguro, S. Iso, T. Kimura (JAERI), 0 Tomioka Y Eokida, 1 Yamamoto
(Nagoya Univ., Japan), J. Ougiyanagi, and K- Ohashi (Ibaraki Univ., Japan)
4. Poster Session - � . . . . . . . . . . . . . . . . . . . . . . . . . . . . . 389Critka�IiSa e . . . . . . . . . . . . . . . . . . . . . . . . . . . . . . . 389
Reactivity Effect of Spent Fuel Due to Spatial Distributions of Coolant Temperature and
Burnup . . . . . . . . . . . . . . . . . . . . . . . . . . . . . . . . . . . . . 391
T. Hayashi, Y Yarnane (Nagoya Univ., Japan), K Suyarna (OECD/NEA) and H, Mochizuki
(The Japan Research Institute, Ltd., Japan)
Reactivity Effect of Axial Burnup Shapes for a Realistic PWR Spent Fuel Transport Cask 399H.A. Tuan, H. Okuno and Y. Nomura (JAERI)
Calculation of OECD/NEA Source Convergence Benchmark Problem No.1 by Using MCNPand Solving Fission Matrix Equation . . . . . .. (. . . . . . . . . . . . . . . . . . . 407
T. Kuroishi and Y. Nomura (JAERI)
The Calculation Results of OECD/NEA Source Convergence Benchmark Problem No.2 andNo.4 by Using MCNP . . . . . . . . . . . . . . . . . . . . . . . . . . . . . . . 415
T. Kiyosun-ri and Y, Miyoshi (JAERI)
Critical and Suberitical Mass Calculations of Fissionable Nuclides sed on ENDL-3.2 423H. Okuno 0AERD and H. Kawasaki (CRC Solutions Institute, Inc., Japan)
Current Status of Criticality Safety Benchmarks for Single Core Composed of Low EnrichedUranyl Nitrate Solution Using STACY . . . . . . . . . . . . . . . . . . . . . . . . 431
Y. Miyoshi and T. Yamamoto (JAERI)
Study on Release Behavior of Radioactive Noble Gases and Iodine Species from Fuel Solutionunder Simulated Nuclear Criticality Accident . . . . . . . . . . . . . . . . . . . . 439
H. Abe, S. Tashiro, T. Koike, S. Okagawa and G. Uchiyama (JAERI)
Invited paper
Vii
JAERI-Conf 2002-004
Development of Solution ehavior Observation System under Criticality Accident Conditions - 447
A. Ohno, H. Yanagisawa, K. Ogawa, E. Aizawa and K. Sakuraba (JAERI)
Measurement of Power Profiles for Long-sustained Criticality Accident sing TRACY 453
K. Nakaima, S, Watanabe, Y. Miyoshi, K. Ogawa and A. Ohno (JAERI)
Power Profile Evaluation of the JCO Precipitation Vessel Based on Record of the Gamma-ray
M onitor . . . . . . . . . . . . . . . . . . . . . . . . . . . . . . . . . . . . . 459
K- Tonoike, T. Nakamura, Y. Yamane and Y. Miyoshi (JAERI )
Basic Test on Cooling haracteristics of JCO Precipitation Vessel Using a Mock-up Device 467
S. Watanabe, Y. Miyoshl, Y. Yamane and H. Shimizu (JAERI)
Separation Process . . . . . . . . . . . . . . . . . . . . . . . . . 473
Evaluation of Safetv Limit for Handling of Hydroxylamine Nitrate/Nitric Acid Solution as a
Plutonium Reductant . . . . . . . . . . . . . . . . . . . . . . . . . . . . . . . 475
S. Sugjkawa, M. yneda, J. Sekino (JAERI), T. Matsuda and T. Kodama. (JNFL, Japan)
Evaluation Models of Inorganic Solids as Separation and Containment Media . . . . . . . 481
M.Tsuji (TIT, Japan)
Spent Fuel Test on Extraction in Advanced Reprocessing Process . . . . . . . . . . . 489
S, Hotoku G Uchiyamaj. Asakura, M, Sato, Y. Itoh ad H, Mineo (JAERI)
Fundamental Sdy on the Control of Minor Nuclides (Np, Te) Behavior by Electrolytic
Reduction . . . . . . . . . . . . . . . . . . . . . . . . . . . . . . . 497
T. Asikura AERI -Z. Wei, M., Kumagai (IRI, Japan) ad G. Uchiyama
(JAERI)
Study on te Adsorbent with Amidoxime Functional Group Utilized to Recover Useful Metals
from Sea-water . . . . . . . . . . . . . . . . . . . . . . . . . . . . . . . . . . 503
1. Asakura, D. T, Hong, A. Zhang and CF. Uchiyama JAERI)
Spent Fuel Dissolution Test Including Dissolver Off-gas reatment in the NUCEFAlpha-gamma Cell: Spent Fueis with Burnops up to 44 WD'I'-1 . . . . . . . . . . . . 511
H M�neo, M. lizuka, S, Fujisaki, B. Isogai, S. Hotoku, T. Asakura, and G. Uhiyama (JAERI)
On the Rate of Reaction between lutonium Dioxide and Silver (11) . . . . . . . . . . . 519
P.J.W. Rance (BNFL, UK) ad G.R Nikitina (RI, Rossia)
Examination f Reaction Conditions for Oxidation of Salt Waste . . . . . . . . . . . . 527
F. Sato, M. yochin (JNC, Japan), H. Terunurna and 0. Arai KAKEN Co., Japan)
Extraction of Radionuclides front Nitric Acid olutions by a TRUEX Solvent . . . .533
T, F 1, H. Yamana, and H. Moriyarna (Kyoto Univ. , Japan)
Evaluation of Confinement Capability of Radioactive Materials under the Fire Accident in
Nuclear Fuel Facility ith CELVA-10 . . . . . . . . 541
Watanabe, H. Abe, J.'rakada, S. Tashiro aDd G. Uchlyama. (JAERI)
YW

JAERI-Conf 2002-004
Clogging Characteristics of Ventilation Filter uder the Fire Accident . . . . . . . . . 549
S. Tashiro, K. Watanabe, B.Abe, J. Takada aud G, Uchiyarna (JAERI)
Study on Supercritical Fluid Extraction of Uranium ad Tansurauium Complexes withI�-diketones and Other Complexones as Applied to Decontamination . . . . 557
A.Yu. Shadrin, A.A, Murzin, VN. Romanovsky nd V.A. Starchenko (KRI, Russia)
Thermodynamic Study of Am 1) and Eu(1111) Extraction by Iso-butyl-bis-triazinyl-pyridm . . . . . . . . ... . . 567
C. Hill and C. Roube (CEA, France)
SANEX-BTP Process Development Studies . . . . . . . . . . . . . . . . . . . . 573
C. Hill, D. Guillalieux, - Berthon and C. Madic (CEA, France)
Development of Fractionation Process of "91 in Preparation for Transmutation of LLFP 579K. Takeshita ad Y. Nakano (TIT, Japan)
Research o Pyrocheinical Process for Nitride Fuel at JAERI . . . . . . . . . . . . . 589
Y. Arai, T wai, 0. Shirai, H. Hayashi and K. Minato (JAERI)
TRU-HITEC - A New Facility for TRU High Temperature Chemistry . . . . . . . . . 597
inato, M. Akabori, A. Maeda (JAERt), S. Miyamoto (JAPC, Japan), 0, Arnano (TEPCO,
Japan) and T. Arai (Tohoku E ectric Power Co., Japan)
Development of Solvent Washing Process Using Butylarnine Compounds . . . . . . . . . 603
Y, ttoh, K, Kaniei S Hotoku, T, Asakura, H. Mineo and G, Uchiyarna (AERI)
Radioactive Waste Disgosa . . . . . . . . . . . . . . . . . . . . . . . . . . 609
Field Tracer Migration Test in Aquifer: Tracer igration Test in Assembly - Cooperative
Research Program on Safety Assessment Methodology between CIR ad JAER - - - - 611
Yang_)�uee, Wang Zhinting, Liu Chunh, Jing Ling, Jiang Hong (CIRP, China), N4. Mukai,
T. Maeda, J. Matsumoto, T. Tanaka ad H. Ogawa (JAERI)
Diffusion Coefficient Test of 237 Np in Bentonite Backfill Materials . . . . . . . . . 621
A.nxiCui, Zhiwen Fan, Jinsheng Zhang, Cunli Gu (CIRP, China), M. Mukai, T. Maeda,
J. Matsumoto, T. Tanaka and H. Ogawa (JAERI)
Study on the Distribution Coefficient for Evaluation of Neptunitun Migration in Loess Media -
Cooperative Research Program on Field Migration Test between CIRP and JAERI - 627
T. Tana L Maeda, M. Mukai, J. Matsurnoto, 14, Ogawa (JAERI), Zhentang Li,
Hongqing Zhang, Xudong Wang, Anxi Cui and Liangtian Guo (CIRP, China)
Analysis of Field Test of Nuelide Migration in Aerated Loess Layer - Cooperative Research
Program on Field. Migration Test between CIRP and JAERI . . . . . . . . . . . . . . . 635
M. Mukai, T, TauakaT. Maeda, J. Matsumoto, H. Ogawa (JAERI), Jinsheng Wang,
Shushen Li, Yingjie Zhao, Qinghua Wu and Zhiming Wang (CIRP, China)
ix

JAERI-Conf 2002-004
Development of Airless Core Smpling System (ALCS) for Safety Assessment of GeologicalDisposal of HLW . . . . . . . . . . . . . . . . . . . . . . . . . . . . . . . . . 643
K. Araki, A. Oushika, M. Ueda and G. Okano (Chuou-Kaihatsu Co., Japan)
Correlation between Molecular Size and Functional Groups of Humic Acid on theComplexation with 2 37 Np, 238 Pu and 24'Am . . . . . . . . . . . . . . . . . . . . . . 651
T. Tanaka, S. Nagao ad H. Ogawa (JAERI)
Sorption Behavior of Neptunium onto Smectite under Reducing Conditions in Carbonate
M edia . . . . . . . . . . . . . . . . . . . . . . . . . . . . . . . . . . . . . . 659
A. Kitamura, T. Tomura and T. Shibutani (JNC, Japan)
Effect of Temperature on the Sorption of Neptunium on Magnetite . . . . . . . . . . . 667
K Nakat S, Nagasaki, S. Tanaka (Univ. of Tokyo, Japan), Y. Sakamoto, T. Tanaka and
H. Ogawa (JAERI)
The Effects of Silica Sand Content and Temperature on Diffusion of Selenium in Compacted
Bentonite under Reducing Conditions . . . . . . . . . . . . . . . . . . . . . . . . 675
H. Sato and S. Miyamoto (JNC, Japan)
Colloids-associated Concentrations Model and Experimental Studies for a Waste Form
Degradation Process Model . . . . . . . . . . . . . . . . . . . . . . . . . . 683
F.M.G. Won-1, C. Stockman2, C. Mertz3, S. Alcornl, and R. Aguilar� ('Stone & Webster, Inc.,
USA, 2SNL, USA, 3ANL, USA, 4Management Solutions, USA)
Effects of Iron on eaching Behavior of Slog Layer of Molten Solidified Products . . . . . . 691
T. Maeda, T. Banba and H. Ogawa JAERI)
Review of Immobilization Techniques of Radioactive Iodine for Geological Disposal 697
H. Kato, 0, Kato and H. Tanabe (RWMC, Japan)
TR U Chemis . . . . . . . . . . . . . . . . . . . . . . . . . . . 705
Actinide Chemistry in Concentrated Alkali: Implications for Cleanup of Processing Plants - - - 707
K.L. Nash, AV Guelis, M.P. Jensen, J.C. Sullivan, A.H. Bond (ANL, USA), A. Yu. Garnov
and L, Rao (LBNL, USA)
Electrochemistry Studies of UO?(acac)2L (aca = cetylacetonate, L = dimethyl sulfoxide,
NN-dimethyl formamide, tetrahydrofuran) Complexes in Non-aqueous Solvents . . . . . . 709
S. Kim, CT. hiyama (JAERI), K. Mizuoka and Y. Ikeda (TIT, Japan)
X

JAERI-Conf 2002-004
. . . . . . . . . . . . . . . . . . . . . . . . . . . . . . .
_A. 0) . . . . . . . . . . . . . . . . . . . . . . . . . . . . . . . . . . 3Ts;lffl
NUCEF . . . . . . . . . . . . . . . . . . . . . . 7(sw
2. . . . . . . . . . . . . . . . . . . . . . . . . . . . . . . . . 17
**[AoAM �_-f: . . . . . . . . . . . 19C. M. Hopper (ORNL, USA)
rL.AT77�n-�,,X�7 9�t a) HI rt, M, A n . . . . . . . 27
C. Madic (CEA, France)
*7-4 � z . . . . . . . . . . . . . . . . . . 39J. Vira (Posiva Oy, Finland)
)J A -�Z�-'O) :[ --7 _L � a;/ M 5� *O)fO)jj . . . . . . . . . . . . . . . . . . . 47
J.M. West, W.R. Alexander, Kaku, I.G. Mckinley (NAGRA Switzerland) and A. Shirrunura (ObayashiCorp-, Japan)
3. []9A" -L"Y . . . . . . . . . . . . . . . . . . . . . . . . . . . . . . . . . . 55
L t f § Ili H Af W.
. . . . . . . . . . . . . . . . . . . . . . . 57T. McLaughl (LANL, USA)
&�j 7 fAp�& .. . . . . . . . . . . . . . . . . . . . . . . . . . . 57
. . . . . . . . . . . . . . . . . 73D.N. Simister (Health Safety Executive, UK)
�5M _fU_ . . . . . . . . . . . . . . . . . 1pit mo, A" a �"Rwff-ft ow)
- . . . . . . . . . . . . . . . . . . 91P.D'hondt K van der Meer, P. Bacten (SCK-CEN, Belgium), D. Marloye, B. Lance and J. Basselier(Belgonucleaire, Beigium)
. . . . . . . . . . . . . . . . . . 99�9�JWIV&, -TT,9�EIPA MAL-M , G.Youmou(CEAFrance)
Aat 7 0 �Xffl rpftj�-� _� 31 �/,X -- . . . . . . . . . . . . . . . . . . . . . . . . 105/111BAR,
xi

JAERI-Conf 2002-004
ffi01)rF1"Lnw4b: I Z I.. ..........A. Renard, P.Kockerols, H, Libon and D, Marloye (Belgonucleaire, Belgium)
MOX �.**05MPMPRM . . . . . . . . . . . . . . . . . . . . . . . . . . . . . . . � 125
V#R-N, Et R R4-UPEQ
. . . . . . . . . . . . . . . . . . . . . . 133,Frrestaurant, JI* rd, sMaa, 511CM9, tl�;Imfg #4 �,)I-Afx)
. . . . . . . . . 141B. A. Hunt, D. Landat, L Dechamp and M. Cavigha (EC-Joint Research Centre, Italy)
. . . . . . . . . . . . . . . . . . . . . . . . . . . . . . . . 147
T.E. Valentine (ORNL, USA)
iMNft%--vf+* --J - FETCH ) TRACY ) . . . . . . . . . . 55
C.C. Pain', Y. Yanrane2, C.R.E.de Oliveira' and A.M. Goddard' (ICST, UK, 'JAERI)
E - . . . . . . . . . . . . 165
77: a
J C 0 r-, k t Z jtK,'� �, I 0) JA- fit:34-4-7D =-+"ffi . . . . . . . . . . . . . . . 173
Lfi*%3J,, 40b V, MM-, itL7JFt- (qg)
. . . . . . . . . . . . . . . . . . . . . . . . . . . . . . . . . . . . . 18 1
31 : MWA, A Efl-0 it
*COGEMA . . . . . . . 183
M.F. Debreuille, P, Padel (COGENU, France) ad F. Drain (SGN Fance)
Z .7P12 4, A . . . . . . . . . . . . . . . . . . . . . . . . . . 189
B. Ya. Zilbennan, Yu.S. Fedorov, E.N. Mishin, L.V. Syffik ON. Shmidt, DN, Kukharev ND. Goletsky,
R.G. Glekov, Yu, V. Palenik ad S.Yu, Sukiweva (KU, Russia)
300 M L PURE X -f 12 -�- A L -C ) PARC 7� -7 . . . . . . . . .197
�]Wwlal X50A*l MAI-i-All'-XI *1i;t, AftS, Xr4111 AR)L 4#*)�fkl
R.J. �Taiqr (BNFL, UK), V.S. Kohnnov, V.1, Marchenko (Bochvar All-Russia Research Institute of
Inorganic Materials, Russia), , Boxall and S. Xiao University of CeDtral Lamashim UK)
. . . . . . . . . .
ITfTMIL VFMW�, ARR FT �,)�Am)
FLt10REXM-,--- - - - - - - - - - - - . . . . 217
�?O, �Ca, MMErt- t��ffi (H �-/ W'�C
xii

JAERI-Conf 2002-004
AOM NZ90) t7 &50)tARA7PO L A . . . . . . . . . . . . . . . . . . . . . . . 225
AL -'j-,_jq�J3.9, *R4 All, AL R�m rpg� A. Bruggeman, M. Gysemans
(SCK-CENBelgium), X RX ( ii&ff�pfi)
7t� �1,7 �i7;�3 t L . . . . . . . . . . 237
M. Leconite P Baron, M. Masson (CEA, France)
r- E �fT �3 � t L 9 6 J9 9 t rffj R 0) 0 L V . . . . . . . . . . . . 239C �" (Tsinghtia Umiv., China)
&1[t44 again -11� �L F'3tA RV) t: &5 0) UNEX 7P --k . . . . . . . . . . . . . . . . . . . . . . . . . . . . . . 247
V.N. Ronianovskiy, V.A, Babain, V.M. Esimantovskiy, LV, Sminiov, B.N. Zaitsev (KRI, Russia),
R.S. Herbst, J.D. Law and T.A. Todd Bechtel BW-XT Idaho, USA)
TODGA MiTt ��7 - Z YO)�\19 . . . . . . . . . . . . . . . . . . . . . . . . . . 255
fp'.Aw- 09O)
rZ YA L M A -C 0) 7 -�i F 0) f L*A lklt . . . . . . . . . . . . . . . . . . . 261
LA t MTM
eTA��99-- �7- t 0) TRU 0) N14R . . . . . . . . . . . . . . . . . . . . 263T WELPfff)
. . . . . . . . . . . . . . . . . . . . . . . . . . . . . 273
J. Rais P Sehicky, N. Sistkova (NRI-Rez, Czech Republic). J. Plesek, B. Griber and B. Casensky
(Institute of Iorganic Chem, CAS, Czech Republic)
)1 T �/ FP ) HDF1-1P, Cyanex 272, Cyanex 302 XY Cyanex 301 ) �, �t -:; A 281
M P. Jensen R. Chiarizia, V. Urban and K L. Nash (ANL, USA)
. . . . . . . . . . . . . . . . . . . . . . . . . . . . . . . . . . . 289
-L' +J I I 9AL *#XUR
�3 tt Z W11tjOVft 9 . . . . . . . . . . . . . . . . . . . . . . . . . . . 291
Ph. Leconte (CEA, France)
Pj. . . . . . . . . . . . . . . . . . . . . . . . . . . . . . . . . . . . . . . . . . 293
MN 'Al Mrpff I H+AW� 100 9A��Z (JIVIT)IRSPRIMI-COFOR/14T-)-Ar, WE)
. . . . . . . . . . . . . . . . . . 301_kWO01 +fffi*nHx1 fxjq-iV�' MCCA Mi4t)
. . . . . . . . . 309Pi
+UIA I A[BIN-m, gqvlpl 4 M al n4 Uqfff)
. . . . . . . . . 315
D. Rai (PNNL, USA) ad M. Yui (NC, Japan)
xffi

JAERI-Conf 2002-004
. . . . . . . . . . . . 323J. I. Kim (FZK, Germany)
1) T �::tS � t Z) M71 rAt L95�OAQIK . . . . . . . . . . . . . . . . . . 325WQMI pWA JM
. . . . . . . . . . . . . . . . . . . . . . . . . . . . 333
F.M.G. Won (Stone & Webster, Inc., USA), C. Stockman, R. Rechard, and P. Brady (SNL, USA)
7 7 -)I/ �3 �t 7 &5 O)M)j *-�E- L T- L PRW 341
M. 0 (BGM En&ieering Ltd., Switzerland)
__- 7 �'O)RIAV . . . . . . . 349
YP. Hart, Y. Zhang, B.D. Begg, Z. Aly, A. Brownscombe, R. A. Day, M. W. A, Stewart, G. R-
Lumpkin, E. R. Vance and A. Jostsons (ANSTO, Australia)
" � : 13 t t,6 ---� �/ � t - � ff rP 0) fAflfioff ff STAR ff 9�foITXR R t; R P M )] 95E 3 5 5Z. Fan, A. Cui, C. Gu, Y. Zhao, Q. Sun (CIRP, China), fAI-*1rATI [E p's
/J111131M JM
. . . . . . . . . . . . . . . . . . . . . . 361
TRU f L . . . . . . . . . . . . . . . . . . . . . . . . . . . . . . . . . . . . . . . . 363
- T 4 �_ - 31 WA-, A R41:
�/Of M - *Of 365H. Nitsche (LBNL, USA)
TRU I Z J�fflg . . . . . . . . . . . . . . . . . . . . 367
A. J. Francis (BNL, USA)
7 F 4 t �/ 0)WICf L*00fjk=p-_f L L/ Fv �'A 7 El -!E�ft . . . . . . . . . . . . . 375
LUT I ANE311-1 IkIlIfIf* Mtt)
. . . . . . . . . . . . . . . . . . . . . 381
P%*31, P, *#A4 (qfff) &F-A R-, W;v-AMt) I MINCI trMEM MiAt)
4. * A �' - -h --Y -:/ L;; . . . . . . . . . . . . . . . . . . . . . . . . . . . . . . . . . 389
aAjr5�� . . . . . . . . . . . . . . . . . . . . . . . . . . . . . . . . . . . . . 389
. . . . . . . . . 391fft (OF.CD/NEA), V)1 (E
399H.A, Tuan, Aff if, ffff JAN (qff)
No. 1 O)ItX . . . . . . ... . . . . . . . . . . . . . . . . . . . . . . . . . . . . . . 407
ME
*MIM&A
xiv

JAERI-Conf 2002-004
OECD/NEA A 4R*dt-� ME No. 2 No 4 Z#t 7 Xf . . . . . . . . . . . . . . 415
i'AliS I A WA (Jlqu)
if,M Pf if] r 7k VA 8 0) M * R i Y 5 1 � On W W M M t Z J E N D L - 3 2 I t x . . . . . . . . . . 423-X9f A (Jqfff) , J (CRC / )
S TA C Y 8 � t Z F-� A 4 � 9 0 r� A -4 -ffi, b 0) 9--" I . . . . . . . . . 431-Af MAil WlIPM f90)
. . . . . . . . 439
J--, lftfr-�Pr, J4-Zhg, FAMA-P-I, F-�LUV VW
-�A z- 4 0) MIR . . . . . . . . . . . . . . . . . . . . . . . 447
)"am , 49pM5Af--l /)llfQ&l t;w#- (JIM )TRACY . . . . . . . . . . . . . . . . . . 453
rpa- AbUEL-, EkTMA, /],Jllfpjx, )�Tff)'93 0,W)
JCOitRWIWJjrRff OAWN . . . . . . . . . . . . 459
-�E';' �"7 ffl f�: CO jtR�fff 0) i�5 4�P*ft �: rA t Z XMIM . . . . . . . . . . . 467i9bflEL-1 4f WAI, MM-, 401* 3A�-- Aff)
. . . . . . . . . . . . . . . . . . . . . . . . . . . . . . . . . . . . . 473
7PA/ 1� 4 AtAIAM 1 El -�- �/A, 7 /M igWAXT&V " �Z 13 �t 475VII it-, VM * WM- 00 I 4i*ll
. . . . . . . . . . . . . . . . . . . . 481
. . . . . . . . . . . . . . . . . . . . 489Vet E, FILHMA, IMMA, PMMA, *A6** (AW)
(Np, TO . . . . . . . . . . . . 497f'qFT 2, 2 A AM 3t fr
P)AIAIJ fl V f ...... 503Mj�p,-fM, D. T. Hong, A. Ziang, 1�1 W WQ 0M)
NUCEFa y 44GWDT-1 . . . . . 11WX *I SO it-, AR t IA E MA&VItAl )w_wa Qqff)
(TI) �--ffl"'t:PUO20)4hTi-ft . . . . . . . . . . . . . . . . . . . . . . . 519P.J.W, Rance (BNFL UK) and G.P. Nikitina (KRI, Russia)
. . . . . . . . . . . . . . . . . . . . . . . . . . . . . 527)14M) MB fi: I# f � (f La)
TRUEX iM �: t 7, �'A oh, 1� . . . . . . . . . . . . . . . . .. . . . . . . 53304*4:�' ftt Tul Awtl MT00
xv

JAERI-Conf 2002-004
CELVA-1D . . . . . . . 541RIS 4:1, A H I-- -, EMUff-Pr, F I TM ORU)
. . . . . . . . . 549
[Bitfg AMM--, I�qih% 4:1, _0ifflifl-, F�,IWTR (AM )
W�O)Zffl �"�3 1 Vmry�i �ITGAO) j3 � :J3 M W O)O R . . . . . . . . . . . . . . . . . . . . . . . .. . . . . . . . . . 557
A.Yu. Shadrin, A.A. Murzin, VN. Romanovsky and VA. Starchenko (KRI, Russia)
BTP �: I L Am(III) 3.t j�r Eu(III)Mth ................ 567
C. Hill and C. Roube (CEA, France)
. . . . . . . . . . . . . . . . 573C. Hill, D. Guillaneux, L, Berthon and C. Madic (CEA, France)
. . . . . . . . . 579
t-FWLI rpqTa)� *EM
. . . . . . . . . . . . . . . . . . . . . 589X#* 78# �tl F�-# 91 4 MD & f u I Qq 0)
TRU-HITEC- . . . . . . . . . . . . 597jo 2,- p (El *AqT
fh#"O
7 :,'f T Z 4A&A-7'0 RI-M . . . . . . . . . . . . . . . . . . . . 603
ORO)
-image . . . . . . . . . . . . . . . . . . . . . . . . . 609
V*JM 7-t �/7'1)H rKOJ95t . . . . . . . . . . . . . . . . . 611
Yang Yuee, Wang Zhiming, Liu Chunli, Jing_ tangJiang Hong (CIRP, ChiDa), Efte�*jrA-f-, /jjj&j6 (U)
� #F� �7- �3 tt 4 -7Np M)AMINM � . . . . . . . . . . . . . . 621Anxi Ci, Zhiwen Fan, Jinsheng Zhang, Cunh Gu (CTRP, China), nn #*Z, Pi IfizAl
Z 3 rtAyjff�t . . . . . . . . . . -627-4,�', A#WL, ZhcntwigLiHongqingZhang,
Xudong Wang, Anxi Cui, Liangtian Guo (IRP, China)
v � ffAeAtAR rMA-)JWt -635A #- WL, H q �,94--, ER tA A, +��* 701 7-, 1,; I I �A It (Aq, f ff J ins hei ig Wa D g, S u sh en Li, Yingj ieZhao, Qinghua Wu, hilnillg Wang (CIRP, OnD8)
LA ffl ft . . . . . . . . . . . . . . . . . . . . . . . . . . . . . . . . 643A tfARX, IJEEA, IMITtViiA 11'�09�RIR)
xvi

JAERI-Conf 2002-004
237Np, 3pU �3 t � 2 Ain 7 651IBTZ5�, A;Mt, /J111IMS 099)
TG L � 7;/ 0),7 9 L VS *R ......... 6594Lff JAI Fffl
. . . . . . . . . . . . . . . . 6674A EH Ifl4i 0 AX) 11,111qU VW
. . . . . . . . . . . . . . . . . . . . . . . . . . . . . 675J?t rrg tr-j �k, -g -Ar -+pA (4� f a f X)
. . . . . . . . 6832, C. Z3 S..M.(j�Won&�, C. Stoekl-nan Mert Alcorn4, and R. Aguilar2 ('Stone Webster, hic., USA,
4'SNL, USA., ANL, U SA, Management Solutions, USA)
igNIM LWX`�� �0-0 MV R t X t A J A 0) 'T,�; W . . . . . . . . . . . . . . . . 691VIBtIkA, 1441-P*1 /')IIY/Ai- Agff)
-- - - - - - - - - - - - - - - - - 697bn I Mrrk fly"-" ffli)-UM7 9-)
TRU IL* . . . . . . . . . . . . . . . . . . . . . . . . . . . . . . . . . . . . . . 705
AME 7)1/ t ) rmAql �ZI3 �t Z) T 7-1- -- F f L* . -7p --7 :/ � NZ 0) Affl . . . . . . . . . . . . . 707K L. Nash A.V. Guelis, M.P. Jensen, J.C. Sullivan, A.H. Bond (ANL, USA), A. Yu. Gamov, L. Rao(LBNL, USA)
4MMFP�:43ttL U02(aCaC)2L (acac = acetylacetonate L = dimethyl sulfoxide, NN-dimethylformamidetetrahydrofuran) AW )MMIL*qM%� . . . . . . . . . . . . . . . . . . . . . . 709
A� V11 [�-Jwwa TM I FMA-M, ittffl-111-�M WEK)

JAERI-Conf 2002-004
Members of Steering Committee:
A. Suzuki (Chairman, University of Tokyo)
K. Higashi (Kyoto University) K. Nishina Aichi Shukutoku University)
M. Hirano (NUPEC) Y. Yamane (Nagoya University)
T. Kawata JNC) A. Yarnato (AESJ)
H. Ojima JNQ S. Fujine JAERI)
S. Matsumoto (Saitama University) K. Noda JAERI)
S. Matsuoka JNFL) Y. Suzuki JAERI)
H. Moriyama (Kyoto University) 1. Takeshita JAERI)
S. Muto (FEPQ M. Tanaka JAERI)
Program Coordinators:
J. Bouchard (Director, Direction de I'Energie Nucleaire, CEA, FRANCE)
S. Ion (Director, Technology & Operations, BNFL UK)
J.A. Lake 2000-01 President of American Nuclear Society, USA)
I. Takeshita (Deputy Director General, Tokai Research Establishment, JAERI)
Members of Symposium Working Group (JAERI's Staffs):
S. ujine Leader, Conference Secretary) K. Minato (Session Coordinator)
S. Dojiri H. Mineo
T. Banba (F-ditor of Proceedings) T Tanaka
Y Nomura Session Coordinator) A. Yamada
Y Miyosbi (Session Coordinator) T. Sato
G. Uchiyama (Session Coordinator) T. Kaneko
Y Morita (Session Coordinator) K, Tonoike
H. Ogawa (Session Coordinator) Y Tsubata (Editor of Proceedings)
H. Kimura (Session Coordinator) H. Yanagisawa
S. Nakayama (Session Coordinator) K. Kobayashi
xviii

JAERI-Conf 2002-004
Preface
The Jntemational Symposium NUCEF2001 was held in Tokai-mura, Japan from October 31 to
November 2 200L Th sbtitle of the smposium was "Scientific Bases for Criticality Safety,
Separation Process and Waste Disposal". The first NUCEF International Symposium was held in
October 1995 at te opportunity of the start of hot operation in NUCEF facility, and the second
Symposium was held in November 1998, NUCEF2001 the third symposium opened with the
Opening Address by Dr. Mitsuru Maeda, Director General of Tokai Research Establishment, Japan
Atomic Energy Research Institute and with the Welcome Address by Professor Atsuyuki Suzuki of
the Uiversity of Tokyo, Chairman of Steering Committee of this symposium.
This symposium was successful as the international forum for the exchange f scientific information
on R&D for Y)ucleaT fel cycle and radioactive waste management. There were over 250 participants
from 14 countries at the NUCEF 2001 symposium. The principal topics addressed irr this symposium
included: 1Criticality Safety; criticality characteristics of solution fuel, phenomena of super
criticality; sub criticality monitor; bum-up credit; JCO accident assessment; (2)Separation Process;
new concept of reprocessing; partitioning; nuclide behavior in chemical processes; (3)Radioactive
Waste Disposal; concept and option of waste disposal; performance assessment; waste management
R&D, and (4)TRU Chemistry.
The chairpersons of each sessions were:
Opening Session: 1. Takeshita JAERI)
Plenary Session: K. Nishina (Aicbi Shukutoku Univ., Japan), K. Higashi (Kyoto Univ., Japan)
Oral Session:
Criticality Safety- C. M. Hopper (ORNL, USA), Y. Nomura JAERI). T. McLaughlin
(LANL, USA), Y. Miyoshi JAERI), P. d'Hondt (SCK-CEN, Belgium), M. Kanamori
QNC, Japan), A.J. Goddard QCST, UK), K. Nakajima (JAERI),
Separation Process- R. Taylor (BNFL UK), H. Ojima QNC, Japan), B. Ya. Zilberman KRI,
Russia), G. Uchiyarna. QAERI) C. Madic (CEA, France), S. Tachimori JAERI) V.
Romanovski (KRI, Russia), K. Minato JAERI),
Waste Disposal- J. Vira. (Posiva, Finland), S. Muraoka (NMCC, Japan), H. Moriyama
(Kyoto Univ., Japan), T. Ohe (Tokai Univ., Japan), J. West (British Geological Survey,
UK), T. Banba JAERI)
TRU Chemistry- J. I. Kim (FZK, Germany), 0. Tochiyama (Tohoku Univ., Japan),
We appreciate all the participants who contributed for the success of NCEF2001 International
Symposium.
xiX

This is a blank page.

JAERI-Conf 2002-004
1. Opening Session
I
I

This is a blank page.

JAERI-Conf 2002-004
OPENING ADDRESS
Mitsuru MAEDA
Director GeneralTokai Research stablishment
Japan Atoini Eergy Researc Istitute JAERI)
Tbank ou Mr. Chairman.Good MOTDiDg Ladies and Gentlemen. On behalf of JAERI I welcome you all foryour participation to NUCEF2001.
This symposium is organized and sponsored by JAERI i cooperation with AtomicEnergy Society of Japan (AESJ) and Division of Nuclear Fuel Cycle and Environmentof AESJ I ear from secretary that we have about 250 attendees from domesticresearch organizations, universities, industries, and about 40 participants from 12 oversea countries. It is a great honor for us to have so big symposium, here, TokaiResearch Establishment, JAERI.
In this symposium, we discuss "Scientific basis for criticality safety, separationprocess and waste disposal," in uclear fuel cycle and waste management, I believethat this NUCEF symposium provides ood opportunity for the experts to exchangethe newest iformation in this field. I think you could remember tat the firstNUCEF symposium was held in October 1995, at the opportunity of the start of hotoperation in NUCEF facility. And we had the second symposium in November 1998.Three years have passed after the second NUCEF symposium.
In the meantime, JCO criticality accident took place in Septembet 1999 in Tokai-mura.We are very disappointed that such a disastrous accident could happen i the vicinityOf OUT safety research activity and feel deep regret to two workers who passed awaycaused by teir irradiation dose in the accident. Although the NUCEF made greatcontribution in counter-measming activities and investigation of the JCO accident, ourhope is such an accident never happens again.
Please take a look at tis picture. NUCEF is the scientific research center for theresearch and development in the field of nuclear fuel cycle and radioactive wastedisposal. We will carry out out research in cooperation with foreign organizations,Government, Private Industries, Government-affiliated research organization andUniversities. There are iportant subjects ahead in this field; Plutonium recycle,MOX utilization, Reprocessing and Waste management, and T.ansTnutation. It is notexaggeration to say tat the future of nuclear industry actually depends on the successof te measures to these subjects. I promise you we, JAERI, will make maximumeffort to ensure the safety of future nuclear facilities and figure out the future ofnuclear technology in cooperation with those who are making effort in the world.
Here, I have to express y hearty thanks to all the members of Conference SteeringCommittee NUCEF2001, in particular, Prof. Suzuki, Prof.Higashi and Prof. Nishina I
3

JAERI-Conf 2002-004
appreciate Prof. Suzuki who chairs the Committee and participating today under theheavy works at his important position as a member of the Nuclear SafetyCommission.
And, I express my appreciation to the� members of Program Coordinators; Dr. JacquesBOUCHARD, Director, Nclear Energy Division, CEA, FRANCE. Dr. Sue ION,Director, Technology Operation, BNFL, UK, ad Dr. James LAKES, 000-2001President of America Nclear Society, USA. and Dr. Isao Takeshita, Deputy directorgeneral, Tokai research establishment, JAERL I appreciate, Dr. Takeshita whopresides over the Program Coordinators. Although the other foreign ProgramCoordinators are not participating here today, they contributed to arrange the programof this symposium in te global perspective. They av snt us teir appeal ofinternational cooperativeness and togetherness in the nuclear fuel cycle field forpromoting te -research a development for the future. I have learned thatinternational symposium ATALANT-2000 has been sccessfully held in South France,last year. Te symposium is named after their esearch facility ATALANT atMarcoule, France, just like NUCEF2001 is amed after research facility NUCE atTokai, Japan.
I sincerely hope tat NUCEF2001 will e vry fruitful ad successful, and ivelyexchange of iformatio trough three days symposium will contribute to the ftitureresearch in the field of nuclear fuel cycle ad waste disposal. I also ope that yourstay in Japan will be very pleasant. I am afraid you would have someinconveniences because of our countermeasures against trror attack, We stronglycondemn the barbarous terror attack i New York. Howevej-, ee, in thissymposium, let us discuss the safety of nclear facility and secure of the future (nergyin the civilized manner.
Thank you very much for your kind attention.
4

JAERI-Conf 20027-004
owed
PMR

This is a blank page.

JP0250278JAERI-Conf 2002-004
PROGRESS OF SAFETY RESEARCH IN NUCEFON NUCLEAR FUEL CYCLE
Sachio UJINE
Japan Atomic Energy Research Institute
Tokai-mura, Naka-gun, haraki-ken, 319-1195 Japan
E-inail: ftijiiie�popsvr.tokaijaeri.gojp
ABSTRACT
Research activities of AERI related to nuclear fuel cycle and waste unatiagernent are overviewed as the
opening presentation of NUCEF2001. Te third onference NUCEF2001 in This series is subtitled "Scientific
basis of criticality safety, separation process and waste disposal" he scope of this symposium is not limited in
the activity of NUCE ad not limited in safety research, but includes more general view of the issue as far as
fuel cycle and waste management are concerned.
Key words: criticality, separation, disposal, plutonium, long-lived nuclide, waste
1. NATIONAL POLICY AND RESPONSIBILITIES
1.1 Governmental Structure
In Japan, Atomic Energy Commission AEC has the responsibility on the matters
concerning ational policy for research, development and utilization of atomic energy. And
Nuclear Safety Commission NSC has the responsibility on the matters concerning regulation
for ensuring safety of atomic energy.
As the reflection of O criticality accident that took place at te end of September 1999,
Nuclear Safety Commission (NSC) is reinforced at April 2000. The Office of NSC, which
supports NSC activities as the secretariat, has been established by increased the staff number
from 20 to 92 and transferred to Prime Minister's Office from STA; Science and Technology
Agency. On the occasion of the Governmental restructuring pogram, January 2001, further
reinforcement was made by transferring NSC and the Office for NSC to the newly-born
Cabinet Office. The NSC in Cabinet Office has strong function of government-wide planning
and inter-ministiy coordination.
In the governmental restructuring program, Safety Regulatory Responsibilities are
re-allocated. e-allocation is shown in Fig.l. The responsibilities on the nuclear fuel cycle
facilities related to fuel fabrication business, reprocessing bsiness and waste management
business. which responsibility used to be in STA, has been transferred to METI; Ministry of
Economy, Trade and Industry, more exactly newly-born NISA; Nuclear and Industrial Safety
Agency, in METI. NSA as now the safety regulatory responsibilities both on the fuel cycle
facilities and OTI CDIfflercial nuclear power plant, and spent fel interim storage facility as
well. STA, sed to be te supervising Agency of JAFRI, has merged with Ministry of
Education into ew ME)CL Ministry of Education, Culture, Sports. Science and Technology.
7

JAERI-Conf 2002-004
The supervising Ministry of JAERI has been changed from STA to MEXT. Regarding nuclear
energy, MEXT deals with scientific and technological aspect. METI deals with its energy use
aspect. Accordingly, JAERI's research activities are directed to scientific ad technological
aspect of nuclear energy.
B efo re After Restructuringn.2001)
STA MEXT
-Fuel Fabrication Business -Research Reactors
-Reprocessing Business -Use of Nuclear Materials
-Waste allagemont Business METt(NISA)
-Research Reactors -Fuel Fabrication Business
-Use of Nuclear Materials Reprocessing Business
MITI -Waste Management Business-Commercial NPP -Commercial NPP
-SF Interim Storage Business SF Interim Storage BusinessJ
Fig. I Re-allocation of Safety Regulatory Responsibilities
1.2 New Movement in Japan
The Atomic Energy Commission (AEC) has defined the new Long-term Program of
Research, Development and Utilization of Nuclear Energy" in TTovl�,mber 2000. Japan's policy
is not essentially ChaDged in the program. Japan's policy of nuclear fuel cycle is to reprocess
spent fuels and recycle te recovered plutonium into LWR as therinal N40X uel, under the
principle of no surplus plutonium, High-level vitrified radioactive waste forn reprocessing
will be disposed in a dep geological formation after the storage or several tetis years. The
spent fuel exceeding the available reprocessing apacity will be stored in the interim
Away-From-Reactor storage.facility as the otential energy resources, util eing reprocessed.
Research and development of FBR fuel cycle technology have biten supported as one of the
greatest potential among the options of resource-saving energy tchnologies for the long-term
future.
New movements are merging in Japan. In fuel cycle, at JNFL-Rokkasho Reprocessing
Plant, cold test has been tarted this year. Tht ommencement of operation of main part of the
plant is scheduled at July 2005, JNFL-MOX fabrication plant is formally poposed to local
authorities of Rokkasho site, requesting cooperation for the facility construction tere. The
commencement of operation is expected at Spring 2009. As for Interi AR Storage Facility,
operation is expected at 2010.
Regarding waste disposal, report on clearance level of solidified aterials arising from
nuclear power plant was issued from special committee of NSC at arch 1999. Final
- -

JAERI-Conf 2002-004
E)isposal Act for Vtrifie JW is legislated in June 2000. The legal framework of HLW
disposal (Fig.2) as een stablished based on ts legislation. Radioactive waste ust be
safely treated, conditioned d disposed of y the. gnerators, Power companies, the generator
of HEW, bave the Yesponsibilities to share te cost for final disposal, The Government, METI,
has the responsibility for settling Oil tile basic policy ad final disposal pan. NUMO; Nuclear
Waste Management Ofganization of Japan, and RWMC; Radioactive Waste Management
Funding ad Research CeIner ave the eonsibilities of tlit implementation and funding
management, respectively. Te Nuclear Safety Commission is now dscussing on the safety
regulation. The GOVeIDTIM-it; NSC and METI, should provide guidanct, to o regulate the
generators to ensure tat the treatment, conditioning and disposal are conducted properly and
safely.
NSC
METIResponsible or
POWER COMPANIES Basic policy,
Final disposal plan.
FundingAction Plan Supervising
NUMO(Nuclear Waste Management RWMC
Prg�qizatiqn of Jap FundManagement
2
Fig.2 Roles and Responsibilities of Organizations in Vitrified H1W Disposal
In our country, radioactive wastes are categorized according to the generation step in the
fuel cycle, which is illustrated in Fig.3. High-level waste arises fom reprocessing. TRU waste
arises from reprocessing a MOX fabrication. Uranium waste arises from uranium fuel
fabrication. Power ant waste arises from power plants. Researc ad development work in
research institute, like JA.ER1. and radioisotope utilization, too, generate wastes. The category
of the waste arising fom research institute and radioisotope, RI, utilization is named RI and
Research Institute Waste, The generators have the responsibility for its safely treatment,
conditioning, ar)d disposal. In order to secure the research capability of using radioactive
materials i atoroic energy research organizations and to ere the safety of waste
management in those istitutes, New organization RANDF.,C- Radioactive Waste Management
and Nuclear Facifitv Decommissioning Technology Center. las bee-ii stablished to implement
9

JAERI-Conf 2002-004
the related investigation, in cooperation with JAERI, JNC and JA (Japan Radioisotope
Association), The NSC is discussing the guidelines of regulations oil these wastes disposal.
�penl :High-Level
WastePower Plant L I ZWaste Reprocessing TRU Wastel
Fuel Cycle
Fuel U, PYJ
a,
Rese RadioisotopeFuel Fabricationand Developmen Utilization
Uranium WasteResearch Institute I TRU Waste RI facilities
.Research Institute Waste RI Waste
3
Fig.3 Radioactive Waste Category in Japan
2. THE ROLE OF JAERI
2.1 Research Activities
JAERI is conducting the safety research for current O near future technology and
fundamental research for long-term future technology options.
Safety is the highest priority for the use of nuclear energy. -tbe safety is essentially
important for the people to accept the policy of nuclear power utilization. A for JAERI, it is
important to study the sientific basis for securing nuclear safety and the phenomena of
accidents to work out ow to cope with for prevention and mitigation, Major objectives of
safety researches are to develop safety efiteria and establish scientific basis for licensing, to
improve the safety of current o near future technology and to clarify the, safety margin of
licensed technology. Our research works are focused mainly on criticality safety,
radionuclide confinement safety ad waste disposal safety, Current key words in prioritizing
these safety researches are putoinum, or MOX and long-lived nuclides,
Objectives of fundamental research for long-term future technological options are to show
or clarify the chemical or scientific feasibitity o advanced system such as for recycling minor
actinides or fo icinerating long-lived nuctides. -Various researches are underway such as on
partitioning of LW, new-type chemical processes, transmutation of trans-uranium with
accelerator, and so on.
2.2 Introduction of NUCEF
- 10

JAERI-Cont' 2002-004
NUCEF; Nuclear Fuel Cycle Safety Egineering Research Facility, is the scientific
research center that provides the support of experiment for these researches, especially for hot
experturents using ranium, plutonium, minor actinides and spent fuels. he operation started
in 1995. There are two criticality facilities, STACY and TRACY, and research
laboratory-BECKY corn sed of a concrete cells, man gt ve boxes and hoods for
handling radioactive materials,
In STACY, Static Critical Experiment Facility, using 10% enriched uranyl nitrate solution,
criticality mass are measured. Figure.4 shows the STACY cylindrical core tank placed in a
water tank that keeps the temperature constant. Measuring devices are inserted in the core.
Cylindrical core can be replaced to slab tank. Now, the experiment of two slab-tank system is
underway to study the neutron interaction effect between two anks.,
TRACY; Transient Critical Experiment Facility is to study supercruical, phenomena of
fuel solution, Figure.5 shows the core tank. The size of 50 cm diameter is Similar size to that
of precipitation tank in which JCO criticality accident took place, Figure shows the
observed power emission under supercritical condition. First, a power burst is observed just
after supercritical condition is achieved. Then, the power is decreased because of bubble
evolution in solution and power swing continues, In the pictures of this figure, the radiolytic
gas bubbles emerged to te surface of the olution is observed with the remote sensing device
m the tank, esearches done in STACY and TRACY were very useful to countermeasure and
investigate what really happened i JCO. Te result of study on WO accident is presented in
the Session of Criticality Safety of this conference.
Criticality mass of 1 0%-enriched uranyl nitrate solution system
Experimental Program
Cy1indrical tank '95-'966000
slab tank 280T '97-'98
Cylindrical tank 1988000
Two slab tanks 199-101
Cylindrical tank '02-'03600 0 UO1. rods
Cylindrical tank '04-wit PU
4
Fi& 4 STACY: Static Critical Experiment Facility
- 11

JAERI-Conf 2002-004
Supercrifical phenomena of 1 0%-enriched uranyl solutionDosimetry
0
1E
IE�4It 1%1.
IE43020 40 OG 80 1 10 140 160 180
Time(s)
5
Fig. 5 TRACY: Transient Critical Experiment Facility
STACY and TRACY are placed in the building A of NUCEE In the building of NUCEF,
research laboratory-BECKY is facilitated. a concrete cells f reprocessing and
partitioning process equipment and many glove boxes and fume hoods have been installed for
radioactive materials handling.
Safety and advanced process for Purex reprocessingPartitioning of HLLW
Fig. 6 BECKY cell for esearch o Reprocessing ad Partitioning

JAERI-Conf 2002-004
Figure 6 shows the inside of BECKY Y 'r cell. The study of safety and advanced process
for Purex reprocessing and process for partitioning of HLLW are conducted here Using spent
fuels of power plant. Research on radioactive, waste disposal is conducted in glove boxes
sbown in Fig.7. Glove boxes of aaerobic condition is facilitated to simulate tDderground
condition, Thermodynamic data of TRU elements are obtained to study the behavior in deep
underground, Field test is also carried out to study the actual behavior of radioactive nuclides
in uderground facility i cooperation with CIRP; China Istitute foi- Radiation Protection.
The result will be presented in the Session of Waste Disposal and Poster Session, today.
Most of these studies related to criticality, process, waste disposal are conducted according
to the new Five-Year Program of Safety Research which is defined by Nuclear Safety
Corrunissiori NSC, last year.
2.3 EDdeavor to Develop Resource-saving ad Inovative Energy Technology
The "Long-term Program of Research, Development and Utilization of Nuclear Energy"
of Atomic Eergy Courraission is promoting research and development of FBR fuel cycle
technology as one of the greatest potential arriong the options to develop resource-saving
energy technologies for the ong-term future. According to this direction, JNC is conducting
"Feasibility Study on a Commercialized BR Cycle System," Meanwhile, JAERI is
COD(lucting the study on "Reduced-moderation Water Reactor System (RMWR)" and
"TraDsmutation in Accelerator-Driven System". Studies on the fuel cycle systern applicable to
these systerns is important from the viewpoint f resource-saving energy technologies.
Data acquisition forthe estimation of thebehavior of radio-nuclides in deep"underground.
Anaerobic grove box(Ar, 0,<1 ppm)Simulate udergroundcondition
Fig,7,Arraerobic Grove Box for Research on Radioactive Waste Disposal
__ 13 -

JAERI-Conf 2002-004
The role of Reduced Moderation Water Reactor (RMWR, Fig,8) is in between the current
LWR system and the future BR system. The technology of RMWR is based on the current
LWR technology but much advanced in the aspect of Pu control in the reactor core. The
reactor of RMWR concept is available as burner or breeder of Pu by control. The fuel cycle
technology applicable to RMV*R system is also based on WR fuel c ycle technology but
much advanced in the aspect of simplification of the process. Realization of RMWR system is
envisaged to be much easier than FBR system. The intention of RMWR development is to
resolve the subjects; saving uranium resources by Pu utilization, control of surplus separated
Pu, reduction of spent fuel in storage and eventually establishment the alternative for fossil
fuels. Simplification of reprocessing process is the important subject in the fuel cycle
technology development for RMWR. It will be carried out in BECKY facility.
F1 FBRPu utilization in WR uel
DgessingMOX fuel SF BVPP ReprocessingMOX fuel fabrication MN fabrication
Ipowder moxOX powder MOX fuel fuel
Rgprpcess1rLq MOX fabrication
F powder Breeding:Alternative for
fossil fuels
Reduction of spent fuel (SF) in storage
Control of surplus separated Pu
Saving uranium resource by Pu utilization
Fig. The role of Reduced Moderation Water Reactor (RMWR) Recycle System
In building of NUCEF, installation of a new e-quiprnef)( Module for TRU
High-Temperature Chemistry (TRU-HITEC, Fig,9), is nderway, This quipment is
composed of tree hot cells shielded by steel ad polyethylene. ,Fundamental researches on
pyro-chemical process with TRU-containihg molten chlorides ae planned, Some new-type
chemical processes are studied for future application. The extractant TODGA is a replacement
of DIDPA for present JAERI's partitioning process for actiDides separation from HLW.
Result of this study will be presented in the Session of Separation Process. Supercritical
carbon dioxide is another new medium to extract actinides. Result of this study is presented in
the Session of TRU chemistry.
14 -

JAERI-Conf 2002-004
3. MAINTAINING TECHNICAL COMPETENCE
The roles of atomic energy research organizations are to provide expertise and technical
capabilities to assist government regulatory activities, to promote R&D for the future
utilization of atomic energy, and to educate students, train professionals and inform general
public or better understanding nuclear science and technology. However, recent trends are
reduction of research fUDd and personnel because of re-orientation of science and technology.
We observe this tyend worldwide.
Nuclear energy is a technology that must essentially be addressed from an international
point of view, because of the wide range of activities involved and the magnitude of its
importance to the people everywhere in the world. In order to nsure the safety of future
nuclear facilities and promote development, research facilities and personnel must be
maintained at the necessary level. We tink maintaining technical competence is very
important for the world nuclear community. From that point of view, international
collaboration by sharing financial burden and expertise is the efficient mechanism among
concerned countries and regions.
Loading part Crane Manipulators
0
0
..... ....... ............ .... .... ........................ ............... .......................... ..... ..................................... .............................................. ........................................................... ...................................... ...... ... ....... ......... .................. .9
Fig. 9 Module for TRU High-Temperature Chemistry (TRU-HITEC, to be available in 2003)
It is important for Japan to make maximum efforts in establishing international nuclear
safety standards. As the effort of such direction, we are planning to conduct critical
experiments of plutonium solution in STACY, which is one of the very few critical
experiment facilities that can handle Plutonium solution large scale in the world. As shown
in Fig.10, critical experiment will be conducted using coniniercial-use plutonium solution to
develop advanced criticality control techniques such as sub-critical monitoring and to validate
criticality safety aalysis methods. Experiment i Planned to start at 2006 with
- 15

JAERI-Conf 2002-004
low-concentration condition at first.
4. SUMMARY
Japan has launched a new research program based on a new long-tenn nuclear policy with
reorganized government structure, NUCEF is the scientific research center on the safety
research and fundamental research for the world nuclear community. Maintaining technical
competence is important to ensure safety of the use of nuclear energy and promote
development of future technology. Efficient international collaboration is encouraged to this
purpose. We think that providing the idea and data useful for ensuring the safety and securing
future energy is required to recover the people's confidence in the utilization of future nuclear
technology.
Critical Experiments of Plutonium Solution
STACY-Criticality Data of Commercial-Use Pu Solution
-Development of Advanced Criticality Control Techniques
-Validations of Criticality Safety Analysis Methods
PHASE 2006-2007)
*Low-concentration Pu Ex centsP
0 Tem perature C 0efficient Of Low-concentration u I
PHASE If (2�07-2009)
*Higher Enrichment U/Pu Experiments
*Lower Enrichment U/Pu Experiments
PHASE III *16;14criticality Data of Wide Range Pu Concentratioll
... .... ... .
Fig. 10 Critical Experiments of Plutonium Solution
16 -

JAERI-Conf 2002-004
2. Plenary Session
I
- 17 -

This is a blank page.

JP0250279JAERI-Conf 2002-004
THE U.S. NUCLEAR CRITICALITY SAFETY EXPERIENCE, NEEDS, ANDFUTURE IN A GLOBAL ECONOMY
CALVTN M. HOPPEROak Ridge National Laboratory, P.O. Box 2008, Oak Ridge, Tennessee 37831-6370 USA
Ph: I - 865) 576-8617, Fax: I - 865) 576-3513, email: hoppercffl�ornl.gov
Nuclear criticality safety in the United Sates of America (U.S.) has experiericed recen sifts in administrative,economic rgulatory ad technological mands. Tese emands are being imposed o the U.S. nuclearcriticality safety (NCS) for existing and ew production objectives. Most of these objectives are new and placeNCS in new "technological sace" with regard to the available dtabases for addressing these objectives.Additionally, there have been growing adrinnistrative demands for programmatically justifying research anddevelopment for experimental evidonce/data to spport the se or evelopment of generalized mid multipurposedworetical models, computational tchniques, mid measurement methods. This growing administrative demandhas shifted emphases om, hstorically generalized ational support to specific pogram/project funding. Theisolated pursuit of specific information without hiftastiuctur ad general support is genet ally costly and usuallynot budgeted for by the original project designers. This shift has retarded the maintenance of reliable NCScapabilities in the U.S. to address the evolving technology. Growing global ommercial competition providesan icreasing nomic emand for NCS to accommodate novel poductivity improvements resulting inincreased poduction with simultaneous cost-reduction. Such economic demands fequently place NCS indifficult positions.Key words: criticality, safety, experience, administration, regulation, needs, economy
1. INTRODUCTIONNuclear criticality safety (NCS) is being tasked with meeting existing and new productionobjectives to address recent economic, administrative, regulatory, and resulting technologicaldemands. These production objectives include* the maintenance of historic nuclear capabilities for national electric power and defense
purposes;* the fabrication of new plutonium-uranium mixed oxide (MOX) fuel-blend types;* the characterization of fissionable-material-process nuclear criticality accidents for
emergency preparedness, training, response, and safety documentation;12 storage, transport, and disposal of spent fuel;
partitioning of major actinides for- radioactive thermal-eleetric generators (RTG)- selective actinide production- fissionable material waste disposal- transmutation;disposal and storage of containerized high-level waste in geological repositories;
M disposal and storage of containerized low-level waste and earth-blended waste ingeological repositories.
Within the U.S., existing and, most recently, accelerating new conomic administrative,regulatory, and technological demands have placed NCS in new technological and regulatoryspace. The future of nuclear energy in the U.S. is uuestionably influenced by theexperiences and needs of ur industry to satisfy these demands. Nuclear criticality safety,though seemingly a small expense in the overaH scheme of national nuclear energy programs,is a long-term, and nearly always overlooked, expense that impacts nearly a phases ofnuclear energy programs using fissionable materials. This is especially true within the U.S.economic, administrative, and regulatory experience, current needs and future participation inthe global economy.
19

JAERI-Conf 2002-004
2. ECONOMIC DEMANDSMany NCS economic issues are, apparent from the operational, administrative, and technicalresearch and development topics bing presented at this NUCEF 2001 Symposium. The U.S.experience with the eonomic issues of NCS has been highly varied over the past 55 years.Almost no economic consideration was given to the use and potential for uclear energyduring its infancy in the U.S. Some ational economic issues were considered during te1950s "Atoms for Peace" initiative with the growing popularity and evolution of U.S. nuclearresearch and indus". In the late 1950 ad 1960 or power utilities ould see the potentialof nuclear power and anticipated improved power poduction efficiencies and cost reduction,Our coordinated and operating research programs arid experimental facilities were vwe asa desirable national asset to be aintained as a necessary governmental nfrastructure for thenew technology, Further, the facilities were judged to assist idustry in "boot-strapping"itself into a waiting global opportunity. Existing facilities such as Los Alamos ScientificLaboratory, later renarned Los Alamos National Laboratory (LANL); Oak Ridge NationalLaboratory (ORNL); and Livermore Radiation Laboratory, later trained LaWretlce LivermoreNational Laboratory LNL), were jointed in their research efforts by numerous follow-onlaboratories sch as Savannah River and Hanford and commercial facilities such as Pratt andWhitney, Babcock and Wilcox, General lectric, Westinghouse, and numerous others, The,economic costs of these laboratories were accepted as perequisites for obtaining the data,creating the technological and ompetitive advantages, and educating the personnel to carryforward the natural" initiatives of a national economic resource, nuclear eergy.
Other nations also moved forward into the nuclear energy economy, most ot of a recognizedneed for cost-effective and (,efficient power generation. In the late 19608 the U.S. moved todevelop a commercial breeder reactor which was ultimately thwarted by a ational ati-proliferation initiative to ban spent-fuel rprocessing Sortly tereafter, in 1978, the U.S.experienced its last nuclear criticality accident aer 14 years of no accidents. That accidentreceived little national otice ad had little economic impact. However, te following year,on. March 28, 1979, the U.S. experienced te accident at the Three Mile Island Unit JM12)nuclear power plant near Middletown, Pennsylvania. The national reaction had significantrepercussions for the nuclear energy industry. Te public 'udged operational and safety risksto be unacceptable irrespective of the actual ipact of the tvent (the best estimates are tatthe average dose to about 2 illion people in the area was about I millirem and about100 millirem. to a person who might be and remain at the site botjtrdary)�
However, te accident permanently anged the U.S. nuclear industry and significantlybroadened te US, Nuclear Regulatory Commission's (NRC's rgulations and versightactivities. Until te U.S. uclear industry was able to accommodate tese changes, therewere significant cost impacts on power reactor facilities, Those i pacts influenced theoperations of nuclear fel fabrication facilities ad their nuclear criticality safety programs,While. these changes strengthened pblic perceptions of te safety of nuclear energy, tecommercial power industry had already started to respond to the �11001)01`nic impacts ofintervening litigates, increased licensing difficulties, ad increased costs Of Operations I theUS. a reactor orders made over the, past 20 years have sbsequently been cancelled.Between 1972 ad 1990, onstruction of 119 nuclear plants was cancelled by U.S. tilities.The decline in commercial iterest uclear energy was accompanied by the losure ofcritical xperimental facilities. By the late 1980s, a but one eeral purpose criticalexperiments facilitator - the Los Alamos Critical Experiments Facility (LACEF - wereclosed within the U.S.
- 20 -

JAERI-Conf 2002-004
Today, 11S. miclear fuel fabrication facilities bav trned their attention to te global market,selling proce,"e ad reactor fuels wid participating in joint ventures. Some previously US.- owned nuclear fuel processing and fabrication, ompanies have tither been sold tointernational etities or have formed joint vntures to continue te use of the acilities.
What ight te tntur b for NCS as iluenced by economics i the, US.? California'senergy orisis ts past year ad the public's eognitio tt there will likely be eergyshortages as a result of ot bilding power plants over te last dcade as enewed interest inthe possibilities of nuclear eergy i the U�S, The Nuclear Energy Institute reported that agroup of utility executives approached teta last year to form a task force, to etermine whatwould be ecessary to dploy a new nuclear plant, The goup's idea is to form a consortiumof companies tat would order several plants, which would be standardized and would benefitfrom econortnes of scale of poduction.
There ae mounting concerns which enhance the economic profile of nuclear energy in theUS. These concerns iclude• the CO,2 `greei)house" ffects on global warming;• the questionable reliability of oil and coal supplies in a highly charged political,
emotional, al spiritual world;• the inability of alternative energy sources to provide reliable energy without
environmental impacts;• the ecent uavailability of significant power-producing plants i, tt U.S,-, and• the problems associated with the U.S. open-ended fuel cycle spent fuel and waste
disposition issues,These concerns srve to acelerate the need for an U.S. national, energy policy that is basedupon sound economics as supported by sound technology.
International ivolvement in U.S. fuel fabrication has istorically icluded Siemens PowerCorporation and, ore recently, British Nclear Fuels, Limited and ramatome, CogemaFuels. Recently, te U.S, nuclear industry as been posturing itself to weather the abovementioned oncerns and unctilaiDties by participating in global oxeltaDgeS Crrently, there isa joint venture of Duke-Cogerna-Stone & Webster in the U.S. to receive excess weapons-grade ptonium, bend it with uranium, at-id acate mixed plutortitim-uranium oxide(MOX) commercial fittl elements Geral Electric Company (B) of America; Hitachi,Ltd.; and Toshiba Corp. stablished Global Nclear Fuel (GNF) a international nuclear-fueljoint venture, Ol JaDuary 1, 2000, The three companies ave itegrated their nuclear fuelmarketing, dsign, evelopment ad manufacturing functional' ito the new company, whichestablished usiness ases in. both Japan and te U�S. These and other joint iternationalbusiness ventures within te U.S. assure a global economic future that will require thecontinued participation by NCS.
3. ADMINISTRATIVE DEMANDSFor the past 25 years there ave been evolving administrative or management mind-sets andperceptions that have rated growing fiscal and regulatory Rmands o U.S. nuclearindustries, Tese Mirld-sots have changed as the result of the same social and economicevents reviewe i Sections I ad 2 above, _,Adurinistrativ ad management mnd-sets haveshifted fom the, wiflingness in the '50s, '60s, and �-,arly '70s to generally embrace apromising an lcrative technology with fisca a itellectual spport. rom the late 1970sthrough te roid- 1990s there was a desire to separate, fiscal responsibilities and administrativeaccountability front a technology perceived as a liability. Recently sce the late 1990s, the
- 21 -

JAERI-Conf 2002-004
administrative and management perception is that nuclear energy may be a promisingbusiness venture requiring limited, if any, additional intellectual o fcal support for researchand development. It is this last perception that places a substantial technological burden onNCS to address seemingly simple but in actuality complex problems with limited fiscalresources, knowledge, computational tools, and data resources.
The fiscal demands on individual programs or projects are to justify specific needs ofresearch for experimental evidence or data and the development of generalized and multi-purpose theoretical models, computational techniques, and measurement methods. Thisdemand has shifted to the crrent requirement that individual programs or projects providetheir own specific project-related information (e.g., critical experiments iproved cross-section data, iproved computational tools) on a mited budget without infrastructure andgeneral support. Therefore, limited fiscal resources are ailable to acquire neededinformation. This shift has retarded the development and maintenance of NCS capabilities inthe U.S. for addressing the evolving "technological space" imposed by new programs andprojects. Maintaining reliable NCS capabilities requires reliable experimental data fromcritical and/or subcritical systems. Additionally, neutron cross-section measurements andevaluations are needed for the production objectives of concern, which may involve fissionproducts, unusual blends of fissionable materials, geologic materials, and often, unusualneutron energy spectra that may carry the fission chains.
4. REGULATORY DEMANDSRegulatory demands on NCS parallel the temporal changes in the economic andadministrative demands iposed by the social and economic changes in the U.S. The meansof addressing regulatory demands on NCS have varied over the decades, ranging from• relatively informal (by today's standards) memos by eminent scientists who were
participating i the emerging studies of the 1940s to• structured aalytical arid safety analysis protocols used by scientific apprentices and
technical engineering graduates and accepted by regulatory bodies during the 1950s,1960s, and arly '1970s to
• increasingly complex and voluminous safety evaluation and safety analysis reportsprepared by formally educated nuclear engineers and reviewed by facility managementstaff and regulatory erSODoiel during the, late 1970s to the late 1990s to
• guidance that may develop from the U. Department of Energy DE) to, includedetailed safety analysis report criticality safety controls for OE central review andapproval.
Additionally, the U.S. American Nuclear Society (ANS) as proposed an initiative to developstandard guidance for the performance of probabilistic risk aalysis for nuclear facilitycriticality safety analyses
The International Organization for Standardization (ISO) has a relatively active workinggroup on nuclear criticality safety within the ISO Technical Committee 5 (TC 85), Nuclearenergy, Subcominittee 5 (SC 5), Nuclear fuel technology, Working Group 8 (WG 8),Standardization. of calculations, procedures and practices related to criticality safety.Existing NCS ISO standards include; ISO 1709, Principles (�f criticality sqfety in Ytoring,handing and processing, ad ISO 7753, Per�ormonce and testing requirementsfor criticalitydetection. Those standards are being spplemented with developing standards onAdministrative criteria related to criticality safety and Nuclear criticality, control and safetyof plutonium-uranium oxide fuel mixtures outside of reactors. A standard Oil tire Estimationof nuclear criticality accident yields has been suggested but as ot ytt been initiated, These
- 22 -

JAERI-Conf 2002-004
existing and developing ISO standards on NCS are ikely to play a prominent role in thefuture in collaborative international ventures involving fissionable materials.
5. TECHNOLOGICAL DEMANDSThe growing global commercial competition provides an nreasing conomic demand forNCS to accommodate novel process iinprovements tat way result in increased productionwith simultaneous cost reduction. The changing administrative or management demandschallenge NS saffs to provide their administrators ad managers with ifon-nation andinsights to recognize te tade-offs associated with the lack of technical resources foraddressing te technical ssues. The sifting regulatory expectations in the U.S., andseemingly throughout the world, demand geater levels of elementary justifications anddemonstrations of subcriticahty for saf6ty with increasingly greater levels of statisticalconfidence and -vanishingly small probabilities of failure.
Those demands, coupled with some existing ad mostly new production objectives, placenew, uDusual, and sometimes conflicting demands on NCS to acconunodate programmaticneeds. Within te U.S. we are working on approaches and methods to address thesedemands.
The NRC has considered various evolving issues that are being generated from thesetypically new pcesses and technological demands. It has supported• the acquisition of critical experimental data from intermediate enriched uranium
experiments for consideration in the evaluation of fabrication processes for extended-lifereactor fuels in combination with the development of a prototypic sensitivity anduncertainty method. for examining ranges of the applicability of experimental data tosafety evaluations;i
• studies to evaluate, the influences of fissionable material waste matrixes? on suticriticalityas it could be affected by reconcentrating ydrogeochemical nlechanisms;3 7and
• examination of spent nuclear fuel issues." 9110,11
12Following the Recommendation 97-2 of U.S. Defense Nuclear Facility Safety Board, DOE,with senior U.S. NCS personnel assistance, designed a comprehensive DOE ImplementationPlan for a igh-level, national DOE Nuclear Criticality Safety Program (NCSP) to assist DOENCS programs and �-,ngineers in meeting some of the above-mentioned demands. The NCSPprovides support for the
acquisition of data (e.g., subcritical and critical xperiments measurementS13, 14 neutroncross-section measurements and evaluations"" 16);
maintenance ad expansion of computational methods (e.g., MCNP 17 and other codeS18,19,20);
training ad gidance of NCS and facility personnel (e.g., issuance of training modulesand assistance in the development of regulations/guides and te conduct of classes); andsharing and communicating of information (e.g., workshops, conferences, OECDHandbook of Criticality Safety benchmark evaluations?" and the dissemination ofhandbook and logbook information 22).
Much of the information ad some of the computational tools that have evolved from theU.S. NRC research support and DOE NCSP have been used to address some of the demandson NCS."'
- 23 -

JAERI-Conf 2002-004
6� U.S. NCS IN A GLOBAL IWONOMYThe NUCEF 2001 Symposium haS DURIerOUS presentations that address ational and globalproduction objectives and tir associated demands on NCS programs and engineers tofunction in the ew "technological spact." Clearly, innovative applications of science andtechnology are neded to accommodate tese demands in a competitive ad growing globaleconomic markets, Through joint iternational ventures a te saring of innovativesolutions and information at symposiums such as this, the U.S. s kely to remain a partner the global, economy for te sccess of nuclear energy. This prticipation is needed and isinevitable for the benefit of te environment that includes us hurnans.
REFERENCES
[1] NRC CN W6479, Development and Applicability of Criticality Safety Software forLicensing Review," Revision dated 913/95, Revision I dated 426/96 and Revision 2 dated05/27/97.[2] C. M. Hopper, R. H. Odegaarden, C. V. Parks, and P. B, Fox, Criticality Saety Criteriafor License Review of Low-Level-Waste Facilities, NUREGICR-6284 (ORNIffM-12845),U.S. Nuclear Regulatory Commission, Oak Ridge National Laboratory, March 1995,[3] L. E. Toran, C. M. Hopper, M. T. Naney, C. V. Parks, J. F, McCarthy, -8, L. Broadhead,and V. A Colten-Bradley, he Potential for Criticality Following Disposal of Uranium atLow-Level Waste Facilities. Volume 1: Uranium Blended with Soil, NREG/CR-6505,Vol. I (ORNLITM 13323N 1), U.S. Nuclear Regulatory Comarission, Oak Ridge NationalLaboratory, June 1997,[41 L. E. Toran, C. M. Hopper, C. V. Parks, and V. A. Colten-BradIty Te PotentialforCriticality Following Dposal of Uranium at Low-Level Waste Facilities,, Volume 2:Containerized Disposal, NREGICR-6505, Vol. 2 (ORNL/TM-13323M), U.S. NuclearRegulatory Commission, Oak Ridge National Laboratory, June 1999.[5] C. M. Hopper, K. R, arn, C. V. arks, and J. J. Lichtenwalter, "Bounding Values forLow-Level-Waste Tansport Exemptions a Disposal," Vol, , pp� 438-446 in roc.ICNC'99, Sixth ternational Conference on Nuclear Criticality Safety, September 20-24,1999, Palais des Corigr�s, Versailles, FRANCE.[6] K. E, Elara� C, M. opper, C. V, Parks, and T. E. Harm, Emplacement Considerationsfor Criticality Sqfety in, Low-Level-Wast Dposal, ORNLITM-13765. UT-Battelle, LLC,Oak Ridge National Laboratory, June 2001.[7] C. W. Forsberg, l.ong-Term Citicality Control in Radioactive Waste DisposalFacilities sing Depleted Urannirn," pp. 99-1,06 i Proc. Topical Meeting on CriticalitySafety Challenges i he Next Decade, Session: Criticality Sqfeiy Challenges in Long-TermDisposal, Septembe 711, 997, Chelan, Washington.[8] S. M. Bowman and L, C. Lal, "ORIGEN-ARP: Automatic Rapid Process for pentFuel Depletion, Decay, ad Source Term Aalysis," NUREO/CR-0200, Rev, 6(ORNL1NURFG/CSD-2R6), Vol, 1, Part 2 Sect. DI, of SCALE., A Modular Code SystemforPerforming Standardized Computer Analyses for icensing Evoluation, ay 2000, Availablefrom Radiation Safety Iformation Computational Center at OA, Ridge, National Laboratoryas CCC-545.F�9] B. L. Boadhead and 1. C. Gauld, "ankings of Nuclide Importance in Spent Fuel forShielding Applications," pp, 702-709 i Proc, ANS2000 Radiation Protection and ShieldingDivision Topical Conference, Radiation Protection for ur Nationai Priorities: Medicine, theEnvironment and the Legacy, Sptember 17-20, 2000, Spokant, Washitigton.[101 J. C. Wagner and C. V. Parks, A ritical Review of the Practice (�f Equating theReactivityofSpentFueltoFresh.twueiiptBurttupCreditCriti(,�(41it�'Sa tyAnalysesforPWR
24 -

JAERI-Conf 2002-004
Spent Fuel Pool Storage, NUREG/CR-6693 (ORNL/TM-2000/230), U.S. Nuclear RegulatoryCommission, Oak Ridge National Laboratory, September 2000,
I I ), R. Carlson, C. J Withee, and C V. Pafks, "S pent uol Burnup Credit in Casks: AnNRC Perspective," in Proc. Twenly-Seventh Wter Reactor Safety Information Meeting,October 25-27,1999, Bethesda, Maryland. NUREGICP-0169, pp. 419-436. March 2000.[1.2] Defeme Nuclear Facilities Safety Board Recommendation 97-2, Continuation ofCriticality Safety, May.1997.
13] R. W. Brewer and R, Cx Sanchez, "SiO - Polyethylene, Reflected Critical Assembly,"LA-R- 150, Los Alamos National Laboratory, 200 1.[14] R, Sanchez D J. Loaiza ad J. Bonnion, "Critical Masses of Highly EnrichedUranium iluted with Gd ad Polyethylont," Los Alamos National Laboratory, 2001.[151 N. M. Larson L C. Leal, and H. Derrien 1999, "erger of Nuclear Data withCriticality Safety Calculations," U Proc. 6th nt. Conf. on Nuclear Criticality Safety,September 20-24, 1999, ersailles, France.[16] H. Derrien J Harvey, N, M. Larson, L C. Leal, and R, Q. Wright, Neutron TotalCross Sections of 35U from Transmission Measurements in the Energy Range 2 keV to300 keV and Statistical Model Analysis of the Data, ORNLJTM-2000/129, UT-Battelle, LLC,Oak Ridge National Laborat ory, April 2000.[17] J. F. Britsmeister, "MCNP A General Monte Carlo n-Particle Transport Code,'�Los Alamos, New Mexico: Los Alamos National Laboratory, 2000.L18] E. Greenspan, Y. Karni, L. M. Petrie, and D. Regev, SWANS: A Prototypic SCALECriticality Sequence for Automated Optimization Using the SWAN Methodology, ORNLJTM-'1999/274 (UC13NE-4226), UT-Battelle, LLC, OakRidge National Laboratory, December2000.[19] B. L. Broadhead, R. L. Cilds, and C. M. Hopper, "Illustrative Examples of Last-Squares Methods for Criticality Safety," in Proc. ANSIENS 2000 International WinterMeeting and Embedded Topical Meetings, November 12-16, 2000, Washington, DC. Trans.Am. Nucl. Soc. 83, 100-103, 2000.[20] B. T. lRearden and R. L. Childs, "Prototypical Sensitivity and Uncertainty AnalysisCodes for Cticality Safety with the SCALE Code System," in, Proc. ANSIENS 2000International Winter Meeting and Embedded Topical Meetings, November 12-16, 2000,Washington, DC. Trans. Am. Nucl. Soc. 83, 98-100, 2000.[21] NEA Nuclear Science Committee International Handbook of Evaluated CriticalitySafety Benchmark Experiments, NA/NSC/DOC(95)03, September 2000. The InternationalCriticality Safety Benchmark Evaluation Project is an official activity of the Organization forEconomic Cooperation and Development - Nuclear Energy Agency (OECD-NEA), Paris,France.[22] T. R McLaughlin, S. R Monahan, N. L. Puvost, V. V Frolov, B. C Ryazanov, andV. 1. Sviridov, "A Review of Criticality Accidents 2000 Revision," LA-13638, Los AlamosNational Laboratory, Los Alamos, New Mexico, May 2000.[23] M. E. Dunn and B. T. Rearden, "Application of Sensitivity and Uncertainty AnalysisMethods to a Validation Study for Weapons-Grade Mixed-Oxide Fuel," in Proc. of 2001 ANSEmbedded Topical Meeting on Practical Implementation of Nuclear Criticality Safety,November 11-15, 2001, Reno, Nevada.
- 25 -

This is a blank page.

JP0250280JAERI-Conf 2002-004
Overview of the Hydrometallurgical, and Pyrometallurgical Processes StudiedWorld-wide for the Partitioning of High Active Nuclear Wastes
by
Charles MADIC
DENCEA/Saclay, 91191 Gif-s-Yvette, France
E-mail: madie�amandin.cea.fir
ABSTRACT
Since ore than 10 years, a revival of the interest for te partitioning of high active nuclear wastes (HAWs)exists world-wide in corniection with possible improvements of the anagement of the HAWs actually producedand with futuristic nuclear fl cycles. The ain aiin of the partitioning processes is to separate, from thecomplex mixtures of HAWs, the long-lived radionuclides LRNs), elonging either to the inor actinides(MAs o to the Fission Products (FPs) families of elements, in order to prepare fuels and/or targets suitable fortheir subsequent transmutation (P&T strategy). An other possible strategy consists i the special conditioning ofthe separated LRNs iino, stable dedicated matrices (P&C strategy).The LLRNs considered f Partitioning are the MAs, neptuniurn aericium and curitmi, but also the Ps,caesium, (echnetium and iodiDe.Most of te partitioning pocesses studied so-far belongs to the domain of hydrometallurgy, but, recently, a newimpetus as observed in the field of pyrometallurgical processes.The main aim of this talk is to present a brief status of the development of both "hydro" and "pyro" processes forthe partitioning of LLRNs developed world-wide, with a special emphasis n te benefitsidrawbacks of eachprocess.
1. INTRODUCTION
Since the end of the 80's a renewal of interest is observed world-wide for LLRNs partitioningtechniques from nuclear wastes (HAWs). This interest is connected with two main fields:(i) the conventional WR closed fuel cycle using the PUREX process.New management methods for nuclear wastes are considered, the so-called Partitioning-Transmutation (P&T) and Partitioning-Conditioning (P&Q scenarios. For this domain,hydrometallurgy is the main route for LLRNs partitioning process development, whilepyrometallurgy is a also subject of some research,(ii) New fuel cycles associated with the development of Fast Reactors Rs), Accelerator-Driven-Systems (ADSs ad Fused Salt Reactors (FSRs). For this field, pyrometallurgy is themain route considered for spent fuel reprocessing and wastes partitioning, while a smallinterest still rernairis for the hydrotnetallurgical route.The aim of the present article is to give a brief overview of the progress realised world-widein the ecent years in the field of partitioning of LLRNs by hydrometallurgical andpyrometallufgical processes.
11. PARTITIONING PROCESSES: AN OVERVIEW
27 -

JAERI-Conf 2002-004
11.1. General considerations [1]
IL 1. 1. TaMet elements Lor the sparations
Actinides:For P&T and P&C scenarios, the elements considered for partitioning are the so-called minoractinides (MAs): neptunium (Np), americium (Arn), and curium (CM), while for New fuelcycles scenarios, uranium (), plutonium (Pu) and the MAs are all concerned withpartitioning/reprocessing pocess development.
Fission ProductsFor P&T and P&C scenarios, iodine (1), technetium (Tc) and caesium (Cs) are the three mainelements considered for partitioning. Some P&C scenarios also consider the partitioning ofcaesium and strontium.In Japan, the separation of the platinum group metals (PGMs) from nuclear wastes is alsostudied for industrial uses of the separated PGMs.
I1.1.2.GoaLsLorthese rationsThe most important goals for the separations are:
minimisation of the 1prig-term adiotQxic inventory of the wastes conditioned in<< conventional matrices, e,& in glasses (removed of LLRNs of MA ad FPs families),
• minimisation of the treat load of the conditioned wastes (removal of 137Cs ad II'Sr)'• more often, hipIr purities of the separated LLRNs are required, for target or fuel
fabrication for sbsequent transmutations of these LLRNs-
11.1.3 ConffqyencesOwing to the fact that Efficient separation methods are needed with low osses of LLRNs andhigh purities of the separated LLRNs, multi-stage processes are most often
11.2. Hydro processes for atWdesApd FPs artitionin
II.2.1 Exam les of sevaragdgo&.S��tatExamples of separation strategies are giveii for some countries and some researchorganisations.
lavaJNC
For FRs closed fuel cycle, NC develops an integrated approach based o hydrome(allurgicalsteps including the: (i) dissolution of MOx R spent fuels wt a aueous nitric acidsolution, (ii) iodine volatillsation, (iii) electrolytic xtraction f technetrum (Tc), palladIUM(Pd) and seleniurn (Se), (iv) crystallisation of os( of the uranitnu contained within the spentfuel dissolution liquor in te form of hydrated uanyl itrate, (v) igle PUREX xtractionstep for recovery of remaining U + Pu + Np, (vi) SETFICS process for A and Crpartitioning.
JAERI
- 28 -

JAERI-Conf 2002-004
JAERI proposed to separate Np and Tc during the implementation of the PUREX process.This organisation develops also, since many years, the so-called four-group partitioningprocess for the treatment of the wastes issuing the reprocessing by te PURFX process ofUOx or MOx WR spent fuels. Tis partitioning process icludes the following steps: (i)MAs partitioning (Np A and C), (ii) Cs Sr extraction, (iii) GMs extraction. Theremaining rrixtute of wastes constitutes the 4th category of elements of the initial mixturetreated.
USAThe situation i the USA is peculiar because partitioning processes developed oncern thetreatment of defence wastes, in particular those accumulated at DOE's Hanford site during thecold war. Several processes were developed for the partitioning of radionuclides from thewastes- (i) TRUFX process for trausuranic extraction, (ii) SREX process for Sr removal and(iii) SFX process or Cs extraction. It should be also noted that in 1999 a Report named "ARoadinap for Developing Accelerator Transmutation of Wastes (ATW) Technology" waspublished by the DOE 2 which considers he possible reatment of the WR spent fuelsaccumulated in the USA in order to separate: (i) U for final disposition as low level waste and(ii) TRUs for urning in ATW systems. The pocesses considered for these separations are: (i)the UREX process, which consists in a modified PUREX process aiming to only extract U,(ii) pyrometallurgical partitioning process for TRU separation from the UREX wastes and forthe ATW fuel cycle.
France WEA)The strategy developed by the CEA for partitioning the nuclear wastes of WR closed cycleconcerns 6 LLRNs to separate from the wastes: 3 MAs (Np, Am and Cm) and 3 Ps (I, Tcand Cs). This strategy is based on the development of successive liquid-liquid extractionprocesses: (i) the iproved PUREX process for U, Pit, Np I and Te separations, (ii) theDIAMEX process for trivalent Am+Cm extraction (FP lantharrides (III), Ln, are co-extracted),(iii) the SANEX process for Am+ Cm/Ln(I11) separation, (iv) the SESAME process forAm/Cm separation, (v) the CALIX-CROWN process for Cs separation.
In some organisations (e.g. in USA, Japan. Czech Rep. or Russia), instead of developing asuccession of separation processes for peculiar LLRNs, the integration of processes for MAsand Ps extraction are studied, For example, the use of a solvent containing a mixture ofcobalt dicarbollide + dioxide of diphosphine allows the combined extraction of Cs Sr (Am+Cm) + Ln.
II.2.2 MAspartitiontgg
One ccle rocesses
DIDPA. process AERT, Japan)This process for MAs partitioning is based on the use of di-isodecylphosphoric acid (DIDPA).The extraction mechanism is the following:
M` + n (HA)2 M(HA2)n + n H+
The separation of the TRU elements is done by successive stripping from the loaded solvent,including te use of diethylenetriaminopentaacetic acid (DTPA) complexing agent foractirrides(IllYta(M) separation (TALSPEAK like process, vide
- 29 -

JAERI-Conf 2002-004
The DIDPA process was recently tested successfully in the BECKY hot-cell at NUCEFPAERL Tokai-Mura).Among the possible drawbacks of this process one can mention the: (i) required feed acidadjustment, (ii) solvent degradation and its delicate clean-up, (iii) limited solvent loading withmetal ions.
SETFICS (JNC, Japan)The SETFICS process constitutes a modification of the TRUEX process (vide infta) based onthe use of the extractant di-isobutyl-phenyl-octylcarbamoylmethylphosphine oxide
(4)C8H17P(O)CH2C(O)0-C4H9). CMPO).The extraction mechanism is as follows:
M` + n N03 + M CMPO <==> M(NO3)n(CMPO)m (2)
The separation of TRUs is done by successive stripping from the loaded solvent, includingalso the use of DTPA for An(111)[Ln(111) separation. This process has not been tested yet withgenuine HAWs. The possible drawbacks of this process are: (i) the limited strippingefficiency, (ii) the management of salts and DTPA containing effluents.
'PALADIN (CEA, France)This process is based on the use of a mixture of extractants a malonamide (131AMEX processextractant) + di-ethylhexylphosphoric acid (HDEHP), the extractant of the TALSPEAKprocess.The extraction and separation mechanisms are the following.Extraction
M3+ + 3 N03- 2 DLAM M(NO3)3(DLAM)2 (3)
An(111)/Ln(11I) separation: done after contacting the loaded solvent with a p adjustedaqueous solution containing DTPA selective trivalent actinide complexing agent, For pHrange HDEHP is the extractant, while at the metal nitrate xtraction step, Garried out withacidic feeds 3 to mol/L in nitric acid, trivalent An and n are extracted with themalonamide.This process was recently successfully tested in the ATALANTE facility (CEA/Marcoule,Fr.).The possible drawbacks of this process are the: (i) necessity to use 2 extractants, (ii) need ofpH adjustment, (iii) co-extraction of numerous ions, (iv) solvent clean-up not yet defined.
Multi cycle processes
P step: An + Ln co-extraction
TRUEX (USA, Japan, Russia, Italy and India)This process is based on the iise of the CMPO extractant. Tis process was developed byHorwitz (ANL) and Schulz (Hanford) in the USA in the 80s. The advantages of the TRUEXprocess are the following: (i) it can extract An (and Ln) salts from acidic feeds, (ii) itsefficiency has been demonstrated with genuine HAWs, (iii) a large experience has beengained world-wide, The main drawbacks of the TRUEX process are the: (i) necessity to uselarge concentration of tri-n-butylphosphate (TBP) as solvent modifier added to the solvent to
- 30 -

JAERI-Conf 2002-004
prevent tird pase formation, (ii) stripping of metal ions which are not so efficient, (iii)delicate solvent clean-up.
DIAMFX (France, Italy, Germany, Europe, Japan, USA and India)This process is based on te use of a malonamide extractant. Te main interests of the processare: (i) An (and Ln) salts can be extracted from acidic feeds, (ii) its efficiency has beendemonstrated OD genuine HAWs, (France, Europe), (iii) no secondary solid wastes generatedowing to the CHON character of the malonamide extractant. Its main drawback relies in thepartial co-extraction. of palladium (Pd) and ruthenium (Ru) with the MAs.
A process based on a new type of diamide a diglycolamide (DGA), which is a terdendateligand having better affinity for An(III) than the malonamide, is under development at JAERI(Tokal, Japan)
' TRPO (INET, Tsinghua University, China)The TRPO process is based on the use of a mixture of tri-alkyl phosphine oxides (R3P(O),with R = alkyl groups) as extractant. This process has been tested successfully in China withgenuine HAW, Its main drawbacks concern, the necessity: (i) to adjust the feed acidity, (ii touse a coDeeDtrated nitric acid solution for An(I1I)+Ln(II1) stripping, which complicates thesubsequent An(111)/Ln(I111) partitioning step.
2 d step: An(III)&n(Ill) separation
TALSPEAK and CTH processesThe TALSPEAK process, developed at ORNL (USA) in the sixties and then adapted (CTHprocess) at Chalmers University, G6teborg, Sweden, can be considered as the referenceprocess for An(lR)/Ln(1f1) group separation. It is based on the use of HDEHP as extractantand DTPA as the selective An(HI) complexing agent. The An(M)/Ln(11I) separation isperformed by the selective stripping of An(111) from the HDEHP solvent loaded with themixture of An(M)+Ln(1M under the action of an aqueous solution containing DTPA and anhydroxocarboxylic acid, like lactic, glycolic or citric acids. The advantages of this processare: (i) the large experience gained world-wide, (ii) its good efficiency. Among the maindrawbacks one can cite: (i) the necessity to adjust the pH of the feed, (ii) the limited solventloading of metal ions, (iii) the difficult solvent clean-up.
SANEX concept (acidic S-hearing extractants)CYANEX 301 process (China, USA, Germany)
The CYANEX 301 extractant consists in a dialkyidithiophosphi-nic acid (R2PSSH, with R analkyl group). Its se for An(IM/Ln(IM was first proposed by Zu at Beijing (China) in 995.The main interest of the process relies in: (i) the large fficiency for An(1lI)/Ln(RI)separation, (ii) the fact that the process has been tested with genuine A(H1)+Ln(1111) mixtures.Nevertheless, for an efficient use of this process the feed solution should be adjusted to pH 3to 5, which is not so easy to carried out industrially. Moreover, the solvent clean-up is also aweak point.
- ALINA process (Germany)To cope with the ain drawbacks of the CYANEX 301 pocess mentioned above, Odoj andModolo at Rifich Germany) proposed the use of a syngergistic mixture made of
- 31 -

JAERI-Conf 2002-004
bis(chlorophenyl)dithio-phosphinic acid ((CI(D)2PSSH) + tri-n-octylphosphine oxide (TOPO)to perform the AnJ11)/'Ln(J1'1) group separation. If the separation factors between An(111 adLn(I1Q are less than those observed with CYANEX 301, the COUCentfatiOR of itric acid in thefeed can be as high as 1.5 inol/L, which makes the ALINA process Ynore attractive than teCYANEX 301 one. The ALINA process was successfully tested with genuine wastes. Thepossible drawbacks of this process are: (i) the solvent clean-up rocess Dot yet dfined, (ii) thegeneration of P- and S-bearing wastes (from the degraded extractalits) which should bemanaged.
0 SANEX concept (neutral N -bearing extractants)- BTPs (Germany, France, Europe)After the discovery by Kolarik at FZ Karlsruhe Germany) of the astonishing properties of thebis-triazinyl-1,2,4-pyridines (BTPs) for An(III)/LnJI1) separation, a process was readilydeveloped and tested in the frame of the European so-called NEWPART project 3.Successful hot tests were achieved both at the EA/Marcoule and at the ITU in Karlsruheusing the n-propyl-BTP. Large efficiency of the BTP process was obtained. One shouldmention also that the feed of the n-propyl-BTP process can be acidic ([HN03 = I mol/L).Nevertheless, even if tis system seems very promising, an instability of the 11-propyl-BTPextractant was observed. As a consequence, efforts are underway at the CEA to modify thesolvent formulation to suppress this major drawback.
- TAHDPTZ + octandic acid (CEA, France)A synergistic mixture made of the terdendate N-ligand, 2-(3,5,5-trimethylhexanoylamino)-4,6-di-(pyridin-2-yl)-1,3,5-triazine (TMAHDPTZ), and octanoYc acid was developed atCEA/Marcoule A process flowsheet was defined and successfully tested with genuineeffluent with good efficiency. The main drawbacks of this process are: (i) the required pHadjustment of the feed, (ii) the management of secondary wastes not yet defined.
- step: AmlCm separation
For this step, processes based on the selective oxidation of Am at the VI or V oxidationstates are developed, te curium remaining unchanged as Cm(M), allowing simple Am/Cmseparation processes to be defined.
' SESAME process (CEA, France, Hitachi, Japan)In strong oxidising conditions, Am can be oxidised from Am(T11) to A(Vl)� This can bedone, for example, by electrolysis in the presence of heteropolyanions (PA) acting ascatalyst. The so-generated Am(VI) can be separated front Cm(III) by xtraction, for exampleby TBP. This is the principle of the so-called SESAME process developed at 0EA/Marcoule.At Hitachi (Hitachi city, Japan), oxidation of Arn to Arn(VI) is obtained by the use ofammonium persulphate, Then, Ar(VI) is extracted by TBR The SESAME process exhibits agreat efficiency for Am/Cm separation. A large experience was obtained at the CEA at pilotscale during the last twenty years with a SESAME like process (kg am, ounts of 241AIn werepurified). Nevertheless, the industrialisation of te process is faced with difficulties such as:(i) the instability of A(VI), (ii) the non-easiness to develop a multi-stage process, (iii) thegeneration of secondary solid waste (made of HPA constituents),
Am(V) precipitation (JNC, Japan)The selective precipitation of double carbonate of Am(V) and potassium (K) is oe of theoldest method for Arn/Cm or AnifLn separations, developed at te end of the 60's in the USA.
- 32

JAERI-Conf 2002-004
This method requires the use a 2 mol/L 2CO3 Solution in Wich the mixture of Arn(111) andCm(111) is dissolved. After chemical or eecoochemical oxidation of Arn(111) to Am(V),Arn(V) precipitates, from te solution a the solid rystalline K5AJ-nO?,(CO'; )3 nH20, whileCm(lIJ) emains in solution, After iltration, Am is separated from Cru, This process: (i issimple, ) is selective for Am, (iii) has been largely used world-wide, The process aindrawbacks are: (i) the Am losses with Cni, which are notso low, i) the act that it exists onlyone stage for the process, (iii) te large amounts of secondary wastes generated,
I1.2.3 Ps Parfitionin%9
Iodine ('291)The separation of iodine is done just after te spent fuel dissolution step within the PUREXprocess, Oxidation of iodide ion, I-, into elemental iodine 12) induces its transfer to thedissolver off-gases (DOGs) where iodine is recovered through DGs basic washing. Torecover most of the iodine spent fuel inventory at that step, slight improvement of theefficiency of the transfer of iodine from the dissolution liquor to theDOGs seems required.
M Technetium (99TOThe soluble fraction of Tc contained in the spent fuels exists in the dissolution liquor asTc(V11) (TcO4-), Its co-extraction with Zr(TV), then U(VI a P(IV), by TBP is well known.So, for example, the separation of the Te soluble fraction is'achieved through a solvent specialscrubbing step i the course of te implementation of the PUREX process at Cog6rn LaHague reprocessing plants, If high Tc partitioning yield is required, te main problemconcerns the ecovery of the Tc fraction that is contained within the solid insoluble residuesremaining after spent fuel dissolution. A special process is required for this Tc recovery,which actually does not exist.
is Caesium and strontium or caesium aloneMany processes were developed world-wide in this field, including the use of:
G) inorganic sorbents, like for the JAERI's 4 group prtitioning process,(ii) crown-ether extractants, like for the SREX and CSEX processes developed in
the USA (ANL),(iii) cobalt dicarbollide extractants, as developed in Czeck Republic, Russia and
Western Europe,(iv) calix-crown extractants, as developed in France, Western Europe and in the
USA.Most of these processes were successfully tested with radioactive effluents.
11.3. Eyro processes for actinide vartitionine 41
I1.3.1 Selected media and possible sfRaration techniques
M Selected mediaMost of the "pyro" processes developed so-far are based on the use of one or two of thefollowing high temperature liquid phases:
Fused salts. The most popular fused salts studied ae:(i) molten chloride eutectic, such as LiCl + KCI,(ii) molten fluoride eutectic, such as LiF + CaF2.
- 33 -

JAERI-Conf 2002-004
Fused metal, such as Cd, Bi, Al, etc...
12 Separation tpShniguesTo partition the actinides contained within the fused salt baths, three main techniques arestudied and developed:
• actinide electrodeposition on solid (pyrographite or metal) r liquid metal cathodes,• liquid-liquid extraction of actinide between fused salt bath and a metal bath
containing a reductive metal solute (Li for example),0 actinide oxide precipitation from the fused salt under the proper control of the
oxygen thermodynamic activity within the salt bath.
II. 3.2. Examl2les oL straLgzLes and J21ro " processes
M USA LANLI Chicago)A "pyro" process was developed at ANL in relation with the treatment of FR metallic fuels(EBR H's type) for stabilisation of these Na bonded fuels, The aims of the process is limited.It consists in the separation of the spent fuel into three major fluxes: (i) most of the uraniumas a low level waste, (ii) cladding noble metals Zr as metallic waste, (iii) TRUs + FPs +Na salt incorporation into a zeolithe matrix in order to obtain a ceramic waste after hotpressing. The key step consists, after the oxidative dissolution of the spent metallic fuel inLiCl + KCI eutectic bath at 500 C into the separation of most of the uranium byelectrorefining on a solid cathode. A demonstration campaign involving the treatment of 100core assemblies 0.4 ton of spent HEU) and 25 blanket assemblies .2 tons of pent depletedU) was successfully carried out at Argonne West in the recent years. License forpyroprocessing the whole EBR 11 spent fuel inventory was obtained recently.
0 Russia (RIAR, Dimitrovgrad)The pyro-process developed at RLAR concerns the treatment of spent oxide fuels (UOx andMOx) in order to recover U and Pu for Mx fuel re-fabrication by the vibro-compactionprocess.The spent oxide fel is dissolved by chloration in a Li, Na, K, Cs chloride fsed alt bath at650-700 'C. Separation of U, Pu or mixture of U + Pu from the salt bath call be obtained byelectrodeposition. or precipitation, For example:
U can be separated as U02 (which is a good electric conductor) by electrodepositionon a cathode made of pyrographite, while chlorine gas is generated at the aode,
0 as P02 is a bad electric conductor, it cannot be electrodeposited on solid cathode.But P02 can be selectively separated by precipitation after bubbling a ixture Of C12 02
gases into the fused salt bath,0 under the addition of a mixture Of C12 02 gases into the fused salt bath, which
stabilises Pu as oxychlorides, electrolysis generates a deposit Of (UPU)02 onto thepyrographite cathode while clorine gas evolves at the anode.An important experience with spent fuel pyroprocessing has been obtained at RIAR with thetreatment of:
33 kg Of U02 spent fuel ( bum-tip) from the VK-50 reactor, done in 968,25 kg Of U02 spent fuel 7.7 burn-up) fom the BOR-50 reactor, done in 1972-73,
' 41 kg Of (UPU)02 spent fuel 47 burn-up) from the BN-350 reactor, done in1991,
.3.5 kg Of (UPU)02 spent fuel 21-24 bum-up) from the BOR-60 reactor, done in1995.
- 34 -

JAERI-Conf 2002-004
0 CRIEPTThe "pyro" process developed at CRIEPI concerns both the reatment of spent fuels fromLWRs (oxide fuels) or FRs (metallic fuels) and the partitioning of TRU elements from thewastes ssuing the reprocessing of spent WR fuels by the PUREX process. The fused saltselected is the LCI + KCI eutectic in which the spent fuels oi- the oxides of high active wastesare dissolved by a carbo-chloration technique, After dissolution, U can be electrodeposited asa metal on a solid cathode, then the TRUs can be recovered by electrolysis using a liquidcadmium or bismuth cathode. CRIEPI is also studying the partitioning of MAs by liquid-liquid extraction using a LiCl+ KC1 salt bath and Cd or Bi metallic solvents containing Li as areducing agent. In this case, liquid-liquid extraction corresponds to the reductive transfer of ametal from the salt bath, where it exists as M" cation, to the metal solvent, where M exists asa MO solute. The equation of the extraction reaction can be written as follows:
Mn+ (salt) n LiO(Cd or Bi metal phase) MO (Cd or Bi metal phase) n Li+(salt) (4)
Large expertise has been gained by CREEPI in this field but only with surrogates of actinides.
A joint CRIEPI-ITU program is under way to test the process with actinides.
0 JAERI
JAERI is studying pyroprocessing for the possible treatment of nitride, oxide or metallic spent
fuels in order to prepare nitride fuels enriched with 15N for Rs. After dissolution of the spent
fuels into a LiCl + KCI eutectic salt bath, the actinides will be electrodeposited on solid or
liquid (Cd) cathodes. The recovered actinide metals will then be converted into actinides
nitrides after their dissolution in liquid cadmium. The nitruration agent will be N2 or Li3N.
0 PNC
PNC is also engaged in the development of pyro processes aiming to reprocess FR spent
fuels. The method selected are similar to those studied by CREEPI : (i) choice of LiCl + KCI
eutectic bath, (ii) electrodeposition method, (iii) liquid-liquid extraction between salt bath and
liquid Cd metal.
E France
Two years ago, the CEA has launched a programme dedicated to the partitioning of MAs by
cc pyro" processing. A research team was created at CEA/Marcoule and special hot facilities
have been created. The programme selected is rather wide. It will consider both chloride and
fluoride melts and the most important separation techniques known to be effective in
cc pyroprocessing", i. e.: (i) electrodeposition, (ii) oxide precipitation, (iii) liquid-liquid
extraction between fused salt bath and a metallic solvent. The results obtained to-date
concern mainly the basic understanding of the chemistry of actinides (U, Pu and Arn) in
solution in the fused melts. Process developments are also underway and active tests on
irradiated objects are foreseen to be done before 2005.
E Czech Revublic
At Rez Institute, Czech scientists are developing a process based on the dual use of actinide
hexafluoride volatilisation and pyroprocessing of the wastes from a fluoride melt. This
research programme is connected with the interest of Czech Republic for the development of
35 -

JAERI-Conf 2002-004
the molten salt reactor (MSR) technology. Facilities are under construction at Rez Institute fortesting the pyro-processes.
111. CONCLUSIONS-PERSPECTIVESConclusionsNumerous concepts have been consolidated or newly developed dring the last few years,both in "Hydro" and "Pyro" processing of HAWs or spent fuels and targets for "new" nuclearsystems.Tests on "real objects" were carried out successfully in several countries, including the EBRII demonstration test at Argonne-West (UA) on pyroprocessing of FRs spent fuels.In the domain of "Hydro", blooming of concepts is observed. Multi-step processes lookpromising but most of the systems developed so-far appear complex. Efforts to simplify theprocesses seem required.In the domain of "Pyro", strong consolidations of "old concepts" were obtained, includingfluoride volatilisation.
Perspectives- HydroIt seems important to work in order to increase the "simplicity" and "compacity" of the MAsand LLFPs separation processes. Some routes for improvement can be proposed:
(i) one cycle process,(H) consideration of igh Active Concentrates instead of High Active Raffinates for
process development (large volume reduction factor).(iii) integration of MAs and LLFPs separation processes,(iv) consideration of possibly new LLFPs for partitioning,(v) maintaining alive the "CHON principle" (minimisation of secondary solid wastes).
- PyroDirections for improving the processes appear to be:
(i) minimisation of TRU losses in wastes and increase of the purities of the separatedactinides which can be obtained through the combined use of several separation techniquesand multi-stage techniques,
(ii) the waste problem, which is mostly corrosion related owing to the aggressivecharacter of the media. and te igh process temperatures, needs to be precisely estimated,
(iii) consideration of the possible separation of LLFPs.
- CollaborationsIt seems a pressing necessity to maintain, or best to increase, the collaborations in thiscomplex field at:
(i) National levels: maintain or create network(s) between academic a appliedresearch bodies, As example i France it e-xist two Networks orking under the auspices ofthe December 1991 Nuclear Waste Act: the so-called PRACTIS and NOMADE Groupes deRecherches,
(ii) Bi-national levels: numerous collaborations exist, e.g. CRIEPT-ANL, CEAJNC,CEA-JAERI etc...
(iii) regional level, As example at te Furopean level it exist common works partlyfinanced by the , e�& the PARTNEW, CALIXPART and PYROREP Programs within the5th FWP of EU 2000-2003), The role of ITU at Karlsruhe is also very iportant for Europeanand wider collaborations,
- 36 -

JAERI-Conf 2002-004
(iv) at te International level, the roles of ECD/NEA for Workshops and WorkingParties managements and also of IAEA appear essential.
So, within few years, one an predict that a large array of robust "hydro" and "pyro" processeswill be available for the efinition of new senarios for the management of nuclear wastesgenerated through WRs and FRs closed fuel cycies, but also for the fuel cycles of futuristicnuclear systems, sch as the MSRs or te ADSs.
REFERENCESOnly very few references will be mentioned here,[1] Proceedings of ETRADWASTES Conference, Luxembourg, November 1999.[2] Aonymous, DOE/RW-0519, 1999), "A Roadmap for Developing AcceleratorTransmutation of Waste (ATW) Technology, A Report to Congress".[3] C. Madic; MI Hudson; J. 0. LiIjenzin; J. P. Glatz; R. Nannicini,; A, Facchini; Z. Kolarikand R. Odoj, 2000), EUR 19149 EN, New Separation Techniquesfor Minor Actinides".[4] "Pyrochemical Separations", Workshop Proceedings, Avignon, France, 14-16 March
2000, OECD/NEA.
37 -

This is a blank page.

JP0250281JAERI-Conf 2002-004
DECISION-IN-PRINCIPLE ON FINAL DISPOSALOF SPENT FUEL IN FINLAND
Juhani ViraPosiva Oy, T6816okat 4 N-00100 Helsinki
Fax: 358-9-2280 3719, e-mail. juhani.vira(&_posiva.fl
ABSTRACTThe main target of the Finnish programme for spent fuel disposal is the year 2020 wen everything should beready to start disposal. The most important milestone so ar has been the selection of te Olkiluoto area in themunicipality of Eurajoki as the site of the repository. The selection was ormally accepted by the FinnishParliament in the so-called Decision-in-Principle in May 2001,The choice of 01kiluoto as the repository site was based on a long investigation process started in the early1980's and including deep drillings ad other geologic investigations on several candidate sites since 1987. Thesite selection was based on the outcome of the Environmental Assessment Pfocess (EIA) conducted in1997-1999. The EIA also included an assessment of the long-term safety of disposal ("TILA-99").The Decision-in-Principle means that the further work on geologic disposal can be based on a KBS-3 typeconcept and the site investigations can be concentrated at Olkiluoto. In January 2001, Posiva published aprogramme for research, development, technical planning and design work for the period preceding theconstruction license. A substantial part of the programme focuses on the planned underground rockcharacterisation facility, ONKALO, at Olkiluoto.Key words: spent fuel, geologic disposal, siting, environmental impact assessment
1. INTRODUCTIONAccording to the present legislation all spent fuel from the Finnish nuclear power plants mustbe handled, stored ad permanently disposed of in Finland, For disposal the two nuclearpower plant owners, 'reollistruden Voima Oy (TVO) and Forturn Power and Heat Oy haveestablished a joint company, Posiva Oy, to take care of the research and development neededand later to construct and operate the disposal facility.The guidelines and time schedules for the work towards final disposal were first set in aGoverninent decision of 1983. The time table still continues to be valid (Fig. 1). The maintarget is the year 2020 when Posiva should be ready to start disposal, However, the mostimportant milestone so far has been the selection of the site for the repository, which,according to the gidelines, was to be made by the end of the year 2000.In May 1999 Posiva submitted an application for the so-called Decision-in-Principle (DiP onthe final disposal facility of spent fuel to the Finnish Government 1 In this applicationPosiva proposed that the spent fuel from the Loviisa and Olkiluoto nuclear power plantsshould be disposed of in a KBS-3 type final repository which would be built at 01kiluoto nearthe 01kiluoto power plant site. The main purpose of the Dip is to judge whether the facility isin line "with the overall -ood of society", but an important part of the judgement is thedecision on the suitability of the intended site of the facility. According to the Nuclear EnergyAct the decision is made by the government but has also to be ratified by the Parliament.The application was based on the outcome of some twenty years of research andinvestigations and o the environmental impact assessment (FIA) that was carried out in theyears 1997-1999 o te final disposal facility 121. The law requires a DiP before anysignificant commitment (e.g., investments) to a nuclear facility is made in Finland. In thiscase the decision was needed before making the decision on an underground rockcharacterisation facility.
39 -

JAERI-C6nf 2002-004
1980 2000 2020 2040 2060 2080
ACCUMULATION OF SPENT FUEL
Loviisa I ja 2 operation
Interim Storage, Loviisa
Olkiluoto I ja 2 operation
Interim Storage, 01kiluoto inesininsisign esminsinsSyn womminn on K��
FINAL DISPOSAL
Site Characterisation
Characterisation Undergroundand Detailed Planning
Construction of the Facility 0111111111
Encapsulation and Final Disposal I gg,� hg�
Closure of the Facility andSealing of the Repository
Figure 1. Time schedule for the spent fuel management in Finland.
The Government approved Posiva's application in December 2000 and the decision wasratified by the Parliament in May 2001. The next major milestone will now be theconstruction licence, the application for which is planned to be submitted in 201 0.
2 THE DECISION-IN-PRINCIPLEAccording to the uclear Energy Act the "construction of a nclear facility... shall requirethe [Government's] decision i principle that the construction project is i line with theoverall good of society." For this purpose the Government must jdge that the followingconditions are fulfilled:- "the use of nuclear energy.. shall be in line with the overall good of society."- "the use of nuclear eergy must be safe"and this has to be done"... paying particular attention to: ... the suitability of the intended site of te facility".The first requirement baslely means a political Judgement about the acceptability of theproposed nuclear facility. A prerequisite for the secondjudgement is that o factors areindicated which should ake it suspect that a afe facility could be bilt. In practice it meansthat the reliminary safety assessment" made by the regulatory agency, STUK, is positive -or at least "non-negativC.A prerequisite for the site suitability is the willingness of the intended host municipality toaccept the siting proposal, In practice te decision is made by te municipality council. Withthis decision the municipality las an absolute veto to stop the DiP process: no uclear facilitycan be sited in Finland against the municipality's will.The process is schematically described in Fgure 2 Accordingly, both STUK and themunicipality can veto the ecision. However, ven with teir acceptance the overnment is,of course, free to make any declsi6n. In this respect the ill is more a political decision than ajudgement of technical or sientific soundness of the proposal. Tis is fainter emphasised bythe fact that the Government's decision as to be ratified by the Parliament.
- 40 -
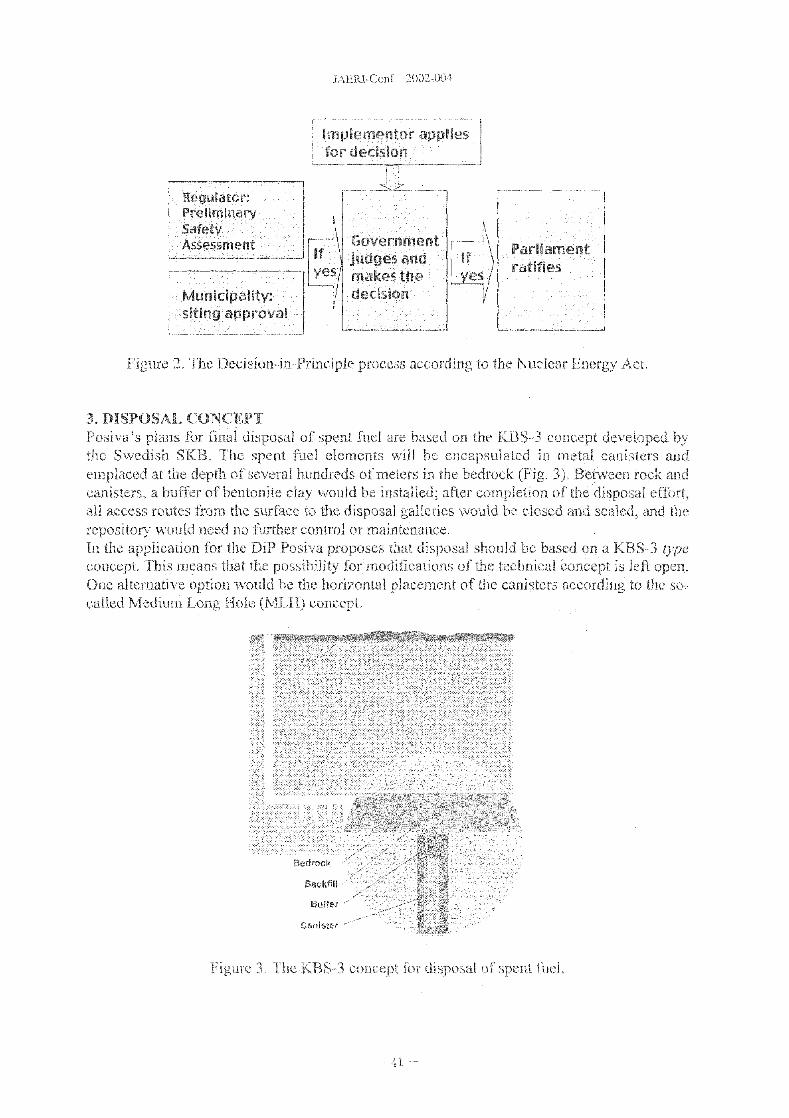
JAERI-Couf 2002-004
Implementor appliesfor decision
Regulator:PreliminarySafei�Assessment Government Parliament
If judgesand If ratifiesmakes the yes
Municipality. decisionsiting approval
Figure 2 The Decision-in-Principle process ccording to te Nuclear Eergy Act.
3. DISPOSAL CONCEPTPosiva's plans for final disposal of spent fel are based oil the KBS-3 concept developed bythe Swedish SKB. The spent fuel elements will be ecapsulated i metal canisters ademplaced at the depth of several Hundreds of meters in the bedrock (Fig, 3. Between rock andcanisters, a bffer of bentonite cay would be installed, after completion of the disposal effort,all access routes from the surface to the disposal galleries would be closed ad sealed, and therepository would need no urther control or maintenance.In te application for the DiP Posiva proposes that disposal should be based on a KBS-3 ) �ypeconcept, Tis means tat the possibility for modifications of te technical concept is left open,One aternative option would be te horizontal placement of the canisters according to te so-called Medium Lng Hole (MLH) concept.
Bedrock
Buffer
Canister
Figure 3, fhe KBS-3 concept fr disposal of spent fel,
- 41 --

JAERI-Conf 2002-004
4. SITE SELECTION PROCESSThe selected repository site is at Olkiluoto in the vicinity of the Olkiluoto nuclear powerplant. Olkiluoto is an island belonging to the municipality of Eurqjoki near the city of Raumaon the western coast of Finland. Eurajoki has a population of little more than 6000inhabitants.Near the power plant there is already a repository for low- and internlediate-level operatingwaste from Olkiluoto reactors (VLJ Repository). This repository is built at the depth of 60 to100 meters and consists of two vertical silos. The planned area for the spent fuel repository isa few kilometres east of te existing repository.Olkiluoto-was selected as oe of the candidates for the spent fuel repository site in 1986together with four other candidates: Romuvaara in Kuhmo, Veitsivaara in Hyrynsalmi, Syyryin Sievi and Kivetty in Konginkangas (later part of Adnekoski). The site selection processbetween 1983-2000 is outlined in Figure 4.
Site Identification Preliminary Site Detailed Site1983-1985 Characterlsation Characterlsation
1987-1992 1993-2000
yrynsalmluhmo uhmo
Slevi
Ad k ki Asnekoskl
Eurajoki Eurajoki
vilsa
Figure 4 The stepwise site characterisation ad evaluation process for siting the deeprepository, in Finland.
Each of the four candidate sites has been subject to an extensive pogramme of surface-basedinvestigations and modelling studies. At least ten deep drillholes (of depths between 500 and1000 metres) have been made at each site; at 01kiluoto already fourteen. The final siteselection was based on the outcome of the nvironmental Assessment Process (EIA)conducted in 1997-1999 2].The whole site selection process includiDg t ivestigations carried out has been described ina summary report 3 In addition to the investigations istory the report makes someconclusions as regards the lessons learnt for further studies by Posiva and also for otherprogrammes planning site characterisation work.
5 ENVIRONMENTAL IMPACT ASSESSMENTThe basis for the DiP application was laid in the report from the Environmental ImpactAssessment published in May 1999 2 Research into the long-term afety of a KBS-3 typerepository (reference concept) had already been carried out in Finland since the early 1980's.
- 42 -

JAEFJ-Conf 2002-004
For the purposes of the EIA the scope of the research prograim-ne was substantially extendedto topics outside the technical and scientific safety issues.A great deal of the riew studies were devoted to the expected social impact. The areasaddressed in the social impact assessment included- effects brought about by changes in the pysical environmental (related to every-day
living conditions and general living standards, amenities, social well-being)- effects on cominunity and population structures and infrastructures- effects on local and regional economics and well-being- psychosocial effects (worries, anxiety, psychic effects)The socio-economical assessment was based on traditional input-output analyses taking intoaccount the direct and indirect effects on local and regional economic activity. Thesociological and psychological aspects of the planned activity were on the one hand discussedin terms of the outcome of inter-views and opinion surveys, on the other hand based on recentscientific studies and literature. Common to the whole assessment of the social impact was theissue of image. A considerable amount of effort was spent on attempts to elaborate themeaning of image and constituents thereof, as it was clearly affecting people's opinion both inthe likely ecoiiomic impact and the ftiture social well-being.Of course, safety was still, a key issue in the assessment. A new long-term safety assessment,"TILA-99" was produced as a part of the EIA activity 4]. TILA-99 considers the long-termsafety of the disposal concept against the general regulations issued in a March 1999Government decision [5]. The discussion is specific of the four candidate sites taking intoaccount all the results from the site investigations conducted since 1987.In addition to the long-term safety assessment, new assessments were prepared on theoperational safety 61 and the safety of transportation of spent fuel from the power plants tothe encapsulation facility 7]. which in the reference design is planned to be co-located withthe repository. A review was also made on possible chemical hazards arising from thedisposed materials [8].The general conclusion of the EIA was that the likely impact on public health and naturalconditions would always be small. The facility will have some impact on the local economicactivity and employment, but this effect will most likely be positive. There may be somenegative social effects also which mainly arise from the negative image and risk concerns thatare sometimes associated with nuclear wastes.The assessment of long-term safety concludes that most probably there will never be releasesthat would lead to meaningftil radiation doses by any individual and even in the worstunlikely future scenarios the doses would not exceed the background evel. All in all, theregulatory requirements can be met with considerable safety argins independent of whichsite is chosen. The conclusions of the studies into operational and transportation safety aresimilar: there should never be any significant health detriment from the planned operationsand even the likelihood of a significant radioactive release from the plant or transport casks isminimal.An important part of the EIA was the assessment of alternatives. This included several levels:- assessment of alternative spent fuel management concepts- assessment of different technical concepts of geologic disposal- comparison of the proposed concept with the zero alternative (continued interim storage
under surveillance)- assessment of te site aternatives.The outcome of the comparison between technical alternatives was that the reference KBS-3type concept would promise the best potential for further development.The conclusion fom the comparison of the reference concept with the zero alternative wasthat both alternatives were technically feasible and both alternatives could provide sufficient
- 43 -

JAERI-Conf 2002-004
protection of man and environment - however, the zero alternative only assuming continues
maintenance of the storage. The active development of a permanent, passively safe method ofdisposal was considered ecessary to provide against the risk of iscontinuation of themaintenance.The assessment of alternative sites for the disposal facility was based o a number of factorsincluding- long-term safety- constructability- possibility of expanding te repository- operation of the disposal facility- social impact- land-use and environmental loading- availability of infrastructure.- costs.As regards long-term safety an important conclusion of the TILA-99 safety assessment wasthat there is no possibility of objective ranking of the alternative sites in terms of the long-term performance of the repository, There were differences between the sites, but none of thesites was clearly superior or inferior to other sites.The most evident difference between the sites was concerned with social acceptance and theexpected social impact. On the basis of the studies the expected social impact would clearlybe smallest in Eurajoki,
6. DECISION PROCESSIn the application for the Decision-in-Principle Posiva proposed that te Okiluoto site beselected as the site of te disposal facility. The proposal was largely based oil the conclusionsof the EIA Aong the factors supporting the choice of Olkiluoto were particularly the factthat most of the spent ruel accumulated is already at Olki luoto ad tile judgement based on theEIA that at Eurajoki any major social controversies can probably e avoided.According to te Nclear Friergy Act, the regulatory authority (STUK) as to make apreliminary assessment of te proposed facility vis-A-vis the legal requirement that tile se ofnuclear energy has to be safe. STUK's assessment was reported, to the Government inJanuary, 2000, n the statement STUK considers that, first, the DiP is justified on safetygrounds and, secondly, the DiP not only can be mde but it should be made.Shortly after the statement of STUK was pblished the municipality 0OUTICil Of FUfajOki made
their decision. After a vote 20-7) the council approved the proposed siting of tile disposal
facility within its area, Te council decision gave rise to two appeals to the regional ourt of
administration ad later to te suprerne court of administration, but all these appeals were
rejected. In December 2000, the Finnish ovemnlent approved the application.
The Parliament started discussing the ecision in, February 2001. The debate (in, two
Parliament committees and two plenary sessions) was very much focused o, tile availability
and status of alternatives, retrievability f the Spent ffiel after disposal, knowledge about long-
term safety, and the subsequent decision-making process. The fal vote oil 18 May, 2001,
was 159-3 in favour of te ratification 37 absent).
It seems that aong the factors contributing to the almost unanimous ratification were
- the fact that spent fel exists ad needs to be managed
- the lack of feasible aternatives to geologic disposal at the moment
- the possibility of stepping back (further licences still needed, retrieval possible even after
repository closure)
- trust in the process.
44 -

JAERI-Conf 2002-004
One of te reasons for timing the DiP application had ben the need to go underground forfurther studies of the 01kiluoto bedrock. The eed or underground characterisation wasemphasised byniany Parliament members as well.
7 THE FUTUREIn January 2001 Posiva published a programme for research, development, technical planningand dsign work for te period preceding the construction license 9 According to theguidelines Posiva is preparing to ubmit the application i 2010. The construction of thedisposal facility could then be started later i the 2010's, which would enable the start ofdisposal operations i 20 0.A substantial part of the programme activities wilt be staged according to the progress of theplanned underground rock characterisation facility, ONKALO, at Olkiluoto. At the momentdifferent alternative designs and layouts are being considered for the facility. The maininterest is i te rock poperties at the actual repository depth for which one or severalinvestigation tUnDelS WUld be excavated. Two access ways are planned, to this level: eitherby a shaft and an access tunnel or by two horiZODtal shafts, as depicted in Figure 5. The planis to start the construction of ONKALO in 2003-2004.
Figure 5. An example of the possible layout for the ONKALO rock characterisation facility.
LIST OF REFERENCES[1] Posiva Oy 1999a, Application for a decision in principle on the final disposal facility ofspent ftiel. Posiva Oy, Helsinki (in Finnish).[2] Posiva Oy 1999b.The final disposal facility for spent nuclear fuel - Environmental impactassessment report. Pbsiva Oy, Helsinki.[3,1 McEwen T & Aikds, T. 2000. The site selection process for a spent fuel repository inFinland - Summary report, Report POSIVA 2000-15, Posiva Oy, Helsinki.[4] Vieno, T. Nordi-nau, 11. 1999. Safety assessment of spent fuel disposal in Hastholmen,Kivetty, Olki kjoto and, Rornuvaara - TILA-99. Report POSIVA 99-07. Posiva Oy, Helsinki.[5] STUK 1999. (4overnment Decision on the safety of isposal of spent nuclear fuel(478/1999), Radiation and Nuclear Safety Authority, Report TUK-B-YT0195, Helsinki.
- 45 -

JAERI-Conf 2002-004
[6] Rossi, J., Raiko, H., Suolanen, V. & Ilvonen, M. 1999. Assessment of radiation doses dueto normal operation, incidents ad accidents of the final disposal facility. Report Posiva 99-16. Posiva Oy, Helsinki (in Fira-lish).[7] Suolanen, V., Lautkaski, R. Rossi, J. 1999. Assessment of health risks brought about bytransportation of spent fuel. Report POSIVA 99-17, Posiva Oy, Helsinki (in Finnish).[8] Raiko, E. Nordman. H. 1999. Chemical toxicity in final disposal of spent nuclear fuel.Working Report 99-18. Posiva Oy, Helsinki (in Finnish).[9] Posiva Oy 2000. Disposal of spent fuel in Olkiluoto bedrock - Programme for research,development and technical design for the pre-construction phase. Report POSIVA 2000-14.Posiva Oy, Helsinki.
46 -

JP0250282JAERI-Conf 2002-004
COMMUNICATION OF NUCLEAR POWER CONCEPTS TOSTAKEHOLDERS - THE USE OF NATURE'S OWN LABORATORILES
J M West', W R Alexander', K Kaku' I G McKinley' and A Shimrnura2
Nagra National Co-operative for the Disposal of Radioactive Waste), Hardstrasse 73, 5430 Wettingen,Switzerland (email isu�nagia
- _h)20bayashi Corporation, Technology Department No 6 Civil Engineering Technical Division, Shinagawa
Intercity Tower B 215-2 Konan, Minato-ku, Tokyo 108-8 502,lapan
ABSTRACTThe history of clear technology development has generated a legacy of nuclear fear in many people, whichbecomes more acute when the problem of radioactive waste is highlighted. Thus a significant element ofincreasing confidence in nuclear power is to generate confidence in the industry's ability to safely dispose of itswaste. The use of natural analogues as a key vehicle for such communication is now fecognised as aninfluential approach, This paper vAll examine how analogues can be used to convey difficult concepts tostakeholders and develop an outline communicatio pogramme.Keywords- natural analogues, nuclear power concepts, communication, stakeholders
INTRODUCTIONNuclear power development has a historical legacy of iational fear for many people(association with nuclear weapons, teratogenesis, carcinogenesis, and environmentalpollution), Nevertheless the considerable benefits - such as pleiltiful electric power - havegenerated a half-hearted acceptance of the technology by some stakeholders. his fear,however, becomes more acute when the 'yet to be slved' problem of the geological disposalof radioactive waste is highlighted. Reluctant acceptance often becomes active opposition -effectively stopping geological waste disposal programmes in several countries. Thus asignificant challenge in increasing confidence in nuclear power is to generate confidence inthe industry's ability to safely dispose of its waste.
Considerable efforts have been made over the past 3 decades to develop rigorous methodsfor the geological disposal of radioactive waste (including siting, design and performanceassessment). However, much of the work has been highly complex and difficult tocommunicate - even to technical audiences. Additionally, many scientists lackcommunication skills and are il equipped to communicate their work to non specialists -particularly when attempting to provide clear and unambiguous aswers to difficultquestions [1]. As a result, stakeholder groups defined here as everyone who benefits fromnuclear electric power) often have little confidence in the ability of the nuclear powerindustry to safely dispose of radioactive waste. This lack of confidence in the industry canbe demonstrated in Japan by the May 2001 plebiscite 'ection of the use of recycledplutonium at the Kariwa nuclear plant. Following this Prime Minister Junichiro Koizumisaid 'The government and utility companies should think about how we can gain public
. thsupportfornuclearenergy,andmakefurtherefforts'(AssociatedPress,28 May2001) Asa result, a government liaison council (involving ministries and agencies) has been devisingeducational and publicity measures to try to improve confidence in Japans nuclear energypolicy. A similar lack of confidence in the industry can also be seen in Germany wherelarge-scale demonstrations in 2001 also highlighted concerns about the movement of nuclearwaste. Such high profile reactions can be compared to those generated by other industry
47 -

JAERI-Conf 2002-004
wastes (coal, oil, chemical tc) where responses, in gneral- have a lower profile - probablybecause these industries 'save longer histories and have built a egree of confidence(however limited) in their stakeholders. Without confidence in the uclear industry,radioactive waste disposal programmes in many democratic ountries axe n grave danger offailing. This has been recogirlsed at high levels within the industry. At a recent NuclearEnergy Agency workshop Mr Matsuura, Chairman of the Nuclear Safety Commission, Japansaid 'In order to restore public onfidence there is no other course but to be prepared fordifficulty and work honestly to our fullest ability, with all steps made openly and onestly'[2]. Such confidence is possible to build as demonstrated by progress in disposalprogrammes in Scandinavia where stakeholders have been involved in specific wastemanagement decisions, However, new ways have been sought to try to communicateradioactive waste concepts to stakeholders (particularly to the general public) and to improvetheir confidence in waste disposal. Natural analogues are now recognised as a key vehiclefor such communication.
REQUEREMIENTS FOR BUILDING CONFIDENCE IN STAKEHOLDER GROUPS
Building confidence in te industry's ability to safely dispose of waste (particularly of high-level waste, HW) must be put in the context of an overall communication strategy whichidentifies the key concerns of different stakeholder groups. Such a strategy shoulddemonstrate the honesty, openness and high level of technical competence of all involvedorganisations. It should also show consistent policy and the use of technical argumentswhich both recognise the concerns of stakeholders and acknowledge the iportance ofdialogue.
Many concepts require communication to stakeholder groups, including, in particular, thefollowing:
* radioactivity occurs naturally and it is only the particularly high concentration ofradionuclides in BLW which makes it so hazardous;
* radioactivity is easy to measure and easily shielded if the source is compact;CD radioactivity in waste decreases with time, with highest specific activity nuclides
decaying fastest-,0 the long period of waste isolation needed can be provided by deep geological
repositories.
The stability of a deep geological repository is acknowledged to be particularly difficult tocommunicate in Japan where the tectonic activity of the country is evident from the manyvolcanoes and regular earthquakes,
THE USE OF ANALOGY AND THE ROLE OF NATURAL ANALOGUES
Visual and mental images play a key role in te advertising mdustry. For example, the useof a particular product is often linked, in a picture to a particular lifestyle. The buyer is thusinvited to emulate the lifestyle by buying that product. a similar way, analogies are usedin the broadcast media to present difficult concepts to non-specialists. For example, the term'aquifef has been explained as 'a giant bathroom sponge' in a recent radio programme andthis mental image quickly and simply gives a seful visual impression of the oncept that thenon-specialist can understand. Analogies are also powerful i putting across eotional
48 -

JAERI-Conf 2002-004
issues. A useful xample can be seen in presenting -risk in a wa tat invites a reaction at theIguf rather than at the intellectual level, Rail, air and road tavel is inherently risky with thepossibility of catastrophic failure but there is widespread acceptance of its risks. Incomparison, a deep geological repository, where no atrophic failure is possible,
idespread fear and poor acceptance. This fear is focused, in part, on theperceptio tat the construction of a geological repository is novel, untested and hence riskyand will result in waste leakage. Using geological analogies, such as the Oklo natural fissionreactors in (rabon (a atural 'nuclear reactor') it is possible to show that radioactivity doesnot move and has been isolated for billions of years, Images are the key with this method ofpresentation, which acknowledges the fear of a repository but puts it into the context of anemotional reaction.
Analogies have been used in the radioactive waste industry f many years. Before arepository oan be built and operated if s safety must be adequately evaluated through formalperformance assessment (PA) which requires detailed mathematical analysis of all aspects oft.he repository system and its evolution with time. Natural analogue (geological andarchaeological) sdies have the objective of providing information which can be useddirectly to support a afery PA fe.g 3 4 5 Tere are many different definitions of 'naturalanalogue'. A very general example is .. , an occurrence of materials or processes whichresemble those expected in a proposed geological waste repository' 6 In technicalapplications, were the emphasis is on testing or validation of models (conceptual,qualitative o quantitative), specific definitions have been proposed, An example is '...theessence of a natural analogue is the aspect of testing of models, whether conceptual ormathematical, and not a particular attribute of the system itself 7 For this paper, whichfocuses on communication and confidence building, natural analogues can be viewed as'occurrences of materials or processes that provide visual or mental images of thefundamental concepts or expected behaviour, of repositories for radioactive waste'. For bothtechnical and communication definitions the ey aspect is the application of naturalanalogues - for communication this means carefully clarifying the link between the analogueand the repository system.
Used in a careful and imaginative way, natural analogues can be presented to opinionformers, politicians, concerned academics and the public to explain safety, for example, byshowing wat happens to rocks through geological time. Another example would be toshow the concept and stability of glass waste forms (often perceived by the non-specialist asbeing like a glass vessel containing liquid waste) using manufactured uraniurn glass productswhich contain uranium as a colouning agent, In addition, natural analogues provide evidenceof the fundamental feasibility of long-term isolation of waste in an underground repository.Care mst be taken, however, as there is a risk in using inappropriate analogues or of over-interpreting data, both of which will lead to loss of credibility.
EXAMPLES OF NATURAL ANALOGUES
Over the past 1 years, most natural analogue studies have had broad scientific objectivesrather than objectives related directly to confidence building or communication.Scientifically based, natural analogue studies have been performed on a wide range of naturalphenomena, such as ore deposits, marine and lake sediments, hyperalkaline springs, andancient preserved forests. These studies have provided the opportunity to investigate various
- 49 -

JAERI-Conf 2002-004
natural processes that have operated over geological time periods. In addition, numerousanalogue studies have examined archaeological artefacts, similar to the materials used inbuilding a repository, which have been subjected to natural alteration and corrosionprocesses over historical time periods (for details of many of these studies, see reference[8]).
The key to communicating successfully the concepts and messages given above, using anatural analogues based confidence building programme, is to match them to stakeholderconcerns and questions thus changing any negative images. These concerns will needdetailed assessment and larification. However, the science behind the natural analoguesmust underpin this dialogue in order to maintain credibility. Iformation from naturalanalogues can thus form the bedrock to structured communication programmes. Somespecific examples of how some existing analogue studies could address questions andnegative images from members of the public and convey positive images are given in Table1. Most of these examples are from studies outside Japan and, as such, they will probably beless intrinsically interesting and relevant to some Japanese stakeholders, There is, therefore,a strong case to instigate more research on selected analogues (both geological andarchaeological) which will attract interest in Japan. For example, it is of crucial importanceto convey the message that the geologically active nature of the Japanese islands does notpreclude building a geological repository, Images of the after-effects of the Kobeearthquake could be contrasted against those of ancient Japanese tombs and ore bodies todemonstrate stability in the long term. However, it must be realised that the use ofanalogues does have limitations. Clearly, there can be no perfect analogue site or artefact.Further, some published studies are not scientifically robust and/of mismatch the analogue toa particular repository concept. There is also a common tendency to oversimplify complexissues in the analogue literature.
THE USE OF NATURAL ANALOGUES FOR CONFEDENCE BUILDE`4G -INTERNATIONAL EXPERIENCEInternational experience has shown that the use of using natural analogues in confidencebuilding must be built on a well established technical programme. For example, inSwitzerland, Nagra, was one of the first organisations to use analogues in confidencebuilding and this was linked to a significant technical programme (reference 91 provides areview and bibliography). The programme was used to address a variety of audiencesincluding opinion formers, technically literate groups, scientific peers and school hildren,Nagra was also the lead organisation for the production of the natural analogue video"Traces of the future" which was sponsored by eight national waste disposal organisationsand has been translated into nine languages including Japanese, Other internationalinitiatives include the Natural Analogue Working Group coordinated by the FuropeanUnion (which Nagra currently chairs) and AEA sponsorship of several technical projects,workshops and expert reviews on analogues. Other national organisations have also usednatural analogues for confidence building notably including A-CL, Canada; SKB, Sweden,Nirex, UK and the US NRC. However, it is of note that, to date, o programme has tried toassess the success of specific confidence building strategies in a detailed manner (althoughthis is now changing) but it can be seen that strategies have evolved with time in someprogrammes. In Switzerland and Scandinavia, in particular, the use of natural analogues(and Public Relations overall) has matured with the national disposal progranune, moving
- 5 -

JAERI-Conf 2002-004
Table 1. Examples of how basic questions and negative images from members of thepublic can be answered using positive natural analogue images
Questions and negative images Answers and positive natural analogue
Questions Answers Positive imagesWhat is radiation? Atomic bombs. Radiation is natural. Morro do Ferro,Is it ot very Cancer. Radiation can be Brazil (very highdangerous? Birth deformities. handled safely. natural radiation butIs radioactive waste Environmental no health effects).something pollution. Other highco ipletely new? background areas.What is a repository? Piles of glowing Repository designs Oklo, Gabon - a
waste in large water- mimic nature where natural 'nuclearfilled pits. U ore has been reactor' whereWaste buried in isolated for billions radioactivity has notdungeon-like crypts. of years. moved.
Geological disposalcan be a safe andappropriate method
Are you sure that Exploding waste Long-term isolation, Cigar Lake, Canadageological disposal is spraying radiation no surface and Tono, Japan oresafe? over homes, people indications of the bodies.
etc. radiation from theLeaking waste orebodies so surfacecausing deformities. environmentMonsters emerging remains safe.from waste.
How do you know Cars rusting after Natural and Archaeologicalthat the barriers will only a few years use. archaeological analogues e.g.last? Decaying 40 year old materials can last Roman nail cache -
concrete apartment for thousands of little corrosionblocks. years. despite 2000 years'Rivers' flowing in burial,rocks bringing waste Dunarobba forestto the surface Italy - trees have not
decayed despite 2million years burial.Maqarin, Jordan -naturally occurringcements which are1-2 million yearsold.Chinese tomb -thousand years'isolation by claylayer.
5 -

JAERI-Conf 2002-004
from generic issues to specifics as sites were identified and repository designs became moredefined.
It is now recognised that any confidence building programme has to evolve and develop atthe same time as the audience, As more information is provided to stakeholders teir viewswill change and awareness evels will rse accordingly. Thus ar
I y programme will need to beiterative, constantly changing and adapting to changing perceptions and concerns. Theoverall approach must be positive, proactive and dynamic in outlook. It must also be awareof anti-nuclear information coming ftom other sources.
A COMMUNICATION STRATEGY FOR JAPAN
The use of natural aaloguesin communicating radioactive waste concepts must be placed inthe context of a structured communication, strategy. The strategy would need to integrate allexisting Japanese waste disposal programmes with organisations involved in radioactivewaste management so that a consistent communication approach can be taken. Audiencesmust be identified and key messages and communication methods and tools (includingnatural analogues) defined. The specific views ad prejudices of audiences inust also becharacterised so that a 'baseline' of perceptions is established. Changes in this 'baseline' canthen be monitored as the ommunication programme takes effect, It is also important thatthe programme is structured to evolve together with te national disposal programme.Consequent developments in the national programme must also be My iegrated intocommunication effors. This is particularly important given te speed of development ofelectronic communication where inconsistencies in information will be immediatelyobvious.
USING NATURAI, ANALOGUES FOR CONFIDENCE HU11,I)ING IN JAPAN
The use of natural analogues as a communication tool requires an gatusational ftameworkwhich would draw ogether technical workers in the natural analogues field from allinvolved Japanese organisatioris (such as CRTEPI, NC) with end sers (predominaudy ftomPA and Public Pelations) and other key contributors (eg. university professors) Te groupcould also be complemented, as necessary, with appropriate foreign experts. An integratedprogramme of analogue projects could then be developed focusing on archaeological andgeological analogues of particular relevance to the Japanese epository concepts, An overallconcept publication will be necessary to convey the ains of the aalogues py 'ect and shouldbe made widely available together ith regular pdates o progress, In order to bring thegroup and its pojects to the notice of technical audiences - both in Japan ad internationally,it could orgarrise workshops and major symposia. Such events, if handled orrectly and in astimulating way, using communication experts, could serve as a focus for communication toall Japanese stakeholders.
In order to reach as large an audience as possible, defined messages win need to becommunicated at 3 overall levels:
• Level I - Educational• Level 2 - Media• Level 3 - Opinion formers and politicians (local, national and international)
- 52 -

JAERI-Conf 2002-004
Establishing two way dialogues with stakeholders is essential and should be mediated byJapanese communication professionals, Communication methods a-re diverse and should betailored to ach level, All of the information should be made available in as many mediaforms as ossible (e.g, print, the inteniet, CDs, DVD etc) to enable it to reach as manypeople as possible. Development of the Iternet is likely to increase over the next few yearsand this method of disseminating information will be critical and it ould be the main pointof access for all data. A web site should contain all iformation (including detailed technicaldetails) which would be accessible to everyone. The site should also be structured in such away that allows browsers to select information at a level of complexity of their choosing,thus promoting a culture of openness igure 1). As a result, children could firid out basicfacts, journalists would be able to find basic digests and briefings, politicians would findopinion polls and a forum for international debate and scientists could access technicalinformation. Feedback andreaction should be encouraged through a contact point.
A variety of other communication methods will also be needed. For xample, press releasesare important sources of news for the media, as are press conferences, Video and televisionproductions and advertisements are also powertul communication tools if material ispresented in an interesting, dynamic manner, However, it is essential that all methods usethe same information and ommunicate the sme messages.
Increasing information Entry Page Emphasis on visualcomplexity images
Frequently Feedbackasked
questions
More details
Emphasis on text plusTechnical informationV hard data
Figure 1. Diagram illustrating development of information complexity within awebsite. Note that direct access is possible to all leve6 and that the user can self select
the level required to meet their information needs. Feedback is vital to establishdialogue.
CONCLUSIONSThere is an increasing requirement to build confidence in the ability of the nuclear industryto safely dispose of its radioactive waste. This has been recently demonstrated by theplebiscite result in Kariwa, which showed the strength of feeling generated by nuclear issues
- 53 -

JAERI-Conf 2002-004
in Japan. As a result, an integrated communication strategy is needed to tackle theseconcerns. Natural analogues provide a approach to address some of the most difficultquestions posed by stakeholders.
ACKNOWLEDGEMENTS
Thanks to Hilary Heason (Political and Media Liaison, British Geological Survey), Drs BillMiller and Caroline Taylor (Enviros QuantiSci) for their help in the development of theideas presented in this paper. In addition, the invaluable support of David McKie and AlinePlayfair (Nagra) and Peter Hogarth (British Trade International) is gratefully acknowledged.J M West is on sabbatical leave from the British Geological Survey until January 2002.
REFERENCES
[1] West, J. M, 2000) Life with Auntie (British Broadcasting Corporation - BBC).Biologist, 47 3) 136-138.
[2] Matsuura, M, 2001) Challenge for reconstruction of public confidence. In: Investing inTrust: Nuclear Regulators and the Public, Nuclear Energy Agency Workshop ProceedingsParis, 29 November - I December 2000 pp 27 - 34, OECD, Paris, France,
[3] IAEA 1999) Use of natural analogues to support radionuclide transport models for deepgeological repositories for long lived radioactive wastes. IAEA Technical Report 1109,International Atomic Energy Agency, Vienna, Austria.
[4] Smellie, J. A. T., Karlsson, F. and Alexander, W. R. 1997) Natural analogue studies:present status and performance assessment implications. J. Contaminant Hydrology, 26, 3-17.
[51 McKinley, 1. G. and Alexander, W. R. 1996) The uses of natural analogue input inrepository performance assessment - an overview. In: von Maravic, H. and Sellie J.(editors) Natural analogue working group, sixth meeting, Santa Fe, September 1994, CECNuclear Science and Technology Report, EUR 16761.
[61 Come, B. and Chapman, N. A. 1986) Natural analogue working group, first meeting,Brussels, November 1985. CEC Nuclear Science and Technology Report EUR 10315, CEC,Luxembourg.
[7] McKinley, 1. G. 1989) Applying natural analogues in predictive performanceassessment. Unpublished Nagra Internal Report, Nagra, Wettingen, Switzerland,
[8] Miller, W, M,, Alexander, W. A., Chapman, N. A., McKinley, - G, and Smellie, J. A. T.(2000) Geological disposal of radioactive wastes and natural analogues. Pergamon WasteManagement Series, Volume 2 Oxford, UK.
[9] Alexander, W. R., Gautschi, A. and McKinley, I.G. 2001) Overview of the Swissnatural analogue programme. In: von Maravic, H. and Alexander, W, R. editors) Naturalanalogue working goup, 8th meeting, Strasbourg, March 1998. CEC Nuclear Science andTechnology Report, EUR (in press).
- 54 -

JAERI-Conf 2002-004
3. Oral Session
Criticality Safety
- 5 -

This is a blank page.

JP0250283JAERI-Conf 2002-004
DEVELOPMENT AND APPLICATTON OF CONSFNSUS STANDARDSIN CRITICALITY SAFETY IN THE USA
Thomas P, McLaughlinLos Alamos NatioDat Laboratory, Los Alamos, NM USA
Email: 1pni6�1ani.guyTelephone: 505-667-7628
ABSTRACTThe development (fDational GODSeDSLIS Standards i tire SA had its beginnings i te document seriestitled "TIre Nuclear Safety Guide". This docrinrent was the product of llaboration among criticality safetyand criticat oxperitnent specialists froyn tire major fissile Material pocessing sites nationwide, Starting in1964 witb te frst Staildat'd, tile IRIDIber as grow t sixteen, with wo currently under development. Theyprovide guidance in ssentially ali aspects of criticality safety tbat are upoylant to accident pevention. Thetwo regrilaloq odies i the USA, which oersee operations witb SigDificarn qijantifies of fissile materials,the Nuclear Reginatory Commission ad the Department of Energy, oth adopt ll of these sixteen nuclearcriticality Safety Standards W te asis for regulation Te application of pilosophies and echnicalguidance found in these sandards sjudged to be he underlying reason for the very low criticality accidentrate that exists i the USA and, indeed, in the world today.
HISTORICAL DEVELOPMENTThe earliest appearance of guidance for criticality safety in pocess Operation-, in adocument authored by and with input rom specialists at several istallations across theUSA was i 1956. This guidance was ontained in the first edition of The NuclearSafety Guide" [1 J. The authors represented Oak Ridge National Laboratory, the HanfordWorks, the Rocky Flits Plant, and Los Alarpos Scientific Laboratory, but additionalcontributors to the document represented the Savannah River Plant, the General ElectricCompany, Goodyear Atomic, Philips Petroleum, nion Carbide (Y-1 2 Plant and K-25Plant) and Lvermore National U boratory.
This first edition of the Nuclear Safety Guide was fllowed by a series of revisions toaccommodate the apidly expanding knowledge base resulting ftom vigorous critical
experiment programs at many §ites within the USA as well as expanded discussions
among the pioneers i the field concerning iproved safety administration and
philosophy. The second edition appeared in 1957, a third edition in 1961 a fourth edition
in 1978 ad afte sgnificant changes a fourth edition with a revised, title, "The Nuclear
Criticality Safety Gide", in 1996 2,3,4,51,
It was at the ti")e that the third edition was being worked on, about 960, tat the first
criticality safety stan6afd was begun. The finished, approved sandard was first printed in
1964 with the title "Safety Standard for Fissionable Materials Outside Reactors". Its
contents ae stilt found today, largely intact, in its escendant standard, ANS-8.1,
"Nuclear Criticality Safety in Operations with Fissionable Materials Outside Rea, ctors".
Nuclear critiGality satoty gtandayd i the USA are now developed and maintained by
Subcommittee ANS-8 ude te secretariat ot the American Nuclear Society within the
administrative oversight of the American National Standards Institute, ANSI.
- 57 -

JAERI-Conf 2002-004
Over the subsequent 37 years, 13 additional standards have been developed and issued bySubcommittee ANS-8 and 4 more are currently under development. However, it was thebasic guidance that first appeared in the Nuclear Safety Guide ad was subsequentlyincorporated into the first standard that formed the foundation for criticality safetypractices worldwide that exists largely unchanged to this day. A list of the current andproposed standards is provided in Table I on the following page 3).
KEY REQUIREMENTS
Three points pertaining to the practice Of Criticality safety are discussed below.These are examples of important principles recognized and documented by theearly practitioners i the 956 Nuclear Safety Guide and the 1964 consensusstandard. These requirements are only three of Hundreds in the sixteen standards,but they are judged to be some of the most significant.
1) Responsibility for criticality safety lies with the line organization, not withthe criticality sfety staff. The criticality safety staff provides support to the lineorganization. In the 1956 edition of the Nuclear Safety Guide one finds thewords:
'The responsibilityfor nuclear safety in the plant considered isplacedupon line organization. Individuals directing activities which are ofsuch a nature as to involve nuclear hazords are responsiblefor controlin these activities to the same extent tat they are responsibleforresearch, design, maintenance, and operation. "
In the current version of the ANS-8.1 and 819 standards, one finds:
4.1.]Responsibilities ......... Supervision should be made as responsible fornuclear criticality safety asforproduction, development, research, or otherfunctions.
5.1 Each supervisor sall accept responsibility for the safety of operationsunder his control.
2) Subcriticality is to be assured whenever pactical thTOugh control of te dimensions ofthe vessels and piping - icluding the spacing etween adjacent eomponents, It isrecognized that fixed neutron absorbers may pove very cost-effective in some large-scale operations and also tat at some point waste solutions cn sually oly bepractically handled iii arge, unfavorable geornetiy vessels. hi the 1956 edition of teNuclear Safety Guide oe finds the words:
"The nuclear safety of any process will be assured, whenever possible, by thedimensions of the components - such as pipe size and container capacities -including spacing between individual components of the same or adjacentsystems.
5 -

JAERI-Conf 2002-004
TABLE I
ANSI STANDARDS SUBCOMMITTEE PRODUCTS
ANS-8.1 Nuclear Criticality Safety i Operations with Fissionable MaterialsOutside Reactors 1998)
ANS-8.3 Cr4ic� � � �Systems 1997)ANS-8.5 Use f Borosilicate-Glass Rascbig Rings as Neutron Absorber in
Solutions of Fissile Material 1996)ANS-8.6 Safety in Conducting Suberitical Neutron-Multiplication
Measurements i Situ 1995)ANS-8.7 Nuclear Criticality Safety in the Storage of Fissile Materials (1 998)ANS-8.10 Criteria for Nuclear Criticality Safety Controls in Operations with
Shielding and Confinement 1999)ANS-8.12 Nuclear Criticality Control 6 Safety of Plutonium-Uranium Fuel
Mixtufes Outside Reactors 1993)ANS-8.14 Use, of Soluble Neutron Absorbers for Criticality Control of Aqueous
Homogeneous Solutions - ProposedANS-8.15 Nuclear Criticality Control of Special Actinide Element
ANS-8.17 Criticality Safety Criteria for te Handling, Storage, andTransportation of LWR Fuel Outside Reactors 1997)
ANS-8.19 Administrative Practices for Nuclear Criticality Safety Training
ANS-8.20 Nuclear Citicality Safety Training 1999)ANS-8.21 Use of Fixed Neutron Absorbers in Nuclear Facilities Outside
Reactors (I 995)ANS-8.22 Nucleat Criticality Safety Based on Limiting and Controlling
Moderators 1997)ANS-8.23 Nuclear Criticality Accident Emergency Planning and Response
_(j� �7_ANS-8.24 Validation of Computer Codes ... ProposedANS-8.25 Postings, Signs, Labels ... ProposedANS-8.26 Criticality Safety Engineer Training and Qualification Program ...
IProposed
59 -

JAERI-Conf 2002-004
In the current version of ANS-8. 1, one finds:
4.2.3 Geometry Control. Where practicable, reliance should be placedon equipment design in which dimensions are limited other than onadministrative controls.
4.2.4 Neutron Absorbers. Reliance may be placed on neutron-absorbing materials, such as cadmium and boron, which areincorporated in process materials or equipment or both.
It is iportant to note tat statement on geometry control, uses e verb"should" wich mean a recoinniendatimi wile the statement o theuse of neutron absorbers uses te vert "may" which is ot arecommendation but only "pefinission". That is, the hierarchy ofimportance of the statements in the standards is first those that use theverb "shall" then those that use the verb "should" ad lastly those thatuse the verb "may".
3) Where suberiticality ased o geometry alone cannot be assured, then multiple barriersto prevent the accident should be present. This is now commonly called the DoubleContingency Principle and in essence states tat defense in depth must be pfesent suchthat no single, credible process upset would ead to the accident appening. n the 1956edition of the Nuclear Safety Guide one finds the words:
"Where safety bsed on geometry alone is precluded, designs may bepredicated on btch size andlor chemical concentrations, orcombinations of them with geometry, and such designs will beconsidered satisfactory only if two or more st rnultaneous andindependent contingencies must occur to promote a chain reaction.
In the original 1964 version of the current ANS-8.1 standard, there afethe words:
"(1) Process designs should, i general, icorporate sufficient.foctorsof safety lo require the occurrence ofat east two unlikely, independentand concurrent changes in, one or more of tire conditions originallyspecified as essential to nuclear safety before a nucleate accident ispossible.
In the current 1998) edition of ANS-8.1 one finds the words:
4.2.2 Double Contingency Principle. Process designs should, ingeneral, incorporatesufficient factors of safety to requ ire at least twounlikely, independent and concurrent changes in process conditionsbefore a criticality accident is possible.
- 60 -

JAERI-Conf 2002-004
While tire wonis describing the Double Contingency Principle (DCP) havechanged slightly over the years, it is clear that tre itent has remained the same.The goat is to ave multiple barriers to te accident ad Dot rely on a singleharrier.
Note that the verb should" is sed in te DCP and ot the verb "shall." Thus theDCP is a recommendation (and Dot a requiferriont) ince Dot all Process operationscan e pactically accomplished ad still omply with tile DCP. For tis reason,perhaps the most important statement in all the standards is duplicated in bothANS-8J, (Sectior 41.2) and .19 (section 8.1) and reads:
"Before a new operation with Fissionable materials is begun orbefore an existing operation is changed, it shall be determinedthat the entire process will be suberitical under both normaland credible ubnormal conditions.
Note that the verb is shall" and thus this statement is a requirement.
Another way to appreciat te elative iportance of tese two statements in thestandayds, the should" in tile DCP ad the "shall" in eterminiog suberiticality,is to rcognize that the DCP is in reality a guide for the preferred way to provideassurance of subcriticality. Hugh Paxton, one of the original authors of both theNuclear Safety Guide and the original, 1964 version of ANS-8.1, stated this aboutthe DCP 71:
Double ontingencLfrinciple. Te so-called double-contingency principle isgenerally accepted as a guide to the proper degree of protection againstoperational abnormalities tat are improbably but still cannot be ignored. Thisrule calls or ontrols such tat no single mishap can lead to a criticality accidentregardless of its pobability of occurrence. It is understood, urthef, that thereshould be pyotection against chains of elated mishaps and gainst ombinationsof other abnormalities that cannot be considered improbable, Obviously, thisrather subjective rule oes ittle more than establish a point of view aboutcriticality ontrol - it cannot substitute for expert udgment. Experience andcommon snse usually provide the oly basis for classifying a conceivable mishapas likely" or unlikely", or for ruling it out as an impractical coDeept. Forexample, leakage between a water jacket ad the vessel that it srrounds may bein any oe of these categories, depending upon such things as material, type ofconstruction, and operating temperatures. Before leaving this subject, we shouldadd that a mistake in a record of chemical aalysis is hardly eer classed as a -remote possibility, because of the frequency of slipped decimal points andtranscription errors.
61 -

JAERI-Corif 2002-004
While one cannot prove that the recognition ad application of mportant practices suchas those stated above were the major reasons for the dramatic decline (see Figure Ibelow) of criticality accidents worldwide in te late 1960's. it is strongly suggestive.Discussions in the late 1990's between the US and Russian authors of te tird edition ofthe ocument, "A Review of Criticality Accidents", indicate tat the ussians also adreached similar conclusions as t these three motor points, Unfortunately criticalityaccident likelihood will ever each zero in spite of the best standards and Quides.However more recent standards provide expanded guidance that, if followed, shouldreduce the likelihood even frther. For example, particular aspects of two newerstandards, ANS-8.19 on administrative practices and, 820 on training, if implemented,might have prevented the recent riticality accident in Japan.
N Rus5ian Federation M United Stalas United Kingdom 00 a P a
45 50 55 60 65 70 75 ao 85 90 95
Figure 1: Reported Process Criticality Accident Worldwide 7)
CURRENT APPLICATION
Initially criticalitysafety in the USA was practiced uder the oversight of policies andprocedures at the individual istallations, with documents such as te Nuclear SafetyGuide ad the early ANS-8 standards eing the foundation for tese policies adprocedures, Beginning i te late 1960's in the USA, regulatory bodies began to issuedirectives that discussed criticality safety. These directives generally were consistent withthe guidance found in the ANS-8 standards, ut ot identical, Eventually it wasrecognized by te government agencies with criticality safety concerns, the NuclearRegulatory Commission ad the Department Of Energy, that it would be best to simplyendorse all the ANS-8 standards as te basis for criticality! safety egulation. Tat is thestatus today, with only inor exceptions.
The ANS-8 standards ave been used as the template for the. few existing iternationalstandards, e.g., ISO 1709 which is analogous to ANS-8.1 There are also aditional ISOstandards uder development which will prallel 819 and other ALS-8 standards.
- 62 -

JAERI-Conf 2002-004
SUMMARY
Essential guidance that was first documented in the 1950's, even before the firstcriticality accident in the USA, remains today as the foundation of criticality safety. Thisguidance is embodied in the ANS-8 standards in the USA and is accepted and endorsedby both regulatory bodies with oversight for operations with significant quantities offissile materials, the Nuclear Regulatory Commission and the Department of Energy.Many other countries also use the ANS-8 standards as a basis for their internal criticalitysafety guidance and regulations.
The historical record of criticality accidents strongly suggests that actions such asmaximizing the use of geometry control and defense in depth, which were heavilyimplemented in the 60's, were large influences in the dramaticdrop in the accidentfrequency from about one a year during the 50's and 60's to about one per ten yearsthereafter, as shown in Figure I on the previous page.
63 -

This is a blank page.

JP0250284JAERI-Conf 2002-004
REGULAIIONS FOR THE TRANSPORT OF NUCLEAR 17LTEL MATERIALINJAPAN
S. FU)"ACmtralResmdiInMftoMe=cPowerhx4suv(CRIEPI) 2-ll-11wad6k#aKomae-shiTokyo JAPAN
FaK: 8 3 3480 7950, a-inail: 1i*uda�aiepLdenken-orjp
As of-the end of July 001, nuclear power gero-ating cpacity towed about 45,000 MW in Japan, with 51 commercial power
reactors in operarion, And nudew power accounted k aout 3511/ of total genenited ekx*ichy in Japan. Fresh fiA and spent
fuel aw trat)spotted t*vwem nuclear power pi" and uclear fuel ycle facilities by �and and sea, MOX fuel transportation
from Europe to apart ws started in 1999, Vitrified high level wage (HLW) is timiTotted fom Europe pesiodically. Low level
radioactive waste eswated fron) nuclear power plants am transported to LLW burial site. uclear fuel materials and nuclear
wastes of toril amourb 2050 tones were 180 times transported Within J*V) in Wr In aXo1da"cewith the reform of
Japanese administmfive, aufliontie o anuar 6 2001, con4een athorities for- transportation of radioactive materials have
been changed, Competent aukwthes we Ministry of Economy Trade and rAish)( METI), Ministry of Education, ukure,
Sports, Science -and Jedmlogy(MEXI) and Ministry of Land, In&stiucture and Transport MM). Japanese competent
authorities revised ornestic iVilattons based on laws ibr transport of radioactive materials by June 15 in accordance with 1996
edition of1AEA Regulations for the Safe Thinsport ofRachoactive Material (ST-1), and those rq0ations. ave become effective
since July 1, 2001.
Key words: nuclear firs material, trwisportatiaii, regatation. systern, MEA ST I
1. INTRODUMONWlide apan has not blessed with rich energy resources, it is essential for Japan to ensure energy security
in order to sustain economic growth and social ativities To secure stable energy supply, establishing
nuclear 4el recycling has a val role in using and developing nuclear power Thaefore, it is esseTfid
and increasing its importance in the field of nuclear fuel cycle on safe and smooth transport among
various,, nuclear inel recycling facih-hes, emichment parits, re-conversion pants, fuel abrication plants,
reprocl,-;ssitig plants, �. In the nuclear fuel recycle policy of Japan, using plutonium fl=nal, flirt bums
plutonium in the form of mixed oxide fuel(MOX fuel) mth uranium in a Light Water Reactor, has been
positively considered with views to Wize plutonium generated by Spent fuel reprocessing and to
achieve more effective use of uarilum. Japanese government has a pnciple not to maintain excess
plutonium and from Aris pint of view, plutonium thermal use is te best way of utilizing plutonium.
Japariese government. based on the cabinet Woval "Promotion Plan for Developing Nuclear Fuel
Cycle, eb.4 1997", requested governors of tree prefectures, ukui, Fokushima and Niigata, where
nuclear power plants are luuw� to acept implementing plutonium thermal use at those power pants
and to assist it When local governments and local communities accept it, plutonium lbenrial use would
be promoted and it would be lead to a aw mount of MOX fuel transportation. But the implementation
of plutonium thermal use bas been postponed, as it was opposed at the resident refeiendum held in
Kartha-mura. village, Nugata prefecture on May 200 .
- 65 -

JAERI-Conf 2002-004
2. NUCLFAR POWER PLANI'S AND NUCLEAR FUEL CYCLE FACItIMS IN JAPAN2.1 Nuclear Power PlantsAs of the end of July 200 1, nuclear power generating capacity totaled about 45,000 megawatts in
Japan, with 51 commercial power reactors in operation. And nuclear power accounted for about 35%of total generated electricity in Japan. Them are 1 uts of the commercial power reactors underconstruction or at the stage of preparation. If those reactors are included, dm will be 61 uts i a,total generating capacity of about 57,000 MW
2.2 Nuclear Fuel Cycle Facilities'there are 2 nits of enrichment plants, one unit of re-conversion plant and 4 units of fuel fabricationplants in Japan. Almost a of nuclear fuel materials such as wanium hexafluoride (UF6) or uraniumdioxideRJ02) powder used in Japan are imported from abroad, and are prowssed in these nuclear fuelcycle facilities. The processing plant is under construction with the aim of starting operation on andafte Jy 2005, and spent fuel reception pools have been completed at presert Meanwhile, the
low-level radioactive waste(LLW) burial facility and the high-level radioactive wa.�W)management facility are both located in Rokkasho-mura village, Aorrion prefecture. The LLW burialfacility has been, in operation sce 1992, and the HW facility, i wich vitrified residue canisters
returned from France are kept, has been in operation snce 1995.
3. STATUS OF NUCLEAR FUEL CYCLE AND NUCLEAR FUEL MATER]ALTRANSPORTATION
3.1 OutfineTable shows the aount of nuclear fuel mawrials transported for nuclear power plaros and nuclear fuelcycle flicihties from 1996 to 2000. The arnount of fiesh fuel transported (tons of urainium) has beendecreasing snce 1996 due to reduction of initial core fuel for new power pants and promotion of high
bum-up fuel.Table mount of Transportation ofNuclear Fuel
(Unit: tons of uram1996 1997 1998 1999 2000
---- TQ �T T T QUF, 50 720 52 704 418 32 534 387
Fresh U02 etc 79 747 74 745 83 731 70 556 66 475
fuel Fuel 77 12)7 5 825 66 1101 65 902 64 1085Assemblies
Fresh fuel Subtotal 206 2684 177 2274 183 2259 167 1992 162 1947Spent fuel 22 199 9 127 6 69 10 107 9 102BLW(Unit: tons) 1 20 1 30 1 20Others 27 6 231 2.71 10 9T- NumbNOTEI.This table shows nuclear fuel aterials transported subject to confirmation by code, which are type A2-UF6 refers to enriched uanium hexafooride,
U02 refers to uranium dioxide, uranium trioxide and other uranium oxides,Fuel Assemblies refers to bundles Of U02 fuel and MOX fuel,
BLW refers to high4evel rachoacbve waste,Others refers to LLW (low-lever adioactive waste) etc.
ft I shows the current situation of major transportation of nuclear fuel materials in Japan.
66 -

JAERI-Conf 2002-004
------------Overseas - NaLural UF6
Enriched UF6e.g. Nuclear fuelFRANCE _ EnrichedU.S.A. UF6 cessing
lantsU02 powder
powder
Fuel assembliesI
U.K Spent Fuel
Low-level radioactive wasteffigh-levelRadioactive Waste
Bigh-level Radioactive Waste Low -level Radioactive WasteManagement acilifte Burial Facilities
,Japan Nuclear Fuel Japaki Nuclear Fuel Ltd.: Aomori
Fi I Current Situation of Major Transportation of Nuclear Fuel Materials
3.2 Transportation of Nuclear Fuel Uterials and Fuel Assemblies
Uranium for uclear fuel used at nuclear power plants is minly irnported. in either form of uranium
hexafluoride UF6) or umnium dioxide (UO�) powder from abroad, and is transported overland from
portstorespectvenuviearftwifabricationplants, IrnporWUF6ischangedintoetmchedUO2through
the etirichment process and the reconversion process, and finally becomes fliel assemblies at fuel
fabricationplants, SuchnuclearfuelmatmalsandfuelassernbhesarereguklyvansportedamongfueIcycle plants and nuclear power plants. Those materials and assemblies are mainly
transported by land sing links or trailers, bit some fuel assemblies are carried by ship depending upon
the location of the nuclear power pant
33 Transportation of MOX Fuel
The fast ipment of MOX fuel, mixture of uranium and plutonium oxides uel, for commercial use in a
light water reactor was cried out from Jy to October 1999, and ft econd sipment was
accomplshed by sea 200 ,
3.4 Transportation of Spent FelIn August 1999, transportation of pent W to the mprocessing plant of Japan Nuclear Fuel Ltd. located
in Rokkasyo-mum Village, Aomori prefecture was carried out for the first time, and calibration test ofbum-up monitors was conducted After te agreement on &a* assurance of the facility and
preservation of environment around was concluded aong local governments and Japan Nuclear Fuel
Ltd- which operates the plant, several shipments of spent fuel have been conducted by the ship of
exclusive use since December 2000.
3.5 Transportation of LLWLow-level achoactive waste prodw-ed. from operation and periodical inspection of nuclear power plants
is packed m drums mixed Path cemeM asphalt or other materials after reducing its capacity by buming
Afler temporary storage in exclusive storage houses, these filled ns am contained in shock-resistant
contaiiiers and sent to the IW bial site of Japan Nuclear Fuel Ltd, (JNFL) lowted at RoWasy0mura
Vilage, Aomon ptefecture
3.6 Tsportation of HLW
67

JAERI-Conf 2002-004
Liquid waste with high level adioactivity generated ftom reprocessing of spent fuel Is melted and mixedtogether with glass which is extretriely sable and they are poured into stainless steel canister forhardening These canisters have been transported several times, as it is arratiged that igh-levelradioactive waste generated from reprocessing pnt i abroad is to be ietumed back to Japan,Throughou tose shipments, canisters of BLW are contained in the transfx)rt packagitigs conforming to
IAEA Regulations for the Safe Tarisport of Radioactive Materials (ST-1), and the packages aretransported by ship, which emptied wh A40's SOLAS Convention and INF code (mlemationalregulations conceming saf� maritime transportation of Iradiated Nuclear Fuel),
4. JAPANESE COMPETENT ArrHORr]rY AND REGUI[AnON SYSTEM4.1 Competent AuthorityIn accordance with the eform of Japanese admirmstnitive authorities on January 6 2001, competentauthorities for tratisportatton of aoactive materials leave been changed. 'Ibrough te above
development, control for rxisportation. of nuclear fuel materials, used M'' commercial nuclear powerplants is executed currently for land tansportation under "Law on the egulation of Nuclear SourceMaterial, Nuclear uel Material and Reactors (Reactor Regulation Lawy' by Miniso ot Economy
Trade and Industry NETI) , Ministry of Land, infiastructure and Transport MUT) and Public WetyCommission, for marine ftwisportatton under "Ship Safety LaV'by WIT and Japariese Coast Guard,and for air tansportation under Civil Aviation Lw" by MLIT, respectively Fig.2 shows theradioactive material transport mode and regulation assignment, Meanwhile, the athorities cncerned
with transportation of nuclear materials,'Ministry of Fconorny, Trade ad Industry", Ministry of Land,Infiastructure and Transporf ', "Japanese Coast Guard", "Muristry of Education, Culture, Sports, Scienceand Technoloe', "National Police Agency" and "Fire Defense Agency", hold coordinating meetingsperiodically to discuss about countermeasures for safe transport and established safety measures to betaken in case of an accident ul February 19 84.
rLand Transports on Ministry of Econmy, Trade and ndusLry(METI)(Law on the Regulation of Radioactive Ministry of EdueRtior, Culture, Sports, Science ToehnologyNuclear Source Materials, packages Ministry of Land, Infrastructure and ransportNuclear Fuel Materislq and (Rules concerning Transport of Nuclear Fuel Materials OW�sideReactors)
Transportear Fuel Materials)
afety Commissionort of Nuclear Fuel MaWriais)
T- ansportnt d TransportMethod Storage of Hazardous,
Lstorage of Ha
TranspoAtell(TiMethod d Transport,Notification Of Law)Route
Fig.2 Radioactive Material Transport Mode and Regulation Assignment
68

JAERI-Conf 2002-004
4.2 Regulation System41.1 Safety Replation, on land TransportationMinistry of Economy, 'Trade and Industry (ME") executes tandards conceming safe transport ofnuclear tuel packages including "Rules concerning Transport of Nuclear Fuel Materials Outside Plants)'under Reactor Regulation Law and verities that nuclear thel packages comply wit te safi* standardsspecified in the rules upon each Occasion of such transport. These safety standards are establishedaccording to the regulations set up by the AEA so that sa&� is nsured not only ing normal
transport but also incase of erroneous cargo handling or traffic accidents, Upon confirmation of nuclear
fuel materials srict eview is executed by MFTJ to verify ffW Or design of packages complies with thesafi�ty standards, then design approval is given to those recognized as comp) ing- Then, it is confirmed
that the 'individua tansport container are fabricated to the approved design and maintained accordiney,
finally, approval for packages will be ssued Aer all these procedures, it is verified, upon each
transportation, tat the nuclear fuel materials housed comply with the approved design specifications and
they am housed in the approved containers before any ransport certificate is issued by respective
authority OtheotherhandMim-stryoflandlnfmstructureandTmnsport(MLIT)estabhshedmfi*
standards conct�ming transportation methods including methods of loading nuclear fuel packages onto
velucles sgns to be put up on vehicles and the maximum package per vehicle in the order of NUT,
"Rules for VehicleTransport ofNuclearFuel Materials" under Reactor Regulation Law.
41.2 Safety Regulation on Marine Transpomoon
For marine transportation, basically the same safety control system is applied as for land tansportation
Ministry of mid, Infi-astriteture and Transport (MI-170 as established sab* standards concerning
nuclear fuel packages and methods of transportation ncluding methods of loading onto the sup in the
order of MLIT, 'Rules concerning Marine Tmirsportation and Storage of Hazardous Materials" under
Ship Safi* Law. If it is recognized that the shipment is to be handled subject to Ship Safi�ty Law, MLIT
verifies, upon each occasion of loading that the subject packages and the tansportation method
concerned comply with these sa* standards As these safi�ly standards for nuclear fuel packages are
basically the same as those for nuclear fuel packages to be andled by tand transportation, those nuclear
fuel packages to be seamlessly andled through land and marine tramporution. are regarded as those
verified by WIT as stipulated by Ship Safely Law If they have been verified by Ministry of Economy,
Trade and Industry METI) under Reactor Regulation Law.
413 Safety Regulation on Air Transportation
Safety standards or air transportation of nuclear fuel materials are set out in. rles such as the order of
Ministry of tand, nfiastructure and Thmsport, Enforcement Order for the Civil Aviation aW' under
Civil Aviation Law
Fi&3 shows the code system concerning transportation of nuclear fuel materials.
69 -

JAERI-Conf 2002-004
Land Transportation -- FR-1,, �wo-rrnuing Transport of Nuclear Fitel Materials Outside Plants
Law on the Regulation of Nuclear vles for Vehicle Transport of .Nuclear Ftiel MRterialSource Materials, Nuclear Fuel
,Materials and Reactors-fOder �Pnc�r-dng Report on Tiaiispurt of Nuclear Fuel Materials
Rules for Actions in Emergency cncerning Transportation of NuclearI., forFFul Materials Outside Plants
Marine Transportation(Ship Safety LawAirTransportation
(Civil Aviation Law -(E-foreernet Order for the ivil Aviation Law
Fig. 3 Code System concerning Transportation of Nuclear Fuel Materials
4.3 Approval System in Japan
Japanese regulation systern has not only approval of package design, same as LNEA Regulatioifs
approval of package desigri, b also Tackage Approval". On each shipment competent authority
examine that each package meet regulation code, Exanining tems are shown below
- Package design sall meetregulation standards
- Each packaging she MM approved package design
- Each Package shall med regulation standards (contents adiation level,, contarnination etc.)
Licensees could get approval of package design and approval of each packaging beforehand. With tose
approvals, licensees do not have to submit docurnents expWmg packages confortnity to egulation and
could be approved by a pproval oWnization designated by compotent authority "Approval of
packaging" requires that each packaging Ls manufactured in accordance with approved package design
and maintained good condition F ig.4 shows the flow chart of confirmation of packages.
Application for ConfirmationPackages
Approval on the, basis of review to confirm whetherthe design weets tbe technical standards st by laws
Design stage Approval of si and regulationsfor the partictriar type, and quantitynuclear fuel pack of nuclear hie] materials to be txansported,
The individual packagings are approved aDdManufacturing assigned registratio DMI)OWS after confirmation of
Appr al of pack� ging the fct that they bave been manufactured instage 170:1191accordanee with the approved dsign. Those who
receive such pproval arc, obliged to undertake anynecessary maintenance ad control
Preshipment App al of design Before, actual tansportation, confirmaticni is made ofthe fac that th pckage is inaccordance with the
stage +Approval of packaging approved design and of meeting o the standardsConfirmation of package regarding te appearance of the package, surface
dose equivalent rate, leakage, etc.
transportation is acomplished by theSafe Transportation transporter wit te accompaDying vehicles,
including the leading vehijL4e, and guarding vehicles.
Fig.4 Flow Chart of Confirmation of Packages(the case of Land Transportation)
- 70 -

JAERI-Conf 2002-004
5. AmmoN o 1996 EDmoNoF L&EAsAFE TRANsPoRrREGULAITONsTO
JAPANESE REGULATIONSIn order to chkiance safety regulation, laws concerning transportation of nuclear fuel materials through
discussion by the Radiation Council, which were enforced after April 1, 1979, complying with
"Guidelines for Safety Standards for Transport ofRachoactive Materials" established in January,
1975 by the Atomic Energy Commission subject to the "Regulation for Safe Transport of Radioactive
Materials(1973Y' issuedbythelntemationalAtomicEnergyAgencyMEA)- Thiseffortwas
followed by aendment of the laws subject to the IAENs "Regulation for Safe Transport for
Radioactive Matorials (1985y", which amendment formed the former rgulations. Japanese competent
authorities revised domestic regulations based on laws for Vansport of radioactive materials by June 5
in accordance with 1996 edition ofRegulations for the Safe Transport of Radioactive Material (ST-1),
and those regulations have become eective snce July 1, 200 1. The revision was examined by both
Nuclear Safety Committee and Radiation Council. Japanese competent authorities will continue to
participate in the ongoing work of revising 1996 eition of IAEA transport regulation.
6. IMPLEMENTATION OF MANDATED REQU][REMENTS OF THE INF CODE
UNDERTHESOLASCONVENTIONSINCE2001
Up to the end of 2000, Japan had made an effort to ensure sip's sakty by issuing order posingnecessary requirements eivalent to the INF Code as well as additional domestic regulations.
Recognizing the situation of INF Code becoming mandatory from the beginning this year and te
revision of sakty replation policy on maritime ftwsport after critical accident curr-ed in Japan, INF
Code and additional requirements were incorporated into Ship Safety Law and its regulation, which
entered into force on January 1, 2001. Thus, Japanese competent authority has strengthened safi*
measure for mantime transport, in term of hull constructions and onboard euipments of ships carrying
irradiated nuclear fuel etc. as well as shipment approval systern.
REFERENCES
1 1 S. Hamada, S. Fukuda and I Nakazald: "Nuclear Fuel Material Transportation in Japarf Poc of
the 13 th International Symposium of the Packong and Tnsportation of Radioactive Matmals ,
Chicago 200 1), (in preparation)
[2] IAEA Safety Standards Series, " Regulations for the Safe Transport of Radioactive Material(ST-ly'
(1996 Edition)
71 -

This is a blank page.

JP0250285JAERI-Conf 2002-004
A UK REGULA:fORY PERSPECTIVE OF CRITICALITY SAFETY - PAST,PRESENT ANI) FUTURE
D N SIMISTER
HM PRINCIPAL INSPECTOR OF NUCLEAR INSTALLATIONS, HEALT14 AND SAFETY EXECUTIVE,ST PETERS HOUSE, BALLIOL ROAD, BOOTLE, MERSEYSIDE, UK, 20 3LZ
This paper reflects on past experiences in the development of the UK nuclear industry from acriticality safety perspective and identifies some key aspects which have helped to influence currentLJK industry practices and regulatory thinking, It will then identify a number of activities whichcontribute efectively to maintaining current high sandards of criticality safety and awareness andthen propose a number of areas which may be of importance to criticality practitioners and regulatorsin the future.
The Health and Safety Executive (HSE) is the load UK regulatory agency responsible for theenforcement of ealth and safety legislation at uclear sites in the UK. This includes inspection andassessment of safety arrangements and for controlling risks from criticality in nuclear plant.
Regulation of nuclear safety in the UK is largely based upon a permissioning licensing systemcombined with an overriding requirement to reduce risks to workers and te public to a level which isas low as reasonably practicable. The licensing system permits a lxible approach to criticalitysafety enabling the operator or Neensee to develop safety cases suited to lcal plant conditions. Theresponsibility for safety rests firmly with the operator and as rgulators HSE needs to be satisfied onthe aequacy of arrangements which are in place to ensure safety, In der to assist nuclearinspectors in orming a view on adequacy HSE has eveloped and pblished it Safety AssessmentPrinciples which describe goal setting standards for the design and operation of nuclear plantincluding aspects relating to criticality safety.
INTRODUCTION
UK regulatory arrangements
Risks to health and safety at nuclear sites in the UK are controlled mainly by theHealth and Safety at Work etc Act 1974(l), the Nuclear Installations Act 1965 2)and the lonising Radiations Regulations 1999(3). This regulatory framework setsout requirements for licensees to produce arrangements for safety cases todemonstrate the safety of operations and to demonstrate that risks to workers andmembers of the public have been reduced so far as reasonably practicable. ' TheHealth and Safety Fxecutive is responsible for enforcing this legislation in the UKand the Nuclear Installations Inspectorate is that part of HSE which undertakeslicensing, inspection and enforcement activities on nuclear sites. A key point to notein Nil's approach to regulation is that site licences and the onditions attached tothem are non-proscriptive and goal stting. This provides licensees with theflexibility to develop safety cases suited to local applications allowing practitionersto make best use of the arious methods for reducing the, risks from plant criticality.
- 73 -

JAERI-Conf 2002-004
Assessment and standards
An important part of HSE's activities is the production of principles and standards bywhich it can judge the adequacy of a licensee's safety cases. A starting point in thedevelopment of such standards is a reflection of current UK best industry practiceand a knowledge of what is considered acceptable internationally. HSE has alreadypublished two documents. The Tolerability of Risk from Nuclear Power (TOR) 4)and N Safety Assessment Principles (5) (commonly referred to as SAPs). TORconsiders the public perceptions and attitude towards risks and identifies thosewhich are considered just tolerable and those which are broadly acceptable. TheSAPs provide a framework for assessing the design, construction, commissioning,operation and decommissioning of nuclear installations and cover a range oftechnical disciplines including criticality, They are by their very nature, broadranging and goal setting. They set out undamental principles, dose and riskconstraints for normal and fault conditions and engineering principles, The SAPshave been published but are intended mainly for internal guidance for Nil assessorsand are not considered to be prescriptive or mandatory in the regulatory sense.
A common theme which runs across both the SAPs and TOR documents is theprinciple that risks to workers and members of the pubic must be kept as low asreasonably practicable - ALARP. This concept has been interpreted by Nil into aset of numerical design targets incorporating an Lipper level, the Basic Safety Umit(BSL - a level of tolerability beyond which actions must be taken to reduce risksand a lower level the Basic Safety Objective (BSO) which efines a point beyondwhich regulatory assessors need not necessary seek further improvements insafety. Between these two levels is the so-called 'ALARP'region where a safetycase must be made to demonstrate why further improvements are not reasonablypracticable.
HSE's Safety Assessment Principles, which are intended to be broad and wideranging, do not explicitly cover specific methods such as moderation control, ameans of criticality control. Safety Assessment Principle SAP P284 is the startingpoint for criticality safety assessment within the UK regulatory framework,Assessors and practitioners need to take account of the need to minimise relianceupon operational control for adequate control of criticality safety but to relypreferentially on passive engineered features, this is reflected i SAPs P61 andP62. The recent criticality accident at Tokai Mura in Japan has highlighted thedifficulties where arrangements rely upon operational control and has demonstratedthe need to include engineered safety features where practicable, HSE supportsthe use of a range of appropriate methods for criticality control in pant design, Asregulators we expect these aspects to be fully covered in the safety case.
HSE's starting point in assessing the adequacy of criticality safety cases is toidentify the extent to which elements of robust engineering design has been used inpreference to other measures such as operational control or probabilisticarguments. We have seen examples where it is not aways possible to designvessels or structures used for holding fissile materials entirely within the constraints
- 74

JAERI-Conf 2002-004
of safe geometrical dimensions. Reasons for extending the design scope beyondthis principle and for perhaps including neutron absorbers may include the need forcompliance with chemical engineering flow sheet specifications, the desire toeliminate ertain unlikely fault conditions and the need to provide additional diversesafety measures which result in defence in epth. The use of probabilisticassessments in criticality safety cases is encouraged to ensure that all likely faultsare identified and equally weighted, As regulators we have seen examples wherethe use of PSA becomes important if passive features are not possibie and indifficult cases we have accepted an approach based upon 'multi-legged arguments'.
Past criticality experiences
In 1957 one of the reactors at the Windscale site (now Sellafield) went on firefollowing a routine operation to relieve the build up of energy in the graphite core.The fire caused fuel melting and the release of radioactivity across the UK andnorthern Europe. The news programmes at the time showed milk being poureddown the drains, By today's standards it would have been classified as an INES event and it was and remains the worst nuclear accident in the UK's history.
As a result of this the Government of the day introduced the first NuclearInstallations Act in 1959 to provide regulation of the emerging commercial nuclearpower programme, but the complex at Windscale and the other UKAEA sites wereexcluded from the provisions of this Act. This Act was a licensing and Insurance Actwhich gave considerable powers to the Minister to regulate the nuclear industrythrough a licensing regime. The Minister was given powers to appoint inspectors toassist him in this licensing process and the Inspectorate of Nuclear Installations NIwas born. This lead to the Nuclear Installations nspectorate (Nil) as we know ittoday which was incorporated into the Health and Safety Executive in 1974 - anOrganisation which in the UK take the regulatory lead for most aspects of workrelated safety.
The early days of criticality safety in the UK were dominated by the UKAEA - agovernment rganisation charged with developing nuclear power in the UK.Criticality safety was characterised during the 1950's and 1960's by a number offactors including the lack of firm experimental data (it was often necessary toextrapolate from a few data points), the need for secrecy (where applications weredefence related) and a need to know basis, the absence of computation power andcodes and the urgent need to design, build and operate nuclear facilities. This hasleft practitioners today with a number of legacies - particularly the desire to imposelarge safety argins in the application of prudence and caution.
Criticality expertise was centred on the UKAEA's Health Authority and SafetyBranch (AHSB) at Risley, which encouraged amongst other things the developmentof Monte-Carlo computational techniques including the novel and unique use of'hole'geometry, eventually leading to the development of the UK standard codeMONK. This was augmented by experimental facilities centred upon the Dimplereactor at Winfrith which closed in the early 1990s. The AHSB also pioneered the
75 -

JAERI-Conf 2002-004
first programme of independent plant criticality inspections of nudear facilities whichis still encouraged today as an example of good industry practice.
Criticality safety in the UK during the 1970's and 1980's saw a period of rapidexpansion in terms of criticality safety practitioner numbers and activities beingboosted by an expansion of the nuclear industry, particularly the design andconstruction of the THORP Plant at Sellafield, new enrichment plants atCapenhurst, the New Oxide Fuels Complex at Springfields and the prospect of afamily of PWR reactors led by Sizewell - although planning permission wasgranted for a second PWR, economic conditions prevented further expansion of thisprogramme. A number of design improvements were aso introduced whichminimised reliance tpon operational control, for example, the introduction of pulsedcolumns based upon safe geometry in preference to mixer-settlers which reliedupon concentration control. This period also witnessedthe evelopment of moresophisticated Safety Mechanisms - sometimes in the form of non-destructive assay,equipment, used to estimate the quantity of fissile materials present in the process,Examples of plant applications are the Thorp hulls rrionitor at Sellafield and onitorsto assay plutonium contaminated materials (PCM)
The UK's record of criticality safety throughout this period was generally good withmany plants, such as the B205 Magnox reprocessing plant at Sellafield operatingsuccessfully. The one and only criticality accident in the UK occurred at the UKAEAWindscale site in 1971, This facility is now part of the 3NFL Sellafield site. Itshould be noted that this criticality had minimal onsequences ie no atalitiesbecause it was within a shielded facility but was partly caused by odifications tothe plant design, There have been a number of instances of loss of anagementcontrol (near-misses) where criticality was a possibility, An example, whichhappened at BNFL Sellafield in 1992 is fully reported in ref 6 in this case a largequantity of concentrated plutonium nitrate leaked out of an evaporator to form theso-called stalactites and stalagmites. One earning point frorn this incident was thatdespite the facility having a comprehensive safety case the fault/mal-operation hadnot been considered,
Present position
The field of criticality safety and other related areas such as reactor physics andshielding may be considered to be mature technical disciplines, This potentially hasboth advantages and disadvantages, The avantages for both practitioners andregulators include the fact that there is a good track record of operationalexperience and applications, an extensive set of good quality experimentalbenchmarks exist for most ndustrial applications and computer codes are generallywell developed to meet ost hallenges. The criticality code MONK and reactorphysics code WIMS enjoy a good international reputation ad are Widely sedoutside the UK. One possible disadvantages is the need to aintain nd recruitsuitable qualified and experience staff in order to support'key teams within ndustry,Even with a narrow area such as criticality there are further specialist areas such asnuclear data evaluation, code development, experimental practices, safety case
- 76 -

JAERI-Conf 2002-004
applications. It is important that the necessary key skills and competencies areidentified and maintained - this necessarily involves a urnber of non-technicalareas such as education, career rewards, progression and remuneration. In the UK,a new initiative has begun in 2001 as a result of co-operation between a number oforganisations which seeks to actively promote continuing nuclear education.
The UK has well developed arrangements to co-ordinate generic research intocriticality safety and other rlated issues through the echanism of HSE's NuclearResearch Index and the industry Management ommittee (IMC) (ref 7. Thisfocusses on generic safety issues and complements research initiated by industrywhich rnay be more commerc tally focused.
The nuclear licensing regime in the UK has been in place for over 40 years and isbased upon a non-prescriptive permissioning system and incorporates a number(36) of standard nuclear site ilcence onditions, some of which relate to criticalitysafety. Fundamental to criticality safety is the need for an adequate safety case(Licence Condition 14). Arrangements in the UK are working well and all relevantfacilities have current sfety cases which are subject to a system of peer review andupdating. Recent advances in safety case methodology have seen a move awayfrom standard 'criticality clearance certificates" and "nuclear safety assessments"towards a more holistic plant safety case which views criticality as one of manypotential hazards which might affect workers and the public - this has the advantageof including criticality safety assessment into a broader analysis of possible plantfaults. This aspect is regarded as important in balancing the overall risks from theplant, including hazards from criticality, so that the overall risk may be reduced to aslow as reasonably practicable (AILARP). This also has the benefit of concentratingscare resources on the hazards which matter most - we have seen examples asregulators where too many safety rules can have disadvantages as well too few.The application of balancing risks allows other methodologies, such as burn-upcredit, to be successfully introduced. Whilst the fundamentals of criticality are stillbased upon the double contingency principle and the need to provide diversity,redundancy and defence in depth, some operators in the UK have recently foundadvantages in developing approaches based upon design basis analysis -. focusingon engineering rather than PSA aspects and basket methodology which identifiesthe need for an adequate number of protection systems.
The UK criticality community continues to co-ordinate national and internationalactivities through the Working Party on Criticality which has successfully operatedon a voluntarily basis for over 20 years. The existence of such a group provides anopportunity for information to be exchanged between organisations for the benefit ofall, subject to normal commercial considerations. Effective se of scarce resourcescan be rnade when coordinating UK participation in nternational meetings, andbenefits can be gained by both industry and regulators in the development ofconsensus best practice guidance. Current topics of 'interest include emergencyarrangements to respond to radiation (criticality) accidents, the introduction of burn-up credit and the archiving of safety dose records.
77

JAERI-Conf 2002-004
Future
This section looks forward and identifies possible threats and opportunities forcriticality practitioners in the UK, Decision makers both in Government and ndustryneed to have an awareness of emerging issues which may need to. be addressed inorder to maintain and improve standards of criticality safety.
I Operational vs Engineered Control
An important challenge to criticality practitioners in the future may take the form ofincreasing the extent to which deterministic engineered controls are employed tocontrol criticality safety rather than placing reliance upon operational oradministrative systems, this is known in the UK as the SAP P1/P62 hierarchy andis a particularly important feature for new plants at the design definition stage. Asregulators we would expect to see a justification for each stage of the hierarchy ieremoval of hazard, passive design features, engineered controls, operational andadministrative arrangements. HSE's Safety Assessment Principles discusses thishierarchy of control and in the UK as regulators we see further opportunities toreduce risks from criticality to a point which is ALARP (as low as reasonablypracticable) - a concept which is built into UK egislation, Engineered improvementscould take several forms for example; re-designing or replacing existing processtechnology with improved methods, undertaking further safety case assessmentwork to further understand criticality scenarios thereby eliminates unnecessarycontingencies, replacing operator requirements by engineered controls or re-evaluating safety case requirements to reduce them from 'satety'status to 'good-housekeeping'. Such an approach may have a number of direct commercial andprocess benefits. As regulators we see advantages in focusing operators limitedtime to a few key safety principles which are important rather than being diverted bya multiplicity of low-level, sometimes unnecessary, procedures, A further socio-political challenge is to enhance confidence in the operation of the industry regulators by reducing the number of low-level infractions which result from anoperator reliant culture which may ultimately lead to reduced public and stakeholderconfidence.
11 Waste disposal
Regulators and industry in the UK are becoming increasingly aware of the futureneeds to address the issue of the long term surface storage and eventualunderground disposal of intermediate level waste (ILW) which may contain fissilematerials. UK Nirex Ltd is the rganisation which takes the ead for developing planfor disposal of the UK's radioactive waste inventory. Current estimates suggest thatthe fissile inventory of a future repository may include 20 te P (total) and te U-235 arising from various waste streams uch of which is in the form of contaminatedwaste materials. We have identified a nmber of regulatory issues which will needto be considered in the future including, stakeholder nvolvement - the need for
- 78 -

JAERI-Conf 2002-004
safety arguments to be understood by non-technical decision makers, passivesafety based upon engineered packaged designs, safety margins which reflect thepurpose and ission of the facility. There is increasing acceptance amongstpractitioners that it will be very difficult, if nol: impossible, to completely eliminate acriticality event in such a facility by deterministic engineered means, but the aimshould be to reduce the frequency of an acident to as low as reasonablyachievable and to minimise the risk of damage to the engineered barriers put inplace in such a disposal facility. An important aspect in this technical area isgaining an understanding of the likely consequences arising from a transientcriticality accident, The experiment facilities at Tokai Mura and other facilities inFrance and USA provide an important means to understand this phenomena andare assisted in this ode by theoretical advances in computational modelling bygroups such as that at Imperial College in the UK. The results of this work willprovide the public, regulators, practitioners and other stakeholders with theconfidence which is needed.
III Suitably qualified and experienced staff
Staff mature with the industry and retire, often taking a lifetime of experience andskills with them. In the future, criticality safety faces a number of possiblechallenges - two of current concern are the recruitment and retention of suitablestaff and the iplementation of a strategy for practitioners to gain skills. In manycountries, the nuclear industry may rio longer seen as an aractive opportunity for alifetime of employment (evidence may actually contradict this widely held view), theresult being that high calibre professionals are difficult to recruit and retain. Thismay lead to ageneration gap'where younger professionals may perceive limitedcareer opportunities and progression potential.. We have found that remuneration isone factor, but not the only feature needed to capture the imagination of potentialrecruits. Other issues which may need to be explored are a sound programme ofnuclear education offered at degree level, followed by suitable development andtraining leading to recognised professional qualifications which are both recognisedand transparent by both the individual and employers alike. A further possiblechallenge may be the provision of suitable training and experience for staff wishingto undertake criticality safety assessments. Experience has shown that it can takeseveral years for suitable practical skills to be gained either through on-the-jobtraining or through structured causes although the availability of trainingopportunities is becoming more limited. Opportunities may exist to address thesequestions on either a national or international basis. In the UK, a recent initiativehas been suggested to more formally structure and record continuing professionaldevelopment.
CONCLUSIONS
The UK has a good criticality safety record. This has been achieved through thedevelopment of soundly based industry practices and through engagement ofcompetent operational criticality safety practitioners operating within the context of a
79 -
JAERI-Conf 2002-004
strong but flexible regulatory regime based upon a rion-prescriptive licensingsystem. Examples have been given which highlight possible areas of future interestto criticality practitioners - but f there must be one mssage then this is the need forcontinuing vigilance in order to aintain high safety standards.
The views expressed in this paper are those of the author and not necessarily thoseof the Health and Safety Executive.
References
1. Health and Safety at Work etc Act 1974.
2. Nuclear Installations Act as amended 1965.
3. lonising Radiations Regulations 1999,
4. The Tolerability of Risk from Nuclear Power
5. N11 Safety Assessment Principles.
6. Leakage into the B205 plutonium evaporator cell at Sellafield. ISBN 7176-0721-6, HSE.
8 -

JP0250286JAERI-Corif 2002-004
DEVELOPMENT OF HURNUP CRF-DIT
EVALUATION METHODS AT JAERI
YASUSHI NOMURA, HIROSHI OKUNO AND KFNYA SUYAMAFuel Cycle Safety Evaluation Laboratory
Japan Atomic Energy Research Institute,
Tokaimura, Nakagun, lbarakiken, PC 311-1) 95, Japan
Fax., 81-29-282-6479, e-mail:nomtiragpopsvr.tokaijaeri.gojp
A guide material to introduce the burnup credit in Japan has been prepared and published by te name of a Guide
Introducing Burnup Credit, Preliminary Version. In this Guide, correction factors xpressed by C/E (ratio of
calculated isotopic composition to measured one) are pepared to apply to the results calculated by the ORIGEN 21
depletion code. A total of 3 sets of PIE data fom PWK such as 0brigheim, Genkai-1, Mhama-3 and Takaham-3
have been sed for this preparation, In addition, two smplified evaluation methods, "Equivaient Uniform Bumup"
and Equivalent Initial nrichment", have been developed and prepared to perfornr criticality safety analysis by the
ORIGEN2.1 depletion code ad te KENO-Va criticality code without ay detailed modelling.
Keywords: burnup credit, RIGEN2.1, KENO-Va, isotopic composition, correction factors, equivalent uniform
burnup, equivalent iitial enrichment
1. INTRODUCTIONRecently, it becomes evident tat light water rectors (PWR and BV*rR) are continually operatedto generate electric power in the long run in Japan, and spent fuel is more and more exhausted tobe accumulated. Most spent fuel is now stored in on-site wet storage pools, ad partly at on-sitedry storage facilities, In aticipation of lack of storage capacity in the next few decades, an
off-site intermediate spent fuel storage facility has been decided for operation from around 2010.
In addition, the first domestic commercial reprocessing plant is ow under construction and is
expected to begin operation from 2005.
In Japan, it is traditional to assume fresh fuel in criticality safety assessments for spent Rel
transport ad storage,� resulting in an excessive safety margin taken in the facility design.
hi consideration of the above situation, new challenges have emerged to introduce burnup credit
into criticality safety assessments among utilities and related industries for pursuit of efficient
facility design ad management of spent fuel storage and transportation.
In order to iplement burnup credit in the design and management of spent ftiel storage and
transportation systems A Guide Introducing Burnup Credit, Preliminary Version [1], has been
successftilly prepared and published by the Working Group o Nuclear Criticality Safety Data
(Leader- Professor Dr. YoshihiTo Yamane of Nagoya University) under the Special Committee
on Nuclear Criticality Safety with JAERI.
2. AN EXAMPLIFTED ANALVSIS FOR SPENT FUEL AMOUNT IN STORAGE POOL
Capacity of spent friel trarisporlation/storage an be increased by introducing bumup credit
when the available space is limited, thus mproving economic feature of the facilities. To make
sure of this statement, an aalysis has been made to illustrate how much spent fuel can be
- 8 -

JAERI-Conf 2002-004
increased per unit area by ntroducing burnup credit. As a result, it Is shown that about twiceamount of PWR spent fel could be stored i a water pool in assumption of 50 GWd/t burnupafter IO year cooling with fission products taken into consideration LI].
3. A GUIDE FOR INTRODUCING BURNUP CREDIT, PRELIMINARY VERSIONThis Guide states that it is pblished as a supplement to the Nuclear Criticality Safety HandbookVersion 2 2 in chapter 1. Basic principles and procedures for criticality safety assessmentintroducing burnup credit are depicted in chapter 2 as shown in Fig. . In chapters 3 and 4 aredescribed methods for evaluation of spent fuel composition and criticality safety. such asmethods to derive correction factors applied to nuclide composition data calculated byORIGEN2.1 and simplified methods called "Equivalent Uniform Burnup" and "EquivalentInitial Enrichment," together with relevant data and information. The last chapter containsimportant remarks for implementing bumup credit, together with methods to ensure burnu ofspent fuel during handling operation.
4 CORRECTION FACTORS FOR CALCULATED NUCLIDE COMPOSITIONCorrection factors have been derived to apply to the results obtained by ORIGEN2, 1, which isused world wide to calculate nuclide composition in spent fue 3 In this attempt, 38experimental sample data of spent ftiel from PWRs, such as Obrigheim, (renkai-I, Mihama-3and Takahama-3, are analyzed in combination with various nuclear data libraries to give (C/E),namely the ratio of calculated result divided by the experimental oe. The correction factor canbe chosen as the minimum value among (C/E)s given for fissile actinides, and as the maximumvalue among (C/E)s given for absorptive nuclides in respect of reaction with neutrons. Inaddition, the value of 1.0 is given to the correction factor whenever the mitrunurn value goesbelow 1.0 and the maximum value goes above 1.0 in order to assure further onservatism. TableI shows a list of the correction factors derived by the method described above. These factors arelisted in A Guide Introducing Burnup Credit, Preliminary Version.
4. EQUIVALENT UNIFORM BURNUP AND EQUIVALENT INITIAL NRICHMENTBased on the PWR spent fuel composition chemical analysis data measured at AFRI, two kinds of simplified
methods, "Equivalent Uniform Burnup" and "EquivaleDt nial FirriChMeDt", haVe been introduced for
simplified criticality safety evaluation of spent fuel storage pool ad traDSPOn C3SkS taking bUroUp Of Spent
fuel into consideration 41.
These simplified methods can be sed to obtain an eective neutron multiplication factor for aspent ftiel storage/traDsportation system by using RIGEN2,1 burtrup code and KFNO-Vacriticality code without considering axial burnup profile in spent fel and other various factorsproducing calculated errors. quivalent Uniforrn, Burnrip" is set up so tat its riticalityanalysis will be reactivity equivalent with detailed, aalysis, i wch tile xperimentallyobtained isotopic composition together with a typical axial burnup profile and various factorssuch as irradiation history are considered on the conservative side. On the other hand,"Equivalent Initial Erichment" is set up so that its criticality aalysis will be reactivityequivalent with detailed analysis sch as above when sed in the so called fresh, ftjel assumption.The methods to derive Equivalent Uniforrn Burnup" and quivalent Initial Enrichment" areshown in Fig.2 and Fig.3. Examples of quivalent iforin, Burnup" and quivalent InitialEnrichment", applied to a spent fuel infinite aay submerged in water simulating a storage pooland a spent firel transport cask, are illustrated in Fg.4 through Fg.7.
- 82 -

JAERI-Conf 2002-004
5. REACTIVITY EFFECT OF SPENT FEL DEPENDING ON BURNUP HISTORYComposition of spent fuel depends on various parameter changes throughout a bumup period.These parameters are the boron concentration ad its change pattern, the coolant temperatureand its spatial distribution, the specific power, the operation mode, and the inspection duration.The composition variation due to these parameter changes has been analyzed by the integratedbumup oalculation code system SWAT which was developed at JAERI. In addition, toestimate the reactivity effect caused by these composition variation, criticality analyses havebeen performed for an infinite array of spent fuel with the continuous energy Monte Carlo codeMVP. As a result, the parameters giving the aximum reactivity effect on the spent fuelmanagement system have been identified to be used for their criticality safety assessment takingburnuo credit into consideration 6].
6 CONCLUDING REMARKSA Guidefor Introducing Burnup Credit, Preliminary Version has been successfully prepared andpublished. Materials containing relevant data ad detailed consideration will be published soonto give theoretical d practical background to this Guide. Pesently, actirride only burnup credit(Level 1) has been introduced ad advancement will be nade with fission products dataavailable in the near future. Correction factors have been prepared to apply to ORIGEN2.1calculated results for PWR spent fuel nuclide composition. It is aticipated that those for BWRspent fuel should be obtained hereafter. Cticality experiments with fresh MOX fuel have beenconducted so far and the obtained data have been utilized to validate criticality codes for Level Ibumup credit application. To promote to Level 2 bumup credit application, criticalityexperiments with spent fuel will be needed. Finally, burnup monitor is mainly used at presentto determine bum-up of spent fuel prior to loading to storage pool and transport casks. Inconsideration of its complexity and tedious maintenance work, monitoring device should bereplaced by the methods referring only to reactor management data.
REFERENCES[1] Working Group on Nuclear Criticality Safety Data, Nuclear Fuel Cycle Facility Safety
Research Committee, "A Guide Introducing Bumup Credit, Preliminary Version", JapanAtomic Energy Research Institute, July 2001.
[21 Working Group on Nuclear Criticality Safety Data, Nuclear Fuel Facility Safety ResearchCommittee, "Nuclear Criticality Safety Handbook Version 2 Japan Atomic EnergyResearch Institute, March 1999.
[3] K.Suyama, M.Murazaki*, H.Mochizuki* and Y.Nomura, "Derivation of Correction Factorto be applied for Calculated Results of PWR Fuel Isotopic Composition by ORIGEN2Code", JAERI-Tech 2001-074 2001).
[4] Y.Nomura, M.Murazaki* and H.Okuno, "Introduction of "Equivalent Uniform Bumup" and"Equivalent Initial Enrichment" for Bumup Credit Evaluation", JAERI-Data/Code2001-029 2001).
[5] K.Suyama, T.Kiyosurni* and H.Mochizuki*, "Revised SWAT - The Integrated BumupCalculation Code System - ", JAERI-Data/Code OOO-027.
[6] T.Hayashi*, K.Suyama, H.Mochizuki* and Y.Nomura, "Reactivity Effect of Spent FuelDepending on Bmup History", JAERI-Tech 2001-041.
83 -

JAERI-Conf 2002-004
Determination of Burnup
t ze NO
valent Initial Enrichin
YES NO ze
Equivalent Unifo
ES
Determination of Determination of EUB
Depletion Calculation ( o Muiti-dim
Determination of Composition
IF -
Analysis for Single Un�it
NO
le Ana
nalysis for M
NO
Fig.1 Procedureforcriticalitysafetyevaluationofspentfueltransport
and storage system taking bumup credit into consideration.
84 -

JAERI-Conf 2002-004
Table I Correction Factors to apply to ORIGEN2 I calculated results
Isotope Obrigbelin Miliama-3 Genkal I Takahama-3PWR-U PWR-US PWR-U PWR-US PWR-U PWR-USPWR-UEPWR4lJ32
U-234 - 1.15 1.15 1.00 1,00 1.30 1.29U-235 U3 0.69 0.91 0.87 0.88 0.82 0.89 0.99U-236 1.09 1.10 1.06 1�07 1.00 1.00 1.00 1.00U-238 1-01 1.01 1,01 1.01 1.01 1.01 1.01 1.01Pu-238 1.49 1.59 1.00 LOI 1.00 1.00 1.10 1.00Pu-239 0,94 0.95 0.85 O�83 0.86 0.94 0.91 0.97Pu-240 1.36 1.23 1.08 1.01 1.00 1.00 1.16 1.07Pu-241 0.94 0.99 0.78 0,84 0.86 0.81 0.86 0.92Pu-242 1.85 1.96 0.94 1 M 0,87 0.86 0.93 0.99Arn-241 2.41 2.62 1.06 1.18 0,82 0.78 1.51 1.62
0.95
Upper bounding curvefor variation case
0.90
keffLower boundingfor base case0.85
0.80
BUequi. BU
0 10 20 30 40 50Bum-up (GWd/t)
Fig.2 Diagram to obtain "Equivalent Unifonn. Burnup" , where variation casemeans. criticality calculation considering bumup distribution with nuclide
composition measured by chemical analyses, and base case means criticalitycalculation considering uniform bumup, distribution with nuclidecomposition calculated by ORIGEN2.1 code.
- 8 -

JAERI-Conf 2002-004
6.0
5.0 (E)
4.0
Initial
Enrichment 3.0
(Wt%) F_ equi.
2.0 .4
1.0
0.0
50
40 6 0.7 0.8 0.9
30 Upper boundingcurve
20
Bum-up
(GWd/t) 10 BU
0
0.6 0.7 0.8 0.9
Neutron multiplication factor (keff)
Fig.3 Diagram to obtain "Equivalent Uniform Burnup", where variation case
means criticality calculation considering burnup, dstribution with nuclide
composition measured by chemical analyses.
86 -

JAERI-Conf 2002-004
35
(1) to 4)
30 in oder
Equivalent25
Uniform
Burnup(GWD/t) 20 ---------
15
10
51lo 20 30 40 50 60
Given burnup (GWD/t)
Fig.4 Correlation diagram of "Equivalent Uniform, Burnup" for an unit cell
infinite array system simulating spent fuel storage pool, showing the cases
(1) for actinides only with cooling, 2) for actinides only with 30 years
cooling, 3) for actinides plus fission products with cooling and
(4) for actinides plus fission products with cooling.
3
--la- (1) to 4)
in order
2.5Equivalent
LInitial
Enrichment
4
1.5 ------ --------- --- 1
L
LJ
10 20 30 40 50 so
. Given burnup (GWD/t)
Fig.5 Correlation diagram of "Equivalent Initial Enrichment" for an unit cell
infinite array system simulating spent fuel storage pool, showing the same
cases as in Fig.4.
- 87 -

JAEFJ-Conf 2002-004
35
(1) to 4)
in order30
Equivalent
Uniform 25
Bumup
(GWD/t) 20
715
10 7"
5.
10 50 60Given burnup (GWD/t)
Fig.6 Correlation diagram of "Equivalent Uniform Burnup" for a spent fuel
transport cask system simulating spent fuel storage pool, showing the same
cases as in Fig.4 and Fig.5.
3.5
(1) to 4) i4
in order iEquivalent 3 ---- - -
Initial 4Enrichment
(Wt%) 2.5 --------
72
10 20 30 40 50 6(
Given burnup (GWD/t)
Fig.7 Correlation diagram of "Equivalent Initial Enrichment" for a spent fuel
transport cask system simulating spent fuel storage pool, showing te same
cases as in Fig.4, Fig.5 and Fig.6.
- 8 -

JAERI-Conf 2002-004
Among the eleven samples, in this study, three samples (Sample No. 3 8) with different
exposures were selected for the present analysis. The irradiation power of each sample and the
irradiation time are described in the ref
3. Analysis Method
Two code systems of Japan and France were used for analyzing the PIE data. The Japanese3)code was SWAT that has been developed in JAERI SWAT is the code system to analyze
miclide evolution problenis by using SRAC 4 (a Japanese standard reactor analysis code) and
ORIGEN2 5) (a nuclide evolution calculation code). The nuclide evolution analysis code
system DARWIN () in France was employed. The DARWIN is the code system combined
APOLL02 with PF-PIN2. SRAC and APOLL02 calculate one-group effective cross section
for nuclide evolution calculation using collision probability method. The 107-group library
based on JENDL-3,2 and te 172-group library based on JEF-2.2 were used in the calculation
by SRAC and APOLL02, respectively. ORIGEN2 (Japan) and PEPIN2 (France) calculate
nuclide evolution. In the nuclide evolution calculation by SWAT, it should be noted that the
fission yield data was also improved by using JNDCFPV2 7) (JNDC Nuclear Data Library of
Fission Products, Second Version) from the original ORIGEN2 library.
4. Analysis Result
Table 41 shows the calculation results for the nuclides of which the C/E values exceeded
over 10%. The calculation results of the other nuclides were agreed with the experimental
values within a few %. It has to be emphasized, however, that in order to facilitate the
comparison between the codes, only a simple cell model was used, whereas for the
qualification of DARWIN, more elaborate models are used. Therefore the French C/E values8)in Table 41 are not exactly representative of the DARWIN actual qualification
4.1 ActinideFor 238PU, 243AM and 244CM, the calculations underestimated in both analyses.
Discrepancies were also shown between the Japanese and French results.
To clarify the reason of the discrepancies, at first, the results of two countries are
investigated. The generation amount of an actinide depends on (n,-y) reaction, (nfission)
reaction, (n,2n) reaction and (n,3n) reaction of not only the actinide but also the parent
actinides on the generation chain. Among those reactions, the (nj) reaction will be the most
important reaction. To examine the (n,,y) reaction, we introduce the probability of the (ny)
reaction, Pc. The Pc value was calculated by the following equation.
U'O= ,
U'.O+UfO+;L a, af a,
pc (n, y) reaction Probability, (Yc Capture Cross Section
Gf Fission Cross Section, a,� Total Absorption Cross Section
- 89

This is a blank page.

JP0250287JAERI-Corif 2002-004
THE REBUS EXPERIMENTAL PROGRAMMEFOR BURN-UP CREDIT
Pierre D'hondt, Klaas van der Meer, Peter BaetenSCK-CEN, Mot, Belgium
Daniel Marloye, Benoit Lance, Jacques BasselierBELGONUCLEAIRE, Brussels, Belgium
ABSTRACT
An international programme called REBUS REactivity tests for a direct evaluation of the Bum-Up credit onSelected iadiated WR fuel bijudles) for the investigation of the bum-up credit has been initiated by theBelgian Nuclear Research Center SCK*CEN and Belgonucl6aire with te support of USNRC, EdF from France,VGB7 epresenting German nuclear Utilities ad NUPEC, epresenting the Japanese indusiry- The programme"us to establis a neuronic benclukiark for reactor pysics codes. This benchinark wfll qualify the codes toperform calculations of the burn-up credit.
The bnchmark exercise investigates the following fuel types with associated bum-up:
• Reference 3% enriched U02 fuel• Fresh ommercial PWR U02 fuel• Irra&ated commercial PWR U02 fuel (51 GWd/tM)• Fresh PWR MOX fuel• Irradiated PWR MOX fuel 20 GWd/tM)
Reactivity effects are measured in the critical facility VENUS. Fission rate and flux distributions in theexperimental bundles will be dtermined. The accumulated bum-up of all rods is measured non-destructively ina relative way by goss gamma-scatming, wbile some ods are examiried by gainnia-specLToinetry for an absolutedetermination of te m-up. Sonie rods ill. be analyzed destructively we respect to accumulated bum-up,actinides content and TOP-19 fission products (i.e. those non-gaseous fssion products that have mostimplications on the reactivity). Additionally some irradiated rods have undergone a pofilometry and lengthdetermination.
The experimenta iplementation of the programme has srted in 2000 with major anges in the VENUScritical facility.Garnma scans, profilometry, length determination and gamma-spectrometR, easurements on the MOX fuelhave been performed, In the course of October 2001 the first fresh fuel configuration wU be investigated. In thesame period the commercial iradiated fuel will arrive at the SCK9CEN hot cells and wiH be refabricated intofuel rodlets of I nietet ength.
Key words: Bum-up Credit Critical Experiments.
1. INTRODUCTION
Present criticality safety calculations of iradiated fuel often have to model the fuel as freshfuel, since no precise experimental confirmation exists of the decrease of reactivity due toaccumulated bum-up. In other occasions only actinide depletion is allowed to be taken intoaccount and the ifluence of fission products has to be disregarded. The fact that this so-called"burn-up credit" cannot (completely) be taken into account has serious economicalimplications for transport, storage and reprocessing of irradiated fuel. For long-termgeological storage it is almost imperative to apply burn-up credit.
- 91

JAERI-Conf 2002-004
Therefor, an international programs called REBUS (REactivity tests o a direct evaluationof the Bum-Up credit on Selected iadiated LWR fuel bundles) has been initiated.The aim of this programme is establish an experimental benchmark for validation ofreactorphysics codes for the calculation of the loss of reactivity due to burn-up, both for U02
and MOX fuel bundles.The reactivity effect Of PWR 02 spent fuel will be measured in the VENUS critical facilityon a bundle of commercial spent fuel with a bum-up of 51 GWd/tM, The same will be doneon a MOX bundle with a burn-up of 20 GWd/tM. Other fuel types can be investigated infuture extensions of the pogramme, like BWFL fuel,At the same time we will measure fission rate and flux distributions in the differentconfigurations.Together with a precise measurement of the reactivity effect, it is also indispensable to have agood characterization of the fuel. The characterization of the spent fuel is performed in twosteps:The first step is nondestructive and is performed before the reactivity measurements, Allspent fuel rods will be easured by gross garnma-scanning in order to etermine thedistribution of total gamma ativity i the fuel rods. One specific od will be investigated bygamma-spectrometry, together with a well-qualified calibration source, to determine te 137CS
content and in this way the bum-up of the rod. Via the gross gamma-scans this will give agood picture of the bum-up of all rods, This first step is necessary to verify that the selectedrods have a similar burn-up.The second step is destructive and is consequently performed after the reactivitymeasurements. It aims at determining both the actinides content, some bum-up indicators (Cs,Nd) and the 19 most important fission products with respect to eutron absorption(representing >80% of the neutron absorption in the spent fuel), The sample for thisdestructive, radiochemical assay is taken from the same rod, on which gamma-spectrometryhas been performed,The fresh fuel content has been well-documented during fabrication,
2. SHORT ESCRI[PTION OF THE VENUS REACTOR
The VENUS critical facility is a water-moderated zero-power reactor. It consists of an open(non- pressurized) stainless-steel cylindrical vessel icluding a set of gids which maintainfuel ods in a vertical position, After a fel configuration has been loaded, riticality isreached by raising te water level in the vessel.Parameters that are measured with the VNUS reactor are te critical water level h, thereactivity coefficient Sp/6h . the axial fission rate distribution, the horizontal fission ratedistribution, spectrum indices F5/F9, F8/179, C8/F9, fission rate distribution, inside fuel rod,detector response and the delayed neutron fraction 0,,-
For details of the measurements performed in the WNUS we refer to reference [I], except forthe flux measurements that are described below.
92 -

JAERT-Conf 2002-004
r,- 1: T-1 d WI M itk 11A,
Figure 1. Vertical cross-section of the VENUS critical facility
Unlike the fission rate distribution, that is measured directly via the fission products created inthe fuel ods, the flux distribution is determined by the insertion of activation wires (e.g. Co)at several positions in the reactor in between the fuel rods and measuring the activity of thesewires after iradiatio i the VENUS facility. Te activation wires typically ave a length of Icm and are placed diagonally between the fuel rods in perspex tubes. The aim of the perspexis to perturb te water environment as little as possible with respect to neutron behaviour.The flux is derived from the measured activity of te wires. Since this activity is due to boththe thermal and epitheri-nal neutron flux, a certain amount of calculations] interpretation isrequired. However, this is limited due to the fact that more than 90% of the activity is causedby thermal neutrons,The flux distribution measurements will be performed simultaneously with fission ratedistribution measurements in order to make a comparison between the results of bothmethods. In te irradiated fuel bundles only flux distribution easurements will beperformed, since fission rate measurements are not possible on iadiated fuel.
3. REACTIVITY MEASUREMENTS PERFORMED AT VENUS IN THE FRAME-WORK OF REBUS
Five fuel bundles or assemblies will be investigated in the framework of the REBUSprogramme. These five bundles are:
* Reference 33% enriched U02 fel
* Fresh commercial PWK U02 fuel, fabricated by Frairratome ANP (formerly SIEMENS)* Irradiated cornmercial PWR U02 fuel (51 GWd/tm), originating from Neckarwestheim
NPP, Germany* Fresh PWR MOX ffiel, oiginating from the BR3, an experimental Belgian PWR* Irradiated PWR MOX fuel 20 GWd/tM), also from the BR3 reactor
All test bundles will be loaded as a 7x7 fuel assembly in the center of a 33% enriched U02
fuel driver zone. The 7x7 assembly is cosen because calculations show that such anassembly will result in a reactivity effect that is large enough or benchmark purposes 1500-2000 pcm) and for practical reasons because the VENUS eactor has removable grids wherethis assembly fits iti,The reference 33 eiched U02 fuel bundle consists of the same 33% enriched U02 fuel asthere is in the driver zotie, Its purpose is to validate a kw calculation,
9

JAERI-Conf 2002-004
The fresh commercial fuel bundle (figure 2a) consists of a 5x5 fuel assembly, The fue is3.8% enriched U02 fuel, fabricated at Framatonie ANP (formerly SIEMENS), Germany, It isthe original composition of the irradiated commercial fuel.The irradiated commercial fuel bundle is the same as te ftesh bundle, as is obvious forexperimental reasons (clean comparison of the fresh and irradiated bundle), The fuel isprovided by GKN, the operator of the Neckarwestbeim NPP in Germany,
Fresh[Irradiated U2
X Structure0 Fresh J02
Figure 2a, Central 0 U02 bundle
The fresh BR3 MOX firel bundle figure 2b) consists of 24 fuel rods (a 7 overmoderatedassembly), In this way the highest reactivity effect could be obtained with the available rods,
The fuel is 69% enriched fissile MOX fuel, fabricated at Belgonucl6aire, Belgium, It is theoriginal composition of the iradiated BR3 fel.
The irradiated PWR MOX fuel of intermediate bum-up originates from the BR3 reactor,
Belgium. The ffiel is provided by SCKeCEN, The bundle design is te same as for the fresh
bundle (figure 2b).
Fresliarradiated MOXX structure
0 H20
Figure 2b, Central 7x7 MOX bundle
The reactivity effect will be measured by loading te different bndles in the center of thedriver zone and measuring each time the critical water level and the reactivity effect of achange of the water level. From these measurements the reactivity effect can be estimated.However, a more direct way of validating the reactor codes is simply calculating the k,,ff forthe different configurations at the measured critical 'water levels, In this case there is no need
- 94 -

JAERI-Conf 2002-004
in usin asurement uncertainty on the
g te measured reactivity effect. which reduces tile eexperimental data ad increases the performance of the benchmark test.In addition of the reactivity MeWSI)Tements the fission 'fate distribution and the fluxdistribution at the main axes will be measured, Due t the impossibility of measuring thisparameters in the spent fel assembly, wire activation measurements will be performed in thisassembly to measure the thermal ad epithermal eutron flux.
Table I gives an overview of the measurements in the different configurations.
Table 1, Overview of measurements in the VENUS critical facilityconfiguration cr Ffi�a- �reactivty rate flux validation purpose
level effect distribution distribution_�eferen(_,-eU0, x x k,.fffresh U02 x x x x k,,ff and fission rateirradiated U02 X x in driver x k,,ff and fission ratefresh MOX x x x X k,,ff and fission rateirradiated MOX x x in driver x kif and fission rate
4. REFABRICTION AND MEASUREMENTS EROFORNIED AT HOT CELLLABORATORY, RADIOCREMICAL MEASUERMENTS
The refabrication of the commercial spent fuel rods from 4 meter rods into I meter rodletswill be executed in the SK*CEN 'hot cell aboratory. Afterwards the rodlets will be cleanedthoroughly, since the contamination level. of the VENUS reactor as to emain very low. Alsothe BR3 spent fuel ods have to be cleaned, but no refabrication is needed,After cleaning the rodlets will be assembled in the experimental 70 bundle. This isperformed at the hot cell of the B2, SCKeCEN's MTR.Details of the measurement techniques used in the hot cell laboratory and of theradiochemical measurements are given in reference [1].
5. PRELfWNARV CALCULATIONS
Some preliminary calculations have been performed to support the design of the bundles. Themain objective of teREBUS programme is validation of reactorphysics codes, therefore it isindispensable to create a reactivity effect that is significantly arger than the uncertainty of thecalculations. Since the uncertainty of the calculations is estimated to be between 300 and 500pcm 0.3 to 0.5 % on ktf), it is considered necessary to create an experimental reactivitydifference of aout 1500 pcm,Preliminary calculations showed a reactivity difference of 2135 pcrn for the high burn-upcommercial fuel mith respect to fresh fuel. For the MOX case the calculated difference isabout 1500 pem.
6. RESULTS
The fst results of the REBUS programme deal mainly with the caracterization of the fuel.The fresh firel, ods originating ftom the VENUS and RR3 (driver zone, reference ndle andMOX fel) ave already been used in previous benchmark programmes and theircharacteristics are well-documented. Additionally, the VENUS rods have been elongatedfrom 50 cm to I r and during this. elongation we took the opportunity to perform some extra
95 -

JAERI-Conf 2002-004
measurements with respect to the cladding inner and Miter diameter and the position of thelower end plug.The irradiated MOX fuel from the BR3 has been examined i the ht cell laboratory withrespect to gross-gamma scanning, burn-up by gamma-spectrometry, profflorrietry and firelcolumn lngth. Typical results are shown in the following figures.
SIX,�EN
Coal
SCK-CEN
The gross-gainma scan results show or certain MOX rods a rather high degree of Csmigration, indicating a high linear power during irradiation. Since tis Cs igration behaviouris not similar for all rods, we have to inake some adjustments with respect to te gamma self-
of 137Crabsorption for the 660 kV gamma pe, order to compensate the differences,
7. VALUE OF THE REBUS BENCHMARK
The critical water level of configurations in te VENUS reactor is IlleasUred with a randomuncertainty of 002 cm ad a systematic uncertainty of 005 to 007 cm, the latter being mainlydue to the uncertainty of the fuel bottom. So te total uncertainty is between 0,05 to 07 cm,whicb results in an uncertainty expressed in pcm of about 25 pnil (the reactivity effect of tepresent core is about 350 pin/cm for a critical level of 45 cni) Te random ncertainty issmaller, about 7 pcm,For the REBUS configurations the critical level will be in the range of 60 to 80 cm with acorresponding lower reactivity effect of the water level, resulting in a smaller uncertainty.However, due to te large reactivity effect between the fresh and spent fel bundle thedifference in critical height will be large, resulting in a change of water level reactivity effect,A simple approximation to determine te total reactivity effect Ap is shown in the followingequation:
96 -

JAERI-Conf 2002-004
AjO Ah, x Pah
where Ah,, is the measured difference in critical height for the two compared configurationsand ap/Ob the averaged value of the reactivity etTect of the water level.When due to the large difference in citical height the values of 6plah will be too different forthe two configurations, in principle an integration should be used for the determination of thetotal eactivity effect Ap:
k2Ap OP A'�
Oh
The uncertainty related to the measurement of the reactivity effect Ap in this way is estimatedto be 20 pcm, based on the present value for a lower critical value ( 0 pern), where the highercritical level will decrease the uncertainty, but were the high value of the reactivity effectwill increase the uncertainty due to the change of aplah in function of the critical height.
The uncertainty of the non-destructive 117Cs burn-up measurement is estimated to be 4 to 5%.
The uncertainties of the determination of the actinides, the burn-up indicators and the fissionproducts by radiochernical analysis are shown in the next tables:
Uncertaint] es iochemical an sis for the different actinides234U 5-10% 238 PU 3-10% !-5% cm 3-7%-"U 10.5-2% _11"�Pu _ ' 0. 2 -0. 5 % 247Am Y- I �O0/. �' �Cm 30-500/.236U 0,5-5% 79Yu___ 0.2-0.5% 243AM 2-5% __"'C�m -3-6%
_" �U 0.3-0,5% 0. 2-0 5% 245��M- 3-10%T9 �u7'0.245% Cm
"Wp__3-10%___2��_ 50%
Uncertaint es by radiochemical an sis for the different bum-up indic137cS 24% 143 Nd 0.5-1% '46Nd 6.54%
-'-"2 �Ce 5-10% 144 Nd 0-.5-1% I48 Nd 0.5-1%14Nd 0.5-1% l-$uNd 0.5-1%
Uncertainties by radiochemical analysis for the different fission products (TOP 1 9),
representing 80-90% o the anti-re ivity of al long-living fission pro et147 113EU
SM 0.5-2% 0.5-2% "'3n 10-20% 143Nd 0.5-1%
24% 154EU 2-5% 1,09 Ag 15-30% "'Rd- -0.5-1%1[7� s -0.5-2% T- 10-20% '--Gd 5-10% 2-5%0. 5 -2% _gy-o � 10-20% '03]?d 10-20% 131CS 2-5%
10.5-2% _M�Ru 10-20% 1 '08 Pd 10-20%
- 97 -

JAERI-Conf 2002-004
8. CONCLUSIONS
The REBUS programme will rovide an experimental benchmark for brn-up credit, takinginto account both fissile isotopes depletion and te production of neutron bsorbing fissionproducts. However, o distinction between both contribuants is possiblewithin the ftameworkof the programme.
With the results of the REBUS programme a validation of reactorphysics codes ith respectto bum-up credit of P" UO.2 fuel with intermediate and high burn-up will be possible.Based on the results of tis validation, and the quoted uncertainties of the experiment, safetymargins can be determined that have to be implemented for bum-up credit calculations,
The REBUS programme will be executed completely at SCK*CEN in its ot cell laboratory,radiochemistry lab and the VENUS reactor, All these facilities have already pi-oven theircapability to execute large-scale international benchmark exercises, like DOMO, ABC,CALLISTO (hot cells, radiochemistry), ARLANE (adiochemistry ad V, VEPO, VIPEX(VENUS reactor).
Future extensions of the REBUS programme can deal with BWR and high burn-up MOXfuel.
9. REFERENCES
[1] K. van der Meer et al., "REBU& A Bum-Up Credit xperimental Programme", IAEATCM on the Evaluation and Review of te Implementation of Burnup Credit i Spent FuelManagement Systems, Vienna, July 10-14, 2000�[2]H. Adachi, J. Basseller, L. Leenders, " `Burnoth�que` A Valuable Standard for AccurateBurn-up Determination by Non-destructive xamitiation", ESARDA IO, proceedings, p, 62, 1 stESARDA symposium, Brussels, April 1979.[3]D.F.G. Reber, B. Denecke, E, De Roost, K, van der Meer, "Standardization of a -0 GBq112, "tu extended volume source", ICRM Conference and International Symposium onRadionuclide Metrology and its Applications, Teddington, UK, 711 June,, 1993, NuclearInstruments and Methods in Physics Research A 339 1994) 334-338 North-Holland,
98 -

JP0250288JAERI-Conf 2002-004
Comparison of nuclide evolution analyses between Japanese and French codes
T. Iwasaki*, H. Hiraizumi*, G. Youinou**
Department of Quantum Science and Energy Engineering, Tohoku University
Aoba 01, Aramaki, Sendai, 980-8579, JAPAN
Fax, f-81-22-217-7908, E-mail. tomobiko.iwasaki�qse.tohoku.acjp
**Commissariat Li I'Energie Atornique (CEA)
Reactor Physics and Fuel Cycle Service, 13108 St-Paul-Lez-Durance, France
Benchmark problem ased on Japanese Post Irradiation Experiment (PIE) data was analyzed by Japanese nuclide
evolution analysis code and Fench one under the cooperative research prograta between the Japanese University
Association (JUA).in Japan ad Commissariat a 'Enegie Atornique (CEA) in France. Significant discrepancies
over 0% were fouud between the Japanese and French results for 119PU, 243 AM, 244CM, 25 Sb, 154 Eu, 134CS and
'44Ce. It was found that those differences were almost caused y the differences of the cross sections and the
fission yields, Furthermore, as for the effect to critical safety, multiplication factors were analyzed based on the
isotopic compositions calculated by the codes. However, no significant effect to the multiplication factors was
observed between Japan and French results.
Key Words: PIE, NUCLIDE EVOLUTION, SWAT, DARWIN
1. Introduction
Various analysis codes are being employed for nuclide evolution analysis in the world. To
improve accuracy of the analysis, it is useful to compare those codes, In this study, we have
compared the Japanese code (SWAT) ad the French one (DARWIN) under the cooperative
research program between the Japanese University Association JUA) in Japan and
Commissanat A IEnergie Atomique (CEA) in France. The data analyzed here is Post
Irradiation Experiment (PIE) data for the irradiated fels in the N41hania atomic power plant
unit-3 (PVvR) of the Kansai Electric Power Co., Inc.
This paper describes the PIE, the benchmark specifications for the PIE, the calculation
methods of both odes and their results, and the multiplication factor calculations. However, itshould be remarked that the results of the nuclide evolution alculations have been presented
in the ref 1 in details. Therefore, only the summary for the nuclide evolution calculations is
presented in this paper.
2. Post Irradiation Experiment (PIE) data
The PIE was arried out in the chemical department of the Japan Atomic Energy Research
Institute JAERI) for the research of the dissolution of high exposure fuels 2 Eleven samples
discharged from the Mlbama unit-3 and Genkal unit- I were measured in the experiment. The
feature of the PIE is sunrinafized in Table 21. Table2-2 shows the exposures of the samples.
- 99

JAERI-Conf 2002-004
(i) 238PU
The generation chain Of 8pU is in Fig.4-1. Table 42 shows the C/E(J/F) value which is
the ratio of the Japanese C/E value and the French one, and the Pc(J/F) value which is the ratio
between the Japanese and French values of the Pc on the chain. There was no difference for P.
between Japan and France in the chain of 238pU generation. Although the'fission probability
(Pf), which was similarly defined as P., was also examined, there were no significant
differences in the PKJ/F) values. For 238pU, two other generation paths exist. One is the (n,2n)
reaction of 239Pu and the other is the decay from 242 Cm. The examination were perforined for
the two paths. As the results, both paths have little contribution to the differences of the 238 Pu
amount. More study should be done for understanding the discrepancy of 231-li.
(2) 'Am
The generation chain of 243 Am is in Fig.4-2. The comparison of P. for 243 Am is shown in
Table 44. Except for 242Am, there was no difference between Japan and France. The Pc(J/F)
value of 242Am 0.93) was considerably small than 1. The Japanese P, value was low than
the French value. It is supposed that this difference of 242'Arn resulted in the C/E discrepancy
Of 243AM (C/E(J/F)=0.93).
(3) "CmOf 244CM from 243AM is 244The generation chain in Fig.4-3. The Pc(J/F) for Cm is shown in
Table 45. There was no difference between Japan and France, in the P. value of the isotopes
on the generation chain from 243AM to 244CM. It is supposed that the difference between Japan
and France for 244CM is caused by the same reason a 243 Am, i.e. the difference of the capture
cross section Of242mArn.
4.2 FP
To investigate the reason of the discrepancy of 12'Sb, 154EU, 134CS and 144 Ce, we examined
the cross section and the fission yield. Table 46 shows the C/E value when the cross section
library of FP was changed to JENDL-3.2 from the ORIGEN2 original library, and the fission
yield data was varied from the ORIGEN oginal library to JNDCFPV2 in the ORIGEN2
analysis.
(1) 125Sb
It is found from Table 46 tat the C/E value was changed to 118 from 219 by using
JNDCFPV2 as the fission yield data. The Japanese C/E values were Dearly I by using
JNDCFPV2 as the fission yield library, although the French values were frorn 134 to 197.
Newer fission yield library is useful for mproving the accuracy of te uclide evolution
calculation of 125 Sb.
(2) 154 EU
It is observed from Table 46 that the C/E value was changed to I 14 from 201 by usingJENDL-3.2 as the cross section library of FR The Japanese C/E value were early I y using
JENDL-3.2 or the cross section library of FP, although the French values were fom 1 .23 to
1.80. For FP nuclides, it is important to use new cross section library.
100

JAERI-Conf 2002-004
144ce(3) "'Cs
The Japanese ad French C/E value is lower tan 0.75-0.9 1) for igher exposure samples
(Sample 3 ad 8), although the value for sample I was almost 1 Te C/E value did not change0largely by te change of the cross section library of FP and te fission yield library as shown
in Table 46. The difference was amost I % arId was not larger tan those of 25Sb and 54 Eu,
however, aother study should be perfortried in both countries.
5. Analysis Related to Critical Safety
The dference of the isotopic compositions between Japan and France may influence on
multiplication factor. Therefore, we performed the calculation of multiplication factor at the
end-of-irradiation by using SRAC. In the SRAC calculation, the isotopic composition wasin a p cell geometry and the two multiplication factors based on the two
cons) In
compositions calculated by Japan and French codes. The results were shown in Table 5-1 As
shown in the table, the differences are very small. Although the code difference between
Japan and Fance produce significant difference for several uclides, it is confirmed that the
difference of isotopic composition owing to the code difference does not cause the difference
of multiplication factor. As for critical safety, no significant difference exists in the nuclide
evolution analysis of both.
6. Conclmsion
We compared the miclide evolution calculation codes that have employed for the analysis
in Japan and France widely, in order to improve the accuracy of those codes. The largediscrepancies of /E over 10% wre found for 238pU, 243A1r,, 244cM, 125 Sb, 154EU, 134cS and
144Ce. It Is spposed tat the difference of C/E for 243 Am an(I 244 Cm between Japanese results
and French oes is due to the (ny) reaction of 242Am. The C/E values for sSb and 114EU are
improved by changing the cross section and fission yield libraries. For 238PU, 134CS and 144 Ce,
extensive studies should be performed. Furthermore, as for te effect to critical safety,
multiplication factors based on isotopic compositions calculated by each code were analyzed.
But, no significant effect to multiplication factor was observed.
Acknowledgement
The athors would like to express the grateful thanks to Dr. K.Suyama of JAERI, for his
helpful COMments and sggestions.
References
[1] T. Iwasaki, H, Hiialzi-Yrrui, G. Youinou, "Analysis of Recent Post Irradiation Tests by
Japanese and French Burriup Analysis Code Systems" Nuclear Data for Science and
Technology, October 712,200 1, Tsukuba, Japan, 200 )
[2] T. Adacbi, et al, "Dissolution Studies of Spent Nuclear Fuels," JAERI-M 91-010, Japan
- 101

JAERI-Conf 2002-004
Atomic Energy Research Istitute (JAERI), (I 99 1).
[3] K. Suyama, T Kiyosuini, H. Mochi7uki, "Revised SWAT -Tbe Itegrated Burnup
Calculation Code System," JAERI-Data/Code 2000-027, Japan Atomic Energy Research
Institute (JAERI), 2000)
[4] K. Okumura, K. Kaneko, K. Tsuchihashi, "SRAC95; General Prpose Neutronics Code
System," JAERI Data/Code 96-015 Japan Atomic Energy Research ffistitute, (I 996)
[5] A. G. Croff. "ORTGEN2 -A Revised and Updated Version of te Oak Ridge Isotope
Generation and Depletion Code," ORNL-5621, 1980).
[6] A. Tsilanizara et al, DARWIN, an evolution code system for a large range of application",
ICRS-9, Oct, 1999, Tsukuba, Japan, (I 999)
[7] K. Tasaka, J. Katakura, H. hara, et al., "JNDC Nuclear Data Library of Fission Products
-Second Version-" JAERI- 320, 1990)
[8] P. Marimbeau et al, Tlie DARWIN fuel cycle package -- rocedure for material balance
calculation and qualifications', ENC'98, Oct. 1998, Nice, France, 1998)
Table 21 Feature of PIE (Mihama unit-3) Table 22 Exposure of Each Sample (MWd/t)
Reactor Westing-House type PVVR Reactor Sa2jELe No, MWd/MtU
Electric Power 826 Mwe 1 6900
Thermal Power 2432 MWt 2 15300
Fuel l5xI5 3 21200
Core Diameter 3.04 m 4 146Mjhama-3Core ActiySjLei�t 3.66 ui 5 29440
Fuel 6 32300Clad Zr-4 7 33700
Pellet Diametei 0.4645 cm 8 1 34100Clad Diametef 0.5360 cm
Irradiation Time 1978-1982Measurement Time 1986-
Sample 9 samples 6900-34000 MWd/tU) Table 4-i UE25 i-mclides .......
23'Tj,236u,23Ftj,237NP,239PU,239PU fisotope Samplel - Sample3 Sample8Measured 240p,,,241 PU�242 P,,,?4?AT)1,243 Am 238pU Japan rance Jap.,[F�.,c, Japan France
242CII 244C,,,�) OOR, 1 12�"Sb,114C, - 0.84 0.94 0.69 0.75 0.81 0.87Nuclides MA ?43
137c, 143Nd,144ce,144 WNd Am 0.56 0.62 0.75� 0.80 0.88 0.91Nd, ?44c
346Nd, 14'Nd,'�"Nd,'54Ej T_ 074 0.87 0.55 0.61 0.65 0.69__J 125Sb U.,)q 1,34 0.98 1,59 1.09 1.97
"4Cs 093 1.01 083 0.86 0.88 0.91144Ce 1. 03 1.03 0.86 0.86 0.75 0.76
1,23 0.74 1,32 0.87 180
- 102

JAERI-Conf 2002-004
Table 42 Ratio of P, on the chain of738N, Table 43 Amount at the en
C/E(J/F) ?,(J/F-) Sainplel Sauiple3 Sample8
MU IM 0.98 WCm 5.85E-02 4.14E+00 1.58E+01
?36u 0.99 1.00 21SPU 2.82E+00 3.62E+01 1.40F,+02
217Np 0.97 1.00Table 45 Ratio of P, on the chain of 744Cm
?-8Np
21 UE(J/F) PjJ/F)'Pu 0.92 IM243An 0.93 1.00
Of743 21AIII -Table 44 Ratio of P, on the eftain Am 244cm ioi--------- -
C/E(J/F) P�(J/F)
238,u LOD 1.01Table 46 C/E at Changing Library in SWAT
239L, -
239N Cross Section ORIGEN2 JENDL-3.2 OGEN2 JENDL-3.2
231Fj 0.98 1.01 Fission Yield ORIGEN2 RIGEN2 NDCPPV2 NDCFPV2
240PU 0.99 1.00 125sb 2.19 116 1. ig 1.16241 PU 0.98 1.02241PU 0.98 1.00 154Eu 2.01 1.14 1 96 1.12
243N - - 134cS 0.99 0,97 0.99 0.96
241 0.98 1.00 144Ce 0.83 0.83 0.84 0.84242mAU, 0.87
243 Am 0.93 1.00
Table 5-1 Difference of multiplication factors by French and Japanese codes
Samplel Sample3 Saniple8
k (Japan) 1.2684 1.1445 1.0642
k(France) 1.2692 1.1471 1.0625
k (Japan - (France) -0.0008 j -0.0026 0.0017
r2A2CM 241 Am 242mAM 243 Am
239pu 239PU
Fig.4-1 238pU generation chain Fig.4-2 243 Am generation chain
2L�"Am��-AQ
Fig.4-3 244Cm eneration chain
103

This is a blank page.

JP0250289JAERI-Conf 2002-004
High-precision Analog Type Neutron Monitoring System
NAOTAKA ODA, YOSHIO KITA-'AND KAZUYA ISHIZAWA**1Toshiba Corporation Power Systern Services Company,
8, Shinsugita-cho, lsogo-ku, Yokohama 235-8523Fax�91-45-770-2054,e-jAiailiiiaotaka.oda�tohiba.cojp
Toshiba Corporation, Fricho Operations-Powet Systems,1, Toshiba-cho, Fuchu-shi, Tokyo 13-8511
Fax,- 81-42-333-0144 , e-niail: yoshio.kitaCo-�toshiba.cojpToshiba Corporation Display Devices Components Company
Shinioishigarni, Otawara-shi, Tochigi 324-8550Fax: 8 L-287-26-6061, e-mail: kazuya.ishizawa�toshiba.cojp
An analog type neutrort monitoring system has been developed. that is applicable to criticality safetymanagement. Te measurernein range can be set to ecades 10';-10" [s "j). Yhe system consists of detector andmeasurement equipirient. Absolute accuracy of set point omparison is achieved as within ± 3 %] by preparing twoparts of circuit for exclusive se in (his system. One part is for an indication and display and another is for setpointcomparison, respectively. Moreover, B oated type j)eirtron proportional counter has been developed, that isapplied high adio frequency (RF) sputtering process for on oating, With te detector and simplifiedmeasurement equipment, the system has seismic-proof performance and is applicable to a safety system-
Key words: neutron monitoring, neutron detector, boron coating, re-processing facility
1. IntroductionFor citicality safety management, monitoring the inventory of truclear-fissile material on real
time is desired. For instance, an effective example is reported that applied the neutron monitoringsystem to confirm the criticality safety i re-processing facilities. This system measures the
neutron induced by plutonium P and onitors the Pu inventory. Generally, no special
functions are equired for this neutron monitoring system except for neutron measurement and
set point comparison. That means, it does not eed he high-clas-, measuretuent ment that is
added the superior intelligen fnction. According to such a situation, the analog type neutron
monitoring system as been developed, that is strengthened with the required function rationally.
This paper shows the required specification, contents of development, and verification results
about the system.
2. System Requirements and Target Specifications
The following is 'st required to satisfy as necessary and enough conditions, when measuring
the neutron from Pu by a nentron monitoring system.
1) To have sufficient sensitivity for measuring the inventory of Pu
2) To take a wide ineasurernent range.
3) To have general functions as an instrumentation system (such as comparison measured
value with set point and interface with the other system)
Thus, the system requirements have been limited to the function of necessary minimum. Thereby,
the system equipment can be simplified. This will make the system:
4) To have seismic-proof performance and to be applicable as a safety system.
As mentioned above, four requirements equirements fin 1) to 3 and item 4 added) were
determined as a development target of the neutron monitoring system.
- 10 -

JAERI-Conf 2002-004
In order to attain these requirements, high-class measurement equipment with the intelligentfunction does ot need to be applied. For this rra6ort, the ineas-urenwirt eqiiJpJT),rn was planned obe constituted of te analog circuit specialized in the above-inentioned equirements.
Detail target specification is sown below.
2.1 SensitivityIn order to easure neutron by high sensitivity, we examined applying nutron proportional
counter (called as "NPC"). Two 2) types are examined: helium-3 nclosed type 3He type) andC 3Heboron-10 coated type OB type)� We call th , type neutron proportional counter "NPC-H" and
"13 type "NPC-B." The target of sensitivity was specified into, NlIC-K 14 [S-1/(CM-2 _ S-1) ] andNPC-B 39 [s_1/(CM-2_S-)] in the case that die active length is 500 nun] for te detectors.
2.2 Measurement rangeThe measurement range as been decided as decades from O-' to 104 [s-'] su that the pulse
from NPC can be masured in a large range. Te lower limit of a range is etermined as thevalue that can constitute an integration ircuit with an analog system, in onsideration fstatistics fluctuation. Te range of decades has been set up as can curry ut measurement of telarge range.
2.3 General FunctionThe system compares measured value (count rate) with set point value, In the case that the
measured value exceed the set point value, output alarm) signal will be transmitted to external.The target of set point coorparison accuracy is set to ±31-%]. Moreover, it could be made totransmit the measured value ount ate) as te external output Te system ends ot the xternaloutput signals via fiber optics. Tis can avoid forming a large electric ground loop between tesystem and the external so as to have noise-proof perforinance.
2.4 Seismic-proof Performance (application as asafety systern)The development target wws to achieve the aove objectives Wthout using iby CJPJP1Jha,'_ed
apparatus. This can add the additional function to the target so tat te systern is possible to he anapplication as a safe system, Te additional function is elst-nic-proof erformance.
3. Development and Verification ResultsThe development targets are arranged in Fig. .
Fiber 02tlcklp The otherSystem
�High Sensitivity 01 5 decade range(2)5 decade range (2DSet point accuracy 3[%]3 Seismic-proof (DEJ0 conversion
tseismic-Proof
Fig.1 Development Target of the Neutron Monitoring System
106 -

JAERI-Cod 2002-004
The contents of development of detectors (NPQ and measurement equipment are shownhenceforth.
1 1 Detector Table I Neutron Proportional Counter Specification3.1.1 ensitivity Iterns Detect
To achieve high sensitivity NPC-H NPC-B 8-10)---- 4a He-�3
measurement, we ave developed �_�Ace�tive terial 3-10two kinds of eutron proportionalcounter (NPC) oe is hell'urri-3 Enciosed Gas He-3 Arenclosure type (NPC-H) and Case Material SUS 304another is boron-10 coated type Outer Diameter 25A fmml(NPC-B) A current amplifier is Core Wire Material Ptapplied or the eector signal Acceptable Gamrna 2.58X 1 0 1,29 xi 0input portion of te easurement Dose Rate [C �g-lh-'] [C kg-1 -W
(10 [lhl) 1 (500 [iln]) Iequipment to decrease an Sensitivity 39 fs-1 /(crr-2 s')] 5.5 [S-'/(Cm-? s1)]influeDce of gatruna ray, (See (Active length (Active length3.2.3). Hence, neutron 5001111ii) 500MM)measurement under high ganunadose rate all be achieved. Thespecification of the developed detectors is shown in Table- This shows that the sensitivity hasexceeded the target.
3.1.2 Seismic-proof function Table- il Seismic-proof Test ConditionThe detectors have the same Tests Frequency Acceleration
structure except active aterial and Vibration Test 25[Hz] Horizontal:enclosure gas sown as Table I -7.8[m/s'] (0.8[G])They are designed to have the spiral Vertical:part in the part of the core wire and -3.9[m/s2] (0.4[G])the mechanism is considered to 490[M/S2, (50G)absorb vration. The structure isdesigned as seismic-proof. Moreover, mechanical strength was raised, having used the detectorouter case as stainless steel. In order to carry out coating of B to inner stainless steel pipe, thehigh radio ftequency (RF) sputtering process as been developed r1l. Thereby, uniform and strong10B coating has been attained.
Furthermore, it has been verified that the developed detectors have sersirlic-proof function bycarrying out a vibration examination. The conditions of the vibration examination are shown inTable- 11 .
3.2 Measurement Equipment3.2.1 Wide Measurement Range and High Accuracy
The measurement equipment requires conflicting functions as measuring a wide range withsufficient accuracy. Generally, accuracy is decided as the relative value that depends on the fullscale in an analog circuit. For this reason, if the range is requested to be wider, the absoluteaccuracy will become severe. Therefore the range must be narrowed, to improve the absoluteaccuracy.
In order to solve this inconsistency, the developed system has the composition that prepares
- 107 -

JAERI-Conf 2002-004
two circuit parts of exclusive use; one is the indication and display part and another is the setpoint comparison part, respectively. The indication and display pail easures a large range byprocessing logarithmic data. The set point comparison part can measure precisely by narrowinga range and linear data processing.
For example, it is possible to have relative accuracy of ± [%] full scale in the case of a
range 0300 [s-']. This relative accuracy can realize absolute accuracy as ±3 [%I at 00 [s-1]set point. By this circuit composition, the measurement range has been able to be set to decades of I -1 _ 104 [s-I], and absolute accuracy of set point comparison to ± 3
3.2.2 Statistics Fctuation and ResponseMoreover, a response of set point comparison is desired to be fast generally. Here, a
response and a statistics fluctuation of radioactive measurement have the following correlation.1
C = 0)
where cr : the standard deviation of statistics fluctuation, n: count rate [s-1], and r time constantof the counting circuit [s].
For monitoring the value and operating a plant, it is desired that the statistics fluctuationwidth is small and the response is fast (the time constant is short). However. these conflict fromthe equation (1). Hence both and 'C that relate with monitoring and plant operation shallbe set up pertinently. Considering the response of a re-processing pant process value., we madethe time constant into 100 [s] in the development. In this case, 3 becomes under 30 atcount rate I sl]. This value is acceptable for the plant operation.
3.2.3 General FunctionThe system. composition of the developed measurement equipment is shown in Fig. 2.
et po ntCompareCircuit LED
From (Linear) Fibera detector :)Setpointaccuracy 4-31%) ara e to Optic
Range 300[s-1 Seria� 0Set point 1 00[s- 1
(for the development T te otherCurrent Amplifier ime constant - 00[s] System
and Pulse Shaping n cat on
Circuit(Log)
(D5 decade rangeIndi and Display
Fig.2 Circuit Configuration of Developed Neutron Monitoring System
In order that neutron monitoring system may process a minute signal, CODSideration of the
- 10 -

JAERI-Conf 2002-004
measure against noise is needed. We consider the following items as the measure:a) To pply coo-ent amplifier for the detector signal aplitudeb) To transinit (lie signal to external system via fiber optics
a) Current AmplifierInpu ipedance is decreased as 75[01 by applying a current amplifier. This has higher
noise-proof performance than a capacitor aplifierHere, bias voltage for NPC-B is different from one for NPC-,H. Te developed system is
for NPC-B. In applying NPC-H, what is necessary is just to change the power supply andrelated ircuit that an supply higher voltage.b) Interface with the Other Systern
It is anxious about the influence of the noise from the exterior. Therefore, concerning aboutthe interface signal (nieasuyeinent value and bit signal), the iiiethod is applied, that carries outelectrical to optical conversion of this as a serial signal (digital ignal). Serial conversion iscurried ot without using software, only using hardware. By carrying out optical-electricalconversion in a reception side, the signal will be able to be transmitted to any specified interface.This could prevent the neutron monitoring system from constituting the large electric groundloop with the other euipments.
3.2.4 Seisfffic-proof FunctionThe same vibration test as examined to the NPC's shows that, the equipment has
seismic-proof.
4. ConsiderationWhen applying the system developed into a plant, such as evaluation of neutron-flux level
and check of noise will be examination subjects.
4.1 Evaluation of Neutron Flux LevelBy Pu isotope composition and the amount of actinides, even if it is the same amount
(concentration) of Pu, the amount of neutron generating will change. Moreover, if a geometricsystem differs, even if it is the same amount of neutron generating, detection efficiency willdiffer. For this reason, in the case thatneutron-flux level is evaluated, these plantconditions shall be considered. I.E+07
IBM I L I I I I I
4.2 Noise Confirmation I.E+067
Noise conditions will change with the I.W. I.E404- Neutron Signal
installation CDditiCull, in the plant and the (D I E4W
conditions of other apparatus. In case aEr T.E+02 - -system is installed, it must be checked thatC I.E401a noise level is low enough to carry out z0
pulse height discrimination. The E+000, Noi;eintegrated pulse height distribution
characteristic of the developed system is 1.E-M 0 -100 2W -M AW -" -7W --8W
shown in Fig.3. In tis example, a pulse Pulse Height Discrimination Voltage [mVJheight discrimination level is adequatelyset as - 20 [mV]. Flg.3 Integrated Pulse Height Distribution
- 109

JAERI-Conf 2002-004
5. ConclusionThe analog type neutron monitoring system applicable to criticality safety management has
been developed.Generally, a special function is not required of this neutron monitoring system that there
should just be functions of detector pulse counting and set point comparison with measured value.From this, the function required for neutron monitoring has been aalyzed and the system hasbeen planned that is strengthened with the required function rationally. It is specifically asfollowing:
1) To prepare the circuit of exclusive use about the indication and display part and the setpoint comparison part espectively, the measurement range is decades of 10-1_104 [S_I],
andabsoluteaccuracyofsetpointcomparisonto ±3[%]�2) NPC (Neutron Proportional Counter) which applied RF (radio frequency) sputtering for
boron coating has been eveloped.Thereby, it has seismic-proof and is applicable to a safety system.
6. Reference[1] N. Oda et al., "Development of the neutron detector by sputtering coating," 2001 Ann. Mtg.
of JAES, E40 2001).
110

JP0250290JAERI-Conf 2002-004
IMPROVING SAFETY IN A MOX PLANT BY QUALIFICATIONOF NFurRON MRASUREMENTSAND CRITICALITY VALUATION
A.Renard, P.Kockerols*, H. ibon*, D.Marloye`BELCYONUCLEAIRE, venue Ariatie 4,12OU Brussels, f3elgitiniFax. (00) 32 2 774 06 14, e-mail:*BELGONTJCLEAIRE, Europalaan 20, 2480 Dessol, BelgiumFax. (00) 32 14 31 70 46, e-mail: h.Jibon�belgonucJeaiye.be
'*BELGONT-JCLEAIRE; Avenue Arian 4 1200 Bussels, BelgiumFax.: (QO) 32 2 774 06 14, e-mail : danarloye�belgonucleairebe
ABSTRACT
Two of the, major aspects of safety in a MOX fuel fabrication plant are radiation doses and criticality prevention.This paper pesents two qualification processes which lead to improvements of the safety when handling andstoring fissile maleria Is.1. Radiation protection of workers depends very much on te reliability of prsonal dosimeters. As a result ofthe introduction of the ICRP 60 recommendatiOlls and the icreasing contribution of the eutron dose to thetotal dose of te Beigonucleairv personnel of the MOX fuel plant, the bubble detector became in use as areliable personal eutron dosimeter.To evaluate the impact of the eutron energy on the detector response, real neutron spectra in the plant weredetermined by a wo-sided approach.Measurements were carried o in ooms where representative eutron spectra ere pesent, by means of areference calibrated eutron spectrometer, in parallel with some types personal bubble detectors. On theother hand, detailed alculations of he measured configurations were performed by means of the Monte CarloMCNP 4 computer code wit a D odel.Comparison etween measinements and calculations reveals good agreement. Additional calculations clarifythe ifluence of some parameters as the presence Of S40011re materials. Te calibrated alculations allow also1 sparate The ourt ibuliou of The )ow energy eutrons in the total dose ale i oer to qualify the method ofcorrecting the calibration factors of the bubble detectors o the basis of the typical spectra, i relation with thelast ICRP fluence-lo-dose conversion coefficients.2. Criticality safety is a permanent issue fo a MOX fuel fabrication plant In order to reduce calculations uncertainties ad improve consequently the safety wle trying to reducemargins, ELGONUCLFAIRE, is pyomoting the new KEOPS international R&D Program to be performed incollaboration with the Belgian Nuclear Research Centre (SCKoCEN), located close to the MOX friel fabricationplant of BELGONUCLFAIRF,ne Safeguard department ofSCKeCEN has developed for many years a original neutron-counting device,based o ouble ad triple eutron coincidence counting, Te K-effective of the measured configuration(which can be as large as a 200 waste druni) can be derived from neutron multiplication measurements with
high accuracy.The KEOPS programme will consist on suberitical measurement of effective mltiplication factors (Kff ofseveral materials available in a MOX fuel fabrication facility pure PuO2 powders, primary blends containing30% PuO?, and fina poduct (fuel pellets). Simple and clean geometrical configurations, such as box orcylinder will be considered.The following measurements are now planned measurements on MOX pellets (case 1), measurements onPuO2 powder case ) whereas measurements on standard PuO2 canisters is nder preparation (case 3.The Pit isotopic composition, powder density, mass, moderation and geometry will be investigated in detail ascriticality prameters. The epected accuracy o the kff is xpected to b blow 5% in absolute value.The paper will pesent with ore details the objectives, the xperimental facility, the proposed tests and the
method to be qualified.
Key words neutron, exposure, bubble, criticality, calibration
- ill

JAERI-Conf 2002-004
INTRODUCTION
BELGON-UCLEAIRE has a mixed Uranium/Plutonium. oxide (MOX) Riel producing plantlocated in Dessel, Belgium. BELGONUCLEAIRE began producing MOX fuel for fastbreeders and light water reactors in 1973. Fabrication was initially realized within theframework of demonstration programs. In 1986 wen the Mixing ad Mas ter blend (MIMAS)fabrication process developed by BELGONUCLEAIRE had been uy demonstrated,commercial-scale production was -begun. Since then, the plant has operated at a nominal annualcapacity of around 35 tons of MOX.
RADIATION PROTECTION
Due to the increasing contribution of the neutron dose to the total dose of theBELGONUCLEAIRE personnel and the introduction of the ICRP 60 recommendations CRPPublication 60), the use of a good reliable personal neutron dosemeter has become even moreimportant.
The BD-PND bubble detector (Ing 1997) manufactured by Bubble Technology ndustries (BTI,Canada) seemed to be a very interesting alternative to the albedo dosemeter used in the past.An extensive investigation program was carried out at BELGONUCLEATRE to determine itseffectiveness in the fuel fabrication plant environment A series of tests were onducted to geta better understanding of this type of dosemeter calibration, temperature sensitivity, ageing read-out accuracy).
To evaluate the impact of the neutron energy on the bubble detectors' response, it wasimportant to have an idea of the real neutron spectra present in the fuel fabrication plant, Toobtain these Sectra, a two-sided approach was applied. Measurements wem carried out atspecific locations in the installations where representative neutron spectra ae present. Also,detailed calculations of the same configurations as the measurements were performed in orderto have a point of comparison with the measurements and to estimate te tbermal prt of thespectrum. After the hiitial comparisons between the measurements and the alculations anumber of supplementary calculations were performed to evaluate te effect of the spectra inother working areas.
This paper gives an overview of te performed calculations and measurements of te neutronspectra, and the method of correcting the alibration factor of the BTt bubbie detectors on thebasis of these spectra and the new ICRP 74 fluence-to-dose conversion coeffiCiellts (ICRPPublication 74).
MATERIALS AND METHODS
Measurements Were carried out i a room sed solely or the intermediate torage of freshMOX fuel ods before their itroduction into nuclear fael assemblies. The fuel rods are placedin steel boxes which a-re stored in racks behind sielded doors. Three configurations wereconsidered for the easurements and calculations.
1. a single steel box containing approximately 150 fresh MOX fuel rods2. 16 steel boxes containing fresh MOX fuel rods placed in a concrete storage vault behind
shielded doors, and
- 112 -

JAERI-Conf 2002-004
3. the same configuration as 2 but with an open door in front of four boxes
The neutron spectra measurements were carried out with the ROSPEC (Rosenstock 1997)neutron spectrometer of the Fraunhofer Institute (INT). The ROSPEC detector consists offour spherical gas poportional counters. Three of the gas proportional counters are filled withpure hydrogen at pressures of 0.75x,05 , 4x 10 ad 16 Pa respectively, The fourth is filled witha ixture of argon and methane at a pressure of 5x10' Pa. The neutrons are detected by themeasurement of the rcoil protons in the gas proportional comAers. Each detector covers awell-defined iergy ange, overlapping with the �,nergy range f the next detector, so that theneutron energy spectrum is measured from 50 keV to 45 MeV. The four detectors aremounted on a circular platform rotating about a vertical axis in order to average out localvariations in the neutron field around the centre of the rotation-circle. The unfolding of themeasured pulse height spectra is performed by a modified version of the SPEC-4 code(Benjamin 1968).
Detailed calculations of the three configurations were performed by means of the Monte Carlotransport code MCNP 4A (Briesmeister 1991) using the standard neutron and photon librariesof this code system and three-dimensional geometrical models. The neutron source intensitieswere calculated by means of the ORIGEN2 code (Croff 1980) for the typical isotopiccomposition of the fuel. Standard energy spectra were associated with the neutrons fromspontaneous fissions on one side, and with those produced from (alphan)-reactions on theother side.
The MCNP 4A code provides the neutron flux averaged over the volume of cells, defined inthe model around te position of the spectrometer. The neutron flux spectrum was calculatedfor 40 energy groups including the groups of the measured spectrum between 50 keV and 45MeV, plus 6 groups between 003 eV and 50 keV representing roughly the thermalizedcontribution. The relative error in MCNP was between and 7 for the cases under study.
At the three positions under study, measurements were carried out with two types of bubbledetectors available from BTI : the BD-PND detector and the BDT detector. The BD-PNDtype detector has a good dose equivalent response for neutron energies above 00 keV.However, the BD-PND has zero response for thermal neutrons, so te BD-PND type was usedtogether with the BDT type detector. The BDT detectors' response is high for thermalneutrons and drops off with /v for epithermal neutrons. The dose response of the BDT forfast neutrons is about one twentieth of its thermal sensitivity. The combined use of both typesof detectoi can give a dose-equivalent response over the entire neutron spectrum.Measurements with mono-energetic neutrons showed that the optimal combination to yield theambient dose equivalent H*(10) according to ICRP 74 is obtained by using a multiplicationfactor of 104 for the BD-PND and 161 for the BDT(Vanhavere 1998). The uncertainty (onesigma level) on the bubble detector results is about 10%.
RESULTS AND DISCUSSION
Single box
The first case consisted of a single box containing 150 fresh MOX fuel rods placed on asupport in the storage room. The box was oriented with, its axes parallel to the ground andparallel to te closed door of one storage vault. The distance from the ground was about one
- 113 -

JAERI-Conf 2002-004
meter and the distance from the oor was also one meter. Walis, coilii)g and other storagevaults were at a distance of tuore than meters and were not taken ito account in thecalculations. The point of measurement was ocated near the n-nd-length of the box, at 0.5meter distance from the box.
Both the calculated and measured spectra are shown in Fig I for this geometry. Thecomparison is based on the absolute values of the product [Energy x Flux (F-)] in MeV/cm�.sfor each energy group of the spectrum. The energy range from 50 keV to 4 MeV is dividedinto 34 energy groups, both for the measured and the calculated flux.
COMPAR;SON BETWEEN CALCULATED AND MEASURED NEUTRON SPECTRASiNGLEBOX
0 05 1 15 2 25 3 35 4 45
E-Gy W.V)
1-0-Calad
Fig. 1 Comparison between measured and calculated neutron spectrum, single box
The Monte Carlo method evaluates the order of magnitude o the uncertainty on the totalneutron flux which, for this case, is of the order of 1%. Of course, te uncertainty can be morefor the flux in a specific energy group where the umber of incident eutrons is not very large.The accuracy of the measured values can be estimated from the overlapping eergy regions,and was about %.
The calculations reproduce the general sape of the measured spectrum w, especiallybetween 02 ad 2 MeV. Fo te ighest eftergy groups, part of te disagreement may be dueto the reference spectrum associated with file eutrons poduced by the (alphan)-yeactions inthe source. For the lowest energy groups, the detector response is omewhat higher than thecalculated figures, pobabl de to the nfluence of the background radiation in te fooln.
In Table I the resulting dose equivalent rates aye presented. Flue-nee-to-dose conversionfactors from the ICRP 74 report (ICRP Publication 74) w(-fe ued to convert te ROSPEC andthe calculated spectrum into dose equivalent fates. The results of the ROSPEC easurementand the bubble, detectors show very good agreement with the calculations, taking intoconsideration the uncertainty level.
114

JAERI-Conf 2002-004
Table 1: Measured and calculated dose equivalent rates
Single Box Open Storage Door Closed StorageDoor
ROSPEC Measurements 169 ill IT6N4CNP Calculations 174 132 10.5
BD-PND bubble detectors 172 131 14.7BDT bubble detectors 10.7 10.5 1.6
COMbiDatiOD Of bt tpes 196 153 17.9of bubble detectors
Storage with sielding door open
The second case refers to the measurement in front of a storage vault ontaining 16 boxes. Thedoor was open only in font of four boxes filled with fresh fuel rods. The other 12 boxes werelocated iside the vault behind the cosed part o the door. The distarice from the centre of theROSPEC spectrometer to e font edge level of the boxes was one meter. The base of thedetector was located at shoot One meter above te concrete loor. Again walls, ceiling andother storage vaults were ot taken into account i the calculatiODS.
Each of the four unshielded oxes was individually represented in the calculation model withthe associated structures. The other boxes behind the door were also taken into account, but ina homogenized way together with te claddings, te steel boxes and the structures of the cells.
The comparison between the measured and the calculated values is presented in Fig. 2 Thestatistical uncertainty is igher than for the single box case due to the lower neutron fx at thedetector position. The alculations reproduce the general shape of the measured flux well,especially above OJ5 MeV. The small peak in the measurement near 13 MeV is alsoreproduced by the calculations. As a result of parametric studies, this peak seems to beassociated with neutron interactions with the steel structures. An eve saller peak near 066MeV also appears i the calculated spectrum, but with a rather high ncertainty.
COMPARISON BETWEEN CALCULATED AND MEASURED NEUTRON SPECTRASTORAGE OF 16 BOXES
PARTLY OPEN DOOR
Al-
0 C 5 5 2 2 3 5 d 4 5 5
r-gy (M.V)
1-4- Cdculo:.�
Fig. 2 Comparison between measured and calculated neutron spectrum, storage withshielding door open
- 11 -

JAERT-Conf 2002-004
Storage with shielding door closed
The configuration for the final case was the same as in case two bt the shielding door wasentirely closed in front of the t6 boxes. Thermalized neutrons are ore important for this casebecause of the closed doors. Therefore outer concrete walls and a ceiling were used in thecalculational model to take into account the thermalization of the fi-action of neutronsbackscattered from the walls and the ceiling of the room. Also, the neutron flux at the detectorposition is very weak so that it was iportant to improve the statistics o f the calculation. Thiswas done by increasing the detector volume around its central position, Tis was an acceptableassumptio n since the flux and the spectrum do not change uc nr te detector. Ahomogenized source term representing a the 16 boxes with their content pus the structures ofthe cells was used.
Fig. 3 gives the measured and calculated spectra. The calculation eproduces the general shapeof the measurement, but with an important underestimation of about 50% on avera, ge below1.5 MeV. Especially te easured peak around 13 MeV does not appear in the calculationresults. Above 1.5 MeV te agreement can be, considered good with an average difference of5%. As can be seen i Table 1, te calculated total neutron dose quivalent rate is lower thanmeasured. This is due to the bckground adiation in the room coming from the other storagevaults. The background neutron dose rate in the middle of the storage room is about tuSv/h.Again the agreement of the experimental measured dose equivalent rates is good for bothmeasurement techniques.
COMPARISON BETWEEN CALCULATED AND MEASURED NEUTRON SPECTRASTORA 'E OF 16 BOXES
CLOSED DOOR
0 5 1 5 2 2 3 3 4 4.5 5
Energy(M.A
[�Calcul&on ... asu,9mrfl
Fig. 3 Comparison between measured and calculated neutron spectrum, storage withshielding door closed
Parametric study
In order to clarify the influence of the presence of some materials on the neutron flux, themodel of the single box was slightly modified by adding screens or removing materials in thecalculational model.
A pseudo-screen of cm thickness was put etween the box and the ROSPEC detector, thescreen is made either of steel or concrete. The flux behind the steel screen was attenuated in
- 116 -

JAERI-Conf 2002-004
the high energy area, but a significant peak is introduced at 066 MeV. This peak also appearsin the measured flux and the calculation of the open storage door. The flux behind the concretescreen has a reduced peak near 066 MeV and is, compared to a steel layer of the samethickness, attenuated over the entire energy spectrum. This agrees with the closed door results.
The contribution of the low energy neutrons to the dose equivalent rate can be separated fromthe total dose rate on the basis of the MCNP measurements. In Table 2 the resultingcontribution from the low energy neutrons is shown considering everything under LOO keV tobe low energy. Since the BD-PND bubble detectors have approximately 100 keV as athreshold energy, the combined result from both the BD-PND and BDT detector types couldbe used to calculate the low energy percentage of the dose equivalent, This is also given inTable 2 The agreement is reasonably good and seems to confirm the calculations. It isimportant to notice that at most the contribution due to thermalization is only about 3 to 5%.
Table 2 Percentage of dose equivalent from neutrons with energy less than 100 keVSingle Box Open Storage Closed Srage
Door DoorMCNP Calculations 0.7% 2.3% 3.2%Combination of two types 0.9% 2.4% 4.9%of bubble detectors
Calibration factor
Another important issue during the investigation of the neutron bubble detector was theevaluation of the impact of the fluence-to-dose conversion coefficients, based on the ICRP 60recommendations (ICRP Publication 60 ad published in ICRP 74 JCRP Publication 74) onthe calibration factor of the bubble detector. From the beginning of the evaluation program atBELGONUCLEAIRE, it was the intention to follow these recommendations in assessing theneutron doses by means of the bubble detector and to use a calibration factor in accordancewith the neutron spectra measured in the fabrication plant. An individual calibration factor foreach bubble detector is provided by the producer. Tis calibration factor is based on the formerradiation quality factors ecommended by ICRP 21 (ICRP Publication 21). It is determinedwith an Am-Be eutron source. Because the spectrum of an Am-Be neutron source differssignificantly from the spectra present in the fabrication plant it was necessary to correct for thisdifference. Terefore a correction factor F was determined, to be sed in connection with thecalibration factor provided by the producer BTI, in order to obtain a calibration factorrepresentative of the situation at BELGONUCLEAIRE. This factor corrects on the one handfor the new ICRF 74 fluence-to-dose conversion coefficients and on the other hand for the realspectra in the working places of the controlled area
GICRP74,BN = F x G1CRM1,AmB-_
GICRP21A.B i the calibration factor (in bubbles per uSv) provided by the producer of thebubble detector, BTI, based on the fluence-to-dose conversion coefficients from ICRPPublication 21 and etermined with an Am-Be neutron source.GICRP74, BN is the calibration factor (in bubbles peruSv) used at BELGONUCLEAIRE, basedon the new ICRP 74 fluence-to-dose conversion coefficieiits and epresentative of the neutron
- 117 -

JAERI-Conf 2002-004
spectra present in the fuel fabrication plant.In formula (1)
F d I CM I, AmBexrl=4,BN (2)
rICM1,A.13e_ dICRP74,BN
with the factors dICRP21,AmB,, rl(-,RP21,AmB,, dCRP74,BN and rICRP74,BN
djcwnjAmBe
i h Pjcm, (E) x D AmB, (E) x dE0
d]CMIAm& f (DAmB, (E) x dE (3)
0
hpICRP21(E) : fluence-to-dose conversion coefficients according to ICRP 21 (Sv.cnIF)(DAmB.(E) Am-Be neutron spectrum (neutronS/CM2)
dICRP21,AmB i te dose per unit fluence, corresponding with an Am-Be neutron spectrum andusing fluence-to-dose conversion coefficients from ICRP Publication 21. This factor is used byBTI at their calibration facility and equals 37 x10-12 S'V.Cm2.
rICRMAmBe
f R(E) x () AmBe(E)xdE RxfOA.&(E)xdE
171CRP21,A� -0 - 100. � -t; R (4)f 6,., (E) x dE j6 Am]3� (E) x dE
0 100
R(E) energy response of a neutron bubble detector.
rICRP21,AmB i the normalized response (bubbles per nit fluence) of a bubble detector in an An-Be neutron field. Te energy response of te bubble detector is pctically zero below athreshold energy of 100 keV and more O e constant above. If we assume that the bubbledetectors' response is zero below 100 keV and CODstaDt above 100 keV, we an use a step
function. Moreover the Am-Be eutron spectrum shows pactically, no eutrons with energies
below 100 keV. Taking into account these assumptions the formula can be simplified as statedin Equation 4.
dCRF'74,BN
f h ,,cRp74 (E) x D BN (E) x dEdi=4,BN 0 (5)
f q) BN (E) x d,0
hp,1CRP74(E) : fluence-to-dose conversion coefficients according to JCRP 74 (Svxae)(DBN(E) : neutron spectrum in TMOX fuel tabricatioji plant (neutrons/cur)
- 11 -

JAERI-Conf 2002-004
d1CRP74j3N i tile Cse per unit fluence corresponding with the nutron spectrum present in thefuel fabrication pant and using fluence-to-dose conversion coefficients from ICRP Publication74.
rICRT-74,BN
f R(E) x D ,4 (E) x dE R x f DBN (E) x dE
r1CRP74,BN - 0___ __ I,----- 11-11, � �;zl (6)f (D x (E) x dE f (D.N (E) x dE
0
R(E) : energy response of a neutron bubble detector
rjcRP74j3N i the normalized response (bubbles p unit fuonce) of a bubble detector in theneutron field present i te istallations of BELGONUCLEAIRF. If we assume that the bubbledetectors' response is zero below 100 keV and constant above 100 keV, the formula can besimplified as stated in Equation 6.
Combining these different formulas, the correction factor F can be written as
f(1) BN (E) x dEF = 3.7x10-12 X 100 (7)
fh P,,cRp74 (E) x D BN (E) x dE0
Thus te factor F converts the number of bubbles peru.Sv (i.e. the calibration factor) accordingto ICRP 21 and measured in an Am-Be neutron field into a nmber of bubbles per ItSvaccording to ICRP 74 and easured in the neutron field at BELGONUCLEAIRE.
The factor F was determined for te 3 cases under stud), (single box, open storage door andclosed storage door) using both the measured and calculated spectra. able 3 gives the resultsof this comparison. Because the lower limit of the neutron energy i te measurements was 0keV, this value was used as lower limit in the bottom integral of quation 7 The agreementbetween the factor F ased on the measurements and the facto F based on the calculations isvery good and, as a result, four more calculations for other typical configurations in the MOXplant were performed.
An average factor F was determiDed based on the results of the seven calculated spectra. Thelower imit of the bottom integrat in Equation 7 was taken as 0 keV this time because thecalculations provided the thermal part of the spectrum. In this way, the thermal neutrons weretaken into accouut. The influence of the new fluence-to-dose conversion coefficients wasestimated by replacing hpICRP74(E) with h,ICRP21(E) in Equation 3 Table 4 summarizes theresults of the comparison. The value of L07 was obtained when using the coefficients fromICRP 21 RP Publication 21). The difference between the calibration spectrum andmeasured spectru)-n can be identified since the calibration coefficient etermined by BT1 is alsobased 1CRP 2L The measured spectra result in a reduction of approximately 7 comparedto the calibration speett-um. One can see from Table 4 hat the mpact of ICRP 74 is moreimportant tal) tile inflUeMe of the neutron spectra. When sing tht fluence-to-dose conversionfactors of IRF 74 instead of ICRP 21, the correction faGtor is -tdoced by 17% 0.89/1.07).
- 119

JAERI-Conf 2002-004
These relatively small correction factors show the good dose equivalent characteristics of theBD-PND in this case. 'A
Thus the correction factor of 089 was applied to the individual calibration factors provided byBTL It is iportant to recognize that the main and individual calibration factors (inbubbles/uSv) are provided by the producer. The correction made at BELGONUCLEAIRE onthe basis of the correction factor F is about 10%, resulting in higher recorded neutron doses.
Table 3 Comparison between the correction factor F based on the measurements andcalculations of neutron s2ectra
Configuration FBN(measurement > 50 keW FBN(calculation > 50 keV) bSingle box, 0.91 0.91filled with fuel rods
Storage rack for fuel 0.94 0.95rods, neutron shieldingopenStorage rack for fuel 0.91 0.91rods, neutron shieldingclosed
a correction factor based on the ROSPEC measurements taking only neutrons above 50 keVinto accountb correction factor based on the MCNP calculations taking only neutrons above 50 keV intoaccount
Table 4 Comparison averaged correction factor with ICRP 74 and ICRP 21dose-fluenceconversion coefficients
Configuration F13N(calculation, ICRP 74)' FBN(calculation, ICRP 21)6Averaged correction 0.89 1.07factor 7 calculations)-
a correction factor based on the MCNP calculations, taking into account all neutron energiesand using fluence-to-dose conversion factors from ICRP 74b : correction factor based on the MCNP calculations, taking into account all neutron energiesand using fluence-to-dose conversion factors from ICRP 21
CRITICALITY PREVENTION
The second aspect of safety in a MOX plant is the prevention of criticality. In order to reducecalculation uncertainties for subcritical. systems and improve consequently the safety,BELGONUCLEAIRE is promoting the new KFOPS (Experimental Detemii-Dation ofKeffective on Various P02 and MOX Pellets Configurations in Subcfitical Conditions)international R&D programme. This should be performed in collaboration with the Belgian
Nuclear Research Centre (SCKeCEN), located close to the 40X fuel fabrication plant ofBELGONUCLFAIRE.The experimental set-up consists in a Hexagon Neutron Counter (see Figure 4 developed atthe SCKeCEN. It is formed by six polythone walls shielded by Cdmium aorber blades.Inside each of the CH2 blocks, three He-3 detectors are installed. The top and bottorn of theset-up is designed on the sme way. The combination of CH-,, arld Cd-absotbers allows thecapture of thernalized neutrons coming from the easured systerG and also pevents the back-
- 120 -

JAERI-Conf 2002-004
scattering of the thermalized neutrons n the C112 aterial). The set-up is presently used by thesafeguard department of SCK9CEN f characterization of 200 L waste drums.
Cd absorber
He-3 tubes
CH2
Area of measurement10(
Fig 4 Hexagon Neutron Counter
The idea is now to use te same evice for determination of subcriticat levels of configurationscontaining spontaneous emitters (eg, Pu 240), using the so-called Coincidence NeutronsMeasurement Method". Dead time corrected total count rates and double count ates wil bemeasured nd reported with teir statistical ncertainty. The measured total count rates can becompared with te count rates calculated with a Monte Carlo code, such as MCNP. Moreover,by sing the Neutron Mtiplicity Equations f fst multiplication point model), anexperimental k-effcctive value may be derived and compared with the calculated oe. To recall,the k-effective value kff is handed to te multiplicity trough
k effin
With the Mtiplicity in function of te sgle and double count rates, and D ad otherparameters, a the detector efficiency, the spontaneous fISSiOD rate of the system, etc.The present frame of te programme consists at measuring configurations made of compoundsused i a MOX fuel fabrication acility ' pre PuO pwders, primary blends containing 3001oPuO.i and t fnal product the petlets. Severat parameters may be varied geometricalconfiguration, nmber of units, presence of structural material (e.g. stainless steel of the boxes),isotopic composition, etc. For the powders, te density aspect will aso be ivestigated. Theplanning presently Cnsiders two casesCase I measurement o MOX pelletsCase 2 measurements on PuO, powder,Previsional calculations ave been erformcd tor configurations of PuO2 powder caus, Thesehave becu carried ot with KENOVa e by te 16 goups cross ections Hansen Roach.The caus, made of stainless steel I rrun thick, contain 3 kg P02 (Pu 701118/10,12) at dnsity -
g/cm wh a certain aount o hurrudity. They are paced against each other i the sameradial, plane, at the editor of the experimental set-up, which is also modelized in the clculation.Table 5 shows typical k-effective values expected for such measurements, up to 4 calis,
3considering also Fair important compaction f the powder, up to 35 g/crn
121

JAERJ-Conf 2002-004
Table 5 : Calculated k-effective-Density 22 g/cm3 Density 35 g/cin 3
Number of cans k,ff ± kff ±
1 0.1527 ± 0.0007 0.2200 0.0010
2 0.1869 ± .0008 0.2,584 ± 0.0011
3 0.2228 ± 0.0009 03040 ± 0.0011
4 0.2417 ± 0.0009 0.3232 ± 00012
Increasing the number of cans inside the exagon eutron COMIter increases the k-eftectivelevel so that a quantitative e-ffect is measurable. Moreover, compaction of the powder is animportant point to assess as it may lead to great fluctuations in the keffectiv lve[, Te k-effective could be still increased by increasing the umber of cans radially and axially, but acompromise between te k-tffective value and the tightness of tle onfiguration is to e found.Numerical simulations of such a configuration with very low k-effective value (- 02) haveshown that an accuracy of 0.5% kff is achievable as soon as the satistics of the sgle anddouble count rates i sufficient (c < 03% on S and D).Further calculations must be performed in order to optimize the framework (tightriess of theconfiguration, parameters to vary, etc.) and the amount of umidity in the powder. Moreoverone has to investigate the experiment with the pellets.
CONCLUSIONS
Upon review of te nutron spectra of the three cases, the specific eatures of each spectrumappear clearly. In the, single box case the spectrum is dominated by the igh energy part. Theopen door case provides the highest eutron flux, �,xcept for the highest energy groups, whilethe closed door case flux spectrum includes a relatively ore domillail lw �,nergycontribution. A parametric study ade clear the Affluence of some structural materials on thespectrum.In general, the results of the calculations agree with the measurements, Only for te closeddoor case is the result low, due to the background radiation coining frorn the ther storageracks present in the oom.Both the calculations ad the measurements idicate that the iluence of the low (-nCTgyneutrons in te spectrum on the cose equivalent rate is very mall ill, omparison with the astneutrons, Tere i DO eed o complement te 3D-PND etectors with BDT detectors forpersonal eutron dosimetry�OD tle baSiS Of te CaIC1,11atiODS a Correction factor was determined to be used in onDectionwith the calibration factor provided by Bt to Correct for tile specific eutfoll spectra in tilefuel fabrication pan a t etefillm a DelltrOl Cse l cordance With the ICRP 74,fttlenCe-to-dose conversion coefficitnts Tis factor appealed to e very stable wth espect to tedifferent neutron spectra hi the installation.
Regarding the KFOPS iternationa pogramme, it wilt lead to increased physical, insight insubeliticality, OD the asis of coincidence Deutrorl Ineasurelliellis amid Mloilte arlo calculations.
REFERENCES
R. Olaerts, P. Kockmols, A. Rard, , Rosentock-, T. K6ble aDd , Vanhaevere,
- 122 -

JAERI-Conf 2002-004
Determination of Neutron Spectra in a MOX Plant for the Qualification of the BD-PNDBubble Detector, Health Physics, 1999.
• Benjamm P.W., Kemshall. C.D., 3rickstock A., The analysis of ?roton Recoil Spectra,AWR Rport 1968).
• 13riesmoister JF,, MCNP-4A eneral Monte Carlo Code for Neutron and PhotonTransport - Version , LA-7396-M, Rev 2 .,os Alamos National Lab () 991).
• International ommissiori on Radiological Protection, Data for rotection against ExternalRadiation. Oxford:Pergarnon Press; ICRP Publication 21 1973).
• International Commission on Radiological Protection, 1990 Recommendations of theInternational Commission on Radiological Protection. Oxford:Pergarnon Press; ICRPPublication 60 1996),
• International Commission on Radiological Protection, Conversion Coefficients for Use inRadiological Protection against External Radiation. Oxford:Pergamon Press; ICRPPublication 74,(1.996).
0 Ing H., Noulty R.A., McLean T.D., Bubble Detectors-A Maturing Technology, Rad. Meas.27(t), 1-11 (1997).
• Rosenstock W., K6ble T., Kruzinski G., Jaunich G., Calibration of a Neutron Spectrometerin te Energy Range 144 keV to 14.8 MV with ISO Energies, Rad. Prot. Dos. 70, 299-303 1997).
• Croff A.G., A User's Manual for the ORIGEN2 Computer Code, ORNL/TM-.7175 1980).• Vanhavere F., Loos M., Plornpen AJ.M., Wattecamps E., Thierens H., A Combined Use
of the BD-PND and BDT Bubble Detectors in Neutron Dosimetry, Rad. Meas. 5, 573-577(1998).
• P. BAETEN, M. BRUGGEMAN and R. CARCHON, "A physical model for thedescription of fast and thermal neutron multiplication effects in neutron coincidence andmultiplicity counting", 21" Annual ESARDA Symposium on Safeguards and NuclearMaterial Management, Proceedings EURI-8963 EN, 493-502 1999).
• HANSEN, G. R and ROACH W. H., Six And Sixteen Group Cross Sections For Fast AndIntermediate Critical Assemblies", LAMS-2543 1961).
• PETRIE, L. M and LANDER, N. F., KENO-Va : An Improved Monte Carlo CriticalityProgram With Supergrouping Computing Telecommunication Division At ORNL 1990).
123 -

This is a blank page.

JP0250291JAERI-Conf 2002-004
SURCRITICAL LIMIT PARAMETERS OF MOX FUEL
SAKURAI Shungo and MITAKE Susumu
Institute of Nuclear Safety, NUPEC.
Fujita Kanko Toranornon Bldg., 7, 17-1, 3-chorne Toranornon, Minato-ku, TOKYO 105-001, JAPAN
FAX:+81(3)3435-3423, E-mail: s-sakurai�nupec.or.ip, mitake�nupec.or.ip
Abstract
Joining in an international corroborative work to reexamine the American Nuclear
Society's standard ANS-8.12-1987 for 'Nuclear Criticality Control and Safety of
Plutonium-Uranium Fuel Mixtures Outside Reactors,' extensive studies on the subcritical
limits of MOX fuels were conducted at INS/NUPEC in the last couple of years.
Analyses were made both for the MOX fuel of homogeneous aqueous mixtures and for the
MOX fel of heterogeneous systems. The survey calculations were made using the
XSDRNPM code with the SCALE44G library based on the ENDF/B-V nuclear data files.
And for the heterogeneous systems, the effective cross-sections of the fuel were evaluated for
a unit cell of dodecahedron containing a spherical MOX fuel pellet with surrounding water
moderator.
The subcritical limit parameters, such as mass, thickness, volume or concentration of the
MOX fuels, were obtained. Differences between these values with latest numerical analysis
methods and those with rather simplified methods of over ten years ago are not so large, and
the standard was unanimously reaffirmed.
1. Introduction
Now, practical utilization of plutonium in WRs being close at hand in Japan, and the
critical characteristics of the mixed oxide fuel is one of the great interests for Japanese
criticality safety colleagues. And, it is becoming more important to confirm the applicability
of our criticality safety evaluation systems, i.e. analytical codes and cross-section libraries, to
MOX fuel system.
Under the prescribed five years review of the American National Standard ANSI/ANS-
8.12-1978 for 'Nuclear Criticality Control and Safety of Plutonium-Uranium Fuel Mixtures
Outside Reactors,' the standard was revised to include subcritical limits for heterogeneou s
lattices of mixed oxide fuel pins in water and published in 1987, and then reaffirmed in 1993.
But, the last real effort of in this development was in the 1980s, and the subcritical limits rely
significantly on computer calculations. So that, in 1997, considering recent substantial
improvement of computational capability and cross-section data, revision of the standard was
proposed and international participation by criticality personnel was called.
The standard gives the subcritical limit parameters for the MOX fuel of homogeneous
aqueous mixtures and for the MOX fuel of heterogeneous systems: ten different physical
- 125 -

JAERI-Conf 2002-004
values are numerically given for the aqueous mixtures, and four values i graphically for the
heterogeneous systems. The limit parameters are defined for oul- different plutonium
contents of the mixed oxide 3, 8, 15 and 30 in P02/(UO2+PU02) weight ratio], and three
different plutonium isotropic compositions;
- Composition 1: Pu-239 100 %,
- Composition 11: Pu-239 79 %, Pu-240 15 %, Pu-241 6 (in weight), and
- Composition III: Pu-239 60 %, Pu-240 25 %, Pu-241 15% (in weight).
Natural uranium is assumed for the uranium dioxide.
The study on the subcritical limits of S40X fuels at the INS was started in 1997, and as
been continued as follows;
- In 1997 and 1998: Preliminary study on the aqueous mixtures with the MGCL- INS
library,
- In 1999: Study on the aqueous mixtures with the SCALE 44-group library, and
- In 2000: Study on the heterogeneous systems with the SCALE 44-group library.
2. Study on Homogeneous NUxtures
Each subcritical limit parameter was calculated using simple physical geometry of MOX
fuels as showing below:
- Mass of plutonium in oxide mixture,
- Mass of uO2 + U02), and
- Volume of oxide mixture: by sphere,
- Diameter of infinite cylinder: by cylinder ad
- Thickness of infinite slab,
- Areal density of plutonium, and
- Areal density of oxides: by slab.
All of these MOX fuels are reflected with H20 layer of 30 cm-thickness.
Also calculated were:
- Concentration of plutonium,
- Concentration of oxides, and
- H:Pu atomic ratio: by slab of infinite
thickness.
The survey calculations were made with SCALE 44 grou library and XSDRNPM code.
A k-effective o k-infinity value of 098 was applied, to etermine the arameter values that
gave the subcritical limits,
Subctitical limits for the uniform aqueous mixtures of the oxides of putonium and natural
uranium obtained in this study are summarized in Table 1, in comparison with those in the
standard.
126 -

JAERI-Conf 2002-004
3. Study on Heterogeneous Systems
Each suboritical limit parameter was obtained using simple physical geometry of the MOX
fuel of heterogerjeous systems as showing below.
- Mass ofplutonium in oxide mixture and mass Of (PuO2 + U02): by sphere, and
- Volume of oxide mixture: by sphere,
- Cylinder diameter: by infinite cylinder, and
- Slab thickness: by infinite
slab.All of tese .OX fuels are reflected with H20 ayer of 30 cm-thickness.
As sbown in Fig� 1, ffective nclear cross-sections of the eterogeneous MOX fuel were
evaluated for a unit cell of dodecahedron containing a spherical MOX fuel pellet with
surrounding water moderator. And, the evaluations were made for a number of different
sizes of the cell (or lattice pitch) and the pellet diameter, and the infinite neutron
multiplication factors were. also calculated for these cells.
The survey calculations, both for the effective cross-sections and for the subcritical limit
parameters, were made using the XSDRNPM code and the SCALE 44CY library based on theENDF/B-V nuclear data files. The S8 angular quadrature set was used, and for the
convergence check of the egenvalue and the fluxes, the criteria of 0.01% was applied. The
minimal parameter values that gave the subcritical limits were determined by the k-effectives
of 095.
Subcritical limits of the oxide mixtures for heterogeneous systems are summarized in
Table 2 with the ratio to the homogeneous systems. And the fting masses of the
heterogeneous systems are plotted in the figure presented in the standard.
4. International Comparisons
Table 3 shows an example of international comparison of the results: the subcritical.
volumes of aqueous mixtures of the three different plutonium compositions. Relatively
good agreement is resulted among the different calculation ethods of the international
participants for this rather simple configuration.
5. Concluding Remarks
This extensive study on the criticality characteristics of, te MOX fuel is a very good
experience for Lis to check the applicability of our criticality safety analysis systems to the
MOX fuel systems. Differences between these values with the latest numerical analysis
methods and those with rather simplified methods of over ten years ago are not so large.
And, the standard was uanimously reaffirmed in the spring of 2001.
- 127 -

JAERI-Conf 2002-004
C=> 00
C/)z cq00 06m OC) 00
Cicl CA
cqC\ O ItC'4 C'4 C,4 cq m m
vp
COD
00 cq
N C14 00 r- M M 03
CZ&�D
tn t-- 0000 0� cn
:::s m C> In m N CIA 0
CL4CJ = OCCZ
W) N C-A 0CA
00 I'D M C;\ C71, \C) CA 110 u. 0�W; tr; 4 4 in tn cq
4. u 00 cq cq0 v)
cl O'N kn tn M 00 00 It (01\ m 00X C)6 6 kri 4 Ifi 4 ItC) N X
0u ON
4.0cn C\ \0 in CZ
\6 tri 00 06x
01) 00 Pbu::3 in r- r ItIt
cl� C-�00 00 00 o6 o6
4Ru
�Dcq C) 1.0 W) Qn
42 E 00 cli cl� C)'Mcq cq N
>u C)
4�b'oC-)
4.
4- CIA 00�0
C)u O T P.CN M
+ cj U �7.00 �D 0 a)
0 unC;j X =50Con 0 �D
00 Cd -0
128

JAERI-Conf 2002-004
C) 00 m C14 C)00 O�
V-) CD 00
00 01\ 00 00 00 CT 00tn "q 6 O�
o
m oq00 CD
CT r-C�
00 01\ clq (01� V-) mt-- Ci C� \�q 06 oq 00
Cf)
m m C14 0000
00 Nt C)00 0000
PE CODm kn 00 cqQn ol�>�
En C*00 v) 01\ ON ON
Q) 0C> 00 00
a) Cf)M to
0u
m 0000 mON 00 Um 00
;:S tr ON 00V.) 00 00 00ON00
u00 m m W) ON09 oo C)
0 Cf) cq C,0 4-
C) C 0 0 0 0 C) 0 0 4�- 0 u 0cq3.2 0 z a) EiCd m + CZ
U U U C)cl �jj
.u L-o
co�bb a) 4� 4�
u + (41C4u 4� Ln uO t5 cn cc)
cn0 �D FE 8" 0 O LnajU Ct
129

JAERI-Conf 2002-004
Table 3 Comparison of Results for Subcritical Volumes'
Subcritical (k=0.98) Volume Q, Pu-239 100%
Basis 3% Delta 8% Delta 15% Delta 30% Delta
ANS 812 23.5 - 14.0 11.0 8,5 -J-Team. (MGCL) 23.2 4.3% 13.3 -5.0% 10.4 -5.5% 8.5 0.0%J-Team (SCALE44) 23.6 0.4% 13.6 -2.9% 10.6 -3.6% 8.6 1.2%Lester 24.1 2.6% 13.7 -2.1% 10.8 -2.3% 8.7 2.4%Larry - - - -Debdas 24.0 2.1% 13.7 -2. 1. a/b 10.9 -0.9% 8.8 3.5%UK Team (k=0.95) 23J 0.0% 14.5 3.6% 10.3 -6.6%UK Team (k+3 0 =0.95) 21 1 -6.0% 13.7 -2.1% 10.1 -8.2%
1UK Team (k+3 0 = 1) 1 25.0 1 15.5 1 11.1
Subcritical (k=0.98) Volume (L), Pu-239 79%, Pu-240 15%, Pu-241 6%
Basis 3% Delta 8% Delta 15% Delta 30% Delta
AN S 812 44.8 - 25.9 20.4 16.8J-Team (MGCL) 44.9 0.2% 25.3 -2.3% 20.0 -2.0% 16.5 -1.8%J-Team (SCALE44) 45.3 1.1% 25.6 -1.2% 20.2 - 1.0% 16.7 -0.6%Lester 46.2 3.1% 25.8 -0.4% 20.3 -0.5% 16.8 0.0%Larry - - - -Debdas 48.5 8.3% 26.7 3.1% 20.4 0.0% 17.5 4.2%UK Team
Subcritii�al (k=0.98) Volume (L), Pu-239 60%, Pu-240 25%, Pu-241 15%
Basis 3% Delta 8% Delta 15% Delta 30% Delta
ANS 82 63.4 - 34.4 - 26.6 - 21.6 -J-Team (MGCL) 643 1.4% 34.4 0.0% 26.7 0,4% 21,7 0.5%J-Team (SCALE44) 65.7 3.6% 35.0 1.7% 27. t 1 �9% 22.1 2.3%Lester 67.0 5.7% 35.5 3.2% 27.3 2.6% 22.1 2.3%Larry - - - -
Debdas 69.5 9.6% 36.1 4.9% 2T2 2.3% 22.1 2.3%UK Team
Notes:Lester: With SCALE-5 and the 238-group library based on ENDFIB-VLarry: With SALE-4.3 and the 239-group ibrary based on NDF/B-V,Debdas: MCNP ad the HNDF/B-VI(,60c) continuous eergy cross-seetion library.UK Team: MONJO ad the UKNDL cross-section library.
Prepared by S. C. Keeton and M, Sheaffer of LLNL, oordinator of the working group.
- 130 -

JAERI-Conf 2002-004
I: 240PU > 41PU II: 240PU > :240 u 25wtl1_PU ,o-si-ion I 15wt%, 241PU 15wt%
241PU 6wt%
3% 30%
Dodecahedron
For each lattice pitch wat Lattice pitchand pellet iameter (D t diameter
DP P
Multiplication factorof infinite array
Calculation of effective cross-section _x__for homogeinzed cell IV
Comparison withMVP calculation
(Continuous energyMonte Carlo Method)
Diameter of Thickness ofcylinder infinite slab t
"Water reflectorin 30 cm
4-10-in pmox4/, t,3icR3 V 4/3icR3
Search for in, V, and t which give k-effective of 095, with -D Sn calculations
Minimum values of in, V, �, and t (and corresponding P and Dp)
Suberitical limits of heterogeneous MOX systems
Fig. I Analytical procedures for subcriticality safety parameters of)Heterogeneous MOX fuel systems.
- 131 -

JAERI-Conf 2002-004
60 ___T___T I I I I
50 Process specifications sh�ljincorporate margins to protect
40 against uncertainties in processvariables and against a limit being
30 accidentally exceeded.25
26 I
1 5
100
+00-
50V)U) 4co
3Isotopic Composition of Plutonium
2 -Curve 240 Pu > 241 Pu
Curve 1 240 Pu :> 15 wt% and 241 Pu 6 wt%240 241Curve III Pu 25 wt% and Pu 15 wt%
1 2 3 4 5 6 7 9 20 30 40
. Concentration of PuO2 in (PU02 + U02) Mixtures, W%
Fig. 2 Limiting mass of heterogeneous mxtures of the oxides of plutonium andnatural uranium in water as a function of the putonium oxide content(excerptfromthestandard). Theresultsofpresentstudyareplottedwith marks corresponding to the three dfferent plutonium compositions.
132 -

JP0250292JAERI-Conf 2002-004
CRITICALITY SAFETY CONTROL
AT THE PLUTONIUM FUEL PRODUCTION FACILITY
J.NINAGAWA, S.TAKAHASHI, Y.YAMAMOTO,
S.FUJIWARA, K.KUNIYASU and T.OHTANI
Plutonium Fuel Center, Tokai Works,
Japan Nuclear Cycle Development Institute,
4-33, Muramatsu, Tokai-mura, Nakagun, Ibaraki
ABSTRACT
Criticality safety in the Plutonium Fuel Production Facility (PFPF) is based on mass control. The nuclear
material handling area is divided into some Criticality Control Units for criticality safety. One Criticality Control
Unit (CCU) corresponds to one or more glove boxes or storage unit. For criticality safety, the amount of nuclear
material handled in each CCU is limited with defined criticality limits. Nuclear material transfers between
CCUs perform only after the confirming that the total of existing nuclear material at the destination CCU and the
nuclear material to be transferred is less than the criticality limits. A computer system controls nuclear material
transfers at PFPF. The computer system uses a 3-level hierarchy design.
Key words: criticality safety control, PFPF, MOX, mass control, computer system.
1. INTRODUCTION
The Plutonium Fuel Production Facility (PFPF) supplies m ixed plutonium and uranium
oxide (MOX) fuel assemblies for the JOYO experimental fast reactor and the MONJU
prototype fast breeder reactor. PFPF was constructed based on MOX fuel fabrication
technologies, plant operation and radiation control technologies developed by the Japan
Nuclear Cycle Development Institute (JNQ and, PFPF demonstrates the possibility a large
scale of MOX fuel fabrication.
The main objectives of the PFPF project are to improve productivity and reduce personnel
radiation exposure compared to JNC's other two fuel fabrication facilities. To achieve these
objectives, remote-controlled and automated fuel fabrication systems were adopted in PFPF.
Furthermore, a dry process was adopted since it increases the production batch size over wet
process. PFPF applies strict controls over nuclear material to avoid criticality. The criticality
safety control at PFPF is based on mass control and moderation control (moisture content,
etc.) are classified for each nuclear material. The criticality safety control system at PFPF
was designed to avoid double loading with nuclear material.
The concept and design of criticality safety control system for pellet fabrication process in
PFPF are mainly described in the following sections.
133 -

JAEM-Conf 2002-004
2. FUEL FABRICATION PROCESS
Fig. shows the MONJU fuel fabrication process flow. The fuel fabrication process
consists of three processes: pellet fabrication, fuel pin fabrication and assembling, and
analytical laboratory. The fuel fabrication system is divided io a group of automated
equipment and their control system.
The intermediate storages, which are connected to glove boxes for the pellet fabrication
process by a transfer tunnel, are located in the center of the pellet fabrication process area.
The glove boxes are arranged on both sides of the intermediate storage, like teeth of a comb.
The arrangement enables to replace and to add the process glove box efficiently. Fig.2 shows
the interconnection between a process glove box and an intermediate storage. The nuclear
material is automatically transferred between each glove box by the computer control system.
3. CRITICALITY SAFETY CONTROL CONCEPT
3.1 CRITICALITY SAFETY CONTROL
The PFPF criticality safety is based on mass control. The nuclear material andling area is
divided into Criticality Control Units for criticality safety. One Criticality Control Unit (CCU)
used for the minimum unit for criticality control at PFPF, One CCU corresponds to one or
more glove boxes or storage unit. For criticality safety, the amount of nuclear material
handled in each CCU is lirnited with defined criticality limits.
Nuclear material transfers between CCUs perform only after the confirming tat the total of
existing nuclear material at the destination CCU and the nuclear material to be transferred is
less than the criticality limits.
3.2 SAFETY FACTOR
The critical safety control system at PFPF avoids double loading of the nuclear material as
follows.
The criticality safety for a nuclear material transfer is checked y oth the Process
Control Computer (PCC) and the Central Control Computer (CCC).
Nuclear material tansfers occur only through the designated CCU entrances/exits. The
transfer route of container is automatically etermined Therefore, the nuclear material can't
be transferred over incorrect routes and using a wrong container.
Criticality shutters are installed on CCU entrance/exits. The shutters have an interlock
function controlled by CCC with process-independent. Therefore., without the permission of
CCC, the nuclear material transfer is physically irnpossible.
As mentioned above, we adopted safety factor (0.7�11) in the mass control in consideration
of the calculation error and the heterogeneous of the nuclear fuel undel- the condition of
avoiding double loading of the nuclear material.
134 -

JAERI-Conf 2002-004
3.3 CRITICALITY LINTITS
Criticality iiTtits for all nuclear materials are determined based on Isotopic composition,
density, shape, moderation, and other factors. The criticality limit is determined by
multiplying te minit-num critical mass y the safety factor. The minimum critical mass is
calculated based n conservative parameters (plutonium fissile concentration, moisture
concentration, etc.) and ideal conditions for becoming criticality. (spherical shape, full
reflection by water, etc.)
The evaluation niodel of a multiple unit reduces the distance between single units more
than the esign value, and decreases the thickness of the material, The thickness of the
material influences the effect of the neutron absorption and the effect of the reflection in the
material. These allow for te possibility of a manufacturing error and an installation error.
The neutron mltiplication factor is calculated by using verified code system to confirm of
securing suberiticality.
Assessment conditions for P02 feed powder minimum critical mass are as follows:
Powder density is 45 g/cm and the isotopic concentrations are 80% 219pU, 10% 24OPu and
10 241 Pu. The moisture contents in the powder are (1) less than wt%, and 2) between
and 5wt%.
The minimum critical mass Of P02 (feed powder) and criticality limits are shown in Table
Table 1: The minimum critical mass Of P02 (feed powder) and criticality limits
mass (kg Pu*')
Parameter rninirnum criticality limitscritical ass
moisture content -� 1 wt% 37.5 26.2
I wt%< moisture content :: 5 wt% 24.8 17.3
safety factor 0.7pU*= 239pU+241-p U+235 --a. U
4.CRITICALITY CONTROL SYSTEM
The transfer control of the nuclear material at PFPF is performed by a computer system
with 3-level hierarchy. The computer system has the layered structure composed of CCC,
PCC and the Equipment Control System (ECS) as shown in Fig.3.
CCC located in the top layer, perfori-ns the criticality safety control and the material
accounting in PFPF.
PCC is installed for each process including pellet fabrication, fuel pin fabrication and
assembling and the analytical laboratory. The transfer schedules for the nuclear material. are
made by PCC, which performs remote operation of the process equipment and the process
control.
ECS is installed with each process and directly controlled by PCC. ECS controls the local
- 135 -

JAERI-Conf 2002-004
process equipments. The ECS also controls the safety for the equipments.
The failure or breakdown of one of computers in PCC or ECS and the associated
equipment controllers does not influence the other PCCs and ECSS. If the computer broke,
following transfer of the nuclear material would be interrupted by ECS and PCC. The transfer
of nuclear material would be stopped except transfer permitted, therefore, there is no
influence in criticality safety.
5 COMPUTER SYSTEM FOR NUCLEAR MATERIAL TRANSFER CONTROL
The PFPF computer system must always manage the inventory of nuclear material in the
facilities to perform the criticality safety control. The control of nuclear material transfers
between CCUs is very important from the viewpoint of the criticality safety control.
The information exchange between computers to execute nuclear material transfers is shown
in Fig.4. The nuclear material transfer control by the computer system is performed as
follows.
PCC that performs operation and the management of the transfer equipment automatically
decides the nuclear material's destination and the transfer route. After the PCC performs the
criticality check for the transfer request, the nuclear material transfer request is transmitted
from PCC to CCC.
CCC confirms that the sum of existing nuclear material and the material to be transferred is
less than the criticality limits. Furthermore, after CCC confirms the transfer request, the
operator in charge of the nuclear material management checks it again. CCC transmits
transfer permission and signal that releases from the interlock of the criticality shutters to
PCC. The nuclear material is transferred ito the destination CCU.
The transfer information (container No., weight, position) about te nuclear material is
transmitted to PCC from the transfer machine controller. Then the operator of process
control section confirms the transfer information by ITV monitor. The tansfer information is
directly transmitted to CCC. This transfer is indicated on the graphic panel (watch board) and
always watched by the operator in.charge of the nuclear material management.
6 CONCLUSION
Criticality safety control is performed to maintain the mass of nuclear material lower than
criticality limit by using the computer system with strict criticality condition and limits at
PFPR
Criticality safety control of facility with large-scale of bulk nlear material was
demonstrated at PFPF. The technologies developed and demonstrated at PFPF can be thought
to make use of the design of the future commercial MOX fuel production plant,
- 136 -

JAERI-Conf 2002-004
REFERENCE
[11 "GUIDE DE RITICTI'E" CEA-R-3314 1967)
[2] K.Asakura, TOhtani, T.1shibashi, "On-line computerized material accounting system for
criticality safety", International seminar On DUClear Citicality safety, pp.272-277, 1987).
[3] T.Obtani, HNakano. MSeya, S.Takahashi, "An introduction of automated MOX facility,
PFPF', INMM 30" ANNUAL MEETING, 1998)
[41 M.Seya, T.Ohtani, STakahashi, Y.Yamamoto, S.1nose, "Fully computerized material
accountancy system", INMM 30,h ANNUAL MEETING, (I 998)
137 -

JAERI-Conf 2002-004
MOX Powder or Pu(`.�,, Powder UO,-, Powder Blanket Pellet
ack Repacking
Weighing 1,oading
ow e PinV
c
Suit Assen U1tie ssem
Diniensio,it ect
1, Dimension/
Density2. Appearance ctio,
Fig. I MONJU Fuel Fabrication Process Flow
Criticality Shutter
sfer Cart
(Lift)
sfer Cartsfer C
(Traverser) (Tr ser)
t duty Con
Intermediate Stora it AccTrans art Glo Process Equipment
Criticality Control Unit (Traveisei) Glove box
Fig.2 Typical arrangement of process glove box and intermediate storage
- 138 -

JAERI-Conf 2002-004
�220-0A
15 4a
MAn I
0
0
U3
0
0
24-40
P2
I rmU�A J M0
cu
139

JAERI-Conf 2002-004
Z
4 4. uLo =
60 U 005
u4ul
u
UJ
J�as
�ZE
Ad
140 -

JP0250293JAERI-Conf 2002-004
APPLICATION OF DEDICATED SAFEGUARDS SOLUTIONMONITORING INSTRUMENTATION TOWARDS IMPROVED
PROCESS CONTROL FOR CRITICALITY SAFETY
13. A. Hunt, D. Landat, L. Dechamp and M. Caviglia
European Commission, Joint Research Centre,21020 Ispra Va), Italy.
Fax: +39-0332-789683, eirrail: brian.hunt
A13STRACTSolution monitoring can augment the safety of a plant by giving a timely response to changes in a tanksconfiguration, or density and solution levels. Assuming tat a precise lank profile as been obtained throughcalibration activity, the profile can be constantly cecked during the plant operations to ascertain whether anychanges ave occurred. These changes in tank profile ould be from precipitation in the tank for example or adiversion) with an accumulation of fissile material, Portable unattended instruments developed at the RC forspecific application i solution roonitoring, house high precision digital pressure transducers of better than0.01% accuracy supported by application software for -rapid data interpretation Tese iristrurrients can detecttank profile changes. Several tanks can even be connected together for monitoring purposes. A quality controlprogram eeds to be eborated and associated with the instrumentation to aintain continuity of knowledge onthe vessel alibration results.
Key words: Solution Monitoring, portable, unattended, instruments.
1. INTRODUCTIONThis paper describes some nuclear safeguards application work carried out in themass/volurne laboratory at the JRC Ispra site of the European Comr-nission and its potentialfor improved process safety. Our laboratory was established some years ago principally toprovide technical support to the nuclear inspectors in the field of measurement of radioactiveliquids in both reprocessing and fabrication facilities. The technical support ranges fromdedicated training courses i mass/volume methodology to the development, implementationand supply of specific solution monitoring instrumentation of high precision for inspector'susage in facilities. Although the objective has always been to provide the nuclear inspectorwith the capabilities for independent tank volume measurements for nuclear materialaccountancy purposes and data interpretation, indirectly te instrumentation providesaccurate process parameter data particularly on the level ad density measurements which isat the worst equal to the operator's control system but generally is far superior due to the highaccuracy digital pressure transducers utilised and application software. The nuclear industrykeeps accountancy records of the nuclear materials it processes for economic, legal and safetyreasons. In the plants where nuclear fuels are processed measurements for accountancypurposes are made when te material is still in the process line mostly in the fonn of a nitricacid solution. The management procedure generally adopted includes among other things,tank volume measurements, the taking of one or more samples of the solution for subsequentchemical analysis and the computation to determine the quantity of nuclear material in thetank. For criticality safety management of fissile material solutions, quality controlprocedures are set in place and can be a variety of measures ftom ever safe tank design,concentration limitations, additions of neutron poisons or indeed the permanent presence ofneutron absorbers.
141 -

JAERI-Conf 2002-004
2. MATERIAL ACCUMULATIONIt is because of the very nature of uclear fissile solutions that within the nuclear industrythere are a variety of tanks of varying sapes and dimensions. Criticality calculations andanalysis play important roles in poviding the designer of tanks the ecessary criteria who inturn matches this with the process requirements for conceptual design and eventualconstruction. All these tanks prior to commissioning need to be accurately calibrated for bothprocess control and nuclear safeguards. For the latter some tanks are of more importancethan others due to the nuclear content form and concentration. However from a criticalitypoint of view considerations have to be taken ito account of possible accumulations offissile material over long time periods in tanks in the form of deposits via precipitation,crystallisation phenomena etc., due to favourable chemical conditions encouraging theseeffects. Solution monitoring instrumentation as proposed offers the potential to give advancedwarning on possible solid accumulation in tanks.
3. SOLUTION MONITORINGIt is worthwhile examining the needs of solution monitoring (SM) and consideration of itspotential for safety improvement 1. Our safeguards programme at the JRC Tspra involvessupport programme activities towards the inspectorate agencies, one such topic being solutionmonitoring. This activity has arisen from the mass/volume methodological training coursescarried out at Ispra over a number of years in te calibrations of tanks of both small and largevolumes. As a consequence of close collaboration with the inspectorate agency a safeguardsapproach for solution monitoring systems in the key processing areas, namely head-end, mainprocess, waste handling, conversion and fabrication areas as been developed. The approachis based on our past and current experience in the application of developed unattended
2solution monitoring equipmentSolution monitoring (SM) in tanks has the principle aim of collecting and determining thevolume, mass ad concentration information of the liquid iside the tank, The resulting dataand information eeds to be analysed in order to arrive at satisfactory accountancy dataconclusions. To generate these data, tanks need some kind of measurement device for eveland density masurement ad also need to be accurately calibrated, Normally tanks in thenuclear processing facilities are usually equipped with a pneumatic easurement systemwhich measures the pressures induced by the airflow through three dip-tubes (level, densityand reference probes) as a result of the liquid level and density of the solution i a tank andsensors measuring the temperature f the solution.The capability ad effectiveness of SM forsafeguards purposes is eavily deperiden o the pior work carried out both b te operatorand the inspector and the monitoring instrumentation installed. Thus to arrive at a trulyefficient and secure system for SM a series of essential activities need to be performednamely:);I- Pre-calibration> Familiarisation with tank operation> Design Information Verification> Calibration activities> Instrumentation specifications> Verification> Data analysesThis is all part of an inspector's work but the importance cannot be over empbasised as theresults provide valuable iformation in subsequent data analysis ot oly for safeguards buton early identification of tank profile changes during the lifetime operation of the tanks.
- 142 -

JAERI-Conf 2002-004
3.1 Pre - Calibration ActivitiesIn order to study the mode of operation and sequence for measurements in a tank thefollowing itenis are needed:
An p-to-date Engineering Flow Sheet that indicates the ad acent tanks, all pipes andvalves
> A detailed onstruction drawing of the tank, including details of all the internals. This isextremely iportant as it indicates were tere are possible linear,-, non-linear zones
> A description on te mode of operation of te tank. This includes te way and sequenceof operation of the mixing, sampling method, the volume measurement operation and themechanism for liquid transfers both in and out.
> The operator's detailed proposal for calibration procedure.
3.2 Familiarisation ith tank operationAny tank to be calibrated is composed of several zones of interest. For each of these zonesanother calibration equation has to be used. In order to determine this equation in an adequatemanner, a certain number of increments in that zone must be foreseen.
Possible zones of interest are:The heel below the major (level) dip-tube. This value can be deduced from the detailedconstruction drawing or could be retrieved from an earlier (test) calibration. Once the vesselis operational, tis portion of the vessel is not anymore directly verifiable. This is due to thefact that the vessel can never be emptied totally or even below the level of the lowest dip-tube.
The non-linear and linear part(s�_of the tank.During operations, rty filling or eptying of the vessel will have been monitored, Althoughthe solution flow rate is ot absolutely constants oriough easurement points wilt be providedto learly distinguish the salient points Within tese zones of the vessel. Te number ofpoints as irreastired a a fixed time interval in this area, will in itself be a measure of thesolution flow rate. 'This information can be Lised to aign the points wthin that area.
Analyses of te data would therefore Concentrate on the decrease in oe vessel and theincrease i the receiving vessel ad for each vessel the profile etermined and compared tothe original profile data for that particular rgion, This is particular important for points in thevessels Wher sdden slope Changes occur, This data as entioned previously will have beenwell determined, This is extrernely iportant since uriug process operations and dataacquisition iformation an be obtained on possible changes i te tank profile ad henceconsideration on whether r not the changes are rlated to aterial accumulation
The overflow 22Lnt.This point is of vital interest to reconcile later calibration verifications or re-calibrations as itmight be the only fixed physical point in the tank that permits a re-verification of the lengthof the dip-tubes.
3.3 Familiarisation with tank operationDesign iformation verification o site is an extremely important and arduous task to beperformed. This usually involves a number of varying tasks, to name but a few, including> Filling/Emptying> Adjusting physical and chemical conditions
- 143 -

JAERI-Conf 2002-004
> Mixing and sampling> Operator's measurement system versus Inspector's
3.4 Calibration activitiesThese activities are adequately described in reference 3 particularly on corrections to beimplemented during data analyses, buoyancy, temperature, scale calibrations.
3.5 Instrumentation specificationsSolution monitoring equipment is usually installed in a position close to theoperator's pressure transducers and manifold. The equipment developed forinspector's usage is a a complete unit with data acquisition ardware, pressuretransducers, associated electronics, programmable logic controller (PLC)including a local data storage capability (EPROM) and an unintenuptible powersupply, all located in a sealed box.
At the core of these dedicated measurement systems is a digital pressure module with amanufacturer's precision of 0,01%. They have fully tested in our Tank Measurementlaboratory and also engaged in nuclear facilities by inspectors and operators. Dedicatedapplication software uder fast data acquisitions (up to acquisitions per second) helps tomonitor events in a tank, interpreting tank profiles and matching with ahived data, Thisallows conclusions to be drawn on tank profile changes during ormal piant operations.
Figure 1. Photograph of an Unattended Volume Measurement Station utilised for SolutionMonitoring
4. CONCLUSIONSSM coupled with fast data acquisition, a precise tank calibration are te essential ingredients
- 144 -

JAERI-Conf 2002-004
in checking a tanks profile. The requirements fr detecting anomalies or changes in tanks canonly be dtected by first obtaining all the relevant information as described in section 3 onSM. Frther detection of possible material accumulation can only be established byelaborating a quality ontrol program to maintain a continuity of knowledge and indeed toestablish in a imeiy fashion whether or not material is accumulating in the tank.
Figure 2 Portable Pressure Measurement Device which can also be connected to the LJVMSto extend the range of tanks to be monitored
5. REFERENCES
I F. Frassen, C. Foggi and B.A. Hunt, "Tank ata Acquisition Evaluation in a LargeScale Reprocessing Plant", 17'h ESARDA Annual Symposium pp 383-388, Aachen May1995.[2] D. andat, B.A. Hunt, M.Caviglia, "Portable Solution Monitoring Instrumentation andData Evaluation for Uattended Application in Nuclear Facilities", 42 n1 R,4MM Annual
meeting Indian Welts, July 2001.
[3] ISO D382/4 Tank Calibration and Volume Determination for Nuclear materials
Accountancy Vessels and Data Standardization.
- 145 -

This is a blank page.

JP0250294JAERI-Conf 2002-004
SUBCRITICAL MEASUREMENTS AND THEIR APPLICATIONS
Timothy E. ValentineOak Ridge National Laboratory
P, 0. Box 2008, Oak Ridge, TN 37931-6354Fax: 1865-574-6182, e-mail: valentiDete(OonAgov
Suboritical easurements have typically been sed at ritical experiment facilities as a means tomonitor the approach to te Gritical condition. However, subcriticaJ ineasurernent ethods have many moreapplications than simply to serve as indicators or te approach to critical. One of te ore fundamental usesinvolves uing drem as benchorark easurements. Monte arlo codes ave been developed that can directlysimulate a vriety of suberitical nreasurements in e same inanne i wch the nreasurements are perforirled.Therefore, suboritical meastifernents can be used to validate Monte Carlo codes ad nuclear data through directcalculation of suberitical quantities. Suberitical easurement ethods can also be sed to determine thesubciiticality of fissile materials in-situ, This requires measurements to be performed and sbsequent analyses ofthe measurements to determine te subcritical kjf value. Suberitical aroasumment ethods an also be used toirlonitor the reactivity of a fissile operation. The purpose of reactivity onitoring would ot be to provide ahighly precise key value fo te fissile operatio bt to provide an idication of a change in reactivity and whenthis change exceeds a specific threshold. This paper adresses the areas of subcritical benchmarking, in-situsubcritical ]AeaStffefflelltS, and subcritical monitoring, Descriptions of te arious applications are provided alongwith the issues and challenges in applying subcritical easurement methods. Filially, recommendations forresolving the issues and challenges for implementation of subcritical measurements are discussed.
Keywords. subcritical, benchniarking, in-situ, monitoring, noise analysis
I INTRODUCTIONSubcritical measurements methods have many more applications than simply serving
as indicators of te approach to critical. Suberitical measurements can serve multiplefimctions that iclude using them as benchmark measurements, as a eans to determine thesubcriticality of fissile materials in-situ, and as a method to monitor he reactivity for fissilematerial operations. These applications are related to each other'but require slightly differentapproaches to implement the measurements and different levels of knowledge about thesystem being measured are needed.
The source-driven noise analysis measurement' is one suberitical measurementmethod that has several advantages as compared to other subentical easurement techniquesand has been applied to benchmark measurements and for the determination of thesubcriticality of fissile configurations. Measurements have also been perfon-ned to investigatethe use of this method as a reactivity indicating measurement.
This papef provides a rief descriptioa of the subrritical source-driven noise analysismeasurement in Section A description of how this ethod is used to benclunark MonteCarlo codes and, nuclear data is provided in Section 3 Application of this measurement for in-situ reactivity measurements is provided in Section 4 wbile the use of this method as areactivity onitor is provided i Section 5. Some concluding remarks are provided in Section6 that include recommendations foy extensions of subcritical measurement methods.
2. SOURCE-DRIVEN NOISE ANALYSIS MEASUREMENTSThe subcritical source-driven noise measurement' known as the 252 Cf-source-driven
noise analysis method) evolved from a simultaneous randomly pulsed neutron measurementand the Rossi-ameasriTernent as an attempt to overcome some of the limitations of othersubcritical measorement methods. Other subcritical measurement methods require acalibration measurement at delayed critical or knowledge of the effective delayed neutron
- 147 -
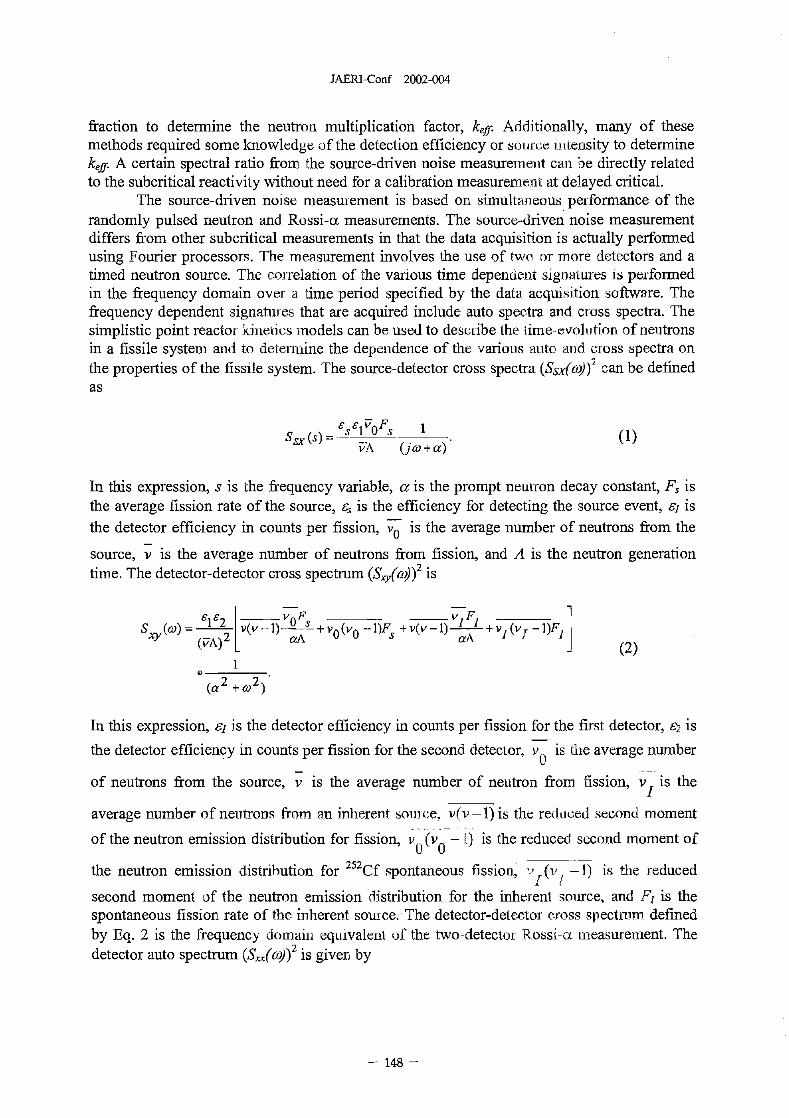
JAERI-Conf 2002-004
fraction to determine the neutron multiplication factor, kff. Additionally, many of thesemethods required some knowledge of the detection efficiency or source intensity to determinekff A certain spectral ratio from the source-driven noise measurement can be directly relatedto the subcritical reactivity without need for a calibration measurement at delayed critical.
The source-driven noise measurement is based on SiMUltaDeOUs performance of therandomly pulsed neutron and Rossi-a measurements. The source-driven noise measurementdiffers from other subcritical measurements in that the data acquisition is actually performedusing Fourier processors. The measurement involves the use of two or more detectors and atimed neutron source. The correlation of the various time dependent signatures is performedin the frequency domain over a time period specified by the data acquisition software. Thefrequency dependent signatures that are acquired include auto spectra and cross spectra. Thesimplistic point reactor kinetics models can be used to describe the time-evolution of neutronsin a fissile system and to detennine the dependence of the various auto and cross spectra onthe properties of the fissile system. The source-detector cross spectra (SSX(C))2 can be definedas
SSX (S) 6S61 �70
i7A (jo) + a)
In this expression, s is the fiequency variable, a is the prompt neutron decay constant, Fs isthe average fission rate of the source, 6, is the efficiency for detecting the source event, 6 isthe detector efficiency in counts per fission, vo is the average number of neutrons from the
source, v is the average number of neutrons from fission, and A is the neutron generationtime. The detector-detector cross spectrum (Sx'(CO))2 s
-V F F(co)= 1 E2 0 Y',
SXY (FA) 2 v -!I + O (VO - )1� + VV - 1) aA + VI (v, - 1FIaA (2)
1(a2 + co2
In this expression, el is the detector efficiency in counts per fission for the first detector, 2 is
the detector efficiency in counts per fission for the second detector, v 0 is he average number
of neutrons from the source, v is the average umber of neutron from fission, is theI
average number of neutrons from an inherent source, v(v - 1) is the rduced second, moment
of the neutron emission distribution for fission, 0(V 0 1) is the reduced second moment of
the neutron emission distribution for 252Cf spontaneous fission, I(V I 1) is te reduced
second moment of the neutron emission distribution for the inherent source, and 'Fj is thespontaneous fission rate of the inherent source. The detector-detector ross sectrum definedby Eq. 2 is the frequency domain equivalent of the two-detector Rossi-CX easurement. Thedetector auto spectrum (&'((t)))2 is give by
- 148 -

JAERI-Conf 2002-004
,III - V 0F v FS, 0)) -�V� (v - U v. (v, - IF� + v(v - ) - + v, (v, - 1F1
A aA aA
(3)�OFs vIFI
y +0�a2+cq ) -aA aAJ
The most significant advantage of the source-driven oise measurement is that a certain ratioof ftequency spectra can be obtained that does ot dpend on detection efficiency. Thedetection efficiency is stated in terms of counts per fission ad is ot directly measurable. Thespectral ratio of interest is defined aS2
S (CO)s (co)R(w = SX SY (4)
SSS (CO)s XY (co)
The ten-n S, is the source-detector cross spectrum between the source s and the detector x.The asterisk denotes taking the complex conjugate of the source-detector cross spectrum, Sx.The terrn Sy is the source-detector cross spectrurn between the, source and the detector y.The term S,y is the detector-detector cross spectrum between detectors and y. The term isthe source auto spectrum and is simply equal to te source efficiency tmes the source fissionrate (S,,=6F,). Te spectral ratio that includes an inherent source is of particular interest forinterpreting measurements for spent nuclear fuel applications or for systems with significantamounts of plutoniurn. The spectral ratio including an inherent spontaneous fission source isexpressed as
es 0R(co) (5)
v(v vo (v - ) -vv 1 F v, (v, - ) ,
1PI v0 1PI 11� v F S
As can be seen from Eq. 5, the spectral ratio that includes the effects of an inherentspontaneous fission source depends on the ratio of the inherent spontaneous fission rate to the252Cf source fission rate. These expressions are similar to those derived by others except thatspatial correction factors and importance functions have been omitted in these equations. Thisdependence can be included in the appropriately weighted cross sections and neutronemission probabilities. The actual use of such expressions to inteipret the measurements isquite limited and a more general approach using the Monte Carlo method has been developedthat does not -have te limitations of the point reactor kinetics models.2 The expressions areonly provided to provide an indication of how the various frequency spectra relate to thereactivity of a fissile system.
3. BENCHMARKING MONTE CARLO CODES
The use of subcritical easurements as a means to validate Monte Carlo codes andnuclear data substantially increases the reactivity and neutron spectrum regimes over whichthe codes and data are validated. In fact, subcritical benchmark easurements are the key todetermining whether the code bias; i.e. the difference between measured and calculatedreactivity indices, is a function of the degree of suberiticality. Suberitical measurements canbe used to validate Monte Carlo codes and nuclear data through direct calculation of themeasured quantities. Alternatively, the Monte Carlo codes ad nuclear data can be validatedfrom the kff value determined from the measurements, Interpretation of measurements
- 19

JAERI-Conf 2002-004
requires a model to relate what is measured to the neutron multiplication factor. In the past,the subcritical measurements were interpreted using equations eveloped itorn point kineticsmodels for the time-dependent behavior of neutrons in the subcritical onfiguration. Thislimited the application of the rneasureinent to situations in wich point kinetics wasapplicable. The most general model to relate the measured quantities to kjj-would involve the
3use of the generalized stochastic model developed by Munoz-Cobos et al. Although ananalytical solution of suberitical measurements in terms of the stochastic model is notpractical, the Monte Carlo method provides a irreans to simulate the suberitical measurementsand to also calculate the eutron multiplication factor. In fact, the same Monte Carlo code andnuclear data can be used for both calculations.
The Monte Carlo code MCNP-DSp4 was developed to simulate a variety of subcriticalmeasurements. MCNP-1)SP can be used to directly calculate the frequency dependent spectrafrom the source-driven noise analysis measurement. Furthermore, MCNP-DSP can beused todetermine k using a perturbation method. The Monte Carlo codes are sed to interpret themeasurement by performing a calculation of the measured parameters and a separateeigenvalue calculation, For exaniple a compairson of measure ad alculated values of tespectral ratio can be used to obtain the "experiniental" kff. If te measured ad alculatedvalues of the spectral ratio ae in agreement, then te bias in the spectral ratio is zero. The biasin the spectral ratio is defirred as the difference between measured ad calculated values of tespectral ratio (R,,-Rd where is the measured value ad R, Is the calculated value. Firstorder perturbation teory an be used to obtain an expression that can be used to determinethe "experimental" kd, and the bias in the The low-frequency alue of the spectral ratiohas been shown in numerous experiments to be linear with kff over a wide range of values ofkff with the values of kff being interpreted using point kinetics models. Given tbe lineardependence of the spectral ratio with kff, the bias in the spectral ratio varies linearly as thebias in kff k-kd. To determine the experimental" kff value and its bias, the Monte Carlomodels are slightly perturbed and new values of the spectral ratio (p ad kf p) eobtained. If the linear dependence is valid, then the perturbation alculations can be used toobtain the experimental" ff and its bias using the following linear relationship:
RM -R C R P C (6)k -k k -- kM C P C
This methodology simply ses a linear interpolation r extrapolation between the standardand perturbed values of the spectral ratio ad kj I rtne t
.f to determine the exper n al" kqf, Usingthis relationship, the value of k, can be determined along with its bias Propagation oferror is used to btain the uncertainty i k.. a([ its ias, Even, if the measured spectral ratiovalue and the calculated value agree. the perturbation analysis is performed, This is requiredto equate the uncertainty in the measured spectral ratio o te uncertarruy i the iferred kffvalue.
This methodology has been sccessfully applied to benchmark source-driven noisemeasurements with uranyl itrate solutions, Te analysis of tese measurenients ave beendocumented i the Handbook of the Iternational Criticality Safety Benchmark valuationProject.5 hi the aalysis of the tiranyl nitrate solution _-xperiarents a variety of perairbatiouswere used to iterpret k,f ad a varieq, of 1100lear data Sts used in the imerpretations. The
results demonstrated tat te in(erpreted /f_jf was dependent of the perturbation metho ad
had a very slight dependence on the nuclear data set, Te interpreted experimental) kjjvalues
for each different cross section data set are presented in 'Fable As can be sieen in this table,
the interpreted kf values differ slightly depending on which cross section data set was used.
15 -

JAERI-Conf 2002-004
A gneral tend is observed that the interpreted kfj-values obtairro(i tsing the NDF/B-V crosssection data are onsistently higher than te iterpreted alues obtainedfrom, the ENDF/B-VIand TIENDL-3.2 cross section data sets. Te largest dfference between te interpreted kffvalues aniong te results produced sg the hree different cross section data sets is
approximately 0003 Ak,
Table 1 Iterpreted experimental kff values for ENDF/B-V, E-NDF/B-Vf, and JENDL-3.2orosssectioti data sets for the high-ennched uianyl nitrate solution experiments.__9_o�ufio-n-___F�FNT)F/BV FNDF/B-V1 JENDL-3.2
-Height (cm) "Experimental" kjf - "Experimental" ff "Experimental" kff30.48 0.9631 ± 00052 0.9602 ± .0052 0.9610 ± 0.005027.94 0.9448 ± 00045 0.9430 00045 0.9432 ± 0004125.40 0.9229 0.0052 0.9215 ± .0050 0.9204 ± 00056
�2 2� 8 88 9 0. �OO 5 F �0,8888i_- �0.0048-__O_��8883 0.0055
20.32 0.8582 0.0055 -- 0.8580 + 00061 0.8571 0.005215-24 0.7464 0.0167 0.7511 ± 0. 0.7507 0.0234
4. IN-SITU SUBCRITICAL MEAStJREMENTS
The second area of applicability of stiberifical noise measurements is for in-situdeterminations of te subentical neutron multiplication factor. The two ways that this a beachieved is y post analysis of the masurements sing te Monte Carlo mthod previouslydescribed or by using the limited point reactor knetics models to relate the measured quantityto the subcritical eutron multiplication factor, The latter mthod sould only be considered ifan on-liDe determination of kfr is desired. in such applications, care irrust be taken to properlyselect the ocation of the orce and detectors sh that the oint kinetics models areapplicable. Furtherinore, alculations of spatial correction factors ad mportance ratios arealso required and must e spplied to the point reactor formulas to determine kff. The use ofpoint reactor kinetics is discouraged because ncertainties in correction factors contributedirectly to the ucertainty in the reactivity estimates. The Monte Carlo method is the preferredway to interpret te measurements because of the limitations of the point reactor models andbecause correction factors do not have to be computed.
Tu-situ suberiticality masurements performed at the Oak Ridge Y12 Plant in Vault16 demonstrated that these types of measurements are practical. in these measurements, thesubcriticality of an aay of high-tirriched uranium metal castings side a concrete storagevault was deternrined sing the Monte Carlo method. Measurements were performed with thesource and detectors placed inside the array. The. source as located in the center of thecentral CaStmg a te detectors were placed on the periphery of te array. Prior toperforming he oise measurements, flux profile measurements were performed to determinean array size that ould approximate the results expected if the array was infinite. Thedetectors ere placed on te outside of the essentially infinite aay Te noise measurementswere performed over inarty weeks to obtain statistically OODVofged spectra ecause of the lowcoherence values. The measurements were interpreted using MCNP-DSP simulations. Thesesimulations were aso perfiornied over several weeks. Te Monte Carlo odels contained asmuch detail as possible about the storage vault configurations, owever. the composition of theconcrete storage vault was not known. The aalyses were performed assuming that theconcrete was dry or wet. Te resulting kfj- value obtained front the aalyses did not depend onthe exact kowledge of the ooncrete composition. Although the oorrorete oornposition was notexactly known, the concrete vault was 25 years old and should lave been comprised of dry
- 15 -

JAERI-Conf 2002-004
concrete. Coincidentally, the calculated spectral ratio value for the dy vault agreed within onestandard deviation of the measured value. The Monte Carlo models included as much detail aspossible concerning the storage vault geometry and composition. Te storage trays weremodeled in great detail, as were the uranium metal castings. The composition of the storagetrays, detectors, and the castings were well known and included in the odels. Although theinterpreted kff value for the HEU storage vault does not depend on the composition of theconcrete, all other details about te measurement are known, The success of the interpretationof the HEU storage vardt measurements occurs because the spectral ratio depends oly on theinduced fission events from the 252Cf source. A significant inherent eutron source does notexist in this configuration.
The MCNP-DSP computed kff values and spectral ratio values for thesemeasurements are provided in Table II along with the interpreted kfj- values from theperturbation analysis. Perturbations were made to various components of the vault and thesubsequent interpreted kff values did not depend significantly on the perturbation. In fact, theassumption that the concrete was wet is a rather large perturbation as compared to theassumption that the concrete is dry. Even though large erturbations ae ecessary for the wetconcrete model, the interpreted kff values are statistically equivalent. T11s application of theperturbation methodology demonstrates the robustness of the model. The success in theinterpretation is due in great part to the fact that detailed nformation is known about themajor components of this system with only the concrete composition being tile majorunknown in the nreasurements. If the vault system had a significant iherent source, theinterpretation would have een ffirther complicated because the inherent source may notpermit a unique one-to-ODe relationship between the spectral ratio and kjf.
Table 11. MCNP-DSP calculated spectral ratio and kff values and interpreted kff values forHEU storage vault in-situ measurements.Concrete Calculated Ratio Calculated Perturbailon InterpretedCondition (R,;) k�jf (k.) k"ff
Dry 0.3894 ± 00027 0.7920 ± 0.0005 Hydrogen content 0.7888 ± 00068,!"'U enrichment 0.7902 ± 00041
Casting length 0.7901 ± 00045Wet 0.5004 ± .0151 0.7354 ± .0005 Casting inner radius 0.7798 ± 00054
Reduced concrete 0.7945 ± 00068density
aMeasured spectral ratio (R,,) is 0395 ± 0012.
5. SUBCRITICAL MONITORINGAnother seful application of suberitical oise measurements is to provide a way to
monitor fissile aterial processing operatiODS, This application would o focus ondetermining the sboritical neutron multiplication ut would se the masured quantities as away to ascertain normal operation. The enhanced sensitivity of the uberitical noisemeasurement would allow fissile processing operations to be morritored ad ontrolled using
the changes in spectral signatures as idicators to -hanges i te systeni Te spectral ratio is
an ideal candidate for process worritonng because it is iudependen( of detection fficiency and
would not change due to drifts i the electronic system. Measurements ad Monte Carlo
simulations of a process condition could be performed to provide bounding values for the
spectral ratio. The measured spectral ratio values could be equated to k,j values for various
operating conditions. Canges in the spectral ratio value ould be monitored ad used to
ensure that the reactivity of the systein remains below some desired value, This would
enhance safety in operations with fissile material by providing some means estimate the
- 152 -

JAERI-Conf 2002-004
subcriticality of the fissile process. If the system is simple nough and the geometry isappropriate, then the point reactor kinetics models could possibly be used to provide an on-line estimation of ke, however, great care would need to be taken to properly estimate theuncertainty on the kjj value from the point reactor kinetics model to ensure that the limits onthe fissile operation can be properly onstrained.
The greatest challenge in applying sliberitical measurements for process monitoring isto measure a antity that does ot depend on changes in the detection system such asdetector efficiency or dead time, o changes in any iherent mtutrons sources that are capableof inducing fission, and o source intensity. The spectral ratio fom the source-driven noiseanalysis measurement satisfies two of tese criteria. However, the spectral ratio as shown inthe simplistic models in Eq. is dependent o te Urherent sources. f the contribution of theinherent source to the spectral ratio is significaDt, then care must be taken to provide anindication of the change i the inherent neutron sources in the process. To circumvent thislimitation a modified spectral ratio termed the bi-spectral ratio could be acquired. The bi-spectral ratio depends only on induced fission events caused b the 252Cf source and isindependent of the source detection efficiency has been developed that requires the
,OnS7measurement of higher-order correlation functi . These higher-order correlationmeasurements leave yet to be applied to subcriticality measurements, but they have beentheoretically sown to possess higher sensitivity to reactivity and are independent of allinherent sources. The bi-spectral ratio is closely related to the standard spectral ratio;however, the bi-spectral ratio involves only events correlated with the timed neutron source.The summary provided in ts section follows directly from the developments of Matting IY7.
The bi-spectral ratio is defined as
T SSX (O)SSY (0) VO (7)XYIS SSSXY (0,O) VO (V 1) RV I )
V 0 VIPI
In this expression s is the average source fission rate. The bi-spectral ratio is essentiallyequivalent to the standard spectral ratio for systems but is independent of the source detectionefficiency, the detector efficiency, or an inherent source. This measurement requires pulseneutron measurements to be performed with two detectors. In addition, the bi-spectral ratiorequires the correlation of the response of two detectors with the neutron source. Thismeasurement can be thought of as a dual pulse neutron measurement. This measurement isonly dependent on fission chains initiated by the neutron source and hence would be moregenerally applicable to in-situ measurements with plutonium and irradiated nuclear fuels. Forsystems close to delayed ritical, the standard spectral ratio will be dependent on the delayedneutrons that will behave as an inherent neutron source. However, the bi-spectral ratio willnot be affected by delayed neutrons and hence would be more useful for systems close todelayed critical. In theory, the bi-spectral ratio can be measured up to prompt critical. Anequivalent signature can be acquired in the time domain by performing a three-waycoincidence measurement between a timed neutron source nd two detectors while at thesame time performing two two-way coincidence measurements between the source and eachdetector. A time dependent signature could be acquired by varying the gate of the coincidenceperiod. A ratio of the two source-detector coincidence measurements to the three-waycoincidence measurement times the source detection efficiency would produce a quantitysimilar to the bi-spectral ratio that should also be independent of inherent neutron sources.
153 -

JAERI-Conf 2002-004
6. SUMMARY
Subcritical measurements can serve multiple functions Te measurements are idealfor use as benchmark measurements because many subcritical masurements sch as theRossi-a, noise analysis, ad Feymnan variance can be simulated rising vtorrte Carlo codes.Quantities from the source-driven noise analysis measurements lave been shown to e moresensitive to nuclear data tan direct calculation of kj tereby making the simulation of thesource-driven noise aalysis measurements more applicable for testing Monte Carlo methodsand nuclear data. Suberitical measurements can also be sed to Interpret in-situ applications.In this regard, the easurements are applied to detemrine k-,ff A model tat relates themeasured quantity to kjf is used to interpret the measurements ad should be fairly robust.Source-driven noise measureffients have been performed to determine the suberiticalreactivity of high-enriched itranium metal i storage configurations. These irleasurementsdernonstrated that the kjf value could be determined without xact knowledge of allconstituents of the storage vault, However, the success of the use of measurements for in-situverifications is ighly dependent on whether or o a inherent neutron source is present. Thepresence of an inherent source omplicates te iterpretation of the easurements and maylimit the application of the measurements. The use of subcritical measurernents s reactivitymonitors is also feasible, For process onitoring application te subcritical easurementquantities should be evaluated for the limits of the standard operating conditions to equate theexpected value of the subedtical measurement uaritity to kjf Te spectral ratio from thesoarce-driven noise analysis measurement is a ideal candidate for process monitoringbecause this quaritity does not depend on the source strength r changes i te detectionsystem. However, the spectral ratio is dependent on inherent neutron sources that may changethe spectral ratio value although the reactivity state ay Dot have changed, For systerns withan inherent neutron source, a signature that is independent of the inherent source such as thebi-spectral ratio or a multi-way coincidence measurement iruist e performed if the addition ofthe inherent neutron source is outside of the standard operating onditions. A, detailed modelsuch as the Monte Carlo method must also be used to equate the suberitical easured quantityto kff if kff is to be the monitoring parameter.
References
1. V. K. Par6 and J T Milralozo, "Reactivity from Power Spectral Density Measurementswith Californium-252," Nuel. Sci. Eng, 56, 213 (1975).
2. T. E. Valentine, Review of Subcriticai Source-Driven Noise Aalysis Measurements,ORNL/TM-1999/288, Lockheed Martin Energy Research Corp., Oak Ridge NationalLaboratory, November 1999,
3. J. L. Muhoz-Cobo n G Verdu, "Neutron Stochastic Tronsport Iheoq with DelayedNeutrons," Airrials Nuclear Energy 4 7327 1987).
4. T. E. Valentine, "CNP-DSP Users N4anual", ORNL/TM-1 3334--R2, Oak Ridge Nat.Lab, October 2000.
5. "International andbook of Evaluated 0ticality Safety Benchmark Experiments,"NEA/NSC/I)OC 95) 03, Nucloar Energy Agency, Organization for EconomicCooperation ad Development (Sep, 2000),
6. J. T. N111halezo, T. E, Valentine, L. D. Phillips, "Subcritical Measuremetits for a E, EUStorage Vault at the Y12 Plant sing the 252Cf_SoUrce_DriVeII Frequency Analysis
Method," Nuclear Safety, 38, 1, January-March 1997.7. J. K. Mattingly, "High Order Statistical Signatures front Source-Driven Measorements
of Suberitical Fissile Systems," Ph.D. Dissertation, University of Tennessee, Kioxville,Tennessee, August 1998.
- 154 -

JP0250295JAERI-Conf 2002-004
STATUS OF THE FETCH TRANSIENT CRITICALITYCODE AND APPLICATION TO TACY DATA AND
DOSIMETRY APPLICATIONS
C C Pain, Y Yan-tane*, C R E de Oliveira and
A J H Goddard
Computational Physics ad Geophysics Goup,
-Department of Farth Science and Engineering,
Imperial College of Science, Technology and Medicine,
Prince Consort Rd, ondon, SW7 2BP, U.K.
JAERI Visiting Fellow
email: c.pain�ic.ac.uk
1. INTRODUCTION
This paper describes the current, ,,status of the FETCH coupled, transient, criticality/multi-phase flow
model and outlines recent applications. The FETCH model has been developed to model criticality
transients i multi-phase media (see 3 4 5) and is applied here to fissile olution transient criticality.
We describe, primarily, research on the application of the FETCH code to modelling three TRACY
transients with step reactivity insertions of 2 25$ and 28$.
Previous work (focussing mainly on SILENE data) has demonstrated the ability of FETCH to achieve
satisfactory agreement with measured power and pressures for high powered transients initiated by a step
reactivity change. Foi transients over 1$ and less than 35$, and for short times relative to heat losses,
detailed features axe determined by radiolytic gas evolution. These solutions are typically highly enriched
and have relatively low ranium concentrations. The solutions used in TRACY, on the other hand, are of
a lower uranium enrichment and higher concentrations. We have investigated if FETCH can be used to
predict TRACY data using the fundamental parameters (determining rate and quantity of radiolytic gas
production) that were obtained when matching FETCH with SILENE pressure data, see 3]. In addition,
the sensitivity of the TRACY simulations to these parameters is examined.
To complement modelling the behaviour of TRACY over short times, we also investigate its behaviour
over 10's of seconds after the initial pulse - still in a time range where heat transfer out of the system is
of minor significance, It is sbown. that there can be a second fission peak some 10 to 30 seconds after the
initial peak and that he tme evolution of this peak is determined by the assumed radiolytic gas bubble
size used in the gas-liquid drag laws.
We conclude the paper with a short discussion of the use of FETCH in modelling dosimetric quantities,
based on results from a transient analysis. That is, predicting the dose to various organs for a worker
15 -

JAERI-Conf 2002-004
located at a particular position relative to the vessel in question.
2. SUMMARY OF MODELLING APPROACH
In this section the approach to solving the radiation transport and multi-phase fluid equations [5 is
discussed. The three fluids conservation equation sets cover mass, momentum and thermal energy. The
mass equation represents the void fraction, densities and velocities of liquids in given phases and also
allows the position of a free surface to be tracked. In addition to momentum transfer terms between
phases, the momentum equation has terms for interfacial pressure and drag forces, virtual mass and lift
[5]. Buoyancy forces evolve naturally on the appearance of temperature differences and radiolytic gas
bubbles in the system.
Scalar field equations include those for delayed neutron precursors and dissolved radiolytic gas con-
centration. Delayed neutron precursors are assumed to exist only in the liquid phase and are in six
delayed neutron precursor group form. The continuity equation for the liquid depends on an equation of
state embodying the response of liquid density to pressure and temperature (via the speed of sound and
the expansion coefficient respectively). This, together with the use of the ideal gas equation, for each
of the constituent gases, allows the pressure to be calculated for both compressible and incompressible
flow. Boundary conditions are those associated with no normal flow at the walls of the container and
perfect slip for both the liquid and gas phase. At the top-most boundary of the domain we specify the
temperature, density and pressure (atmospheric) for the inflowing gas. The boundary conditions for
gas outflow are specified normal and zero shear stress conditions. The finite element discretisation and
solution of the multi-phase flow equations are described in [1].
The Boltzmann neutron transport equations are solved using the even-parity principle, see 6 To
discretise the equations we have used finite elements in space, PN approximations in angle, finite difference
in energy and a two level discretisation in time. In the examples shown six energy groups are used. The
associated material cross sections are obtained by interpolating group condensed (by WIMS 7 cross
section sets in voidage and temperature, see [5]. Also the PI approximation in neutron angle direction is
used here.
3. SIMULATION RESULTS
The fuel has the following properties: The enrichment is 10% V235; nominal Og U /litre a nitric acid
molarity of 07 and an initial temperature of 2.3 Deg. C. The vessel consists of a stainless steel lined
annulus, and the central region contains a control rod wich is ejected, i te experiment, to produce the
required reactivity insertion. The geometry of TRACY is described in 2] A ummary of the comparison
of TRACY experiments with FETCH simulations is shown in .
- 156 -

JAERI-Conf 2002-004
3.1 Physics of the initial fission pulse
As the power rises it as a doubling time which is dictated largely by flff and at this stage the dynamics
have no nonlinear feedback mechanism. However when the solution temperature rises the negative
coefficient terminates the rise. Around this maximum, radiolytic gas bubbles start to e produced in the
solution,. On comparing the maximum fission rate curves with and withotit radiolytic gases from FETCH,
see figure (a), it is seen that gs feedback reduces the fission rate maximum by about 15%. Shortly after
the maximum, radiolytic gas evolution becomes more important and qickens the decrease in the fission
rate, significantly effecting the total yield in the first fission peak.
We have performed simulations with various quantities of radiolytic gas produced per fission (G value)
of G=0.6 and G=1-5 (number of hydrogen molecules per 100 eV). The latter simulation seems to match
the experimentally observed fission rate after the initial fission pulse and is the default value used here.
However, it should be noted that the decrease in FETCH fission rate is slightly more rapid than that
shown in the experiment. This can only be partly due to the relatively large time delay (some 0.01
s) of the fission rate sensor in the experiment when the fission rate is decreasing, see 2 Most of the
discrepancy implies tbat, in the model, too much radiolytic gas is produced at the trailing edge of the
fission pse. However, decreasing this quantity, that is slowing down the rate of bubble production,
decreases the maximum pressure and reduces the agreement of the modelled pressure pulse with the
experiment. This seemingly contradictory behaviour requires further study.
Rom the modelled pressure trace, shown in figure 1(b), for the 20 step case, it is evident that,
in this simulation, much of the gas deposited is trapped in the liquid and therefore undergoes pressure
oscillations which are damped due to viscous damping and the rise and bursting of radiolytic gas bubbles
out of the liquid. This oscillatory expansion contraction of a pocket of gas bubbles also manifests itself
in the modelled fission rate curve, figure I(b), just after the large fission spike. For the higher powered
2.5 and 28 step transients, much of the gas quickly escapes the system and thus there is not a high
frequency pressure oscillation, see figures 2(a).
The pressure and fission rate for the 2 and 28$ step reactivity simulations are shown in figure I(b),
2(a). The time axis has been shifted to match the maximum fission rate of the experiment. The following
correlation is used to calculate the rate of radiolytic (hydrogen) gas mass produced in the form of bubbles:
F = h (C - Co) al N (C - 00) n C - CO). (1)
C, is the concentration of radiolytic gas dissolved in the solution, Co is the critical concentration at which
radiolytic gas bubbles start to appear in the solution 3 Co is the concentration at the bubble surface
for a bubble 2 x 10⁻⁵ cm in diameter in thermodynamic equilibrium, a, is the liquid volume fraction
157 -

JAERI-Conf 2002-004
and h(C - CO) is the heavy side function. The sensitivity of the parameters and N to the resulting
pressure are shown along with the experimentally observed pressures in figures 2(b) 3(a),(b). The default
parameters here are n = 3 and N = 471 x 0" which were obtained i 3�
3.2 Dynamics after the initial fission pulse
Various fields modelled at 30 seconds into the simulation, for 2 and 28$ step reactivity insertions, are
shown in figures 6 and 7 respectively. In the temperature and 'longest lived delayed precursor' fields we
can see the mixing associated with the overturning of the fluid. In addition, the power at 3 seconds is
shown in the shortest lived delayed neutron group and shows a slight displacernent of the peak power
away from the central region on the left) in which there is a void surrounded by steel.
The fission rate versus time curves for the 2 and 28$ step reactivity isertion imulations are shown
in figure 8(a). It is seen that tere is a second fission peak wich occurs at about 10 seconds i figure
8(a) following an increase in criticality of the system. This is due to the the rise of the bubbles out of
the system. All simulations conducted here were performed with a blibble diameter of 0.5 111m. The
exceptions to this leave results shown shown i figure 8(a) in which we have epeated tile 28$ step
insertion simulation with bubble sizes of 0.2mm. and 0.3mm. As expected the saller te bubble size the
longer it takes for the bubbles to rise out of the system and produce a second fssion peak. The gas volume
fraction in the solution is relatively small, see 7(a) for example. Thus the bubbles are airly isolated and
thus rise out of the system at approximately terminal velocity, with only a sall Swann correction for
the surrounding bubbles. In addition, the convoluted path the bubbles take to te free urface further
increases the time they take to each the surface. Thus the time to reac te sorface is approximately
twice that one would expect if they were isolated and were to rise vertically in a liquid at rest.
The overturning of te fluid can also been seen in figure 8 (b),(c wch shows the temperature at 3
detectors place i the liquid at 21 cm away front the central axes an i a, vertical line at eights of
cm, 25cm. and 45cm. above the ottom. of the liquid filled vessel. Te maximurn emperature versus time
is also shown in figures 8(b),(c). The temperature graphs show in general te radual equalisation of the
temperature distribution, wich is also evident in te temperature fields hown i figures 6(b ad 7(b).
4. 3-D modelling
We expect that at some point during the transients studied here the flow will reak its axi-symmetry
and become fully three dimensional. This is expected to occur hortly after the the radiolytic gases are
initally deposited in the solution and at the stage when the mass of radiolytic gs bbbles wich initially
take up a toroidal shape, start to rise to the free srface. Thus athough file dynamics of te first pulse
will be largely axi-synnnetic this will not be the case subsequently. Te exploration of 3-D aspects of the
flow and its effect on power ad pressures is currently uderway.
- 15 -

JAERI-Conf 2002-004
5. Application of FETCH to dosimetry.
We have applied FETCH in a simplified, exploratory, study of the neutron dosimetry of worker A - who
received the agest dose during dre JCO Compauy criticality icident This dose was received mainly in
the first, few secouds of the ensuing nuclear criticality transient, (the 'burst' period). In addition to the
multi-organ Iosimetyy of worker A, this work provides a method of elping to evaluate the yield in the
initial pase of the criticality'incident. This can e used to calibrate kinetic simulations which aim to
investigate the physics behind te incident.
FETCH simulations of the accident [10] have yielded transients representing the time variation of
fission rate within the tank.
The radiation transport code EVENT 6] was then used to find information concerning the flux within
the uranyl nitrate solution de to each of the energy groups. The aim was to relate the steady- state
fission rate to the flux at a series of 'pixels' at points outside the water jacket representing the locations of
body organs. Bay-tracing techniques in the void combined with various nentron angular approximations
ranging from PI to P5 yield a value for the mean flux, O', in each of the pixels due to each energy group.
This relationship was converged for the P5 angular flux approximation, and were used to calibrate the
FETCH modelled power distribution during the burst period to yield the fluence at each pixel. Conversion
factors take into account the eutron cross section properties and energy dependence of the damage to
the various organs. These were taken, assuming antero posterior geometry (AP) from ICRU report 57
([8])-
The doses alculated to the various organs compare well with whole body doses estimated (see 9)
at between 16 Gy E and 20 Gy Eq calculated from the worker A's symptoms, lymphocyte counting,
chromosome analysis and 24-Na activation. In addition the Tokai-Mura tank was modelled in good
geometrical detail which has enabled us to show the influence of the vessel and moderating water jacket
on the spatial variation of the dose. For example, the dose to the head was found to be particularly large
due to the energy spectrum of the impinging radiation - the faster eutrons resulting in more biological
daznage, The comparison between modelling and published dose estimates indicates that the number of
fissions to which worker A was exposed was approximately 7 x 10¹⁶.
Aknowledgments
This research has been supported in part by the UK Health and Safety Executive (Nuclear Installations
Inspectorate). We would like to thank Toshihiro Yamamoto and Ken Nakajima for providing advice on
the TRACY simulations. However, the opinions expressed are those of the authors alone.
159

JAERI-Conf 2002-004
Table 1: Summary of FETCH (FETCH) simulations of TRACY (TRACY) experiments - comparison of
Case K,ff max Max. pressure
-1 Power(MW) bars
R54 TRACY 2.0 500 2.6
R54 FETCH 2.0 470 2.6
R55 TRACY 2.5 900 5.4
R55 FETCH 2.5 880 4.3
R56TRACY 2.8 1200 7.3
R56 FETCH 2.8 1193 5.3
results.
.................. ...
(a) 2.0 step variable G (b) $ 20 step
Figure 1: Simulated 20 step reactivity insertion. (a) fission rate for various quantities of gas production
(G value). (b) pressure and fission rate.
References
[11 C C Pain, Mansoorzadeh C R E de Oliveira, A J H Goddard, 'Numerical Modelling of Gas-Solid
fluidised beds using the two-fluid approach', International Journal of Numerical Methods in Fluids.
36, 91-124, 2000).
[2] H.Yanagisawa, A.Ohno, K.Ogawa, E.Aizawa, M.Yokoyarna, 'Time Delay of Thermal Neutron Detec-
tion during Power Burst in TRACY', Nuclear Science and Engineering, 38, NO, , 591-599, 2001).
[3] C C Pain, C E de Oliveira, A J H Goddard, A P Umpleby, 'Transient criticality in fissile solutions
- compressibility effects', Nuclear Science and Engineering, 138, NO, 78-95, 2001,
[4] C C Pain, C R E de Oliveira, A J H Goddard, A P Urnpleby, 'Criticality behaviour of dilute
plutonium solutions', Nuclear Technology, 135, NO. 3 194-215, 2001.
[5] C C Pain, C R E de Oliveira, A J H Goddard, 'Non-Linear Space-Dependent Kinetics for Criticality
Assessment of Fissile Solutions' Progress in Nuclear Energy, 39, 53-114, 2001).
[6] C. R. E. de Oliveira, 'An Arbitrary Geometry Finite Element Method for Multigroup Neutron
Transport with Anisotropic Scattering', Prog. in Nuclear Energy, 18, 227 1986).
- 160 -

JAERI-Conf 2002-004
. ........ ... . ....... ..... ......-. ............ ..... .... . ........................... ......... ...... ............ ............................. .............. ............ ..... .................... .. .............................T
j 4
. ... ...... .L
(a) pressure a(] power, fission rate) (b) assessment of riticleation
Figure 2 Simulated $ 2� sp reactivity insertion. (a.) pressure wid fissioll rate. (b) assessnient of
nucleation rate parameLer N f a 2, by comparison with pressure.
VAV
(a) 2.0 step, n 2, variable N (b) $ 20 step, n 3, variable N
Figure 3 Assessment of nucleation rate parameters n and N, by comparison with pressure.
[7] WIMS7 User Guide, AEA Technology Report ANSWERS/WIMS(95)4, June 1996).
[8] 'Conversion Coefficients or use in Radiologica Potection Against External Radiation', CRU Re-
port 57.
[9] M. Akashi, 'Exposure to Netaxon Irradiation je te Criticality Accident i Tokaimura', Division of
Radiological Sciences .eport, 2000).
[101 C. C. Pain, C R d Oliveira A J H Goddaid, Itansient, analysis awl dosimetry of the Tokaimura
criticality incident' rit prep.
- 161 -

JAERI-Conf 2002-004
Z71 246- b- 1.47-10'9,17.10 9,V 1 k1 2.545� 0 I..7 10'
144. IC'e,02 I O -6,30 10M 83, W, 244
" ;0-' -7.U,�O Amiga.: 611", I, Wl� TW qZl. W 05 IW
5.M O' 6X� G 10' NO ,�3-10. - N "-la,1.7 -�O- 54,-1 n2.,01 ar"G,�M-Icr, 1.760P 1: 5,86.W -7�4e-,G3,20 T� 11.10" 737A 1 a, -3�� 0 J3 OU33-10- - -w, .6 01 �J�Oc,, 6.21.10 2, 0 -�I,
.;DC :;O -2.� ;O:.6' 117-106.42-Hr' -I IN 1,2,2,57.10, o�:10: 1.2- 02.9 147.1 7:�':142 !0" 0 0�.b. 2.5' ;O b!" U9.10,
(a) volume frac. (b) liquid temp. (c) 1st delayed group. (d) 6th delayed group.
Figure 4 Various felds at I second into the simulation with a 2,0 step reactivity insertion. The
diagrams show a cross section of an annular tank (TRACY geometry) modelled in rz-geometry.
&743�10 �M O',2-SB-;O-: -2.52 10 5.36.10. -5.61.10 1.18.10" Ej 959-10, -1�06-100�
5.11.10. 506.10fall: 100- O, &O'.10, -�.69.,O,,.a RAI-10,1.89- 'O- - Z12-;O '.60-;OO: 4% 5. � 00 1.96.10" -L12-70 ..
4.60.10 &75-I07 -9.96-10-�.66 107' -29.107 Ug:,Q 1.06-
.,3.10-. -1.66.10- 10,:10: -.-,,:�O 1,11, 'O"-8,71,IT'120-10" -1.43-10' .1, :;.
ILOI;G: 12: � .0 5.10-IT' -&32-10-' 336-10' -4.44-103.89-10- -5.10-10" ? 60. 3,6.10
105 7AB-10` ,O. 1.67.1(r' - 3Z9.10" U9.10IAG :ff: - 2.67 9.311.10. -1.81.10
�,"-10` -2.77-10- Z- O- -1.46::0 C 31-10" -9.38-10'2.60-10 0�'�� I �?- 1 I 2.431C �K, SZ5.,O-
(a) volume frac. (b) liquid temp. (c) Ist delayed group. (d) 6th delayed group.
Figure 5: Various fields at 38 seconds into te simulation with a 2.0 step reactivity insertion. The
diagrams show a cross section of an annular tank (TRACY geometry) modelled in rz-geometry.
- 162 -

JAERI-Conf 2002-004
162-10 - .67.10-�.37:10 - 52-10'
7.12 lo" kg& 0 22 ID--1-37.10'�r7,10- - ILS.10. -121.10:
Oa 131.;�D: 1,0 10
320-10" -uao(r, M t=o- 1.1112 1'�24 7.78-10' .: - ��O;0-: - 2 U6.101-.163-;O
M2.10 �,03"O, 2M O ;O3,73-10'. 12.,O-: 243 a I.:;O:"' , I 3"IT ,- ?, It
(a) volume frac. (b) liquid temp. (c) Ist delayed group. (d) 6th delayed group.
Figure 6 Various fields at 30 seconds into the simulation with a 20 step reactivity insertion.
�17 1�. 1-10-W 2-33-1W _Z45 0J.S. - , 9 . .99-10'.11 1W Cn-:.1: 1 0 Z11-10 - � Wd3& a.72-10' IS5.10. -Z11.10, 1.7,110'
. 2: T 7.9= am C=.O: -&36. .. 2: ::-4S`:12:1w:-7.1 '. a" i . -= 1: -5,6-to: - ;:7&;.:
1-17 : LM �27-�O: -,36-10' �.11.10, 126 0.O., .7-:. �1
4n.R' �38-10'
r"Q = T: 32.M 162.10, - 1.18-10- �74-10- -iw-w ka-0, -U8.10,132-10' �2-0,I'd 441 �46- 0: - 25-W
�14:;O O- -10' ?07-10' -10'101-W 3�44V -'I �G: 2AD-10' -2.07-10� �,,-O- - M;O
In 0 I �10 .14- 0:
(a) volume frac. (b) liquid temp. (c) 1st delayed group. (d) 6th delayed group.
Figure 7 Various fields at 30 seconds into the simulation with a 2.8 step reactivity insertion.
lo' 80.0 100.0
1". 70.0
- I S MW .6 WWI. PROlo" ---- : S �p 02 bbW. MO
ZS AP 03 WM.2 Wp - bl.lo" 50..
La oooL L
101. 40
t-P. 40.0 hoght-�-Wght.6- ---- Wgh�25-
lo' 30.0 ---- hd1Qh62S.. h.01-45-
- h.01-45-
10.1 O 20.0 0.0 20.000 10.0 210 10.0 20.0 30.0 40.0 0.0 10.0 20.0 30.0 40.0JW. U- (.-Id.)
(a) fission rate (b) 2.0 step (c) 2.8 step
Figure 8: (a) Simulated fission rate also showing its sensitivity to bubbles size. (b) Simulated maximum
temperature ad temperature at 3 detectors placed in the liquid domain at 21cm from the central axis
and heights 5cm, 25cut, 45cm above the bottom of the liquid filled vessel. The results are shown for the
2.0 and 28 step reactivity insertion.
- 163 -

This is a blank page.
JP0250296JAERI-Conf 2002-004
Subcriticality Measurement by Source Multiplication Methodwith Higher Mode Flux
Tsuyoshi MisawaNuclear Energy Science Division
Research Reactor Institute, Kyoto University
Kumatori, Osaka 590-0494, Japan
Fax: 81-724-51-2603, e-mail: misa�kuca.rri.kyoto-u.acjp
New ource multiplication method considering higher mode flux was developed to overcome the difficulty of the
ordinary neutron source multiplication method, namely, position of both neutron detector and neutron source
cannot be considered in analysis and it is possible to applied only to small subcriticality measurement. In the
present method, neutron flux distribution with an external neutron source in subcritical state was expanded in a
series of higher mode flux, and when neutron count of detector was measured at a known suberitical state, other
un-known subcriticality can be obtained by measuring its neutron count. Numerical simulations were carried
out to demonstrate the present theory by simulating a KUCA core experiment. It is found that in the present
method subcriticality can be obtained accurately up to 20%dk/k, and detector position dependency of obtained
subcriticality was also greatly decreased compared to the ordinary source multiplication method.
Key words: subcriticality measurement source multiplication method, higher mode flux, NUMAC-3, KUCA
1. INTRODUCTIONSuberiticality measurement at nuclear fuel facility is one of the main issues in criticalitysafety study. For this prpose, several methods have been proposed and studied so far. Forexample, neutron source multiplication method, pulse neutron method with use of external
pulse generator system, neutron noise analysis method such as Feynman-(x method (varianceto mean ratio method) and frequency analysis method and so on. Among these method,source multiplication method is a well-known method as its simplicity of measurement; use ofan external, neutron source and neutron detectors and method of data analysis is also simpleway, and it has been often adopted in basic reactor experiments. Usually, its formulation ofdata analysis is based on the one point reactor theory with assumption of a bare homogeneouscore, therefore, for accurate subcriticality measurement by tis method, it is necessary tolocate the neutron detectors carefully to eliminate the effect of higher mode componentsexcited by an external neutron source, for example, the center of core is usually appropriateposition for this measurement to obtain subcriticality accuratel ). However, when adetector is located at an arbitrary position of the core, such as in reflector region, the accuracyof measured result is assured only in a slightly subcritical state, roughly less than severaldollars. One of the methods for taking into account the spatial dependence of neutron fluxdistribution in large subcritical state is to consider higher mode components of neutron fluxexcited by a neutron source. Recently, new reactor analysis code (2) was developed forcalculation of higher mode flux accurately in multi-group and modified higher mode analysis
- 165 -

JAERI-Conf 2002-004
method was successfully applied to estimate the change of flux and reactivity caused by
arbitrary perturbation (3). The present study is preliminary application of higher mode
analysis to the source multiplication method for accurate subcriticality measurement.
2. SOURCE MULTIPLICATION METHOD
In the ordinary source multiplication method, it is assumed that neutron count of detector (Co),
is proportional to external source intensity (S) and efficiency of detector (,-), and written as
follows:
CO = EsI - kff
where kff is multiplication factor. If neutron count C is measured at known subcriticality
(po), it is possible to determine e S value through Eq. (1), then other unknown subcriticality
(p) can be obtained using count C by the detector as follows:
P C (2)I_
Es
The derivation of above equation is based on simplified one-point reactor theory where both
neutron detector position nor source position are not taken into account. Therefore ordinary
source multiplication method has been applied to the measurement of small suberiticality.
To overcome this ifficulty, new source multiplication method considering with higher mode
flux, namely, higher harmonies of the system was developed, In this theory, neutron flux
distribution with extemal neutron source is expanded by higher mode fluxes, Therefore,
both detector and source position in each measurement can be cnsidered in this theory.
Neutron balance equation of fundamental mode i static state can be written as follows:
ILO =-MO (3)
where L is a destruction operator such as absorption and leakage terms, M is a production
operator such as fission term, is neutron flux, and X. is eigenvalue of ftindarriental mode,
which is unity in a critical state, If the system becomes subcritical because of change of
destruction and production operators in Eq. 3 neutron balance euation with an external
neutron source i subcritical state can be written as follows:
(L ,SL)O' (M + M)0 = 6 (X0) (4)
- 166 -

JAERI-Conf 2002-004
where & nd W are hange of L and M operators, respectively, (# is new neutron flux under
subcritical sate, is source intensity, xG is source position, ad 6x) is the Dirac delta
ftinction.
Higher mode flux (pi is defined by eutron balance equation of higher mode as follows:
TTi MT� (5)Ai
where �,i is i-th higher mode eigenvalue. Then, �# in Eq. 4) is expanded in a series of higher
mode luxes of Rq, (5) as follows:
N
Ci (pi (6)i=O
where Al is maximum nmber of expansion modes ad i is an expansion coefficient.
Multiplying ajoint lux of fundamental roode iin both sides of Eq. 4 and integrating
over whole space and energy, the following equation can be obtained:
N< To+LY c,( (Ppi > < p,,+3L40'> - < p,,+Mjc,(p > - < p,,+8MO'> S 0+(xo) (7)i=O i=O
Using the following orthogonality equation for the higher mode flux,
"-'Pi+m(p > (8)
Eq..(7) is modified as follows:
I I co - < To+ -3L + 3 M)O > = SO+ (xO) (9)
Here, using perturbation theory without assumption and Eq. 9 reactivity Ap that is
subcriticality can be obtained as follows:
167 -

JAERI-Conf 2002-004
<To+ -3L + 3M)O'> 1 1AP = - S(P,,+ (X,,) CO
< T�+Mo > CO (10)
S(P" (XO)CO
In derivation of this equation (10), it is assumed that is unity. Therefore, Ap is in
proportional to source intensity and adjoint flux of source position and inversely as an
expansion coefficient of fundamental mode,
Same as fundamental mode, in order to derive coefficients of higher order term, multiplying
higher mode adjoint flux in both sides of Eq. 7), the following equation can be obtained:
I I C - < Tj+ (-8L + 3 M)O > = S(pi+ (xO) (I )Ai
Here, assuming that changes of both M and L operators are uniform in the system, second
term of left hand side of above equation can be approximated as follows:
+ ( 8M-3L + I< 3 + 5 M) > � < MO >M (12)Ap < (p, + MO' > = Ap ci
From these results of Eqs. (10) and 12), neutron flux of Eq. 6) in subcritical state can be
written as follows:
N N(Po+(XO) Po (Pi+(X,,) P S
-IC ( (13)i=O AP i=1 I-AP
Ai
Therefore, neutron count at position of x can be written as follows:
N
NO=Eo'= TO+(xO)(P.O(X)+Y-(Pi+ (X.) (P (X) Es (14)AP _IAP
When the neutron count is measured at an known subcritical state, and higher mode flux and
higher eigenvalues are known beforehand through calculations, then - S can be determined by
168 -

JAERI-Conf 2002-004
the above equation 14). And when neutron count is measured at other unknown subcriticalstate, subcriticality is obtained by solving this equation nmerically.
3, SINWLATIONTo demonstrate te present formulation of new source multiplication method, numericalcalculations were carried ot to simulate a core f Kyoto University Critical Assembly
(KUCA) at Kyoto niversity Research(4)Reactor Institute The horizontal Detectors Neutron Source
core configuration is shown in Fig. Fuel element is composed of highlyenriched uranium-ahiminum, alloy platesas fuel and polyethylene as moderator,and polyethylene reflectors surround
the fuel elements. Control rods arelocated adjacent the core. An externalneutron source i the reflector region isan 241 Am-Be and 16 neutron detectors
are located at the reflector region asshown in Fig. 1. ectorBefore the source multiplicationanalysis, higher mode calculations were 1/Z
carried out to obtain higher mode fluxes Control Rods Fuel Elements
and eigenvalues. For this purpose,NEUMAC-3 code that been developed Figure Horizontal cross section of core
by author and Nagoya University was configuration
used. NEUMAC-3 is based on two orthree dimensional diffusion theory in multi energy groups, and has an ability to calculatehigher mode flux and its eigenvalue by the deflation method with power iteration or thedouble R method to solve operator matrix of diffusion euation directly. In the presentstudy, 2-dimensional x-y geometry in 2-energy groups was adopted and higher mode fluxesup to 150-th order were solved. Figures 2 and 3 are examples of higher mode fluxdistribution of the present core calculated by NEUMAC-3 and Fig. 4 shows eigenvalues ofeach higher mode of the present core. It is found that higher mode eigenvalues decreasewith an increase of mode number.In the present analysis, neutron flux distribution with external neutron source was calculatedby CITATION code, which is a multi-dimensional and multi-group diffusion code, and
subcriticality of the core which was calculated by the eigerivalue calculation was changedfrom approximately %dkJk to 20%dVk by altering the vertical buckling to simulate thechange of vertical length of the core. Figure shows an example of neutron lux distributionwith an external neutron source calculated by CITATION.
- 169 -

JAERI-Conf 2002-004
0.2 0.2 0.2
0 05.
-0.05 q-0. -u -0J5S -0.15
-D.15 -0.20.25
60U 30rn
40 3U 3C20 _U
2CIC
0 L) 0 0
Figure 2 I-st higher mode flux Figure 3 3-rd higher mode flux
of fast energy group of fast energy group
7-�-:
4.5 454
3.5 3.5CD 3 3:3 2,5 2-5
21
P 05-. 0
40
So'
40 AC3 to
0
0 0 50 100 150
Mode Number
Figure 4 Eigenvalue of each Figure 5 Neutron flux distribution of
higher mode fast energy group with external neutronsource
4. RESULTSThe results of present source multiplication method, including higher mode lux to obtain
subcriticality of each core are shown in Fig. 6 together with both the results of eigenvalue
calculation by CITATION and ordinary source multiplication method. In this analysis, -
value in Eq. 14) was obtained at the smallest subcritical state by 'using its calculated
suberiticality.
It is found that the results of ordinary source multiplication method are getting apart from
calculated results when subcriticality is more than -7%dk/k ad large discrepancy between
- 170 -

JAERI-Conf 2002-004
those results by different detector positions are observed especially when subcriticality ismore than -10 %dk/k. On the other hand, the present results by new source multiplicationmethod show fairly good agreement with calculated ones and dependency of detector position
is also very small.
Big' 7777
-- -- -- --- -- --
. . . . . . . . . . . . . . . . .-- -- --- -- - - -- -- --
- - - --- -- --- - --- --- - --- -- -- -- -- - -- -- -
2:
-4
.0 . . . . .Prewt Method,
U)
44 - : -- -.d' UeffiY - - ----
- --- - --- --
-80!-0.04 0.06 0.08 0.1
Vertical Buckling (1/cm2)
Figure 6 Results of subcriticality by the present source multiplicationmethod together with both the results of eigenvalue calculation byCITATION and ordinary source multiplication method
5. CONCLUSIONMethod of new subcriticality measurement by neutron source multiplication method withconsidering higher mode flux was developed. Through simulation, it is found that comparedto the ordinary source multiplication method, the accuracy of the present neutron sourcemultiplication method is much improved even in large subcritical state because the effect ofhigher mode flux on the neutron flux distribution becomes much remarkable with an increaseof subcriticality, and detector position dependency of obtained subcriticality can be greatly
decreased.In the near future, experimental study to investigate applicability of the present source
multiplication method will be carried out at KUCA.
171 -

JAERI-Conf 2002-004
References
[1] T. Misawa and S. Shiroya, Annu. Rep. Res. Reactor Inst. Kyoto Univ., 26, 125-128
(1993).
[2] T. Misawa, A. Yamamoto and Y. Yamane, J. Nucl. Sci. TechnoL, 33, 668-670 1996).
[3] C. H. Pyeon, Y. Yamane, T. Misawa and S. Shiroya, Ann. Nucl. Energy, 27, 345-354
(2000).
[4] T. Misawa, S. Shiroya and K. Kanda, Nucl. Technol., II 6, 11-20 1996).
172 -

JP0250297JAERI-Conf 2002-004
Study on Neutronic and Termal Characteristics of thePrecipitation Vessel i JCO Criticality Accident
Yoshinori MIYOSHI, ToshihiroYAMAMOTO Kn, NAKAJTMA,Ybichi YAMAN ad Shouichi WATANABE
Japan Atomic, Energy esearch InstituteDepartment of Fuel Cycle Safety Rsearch
2-4 Shirakata Shirane, Tokai-nrura, Naka-gun, lbaraki-ken, 319-1195 Japan
In Order to investigat te neUtTonic ad termal characteristics of the precipitation vessel in the JCOcriticality accident, static ad kinetic analyses were made to -valuate the iitial reactivity ad power profile inthe initial burst part, respectively, In addition, a series of simulation tests using a thermal mock-up devicewere conducted to estimate the total amount of te evaporatio ad the temperature which reproduce the.characteristics of power eduction of 19 hours in the pateau part.
Key Words JCO criticality accident, Static and kinetic analyses, MCNP-4B, AGNES2,Thermal mock-up device, Simulation test
1. INTRODUCTION
The first criticality accident in Japan occurred on September 30, 1999 in Tokai uranium fabricationplant of CO, JAERI as evaluated the physical phenomena of tis accident using calculation codes for
static and kinetic aalyses. For the evaluation of the inserted reactivity to the pecipitation vessel, thecondition of the 8.8% enriched uranyl itrate solution fel and the pocedure of the two workers were
investigated in detail. Based on the process sheet and the iformation from JCO staffs, the range of theexcess reactivity wich, is dependent on the fuel concentration, acid olarity, ad temperature, were
evaluated with the validated calculation systems. The dimension of the precipitation vessel was
measured o the JCO site, and etails of te structural material was confirmed. Reactivity effects ofstructural material srrounding the vessel, the side wall of the building ad bodies of JCO workers were
also evaluated by making a detail model of a continuous energy Monte Carlo code. For the evaluation
of the power pofile in the initial burst part (up to 25 minutes after accident initiation), a one-point kinetic
code, AGNES 2 was sed for Revaluating the naximum peak power ad fission number of the first pulse
and the total fission number in the initial burst part. The accuracy of tis code was confirmed by
evaluating the transient data obtained by TRACY experiments.
The JCO criticality accident continued long time, which was mainly due to the cooling water
surrounding the vessel. As the power profile in the plateau part is dependent on the termal characteristicsof the pecipitation vessel, a series of thermal simulation tests were performed for determining the
condition that eproduce the power pofile A main factor which affects te power decrease in the plateau
region is onsidered to he water evaporation of the fuel solution. Main experimental parameters of thesimulation test are the initial temperature of the plateau art corresponding te inserted reactivity and the
flow rate of cooling water which has effect on the heat removal.
2. STATIC ANALYSES
2.1 Operating ConditionThe, pecipitation vessel is designed essentially to be used t precipitate ammonium diuranate
(ADU) by chemical reaction of uranyl nitrate solution with ammonium gas ad is equipped with cooling
system to control the temperature during the chemical reaction and tirrer to accelerate the reaction.
Peeping bole is also equipped to it to see the inside. The chain reaction was initiated in the vessel whenone worker amost inished to porn the seventh batch of uranyl itrate solution in 5-liter stainless-steel
beaker into the vessei toug te peeping hoJe, while the aother worker standing o the floor supportedthe funnel iserted in, the hole. Initiating condition of te workers ad precipitation vessel is shown in
Figure 1 The supervisor of those operators was working at a dsk i the next door, which was several
meters fa fo te vessel, The stainless beaker was left on te floor near y the vessel, in which smallamount of uanyl itrate solution was remained not being poured, The cooling system of the vessel
- 173 -

JAERI-Conf 2002-004
was in operation, however, the stirrer was not working. Recording systern of te temperature of thevessel was also switched off since two days before the accident. Ventilation systern of the ConversionTest Building was being operated all through the accident period ad he egative pressure in thebuildings was maintained. Air from the building was being exhausted after filtering with HEPA filter.However, it is presumed that the vent gas line from the vessel was ot i operation.
Gamma ray area monitoring system over the JCO facilities was in operation and workers inbuilding of the JCO site started evacuation when the alarm sounded, Radiation level in the ConversionTest Building was too high to be recorded. On the other hand, gamma ray area monitor in the 1stFabrication Building which is located about 100 m far from the precipitation vessel continuouslyrecorded the dose which is proportional to the power of the precipitation vesselt'l.
2.2 Criticality CharacteristicsFor evaluating the static criticality characteristics of the precipitation vessel, it is necessary to
determine the solution height in the pouring procedure made by two workers, The uraniumconcentration was estimated 37OgU/L as nominal value and the volume of each batch was estimatedabout 65 liter from the uranium mass of 24 kg-batch. The nitric acid of the ulaftyl nitrate solutionwas assumed 0.5 mol/L based on the specification of the fuel solution products.
The change of the effective neutron multiplication factor with the uranium solution height in theprecipitation vessel was calculated. A system of the continuous energy Monte Carlo code MCNP-413with Japanese Evaluated Nuclear Data Library JENDL3.1 was adopted for evaluating the neutronmultiplication factor and excess reactivity. The calculation bias of above system bad been confirmed tobe small by the benchmark calculations using the critical data of uranyl nitrate solution at the StaticExperiment Criticality Facility, STACY. The change in neutron multiplication factor is shown inFigure 2 It can be noted that the precipitation vessel was subcritical after te pouring of the fuelsolution of the 6th batch and supercritical after that of the 7th batch.
The critical volume and critical solution height were estimated 41,0 liter and 28.5 cm,respectively. Figure 3 shows the dependence of the reactivity on the final ranium concentration.When the uranium concentration is smaller than this nominal value of 370 /L, reactivity of theprecipitation vessel increases due to the increase in the solution eight. Taking account of theuncertainty of the each parameter and calculation model, and repfoductivity of the criticality safety code,the. inserted reactivity to the precipitation vessel was evaluated in tile Uallge of 1.5 to 30 approximately. Sensitivity aalyses of the reactivity for main criticality factors such as uraniumconcentration, free acid molarity and temperature were ade to determine the possible range of theinserted reactivity. Figure 4 shows the contour of the inserted eactivity for uranium concentration andacid molarity of the fuel solution[2].
For the evaluation of the reactivity and the fundamental parameter used i aalysis of thetransient behavior, kinetics parameters such as prompt neutron generatio tes effective delayedneutron fraction, temperature ad void coefficients of reactivity were calculated with the calculationsystem, SRAC and TWODANT with the latest Japanese nuclear data file, JENDL3.2. Kineticparameters are summarized in Table .
3. KINETICS ANALYSIS3.1 Validation of AGNES2 Code
To investigate the power profiles of the criticality accident, we have conducted the kinetics analysisusing a code AGNES2. AGNES2 is a one-point kinetics code developed at JAERI, to calculate thenuclear excursion in fissile solution systems. Since radiolytic gas voids are poduced in the nuclearexcursion, and they affect the power behavior significantly, the calculation odel to treat te gas voideffect has been developed ad incorporated in te AGNES2 code.
The prediction accuracy of AGNES2 code was validated through the analysis of the TRACYexperiments. Figure shows the comparison between the calculations ad the eperiments for the peakpower and the total fission yield of TRACY transient experiments. Tose expefirnents were initiated bycontinuous feed of low-enriched uranium solution to the TRACY core tank, which is similar to thesituation at the JCO accident. As seen in the figure, the calculation agrees well with the experiments,and the difference is smaller tan 20%. Due to the similarity of JCO accident to the TRACYexperiments, we conclude that the accuracy of the accident analysis using AGNES is assured.
- 174 -

JAERI-Conf 2002-004
3.2 Analysis of the First PulseIn the JCO accident kinetics analysis, the inserted reactivity is one of key parameters. Figure 6
shows the results of ANFS2 calculation for the variety of inserted reacivities. The maximumreactivity, 3 dollars, was determined from the results of neutronic calculation as shown in the previoussection. For all cases, the reactivity insertion time was assumed to e 12 seconds. Although the peakpower varies slightly epending on the reactivity, the fission yield at the end of first pulse becomesalmost same, about 6xiOr", independent of the reactivity. This is due to the fact that the insertedreactivity at the ed of first pulse is almost same for all cases.
The comparison of calculated power pofiles with the "measured power" is shown in Figure 7.The measured power in the figure was derived from the record of gamma-ray monitor which wasinstalled at the JAERI-Naka site, Because of the slow response of the monitor, the record wasproportional to the time-averaged profile of the nuclear power. By the fact that the measured power isbetween the calculations with the reactivities of 1.5 and 3 dollars, we estimate that the inserted reactivityin the accident is in that range.
3.3 Analysis of the Initial Burst PartThe power behavior for a prolonged period would be controlled by the cooling condition, because
the temperature reactivity effect becomes dominated for that case. We have investigated the coolingeffect in the JCO accident using AGNES2 by changing the heat transfer coefficient between the fissilesolution and the cooling jacket as shown in Figure 8. In the calculation, the inserted reactivity isassumed to be 3 dollars. As seen in the figure, the power profile aer about 200 seconds stronglydepends on the heat transfer coefficient. In comparison with the record of gamma-ray area monitor,which hasa peak around 1000 seconds, the result using the coefficient of about 180 [kcal -m-2 h-1 -K-1](-210 [W-m-2-K-1]) reproduces the accident well. Since the power profile varies with insertedreactivity as well as te cooling condition, we have performed a series of calculations for differentreactivity and cooling conditions. Finally, we have concluded that the fission yield in the "Burst part",which corresponds to the period up to 25 minutes, was about 2 to 5x 10¹⁷.
4. THERMAL CHARACTERISTICS USING A MOCK-UPIn the criticality accident of JCO precipitation vessel, a significant power level continued from the
viewpoint of thermal feedback to reactivity, and the power was recorded as observed data of the JCOgamma-ray area monitor. A thermal mock-up device of the JCO precipitation vessel was manufactured3l,and a series of simulation tests of thermal characteristic were performed covering the plateau part bychanging electric-heater power based on one point approximation of nuclear kinetics equation.
4.1 Mock-up DeviceA mock-up of the JCO precipitation vessel is shown in Figure 9 The vessel to which a
cooling-water jacket and an agitator are attached, mocks up dimensions and configurations of the majorpart of JCO precipitation vessel. The water in the vessel is heated by 3 electric heaters with 15kW(5kW X3) of maximum capacity. A funnel is inserted into a "hand hole". The inner diameter of the hole and thefunnel are 83 min and 46 im, respectively. The solution volume is 43 L, and the solution dimensions are45cm in diameter ad 31 cm in height.
The measurement and control system of the mock-up device is shown in Figure 10. The heaterpower was controlled by a personal computer. Both the solution temperature which was determined byaveraging values of 6 measure points in the solution, and the solution height which is reduced by thewater evaporation flowing out through the hand hole are measured continuously. These measured valuesare considered as inputs for one point approximated nuclear kinetics equation. The solution was stirredslowly using the agitator considering volume-heating of the solution in the JCO precipitation vessel.The reactivity effect by the water evaporation was considered as follows:
The relation between tire aount of water evaporation ad the Yeactivity change was evaluated byusing a Monte Carlo transport code, MCNP 4B with the contiritious-energy cross sections based on theevaluated nuclear data library, JENDL-3.1. Reactivity change with evaporation in the simulation wasgiven as a quadtafic-function of the amount of the evaporation. Reactivity coefficient of evaporation was
- 175 -

JAERI-Conf 2002-004
estimated to be about 0.6 $/L.
4.2 Experimental MethodAs parameters which affect the behavior of power level change, te initial solution temperature
corresponding to the initial reactivity 15-2.7 dollars and the cooling-water flow rate were considered.The simulation tests were performed as follows: As an initial ondition power level was set to be 2kW,and the flow rate was determined so as to satisfy both the initial power and the equilibrium temperature ofthe solution. The simulation test in the plateau part was performed for 17 hours i order to confirm theevaporation effect and the consequent power level reduction. The eactivity feedback by te evaporationwas considered after the start of te simulation, although the evaporation had been continued before thesimulation. The test was continued for 3 hours after the cooling-water circulation stopped, in order tomeasure the transient of the power level.
4.3 Experimental ResultThe relation between initial temperature and the water flow rate for the initial power was
measuredE31. For the initial reactivity 15-2.7 dollars (reference temperature 25 'IC which corresponds toinitial temperature 66-91t, the cooling-water flow rate which atisfied the initial condition of 2 kW ofpower was found to be 06-0.2 L/min. The simulation test was performed for the cases of t .5-2.7 dollarswith the cooling-water flow rate of 06-0.2 L/min, The result of the simulation test is shown in Figure 11.The power profile approached the observed power as the initial reactivity temperature) increases. Andthe power level at the cooling-water circulation stop approached the observed power in the case of 27dollars.
The result of the test before and after the cooling-water circulation stop is shown in Figure 12.The solution temperature for each case approaches about 55-60 cC, and shows igher value as the initialreactivity increases. On the other and, the power level which corresponds to the solution temperaturebecame about 03-0.4 k and also showed fiigher value as the reactivity increased. The power ratiobefore and after the cooling-water circulation stop, approached observed value of 0.34 in the case of 2.5dollars.
When considering the power profile after water circulation was stopped, and the possibility of thetemperature increase of fuel solution in dissolution process which is mentioned previously, it is estimatedthat the initial reactivity of the precipitation vessel was-2.5 dollars and the total amount of theevaporation in the plateau part was about 2 L.
5 SUMMARYIt is not easy to determine the excess reactivity only by criticality analyses based on limited
information concerning to fuel condition and working process. There is large uncertainties in initialtemperature of the solution in the precipitation vessel and the uranium concentration of te 7h batch.Taking account the total uncertainty of the critical paramete tat affect the eutron multiplication factor,the inserted reactivity was estimated from, 1.5 to 3 dollars, Te ivestigatio o the kinetic behavior inthe initial burst part is consistent wth the result of the static caracteristics taking count of the totalfission number. In addition, the range of the expected inserted reactivity from the static and kineticanalyses covers the estimated value of 2.5 dollar obtained by the thermal mock-up simulation test with fora long plateau part.
REFERENCE1) K. Tonoike et al., "Power Profile Evaluation of the JCO Precipitation Vessel based on Record of the
Gamma-ray Monitor," Proceeding of NUCEF2001,,PC-11 2001)2) Y. Miyoshi et at., "Study o Static and Kinetic Characteristics of JCO Criticality Accident,"
Proceeding of 2001, ANS Annual Meeting, Milwaukee, Wisconsin 001)3) S. Watanabe et al., "Basic Test on Cooling Characteristics of JCO Precipitation Vessel using a
Mock-up Device," Proceeding of NUCEF2001, ?C-12 2001)
- 176 -

JAERI-Conf 2002-004
nitrate solution370 gUlt, 0.5N, 25-C
4Highly concentrateduranium soluton 3(370gil) was 2directly fed to a I"nsLafe 7 batchprecipitation ank, 0
+4i6 batch 1st fe
A -2 ed of 7th batchFinally 16.6kg ofuranium 8.8 t% -3 6 bat i + 2tenriched) were fed. -4
26 27 28 29 30 31
Solution height (cm)
(7 batch = 6 batch 65 )
Fig. 1 Precipitation Vessel Fig. 2 Estimation of excess reactivity
Excess reactivity -. 3$ 2$ 1$ Os6 0.5
259C 16.6 kg(DUraniurn ass =16.6 kg Uranium inventory
5 AS010tion volurne�44.8 L �i0,4
4 25,c 11 11 11------ 35C------------- 0.3 14 11 11
> 3350C Sensitivity on
2 0.2 U concentration -0.07
_e Acid molarity -1.7 IN %(A -Solutionlevel 1.2 Ven,
EMEM!u!e -0.04 -- 1 It
.5mol/L 0 . . . . . . .
330 340 350 360 370 380 390 400 410 330 340 350 360 370 380 390 400 410
Uranium eoncentratioo(g/L) Uranium concentration (gUM)
Fig. 3 Reactivity vs. Uranium Concentration Fig. 4 Sensitivity of Reactivity on Fuel Condition
Table I Calculated kinetic parameters
�eff 0.00788
3.0 X 10⁻⁵ (s)
Temp. cofficient -0.0022%dk/k/'C
Void coefficent I-0.31%dk1k1%ovoid
Fatman, room-return, and other effects < 20o
Calculated with TWODANT/JENDL-3.2
- 177 -

JAERI-Conf 2002-004
30 8TRACY
gU/1iterRun6l -42,t- 39225 - I . 4-$--- C'*' 0.73-0.Umol/liter18 /S A .2
u'7RapfeeTim-ode�Z_ rV
Run76rL 15 -Run Jlun9&- X RuOl2.69 $ 1.81 $
0 5 t/s 15 O /slo
75 IN i .5 ;�" I fIL
Run7l Z,5 2.75 $
9.6 /s Run6l0 04
0 1 0 20 30 4 5 6 7 8
Experiment P.), (MW) Experiment F, ( 1017fission)
Fig. 5 Comparisons of Calculations (AGNES2 code) with TRACYExperiments. (P: Peak power, F: Total fission yield
JCO: Flow Rate 0.5 L/min108
2.5$ irst pul e3 0$ 2 0$ Fission Reactivityl
1.5$ 6.14E+ 6 1.5$lo, 5.95E+16 U$
5.78E+1 6 ZO6.01E+16 3.0s
106
0
105
104
0 5 10 15 20Time (s)
Fig.6 Calculated first pulse as a function of inserted reactivity.
10, 10,Ist peak power - -WeigMfnrtempcoefofreactivityrlO
IOMW (1.5$) 1 U:HeattrarbferCoefficient(kcai/O'h,1017MW (10$) 'P Measurement 106
lo,10, U 2400
EL 10,0-
102104
1.5$103
0 50 100 150 200 0 200 400 600 800 1000 1200 1400
Time (s) Time (s)
Fig.7 Calculated power profiles in comparison Fig.8 Effect of heat transfer coefficient onwith measured data. power profile.(Inserted reactivity: 3)
- 178 -

JAERI-Conf 2002-004
Measure and Control System-----------------------------------------
Lnt,.] Rathfty _0, Temp TO, P.-_ PO
Temp, Effect: 0T mp.
V
---------------------------
Precipitation Vessel
Outlet Temp.:Tout
Row Rate: FInlet Temp.: 71n
Fig. 9 Mock-up Device Fig. 10 Measurement and Control System
5 100 5 100Compensated reactivity at initial temperature Compensated reactivity at initial temperature
(reference temp. -. 250C) (reference temp 25C)2.7($)
4 Temperature 80 4 Temperature 80PQ:3 2.7($)41 2.5
3 60 2 D 3 ' 60 0 3: 2.00 OL 0 CLIL E a. 1.5 E
F- fingcooling
2 wStaotpe r cfi rc u I at i o n 40.2 02 wStaotpe r Oc firccual aot i o n . 40.2Power Power0 0.5 1.5
2.01 20 1 2.5 27 20
2.7 2'. 5Observe r Observed Power 2.0
1.50 0 - - "' , I 0
0 5 10 15 20 10 15 20Elapsed Time in Plateau Part(hr) Elapsed Time in Plateau Part(hr)
Fig. 11 Power and Solution Temperature Figure 12 Power and Solution Temperature
Plateau Part Before and After Flow Stop)

This is a blank page.

JAERI-Conf 2002-004
Separation Process
- 18 -

This is a blank page.

JP0250298JAERI-Conf 2002-004
PRESENT STATUS OF R&DON REPROCESSING PROCESS IN COGEMA
Marie-Franqoise DEBREUILLE, Philippe PRADELCOGEMA
2 rue Paul DautierB.P.4 78141 VELIZY CEDEX, FRANCE
Franqois DRAINSGN
1 rue des Wrons78182 SAINT QENM YVELINES CEDEX, FRANCE
Introduction
Reprocessing is a complex industry.The bases of PUREX process, universally adopted today, were established in the 50's, withplants designed for defence purposes. Later on, first generation of commercial plantsdedicated to LWR oxide fels appeared in Europe (France. Belgium and Britain) and in Japan.
These plants have been designed and started up in the 60's and 70's and had limited capacity.The requirement f process performances in commercial plants are stringent: very highpurity of U and Pu end products and high recovery ratio, authorised limits for releasebecoming more and more severe, necessity to condition all waste.The risks of criticality, contamination and irradiation have to be mitigated and therequirements are also more and more stringent, especially concerning dose to operators.
To cope with these difficulties and to become today the world leader for reprocessing,
COGEMA has always maintained a high level of R&D and is continuing his effort today to
prepare the future.
Second generation plant: the industrial maturity
At the end of the 70's, the bases of the second generation of commercial reprocessing plants
werelaunched.
The main lessons from previous plants of COGEMA, i.e. UP2-400 in La Hague, started up in
1976, were as follows:
- Good safety ecords. No significant incident has been recorded, and release to the
environment were significantly below authorised limits,
- Design capacity was reached slowly due to insufficient reliability during the very first
years of operation. Indeed, UP2400 reached nominal capacity roughly ten years after its
start-up, .
- Process performances were reached; however solvent quality was an item of concern and
frequent renewal of solvent hold-up was necessary to maintain performances of extraction
process,
- The process and technological waste were not conditioned.
Therefore the following objectives have been set up for the new plants:
Increase plant availability through:
• the use of corrosion free materials, especially for the equipment with boiling nitric
acid solutions,
• fully emote maintenance,
183 -

JAERI-Conf 2002-004
duplication of most sensitive quipment,
Improve process performances by adopting fully continuous process and through stableperformances of extraction process,Improve safety records: reduction of dose rate to operators and of release to theenvironment,Conditioning all process and technological waste.
A huge R&D effort for more than 10 years and a strong co-operation between design teamand operators from previous plant result in the construction of the two new reprocessingplants UP3 and UP2-800 etering commercial operation in 1990 and 994.The main features of both plants are:
- Continuous dissolution process using a rotary dissolver [1],- New extraction equipment such as geometrically safe pulsed columns with efficient
packing 2] 31,- Improved solvent management including a distillation unit able to purify and recycle both
solvent and diluent 4],- Conditioning process for all waste: for instance vitrification for high active process waste
and grouting for low and medium active technological waste[5].
The operational results demonstrate clearly that the objectives fixed at design stage have beenfully reached, and in most of the cases far over the expectations 6]:
- very high plant availability demonstrated through the reprocessing of more than 12000tons of oxide fuels since the start-up of UP3,
- very high and stable process performances,- drastic reduction of dose to operators, of release to the environment and of volume of final
waste.
La Hague plants: 10 years of improvement thanks to continuous R&D
After the successful start-up of new La Hague plants, R&D effort has been pursued andnumerous advances have been made possible thanks to it, It is worth to notice that te strongco-operation between R&D, engineering and operators as played a key role, in the success.Some examples of the most significant improvements are given hereafter.
Core of the chemical process: decontamination of uranium
At design stage, two extraction cycles were foreseen to decontaminate uranium fromneptunium, plutonium and fission products after its separation from plutonium in firstextraction cycle. mmediately after active start-up of the plant it appeared thatdecontamination (for plutonium in uranium ad for fission products) performances of firstcycle was far ove te expectations. The decontamination factor for fleptutrium in uraniumcycle was also higher than expected, but still too low to reach neptUl'u"M specification withonly one -cycle. Operation was then optimised and additional R&D was ached. Theresulting decontamination factor for Np is over 1000, and thus today only one cycle is used topurify uranium.
184 -

JAERI-Conf 2002-004
Vitrification facility 61
There are two vitrification facility on La Hague site- R7 eruffed in active operation in June1989 ad began to treat te 1200m3 stock of HLW solutions produced y P2 plant since itsStart-up in 1966 ad T7 facility is devoted to treat te HW solutions produced by UP3 plant.It entered in active service in July 1,992 3 yars after its "twin" facility R7.Several significant improvements have been brought since active� start-up:
- addition of an in-cell washable pre-filtering device on the ventilation of main hot cells(vitrification, pouring, dism"fling i order to protect HEPA filters from contamination;
- modification of te ranes to improve the reliability of some coniponerits and to reducethe eed for teir maintenance;
- improvement of the canister decontamination device (higher water pressure andthroughput);
- optimisation of glass homogenisation;
increase of service life of melting pot through optimisation of material ind operatingCondition',,
Most of these improvements have been implemented while facilities were i active operation,demonstrating tire flexibility of the design.
New liquid waste management 6]
Active operation of UP3 was started i 1989. The initial liquid waste managernent led to theproduction of two types of solid waste glass canisters containing tile bulk Of activity andbitumen drums.
The very good decontamination performances of first Extraction ccie gav te opportunity tomodify liquid waste inanagement in order to delete production of bituminised waste. Mainfeatures of this new management are:
- all salt fee acidic waste ad sorne of the salt bearing waste aft, concentrated byevaporation and concentrates are routed towards vitrification,
- most of te salt bearing waste have an activity low eough to bt released to sea, afteractivity hecking and filtration,
- three, new evaporation units ad a specific uit for treatment of aboratory waste, forwhich specific R&D has been conducted, 71
- new piping and vssels to perform waste transfer to the ew limits
The povisions take ito account i the original design have allowed to perform thesemodifications with �,xtremely low dose rate to the, personnel and wthin short duration, whilethe plant emained in active perations
Light robotic equipment for in cell exceptional operations
R&D is pursued also in this domain. A recent example of application is the repair of the shearchute of R1 (head-end facilities of UP2-800 plant). A small hole, caused by wear wasdiscovered in February 2001 A repair has been conducted as (--ariv as April, taking advantageof the ongoing D for light obotic.
18 -

JAERI-Conf 2002-004
Present R&D's main objectives
The R&D under way in COGEMA follows several objectives, the most significant eing
- reprocessing of high urn-up fuels, both uranium oxide and ixed oxide, and RTR fuels;- increase of storage pools capacity and of flexibility of head-end process through use of
burn-up credit;- development of light robotics for in-cell inspection and repair after exceptional incident,
such as in the case of sear chute mentioned here above;- extraction process: further simplification with a single extraction cycle including
neptunium. barrier;- evaluation of partitioning of actinides and other long life nuclides;- simplification of vitrification facilities through development of cold crucible melter which
could be used also for other incineration purposes. A large scale derflonstration platformhas been recently started-up;
sOMI
- liquid waste management: although a drastic decrease of release has already beenachieved since second generation plants sart-up, R&D is still performed to developcomplementary technologies such as ultrafiltfation;
- 186 -

JAERI-Cont 2002-004
solid waste roanagernent: minimisation of generation of waste, recycling of equipmentafter repair, deCOManliflation of waste prior to disposal, best appropriate conditioningprocess;decontaminatio a dismantling: te decontamination and dismantling of UPI plant inMarcoule is going on, Large experience, sustained by xtensive R&D, is gained on rinsing,new reagefits, removal of hot spots, The main purpose is to downgrade waste and reducetheir volume in order to minimise disposal costs.
Next generation facilities in COGENIA
Two new facilities o La Hague site are entering Cmmercial srvice in 2002: plutoniumfinishing facility 4 [8] and bulls and end-pieces super-compacting facility ACC 9].These two facilities are a first step towards a new generation of reprocessing plants.
R&D played key role in design of R4, which is characterised by:
- use of a single extraction cycle for plutonium purification and concentration, validated byspecific R&D [10] and UP3 feed-back,
- technological innovations, such as centrifugal extractors, supported by extensive R&Dprogram,
- extensive se of in-line measurement, allowing short response time and decreasinganalytical workload and effluents,
- significant ivestment cost reduction.
The waste volume reduction is the main goal of ACC facilities. Compared to directcementation, volume Of fillal waste is divided by 4 The main other characteristics of ACCare:
- standardisation of package through use of universal canister,- accommodation of technological waste,- innovative uclear measurement devices.
187 -

JAERI-Conf 2002-004
Conclusion
The steady efforts of COGEMA over the last 25 years led COGEMA to operate safely twomodern reprocessing plants, highly reliable, with an outstanding record for throughput, lowrelease rates and low occupational doses.This was obtained thanks to an R&D effort which addressed the actual industrial challenges.This effort is continued in order:
- First to give to COGEMA the capability to deal with new challenges: new fuet and newconstraints.
- Second to be able to build new reprocessing plants as soon as there will be a need withsignificant lower capital costs than previous plants, thank to simplification of process andtechnologies based upon this R&D effort.
References
[1] Head-end process technology for the new reprocessing plants in France and Japan,F.J. PONCELET, D. HUGELMAN and al., RECOD 91[2] Extraction process technology for the new reprocessing plants in France and Japan,F. DRAIN, B. BOULLIS and al., RECOD 91[3] Uranium Plutonium Separation in Annular Pulsed Column, F. DRAIN, J.P. MOULIN, andal, GLOBAL'97, 250-254, Yokohama, Japan[4] Advanced Solvent Management in Reprocessing: 5 years of industrial experience,F. DRAIN, J.P. MOULIN, ad al., ISEC'96, p.789-794, Melbourne, Australia[5] Management of waste from French nuclear fuel cycle: what are the, key issues,V. LONDRES, R. DO QUANG, Ph. FOURNIER, International Youth Nuclear Congress2000, Bratislava[6] COGEMA Reprocessing Complex Already 9 Years of Operation, Mature and Flexible,JL DESVAUX, F. DRAIN, RECOD 98[7] Treatment of active laboratory liquid waste by ultratiltration, R. LIBERGE and al.,GLOBAL'97,Yokahatiia, Japan[8] Innovative concept for the R4 plutonium fishing facility at La Hague, GBERTOLOTTI,B. GILLET, I.V. de LAGUERTE and R. RICHTER RECOD'98[9 A compaction facility for solid high level waste, F. CHOTIN. G. MAURIN, Safewaste2000, Montpellier, France[10] Plutonium purification cycle in centrifugal extractor : comparative study of flowsheetsusing uranous nitrate and h]TOXylafflifle nitrate, P. BARON, B. DINH, F. DRAIN,B. GILLET and B. MAUBORGNE, RECOD'98
18 -

JP0250299JAERI-Conf 2002-004
SU'PERPUREX AS A TBP-COT\4PATIBLE PROCESS FOR RECOVERYAND PARTITIONING OF LONG-LIVED RADIONUCLIDES FROM NPP
SPENT FUEL
B.Ya. Zilbernian, Yu.S. Fedorov. E.N. Misbin, LV. Sytnik, 0,V. Shnildt, D.N. Kukharev,N.D. Goletsky, R.G. Glekov, Yu V. Palenik, S.Yu. Sukhareva
V.G. Khlopin Radium Lastitute, 28 2 dMurinsky av., St. Petersburg 194021, Russian FederationFax: 7 812) 247-80-95; e-mail: zby�atom.nw.ru
Partitioning of long-lived radionuclides (minor actinides and fission products) is considered within theframeworks of Superpurex process, where Modified Purex-process using 30% tributyl phosphate (TBP) as asolvent is combined with 'I'BP-coinpatible ZEALEX-process for extraction and separation of TPE and REE aswell as some other elements, which are not extracted by 30% TBP. Zirconium salt of dibutyl phosphoric acid (ZSHDBP)dissolved in 30%TBP is used in the ZEALEX unit as a solvent. The both extraction systems are compatible.
In the Modified Purex-process U Pu, Np, To and Zr are totally extracted ad separated in three or fourfractions. One or two of these ftactions contain Np, Tc and Zr altogether or i a combination. Lanthanides, Y andTPE, as well as Mo and residual amounts of Np, Pu U are extracted from high-level raffuiate in I" cycle ofZEALEX-process, TPE&REE being separated from the polyvalent elements by selective stripping. TPE/REEpartitioning is achieved in the 2d cycle of ZEALEX-process.
Salt-free reducing and courplexing agents are used at all the stages of the process, to allow minimizing wastevolume. Superpurex process flowsheet can be designed also as applied to peculiarities of FBR reprocessing.
Key words: extraction, partitioning, TBP, HDBP, zirconium salt, actinides, REE, Mo
INTRODUCTIONCurrent state and expected development of nuclear power industry are haracterized by
increasing fissile born-up and raising content of fission products and minor actinides in thespent nuclear friel (SNF), It should exert significant influence on future fuel reprocessing,causing the necessity of further improvement of the processes used now at the plants. At thesame time, the problem of radioactive waste minimization becomes more acute because ofmodern ecological requirements, which should be taken into aaccount when developing newreprocessing flowsheets,
Consideration is being given in this paper to development of an advanced technologyintended for reprocessing of the fels of higher bum-up. Te technology, named Superpurexprocess, eables recovery and partitioning of practically all long-lived radionuclides, whichare contained in NPP spent ftiel, to ensure ecologically safe disposal of the nuclides. Principalprocess flowsheet of Superpurex is shown in Fig. . It combines single-cycle Modified Purex-process and two-cycle ZEALEX-process.
U, Pu, Np, Tc and Zr are extracted in the Modified Purex-process, as completely as possible,and Zr, Tc and Np are localized in one or two fractions, ad Pu are stripped in twoproducts, of which the first is U-Pu mixture, and the second contains the excess U. In the caseof LWR SNF reprocessing and further production of mixed U-Pu oxides based on depleteduranium, the tasks of I" extraction cycle should include U/Pu separation. So, the technologytakes into consideration t possibility of utilization of the regenerated plutonium, in amixture with uranium, for fabrication of MOX fuel.
ZEALEX-process is sed for processing the high-level raffinate of the Purex-process toseparate T PE fraction and some other fractions.
Modified Pnrex-process implies usage of 30% TBP as a solvent, while ZEALEX-processuses a TBP-compatible solvent - Zr salt of dibutyl phospboric acid (ZS HDBP) dissolved in
189 -

JAERI-Conf 2002-004
30% TBP. Accidental mixing of te wo solvents can not cause a atat violation of te process.The compatibility of the two extraction systems is based on the fact that HDBP is tile degradationproduct of TBP and can be easily removed from the solvent by carbonate washing. When ZSHDBP admixing to the Purex-process solvent, no precipitates are formed, and ZS HDBP isremoved from the solvent to waste during in-cycle carbonate washing of the solvent.
Salt-free reagents are used at all the stages of the Superpurex process,30 % TEP
------------------------- T------------i-------------
Feed
i� Tc flu-1CFE, NPMG
ZS HDEP in 301/ TPr ----------- I ----------- ----------------
FP
I t
N03 ![TPE:�
Fig. 1. SUPERPUREX process principal flowsheet
MODIFIED PUREX-PROCESSThe main features of te Modified Purex-process are most omparable to those of UP-3
reprocessing plant in France I] and, especially, of the Japanese PARC process 2].Localization of Zr is one of the most hard task, as tis elerneirt is oderately extracted by
30% TBP. Removal of Zr to high-level raffinate is complicated with the effect of higher Zr distri-bution coefficieDtS in the U extraction zone of real unit (DR), as compared to the values of thecoefficients, predicted by laboratory-scale equilibrium database (DB) [. The differencebetween DI3 and DR 'Is increased with lowering acidity and rising U content, as Table Idemonstrates.
Table 1. Difference of Zr distribution coefficient in single-stage and multistage contactorsUranium Zr distribution coefficient
concentration, In 4.5+0.5 M) HN03 In (15+0�5 M) 03
g/l DB DR D / DR DE - DR DE DR
0 0.6 0.6 LO U 0.1 1.042 0.25 0.45 1.8 0.05 0.13 2,676 0.09 0.27 3�0 0.02 0.10 5.0106 0.02 0.09 4,5 0.004 0.048 12
Full extraction of Zr is attained by means of supporting te elevated acidity and by valueof solvent-to-aqueous flow ratio ot lesser ta 27 in the ead contactor 4]. These onditionsalso contribute to better recovery of T ad Np. Recovery of r i I" extraction cycle resultsin almost twofold reduction of the volurne of the igh-level raffinat ad simplifies, therefore,further partitioning of ong-lived adionuclides.
Practically full extraction of , c ad Np )if I" cycle is demonstrated aeady in the firstversion of the Modified urex-process [5 . Extraction of these eements is realized then in theprocess flowsheet of projectedRussian RT-2 reprocessing plant 61, wich may be considered
- 190

JAERI-Conf 2002-004
as the next development stage of the Modified Purex-process. The two versions of the processflowsheet are dist'jiv_uished with different combinations of Zr, Np and Tc during their localiza-tion within I extraction ycle. In the first version of the flowsheet, Zr is stripped together withPu wile Np ad Tc are directed to two individual streams The second version of the flowsheet
'des for separation f Zr as in an individual fraction, hile rc and Np are strippedjointly.However, cornbined stripping of Z, Tc and Np, as it is described in joint patent of Kh1opinRadium Institute (KRI ad BNFL 7] represents more effective variant of management of theseelements (Fig.2). Later esearch allowed smplifying the process, as it is shown in Fig.1,combining barrier scrubbing ad Pi stripping with the use of acetohydroxamic acid (AHA),which was proposed by us as an effective agent for complexing Pu, as well as Np [8] long ago.
...... ... .... .... .... ........ ... ....... .. ........ .. ............ ..... ........ .... ........ ...... ............................. .......... ..... ..... ... .. ... ...... ................ ....................... ............................. .................................... .30% TBP solution
...........................TPE FP U, Pu, Np, Zr, Tc extractio. . . .............. ...... . .. .. .............. ... .. ....... Stron HN0 3
N2H4
NpU ... ... .... ... ........ ................ .... ........ ....... .............. ............... ... ... .Strong HNOI (IV)
2 4
.....................Pu Reducing splitting of Uand]?
............ ....................................... .............. A A ''N 2 14 4
To SNF dissolution Pu & Np barrier scrubbing with complexant----------J............................... ............... ............... ...... ........ ...... .................................................. .......................... Hio ........................................... ......
....................U
. ... ..... ....... ....''Soda
To waste Solvent regeneration .........1...................................
Fig. 2 1 etraction cycle of Superpurex process for NPP SNF reprocessing
The process flowsheet was tested using simulate solutions in small-sized centrifugal-contactor facility. Flow diagram of the unit of joint Zr, Tc and Np stripping is shown in Fig.3,and the results of te test are present in Table 11. Te results point to possibility of gatheringall Zr, Tc and Np injoint product, which is of relatively large volume and should be sent toevaporation facility for concentrating and itric acid regeneration. About 2 Pu is strippedwith the above eements-,- to suppress this effect, Pu(III) can be oxidized by hydrogen peroxide,as it has been proposed in the KRI& BNFL patent 7].
U, Pu, Np, r, Tr in 30%TBP
30%TBP IM H202 IMN2H4+7MHN03 IMHN03
+ I ' TI, Pu,
5 7
NpJ c
Fig. 3 Flow diagram of Zr, Tc and Np stripping unit
The last variant of the process flowsheet allows for two ways of Pu stripping: eitherformation of tirairluni-free strip solution (as in the project flowsheet of RT-2 reprocessing
- 191

JAERI-Conf 2002-004
plant) 7], or conjointly with a minor part of uranium, the main pall o te I ast element beingbackwashed at the next stage of the process, The second way of Pu sipping ooks promising,because joint Pu&U strip solution could be used for fabrication of MOX-fuel, while excessbackwashed uranium should be sent to enrichment by U235 . The second way of Pu manage-ment is in better accordance with the requirements of fissile material onproliferation as well.In both cases, Pu stripping is conducted with the use of AHA.
Table 11. Test results on product composition in the unit of joint Zr, Tc and Np stripping
Stream Concentration, g/1HN03 Zr Tc Np U P
Feed 200 0.9 0.3 0.37 270 0.27
Raffinate 185 0.006 <0.01 <0.001 0.003 -Solvent product - 0.4 0.11 0.12 87 0.087Zr, Np, Tc strip 280 0.41 0.29 0.11 0.03 0.006U&Pu solvent product - - - 0.008 72 0.075
PARTITIONING OF TPE AND REE USING ZEALEX-PROCESSWithin the Superpurex technology, the main task of Zealex-process consists in extraction of
REE and TPE from the high-level raffinate and partitioning of these elements. Simultaneouslywith REE and TPE, some oher elements o, Fe) can be extracted and separated by fractionsusing the solution of ZS HDBP in 30% TBP diluted with paraffines as the solvent. In startinglaboratory-scale experiments 9] it was found out that maximum extraction of REE&TPE by thesolvent corresponds to Zr: HDBP ratio around 1 9 at HDBP concentration of 04 M.
In further investigation, concentration of ZS HDBP in the solvent was educed twofold, inorder to facilitate stripping of TPE and increase their concentrating, The real capacity of thesolvent 0.2 M HDBP, Zr: HDBP = 9) happened to be 006-0.07 M for the surn of theextracted elements (REF + TP + Mo), as follows from Fig.4. The dependence of distributioncoefficients of some EE ad TPF, as well as Mo, Y, Np, Pu and Fe on aqueous phase acidityis demonstrated i Fig. 5. The dependence is most strong for Am and La (inverse proportion toabout the cube of acidity), being a little weaker for Eu and much weaker ID case of Y (inverseproportion to the square of acidity). It allows to separate Y not only from A. but also fromthe cerium group of lanthanides, but it hinder in stripping Y by nitric acid solutions.Distribution coefficients of Fe and Mo first decrease to minimurn values with the rise ofacidity, but then slowly increase,
Maximum distribution coefficients of REF&TPF during extraction frorn low-acid solutions(1. M HN03) by the solvent containing 02 M DBP also correspond to Zr-to-HDBP ratioaround I 9 At low solvent loading (not higher tan 1% of te solvent capacity), Ce isextracted as well as Eu, while Am is weaker extracted (Fig.6A) I the area of 25 M HNO3,
maximum distribution coefficients of RFF&TPF ae attained at Zr-t0-HDBP ratio I 9 I 0(Fig.6B), while the factor of separation of Ce&Eu ftorn A is near 3 however, the values ofdistribution coefficients of these elements can not ensure real separation of Am from Ce andEu in a counter-current extraction cascade.
At the acidity of M HNO3, the distribution coefficients of RFF&TPE do not change whenZr-to-HDBP ratio varies in the range from I .- to I 25, though te alues f the distributioncoefficients are essentially lower than at the acidity of 25 M HNO3. especially, for TPE (Am)and cerium-group of REE 9 It should allow partitioning of yttritin-i-group from cerium-group of REE (Fig.6C), ensuring separation factor from to 50; ai tis case, TPE go withcerium-group, while Y is stripped much weaker, as well as Ho or Tin (the last two elementsdo not present in SNF). t can Lie used also for separation from Mo.
- 192 -

JAERI-Conf 2002-004
These date allows to elaborate the calculation code used for flowsheet designing and testing.10 e) 10000�- D Np
0 D(Eu) - El P.A Ani
D (-Ani X1000: La
X Ea,10 0 D(Ce)Fe
100
0 Y
10
0.1
0.1
...... j - nj 0.01
0.0001 0.001 0.01 0.1 1 0 1 2 3 4 5 6 7 8
Concentration, M HN03,,q., M
Fig.4- Dependence of some TPE and REE Fig.5. Dependence of TUE, REE, Y, Mo anddistribution coefficients D on the element Fe distribution coefficients (D) on nitric acidconcentration in solvent during extraction by concentration at extraction by ZS HDBPZS HDBP 02 M HDBP) in 30% TBP (0.2 M HDBP) in 30% TBP (decane as a(decane as a diluent) from 1. 5 M HN03- diluent).
DmeDme 'A 25 D B 0.2 c aD Eu6 a, DEu 0.18 A OD Ce
OD Am14 2 0 DCe 0.16
ODAm2 O.:4
A D Eu
10 ODCe 1.5 0 2
8 GDAm 0.1
6 0.08
0.06
40.5 0.04
2 0.02
0 0 0
0.00 0.01 0.02 0.03 0.04 0 0.01 0.02 0.03 0.04 0.00 0.01 0.02 0.03
CZr, M CZr, M C Zr, M
Fig.6. Influence of the Zr-to-HDBP ratio on distribution coefficients of Eu, Ce and Am atextraction by ZS HDBP solution 0.2 M HDBP) in 30% TBP (decane as a diluent). Aqueousconcentrations: HN03 (equilibrium), M: A-1.5; B-2.5; C-5.0; REF (starting) 0 I g/l.
Further investigation was developed in the direction of finding conditions for TPE/REEseparation of with the use of a complexing agent. The mixture of diethylenetriaminopenta-acetate (DTPA) with an organic acid (see Table 111) was used for completing. The best results onAm/Eu separation were obtained when using DTPA mixed with one of the following organicacids: lactic, ascorbic and formic. However, the lactic acid destroys the solvent by stripping Zrfrom ZS BP, while ascorbic acid is relatively expensive. Therefore, the formic acid wasselected for ftirther research. Table IV presents the dependence of REE&Am. distributioncoefficients oil OTPA concentration in 1.5 M formic acid. The data show that separation ofthe pair Ri/Am is ritical, while the amount of the EE heavier than Eu is negligible in SNF.The separation coefficients for the pairs Ce/Am and Eu/Am equal, respectively 167,5 and 22,5
- 193 -

JAERI-Conf 2002-004
at the optimum concentration of 0 I N4 DTPA. Increasing of the solvent loading leads todiminishing of the distribution coefficients, especially in case of Ain. and, consequently, tothe rise of REE/Am separation coefficient.
Table 111. Eu&Am extraction by ZS HDBP 0.2 M HDI3P) in 30% TBP (decane as a diluent)from solutions of DTPA (0.0 M and organic acid (1.5 M). Starting Eu concentration- 2.0g/l.
Aqueous phase pH DEu D,,,,, DEv/J)Am Zr in solvent, g/I
DTPA+ lactic acid 2.5 17.2 2.12 8.1 0.57DTPA + aminoacetic acid 5.0 0.04 0.04 1.0 2.0DTPA formic acid 2.0 6.12 1.35 4.5 1.92DTPA ascorbic acid 2.5 5.54 1.08 5.1 1.92DTPA citric acid 1.5 21.3 16.6 1.3 1.33
Table IV. Distribution of RFE and Am at extraction by ZS HDBP 0.2 M HDBP) in 30% TBP(saturated hydrocarb ns as a diluent) from 15 M formic acid. Starting REE&Y content - I g/1.
DTPA content, Distribution coefficientsM La Ce Nd Eu Dy Y Am
0.05 16 6.90.1 205 51 9 4.3 81 0.40.2 28.5 0,55 0.350.25 0.4 I 0.15 0.2
Possibility of partitioning of TPE and REE was also checked during stripping of theseelements from ZS HDBP by the complexing mixture of 0. M DTPA with I Ml formic acid.HDI3P concentration was chosen as low as 0.1 M. Optimum REE concentration in solventproduct, as well as appropriate temperature and solvent-to-aqueous flow ratio were determined
Table V. Stripping of REE and Am during by 1.5 M formic acid containing TPA.Solvent - ZS HDBP (0. M HDBP) dissolved in 3 % TBP (Isopar L as a diluent).
Summary REE&Y concentration 12 g/LConcentration of REE Tempera- Solvent-to-aqueous DTPA D(Me)in solvent product, g/l ture, C volume ratio content, M Ce Eu Am
1 20 1 0.2 3.9 038 0.08It 0.1 7 O�88 0.21
40 0.1 13 0.43 0.151 20 2 0.1 12 L3 0.69
20 0.2 3.2 0.78 0.5540 0.1 9 0,51 0.09
1 1.4 20 1 1 1 0.1 1 3.1 0. 6 _q. 0 8_j
Basing o the results of te above research, a two-cycle process flowsheet for RE andTPE partitioning (ZEALEX-process) was developed. he process provides for purification ofTPE from Y ad, partially, from Sin a En. as well as froin M ad Zr in I" cycle, insolutions of considerable acidity. Final purification of TPF is carried out in 2 cycle, usingDTPA as a complexing agent, The process flowsheet is shown in Fig. 7,
The process was tested. rising simulate solutions in a pilot facility containing 4 siriall-sized12-stage centrifugal contactors. " partitioriiiig ycle included te iinits as foflows� the uit forREE, TPE and Mo extraction; the unit for stripping ofTPF and ceriun-i group of REF; the nitfor stripping of Y, Mc and residoal REF� the unit of removal f (txcess r, Concentration ofHDBP in the solvent was f 02 N4.The performance f the two-cycle pocess flowsheet canbe seen in Table VI. Two strip solutions were otained in I" par(itioning ycle, the first one
- 194 -

JAERI-Conf 2002-004
containing TPF and ceriurn group of REE, the other one containing Mo, Y, residual REE andless an 0 I% If ecessary, Mo can be preliminarily oncentrated Possibility of Zrstripping from a pr( of solvent product, to upport Zr alance, was also successfullydemonstrated. Tlie extracted inicroamounts of U, u Sued Np are removed together with Zr.
Zs HBP IMHN03 8M HN01jet 30%TBP 0,5M H202+ U,5 M H2 C7 04 H20
'St cycle H20 WHNO� H,20 M HN
TPE oY, RE E (SmEu) c wasteFP L____0
ZS HDBP SM HN03in 30%TBP H20 H20comple
e -HN03 TPE
Fig 7 Two-cycle pocess flowsheet with the use of ZS HDBP for partitioning Mo, TPE, REE, Yfrom high level raffinate of Purex-process.
Table VI. Characteristics of two-cycl partitioning process productsHNO3, Eleme percentage (to t ing amount),
ProductM Am REE Y MO Zr
Feed of " oartitioninp cycle 1.7 100 100 100 100 100Raffinate of I" partitioning cycle 1.8 < 0.5 <0.2 < 0.5 < 01
TPE&REE strip solution 4.3 99.3 38.5 < I < 0.1 < 01
Mo. Y and REE (Srn, Eu) strip solution 4.9 < 0.1 61 96 98.5 < 0.1Zr strip solution 0.2 - - 4 < 0.1 99Feed of 2' partitioning cycle 0.6 99.3 38.5 < 0.1 < 0.1 < 0.1
Raffinate of 2 no partitioning cycle 0.6 < 0.5 <0.2
TPE strip solution <0.1 99 -2
REE strip solution 4.0
Feeding solution for testing of 2 d partitioning cycle was simulated as diluted REE&TPEstrip solution of I" par(Itioning cycle. 0 I M ZS HDBP in 30%TBP was used as a solvent.TPE (Am) was stripper-] with the use of complexant (DTPA with formic acid). It has beenfound Out (Table VI), that Ce is completely separated fom rn and passes to REE stripsolution, wile Nd distribution, because of high content of this lement in SNF, is critical forAm purification, The resulted REE strip solution did not contain TPE (Am), while Amdecontamination factors, ccording to composition of Am strip solution, were higher than 200on La.&Ce, 20-30 on Pr&Nd, and 3 OD SM& F-11. In both cycles, REE strip (including Y)contain less than 0 I % of TPE.
Interstage sampling trough te both cycles ad determination of distribution coefficientsof the present elements allowed making computation of optimized product characteristics,using a simplified athematical model of the process. The characteristics (Table VII) provedto be better than te experimental results.
CONCLUSION
195 -

JAERI-Conf 2002-004
The proposed version of the Modified Purex-process makes it possible to localize more than99% of Tc and Np in Is' cycle of the process. It also provides for Zr I ocali zation as a separateTable VII. TPE decontamination during partitioning in two-cycle pocess sing ZS HDBP.
Assumed burn-up of WWER I 00 spent fuel - 40OW * day/tFactor of Am pu fication from EE Element content, gr per ton SNF
Element Experimental Optimized process I Expefirrientat Optim. processStart
Cyclel Cycle2l Y CyclellCycle2 Y [1-c� tire F2cyo;Ae-s` I cycle 12 cyclesAm I I 1 1 1 1 475 475 475 475 475La 2.1 314 659 1.06 >1000 >1000 1637 779.5 2.5 1544 <1.5Ce 2.2 234 515 1.5 >1000 >1000 3214 1461 6.2 2143 <2Pr 2.3 31 71 1.9 193 367 1411 613 20 743 2Nd 2.5 21 53 2.0 126 252 5590 2236 106 2795 11PM - - - 2.8 75 210 310 - - 110 1.5Sm 3.4 3.4 12 3.5 23 81 1070. 315 93 306 4Eu 3.3 3.7 12 6.1 29 177 52.4 16 4.3 8.6 0.05Gd - - - 8.0 20 160 223 - - 28 1.4Y >10 - - 36 14 504 728.5 <73 - 20 1.4
Y REE 2.6 23 60 1.9 315 600 1 5493 232 7588 23
Y, REE /Am 29.3 1L6 0.5 6 0.05
fraction and, due to it, for two-fold reduction of high-level raffinate flowrate. which is importantfor further TPE partitioning.
In two-cycle ZEALEX-process, TPE separation from REF npoi�ecca resulted indecontamination factor - 60; optimization of the process should allow obtaining TPE productcontaining only -5% REE, mainly residual Nd.
As a whole, in combination with iodine-129 blowing-off at the stage of SNF dissolution,very effective partitioning of the main long-lived radionuclides can be attained, while nosecondary organic waste is generated.
The work has been carried out with partial support of ISTC, Project 1608.
REFERENCES[1 - Baron P., Boullis B., Germain M. et al. Proc, Int. Conf. Global'93. Vol. , p63-70�[2 - Uchyama G., Asakura T., Hotoku S., Fujine S. The 5 th. Int. Nucl. Conf. Recycl. Cond. &Dispos. "RECOD'98" (I 998, France). Vol. . p.393-400.[3 - ZilbermanB.Ya.,MishinE.N.,FedorovYu.S. etal. Chemical Tochnology(Rus). 2001), O.[4 - Zilberman B.Ya., Dzekun EG., Nardova A.K. et al. "Method of spent fuel elementprocessing". USSR Patent 804652 (Bul. It, 993)[5 - Zilberman B.Ya.. Fedorov Yu.S., Mashki AX Proc. Int, Topical Meet, on Nucl. andHazardousWasteManagement"Spectrum'94" (1994,AtlantaUSA). Vol.1, p.581-585.[6 - Zilberman B.Ya., Russian Radiochemistry, 2000). Vol.42, T. .3 15.[7 - Zilberman B.Ya., Fedorov Yu.S., . Denniss I.S. et al. "Process for NPP spent fuelreprocessing". Russian Patent 2132578 (Bul. 18, 1999)[8 - Zilberman B.Ya., Mashkin A, Nardova A.K. et al. "Method of spent nuclear fuelreprocessing". Russian Patent 2012075 RU (3ul. 8, 1994).[9 - Zilberman B.Ya., Fedorov Yu.S., Shmidt .V. et al. Russian Radiochemistry,(2000).Vol. 42, 4, p.338-344, 345-348.
- 196 -
JP0250300Jfi&FJ-Conf 2002-004
FARC PROCESS AS ADVANCED FUREX PROCESS
G. UCHIYAMA, H. MINEO, T. ASAKURA, S. HOTOKU, M. UZUKA,S. UJISAKI, H.1SOGA1, YHOH, M. SATO, N.HOSOYA
Process Safety LaboratoryJapan Atomic Energy Research Institute JAERI)
Tokai-mura 'Naka-gun, Tharaki-ken, Japan, 319-1195Fax:8129-282-6677, e-rnaii: uhi ania &rocsa�fe-tokai�-Jaeri- 9�-
ABSTRACT
An advanced PREX process, PARC process, has been developed for establishing the coming generation's fuelcycle technologies, Key technologies applied in the pocess are: 1) removal of carbone-14 and iodine-129 withadsorption techniques in dissolver off-gas, 2 separation of neptunium ad teebtretium by selective reduction ofNp(VI) by norlyjal-butyraldehyde and e high acid sabbing of teebnetium 3 separation of americium from theraffinate of co-extraction step wit asorption technique, 4 solvent-washing with norma(-butylamme compounds.The separation eiciency of long-lived uclides in the pocess was studied in chemical flow sheet experimentsusing spent fuels burned up to 44,000 MVM/tU.
Keywords: Reprocessing, Long-lived nuclide, PUREXprocess, PARCprocess, Separation
INTRODUCTION
The utilization of nuclear energy as power generation is considered as a realisticcountermeasure for the evironmental problem relating to the C02 emission and for theenergy security due to the increasing population. WR fuel cycle age is extended further forthe delay of establishment of FBR fuel cycle technologies and the use of MOX fuel in WRs
will be erilarged for saving �_-rrergy resource. The reprocessing process technology in WR fuelcycle applies a current PURFX process. Present commercial reprocessing plants have achieved
a 99.88% ecovery of the fissile material contained in spent fuel and have developed safe wasteconditioning tough vitrification for high-level waste [11, ne effort to applying newtechnologies to nuclear fuel reprocessing for long-term energy security is further continued forreduction of radioactive waste volume and minimization of toxicity based on the ALARAprinciple 261. Also te irnprovernent of te process safety on the capability of confiningradioactive materials in the process and te cell ventilation systems are conducted under normaloperation and accidental conditions such as fire, xplosion and criticality in reprocessing plants
[7-91.In JAERI the pocess safety studies have been conducted mainly in NUCEF (Nuclear Fuel
Cycle Safety Engineering Research Facility) according to te government five-year nuclear
safety research plan [10], Researches are radioactive nuclides confinement safety inreprocessing under normal conditions and accidental conditions such as criticality accident ofuranium, solution fuels, fire and xplosion accident [11]. An advanced PUREX process, PARC
(Zartitioning Conundrum Key) pocess having a partitioning function of long-lived nuclides hasbeen developed to improve the process safety in BECKY in NUCEF 12-18]. Also thedistribution behaviors of adioactive nuclides in the process to valuate the safety margin of
radioactivity CfilleMellt capability have been studied. On the capability of confiningradioactive materials in criticality accidents of free] solutions, the release behavior of radiolysisgases and radioactive fnatefials, frorn the fuel solution to the gas phase in criticality accidentof the fuel solution has been sdied in TRACY 19-241 O the capability of confiningradioactive materials i fire and explosion accidents. data on te source terms, such as mass,
197 -

JAERI-Conf 2002-004
energy and smoke release rate fom burning materials, and ClOggifig properties of the HEPAand pre filters have been obtained in engineering scale equipment 22-23]. These researcheslead to develop safety criteria and to establish technical base fr 1iCeDSiBg.
In this paper the outline of the development of PARC process is described i detail.
OUTLINE OF PARC PROCESSPARC ProcessThe PARC process has been developed to enhance te confinement capability of long-livednuclides in simplified reprocessing. Principal feature of the process is a simplification ofPUREX process. In the development of the process, the following intentions are taken intoconsideration; 1) reduction of adioactive waste volume containing TRU elements, 2 eductionof environmental ia7ard risk due to long-lived nuclides such as techiretium-99, carbon-14 andiodine-129 3 ehancement of economical competitiveness 4 enhancement of nuclearnon-proliferation and 5)enhancernent of process safety.In an advanced fel cycle in which the, PARC process concept is applied, the power plantsystem consists of WR icluding reduced moderation water reactor (RMWR) and FBR withuranium, plutonium and some neptunium being recycled Lg-lived uclides oftechnetium-99, carbon-14 and iodine-129 are separated ad confined in a long-term storagefacility. Transmutation devises are developed to reduce the waste volume i the long-termfuture[24].The process consists of four systems. Iodine-129 and C14 are emoved from dissolveroff-gas in the head-end treatment system. Tc and Np are extracted by TBP with U and Pu inimproved co-extraction step, Extracted Np and Tc are separated effectively from U and Pustream before U/Pu partitioning step. In this step selective reduction of Np(VI) to Np(V inthe presence of U(VI) and Pu(IV) is a significant technique. Figure t shows the comparison ofthe extraction step between current PUREX and PARC processes. In the Current PREXprocess, there are tree extraction cycles for recovery of purified U ad Pu which are I" cyclefor extraction of U ad Pu from spent fuel, and Pu prification cycles as shown in Fig.1 Onthe other hand, the PARC process is only one cycle process for ecovery of purified U and Puwithout purification cycles. The decontamination of not only Np and Tc but aiso fissionproducts from U and Pu are expected in the added separation steps of Np and Tc betweenco-decontamination and U/Pu partitioning steps.
1 Si cycleVP 'TeAD UJIIIAR
Co -lAnction 2*d FP Scrub.
I It FP S rub. PR
process
ent lie I -� cycle
Co -Extractio C+
Ss
Fig.1 Comparison of extraction step between urrent PUREX process and PARC
- 198

JAERI-Conf 2002-004
Am and Cm are separated from the raffinate of the CO-eXtTaction step with adsorptiontechnique. Reagents such as nitric acid and TBP solvent art treated and recycled in theprocess. Recovered U and Pu are recycled in te light water eactors as U02 fuel and MOX
fueL And others loRg-fived nuclides are transmuted with accelerator r fission reactors. In the
PARC pocess U ad Pu purification steps are ot included., like one cyclt process.
Target of decontamination factors
Targets of separation fficiency in the PARC process are shown in the Table I The targets of
separation efficiency of iodine, Np-237, c-99 are determined based on the designed values of
current reprocessing plant [25]� The target of separation eiciency of 14 is almost the same
as that of 1129. As for Am and Cip, the targets of separation (,efficiency are the same as those
of Am a Cm from the high level liquid Waste in the OMECTA pr 'ect in Japan 26], whereQjthe targets of separation efficiency are determined to make the hazard index of a vitrified
HLLW after storage for 1,000 years comparable to that for naturally occurring minerals
containing 3 of titanium. In a current PUREX reprocessing plant, high decontamination
factors were obtained, that is, the decontamination factor of fission products in separation
cycle is more ta 2 105 for and ore than 8 x 10⁴ fr pU [27] I the extraction step of
the PARC process, the decontamination factors for fission products will be beyond the
designed values ad required values for recycling and transmutation.
In order to fd the feasibility of te PARC pocess, chemical flow sheet experiments have
been conducted by rising spent fuels burDed up to 44,000 MWD/tU.
Table 1, Target of separation efficiency of long-lived nuclides in PARC process
Step Separation Efficiency
Head-end C- 4 99 %
1-1,29 99.6 %
Np 99.4 %
Extraction TIC 99.97 %
U 99.96 %
Pu 99,93 %
Aqueous waste Am 99.99 %
treatment Cm 99.9 %
CHEMICAL FLOW SHEET EXPERIMENTExperime"tal
Chemical, flow Sheet experiments were conducted by using a uratt scale reprocessing process
equipment (PARCY) installed in alpha-gamma cell in NUCFF as shown in Fig.2. The
reprocessing process equiparent consists of head-end, extraction, off-gas treatment and waste
treatment steps. The head-end step consists of a batch-wise dissolver, an iodine-stripping tank, a
clarification filter and a feed tank for xtraction step.
Spent fuel of PWR 44,000 NWD/tU was dissolved in the dissolver under three different nitric
acid conditions. Each txptriment used aout 400 of the spent fuel. Iodine -remained in the,
dissolver solution was stripped by the Nx gas ubbling in the iodine stripping tank. The
dissolver solution was clarified with the clarification filter. NOx gas in the dissolver off-gas was
- 199

JAERI-Conf 2002-004
SeparationtestofNpandre
Test of dissolutionand iodine evolutio
Head -and Step
Am separation co
a Rt ESolvent wash
-levelAcid ocycling test Waste Treat enl Step
shing)
Fig. 2 Reprocessing pocess equipment installed in alpha-gamma cell in NCEF
removed in the Nx scrubber. Iodine in the dissolver off-gas was captured in the iodineadsorbent columns. Carbon-14 was treated in a trap mounted to the iodine adsorbent columns.The extraction step with five mixer-settleTs was used to investigate xtraction behaviors of.uranium, pl utonium. neptunium, techrietituri, zirconium, ruthenium, cesium and iodine. Theflow sheet consists of eight steps: co-decontamination, Np separation, Tc separation, Urecovery and U/Pu partitioning, U stripping, diluent washing ad solvent washing steps.Normal-butyraldehyde was used as a Np(VI) reductant. The scrubbing solutions or neptuniumand technetiurn were 3 M and 6 M nitric acid, respectively. Uranium (IV) was used as a Pu(IV)reductant instead of iso-butyraldehyde in this experiment.Purchased reagents such as TBP, n-butyraldehyde, u-butylamine compounds and n-dodecanewere used without any special pretreatment. The dissolver solution of spent fuel as a feedcontained 216 g ranium, 243 g1l plutonium and 31 M nitric acid. The valence states ofplutonium and neptunium i t feed solution were ainly Pu(IV) and Np(V), espectively bya spectrophotometer analysis. The concentration of nitrous acid in te feed solution was about6E-3 M. Tracers of technetium-95m, zirconium-95 and 1131 were added into the feedsolution after diluted with nitric acid solution.
Results and discussionIn the study on the head-end step, the dissolution behavior of uranium, plutonium and fissionproducts, the migration behavior of volatile elements such as iodine-129, caTbon-J4 and kyptonand the characteristics of insoluble residues were focused. Iodine 1-129) was released into thedissolver off-gas and then collected in the absorbent columns loarfed with silve ipregnatedsilica-gel (AgS) as shown in Fig,3. It was confirmed that te adsorbent was effective for iodineremoval i the actual spent el issolution pfocess. By the filtration of dissolver solution, theparticle size diameter distribution of insoluble residue in te solution was obtained i the, fangeof 04 a m to 10 a .In the extraction step, the concentrations of tuarriurn and putonium were almost constant inboth the organic and the aueous phases i te Np and te separations steps. As forneptunium and technetitim, the concentrations in both the organic ad the aqueous phases nboth the Np and the Tc separation steps are sow i Fig.4. About 75% of the nepturrimn that
200 -

JAERI-Conf 2002-004
1 6I- 129
I 1-131C3- 1-133
4 U
31 0 t3.
I 21A.
I
1 0
I
Cartridge number in Column 2
Fig. 3 Concentration profile of iodine in adsorbent column.
flowed to te Np separation step was back-(-xtracted frorn the solvent stream loaded withuranium and plutonium and flowed to the neptunium poduct. This implies that Np(VI) wasreduced to Np(V) by n-butyraidehyde.As for tochrre�tiurn, about 90% of te technetium that flowed to the T separation step wasback-extracted fnt the Slvent StTeaffl and flowed to the technetrum poduct. The separationefficiencies are not high enough due to the limit of conditions for experiments. The separationefficiencies will increase by optimizing te concentration of Np eductant, flow ratios (O/A)and separation stages in the steps. Simulation codes have been developed for designing andevaluating chemical flow sheet.
U Np TCRECO SEPARATION SEPARATION
LE+00
........ .... ..... ...... ......... ......... ......... .. .....
LE-01
LE-01Np in organic phase I
Te in organic phaseLE-03Np in aqueous phase
Tc in aqueous phaseLE-04
1 23 4 5 6 7 8 9 1011121314151617181920Stage Number -
Fig. 4 Concentration profiles of Np and Tc in Np and Tc separation steps
In the U/Pu partitioning step, the plutonium concentration in oth the organic and the aqueousphases decreased with approximately the same gradient as in the U/Pu partitioning step. More
201 -

JAERI-Conf 2002-004
than 99.8 of the plutonium that flowed to the U/Pu partitioning sp was back-extracted fromthe solvent stream and flowed to the ptonium product. Te absorption spectrum of theplutonium product solution sowed that te plutonium valency in the poduct solution wastrivalent. It was found that Pu(IV) was reduced to Pu(Ill) by uranium (IV).As for the extraction behaviors of neptunium and technetium, only of the neptunium thatflowed to the U/Pu partitioning step was back-extracted from the solvent stream oaded withuranium and flowed into the plutonium product solution. About 50 the technetium thatflowed to the step was back-extracted from the solvent stream loaded with uranium andflowed as plutonium product.AM3'-selective adsorption was studied by using an adsorbent to develop an actinideslanthanide separation process. The adsorbent was made by porous silica-polymer compositematerial which supports itrogen donor aromatic compound, 2,6-bis (5, 6-dialkyl-1,2,4-triazin-3-yl) pyridine (Alkyl-BTP). In the case of Ethyl-BTP adsorbent, the distributionratio of AM3, was 60 m-g-j � The valued of adsorption selectivity of Am 3' against Ce3', EU3,
or Gd 3, was 390, 13 o 9 respectively. Therefore, it is possible to adsorb Am 3, ionselectively aainst lanthatudes ions by that adsorbent 28],In the solvent washing Step, total alpha activity in the U stripped solvent decreased from 3200Bq/ml to 36 Bq/ml through the use of n-butylarnine compounds carbonate ad oxalate). Tedecontamination factor for total alpha activity in the solvent washing stop I nd 11 wereabout 1,000. There was not a large difference in solvent washing effect between ubutylaffliftecarbonate and oxalate in solvent washing step 11 �The destruction of butyraidehyde isomers a(] butylaurtne has been studied using a silvercatalyzed olectrocheirrical oxidation technique 291. The estruction fates of te compoundswere measured as a function of the concentrations of the ompounds silver and nitric acid inaqueous solution, anode potential and temperature, About 95 of n-butyraldehyde in 3 Mnitric acid was destroyed within 300 inutes by electrochemical oxidation at the anodepotential of 1.6 versus a reference saturated calomel electrode (SCE). About 95 ofbutylamine in 3 M itric acid was destroyed within 270 minutes by electrochemical oxidationat the anode potential of 16 versus SCE. Te process was found to be applicable to thedestruction of butyraidehyde isomers in nitric acid solutions.The effectiveness of the salt-free techniques of i-butyraidehyde as a Np reductant andn-butylamine compounds as washing eagents was found i te chemical flow sheetexperiments. Frther sudy is required to optimize the flow sheet conditions of te PARCprocess.
CONCLUSIONS
Demonstration experiments of an advanced PUREX process, PARC process, have beenconducted by usingspen fel of 44,000 WD/tU in NUCEF.The dissolution behaviors of manjum, plutonium ad fission products, te migration behaviorsof volatile, eements sch as iodine-129 and carbon-14 and kypton ad characteristics ofinsoluble residues were sudie i headband step. The distribution behaviors of minor nuclidessuch as nepturrimn and technetimn in te PARC pocess were studied in extraction step.It was found tat Np(Vf,) was Yoduced to Np(V) by n-butyraidehyde selectively n the presenceof U(VI), Pu(IV) and Te(VII), igh acid scrubbing was t�ftective for technetrum separation andthat butylamine compounds carbonate ad oxalate) were effective, solvertt-washing reagents.
- 202 -

JAERI-Conf 2002-004
REFERENCES
[I]M.F.I)hI3RFUlLl1F,P.PRADFL and F. DRAIN, "Present status of R&D on reprocessingprocess in CGEMA", JAERI-Conf, "The 3rd NCEF International Symposium(NUCEF2001)", to be published.
[2 BYA, ZILBERMAN, YU. SF-DOROV, F N MISHIN, LV.SYTNIK, 0. V. SHMIDTand D. N. KUKHAREV, "SUPER PUREX-Process for partitioning of U, Pu, Np, TPE andsome long-lived fission poduct at NPP spent fuel eprocessing ", Proc. SAFEWASTE2000, Montepellier, France,736,2000,
[3] SUE ION, urrent options for the back ond of the fuel cycle", Proc, ATALANTE 2000,Avignon, France, 103, 2000�
[4] VSKOLTUNOV, R.JTAYLOR, S.M. BARANOV, E.A. MEZHAV, V-G, PASTUSHAKand G. V. KOETUNOV, "Acetaldoxiine-a promising educing agent for Pu, and Np ions inthe P REX process", Proc, ATALANTE 2000, Avignon, Fiance, 0 1 06, 2000.
t5] C� CAU. D. COUMES, J. C DUMAS d F. DEVISME, "PUREX dissolution off-gastreatment: Potentials of hydroxylammoiriurn, nitrate as a scrubbing reagent for iodine andnitrogen oxides", Proc, ATALANTE 2000, Avignon, France, 1-07, 20W
[61 Y� WEI, M KUMAGAI, TAKASHIMAH, YOKOI T HOSHIKAWA, "Developmentof silica-based liolating exchangers and their separation behavior for lanthanides andacturides y column cromatography", Pfoc. RECOD 98, Nice, France, 701, 1998.
[71 G. NSHIO, K. WATANABE, K. KOUNO, N. YAMAZAKI, S. MUKAIDA and YOSHIOKA, "Developirittit of the CELVA-ID code to evaluate the safety of anaii--ventilation system during postulated fire and explosion i the eprocessing plant",JAERI-DATA/Code 98-017,1998, in Japanese.
[8] S. TASHIRO, B. ABE, B. NAGAI, T KKE, S. OKAGAWA and . TJCHrYAMA,"Release behavior of mist from fuel, solution in tansient critical experiment usingTRACY", Proc. AAAR 2000, USA, 2000.
[91 R. ABE, S. TASHIRO, H. NAGAI, T. KIOKE, S. OKAGAWA and G.UCHIYAMA,"Studies o release behavior of radioactive oble gases from fuel solution under simulatednuclear criticality accident", J. Nucl. Sci. Technol, in press.
[IO]Nuclear Safety Commission, "The five-year plan for nuclear safety research",2000.[II] M MAEDA, S. FUJINE, G. UCHTYAMA, T, KIHARA, T. SAKURAI and T TSUJINO,
"A pocess coriception of an advanced eprocessing based on PUREX incorporating thepartitioning". Poc. GLOBAL'1995, Versailles, Fance, 556, 1995.
[12] S, FUJINE, G. HIYAMA, T. KARA, T. ASAKURA and T. SAKURAI,"Radioactivity confinement capability of PARC concept for the future reprocessing",Progress in Nclear Energy, 32, 1998.
[131G. UHIYAMA, T. ASAKURA, M. WATANABE, S. FJINE and M. MAEDA, "Theseparation Of fleptUllil.fln and technetium in advanced PUREX process", Solvent. Extr.. IonExch., 16 1191, 1998.
[14] G. U`CHJYAN4A, S. FURNE and M. MAEDA, "Solvent-washing process usingbutylarriin i reprocessing', Nucl. Technol., 120,41,1997.
[15] H� MINEO, T. YAGI, A. TAKAHASHI, G. UCHIYAMA, S. FUJINE, "Development oftreatment technology for carbon-14 in dissolver off-gas of spent fuel", Proc. ICEM'99,1999.
[16] T, ASAKURA, S.HOTOKU, M. IIZUKA, S. FUJISAKI, M. GTOE, H. MINEO and G.UCHIYAMA, "eprocessing xperiment using spent fuel at N`UCEF facility", Proc.ATALANTE 2000, Avignon, France, 01-03,2000.
[17] K KAMEI, S. HOTOKU, T. ASAKURA, M. WATANABE, G. UCHIYAMA and S.FUJINE, "A study on decomposition of butylamine solvent washing reagent",
203 -

JAERI-Conf 2002-004
JAIERI-Research 2000-021, 2000. in Japanese.[18] G. UCHIYAMA, T. ASAKURA, S. HOTOKU, H. MMNEO, K. KAMEI M.
WATANABE, S. UJINE, "Solvent Extraction Behaviors of inor Nuclides in NuclearFuel Reprocessing Process", J. Radioanal. Sucl. Chem., 246, 683, 2000�
[19] H.ABE, S.TASHIRO, HNAGAI, T.KOIKE, S.OKAGAWA and M.MURATA, "Study onthe release behavior of radioactive Iodine spices and noble gases from the fuel solutionunder simulated nclear criticality accident", JAERI-Tech 99-067 (in Japanese), 1999,
[20] H.ABE, S.TASHIRO, HNAGAI, T.KOIKE, S.OKAGAWA and MMURATA, "Studieson Source Term Release Behavior from Fuel Solution under Simulated Nuclear CriticalityAccident", ICNC'99 Proceeding Vol.3 p 1293 1302, 1999
[21] H.ABE, S.TASHIRO, T.KOIKE, S.OGAWA and G.UCHTYAMA, "Study on ReleaseBehavior of Radioactive Noble Gases and Iodine Species from Fuel Solution underSimulated Nuclear Criticality Accident," JAERI-Conf, "The 3rd NUCEF IternationalSymposium (NUCEF2001)", to be published.
[22] S.TASHIRO, K.WATANABE, H.ABE, J.TAKADA and G.UCHTYAMA "CloggingCharacteristics of Ventilation Filter under the Fire Accident," JAERI-Conf, "The 3rdNUCEF International Symposium (NUCFF2001)", to be published.
[23] K.WATANABE, H.ABE, J.TAKADA, S.TASHIRO, and G.UCHIYAMA "Evaluation ofConfinement Capability for Radioactive Materials of Nuclear Fuel Facility under the FireAccident with Celva-11),` JAERI-Conf, "The 3rd NUCEF Iternational Symposium(NUCEP2001)", to be published.
[24] K.NISHIHARA, H. TAKANO and K. MINATO, "Transmutation of minor actinide,iodeine129, technetium-99 using accelerator-driven system", Poc. GLOBAL2001,held inParis, 2001.
[25] MHI, JNFS R-91-002.1996.[26] M. KUBOTA, S, DJIRI, 1. YAMAGUCHI Y MORITA, 1, YAMAGISHt, and T.
KOBAYASHI, "High Level Radioactive Waste and Spent Fel Management. Vol. 1, 537,1989.
[27] J.L. DESVAUX, F. DRAIN, F. DUTERTRE, P.H. HURON, J. N. PINEAU R.VINOCHE, Proc. RECOD98, Nice, France, 1998.
[28] Y. WEI, N. SABHAWAL, M. KUMAGAI, T. ASAKURA, G.UCHPYAMA, S. FJINE,"Preparation of novel silica-based nitrogen donor extraction resins and their adsorptionperformance for tfivalent americium ad tanthanides", J. Nucl. Si, Technol., 37, 108,2000.
[291 G. UCHIYAMA and S. UJINE, Destruction of butyraldebyde isomers using silvercatalyzed electrochemical oxidation", J. Radioanal. Nucl. Chem., 230, 1998.
204 -

JP0250301JAERI-Conf 2002-004
RFcFN'r STUDIES OF ETEROGENEOUS AND HOMOGENEOUSREDUCTION - OXIDATION REACTIONS OF U(IV) IONS N NITRIC
ACID AND TBP P-TASES
ROBIN J. TAYLOR, VALENTIN S. KOLTUNOV*, VALERY 1. MARCHENKO*, COLINBOYALL'AND SHAORONG XIAO'
BNFT_ Technology Centre, Research and Technology, BNFL Sellafield, Seascale, CA20 IPG, U.K.Fax7 44 19467 79007 eail: robirrj.taylor(a,)bnfl.corn
A.A. Bochvar All-Russia Research Institute of Inorganic Materials, PO Box 369, Moscow, 123060, Russia.Fax: 7095 196 4252, email: rnarch�bochvar.ru
Centre for Materials Science, University of Central Lancashire, Preston, Lancashire PR] 2HE, U.K.Fax: 44 1772 892996 email: cboxall�uclan.ac.uk
The results from some of our recent investigations of actinide redox reactions i nitric acid and tributylphosphate phases are reviewed, including the oxidation of J(IV) by HNO, and N02 and by Np(VI) and Np(V)in 30 TRP and by Np(VI i f4NO1. The nusual interactions between U(IV), Tc(VIT) and NH3OH+ in I4NO3are also discussed. Finally, the pliotocatalytic heterogeneous reduction of U(VI) by a colloidal semiconductor ispresented.Key words: redox, kinetics, actinides, photocatalysis
1. INTRODUCTIONThe behaviour of actinide ions in the Purex process is governed by the thermodynamics oftheir solvent extraction between N03 and TBP and by the kinetics of their redox. reactionsand mass transfer I J. Reaction kinetics are particularly important in contactors where redoxreagents such as frrous sulfamate or uranous ntrate.are introduced, and in contactors whichhave short residence times such as centrifugal contactors. It is well known that actinide ionsundergo ractions in both aqueous and so Ivent phases and so, to properly understand andmodel the process, kinetic information on reaction rates in both phases are needed 121.There is a large amount of historic data available in the literature but there are still surprisinggaps in this database, where either the reaction has not been studied under relevant conditionsor no conclusive understatiding of the kinetics has been reached despite various investigations[1-3]. Also if we start to consider new redox-active reagents then kinetic data is needed inorder to understand and model their behaviour in the process 3]. This paper surnmarises theresults of some of our recent investigations in this field.
2. REDUCTION OF Np IONS BY U(IV)The interaction between Np ions and U(IV) ions is important in. the U/Pu separation stage ofthe Purex process, as it determines the routing of Np in the process 4 The reduction ofNp(VI) by U(IV) in the aqueous phase is a rapid reaction which has, surprisingly, onlypreviously been studied in HC104 [5]. We investigated the reaction in NO3 and found it tobe similar in many respects to the reaction in HC104 6 The reaction stoichiometry is thesame as in HC104 (Eq. 1) and the rate of reaction was found to be idependent of ionicstrength and [U(Vl)]. The rate equation is given in Eq. 2 where k = 696 ± 20) Nll-'mid' at IO'C and [NH2SO3H = 0.0005 M) and the activation energy is equal to 66.5 ± 49 kJmol-1.
2NpO2 2+ U4+ + 2H20 =2NP02+ + U02 2+ + 4W (1)
d[Np(V)] d[Np(VI)l [Np(VI)][U(1V)]- = k (2)
dt dt [UN031 0.7
205 -

JAERI-Conf 2002-004
The reaction in HN03 was found to e faster than that in HC104, Which is quite common forNp redox. reactions. The mechanism. via a slow stage of charge (B atoni) transfer from thehydrolyzed reductant ion, tjo"3j-� to the hydrated oxidant io (q 3 was thought to beretained in HN03. However, the variatio i the order of reaction with respect to [H+j from 1in HC104 to 0.7 in HN03 was attributed to a parallel reaction route in which Np(VI) reactswith non-hydrolysed U(IV) ions (Eq. 45, where stage 4) is a relatively slow stage and stage(5) is rapid).
NP02' + UOH' - NpOH 2 + U3+ (3)
NpO2 2 + U4+ 2120 NpO2 + U02+ + 4H+ (4)
NpO2 2+ + U02+ --> NpO2 + U02 2+ (5)
So, the rate of reduction can be expressed as a combination of both slow stages 3) and 4) Itwas shown that these ypotheses were consistent with the experimental data and tat the rateequation could actually be expressed a for silar to that Sullivan [5� (Fq 6 where terate constants for stages 3 - 4) are = 404 inin-1, k = 275 M Irain- and te I" U(IV)hydrolysis constant PI = 0. 009 M at I T and pi = 2.
d[Np(Vl) = k3 + k4 H+ ) [Np(Vl)] [U(IV)] (6)dt PI [H+]
The reduction of Np(VI) as been studied previously in the TBP phase but the results werenot entirely conclusive 7 Recent work as reinvestigated this reaction, 8 omplicationswere encountered due to the formation of complexes between Np(V) and U(VI) and UV).The Np(V)-U(VI) complex has been reported by several authors [e.g. see reference 9 andreferences therein] bt the U(IV)-Np(V) complex is lesser kown. This complex wasidentifiable by the growth of an absorption band at -1000 wh ould ot be related, toNp(VI), U(IV) or the Np(V)-U(VI) complex (Xm,, = 993 rn '). Assuming an analogous 1:1complex between QV) and Np(V) (probably ofthe orm. in Eq 7, we otained equilibriumconstants (K) of 360 40 M-' at 15 C' and 400 M-' at 35 C.
NpO2NO3.xTBP + UNO3)4.2TBP --;:t NpO2.U(NO3)5.yTBP (7)
The rate equation for the Np(VI - U(N) reaction was ultimately ound to, be as in Eq. ,where PI and P2 are te I" and 2 d U(IV) ydrolysis CODStantS.
d[Np(Vl)] [Np(VI)j[U(1V)][H2 oi2= k (8)
dt [HN03 12 +0,[HNO-,j[H201+P2[H20f
The mean value of the rate constant was k - 59.3 ± 17 Mmin" at 20,0 T ad the activationenergy was E = 66.6 ± 3 Untol-1. Interestingly, U(VI) was observed to increase te reactionrate in a linear manner.
Comparing the mechanisms of the Np(VT - UV) reactions in TBP (Fq 91 1 ad aqueous(Eq. 35) solutions shows that, in both environinents, ydrolyzed forms of U(IV) are active
'At [H20 = 036 - 0.40M; [HN03 = 026 - 031 M.
- 206 -

JAERI-Conf' 2002-004
forms, However, in 'TBP, U0F)2 21- ions seem to be more active as electron donors thanUOH' os, Also, athough Nip(VI) is reduce([ at a ruch Higher rate i a aqueous solutionthan i 301/o'FBP, if te oncentration of water in aqueous solution (-55 M) is substitutedlintoequation (8), ie te reaction in T3P. trie 2 order rate constant in I N4 HN03 at 20.0 C isonly a factor of 3 less tan that i aqUeOus solutio uder te same conditions, This clearlyillustrates te irnportant role of H20 in TBP phase actinide redox reactions. It is alsointeresting to note te activation eergies i aueous, and 30% TBP soititions are equivalent(66.5 and 66,6 kJmo1-' respectively bt the activatio etropies vary trom 2 to 26 (±13)JK- I mo " It is, however, difficnit to find a reasonable explanation Of the acceleration of theTBP phase, reaction in te pesence of U(VI),
U' + 2H20 U(01-1),'+ + 2H+ (9)
NP022-'+ U(OH)2 2+ NP02-' + U02+ + 2H_'_ (I )
U02+ + NP02 2-1 ---� IT02 2+ + NpO2+ (I )
The reduction of Np(V) as not previously been studied in TBP b oly in e aqueous phase(HC104, HC1, HNOA were there is a ftirther reduction (and ten reoxidation) to Np(III) [0-12]. We 91 ave determined tberate equation to e given by Eq. 12 were at 35 C, k 23.8
2.7 NT'irnn-'. The activation eergy (E,,) is equal to 89.0 ± 22.0 kJmol-1. Within theconcentration ranges studied2, no dependence on [HNO31 or [J+)Oj were observed. The higherror o the E�, value was dire to the very approximate determination of the temperatureDependence Of te Ui1ibtiUM onstant K.
d[Np(IV)] [Np(V)I[U(IV)]&�� (12)dt + D[U(IV)]
In this reaction, U(VI) retards the rate of reaction which is probably ue to the incorporationof some Np(V) iii to te unreactive Np(V)-TJ(VI) complex. It is interesting to compare therates of the 'Np(V - TJIV) reactions i TBP and HN03 121, The 2 rder rate constant inaqueous solution at 35 ad [HN031 I M is approximately k, ;� 0006 M.-'min-', but k;z:�50 M-lmin-� an TBF (at H201 � O� - 0.5 M). The substantially acelerated rate of reductionof Np(V) wt UV i TBP indicates that the reaction is songly ihibited by water asdistinct from the Nip(VI - U(IV)reaction that was found to be atalyzed by water.
The mechanism of the Np(V) -- TJ(IV) reaction in TBP is omplicated by the formation ofnon-reactive complexes of pentavalent neptunium wine T.T(lV) and U(VI), i.e.,7NPO')tT(N03)51" and "Np02U02(N03)3j"- Charge transpor tus occurs between non-complexed solvated itrates of -,Np(V) and UV). Note that there was no evidence of furtherreduction to N)(111) unlike the aqueous phase reaction.
3. SOLVENT PHASE OXIDATION OF U(IV) IONSThe oxidations of tJQV) by, N0,A and HN02 in TBP solutions have been well studied butthere are inarry variations nd inconsistencies betwee te poblisi-led data F 3. We developedcareful, experin-rental methods to study these reactions uder strictly controlled conditions[131.
2[HN03 = 0. 15 - 06 M aod [H20 = 033 - 064 M at 35 OC.
207 -

JAERI-Conf 2002-004
The oxidation by IIN03 was shown to be autocatalytic, with a initial slow nitric acidoxidation followed by a faster nitrous acid oxidation (Eq. 13-14) once HN02 has accumulatedwithin the reacting solution (the NO formed reacts to produce more HNO2).
U 4+ + HN03 H20 -� U02 21- + HN02 2T+ . 13)
U 4+ 2N02 UO2 2+ + 2NO + 2H+ (14)
If, however, HN02 is present as a reactant in the iitial solution at tO then both reactions (I 3 -14) occur from the outset. We found the rate equation for the oxidation of U(IV) by HN03 in30% TBP/ n-dodecane to be given by Eq. 15, which is a combination of the rates of reactions13 and 14 ("non-catalytic" and "autocatalytic" routes). Whereas the overall rate of the directoxidation of U(IV) by N02 in a HN03 solution of 30 TBP is described by Eq. 16.
d[U(IV)l 1U(1V)11HN0211H2 0]2 (15)= k,1U(1V)11HN03P k3 ]2 0]2
dt [HN03 PHN03][H20]+P2[H2
d[U(1V)j 1UQV)11HN0211HN03][H201= k, � � (16)dt IHN03 ]2 +Pj[HN0311H2O1+P2[H2 0)2
If we compare some of the fatures of the U(IV - HN02 reaction obtained in the study of tedirect reaction with those found in te study of the same reaction but as part of teautocatalytic route in the U(IV - HN03 reaction 13], we see that they agree on tile orders ofreaction with respect to the reagents, U(IV) and HNO2. There is also qualitative agreement onthe effect of [HNO31 and [H,20] on the reaction rate but te actual values of the orders forthese species differ substantially, at least wider the conditions studied. inally, the values ofthe rate constants estimated in the direct reaction are lower than those found in theautocatalytic reaction tinder comparable conditions. These differences suggest a hange inpart of the reaction echanism. which we suggest is due to te reactive (TV) species in theslow stage changing from the 1" hydrolysis product 17) to the 2"d hydrolysis poduct (I )
UOH' + HN02 ---> U02+ + NO + 2W (17)
U(OH)2 2+ + HN02 --> U02 + NO H H20 (18)
It can be sown that the overall rate equations in ach study can be derived assuirling that theslow stage of te reaction proceeded via te I" or 2 d hydrolysis products i the direct adautocatalytic reactions respectively. So, as te general oase, it is sggested, that the TJ(IV -HN02 reaction in TBP all actually proceed via two parallel routes wich have te slowstages (I 7) or (I 8). The contribution each. route rnakes to te observed reaction rate dependson the specific conditions wider which the reaction occurs.
However, calculations sggest this only forms part of the expJanatiou, so we ave to c�onsiderthe influence of the oher reagents, UNO2, on te rate of the reaction. It call e shown that thevalues of the 2d order rate constants (k2) wic sould be idependent of [HN0210 atuallydecrease with increasing [HN021. The values of k2 at 0.1 M HN03 and,-0.4 H0 (T= 55
'Q were:
- 208 -

JAERI-Conf 2002-004
THN0210 0 0.002 0.005 0.015 0.02k2 min-') 7.1 3.5 3.29 1.17 0.975
So, we have the strange conclusion that the rate (the rate constant, k2) Of the U(IV - HN02reaction i a ffN01 solution of TBP mst be a maxitriurn when N02 is not present in theoriginal solution ad ininimal at a igh initial concentration f H`N02 (in our case at [NN02]0
= 002 M), Ftirther evidence is rovided by te fact that te formal orders of reaction withrespect to [HN031 as [HN0210 - approach those observed in the autocatalytic reaction,where [HN0210 = 0.
These observations lead to a conclusion that HN02 in TBP solutions ay exist in at least twoforms wich ave different reactivities for U(TV). The ore kinetically active form isproduced in-sit i the reaction solution when HN03 is reduced by U(IV). The less kineticallyactive form predominates in the TBP stock solution of HN02, which was used to study thedirect U(TV - HN02 reaction. It may be that these forms are the cis- and trans- isomers of theTBP-HN02 omplex 41 Idirect evidence for this may be the fact tat in both the cases(with and without adding HN02 to the initial solution) the activation energies have similarvalues. Hence, the observed difference between the reaction rates is due to the entropy factorAS*, i.e., related to the steric features of the reacting forms (see Table 1).
Table 1, Activation Energies And Entropies For The U(IV - HN02 Reaction In TBP
EA (Umol-') AS* at 298K (Jmol K-Direct reaction 112 ± 17 43Autocatalytic reaction 93 ± -6
4. U(IV - Tc(VII) INTERACTIONSThe interactions of Te with redox reagents such as U(TV) or N2H4 are well known to be bothimportan ad omplex within the'Purex process [1]. We have recently studied the reactions
I IN n - andof Te wth NH�Off' 3151, At oderate teiriperatures and 031 SlUtiO s of TcO4NH30H+ are essentially stable, as are NH30H_' stabdised U(IV) soJittions in HN03. However,when Tc(VIT) is aded to solutions containing TJ(lV)/ NH30H+ in N03, an unusual series ofreactions are observed, itially, there is a rapid oxidation of U(IV) followed by a slower zeroorder reaction hic ten speeds up towards the ed of te Oxidation Tis situation is verydifferent from the well known T(VII) catalysed oxidation of hydrazine. Te addition ofU(IV) to T - NJ714 810011 oly eliminates the inductio priod by rducing T(Vll) to alower oxidation state more rapidly tan N2T-14. After this the reaction mechanism is essentiallyunchanged.
Clearly, this system is very complex but we have derived a kinetic equation for the slowerzero order reaction tinder conditions n which NH 30H+ is a net scavenger of HN02 rather than
a net gnerator. It is thought that TIN02 i essentially unavailable at this point in the reaction
cycles, because it is scavenged by NH20H, and also that te U(IV + Tc(VIl) reaction is
rapid. The slow rate determining reactions are, therefore, considered to be the HN03
oxidations of U(IV) and Tc(IV) (Eq. 19-20). Kinetic analysis of the experimental data leads to
the derivation of a rate equation 10) where the rate constants of reactions 19) and 20) are,O�10 X0-3 il.05MOrl.05Min-1 ± 1 12.4MOI-2.4
respectively, k�) � 2, ± I ; k2o= 23 min-' at 35 'C.
The activation energies e E = 73 ± 3 E20 = 86 -t 2 Uniol-1. As the overall oxidation
reaction proceeds, the iitial U(IV) term in eqn. 21) decreases in importance, the Tc(IV)
209 -

JAERI-Conf 2002-004
oxidation reaction becomes solely rate determining and the reaction ends towards zero orderrelative to U(IV).
U4-1 + HN03 H20 U02 2-1- + HN02 2H+ (Eq, 19)
2TcO2- +3HNO3 + 3H20 --* 2TcO4'+ 3HN02 6H+ (Eq. 20)
-d[U(TV)]/dt = k[U(IV)J[HNO31 k20[Tc(IV)j 1�8 [HNO31 1.6 (Eq, 21)
Current work is in progress to try and understand the complex mechanisms of U(IV - Tc -NH3OH+ reactions in the absence and presence of N2114 3 particularly the verification of
intermediate Tc oxidation states,
5. PHOTOCATALYTIC GENERATION OF Uff) IONS 16]Using SnO2 as a colloidal semiconductor we have investigated the feasibility of reducingvarious metal ions in NO3 sing photocatalysis, In particular., we have studied te reduction
of U(VI) ions in both H)SO4 iadiation wavelength 312 nin) and -TNO3 (k = 350 rm)media using ethanol a hydrazine as hole scavengers. The reaction is tollowed
potentiometrically on a Au electrode and the E vs, t graphs obtained experimentally can beconverted to O2 2+1 vs. t plots using equations based on a inxed otential approach. Asteady'state potential is reached after 180 s, It as been shown t te potential in
H2SO4/CH3CH2O i governed by the same species as in HNOy'N)H- - ,(�. te process is thesame, although the kinetics are different. Te photopoteiihonjetric responses can betheoretically modelled, showing that the photopotential is controlled y a transientconcentration of UV), wch then disproportionates to U(IV ad U(VI) tus driving the
reaction to complete U(IV) formation. 1V/vis spectrophotorrietry, which all, be used tofollow the accumulation of the ultimate U((V) product, indicates that 100 ?/ 001 M t)(VI isphotocatalytically reduce(] to UV) after 30 minutes in 2S04 sing tnol as a holescavenger. In a 4-NO3/N2144 SYSteul, reduction is slower due to reduced light absorption at 3 0i-irn compared with 312 nin, So, te combination of potentiouretri ad spectrophotomaricresults allows the odelling of te ast U(VI) -- U(V) photocatalytic eterogeneous reduction
and the subsequent U(V) disproporboiiation. ur mathematical treati-nent e t Values ofthephotocatalytic valence ool rate couslauts, v(,,. o 1.7xi 0,3 d and L79x10-1 s" in
H28O4/CHXH-)OB ad HNO�/N21714 respectively, Tlie difference gain eing clue to thegreater light absorption at 312 Hil i the f-12801/MC1420H ystem, We aso (-stirnated te
hornogeneous UV) isproportIODabOu ate GOnStan t be 1300 linot-Y' in RNO_�/N)A,which compares approxii-nateiy to literature values [G.g, see 17-1. Tlie. fate of U(TV) generationis increased by the presence of 0 probably de to oxygen facilitating te reaction of the
appropriate ole scavenger, Photogenerated tJ(IV) ai fNO3/N-)H4 is stable for >70 our inair, It is also possible to rduce [YVI) photocatalytically in mixed 14NO-3/'T3 pases nsingthe TRP as a ole savenger were it has ee sown, tat he photoreduc(ion ocurs i te
aqueous pase oy nd that this is slow compared to roass transfer eween phases.
Photogerierated U(IV) is stable i F for >70 hours i ar. Farly idications are that it ispossible to photocataiyticafly reduce 1)'(VI i the preserice of other metal ions,
6. CONCLt-JStONSThe reactions of U(IV) in solutions of HNO I
I - and'FBP are important in the furex process adare also of intrinsic interest, Te rates of tese reactions are ueededtor inciuslon in to processmodels for the accurate coinputerised simulation of rocess flowsheots, We ave ecentlyinvestigated a series of IV) oxidation reactions i aqueous ad solvent pases. including
- 210 -

JAERI-Conf 2002-004
those with Np(VV-1) ions (both pases), HN03 and HN02 (in'FBP) and U(IV) oxidation inHN03 wheu Tc(VII) nd NH30H-' are ,simultaneously present, These reactions are generallyrather complex but interesting features includt the roles f water and hydrolysed U(IV) ionsin te eaction niechanisms., particularly TBP phases. We have also studied a novel methodof ciently generating I-IN
tf(TV) by the photoelectrochemical reduction of U(VI) in 03
using a colloidal semiconductor, This rocess can be modelled theoretically. Further work isaimed at investigating the kinetics of T ad Pu ion catalyses �JN03 U(JIV) oxidation in TBPand iriore etailed studies of reaction echanisms. Further studies of (controlling metal ionoxidation states potocataiytically are ongoing, icluding a continuous photoreactor design.
7. ACKNOWLFDGEMENTSWe would like to tank our colleagues at VNTINM (K.N. Dvoeglazov, O.A. Savilova, G.I.Zhuravieva, E.A. Mezhov, G.V. Koltunov), UCLAN (G. LeGurun) and BNFL (C.J. Broan,I. S. Denniss) for their contributions to the work presented here.
8. REFERENCES[1] W. W. Shulz L L. Burger, J. D. Navratil and K. P. Bender, (ed), "Science and
technology f tributyl phosphate, Volume 111. Applications of tributyl phosphate innuclear fuel reprocessing", CRC Press Inc., Florida 1990).
[2] V. S. Koltunov, The Kinetics of the actinide reactions", Atornizdat, Moscow (I 974).[3] R. J. Taylor ad 1. May, Sep. Sci. Tech., 36, 1225-1240 2001).[4] R. J. Taylor. 1. S. Dermiss and A. L. Wallwork, Nuclear Eergy. 36, 39-46 1997).[5] J. C. Sllivan, A. J. Zielen and J. C. Hindman, J. Amer. Chem. Soc., 82, 5288 1960).[6] V. S. Koltunov, R. J. Taylor, V. 1. Marchenko, G. I. Zhuravleva. E. A. Mezhov, G. V.
Koltunov ad K. N. Dvoeglazov, Radiochini. Acta, Under Review.[7] L. M. Frolova, G. A, Timofeev and A. G. Rykov, Radioklitmiya, 15, 867-868 1973).[8] V. S. Koltunov, R. J. Taylor, V. 1. Marchenko, E. A. Mezhov, G. I. Zhuravleva, K. N.
Dvoeglazov aid 0. A, Savilova, Proc. Actinides 2001, forthcoming.[9] N. J. Stoyer, D. C. Hoffmann and R. J. Silva, Radiochim, Acta, 88, 279 2000).[10] N. K. Shastri, A. E. Amis and J. 0. Wear, J. Inorg. Nucl. Chem., 27, 2413 1965).[11] N. B. Bokfiln, V. A. Ermakov and A. G. ykov, Radiokbirnlya. 355 1974).[12] 1. V. Shilin and T. A. Rumyantseva, Radiokhimiya, 20, 536 1978).[13] V. S. Koltunov, R. J. Taylor, V. 1. Marchenko, K. N. Dvoeglazov, 0. A. Savilova. and I.
May, Radiochim. Acta, 86,41-49 1999).[14] J. M. Fletcher, . Scargill and J. Woodhead, J. Chem. Soc., 1705-1707 1961).[15] R. J. Taylor. 1. S. Denniss, C. J. Broan, V. S. Koltunov, V. 1. Marchenko, K. N.
Dvoeglazov, 0, A, Savilova and G. 1. Zhuravleva, Proc. Actinides 2001, forthcoming.[16] C. Boxall, X. Xhao and R. J. Taylor, In Preparation.[17] H. Kaneki and H. Fukutorni, Bull. Res. Lab. for Nucl. Reactors, 5, 27-3 9 1980).
211 -

This is a blank page.

JP0250302JAERI-Conf 2002-004
STUDY ON U CRYSTALLIZATION FOR ADVANCED REPROCESSING
Kazunori NOMURA, Atsuhiro SHIBATA and Atsushi AOSHIMA
Tokai Works, Japan Nuclear Cycle Development Institute,
Tokai-Mura, lbaraki, 319-1194 JAPAN
Fax: 81-29-287-2419, e-mail: kaz�tokaijnc.gojp
Key words: crystallization, advanced reprocessing, plutonium behavior
1. INTRODUCTION
JNC (Japan nuclear cycle development institute) has proposed the advanced fast reactor fuel
cycle system as a part of the Feasibility Study (FS) . The advanced cycle should have a
basic concept constituting simple and compact processes under a nonproliferation
accountability and minimum burden to environment.
In the PUREX process, uranium and plutonium are extracted into the organic phase, tri-n-
butyl phosphate in dodecane, in the first extraction cycle. Then plutonium is stripped into
the aqueous phase including reducing agent, while uranium remain in the organic phase.
After the plutonium stripping, uranium is stripped into the dilute nitric acid.
Plutonium product is mixed with uranium in order to fabricate MOX fuel. If
uranium/plutonium ratio in active feed solution to the first extraction cycle is adjusted as
convenient to MOX fabrication, that is rather high plutonium ratio such as 50 - Pu, suitable
mixed product of uranium and plutonium is obtained by collective stripping of both uranium
and plutonium. It causes uranium/plutonium partitioning process to be deleted and PUREX
process to be shortened.
Generally, dissolver solution has higher ratio of uranium to plutonium than that of required
product described above. Thus excess amount of uranium needs to be removed before
simplified PUREX process. NC has studied crystallization of uranium as the method for
this partial uranium separation.
As uranium solubility in nitric acid solution decreases with decreasing of its temperature, a
part of uranium is separated from the solution as uranyl nitrate hexahydrate (U`NH by
lowering temperature of the solution. Quantity of UNH educed by crystallization can be
controlled according to the solubility at cooled temperature. When crystallization method is
applied to dissolver solution, uranium is precipitated with priority to other elements because
concentration of uranium in dissolver solution is higher enough than that of other elements
such as plutonium, fission products and so on. Ai-id oly uranium concentration reaches own
solubility at the temperature of initial cooling. It causes only uranium and not other
- 213 -

JAERI-Conf 2002-004
elements to be separated from te dissolver solution.
Partial separation of uranium from dissolver solution produces less liquid wastes, because the
separation is done only by the control of temperature, that is to say, no additional chemical
reagent is required for the crystallization, Furthermore the uantity of components to be
processed by solvent extraction also decreases by applying the crystallization.
In this paper experimental results on uranium crystallization are described. Behavior of
plutonium under crystallization condition is important in order to prevent plutonium from
significantly accompanying uranium and that will be also discussed in this paper.
2. Crystallization of uranium
In dissolver solution of spent fuel from fast reactor (FR) a portion of insoluble residue is
existed. Behavior of insoluble residue was confirmed by batch experiment with simulation
powder in uranium-nitric acid solution under crystallization condition.
2.1 Experimental
Reaction vessel for crystallization shown in Figure was made by glass and had a cooling
jacket. 60 - ethylene glycol that was
controlled its temperature was used as
coolant and flowed through the cooling Liouid Temo. Stirrer
jacket. Stirrer and thermocouple were ISolution
installed into the vessel, Effective volume
of the vessel was 500 mL.
Uranium solution of 500 g-U/L in 44
mol/L nitric acid was prepared ad put into A f --- Ithe reaction vessel. Uranium saturated
Coolanttemperature of this solution is 32 'C� Temp,
Simulated insoluble residue was added into
the uranium solution while stirring, then
the solution was cooled from 40 'C to 0Jacket'C at about I 'C/min, 'Ibermostatic
The mixture was filtered to recover UNH BathCoolant
educed and simulated insoluble residue andliquid phase was taken as mother solution. Figure I Outline of experimental apparatus
100 ml of mol/L nitric acid solution was poured on the UNH and sulated insoluble
residue on the filter in order to wash a part of mother solution stuck on their surface. This
washing was performed 3 times.
Concentrations of uranium and nitric acid in mother solution mid washing solution and weight
of simulated insoluble residue in mother solution, washing solution and solid obtained on the
filter were measured.
- 214 -

JAERI-Cod 2002-004
2.2 Result
Figure 2 sbows record of temperature of
the solution during uranium crystalh- ion)
zation test, I minutes after of starting cooof te test, exothermic henomenon was U
observed and it occurred at around )2
'C� Since the ternperature that this
uranimn solution is saturated is 32 C, r R
this phenomenon is due to the reaction
beat from UNH crystallization, Tat is
to say, the presence of insoluble residue
gave no influence in the UNH
crystallizing temperature.
Mass balance of insoluble residue in
this experiment is tabled in Table Even after 3 times washing of the UNH time (min.)
crystal product by the nitric acid solution. Figure 2 Temperature of the solution
about 20% of the insoluble residue still
remained with the NII crystal. Although the particle of the insoluble residue did not
behave as the nucleus of the UNH crystal, it inight stick on the UNH crystal even during the
washing of the crystallization product.
Figure 3 shows the particle sze distribution of UNH crystal obtained in this experiment.
Left bar indicates particle size of crystal otained from crystallization test without insoluble
residue and right bar is from the test with irlsoluble residues
50Table I Mass balance of
insoluble residue (%) 40 -
Initial 100 30 NO
Mother solution 29 20 -
Washing 3 times) 53 10
Crystal (after washing) 1 8 0 LEE - 106 300 500 710 1000
Particle size gin)
Figure 3 Particle size distribution

JAERI-Conf 2002-004
Both particle size distribution were similar, namely presence of insoluble residue was not
influenced in particle size of UN14 crystal,
As a result, the presence of insoluble residue in the initial solution did not influence the
uranium crystallization behavior, but the clarification process is required to place before the
crystallization process because of the difficulty of separating the residual particle from the
UNH crystal particle.
3. Plutonium behavior under UNH crystallization condition
It is important to check the behavior of plutonium under the uranium crystallization operating
condition because it can have different valence in the nitric acid solution and belong to
actinide elements same as uranium.
3.1 Experimental
Two kinds of solutions of 20g/L - plutonium in 6 mol/L - nitric acid without uranium was
prepared. In the first solution, plutonium was adjusted at tetravalent state, and in the other,
plutonium was at hexavalent state. These valences were confirmed to adjust by the UV/VIS
spectrometer. Each solution was cooled slowly until around -60 'C.
3.2 Result
No crystallization of plutonium was observed under any temperature until about 40 'C and
finally the solution was solidified. This freezing temperature almost coincided with the
freezing point of 6 mol/L - nitric acid solution. and H20 and HNO3-31120 are expected to
crystallize. In both case, the freezing point of the solution was far lower than the operation
temperature of uranium crystallization process. Valences of solutions both before ooling
and after experiment were measured and there were no change of valence.
4. Conclusion
UNH crystallization batch experiment was performed with UNH solution with simulation
insoluble residue. Although the presence of insoluble residue in the initial solution did not
influence the uranium crystallization behavior, the clarification process was required to place
before the crystallization process because of the difficulty of separating the residual particle
from the uranium crystal particle.
Beaker scale plutonium tests were performed to confirm behavior of plutonium nitrate under
temperature of UNH crystallization operation condition. Plutonium nitrate crystallization
was not observed in both case of tetravalent and hexavalent. This result seems to mean that
uranium is separated from the dissolver solution and no adjustment of valence of plutonium is
needed to hold it In the mother solution. However, chemical smilarity often brings different
result from one obtained in he simple system such as described above and the behavio of
hexavalent plutonium in the presence of uranium is expected to be important,
REFERENCE
[I] S. NOMURA, A. AOSHIMA, T. KOYAMA and M. MYOCHIN, GLOBAL 2001, 1, 042
(2001)
- 216 -

JP0250303JAERI-Conf 2002-004
DEVELOPMENT OF NEW REPROCESSING TCHNOLOGY,FLUOREX FOR LWR FUEL CYCLE
-Hybrid Process of Fluoride Volatility and Solvent Extraction-
0. Amano F. KawamurW, T. Fukasawa2 and A. Sasahira3
'Nuclear Power R&D enter, Tokyo Electric Power Company4-1 Egasaki, Tsurumi, Yokohama, 230-85 1 0 Japan
Nuclear Systems Divisioi), Hitachi, Ltd,3-1-1 Saiwai, Hitachi, Tharaki, 317-8511 Japan
Fax:81-294-23-6626, e-rnail:fiijiiio__kawamura�pis.hitachi.cojp3power and Industrial Systems R&D Laboratory, Hitachi, Ltd.
7-2-1 Omika, Hitachi, Ibaraki, 319-1221 Japan
A new reprocessing technology, FLUOREX was proposed for thermal reactors cycle and ftiture thermal and
fast reactors coexistence cycle. The proposed system is a hybrid system that combines fluoride volatility and
solvent extraction methods where the major U in spent fuel is separated efficiently by fluoride volatility method
and MOX is recovered by well-established conventional solvent extraction method. The system can recover
pure U and MOX with e high decontamination factor and can drastically reduce the cost and waste generation
compared with the conventional PUREX method. When FLUOREX reprocessing system is adopted in LVVR
fuel cycle, the conversion facility for re-enrichment can be deleted, which leads a large reduction in fuel cycle
cost. One cycle scenario is that it will take long time to shift from present LVVR to future FBR systems. In this
shift period, interim storage of spent ftiels is one option, which needs large storage space and interrupts the
continuous Japanese recycle storategy, FLUOREX reprocessing system proposed here is suitable for this
situation. Several features of the proposed system are discussed in the present paper.
Key words: spentfuel reprocessing, fluoride volatility, hybrid, storage, solvent extraction
1. INTRODUCTIONOne of the most important factors to be considered for fture nuclear fuel cycle technology
is the flexibility of the technology to fit various cycle scenarios. Development of flexiblenuclear fuel cycle system and transparent management of plutonium are quite important forthe sustainability of nuclear power. In the present nuclear idustry, it seems to take so longto replace all light water reactors WRs) with fast breeder reactors (FBRs) which canenhance much the utilization efficiency of uranium resource. Thus it is important toconsider in the near ftiture reasonable and transparent VVR fuel cycle system which canrecycle MOX (mixture of plutonium and uranium), hold no excess plutonium, utilize muchthe existing technologies.
Requirements for te future nuclear fuel cycle system may become different depending onthe phase from WR era to FBR recycle age as shown in Table I In the first phase nuclear
power generation is dominantly made by LYv'Rs and te scond is the co-utilization period ofboth WRs and FBRs, the third in which the independent FBR ftrel cycle will be established.In the first pase, the role of fuel reprocessing is mainly in WR fuel cycle in which Pu is
217 -

JAERI-Conf 2002-004
reprocessed to produce MOX fuel for Pu-thermal utilization and is separated for
re-enrichment or storage. [n this pase high decontamination factor (0F) may be required
for both U and Pir products. I the second phase, the fuel production for the initial fuel
loading to FBRs will be added to the role of ftiel reprocessing and high 1F may not be need
for MOX any more. However, the DF of U should be still high (we i this period since
excess U will be produced over the utilization i MOX ftiel production, Line to the difference
in the Pu contents of the fijels for WRs and FBRs. From late second phase to third phase,
fuel reprocessing will be performed to recycle FBR fuels. Te low DF fuels may be
adequately used in FBRs ad thus simplified fuel reprocessing system will be adopted in this
era.
Thus in the near future LWR fuel cycle system, U should be reprocessed with high DF and
that of MOX should be flexible from low to high. As for the fuel production, it is desirable
until the second phase to utilize the infrastructure of conventional fuel pellet production,
although the more simplified vibratory packing method may be developed for less
decontaminated fuel production in the third phase. Besides DF of the fuel products, te
future nuclear fuel cycle system will need safety, reduction of the cycle cost, efficient
utilization of resources, inimization of environmental burden, nonproliferation and
technological maturity. In the present study, new reprocessing technology, FLUOREX was
proposed to meet these future requirements laying emphasis on MOX recycling In LWRs.
Table I Requirements for the future nuclear fuel cycle system
Period Transition er FBR Pe;�o- �to LAIR) (LWR to FBR) (FBR to FBR)
Feature o ts of U > 95% Driver: U: about 70%Spent Fu > -1% Same as left PW about 30%
1 Blanket- U > about 95%
Usage of Recovered U: Re-enrichnient U: Same as Fitei pellet orU and MOX or storage MOX: Fuel pellet or Vibro-packing
MOM Fuel pellet Vibro-packing MOX: Sairre as left
U: High AT High/Low DF*Required DF for N40X: High DF tj� Sajue as left MOX� Low OF
Reprocessing (DF > - lo) MOX: Sarne as left
In the case that high DF U is used for blanket fuel (over aout 50% of FBR loaded fuels) blan, ketprocess can be neglected in the FBR fuel production.
2. SCHEME OF THE FLUOREX PROCESS
Spent fuel from WRs contains about 94% ranium, 1% plutonium and 5% fission
products. The key point of the cycle system is how to efficiently separate these oements
into three parts: N40X for fuel fabrication, most of uanium for re-enrichment ad fission
products for wastes. The survey showed the Ingh possibility of fluoirde -olatility process for
the easy separation of spent ftiel components ito tree parts d its difficulty to get pure
MOX for conventional friel fabrication facility. Tus, te athors proposed new fuel
reprocessing technology, FWOREX process, which is the combination offluorlde volatility
- 218 -

JAERI-Conf 2002-004
and solvent extraction metbods, and started further technological investigation. Fluoridevolatility process has been applied to remove most of uraniu fm spirit nuclear fuels beforepurification of the mixture of plutonium and residual uraniurn from fission products bysolvent extraction,
Several countries had stopped developing fluoride volatility reprocessing method in the19Ws due to difficulty in Isolating pure plutonium with hgh recovery ratio-'). Thisdifficulty an be solved by the process mprovement to recover dirty plutonium or to adoptPUREX ethod for plutonium purification, T proposed ybrid reprocessing processchose the iatter to avoid the dfficulty experienced in the past.
The FLUORhX reprocessing consists of seven ain processes as shown in Fig. 1. Spentfuel from termal reactors will be disassernbled and fuel pins are sheared into sort pieces.The ftiel is plverized nd separated front cladding by dry oxidation and reduction methodsuch as AIROX process. Fluorination of most uranium (ab out 90% in spent fuel) to volatileUF6 can be asily achieved by luoride volatility ethod with compact facility. Then the
(107 0Volatile UF Wl be PUnified to igh DF 109) by passing through absorbents such asNaF ad by rectification, Highly purified UF6 can be transferred directly to re-enrichment
facility without conversion WR recycle again), or to simple storage facility with or without
conversion to store certain period for future FBRs, About I% residues icluding plutonium,
uranium and fission products (FP) will be de-firiorinated and then dissolved into nitric acid
solution. This solution can be treated in well-established solvent extractiort method (same as
PUREX), and this process facility size will be reduced to about 1/10 of the conventional
PUREX facility with same treatment capacity of spent fuel. Pure Pu and U mixture product
(Pu l%/U 419% in spent fuel) can be obtained by solvent extraction method without
separating Pri and LT, which is suitable for conventional 40X fuel fabrication. Another
optional process for treating luorination residues (Pu 4 FP) is to store them in a compact
facility with adequate cooling system until the FBR era comes reality. This storage facility
needs to store only Pu + FP, the volume of which is about 120 of spent fuel.
Spent fuel: [U(94%),Pu(l %), FP(5%)]
Xe(l%) (0.03%) Np(0.07%)Tc(0.l%)U(75-90%), FP(I%) +
ea Dec a Fluorina U(75-90%)(To Storage
- - - - - - - - - - - - - - - - - -- - - - - -- or Enrichment)Pii(l %), FP(30/)
U -19%), FP(3%) (4%) (To Disposal)
Pu+FP
Storage on Dissolution PUM 0 Pu(I %)/U(4-19%)---------- (To Fuel Fabrication)
-----------------Optional process Am/Cm(O.05%)----------------
Fig. I Process flow of FLUOREX reprocessing for LWR cycle
- 219 -

JAERI-Conf 2002-004
The FLUOREX method has aother feature in nuclear fuel cycle. Uranium enrichment
industry produces large amount of depleted uranium (about 02% U-235) in a for of
hexafluoride, which would need its transformation into more stable form such as oxide for its
utilization and disposal, and produce plenty of fluorine. The FLUOREX process can
effectively utilize and recycle fluorine in its nuclear fuel cycle.
Thus, the FLUOREX reprocessing has many merits compared with te present PUREX
reprocessing and can meet the thermal reactor fuel cycle demands in near future and also has
flexibility to be applied not only to thermal reactors cycle but also to future thermal and fast
reactors coexistence cycle and FBR cycle.
3. FEATURES OF THE FLUOREX PROCESS
This system can drastically reduce the cost and waste generation environmental brden),
have high technical maturity, similar safety and energy sustainability (resource utilization
efficiency), and higher proliferation resistance compared with conventional fuel cycle system.
Preliminary estimation results are shown below on the features of the proposed FLUOREX
system.
1) Technological Maturity and Collaboration
Technological investigation was conducted in this work and clarified that most
techniques have already been developed industrially in the past and current nuclear fuel
cycle worldwide, and only a few subjects remain to be solved for actual use. Solvent
extraction has much experience in reprocessing industry of spent fuel including
plutonium. Fluoride volatility has also much industrial experience in oversion
between uranium oxide and fluoride and in uranium enrichment, and pilot scale
experience in, uranium purification, Remote handling techDO10gle sch as robotics
developed in Japan and other countries could be applied to te FLUOREX system for its
much safer and easier operation.
The technologies developed in the past in the world can accelerate the development of
FLUOREX reprocessing system, which indicates the importance of worldwide
collaboration for the industrialization of the system and for the sustainable tilization of
nuclear energy. The worldwide infortuation exchange and collaboration is also
indispensable to emerge from the present global nuclear shrinkage situation.
2) Economics
The FLUOREX reprocessing has a compact fluorination and U purification equipments,
and less than 10% materials in spent fuel (fluoriDation, residues) are treated solvent
extraction process. This leads the large reduction in reprocessing plant -/olume. The
second economical feature of the FLUORX system is the cost reduction in the low-level
waste treatment. Since the amount'of materials to be treated in solvent extraction is
reduced to less than 10% of the conventional system, the arriounts of reagents and
solution to be used are reduced accordingly and thus the process scale and the treatment
cost in the low-level waste treatment are reduced by one digit. Taking these features
into account, the preliminary investigation revealed that the reprocessing plant volume
can be reduced to about 60% that of the conventional system,
The third feature is the negligibility of conversion facility in the fuel cycle. Since the
220 -

JAERI-Conf 2002-004
chemical form of recovered U in FLUOREX system is U176 which is same as that in
re-enrichment process, the conversion facility for re-enrichment can be deleted, while the
conventional facilities of enrichment, re-conversion, fuel fabrication, thermal reactors
and spent fel storage can be utilized without any change.
3) Safety
Fluorination and U purification processes treat gaseous uranium, but its amount is only
2kg-U/d for 100t/yr capacity FLUOREX plant with reduced pressure equipments and
cells. Volatile fission products are fixed ]if suitable adsorbents in U purification process
and other fission products are treated in solid forms in te fluorination process. In the
original loride volatility reprocessing, Pu is fluorinated to the volatile PuF6 after U
fluorination'-'), but the FLUOREX system dose not include Pu fluorination process and
thus no gaseous Pu exists in the whole system. This eans FLUOREX system has
much higher safety than the original fluoride volatility system.
In a solvent extraction processes, treated amount is less than 1/10 of the same capacity
conventional aqueous plant (PUREX). Then the sufficient safety with ALARA can be
predicted similar to the conventional reprocessing facilities,
4 Efficient Utilization of ResourcesIn FLUOREX system, high decontamination factor of recovered U from 107 to 109 is
attainable by chemical sorption and rectification in U purification process. The same
level of DF (I 07 i expected for MOX as the conventional solvent extraction (PUREX)
system. These high DF for both U and MOX will ehance the nuclear energy'tzation, efficiency, Those fuels would also be utilized advanced reactors such as
ut I In
reduced-moderation water reactors and fast breeder reactors, which can enhance more
the sustainability of nuclear energy.
5) Minimization of Environmental Burden
The purification processes generate small amount of adsorbents as radioactive waste
because of a few volatile fission products accompanied with -uranium. The solvent
extraction processes generates less than 1/10 of waste compared with conventional
facilities of same capacity. Then the total amount of the waste generated from
FLUOREX reprocessing is about 1/10 of the conventional ones. In the FLUOREX
cycle, conversion facility for recovered uranium can be deleted and waste from the
facility is eliminated.
6) Proliferation Resistarice
Plutonium always exists with uranium even in a purified form in FLUOREX solvent
extraction processes, so the proliferation resistance is considered to be higher than a
conventional PUREX system where plutonium alone exists in its purification process.
If plutonium is stored with fission products for future, the resistance would be much
higher.
4. KEY TECHNOLOGIES
The FLUOREX system is a hybrid system that CMbiDOS fluoride volatility and solvent
extraction methods, The adopted processes of each method themselves are well developed,
but there are some subjects to be confirmed technologically in the interface processes of
221 -

JAM-Conf 2002-004
adopted methods. Those subjects include:(1) Selective volatilization of uranium fom pulverized actual spenttuel.
Optimum fluorination conditioris such as temperature ad F2 feed will be clarified based onthe results of previous researches on the fluorination mecharnSITI Of PIL
(2) Conversion of non-volatile fluoride residues to oxides soluble in itric acid.As for the uranium fluoride, oxide conversion has much experience in the conventionalconversion facilities. Very little has been experienced on the conversion of plutoniumfluorides, but it is expected from a thermodynamic evaluation that plutonium fluoridesconversion will proceed more easily than uranium fluorides. Experiments will beperformed using spent fiiels to clarify this issue.
(3) Dissolution of the oxides.Converted oxides are expected to have sufficient solubility and this will be confirmed withthe experiments using spent fuels in conjunction with the those stated above.
Pulverization of actual spent fuel is another subject to be confirmed.
5. INTERIM STRAGE OPTION
One cycle scenario is that it will take long time to shift from present LViR to future BR
systems. In this shift period, interim storage of spent faels is oe option, which eeds large
storage space and interrupts the continuous Japanese recycle storategy, The. FLUOREX
process proposed here is sitable for this situation.
The above-mentioned, UOREX consists of two processes. First process rernoves the
cladding materials of spent fuel, separates most (over 90%) urarriurn by its rapid fluorination
(volatilization), and purifies the volatilized uranium to get pure U6. On the other hand,
solid fluorination residues, which contains small amount of uranium, P. tutonium and fission
products (less than I % of spent fuel), can be stored under closed noble gas condition with
high proliferation resistance of plutonium. Volume of the residues is about 120 of the spent
fuel assembly ad the sorage space, which is determined by Treat removal, radiation shielding
and cticality control ainly beat removal), will be 1/5 compared wth the direct storage of
spent fuel as shown in Fig.
During water can not enter the canister, solid fluoride residues maintains stable condition.
However, when water invades in te canister, a part of residue (such as U, Pu and noble
matal) reacts to water and generating HF a i worried about the corrosion of the canister.
When a large aount of water invades, a part of residue (such as alkali meta ad noble
matal) dissolves. erefore, for the long terin storage of the residues, lorides might be
converted to ore stable oxides.
According to the preliminary evaluation including uranium fluorination separation, relative
storage costs of spent fuel, fluorination residires, and fluorination esidues after oxides
conversion ae estimated to be 1 075, and 0.8, respectively. This evaluation considers only
the storage costs and does not consider the value of pure UF6 Which contains about %
U-235.
- 222 -

JAERI-Conf 2002-004
In the era of FBR,, stored residues, mixture of uranium, plutonium and fission products,
should be teated i te second solvent extraction) process of FLUOREX to get L\40X fuels
for FBR. The above two step concept I)as the following nerits.
- -It can maintalnuramum resource security.
-It can reduce storage volume to about 1/5 with same proliferation resistance as spent
fuel,
- It can respond rapidly in case of abrupt FBR realization.
-It is econornical for the reprocessing of residues.
spent l'uel Direct Stucage Fpace Cost
Compaction by
FLUOREX 0.2 0.75
Fluoride Ash
Oxide Ash1/20 0.2 0.8
UF, + PuF + FPF. Conversion4
(Fluoride- Oxide)
Fig.2 Compared with the direct storage of spent fuel
6. CONCLUSION
New reprocessing technology, FLUOREX was proposed to meet the requirements for the
near future LWR ftiel cycle system. The FLUOREX system can recover pure U and MOX
with the high decontamination factor and can drastically reduce the cost and waste generation.
The system also as high technical maturity, similar safety and energy sustainability and
higher proliferation esistance compared with conventional ftiel cycle system.
Most elemental technologies of FLUOREX method were already established worldwide
and only a few sb' ained for industrialization. Solvent extraction method is a part
of industrialized tJR-FX process and fluoride volatility method is also industrialized as UF6
conversion ad reconversion processes.
Contintious development of FLUOREX can inherit the teebiiologies and keep the scientists.
223 -

JAERI-Conf 2002-004
AcknowledgmentThis work was financed by The Institute of Applied Energy (IAE). The authors gratefully
acknowledge the IAE's permission to publish this work.
REFERENCES[1] M. Kamoshida, F. Kawamura, A. Sasahira, T. Fukasawa, T. Sawa and J. Yamashita,"A New Concept for The Nuclear Fuel Recycle System: Application of The Fuoride VolatilityReprocessing", Proceedings of 3rd International Symposium on Global Environment andNuclear Energy System, Tokyo Institute of Technology, December 14-17, Japan 1999).[21 T. Fukasawa, T. Sawa, J. Yamashita, M. Karnoshida, A. Sasahira and F. Kawamura,"Hybrid Recycle System for The Recovery of Dirty Plutonium and Pure Uranium",Proceedings of 8th International Conference on Nuclear Engineering, ICONE-8627, April 26,Baltimore, MD USA (2000)�[3] M. Takahashi, T. Fukasawa, T. Sawa, J. Yamashita, M. Kamoshida, A. Sasahira and F.Kawamura, "Improved Fluoride Volatility Reprocessing for MOX Fuel Cycle", Proceedingsof International Conference ATALANTE 2000, Scientific research on the back-end of the fuelcycle for the 2 " century, p3.13, October 24-26, Avignon, France 2000).
224 -

JP0250304JAERI-Conf 2002-004
AN ADVANCED AQUEOUS PROCESS FOR NUCLEAR FUELREPROCESSING
Y-Z. WFr� T. ARAI', H. HSHr, M. KUMAGAI% A, BRUGGEMAN", M. GYSEMANSb and T. SAWA`
Institute of Research and Innovation (IRI), 1201 Takada, Kashiwa, 277-0861 Japan, yzwei �iri.orjp
bBelgian Nuclear Research Center (SCK CEN) B-2400 Mol, Belgium
cHitachi, Ltd., 72-1, Ornika, Hitachi, 319-1221 Japan
AbstractTo develop an advanced aqueous reprocessing process using a inimal organic solvent and compact equipment to
separate U, Pu and long-lived inor actinides from spent nuclear fuels, we have developed a new type of aion
exchanger (AR-01) and Several ovel extraction resins containing a chelating ligand sch as CMPO, Cyanex-301 and
R-BTP AbotseparationexperimentforaspentBWR-ftielsoliitionwasearriedotitbyaiiionexchangecolumnpacked
with A-01. To nhance theseparation factor between U and FPs, electrolytic Iedt)COOD Of UO, t LT" was studied
iisingatlowtyt)eelecti-olysisceilwithearbuD-tiberelecLiode. SepatatioiibehaviorofAni(ll�I)f-roiiisimulatedBLWby
CMPO and R-BTP irnpregnated resins were investigated. On the basis of the xperimental results, an advanced
aqueous process which consists of anion exchange as main separation method, electrolytic -reduction for reducing U(VI)
to U(IV) and extraction chromatography for MA partitioning has been designed and evaluated preliminarily.
Keywords: reprocessing, anion exchange, electroreduction, extraction chromatography, minor actinides, process design
1 INTRODUCTIONAlthough the Purex process has been developed and applied to commercial reprocessing plants forabout fifty years, there are also some significant unsolved disadvantages such as the generation of agreat amount of waste and the uization of large scale extraction equipment. In nitric acidsolution, U and Pu exhibit distinct adsorption on an anion exchanger as they form anionicnitrato-complexes wile many fission product (FP) and minor actinide (MA) elements mostly existas cations and show no of very weak adsorption')-". This indicates that U and Pu could beseparated principally from FP and MA (Am, Cm, etc.) in a nitric acid solution of spent nuclear fuels
by anion exchange technology. Compared to the Purex process, an ion exchange process shouldhave the following advantages: (1 a minirnal organic solvent ulization, 2) compact equipment,and 3) simultaneous separation of multi-components.In recent years, we have been studying an advanced aqueous reprocessing process which consistsof anion exchange as ain separation method, electrolytic reduction for reducing U(Vl) to U(IV)and extraction chromatography for MA partitioning. We have developed a new type of anionexchanger, AR-0 2)3) and several novel extraction-resins containing a chelating ligand such asCMPO, Cyanex, 301 or R-BTp4)5) . These resins are imobilized in porous silica particles with adiameter of 50 �trn. Compared to conventional polymeric matrix resins, these new type of resinshave rapid adsorption-elution kinetics, excellent stability in nitric acid media and significantly lowpressure drop in a packed column.This article desedbes the configuration and preliminary evaluation of the advanced aqueousreprocessingprocoss. SeparationexperimentresultsforanitticacidsolutionofaspentLWR-fueIby AR-0 I packed co] unm are demonstrated. Furthermore, recent studies on electrolytic reduction
- 225 -

JAERI-Conf 2002-004
of U(VI) to JV), separation of IJ(fV) from Ps and partitioning of' N�4A by ovel extraction resins
are also reported.
2 OUTLINE OF THE ADVANCED AQUFOUS PROCESS
Schematic flow sheet of the proposed aqueous reprocessing system is shown in Fig. . This
system consists of two anion exchange separation processes, one electrolytic reduction process and
two extraction chromatography processes. In the main separation column packed with AR-01
anion exchanger, the elements contained in spent ftiel solution are eparated to the following five
groups, i.e. (1) FP-LnQantl-rarndes)-MA, 2) U-Np-FP, 3) Pu-Np, 4) Pd ad (5) c. depending on
their different adsorption-elution behavior. The purpose of the electrolytic reduction process is to
reduce UVI), Np(VVI ad u(M) to U(IV), Np(IV) and Ru(B), respectively, Subsequently, the
reduced solution is fed to the U-purification column packed with AR-01, where the tl(IV is
isolated from the remained P and Np(TV) due to the great difference i their adsorbability on
AR-01. In order to isolate te trivalent MA, the, effluent (1) frorn the main separation column is
supplied to the fst extraction chromatographic colunin packed with CMPO (or TGGA)
impregnated resin, where, the elements can be separated to three groups, i.e. P, Ln-MA ad 7-r-Mo.
7he effluent containing 1,ri-MA from CMPO impregnated resin olumn is then applied to the
second extraction chromatographic column packed with R-BTP (or Cyanex-301) inipregnated resin
to isolate MA from Ln.
3. A HOT EXPERIMENT OF THE MAIN SEPARNfION PROCESS
To demonstrate separation behavior of the elements in the main separation process, a hot
experiment using a Sellt filel solution was carried out by the aion exchange column packed with AR-01.
The sample solution was prepared by dissolving a spent fuel discharged rom a commercial WR
with burnup of 55,000 MWd/tHM in nitric acid solution. After filtration te resulting solution
was adjusted to approximately 07 M (I =1 kn -101/1,13) U and 6 TO HN03, A small aitrount of
NaNO2 (to 0.05 N) was aded to the solution to hold te Pu in tetravalent state (Pu(1V))')- The
analysis results of ain element,.; and uclides in die sample solution are illustrated i Table
The Pyrex-glass olunin (020rom X hl,000rnni pcked with the AR-01 was istalled in, a hot celland the temperature in the cell was aintained at 296 K uring the oxperimew. About 40 CM of
the sample solution was fed to te olumn y a metering pump at a constant ie flow rate of 38
m/h. Then eluent ad washing solutions were supplied to te colunin at the sarne t1ow rate,3successively. The ffluent rom the column was collected by aito-fractional collector In 1 ell)
aliquot. The oncentrations of eement o nuGlide i ach raction were ateasured y 1CP-mass
spectrometry, x- or -�-spectrornetry.
Figure 2 shows the ros(ilts of the ot separation �,Xperlrnent, A can be seen, most l? elements
such as Cs, Sr, Mo, Ru, Rh and te trivalent MA and Ln showed no or slight asorption, Theseelements flowed ot e colunin with the sample solutio ad the 6N/1 HNG� washing solution.
AD the U was adsorbed the aion exchanger (] then elute(I off y 6M 1O3 and I 1 N03
solutions. 2\4ost of the above FP a A �-,Jernents were satisfactorily separated o U.
However a portion of the F pticularly Ru, Zr a( N (weakly adsorptive FPS) were adsorbed
and mixed with the U eluate raction. Asi-nall portion of Ru finally ppeared i thefina tuate
(0.1Mand9N1HN03S0lUti011S). uwascompletelyadsorbecibyttieatiiotiexcliaiigei-ajiciitwas
- 226 -

JAERI-Conf 2002-004
eluted ot effectively by ising I HCOOF as the cluent, showing a sharp peak. Successful
separation of Pu tom U a Ps was ahieved. Np sowe a omplicated elution behavior
probably de to its different oxidation states. Np(`V) and Np(VI) were mostly ixed with the
fractions while'Np(W) was, round in te Pu t�luate fraction. P and Tc were not detected in all the
effluents, athoogh they were xpected to be, e1i ited by 0 I M CS(HN2)2 ad HNO3 respectively21)3�7),as, n, Cold experiments The behavior and efficient elution ethod of Pd and Tc need to be
investigated frther.
4. ELFCTROREDUCTION OF U(VI) TO UM AND SEPARATION OF Uff) FROM FPs
4.1 Electroveduction of 1J(VI) to TJQV)The icomplete separation between U a t FP �,-lements in the main separation column is
considered to b de to die relatively low adsorbability of UVI) in HN03 solution onto anion
exchanged). To z-uhance te separation factor between _LJ and Ps, we have investigated theelectrolytic reduction Of 1.117anyl U02 2-,) to uranous ion 4+) which sows significantly higher
adsorbability 8)91�, hiectroreduction xperiments were carried out using a novel flow type
electrolysis cell as shown i Fig, 3 The cathode of glassy arbon fibers fined in a cylindricalcolurrui of vycor lass (Porous silica lass) works as the working electrode, The glass column
works as both cathode compartment and separator, In the -xperiirients a sample solution
containing UVl) nd/or some typical FPs in HNO3 solution was introduced into the vycor glass
column by etering pump. As a holding reducing agent of UV), hydraziite(N2H4-H20) was
added to the sample solution, The electroreduction was conducted at a onstant potential. The
concentration of U(IV) in the outlet solution of the cell was detern-ri ned by UV spectrometry.
Figure 4 sows te xperimental results of electroreduction or the sample solution containing
0. IM U`(VI), 6,OM NO ad IM N2H4. The sample solution was passed trough the electrolysis
cell at the flow dte, of 2.0 citt/min once-through and the electrolytic potential was fixed at _300 mV
(vs.Ag/AgCl). AscanbeseeninFig.4,despiteofthehighconcentrationofHN03(6.OM),U(VI)
wascoinpletelyreducedtoU(IV)withtheconversionoi'100%. Tetotalcurrentefficiencywas
higher than 90%. indicating the effect of side reactions such as -LN03 decomposition is
significantly slight. The observed constant current means that the reaction rate for UVI)
reduction was unchanged during the electrolysis. Although the standard redox potential of HN03
reduction (Table 11) is much Wgher than that of U(Vl) reduction, the very high U(IV) conversion
and the urrent efficiency reveal that the reduction reaction of UNT to U1V) took placepredominantly.
On the other hand, from the ot experiment results shown in Fig. 2 the eluate obtained from the
main separation column contains VT), ip(V, Vl) and a small portion of various Ps. In the
electroreduction system or a practical process solution, the possible reactions taking place in the
electrolysis cell are listed in TableU and the hot electrolysis experiment using spent fuel solution is
in execution.
4.2 Separation of TJ(IV) from Ps by Anion Exchange
Separatioti (�Xperijjwnts o simulated process solutions containing U and some typical FPs were
carried out osing AR-01 packed column before and after eectrolytic reduction. Fig. and Fig. 6
show the experimental results for the sample solution containing U, Sr, Fe, Ru, Z and 6.OM HN03
227 -

JAERI-Conf 2002-004
before and after electroreduction, respectively. As seen in the case wthout electroreduction (Fig.
5) a part of Zr(fV) and most portion of Ru(" were also adsorbed by te anion xchanger and
mixed in the UVl) cluate. The separation of UV� from the PK especially the adsorptive
Ru(111) and Zr(IV) was not complete. On the other hand, after electroreduction as shown in Fig. 6
the UV) was strongly retained by the AR-01 and the adsorbed U(IV) was eluted off by using
UM HN03 as an eluent, showing a sharp peak. Perfect separation between U(IV) and the Ps
was achieved. Note that the Ru in the reduced solution was not adsorbed by the AR-01 and
showed the same behavior with the non-adsorptive Sr(H) and Fe(11). This indicates that the0)adsorptive Ru(M) was completely reduced to the non-adsorptive Ru(M by the electrolysis' .
5. SEPARATION OF MINOR ACTINIDES BY EXTRACTION CHROMATOGRAPHY
To separate the MA from the process solutions for the partitioning/transmutation option, several
novel extraction resins were prepared by impregnating a chelating figand such as CMPO, TODGA,
R-BTP or Cyanex-301 into styrene-divinylbenzene copolymer which is imobilized in, porous
silica particles of 50 [im diameter (SiO2-P). Fig. 7 shows the chemical structure of the ligands
used in this work. CMPO and TODGA can efficiently extract trivalent MA and Ln from
concentrated nitric acid solution, and have been extensively studied for the co-extraction of MA-Ln
from BW solution 1 1) 1 2) . R-BTP and Cyanex-301 are known as soft donor (N. S) ligands whichhave high extraction selectivity for MA over Ln(U4)5)13)14).
Figure 8 presents a separation experiment result for a simulated HW solution containing typical
Ln(111) and FPs and 3M INO-j by the column packed with CPO impregnated resin. As can be
seen, the elements were essentially separated to three groups, i.e. (1) Sr-Rh-Ru; 2) Pd-Gd-Nd; and
(3) Zr-Mo, although Ru and Pd showed complicate elution behavior. Sr(11) and Rh(E11) were not
adsorbed and leaked out firstly The adsorbed Gd(III), Nd(M) and most Pd(II) were eluted off
efficiently by using only water. On the other hand, we have found that Am(M) exhibits a very
similar elution behavior with Nd(HD 15) and would mixed in this effluent, Zr(IV) and Mo(V)
showed strong adsorption and finally could be eluted and separated by using oxalic acid as an
eluent.
In the MA partitioning process, the separation between trivalent MA and n is the most difficult
step due to their similar chemical behavior. In recent years, Cyanex-301 and RBTP were4)5)13)14)reported to be the promising ligands for MA/Ln separation We have synthesized several
R-BTP ligands with different alkyl groups (C = 1-8) and impregnated em into the SiO2-P spport.
Figure 9 shows the adsorption behavior of Am("(243 Am tracer), e(ffl), Eu(III) and Gd(lfl) from
nitrate solution onto the Bu-BTP impregnated resin, Note tat the adsorption of AmW increased
dramatically with increasing NO-�_ concentration. Although the adsorption of Eti(111) and Gd(HD
(heavier n) increased with, N03- concentration, the separation factor for AnVEu-6d is up to about
102. Moreover, Ce(M) (a light n) showed almost no adsorption and the separation factor for
Am(M)/Ce(M) is as high as V. From these results, it is expected that Am can be effectively
separated from Ln by means of extraction chromatography using the R-BTP impregnated resins.
6 CONCEPTUAL DESIGN AND PRELIMINARY VALUATION OF THE PROCESS
On the basis of the experimental results, conceptual design and pelin-iinary valuation of the
proposed aqueous process as shown in Fi& I has been carried out by omparing with the
- 228 -

JAERI-Conf 2002-004
conventional Purex process. Te process is designed for a reprocessing plant having capacity of
800 t-U/y with operation days of 200 d/y (Id = 24h). The structure, size, number and installation
layout of main machines and equipments for separation processes were designed and estimated.
Furthermore, chemical flow sheet, mass balances and the amounts of waste generation were
calculated ad evaluated.
Table 111 shows the, preliminary evaluation results for the advanced aqueous process. Overall flow
sheet of the process for reprocessing spent nclear uels is iustrated Fig. 10. The required size
for the colunins was calculated from the adsorption capacity of the, resins and the pressure drop in
thepackedcolumn. Astlieresults,thesizesoftheAR-Olcolumnsforthemainseparationandthe
U purification are 150 cm (diameter) x 160 cm h (height) and 100 cm Ox 160 cm h, respectively
In the MA separation pocess, since the Am and Cm are significantly less abundant than U and Pu
in the spent fuel, so that the scale of the columns for their separation from concentrated HLW is
considerably sall. Te column sizes of CMPO and R-BTP impregnated resins were estimated
to be 15 cm x 50 cm h and 15 cm x 20 cm h, respectively In the electroreduction process, a
novel flow type of electrolysis vessel, which consists of parallel multi-cells, has been designed.
The estimated size for the cubic electrolysis vessel is 280 c aength) x 150 cm (width) x. 18 cm
Cheight), Besides the above main equipments, pumps for solution supply and about 30 vessels
for solution adjustment and storage are required. In a conventional Purex process with the same
treatment capacity, some 35 units of extractors and contactors including the 12 units with 13 i in
height as well as 32 vessels are needed'6). Therefore, the number of the machinery and equipment
can be reduced to approximately 12 and significantly compacter equipments are used in the
advanced aqueous process. In addition, compared to the multi-stages separation procedures for
extraction, striping and scrubbing in the Purex process, fewer and simpler operation procedures arerealized.
In this process, the separations are based on the adsorption-desorption of nitrato-complexes,
therefore the required amount of HN03 i large. However, about 95% of the HN03 is recovered
for reuse. Since the high-level-waste is essentially determined by te aounts of FPs in spent ftiel,
its amount should be almost the same with the Purex process. Unlike the Purex process, the ion
exchange process does not use the organic solvents such as TBP ad dodecane, so a great amount
of the alkaline waste solution resulted from the solvent cleanup witl aot be generated. Therefore,
the low-level-waste generation was estimated to be less than 13 of te amount in the Purex process.
Alternatively, the process utilizes the AR-0 I ion exchange resin and the extraction resins containing
CMPO and RBTP, the AR-01, resin will be replaced after use for 2 years with approximately 20%
degradation'7). The depleted AR-01 resin for disposal was estimated to be 23 m/y. From the
evaluation results described above, it is concluded that compared to te conventional Purex process,
the size and number of required machinery and equipment as well as the amount of waste
generation are expected to be reduced greatly in the advanced aqueous process. With these
distinguished advantages, a considerable saving in the costs for plant construction and process
operation can be expected.
7. COCLUSIONS
1) The separation experiments of a spent WR-fuel solution tising AR-01 anion-exchanger
column demonstrated that most of the elements (Cs, Sr, Mo, Rh, n, Am, Cm) could be
229 -

JAERI-Conf 2002-004
separated from UVI). Some Ps especially Zu, Zr. N slowed weak adsorption and
contaminatedtheU. Theetu(e(tUiieedstobepurifiedt)ytherefiti'lligprocess.
2) Pu(IV) was eluted effectively y dilute HC0011 and successfully sepafati�xl ftom U and Ps.
Np showed a complicated elution behavior due to its differew oxidation states. ?d and Tc
presented significantly strong adsorption and their efficient elutiori eeds to be investigated
further.3) The electircireduction. of U(V1)-U(1V), Np(VV1)-Np(1V), Ru(TIT)-Ru(H) was successfully
performed by the novel flow type electrolysis cell. U([V) presents significantly stronger
adsorption onto A-01, ta UVI) and perfect separation etween U(1V) and the adsorptive
FPs (Zr, Ru, etc) was obtained
4) CMPO impregnated resin showed effective group-separation f MA(Ai-nCm)-Ln from
high-level-waste. The soft-donor ligand, R-BTP impregnated esin exhibited high adsorption
selectivity for MA over Ln with separation factor higher than 00. ffective separation of MA
from n is expected by extraction chromatography using the novel extraction resin.
5) An advanced aqueous reprocessing process which consists of anion t�xcbange, electrolytic
reduction and, extraction chromatography has been designed and evaluated prelfi-ninarily.
Compared to the Purex process, the number and size of main equipment could be reduced to
approximately 12-1/3. The amount of tow-level-waste would e reduced to less than 13.
A considerable cost-down i plant construction and process operation cr be epected
Acknowledgement
This work was financed by the Ministry of Education, Culture, Sports, Science and Technology of Japan MEXT).
The authors gratefully acknowledge the ministry's permission to publish this work-,
References1) J.P. Faris and R.F. Buchanan, Anal. Chem., 36,1157-1158 1964)
2) Y-Z. Wei et al., Ion xchange Development and Application, J. A. Greig ed., SCI, London, 1 ?4-181 1996)
3) Y-Z. Wei, et l. J Nucl St, Technol., 35, 357-364 1998)
4) Y-Z. Wei, et al., Nuct, lechnot, 132, 13-423 (2W01)
5) Y-Z. Wei, et al., J. Nuci. Sci. 1�chnol., 37,1108-1110 (2(XX))
6) M. BenedictT, H, Pigford and H. W. Levi, Nuclear Chemicai Engineering, MeGfaw-Hill, New York, 478 198 )
7) Y-Z. Wei, et al., A ys amid Compounds, 271-273, 693-696 1999)
8) E. L. Kazantsev a V L, Koroheinikov, Izv, Vys8hikh Uchebei, lo vedenii 7�vetn. Mer, 4 9-94 1966)
9) Y Z. Wei et a., lot) Exchange at tbe Millennium, J. A, Greig ed., SCJ, Lon6on, 116-123 (20W,)
10) T. Arai, et al,, Pfoc, Global'2001, Paper-0, 04 913 Sep�, _2001 Pris rance)
11) E. P Horwitz, et al., Proc, Solvent Extr, 1990, p, 357, T. SEKINE. Ed,, Elsevier Sci. ub. 1990)
12) Y Morita. et cit., Proc, Giobal'2001, Paper-036,9-13 Sp., 2001, Paris (France)13) Y Zhu, et al- olvent oth Ion Exch, � 14, 61 996)14) Z. Kolarik, ei oi., Solvent &a. on Exch., 17,23 1999)15) Y-Z, Wei, et at., Proc. Actir:rides-2001,4 9 Nov, 2001, flayama Japan i pess)16) Japan Atomic Information Cnter, "The Details of e Main Processes i ok"-ho Reptocessing Plant, Report
No. 9408630 (in Japanese) 1994)17) T. Hoshikawa, et al., Proc. Global'97, 1454-1459 510 Oct., 1997, Yokohwna (Japan)
- 230 -

JAERI-Conf 2002-004
Table I Analytical results of elements and
nuclides in the spent BWR-,fuel solution 'Table II Possible reactions in the electrolysis cell
Analysis4g/P_-Sojn mm Reactiom Remarkmethod
122000 709 1CP-MS In (athodic Compartment:
768 4.52 ICpMS t-JO'2' + e = U02' (1) E = 0062 V
P L-240 259 1.49 ICpMS '2t)02' + 4H' = U02 2 + U4 + 2H20 (2) K, 9 x 10'
Am-241 51.89 0.30 -r -,pec 2UO2 21 + 4H' 2e = U4+ 2HO (3) E' 0.327 V
Np-237 68.3 0.40 ICpMS NPO2' +4H� e�Np 41 2HO (4) E0 0.739 V
Eu-154 1.78 0.016 r -spec NP02 21 + 4H + 2 = N 4, + 2H20 (5) E0 0.938 V
Eu-153 21.2 0.19 1CP-MS RuNO3+ + = RU2 + No (6) E0 0.249 V ?
Nd-145 123 1.17 ICPMS Fe 3 + e Fe 21 (7) E0 0.771 V
Ce-140 243 2.40 ICPMS 2H' + 2e H2 (8) E0= OVCs 3 193.92 1.96 -r -spec
HN(3 + 2H + 2 = HN02 H20 (9) 0.94 V, slowCs-133 214 2.23 lCp-MS HN02 + H + e = NO H20 (10) E = 099 VAg 109 1.17 0.015 lCp-MS
3HN02 = HN03 + 2N + H20 (I 1) slow
Pd- 105 ?3.7 0.31 ICpMSHN03 + NO H + e = 2HN02 fast
Rh-103 363 0.4) jCpMSHN03 HN02 = 2NO2 H20 (I 3 autocatalytic, fast
Ru-101 63.9 0.88 1CP-MS2Fe2+ + N03 + 3H = 2Fe 31 + HN02 H20 (14)
TC-99 102 1.43 ICpMS U' + 2HN02 U022+ + 2H+ +2NO (15)Mo-95 27.6 0.40 jCpMS
HN02 + NHj+ HN3 + 2H20 H' (16)Nb-93 139 2.07 ICP-MSZr-91 99.3 1.51 ICpmS HN3 + HN02 = N20 N2 + H20 (17)
Y-89 100 1.56 JCpMS In Anodic Compartment:
Sr-88 558 8.76 jCpMS 2H20 - = 02 4H+ E0 1.229V
14NO3 6000.... .- -----NaNO2 50
Table III The results ofpreliminary evaluationfor the advanced aqueous reprocessing process
Item Estimated Aount Remark
Main equipment: units Two ion exchange columns
1. Machinery Punips for solution supply: units (1.5m x 1.6mh, .0m x 1.6mh)
& Facility Vessels for solution One electrolysis vessel (2.8x 1.8x 1.5m)Adjostment storage: 30 units Two extraction chromatographic columns
Constructionarea: -13OOm' (I 5cmo x 50cmh , 15cirio x 20cmh)
Nitric acid: 306 kmol/day 95% of nitric acid is recovered
2. Reagent* Formic acid: I I kmol/day 70% of formic acid is recovered
Thiourea: 1 kmol/day Thiourea is optional
Hydrazine: 3 kmol/day Hydrazine is the holding reductant of U(IV)
3. Waste High level liquid waste: 93 m/day
Generation* Lo level liquid waste: 120 0/day
used nitric acid solution: 120 m/day To nitric acid recovery process
Depleted resins-, 2-3 M3 /year AR-01 resin is replaced every 2 years
Those for MA eparation process are not included.
231 -

JAERI-Conf 2002-004
Spent fuel solution(6M-HN03)
-------------------------- ------------- FP washing (6M HN03)
FP Cs, Sr, Z M, Ru, Rh, etc.Uelution (IMHN03)Ln La, Nd, Y, etc
1MA: Am, Cm Pli clution I M HCOOHAR-01
exchanger Pd elution 0 I M CS(NH2)2
column Tc elution 6 - M HN03)
FP washing (6M HNO FP, Ln MA3) U(VI), Np(V, VI), P Pu(IV), Np(IV) Pd(II) Tc(VII)
Ln, MA elution ( dil. HN03) CMP( U(vP Uyv)
Zr M elution (0.5M adsorbent Electro-reduction Np (V, VI) - Np (I )(COOH)2or column Ra(111) -Ru(11)
TODGA r FP washing 3 - M HNG,)FPadsorbent O.. U(IV) elution 0 I -0.5M HNOLn MA 3)
Ln washing dil. 4NO AR-013) Np(IV) elution (0.01M HNOexchanger 3
MA elution (pH I - 2 P columnntor
Cyancx301adsorbent
Ln MA F? U(IV) Np(lV)
Fig. I Schematicflow sheet ofthe proposed aqueous process
for reprocessing spent nclear fuels
UT.W
(3) (Z (7) S 235U800 80 240
PU241Am
(1) Dead Volume 237Np(2) Sample Solution 4cM3) 154Eu
600 6M-l-lN0 - 603(70c 153Eu(4) I M-HN03 (150CM3) bo t45
NdCM3)I M-lAC00 6 140
CeOCM3)0 I M-HNO, (5 137
Cs3)400 (7) 9M-HNO, (100cm 40 2 114
al Cs(B) 6M-14NO3 (300CM3) 133
Cs
109Q Ag0
105PdU 200 20 15 103Rh101Ru
Tc95
MO
0 93
0 200 400 60 0 Nb9'Zr
Effluent weight (g) 89),
Fig. 2 Separation experiment resultsfor a spent WW-Juel solutio b oion exchange3(Column 20 mm Ox] 000 mm h AR-01 B V 282cm ,Flow rate 38 m1h, Ternl). 296K)
- 232 -

JAERI-Conf 2002-004
................... .............
(D Electrometer L
Cotdombmeter
(M Potentiostat
Computer/Recorder................... ...........................
9 011
R.E.(AgAgO
CE.(Pt wire)
Input Pump Csolution W.E.
(Vycor glass/Carbon fiber)
0 .. .....solution
Fig. 3 Schematic diagram of theflow type electrolysis apparatus
100 1200Feed solution
[U(Vi)]=O.l M80 1000
[HNO 31=6 M
800[N H =I
60 U(I-V) yield 2 4
Cd - 600-0- Current efficiency40
UCur-rent 400
20 200
0 00 30 60 90 120 150
Effluent volume (ml)
FlowrateAn-d/min, Potential:-3OOmV(vs.Ag/AgCl), Temperature:298K
Fig, 4 Electroreducton behavior of U(VI) in nitric acid solutionusing theflow type electrolysis cell
- 233 -

JAERI-Conf 2002-004
0.15 10
Dead Volume
OAFeed Solution
�D4-4 (a) 6 M-HNO4-4 0.3 3 6 4,
(4) I M-HNO 03
0.2 40.1 M-HNO
300
U 0.1 2 U
0 00 50 100 150 200
Effluent Volume (ml)
U(VI) " Fe(III) Zr(IV) Ru(111) Sr(II)
[U(VI)]=10 M, [Fe(III),Zr(IV),Ru(III),Sr(II)]=O.I M, [HNO3]=6 M, Temperature: 333 K
Fig. 5 Results of separation experimentfor U-FPs solution by anion exchangebefore electrolytic reduction
5 120
Dead volumeT - 1004 Feed
3 (a) 6 MANO �D-4 4�
0
600 (4 0 M-HNO 32
40
U U20
0 00 50 too 150 200
Effluent volume (ml)
U(IV) - Fe(II) Zr(TV - Ru(II) -- Sr(II)
[U]=100 mM, [Fe, r, Ru, Sr]=l nM, [HNO =6 n-LM, Temperature: 300 K3
Fig.6 ResultsofseparationexperimentforU-FPssolutiotib��(iniortexchangeafter electrolytic reduction
_ 234 -

JAERI-Conf 2002-004
0 0
C8"17 11 11 CH2 H(CH3)>P-CH2-C-N< CH2cH(CH3)2
CMPO (Octyl(phenyl)-N, N-diisobutylearbanioyiniethylphosphine Oxide)
0 07 11 11 8H]7>N-C H2-0-CH2- N
TODGA (NNN',N'-tetraoctyl-3-oxapentane-1,5-diamide)
CH3-CH2C(CH
HS CH2-CH 3)3>P
S <CH2-CH-CH2C(CH3)3I
CH3
CYANEX-301 ((Bis(2,4,4-trimethylpentyl) Dithiophosphinic Acid)
R
N
R = CIH 2n I (n= 1- 8)
R-BTP (2,6-bis-(5,6-dialkyl-1,2,4-triazine-3-yl)-pyridine)
Fig. 7 Chemical structure of the ligands impregnated in SiO2-P supportfor.AM separation
235 -

JAERI-Conf 2002-004
IV
--- >-1.6ri Sr1.4 Zr
M O1.2 A Ru
PdNdG d
'O.8
0.6
0.4
0.2-
00 50 100 150 200 250 300 350
Effluent volume /CM3
I Dead Volume; Feed solution; M H20. IV 0,5M (COO H)2
Fig. 8 Results of separation experimentfor a simulated HLWsolution using CMPO
impregnated resin
(Column 10 mmox5OO mm h, 0.5g CMP01Si02-P, Flow rate 38 m,1h, Temp. 333K)
10,
AmA Ce
lo, 0 Eu
0 Gd
10,
0.5g Bu-BTP/S102-P
pH=1.0, 2h10,
298K, 120 spm
10,0 1 2 3 4 5
NaNO, Cone. (M)
Fig. 9 Adsorption behavior of trivalent americium and lanthanides
from nitrate solution onto Bu-BTP impregnated resin
- 236 -

JP0250305JAERI-Conf 2002-004
R&D OF THE PARTITIONING OF THE LONG-LIVEDRADIONUCLIDES IN FRANCE
M. Leconite, P. Baron, M. Masson
Commissariat Li Vgnergie Atomique (CEA), Valrh&Marcoule, DENIDRCPBP 17171, 30207 Bagnols-sur-CLe Cedex, France
In December 1991 te French parliament passed a law identifying three axes of researchconcerning long-lived and high-level radioactive waste managernent. The first axis is relatedto processes capable of separating long-lived radionuclides-notably the minor actinides(neptunjurn, americium and urium) but also the fission products (caesium, iodine andtechnetium) -for transmutation. The cuffent reference strategy for separating the minoractinides from the high-level liquid waste stream (HLLW) produced by thereprocessing/recycling of the used fel by the PUREX process is:- firstly, to modify slightly the P-TREX Process in order toseparate neptunium,
secondly, to develop liquid-liquid (Extraction processes involving two steps, considerin thedifficulty of separating the trivalent actinides americium and curium) from the lanthanidesand the strong acidity of the process solution:
• DIAMEX: coextraction of the actinides and lanthanides from HLLW
• SANEX: separation of the actinides from the lanthanides in the flow generated by theDIAMEX process (three variants are currently being investigated).
The CEA intends to select by the end of 2001 the best route for the demonstration of theminor actinides separation technological feasibility to be done before 2006.This paper presents the recent advances of the development of long-lived radionuclidesseparation processes, focusing on the results obtained thanks to the hot tests conducted inATALANTE Facility,
237 -

JAERI-Conf 2002-004
E E -E -E
<it o
Z3
toLi
Mm
21
cn
LU
<
I FE E
E-E E
<
0:E
3: ......... ...
-E<
238 -

JP0250306JAERI-Conf 2002-004
OVERVJFW OF THE RESEARCH ACTIVITY IN PARTTTIONING AT
INSTITUTE OF NUCLEAR ENERGY TECHNOLOGY
CHONGLI SONG
institute of Nuclear Energy Technology (INET), Tsinghua University
100084 Beijing, China
Fax: 86-10-6277 1150, e-mail: songchJArnai1.tsinghua.edu.cn
The study on the part itioning of high lever radioactive liquid waste (HLLW) is andertaking in INET, Tsinghua
University. Tbe adjective of the study is se the partitioning as a waste volume reduction method in near future
and is se it i coni)ected wt tansmutation (P&T) in te future to reduce ong erm isk of radioactive waste, A
TRPO pocess was studied or the removal of actirride (An) from HLLW A ttal partition process was developed
to separate A as well as Sr ad Cs from HLLW A purified Cyanex 301 process was innovated for the
separation of actinide nd lanthanide. The Research activity in partitioning of HLLW at INET was reviewed.
Key words: Partitioning, HLLW, TR-PO, Cyanex 301
1. INTRODUCTIONHigh level liquid waste (HLLW) contains more than 95% of radioactivity in spent nuclear fuelelements. The final disposal of high level radioactive waste (HAW) is a high public conceitedsubject. The traDsuranium (TRU) elements and long-lived nuclides such as "Tc and 129i
contained in HLW ave high toxicity and very long half-life, They dominate the long-termradiological risk of radioactive waste. Partitioning and Transmutation (P-T) of HLLW is an
advanced nuclear fuel cyclei'l. The P-T concept involves chemical separation of transuranium.
(TRU) elements as well, as long-lived nuclides (for example, 9'Tc, "'I, etc.) from HLLW, and
transmutation of them to either stable or short-lived nuclides, The P-T ould decrease long-
term risk of radioactive waste as well as the waste volume that should disposed in deep
repository. It is a pospect technique for treatment and disposal of HLLW.
A clean use nuclear energy (CURE) conceptr2� was proposed for the back-end of the nuclear
fuel cycle. In CURE concept the partitioning requires not oniy to remove the TKU, 99Tc and
12'1, but also to segregate 'OSr and "'Cs. After partitioning, the Ht.LM," is downgraded to a non-
a, low lever radioactive waste that will be eligible for near-surface disposal. he partitioning
can used as a pretreatment inethod. of HLLW to reduce a waste and HAW volume.
The study on the partitioning of I-lLLW is undertaking in INET, Tsinghua University. The
objective of the study is use the partitioning as a waste volurne reduction method in near
future and use it i connected with transmutation (P&T) to reduce long term risk of
radioactive waste in the future.
2. PARTITTONiN6 OF I RU ELEMENTS BY TPO PROCESS
The partitioning study n INET, Tsinghua University began in 1980 A trialkylphosphine[3]
oxide was fund to ave cood extraction behavior forTRU elementsIn
239 -

JAERI-Conf 2002-004
2.1 TRPO extractantThe trialkylphosphine oxide is a commercial extractant. Its trademark is TRPO in China andCyanex 923 in USA. It has different composition for various products but its maincomposition is a mixed phosphine Oxide with three alkyl groups of 68 carbon atoms. TheTRPO has very good physical properties. It can mix with Kerosene or dodecane in anyproportion and has very low solubility in water.TRPO has quite good radiation stability no significant change i physical and extractionproperties occurred until a radiation dose of 5 X 1'Gy was absorbedE'l. Main gaseousradiolytic products and acidic radiolytic products of 30%TRPO-kerosene extractant wereanalyzed. Their radiation yield (G value) was determinedt'l. When the radiation dose wasabove 2 X 10⁶, some retention of heave elements were observed E61 . Research indicates that thepolymeric products with high molecular weight cause the retention.The chemical properties and extraction behavior of TRPO are similar to that of the tri-octylphosphine oxide (TOPO). Tetra- and hexa- valent TRU ions are highly extractable in wholenitric acid concentration (0.05-10 M) by 30% TRPO. Trivalent TRU ions, such as Am(III),Cm(III), and Pu(Ill) are effectively extracted at low and medium nitric acid solution(fromO.05 to 2 M). But the extraction of penta-valent NPO2' is very poor. Among the fissionproduct (FP) elements, Zr is highly extractable. The extraction ability of 30% TRPO forTc(VII) is very high at low and medium nitric acid concentration, but it drops sharply withincreases of nitric acid concentration. The extraction of Mo is sufficiently highf'l.2.2 TRPO processA TRPO process had been developed for the partitioning of TRU elements ftorn HLLW in1980s['-']. In the TRPO process the HLLW is adjusted to 12 M nitric acid concentration Inthe meantime the neptunium valence is adjust to the extractable p(IV), The feed solution ofHLLW is contacted with by 30% TR-PO. The TRU elements are extracted into organic phase.The raffinate was downgrade to a non a HLLW raffinate. Aey washing with diluted nitricacid, the extracted TRU elements are stripped stepwise with 5.5 nitric acid, .6 oxalicacid and 5% sodium nitrate and divided into three groups: Am+Cm, Np+Pu and Urespectively. The 30% TRPO organic phase is subsequently recycled into tile rocess afterwashing with water, The no a HLLW raffinate can be sent to the further steps for separationof Sr- 90 and Cs-137.A mathematical model was developed to calculate the extraction of Am, Nd and nitric acid in30% TRPO/HNO3 at different Na, Al, Fe, and RE concentration0l. The mathematical modelwas used to optimize the TRPO process parameters for removing Ain fom simulated ChineseHLLW. The experimental results fit very well with the calculated ones.The counter current riot tests of the TRPO process were undertaken in the Institute forTransuranium Element (ITU) in Karlsruhe, Germany with genuine HLLW solutions of WAKreprocessing plant in 1993"0-"1. The hot test was completed with 24 stages of miniaturecentrifugal contactor in hot cell. The results of the hot tests showed that all TRU elementswere completely extracted by TRPO and their concentration was decreased o the analyticaldetection limit. The extracted TRU elements are thoroughly stripped ito three fractions by5.5 M nitric acid (Am+Cm), 06 M oxalic acid (Pu+Np) and 5% sodium nitrate (U). TheTRPO process can also extract "Tc from HLLW solution. The DFs of "Tc are as high as 1400.Among the fission product Zr, Mo and lantharride elements are totally (,extracted. The hot tests
240 -

JAERI-Conf 2002-004
demonstrate that te TRPO process is an effective and prospective process for partitioningTRU elements as well as 99Tc from HLLW.2.3 Enhanced TRPO processThe ehancement of TRPO Process for commercial HLLW was studied to meet the requiredDF or CURE project. The optimal parameters of the TRPO process was calculated for a DFof 40 X 10' for Am[121 A multistage counter current ascade experiment with simulatedHLLW skipped with 21 'Am was carried out with centrifugal extractor in glove box to verifythe calculated results. The cascade included 12 stages or extraction, 2 stages for scrubbingand 6 stages for stripping, Very good results were obtained in the cascade experiments["]. Theobtained DFAn, was 1 �25 X 106 . The experiments show that the required DF for treating typicalcommercial HLLW to a waste, that is suitable for sallow land disposal, can be reached withthe TRPO process.
3. TOTAL PARTITION PROCESSIn INET, the partitioning research is also focused on the waste volume reduction of ChineseHLLW. Chinese HLL)X1 is a defense waste with high salt content. Sr and "'Cs are the twohighly toxic nuclides and major heat generators in high level radioactive waste, so that theyare quite important for the handling and disposal of HLLW. The removal of strontium andcesium from HLLW can degrade the HLLW to a low and intermediate level waste thateligible for near-surface disposal.3.1 separation of strontium and cesium from HLLWThe extraction behavior of strontium and the ion exchange process for cesium have beenstudied. Dicyclohecano-18-crown-6 (DCH18C-6) in I-octanol was used as an extractant Ithas good extraction properties for strontium from nitric acid. The extraction properties ofDCH I 8C-6 for strontium in simulated Chinese highly saline HLLW solution were studied inour laboratoryE"] A Crown Ether strontium Extraction (CESE) process and a strontiumextraction calculation model (SECM) to separate "Sr from HLLW were developed. Finally, ahot test of the CESE process was carried out with genuine Chinese HLLW with centrifugalcontactorP'1. The hot test results of the CESE process showed that after 10 extraction stagesabout 99.96 strontium were separated from genuine Chinese HLLW. More than 99.84 ofstrontium was back-extracted with 4 stripping stages. The hot test results showed that theCESE process could satisfy the partitioning requirement and SCM could be used to predictthe strontium activity profiles and to optimize CESE process parameters.Various inorganic ion exchangers were tested to remove Cs from HN03 waste solution.Spherical potassium titanium hexacyanoferrate(II) (KTiFC) ion exchanger was chosen. TheKTiFC was prepared by sol-gel method and has excellent selectivity and high Cs absorptioncapacity from the highly saline nitric acid solutionr"]. The static capacity of KTiFC for Cs isabout I mmol/g in the simulated Chinese HLLW at 0.5M N03 and the dynamic exchangecapacity of KTiFC was about 075 mmol/g at 90% breakthrough. It has good chemicalresistance in 0.5-1.5 mol/L nitric acid solution as well as good radiation stability. Its staticcapacity and its appearance do not change until a dose of Ix 10' Gy was adsorbed. Thedynamic cold test was carried out with two columns connected in series and the resultsshowed that 99 to 99.9% of Cs could be remove from simulated Chinese HLLWI").3.2 Total partition process for Chinese HLLW
241 -

JAERI-Conf 2002-004
A Total Partition process was developed in IN ` T to partitioning TRU (�,Jements, Tc, Sr and Csform Chinese HLLW and to degrade It to LLW or MAW"]. Te TP process includes theTRPO process for the removal of TRU elements, a crown ether extraction process (CESE) forthe separation of Sr and a KTiFC ion xchange process to sgregating "'Cs, The [lot test ofthe TP process was carried out in 1996 with genuine Chinese HLLW"91, The hot test wascompleted with a compact centrifugal contactor set and a small oll exchange colurrin. Thecompact contactor set contained 50 stages of p 10 miniature centrifugal contactor including12 extraction stages for the TRPO process and 10 extraction stages for the CESE process.Very encourage results have been obtained, The DFs for total a activity was 588, that for "Tc,
9OSr and "'Cs was 125, >2500, and >200 respectively. After partitioning the highly aline
Chinese HLLW become a non MAW that was suitable for cementation nd shallow land
disposal. High volume reduction factor for HAW waste was obtaffled. The TP process could
be used to partitioning Chinese HLLW and to reduce HAW waste volumes.
3.3 Total partition process or commercial HLLW
In commercial, HLLW, the salt content is much lower tan that in Chinese HLLW but the
radioactivity is much igher. The hot test of the TP process for Chinese 11.LW ad proved
that the CESE and the KTiFC process could meet the required DFs of strontiu ad cesium in
commercial HLLW. The ehanted TRPO described i paragraph 2 a meet the DF
requirement for TRU elements to degrade the HLLW to a non a waste�`I. So the TP process[201for high saline HLLW can also be used for cornmercial HLLW after modification
3.4 The auxiliary processes of the TP process
The auxiliary processes of the TP process are studied. The auxiliary processes ake the TP
process become a complete process. They include the microwave enitration and calcination
for Am (RE) stripping solution, Np/Pu separation in H2C'04-HNO, solution, the onversion
process for uranium stripping solution and immobilization process for Cs-loaded KTiFC ion
exchanger.
4. ACTINIDE-LANTTHANIDE SEPARATIONThe separation of lanthanide and actinides is necessary not only for LW partitioning but
also for degradation of HLLW to MAW. The separation chemistry and process is one of the
research subjects i INET Te extractatit with different donors such as P, N and were
studied for its extraction ad separation ability of actirride/Janthalude. S-coordinated
extractant has good behaviors for the separation of trivalent An rom Ln.
4.1 Actinide-Lanthamde separation process by 14BTMPDTP extraction
In [NET, CyaDex 301 has been proven to be a effective extractant for the separation of
trivalent Am frorn Lns [21-21) A purified Cyanex 301 has a ompositiou of >99% bis (2,4,4,-
trimethylperityl) dithiophosphinic acid (H3TTvIPDTl?), It prefers to xtract Ain rather than Ln
and the separation fctor is higher tha tousands,
A conceptual Am/Lns separation flowsheet y HBTMPDTP extraction was proposed, The hot
test with cross flow extraction was carried o and nly 3% Ln was extracted by
HBTMPDTP. Te average separation ator between Am and Ln was 3500 for first tree
stages E21J . The counter current ot test was carried out recentJO'J Aer cletritration to 03 M
HNO31 the feed solution was first treated with Cyanex 301, to remove impurities. It was then
fed into extraction section ad contacted with saponified 4BTMD'rP. More tan 99.9 of
- 242 -

JAERI-Conf 2002-004
Am was extracted ito the organic phase with extraction stages. About 1 of Lns was co-
extracted with Am Te ot test results proved that the separation process was effective.
4.2 The synergic extraction of Am and Ln by I-IBTMPDTP/'rBP-Kerosene
The synergic xtraction aDd separation of An ad L by HB'tMPDTP/TBP-Kerosene was
studied, At pH 18, quite high separation factor for Am/Ln could be obtained, A multistage
counter current ascade experiment was performed included 7 stages for extraction, 3 stages
for scrubbing a 2 stages or stripping. The separation factor of Am from Ln was 5x 10⁴
and the separation factor of Ln frorn Am was 2500[211.
4.3 'The coordi nation structure of Am/Lns and BTMPDTP
The coordinatio cemistry, of Am/Lns ad HBTMPDTP was studied. The structure of the
extraction complexes in organic phase was characterized with EXAFS and other instruments.The EXAFS data [26-211 illustrates that the structures of the extraction complexes of Am(III) and
Nd(111) with HBTMTf)TP are different. Together with the results from extraction experiment,
the molecular formula of complex of Ain(III) is deduced being HAmL4 and that of Nd(III)
being HN&,�H,0. There are atoms from 4 xtractants coordinated with Am in thecomplex of Arn. But there are 7 atoms from 4 extractants and one atom from H20
coordinated with Nd in tile extraction complex of Nd. The excellent selectivity of HBTMDTP
for Am(fII) over Lj)(111) in extraction behavior may derives from the deferent coordination
structure of the complexes of Arn(III) and Nd(III) with HBTMDTR
5. INTEGRATED PROCESSThe integration process coupling with reprocessing and partitioning would, simplify the back
end of the nuclear ftiel cycle and would make it more reasonable and economical. The
integrated process based on the Purex process for nuclear fuel reprocessing and the TRPO
partition process is studying in INET 1211 . Different combination of the TBP ad TRPO process
is studying. Te target is to make the integrated process more simple, more effect and more
economic.
6. STUDY OF EXTRACTION EQUIPMENTS
The advanced extraction equipment such as pulsed column and centrifugal contactor for the
TP process are also being studied. It lias been proved that the plsed column could be used in
high viscous T-PO-kerosene-HN03 system. The study of the centrifugal contactor for nuclear
industry is carried ot. he module pattern of centrifugal contactor with rotor diameter 70
and p I 0 were produced and tested. They have good hydraulic ad ass transfer properties.
A prototype nstallation is planning to construct in order to test the t1owsheet and equipment
for the partition process.
7 REFERENCESLt] A.C. Croff, J.O. Blomeke, Actinide Partitioning-Transmutation Program, Final Report,
ORNL 5566(1980).[2] S. . BINNFY, CURE: Clean Use of Reactor Energy, WHC-EP-0206 Westinghouse
Hanford Company, Richland, WA 99352 1990).
[3] R. Jiao, S. Wang, S, Fan, B. Liu, Y. Zhu, H. Zherig, S, Zbou, S. Chen, Trialkyl (C6_C8)
phosphij)e oxide for the extraction of actinides and lanthanides from high active waste,
243 -

JAERI-Conf 2002-004
Chinese J. Nucl. Radiochem 7 65 1985). (In Chinese).[41 R. Xin, P. Zhang, J. Liang, C. Song, Study on the radiation Stability of Trialkyl Phosphine
Oxide, to be published.[5] R. Xin, C. Song, J. Jiao, J. Liang, Investigation of Radiolytic Products of Trialkyl
Phosphine Oxide by Gas Chromatography, Chinese J. Spectroscopy Laboratory, 16, 498-502 1999).
[6] P. Zhang, C. Song, J. Liang, R. Xin, Solv. Extr. & Ion Exch., 19, 51 2001).[7] C. Song, Y Zhu, D. Yang, L. He, J. Xu, The removal of actinide elements from HLLW by
TRPO extraction -The cascade extraction experiment of the TR-PO process withsimulated feed solution, Chinese J. Nucl. Sci. Eng., 1992, 12 3), 225 (in Chinese)
[8 Y Zhu and C. Song, Recovery of Neptunium, Plutonium and Americium from HighlyActive Waste, Tri-alkyl phosphine Oxide Extraction, in Transuranium Elements: A HalfCentury, Edited by L.R. Morss and J. Fuger, ACS, Washington D.C. USA, 1992) pp.318-330
[9] C. Song, J-P. Glatz, Mathematical Model for the Extraction of Americium from HLLW by30% TRPO and its Experimental Verification, in A Value Adding Through SolventExtraction: International Conference on Solvent Extraction, The University of Melbourne,Australia, 1996, v2 pp
[10] C. Song, J-P. Glatz, X. He, H. Bokelund, L. Koch, Actinide Partitioning by means of theTRPO Process, RECORD'94, 24-28 April 1994, London UK
[I II J-P. Glatz, C. Song, L. Koch, H. Bokelund, H. He, Hot tests of the TRPO Process for theRemoval of TRU Elements from HLLW, Proceedings of the Global'95 Conference,Versailles, France 10 14 Sept. (I 995) vol. 1, pp548.
[12] J. Chen, J. Wang, C. Song, Tsinghua Science and Technology, 6180-4 2001).[13] J. Wang, Q. Wang, J. Chen, B. Liu, P. Zhang, C. Song, Cascade Test of Removing ND"
and Am" from Simulated High Level Liquid Waste of Nuclear Power Station, J. TsinghuaUniversity (Science and Technology) 40 12), 21-4 2000). (In Chinese).
[14] L. He, X. Weng, D. Yang, "Extraction of strontium from high-level active waste withcrown-ether process study" Chinese J Nucl. Eng., 15, 76 200 1) (in Chinese).
[151 J. Wang and C. Song, Radiochim. Acta 89,151-154 2001)[16] C. Jiang, S. Wang, C. Song, The removal of cesium from simulated HLLW with
potassium titanium hexacyanoferrate, Chinese J. Nucl. Radiochem, 17, 99 2001). (InChinese)
[17] C. Song, S. Xu, Y. Sun, R. Jiao, Separation of Cesium from Highly Saline HLW withPotassium Titanium Hexacyanoferrate, to be published in NRC4 4th nternational conference onNuclear and Radiochemistry 813 September 1996, St. Mato France.
1 8] C. Song, The concept flow sheet of partitioning process for.the Chinese high-level liquidwaste, Atomic Energy Science and Technology, 1995, 29, 201-9 (in Chinese)
[191 C. Song, J. Wang, R. Jiao, Hot test of total partitioning process for the treatment of highsaline HLLW, in Global'99: International Conference on Future nuclear systems,Proceedings (August 29-September 3 1999, Jackson Hole, USA.)
[20] C. Song and J. Xu, Recent progress on partitioning study in Tsinghua university,Actinide and Fission Product Partitioning and Transmutation, OECD 6 InformationExchange Meeting, Madrid. Spain 1 - 3 December 2000
- 244 -

JAERI-Conf 2002-004
[2 1 ] Y. Zhu, J. Chen, R. Jiao, Solv. Extr. & ion Exch. 14, 61 1996)[22] J. Chen, Y Zhu, R. Jiao, Nuclear Technology, 122, 64 1998)[23] J. Cen,, R, Jiao, Y. Zhu, RadiochirDica Acta, 76, 129 1997)[24] J. Chen, CT.X.Tian, R.Z. Jiao, Y.J. Zhu, A hot test for separating Am from fission product
lanthavides by purified cyanex 301 extraction, Actinides'2001, Japan[25] X, Wang� Y. Zhu, R, Jiao, Separation of Am from Lanthatrides by a Synergistic Mixture
of Purified Cyanex 301 and TBP, to be published in J, Radioanal. Nucl. Chem.[26] G. Tian, Y. Zhu, J. Xu, "Characterization of Extraction Complexes of Am(III) with
Dialkyldithiophosphinic Acids by Extended X-ray Absorption Fine StructureSpectroscopy" Actinides'200 1, Japan
[271 G. Tian, Y. Zhu, J. Xu, P. Zhang, Characterization of Extraction Complexes of Nd(Ill)with Dialkyldithiophosphinic Acids by EXAFS, to be publich in high energy and Nucl.Phy. (In Chinese)
[28] Zhu, Y.; Han, B.; Wu, Q. "Study on the integration of the Purex process and the TRPOprocess in nuclear fuel cycle backend" Global'99 Proceedings of the InternationalConference on Future nuclear systems, Aug.29-Sept.3, 1999.Jachson Hole, USA
245 -

I
This is a blank page.

JP0250307JAERI-Conf 2002-004
UNEX PROCESS TESTING OFTHE REMOVAL OF CESIUM,STRONTIUM, AND ACTINIDE ELEMENTS FROM RADIOACTIVE
ACIDIC WASTE
VN, ROMANOVSKIY', V.A. BABAIN', V3\4, ESIMANTOVSKIY',I.V, SMIRNOV', and B.N. ZAITSFV'
R. S. HRBST", J, D. LAW, T. A. TODD 2
'Khlopin Radium Institute, 28 2nd Murinsky Ave, St. Petersburg, Russia 1940212Bechtel BWXT Idaho, LLC, P.O. Box 1625, Idaho Falls, 11) 83415-5218
ABSTRACT
The presence of long-lived radionuclides pesents a challenge to the management ofradioactive wastes. Separation of the radionuclides fi-om te waste solutions has the potentialof significantly decreasing te costs associated with the immobilization and disposal of theradioactive waste by minimizing waste volumes. Typically, several separate processes arerequired or the separation of cesium, strontium and actitildes from radioactive wastes. Anovel solvent extraction pocess, the Universal xtraction (UNEX) process, has beendeveloped for the smultaneous separation of cesium, strontium, and the actinides fromradioactive acidic waste SOILItiODS. The UNEX process solvent onsists of chlorinated cobaltdicarbollide for the extraction of 117CS, polyethylene gycol for te extraction of 9Sr, and(iiphejiyl-NN-dibotylcarbainoyI posphine oxide o the extraction of te actinides andlanthanides A non-nitroaromatic, polar diluent, phenyltrifluoromethyl sufflone, is used for thisprocess. A NEX flowsheet consisting of a single solvent extraction cycle has beendeveloped as a part, of a collaborative effort between the Khlopin Radium nstitute KRI) andthe Idaho National Engineering and Environmental Laboratory (MEL). This flowsheet hasbeen demonstrated with actual dissolved radioactive calcine waste at the NEEL using 24stages of 2-cm diameter centrifugal contactors installed in a shielded hot cell facility. For themajor radionuclides, 99.99% of the 137CS' 99.73% of the 9Sr ad >99.9% of the actinides inthe initial dissolved calcine feed were extracted and recovered in the high activity fraction.For the stable matrix elements, 12% of the Mc, 07% of the Zr, and 2 of the Fe wereextracted and recovered in the strip product. The minor components Ba and P werequantitatively extracted and recovered in te strip product; 23% of the Mu was also present inthis fraction- Very little aluminium, Ca, Cr, Na, and Ni were extracted into the UNEX solvent.
WTRODUCTION
Waste treatment processes for the removal of radionuclides from acidic wastes arebeing developed worldwide in countries such as the United States, Britain, France, Japan,China, and Russia [1], Typically, the processes under development require several unitoperations, each separating specific radionuclides from the waste solutions.
The use of a single process to remove the desired radionuclides, as opposed to acombination of different uit operations that remove tese same radionuclides, evolved fromprevious collaborative efforts with scientists from the hlopin Radium Institute and BechtelBWXT Idaho M. A uversal solvent containing chlorinated cobalt dicarbollide (CCD)
- 247 -

JAERI-Conf 2002-004
for the extraction of cesium, polyethylene glycol (PEG) for the extraction of strontium, anddiphenyl-N.N-di-n-butylearbamoyI phosphiDe oxide for the xtraction of actinides andlanthanides from acidic, waste solutions has subsequently been developed 3 This UniversalSolvent Extraction (UNEX) pocess povides a simplified and cost effective method forradionuclide separations as compared to using two or three separate unit operations.
The high and low-activity waste fractions resulting from te IJNEX process wouldlikely be disposed of as glass or grout waste forms, respectively. Separation of theradionuclides from the wastes must result in a reduced quantity of high-activity wasterequiring disposal (e.g., a federal geological repository). Tis criterionrequires minimizationof the bulk matrix components (notably Zr and Ca) in the dissolved calcine feed that partitionto the high-activity fraction,
The ultimate fate of the low-activity waste resulting from UNEX processing of thedissolved calcine is currently ebulous A contact handled non-TRU grout waste for the low-activity raffinate from the UNEX process is currently the most probable final waste form thatwould meet near-surface disposal criteria. Thus, a conservative set of assumptions was usedto anticipate the necessary radionuclide removal efficiencies required for the application ofthe UNEX process to calcine treatment. These assumptions include using the groutformulation developed for UNFX raffinate produced from treatment of the tank waste 45%waste loading resulting in L4 in 3 of grout formed per I O in� of low-activity waste raffinategenerated) 4]. Te NRC Class A LLW it for Cs (1,0 Ci/M3 in the final waste form) adthe non-TRU iit for the actinides (100 nCilg in the grout) would onservatively suffice toinsure the contact handled, non-TRU criteria are met. These assumptions would require>99.3% of the 137CS and >93% of the actinides be emoved by te UNEX process,
The required 9)SY removal requirements for calcine are even less clear, Previousresults indicate extremely high Sr removal efficiencies can be obtained with the UMXprocess applied to the liquid MEL tank waste >99.999% 4 However, this extremelyhigh Sr removal efficiency slightly reduces 137CS and actinide removal, Consequently, thegoals set for 9Sr emoval efficiency in, this flowsbeet testing were simply as "high as
achievable" while maintaining the above described >99.3% and >93% emoval of 137Cs and
actinides, respectively.
METHODOLOGY/EXPEREIENTAL PROCEDURE
Calcine Dissolution and COMDOSit on
A total calcine inass of 14.1 g was dissolved in 2.9 M HNO-3 at a ratio of 100
calcine per L L of acid. The calcine/acid srry was eated to boiling wit cnstant reflux
for 60 minutes. tnder these conditions 9,8 wt, % of the calcine mass was dissolved. The
dissolved calcine was diluted by 30% with 0.5 M. HF to increase the added fluoride
concentration to 0 I M F-. The additional fluoride ion was added in order to complex the Fe,
Mo, Ca, and Zr thus minimizing their extraction by the actiide extractant (CMPO) in the
UNEX solvent, ultimately reducing the volume of high activity waste. The composition of
the solid calcine and the concentrations of select elements in the dissolved, diluted calcine
solution are indicated in Table .
- 248 -

JAERI-Conf 2002-004
Table 1. Solid and dissolved calcine composition
Solid Calcine Dissolved Calcine (w/ BF Dilution)Stable Element: (Wt. %) (Hg/mL) (M)
Al 9.8 7.87E+03 0.29Ba 0.018 3.89 2.8E-05Ca 26 2.09E+04 0.52Fe 0.5 250 0.0045K 0.67 483 0.012
Mn 0.09 68.1 1.24E-03MO <0.01 14.3 1.5E-04Na 2.8 2.30E+03 0.10Ph - 21.8 LIE-04Zr 7.32 5.80E+03 0.064F- 8.44 1.41E+04 0.74W - - 0.86
Radionuclides: (Bq/g) (Bq/mL)Cs-137 8.4E+07 7.39E+06Sr-90 7.5E+07 6.17E+06
Gross cc 1.34E+05Arn-241 3.4E+04 2.25E+03Pu-238 1.3E+06 5.19E+04Eu-154 6.7E+05 5.28E+04
Analytical
Analysis of 7Cs in the organic ad aqueous samples was performed using HighPurity Germanium Gamma Spectroscopy (BPGE). Alpha spectroscopy was used for gross ot,241 AM and 2"Pu analyses. Inductively Coupled Plasma Emission Spectroscopy (ICP-ES) wasused for Al, Ba, Ca. Cr, Fe, Mn, MO, Ni, Pb, and Zr analyses. Sodium and potassium analyseswere performed using Atomic Absorption Spectroscopy (AAS).
Flowsheet Configuration and Centrifugal Contactors
The NEX flowsbeet demonstration was performed using 2-cm diameter centrifugalcontactors installed in a shielded hot cell facility. The centrifugal contactors consist of 24stages of 2-cm dameter centrifugal contactors, feed and receiving vessels, feed pumps, and anair purge system for the contactor bearings,
The centrifugal contactors were designed and fabricated by Argonne NationalLaboratory. The contactors were modified at the INEEL for remote installation and operationin the shielded hot cell facility.
RESULTS AND DISCUSSION
Countercurrent Flowsheet Test
Based on the above results, as well as those from previous batch contact and flowsheettests with simulated and actual dissolved calcine 56] a flowsheet was proposed forintegrated testing with actual, radioactive, dissolved calcine as indicated in Figure 1. The
- 249 -

JAERI-Conf 2002-004
UNEX flowsheet consisted of thirteen extraction stages an organic to aqueous phase ratio(O/A) of 1.5, one stage of scrub 0.2 N4 NH4NO3) at an OIA of T5 ad 10 stages of strip(I M guanidine carbonate, 20 g/L DTPA) at an /A of 2.0.
Strip Feed Scrub Feed Dissolved Calcine1 M Guanicline Carbonate, 0.2 M NKN03 Feed
20 g/L DTPA
3.0 mUrnin 0.8 murninj j 32 mUminle
7 11 112 13 14 15 16 17 18 191!� 2122 2� recy
3.0 mUrnin 4.0 Urnin
6 murnin UniversalSolvent
Fig I UNEX flowsheet configuration for testing with dissolved H-3 calcine
Flooding was ot observed in the effluent streams. Precipitate formation was notobserved in ay of the samples taken during operation or in the contactors after shutdown.
The percentages of 37CS, "Sr, "tu, total alpha, 141AM 21pri, in each of the uentstreams at shutdown are ndicated in Table 2 Overall material balances (calculated as thepercentage of outfin) are also indicated in Table 2 The activities of total alpha, 137CS and Srin the raffinate throughout the test are given in Figure 2 Distribution coefficients weremeasured for total alpha, 137cS, 90sr, 241Arn, and 28Pu on select stages, The resulting
distribution coefficients are given in Table 3
Table 2 Percentage of radionuclides in the WFX euent streams
1:3 90sr 154 241,4 -- "�IlpuStream Cs Eu Gross ot M
Raffinate 0,013% 0. 27% aND 0. % <0�01% 0.071%Strip W92% 103,0% 1011% 97,94% 1133% 179,2%
Organic 0.0002% 4. 1% <<O. 1% <(0 I% 0.0006% 0.0001%
Material 98,93% 103.3% 1 01 I% 98.04% 113.3% 179-3%
Balance
aND = Not Detected
- 250 -

JAERI-Coni 2002-004
1.00E+05Cs-137 NRG Close, A LLW Limit of 1.0 Cifiva
1.00E+04wm-irw limit of 100 nIV9
1,OOE+02
Alpha1.00E+01
0 50 100 160 200 250 300
Timo (mlnuivsi
Fig. 2 Activity of 9OSr, 13"Cs, and gross a in the raffinate as a function of time
Table 3 Distribution coefficients from the UNEX flowsheet demonstration
Stage Dcs-137 DSr-90 DGRoss DAm-241 DPu-238
Extraction 24 0.611 0.75 0.23 - -
23 0.951 1.02 0.19 - -
20 1.87 1.38 0.42 - -
1 8 - 1,19 0.68 - -
1 6 1.88 1.25 0.29 - -
1 4 2.41 1 29 122 9.3 8 1
13 3.44 1.29 108 10.2 203
1 2 3.79 1.10 120 10.1 149
Scrub I 4.64 61,6 106 177 846
Strip I 0 0�05 0.001 0.006 0.015 0.006
9 0.057 0.002 <0.001 0.001 0.001
8 8.7E-05 0.15 0.006 0.006 0.009
The 137Cs activity was reduced from 7.39F+06 q/mL in te feed to 7.53E+02 Bq/mL
in the aqueous raffirlate at shutdown of the system. This corresponds to a removal efficiencyof 99.99%. In the Strip etion, the 137Cs distribution coefficients anged &om 8.7E-05 to
137CS exit,0.057, resulting in >99,99% of the extracted ing in the strip product. Assuming grout
formulation similar to that developed for INEEL tank waste, 14 M3 of grout would be
generated Kom eac L m 3 of low-activity waste. Under these assumptions, the 137 Cs activity
in the final waste forin of approximately 0014 Cihn which is sufficiently low to insure a
contact handled waste based on y-activity.
- 251 -

JAERI-Conf 2002-004
The Sr activity was reduced from 6.17E+06 Bq/mL in the feed to 1.37E+04 Bq/mLin the aqueous raffinate imediately prior to shutdown. This corresponds to a removalefficiency of 99.73%. Assuming, as before, that 14 m3 of grout would be generated from each1.0 rn� of low-activity waste, the 9 Sy activity in the grout would be approximately 026 Ci/m3in the grout. In the strip section, distribution coefficients for "Sr ranged from 6.7E-04 to 0. 15.As a result, the extracted 9Sr quantitatively exited (>99.99%) in the strip product.
The alpha activity was reduced from 1.34E+05 BqhnL in the feed to 107 Bq/mL in theaqueous raffinate immediately prior to shutdown. This corresponds to a removal efficiency of99.9%. Under the previous assumptions for a final grout waste, the total alpha activity isapproximately 1 I nCi/g in the final waste form, well below the non-TRU limit of I 0 nCi/g.Removal efficiencies of >99.99% and 99.93% were obtained for 241AM and 211pU,
respectively. In the strip section, the total alpha , 241AM, and 238 pU were quantitativelyrecovered >99.9%) fi7om the solvent.
The effluent streams were also analyzed for Al, Ba, Ca, Cr, Fe, Mn, Mo, Na, Ni, K,Pb, and Zr. The percentages of these elements and the overall material balances (calculated asthe percentage of out/in) in the effluent streams are given in Table 4 The distributioncoefficients of the more interesting matrix components, including Ca, Fe, Mo, and Zr, weremeasured on several select stages in the flowsheet. The measured distribution coefficients arelisted in Table 5. Of the bulk matrix components, Ba and Pb were quantitatively extracted andexited in the strip product. Due to the ininor amounts of these components in the calcinewastes (Table 1), efforts have not been directed at limiting the amount of tese elementswhich extract and enter the strip product, Additionally, immobilization of Pb with the high-activity glass waste may be perceived as beneficial due the hazardous nature of Pb (from aRCRA perspective).
Table 4 Percentage of stable metals in the UNEX effluent streams
Stream Al Ba Ca Cr Fe MnRaffinate 107.6% <0 17% 106.8% 102.6% 98.32% 77.15%
(Normalized) (99.88o) (< 0. 1 9 Yo) (97.33%) (9 8. 74 o) (88,50%) (77.2 7Yo)Strip 0.13% 93.96% 2.93% 1.31% 12,78% 22.68%
(Normalized) (0. 1 2 ?o) (99.81 o) (2. 6 7 Vo) (L 2 6 Yo) (I 1. 5 0 %) (2 2. 7 3 916)Material Balance 107�8% 94.13% tO9.7% 103.9% 111.1% 99.83%
Effluent MO Na Ni K Pb ZrRaffinate 88.82% 107.2% 103.5% 65.62% <0.40% 99.30%
(8 7.93 Yo) (68.59o) (98. 71 Yo) (60.90%) (< 0 3 2 Vo) (93 03 Yo)Strip 12.20% 49.12% 1.35% 42.14% 121.9% 7.44%
(12. 0 7o) (3 1. 4 1 916) (1 2 9 016) (39. 1 0 Vo) (99. 68o) (6 9 7?lo)Material Balance 101.0% 156.4% 104.9% 107.8% 122.3% 106.7%
Table 5. Measured distribution coefficients of select matrix metals
Stage De. DF, Dm, DzrExtraction 14 0.034 0.42 0�11 0.05
13 0.038 0.38 0,10 0.0512 0.034 0.53 0.09 0.05
Scrub I I 0.011 310 0,09 4.4strip 10 0.32 1.0 <0 0.004
9 - 1.7 < 0.05
- 252 -

JAERI-Conf 2002-004
Aluminum, Ca, Gr, Na, and Ni were not extracted into the UNEX solvent based on thepercentages of tese omponents in the raffinate relative to the feed, The limited extraction ofthe bulk matrix omponent Ca is an excellent indication that the fluoride addition wassuccessU in firniting a extraction. The material balance for Na was particularly poor at-156%, and is attributed to contamination of the strip product sample. Manganese 22.7%)and K -40%) in the dissolved calcine solution were extracted into the UNEX solvent andexited with the strip product, Minor amounts of Mn and K are present in the calcine wastes(Table ) and, as with Ba and Pb, efforts have not been directed at limiting the amount ofthese elements that extract and enter the strip product. Based on the raffinate samples, 12 ofthe Mo, 17% of the Fe, and 07% of the Zr in the waste feed were extracted by the UNEXsolvent. Thus, the extraction of Zr, Fe, and Mo appear to be substantially suppressed,presumably due to the addition of fluoride ion to the dissolved calcine waste.
CONCLUSIONS
A novel solvent extraction process, the UNEX process, has been developed for theseparation of cesium, strontium, and the actinides from acidic waste solutions. A counter-current UNEX flowsheet was successfully developed and demonstrated for the treatment ofactual dissolved INEEL calcine waste. With the UNEX flowsheet, removal efficiencies of99.99%, 99.73%, and 99.9% were obtained for 17CS, 10Sr, and the actinides, respectively.These high removal efficiencies are currently believed to be sufficient to achieve a non-TRU,contact handled waste form for near surface disposal. Of the non-radioactive metalsevaluated, Ba and Pb were quantitatively extracted and recovered in the strip product.Potassium, Mo, Zr, Mn, and Fe were also extracted 40%, 12% 7, 23%, and 2 to 10%,respectively) and recovered in the strip product.
ACKNOWLEDGEMENTS
This work was supported by the U. S. Department of Energy Office of Science andTechnology's Efficient Separations and Processing Crosscutting Program under the auspicesof the Joint Coordinating Committee for Environmental Management (JCCEM), and theTanks Focus Area.
REFERENCES(I)E. P Horwitz and W. W. Schulz, Solvent Extraction in the Treatment of Acidic High-LevelLiquid Waste: Where Do We Stand?, ANL/CIWCP-93488, 1998).(2)J. D. Law, R. S. Herbst, et al., Proc. of SPECTRUM'96, August 18-23, 1996, Seattle, WA,3, 2308,(1996).(3)V. N. Romanovskiy, 1. V. Smirnov, et al., Solvent Extr. Ion Exch., 9(l): 1 200 1).(4)J. D. Law, R. S, Herbst, et al., Solvent Extr. Ion Exch., 19(l) 23 200 1).(5)J. D. Law, R. S. Herbst, et al., "Demonstration of a Universal Solvent Extraction Processfor the Separation of Radionuclides from Actual INEEL Sodium-Bearing Waste andDissolved Calcine," [NEEL/EXT-98-01065, 1998).(6)J. D. Law, R. S. Herbst, et al, Proc. Of Waste Management, 2001, Tucson, AZ, Feb. 25-Mar. 1, 2001).
253 -

This is a blank page.

JP0250308JAEPJ-Conf 2002-004
ACTINIDE SEPARATION BY TODGA EXTRACTION
YASUJI MORITA, YUJI SASAKI AND SHOICHI TACF11MORI
Japan Atomic Energy Research Istitute, Tokai-mura, Tbaraki-ken, 319-1195 JapanFax: 81-29-282-5937, e-mail: nlofita�nuceftokaijaeri.gojp
Extraction process o actiuide separation from high-level liquid waste (HtLW) with NNN',N'-tetraoctyl-3-oxapentanediamide (TODGA) was pyeliminarily evaluated by simulation of Am and Sr behaviors. Thesolution olume required for the ratment of an unit arnount of HLLW was aso evaluated rising data onextraction capacity of te solvent. Results of the alculation showed that it is possible to establish an extractionprowess with 0.2M TODGA in ri-dodecaDe, where Am is extraQted in avery igh yield of more tan 99.99% andmore tan 99-95% of Sr is kept i the aueous pase, Te present sudy also deals with the effects of the flowrate cange of be scrub ud the solvent o the Sr contamination in te A fictio ad te possibility of thirdphase formation i ox-der to ecidate the characteristics of the extraction process y TODGA.
Key words: Actinide separation, NNN',N"-tetraoctyl-3-oxapentanediamide (TODGA), Process simulation,Sr separation, Process scale estimation
1. INTRODUCTIONThe extraction with tridentate neutral ligands, diglycolamides (I)GA), has been studied
for the separation of actinides from hgh-level iid waste HLLW). From fundamentalstudies aiming at a ugh extractability toward actinides and a high solubility of te extractantin n-dodecatie, 'N.NN',N'-tetraoctyl-3-oxapetitanediamide (tetraoctyldiglycolamide, calledTODGA hereafter) was selected as the most proper DGA extractant[l]. Structure ofTODGA is showniflFig I Distribution ratios of Am and Cin are high enough at the nitricacid concentration higher than IM ad are low eough for the back-extraction. at .01M nitricacid. Lanthallides show te similar behavior as Am ad Cm in the TDGA extraction.
In the present study, actinide separation �from HLW by TOCTA extraction process waspreliminary evaluated by alculation. Elements selected in te present evaluation are Amand Sr. Since two elements, Sr and Cs, are the main contributors for te radioactivity inT-TLLW, decontamination of them is one of themost important factors in the development of aseparation process for actinides from HLLW. The distribution atio of Cs is very low, butthe distribution ratio of Sr (Ds,) is a little high in the TODGA extraction[l]. For instance,Ds,is2.7at3Mt-�tricacidititheextractionwitliO.IMTODGA, Itisthereforeimportanttoevaluate the Sr behavior and to find a condition which gives a good separation of Am from Sr.
In the present sudy, volume of he TODGA solvent rquired for the treatment of HLLWproduced from a unit amount of spent fuel was also evaluated sing experimental data onextraction apacity of te TODGA solvents Volumes of various aueous solutions wereobtained from the flow rate ratio of the aqueous solutions to the olvent. The ealuation ofthe solution volume would contribute to the estimation of the process scale and applicability.
An additional evaluation was performed on the effects of the flow rate change of thescrub and the solvent on the Sr ontamination in the Am fraction and the possibility of thirdphase formation in order to t4uoidate the haracteristics of the extraction rocess by TODGA.
Although the present study lies in the H2
preliminary stage o te process development, it C81117 Creveals the portant points of te DGA extraction \N_C / '_�OCH2 CBH17
process an gives necessary information for C-N
experiments on oontinuous counter-current C8HI7 0 \C8H17
extraction.Fig. I Structure of TODGA
- 255 -

JAERI-Conf 2002-004
2. EVALUATION METHOD Solvent Feed Strip'LLW Scrub10.2M TODG� F3M HN 5-3M HN03 10.01M HN0312.1 Extraction System Evaluated
The system evaluated contains three 9sections: 5-stage extracting section, 3-stagescrubbing section and 4-stage sripping FUsed Solvent]
section, which is shown in Fig. 2 At the Fig. 2 Extraction process evaluatedextracting section, Am, Cm and rare earth in the present studyelements (RE) are extracted with TODGA- n-dodecane solvent ftom HLLW. In thepresent system, Cm and R always show amost the same behaviors as Am. The nitric acidconcentration of the HLLW feed was fixed to, 3M. The solvent used in the evaluation was0.2M TODGA in n-dodecane, Concentration of nitric acid in the scrub is one of the processparameters to be optimized. At the stripping section, te elements in the organic phase areback-extracted with .01M i'tric acid. Flow rate ratios of the solvent, the scrub ad the stripto the HLLW feed were adjusted to achieve the objective separation of Am and Sr. Theobjective value for the Am and Sr separation in the present study is more than 99.99% for Amrecovery and less than 0.05% for Sr contamination in the Am fraction (more than 99.95 ofSr as an yield in the raffinate).
2.2 Distribution RatioData on te distribution ratio of nitric acid DIN00were obtained by batch extraction of
nitric acid at various oncentrations of TODGA (0.1-0.5M). A logarithmic plot of theequilibrium concentration of nitric acid between the organic and queous phases lay well on astraight line. The results showed tat DnN01 is proportional to the 0.7th power of theconcentration of nitric acid in the aqueous phase ad is proportional to the TODGAconcentration. The values of DHNO, obtained from these relationship were used in thecalculation of nitric acid behavior in extraction processes[21,
The dependence of the distribution ratio of Am (D,,,,,) on the itric acid, concentration wasobtained experimentally for 0.1M TODGA - -dodecane. Using these data, an, equationwhich gives D,,,, as a fifflCti0f) of the nitric acid concentration in the queous pase (D,=F([HN03]Aq )was obtained by the ethod of try and error without ay scientific basis[21.Then, D, for 0.2M TODGA was calculated by the experimental data tat D, is proportionalto the 3.7th power of the TODGA concentration[l]. Dependence f distribution ratio on theelement concentration was not considered i the present evaluation,
The distribution ratio of ST (Ds,) at 0,2M TODTAwere obtained by the same method asin the case of Am described above, except ta D, is proportional to te second power of theTODGAconcentration[l]. ThedistributionratioofBaislowenotighanditsextractionwasnot considered in te present study.
2.3 Calculation MethodBehaviors of nitric acid, Am and Sr in te system of extraction process employed in the
present study were calculated by a spreadsheet software sing mass balance equation anddistribution ratio of each component at each stage, Stage efficiency was assurned to be .
A concentration profile of nitric acid was obtained first. Since Dth'03 depends on thenitric acid concentration, the profile annot e obtained directly with analytical quations.Therefore, the repetition calculation method was employed.
Then, DA. and Ds, at each stage were calculated by the equation described above usingthe concentration of nitric aid at te stage. Concentration profiles and fractionaldistributions of Am and Sr can be obtained analytically.
- 256 -

JAERI-Conf 2002-004
2.4 Estimation of te Process ScaleExtraction capacity of the TODGA solvent was measured by performing the extraction of
Nd at high concentration[2]. In the case of the TODGA solvent. the capacity is determinedas the maximum eieweDt concentration where the third pase (the second organic phase) isnot formed, and it depends on te nitrio acid oncentration in the aqueous phase. In thepresent study, t was assumed that the capacity against Am and Cm, RE) and Sr is the sameas te capacity against Nd.
The volume of the TODGA solvent required for the treatment of HLLW produced froman unit spent fuel was evaluated using the extraction capacity. The unit spent fuel used inthe present sudy was 'toll of U02 spent fe brned up to 45,OOOMWd/t in light water reactor.The HLLW produced ftoin such unit spent fuel (the unit HLLW, hereafter) contains 103molof An-i+Cm+RE at-id 13mol of Sr. The total concentration of these elements in the organicphase was supposed to be able to increase up to 80% of the extraction capacity describe above.To detemline the maximum total concentration, it is important. to evaluate the elementaccumulation at the extracting and scrubbing sections. Volumes of aqueous solutionsrequired or the treatment of the unit HLLW were obtained from the flow rate ratio of theaqueous solutions to the solvent in each process condition. The volume of the HLLW feedfor the unit HLLW is One of the process parameters.
3. RESULTS AND DISCUSSION Solvent HLLW Feed3.1 Optimized Process 0.2M TODGA 3M HN03
::� I o �-. I 0 O� -Fow II GO IVarious conditions of the extraction process were 6.6 M3 6.6 m 9. M
evaluated to achieve the objective separation of Amand Sr. Table I shows the conditions of selectedprocesses from many evaluated processes and the --------------- Vcalculated results on the behaviors of Am and Sr and Stripthe volumes of the solutions required for the treatment 0.01M HN03Flow: 0Sr9 9of the nit HLLW. Recovery (%) in Table I meansthe ratio of element amount in the stripped solution(the Am fraction) to the initial amount. Among theseprocesses, the Pocess No.4 would be the most 3.3 6.6 3
optimized process, where Am is recovered in a very M Used Solventhigh yield of ore than 99.99% and the Sr 9 7 Am 0003%
contamination was less than 0.05%. Figure 3 shows Sr 0044% Sr <0.001 %the condition and the evaluated results on the Process Flow: 50 Flow: 100No.4. The volume of the HLLW feed was 66 M3, Fig. 3 The optimized processwhich means tat the Purex raffmate can be used (Process No.4 in Table I)almost directly as the feed to this process. One of thedrawbacks of this process is that the volume of the raffinate is increased 4 times as much asthat of the HLLW feed.
Table I Results of the evaluation for the process with 0.2M TODGA
No. [HN031 M Flow rate ratio (-) Recovery (%) Volulne ni 3) to treat the unit HLWFeed Scrub Strip Solvent Feed Scrub Strip Am Sr Solvent Feed Scrub Strip Total
1 3 1 0,01 TS�l 00 100 25 99.90 90.8 8.3 11.0 11.0 2.8 33.12 3 1, 0.01 37.5 100 100 25 >99.99 16.0 7.6 20.3 20.3 5.1 53.43 3 0.5 0.01 100 100 200 50 >99.99 0.52 6.8 6.8 13.6 3.4 30.74 3 0.5 0,01 100 100 300 50 >99.99 0M44 6.6 6.6 19.7 3.3 36.25 3 0.5 0,01 150 100 450 75 >99 99 0.030 6.5 4.3 19.4 3.2 33.46 3 0�5 0.01 200 100 550 75 >99.99 0.037 6.3 3.1 17.3 2.4 29.17 3 3 0.01 75 100 100 75 >99.99 99.92 11.5 15.3 15.3 15.3 57.4
- 257 -

JAERI-Conf 2002-004
3.2 Effect of Flow Rate Change - 0 18 150Further evaluation was performed on the
effects of the flow rate change of the srub and CO 0�16 140 270 2
the solvent on the Sr contamination i the Am 0.14 130
fraction and the possibility of third phase :5 120.2 0.12formation in order to elucidate the.2 110
characteristics of the optimized process which 76 0.10was shown in Fig. 3 Figure 4 shows the co 100 C 0
E 0.08 V -Ueffect of the change in the scrub flow rate. < 90 2aAs plotted in closed squares, the Sr 0.06 X
80.2contamination increased sharply with the C:0.04 070decrease of the scrub flow rate. The change E
in the scrub flow rate was sensitive to the Sr B 0.02 60 E0contamination. On the other hand, maximum 2 0.00 50element concentration i the organic phase, -20 -10 0 1 0 20
which is plotted in pen circles as the ratio to Chage in the scrub flow rate (%)
the extraction capacity, was less affected by Fig, 4 Effect of te hange inthe change in the scrub flow rate. Even by the scrub flow ratethe 20% increase, the element concentration iskept lower tha te extraction capacity. Thevalue of I 0 i this fig e
,ur means that theelement concentration in te organic phase 0'18 150
2reaches the extraction capacity. The third 0.16 140U)phase must be fortired from this point. 0,14 130
The change in the solvent flow rate 120 a)gives much effect both on the S r 0.12 20
110contamination and o the aximum element -c 0.10z 100%-
concentration in the organic pase, as shown 100 S0.08
in Fig. 5. Only 10% decrease of the solvent 90
flow rate would cause the third phase s 0.06 4- 0. 80---- ------formation. Since the maximum element .0 r- C1� 0.04 70 0concentration is 80% of the extraction capacity s;
E 0.02 60in the normal condition, 20% decrease in the 2 Esolvent flow rate should be acceptable, bt the 0.00 50 Wdecrease of the olvent flow rate results in -20 -10 0 10 20more accumulation of the elements i te Change in the solvent flow rate (%)
extraction ad scrub sections. This is the Fig. Effect of the aDg inreason why only I % decrease is acceptable. the soiveDt flow rateThe flow rate of the solvent should be muchmore strictly controlled in order to avoid thethird phase formation and to keep the Srseparation.
3.3 Effect of decrease in distribution ratioAs described before. the drawback of the optimized process evaluated in the present
study is the high scrub flow rate, which is due to the high distribution ratio of Sr, From theviewpoint of the volw-De reduction of the raffinate, ypothetical processes we evaluatedwhen distribution ratios of both Ar ad Sr were decreased. Te volume reduction of theraffinate would be very portant because the raffinate should be treated for the separation ofelements other than atinides sch as Cs, Sr and PGIVI, or for solidification.
- 258 -

JAERI-Conf 2002-004
The results of the evaluation showed that the �Solventl �JHLLWFee �, Scrub
volume of raffimate would be reduced ftorn 26 3 ml 10.2M TODGAI j 3 N03 10.5M HN03F_Tk�w Io 0 0 Flow:1175
to 19.9 in', which is 24% reduction, if distribution 7.2 m3 12.7 3
ratios of botb Ain and Sy were dcreased to tbe alf, IFas sown In Fis4, 6 If distribution atios of both Ainand Sr were decreased to the 14, the volume of 9�9 ---------------- Y
raffinate would be reduced to 15.0 in', which is 43% StripFreduction. 0 01M NO.3Am <0.001 I ISr 99.959% F1 25
3.4 Sr Separation at Strip Step IF 1.8 M3
As was sown in the evaluated results forProcess No, i Table 1, it is also possible to extract
3M3 7.2 M3Sr quantitatively with 0.2M TODGA. An Vadditional evaluation was devoted to a process were AmCrr RE Fused Solvent
Am 99.994 Am 0006%both Ain ad Sr are extracted and they are separated Sr 0.041%- Sr <0.001%
from each other at the following two strip steps, At Flow: 25 - - E LO W_ --_1 00-the first strip� Sy is 'back-extracted, and here an Fig. 6 The hypothetical process,organic scrub is ecessary to keep the Am in the when the distribution ratioorganic phase I the present evaluation, the first is decreased to the halfstrip step composed of 8-stage stripping section for Srback-extraction and 4-stage scrubbing section with the organic solvent for Am re-extraction.The nitric acid concentration of the first strip (strip 1) is one of the parameters to be optimized.The nmber of stage at te second strip step for Am back-extraction was increased to 6 stagesin order to decrease the flow rate ratio of the second strip (strip 2 The most important pointof this system is to recover Sr from the solvent in a high yield with low contamination of Am.The nitric acid concentration of the strip I and the flow rate ratios of the organic scrub and thestrip I were adjusted in tis point of view. The flow rate ratio of the scrub at the extractionstep was decreased to extract Sr quantitatively.
Various process onditions were evahiated[2] and one of the process which gives theobjective separation of Am and Sr is shown in Fig. 7 As shown in this figure, it is possibleto establish a process where Sr is separated in a yield of more than 99.95% with the Amcontamination less tan 0.005% and Am is recovered in a yield of more than 99.99% with theSr contamination less than 0.05%.
--------------
Solvent cru PFgan-c Scru] Strip I�A 3M HNO 02M TOD" OAM HNO.3
Ln!�w -, 2011 Ow: F Flow: 120 Flow: 07.8 ml 3.9 rn 2.0 M3 47 M3 :7.8 ml 5. M3
9 0
m3 r ---------------------
F-Strip 2< HNO,
75rO. 1'12.5 3:1 2.9 3
1 23
2.9 m 12.5 3
se o venmFig 7 The evaluated process for Sr r<
separation at strip step Ow
259 -

JAEFJ-Conf 2002-004
Compared to the Process NoA where Sr is kept in the raffinate, te required volume ofthe solvent including the organic scrub had to be increased to about twice, but the totalvolume of the organic and aqueous solutions was reduced. The voitune of the HLLW feedwas 39 in'.
Various factors sch as the behaviors of other elements have to be examined in order todetermine which extraction system would be better, the system as shown in Fig. 3 where Sr iskept in the raffinate or the system as shown in Fig. 7 where Sr is extracted together with Amand Cm and it is separated fi-om tem at strip step.
4. CONCLUSIONExtraction process for actirride separation from FLLW with NNN',N'-tetraoctyl-3-
oxapentanediarnide (TODGA) was preliminarily evaluated by simulation of Am and Srbehaviors. Results of the calculation showed that it is possible to establish an extractionprocess for the actinide separation from HLLW with 0.2M TODGA in n-dodecane, where Amis extracted in a very igh yield of more than, 99.99% and Sr is kept in the aqueous phase in ayield of more than 99.95%. The process is suitable to use the raffinate from the first cycle ofthe Purex process almost directly as the feed. t is, however, necessary to increase the scrubflow rate to 300% of the HLLW feed flow rate in order to achieve the above Sr separation.
Examinations on the effects of the flow rate change showed that the change in the solventflow rate gives much effect both on the Sr contamination in the Am fraction and on themaximum element concentration in the organic phase. Te flow rate of the solvent shouldbe strictly controlled in order to avoid the third hase formation and to keep the Sr separation.
Anadditionalevaluationwasperformedonaprocesswhereboth, i d Sr are extractedand they are separated from each other at the following two strip steps. Results of thecalculation showed that it is possible to establish a process where Sr is sparated in a yield ofmore than 99.95% with the A contamination less than 0.005% and Am is recovered in ayield of more than 99.99% with the Sr contamination less than 0,05%.
Although the present study still lies in the preliminary stage of the process development,it revealed the iportant points of the extraction process by diglycolamides (DGA), Theresults of the present study indicate that there is still some room, for optimization of theactinide separation process by DGA extractants. The optimization would, be achieved veryeffectively by using a solvent which has a higher extraction capacity and gives a lowerdistribution ratio of Sr.
For the process development, it is also necessary to examine and control the behaviors ofother elements and to perform continuous covinter-current extraction tests.
REFERENCES[11 Y. Sasaki, Y. Sugo, S. Szuki and S, Tacbimori, Solvent xtr. Ton Exch., 9, 91 2001).[2] Y. Morita, Y. Sasaki and, S. Tachimori, Proceedings of nternatiotiat Conference on
"Back-End of the Fel Cycle- From Research to Solution" GI.OBAL2001), September 9-13,2001,ParisFrancePaperNo.036(publishedinCD-ROM)(2001).
260 -

JP0250309JAERI-Conf 2002-004
SYSTEMATIC CARACTERISTICS OF LANTHANIDES AND
ACTINIDES IN PYROCHEMICAL AND AQUEOUS CONDITIONS
Hajimu Yarnana
Research Reactor Institute, Kyoto University
Noda, Kumatori-cho, Sennan-gun, Osaka 590-0494, Japan
Pyrochernical processing techniques have received attentions for the future reprocessing and
partitioning technique, and the assessments on their technological feasibility are now under way.
Actirrides and lanthanides are the major elements to be treated by this technique, and thus it is desired
to establish a thorough interpretation of their complicated chemical characteristic. Among various
scientific trials to investigate the chemical properties of actinide and lanthanide in pyrochemical
systems, assessment of their systematic feature along the 4f(lanthanide)- and 5f(actinide)-series is a
useful method for this purpose, In a pyrochernical system consisting of molten salt and liquid metal,
the interaction of f-elements; with the components of liquid phases significantly controls their chemical
behaviors, and this creates a characteristic feature of the systematic variation of chemical properties
along the series. In this presentation, the systematic variations of some chemical properties of
lanthanides and actinides in pyrochernical and aqueous system are compared and discussed. Values
of thermodynamic quantities of lanthanides and actinides in pyrochemical systems, which were
experimentally determined or reported by literatures, are analyzed, and their systematic characteristics
are compared with similar characteristics of aqueous system.
Experimentally determined formal potential between MC13 (M; lanthanide) and their metallic states in
molten alkaline chloride corresponds to the standard Gibbs energy change of formation Of MC13 that is
dissolved in molten salt (AGNMC13 in S), and relates to the excess Gibbs energy changes Of MC13
dissolved in the molten salt (AGx[MC13 in S). This is the result of te chemical interactions of M31
with the components of the melt. AGx[MC13 in shows a rough tendency to decrease toward more
negative side as the elements proceed along the 4f series. This rough decreasing trend of AG"[MC13
in S in light lanthanides is similar to the solution enthalpy change Of MC13 in aqueous solution
(A.H,01[MC13 aq.]), suggesting that a rough similarity of the electrostatic mechanism of the formation of
aquo-ions in aqueous solution and that of chloride complex in molten salt. However, the variation of
AG"[MC13 in SI has less smoothness than the variation Of AH,,,I[MC13 aq.], which implies the possible
presence of element-specific interaction of M31 in the molten salt. This is different from the
monotonic variation of the bonding in the aqueous system. The enthalpy changes arising when
transferring gaseous M" into the liquid are estimated by Born-Harbor cycle procedures using reported
ionization otentials and sublimation enthalpy changes. A slight difference can be seen in the
comparison between aqueous system and molten chloride, and this is considered to show a difference
of the chemical satus in a solution and molten salt.
- 261 -

JAERI-Conf 2002-004
In the liquid metal hase, the tbermodynamic stabilities of larlthanide sbow unique systematic
variationalongtheseries, ItwasfoundthatAHe'[MinB]'sofLaCyd,TbDy,andErapproximately
satisfy the semi-empirical rule for mixing two liquid metals with the use of a proper constant. But,
Ce, Pr, and Nd were found to deviate from this rule, suggesting the irregularity of these three elements
in the formation of intermetallic; complex in the liquid bismuth[l][2]. The difference of the
systematics of AH"[M in Bs between lanthanide and actinide can be obviously seen in the behavior
of light actinides[3].
UV-Visible spectrophotometric measurements of trivalent lanthanides and uranjinn in molten alkaline
chloride were comprehensively carried out. For comparison, measurements of lanthanides in
aqueous chloride solutions were carried out too. The hypersensitive absorption peaks observed in
molten salt in a visible-region showed different magnitude of absorbance and slight shifts of
wavelength compared with those observed in LiCl aqueous solutions, Hypersensitive absorbances of
lanthanides are considered to indicate the status of coordination around the cation, and thus systematic
variation of the hypersensitivities of lanthanides is expected to give informations of the difference of
the surrounding conditions of lanthanide cations in the melt.
Refeirences[11 H. Yamana, N. Wakayama, N. Souda, and H. Moriyama, J. NucL Mater., 278(2000 37
[2] H. Yamana, J. Sheng, N, Souda, and H. Moriyama, J Nucl, Mater, 294(2001) 232[31 H. Yamana, J. sheng, K Kawamoto, and Ii. Moriyama, J. NuCL Mater., 294(2001 53
262 -

JP0250310JAERI-Conf 2002-004
TRU recovery from HLLW by a pyrometallurgical process
MASAKI URATA, KENSUKE KINOSHITA, AND TADASHI INOUE
Central Research Institute of Electric Power Industry,
Iwadokita 21 - Komae-shi, Tokyo 201-851 Japan
Fax: 8-33-480-7956, e-mail: kurata�criepi.denken.orjp
A pyrometallurgical process to recover TRU from HLW has been developed at Central Research Institute of
Electric Power ndustry since 1987, Based on the developed process flow sheet, two kinds of series test were
performed to measure the material balance of various elements in the series of process operations and to clarify
the major concerns that needed to e solved for industrial deployment. Reductive-extraction, electro-winning,
and nrultistage-extfaction of TRU were per-formed in the first series using molten salt containing TRU, and in the
second one, denitration, chlorination, and reductive extraction were performed ising simulated HLLW. In the
first test, greater than 99% of TRU was recovered as metal with a condition of DFRE > I . In the second test, the
material balance of various eements was measured and the molten salt prepared from simulated HLLW was
confirmed to be suitable for reductive extraction. A demonstration test using genuine HLLW is planed to confirm
the variation in the material balance, especially as this process applies to the recycling use of molten salt solvent.
Key words: HLLW, pyrometallurgical partitioning process, TRU
1. INTRODUCTION
A pyrometallurgical partitioning process (Pyro-partitioning) has been developed at Central
Research Institute of Electric Power Industry (CRIEPI) to recover trans-uranium elements
(TRU) from high-level liquid waste (HLLW) generated from reprocessing spent WR fuels.
Compared to conventional aqueous processes, Pyro-partitioning is expected to generate fewer
process wastes and to favor more compact facilities, because inorganic solvents, reductants,
and gases are used in Pyro-partitioning instead of the organic materials used in the aqueous
processes. Nevertheless, many technical uncertainties must be resolved prior to the industrial
deployment of Pyro-partitioning, especially in respect of maintaining the advantages shown
above. One of the key issues is an accurate assessment of waste generation, including release
of effluents and process wastes due to the volatilization of various materials or to the
accumulation of FP or impurities. As the first step, two kinds of series tests were performed to
measure the material balance of various elements in the series of process operations and to
clarify the points to e resolved for industrial deployment. The first run performed
reductive-extraction, electo-winning, and multistage-extraction of TRU using molten salt
- 263 -

JAERI-Conf 2002-004
containing TRU [, and the second run performed denitration, chlorination, and reductive
extraction using simulated HLI_W 2].
2. PROCESS FLOW
Figure I indicates the process flow ofHLLW
Pyro-partitioning [3]. The various TRU RE II 0 (in wei&t)
elements in HLLW are first dehydrated alkali eements n on H20, NOXTc, Mo Se
and denitrated to oxides by heating inFe,ZrM0 c at C12, LiC]-KCI
the denitration step, then converted to
chlorides via a reaction with chlorine noble metals reductive-
........ extraction [sralt wastegas in a LiCl-KC1 eutectic salt bath in t
�Electro-winni atinentthe chlorination step. These two steps MU stage-produce chlorides suitable for the U on Ba
following pyrometallurgical processes.
Since the alkali nitrates are stable and �Iectro-winnQ
are not denitrated in the following >99% of TRUTRU / U > I I
denitration step with temperature Fig.1 ProcessflowofPyro-partitioning.
maintained at 773K or lower, the alkali
elements are separated from other oxides by rinsing with water after denitration, Rough
separation of Fe, Zr, and Mo is performed in the chlorination step due to the high volatility of
the chlorides. The chlorides recovered in the salt bath are supplied to the pyrometallurgical
processes, which consists of (1) reductive extraction and (11) multistage extraction. (111)
Electro-winning of U ight be introduced between these two steps as an optional step, for the
effective recovery of U. The reductive extraction is performed in a molten-salt/liquid-Cd
system on the basis of the differences in the Gibbs energy of formation for chlorides in the
molten-salt phase and the Gibbs energy of solution for solute metals in the liquid-Cd phase.
The elements nobler than U are recovered in the liquid-Cd phase by adding Li reductants. The
molten-salt phase is then supplied to the multistage extraction step, where the actinides are
selectively reduced and extracted in the liquid-Bi phase by adding Li reductants in a
molten-salt/liquid-Bi system, whereas aikaline-earth elements and RE remain in the
molten-salt phase. In the spent salt treatment step, alkaline-earth elements and RE are
recovered into a lead-electrode by electrolysis of the spent salt. Chlorine gas and LiCl-KC1
generated in this step are recycled back to the chlorination step. The present process aims at
recovering 99% or more of the actinides from HLLW with no accompanying FP other than
RE. Concerning RE, accompanying RE weights comparable to TRU weights is, however,
- 264 -

JAERI-Conf 2002-004
allowed for in the TRU transmutation, when the transmutation is carried out in metallic-fuel
fast reactors 3].
3. FIRST SERIES TEST
3. 1. Procedure
All operations for the first series test were Table I Initial condition of first series t,performed in an AT-atmosphere glove box.
Initial weight CompositionThe starting composition and weight of Element __L:j_ (wto/)
U 420.00 9.09various elements are listed in Table 1, roughly Np 119.21 2.58
corresponding to the products after Pu 14.50 0.31
chlorinating 50 ml of HLLW. Each chloride of Am 119.22 2.58Fe 581.85 12.59
these elements was dissolved in a molten salt Zr 412.59 8.93
bath. First, Fe was extracted and separated Y 102.76 2.22
into liquid Cd by the addition of Cd-Li LA 288.50 6.24
reductants. The applicability of the optional Ce 570.48 12.35Pr 267.95 5.8
electro-winning process for U was Nd 999.96 21.64Eu 237-01 5.13
investigated in the following manner. Various Gd 41.34 0.89
elements, with the exception of Sr and Eu, Sr 445.05 9.63
were reductively extracted into new liquid Cd by supplementary addition of Cd-Li reductants
after replacing liquid Cd, and U was then recovered by electro-winning between the liquid,
Cd anode and a Ta cathode. Then, U and TRU remaining in the Cd anode were oxidized and
extracted completely into the molten salt by the addition of CdC12. The molten salt was
mechanically separated from Cd and then supplied to the 4 steps of multiple batch extraction,
in which a Bi-Li alloy was used as a reductant. After each extraction, the B phase containing
the extracted TRU was separated from the salt phase for submission to the succeeding stage.
The loss of Am, which was the quantity of Am remaining in the salt phase after the fourth
extraction, was estimated to be approximately 04%. As for Np and Flu, these losses were
estimated to be smaller than those for Am, since Np and Pu are more easily reduced. Finally,
the recovered Bi phase was used as an anode and TRU was collected on a Ta cathode by
electro-winning. The temperature of these operations was around 773K.
3.2. Results and discussion
Table 11 shows the material balance in the first series test. Observations on each step are
summarized in 32,1. Concerns regarding industrial deployment arising from these
observations are also summarized in 32.2.
- 265 -

JAERI-Conf 2002-004
Table 11 Material balance in first series test
(1) Reductive (2) Reductiveextraction of extraction of (3) Electro wmnifig of U (4) Multistage extraction (5) lecho-winning of U and
noble metal U, TRU, and TRUelement Ratio Ratio Tu � Recovering Recovering Recovenng Recovering Ratio
eliminated remained in recovered on Composition ratio after I st ratio after 2nd ratio after �vd ratio after 4t� recovered on Composition
from salt w.r.t. salt w.r.t. solid cathode in cathode stage w 'r' t. stage w.r.t. stage w.r.t. stage I, solid cathode in cathodeinitial amount initial amount w.r.t. input deposit Wt,/) input input input input W.k.t. input deposit wt/)
(%) (%) amount(%) amount(%) amount(%) amountC/.) mount ountL/.U 1.29 0.04 81.02 97.88 95.69 98.56 99.22 99.01 49.69 12.55Np 0.01 0.01 1.59 0.89 95.34 99.20 99.82 99.94 93.59 54.54Flu 0.097 0.00 0.78 0.08 94.46 98.96 99.79 99.90 96.67 10.74
Am 0.00 0.02 0.38 0.19 86.75 96.69 99.24 99.81 24.19 12.41Fe 100.00 0.00 0.00 0.00 0.00 0.00 0.00 0.00 0.00 0.00Zr 2.09 0.03 0.54 0.23 77.93 82.70 94.49 95.68 30.56 0.16Y 0.22 0.30 0.00 0.00 0.15 0.15 0.17 0.33 8.62 0.04
LA 0.05 0.03 0.00 0.00 3.41 5.45 8.45 10.64 4.78 0.16Cc 0.05 0.01 0.00 0.00 10.29 16.15 23.64 28.9 14.13 3.26Pr 0.04 0.02 0.12 0.16 12.36 19.07 27.62 33.10 17.60 2.29Nd 0.05 0.02 0.06 0.31 10.06 15.38 22.58 27.22 10.94 3.74Eu 0.03 41.43 0.00 0.00 0.14 0.15 0.14 0.34 4.35 0.01Gd 0.10 0.05 0.10 0.03 3.40 4.95 7.05 8.56 13.76 0.11Sr , 0.00 1 44.44 .21 1 0.00 I 0.00 0.00
3.2. 1. Observations
(1) Reductive extraction of noble metal
-Fe was completely eliminated from the salt and separated from other elements.
-The loss of each TRU extracted in liquid Cd was around 01% or less with respect to the
initial input.
-Small amounts of U and Zr were extracted in liquid Cd.
(2) Reductive extraction of U, TRU, and RE
-Significant amounts of Eu and Sr still remained in the salt, separated from other elements.
-The loss of each TRU remaining in salt was less than 002% with respect to the initial
input.
(3) Electro-winning of U
->80% of U was collected on a solid cathode.
-The end-product composition consisted of approximately 98% of U and 1% of TRU, plus
0.5% of RE and 0.5% of other impurities.
(4) Multi-stage extraction of U and TRU
->99% of U and >99.8% of TRU were extracted and recovered in liquid 31,
-A significant amount of RE was separated froin TRU, although some RE still
accompanied the TRU.
(5) Electro-winning of U and TRU
->90% of Np and Pu were co-recovered on the solid cathode, as well as significant amounts
of U and Am.
-RE concentration in the cathode deposit was less than 10 wt.%.
3.2.2. Concerns
-The Fe-solubility in Cd is too low to recover Fe as the liquid phase Snce some of noble
metals have low solubility in Cd, the development of a recovery systern for noble metal
- 266 -

JAERI-Conf 2002-004
sludge is necessary.
-The method of controlling reductant amount should be designed to be individually suitable
for each step.
-Uranium acquires oxygen in this system. Since a small amount Of U02 sludge is formed, it
should be recovered, especially when recycling molten salt.
-The method of controlling the salt composition should be designed to maintain product
composition.
-Since complete anode-dissolution of U and TRU is difficult, a method of recovery of U
and TRU remaining in the anode should be designed.
-Since FP and other impurities are accumulated in liquid metal solvents, the effect on
TRU-extraction should be estimated, especially in terms of recycling.
4. SECOND SERIES TEST
4. 1. Procedure
Two samples were Table III Initial composition and concentration of simulated HLLW in the second series test
prepared. The starting element I run I I run-2 containe category element comp. cone, 0) I element comp. conc. (gil)
din used ato/.concentrations and used (at%)U
compositions are listed in _ Np actinide Actinide was not added in run-L U 2.50 12.01Am
Table 11, which includes Na TIKalme wa-ste Na 58.57 26.59 Na 56.48 26.21Rb� � alkali metal Cs 3.45 05the contribution of Cs 9 Cs 3.29 8.79
Sr alkaline-earth Ba 2.61 7.09 Sr 3.02 5.34Baconcentrated raffinate, y- Y 0.93 1.63
Gd Ce 5.60 15.83concentrated alkaline La Ce 3.83 10.59
Ce rare-earthwaste, insoluble residues, Pr Nd 4.40 12.53
Nd Nd 5.20 15.15Sm Sill 0.94 2.8
and corrosion product f- EllZr Zr Zr 5.63 0.13 r 5.55 10.22
MO MO 5.23 9.90 MO 5.05 9.79claddings. These values Tc Tc Re 1.13 � 4.15� Re 1 03 3.85
Ru Ru 2.88 .75 _-Lu. 2_95 6-02are determined from a Rh noble metal 1 Q..61 1,24
I'd Pd 2 38 __j00 I'd 2.89 6.21
calculation using -- e- corrosion Fe 4.38 4.83 Fe 5.60 6.31Ni Ni 1.48 __T72_Cr product Cr 0.87 0.89- Cr 0.86 0.90
ORIGEN-11 code, and Se calcogen Se 0.10 0.16 Ne and I e were notTe I Te 0.59 1.49 added in nin-2
assuming the following
conditions: 48,000 MWD/t-U for PWR spent fuel, 4 years cooling, and 99.5% recovery of
heavy metals using the PUREX process. To the alkali waste and corrosion products, Na and
Fe, N, and Cr were added, respectively. To simplify the aalysis, several elements are
substituted with other elements. First, the simulated HLLW, 100 ml in volume, was heated at
373K to volatilize water and a surplus of nitric acid. Then, the sample was fleated at 773K to
decompose the various itrates, except for the alkali elements, The denitrated sample was
- 267

JAERI-Conf 2002-004
then rinsed with water to recover water-soluble alkali nitrate in an aqueous phase. The residue
recovered with a centrifugal separator was calcinated again at 773K. The residue,
approximately 10 g in weight, was then supplied to the subsequent chlorination test. The
sample was heated at 973K in the molten LiCl-KCI salt, and then chlorinated by the
introduction of chlorine gas. Since some chlorides were volatilized during chlorination, they
were collected in a cold trap attached in an off-gas line. Three pieces of the chlorinated
sample were supplied to the reductive extraction test. The first piece was made to react with
Cd. The second and third pieces were made to react with a Cd-Li alloy, which contains Li
sufficient to reduce approximately 80 and 120% of U and RE present in the salt, respectively.
4.2 Results and discussion
Table IV shows the material balance in the denitration and chlorination steps. Table V shows
the material balance in the reductive extraction step. Observations on each step are
summarized in 42.1. Concerns regarding industrial deployment arising from these
observations are also summarized in 42.2.
Table IV Distribution of various elements in pre-treatment process (g)
eleffi-ent -_ FnifiaT""��_ voTaRiTEed recovered in volatiFzeu- sum Ot detectedrun no. contained weight in in aqueous in recovered in detected ratio to
in HLLW 'o n salt bath Wei2ht ini ueNa 2.�559 cyw l� 0.0321 2.570Cs 0.905 0.00182 0.890 0.00232 0.00698 0.901 99.6%Ba 0.709 0.000376 0.000737 0.00762 0.765 0.773 109.1%Y 0.163 0.000103 ND 0.00099 0.156 0.157 96.4%Ce 1.059 0.000582 ND 0.00547 1.080 1,087 102.6%Nd 1.253 0.000789 ND 0.00871 1.207 1,216 97.1%SM 0.280 0.000196 ND 0.00218 0.303 0.305 108.9%Zr 1.013 0.000294 ND 0.903 0'0286 0.932 92�0%
MO 0.990 0.000208 0.497 0.337 0.00171 0.836 84.4%Re 0.415 0.00252 0.421 0.00247 0.00404 0.430 103.5%Ru. 0.575 0.138 ND 0.0104 0.429 0.577 100.3%Rh 0.124 ND ND ND 0.129 0.129 104.3%Pd 0.500 0.000865 ND 0.00952 0.462 0.473 94.5%Fe 0.483 0.000232 ND 0.452 0.0177 0.470 97.4%Cr 0.172 0.000421 0.0762 0.0181 0.0818 0.177 102.6%Ni 0.089 0.0000401 ND 0.00224 0.0851 0.087 98.2%Se 0.016 ND 0.0143 0.00236 ND 0.017 103.8%Te 0.149 ND ND 0.150 0.0108 0.160 107.6%U 1.201 ND ND 0.0543 1.027 1.081 90.010Na 2.621 0.00233 2.515 0.00307 0.0910 2.611 99.6%Cs 0.879 0.000721 0.890 0.00190 0.0197 0.912 103.7%Sr 0.534 0.000198 0.000395 0.00856 0.483 0.492 92,1%Ce 1.583 0.000190 ND 0.0211 1.522 1.543 97.5%Nd 1.515 0.000970 ND 0.0242 1,385 1.410 93.1%
2 Zr 1.022 ND 0.0000818 0.831 0.0984 0.929 90.9%MO 0.979 ND 0.372 0.456 0.00262 0.830 84.8%Re 0.385 0.000339 0.381 0.00684 0.000190 0.388 100.8%Ru 0.602 0.139 0.000223 0.00449 0.149 0.294 48.8%Pd 0.621 0.000484 ND 0.0124 0.654 0,667 107.4%Fe 0.631 0.000259 0.0000126 0.431 0.0447 0.476 75.5%Cr 0.090 ND 0.0774 0.00665 0.0100 0.094 104.5%
- 268

JAERI-Conf 2002-004
4.2. 1. Observations
(1) Denitration and Rinsing
->98% of Na, Cs, and Re with respect to the initial 100% values were recovered in the
aqueous phase, as well as significant aounts of Mo, Cr, and Se.
-Approximately 30% of Ru was volatilized in denitration.
-The morphology of recovered product was that of a very fine powder, suitable for the
following chlorination step.
TableV Dstributionofvariouselementsinreductive-extractionprocess(g)element sum of
run no. containedm' InItIal weightmi remamiedm recoveredmi detectedm' detected detected ratioBLLW 100ml salt liquid Cd third phase WeWA to initial value
Na 2.659 0.0310 0.000339 0.000209 0.032 1. 2%Cs 0.905 0.00580 ND ND 0.006 0.6%Ba 0.709 0.818 0.00283 0.000354 0.821 1 1 5. 8%Y 0.163 0.00666 0.126 0.0239 0.157 96.3%Ce 1.059 0.00677 1.093 0.0426 1.142 107.9%Nd 1.253 0.00573 1.199 O�0603 1.265 101.00/0Sm 0.280 0.119 0.0570 0.133 0.310 1 1 0. 7%Zr 1.013 ND 0.0174 0.00923 0.027 2.6%MO 0.990 ND 0.00112 0.000298 0.001 0. 1%Re 0.415 ND ND ND 0.000 0.00/0Ru 0.575 ND 0.426 0.00218 0.428 74.5%Rh 0.124 ND 0.132 0.000255 0,132 106.6%Pd 0.500 ND 0.468 0.000162 0.468 9 3. 6%Fe 0.483 ND 0.0177 0.00242 0.020 4.2%Cr 0.172 ND 0.0715 0.0105 0.082 47.7%Ni 0.089 ND 0.0931 0.0000304 0.093 104.6%Se 0.016 ND ND ND 0.000 0.000Te 0.149 ND ND ND 0.000 0.000U 1.201 ND 0.051 1.0895 1.141 9 S. 00/0Na 2.621 ND ND ND ND 0.000Cs 0.879 ND ND ND ND 0.000Sr 0.534 0.521 0.00268 0.000138 0.524 9& 1%Cc 1.583 0.0401 1.525 0.0323 1.597 100.90/0Nd 1.515 0.0384 1.459 0.0309 1.529 100.90/
2 Zr 1.022 ND 0.1039 0.00426 0.108 10. 6%MO 0.979 ND 0.00346 ND 0.003 0. 4 0/6Re 0.385 ND ND 0.000427 0.000 0. 1%RU 0.602 ND 0.00240 0.310 0.312 51.9%Pd 0.621 ND 0.601 0.00788 0.609 98.1%Fe 0.631 ND 0.0510 0.00828 0.059 9.4%Cr 0.090 ND 0.00912 0.000840 0.010 11.1%
(2) Chlorination
-Attained chlorination ratio greater than 99%.
->90% of Zr, Fe, Mo, and Te with respect to the amount of each supplied from denitration
were volatilized and collected in the cold trap.
-A small amount of U was also volatilized and collected in the cold trap.
(3) Reductive extraction
-Noble metals and Ni were selectively recovered in the Cd phase without the addition of Li.
269 -

JAERI-Conf 2002-004
-A significant amount of Fe and Zr removed from the salt phase formed the intermetallic
compounds.
->99% of Ce and Nd were removed from the chloride phase, along with the noble metals as
well as a significant aount of Y and Sm, when Li-reductant was added to the system.
-The amount of intermetallic compound decreased when Li-reductant was added to the
system.
-These facts suggest that the product supplied from the chlorination step is chemically
suitable for the reductive extraction step.
4.2.2. Concerns
(1) Denitration and Rinsing
-A recovery system to collect volatile FP, mainly Ru, should be developed.
-A method to convert the volatile material and aqueous material to the proper waste forms
should be developed.
-The development of a system for filtering and recovering powder is necessary.
(2) Chlorination
-A method of recovering volatile chlorides deposited on piping or on the wall of a
chlorinator should be designed, although the amount of such chlorides is small.
-Crucible life should be increased.
(3) Reductive extraction
-In the context of transporting both the Cd and salt phase among steps, a method of treating
the intermetallic compounds should be developed.
-Small amounts of RE formed oxides or oxychlorides by reacting with oxygen, and were
deposited at the bottom of the salt phase. The recovery of this deposit is necessary.
5. SERIES TEST PLANNED USING GENUINE HLLW
A new series test using genuine HLLW is now planned in the context of a collaboration study
between CRIRPI and the Institute for TransUranium elements (ITU). The collaboration study
has been ongoing since 1997 and has as its aims (1) electro-refiDing of U, Pu, and minor
actinides (MA) from U-Pu-Zr metal fuel, (11) multistage reductive extraction of MA, and (III)
preparation of chloride from HLLW Small amount of genuine HLLW (approximately 500 ml)
will be prepared as the initial material for 11) in 2001.
6. SUMMARY
Two kinds of series test indicated that the proposed flow sheet for Pyro-partitioning is
chemically feasible in laboratory-scale processes. The various elements Gontained in HLLW,
- 270 -

JAERI-Conf 2002-004
including alkaline waste, corrosion product, and nonsoluble residue, are efficiently
chlorinated, athough a small amount of chloride is volatilized. More than 99% of TRU is
recovered in metal form suitable for transmutation using metallic fuel fast reactors. The issues
to be solved for industrial deployment are thus clarified through the detailed observation of
series test results.
REFERENCE
[1] K. Uozumi, K. Kinoshita, T. Inoue, S.P. Fusselman, D.L. Grimmett, J.J. Roy, T.S. Storvick,
C.L. Krueger, and C.R. Nabelek J NucL Sci. TechnoL 38 2001) 36.
[2] M. Kurata, K. Kinoshita, and T. Inoue, J. NucL Sci. TechnoL 37 2000) 682-690.
[31 K. Kinoshita, T. Inoue, S.P. Fusselman, D.L. Grimmett, J.J. Roy, R.L. Gay, C.L. Krueger, and
C.R. Nabelek, and T.S. Storvick J Nud. Sci. Technol., 36,(1999) 189-197.
271 -

This is a blank page.

JP0250311
NEW DEVELOPMENTS IN DICARBOLLIDE EXTRACTIONS
J. RAIS, P. SLUCKY, N. �'STKOVA', J. PFSEK*, B. GRUNER* and B.e_'ASENSV�*
Nuclear Research Institute plc Rez, 25068 Rez, Czech Republic*Institute of Inorganic Chemistry CAS, 25068 Rez, Czech Republic
ABSTRACTIn this paper, the recent developments in the area of research on dicarbollide extractions performed at
the title istitutes are describe Tese consist in synthesis and testing of new specific dicarbollide derivatives,studies in the area of new potential synergists to be used with chlorinated dicarbollide and new non-toxic cheapsolvents that might be used for dicarboRide.
KEY WORDS:Extractions, dicaxbollide extractants, synergists, solvents
INTRODUCTION
Dicarbollide anion [closo-commo-(1,2-C2B9Hll)2-3Co)](-' (COSAN) and especially itshexachlorinated derivative [(8,9,l2-Cl3-C2B9H8)2-3-Co1(_) (CI-COSAN, BCV) (Figure 1) are
�'i used as extractants in nuclear technology of treatment oflet (1) spent nuclear fuel for isolation of radioactive "'Cs and 9Sr.
For an efficient isolation of the latter radionuclide, asynergist of the polyethylene glycol type, PEG, must be
added to an extractant. The process was patented by the two
0 title institutes and developed into industrial scale applicationduring cooperation of the Radium Institute, St. Petersburg
and NRI, Rez in early 80ties.The process is working until now as the only one
-A process in the area of extraction processes in nuclear
technology (besides PUREX process of course) operating ona full-scale level at Mayak, Russia.
The reasons for its success are extraordinarychemical and radiation stability of the used inorganic
Fig CCOSAN extractant in contrast to many proposed organic reagents.Hence, the extractant can be recycled many times without
loss of its extraction efficacy,Naturally, the success of this reagent has evoked many consecutive studies, the part of
them performed recently at NRI, Rez and ITCH, Rez is reported here.Mainly technologically oriented studies are performed in Russia and in the frame of
Russian - DOE, USA cooperation. From quite recent results, the UNEX process may be
mentioned which is treated in another paper at this conference II. At the process, C-COSANis used in a mixture with PEG 400 and diphenyl-NN-dibutylcarbamoyl phosphine oxide. A
new solvent phenyttrifluoromethyl sulfone (FS-13) is used, Other important achievement is a
proposal to include dicarbollide extraction in a preceding part of PUREX process; this might
remove the main portion of radioactivity prior to PUREX 2]. To a great satisfaction of the
originators of the process, CCOSAN and PEG are again used in these newly proposed
schemes.
- 273 -

JAERI-Conf 2002-004
In the frame of Eropean cooperation, new boron derivatives are synthesized at theUniversity of Barcelona, the University of Lyon and the Institute of Inorganic Chemistry,Czech Republic and their extraction behavior is tested at CEA, Cadarache and NRI, CzechRepublic. The studies were performed in two consecutive EC COPERNICUS projects and arelargely documented in the relevant articles and conferences.
Particular to own NRI studies are those of the use of various synergists added to Cl-COSAN and screening of new solvents applicable for dicarbollide extractions, Recent resultscovering both areas of research are presented here.
NEW DICARBOLLIDE DERIVATIVES
The following dicarbollide derivatives were all prepared at the Institute of InorganicChemistry, Czech Republic. One of the phosphorus substituted dicarbollide bridgedderivative, COSBREPHOS, is shown in Fig. 2 Ts derivative is soluble in nonpoiar xyleneand is effective for extraction of EU3, from acidic media. D = 48 for IM HN03 ad 247
for 5M HN03 if .01M reagent in xylene isused.
Analogical to the above reagent isc) COSBRIPHEPHOS, see Fig. 3 This extractant
is effective only at low acidities of aqueousphase, giving distribution ratios D_,,, D, and Ds,equal to 32.2, 056 and 041, respectively for0.01M reagent in xylene and 0. IM HN03-
Non-bridged dicarbollide derivativesOH with a substituted crown ether moiety were
prepared recently. One of them with 21-crown-7substituent, COS21CROWN7, is shown in Fig.4. As expected, the derivative shows affinity forextraction of Cs and Sr, the distribution ratios of
Fig. 2 COSBRIPHOS
09
jfI2
0
"or
0 H
Fig. 3 COSBRIPHEPHOS Fig. 4 C0821 GROWN7
274 -
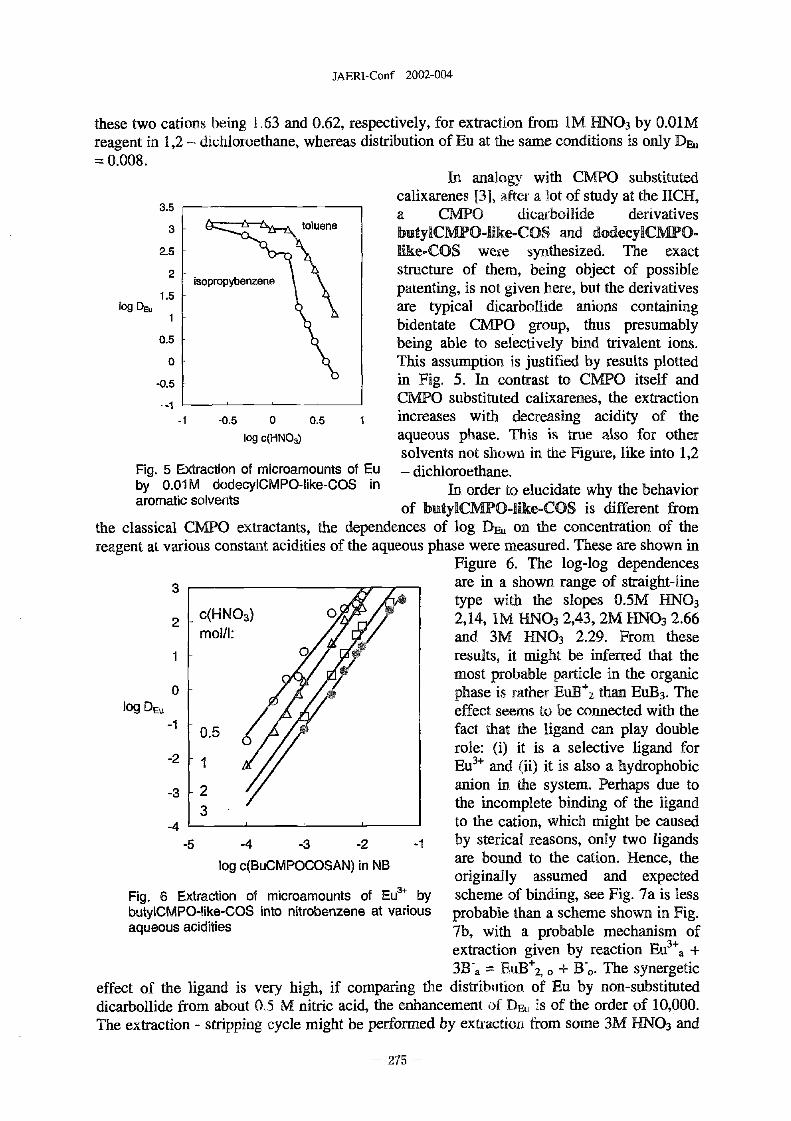
JAERI-Conf 2002-004
these two cations being 1 .63 and 062, respectively, for extraction from IM HN03 by 0.01Mreagent in 12 - dichloroethane, whereas distribution of Eu at the same conditions is only DF.u
0.008.1n analogy with CMPO substituted
3.5 -- calixarenes 3], after a lot of study at the lICH,a CUPO dicarbollide derivatives
3 toluene butylCMTO-Iike-COS and dodecylCWO-2.5 Rke-COS were synthesized. The exact
2 isopropybenzene structure of them, being object of possible1.5 patenting, is not given here, but the derivatives
log DE. 1 are typical dicarbollide anions containingbidentate CNIPO group, thus presumably
0.5 being able to selectively bind trivalent ions.0 This assumption is justified by results plotted
-0.5 - in Fig. 5. In contrast to CNIPO itself andCMIPO substituted calixarenes, the extraction
-1 -0.5 0 0.5 1 increases with decreasing acidity of thelog c(HN03) aqueous phase. This is true also for other
solvents not shown in the Figure, like into 12Fig. Extraction of microamounts of Eu - dichloroethane.by 0.01 M dodecylCMPO-like-COS in In order to elucidate why the behavior
aromatic solvents of butylCMIPO-like-COS is different from
the classical CM[PO extractants, the dependences of log DEu on the concentration of the
reagent at various constant acidities of the aqueous phase were measured. These are shown in
Figure 6 The log-log dependences
3 are in a shown range of straight-line
c(HN03) type with the slopes 0.5M HN032 - 2,14, IM HN03 243, 2M HN03 266
Mol/I: and 3M HN03 229. From these
1 - results, it might be inferred that the
most probable particle in the organic
0 - phase is rather BuB +2 than EuB3. The
log DE, effect seerns to be connected with the
-1 - 0.5 fact that the ligand can play double0 role: (i) it is a selective ligand for
-2 - 1 EU3' and (ii) it is also a hydrophobic
-3 - 2 anion in the system. Perhaps due to
3 the incomplete binding of the ligand-4 1 I to the cation, which might be caused
-5 -4 -3 -2 -1 by sterical reasons, only two figands
log c(BuCMPOCOSAN) in NB are bound to the cation. Hence, theoriginally assumed and expected
Fig. 6 Extraction of microamounts of Eu' by scheme of binding, see Fig. 7a is lessbutylCMPO-like-COS into nitrobenzene at various probable than a scheme shown in Fig.
aqueous acidities 7b, with a probable mechanism of
extraction given by reaction EU3'a +
3B-a = F-uB+2,, + B-.. The synergetic
effect of the ligand is very high, if comparing the distribution of E by non-substituted
dicarbollide from about 0.5 M nitric acid, the enhancement of D, is of the order of 10,000.
The extraction - stripping cycle might be performed by extraction from some 3M HN03 and
275 -

JAERI-Conf 2002-004
stripping by 8M HN03 into suitable non-polar aromatic solvent or by sing some completingagent like DTPA for stripping.
charge HYDROPHORTCAMON charge HYDROPHOBIC(1-) is 0 (I-) is ANION +
spread spreadover overthe thesurface surface
R X*- RW
01' o"
R R
RaFig. 7 Possible composition of Eu3+ with bidentate Cdicarbollide anion in the organic phase: 0)
a) formation of neutral on pair % (b) formation of univalent ationic complex + ligand
functioning also as a hydrophobic anion
Besides the studies ofCIM liquid - liquid quilibria the
solid phase structures of some
compounds were also
evaluated. As an example a
Platon presentation of the
molecular sucture of the Cs+
complex of the [8-(15-crown-5-
CH20)-8'-(OH)-COSAN]-,
congener with the smallest
C21 crown ether ring size is shown
6� I in Fig. (two crown etherMdicarbollide anions bound to
two Cs+ cations).
Fig. Platon presentation of the molecular structure of the Cs+
complex of the 8-(15-crown-5-CH20)-8'-(OH)-COSANJ-
- 276 -

JAERI-Conf 2002-004
SYNERGETIC NILXTURES WITH Cl-COSAN
Continuing our tudies on synergetic mixtures of CCOSAN with bidentate neutralextractant 4 1, we have measured extraction efficacies for Fu 3+ for a new malonamidedhnethyl dioetyl hexyl etboxy nialonamide, DMDOBEMA (compound kindly supplied byDr, Nicol, Marcoule, France) in mixtures with O-COSAN. Typical pattern for this compound
4 4
0,05M DMDOHEMA
3 -0.02M 0. M 3 7101in
isopropyl- 6.10'2 �2-10'
2 0.01 enzene 10-3
5.10log DEL, A 1 -
log Dft 5 10-4
0.0050
00.001M -1 -10-4 TODGA
0.01M
0 in-2- isopropyl-
benzenec(HB c(HBCI), M:
-2 -3-1 -0.5 0 0.5 1 -1 -0.5 0 0.6 1
log c(HN03), M log (HNO)3
Fig, 9 Extraction of microamounts of Eu Fig. 10 Extraction of microamounts of Euby OAM DMDOHEMA into by 0.01M TODGA into isopropylbenzeneisopropylbenzene with added HBC1, with added 1-18131, concentrations of HBC1concentrations of HBCl given in Figure given in Figure
is seen from Fig. 9. This does not differ much from the previously studied malonamides 4]and may be explained by applying the previous model 4, 5]. Namely, it is apparent that theparticle Eu 3, xL,3NO-3 (where x = 2 or 3 existing in the organic phase in the absence of Cl-COSAN anion B- is progressively substituted by Eti3+,xL.3B-3- he latter is much morehydrophobic than the former one; this explains targe synergetic effect at low acidities.
More intriguing is the pattern with recently proposed tridentate figand tetraoctyl - 3 -oxapentan - 1, - diamide (TODGA) front JAERI, Japan (compound kindly supplied byDr. Tachimori), see Fig. 0. The behavior apparently can be divided into two separateregions, fst, up to concentration of HBCl to 2x 10⁻³M i characterized by gradual increase ofDF,, with increasing concentration of HBCl. In second region, the behavior is irregular andmaximum appears at about 1 HN03- Interestingly enough for both reagents there exist an"isodistribution point" at which, disregarding the concentration of HBCl, the DEu is same, andthis point lies nearly at the same concentration of nitric acid in the aqueous phase for bothreagents. At present, te exact mechanism of extraction is yet to be elucidated. From practicalpoint of view, te systems with malonamides can be used in extraction - strip cycles.
- 277 -

JAERI-Conf 2002-004
Certainly, it is not so for mixtures of TODGA with chlorinated dicarbollide. However, in thelatter case conspicuously high DEI� can be achieved from ca. IM HN03 with very smallconcentrations of reagents (e.g. .01M TODGA + 0.005M HBCl, D, = 200), so this variantmight be well applicable for one-through process in which the organic extract is evaporated ordestroyed.
NEW NONPOLAR SOLVENTS FOR CI-COSAN
For a long time it was believed that a polar solvent is indispensable for the extractionswith dicarbollides. In fact, the use of toxic nitrobenzene or other nitro - solvent was one ofthe main obstacles in implementing the dicarbollide process in several countries.
As seen above the choice of suitable solvents is broadened for several ew substituteddicarbollides, enabling extractions into aromatic solvents like toluene, xylene etc. Also formixtures of Cl-COSAN with particular synergists, as are bidentate phosphonates andmalonamides or tridentate ligand TODGA, aromatic solvent Re isopropylbenzene can beused.
In this work, we were mainly interested in fding out a noupolar solvent for a basicprocess of 137 Cs and Sr isolation. Moreover, the ultimate goal would be to have a solvent ofthe type of alkane used in PUREX process. Since dicarbollides are essentially insoluble inalkanes a suitable modifier must be used and the question reduces to fding out such amodifier.
According to our detailed previous analysis of the data on Gibbs eergies of transfer ofunivalent cations between two solvents 61, the main factor determining high selectivity is lowbasicity or donor number of the solvent. However, certain basicity is indispensable in thepresent case in order to form weak bonded HS', BCl- ion pair in nonpolar solvent. Otherlimiting factor at use of nonpolar solvents for HBCl is a formation of the third phase in thesystem; especially HT3C1 will tend to escape into a third phase of higher polarity formed froma mixture of two solvents - alkane and modifier. For extraction of Sr a suitable polyethyleneglycol, PEG, must be added to the system and, as found by several preliminary experiments,the formation of the third phase is also strongly dependent on the type of the polyethyleneglycol even if the PEG's are very similar. E.g., the results differed completely wen usingcommercial PEG of m.w. 400 or similar H0(CH2CH2O)8(CH2)11CH3-
Thus, fding out appropriate recipe for a viable solvent combination is a question offine-tuning of the kind and concentrations of used components. After number of experimentalstudies, we were successful at this task 7]. Only one working combination is shown here.
We have used TPH ("hydrogenated tetrapropene" used in France as a diluent in thePUREX process) as an alkane, dioctyl sebacate, DOS, as a modifier, and Slovafol 909 (p-nonylphenol nonaethylene glycol) as a synergist for Sr.
As is seen from Fig. I , formation of the third phase takes place up to concentration ofsome 0. - 0.85M of DOS in TPH. The second organic phase was-of lower volume and BClpreferably concentrated in it what is also apparent from the distribution ratios of Cs ad Srbetween the aqueous phase and third organic phase shown in the Figure I .
The system, with no formation of third phase (IM DOS) can be used for extractionof both Cs and Sr from a medium of IM N03 with stripping of both radionuclides by some4M HN03 as shown in Fig. 12.
- 278 -
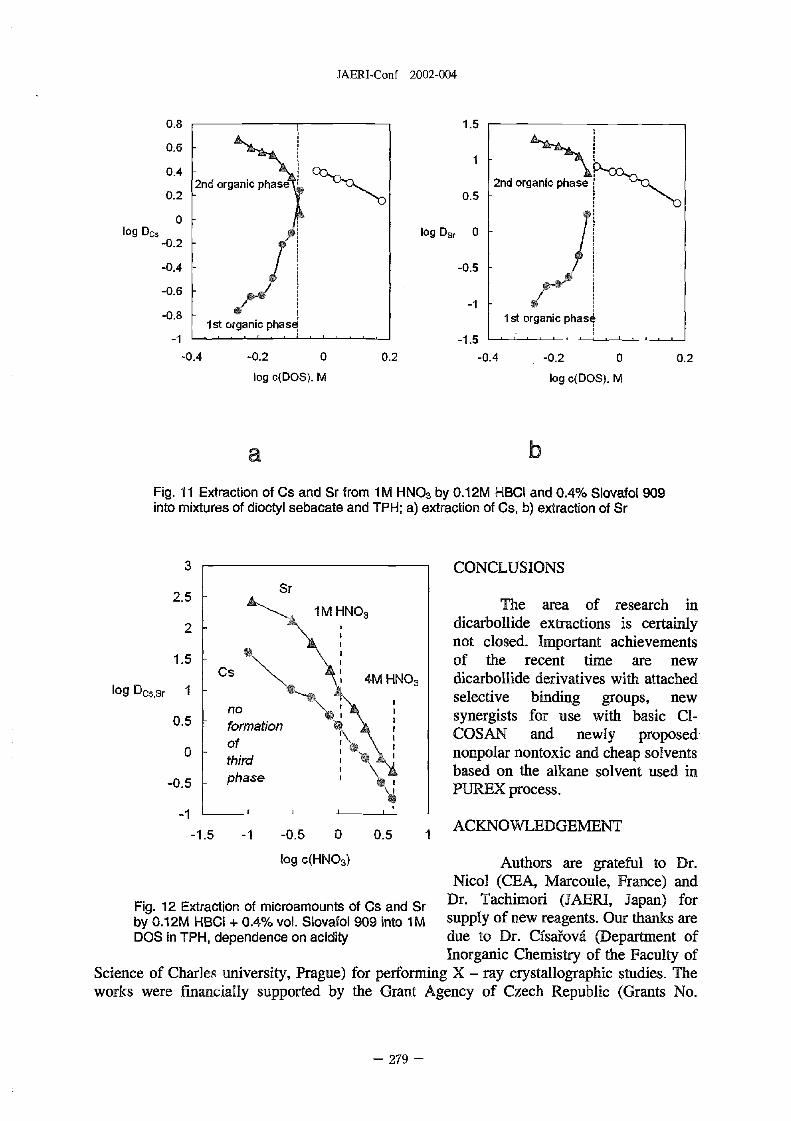
JAERI-Conf 2002-004
0.8 1.5
0.6
0.4 i co'c�.� �2nd organic phas 2nd organic phase
0.2 0.5
0log Dc, log Dsr 0
-0.2
-0.4 -0.5
-0.6-1
-0.81st rganic phas 1st organic phase
-0.4 -0.2 0 0.2 -0.4 -0.2 0 0.2
log c(DOS). M log c(DOS). M
a b
Fig. 11 Extraction of Cs and Sr from I M HN03 by .12M HBC1 and 0.4%Slovafol 909into mixtures of dioctyl sebacate and TPH; a) extraction of Cs, b) extraction of Sr
3 CONCLUSIONS
2.5 - SrM HN03 The area of research in
2 - dicarbollide extractions is certainlynot closed. Important achievements
1.5 - of the recent time are newCs 4M HN03 dicarbollide derivatives with attached
log Dcssr I - selective binding groups, newno synergists for use with basic Cl-
0.5 - formation COSAN and newly proposed0 - of nonpolar nontoxic and cheap solvents
third based on the alkane solvent used in-0.5 - phase PUREX process.
-1-1.5 -1 -0.5 0 0.5 1 ACKNOWLEDGEMENT
log c(HN03) Authors are grateful to Dr.
Nicol (CEA, Marcoule, France) and
Fig. 12 Extraction of microamounts of Cs and Sr Dr' Tachimori (JAERI, Japan) forby 0. 1 2M HBC1 + 04% vol. Slovafol 909 into 1 M supply of new reagents. Our thanks areDOS in TPH, dependence on acidity due to Dr. Csafovd (Department of
Inorganic Chemistry of the Faculty ofScience of Charles university, Prague) for performing X - ray crystallographic studies. Theworks were financially supported by the Grant Agency of Czech Republic (Grants No.
- 279 -

JAERI-Conf 2002-004
104/01/0142 and 104/99/1096) and in the area of new boron compounds also by EEC ProjectIC15-CT98-0221.
REFERENCES
[1] V. Romanovski, UNEX process for Liquid Radioactive Waste Reprocessing, NCEF2001.[2] B. Ya. Galkin, D. N. Shishkin, Extraction withdrawal of cesium and strontiumradionuclides from the solution of spent nuclear fuel, Global 2001, September 9 - 13, 2001,Paris, France.[3] L. H. Delmau, N. Simon, M. J. Schwing-Weill, F. Arnaud-Neu, J. F. Dozol, S. Eymard B.Toumois, C. Gultner, C. Musigmann, A. Tunayar, V. Bohmer: Extraction of trivalentlanthanides and actinides by "CMPO-like" calixarenes, Separation Science and Technology34, 863 1999).[4] J. Rais, P. Seluck*, N. V. �fstkovd and J. Alexovd, 2nd NUCEF Symposium, Hitachinaka,Japan, p. 215-225 1998).[5] J. Rais, P. Seluck�, N. V. �fstkovd: Effect of anion and solvent in extractions of cationswith neutral cation binding ligands, International Conference ATALANTE 2000, 24 - 26October 2000, Avignon, France, p 339.[6] J. Rais, T. Okada: Linearities in Gibbs Energies of Transfer of Alkali Metal Cationsbetween Two Solvents and a New Aspect of Resolvation Related to Gas Phase Data, J. Phys.Chem. A 2000, 104, 7314.[7] J. Rais, P. Seluck�: Method of separation of radioactive cesium and strontium from acidicnuclear waste by extraction, Czech. Patent Appl., PV 2001 - 3468, (September 26, 2001).
280 -

JP0250312JAERI-Conf 2002-004
AGGREGATION OF THE NEODYMI UMCOMPLEXES OF HDERP9CYANEX 272, CYANEX 302 AND CYANEX 301 IN TOLUENE
M. P JNSEN,"* . HIARIZIA,' V. URBAN"2, ' and K L. NASH'
biernistry Division, Argonne National Laboratory, Argonne, Illinois 60439 USA'21PNS Division, Argonne National laboratory Agonne, Illinois 60439 USA
3Present address: European Syncluotf on Radiation Facility, F-38043 enoble, FranceFax: 1630-252-7501, e-mail: rqjensen�anl.gov
Visible absorption spectroscopy and sniall-angle neutron scattering have een used to study the morphology andaggregation of a series of prified acidic gairophosphorus oxtractaws with oxygen ad slfur donor atoms andthe Nd(111) omplexes of these ex(ractants in toluene solutions. The extractants bis(2-o-thy1hexyl)phosphoric acid(HDEHP), bis(2,4,4-tiiiiiethylpeiityl)piiosphiiiic acid (HC272), bis(2,4,4-ti-ii-netbylpentyl)moiiothiophospbinicacid (C302), and bis(2,4,4-trimetliylpentyl)ditbiopliosphiiiie acid (HC301) wore studied Te phosphinic acidbased extractants are te pu-nary constituents of the ommercial extractamS Cyanex 272, Cyanex 302, andCyanex 301 respectively. Small-angle eutron sattering experiments sow that although 0, 10 M solutions of theoxygen ontaining extractants HFRP ad C302 are dirneric in toluene, H301, wich contains only sulfurdonor atoms, is monomeric within the uncertainty of the experiment, hen high concentrations of Nd greaterthan 30% heoretical Nd capacity) are xtracted itito the organic phases, the xygen ontaining extractants,BF)PUP, C272 ad HC302 all form dinuclear omplexes with a 26 metal:extractant atio. Te sulfur bearingextracrant -301, on the other hand, forms only 13 inetaiextractairL complexes wen the Nd loading is less than50% of the theoretical capacity of tile olution. However, at higher Nd loading, 86% of te teoretical capacity,2:6 Nd:C301 complexes are formed.
Key words: Solvent xtraction, Neodymiurn, Cyanex, Aggregation, Small-angle neutron scattering
1, INTRODUCTIONThe chemistry of lantbanide ad actinide cations with acidic organodioxophosphorus
extractauts like the dialkylphosphoric, -phosphoiric, and -phosphinic acids has been wellestablished by numerous sdies of the tracer and macro scale extraction equilibria.,[1] thecoordination chemistry ad even crystallization 5-71 of �Lelement-extractant complexes.The related acidic organophosphorus acid extractants tat contain sulfur dotiors rather thanoxygen doirors are of iterest for separating trivalent lantharlide and actinide cations. While
the extraction tquilibria of ertain organo monothio- and dithlophosphorus extractants have
been studied,[8-14 tere is omparatively little information on te etal coordination or
molecular structural of tose sulfur containing complexes in organic olutions.
Fundamental studies of tese extractants are important fr developing seful separations
processes, but the laboratory-scai sdies r typically performed at low metal ion
concentrations to discourage te oation of polynticlear aggregates in the organic phase.
Industrial scale solvent extraction processes, on the other hand, usually are operated under
GODditiOnS of high inetal loading (i.e. hgh metal concentratioirs eative to the theoretical
inetal ion apacity of the extractant solution), which tends to proraote the formatio of
polynuclear species, Tis work reports on the aggregation and morphology of a series of Nd 3,
complexes at high metal oading in toluene with acidic organophosphorus extractants
containing either two oxygen, one oxygen and one sfur o two ulfur donor atoms per
extractant Te vriation Of the Dumber of oxygen atorris attached to the phosphorus atom
alters the acidity and ydrogen bonding characteristics of ack extractant. In dilute metal ion
solutions, this gives thefion complexes of dioxo, monothio, ad dithio extractants different
- 281 -

JAERI-Conf 2002-004
structures and stoichiometries. Three of the ligands studied (Fig. 1) are the major components(75-90% [15]) of commercially available dialkylphosphinic acid based oxtractants intendedfor industrial scale processes: Cyanex 272 (bis(2,4,4-tiimethvipentyl)phosphinic acid,HC272), Cyanex 302 (bis(2,2,4-triniethylpentyl)monothiophosphijiic acid, HC302), andCyanex 301 (bis(2,4,4-trimethylpentyl)-dithiopbosphinic acid, HC301). The other extractant,bis(2-ethylhexyl)phosphoric acid or RDEHP, is the most extensively studiedorganophosphoric acid extractant. It is used for industrial scale intra-lanthanide separations.
0 0 S S CH3II.,..O R' 11 .R 11,.-R 11 .-R I
�111P 1-1 PW -IP 1�11P 1,� R =CH2CHCH2C(CH3)3HO NOR' HO N. R HO N R HS NR
R'= CH2CHC4H9I
HDEHP HC272 HC302 HC301 L;H2L;H3
Fig. 1. Ligands used in this study
2. EXPERMffiNTALPurification of the extractants, as described previously,[8, 16] resulted in purities of
HDEBP: 99+%, C272: 99%, HC302: 97%, and HC301: 99% as determined by rH and PNNM. The extractairts were dissolved in demerotoluene (toluene-d8 99 atom% D Adrich togive 0.10 M solutions, except for AC272 Te HC272 samples were not suitable for neutronscattering measurements because the maximum metal loading that could be achieved beforethe onset of precipitation was only 8% of the theoretical Nd loading capacity, (The theoreticalNd loading capacity is the maximum amount of Nd that would be present in the organic phaseassuming that all of the extractant is present as Nd complexes with a 1 metal:extractantratio). Therefore, HC272 was dissolved in normal, non-deuterated toluene 99,9%, Aldrich)for use in the spectrophotometric measurements. The organic phases were loaded with Nd bytwo phase t1trations of aueous 00337 M Nd(CJ04)3/0-10M extractan i toluene wit I MNaOH. Volume ratios of t oganic to aqueous phases of 1-0 or 2�O were used to vary themetal loading. Precipitates of the Nd-extractarn: complexes Could be avoided if the NOH
titrant was added sowly i sall increments. The concentration of Nd in the aqueou pases
was determined y ICP-AES, and the organic phase Nd concentrations were calculated from
the differences between the initial and final amount of Nd in the aqueous pases.
Sma.11-angle neutron cattering (SANS) measurements on te 14D-HP, HC302 ad C301
samples with and without Nd were ade at the Argonne National Laboratory Intense Pulsed
Neutron Source's time-of-flight Small-Arigle Diffractometer, which was calibrated to give
absolute scattering intensities. The lirlstrurnent and data collection procedures have been
described previo"sly.[17-191 The SANS measurements were made at 2 2 C Tile
absorption spectra of the organic phases in 1,000 cm quartz ouvettes, were measured four 350
to 850 nm using a odified Cary-14 spectrophotometer (OLIS, Inc.) at a fixed bandwidth f
0.06 nm and 2 'C. Fuller descriptions of the experimental conditions can be fund in the
literature.[20]
3. RESULTS
The results of a Guinier analysis 21] of the SANS data sets are smmarized in Table I and
Fig. 2 The neutrons are scattered most strongly by hydrogen atorns wich i this case, are
part of the extractant molecules, The presence of Nd a comparatively poor eutron scatterer,
is only observed indirectly, by its effect on the assembly of the small extractant molecules into
- 282 -

JAERI-Conf 2002-004
larger coordination complexes. Although Nd cations promote the assembly of extractantmolecules into larger groups, none of the data sets show the telltale signs of large aggregates(aggregates composed of 20 or more monomers), increasing scattering intensity, IQ), for lowvalues of Q, the momentum transfer.
C
-2.0-1.0
EC.) 1.5
-2,0
-2,5
-1,5
-2�O
-2.5
ZK-3.0
-3.50.000 0.005 0.01 0 0.015 0.020
0 2 A 2
Fig. 2 Guinier plot of SANS data for (A) extractants only, (B) each extractant with lowestNd loading, (C) each extractant with highest Nd loading, 3) HEBP, oHC302, (A)HC301, and -) inear least-squares fit.
The slope obtained from the Guinier analysis (when QRg 1) can be used to calculate theradius of gyration, R., which is a measure of the average spatial extension of the particles inthe solution. Te radius of gyration is the root-mean-squared distance of each atom in aparticle from the center of gravity of the particle. This means that the geometric radius,diameter, or length of a iven particle depends on the shape of the particle. For a sphericalparticle, for example, the actual geometric radius, R, is (513)112R.. The gyration radii increasewhen Nd is extracted into the solutions (Table 1), demonstrating through simple geometry thatthe monomeric and dirneric molecules of extractant, which exist in the absence of the metalcations, are converted into larger, metal bound aggregates in the presence of Nd.
The magnitude and variation in the gyration radii suggest the presence of small aggregatesin the solutions. The y-Intercepts, 1n I), derived from the Guinier analysis can be used tocalculate n, the weight average aggregation number of the extractant molecules in thescattering particles, using the equation
6.022 x 1026 dHLI(O) in 2[(HL)"]nw = - n
[L].., Ap 2 MWH2L
- 283

JAERI-Conf 2002-004
where dHL is the density of the undiluted extractant, is the total extractantconcentration, Ap is the difference of the scattering length dsities of the extractant andsolvent, and MWHL i the molecular weight of the extractant.L18, 191
Table L Results of the Guinier analysis of the SANS data of the 010 M extractant solutions
% Theoretical fHLI Best ModeledEL Nd Capacity [Nd] R4 n' n, calc. Nd Species
HDEHP 0 5.8 t 17 2.0 0233 9.0 8.5 ± 06 3.3 03 3,30 Nd2(DEHP)636 8.2 8.0 t 06 3.9 03 3.43 Nd2(DEHP)6
HC302 0 9.2 ± 1.0 2.0 0248 6.3 8,2 ± 06 3.5 ± 03 189 Nd2(C302)690 3.3 9.4 ± 04 5.3 t 04 5�59 Nd2(C302)6
HC301 0 9.3 t 06 1.07 ± .0946 6.5 8. ± .0 2.0 0.2 1.99 Nd(C300386 3.5 11.9 ± 04 5.2 0.4 5,33 Nd2(C301)6
All of the extractant species in the solution contribute to n,, and ecause each solutioncontains at least some uncomplexed extractant, the number of extractant onomers present inthe Nd complexes cannot be directly derived from the aggregation numbers, presented in TableL However, the contribution of each species to n is directly roportional to its fraction of thetotal extractant concentration in the solution. Each n-mer of extractant, RL),,, which may ormay not also contain Nd, contributes n 2[(HL)"j1rLjt"tj to n,,. This provides a nechanis todetermine the predominant Nd species present een when there is a significant concentrationof uncomplexed extractant. Assuming that Nd(OH).,3-, or Nd(CJOt)Y3-y cornplexes are notextracted under the conditions of the experiment, least-squares murn-nization of te n,, valuecalculated from a wide variety of integral Nd:extractant stoichlometries (Nd,,'Lf m = 1,3; =3,4,5,6,9) should give the most probable formula of the predominant species. The bestcalculated n values ad the corresponding Nd omplexes are also summarized in Table .
Only small concentrations of Nd ould b dissolved, in 0 IO M solutions of HC272 before aprecipitate began to form. RHP, which could be loaded to ca. 35% of te theoretical Ndcapacity under these conditions, was used for te SANS studies 111stead, aSSuM11)g tat thecoordination and aggregation of the two dioxo fxtractants is similar, To support tisassumption, the Nd coordination environment in the HC272 ad DERP complexes wascompared by visible absorption spectroscopy. Thej-ftransitions of Nd omplexes are verysensitive to the coordination environment Te spectra of HDEHP and C272 solutionsbetween 500 arid 625 rn are shown in Fig 3 for solutions near each extractairt's maximumNd loading, and lso or a 4DEFTP solution with low Nd loading. The spectra easured earthe highest achievable Nd loading are iistinguishable, which indicates a similarcoordination environment, ie, W24, for oth omplexes Te itensity of the absorptionbands are significantly lower for the Nd-1iDFKP complex at igh extractant oncentration(1.5 M) and low Nd loading 3%) idicating te presence of a dfferent omplex.
- 284 -

JAERI-Conf 2002-004
14
7
E 12
>
z
0 8
> 1P9
Cn4
co0 2
0
500 525 550 575 600 625
Wavelength / nm
Fig. 3 Hypersensitive 419/2 _>4G5/2' 2G7/2 transitions for the Nd3' complexes of HDEHP and
HC272, (-) low 3%) Nd loading of 1.5 M HDEHP in dodecane, (- -) high (8%) Nd loading
of 0. I 0 M HC27 2 in toluene, and ) high 33 %) Nd loading of 0 I 0 M HDEHP in toluene.
4. DISCUSSION
The properties of the upurified, commercial grade Cyanex extractants have been
reported i the literature peviously, Vapor phase osmometry has demonstrated that HC272
and HC302 exist primarily as dirneric species, (BL)2, in non-polar organic solvents in the
absence of metal ions, while the results of a variety of techniques have shown that
dithiophosphinic ad dithiophosphoric acids related to HC301 are primarily monomeric at
concentrations below ca. 02 M.[22] These findings are completely corroborated by the SANS
measurements presented here, At extractant concentrations of 0 IO M in deuterated toluene,
the oxygen containing extractants exist as HDEHP)2 and (14C302)2 (n = 20 ± 02) In
contrast, HC301, which oes not contain any oxygen can be considered monomeric within the
experimental Uncertainty of the measurement (nw = 107 ± 009). The S-H .. S hydrogen bonds
required to form di ners, of HC301 are much weaker than the O-H .. 0 and S-H .. 0 bonds
found in ftDERP)2 and (HC302)2.[23] They are too weak to promote dimerization of HC301
under these conditions.
The combination of the SANS data and the visible absorption spectra provide unequivocal
evidence of the formation of dinuclear 26 (Nd:extractant) complexes for each of the
extractants Linder certain conditions, The average aggregation ]lumber calculated for Nd24
(Table T) gives te best agreement with the measured aggregation numbers for all of the Nd
containing solutions except for the HC301 solution at low loading 46% theoretical capacity).
In this case, the 13 complex Nd(C3003 i superior at reproducing the measured value of n,
which is 204 (alculated n = 199). As an example of the superiority of Nd(C301)3 in
285 -

JAERI-Conf 2002-004
reproducing the measured aggregation number, the hypothetical, complex Nd(C301)3(HC301)in the 46% Nd loaded HC301 solution gives a calculated n = 290, while the dinuclearcomplex Nd2(C301)6 gives a calculated n, = 339. Other Nd:L stoichlometries were evenworse at reproducing the measured aggregation number.
The presence of 13 and 26 Nd:L complexes in the organic phases agrees with the knownstructural chemistry of dithiophosphinate and monothiophosphinate complexes. Crystalstructures of discrete 13 and 14 R2PS2 Cmplexes of trivalent lanthanide cations have beenreported in which steric constraints force the smaller trans-Nd lanthanide cations to form onlythe 13 complex with bis(cyclohexano)dithiophosphinic acid,[24] while Nd crystallized bothas 13 and as 14 complexes. Both mononuclear 12 and dinuclear 24 M:L complexes ofdithiophosphinic acid ligands with divalent d-transition metal cations have also been knownfor some time. The metal centers of the 24 complexes are bridged by two dithiophosphinateligands, and each metal center is capped with an additional bidentate RPS2- ligand.[25, 26]Similar structures for d-transition metal complexes of phosphinic and monothlophosphinicacid ligands are also nown. The dinuclear lanthanide complexes of bis(methyl)-monothiophosphinic acid have also been studied by x-ray crystallography,[27, 28] and severaldifferent structures, with and without bridging sulfur atoms, were observed.
The Nd2L6 stoichiometry reproduces the values of n,, better tan any other single speciesfor the extractants that contain at least one oxygen atom, HDEHP and HC302. However, thecalculated n values of the 26 Nd:C302 complexes are both modestly larger than theexperimentally determined values, suggesting that smaller amounts of other species, possiblyNd(C302)3,[22] could be present in the solution. An organic phase containing 99.5 mMHC302 and 15.8 mM Nd with an experimental n = 352 ± 026 (the 48% theoretical capacitysample), could be composed of 43 ± 29 mM Nd(C302)3 and 5.8 ± 14 mm Nd-)(C302)6 Anorganic phase containing 99.5 mM HC302 and 29.8 mM Nd with an experimental n = 5340.40 (the 90% theoretical capacity sample), could be composed of 28 ± 44 mm Nd(C302)3and 13.5 ± 22 mM Nd2(C302)6. By itself, the SANS data does not offer guidance in selectingbetween a Nd2(C302)6 only model or one that includes Nd(C302)3 and N2(C302)6, but the,absorption spectra are seful here. If the absorption spectra of Nd(C302)_ and ,2(C302)6 aredifferent, which is likely since the absorption spectra of Nd(C301)3 and Nd2(C301)6 areclearly different, the change in Nd speciation. that would be caused by increasing the Ndloading when multiple Nd species are present would give the two solutions differentabsorption spectra. The visible absorption spectra of the Nd ontaining HC302 solutions areidentical within the experimental ucertainty in the Nd concentration,[201 The equivalence ofthe Nd-HC302 spectra is a strong indication that te relative concentration of the Nd speciesis the same in both solutions, and, as a consequence, that Nd2(C302)( is the only significantspecies in both solutions,
The absorption spectra of the Nd complexes with the dioxo ligands BDEHP and HC272support and extend the findings of the SANS measurements. In the 010 MHDERP solutions,a precipitate began to form when the Nd loading xceeded ca, 40% of the teoretical Ndcapacity of the extractant with a 13 Nd:L ratio. Precipitation began at much ower Ndloadings (8% theoretical capacity) for the Nd containing solutions of the phOSphillic acidextractant, HC272, Despite the difference in the loading capacities of the two (�xtractants, theabsorption spectra of the Nd2(DERP)6 solution at 33% Nd loading a the Nd-HC272solution at 8% Nd loading are indistinguishable (Fig. 3 This demonstrates that the Nd-HC272 complex has the same stoichiometry and coordinatio eetry as te HDEHPcomplex, Nd2(C272)6, even though the absolute Nd loading is significantly lower in theHC272 solution. The spectra in Fig. 3 also show that a different complex with differentoscillator strengths, presumably the mononuclear Nd[H(DEBP)213 or Nd(DEHP)3 complexes
- 286 -

JAERI-Conf 2002-004
observed at low metal loadings,[29, 301 predominates at igh HDEHP concentrations and low(3%) Nd loading, The precise conditions of the formation of the 26 Nd:L complexes ofdialkylphosphoric ad dialkylphosphinic acid extractants is ot a simple function of the metalloading. The mechanisms that affect the relative solubility of the complexes in the organicphase, like the ature of te alkyl groups and the extractant basicity, also appear to affect theformation of small ofigorneric species, with the less soluble complexes forming oligorners atlower metal loadings. The Nd2L6 Cmplexes that are observed for each of the ligands near Ndloadings that cause precipitate formation seem to be a discrete step from mononuclear
.complexes, like NdL3, tO Deutral polymeric species with a metaNigand ratio of n3n thateventually become insoluble in the organic solvent.
5. ACKNOWLEDGEMENTSThe athors thank P. G. Rickert for purifying the extractants and D. Huff and S.
Lopykinski of te Argonne Analytical Chemistry Laboratory for the ICP-AES determinations.This work was performed under the auspices of the Office of Basic Energy Sciences,Divisions of Material Science (for the SANS measurements made at the Intense PulsedNeutron Source) and Chemical Sciences, U. S. Department of Energy under contract numberW-31-109-ENG-38,
6. REFERENCES
[1] T. Sekine and Y. Hasegawa, "Solvent Extraction Chemistry", Marcel Dekker, New York(1977).[2] T. Takahashi, Y. Suzuki and A. Yamasaki, "Solvent Extraction 1990: Proceedings of theInternational Conference on Solvent Extraction (ISEC'90)", Kyoto, Japan, Ed. By T. Sekine,Elsevier, New York, 189-193 1992).[3] Y. A. Barbanel ad N. K. Mikhailova, Russ. J. Inorg. Chem., 18, 365-368 1973).[4) J. V. Beitz and J. C. Sullivan, J. Less-Cornmon Met., 148, 159-166 1989).[5] V. G. Lebedev, K. K. Palkina, S. I. Maksirnova, E. N. Lebedeva and 0. V. Galaktionova,Russ. J. Inorg. Chem., 27, 1689-1690 1982).[6] D. N. Suglobov, Y. I. Trifonov, E. K. Legin and A. G. Tutov, J. Alloys Compd., 213-214,523-527 1994).[7] A. Tomita, T. Kanki, T. Asano and N. Sano, J. Chem. Eng. Japan, 33, 661-664 2000).[8] Y. Zhu, J. Chen and R. Jiao, Solvent Extr. Ion Exch., 14, 61-68 1996).[9] Y. Zhu, J. Xu, J, Chen and Y. Chen, J. Alloys Compd., 271-273, 742-745 1998).[10] G. Modolo and R. Odoj, J. Alloys Compounds, 271-273, 248-281 1998).[ 1 1 ] C. Hill, C. Madic, P. Baron, M. Ozawa and Y. Tanaka, J. Alloys Compd., 271-273, 159-162 1998).[12] H. Hoshi, A. Tsuyoshi and K. Akiba, J. Radioanal. Nucl. Chem., 243, 621-624 2000).[131 Y. Zhu and R. Jiao, Radiochim. Acta, 69,191-193 1995).[14] D. Li, A. Luo, C. Wang and M. Yuan, "Value Adding Through Solvent Extraction:Proceedings of the nternational Solvent Extraction Conference (ISEC'96)", Melbourne,Australia, Ed. by D. C. Shallcross, R. Paimin and L. M. Prvcic, University of Melbourne,Melbourne, 165-170 1996).[ 1 51 K. C. Sole and J. B. Hiskey, Hydrometallurgy, 30, 345-365 1992).[16] J. A. Partridge and R, C. Jensen, J. Inorg. Nucl. Chem., 3, 2587-2589 1969).[171 P. Thiyagarajan, H. Diamond, P. R. Danesi and E. P. Horwitz, Inorg. Chem., 26, 4209-4212 1987).
- 287 -

JAEPJ-Conf 2002-004
[181 R. Chiarizia, V. Urban, P Thiyagarajan and A. W. Herlinger, Solvent Extr. Ion Exch.,16,1257-1278 1998).[19] R. Chiarizia, V. Urban P Thiyagarajan, A. H. Bond and M. L. Dietz, Solvent Extr. IonExch., 18,451-478 2000).[201 M. P. Jensen, R. Chiarizia and V. Urban, Solvent Extr. Ion Exch., 19(5), in press 2001).[21] A. Guinier and G. Fournet, "Small Angle Scattering of X-rays", John-Wiley and Sons,New York 1955).[22] M. P. Jensen and A. H, Bond, Radiochim. Acta, submitted.[23] G. Allen and R. 0. Colclough, J. Chem. Soc., 3912-3915 1957).[24] A. A. Pinkerton, Y. Meseri and C. Rieder, J. Chem, Soc. Dalton Trans., 5-90 1978).[25] M. Calligaris, A. Ciana, S. Meriani, G. Nardin, L. Randaccio and A. Ripal-nonti, J. Chem.Soc. A, 3386-3392 1970).[261 G. Svensson and J, Albertsson, Acta Chem. Scand., 45, 820-827 (1991)�[271 K. M. MtHsiepen and R, Mattes, Z. Anorg. Allg. Chem., 506, 115-124 1983).[281 K. M. MUhIsiepen and R. Mattes, Z. Anorg. Ag. Chem., 506,125-1,32 1983).[291 J. M. Sdnchez, M. thdalgo, V. Salvad6 and M. Valiente, Solv. Extr, on Exch., 17, 455-474 1999).[30] D. F. Peppard, G. W. Mason, J. L. Maier and W. J. Driscoll, J. Inorg. Nucl. Chem., 4,334-343 1957).
288 -

JAERI-Conf 2002-004
Radioactive Waste Disposal
- 289 -

This is a blank page.

JP0250313JAERI-Conf 2002-004
OVERVIEW OF THE MAIN RESULTS CONCERNING
WASTE MANAGEMENT IN FRANCE
PH. LECONTE
Nuclear Energy Division
CEA- Saday, 91191 Gif sur Yvette, Cedex, France
France has launched a process of optimizing waste management by separating and
recycling recoverable energy materials, reducing, conditioning and storing final waste.
Once operations in the back-end of the cycle have been completed, long-lived highly
radioactive waste (vitrified waste) represents the major portion of the waste's total
radioactivity 99%), conditioned in a small volume (- 150m 3/year of glass packages).
Nevertheless, the radioactive content of the waste constitutes a potential risk for human
beings and environment. The French Law of December 30,1991 set the major
orientation for the public policy in the field of -ILLW management, and constitutes the
first global legislative instrument in that field. It prescribes the research areas to be
explored in order to exploit the broadest range of scientific and technical expertise and
to provide the elements needed to allow choices on how best to manage long-lived
highly radioactive waste. The law set out three areas of R&D:
- minimization of the quantity and toxicity of waste, by studying their partitioning
and transmutation;
- packaging and conditioning of long-lived radioactive materials in order to ensure
safe and long-lasting containment, and also studying long-term storage;
- evaluation of the feasibility of a deep geological disposal whether reversible or
irreversible; underground laboratories are essential tools for this research
program.
Public authorities have designated a pilot for each area: the French Atomic Energy
Commission (CEA) for partitioning-transmutation, and for conditioning and long term
storage, and the National Radioactive Waste Management Agency (ANDRA) for
disposal in geological formations.
The law defined a calendar which stipulates that a comprehensive report evaluating
research will be submitted to the French Parliament in 2006, and decide whether it is
appropriate to create a repository for HLLW.
Research is conducted in the framework of cooperation among CEA, Andra, partners in
the nuclear industry - EDF, Cogema and Framatome - and in research - the French
National Council for Scientific Research, CNRS, and universities. It benefits from
significant cooperation at the European and international levels. It is constantly
- 291 -

JAERI-Conf 2002-004
evaluated by the National Evaluation Commission (CNE), which draws up andpublishes an evaluation report annually.
The objective is to identify a set of complementary scientific and technical solutions,which serve to define open and flexible strategies for the back-end of the cycle and laythe groundwork for a decision in 2006.
The results already obtained and the fture prospects will be presented in the paper. Themost outstanding results lay in the domain of partitioning and in the domain of theassessment of the long term behavior of packages in storage or in deep geologicaldisposal conditions.
292 -

JP0250314JAERI-Conf 2002-004
R&D ON DISPOSAL CONCEPT FOR I-UGH-LEVEL RADIOACTIVE WASTE:TECHNICAL SU13JECT ON HLW DISPOSAL AT COASTAL AREA IN JAPAN
M. KAWANISHI, T. HASEGAWA, T. IGARASHI% H. TSUCHI " and F. ONOCentral Research Institute of Electric Power Industry, 1646 Abiko, Abiko-shi, Chiba-ken., 270-1194 Japan,
Fax: 81-471-82-2243, e-mail:.kawanisi(&,crieni.denken.p t criepi.denken.orjp
Graduate School of engineering, Hokkaido University, Kita 13, Nishi 8, Kita-ku, Sapporo, 060-8628 Japan
Fax: 81-11-706-6308, e-mail: tosifurni�eng.hokudai.acjp
"Nuclear Waste Mnagement Organization of Japan, (Mita NN Bldg.) 123, Shiba 4-Chorne, Minato-ku,
Tokyo, 108-0014 Japan, Fax: +8 1 3-4513-1599, e-mail: htsuch�numo.orjp
*** Tokyo Electric Power Company, 13 Uchisaiwai-cho I-Chome, Chiyoda-ku, Tokyo, 100-0011 Japan
Fax: 81-3-3596-8562, email: oo.fiunihiko�tepco.Cojp
In Japan, the concept for high-level radioactive waste (HLW) disposal has been mainlystudied in the based on the data of inland. However, Japan is an island country, so it isnecessary to make clear the feasibility of coastal repository concept. In this paper, thepresent status of the research and development(R&D) for the repository concept, especiallyfor coastal one in Japan is described, Based on the results of the RD, we summarized theoutline of feasibility mid picked up the technical subject for future development on thoserepository concepts. From these results, it was shown that there is enough feasibility for thecoastal concept as well as inland type of repository concept in Japan. Furthermore, for thecoastal repository concept, there might be some technical subjects such as the influences ofsalinity, uplift/subsidence, sea-level change etc. on the performance of repository and it -isnecessary to proceed further R&D on these.Key words: igh-level radioactive, disposal concept, deep sub-seabed, coastal area, salinity
influence, performance assessment
1 INTRODUCTIONIn Japan, the law relating to final disposal of "specified" radioactive wastes was
officially announced in June 2000[l]. Based on this law, the Nuclear Waste ManagementOrganization of Japan (NUMO) was established in order to promote the implementation ofdisposal of HLW(vitrified waste) originating from nuclear power generation in October 2000.It is more important to proceed smoothly with the siting investigation for preliminary area andestablish the rational concept of repository appropriate for several types of site condition inJapan. Until now, the HW disposal concept has been mainly studied in the representativereports[2,31 based on the data of inland in Japan. However, Japan is an island country, so itis necessary to make clear the feasibility of coastal repository concept.
In this paper, the present status of the research and development(R&D) for the repositoryconcept, especially or coastal one in Japan is described. Based on the results of R&D, wesummarized the outline of feasibility and picked up the technical subject for futuredevelopment on those repository concepts.
293 -

JAERI-Conf 2002-004
From these results, it was shown that there is enough feasibility for the coastal concept aswell as inland type of repository concept in Japan. Furthermore, for the coastal repository
concept, there might be some technical subjects such as te influences of salinity,uplift/subsidence, sea-level change etc. on the performance of repository and it is necessary toproceed fin-ther R&D on these[4,51.
2. AIMS OF TIHS STUDYJapan is an island country, so it might be more rational from the viewpoint of
transportation etc. to site the repository of HLW in the deep geological formations orsub-seabed at the coastal area. Especially, for the deep sub-seabed repository concept, it isconsidered that there might be advantages to be able to reduce the performance of engineeredbarrier system (EBS) due to the very low groundwater flow velocity field. On the contrary,such a repository concept might have any disadvantages like salinity influences against theperformance of the engineered or natural barrier system of repository. Fig.1 shows theillustrated concept of the groundwater and repository system at the coastal area.
In this paper, we show the outline lowof feasibility for LW disposal at thecoastal area, especially for the deepsub-seabed disposal concept
adv"O." and ft
considering the conditions of
topographical, geo-hydrological, FmIsmater 1aftrLu Who water
'the velocity in saline water is slDwerttongeo-cheinical and geological that in fresh water is expected
environmental change of the Japan Fig. I Conceptual model of groundwater flowislands, so that we make clear the at seashoreadvantages or disadvantages of such a repository concept and the technical subject on thefuture R&D for establishing the more rational repository concept in Japan.
3. FEASIBILITY STUDY ON SUB-SEABED REPOSITORY CONCEPT3.1 Topographical feature of Japanese Islands
The Japanese islands are located in the Pacific Ocean, surrounded by sea and with thecontinental shelf In case of discussing the feasibility of HLW disposal at costal area in Japan,it is necessary to consider the long term stability for conditions of sea-level change, up-lift/subsidence relating to the groundwater or intrusion scenario of the safety assessment. Fig.2shows the representative contour lines of the elevation with a few hundred meters depth ofseabed on the continental shelf around the Japan islands[4]. In this study, the feasibility ofsub-seabed disposal concept is investigated considering the sea-level change and thetopographic steep- or gentle- slope coastal site conditions.
3.2 Literature survey for observed dataUntil now, the HLW disposal concept has been mainly studied for the deep repository of
inland in Japan, so there is not so enough own data observed for the investigation offeasibility on the deep sub-seabed repository concept. Therefore, at the first step of feasibilitystudy like this, it is necessary to survey the literatures including te existent observed data for
294

JAERI-Conf 2002-004
the undersea railroad tunnel and so on. Forexample, Fig.3 sows the data of chemical
properties for the groundwater samples takenat a coal mine at the Hokkaido Area. It is Steep
shown that the saline groundwater under thecoal-bearing formation is not the seawater
based on this data and so on. Coast line-200mIn this study, we investigate the gent !!�5
feasibility of sub-seabed repository conceptbased on the literature survey data asfollows.3.3 Sea-level changes
Fig, 4 shows an example of sea-levelchanges during the past 350,000 years[3]. steep j
The sea level changed periodically by more Fig,2 Seabed contour map around Japanthan I 0m during about I 0,000 year cycles.
In case of evaluating the effect of seawater Fmsh W.-two., S.1i". WVMd'.t.' Sea WAS,
intrusion into the groundwater, it is C.6._ WL _ Q�
necessary to consider the sea-level changes,uplift/subsidence as well as topographicalconditions et at. at coastal areas. W3.4 Groundwater flow modeling
As a preliminary performance Sea water
assessment of deep sub-seabed disposal, westudied the feasibility of the disposal Coal-bearing formation
concept[4,51 as follows.(1) Topographical site condition and Fig.3 Example of observed data for distribution of
fresh Groundwater and saline groundwaterdiscretization by finite element method at seashore (T-coal mine, HokkaidoIn this study, two different types of site
condition were selected and the groundwater ---M- 8110 of fossi Iforasinifera (Shackleton. 1987)Marine trraces at Huon pninsula(Cham 11 ard Sackleton.1986)
flow modeling relating to the sub-seabed Marine terraces et Huon penineula(Shacklaton. 9M)0 Marin trraces at H" panimula(ChsWe I et &I,, 1995)
geological disposal near coastal areas hi Marine terraces in Caribbean sea(Branchon R�d 1995)--O-- 6110 of fotsil formwiWere(Chap"11 104)
Japan was conducted. The first site is aE20
topographically gentle-slope site (Fig.5a) 0 -40
where is basically in continental shelf. The '.3 '00,M 120second one is a topographically steep-slope At -1400 5
fn 15 26 30 W
site (ig.5b). The degree of effect for the AV X 89J00yes,;
"be"aa-'eelchaus" by 048 of fossilized foraminifer andsea-level changes and uplift/subsidence may Altitude ofCongtaltermee !we Hyann Penlosulm modParnbcdos peninsula,
be different between two sites. It shall be Fig.4 Sea-level changes uring the past 350,000
greater at the topographically gentle-site than years 31the steep one.
- 295 -

JAERI-Conf 2002-004
Sell level(Present M bVeD 04 Morembis a Man ARAN Sea live 165k.
Sea laveat two
(PMWM9 sea leveoloom
,sehlavelchamSe Isom Walat1wesealavelckagge 175m-�efilevelctumgt ISOMamid stsboldemee mod mpM ::20m
L
r7AbJS.2kX 44.2s. T I&M. I Coafturatiom of Madefims a Fee for slec"Actre site
Fig.5a Geological formation and Fig.5b Geological formation and finite elementfinite element discretization discretization for steep-slope sitefor gentle-siope site
land surface Seabed(2) Boundary conditions for groundwater flow Constrained Pressure Constrained pressure ftdovaindc pressure)
analysis coscaftrade I Flux controW Casaftal"d comeftrzdam
asesk Invel cbamp due to anagnesiam and regrescriDsFig.6 shows the schematic view of (Perisdical chafte due to transgression cad regression)
boundary conditions for groundwater analysis.
In this analysis, the sea-level changes due toMseo level Lvel
the transgression and regression are att"m2giftsbou, at Wommium
considered as mentioned in Section 33. swe�Comtuaiotd iressum (Hydeawatic. mwffire)
(3) Results of groundwater flow analysis :cOnstualsed Concentration
Fig7a shows a normalized contour map No "lox at to"Oss
of salinity and the velocity distribution Fig6 Boundary conditions on
calculated at transgression period for the groundwater flow
gentle-slope site in this case study. Fig.7b is a result at regression period for the
gentle-slope site.
Constat one,a (Defter 500,00 0 ymrs)0.80.7
0.6 0A
0.5 Q'S
0.4 a.4
0.3 0 3
0,2
0
XC_;r"
5 +
4, at,-/G.OL-/'Y' 0
Contour mp absolute velod4� mop ofsh-olute elod*,
Fig7a Salinity and velocity distribution Fig7b Salinity and velocity distribution atat transgression (gentle slope site) regression (gentle slope site)
.- 296 -

JAERI-Conf 2002-004
On the other hand, Fig.8a and 8b shows respectively the results with trajectory lines of flowpathway at tnsgression and regression period for the steep-slope site. The results show
that the groundwater in seawater condition flows downward and that its velocity is one to twoorder slower than that in the fresh-water condition. However, for the gentle-slope site, thegroundwater changes fresh to seawater at sub-seabed due to regression, even if thegroundwater is saline at present condition. The difference in the velocity between minimumvalues and maximum values for the gentle-slope site was smaller than that the difference forthe steep-slope site. These results depend on the topographical gadient and the movement
of saltwater-freshwater interface due to the sea-level changes.
0.8 0.110.7 0.7O 0.6,
0.4U 0.30.2 0.201
Seawater distribution Sea water distribution(normalized by oncentration of seowttter) (norinalized by concentration of sea water)
too in"
0.0
.1.0-2.0
-2.0-3.0 -3.0-4.04.0 i
Contour map of absolute velocity Contour M*P of absolute velocity
Fig.8a Salinity and velocity distribution with Fig.8b Salinity and velocity distribution withtrajectories at transgression(steep-slope site) trajectories at regression(steep-slope site)
(4) Performance assessmentRadionuclide tnsport is evaluated by one-dimensional advection-dispersion analysis
based on the trajectories calculated by groundwater flow analysis mentioned above. Theresults show that the main feature of transport is diffusion in saline condition and advection infresh-water condition. This indicates that the groundwater flow near the boundary is very
sensitive to the location. The seawater and turlidwater-fiow-and salinity distribution
fresh-water boundary caused by regression low velocity, swhay
and transgression is shown to be important. IPerformance assessment
Fig.9 shows the schematic flow of Defmit Of of engineered barrierreference
performance assessment of engineered barrier biosphere corrosion, solubility
system and safety assessment for repository. ,O. athmmy, dilu W Performance assessme
Fig 10 shows an example of results of L of natural barrier
preliminary safety assessment for the solubility, KdI Safety assessment I
sub-seabed repository sites with gntle-slope Fig.9 Scbematic flow of performanceor steep-slope condition. The location of a assessment for engineered barrierrepository might be changed from I to 6 km system of repository
- 297 -

JAERI-Conf 2002-004
---------------------from coastal line, because the conditions of --- I ICMA�slopesk � 1 i-I PCs
flow and salinity of groundwater mightdepend on the location. Discontinuity was Ffound at 120,000 years. In particular, that 'I.Lis remarkable for the steep-slope site because
10the groundwater of 4km offshore wassuddenly changed from saline to fresh at that
period. However, the difference betweenTine (y) Time Cy)both sites was not remarkable, and the L 5 iUT4 -50 n L 4 kM z ='50 Hi
maximum dose rate was sufficiently low * Dose rate 10 m ftom H& 1 distance ftm coWIme, 2! : depth
compared with that for the island disposal Fig.10 Resultsot'preliminarysafetyassessment for sub-seabed disposal
case[2,31. trajectories at gression(steep-slope site)
4. CONSIDERATION FOR FEASIBILITY OF REPOSITORY CONCEPT ATCOASTALAREAS
Fig. 11 shows an example of options forthe repository at coastal area. As shown inthe preliminary case study for the feasibility ofsub-seabed repository site conditions as anexample of repository at coastal area, basically,there is fficientfea-sibifity of such type ofrepository. However, we have not enoughdata to establish the more detailed repositoryconcept at coastal area, so it is necessary toconsider the advantages or disadvantages andinvestigate the technical subjects for this type
of repositories at near coastal areas. Fig.11 OptionofHLWdisposalconceptThe representative advantages and at coastal area
disadvantages might be as follows:(advantage) (!)Low groundwater flow velocity (diffusion > advection)
Uational transportation and infi-astructure(�)Restriction of pathway in the biosphere
(disadvantage) ()High salinity (chemical influences to materials of bentonite, cement orover-pack, rocks, groundwater, radionuclide migration and so on)
OUplift/Subsidence, Sea-level change (human intrusion scenario et al.)(3)Site characterization techniques
For the disadvantages that are the future R&D subjects, furthermore, we need to
investigate and integrate the technology for establishing the reasonable repository conceptsbased on each site conditions,
5 CONCLUSION REMARKSIn this paper, the feasibility study for the sub-seabed disposal at near coastal areas in
- 298 -

JAERI-Conf 2002-004
Japan was described. From these results, it was shown that there is enough feasibility forthe coastal concept as well as inland type of repository concept in Japan.
From now on, the selection plan for the preliminary investigation areas will be startedby NUMO. We expect that the results of this study will be reflected in proceeding suchsiting approach flexibly and steadily.
REFERENCES[I] Specified Radioactive Waste Final Disposal Act, 2000).[21 Central Research Institute of Electric Power Company and Federation of Electric Power
Companies, Execution Techniques for High-Level Radioactive Waste Disposal, 1999).[31 Japan Nuclear Cycle Development Institute, H12: Project to Establish the Scientific and
Technical Basis for HLW Disposal in Japan, 2000).[4] T. Igarashi, T. Hasegawa, CRIEPI's Research on Deep Sub-seabed Disposal of HLW Near
Coastal Areas, Performance Assessment of Deep Sub-seabed Disposal of HLW NearCoastal Areas, Coastal Workshop for a Deep Repository for HLW: Topical Workshop,
NAGRA, 2000).[51 T. Hasegawa, et al., Study on Groundwater Flow Behavior for Sub-seabed Disposal at
Coastal Areas, JSCE Annual Symposium, No.56, 200 1).
299

This is a blank page.

JP0250315JAERI-Conf 2002-004
Separated Disposal of HLW Wastes for Reducing the Total OccupationalArea of the Repository
OBE Toshiad, NAKAMURA Kiyone,
TSUKAGOSHI Atsushi, and NISEE[YORI Takehiro
Energy Engineering Course, Applied Science Dept., Tokai University
1 17, Kita-Kaname, Hiratsuka, 259-1292, JAPAN
FAX: 81-0463-50-2017, e-mail: ohe�,keyaki.cc.u-tokai.acJp
This paper describes the efficiency of the segregated disposal to reduce the total load of the high-level
waste into the repository. (1) The nuclides were classified into several groups having similar properties by using
the cluster analysis. 2 The disposal depth required the maximum dose rate of each group was less than
10 Sv/y was assigned by the sple migration analyses. 3 Disposal density were calculated by the thermal
analysis to maintain the maximum temperature rise below 00'C. The grouping ad configuration analyses
imply some gioups are not necessary to be disposed into deep underground and call be disposed more densely.
The result emphasizes different repository design may be seen where the nuclide dependent characteristics are
extracted and classified into certain groups.
Key words: high-level waste disposal, separated disposal, and partitioning, statistical analysis
1 INTRODUCTION
Hi2h-level radioactive waste (HLW) disposal becomes one of the key issues for the
nuclear power to survive in the future. Although partitioning and transmutation (P&T is
considered to reduce the potential radio toxicity in HW disposal ], the goal of the PT
process such as the target of the separation elements, decontamination factors, and
transmutation rates, are however not fully investigated from a viewpoint of the radiological
impact so far. As for the partitioning, the selection of the element for grouping seems to be
rather subjective because of the weak connection wth the safety analysis in the selection
process even though the potential hazard index is frequently used. It is claimed this index is
not an optimum indicator of the radiological impact and does not show the safety of the
disposal explicitly.
In this paper, a procedure to assign the goal of the element separation from HLW liquid
in the reprocessing is presented. This procedure may show the advantage of the segregated
disposal as used in a common treatment of ordinary non-radioactive waste.
301 -

JAERI-Conf 2002-004
2. METHOD
2.1 Consistency with the current management program
As for the discussion of the separation procedure of high-level radioactive waste,
consistency among the different waste types was considered in the design criteria as shown in
Table .
Table I Disposal concept consistent with the current management program
cateLog _ Criteria Current proEani Ref
Mininium Isolation Period 300 years ILW* by institutional control [2]
Dose Objectives 10 IASV/Y LLW* for norinal evolution [2)
1 Vitrified Glass
Integrated Engineered Barrier Overpack
Bentonite Non-separated HLW [31
Maximum Temperature Rise look
Low-level Waste disposal
2.2 Classification of elements
The authors employed two statistical methods for grouping of the nuclides into several
groups: the cluster analysis and the principal component analysis.
1) Factors used in the statistical analyses
(1) NEgration impact factor
The equation of the peak nuclide concentration in groundwater was simply derived 4]
for instantaneous discharge of soluble nuclide by Eq.(l),
C.(L) L 10 (IO -exp Eq.(l)
Ms va-K 4K 10 up
where, C nuclideconcentration[Ba/111'] L distance from te source [n]
M nuclide inventory [Bq] S cross-section '] (set as )
decay factor [y-1] Up pore water velocity [m/y]
4 af L I I+ 4 . _Rf L s5 10 (for knostcases).up IO up
The above equations were characterized by factor A(== P, L / U, ) wich was divided
;nto the nuclide dependent term k Rf and the geologic term L/U, and the latter was
independent of nuclidC Droperty thus Rf (or T,,/ R term was used for nuclide grouping
302 -

JAERI-Conf 2002-004
(2) Thermal impact factor
For simplicity, the underground repository was treated as a spherical medium. The
maximum temperature rise was calculated by the empirical expression EQ.(2) 4],
K'&T',= 3 rl 0.110(,R'A) 02781 Eq.(2)W 4xR 3
where, AT.,.,: maximum temperature rse C]
K thermal conductivity of surrounding medium [W/m K]
W. initial heat generation in a single waste [W]
R waste radius [m].
The equation 2 indicates the general tendency of the temperature rise is a function of
R2k and the thermal impact of each nu�lide having initial heat generation W. can easily be
speculated. The term of KAT.I./W. was thus used as a representative factor of the thermal
impact.
2) Cluster analysis for appropriate grouping
Grouping of nuclides was conducted by employing the cluster analysis [5]. In this
analysis, the following factors were introduced to identify the properties of nuclide to be
concerned: (1) T12/Rf, 2 KAT,,. , 3 Dc.. (dose conversion factor in ttSv/y / B/m'),
(4) M (inventory in Q, (5) Qjsolubility in moIAL) 6 LET (linear energy transfer in
eV/mm), and 7) F.h.(chemical factor). The degree of the underground-water radiolysis by
the nuclide was simply estimated by the 7 value, which was linearly interpolated from the
energy of the emitted a, P, y - rays. The chemical factor Fvhe.was defined as the element
property including (I)electronegativity, (2)Gibbs free energy of formation of the
corresponding oxide in the waste form, (3)redox potential of the dominant valence species
speculated in undergroundwater. The factor Fch,,n was determined as a single value for each
element by using the principal component analysis 6]. This factor was introduced in the
cluster analysis for simply taking into account (1) the degree of complex formation 2)
chemical stability in the waste form, and 3) redox sensitivity in the repository environment,
respectively.
3) Repository deign for segregated disposal
Accordinu to the recent report 3 suggesting the key parameters to dominate the
repository size are the dimensions of overpack, bentonite, and the disposal pitch, a very
simple procedure to determine these factors was developed and applied to assign the
303 -

JAERI-Conf 2002-004
repository dimensions deigned or each waste tpes. Of course, the validity of the procedure
had been checked prior to the analyses. A brief summary of the repository design criteria
used here is shown in Table 2,
Table 2 Repository design criteria
Method Limit NoteNuelide Inventory ORIGEN2 weight lmit(15% as oxide) use smaller limit
thermal limit(2.3kW) Ref 7Necessary rn' ation
Repository Depth Eq.(l) IORSV/y length
Overpack Dimension ASNM code hydrostatic pressure+ Bentonite swelling pressure Ref. 8
relaxation of the volume epansion after 300yearsBentonite Dimension Eq. 3) (5) sure due to overvack crrosion overpack corrosionWaste Configuration Thermal analysis Below 00'C
(1) Overpack corrosion
The corrosion during the 300 years was estimated using the empirical equation of the
corrosion rate extracted from the natural analogue study of the embedded steel pipes of the
drinking water supply system buried for 20 - 66 years 3 The corrosion depth
corresponds to te 300 years was estimated approximately I cm tinder oxidizing atmosphere
from such an equation, This value was added on the estimated tickness to assure the
mechanical stability after the 300 years corrosion.
(2) Simple mechanical interaction model
The stress arising from the volume expansion of t he overpack was simply calculated by
E2E3(2L + .(k� + Eq.(3)E2,(24 + 4)L3+ E3(21 + L + -3)L,
where, G stress due to corrosio [Pal
E,, elasticity modulus of medium n [Wa]
LI, thickness of medium it [n']
ke volume expansion rate (set as 2.
n medium identifier (n=l:overapck, 2:corTosion layer, 3:buffer material).
The general expression for the radial displacement at radial position r is dpicted as 9]
Ar'J(l -v)r' (I v)r,'l P'4$ - v)r' (I Eq.(4)2 _ 2)
E(r2 r
- 304 -

JAERI-Conf 2002-004
where. u(r): radial diSDIacement at radius r [m]
r. radius of a cylinder [m] (n =:inner radius, 2:outer radius)
P, pressure on a cylinder Wa] (n=1:interna1 pressure, 2:extemal pressure)
E elasticity modulus �-MP].
When one applies Eq.(4) on the corrosion laver and assumes u(r,)=O because of the hard
overpack wall, the above equation ay be simplified as below and this formula gives the
loading pressure (p,) on the overpack outer surface.
2A= P2r2 Eq.(5)
2+(,+V 217 - V). r.
where, Pi internal pressure of the corrosion layer Wal
U Poisson ratio of the corrosion layer (assumed 0.3)
P2 external pressure of the corrosion layer [NVa]
(= cy in Eq.(3) + swelling pressure)
r. radius of the corrosion layer [m] (n =Linner radius, 2:outer radius)
The minimum thickness to relax the swelling pressure due to corrosion was calculated with
changing the initial bentonite thickness to meet the Tresca's yield critelionrloi.
(3) Waste configuration
The pitch between two wastes was mainly determined y the thermal analysis to
maintain the temperature below 100T, The temperature rise due to a single heat source
with radioactive decay was derived [11] then the affect of neighbor heat sources were
accounted by the ethod of superposition, The nderground repository was treated as a
homogeneous ad spherical medium and necessary correction of the thermal properties of
composite media were carried out,
3. RESULTS DISCUSSION
3.1 Appropriate grouping extracted by the statistical analyses
The data set for some typical nuclides used in the present analyses are shown in Table 3
below. Two nuclide groups were then extracted from the cluster analysis as seen in Fig.
shown as a hierarchical tree. The result suggests there are two distinct groups of (a) fission
products and (P) TRU their daughters. The supplementary analysis using the principal
component analysis also supports this findings and the results from both two statistical
analyses suggest the independent disposal for (cc) fission products and (P) TRU their
305 -

JAERI-Conf 2002-004
daughters are plausible because of the different impact Dronerties.
Table 3 Data set used in the statistical anelvscsLoo of Factor,.-,
Nuclide II, / R� K AT,,,,,,, �Wo Inventon, Dose ConvFactor�ci -,I [cij
I Sv/y / Bq/
Cs 35 1,397 -0.738 -0.326 -0,535
Am 243 -0-887 0-403 4 1.640 -h560
Cm 247 0,924 0,405 -2347 0.663 -0,744
1 129 3,691 -0,656 1.282 -0,263 1205
Np 237 O�835 0.393 0 640 0500 -1,539
Pa 231 -0,155 0,388 1,816 1-653 1 -0�0931,642 -1. 170 0.393 -2 704 0 842
Pu 244 1.700 0.381 2 A 52 -0,183 -6,835
i Ra 226 -0,704 0.073 -3,409 0,538 -0.432
Se 79 1.097 -0.812 0.672 -0,506 1 2. 590Sm 148 5�66 9 0 159 -3 992 -0,212 -1.698
Sn 126 0.111 -0,409 M93 -0.146 L280
Sr 90 -0,564 -0.002 3 142 -0.175 -0,349
'IC 99 1 914 -0,636 1 377 -2,057 1-235
U 38 2 64 3 0,347 0.587 -0,492 0,242
1 002 0,979 -1 403 -0.254
C%.134
CS-137Sr-"C5-13SZr-93Tc�q9Sa-126Se.79
Ra-226-'
Pa.t31
Np-237
Am-241-
Cni-24_4-
Fig.1 The hierarchical tree of he nuclides n the sent fuel
3 I ReDOSItory depth
Minimum migration length to maintain the dose rate below 10[tSv/y for some fission
products were calculated by Eq.(l). The results indicate hvo distinct groups: one has short
306 -

JAERI-Conf 2002-004
distance below 100m and the other has long distance more than 10000m. In practical
manner, the partitioning process can be developed by employing chemical separation
technique, The grouping was thus revised by the element basis. The isotope with the
maximum migration length was selected as the representative of each element and the
grouping was conducted again.. The appropriate element groups for artitioning from the
viewpoint of underground disposal were extracted as follows. The oup B (fission products
with shorter half-lives) is not necessary to be disposed in deep geologic environment after
appropriate decay period and another nuclides not shown here are to be included in this group
B as well. On the contrary, groups A (fission products with extremely long half-lives) and C
(TRU their daughters) require the deep geologic disposal to attain the longer migration
distance L and/or reducing environment. All decay chain member nuclides are included in
the group C because the production and accumulation would occur and mix again sooner or
later even if complete elemental separation is accomplished.
3.3 The variation of the engineered barrier system for the different waste types
The dimensions of the engineered barrier system for each type of waste are summarized
in Table 4 When the proposed grouping is introduced, the total area of the repository
corresponding 32000 MTU of spent fuel would be reduced about 50% if compare to the non-
separated BW disposal.
Table 4 Dimensions of the Engineered Barrier System for Different Waste Types
A B C HLWP group Short FP group Actinides for comparison
No. of waste 1.75E+04 2.47E+04 I 3.22E+03 IF 3.99E+04
diameter [cm] 43
Glass height [cm] I 35
isolation period L] 1000 300 1000 1000
corrosion depth [cm] 4 1 4 4
Overapck wall [cm] 19 15 9 19
rid [cm] 19 3.5 15 19
Bentonite thickness (cm] 70 10 40 70
pitch [Ml 6 1.6 1 4 6.5
Repository Repository m 2] 6.30E+05 6.33E+04 1.71E+05 1.69E+06
Area Reduced 51.2 100
4 CONCLUSION
Separated disposal of the high level radioactive waste (HLW) is discussed by the
following procedures; (1) the nuclides in the waste are classified into several groups having
307 -

JAERI-Conf 2002-004
similar properties by using the cluster analysis, 2 the disposal depth required that the
maximum dose rate of each group is less than IORSv/y is assigned by the simple migration
analyses, 3 the dimensions of the engineered barrier system for segregated wastes are
calculated by the simple procedures.
The grouping and configuration analyses imply that fission products with shorter half-
lives is not necessary to be disposed in deep geologic environment after appropriate decay
period and can be disposed more densely. On the contrary, fission products with extremely
long half-lives and IRU their daughters require the deep geologic disposal to attain the
longer migration distance L and/or reducing environment, Even though, the total disposal
area necessary for the three segregated wastes is about half of that for the non-separated HLW
disposal. The result emphasizes the advantage of the segregated disposal for nuclear energy
to survive in the future.
S. REFERENCES
[1] IAEA, "Safety and Environmental Asoects of Partitioning and Transmutation of
Actinides and Fission Products", IAEA, 1995).
[2] Shimoda, S., Iimura, H., and Kuroda, T., J. Atomic Energy Society of Japan, 33(11),
1049, 199 1). (in Japanese)
[3] Japan Nuclear Cycle Development Institute, Second Progress Report on Research and
Development for the Geological Disposal of HLW in Japan, JNC TNI410 2000-001 -
2000-003, April, 2000).
[4] OHE, T., Proceedings of The Second Fujiwara International Senlillar, S4-2, usono,
Japan, Nov.6-9, 2000). (will be published in J. Progress in Nuclear nergy, Elsevier)
[51 AnderbergM.R.,"ClusterAnalysisforapplications",AcademicPress, 1973).
[6] HarrisR.J., "A Primer of Multivariate Statistics ", Academ ic Press, New York, pp 1 5 5,
(1975).[7] Croff, A.G., ORIGEN A Revised and Updated Version of the Oak Ridge Isotope
Generation and Depletion Code, ORNL-5621, 1980).
[8] ASME, Pressure Vessel and Boiler Tube, Section III, Subsection NE, Division 1 D55
[9] BlakeA., "Practical Analysis in Engineering Design", Marcel Dekker, New York,
1982).
[10] DerbyB., HllsD.A., and RuizC., "Materials for Engineering: Afundamental Design
Approach", Logman Scientific&,rechnical, Harlow, pp7l,(1992).
[111 Muftij.R., J.Geophys.Res., 8568,76(35), 1971).
308 -

JP0250316JAERI-Conf 2002-004
WASTES GENERNFED BY APPLICATION OFJAERI PARTTTIONING-TRANSMUTATION SYSTEM
TO HGH LEVEL RADIOACTIVE WASTE
SHINICHI NAKAYAMA*, YASUJI MORITA, KENJI NISHIHARA,HIROKAZU HAYASHI. AND OSAMU SHIRAI
Japan Atomic Energy Research Institute, Tokai, lbaraki, 319-1195 Japan.'FAX., 1 29-282-5625, e-mail: akayaam�sparclt.tokaijaeri.gojp
Production f low-level radioactive wastes, as well as the reduction i radioactivity of HLW, are important inassessing te echnological feasibility of a partitioning-transtrintation systeui� We have begun o identify thechemical compositions and to quantity the amounts of radioactive wastes that inay be generated by JAERI'sprocesses, Long-lived adionuclides such a 4C ad ,Ni ad spallation products of Pb-Bi coolants are added tothe existing ifivernory of the nitelides that are generate i the current fuel cycle. Spent salts of KCI-LiCl, whichare not generated front (he currew fuel cycle, will be introduced as a waste.
Key words: parritioDing-transinutation system, long-lived activation and spallation products, spent KCI-LiCl salt,Pb-Bi coolant and target
I. INTRODUCTIONSeparation of short-lived fission products through partitioning reduces the initial radioac-
tivity of igh-level radioactive waste (HLW). Transmutation of long-lived minor actinidessuch as 23 7Np reduces the radioactivity f HLW oer tens of thousands of years. The partition-ing-transmutation technology accordingly helps reduce the potential hazard of HLW[l].
The physical and chemical processes used during te application of partitioning-transmutation tecl-mology, however, generate ther; low-level, radioactive wastes. Althoughthe new LLW waste does not represent a significant increase i potential hazard after disposal,the waste ay be, produced i different chemical forms and may therefore require differentwaste immobilization forms from those in the current nuclear fel cycle. The type of solidify-ing matrix material Is chosen depending on the chemical compositions of the wastes. Thevolume of waste forms is determined by the matrix material employed, the quantity of loadedraw wastes, as well and level of radioactivity. The chemical compositions and the amount ofthe wastes influence the treatment method ad the total waste volumes, and therefore the costfor final waste disposal.
Assessing the technological feasibility of the partitioning-transmutation system shouldinclude the feasibility of safe and reasonable treatment and disposal of radioactive and non-radioactive wastes that remain after the introduction of the system. The assessment is de-pendent on reliable information on the quantities and chemical compositions of the wastes,and of course their radioactivity.
We have begun to identify the chemical compositions and to quantity the amounts ofradioactively contaminated wastes that may be generated by each of te partitioning-transmutation processes. There are two general waste sources - process losses, and wastesarising froin the maintenance and decommissioning of the plants. The process losses can beestimated trom, the material balance calculations for each process, and so, in principle, thetypes ad amounts of wastes generated can be assessed quantitatively. The types and amountsof plant maintenance ar)(1 decommissioning wastes can be estimated, at least on a semi-quantitative basis b i-ising industrial experiences ad expertjudgment. This paper presentsthe results of stimates of process losses obtained so far by material, flow analyses of the parti-tioning, tansmutation, and nitride fuel reprocessing processes of the partitioning-transmutation system proposed by Japan Atomic Energy Research Institute, JAERI. The
- 309 -

JAERI-Conf 2002-004
analysis for the nitride fuel fabrica- Commercial Power
tion process has riot been examined Reactor Fuel CyclePartitioning-Transmutationyet. Fuel Cycle - HLW
Fuel 11 MEnsmn�ter N11 N
2. JAERFS PARTITIONING AND (.4DS) T�- Fabrication lilLLFP
TRANSMUTATION SYSTEMJAERI has proposed a "double SF
strata" nuclear fel cycle, in which Pyrochemical
the current Japanese reprocessing Reprocessing LLFP
fuel cycle would be the first stratumor layer of the cycle, and a partition-ing-transmutation system would be Figure 1: JAFRI's "double strata" fuel cycle system. Te commercial
power reactor bel cycle is the first sratum, and the partitioning-the. second layer. This cycle is tranStilkitatJO fel. cycle is te second. HLW: High Level Waste, MA:shown schematically Figure 1. Minur Actirride, LLFP- Long-Lived Fission Product, SF: Spent Fuel.
The partitioning-transmutation cycle ADS: Accelerator-Driven subcritical System.
system is composed of four proc-esses -- partitioning of elements into groups, fabrication of nitride fuel, accelerator-driventransmutation of the nitride fuel, and pyrochemical reprocessing of the nitride fuel aftertransmutation. This system is independent from the commercial power reacto fel cycle.
The partitioning-transmutation layer of the double strata cycle begins when high-levelliquid waste, discharged from fnel reprocessing plants of the first layer of the cycle, is re-ceived at the partitioning plant. inor actinides and the long-lived fission product 99Tc, areextracted in the partitioning process and converted into fuet for transmutation,
Material flow in the partitioning-transrautation system is smmarized in Figure 2 Thecore inventory of minor actirrides in te ADS, aceeterator-driven suberitical system, is 225tons. One and one-quarter tons of minor actinides 0.25 tot-is from te PUREX reprocessingplant - layer one, and 1.0 ton already in the system ft-om pyrochemical reprocessill-1g), are be-ing fabricated into fel, which is loaded into te core. In addition, oe ton of the core inven-tory is returned for pyrochemical reprocessing, and is cooled for two years before being re-processed. The system-wide inventory of minor actinides is then 5.5 tons at loading,
The 025 tons of minor actinides supplied from the PREX reprocessing is te quantityof minor actinides produced by 195.7 tons of 45,000 MWd/t burnup spent nuclear fuel firoin
light water reactors. Conse-
ej, Reactor Fuel Cycle ittly, the following satesPUREX .Reprocessing are based on reprocessitig andLWR 5F 195.7t 45,000 MWd/t) applying partitioning-
�!V__ 2.5t/yr: to be reqLded transmutation technology to0.25t/yr (NP A 195.7 tons of spent light water
Partitioning n5mu onFuel Cycle reactor fuet reprocessed each
Paivvo&7_q.0.25t/yr MA year.MA system inventory: 5.5t The Accelerator-Driven sub-MA transmutation rate: 0,25t/yr critical System (ADS) is cur-
P�,rochemical rently esigned to be 800 MWtAD5:800 M & Fuel Fabrication
MA-N:Y-N=25:75 0 t/yr of unloaded MA fuel, with a lead (Pb - bismuth (Bi)Transmutation rate: r cooled for 2 years eutectic coolant, and to transmute
MA core inventory: 01.25t/yr of MA nitride fuel 0.25 tons of mnor actinides per
year[21� The fuel composite is a
Figure 2 System-wide material low in JAERI's partitioning- homogeneous mixture of minortransmutation cycle system actinide, nitrides ad an yttriurn
- 310 -
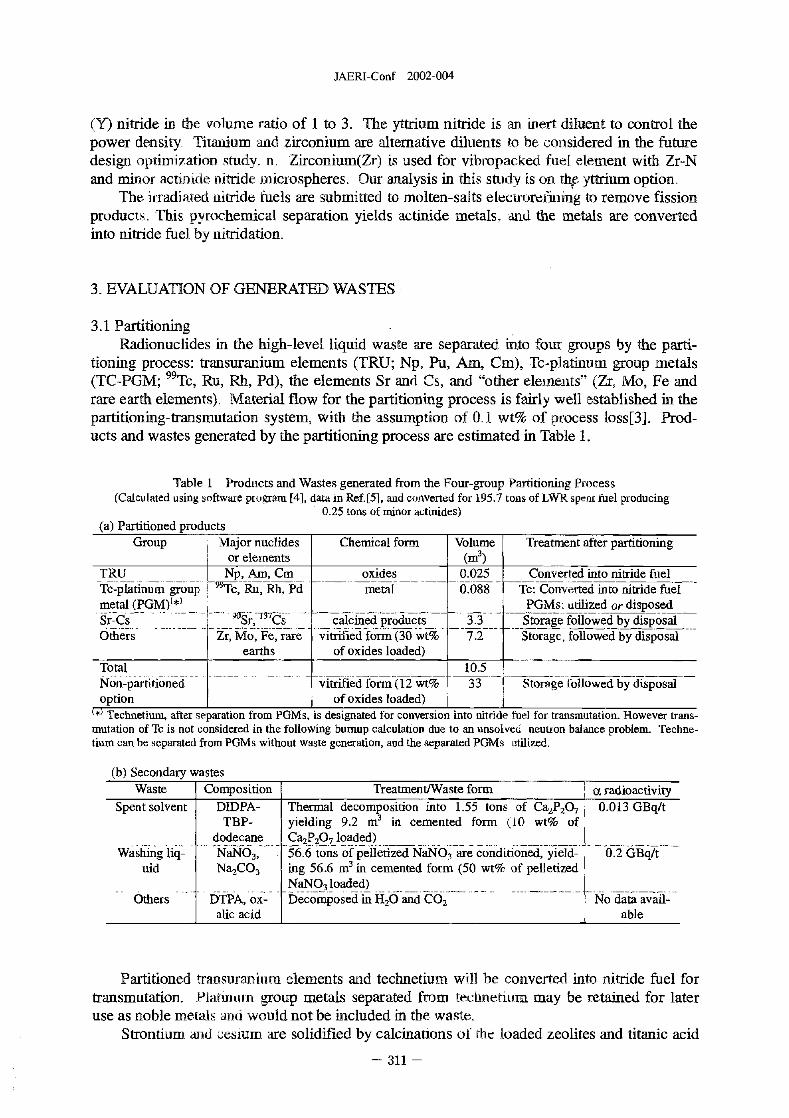
JAERI-Conf 2002-004
(Y) nitride in the volume ratio of to 3 The yttrium nitride is an inert diluent to control thepower density. Titanium, and zirconium are alternative diluents to be considered in the futuredesign optimization study. n. Zirconium(Zr) is used for vibropacked fue eement with Zr-Nand minor actinide nitride riticrospberes. Our analysis in this study is on te yttrium option.
The irradiated itride fuels are submitted to molten-salts electrorefining to remove fissionproducts. This pyrochemical separation yields actinide metals, and the metals are convertedinto nitride fuel by nitridation.
3. EVALUATION OF GENERATED WASTES
3.1 PartitioningRadionuclides in the high-level liquid waste are separated into four groups by the parti-
tioning process: transuranium elements (TRU; Np, Pu, Am, Cm), Tc-platinum group metals(TC-PGM; 99Tc, Ru, Rh, Pd), the elements Sr and Cs, and "other elements" (Zr, Mo, Fe andrare earth elements). Material flow for the partitioning process is fairly well established in thepartitioning-transmutation system, with the assumption of 0.1 wt% of process loss[31. Prod-ucts and wastes generated by the partitioning process are estimated in Table .
Table Products and Wastes generated from the Four-group Partitioning Process(Calculated using software program 4], data in Ref.[5], and converted for 195.7 tons f WR spent fuel producing
0.25 tons of minor actinides)(a) Partitioned products
Group Major nuclides Chemical form Volume Mr-eatrnent after partitioningor elements W)
TRU NP, AJA Cm oxides 0.0-25 Converted into nitride fuel_fc__Oh�tinum group 'Tc, Ru, Rh, Pd metal 0.088 Tc: Converted into nitride fuelmetal (PGM)(*) PGMs: utilized or disposed§r-C '_ ____ ___ 90S�j,_T37-s s calcined products 3.3 Storage followed by disposalOthers Zr, -vit6hed for m 30 w t17o 7.2 ------- Sto-rage, followed by disposal
earths of oxides loaded)Total 10.5Mon --p arti tio ne d---- -- wt% 33 Storage followed by disposaloption I of oxides loaded)
�*) Technetium, after sparation from PGMs, is designated for conversion into nitride fuel for transmutation. However trans-mutation of Tc is not considered in the following burnup calculation due to an unsolved neutron balance problem. Techne-tium can be separated from PGMs without waste generation, and the separated PGMs utilized.
(b) Secondary wastesWaste Composition Treatment/Waste form a radioactivity
Spent solvent DIDPA- Thermal decomposition into 1.55 tons of Ca2P207 0.013 GBq/tTBP- yielding 92 in cemented form (10 wt% of
dodecane Ca2P207loaded)wash-ing-liq_- _NaN___ ______56.6 ton-s 0fpefie-d-zed Na N _0. 2 G Bq/ i03, 03 are conditioned, yield-
uid Na2CO3 ing 56.6 rn� in cemented form (50 wtO/o of pelletized
Others In j�A, 0 __ tiec 0--m p o s ed -M'- A2 NaNO31oaded) -6 u id t b -- N o data awali 1 -alic acid able
Partitioned transuranium elements and technetium will be converted into nitride fuel fortransmutation. Platinum group metals separated from technetium may be retained for lateruse as noble metals and would not be included in the waste.
Strontium and cesium are solidified by calcinations of te loaded zeolites and titanic acid
- 311 -

JAERI-Conf 2002-004
into 33 in 3 of waste, and the remaining group of elements is solidified into 72 M3 of Vitrifiedwaste. These last two groups are te primary wastes from partitioning, totaling .5 M3. This
is much less than the 33 ni of Vitrified waste that would be produced by solidifying anequivalent quantity of non-partitioned igh-level waste. This reduction volume resultsfrom the removal of short-lived fission products "Sr and MCs� The loading of high-levelwaste liquid into class is limited by the temperature rise due to decay heat, Removal of Srand 137Cs allows the increased loading into glass, and accordingly the number of glass wasteforms is expected to decrease. The secondary wastes that would result from the partitioningprocess include spent solvent (DIDPA-TBP-dodecane) and sodium salt solutions (sodium car-bonate and sodium nitrate). Calcium phosphate 9.2 n) from the spent solvent and 56.6 tonsof pelletized sodium, salts are solidified into cement waste forms. The calcined products withzeolites and titanic acid are wastes that are not generated from the current fuel cycle, but willbe generated from the partitioning-transimitation system.
3.2 Accelerator-Drivert subcritical SystemRadionuclides produced by the ADS include short-lived fission products produced in ni-
tride fuels, activation products and spallation products generated in fuel pins, and the Pb-Bieutectic target and coolant.
Nitrogen-15, enriched froni natural nitrogen, is used for the nitride fuel. Carbon-14(5,730 yr) is produced trough activation of the remaining 14 N during te transmutation proc-ess. The amount of 14C Produced is proportional to that of 14 N. A 90% enrichment of 15N
yields 20 TBq (II 0 g) of 4C per year. Activation products of SUS316 fuel cladding includeof 58C
radionuclides of various lifetimes. Twenty thousand TBq _0 (71 d) don-tinate the initial
radioactivity of the discharged fuel, and 04 TBq of 59Ni will dominate 10,000,years after fel
discharge ftom the ADS.
Some of the yttritun in the yttrium. nitride in the fuel is activated dring transmutation to
produce 0018 Bq of 9r`Y 64 hr'. This isotope quickly decays to a stable isotope of 9Zr.
About 24 tons of Y ad 56 kg of Zr will remain, affecting the subsequent partitioning-
transmutation processes, ad finally will be disposed of as a waste,
About 7000 tons of the Pb-Bi eutectic metal (target and coolant) of te ADS are a source
of spallation and activation products. An e-xample of alculation of radioactivities of the spal-
lation and activation products for an 800 MWt ADS is shown in Figure 3 Polonium-210
(138 d; 8x 10¹⁷ Bq) is one of the main ra-
dioactivity-dormnating adionuclides that I.E+20
will be present at e end of 50-year op-
eration of the ADS. This isotope is in ra-TOTALdioactive equilibrium with the long-lived cc
precursor, 21OFn Bi (3x 10⁶ yr), after I I.E+16Z�years. A long-lived spallation product of 202Pb-202T 2 U ........ ------- ........ ......02Pb(3xlW yr)-'(7Tl(22 d) and an activa- 4"'
product of 2 .0 I.E+12 210MB�^Ti 94tion 10mBr-'0'T1(4.2 m) will -0, 210po Hcj-"Aucontribute 50 TBq of total radioactivity at -------- -
10,000 years after te 50-year operation, '075�207"Pb
This radioactively COMattrinated Pb-.Bi LE+08
metal is discharged i decommissioning 1 10 100 1000 10000
the ADS facility. This waste will only begenerated once in the lifetiffle of the facil- Time after 50-year operation (yr)
ity, that is nce in tens of years of opera- Figure 3 Radioactivity generated i the Pb-bi tai-
tion. 'Ibis radioactively contarninated Pb- Zet and oolant for 50 years f operation of the
]Bi waste does not exist in t crrent fel 800 MWt.ADS, Partial results of the burn-tip cal-culation[6 ae plotted.
- 312 -

JAERI-Conf 2002-004
cycle, bt will be generated from the pattitioning-transmutation, system, The radioactivity of
the contaminated Pb-Bi waste is low, Te cemical toxicity of these tnetals may dominate the
risk of Groundwater contaminatio wen the waste is disposed of into the underground.
33 Fuel fabrication
JAERI's partitioning-transmutation system needs two different fuel fabrication processes
as schematically Shown i", Figure 4 One is a et process: Actitwides xtracted in the
partitioning process are fed to sot-get process oowed by conversion into nitride tuel
through carbo-thermic synthesis. Te other fabrication is a dry reprocessing of spent fuel.
Spent nitride el is first sul:iject to pyrochemical treatment ushig molten KCI-LiCI salt to
separate actirrides. The obtained actinide metal/alloys are converted into nitride fuel though
nitridanon with 15N.
Because the design of these fuel fabrication processes has not progressed as far as the de-
signs of the partitioning and transittutation
processes, engineering data are not yet avail- 7Pa rti y�ti o ni �n,able to uarrtify the aterial low in the fuelfabrication processes. Data o the material LActinide�ijlosses therefore are mucli limited.
Typical wastes produced from the ftiel re-processing are ulls ad fission product etals,and radioactively contaminated KCI-LiCl salt Carbc-Thenn_ _____'�LSyntjesjs ,\ft\\\\\RN-15mixture� A semi-quantitative, preliminaryevaluation with InDited ata indicates that tecontaminated KCI-LiCl salt waste generated Actinide nicould range froin t to 10 tons per year, depend-ing mostly o the amount of Y remained in thewaste.
ernU4. DISCUSSIONS AND CONCLUSION
Introduction of the partitioning- Ln
transmutation system into the Crent nuclear Zfuel cycle decreases both ort- and long-termradioactivity of HI_W, but it also produces \-_. . Nitride Fue/ Cyclevarious additional forms of low-level radioac-tive wastes. Long-lived radionuclides sch as Figure 4 Fabrication process for the actinide nitride14 C and 59Ni and spallation products of Pb-Bi fuel in the JAERI partitioning-transmutation cyclemetal are added t the existing inventory of the (modified from Ref F21.)
wastes tat are gnerated )it the current fel cycle. Wastes uch as spent salts of CI-LiCl,which me Dot -enerated from the crrent ftiel cycle, will also be introduced by a partitioning-transmutation ystem.
ChloriDe, Pb and N ay be sources of groundwater contamination if disposed under-ground. Tite chemical toxicities may be of more concern than the radiological toxicity. Thesewastes sould be treated �ind disposed of as safely as "radioactive wastes". In this sense, theproduction of the aditional, low-level radioactive wastes, a well as te reduction in radioac-tivity of HLW, are unportant performance indicators that should be quantitatively evaluated inassessing the vability of a partitioning-transmutation system.
Based on the current studies to quantifying the wastes, it is suggested that waste man-agement arilizing JAERI's "double strata" fuel ycle may result in saller sized "HLW" re-positories esignated for separated short-life, highly-active radionuclides, and may need'de-
- 313 -

JAERI-Conf 2002-004
velopment of treatment and disposal technology to manage -B1 metals and KCI-LiC1 saltmixture. This is a concluding remark for for waste management considerations in itroducinga new technology into the nuclear fuel cycle, the JAERI partitioning-transmutation system.
AcknowledgementsThe authors wish to thank H. Yamana of Research Reactor Institute, Kyoto University,
M. Kurata of Central Research Institute for Electric Power Industry, M. Shiotsuki of JapanNuclear Cycle Development Institute, T. Ohe of Tokai Uiversity ad T. 0mori and T. Koba-yashi of Toshiba Corporation for their advice and discussion, and G. McCrank of Japan Nu-clear Fuel Cycle Development Institute for his stylistic revisions. Pt of this work was pre-sented at the GLOBAL 2001 conference held at Paris on September t - 16.
References[11 Japan Atomic Energy Commission's Advisory Committee on uclear Fuel Cycle Back-
end Policy, "Research and Development of Technologies for Partitioning d Transmuta-tion of Long-lived Nuclides - Status and Evaluation Report -, arch 31, 2000 (in Japa-nese).
[2] T. Mukaiyama, T. Takizuka, M. Mizumoto, Y. Ikeda, T. Ogawa, A. Hasegawa, R. Takada,and H. Takano, "Review of Research and Development of Accelerator-driven System inJapan for Transmutatio o Long-lived Nuclides", ATuel, Energy, 38, 07-134 2001).
[3] Y. Morita et al., "The First Test of 4-group Partitionnig Process with Real High-level Liq-uid Waste", Proc, Fourth Int'l Cotf Future Nuclear Systems, GLOBAL 99, August 29 -September 3 Jackson Hole 1999) published in CD-ROM),
[4] Japan Atomic Energy ResearchInstitute, "Mass Flow Computer Code or JAERls' Parti-tioning Process: User's Mannal" 2001) (In Japanese).
[5] M. Kubota mid Y. Morita, Preliminary Assessment on Four Group Pw-fitiorring ProcessDeveloped in JAFRJ", Proe. Third fuel. Conf onFwure Nuciear Silsoems, GLOBAI297,Vol. 1, 458-462, October 5-10, 1997, Yokohama, Japan 1997),
[6] K. Nishihara and N. Sasa, Estimation of Activity aDd Toxicity for Spallation Productfrom the Target for Accelerator-driven Transmutation System", JAERI-Research 2001-015, Japan Atomic Energy research Institute 2001),
314 -

JP0250317JAERI-Conf 2002-004
STATUS AND FUTURE NEDS IN ACTINIDE CHEMISTRYFOR PERFORMANCE ASSESSMENT OF NUCLEAR WASTE DISPOSAL
Dhanpat Rail and T\4ikazu Yui 2'Pacific Northwest National Laboratory, Richland, WA, USA
2japan Nuclear Cycle Deveiopment Istitute, Tokai Works, Japan
ABSTRACT
Actinides are important components of nclear wastes. Many actinide isotopes have sch long half-lives thatthey e expected to persist i unclear wastes over periods extending to hundreds of thousands to millions of
Years, Because. the environmental bebavioj- of actinidets is hghly dependel o any faoors including chemical,
physical ad ineralogical properties ofwaste-forin/geologi mdia a tes poperties are ot expected to
stay constant over millions of years, fundamental approaches eed to be dewtloptd to edici actinidt behavior
over long periods, Before these approaches an be dveloped, thermodynamic data pertaining to dontinant
aqueous species ad solubility of environmentally important solid phases ae rtquived� These data ate generally
usediusetuppet-Iiiiiitsoiisolubleactinideconcenti-aLiotisuijdefspecificeiivifoiii)ieiiiaicoiiditions, The
reliability of te pedicted concentrations will depend upon te quality ad extensiveness of tat thermodynamic
data that is obtained.
This paper provides only a cursory discussion of the ality and extensiveness of currently available data for
actinide reactions with envirournentally important ligands, Areas where further fndamental actirride data are
required iclude ixed ad omplex systems elevated emperatures, solubility-contrulling solid phases in waste
forms, solid solutions, complexing/binding agews, and kineticiequilibrium redox reactions. This paper provides
examples that illustrate the iportance of tbese arious aspects ad the challenges we face in acquiring the
necessary data.
Key Words: Thermodynamic dara, actinides, complexation, solubility
INTRODUCTION
Depending on the concentrations, radioactive materials are or will be disposed of in low-levelor high-level waste geologic repositories. A common concern for both types of theserepositories is that the disposal environments are expected to be ite diverse. The geologicenvironments may differ significantly in ionic strengths (e.g., salt repositories versusrepositories i other geologic formations), pli, and redox conditions. In Addition, the waste
forms may themselves considerably modify the chemical environment in and around the
repository. Bocarrst of the waste characteristics, low-level waste repositories, when compared
with high-level waste repositories, are expected to have lower radioactive material
concentrations ad temperatures, and higher levels of organic matter, organic complexing
ligands, and carbonate concentrations. The types of solid-phases/waste forms are expected to
be quite different between low-level and high-level waste repositories. Chemical variations,
along with the facts that the alf-lives of most important actinides are hundreds of thousands
of years, the chemical environment may change over time, and tile Jong-term chemical
behavior for site specific repositories cannot be determined experimentally, dictate that
fundamental rather than empirical approaches are required to predict ong-term actinide
behavior under different repository environments, Thermodynamic data 1) provide a
fundamental approach and ong-term predictability, 2 help set reliable upper-limits of
actinide concentrations a 3 form the basis to predict the effects of different chemical
environments ad to develop fundamental data for adsorption and diffusion reactions. For
315 -

JAERI-Conf 2002-004
these reasons, this aper will mphasizG the need for additional researc ad hermodynamicdata for actinides important to radioactiIve waste disposal i geologic repositories as theprimary objectives of this discussion.
DISCUSSION
Different actinides and their nvironmentally important oxidation states e SOWD i Fig. .Inorganic ligands, such as chloride, hydroxide, sulfate, carbonate, and phosphate, afe presentin most geologic envirortmetus. Based o te concentrations of tese ligatids, they can makestrong complexes with actinide elements. Quite a large body of ata on sirnplesystem atroom temperature for actinide coiriplexes and solid phases with these ligands is eheravailable or is being developed y everal organizations Aong he data at are availableare comprelieDsive, reviews conducted by te Nclear nergy Agency of the Ofganization forEconomic Co-operation aDd Developmera or UM, An)(2), aDd for Np ad p"(3), JD addition,recent eviewS(4-6) CDducted for the waste repositories i apan provide a ummary ofavailable thennodviiamic data for actiDides. Since most of the available data have eenadequately summarized. we will concentrate on discussing or views o were there is furtherneed for additional data.
VT
UV
1V
0
Th ?a U Np Pu Am Cur
Fig. I Fnvironmentallyirnportantidationstates of actinides.
Although a arg aount of oom temperature data for ost of the common igand isavailable, validation of key data i some cases is stilt required. Extremely linifted data areavailable i te areas Of I'DiXed SSteDIS, elevated temperatufes (steel) as those xpected to bepresent in high-level waste repositories), sohibilitv-controlling Soli pases in waste forms,solid solutions, complexingibinding agents (especially in low-level waste repositories) adkirretic/equilibrium redox reactions, Te data needs iD these areas ate briefly discussed below,
Mixed Systems
Thermodynamic data are generally available or simple systems ivolving oe ligan a afixed concentration of ionic redia, Tbe challenge we face is t demonstrate, through furtherstudies tat simple system data are applicable to ixed ad complex, systerns (nvolvingmultiple ligands), arid that the ionic media effects ate predictable. We kow tat inixedsystems can ave a dramatic effect o t queous concentrations and activities of varioustons. For example a tfiermodynamic model ase o TK)2(arti) solubility in Na-'C0 orNaHCO3 SolutionS(7), where sed to predict behavior in Na?,CG3 Slution GIrtainin 47 ill
- 316 -

JAERI-Conf 2002-004
NaCl such as mght be, expected in low-level waste repositories ill salt), showed that thepredicted coucewratioris were up to 3 to 4 oders of magnitude higher han. theCOTICeD(tabODS actually oserved i inixed carbonate-chlorlde systems, and they were up to 3orders higher fla tose pedicted assuming tat inixed carbotiate-perehiorate parameters areapplicable to te mixed carbotiate-chloyide systern (Fig, 2)(8) Tese reskift sow the impactsmixe ad complex queous systems care ave on the solubilities and the eed toexperimentally evaluate these aspects Tese results also point out tha wthout properconsideration of ionic tuedia effects, thertnodyuarnic alues oxtrapolated fom high andconstant onic sength Systems involving DnXed electrolytes will be of questionable quality.Reliable data f0f eDViT0DJueDta1ly important mixed systerns and actinidesioxidation states arecurrently lackijig and represent a area for further study.
No Mix'
-2
-3
-4_E
A New Model
-6
-7 CIO' Terms
0.0 0.5 1.0 1.5 2.0 2.5Naco.3(M)
Fig. 2 Observed and predicted concentrations ofTh in equilibrium with ThO2(arn) in the presenceof 47 in NaC1 and variable concentrations ofN82CO3 (after Felmy and Rai(8)).
Elevated Temperatures
Higher than ambient temperatures are expected in the high-level waste repositories. Elevatedtemperature call significantly affect aqueous concentrations trough 1 canges in solubilityproducts and complexation constants of actiuide species, 2 changes i activities of ancillaryspecies, a 3 hanges i the crystallinity of actinide solid pleases For xample, Treatingamorphous ThO2 to 90'C converted it to crystalline O2 resulting i about 10 orders ofmagDjtUde decrease in solubility (Fig. 3(9). Our unpublished clata wt te orrespondingU(IV) systern alsoshows similar dependeDCieS on temperature, Exteflsive data on the effectof temperature o ost oil' the aspects discussed above are lacking and are eeded before wecan make reliable predictions for the expected elevated temperatures in high-level wasterepositories.
- 317 -

JAERI-Conf 2002-004
-2.0 CUdD§Zdhoo
-2.5
-3.0
ThWam), 230C3.50 SetI,6d 'VV0 Set 1, 21 d A
-4.0 A Set II, dV Set U, 13 d
this study A
-4.5 T (am->c), 900C0 Set I, 76 d- - model
-5.0 1 1 11 2 3 4 5 6
pH
Fig. 3 The effect of heating equilibrated suspensionsof ThO2(am) in 0 I M NaCl (after Rai et a.(9))
Characterization of Solubility-Controlling Solid Phases
In order to set reliable upper limits for actinide concentrations, data are needed on whetherthe concentrations in waste forms are solubility-limited, and if they are, then we need data forthe exact nature of the solubility-controlling solid. The challenges we face in popercharacterization of solubility-controlling solid phases in waste forms iclude ) here may bemultiple solid phases of a given actinide or oxidation state, 2 solids rnay be amorphous orcrystalline, 3 the most soluble phase will iitially control the solubility, 4 existingcharacterization techniques are inadequate, especially when solids ae amorphous or whenpresent in trace concentrations, and 5) thermodynamic data for all phases may ot beavailable. Methodologies, therefore, must be developed to overcome these hallenges.Comparing experimental solubilities of waste forms as a fnction of pH and other importantvariables to the solubilities of known solid phases can be used to predict te solubility-controlling phases that are otherwise difficult to characterize Fr eXaMple, the Closeagreement between the solubility of Nd-doped glass in a 02 atmosphere s a function of pHand the predicted NdOHCO.;(c) showed that the sollibility-controlling pas i this ystemmust be NdOHC03(C) (Fig. 4(10). The solubility method is very sensitive d an, ll solnecases, also be used to characterize solid phases that are present in trace quantities. Forexample, the solubility of crystalline ThO2 prepared at 750'C and as a fnction of pHsuccessfully identified the presence of far less tan 1 of a less crystalline.phase (Fig. 5(9).
- 318 -

JAERI-Conf 2002-004
-4 -0 6 and 9 dayA 22 day
-5dOHCO,(c)
-6
-7
0-8 0
Detection Limit
-9
5 6 7 8 9 10pH
Fig, 4 Solubility-controlling solid of Nd in JNCglass equilibrated in 0001539 atm. CO,2 (Rai etal.00)).
-2
-3 ThO2(2')
-4
M -5-
-6
-7tM-8 ThO2
0
-9. A
-10 1 2 3 4 5 6
pH
Fig. Characterization of ThO2 solids when presentin trace concentrations (Rai et al.(9)).
Solid Solutions
The formation of solid solutions can decrease the solubility of a minor components by manyorders of magnitude. Possibilities of solid solutions exist between trivalent rate earths andactinides among teLTavalojit actinides, and possibly among other actinide oxidation states.Reliable data for solid soWtions do not exist. In order to develop these data, it is imperativethat the quality data for ed mernbers are available. The ed inember data for importanttrivalent and tetravalent actinides have recently become available, making it possible in thefuture to develop meaningful data for solid solutions of environmental importance.
- 319 -

JAERI-Conf 2002-004
Complexing/Binding Agents
In addition to inorganic reactions i geologic materials involving prtcrpitation/dissolution andadsorption/desorption, actinide reactions with organic ligands and microbial srfaces can insome cases enhance mobility (e.g., reactions with organic ligands that ma b present in low-level waste repositories) ad in others iminobilize actinides (e.g., inding to microbialsurfaces). There also are a variety of natural (e.g., isosaccharinic aid) and synthetic (e.g.,ethylenediaminetetraaectic acid, EDTA; nitriloacotic acid, NTA oganic ligands oftenassociated with low-level waste repositories that can strongly complex actinicie ions, whichcan mobilize actinides in geologic environments, lsosaccharinic acid JSA) is a degradationproduct of cellulose(II-13 ad isshown(11-141 tosolubilize actmides i a wide p range. Eventhough some of these organic ligands a-re very strongly cornplexing, their reactions withactinides are currently poorly understood. For example, 1 te srictures, species, andconstants of actinide-ISA ae uknown 2 no data are available for trivalent atInide-ISAcomplexes, and 3 new inovative techniques are required to dentify these species. Microbialsurfaces can uptake high concentrations of actinides. However, these eaction ae also poorlyunderstood. There are many technical callenges in deciphering these fundamental reactions.Technical difficulties include microbial surfaces contain different functional groups whichprovide sites for binding actinides with different strengths 2 cernical enviyontirents offunctional groups depend o te cell structure, 3 data o tire caracterization of functionalgroups are not available, ad 4 data on actinides binding to microbial surfaces are extremelylimited.
Kinetic/Equilibrium Redox Reactions
Oxidation/reduction reactions can significantly affect actinide behavior in geologicenvironments, or example, reducing conditions an imrnobilize U(VI ad Np(V byconverting them to there fairly isoluble tetravalent states ad can make Pu potentially moremobile by converting Ptj(IV), commonly considered to be te doininant and immobileoxidation state in geologic environments, to PuJIT). Significant challenges exist Indeciphering te effect of oxidation/reduction reactions fundamental bases. Tesechallenges include 1) overcoming difficulties i characterizing iedox potentials of mostgeomedia because of mixed potentials, redox couples not ni quilibrium ad difficultiesquantifying all redox species participating in a given eaction ad 2 obtaining eliable datafor actinides for enVirODY"eirtally i-11POrtant conditions sch as te effect of pH ad educingagents (e.g., Fe(IT), suffides, organics ad hetber te reactions are ontrolled by equilibriumor kinetic phenomena Inovative techniques are equired to characterize the redox potentialsofgeologicrnedia. SonieOfOLlrrecentsttidie,,s(1-5)tiavesl)owtltilattilet�e(juctiollofpo(jv)toPu(III) can occu i th pesence of reducing agents courmorny ecountered in geologicenvirom-nents (e.g., Fe(IT ad hydroquirione a analog for humic acid) ad an enhance thesolubility of PuO2(arn) by as much as 20 orders of magnitude. Tis process, ortion underenvironmental onditions, has been completely gnored i the past, yet a pay a veryimportaiitroleindeterrnliiiiigl-'tit)ehavioritire(itteiiiggeologicei)vil'olll)lents. Obtainingreliable fundamental data o all oftho-se aspecis is required before fundamental capabilitiesfor determining actinide ehavior in geoJogic environmems care be eveloped.
- 320 -

JAERI-Conf 2002-004
SUMMARY
As discussed, there are many aspects or aeas that need further sudy and validation in order toaddress future thennodyDamic data needs i disposing of radioactive wastes. Areas forfurther study include mixed systems, elevated temperatures, solubility-controlling solidphases, solid solutions, complexingibinding agents ad kitietic/equilibrium redox reactions.The challenges are not iiisurmountable, but careful and extensive frther experimental studiesare required to develop reliable long-term predictability of actinide behavior i geologicenvironments.
ACKNOWLEDGMENTS
This research was conducted at the Pacific Northwest National Laboratory, operated byBattelle for the U. S. Department of Energy (DOE) tender contract DE-AC06-76RLO 1830 incollaboration with Japa Nclear Cycle Developurent Institute (JNQ unde a agreement withDOE for a project o "Development of Fujidarrielltal Thenriodynarai ad Adsorption Data".We tank Ms, Kathleen R. Hanson for editorial and Ms. Debra M. Hinton for text processingof tls document (NUCEF paper 9.doc).
REFERENCES
[1] 1. Grenthe, J. Fuger, R. J. M. Konings, R. J. Lemire, A. B. Muller, C. Ngyen-Trung H.Wanner., Chemical Thermodynamics of Uranium, Vol. 1. North-Holland, New York 1992).
[2] R. J. Silva, G Bidoglio, M. H. Rand, P. B. Robouch, h. Wanner, I. Puigdomenech,Chemical Thermoc�ynamics ofAmericium. Vol. 2 Nuclear Energy Agency, Organization forEconomic Co-Operation and Development, New York 1995).
[3]. R. J. Lemire, J. Fuger, S. Kastriot, H. Nitsche, W. J. Ullman, P. Potter, P. Vitorge, M. H.Rand, H. Wannej�, and J. Rydberg, Chemical Thermodynamics of Iveptunium and Plutonium.Chemical 7hermodynamics: Vol. 4 Elsevier Science B. V., Amsterdam 2001).
[4] D. Rai, L. Rao, H. T Weger, A. R. Felmy, G. R. Choppin, and M. Yui, ThermodynamicDatafor Predicting Concentrations of Pu(III), Am(III), and Cm(Iff) in GeologicEnvironments. JNC N8400 99-010, (Japan Nuclear Cycle Development Institute, TokaiWorks, Japan, S taLe 1999).
[5] D. Rai, L. Rao, H. T. Weger, A. R. Felmy, G. R. Choppin, and M. Yui, ThermodynamicDatafor Predicting Concentration of Th(IV), U(IV), Np(IV) and Fu(IV) in GeologicEnvironments. NC TH8400 99-009, (Japan Nuclear Cycle Development Institute, TokaiWorks, Japan (I 999).
[6] G. R. Choppin, M. Bronikowski, J. Chen, J. Byegard, D. Rai, and M. Yui,Thermodynamic Datafor Predicting Concentrations of AnO2 + and AnO2 2+ Species in
Geologic Environnients, JNC N8400 99-012, (Japan Nuclear Cycle Development Institute,Tokai Works, Japan State,1999).
- 321 -

JAERI-Conf 2002-004
[7] A. R. Felmy, D. Rai, S. M. Sterner, M. J. Mason, N. J. Hess, and S. D.Conradson, J. Solution Chemistry 26, 233-248 1997).
[8] A. R. Felmy and D. Rai, J. Solution Chemistry 28, 537-557 1999).
[9] D. Rai, D. A. Moore, C. S. Oakes, and M. Yui, Radiochimica Acta 88,297-306 2000).
[10] D. Rai, A. R. Felmy, R. W. Fulton, and J. L. Ryan, Radiochimica Acta58,9-16 1992).
[II] B. F. Greenfield, A. D. Moreton, M. W. Spindler, S. J. Williams, andD. R. Woodwark, Materials Research Society Symposium Proceedings 257,299-306 1992).
[12] B. F. Greenfield, M. H. Hurdus, N. J. Pilkington. M. W. Spindler, andS. J. Williams., Materials Research Society Symposium Proceedings 333,705-710 1994).
[13] B. F. Greenfield, G. J. Holton, M. H. Hurdus, N. OKelley, N. J.Pilkington, A. Rosevear, M. W. Spindler, and S. J. Williams., MaterialsResearch Society Symposium Proceedings 353, 1151-1158 1995).
14] D. Rai, L. Rao, and D. A. Moore, Radiochimica Acta 83, 09-13(1998).
[15] D. Rai, Y. A.. Gorby, J. K. Fredrickson, D. A. Moore, M. Yui.,Journal of Solution Chemistry (submitted) 2001).
322 -

JP0250318JAERI-Conf 2002-004
IS THERMODYNAMIC OF ACTINIDES APPLICABLE TONATURAL DYNAMIC SYSTEMS?
Jae 11 Kim
Forschungszentrum Karlsruhe, Germany
A modeling of the actinide migration bebaviOT in natural aquifer systems entails sound
knowledge of thermodynamics of actiDides, which is considered as relevant to describe
their geochemical reactions. For obvious reasons, thermodynamic constants of
actinides are appraised from closed laboratory systems of equilibrium. state. On the
other hand, the geochemical reactions of actinides in natural dynamic systems undergo
open chain of multiple reactions that appear to be non-equilibrium or often irreversible.
For the appraisal of such complexities, a challenging question indubitably arises: "Is
thermodynamics of actinides applicable to natural dynamic systems?" The question
inevitably triggers off another: Is there any alternative scientific tool available then?"
This paper sununarizes the present state of the thermodynamic approach being applied
to the assessment of various geochernical. reactions of actinides and discusses the
limitations involved in application to natural dynamic systems.
323 -

This is a blank page.

JP0250319JAERI-Conf 2002-004
PRESENT STATUS OF THE STUDY ON RADIONUCLIDE DIFFUSIONIN BARRIER MATERIALS
Tetsuji YAMAGUCHI and Shinichi NAKAYAMAFax., 81-29-282-6678, e-mail: yamaguch�sparelt.tokai.jaeri.go.jp
Japan Atomic Eergy Research Istitute
Tokai, Ibaraki, 319-1195 Japan
When ong-lived adionuclides are transported by goundwater through fractures i the rock mass surrounding a
high-level radioactive waste repository, their diffusion into pores in the rock atrix and ensuing sorption onto
mineral surfaces are expected to retard heir ansport along the pathways. There are pressing needs to
mcorpoj�ate the retardation echanism into performance assessment of geological isposal in fractured rock. In
JAERI, we have caracterized the pore structure of the Japanese hiada biotn ganite ad confirmed that Fick's
diffasiou law can be applied to the transport of aqueous species in granite. Effective dithisivity was determined
by the through-diffusion method for cationic, anionic and actinide complex species to explore the mechanism of
diffusion of he aqueous species. Contribution of surface dfusion, or diffusion in asorbed state, was observed
in addition to pore diffusion for divalent cationic species. The results of this study eable us to provide a
scientifically sound basis for adionuclide diffusion in granite for performance assessment of geological disposal.
Key words: Matrix diffusion, Granite, Pore structure, Diffusion coefficient, Surface diffusion,
1. INTRODUCTIONAfter emplacement of radioactive wastes in a deep underground repository, long-lived
radionuclides mav be leached from the wastes and may subsequently be tansported troughthe surrounding rock ass Mor water bearing fractures in the rock surrounding -therepository are considered to form he main transport paths. Diffusion into the pores or microfissures in the rock matrix and esuing sorption onto mineral srfaces are important processesleading o the retardation of radionuclide transport through the geosphere. To evaluate themigration of radionuclides in eep geological formations, it is essential to understand the
mechanisms of the diffusion of radionuclides into the rock atrix and to quantify thediffusively. Granite was used i tis study because it occurs widely in Japan and is beingconsidered as a potential host rock for the deep uderground disposal of radioactive wastes.
It is well-known that Fick's diffusion law can be applied to diffusion 4i porous materials.
J = -D, aclax (1)
where i diffusive flux (Bq M-2 S-1),
D, effective diffusion coefficient m� s-1),c concentration of radionuclides in pore water (Bq Mx length coordinate in diffusion direction (m).
When this teory is pplied to tile diffusion0 ins in a rock, te pore size is assumed to besignificantly larger tban the diffusing ions. This assumption sould be verified. The effectivediffusively of a queous species trough the interconnected pore space in a rock matrix is oftenassumed to be proportional to its diffusively in bulk solotion (D,) and to the geometric
325 -

JAERI-Conf 2002-004
parameters of the rock: (porosity), (constrictivity) andr-2 v tortuosity).
D = DP 8r'. (2)
This relationship has been proposed for diffusion in macro-porous media by Brakel and
Heertjes [1], and has been applied to the diffusion in the rock atrix by Neretnieks 2.
Although it is convenient to use this relationship to describe diffusion i rock matrix, several
researchers 3-5] suggested the contribution of diffusion in adsorbed state, or surface diffusion,
based on the fact that effective diffusion coefficients of cationic species were much larger than
the calculated values based on Eq. 2). The evidence of the surface diffusion, however, has not
been provided.
For actinides, empirical data on diffusion in barrier materials aye very limited in number
except for U(VI) because of difficulty in experiments such as low solubility, strong adsorption
onto minerals and onto container walls, complexation with ligands in water and redox
reactions. In order to overcome these difficulties, experiment sould be performed under
well-controlled conditions for a long time.
In this study we have characterized the pore structure of the Japanese Inada biotite granite
to confirm that Fick's diffusion law can be applied to the transport of aqueous species in
granite. Effective diffusivity was determined by the through-diffusion ethod for cationic,
anionic and actiDide complex species to explore the mechanism of diffusion of the aqueous
species.
2. EXPERIMENTAL
2.1 Analysis of pore structure
The water saturation method ad the mercury intrusion porostmetry were applied to the
characterization of micropores in granite from Inada, lbaraki, eastern Japan 6 Athough
these techniques have been commonly raised to characterize pores i -rocks, special cares
should be taken for precise easurement of te porosity and the pore size of low-porosity
rocks. In the water saturation method aalysis of drying curves of water-saturated weight 7]
enabled precise measw-enients of porosity. tu the mercury intrusion porosit-fletry a major part
of the error comes froin rough uaces of the sample., which was reduced by cutting tile
samples into rectangular parallelepipeds, istead of ciushing. 'Me volume of te rock sample
put into the measurement cell of the mercury porosimeter was optimized. The pore structure
of Inada. granite was observed by SEM (Super Scan 330 FEG, himadzu) after polishing and
depositing carbon on the surfaces.
2.2 Diffusion experiment
Diffusive transport of aqueous species in granite was stud ies by a through-diffusion
method. A granite disk having a diameter f 4.Ox 0 in and a thickness of 5x 10⁻³ m, Without
visible cracks was fitted tightly in an acrylic diffusion cell 8 and any gap etween the rock
disk and the acrylic were filled with a silicone asket, The grairite disk was sandwiched3between two reservoirs, each, with a capacity of I ISxIO4 RI . Te assembled iffusion cell was
soaked in a working solution to be raised in the diffusion experiments Of in distilled and
deionized water (DDW) utider vacuum o evacuate all air from te interconnected pores in the
granite. The diffusion cell was then kept under atmospheric pressure for 30 days to
326 -

JAERI-Cont 2002-004
pre-condition the granite disk with the working solution. Solutions were prepared fomreagent grade chernicals (Wako Pure Chemical Industries, Ltd., Tokyo) and DDW (Milli-QLabo System, Millipore).
After preconditioning the gTanite disk with a 102 MO, -3 K Slution, the solution in a102reservoir, source reservoir, was replaced by a mol rn-3 K solution containing 'I and
134Cs t start the iffusion of F and Cs, At 7 days intervals, WO-6 ml aliquot was taken from
the other reservoir, measurement reservoir, and its activity deten-nitted by y-spectrometry witha pure Ge detector. The IXIO-6 3 aliquot removed from te measurement reservoir wasreplaced by an qual volume of the 12 MO, -3 K solution to maintain the water levels in the
two reservoirs. This balancing avoids occurrence of pressure difference that leads to advectivetransport from the source to measurement rservoir. The experiment was performed at 25.0 -+-
0.5)'C in a water bath. At the termination of the diffusion, the inner wall of the measurementreservoir was rinsed with 104 ol rn� N03 to determine the amotmt of the tracers adsorbedon the cell walls. Diffusion experiment for tritiated water. 13Bal-,,, Np(IV) and Pu(IV)carbonate complexes were performed in the same manner. The experimental conditions weresummarized in Table .
3. RESULTS AND DISCUSSION3.1 Pore structure
The porosity of nada granite sample was determined to be (0.4%_0.07) % by watersaturation, wich agreed with the value determined by mercury intrusion. The pore-sizedistribution of the granite was logarithmic normal with the modal diameter of 160 um asshown in Fig. 1. Figure 2 shows the SEM images of the polished srface of the granite. Poresof a few tens to a few undreds nm wide were observed at grain boundaries. This size is solarge that the Fick's diffusion law is applicable to the diffusion of ions in the granite. The fact
that the pore size was fairly uniform suggests the applicability of te pore-diffusion model tothe diffusion of ions in the granite.
0.12
0.10
0.08 -
0 0.06 -CL
ta 0.04a.
02
QAO-9 -8 -7 -6 -6
Log pore diameter W
Fig. I Pore size distribution obtained by mercury intrusion (left) and SEM iage (right) for Inada granite.
327 -

JAERI-Conf 2002-004
Table I Sununary of diffusion experiments
Species D, M2 s Rd M 3 kg-1) Conditions
(5.8O±O.05)xl0-"' (1.3±0.6)xlO-4 102 Ml -3 KI solution114CS+ (5.04±O.l8)xl0-" (7.5±0.8)xlO-4 pH = 6, 25 'IC, aerobic
(7.99±O.07)xl0-" < 2.3xIO-4 IOT�Mojyn-3 CSI Slution*
134cS+ (6.32±0.09)xlO-" _7�1,8xjo` 25 OC, aerobic
(5.06±0.09)xlO-'7 2.8x, 1O-5 102 M-1 rl , solution*
25 'C, aerobicHTO (8.97±0.07)x 10-13 (4.0±1.9)x 10-' DDW
(7.78±0.06)x 10-13 (-7.4±5.7)xlO-5 pH � 5.5(6.41±0.07)x 10-13 (3.6±5.3)xlO-' 25 OCavg. (7.7±1,4)x 10-13 avg. < 8XIO-5 aerobic
133 Ba 2+ (1.66±0.03))<io-13 (7.4±0.6)xlO-5 10 mol in- BaC12 solution
(2.12±0.03)x 10-13 (9.0±0.5)xlO-' pH 65(2.08±0.03)x 10-13 (7.6±0.7)xlO-' 25 OCavg. ( 95±0.21)x 1(-13 avg. g W.9)XjO-5 aerobic
ITT ±0.31*10--l(5.15+0. 1 O)x i _6(7.22±0.3 I)X10-13 (-0.3±1.0)x]O-'(6.07±0.13)x 10-13 (-1.28±0.45)xlO-'avg. 6 .1±0.9)XIO-13 avg. < 1.6xlO-5
10-13 IO)XI04Ba�+ (1.99±0.04)x (1.94±0. 1 mol m�BaC12 solution(2.25±0.03)x 10-13 (2.12±0.09)x 104 pH = 61(2.90±0.07)x 10-13 (2.72±0.20)x 104 25 'IC
avg. (2.38±0.38)xlO-13 avg. (2.26±0.35)xIO-4 aerobic125r (6.62±0.36)x]O-" (0.9±1�0)xlo-l
(8.6±0.9)x 10-13 (-2.7±3.2)xlO-5(10.08±0,3 I)XIO-13 (3.2±0.9)xlO-savg. (8.4±1.7)x 10-13 avg. < 3.lxlO-I
133 Ba+ (6-57±0,21)xlO-" (8.1±0.7)x 10-4 10-1 rol M-3 BaC12. solution
(7.43±0,O9.)xl0-" (9.56±O.30)xI0-4 pH=62(5.71±0.1 I)x 10-" (7.59±0.34)xlO-4 25 Cavg. (6.6±0.7)xlO-" avg. (8.4±0.9)xlo-" aerobic
125r (10.05+0.48)xlO-"' (5.6±1.9)xlO-'
(3.90±0.47)x 0-" (-5.3±1.8)xl0-'(6.29±0.39)x 10-13 (-3.9±1.4)x 10-5
avg, (6.7±2.6)xlO-" avg < 3 9X10⁻⁵
Pu(C0j),(0H)2'2- (1,28±0_29)YIC' [NaHC03-1 = 102 mol n-3
(2.00±0.45)XIC' (5-7±17)xle [S2(;"- = r n-3 .
(2_767H).6J)xI0-" pH 92, h 70 rnV vs. NHEavg.(2.0±1 .4)x 10 13 24.5±3.2'C, Ar, 02 content-3xlO-6
Np(CO3)14-, (5.41±0.10)xIO` (1,2.3±t.5)xlO--' [NaRC03- = IO' MOI M_'
Np(CO,)�'- (2-857i�) 10)x 103 (4.7±1.5)xlO-' IS2 0,12-) = 50 filol 11-3
(3.94±O,14)xI0-" (-0,6±2.3)xlO-' pH = 97 Fh = 450 rnV vs, NBEavg.(4.0±L5)xlG-1 3 avg, < 1,4xlO-4 26±I'C, Ar, IXI 6
DDW was pace i he measurement eservoir,
3,2 ffective diffusivity
The concenb7ation of an species in pore water in one-dimensional diffusion system is
derived from Eq. 1) as:
(F-+PRd)ac /at= D, a2C / aX2 (3)
assuming that local adsorption equilibrium is attained
q RdC (4)
328 -

JAERI-Conf 2002-004
where q amount of the species adsorbed onto the rock (mol kg-),
p bulk density of the rock (2.64x I 03 kg M-3),
Rd distribution ratio (m� kg-').
The initial and boundary conditions are
c(xO)=O at0<x<_L, (5)
CA = c (6)
c(L, = 2 << C (7)
where L thickness of the rock sample (5xlO-3 m),
cl concentration of a species in the source reservoir (Bq M-3),
C2 concentration of a species in the measurement reserv oir (Bq m -3
The solution of Eq. 3) under the conditions of Eqs. ( - 7) had been given by Crank 9]. he
concentration of a species in the measurement reservoir after a long period is approximated to
CAWC1 = AV2-1(DL-lt - F+pRd)U6) (8)
where A : cross section of the rock sample (1.256xlO-' M2),
V2: volume of the measurement reservoir (I. 8x 1 04 m3).
The values of D, and (P-+pRd) were determined from the slope and the intercept on the
concentration axis of the extrapolated linear region of the diffusion curve, Eq. ).
Figure 2 shows te time dependence of the concentrations of 134CS and 121, in the 102
Mol M�3 KI solution in the measurement reservoir. The concentration of 125, increases linearly
with time. The effective diffusivity of (5.80-+0.05)xlO- 13 M ? s- 1 was obtained from the slope by
using the least squares fitting. The intercept on the concentration axis was very small, which
indicated that the adsorption of on granite was negligibly small (Rd < 19x I -4 rn� kg-'). The
concentration Of 134CS increased linearly after 140 days from the start, of the diffusion. An
effective diffusivity of (5.04+_0.I8)xl0-" rn� s-1 and a distribution ratio of (7.5+_0.7)xI0-4 m3
kg-1 were obtained, Results of all of the diffusion experiments were summarized in Table .
In order to check the validity of the constant proportionality between D, and D, assumed in
Eq. 2), experimentally obtained ,'s and lterature data for strontium, cobalt [101, uranium [8,
1 1 ] and uranine 12] are plotted versus D, in Fig. 3 Ds for the diffusing species under the
experimental conditions were estimated by taking into account mode of diffusion 13] (salt
diffusion or tracer diffusion), concentration of the diffusing species, ionic strength of the
solution and temperature [II]. Except for the data for Ba�+ and S2+ the data points lie on a
curve. A positive correlation with a nearly constant ID, ratio is observed between D, values
in the granite and diffusivity in water for most of the species, which validates the constant
proportionality between D, and D, However, unexpectedly high D, values are obtained for Sr
and Ba, which have igh distribution ratio. The data for Sr had been explained by supposing
that the adsorbed Sr ons are mobile in adsorbed state (surface diffusion) 10].
In case that both the surface and the pore dffusion contribute to the diffusion on ions in
rocks, effective diffusivity should be expressed as 101
D = D, e 8,C-2 + Dp Rd (9)
329 -

JAERI-Conf 2002-004
0.04 -1010
M Cs-134 1U)0 1125
E2+
0.03 _11 Sr10 (Surface
diffusion
UO Ba2+
0.02 M HTOZ_ 10 diffusion) I -, Cs+
aclinide 2+ C02+]!crfbrn.,. Compleyes. Sr
:3 13 � Ba2+0.01 Pore
ii5i 0 diffus (003 34> Lj a nine
2CD n _KCr2
amp t0 LU -14
10 -lo -9 -80 100 200 300 400 10 10 10
Time (day) Diffusivity in water D, M2 S-1)
Fig. 2 Through-diffusion curve of cesium and iodine Fig. 3 Correlation between affective diffasivities
through a 5-mm thick Inada granite disk. of species in Inada granite and their
diffusivity in aqueous solution.
The I" term of Eq, 9), contribution of the pore diffusion, was estimated to be (2,1±0.5)x 10-13
rn� s-1 for B2+ based o a a C-2 value of (2.5±0.6)xlO-4 [10] and a D, value of 8.48XIO-" rn� S'
[13]. In the diffusion xperiments using the 0 mol m3 BaC12 solution, the effective difffisivity,
D, of (l.95±0.2l)xiO-" m2 s-' and the distribution ratio, & of (8.0±019)xIO iW kg-, were
obtained. This value is close to the estimated value of (2.1±0�5)xIO-1 3� The I inot in-' BaC12
solution produced the larger D, and the larger Rd of (2.39±038)xlO-1 �� In 2 S-1 and-4 -1(2.26±0.35)xlO in- kg respectively. We obtained the largest , (6.6±0,7)xlO- m s-1, and
the largest Rd, (8.4±0.9)xlO-4 in' kg-', for the 10-' moi n-'3 BaCI-2 solution.
The effective diffusivity of F, non-sorbed species, was not afected by BaC12 concentrations;
(6.1±0.9) xlff", (8.4±1.7)xlO-13 and (6.7±2_6)xl03 m s-t for 10, t mid 10-1 mot -3 BaC12
solution, respectively, These values are close to a estiunmed value, 6.4xlO-" in' s-', btained
from an equation for the effective diffusivity of iodine in rocks o,]
DL = 64xIO-u'F'-' (10)
where was 00049.The results for F show that the physical property of the pore ,structure was almost the same
between the experiments, ad accordingly te variation in D, of Ba 2+ was not physically
caused. The variation in D, value was also tiot due to the speciation of barium in the solution
because complexations of Ba 2+ by C- and S203 2- are egligible ad arbonate precipitation is not2favorable under the working pH range 61 - 65) [15], The effective diffusivity o Ba +
increased as the distribution ratio increased. This fact is strongly indicative of surface
diffusion. The linear relationship between the effective diffasivity and tire distribution ratio ofBa 2+ gives the D, value in Eq� 9) of (14±0. Dx , 0_'3 M2 S-'. Tris I
h 9, value is smaller than the
value for Sr2+, 3.5x IOA2 D2 s- obtained previously L 10].
330 -

JAERI-Conf 2002-004
Figure 4 shows schematics of the 41 Measurementreservoir
3 2 +diffusion cif , Ba through the granite (low roncentratio.n)
in the present experiment. Gradient of2+133 Ba concentration existed, both in
aqueous phase and in adsorbed phaseSource reserv r F
between the source reservoir and the (highL)iffmeasurement reservoir, USio f nc.ntrabon)
2+13'Ba is driven by both of these
gradients. Diffusive lux in adsorbed
phase, -Dpaq16x, prevails over tat in Fig 4 Schematics of the aqueous and adsorbed phase
aqueous phase, -Dpedclax, when diffusion of Ba2, in the diffusion experiments
distribution ratio is igh. through Inada granite disk.
Speciation calculation using a
thermodynamic database 16] showed that Pu and Np were present predominantly as
Pu(CO3),2(O14)2 and NPW03)�,4-?, (n = 4 5), respectively, under the experimental conditions.
'lbe oncentration of plutonium in the measurement reservoir increased linearly with time in the
period of 400 - 88 d after the start of the diffusion. An effective diffusivity value of
(2.0±l.4)x10-" J-112 s-1 was obtained on the average of triplicate experiments. The concentration
of neptunium in the measurement reservoir increased inearly with time in the period of 5 - 329
d after the start of the diffusion A , value of (4.0±1.5)x tO-" m2 s-' were obtained. These D,4-values are comparable to previously obtained value for UO2(CO3)3 ,which was consistent
with an empirical correlation between D, and D,. The range of D, for actinide carbonate
complexes were also shown in Fig, 3 The diffusivity is not high enough to be indicative of
surface diffusion.
4. CONCLUDING REMARK
We leave characterized the pore structure of the Japanese Inada biotite granite, which
showed applicability of te Fick's diffusion law to the transport of aqueous species in granite.
Effective iffusivity was determined by the through-diffusion ethod for dationic, anionic
and actinide complex species to explore the echanism of diffusion of the aqueous species.
Contribution f urface diffusion, or diffusion in adsorbed state, was observed in addition to
pore diffusion for divalent ationic species. The results of this study enable us to provide a
scientifically sound basis for radionuclide diffusion in granite for performance assessment of
geological disposal.
Diffusion of adionuclides in low-permeability engineered barrier materials such as
compacted bentoulte and cementitious materials is of great iportance in the performance
assessment of repositories. However, long-term assessment of the difftisive mass transport in
low-permeability aterials includes large ucertainties because pore structures and long-term
degradation of the aterials are poorly known. Future studies should emphasize
understanding the dusion mechanisms in low-permeability engineered barrier materials,
data acquisition o og-term degradation of the materials and quantifying uncertainties
associated with long-terni ass transport analysis.
- 331

JAERI-Conf 2002-004
5. ACKNOWLEDGEMENT
Authors acknowledge Professors K. Higashi and H. Moriyarna (Kyoto University), Dr. T. T.
Vandergraaf (AECL) and Prof, S. Nakashima (Tokyo Institute of Technology) for helpful
discussion. Dr. H. Isobe present affiliation: Kumamoto University) is acknowledged for
technical support. We are grateful to Mr. Y Tamura, Mr. 1. Kitagawa, Mr. H, Okamoto, Mr. A.
Kijima, r. Y. Kawasaki (WASTEF, JAERI) for performing Pu experiments. Experimental
supports from graduate students, Ms. C. Kawada (Tokai University, present affiliation:
Toshiba Corporation) and Mr. K. Asahara (Kyoto University, present affiliation: Chubu
Electric Power Co., Inc.) are greatly acknowledged. I hereby acknowledge tat this study was
performed as a part of nuclear safety research program of JAERI for many years.
6. REFERENCES
[I] J. V. Brakel and P. M. Heertjes, Int. J. Heat Mass Transfer, 17, 1093-1103 1974).
[21 I. Neretnieks, Geophys. Res. 85, 4379-4397 1980).
[3] M. H. Bradbury, A. Green, D. Lever and 1. G. Stephen, Diffusion and permeability based
sorption measurements in sandstone, anhydrite and upper magnesian limestone samples",
AERE-R 11995. 1986).
[4] K. Skagius and 1. Neretnieks, Water Resour. Res., 24, 75-84 988).
[5] M. Tsukamoto and T. OheT., Chem. Geol. 90, 31-44 199 1).
[6] T. Yamaguchi, 11. Isobe and S. Nakayama, Radioactive Waste Research, 3 99-107 (in
Japanese) 1997).
[71 T. W. Melnyk and A. M. M. Skeet, Can. J. Earth Sci., 23, 1068-1074 1986).
[8] T. Yamaguchi and S. Nakayama, J. Contam, Hydrol. 35, 55-65 (1998)�
[9] J. Crank, "The mathematics of diffusion. 2nd ed.", Oxford Univ. Press, London 1975) pp.
49-53
[IO] T. Yamaguchi, Y Sakamoto, and M. Senoo, J. Nucl. Sci. Technol_ 30, 796-803 1993).
[11] T. Yamaguchi, Y. Sakamoto. S. Nakayama and T. T. Vandergraaf, J. Contain. Hydrol., 26,
109-117 1997).
[121 A4. Kumata, T. Iwai T Sagawa, T. Szuki and K. Nishiyama, Diffusion experiment of a
radionuclide in granitic rock cores", AERI-M 90-179 (in Japanese), JAERf, Tokai, Japan
(1990).
[13 Y H. Li and S. Gregory. Geochirri. Cosmochim. Acta, 38, 703-714 1974).
[141 K. Nishiyama, S, Nakaslurna, R Tada and T. Uchida. Mining Geot. (in Japanese), 40,
323-326 1990).
[15] A. Dean, "Lange's Handbook of Chemistry", McGraw-Hill, New York 1978) pp 57,
[16] T. Yamaguchi, "Consideration of thermodynamic data f predicting solubility and
chemical species of elements in groundwater. Part 2 Np, Pu", JAERI-Data/Code
2000-031 [in Japanese], JAERI, Tokai, Japan 2000).
- 332 -

JP0250320JAERI-Conf 2002-004
OVERVIEW OF WASTE FORM DEGRADATION PROCESS MODELSFOR PERFORMANCE ASSESSMENT
F.M.G. Wong', C. Stockman2, R. Rechard 2, and P. Bradi
Yucca Mountain Site Caracterization Office1551 Hilishire Dr. M/S 471
Las Vegas, N-V 89134Fax: 702) 792-1323, e-mail: frank wong�notes.ymp.gov
2Stone & Webster, Inc., Sandia National Laboratory
The Wte Form Degradation Process Model Rel)ort (Waste Form Degradation PR)[11 is one of nine PNiRsthat have the shared objective of describing tbe technical information that was used i the total systemperformance assessruent (TSPA) conducted to evaluate the postelosure perfou-nance of a potential monitoredgeologic repository at Yucca Mountain. The TSPA-SR (site recommendation) will be used in the preparation ofa document for a Secretarial ecision on wether to recommend the Ycca Mountain site for development as arepository, The Waste Forin Degradation PNS summarizes the esults of investigations o the degradation ofthe radioactive spent uclear fuel (SNF), high-level waste (HLW), dissolved radionuclides, and colloidalradionuclides,
The clmination of these investigations was the construction of the Waste Form Degradation Model topredict te dissolved or colloidal radionuclides available for transport in the TSPA for SR (TSPA-SR). TheWaste Form Degradation Model onsists of eight mjor modelingianalysis components (1) RadioisotopeInventory, 2 In-Package Chemistry, 3 Commercial Spent Nuclear Fuel (CSNF) Degradation, 4 CSNFCladding Degradation (5) U.S. Department of Energy (DOE) Spent Nuclear Fuel (DSNF) Degradation, 6) BWDegradation, 7 Radioisotope Dissolved Concentration (solubility), a (8) Radioisotope ColloidalConcentration. These eight components are generally onnected sequentially starting with the radioisotopeinventory as input ad ending with projected radioisotope dissolved and colloidal concentration.
Within (be analysis for the TSPA-SR analysis, the function of theWaste Form Degradation Model is todetermine three outputs over time: (1) dissolved concentration, 2) reversible colloidal concentration, and 3)irreversible colloidal concentration of radionuclides.
This pper will describe ad surnmariz te eight components of the Waste Form Degradation ProcessModel.
Key Words: Waste Form Degradation, Performance Assessment, Process Model
1. INTRODUCTIONThe overall objective of the Waste Form Degradation Process Modeling Report (Waste FormDegradation PMR)[11 is to summarize the technical basis of the Waste Form Degradationmodel. The degradation of the waste eventually leads to mobilization of radionuclides andrelease into other components of the engineered barrier system (FBS) which are simulated inthe total system performance assessment (TSPA). The function of the Waste FormDegradation odel is to determine three outputs over time: () dissolved concentration, 2)reversible colloidal concentration, and 3) irreversible colloidal concentration of radionuclides(Figure 1).
2. COMPONENTS OF THE WASTE FORM DEGRADATION MODELThe Waste Form Degradation Model consists of eight major modeling/analysis components:(1) Radioisotope Iventory 2 In-Package Chemistry, 3) Commercial Spent Nuclear Fuel(CSNF) Degradation, 4) CSNF Cladding Degradation (5) U.S. Department of Energy (DOE)Spent Nuclea Fel (DSNF) Degradation, 6) HLW Degradation, 7) Radioisotope DissolvedConcentration (solubility), and (8) Radioisotope Colloidal Concentration. These eight
- 333 -

JAERI-Conf 2002-004
components are generally connected sequentially starting with the radioisotope iventor as
input and ending with projected radioisotope dissolved and colloidal concentration (Figure 2.
The Radioisoiope.Inventory Component developed for the TSPA-SR uses updated values for
the inventory. The sources of information are based on internal documents for CSNF, reports
from the National Spent Nuclear Fuel Program (NSNFP) for )SNF, and tile Environmental
Impact Statement (EIS) for HW, An updated screening was onducted and resulted in 27
radionuclides identified as important 24 based human dose an 3 mandated by the
Groundwater Protection Requirements of the proposed U.S. Environmental Protection
Agency [EPA] standard 40 CFR 197 64 R 46976]).
The In-Package Chemistry (component developed for the TSPA-Sk couples the seepage rate
of water into the package ad degradation of te steel, uminurn, DSNF, CSNF ad HLW
inside the package to evaluate water chernistry parainelers sch as hydronimn ion
concentration, total carbonate concentration. dissolved partial pressures of carbon dioxide and
oxygen, ionic strength, and fluoride and hloride i0tl COMeritfatiOlIS (i.e,� H, P[CO31T PCO75
Po,� LI], (F], [Cl]), The aalysis is performed rising the Q3/6 geochernical code. The
sources of information for the EQ3/6 geocheinicat simulations include a chemical
thermodynamics database nd information on te in-package evironment. These results
influence degradation of te CSNF cladding ad matrix, 1LW egradation, radionuclide
solubility, and colloid availability and stability. The degradation of tile CSNF matrix d
fILW, in turn, ifluence the In-Package Cemistry Component.
The CSNF.Matrix Degradation Component predicts a log rate using two linear regression
equations based on pli, PFC031T, Po2, and temperature (T) to valuate matrix degradation ver
time; one equation is applicable for pH less than o equal to 7 and the other is applicable for
pH greater than 7 The regression variables used, p, pCO31- ad ?o 2' are coupled to n-
package chemistry to account for ncertainty, The sources of information ilude flow
through, static, batch eactors and drip tests involving the dissolution of fes ad spent
reactor fuels under both saturated and unsaturated conditions.
The CSNF Cladding Degradation Component evaluates degradation of the cladding and is
coupled to the CSNF Matrix Degradation and In-Package Chemistry components developed
for the TSPA-SR. The sources of iformation iclude filure data frorn reactor peration,
pool and dry storage. and transportation. To better (�valuate the performance of te cladding,
two steps f degradation ae iluded: perforation a ratrix exposure. Perforatiori
mechanisms iclude cladding darnage drilling reactor use, creep failures at igh temperatures
during (try storage, transportation, or initial disposal, ineclianical failure from earthquakes,
and localized corrosion aer disposal, The process of xposing the matrix ad releasing
radionuclides is through potential nzipping f the cadding caused by expansion of te fuel
matrix as te uranium dioxide W02) forms secondary minerals,
The DSNF Degradation Component developed, for TSPA-SR ses a onstants bounding
degradation rate based pon experimental data for N-Reactor SNV for all the SNF waste
types with the exception of naval SNF, Rowever, the radioisotope inventory is the weighted
mass average of DSNF waste types. Iaval SNF egradation beh avior is bounded by that of
the CSNF.
The HW Degradation Component developed or TSPA-S.R uses b0tindS on parameters of a
phenomenological model to develop a simplified (Arflietrius-type) ae equation of
- 334 -

I
JAERI-Conf 2002-004
degradation that is dependent only upon pH ad temperature. Conservative estimates of themodel parameters are based upon experimental data for the degradation of borosilicate glass.
In the Dissolved Radioisotope Concentration Component, the solubilities of importantradionuclides (as determined y updated screening) were reevaluated. The sources ofinformation ilude FQ3/6 simulations of in-package chemistry for three categories ofradionuclides. Three adioisotope solubilities were abstracted is a direct function of in-package chemistry (Np, U�, Arn) and three radionuclides solubilities (Ac Cm, Sm) set equal tothat of Am. Four dditional radioisotope solubilities were defined by probability distributions(Pti, Pb, Pa, Ni). All other radioisotope solubilities were set at bounding values. Thedistributions and bounding values were based o results of te process modeling of the in-pack-age chernistry.
1-'oi- the Colloidal Radioisotope Concentration Component, the conceptualization directly usedYMP-reievant experimental results firorn YMP-specific work and firom the publishedliterature. The oonceptualization identified te availability and the stability of three categoriesof colloi& (1) existing colloids in the groundwater, 2 colloids generated duringdegradation of te waste, and 3 colloids generated during degradation of the disposalcontainer.
3. DISCUSSION OF THE MODEL COMPONENTS3.1 Radionkielideinventory ComponentThe fnction of the radioisotope inventory abstraction component is to estimate the inventoryof those radionuclides ost important to human dose. The inventory abstraction componentis input for te waste orm degradation models and is developed from a series of steps thatstarts with radioisotope inventories of various spent nuclear fuel assemblies and HLW thenestimates te radioisotope inventory when packaged in disposal containers. Three importantaspects of the radionuclide inventory are (1) selecting the most important radionuclides forhuman dose ot of the few undred found within the waste, 2 obtaining the radioisotopeinventories of various wastes. and 3) grouping the fuels into the waste packages selected formodeling in the TSPA-SR analysis.
Three sources were used for inventory data[ I ]: the commercial vitilities for. the DOE NSNFPfor DSNF, and the Ycca Mountain Environmental Impact Statement (EIS) program for theHLW, mixed oxide fuel (MOX), and plutonium ceramic. From this radioisotope inventory,the most important radionuclides for human dose were evaluated, Arrival scenarios weredeveloped for CSNF '. and the inventory was assigned to WP onfigurations. Average andbounding inventories were developed for each package configuration recommended for therepository, Ten, the package-specific radionuclide activities were combined using thenumber of WPs in each group as a weighting factor to get the radionuclide activities in eachallocation category.
The relative importance of individual radionuclides for human inhalation and ingestion doseswas evaluated for several waste types, time frames, and release scenarios. In this evaluation,the effects of inventory abundance, radionuclide longevity, eement solubility, and elementtransport affinity were considered.
3.2 In-Package Cbernistry ComponentThe function of the n-package Chemistry Model Component is to estimate the fluidchemistry iside te waste package over time after the initial breach of the waste package.
- 335 -

JAERI-Conf 2002-004
The water chemistry parameters in the model include hydronium on concentration, dissolvedpartial pressures of carbon dioxide and oxygen, ionic strength, and fluoride and chloride ionconcentrations. This chemistry is used by the several other odel components (see Figure 2)because the rate of degradation of the rnatrix of waste, the resulting dissolved concentration ofradionuclides, the stability of ay colloids, and degradation of cadding are all dependent onthe chemistry of fluids within the WP. The in-package chemistry component in te TSPA-SRcouples the seepage rate of water into the package with the degradation of the steel,aluminum, SNF, and HLW inside the package to evaluate the key water cemistryparameters. These results influence degradation of the CSNF cladding and matrix, HWdegradation, radionuclide solubility, and colloid availability and stability. The degradation ofthe CSNF cladding and matrix, and HLW, in turn, influence te in-package chemistrycomponent.
3.3 CSNF Degradation ComponentThe main function of the CSNF Degradation Model Component is to determine the rate ofdegradation of the CSNF matrix as a function of temperature and water chemistry(specifically, pH and partial pressures Of 02 and C02)- This degradation ate is then directlyused by the Cladding Degradation Model Component (Section 34) to determine the rate atwhich the CSNF cladding splits open and exposes more of the fuel atrix. In addition, theCSNF degradation model examines the distribution of radionuclides within the fuel andestablishes a gap fraction for the more volatile radionuclides.
Under oxidizing conditions, in the presence of water or water vapor, U02 in CSNF is notstable and alters. Alteration of the U02 matrix can iberate radionuclides mportant to humandose. As described in Section 2 the CSNF matrix degradation component uses two linearregression equations to predict a log rate for matrix degradation over time.
The CSNF matrix degradation component is based on experimental measurement of thedissolution rate of a number of fresh and spent fuels. These materials were xamined underboth saturated and Unsaturated conditions using flow-through reactors as well as static, batch,and drip reactors. These tests also give empirical information on secondary pas poduction,colloids, and effective solubility limits for the more insoluble radionuclides. Te secondaryphases are similar to those observed in the corrosion of natural uratunite deposits. idicatingthat the experimental results are indeed relevant to the long-term behavior.
3.4 CSNF Cladding Degradation ComponentThis component evaluates degradation of the cladding and is coupled to te CSNF atrixDegradation and In-Package Chernistry COITIPODeutS in te TSPA-SR. The degradation ofCSNF cladding is assumed to proceed through two distinct steps. cladding failure (usually bysmall perforations), and progressive exposure of the fuel matrix,
Initial breach of the cladding may occur because (1) the cladding fails within the reactor orduring storage or transportation, 2) an earthqtiake severely shakes� and svers the rods, 3) thecladding fails from localized corrosion, or 4) the cladding fails rom creep or stress corrosioncracking. While other mecharrisms of initiating cladding perforations, ,,rich as rock fall orDHC, were explored, they were screened out based on low probability.
After the cladding has initially been breached, it is assumed to unzip because the fuel volumeincreases during alteration of the U02� (i.e., the alteration Of the 02 t secondary phases ofuranium is assumed to cause enough pressure due to volume expansion to urst te cladding
- 336 -

JAERT-Cont 2002-004
from within). This mechanism for increasing the exposed surface area of the matrix issensitive to environmental conditions such as temperature. The anticipated temperature of thefuel atrix is ot high nough, nor does it occur for a long eough period, to cause unzippingin a dry environment, so the dry unzipping i Dt included O te Zircaloy cladding hasbeen perforated, uzipping in a wet environment does not occur in time periods of 40 years,based on observed behavior within storage pools at reactors. However, because unzipping ina wet environment could not be entirely ued out, and because omplete exposure of thematrix bounds diffusive eleases of radionuclides through the perforation, it is conservativelyassumed that clad uzipping i a wet environment can occur. The rate.of wet unzipping wasconservatively estimated by relating it to the movement of the alteration front.
3.5 DSNF Degradation ComponentThis component detennines the rate of degradation of the DSNF waste category and of theimmobilized putonium ceramic waste. The degradation behavior of DSNF (excluding thenaval SNF) will be represented by the metallic uranium SNF frorn NReactor, The naval SNFdegradation behavior will be represented by that of the CSNF. TSPA-SR will use adegradation rate and a corresponding effective surface area that bounds te experimental dataon N-Reactor fuel collected over a range of conditions in the last few years, In the TSPA-SR,the DSNF degradation component uses a constant, bounding degradation rate of N-ReactorSNF to bound all the DSNF waste types except naval SNF, However, the radioisotopeinventory of the DSNF components is the weighted mass average of all waste types.
In addition, the immobilized ceramic plutonium waste form was also evaluated. This wasteform will onsist of disks of a plutonium-containing, titanium dioxide-based ceramic that willbe enclosed in stainless steel cans, which in turn will be encased in a borosilicate glass matrixwithin the high level waste canisters.
3.6 High-Level Waste Degradation ComponentThis component provides a conservative model for calculating the rate of degradation ofborosilicate glass for the range of conditions (immersion, humid air, and dripping water) towhich it may be exposed after the waste packages fail. For TSPA-SR, this component usesbounds on parameters of a phenomenological model to develop a simplified (Arrhenius-type)rate equation of degradation that is dependent only upon pH and temperature.
The HLW model is implemented in the TSPA-SR analysis to calculate the rate of glassdegradation, 'The rate of radionuclide release from the HW matrix will be calculated bymultiplying the lass degradation rate by the mass fraction of the radionuclide in the glass.This approach for calculating the radionuclide release rate is based on the conservativeassumption that the release of radionuclides is congruent with the degradation of borosilicateglass.
The model parameters account for the pH, temperature, surface area, and the combined effectsof glass composition and solution composition on the rate of glass corrosion. Conservativeestimates of the values for the model parameters are provided based n experimental data.Consistent with the conceptual model for in-package chemistry, degradation of borosilicateglass is conservatively assumed to occur as if the glass were fully immersed, although it isexpected that much of the glass will be exposed to humid air or dripping water conditions.
- 337 -

JAERI-Conf 2002-004
3.7 Dissolved Radioisotope Concentration ComponentThis component evaluates te dissolved concentration of radionuclides (or parents ofradionuclides) that are iportant to human dose., as etermined by the radioisotope screeningdescribed in the inventory section Sectio 3 ). In the dissolved radioisotope concentrationcomponent, the solubilities of important radionuclides were reevaluated, three radioisotopesolubilities were abstracted as a direct function of in-package emistry (and three moreradionuclides equated to one of these); four radioisotope solubilities were defined by aprobability distribution; and all others were set at bounding values based on results of theprocess modeling of the in-package chemistry.
The dissolved concentration limits calculation builds upon three primary feeds: (1) estimatesof in-package fluid major element composition (pH, Eh, ionic strength, carbonate levels), 2)measured (and estimated termodynamic parameters describing te stabilities of aqueousspecies and solid radioisotope phases, and 3 a determination of te likely solubility-controlling phases for the specific radionuclides of concern, In ature te controlling phasemay either be a pure radionuclide solid phase with the radioisotope as the dorninant element,or a solid phase with trace arnounts of the radionuclide as ca ocur with coprecipitation, ForTSPA-SR, the pure phases were chosen because, in general, they yield igher dissolvedconcentrations. Where isufficient information can e gleaned frorn field observations orexperimental results, it is conservatively assurned that the most aorphous and hydrated(hence, most soluble) oxide of the particular radioelement forins.
A systematic review of thermodynamic data ad controlling hases as been performed for alarge range of chemical conditions. When uncertainties were encountered, choices were madethat would result i higher predicted solubilities. nherent limitations ithin the databases canlead to an uncertainty, up to a factor of 2 when the ionic strength oxceeds about 07 ol/L.However, this uncertainty is small relative to other uncertainties within te system.
3.8 Colloidal Radionuclide Concentration ComponentThe function of this component is to calculate the concentration of 0olloid-associatedradionuclides that ay be transported from the waste package. A conceptualization wasdeveloped that directly sed xperimental results, The conceptualization dentified theavailability and the stability of three categories of colloids: (1) Waste-form colloids formedduring degradation of W glass (Note� these colloids are turther classified into "reversiblyattached" a "irreversibly attached" radionitclide types), 2 Corrosion-product Qolloidsformed during corrosion of iron-containing waste packages, 3 Goundwater colloids presentin the waste-foirn area,
Colloid transport is potentially important for radionuclide lements tat have ow solubilityand can be entrained in, or sorbed onto. waste form egineered barrier, L r gologic arriermaterials that form colloidal particle substrates. Of these adionuclides, only tose that are amajor part of the waste inventory and ave potentially large dose conversion factors ae ofpotential importance to the performaDee of the disposal systern. Considering tese sreeningcriteria, plutonium is te dominant radionuclide. Americium is also considered for theTSPA-SR.
Radionuclides are attached to colloids as a result of two types of pocesses: irreversible andreversible attachment. For waste forin colloids, radionuclides (-an be norporated into thesubstrate material before it is sspended as colloids. All colloid types nray sorb radionuclidesto form pseudocolloids, depending on the affinity of the colloid mineral substrate for a
- 338 -

JAERI-Corif 2002-004
dissolved radionuclide, The contributions of each colloid type are summed to produce themobile colloid source tern) for each important radionuclide.
The abstractions are based on laboratory results from waste form corrosion testing and testingof asorption and esorption poperties of Pu and Am o clay and on-(hydr)oxide colloids.To the extent that the laboratory tests ad test conditions epresent anticipated repositoryconditions, the abstraction is valid for calculating the �,olloid-associated radionuclideconcentrations and colloid ass concentrations.
4 SUMMARYThe performance of te potential Yucca Mountain repository will depend on the rate ofradionticlide release from the waste packages after the containers are eventually breached.After breach, water, or water vapor ay enter the packages ad contact exposed waste fori-ris.The waste forms will degrade slowly and elease radionuclides, as solutes ad colloids, intothe contacting goundwater as a result of a broad range of processes and events. This WasteForm Degradation PMR [1], together with te supporting Analysis Model Reports AMRs,describes the approach and scientific basis for modeling.
5 RFERENCES[1] DOE Office of Civilian Radioactive Waste Management (OCRWM), Waste Form
Degradation Process Model Report, TDR-WIS-MD-000001 Jly 2000,
Waste Form Degradation,and Radioisotope
Mobilization Components
: Radioisotopic inventoryInitial conditions for In-package Chemistry
Cladding dmage (including Inner Container SupportChemistry of water & Corrosion)entering pckage Commercial Spent Nclear Fue4
(CSNF) degradationDOE Spent Nuclear Fuel DSNF dgradation
.0111,iti .. ?,: Cladding degradationRadicii"opi iventory High-Level Warste (HLW) degradationof arious waste types Radioisotope Solubilities
Waste ackage Surface Colloid formationtemperattire
Water volume entering Aqueous radioisotopewaste package concentration
Fixed vWkrow inputs Outputs Irreversible Col"d Fraction
Rust adsorptioncoefficients Reversibie Colloid Fraction
corrosion rates ofcontainer and basketmaterial Dissolution tests on CSNF
Dissolution tests on HLWSpecific surfacps arews Dissolution tests on DSNFof waste types Literature on claftng failure
CoIW measurementsThermodynamic data Solubility tests & literaturefor element solubilities
DravArkg Dt lo �Ie
Figure 1. Summary of Inputs, Outputs, Components, and Assumpti ons of WasteForm egradation Model I]
339 -

JAERI-Conf 2002-004
c LL
IL
11 0 a-0 N
F Co 75
0 02
3f
(D ; CL
ODCL r-0
7 a
C,6
x
g
LL clz 3i
CD
uj 0C4�
cd
tn1-- F- a-Ex
x
LL 7E77Ck MP0CL
:.cL\ CO
aDz
ej
340

JP0250321JAERI-Conf 2002-004
THERMODYNAMIC MODELS AND DATA FOR ASSESSINGRADIONUCLIDE MIGRATION IN THE NEAR FIELD:
USES AND LIMITATIONS
M. OCHS
BMG Engineering Ltd.Ifangstrasse I CH-8952 Schlieren-Zfirich Switzerland
Tel.: 41 - I - 732 92 83, Fax.: 41 - I - 730 66 22, e-mail: n-6chae1,ochs�hrngeng.ch
The focus of the present contribution is on the use of thermodynamic data and models to explain and predict the
effects of solubility limits ad sorption/uptake reactions on dissolved concentrations and migration of
radionuclides in clay- and cement-water systems This topic is approached by addressing the current state,
limitations, and possible pitfalls of relatively common applications of speciatio ad sorption models:
* calculation of near field water chemistry as influencecl by compacted clay o cement,
* prediction of adionuclide solubility limits in homogeneous solutions.
Subsequently, promising developments, as well as critical shortcomings and future challenges in this field are
discussed, in particular with regard to:
* model-supported selection of Kd values for clays and cement,
* extrapolation to "intact" aterials, such as compacted bentonite or whole concrete,
* linkincy to diffusive and advective transport.
Key Words: thermodynamic data, models, solubility limits, sorption, speciation
1. INTRODUCTION
In the field of environmental (geo)chemistry, thermodynamic solution and surface chemicalmodels today represent fairly well established tools for interpreting and predicting themovement and fate of many trace elements. In comparison, the development and use of suchmodels for the assessment of radionuclide igration through the near field of nuclear waste
repositories is stilt largely neglected. As the only notable exception, the frequent use of
thermodynamic speciation calculations to predict dissolved concentrations of radionuclides
may be cited, and to a lesser degree, also the definition and assessment of general water
chemistries.
As a matter of fact, it could be argued that the role of solubility calculations for setting
maximum radionuclide oncentrations in the near field is often overestimated. On the other
hand, the capabilities of thermodynamic speciation/sorption models for addressing questions
of radionuclide uptake ad transport are arely tilized to their full potential. Distribution
coefficients d) wich are crucial input parameters for performance assessment models, are
often selected from sorption databases without considering te use of thermodynamic
sorption models. Further, the application of speciation and sorption models to transport
phenomena is only weakly developed.
2. ASSESSMENT OF GROUNDWATER CHEI�GSTRY
Calculations of ear field water chemistries are necessarily ased on a clear definition of the
composition of te srrounding groundwater(s). In most recent or on-going PA exercises, the
composition of the groundwater surrounding a repository is sufficiently well kown from
- 341 -

JAERI-Conf 2002-004
sampling campaigns and measurements pertaining to a specific candidate site (e. g. [1]).Alternatively a hypothetical grouirdwater composition an be defined (e, g 2. No matterwhich approach is taken, termodynamic ("speciation") calculations have shown to be a veryimportant tool for establishing and cross-checking the composition of incominggroundwater. Of particular importance is tat thermodynamic models, if used appropriately,can be used to guarantee an internally consistent composition in terms of* mineral solubility limits and concentration of dissolved species,* solution composition and partial pressure of relevant gases,* pH, pe, and the concentrations of all related redox species.
Although the calculation of a groundwater composition is frequently done and iscomparatively straightforward, there are several potential problems which are oftenunderestimated:• In order to derive an aurate and internally consistent composition, it is of course
necessary to use an Internally consstent thermodyDarnic database, Criteria for theinternal consistency of a thermodynamic database are ive i e. g 3 and 41 and arenot further discussed ere.
• Many redox reactions tat are thermodynamically favorable will not take place in theabsence of microbial ediation. Similarly, many Tedox-sensitive species will react onlywith chemical reaction partners suitable for transferring elections. Therefore a pe valuecan only reflect a ven system's potential, but the redox-reactions allowed to take placestill have to be very carefully selected by the modeler.
• Similarly, many thermodynamic databases correctly) contain solubility products KSP)for minerals that for uder eological" conditions (effects of temperature, pressure,reaction pathways...), bt that do not precipitate from homogeneous olutions While thedissolution of such inerals as to be accounted for, their precipitation is usually notrelevant under repository conditions. The proper selection of mineral equilibria is againdependent on the modeler's expertise.
These three points are of course very general. However, it is important to kee them in mind,since they do not only apply to the calculation of groundwater Cmposition, but Lo practicallyall thermodynamic databases and calculations, icluding sorption models,
3. ASSESSMIENT OFINEAR FIELD WATER CHEMISTRY
In order to derive te composition of the treaty field aqueous phase, te interaction ofgroundwater with buffer aterials an wh waste ontainers/colrosion Products, ctcj ha tobe considered. The mst common buffer aterials aye clay entointe) and cements, whichpossess drastically ifferent properties. Because of their overriding importarrce for modeling(i) the ear field water chemistry ad (ii) radionoclide retention, relevant features rid odelsare discussed in some detail below.
3. 1. Bentorrite
Bentonite consists largely of striectite clays as well as a number of accessory minerals. Thecomposition of bentorrite porewater is etermine(-[ y two rocesses:0 The iteraction of goundwater constituents with srface fnctional groups of te clay
minerals. The nrain reactions ifluencing porewater chemistry a, re the echange of major
- 342 -

JAERI-Conf 2002-004
cations with the exchangeable ions already present at the clay siloxane surface, and acid-base reactions at the edge surface.Mineral equilibria involving the accessory urinerals of bentorrite as well as new phasesthat ay precipitate upon oversaturation.
Mineral equilibria can e modeled in the standard fashion (see section 2 then-nodynarnicmodels and data for reactions at clay surfaces are discussed further below.
Smective itself s made up by 2:1 expandable layer silicates, which feature two differenttypes of surfaces [5):(1) The soxane (layer)-surface hosts a permanent (structural) negative charge due to
isornorphous replacements in the tetrahedral (e, g, Al for S o octahedral (e, g. Mg forAl) layers, and therefore acts as an ion exchanger. Exchange reactions can in principlebe modeled by electric double layer (F-DL) or mass-action/site-binding models. Inpractice, the larter are used almost exclusively.
(2) The edge srfaces of clay platelets are characterized by broken bonds, leading to silanoland alumiriol surface functional groups, similar to those of Si- and Al-oxides. The acid-base equilibria of these groups, as well as teir interaction with dissolved metal speciesand ligands can be described with established surface complexation models.
While the basic triodel approaches are well established, there are ifferent methods for takingthe activity of the surface species into account 6, 71. These include the mole- or equivalent-fraction approach in case of ion exchange quilibria, and in oase of surface complexformation the use or omission of electrostatic correction terms, which can also be calculatedwith different L models (double layer, triple layer, etc.).
Therefor e, it is extremely important to realize that the corresponding surface chemicalthermodynamic databases are model-dependent and not generally valid. In addition, theequilibrium onstants for srface chemical reactions are dependent on the speciation of therespective key elements, and thus on the underlying TDB for solution species.• The situation is relatively simple in case of the ion exchange equilibria, for several
reasons: 1) the properties of the surface sites can be treated as bing constant under allconditions; 2) the major cations involved exist under most conditions only in the form ofa single species (Na+,.,); 3) in many cases, constants derived with different models canrelatively asily be converted to each without having to reevaluate the original raw data,because of (1 ad 2) above, However, in case of thermodynamic sorption models ofradionuclides that smultaneously udergo ion exchange and surface omplexation, theion exchange constants are, of course elated to the surface cornplexation model and bothmodels need to be ealuated together (see elow).
• On the other hand, stuface complexation onstants for the iteraction of metal species orligands with the edge sites of clays are always directly connected with the respectivesurface hydrolysis constants, which are in urn dependent on te type of electrostaticcorrection model sed. Therefore, srface complexation oonstairts cannot be useddirectly with other odels, ut eed to be re-fitted using the oginal experimental data.At te same tme, te derivation of srface complexation constants implicitly contains allthermodynamic cata fr the relevant solution species of te respective element. Thismeans that srface complexation models need to be re-evaluated wen changes are madeto relevant entries in a solution IDB.
- 343 -

JAERI-Conf 2002-004
3.2. Cernentitious materials
Cementitious materials are fairly complex, but it appears that their influence on polewatercomposition can be described sufficiently well by relatively smple models that assume
ilibrium with only a few mineral phases [8]. The critical issue Is to obtain a correctdescription of cement evolution a a fl`10011 of ine; however, this is not within tile scopeof this contribution. Te most characteristic feature of all cenienL-equilibrated solutions is ahigh pH: freshly hydrated cement leads to a pH of >13, whereas for degraded cementequilibrium with portlandite can be assumed, which gives a pH of 12.5.
3.3. Calculation of porewater composition for compacted bentonile
After re-saturation of the buffer, the interaction of groundwater with buffer materialsdetermines the composition of the water that will come in contact with the immediate wastecontainments/overpack, A correct description of the interaction of groundwater with buffermaterials is also the basis for all subsequent assessments of radionuclide igration.
The basic aspects of modeling groundwater-bentonite interaction have already beendiscussed in section 3.1. While a description of porewater chemistry seems to be fairlystraightforward, one encounters difficulties when applying the respective thermodynamicmodels to compacted bentonite. The main water parameter, pH, is controlled by twoimportant buffer systems: the edge sites of the clay edge surface, and the carbonate buffersystem 9]. In case of the edge site buffer, the calculated pH is ependent on te surfacechemical model, e. g., because different electrostatic correction erms react differently tochanges in ionic strength. Since most bentonites contain calcite, gypsum, and halides asimpurities, pH becomes also a function of the amount of impurities pesent, or of the amountof impurities that is allowed to dissolve in the model calculations. This is illustrated inFigure .
3.4. Assessment of radionuclide solubility limits
Based on the above discussion, two areas can be identified that are critical fo a reliableassessment of radionuclide solubility limits throug termodynamic calculations:(1) A reliable ad corlsistent thermodyflarnic database s Deeded for the adionuclide
considered [31� If sparate adionuclide and geochi�,mical databases are Lised, it is notonly necessary tat the radionuclide database is Internally onsistent bt it must also beconsistent with egard to the geocherilleal database. Wile an VaklatiOn of te availablethermodynamic data Is clearly outside te scope of this paper, some shortcornings a bepointed ot:• Tere is a clear lack of high-qUality data for less-well esearched elements (e. Zr)
and some Important hgands (e. g. carbonate species). This is especially true forhighly akaline cement-equilibrated near field waters 10].
• Methods and data for activity coefficient corrections are oten not adequate (but inmany ases the resulting error is probably small in comparison to, uncertaintiesassociated with the TDB itself).
(2) It is necessary to obtain a good description of the near field water composition itself. Asillustrated in section 33., this may not be a trivial task. However, pH variations of ±1unit and the concomitant changes in carbonate speciation could have significant effects.
- 344 -

JAERI-Conf 2002-004
9
7
Kunigel-V17.5 -
Kunipia-F:7 . . ......... 0.07% NaCI dissolve
- 0.001 % NaCI dissolved6
I 06 0,0001 ('001 0,01 0.1 10. -
0.4
O.
0.24-1O
0 .1 ........ ...........0
10-5 0.0001 0.001 0.01 0.11 1
0
-0.05
4�
4� -0 . ................... ....... -----........ .....................0
O-
CDU -0.15co
ZI
-0.210-5 0.0001 0.001 0.01 0.1 1
% CaSQ4
Figure 1: Illustration of the interdependencies between pH, ionic strength and edge
surface potential in compacted bentonite. These parameters are plotted vs.
CaSO4 UnpuTity dissolved in the porewater of ompacted Kunigel-VI (dry
density 1800 kg/m3) and Kunipia-F (dry density = 1800 cg/m3) bentonite.
The total content of CaSO4 is 038% ' Knigel-VI and 067% in Kunipia-F;
the total content of NaCl is 0.001% in Kunigel-V ad 0071% in Kunipia-F;
both bentunites contain enough calcite to reach saturation (from 91)
- 345

JAERI-Conf 2002-004
4. DEVELOPMENTS AND POTENTIAL FUTURE APPLICATIONS
4. 1. Model calculation of Kd values
The use of thermodynamic sorption models, in particular surface complexation and ionexchange models, for the calculation of Kd values is receiving increased attention within theradioactive waste management community [111, Such models allow to simultaneouslycalculate the speciation of a key element in solution and on the surface, and Kd may the becalculated as follows:
Kd [m3/kg = stoichiometric sum o'surface species of elemen X [mol/kgj (1)stoichi6metri sm of solution species of element X [mol/M3]
There are a number of examples available that illustrate the successful development andapplication of thermodyDanric sorption models (e. g. 12, 13]), which 'are not reviewed indetail here. Instead, some issues that may be critical for the future development in this areaare briefly discussed,• The availability of a reliable radionuclide TDB is probably even more iportant for
sorption modeling than for the calculation of solubilities. his is ot always easilyrecognized, but the extent to which an element undergoes srface cornplexation can beextremely dependent on the stability constants for the solution eactions formation of
2-dissolved species with e, g) OH-, 03 "A• Similarly, an adequate description of the overall water chemistry is extremely important.
While in the traditional" areas of application (simple oxides etc) solution compositionsare usually well constrained, the uncertainties in the porewater composition of bentonitesmake sorption odeling very challenging. Such uncertainties are probably ore criticalthan shortcomings in the sorption models themselves.
• While surface complexation/ion exchange models promise to be very valuable tools formetal oxides, bentonit ad other clays, as well, as other cornplex sorbents (e, g, fractureinfill), there i ireasing evidence [10, 4 that radionuclide uptake y eMeDtitiousmaterials occurs through incorporation mechanisms that may e described by solid-solution models.
• Finally, it needs to be pointed out that model spported Kd values must nly be derivedbased on sorption models as described above. It can be very misleading to calculatesolution speciation alone and then make qualitative judgernents about sorption, sincespeciation may be influenced drastically by the presence of surface unctional groups.
4.2. Linking Kd values ad transpoil pararneters
In the case of both bentonit ad, cement-based buffer materials, the link b etween batch-typesorption and transport modeling involves a extrapolation of modeling approaches typicallydeveloped for dilute sspensions to tact" or real" materials, such as compacted bentoniteor concrete, Basically, it should be possible to apply thermodynamic Models t Sh systems,and attempts to link relatively simple sorptio ad diffusion odels air rder to calculateoverall (apparent) diffusion coefficients for con-ipacted bentoruteshow promising results r. t 5-17]. However, one has to e aware that te direct experimental acquisition of transportparameters is often not possible (in contrast t batch sorption data!) and data eductionprocedures based on transport odels eed to be used to erive eaningful constants.Therefore, a direct comparison of thermodynamic model results and experimental data isoften not possible. This is Also demonstrated for intact hardened cernent paste, where
- 346 -

JAERI-Conf 2002-004
changes i physical parameters (porosity) due to mineral dissolution/precipitation reactionsneed Lo be understood efore sorption in such systems can be nterpreted 8]. It finally hasto be adirutted that to date, there is a cear ack of experimental data from sufficientlyconstrained systems to test te application of thermodynamic models to ntact materia s.
5. CONCLUDING REMARKS
Some of the gaps i trms of model development and contents of thermodynamic databaseshave already been addressed in different sections above. Further gaps are not discussed indetail here, but It i pointe ot tat pesent applications are ore or less restricted to 25 'C.
Instead, oly sorne concluding remarks are rnade ere. Thermodynamic odels are usually
non-unique, d this holds not oly for application-orionted models, such as sorption
models, but also for basic chemical models used to derive thermodynamic constants (e. g.
selection of species to be considered for evaluating titration data). It has to be realized that
model development depends not only on experimental data and available supporting
information, but to a significant degree on choices made y the modelers. The more different
decisions in odel building can be constrained by an improved system understanding or
definition, the more likely it will he that thermodynamic modeling can be sed successfully
for performance analysis. An appropriate and effective use of thermodynamic data and
models is therefore critically dependent on an improved definition of repository-specific
boundary conditions.
6. REFERENCES
[1] Nagra, "Geosynthesis Wellenberg 1996. Results of investigation phases I and II",
NTB 96-0 1. , Nagra, Wettingen Switzerland (I 997), in German
[2] JNC, `H12: Project to Establish the Scientific and Technical Basis for HLW Disposal
in Japan", TN1410 2000-001, JNC, Tokai-mura, Japan 2000),
[3] Wanner, ,, Mat, Res. Soo. Symp. Proc. Vol. 212, 815-822 1991)
[4] Engi. M., "Thermodynamic data for minerals: A critical assessment", Ed. by G.D.
Price and N.L. Ross, Chapman Hall, London, K 1992), pp. 267-328.[5] Sposito, G., "The Surface Chemistry of Soils", Oxford University Press, New York
(1984)[6] Sposito, G., "The Thermodynamics of Soil Solutions", Oxford University Press, New
York (I 98 )[7] Stumm, W., organ, J.J., "Aquatic Chemistry", 3rd. ed., John Wiley Sons, New
York 1996)[8] Berner, U., "A thermodynamic descriTition of the evolution of pore water chemistry
and uranium speciation during the ( gradation of cement", PSI Report 62, PaulScherrer Institut, Villigen, Switzerland 1990).
[9] Ochs, M., Lotheribach, B,, Shibata, M., Yui, M., "Bentonite Porewater Chemistry",-JNC TN8400 99-075, JNC, Tokal-mura, Japan 1999).
[10] Berner, U., "Concentration limits in the cement-based Swiss repository for long-lived. intermediate-level, radioactive wastes MA)", PSI Report 99-10, Paul ScherrerInstitut, Villigen Switzerland (1999).
[111 OECD-NEA, "Using thermodynamic sorption models for guiding radioelementdistribution coefficient (Kd) investigations. A status report", OECD, Paris, France(2001).
[12] Wanner, H., Albinsson, Y., Wieland, E., Fresenius J. Anal. Chem., 354, 763-769(1996)�
[13] Bradbury, MH., and Baeyens, B., J. Contam. Hydrol., 27, 223-248 1997).[14] Ziegler, F., Scheidegger, A.M., Johnson, C.A., Dahn, R. and Wieland, E., Environ.
Sol, Technol., 35, 1550-1555 2001).
- 347 -

JAERI-Conf 2002-004
[151 Ochs, M., Boonekamp, -N4,, Wanner, H., Sato. H., Yui, M., Radiochim. Acta, 82,437-443,(1998)
[16] Ochs, M., Lothenbach, B., Wanner, H., Sato. H., Yui, M,, J. Contarn. Hydrol., 47,283-296 2001).
[17) Tachi, Y., Shibutani, T., Sato, H, Yui, M., J. Contam, Hydrol. 47, 71-186 2001).[18] Bemer, U., Radiochim. Acta 82, 423-428 1998).
Acknowledgements: This paper benefited from many discussions with co-workers and colleagues, which are
warmly appreciated, Many ideas ad concepts were developed in the framework of projects carried out under
the auspices of JNC and ANDRA, whose support is atefully acknowledged.
348 -

JP0250322JAERI-Corif 2002-004
THE ROLE OF TTANATE CERAMICS IN IMMOBILISATION OFWASTES ARISING FROM PARTITIONING AND WEAPONS
DISPOSITION
K.P. HART, Y. ZHANG, B.D. BEGG, Z. ALY, A. BROWNSCOMBE, R. A. DAY, M.W.A.STEWART, G.R. LUMPKIN, K R, VANCE AND A, JOSTSONS
Australian Nuclear Science and Technology OrganisationPMB I, Menai, NSW 2519, AUSTRALIA
Fax: 6129 5437179, e-mail: kph�ansto.gov.au
The development of ceramics for the immobilisation of radioactive wastes has been on-going at ANSTO
since 1980 and as involved collaboration with JAERI. the USDOE, LLNL and other international laboratories.
This work has examined various processing routes, radiation damage effects and long-term aqueous durability
for a range of titanate ceramics. Within these studies, information on the long-term behaviour of ceramics chosen
to immobilise excess Pu and actinide-rich wastes arising from partitioning strategies have been obtained. Overall,
the long-term durability, limitations on criticality under processing and disposal conditions and existence of
viable natural analogues endorse the use of titanate ceramics for immobilisation of actinide-rich wastes.
1. INTRODUCTION
Most of tire early development of synroc focused on the synroc-C formulation forHumobilising liquid HLW from the reprocessing of comi-nercial LWR spent fuel.Subsequently, ANSTO has responded to developments in R&D on partitioning andtransirrutation, excess plutoniunr disposition and the needs of global rernediation programs bydeveloping a variety of titanate ceramic waste forms for specific applications.
The actinides in synroc-C partition primarily into zirconolite (CaZrTi2O7) with smalleramounts into perovskite (CaTiO3). Perovskite is mainly designed to immobilise strontium andhollandite (BaAl2Ti6Ol6) is used mainly to immobilise caesium. The synroc-C formulation isflexible and a single precursor composition can be used to immobilise HLW loadings in therange to 30wt.% without significant effects on the chemical durability in aqueous media. Asummary of the early work o Synroc-C, including process demonstration, has been publishedpreviously (). Matrices including pyrochlore-rich and zirconolite-rich ceramics have beenconsidered for the conditioning of the Am/Cm/rare earth stream from HLW partitioning 2).
In the aftermath of the cold war, the US and Russia agreed to large reductions in theirstockpiles of nuclear weapons. The US initiated a two-track strategy for the disposition of 0tonnes of surplus plutonium:
* using the plutonium as mixed-oxide ftiel in existing corntnercial power reactors; and
* geologic disposal of plutonium immobilised in a pyrochlore-rich titanate ceramic
ANSTO began work on Pu immobilisation in 1994 with Lawrence Livermore NationalLaboratory, California, USA, the local laboratory for US DOE on Pu disposition. The initialeffort was on zirconolite-rich formulations but the change in US DOE program requirementsshifted the emphasis to pyrochlore-rich titanate ceramics. For these ceramics doped with highlevels of Pu, the avoidance of nuclear criticality is essential during waste form processing,storage, and over the very long term in the repository environment. Avoidance of nuclearcriticality is ensured in Pu-rich titanate wastefornis by having high loadings of neutronabsorbers such as Gd, Sin ad Hf in solid solution in te Pu ost phases. Such conditions can
- 349 -

JAERI-Conf 2002-004
be met by the zirconolite-ric ad pyrochlore-rich titanates. In fact, pyrochlore-rich ceramicshave been selected for the immobilisation of this Pu by the US.
Results from the above studies on pyrochlore-rich ceramics will be presented in detail for theimmobilisation of excess Pu ad further discussion will focus on teir relevance to theimmobilisation of other actinide-rich waste streams.
2. STUDIES ON PYROCHLORE-RICH TMkNATES
The baseline pyrochlore waste form was designed to consist of 95wt.% pyrochlore(CaO.89GdO.22HfO.23UO.44PUO.22Ti2O7) and 5wL% of a haffilum. substitute Futile (Hfo.,TiO.902).The actual product, formed after sintering for 4 hours at 1350T, contains some bannerite(UTi2O6) which also contains Pu, Gd ad Hf A small <2% aount of te P iventoryremained unincorporated in te sintered pyrochlore ade from high-fired oxides, as a reactedoxide (HfREEPuSJ)O2 wereas in materials ade from alkoxide powders the atinideswere fully dissolved in te titartate phases, The theoretical density of the baseline pyrochloreceramic is about 60 gm/cm I and the observed density of ceramics sunered for 4 ours at
.313500C is about 56 gm/cm
The mineralogy and partitioning of Pu, U and the neutron absorbers aong te phases in thepyrochlore-rich ceramic have been studied extensively. It Is influenced by impurities in the Pufeed stocks destined for irnmobilisation. The putonium assay in the candidate materials variesfrom under I Owt.% to over 99wL%. The uramurn content varies from trace depleted uraniumin plutonium to trace putonium in fully enriched 93% 235U) rtramrun� In general, teimpurities in te existing feed stock include- animinium, carbon, alcium, chlorine, iron,fluorine, gallium, potassium, magneslinn, olybdenum, sodium , silicon, tantalum, tungstenand zinc. The observed olume abundances of pyrochiore 60-90%), brannerite (0-22%),zirconolite 0-25% ad rutile (0- 6%) depend on impurities in the various sources of Pu. Allprimary Pti-containing pases have been ound to accommodate more eutron absorbers (Gdand Hf) than plutoniu o a molar basis as per te original design.
Leach testing was carried out at 90'C in deionised water, as described elsewhere 3). Analysisof inactive elements was arried out by 1CP/MS but for Pu, the level of activity wasdetermined by alpha spectrometry carried out on 0�1 mL of leachate evaporated onto astainless steel planchette, This method allowed the contribution of 24'Am, to be separated fromthat of the Pul, unlike in our previous studies 3).
The test results for Pu releases or a wide range of zirconolite-rich and pyrochlore-richfortnulations 4 are shown in Figure 1. Te variation bween the Pu release rates after 7days is about a factor of 20 wt te difference reducing to about 4 for the smaller nmber ofsamples sudied so far, after about 300 days. Overall, the release rates decreased by about oneorder of magnitude between 35 days (i.e. to 7 day period) arid 324 days.
The Pu used in this study onsisted of (wt%): 93% 2Pu, 5% 24"Pu, 0.54, 2"Pu and 1 �5% 2"Arri, Front alpha
spectrometry te cntribution of 'Pu could ot b separated fron) 2"'Pu and heoce, the velease rates of Pu are
based o both isotopes.
- 350 -

JAERI-Cont 2002-004
10-2
brconoliie-rich3 O
1� lo- 0 Pyrochlore-Nch
W -410 0
00
0
LLIW 10< CW 0 0_j 0W
lo
0
10-7
0 50 100 150 200 250 300 35
TIME (days)
Figure I Total, normalised Pu release rates from zirconolite-rich (HIPed) and pyrochlore-rich(sintered) formulations measured at 90'C in deionised water. For convenience, all thedifferent batches of sintered material have been given the same symbol and the lineshown on the graph is intended to be idicative only.
The addition of impurities to the baseline ceramics improves the overall durability of the
formulations. Studies of the microstructures of these formulations has shown that the addition
of impurities reduces the amount of unreacted actinide oxides and improved the development
of the design phase composition (5).
Overall, it appears that for multi-phase compositions, correctly milled, that all ceramic phases
tend to have a, similar, high aqueous durability. The releases of Gd, U and Pu approach similar
longer-term release values and suggest that there should be no long-term criticality
considerations for a repository environment, However, I-if (also a neutron absorber) under
these test conditions has tended to have lower releases than those for the former elements.
Longer-term releases of U and the neutron absorbers bracket those of Pu, suggesting that
these elements ay have similar source erms from the ceramic matrices within a repository
environment.
In addition to the static tests, extensive flow through testing of the ceramics was carried out to
evaluate the kinetics of releases to help develop an understanding the long-term releases of Pu
and U relative to the neutron absorbers (Gd and Hf).
Dissolution tests (Single-Pass-Flow-Through), tests for Pu-doped samples were carried out at
700C with pH 56 ffer wthin e N2 glove ox 6) Te powdered sample was placed
between Teflon menibrailes, held together by two Teflon rings, and positioned near the
- 351 -
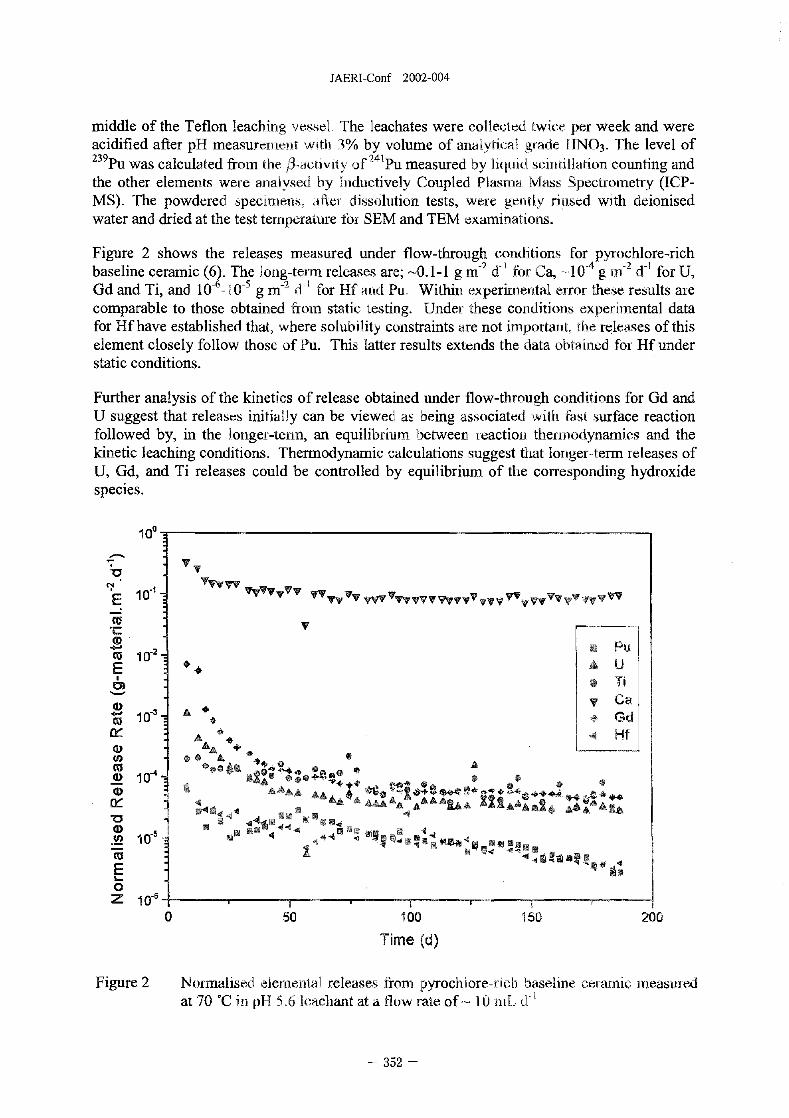
JAERI-Conf 2002-004
middle of the Teflon' leaching vessel. The leachates were collected twice per week and wereacidified after pH measurerrient wit 3 by volume of analytical grade HN03. The level of239 �_aetVjty Of 241piiPu was calculated from the I measured by liquid scintillation counting andthe other elements were analysed by Indrictively Coupled Plasma Mass Spectrornetry (ICP-MS). The powdered specimens, after dissolution tests, were gently rinsed with deionisedwater and dried at the test temperature for SEM and TEM examinations.
Figure 2 shows the releases measured under flow-through conditions for pyrochlore-rich-2 -4 fbaseline ceramic 6). The long-term releases are; 0.1-1 g M d-1 for Ca, -10 g -' d-' or U,
Gd and Ti, and 10-6_ 0- g M-2 d-1 for Hf ad Pu. Within experimental error these results arecomparable to those obtained ftom static testing. Under these conditions experimental datafor Hf have established that, where solubility constraints are not important, the releases of thiselement closely follow those of Pu. This latter results extends the data obtained for Hf understatic conditions.
Further analysis of the kinetics of release obtained under flow-tbrough conditions for Gd andU suggest that releases initially can be viewed as being associated with fast surface reactionfollowed by, in the longer-term, an equilibrium between reaction thermodynamics and thekinetic leaching conditions. Thermodynamic calculations suggest tat longer-tenn releases ofU, Gd, and Ti releases could be controlled by equilibrium of the corresponding hydroxidespecies.
100
b VC4. VVVVV
E 10-1 vvvvv'Vv vvvvvvwvvvvvvvvvvvvvvvvvvvvvvvvvvvvw
V0 PUCa U
E0 Ti
10-3 A GdA Hf
a) AAU) ea A A
10-4 0age
AA&
AA& XIIAAAMI* A,& 4AZAA AAAA*AtG*I A0 A
Wm lm�j0
.0
E0z i 0-6
0 50 100 150 200
Time (d)
Figure 2 Noinialised elemental releases from pyrochlore-rich baseline ceramic easuredat 70 in pH 56 leachant at a flow rate of - I nrL d-1
- 352 -

JAERI-Conf 2002-004
Examination of the leached solids using SM and TEM supported the overall findings of theleaching results for both static and flow-through conditions.
The long-term dability of actinide-containijig phases in the pyrochlore-ricb ceramics overgeological time as also been investigated using atural samples, The results from thisextensive study are reported elsewhere 7). Importantly, the results showed that the relativedurability of phases i the natural samples increased in the order of perovskite << brannerite <pyrochlore zirconolite which is consistent with that determined from studies on syntheticsamples.
These recently obtained results fr pyrochlore-rich ceramics are supported by extensivelaboratory tests of polyphase synroc and single-phase aterials that have been carried outover the previous 20 years at ANSTO and laboratories overseas. Most of these experimentshave been carried ut at temperatures of 70-150'C in deionised water, sodium chloride,bicarbonate or silicate solutions. Extensive investigations on zirconolite, te ost durable ofthe syrroc phases, have been carried out by Malmstr6m, (8) under hydrothermal conditions150-700T, at pressures of 50 and 200 Pa, Overall the results show that pyrochlore is thenext most urable phase to zirconolite followed by perovskite and brannerite. Otherlaboratory studies, involving leaching tests beyond 3000 days, continue to be supported bystudies of natural minerals of the relevant synroc phases fiorn, known geological evironments.
Previous work on the effect of radiation damage on releases from ceramic waste forms,carried out in conjunction with JAERI and other laboratories, have shown that the Pit leachrate may increase by about a factor of 10 from titanate ceramics accelerated damage testsafter amorphisation. The leaching behaviour of actirride doped specimens in accelerateddamage tests could be ifluenced by alpha radiolysis effects that would not be important in Puimmobilisation given the longer half lives Of 1pU and 25U then those of actinides used in theshort-term tests. The latter is in accordance with results from natural titanate minerals thathave shown that tese materials have generally remained as closed systems for migration U-Th-Pb isotopes for time periods of up to 5.5 x 10⁸ years 7).
3. CONCLUSIONS
Overall, the results from current studies extend the database for titanate ceramics and confirmthe suitability of these matrices for the immobilisation wastes arising from actinide-richstreams. Further, te ability to tailor the phase composition to reflect additives and impuritiesin the wastes streams underlines the applicability of this approach to a wide range of actinide-rich wastes including those arising from partitioning and transmutation initiatives as well asdisposition of fissile materials. Of additional importance is the ability to include high loadingsof neutron absorbers, like Gd and Hf, to avoid criticality during processing and also underrepository conditions.
4. REFERENCES
[11 A. Jostsons, Status of synroc development, proc. of th Pacific Basin Nuclear Conference,Sydney, 16 May, 1994, N.R. McDonald, Ed., pp 865-871, 1994).
[2] J. Lefevre, G. Baudin and M. Salvatores, Partitioning of long-lived radionuclides", Proc.Safewaste 9 Avignon, France, June 14-18, 1993, Vol. 1, pp 416-429, French NuclearEnergy Soc., Paris, France, 1993).
- 353 -

JAERI-Conf 2002-004
[3] Hart, K. P., Vance, E. R., Stewart, M. W. A. Stewart, Weir, J., Carter, M L Hambley, M.,Brownscombe, A., Day, R. A., Leung, S., Ball, C. J., Ebbingbaus, B., Gray, L. and Kan, T.(1998) Mat. Res. Soc. Syrup, Proc. 506, 161-168.
[41 K. P. Hart, Y Zhang, E. Lor, Z. Aly, M. W. A. Stewart, A. Brownscombe 3 ,Ebbinghaus and W. Bourcler, Aqueous durability of titanate cerarnics designed toimmobilise excess plutonium in Scientific Basis for Nuclear Waste Management XXIII,Mat. Res. Soc. Symp. Proc. oi 608, Eds. R W. Smith and D. W, Soesmith, MaterialsResearch Society, PittsburghPA, USA, 353-358.
[5] Vance, E.R., Jostsons, A., Moricca, S., Stewart, M.W.A., Day, R. A., Begg, B. D.,Harnbley, M. J., Hart, K, P. and Ebbinghaus, B. B., Ceramic Transactions, 93, 323-329,1999.
[6] Y. Zhang, K. P. Hart., W. Bourcier, M. G.Blackford, A. Brownscombe, P. J. McGlinn Z.Aly, B. S. Thomas, and E. Loi, Kinetic dissolution studies oil pyrochiore-rich titanateceramics, 20 International Symposium on the Scientific Basis for Nuclear WasteManagement, August 27-31, 2000, Sydney, Australia (in press).
[7] G.R. Lumpkin, "Alpha-decay damage and aqueous durability of actinide host phases innatural systems", J. Nucl. Mat. 289, pp 136-1666 2001).
[8] J.C. Malmstr8m, "Zirconolite: experiments on the stability in ydrothermal fluids" Ph.D.Thesis, ETH ZMcli, Switzerland, published by te Swiss Geotechnical Commission, No93 2000).
- 354 -

JP0250323JAERI-Conf 2002-004
Field Test of Nuelide Migration in Bentonite-based Materials at Aerated Zone
--- Cooperative Research Program on Field Migration Test between CIRP and JAERI ---
Fan Zhiwen*, Cul Anxi*. Gu, Cunli*, 7bao Yingiie* Sn Qinghong*
M.Mukai**, IMaeda**, JMatsumoto**, T.Tanaka**, H.Ogawa**
China Institute for Radiation Protection
270 Xuefu Street, Taiyuan Sanxi 030006 China
Fax: 86(351)7020407, E-mail: fanzw&pub1ic.ty.sx.cn
** Department of Fuel Cycle Safety Research
Tokal stablishment, Japan Atomic Energy Research Institute
Slilrakata 24, Tokai, Naka, lbaraki, Japan, 319-1195
Fax: 029-282-5934 E-mail. iiiukai_sparcit.tokai.-jaeri.ggjp
ABSTRACT
A field test was ointly conducted by China Institute for Radiation Protection (CIRP) and JapanAtomic Eergy Research Institute (JAERI) to explore moisture wovement with Br- and igration of
traCer 23 , 238pU I -based materials at aerated zone. The test ran under tworadioactive ?Np and Sr in benton'terainfall conditions, the artificial rainfall with sprinkling density of 15 min/d ad mijOir, and the naturalrainfall.
Tracing test of 3r implies that there does ave water going trough the bentonite specimen. However,the curves are very omplex ad furthei- work need be conducted to antity tis movement. "Pu has noobservable movemeal during the test period uder (tither rainfall conditions, and 21'Np has very shortmovement dominated by diffilsion. Bentonite-based materials are effective to retard nuclide migration.
Key words: LILW, Disposal, Bentonite, Nuclide Nligration, Aerated zone
1. I`NTRODUCTION
Safetv of radioactive waste disposal is one of the challenges for nuclear powerdevelopment ad unclear application A seven-year project was launched by China Institute.for Radiation Note(Alon (CIRP) and Japan Atomic Energy Research Institute (JAERI todemonstrate afety ad improve safety assessment methodology of near-surface disposal oflow-and-intermediate level radioactive waste. The project includes field test, laboratory testand modeling of nuclide igration in aquifer, in aerated zone soil and in engineered barriermaterials at aerated zoneti I.
For a multi-barriered disposal system, engineered barriers play important roles in thelong-term safety, Bentorute and bentonite-based materials leave been widely investigated asbackfillibuffer aterials ai a disposal facility. he field test for bentonite was designed to
237explore tingfation of stable ttienront tracers Br, Sr, N ad ce� and adioactive tacers Np,
"'Pu ad 'Sr la bentornte based aterials"'. It is �,-xpected that te field test would obtain
reasonably realistic da(a orimpared to the laboratory ("Xperifflent. Tis paper will focus on
moisture inoverriont taced y Br atid. migration of radioactive tacers 237 Np� 2"Pu and "Sr.
355 -

JAERI-Conf 2002-004
2 EXPERIMENTAL
2.1 MATERIALS
The materials used in the test are mixture of sand and bentorrites. Two kinds of bentoniteswere tested, Japanese bentonite (JB) named Kunigel VI, and Cbinese bentonite (CB)collected from a bentonite mine in inter-Mongolia, China. Tabie I lists the chemicalcompositions of the two bentonite used in the tests. Mineral constitutes of Japanese bentoniteare given in Table 11. Chinese bentonite is Ca-based bentonite, while Japanese bentonite isNa-based. According to X-ray refraction analysis, the primary mineral in Cinese bentonite ismontorrite with content up to 80.92%. The secondary minerals are x-cristobalite, mordeniteand orthoclase.
Table 1. Chemical compositions of the two bentonite
Chemical Composition Chinese Bentonite Japanese Bentonite
S10, 60.97 68.90
Fe2O3 1.26 1.69
FeO 0.09 0.71
A1203 12.69 13.70
TiO2 0.099 0.24
Nino 0.018 0.08
CaO 1.72 2.62
mgo 2.65 2.54
K20 0.119 0.36
Na.20 0,75 2.72
P205 0.030 0.05
Burnt loss 19.87 9.11
Total 100.26 99.41
Table 11. Mineral constitutes of Japanese bentonite
Mineral constitute Content Nfineral constitute Content
Smectite 46 49 Calcite 2.1, -- 26
Quartz 0.5 - 07 Dolomite 2.0 -2.8
Chalcedony 37 - 38 Analcime 3.0 3,5
Plagioclase 2.7 - .5 Pyrite 0.7
2.3. PROCEDURES
2.2.1 Specimen preparation and buric-411
Fig. I shows the bentorute specornen. ach bentonite specimell Includes ree sections,bentonite section, tracer iayer ad oess section. Bentorute section is a mixture of bentorrite(15%) and sand (85%), which is compacted to bulk densjt�, of 1,80 /CRT' with iitial watercontent of 10% (wt). Tracer iayer_ quartz sand dipped we tracer solutions., is put on thesurface and is trimmed as plain as possible. For adionuclide tracers te arnount of tracers ineach specimen is 62, IO' B for ... Pu 5.2xlO'Bq for 2"Np ad 3.0x10'Bq or "Sr. After
- 356 -

JAERI-Cont 2002-004
placing the tracer laver, loess with size less than 2 mni is filled wd compacted to field density.Then te specimen is placed in the pits[21.
tLoess
Tracerlayer
Bent0rute/Sand
PVC Ribe
h 50 underartificial rainfall,
100 under natural rainfall
Fig. I Schematic of bentonite specimen
2.2.2 SAMPLING AND NUCLIDE MEASUREENT
Table III lists the sampling dtes of each designed specimen, Due to very slow inovement,we can ot -et effluents, The specinien is excavated on te designated date mid take tolaboratroy. he specimen is sliced or tracer distribution analysis.
Table III Sampling dates of the field test for bentonite
[-Pit N_o_ Tracers Start-Sampling Duriit-lon'Bentonite date (days)
Additional JB Br- 1998/08/02- 380-------- _1999/0_8_-_17
Additional CB Br- 1998/08/02- 3901999/08-17
J13 238PU, 237 1997/07/01-3 Np, 9`Sr 1106
CB 2000/07/ I I
4 J13 238pn 27 Np, "Sr 1997/06/25- 10502000/05/10
JB 1997/07/01-r 385
CB 238pu, 237 1,998/07/215 Np, 9Sr
1997/07/01- 762
CB 1,999/08/02
3, RESULTS AND DISCUSSIONS
3,1 WATER, MOVEMEN'r IN THE TESTPITS UNDER NATURAL RAINFALL
Fig, 2 shows te distribution of Br and oisture content in te beritonite/sand specimentinder natural rainfall. During tis period of time, the rainfall is 07.5 mra, lower thari annual
357 -

JAERI-Conf 2002-004
average [4] . The distribution curves of Br- demonstrate that Br- moves through diffusion undernatural rainfall conditions, The distribution is symmetric with sort up-wald ovement of theconcentration peaks. The moisture distributio cve fulilter provers tile distribution, As theinitial moisture 'Hi the bentonne/sand specimen is 10%, it is lear that after the experiment, themoisture in the bentonite/sand section rei-nains at its original wile the upper and lower loesssection both are at very low moisture content 6 and 8% respeavely, which implies thatthere is no moisture exchange betwee te specimen and its surrounding edia. Diffusion isthe only driving force of nuclide migration uer ie natural rainfall condition. This isimportant to interprete the nucilde migration dstribution,
3.2 WATER MOVEMENT IN THE TEST PITS UNDER ARTIFICIAL RAINFALL
Fig. 3 shows the distribution of Br ad moisture content in the bentonite/sand specimenunder the artificial rainfall. Since we added tile. same amount of Br- to specuriens for the tworainfall conditions, we can see that under artificial ainfall condition, part of y- added havemoved out of the boundary of bentonite specirnen. The shape of te fgures for both Chinesebentonite and Japanese bentorate demonstrate the complex water flow i the specimens Asthe specimen is composed of three sections, te loess section, tile uartz tracer layer and thebentonite/sand section, there exists two interfaces in the specimen. learly, the quartz tracerlayer is conductive. Te laboratory measurement shows that the ydraulic conductivity values
---*-CB -JB JU -0--JB
5 255 20
20
-250 200 150 10(1 50 0 50 100 150 200 250 -250 200 150 -()O �50 0 -50 )W 150 200 250
004a"ce(rnm) oktance (""lo)
Bento Bento'Sand Sand
16 16
14
2
0 108
64 42
-250 200 150 -100 50 0 50 RX) 150 200 250 -25U 200 150 -10) 50 50 100 150 200 250
Distance (mm) "istaftee wo))
Fig.2 Distribution of Hr- and Fig.3 Distribution of r andmoisture in bentonite/sand moisture in beoto"itelsaildspecimen under natural Specimen under artificialrainfall condition rainfall condition
- 358 -

JAERI-Conf 2002-004
of loess and bentonite/sand are at the order of O-' m/s and IO-` m/s respeavely.1', There issignificant dfference in water penneability. The moisture distribution may furhter help tointerprete such distribution of Br- along the specimen. The flux in the specimen is controlledby low permeable bentonite/sand. Since the moisture content wi loess is up to 14%, therewould have bigger diffusioD capacity. In addition, de to bigger water flow in both upper andlower loess, tere exists bigger concentration gradient. As a results, the Br moved to the loesswas taken away by faster water flow.
3.3 RADIONUCLIDE MIGRATION IN THE SPECIMEN UNDER NATURAL RAINFALL
Fig. 4 demonstrates the distribution of radioactive tracer Np, "Pu and 'Sr in thebentonite/sand specimen under natural rainfall condition after 1050 days. "Pu has noobservable movement. Np has small down ward movement but without concentration peakmovement. "Sr is widely distributed and it seems tat the fraction in the upper direction islarger than that in the lower direction. As described in Section 31, the migration of nuclidesunder natural rainfall condition is driven by diffution, the difftision capacity of the threenuclides should be i te order of "Sr > ... Np> ... Pu. Laboratory easured Kd values of ... Np,... Pu and Sr in bentonite/sand also provide evidence to such dstributional
HO i2e
100 100-E--Pu-238 -41---Pu-2388 > --A� Sr-90 80
--A- Sr-90
60 60
40
94 20
-100 -50 0 50 100 -100 -50 0 so 100CD Distance(mm) jn Distance(mm)
(a) (b)
Fig. 4 Distribution of radioactive tracer Np, 2Pu and "Sr in the
Chinese bentonite specimen (a) and the Japanese bentonite
specimen (bl under natural rainfall condition after 1050 davs
3.3 DISTRIBUTION OF 217NP WITH TIME
Fig.5 shows distribution of 21'Np in -specimen made of Chinese bentonite and sand :,0,0 -w-ar-385d
at various times under artificial rainfall -- A-ar-762d80 X ar-1106d
condtion (ar) and under natural rainfallnr-1050d
condition (nr). "'Np moved down with time tunder the artificial rainfall condition. There isno remarkable differences in distribtuionbetween the artificial rainfall and the naturalrainfall. In the first 385 days, the movment is -30 -20 -10 0 1 0 20 30
the fastest. Later, the migration slows down. Distance (mm)
Further calculation of the radioactivity movedbelow the tracer layer is listed in table IV. As Fig.5 Distribution of 237 Np in
bentonite/sand specimenmentioned in Section 31, nuclide migration with times under two
under the natural ainfall is driven by diffusion. rainfall conditions
The calculated activity moved below the tracer
- 359 -

JAERI-Conf 2002-004
layer is 15852 Bq for 1050 days under the natural rainfall, which is even smaller than the 385day's migration under the artificial rainfall. Even for simple and conservative, the 1050 day'sdiflusion. contributed 79.2% of the total migration of 1106 days under te artificial rainfallcondition.
Table IV Total radioactivity below the tracer layers
Duration Total Radioactivity belowRainfall (days) the tracer layer (13q)
Artificial rainfall 385 16472Artificial rainfall 762 17710Artificial rainfall 1106 20017
Natural rainfall 1050 15852
4 CONCLUSIONS
"Pu does not have observable movement in the bentonite/sand specimen under theartificial rainfall and the natural rainfall conditions within the period of the field test.
137Np has some movement bigger than ... Pu and smaller than 'Sr. In the test period, ` Npmoves down with time under artificial rainfall. Diffusion is the primary driving force for 137 Npmovement in the bentonite/sand specimen uder both natural rainfall condition and artificialrainfall condition.
Tracing test with B demonstrates that the water do go down through the bentonitespecimen rather than go around the specimen. However, the water flow along the specimen isvery complex.
REFERENCES
[1] Li Shushen, Wang Zhiming, Safety Assessment Methodology for Shallow Land Disposal of Low
Level Radioactive Waste - Overview Report (Draft). September 200 .
[21 Fan Zhiwen, Toshi Maeda, Feng Shengtao, Gu Cunli and etc. Field Test of Nuclide Migration in
Engineered Barrier Materials at Aerated Zone. Sub-project Report 9 September 2001.
[3] Zhao Yinjie, Wu Qinghua etc. Field Tracer Test for Nuclide Migration in Loessial Aerated Zone, Sub-
project Report 8. September 200 .
[4] Du Zhongde, Zhou Honggui, Wu Qinghua and etc. Environmental Characteristics of CIRP's Field
Test Site, Sub-project report 1. August, 2001.
[5] Cui Anxi, Fan Zkiwen and etc. Barrier Performance of Bentonite Materials. December, 2000.
[61 TADAO, Tanaka. Adsorption characteristics of 85, 9Sr, 237Np, 239Pu and Stable Sr, Ce, Nd for Soil,
Bentomte, Mortar and Quartz Sand. Sub-pi-oject Report 4 September 2001.
360 -

JP0250324JAERI-Conf 2002-004
RECENT ACTIVITIES AT UNDERGROUND RESEARCH
LABORATORIES IN JAPAN
KAOKI
Japan Nuclear Cycle Development institute
4-49 Muramatsu Tokai-mura Naka-gun Ibaraki, 319-1184
With a view to contributing to the HW disposal project, JNC carries out R&D on geological
disposal technologies for HLW and its basic ge oscientific research in two Underground Research
Laboratories (URLs) located in Mizunami and Horonobe. The URL in Mizunami is for conducting
research on crystalline rock as an example of fractured media, while that in Horonobe is for
sedimentary rock as porous media. The aim of the URLs is to enhance the reliability of geological
disposal technologies and develop advanced safety assessment methodologies by collecting data for
design studies and for input to safety assessment and by developing investigation and characterization
techniques.
Investigation of the geological environment will be conducted in a stepwise manner as the
investigation program moves forward. Investigation from the surface (first phase) will be followed
by excavation of shafts and drifts (2nd phase) and, eventually, detailed investigations in the
underground facility (3rd phase). In each phase, information on the geological enviromnent will be
collected, evaluated and verified. The investigation techniques used will also be improved and
integrated as necessary. At the same time, the applicability of engineering technologies for the
design and construction of an underground facility will be verified.
The URLs can provide a wide range of possibilities for underground research by universities or
other research institutes, as well as serve as a tool for enhancing public understanding of R&D
activities related to the geological disposal.
[11 URL in Mizunami
As part of the first phase surface-based investigation initiated in 1996, geological mapping,
airborne and surface geophysical survey have been performed followed by research of four deep
boreholes of a thousand meter depth. The geological environment from the surface to deep
underground has been modeled and the excavation effects of the underground facility on the
geological environment are to be evaluated.
Shaft sinking will start in 2002, with excavation of a major part of the research drift scheduled for
completion by 20K The Mizunami URL will examine techniques for investigation and
characterization of the geological environment and application of basic engineering technologies deep
underground foT eyyslalline rock.
Subsequently, as part of the investigation phase during construction, modeling results w be
verified by comparing them with actual data. The techniques used for the surface explorations and
- 361 -

JAERI-Conf 2002-004
the modeling of the geological nvironment will be documented iii technical reports. The
appropriateness of engineering strategies, including design and construction techniques for the
underground facility, will also be confirmed.
[21 URL in Horonobe
The underground facility will be constructed at a depth of 500 m or more; shaft sinking will begin
in 2005, with the aim of completing a major part of the drift by 2010. In the Horonobe URL
Research Center, the focus will be on sedimentary rocks, with studies conducted on investigation and
characterization techniques for the geological environment, long-term stability of the underground
facility and the surrounding rock mass and application of asic engineering technologies deep
underground. Verification of the design for the engineered barriers, the complex long-term evolution
of the barriers, improvement of models, verification of the applicability of design techniques and
safety assessment methods will also form part of the program.
Identifying the site for constructing the underground facility within Horonobe will be the first
step of the surface-based investigation phase. At the selected location and in its neighboring region,
preliminary activities will include data acquisition from the surface such as geophysical surveys and
boreholes, modeling of the geological environment from the surface to deep underground and
estimating the effects of constructing an underground facility on the geological environment. Based
on the results of these studies, an underground facility will be designed and the project will enter the
next phase of investigation.
The results obtained from these URLs wl be widely published and are expected to make a
timely contribution as follows to the disposal program and to the establishment of safety regulations:
i. Techniques will be developed for characterizing the geological nvironment from the surface to
deep underground, based on investigation from the surface. This will take into account
requirements relating to the design of the disposal system and safety assessment.
ii. Data obtained from investigations during the excavation phase will serve to verify the results
from the surface-based investigation phase and the evolution of the geological environment
during drift excavation. Models will also be refined based on the geological data.
iii. Detailed investigation in the underground facility during the third phase will contribute to
ameliorate geological investigation techniques that take into account the requirements of disposal
system design and safety assessment. Data will also be collected on the geological conditions to
check the reliability of models.
362 -

JAERI-Conf 2002-004
TRU Chemistry
- 363 -

This is a blank page.

JP0250325JAERI-Conf 2002-004
MOLECULAR INTERFACIAL REACTIONS BETWEEN PLUTONIUMAND MANGANESE OXIDE HYDROXIDE SURFACES
H. NITSCHE
Univ. of California at Berkeley and Lawrence Berkeley National Laboratory, The Glenn T.Seaborg Center, I Cyclotron Road, Ms 7A-1150, Berkeley, CA 94720, USA,HNitsche�lbl.gov
Actinides can migrate in the environment mostly via aqueous edia such as groundwater andsurface, river, lake and seawater. Models predicting the hydrological transport through theenvironment require as input an actinide concentration, the true amount that is actuallyavailable for transport. Three major processes define the actinide source term: (1) solubility,(2) organic interaction, and 3 sorption. They are dependent on each other and eachindividual process is the result of several sub-processes. Also, colloid formation plays amajor role in the actinide source term, and it is common to each of the three main processes.The current state of knowledge of several of these processes will be discussed and emphasiswill be given to the interfacial reactions of plutonium with manganese oxides andoxyhydroxides surfaces.
Manganese oxides, present as minor phases in the vadose zone and other subsurfaceenvironments, may preferentially sequester actinides and transition metals over ironoxide/hydroxide minerals present in much larger amounts. Key thermodynamic and kineticparameters governing the sorption of aqueous plutonium species in defined oxidation stateson characterized mineral surfaces as a function of pH, actinide concentration, and ionicstrength were determined on manganese oxyhydroxide minerals.
The minerals were characterized using X-ray diffraction, X-ray absorption spectroscopy(XAS), and potentiometric titration, and the oxidation state of the sorbed plutonium wasdetermined using XAS and optical absorption spectroscopy. The results indicate thatmanganese oxide hydroxides, which show a variety of structure and manganese valencestates, have large sorption capacities for Pu(VI) and Pu(V). Sorption increases as a functionof mineral surface area and pH, especially at pH values above the pHpzc where the mineralhas a net negative surface charge. In addition, manganite and hausmannite (bothpredominantly Mn(III) minerals) reduce Pu(VI) and Pu(V) to Pu(IV), which then sorbs to themineral. Redox reactions occur between the plutonium and the manganese, both in solutionand on the minerals. XAS measurements show that plutonium is bound to these minerals inan inner sphere configuration, and that there is no evidence Of P02 precipitation on thesurface. Based on these initial results, if plutonium contaminants in the environment contactmanganese oxide hydroxide minerals, the plutonium can be sequestered through sorption atthe mineral surface under specific conditions.
365 -

This is a blank page.

JP0250326JAERI-Conf 2002-004
MICROBIAL TRANSFORMATIONS OF RADIONUCLIDES INTRANSURANIC WASTES
A.J. FRANCISEnvironmental Sciences Department
Brookhaven National Laboratory, Upton, New York 1 1 973, USA
ABSTRACT
Microorganisms have been detected in transuranic wastes and in waste-repository sites underconsideration for the disposal of nuclear waste. Microorganisms can facilitate the mobilization andimmobilization of radionuclides under appropriate conditions. Dissolution of radionuclides by microorganisms isbrought, about by changes in the Eh and pH of the medium, by their production of organic acids, such as citricacid, extracellular metabolites, and siderophores Imobilization or precipitation of radionuclides is due tochanges in the h of the environment, enzymatic reductive precipitation (reduction from higher to loweroxidation state), biosorption, and bioaccumulation, and bioprecipitation reactions. Free-living bacteria suspendedin the groundwater fall withiii te colloidal size range and may have strong radionuclide sorbing capacity, givingthem the potential to li-anSpOrt Tadionuclides in the subsurface To date, we ave only limited information on theinteractions of icroorganisms with radionuclides. Additional studies are needed to fully evaluate the role ofmicrobes in the mobilization and immobilization radionuclides in the waste repositories and in the environment.
Key words: Uranium, technetium, biotransformation, bacteria, biocolloids
1. INTRODUCTION
Transuranic waste is radioactive waste containing more than 100 nanocuries (nCi)(3700 becquerels (Bq)) of alpha-emitting transuranic isotopes per gram of waste, with half-lives greater than 20 years, The term transuranic means tose elements with an atomicnumber greater than that of ranium (i.e., atomic number >92). Radionuclides present in TRUwaste include among others Am-24 1, Ba- 3 7, Cm-244, Co-60, Cs- 3 7, Pu-23 8, 23 9, 240 -241, Ra-226, Sr-90, Tc.-99, Th-230, 234, U-233, 234, 235,-236, 238; Y90. Of particularconcern are the radionuclides U, Pu, Am, Np, and Te because of their long half-life. Theradionuclides in TRU waste may be present in various forms, such as elemental, oxide,coprecipitates, ionic, inorganic-, and organic-complexes, and naturally occurring mineralsdepending on the process and waste stream. In addition to the radionuclides the TRU wasteconsists a variety of organic materials (cellulose, plastic, rubber, chelating agents) andinorganic compounds (nitrate and sulfate). Significant microbial activity is expected in thewaste because of the presence of organics and nitrate, which serve as carbon and nitrogensources and nitrate and sulfate as electron acceptors in the absence of oxygen. This causesgreat concern in terms of gas generation and pressurization of containment areas in therepository.
Microbial activity could also affect the chemical nature of the radionuclides byaltering the speciation, solubilities and sorption properties and tus could increase or decreasethe concentrations of radionuclides in solution. Under appropriate conditions, dissolution orimmobilization of radionuclides is brought about by direct enzymatic or indirect non-enzymatic actions of microorganisms. These include (i) oxidation-reduction reactions, (ii)changes in pH and h, (iii) chelation or production of specific sequestering agents, (iv)bioaccumulation y biomass, v) biocolloid formation, (vi) bioprecipitation, and (vi)biotransformatioti of radionuclide'organic and -inorganic complexes. Key microbial processesinvolved i t obilization or immobilization of selected radionuclides of interest issummarized i 'table 1 Aong the radionuclides, biotransformation of uranium has been
367 -

JAERT-Conf 2002-004
extensively studied, whereas we have only limited understanding of the microbialtransformations of other radionuclides present in TRU waste [1 2.
Table 1. Biotransformation of Selected Radionuclides in TRU Wastes.
Process Th U Np Pu Am Cs Tc Ra
Dissolution' + ++ ? + ? ++ ++ ++
Reduction2 NA !+ ? ? NA NA ... NA
Biosorption ? ++++ + ++ + ++ + ND
Biocolloid3 + + + + + ND ? ND
NA- not applicable; ND- not determined.'- Dissolution due to oxidation from lower to higher valence state, changes in pH, production oforganic acids and sequestering agents such as siderophores.2- Reductive precipitation due to enzymatic reduction from higher to lower valence state.3- Association of radionuclides with suspended bacteria, which can be potentially transported asbiocolloids.
Fundamental understanding of the mechanisms of microbial transformations ofradionuclides under repository relevant conditions would help to assess the microbial impacton long-term behavior of radionuclides stored in deep geological formations, In this paper,biotransformation of various chemical species of U under aerobic and anaerobic conditions,and the bioreduction of Tc by clostridia under anaerobic conditions, and the potentialformation of radionuclide bearing biocolloids are examined.
2. BIOTRANSFORMATION OF URANIUM
Uranium exists in U11), U(IV), UV), and UVI) oxidation states, of which U(IV)and UVI) are the predominant ones in the environment. The direct implication ofmicroorganisms in te biotransformation of uranium is of considerable iterest because of itspotential application in bioremediation of contaminated sites, i preheating radioactivewastes, and in processes critical to the performance of nuclear waste repositories. Bothaerobic and anaerobic microorganisms are involved in the mobilization and immobilization ofvarious chemical forms of uranium. Dissolution of uranium, by autotrophic sulfur- and iron-oxidizing bacteria due to production of sulfuric acid and by heterotorphic bacteria and byfungi due to production of organic acids ad chelating agents such as siderophores, has beenwell documented in the literature.
2.1. Immobilization of Uranium
The immobilization of U is brought about by bioreduction and bioprecipitationreactions. Uranium is reduced by a wide variety of facultative and strict anaerobic bacteriaunder anaerobic conditions in the presence of suitable electron donof. Consequently, the
- 368 -

JAERI-Conf 2002-004
potential exists for the use of anaerobic bacteria to concentrate, contain and stabilize uraniumin contanniDated groundwaters and in waste with concurrent reduction in, waste volume.However te long-term stability of bacterially reduced U in the atural environment is notknown.
2.1.1. Biosorption and Bioaccumulation of Uranium, Biosorption and bioaccumulationof U has been observed in a wide range of microorganism. It has been and perhaps it still isone of the intensely investigated areas of research because of the potential use of biomass toremove U rom waste streams, xtracellular and intracellular association of U with bacteriawas observed but the extent of its aectu-nulation differs greatly with the species of bacteria.Uranium forms complexes with te carboxylate, phosphate armDO ad hydroxyl functionalgroups present o the cell surface; and intracellularly, by -binding to anionic sites orprecipitating as dense deposits.
Extracellular association of uranium with bacterial cell surfaces is primarily due tophysical- and cemical- interactions involving adsorption, ion exchange, and complexationand does not depend on metabolism. Bacterial cell walls, exopolyrriers, proteins, and lipidscontain functional goups, which are able to bind uranium.
Intracellular accumulation of i Pseudoatonasfluorescen ad P. aeruginosa hasbeen observed, but it existed as fine-grained, platy minerals 3 4. In P.,fluorescens, Kruegeret al. 41 observed that srface bound J was spread over te entire cell envelope (outermembrane-peptidoglycaii-plasma embrane complex) and i about 10% of the cells, the Upenetrated ito the cytoplasm which appeared as platy U-crystals aligned in the periplasmicspace, n contrast, intracellular accumulation of dense deposits of in P. aeruginosa wasextremely rapid; tis did ot involve etabolically ediated active tansport. In Halomonassp. U accumulated as eeCiTon-dense intracellular granules and was aso bound to the cellsurface. Intracellular acumulation involves transporting the metal across te cell membrane,which depends on the cell's metabolism, e intracellular transport of the U into the cellinvolves an as-yet unidentified transport system. Uranium transport across bacterial cellmembranes may be mediated by the mechanism used to convey etabolically essential ions;however, additional studies are needed to clarify the exact mechanism involved.
2.1.2. Charaterization of Uranium Associated with Bacteria. Recently, nuclearmagnetic resonance spectroscopy (NMR), time resolved laser fluorescence spectroscopy(TRLFS), and extended X-ray fluorescence spectroscopy FXAFS) have been used todetermine the the ftuictional groups involved in the complexation of U with bacteria.
3'P-NMR studies showed that U was bound to the phosphate of the phospholipidfraction isolated from 4ycobacterium smegmatis [5 6.
TRLFS studies with several species of Bacillus showed the formation of inner-spherecomplexes of U with phosphate groups on cell surface of te biomass, and suggested that thepolysaccharides, techoic acids or phospholipid layers of the embranes are responsible foruranium binding. Intact cells formed more stable complexes wth U(VT) than did the cell wallfraction. The bacterial phosphate binding occurs through organophosphate groups. Theacidophilic bacteria Thiobacillus ferrooxidans and Thiornonas cuprina accumulated largequantities of U(VI) at p's from 1.5 to 4 TRLFS studies showed that T. ferroxidans formed astrong inner-sphere complex with U(VI) whereas T. cuprina formed a weaker one 7].
EXAFS analysis of the association of with halophilic and non-halophilic thebacterial cells sowed that it was associated predominantly with phosphate as uranylhydrogen phosphate and additional forms of phosphate such as hydroxophosphato orpolyphosphate coinplexes as well as other ligarids such as carboxyl species. These resultsdemonstrate that phosphate, including the polyphosphates, ind significant amounts of U inbacteria.
- 369 -

JAERI-Conf 2002-004
Uranium associated with the bacteria is not very stable, as it was removed completelyby Na2HCO3 from Halomonas sp, ftom an Arthrobacter sp by 0 I sodium ydrogen carbonate[8], 0M EDTA, and N82CO3 9 nd rom Bacillus strains by EDTA [10]. Althoughbacteria possess a variety of functional groups, studies suggest that cellular phosphate is thepredominant functional group complexes with U. Inorganic phosphate generated inside cellsduring starvation or under stress bind U and other cations.
2.2 Biotransformations of Uranium-Organic and -Inorganic Complexes
Although a wide variety of microorganisms are present in radioactive wastes and innatural radioactive mineral deposits, the extent to which tey regulate te mobility ofradionuclides complexed with organic ligands is not fully evaluated, Chelating agents usedfor decontamination and c4eanup operations at the nuclear facilities constitute a significantportion of the waste. The persistence of radionuclides complexed with ceating agents in thedisposal enviTODInent is a major concern because, of the potential for increasing the transportof radionuclides. The types of organic complexing agents used are carboxyfi aids (such ascitric, hydroxy-acetic, oxalic, and tartaric acids), ad aino-carboxylic acids (such asethylenediaminetetraacetic acid (EDTA), diethyieneiriaminepentaacetic acid DTPA),nitrilotriacetic acid (NTA), and N-Iiydroxyethylene-diaiiiinetriacetic acid (HEDTA)).
Many of these cbelates ether are poorly biodegraded under aerobic (conditions orundergo little aaerobic bodegradation, Biotransformation of radionuclide-complexes mayresult in precipitation of the released ion as water-insoluble ydroxides, oxides or salts. Suchtransformations may result in the retardation of nuclide igration, Information o microbialtransformation of c-helating agents is linuted in particular there is a paucity of information ontire biotransformation of organic ligand complexed we adionuclides s well as their fateunder anaerobic onditions. This lack of knowledge often omplicates studies aimed atpredicting soil-rote-ntion caracteristics of radionuclides and developing ethods for in-situ.stabilization of radionuclides. Te following is a brief review of or nderstanding of thebiotransformation of urarnuni-on-,anic and -inorganic complexes uder aerobic a aaerobic(denitrifying, iron-reducing, fermentative, sulfate-feducing) conditions.
2.2.1. Aerobic Conditions
2.2.1.1. Motransformation of Binary Uranyl-citrate Complex by Pseudomonasfluorescens. Citric acid, a aturally occurring compound, is a roufidentate ligand, whichforms stable complexes Mth various etal ions, It orms different types of omplexes withtransition metals and actinides including ormation of a bidentate, tridentate, binuclear orpolynuclear complex species. iodegradation of metal eitrate complexes is dependent uponthe type of complex forniedbetween the metal and citric acid-, bidentate omplexes are readilybiodegraded whereas the tridentate complexes are recalcitrant LI 1]. Pseudomonasfluorescensmetabolized the bidentate complexes of Fe(111)-, Ni-, and n-citrate, whereas omplexesinvolving the hydroxyl group of citric acid, the tridentate Al-, Cd- and Cu-citrate omplexes,and the binuclear U-citrate complex ae'not 121. he presence of the free hydroxyl group ofcitric acid is the key deterrrunaDt in effecting biodegradation of the etal eon, plex. Te lack ofdegradation was not due to teir toxicity t was limited by te transport and/or metabolis ofthe complex by the bacteria, No relationship was observed- etween biodegradability adstability of the complexes, The tridentate Fe(11)-citrate complex, although ecalcitrant, wasreadily biodegraded after oxidation and hydrolysis to te bidentale Fe(11)-citrate form,denoting a tructure-function. relationship i the metabolism of the cornplex, 13].
Nunes and Gill [, 41 reported the formation of a cyclic 2:3 tf-ortrate complex ivolvinghydroxo- and oxo-bridges above pH 65, Adding excess itric acid to equilliolar (0,52mM)uranyl citrate resulted i t metabolism of the excess citric acid; te uranyl citrate complex
- 370 -

JAERI-Conf 2002-004
was not toxic to the bacterium. In the presence of l- 2 and, 3-fold excess citric acid, thecitric acid remaining in each complex after biodegradation was 075, 0.80, and 083 MM,respectively, The final stoichiometry of U-citric, acid i all three treatments wasapproximately 23 idicating the formation of 2:3 U-citric acid corlip I ex [ 1 5 �
2.2.1.2 Ternary ron- and Uranium-citrate Complexes. Citric acid forms ternary mixed-metal complexes with various metal ons involving the hydroxy ad carboxyl groups of citricacid. Te presence of 11-:2 Fe:Ucitric acid it slution was confirmed by potentiometric,titration, UV-vis spectrophotometry, gel-filtration chromatography, and extended X-rayabsorption fine structure (EXAFS) analysis. Comparison of be EXAFS spectra show the1:1:2 Fe:U:cittic acid complex as structural haracteristics similar to the 1:1 U:citric acidcomplex [151. Biotransformation studies of Fe-U-citrate complex by P. fluorescens showedthat te ternary 1:1:2 Fe:U:citric acid complex was recalcitrant, Wen a one-fold excess citricacid was added to this complex, the excess citric acid was completely degraded with nochange in the stoichiornetry of the complex. However, with two-fold excess citric acid, a1:1:1 Fe:U:citric acid complex remained in solution after the excess citric acid wasbiodegraded, Tose results suggest that similar to the U-citrate complex, the Fe-U-citratecomplex is recalcitrant to biodegradation, The persistence of mixed-metal-citrate complexesin wastes ad cmitai-ninated environments may result in the mobilization of uranium.
2.2.2. Denitrifying Conditions
2.2.2.1. Metabolism of Uranyl-eitrate Complex by Pseudomonas fluorescens. Citratemetabolism by Pseudomona5fluorescens under denitrif�iiig conditions was facilitated by theenzyme aconitase as in aerobic metabolism. Biodegradation of the various metal-citratecomplexes by P, fluorescens under denitrifying conditions was similar to that observedaerobically, but the rates were much lower. The bacterium completely degraded bidentatecomplexes of Fe(Ill)- and n-citrate, whereas the Ni-citrate complex was degraded onlypartially (-59%). Te released ferric ion was in the colloidal form, and was not reduced toFe(II) tirider denitrifying condit)'ODs, Tridentate complexes of Al-, Cd-, Ca-, and Fe(Il)-citrate,and the binuclear U-oitrate complex, were ot metabolized by the bacterium.
2.2.2.2. Biotransformation of Uranyl-organic and -inorganic omplexes by Halomonassp. Biotrailsformations of uanyl nitrate, urarryl-citrate, uraiiyl-(-thyleDediaminetetraacetate(EDTA), and uranyl carbonate by a denitrifying halophilic bacterium, Ralomonas sp., isolatedfrom the Waste Isolation Pilot Plant (WTPP) repository site was investigated 6]. Addinguranyl nitrate, uranyl-citrate, or uranyl-EDTA to the brine or bacterial growth mediumresulted in the precipitation of uraniura as a uranyl hydroxophosphato species[K(TJ02)5(PO4)3(0H)2-nT-I20j. Dissolution of the uraniurn precipitate was concomitant withthe growth of the bacterium under anaerobic conditions, The bacterium completelymetabolized the citrate released from uranyl-citrate complex, but not the FDTA released fromthe U-EDTA complex. The V-vis spectra of the culture medium during growth revealed theformation of a uranyl dicarbonate complex O2(CO3)2]2- due to C02 production from themetabolism of tbe'carbon source. There was no change in the speciation of added uranylcarbonate. I'liese results show that uranium phosphate can be solubilized to uranyl carbonatespecies as a result of bacterial action.
2.2.3. Anaerobic Conditions
2.2.3.1. Biotransformation of Uranyl-inorganic Complexes. A wide variety of facultativeand strict anaerobic bacteria reduced UVl) added as uranyl-nitrate or uranyl carbonate to
371 -

JAERI-Conf 2002-004
U(IV) under anaerobic conditions. These include axenic cultures of iron-reducing,fermentative, and sulfate-reducing bacteria. Mixed cultures of bacteria in uraniumcontaminated ground waters a in wastes also reduced uanium. Clostridia are strictanaerobic spore-forming fermentative bacteria ubiquitous in soils, sediments, and wastes.
dissimilatory metal reducersU VDaq fermenters, su�fatereducers ) UP),
They catalyze the reduction of metals from higher to lower oxidation state, Reduction ofsoluble UVI) to insoluble U(IV) by the anaerobic bacterium, Clostridium sp. in culturemedium was confirmed by X-ray absorption near edge spectroscopy (XANES) and X-rayphotoelectron spectroscopy XPS). Uranium was reduced only in the presence of growing orresting cells. Organic-acid metabolites, the extracellular components of the spent culturemedium, and heat-killed cells failed to reduce uranium under anaerobic conditions [ 1 7].
2.2.3.2. Metabolism of Uranyl--organic Complexes by Fermentative, Iron- and Sulfate-
reducing Bacteria. Clostridium sphenoides (ATCC 19403), which utilizes citric acid as the
sole carbon source, metabolized equirnolar FeaIl)-citrate with the degradation of citric acid
and reduction of Fe(III) to Fe(II) but not the UVl)-citrate complex. However, in the presence
of excess citric acid or added glucose UVl)-citrate was reduced to U(IV)-oitrate. Clostridium
sp. (ATCC 53464) which ferments glucose but not citrate reduced Fe(III)-citrate and UVl)-
citrate only when supplied with glucose. The metals reduced by the Clostridium sp. were
present in solution as metal-citrate complexes. These results how tbal the complexed
uranium is readily accessible as an electron acceptor despite the inability of the bacterium to
metabolize the organic ligand complexed to the actinide. We have also shown that the
metabolism of the metal-citrate complex is dependent upon te type of complex formed
between the metal and citric acid. Fe(III) forms a bidentate complex with itric acid and was
metabolized, whereas U forms a binuclear complex with citric acid and was recalcitrant.
The resting cells of the sulfate-reducing Desulfovibrio desulfuricans and the
facultative iron-reducing Shewonella halotolerans bacteria reduced UVI) complexed with
oxalate or itrate to U(IV) under anaerobic conditions with little precipitation of uranium. The
reduced U(IV) remained in solution complexed ith oxalate or citrate 18, 191. These results
show that complexed uranium is readily accessible for te Microorganisms as an eectron
acceptor, despite the inability of the bacteria to metabolize the organic ligand complexed to
the actinide.
3. BIOTRANSFORMATION OF TECHNETILTM
Technetiurn (Tc) can exist in oxidation states 0, 3, 4, +5, 6, and 7. Te is readily
reduced and oxidized, Uncomplexed T(111, TV) undergoes hydrolysis and precipitates from
solution. T(V) and Tc(VI) undergo disproportionation to Tc(IV) and TVII). Te safe
disposal of the Tc-containing wastes and environmental contamination of Te are majorconcerns.
Microorganisms affect the dissolution or precipitation of Te by oxidation-reduction
reactions and by complexation with organic by-products and macromolecules.
Chemolithotrophic, aerobic, facultative, and anaerobic fermentative d sulfate-reducing)
bacteria reduced pertechnetate ion to an insoluble form. For examples Clostridium sphenoides
capable of citrate and glucose metabolism and Clostridium sp. capable of fermenting glucose
but not citric acid reduced Tc(VII) to Tc(IV). The reduced Tc was predominantly associated
with the cell biomass. It also was present in solution complexed with, bacterial metabolic
- 372 -

JAERI-Conf 2002-004
products (MW>5000). Adding diethylenetriaminepentaacetic acid (DTPA) to Clostridium Sp.resulted in the formation of a soluble Tc(IV)-DTPA complex, whereas with C sphenoidesonly a small amount of Tc was present in solution, indicating that insoluble Tc species wereformed.
The nature and stability of the T-organic complexes is not known. Moreover, theability of the bacterium to metabolize Tc-organic complexes such as Te-citrate is also notknown. Tc may be present as insoluble or soluble form or as colloids, depending on the typeand extent of bacterial activity in subsurface environments and therefore, te potential existsfor the transport of reduced Tc in these forins. lostridia are ubiquitous and form spores,which are highly resistant to destruction. They can survive on almost any surface for longperiods of time. These results suggest that these organisms may play a major role inregulating the mobility of Tc under anaerobic conditions in wastes and subsurfaceenvironments.
4. BIOCOLLOIDS
Microbes can affect the transport of actinides by forming biocolloids. Significantnumbers of bacteria exist in all subterranean environments including extreme environments.They are present in the groundwaters of all the repository environments investigated, they fallwithin the colloidal size range of I irm. to I gin, and can be transported with bulk-liquid flow.Growing bacteria are several micrometers long with volumes of several cubic microns, wilenon-growing bacteria, under oligotrophic conditions, at a minimum may be as small as 02 -
30.3 gm with a volume not less than 0.05 m In addition, biomass accumulated on surfaces(biofilms) can become detached and generate biocollids. Microorganisms are importantsources of organic colloids, as are their metabolic by-products and exocellular polymers.Microbes bioaccumulate and biosorb radionuclides intracellularly or extracellularly. Franciset al., 20] evaluated te interactions of dissolved actinides 232-m, 238u, 237 Np 239PU, and243 Am, with a pure and a mixed culture of halophilic bacteria isolated from the WasteIsolation Pilot Plant repository under anaerobic conditions. The sizes of the bacterial cellsranged from 054 x 048 m to 77 x 067 �tm. Th e association of actinides with mobilebacterial cells (106 to 109 cells ml-') suspended in a fluid medium containing NaCl or MgCI2brine, at various growth phases was determined by sequential microfiltration. The amount ofactinide associated with the suspended cell fraction (calculated as mol cell-) was very low:Th, IO-"; U 10-1 _ -11; N 1-1 _ 10-19; p 1-1 _ 1-21, and Am, IO-" - 109; it varied
with the bacterial culture. The differences in association were attributed to the extent ofbacterial bioaccumulation and biosorption, pH, the brine's composition, and the speciationand bioavailability of the actinides. Plutonium uptake by Acetobacterium sp. isolated fromgroundwater from Grimsel Test Site (GTS) Switzerland, varied from 30-145 pg of Pu mg-idry wight of cells 21, 22]. The chemical form of the Pu, i.e., its ionic-, organic-, andinorganic-complexes and its solubility affect its bioavailability to bacteria. These resultssuggest the potential for the subterranean microbes to facilitate the transport of actinidesassociated with them.
Fundamental knowledge of the microbial transformations of several chemical forms ofradionuclides under various microbial process and environmental conditions will be useful indeveloping appropriate waste treatment and management strategies as well as predicting themicrobial impacts on the long-term performance of the waste repositories.
Acknowledgments
This research in part was supported by the Environmental Sciences Division, Office ofBiological Environmental Research, Office of Science, U.S. Department of Energy, undercontract No. DE-AC02-98CH10886.
373 -

JAERI-Conf 2002-004
REFERENCES
1. Francis, A.J. 1998. J. Alloys and Compounds 271/273:78-84.2. Francis, A.J. 2001. Microbial transformations of plutonium and implications for its
mobility. In "Plutonium i the Environment" A. Kudo, (Ed) Elsevier Science Ltd., Co.,UK. pp 201-219.
3. Strandberg, G.W., S.E. Shumate TI, and J. R. Parrot Jr. 1981. Appl. Environ.Microbiol.41:237-245.
4. KruegerS., G.J. Olsen, D. Johnsonbaugh, and T.J. Beveridge. 1993. Appl. Environ.Microbiol. 59: 4056-4064.
5. Andres, Y., J. MacCordick, and J. C. Hubert. 1993. Appl. Microbiol. Biotechnol. 39:413-417.
6. Andres, Y., J. MacCordick, and J. C. Hubert. 1994. FEMS Microbiol. Lett. 115: 27-32.7. Panak, P., S. Selenska-Pobell, S. Kutschke, G. Geipel, G. Bernhard, and H. Nitsche. 1999.
Radiochim. Acta 84: 183-190.8. Sakaguchi, T. 1996. Bioaccumulation of Uranium. Kyushu University Press, Hukuoka,
Japan. pp 61-95.9. Marques, A.M., X. Roca, M.D. Simon-Pujol, M.C. Fuste, and F ongregado. 1991. Appl.
Microbiol. Biotechnol. 35: 406-410.10. Panak, P., J. Raff, S. Selenska-Pobell,, G. Geipel, G. Bernhard ad 14. Nitsche. 2000.
Radiochim.Acta. 88: 71-77.I 1. Francis, A.J., C.J. Dodge, and J.B. Gillow. 1992. Nature 356:140-142,12. Joshi-Tope, G. and Francis, A. J. 1995. J. Bacteriol. 177:1989-1993.13. Francis, A.J. and C.J. Dodge. 1993. Appl, Environ. Microbiol. 59:109-113.14. Nunes, M.T.and V.M.S. Gill. 1987. Inorg. Chim. Acta. 129: 283-287.15. Dodge, C.J. and Francis, A.J. 1997. Environ. Sci. Technol. 31: 3062-3067�16. Francis A.J., C.J. Dodge, J.B. Gillow, and H.W. Papenguth. 2000. EnViron. Sci. Technol.
34: 2311-2317.17. Francis, A.J., C.J. Dodge, F. Lu, G. Halada, and C.R. Clayton. 1994. 28:636-639.18. Ganesh R., K.G. Robinson, G.R. Reed, and G. S. Saylor. 1997. Appl. Environ, Microbiol.
63:4385-4391.19. Ganesh R., K.G. Robinson, L. Chu, D. Kucsmas, and G.R. Reed. 1999. Wat. Res. 33:
3447-3458.20. Francis, A.J., J. B. Gillow, C.J. Dodge, M. Dunn, K. Mantione, 13.AStrietelmeier, M.E.
Pansoy-Hjelvik, HW, Papenguth. 1998. Radochim. Acta. 82: 347-354,21. Gillow, J.B., unn M Francis, A.J., and, Papenguth, H.W. 2001. zadiochim Acta.
88:769-774.22. Gillow, J.B., Francis, A.J,, Lucero, D.A., and Papenguth, HW. 2000, Te interaction of
plutonium with bacteria in te repository environment. Plutonium futures-The Science,Ed., K.K.S. Pillay and K.C. Kim, American Institute of Physics. pp 51-51
- 374 -

JP0250327JAERI-Conf 2002-004
Electrochemical investigation of actinide ions for redox flow battery
T. Yarnamura, N. Watanabe, Y ShiokawaKINKEN, Tbhoku University, Oarai, lbaraki, 311-1313, Japan
FAX: 81-29-267-3181, email: yamamura�imr.edu
Key words: actinide, neptunium, uranium, redox flow battery
1. INTRODUCTIONThe actinides produced by our domestic nuclear power plants are estimated as 7.2x10⁴
tons for the depleted uranium, 9 I 1 03 tons for the recovered uranium, 63 tons for neptunium,1,0x102 tons for plutonium, 40 tons for americium and 048 tons for curium per ten years.The minor actinides such as neptunium, plutonium, americium and curium are regarded as thehigh radioactive wastes to be disposed of iri the deep underground repository. As for thewastes, in the 19th century just after the industrial revolution in Europe, the coal tar was theserious industrial wastes produced as the remainder of the coal after the production of thecoke for steel manufacturing and the coal gas for illurninants. However, by the investigationsof the coal tar chemistry the wastes have become a precious resource of the organic chemicalindustry. This historical episode suggests the importance of the chemical researches of theradioactive wastes.
Among all the elements in the periodic table, only four actinide elements (An: U, Np, Pu,Am) have the quite unique nature that the single element possesses two redox couples withidentical structures (AnO2-1-/AnO2 2+' An3+/An4+). The actinides satisfy the necessarycondition for the redox battery, i.e. the two redox reactions are reversible, whereas in theexisting vanadium redox flow battery one of the electrode reaction V2+NO2+ is sufferedfrom the extreme slow dnetics due to the rearrangement of the coordination structure.Therefore we have proposed the actinide redox flow batteries for the electric power storagewhere An(IIl)/An(lV) and An(V)/An(VI) couples are used for the negative and the positiveelectrolytes, respectively 1 2. Despite that all of the oxidation states of the neptunium arestable in aqueous solutions, the uranium aqueous system is suffered from the instability ofU(V) .due to the disproportionation reaction with the proton released by water. Thus theuranium battery requires aprotic solvents. In the present study, we are conducting theelectrochemical investigation of the redox flow battery with the neptunium to choose thesuitable carbon materials for the battery electrode, and with the uranium to investigate into thesuitable active materials of the redox flow battery.
2 EXPERIMENTALNeptunium(IV) was obtained by the reaction of a neptunium stock solution with
platinum black and hydrazine dihydrochloride. The neptunium(IV) was purified by an anionexchange resin ai)d a part of the neptunium(IV) solution was oxidized to prepare theneptunium(IV) solution by the electrolysis. The uranium complexes such as U(acac)4,
U(dbm)4, U(ba)4, U(btfa)4 3 U(fod)4, U(Pta)4, U(dPM)4 4 U02(hfa)2, U02(pta)2,
U02(fod)2 51, U02(dPM)2 4,6 , U02(ba)2, U02(dbm)2, U02(btfa)2, U02(dmso)5(CI04)2
- 375 -

JAERI-Conf 2002-004
[7] were synthesized according to the previous works and these compounds were purifiedmainly by the sublimation. The purified uranium complexes were transferred into an inert gasglove box, whose atmosphere was maintained to reduce the concentration Of 02 and H20 lessthan I ppm, and dissolved in solvents at relatively high concentrations as stock solutions. Thisstock solutions with or without undissolved complexes were kept at 23 ±PC in the glove boxand shaken twice a day. After three days only the stock solutions with undissolved solids weremeasured. A small amount of sampled solutions were transferred out of the glove box, theirsolvents were evaporated under a reduced pressure and the remnants were dissolved in NHN03 and measured by ICP-AES (Shimadzu Corp., ICP-7500). Cyclic voltarnmetrymeasurements were conducted by using an electrochemical measurement system (HokutoDenko Corp., HZ-3000) and an electrochemical cell installed inside of the glove box.Working electrodes such as the platinum (1.6�), the plastic formed carbon (PFC, 3), theglassy carbon (GC, 5), the pyrolitic graphite with a surface (aPG, 5) and with surface(cPG, 5) were well polished and preprocessed in 0.5 mol dm-3 sulfuric acid. All of theorganic solvents used were purified by the distillation.
3. ELECTROCHEMICAL INVESTIGATION OF NEPTUNIUM FOR REDOX FLOWBATTERY
The anodic and cathodic peak potentials of Np(IV)/Np(III) and Np(VI)/Np(V) werereported [8 9 for I mol dm-3 HNO3, 0.5 mol drn-3 HC104, 0.5 mol dm-3 H2SO4 and 0.5 moldm-3 CI-13COOH aqueous solutions. According to the works, &EP for Np(IV)/Np(III) andNp(VI)/Np(V) are ca. 60 mV in nitric and perchloric media. The standard electrode rateconstants for the carbon electrodes which are used in the practical battery have not beenobtained and they are therefore evaluated in the present study.
The cyclic voltammetry of the neptunium aqueous solutions were carried out in nitricacid solutions (Fig. ) with four types of carbon working electrodes, i.e. GC, aPG, PG andPFC. The emf of the battery is estimated as ca. LV, which is independent of the types of theelectrodes (Table I). The standard electrode rate constants ko calculated [10, 11] aresignificantly large for both Np(VI)/Np(V) and Np(IV)/Np(III) couples. Among the carbon
2 - Np(IV) Np(VI) N 'V Np(VI)1 IP(/NP(III) /NP(V) Np(111�) /NP(V)
C� cmE E0
0v= 0025 V I020.05 05'
0.1 0.10.2 0.2
-2 0.4 0.40.8 0.8 (b)1.6 (a) 1.6
-0.5 0.0 0.5 1.0 1.5 -0.5 0,0 0.5 1.0 1.5E N vs. SCE E IV vs. SCE
Fig. 1. Cyclic voltammograms of 3.18x 03 mol dm-3 of Np(VI ad Np(IV) in 1 mol drn-3 HN03 at (a) cPG and (b) aPG electrode, respectively.
- 376 -

JAERI-Conf 2002-004
Table 1. Standard rate constants for Np(IV)/Np(IIT) and Np(Vl)/Np(V) and opencircuit voltage of Np battery in I mol dm-3 HNO,.
Electrode kolcm s I for El/2(fV/11 kolcm s I for El/2(VIN AE NNp(IV)/Np(III) I) N Np(VI)/Np(V) N
GC (9.3±1.0)xlo-3 0.878 (4.8±0.5)xlO-3 -0.151 1.03
PFC (2.1±0.5)xlo-2 0.877 (2.8t0.9)xl0-2 -0-146 1.02
aPG (5.6±0.3)x 10-3 0.874 (2.8±0.2)x 10-3 -0.151 1.03
cPG (I.3:t0.2)xI0-2 0.879 (1.2±0.3)xlo-2 -0.142 1.02
materials, the PFC and the cPG have especially large ko values exceedin 1-2 CT,, S-1 (Table )
and these carbon materials are regarded as the candidate for the battery electrodes.
4. ELECTROCHEMICAL INVESTIGATION OF URANIUM FOR REDOX FLOWBATTERY
The emf of the uranium battery based on the aqueous solutions can be evaluated asAE=0.68V according to the literature data EO(UO2 2+/UO2+)=0,16V and EU4+/U'+)=-0.52V[121. This voltage is not enough for practical batteries and, moreover, this aqueous system is
Table II. Solubilities of uranium complexes in aprotic solvents.
solubilities mol d-3 )
complex AN DMSO DMF PC
UO2(ClO4)2 a) ---- >0.8 >0.8 ----
U02(hfa)2 >0.8 >0.6 >0.4 >0.6
UO2(f0d)2 >0.4 I.lXI0-3 >0.4 >0.4
U02(Pta)2 >0.4 0.26 >0.4 >0.4
U02(dPm)2 3.OxIO-2 0,16 >0.4 7.IxI0-2
U02(acac)2 >0.4 >0.4 0.32 >0.4
U(fod)4 2.6x 04 b) 2. 1 XI 04 b) 7.4x 02 8.9x 02
U(Pta)4 1.8xlo-2 >0.4 >0.4 8.0xl0-4
U(dPM)4 1 I XI 04 b) 8.9xI0-5 b)
a) Examined by dissolving U02(dmsO)5(ClO4)2 orUO2(dmf)5(C"04)2 into each solvents.
b) Equilibrated for 6 nionths.
c) The sign of iequality indicates that the stock solution with te shown concentration
was successfully prepared. The figure without the sing of inequality idicates that the
solubility easurements was conducted.
377 -

JAERI-Conf 2002-004
suffered from the instability of U(V de to the disproportionation with the proton released bywater. Therefore the uranium battery requires the aprotic solvents,
For the uranium system with the polar aprotic solvents, the uanium P-diketones wereexamined because the solubility of the omplex are expected to be igh. The solubility of theactive materials is one of the most important factors for the redox flow battery because thecapacity of the battery per unit volume is determined by the solubility. Although the solubilitydata is poor on the uranium complexes with organic ligands into polar aprotic solvents 13],the solubilities of U(VI) P-diketone complexes are expected to be relatively high in previousworks 4 7 14-17]. Furthermore there are important electrochemical works tat the uraniump-diketones undergo electrode reactions with relatively simple mechanisms 5, 16, 18].
According to the result of the solubility experiment, the solubility of more than 0.8 moldm-3 for U(VI) complexes and more than 04 mol dm-3 for a U(IV) complex were obtained(Table 11). The solubility of I mol dm-3 is desired for the active materials for the battery andfurther investigations are required. Fig.2 shows the typical result of the cyclic voltammetryexperiments for O2(dpm)2 . Referring to the Fig.2 and other results, the reaction scheme isdeduced as following. UVI02(dpm)2 is reduced to UV02(dpm)2- PcI) which is decomposedto UV02(dpm) through an itermediate. The intermediate is responsible for pal and teUV02(dpm) complex are stable in the solvents (pa2/pc2). Fig.3 idicates tile redox potentialsof the UVl)/IJ(V) complexes with two p-diketones coordinated and the U(IV)JJ(III)complexes with four �-diketones coordinated. In order to avoid the mutual contamination of
PC1
-2 -
pc2
0 E ..... .. .. .... ...... .................................-
(a)pa2
�ci
- -
pc2
0 .............................................................
al (b)5-
pa2
-0.5 -1.0 -1.5 -2.0F IV Vs Fc/Fe
Fig. 2 Cyclic voltammograms Of 02(dpm)2 complex dissolved in DMSO slutioncontaining 01 mol dm-3 TBAP. oncentration Of 02(dPM)2 is I XI -3 mol d-3.
Initial sweep direction is cathodic. (a) Potential is scanned repeatedly between -0.18V and -2.07V vs F/Fe'-. Change n shape of voltarnmogranis between initial(thick curve) mid 20th (thin curve) sean are indicated. (b) Sweep velocity rangesfrom 0 IO to 2 0 s-
Hereafter the further slvation of complexes in aprotic solutions is omitted.
- 378 -

JAERI-Conf 2002-004
E; ECU
U-0U-
em
Z!
W
4 6 8 10 12 14 1 6pKa of P-diketones
Fig. 3 Summary of redox potentials of uranium P-diketones measured by cyclicvoltammetry. Open triangles ad closed triangles indicate potentials of t(VI)/TJ(V) withtwo f3-diketones coordinated and U(IV)/tJ(111) with four fi-dikotones coordinated,respectively, Upper triaDgles and lower triangles indicate potentials of reduction wave andoxidation wave, respectively. Horizontal bar idicates E1/2
the electrolyte by the permeation of different tigands through the battery membrane, thediketone: ligand coordinated to the uranium is required to be common in the negativeelectrolyte, U(IV)/U(III), and the positive electrolyte, UVl)/tJ(V). Therefore the enif of thebattery is evaluated as the difference along te potential axis between the UVl)/TJ(V) and theU(IV)/U(111) as sown in Fig.3 by assuming that no ligand dissociation and associationreaction occur. he open ircuit voltage is estimated more than IV by using the U(VI)/U(V)acetylacetone solution as the positive electrolyte and U(TV)/IJ(111) acetylacetone solution asthe negative electrolyte, The larger electromotive force is expected when the ligands with thelarger basicity is used in the battery.
5. CONCLUSTONSThe carbon material for the neptunium, battery electrode is investigated and the PFC is
regarded as te candidate by referring to the electrode rate CODstants of both Np(Vl)/Np(V)and Np(IV)/Np(III) and also to the enif of the neptunium battery, The uranium p-diketoneswere ivestigated as the active materials of the uranium battery. Although the solubility of theU(VI) complexes are relatively high, it requires further studies to increase the solubility of theU(IV) complexes. he emf larger than 1V is expected by rising the identical p-diketone ligandfor both te positive and the negative electrolytes by assuming the ligand dissociation and theassociation processes followed by the redox reaction are suppressed.
- 379 -

JAERI-Conf 2002-004
REFERENCES[1] Y. Shiokawa, H. Yarnana, and H. Moriyarna, J. Nucl. Si. Tech., 37, 253-56 2000).[2] T. Yarnamura, Y. Shiokawa, H. Yamana, and H. Moriyarna, Electrochim. Acta,
(submitted).[3] T. Yoshimura, C. Miyake, ad S. Irnoto, Bull. Chem. Soc. JpD,, 46,2096-101 1973).[4] Y Shiokawa, R. Amano, A. Nomura, and M. Yagi, J. Radioanal. Nucl. Chem., 152, 373-
80 1991).[5] A. Ekstrom, H. Loeh, C, H. Randall, L. Szego, and J. C. Taylor, Inorg. Nucl. Chem.
Lett., 14,301-04 1978).[6] K. J. Eisentraut and R. E. Sievers, J. Am. Chem. Soc., 87, 5254 1965).[7] T. Yarnarnura, S. Iwata, S. Iwarnaru, and H. Tomiyasu, J. Chem. Soc., Faraday Trans., 90,
3253-59, 1994).[8] S. Casadio and F. Orlandini, J. Electroanal. Chem., 33, 212 971).[9] U. Niese and J. Vecernik, Isotopenpraxis, 18, 191 1982).[10] R. S. Nicholson, Anal. Chem., 3 7, 13 51 1965).[11] A. J. Bard and L. R. Faulkner, Electrochemical Methods, John Wiley&Sons, New York,
1980.[12] A. J. Bard, R. Parsons, and J. Jordan, Standard Potentials in Aqueous Solutions,
IUPAC(Marcel Dekker), New York, 1985.[13] R. Keirn, ed., Chemistry in nonaqueous solutions (conductivity, molecular weight,
solubility), Gmelin handbook of inorganic chemistry, Vol, System no. 55 U, uraniumSuppl. v. D5, Springer, Berlin, 1995.
[14] A. Al-Alousy and J. Burgless, Polyhedron, 11, 531-39 1992).[15] K. Mizuguchi, Y.-Y. Park, H. Tomiyasu, and Y. Ikeda, J. Nucl. Sci. Technol., 30 52
(1993).[16] S.-H. Lee, K. Mizuguchi, 1-1. Tomiyasu, and Y. Ikeda, J. Nucl. Sci. Technol., 33. 190-92
(1996).[17] K. Mizuguchi, S.-H. Lee, Y. Ikeda, and H, Tomiyasu, J. Alloys Compds., 271-273, 163-
67 1998).[18] A. Vallat, E, Laviron, and A. Dormond, J. Chem. Soc. Dalton Trans., 921-24 1990).
380 -

JP0250328JAERI-Conf 2002-004
SUPERCRITICAL FUM TECHNOLOGYFOR ADVANCED NUCLEAR FUEL CYCLE
ZENKO YOSIUDA, YOSHTHRO MEGURO, SBUICHI ISO, TAKAUMI KIMURA,OSAMU TMIOKA*, YOUICFH ENOKIDA**, CHRO YAMAMOTO*,
JIN OUGIYANAGI***, KOUSABURO OHASFH***
Advanced Science Research Center, Japan Atomic Energy Research Institute, Tokai 'lbaraki 319-1195, JapanFax;+81-29-282-5927, e-niail; zyo-hida�popsvr.tokol..I'ae'.go'p
*Department of Nuclear Engineering, Nagoya Thilversity, Fiiro-cho, hlkusa-ko, Nagoya 464-8603, Japan**Research Ceitter of Nuclear Materials Recycle, Nagoya University, Furo-cho, Chikusa-ku,
Nagoya 464-8603, Japan***Department of Environmental Sciences, Faculty of Science, Ibaraki University, Mito 310-8521, Japan
Recent progress in the development of new methods for the separation of metal ions uing supercritical CO,fluid media is reviewed. A principle, a procedure and advantages of the supercritical CO, fuld extraction method(SFE) oi leaching mthod (SFT,) for the separation of uraniur ad plutonium 3Te suirrinarized ad feassibility ofthese methods to sch processes as a reprocessaig of the nuclear spent fuel, a partitioning of the high-levelliquid-wastes, and a decontamination of the radioactive solid wastes is discussed
Key words; supercritical CO,, separation, uranium, plutonium, reprocessing, decontamination
1. INTRODUCTION
Recently, much attention has been paid to a supercritical CO, fluid as a medium forthe separation of metals.'-") Supercritical CO, fluid extraction (SFE) using the supercriticalC02 exhibits several advantages as follows over a traditional solvent extraction procedureusing an organic solvent. The extraction efficiency and the extraction rate ae expected to beenhanced due to rapid mass transfer in the supercritical fluid phase. The rapid and completeremoval of the extraction medium is attained by gasification of C2 at ambient temperatureand pressure after the extraction process. The extraction efficiency or selectivity can beoptimized by changing the properties of the C2 medium optionally by tuning thepressure. 1,6,13) The use of SFE process in the field of nuclear technology exhibits a particularsignificance for minimizing the amount of the solvent waste. 12,1') The authors have developedthe SFE of U(VI) and Pu(IV) from nitric acid solutions using the supercritical C2 containingtri-n-butylphosphate (TBp) 16,13)
An alternative and more attractive method is supercritical CO, fluid leaching (SFL ofmetals from the solid samples. In this method, acid for the dissolution or pretreatment of thesolid sample is not necessary. The authors ave sdied the leaching behavior of metalsfrom lanthanide oxides, zirconium oxide, strontium oxide, uranium oxides, etc',7,' 1,16) with thesupercritical CO, containing the HN03-TBP complex as a reactant, and a method has beendeveloped for te removal of the uranium oxides ftom the solid").
In the present paper, SFE and SFL methods developed in our research group are reviewedand feasibility of the methods for the inetal separation processes in the field of nucleartechnology is di SCLIssed.
381 -

JAERI-Conf 2002-004
2. EYPERIMENTAL
2.1 ApparatusApparatus for SFE and SFL is shown in Fig. 1. Main part of the apparatus consisted of
(1) extraction vessel made of stainless steel, 2) syringe pump, ISCO Co. Ltd.,. model 260D or500D, 3) pre-warming coil, stainless steel tubing of 025 mm I d. and I - 2 n in length, 4)restrictor, ISCO Co. Ltd.., stainless steel capillary of 57 4 in i.d. and 30 cm in length, (5)
filter, 6) thermostat oven, and 7) liquid Co, cylinder. The batchwise extraction vessel 0ml and flow extraction vessel 40 or 10 ml were products of JASCO, The extraction vesselfor the batchwise experiment was equipped with (8 a sampling vessel of ml to take aknown volume of te aqueous pase after the extraction equilibrium was attaiDed. The vesselfor the flow extraction was equipped with 9 a collecting vessel where Co, gasified atatmospheric pressure and the solutes in the supercritical CO, were recovered.
2.2 Procedure for the batchwise SFE of U(VI) and Pu(IV) ionsThe HNO, solution containing U(VI) or Pu(IV) ions was taken in the extraction vessel. A
known amount of TBP was added to the solution in the extraction vessel, and te Co, fluidwas introduced to te extraction vessel by using the syringe pump. T lie pressure and thetemperature inside the extraction vessel were kept at Pex higher than the ritical pessure of
Co,, Pc 7.4 Wa) and at Tex higher than the critical temperature of Co,, T 31.2 'C). The
extraction equilibriuni was reached by stirring the aqueous solution and the supercritical Co,phase for 60 min. Then, ml of the aqueous phase was taken quickly into the sampling vessel.The concentration of U(VI) or Pu(IV) in the aqueous phase under the extraction equilibriumwas determined and the distribution ratio, D, was calculated as a ratio of the oncentration ofU(VI) or Pu(IV) in thesupercritical CO, to those in the aqueous solution.
2.3 Procedure or the flow SFE of (VI)The HNO, solution containing U(VI) was taken in the extraction vessel, The Co, fluid is
allowed to flow through the systern at a given flow rate. An appropriate portion of TBP wascontinuously added to the C2 stream using a lunger-type pump, After being warmed up toT,,,, on passing through the pre-warming coil, the supercritical C.-TBP mixture was
(a)F 1
-------------------- ----------7 2
C02 gas
02 gas
10
--------------------------------------
Fig. I Apparatus for the SFE or SFL using supercritical C2
- 382 -

JAERI-Conf 2002-004
introduced continuously into the extraction vessel while being bubbled through the samplesolution for 30 min, Supercritical. CO, without TBP was allowed to flow through theextraction vessel or 30 inin, Te effluent from the extraction vessel was depressurized downto atmospheric, pressure by passing through the restrictor, and then introduced into thecollecting vessel, After the extraction pocedure, the concentrations of U(VI) in the samplesolution and in the collecting vessel were determined. The extraction efficiency and therecovery efficiency were calculated from these results.
2.4 Procedure for SFL of uranium from solid sampleThe solid sample, e. g, sand containing UO, or UO, powders, was taken in the extraction
vessel and the temperature inside the vessel was kept at 40 to 60 'C. The mixture ofsupercritical, CO, ad the IJN0,-TBP complex was introduced into the extraction vessel andallowed to stand at 40 to 60 'C and 12,5 t 25 a fo a gven period of time static SFLprocedure ]. After the static SFL, neat CO, ws allowed to flow through the extraction vesselat 60 'C' and 20 a [ washing procedure ], Te static SFL and washing procedures wererepeated twice, The euent was introduced to the collection vessel. The solutes such asU(Vl)-TBP complex and HN03-TBP complex in te supercritical C02 phase were recoveredin the collection vessel.
2-5 ChemicalsThe solid sample for SFL was a mixture of ca. 100 - 200 mg of UO, or U30, powders and
50 g of te standard sea sands Wako, 20-30 inesh ), The O2 powder was obtained bygrinding mechanicall te UO, nuclear fuel pellet and the O, was prepared by heating theU02 powder at 40 'C in air for 2 hrs.
The HNO,-TBP complex was prepared by mixing vigorously 100 ml of 70% BNO3Wako Pure Cemicals Co. with I 0 ml ofTBP ( Koso Cemical Co. in a conventional
extraction tube for 30 min, The HN03-TBP complex liquid thus obtained was determined tocontain HNO, and TBP at a mole ratio of 14 - 1.5 I as the ixture of (HNO,)2(TBP) andHN03(TBIP) complexes. Te water content of the HN03-TBP complex was determined to be1. 3 M by Karl -Fischer ttration method.
3. RESULTS AND DISCUSSION
3.1 The SFE of U(VI), Pu(IV) and fission product ions from FINO, solution with TBP' 6,)3)
Extraction behaviors of U(VI) and the fission product ions fom HNO., solution into asupercritical Co, containitig'YBP were studied under batchwise and flow extraction condition.Uranium(VI) was found to be extracted in the supercritical Co. as a form of U02(NO3)2(TBP)2
with a dstribution ratio, D, of, e. g. 22 + 03 for the extraction of 2 x10⁻⁴ to 2 x 1-2 M U(VI)from 3 Ml HN03 ito the supercritical CO, containing 03 M TBP at 60 'C and 15 Wa. Thereaction scheme of SFF of U(VI) was confirmed as shown in Fig. 2.
The D of U(VI), Du(,,), increased with an increase of IJN03 oncentration ( 0 I - 6 M orTBP ( 0 I - 0, 3 M ), along with a decrease of pressure 1 - 40 1pa ) at 60 'C, and with anincrease of the temperature 40 - 0 '(7 ) at 15 Wa. A salting-out effect enhancing thedistribution of U(Vt) was observed by addition of a fairly igh oncentration of LiNO, to theaqueous pase, Results of flow extraction using a continuous flow of the supercritical Co, -TBP throug te queous nitric acid solution showed that >98% of U(VI) could be extractedfrom 3 A HNO3 solution into the superefitical C02 - 0.08 M TBP 60 'C, 15 Wa
- 383 -

JAERI-Conf 2002-004
H(NO3)(TBP) UOZ(N(3)2,(TBP)2
TBP
SF-CO2phase
Aqueous KDTBP KDH-TBP KDU-TBP-
phaseTBP
KfH-T'BPH+ + N03- + toy rIUNkJ3)(rBP)
KfU-TBP,,U02 2+ + 2NO3- + 2TBP 11;��� U02(NO3)2(TBP)2
Fig. 2 Reaction scheme of extraction of U(VI) from HN03 solution into
supercritical CO, contaioning TBP.
Plutonium(IV) was found to be extracted into the supercritical CO, containing TBP as
Pu(NO3)4(TBP)2 complex through identical eaction scheme as Shown in Fig. 2 The
distribution ratio, PU(IV), was determined to be DFu(lv) 3 1, e. g, for the extracti on of 2 x 10⁻³
M Pu(IV) from 3 4 HN03 into the supercritical C02 containing 03 M TP at 60 'C and 5
MPa.
Main fission product elements such as lanthanides, Cs, Sr, Ba, Zr, Mo, ad Pd were hardly
extracted into the supercritical CO, phase uder this condition, which suggests that SFE is
feasible as a method for the separation and recovery of uranium and putonium from the
fission product elements,
Extraction equilibrium of U(VI) and Pu(IV) between HNO, solution and the supercritical
CO, phase containing TBP was formulated taking into account tat (i a distribution ratio of a
metal extracted is a function of a distribution constant of each component involved in the
extraction reaction see Fig. 2 ), (ii) the distribution constant is defined as a ratio of
solubilities of the component in both phases, and (iii) the solubility in te C2 pase is
correlated with density of C02 A simple linear relationship betwee te distribution ratio, D,
ofthemetalionanddensity, loOfCo2wasderived;logD=aiogp+A+Binwhichais
a proportional constant implying the slvation characteristic of the soitite in superentical CO.,A is a pressure-independent onstant, and is a variable determined by te dstribution
equilibrium of HNO, Te equation derived was verified experimentally t a me t
of te dstribution tio of U(VI) ad u(IV) vinder various oditions of pressure and
temperature. Te slopes a of the log D v log pots wre -(2.7 -_ 0,5) and -(1.6 + 0.1)
for the extraction of U(VI) arid Pu(IV), respectively The differences i D as we] I as the slope
a between U(VI) and Pu(IV) make it possible to design the and u separation ethod by
which one can achieve an enhancement of the extraction efficienc ad selectivity by tuning
the operation pressure.
The SFE behavior of U(VI) of relatively high concentration was investigated i the flowSFE system using te supercritical CO, with TBP'7". Te aueous pase was 30 rol of 3 M
HN03 solution of 3 to -1 TV U(VI) and te supercritical CO pase ontained 10' to
10' M TBP and forced to flow trough the aueous phase at a flow rate of I to ml/min. The
extraction-rate curve was easured in t SFE at 60 'C a 15 Wa, from which the
- 384 -
JAERI-Conf 2002-004
distribution ratio fl.,, of U(VI) in the flow SFE was determined. The Dw of U(Vl) wascompared with the D,(,, determined under the equilibrium condition as described above andit was found tat the extraction equilibrium of U(VI) was attained rapidly even in the flowSFE pformance. The reaction process determining the extraction rate was evaluated on thebasis of the modeling of the flow SFE system.
A modeling was examined") for the analysis of the results of extraction of U(VI) in a flowSFE system by supercritical C02 containing TBP from a NO3 solution, in which theextraction was not limited by the solubility of the U(VI)-TBP omplex. The model used wasthat of diffusion out of a sphere into a medium in which U(VI) extracted was infinitely dilute.The extraction was shown to follow a similar mechanism to that seen in conventional solventextraction.
3.2 The SFL of uranium form solid sample' 2,16,19)
The dissolution behavior of U30, and U2 using the supercritica C2m. edium. containingHN03-TBP complex as a reactant was studied. The dissolution rate of the oxides increasedwith increasing the HN03/TBP ratio of the HN03-TBP complex and the concentration of theHN03-TBP complex in the supercritical C2 phase. A remarkable increase of the dissolutionrate was observed in the dissolution Of U30, when the HN03/TBP ratio of the reactant washigher than ca 1, which indicates that the 21 complex, HNO3)2TBP, played a role infacilitating the dissolution of the oxides. Half-dissolution time j as an indication of thedissolution kinetic was determined from the relationship between the amount of uraniumdissolved and the dissolution time (dissolution curve). A logarithmic value of a reciprocal ofthe ti, was proportional to the logarithmic concentration of HN03, CHN03, in the supercriticalC02. The slopes of the In (181/2) vs In CHN03 plots for U30, and U2 were different from eachother, indicating that the reaction mechanisms or the rate-determining steps for the dissolutionof U30, and , were different. A principle of the dissolution of uranium oxides with thesupercritical C2 medium was found to be applicable to a method for the removal of uraniumfrom solid matrices.
The SFL method, which is based on the efficient and selective dissolution of uraniumoxides with the supercritical C2 containing HN0,-TBP, has been developed for the removalof uranium from the solid waste contaminated by the uranium oxides. It was found thaturanium oxides, U2 or U308, could be dissolved almost completely in the supercritical C2
phase at 60 'C and 15 to 20 Wa. Feasibility of the SFL method to the decontamination ofuranium from the solid wastes was demonstrated using a synthetic waste, i. e. a mixture ofthe standard sea sands ca. 50 g and U2 or U30, powders ca 100 mg of U ). The sandsample after the decontamination procedure was leached completely by the concentratedHN03 by keeping at the boiling point for 30 min, and the concentration of uranium in HN03solution was analyzed by an ICP-AES ( Shimadzu, ICPS-8000E ). The results are shown inTable I
The solid sample after the SFL treatment was in a form of dried solid which containsneither cid and organic solvent nor reactant. It was found also that most of uranium ( 95-99% taken was recovered in the collector. This allows the further treatment of the solidwaste more easily. Uranium.(VI) was quantitatively stripped as U(VI)-carbonate from theUO,(NO,)2(TBP), using NH,),C03 aqueous solution and the TBP recovered can be reused.
The most distingtiished advantages with the proposed SFL method are that (i) the highlyefficient removal of U(VI) is attained, (ii a generation of the secondary wastes from thedecontamination pocess is totally minimized, and (iii) CO, and even HN03-TBP reactant canbe easily reused.
- 385 -

JAERI-Conf 2002-004
Table I econtamination efficiency of synthetic uraniurn-containing solid wastesby the SFL method using the supercritical C2 HNO,-TBP complex
total amount of Usynthetic solid wastes remained in the solid decontamination factor
after the SFL (D.F)al
A; 120 Mg U02 powders 0.3 mg 3,5 x 10'+ 50 g sea sands
B; 120 mg U30, powders 0.01 mg 1 I X 104
+ 50 g sea sands
SFL condition; 60 V, 20 NIPa, the static SFL for 150 mins
and washing for 100 mins (flow-Tate of CO,' 3 - ml/min
')DF = {U content before SFL - (U after SFL)� / (U Ibefore SFL)
3.3 Other methods for the separation of metal ion from the aqueous solution by SFE using
various extractants,
3.3.1 SFE of Pd(IT) from the aqueous chloride solution using 2-rnetbyl-g-quinolinol11, 20 2)
HMQ ) ; Te SFE behavior of Pd(H) was investigated with 2-methyl-8-quinolinol
(HMQ). The Pd(H)-HMQ omplex extracted from a weakly acidic solution (pH 2 - 3 into
SF-CO2 was determined to be Pd(N4Q),, on the basis of a slope aalysis, The extraction
constant K..,,SF (= [Pd(MQ)21,,LH'12[Cl-]'[PdCl,'-]-'[HMQ]-') was determined to be I 0` t '? at
45 'C , 8.5 NIPa and I = 04 N4 (H, Na)CI, The distribution behavior of HQ between an
aqueous and supercritical CO, hases was examined so as to dscuss quantitatively the
extraction equilibrium Te extraction constant K,,,,Y) of Pd(II) with MQ into cyclohexane
with a similar polarity to supercritical CO, was determined and the K,,,, was ompared with
the Kecy. Pd(TI) at the concentrate on range of IO-' to 10-4 M in the aqueous solution (pH < 3)
containing relatively igh oncentration of chloride ion was found to be extracted efficiently
by SFE.
Pressure effect on the distribution of Pd(TI) in SFE using Q was ivestigated, The
distribution ratio D f Pd(11) was independent OD the )feSSUre ill tile ange Of 8,5 to 23 MN,
when the pH of the aqueous solution was buffered at PR = ,7 - 3. The C02 Pressure
affected te solubility of CO, in the aqueous phase and therefore the pH of the non-buffered
aqueous solution changed with the pressure wich resulted a cange of the distribution ratio
with the pressure, The SFE method using 1MQ is promising or te recovery of PdQI) in the
aqueous chloride media, Te MIQ forrns the water-soluble protonated form, MQ+, which
allows the coexistence of \4Q- of enough igh concentration in te xtraction system.
3.3.2 SFE of U(VI) and Janthanide(Iff) from aqueous solution sing [i dikeroneS22); The
SFE behavior of U(VI), La(III ad Lu(111) was investigated comparatively wit te solvent
extraction behavior with the (3 -diketones (FIA) such as 2thenovitrifluoroaoetone (Htta),
- 386 -

JAERI-Conf 2002-004
1,1,1,2,2,3,3-heptafluoro-7,7-dimethyl-4,6-octanedione (Hf6d) and 1phenyl-3-methyl-4-benzoyl-5-pyrazolone (Hpmbp) together with TBP. An addition of TBP to the extractionmedium contributed to an increase of the extractability through a so-called "synergisticeffecf' and an enhancement of the solubility of the solutes, i. e., an extractant and a metal-extractant complex in the supercritical CO,, modifier effect ). hese effects of TBP enablesthe SFE procedure for the separation of U(VI) and lanthanide(III) from the aqueous solutionof pH in the range of I to 3 The U(VI) species extracted into the supercritical CO, orcyclohexane was found to be U02ATBP. The extraction constant by SFE of these metal ionswith 8 -diketones and TBP were one or two orders smaller than that by the cyclohexane
extraction.
4. CONCLUSION
The SFE using supercritical C2 containing TBP as an extractant shows highapplicability to the separation and recovery of uranium and plutonium from nitric acidsolution of relatively high concentration. The SFE was concluded to be applicable to thereprocessing of the nuclear spent fuel or the partitioning of the nuclides in the high-levelliquid-waste. The distribution ratio of U(VI) and Pu(IV) can be controlled by varying theoperation pressure, i. e., the density Of C2 medium. This suggests a potential of a newmethodological concept of "pressure-tuning" or "CO2 density-tuning" SFE to enhancethe separation efficiency and selectivity of the metal extraction.
The SFL using supercritical C2 containing HN03-TBP complex as a reactant ispromising as a method for the decontamination of uranium oxides from the uranium-containing solid wastes. High decontamination factors were obtained for the removal andrecovery of uranium in the solid samples present as U2 or 30,. The most distinguishedadvantages with the proposed SFL method are that (i) the highly efficient removal of U(VI isattained, (ii a generation of the secondary wastes from the decontamination process is totallyminimized, and ' C2 and even HN03-TBP reactant can be easily reused.
REFERENCES
1) Y. Meguro, S. Iso, Z. Yoshida, Anal. Chem., 70[7], 1262 1998).2) 0. Tomioka, Y. Enokida, 1. Yamamoto, J. Nucl. Sci. Technol. 3 7], 515 1998).3) M. D. Burford, M Z Ozel, A. A. Clifford, K. D. Battle, Y. Lin, C. M. Wai, N. G. Smart,
Analyst, 124, 609 1999).4) C. M. Wai, Y. M. Kulyako, B. F. Myasoedov, Mendeleev Commun., 180 1999).5) M. A. Khorassani, L. T. Taylor, Anal. Chim, Acta, 379, 1 1999).6) S. Iso, S. Uno, Y. Meguro, T. Sasaki, Z. Yoshida, Prog. Nucl. Energ., 37[1-4], 423 2000).7) 0. Tomioka, Y. Enokida, I. Yamamoto, T. Takahashi, Prog. Nucl. Energ., 37[1-4], 417
(2000).8) M. Shamsipur, A. R. Ghiasvand, Y. Yamini, J. Supercrit. Fluids, 20, 163 2001).9) Z. J. Cui, J. C. Liu, L. C. Gao, Y. Q. Wei, J. Environ. Sci., 12[4],444 2000).10) C. Erkey, J. Supercrit. Fluids, 17, 259 2000).1 1) J. Ougiyanagi, S. Y. Choi, N. Ishikawa, H. Imura, T. Oriyama, K. Ohashi, Prog. Nucl.
Energ., 37[1-41, 435 2000).12) 0. Tomioka, Y. Meguro, S. Iso, Z. Yoshida, Y. Enokida, 1. Yamamoto, J. Nucl. Sci.
- 387 -

JAERI-Conf 2002-004
Technol., 38[6], 461 (2001)�13) Y. Meguro, S. Iso, H. Takeishi, Z. Yoshida, Radiochim. Acta, 75, 8 (996).14) N. G. Smart, Z. Yoshida, Y Meguro, S. Iso, A. A. Clifford, Y, Lin, K. Toews, C. M. Wai,
Proc. Int. Conf. Future Nucl. Systems (Global 97), Oct., Yokohama, Japan, 3 0 1997).15) 0. Tomioka, Y. Enokida, 1. Yamamoto, Separ. Sci. Technol. in press.16) 0. Tomioka, Y. Meguro, Y. Enokida, 1. Yamamoto, Z. Yoshida, J. Nucl. Sci. Technol.,
in press.17) Y. Meguro, S. Iso, Z. Yoshida, Proc. ISEC 2002, in press.18) A. A. Clifford, S. Zhu, N. G. Smart, Y. Lin, C. M. Wai, Z. Yoshida, Y. Meguro, S. Iso,
J. Nucl. Sci. Tech., 433-438(2001).19) 0. Tomioka, Y. Meguro, S. Iso, Z. Yoshida, Y. Enokida I Yamamoto, Proc. ISEC 2002,
in press.20)J. Ougiyanagi, Y. Meguro, Z. Yoshida, K. Ohashi, Talanta, in press.2 1) J. Ougiyanagi, Y. Meguro, Z. Yoshida, K. Ohashi, Proc. ICAS 200 1, Anal. Sci., in press.22) Y. Meguro, S. Iso, J. Ougiyanagi, Z. Yoshida, Proc. ICAS 2001, Anal. Sci., in press.
388 -

JAERI-Conf 2002-004
4. Poster Session
Criticality Safety
- 389 -

This is a blank page.

JP0250329JAERI-Conf 2002-004
REACTIVITY EFFECT OF SPENT FUEL DUE TO SPATIALI)TSTRIBUTIONS OF COOLANT TEMPER.xruRE AND BURNUP
YRAYASHT Y.YAMANE KljYAMA*' R.M(CRIZUKI*2
Deparknent, of Nuclear Engineering, Graduate School of Engineering, Nagova UniversityFuro-cho, Chiktisa-ku, Nagova city, Aichi prefecture, 464-8603, Japan
*i0RCD/NEA*2'1'he Japan esearch Istitute, Limited
We investigated the reactivity effect of spent fuel caused y the spatial distributions of coolantternpel:ature and burnup y rising the integrated bijrnup calculation code system SWAT. The reactivityeffect which aises font taking accotint of the patial coolant temperature distribution increases as theaverage btirnup increases, ad reaches te 1-naximum value of 069%Ak/k at 50GWd/tU when the burnupdistribution is murrently considered. When the burnup distribution is ignored, the reactivity effectdecreases by approximately one-third.
I INTRODUCTION
In the near future, a storage capacity of spent nuclear fuel will not be enough in Japan.
In order to storage spent fels as reasonably as possible, an itroduction of burnup credithas been lanned. When the burnup credit is employed for the storage of the spent fuels,a -nuclear criticality safety nalysis is indispensable. Therefore, spent fuel compositionsmust be evaluated to alculate the effective multiplication factor, kff, for the storage of
their spent fuels.The composition depends on various prameters, such as boron concentration and its
change in time, roolant-temperature and its spatial dstribution, ad an operation history
and so on. When the composition of spent fuel is evaluated y bur-niip calculation, theseparameters should be considered s rigorous s possible. However it is difficult that wetake all the parameters into consideration completely, since huge calculation is neededwhen we deal with many fuel rods.
Then, to reduce te number of parameters taken into arcount, we assume that someparameters, which cause little reactivity effect, do not vary with each fuel rod, and thattheir parameter-values are fixed to give a higher value of k,,ff. owever, there is fewdetailed investigation on the parameters causing little reactivity effect, such as coolant-temperature and its spatial distribution, and an operation history and so on. Thenthe purpose of this study is to investigate the reactivity effect of spent fuel due to theconsideration of the spatial distributions of the coolant-temperature and burnup.
- 391 -

JAERI-Conf 2002-004
2 Outline of Calculation
At first, we assume the distribution of coolant-temperature along the axial direc-tion of fuel rod. Then a fel rod is divided into imaginary sbregions along its axis,and the coolant-temperature corresponding to the dstribution asumed is assigned tothe water region surrounding each region. Secondly, te spent fel composition in each
region is determined by the burnup, calculation with SWAT code'). By using these com-positions calculated for all subregions, the spatial distribution of composition along theaxial-direction of a fuel rod is determined. Fnally, te effective multiplication factor,kff, for a two-dimensional infinite array of these fuel rods is evaluated by the continuousenergy Monte Carlo code MVP') developed by Japan Atomic Energy Research Institute.
The effective multiplication factor is named as kdisftibtion-
On the other hand, the k,.if,, is also calculated for the same two-dimensional infinitearray of spent fuel rods, which compositions have been obtained for all average coolant-
temperature without the consideration of its distribution. Comparing the kdistribution withthe k,jf�, we discuss the effect of the coolant-temperature distribution. This procedurewas performed for the systems having their average burnup of 10,20,30,40, and 50 GWd/t.These comparisons were also done in the cases without the burnup distribution and/orfission products(FPs).
3 Coolant-Temperature Distribution
In Table.1, the coolant-temperatures at inlet and outlet of reactor, and their differ-ence are shown'). These are typical values of PWRs in Japan. in this study, we determinedthe coolant-temperature distribution based on these temperatures. We assumed that theaxial specific power dstribution was represented by a cosine curve, nd that te ascendingrate of coolant-temperature was in proportion to the specific power, Ten we determinedthe coolant-temperatuie distribution as its integral from the bottom to te top of fuelrod gave the temperature-difference, 35.1K. The axial coolant-temperature distributionis shown in Fig. 1.
Table I Typical Coolant Temperature for Japanese PWR
Inlet of reactor 560.6KOutlet of reactor 595.7K
Difference 35-1K
392 -

JAERI-Conf 2002-004
600
580-
Ea)
F-
Ca00O
560
0 100 200 300Distance from ottom of Fuel Rod(cm)
Fig. 1 Axial Coolant Temperature Distribution: PWR
4 Axial Burnup Distribution
When we take account of the axial burnup distribution, we adopted the distribution
which was used in the phase 1 A task of the OECD/NEA Burnup Credit Criticality
Benchmark 4) . The shape of its distribution, which is normalized by the average burnup,
is shown in Fig.2.
1.0
E0. -
E0Z 0.6 -
0.4 -0 100 200 300
Distance from Bottom of Fuel Rod (cm)
Fig. 2 Axial B-arnup Distribution
- 393 -

JAERI-Conf 2002-004
5 Conditions of Burnup Calculation
Several data for burnul) calculation, such as the dimension f fuel rod, temperatureof each region in fuel rod, an(I peration history are suminaalzed l Table.11. These
data were used also in the phase A task of OECD/NEA Burnup Credit Criticality
Benchmark.Twenty-two subregions representing the axial spatial dependence re determined as
follows. Each end region of a fuel rod was divided into four subregions wich were identicalwith those for the burnup distribution as shown in Fig.2. Moreover te center region of afuel rod which length is 285.7cm was divided into fourteen regions equally. Specific powerand coolant-temperature were assigned to each subregion as entioned in the outline
of calculation. An example of both distributions are shown in 'rable.11I. Then burnupcalculation was performed for every subregion to obtain the fuel compositions.
Table 11 Data of OECD/NEA Burnup Credit Criticality Benchmark Phase H A
Lattice 17 X 17Fuel Temperature 811K
Cladding Temperature 620KSoluble Boron cycle av. 550ppm
Pellet Density 94.5 T.D.Fael Rod Pitch 1.25984cmF`uel Rod OD. 0.94966cmFuel Rod I.D. 0.83566cmPellet O.D. 0.81915eniFuel Length 365.7cm
IAiel Enrichment 4.5wt %Specific Power 4OMW/tNo. of cycles 5
Uptime 250days X 5Downtime 62.5days
6 Conditions of Criticality Calculation
The criticality calculations were executed by raising the following 9 miclides ?34u, 235u,
238u, 238pu, 239pn, 240pu, 241T)U, 242pU, Afl(j 141AM, in te case of o(, taking fisson products
(FPs) into account I the ease of including FPs, we took accoun ito tire following 27nuclides, 234u, 235u, 236u, 238u, 237NI) , 238pu, 239pu, 240PU. '241 Pit, 242 1-11"I ,'241 Am, 243 Am
95Mo, 99Tc, 10'Ru, 103 Rh, t9Ag7 133cs, 147sm, 149 Sm, "Osal, 15IS11, 1,2Sril, 143Nd7
- 394 -

JAERI-Conf 2002-004
Table III Specific Power and Coolant Temperature of each Regions
Reg] agth(cm) Specific Power(MW/t) Coolant, Temperature(K)
1 5 17.252. 560.56
2 5 19,218 560.59
3 10 24.464 560.70
4 20 32.339 561-15
5 20.4 43.684 562-18
6 20.4 43.684 563.70
7 20.4 43,684 565.67
8 20.4 43,684 568-01
9 20.4 43.684 570.66
10 20.4 43.684 573.55
11 20.5 43,684 576-57
12 20.4 43.684 579.65
13 20.4 43,684 582.67
14 20.4 43,684 585.55
15 20.4 43,684 588.20
16 20.4 43,684 .590.54
17 20.4 43,684 592.51
18 20.4 43,684 594.03
19 20 32,339 595-05
20 10 24,464 595.50
21 5 19,218 595.61
22 5 17,252 595.64
14:5Nd, 153Eu, and '55Gd. The configuration of criticality calculation is shown in Fig.3.
Vacuum boundary conditions were applied to both the top and bottom of water reflector
region, and mirror reflection condition to the side of the system. These calculations were
performed for the systems having their average burnup of 10,20,30,40,and 50 GWd/tU.
7 Results
To investigate.the reactivity effect due to the consideration of coolant-temperature
distribution, we defined the coolant-teinperature. distribution effect as follows,
Coolant-Temperature Distribution Effect : kdistribution - kuniformkuniform
- 395

JAERI-Conf 2002-004
Vacuum Boundary Condition
Ocm
Fuel Re9ib-h=,F- 5cmFuel RedloFT1 5cmFuel Reglon2O I ()cm
Fuel Region 1 9 20cm
FuelReglon'18 120.4cm
Fuel Region'] 7 T 20.4cm
Fuel Regionl 6 20.4cm
Fu 20.4cm
Fuel Regionl 4 20.4cm,0210.4cm 0
LU L4
LLIFuel Regionl 2 20.4cm
Fuel Regionl I 20.4cm 0 0oil
Fuel Region 1 0 0.4cm 2
Fuel Region9 20.4cm
Fuel Regions 20.4cm
Fuel Reglon7 20.4cm
Fuel Region6 20.4cm
Fuel Reglon5 20.4cm- ---------------
Fuel Region4 20cmFuel Region3 OC-m__________, 77-Fuel Region2 5cm ------------Fuel Regfanl ---
30cm
Vacuum Boundary Condition
Fig 3 X-Z Cross-Section of MVP Calculation model
396

JAERI-Conf 2002-004
where kdist7-ibution and k7,if,, have been defined already in the outline of calculation.
The calculational results of the coolant-temperature distribution effect are shown as thefunction of burnup in Fig.4.
The following results were obtained.
L Distribution effect increases as the burnup increases.
2. Distribution effect becomes higher in the case of axial burnup distribution is consid-
ered concurrently.
3. The effect of FPs is negligible small.
As shown in Fi g.4, though there are a few negative values in the low-burnup region,
the coolant-temperature distribution effect is positive intrinsically. Because it seems that
negative values are due to the statistical error of Monte Carlo calculation. Moreover,
we can explain the reason why the coolant-temperature distribution effect is positive as
follows. An axial neutron flux distribution has its maximum value at slightly upper part
of the fuel rod center. And, the number densities of 135U, 39Pu, and 241 Pu become
large gradually toward the top of fuel rod in the case of taking the coolant-temperature
distribution into account, because the neutron spectrum of the upper region becomes
slightly hard so that 235U does not decrease and plutonium arises. As a result, the
number densities of the fissionable nuclides at the high flux region becomes large, so that
the coolant-temperature distribution effect becomes positive. Then, the distribution effect
reaches the maximum value of 0.69%Ak/k at 5GWd/tU when the burnup distribution
is considered concurrently without FPs.
Positive effect means that the consideration of the coolant-temperature distribution
gives higher kff value than the assumption of the average temperature. Hence, from
the criticality safety point of view, the coolant-temperature distribution is an important
parameter when the burnup credit is introduced into the storage of the spent fuel.
8 Conclusion
In the near future, the introduction of burnup, credit is planned in Japan to enlarge
a storage capacity of spent nuclear fuel as reasonably as possible. In this study, we
intended to investigate the reactivity effect due to the introduction of burnup credit from
the criticality safety point of view. Then, it is concluded that the concurrent consideration
of both the coolant-temperature distribution and the burnup distribution is necessary to
evaluate the storage capacity reasonably.
- 397 -

JAERI-Conf 2002-004
---------- With B.D. and with FPsWithout B.D. and with FPs
0�=r 0.6 -------- ------- With S.D. and without FPs0(D ------- ------ Without B.D. and without FPs(D
0
0.4 -
_0CD
cu 0.2 -(DQ_E
X0
7500 1 0 20 30 40 50
Burnup(GWd/t)
Fig. 4 Coolant-temperature distribution effect as the function of burnup
REFERENCES
1) Kenya SUYAMA, Takehide KIYOSUMI, and Hiroki MOCHIZUKT. Revised SWAT
-The Integrated Burnup Calculation Code System-. JAERI-Data/Codes 2000-027,
2000.
2) Takamasa MORI and Masayuki NAKAGAWA. MVPIGMVP: General Purpose
Monte Carlo Codes for Neutron and Photon Transport Calculations based on Con-
tinuous Energy and.Multigroup Methods. JAERI-Data/Codes 94-007, 1994.
3) Takafurni HAYASHI, Kenya SUYAMA, Hiroki MOCHIZUKT ad Yasushi NOMURA.
Reactivity Effect of Spent Fuel Depending on Runt-up History. JAERI-Tech 2001-041,
2001.
4) Makoto TAKANO and Hiroshi OKUNO. OECDINEA BURNUP CREDIT CRITI-
CALITY BENCHMARK -RESULT OF PHASE IIA-. JAERI-Research-96-003, t996.
398 -

JP0250330JAERI-Conf 2002-004
REACTIVITY EFFECT OF AXIAL BURNUP SHAPESFOR A REALISTIC PWR SPENT FUEL TRANSPORT CASK
H. A. TUAN% H, OKUNO AND Y. NOMURADepartment of Fuel Cycle Safety Research,
Japan Atomic Eergy Research Institute, Tokai-mura, lbaraki-ken 39-1195, JapanFax: 8-29-282-6479, e-niail: noniufa�popsvr.tokaijaeri.gojp
*) Permanent address: Vietnam Atoinic Energy Commission,
59 Ly Thucing Kiet, Hanoi, Vietnam. Fax: 94-49-424-133, e-mail,. hatuan�euduramail.com
The reactivity effect of the asymmetry of axial burnup shape in burnup credit criticality safety is studied fora realistic PWR spent fuel transport cask based on the current OECD/NEA's Phase H-C benchmark problem.The axial burnup profiles varying from strong asymmetry to more or less no asymmetry based on in-core fluxmeasurements are modeled in 21 zones. Continuous energy criticality calculations in 3-13 model have beenperformed using the Monte Carlo code MCNP4B and the nuclear data library JENDL-3.2. Calculations showthat keff value increases with icreasing asymmetry degree of axial burnup shape. This leads to the fact that the
end effect is enhanced by the possibly realistic asymmetry of burnup, shape from to 35 k/k and from 34 to7.7 k/k respectively for average burnups of 32 MWd/kgU and 50 MWd/kgU. The end effect is moresensitive to the asymmetry of burnup shape for the higher burnup. For an axially distributed burnup, the axialfission density distribution becomes strongly asymmetric as its peak shifts toward the top end of the fuel zonewhere the local butnup is ess than that of the bottom end. The peak of fission density distribution gets higher aseither the asymmetry of burnup shape or the average burnup increases.
Key words: criticality safety, burnup credit, axial burnup shape, end effect, asymmetry
1. INTRODUCTION
In reality, the axial burnup profile of spent fel is asymmetric due to asymmetry of reactorcore configuration and operation history as well. In the late 2000, the OECD/NEA Phase II-Cbenchmark has been proposed by J. Ch. Neuber and Th. Lamprecht (Germany) in order tostudy the effect of the asymmetry of axial burnup, shape on the criticality of PWR spent fuel[1]. As a study of this effect, we have performed 3-D and continuous energy Monte Carlocalculations by using the code MCNP4B 21 and the nuclear data library JENDL-3.2 at 293 K[3]. The calculated esults of multiplication factor (keff), the end effect and axial fissiondistribution will be, analyzed in this paper. In addition, the end effect in the actinide-onlyapproach 4] is also evaluated and compared with that considering both actinides and fissionproducts. The obtained results contribute to the currently required international comparisonand help to better uderstand the physics of PWR spent fuel criticality safety.
2. BRIEF DESCRIPTION OF THE BENCHMARK
The benchmark is based on a sample of 850 axial burnup shapes in fuel assemblies of theSiemens Konvoi type received from the Nuclear Power Plant Neckarwestheim 1, Germany.All shapes are derived from in-core 3-D power density distribution measurements based onflux measurements performed every 14 days from the cycles through 12 at ECs. At 28fuel assembly A) positions the flux data are monitored at 32 equidistant axial nodes. All the850 shapes are collapsed to a normalized shape that is represented by mean burnupratios xi (i.e. Cxi is the sample mean of the ratios c�j of the burnup Bj at node i of the j-th axialshape to the average burnup of this axial shape, = to 32 and j = I to 850). The sample meanand the sample vaniance reflect all the effects determining axial burnup shapes.
The benchmark assumes an initial enrichment of fuel assemblies of 40 wt.-%, averageburnups of 32 VWd/kgU and 50 MWd/kgU, and a cooling time of years. The transport cask
399 -

JAERI-Conf 2002-004
containing 21 spent fuel assemblies of 18xl8 square lattice type is assumed to be fullyflooded with water. The geometry and material specification of the benchmark, includingatomic number densities for fuel assembly and transport cask, is gven in 1].
1.2
1.1
1
0.9 B32CO5AI 1 1 1 1F
0.8 B32CO5A222222
B32CO5A333333;g 0.7
--- )K--- B32CO5AI222230 0.Z 0- B32CO5A332211
0.5 B32CO5A1 12233
0.4 -
0.32 3 4 6 7 9 1 12 13 14 15 16 17 18 19 20 21 22 23 24 25 26 27 28 29 30 31 32
(Top Part) Axial Node (Bottom Part)
Fig. Typical axial burnup shapes for the average burnup of 32 MWd/kgU
The variations of the mean values 6ti of the top nodes of the fuel zone are bounded by the
minimum and maximum values of the bumup ratios %-j for each average bumup, observed inthe sample of axial shapes under examination. A decrease of the height of the shape at the topnodes results in higher asymmetry of the shape because of normalization. The benchmarkproposes seventeen cases of axial burnup, shapes for each average burnup. These cases areidentified as BbbCyyAnnnnnn, of which Bbb, Cyy and Annnnnn respectively stand for theaverage bumup, (1332 denotes the average burnup of 32 MWd/kgU), the cooling time (CO5denotes five years of cooling time) and the identification of the variation of the mean valuesof the top nodes I to 6 n = 2 or 3 denotes Min, Mean or Max, respectively). All cases arewell suited to study the impact of the axial shape o the local reactivity within the fuel zone.Six typical axial burnup shapes out of seventeen for 32 MWd/kgU urnup are plotted in Fig. for 32 equidistant odes numbered from the top part to the bottom pail of the fuel zone.Shapes for 50 MWd/kgU burnup are less asymmetric in comparison with those for 32MWd/kgU burnup. The proposed cases represent the variation of the axial sapes from strongasymmetry to more or less no asymmetry: the cases BbbCO5A I I I I 1, BbbCO5A222222 andBbbCO5A333333 respectively correspond to the most asymmetric shape, the ean shape andthe least asymmetric shape, In addition, the benchmark provides nuclide inventories for thecases of uniform axial burnup that are identified as 1332COAunifo and 135OC05Aunifo.
All burnup shapes are divided into 21 axial zones based on 32 equidistant odes by meansof collapsing every two or three nodes of similar burnup. Nodes in oth the top and bottomparts have low 'er local burnups and contribute significantly to the criticality. Therefore, nodesI to 6 and nodes 29 to 32 respectively correspond to six zones in the top part and four zonesin the bottom part, nodes 7 to 28 are collapsed ito eleven zones i the middle part I]. Such amulti-zone model is well adequate for treatment of axial bumup profile 4,51. The benchmarkprovides atomic number densities of both actinides and fission products for 21 axial burnupzones and requires results of keff as well as axial fission distribution of this 21 -zone model.
- 400 -

JAERI-Conf 2002-004
3. CALCULATED RESULTS
3.1 Fission source convergence
In these multi-zone Monte Carlo calculations, the initial source was specified in zones ofhigher fissile density. The number of neutron histories and the location of initial source, thatwere investigated to make convergence and applied to obtain the results presented in thispaper, are given in Table I. It was found that a good convergence calculation for a uniformburnup could be obtained using NPG = 0 million histories, i.e. a alf of that given in Table .
Table 1. Use of neutron histories ) and location of initial source
Case ID NPG GEN NSG G Location of initial source in the217axial-burutip-zone model
In the zones numbered 10, 1 1BbbCO5Aunifo 20,000 1,200 200 0.00015 and 12 of four central fuel rods
of the central fuel assemblyBbbCO5Annnnnn In the zones numbered 3 and(Distributed 3,000 1,000 300 0.00045 19 of all fuel rods of all fuelburnup) I I I assembliesNPG - Number of histories per generation, GEN - Number of generations, NSG - Number of skipped
generations, - Standard deviation of keff. Total active number of histories = NPG x (GEN - NSG).
3.2 keff vs asymmetry degree of axial burnup shape
In order to illustrate the reactivity effect of the asymmetry, we introduce an asymmetrydegree of axial burnup shape for the 32-equidistant-node model as follows
8asyrnj= 1 ("33-ij _ (Xij)2 (1)
where, c�j is the burnup ratio at the node i of the j-th burnup, shape. For a uniform burnup aswell as for a symmetric burnup shape, ,ym equals to zero.
0.90 1 1
0.85
0.80AA%
0.75
0.70 Unitorm Burnup, 32 MWdt'kgU32 MWd/kgLJ
0.65 o Unifoi'm Burnup, 50 MWd/kgU50 M\N(J/kgO
0.60 =-"-L-- -0.00 0.02 0.04 0.06 0.08 0,10 0.12 0.14 0.16
Degree of Asymrnetry
Fig.2 keff value as a function of asymmetry degree of axial burnup shape
- 401 -

JAERI-Conf 2002-004
Calculated results show a get-teral tendency illustrated in Fig.2 tat keff increases with
increasing asymmetry degree of axial burnup shape. This general tendency can be representedby the following linear functions respectively for the two average burrillps
keff 32 MWd/kgU] 0.260 8asym 0852 (2)
k eff [50MWd / kgU I 0.390 sym 0739 (3)
where, 8asym is determined by the formula (t).
Values Of Sasy1n, keff ad the end effect considering both actinides and fission products are
tabulated in Table 1 for nineteen cases of uniform burnup, symmetric burnup and asymmetricburnup. The atomic nuiriber densities of the symmetric burnup proposed by the authors,BbbMAsyrn, were re-obtained by averaging those of sytirmetric nodes of BbbCO5A333333.
Table IL Asymmetry degree of axial burnup shape, multiplication factor and end effect
32 MWd/kgU 50 MWdlkgUCase ID Serial Degree of End Degree of End
No. asymmetry keff effect asymmetry keff effectX 100 (%Ak/k) X 100 (%Ak/k)
BbbC05Aunif6*' u ifo 0 0.85859 0 0 0.72593 0BbbCO5ASYM*) s In. 0 0.85669 -0.2 0 0.74402 2.5BbbCO5A222222 1 9.45 0.87558 2 9.45 0.77601 6.9BbbC05Al I I I I 2 14.23 0,88852 3.5 10.91 0.78161 7.7BbbC05A1 1 1 12 3 13.71 0.88898 3.5 10.79 0,78068 7.5BbbC05A1 1 122 4 13.17 0.88785 3.4 10.66 0.78209 7.7BbbC05AllI222 5 12.12 0.88491 3.1 10.34 0.78100 7.6BbbCO5A 12222 6 11.40 0.88081 2.6 10.03 0.77842 7.2BbbCO5AI22222 7 10.46 0.87966 2.5 9.77 0 77717 1 7.1BbbC05A222223 8 8.91 0.87621 2.1 9M 6.7BbbCO5A222233 9 8.21 O�87479 1.9 8.41 0.77326 6.5BbbCO5A222333 I 0 6.83 0.87116 1.5 7.28 0.77189 6.3BbbCO5A223333 I 5.87 0.86674 0.9 6.38 0.76513 5.4BbbCO5A233333 1 2 4.64 0.86184 0.4 5.29 0.75575 4.1BbbCO5A333333 3 3.83 0.85830 -0 4.44 0,75036 3.4BbbC05A122223 1 4 9.93 0.87801 2.3 9.35 037789 7.2BbbCO5A 12233 5 JGJ8 0.88092 2,6 9.01 R77858 7.3BbbC05A32222J 1 61 9.06 0.87392 1.8 839 0,76857 5.9BbbCO5A332211 1 7 8.52 0.87200 1.6 7.94 a 7§g�Results for uniform burnup ad for smmetric bumup shape were obtained using 24 million histories.
All other results for axial bumup shapes were obtained rising 3 million histories (see Table ).+) Two rion-active regions of a friel ssembly located etween the active region and the ardware were treated ina detail geometry assuming the non-active zorte of fuel rod to e a ixture of 50%/50% Zitcaloy/Air.
3.3 End effect vs axial burnup shape and assembly-averaged burnup
The end effect is defined as the relative difference between keff calculated with explicit
representation of the axial burnup shape and keff calculated assuming a uniform axial burnup:
- 402 -

JAERI-Conf 2002-004
k. ff (axial shape) - k df (uniform)End ffect I% k. / k = 00x - kff uniform) (4)
We will ivestigate two humup credit approaches: the actinide plus fission product (FP)approach and te actinide-only approach. The reactivity effect caused by the most typicalbuinup shapes for the wo approaches is showii in Table III and Fig.3.
Table 11, Reactivity effect'of the axial burnup shape asymmetry with and without Ps
Type of Reactivity Effect With Ps at Without Ps
(keff change, k//k) burnup of at bumup of[NMd/kgUj [MWd/kgU]
32 50 32 50
The most asymmetric shape to the least asymmetric shape 3.5 4.2 2.1 3.0
End effect due to te symmetric shape -0.2 2.5 -0.8 0.1
End effect due to the least asymmetric shape -0.0 3.4 -0.7 0.9
End effect due to te mean asymmetric shape 2.0 6.9 0.4 3.2
End effect due to the most asymmetric shape 15 7.7 1.4 3.9
98 - - -o-- Symmetric shape
7 --w- Mean shape
Most asymmetric shape
0- 4 ---o- Symmetric shape, No F.Ps
4- ---a- Mean shape, No F.PsCD 2 Most asymmetric shape, No F.Ps
C: C)W -1
-2-
0 5 1 0 1 5 20 25 30 35 40 45 50 55
Average burnup [ MWd/kgU
Fig.3 End effect as a function of assembly-averaged burnup for typical axial bumup shapes
It is clear from Table III that te actinide plus P approach assuming a uniform burnup isnon-conservative at ost by 35 to 77 Ak/k. for the buTDUP of 32 to 50 Mwd/kgU. In thisburnup range, the ost asymmetric burnup sape results i a significantly positive reactivityof 37 to 52 Ak/k to the end effect caused by the symmetric sape. The same situation isobserved for the acthride-only approach, for which the reactivity ffect of burnup shape isweaker tan that of the actinid pus P approach, For both approaches, the end effect is moresensitive to the asymmetry of burDUP shape for the higher bumup as it is seen clearly in Fig.3.
It is noted that the actirride plus P approach using the most asymmetric and realistic axialburnup, shapes gives maximal keff values of 0889 and 0782 (see Table , cases
BbbCO5A III III) respectively for the two burnups,. whereas the actinide-only approach
403 -

JAERI-Conf 2002-004
assuming a uniform burnup gives larger keff values of 0934 and 0824, respectively for the
two burnups. So, the actinide-only approach assuming a uniform burnup is about AMconservative regardless of average burnup. Obviously, this approach is more simple and freeof P data error. It may be required to investigate the effect of radia aangement of FAs ofdifferent axial burnup shapes in the cask to make sure that the actiflide plus FP approachassuming the most asymmetric and realistic axial burnup shape is always conservative.
3.4 Fission fraction and density
Fission fraction in zone i (the number of fissions in zone i) is normalized to one fission inthe whole system as follows 6]
fI f (i, E)(D (i, E)didEFi Vi (5)
f Z f (i, E )D (i, E )didEVi
Fission fractions of 21 axial fuel zones defined by Eq. (5) are given in Table Irv for thetypical cases of both average burnups, including the uniform bumup case and the casesnumbered 1 2 13, 15 and 17 being identified in Table 11. The heights of the upper bounds ofzones are also given in the 2 nd column of Table IV.
Table IV. Normalized fission fraction in 21 axial zones for 12 typical cases
Zone Height Fission fraction [%] at burnup of Fission fraction [%], at burruip of[cm] 32 MW for serial No. MWd/kgU or serial No.
unifo 1 2 13 15 17 unifo I 13 15 171 12.19 0.50 0 0 0.62 0 0 0.51 0 0 0 0 0
2 24.38 0.91 0 0 0.82 0 0 0.93 0 0 0 0 03 36.56 1,33 0 0 0. I 0 0 1,34 0 0 0 0 0
4 48.75 1.73 0 0 C�75 0 0 1.75 0 0 0 0 073. �0 0 I 04.68 0 1.35 0 4.76 0 0 0 0
5.31 2.91 0 0 0.59 0 0.01 2.94 0 0 0 08- - 0
7 121,88 10.6 0.03 0 L10 0.02 0.09 10.88 134.06 4.04 �0.02 0.28 601--d.-O9- 4.18 0 0 0 0 09 158.44 -T7 1 ' 0.08 0.02 0.70 0.05 0.25 8.91 0.01 0 ' 003 0 0lo 182.81 9.31 020 1 007 1,14 0.12 041 9.33 0.02 0.01 0.07 0 0.0211 195.00 4.75 0.19 0.09 0.81 0.11 0.31 4.76 0.01 0.01 0.07 0 0.0212 231,56 14.3 1.17 0.66 3.85 0.78 1.79 14.2 0.10 0.06 0.10 0.21
13 243.75 4.56 0.78 0.51 2.09 0.58 1,14 4.50 0.09 0.08 0.38 0.12 0.19�14 28 0. 3 �I �24 3.40 9.12 3.36 6.44, 12.3- -0.93 -0.92 253 -1,09 1.85
1 5 316.88 9.83 13.3 11.4 16.8 10.2 16.7 9.69 5.56 5.37 8.59 4.94 8.721 6 329.06 E57 �7.9 8 770 765 K 62- 953 251 5.05 4.83 5.86 4.34 6.69
34 I �0. 8 0.8 913 -�. 66-25 2.20 11.9 2,13 8.46 8.29 8.92 7.56 10.3
1 8 353.44 1.81 14.4 14.9 11.0 14.4 14.3 1 32 14.3 14.0 13.9 13.7 15.6
19 365.63 -'�38 �16.4 -17.5 11,6 17.9 14.6 1,31 19.4 19.7 I&I 19.7 M 120 377.81 0.97 17.0 18.5 IL3 20.1 111 0.90 24.3 24.7 22.0 25.5 20.4
1 390.00 0.54 13.2 14.4 8.43 9.26 0.49 -21,7 -22.O -19.1 -22�9 16.99.47 3.5 7.8- 3 89.0Sum Fi, i =16 to 21 79.8 83.9 9,1 7 2.8 .05 3.3
Fission density in zone (the number of fissions by unit vlume in zone i) is ormalizedto one fission by unit olume in the whole system as follows 6]
- 404 -

JAERI-Conf 2002-004
f Z f (Y, E)(D (Y, E)didE / vPi Vi (6)
f , J, E)(D (i, E)didE / vVi
Fission densities defiried by Rq, 6) can be obtained directly from te data given in Table17V. The effect of burnup shapes o the fission density istribution is illustrated in 32
'distaDt axial nodes n figures 4 and 5, in which fission density istributions were educedfrom te results obtained for the 21-zone model te nodes i figures 4 and are numberedfrom the bottom part to the top part of the fuel zone, i.e. in the reversed order to that in Fig. ).
0.25 -
-9- B32CO5Aunifo
ZI 0, - ---a- B32005A22222283200SA I I 1 1 1
832CO5A333333
0.15 B32CO5A 22223
-- o- B32006A 12233LL
B32CO5A332211O'l
E0Z
OM
01 2 3 4 7 0 11 12 13 14 15 16 17 18 19 20 21 22 23 24 25 26 27 28 29 30 31 32
(Boftom part) Axial Node (Top part)
Fig. 4 Fission density distributions for typical axial burnup shapes at 32 MWd/kg burnup
0.3 -
0.25 85OC05AunifoZI 660COSA222222
85OC06A I I I I I a 0.2C 850COM3333330CO) 65OC05AI22223coU. U.15 -
N
E 0.1 0Z
0.05
01 2 3 4 6 7 9 1 12 13 14 15 16 17 18 19 20 21 22 23 24 25 26 27 28 29 30 31 32
(Boftom part) Axial Node (Top part)
Fig. Fission density distributions for typical axial burnup shapes at 50 MWd/kg burnup
- 405 -

TAERI-Conf 2002-004
The axial fission density distribution in a fuel assembly as a near-cosine shape for auniform burnup as shown i figures 4 a 5 In case of asymmetric burnup shapes, the fissiondensity distribution becomes strongly asymmetric as the peak shifts fom the center towardthe top end of the fuel zone where the local burnup is less than that Of the botto ed, Mostof the peaks are seen being located in te 3 node, i.e. about 20 cm from the top end of thefuel zone. Approximately, up to 80% ad 90% of fssion reactions respectively for te twoaverage burnups assuming the mean burtrup shape could be found in the six top nodes 27 to32 (i.e. in the zones 16 to 21 as indicated in Table IV), wile the total length of these nodes is73 cm which acounts for less than 115 of the total active length.
4. CONCLUSION
Our study has been based on the current OECD/NEA's Phase fl-C benchmark problemfor PWR spent fuel transport cask, which consists of a realistic set axial burnup sapes forhigh burnups of 32 MWd/kgU` and 50 MWd/kgU`. ContunJOUS eDefgv onte Carlocalculations ave been made for this benchmark using a 3-D model with 2t axial bumupzones, Calculations show a general tendency that the end effect increases linearly from to3.5 %AkJk and from 34 to 7 %Ak/k respectively for the two burnups as the axial urnupshape varies from slight asymmetry to strong asymmetry Te ed effect is found to be moresensitive to te asymmetry of axial burnup shape with increasing burn"p.
The axial fssion density distribution becomes strongly asymmetric for an axiallydistributed burinip as the peak shifts toward the top end of the fuel zone where tile localburnup is less than that of te bottom end. The peak of fission density istribution gets higheras either the asyrnmetry degree of burntip shape or the, assembly-averaged burnup increases.
As far as conservatism of burnup credit criticality calculation is concerned, the followingconclusions can be drawn. The actinide plus fission product approach assuming a uniformburnup is non-conservative at most by 35 to 77 Ak/k for the average burnup of 32 to 0MWd/kgU, while te actinide-only approach assuming a uiform burnup is about % A/kconservative. However, te trade-off between the simplicity of the latter approach ad its lessincentive of burnup credit sould be further considered.
Whether te effect of the asymmetry of axial burnup shape on te end effect is negative ornot and its magnitude for a burnup below 32 MWd/kgU should be investigated in the future.
REFERENCES
[11 OECD/NEA Burnup Credit Benchmark Phase 11-C,http://www,nea,fribti-ni/science/wpncsibucispecificationsiphase-2c
[21 MCNP - A General Monte Carlo N-Particle Transport Code, Versio 4, LA-12625-M,March 1997).
[31 JENDL-3,2 - Japanese Evaluated Nuclear Data Library version 32,http://wwwiide,tokai.j'aert.gojp/jeiidllj32/j32,htmI
[4) 1 C. Wagner, M. D. Dehart, Review of Axial Btirnup Distribution Considerations forBurnu Cedit CalculatioDs, ORNLJTM-1999/246, March 2000),
[51 M.D. DeHart, Sensitivity and Parametric Evaiuations of Significant Aspects of BurnupCredit fo PWR Spent Fuel Packages, ORNLIM- 2973, May (I 996).
[61 A. Nouri, Analysis of Pase 1-B Results: Conceptual PWR Spent el TransportationCask, IPSN/98-05, NEA/NCS/DOC(98)1.
- 406 -

JP0250331JAERI-Conf 2002-004
CALCULNHON OF OECD/NEA SOURCE CONVERGENCEBENCHMARK PROBLEM N.1 BY USING MCNP AND SOLVING
FISSION MATRIX EQUATION
TAKEStil KUROISHI AND-YASUStil NOMURAFuel Cycle Safety Evaluation Laboratory,Japan Atornic Energy Research Institute,
Tokai-mufa, Naka-gury, Tbaraki-ken 319-1195, JapanFax: 8-29-282-6479, e-ma& kuroishigeyclone.tokaijaeri.gojp
The OECD/NEA source convergence benchmark problem 1: checkerboard storage of assemblies is calculated byusing the MCNP-413 continuous eneygy Monte Carlo Code ad JNDL3,2 library. Calcrilated results show thatthe fission source distributions for te tbirty-six cases I with various alculation conditions eired in theberichnrark are affected by the initial source distributions, and ot converged because of te weak neutroncoupling between fel assemblies. In order to approximately stimate the converged ource distribution, thefission matrix equation for te ceckerboard storage is solved with te deterministic method of iterativecalculations, were the multiplication factors for the isolated single assembly and the neutron interactionsbetween two assemblies aye alculated and applied to te atrix elements, Then we calculate te special case,that is, the assernbiy-averaged source levels ae set to the fission atrix solution d the distributions insideasserriblies are assumed to be cosine-like shapes as the iitial fission source. Most of the source levels of themajor assemblies for his case do not change at all as the generations increase. Thkis the fission sourcedistribution is obtained as almost converged,Keywords: source convergence, onte arlo method, fission matrix, weak neutron coupling, criticality safety
1 INTRODUCTIONIn the criticality safety atialysis for a configuration comprising fissionable regions that arecoupled weakly in neutron reactions each other, the Slow Convergence of the fission sourcedistribution sometimes causes te non-conservative estimation of e effective multiplicationfactor (kjT). In order to improve the robustness of criticality safety analyses, four differentbenchmark problems with respect to the source convergence are proposed by te OECD/NEAExpert Group on Source Convergence.In this Pper, we show the calculated results ad discussion for the bellchrryark problem checkerboard storage of assemblies. Chapter 2 describes te overview of benchmark 1. Thegeometric features d the calculation method ae briefly described and the calculated resultsfor the representative cases are also shown i chapter 2 It is shown that te fission sourcedistributions for the cases required in the benchmark 1, do not achieve the convergence. Theestimation of the converged fission source distribution for the checkerboard storage isdiscussed in chapter 3 Concluding remark is described in chapter 4.
2 OVERVIEW OF BENCHMARK 2.1 Problem configurationThe benchmark problem I comprises a notional 240 WR fuel storage rack with thirty-sixassemblies stored in alternate locations. This configuration is referred to the checkerboardstorage. Fgure I shows the problem geometry Te material compositions are specified in thebenchmark 1. The detait information can be referred to the web site as shown below.
http://www.iiea.-fr/htmi/s-ciejice/wpoes/convergeiieeThe fel assemblies are formed fro a 5xl5 square lattice of Zirconium-olad IJ02 fuel rodsenriched to about 5.0%, Tey are centrally located wthin flly water-flooded steel storageracks surro-un6ed by concrete o te three sides, water on the remaining side and water on thetop and bottom. In the checkerboard storage, the water cannels make the neutron interactions
407 -
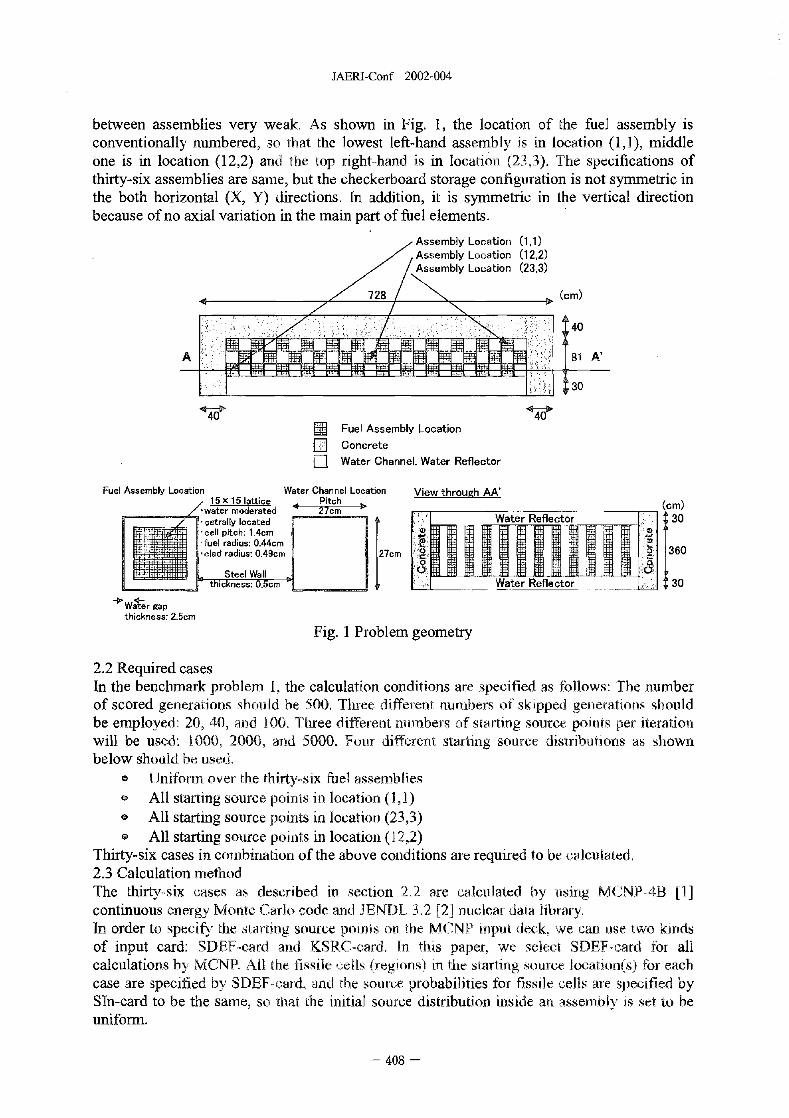
JAERI-Conf 2002-004
between assemblies very weak, As shown in Fig. 1, the location of the fuel assembly isconventionally numbered, so that the lowest left-hand assembly is in location (1,I), middleone is in location 12,2 a te top right-hand is in location 23,3). The specifications ofthirty-six assemblies are same, but the checkerboard storage configuration is not symmetric inthe both horizontal (X, Y) directions. In addition, it is symmetric in the vertical directionbecause of no axial variation in the main part of fuel elements.
Assembly Location (1,1)Assembly Location 12,2)Assembly Location 23,3)
(cm)
40
A'
�,30
EM Fuel Assembly LocationE] ConcreteL] Water Channel, Water Reflector
Fuel Assembly Location Water Channel Location View through AA'15 15 lattice Pitch (cm)
water moderated 27cmcetrally located Water Reflector 30
�cell pitch: 1.4cm-fuel radius: 0.44cm-clad radius: 0.49cm 360
Stee Wall0.5cm Wa ar eflector 30
-io-Water gapthickness: 2.5cm
Fig. I Problem geometry
2.2 Required casesIn the benchmark problem 1, the calculation Cnditions are specified as follows: Tbenumber
of scored generations sould be 500. Three diffefeDt umbers of skipped generations sould
be employe& 20, 40 ad 100. Three differerit numbers of starting ource points per iteration
'II be rised: 000, 2000, and 5000. Four different starting source dstributions as sown
below should be used.
* Uniform over the tirty-six fuel assemblies
* All starting source points in locatio (,I)
* All starting source points in location 23,3)
* All starting source points in location 12,2)
Thirty-six cases in combination of the above conditions are required to be ca, lculated,
2.3 Calculation method
The thirty-six cases as described in section 22 are calculated by sing MCNP-413 [1]
continuous energy Monte Carlo code ad JENDL 32 21 nuclear data library.
In order to specify the starting source points on the MCNP )input deck, we can -use two kinds
of input card: SDFF-card and KSRC-oard. In this paper, we select SDEF-card for all
calculations by MCNP. All the fissile cells (regions) in the starting ource locationts) for oach
ified by SDEF-card ad te source probabilities for fissile ells are specified by
SIn-card to be the same, so tat the initial source distribution 'inside a assembly is set to be
uniform.
- 408 -

JAERI-Conf 2002-004
2.4 Calculated results2.4,1 Effective multiplication factorThe calculated results of kfF for the thirty-six cases and the trend of kff per generation for thecase 27 (as a representative case) are sown in Fig. 2 and Fig. 3 respectively, where thefluctuation of Monte Carlo (I a) is shown by error bar. The average value of keff for thethirty-six cases is 0889 ad the keffs are distributed in the range of +0,003, 0.002 (max: 0892,min: 0887). As compared with Icy, the differences among the kffs for thirty-six cases arerather age. The change of k,ff closing to 500 generation is very small as shown in Fig. 3.This tend can be seen in the other cases.
0.895 0.90st.w"g -". pill P.,ift-ti..
20M 5000MW - Dit'ibti- WtW S- Di.bbdi- MW S-,.. Di.bb,,U-
U.rf_ (1.1) (23,3) 02�2) )K- (1.1 MA (12 J� 1.1 (23. (12,2)
t 0.890 T T - 4- 0.8
0.88O'885 2 3 4 7 9 1 21311151517 8192021222324252827282930313233M3�36 0 100 200 300 400 5DO
Calculated Case Number Generation(The 136 cases are repeated with the skip numbers of 20, 40 and I 0.)
Fig. 2 Calculated results of k,ff Fig. 3 Trend of keff per generation (case27)
2.4.2 Fission source distributionThe fission source distributions are calculated by tallying the cell averaged neutron flux overeach assembly. The relative fission source levels are calculated by normalizing the averagevalue of the fission source distribution to .O. The results of the relative fission source for case27, 30, 33 and 36 are shown in Fig. 4(l - Fig. 44), respectively. These four cases areassociated with the largest istory number among other cases: 100 skipped generations, 500scored generations and 5000 starting source points.
41z
3
3 3
(1) Case27: uniform initial source (2) Case3 0: initial source (1, 1)
7
6
92
32 CY) (Y)
(3) Case33: initial source 23,3) (4) Case36: initial source 12,2)
Fig. 4 Relative source distributions at 500 generation
- 409 -

JAERI-Conf 2002-004
The trends of relative fission source levels per generation for the four cases are shown in Fig.5(l - Fig. 54), where the relative fission source levels at several representative locations areshown every 10 generations.
9 18b L":t
-A16 Y L> A:'.:Z:Y
> A,4 Ass.
�bl, L..V- 23.1) 2
0 0 0E0
.0 .2Vj4 8
LL 6
> >
00 100 200 300 400 500 0 100 200 300 400 500
Generation Generation
(1) Case27: uniform initial source (2) Case3O: initial source (I, )12 10
A,:: Y L, ::n �231.1)1 A:::bbly L ... tim NAs :b n '�2) L..:ti.n 0:
> >
L U._j Asse.bly LZ.ti n (1 3.37
.10 Asse.b:y 31.3) 3)
8 Lo 6
a6 5o .......... 0
AL 4LL LL
0 3-:9 22
0 00 100 200 300 400 500 0 100 200 300 400 500Generation Generation
(3) Case33: initial source 23,3) (4) Case36: initial source 12,2)
Fig. Trends of relative fission source levels per generation
The calculated results of fission source distribution are summarized below.* In case of uniform initial source, fission source distributes over all assemblies and
has a local peak as shown in Fig. 4(1). The source level at the peak assembly is stillincreasing at 500 generation as shown in Fig. 5(l).
* In cases of iitial source location (1,I), 23,3) and 12,2), te maximum peak locatesnear the initial source location, respectively, and there are many zero-sourceassemblies at locations far from the maximum point as sown in Fig. 42 - Fig. 44).The source levels at the peak and its neighboring assemblies are still changingmonotonously (increasing or decreasing) at 500 generation as sown in Fig 52 -Fig. 54).
* The dependence on the other parameter such as the nmber of skipped generations,the histories per generation is not observed.
It is found that the fission source distributions for the thirty-six cases cannot be converged asshown in the above results.
3. ESTIMATION OF THE CONVERGED FISSION SOURCE DISTRIBUTION3.1 Derivation of fission matrix euationHere we consider the weakly coupled multi cell problem as shown simply in Fig. 6.
Neutron interaction- P,-,Fissile reg on issile regio
n-Aj Pji k. --k neutroWhole configuration: kff
Fig, 6 Concept of weak coupling problem
- 410 -

JAERI-Conf 2002-004
For the fissile region 1, the ltiplication factor of isolated single region system kio isassumed to be k where the region I and the other regio J are coupled weakly inneutron iteractions Pj O*i). The neutron balance in the n'th generation is described byequation
n+1Ai kff N' = ki Ain Y, F�_ A"J
j;-i
The euation (1) in matrix expression is generalized to fission atrix equation: (F - kff E A:-- 0, here the elements of fission atrix F comprise ki and ij, E is the Unit matrix and the
elements of vector A are A, is the zero-matrix. The non-trivial solution (A+ 0) induces the
equation 2).
F - , E 0 (2)
When the eigerivaitre �, equals to kfy equals to the maximum of k. In case of thetwo-region problem in=2), it is very easy to solve the equation 2) for fl aalytically, whenthe fission matrix elements are given. The rsult of kff and the A/A2 i shown in equation 3)and 4), respectively. I ase of a syrru-netric two-region problem, more simple relation isderived, so that, kt-f = k + P, where, k = k = k2, P P12 = P21 and Al = A2-
'keff = k - Ak/2 + F(Akl2y + 12p2t- here k = max(k, k2) Ak = k - k2l (3)
A/A, = k.ff k/P = P121(keff k) (4)
3.2 Isolated single assembly and diagonally placed two assembliesIn the benchmark problem I as shown in Fig. 1, the checkerboard storage has thirty-sixassemblies of the same specification with three different sorts of boundary conditions. Namely,
one assembly is adjacent to the oncrete wall of 40cm thickness oil two side surfaces, thirteenassemblies are adjacent to the concrete wall on one side surface, and the others are adjacent tothe water reflector or the water channels on all surfaces. The multiplication factors of isolatedsingle assembly ki,s) for the corresponding boundary conditions are different because of thedifference of the reflector effect between water and concrete. So we calculate the three
different k,,s of k, kp and k, (here, the suffixes of cc, and indicate the three differentboundaries) as shown in Fig, 7(l - 3) by using MCNP. The calculation condition is 500scored generations, 20 skipped generations, 2000 histories per generation and uniform initial
source distribution.
ki,.=k, ki�.=kp kiso=k-(Water 30cm Concrete 40cm Concrete40.rn
.1
r 'Water30cm
[___�Rack 7cm Rack 27cm C cm
(1) All water reflected (2) concrete on 14 side (3) concrete on 24 sides
Fig. 7 Configurations of isolated single assembly surrounded by three different boundaries
In case of diagonally placed two assemblies as a part of the checkerboard storage, there arefour types of assembly combirtation of the above tree boundary conditions as shown in Fig.
8(l - 4). The multiplication actors or the four onfigurations (kdWS) Of k,"', kap, kpp and ky
and the fission source rations of A/Aj (i =ot, and y) are calculated by MCNP. Then the
neutron interactions between two assemblies (P ...... Pop, Pp,,, Ppo, Py and a) can be calculatedby using kios, kdias and A/Aj according to the equation 3) and 4).
411 -

JAERI-Conf 2002-004
kdi.=ka, kdia=kp kdi.=kpp kdi.=ka-y
ter 30cmoncrete cm Concrete 40cm Concrete 40cm
:a, k�, kp, ky,AB Poa AB A,
ka, PA ka,
A,,, AB A.
cm ter m ter In
(1) All water & all water (2 14 concrete & /4 water (3 14 concrete & 14 concrete (4 24 concrete & all water
Fig. Configurations of the diagonally placed two assemblies
The calculated results of ki,,,, kdia (also IT) and A/Aj by MCNP for the cases as mentioned
above are listed in table 1. And the results of the neutron interactions are shown in table 11.
Table I Calculated results of isolated single assembly and diagonally placed two assemblies
kc, kp ky ka k4 kpp kykiso, kdia 086793 I 087783 0.88810 087166 0.87926 I0.88354 0.88852
.......... -------
la 0.00082 0.00072 000078 000078 0.00073 000079 0.00077
Ai/Ai 1.073 2.037 0.944 3.726
Table II Neutron interactions between diagonally placed two assemblies
P. 1 PQ 1 Ppa PDD P i P
0.00373 0.00556 0.00291 0.00571 0.00553 1 0.00157
3.3 Solution of fission matrix equation by iterative calculation
In this section, we sow the solution of fission matrix equation with some approximations for
matrix elements in order to estimate the converged fission source distribution for the
checkerboard storage, The approximations are described below.
* As shown in the Fig, 9 the ki,,,s of the thirty-six assemblies in the checkerboard
storage are represented by k, kp and ky listed in table .
* The interactions between diagonally placed two assemblies in the checkerboard
storage are represented by Paa P�, Pp, Ppp. Pm and Rya as shown in table 1.
* The neutron interaction between to assemblies across a water hannel Is supposed
to be 0002. The effect of this value on kff of the checkerboard storage is sroall, but it
affects the fission source distribution to some extent. This value is determined with
some calculations for 0 configuration.
* The neutron interactions except the oes mentioned /above are negligible.
Concrete Nvall 40cm
+ I
Water reflected 30
Fig. 9 Checkerboard configuration
- 412 -

JAERI-Conf 2002-004
Figure 10 shows the solution of the fission 14
matrix equation by deterministic method of0
iterative calculation. The number ofiteration to converge the fission sourcestarting from the uniforni initial guess is t>more ten 4000. The convergence criterionto source cange is less tan IOE-05. It is Cr
0 2found tat the fission source distribution of 11 1 13 14 15 1 M
the atrix solution as the aximum peak Asse.b�/ LoGati .(X)
at the comer where the ki,,, of an assembly Fig. I 0 Solution of fission matrix equationbecomes the aximum because of itsreflector effect of the concrete wall on its two sides. Te farther the distance from theassembly of the peak fission source is, the less fission source level the other assembliesindicate. The change of tbe fission source level is similar to the exponential curve, and itbecomes very low but not zero at some assemblies located far from the assembly of themaximum peak. I comparison with te results by MCNP as shown in Fig. 4(l - 4), they arefound to be intermediates between the each initial source distribution and the solution of thefission matrix equation. The kff of te fission matrix equation (=0.8916) is almost the same asthe maximum value for the thirty-six cases by MCNP.3.4 Special case calculation by MCNPThe special case calculations are carried out by MCNP. As the initial source distribution, theassembly-averaged source levels are set to be the solution of the fission matrix equation asshown in Fig. 10, at the same time, the distributions inside assemblies are assumed to becosine-like shapes to which the result of the single assembly distribution is fitted as shown inFig. 12. The fission source distributions inside assemblies calculated by MCNP for the casesas shown in Fig. 7(l) (a type) and Fig. 84) (oy type) are shown in Fi I l) and Fig. 11 2),respectively. They show that the neutron interaction between two assemblies affects thefission source distributions inside assembly just a little, and they are similar to cosine shape.
14
2 0.8
0.6 0
0Cr O,
0.0Rod on
R.d position 15
Rod position (X) 22 25 2 Rod position (X)
(1) Single assembly (cc type) (2) Two assemblies (a-y type)
Fig. I I Fission source inside assembly by MCNP Fig. 12 Fitting cosine shape
The calculation conditions and the results for kff are shown in table III.
Table III Calculation conditions and results for the special cases
Special case Histories per Generations Skipped Total k., result I ageneration generations histories
1 5000 500 20 2500000 0.89029 0.000512 50000 50 5 2500000 0.89289 0.00050
3 100000 50 1 5 1 5000000 0.89266 0.00033
413 -

JAERI-Conf 2002-004
From the viewpoint of converged source estimation, there should be many assemblies of verylow source level as shown, in Flg I obtained by fission matrix quation. So, very largenumber of histories per generation is necessary for Monte Carlo method to reach convergencein the source distribution. The k,11- of the special case I is about 02% underestimated becausethe number of histories per generation 5000 is not enough, The kffs of the special case 2 and3 are almost the same in comparison with their Io, and they are greater tan the thirty-sixcases by MCNP as shown in Fig. 2 The trends of relative fission source levels per generationand the relative fission source distribution at fiftieth generation for the special case 3 areshown in Fig. 13 and Fig. 14, respectively Even though the umber of histories pergeneration is very large 100,000) a few assemblies have zero-source o the opposite side ofthe maximum peak because of their very low source level, and as shown in Fig. 13, most ofthe fission source levels of the assemblies around the peak source level are almost constant asthe generation increases. So the fission source distribution must be almost converged.
16
- I 4>120 J-AnemblyLo�to (�'I) -A.se.b�y L (2-1)
�A-- b ('.3)" --A,::,bJY U"YYLo'M ' L.0 :..b O.' O. As bly L ... ti- 24,2)LoAssembl oo (I 9.3)"..�bly �Lomatio
.2
> 2
Cr2 2 3
0 ........ ............................. ........ I0 10 30 50 As-bly L-6- (Y)
Generation
Fig. 13 Trends of relative fission source Fig. 14 Fission source distribution at thelevels for the special case 3 50th generation for the special case 3
4 CONCLUDING REMARKIn the OECD/NEA benchmark problem 1: checkerboard storage of assemblies, it is verydifficult to obtain the converged fission source distribution by the Monte Carlo methodbecause each assembly is coupled in neutron reaction so weakly that te source convergencebecomes very slow. This causes sometimes non-conservative estimation for the (,effectivemultiplication factor, and the results for te thirty-six cases of various alculation conditionsspecified in te benchmark I show the uderestimation of keff.As compared with the above, it is easy to obtain the multiplication factors for te isolatedsingle assembly with its reflector effect, ad also comparatively not difficult to estimate theneutron iteractions between adjacent two assemblies, It is a good approximation to applythese multiplication factors ad neutron iteractions to the fission matrix eements for theweakly coupled configuration. The solution of the fission matrix equation shows that tefission source distribution of the checkerboard storage as the maxinium peak at the comerwhere the isolated ultiplication factor is the maximum ad tere are many assemblies of avery low fission source level far from there. This fact insists the -necessity of the very largenumber of histories per generation in the Monte Carlo method to obtain te correct k'ff value.In addition to using the solution of fission matrix for the initial source distribution, theassumption of the cosine-like shape inside the assemblies reduces te number of generationsto reach convergence. This calculation gives amost the converged fission source distribution.
REFFERENCES[1] "MCNP-A (3eneral Monte Carlo N-Particle Transport Code Version 413". LA-12625-M,Ed. by J. F Briesmelster, Los Alamos National Laboratory, Los Alamos, NM (I 997)[2] T. Nakagawa, et al., J. Nucl Si, Technol., 32[12] 1259-1271 1995)
- 414 -

JA8RI-Conf 2002-004 JP0250332
THE CALCULATION RESULTS OF OECD/NEA SOURCECONVERGENCE BENCHMARK PROBLEM NO.2 AND NOA BY
USING MCNP
Takehide KIYOSUMI and Yoshinori MIYOSHI
Criticality Safety Laboratory,
Japan Atomic Energy Research Institute,
Tokai-mura, Naka-gun.. lbaraki-ken 319-1195, JapanFax: 81-29-282-6798, e-mail: kiyosumi�melodytokai.iaeri.go.jR
OECD / NEA source convergence benchmark problems treating e neutron weakly coupled system
were evaluated using te Monte Carlo code. The neutron source distribution and the neutron flux showed the
biased convergence in each case. Moreover, convergence of ke was ceckedwhen k,.�ff skipped a certain amount
of generation.
Key words: Monte Carlo method, the neutron weakly coupled system, convergence, skipped generation, random
numbers sequences
1. IntroductionWhen the distance between the fissile material units increases, an exchange of the
neutron between units decreases and the neutron source distribution converges more badly forMonte Carlo calculation. In order to inquire te estimation how it applies the Monte Carlomethod to such the neutron weakly coupled system, OECD/NEA prepared the four problemswhich set up te system concretely. In this time, we choose No.2 and No.4 among theseproblems and we evaluate the change for every generation of the source distribution of aneutron and the onvergence over the umber of skipped generations of k,ff, neutron sourcedistribution and neutron flux by using the Monte Carlo code.
2. Calculation geometryFigure I and Figure 2 show the geometry of OECD/NEA source convergence
benchmark problem No.2, and Figure 3 show the geometry of problem NoAThe geometry of problem No.2 is a infinite fuel pin array in water. The both ends of
the fresh fuel rod or low bumup fuel rod are separated by central natural uranium or highburnup fuel region. The enrichment of fissile aterial in two ends of the fuel rod is axiallyasymmetric.
The geometry of problem No.4 is a lattice of X 5 X I separated highly enricheduranium etal spheres, The radius of sphere at the center of a lattice is 1.29cm larger thanother radius of sphere. In this problem, we designate the sphere at the lowest left-hand left ofa lattice cell 1, and the sphere at the uppermost right-hand cell 25.
3. Calculation methodsThese benchmark problems were calculated with the continuous energy Monte Carlo
neutron transport cde, MCNP-4132, and the Japanese Evaluated Nuclear Data, JENDL-3.2.Calculation of 1000 generations was performed by 10000 histories per generation at
the problem No.2. One iitial neutron source distribution assumes the flat, the other initialsource distribution assumes the distribution depending on the abundance of fissile material.On this problem, the change of source distribution, ff sandard deviation, neutron flux andreaction rate was derived, respectively. It is checked the results of kelTand neutron flux afterskipped 0, 50, 200, 400 generations. A list of each calculation is shown in Table I
- 415 -

JAERI-Conf 2002-004
Calculation of 1000 generations was performed by 1250 histories per generation atthe problem No.4. Initial source distribution is as follows: 1010 neutrons are generated at cell1, and 10 neutrons are generated at other 24 cells. On this problem, the change of kff,standard deviation, source distribution and neutron flux was derived, respectively. Theskipped generation which is checked is the same of problem No.2.
4. Calculation resultsThe calculation result of benchmark problem No.2 is as follows table II is kff in
each case. The change of k.,ff at the fresh fuel is shown in figure 4 and the change of keff at theirradiated fuel is shown in figure 5. The keff increases with skipped generations, but if 0generations are exceeded, it is almost constant as shown in figure 4 and figure 5. The set ofinitial neutron source distribution dose not influence the convergence of this calculation.
About the neutron source distribution of benchmark problem No.2, if generationsincrease, neutron source will come to concentrate on each end containing a lot of fissilematerial, and if generations increase over I Oh, it will come to concentrate on upper endcontaining more lot of fissile material and the neutron source at the lower part of fuel rod isset to 0. In spite of the consideration of the initial neutron source distribution for both fuelrods, the method of convergence is the same. In the case of iradiated fuel, the neutron sourcecomes to concentrate on upper end of fuel rod over 50th generation.
Figure 6 shows the change of neutron flux distribution about the fresh fuel rod, andfigure 7 shows about the irradiated rod. As shown in figure 6 when the skipped generation is0, the neutron flux distribution at the central part of fuel rod becomes flat under the influenceof the initial neutron source in the case of the fresh fuel. Then, the reason that the kff skipped0 generation is small is the influence of the neutron flux at the central part of fuel rod. Whenthe skipped generation increase, the neutron flux decrease by reduction of the neutron sourceintensity at the central part of fuel rod. And when the neutron source intensity at the bottomend of fuel decreases, the neutron flux of this region also decreases, and finally, only teneutron ingredient at the top end of fuel remains. It is thought that the k.,ff skipped over 0generations is based on the influence of the neutron at the top end of fuel. In addition, theconsideration of the initial neutron source distribution hardly influences the change of neutronflux distribution. As shown in figure 7 the neutron flux in the lower half of te fuel roddecreases when the skipped generations increase in the case of the irradiated fuel. heconvergence of the neutron flux in the irradiated fuel is fasten compared with the fresh fuel. Inaddition, the consideration of the initial neutron source distribution does not influence aneutron flux distribution.
The calculation result of benchmark problem No.4 is as follows: figure shows thedependence of k and standard deviation on randorn numbers sequences and skippedgenerations. When the skipped generation is 0, kfr shows the values between I - IO to 1. 1 15and when the skipped generations exceed 200, keff is stability between 1, 1 15 to 1. 1 18. So,skipped generations are adequate over 200 for converging kef ad there is no effect on thecalculation results for any random number sequence. In addition, hen the skipped generationis 0, the standard deviation is 0.08 0.09%. When the skipped generations are over 200, thestandard deviation is 006%.
As for behavior of the source distribution of neutron, 80% or more neutrongenerates at -50 generations from cell 1, but it comes to generate from cell 13 exceeding 0generations, and finally, 90% or ore neutron comes to generate from cell 13. To estimatethat the keff of single sphere at cell 13 is 1. 1 18 and the kff of single sphere at other cell is1.001, it is thought that the kfrof benchmark problem No.4 is influenced from cell to besmall when the skipped generation is 0. Conversely, when the skipped generations exceed 200,kff almost is decided by cell 13 and it is stabilized between 1. 1 15 to 1. 1 1 8.
- 416 -

JAERI-Conf 2002-004
As shown in figure 9 the neutron flux is the axis symmetrical distribution and theflux of cell 13 is 102 times larger than other cells. This is one of the reasons why the k,f ofthis geometry is equal to the keff of the single sphere at cell 13, Because the neutron flux ofany cell which is the sadow of cell 13, this is considered because the neutron has diffusedfrom cell 13 as a enter. In addition, the shape of neutron flux distribution is not so changedwhile skipped generations increase except for cell .
5. ConclusionWe evaluate the end effect for benchmark problem No.2 and the dispersed uranium
metal spheres for benchmark problem No,4 by using Monte Carlo method.In probiem No.2 te keff converges skipped over 50 generations in the case of fresh
fuel, and skipped over 200 generations in the case of irradiated fuel. Regardless of theconsideration of the initial neutron source distribution, the neutron source concentrates at theregion where the most numerous fissile material is. he neutron flux distribution does notchange at the upper region of the fuel rod and it decrease at other region with increasingskipped generations, Although the neutron flux of the fresh fuel and the irradiated Rielconverges to at the lower region of the fuel rod skipped 400 generations, it is a questionabout whether this distribution is right. From now on, we will use the deterministic methodand check that it is reappeared those results.
Tn problem o.4, there is the same tendency of problem No.2 that the neutron sourcedistribution and neutron flux concentrate at the location were the most numerous fissilematerial is. Although the neutron flux distribution is seldom influenced when te skippedgenerations increase, the keff obtains convergence with better skipped 200 or more generations.Since the influence of the neutron at the cells 1-12 and the cells 14-25 decreases small ifthe skipped generations increase, the keff of this geometry becomes large gradually and is soonconverged of the kff of the single sphere at cell 13. In addition, the k._ff of this geometry is notinfluenced to change the random numbers sequences even if the skipped generations increase.
417 -

JAERJ-Conf 2002-004
Table I The list of each calculation at problem No.2
Initial source Skipped Case 12 Case2-2guess generations (Fresh fuel) (Irradiated fuel)Flat 0 Case A I Case C-1
50 Case A-2 Case C-2200 Case A-3 Case C-3400 Case A-4 Case C-4
Depending on 0 Case B-1 Case D-1the abundance 50 Case B-2 Case D-2of fissile 200 Case B-3 Case D-3material 400 Case B-4 Case D-
Table The kff and standard deviation for increasing skipped generations (No.2)
Skipped Case A Case Case Case Dgenerations
0 1.348144-0.00085 1349264-0,00043 1,06748±0.00034 L067814-0.00031
50 L35005±0.00028 1.35016±0.00027 L06916±0.00021 L06917±0.00020
200 1.35007±0.00027 1.35051±-0.00027 L06920±0.00021 L06910±0.00020
400 1.35103±0.00020 1.35044±0.00027 1.06916±0.00020 1.06907±0.00020
Table IJI The kff and standard deviation of each random numbers sequences and skipped
generations (No.4)
Random Skipped nerationsnumbers 0 50 200 400sequence
1 1.111724-0.00093 1.11506±0.00065 1.11639±0.00066 1.11681±0.00066
3 1,11125±0.00102 1.11558±0.00065 1.11632±0.00064 L11651±0.00064
5 1.11231:L-0.00096 1.11611±0.00068 1.11618±0,00065 L11603±0.00065
7 1.11028±0.00103 1.11450±0.00074 1.11493±0.00066 1.11472±0.00066
9 1.11056±0.00108 1.11524±0.00067 1,116894-0.00068 1,11666±0.00068
11 1.111284-0.00100 1.11549±0.00062 1.11728±0.00065 L117404-0.00065
13 1.11223-i-0.00091 1. 11558 ± 0 � 00068 1.11623-1-0.00063 1.11682-1-0.00064
15 1,113167L-0.00095 1.11622±0.00067 IA1674±0.00068 1,116394-0.00066
17 1.11422±0.00095 1.11750±0.00066 1.11735-M00068 L117564-0.00066
19 1,11186±0.00096 L11574±0.00066 1.11641±0.00066 1.117134-0.00066
Default L11467±0.00093 1.11757±0M066 1.11789±0.00066 1 1.11715±0.00066
418 -

JAERI-Conf 2002-004
Water Fu I
add il
Ref lective BaundarV Condition
Fu I 0. 412cmG I a dd i ne = 0. 47 SemLight ',Vatar= 1. 33cin
Figure.l. Radial dimension of problem No.2
later F WaterEnd Plue
30cm
NO Pegion EndP lug
Fw w1on ?be m
Fuel Region IFtel Pegion Region 9
5cm
Fu I Region 2Region 5cm
Fit! P...Zion Fuel Region 3
Region 710cm
Fuel Region 4Region 6
FM! Region 20cm
Fuel Region
FMI Ikgion 285 7 cm
NO Regi
RalEN Pi a
later
Vac uum Boundar y Coid i t an
Figure.2. Axial dimension of problem No.2
- 419 -

JAERJ-Conf 2002-004
au=
O 0
U METAL R 3, 71cs
U METAL R W.0m
F-1 AIR
Figure 3 Geometry of problem No.4
1 .354 . ............................... ....... ..... ................ ................................ A
1 .352 . .............................. ................... ............................... .
1 .350 .......... ..................
1 .348 L ............................... .......... .............. ................................ . ...............................-
1 .346 ............................... .......... ................ .................................................................. .
0 100 260 300 400
Skipped generations
Figure 4 Change of k..ff for skipped generations at problem No.2
(Case A and Case )
- 420 -

JAERI-Conf 2002-004
1 .0730 . . . .
1.0720 . ............................... ................................. .............................. . .... ...7
1.0710 ............................... ..................... ........... ...................................I...............................
1 0700 .......................... ................................. ................................. ............................... .
................................ MZ ......... nnn
1.0690 ...... .... ............................... Z=
1.0680 1� ........................... ................................. . .................................................. ..............
1.0670 ................................................................. ...................................................................
1.0680 .......................... ................................. I................................. . ............................... 7t
1 0500 100 200 300 400
Skipped generations
Figure Change of keff for skipped generations at problem No.2(Case C and Case D)
. . . . . . ... .
.................. ........ . ....... .................. ................. .. ........ ...... I.......... ............
........... ................. . . ............... ................. .................... ..... ..........
IC-3 ... ..................................... .................. ........ ...................... ..........
.................. ----------
I 09 ......... ...... ............................
0-4 ................. ......................... ..........
--e-Skipped generatims -a- Skipped generations 5
I ........................... ............... .............. -*- W pP*d genereticos 200--A--Skipped genemflons 400
-150 -100 -50 0 50 100 150
Axial Position [cal
Figure 6 Neutron flux at problem No.2 (Case )
............................. . .................. ................. ........ ..........
.......... .................................... .................. ...... .... .............................
lo-, .... .................. .................. ..........
................. .................. ..............................
lo-, .............................. ..... . . .... .................. .................. .................. .........
Sk i-,.ed gene-t i Om 0.......... ......... -------------- ............. -a- Skipped zenergLi ons 50
lo ................. -0 Skipped cenera ins 200-A- -SkIpped generations 400
10-Y-150 -100 -50 0 50 100
Axial Position [co]
Figure 7 Neutron flux at problem No.2 (Case D)
- 421 -

JAERI-Conf 2002-004
1.1200 . . .skipped generations
-a- Skipped generations 0-o - kipped enerat Ions ZOC
Skipped-generations 400I .1180 .................... ...... ................... ..... ..... ............ .... -
............. .......... ..
1.1140 ----- ... .... ... ...................... .......
1.1120 ................. L................... ...... ....... . ......
1.11go' L
a 4 8 12 16 20
random number
Figure Cbange of keff for random numbers sequences at problem No.4
---e--Skipped generations
M pped generat. I onT 0I g-2 . ................... . ... I--------------------------- ------- _------------------ Skipped generatiora 200
--A --Skipped generations 46
10-3 ------------------------ 7.......................... ........... ----- .......................... ........................
. ......................... .......................... .......................... .........................
C ............... i... . ........ .. .... ............. ........................lo-,
lo-, .... ............................. ................... .........................
lo-,
0 5 10 15 20 25
Ce I No.
Figure 9 Neutron flux at problem No.4
422

JP0250333JAERI-Conf 2002-004
CRITICAL AND StIBCRITICAL MASS CALCULXF]ONS OFFISSIONABLE NUCLIDES BASED ON JENDL-3.2
H. OUNO ad R. KAWASAKI*Japa Aomic Energy esearch Institute, Tokai-roUra, 319-119-5, Japan
Fax: 81-29-282-6479, e-uiail� otitto(deyciotie.tokaijaer'.gojp"CRC Solutions Institute, Inc,, Mito, I- 1-8 Japan, 310-0803, apan
Fax: 81-29-221-1169, e-mail: h-kawaAcrc.cojp
We calculated critical nd subcritical asses of 10 fissionable actinides (23 1 J, �35 (j, 238 Pu, 239 Pu, 241 Pu, 242mAm,243crit 24C 2411(,'f and 2Cf i etal ad in metal-water triixtures (except 21pt, and 244CM). The calculationwas made with a combination of a continuou eergy Morrie arlo eutron tansport code, MCNP-4132, and thelatest eleased version of te apanese valuated Nuciear Data Library JNDL,-3.2, Other evaluated nucleardata files, NDF/B-VI, IFF-2.2 ad )ENDL-3.3 in its prelirninary ersion wer ao applied to find differencesin results originated fo dfferent nuclear data files. For the so-called big three fissiles (211U .' 35 U and 239PU),
analyzing the criticality experiments cited in ICSBEP Hndbook validated te code-library combination, andcalculation errois were consequently evaluated. Estimated critical and lower limit critical asses of the big threein a sphere with/withou a wate o SS-304 reflector were supplied, and they were compared with the subcriticalmass limits of ANS-8. 1,Key wrds: critical mass, subcritical mass, actinide, JENDL-3.2, MCNP-4B2
1. INTRODUCTION
As the btlTnUp of fe] proceeds, amounts of minor actinides increase remarkably. Their
influences o riticality satet), of the fel cycle facilities ad transportation should not be
disregarded for high burnup fuels [1]. For criticality safety control of transmutation andactinide science test facilities, criticality data on minor actirrides also serve as basic data.
Because it is sometimes difficult to find proper quantities we are looking for in the literature,
calculations were ade for te critical ad subcritical asses of 10 fissionable actinides (233U,235u, 23 239 242rn 243cM, 244ctri, 249C ad 25ICt)
'Pu, PLI, lllpu� Am, in rrietal, and in metal-watermixtures except 238pU and 244CIn , These IClides were selected that they are relatively
popular and their ritical asses are comparable to or smaller tan that of 235U . The present
study is expected to become a first step to fulfil the above purposes.
2. OBJECT AND METHOD OF CALCULATION
The fissionable nuclides of which critical and subcritical masses were calculated in this study
are divided into two categories:
(1) Fissile irticlides tat the fission can be occurring with the termal neutrons, such as235u. 239pu, 233U. 241 13u, 242m Am, 143CM, 249 Cf and 25 Cf, for which both metal and a
mixture of metal and water were studied.
(2) Fissionable fluorides tbat the fission can be occurring only with the fast neutrons, suchas 211pt, and 244CDI, for which only mtal was studied.
The density of each actirude in etal was alculated basically based on the compilation by
R.G. Haire [21� 're ue sape was a sphere and the reflector conditions assumed were three
kinds: are, surrounded with a 30cm-thick reflector of water or stainless steel specified as SS-
304. The umformity of ftiel was assumed.
+ This work was carried out by te Japan Atomic Fnergy Research Institute (JAERI) under entrustment by theMinistry of Ed rication, Culture, Sports, Science and Technology (MEXT) of Japan.
- 423 -

JAERI-Conf 2002-004
The criticality calculation ode applied was a continuous energy Monte Carlo neutrontransport code, Version 4B2, TVICNP-4B2. The evaluated nclear data file adopted was thelatest released Japanese Evaluated Nclear Data Library, JENDL-3,2 as a, standard. BesidesJENDL-3.2, ENDF/B-VI, JEF-2.2 ad JENDL-3.3 in its preliminary version were also appliedto see differences in kffcaused by the differences of the evaluated nclear data file.
In this paper, the mass of actinide, orresponding to the calculated kj = I with each specificcombination of code and data library, is alled "critical rnass, ad the masses correspondingto kff = 09 and 0.8 are called "suberitical asses," These quantities �for the 10 nuclides werecalculated in a precise way described as follows. The neutron multiplication factor in theinfinite media, k.., and those for at least four sizes of the fuel sphere expected to sandwich te
AXYkff values of 1 09 and 0.8 were applied to the curve k, k_ I e where a, and
were parameters 3]. The number of neutron histories of the criticality calculations was set toone million.
3.RESULTS
3.1 Critical and suberitical masses of actinides in metal
The results for critical and suberitical masses of actinide metals are listed in Table 1. It isinteresting to note the following observations of the results:
Table 1. Critical (kff = 1.0) and subcritical (kff = 09 and 0.8) masses of actinides in metal
Density Mass [k -- 7-----Nuclide Reflector
[g/crn'] kff = .0 kff = 0.9 kff - 0.8None 14.81 6.58
233U 18.76 Water 6.94 4.58 2.97SS-304 4.60 3.19None 46.04 21,21
235U 18.92 Water 21,19 13.67 8.67
SS-304 18.66 13.06 9.04None 1 10,13 7.00 4.68
231PU 19.85 Water 5.45 3.71 2.48
SS-304 4.94 3.53 2.47None 8.16 5.58 3.70
238 PU 19.77 Water 6.70 4.59 3.05SS-304 4.43 3,12 2 16None 11,75 8.18 5.54
241PU 20.02 Water 5.55 3.80 2 0
�-SWS-1304 -1- 5.40 3.85 2.721 None 12.59 8.82 6.00
242 mArn 13.72 Water 4.41 3.03 2.01i SS-304 4.73 3.45 2.49
None 10.03 7.08 4.80243 Cm 13.45 Water 3.51 2.43 1.60
SS-304 3.91 2.84 2.05None 29.95 20.07 I 320
244cM 13.51 Water 24.84 16.51 1 10.72- ------------ ------
SS-304 15.36 --1 0.62 ------- ------ 7.11None 6.26 4 47 3.07
249cf 15.11 Water �!.39 1 69 L14SS-304 2.81 2AG 1.52None 2.50 1.77 1.20
251cf 15.23 Water 1.33 0.95 0.66Ss 304 1,29 0.95 _L-J�-68�
424 -

JAERI-Conf 2002-004
(1) The water-reflected critical mass ranges from 35% (for 141-Am and -41CM) to 83%(for ... Pu and 144.M) of the bare critical mass. The stainless steel (SS) reflectedcritical mass anges ftom 038% (for 141mArn and 211CII-1) to 0.54% (for 138pU), which isnarrower than the water-reflected ases.
(2) The SS-reflected critical mass is smaller than the water-reflected critical mass exceptfor 247 mArn , 243 Crn and 249Cf.
(3 Tere are at least nine actinides tat have a saller bare critical mass than of 21U.
3.2 Critical ad suberitical asses of actinides n a metal-water mixture
The critical ad subcritical asses of eight actirrides ("5U, "'Pu. 233u, 241PU, 242mAm , 243CM,
249Cf and "'Cf) in a etal-water mixture were calculated. As an example, critical andof 243
subcritical asses of a sphere CM-H20 in bare. wth a 30-cm-thick water, or SS are
shown in Fig, 1 Te minirmitir of te curves or the eight actinide-water mixtures is listed in
Table 11, It is observed fro ts table tat te ritical rnass of actirride is well described as in
a power of te WrfeSpOflding actinide concentration. To show the relation more clearly, a
graph is draw i Fig. 2 for the bare case.
crit_=243�bare crit-cm243-sus100 1 0 ................................ .................... ................... ............... ... ;� ..................... .............. --- ............................... ---------- ........... - -................. ........ :---------------------- -----------------. ................... .......................................... :1 ------- ......... --- -----------------............. ............. .......................... ........... ------- ............................
................ ------ I'll ............................. .............. . - ------------------- -------------- ------------------E......................... --------- ...........................---------------------- ........------------------- . ................... ------ ..................... .............. . .................... . ::::: --............. ........ ............... ----------
... ............... .... .................. ............ ........ ,:, "..,.............. ..........E 7 ...... E ........... .......
U ............ ....... ----- U . .... .............0 0 .1 ... ----------------- ............
....... ............. . ................... --------------------- ......................... . ..................... - ------------------- ---_ --------------- 11_ .........-------- - ------------- ..... co :------- ............................... ------- . ................... --------------------- ............
.......... : ............. .......... ................... ......................I.................... ...............----------- ---- ----------- .. ..... ------------- ----------------- - ................... ......................I.................... ...............
0. 1 0.01 _U0�01 0.1 1 10 100 0.01 0.1 1 1 100
Cm Concentration [qCm/cm3] Cm Concentration [gCm/cmj
(a) are case (c) SS-reflected case
crit_=243_�wat Fig.l. Critical and subcritical masses of a10 sphere of 41 Cm-H20-
............ I............ ........ ................................ --------- -------- ........... - -----------------
.................... .... ............. ... �; ..................------------------------------------- - � ;:f�� ..... 10 ............
................. :� ..........
0 233U ..................................... ........ .......
c) --------------------- 0 235U I- ----------------------------------------------------------
---------------------------------- -------------------------------- ----------............ 4------------------- . ............
..................... ; ------------ ----------------------
E PU............ ... 2'71'Arn
0 -Urn0.1 =� ......................... 0 --- I 11cf ....... ................
U) ... ::::::::: .... ::::::: ..................................................... --------- (n--------------------- -------------------- -------------------- ---------- ------- 0 --- L .:_ I � Icf . ...... .............................................. -------------------- ................. co------------------ I........ ....... .. ...................
....................................... ................... ------ ------- - -------------------............. .......... .............................. .--------------------
..............
........................................... ...........................................0.01
0 .0 1 0 .1 I 1 0 10 0 .................................. ........ ........................................Cm Coneentration qCMjGM3j 00.010.601 0.01 0.1(b) water-reflected case Actinide Concentration [g/CM3]
Fig.2. Relation between the minimum critical
mass of eight actinides and the
corresponding actinide concentration forthe bare case.
- 425 -

JAERI-Conf 2002-004
Table 11. The mininium critical and subcritical masses of eight actinides
k, 10 kfrA.9Nuclide Reflector conc Mass [kg] Conc. Mass [kgl Conc Mass [kg]
IgicrilNone 0.049 1.064 0.037 0.755 0.035 0.524
113U Water 0.060 0.565 0.056 0.381 0.049 0.254F ss 0.060 0.440 + 0.053 0.311 0.049 0.217
None 0.046 1.409 0.040 0.952 0.032 0.637211U Water 0.056 0.788 0 049 0.504 0.043 0.321
Ss 0.061 0.611 0.411 0.046 0.276231pU None 0.027 0.883"-,--,,-0.023----�l----0.591 0.020 0.390
Water 0.031 0.502 0.027 0.025 0.200Ss 0.036 0.372 I 0.03 0.247 0.027 0.162
None 0.020 0.526�1 0017 0.364 0.016 0.249241 PU Water 0.280 0.023 0.186 0.020 0.122
Ss 0.220 0.023 0.152 0.020 0,104None 0.0026 0.045 0.0024 0.033_ 0.0020 0.024
212mAm Water 0.0034 0.022 0.0031 0 015 0.0031 0.011Ss 0.0034 0.019 0.0031 0.014 0.0029 0.010
None 0.028 0.391 0.028 0.298 0.022 0.224243 Cm Water 0.041 0.186 0.039 0.135 0.036 0.098
Ss 0.041 0.155 0.036 0.117 0.034 0.088None 0.010 0.126 0-008 0.097 .007 0.073
249Cf 0.059 0.012 0.032Water 0 013 0.012 1 0.046Ss 0.013 0 040 0.010 0.031
None 0.0034 1 0.065 0.0031 0.048 0.0026--L- 00350.0041 0.033 0.0038 0 023 0.0034 0.01621ICf Water L-S S 0.0041 0.028 0.00�8__L �O.020 0.0034 r 015
3.3 Comparison of NMF calculations based on various evaluated nuclear data files
To investigate the effect of the evaluated uclear data, the eutron 11-niltiplication actor wascalculated sing NDF/B-VI, JFF-2.2 ad JENDL-3.3 in te firial prelitninary version)instead of JENDL-3.2. The evaluated nuclear data were applied to (1) Infinite -uedi ad 2)the critical sphere in (a) metal and in (b a ixture of metal ad water (only for fissiles). Theresults are shown i Table 11L It is seen frorn this Tble that te differences are sinall,maximum 2, for te big three, owever, they e sonietimes larger for oher clides.
01,241C,3.4 Comparison of microscopic cross sections in
To clarify the reason of te differences ai te results of the neutron multiplication factor(Table 111), te icroscopic capture ad fission cross sctions ad the nurnber of eutronsinduced per fission were compared (Fig. 3 For the well-i-noderated systern of Cm
3 -neV. The ENDF/B-Vlconcentration 003 gCrn/crn te eutron flux as a peak around 50 ihas a smaller capture ross section and a larger fission cross section than the JFNDL-3�2,Considering the differences win amost the sarne v-values, Te JFF-2.2 has a irialler fission
cross sctio ad a smaller v-value with nearly equal capture coss section cornpare t teJENDL-3.2. These cornparisons quantitatively explain tat te kfs of ENDF/B-Vl are largerthan those of and JENDL-3.2 ad te kff's of JF-3.2 are sirialle tan those ased oilJENDL-3 2.
426 -

JAERI-Conf 2002-004
Table 111. Comparison of k. s for IO fissionable nuclides based on different evaluated nuclear data
files
__T�e`Iative to JENDL-3.2Conc. Radius kff Akff /k�ff [%]
Nuclide g/C,1131I jC1111 JENDL- ENF)F/B- JENDL- JEF-2,2 ENDFA3- JENDL- JEF-2.2
3.2 VI 3.3 i�e.) VI 3.3 (pre.)
18.76 I_ 37 L-I 016 LON_ N.X -2.0 -0.8- -- N.A.1550 2.563 2.560 N.A, 0.5 0.4 N.A.
U-2330.05 1.041 1 M6 1,036 N.A� -0.4 -0.5 N.A.
1 378 1.773 1,773 N.A, -0.3 -0.3 N.A.Z 1.062 1 055 MA. N A. -0.7 N.A. N.A.
M92 ---00 2_28 7 2.279 N.A. N.A. -0.4 N.A. N.A.
U-2350.05 20 -1,045 -1-033 N.A, -1.1 N.A. N.A.
1.636 1.629 N.A. N N.A. N.A.5 1.008 I 010 1.009 1-0016 1, 0.2 0.2 -0. 1
19.85Pu-239 2.956 2.988 2'956 1 2.925 1.1 0.0 -1.1
0.03 20 1.030 1,025 1,025 1,031 -0.5 ___-0.5 0.11.624 1 617 1.623 1.617 -0.4 -0. -0.4
Pu-238 19.77 5 _1066 1.019 1.039 1,040 4.5 -2.6 -2.52.878 2.871 -4.1 -2.3 -0.2
6 1,049 1 M8 1,050 1 M6 1 -2.0 0.1 -2.220.02
Pu-241 00 2.910 2.919 2.912 2.738 0.3 0.1 -5.90.02 20 I 1.065 1 075 1.065 1.070 0.9 -0.0 0.4
00 1 1 678 1.690 1.677 1,683 0.7 -0. 0.3
13.72 6 I L025 N.A. 1,025 0.987 N-A --0.0 -3.7
Ani-242m 3.250 N.A. 3.304 3.142 N. A. L6 -3.30.003 6 1.049 N.A. 1.030 1.031 N.A, -1.8 -1.7
2.027 N.A. 2.024 1.953 N.A. -0.2 -3.76 1.058 1 1.107 1.190 1.158 4.7 12.5 9.5
13.45 -Cm-243 3.553 3.577 3.488 3.653 0.7 -1.8 2.8
1 1 M9 1.163 1.001 0.895 12.9 -2.8 -13.00.03 -7 2.335 M -12.0
9 1,084 1.113 1,107 1 064 2.7 2.1 -1.9Cm-244 13.51
2.605 2.643 2.583 2.511 1.5 -0.9 -3.6
15.11 5 1.073 1.029 1.102 1.092 -4.1 2.7 1.8
Cf-249 00 4.040 3.678 3.979 4.185 -8.9 -1.5 3.60.01 5 1.042- 0.995 1.020 1.030 -4.5 -2.1 -1.2
2.190 2.103 2.187 2.183 -4.0 -0. 1 -0.3
15.23 4 1.055 0.-824 N.A.- 0.825 -21,9 N.A. -21.8Cf-251 - --- �,_____T479 4.320 N.A. 4_._3I9__1_ -3.5- N.A. -3.6
0.003 is 1.036 1.120 N.A I.I20 8.2 N.A. 8 I1.824 N.A. 1.976 8.3 N.A. 8.3
N.A.: Not applied.pre.: preliminary version
3.5 Validation of the method for 235u, 239PU and 233U critical systems
Validation of our vriticality calculation method was made by analyzing 20 each evaluated
critical experiments with various kinds of reflectors registered in the ICSBEP Handbook 4]235u, 23 233
for 9P ad U critical systems. The results showed that the bias from unity is less
than I Ak.
- 427 -

JAERI-Conf 2002-004
Neutron Capture Cross Section by Cm-243
1.E+03JENDL3.2
II.E+02 ------ ENDFBIVI��JENDI-3.3
II.E+01
1.E+00
1.E-01
II.E-02
1.E-03 L
1.E-03 II.E-01 1.E+01 II.E+03 II.E+05 1.E+07
Neutron Energy [eV]
Neutron Fission Cross Section by Cm-243
1.E+04
1. E+03��JENDI-3.2
--- ENDFBNI
II.E+02 JENDL3.3
JEF2.2
1.E+01
1.E+001E-03 II.E-01 1.E+01 1.E+03 1.E+05 II.E+07
Neutron Energy eV]
Neutron Number Released per Fission (v)5
��JENDL3.2
------ ENDFBNI,
4 � �JENDL3.3��JEF2.2
3
21.E-03 -E-01 1.E+01 I.E+03 1.E+05 1.E+07
Neutron Energy [eV]
Fig. 3 Comparison of capture and fission cross sections, and number of neutrons released per fission.
- 428 -

JAERI-Conf 2002-004
3.6 Estimated critical and tower-limit critical masses of 235U, 239pU and 233 U in a metal-watermixture
The estimated riticality multiplication factor was detennined to 10045 10019 and 10065for 235U, 239pU and 233U , respectively, by te benchmark alculation as their correspondingaverage value. Te estimated criticality lower lirnit ultiplication factor was commonly setto 098. Te estimated ritical mass and estimated critical lower limit ass curves weredrawn in Figs. 4 - 6 for a uniform homogeneous mixture of water and ... U, "'Pu and "'U,respectively, i a sphere with a ftilly-thick water reflector, The irrinimurrivaiues of the curvesare listed in Table TV in comparison with the suberitical mass limits of ANSI/ANS-8.1 [51 andother related values reported in 6].
mcrft-.235100
........... ...................
...............................--------------- I..........
................... ................. .......................................... --------------------
---------------------------------------- --------------- -- � . .............Z)CD
10 ............................ ............................
U) ................
................................. ...................
E ------------- -
---------- -..........CO - ------------- 1------------------ .............
Estimated Criticality k.,, 1.0045) - -----
0.10.01 0.1 1 1 0 100
U Concentration [gU/crnj
Fig. 4 The estimated critical and estimated critical lower limit masses of homogeneoUS 231 U-H20-
mcrft-pu239100
............... ................
Estimated Criticality 1.0019
13 Estimated Lower L;.n)ik Ce.!:caMy N,--0.9
10 --- ------- .. . ................ ..................
------ -------------------- -- *. ................. .... ........
CD ------co ................... ----------------- --1 ------------------------------................... ;.. ......... ........
------ -------------- --- ----.................... ......... --------- ------------------- L................----------- ..... -----------FE.......... ........ ...................
.2 .............. .................... -------- _ ------------ --
.................... ......... .......... ................... ...................
.................... .................... ................... .........
0.10.01 0.1 1 10 100
Pu Concentration gPu/cm)
Fig. 5. The estimated critical and estimated critical lower limit masses of homogeneous 239 PU-H20.
mcrft-u23310 ----- j... !.Built!
M
----------- .... ................................................ ------------------ ....................--------------------------------------- --------------------. .................... ....... ........ ...CI)M
-------------------------........... ...................... ........ ........E ................................ ........... ................... ............ �:2 ------------------- I---------------------..................... I....................L.................... ...................
Estimated Criticality (k., 1.0065)...... -----�:stirn led Lowef LimitU Criucal-J_"6.01 0.1 1 10 100
. U Concentration [gU/ c m3l
Fig. 6 The estimated critical and estimated critical lower limit masses of homogeneoUS 233 U-H20-
429 -

JAERI-Conf 2002-004
Table IV. Minimum of estimated critical mass (ECM) and estimated critical ower limit mass(ECLLM) for a homogerreous sphere of water mixture of 231U, "'Pt, and 2"U with a fully-
thick water-reflector, compared with subcritical mass limits (5 I and elated values 61
ReflectorNuclide Note Inforniation Source
None Watef Iron or SS
1,09 0.58 0.45 ECM1.00 0.53 0.41 ECLLM
233 U 0.50 Subcritical rnE��s irna 510.55 Maubert[61
1.15 0.58 Trombay[6L_-_________1.44 0.80 0.62 ECM1.31 0.72 0.57 ECLLM
235U 0.70 Subcritical ass limit0. I Maubert[61
1.69 0.95 Ti-ombay[6]0.89 0.51 0.37 ECM0.82 0.46 0.34 ECLLM
239 Pu 0.45 Subcritical mass limit ___L5j0.51 Maubert[610.48 IPSN[6 _
1.00 0.56 Trombay[6]
4 CONCLUSIONS
In summary, critical and subcritical masses were calculated for 10 fissionable nuclides (233U,235u, 239PU, 238p.u. 241PU. 242m Am, 243cM, 244cM, 249Cf, and 251 Cf) with a, combination of
JENDL-3.2 and MCNP-4132. Other nuclear data produced several different values for theneutron multiplication factor even of metal in infinite media.
REFERENCES[11 I.C. Gauld and JC, Ryman, "Nuclide Importance to Criticality Safety, Decay Heating, and
Source Terms related to transport and Interim Storage of High-Burnup LWR Fuel,"NUREG/CR-6700, RNL/TM-2000/284 2001).
[2] R.M. Westfall, private communication.[3] C.T. Rombough, S.H. Martonak. and N.L, Pruvost, ANS Trans. 76, 197 1996).[4] "International Handbook of Evaluated Criticality Safety Benchmark Experiments,"
NEA/NSC/DOC(95)03, September 2000 Edition 2000).[5] "Nuclear Criticality Safety in Operations with Fissionable Material Outside Reactors,"
ANSI/ANS-8.1-1998 1998).[6] J. Ano and G. Seri, "French Participation at ANS/ANSI 8/15 Working Group Updating
Criticality Data on 211 Np. Criticality Transportation Proposals," Proc. of ICNC'99(I 999).
- 430 -

JP0250334JAERI-Conf 2002-004
Current Status of Criticality Safety Benchmarks for Single Core Composed of
Low Enriched Uranyl Nitrate Solution using STACY
Yoshinori MIYOSHI and Toshihiro YAMAMOTO
Japan Atomic Eergy Research Institute, Department of Fuel Cycle Safety Research,
2-4 Shirakata Shirane, Tokai-mura, Naka-gun, lbaraki-ken 319-1195 JAPAN
Fax: 81-29-282-6798, miyoshi�melody.tokaijaeri.gojp
Criticality experiments using 10% enriched uranly nitrate solutions have been performed at the STACY facility
of NUCEF since the first criticality in 1995. The criticality data of the STACY that were published in the
ICSBEP handbook contribute to diminishing the shortage of low enriched uranium solution criticality data. The
temperature coefficients of reactivity of low enriched uranyl nitrate solution were measured at the STACY The
measured reactivity coefficients in the 600mm-diameter and The 800mm-dianieter core tanks are 4.1 /C and
-3.0 /C, respectively. Kinetic parameters Peff/k were measured by using the plsed neutron method, the reactor
noise analysis methods. The reactivity effects of reflector materials (concrete ad polyethylene) were measured
by the difference of the critical solution heights.
Key words: STACY, criticality, benchmark, temperature coefficient of reactivity, reflector, kinetic
parameter
1. INTRODUCTION
From the view point of criticality safety for nuclear facilities related to the nuclear fuel
cycle in Japan, experimental criticality data on low enriched uranyl nitrate solution and
plutonium nitrate solution are especially needed for verification of criticality safety
evaluations. Since the initial criticality in 1995 a series of experiments have been performed
to procure criticality data on 10 enriched uranyl nitrate solution for single core system at
the Static Criticality Experimental Facility, STACY[1,2]. Critical solution height, neutron flux
distribution and kinetic parameters were obtained with three core tanks with changing the
uranium concentration between 170 gU/1 and 460 gU/I. The diameters of two cylindrical
tanks were 60 cm and 80cm, respectively. The thickness and width of a slab tank were 28
cm and 70 cm, respectively. Through these criticality experiments, important parameters
related to criticality safety such as kinetic parameters and the effect of reflector materials have
been measured. Tis paper describes how the experimental data of STACY contribute to
benchmark in the criticality safety related issues.
2. CRITICALITY BENCHMARK DATA OF STACY
Criticality benchmark data on low-enriched uranium solutions had been insufficient since
This paper icludes the result of experiment performed under the contract with the former Science and Technology
Agency of Japan
- 431 -

JAERI-Conf 2002-004
most existing criticality data of uranium solutions are for high-enriched uranium. The
criticality experiments at STACY started in 1995 to obtain criticality benchmark data of
low-enriched uranium and plutonium solutions that are usually handled in a commercial
reprocessing plant. As of yet, using a Owt% enriched uranly nitrate solution, criticality
experiments have been performed and criticality data usable for verifications of criticality
safety analysis methods have been accumulated. Figure shows the schematic view of the
reactor room of STACY. The core tanks are installed in a water-reflector pool tank. Therefore,
criticality experiments in a fully water-reflected condition is possible in addition to a bare
condition.
We have participated in the International Criticality Safety Benchmark Evaluation Project
N
Shielding door
c�B Air lock room
room
Hood
4020
5775 4225
13110 10000 1 3
1800 12600Water pool
BPlan view Safety power detector
Core tank Water pool 00
Reactor roomMLtor room
Hood
C, C>
C>
Dimensions in mm C> Level of core tank bottom VA, r I ._ck n.
Elevation view Side view
A-A Cross Sections B-13 Cross Sections
Fig. 1 Schematic view inside STACY reactor room
- 432 -

JAERI-Conf 2002-004
1.025 MJ)MCNP4B(JENDL3.2)
1.020 N(ZMCNP4B(ENDF/B-V1)W(�)MCNP4B(ENDF/B-V)
1.015 M(4)KENO(ENDF/F3-V)a SAPOLLO 2MORETIV(CEA93)
1.010
1.000
00,995 verage1 1.0097--+-0.0012 1.0007*0.0012(I 0060+0.0021 () 1006,3-i-0.0026
0.990 (S 100754-0.0015
0.985
464 430 372 351 329 311 300U conc. (gU/L)
Fig.2 Calculation Results for STACY Benchmark Model
(ICSBEP) of OECD/NEA since the beginning of this project. The criticality data obtained at
STACY have been carefully evaluated based on the benchmark evaluation method of the
ICSBEP 3]. In the latest International Handbook of Evaluated Criticality Safety Benchmark
Experiments" published by the ICSBEP, 56 out of totally 77 evaluated criticality
configurations of low-enriched uranium solutions stem from the STACY experiments. The
experimental data of STACY have contributed to aeviating the world's lack of low-enriched
solution criticality date. Figure 2 shows the calculated keff's by several calculation codes for
the benchmark model of the STACY criticality experiments that was obtained at the
water-reflected 280 cm-thickness slab core tank. This figure indicates that JENDL-3.2 gives
higher keff 's as much as 1 %. Through the series of the STACY experiments, it is found that
the overestimations of keff's by JENDL-3.2 may be mostly attributed to the evaluations of
231U and 14 N. These two nuclides are
to be revised in the release of 1.010 0 MVP+JENDL-3.2
JENDL-3.3. The comparisons of
keff's calculated by JENDL-3.2 and
JENDL-3.3 (preliminary evaluation) 1.005
are shown in Fig. 3 4 These 00 0 0 0
calculations were performed for the 1.000 0 0
STACY experiment with the 0 MVP+JENDL-3.3
water-reflected 600-mm-diameter core 0.995 1
tank. The reevaluation of 231 U and 14 N 200 250 300
in JENDL-3.3 largely improved the U conc. (gU/L)
calculated keff's. Fig.3 Comparison of JENDL-3.2 and JENDL-3.3
- 433 -

JAERI-Conf 2002-004
3. M]EASUREMENTS OF KINETIC PARAMETERS
Very few measurements of kinetic parameters such as ff/k Pef : effective delayed neutron
fraction, prompt neutron life ime) of low-enriched uranium solutions, which are important
for criticality accident analyses, have been eported in te world. At the STACY facility,
Deffa were measured with several techniques such as pulsed neutron method, reactor noise
method, and the ennet method [5]. Taking account of man), aspects regarding operation
conditions and S/N ratio, systematic masurements were perfort-ned mainly with the pulsed
neutron method for wide range of uranium concentrations,
A pulsed neutron source (PNS), eutron counters and multichannel scalars (MCSs) were
used for the measurements. The MCSs were synchronized with the PNS, The PNS fires
neutrons, which are generated by D-T fusion reactions, every 50 nisec. The burst width of
each fire was less than 10 micro second. eutron counters are B-10 proportional counters and
180 located outside the core tank as600� 280T Slab Core well as the PNS. If water reflector170 Cylindrical
1 60 Core was used, the PNS and the
150 counters were submerged in the
4 water. In the case of are core,
130 polyethylene moderators were
120 WaterReflected attached to the PNS and theA
110 Bare counters. After the criticality state
100 was achieved, measurement of the
90 800� Cylindrical Core (Bare) PNS method 'was .repeated at80 L I1 50 200 250 300 350 4 00 4 50 several subcritical solution levels.
U Concentration (gU/Iit.) To evaluate the prompt neutron
Fig. 4 Measured f/k vs. Uranium Concentration decay constant, an exponential
decay function:
n = C exp(-at) + B (1)
was fitted on to the measured decay and the decay time constant cc (sec-') was determined for
each signal channel and for cach subcritical condition. The x values were averaged over the
signal channels. The ff/X value of each solution condition were etermined by extrapolation
of the linear relation between the subcriticalities and the decay time constants to the critical
condition. The values of �,,ff/X measured at 600-mm-diameter and 800-mm-diameter
cylindrical core tanks and 280-mm-thickness slab core tank ae shown in Fig. 4 as a unction
of uranium concentration.
Using the perturbation calculation capability of SRAC code system 6], the analyses for
these measurements of �,EF/X were performed. off ad X were calculated by
SRAC-CITATION code ad ENDL-3.2. The calculated ff/k agreed with the measurements
within experimental uncertainties.
- 434 -

JAERI-Conf 2002-004
4. MEASUREMENTS OF TEMPERATURE COEFFICIENT
A temperature coefficient of reactivity of a solution fuel is a main parameter that affects the
transient behavior in case of criticality accident. The verification of temperature coefficient
that is used for a criticality accident analysis is important to assure the reliability of the
accident analysis. The temperature coefficients of solution fuel, however, have never been
reported throughout the world. At the STACY facility, reactivity effects due to the change in
fuel temperature were meas tired with two cylindrical cores of 600 mm and 80 mm in diameter,
which contain 10% enriched uranyl nitrate solution. Uranium concentrations in these
experiments were about 254 gU`/L and 201 gU/L, respectively, Fuel solution was heated in a
dump tank at first, and core tank and feed line were also heated before feeding the fuel
solution from the dump tank. Three divided electric heater and an annular type insulator
were located on the side wall of the core tank. Temperature distribution along the axial
direction was measured with a thermometer attached to the driving mechanism which was
inserted in the core tank. From the change of the critical solution beight with fuel
temperature, the reactivity effect of temperature was evaluated from the differential worth of
the solution height. Differential reactivity of fuel solution height was measured with a digital
reactivity meter.
0 The experimental analyses were
-10 800-mm-dia. performed using SRAC code system and
-3.0 /C JENDL-3.2. The density change due to20
U the temperature rise was obtained by the- 302:1 600-mm-di density formula developed by Sakurai 7].
-404.1 /C The temperature coefficients were
-50 0 easurement calculated by a discrete ordinates-60
0 cu ation transport code TWODANT [8] and-70
25 30 35 40 24-group macroscopic cross sections. TheTemperature 0c) measured and calculated results of
Fig.5 Calculated and Measured Reactivity reactivity effect of fuel temperature forDue to Temperature Change two cylindrical cores are shown in Fig. .
The first-order temperature coefficients
measured at the 600-mm-diamete and the 800-nirn-diameter core tanks were 3.0 cent IT and
-4.1 cent C, respectively. The calculated coefficients agreed with measurements within 3.
5. REFLECTOR EFECTS OF STRUCTURL MATERIALS
Reflector effects of structural materials in a nuclear fuel facility affect the criticality. To
enhance the reliability of criticality analysis method including the reflecting materials, the
reflector effects of polyethylene and concrete were measured at STACY. The
600-mm-diametei- core tank was surrounded b annular geometry reflectors. The
280-mm-thickness slab core tank was sandwiched on the both sides by slab geometry
- 435 -

JAERI-Conf 2002-004
reflectors. The critical solution fuel heights were easured with and without the reflectors.
The reactivity effects of the reflectors were
measured by the difference of the critical4 .. . .. .. . . . .. . . . . . . . . . ... . . . . . .. . . . . . . . solution heights. The distributions of theConcrete
neutron flux and the neutron spectrum index3 . . . . . .. . . . ... .. . ... . .. .
'i ..... were measured for the validations of thePolyeftlene-
analysis methods as well. The measurement2 results for the 280-mm-thickness slab core
tank are shown in Fig. 6 It was found that
Measureme the reactivity effects saturate beyond the
Calculation thicknesses of cm polyethylene and 20 cm0 ---- .... .....
concrete. The saturated reactivity effect of
the concrete is 1.8 times as large as that of0 5 10 15 20 25 30 35 the polyethylene. The reactivity effects were
Reflector thickness (cm) calculated by SRAC-TWOTRAN and
Fig.6 Reactivity Effect of Concrete and JENDL-3.2. The calculation underestimatesPolyethylene Reflectors
the saturated reactivity of the concrete by
0.2%Ak/k and, on the contrary, overestimates the polyethylene slightly. Relatively good
agreements between the measurements and calculations, however, might be observed.
Critical configurations of the 600-mm-thickness cylindrical tank and the
280-mm-thickness slab tank with the reflectors (polyethylene, concrete, borated concrete)
were evaluated as the criticality benchmark. These evaluations are published in the handbook
of the ICSBEP.
6. FUTURE PROJECTS
A series of critical experiments on neutron interaction system composed of
35-cm-thickness slab core tanks started in 1999 in order to confirm the criticality safety
design method for multiple unit system. Figure 7 is an anomalous example of Monte Carlo
calculation for weakly interacting STACY core tanks. The ratio of fission source in symmetric
core tanks, which is supposed to be unity, deviates far away from unity with 30-cm-thickness
concrete. The neutron interaction effect between two tanks through variou� isolation materials
(polyethylene and concrete) is now being studied.
Experiments on heterogeneous system simulating a dissolving process will start in 2002.
Criticality benchmark data in a heterogeneous geometry simulating a dissolving process are
very limited in the world 9] � It is, however. pointed out that the existing criticality data are
not available for benchmark since the criticality data has devastating contradictions [10].
Therefore, the experiments of the heterogeneous system that are being planned at STACY will
provide the significant benchmark data for a dissolver condition. PWR type fuel rods are
arrayed in a 600-mm-diameter cylindrical tank containing 6 enriched uranyl nitrate solution.
- 436 -

JAERI-Conf 2002-004
Three grid plates having different lattice pitches are prepared for changing the volume ratio of
fuel solution to fuel pellet. Reactivity effects of gadolinium as soluble poison will be
measured from the change of critical solution heights. Furthermore, to investigate the neutron
absorption effect of fission product elements in a criticality safety design of a dissolving
process, fission product elements (Eu, Cs, Sm, Nd etc.) will be dissolved in the solution fuel
and the criticality data will be measured. The criticality data will be useful for validation of
criticality safety aalysis methods of dissolver including the fission product elements.
Critical and subcritical experiments on plutonium solution system are scheduled after 2005.
Main solution parameters are concentration of plutonium and uranium, acid molarity and
concentration of soluble poison. Three cylindrical tanks will be mainly used in the
benchmark experiments for single core configuration. The maximum concentration plutonium
and uranium is 300 g/L. The contents of Plutoinum-240 is approximately 25%, which
corresponds to the composition of typical VVR spent fuel. In the series of the experiment, a
positive temperature coefficient of very dilute plutonium solution will be demonstrated
experimentally.
4.0
3.5 30cmGmcret
3.0 Ocm Concrete
2.5Cq2.0
1.5
1.0
0.5
0 100 200 300 400 500
Generation HFig. 7 Fission source ratio in each generation with and without
concrete isolator
REFERENCES
[1] Y Miyoshi, "Critical Experiments on Low Enriched Urany] Nitrate Solution with STACY," Proc.
Ist NUCEF Int. Symposium, JAERI-Conf 96-003,102 Japan Atomic Energy Research Institute
(1996).
[2 Y Miyoshi et al., "Critical Experiments on 10% Enriched Uranyl Nitrate Solution using 60-cm
Diameter Cylindrical Core," Nucl. Technol., Vol. 118, No.1, 69 1997).
[31 J.B.Briggs et al.. "Status of the International Criticality Safety Benchmark Evaluation Project,"
Noc. 6th It. Conf Nucl. Criticality Safety, Versailles, France, Sept. 20-24, 1999, 140 1999).
- 437 -

JAERI-Conf 2002-004
[41 K.Okumura, private communications.
[51 K.Tonoike et al., "Kinetic Parameter ff/x Measurement on Low Enriched Uranyl Nitrate
Solution with 600 Cylindrical Core of STACY,` Proc. 6th MI. Conf. Nucl. Criticality Safety,
Versailles, France, Sept. 20-24, 1999, 1215 1999).
[6] K.Okumura et al., `SRAC95; General Purpose Neutronics Code System," JAERI-Data/Code
96-015 1996) [in Japanesel.
[7] S.Sa-urai et al., "Density Equation of Aqueous Solution Containing Plutonium (IV), Uranium
(VI) and Nitric Acid," J.Nucl. Sci. Technol, Vol.33, No.2, 187 1996).
[8] R.E.Alcouffe et al., "DANTSYS A Diffusion Accelerated Neutral Particle Transport
Code System," LA-12969-M, Los Alamos National Laboratory 995).
[91 R.C.Lloyd et al., "Criticality of 4.3wt% Uranium-235 Enriched U02 kods in Uranly
Nitrate Solution Containing Gadolinium," Nucl. Sci. Eng., 78, 121 1981).
[10] H.Okuno et al., "Benchmark Calculations of JACS, Code System for the Criticality
Experiment of Pellet-Solution Coexisting Low-enriched Uranium Fuel,"
JAERI-Data/Code 94-014, Japan Atomic Energy Research Institute 1994) [in Japanese].
438 -

JP0250335JAERI-Conf 2002-004
STUDY ON RELEASE BEHAVIOR OF RNDIOACTTVE NOBLE GASES ANDIODINE SPECI-ES FROM FEL SOLUTION UNDER SIMULATED NUCLEAR
CRITICALITYACCIDENT
Hitoshi ABE, Shinsuke TASHIRO, Tadao KOIKE, Seigo OKAGAWA and Ginzo UCHIYAMA. Japan Atomic Energy Researeb Institute
Tokai-mura, Naka-gun, lbarak-i-ken, 319-1195 JAPANFax. 81,29.282.5745, E-mail: abe�aero.tokaiJaeri.go.Jp
To estimate confinement capability into the facility for the volatile fission products, such as noblegases and iodine species, which have a possibility of affecting serious public dose, under thenuclear criticality accident in the ftiel solution, release and transport behavior of the radiolysisgases and the radioactive materials under the simulated criticality accident in the fuel solution hasbeen examined by rising NUCEF-TRACY As the results, G-value of release of the hydrogen,one of the radiolysis gases, was estimated about 0.8 molecules/100 eV by observing relationshipbetween the energy release from fissions and released molecules of the hydrogen. At 45 h afterthe transient criticality, the release ratio of the iodine species were about 02% in case that thetransient od was re-inserted to the solution just after transient criticality and about 09 in casethat the rod was not re-inserted. The release coefficient and release ratio for Xe-141 wereestimated and correlation between the values and inverse period was observed. It was provedthat the release ratio of Xe-141 from the solution was over 90 in case that the inverse periodwas over about I 0 I /S.Key words: Fuel solution, Criticality accident, Radioactive materials, Confinement,
Fuel reprocessing plant
1. INTRODUCTIONIn nuclear criticality accident in the fuel solution, it is considered that radiolysis gases andradioactive materials (fission products) are released from the so ,iution to outside of the facility.Since radioactive oble gases and iodine species in the fission products have relatively highvolatility, release ratio of the nuclides is larger than the ratio of the other non-volatile nuclides.Therefore, quantitative estimation data about release behavior of the volatile nuclides are veryimportant for the accurate and rapid evaluation of the accident and public dose. In NRCRegulatory Guide 333 (NRC 1977) 1], the release ratios of the noble gases and iodine species,under -the iadvertent nuclear criticality accident in a uranium fuel reprocessing plant, wereassumed as 100% and 25%, respectively. However, since these values were quoted from theRegulatory Guide 13 2 which referred to the loss of coolant accident for boiling water reactors,it is considered that safety margin is included in the values in the Regulatory Guide 333 InJapan Atomic Energy Research Institute (JAERI), to verify the confinement capability for theradioactive aterials in the ventilation system in the facility and the safety margin for the valuesadopted in the safety evaluation of the facility, release and transport behavior of the radioactivematerials and te radiolysis gases (e.g. hydrogen) under the simulated riticality accident in thefuel solution has been examined by using NUCEF kLuclear Fuel Cycle Safety EngineeringResearch Facility) - TRACY (Transient Experimental Critical Facility). Furthermore, therelease properties, such as release ratio (%) and release coefficient (1/s) for the radioactive
439 -

JAERJ-Conf 2002-004
nuclides and G-value of release for hydrogen from the solution, have been evaluatedquantitatively. In the present paper, perspective of the TRACY experiments including theexperimental methods and evaluation results about the release properties of the compounds fromthe solution are reported.
2. EXPERIMENTAL2.1 Experimental devicesThe block diagram of TRACY is shown in Fig. 1. TRACY is a transient criticality experimentalfacility for studying the transient criticality characteristics of low-enriched uranium fuel solution(enrichment 10 %). The characteristics are investigated under the various conditions of theexcess reactivity and reactivity addition rate. The maximum total fission in RACY i 118.
TRACY has an annular type core tank with 10 cm inner diameter, 50 cm outer diameter and 200cm height. Volumes of the gas phase and the fuel solution phase in the tank are almost 027 m 3and 012 in respectively. There is a vent -gas line connected to the tank and the vent-gascirculates through the line. The radioactive materials and radiolysis gases, released from thefuel solution to the gas phase, effuse into the line during the transient criticality. Te vent-gasline is equipped with a dilution tank (I I in 3) as a large volume element. Total volume of the line
3is almost 11.5 in including the dilution tank.To observe release and transport behaviorof the radioactive materials and the
dine f It radiolysis gases, the core tank and the linerandent rod are equipped with cascade impactors (Mst
and Q and maypack samplers (M) forcollecting radioactive aerosol and iodine
verd- 42 and gas concentration, measurement devicesfor measuring radiolysis gases. The Mst
Fuel sampler consists of one membrane filtersolut LXD and four stage impactors for collecting the
Core an mist with liquid collector and the C samplerMst : Cascade impactor for mist and iodine consists of one membrane filter arid sevenC :Andersen-typecascadeirnpactor stage impactors without that. The MM Maypack sampler f or iodineG Gas monitor (f or H2 and N Ox) sampler consists of one membrane filter
Fig. I Block diagram of TRACY and iodine collection filter element, such asfive silver plated fibrous filters (forinorganic iodine species), two silver nitrate
impregnated alumina beds (for organic iodine species). The Mst and C samplers were alsoequipped with the iodine collection filter element. After sampling, the respective samplers weretaken apart to each component and the radioactivity of the collected nuclides i the componentswere determined by gamma-ray spectrum analysis and corrected to those at the respectivesampling times by the decay correction calculation by using NDC nuclear data library 3.Moreover, the quantities of the nuclides in the fuel solution before and after the each experimentwere also detennined by gamma-ray spectrum analysis. In the present study, release behavior ofradioactive noble gases from the fuel solution to the gas phase was evaluated by using the data ofthe nuclides in the fuel solution.
- 440 -

JAERI-Conf 2002-004
2.2 Experimental conditionsInitial concentrations of uranium and nitric acid in the fuel solution, were about 400 g/dm' and 07mol/dM3, respectively, The volume flow rate of the vent-gas was about 027 m/min Tocollect radioactive iodine that is emerged from the hief solution with a time lag, the fuel solutionhad been kept in the core tank for hours after the transient criticality.In TRACY, reactivity can be added to the fuel solution by different three reactivity additionmodes, which are ramp withdrawal (RW) mode of a transient rod (variable withdrawal rate),pulse withdrawal (PW) mode of the rod and ramp solution addition mode. In the present study,the former two modes have been onsidered. Furthen-nore, to observe effect of the temperatureof the solution and increase of the surface area between gas and solution phases with producingthe radiolysis gas in te solution on the release behavior of the iodine species. two operations forthe PW mode, in which the transient rod was re-inserted in the solution just after the transientcriticality and the rod was not re-inserted for the hours after withdrawal of the rod, wereconducted. The fission rate oscillated with time and several fission peaks occurred for severalminutes for the RW mode, whereas one sharp fission peak with a few milliseconds wide wasobserved for the PW mode. In case that the transient rod was not re-inserted, the fission ratedecreased with time after divergence, attained minimum value at aost 2000 s after thewithdrawal of the rod and, after the minimum point, increased again and oscillated with time. Inthe present study, reactivity addition was varied from 07$ to 29$ as a parameter under the PWand RW modes.
3. RESULTS AND DISCUSSIONS3.1 Release behavior of hydrogen from the fuel solutionThe hydrogen concentration in the vent-gas attained to the peak just after the transient criticalityand decreased exponentially with time. Fig. 2 shows the relationship between the energy causedby fission and the released voluine of hydrogen from the TRACY core tank to the vent-gas line.The former was calculated by using3.2x10-11 Pfissions and the latter 1.5was calculated by integrating release 0 PWrate of hydrogen for 1,000 s after the A 0 RW (100ctransient criticality. This time 0 RW (300cm/rnin)
r: &
width almost corresponds to the CD ED RW (600cm/rm4X 1.0width of the first main peak of the
hydrogen concentration. The plusand linear correlation were observedbetween the both values and theslope, in other w ord, G -value of 0.5 . .............................. ....... ........... ..............................-release of the hydrogen could be iestimated about 0.8 inolecules/100
eV. In the CRAC, experiments,
which had been executed in France, _S1_0Pe [ecules/100eV�-
0.6 molecules/100 eV was reported 0.0as the value 4 The value in the z 0.0 0.5 1.0 1.5
present study was approximately Energy with total fission (X 1-24 OeV)
30 larger than the CRAC results. Fig. 2 Relationship between energy with total fission and
number of hydrogen released from fuel solution
441 -

JAERI-Conf 2002-004
3.2 Release behavior of iodine speciesThe concentrations of 1131 aDd 1133 in the gas pase of the core tank began to increase with atime lag of several minutes from the transient riticality ad attained approximately constantvalues. In the present study, reJease ratio of the volatile nuclides, such as iodine species andnoble gas in the fission products, fi-om te f4el solution to te gas phase in the TRACY core tankwas estimated by using the following calculation model. In the model, it was assumed that thevolatile nuclides are released from te fuel solution to the gas phase with release coefficient, (1/s), and it is effased from the gas phase to the vent-gas line, with dilution coefficient, V (/s),on the basis of the dilution effect of the vent-gas. By using tese coefficients and radioactivedecay constant, (1/s), of the each nuclide, the variation with time of the number of the eachnuclide in the fuel solution ad the gas phase of the core tank was calculated by solving thefollowing differential equations simultaneously.
(in the fuel solution)dP,.I/dt Fs X y1p + p, X Xp, X P1.1.1 - kP X Pso, (1)dX,.I/dt FS X'qX + Kp X kp X Psul - Xx + W X Xs.i (2)dDsO1/dt FS X'qD KX X %-, X X,,,l - XD X Doi (3)
(in the gas pase in te ore tank)
cLxgas/dt � x X Xs., -- (kx + V) X Xgas (4)
dDgas/dt = icx X Xx X Xgas - (kD + V) X Dgas (5)
where, Fs (fissions/s) is fission rate and ic (-) is branching fraction. The sbscripts P, X and D
mean the values of parent nuclides (P' means arent nuclides of the P), remarkable volatile
nuclide (I-131. 1133 o Xe-140, Xe-141) and daughter miclides and sol and gas rean the values
in the fuel solution and in the gas phase of the core tank, respectively, The time-integrated
numbers of the X atom i the both phases were also calculated by ornitting decrease of the
number of the X atom or dilution effect by the vent-gas and the rlease ratio of te X atom, Rx
(%), from the fuel solution to the gas phase was calculated by solving the following equations
simultaneously.
(in the fuel solution)
dX*SO1/dt = Fs Xqx + Kp X Xp X P,,,l (6)
(in the gas phase in the core tank)
dX*gas/dt = �x X Xs,,, (7)
(release ratio of the X atom from the fuel solution to the gas phase)
Rx = (X*g./X*,(,) X 100 (8)
where, the asterisk means the time-integrated numbers of the X atom. The Rx means the ratio
of total release numbers to te total produced numbers of the X atom.
It is assumed that the time variation between the measuring points of the numbers of iodine atom
in the gas phase of the core tank J.as), orresponding to the X,, ewi be represented as the
following equations.
Xgas H gas) = axexp(Pxt) (9)
- 442 -

JAERI-Conf 2002-004
dXg./dt = axpxexp(pxt) (I 0)
And the release coefficient, x, can be represented by combined the above equations as follows.
�x = ctxPxexp(pxt)x(p+kx+V)/X,,,, (I )
At first, cc (-) and P (-) were estimated ftom relations between time and te relative measuringpoints of nmbers of iodine atom, next, te release coefficients of iodine (�, i the relativemeasuring points was calculated by sing equation (I 1). Moreover, the release ratio of iodine(RI) was estimated by solving from equation () to (8) simultaneously by Runge-Kutta-Gillmethod, As te nclear data, such as teq and �,, the respective value m fNDC nuclear datalibrary 3] were used, he V was masured in an experiniCrlt using te inock-up vessel that hasthe same dimension and ventilation flow as the TRACY core tank and could be estimated as0.016 I/s,Examples of the evaluation results of the release ratio of I133 were shown in Fig. 3 Thetendency of the tirne dependencies of the evaluated release ratio for I- 3 and I- 33 'was almostsame. Al 45 h after the withdrawal of the transient rod, te release ratio of the iodine specieswere about 02% in ase that the transient rod was re-inserted to the solution just after transientcriticality and about 09 incase tat the rod was not re- 100inserted. Temperature of thesolution and hydrogenconcentration i the vent-gas,effused from gas phase of the
or Elm:
core tank, for the later case were Cn 10-1 .......... ........ ........1.7 and 41 tirries as igh as thevalues for the former case,
0respectively. Therefore, it wasattributed that the release ratio Reactivity: .5 $ (PW mode
Total fissions 8.5xlOI7for the latter case was higher 10-2 .... (not re-insert of the transient r d)than the former case because the
temperature of the solution in Reactivity: I 5 $ (PW 0
the latter case had been Total fissions 3 x I
sustained relatively high and the sert of the transi rod)
surface area between gas and 10-1,solution phases increased with 0 1 2 3 4 5
producing the radiolysis gases in Time after the withdrawal of the transient rod (s)
the solution. Fig. 3 Examples of evaluation results of release ratio of 1133
3.3 Release behavior of noble gases
Since the noble gases have poor chemical activity, it is regarded that the release behavior of the
noble gases from the fuel solution under the transient criticality conditioris is affected by the
mechanical effects, such as the stirring of the solution and icreasing of the surface area between
gas and solution phases the solution by the generated radiolysis gases, directly. The
generation property of the radiolysis gases in the solution is represented as the function of the
dynamic characteristics in the solution. Therefore, there is a possibility that the comprehensive
443 -

JAERI-Conf 2002-004
model for evaluating the nuclear criticality accident in the solution can be established byobserving the relationship between the release behavior of the noble gases and the dynamiccharacteristics.The mechanical conditions in the solution are varies with time under the transient criticalitycondition. Therefore, analysis of the time-course of the release behavior of the noble gases isalso important. In the present study, the time-course of the release behavior was evaluated byusing the isotopes, Xe- 1 40 and, Xe- 1 4 1, with different lifetimes Xe- 1 40 : 13.6 s, Xe- 1 41 173 s).Since Ba-140 and Ce-141, the daughter nuclides of the Xe-140 and Xe-141, have appropriatelifetimes (Ba- 140 12.8 d, Ce- 41 : )2.5 d) and specific activities for the reliable determinationin the remaining nuclides in the fuel solution aftei, the experiments, the release behaviors of theXe-140andXe-141wereovaluatedbyusingconcentrationofthedaughternuelides. Theabovedifferential equations were solved simultaneously by using the release coefficients of the Xe- 40and Xe-141, Xe (=�x), as parameters and the radioactivity concentrations of Ba-140 and Ce-141in the fuel solution at h and 40 h after the withdrawal of the transient rod from the solution.This time periods of 5h and 40 h after the withdrawal were determined for removing theremaining amount of the parent nuclides of the Ba-140 and Ce-141 in the solution. It wasassumed that the Xe- 1 40 and Xe- 1 41 were released from the solution to te gas phase in a veryshort time period just after te transient criticality and the release coefficients could beconsidered as a constant and average value. The release coefficients and the release ratios of theXe-140 and Xe-141 were determined and estimated by iteration calculation with the aboveequations until the calculated concentrations of Ba-140 and Cc-141 were consistent with themeasured concentration, respectively.To investigate the relationship between the release behavior of the noble gases ad the dynamiccharacteristics in the solution, correlation between the estimated release coefficients and releaseratios of the Xe-140 and e-141 and the inverse period (1/s), which was one of the dynamiccharacteristics, of the each experiment. As the example, the correlation between the estimatedrelease coefficients of the Xe-140 and Xe-141 ad the inverse periods is shown in Fig. 4 Incase tat the inverse period was lessthan I I/s, the release coefficients 101and release ratios of the Xe-140 andXe-141 increased with ireasing
14]Xe(tthe inverse period rapidly. The ,2�1.73s)...................... ?........................ ....... ........... ...................... .release coefficient and release ratio 100of Xe-141 attained to about sand 90 in case that the inverseperiod was about 100 I /s, ..................... ........
10-1 . ......... W .- .......... .........respectively. At this point of the 54inverse period, the releasecoefficient of the Xe-141 was larger
than the coeffi cient of the Xe 140 2 10 . ..................... ............ 14OXe(tl/2=13.6s) ...................
by almost two orders of magnitude.
The mechanical effects, which affect
the release behavior of the oble 10-3
gases, increase with divergence with 0 100 200 300 400
transient criticality and decrease and Inverse period (1/s)
attenuate after convergence of the Fig. 4 Relationship between estimated release coefficient
divergence by re-insertion of the of Xe and inverse period
- 444 -

JAERI-Conf 2002-004
transient rod into the solution. Since the lifetime of the Xe-140 is relatively long, this remainsin the fuel solution in considerable time width after the convergence of divergence. As notedabove, in the present study, the release coefficient of the noble gas was estimated by treating asconstant and average value, therefore, it was regarded that the estimated release coefficients ofthe Xe- 1 40 represented not only the values in the time region of divergence but also the values inthe time region after convergence of the divergence. On the other hand, the release coefficientsof the Xe 141 could represented the influence of the mechanical effects on the release property ofthe nuclide corresponding to the time region of divergence directly because the lifetime of theXe-141 is shorter than Xe-140. Consequently, it was considered that the release coefficients ofXe-141 were larger than the values of Xe-140.
4. CONCLUSIONSThe release properties of the radiolysis gases and volatile nuclides, such as iodine and noblegases, under the simulated transient criticality condition were observed and estimated by usingTRACY As the results, G-value of the hydrogen was estimated about 0.8 molecules/100 eVand the release ratios of iodine species were evaluated about 02% in case that the transient rodwas re-inserted to the solution just after transient criticality and about 09% in case that the rodwas not re-inserted, at 45 h after withdrawal of the transient rod from the solution. Similarlythe release coefficient and release ratio for xenon isotopes with different lifetimes were evaluatedand correlation between the values and inverse period, which was one of the dynamiccharacteristics, was observed. It was proved that the release ratio of Xe-141 from the solutionwas over 90 (%) in case that the inverse period was over about I 0 (I /s).In future, time dependencies of the release properties, such as the release coefficient, of the noblegases will be investigated and the comprehensive model for evaluating the nuclear criticalityaccident in the solution will be established by observing the relationship between the releaseproperties of the noble gases and the dynamic characteristics, quantitatively.
5. REFERENCES[1] RegulatoryGuide3.3,U.S.NuclearRegulatoryCommission(1977).[2] RegulatoryGuidel.3,U.S.NuclearRegulatoryCommission(1974).[3] K.TASAKA, et al., AERI 1320 1990).[4] H.M.Forehand, Jr., NUREG/CR-2517 1982).
445 -

This is a blank page.

JP0250336JAERI-Conf 2002-004
Development of Solution Behavior Observation System under Criticality
Accident Conditions
Akio OHNO, Hiroshi YANAGISAWA, Kazuhiko OGAWA, Eijyu AIZAWA
and Kouichi SAKURABA
Japan Atomic Energy Research Institute
Fax: 81-029-282-6024, e-mail: ohno�nuceftokaijaeri.gojp
A solution behavior observation system was developed for observing the behavior of fissile
solution and radiolytic voids under criticality accident conditions in TRACY The system
consisted of a radiation-resistive optical fiberscope and a CCD color video camera. The
system functioned properly in the mixed high radiation fields of gamma rays and neutrons
under criticality accident conditions, and it succeeded in taking the images of their behavior.
They provide an important information to understand phenomena of fel solution at criticality
accidents and to construct computational kinetic models. The images can also be used as
teaching materials for plant workers and students in universities.
Key words: Solution behavior observation system, Radiolytic, void, Criticality accident,
TRACY
1. Introduction
Radiolytic gases('� are generated with rapid increase of nuclear power in initial course of
criticality accidents in fissile solution systems. The radiolytic gases are minute and grow
together into voids. The voids play an important role as negative reactivity -feedback for
quenching nuclear power excursions in combination with increase in temperature of the fissile
solution. Since the voids move up to the solution surface, nuclear power is governed
dominantly by the behavior of the voids. It is necessary to observe the behavior of the voids
and fissile solution for understanding phenomena of criticality accidents and constructing
computational kinetic models. Moreover, requests of asking what happens at criticality
accidents were brought from various fields. To meet these demands, a solution behavior
observation system (2) was developed in TRACY.(')
2. Solution behavior observation system
For the development of the solution behavior observation system, two points were taken
into consideration. One is mixed high radiation fields of neutrons and gamma rays where the
system is placed. 'The other is to assure the soundness of a penetration structure through the
TRACY core tank from the safety viewpoint. To meet above conditions, a radiation-resistive
optical fiberscope was adopted to lead images inside the TRACY core tank to a CCD (Charge
Coupled Device) color video camera outside. A graphite-made fiber penetrator called Conax
Seal, which is often used at high pressure boundaries in research reactors, was used in
- 447 -

JAERI-Conf 2002-004
TRACY.
The solution behavior observation system consisted of the radiation-resistive optical
fiberscope a CCD color video camera and a light source as shown in Fig.l. The radiation-
resistive optical fiberscope and the CCD color video camera are guaranteed up to 101 Gy and
10' Gy of gamma rays, respectively. But they are not guaranteed for neutrons. The fiberscope
was connected with the CCD color video camera and the light source placed at about m
away from the TRACY core tank. The pixel number of the fiberscope and the camera are
30,000 and 410,000, respectively. The pixel number of the fiberscope therefore, determines
the resolution of the system. The detail specifications of the system are shown in Table 1. The
optical fiberscope was inserted into the core tank with a stainless steel tube to avoid
contamination from the fissile solution as shown in Fig. I and the tip was adjusted to be 60cm
from the bottom of the TRACY core tank to obtain optimum images.
3. Experiments and results
Experiments simulating criticality accidents were carried ot with the solution behavior
observation system. Reactivity was added up to 3 at the rate of 0.2$/s by ramped withdrawal
of the transient rod (Case 1) or 1.5$ at the rate of 0.14$/s by feed of fissile solution (Case 2,
respectively. Reactivity addition in both experiments is close to the possible condition of the
JCO criticality accident. The reactivity addition condition is shown in Table 2 in detail,
together with the fissile solution used in the experiments. The fissile solution is 998%
enriched uranyl nitrate solution and its uranium concentration is about 376gU/1.
Figure 2 shows typical still images obtained in the Case I experiment, The images were
compared with the power around the first power peak. As shown in Fig. 2 no ripples on the
solution surface were observed in course of withdrawal of the transient rod before power
started to increase sharply. At the first power peak, radiation of the radiation-resistive optical
fiberscope including attachments on the tip was seen due to extremely high radiation dose rate
of neutrons and gamma rays. It was clearly observed in about 2s after the first power peak that
the torus-shaped cluster of voids reached solution surface and then spread over. It would be
understood that the torus-shaped cluster of voids reflected spatial distribution of neutron flux
in the TRACY core tank, because the concentration of voids became proportional to fission
density in the solution. After the voids spread over the solution surface, no cluster of voids
came out until the second power peak appeared. Figure 3 shows also typical still images
obtained in the Case 2 experiment. Imediately after start of solution feed, ripples were seen
on the solution surface. That is due to stirring of the solution brought by solution feed. Voids
of large bulk, appearing on the solution surface, were observed in about 2s after the first
power peak and then spread over.
As is seen in Fig.2 and 3 the voids are observed on the solution surface in about 2s after
the first power peak appeared. As the production rate of radiolytic gases is dependent to
power density at each position in the core, the voids are largely generated at the central part of
the core. By taking account of the solution level of about 60cm. the elevation speed of voids
- 448 -

JAERI-Conf 2002-004
in the solution was estimated to be about 15cm/s in the range of the experiments.
In order to meet the external requirements, the color motion pictures taken by the system
were complied to make a video tape for education and training not only for plant workers but
also for students in niversities. It can also be used in activities of public acceptance and is
available to distribute for demands.
4. Conclusions
The solution behavior observation system was developed in order to observe behavior of
the solution and the radiolytic voids under the criticality accident conditions. The system
functioned properly in the mixed high radiation fields of neutrons and gamma rays and
provided clear color motion pictures necessary for understanding of critical accident
phenomena and development of computational kinetic models. The elevation speed of voids
in the solution was estimated from the experiments to be about 15cm/s. The images can also
be used as teaching materials for plant workers and students.
-References-
(1) Spiegler, P., et al.: NAA-SR-7086, 1962).
(2) Ogawa, K., et al.: J. Nucl. Sci. Technol., 37(12),1088(2000).
(3) Yanagisawa, H., et al.: Proc. 6h Int. Conf Nuclear Criticality Safety (ICNC'99), V61.11, p.
900(l 999).
449 -

JAERI-Conf 2002-004
Table I Specification of solution behavior observation system
1) Optical fiberscope
Type Fluorine containing glass coreModel RCD30-AI912 by Mitsubishi Cable, Ltd
Length 12mRadiation resistivity 104Gy of r -rayNumber of pixels 30,000
2) Light source
Type Xenon lamp of 50OWModel LS-501 by Mitsubishi Cable, Ltd.
3) Video camera
Type 1/2 inch color CCD,Model 82132500by Mitsubishi Heavy industries, Ltd.
Radiation resistivity 103Gy of r -rayNumber of pixels 410,000
Table 2 Experimental conditions
Conditions Case I Case 2
1) Reactivity additionOperation mode Ramped withdrawal Ramped feedAdded reactivity($) 3 1.5Average reactivity addition rate($1s) 0.2 0.14-Withdrawal speed of transient rod(cm/s) 4.3 N/A-Flow rate of solution feed(l/min) N/A 67.8Initial solution level(mm) 652.8 400.3Final solution level(mm) 652.8 578.9
2) Solution2315U enrichment(wt%) 9.98 9.98Uranium concentration(gUll) 376.1 375.7Concentration of free nitric acid(mol/1) 0.63 0.65Delayed critical level(mm) -Transient rod withdrawn 526.5 525.7-Transient rod inserted 652.8 651.1
- 450 -

JAERI-Conf 2002-004
Radiation-resistive optical fibTransient rod (18 mm x12m)
E
--- TRACY core tankOuter diameter: 50cmInner diameter: 8cm
Solution feed/ Solution fueldrain line
Uranyl nitrate solution(enrichment 10%, 3769U/1)Solution level: about 60cm
Transient rod guide tube
Fi& I Layout of solution behavior observation system
In course of withdrawal Moment of the first Torus-shaped cluster of voidsof transient rod __--reaches-soilutlon-surface
71'0
10
lo, Voids produced in thesecond oweUeak
'TerMil.t'." of wthdrawal
Maximum power: 33MW
a 10 20 30 40 50 60 Integrated power: 18MJTime (s) (=5.6xl 011fission)
Fig, 2 Behavior of solution surface i Case (3.0$, 0,20$/s.ramped withdrawal 4.3cm/s)
- 451 -

JAERI-Conf 2002-004
.ig
RP
In Process of solution feed Moment of first pLvLer peak Voids urface
.... ... ................. .A . ...... ..............
Delayed.Criticality
a Voids spread over surfacert 0
lo feedTermination or feed.
lo' Maximum power: 18MW0 20 40 60 BO 100 120 140 160 180 Integrated power: 1 1 MJ
Time (s) (=3.5x1Ol7fIssion)
Fig. 3 Behavior of solution surface in Case 2(1.5$, 0.14$/s:ramped feed 58 L/s)
452 -

JP0250337JAERI-Conf 2002-004
MEASUREMENT OF POWER PROFILES FOR LONG-SUSTAINEDCRinCALITY ACCIDENT USING TRACY
KNAKAJIMA, S.WATANABE, Y.MIYOSHI, K.OGAWA, A.OHNOJapan Atomic Energy Research Institute
Tokai-mura, Naka-gun, lbaraki, 319-1195 JAPANFax: 81-29-282-6743, e-mail: nakajima�melodytokaijaeri.goJp
To study the characteristics of long-sustained criticality accidents with natural cooling conditions, a series ofsupercrifical experiments were conducted using the Transient Critical Experiment Facility, TRACY It wasfound that the power profiles in sch accidents depended on te amount of iserted eactivity, not the methodof reactivity insertion. This is due to the fact that the power behavior in the long period is dominated by thetemperature only. Reactivity analysis and kinetics calculation were also performed to obtain the temperaturecoefficient of reactivity and to investigate the effect of cooling conditions.Key words: Long-sustained criticality accident, TRACY, Power profile, Reactivity analysis, Yinetics calculation
1. INTRODUCTIONTo the present, 22 criticality accidents in fuel processing plants were reported.Ell Althoughabout half of them were terminated in a short time (less than 20minutes), six of them,including the JCO accident occurred at Tokai-mura, Japan, in 1999, continued over thanseveral hours (from 7hr to 37.5hr). It was reported that the accident tank at the JCO has anexternal cooling system, and it sustained the stable nuclear power. [2,3] Oil the other hand, therest accidents had no cooling system, and then it was observed that the power in thoseaccidents oscillated very slowly under the natural cooling conditions.To study the characteristics of such long-sustained criticality accidents with natural coolingconditions, a series of supercritical experiments have been conducted using the TransientCritical Experiment Facility, TRACY at the Japan Atomic Energy Research Institute (JAERI).
2 EXPERIMENT2.1 Experimental conditionsTRACY is a supercritical experiment facility using Rod guide tube: 76.3mm-diam., 3.6mm-thick
10wt% enriched uranyl nitrate aqueous solution tosimulate a criticality accident in fuel processingplants. E41 T core, tank of TRACY is 52cm.diameter cylindrical tank made of stainless steel. Side wall:The thickness of sidewall is 1cm and that of Solution 10nun-thickbottom plate is 8cm. It has a central guide tube height
where an absorber rod, which is denominated as a Mauritania*�r Inn. Diarn.:transient rod, positioned. Reactivity is inserted
by the following three methods: 500mm
1) Pulse withdrawalThe transient rod is withdrawn pneumatically Bottom plate:
in a very short time (about 0.1s). 80mm-thick
2) Ramp withdrawal Fig. I TRACY Core Tank
The transient rod is withdrawn mechanicallyin a constant speed.
3) Ramp feedFuel solution is fed to the core tank from the bottom of the tank in a constant feed rate.
In the present study, the ramp feed method with a feed rate of about 601iter/min was employed,
- 453 -

JAERI-Conf 2002-004
the corresponding reactivity insertion rate was about 0.15$/s. The inserted reactivity wasvaried from 0.5 to 1.5$. The power profile was measured for about hours after thereactivity insertion. Table shows the experimental conditions.
Table Experimental Conditions
U conc. Acidity Temp, Hc HO HF) I Feed rate ReactivityRun I (gUN (N) I (0c) (mm) I (mm) I (mm (Ymin) M
160 379.5 0.6 29.1 524.21 400.26 541.22 59.5 0.51161 380.4 0.61 29.1 522.89 400.07 551.07 60 0.83163 379.8 0.61 29.0 520.95 399.90 564.67 60 1.25.164 382.3 0.62 29.0 516.90 400.13 570.02 59.5 L52
2.2 Results of experimentsThe measured power and temperature profiles are shown in Figs. 1 to 4 As seen in Figs. and 2 the power decreased exponentially due to the temperature rise after the peak followedby several small oscillations. These small oscillations are caused by the production anddisappearance of radiolytic gas void. However, about I or 2 hours later, the solutiontemperature decreased slightly due to the natural cooling effect, then the power started toincrease, as seen in Figs. 3 and 4 When the power reached to about I kW, which resulted inthe temperature ise, the power turned to decrease again. Such slow power oscillationcontinued for several hours, and fally the power and temperature became stable. It wasobserved in the figures that the larger inserted reactivity generated shorter ocillation period,because the larger reactivity causes larger temperature increase, i.e. the larger temperaturedifference from the ambient one, which is easier to decrease (cool down).
l.E+08 Reactivity Max Power 70�.5$ W (MW)
1.E4-07 0.5 0.11 US ........... ... ....... .......0.83 0.52 60 1.25$
.1.E+06 83$ 1.5$, . .....1.25 13 55
I..E+05 50
I.E+04 45.25$ E 40I.E+03 0.5$ �2 35 ).83$
0.511+02 30 $25 - --J.F*01
0 50 100 ISO 200 25b0 50 100 150 200 250
Time S)Fig. I Measured Power Profiles Fig. 2 Measurttd Tmperature Profiles
(Burst part) (Burst part)
1.E+09 1-5$ Step (Pulse withdrawal) I.E+09I 1.E+081:E+08
A Ramp (Ramp feed) I.E+01IE+0T --- r
Step I.E+051.E+O6 .1.5$ i'P( Ramp E404LE+03
l.EQ4 0 I.E+020.5$ LE+01 0.5S1.E+03 I.E+06
l.E-01I.E+02 Ram1.E-02
I.E+ 1 1.E,03�100 0 100 2bo .300 400 500 0 5000 10000 15000 20000
Time S) Time "
Fig. 5 Comparison of Power Profiles with Fig. 6 Comparison of Power Profiles withDifferent Reactivity Insertion Method Different Reactivity Insertion Method
(Burst part) (Whole period)
- 454 -

JAERI-Conf 2002-004
2.3 Effect of reactivity insertion methodTo investigate the offect of reactivity insertion ethod on te power behavior, the pulsewithdrawal o-xpofimerits with reactivity of 0.5 and 1,5$ Were erf0f)-fled. In tese cases, thereactivity was inserted in about 0 Is, we, can treat 'it as a stop reactivity insertion,Results of the pulse withdrawal experiments are compared with the ramp feed xperiment inFigs. ad 6 As seen in the, figures, the power profiles of both methods aye amost sameexcept the very early part. Since the temperature dominated the, power ehavior in the longperiod, we, can conclude that the, temperature change after the first burst is almost same for thesame inserted reactivities. Thus, it is important to calculate the thermal balance during theaccident, when it sustained for a long time.
70 -1.EtOg
651.5$I.E+07 60 . ..... . .......1.25S
E+05 5515S 1.25S 50
I E03 'Afghan, .83$-CD0
l.E4-01 E 40 0.5$0.5$ 35
LE-01 30
1.E-03 26.0 5000. 10000 1.5000 0 tooo 10000 A 5000
time S) Time (S)
Fig. 3 Measured Power Profiles Fig. 4 Measured Temperature Profiles(Whole period) (Whole period)
3. REACTIVITY ANALYSISBy using the obtained power profiles, we have calculated te reactivity change with theinverse kinetic technique.151 In this technique, the reactivity profile ps is calculated using thefollowing equations.
A d [In p(t), P(t - -r)P$ f.,8,ff dt PO
D(,r = exp(-,Zir).i fl�ff
where Pt) : Power at time t,,8,ff : Effective delayed neutron fraction, A: Prompt neutron lifetime, 8 Ili: Delayed neutron fraction and decay constant of i-th group delayed neutronprecursor.Figures 7 and 8 show the profiles of 150 65
___L Tempetaturereactivity as a esult of iverse kinetic 100 6.0
calculation, and solution temperature for te - �O 55Z"(Dinserted reactivity of 125$. As shown in 0 50
Fig.9, the temperature dominates the -5( 45reactivity change in such a long period. 100 40 Q.
M EM - 4)
Using those data, the profile of feedback M 150 .3.5reactivity(Ap) is obtained by subtracting the -200 30
inserted reactivity(i.25$) from the 250 100 200 300 400 500
calculated one, and it is sown in Fig. 9 Time (Si'
with the solution temperature change(AT) Fi 7 Reactivity Profile for 125$ hisertionfrom the initial one. The atio of feedback
(Burst part)
455 -

JAERI-Conf 2002-004
-140 ............ . . ................. . . .....................
15 60Reactivity > 15
105 130 29
CDow ��125 0!!S� 28
-5 58 27
0 10 CLE -60. 26.5.7 -4 ,
Temperature20 4
�44
0 50M 10000 15wo -4.2.Time (s) -4:0
D 5000 10000 11,000
Tme'(S)Fig. 8 Reactivity Profile for 125$ Insertion
(Whole period) Fig. 9 Calculation of Temperature Coefficient
of Reactivity 1.2$ Insertion)
reactivity and solution temperature change (Ap/AT), that is the temperature coefficient ofreactivity, is also shown in the lower part of the figure. This ratio varies with reactivity andtemperature change; this variation would be caused by the change of teraperature distributionin the fuel solution. At the end of experiment, the ratio became stable; it is about 42 cent/oC.This value almost agrees with the calculated temperature coefficient of reactivity.
4. KINETICS CALCULATION
The power profile for the inserted reactivity of 1.5$ was calculated using a one-point kinetics(3,11code AGNES2 . To investigate the effect of cooling conditions on the power profile, two
cases of cooling conditions were used in the calculation.Case 1: The heat is removed by the natural convection from the sidewall only. The heat
capacity of the sidewall is also considered. (The cooling effect of the bottom plateis not considered.)
Case 2 The heat is removed by the natural convection from the sidewall and the bottomplate. The heat capacities of the sidewall ad bottom plate are considered.
The calculated power profiles are shown in Figs. 10 and 11 with the measured one. For theburst part, the two calculated results agree well. They reproduce the peak power ofexperiment wll, although they show lager oscillations than the experiment. This differenceis caused by the lager void production in AGNES2 calculation. For longer period, two
1 E+08 I.E+08 LE+08Ene
I.E+07 k I.E+66I.F+04 I �F+O�
I.E+06 Experiment I.E+02
1.E405 1.E+00 1.406 �3LE"02
I..E+o4 LE-04 I.E+05 'EL LU
Calculation I.E-06 SC )1,E+03 (Cases I I.E-08 1.&�041.E+02 CalculationI.E-10
T (�as 2 -I I.E+031.E+01 : I.E�120 100 200 300 400 500 0 5000 1000( 1,5000
Time (s) Time:(s)
Fig. IO Calculated Power Profiles in Fig.11 CalculatedPowerProfflesinComparison witli EXPCTiMent Comparison with Experiment(1.5$ Insertioji, burst part) (1.5$ Insertion, Whole period)
- 456 -

JAERI-Conf 2002-004
calculations show quite different behavior. The case shows almost the same behavior asthe experiment. On the other hand, the case 2 shows a very large and long intervaloscillation, it differs from the experiment greatly. However, the eergy profiles are amostsame for a cases, because the most of energy was released in the burst part.
5. CONCLUSIONThe power profiles of long-sustained (about 5hr) criticality accident have been measured.The following conclusions are obtained.
* The power behavior depends on the total amount of inserted reactivity. Almostindependent of the reactivity insertion method.
* The reactivity analysis was conducted using the measured power profiles, and thetemperature coefficient of reactivity was evaluated. It varies about 10% during thepower transient; this would be caused by the change of temperature distribution.
* Kinetics calculation shows the cooling effect of the bottom plate of the core tank issignificant.
REFERENCES[1] T. P. McLaughlin et al., "A review of Criticality Accidents, 2000 Revision," LA-13638,
Los Alamos National Laboratory 2000).[2] NSC Investigation Committee, The Report of the Uranium Processing Plant Criticality
Accident," Nuclear Safety Commission, Science and Technology Agency, Japan 1999)(in Japanese).
[3] JAERI Task Force for Supporting the Investigation of JCO Criticality Accident,"JAERI's Activity in JCO Accident," JAERI-Tech 2000-074, Japan Atomic EnergyResearch Institute 2000).
(4] 'H. Yanagisawa et al., "Experiments on Transient Behavior of a low-enriched UranylNitrate Solution System with TRACY to Study Hypothetical Criticality Accidents inReprocessing Plants," Proc. 6th Int. Conf. Nuclear Criticality Safety (CNC'99),Versailles, France, Sept. 20-24, 1999, Vol. 11, p.900 1999).
[5] K. Nakajima. et al., "Study on Reactivity Feedback Effects in the TRACY TransientExperiment," ibid., Vol. 111, p.1286 1999).
[6] K. Nakajima et al., "Development of a Kinetic Code in Solution Fuel Systems for theEvaluation of Criticality Accident in Solution Fuel System," Proc. Int. Seminar CriticalitySafety (ISCS'87), Tokyo, Japan, p.427 1987).
457 -

This is a blank page.

JP0250338JAERI-Conf 2002-004
POWER PROFILE FVALUATION OF THE JCO PRECIPITATION VESSELBASED ON RECORD OF THE GAMMA-RAY MONITOR
K. Tonoike, T. Nakamura, Y. Yamane and Y. Miyoshi
Criticality Safety Laboratory, Department of Fuel Cycle SafetyResearch,Nuclear Safety Research Center, Japan Atomic Energy Research hstitute
Tokai-mura, Naka-gwi, lbaraki-ken 319-1195, JAPANFAX: 81-29-282-6798, e-mail: ojioike(i,-vnuceftokaijaeri.gojp
The y-ray monitor installed in the Processing Facility I in te JCO Tokai-works had recorded the y dose ratechange over time which was proportional to te power (nuclear fission rate) in the precipitation vessel fromoccurrence of the criticality accident to termination of the critical ondition. The shape of y dose rate recordfrom the point of 25 inutes after occurrence to the point of termination ("plateau" part) was normalized usingthe fission nmber 2.2x 10¹⁸ and absolute value of te power was evaluated.
Key words: criticality accident, SCO, y-ray monitor, power profile
1. INTRODUCTIONThe first criticality accident in Japan occurred on September 30, 1999 in the JCO
Tokai-works. Workers violated safety regulations and feed uranium solution of 18.8% U-235 enrichment manually into te precipitation vessel which has no criticality safe shape.The uranium solution reached critical condition and fission chain reaction initiated on10:35 AM of the day. he critical condition had lasted for more than 19 hours and the longduration of criticality is a feature of this accident. It also lead the large number of fissionswhich was 2 5 x I ", r'l
During the accident, information source had been very limited to estimate the
criticality of the precipitation vessel. Only clear evidence available which can indicate the
criticality was report of the periodic neutron dose survey ch ad been conducted about
every I hour around the JCO Tokai-works. From the limited information, it was difficult to
describe how the chain reaction went on, how fission rate changed over time or whether
power bursts existed.
In the post accident investigation where Japan Atomic Energy Research Institute
(JAERI) provided intensive support E2] , however, chart record of the y-ray monitor was
revealed. The record covers from the occurrence to the termination and shows the fact that
quite stable chain reaction had endured for about 19 hours ("plateau" part fission number
2.2xl018) following te initial burst of about 25 minutes ("burst" part fission number0.3x 10 I ).
The record is fairly informative and makes it possible to estimate absolute fission rate
in, the precipitation vessel at any time point of the accident. It also shows how fission rate
was reduced during the water purge effort from the cooling water jacket of the precipitation
vessel to terminate the critical condition.
2. FACILITY LAYOUT GAMMA RAY MONITOR
Major facilities in the JCO Tokai-works are the Processing Facilities I and 2 for re-
conversion work of uranium for WRs and the Conversion Test Building where the accident
occurred during prification of uranium for the test fast reactor. As illustrated in Fig. 1, the
Conversion Test Building is located at west comer of the JCO Tokai-works and the
Processing Facility I is about 150 in east of the Conversion Test Building. The Processing
Facility 2 is more far to north-east.
Gairtma-ray onitors are installed in each of these facilities and sensed abnormal dose
rate due to te accident, Dose rate in the Conversion Test Building was too high and over
459 -

JAERI-Conf 2002-004
rec ation Vesse:1] 1-y-ray MO-nitorsUF6 gas Storage Room
Calcination Room
ConversionE:1 UO, powder Sto rage Room
Test Buildi
ProcessingProces ig Facility 2Facility I
F-1
Mito Main Gate
Administration Buildi6
RITokai 1. M M IEtachi
Fig. I Facility layout in the JCO Tokai-works
the range where the monitor can work. In the Processing Facility 2, dose rate became higherthan normal but the difference was relatively small. The monitor in the Processing Facility Irecorded y dose rate change most clearly and the record was provided for the examination.Gamma dose rate had been measured at three locations in the Processing Facility I andrecorded on one chart paper. Those locations are the U02 powder storage room, the UF6 gasstorage room and the calcination room.
3. EXAMINATION OF RECORDGamma dose rate of those three locations in the Processing Facility I was recorded
periodically by a dot-impact type chart recorder as shown in Fig The recorder has 6 inputchannels and 3 of them has been occupied. The recorder prints a dot for the first channel,waits 12 seconds, prints another dot for the second channel, waits another 12 seconds andrepeats this sequence for other 4 channels. For one channel, time interval of record is 72
seconds. In fact, the first three channels are assigned for the calcination room, tile U02
powder storage room and the UF6 gas storage room and other three channels are not assigned.Thus, the recorder prints three dots in 24 seconds for those three locations, waits 48 secondsand resumes next series of print.
Around the time of accident occurrence, normal dose rate of the calcination room wasrecorded and abnormal high dose rate of the U02 powder storage room was printed 12seconds later. Other 12 seconds later, high dose rate record of the UF6 gas storage roomappeared. The first abnormal record of the calcination room came out more 48 seconds later.For convenience, time of the first abnormal record of the U02 powder storage area is set totime zero.
Just before the occurrence, normal dose rates of those locations were 3 x 0-2 mRJhfor the calcination room, I 5 x10⁻² mR/h for the U02 powder storage roorn and 1,6x 10⁻² MR/hfor the UF6 gas storage room. Observed high dose rates were read, ot from each printeddots on chart paper and additional dose rates due to the criticality i he precipitation vessel isillustrated in Fig. 3 by subtracting those normal dose rate of each location from those
- 460 -

JAERI-Conf 2002-004
mR/h1 0 0 .. ...... ... ... ..
.. ............... ... .. .. .... .... ;i .... .......Time Duration
I 0U0j pp-de . ... ....St0age Room, .-Y ........ ...
......... ... ..... . ............ .... ... .... ................. ...... ... T z.. .......... ........ . . ........... ... . ............... ... . ... . ..........
SO je�R om . ..... ---- ....... ........ .. .... ...... .....
0. 1...... ........ ............. . .. .... .... ..... ...... .....
70 .0 1 .. ...... .... ......... .......... .............. ........ ................ ..........
...........a&-Water Purge Effort
from Cooling Water Jacket Accident..... .- - -----------
--::.:- ............. ..... .. .............to Terminate Criticality . .. ....... .. Occurrence.......... ..... ..SeptembOctober 1 320 - 600 er 30
pov� ler-StoAge-1 V01W 10:35
........ ... .... .......... ........ .. ......
0 Pom11 11. 11
Fig. 2 Chart record of the y-ray monitor in the Processing Facility I
100 100- U02 powder storage room (actual value)
- JJF 6 gas storage room (adjusted)
--A- calcination room adjusted) I
10 1
0 -6- U02 powder storage room (acual vahie)0 0
0.1 - UF6 gas stroage room (adjusted)
6- alDmatiDn room adjusted)
0.01
0 10 20 30 0 5 10 15 20
Durution Time (minute) DuraWn Time (hour)
Fig. 3 Comparison of y dose rate change of three locations in the Processing Facility I
observed high dose rates. In the figure, curves of records of the UF6 gas storage room andthe calcination room are normalized so that their integration become equal to integration ofthe U02 powder storage room. It can be seen that those curves are almost same althoughtheir absolute values are different.
Curves of power profile appeared in Fig. 6 is an average of records of those threelocations. As discussed above, the first high dose rate was recorded within 12 seconds afterthe criticality initiation. In other words, however, there is no information i this figure aboutthe first maximum 12 seconds of the accident.
4. RESPONSE OF GAMMA RAY MONITORRecords of different place where one decade divergence of dose rates existed show
almost same shape. This fact suggested that all ionization chambers operated properly intheir working range and correct dose rates were recorded, but there is still possibility that
461

JAERI-Conf 2002-004
LE+07
L E 06 .. ............................Moniior
STACYLE+05 .... ....................... Reactor Room Reactor Room
Concrete WaHThickness: 1.8 m
0P-64
L E 04 ................................. ............
- Neutron Tnstrumentation- Gamma-ray Monitor
LE+03 ' I I I I I I I
0 50 100 150 200 250 300 350 400 450
Time (sec)
Fig. 4 Response comparison of the y-ray monitor and neutron instrumentation at TRACY
ionization chambers exposed to too high dose rate radiation and responded improperly forseveral minutes following the occurrence. To confirm response of the y-ray monitor, amonitor system including ionization chambers amplifiers and recorders of the same type as ofthe Processing Facility I of the JCO Tokai-works was tested using the TRACY in the NUCEF,JAERI-Tokai.
The TRACY is a critical assembly using uranium nitrate solution which an realizecriticality accident condition under controlled environment. Its core tank is ocated in thereactor room surrounded by concrete walls of 1.8 m or 22 in thickness and uranium solutionis fed into the core tank beyond the critical condition. Composition of the uranium solutionare about 390 gU/L for uranium concentration, about 10% for 235U enriclunem. Diameter ofthe core tank is about 50 cm. Fission rate change is measured by 235U fission, chambers(FCs) which are located in the reactor room and are sensitive to neutrons leaking from theCore tank. 31
The monitor system was set up in the next reactor room of the STACY which is theother critical assembly. The core tank and the monitor was isolated by the concrete wall of1.8 in thickness but the monitor could detect high dose rate due to the citicality of TRACY.Figure 4 shows comparison of dose rate change observed by the 7-ray monitor and fissionrate change observed by the FC. Those shapes are almost same, which imply the y dose rateis proportional to the fission rate. Even in the case where initial dose rate of burst was overthe range, indication of observed dose rate recovered normal within 2 or 3 minutes. Fromthis results, it is assured that the record of JCO's y-ray monitor indicates dose rate changecorrectly from just after the occurrence while the first two or three dots may be improper.
Next question is origin of the y-ray, which may be prompt y-ray emitted by fissionreaction or secondary y-ray produced by neutron capture reaction, Gaympa-ray from fissionproduct (FP) built up in core tank may be negligible. To carify the question, computeranalysis using the Monte-Carlo code N4CNP-4B 141 was conducted with te nuclear data fileJENDL-3.2l']. For the test at TRACY, eigen value analysis was carried out about the coretank containing the uranium solution to evaluate neutron and �-ray emission from the coretank. Then, fixed source analysis followed utilizing the result of eigen value analysis about
- 462 -

JAERI-Conf 2002-004
both of the reactor rooms of TRACY and STACY indicated in te Fig, 4 The fixed sourceanalysis onsists of two cases for y-ray only and for both of neutron and y-ray. Comparisonof those two cases shows that prompt y-ray contributes less half 20% of total y dose andsecondary y-ray is doininaw. In te same mnner., the precipitation vessel in the ConversionTest Bilding of te JCO Tkai-works was aalyzed by eigen value calculation first. Then,dose analysis around te Conversion Test Building and the Processing Facility I wasconducted where the precipitation vessel was treated as a fixed source. The analysis aboutthe JCO Tokai-works aso indicates the same tendency about ratio of prompt y-ray andsecondary y-ray as of the TRACY case.
5. FISSION NUMBERIf total fission nurnber or integrated power output of the accident becomes known,
curve of the chart record is able to normalize so that integration of the curve is equal to theintegrated power to estimate fission rate change or power profile.
Small amount sample of uranium solution in the precipitation vessel had been takenand analyzed i the analytical laboratory i te NUCEF, JAERi-Tokai. Density of fissionproduct in the solution was measured and total fission number of the accident was derived as2.5xl018. The derivation was based on volume ratio of solution in the precipitation vesseland the sample and the FP yield data. The method of fission number estimation by FPdensity anaVsis bad been employed for routine analysis to characterize the TRACY
1experimentJ IAlthough the chart record of the y-ray monitor indicates y dose rate which is
proportional to the fission rate in te precipitation vessel, there ay be missing of recordabout the first spike within several seconds just after the occurrence. Ts means that theshape of record annot be ormalized using the total fission mber because fission numberof the first spike is still unknown. As long as for the fst several seconds of the accident, itis possible to estimate fission number by calculation with fairly good accuracy. In theaccident investigation, however, derivation front the measured data was strongly requiredinstead of calculation. It was the record of a neutron counter in the monitoring post ofJAERI-Naka that relieved the difficulty.
"Plateau" part:87%"Burst" part
: 2.2 x I 0 1 8 fissio ns:13%1018 &A3x s 10ris
0 5 10 15 20Duration Time (hour)
Fig. Record of neutron count at the monitoring post of JAERI-Naka
- 463 -

JAERI-Conf 2002-004
The neutron counter is located about 2 km away to the west from the precipitationvessel. Neutron count had been recorded continuously as shown in Fig. Although a clearspike can be seen in the "burst" part, it is difficult to discrete higher count rate of the plateaupart than the background level observed before the accident occurrence. However, ratio ofcount number accumulated i the "burst" and the "plateau" parts was able to be determinedeasily as 13 87. This concluded that fission numbers of the "burst" and the "plateau" partsare 0.3x 10¹⁸ and 22 x1018 , respectively.
6. POWER PROFILE AND DISCUSSIONThe curve of y dose rate change illustrated in Fig. 3 was normalized from the time
point of 25 minutes after the accident occurrence to the termination so tat its integration beequal to 22 x 1018 fissions, e.g. 70 MJ. Figure 6 shows results of the normalization.Following the power transient of the first 25 minutes, the "plateau" part started with the powerlevel of about 2 kW. The power had descended slowly fore more than 1 1 hours and becamestable at 820 W.
Even in the power descend, the change was quite slow ad the power was almoststable if every minutes was focused although there was no manned reactivity control. Thisstability suggests strongly that thermal reactivity feedback was effective i the precipitationvessel. Similar situation was also observed in the TRACY when the TRACY was operatedin the stable mode at the power level around I kW or more. If heat removal capability iscomparable to heat generation, chain fission reaction is inherently controlled so that heatgeneration be equal to heat removal.
The precipitation vessel has a cooling water jacket and was connected to a coolingtower because there might be significant heat generation from the precipitation process whichis original purpose of the vessel. he cooling tower was working during the accident but itwas not clear that the cooling water flowed in the jacket of the precipitation vessel becausethe cooling tower provided cooling water also to other process devices. Figures 6 shows thatthe power dropped ftom 20 W to 280 W around 330 October I when a outlet of a coolingwater pump was disconnected from a cooling water pipe in the initial action to terminate the
September 30 October 10:3 1:00 3-30 --6-15
5I 0
Missing record of mam 12 see. is possible.Power burst during several seconds
just after occurrence may not included. Chain reaction stop
4 caused by water purgeI 0
Power drop caused by;-4V lant water
30 1 0
P-4 82OW
"Plateau" part - 2.2xlO'8 fissions
10 20 5 10 15 20
Duration Time (Hour)Fig. 6 Power profile and events chronology
- 464 -

JAERI-Conf 2002-004
criticality. This behavior could prove that, at this time, water flow in the jacket of theprecipitation vessel stopped and heat removal capability reduced.
Water still existed in the jacket after its flow stopped and criticality had sustained forabout 3 ours at the power level of 280 W. Te water was purged finally from the coolingwater jacket of the precipitation tank around 615 October I and criticality was terminated.
Reason of the power descend from 2 kW to 820 W is silt unknown but one possibilityis reduction of excess reactivity due to water evaporation. If excess reactivity was I.5 or3.0$, initial temperature of the uranium solution when the "plateau" part started was 66 'C or87 'C, respectively. Under such temperature condition, water could evaporate at significantrate and volume of the solution could reduced. This might lead reduction of excessreactivity. Smaller excess reactivity caused lower solution temperature and lower heatgeneration due to the thermal reactivity feedback. Unfortunately, there is no record aboutthe temperature and temperature estimation by calculation still has large uncertainty.Thermal mockup of the precipitation vessel was constructed and several series of experimentusing water and electric heaters has been conducted to get information of thermal behavior. [7]
7. CONCLUSIONIn the post accident investigation of the JCO criticality accident, chart record of y-ray
monitor installed in the accident site was revealed. It is confirmed in the TRACY test thatthe y-ray monitor has enough speed of response. It could be expected that the monitorsensed and indicated y dose rate proportional to power (fission rate) in the precipitation vessel.Absolute power (fission rate) in the precipitation vessel has been estimated for any time pointof accident duration. It has been derived from the norinalization so that integration of thedose rate curve of the "plateau" part is equal to the fission number 2.2x IO". Quite stablebehavior can be seen in the plateau part even though there was no manned reactivity or powercontrol. It is strongly suggested that the power was so high that thermal reactivity feedbackhad been effective. The estimated power of several hundreds watt or more is consistent tothe suggestion. In the-water purge effort to terminate criticality, cooling water flow stopped,first. Due to the flow stop, heat removal from the precipitation vessel had been reduced.Power (fission rate) of the vessel dropped from 820 W to 280 W so that the power wasbalanced to the reduced heat removal. The power of the plateau part is initially about 2 kWbut reduced to about 820 kW in the next 1 1 hours. The reason is still unknown but it couldbe reduction of excess reactivity. There is no measurement data about temperature of theuranium solution in the precipitation vessel which would relate the excess reactivity andwould help to understand thermal behavior of the accident. Thermal mockup test of thecriticality accident has been conducted to clarify the thermal issue.
References[1] NSC Investigation Committee 1999), "The report of the uranium processing plant
criticality accident," Nuclear Safety Commission, STA, Japan, (1 999) (in Japanese).[2] JAERI Task Force for Supporting the Investigation of JCO Criticality Accident,
"JAERI's Activities in JCO Accident," JAERI-Tech 2000-074, 2000) (in Japanese).[3] H. Yanagisawa, K. Nakajima, K. Ogawa, et al., "Experiments on Transient Behavior of
a Low-enriched Uranyl Nitrate Solution System with TRACY to Study HypotheticalCriticality Accidents in Reprocessing Plants," Proc. 6th Int. Conf. Nuclear CriticalitySafety (ICNC 99), Versailles, France, Sept. 20-24, 1999, Vol. II, p.900,.(1999).
[41 J. F. Briesmeister ed., "MCNPTm-A General Monte Carlo N-Particle Transport CodeVersion4B," 1A-12625-MLosAlamosNationalLaboratory, 1997).
[5] T. Nakagawa, K. Shibata, S. Chiba, et al., "Japanese Evaluated Nuclear Data LibraryVersio 3 Revision-2: JENDL-3.2," J. Nucl. Sci. Technol., 32 12], 1259 1995).
- 465 -

JAERI-Conf 2002-004
[6] G. Uchiyama, K. Watanabe. M, Miyauchi, et al., "Analysis of ranium Solution forEvaluating the Total Ntunber of Fissions in the JCO Criticality Accident in Tokai-mura, " J. Radiat. Res., 42 SUPPL, I I -S 16, 200 1).
[7] S. Watanabe, Y. Miyoshi, et L, "Basic Test on Cooling Characteristics of JCOPrecipitation Vessel using a Mock-up Device," Proc. 3rd NUCEF nternationalSymposium (NUCEF 200 1), Tokai, Japan, Oct. 3 -Nov, 2 200 1, (to be published).
466 -

JP0250339JAERI-Conf 2002-004
Basic Test on Cooling Characteristics of JCO Precipitation Vessel
using a Mock-up Device
Sbouicbi WATANA.BF, Yoshinori MI-YOSHI, Yuichi YANLANE, Hiroshi SHIMIZU
Japan Atomic Energy Research InstituteDepartment of Fuel Cycle Safety Research
2-4 Shirakata Shirane, Tokai-mura, Naka-gun, lbaraki-ken, 319-1195 JAPAN
This test concerns thermal characteristic of the JCO precipitation vessel, and aims at confirmingevaporation effect ad grasping behavior of solution temperature change, A mock-up device wasmanufactured, and cooling caracteristic tests for pateau part in the accident were performed by
changing the power of electric heaters based on the observed data of the JCO gamma-ray area monitor.
Relation between equilibrium temperature and cooling-water flow rate for the observed initial powerwas easured. Significant amount of water evaporation and temperature change in the plateau partwere easured, and the experimental condition was found having a possibility of giving a condition
of the accident.
Key words: JCO criticality accident, Precipitation vessel, thermal mock-up device, Static test,
Power-tracking test, Water evaporation
1. IntroductionIn the criticality accident of the JCO precipitation vessel, the significant power levelcontinued from the viewpoint of thermal characteristic, and it was recorded as observed dataof the JCO gamma-ray area onitor. The mock-up device for te pecipitation vessel was
manufactured to trace the change of power level, and a series of basic tests covering about20-hour duration of the plateau part in the accident were performed using the device. The testconcerns the cooling characteristic of the precipitation vessel, and aims at confirming theevaporation effect which can be a cause of the power reduction during the accident, andgrasping the behavior of solution temperature change which can be related to the reactivitychange. Static tests were performed to estimate the relation between solution temperature andcooling-water flow rate of the precipitation vessel. And power-tracking test was performed toestimate the amount of water evaporation and the solution temperature change by changingthe power of electric heaters based on the observed data of the JCO gamma-ray areamonitor
2. Mock-up Device
2.1'Precipitation VesselFigure I shows a major part of mock-up of the JCO precipitation vessel made of stainlesssteel. The vessel to which a cooling-water jacket and an agitator a attached, mocks updimensions and configurations of the major part of the JCO pecipitation vessel. The solution
(water) in the vessel is heated by 3 electric heaters with 15kW (5kW X 3 of maximum
capacity. A funnel is inserted in a hand hole. The inner diameters of the hole and the funnel
are 83 mm and 46 mm, espectively. The solution volume 43 L was determined so that the
heat capacity of the solution was the same as that of the JCO pecipitation vessel, considering
difference of specific heat etween water and uranyl itrate lUtiOn. The solution dimensions
are 45 cm i diamete ad 31 cm in height. As shown in the figure, thermometers locate
vertically at "high", "middle" and "bottom" positions, and te three for each vertical position
are arranged in 'radially symmetric position.
_ 467 -
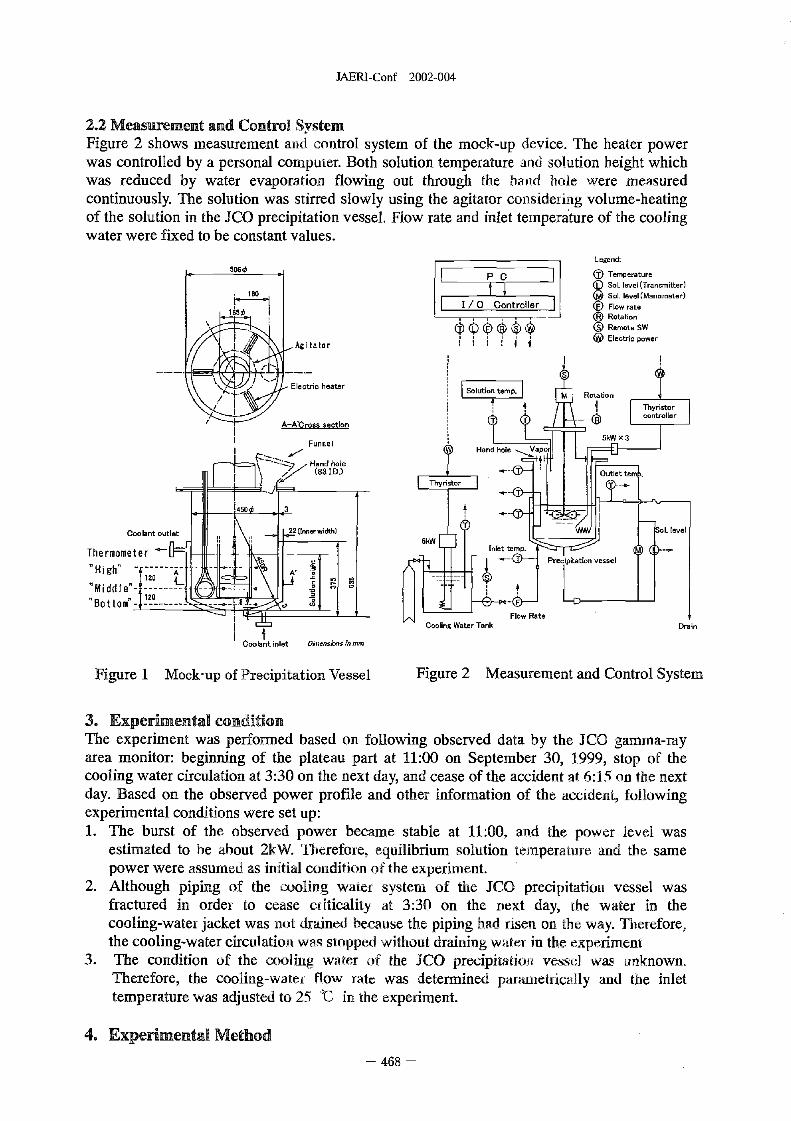
JAERI-Conf 2002-004
2.2 Measurement and Control SystemFigure 2 shows measurement and control system of the mock-up device. The heater powerwas controlled by a personal computer. Both solution temperature and solution height whichwas reduced by water evaporation flowing out through the and hole were easuredcontinuously. The solution was stirred slowly using the agitator considering volume-heatingof the solution in the JCO precipitation vessel. Flow rate and inlet temperature of the coolingwater were fixed to be constant values.
Legend:
506 0 P C (1) Temperature
(Z) Sol. levei(Transmitter)180 Sol. level (Manometer)
Flow rateRotation
(3) Remote SWQ) Electric power
tor
heaterSolution temp. Rotation
4 4 Thyristorcontroller
A-A'Cross section
5k 3Funnel
Ha
Z Hand hole(83 LD.) Outlet tem).
r stor
11 !4500 1-3
I 22(1--width) Sol. levelCoolant outlet : -
Thermometer Inlet temp.
'High Precipitation vesselA' 'r
4-'Middle''Botto 1 120 -2
M - ---- --
/N Flow RateCoo fing Water Tank Drain
Coolant inlet Din-;- n
Figure Mock-up of Precipitation Vessel Figure 2 Measurement and Control System
3. Experimental conditionThe experiment was performed based on following observed data by the JCO gamma-rayarea monitor: beginning of the plateau part at 11:00 on September 30, 1999, stop of thecooling water circulation at 330 on the next day, and cease of the accident at 615 on the nextday. Based on the observed power profile and other information of the accident, followingexperimental conditions were set up:1. The burst of the observed power became stable at 11:00, and the power level was
estimated to be about 2kW. nerefore, equilibrium solution temperature and the samepower were assumed as initial condition of the experiment.
2. Although piping of the cooling water system of the JCO precipitation vessel wasfractured in order to cease citicality at 330 on the itext day, the water in thecooling-watef jacket was not drained because the piping had risen on te way. Therefore,the cooling-water circulation was stopped without draining water in the experiment
3. he condition of the cooling water of the JCO precipitation vessel was unknown.
Therefore, the cooling-water flow rate was determined parametrically ad te inlet
temperaturewasadjustedto25 IC intheexperiment.
4. Experimental Method
- 468 -

JAERI-Conf 2002-004
Prior to the experiment, the relation between the initial solution temperature and thereactivity which compensates the solution temperature was evaluated by using a neutrontransport code. As a initial condition, power level was set to be M and the solutiontemperature was assumed to be in equilibrium which corresponded to initial reactivity, andfollowing two tests were performed:(1) A static test was performed before the power-tracking test. The cooling-water flow rate
was searched so as to satisfy both the initial power and the equilibrium temperature ofthe solution. One flow rate for one solution temperature was determined by followingmethod: the solution was heated at a stretch by maximum heater power fromroom-temperature to the target solution temperature, en the heater power was set to be2M, and the steady state was attained by adjusting the flow rate in which 45 hours werespent. As parameters, the initial solution temperature corresponding to the initialreactivity and the cooling-water flow rate were varied.
(2) Using the result of the static test and the power profile of the JCO gamma-ray areamonitor, a power-tracking test in the plateau part was performed for 17 hours in order tomeasure the amount of water evaporation and the solution temperature change. And thetest was continued for additional 3 hours after the cooling-water circulation was stopped.The initial condition of the test was made using the above method (1).
5. Expeirimental Result
5.1 Static TestPrior to the experiment, the relation 0.8
between the equilibrium temperature of 0.7 - rium power 2kWsolution and the iitial reactivity which E 06 -compensates the temperature was evaluated _J 0.5 -<--------
by using a two-dimensional transport code,TWOTRAN, and a 16-energy-group cross 0.4 --------------- ---section set collapsed from the 03107-energy-group SRAC public library, --------------- 4.-
48 0.2 <--------------- ---- -----JENDL-3.1. As shown in Figure 3 the M 1
3: 0.1 1.5$ 2.0 2 27$equilibrium temperature was evaluated tobe 66-91 "C for the initial reactivity 15-2.7 - 0dollars with reference temperature 25 'C. --------
------------------24J
The relation between the equilibrium M .30 Reference temp. 25 'C
temperature and the cooling-water flow Q� I4
rate for the initial power was measured. As 40 50 60 70 80 90 100
shown in the figure, the cooling-water flow Equilibrium solution temp.(C)rate which satisfied the initial condition of2 kW of power was found to be 06-0.2 Figure 3 Relation between Water Flow RateL/min for the temperature 66-910C, while the and Initial Solution Temperature
flow rate had been supposed to be 2 Umin for the normal operation of the JCO precipitationvessel.
5.2 Power-tracking TestThe power-tracking test was performed for the case of 25 dollars with initial solutiontemperature o 87r� and cooling-water flow rate of 024 Umin from the viewpoint ofsignificant water evaporation. As shown in Figure 4 the solution temperature decreased with
- 469 -

JAERI-Conf 2002-004
the power reduction and approached constant value of about 55 IC, The significant amountof water evaporation in the pateau part was observed and measured to be 2 L. Before andafter the circulation stop of te cooling water, very small change of the olution temperaturewas observed, and it implies that the reactivity depending o the solution temperature wasalmost kept constant at this time, On the other hand, it should be noted that the reactivity inthe JCO precipitation vessel was considered to be unchanged at this time, because thewater-reflector condition was not changed. So, it can be mentioned that this experimentalcondition has a possibility of giving a condition of the accident.
53 Heat Balance and Thermal ConstantHeat balance for the tracking test was estimated. The total heater power is balanced with heatremovals by the cooling water, the room air circulation at outer surface of the vessel and thewater evaporation. The removal heat by the cooling water ad the evaporation were estimateddirectly. As shown in Figure 5, the heat removal by room air circulation is significant,
5.0 100 2.50.24 Umin i0Urnin
< 0.24 Urnin 0 Umin4.5 p.(UpperMiddlel3otto4 I 90 -e -
4.0 80 2.0 Total (Electric heater)
3.5 70.2.1 -0 3.0 0 et olartt m 60 1.5CLM> -NC
2.5 500
Zu Evaporation 0-1.0 cooling rer power 40 o' waV
0 1.5 30CL ir eiroulat o% 1.0 20 0. -
0.5 evaporate
0.0 0 0.00 2 4 6 8 10 12 14 16 18 20 0 2 4 6 8 10 12 14 16 1 20
Elapsed time in plateau part(hr) Elapsed time in plateau part (hr)
Figure 4 Temperature and Evaporation Figure Heat Balance
300 30
because of the low cooling-water flow rate.In the beginning of plateau part, the 250 -------- ......... --------- -------- 25percentages of te amounts of the heat HI
removals by the cooling water, the room air 200 ------ -/ ------------ 2 0circulation and the evaporation are estimatedto be about 50%, 40% and 10% for total 7 I 0 ------ 15heater power, respectively.
100 ......... ...... 10Thermal constants were estimated based onthe static test. As shown Figure 6 beat H2
50 .......... ................transfer coefficient of the cooling-waterjacket (HI) and the coefficient at outersurface of the vessel (H2) were estimated to 0 -------- ----------- -- 0
be 250-100 W/m7/K and -10 W/m2/K for the 0.1 0.2 0A 0A 0.5 0.6
flow rate 06-0.2 1_�niin, respectively Cooling-water flow rate
Figure 6 eat Transfer Coefficients
470 -

JAERI-Conf 2002-004
6. SummaryThe results of the ock-up test on the JCO precipitation vessel are summarized as follows:
- The relation between initial temperature and the cooling-water flow rate for the initialpower was estimated as follows; for the initial reactivity 15-2.7 dollars whichcorresponds to initial temperature 66-911C, the cooling-water flow rate which satisfiedthe initial condition of 2 kW of power was found to be 06-0.2 L/min,
- The cooling-water flow rate in the accident was estimated to be less than that of JCOprecipitation vessel in the normal operation 2 I/min).
- Significant water evaporation 2 was observed in low flow rate 02-0.3 Umin).- The experimental condition of 2.5 dollars was found having a possibility of giving a
condition of the accident.- Thermal constants which are available for thermo-hydrodynamics analysis of the JCO
precipitation vessel were estimated.
Refereimee1) K Tonoike, T.Nakamura, YYamane, Y.Miyoshi "Power Profile Evaluation of the JCO Precipitation
Vessel based on Record of the Gamma-ray Monitor" NUC EF2001 Poster Session PC-11
471 -

This is a blank page.

JAERI-Conf 2002-004
Separation Process
- 473 -

This is a blank page.

JP0250340JAERI-Corif 2002-004
Evaluation of safety Timit for handling of hydroxylamine nitrate/nitric acid solution as a plutonium reductant
Susumu SU`GIKAWA*, Mild UMFDA *, Junichi SEKINO*Takashi MATSUDA**, Takashi KODAMA**
Japan Atomic Energy Research Institute*, Tokai-mura, Naka-gun, lbaraki-ken, 319-1195 JapanJapan Nuclear uel U-nited", Rokasho-mura, Kitakami-gun, Aomori-ken, 039-3212 Japan
Fax: 81-282-6680, e-mail: sugikawa�nuceftokaijaeri.gojp
An autocatalytic reaction of hydroxylamine nitrate (HAN) in nitric acid solution was investigated to evaluatesafety limit for bandling of HAN/aitric acid solution as a plutonium reductant mainly by a thermal analysis.The initiation emperatures, minitnuin temperature for the autocatalytic reaction, were remarkably loweredwith icrease ot itric acid and iron concentrations, By ageing the solution, the initiation temperatures werefurther lowered due to an am-umulation of nitric acid produced from slow decomposition of HAN. From theseexperimental data, safety imit for handling of HAN was evaluated.Key words: hydroxylarrune nitrate, nitric acid, safety limit, plutonium, reductant
E4MODUMON
Hydroxylamine nitrate (HAN) has been used for many years as a plutonium reducing agent in plutoniumpurification processes at nuclear fuel reprocessing plants. A violent explosion of HA N/nitric acid solution in areagent tank occurred on May 14, 1997 at the plutonium reclamation facility in the Hanford site. The accidentinvestigation was eported by the Department of Energy (DOE) office 1-2]. The explosion was due to anautocatalytic reaction of HAN/Wtric acid solution which had been concentrated due to natural evaporationthrough ventilation over long term storage. The autocatalytic reaction of HAN with nitric acid was reportedmore than 50 years ago -4], but there are not enough data for the evaluation of the reaction of the solution.The Hanford experiments focusing on the explosion senario were carried out, but the conditions were limitedto high concentration of HAN 3.1 to 16.7M)/nitric acid (5.5 to 8.5M) solution including iron ion 2]. Thetemperatures of the autocatalytic reaction were measured by a thermal analyzer using an open chamber. Thetemperatures were showed to b in the range from 39 to VC. These data were expressed in Instability Index asa function of the nitric acid to I-IAN ratio, nitric acid and iron concentration. These data, however, were only forhigh concentrations of the chemicals. The data including the lower concentrations, therefore, are desired norder -to evaluate safety limit under the conditions of atual use. Tis paper describes the results of thermalanalyses with a wide range of HAN/nitric acid concentration and evaluation of the safety limit for handling ofHAN.
EXPFREIAENTAL
AR chemicals sed for the experiments were reagent grade. HAN was obtained from Tomiyarna PureChemical Industries, lid.The thermal analyzer used in the experiments was a RADEX reaction calorimeter (SYSTAG Ltd.). A solutionsample was contained in a sealed reaction vessel 7 ml). The reaction vessel was equipped with a temperatureprobe and a pressure transducer. The vessel was made of platinurn-coated titanium for avoiding a reactionbetween the vessel and chenucals."he sample aount of 2 ml was selected considering maximum pressure ofthe reaction vessel (4,9MPa) and the real results for the sample.
475 -

JAERI-Conf 2002-004
The temperature and heat flow sensitivity of the reaction calorimeter were calibrated by indium. metal. The twomethods of thermal analyses, constant rate beating and isothermal heating, were applied for te examination ofautocatalytic reaction. The constant rate heating was set at a rate of 0.51C/mia considering slow reactionkinetics. The gaseous products such as N20, Nx and N2 during autocatalytic reaction were determined bygas-chromatograph and chernfluminescence analyses.
RESULTS AND DISCUSSION
1) Critical parameters for the autocatalytic reactionThe critical parameters on autocatalytic reaction of HAN/mtric acid solution were examined by thermalanalysis at constant rate heating. Figure I shows the initiation temperatures as a unction of nitric acid andHAN concentration. The iitiation temperatures were remarkably lowered from 190 to 509C. with increase nacidity from 0.2 to 4M HN03. At nitric acid concentration above 4M, the autocatalytic reaction was moderatelyoccurred even at room temperature, which was visually confirmed by the formation of gaseous products. Theincrease with HAN concentration and nitric acid to HAN ratio did not cause the lowering of the initiationtemperature. Tese results were inconsistent with the, results of the Hanford experiment 2]. The autocatalyticreactions between HAN and nitric acid are known as follows 4]:
NH30I-r 2HN03 - 3HN02 H20 + H30+ (1)
NH301-r + HN02 - N20 H30+ (2)
Iron ion is known to act as a catalyst for the reaction of HAN with itric acid 2]. In the presence of iron ionsbetween 0.01 and 5gFe/l at 02 M HN03, for example, the initiation temperatures at 190cC without iron ionwere lowered to the temperature range between 180 and 759C as shown in Figure 2 be iron-catalyzedautocatalytic reactions are known as follows 2]:
2NH30I-r+ 4Fe - 4Fe�' + NO H20 + 6W (3)2Fe +HN03 2r -2Fe3 + HN0 + H20 (4)
With increase of nitric acid concentration, the effect of iron ion gradually decreased. At low nitric acidconcentration, the iron-catalyzed reaction may be predominant for the autocatalytic reactions shown nequation (1) and 2). Al high nitric acid concentration. the autocatalytic reaction with nitric acid may bepredominant. The use of sainless steel reaction vessel instead of platinum-coated titanium reaction vessel alsoshowed the lowering of the iitiation temperature. This was due to leaching of iron ion from the reaction vessel,since the iron concentration of 0.14gFe/1 was determined by analysis of the sample solution after the thermalanalysis.
2) Heat generation of the autocatalytic reactionThe heat of the autocatalytic reaction was determined by thermal analysis at constant rate heating. As shown inFigure 3 the heats of the reaction at 1.5M HAN increased with nitric acid concentration, while the beats of thereaction at 0.5M HAN became nearly constant at nitric acid concentrations above 2M. At the 1.5M HAN/0.2MHN03 solution used as a plutonium reductant, for example, the heat of te reaction is 75 joule/g of solution.The heat generation of the reaction may accelerate water evaporation. Due to oncentrating HAN and nitricacid, the explosive potential of the solution will be increased.
3) Ageing effect of HAN/nitric acid solutionIn order to examine self-accelerating effect of the autocatalytic reaction due to ageing of HAN/nitric acid
- 476 -

JAERI-Conf 2002-004
solution, thermal analyses at isothermal heating were carried out with reaction parameters of itric acid, HANand iron concentration. The typical diagram is shown in Figure 4 which an exothermic peak and abruptpressureincreasewereobtainedduringtheheatingat7OoC- twasalsofotindthatthenitricacideoncentrationin the solution increased while HAN concentration decreased with lapsed time. This nitric acid concentrationincrease was due to slow decomposition of HAN and caused the lowering ot the iitiation temperature. In orderto define stability of the autocatalytic reaction of HAN/mtric acid solution, these data were plotted in Figure .An occurrence of the autocatalytic reaction was defined not only by indication of exothermic peaks, but also byindication of moderate pressure increase in consequence of the evolution of gaseous product (N20). Thereaction boundary was at temperature of 60'C in nitric acid below 1M and at temperature of 500C in nitricacid between I and 3 M.
During the reaction, large amounts of N20 and N2 and sall amounts of NOx, which cause abrupt pressureincrease in reagent mks, were determined by gas analysis. Figure 6 shows the formation of N20 versus nitricacid concentration. The formation of N20 did not depend on nitric acid concentration. One mole of HANproduced a half mole of N20. The stoichiometry of the reaction was consistent with sown by the equations )and 2) or 3) and 4), since two moles of HAN produce one mole of N20. Since the N2 is not produced fromthe reactions, it seems to be produced from thermal decomposition of HAN as follows [5]:
3NH301-r N03 -N20 N2 + 5H20 2HN03 (5)
4) Safety linut for handling of HAN/nitric acid solutionSafe handling of HAN/Wtric acid solution can be accomplished by controls of the citical parameters, nitricacid and iron oncentrations and temperature of the solution. Iron ion which acts as a catalyst for the reactionmight est as a corrosion product of stainless steel construction material and impurity in nitric acid reagentBecause control of iron concentration in the proces may be difficult, safety limit for prevention of theautocatalytic reaction sould be evaluated with the presence of the iron ion. In particular the safety limit forpreparation of chemical makeup and storage of the solution are recommended as follows consideringsomewhat safety margin; M HN03 and MC.
CONCLUSION
The critical parameters for the autocatalytic reaction were nitric acid and ron concentrations and temperature ofthe solution.. The initiation temperaturesiernarkably decreased from 190 to 50'C with increase in acidity from0.2 to 4M HN03. In the presence of iron ions between 0.01 and 5gFeA at 02 M HN03, te inifiationtemperature at 1909C without iron ion lowered to the tmperature range between 180 and 750C By ageing thesolution, the initiation temperatures were finther lowered due to an accumulation of nitric acid produced fromslow decomposition of HAN. Dring the reaction, large amounts of N20 and N2 and small amounts of NOx,which cause abrupt pressure increase in reagent links were identified as reaction products. he safety limit forpreparation of chemical makeup and storage of the solution are recommended as follows consideringsomewhat safety margin; M HN03 and 501C.
ACKNOWLEDGMENT'S
The authors thank Dr. Y Suzuki of JAERI for the suggestions and support to this work.
REFERENCES
477 -

JAERI-Conf 2002-004
1. R. Washington, DOF,/RL-97-59 1997)2. D. G. Harlow, DOF,/M-0555 1998)3. A. Bothner, et. al., J. of Chem. Physics, Vol. 20 No. 3 pp459-463 1951)4. R. J. Gowland, et, al., J. Chem. Soc. Commun., pplO38-1039 1983)5. J. C. Oxley, et., al., SPIE, Vol.872, pp63-70 1988)
0 250
1. 5M HAN8 20%0 0 0. 5M HAN
0150-
0
100- C
50
0 1'0 i0 3.'O 4.'O
HNO3(M)
Figure I Effect of HAN and nitric acid concentration
on initiation temperature of autocatalytic reaction
Ti-Pt reactonvesselHAN:1.5M No iron,20
C) 00 0.03Feg)lOAFegil051`egil0 -1 9
A I.OFegh2.0Feg/lUFegii
loo Slainless steel reaction vessel+ No iron
Q
50
0 1.0 2.0 3.0 4.0 5.0
HN03 M)
Figure Z Effect of iron concentration on initiationtemperature of autocatalytic reaction
478 -

JAERI-Conf 2002-004
200 A HAN: 0.5M
150 0 EAN: 1. 5M
100
0 A50 A
0 1.0 2.0 3.0 4.0 5.0HN03 (M)
Figure 3 Effect of nitric acid a-ad HANconcentration on heat of reaction
1 0 50
HAN 1.5MC--p.&� NO(%)
NO.(%) HNO 3 OM0. gen LOE go 40 T0x
FM, 04 3080
207 I eraperature: 70'C
74 50 0 022 1
I 0
60 ssum
50 100 150 200 'oLapsed time (hr)
Figure 4 Typical diagram of ageing effectof HAN/nitric acid solution
479

JAERI-Conf 2002-004
150HAN concenimfio 1.5MAN Iror, impurity .03gh
(A[j JMrLimpurityO.jgpjC) & Imr impurity 0.5g)l
0 HAN concentration: O5M
VO : Imr impurityO.IgA
-1 1000 abrupt tempeW3 Autocatalytic reaction zone
arLd pressure :tM.AV: moderaite pressure mcre
-6 [10:noreactiorLA, A
50
Wo reactio zne
I
0 1.0 2.0 3.0 4.0 5.0HN03 M
Figure 5 Boundary temperature and nitric acid concentration
for autocatalytic reaction of HAN/nitric acid solution
2.00.5MHAN
1.5 1.5MHAN
1.0
CZI-q0 .51
0 1.0 2.0 3.0 4.0
HN03 (M)
Figure 6 Formation of nitrous oxide autocatalyticreaction of HAN/nitric acid solution
- 480
JAERI-Conf 2002-004 JP0250341
EVALUATION MODELS OF INORGANIC SOLIDS AS SEPARATIONAND CONTAINMENT MEDIA
MASAMICHI TSUJITokyo Institute of Technology, Research Center for Carbon Recycling and Utilization,
2-12-1, Ookayama, Meguro-ku, Tokyo 152-8552
FAX: 81-3-5734-3337, e-mail: mtsuji�chem.titechacjp
Several ealuation models of inorganic solids have been reviewed for their extent of validity. They include use
of the corrected selectivity coefficients (CSC), Langmuir's equation, power-exchange function, Vanselow's
equation, and others. Use of the CSC plot allows calculation of the isotherm and the distribution coefficient as
functions of the total charge concentration of solution phase and ratio of solid weight to solution volume.
Langinuir equation is a modification of the CSC. Other models are simplified forms of the CSC plot.
Activity coefficients are crucial to calculate the CSC values. Unfortunately, they are not available for actinides
and ence te ion-exchange process cannot be predicted as a finiction of the carge fraction in solid and solution
phases. Low distribution coefficients often observed on clay nunerals may include electrolyte absorption or
invasion into solids. Their chemical bond states of ionic species could be clearly distinguished from each other
by using the MASNMR.
Key words: evaluation model, distribution, ion exchange, thermodynamics, MASNMR
1. INTRODUCTIONIonic constituents in environmental electrolyte solutions, including ground water, seawater,and river water, replace ionic chemical species in environmental inorganic materials, e.g.,various clay minerals, oxides and hydroxides of multivalent metals, and carbonates. Thesecharge substitution phenomena could be effectively treated using the chemicalthermodynamics if tey form the equilibrium systems. Unfortunately, chemicalthermodynamic expressions are seldom used for evaluation of the chemical processes on thesesolids, and instead, distribution coefficients Kd), isotherms, Langmuir equation, and otherempirical equations are often used [1-10]. But these evaluation methods of inorganic solidsrequire lots of time-consuming work to carry out numerous distribution experiments. Inaddition, these are not suitable for description of ighly selective solids that are suitable foreffective separation of ionic constituents in highly concentrated electrolyte solutions.Distribution Of inic constituents strongly depends on the chemical environment of thereactive site in local level in inorganic solids. Hence, inorganic solids should be welldefined prior to evaluation as distribution and containment media of ionic constituents usingphysical proves, .g,, MASNMF� ESCA, FTIR, and XRD o on-site, short-range, andlong-range informations of atoms and crystal lattice. These probes will help us interpret thechemical reactivity of these environmental inorganic solids.The present paper compares several evaluation models for distribution of ionic constituents onenvironmental inorganic solids.
2. EVALUATION MODELS2.1 Plots of corrected selectivity coefficientsPlots of the corrected selectivity coefficient (CSC) as a function of the charge concentration in
an ion exchanger phase are the reduced expression of thermodynamic generality 11-13].
They can give any distribution coefficient required for column separation or separation factors
- 481 -

JAERI-Conf 2002-004
numerically as functions of the concentration of exchange ion ad atio of solid weight tosolution volume.In the following, an exchange reaction of I to n valent cations is described as an example[14-18]. The same equation a be applied to other combination of cations and anionexchange. If the following Na+ _Mn-,- exchange reaction is reversible, the correspondingequilibrium constant, K, is defined uniquely,
nNa' + M" M n+ + nNa+
Xm[Na+ jny,,.fmK= N (2)
-n [Mn+ ].YMXNa f Na
where fm and fN,, denote the activity coefficient of the ion in solid phase-, [M'+] and [Na+]
molal concentration of the ion in liquid phase; ym and N.: activity coefficient of the ion in
solution phase; Xm and X-N.: the charge fraction of ions in solid phase. The following
equations define the charge fraction of ions in solution ad solid pleases, respectively.
n[Mn+] [Na+ jX = X = (3)
n[M n+ ] + [Na+ Na n[M'+] + [Na+
n[Mn+] [Na+ (4)XM = XN.
n[Mn+] + [Na+1 in [Mn ]+[Na+]
Obviously the sum of the charge fractions in each phase is unity:
XM+XN,=l and j�M+j�Na=l (5)
Generally the on-exchange experiment is arried out with the constant total ion concentration
kept constant in solution phase, The ionic strength varies through the exchange of ions, but
the total charge concentration is kept constant in solution phase as well as in solid phase.
Hence,
n[Mn+l + [Na+ = ct, n Mn+ ] + [Na+ Ct. (6)
Of N=MeqUiV/CM3'The total charge oncentration of the ion in solution is given in terms
and the total concentration C� of the ion in solid phase is expressed by the total exchange
capacity rnequiv/g). If a concentration of electrolyte solution is low, molar onceritration an
be used instead of the moial ocentration, It will be necessary to take density into
consideration for concentrated eectroiyte solution. The thermodynamic equilibrium
constant can be determined when giving each amount in eq. (2)�
The thermodynamic constant is rewritten as follows using the activity oefficients of ions in
solid phase and the corrected selectivity coefficient Km given by the physical quantitiesNathat can be easily measured.
K=Km fm (7)Na fNna
In the constant total charge concentration in each phase, eqs 3 - 6) can be used to give
Km by a simple algebra as follows.Na
- 482 -

JAERI-Conf 2002-004
nNa XMXN. -qrKm = (8)
-nXNaXm
wheren
i = ncn-I and r= Na (9)tYm
If the Gibbs-Duhem equation is applied to this equilibrium system, the following equation isderived by combining the CSC (eq. (8)) and the thermodynamic equilibrium constant (K).That is, the CSC is the "differential form" and the K value is the "integral form" of thethermodynamic equilibrium constant.
In K = (I - n) + f (In Km d- (I )0
The thermodynamic equilibrium constant is not dependent on the total charge concentrationof ions in the nature. If one considers the case of 1 I exchange in eqs. (8) and 9) at highelectrolyte concentrations, the CSC values only depend on the ratio of the activity coefficients,and the effect of the total charge concentration in liquid phase can almost be neglected in theconcentration range usually used. The corrected selectivity coefficient is plotted as afunction of the charge fraction of the exchange ion in solid phase, and integration is carriedout in the range of Xm = - This plot may be called a Kielland'splOt 1-the CSC plot.Often the maximum value of Xm differs greatly depending on the cations in case ofinorganic solids. However, if distribution experiments in a binary exchange system werecarried out in different total charge concentrations, experimental values will fall on the sameCSC plot even if the amounts of the maximum exchange differ substantially.The CSC plot can be expressed with the following equation using common logarithms. C.is a generalized.Kielland's coefficient.
log K m = log(K m ) m,5�m cm -M
Na Na _+ + E(m + 1) XmM=1
Initial concentration of M ion, [Mn+]o (moUdm 3), the volume of solution, V CM), and thetotal charge concentration, c, (mequiv/cm 3), can be used for calculation of the equilibriumcomposition in the solution phase when w (g) of solid in the W form was used. Eqs. (5), (8),(9) and (I 1) are combined to obtain the following relation.
log XM (I .- XM)' -qr' = log(K m (12)(I- Xm)nXm Na
The equation of the charge balance is
n[Mn+],,-V=Xm-V-ct + XM w-Ct (13)
The value of (Xm, logKm on the CSC plot is substituted for eq. 12) within the limitimposed by eq. 13) to calculate Xm. Thus, a set of (Xm, Xm) obtained can be used forcalculating the distribution coefficient Kd) at any total charge concentrations in solutionphase as follows,The Kdvalue is defined by the ratio of the equilibrium ion concentration in solid and solution
- 483 -

JAERI-Conf 2002-004
phases. The following equation is obtained using eqs. 4) and 6).
Kd = (14)
[Ml'+] CtXT',
Hence, parameters required for distribution of chemical species can be evaluated as functionsof the total charge concentration and ratio of solid weight to solution volume. Using theCSC plot, the Kd values at the infinitesimal exchange that are too large to directly determinecan be estimated using the following equation derived from the above equations (I 1), (I 2) and(14).
(Km )xmxm _+ - nct)n *4 (K (15)Na Ct TM d)X MX +
A low Kd value may include electrolyte absorption or invasion into solids as well aselectrostatic bonding of ionic components -that occupy the ion-exchange sites. Thesechemical states could be distinguished from each other by MASNMR. This effect may notbe neglected in clay minerals.The integration of the CSC plot over the whole range of Xm= 0-1 gives the thermodynamicconstant for the specified ion-exchange reaction.
In K = - n) + 2303 y_Cn, + log(Km (16)M
AG" = -RT InK
RT[(I-n)+2.303{ECn,+ log(Km)x,,-.
Na x __,O (17)M
A van't Hoff's equation can be used for the standard enthalpy change AW and then thestandard entropy change AS'.
O(AG-) = _AHO (I )a(11T)
AGO = AIV - TASO (I 9)
When AG` is a positive value, a pure Mn+ form ion exchanger will not be formed in theexperimental conditions. It should be noted that this integral value should be used -forprediction of the formation of the specified ionic form, but not for evolution of the selectivityat small extent of exchange. For the latter, the differential form given by eq. (I ) should beused. Onemaybeoftenconfusedwithuseofeqs.(10)and(II),2.2 Langmuir equation 19]The following Langmuir equation is one modification of the CSC by eq. (8).
cm = I + CM (20)
Qm KQmax max
Qm denotes the solid phase ion concentration, cm the ion concentration in the solution phase,
- 484 -

JAERI-Conf 2002-004
K Langmuir constant, and Qn,,, the maximum uptake. The following equation can beobtained by rearranging eq, (8) [I 1.
YM
cm _ rct N. r -CM (21)Km Ct _'�NQm Na + � t
or
cm =t I -I.Cm, (22)QM n t mct
where in KN' Normall the in value is much larger tha n unity. Thus, Langinuirr'19 y
equation is derived when one uses the following relations.
Qm = Ct and K = m/ct. (23)
It should be noted that the K value depends on the experimental conditions and hence is not aconstant.2.3 Power-exchange functionSince this function expresses the ion selectivity using the charge fraction to solid-phase ionsand the activity to liquid-phase ions in eq. 2 it takes the same form as the CSC. Theactivity coefficient of the solid-phase species is neglected and instead a power (n) is used asan adjustable parameter. In the Na+/M2' exchange,
2 naN.Kex (24)
amThe logarithm of both sides is taken to get
10, aN- = log Ke, + n log RN-2 (25)am XM
A power (n) is determined in a region where Kex keeps a constant, Thus, this relation claims
that the "exchange constant" K, and an n value can describe an ion-exchange reaction. The
ion-exchange data in some aluminosilicates were tabulated by Walton rising this relation and
have been used by Garrels et al. 20]. These data are collected mostly in low electrolyte
concentrations of 10-6 to 10-4M. Later, this equation is called the power ion-exchange
functionbyLangmuir[19]. Buta&,,valueisnotaconstantaithoughthequantityiscalled
an exchange constant. Since the n value is generally not an integer, the stoichiometry in an
ion-exchange reaction is neglected and, hence, eq. 24) cannot be used to predict
ion-exchange behavior at different concentrations. In addition, hydrolysis of
aluminosilicates may iterfere the uptake of ions in low electrolyte concentration. In such
cases'' the ternary exchange system has to be treated and will make the analysis complicated
[21]. AfatallackwillbethatnoKe,,valueforexchangeoftrivalentionsisavailable[22].
A Gapon equation uses the molar concentration instead of the activity in the solution phase in
eq. 24), and is even now used in the soil study 23]. Unfortunately, the generality of
description has been completely lost and this relation should not be used for description of
distribution of ions.
- 485 -

JAERI-Conf 2002-004
2.4 Activity coefficientsIt is important to correctly evaluate an activity coefficient for evaluation of the CSC values.For mixed electrolyte solutions te average salt method is often used 24-26].
y2nYNa . YnNaYnA= ±NaA (26)
n n+1YM YMYA T±MA
Here, the activity coefficient of mixed electrolyte solution should be used instead of theactivity coefficient of a single electrolyte 27]. Several equations to evaluate the activitycoefficients of each electrolyte have been used. The equation used by Kraus et al. includesthe ionic strength alone and has neglected the nature of each electrolyte 28]. Hence, a largedeviation cannot be avoided at concentrated electrolyte solutions, The following expressionsby Glueckauf have been used for estimation of the activity coefficients of the 21 typeelectrolytes 29]. The activity coefficients of M(NO3)2 and NaNO3 in their mixed solutionare expressed using the activity coefficient of each electrolyte by eqs. 27) and 28),respectively.
log M(NO3)2 log yM(NO3)2 + [Na I log M(NO3)2 - log NaNO3 -1/2) (27)(NaNO3) 4�L 3 3(l +
2+log NaNO3 log NaNO3 + [M" 8 log YNaN03 _9 log yM(NO3)2 1 (28)
YMN03)2) _'� T4�L 2 2(l + �L-'/
Here, �t is the ionic strength given by (1/2)Zzi2mi where zi and mi denote the formal charge ofion i and the molal concentration, respectively. Change in the activity coefficient withtemperature can be estimated by the method of rectifying the term of the dielectric constant.
3. CONCLUDING REMARKSEquation (8) is the differential form of the thermodynamic constant, as shown by eq (0) Itis also the reduced expression of the ion-exchange isotherm. In other words, although theform of the ion-exchange isotherm varies with the total charge concentration of solution phase,all the experimental points fall on one CSC curve. It can be exemplified by severalexchange systems, including ion-exchange resins and inorganic ion-exchange materials 301.The distribution coefficient K can be calculated using the CSC plot as a function of thecharge fraction in the range of zero to the maximum charge fraction at different total chargeconcentrations. But any other models described above cannot generate these quantities as afunction of the charge fraction.Ali ion-exchange isotherm at any total charge oncentration can be calculated sing the CSCplot determined at one total charge concentration, as long as the activity coefficients ofexchange ions are given. Unfortunately, those of the actinides are ot available, and hencethe Kd value at a specified concentration will be determined,The total exchangeable charge is crucial to make the CSC pot, An individual standard fordetermination of the total exchangeable charge needs to be sed for different types of solids.The following three types of inorganic solids with adsorption/ion-exchange properties occurnaturally or have been synthesized,(a) Variahle-charge type of solids, eg., oxides/oxyhydroxides ad acidic salts of metals(analogues of acidic and basic resins).(b) Substitution type of solids, eg,, layered double hydroxides (LDRs), aluminositicates (clays,zeolites), tobermorites, and Donstoichiometric mixed valence compounds, e.g., O2-.s and
- 486 -

JAERI-Conf 2002-004
their salts. (c) Mtrinsically charged type of solids, e.g., hydroxyapatites and bi smutites.It is not always easy to determine the total ion-exchange capacity giving the point of Xm =1in the CSC plot, Fspecially it is true for the case of clay minerals, soils and mixed solids.A reasonable and conventional basis has to be used to determine the total exchangeablecharge of single-phase solids belonging to each category. Zeolites are typicalcation-exchange aterials with several exchange sites. Hence, often the CSC plots do notgive a straight line, The total ion-exchange capacity of these aluminosilicates can bedeternrined using te population ratio of the tetrahedral Si and Al with MASNMR and thechemical content of Si and Al. The population ratio of the tetrahedral Si and substituted Alcan be determined by the intensity ratio of each signal as follows 3
n=3Si1v lsi(nm)
(29)Al IV n=3 nZ -ISi(nAJ)
n=I 3
Generally, several techniques have to be used to determine the total charge of mixed-phase orill-defined solids such as atural clays, their deteriorated clays, or soils.If the CSC plots could be determined using the first principle calculation based on atomicconfiguration of ion-exchange solids, all parameters necessary for dphasic partition of ionicconstituents could be calculated including the ion-exchange isotherm. However, theinformations about the relations between the atomic configuration and the ion-exchangeprocess are not sufficiently available. But a promising case of bismutite family indicates anew avenue to use the first-principles process for smart-designing of high-performancematerials 32,33].
References[1] C. E. Marshall, "The Colloid Chemistry of the Silicate Minerals", Academic Press, New
York (I 949).[2] L. Wiklander, "Chemistry of the Soil", Ed. by F. E. Bear, Reinhold Publishing Co. ACS
Monograph 126, New York 1955).[3] S. Wada, Clay Science, 27, 227-236 1987).[4 Y Inoue and S, Morisawa, J. Atomic Energy Soc. Jpn., 18, 524-534 1976).[5] N. Kato, T. Murakami, H. Tasaka and S. Ueda, J. Atomic Energy Soc. Jpn., 29, 834-839
(1987).[6] S. Morisawa, J. Atorni'Energy Soc. Jpn., 15, 503-508 1973).[7] T. Igarashi, J. Atomic Energy Soc. Jpn., 35, 237-244 1993).[8] N. Kato and h. Tasaka, J. Atomic Energy Soc. Jpn., 27, 963-967 1985).[9] N. Kato, K, Nakamichi, H. Tasaka and T. Asano, J. Atomic Energy Soc. Jpn., 25,
577-582 1983).[10] A. Dyer, "Recent Developments in Ion Exchange", Ed. by P. A. Williams and M. J.Hudso n, Elsevier Applied Science, New York 1990), pp. 43-55.[1 1] M. Tsuji, H. Kaneko and Y Tarnaura, J. Chem. Soc. Faraday Trans., 89, 851-856 1993).12] M. Tsuji and S. Komameni, Sep. Sci. Technol., 26, 647-659 199 1).
[13] M. Tsuji ad S. Komarneni, Sep. Sci. Technol., 27, 813-821 1992).[14] G. L. Gains, Jr, and H. C. Thomas, J. Chem. Phys., 21, 714-718 1953).[15] R. HaIjuia, A. Dyer and S. D. Pearson, J. Chem. Soc. Faraday Trans. 88, 1591-1597(1992).[16] R. M. Barrer and J. D. Falconer, Proc. Royal. Soc. Lond, Ser A 236, 227-249 1956).
- 487 -

JAERT-Conf 2002-004
7 R. M. Barrer, "Natural Zeolites, Occurrence, Properties and Use", Ed. by L. B. Sand andF. A. Mumpton, Pergamon Press, Oxford 1978), pp. 385-395.[18] R. M. Barrer and J. Klinowski, J. Chem, Soc. Faraday Trans. . 70, 2080-2091 1974).[19] D. Langmuir, "Aqueous Environmental Geochemistry", New Jersey, Prentice Hall(1997).[20] R. M. Garrels and C. L. Christ, "Solution, nerals, and Equilibria", New York, Harper& Row 1965) p.270.[21] R. Hadula, J. Lehto, J. H. Pothuis, A. Dyer, and R. P. Townsend, J. Chem. Soc. FaradayTrans., 89, 971-976 1993).[22] M. Tsuji, Solvent Extr. Ion Exch., 19, 531-551 2001).[23] H. Tsuno, 1. Somiya and H. Yanase, J. Society of Environmental Science, Japan, 13, 1-10(2000).[24] H. S. Harried and B. B. Owen, "The Physical Chemistry of Electrolytic Solutions",Appendix Wereinhold Publishing Co., New York 1950).[25] D. R. Lide (Editor-in-Chieo, "Handbook of Chemistry and Physics", CRC Press, 76ThEd., Boca Raton, FL. (I 995).[26] D. Dobos, "Electrochemical Data7, Elsevier Scientific Publishing Co., Amsterdam(1975).[27] E. Glueckauf, Nature, 63, 414-415 1949).[28] K. A. Kraus and R, J. Paridon, J. Phys. Chem., 63, 1901-1907 959).[29] L. V C. Rees, "Properties and Applications of Zeolites", Ed. by R. P. Townsend, TheChemical Society, Burlington House, London 1980) pp. 218-243.[30] M. Tsuji, R. Harjula and Y. Tamaura, Annual Rep. Salt Sci. Res. Found., Salt Sci. Found.,Tokyo 2001) pp. 139-156.[3 1 ] J. Sanz and J. M. Serratosa, J. Am. Chem. Soc., 106, 4790-4793 1984).[32] M. Tsuji, Y Ikeda, M. Sazarashi, M. Yamaguchi, J. Matsunami and Y Tamaura, Mater.Res. Bull., 35, 2109-2121 2000).[33] M. Tsuji, Solid State Ionics, (in press).
488 -

JP0250342JAERI-Conf 2002-004
SPENT FUEL TEST ON EXTRACTION IN ADVANCED
REPROCESSING PROCESS
S.HOTOKU, G.UCHIYAMA, T.ASAKURA, M.SATO, Y.ITOH and H.MWE0
Japan Atomic Energy Research Institute
Tokai-mura, Naka-gun, baraki, 319-1195 Japan
Fax. 81-29-282-6677, e-mail: hotoku�procsafe.tokaijaeri.gojp
ABSTRACT
Extraction tests of the 44,OOOMWd/t spent fuel dissolver solution using bench scale reprocessing
experimental equipment at BECKY(Back-end Fuel Cycle Key Elements Research Facility) were carried out
using three extractors. The equipment composed diluent washing, Np oxidation, co-extraction, FP scrubbing, Np
separation, Tc separation, U/Pu partitioning and U recovery steps.
Vanadium (V) oxide with nitric acid was used as an Np oxidizing agent. Butyraldehyde (decomposable
and salt-free organic reducing agent) and 6M nitric acid were fed into the extractor in order to separate Np and
Tc. As a result 64.8% of the Np and 98.9% of the Tc were extracted in the co-extraction step. 75.0% of the
extracted Np was separated from the U and Pu stream in the Np separation step. On the other hand, 81.8% of the
Tc was separated by 6M nitric acid in the Tc separation step.
In the U/Pu partitioning step, Pu was reduced from Pu (IV) to Pu (III) and stripped into aqueous phase by
uranous nitrate and hydrazine in 1M nitric acid. Most of the Np remained in the U loaded solvent (organic
phase). To the contrary, Tc migrated to the Pu solution (aqueous phase).
It was found that butyraldehyde and 6M nitric acid were effective in separating Np and Tc from the U and
Pu stream. These technologies are expected to be applied to simplified reprocessing process.
Key words: PUREX, extraction, reprocessing, neptunium, technetium
1. INTRODUCTION
NUCEF(Nuclear Fuel Cycle Safety Engineering Research Facility) Experiment
Building is referred to as BECKY(Back-end Fuel Cycle Key Elements Research Facility).
It contains bench scale reprocessing experimental equipment for dissolving, off-gas treatment,
extraction and liquid waste recycling process units in the a cell. The extraction equipment
is made up of five extractors (mixer-settler), several tanks and pumps.
Fuel reprocessing technology is required to remove the long-lived nuclides from high
level liquid waste, simplify the chemical process, and also to make reprocessing process more
economical in the future.
The JAERI (Japan Atomic Energy Research Institute) has been pursuing the advanced
technology of fuel reprocessing. "PARC"(Partitioning Conundrum Key) process"). it is
designed to separate og-lived extractable nuclides, such as 237 Np and 99Tc during the
- 489 -

JAERI-Conf 2002-004
extraction step. This process is based on the current PUREX process ad aims to enhance the
separation efficiency of the extractable Np and Tc as well as a Pu. In the separation of
Np and Tc from the U and Pu stream before the U/Pu partitioning step in the PARC process,
Np (VI) is selectively reduced to the Np (V) by normal-butyraidehyde (decomposable and
salt-free organic reducing agent) and the 6M-nitric acid scrubbing of Tc.
The purpose of this study is to examine the behavior of the first extraction cycle (from
co-extraction to U/Pu partitioning) of the PARC process used by 44,OOOMWd/t spent fuel
dissolver solution.
2. EXPERIMENTAL
2.1 Reagents Table Composition of dissolver solution
Purchased reagents such as vanadium(V) Element Concentration/ substance
oxide, normal-butyraldehyde, tributyl phosphate Nitric acid 3.1 M
(TBP), normal-dodecane(nDD) and hydrazine Nitrous acid 5.8 X 10⁻³ M
nitrate were used without any special pretreatment. U 216 g/l
The spent fuel dissolver solution was adjusted to the Pu .2.4 g1l
concentration of nitric acid about 3M. In addition, Np 176 mg/1
the short-lived gamma-ray nuclides, 95mTc(6.lMBq),
95 Zr(10.4MBq) and 131 I(2.7MBq) were diluted with Tc 366 mg/lRu 792 mg1l
nitric acid solution in order to measure the Zr 441 mg1l
extraction behavior of these elements. The Cs 751 mg1l
composition of the dissolver solution is shown in Eu 18 mg/l
Table 1. Am 181 mg/1
2.2 Analysis
U and nitric acid were analyzed by the potentiometric titration method. Alpha-ray and06 239
gamma-ray spectrometers were used to analyze the concentrations of ?U, I Ru, Np and
other elements (95'Tc and 95 Zr etc.). A spectrophotometer was used to analyze the
concentration of Pu and the valency of the elements in the nitric acid solution. An
ICP-AES(Inductively coupled plasma atomic emission spectrometry) was used to analyze
trace amounts of U, Tc, Zr and Ru in the aqueous sample.
2.3 Procedure
Extraction tests of the 44,OOOMWd/t spent fuel were carried out using three extractors
(there were 20 stages for each extractor). The extraction flow sheet is shown in Fig.l. The
extraction test was made up of these steps: diluent washing, Np oxidation, co-extraction, P
scrubbing, Np separation, Tc separation, U/Pu partitioning and U fCCOVeTy,
The dissolver solution was fed into the 14'h stage of extractor No.1 for 10 hours. Fig.2
shows the absorption spectrum of the dissolver solution by spectrophotorneter analysis. The
- 490 -

JAERI-Conf 2002-004
valency of Pu and Np isNp oxidani Dissolver solution
Diltien' Solvent (0.05M-V205)(3.lM-HNo3) FPscrubbingpresented as Pu(IV) or Pu(VI) (nDD) 30%TBP/nDD) (3M-HN03) (216r U) (2M- HNO,)
97mVh 48ornUh RIML/h 193MM 91MVhand Np(V) in the solution.
1 5 10 14 70Vanadiurn(V) oxide Dilu�ntwashing Npoxidation co-extraction FF sciubbing
with 3M nitric acid was used Exiractor No.16 ) R affinate ................ ........... ........................................................
as an Np oxidizing agent andNp reductant
FP scrubbing solution (2N4 Om- CHCHO) Solvent Np scrubbing Tc scrubbing(30%TBPInDD) (30%TBP/nDP) (3M- HNOD (6M- HN03)
nitric acid) was fed into 7OmL'b .............. :1 25inn 4OmUh 90MI/h
extractor No.l. FP scrubbing I U 4recovery Np separation Tc separation
solution scrubs mainly Zr wasExtractor Nol
Np solution TC Solution ............. I'll ........................extracted with 30%TBP/nDD. ....... ...Pu reductant
It has been proposed that (14.9 g/ UM)Pu reductantDiluent Solvent U was4 .ing (lM-HN03) (0.2M-HN03)(nDD) (3OToTBP/"DD) (IOM-1-INOO COIM-N-A) 02M-N21'4)
butyraldehyde used for the P C'Snkm Tim
selective separation of Np I Diluent 5 U 1 19
l)-5) washing recovery U/Pu partitioningfrom the U and Pu streamExtractor No,3It was fed into the 1" stage of Pit solution U loaded solvent
extractor No.2 with 30% Fig.1 Extraction flow sheet of PARC process test.
TBP/nDD.
Tc scrubbing solution
(6M nitric acid) was fed into the 20 1h stage of extractor N.2. Uranous nitrate and hydrazine191h 1hwith nitric acid solution were used as a Pu reductant agent and fed into the and 20
stages of extractor No.3.
1.5
Arn M(Ln ()
Pu (VI)
0 P. (IV)0.5 - Np (V)
(1v)
0�400 600 800 1000 1
Wavelength nal
Fig. 2 Absorption spectrum of dissolver solution.
3. RESULTS AND DISCUSSION
Fig.3 sows concentration profiles of nitric acid, U and Pu in extractor No.1 and
- 491

JAERI-Conf 2002-004
Table 2 Distribution fraction of each element M
Product stream U* Pu Np Tc Ru Zr
Raffinate <0.02 <0.098 35.2 <1.1 90.8 84.2
Np solution 0.001 9 X 10⁻⁴ 31.9 0.24 0.35 5.5
Tc solution 0.32 0.46 19.3 81.8 7.3 2.2
Pu solution <0.009 70.1 0.34 8.3 0.48 2.6
U loaded solvent 102.97 29.2 13.3 <8.6 1.1 <5.6
The value containing uranous nitrate.
Table 2 summarizes the result ofDO- SW_ (3.IM- HNO,) FF -bbig
distribution fraction of each element (.?D) (30%T�PIOD) 3M- HN00 (Z16 U) (ZM- W400
; i I r, Iin the product stream. From the 7 R-t!!jID1- 5 10 14 21
hi-9 --- F F��N.2
Aq.U -0E Aresults, it was discovered that more i-M 0'Cr -0-0- -0,lo 0
than 99.9% of U and Pu were
extracted by 30%TBP/n-dodecan inZS
the co-extraction step. 12 lo-
Fig.4 shows concentration r lorprofiles of Tc and Np, as a result 00 lo-r064.8% of the Np and 98.9% of the U lo-
Tc was extracted with 30% 2 4 6 8 0 12 14 16 18 20Stage No.
TBP/nDD in the co-extraction step.
It was found from the result that Fig.3 Concentration profiles of nitric acid uranium and
oxidant rate of Np was insufficient plutonium in extractor No. 1.
in this condition. There is room for
reconsidering this matter. It is Np..id- DmW-W.i..
(0-05M VA) (11M. MD,) FF -bNg(OD) (M%'MP/.DD) (3M- HN0,) (2160. U) (2M- HNOS)necessary to improve extraction
R.M-.condition such as concentration of Da- 5 Np..idm 11 C-i. 11 FP -bbi-W.g ng 20
vanadium oxide or aqueous andA '140: ftT.organic flow rate(O/A ratio). 100
However, vanadium oxide seems toP-0
be expected for oxidation of Np and lo-
extracted from raffinate solution.lo-
Fig.5 shows concentration
profiles of nitric acid, U and Pu in lo-extractor No.2. U and Pu were 2 4 6 8 10 12 14 16 18 20
Stage No.almost constant in both the organic
and the aqueous phases in the Np Fig.4 Concentration profiles of technetium and
separation and the Tc separation step. neptunium in extractor No. .
- 492 -

JAERI-Conf 2002-004
Almost all of the U and Pu wereNp S.1- T. -. bftg.. C-7--) - "�� (%= (6M HNO,)
recovered from aqueous phase in theNP
-- Y 20 -Z:-. N.3recovery step. I U 4 NP -P-'-fi- 10 T..*�-
A,�Fig.6 shows concentration.M: Aq.PU io -0 -0- 0- o 0 0- 0- 0�0:ftu a.0-0+ -0.
A: ftHNO, -0-profiles of Tc and Np. 75.0% of the 0: 0 P.
extracted Np was separated from the 100
U and Pu stream in the NP
separation step. Part of Np was
reoxidized from N V) to lo-,-PNp(VI) by 6M nitric acid, O lo-
Aconsequently, was extracted to 2 4 6 8 1.0 12 14 1'6'l8'2'0Stage No.
30%TBP/nDD again in the Tc
separation step. On the other hand, Fig.5 Concentration profiles of nitric acid uranium and
81.7% of the Te was separated by plutonium in extractor No.2.
6M nitric acid. However, 16.1 of
the Tc transferred to U/Pu
partitioning step that was not Np R.&�- S.1- N T.S-ftiAg
(1M-CHCH0) (30%-M?/.DD) p=�
separated from the U and Pu stream. (30%-MP1rDD)
Fig.7 shows concentration N� bfui. T.Sq-.d-
T.
profiles of Zr and Ru in extractor
No.2. As the diagram indicates, Zr lo-
was scrubbed to some extent in the
1ONp separation step. On the other
hand, the concentration was constant 0lo- 0: Aq.T.
in the Tc separation step. 0: ftn(,&Np
The concentration of Ru was 0-Aconstant in the Np separation step, - 2 4 6 8 10 12 14 16'18'2'0
Stage No.
but almost all of the Ru was
scrubbed by 6M nitric acid in the Tc Fig.6 Concentration profiles of technetium and
separation step. neptunium in extractor No.2.
In the U/Pu partitioning step
(Extractor No.3) Pu was stripped
into aqueous phase that was reduced from Pu(IV) to Pu(III) by U(IV) with hydrazine as
shown in Fig.8. The concentration of U in organic phase was almost constant. As for Pu, the
concentration in both the organic and the aqueous phases decreased in the UPu partitioning
step.
Fig.9 shows concentration profiles of Tc and Np. Most of the Np remained in the U
loaded solvent (organic phase). To the contrary, Tc migrated to the Pu solution (aqueous
phase).
- 493 -

JAERI-Conf 2002-004
Np S.1- Np -Wlb-g(3M. H(,,) OM- HNN
NP.,p..fi- T.
Np -y 4 10 P-i 2' W. N.3
MAq. Z,VAq R.D: 0 Z,
lo- V0 R.
0 -P
lo- i
5
0U
4 ilo- 2 4 6 8 10 12 14 16 18 20
Stage No.
Fig.7 Concentration profiles of zirconium and ruthenium in extractor No.2.
P.,.&-�14 -U
Dg� S.1-1 U-wqC0%TBP/.DD) (]OM-HNO,), - NUZ)
F� N.2
P.ldti- IDD- P-W-i-g 'O Ulddh-
S
0: A UA: Aq. HNO, 0- -0 0
101 0: 0,&U IO- -C> 0 O-
A; 0&HNO,0: 0,&N 'O
-0 D O 0
lo(
41-
B lo-
0U
lo-4 6 10 12 14 16 1 20
Stage No.
Fig.8 Concentration profiles of nitric acid uranium and plutonium in extractor No.3.
�14.%UOV) .-
W- S6- U" m" NOA (02M-HNOo(.�D) (3.%TBP/.DD) ('OM'HNO E N�I (02M-NH.) ("M-MAY
P.
5 9 10 Uft,.ki.-, 19 20�U
9: A T.&: Aq. NpA: ftNp
10
0
10
U
lo-�
1042 4 6 8 10 12 14 16 18 2U
Stage No.
Fig.9 Concentration profiles of technetium and neptunium in extractor No.3.
- 494 -

JAERI-Conf 2002-004
4 CONCLUSIONS
These results led to the conclusion that 64.8% of the Np and 98.9% of the Tc were
extracted in the co-extraction step. 75.0% of the extracted Np was separated from the U and
Pu stream using by butyraldehyde as a reducing agent in the Np separation step. On the other
hand, 81.8% of the Tc was separated by 6M nitric acid in the Tc separation step.
The separation efficiency of Np was not enough under this condition. It is necessary to
optimize to trihance the Np oxidation and separation rate. However, it was found that
butyraldehyde and 6M nitric acid were effective in separating Np and Tc from the U and Pu
stream. A further direction of this study will be to clear the chemical reaction of Np. These
technologies are expected to be applied to simplified reprocessing process.
REFERENCES
1) M.Maeda et al., GLOBAL95, Versailles, 11-14 Sep, 1995
2) S.Fujine et al., 101h Pacific Basin Nuclear Conference, Kobe, 20-25 Oct, 1996
3) G.Uchiyarna et al., Nucl.Technol.,102,341, 1993
4) G.Uchiyama et al., ICEM97, Singapore, 12-16 Oct, 1997
5) S.Fujine et al., GLOBAL97, Yokohama, 10 Oct, 1997
6) N.Srinivasan et al., B.A.R.C-734 and 735, 1974
495 -

This is a blank page.

JP0250343JAERI-Conf 2002-004
FUNDAMENTAL STUDY ON THE CONTROL OF MINOR NUCLIDES
(Np, Tc) BEHAVIOR BY ELECTROLYTIC REDUCTION
T. Asakural, H. Hoshi2, Y.-Z. Wei2' M. Kumagai2 and G. Uchiyamal
1. Japan Atomic Energy Research Institute, Tokai Research Establishment, Shirakata-Shirane 24, Tokai-mura
319-1195
2. Institute of Research and Innovation, 1201 Takada, Kashiwa-shi, 277-0861 Japan
FAX: 81-(0)29-254-4006, e-mail: asakura�procsafe.tokaijaeri.gojp
The reduction of technetium, neptunium, and uranium was studied using a flow type electrolytic cell containing
a carbon-fiber column electrode. Qualitative reduction of Np (VI) into Np (V) was confirmed at the potential
of 0.3 V vs. Ag/AgCI in 3 mol-1-1 HN03 solution. Quantitative reduction of U (VI) into U (IV) with co-existing
Np and Tc was also confirmed at 0.3 V vs. Ag/AgCl in 3 mol-1-1 ffNO3 solution. The eductive behavior of Tc
still needs to be studied finther.
Keywords: Electrolysis, Reduction, flow type electrolytic cell, Neptuniurn, Technetium, Uranium
1. INTORDUCTION
In the field of nuclear fuel reprocessing, it is important to control the behavior of minor
elements such as neptunium and technetium. In spent fuel solution, Np can exist as three
valence states, Np (IV), Np V) and Np (VI). Np (VI) and Np (IV) are well extracted by
TI3P, but Np V) is less extracted [1]. In the case of Tc, it exists as its heptavalent state,
T604- anion or R04 molecule, in spent fuel solution. Te VII) is fairly well extracted from
spent fuel solution by TBP with uranium 2] or zirconium 3]. Tc in tetravalent state, Tc02+
cation typically, is less extractable. Thus, it is possible to control the behavior of Np and Tc
by controlling their valence state.
Standard electrode potential of redox reaction,
NP02 2+ +C = NP02+,
is reported to be 1.1 4 or 1.236 [5 V vs. NHE (normal hydrogen electrode). For
reaction,
Tc04_ +4H+ +3e- T02 +21120,
*This work was participated under the framework of the collaboration between JAERI andIRI. A portion of tis work was performed by IRI unde a contract from the Ministry ofEducation, Culture Sports, Science and Technology.
- 497 -

JAERI-Conf 2002-004
the potential is 0. 7 4] or 0. 73 [5 ] V vs. NHE and the potenital for reaction,
U02 2+ +4W +2e- = U4+ +2H20,
is 0.273 to 0.330 46] V vs. NHE. Thus, it is possible to reduce Np (VI) to Np (V)
selectively without reducing Tc VII) and U (VI). If Tc VII) is reduced, p (VI) will be
also reducedbut U (VI) will not. If U (VI) is reduced, both Np (VI) and Tc (VII) will be
reduced.
In this paper, electrolytic reduction of Tc, Np, or U-Np-Tc in aqueous HN03 solution using a
flow type electrolytic cell containing a carbon-fiber column electrode is studied. First
purpose of this study is to confirm electrolytic reduction of U (VI) to U (IV), to developing a
reprocessing process basing on ion exchange. The Second is to utilize electrolytic reduction
for selective separation in improved PUREX process 7, which is designed to separate Np
and Te selectively from U and Pu.
2 EXPERIMENTAL
Electrolytic reduction of Tc, Np, or U-Np-Tc solution
A flow-type electrolytic cell containing a carbon-fiber column electrode (Hokuto Denko Corp.,
HX-201 2 mo was used to reduce Tc, Np or U-Np-Tc solution. Table I summarizes the
conditions of respective experimental runs. Conditions in Run and 2 are selected to obtain
knowledge about Tc behavior under U (VI) reductive conditions. Those in, run 3 are for Np
(VI) reduction. Run 4 was participated to confirm U (VI) reduction with coexisting Np and
TO.
Table I Aqueous solution for electrolytic reduction and applied potential
RUN Concentration I moH-1 Applied potentialTC Np U HN03 N21714 V vs. Ag/AgCl
1 IV 6 -0.32 le 6 le -0.33 lo, - 3 0.34 lo-, le 0.1 6 le -0.3
Respective solution passed through the cell at the rate of I ml-min- and solution fraction
flowing out from the cell was collected. Te concentration of respective elements remaining
in the solution was determined by 1CP-AES for U and Tc, or gamma spectrometry (radiation
at 277 eV) for Np. Photo-absorptive spectra were also measured.
Ion exchange behavior
Five milliliters of Tc solution after reduction was contacted with about , g of ai)jon exchanger
- 498 -

JAERI-Conf 2002-004
(AR-01. silica-polymer composite, benzimidazole functional group) at 25 'C for 2 hours.
The concentration of Tc remaining in the solution was determined by ICP-AES.
3, RESULS AND DISCUSSION
At first, Te reduction was studied using a flow-type electrolytic cell, without N21-14 in feed
solution Run 1), The electrolysis, however, did not work well because of bubble formation
in the solution. The solution flowing out from the cell showed a blue color, and a 380 rim
peak implying the formation of nitrous acid was observed in its photo-absorptive spectrum.
Then, solution with N2H4 was prepared as feed solution (Run 2 In this case, the formation
of nitrous acid was well suppressed as expected. The concentration of Tc in the solution
flowing out from the cell was almost not changed, implying that no electro-deposition
occurred, Any absorption peak of Tc (IV), however, could not be observed in the spectrum
of the flowing out solution. Moreover, the adsorptive distribution coefficient ratio of T to
AR-01 increased to 13 ml-g�' after reduction from 7 ml-g�' before reduction. If Tc exists as
TcO2+' it is expected not to be adsorbed to an anion exchanger. The increase might be
explained by Tc (IV)-nitrate complex formation, although there is not enough proof
Further, Np reduction was also studied (Run 3 Figure I shows a photo-absorption
0.30
-Feed solution0.25 ------- :_ ___-
Flowing out solution0.20 -------
0.15 ----------------------------------------
0.10 ------- t------ ------- ------- -------
0.05 ------- ------- ------- ------
0.00
-0.05 . . . .
350 450 550 650 750 850 950 1050
Wavelength nm
Fig. I Photo-absorptive spectrum of feed solution, or that of solution fraction flowing
out from the electrolytic cell, collected during to min. Feed solution; Np le
moi-ri, HN03: 3 moi-ri. Flow rate: m-min-1. Applied potential: 0.3 V vs Ag/AgCl.
spectrum of feed solution, or that of solution flowing out from the electrolytic cell,
respectively. As is apparent from Fig. 1 a photo-absorption peak at 979 m corresponding
- 499 -

JAERI-Conf 2002-004
to Np (V) fairly was stronger in flowing out solution if compared to that observed in the
spectrum of the feed solution, Respective solution fraction collected during to min (in
Fig. 1), 5 to IO min, I to 15 min r 15 to 20 min had almost the same absorbance value at the
peak. Qualitatively, electrolytic reduction of Np (VI) into Np (V) by using the flow-type
electrolytic cell was confirmed. It is reported that Np can be selectively stripped by
batch-wise electrolytic reduction from TBP solvent loaded by U, Pu and Np [8]. Current
reductive technique can be applied to selective Np separation.
Finally, the reduction for U-Np-Tc solution was examined (Run 4 The absorption
spectrum of flowing out solution showed typical absorption peaks of U (IV) as Fig. 2 and
1.2Feed
------ -------- 10-18 min ------------------1.0 T
18-26 min
0.8 -- 'I - - - - - - - - - - - - - - - - - - - - - -T- - - - - - - - - - - - - - - - - - - - - - - - - - - - -G
------- ----0.6
------------0.4
---------------0.24
0.0
350 450 550 650 750 850 950 1050
Wavelength mFig. 2 Photo-absorptive spectrum of feed solution, or that of solution fraction flowing
out from an electrolytic cell, collected during 10 to 18 min, or 18 t 2 min, respectively.
Feed solution; U: 0.1 mol-1-1, Np: 10-3 mol-1-1, Tc: 10-3 mow', N03: 6 mol-1-1, N2H4:
10-3 mol-t-1. Flow rate: I ml-min-1. Applied potential: 0.3 V vs AgiAgCI.
quantitative U (VI) reduction into U (VI) was confirmed with co-existence of Np and T In
this experiment, however, nitrous acid was formed and U reduction efficiency decreased to
almost zero after 18 minutes of reduction. After 18 min, the cathodic client suddenly
increased as shown i Fig. 3 ad the lowing ot solution contained little U (IV) (Fig. 2.
Thus, N2114 concentration i feed solution should be increased to savenge itrous acid.
Unfortunately, reductive behavior of NP was not known in this experiment, because large U
concentration interfered photo-absorptive observation of Np valence state. T behavior of
Tc was uncertain, too.
- 50 -

JAERI-Conf 2002-004
t
---------------- ---------------- - -------------
---------------- --------------------------
=W 0.5 ---------------- --------------- --- ---------
0 I L_ J
o 10 20 30Time min
Fig. 3 Cathodic current for U-Np-Tc solution. Feed solution; U: 0.1 moi-rl, Np: 10-33 1Mol-1-1, T: 10- mol-1-1, N03: 6 mol-1-1, N2H4: 1073 M1-1-'. Flow rate: m-min-.
Applied potential: 0.3 V vs Ag/AgCl.
4 CONCLUSIONThe reduction of Tc, Np and U was studied using a flow type electrolytic cell containing a
carbon-fiber column electrode. Qualitative reduction of Np (VI) into Np V) was confirmedat the potential of 03 V vs Ag/AgCl in 3 mol-1-1 HN03 solution. This reductive techniquecan be applied. to a selective Np separation. Quantitative reduction of U (VI) into U (IV)with co-existing Np and Tc was also confirmed at 0.3 V vs Ag/AgCl in 6 mol-1-1 HN03solution. The reductive behavior Tc still needs to be studied further.
References[1] B. Guillaume, C. Maurice, "Chemical properties of neptunium applied to neptuniurn
management in extraction cycle of PUREX process", Extraction 84, Institute of ChemicalEngineers Symposium Series No. 88, Institute of Chemical Engineers, Rugby, 31(1984).
[2] D. J. Puett, "The solvent extraction of Heptavalent Technetiurn by Tributyl Phosphate",
Sep. Sci. Technol., 16, 1157(1983).[3] J. Garraway, "The behavior of technetium in in a nuclear reprocessing plant", Extraction
84, Institute of Chemical Engineers Symposium Series No. 88, Institute of ChemicalEngineers, Rgby, 47(1984).
[4] R. Tarnaniushi, Denki-kagaku (Electrochemistry), Tokyo Kagaku Dojin, Tokyo,299(1967)� [in Japanese].
- 50 -

JAERI-Conf 2002-004
[5] The Chemical Society of Japan, Ed., Kaitei 4-han Kagaku Binran Kiso-hen II, Maruzen,
Tokyo, 464(1994), [In Japanese].
[61 M. Gourong, Z. Liufang and L. Chengfa, "Investigation of the redox potential U02 2+/U4+
and the complex formation between U4+ and N03- in nitric acid", Radiochim. Acta, 37,
145(1985).
[71 G. Uchiyama, T. Asakura, S. Hotoku, et al., "Solvent extraction behavior of minor
nuclides in nuclear fuel reprocessing process", J. Radioanal. Nuc. Chem., 246, 683(2000).
[8] G. Uchiyama, S. Hotoku, S. Fujine, et al., "The method of controlling the valence state of
neptunium", PAT. No. 2589886, Japan, Dec. 5, 1996.
502 -

JAERI-Conf 2002-004 JP0250344
STUDY ON THE ADSORBENT WITH AM[1DOXIMF FUNCTIONAL
GROUP UTILIZED TO RECOVER USEFUL METALS FROM SEA-WATER
T. Asakura, D. T. Hong, A. Y. Zang ad G. Uchiyama
Japan Aomic Energy Research Institute, Tokai Research Establishment, Sirakata-Shiran 24, Tokai-mura
319-1195
FAX: 81-(0)29-254-4006, e-maiL asaktira�procsafe.tokaijaeri.gojp
Japan Atomic Fnergy Research Institute has developed fibrous polymer containing amidoxime chelating
functional Poup adsorbent (FPAO) for recovering U frorn seawater. Recovery of uranium from seawater
provides a additional head-end ption to nuclear fitel cycle. Fundamental experiments showed tat FPAO
adsorbs O(Vl) the best around pH 60, and that adsorptive reaction is a thenno-activated process having
activation energy of 28,54 KJ-mol-'. Uptake values for metals in FPAO which was imersed to actual
seawater for 2 months, were determined to be 9690 for Mg, 0026 for r 00036 for Au, 320 for V, 290 for U,
0.97 ot La 083 for Ce, 86 or Ti, and 097 for Zr, as in unit of ug-(g-dry FPAO)-', From batch desoption
experiments, it is suggested to possible to recover Mg, U or La/Ce separately by using HCI and H2C204 (oxalic
acid) as elutants.
Key words: Metals, Adsorbent, Sea-water, Amidoxime, Desorption
1. INTRRODUCTION
Seawater contains many kinds of useful elements such as uranium, rare-earth elements and
noble metals etc, Their recovery has gained great interest in many countries. If it is
possible to recover ranium from seawater, it provides an additional head-end option to
nuclear hiel cycle, Since concentration of metals in seawater is very low (in parts per
billio n), efforts have been made over years to find an efficient method to concentrate and
separate these metals from seawater. Among separation processes sch as solvent extraction,
ion exchange, adsorption, precipitation, etc, adsorption of metals o various inorganic and
organic adsorbents shows a lot of advantages from the viewpoint o nvironmental protection.
Requirements f the adsorbents include high physical and chemical, stability, fast and
selective uptake of metals, sufficient loading capacity and easy desorption.
Japan Atomic Energy esearch Institute (JAERI) as developed fibrous polymer containing
amidoxime helating utional group adsorbent (FPA0) for recovering U from seawater.
This adsorbent has a affinity with divalent cation, typically U(VI), and demonstration test to
produce titanium rom seawater has been performed. Many other valuable metals such as ,
Mg, Ir, Art, La, Ce, Ti, Zr ave yet to be tested on this adsorbent,
Present study deals with the kinetics of adsorption of tf(VI), determining the uptake of
- 503 -

JAERI-Conf 2002-004
valuable metals in FPAO imerse in actual seawater, and identifying the proper conditions
for desorption of the metals.
2. EXPERIMENTAL
2.1 Preparation of adsorbent
Using a fibrous polypropylene resin sheet as base material, acrylonitrile and methacrylic acid
were graft polymerized b 7-irradiation. The grafted fibrous resin sheet was reacted with
hydroxylamine at 60 'C for I hour and converted into fibrous polymer containing amidoxime
chelating functional group adsorbent (FPAO, hereafter). The average content of the
flinctional group in FPAO was about 361 nunol-(g-dry FAO)-'.
2.2 Kinetics of U(VI) adsorption
The adsorbent was cut into about 3x4 mm of small pieces, conditioned with 25 KOH
solution at 80'C for 60 min and then washed with distilled water to natural before use.
U(VI) solution with a desired pH value maintained by CH3COOH-CH3COONa or
Na2B407-H3BO3-NaCl and with the ionic strength y) of 0 I mol-1-1 maintained by NaCl was
prepared. Other reagents used in experiments were of analytical grades and without further
purification. Known weight of FPAO, pre-equilibrated by appropriate buffer solution at least
for 24 h was mixed with UVI) solution in 100 ml triangle flask. Te flask was shaken
mechanically for a desired contact time in a thermostatic water bath at the desired temperature.
The concentration of UVI) in the solution was determined by CP-AES (Shimazu
ICP-1000III). The amount of U(VI) adsorbed, Q, / mg-(g-dry FAO)-' was calculated as
follows:
Qt = (VI)10 [(VI)lt)- /W.
Where [U(Vl)]o or [U(Vl)]t is the concentrations of U(VI) in feed solution at initial or at any
time, t, respectively, V or W is the volume of U(VI) solution or the weight of dried
adsorbent.
2.3 Determination of respective metals contained by FPAO immersed in seawater
FPAO was imersed in seawater, about k frorn the seashore of Sekine-hania, Aornori-ken,
in 1999 for 2 months, This loaded FPAO was decomposed to by nitric acid or calcination.
A sheet of loaded FPAO (approx. g), washed and dried, was ct into pieces of 5 x5 m, and
then decomposed by I 0 ml of concentrated itric acid (I 3 8 N) at 160-1 80 T for about 2 h.
Then distilled water was added. the solution was filtered. he solution was adjusted to I 0
ml volume, ready for aalysis. This method was also used to eteri-nine the amount of metal
remained in FPAO after desorption. Iti the second method, loaded FPAO was but-lied i a
furnace to ash, which was then dissolved in acid solution. Concentration of respective metal
was determined by ICP-AES and ICP-MS.
- 504 -

JAERI-Conf 2002-004
2.4 Desorption of metals
Loaded FPAO was washed by distilled water, dried at ambient temperature and cut into pieces
of 5x5 mm. Each batch experiment was conducted with one sheet of about g in a 3 -liter
beaker at room temperature. After finishing experiment, adsorbent was immediately
separated from solution. Respective batch experiment was conducted at various
concentrations of different acids (HCl, HNO3, CH3COOH, H2C204, H2SO4, HC104), varying
stirring speed, temperature and. solid/liquid ratio. Concentration of metals in the solution
was analyzed by ICP-AES and ICP-MS, allowing the amount of metals desorbed from
FPAO to be calculated.
After desorption, the adsorbent was washed with distilled 'water and decomposed by
concentrated HN03 as described above to determine the aount of metals remained in
amidoxime adsorbent.
Desorption efficiency (-7 %) for each metal was calculated as follows:
Md77 Md + Mr
with Md and Mr being the amount of metal desorbed from adsorbent and that of metal
remained in adsorbent, respectively.
100 3. RESULTS AND DISCUSSION
3.1 Kinetic and equilibrium study 80
on U adsorption 1.11,
Figurel shows the influence of �D 60 - 3acidity of feed solution, pH: 10-9.0, 'oo
on the adsorption of U(VI). It is to 40 - 1: 30min2: 60minbeen seen that the amount of U(VI)
adsorbed with FPAO in feed 20 - 3: 120min
solution rapidly increases with 0
increasing the pH values from pH 0 2 4 6 8 101.0 to 30, slowly increases from pH pH -
3.0 to 60, reaches the maximum Fig. I The influence of pH values on the adsorption.
value when pH value is 60 and FPAO: 0 I 0 g, 7.26 x I -' mol-1-1).
subsequently rapidly decreases from [U(Vl)]: 128 mg-1-1 (PPM).pH 60 to pH 90. So the optimum
acidity is determined as pH 60. These facts implies that a process of releasing proton,
R-C(NH2)N-OH->R-C(NH2)N-O-+H+,
- 505

JAERI-Conf 2002-004
in FPAO molecule is a rate controlling-step for the adsorption of U(Vl) with FPAO when the
acidity of feed solution changes from pH 1.0 to 60. It is benefit to the adsorption of FPAO on
U(VI) because decreasing the acidity of solution, that is increasing the pH value, can
accelerate this process to take place. At pH value more than 60, especially at 90, the
decrease is explained by the precipitation of U(VI).
As expected, the amount of
FPAO and concentration of C
U(VI) affect on the adsorption 300 -
of UVI). Figure 2 shows the
the influence of the
concentration of UVI), 50-300
ppm, on the adsorption of U(VI). �D
In the case of 0 I g, the 100 2
adsorbed amount of U(VI)
slowly and linearly increased, -< 0
and the adsorption percent of 0 100 200 300U(VI) was decreased with
[U(Vl) / PPMincreasing the concentration of Fig.2 The relationship between the amount of
U(VI). The adsorption adsorbed U and the concentration of U. FPAO: 1)percentage of UVI) at 20 mindecreased from 99.8 % to 0.015g,2)0.10g. pH:6.0,,u:O.1mo1-1-'.
81.3 if the concentration of UVI) increased from 59ppm to 300ppm. This shows the
saturated adsorption capacity of U(VI) is far not reached in excess of FPAO. In the case of
0.015 g of FPAO, adsorbed U amount increases rapidly with increasing the concentration of
U(VI), and subsequently slowly increases. It indicates the adsorption of the fibrous
adsorbent FPAO on UVI) gradually approach to its maximum adsorption capacity. These
facts imply that FPAO possesses a large adsorption capacity on UVI). The influence of the
size of the adsorbent on te adsorption of U(VI) was also studied. Under constant amount of
FPAO, the rate is faster as the size is smaller, comparing square adsorbent, 2x2mm. 3x4mm
and 6x6mm.
The influence of temperature (25-45'C) on the adsorption of UVI) with FPAO was
investigated for the weight of FPAO 0.1g, pH 60 and the concentration of (VI) 128ppm.
The results show that the adsorption process was an endothermic reaction because the amount
of U(VI) adsorbed increases with increasing the temperature. According to
An(l -F)=kt, F = QIQ,,,
- 506 -

JAERI-Conf 2002-004
a graphs of An(I-F) versus t
6 are shown in Figure 3.5 The results shows that the
adsorption process of U(VI)
4 with FPAO is a chemical
adsorption because the
linearity between -ln(l -F)2 and t. In table I, the values
of the constant k at respective
0 ------------------ temperature is summarized.
o 15 30 45 60 In Figure 4 values for k are
Time/ plotted agenst 11T according
Fig,3 he relationship between -ln(1-P) and time. to Arrhenivis' law. The
Dependence on the temperature. relation between k min and
1) 25 C 2 30 C 3 35 C 4 40 C, 5) 45 -C. temperature T K is
pH: 60, PAO 010 g, [U( VI)]: 120 ppm. expressed as,
28.5xiO'
k = 743 X103 e RT
and activation energy of 28.5 KJ-mol-" is obtained for this endothennic reaction.
Table I k value at respective temperatureTemperature I 'C 25 30 35 40 45
k / min-' 0.0771 0.0873 0.1081 0.1312 0.1558
-0.7 3.2 Adsorption of metals in FPAOcontacted with seawater
-0.8 - The experimental results are
-0.9 - summarized in Table II. Apparently,uptake of Mg, V, or U was
-1 - significantly high, while Ti, Zr, La or
Ce uptake was rather low. Uptake
of Au or Tr was the lowest.
-1.2 Con �entratioij factor of V, U, La, Ce,
0.0031 0.0032 0.0033 0.0034 Ti was high, and that of Au was1 T moderate. This suggested that
Fig-4 Arrhenjusplotfork. FPAO can be used for recovering U,
V and some other valuable metals such as La, Ce, T, Zr froin seawater.
- 507 -

JAERI-Conf 2002-004
Table 11, Uptake and concentration factor of metalsConcentration in
Uptake ConcentrationElement seawater ILI] Principal species pg-(g-FPAO)-' factor rnbg�i
Y-1- -2+Mg 1.35XIO, Mg ,M9SO4 9690 7.18
Ir - 0.026Au 0.004 AuC14 0.0036 1000V 2 V02(OH)3 2- 320 160000U 3 U02(CO3)3 4- 290 97000La 1.2xlO-2 - 0.97 81000Ce 5.2x 1 0-3 - 0.83 160000Ti 1 - 8.6 8600Zr - 0.97 -
3.3 Desorption isotherms of loaded FPA0
Figure 5 shows the desorption isotherm of U or La with changing the kinds of elutants. As
shown in the figure, 80 or more U was eluted from loaded FPAO by HCI with
concentration of 0.5 N or more, or by I N 1-12C204 in 30 min. On the other hand, 0.05 N HCI
or I N CI-13COOH was less effective to eluting U. In the case of La, I N H2C2O4 did not
elute it well. 05 N HCl eluted 90 % of La in 30 min. Ce showed the same trend as La, and
about 80 % Ce was desorbect with 0.5 N HCl in 30 min. In the case of Mg, approximately
99 of Mg was eluted by 0.05 N HCl in 30 min. In figure 6 temperature dependence of
desroption of Mg, U, Ti, V is shown. It is clear from the figure that temperature hardly
IN HC1 IN H2 IN HC1 0.5N HC10.5N HCI 0.1 0 IN HCl 0.05N HC10.05N HC1 -o- IN IN 2C204
1008 - 80
60 - 604�
40 -Q 40
20 20
00
0 1 2 3 4 5 0 1 2 3 4 5Time h Thne It
Fig, Desorption isotherms of L), or La. DepenceflC o the ionos o elulants.
affects Mg desorption. On the other hand. U is desorbed faster if the temperature is higher.
Thus, it is possilbe to develop a ititual separation method or Mg, U ad La/Ce, Mg can be
easily desorbed from loaded APO with 0.05 N HC1. Lower temperature is esirable.
Under this condition, majority of U, La/Ce still remains in te FPAO� Ten U can be
- 50 -

JAERI-Conf 2002-004
100 desorbed by H2C204, whileLa/Ce remains in FPAO, again.
80 After those, 0.5 N HCI desorbsLa/Ce.
Mg60 - HC1 is effective elutant for Mg,U U, La/Ce. It, however, seemsTi'80 40 - be less effective for , Zr and Ti:V
L --------------- i only about 20 Ti was desorbed20 - with 0.5 N HCl and several
percentage of V was desorbed0 7
with I N HCI. About 25 V20 30 40 50 60 was eluted by using H2C204-
Temperature IC Many another eluants such as
Fig. 6 Desorption of U, Mg, Ti and V. HC104, H2SO4, NH40H, N114NO3,
Dependence on temperature.. NTI�Cl, some organic acids and
mixtures of acids were examined for V, Zr and Ti but none of them showed to be suitable for
V. About 60 of Ti was eluted with 1 I mixture of I N HCI and I N CH3COOH 1N.
About 60% of Zr was desorpted from FPAO adsorbent with I N NH40H.
Concentration factor for V is quite large and the uptake is also high. In the present work,
however, no effective desorption agent for V was found.
4 CONCLUSION
Kinetics of UVI) adsorption to FAPO is established, as endothermic process having 27.2
KJ-mol-1. The kinetic study should be expanded to other kind of metals, such as La, Ce V,
Au, Ir, Zr. The amidoxime adsorbent can be effectively employed for recovering U and
some other valuable metals such as Mg, La, Ce from seawater. Value of concentration factor
for V is quite high but an effective desorption agent has to be seeked.
Work in progress includes column experiments for both kinetics study and desorption study.
References
[1] R. A. Hom, "Marine Chemistry. The Structure of water and the Chemistry of the
Hydro-sphere", Willey-Interscience, New York, (1 966) p. 15 5.
- 509 -

This is a blank page.

JP0250345JAERI-Conf 2002-004
SPENT FUEL DISSOLUTION TEST INCLUDING DISSOLVEROFF-GAS TREATMENT IN THE NUCEF ALPFIA-GAMMA CELL:
SPENT FELS WITH BURN UPS P TO 44 GWDT-'
H. Mineo, M. lizuka, S. Fujisaki, H. Isogai, S. Hotoku, T. Asakura, G. UchiyamaProcess Safety Laboratory' Department of Fuel Cycle Safety Research
Japan Atomic Energy Research Institute2-4 Shirakata-shirane Tokai-mura, Naka-gun
lbaraki, 319-1195 JapanFax: 1-29-292-6677, e-mail: miDeo�procsafe.toka1jaeri.gojp
Spent fuel dissolution test was carried out to study the dissolution behavior of nuclides and the behavior ofvolatile "clides, using a bench-scale reprocessing test rig in the NUCEF aipha-gannna cell, 29 and 44 GWdf Ispent fuels were respectively dissolved. Study on the dissolution behavior sbowed that the dissolution rate ofuraniu ad putonium were similar, Also, other species: Cesium, Americium, Strontium and Neodymium werefound to dissolve i the similar roanor to titanium. The faction of Mu dissolved was found to decrease duringthe dissolution. Zirconium molybdate (Zr(M02O7)(OH)2(R2O)2) was identified fom the XRD pattern of residuein the 29 GWdt7' spent fuel dissolution. Those results suggested the precipita (ion of the hydrate duringdissolution. As or the iodine-129 removal, decontamination factor of AGS (silica-gel impregnated with silvernitrate) column was more than 36,000. Measurement of iodine-] 29 in the dissolver solution revealed that lessthan 057% of total iodine-129 generated, which was estimated by ORIGEN 11 calculation, was emained in thedissolver solution- Also, easurement of iodine 129 by an iodine-stripping Elevation fom the dissolver solutionusing potassium iodate suggested at aother 272% of total iodine-] 29 precipitated as iodide. In addition, about70 % of total iodine generated was measured in the AGS columns. Rest of iodine-I 29 was supposed to adsorb tothe HEPA filter and the inner surface of dissolver off-gas lines. Those results on iodine-129 distribution werefound to be almost identical to the results obtained in the study uing iodine-131 as tracer. Release of carbon-14as carbon dioxide dring dissolution was found to occur when the release of Kr-85. From the measurement ofcarbon-14, initial nitrogen-14 concentration in the fuel was estimated to be about several ppms, which was-within the range reported.
Key words: Reprocessing, Spent fuel, Dissolution, Off-gas treatment, iodine-129, carbon-14, insoluble residue
1. INTRODUCTIONIt is indispensable to control and confine radioactive material safely within an area in the
nuclear fuel reprocessing process. Most of radioactive material contained in spent fuel isseparated from nuclear material and finally vitrified as highly radioactive waste. However,some elements like neptunium. can easily be mixed into process products and waste stream,and others like radioiodine are volatile and diffusive. It is, therefore, necessary to study thebehavior of such radioactive nuclides in the process and to assess the safety margin of theconfinement capability.
In the dissolution process, most of volatile species in the spent fuel are released andtransferred into the dissolver off-gas (DOG). Among the volatile species, iodine-129 is along-lived (half-life: 1.57xl 07 years) and hazardous nuclide. The nuclide should strictly becontrolled ad confined within the process. Confinement of iodine is done by expelling asmuch as possible from te dissolver solution to the DOG and ten by removing the iodinefrom the DOG sing a caustic scrubber and/or adsorbent, which is called iodine-strippingoperation. As a result, stnall portion of iodine-129 remain in the dissolver solution andinsoluble residue. Sch iodine distribution behavior over the dssolution process is importantfor the estimation of iodine release into the environment. Studies using beaker-sizedequipment has been carried out, and suggested that the iodine distribution behavior wasdifferent fo tat obtained in a reprocessing plant and that data on iodine- 1 29 distribution ina larger oxperfluental rig became necessary [1]. Adsorbent such as AGS (Silica-gelimpregnated with silver nitrate), will be used in the large reprocessing plant under
511

JAERI-Conf 2002-004
construction. It is important to confirm the confinement capability of the iodine removalsystem employing the adsorbent using actual spent fuel.
The DOG contains carbon-14, which has a half-life of 5.7x 0 years, is generated fromthe neutron absorption by nitrogen and oxygen during the irradiation of nuclear fuel. Thenitrogen and oxygen are an impurity and a constituent of fuel, respectively. Most of carbon-14is released as carbon dioxide during the dissolution 2]. In the present, carbon-14 is notincluded in the nuclides that have to be removed in Japan. The nuclide is, however, the largestcontributor to the equivalent dose rate of nearby residents 3], and it is important to studybehavior of carbon-14 in the dissolution and off-gas treatment processes.
Insoluble residue has been studied extensively since it affects the operation andmaintenance of a reprocessing plant 4]. The residue includes precipitates as well as metalalloy consisted of Ru, Mo, Tc, Pd and Rh. The amount of residue increases with burnup of thespent fuel [5]. Also, the amount of precipitate is affected by the acidity in the dissolution 6].Previous work using GWdt-' found that zirconium molybdate (Zr(M02O7)(OH)2(H2O)2)precipitated during dissolution, which was identified by the measurerneDt of X-ray diffractionpattern 7]. It was reported that the generation of this hydrate increased the plutonium in theresidue, which may adversely affect the recovery ratio of plutonium 6]. The precipitationtends to occur under low acidity and high temperature in simulated HLLW [8].
The aim of the present study is to obtain data on the behavior of nuclides duringdissolution including off-gas treatment and to confirm the confinement capability. It alsoincludes the characteristics of insoluble residue. This paper describes the results obtained inthe dissolution test using spent fuel up to 44 GWdt-' carried out in the y Icell of NUCEF(Nuclear Fuel Cycle Safety Engineering Research Facility)
2 EXPERIMENTAL2.1 Dissolution test rig
Fig. I shows a schematic of experimental reprocessing head-end equipment used in thestudy. The dissolution process comprised a dissolver, an iodine-stripping tank, a dissolversolution filter, an extraction-feed tank, a condenser, a scrubber, a HEPA filter, iodineadsorbent columns and a blower. The equipment was installed in the cell except for theadsorbent columns and blower, which have been accommodated in a glovebox. above the cell.
(glove box)
MS-3A Mumn
A
blower
Iodine adsorbent columns Dissolver off-gas NOx monitor
and C02 trap
[OH KoT.P] Tr P Filterclarification filter 7aH
Kr monitor
ser acuum
Iter
L-()-l Extractionstep
scrubberdissolver _T cartridges)
U MS-3A AGS AGS AGSiodine-stripp Column A ColumnS Column C Column D
(333 K) (423 K) (423 K) (423 K)
6vcefl)
Fig. I Schematic diagram of dissolution test rig Fig. 2 Iodine adsorption columns
512 -

JAERI-Conf 2002-004
The blower is 'used to maintain the dissolution process under negative pressure for alloperating condition.
Fig. 2 shows a schematic diagram of adsorbent columns used in the present study. Thefirst column (column A) contained MS-3A to remove H20 in the dissolver off-gas (DOG).Other three olumns Columns B, C and D) were filled with AGS (silica-gel impregnatedwith silver nitrate). Columns and C had seven cartridges respectively and each cartridge isfilled with 34 g of AGS. The AGS was supplied as AC6120 from SUD CHEMIE AG. Morethan 98 of the adsorbent were sized between I and 2 m. The bulk density was 719 kg m-3and its silver content was 12 in weight. A K onitor and a N02 monitor were installed inthe same glovebox. KOH aqueous solution was used to trap the carbon-14 contained in theoff-gas as carbon dioxide. Two traps were connected and sed for the measurement ofiodine 129 as well as carbon-14 so that the decontamination factor of columns and C withrespect to iodine could be measured.
2.2 AnalysisThe dissolver solution was sampled and analyzed to measure the concentration of species
contained in the sample. Potentiometric titration was used for the acidity and uraniumconcentration measurement. ICP-AES, et andy spectrometries were employed to measure theconcentrations of uranium. plutonium, other TRU elements and FPs. The ICP-AES and anX-ray diff-ractornetry were employed to analyze the constituent of insoluble residue collected.Kr concentration in the DOG was measured using the Kr monitor with a NaI scintillationcounter. The Nx monitor measured the concentration of N02 in the DOG. The amount ofiodine-129 on each cartridge was measured with a Ge detector for low-energy gamma ray 9].The distribution of the nuclide over the dissolution process and DOG treatment system wasmeasured as follows. Iodine-129 in dissolver solution was determined using a method shownby Castleman et al. [10]. Iodine remained as precipitates (AgI and PdI2) in the residues wasrecovered by the iodine-stripping mthod developed by Sakurai et al. [I I] which employsK103. The precipitates can be decomposed by the below reactions and the iodine is releasedinto DOG and trapped by the adsorbent.
5AgI + K103+ 6HN03-> 312+ KN03+ 5AgNO3+3H20 (2.1)
5Pdl2+ 2KI03 +12HN03 --> 612 2N03+ 5Pd(NO3 ) 2+6H20
The amount of carbon-14 trapped from the DOG was determined by a liquid scintillationcounter. Other iodine species such as iodine-131 generated from Cm-244, if existed, werecaptured by the AGS columns and were detected by the y spectrometry.
2.3 Experimental conditionThe present study used about 1.0 kg of PVVR spent fuel 29 GWdt-1, cooling time: about
17 years) and about 12 kg of PWR spent ftiel 44 GWdf 1, cooling time: about 12.3 years),which had respectively been cut into short pieces with a length of 40 mm before transferredinto the cell. Table I shows the dissolution conditions employed in the present study. Nitricacid with 4 to mol 1-1 was used in the dissolution. Dissolution was carried out three tmesand about 300 to 400 g of the spent fuel was used in one batch of dissolution. The procedureof the dissolution was: 1) prepare HN03 with designated acidity and volume in the dissolver,2) put the spent fbel into the dissolver, 3 start dissolution (time = 0) by elevating thetemperature of the dissolver from ambient temperature to 373 - 374 K and 4 hold thetemperature for designated dissolution period.
After the dissolution, the resultant dissolver solution was transferred to theiodine-stripping tank where remaining iodine in the solution was stripped. Table 2
- 513 -

JAERI-Conf 2002-004
summarizes the operations of iodine stripping used in the present study. In the 29 GWdt-spent fuel dissolution, two-steps operation was employed. In the first-step operation, K10 isadded to the dissolver solution being heated up at 373 K to decompose the iodine precipitatesaccording to the reaction 2. 1) ad then the solution is maintained at the same temperature fortwo hours. In the second-step operation, 50 % N02 gas is introduced and maintained at 373 Kfor two hours. At the 44 GWdt-1 spent fuel dissolution, as shown in the table, iodine-strippingusing N02 gas was firstly sed, which was normal procedure employed in a reprocessingplant. In addition, the two-steps method was used as well, in order to enhance the effect of themethod and to measure the amount of iodine remained as precipitates.
Table I Dissolution conditionsBum-up Run No U element HN03 Concentration[N] Temperature Dissolution time
[GWd/t] [g] (volume [1] ) [K] [min]
29 SFD2-1 372.66 5.21 (1.57) 373 220
29 SFD2-2 283.95 3.98 (I A4) 373 160
29 SFD2-3 274.36 4.06 (1.29) 373 140
44 SFD3-1 325,72 5.26 (1.59) 373 220
44 SFD3-2 325.54 4.68 (1.64) 373 220
44 SFD3-3 342.74 3.93 (1.61) 373 220
Table 2 Iodine-stripping operations employedBum-up Iodine-stripping operations'
[GWcl/tl
KI03, 373 K, 120 min29 + N02 gas, 3 73 K, 120 min
44 1) N02 gas, 363 K, 120 min 2) K103, 373 K, 120 min+ N02 gas, 373 K, 120 min
In all experiments the flow rate of DOG was maintained at approximately 0A m3h-1.After the iodine stripping, the dissolver solution was filtrated to remove particulate residueusing sintered stainless steel filters and subsequently adjusted to 3 mol 1-1 HN03 and 250 gU1-1 as extraction feed solution.
600 6 -3. RESULTS AND DISCUSSION U E
3.1 Dissolution behavior --&-HN03
Fig. 3 shows the change in the -- Temp -
concentrations of uranium, nitric acid, 400 - 4 cDXKr-85 and temperature during the
E 300- 3dissolution of 44,000 MWdt-1 spent (Dfuel using 526 mol ' of HNO,, The 200 2uranium concentration increased during SFD3-1 Ethe first 60 minutes, After 10 mnutes, 10the concentration (lid not increase, D 0
Zwhich could irrean the dissolution 0almost completed. The Kr-85 Time min I
concentration reached the maxinum at40 to 50 minutes and then leveled off. Fig.3 Change in te concentrations of uranium,After 100 minutes the concentration nitric acid, Kr-85 ad temperature
514 -

JAERI-Conf 2002-004
was close to background level, which could mean the end of dissolution, At lower acidity (e.g.3.93 mol 1-1 EIN03), more than 200minutes was required to complete the 1.5dissolution. SFD3-1
The hange in the dissolved fractionof plutonium with dissolution time 0 1- -------- -----------compared well with that of urani-arn, as >0shown n Fig 4 wich suggests that bothelements dissolved similarly. The
c O�5-dissolved fraction of plutonium was the .0ratio of the mass of an element to total Ca Umass of the element estimated by U- PLi-239+Pu-240
ORIGEN 11 calculation. The extent ofburnup of spent fuel was determined by 160 200 300the ratio of Cs-134 concentration to Time min ICs-137 concentration 12] wich were Fig. 4 Change in the tractiom of uranium and
meaSUTed and adjusted taking into plutonium dissolved
account of irradiation history of the ftiel.
Fig. 5 illustrates the dissolution
behavior of fission products contained in 6
the 44,000 MWdt-1 spent fuel using 393LU
mol -1 of ffNO3. The ordinate of the O -5
figure is ZcondUconoexpf (ZcondUconc.)ORIGEN, �cc13
where (ZconcJUconc.)exp denotes the ratio of C ------------------ ---------- 4
the concentration of element Z in the U-MO 3 E
dissolver solution to the uranium-*-Zr 0concentration obtained from the same ��0.5 - Nd 2 Z
Xsample taken. (7c,,,./Uconc,)OR1GEN denotes -2� Ru. xC3 0--Sr.C_the ratio of te mass of element Z that 0
0 - SFD3-3 .-G--HN03can be estimated by ORIGEN-11 ;?
calculation at a given burnup, to the _0 100 200 3 00
mass of uranium estimated in the same Time [min]
calculation. When the ratio has the value
1, this could mean that the element Z Fig. Dissolution behavior of fission productsdissolved in the same manner as uranium.
It can be seen in the figure that the value ... 29 GWdt-1 residueof Nd and Sr showed about I and were ...
supposed to dissolve in the same manner ....- -;-1\-)aas uranium. Similar dissolution behavior
was obtained for Am and Cs. Ru showed B'GWdt-I resi�uethe value 0.5 to 06 during the dissolution, I I I I
i.e. 40 to 50 % of total Ru generated was L-JU-J I isupposed to remain as the insoluble i
residue. Mo showed different behavior zirconium mo ybdatefrom other (4ernents and the Lbconcentration decreased with time, which 1 0 20 30 40implies that Mo pecipitated. Also, the
decrease in the Zi- oncentration can be 2o [deg]
seen in te figure, Similar change in Mo Fig,6 YkD patterns of zirconium molybdate and
concentration was observed in the 'dues obtained after dissolution testresi
- 51 -

JAERI-Conf 2002-004
dissolution of 29 GWdt-1 spent fuel, and zirconium molybdate was identified as precipitate inthe residue as shown in Fig, 6 As for residue of 44 GWdt-1, the XRD analysis was notpossible because of the high radioactivity But the molar ratio of Mo to Zr remained in thesolid phase during the dissolution was estimated from the result of concentrationmeasurement and showed the value to be close to two, which suggested the formation ofzirconium molybdate. The mechanism of the precipitation during dis solution is not wellunderstood. Further studies are required so that the crease of the residue amount can beavoided.
In Fig. it was shown that a certainfraction of Ru generated remained inresidue. This fraction decreased when thedissolution of spent fuel with lower burnup
W Vof 29 GWdt-1. Fig. 7 shows those fractionsas a function of burnup, together with the --G---SFD2results obtained by other workers 13-15]. 13 A SFD3
(DO.5 - A leyearnp--&-- Tsukada et al.In the figure, SFD ad SFD3 denote the 13 Adachi et al.
dissolution of 29 and 44 GWdf 'spent fuels, :3 a Adachi et al.(Estmated)
respectively. It can be seen that the fraction v CRIEN (BWR)
increases with the burnup. At lower burnup,the degree of agglomeration of metallic- 0.5 1 1.5fission products such as Ru is not high, and Burnup MWdt" [XIO5consequently they are fe particulates easyto be dissolved 16]. As the burnup of spent Fig. 7 Effect of burnup on the ratio of Ru infuel increases, more metallic FPs will residue to total Ru generated
agglomerate and become hardly dissolved [16] by HN03 with 4 to 7 mol 1-1 at boilingtemperature, which are typical dissolution condition of reprocessing process.
3.2 Radioiodine behavior jolS -Profiles of iodine-129 captured in the AGS I r
colunin were ilustrated in Fig. 8, which were lo 1- 29obtained in the dissolution of 44 GWdt-1 spent -6-1-131fuel. Most of the iodine was captured in the firs 1- 33and second cartridges in the u stream AGS 104 -p 13
Wcolumn (Column B), The decontamination 0 '103 -factor of the AGS columns (B and used in co
the study was found to be more than 36,000 Itwas demonstrated that the radioiodine was (D JOZ 13
A.effectively trapped by the adsorbent under the S? "-&,,.0 101dissolution of actual spent fuel. 0
Iodine-131 and iodine-133 were detectedand plotted in Fig. 8. Those nuclides are -E 100 -
:3
short-lived and generated from spontaneous OEfission of nuclide, mainly curium-244 and also < 10-1from neutron-absorption fission. The gradient 1_ 2 3 4 5 6 _7of the profiles should be same as the profile of Cartridge number in Column iodine-129 because the AGS adsorbent capturesmolecular iodine. Fig. Radioiodine profiles in AGS
Measurement of iodine-129 in the column SFD3-1)dissolver solution showed that less than 057%of total iodine-129 generated, which was estimated by ORIGEN 11 calculation, was remained
- 516 -

JAERI-Conf 2002-004
in the solution. Also, measurement of iodine-129 by an iodine-stripping operation from thedissolver solution using K103 suggested that another 272% of total iodine-129 was trapped inthe insoluble residue. Also, about 70 of total iodine generated was measured in the AGScolumns. Rest of iodine-129 was supposed to adsorb to the HEPA filter and the inner surfaceof dissolver off-gas lines. As shown in Table 3 the results in the present study were found tobe almost identical to the results obtained in the previous study using the same test rig andiodine-131 as tracer 17]. The present study obtained comparable results to the study byBoukis and Henrich 181. However, the fraction of iodine in the residue of the present studywas sornewbat higher. Also, Herrmann et al. measured higher fraction of iodine in thedissolver solution 191. Sakurai et al. suggested that the iodine remained as precipitatewould increase in a larger dissolver. Further studies are necessary to explain the difference inthe distribution behavior of iodine- 1 29, although the difference is not significantly large.
Table 3 Iodine distribution over the dissolution process and DOG treatment systemAuthors Boukis and Henrich Herrmann et al. This study
(1991) (1993)Equipment size Laboratory scale Plant Bench scale
1-1 31 tracer withBurnups of spent fuel used 45 GWdt-I Spent fuel up to 40 fuel of U and FP 44 GWdt-'
GWdt-' simulating 45GWdt-' spent fuel
Balance Balance(74 % of total 1129 (70 % of total 1129
Off-gas Balance Balance on adsorption on adsorptioncolumns) columns)
Dissolver <5 %Distributions solution 0.52 (2 to 3 % for high 0.37 % < 057 %
burnup spent fuel)
Residue 0.18 % 1 % 1.49 % < 272 %
3.3 Carbon- 1 4 behaviorAmount of carbon-14 released as 400 I [ I ']
carbon dioxide during dissolution was SFD2-2measured, which estimated the initi 0.8
300 -concentration of nitrogen-14 in fuelsas impurity to be several ppms with
---- Kr 0.6the aid of ORIGEN II calculation for 200 - - C-14CU29 and 44 GWd/t spent fuels. The ..... Temperature - 04
result could compare well with the 100 reported concentration of nitrogen in 0.2
Eother PWR fresh fuels ranging
�ebetween 5 and 20 ppm 20]. 10 5 100 150 2
Fig. 9 shows the change in beta Time minradioactivity of carbon-14 measured in
the sample, which was obtained in the Fig. 9 Change in Kr-monitor reading anddissolution of 29 GWd/t spent fuel. carbon-14 released during dissolutionKr-monitor reading was also plotted in (29 GWdt-')the same figure. It was found thatrelease of carbon-14 as C02 into dissolver off-gas occurred when gaseous radionuclides suchas Kr-85 were released.
517 -

JAERI-Conf 2002-004
4.CONCLUING REMARKSSpent fuel dissolution test was carried out to study the dissolution behavior of nuclides
and the behavior of volatile radionuclides.About 400 g of spent fuel can be dissolved within 150 minutes at 373 K when moll-'
HN03- It was found that Pu and ost of MA (Am) and FPs (Nd, Sr, and Cs) dissolved in asimilar manner to U. Zirconium molybdate precipitated during dissolution of spent fuel. Inaddition, the ratio of Ru remained in residue to the total Ru increased with burnup.
As for radioiodine treatment, the decontamination factor of the AGS columns used in thestudy was found to be more than 36,000. It was demonstrated that the radioiodine waseffectively confined by the adsorbent under the dissolution of actual spent fuel. The fractionof I- 1 29 remained in dissolver solution was measured to be less than 057 of total generated1-129. Another 272 was detected as iodine in precipitates.
It was found that release of C14 as C02 into dissolver off-gas occurred when gaseousradionuclides such as Kr-85 were released. Concentration of N-14 initially contained in fuelsas impurity was estimated to be several ppms for 29 and 44 GWdt" spent fuels, wich couldcompare well with the reported concentration of nitrogen in other PWR fresh fuels.
Dissolution test will be continued to obtain data on the above subjects to contribute to theenhancement of the safety of reprocessing process.
ACKNOWLEDGEMENTPortion of this work was carried out by Japan Atomic Energy Research Institute under the
auspice of Ministry of Education, Culture, Sports, Science and Technology. Authors aregreatly indebted to Messrs. T. lijima, S. Kimura, T. Yagi H Hagiya M Sawada, M. Sato, S.Yoshida and T. Shoro for their support to the dissolution tests.
REFERENCES[11 T. Sakurai, K Komatsu, A. Takahashi, Proc. the 24th DOR/NRC Nuclear Air Cleaning and TreatmentConference, NUREG/CP-0153, CONF-960715, 550(1996).[2] A.Leudet, P.Miquel, P.J. Goamondy, G. Charrier, Proc. 17th DOE Nuclear Air Cleaning Conftence, V61.140(1983).[3] T. Sakurai, T.Yagi, A., Takahashi, J. Nucl. Sci., Technol., 35, 76(1998).[41Handbook on Process and Chemistry of Nuclear Fuel Reprocessing, JAERI-Review 2001-038, 2001).[5] T. Tsukada, T. Kameyama, H. Yokoyarna, J.-P., Glatz., J.-P., Koch, L., Garcia-Alonso, I., Proc, RECOD'94,(1994).[6] Tsukada, T., Yokoyama, H., Sdtmark, B., Glatz, J.-P., Koch, L., Pagliosa, G., Poc, RECOD'98, 274(1998).[7] H. Mineo et al., Proc. NUCEF'98,498(1998).[8] T. lzumida and F. Kawamura, J. Nucl. Sci. Technol., 27(3), 267(1990).[9] T. Sakurai, A. Takahashi, Y.E. Ming-lu, T. Kihara, S. FuJ ine, J. Nucl. Sci . Technol., 34, 211(1997).[10] A.W. Castleman, Jr. Tang, I.N., and H.R. MulkelwitsJ. Inorg. Nucl Cem., 30 51968).[I I] T. Sakurai, A, Takahashi, N. Ishikawa, Y. Kornaki, Nucl. Technol., 85, 206(1989).[12] Y. Naito, private ornmunication[13] H. Keycamp, Proc. RECOD'87,583(1987).[14] T. Aachi, M. Ohnuki, N. Yoshida, T. Sonobe, W. Kawamura, H. Takeishi, K. Gunji, T. Kimura, T. Suzuki,Y. Nakahara, T. Muromura, Y. Kobayashi, H. Okashita, T. Yarriamoto, J. Nucl. Mater., 174, 60(1990),[15] T. Kameyama, T. Tsukada, M. Kinoshita, H. Yokoyania, Deiiryoku-Chtio-Kenkyusbo-14okoku, T91022,March, (1992)(Japanese).[16] K. Takahashi, D. Sugiyama, T. Fujita, T. Tsukada, M. Tsukamo(o, H. Yokoyarna, Denryoku CbuouKenkyusho Hokoku, T96075, 1997), (Japanese).[17] T. Kihara, T, Sakurai, Y. Nakano, and S. Fujine, Proc. the 5th inter-national Conference on Nuclear FuelReprocessing and Waste Managenlel)t (RECOO'98), 1998).[18] N. Boukis, E, Henrich, Radiochimica AeLa, 5, 37(1991).[19] F.J. Herrmann, V. Motoi, B, Herrmann, D. Fang, L. Finsterwaider, KD, Kuhn, A. van Shoor C. Beyer, J.Furrer, W. Knoch. Proc. 22nd DOF/NRC Nuclear Air Cleaning and Treatrytont Conf, NUREG/CP-0130,CONF-902083-VI, 75(1993),[20] Japan Nuclear Fuel Ltd. et al., J`NFS R-91-001 (2nd ed.), 1996).
- 51 -

JAERI-Conf 2002-004 JP0250346
ON THE RA7FE OF REACTION BETWEEN PLUTONIUM DIOXIDEAND SILVER(II)
P.J.W. Rance' and G.P. Nikitina 2British Nuclear Fuels, Sellafield, Seascale, United Kingdom
Tel: 44 19467 79263, Fax: 44 19467 79007, e-mail: PJWRI�BNFL.com7 V.G. Khlopin adium Institue 2dMurinsky Prospekt, St. Petersburg, Russia
The rate of dissolution of putonium dioxide by electro-generated Ag(II) in nitric acid has been investigatedunder conditions i which the potential generation rate of Ag(II) far exceeds its rate of reaction with P02 Insuch cases, the silver(II) concenif ation is governed by the ratio of its electrolytic generation rate and the rate ofconsumption by is second order reaction with water and thus emains approximately constant allowing the rateof raction between Ag(II) au P02 to be determined The calcination teinperature Of h P02 was found toeffect o oly the rate of dissolution but te form of the dissolution process. Te knetics of the dissolution of
AM PU02 calcined at 550'C are best fitted by a surface area context expression - =k[Ag(Il)1PU021?,'3,
dtwhereas The dissolution of PuO-, alcined at 1200'C is best described in a mass context i.e.
-dIPU02i � k'1Ag(II)1{PU021,. A value for k of 107±14 (/mol)2"h-' was determined at 25'C anddt
38±0.5 M1h-1 for k' at 40')C.
Key words: dissolution, kinetics, P1102, plutonium dioxide, electromediated
1. INTRODUCTIONThe electromediated dissolution Of PU02 using silver(II) in nitric acid was first described byRyan et all in 1982. The Process essentially involves the generation of te highly oxidisingAg(11) ion at e anode of an electrochemical cell, this unstable species ten brings about thedissolution of te otherwise isoluble P02- Silver(II) is a very strong oxidising a ent, the
standard electrode, potential of the AgQI)/Ag(I) couple (+1.98V i 4 M nitric acid is onlyexceeded by species such as ozone, persulfate and fluorine. In addition to the greater
simplicity of working with sver compared to fluorine or ozone, the pocess has the
significant advantage that much less than stoichiometric quantities of silver are required as the
oxidising form of the silver, Ag(II), is regenerated by electrolysis following its reduction as a
result of reaction with P02-
In simple terms the process can be considered to be;
Ag(I) - Ag(II) + e ... (1)
Ag(11) + PUO 2 Ag(l) + PuO + (2)2
2PuO + + 4H + Pu 4+ + Puo 2+ + 2-120 ... (3)2 2
4+ (4)Ag(11) + Pu + 21-120 Ag(I) + PuO+ + 4H+2
However, this series of reactions will only occur in the absence of other oxidisable materials
and at low temperature under conditions of low Ag(II) concentration as otherwise the second
order reaction between Ag(11) and wate? (5) can become a significant side reaction.
- 519 -

JAERI-Conf 2002-004
2A9 2+ + H20 2Ag+ +'0.502 ... (5)
In practice the process is best carried out at a temperature of around 40T which appears to bethe optimum in terms of the rate of reaction between Ag(II) and P02 or H20. One potentialsource of oxidisable material is the cathodic reaction product, dissolved 'NOx' in a nitric acidsystem. In order to limit this interference the process is conducted an electrolytic cellwhich contains a divider between anolyte and catholyte chambers. Using such a system,Bourges et aV, showed that the reaction efficiency remained high and essentially constantuntil the majority of the P02 was dissolved. However, towards the end of the dissolutionprocess the Faradaic efficiency was shown to decline as a result of icreased build-up ofsilver(II) in the system and hence an increase in the significance of the parasitic reaction withwater due to a reduction in the amount Of P02 available for reaction. The effect of thereduction in available PuO2, was to reduce the overall aradaic efficiency of the process from0.75 (the value achieved up to the dissolution of 78% of the PuO-2) to 50%. Zundelevich� haspointed out the importance of realizing that the rate of reaction between Ag(II) and P02 is
not instantaneous, this is particularly important when one considers the treatment Of P02 incombination with other oxidisable materials. In these cases it is necessary to nderstand therate of reaction of Ag(II) with the various components in order to be able to predict the rate ofdissolution of the plutonium component. Despite this, the only estimate for the rate ofreaction with Ag(II) and P02 in the literature is that deduced by Zundelvich's modelling ofBourges's results with all its implicit and explicit assumptions. Below we report somepreliminary findings for the direct measurement of the rate of reaction between P02 andAg(II)_
2. EXPERIMENTAL
The experiments were arried out in the euipment shown in Figure 1. The six necked vesselhas a working volume of 100 ml. The anode was made from a Ox4 m platiDUM f0il, 0.1
mm thick. Te cathode was a Pt/Ti strip 4 m 2) housed in a 10 nun iameter glass tube thelower end of which was closed with a giass trit above which a laid a bed of silicic acid gel toprevent egress of the atholyte and cathodic reaction products.
6
VM JI
1. anode2. cathode3. silicic acid' el4. sintered glass frit5. sparger6. sockets for reflux condenser,thermometer, sampling etc.
2
.3
54
Figure 1. Electrolysis Vessel
- 520 -

JAERI-Conf 2002-004
The catholyte used was 4 molar itric acid and the anolyte was 6 molar nitric acid. Agitationwas brought about by sparging through another neck (- 5 litres/hour). The remaining neckswere used for a thermometer, for sampling and a reflux condenser. Electrical power wassupplied by a potentiostat capable of delivering up to amps current at a potential of 020 V.
The dissolution rate of two forms Of P02 was investigated in this work, one was a largesurface area powder 27 m2/g) aving ben calcined at 550'C Wherea te other had beencalcined at 1200T and bad a much smaller sufface area (-0,6 m2/g) both having particles inthe 0.5-1 Micron range. Te different surface areas of the aterials ecessitated the use ofdifferent reaction conditions in order to study the dissolution kinetics. The rate of dissolutionof the large surface area material was investigated at 25'C using I x 10-3 M silver and acurrent of 02 A whereas for the low surface area material it was -necessary to increase thetemperature to 40T, the sver concentration to 0.05 M and the current to 04 A in order toachieve a convenient rate of dissolution. In each case approximately 100 Mg Of P02 wasplaced in the anodic compartment of the electrolysis cell, then agitation and power to theelectrodes was applied and dissolution commenced. Samples of the anolyte were takenperiodically throughout the dissolution process and the plutonium concentration determinedradiometrically.
3. RESULTS AND DISCUSSION3.1 High Surface Area P02
The decrease in mass of undissolved plutonium with time is shown in figure 2 for twodissolution experiments.
5. ...........................................................................................................................................................
40
3,
CY
2 -
0
0 1 2 3
Figure 2 Dissolution rate of high surface area P02
Assuming that the dissolution process is a heterogeneous surface controlled reaction betweenAg(II) ions and the P02 surface then the rate expression should have the form
- df PUO 21=k[Ag(II)]fPUO2121' ... (6)
dt2/3
-- So Mt-as S t (7)0
(St and mt being the surface area and mass at time t and So and MO being the initial surfacearea and mass)
- 521 -

JAERI-Conf 2002-004
Rearrangement and integration of 6) gives
Pf PUO 2 IV' 't=ot = k,�, t ... 8)
in which kf = k[Ag(Il)]
A plot of f PuO?1113agaiDst tirne should thus give a straight line with a gradient of one-third of-k,,f, this is the case nd is shown as figure I Silar results were obtained with two furthersamples Of PU02 te fll esults are shown in table .
0.18 .........................................................................................................................................................
0.16
Y -0-0336x + 0. 616ma O� 14 --IR'= 09861
0.12fill
0.1Y -0-0337x + 0 142
0.08 2R 0.9962
0.06
0.040 1 2 3
T, h
Figure 3 Surface area context, pseudo-first order plot of data in Fig. 2.
Table 1. Rate of dissolution of high surface area PuO2
PU02, Mg keb (m)1/3 /h
I 109.9 0.101±0.006 0.9862 90.2 0.127±0.007 0.9893 75.7 0.101±0.003 0.9964 130.1 0.098±0.004 0.992
mean 0.107standard deviation 0.014
Such an analysis relies on the Ag(ll) concentration remaining approximately constant dringthe reaction period. For tis to be the case, the potential poduction rate of silver(II byelectrolysis must significantly exceed that of its reaction with PU02 as in such cases the Ag(11)concentration wl attain its maximum value overned by the total sver concentration or theratio of the rates of electrolytic generation ad the Ag(ll)-water reaction. EtTapotation of theinitial dissolution rate shown in figure 2 indicates a P02 dissolution rate of the order of 3 x10⁻⁶ mol/min (100 mg over 2 hours) A current of 02 A is theoretically capable of oxidising1.2 x 10-4moles of slver per minute and the oxidation of slver at a platirturn aode is knownto occur with high current efficiency. Thus the potential silver(H) generation rate exceeds therate at which it is consumed by a factor of 20 (given a Ag:Pu stof'Chiornetry of 2 implyingthat the assumption of constant Ag(11) concentration throughout the (_-xperiment is valid.
- 522 -

JAERI-Conf 2002-004
Using the data of Po et ae, it can be shown that for these conditions (25T, 10-3 mol/ Ag) themaximum rate of reaction between Ag(II) and water is of te ordej- of 1.5 x 10⁻⁵ Ml. lMin -1i.e. L x 10-5 mol/min in the 100 ml used for tese experiments. This is a factor of lowerthan the potential rate of Ag(II) production i these experiments and thus, to a goodapproximation, essentially all the sver hi the system can be assumed to be present as Ag(II).
Therefore te mean value for kf given in table I of 0107±0.014 Ml/3/h equates to a value ofk= 107±14 ( MOI)II3 h-1 -
3.2 Low surface area P02
The rate of dissolution Of P02 calcined at i2OO T is shown i figure 4 and thecorresponding surface area dependent plot in figure .
3.0 . ........ .................... ..... ............................................ .........................-
2.5
2.0 -
V 1.5
0.5
0.00 2 4 6 8
-C' h
Figure 4 Dissolution rate of low surface area P02
0.16 . ............................. ........ .. ..................................................................... ..0:1
20.100.080.060.040.020.0 0
0 2 4 6 8
-E, h
Figure 5. Surface area context, pseudo-first order plot of data in Fig. 4.
It is clear from the distinct curvature shown in figure that the surface area dependencyexhibited by the P02 specimen calcined at 550'C is not shared by this high temperaturecalcined material. Instead if one pots the more usual, mass or concentration dependent formof a pseudo first oder xpression a good straight-line fit is obtained as shown in figure 6.This result was restated with two further samples of high temperature calcined P02, in eachcase the diSSOILIL1011 was fitted by the conventional, mass context, form of the rate expression
(9)_
- 523 -

JAERI-Conf 2002-004
- djPuO,2j = k 1PUO211Ag(I1)Jdt
The fll results are given in table 11.
011 2 4 6
-2-Y -0-2884x - 2.7391
R 0.9708-3
-4
-5
h
Figure 6. Mass context, pseudo-first order plot of the data in Fig. 4.
Table 11. Rate of dissolution of low surface area P02
2PUO2� Mg Wef" h-1 F
1 117.0 0.50±0.03 0.9792 140.0 0.57±0.05 0.9433 75.7 0.66±0.04 0.971
mean 0.58standard deviation 0.08
k',f k'[Ag(Il)]
Although the potential Ag(II) generation rate significantly exceeds its rate of reaction withPU02 (by a factor of 50) thus aowing the assumption of constant Ag(II) concentration, it isnot the case that under these conditions the Ag(II) concentration approximates to the totalsiver concentration as was so under the conditions used for the dissolution of the high surface
area PO2. The higher temperature and silver concentration used fi-i this part of the study
significantly increases the significance of the silver-waterreaction. Again using the data of
p03 one can calculate that under these conditions approximately one-third of the silver wil be
present as Ag(II), that is the potential electrolysis generation rate of Ag(II of
2.5 x 10⁻⁴ moles/min is matched by an equivalent rate of consumpt 'ion of Ag(II) by water
when the Ag(II) concentration equals 0.015 M (and the Ag(I) concentration equals 0035 M).
Dividing the mean value of k f given in table 11 by the predicted Ag(1l) concentration gives a
value for k' of 38±0.5 M1h_'.
4. CONCLUSIONS
By use of conditions which result in a steady state concentration of silver(II), its rate of
reaction with P02 has been determined. The calcination temperature of the P02 has been
- 524 -

JAERI-Conf 2002-004
shown to have an important effect in determining the reaction kinetics. As might be expectedthe high temperature calcined material had an appreciably slower rate of reaction with Ag(II)than did the high surface area, low calcination temperature material, to an extent that it wasnecessary to increase the silver concentration by a order of magnitude and the temperatureby 15'C in order to achieve the same order of dissolution rate. Additionally, the two materialsexhibited different forms of reaction kinetics in that the reaction of the high surface area P02
followed surface area dependent pseudo first order kinetics whereas the low surface areamaterial appeared to follow the standard mass context form of fifst order kinetics. Thisfinding points to differences in the surfaces of the material affecting how the electron transferprocess between silver and P02 is occurring.
Values for the rate constant of reaction (10) have been determined as 107±14 ( /Mol)2/3h_1 inthe case of high surface area material at 25'C and 38±0.5 M-'h-' for low surface area materialat 40')C.
PU02 + 2Ag 2+ -). PuO 2+ + 2Ag+ ... (10)2
Work is continuing to refine the accuracy of these values, to determine the effect oftemperature and to investigate the competition kinetics of Ag(II) with P02 and othersubstrates.
5. REFERENCES
1. L.A. Bray and J.L. Ryan in Actinide Recovery from Waste and Low Grade Sources, J.D.Navratil and W.W. Schultz (eds.), Harwood, New York, 1982, p129.
2. M. Pourbaix Atlas of Electrochemical Equilibria in Aqueous Solutions, NACE 19743. H.N. Po, J.H. Swffieheart and T.L. Allen, Inorganic Chemistry, 7 244 1968)4. J. Bourges et al., Journal of the Less-Common Metals, 122, 303 1986)5. Y. Zuridelevich, Journal of Alloys and Compounds 182, 115 1992)
525 -

This is a blank page.

JP0250347JAERI-Conf 2002-004
Examination of reaction conditions for oxidation of salt waste
Funiinori SATO, Munetaka MYOCHIN, Hitoshi TERUNUMA* and Osamu ARAI*
JAPAN NUCLEAR CYCLE DEVELOPMENT INSTITUTE JNQ
Dry Pocess Technology Group, Tokai Works
FAX: 81-029-283-2164, e-mail: fsato�tokaijnc.gojp
*KAKEN CO. Engineering Development Dept.
FAX: 81-029-227-4082, e-niail: kaken�po.sphere.nejp
For vitrification of salt wastes from pyroprocessing a high temperature steam oxidation method was examined
for conversion of chloride salt to oxide. The solubility of oxide in typical waste glasses is much higher than that
of chloride. In initial tests, the reaction of chloride to oxide by steam was only a few %. In later tests, B203 was
added to salt to increase the extent of chemical reaction. Aer optimization of reaction temperature, highest
oxide conversions of 52 and 44 mole% were attained for LiCl-KCI-13203 and NaCl-KCI-CsCI-13203 respectively.
Key words: salt waste, vitrification, pyroprocess
1. INTRODUCTION
Feasibility Studies for the commercialized fast breeder reactor (FBR) cycle system are
underway at Japan Nuclear Cycle Development Institute (JNC). The purpose is to select
promising cone epts and identify the required R&D tasks to commercialize the FBR cycle
system. In these studies, pyroeben-lical processing is a candidate technology for advanced
nuclear fuel reprocessing of the future. Using pyroprocessing, spent uclear fuel is often
treated in molten chloride salt. Basically, molten salt is reusable but fission product (FP)
material is accumulated after reprocessing large amounts of fel. Molten salt with excessive
FP must be removed from the process and treated.
Salt waste containing large amounts of highly radioactive P may be immobilized for final
disposal. But it is known that chloride as a major constituent of the salt waste has an
extremely low solubility in niany glasses.
For vitrification of salt waste generated by pyroprocessing a high temperature steam
oxidation method was exairdned to convert chloride to oxide, which has high solubility in
glass [1]. This method is based on the following chemical reaction 2].
2MCI + H20(Gas) > M20 + 2HCl ( T ) (M: Alkali Metal)
By this reaction, chloride salt is converted to oxide and chlorine is separated as hydrogen
chloride. In this study. [NaCl-KC1-CsCl] and [LiCl-KCII salts were selected as representative
of the RIAR and ANL pyrochemical processes.
- 527 -

JAERI-Conf 2002-004
2. EXPERIMENTAL
A schematic of the test equipment is
shown in Figure 1. Chloride salt samples Gas-supply line Gas-exhaust line -4-- Ar + H20 -4- Ar
(- 20g each) were placed in crucibles and
fused at 1,073K-1,273K. Afterwards, HQ --O- c
steam from a moisture generator mixed C
with argon gas was passed through the Moisture gnerator
salt. The chloride salt was partially
converted to oxide. Chlorine was
separated as hydrogen chloride, which Heater Molten salt Scrubber Ar gas
was trapped by a scrubber. Fig. 1. Test equipment
Test parameters were salt
composition (LiCl-KCI and NaCl-KCI-CsCI), reaction temperature, total weight of added
water (steam ventilation time), and presence of boron oxide (B203) which assisted oxidation.
After each test, the product was weighed and analyzed by XRD. The amount of hydrogen
chloride in the scrubber solution was analyzed by ICP-AES and ion chromatography. From
these analyses, the chemical form of the products and the extent of conversion of chloride to
oxide were found.
3. RESULTS
Test results are shown in Table I
Table I. Test resultsTemperature Addition Amou TateOWN LL�iL
LiCI-KCI 1173 9.3 2.58
2 LiCI-KCI 1273 0.9** 0.94
3 NaCI-KCI-CsCI 1073 8.2 0.04
4 NaCI-KCI-CsO 1123 8.2 0.03
5 LiCl-KCI-B203 1073 6.2*** 35.6
6 LiCl-KCI-B203 1203 3.3*** 51.6
7 NaCI-KCI-CsCI-B203 1153 10.0 38.7
8 NaCI-KCI-CsCI-B203 1153 21,8 43.82 _C
�F: Reaction "NaCI+l/2HO = 1721qa rffMI-sf=IcIOrnetnc amount of B2
Volatilized salt blockades gas exhaust ine and test was interrupted.
***: See discussion in section 4.
In these preliminary salt-steam reactions (test No. 1), the oxide conversions were only a
few %. To improve the extent of reaction, the salt temperature was raised to 1,273K (test No.
2). In this case, molten salt volatilized and caused blockage of the gas exhaust line of the test
vessel.
To improve oxide conversion without volatilizing salt, boron oxide (B203) was added to the
samples. The chemical composition of samples with added B203 was fixed as
- 528 -

JAERI-Conf 2002-004
LiCI:KCI:B203=59:41:100 and NaCl: KCI:CsCI:B203=1:1:1:3 (molar basis).
In test No. with LiCl-KCI-B203 at 1,073K, the formation of hydrogen chloride was
confirmed but blockage of the gas supply line occurred, To minimize blockages, reaction
temperatures were, selected as 1,203K for LiCl-KCI-B203 and 1,153K for
NaCl-KC1-CsCl-B,)O3. The reason for choice of these temperatures is explained in Section 4.
The highest oxide conversions reached were 51.6 and 43.8 mole% for LiCl-KCI-B203 and
NaCl-KCI-CsCl-B203 respectively as seen in Table I for test No. 6 and 8.
4. DISCUSSION
From the results of tests No. 14 in Table 1, it was confirmed that it is difficult to convert
chloride to oxide by use of steam only.
In tests No. 5-8 B203 was added to salt samples to promote oxidation reaction. As a result
of the addition, the conversion of the samples were improved and maximum conversion
reached to about 50%. But in test No. (LiCl-KCI-B203 at 1,073K) the blockage of the gas
supply line occurred and prevented progressing the reaction any more. It is thought that a
reaction product with high melting point (>1,073K) was generated in the salt as the reaction
progressed and caused the blockage of the gas supply line because LiCl-KCI-B203 system had
homogeneous liquid phase at 1,073K. (m.p. of LiCl: 883K, KCL 1,044K, B20j: 850K)
Typical result of X-ray diffraction analysis (XRD) of the reaction product is shown in
Figure 2.
Test6040
20
83 0 KC160 v UCI H2040
20
KC1
20
IOUII, LiCI-H20
40
20 j0 r. .... - --------- .... ... ...... ............
1 20.0 30.0 400 50.0 80.0 70.0 SU.0 so
2 (deg.)Fig. 2 XRD result of test No.6
XRD result proved that the profile had a halo pattern attributed to amorphous phase and
Bragg peaks of crystalline phase. From consideration of NIST data it was confirmed that
crystalline phase was a mixture of LiCl and KC1. (See Fig. 2)
529 -

JAERI-Conf 2002-004
XRD result in tests No. 7 and had same tendency. From these data it was confkmed that
the reaction product of tests No, 68 was a mixture of amorphous product and unconverted
chloride. Therefore it is thought tat in test No. 5-8 the oxide generated did not exist as a
simple substance but was mixed with B203 by the following two chemical reactions, and
detected as amorphous in XRD.
2MCI + H20 (Gas) ---> M20 + 2HCI (T) (M:Alkali Metal) ()
nM20 B203 --+ [ M20 in B203 I (detected as amorphous in XRD) - 2)
Especially in test No. 5, it is thought that the ixture Of M20 and B203 was deposited as a
solid in the gas line. To explain this deposition the phase diagrams of U20-B203, CS20-B203,
Na20-13203, and K20-B203 are shown in Figures 36 3]. How above two reactions take place
in the molten salt is explained in Figure 6.
Liq.id
A-Ixk-�- PA
7w
Goc -
r 'r r 66 6100- S, -� J 4IDII 6L -L
Vh � ZQ wl% a so
Fig. 3 Phase diagram of U20-B203 Fig. 4 Phase diagram Of CS20-B203
LIQ.W moo
900
Test st edRatio of K20 B203increased
Nep YJA- UPW
90( - K204B203depositedL
Goo
700
So 60 SD 90
N40
Fig. 5. Phase diagram of Na2O-B203 Fig. 6 Phase diagram of K20-B203
530 -

JAERI-Conf 2002-004
It is thought that the alkali metal oxide (M20) formed by reaction (1 imediately started
to mix with 203 by reaction 2). As conversion progressed, te ratio of the oxide W20 to
B20- icrease Util finally M20 mB203 deposited as a solid as seen in Figure 6 and this
blocked the gas supply line�
Therefore it was coDfirrned tat the reaction temperature as to be ore than 1,190K
(melting point of Li2O 2B203, see Fig, 3 or LiCl.-KCI-B203 and 1, 130K (melting point of
K20 4B2(3, see Fig. 6) for NaCt-KCI-CsCl-B203.
5 CONCLUSIONS
For vitrification of salt waste from pyroprocessing a high temperature steam oxidation
method was examined to convert chloride salt to oxide.
In te reaction of chloride and steam only, it was confirmed that the oxidation conversion
of chloride was difficult because the conversion did not progress at lower temperature <
1,173K), and chloride volatilized at higher temperature 1,273K).
By adding B203 to promote oxidation reaction, the highest oxide conversions were 51.6
and 43,8 mole% for LiCl-KCI-B203 and NaCI-KCI-CsCI-B203 respectively. But when the
reaction temperature was lower (1,073K), the blockage of the gas supply line occurred. From
consideration of te relevant phase diagrams, the cause of this blockage was thought to be
nM20-mB203 mixture that solidified in the gas line. It was confirmed that the reaction
temperature has to be ore than 1,190K for LiCI-KCI-B203 and 1,130K for
NaCl-KCI-CsCl-B203.
In this examination, B203 was used at the same molar amount as chloride to assist chemical
conversion and this caused a increased antity of waste. Consequently, further optimization
of reaction temperature and minimization of B203 added are the next subjects for
examination.
References
[II Osamu ARAI, Hitoshi TERUNUMA, (in Japanese with English abstract)
JNC Technical Report, JNC T8400 2001-004 2001)
[2] Fun-& NOGUCHI, (in Japanese with English abstract)
J. of Mining and Metallurgical Institute of Japan, 94 10871, 605-610 1978)
[3 Enest M. LEVIN, Carl R, ROBBINS, and Howard F. McMURDIE,
"Phase Diagram for Ceramists Vol. I", American Ceramic Society, inc., America 1964)
531 -

This is a blank page.

JP0250348JAERI-Conf 2002-004
EXTRACTION OF RADIONUCLIDES FROM NITRIC ACID
SOLUTIONS BY A TRUEX SOLVENT
TOSHIYUKI FUJTI*, HAJIMU YAMANA* AND HROTAKE MORIYAMA"
*Research Reactor Institute, Kyoto University, Noda, Kumatori, Sennan, Osaka 590-0494, Japan
Fax: 81-724-51-2634, e-tnail� tosiyuki�HL.rri kyoto-uacJp
**Department of Nuclear Engineering, Kyoto University, Yoshida-Honmachi, Sakyo-ku, Kyoto 606-8501, Japan
The extraction behavior of short4ived fission products and neptunium under the TRUEX and PUREX conditions
was studied. Fission products and neptunium were produced by neutron irradiation of natural uranium or
metals of these elements. The extraction in the presence of oxalic acid was examined. The separation
efficiency of radionuclides under the TRUEX condition was discussed by considering the obtained results.
Key words: TRUEY, PUREX, CNIPO, Fission Products
1. INTRODUCTION
Oetyl(phenyl)-NN-diisobutylearbamoylmethylphosphine oxide (0�D[1131CW0 or simply
CWO) is known to have high extractability for trivalent elements from acid solutions.
Horwitz and co-workers' have presented the transuranic element extraction RUEX) process
by using a TRUEX solvent, which is a mixture of CWO and tri-n-butyl posphate (TBP in
paraffin diluents. The distribution behavior of radionuclides in the process is essential
information for the design of the system, and has been studied in detail for actinides and some
major fission products (FP) of Sr, Cs, Ru ad sd on'. However, there aid few'studies n the
distribution behavior of other MI'nor FP. Since some of these minor FP have large neutron
capture cross sections. the presence of them affects the reactor activity when they are recycled2with TRU. In this context, we have studied the extraction behavior of molybdenum ,
palladium 3under the PTREX and RUEX conditions in our recent study. For comparison,
the extraction behavior of several FP (including molybdenum and palladium) and neptunium
was studied in the present study. The dependence of distribution ratios on nitric acid
concentration was experimentally studied, and the extraction in the presence of oxalic acid
was also examined.
2 EXPERIMENTAL
Short-lived FP and 239Np were produced by neutron irradiation of natural uranium. About 2
Mg Of U02 sealed in a quartz tube was irradiated for 20 minutes in a pneumatic irradiation
- 533 -

JAERI-Conf 2002-004
system with a thermal nutron flux 0jh = 275 x 1013 n/cM20SCC in te Kyoto University
Research Reactor. After the irradiation, the rradiated U02 was dissolved in 7 mol din -3 M)
HN03. Insoluble residues wei:e removed by a filter having 045 �tjii pore size. adioactive
tracers "Mo, "Pd, and 122 Sb were produced by neutron irradiation of metals of these
elements. These pure metals were purchased from Nilaco, Inc, The iradiated metals were
dissolved in HN03 by heating. The filtered solution or the supernatant after centrifugation
was used for preparing aqueous phase. Portions of these solutions were used, and HN03 Of
various concentrations were prepared. Nitric acid solutions with 002 H2C2(4 were also
prepared.
An organic solution of .0 M TBP diluted with n-dodecane was prepared as the PUREX
solvent. The mixture of 02 M 0�1)[EB]CWO (Elf Atochem North Aerica, Inc., 95%
purity) and 1.0 M TBP diluted with n-dodecane was pepared as te TUFX solvent. The
TRUEX solvent was scrubbed twice with 0.5 M Na2CO3 S111tiO t eove degradation
products of CNVO. The PUREX and the TRUEX solvents were pre-equilibrated with fresh
nitric acid solutions.
Fifteen mL each of the aqueous solution and the organic solution were contacted by magnetic
stirring in a glass centrifuge tube for 20 minutes at, room temperature. After separating the
two phases by centrifugation, weighed portions of both phases were taken fory-spectrometric
analysis to determine the distribution ratios (D). In the y-spectrometric aalysis, the y-ray
measurement of 37Te was interfered with the presence of 239Np y-ray, and the ontribution of
219Np 7-ray was corrected.
The concentrations of hydrogen ion, [HI, in the equilibrated aqueous pases were determined
by a titration using Na0H, AB quantifications of aqueous and oganic solutions were
performedgravimetricallyto.avoidthelargeert-ofassociatedwithvolumetrictreatmcnt, The
gravimetric concentrations were converted to volurnetric concentrations using the density of
the solutions. he chemical reagents used were all of analytical grade,
3.,RESULTS AND DISCUSSION
The distribution ratios of radionuclides under the PtJRFX and TRtJEX conditions are shown
in Figure I as functions of [H+I. Under the TRUEX ondition the distribution ratios with
and without oxalic acid at 3 M HN03 are shown in Figure 2 In Fig. 2 eors shown
together are experimental ones of I standard deviation 'via 7-spectrometry. The
characteristics of the TRUEX extraction behavior of each nuclide an be smply summarized
534 -

JAERI-Conf 2002-004
as follows.
PUREX TRUEX 0- 97zr
-0- 99MO1 0 2 - ----------------------------------------- . ...... ............
109Pd
122 Sb
lo, .......... -------- ... --- 132T e----------1331
143ce
0 ------------------------------ ----- -------------23 9Np
....... . ..........
10 -2 ------ --- ---- - ------------- ------- -------- --- ----
10 -3 ......... ................................
10-4
lo-, lo,, lo, lo-, 100 lo,
[H+ /M
Figure 1. Distribution ratios of FP and 239Np as functions of [H+].
O Without oxalic acid0 With oxalic acid
103 . .... .
1 02*d -Q -------------------------------------------------------------------------------
-------- ----- ---------------l o , =- ------------------------------------------------------0
10 0 -- ------------- 6 ------- ( -0 -) --------------------------------------------------------
1 0 -1 ------------ ----------------------------------------------------------------
10 -2 -----------------------
10-3 19"Z r 99M 109Pd 122sb 132Te 133i 143 C e 23 9Np
and 23INP With an(j WithoUt oXali a,Figure 2 Distribution ratios of FP e 'id Under the
TRLJEX ondition with 3 M HN03. The distribution ratios of 9Pd were obtainedunder the condition of ca. 0. 15 M HN03-
Cerium
Since the distribution ratios of cerium under the RLJEX condition have been reported to be
- 535 -

JAERI-Conf 2002-004
4close to americium ,the separations of radionuclides from cerium can be regarded as those
from americium. As shown in Fig. 1, the extractability of cerium as a representative of
trivalent felements with the TRUEX solvent is much higher than the PREX solvent. Such
a high extractability is due to the following extraction reaction of trivalent felement by
CNVOI:
R" + 3NO, + 3CMPO <-> R(NO3)3o3CNWO,
where R 3+ denotes trivalent cation. At 3 M HN03 under the TRUEX condition, the largest D
value can be obtained. Under the same condition, the presence of oxalic acid does not
change the D value.
Zirconium
The D values with the IUEX solvent are about 1,000 times larger than those with the
PUREX solvent. The results are consistent with the following extraction reaction which
have been obtained from the PUREX6 and TRUEX7 studies,
Zr(NO3)2 2+ + 2NO3 + CMPO -> Zr(NO3)40CWO, (2)
At the high acid region under the TRUEX condition, the D value of Zr is larger than that of
Ce. Hence, the suppression of Zr extraction is required. This can be improved by adding
oxalic acid. As shown in Fig. 2 the presence of oxalic acid results in a suppression of Zr
extraction, which is about 1/1,000.
Molybdenum
Under the TRUEX condition, a high acid dependence of D can be seen over 3 M HN03 in
which the following extraction reaction is considered 2:
2+M002 + 2NO3 + 2CWO <4 M002(NO3)2e2CMPO, (3)
The large D of Mo suggests that the high acid region is not preferred for the separation of Am
from Mo. In the low acid region, however, the extraction mechanism of Mo is much
complicated by the presence of anionic and polymeric species8. Although the D value is
- 536 -

JAERI-Conf 2002-004
reduced to about 1/10 with the addition of oxalic acid, this is not enough for the purpose of
the separation of Am andMo. Further studies of Mo decontamination are thus required.
It should be noted that the significant problem of Mo extraction is the low reproducibility of
D possibly due to its complicated aqueous chemistry.
Palladium
The Pd extraction shows high acid dependence. The D values decrease with the increase of3 -over I M HN03 suggesting that the predominant species in the aqueous phase is an
anionic species Pd(NO3)3-. The high acid region is thus preferred for the separation of Am
from Pd. This is an inverse tendency compared with the case of Mo.
Antimony and Tellurium
To our best knowledge, there is no data on the TRUEX extraction behavior of Sb and Te.
Although no details of the extraction mechanism of these elements are obtained in the present
study, it is much interesting that both Sb and Te show similar D values under the TRUEX
condition. These D values are small enough to separate Sb and Te from Am. Also the D
value of Sb is reduce to about 1/10 with the addition of oxalic acid.
Iodine
Iodine can be removed in the degassing process before the PUREX and TRUEX processes,
and the decontanunation of iodine is not a primary concern. of this study. Although the D
value of iodine does not show any distinct dependence with the extraction conditions; i. e.,
kind of organic phase and presence of oxalic acid, the result is considered to be the
distribution of neutral 12. The D value decreases with the increase of [HI. This possibly
due to the oxidation Of 12 into I03--
Neptunium
The distribution ratio steeply increases with M , and its acid dependence increases in high
acid region. As is known, Np(V) is oxidized to Np(VT) with the increase of W], which is
much extractable by the PUREX and TRUEX solvents9,10. In the case of the TRUEX
extraction, the following extraction reaction of Np(VI) by CPO has been reported 1,
NP02 2+ + 2NO3 + 2CNWO -> Np02(N03)292CN4P0. (4)
- 537 -

JAERI-Conf 2002-004
Thus the accelerated increase of D in high acid region can be attributed to the oxidation
reaction of Np. For the purpose of Np recovery with Am, the high acid region is preferable.
However, at the low acid region, Np can be recovered by controlling valency; C. heating or
adding oxidizing reagent.
lo,(a)
10 2 ------------------------------------ - -------------------------------
lo , ---------------------------- 0 ---------------------------------------E-1 E-1
----------------------------------------------------------------------I 00
lo -, - -------------------------------------------- ....................
10-2 1 1 1 1 1 1
lo, -
0 102 - -------------------------------------- EJ+� -------- I ---------------C-) EJ
l o , ------------------------------------------------Ej ---------- ---------
I 00 =----------------------------------------------------------------------Cd
Cdlo-, ------------------------------------------------------------------- ---
10-2
03
(C)10 2 - --------------------------------------
Ci -------- -------------------Z:
lo , - ---------------------------------------------------------------------
100 - --------------EJ -------------------------------------------------
lo-, - ---------------------------------------------------------------
10-2
9 7Zr 99MO 109Pd 122 Sb 132T 23 9Np
Figure 3 Separation factors between 143 Ce and radionuclides: (a) [HN031ilit = I M,
(b) [HN031init = 3 (Ei: withoutR2C204, 0: With H2C204), (C) RIN031 it = 7 MSeparation factor is defined as Dc,/DradjOr,,jjdc.
Separation factors between 143 Ce and other adionuclides are shown Figure 3 From Figs.
1 2 and 3 it can be concluded as follows. Since the maximum distribution ratio of 143 Ce
- 538 -

JAERI-Conf 2002-004
was observed at 3 N41 HNO3, the Am recovering would be the most effective as well. The
id dependence of Mo extraction changes at 3 M [W] and Mo extraction accelerated in the
region LH+ > 3 M However, the region [WI < I is not preferable considering hydrolysis
and polymerization, and the region 13 M HN03 is preferable for the purpose of Mo
decontamination. On the other hand, the high acid region is preferable for the purpose of Np
recovery and Pd removal. However, Np can be recovered by oxidizing Np(V) to Np(VI)
even in the low acid region, and oxalic acid would be effective for the suppression of Pd
extraction. Consequently, the TRUEXI extraction with oxalic acid at the region of 13
HN03 is considered to be preferable at the present stage, though this condition is less
effective for Mo decontamination.
CONCLUSIONS
The PUREX and TRUEX extractions of FP and 239Np were performed. The extraction
behavior of 97 Zr, 99Mo, 19Pd, 122 Sb, 132Te, 133i, 143 Ce, and 239Np was studied. The TRUEX
extraction in the presence of oxalic acid was examined. The conditions and performance of
the TRUEX extraction were discussed by considering the obtained results. The TRU
recovery by the TRUEX solvent is much effective at the region of 13 M HN03 with the
presence of oxalic acid. For Np recovery, its valency should be controlled to be Np(Vl).
ACKNOVVLEDGEMENT
The authors wish.to thank Mr. M. Watanabe and Mr. M. Kamiya of Japan Nuclear Cycle
Development Institute for their technological comments on the present study.
REFERENCES
[I] E. P. Horwitz and D. G. Kalina, Solvent Extr. Ion Exch. 2 179 19 84).
[2] T. Fujii, H. Yamana, M. Watanabe, and H. Monyama, Solvent Extr. Ion Exch., 19, 127
(2001).
[3] T. Fujii, H. Yamana, M. Watanabe, and H. Moriyama, J. Radloanal. Nucl. Chem., 247,435
(2001).
[41 M. Ozawa, S. Nemoto, A. Togashi, T. Kawata, and K. Onishi, Solvent Extr. Ion Exch., IO,
829 1992).
[51 K. L. Nash, "Mandbook on the Physics and Chemistry of Rare EartV, K. A. Gschneidner,
Jr., LeRoy Eyring, G. R. Choppin, G. H. Lander, Eds., Elsevier Science, North-Holland,
Amsterdam, (I 994) pp. 197-238.
- 539 -

JAERI-Conf 2002-004
[6] R. L. Hickok, R. D. Cannon, "Zirconium Extraction by Tributyl Phosphate", IDO-14487,
Philips Petroleum Co., Idaho, 1959.
[71 J. N. Mathur, M. S. Murall, P. R. Natarajan, L. P. Badheka, and A. Banerji, Talanta, 39,
493 1992).
[81 K. H. Tytko and 0. Glemser, Adv. Inorg. Chem. Radiochem., 19, 239 1976).
[91 Yu. S. Fedorov, B. Ya. Zl'berman, Soviet Radiochem., 30, 546 1988).
[IO] W W Schulz and E. P. Horwitz, Solvent Extr. Ion Exch., 23, 1191 1988).
[I I] J. N. Mathur, P. B. Ruikar, M. V Balarama Krishna, M. S. Murall, M. S. Nagar, and R. H.
Iyer, Radlochim. Acta, 73, 199 1996).
540 -
JP0250349JAERI-Conf 2002-004
EVALUATION OF CONFINEMENT CAPABILITYOF RADIOACTIVE MATERIALS UNDER THE FIRE ACCIDENT
IN NUCLEAR FUEL FACILITY WITH CELVA-11)
Koji WATANABE, Hitoshi ABE, Junichi TAKADA, Shinsuke TASHIROand Gunzo UCHIYAMA
Japan Atomic Energy Research InstituteTokai-mura, Naka-gun, baraki-ken, 319-1195 JAPAN
Fax: 81.29.282.6479, E-mail: watanabe�aero.tokaijaeri.gojp
To reduce the clogging of smoke on the BEPA filt ers under the fire accident, some of ventilation systems inthe plant are equipped with the pre-filters in front of the BEPA filters for collecting the relatively large smokeparticles. Appropriate correspondence such as the exchange of the pre-filter is important for confinement ofradioactive materials in the ventilation system under the fire accident. To study smoke generation behavior dueto the burnable wastes and clogging properties of the ventilation filters by smoke loading, the verification testhas been performed. Ile cell ventilation system analysis code, CELVA-11) was used for analysis of smokegeneration and the ising of pressure drop at both the pre-filter and the HEPA filter. With the change of sourceterm, the breakage of time of the pefilter was also estimated.
Key words: Reprocessing plant, Mre accident, Smoke, Ventilation filter, CELVA-ID
1. INTRODUCTIONThe ventilation system of nuclear fuel facility has a function with the confinement of the
radioactive airborne materials in the facility. The ventilation systems generally consists of
cells, ducts, confinement devices including ventilation filters and blowers. As the fal
confinement device, he ventilation filters are set at the end of the ventilation system.
Therefore it is very important to keep the confinement capability of the ventilation filters.
In some ventilation system of nuclear fuel facilities, the pre-filters for collection of large
particles are equipped in front of the HEPA filters. The pre-filters are expected to play a role
of preventing smoke from loading onto the HEPA filters at the fire accident in the facility and
transports into the ventilation system of the facility. But excess smoke loading onto the pre-
filters can cause the clogging of pre-filters themselves. Clogging of the pre-filters will make
their the differential pressure rise and then them break. Moreover, much smoke directly
loading onto the HEPA filters will cause the rapid clogg' and the breaking of the HEPA
filters. To avoid much smoke directly loading onto the HEPA filters, the exchange of the pre-
filters is needed before the breakage of the pre-filters. However, the prediction of breakage
time of the pre-filters has been little studied experimentally and theoretically.
In Japan Atomic Energy Research Institute, the verification test on safety of a cell
ventilation system equipped with the pre-filters and the HEPA filters under the fire accident
has been performed. Behavior of Smoke generation, decontamination factor (DF) of the pre-
filters and clogging properties of the pre-filters and HEPA filters due to smoke loading has
been experimentally studied through the combustion test of the mock burnable materials or
the mock recovery solvent. The fal purpose of this test is to establish the method of
- 541 -

JAERI-Conf 2002-004
prediction of the breakage time of the pre-filters under the fire accident of nuclear fuel facility.
In this study, we propose the aalytical approach to predict te breakage time of the pre-
filters under the fire accident of nuclear fuel facility using a ell ventilation analysis code,
CELVA-1I)(1). We estimated the smoke generation due to combustion of the mock burnable
materials by the source term model related to the release rates of the ass, energy and smoke
from the combustion at the cell. We made the model of time dependency of the differential
pressure of the pre-filters taking account of the clogging properties and the DF of the smoke
at the pre-filters. Then we combined above models into CELVA-1D and calculated the time
dependency of the differential pressure of the pre-filters and HEPA filters due to smoke
loading. The calculation results were compared with experimental results to verify our models
in CELVA-1D.
2. EXPERIMENTAL DEVICES AND CONDITIONSThe schematic diagram of the experimental facility is shown in Fig.l. The facility consisted
of the air supply duct, the Ist model cell, the 1st duct, the 2nd model cell, the 2nd duct,
dilution duct, mixer, the 3rd duct,filter chamber, the exhaust duct, the 2M rmdel ell 2rd dd
blower, stuck. Air samplers and -Lmpressuretyw
cascadcascade impactors were set for the 'Air filter
Law PressuretyPe
measurement of time dependencies of DI[Won dW cascade -Ped-Cart- box (5 pi-.0 Airliftersaffoers
Total vmgtt 9ft 1 1smoke concentration and smoke size burwiv ffma &ft Rtack
distributions, respectively. The test M fifter samplers
Istm"oellresults under burning 75 kg of rubber WW)
as the mock burnable material in the Filter cham
Blower
Ist model cell was analyzed by the
CELVA-1D. Fig. 1 Block diagram of the experimental facility
3. OUTLINE OF CELVA-IDThe outline of calculation functions of CELVA-ID is shown in Fig.2, The nalysis of the
cell ventilation system by ELVA-11) begins from preparation for the ode junction data
from the information on shapes and scales of the cell ventilation. The source term data, inputs
of the release rates of mass kg/s) and energy (J1s) to CLVA-11) can alculate the time
dependencies of temperature, pressure propagation and low rates by the eat low aalysis
function of CELVA-11) based on one-dimensional thermolluid analysis, which takes account
of flow resistance and heat transfer of the ell ventilation system. The release rate of soke
(kg/s), smoke size distribution, the DF of the pre-filters and the clogging properties of te pre-
filters and HEPA filters are inputs for calculation of the transport f the smoke and the time
dependency of the differential pressure of the pre-filters and the HEPA filters.
- 542 -

JAERI-Conf 2002-004
0 Smoke release rate:6 (kg/.)Fe ss release rate:M.(kg/s 0 Smoke size distribution
0 Energy release rate:E J/s) 0 Decontamination iactor (DF)Sh.pe of the ventflati.n y.tem 0 Clogging Coefficients a,
f the fertility
Node junction dta
eat Flow N a oactive Mater a Analysis Funct ons I Confinement
ne- mensionaiThermofluid An ysis E4 Analvsis FunctionsFlow Resistance Calculation loactive Materiais Transport Anal
eat Transfer Analy Pfopagation of Filter Efficiency AnalysisPressureTemperat re
and Velocity
Fig.2 Outline of the Calculation Functions of CELVA ID
4. CALCULATION MODEL
4.1 PREPARATION OF NODE JUNCTION DATA OF THE FACILITY
The node junction data of the ventilation system in the experimental facility were discretely
divided into some volume, elements (nodes) and connecting points between the nodes
Ounctions). The node junction data used for the analysis by CELVA ID is shown in Fig. 3.
The ventilation system was 2W dud
divided into totally 49 sections !k Nubonduct -
including the following; 66thaust duct
sections of the air supply duct 2W model
system, 10 sections of the
second duct system, 9 sections Ist
of the third duct s stem, y
sections of the exhaust duct,
sections of the dilution ductr supply W istmodelcell Fft4w charnlxw Bower
and the model cells, the filter
chamber and atmosphere. Fig.3 Node junction data for the analysis
4.2 ESTIMATION OF SOURCE TERM
. The time dependencies of the release rates of mass, energy and smoke calculated by
CELVA-11) are shown in Fig. 4 In the calculation, the following assumptions were
considered.
Firstly, we assumed that mass release rate kg/s) was proportional to the time dependency
of the temperature of the gas phase at the first model cell 19 m 3) where the mock burnable
materials were combusted. Under this assumption, we determined te mass release rate from
the normalization of the time integration of the temperature with total burned mass of the
mock burnable materials.
Secondly, we assumed that the release rates of smoke and energy were proportional to the
mass release rate. We alculated the smoke concentration at 3rd duct and temperature of gas
phase at the first odel cell using CELVA-11) to compare with experimental results and
inversely determined the proportional constant of the relationship of the release rates of mass
- 543 -

JAERI-Conf 2002-004
and smoke and the relationship of the release rates of mass and energy, 0.11 (-) and 25 X 10'
(J/kg), respectively.
Thirdly, we determined tat the smoke size distribution followed the log-normal
distribution with 0.5 /Lm) of mass median diameter and 36 of geometric standard
deviation from comparison of experimental result.
5 10-3 X10⁵
Thermmetry 5.0 xi 0PO
4X10' 1.0 X I ,::�4.0X10'
ID8.0 104co
3 X 10⁻³ -41st model oell ID :3.0 X106.0 X 104 0
a)0 2 4X.01 04 2.0 x1l 0 4
I X 10-3 .0 X, 04 CD .(X,0,4C E
2 W CO
0 0 00 1 0 20 30 40 50 60 70 80
Time (min)
Fig.4 Estimation results of the mass, energy and smoke release rates
4.3 DECONTAMINATION FACTOR OF THE FILTERS
After the experiments of combustion, penetration experiments of di-octyl phthalate (DOP)
particles through the pre-filters were
performed and DOP particle size distribution 1400
were measured at upstream and downstreamZ 1200 -
of the pre-filters, The DOP particle DF of the0 3 11 mt 1000 '�4Upre-filters was determined rom the ratio of :�:'Oco --V-0.5 /I m4--
the concentration of each DOP particle size r_ 80 - --Or- 0.7 /I m.0 -1E+ 1 g M
at upstream and downstream of the pre- 16 --C- 2 U m- 600Efilters. The relationship between the smoke
400 loading on the pre-filters and the DF of DOP 0
200 particles is shown as a function of DOP
particle size in Fig. 5. 0
The dependency of the DF in the pre- 0 0.2 0.4 0.6 0.8 1
filters to smoke loading was used for the Smoke loading per filter area(kgjm�
calculation of time dependency of the
differential pressure of the pre-filter by Fig.5 Relationship between the smoke loading
CELVA-ID. The DF of the HEPA filters on the pre, filter and DF of ach particle
was determined from the previous study(3). size of DOP-particle
4.4 CLOGGING COEFFICIENTS OF THE FILTERSThe rising of the differential pressure between the ventilation filters was expressed by the
following equation(r)-(') in CELVA-11),
AP = APO( I+ am +8 ml
where A PO: Differential pressure across clean the ventilation fter (?a)
- 544 -

JAERI-Conf 2002-004
A P : Differential pressure across the ventilation filter (Pa)
M: Smoke loading per unit area of the ventilation filter kg/m2)
a: Linear clogging coefficient of the ventilation filters (m 2 /kg)P: Second order of clogging coefficient of the, ventilation filter (m 4 /kg2
The experimental results of the 3relationship between smoke loading and 0 E"rimental result
the differential pressure of the pre-filtersa) 2 -are shown in Fig. 6 The line of this figure -C
shows the fitting of Eq. [1] We
determined the coefficients' of pre-filters2
from the fitting, o=72 (m /kg) and P=586 -a a = 72 (rn2ft)in4/kg 'E I 8 = 586 (m4lko
respectively. We determined the 2!CD4=coefficients of HEPA filters, a=138 5 0
(in 2/kg) and P=3690 (m I /kg 2 0.0 0.1 0.2 0.3 0.4Smoke loading per with area of the
respectively from the experimental results pre-filter (kg/M2)
of previous study(r). Fig. 6 Relationship between smoke loading andthe differential pressure of the pre-filter
5. RESULTS AND DISCUSSION
5.1 EVALUATION OF DIFFERNTIAL PRESSURE OF THE FILTERS
The comparison between calculated and experimental results of time dependency of the
differential pressure of the pre-filters and the HEPA filters is shownin Fig. 7 The calculated
lines of the pre-filters and the HEPA filters show the same dependency of the experimental
results. From the agreement of the calculated and experimental results, It is found that the
model combined with CELVA-11) is valid for the estimation of differential pressure of thepre-filter and HEPA fter.
From experimental results among the other conditions of combustion, we found that the
_e 3 Broken ;.i.t f Pre�-fiftrCL Rubber 100% 7.5 kgZ:51(D Pre-filter calculation)
2(n Pre-filter (experiment)CD0-7�
filter calculation)
HEPA filter (experiment)6
00 2 4 6 80 100
Time (min)
Fig.7 Comparison between calculation and experimental resultsof the differential pressure of the filters
- 545 -

JAERI-Conf 2002-004
differential pressure at the pre-filter broken was from 0.8 to 27 kPa. The scattering of this
value was caused the inhomogeneous strength among the pre�fi Iters tested. Therefore, taking
into account of the scattering of the differential pressure at the pre-filter broken, we can
estimate the breakage time of the pre-filters using our model when the mass release rate is
known.
5.2 ESTIMATION OF BREAKAGE TIME OF THE PRE-FILTERSTo discuss the effect of the mass release
rate to the breakage time of the pre-filters, 8 x 03
the calculation of the time dependency of -U)0)the differential pressure of the pre-filters _V 6 03
was demonstrated with the change of the a) ass re ease rate used in
15 rEvaluation ofIncreasingmass release rate. Differential Pressure ofthe
4 IO-' Filters JThe input conditions of mass release rate 2
W
are shown in Fig. 8. The maximum of the a)
mass release rate were changed from 0.5 X U) 2 I
10' to 70 X 10. It was assumed that from
the time at the start to maximum value of 00 50 100 150 200
mass release rate, the slopes of mass Time (min)
release rates were the same with the value Fig.8 Time dependency of the assumedunder 75 kg rubber burning and that after mass release rates
the time at maximum, the mass release
rates were constant. We also assumed that other necessary constants and conditions for the
calculation were used the same values under 75 kg of rubber burning, From these
assumptions, the shapes of the release rates of energy and smoke were same in Fg. 8. Here,
we should note that this sapes of the mass, energy and smoke were quite different from those
under 75 kg of rubber burning.
The time dependency of the differential pressure of te pre-filters uder te conditions of
the mass release rate in Fig. is shown in Fig. 9 The broken lines show imum and
maximum of the differential pressure of the pre-filters broken among the experiments. From
this figure, we can read the minimum and the maximum of beakage time of the pre-filter
from the cross point of the curves and the broken lines. We can also see that the slope of the
differential pressure of the pre-filters tends to increase rapidly with the increase of the mass
release rate.
The estimated result of the breakage time of the pre-filters is shown in Fig. 10. Below 20
X 10-3 kg/s) of the mass release rate, the breakage time rapidly decreases with the increase of
the mass release rate. On the other hand, above 20 X 10-3 (kg/s) of the mass release rate, the
breakage time tends to decrease gently. owever the turning point of the tendency can vary
under the actual condition of the mass release rate, the existenc, of this point is interesting in
the view of consideration of the role of the pre-filters for preventing from clogging of the
- 546 -

JAERI-Conf 2002-004
HEPA filters due to smoke loading. This tendency also will help the estimation of the time for
exchange of the pre-filters to keep the confinement capability to the ventilation system
including the prt-filters and the HEPA filters.
TOe-3 kg/s)3.0e-3 (kg/IS)
2.7(kPa)2.0e-3 kg/s)
I.Oe-3 (kg/s)CL 2CD The breakage differential
ressure of the pre-filterW_ P0 (experiment)
Q e-3 (kg/s)
0.8(kPa)
C(D
a)M=
00 50 100 150 200
Time (min)
Fig.9 Time dependency of the differential pressures of the pre-filter,calculated by assuming the mass release rate as a parameter
200
E
W
150
CL
A P 2.7(kPa)100 B
EA PB 0.8(kPa)
CZCU 50
0
0 2xlO-' 4XlO-' 6X10⁻³ 8 X 10⁻³
Mass release rate kg/s)
Fig. 10 Evaluation results of the breakage time of the pre-filter
547 -

JAERI-Conf 2002-004
6. CONCLUSIONSThe confinement capability of radioactive materials was evaluated by the calculation code
CELVA-11) in the ventilation system equipped with pre-filters and HEPA filters as the
ventilation filters under the fire accident. In the CELVA-1D code, the source term model was
the model of smoke generation due to combustion of the mock burnable materials related to
the release rates of the mass, energy and smoke. The prediction model was proposed of the
time dependency of the differential pressure of the pre-filters and the HEPA filters taking
account of the clogging properties and the DF of the pre-filters. It was found that the
calculation results of the time dependency of the differential pressure of pre-filters and HEPA
filters were in fair agreement with the experimental results obtained from the test using the
demonstration facility. The validity of the proposed model in the CELVA-lD was confirmed.
Moreover, the breakage time of the pre-filters was estimated as a parameter of the mass
release rate with the CELVA-11). It was found that the breakage time was drastically0-3decreased with increasing the mass release rate in the range of below 2xl kg/s of the mass
release rate.
ACKNOWLEDGMENTThis work was carried out by Japan Atomic Energy Research Institute under the auspices of
the Ministry of Education, Culture, Sports, Science and Technology.
REFERENCES(1) G.Nishio, 1CWatanabe, K.Kouno, N.Yamazaki, S.Mukaide and I.Yoshioka, JEARl-
Data/Code 98-01 1998) [in Japanese].(2) G.Nishio, M.Suzuki, S.Mukaide, J.Takada, M.Tsukamoto and T.Koike, Nucl.Technol.,
Vol.95, 325-336 1991).(3) Ozaki.M., Kanagawa.A., Kuki Seijo, vol.25 No.6, 1-15 1988) [in Japanese]
548 -

JAERI-Conf 2002-004 JP0250350
CLOGGING CHARACTERISTICS OF VENTILATION FILTER
UNDER THE FIRE ACCIDENT
Shinsuke TASHIRO, Kouji WATANABE, Hitoshi ABE, Junichi TAKADA
and Gunzo UCHIYAMA
Department of Fuel Cycle Safety Research, Japan Atomic EDergy Research Institute
Tokai-Mura, Naka-gun, Ibaraki-Ken, 319-1195 Japan
Fax: 81-29-282-5745, e-mail: tashiro�aero.tokaijaeri.gojp
To evaluate the smoke behavior and its loading characteristics to the entilation flters, the verification tests onsafety of a celi ventilation system under the fire accidents burning the solid wastes rubber, cloth) or therecovered solvent (-dodecane, 30% tributyl phosphate (TBP)/70% n-dodecane), which are often used andwasted in the nuclear facilities, have been performed. Maximum of soke concentyation before the ventilationfilter was less than 1000 mg/jil'. Mass Median diameter abd geometric standard deviation of smoke before theventilation filter were 0.2-0.4ym and 34 in the case of the solid wastes burning, 0.2-1,um 34 in the case of therecovered solvent, espectively, The differential pressure.of a pre-filter or a BEPA filter to the mass loading perunit aea were expressed by quadratic function under the different kind of the solid wastes or recovered solvents.
Key words: fire accident, smoke, filter clogging, pre-filter, ventilation system
1. INTRODUCTION
In a nuclear fuel facility, air ventilation systems consisting of cells, ducts, ventilation
filters and blowers are used to confine radioactive airborne materials to the facility. Because
of complexity of the air ventilation systems, the calculation code is often used to evaluate the
confinement capability of radioactive airborne materials to the nuclear fuel facility. To
evaluate the confinement capability of radioactive airborne materials under a fire accident in
the nuclear fuel facility, it is very important to handle the information on smoke generation,
mass transportation of the smoke to the air ventilation system and clogging characteristics of
the vntilation filters by smoke.
The pre-filter is often set for te collection of large particles to prevent HEPA filter
from clogging by large particles under usual condition in some nuclear fuel facilities.
Moreover under the fire condition, the pre-filter can be expected to play the role of preventing
HEPA filter from rapidly clogging. Because the concentration of smoke near the fire is so
high that rapid coagulation will occur and smoke size distribution at upstream of the
ventilation filter will shift larger size. But excess smoke loading onto the pre-filter will make
the pre-filter clog and finally break. Then much smoke directly loading onto the HEPA filter
will cause the rapid clogging and the breaking of the HEPA filter. Then the radioactive
airborne materials will be released to the atmosphere. Te air pollution by radioactive
airborne materials is great serious problem to the public. To avoid the destruction of
confinement of the radioactive airborne materials with the pre-filter broken, the exchange of
the pre-filter will be necessary before the breakage of pre-filter and the rapid clogging of the
- 549 -

JAEHRI-Conf 2002-004
HEPA flifter, Therefore it is very important for the estimation of the exchange time of the
pre-filter to evaluate the cloggin(T of the pre-filter quantitatively. Unfortunately the study on
the clogging of the pre-filter under the fire accident ties not been found experimentally and
theoretically.
In Japan Atomic Energy Research Institute, the large-scale experiments focused on
safety of a cell ventilation system of installed the cascade combination of pre-filters ad
HEPA filters burning te mocked materials of the radioactive wastes in the nuclear fel
facilities have been performed, The purposes of our experiments are tree, the first is to study
the fire behavior of radioactive wastes such as rubber, cloth and recovered solveDt. The
second is to verify the role of the pre-filters preventing HEPA filters from rapidly clogging
and to evaluate the differential pressure rising of pre-filters with faction of mass of smoke
loading oto pre-filters. The third is to establish the evaluation and simulation approaches of
safety analysis of the ventilation systems in a nuclear fuel facility under such fire condition
using CELVA-IDI'l.
In this study, the time dependencies of smoke concentration and size distribution at
the neighborhood ventilation filters and clogging characteristics of ventilation filters by
smoke obtained from the experiments are mainly described.
2. EXPERIMENTAL
1 EXPERIMENTAL FACILITYDilutionThe block diagram duct
and the scale of the2nd duct
experimental facility are mixer Low pressure typeLow pressure type cascade impacorsn &
shown in Table I and Fig. 1, cascade impacors mo e ce Air fitter samplers
respectively. The Mork &Air filter samplers letduct 3rd irfil
materials were brned in the duct9
lst model cell and theAir supply
smoke generated was, duct
transported to the stack byway of te 2nd model cell, 1st mode cell Fitter chamber Blower Stack
mixer and filter chamber. Fig. I The block diagram of the experimental facility.
The filter chamber has three sets of full-size pre-filter (model CM-31-KW-R-SOZ, Nihon
Muki Corp.) at upstream stage and six sets half-size HEPA filter (model ATM-31H-P-E,
Nihon Muki Corp.) at downstream stage, respectively. Specification of testfilters is shown in
Table 11,
Smoke size distributions and concentrations at st duct, 3rd duct and downstream of
pre-filters were measured by Andersen-type low-pressure cascade impactors (model LP-20,
Tokyo Dyiec Corp.) and air filter samplers, respectively, The pressure in the vtilation
system including at upstream and downstream of pre-filters and HEPA filters were measured
550 --

JAERI-Conf 2002-004
by dial-gauge type differential manometer. The temperature in the ventilation system was
measured by thermocouples. The characteristic of the burning at the Ist model cell was
monitored by video system.
Table I The scale comparison of the experimental facility with a reprocessing plant.
Component Experimental acility Reference plant Scale factor
1st model cell 19 ml, cylindal 80irO, rectangular 1/4 scale.
1st duct 5 in long, -6m long 1:1 scale of long.0.4 in inner diam. 2/3 scale of inner diam.
2nd model cell 6 m3, cylindal -30m 3 1/4 scale.
2nd duct 10 in long, -70m long 1/3 scale of inner diam.0.2 m inner diam.
3rd duct 10 in long, -70m long 1:1 scale of inner diam.0.6 in inner diam.
Filter chamber I camber with 2 stages 18 chamberscascaded.
Table 11 Specifications of test filters
Specification Pre-filter HEPA filter
Size (mm) 61OX61OX50 610X305X292
Thickness (mm) 50* 0.39Area of filtration n 2) 0.37 11.3
Diameter of fiber (um) 30--F-4 (layer 1) 0.7230-+-4 (layer 2)
Initial collection efficiency of particles 85 % 99.99
*Double layers combined. Tickness of each layer is 25 mm.
2.2 CONDITIONS OF BURNABLE MATERIALS AND VENTILATION TIMES
The gloves made of rubber and cloth packed in pieces of carton box 225
rmnX350 imH, 0.5 kg) were used as the mock burnable solid wastes. Normal-dodecane
solvent and the mixture of n-dodecane 70%/ tri-n-butyl phosphate (TBP) 30% solvent filled in
a stainless steel pail (0422mm, area, 0.14m) was used as the mock burnable recovered
solvent.
As the parameters, the burnable materials (rubber 100 % 27.5 kg, rubber 50% and
cloth 50%; 15-20 kg, cloth 100% 75 kg, n-dodecane 100% 512 kg, n-dodecane 70%/ TBP
30%; 12 kg) and the times of ventilation in the st model cell 5-20 times/hour) changed but
the face velocity tbrough the filters was adjusted 13 m/s in all runs to simulate normal
conditions in the reference reprocessing plant.
- 551

JAEFJ-Conf 2002-004
3. RESULTS AND DISCUSSION
3.1 TIME DEPENDENCIES OF PRESSURE, FLOW RATE AND TEMPERATURE OF
VENT GAS
Pressure and flow rate of vent gas L-
80 -A ubber 50% 1 st model cellexcept near the filters did not change during +cloth 50% Ist duct
- - - - nd model eelburning in a runs. 600 - ------ 2nd duct
3rd ductFig 2 shows the typical time 400 - Ventilation: 20 times/h
dependencies of temperature of vent gas at Weight of waste: 20 kg
the 1st model cell near 1st duct, the inlet of 200 OmwaWa
Ist duct, the outlet of 2nd model cell, the 0
outlet of 2nd duct and the inlet of 3rd duct. 80 - b)13- decane 70%
In the mock solid wastes burning, E 6001- CD TBP 30% Ventilation: 20 times/h
the time dependency of temperature of vent 400 - Volume of waste: 12L
gas at the 1st model cell had one peak. The
peak value of temperature at this point with 200
the time of ventilation fixed strongly 0
depended on both the composition and 0 60 120
weight of the burnable materials. The Time (min)
maximum value of temperature at this point Fig. 2 Time dependency of temperature of
with the change against both the vent gas.
composition and weight of the burnable materials under the 20 times/h of the ventilation at
the 1st model cell fixed was about 600 in the case of the mixture of 10 kg of rubber and
10 kg of cloth burning as shown in Fig. 2(a).
In the mock recovered solvent burning, the time dependency of temperature of vent
gas at the 1st model cell was stationary in the case of n-dodecane solvent burning with the
change of the volume of the solvent under the 20 firnes/h of the ventilation. The value of
temperature at this point was about 500 in the case of 12 litter of n-dodecane burning. But
in the case of the mixture of n-dodecane/TBP burning, the time dependency of temperature of
vent gas at the 1st model cell had two peaks as shown in Fig. 2b). The temperature at 2nd
peak was higher than the one at 1st peak. The maximum value of temperature at 2nd peak was
about 780 'C. Just after the 2nd peak of temperature, the fire was quenched naturally. It was
considered that the lack of the oxygen at 1st model cell was ocurred due to the boiloverbUrning[2],[3]
However the vent gas at the 1st model cell had different dependencies of temperature
among the condition of the burnable materials or the ventilation times, te temperature of the
vent gas downstream of the 3rd duct did not change as shown in, Figs. 2(a) and (b). From the
results of time dependencies of pressure, flow rate and temperature of vent gas, we can
conclude that these properties from the fire did not have influence on the ventilation filters in
our experiments.
- 552 -

JAEPJ-Conf 2002-004
3.2 TIME DEPENDENCY OF SMOKE CONCENTRATIONS AND SMOKE SIZE
DISTRIBUTIONS
Fig. 3 shows the time dependency of1000 iT1bb117070.,;.0kg
smoke concentrations at the 3rd duct with 13 ubber 100%, 7.5kg&cloth 100%, 7.5kgthe change of kind and amount of burnable 100 rubber 50%+cloth 50%, 7.5kg
materials under the ventilation times fixed. ,5--EIn the mock solid wastes burningCD 1 0
under the ventilation fixed, increasing the E
ratio of cloth in the same amount of solid 0 1wastes tended to reftain from smoke E 100o CDgeneration. In the mock recovered solvent 0
burning under the ventilation fixed, smoke 100 70 0 n-dodecane
concentration generated from n-dodecane Q 100%, 5L13 n-dodecane1 0 100%, 10Lburning was stable but smoke n-dodecane
100%, 12Ln odecane 70%concentration generated from the mixture TBP 30%, 12L
of n-dodecane and TBP burning had two o 60 120peaks. 2nd peak of smoke concentration Time (min)
was considered due to the boilover Fig. 3 Time dependency of smoke concentration at[2],[31 the 3rd duct.burning . In the same amount of pure
rubber burning with change of ventilation at 1st model cell, decreasing of ventilation tended
to refrain from smoke generation.
The time dependencies of smoke size distributions did not change well under burning.
Assuming the smoke size distributions were log-normal, in all runs, the range of mass median
diameter and geometric standard deviation were 0 16-0.75 /,am and 24-5.3, respectively.
Table III Time average of MMD and org of smoke size distributions at the 3rd duct.
Wastes Weight or volume Ventilation times MMD org
of wastes (times/h) (lum)
Rubber 7.5 kg 5 0.46 5.310 0.75 4.020 0.47 3.4
Cloth 7.5 kg 20 0.54 2.4Rubber 50%+cloth 50% 7.5 kg 20 0.25 3.0
N-dodecane 12L 20 0.16 4.2N-dodecane 70%/TBP 30% 12L 20 0.69 2.5
3.3 THE CLOGGING CHRACTERISTICS OF THE PRE-FILTER AND THE HEPA
FILTER
553

JAERI-Conf 2002-004
The typical dependency of the differential pressure at the pre-filter and the HEPA
filter is shown in Figs. 46.
In the mock solid wastes 3
burning under the ventilation fixed, 2.5 - -q�._ Broken point
the differential pressure at the of pre-filter,a- 2 -
pre-filter strongly rose but the one IL Rubber 1 00 %7.5 kgof HEPA filters did not rise, as -'�e 1. -
CLshown in Fig. 4 In this figure, the < 1 re-filtersudden drop of the differential
pressure at the pre-filter shows the 0.5 HEPA filter
breakage of the pre-filter. The 0
rising of the differential pressure at 0 1 5 30 45 60 75
the pre-filter after the breakpoint Time (min)
shows that all sets of the pre-filter Fig. 4 Time dependency of the. differential pressure ofwere not broken but some sets was the ventilation filters de to te smoke loading under
20 times/ h of the ventilation at the I st model cell.broken. After the experiment, it
was found that only one set of the pre-filter of three in the filter chamber was broken. Similar
tendency of the differential pressure at the pre-filter and the HEPA filter was shown among
another solid materials condition including rubber, but the pre-filter was not always broken at
the same differential pressure. The value of differential pressure at the breakpoint of the
pre-filter were 09-2.7 kPa. 07 kPa under 100% rubber, 50% rubber 50% cloth burning,
respectively. After the experiment, masses loading per set of the pre-filter were 0086-0.14 kg
between the burning under 3
materials including rubber. Fromthese results, it was considered 2.5 - n-dodecane 100%.
that the differential pressure at the -6 2 -
pre-filter broken was not strongl CLy 1. - HEPA filter
dependent on the inhomogencous rL
strength of the pre-filter but on the < 1 re4ilter
smoke characteristics loading onto 0.5
the pre-filter. Under 100% of cloth 0
burning, the differential pressure at 0 1 5 30 45 60 75the pre-filter did not rise. It is Time (min)
considered because smokeFig. Time dependency of tre ifferential pressure of
concentration under 100% of cloth the ventilation filters due to e sirtoke loading under
burning was lower than ones under 20 times/ h of te ventilation at te Ist model cell.
another materials burning, as shown Fig. 3(a).
554 -

JAERI-Conf 2002-004
In the mock recovered solvent burning under the ventilation fixed, the rising of the
differential pressure at the, pre-filter under 100% n-dodecane solvent burning was different
from the solid materials burning. The rising of the differential pressure at the pre-filter under
100% n-dodecane solvent burning was less than the one at the EPA filter as shown in Fig. .
It is considered because smoke size distribution under 100% n-dodecane solvent burning as
shown in Table III was so small that most of smoke was penetrated through the pre-filter and
directly loading onto the HEPA 3 I a U
filter. But the loading of smoke 2.5 - n-dodecane 70%
having small size distribution onto Broken point TBP 30%:12 Lthe HEPA filter was not generally 2 - of pre-filter
affected to the confinement 1. -capability of the HEPA filter. a. Pre-filter
The rising of the
differential pressure at the pre-filter 0.5;
under 30% TBP/ 70% n-dodecane 0 er
solvent burning was little gentler 0 1 5 30 45 60 75
than ones under the solid materials Time (min)
including rubber burning as shown Fig. 6 Time dependency of the differential pressure ofin Fig. 6 The differential pressure the ventilation filters due to the smoke loading underat the HEPA filter rose with delay 20 times/ h of the ventilation at the I st model cell.
but was not broken. The broken characteristic of the pre-filter was similar with the case of
solid materials burning from the observation of the pre-filter after the experiment. The value
of differential pressure at the breakpoint of the pre-filter were 084-1.41 kPa under 30% TBP/
70% n-dodecane solvent burning. After the
experiment, mass loading per set of the
pre-filter was 013-0,19 kg. 0 Rubber 100%E3 Rubber 50%
From these results, it was =5 + cloth 50%0 n-dodecane 1 00%
considered that the differential pressure at 2 - TBP30%
the pre-filter broken was not strongly +n-dodecan970/6
dependent on the heterogeneous strength of a =98, a =86,6=108 8 =0.4
the pre-filter but on the smoke 0 a =54,8 =20
characteristics loading onto the pre-filter.
Under burning, the differential A P= A P(l a M,8 M2)
pressure of pre-filters strongly rose but the
one of HEPA filters did not rise. It was 0 0.2 0.4 0.6 0.8
found the prefilter was useful for Mass of smoke loading per filter area (kg/M2)
preventing the clogging of HFPA filters. The Fig. 7 The relationship of mass of the smoke
differential pressure of a pre-filter to the loading to the differential pressure of pre-filter.
- 555

JAERI-Conf 2002-004
mass loading per unit the pre-filter area were fitted by the equation [1]J41
AP=APo(l+aM+PM 2 ,
where a and were the clogging coefficients, (m' kg-') and (m� kg-'), respectively.
The obtained values of a and rom the experiments are shown in Fig 7 and Table IV.
Table IV The clogging coefficients a and
Weight or Ventilation a P MWastes volume (times/h) (m2 kg-1) (m4 kg-2) (kg)
of wastesRubber TS kg S 1725- 99 0:5,M!!�0.19
10 129 178 0 5.- M:! -0. 1 820 72 586 0:!r.�0.35
Cloth 7.5 kg 20 0 0 0!_.M_-50. 1 0Rubber 50%+cloth 50% 7.5 kg 20 98 108 0s-M:r0.25
N-dodecane 12L 20 86 0.4 0:!r.M:50.34
N-dodecane 70% 12L 20 54 20 O:r.M!-.0.54/TBP 30%
4. CONCLUSIONS
The time dependencies of smoke concentration and size distribution near the
ventilation filters and clogging characteristics of ventilation filters by smoke were obtained
from large-scale experiments using a cell ventilation system installed the cascade combination
of pre-filters and HEPA filters at burning the mocked materials of the radioactive wastes in
the nuclear fuel facilities. The smoke concentration was considered related to temperature of
gas phase near the fire. The clogging characteristics of prefilter were experimentally
considered related to smoke size distribution, concentration, and mass loading of smoke onto
the pre-filter. It was concluded that the pre-filter was effective for the preventing the HEPA
filter from rapid clogging. Values of the coefficient will be adapted to the safety analysis on
the confinement ability of radioactive materials in a ventilation system under a fire accident.
ACKNOWLEDGEMENT
This work was carried out by Japan Atomic Energy Research Institute under the aspices of
the Ministry of Education, Culture, Sports, Science and Technology.
REFERENCES
[1] G. Nishio. IC Watanabe, K- Kouno, N. Yarnasaki, S. Mukaide and 1. Yoshioka,
JAERI-Data/Code 98-017 1998)
[2] K. Hashimoto, G. Nishio and IC Soda, Nuclear Technoi., 104, 21.8-26 1993)
[3] G. Nishio, J. Japan Air Clean. Assoc., 25, 16-31 1988) [in Japanesej
[4] H. Abe, J. Takada, M. Tsukamoto, K. Watanebe and M. Murata. J. Nuclear Sci. Technol., 36,
619-25 1999)
- 556 -

JP0250351JAERI-Conf 2002-004
STUDY ON SUPERCRITICAL FLUID EXTRACTION OF URANIUMAND TRANSURANIUM COMPLEXES WITH DIKETONES ANDOTHER COMPLEXONES AS APPLIED TO DECONTAMINATION
ANDREW SHADRIN, ANDREW MURZIN, VALERY ROMANOVSKY ANDVADIM STARCHENKO
V.G. Kb1opin Radium institute194021, Russia, St. Petersburg, 2,d Murinskii Ave, 28
shadrin�atorn.nw.ru
INTRODUCTION
The supercritical fluid extraction (SCFE) of metals is a field of science and
engineering which has been actively developed in the last ten years. SCFE is based on the fact
that the substances in supercritical state (fluids), i.e. at temperature and pressure being above
the critical values, have a density close to liquid density, which provides high dissolving
ability and viscosity near to that of gases which provides high penetrating ability and high
extraction on rate. Carbon dioxide is the most common choice in supercritical extraction,
because this gas is nontoxic, easily available, inexpensive and has moderate critical
parameters (t > 37'C and pressure > 72 atm) [1].
The routine decontamination methods of surfaces and soils involve the use of acidic
and alkaline complexone solutions for removal of radionuclides. The majority of the routine
decontamination techniques generates large volumes of secondary aqueous radioactive wastes.
In the case of SCFE the decontaminating agents dissolve in carbon dioxide rather than in
water or organic solvents; this enables to reduce the volume of secondary radwastes
considerably. Under changes of pressure or temperature the supercritical carbon dioxide turns
into gaseous state, and tis allows to remove readily the "solvent" and to obtain the dissolved
compounds in compact form. These peculiarities of SCFE motivate interest in this process as
a promising technique for surface decontamination. The conducted studies and literary data
make it possible to propose the key diagram for decontamination in SC-CO2 (Fig. 1).
557 -

JAERI-Conf 2002-004
..... .. .... ... ....... ...
... .. . .. .... . ..... .. ..
..... ..... .
............ ....
...... ... .... ..... ... in.................................................. ....
.. . ................ . .. ........... .... .... .. ... ......... ..........................ar. inw....... .... ............... ..... ................. ............................... ..... ......... .... .... .. .... .... ............ ...
.. . .... ......... ........... ... ............ ................................... P urifi ed i..................................
Fig. 1. Key flowsheet for supercritical fluid purification and decontamination of surfaces.
The technologies for supercritical fluid extraction of metals have been developed in
the last ten years in Europe, USA and Japan. Intense studies in this field ate conducted by
CEA (France), BNFL UK), DOE (USA), AERI (Japan). The studies on SCFE of metals are
aimed primarily at elaborating the methods for removal of metals from solid surfaces by.SC-
C02 to decontaminate soils, fabrics, asbestos, ubber etc., as well as to simplify sample
preparation to analysis of environmental objects. The studies conducted in the famework of
these projects have shown that the salts of heavy metals, uranium a raie-earth elements
(REE) can be extracted from solutions and from solid surfaces (filter paper, steel andquartz
sand) by SC-CO2 containing 0-diketones (hexafluoroacetylacetone (HFA, as a rule),
dialkyldithiocarbamates, organophosphorus compounds or crown-ethers 29].
Our studies conducted in the last five years in collaboration with BNFL (Great Britain)
and in the framework of ISTC Project 1 60 were directed to checking the potential of SCFE
of radionuclides extraction and elaborating the scientific udamentals of SCFE
decontamination technology. Experimental procedure is comprehensively described iii 9-12].
IMPROVEMENT OF SCFE PROCESSES FOR EXTRACTION OF URANIUM AND
TRANSURANIUM ELEMENTS BY �-DINCETQNES.
It is known that the salts of uranium and rare-earth elements can be extracted by SC-
C02 containing HA and water 6]. It is also known that only the enol form of HFFA forms
- 55 -

JAERI-Conf 2002-004
chelate complexes with metals according to reaction of cation exchanges (equation 1), while
the keto-form of HFAA cannot form complexes with metals.
Mn+ <(NO-), H+HFFA- _> Mn+ (HFAA-)n + nHN03, (1)3
Keto-enol tautomerism and thus the formation of 0-diketone complexes with metals
crucially depends on pH-medium. In 13] it is shown that the aqueous phase being in
equilibrium with SC-CO2 has pH 28, which is far short of optimum for formation of HFA-
complexes (pK,,=4.46) 14] with metals. These facts are indicative of the necessity of
changing pH-medium in te course of SCFE-process. In collaboration with BNFL we have
suggested some modifiers (nitrogen-containing compounds) which permit to increase
significantly the efficiency of uranium extraction (Table ) [15].
1Table E Uranium extraction from air-dry uranylnitrate (SC-CO2, 300 atm, 60T)
HFA, �tl Pyridine, d Extraction of uranium, 10 --- 8 310 30 60 1030 30 80 10
Introduction of pyridine as pH-modifier enables to decrease the HFA-amounts needed
for efficient extraction by a factor of 50-100. The results obtained were used in SCFD of
really contaminated samples.
STUDY ON SOLUBILITY OF ACTINIDE COMPLEXES IN SC-CO7,
By solubility of complexes in SC-CO2 it is usually meant the highest concentration of
complex in C02- In 12] is shown that the supercritical carbon dioxide cannot be considered
as an inert diluent, because C02 being in supercritical state interacts with soluble uranyl
complexes, while forming the monosubstituted complexes and uranylcarbonate. Therefore, in
what follows the "solubility" value was considered ass the amount of complex transferred into
SC-CO2 solution under given conditions. The conducted studies have shown that the
solubility Of U02('FFA)2.PY Cmplex is rather high and exceeds 100 g 36 mg U/ml) (Fig. 2.
This value is much higher than estimates according to literary data. It should be noted that the
- 559 -

JAERI-Conf 2002-004
detected value of complex solubility considerably exceeds the solubility needed for
commercial use of processes for decontamination of solid surfaces by SC-CO2.
120 -
100 L)
-4 80 0 0 16,3 mg of oomplex
13 46 mg of con plex0 60 -A- 64,1 ig of oomplex
100,5 ig of oomplex447,2 mg of complex
0 40E_=CZCZ 20
-4 A AM
O 0 Cla 1S.4
0 1 0 20 3 0 40 50V o lum e 0 f C 2 M I
Fig. 2 Recovery of uranium from U02(TFA)2*PY complex and collection of extract 300 atm,
60'C, 20 min, water traces)-
Analysis of the data given in Table l� has revealed that the solubility of actinide
complexes increases, as a rule, in the order of AA Z� DPM ;�- TTA < TFA Zt HA and for
additional ligands in the order of water < pyridine < TBP. There are exceptions presented by
the hydrated complexes of actinides with HA and TFA. It should be noted that the solubility
of similar complexes of uranium(VI), plutonium(IV), europium(III) and americium(III) differ
from one another only slightly. At the same time the solubility of corresponding complexes of
neptunium(IV) is considerably lower (by a factor of 2-5).
So, the solubilities of different actinide complexes with �-diketones in SC-CO2 were
determined. It was shown that the solubilities of uranium, neptunium and plutonium
complexes with non-fluorinated �-diketones (acetylacetone, dipivaloylmethane) and their
adducts are not sufficient for the purposes of supercritical fluid decontamination. An
exception i U02(DPM)2,TBP adduct the solubility of which is 13 g/l (uranium) under
standard conditions and can attain 20-30 g/l in the case of the high initial quantity of this
complex. However, this fact is not of interest from the standpoint of developing the
technology of supercritical fluid decontamination (SFD), because all the actinide elements
should be removed by decontamination process. Hence, only fluorine-containing P-diketones,
in particular TFA and HFA are promising SFD. Adducts of actinide complexes and fluorine-
- 560 -

JAERI-Conf 2002-004
containing O-dilctones with water, pyridine and TBP are readily soluble in SC-CO2 and can
be used in the technology of supercritical. fluid decontamination.
Table Ch Solubility of complexes U(VI), Pu(IV), Np(IV), Eu(Am)(111) (SC-CO2, 300 atm,
60T. one-cell procedure, 20 mg of metal)
Neutral ligand Solubility of actinide complexes with diketone, mmAA DPM TTA TFA T_ GFA
Comple s of U(V1)Water ------- 0.012 0.014 0.006 0.2 + o., 7 4
Pyridine 0.075+o.007 0.3 +o.1 0.2 + o., 2 0.8 ±0.4
TBP ------- 5 + 2.0 J- 0.8 4 4.2 0.6
Complexes of PU(1V)Without ligand 0,6 _-0,4 0,4 0,2 unstable unstable unstable
Water unstable unstable 0504 ± ol 3,0 ± ,o 5�O ±3,0
Pyridine unstable unstable OJI 0,08 6,2 +0,8 0, 17 ± o5TBP unstable unstable 0,13 ±oog 4� ± ,o 4,0 ,0
Complexe of (NpIV)Without Hgand 0, 18 ± oog 0,39 ±0,06 unstable unstable unstable
Water unstable unstable 0,019 ±0,003 1�5 ±0,5 2,2 ± 06
Pyridine unstable unstable 0,008 ±0,003 1�5 ±o,5 0,010 ±0,005
TBP unstable unstable 0,23 0,06 0509 0,06 0,6 ±olComplexes o Eu(Am)(IM
Water 0,04 ±0,02 0,04 ± 003 LO ±0,2 3 +1 7 1Pyridine 0,24 ± oog 9 ± 3 0,09 ±0,06 not detected* 0,07 + ool
TBP 8,9 'q - 7 ±3 13 4 6,9 0,5 - 7 3
SELECTION OF COMPLEXONES FOR SUPERCRITICAL FLUID EXTRACTION
OF CESIUM AND STRONTIUM
It is known that the contaminated soils and other objects, as a rule, contain not only
transuranium elements, but also such radionuclides as Cs-137 and Sr-90. SCFE of cesium and
strontium is studied to a much lesser degree than that of uranium, heavy metals and even
transuranium elements. Analysis of the available literary data on SCFE of metals shows that
the metals forming complexes according to ion-exchange mechanism are extracted most
efficiently 16]. In this case a neutral complex of metal cation and hydrophobic anion is
transferred into SC-CO2 phase. It was also shown that cesium and strontium can be efficiently
extracted by solutions of commercial D2EHPA and dicyclohexyl-18-crown-6 (DCH18C6 in
SGC02 [91-
- 561 -

JAERT-Cont 2002-004
The solutions of X11EHPA and DCHISC6 in SC-CO2 perrnit to remove from solid
surfaces ot oly cesium a strontium bt also uraniurr ad plutonium (Fig. 3 i.e. to
conduct the combined decontamination of suffaces. As a result of studies, a mixture of
commercial complexones was prepared; solution of this mixture in SC-CO2 enables to remove
efficiently uranium, transuraniurn clernents, cesiurn and strontium from stainless-steel
surfaces.
1009
B
7
50
0 400
cc 30
200
10
Gs Sr Am u Np Pu
Fig. 3 SFE of radionuclides by solutions of D2EHPA and DCHtSC6 in SC-CO2
SCFE DECONTAMINATION OF REAL CONTAMINATED SPECIMENS
In collaboration with "Mayak" PA there was performed a series of tests on SCFF
decontamination of porous materials (asbestos, rubber), fabrics (cotton, Dacron), metal
surfaces (stainless-stecl, carbon steel, brass, copper, ickel), plastics and soils, he studies
have sown that the SC-CO2 containing HA and a modifier enables to remove 97-99% of a-
emitters from surface of a material being processed in two sccessive operations (Fig. 4 and
5), which, as a rule, is sufficient fr re-use of dcontaminated fflatffiak
-- 562 -

JAERI-Conf 2002-004
100
90
e 80 >�, -0-Alpha-nudides
-41-Gamma-nuclides
70 -
60 -
50
0 0,005 0,01 0,015 0,02 0,025
Amount of modifier (pyridine) ml
Fig. 4 Effect of modifier on radionuclide removal from stainless-steel surface by SC-CO2
containing HFA and pyridine
100
90
80IMS
70
60
0C3 50is Arn
40 M PU
30
20 -
10 -
0
Stainlew-steel Rubber Asbestos
Fig. 5. Decontamination of surfaces of different materials by SC-CO2 containing HA and
pyridine
The process of soil decontamination is a considerably more complicated task as
compared with surface decontamination. The studies conducted with the use of labeled soils
and quartz sand showed that the SCFE of americium decreases by a factor of 46 in the
presence of bumic acids and calcium carbonate. At the same time it is possible to extract 55-
- 563 -

JAERT-Cotif 200M04
7517o of cc-emitters in three sccessive operations of soil treatment bY SC-CO2 Cntaining
HFAA (ig 6.
80
70
60WAm
0 Q u40
30
20
10
0
Moos C I ay Loam
Fig. 6 Decontamination of soil by SC-CO2 containing HFA ad pyridine
The use of D2EHPA and DCH18C6 solutions in SC-CO2 for supercritical fluid
decontamination akes it possible to remove fTom the surface being decontaminated not only
transuranium elements, but also such / ad P-ernitting long-lived nuctides as Cs-137 ad Sr-
90 (Fig 3 To dmonstrate efficiency of this system, the real contaminated stainless-steel was
decontaminated wit te use of SC-CO,? containing DCRISC ad D2EHPA. It is sown that
92-95% of oc-activity and 70-75% of Co-60 c be removed from stainless steel in oe
extraction by SC-CO2 containing water, D2EHPA and crown-ether.
Hence, the conducted tests ave dmonstrated the possibility for decontamination of
solid surfaces by SCFE. To demonstrate the potential of the subcritical CO,-, for
decontamination purposes, some experiments on decontamination of really contaminated
stainless-steot surface were carried Out. The ata obtained are given i Tables III and [V.
Table Ill. Removal of transuranium elements from real contaminated stainless-steet srface
by subcritical (Equid) and supercrifical (02
Amount of com lexone, tl, Residue of element on srface, 1/0Pri�fiue TFA D2EHPA AmWater Pt,
Subcritical (liquid) CO2 70 atin, 40 55 5610 14
10 W 30 31, '10 6
10 595upercritical CQ? 300 atin, 60 C)
10 I0 451-0 W 30 15 6 81 4
22 39 3
-J 14
564 -

JAERI-Conf 2002-004
Table IV. Decontamination of real contaminated stainless-steel surface in liquid 60 atm,
25 and supercritical 300 atm, 60 f4) C02
Compositio of decontaminating mixtureI
10 tl, i 2 30 �tl, HFA, 10 10 �tl, f 21 , 10 tl_ D2EHPA, 40 mgMaterial �tl, pyridine in 35 mL DCH18C6 in 35 M 2
,)kM241, Residue Residu 'e Residue CS137 %U154-155, Ce,44 % Am241, 154-155, 144, a/Eu Ce 0
Plastic 48 9 73 ±8 42 ±1Cotton 60 ±12 28 ± 46 8
Steel 15 ±4 17 ±6 47 ±7
In the course of the experiments no significant difference was detected between
decontamination under liquid and supercritical conditions. Americium ad plutonium were
recovered by 70-80% with the use of both liquid and supercritical C02 containing D2EHPA
or TA (in the presence of pyridine). The conducted experiments show that the subcritical
C02 can be applied to surface decontamination. Recovery of transuranium elements by 99%
can be achieved in two-three successive treatment operations of stainless-steel surface by the
subcritical C02 containing D2EHPA or TA (in the presence of pyridine).
CONCLUSION
During the experiments on supercritical fluid decontamination of really contaminated
materials it was revealed the following:
• double treatment of surfaces by supercritical carbon dioxide containing
hexafluoroacetylacetone and modifier enables to remove 97-99% of a-emitting
actinides;
• double treatment of surfaces by supercritical carbon dioxide containing di-2-
ethythexylphosphoric acid and dicyclohexyl-18-crown-6 enables to remove more
than 99% of y-emitters and more than 90% of cc-emitters;
• triple treatment of soils by supercritical carbon dioxide containing
hexafluoroacetylacetone enables to remove 55-75% of a-emitters;
• the decontamination efficiency with the use of complexone, solutions in liquid and
supercritical C02 differs only slightly 70-80% of TRU and more than 50% of Sr
and Cs were removed from really contaminated stainless-steel surface in single
- 565 -

JAERI-Conf 2002-004
treatment operation with the use of D2EHPA and CH18C6 solution in liquid
C02).
So, the studies conducted at the Khlopin Radium Institute in the last five years have
shown that the methods of supercritical fluid extraction and extraction by liquid C02 can be
successfully used for decontamination of surfaces and porous materials.
The work was done under financial support of RF MinAtoin, BNFL (UK) and ISTC
(Project 1160).
REFERENCES
[1] J.L. Hedrick, L.J. Muicahey, L.T. Taylor, Microchhnica Acta", 1992, Vol. 108, p.115.[2] N. Saito, Y. kushima, T, Goto Bull. "Chem. Soc. of Japan", 1990, Vol. 63 N 5, p. 1532.[3] C.M. Wai, Anal. Sci., 1995, Vol. 11, p. 165.[4] K.E. Laintz, C.M. Wai, C.R. Yonker, R.D. Smith, J. "Supercritical Fluids", 1991, Vol. 4,p. 194.[5] K.E. Laintz, C.M. Wai, C.R. Yonker, R.D. Smith, "Anal. Chem", 1992, Vol. 64, p. 2875.[6] Y. Lin, C.M. Wai, F.M. Jean, R.D. Brauer, "Environ. Sci. Technol, ",'1994, Vol. 28 N 6,P. 1190.[7] K.E. Laintz, E. Tachikawa, Anal. Chem, 1994, Vol. 66 N 13, p. 2190.[8] Y. Lin, R.D. Brauer, .E. Laintz, C.M. Wai, "Anal. Chem. ", 1993, Vol. 65, p. 2549.
[9] A. Shadrin, A. Murzin, V. Starchenko, "Spectrum'98, DenVeT, Colorado, USX',September 13-18, 1998, "Proceedings, American Nuclear Sciety IDC, USA", 998, p 94.[10] A. Shadrin, A. Murzin, N. Smart, "5th Meeting on Supercritical Fluids", 23-25 March1998, "Nice, France, Proceedings", 1998, p. 155.[11] A. Shadrin, A. Murzin, V. Babain, "5th Meeting on Supercritical Fluids", 23-25 March1998, Nice, France, Proceedings, 1998, p.791.[12] A. Murzin, V. Babain, A. Shadrin, 1. Smirnov et al. Paper for "Radiochernistry", in press.[13] K.L. Toews, R.M. Shroll, C.M. Wai, N.G. Smart, "Anal. Chem. ", 1995, Vol. 67, p. 4040.[14] J. Stary, "The solvent extraction of metal chelates", 1964, el:gamon Piess.[15] Patent PCT/GB99/01629/[16] A.A. Clifford, N.G. Smart, A.Yu. Shadrin, "Analytica Chimica Acta", 1997, Vol. 356,p. 73.
- 566 -

JP0250352JAERI-Conf 2002-004
THERMODYNAMIC STUDY OF Am(111) AND Eu(TTT) EXTRACTION BYISO-BUTYL-BIS-TRTAZINYL-PYRIDINE
CLtMENT HILL AND CtCILE ROUBE
Commissariat A FEnergie Atornique, DEN/DRCP/scPs/LC.SE - BP 17171 - 30207 Bagnols-sur-C&e, France
Fax: 33 - 466.79.65.67, e-mail : clement.hill�ceq.fr
In order to better Understand the extraction inechanisras of An(111) and Ln(III b bis-triazinyl-pyridines (Btp) aswell as the affinity of the latter towards Ai(III), the extraction of 112 Eu al)d 74'Am by 2,6-bis(5,6-iso-butyl-l,2,4-triazin-3-yl)-pyridine (iBu-Btp) was deeply studied. The distribution ratios (Dm) of both radiotracers weredetermined by y spectrometry. Te analyses of the slopes of "log-log" plots of experimerital D values vs theconcentration of iBu-Btp or that of itrate anions at equilibrium, allowed the stoichionretry of the extractedcomplexes to be estimated. Tbe extraction constants of Eu(III ad Ani(TTT) were thereafter calculated at differenttemperatures ad thermodynamic data, such as AH,, ad S,,, were deduced from the Van't Hoff s law.
Key words: actinides(III), lanthanides(III), bis-triazinyl-pyridines, extraction, thermodynamics
1. INTRODUCTION
The separation of trivalent minor actinides (An(111 = A(T11) and Cni(Ill)) from trivalent
lanthanides (n(III), accounting for about one third of the total amount of fission products), is
a key step for the partitioning of long-lived radionuclides from the highly active effluents
issuing the reprocessing of nuclear spent fuels. However, this separation is very difficult
because An(Ill) and Ln(III) exhibit similar chemical properties.
Several studies in media of low acidity have shown already that nitrogen-containing
polydendate ligaDds were able to separate An(III) from, Ln(ITT) when mixed with lipophilic
anions 1,2]. However, a new family of extractants, namely bis-triazinyl-pyridines (Btps, Fig.
1), has been developed by Z. Kolarik et aL 3 in the framework of te European contract
NEWPART (FI41-CT-96-0010 4 These molecules appeared to be vry efficient extracting
agents. As compared to former studied nitrogen-containing polydendate ligands, Btps are still
selective towards An(III) in very acidic conditions ([HN031 2 mol/L).
F.Z2
with RI = H, Methyl, n-Propyl,F�l i-Propyl, n-Butyl, i-Butyl andRXN F� R = H, i-Nonyl
IN N 11N R,
Fig. I General formula of Btps
In order to better understand the extraction mechanisms of An(III) and Ln(111) by Btps as
well as the affinity. of the latter towards An(III), the extraction of 112 Eu and 24 'Am by 2,6-
bis(5,6-iso-butyl-1,2,4-triazin-3-yl)-pyridine (iffii-Btp) was investigated. iBu-Btp was chosen
for this thermodynamic study, because it was fairly stable against acidic hydrolysis and rather
hydrophobic a compared to former studied Btps. of 152 241
Thanks to the systerriatic determination of the distribution ratios Eu and Am, the
stoichiornetry of the extracted complexes was estimated through the analysis of the slopes of
"log-log" pots of experimental isotherms. Moreover, thermodynamic data, such as AH,,, and
ASx, were calculated tanks to the Van't Hoff s taw.
- 567 -

JAERI-Conf 2002-004
2 EXPERIMENTAL
2,6-bis-(5,6-di-iso-butyl-1,2,4-triazin-3-yl)-pyridine was synthesized at CEA-Marcoule(initial purity 98.5%). Other reagents were commercially available and used as received.iBu-Btp was dissolved in a mixture of hydrogenated tetrapropene (TPH) and n-octanol(80/20%vol).Liquid-liquid experiments were performed in 2 mL Eppendorf microtubes, vigorously shakenfor 90 minutes, the time required to reach the equilibrium state according to preliminarykinetic studies. Temperature, ranging from 10 to 50'C, was monitored with the help of athen-nostated bath.The experimental determination of distribution ratios DM) of Am(III) and E1,1(111) was thefollowing: 200 tL of organic phase were contacted with 200 [L of aqueous phase, spikedwith tracer amounts Of 2AM and 112 Eu. ([ActivitYlaq, ini - 8000 kBq/L). After phasedisengagement by natural gravity, temperature being kept constant, aliquots of each phase 40�tL diluted in 560 tL of original matrix: itric acid for aqueous samples aDd TPH/H-octanol(80/20%vol) mixture for organic samples) were withdrawn for ganuna radiometricmeasurement. The y-activities at 59.54 keV and 121.78 keV, for 24'Arn and 15�Eu respectively,were measured using a HPGe detector (Eurysis Mesures).DM values were calculated as follows: DM = [Activity]og qActivitylaq, eq.5 where[Activity],,,g, q. and [Activity]aq, eq. were the radioactivity concentrations of 241 Am and 152 Eu inthe organic and aqueous phases at equilibrium, respectively. Separation factors SFAnVEu werecalculated from the ratio: A .. /L)E,,.
3. LIQUID-LIQUID EXTRACTION STUDIES
3. 1. Determination of the stoichiometry of the extracted complexes
The well-known "slope analysis method" was applied to the log-log plots of experimentalisotherms, that is to say the variations of
- D vs [iBu-Btpl,, (Fig. 1);- D vs [NO3-]eq (Fig, 2;- D vs [HN031,q at onstant or variable ionic strength.
log Dm(111) m Americum2 Europium slope = 268
2R =1.00
0 slope = 267R2 0.998
-2
-3log [iBu-BTPjj,,j
-4- ,7'' - - __ , ", " -
-2,5 -2 -1,6 -1
Aqueous solution: 241Arn 152 Eu (tracers) in [HN031ini Imol/L.Organic solutions: iBu-BTP in a mixture of hydrogenated tetrapropene (TPH) and n-octinol (80%/20%vol).
Fig. I Log-log plots of the variations of DM vs 09 -B at 300C
- 568 -

JAERI-Conf 2002-004
In all these experiments, [iBu-Btp],q was approximated by [iI3u-I3tp]in6 since only traceramounts of 241AM and 112 Eu spiked the aqueous solutions. The possible dissolution of iBu-Btpinto the aqueous phases was neglected. Indeed, TOC measurements performed on acidicaqueous samples previously contacted with iBil-Btp solutions did not reveal any presence oforganic compounds when [HN031i.i < 2 mol/L.The possible extraction of nitrate salts, N03 (with X = Li, Na or N114), used to set the ionicforce up, was also neglected. Therefore, [NOfltot, eq. was assumed to equal [XN031ini +
[HNO3jq. However, since non ideal conditions were involved when investigating the salting-out effect of XNO3, experimental Dm values were corrected by stoichionietric activitycoefficients 5T4(M 3+ ), calculated by the Mikulin relation (same values of y4(M 3+ were used for241 Am and I5'Eu). [HNO31,q was measured by titration.
IY4(M3+))log (13m(111)
slope = 2852a Americum R 0.990
o Europium3
j
slope 2.892R 0.99T
log [NO31to eq-3
-1 -0.5 0 0.5
Aqueous Solutions: 24 'Am 152 Eu (tracers) in mixtures of HN031in = 1 moVL and [UN031ffii:! 2 mol/L.Organic solutions: [il3u-BTP]jn = 001 mol/L in a mixture of TPH and n-octanol (80%/20%vol).
Fig. 2 Log-log plots of the variations of Dm vs [NO3-1,q at 10-C
These systematic studies allowed the stoichiometry of the extracted complexes to be
determined:
M3+ Ke,%Eq. I 3 BTP 3 NO- M(NO3)3 (BTP3 )3
This result was in good agreement with the X-ray crystallographic pattern previously obtained
for the Gd(III) complexes of 2,6-bis-(5,6-diethyl- 1,2,4-triazin-3 yl)-pyridine 4].
Obviously, HN03 did not take part to the formation of the metallic complexes, since no
increase of Dm vs [HNO3jq was observed at constant ionic strength (I = 2 mol/L for LiNO3,
NaNO3 and N114NO3, Fig. 3.
However, HN03 might be directly extracted by iBu-Btp, since a bell shape curve was
observed for Dm vs rHNO31,q, when N031eq exceeded 2 mol/L (Fig. 4 Besides, partial
dissolution of iBu-13tp into acidic aqueous phases was pointed out by TOC measurements,
when [HN031,, exceeded 2 mol/L.
569 -

JAERI-Conf 2002-004
log(Dmpjj�Y4 StM(III) AtHNO�)
4.5 -A
4, Am NH4) 0 Eu (NH4)AAm (Na) A Eu (Na)
2.5 - A Am (U) 0 Eu (LI)
A A0
Iog([HN03].q)0 .5 . . . . . . . . . . . . . . . I
-1.5 -1 -0.5 0 0.5
Aqueous solutions: 24 1Am & 152 Eu (tracers) in mixtures of HN031ini + [XN03Li = 2 mol/L. Temp. 20'C.Organic solutions: [iBu-BTP]i,,i = 0.01 mol/L in a mixture of TPH and n-octanol (80%/20%vol).
Fig. 3 Log-log plot of the variation of DM vs [HN0311qat constant ionic strength (I 2)
Dm(III) F.S-AVE,
102 Americum 1000Europlum
Selectivity Am/Eu 0 0110%
100
100
10-2-
10-41 [HNO 31.q (m oI/Q 10
0.01 0.1 I 10
Aqueous Solutions: 24 'Am & 152 Eu (tracers) in 007 [HN031ii 35 mol/L. Temp. = 20'C.
Organic solutions: [iBu-BTP]ini = 001 mol/L in a mixture of TPH and n-octanol (80%/20%vol).
Fig. 4 Log-log plots of the variations of T)m vs [N031,, at variable ionic strength
3.2. Determination of the ext Faction constants K,,,
Assuming Eq. , apparent extraction constants of Am(III) and Eu(Ill) were calculated for eachpoint of experimental isotherms, Table I gathers the average data obtained for each variationof DM vs [iBu-BtP]eq, for a given temperature ranging from 10 to 50 'C.
Table I Extraction constants of Am(III) and Eu(IIT) at different temperatures
Aqueous solutions: "'Am & "'Eu (tracers) in [HN031ii I mol/L.
Organic solutions: 0003 [iBu-BTP] 004 mol/L in a mixture ofTPH andn-octanol 80%/20%vol).
t (-C) 10 20 30 40 50
log(Ke,, Arn) 9.25 8.92 8.42 8.07 7,80
log(K,,, Eu) 7.09 6.80 6.34 6.09 5.90
- 570 -

JAERI-Conf 2002-004
3.2. The-rmodvnamic data
Thermodynamic data, such as AH,,, and AS,,, were deduced from the application of the Van'tHoff s law (Fig. 5):
AH,,(Am) -66 IO kJ/mol AS,, (Arn = -55 30 J-nol.KAH,,(FLi) -54 ± 15 kJhnol AS,,(Eu = 56 ± 30 J/mol.K
iog K,,, MAmerickim
L_�_Europiumlog K,.(Am) 3438/T - 287
29 R 0.994
7
6 g K).(Eu) 28381T - 2942R =0.985
M Orr K
3 3.1 3.2 3.3 3.4 3.5 3.614 112
Aqueoussolutions: 'Am& Eu(tracers)in[HN031illi=lmot/L(IO'C<temperature<50'C).
Organic solutions: 0003 [iBu-BTP] 004 mol/L in a mixture of TPH and n-octanol (800/o/20%vol).
Fig. 5 Van't Hoff's law: logKx vs I/T
4. CONCLUSION
The extraction of trivalent americium and europium by iBu-Btp was deeply investigated inthe "TPH/n-oci 'anol (80/20%v�,)` ixture. he stoichiometry of the extracted complexes wasestimated thanks to the "slope analysis" method, by varying different parameters, such as theinitial concentration of iBu-Btp in the organic phase or that of itrate anions in the aqueousphase. Thermodynamic ata were calculated, based on the presumed, extraction equilibrium.The extraction appeared more exothermic for Arn(III) than for Eu(111). Considering thecomplexation of Irivalent metallic cations by iBu-Btp as the driving force of the free enthalpyof extraction, te fact that AHex(Arn) < Mex(Eu)" could reflect a more covalent character ofthe N ... Ani(M)" bonds as compared to the N ... Eu(III)" bonds in the extracted complexes.
REFERENCES[1] P.Y. Cordier, C. Hill, P. Baron, C. Madic, M.J. Hudson and J.O. Li1jenzin, J. All. Comp.,271-273, 738-741 1998).[2] 1. Hdgstr6m, L, SpJuth, A. Enarsson, J.0. Li1jenzin, M. Skdlberg, M.J. Hudson, P.B.Iveson, C. Madic, P.Y. Cordier, C. Hill, and N. Frangois, Solv. Extr. Ion Exch., 17(2), 221-242 1999).[31 Z. Kolarik U Mi0ich and F. Gassner, Solv. Extr. Ion Exch., 17(l), 23-32 1999).[4] C. Madic, JVJ.J, Hudson, J.O. Li1jenzin, J.P. Glatz, R. Nannicini, A. Facchini, Z. Kolarikand R. Odo'j, "New partitioning techniques for minor actinides", Project report EUR 19149
EN, Ed. by the European Commission, Luxembourg 2000).
571 -

This is a blank page.

JP0250353JAERI-Conf 2002-004
SANEX-BTP PROCESS DEVELOPMENT STUDIES
C. HILL D. GUILLANEUX, L. BERTHON and C. MADIC
Commissariat A 'Energie Atornique, DEN/DRCP/SCPS[LCSE - BP 17171 - 30207 Bagnols-sur-C6ze, France
Fax 33 - 466.79.65.67, e-mail : clement.hill(a)cea.fr
Bis-triazinyl-pyridines (Btpv) have been developed at CEA-Marcouie to separate actinides(III) fromJanthanides(III) Athough igh separation performances were observed in the counter-current hot test crried outin 1999 on a highly active effluent, the extractio ad back-extraction yields of actinides(III) were lower thanexpected from calculation A strong sensitivity of te extractant towards air oxidatio ad acidic hydrolysis wasactually pointed wit. Therefore. the hydrolysis of bis-triazinyl-pyridines was deeply investigated (qualitativedetermination of te degradation products) in different experimental conditions. It appeared tat te branching ofthe alkyl groups o the ot position of the triazine rings indered the ydrolysis of the extractant. The formulationof the solvent was thus optimized and tested again in 2001 o a genuine DLAMEX back-extraction solution in theATALANTE facility.
Key words: actinides(IJI), lanthanides(III), bis-triazinyl-pyridines, separation
1. INTRODUCTION
The separation of trivalent minor actinides (An(III) = Am(III) and Cm.(111)) from trivalentlanthanides (Ln(lll), accounting for about one third of the total amount of fission products), isa key step for the partitioning of long-lived radionuclides from the highly active effluentsissuing the reprocessing of nuclear spent fuels. However, this separation is very difficultbecause An(III) and Ln(Ill) exhibit similar chemical properties.Several sdie i media of low acidity have shown already that nitrogen-containingpolydendate ligands were able to separate An(III) from Ln(111) when mixed with lipophilicanions [1,2]. However, a new family of extractants, namely bis-triazinyl-pyridines (Btps, Fig.1), has been developed by Z. Kolarik et aL 31 in the framework of the European contractNEWPART (FI41-CT-96-0010 4 These molecules appeared to be very efficient extractingagents. As compared to fonner studied nitrogen-containing polydendate ligands, Btps are stillselective towards An(III) in very acidic conditions ([HN031 2 mol/Q.
.2R
with RI H, Methyl, n-Propyl,
F�j N R, i-Propyl, n-Butyl, i-Butyl and
N I R = H, i-NonylR, RI
Fig. I General formula of Btps
Various Btp molecules were synthesized and studied at CEA-Marcoule for "An(III)/Ln(III)"groups separation. Among them, 2,6-bis(5,6-n-propyl-1,2,4-triazin-3-yl)-pyridine (nPr-Btp)was chosen to perforru a counter-current hot test in December 1999 on a genuine radioactiveeffluent in ATALANTF facility, The observed decontamiDatiOn performances were verysatisfactory 1,400 < Di_,,(jtj < 450,000), although extraction and back-extraction yields ofAm(III) and tri(Ill) were lower than predicted by flowsheet modeling. Since experimentalconcentration profiles of Aii(111) and Ln(III i rganic and aqueous solutions were bettermodeled wen the actual concentration of nPr-Btp was lowered by 20%, partial degradation
573 -
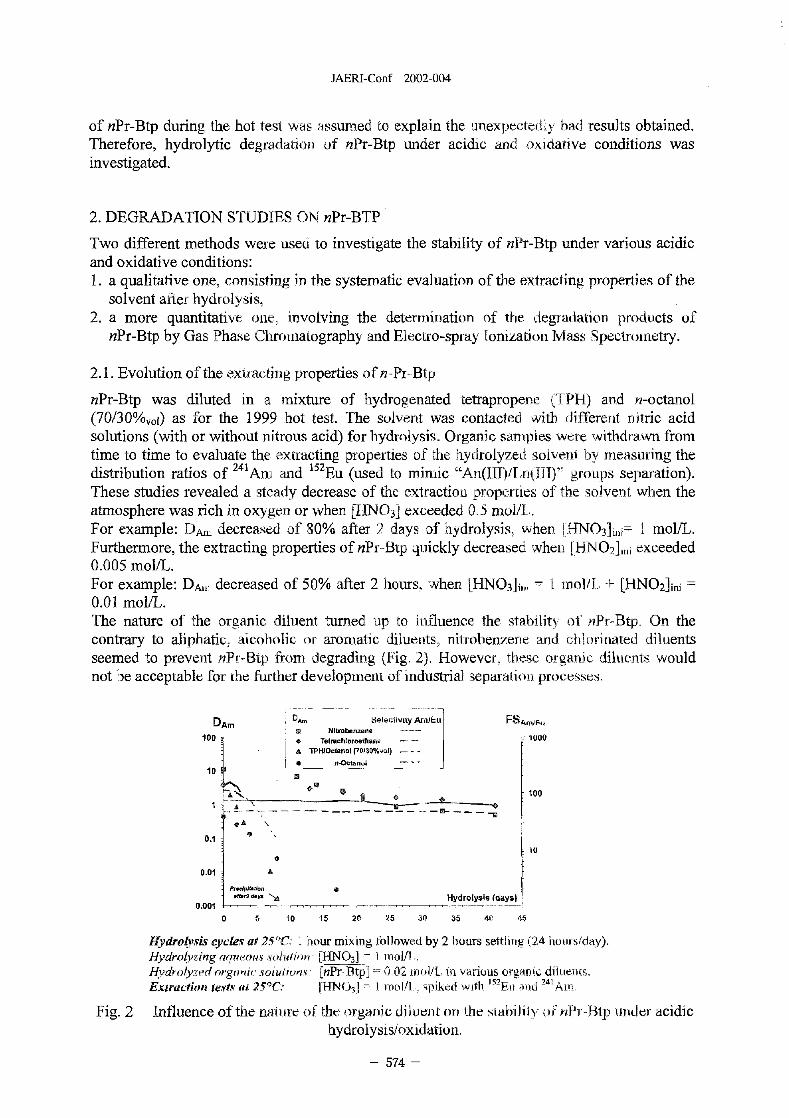
JAERI-Conf 2002-004
of nPr-Btp during the hot test as assumed to explain the unexpectedly bad results obtained.Therefore, hydrolytic degradation of nPr-Btp under acidic a oxidative conditions wasinvestigated.
2. DEGRADATION STUDIES ON nPr-BTP
Two different methods were used to investigate the stability of nPr-Btp under various acidicand oxidative conditions:1. a qualitative one, consisting in the systematic evaluation of te extracting properties of te
solvent after hydrolysis,2 a more quantitative oe, involving the determination f the degradation products of
nPr-Btp by Gas Phase Cromatography and Electro-spray Ionization Mass Spectrometry.
2. 1. Evolution of the extracti ng properties of n -Pr-Btp
nPr-Btp was diluted in a mixture of ydrogenated tetrapropeDe (TPH) and n-octanol(70/30%,,,j) as for the 1999 hot test. The solvent was contacted with different nitric acidsolutions (with or without nitrous acid) for hydrolysis. Organic samples were withdrawn fromtime to time to evaluate the extracting properties of the ydrolyzed solvent y measuring the
of 241AM 112distribution ratios and Eu (used to mimic "An(IIl)/Ln(llI)' groups separation).These studies revealed a steady decrease of the extraction properties of the solvent when theatmosphere was rich in oxygen or when [HN031 exceeded 0.5 ol/L.For example: DA.. decreased of 80% after 2 days of hydrolysis, when [ffN03jni I MOI/L.Furthermore, the extracting properties of nPr-Btp quickly decreased whe [NO?],,,� exceeded0.005 mol/L.For example: DA,,, decreased of 50% after 2 ours, when [HN031mi I riol/L + HN021il,
0.01 mol/L.The nature of the organic diluent turned tip to influerICC the stability of Pr-Btp. On thecontrary to aliphatic, aoholic or aromatic diluents, nitrobenzene and chlorinated diluentsseemed to prevent nPr-Btp ftom degrading (Fig. 2. However, tese oganic diluents wouldnot be acceptable for the frther development of industrial separation processes,
DA. Seloctivity AmiEu FSADVEoDA.El Nitro enzenefrachloroethan.
100 re 1000A TPH/Octanol (70130%.Ui)
e n-OatanolI 0
100
A
0.1
10
0.01 A
�A Hydrolysis (days)0.001
0 5 10 15 20 25 30 36 40 46
Hydro�vsis ccles at 25'C 1 our mixing followed by 2 ours settling 24 hoursiday).Hydro�yzing aueoussolution.- [HN03 = 1 IYIOI/'--
4ydrolyzed Organic iulions [nPr-Btp] - 002 itiol/t, in various organic diluerits.152FEx1raefion tests (it 25'C,- [TJN0j] I noW, spikedwith �11 and 24 'Am.
Fig. 2 Influence of te nature of the organic iluen o the stability of Pj--Bip under acidic4ydrolysis/oxidation.
- 574 -

JAERI-Conf 2002-004
2.2. Determination of nPr-Btp degradation products
The niain egradation products of nPr-Btp were qualified by Gas Phase Chromatography andP',Iectro-spray Ionization Mass Spectrometry. They appeared to be almost the same whateverthe initial experimental conditions presence or absence of a acidic aueous phase in contactwith the nPr-,Btp solvent), only their quantities and rates of occurrence varied.A degradation pathway was proposed for nPr-Btp, the first step o which being the attack ofone -CH? group o the a position of the triazinyl rings, resulting in the forniation of a nitrocompound (observed by 15 N NMR). Thereafter, te compound would, degrade into an alcohol(which as the min degradation product observed in te asence of ydrolyzing aqueousphase) or ito a ktone (which was te main degradation product after the hydrolysis ofnPr-Btp y nitric acid). I t same way, the attack of a second 2 group would result in theformation of ditunctional compounds (dialcohols and diketones), The alcohol compoundscould also loose oe propyl chain. Side and minor reactions could consist in the breaking oftriazinyl rings leading to yano compounds.
3. OPTIMIZATION OF THE BTP SOLVENTFORMULATION
Since nPr-Btp proved to be unstable, other substituted Btp olecules were investigated todevelop a new BIV solvent. Acidic hydrolysis being the most relevant criterion for theselection of the new candidate, the stability of several Btps was compared.
3. 1. Hydrolysis of substituted Btp molecules
Molecules bearing branched alkyl groups on the a position of the triazinyl rings, such asCy-Btp-Me and iPr-Btp, appeared to be much more stable than nPr-Btp or nBu-Btp, bearinglinear alkyl groups, Cy-Btp-Me and iPr-Btp had not been chosen when preparing the hot testof 1999 because of several practical reasons. tedious synthesis, low solubility in organicdiluents, slow kinetics of extraction. However, they showed good stability over 30 days ofhydrolysis (Fig. 3.
DM(,,,) SFArnlEu
100 1000
I ID A Is iPr-BTPA- A iBu-BTP
A 171 Cy-BTP-MeA nPr-BTP
A ion 0 nBu-BTP
0.1 JPr-BTPjBu-BTPCy-BTP-Me
0.01
- Hydrolysis (days)0.001 ------ , - "", 1 10
0 10 20 30 40 50
1�vdrolysis cycles of 251C, I hour mixing followed by 2 hours settling 24 hours/day).I�ydro�yzing oqueous solution, [N03 I mol/L.Hydrolyzed organic solutions: [fftp = 0.005 or 0. I ol/L in n-octanol or "n-octanol /TPH".Extraction iests at 251C. [ffNO3 I mol/L, spiked with "Eu and 21'Arn.
Fig. 3 Comparison of the stability of different Btps under acidic hydrolysis.
- 575 -

JAERI-Conf 2002-004
3.2. Kinetics of extraction of substituted Btp molecules
The major common drawback of Cy-Btp-Me and iPr-Btp was their too slow kinetics ofextraction for the implementation of counter current hot tests in mixer-settlers or centrifugalcontactors. Several attempts ere made to accelerate their kinetics by using other co-extractants, such as: TBP or diainides. In some cases, the latter modifiers -fastened the kineticsof extraction of the Btps and in other cases, they enhanced their extraction performances ortheir stability under acidic hydrolysis, but lowered their selectivity.The case of iPr-Btp was rather peculiar. When aqueous solutions were spiked with 241 Am and152 Eu at tracers level ad iPr-Btp diluted in mixtures of TPH ad n-octanol (as for nPr-Btp),the observed kinetics of extraction was fast for Am(III) and very slow for Eu(Ill) (Fig. 4.Moreover, a precipitate occurred when aqueous solutions simulating genuine DIAMEx back-extraction effluents were used [Ln(III)]t,,t, ini - 18 10-3 mol/L).
D mom N Am * Eu SFAm/Eu
100 Selectivity Am/Eu 1000
OM M10
100
100.1
Mixing time (minute0.01 I I I 1- _T_____1 I I ) I 1 1
o 40 80 120
Aqueous solution: [HN03 I mol/L, spiked with 152 Eu and 24 'Am.
Organic solution: [ir-Btp = 0.01 mol/L in "TPH/n-octanol" mixture; 25'C,
Fig. 4 Kinetics of extraction of iPr-Btp in "TPH/n-octanol"
No precipitation occurred with these feed solutions when iPr-Btp was dissolved either in puren-octanol, tetrachloroethane or nitrobenzene, but the kinetics of extraction became very slowboth for Am(III) and Eu(IIT): more than a hour required to reach te eqtiilibriurn state inmicro-tubes (Fig. 5: case of n-octanol). Tetrachloroethane and itfobeDzene beingunacceptable for further industrial process development, n-octariol was finally cosen.Phase transfer catalysts, such as diamides were i-nixed with iPT-Btp to fasten its kinetics.Figure also shows the case of dimethyl-dibtityl-tetradecyl-malonamide (CJ4) in n-octanol:equilibrium was reached within 15 minutes, bit selectivity, decreased a little bit as comparedto pure n-octanol. Other diaruides have been tested as co-extractants of iPr-Btp in n-octanol.Good results were observed with diniethyl-dioetyl-hexylethoxy-inalonaniide (C2OC6), buttheir back-extraction appeared to be too slow diluted nitric aid to develop a processflowsheet (the equilibrium was reached only after 2 hours of ixing). Tat is why,hydrophilic complexing agents, such as citric acid or glycolic acid., Nvere equired to favor and
fasten the back-extraction of An(III) and Ln(III).
- 576 -

JAERI-Conf 2002-004
Am Eu Selectivity0 - n-octanol/jC = .5 mol/LC] 0 n-octanol
DM(111) FSAm/Eu100 7,� 1000
0
0
0
100
0.1
Temps d'agitation (minutes)0.01 I . ''I',"", . . _ 10
0 10 20 30 40 50 60 70
Aqueous synthetic solvition smulate a DIAMEX back-extractioD effluent, spiked with 112 Eu. and24 'Am
Organic solution. [iPr-Btp = 0. I mol/L in various diluents; 0 = 25'C.
Fig, 5 Kinetics of extraction of iPr-Btp in n-octanol and "n-octanol/diamide" mixtures
3.3. OptirDization of the fori-nulation of SANEX-iPr-Btp solvent
Prefirninary to the ot test of June 2001, numerous series of experiments have been carried
out i micro-tubes on synthetic aqueous solutions simulating DIAMEx back-extraction
effluents. The ifluence of different parameters. such as the concentration of iPr-Bt or
C2OC6 in n-octanol and tat of Ln(III), An(III) and Pd(IT) in the aqueous feed to be treated,
was evaluated on te extraction yields and extraction kinetics of Ln(111) and An(III) A
process flowsheet was designed on the basis of the following solvent formulation:
�iPr-BTPI t = 0.0 1 mol/L [C20C61 i.i = 0. 5 mol/L in n-octanol.
The flowsheet was first tested on a battery of eight centriftigal-contactors, using a synthetic
nitric acid solution containing Nd(III) and Eu(III) at 2000 and 100 mg/L, respectively. The
hydrodynamic behavior of the solvent was very satisfactory and the concentration profiles of
Nd(III) and Eu(III) in aqueous and organic phase appeared in good agreement with the
models.
The flowsheet was then tested on genuine highly active effluents in June 2001 (no palladium
)n the fed), using two batteries of 16 stages (Fig. 6 in the CEA-Marcoule ATALANTE facility.
SoNent S ANEX-BTP - Feed:Rr�BTPI.i - . I mol/L IHN031i = 0.5 mol/L d scabbing:
[C,0CIM - 0.5 mol/L [Am Cm]6i - 320 mgIIi0.05 moi� n-octanol Ln(IM - I g/L i 0.05 mol
Extraction Stripping14 stag" 16 stages
nn
Fig 6 Process flowsheet of the SANEX-Btp hot test of June 2001
- 577 -

JAERI-Conf 2002-004
A one through process flowsheet was firstly run and gave far better recovery yields forAn(Ill) than the solvent base o Yi.Pr-Btp tested in 1999, Analyses of aueous and organicsamples are still under progress, bUt ODline analytical measurements of Arn(III) and Eu 154
allowed satisfactory decontarnmation factors to be foreseen.After this opened-cycle process flowsheet a solvent recycling process flowsheet was run totreat 3.85L of DAmEx back-extraction effluent and produce 65L of "AM(111) + Cm(Ill)"raffinate. This hot test pointed ot partial degradation of iPr-Btp pobably because of alpha-radiolysis. For instance, the extraction performances of te solvent decreased by 40% aftertwo cycles (much less indeed than revious nPr-Btp solvent, the extraction performances ofwhich had decreased by more than 50% after just one cycle). Analyses of aqueous andorganic samples are also still under progress.
4 CONCLUSION
The SANEX hot test carried out at CEA-Marcoule in 1999 with 2,6-bis(5,6-n-propyl-l,2,4-triazin-3-yl)-pyridine pointed out te strong sensitivity of this extractant towards air oxidationand acidic hydrolysis. Qalitative determination of the degradation cornpounds of nPr-Btpallowed a better understanding of its dgradation mechanism.- Pr-Btp mainly degraded intoalcoholic derivatives through the oxidation of its propyl substituents. Therefore, any ffortswere put forward to strengthen te stability of Btps under ydrolysis and to optimize theformulation of the ew Btp solvent. 2,6-bis(5,6-iso-propyl-1,2,4-triazin-3-yl)-pyridine(iPr-Btp) mixed with dimethyl-dioetv]-hexyletboxy-malonamide (C,)OC6) in n-octanol waschosen to carry out two bot tests o genuine AMEx back-extraction solutions i June 2001(no palladium in the feed), During these hot tests, iPr-Btp turned out to e sensitive to alpha-radiolysis and became unusable in multi cycles process flowsheets, Furtker researches will bedevoted to the strengthening of iPr-Btp towards alpha-radiolysis.
ACKNOWLEDGEMENTSThis work has been partially financially spported by the European Union Nclear FissionSafety Program.
REFERENCES
[1] P.Y. Cordier, C. Hill, P. Baron, C. Madic, M.J. Hudson and J.O. Li1jenzin., J. A. Comp.,271-273, 738-741 1998),[2] 1. Hdgstr6m, L. SpJuth, A. Enarsson, J.0, 4jenzin, VA SkAlberg, .J. udson, P.B.Iveson, C. \adic, .Y. Cordier, C. Hill, and N. Fran�ois, Solv. Extr. Ion Exch., 17(2), 221-242 1999).[3] Z. Kolarik, U. Mifflich and F. Gassner, Solv, Extr. Ion Exch., 17(l), 23-32 1999).[4] C. Madic, M.J. Hudson, J.O. Lilienzin, JY, Glatz, R. Nannicirri, A. Facchini, Z. Kolarikand R. Odoj, "New partitioning techniques or minor actinides", Project report EUR 19149EN, Ed. by the European Cominission, Luxembourg 2000).
578 -

JP0250354JAERI-Conf 2002-004
DEVELOPMENT OF FRACTIONATION PROCESS OF 129,
IN PREPARATION FOR TRANSMUTNFION OF LLFP.
Keuji TAKESHITA and Yoshio NAKANO
Department of Environmental Chemistry and Engineering,
Tokyo Institute of Technology,4259 Nagatsuta, Midori-kii, Yokohama, 226-8502, Japan
ABSTRACT
A new off-gas treatment systern with a Ago-impregnated adsorbent rocess and a thermalswing adsorption (TSA) process using W-exchanged morderrite was proposed for thefractionatio ad recovery of a long-lived fission pduct (LITP)� '291,- in issolver off-gas
(DOG). he asorptio ad desorption tests of simulated off-gas oil exchanged zeolite werecarrie ot, From the experimental results, te features of te poposed syste ad the operatingCondition',, required for the ecovery of odine were discussed. Te cricloslons obtained are
sullnuarized as follows,(1) h te TSA process, alkyl iodide in DG can e recovered completely as molecular iodine
(1,) wen the adsorption operation is switched to the esorption one at the beginning of the
breakthrough of NOx, All of iodine ad alkyl iodide i DOG is immobilized as Agl on theAg"-irupregna(ed arlsorbents b recycling the recovered 12 from te TSA process to theAg"-finprtgrialed asorbent process.
(2) In the TSA process C2 and noble gas are partitioned from Nx, HO and iodine under theconditiou that the concentration of oxygen i DOG is aintained to ore than 10V01%. 14C
as well as "'91 can be fractionated in te TSA process.
(3) The TSA pocess plays a important roie for the fractionation and recovery of long-livedradioactive, nuclide i DOQ 1291 ad 14C . The volume of zeolite equired for the TSAprocess is evaluated as 0.38m - =0.19 M3/Column x 2 column) for an 800 ton/y reprocessing
plant. The'I'SA process can be designed compactly.
1. INTRODUCTION
In the dissolution process of reprocessing plant, most of volatile radioactive elements
contained in the spent nuclear fuel, 14C tl/2=5370y, chemical form: C02) , 3H tl/2=10y, H20),
1291 (tl/2=1.6x 107y, 12 or alkyl iodide) and 85 Kr (tl/2=30y, Kr). are transferred to the DOG
(dissolver off-gas) treatment system. If the long-lived nuctides such as 129 1 and 14 C are
released to t atmosphere, they remain in the biosphere for a long time and may be
accumulated finally in human beings and animals according to te food chains. The
transmutation of a long-lived fission product LFP), 129j, which is fissioned to other short-lived
(2)miclides i a nclear reactor, is attractive from the viewpoint of environmental protection
Therefore, Off-ga teatment technology to fractionate and recover iodine effectively from DOG
should be applied to the transmutation system of 191.
- 579 -

JAERI-Conf 2002-004
Both alkaline scrubbing process using NaOH solution ad solid ads-orberit process using
AgNO3-impregnated adsorbelrits were investigated previously for die ecover), of iodine from
reprocessing off-gas. In the commercial reprocessing plants, which are operating now in France
(1),(3)and U.K., the alkaline scrubbing process was applied to the recovery of iodine from DOG
NOx and C02 are co-absorbed simultaneously with iodine and NaNO3, Na2CO3, NaHCO3, Nal
and NalO3 are formed i the NaOH solution. The decontamiriatiou factor of 100 is obtained
for the iodine, however, the alkaline scrubbing process has some disadvantages that a large
amount of alkaline sludge containing both 14 C and 121I is generated and alkyj iodide can not be
(3)recovered . On the other hand, the solid adsorbent process shows the decontamination factor
higher than 1000 and can fractionate iodine from other radioactive nuclides From these
futures, the solid adsorbent process was adopted in te commercial reprocessing plant
constructing at Aomori Prefecture, Japan. When these conventional iodine recovery processes
are applied to commercial reprocessing plants, the individual irradiated dose, by the release of
off-gas to the atmosphere does not exceed that recommended by ICRp �4), However, the
accumulation of iodine to the environment should be considered for a long-term peratio of
reprocessing plant. A new off-gas treatment system with high recovery tfficiency of iodine is
worthy to be developed. In this study, a new system with an Ag"-implegilated adsorbent
process and a thermal swing asorption (TSA) process was proposed.
Figure I shows the flow sheet of proposed system. Moleculai iodine (I?.) is immobilized
as Agl on the Ag"-impregnated adsorbents. Alkyl iodide is trapped as 12 in tht'rSA process, as
shown in the ater section, ll. Results ad discussion", ad the recovered I-, is ritcycled to the
HO AgI 14CO. Mlki
A AHO +r--------- I
d Ag"-lmp,,gna1,dj Noble Gas I-C0,
.reRl),Imraidify g'- .�:�.j RecoverP ig �.r"e:,aled.......... AL 0, 3 y 0-r.css
Process Process Process............. itack
Process Process
Rec............ ...... --Air If necessauy, sKr can be
NO Idine HNO, recovered easily byAbsorptio. tripping � !ndenser conventional methods, such
process Process as low temperature distillation.
Conden5e, Air RecoveredHNO,
Ah
Ah: ...Iodine
uo-,--§> To Extraction ProcessStrippi.g of Urani"m and PIntonium
HN0.7_1> P--
0Fig.1 DOG treatment system with Ag -impregnated adsorbent process andthermal swing adsorption (TSA) process.
58 -

JAERI-Conf 2002-004
solid adsorbent process. Then, both Nx Electro-Dry Al magnetic
and C) are also co-adsorbed with iodine Valve
in te TSA process ad ecovered as HNO:3. ------------ - Off-gasfil-Mineral outlet
The recovered HN03 is transferred to the Mordenite
iodbie stripping process and is reused,
AgI n the spent adsorbents is reduced by
hydrogen gs a converted to Nal by Off-gas Heater
reacting with NaOH(5). Nal is used as a inlet
fuel an the traosmutation system. Then, the Recycling
regenerated Ag('-impregnated adsorbents loop of 1, Airondenser
are eused for the adsorption of iodine (5). if Recycling
NOx, H20 and iodine are partitioned from loop of HN03
C02 and noble gas in the TSA process, 14C
and 115 Kr can be fractionated and recovered Fig.2 Thermal swing adsorption (TSA) process.
by the conventional separation techniques
without pretteatment(9). The secondary wastes may be depressed y introducing the proposed
system based on the concept of material recycle and reuse. Figure 2 shows the schematic
diagrams of TSA process, in which polar gases, such as Nx, H20, 12 and akyl iodide, is
recovered continuously by repeating thermal swing operation between two zeolite columns.
The main object of this study is to evaluate the applicability of proposed system to the
fractionation and recovery of 29, from DOG. The adsorption and desorption of simulated off-gas
on W-exchanged zeolite were tested by a temperature-programmed desorption (TPD) equipment.
From the experimental results, the features of proposed system and the operating conditions
required for the improvement of iodine recovery were discussed. In the present stage, the
adsorption of iodine o the -impregnated adsorbents can be estimated easily by the
mathematical model shown in the previous paper (6) . Thus, the mass balance of proposed system
was calculated by use of both the extended ABNOX code (8) and the athematical model (6),(1).
From these calculation results, the dimensions of TSA process were evaluated for all 800 ton/y
reprocessing plant.
11. EXPERIMENTAL
2.1 Preparation of zeolite
Mineral zeolite mined in Akita Prefecture, Japan, was used as an adsorbent, which has
mordenite structure and a trace amount of quartz. The zeolite was cushed and sieved in the
58 -

JAERI-Conf 2002-004
range of 100 to 200 �tm i diameter. Tablel Chemicalcojiil)ositioiiofusedzeolite
The exchangeable cations in the zeofite,
such as Na', K, Ca�' and ", were Mineral moideaile H+-exchanged9 final mordenite
ion-exchanged to H in IM HN03 Na 0.986 0.458
solution at 80 -C for 24 h. Table Ca 0381 0.053
shows the components of zeolite before Mg 0.108 0.054
and after the ion exchange. These K 0322 0.05
results suggest that about 60% of Fe 0.285 0.289
exchangeable cations are exchanged to 11 0.025 0.023
W. Al 1.29 134
2.2 Adsorption and desorption tests 7S9 8.52
of simulated off-gas 6.17 634
The adsorption and desorption of [mmol/g-zeolitel
simulated DOG were measured by
using a temperature-programmed desorption (TPD) equipment, which consists of a generator of
test gas, an adsorption column and a mass spectrometer, as shown in Fgure 3 he simulated
off-gas was the mixture of NO 0.34 vol%), C02 (0.05vol%), H20 0,23 vol%), CH31 and 02
balanced with He. The concentrations of CH31 and 02 were adjusted in the rnge of to 0.01
vol% and 29 to 10 vol%, respectively. 0.5g of H'-exchanged zeolite was packed in a quartz
column (6mm in diameter) and degassed by the gas stream of He at 500'C. After that, the
Flow meter
Pre-heater
Electric
H20 Furnace
ZeoliteAdsorptionColumn Gas outlet
He CH31 NO 02 mass
Spectrometer
Fig.3 Experimental apparatus to measure adsorption and desoip ionof simulated off-gas.
582 -

JAERI-Conf' 2002-004
column temperature was kept constant at 64'C. The breakthrotigh crves of Nx, C02, H20
and CH31 eve, measured by flowing the simulated off-gas at 100cn-i 3-STP/min. The
desorptio e were carried out by switching the simulate o-gas to pule fie gas during the
course of eaktiuough xperiment. Then, the olumn teruptiature was increased at the rate of
10 (",/min by the electric furnace and the concentrations of gas components released from the
colurnii, CO,. NO, N02, H20 and CH-J, were measured y the mass spectrometer. The
concentration f I-) in the released gas was measured by the KMnO4 absorption method (6). It is
knowi� that a part of N02 form-, N204- In this paper, the concentration of N02 was given as
[NO21+2[N2(41 by counting a N204 molecule as two N02 molecules.
111. RESULTS AND DISCUSSION
3.1 Adsorption and Desorption Behavior of Smulated off-gas in TSA Process
Figure 4 sows the breakthrough curves Of C02, NO, N(2 (Hl and H20 under the
condition that the oxygen concentration in the simulated off-gas is 10vol%. The order of
breakthrough WaS CO2>NOx (N`0+N02)>CH3I>H2O, C02 was expelled by Nx. This means
that C02 ran be eparated from Nx, HI and H20, when the adsorption operation of TSA
process is switched to te desorption one at the beginning of the breakthrough of NOx. It is
0.35
0% oco0.3 z
N02 "O.&P, Z0 000 1b6b .00.25 % Rp
0 -00 NO -034 ol%]
C02 0.05 ol%] 0% -. 4400111-V0.2 0 CM: .01 Vol%] 'od b 69
02 10 V%] 0 0MO 0.23 ol%] H20
'0 0 a0.15 %9W 0 0N 0 (9
C02 0 d, Qb0.1 0 d?
.0 (9e
0.05
C
00 50 100 150) 200
Time (Ptin]
Fig.4 Breakthrough curves of simulated off-gas containing CH31 The oxygen content in the
simulated off-gas was adjusted to 10vol%.
- 583 -

JAERI-Conf 2002-004
0.35No 0.34 [vol%]C02 : .05 vol %
0.3 02 :2.86 [vol%)MO: 023 [vol%) N02
0.25 H20S>0.2
0.15
0.1 -0 0
00A0 C0200.05 - 00 000000 0
00 so 100 150 200 250
Time (min]
Fig.5 Breakthrough curves of simulated off-gas. The oxygen content in the simulated
off-gas was adjusted to 2.9vol%.
possible to fractionate 129 1 and 14C Cmpletely in the TSA process. If stting a simple zeolite
process after the TSA process, 14 C02 can be recovered easily from DOG. This ii because DOG
at the outlet of TSA process does not Heating tme [winj
contain polar gases, such as Nx, H20 0 10 20 30 403
and CH31. Furthermore, it should be 0
noted that the breakthrough curve of 2.5
N02 was obtained, in spite that NO was 2 0N02
added in the simulated off-gas. These 0
results suggest the formation of the 0
I 0adsorption band of N02 Oil the zeolite. 0
0 H20000.5 oNO may be oxided catalytically to N02 0 *lb%Q 0f.J 0
on the zeolite in the presence of oxygen. 0 M % One 002po a n
Figure shows the breakthrough 0.05 op 00 0
curves under the condition tat the 10
oxygen concentration in the simulated 0 00,
0off-gas is 2.9vol%. NO is not oxided 0 100 200 300 400 500
sufficiently to N02 ad is co-adsoibed Temperature L'CJ
14with C02- C02 can not be fractionated
under the condition that the Fig.6 Desorption curves ot N02, 12 and Ti20. Thecolumn operation was switched 1'roin adsorption
concentration of oxygen is low. For to desorption at te brtakthfMlgh point f NOx.
- 584 -

JAERI-Conf 2002-004
the fractionation of 4C, it is important to promote the oxidation of NO to N02 by maintaining
the cncentration of oxygen more than 10vol i DOG.
Figure 6 shows the results of desorption test, in which the adsorption operation was
carried out under the same conditions as Fig.4 and was switched to the desorption one at the
beginning of the breakthrough of Nx. Most of NO2, I2 and H20 were recovered by
increasing the column temperature until 300'C. The desorption Of 12 indicates that CH31 is
decomposed to 12, according to
CH3 + N02 CH N3 122 2
CH31 can be recycled as 12 t the -impregna. ted adsorbent process at the presence of oxygen.
3.2 Evaluation of Dimensions of TSA Process
'lb evaluate the dimensions of TSA process required for an 800 ton/y reprocessing plant,
the relation between the component of DOG and the flow rate of air blown to the dissolver was
calculated by the extended ABNOX code(8). Table 2 shows the operating conditions of
dissolver, condenser, NOx Table 2 Operating conditions of condenser, Nx absorber,absorption process, dehumidifying iodine stripping process, dehumidifying process and
process and Ago-impregnated AgO-impregnated adsorbent process
adsorbent process. The evolution Process Ope ratio n Co nditio ns
of radioactive elements, 121j, 4C Temperatureofinletgas :363K
85 Condenser Temperature ofoutlet gas 303 Kand Kr, was calculated from the Residence time -. 20 see
data of the nuclide composition of Reactor:Bubble-cup column 12 stages)NOx absorption Temperature 303 K
spent PWR fuel average fuel Off-gas containing Nx is in contact with watercountercur ntly.
exposure : 33 MWd/kg) stored for Reactor:Gas-bubble columnIodine Stripping Temperature 303 K
Iodate is reduced to 1, by the reaction with Nx.150 days after discharge Aircontaining Nx is used as the stripping gas.
Table 3 shows the components of Reactor: Silica gel columnDehumidifying Contentof water vapor in inlet gas 3.2 vol%
DOG at the inlet of TSA process. Content of water vapor in outlet gas 032 vol%
0The concentration of oxygen in Ag - Adsorbent: Ag'-Ioaded silica gel (AgOS)impregnated Temperature 403 K
DOG increased with increasing the adsorbent Decontamination factorofl, : 100
flow rate of air blown to the
dissolver. The appropriate air flow rate is evaluated as about 70 M3 /h under the conditions that
the oxygen concentration higher than 10 vol% is aintained and that the Nx concentration is
minimized.
From these alculation results, the dimensions of TSA process required for the iodine
recovery was estimated oughly for an 800 ton/y reprocessing plant. The factors concerning
adsorption kinetics, for example the shape of breakthrough curves, were not considered in this
58 -

JAERI-Conf 2002-004
Table 3 Composition of D06 at the inlet of thermal swing adsorption process. Flow rate of airblown in the dissolver was changed in the range of 30 to 200 M31/11
Flow rate of air blown indissolver n3 30 50 75 too 200
H20 vapor 0.319 0.319 0.319 0.319 0.319
N, 94.805 90.331 86.475 84.507 81.601
Composition 02 1,087 8.345 12.273 14.228 17.010
of off-gas at NO+NO2 3.144 0.621 0.677 0.750 0.959
298 K 12 + CH31 1.32E-03 7,53E-04 4.80E-04 3.32E-04 1.70E-04
[Vol%] Kr 0.063 0.036 0.023 0.017 0.008
Xe 0.543 0.311 0.198 0.145 0.070
co, 0.038 0.036 I 0.034 0.034 0.032
calculation. As shown in Fig.2, the adsorption and desorption operations are repeated between
two zeolite columns in TSA process. The requisite to operate the TSA process is that the time
required for the regeneration of column is the same as that for the asorption. The regeneration
time of column is given as the sum of the heating time of column and the cooling one by
blowing air. Therefore, the adsorption capacity of Nx required for a zeolite column is
described as
[Adsorption capacity of NOx] = [Flow rate of DOG] x [Conc. of NOxI
x [Regeneration time] (2)
Thus, the volume of zeOlite column is given as
[Column volume] = [Adsorption capacity of NOx / ([Adsorption capacity of NOx]
x [Bulk density of packed zeoljtej (3)
The adsorption operation is switched to the desorption one at the beginning of tlt� breakthrough
of Nx. Then, the adsorption capacity of Nx on the zeolite coLumn is evaluated as 16
cm 3-STP/g-zeolite, which was calculated from the experimental results of Fig.4. The
shell-and-tube type reactor is used as the zeolite column, because of the pomotion of heat
conduction of column, The tbes are packed with the zeolite particles. 'lle dinit'-risions of tbe,
which are packed with zeolite particles, were assumed as 0.1m in diameter irid 2i i egth.
The heatifig and cooling experiments for the tube packed with zeolite ere aui-jed out. The
regeneration time = heating time + cooling tinje) was given as 47 hr uder tile, Condition Of
the heating until 500'C at 10'C/min and the cooling by bowing air. Assuming tat tile bulk
density of packed zeolite is 07 g/CM3, the volume f zeolite column is given as 09 ni' trom
Eqs.(2) and 3). Then, the umber of tubes is evaluated as about 2. Accordingly. total volume
586 -

JAERI-Conf 2002-004
of zeolite required for the TSA process was evaluated as 0.38M3 (=O. 19 M3/ColUmn x 2 columns).
These ntsults suggest that the TSA process can e designed compactly
IV. Conclusions
(1) In the TSA process. alkyl iodide in DOG can be recovered completely as molecular iodine
(I2) wen the adsorption operation is switched to the desorption one at the beginning of the
breakthrough of Nx. By recycling the recovered 12 t the Ag"-impregnated adsorbent
process. all of iodine and alkyl iodide in DOG is immobilized as AgI on the
Ag"-impregnated adsorbents.
(2) In the TSA process, C02 and noble gas are partitioned from Nx, H20 and iodine under the
condition that the concentration of oxygen in DOG is maintained to higher than 10vol%. 14C
as well as 291 can be fractionated in the TSA process.
(3) The ISA process plays an important role for the fractionation and recovery of long-lived
radioactive nuclides in DOG; 14 C and 129 1. Total volume of zeolite required for the TSA
process is evaluated as 0.38m-3 for an 800 ton/y reprocessing plant. The TSA process can
be designed compactly.
Acknowledgement
The present research was performed under the Innovative and Viable Nuclear Energy
Technology (IVNET) Development Project of the Ministry of Economy, Trade and Industry
(METI) of Japan.
References
(1) D.W.Holladay, "Literature Survey: Method for the Removal of Iodine Species from Off-gases and
Liquid Waste Streams of Nuclear Power and Nuclear Fuel Reprocessing Plants, with Emphasis on
SolidSorbents",ORNL/TM-6350,OakRidgeNationalLaboratory 1979).
(2) L.H.Baetsle et al., "Status and Assessment Report on Actinide and Fission Product Partitioning and
Transmutation", Proc. of 5th International Information Exchange Meeting, Mol Nov.25-27, p.87 1998
(3) J.C.Wilhelm et al.' "Inorganic Adsorber Material from Off-gas Cleaning in Fuel Reprocessing Plants",
Proc. of 12th AEC Nuclear Air Cleaning Conf., p.540 1972).
(4) S.Matsuoka and T.Sakurai, "Radiological Significance and Management of Off-gas Arising from
Reprocessing Plant", Nihon-Genshiryoku-Gakkai Shi, 28, 701 1986) [in Japanese]
(5) G.Modolo and R. Odoj, "Investigations on the Partitioning of 129, from Silver-impregnated Silica in
- 587 -

JAERI-Conf 2002-004
Preparation for Future Transmutation", Nuclear Technology, 117, 80 1997)
(6) K.Takeshita and Y.Nakano, "Prediction of a Breakthrough Curve of' Iodine on a Reduced
Silver-loaded Adsorbent Bed", Nuclear Technology, 133, 338 2001)
(7) K.Takeshita et al., "Effect of Grain Size of AgNO3 Loaded in Porous Material on Adsorption of CH31",
J. Nucl. Sci. Technol., 32, 941 1995)
(8) R.M.Counce, "Nitrogen Oxide Absorption into Water and Dilute Nitric Acid in an Engineering-scale
Sieve-plate Column. Description of a Mathematical Model and Comparison with Experimental Data",
ORNL-5438, Oak Ridge National Laboratory 1978)
(9) M.Benedict et al., "Nuclear Chemical Engineering (2nd ed.)", McGraw-Hill, Chapter 1981)
58 -

JAERI-Conf 2002-004 JP0250355
RESEARCH ON PYROCTIBUCAL PRO(TSS FOR NrIME FLAELAT JAM
Yasuo Arai, Takashi wai, Osamu Shirai, Hirokazu Hayashi and Kazuo Minato
Tokai Research HstablislunentJapan Atomic Energy Research Istitute
Tokai-mura, Naka-gun, baraki-keii, 319-1195 JapanFAX: 81-29-264-8420, e-mail; afai�popsvr.tokaijaeri.gojp
Research on pyrochemical process for nitride fuel at JAERT is summarized. Following the introduction ofnitride fuel cycle for transmutation based on te double-strata concept, recent experimental results of electrolysisof actirride nitrides in chloride molten salt, edox eaction of actinides at liquid eectrodes, nitrogen releasebehavior at dissolution of metal nitrides and nitride formation of actinides in liquid Cd are given besides thepreparation of tbermodynarme database relating to pyrochemical process. Although ost of the present resultsconcerned U, Np and Pu bearing materials, it was suggested that pyrochemica pocess is a promising technologyfor the treatment of spent nitride fuel for transmutation of long-lived minor actirrides.Key words: pyrochemical process, transmutation, minor actirrides, nitride fuel, molten salt
1. IntroductionJAERI (Japan Atomic Energy Research Institute) has poposed the transmutation of long-lived NIAs (minor actinides) such as Np, Am and Cm by use of sub-critical ADS (acceleratordriven system) based on the double-strata fuel cycle concept [1]. Besides the construction ofhigh-energy proton beam accelerator or design study of transmutation plant, the technologicaldevelopment of separation of NIAs fom HLW (high-level liquid waste), fabrication of NIAsnitride fuel for ADS and treatment of spent fuel is the important subject investigated hereafter.Pyrochenrical process has several advantages over aqueous process for the treatment of spentfuel for NAs transmutation. They include compactness of the equipment, resistance toradiation damage, safety margin to criticality and high proliferation resistance, which shouldbe essential for treating highly radiotoxic, spent fuel containing MAs as a primary component.In addition, JAERI's ADS will use MAs itride fuel with N- 15 enriched nitrogen in order toprevent the formation of azardous C14 from N14. Pyrochemical process is expected tohave practical feasibility of recycling expensive N-15 compared with aqueous process.Recent R&D activities on pyrochemical process at AERI include electrolysis of UN, NpN,PuN and (UPu)N in LiCl-KCI molten salt, redox reaction of LJ"/TJ, Np"/Np and Pu"/Pu atliquid (Cd, Bi) electrodes, nitrogenrelease ehavior at dissolution of metal nitrides and nitridefon-nation in liquid Cd besides preparation of thermodynamic database relating topyrochemical process for nitride fuel. In this paper the typical results obtained so far aresummarized 2].
2. Double-Strata Fuel Cycle [1]In several countries senario study of MAs transmutation is prsued by use of power reactorsor dedicated system such as ADS. From the viewpoint of fuel cycle, the latter is regarded asa "double-strata" concept that is constituted by commercial power reactor fuel cycle (the firststratum) and MAs transmutation fuel cycle (the second stratum). In the double-strataconcept, each fuel cycle shall be designed and optimized independently. Commercial
- 589 -

JAERI-Conf 2002-004
power reactor fuel cycle insists on conomy and reasonable utilization of Pit in LVR or FBRcycle, while NfAs transmutation fuel, cycle focuses on effective transmutation of hazardouslong-lived MAs. According JAERI's concept, pyrochemical process is used for thetreatment of the spent fuel of the second stratum, in which Ms are concentrated with largedecay heat and fast neutron emission. A flowsheet of the second stratum is shown i Fig. .
HLLW from the irst stratum
Partitioning N-15
Carbothermic reduction -4 - - - - - - - --
MA+Pu Nitride
AUb
Spent nitride fuelN-15
IPyrochemical separation - - - - - - - - - - -
Recovery of MA+Pu at liquid Cd cathode
Nitride formation in liquid Cd '14 - - - - - - -
Fig. I Flowsheet for MAs transmutation fuel cycle proposed by JAERI
Since the second stratum handles principally MAs partitioned from HLLW of the first stratum,the heavy metal througIrput of the second stratum is less than 1/30 of that of the first stratum.This point will result in compact equipment ad effective MAs transmutation in the secondstratum. According to JAERI's concept, one ADS plant transmutes MAS and LLFP (longlife fission products such as Tc-99 and 1129) produced by ten LWR plants of 1,00OMWe peryear. In this case, the As amount transmuted corresponds to -250kg/y and the MAssystem inventory is estimated as -5.5ton based o some assumptions. This means that, if N-15 is recovered and recycled in the second straturn, necessary amount of N-15 is only 20-30kg/y, which will not be a penalty from conomical viewpoint. Tis is one of the reasons thatpyrochemical process has been developed at JAERI for TMAs transmutation fuel cycle 3].
3. Electrolysis of Actinide Mononitrides 4-61The spent nitride fuel is submitted to the eectrolysis in LiCl-KCL molten salt in order toremove fission products. Metallic eectrical poperty of nitride fuel nables us to apply tesimilar manner with that developed in ANL (Argorme National Laboratory) for etal fuel 7].So far, electrolysis o UN, NpN, PuN and ((JPu)N lias been carried out in tile Molten saltcontaining a small amount of trivalent ions of actirrides. The temperature of the electrolysiswas chosen at 723, 773 and 823K. Cyclic voltarrunograms for NpN are sown in Fig. 2 in
- 590 -

JAERI-Conf 2002-004
which anodic and cathodic peaks ae observed. They correspond to the following reaction:NpN = Np3' + 3e- + 0,5N2 (1).
Equation (1) was a slow reaction and considered as a rate-determining step of the electro-dissolution, since te current did not increase in proportion to square root of the potentialscanning rate, and te athodic peak seemed to shift more egative side as increasingscanning rate. I addition, the equilibrium potentials of UN, NpN a PuN vs. A/AgCIreference electrode were determined from electromotive force measurements, The results at723, 773 and 823K were summarized i Table The quilibrium potential could beinterpreted by comparison with the teoretical redox potential of the nitrides derived fromfree energies of formation and nitrogen partial pressure in te molten salt.
0.15
0.10 723K773K823
0.05
U 0
-10.05
-0.10 ----- ----
-1.2 -1.0 -0.8 -0.6 -0.4
PotentialN vs. ALY/AgO,
Fig. 2 Cyclic voltarnmograms of NpN in LiCl-KCI-NpC'3 melt(NPC13 concentration; 0.53wt.%, scan rate; 0.01V/s)
Table 1 Equilibrium potential of UN, NpN and PuN vs. Ag/AgC1 reference electrodedetermined from electromotive force measurements at 723, 773 and 823K
UN _ __�!pN PuN723K DA* -0.779V DA.'773K -0.670V -0.773V -0.880V823K DA' -0.766V iid.'
. Dot determinedIn case of the electrolysis of UN, however, the formation of ternary compound UNCI wasidentified at anode along with U3'. Since UNCI is hardly soluble i the molten salt, theformation of UNCI would adversely affect the efficiency of recovery at cathode. On theother hand, the formation of such a compound was not observed in case of the electrolysis ofNpN and PuN. Te results were derived from greater stability of trichloride of transuranium.elements and lesser stability of the tetra valence ions compared with uranium. Nitride fuel
591 -

JAERI-Conf 2002-004
for MAs transmutation is so-called U-free fuel, so the problem of formation of actinidenitrogen chloride could be avoided in this case.Fig. 3 shows the appearance of Np etal recovered at solid Mo cathode from electrolysis ofNpN. Since the electro-deposits ontained a large amount of the salt, they were heated at1073K in Ar gas stream to separate it from Np metal, However, some salt components suchas LiC1, KCI and NpC'3 were still identified in the X-ray diffraction pattern in addition toalpha-Np phase.
Fig. 3 Appearance of electro-deposits at solid Mo cathode obtainedby current-controlled electrolysis of NpN at 773K
The electrolysis of ,-,Pu,,)N with several compositions is also investigated, In addition,actinide nitride samples prepared from carbotheTmic reduction usually contain severalhundred to a few thousand ppm of oxygen as primary ipurities, The effect of oxygenimpurities on the efficiency of electrolysis is being studied for technological application.
4. Redox Reaction at Liquid Electrode [8-10]In the treatment of spent nitride fuel for transmutation, NAs and Pu are recovered at liquidcathode together. For the moment liquid Cd is the first candidate of cathode material andliquid Bi is considered as the second. So the redox reaction of U"/U, Np"/Np and Pu"/Pucouple at the interface between the olten salt and liquid metal phase (Cd, Bi) wasinvestigated by comparison with that at solid cathode. Cyclic voltammograms of LiCl-KC1molten salt containing a small amount of actitude tricb1oride were obtained at 723, 773 and823K. Typical results for LiC1-KC1-NpCl3 melts were shown in Fig, 4 Thevoltammograms at liquid Cd and Bi electrodes were compared with that at solid Mo electrode.Peaks corresponding to electro-dissolution and -deposition were observed as shown in thefigure. At 773K, the redox potentials of U/U, N 3'/Np and Pu"/Pu couple at liquid Cdelectrode vs. Ag/AgCl reference eectrode were observed more positively by 0,01, 0.18 and0,28V, respectively, than those at solid Mo electrode. On the other hand, those at liquid Bielectrode were observed more positively by 038, 048 and 0.31V than those at solid Moelectrode at the same temperature. These potential shifts could be thermodynamicallyinterpreted by a lowering of activity of actinide i the liquid pase due to the formation ofintermetallic compounds with Cd or Bi. Indeed, the potential shift almost corresponded tothe free energies of formation of the intermetallic compounds such as UCd,,, NpCd6, PuCd6l'UB'2, NpBi2 and PuB'21 which are considered as the most stable intermetallic compounds in
- 592 -

JAERI-Conf 2002-004
the respective binary systems at 773K.
Cd electrodeMo electrodeBi lectrode
-0.005<
0
U 0.0057
0.01
OM 5 7., . . . . . . . . . . . . ..
-2�O -1.6 -1.2 -0.8 -0.4
Potential V) vs. Ag/AgCl
Fig. 4 Cyclic voltammograms of Np3/Np couple at Cd, Bi and Mo electrodes at 723 K.Concentration of NpCI3 and scan rate are 0465 wt.% and 0.01 V/s, respectively.
In addition, te recovery of Pu into liquid Cd cathode with high concentration wasdemonstrated under a joint research with RIEPI (Central Research Institute of ElectricPower Industry), Cathodic current density for effective recovery of Pu was considered to becontrolled by diffusion of Pu" in the molten salt and proportional to its concentration. At Puconcentration of 2.llwt.% i the molten salt and cathodic current density of 41m.A/CM2 , forexample, te current efficiency was nearly 100% and the concentration of Pu in the cathodereached 7.75wt%. Recent results showed that the concentration could reach more thanlOwt.% without any problems. At igher cathodic current densities, however, Li and Pumetals were precipitated at the surface of liquid Cd cathode ad reacted with ceramic parts,which decreased recovering efficiency. Further, it was shown that Pu recovered beyond thesolubility limit in liquid Cd formed an intermetallic. compound uCd. and accumulated at thebottom of cathode, Figs. shows the appearance of liquid Cd cathode after recovery of Pu.Investigation of co-deposition behavior of Pu and U is underway.
2 mm
Fig. Appearance of liquid Cd cathode after recovery of Pri('Upper part is the solidified salt containing PUC13)
- 593 -

JAERI-Conf 2002-004
5. Nitrogen Release Behavior at Dissolution of Metal Nitrides II]The cost accompanying te use of N-15 may become prohibitive, unless one makes devices torecover and recycle it i the fuel cycle. It is the one of the key technologies of MAstreatment of spent nitride fuel for transmutation.This point has been demonstrated by dissolving NdN and DyN, which are regarded assurrogates of TRU nitrides, by oxidizing them with CdCI2 in LiO-KCI molten salt at first.During heating, the carrier gas (He) was introduced to a gas cromatography apparatus withan automatic gas sampler. A fraction of the gas was also sampled and analyzed by massspectrometry. It was found that nitrogen contained in DYN was readily released for 97-99%as N2gas, while that in NdN was slightly less tan these values. Te difference in behaviorbetween DyN and NdN was considered to be related with te relative larger amount ofoxygen impurity in the latter; 0.51wt.% for the former and 1.45wt.% for the latter. It islikely that some nitrogen exists in the bottom sediment along with Nd, 0 and C1.Secondly, nitrogen releasing behavior is examined during the electrolysis of UN, PuN and(UPu)N as mentioned in the preceding chapter. Using the similar apparatus with the abovecase, N2 gas release behavior during te electrolysis has been monitored, These resultssuggest that recovery of more than 90% of N-15 in the spent fuel is technically feasible as 2
gas. If it is the case, N15 has to be added to the second stratum only at the rate of 20kg/y orless, which would not be penalty from economical viewpoint.
6. Nitride Formation Behavior in Liquid Cd 12]The actinide metal recovered by te electrolysis is to be converted to their nitrides. This willbe done by nitride formation i liquid metal such as Cd. The existing termodynamic dataindicate that te free energy of formation of actinide mononitrides is rather close to each otheramong actirride elements, those of trichloride are significantly more negative for the rareearths compared with actirrides and activity coefficients of metals in liquid C alloys aresmaller for the rare earths compared with actirrides 13].So nitride formation behavior in liquid Cd containing actinide and rare arth elements areinvestigated at first. Nitrogen gas was fed into liquid Cd-2wt.%U-Iwt.%Gd-lwt.%Ce alloyin Mo container at 773-873K. It was found that was preferentially onverted to U2N3
while most of the rare earths remained dissolved in liquid Cd. The similar result wasreported from Japan elsewhere 141. These results follow the theoretical expectation basedon the above termodynamic characteristics. Nitride formation of Pu recovered in iquid Cdwith high concentration has ben also investigated. However, detailed characterization ofsuch nitrides is the iportant subjects hereafter since plletized or vibro packed nitride fuelfor transmutation has to be industrially fabricated.
7. Basic Study and Preparation of Thermodynamic Database 15, 61In order to support the development of pyrochemical process for itride fuel, some basicresearch has been carried out, In addition, suctural analyses of molten salts, such as LaC'31YC13 and C131 were made by XAFS and die computer simulation method was developedusing molecular dynamics. The electrochemical behavior of lantharrides was studied byhigh-temperature UV-visibie spectrophotometry as well as electrochemical measurement in
- 594 -

JAERI-Conf 2002-004
LiCl-KCI eutectic melt, Lanthanides were used as surrogates of americium in this case.
From the high-ternperature UV-visible spectra of Nd" and Nd" in LiCl-KC1-NdCl3 melt with
Nd metal, it was found that the disproportionate reaction ocurre i tile presence of Nd metal.
The aalysis of tis kind of behavior is very iiseml to evaluate te behavior of americium in
the chloride salt. Besides the experimental approach, the thermodynamic analysis becomes a
strong tool to predict the high-temperature processes. The thermodynamic datafile is being
prepared for the calculation of the LiCl-KCI-MCI,,-CdC'2-NW-Cd-M-N-C-0 system M;
actinides).
8. Conclusion
Recent activities of JAFRI on pyrochemical process for spent nitride fuel for MAs
transmutation are smmarized. Electrolysis of UN, NpN, PuN and (UPu)N, redox reaction
of U"/U, N"/Np and u"/Pu at liquid Cd and Bi electrodes, nitrogen release behavior at
dissolution o etal nitrides and nitride formation behavior in liquid C have been
experimentally investigated in addition to preparation of thermodynamic database in relation
to pyrochernical process. Although the results obtained so far oncerned mainly U, Np and
Pu bearing aterials, it was suggested that pyrochemical process is a promising technology
for the treatment of spent itride fuel for MAs transmutation. On the other hand, TRU-
HITEC (Module for TRU High Temperature Chemistry) is under construction at NUCEF of
JAERI Tokai for he experiments on Am and Cm bearing materials. The first electrolysis
test of AmN is planned from fiscal year 2003. 17]
ACKNOWLEDGEMENT
The authors wsh to express special thanks to Drs. A. Iwamoto and T. Ogawa of Department
of Material Science and Drs. M. Ochiai and T. Osugi of Department of Nuclear Energy
System of JAERI for the interest in this study.
REFERENCES
(1) T. Mukaiyama, T. Takuzuka, M. Mizurnota, Y. Ikeda, T. Ogawa, A. Hasegawa, H. Takada
and H. Takano, Review of research and development of accelerator-driven system in Japan
for transmutation of long-lived nuclides, Progress in Nucl. Energy, 38, 107-134 2001).
(2) Y. Arai and T. Ogawa, Research on nitride fuel and pyrochemical process for A
transmutation, Proc. 6th OECD/NE-A Information Exchange Mtg. on Actinide and Fission
Products P&T, December 11-13, 2000, Madrid (CD-ROM) 2001).
(3) T. Ogawa and Y. Aai, Nitride/pyroprocess for MA tansmutation and fundamental
database, Proc, 0ECD/NEA Workshop on Pyrochemical Separation, March 14-16, 2000,
Avignon, 157-164 2001).
(4) F. Kobayashi, T. Ogawa, M. Akabori and Y. Kato, Anodic dissolution of uranium
mononitride in lithium chloride-potassium chloride eutectic melt, J. Am. Ceram. Soc., 78,
2279-2281 1995).
(5) 0. Shirai, M. lizuka, T. Iwai and Y. Arai, Recovery of Np by electrolysis of NpN in LiCl-
KC1 eutectic melts, J. Nucl. Sci. Technol., 37, 676-681 2000).
(6) 0. Shirai, T. Iwai, K. Shiozawa, Y. Suzuki, Y. Sakamura and T. Inoue, Electrochemical
595 -

JAERI-Conf 2002-004
dissolution of plutonium nitride in LiCl-KC1 eutectic melts, J. Nucl. Mater., 277, 226-230
(2000).
(7) Y. 1. Chang, The integral fast reactor, Nucl. Technol., 88, 129-138 1989).
(8) 0. Shirai, M. lizuka, T. lwai, Y. Suzuki and Y. Arai, Electrode reaction of plutonium at
liquid cadmium in LiC1-KCl eutectic melts, J. ElectroaDalytical Chem. 490, 31-36 (2000)�
(9) 0. Shirai, M. lizuka, T. wai and Y. Arai, Electrode reaction of the Pu3'/Pu couple in Licl-
KCI eutectic melts comparison of the electrode reaction at te surface of liquid Bi with
that at a solid Mo electrode-, Analytical Sciences, 17, 51-57 2001).
(10) M. Iizuka, K. Uozumi, T. Inoue, T. wai, 0. Shirai and Y. Arai, Behavior of plutonium
and americium at liquid cadmium cathode in molten LiCl-KC1 electrolyte, J. Nucl. Mater.,
299,32-42 2001).
(11) F. Kobayashi, T. Ogawa, M. Takano, M. Akabori, A. Itoh and K. Minato, Dissolution of
metal nitrides in LiCl-KCI eutectic melt, Proc. Int. Conf. Oil Future Nuclear Systems
(GLOBAL'99), August 29-September 3 1999, Jackson Hole, (CD-ROM) 999).
(12) M. Akabori, A. Itoh and T. 0gawa; Nitridation of uranium and rare-earths metals in
liquid Cd, J. Nucl, Mater., 248, 338-342 997).
(13) T. Koyama, K. Uozumi, M. lizuka, Y, Sakamura and K. Kinoshita, Pyrometallurgical
data book, CRIEPI Report T93033 1995) (in Japanese).
(14) Y. Kasai, 1. Kakehi, S. Moro, S. Yonezawa, T. Higashi and K. Tozawa, Design study on
advanced nuclear fuel recycling system -Conceptual design of recycling system using dry
reprocessing technology-, Proc. Int. Conf. on Future Nuclear Systems (GLOBAL'99),
August 29-September 3 1999, Jackson Hole, (CD-ROM) (I 999).
(I 5) Y. Okamoto, M. Akabori, A. Itoh and T. Ogawa, X-ray absorption study of molten
uranium chloride system, Actinides-2001 International Conference, November 49, 2001,
Hayama, Japan.
(16) H. Hayashi, et al., unpublished data.
(17) K. Minato, M. Akabori, A. Maeda, S. Miyamoto, 0. Amano and T. Arai, TRU-HITEC -a
new facility for TRU high temperature chemistry-, NUCEF 200 1, Octo'ber 3 -November 2,
2001, Tokai, Japan.
596 -

JP0250356JAERI-Conf 2002-004
TRU-HITEC -ANEWFACI]LITYFOR
TRU HIGH TEMPERATURE CHEMISTRY
Kazuo Minato', Mitsuo Akabori', Atsusbi Maeda,Satoshi Miyamoto', Osamu Aniano4and Tomoaki Arai'
Department of Materials Science, Japan Atomic Energy Research.InstituteTokai-mura, Naka-gun, lbaraki-ken, 319-11.95 Japan
Fax: 81-29-282-5922, e-mail. miiiato�popsvr.tokaijaeri.gojp
'Department of Safety Research Technical Support, Japan Atomic Energy Research InstituteTokai-mura, Naka-gun, IbMki-ken, 319-1195 Japan
'Research and Development Department, The Japan Atomic Power Company6-1, 1 -chome, Obtemachi, Chiyoda-ku, Tokyo, 100-0004 Jpan
4Nuclear Power R&D Center, Engineering Research & Development DivisionTokyo Electric Power Company
4-1, Egasaki-cho, Tsurumi-ku, Yokohama, 235-8510 Japan
'Nuclear Power Engineering Sec., Nuclear Power DepartmentTohoku Electf ic Power Company, Inc.
7-1, Ichibancho 3-chome, Aoba-ku, Sendai, Miyagi, 980-8550 Japan
For a basis of te future nuclear fuel cycle, it is very important to understand and control the behavior ofTRU in the nuclear fel cycle, owever, the properties ad behavior of TRU, such as Am and Cm, are notknown very well, Oe of the reasons why the data are lacking is tat few facilities are available for the researchon Am ad Cm in a ontrolled atmosphere in te world. Witbiu a collaborative pogram between the JapanAtomic Eergy Research Institute and the apan Atomic Power Company - Tokyo Electric Power Company -Tohoku Electric Power Company a new facility, called the Module for TRU High Temperature Chemistry(TRU-1-ITTEC), is uder FIstruction in NCEF. It consists of three hot cells shielded by steel and polyethyleneand a glove box shielded by eaded acrylic resin, where a high purity argon gas atmosphere will be maintained.At TRU-NITEC fundamental properties and behavior of TRU, especially of Am, are to be studied for a basis ofthe future nuclear fuel cycle including te partitioning and ransmutation of long-lived nuclides. TRU-HITECwill be aailable in 2003.
Key words: Transuranic elements, Americium, Curium, Pyrochemical processes, Transmutation
1. INTRODUCTION
The concentration of transuranics (TRU) in the spent nuclear fuels will increase whenusing igh burnup fuels and MOX fuels. For a basis of the future nuclear fuel cycle, whichmay include the pyrocbemical processes for spent fuels and the partitioning and transmutationof long-lived nuclides, it is very important to understand and control the behavior of TRU inthe nuclear fuel cycle. However, the properties and behavior of TRU, such as Am and Cm, arenot known very well. An application of the pyrochernical processes to the reprocessing of thespent fuels is expected to reduce the costs of the reprocessing, but few data are available onthe chemical and electrochemical properties of Am and Cm that are necessary to develop theprocesses. One of the reasons why the data are lacking is tat few facilities are available forthe research on Am and Cm in a controlled atmosphere in te world.
- 597 -

JAERI-Conf 2002-004
Under these circumstances, a new facility is needed to study TRU behavior in thenuclear fuel cycle. Within a ollaborative program between the Japan Atomic EnergyResearch Institute and the Jpan Atomic Power Company - Tokyo lectric Power Company -Tohoku Electric Power Company a new facility, called t Module for TRU HighTemperature Chemistry (TRU-HITEC), is under construction i NUCEF.
2. OUTLINE OF TRU-HITEC
Figure I shows a schematic diagram of TRU-HITFC. It consists of three hot cellsshielded by steel and polyethylene and a glove box shielded by leaded acrylic resin. The hotcells and glove box are onnected with each other. Each oefl is quipped with a wide windowmade of leaded glass ad acrylic resin and three inaster-siave manipulators. At the rear of thecells, windows and ports for gloves and suits are arranged wich enable its to access installedapparatuses by hands when the radiation dose rate is adequately low. A high purity argon gasatmosphere will b maintained in the cells and glove box, where impurities of oxygen andmoisture are 02 I ppm ad dew point < 70'C�
1 -2F-
M
Fig I Schematic diagram of TRU-NITEC.
The experimental apparatuses listed in Table I are to be installed in the cells and glovebox. Electrochemical cells and a athode processor are for pyrochemical process studies, ada differential thermal analyzer, a high-temperature X-ray diff-ractometer, etc., are forfundamental property measurements.
Table I Experimental apparatuses installed irITRU-111TEC
- Electrorefiners 2 sets): electrocheinistry/electolysis
- Cathode processor
- Differential thermal analyzer
- Induction beating equipment: sample preparation/treatment
- Infrared image urnace- sample preparationitreatment
- High temperature X-ray diffractometer
- Oxygen potential measurement equipment
- 598 -

JAERI-Conf 2002-004
In TRU-HITFC, radioisotopes of Am-241, Am-243, Crn-244 and Np-237, and nuclearfuels of Pu, U and spent fuel can be handled. Table 11 shows maximum quantities of actinidesthat can be andled in TRU-HITEC.
Table 11 Maximum handling quantities of actinides in TRU-HITEC
Arn-241 I g (1.27 X 10¹² B)
Arn-243 0.2 g (1.48 X 10⁹ B)
Cm-244 0.02 g (5.99 X 10¹⁰ B)
Np-237 log (2.61 X 10⁸ Bq)
PU 50g
U 400 g
Spent fuel -0. g
3. RESEARCH PLAN AT TRU-HITEC
At TRU-HITEC fundamental properties and behavior of TRU, especially of Am, are tobe studied for a basis of the future nuclear fuel cycle including the partitioning andtransmutation of long-lived nuclides.
One of the main research objectives at TRU-HITEC is to study pyrochemical processesfor nuclear fuels. Two sets of molten salt electrochemical cells, a cathode processor, a furnacefor sample preparation, etc., are being designed tat are to be installed in TRU-HITEC. Figure2 shows a schematic diagram of experimental apparatus for pyrochernical reprocessing.
Fig. 2 Schematic diagram of experimental apparatus for pyrochernical reprocessing.
599 -

JAERI-Conf 2002-004
Figure 3 shows EpO'- diagram for Pu in LiCl-KC] eutectic melts, as an example ofbas ic data that are important for evaluation of the pyrochemical reprocessing. The diagramshows the chemical forms of Pu as a function of EM and P02'. As shown in Fig. 3 an
agreement of the experimental data with the thermodynamic estimation is not good even forPu.
C.---O.Ol MOI/I PIJ4+0
-0.5
PU02-1.0 4I-1.5
pU3+-2.0
LLJ -2.5 PU203
-3.0 -----------
-3.5 PUI
-4.05 10 15 20
p(02-)
Fig. 3 EpO' diagram for Pu in LiCI-KCI eutectic melts.Solid lines indicate experimental data by L. Martinot and J. Fuger;
Broken lines indicate thermodynamic estimation by JAFRI.
As the first experiment at TRU-HITEC a basic study on chemical and electrochemicalbehavior of Am in the pyrochemical processes is planned. The data of E-pO'- diagram for Amare important for evaluation of the pyrocbemical reprocessing. The basic data in the Am-Cl-O-N system are to be studied for the reprocessing of oxide fuel and nitride fuel. The nitridefuel is a candidate for a transmutation fuel of minor actmides,
Fig. 4 Photograph of the Am recovery apparatus.
- 600 -

JAERI-Conf 2002-004
For the experiments at RU-HITFC, Am-241 will be recovered from an americiumaqueous waste in NUCEF. The process of the americium recovery is based on adsorption ofAm by tannin gel. The construction of the A recovery apparatus has been completed inN-LJCEF, The Am recovery apparatus consists of tannin gel columns, pumps, heaters, etc., inglove boxes, Figure 4 shows a potograph of te A recovery apparatus, where the panel ofthe glove box is removed for an illustrative purpose.
4. SCHEDULE OF RU-HITEC PROGRAM
Table I shows the schedule of the TRU-HITEC program. 'IRU-HITEC is now underconstriction and will be available i 2003. For the Am recovery, hot Tuns will be started in2002 after the confirmation of the processes through cold runs. The recovered Am will besupplied to the experiments at fRU-HITEC.
Table III Schedule of the RU-HITEC program
2000 2002 2004 2006
* TRU-HITEC- Design
- Construction
- Research on Am and Cm
* Am recovery apparatus
- Design/construction /Am-241//
- Am-241 recovery
ACKNOWLEDGEMENTS
The authors wish to express their thanks to Dr. A. Iwamoto, Director of Department ofMaterials Science, JAERI, Dr. T. Ogawa, Deputy Director of the Department, and Dr. Y.Suzuki, Director of Department of Safety Research Technical Support, JAERI, for theirtechnical support and interest.
601 -

This is a blank page.

JP0250357JAERI-Conf 2002-004
DEVELOPMENT OF SOLVENT WASHING PROCESS USINGBUTYLAMINE COMPOUNDS
Y. ITOR, K. KAMET, S. HOTOKU, T. ASAKURA, H. MINEO
AND G. UCHIYAMA
Process Safety Laboratory
Japan Atomic Energy Research Institute
Tokai-mura, Naka-gun, Ibaraki-ken, Japan, 319-1195
Fax: 81-029-282-6677, e-mail: itoh�procsafe.toka-i.jaeri.gojp
An advanced PUREX process has been studied in which salt- free technologies are applied for
the reduction of radioactive waste volumes. Normal butylamine compounds are developed as
salt-free solvent washing reagents.
The solvent washing tests were carried out with two types of butylamine compounds for solvent
washing reagents, A small size mixer-settler used in the tests was composed of two washing steps.
DBP in the solvent was washed effectively under the conditions of pH of more than 1.5.
Decontamination factors for DBP and for total alpha nuclides were 25-7.9 and 120-2,500.
Those for total beta nuclides varied widely.
As for the solvent washing mechanism of DBP ad radionuclides, some reaction formulae were
proposed on the basis of the information of the previous papers about the pH dependence of
partition and the complex formation in the washing process.
The study on electrolysis of butylamine was also conducted for waste treatment.
Key words: PUREX process, salt-free, solvent washing, butylamine compounds, electrolysis
LINTRODUCTTON
An advanced PUREX process has been studied in which salt-free technologies are
applied for te reduction of radioactive waste volumes. As a part of the advanced
technologies normal butylamine compounds are developed as salt-free solvent
washing reagents.
Normal butylamine (n-butylamine) has some properties suitable for the solvent
washing reagent. It is a basic compound (Kb=3.36, at 25C), and is stable and easy
to prepare. Furthermore TBP loss is expected to be very small during plant
operation, because the TBP distribution ratio, which is defined as the rtio of TBP
concentration in the 0.25M n-butylamine oxalate aqueous phase to that in the
organic phase 30% TBP - 70% n-dodecane), was measured to be smaller than 2
X 10-3. The effectiveness of n-butylamine compounds as solvent washing reagent
was found with te bicarbonate and the oxalate in the previous experimental.
603 -

JAERI-Conf 2002-004
2.EXPERIMENTAL
2.1 Washing test
In this study the solvent washing tests were carried out wth two types of
butylamine compounds for solvent washing reagents and with degraded solvents
which w ere generated through the uranium stripping process. The burnups of the
spent fuel were 8,000, 29,000 and 44,000 MWd/tU,
The experimental flow seet is shown in Fig.l A small size mixer-settler of 16
stages in the glove box was used in the tests, The solvent washing process under
development consists of two washingsteps. In the ashing tests, 44 stages and
7-9 stages of the mixer-settler were used for each washing step. The solvent
washing behaviors were studied under many flow sheet conditions such as
butylamine. compounds and pH in aqueous. phase. For comparison sodiume
carbonate and nitric acid were also used in the case of 44,OOOMWCI/tU.
Degradedsolvent Butylamine oxalate Butylamine oxalateButylaimn bcarbonate
Sodium carbonate Nitric acid2OOmL/h 40mLlh 4OmL/h
Step 10 Step
(4 or 7 stages) (4 or 9 stages)V
:-------------------------- - ------------------------
Fig. Solvent washing flow sheet
Analysis items of each stage are shown in Table I DBI'samples were prepared
by the separation process sing sodium hydroxide and carbon tetrachloride.
Table I Analysis iteins
Items Methods
pH Potentiometric titration
DBP Ton exchange chromatography
Radionuclides 2 7r gas flow counter
Ge detector
Si detector
2.2 Electrolytic decomposition study
Butylamine decomposition cell is shown in Fg.2. B-Litylarnine, nitric acid and
- 604 -

JAERI-Conf 2002-004
silver nitrate were mixed in the cell. Experimental conditions are shown in Table
IL
POTENT[OSTAT7
J7"---F RECORDER
(1) Anode (Pt-galvanized TO
Cathode (Pt-galyanized Ti)
Saturated calomelreference electrode(SCF)
(4) Glass tube with porous frit
05 Thermocouple
6 Nozzle for air bubbling Fig,2 Decomposition cell
(D M Condenser (volume mL
Table E Experimental conditions of electrolytic decomposition
Items Conditions
Nitiric acid concentration (M) 0.01 1.0 20 3.0
Silver concentration (gfL) 0 2 4 6 16
Butylamine concentration /0 0.18 0.36 072
Potential V vs SCE) 1.5 16 17 1.8 19 20
Temperature (C) 40, 50 60
Underlines idicate reference values.
3.RESULTS AND DISCUSSION
3.1 Washing effect
(a) DBP
DBP concentration profiles in case of 29,000 MWd/tU is shown in Fig.3.
Comparing pH of aqueous phase of each stage with that of washing reagents, the
difference ws explained by the influence of nitric acid in the solvent and of
dissolving of hydrogencarbon.
DBP in the solvent was washed effectively under the conditions of pH of more
than 1.5. The result is consistent with the fact that the wash efficiency for DBP
increased as the p of the washing reagent[2]. It can be said that DBP is washed
with butylamine compounds by dissociation with the hydroxide ion in the
following.
- 605 -

JAERI-Conf 2002-004
HDBPorg+ H-a - DBP-aq+ H20
DBP-aq+ C4H9NH3+aq - C4H9NH3DBPaq
Decontamination factors for DBP were 25-7.9 in three burnups experiment.
butylarnine oxalate butylannine oxalatepH 2 pH
I I 14-0- DBP (org)-0- DBP(aq)
0 -A- pH (aq) 12E degraded solvent fl )w I
0-o 102 8washing reagent fl
feed4_j 6
0 1 0 4n pH=l, 5 - 2----------------
100 01 2 3 4 5 6 7 8stage no.
Fig.3 DBP concentration profiles 29,000 MWd/tU)
(b) Radionuclides
a-and �-nuclidesconcentratl'.Onprofilesintheorganicphaseare,-,howninFig.4,
obtained by means of 2 c gas flow counter. Decontamination factors for a -
nuclides were 120-2,500. Those for 24'Am and 239PU+240PU were of the imilar
orders analyzed by a and 'r ray spectra. Washing process proceeded almost in
the first step, which was low pH region and used butylamine oxalate reagent.
This implies that a nuclides, Am and Pu would make complexes with the
oxalate ion.
Decontamination factors for -nuclides varied widely. Those for 137CS were of the
orders of several 10s and 100s, while those for 1(6-Ru, 9Nb and 95ZY were about or
less than 10. The profiles in Fg.4(b) was similar to that of 13"Cs. It may be said
that Cs also would make oxalate complexes. 106Ru was washed not so much n
both steps. Since pH did not exceed 7 in the most cases, the result can be
explained by pH dependency of the washed fraction for Ru as shown in 2].
- 606 -

JAERI-Conf 2002-004
feedfeedstep (D step ) step(D step(2)1 3 d' I I 1:
0 - testA-0- testA 0 - testB-0- testB -A - testC-A- testC E -A - testD
2 -A- testD10
0 00 10 C.)
(D
=63 100Oa
10-1 id' I I I I I I I I I I - 1 I I1 2 3 4 5 6 7 8 1 2 3 4 6 7
stage no. stage no.
(a) C - nuclides (b) - nuclides
Fig.4 a - and - nuclides concentration profiles in organic phase 29,000 MWd/tU)
Washing reagent in step(D + step(2) TestA butylamineoxalate(pH2)+butylaminebicarbonate(PH7)Test B butylamine oxalate (pH2) + butylamine oxalate (pH8)Test C butylamine oxalate pH8 + butylamine bicarbonate (pH7)Test D butylamine oxalate (pH8) + butylamine oxalate (pH8)
Compared with decontamination factors obtained by using sodiume carbonateand nitric acid, butylamine compounds would be more efficient as the washingreagent for a - nuclides.
3.2 Electrolytic decomposition behaviorThe optimum condition for electrolytic decomposition of �utylamine was the nitric
'd concentration of 3M, the silver nitrate concentrate n of g/L, the solutionaci 1 IO
temperature of 60 'C and the decomposition electric potential of 17 V vs. SCE.
Its decomposition curve is shown in Fig.5. Decomposition rate suddenly decreasedover 100 min. The potential dependency of decomposition rate constant is shownin Fg.6. As potential loaded the rate constant increased especially at 17 V vs.SCE. On the other hand efficiency is going down because of the increase ofover-current.Electrolytic decomposition of butylamine oxalate was also conducted, the curve ofwhich was the same shape as in Fg.5.
607 -

JAERI-Conf 2002-004
100
80 95 %00 (270min
V) 9 Lin0OL 60E0U decomposition rate constant-a) 400a) 3.09x 10 Mg/mipC: �calculated in 0-70 0/)
E 20M4-
0 100 200 300 Fig.5 Decomposition curveat optimum condition
time min
0.4 5
E rate constant,I- 0.3 4 'C-)to
(D E r-E
increase of Iover-current 0(U 0.2 3
C: � i0 V) X0
0 00.1 efficiency 2
0 .20 IM(D a) Fig.6 Potential dependency of
0 11.4 1�6 13 2.0 rate constant and efficiency.
potential (V Vs SCE)
4.CONCLUSION
These results confirm the effect' ness of n-butylainine COMPOUDds as solvent
washing reagent in te case of the reprocessing for te power plant's pent fuels.
It is the next subject to improve the washing efficiency of n-butylamine
compounds, such as the pH adjustment.
REFERENCE
[11 G. Uchlyania, S. Fujine and M. Maeda, Nuel. Technol., 120, 41-47, 199T
[21 N. Uetake, H. Yamamoto, K. Tutumi, Y Kondou, N. Tamitra M Ozawa and Y
Kishimoto, J. At. Energy Soc. Jpn., 33, 96-106, 1991,
- 608 -

JAERI-Conf 2002-004
. Radioactive Waste Disposal
- 609 -

This is a blank page.

JP0250358JAERI-Conf 2002-004
FIELD TRACER MIGRATION TEST TN AQtIFERTracer Migration Test in Assembly
Cooperative Research Program on Safety Assessment MethodologyBetween CIRP and JAERI--
Yang Yuee*, Wang Zhiming*, Liu Chunli*, Jing Ling*, Jiang Hong*M.Mukai**, T.Maeda**, J.Matsumoto", T.Tanaka**, H.Ogawa**
*China nstitute for Radiation Protection270 Xuefu Street, Taiyuan, Shanxi 030006 China
Fax: 86-351-7020407
"Department of Fuel Cycle Safety ResearchTokal Establishment, Japan Atomic Energy Research Institute
Shirakata 2-4,Tokai, Naka, lbaraki, Japan, 319-1195Fax: 29-227-5401
ABSTRACT: A field tracer migration test in aquifer at the China Institute for RadiationProtection's fieid test site is briefly introduced in tis paper. racer migration test in experimentalassembly is the ephasis of the paper. Test conditions and assembly construction are introduced.Assemblies filled with undisturbed aqueous medium were inserted iDtO the aqueous mediumthrough xperimental Shaft wall, in order to acquire the data o tracer migration in aqueousmedium. Comparison of migration velocity between 3H and BC in the assembly is introduced inthis paper. The results indicate that Bf migrates at faster velocity than 3H under same condition.Migration velocity, retardation coefficient, distribution coefficient, dispersion coefficient anddispersivity of tracers are evaluated for 9OSr, "Np and "'Pu from the test results. It is found fromthe results tat the etardation coefficients of 9OSr range from 195 to 251. And the retardationcoefficients of 237Np and 238Pu are igh. Migration distance of 9Sr, "Np and 211pU in soil are
less, especially. for 238pU. It is indicated that toess has stronger sorption capacity for the
radionuclides. A comparison of nuclide migration pattern suggests that their migration velocity
follows 90S r> 237 Np> 238ptl. It is found that there are the eccentric phenomena of radionuclide
migration and effect of humic acid on Sr migration.
Key words: field tracer migration test, radionuclide, migration, experimental assembly, 3 H, Br-,9OSr, 237XP, 238PU
I FOREWORD
Field tracer migration test in aquifer is an important part of the methodology study on safety
assessment of radioactive waste disposal. This test is also the cooperative research between China
Institute for Radiation Protection (CIRP) and Japan Atomic Energy Research Institute (JAERI)
about Cooperative Research on Assessment Method on Radiological Safety for Shallow Land
Disposal of Low-level Radioactive Waste Phase 11 ". The test mainly consists of 3 parts: (a) the
tracer migration test in the assemblies (Type 1); (b) the radioactive tracer migration test in aquifer
with a frame (Type 11); (c te stable element migration test in aquifer (Type 111). To understand
611 -

JAERI-Conf 2002-004
the migration differences of non-adsorption tracers, the mixed migration experiments for 3 H andBr- were carried out using assetnNy.Field tracer migration test was conducted in the Undergrotind esearch Facility (URF) of teCIR-P's field test site. URF consists of an Iclined Shaft, a allery 3 Vaults and all ExperimentalShaft. A plain view drawing o Gallery, Vaults and Experimental Saft is shown in Fig. . Thedepth of UPW is 28 m to the ground level, Experimental shaft with , size of 2.5 m diameter x 6 ndepth is in the west of Gallery of URF. It penetrated the first phreatic aquifer, Water table is 30in. Type 11 and Type III were directly conducted below undisturbed aqueous medium of Vault Iand Vault 2 and Type I was onducted in the asserriblies filled with undisturbed aqueous mediumsampled from aquifer. Assemblies were inserted into the aqueous medium through ExperimentalShaft wall.
N
Vault I Vault 2
7'
11', 17. 12. ".-18'
Exp. Shafi
Gatlery
Inclined Shaft
F
0 0,O)
S.Ic a 1 5
Fig. I Plahr view drawings of Gallery, Vaults ad xp, Shaft
2 EXPERIMENTAL
The purpose of migration test in assembly is to acquire the data on tracer migration in aqueousmedium filled the assemblies. 2 kinds of tracers are sed for the tests, One ncludes radionuclides,3H, 9Sr , 237 Np rd 238pU� The other is staple lement, Br', Sr, Nd and Ce. The objective ofmigration test of H and r i to get exact groundwater velocity through aqueous medium,An assembly consists of two coiturins Filled with udisturbed aeous edium, fiang adsampling plate, Fig.2 sows the shematic diagram of tire assembly,The assemblies were inserted aquifer through wall o experimental shaft, One end of teassembly was coritact losely with loess of auifer and groundwater trough the assembly flowout from the other end of assembly Te effluent trough the assemblies was collected intosample bottle ad measured. The tracers in the assemblies disperse ad migrate due to waterdynamics. The assembly test an confine tracer to a given area,
- 612 -

JAERI-Conf 2002-004
An entire ssembly is designed toconsist of two sections of Tracer sourcecolumns, each with a ength of 50 Column layer- Flauge
cm. The column was designed toSainpling plate
have two kinds of innerdiameters, 108 and 240, for -p- Growidwateruse in lacement of either plane tube
source or point source separately.Un&turbedThe column is ade of plexiglass. dium
The undisturbed aqueous medium 2�e, me \Permeable stone
is collected at aquifer layer 3 rnvertically below te opening ofthe experimental shaft. Aqueous Fig.2 Schematic diagram of assemblymedium is loess. The colurrins'so['I was collected at horizontaldirection according to actualwater flow direction, The 12d' 60measuring results of aqueousmedium are: dry bulk density is 32
(I 62 ± O I 0) g/CM3, water content 42
(v/v) is (42A7�-12)%.Tracer absorbed on quartz sandacts as tracer source layer, The 181? Op
size of point source is 14 rm-n X
24 mm high. The tickness of
plane source is nm�
The effluent through the
assemblies was periodically 2400 30?collected in sarnple bottle, and
transported to laboratory for Fig.3 Soil sample distribution cross-sectionmeasurement of 34 and Br',
Assemblies were taken out when for the assembly with 4) 240nrm
test finished, Te soil filled the
assemblies is cut into ne-
dimensional sample for Plane Source assembly and two-dimensional sample for Point Source
assembly. The umber of Point Source samples for each layer is 3. Figure 3 show soil sample
distribution in cross-section for the assembly ith 1) 240 mm,
Soil samples were put i plastic box. After atural air-dry and weigh, samples were transported to
laboratory for easurement,
3 EXPERIMENTAL RESULTS AND ANALYSES
3.1 Measurement ethod of samples
613 -

JAERI-Conf 2002-004
Direct measurement of 3H concentration in water sample was made sing Tri-comb 2250 liquidscintillation counter; B in water samples was measured with odel 721 spectropbotometer.Concentration of Sr, Nd ad Ce in water sample was measured using CP, 237Np concentration insoil samples were first measured with HPGe low energy photo-spectrornetry ad then, afterchemical separation and concentration, the concentration of Sr and 38pu were measured usinglow background a counter ad low background spectrometer respectively.
3.2 Migration Of3 H and Be
I Water flow velocity
The pore velocity, u, was calculated by the following equation
LUW __t
where, u is pore velocity (cm/d), L is distance from source layer (cm), to is time at which peak ormass center appear.The water velocities during non-adsorption tracer migration test are listed in Table , The watervelocities during the entire non-adsorption tracer migration test is needed when retardationcoefficient Rd and 10rigitUdiDal ispersivity ct of radionuclides were calculated. Because thewater velocities of sorne assemblies during the etire non-adsorption tracer migration test are notconstant, the water velocities calculated need to be corrected. The correction coefficient of watervelocities for assemblies 2 3 7 and are 126, 1.58 119 and 168 respectively.
The pore velocities are listed in Table I
Table I Water velocity during non-sorption tracer migration test
Assembly Tracer Accumulative water L (cm) Pore velocityNo. volume by peak (L) (cm/d)
2 H 1.80 47.6 0.70
3 L54 45.0 1.71
7 Br 1.53 48.0 1 40
8 3H 1.61 T5�5_ 11 4
Tracer source layers are plane source in Table I Te iner diameter is b 108 111m,
(2) Comparison for migration velocity of both 3H and Br-
In order to compare the migration velocities of both 3H and Be tinder the same experimentalcondition, mixed migration experiments for 3H and r- were conducted using assemblies filledwith disturbed aqueous mediurn,Based on the results ad breakthrough curves, the migration velocities of 3H and By- werecalculated using moment method. as shown in able 11. Figure 4 shows the breakthrough curves
614 -

JAERI-Conf 2002-004
of 3H and Br- i effluent f the assembly 144, Similar phenomena also were observed in othertracers mixed migration experiment.
Table 11 Migration velocities of 3H and Br'
Assembly Shape of source Inner diameter of Tracer Pore velocityNo. assembly (cm) (cm/d)
12 Point source 24 3ti 1.04Br 1.23T T
3 Point source 29 H 0.90Br' 1.053H 1.11
14 Plane source 29 Br 1.31
It can be fo"nd from Table 11 thatBr:' migrates at faster velocity than Br- -X-H-3H whatever tracer source layer is 1. 00point source or plane source when 0. 80the aqueous medium is loess. P 0 60
U X0. 40 -3.3 The migration of Sr, "'Np and U 0 20
238PU 0. 00 X-X"X.
0 20 40 60Figure 5 shows longitudinal Cumulative Outflow (L)distribution of the radionuclides insoil. Fig.4 Breakthrough curves of 3 H and B-Migration velocity of tracers can be in assembly 140calculated by the following equation
UN X../ t (2)
where, UN is migration velocity of 1. E05> 1. E04 0 Sr-90
tracer (cm/d), Xnax is position of peak z., -X-Np-237U tol. E03
(or mass center) of tracer (cm), t is < L E02 Pu-238
test period (d). 1. E01The retardation coefficient, Rd, is 1. E+00
1. E-01 -
Rd= (3) -200 0 200 400 600UN X (mm)
also Fig.5 Specific activity distribution of radionuclidesin soil of assembly 2 Q=976 d)
PRd = I Kd (4)e
- 615 -

JAERI-Conf 2002-004
Where, Kd is distribution coefficient (ml/g); p is dry density of soil, p1,62 g/cm 3; n, is effectiveporosity, n,=0.254.The fitted results of nuclide migration arameters are listed i Table 11, Form of source layer isplane source. It can be found tat migration distances of other tracers are 'Very short except 90 Sr.
Table III Fitted results of radionuclide migration velocity and other parameters
Assembly Radio- XM8X Migration Retardation DistributionNo. t (d) nuclides (cm) velocity coefficient coefficient
UN (cm/d) Rd Kd (ml/g)_�"Sr __2�95 3.02E-3 290 45.3
2# 976.3 217 Np 0.1 1.0213-4 8,60E+3 I 3 5E+3238PU 0.1 1.02E-4 8.60E+3 1.35E+3
90sr 5.25 5.38E-3 502 7K63# 976 .0 23INP 0.1 1.02E-4 2.64E+04 4,14E+03
238PU 0.1 I 02&4 2�64F+04 4,14,+0390S r 2.05 3.99E-3 481 75.3
8# 514 .0 217 Np -0.95238PU 0.55 1.07E-3 139E+03 280
Longitudinal dispersion coefficient, D,,, is calculated by
I d 7., 2D� = - (5)
2 dt
Where, D is longitudinal dispersion coefficient (cm 2/d); u,2 is variance of longitudinalconcentration distribution (crn 2).
The mass center and variance of concentration of tracers are calculated by moment method.Position of mass center is calculated by first moment
(x, t) xdx ECI 'Xi Axi(6)X0 W �O IC, Ax,
fC(x, t)dx
Where, xO (t) is distance of mass center at time (cm); c (x, t) is concentration of tracer at x and t(Bq/g), x is longitudinal coordinate(cm).Variance is calculated by quadratic moment
2 fC(X X ) X IC,(x-x,)2 �Ax(7)
fCdx zC I AX
- 616 -

JAERI-Conf 2002-004
And the relationship between longitudinal dispersiviiy, aL, ad ongitudinal dispersion
WeffiCieDt, Dx, is as follows
D" U. (8)
The itted results of longitudinal dispersion coefficient and longitudinal dispersivity arc listed inTable IV
Table A Fitted results of ariance and dispersion coefficient
Assembly Pore Radio- Variance Dispersion Longitudinalt (d) Velocity �'Oefficierit dispersivityNo. I nuclides X2 CM2) 2�
uw (mid) D, (cm d) C LCM)
-- "'Sr 3 3.03 1,69E-2 2.28E-22 976.3 0.59 2.90 1.4913-3 2.0 E-3
23 U 0.50 2.56E-4 3.46E-6_7S-r 29.76 1.52E-2 7.72E-3
3 976.0 1.25 237 Np 1.611 8.25E-4 4 19E-4238PU 0.662 33.39E-4 1.72E-4
90ST. 15.61 1.52E-2 9.05E-3
8 514.0 1.00 p 1.911 1.86E-) 1 I I E-3238PU 0338 -3 ).29E-4 1.96E-4
3.4 Effect of humic acid on nuclide migration
Humic acid is placed upstream of tracer source layer in assemblies 3 and 8 The objectiveof placing hurnic acid is to observe effect of it on nuclide igration. Normalized migrationvelocity, g, is used as inter comparison scale. It represents nuclide migration distance at unit timeand unit water flow velocity. In other words, it is the nuclide migration velocity at unit water flowvelocity.
Comparison is conducted only for the radioactive, 9Sr, because the peaks or mass centersof concentration dtribution of the other tracers (237Np and 238 Pu) are very short, so it is difficultto compare their migration, The normalized migration velocity of Sr is calculated and listed inTable V.It can be found from the table V that the normalized migration elocity f Sr in assembly �without humic acid is smaller than those in the assemblies with humic acid whatever according tothe peaks or mass centers. This indicates that the humic acid retards igration of Sr in Loess Itis difficult to decide whether or not the effect exists for 21'Np and 21'Pu, because the peaks ormass centers of concentration distribution of thein are minor.
Table V Normalized migration velocity of Sr
Assembly um Re NotesNo. By peak By mass center
2 3.44E-3 7.42E-3 Without humic acid3 3.58E-3 With humic acid I g8 5.52E-3 Wi�h hurnic acid I Og
617 -

JAERI-Conf 2002-004
3.5 Eccentric phenomena of concentration distribution
Assembly 5 was filled undisturbed2500
aqueous medium. The inner 2000
diameter of it is 240 mm. Tracer'5: 1500source is point source, Figure 6 is0 1000radial distribution of S i soil of 2',
assembly 54 when longitudinal 500Z
distance is 16.5 mm. 0It can be found from the figure 6 -110-90-70-50--22 22 50 70 90 110
that the concentration of each sector Radial Coordinate ine)at downward orientation is larger
than the corresponding sector at Fig.6 Radial distribution of Srupward orientation. in soil of assembly 5 (x--16.5 mm)As an example, eccentric grade of9OSr at orientation 52-55 in soil isshown in Fig.7. The eccentric grade,P, is defined as 4.5
43.5
P=Ad/A,, (9) Cd 3bjD 0 0
2.5 00: 0 0Where, Ad is specific activity of .0 002 0 oe 0 0nuclide at downward orientation, 1 5 0 0 0 0and A. is specific activity of nuclide Iat upward orientation. 0.5
It is found from the figure tat all of 0-50 0 50 100the eccentric grades are more than
The eccentric grade near tracer X (mm)source are 1.77-2.84 and theaverage value is 23. Moreover, the Fig.7 Eccentric grade of 9Sr aiong orientation 52-55eccentric grade decreases with in soil of assembly 4longitudinal distance, x, and tends to (square frame in Figure represent position of point source tube)1. The eccentric grades also exist forother nuclides.
4 CONCLUSION AND DISCUSSION
According to measuring results of effluent and soil samples, some preliminary conclusions wereobtained:(1) As a whole, migration distance of peak or mass center for "Sr, "'Np and ... Pu in soil are minor.Especially, there is no obvious migration for 238ptI, It is idicated tat oess has stronger sorptioncapacity for the radionuclides.(2 A comparison of nuclide migration pattern suggests that teir 1111gration velocity follows90sr�>237 Np >23 'Pu.
618 -

JAERI-Conf 2002-004
(3) 3H and Br- are all non-adsorption tracers, but their migration velocities are different. The studyof this phenomenon is worth. Bf migrates at fster velocity than 3R Tis may be due to that Bf-is negative charge, The migration of Bf increases because of effect of exclusion.(4) It is show te umic acid retards migration of Sr under tile same condition (for example,
assembly diameter, tracer source type, and tracer quantity). It is difficult to decide whether or notthe effect exists for 21'Np and 21'Pu, because the peak or mass centers of concentrationdistribution of them are minor.(5) It can be found from the Figure 7 that eccentric phenomena exist in course of tracer migrationin assemblies. Te possible reasons are that rdionuclides sedimentated down or water flow fieldis not uniform in this area. This phenomenon should be noted.
- 619 -

This is a blank page.

JP0250359JAERI-Conf 2002-004
DIFFUSION COEFFICIENT TST OF 217Np IN BENTONITE
BACKFILL MATERIALS
Anxi Cui*, Zh1wen air*, Jinsheng Zhang*, Cunh Gu*M. Mukai**, T. Maeda'*, J. Matsumoto", T. Tanaka'*, H. Ogawa**
*China Institute for Radiation Protection
270 Xuefu Street, Taiyuan Sanxi 030006 Cina
Fax: 86-351-7020407, e-uiait: citianxi�lrounail.corn
"Department of Fuel Cycle Safety Research
Tokal Establishment, Japan Atomic Energy Reseatch Institute
Shirakata 2-4,Tokai, Naka, lbaraki, Ja'an,319-1195
Fax: 8-29-227-5401
ABSTRACT: This paper describes thework on diffusion coefficient test of Np i bentonite backfill materials.
Due to its very low permeability, diffusion is the dominant migration mechanics in beirtonite. The bentonite
comes frorn Inner Mongolia of China, "Np was used as tracer. Te special apparatus for diffusion test was
setup, te diffiision coefficient of Np in pure bentoiiit ad sand-bernoitite rtrixtrif e were tested. The tracer was
introduced between two bentonite columns. After a specific contacting period, the bentonite columns were
taken o ad out to very tbin slices. The adioactivity i bentonite slices was analyzed to give the nuclide
concentration versus distance curves. The difftjsjoo coefficient could be estimated. The diffitsion coefficient of
pure belitorifte at different density was tested. When the density of pure bentorrite samples varied from 1. 1 13,
1.5 to 1.7ghril, their diffusion coefficient were 1.36xlO-"m/s l.l6xl0-`m'/s, i.07x10"m�/s and 8.26xlO-
14m'/s respectively. The diffiision coefficient of Np in sand-bentonite mixture sample was 4.13x I 0-"rn'/s To
estimate the distf ibution. coefficient (K� value of Np in mixture sample by diffusion method, the diffusion
coefficient of By was measured. The concluded Kd value was 77ml/g for the sand-bentonite mixture. The K,
value obtained by batch test methods was 3ml/g. The reason is related with the eor of Br diffusion
coefficient ad solid-liquid ratio.
Key words: Np, Diffusion coefficient, Bentonite, Backfill materials
1. INTRODUCTIONDisposal is considered as the final solution for radioactive waste. To design the disposalfacility, both or /1,LW or HLW, multi-barrier concept is always the important principle tofollow for isolatifig the radioactivity in the disposal site for a long time. entonite (somecases te ixture of Bentonite and sand) is usually used as backfill aterial in radioactivewaste disposal facility due to its low permeability and strong sorption ability forradionuclides. Performance assessment sdy of the disposal facility shows that backfillmaterials plays iportant role for the whole system as engineered barrier. Model calculation
of the adionuclide rigration in the backfill material needs mny parameters, of those,
diffusion coefficient is the important oe. This paper describes the work on diffusion
coefficient test of Np M entoirite backfill materials.
The tested bernonite was collected from Inner Mongolia of China mixture 2 uses the
- 621 -

JAERI-Conf 2002-004
bentonite from Japan). The chemical composition and properties of the bentonite are givenin table I and table II. The difftislon coefficient of pure bentonite was ested, for differentdensities, as 11 13, 1.5 to 1,7g/cm3 respectively. The mixture of sand ad bentonite wasmade with sand: bentonite as 85%:15% in weight, the initial water content is 6 for purebentonite and 10% for mixiftire. The tracer used in test is 13'Np.
Table I chemical composition of bentonite
Components W, % Components W, % Components W, %
S'02 60.97 T'02 0.099 K20 0.119Fe2O3 1.26 Mno 0.018 Na2O 0.75FeO 0.09 CaO 1.72 P205 0.030A1203 12.69 65 Burnt loss 19.87Total: 100.26
Table 11 Basic properties of the bentonite
Items value Items valueParticle density(g/cm3) 2.61 Cation exchange capacity 83.40
(mmol/100g)Water content(%) 30.44 Exchangeable K(mmol/100g) 0.34Dry bulk density(g/cr �) _F3 -l � Exchangeable Na'(mmol I 00g) 1�.60 �Saturation ratio(%) 80.25 Exchangeable Ca'(mmol/ I 00g) 52.92Liquid limit(%) 99.8 Exc�angeable Me(mmol/100g) 27.86PH 7.32 Plastic index 58.8
(M2/g)Total surface area 617.48 Plastic limit(%) 41.0Particle distribution(mm
> 025 3.090.25 - .10 0.920.1 - 0.05 22.690.0 - .01 8.40.0 - .005 5.2< 0.005 59.7
2. DIFFUSION THEORYMolecule diffusion in aqueous phase is the dominant mechanism when onsidering atracer diffusion in a porous edia. The diffusion is caused by chemical potential wen theconcentration difference existing. Diffusion equation can be described as tile Fick's law asfollowing:
dCF = D (1)
dAwhere: F is the solute flow rate in nit time(per second) ad nit area (per M) D is
diffusion coefficient; C is the concentration of the diffusion soitue.
dC is concentration difference.dA
The equation of diffusion in a one-dimension case can be described as Fick's second law
- 622 -

JAERI-CODf 2002-004
as follows:
dC d'C
dt dx 2
The solution of equation 2) in the one-dimension case, where the diffusion coefficient isregarded as constant value, and independent of concentration, is written as:
M 2
- exp( (3)C(x't = VZOt 4
where: t is the diffusion time; x is the diffusion distance- M is the total amount of diffusionspecies per unit area.Equation 3 can be rewritten as:
M x 2(4)
In C(xt = I �4�t + 4Dt
The equation shows the relation between concentration and distance under the assumptedcondition, that is the InC has a liner relationship with x. If the curve of C and X2 can beobtained through test, then the diffusion coefficient will be drawn of from the slope of theline 12].
3. DIFFUSION TEST AND SAMPLE CUTTING APPARATUS ,2,3,4,5]The apparatus for diffusion test consists with two parts: over package ad diffusion cell.The specialty designed diffusion cell an. hold and maintain the specimen as integratedduring and after testing. The diffusion cell was put into over package and first wassaturated for a certain period of time, then under the saturated condition. The diffusion cellis easy for connection with a sample cutting device. The diagram sketch of the diffusionapparatus is shown in figurel to figure 3.
Figure 1. Diagram of diflusion cell from birds view and A-A section
nPermeable
piate
U
Figure 2 Diagram of diffusion apparatus over package
623 -

JAERI-Conf 2002-004
bentonite specimen
--- 2. tracer layer
L--j U
Figure 3 Diagrarn of inside view for diffision apparatus
For the test specimen preparation in diffusion cell, the certain amount of bentonite
estimated by the expected density was put into the cell and compacted, The same two
diffusion cells with bentonite specimen were set in oe over package and saturated by
pressured water. After two months contacting with pressure water, te bentonite column
was saturated. Then the '37Np tracer was introduced between the two cells. The contacting
time for ... Np and diffusion column was about 50 days. And the diffusion olujim was
taken out for cutting to thin slices.
Sample cutting apparatus was designed with screw thread for the distance ounting, When
the screw turning for one rotation, the screw was push forward for I run. Thus according
to the angle the screw turned, an expected distance of specimen an be pt out of the cell
for cutting. Experiments showed the pure bentonite specimen could be out to a ,2 mm
thin slices. The diagram of the cutting device is ahown in figure 4,
Bentonite
Figure 4 Sample cutting apparatus
In fact, after contacting with 21'Np tracer, the diffusion cells were taken ot and the
bentonite column was out to a ,5 or .Omm slices, air dried for two weeks for sample
analysis. The measurement of the sarnple was done by a 7 spectrometer for the Np
concentration in each sample. And te alculated InC was obtained to draw te curve of
InC versus x2, then the diffusion coefficient an be estimated according to equation 4 The
density of pure bentonite samples varied from 1, 1 13, 1 5 to I 7g/= i experiment ad
the sand -bentonite mixture is 1. 85g/cin'.
4. RESULTS
The diffusion test results for different density of bentonite a-re shown in figure to figure
624 -

JAERI-Cont 2002-004
10. The equation in the fiWlre i the regression results of the tested data. The estimateddiffitsion oefficient is listed in table 1.
B y ---- -0.4074x 79004 10 = 0 4773X 8722
7 R2 � 09817 8 = 96756
6
3 42 2i !L0 -- - - '' -- - - I 0
0 5 10 15 0 5 10 15x2 x2
Figure 5 Difflusion curve of Np in bentonite Figure 6 Diffusion curve of Np in bentonitep� I. I g/cin', contacting time 50 days p=1.3g/cm', contacting finie 50 days
I F y = 0.5213x 67587 -0.7006x + 7185
R = 08598R' 0.9581
44
2 2
0 . .... . 0 -------
0 to 20 30 0 10 20 30X2 (,nIn) X 2 (TM,)
Figure 7 Diffusion curve of Np in bentonite Figure Diffusion curve of Np in bentonite
p=1.5g/cm', contacting time 50 days p=1.7g/crn, contacting time 50 days
y--0.1346x+8.3964 12 y--0.0549x +8.4162
I R2=0.9204 1 0 R'= 09316
8 8
64 4
2 20 0 ----------
0 20 40 60 0 50 100 1502 (MM)
XI (MM) x
Figure 9 Diff-usion curve of Np in mixturel Figure 10 Diffusion curve of Np in mixture2p=1.85g/cm', ontacting time 50 days p=1.85g/cm�, contacting time 50 days
625 -

JAERI-Conf 2002-004
Table III. Diffusion coefficients (m2/s) of Np in Bentonite
Sampl media Density(g/cm') Regressed equation Diffiision coefficientse No. (1112/S)
I Bentonite 1.1 InC=-0.4074X2 +7.9004 1.36xlO-"
2 Bentonite 1.3 hiC=-0.4773X2+8.0722 1. 16x 10-13
3 Bentonite 1.5 InC=-0.5213X2 + 67587 1.07x 10-13
X2 10-144 Bentonite 1.7 InC=-0.7006 7185 8.26x
5 Mixture 1.85 hiC=-O 1346X2 +8.3964 4.13x 10⁻¹³
6 Mixture2* 1.85 InC=-0.0549X2+8.4162 1.01 X 1-12
*Mixture2 used the Japan Bentonite Kunigel-VI
4.1 The diffusion coefficientbecomes lower with the density increased, this is because of
the lower porosity and thus te lower water content.
4.2 The addition of sand caused the diffusion coefficient also decreased because of the
lower adsorption ability of mixture.
4.3 The diffusion coefficient of pure bentonite at different density was tested. When the
density of pure bentonite samples varied from 1.1, 13, 1.5 to 1.7g/ml, their diffusion
coefficient were 1.36x lo-IIM2/S 1. 16x lo-11M2/S' 1.07x lo-11M2/s and 8.26x 10⁻¹⁴m 2/S
respectively. The diffusion coefficient of Np in sand-bentonite mixturel sample was
4.13x lo-11M2 /s and mixture2 1�01X10-12M2/S.
4.4 To estimate the distribution coefficient (Kd -value of Np in mixture sample by diffusion
method, the diffusion of non-adsorption species B (added as KBr) in mixture was
conducted. The diffusion coefficients of Br in mixturel and mixture2 were 1.55x 10-IOM2/S
and 2.80x 1 0-IOM2/S, the concluded Kd value were 77ml/g and 54ml/g[l], However, the Kd
value obtained by batch test methods was 30ml/g and 24ml/g respectively. The reason is
related with the error of Br diffusion coefficient and solid-liquid ratio.
Reference:
1. Yngve Albinsson, Radioactive Waste Management and Nuclear Fuel Cycle, 199 1,Vol. 54), pp. 22 -
239.
2. Yao Jun et al., Diffusion of 2'Np in Bentonite, China Institue of Atomic Energy, 1998.
3. Xu Guoqiang et al., Diffusion Study of Cs-137, Pu-239, Ani-241 in Bentonite, Beijing Geological
Research Institute of Nuclear Idustry. 1997.
4. Masaki Tsukamoto, Radiochimica Acta 66/67, 397-403(1994).
5. Zhou Kanghan, Performance Study of Backfill Materials for Geological Disposal of HLW, pp.98-
106, Thesis Application for Doctor Degree of Qinghua University, 1997,
- 626 -

JP0250360JAERI-Conf 2002-004
STUDY ON THE DISTRIBUTION COEFFICIENT FOR VALUATION OFNEPTUNIUM'MIGRATION IN LOESSIMEDIA
--- Cooperative Research Progra o Field Migration Test etween CIRP and JAERI---
Tadao TANAKA*, Toshikatsu MAFDA*. Masayuki MUKAI*,Junko MATSUMOTO*, Hiron-iichi OAWA*,
ZhenLang LI**, Hongqing ZHANG**, Xudong WANG", Anxi CUI**, Liangtian GUO**
* Department of Fuel Cycle Safety Research,Tokai Establishment, Japan Atomic Energy Research Institute,
Shirakata 24, Toka', Naka, lbaraki, Japan, 319-1195.Fax. 1-292-282-5934, email: tanaka�sparelt.tokaijaeri.gojp
** China Institute foi- Radiation Protection,270 XueFu Street, Taiyuan, Shanxi 030006, China.
We have performed adsorption exper 'ments of 237 Np oto the loess by a batch system, migrationexperiments of 13'Np through the loess media by a column ysterri, and migration ets of'-";7 Np through naturalloess media in the field test site o CIRP, Shanxi, China, The valid distribution coefficient (Kd) value was
717determined on the basis of the - Np concentration ii) both the static batch and the dynamic column experiments.An adsorption ratio corresponding to the 237 Np concentration at the peak position of the 237 Np migration throughthe column was calculated from the adsorption isotherm. The apparent Ke calculated was in well agreementwith the Kd value estimated from the migration behavior of 237 Np in the migiation system, The valid Kd valueof 237 0 C,
Np� of which specific activity is very low due to a long half-life, can be determined in the batch and columnsystems, Applicability of the Kd determined by the batch system into the evaluation of radionuclide migrationwas confirmed through aalyses of the result obtained from the 237 Np migration test in natural loess media.
237Key words: Adsorption , Np, Loess, Migration, Distribution coefficient
1. INTRODUCTIONLow-level radioactive waste disposed to geologic media can migrate into the
biosphere with circulating roundwater, accornparried with retardation by adsorption onto thegeologic barriers Thus, inderstanding the retardation process in radionuclide migration isimportant in te assesstrient of radioactive waste disposal sites. The retardation process can
be conservatively quantified y using s1n-ipJe thermodynamic eilibrium: distribution
coefficient I) that is defined by te ratio of radionuclide oncentrations on geologic media
and in groundwater[l],[2]. The Kd has been generally determined from adsorption
equilibrium in a static batch system, despite adsorptive conditions in te batch system are
different from those in the dynamic migration system. Therefore, there is a need to validate
whether Kd values obta)ned from the batch system are adequate to estimate the migration
behavior of radionuclides through the geologic media.
JAER ad China Institute for Radiation Protection (CIRP) have studied on the
migration behavior of some elements including transuranic radionuclides in natural
environment, nder the cooperative esearch project[3],[4] I e research project, we have
performed adsorption experiments of 237 Np in a batch system to. provide relevant adsorption
data of 237 Np onto te loess, igration experiments of 217 Np in a column system to elucidate
the igration behavior of 237 Np through the loess media, and we have also conducted
migration ests C)f 217 Np through natural oess media in the field test site of CIRP, Shanxi,
China. In the present sudy, we discuss on determination methodology of valid Kd value to
evaluate quantitatively the igration behavior of 237 Np through the toess. In addition,
applicability of the Kd determined by the batch system into the evaluation of radionuclide
migration was discussed trough analyses of the result obtained from the 237 Np igration test
in natural loess inedial
- 627 -

JAERI-Conf 2002-004
2 BATCH ADSORPTION XPERIMENTS2.1 Loess sample, radionuclide an S416011
The loess samples ollected from the aerated zone and the aqUifff zone of the fieldtest site of CIRP was used in tis expernrient. he loess ws sieved to remove coarse
of 27particles larger than 0.5 irrili, Nitrates NpO2' was used for the experiment Anequilibrated solution sing for experiment was repared as follows: the loess sampleamounting to g had been contacted with 100 ern 3of deiortized water for 7 days. Tesolution was filtered using Millipore filters of 450 irm pore dameter, Tile solution phaseseparated by the filtration was sed as the equilibrated solution.
2.2 Experimental procedureThe loess sample amounting to O�5 g ad been contacted with 10 cm 3 of deionized water
for 7 days. Then 0 I cm 3 of 237 Np stock solution was added. The eiriperature was
controlled at 25 IC by using a air circulation box. The S1110011 containing the sample wasgently agitated on a shaker at 60 rpm for 7 d. After the adsorption process of 7 d in thecontact time, the Slution was filtered using Millipore filters f 450 nol pore diameter.Concentration of 237 Np in the filtrate was easured using a), -ray detector,
Distribution coefficient of 237 Np, Kdad, (C,113/g), was alculate by
Kdads co V
C Wwhere Co is the initial concentration of 237 Np in solution (Bq/cin), C the concentration of237 Np solution after the asorption process (Bqic,113), V te volunle of olution (enrl ), W theweight of loess sample (g).
2.3 Adsorption properties of 237 NpSpecific activity Of 237Np is very low, due to a long half life, The concentration of
237 $ 3Np applying in the present experiments is i about 10-9 - 10- rnol/dril In higherconcentration range, the asorption isotherm of 237 Np ay be ot based on Henry's type, fso, the adsorption properties of 27 Np on the loess are affected by its concentration.
Figure 3 shows, the asorption iSodierrn Of 237 Np o the oess. Plot of InQ versus MCwas in a linear relations This result idicates tat te adsorption iSottler1l, Of 237 Np is asedon Freundlich's ype:
1/nQ = aC . (I<n<10) (2)Hence,
Kdads = aC(1 - n)/n (3)
where a and n are constant.
Thus relationship between 217 Np concentration and apparent Kdads is given y K(s = 4x io2 c-0.42 or Kd�"' 3 XI O' Q-11M , Te relationship beLWeen 237Np concentration and
apparent distribution coefficient K'd' corresponding to te 237Np concentration (Q) adsorbedon the loess is shown in Fig.4, The Kd'd,-, VaILIOS deCreaSed With increasing 237 Npconcentration. In the igration test of 2-'Np, self as olunin experirrierit ad field test, the237 Np concentration is expected vary i wide rangs during the test period, I sch cases,
,nf, else of 37it is necessary to take account of the LI Np concentratio ito the evaluation of231 Np migration.
In the migration test, information relating to .237Np concentration through a ledia fo Kddetermination was the 237 Np concentratiot) introdoced into the rnedia and b(, coricentrationpeak of 237 Np migrated tough the edia, Tile 237 Np concentratio iroduced io te
- 628 -

JAERI-Conf 2002-004
media is defined as in initial concentration; Co n the case ntroduced as a solution or Qo inthe cast, introduced as a aveled soil. Te oncentration peak-, of � T17 Np nugrated through the-media is Indicated y the peak dissolving in solution phase C,,,, which is observed inbreakthroug crves of 237 Np concentration in solution pase, r the peak asorbing on solid
of 237phase Q,,,, which s observed n distribution rofiles Np in the triedia. Based on the Co,Qo, Cill or Q, alid Kd value for the migration (Evaluation relay be estimated from the resultsobtained i te batch asorption experiments.
3.DIS'rRtBUT1ON COFFF11CIENTS FOR ANALYSES OF RADIONUCLIDE MIGRATIONIn the porous loess edia, 237 Np migration with water ovement is expressed by the
equation I :
ac P aQ a1c ac+ - = D V - (4)
0 at _� X-7 ax23� 3), of 237where C is Np concentration In Slution (Bq/cm Q concentration Np adsorbed on
porous loess rnedia (Bq/g), p density of loess media (g/cm 3), 0 water content, D dispersion2/111,11),coefficient (crn V velocity of water (cmirnin), t time (min), X length (cm).
Provided the reaction of 237 Np between solution and loess media is based on theinstantaneous reversible reaction, the igration of 27 Np can be explained by introducing thedistribution coefficient:
Q = Kd jnigC (5)
andRf= I (I -J)p Kd Mig (6)
0where f porosity, Kd"'g distribution coefficient in migration system (CM3/g) Rf retardationfactor.
Substituting Eq.(5) and 6) into Eq.(4), we obtain
a2QaQ aQ I- = (D V - ) (7)at aX2 ax Rf
Therefore, if the values of Kd"9, V and D in the column system are known,one-dimensional concentration distribution of 237 Np in the oess media can be estimated bysolving Eq.(7). On t oer hand, if the K'g value is unknown, it can be determined byfitting h concentration distribution calculated from the Eq.(7) to that obtained in themigration experirrient uder the available initial and boundary conclitions[5],[6].
4.MIGRATION TSTS OF NEPTUNIUM. Migration tests on te cooperative research program consist of tracer migration tests in
aerated and auife Znes at a CRP's field test site, large scale SilnUlation test, fundamentallaboratory experiment, Details of these migration tests were reported elsewhere[31,[4].Schematic illustration of ttach migration test is shown in Fig.5, together with the test resultsobtained as migration behavior.(1) Fundamental experiment by small-scale colunin (MT-1)
The column made of Teflon was 25 cm lie nner diameter and cm in height, and it hadmembrane fihers, 5 l,trn pore size, at the top and the botton) A ess layer was prepared bycharging 32. , g of te loess into the column to make a bed thickness of cm. Bulk density
629 -

JAERI-Conf 2002-004
and porosity of the loess ayer were 131 g/cm3and 48 % Ar the toess la er wascontaminated by passing through cm3of the 237 Np solution, a total of 500 X of theequilibrated solution was fed Mto the contaminated loess layer, fron-1 the ottom at a flow rateof ca. 0.5 cm 3/Min by a micro tbe pump. At the end of the experiment, oess samples weretaken from the column at every 0.5 cm section in depth. The water velocity, V, and thedispersion coefficient,2D, in the present experimental system had been found to be 019cm/min and 0028 cm /min, respectively, from breakthrough property of tritiated water as anon-reactive tracer.
100000
*Aerated soil
10000 OAquifer soil
1000 0
M%_1CY 100
10
0.01 0.1 1 10 100 1000
0 (Bq/CM3)
Fig.3 Adsorption isotherm of 237 Np on the loess.
10000�*Aeraterlssoil0 ui oil
O Aquifer soil
E 1000
0
C0
100
CL
10
10 100 1000 10000
Q (Bq/g)
Fig.4 Influence of 237 Np concentration on Kd�"J'
- 630 -

JAERI-Conf 2002-004
(2) Simulation tests by arge-scale column (MT-2 and MT-3)Demonstrative smulation test by large-scale column was onducted in laboratory of
the CIRP, sing undisturbed soil saniples taken from the aerated zone and the aquifer zone inthe field test site. wo sets of equipments wre provided to perform ach migration test; oneis tested for 1.5 years ad the other for 3 years, The undisturbed soil column for the aeratedzone test MT-2) had 28 c in diameter ad 20 cm in height ad it ad dturbed soil layersat te top and the bottom a wick rope that educed water content i the column and asprinkler, Quartz sand witli 60-80 ruesh mixed with racer solution, as placed on theundisturbed soil to be nrade a bed thickness of mm. Distilled wter was used as test waterand the averaged sprinkling density was 55-5.6 rinn/d for each CJUmn.
The soft tank set the undisturbed soil of 0 x 30 x 30 ciri was prepared for the aquiferzone test MT-3). A point source with 4 cm x 4 mm, which was mixture of the quartz sandand tracer, was placed on te center axis at a distance of 1 c from the inflow section. Thegroundwater was directly introduced into the test tanks through a pump.
(3) In-situ igration tests in aquifer zone (MT-4)The in-situ colunin tests were conducted using an undisturbed soil column referred as
assembly, in the Underground Research Facility (URF). Two sizes of tracer source wereapplied- one is point source with 23 cm Ox 1.8 cm, and te other is plane source with athickness of mm (Assy 2 and Assy 3 Both are mixture of tracer ad the quartz sand.Tracer igratio i the assembly is tested by directly installing tile assembly from theexperimental shaft wall into the aquifer. Flow rate of the groundwater was controlled by anattached valve on the end of out flow port.
(4) Field migration tests in aerated zone (MT-5 and MT-6)The pits for the tests were dug to 50 cm deep from the ground surface. Tracer
source material placed on te bottom with 120 x 50 cm and thickness of 7 mm, and then thepit was filled with loess soil Lip to ground surface level. The qartz sand is used as the tracersource material for the tests under artificial rainfall condition (N4T-5) while loess soil for thetests for natural rainfall condition (MT-6). The intensity of the artificial rainfall is controlledat a rate of 5rnm/h ad each pit is showered for 3 hours a day.
(5) Field migration tsti n aquifer zone (MT-7)The test pit was provided in the URF for testing three dimensional migration
behavior of tracer eienients under atural groundwater flow condition. The dimension of thepit was 2 Jong ad 1.5 n in width. In the pit, one tracer injection pipe and twelvesampling pipes were insetted into the aquifer layer up to the depth of about 26 in below thefloor of the URF.
5.DETERMINATION OF VALID DISTRIBUTION COEFFICIENTResults of te adsorption experiments showed that the adsoTtion properties of 237 Np
on the oess are affected by its concentration and relative Ki'd's of 37 Np between loess andsolution decreased wth increasing 237 Np concentration. In te present migration tests,information relating to 237 Np concentration through a media fc)r Kj determination was the237 Np concentration ntroduced into the media and concentration peak of 1 237 Np migratedthrough the media. Based on the concentration peak adsorbin o the loess, which wasobserved in distribution profiles of 237 Np in the edia as shown i Fig.3, valid Kd value forthe migration evaluation as estimated from the, results obtained i the batch adsorptionexperiments. Kd" value was determined by fitting the concentration distribution calculatedfrom the 237 Np migration odel of Eq.(7) to that obtained in the mgration tests (in Fig.5).
- 631 -

JAERI-Cont' 2002-004
WatersaturationM'F 1 Mcm 5m
Pump
co100
ricer1trati � 0on(Bq
O.SeM31min 01 0 1 2 3 4 5
Effluent Radioactive olution =3 Distance from influent edge (GM)Equilibrated solution: 500 cm3
MT-2Water tank
meter2500
Sprinkler2000
Disturbed sail C15000racer source '�p
31000Undisturbed s6 C
co 500
10 0 lo 20 30Disturbed soil Distance from tracer Source (cm)
VVCk rope
MT-3 20 BOX30X30 cm 20 2000
1750
1500-Trace
1250Undosturbed 1000
$oil sample d=4'My,750Pum C
outflow Soil tank inflow Soo meC0 2500
Well -20 -10 0 10 20 30 40 50 60
Distance from tracer source (cm)
MT-4
Outflow portPlexiglas ipe 100000 Le 2
10000 -Y
1000C::-N
100Permeable
Undisturbed soil stone 10 -5 0 5Range�-L Distance from tracer source (cm)
Fig,5 (a),Migration tests condUcted wider te cooperative research project[3],[4].
- 632 -

JAERI-Cont 2002-004
MT-5
Tracer ay jLt-j NP-237)
0OCOET 'a 00
�U 43
600 E 534E 751
E 400 697
200
Water sucker Ti Tensiometer0
N: Neutron moisture -5 -4 3 2 I 0 1 2 3 4 5
meter Distance from tracer,5ource (m)
120 cm
EEO E U
U-1
A,
MT-6 Tracer Layer [P:t:2 =(Np-=237)
E
0U1 low 142
E 394E A 527E 100 759
if 904
E C, 10Water sucker T� Tensiorneter
Jr N� Neutron moisture
meter - 4 3 0 1 2 3 4 5
oistance from tracer source (cro)
MT-7
4 000-21
300Q
rest pit 2000
1OQO
0
Groun Ole -10 0 1 0 20
Distance from tracer source, (cm)
FTJ (b) Migration tests conducted under the cooperative research pi-o'ect[3],[4].
633

JAERI-Conf 2002-004
ad,The Kd calculated was in well agreement with the K"�' value estimated from the
migration behavior of 237 Np in the oluain system. In the MD-6 and D-7 of the field tests,of 237their Kd`9 values could not caicuiated since the peak Np concentration did not move.
On the other hand, we had crified that the concentration distribution roffles of 237 Np inMD-6 and MD-7 could be estimated by using mean Kd"' Value 200 c /g, calculated from
ad, -iber ND- 1 to MD-5 4].K d values from migration test un
Table I Comparison between Kd ad' and Kdm'g in the migration tests.
Test No. 0 (Bq/g) Kd ads (Cm,/g) Kdmil (Cm,/g)
MD-1 300 490 300 - 500
MD-2 1700 - 2100 120 - 140 110 - 200
MD-3 80 - 900 220 - 240 190
MD-4 1000 3000 90 - 210 110 - 390
MD-5 450 - 00 240 - 370 55 - 190
MD-6 1000 200 - 200)
MD-7 4200 70 - (200)
6.CONCLUSIONSThe adsorption properties of 237 N on the oess are affected by its concentration and
apparent Kd"' decreased with increasing I Np concentration. pparent Kd ads corresponding237 237to the Np concentration at the peak position of the Np migration thi-OLIgh tile column was
calculated from the adsorption isotherm, and it was In well agreement wit te Kd"I valueestimated from the migration tests. The valid Kd value can be determined o te basis of the237 Np concentration in both the static batch and the dynamic column experiments.
REFERENCES[1] Y.Inoue, W.J.Kaufman: Health Phys. 9 705 1963).[21 H.M.Selim, J.M.Davidson, P.S.C.Rao: Soil Sci.Soc.Am.J., 41 3 1977).[3] M.Mukai, el at.: JNucl.Fuel Cycle and Envirom 7 31 200 ).[4] CIRP and JAERL "Final report: Cooperative Research Program on Field Migration Test
between CIRP and JAERT', 2001), in press.[5] H.Kamiyama, et al.: JAERI-Research 94-009, (in Japanese), 1994).[6] T.Ohnuki, S.Takebe, T.Yamamoto: JNucl.Sci.Technol., 26,795 (t989).
634 -

JP0250361JAERI-Conf 2002-004
ANALYSIS OF FIELD TEST OF NUCLIDE MIGRATION
IN AERATED LOESS LAYERCooperative Research Program on Field Migration Test between CIRP and JAERI -
M.Mukai, T.Tanaka, T.Maeda, J.Matsumoto, H.0gawa,
Jinsheng Wang*, Sliushen Li*, Yingjle Zbao*, Qnghua Wu*, Zhiming Wang*Japan Atomic nergy Research Institute, Tokai, lbarakj,, 1 9-1195 apan
Fax� 81-292-82-5934, e-maili mkai(c�,sparclt,tokaijaeri.gojp
China Institute for Radiation Protection,
XueFLi Street 270, Taiyuan. Shanxi, 030006 Cina
Field test of nuclide migration les been conducted as a cooperative research progiain between JAERI and CIRP.
I te program, nuclide migra tion in aerated loess layer has been tested to evaluate conventional migration model
demonstratively. Using thevalijes deterniined from laboratory tests, concentration distribution offield test has been
estimated. The estimatio sowed difference with the actual distribution in view of tbe movement of concentration
peaks. From the observation on water potential, adjustment was needed for water flow rate. Two values of water
flow rate, and 086 /d from spplemental tests, were used for the re-estimation of Sr-90 migration. Between
these, rn/d showed better agreement to the concentration distribution corrected with recovery ratio and fitting
analysis showed very low water flow rate of 0 13 cm/d. Dispersivities calculated using 0 13 m/d of water flow
rate for Sr-90 and Np-237 were almost a half as small as tose obtained by fitting analysis because of difference
of water saturation condition between estimation and the actual test. Though some care was needed to determine
water flow rate and dispersivity, the conventional migration model was able to estimate nuclide migration in
natural aerated loess layer as long as obtained a appropriate set of parameter values.
Key words: Radionuclide migration, Field test, Aerated layer, Loess, Cooperative esearch
1. INTRODUCTIONMigration of radionuclide in geologic media is generally evaluated using a migration model on the
basis of combined equation for advection and dispersion by groundwater flow together with
adsorption onto geologic media. This model has been included into a part of safety assessment
for low level radioactive waste in shallow land disposal, because this is a single existing model
practically applicable to actual situation. Though this ugration model has been applied to various
scale laboratory experiments with satisfactory results, there has still been uncertainty in the
applicability to migration in natural environment specially for transuranic nuclides. Thus, to
demonstrate the applicability of the migration model to the nuclide migration in natural
environment is one of most important issue to secure the reliability of safety assessment.
Japan Atomic Energy Research Institute (JAERI) and China Institute for Radiation Protection(CIRP) have been conducted field migration tests of radionuclides as a cooperative researchpro gram[ I]. In the pro gram a field test of radionuclide migration in aerated loess layer has been
1-7 Z-7
performed at the CIRP's field test site. Tracing test in aerated layer was performed to observe
tracer migration behavior in loess soil using the radioactive tracers of Sr-90, Np-23 7 Pu-23 8 and
H-3 and stable element tracers of Sr, Nd, Ce and Br. Four pits were provided for tests under
artificial rainfalJ ondition by regular water showering and five pits were for natural rainfall
- 635 -

JAERI-Conf 2002-004
condition. Soil samples wel-e tak-�etj several times to observe i-Digration behavior of tracers.
Laboratory experiments b batch and column method were also performed to provide Kd and
dispersivity for migration model to aalyze the results of the field testPrimary objective of this study is to evaluate the applicability of conventional migration model to
estimate TRU radionuclides mgi�ation in natural loess layer. To accomplish this objective,
following procedure has been performed:
1) Obtain the values of input parameters to migration model, using the information which is
available from the information sources of the site investigation, laboratory experiments, test
condition of the field migration tests before the finish of field test.
2) Comparison of migration distributions between estimated by te model using the determined
values of input parameters ad the actual field migration tests.
3 )) Discussion on the comparison. f there is difference between the distributions, review the values
of input parameters and nugration model.
2. ANALYSIS MODEL AND NECESSARY PARAMETERS
2. Migration model for calculationA migration model to be evaluated is conventionally applied to the field of Study o radionuclide
migration'.
aclat+(l f)p/(. 0�Q/at=D(a2(,./(3X2)-Vx(dC/aX) (1)
Q=KdXC (2)
where, Q epresents concentration of radionuclide in soil, C that in water, D dispersion coefficient,
Vx water flow rate in x direction, f porosity, p specific gravity, 0, watel- contents, and Kddistribution coefficient his model treats radionuclides migration by advection of water flow and
dispersion, and, simple thermodynamic equilibrium aong many models proposed or adsorption
behavior of radionuclide onto aeologic medium.
2. 1 Water flow rateMost general method to obtain water flow rate (V. cm/s) is by Using specific fx (q cin/s)
calculated with infiltration amount into the pits and effective porosity (ne) which oontributes
water flow path,
V = q/ne (3)
This method can be used very tffectively to obtain water flow rate foi- whole period of test nder
the condition like artificial rainfall where water content at te depth of several t () 111 oul be
assumed to be constants
2. 1 I Amount of infiltration wterAmount of infiltration watei- is otained using monthly amount of at ficial sprink ling and indoor
636 -

JAERI-Conf 2002-004
evaporation nder atificial rainfall condition When calculating specific flux in equation (3),
intermission of sprinkling should be taken into onsideration because sprinkling is interrupted by
some reasons stich a an adjustment of te sprinkling device, 3ollsampling, electric interruption,
and so o. Average nfiltration rate at time is calculated as follow:
Fav(t) � (acc(t - Eacc(t)) / Nday (4)
where, Fav(t) represents average infiltration rate m/d), Qacc(t) and Eacc(t) are accumulative
amount of sprinkling ad evaporation (cm), respectively, Nday number of days from the start of
sprinkling (d). Combining equation ) and 4), average water flow ate at time t (V(t : crn/d Is
Z.)given by using effective porosity as-
V(t = Fav(t / ne (5)
2.1.2 Effective porosity
Effective porosity was obtained from results of field migration test using H-3 ) and Br tracers under
'ficial rainfall condition by calibrating the equation ). In Pit- I and 'Pit-7, 11-3 ) and Br were
used as water tracer, and the tracers were sampled periodically at the depths of I m and 1. 5 i in
the pits with wter ,suckers. Average infiltration rates during the period when the peak of the
tracers was oving, fro I to 1.5 in are 9 06 nim/d for Pit-l and 965 mm/d for Pit-7.
Water flow rate can be directly obtained by analysis on concentration change of the tracers at the
two depths as 227 cmld or Pit I and 2 00 cm/d for Pit-7 by smple calculation dividing the
distance between two water samplers with the period of which a oncentration peak needed to
pass through. Froin these results, effective porosity of soil in Pit- I ad Pt-7 under artificial rainfall
condition are calculated ad summarized as 040 for Pit I and 048 fol- Pit-7.
2.2 Distribution coefficient
Two results from different tests are available to obtain distribution coefficient for aerated loess.
One is laboratory experiments by batch method[2], the other Is migration test using undisturbed
aeratedlayercolurnris[3]. Partoftheresultofthetestsaresummarizedasbelow-.
Sr-90 Np-23 9 Pu-2' ) 8
Batch method 190 70 - 1600 1200
Column test 55 133-199
2.3 Dspersivity
Among the three radionuclides used for the test, Pu-23 8 could not be determined the value
because of insufficient information on its migration in the laboratory tests. Information on the
migration for the other nuclides was able to be obtained and analyzed to determine the relationship
between dispersion length (DL) and migration distance of tracer peak (Lp).
DL (cm) - 0 I x Lp (cm) (6)
- 637 -

JAERJ-Conf 2002-004
The procedure to determine dspersion length for a certain nuclide is as ft-)Ilows�i) Determine movement dstance of water using test period and flow rate,
11) Calculate retardation actor sing soil properties and distribution oefficient.
iii) Estimate migration distance of the peak of nuclide concentration using te movement distance
of water and the retardation factor.
iv) Estimate dispersion length of the nuclide using the equation 6).
COMPARISON BETWEEN ESTIMATED AND ACTUAL DISTRIBUTION
The following values of the parameters were used in an estimation of migration distribution for
Pit-I after 3 years.
Water flow rate (cm/d) 3. ) 6 (at effective porosity: 0. 40)
Sr-90 Np-23 7 Pu-23 8
Distribution coefficient (cm'/g) 5 5 200 1200
Dispersion length (cm) 2.47 1.04 0.59
Initial concentration (KBq/cm') 6.91 1.87 0.189Soil properties porosity 0.5
density 2.7 g/CM3
degree of saturation 0.8
Figures I shows estimatedI Estmatwn of-migration Fri" SI-90)]
distribution of tracers in 500 1400
Pit- 3 years after the test 4(0 1200 1431000 395
start and measured 300 5347 �7,7 -200 2600 -751distribution of tracer - Pu-M (V100 400 1,1117
concentration n Pit I at 6 U0 200I C) 0 �1�1 0
'I sampling ti I -10 0 10 20 -10 0 10 20sol im es, Distance from tracer source (cm) Distance from tracer source (cm)
r e s p e c t i v e I y No�Pjt--l -(Np--237)] FP t -1 n-236)]movement of the
1000 1(0concentration peakwas 800 80 143
395 39560 060 534.0 534
-75- 10751concentration distribution 400 40897 897
?00 L:�� r- 20of Sr-90 as well as Np- - 00 0
237 in the field t t -4 3 2 0 1 2 3 4 5 - 4 3 2 0 1 2 3 4 5e S Distance from tracer source (c Distance from tracer source (cm)
Migration of Pu-238 mL--jdistribution of the field Fig. I Estimation and ineasureddistribution of tracer
test shows go d concentration in the Pit-1.
agreement with that of the
estimation in the sense that the both are remained at the original position,
4. DISCUSSION ON ESULT OF COMPARISON
Some dearee of disagreement was found from the result of the comparison between the estimation
and actual distribution. To discuss the reason for this, further analyses have been done on
- 638 -

JAERI-Conf 2002-004
hydraulic condition in test pit, recovery ratio of sampling, and migration estimation under a low
rate of water flow.
4. 1 HdVaUlIC ODdition In test pitSupplemental tests were performed to study hydraulic condition in the test pit where quartz sandwere sed as tracer source. The test was conducted as the same sprinkling condition as Pt I and
?it-7 Msured data, of triartic potential was converted to water content and unsaturated water
conductivit ad surnmarized as tlieii- vertical distribution in Fig. 2 Both water content and
conductivity sow considerably cance between the upper and lower layers of the plane ofCDdiscontinuity which corresponds to the position of the quart7 sand ayer The discontinuity of
water conductivity can affect considerably on water infiltration movement through the plane and
could generate orizontal water flow on the plane.. .. ....... ....
Watercontent Hyd1auric�conducWty,(muVd) Pit-I (Sr-90 corrected)l0,3 0.35 0.4 0,45 0.5 0 10 20 30 400 0 10000
20 20 OA 39510040 .0 634
If t 4,7510. o 89760 4) 60 q,, 0 . 0 1078
80 80 U 10 00 5 10 15
100V 100 Dislwncefrqmtraper sourpe (rri)
Fig. 2 Vertical distribution of water content and Fig. 3 Corrected istribution changeunsaturated hydraulic conductivity of Sr-90 ith recovery ratio
calculated in Pit-1.
4.2 Correction using recovery
Recovei y of tracer s fo r 6 soil samplings was obtained by integrati i ig concentrate on distribution of
tracers in soil sample, Recovery showed smaller difference between Sr-90 and Np-23 7 compared
with the difference among 6 sampling times. Figure 3 shows corrected distribution of Sr-90 with
the recovery ratios, Concentration decreases quickly in the upper layer above the tracer source,
while in the lower layer below the source, concentration near the source deceased gradually, and
concurrently, concentration between and t cm gradually increased.
43 ) Estimation of water flow rate through quartz sand layer
To study on the effect of a quartz sand source layer on the soil wter flow passed through it, a
comparative test has been performed using quartz sand and loess tior the tracer source layer[4].
From the test, water flow ate of 0 86 cm/day was obtained by analysis on the movement of H-' )
addedasatracerintl)eqtjartzsandlayer. Thisvalueindicatesthewatertlowrateatthebeginning
stage of 3-year tst, owever, 'It is questionable that the test could smtriate the flow condition at
the iddle to last stage of 3-year test where the flow condition had Changed from unsteady to
steady unlike at life begintring stage
Obtaining the water flow rate by other methods is very difficult eve b means of numerical
- 639 -

JAERI-Conf 2002-004
simulation together with detailed information on the water characteristics of quartz sand and loessbecause of the nonlinear equation of unsaturated water movement and tile hysteresis of soil water.
Thus, the value of 0.86 cm/day is onsidered to be a single practical Information on the flow rate
of soil water. Only exception tc be worth to consider would be the vaiue of zero (O cm/day) whenassuming that the water flow at the beginning has caused by a burst low and the water flow at the
middle to final stage has been kept at zero by the barrier effect of quartz sand layer Hence using
0.86 and cm/day, concentration distribution of Sr has been alculated as estimation and
comparison to the actual distribution which was distinctly obtained froin te Pit- I tesL
4.4 Comparison between re-estimated and actual d istribution
The estimation result with 6 cm/day is shown in Fig, 4 and that with 0 ont/day is ill Fig. .
Judging from the result, distribution using 0 cm/day shows uch better kgreement to the actual
distribution than that using 6 cm/day Hwever, this dose ot directl); indicate tat the flowrate in Pit-1 was almost zero In addition to that. it is ucertai tat the istantaneous release
condition of tracer has been satisfied under such a flow condition were water flow was blocked
by quartz sand layer.
[-PIt_� (ar-9-0)] Fr� t -llsrgo)w 143
1000( 351 10(00
534
751
C: 1000 A 897 1000.2 - 1078 1078
0 143 143
351 100 35,
o 534 5U
0 751 0 75
0 10 897 0 10 897
0 5 10 15 1 1078 0 5 IC 15 1078
Distance from-tracer source (cm) Distance from tracer source (cn)L I'll - ,"" , - 1- 11 ,111,11111, . . I
Fig. 4 Calculated disiribution of Sr-90 Fig. 5 Calculated distribution of Sr-90concentration using water flow of concentration assuming tio watei flow0.86 in1day troug te racer layer thf ough the tracer layer i the P- 1,in the Pit I
Fitting the actual concentration distribution to determine parametet- values would epart from the
demonstrative procedure, where parameter values should be obtained from experiments aiid tests
priortothemaiiitest,toevaluategivenmodelsbyeoiiipariiigestitiiatiotiwitliacttial. Whilefitting
'de us for supplernentalinformation o te vlue ofovatey flow otherwise instifficient. Forthis reason, we ave obtained the values of watei- flow rate, ispet'sivity and Initial concentration
in Pt I by fitting.
In the procedure of fitting, correction has been made on the actual Goncentj ation distribution withrecovery ratio for each sampling, their alue of distribution coefficient was fixed at 5 5 on the basis
oftheresultsfromlaboratoi-���,xpei'li-tietitsitiittlatiotitestsaridasseniblyte8t Thevaitiesateverysampling times of each parameter were averagedw th weight of tle umber f eiapsed dys he
'3
values for water flow rate ad ispersivity are determined and sumolarizod as 135 call,/ Iday and1,68 CM2 /day, respectively, As a matirej of course, oncentration distribution at ea, h sampling
- 640 -

JAERI-Coni 2002-004
showed easonable agreement with the actual dstribution Fla 6)
Water flow ate y fitting 0135 cm/day, is found to be not close to ,96 but cm/day.ZDispersivIty by fittinp_ 6 rn/day, is found to correspond to almost twice as large as the value
of G 78 which is estirilated by elationship etween flow rate and dispersivity determined mainly
from te result ofthe assembly test. The larger dispersivity could he caused by more complicatedbebavlot of water flow tinder unsaturated ondition compared with the low under saturated
condition of the assembiv test
As to te Np tie P - rsult of the istribution alculation using 0 I ) 5 cm/day for water flow rate
in Fig 7 showed reasonably oomparable to the actual one. As the sarrie as the case of Sr, the
value of diffusivity or p 02 rn'/day, obtained y fittin- was aout twice as large as theestimated value Ailing the esult of the assembly tests 0.09 cm2/day),
pit-1 (Np-237)�O)1pit-1 r-9W m 143
10000 351 10000 351 1
A534 Cr 5
q- 751 10 1000 I. 7341
100( 997 8970 1078
1078 0 143143
100 351 351W
534
151 0 751
97
0 V 15 1078 0 2 3 4 5Distance from tracer source Distance from tracer source (cm)
Fig. 6 Calculated distribution of Sr-90 Fig. 7 Calculated dstribution of Np-237concentration using watej- flow of 0 13 concentration using ater flow of 0 135ontid through I he tracer layer i the Pit- 1. cni/d tlif ough te tracei- iaver in te Pit- .
5. MIGRATION DI STRIBU TION LFNDER NATURAL R N ALL CONDITIONIn the Phase-11 program a few of the instruments necessary for measurement of evaporation could
not be used beCaLlSe of mechanical troubles. Obtained data without these instruments is
considered o lave less aGCL11_aCy than the Phase-I data. For this eason, nst�ad of analyzing in
the same course as tificial ainfall condition, fitting procedure hs be taken for analysis on the
data of atural raiiifall condition. Distribution of Sr-90 concentration is shown in Fi(Y. 8.Z.)Jn the fitting pocedure dstribution coefficient was fixed, while watei- flow rate, dspersivity and
initial oncentration were fitted to obtain ood agreement with concentration distribution of each
samplMLY orne, [Wafionship between values of these parameters and elapsed time from the test
start is shown in Fig. 9 In the figure, initial concentration and dispersivity show relatively steady
while water flow rate shows oradual decrease with elapsed time,Z)
This could be explained that the test was started in June of rainy season, Rainfall in rainy season
moved tracers uick-ly first, then it slowed with decreasing raillfall amount and increasing
evaporation. Long term average of water flow rate by the analysis was found to be 024 cm/day.
Assumine 0. 15 or early average of water content in aerated loess, the value of 024 cm/day
corresponds to about 130 mm of infiltration amount. This value is considered to be reasonable
- 641 -

JAERI-Conf 2002-004
because the amount of nfiltration at the test site observed in Phase-1 as about 100 mm. As to
dispersivity, analyzed value of 0 7 onr2/day is about a half as sinalJ as tat obtained from the testunder artificial rainfall condition
[ararn=s obtaPit-2 (Sr-go) a�ned by fitting fo' tel.ra rnfall cndition
10000 E 2.5 8000RE
142 5 2.01000 394 6000S
0 527 1.5100 4000T
759 1.0904
10 200Doi5 U0 76C) 1 0 :E
-10 0 10 20 0 200 400 600 8DO 1()00 1200
Distance fromtracer source.(cm) Time (day)
Fig. Result of distribution of tracer Fig. 9 Relationship between tese parameters andconcentration at each soil sampling elapsed time of sampling fom the test startin the Pit-2. in Pit-1.
6. CONCLUSIONS
Determining method to obtain reliable values of parameters for migration aalysis were discussed.
Using the values, estimation of concentration distribution of aerated field igration test under'fic'al rainfall cond't'on as been calculated. The estimation showed difference with the actual
distribution in view of the movement of concentration peak of tracers Fro te observation on
water potential, a, plane of discontinuity of water content and conductivity existed at the depth of
tracersourcelayei-andadjustiiientoiiwaterflowratewasneeded Twovaluesofwater flow rate,
0 and 086 cm/d from the comparative test on quartz sand tracer source layer, were used for the
re-estimation calculation of Sr-90 migration. Between these, cm/d showed better agreement tothe concentration distribution corrected with recovery ratio and fitting analysis showed very low
water flow rate of 0. 1 33 5 cm/d. Dispersivities calculated using 0 I 3 5 c/d of water flow rate forSr-90 and Np-237 were almost a half as sinall as tose obtained by fitting arlaiysis because of
differenceofwatersatui-ationconditionbetweenestliiiationandtheacttialpit Thoughsoniecarewas needed to determine water flow rate and dispersivity among the thvee parametet s tre existing
model for radionuclide migration was able to estimate radionuclide tiligration n natural aera ted
loess layer as long as obtained an appropriate set of parameter values.
REFERENCES
I M.Mukai, et al., Journal of Fuel Cycle and Environment, 7(l), 3 140 200 1).
[2] H.Ogawa, Li Shushen, et al,, "Safety assessment methodology fo sallow and disposal of low
level radioactive waste Overview Report-", l printing
[3 )] N Shiwel, et al., Laboratory smulation tests of radionuclide and stable element migration in
loess aerated zone", Proc. NLCEF 98, Tokal, Japan (t998)
- 642 -

JP0250362JAERI-Conf 2002-004
DEVELOPMENT OF AIRLESS CORE SAMPLYNG SYSTEM (ALCS)
FOR SAFETY ASSESSMENT OF GEOLOGICAL DISPOSAL OF HLW
KUNIO ARAKI, AKIFUMI OUSHTKA, MASATO UEDA AND GUNJI OKANOEnterprises Promotion Buraeu, Chuou-Kaihatsu Co.
Post 169-8612 313-5, Nishiwaseda, Shinjuku-ku, Tokyo, Japan
Fax: 81- 3- 3208- 3572, e-mail: kunio__araki�ckc-unet.ocn.neJp
Airless Core Smpling System (ALCS) is being developed to obtain core samples maintaining the original
underground conditions especially without any penetration of water by cooling water into the core during a
series of operations, ALCS consists of De-Aerated Water Supply System (DAWS) and Improved Fresh Water
Core Sampling System JFCS). DAWS is the de-aerated water preparation system reducing air pressure at an
elevated temperature, IFCS is the airless water generation system by the introduction of suspended pure
nitrogen bubbles with surfactant. The airless water thus prepared as ubricated fresh water is supplied to the bit
of the boring machine with an additional function such as sooth cutting down function of a core with gravels,
fractured ocks and/or clay in any formation, automatic slime removal function by suspended bubbles and an
automatically casing function for the core sample to be isolated from the air during the transport of the sample
into the testing facility filled by an inert gas.
IFCS was tested using suspended air bubbles, where core samples with fractured structure were taken up
smoothly filled with fine particles in those cracks without any relaxation. The theoretical analyses have been
carried out on the effect of ALCS as a total system and the final concentration of oxygen is calculated to be as
low as ca.0.2ppm in the airless water to be supplied to the boring machine. The field test of ALCS must be
carried out further. The application limit of ALCS has also been discussed.
Key words: Airless Core Sampling System, Radioactive Wastes, High-Level Waste, Safety Assessment,
Geological Disposal
1. INTRODUCTIONFor the safety assessment of the radioactive waste disposal system underground, the
characteristics of natural barrier is important [I] 3 Especially, the reductive-oxidativecondition characteristics are important to assess the safety of the geological disposal ofhigh-level waste and TRU wastes into the geological formation, because some nuclides suchas Pu, N, U and Tic easily change their solubility and Kd values according to their chemicalforin [41 7.
There are 3 traditional all-core sampling methods by drilling for all core sampling, i.e., themethod with ud sucb as slurry of bentonite and high-polymer, the method () with freshwater (hereafter the abbreviation of the traditional FWCS is used, tentatively) and the method(M with mist or jet oam. However, almost all of the three methods ave some problemsduring the sampling procedure. For example, permeability, chemical condition and
mechanical property of the core will be changed by penetration of water by the traditionalFWCS (method Cl)) srry of mud(method ) with air and air directly (method ) In
- 643 -

JAERI-Conf 2002-004
addition, the core sampling "ethods with mud or fresh water are ifficult to give a smoothcore with gravels, crushed rock ad/or clay in, an unconsolidated lyer nd/or fractured zone.In this paper, it is reported tat ALCS is being developed to obtain core samples keeping the
original underground conditions.
2. PURPOSEThe purpose of this paper is to report that ALCS [8] is being developed to obtain core
samples keeping those original characteristics in the underground conditions-, such ashydrological characteristics and geochemical characteristics without any penetration of thesurface water with air into the core in the sampling processes, as well as keeping its originalmechanical characteristic with smooth surface cutting and without any relaxation of cores.
3. ALCS AS A SYSTEMALCS mainly consists of De-Aerated Water Supply System (DAWS) and Improved
Freshwater Core Sampling System (IFCS) 9]. DAWS is the de-aerated water preparationand supply system where the partial pressure is reduced at an elevated temperature and thede-aerated water is supplied to IFCS. IFCS is the airless water generation system withnitrogen suspension and with strongly electrolytic and neutral surfactant (Fig, ). The airlesswater is supplied to the bit of the boring machine equipped with a case to confine the core
automatically.
N2 introduction
Airless water with De-aeration
N2 suspension e-aerated welt at 303K
0.2imm 340ppm[021
Boring Pump IFCS DAWS
Boring machine
equipped with a sampling case
Fig. I Block Diagram of ALCS wth FCS and DAWS
ALCS with lubricated airless water provides several functions such as the smooth corecutting function for gravels, fractured rocks ad/or clay in the unconsolidated formation
and/or fractured zone, the automatic shme removal tMIC6011 by SUSPeDded bubbles, the
automatic casing function for a core sample ad an excellent core supply fction keeping
original characteristics. These functions provide the core which retains the oginal
underground characteristics s-och as hydrological, geocheirrical ad mechanical caracteristics.
These functions are important or the safety assessment of the underground disposal of
radioactive wastes, especially for the geological disposal of igh--level waste and of
- 644 -

JAERI-Conf 2002-004
TRU-wastes.The explanation will be started with 1FCS in its mechanism to take an excellent core with
the original characteristics underground and its test results. DAWS will be explained withinthe oxygen removal analyses in ALCS as a total system.
4. IFCS MECHANISM AND ITS TESTING RESULT
IFCS has specific functions to smooth cut down taking an excellent core from a layerwithout any penetration of water, to remove slime automatically after utting down process bya bit and to extract almost entire oxygen from the de-aerated water supplied by DAWS,4� 1 Mechanism of JFCS for Smooth Cut Down to Take a Core with Little Water Penetration
IFCS generates the lubricated airless water with smalt amount of surfactant and suspendednitrogen to the boring machine. The surfactant gives lubrication to e de-aerated waster forthe smooth water spply to the bit of boring achine, for te smooth cutting down to take acore and for te stabilization of suspended nitrogen bubbles, which is good for the automaticslime removal beyond te bit resulting upward flow decreasing the water pressure and theamount of water to be spplied (Fig. I and Photo, 1).
FWCS W.� R..
IFOS W.�. p-
O O
Fig, I Principle of Water Pressure Reducing Photo I Testing View of FCS in CretaceousEffect for 1FCS froin the Traditional Fresh Granite o a River side by a 5 66mm. Bit, TheWater Core Sampling Method (FWCS) Applied Air: times to the Water Volume
In the case of the traditional FWCS method and the mist core sampling method, thepressurized and high-speed water or air must be supplied to remove slime to the surface of theground. The pressurized water or air causes the penetration of the surface water and/or the
penetration of the air, where the penetration of the air by any way may result the relaxation ofthe core, boiling phenomenon at the bit and the flow away phenomenon of fine particles
and/or clay in the layer from the core.4.2 Typical Test Results of CS on Smooth Cutting and Automatic Slime Removal Functions
IFCS was tested with a machine -using air, in a Cretaceous granite zone between GL-80 m
-90 m on the river side with a 66 mm bit and the suspended air volume was times to
the -unit volume of the lubricated water. The core samples were taken between GL-80.0-
-87.5 m by 1CS ethod where the recovery of core was 100 %, the drilling rate was 2.0-
- 645 -

JAERI-Conf 2002-004
2.6 m/hr, the applied pressure of imbricated water for drilling was ca. 100 kPa (ca. 12.5 of the
traditional FWCS) and the amount of the apparent water volume with air'suspension was 5.1L/min, hence, the actual volume of the water was 064 L/min (ca. 1/20 of the FWCS). For
comparison, the core samples were taken between GL-87.5--90.0 by the traditionalFWCS method where the core recovery was 100 %, the drilling rate was 19 m/hr, thepressure and the amount of the fresh water was 250-300 kPa and 15-20 /min) (Photo. 2.
Photo.2a Ganite Cores by TFCS (Upper 2 GL Photo.2b Close-up of the Core in Photo.2-85.6--87.0 m with fine particles vs. Cores (Circled on the top) Taken by the IFCSGL-87.6--90.0 m by Fresh Water Sampling Method GL between -85,7 - 86.0 m withMethod with relaxation and no fine particles naturally filled fine material in the crack
The core samples taken by IFCS were observed to be cores with little relaxation and withtight and fine particles n racks On the other hand, the core samples taken by the traditionalFWCS method were observed that they were partly fractured with strong relaxation and partlycracked with no fifle nor any small particle.
IFCS was also tested by air a a (� 116 mm bit, in a Jurassic siliceous mud layer on theriver side in the direction 40' from vertical axis at ca.-32.0--32.3 m in the direction ofboring (Photo. 3a, 3b). Excellent core samples were obtained with the fractured structure
Photo.3a Siliceous Mudstone Cores Taken by Photo3b Cores by the Traditional Mist BoringIFCS Method between 32.0-32.3m, with Method between 32.3 - 32.6m, excesswater pressure of kPa with fine particles compressed air over inner water pressureand without any relaxation resulting relaxation and no fine particles
and fine particles in detailed natural shape, where the rate of drilling was 06 m/hr, the 2volume of the air was charged to the I volume of the lubricated water, the pressure and theamount of water supplied for automatic removal of slime was ca. 40 kPa (in the case of thetraditionalFWCSairpressurewasea.7timestothatoflFCS). Forcomparison,,MistBoring
methodwastestedatthepositionofca.-32.3--32.6mnexttothetestpositionofIFCS. Thecores were obtained in fractured pieces due to the compressed air penetration in jet foam atthe bit removing slime from the bottom to the surface and the rate of drilling was 025 m/h.
The applied air was 300 kPa and 10-15 L/min under the pressure to the bit of the boring
machine. In the case of the traditional FWCS method, only slime was obtained instead of
- 646 -

JAERI-Conf 2002-004
core at the orresponding siliceous mudstone layer due to the water penetration by raisedwater press-tire to remove slime from the top of te bit.
These results sow tat IFCS with a 116 mm bit or a 66 m bit has the effectivesmooth cutting function d the atomatic slitrie removal inction without any relaxation ofthe core D17 losing firle particulates froru the core, because of the lubricated water withsurfactairt and air suspension, where the water pressure and the water volume were reduced.
5. THEORETICAL ANALYSES OF AIRLESS WATER, GENERATION BY ALCS
In ALCS.. DAWS provides the de-aerated water under the reduced pressure at an elevatedtemperature and their IFCS provides arless water with nitrogen suspension. Te theoreticalconsideration has been made by the application of lienry's Law in the analyses as follows.5. 1 Reference Case r Au alyses
The reference case is assumed as follows: The operation temperature is 293 K which isalmost same as e average temperature in Japan. In DAWS, the total pressure is kept at firstunder 101 kPa with the saturated water vapor pressure of 424 ka and the dry air partial
pressure of 97 I kPa at 3 03 K. The total air pressure is reduced to 507 kPa with the saturatedwater vapor pressure of 424 kPa and the partial dry air pressure of 0830 a. This totalpressure is selected not to have any boiling of water nder the pressure. In IFCS, thenitrogen suspension was introduced 10 times of de-aerated water in volume at 293 K withsurfactant.
Finally, the airless water is supplied to the bit of the boring machine equipped with a casein order to confine a core automatically, which should be isolated from air during thetransportation to the experimental facilities filled with the inert gas, such as the one inNUCEF.5.2De-Aeration of Water in DAWS
The oxygen concentration in the de-aerated water is analyzed, where the total pressure ofthe lubricated water is decreased from 101 kPa into 507 kPa at an elevated temperature of293 K in DAWS.
The reducing factor of the oxygen partial pressure over the water from IO kPa to 507 kPa
P1=101kPa-+5.07kPa at 303 K is calculated to be 0.00855 taking the saturated water pressureK=302K
into account (eq. 51).
PI=5.07kPa T) IPt-5.07kPaPt=101kPa->5.07kPa_ (latal IK=303K _- WIK=303K 0.00855 (eq. 5-1)
f, K=303K P1=101kPa _PW 0=101kPa(Potal IK=303K K=303K
ptotal jPt='01kPa p'Where and total IPI=5.07kPa are of those dry air partial pressure under the totalK=303K K=303K
pressure at 303K, Pw I=5.07kPa and P IP,=101kpa are the same partial pressure of the waterK=303K W K=303K
vapor at 303K [101�
The oxygen ontent in weight 02 '='-07kPa under 507 kPa at 303 K is calculated to beK=303K
- 647 -

JAERI-Conf 2002-004
3.07* 1 0-' 902/1, H20 (eq. 52),
a=f - Pa =303KPI=5.07kP Pt 101k ->5.074Pa Pt=101kPa1021W IK=303K IK=303K 102L =3.07*10-') (902/L"20) (eq.5-2)
Where [021w JP'="07kPa and [021W jP,=101kPa (0.359 02/1, H20 uder 101 Pa at 303 K[10])K=303K K=303K
are the oxygen concentration in the waterunder the total airpressure of 507 kPa and 101 kPa.
Thus, ca. 3 ppm of oxygen concentration is obtained theoretically in the water of DAWS by
the reduction of total pressure from 101 kPa to 507 kPa at 303 K.
5.3Preparation of Airless Water in CS
In IFCS, the pure nitrogen is introduced and dispersed in the form of suspension into the
de-aerated water supplied from DAWS. The ca. 3 ppm (for calculation, the value of 307
ppm must be used again) of oxygen in de-aerated water must be redistributed again between
theunitvolumeofwaterandthelOtimesvolumeofgasphaseunderlOlkpaat293K. The
partitioning constant (R.,gip"O'kpa) is estimated from the rate between the oxygenK=293K
concentration in the airless water and that of in the gas phase, which must be corrected by the
water vapor pressure.
The partial pressure of the dry oxygen under the total pressure of 101 kPa at 293 K is
calculated and found to be 19.8 kPa (eq.5-3).
Pt=101kPa Pt=101kPa Pt 101kPaPO, IK=293K = 02 * (lotal IK=293K _PW IK=293K 19-75 (kPa) (eq.5-3)
The amount of the oxygen in 10 L of the air is calculated to be 251 902/10 LH20 (eq.5-4).Pt 101kPa M P Pt_101kPa
* 02 IK=293K02 ir 1K=29 lo* - 2.51 02/10 H20) (eq.5-4).
3K - Pf=lolift24.0 P.1al IK=293K
The distribution factor of oxygen concentrations between 10 L of air and I L of water is
calculated to be 00578 (eq. -5).
jPt=101kPaPt=OIkPa 102110G K293K0 1 kP'4
10G1W IK=293K 0.0578 (by weight) (eq.5-5)1021W IKt==293K
The concentration of the oxygen in the lubricated airless water is calculated to be 0168
ppm (eq.5-6).
P'='Fcs R10G1W 1120913kKa102L1K=293K=3.07*_ F-- � 0 168 (pprn) (eq.5-6)I+R 101
10G1W 293K
Thus, ca.0.2 ppm in the airless water is obtained theoretically by IFCS.
6.RESULTS AND DISCUSSION
6.lResults
The following results are obtained:
(1) The concept of ALCS 11as been established, which consists of DAWS and TFCS with
several functions such the sooth core cutting function with gravels, fractured rocks
- 648 -

JAERI-Conf 2002-004
and/or clay in a formation, the automatic slime removal function by suspended bubbles,the atomatic casing function to confine the core and an excellent core supply function to
retaii) the original hydrological, geochemical and mechanical characteristics as it isunderground
(2) It as been confirmed by the tests, wich has been done, that 1FCS has the effectivesmooth cuttina function and the automatic slime removal function without any relaxationof te core or loosing fine particulates, because the lubrication of the water and
suspended air works effectively.(3) Te operation condition of IFCS is compared mainly with that of te traditional FWCS:
IFCS was tested by air, in granite etween GL-80.0 m-87.5 m wit a 66 mm bitand te air/water ratio was 8/1 in volume. The cutting rate was 20-2.6 m/hr (FWCSmethod gave 19 /hr) and the core recovery ratio was I 0%, Little relaxation wasfound i te recovered core and the crack was filled by fine material. The pressure
applied for IFCS boring was found to be 100 kPa (about 12 of the traditional FWCSmethod). The apparent amo-Lmt of te lubricated fresh water was 5.1 L/min (thisvolume is about 13 of the traditional FWCS) and the actual water volume without air iscalculated to be ca. 120 compared with that of the FWCS
1FCS was also tested by air and a 116 mm bit in siliceous mud layer in the directionof 40' at ca, - 30 n in its direction. Te core recovery ratio was I 0% without anyrelaxation. Core was recovered with natural, fine material in the fracture, however, themist boring ethod gave cores with relaxed structure without any fine material incracks ad te traditional FWCS method gave only slimes at the corresponding positionof the same layer. The cutting rate by 1FCS was ca. 06 m/hr, where this value was 3times to that of mist boring method. The pressure of the lubricated fresh water forEFCS was 40 kPa (at GL ca. 20 in its depth), which is the ca, 1/8 value of the mistboring. The apparent volume of the water applied was found to be 5 L/min 1/2 vol.of the compressed air for the mist boring), where the actual water volume wascalculated to be ca. 025 L/min.
(4) The analyses have been carried out on the de-aerated water preparation in DAWS and onthe airless water preparation in IFCS, as a system. The de-aeration of air under 507 kPais found to be effective to get de-aerated water with ca. 3 ppm oxygen dissolved at anelevated teiriperature as high as 303 K. The introduction of pure and suspended nitrogeninto de-aerated water under 101 kPa is found to be effective to get airless water with ca.0.2 ppm. oxygen dissolved at 393 K.
(5) It is confirmed that ALSC are useful for the safety assessment of underground disposal ofradioactive wastes, especially for the geological disposal of high-level and TRU wastes.
6.2Applicability of ALCS(1) ALCS is applicable to provide cores with their original characteristics underground such
as mechanical property, geohydrological property and geochemical property, especially,without any penetration of cooling water with air during te core sampling procedure.
(2) ALCS is aso applicable to provide bore-holes for several field tests i a good conditionsuch as echanical property, geohydrological property and geochemical property,
649 -

JAERI-Conf 2002-004
especially, without any penetration of the cooling water with air into the wall of abore-hole.
6.3Further Investigation to be made(1) ALCS seems to have some limit to get nice core from coastal sand, where some
characteristics may be hanged from underground condition, because of the suspendednitrogen. Therefore, the frther development must be continued on this point.
(2) Concerning with FCS, it is desirable to continue all-core boring test further for thepractical use on some other layers than tose tested already.
(3) The result of theoretical analyses must e confirmed by field test as a whole.
ACKNOWLEGEMENTAuthors would like to express their hearty thanks for Mr. S. Takebe, Mr. S, Hagiwara,
Japan Atomic Energy Research nstitute, W 1. Seko, Mr. J . Setoyama, Mr. M. Salto, Mr.Nishie, Mr. Y Shinohara and r. A. Oubo, Chuou-Kaihatsu Co. for their elpful discussions.
REFERENCE[1] D. Isherwood, Preliminary Report on Retardation Factors and Radio-nuclide Migration,Lawrence Livermore Lab. ep. UCID 17551 1977)[21 K. Araki, S. Tashiro, T. Banba, K. Abe, K. Kobayashi, K. Sato, 14, Amano and T.Kashiwagi, Preliminary Research on Geological Isolation of High-Level Radioactive Waste atthe Japan Atomic Energy Research Institute, Proc. Symp, Underground Disposal of Radio-
active Wastes, Otanierni, July 1979, vol 2 pp35, LAEA 1980)[3] K.Araki, M. Motegi, Y. Emoto Y Kaji, S. Ikari, T. Nada, and T. Watanabe, NaturalAnalogue Study on Engineered Barriers for Underground Disposal of Radioactive Wastes,Joint hiternational Wastes, Joint International Waste Management Conference, ProgressReport, pp601-609, ASME, JSME, and AESJ, 1989, Oct., Kyoto, Jpan[4] D. G. Brookins, Geological Aspects of Radioactive Waste Disposal, Springer-Verlag, NewYork 1984)[5] OECD/NEA, Using Thermodynamic Sorption odels for Guiding RadioelernentDistribution Coefficient Kd) Investigations, A Status Report, OECD/NEA, Paris, Republic ofFrance 200 )[6] T. Shibuya, M. Sbibata and Y. Sueyama, Data Base on Sorption of Radioactive Nuclidesto Bentonite and Rocks, NC TN8410 99-050, JNC, Japan 1999)[7a] S. Takebe and M. Abe, Development of Data ase on Dstribution Coefficients (1) ataCorrection of Distribution Coefficients, JAERI-Data/Code 2001-005, JAERJ, Japan 2001),[7b] ibid 2), JAERI-Data/Code 2001-006, JAERI, Japan 2001)[8] Y. Oubo, K. Araki and S. Nishie, Core sampling ethod and Core Sampling System,Japanese Patent Application No. 2000-141163 2000)[9] 1. Seko, G. Okano, K. Araki, Y, Oubo and T. Oukuma, Co-re sampling 10ethod nd CoreSampling System, Japanese Patent Application No. 2001-95066 001)[IO] Chemical Society, Japart, The Chemical Hand Book, aruzen Co., Tokyo, apaw (I 984)
- 650 -

JAERI-Conf 2002-004 JP0250363
CORRELATION BETWEEN MOLECULAR SZE AND
FUNCTIONAL OtJPS OF HUMICACIDONTHE COMPLEXATION WITH 237 Np, 239 Pu AND 21'Am
Tadao TANAKA, Seiya NAGAO'and Hiromichl OGAWA
Department of Foei ycle ately Research,Tokal Establishment. Japan Aromic Energy Research Institute,
Shirakata 24, Tkal , Naka, 1baraki, Japart, 319-1195.Fax: 8-292-282-5934, e-mail: Laiiaka�sparcit.tokaljaeri.gojp
The (4fects of humic acid on interaction affinity with "'Np, 131pir ad 2"'Am lave been examined withrespect to differerit molecular Size fractions, whicli were solated frorri te Aldrich Chemical's hunric acid into
5,000-30,00() daltons 3,000-100,000 daltons ad 00,000 daltons-450 o i olecula sze range. At the pH
of 5.5, little 237 Np iteracted with the hurnic acid. The 8Pir and 24 �Arn preferentially interacted with the humic3
acid f 100,(X)O daltons-450 line in the humic acid oncen(ration rnge elow sveral mg/drn , although the
interaction affinity Yeduced with increasing hunric acid concentration. On te other hand, te 211pu and 21 'Am
preferentially imeracted with [lie homic acid Fractions of 30,000-100,000 daiLons, iii the humic acid
concentration ange over several mg/din 3. FTIR spectral structures, CAPIMAS '"C-NMR spectral structures
and acid-base titration curves eveale tat there are different structures and functional groups between different
molecular size fractions The molecular size selectivity of humic acid on the complexation with TRU nclides
may be caused by or h two ifferent functiona goups concerning t the complexation, steric hindrance
around the fuiwtional groups,
Key words: Humic acid, Functional groups, Molecular size, Complexation, TRU nuclides
1. INTRODUCTIONMuch of the dissolved organic matter in natural groundwater consists of hurnic
substances, wch are formed during microbial degradatio o biomass in soil andgroundwater. Humic acid is one of the resulting product and stable to frther degradation.As such hurnic acid has substantial chelation properties for metals, it considerably affects thesorption and migration behavior of radionuclides in soil. From a geocheinical point of view,it is mrtant, to know the reactivity of hurnic acid with radionuclides released fromradioactive-waste repository[l]. Molecular size of hurnic acid may be particularlysignificant to te migration behavior of radionuclide.
Tire interaction affinity of hurnic acid With 27 Np 28pU and 24 'Am has been examinedwith respect to different molecular size fractions, which were isolated from the AldrichChemical's hUlDiC acid into 5000-30,000 daltons, 30,000-100,000 daltons and 100,000daltons-450 nur in moleCkflar size range. Each molecular size fraction has been characterizedwith respect to their TIR spectral structures. CAP/MAS 13CN MR spectral structures andacid-base titration curves.
2. EXPERIMENTALHumic ad purchased from Aldrich Cemical Co. was forther purified to remove
insoluble hurriln, trilViC acid and ash following the procedure described by Nash et al.[2],[3].The purified ht,1111[Cacid was dissolved in a sall amount of 0 I M NaOH, and the hurnic acid
Present address: Hokkaido University, Sapporo, Hokkaido 060-0810, Japan
- 651 -

JAERI-Conf 2002-004
solutions of desired concentrations were prepared by diluting with 0. I M NaNO3-The 0. 1 CM3 of radioactive solution containing 237 Np, 239 PLI Of 241 Am, which were
3prepared in ca. 104 Bq/cM (carrier free), was added to 10 cm of the humic acid solution.The ionic strength was adjusted to 0.0 M with NaNO3. pH of the solution was adjusted to5.5 with 0. M HC1 or NaOR to minimize hydroxyl metal complex formation. Sampleswere gently agitated at 25 IC for 7 days i a water jacket. Tese were then ultrafiltratedwith Millipore filters of 450 nm in pore size, and 5,000, 30,000 and 100,000 in molecularweight cut-off (nominal molecular weigh i dalton). Concentrations of the 23'Np and "'Amin each filtrate were determined using an Ortec -ray detector, ad that of the 238 Pu was
determined using a Packard liquid scintillation counter. Concentration of dissolved organiccarbon in each filtrate was determined using a Shimadzu spectrophotometer[3].
The humic acid solution used was fractionated ito different molecular sizes namely100,000 daltons-450 nm, 30,000-100,000 daltoris and 5000-30,000 daltons by a sequentialultrafiltration technique. The fractionated humic acid samples were potonated with AM
13HCl, freeze-dried for FTTR spectral analysis, CAP/MAS C-NMR spectral analysis andacid-base titration. The FTTR spectra were obtained using a Jasco Modet VAROR U FI`1Rspectrophotometer with % KBr disks. The CAP/MAS "C-NMR spectral were obtainedusing the cross polarization with magic angle spinning. he spectra were collected using aJEOL CSH270 spectrometer at a magnetic field of 67.8 MHz with a 90" pulse width of 4 s and a contact time of 2 ms. The external standard was hexa-methoxy bnzene with theshift of the methyl carbons assigned as 17.36 ppm. The exchangeable roton capacity wasdetermined from the acid-base titration curves. About 10 mg of the factionated iumic acidwas dissolved with a sufficient amount of 0.0 M NaOH in titration cell maintained at 25 C.Nitrogen gas was passed over the solution to avoid the absorption of cat-bon dioxide from theatmosphere during the titration, and the sample was titrated from a p of about I I to a pHwith 0. I M HCl at a total ionic strength of 0.0 M.
3. RESULTS AND DISCUSSION3.1 Interaction between radionuclides and humic acid
Figure shows size distribution of humic acid and radionuclides, which were eterminedfrom their concentrations in each filtrate passed through the filters. From the distributionprofile of humic acid concentration, the bulk of issolved humic acid is in the olecular size
range from 30,000 to I 0,000 daltons. In ddition, with icreasing hurnic acid concentrationthe fractional percentage gradually shifts from 100,000 daltons-450 Ji t 30,000-100,000daltons. It has been reported that humic acid molecules wind up like random coils fromspread molecules as flexibie, linear or bfanclied polymer with increasing humic acidconcentration[4].
The distribution profile Of 238pU was similar to that of humic cid, except for mg/dM3 of
humic acid concentration, in which 238pU forms particulate species due to pH, igher than 6.
These results indicate that the dissolved humic acid contributes a fori-ning o humiccomplexes Of 238pU. The distribution profile of 24 'Am reveals that 24 'Ani also interact with
hurnic acid. However, ost of 2 Am species was trapped by the filter of30,000 daltons incut-ff molecular, except for ing/drn 3 of HA concentration. Thus 241 Ain ay preferentially
interact with the hunfic acid fractions larger than 30,000 daltons-
- 652 -

JAERI-Conf 2002-004
Distribution of Np in each fractionated size rng.100 [30 mg/drO
aR so 133 ung/dm3E31 1,5 mg/dm3
04j 60 3 0 mg/dM34-0 0 6 5 mg/dm3C40 11 131 mg/dM3
.24J0 20
LL 0 El>450 nm 100kdaltons-450nm 30k-100kdaltons 5k-30k daltons <5k daltons
Molecular size
Distribution of Pu in each fractionated size rang.70 C30 mg/dm3
60 [33.5 vng/dm3
50 i1311-5 mg/dm30 0 35.0 mg/dm3
404- U65.5 g/dM30
30 N 131 mg/dni320
LL 10
0
>450 nn WOk daltons-450 nin 30�- 1 00k daitons bk-30k daltons Ok daltonsMolecular size
Distribution of Am in each fractionated size rang.100 [30 mgldm3
03,5 mgidM3aR so-- 0 1.5 mg/&Qco4j 1035.0 mg/dm304ja N65,5 mg/dm3.2 40 6 A 3 mgidm-3
20LL
>450 nm 100k daltons-45� nm 3%-)i)lbk daltons %-30k daltons <5k daltons
Molecular size
Distribution of humic acid in each fractionated size rang70 -[E23 0 mg/d,,m360 O 35 mgldm3
co 5( 0 1.5 mgidm34i0 M 35 mg/&W
4j 40 mo- .. Y�.E65�5 mg/Z30131 /d 3C30 0 131 mg/dm30 mg
20
LE 10LC)
>450 tirv 100k daltons-450 nm 30k-100k daltons 5k-30k daltons <5k daltons
Molecular size
Fig. I Size distribution of radionuclides and hurnic acid.
- 653 -

JAERI-Conf 2002-004
100 100� 0 ON daltons-450 nm1
80 A3nk-100k daltons 0
85k-30k daltons 80 A AA A A A60 46 60
41 A -.14- I`0 0 0
C 0 a A40 40 0 100k dalt"s-450
A 410 A30k-100k daltons0
U- 20 - 0 20 - M5k-30k daltons 0 0
A0 0
0.1 10 100 0.1 I 10 100Humic acid concentration (mg/drA) Hurnic acid concentration (mg/drA)
(a) 231PU (b) 24 'Am
Fig.2 Relationship between radionuclide concentration and huntic acid concentration
The distribution of 27 Np in the filtrates showed a different profile from those of humicacid, "'Pu and 21 'Am. Whole 237 Np species was not trapped y all the our kinds of filters
and was in the fraction less than 5,000 altons, in wich fraction the 237Np is existed ascationic species. This indicates that the 237 Np did not form hurnic complexes. It has beenknown that 237 Np(V) have little interaction with humic substances in acidic coirditions[5],[6].
At the pH of 5.5, little 237 Np interacted with the humic acid, Fig"re 2 shows the
relationship between percentages of radionuclides ad 11 M-nic acid oncentration in e-ach sizefraction, for 238 Pu ad 24 'Am, which were bserved any iteractions with humic aci i Fig.l.The 238 Pu and 24 'Am preferentially interacted with te hunric acid fraction of 00,000
3daltons-450 rm, in the humic acid concentration range below several irig/drn although theinteraction affinity reduced with increasing hurnic acid concentration. O the ther hand,
concentration of ... Pu and 14 'Am in the fraction f 30,000-100,000 altons increased withincreasing humic acid coricentration ad the M Pu and 24 'Am peferentially iteracted withthe humic acid of 30,000-100,000 daltons, in the hurnic acid concentration range over several
3 -nmg/drn . These show tat the binding between the radionuclides a], tile title ic acid of100,000 daltons-450 nm. is ot based o coordination ond ut rather soft bond such aselectrostatic attractive forces, as compared with the binding with hirmic acid of30,000-100,000 daltons. The interaction of Pu we the hi-rinic acid of' 5000-30,000daltons was in te same manner as that with 30,000- 00,000 daltoirs, wile tat of'24 'Am waslittle detected. This idicates that 238 P os a omplex with hurnic acid of 5000-30,000daltons, while 24 'Am does not. These results indicate tt f)oth 21'PU and "'Am
preferentially form complexes with hurnic aid of 30,000-100,000 daltons,
3.2 Functional groups of bnfliC acid
The FTIR SeCtl-a f hUnTiC acid', fractionated y moiecolar size clearly indicatedominant absorbance due to aomatic, aliphatic, carboxylic and pheriolic groups[71,[8] asshown in Fig.3. The road and at 3400-3,000 orn- IIs aributed to hydrogen bonding andO-H stretching. The strong doubiet between 2970 an 2850 eiri- ad th sgle ear 1470
- 654 -

JAERI-Conf 2002-004
cm- I represent aliphatic groups. The strong absorbance at about 1720 cm-' is arepresentative of the protonated carboxylic acids COOH and ketonic C=O grou , The peakat abou 1610 em- Iat)(I tire weak but broad absorhance between 1400 and 1,500 cm- Ican beassigned to te CC stretching of aromatic rings. The distinct eak ear 400 cm- I may bedue to the OH bending eormation nd C-0 stretching of penolic OH. The OHdeformation ad C-0 stretching of COOH is evidenced by the week absorbance in the region1,300 to 1200 cm-'.
Mos( important difference between the spectra of the hurnic acid fraction of 100,000daltons-450 nrn daltons and those of 30,000-JOO,000 daltons and 5000-30,000 daltons is theloss of the aphatic groups at 2970-2,850 cm" ad at 1470 em". Alternatively, the spectra
of 30,000-100,000 daitons ad 5000-30,000 daltons indicate increased absorbance of thearomatic C=C at 1610 cm- and at 1500-1,400 cm-' as compared to the spectra of the100,000 altons-450 nn fraction. The absorption band at 1400 c- Ithat is attributed tophenolic OH las disappeared from the spectra of 5000-30,000 daltons. Such distinctdifferences between the spectra indicate that the characteristics of reactive fnctional groupson humic aid are ependent on the molecular size. The present TIR analyses show, themain reactive functional groups o the I-rumic acid of 100,000 daltons-450 Jim are aliphaticCOOH (and OH), while those of 30,000-100,000 daltons and of 5000-30,000 daltons arearomatic COOH and phenolic OH, and aromatic COOH, respectively.
Ok daltons-450nm
30k-100k daltons
5k-30k daltons_Z I I I I I _
4600.0 3000.0 2 A 0 0. 1000. 400.0
Wavenumber (cm-')
Fig.3 FTIR spectra of the fractionated hurnic acids.
- 655 -

JAERI-Conf 2002-004
100k daltons-450nm 30k-100k daltons
(a) Hurnic acid of 100,000 daltons-450 nm (b) Humic acid of 30,000-100,000 daltons
Fig.4 CAP/MAS "C-NMR spectra of the fractionated hurnic acids.
Table I Chracterization of humic acid by 13 C-NMR spectral structures.
Chemical sift (ppm) Spectrum area (%)Functional group
100k-450nm 30k-100k 5k-30k
Aliphatic C 10- 50 49.8 17.7 15.6o-alkyl 50-100 7.0 12.5 11.2
-CH20H 100-107 0.8 2.5 2.0
C=C & Aromatic C 1,10-160 22.2 41.8 42.9
-COOH 160-200 15.2 20.6 23.5
Carbonyl C 200-220 5.0 4.9 4.8
The solid-state 13C-NMR spectra of the hurnic acid fractions of 100,000 daltons-450 nmand 30,000-100,000 daltons are shown in Fig.4. The "C-NMR spectrum of the5,000-30,000 daltons fraction was nearly same as tat of the 30,000-100,000 altODS. Thespectra were assigned as shown in Table 19]. Although the 1 3C-NMR data are not highlyquantitative, relative amounts of aliphatic vs. aromatic carbons were cmpared y alculatingthe integrated areas for the selected regions of interest with the results for ach factionatedhumic acid listed in Table . Tese data show that the 00,000 daltons-450 M fraction ismainly occupied with aliphatic carbons, but the 5000-30,000 daltolls ad tile 30,000- 00,000daltons fractions are dominated with aromatic carbons. Relative area of reactive COOHgroup increased with decreasing olecular size.
- 656 -

JAERI-Conf 2002-004
0 00k daltons-450 nm
10 L 30k-I 00k daltons
5k-30k daltons0
X 6CL
4
2
0 5 0 1 5 20
Volume of HCI (cm )
Fig.5 Titration curves for the fractionated humic acids.
Table Characterization of proton exchangeable groups of te fractionated humic acids.
100k-450nm 30k-100k 5k-30k
First equivalent point (-OH)pH 8.4 8.1 8.2
pKa 10.6 9.9 9.7
11' exchangeable capacity (meq/g) 5.5 3.3 2.5
Second equivalent point COOH)
pH 5.1 5.2 5.2
pKa 6.7 6.6 6.3
H' exchangeable capacity (meq/g) 2.5 3.3 3.3
Protonation capacity and pKa of the functional groups were discussed from the acid-base
titration curves, as shown in Fig.5. All three hurnic acid fractions had two equivalent point
in the titration curves; First equivalent point seems to be corresponding to the carboxylate
-COO- groups ad te second seems to be corresponding to phenolic or alcoholic -0- groups.
The COOH and the -OH group equivalences of the fractionated hurnic acid fractions were
determined which, in turn, allowed calculation of pKa values of these groups. Table 1
gives the calculated equivalence of COOH and -OH groups and their pKa values at ionization
of 0.5. The data indicate that the humic acid fraction of 100,000 altons-450 nm has higher
proton exchangeable capacity and are weaker acids as compared with that smaller than
100,000 daltons. However, COOH groups corresponding to the second equivalent point of
100,000 daltons-4,50 nm fraction are lower than the smaller fractions, Amount of proton
exchangeable capacity corresponding to -OH group in the fraction of 5000-30,000 daltons is
smaller than te others. These reflect the results observed in the FYIR and the 13 C-NMR
spectra.
- 657 -
JAERI-Conf 2002-004
3.3 Correlation between complexation ability and functional groirps of hurnic acidThe FTIR spectral sricture ad the 13 C-NMR spectral structores indicated that the
functional groups on the hurnic acid of 100,000 daltons-450 nrn ere dominated with COOH,CHO and OH groups of aliphatic carbon structures, wle tose on te hurfflic acid of5,000-30,000 daltons and 30,000-100,000 daltons were dotoinated with both aromatic COOHand phenolic OH. The acid-base titration curves showed that pioton exchangeable capacityof the hun-fic acid of 100,000 daltons-450 nm is larger tha te other molecular size fractions.The results from the FTIR and the 1 3C-NMR spectral analyses suggest tat the aliphaticfunctional groups may not take part in the omplexation of etals. For the 100,000daltons-450 nm fraction having aliphatic branched structure, small amount of COOH groupand large proton exchangeable capacity possibly seem to cause low cornplex ability and highion exchangeability. In addition, steric hindrance may have has air effect on thecomplexation by humic acid winding up like random coils from the branched structure.
Gamble et al.[101 studied on interactions between Cu 2+ and fulvic acid, and postulatedthat two types of reactions are involved in the interactions; the most important reactioninvolves both the phenolic OH and COOH groups, and another reaction of lesser iportanceinvolves the COOH groups only. The present results can be explained by the theoryreported by Gamble et al.. The hurnic acid of 30,000-100,000 altons is ominated with thearomatic COOH a phenolic OH and it preferentially interacts with 738K ad "'Am. On
24 'Am did ot interact with the hunric acid of 5000-30,000 daltons, which isthe other and , I
mainly dominated wit te aromatic COOH, despite 238 Pu is interacted. Ts contradiction
may be attributed to that the interaction with 241Am involves steric hindrance of the COOH
groups.
4.CONCLUSIONS
The effects of humic acid on interaction affinity with '217 Np, 'Pu an(-t 14 'Ani have been
examined with respect to different molecular size fractions. At tile pH of 5.5, little 13'Np
interacted with the hurnic acid. The humic complexation ability of 238 Pu ad 24 'Am were
affected by the molecular size of humic acid. The hurnic acid faction at different olecular
size ranges had different structures ad functional groups, each ther. Te molecular size
selectivity on the complexation with transuranic truclicles may be caused by ore than two
different functional groups concerning to the complexatiOD and/or steric hindrance around the
functional groups.
REFERENCES
[1] J.F.McCarthy and J.MZachara: EnvironSci.Technol., 23, 496-502 1989).
[2] K.NashK, et ai.: Environ.Sci. Technoi., 15, 843 837 198 1)�
[3] T.Tanaka ad S.Ni: AERI-M 93-185, (993),
[4] T.Kanno: Radioactive Wste Research, 1, 131-162 1995).
[5] K.H.Lieser and U.Muhlenweg: Radiochim-Acta, 43, 27-30 (,988),
[6] G.A.Burney and R.M.HarbOLir: NAS-NS-3060,(1974),
[71 J.J.Alberts, Z.Filip a N Hertkorn: J. Contaminani Hydrogy, 1, 217-330 992).
[8] F.J.Stevenson "Humus Chemistr 'y", pp,26?-278, John Wiley Sons, New York 1982).
[9] Nihon-kagaku-kai- "agaku-to-sorisetsu No.4, Tsufi-no-kagaku", pp,85-96, 1998),
Gaku .utsu-Shuppan-Senta,'rokyo 1989).
[10] D.S.Gamble, M.Schnitzer and Ll-loffman: Can.J.Chem., 48, 3197-3204 1970).
- 658 -

JP0250364JAERI-Corif 2002-004
SORPTION BEHAVIOR OF NEPTUNIUM ONTO STVlECTTTE UNDERREDUCING CONDITIONS IN CARBONATE MEDIA
AKIRA TAMUR-A, TSUTOMU TOMURA AND TOMOKI SHIBUTANI
Waste Isolation Research Division. Waste Management and Fuel Cycle Research Center,Tokaj Works, Japan Nuclear Cycle DevelOpTuet Istitute (JNQ
4-33 Muramatsu, Tokai-mura, Naka-gun, lbaraki, 319-1194, JapanFax: 81-29-287-3704, e-mail: ak�tokai.jnc.goJp
Sorption behavior of neptunium onto SiDeCtite was investigated under reducing conditions in carbonate media.Distribution coefficient (Kd) of neptunium on stnectite was determined by a batch ethod as a function of totalcarbonate concentration (CT) in a weak alkaline Solution- The CT value as ranged from 0.09 N4 (M=moHM-3)
to 1.0 M� The obtained Kd value decreased with increasing the total carbonate oncentration, It was found
that both Np(JV) and Np(V) coexisted in the solution by a TTA-extractron method, the present experimental),(2n-l)-
conditions, contribution ofneptunyi ion, NP02�, carbonate complexes ofNp(V), NP02(C(3 (n=] 2 and 3,2-
and a arbonatolrydroxo complex of Np(IV), NP(CO3)2(OH)2 , to tile sorption onto smectite was expected. The
Kd value- of respective species of rrepturrium were estimated by a least-squares fit to the experimental data.
From te obtained K values ofrespective species, sorption behavior, ofneptuniur oto smectite was discussed.
Key words; adionuclide migration, nepturnum, sorption, snecure, reducing conditions, carbonate media
1. INTRODUCTIONUnderstanding the radionuclide migration behavior is important for safety assessment of
a geological disposal of high-level radioactive wastes (HLW). Chemical compositions andpH value of a groundwater around the repository of HLW will affect the migration behaviorof cationic radionuclides de to the complexation with anionic igands when the radionuclideswill dissolve to the groundwater. In the report of H12: Project to Establish the Scientificand Technical Basis for HLW Disposal in Japan" [ J, several types of hypotheticalgroundwater are summarized. Four types of hypothetical groundwater, which are FRHP(fresh-redricing-high pH)� FRLP (fresh-reducing-low pH), SRJ-TP (saline-reducing-high pH)and SLP (saline-reducing-low p-T), have been defined and modeled as generic groundwatercompositions for the prformance assessment or HW disposal i the "H-3" first progressreport 2]. In some special locations in Japan, however, middle salinity, reducing, neutral pHwaters which contain high concentration of HCO3- have been found, Thus, a new type ofhypothetical groundwater "MRNP" (inixing-reducing-rieutral H) has been defined as anadditional generic groundwater compositions 3 The NIP groundwater contains highconcentration of CO3- (5xlO 3 ppm) and CY (IxIO 4 ppm).
Thus ivestigation of migration behavior of radionuclides in buffer materials and rocksin highly carbonate media is important for the performance assessment for HLW disposal.Especially, Np-237, which is an a-emitter and as the og hlf-life of 2.14xl 06 years, isregarded as one of the most hazardous radionuclides for HL'Wdisposal, In a deep geologicalenvironment which is expected to e under reducing conditions a tetravalent neptunium will-be dominant, while a pentavalent neptunium is dominant in the Dear-Deutral solutions contact
with air. Fxpected ominant aqueous species of nepturrium in a deep geological
environment are NP(OH)4(aq ad Np(C03)2(0H)22,, in the `H- 2 eport I]. Consequently,
it is important to un6erstand the migration behavior of Np(IV), EXterlSiVe tudies have been
performed to obtain the data to elucidate the sorption and iffusion ehavior of neptunium.
The previous tdies on neptunium sorption oo bentonites under reducing conditions,
however, are )'DSUffiCiellt to evaluate the sorption ehavior of Np(IV), especially in highly
659 -

JAERI-Conf 2002-004
carbonate media.In the present study, sorption of neptunium onto smectite under reducing conditions in
highly carbonate media has been investigated. Distribution coefficient (Kd) of neptunium.onto smectite, which is a major omponent of bentonite, is determined in a weak alkalinesolution as a function of total carbonate concentration CT). Considering the redox statespeciation of neptunium, the Kd values of respective aqueous neptunium species are obtained.The sorption behavior of nepturrium. carbonate complexes is discussed.
2. EXPERIMENTAL2.1 Preparation of Smectite
The bentonite sample of KunTia-Fe (Kunimine Industries Co.), which wascommercially purified from Kunigel-VI (Kunimine Industries Co,), was used as a startingmaterial for purification of sinectite. Before purification, KUDipia-F 9 Contains 99 Wt.% Of
Na-type smectite and some impurities, for example, quartz and calcite. A counter on of Na+
on the smectite may be replaced with other counter ions such as Ca 2+ . Thus, further
purification was required for the present study.. The dried Kunipia-Fe of 20 g and I M M = Ml.dM-3 ) NaCl of I dM3 was mixed in a
glass beaker and was shaken for 3 hours. After I hour leaving, the coagulated suspension
was obtained by a decantation method. After adding an aliquot of distilled water to the
suspension, the suspension was centrifuged at 3 103 rpm for 15 min for removal of the
mineral impurities and large particles above 5X 10⁻⁷ m. The centrifuged suspension was
washed with a HN03 and NaCl mixed solution at a pH around 3, re-centrifuged and
decanted for several times. For removal of NaCl a dialysis method was performed by using
a semipermeable membrane, The remained suspension was finally evaporated to dryness.
The detail of the above procedure is described in the literature 4].
2.2 Sorption Procedure
Distribution coefficient (Kd) of neptunium onto smectite was determined by a batch
method. A stock solution of 237 Np02C1 in an 14 M HCl solution was obtained from
Amershain Co., and used without further purification. In a polypropylene tube, .2 g of
smectite powder was added into 20 ml of an I M NaCl and 0.01 Na2S204 mixed solution.
Reagent of NaHC03 powder was also added ito the tube for ranging a total carbonate
concentration (C-r) from .09 M to 1.0 K The initial concentration of Np-237 was set at
IX10-6 M. The sample was gently contacted with shaking at 22±3 'C to attain sorption
equilibrium. The pH value was measured by using a phon meter, IM-55G (DKK-TOA
Co.), with a glass electrode, GST-5421C (L)KK-TOA Co.), ad te pH of the solution was
adjusted around 9 The redox potential Fh (vs. SHE) in the solution was onitored during
the experimental rocedure by rising a glass electrode, PST-542 IC KK-TOA Co.).
After shaking time of 16 d and 42 d, the solution of the sample was filtered by using an
ultrafilter with the molecular weight cut-off (N4WCO) of 104 (Advaritee UY-1, Toyo oshi
Kaisha Ltd.), and the total neptunium concentration in the solution was determii)ed, After
shaking time of 42 d a TTA-extraction method [5 6 was applied to the determination of the
oxidation state of neptunium, Te method was performed as follows. 'The oncentration of
HN03 in the filtrate was usted around I M by adding I M `N03, The filtrate and . M
TTA (thenoyltrifluoroacetone i a xylene solvent was vigorously shaken for 10 min for
extraction of Np(IV) to the organi pase, After removal of aqueous phaSe, IO M N03 was
added to the organic phase and -vigorously shaken again for 10 i for back-extraction of
Np(IV) to the aqueous phase. Te concentrations of Np(IV ad Np(V) were defined as the
concentration of neptuniur i the rganic and aqueous phase after the TTA-extractiori method,
respectively. The (-ray counting of Np-237 was performed by using either the alpha
660 -

JAERI-Conf 2002-004
spectrometer Oct�te CTM (EG&G ORTEC Co.) or the liquid scintillation counter,2770TRJSL (Packard Istruments Co.) with the sintillator Ultirna Go1dTM XR (PackardInstruments Co,),
All the procedures except -ray counting were performed in a glove box filled with 2
gas 02 I pprn) to avoid the contamination Of 02 and C02 gas in air.
2.3 Desorption Procedure,A desorption experiment was performed after the sorption procedure. After
equilibration of sorption experiment, a ixed solution ontaining I M KC1 and 0.01 MNa2S204 was added to the suspension which was contairiing the neptunium-sorbed smectite.After a shaking time of 3 d a aliquot of the solution was filtered by using te ultrafilter withthe MWCO of 104 , and te a-ray of Np-237 i the filtrate was detected by either the alpha
spectrometer or the liquid scintillation counter. A HCl solution was added to the suspensionadjusting the HCI concentration to I M after the desorption procedure with KCI. The sameprocedures for the filtration and a-ray COUDting was performed after saking time of 3 d.
Finally, sorption of nepturriurn onto the vessel wall of polypropylene tube wasinvestigated. After removal of the smectite and the solution which was not used to the abovedesorption experiment, te polypropylene tube was washed by distilled water. Aconcentrated HCI solution (around 11.4 M) was introduced to the tube, and the neptuniumconcentration in te concentrated HCI solution was determined.
Similar to the previous procedure (see section 22), all the procedures except cc-raycounting were performed in a glove box filled with N2 gas 02 I M).
3. RESULTS AND DSCUSSION3.1 Distribution Coefficient the Batch Experiment
3Experimental Kd (M kg- of neptunium onto smectite is calculated by the followingequation:
Kd_ (Co - COV (1) 100CfW 16 d
R 42 dM 16 d (cal)
where Co (M ad Cf (M) denote the 0 42 d (cal)concentrations of the neptunium. beforeand after equilibration, respectively, V 10-1 -(M)
the volume of the solutions and 74W (g) the weight of the dried smectite -14
sample. E 0The obtained Kd values are -0
shown as a function of CT in Fig. 1. 10-2
The final pH value of the samples was 0 El8.6±0.3. It is found that the Kd valuesdecrease with ireasing CT. Asshown in Fig, 1, little difference in the
lo-,Kd values between the shaking time of lo-, IOU16 d and that of 42 d is found. Based CT(M)on this, it is judged tat the sorption ofneptunium onto smectite Fig. I Experimental and calculate-d K d values of
approximately ilibrated. Below neptunium onto smectites as a function of CT
CT Of 08 M, ilwas presumed that the
- 661 -

JAERI-Conf 2002-004
concentration of neptunium in solution was steeply decreased with decreasing CT due to theprecipitation of Np(TV). Thus oly the Kd values above CT (f 0.0 M were adopted asreliable data in the present study, The Kd values were not determined for several samplesdue to a weak sorption of neptunium onto smectite, especially in high C-1- solutions,
3.2 Speciation of Redox States of Neptunium in SolutionExperimental results for the ratio between the concentration of Np(IV) ([Np(IV)]) and
the total neptuniurn concentration 1.0([Np],oa0 in the solution are shown asa function Of CT in Fig. 2 The E (vs. 0SHE) values have been held around 0. --0.4 V. It is found, however, that a 0major oxidation state below CT of .05 '7tM is pentavalent. According to the WL� 0.6 -thermodynamic database developed by Zthe Nuclear Energy Agency in theOrganization for Economic Co- 0> 0.4 -1-1 0 0operation and Development (OECD 0 0 0/NEA 7 a major oxidation state is Z 0 0tetravalent in the present experimental 0.2 -conditions. The dominant aqueousspecies of Np(IV), on te other hand,only Np(OH)4 (aq.), Np(CO3)4 4- and 0.0Np(CO3)5 6- are accepted to the thermo- lo-, 100dynamic database by OECD/NEA 7]. CT (M)
Considering the two aqueous species Fig. 2 Ratio between aqueous concentrationof Np(IV), however, te oubility of of Np(TV ad that of total DeptUniUM
Np(IV) is calculated to be much lower detennined by a TTA-extraction ethodthan the concentration of Np(IV)experimentally obtained from the 101present study. Several researchershave determined an equilibrium lo-,- Np(C0 6
constant of a carbonatohvdroxo - Totalcomplex of tetravalent actiDides,An(CO3)2(OH)2 2- (An: U 891, Nip [9- 10-3-
1 1 ] or Pu [I 213]), which is considered 10-5to be a dominant species of An(IV ina weak alkaline solution containing
10-1 Np(COcarbonate or hydrogencarbonate ions. 3)2(OH)2
The solubility of NpO2(am), including 10-9 P(COthe carbonatohydroxo complex of 3)4
2-Np(CO3)2(OH)2 , in an M NaC1 Io-Hsolution as a function Of CT at pH 86 Np(OH)4(aq)-is calculated as shown in Fig. 3 The 10-13
ionic strength correction is performed 10-4 lo-, lo-, 10-1 lo, lo,by a "specific ion interaction theory CT 4)(SIT)" model [ 4.
It is also found that te ratio of Fig. 3 Solubility of Np(IV) as a function of C-11[Np(IV)]/[Np]i.,., increases with in an I M NaCl solution at pH 86increasing C The present result
- 662 -

JAERI-Conf 2002-004
shows that te steady-state is reached rapidly in high hydrogencarbonate solutions and thathigh drogencarbonate solutions ppear to stabilize the tetravalent state, similar to the resultsby Rai et al. 01.
3.3 ArIalytical ProcedureAs mentioned above, result of I 00
the TTA-extraction ethod shows that NpO 2+
both Np(IV) and Np(V) coexist in the NpO 2co 3- NpO 2(CO3)3'-
solution for the sorption experiments.Based on t result, it is consideredthat Kd Value Sown Fig, I reSU]t in NpO 2(CO 3 2
= 60 sorption by several species of Np(IV) 2and Np(V). Thus, the experimentalKd value is expressed as
t� 40 -
Kd =jKdjXj, (2)i 20
where Kdi and Xi denote thedistribution 00effiCiell ad the molar 0fraction of species of neptunium. in 10-4 10-3 10-2 lo-, 100 lo,
solution, respectively. CT )
According to the thermodynamicdata by OECD/NEA r7j. several Fig. 4 Fraction of Np(V) species as a function ofhydrolysis species and carbonate CT in an I M NaCl solution at pH 86complexes are considered to be formedin a weak alkaline solution containingcarbonate or hydrogenearbonate ions. The fractions of the species of Np(V) at pH 86 in anI M NaCl solution are shown as a function Of CT in Fig. 4 In the present experimentalCondition (-r from .09 to 1.0 M), three carbonate complexes, PO2(CO3)�' (2n-])- (n = 1 2 or3), areCODsidered to be the dominant species. Neptunyl ion (NpO2,-) is also considered to beremained in the present conditions. On the other hand, the orninant species of Np(IV isconsidered to be Np(CO3)2(OH)2 2- as shown in Fig. 3 Thus, equation 2) can be representedas
Kd (Kd I NP02+1 + Kd2[NPO 2C 31 Kd 3 NPO 2 (Co 32 3-1Cf
+Kd4[NP02(COI)3 5-] + Kd5[NP(CO3)2(OH)2 2- (3)
where Kdl , Kd2, Kd3, Kd4 and Kd5 denote the distribution coefficient of NpO2+, NpO2CO3-,5- 2-
NpO2(CO3)2'-, NP(2(CO3)3 and Np(CO3)2(OH)2 ,respectively,Respective concentrations of Np(V) are calculated as multiplying the molar fraction
with [Np(V)] wich is obtained from a TTA-extraction method, T concentration ofNp(CO3)2(OH)22- is onsidered to be equal to [Np(TV)] of experimental results as shown inFig. 3 For the K values after 16 d, the concentration ratio between [Np(IV)l and [Np]"',a is
assumed to be sme as that after 42 d. Then, a least-squaresfittilIg aalysis with equation(3) is performed to the experimental data shown in Fi& In te analysis, distributioncoefficients of respective species, Kdn (n = I - ), are treated as a free parameter. The result
- 663 -

JAERI-Conf 2002-004
of numerical computation is shown as painted marks in Fig. 1, and the obtained Kd,, values arelisted in Table 1. The obtained Kd] (for NpO2+) and Kd2 (for N02CO3') values are similar tothe previously reported Kd values in weak alkaline groundwaters under aerobic conditions[15-18]. It is considered to be reasonable that the obtained Kd values of respective speciesare decreasing with increasing te number of negative charge of the s ecies. because thesurface of the smectite is considered to be negatively charged i alkaline solutions 419].The obtained Kd5 (for Np(CO3)2(OH)2'-) value will be discussed later,
3.4 Desorption ResultsThe fractions of neptunium 100
desorbed by I M KCI and the residualcompletely desorbed by I M HCI Ksolution are shown as a function Of CT 80 Hin Fig. 5. It is reported thatneptunium. desorbed by I M KCI esolution is probably located ion- a 600exchange site on the outer surface ofthe mineral, while specifically sorbedneptunium was fixed in the interlayer tE 40of smectite 20]. At low CT valuesbelow 02 M, it is observed that mostof neptunium is not desorbed by K1 20but desorbed by only HCL At highCT values above 0 3 M, on the other
0hand, it is observed that all neptuniumis desorbed by KC1. The present CD C-- Cresult is considered to be due to the Ccontribution of different neptuniurn T (M)
species for the different CT values. Fig. Fraction of nepturriurn sorbed ion-exchange-Considering the results sown in Figs. ably and specifically onto smectite by the2 and 4 the dominant species of desorption experiments with I KCI andneptunium contributed to the sorption I M HCI, respectivelyonto smectite is expected to be NpO2+
at lw CT solutions. At igh CT solutions, on the other hand, that is expected to be2-Np(CO3)2(OH)2 . As mentioned previously, the surface of the smectite is considered to be
negatively charged in alkaline solutions 49]. Thus, N02+ is expected to be sorbed ontonegatively charged smectite surface as a electrostatic sorption, while N(CO3)2(OH)2 2-
expected to be sorbed as a weaker sorption than NpO2+. Further investigation may berequired to elucidate the desorption behavior,
3.5 Discussion of Mechanism of Sorption of Neptunium onto SmectiteDespite the low Eh values around 0A V easured in the preseitt study, it is found that
the dominant redox states Of Deptuniurri for the sorption DtG MeCtite is pentavalent incarbonate media below CT of 0.5 N, as shown i Fig. 2 As entioned above, the obtainedKd dependency on CT as been well explailled by considering te major contribution ofNP02+. The Kd value for Np(IV) (Kd5) also has been determined.
There are a few studies on the sorption of Np(lV) onto mineral surfaces onsideringwith the aqueous neptunium species. Pratopo et al. study on NP(JV) sorption onto quartz[21] and Ca-type bentonite 22] tder reducing conditions in carbonate media with pH rangedfrom 4.5 to 13. As swn in Table 1, Pratopo et al. have determined the Kd of
- 664 -

JAERI-Conf 2002-004
NP(CO3)2(OH)2'- (Kd5) onto quartz [21J and Ca-type bentonite 221, which are much largerthan that of Np0,2+. There is a large discrepancy between the Ks value by the present studyand tose by Pratopo et al, A reason of te discrepancy may be due to the calculation ofmolar fraction of aqueous neptunium, species, even the distribution coefficient is dependent onpH in general. The studies of Pratopo et al. ave no information for the speciation ofDeptunium in te experimental results. Thermodynamic alculation of the redox states andmolar fractions of rieptunium, may provide the major contribution of Np(IV) under reducingconditions in alkaline solutions. The xperimental results, however, the contribution ofNp(TV) is smaller than the hermodynamic alculation, such as the present study and thesolubility study on Np(IV) by Rai et al, [10). Furthen-nore, it is difficult to describe theexperimental Kd value wich decreases with increasing CT, without the contribution of Np(V),especially of NpO2', Thus, the small d5 value for NP(CO3)2(QH)2 2-) in the present study is
considered to be reasonable.
As shown in Table 1, it is found that the Kd, value of te respective species decreases
with increasing the number of negative charge of the species independent of the redox state of
nepturrium in the present study. Considering with the desorption results as mentioned above,
carbonate and arbonatohydroxo complexes of neptunium are expected to be sorbed onto
smectite as a weak electrostatic interaction (it may. be ion-exchangeable). The neptunyl ion
(NpO2+), on the other hand. may be sorbed onto smectite as a fonnation of surface complex.
Further experiments will be required to elucidate the mechanism of sorption of neptunium
onto smectite uder reducing conditions in carbonate media.
Table I Distribution coefficient of respective neptunium species onto smectite,
quartz and Ca-type bentonite obtained from a least-squares fitting
analysis
Kdi (m'.kg'
species smectite quartz* Ca-type bentonite
(present) ([211) ([22])
NpO2' Kd = 4.8X IO-' (1.31-13.1)x 10-3 I o-2. 0±0.01
NP02(OH)2_ I o2.82+0.39
NpO2CO3_ Kd2 = 1.8 IO-' < 393 10-4NpO2(CO3)2 3- Kd < 53 10-4 < 393 10-4
Npo2(CO3)3 5- Kd < X 10-5
Np(CO3)2(OH)2 2- Kd5 = IAX 10-2 6.56 IO-' iol.01+-0.24
Np(CO3)2(OH)44- 6.13 X 10⁻² 1 (0.93+-0.37
Np(OH)5- > 1.04X 10⁴
Converting the surface-based distribution coefficient with the specific surface area
of 131 102 M2 kg-' in the literature 21].
4. CONCLUSIONS
Distribution coefficient of neptunium. onto smectite was determined under reducing
conditions in carbonate media by a batch method. The experimentally determined
distribution coefficient decreased with increasing the total carbonate concentration.
Considering with the molar fractions of Np(IV) ad Np(V), distribution coefficient of
respective species of neptunyl ions, carbonate complexes of Np(V) and carbonatohydroxo
- 665 -

JAERI-Conf 2002-004
complex of Np(IV) was determined by a least-squares fitting analysis, It was found that thedistribution coefficient of respective species decreased with increasing te norriber of negativecharge. Considering with the desorj)tion results, carbonate and Qarbonatohydroxo complexesof neptunium are expected to be sorbed onto smectite as a weak electrostatic interaction.
ACKNOWLEDGEMENTSThe author should aknowledge r. H. Sato, Waste Isolation Research Division, Waste
Management and Fuel Cycle Research Center, Tokai Works, Japail Nuclear CycleDevelopment Institute, for many suggestions and useful discussion.
REFERENCES[1] Japan Nuclear Cycle Development Institute (JNC), JNC TNI 410 2000-001(2000).[2] Power Reactor and Nuclear Fuel Development Corporation NC), PNC TNI410 93-
059(1993).[3] M. Yui et al.: JNC TN8400 99-030(1999).[4] T. Shibutani et al., JNC TN8400 99-066(1999) (in Japanese).[5] A. M. Poskanzer, B. M. Foreman Jr., J. Inorg. Nucl. Chem., 16, 323-336(1961).[6] S. C. Foti, E. C. Freiling, Talanta, 11, 385-392(1964).[7] R. J. Lemire et al.: "Chemical Thermodynamics of Neptunium and Plutonium", North-
Holland, Amsterdam(2 00 1).[8] D. Rai et al., Radiochirn. Acta, 82, 17-25 (1998).[9] M. I. Pratopo, H. Moriyama, K. Higashi, Radiochim. Acta, 51, 27-31(1990).[10] D. Rai et al., Radiochirn. Acta, 84,159-169(1999).[11] A. Kitamura, Y. Kohara, JNC TN8400 2001-006(2001).[12] D. Rai et al., Radiochim. Acta, 86, 89-99(1999).[13] T. Yamaguchi et al., Radiochim. Acta, 66/67 914(1994).[14] 1. Grenthf,- et a,-, "Modelling in Aquatic Chemistry", OECD, Paris(l 997).[15] L. L. Ames et al., RTO-BW-CR-127-P/PNL-3992(1981).[16] B. Torstenfelt et al., Radiochim. Acta, 44/45, 1 1 - J 7(1988).[17] D. Starnmose et al., Appl. Clay Sci, 7 225-238(1992),[18] J. F. Relyea et al., PNL-SA-7352, vol 21978).[191 W. Stumm, J. J. Morgan: "Aquatic Cemistry", 3rd ed., John Wiley Sons Inc., New
York(I 996).[20] N. Kozai et al., J. Nricl. Sci. Technol., 30, 1153-1159(1993).[21] M. I. Pratopo et al., Radiochim. Acta, 55, 09-213(1991).[22] M. 1. Pratopo et al., J. Nucl. Sci. Technol., 30, 60-566(1993).
666 -

JP0250365JAERI-Conf 2002-004
EFFECT OF TEMPERATURE ON THE SORPTION OF NEPTUNIUM
ON MAGNETITE
&-NAKAJA, S NAGASAKI*, S. TANAKA, Y. SAKAMOTO", T.TANAKA** AND
H�OGAWA**
Departments of Quantum Engineering and Systein Science, University of Tokyo, Bunkyo-ku, Tokyo 113-
9656,Japan
Fax: 81-3-5841-8622, e-mail:na-ata�flanker.q.t.u-tokyo.acjp
*Graduate School of Frontier Sciences University of Tokyo Bunkyo-ku, Tokyo 113-8656, Japan
"Departments of Environmental Safety Research, Tokai Research stablishment Japan Atomic Energy
Research Institute, Tokaimura, Naka-gun, Ibaraki 319-1195japan
Sorption and desorption experiments of Np on iron oxide were carried out at 25, 40 and 60
'C under ambient aerobic condition. Magnetite(Fe301) was used as one of representative iron oxide
and sorption behavior was investigated. The sequential desorption method by using 1.0 M KCI and
0 I M KC204 solution was applied to magnetite-Np system to obtain the information on the sorption
form of Np at each temperature, The results sowed that the Np sorption on magnetite was strongly
influenced by temperature. The amount of sorbed Np at each pH value increased with increase of
temperature. Furtbermore, the results of desorption experiment showed that the amount of Np
sorbed exchangeable and the amount of Np sorbed on non-crystalline phase increased with increase
of temperature. According to these results, the sorption of Np on magnetite is considered to include
chemical sorption.
Apparent standard reaction entropy was calculated using of Vant't Hoff equation for
exchangeable sorption and sorption on non-crystalline phase as 35-37 and 52-54(KJ/mol),
respectively. These two different values of standard reaction entropy are considered to indicate the
possibility of two or more kind of sorption site on the surface of magnetite.
Key words: Neptunium, Magnetite, Sorption, Desorption. Temperature
1. INTRODUCTION
According to te performance allocation analysis on nlulti-barrier system for high-
level radioactive waste disposal, it was found out that Np-237 ominates the hazard at the
exit of the natural barrier, amely at the inlet of the biosphere. eptuflium-237 is present in
the high-level radioactive wastes, although in comparison to other radionuclides its amount
is small, However, because of its long half-life and its mobile nature under aerobic
conditions due to te high chemical stability of its entavalent tate, NP02', Np-237 is
- 667 -

JAERI-Conif 2002-004
considered as a possible long-term pollutant of the ecosystem[ I]. The understanding of the
Np sorption behavior is required i order to describe quantitatively its tansport in surface
and groundwater systems. Iron oxides are expected to play an important role in regulating
the migration of radionuclides because of their widespread existence, and high sorption
capacity[2]. Therefore, Np sorption data on, iron oxides are required to describe the mobility
of Np in natural waters. Neptunium sorption on iron oxides has been investigated in some
cases 34]. However, the effect of temperature on sorption, which may yield important
information about sorption mechanisms, have not been extensively studied in Np-iron oxide
systems.
In this work, sorption and desorption experiments of Np on iron oxides were
carried out at 25, 40 and 60 'C under ambient aerobic condition. Magnetite(FeA)was used
as one of the representaive iron oxides and sorption behavior was investigated. The
sequential desorption method by using 1. M KC1 and 01 M K2C204 solution was applied
to these system to obtain the information on the sorption form of Np at each temperature.
2 EXPERIMENTAL
2.1. Chemicals
Magnetite powder was obtained from Rare Metallic Co., Ltd. (Tokyo, Japan).
Magnetite powder was sieved to a particle size of less than 250 m before the sorption
experiment.
9.2xl 0-2 M Np in 22 M HN03 was obtained from MRI, France and diluted with
deionized water to obtain a 1.8xl 0-2 M Np stock solution. The oxidation-state of Np was
confirmed to be pentavalent because the evidence of presence of Np(TV) was not obtained
by a solvent extraction technique using 05 M thenoyltrifluoroacetone YIA) in xylene [5].
2.2. Procedures
(1) Sorption
Sorption experiments were conducted by batch method. Batch experiments were
conducted as follows: I g of individual iron oxide were placed in 50 ml polypropylene tube
with 40 ml of solution. The pH of the solution was adjusted, to 4 to using HNO, and
NaOH solutions. The ionic strength was adjusted to 0. M by a aN03 solution. The
polypropylene tubes were placed in a saker bath at 25, 40 or 60 'C for 7 days to allow
equilibrium of the pH. Then, Np solution was added to ach tube so tat the concentration
of Np became 6.Ox 1 0-6 M. The tubes were placed in a shaker bath, gain at each emperature
for7 days. After 7 days, the pH was measured ad ml aqueous samples were taken from
each tube after filtration with a 045 gm-pore size membrane filter, The Np concentration of
- 668 -

JAERI-Conf 2002-004
the aqueous samples was measured. Blank tests with 01 M NaNO, solutions were carried
out in parallel with the sorption experiments in, order to measure the Np sorption onto the
wall of polypropylene tubes.
(2) Desorption
To investigate the chemical form of Np sorbed a sequential desorption method
was applied, After the end of the sorption experiments, liquid and solid phase were
separated by centrifugal separator. At first. for the I g solid phase, 40 ml of the 1.0 M KCI
solution was added and placed in a shaker bath for 7 days at each temperature that the
sorption experiment was carried out. Then the liquid phase and solid phase were separated
using a centrifugal separator. The liquid phase was filtrated with a 045 gm-pore size
membrane filter, and the Np concentration in the filtrate was measured to evaluate the
amount of Np desorbed by the KCI solution. After that, same procedure was carried out
with 0 I N4 K2C204 solution.
In this work, the concentration of Np was measured using a liquid scintillation counter
(Packard Institute).
3. RESULTS
3.1 SpeciatiQn
The speciation of Np(V) in 0 I M NaNO3 was calculated at the pH range between 2
to 10, at 25 and 60'C to ivestigate the change of speciation at 25'C and 60'C. The
1En
.2 + NpI NPO 0 20.8- 2 0. -
CLi 0.6- CL, 0.6 -1-i 0 NpO (OH)
.0 NpO OH .0 22
0.4 - �5 0.4 -NpO HCO Np HO
2 3 2 30.2 0.2 -
NpO 2(No 3 NpO 2 (NO30 0
2 4 6 8 10 2 4 6 8 10p 14 p H
(a) 25 C (b) 60 C
Figure 1. Calculated speciation of 6x 06 M p(V) in 0 I M NaNO, (a) 25 C (b) 60 'C.
Equilibrium constants used in Np(V) speciation were quoted from 6] and 7].
669 -

JAERJ-Conf 2002-004
calculated speciation was showed in Figure. I (a)25 C and (b ')60 'C. According to the
calculated speciation, NpO,-, is dominant spices in solution at oth 25 and 60 'C, This result
indicated that the change of Np species in solution with the change of temperature do not
affect the results of sorption and desorption experiments.
3.2 SoMtion
The results of sorption experiments on magnetite are summarized in Figure 2 The
fraction of sorbed Np, K (%), was calculated by using the following equation,
K = Cb - Cf X 00,
Cb
where C and Cf represent the final
concentrations of Np in the absence and40 - 60 0C 0
presence of iron oxides, respectively. These 0A
results showed that the Np sorption onr
magnetite was strongly influenced by 020 - A 40 C -
temperature. The aount of sorbed Np at each El 0
pH value increased with increase of OM 25 0C
temperature. According to results of sorption Fl I 01 10
experiments, the sorption of Np on magnetite 4 5 6 7 8
is considered to include the chemical sorption pH
because the aount of Np sorbed on magnetite Figure 2 The fraction of sorbed Np
was strongly influenced by temperature. on magnetite at 25, 40 ad 60'C
3.3 DesoQ21i=
In the sequential desorption method used in this study, Np loosely or ion-
exchangeably sorbed was considered to be desorbed by a KC) solution, Previous
investigations[8] indicated that oxalate can desorb only noncrystalline phase of iron.
Furthermore, we confirmed by using 1CP ad XPS tat we could extract oncrystalline
phase of iron oxide by a K2C204 solution. According to these investigations, NP sorbed on a
non-crystalline phase of iron oxides and Np sorbed o te srface of agnetite on-
exchangeably is considered to be desorbed by a KCO, solution. The remaining Nip which
was not desorbed by KC ad KCO, solutions sorbs on te crystalline phase of iron oxides.
Therefore, in this paper, we defined the p desorbed by te KCI solution as Np sorbed
exchangeable', and that desorbed by the K2C204 solution as "NV sorbed o noncrystalline
phase" and the remaining Np as "Np sorbed o cystalline pase".
The results of desorption experiment from magnetite with KCI and KC2(4 solition
- 670 -

JAERI-Conf 2002-004
6x10_8
4 x10 -8 060 60
U 4x10El
040
-8 E-C 2x102x 10 00 40
0 A25 0A El
will& 0 0 E]A, 0Z oe
4 5 6 7 8 4 5 6 7 8pH pH
Figure 3 The amount of desorbed Np with Figure 4 The amount of desorbed Np wth
1.0 M KCI solution at 25, 40 and 60 C 0 I M K2CO, solution at 25, 40 and 60 C
are summarized in Figures 3 ad 4 respectively. As sown in Figures 3 and 4 the amount
of Np desorbe wh KCI at-id K2C204 increased with increase of temperature. Tese results
were coinsidered to indicate Np sorbed exchangeably and sorbed on non-crystalline phase
also include te chemical sorption.
The relationships between the amount of Np sorbed exchangeably and that sorbed
on non-crystalli-ne phase was also ivestigated. It was found out that the amount of Np
sorbed on non-crystalline phase was proportional to the amount of Np sorbed exchangeably
for magnetite-Np system at each temperature (Figure5). Furthermore, it was also found out
that the slope in Figure 5 icreased with increase of temperature.
To explain these results, we
considered the following possibilities. -8
It was proposed in o previous 4 10 00C
study[9] that the srface of magnetite inA
both acidic and alkaline solutions 10"S' 2 10-8 C_
would be covered with non-crystalline
phase. Np would be sorbed on the50 C
surface of non-crystalline phase by 2Z 0 --------
kinds of sorption mechanistris. One of 0 2 -8 4 10-8 6 10-8
the sorption mechanisms iss conjectured Np desorbed with KCI (mol)
to be ion-exchangeable sorption becausesome fraction of sorbed Np was desoebed Figure 5. Relation between the amount of Np
desorbed by KC1 and K2C2O4
671 -

JAM-Conf 2002-004
with 1.0 M KCI solution. T other sorption mechanism is onjectured to be non-
exchangeable sorption, such as surface complexation, and desorbed by K2C204 solution
because K2C204 solution dissolved the non-crystalline phase that covered the surface of
magnetite. It is also conjectured that the slope in Figure 5. increased with increase of
temperature because dependence of sorption on non-crystalline phase on temperature was
different from that of ion-exchangeable sorption.
To investigate the possibility of 2 kinds of sorption mechanisms, apparent standard
reaction entropy was calculated using of Vant't Hoff equation for ion-excharigeable sorption
and sorption on noncrystalline phase, as follows. At first, the apparent-equilibrium constant
K was calculated by using following equations.K, (Amount of Np desorbed with KQ
(Concentration of Np i solution
K2 (Amount of Np desorbed with K2C204)
(Concentration of Np in solution
Then results were plotted with lT as abscissa against K calculated in the manner described
above in logarithm. According to the Vant't Hoff equation, the slope of tis plot represents
the value of -AH/R. Figure 6 shows the plot for calculation of apparent standard reaction
entropy for ion-exchangeable sorption at pH=6.5 and 70.
dLnK A.H (Vant't Hoff equation)dT RT 2
Apparent standard reaction entropy was calculated for exchangeable sorption and sorption
on non-crystalline phase as 35-37 and 52-54(KJ/mol), respectively, These two different
values of standard reaction entropy are aiso considered to indicate the possibility of two or
more kind of sorption mechanism on the surface of magnetite.
I I
AH=35.5KJ/mol
pH=7.0
AH 38.60.1 -
0.003 0.0032 0.0034
I/T
Figure 6 The plot for calculation of apparent standard reaction entropy for
ion-exchangeable sorption at pH=6.5 and 70.
672 -

JAERI-Conf 2002-004
5. CONCLUSIONS
1. The amount f sorbed Np increased with increase of temperature. This is considered
because the sorption of Np on magnetite includes chemical sorption
2. The amount of Np desorbed with KCI and K2C204 Slution increasedwith increase of
temperature. These results are considered to indicate Np sorbed exchangeably and
sorbed on non-crystalline phase also iclude the chemical sorption.
3. The amount of Np sorbed on non-crystalline phase was proportional to the amount of
Np sorbed exchangeably for magnetite-Np system at each temperature. Furthermore,
the proportion of amount of Np on non-crystalline phase to the amount of Np sorbed
ion-exchangeably increased with increase of temperature. This is conjectured because
Np would be sorbed on the surface of non-crystalline phase by 2 kinds of sorption
mechanisms.
4. Apparent tandard reaction entropy was calculated using of Vant't Hoff equation for
exchangeable sorption and sorption on non-crystalline phase as 35-37 and
52-54(KJ/mol), respectively. These two different values of standard reaction entropy
are also considered to indicate the possibility of two or more kind of sorption site on
the surface of magnetite.
REFERENCES
[I] R. C. Thompson, Radiation Research, 90, 1 1982).
[2] K. Idemitu, K. Obata, H. Furuta, Y. Inagaki, Mat. Res. Soc. Symp. Proc., 353, 981
(1995).
[3] S. Nakayama, Y. Sakamoto, Radiochimica Acta., 52/53, 153 1991).
[4] 0. Tochiyama, S. Endo, Y. Inoue, Radiochimica Acta., 68, 105 1995).
[5] F. L. Moore and J. E. Hudgens Jr, Analytical Cemistry, 29, 1767 1957).
[6] F.P.Bertetti, Mat.Res.Soc.SympProc., Vol 412, 631 1995).
[7] J.C.Sullivan, Radiochim. Acta, 61, 57 1993).
[8] U. Schwertmann, Can. J. Soil Sci., 53, 244 1973).
[91 K. Nakata, S. Nagasaki, S. Tanaka, S. Tanaka, Y. Sakamoto, T. Tanaka and H. Ogawa,
Radiochimica Acta., 88, 453 2000).
- 673 -

This is a blank page.

JP0250366JAERI-Conf 2002-004
THE EFFECTS Of SILICA SAND CONTENT AND TEMPERATURE ONDIFFUSION OF SLENIUM IN COMPACTED BENTONITH UNDER
REDUCING CONDITIONS
HARUO SATO AND SHINYA NYAMOTO*Japa Nclear Cycle Developeint Institute (J NC),
4-33 Murarnatsu, Tokai-inura, Naka-_iWn, baraki-ken, 319-1194, JapanFax: 81-29-287-3704, e-mail: saLo�tokai.jDC.gO.jp, *rushmya�tokai.jnc.-o.jp
Apparent diffosivities (Da) in compacted bentonit fr Se wercobtained at dry density of 16 Mg/m'
as a fnction f silica sand ontent (0-50wt% ad temperature 22.5, 60'Q uder reducing
conditions A Na-bentonne, knigel-VI& ad �"Se were used as a cay material and as a tracer in
diffusion xperiments, respectively. Tbe obtained Da values showed a tendency to increase with
increasing silica sand ontent nd temperature Te a values we moreover well correlative with
sinectite partial density, defined y the density of sniectne aggregates i beritourte. This idicates that
Se diffusion is predominantly controlled by the properties in part of siectite.The activation energiesfor Da alues calculated fror te temperature ependencies were in a ange of 17 to 32 0/mol but
neither systernatic tendency with respect to dry ensity nor smectite partial density was found.
Key words: Apparent diffusivity, Diffusion, Bentonne, Selenium, Activatior eergy
1. INTRODUCTIONIn JNC, tests a researches regarding geochemistry and radionuclide migration in buffer
Is and 'sposal of high-level radioactivernateria geosphere as problems related to a geological diwaste J-11.W) ave een carried out in file Quantitative Assessment Radionuclide Migration
Experimental Facility QUALITY) as a link i the chain of a follow-tip of tile second progressreport -I 2 eport I which has explained on a technical feasibility of the geological disposalof HW i Japan. Te QUALITY is a ot facility, wich has 12 controlled atmosphere glove
boxes and 9 air glove boxes, and tire hot operation started on Agust 18, 1999. Much hot data
regarding Slubility, sorptio ad diffusion have been btained and sorne outcomes have been
reported to date [eg, 21. The equipmo-rits and etails of the QUALITY are described in 3].
Although, Much data we respect to diffusio ad sorption of radioriuclides for bentonite
have been reported so far, almost data have been obtained under air d ata for redox sensitive
elements obtained under reducing conditions, reflected a deep geological environmental
condition, are quite linrited. elenium, Iunportant for dose evaluation in safety assessment, is
one of the redox sensitive eletrients. Particularly '9Se, its half-life T02>6JE4y, is identified asone of te important radionuclides, Although the half-life of 79 �e has not distinctly been
detern-urred a value of Ti,2� , 13F6y has also been reported recently 4 It is known from
converitiorral sudies that Se forms anions in solution and is little sorptive on bentonite [e.g. 5].
Selenium IS fund in, Oxidation states between -11 and VI. In the pl-I range of natural waters,
SC04'- s predominant uder strongly oxidising conditions 6 wile SC dominates underreducing onditions 6, 71� Thu te chemical species of Se depends on the redox condition and
pH of solution, bing possible tat Se retardation in bentonite can ot he expected.
In the H12 report, istribution coefficients (Kd) of radionuclides on bentonite were
conservatively etermined from measured apparent and (,effective diffirsivities (Da and De,
respectively), The Kd values for cases that no easured datum exists or tose for cases that the
reliability of ata is cootroversial, ere therefore etermined base o chemical analogy or
existing knowledges, The Kd of Se was also conservatively estimated to e Kd=O based on Davalues for Se obtained under reducing conditions [1 ad e alues for (data of I- were used
as an analogire of HSe-). Te arithors have proposed for Se an experimental method regarding
rion-stead state diffusion In berit0frit uder reducing conditions in previous study [8] and haveYreporte a density dependency of Da values for Se. Quantitative data with respect to retardation
- 675 -

JAERI-Conf 2002-004
property in compacted bentoDite and thermodynamic data of Se for diffusion are howeverlacking. Thereon, in tis study, a values for Se in bentorrite nder reducing conditions wereobtained as a function of sica sand content and temperature as a link in the cain of atabasedevelopment and the reliability improvement of the H 12 report, and furthermore the effects ofthose parameters on diffusion i bentonite and diffusion mechanism for Se were discussed.
2.EXPERIMENTAL Table I Experimental conditions for diffusion2.1 Experimental conditions experimentsThe experiments were carried ot by Method 7 In-diffiision method (one way difflision)an in-diffusion method [e.g. 8]. Bentonite: Kunigel-Vl� (Na-smectite, 46--49wt%)Table I shows the experimental Dry density: 1.6 Mg/m' (sample size. 020minxMnin)
Silica sand content 0, 30, 50wt% (ixed with ica sand with particleconditions. A sodium bentorute, sizes of 1-5mm and 0.1-Inun at a mixture ratio ofKunigel-VI� (Kirnin-drie Industries Tracer solution 1: )Co. Ltd.), of which a lot of data (carrier concentration) "Se (Na, SeO, solution, 263 MBq/5ml 1.3 E-8 M)
regarding fundamental proper-ties 50ppm-Se (6.3E-4 M)EC, T,,,: 119.8d (136keV 58.3%), 265keV (58.5%),
have been reported, was ued in a Introduced tracer 280keV 24.8%), 12 1 keV ( 7M), 401 keV (I 14%))series of diffusion experiments. The quantity 50p Usampltt 21.96 kBq/sampie)major constitutent inerals of te Temperature foom emperature (22.5-+2�5'Q, 60±0. VC (oven)
Atmosphere N. atmosphere (0, CHCeDtMio < ppm)bentonite are Na-smectite and Saturated solution degassed distilled water feductantchalcedony, which makes Lip 46-49 (initial [Na,&0,J-5.2F-3 )and 37-38wt%, respectively [9]. p o contacted solution 7-7.5 (pH of solution contacted with bentonite)
S Diffusin- time: I- 14 daysSome other minor minerafs such a Repetability n=2quartz, plagioclase, calcite, dolomite,
analcime and pyrite are also Coutrolled N, atmosphere GB (02<1PPR1)contained as impurities.Quantitative details of the minerals pH electrodeare described in 9]. The iffusionexperiments were perfornied at a SCE elect;.&dry density of 16 Mghril. Since Polyethylene lid Tracer solution
Se is redox sensitive, all iffusion Polypropylene vesselexperiments were carried o in a Hole or Dicontrolled N2 atmosphere glove saturation elitonite
box to reproduce a relevantdisposal condition. A stocksolution, Na2"SeO3 (purchased
from AEA Technology), was sed S utio a ded Acylic ainic filteras a tracer in the experiments, All reductant colip"Inexperiments were carried ot atroom temperature (22.5'C) and Collmin ooder ioiniersioit (left) and eolun)n under diffusion (right)
60'C in order to discuss diffusion
behaviour thermodynamically, Fig.] Set-up for diffusion experiments for Se2.2 Diffusion experiments The left side of the fore shows the diffusion columnFig. I shows set-up for diffusion under immersion d the right side of te figure, showsexperiments of Se. he diffusion the iffusion column Lnder diffusion.columns to be used in a series ofdiffusion experiments are made of acrylic rin ad ave a cylindrical space of 20ni indiameter and 20irim thick, i wich bentonite can be filled� 'tire bentonite powder was dried atII OT more than overnight and was filled into tbe ylindrical space of tile diffusion olumntogether with silica an(! so as to obtain ontents of 30 nd 50wt%, 7be fffling and compactionof the bentorrite were performed by rising a ydraulic press IO], Ti)e fiffu sion colurnirs filledwith the bentonite were evacuated for air by exchanging with N-, gas in a acuu camber, andwere then transferred to a Controlled N, ,atmosphere glove-box. Tire diffusion coluinns withbentonite were after this inuriersed n egassed Jistilled water with sodlurn ditbionate (NaS204)
- 676 -

JAERI-Cont 2002-004
for about onths to be saturated. Throughout the saturation of the bentonite, the bentonitecontacted with te degassed distilled water added Na2S204 in order to keep low Eh via alumina
ceramic filters with a pore size of 2�Ltn used to prevent the bentonite from the swelling as shownin Fig.],
After the saturation f te bentonite, a sniall volurne of Na2l'SeO3 (50[d, about 22 kBq), waspipetted o the srface of one nd of each ylindrical bentrinite and a bnd lid was then sealedshut. Te other ed of te beDtOnite emained in contact with degassed distilled water withNaS204 via a ceramic filter Te Eh and pH f die solution contacting with the bentonite weremonitored throughout te saturation a diffusion experiments. Although t e r uctant wasadded to obtain initially a Concentration of [NaS204J=5,2F-3 M, t was ten added to adjust theFh of the solution if ecessarily. Te experiments were run for I to 14 days, Aer the diffusionperiods, each cylindrical bentonite was rxit with a kif ito about I rnm thick slices. Each slicewas imediately weighed, in order to aurately calculate distance sdiced from the surface ofbentonite specimen and was aalyzed for radioactivity with a Geiger M(Iller GM) counter(Aloka Co., Lt([,). The concentration pofiles of "Se in the bentointe were obtained based onthe analyzed data. Sce die half-life of 7Se, II 9 8d, is sort, the concentration profiles weredeternuned by correcting the decay of radioactivity in the aalyses.
2.3 Background measurements for ft-radioactivity including 15 Se from bentonite
The background of �T-radioactivity including 15 Se from bentonite was antitatively measuredas a fnction of dy density (0. 8, 1 � 6, 18 Mg/M3 ') and s lice thicken es s (0. 5, 1. 0, 5. Omm). Thesame, type of diffusion columns as those used in diffusion experiments were used in themeasurements A eries of measurement procedures were also carried ot in the same way.2.4 Peparation of a standard sample of 7SCA standard sarnple loaded "Se was prepared to determine detection efficiency for "Se of GM
counter. The standard sarnple was prepared by pipetting a stock solution of 50gl with aradioactivity of 20.635 kBq on a paper with approximately the sarne size as bentonite slice.
of Se is SSince die half-life � hort, initially loaded radioactivity of 75 Se was accurately correctedby considering the half-life wben the standard sample was analyzed.
3. DIFFUSION THEORY'Me Da values for 75 Se were determined based on the Fickian law I I. The diffusion equationfor one-dimensional non-steady state considered decay term is generally expressed as follows.
aC (Da'C)-X.C (1)a t a x
Assuming that Da is independent of distance and is constant, Eq.(l) is arranged as follows.
a a2 De a2 CDa- - X-C (2)a X 2 CC) a 2
Where C is the radioactivity concentration in the bentonite (cpm/rn 3), t is the diffusing time (s),
x is the distance from diffusion source (m), Da is the apparent dffusively (2/s), X is the decay
constant (1/s), 1-,,)e is the effective diffusively (M2/S) , and i is the rock capacity factor (-).With respect to soluble elements, the analytical solution for an istantaneous planar source
can be applied f te calculations of Da values. However, with respect to elements whichsolubilities in the porewater of bentonite are low, there is a possibility to precipitate on thesurface of boutonite. The oundary condition in this case is presuitted- to be controlled by thesolubility of the tracer. If the bentonite sample is assumed to be a emi-infinite medium, theanalytical solution or a constant concentration of boundary condition is erived as follows.
- 677 -

JAERI-Conf 2002-004
Initial condition: C(t, x)= 0, tO, xABoundary condition: C(t, x�Co, t�!.), x=O; C(t, x=O, tO, txl=-c
C I f XI er rk- (3)exp XI er c -- L-- + \r t + exp -141Co 2 F6a 2-�-Da t M at
Where Co is te boundary Concentration eptri/in).Analytical method to determine Da was considered from the oncentration profiles of S in
bentonite in a sries of iffusion experiments. Comparing the concentrations at the surfac ofbentonite (Co), neitber Co change with tit-ne or that with temperature was found. This idicatesthat Co is constant. Since te tracer solution sed in this study includes a 0ppin of Se(equivalent to 6.3F,-4 A as a carrier, it is considered that Se precipitated at the surface ofbentonite and that o was controlled by the solubility of Se. The Da values for "Se weredetermined by a least squares fitting to the concentration profiles Snce . 3 icludes infinitearithmetrical series, it is difficult to etermine Da values by fitting Lo Fq� (3). Thereon, a valueswere numerically determined by discretizing N. 2) based on a difference 1ned)od I I]. In tilecalculations of Da values, DBENTOI a calculation code for a least squres fitting, was used,
4. NUMERICAL ANALYSES BASED ON DUTERENCE METHOD4.1 Governing euationsThe calculations were ade by an explicit method wich can forwardly e calculated amongdifference methods. Te concentration profile of a tracer in bentonite can be calculated byFq.(2).Initial and boundary coWitions are the same as those for a constantboundary oncentration.4.2 Discretization and simulation by �-xplicit methodFig.2 shows a conceptual model for non-steady state diffusion smulation by the (-explicit methods
Let consider Ax ad At as a thickness in the direC6011 Of tfle deptil Of beutOfute divided equallyand a width of time, espectively, Both distance an tme step art nurnbered as sow n ig.2,and each node expresses concentration at a distance and a tme step. The discreted eoations forEq.(2) and initial and boundary conditions ased on te explicit method are given as follows.
Defining as Qt, x)=Ci, j, Fq.(2) is written as the following difference itquation-
(Ci+1, j- Ci, j)/A t = Da (Cij+l 2Cij +Ci, j-1)/AX1 i �Cij (4)
Therefore, the following difference equation is derived, arranging Eq.(4).
Ci+l j = Ci j+ Da At/A X2 (Cij+ - Xi, j + C, j-1) -A t X Ci, j(5)
(i = 1 2 3 j = 29 3 49 n
Where nx is the number of divisions in the direction of the depth of bontonite. Where inputX2 condition of Da-At/A in the numerical analysis adopted �i this analysis must be constantlyI
(I -At-A,)/2 not to cause numerical dispersion [ 21. Distance from starting point ad accumulative time, xj and ti, respectively are calculated as
follows.
t = i-- I)A t (i = 1 2 3 ... ), xj = (j- ) x (j 1 2 3 + 1) (6)
Initial and boundary conditions are expressed by the following ifference quatjODS,
Initial condition: Ci, j=O, i 1, j I
- 678 -

JAERI-Conf 2002-004
Boundary condition: Q, j=Co, i 1, J� 1: Ci, j=(), 1, j=nx I
Tbe concentration profiles were -- lb Bentonite
calculated as parameters for a nd Co, and CoSion
Da and Co inpirt wen total sir"A Of Ole TrIlIe r f 0 0 0 0residuals squared between calculated ad sotlixe CoAlmoto-A on profile
measured conceirtrations was the smallest,
were chosen, 0 X
Boundary Boundary5 . RESULTS AND DISCUSSION
H5.1 Background for �T-radjoactrvity
including 75S fom be-titonite s
Fig.3 sows a cot-relation etween counts
per minute (cpin) and cy weight of
t)einornte T obtained cpni values were t
approximately the same degree as level fornatural radioactivity over the irreas"renients,
indicating drat te obtained cpi-n values ae
not originate(I fom bentorrite, Average 03value was terefore usffl hi the alculations t27
of concentration profiles of "Se.ahreS Of 7 ti i I nitial
5.2 Dav 'Se and correlations with 0 X AX cone.'I cast , sand content and temperaturt, j=1 2 3 4 ............ nx+1 AX=IHVrh
Although te Eh of solution contacted wh Y. I X2 X3 X4 ...... Xi - -- Xn.+1bentonite rose a little, with respect todiffusion etxperirrients oriductect at 60'C, influence area of node (control area)
that, of the solution at 22,5'C was stable infinite dference tradearound -400nrV troughout the saturation
and diffusion experiments. The pH of die Fig.2 A conceptual model for non-steady state
solution was also i a ange of 7 to 75 and diffusion simulation by explicit methodno significant change was found, he H is the thickness of the sample in the figure.
(10111111ant species of Se in the porewater ofbentornt i this condition is predicted to be 40
HSe jdging front Eb-pH dagrams 6 7,
Fi 4 shows examples of concentration 00profiles for Se as a unction ot the deptir of 30 jj�Q
bentonite frorn iffusion source at 22.5 and
60'C. Although iffusion experiments were
carrie ot in dplicate for the saine condition, 20 I BG:
similar concentration profiles were obtained.The diffusion of e at 60'C is faster than that
at 22.5'C. e detection efficiency for the 10analysis of "Se by Glyl counter was 0, 88% 0 1 2 3 4 5
from comparison with standard sample. Dry weight of bentonite [g]Fig. 5 and Table show ependencies of Da
Fig.3 A correlation between cpm valuesvalues for "Se On silica sand content and and ry Neight of bentonite
temperature ad a sunimaq of the Da values The plot on the vertical line shows cpmobtained in this sdy, respectively. The obtained without bentonite.obtained Da values sowed a edency to
increase Nvith increasing silica sarrd content ad temperature Te effects of silica sand contentmid temperature on Da are on title whole surrimarized as oflows�(1) The Da alues or both temperatures sow a tendency to increase wine increasing silica sandcontent hi bentorrite. 2) Tlie Da values show a tendency to increase ith increasing temperature.
679 -

JAERI-Conf 2002-004
(3) The increasing rate of Da for temperature is approximately constant, unconcerned with silicasand content.
10-9T, -T--1 .5uc
1010 ... Kunigel-V I Se:60'C
Densityl.Wg/M3 Density 1.6Mg/Silica sand 30wt6
109 0: 12'.84d/22.5C lo-10 El: 9.22d/60C'
El 0E lo, lo-11
710
lo-12
0 10 20 30 40 50 60lo, Silica sand content [wtl
0 0.005 0.01 0.015 0.02 0.025
X [nil Fig.5 Dependencies of Da values for 7, Seonsilica sand content and temperature
Fig.4 Examples of concentration profiles for 'Tbe Da values for "Se were compared with"Se as a function of distance from those for vari its lements previously reporteddiffusion source at 22.5 and 601C 10[8, 13-171. Fig,6 sows ependencies of Da
values for various elements previously reported together with new data for "Se with respect toKunigel-VIO on the dry density. The Da values for "Se are smalier than tose for Seo 3 2-
obtained under anaerobic conditions and are similar egree to those for Cs I 3 and Ni [6 atthe same dry density. These Da values for "Se are additionally about orie order of agnitudelower than those for Tc, of which dominant species ID the porewater of bentOrlite is 04-which is the same amon as Se. A described above, it is clear i, any cases that Se is etardedunder reducing conditions.5.3 Correlations between a Table 11 A s"mmary of Da valrie� for '�Se obtained as a
values and smectite partial function of silica sand content ad temperaturedensity No. Temp. Silica sand Trnefdl Darm'lsl Corcpm/M'J P,5iJMgW1*
The Kunigel-Vl� is composed of46--49wt% of smectite and some 122.5 0 14.03 5.OE 12 IJE9 1.14
2 22,5 0 13.96 4.OE 12 1.5E9 1.14impurities. Smectite, major clay 360 0 13.03 1.017 I 2.OF9 1.14
mineral of the bentonite, is 460 0 12.17 I.OF I I 2.OE9 1.14considered to compensate spaces 522.5 30 12.84 LOF 1 1 2�OF,9 ('91between the impurities bentonite 622.5 30 IT80 5.0F 12 2.OE9 0�91
and it is presumed that 760 30 9�22 3,01i I I LOE9 0.91radionuclides mainly diffuse in 86o 30 9�01i 3,0E- 1 1 I.OF9 0.91smectite compensating the spaces 922.5 50 L964 2.5F I I ),OF-9 0.72
between the impurities, because 10 22.5 50 1.8(9 2.5E- 1 1 J'OF9 0.72
radionuclides can not pass through I 60 50 1.881 8.OE I I I (F19 0.72minerals composing te impurities. 1260 50 1.094 8.011 i 1 1.5h9 0.72
It is well known also from many *p,�: smectite partial density which was defined by the density of only
literatures reported to date that the miectite aggregates in bentonite a can be calculated by Fq.(7)
diffusion of radionuclides in secure depends n the dy density. We bere consider a ensityfocused on smectite aggregates, so aled the smectite partial ensity". This parameter isequivalent to the "montmorillonite density" reported by Kuroda et aL [ 1 8]. The snecure partialdensity defined here is more generalized than that proposed y Kuroda et at d can be appliedfor all kinds of benton tie . The s inectite pat-tial deris ity for a en on ite added mi arbitrary weightof silica sand is calculated by the following equation.
- 680 -

JAERI-Conf 2002-004
Polm O fS)'frn � Pd (7)1 n
(1-fs)(I-fni - Y Pi.,k + fS/Ps PdVn k=1
Where p,,n is the smectite 0
partial density gliW), Pd is A T(mVs)
the dry density of bentonite A Se(ox)(ImVs)(Mg/rn) f is lo-,
1 the silica sand 0content (Mg/Mg), fm is t A Na(rnVs)
smectite content in bentonite lo-10 16 T Zr(mVs)
(Mg/Mg)(assomed as 0,5 for N Am(mVs)lo-II 0 WmVs)Kunigel-Vl�), p, is the pure V Sm:pH8(rr2/s)
density of silica sand X SmpHl 1 (ImVs)
(Mg/m`)(2.7Mgim'), p,,,,, is 'E io-" EB Pb:22.5'G/sandO%
the pure density of the k-th cl S 22.5`C/sand05%
impurity (Mg/Tn')(assumed as io-13Mg/M32.7 for all inipuritJes),
and n is the number of the io-14 Vkind of ineral composing
the impurities of bentonite. io-15Fig.7 shows correlations
between Da values for 71 Se EB
and Pdm. The Da values were io-16
well correlative with Pd,,, for 17
both temperatures. This 10indicates that Se diffusion is 0.0 0.5 1.0 1.5 2.0 2.5
predominantly controlled by Dry density of bentonite [Mg/m3i
the properties in part of Fig.6 Dependencies of Da values for various elements
smectite. However, the reported to date together witb new data for 75 Se E] Se:tendency found in this study 22.�'C/sand 0%) on te day oensity
is different from that found in Selenium inarked (ox) was measured under anaerobic
Pb diffusion 17]. Since both conditions, but not under reducing conditions.dominant species and sorption
behaviours, betweeii both eements are different, 10-9 0 Se:22.5�'Cthe diffusion bebaviours of both eements can not
Kunigel-Vibe simply compared, but this difference is one of 3 El Se-60'C
Density 176Mg/mthe future studies to be paid attention. 10
lo-5.4 Activation ene-rgy (AFa) for Da
COOThe Da values for "Se clearly increased with 0 El'
increasing temperature as described above. lo-
Activation energies (Aa) for the Da values of 0
"Se were calculated from the temperature -1210dependencies based on the Arrhenius plot 19].
The calculated AFa values were in a range of 17
to 32 kJ/mol and neither systematic tendency lo-13
with respect to dry density of bentonite nor that 0 0.5 1 1.5 2
with respect to secure partial density was found. Smectite partial density [Mg/m)Since no temperature dependency of ionic
diffusivity in free wter JY) for HSC, UHS--� Fig.7 Correlations betwren Da values for
has been reported, Ea for DHS,- can not be, "Se and smectite partial density
- 681 -

JAERI-Conf 2002-004
calculated, but AEa values of TY' values for popular ions are enerally 15 to 25 kJ/mol.
Although AEa values obtained in this study are a little higher tan hose A-a values, they areapproximately the same degree, It is difficult to discuss quantitativeki based on this study the
difference between AEa values obtained in tis study and those of If alues for popular ions.Although the difference of porewater is considered as a possibility, we will treat as a futurework with respect to quantitative discussion.
6. CONCLUSIONSThe Da values for "Se in compacted sodium bentonite were obtained at a dy density of I 6Mg/m' as a function of silica sand content and temperature under reducing conditions. Theobtained conclusion is surrimarized as follows.(1) The obtained Da values were smaller tan those for SeO,2- Obtaine uder anaerobic
conditions and it was found that Se was retarded under reducing conditions.(2) The Da values increased with increasing silica sand content in bentonite and temperature.(3) The Da values were well correlative with sinecure artial ensity, Based on this Se
diffusion in bentonite is predominantly controlled by the properties III part of suitctite.
(4) The AEa values for Da, i a range of 17 to 32 k/mol, were similar degree to tose of y
values for popular ions. However, quantitative discussion for fact that AEki values obtainedin this study were a little igher than those of 1Y values for popular ions is future study.
REFERENCES[ 1 ] Japan Nuclear Cycle Developernent Istitute, JNC TN 1410 2000-001 2000)[2] T. Ashida, T. Shibutani, H. Sato, Y. Tachi, K. Kitamura ad K. Kawamura, JNC
TN8400 99-083 1999) i Japanese.[3] H. Igarashi, K. Kawaniura, K. Yamada, M. Yui, and J. Obuchl, WM'00 Conference,
February 27-March 2 2000, Tucson, AZ, USA 2000).[41 C. Li, J. Guo, and D. Li, J. Radioanalytical ad Nucl. Chemistry, Vol. 220, No. 1, 69-71
(1997).[51 T. Shibutani and M, Yui, PNC TN 410 96-071, 153-55 1996), in Japanese.[6] K. V. Ticknor, D. R. Harris, and T. T. Vandergraaf, Atonic hinergy of Canada Lited
Research Company, TR-453 1998).(7i aG. Brookins, "b-pH fhagrams for Geochenristry", Springer-Verlag, Berlin Heidelberg
(1988).[8] H. Sato, Radiochirnica Acta, 82, 173-78 1998).[9] Ni Ito, M. Okamoto, K. Suzuki, N1 Sibata, and Y. Sasaki, J. At. Friergy Soc. Japan,
Vol.36, No. II, 1055-58 1994), in Japanese,[10]H. Sato, T, Ashida, Y, Koliara, M. Yui. wid, N Sasaki, J. Nucl. Set'. TeChDOI,, V01.29,
No.9, 873-82 1992).[I I]J. Crank, "Me Mathematics o Diffrision", 2d Ed., Pergairion Press, Oxford 1975).[121Y. Fujiwara, Analytical Method for Partial ffferential Equation by Computer", Science
Library, Tokyo (I 97 1), in apanese.[13]H. Sato ad T. Shibritarri, PNC TN8410 94-284, 71-89 994), in Japanese,[14]H. Sato ad M. Yui, Scientific 3asis for uclear Waste Managerneri(XV1,11 (T, Murakarrii
and R. T. Ewing, eds.), at, Res. Soc., 269-76 995)�[15]Y. Tachi, Y. Kohara, N. Uchidate, and T. Shibutant, JNC TN8400 9-089 999) in
Japanese.[16]H. Sato and M. Yui, J. Nucl. Sci. TechDol., Vol.34, No.3. 334-36 997)�[17]H. Sato and S. Miyarnoto, JNC TN8400 2001-018 2001).[18]Y. Kuroda, K. demitsu, H, Furuya, Y. Inagaki, and T. Aima, Scientific Basis for
Nuclear Waste Mianagernent XX (W. J. Gray an6 . R. Tiay, eds.), Mat- Res. Soc., 909-16 1997).
[19]T. Keii and Y. Ono. Activation Energy", Kyoritsu. Press, Tokyo 985), in apanese,
682 -

JP0250367JAERI-Conf 2002-004
COLLOIDS-ASSOCIATED CONCENTRATIONS MODEL ANDEXPERIMENTAL STUDIES O A WASTE FORM DEGRADATION
PROCESS IODEL
F.M.G. Wong', C. Stockrriin2, C, Mertz3, S. ACOM4, and R. Aguilar'
Yucca Mountain Site Characterization Office1551 Hillshire Dr. S 471
Las Vegas, NV 9134Fax: 702) 792-1323, e-mail: frank - worigramotesyinpgov
Stone & Webster, 111C� 2Sandia National Laboratory, Argonne National Laboratory " Management Slutions
A Waste Forin Degradation Process Model [IJ s been developed as part of the total systemperforruarice assessi-nent (TSPA tat will be used to evaluate the pustelosure performance of a potentialmonitored Peologic repository at Ycca Mountain, For the Colloidal Radioisotope Concentration Component ofthis degradation model. the onceptualization directly used Yucca Mountain Project (YNT)-relevantexperimental results from YMP-specific ork and frorn te published literature. The conceptuallizationidentified the availability d te stability of three categories of Colloids () existing colloids in thegroundwater 2 colloids generated during egradation of ie waste, a 3 oids generated duringdegradation f the disposal cornainer, The furiction of te colloidal radioisotope concentration ;ornponent is tocalculate the concentration of colloid-associated radionuclides that may be transported frorn te waste package.
Attachment f radiorructides an ange fon istantaneously reversible to completely irreversibly bound
attachment This process was odeled sing these two bontiding and itiernbers. For waste form colloids,
radionuclides cat) be incorporated ito te sbstrate rnaterial before it is sspended as colloids, All colloid types
may sorb adionuclides to rn) pseudocolloids, epending on th afinity of the colloid mineral substrate for a
dissolved adionuclide. The contributions ofeach olloid type are summed to roduce he mobile colloid source
term or each importartt radionuclide.The models are based on laboratory results fnt waste form corrosion testing and testing of adsorption
and desorption properties of Pu ad A) on clay ad iron-(hydr)ox1de colloids. To the extent that the laboratory
tests ad test conditions represent aticipated repository conditions te model is valid for calculating the colloid-associated adionuclide concentrations ad colloid trials concentrations.
This paper will escrib ad sunuriarize the inodels and experimental studies used in the colloidal
radioisotope concentration component of this waste form degradation process odel.
Key Words: Colloids, Colloidal Source Term, Colloidal Concentration Limits, Waste Form Degradation
1. INTRODUCTIONThe function of te colloidal radioisotope concentration component of the Waste FormDegradation Process Model [11 is to calculate the concentration of colloid-associatedradionuclides that may be transported from the waste package 2 This colloidal modelcomponent describes the observed types, formation, and stability of radionuclide-bearingcolloids that resu It font degradation and decomposition of the waste forms contained in failedwaste packages. In addition, contaridinant-colioid attachment/detachment mechanisms andtransport characteristics anticipated in the repository are discussed for colloids formed fromdegradation oil' te waste fornis, colloids formed rom man-made materials introduced into therepository, and naturally ocurring colloids, The abstraction of these models is intended tocapture te most important characteristics of radionuclide-colloid behavior for use inpredicting the potential impact o repository performance of colloid-facilitated radionuclidetransport.
Colloid transport is potentially important for radionuclide elements that have low solubilityand can be entrained in, or sorbed onto, waste form, engineered barrier, or geologic barrier
683 -

JAERI-Conf 2002-004
materials that form colloidal particle substrates. Of these radionuclides, only those that are amajor part of the waste inventory and have potentially large dose conversion factors are ofpotential importance to the performance of the disposal system. Considering tese creeningcriteria, plutonium is the dominant. Americium is also considered for the TSPA analysis.
2 COLLOID TYPESThe radionuclide-bearing colloids are formed by radionuclide entrainment as discrete phasesin, or by radionuclide sorption oto, colloidal substrates. They are, therefore, classified into"types" based on the source of the substrate aterial and can be frther classified based onhow the radionuclides are attached to the substrates. Three major types of colloids arerecognized to be important for the colloidal radionuclide concentration component based onthe source of the colloid substrate material: (1) Waste-form colloids forrned duringdegradation of high-level waste (HLW) glass (Note: these colloids are further classified into"reversibly attached" and "irreversibly attached" radionuclide types); 2) Corrosion-productcolloids formed during corrosion of iron-containing waste packages; 3) Groundwater colloidspresent in the waste-form area.
Based on laboratory evidence, waste-forrn colloids are produced fom degradation ofborosilicate HLW glasses, Fewer colloids have been observed laboratory testing ofcommercial spent nuclear fuel (CSNF), and experimental data are not yet available fordefense spent nuclear firel (DSNF) and other waste forms, although testing is underway atNational Spent Nuclear Fel Program. The waste-form colloids that have been observedconsist principally of smectite-type clay minerals, The laboratory evidence sggests ta asHLW glass degrades, colloids are generated and often contain, entrained" plutonium. Theengulfed solid inclusions of plutonium may be isolated from the queous systern by thecolloid itself and so ay not be in equilibrium with the surrounding aqueous environment.Therefore, the engulfed plutonium in the waste-form colloids is conservatively assumed to beirreversibly associated with the waste forin colloids.
Corrosion-product colloids consist of ferric iron-(hydr)oxide minerals, pmarily goethite(FeOOH) and hematite (Fe2O3) that are assumed to form as a result of crrosion of the wastepackage (WP) materials 2].
Groundwater colloids potentially present in the repository include those already present in thegeosphere such as microbes, organic macromolecules (hurnic substances, including humic andfulvic acids), and mineral olloids (primarily clay minerals, silica, and iron-[hydrjoxideminerals). Microbe-facilitated radionuclide transport is disregarded because the relativelylarge size of microbes makes them susceptible to filtration. Based on the very lowcomplexation capacity of urnic substances in tis systern, they are not considered to beimportant groundwater colloids. Clays. silica, ematite ad goethite colloids occu ingroundwater in the vicinity of Yucca Mountain, and it is assurned that small quantities ofthese colloids will tenter a failed WP and be available to interact with eleased radionuclides.Consequently, ineral colloids are onsidered and will, enceforth, be rferred to genericallyas groundwater colloids. These groundwater colloids are assinned to consist of ecureclays, which are fairly strongly sorbin aunerals, and have been recognized at YuccaMountain 3 This assumption is based on the fact that smectite colloids are the dominantcolloid in groundwaters at te Nevada Test Site and the fact that it is a conservative choicebecause clay minerals are more sorptive than silica and are comparable to iron-(hydr)oxideminerals.
- 684 -

JAERI-Cont 2002-004
The colloid source term includes contributions from the various types of colloids, discussedabove (ie., waste-form, corrosion-product, and groundwater colloids with reversibly andirreversibly attached radionuclides). The contributions of each colloid type are summed toproduce the mobile colloid source tertu for each important radionuclide. The concept ofreversibly and irreversibly attached radionuclides on colloids is illustrated in Figure .
Thin Section ofTuff Host Rock
cm scale
PU(IM4, Fracture
Pu F" Pu-collaid F1 Id FloP I Ibly (mobile) PU
attached to colloid ALIGOUS) onscale
Fracture Pu-co4iold (mobile)Fluid Flow Pu Irreversibly Colloids thout plutonium
attached to colloid obile and Immobile.I ': on odelible odel onsiders
Matrix s type of lloid matrix
enters matft po byby advection only and advectflon
qj=1b clay
Considered In I Iron Oxide
Plutonium Pu
Figure 1. Conceptual Model of Formation of Reversibly and Irreversibly Attached Radionuclides on Colloids
3. MODEL DESCRIPTIONThe colloid concentration component is implemented by summing the contributions of thethree colloid types to the colloid radioisotope concentration for each radionuclide. A modelwas developed to calculate the colloid radioisotope concentration for each of the three colloidtypes� The odel for the waste form colloids includes the contributions of the engulfed(irreversible attached) piutorriurn observed in waste glass tests. Te models for all threecolloid types include reversibly attached radionuclides. These odels are based on thepopulation of each colloid type (expressed in terms of mass of colloids per volume of fluid)and experimental data for the sorption of radionuclides onto the colloid substrate materialsinvolved. The effects of pH and ionic strength on te stability of dispersions of each colloid
685 -

JAERI-Conf 2002-004
type are considered. The location of the boundaries between pH ad ior6c strength regimes inwhich each type of colloid substrate is stable or unstable are defined together with te colloidmass concentration in each egime.
3. 1 Waste-Form ColloidsThree broad categories of waste form are to be placed in the repository. The most abundantwaste type is CSNF from commercially owned and operated electric power reactors. SNF isa diverse collection of waste from reactors at OE nuclear-cornplex sites. HLW is aborosilicate glass-based waste form. In the following escriptions, CNV and DSNF aretreated together.
The waste form concentration model includes contributions from colloids with reversibly andirreversibly-attached radionuclides. The model for the concentration of rreversibly attachedradionuclide is based on the experimental data for 14LW glasses. It was observedexperimentally that, as the ionic strength increased, colloid concentration generally decreasedand ultimately a threshold alue was reached above which the colloids were not observed orwere observed in very low quantities [4]� As this threshold was approached, it was alsoobserved for one glass that the colloid size increased significantly due to aggregation of thecolloids. The threshold at which flocculation ocurred was approximately 0,05 moVkg�
Colloids formed frorn HLW glasses i the ANL tests consist predornitrantly of a snecure claysubstrate often ontaining discrete radionticlide-bearing phases etrained within te clay. Formodeling purposes it is assumed tat colloids derived front HLW are all radionuclide-bearingsmectite. The radionuclides are conservatively assumed to be irreversibly attached to thesmectite colloid sbstrate. Figure 2 represents the abstraction of the experimental esults.Based on ionic strength conditions near the waste form, te concentration of irreversiblyattached colloidal plutonium is calculated.
X lo",
X 0 Golkhd Zone
7 x 10⁻⁸ instability
6 X 10⁻⁸ C;pu. furnfion wc.,jj, wt. is)
5 x 10⁻⁸ -
4 x 10⁻⁸ -0.
3 x 10⁻⁸ -
2 x 10⁻⁸ -
X w,
00.00 0,01 Cr02 0,03 0.(4 0,05 0.06
Ionic Strength (M) I
NOTE: Schematic relationship used in abstraction) between RN-bearing colloid concentration ad ionicstrength. 717h fnction represents the tx)und of the KM corrosion experimental data- the maximumvalue represented, x IO, is the maxinuirij concentration of colloids observed in tile 11Wexperiments.
Figure 2 Schematic Relationship Between Radionuelide-Bearing Colloid Concentration and onic Srength
- 686 -

JAERI-Conf 2002-004
3.2 Corrosion Product ColloidsCorrosion product colloids are assumed to be the corrosion of iron-bearing components of the WP. In this section, radionuclide uptake of mobile corrosionproduct olloids assumed o be ir(-.)n-(hydr)oxides such as hematite and goethite, is described.
Data are ot available on the concentration of corrosion poduct colloids that may begenerated as a result of orrosion of the WP materials. Litinted data do exist, owever, forconcentrations of iron-colloids in natural systems A the Morro de Ferro natural analog site(Pocos de aldas, Brazil) oncentrations of iron-hydroxide [Fe(014)-3] colloids were measuredin deep groundwaters atiacerit to an irort-rich rock body. The measured concentration, .25mg/L, is su-nilar to concentrations of other inorganic colloids found in natural waters at otherdeep sites [51, Consequently, it is conservatively assumed that the oncentration of thesecolloids is comparable to that of the groundwater colloids (all mineralogies) that are observedin natural groundwater 2 Colloid concentrations observed in natural waters representconcentrations developed ver a wide range of hydrogeochemical conditions, which providessorne assurance that the approach used is reasonable. A maxitrium value of I mg/L [11 wasused in the TSPA Qalculations, wich imparts a four-fold conservatism relative toconcentrations observed at the analog site.
The abstraction of corrosion-products colloid stability is sown in Figure 3 At pH valuesclose to the pfizpc (pH at zero-point charge), the dispersion is determined to be unstableregardless of ionic strength, and a minimum mass concentration is established. The samesituation applies if an, input pH value is several pH units away foin the pHzpc and ionicstrengths are greater than .05 moUkg, At intermediate values the combined effect ofionic strength ad pH are described by two lines; above the lines, the colloidal dispersion isunstable, and a minii-nurn, mass concentration is established.
ircn o*"odde colloidzcnecf insW14
0.0 -
1=-002pH+017
1=Q02PH-OL
0.01
6 8 9 1 1
NOTE: Schematic representation (used in abstraction) of iron-(hydr)oxide colloid stability as a function of ionicstrengt ad pH. At and near the ZPC colloids are nstable, even at low ionic strengths. At higherionic strengths the pH range at which colloids are UDstable is greater. Above ionic strength 0.05colloids are assigned to be unstable for all pH (For details, see 2])
Figure 3 Scbernatic Representation of ron-(Hydr)oxide Colloid Stability as a Function of pH and Ionic
Strength
- 687 -

JAERI-Conf 2002-004
3.3 Groundwater ColloidsSmectite colloids are expected to be in the groundwater that enters the degraded WPs. Thebasis for modeling the mass concentration and the radioisotope concentration associated withthese colloids as they exit the WP is described below.
Several workers 56] have studied and compiled the characteristics of colloids ingroundwaters from crystalline and sedimentary rocks in saturated and nsaturated hydrologicregimes throughout the world, Data on colloid concentration and ionic sength for thesegroundwaters [1] show a general inverse correlation above an Ionic strength of about 0.01mol/kg and provide a predictive tool for estimating groundwater colloid ass concentration.This relationship is not precise because there are other factors, such as pH, that cansignificantly affect concentration.
To be useM for TSPA analysis calculations, these data were converted to mass o srfacearea per unit volume. For naturally occurring colloids, it has been observed that the numberpopulation and colloid size correlate using a power 2]. In general, the nmber of colloidsincreases by a factor of 1000 as colloid diameter decreases by a factor of 10 assumingspherical colloids). Expressed mathematically, the colloid population is proportional to theinverse of the colloid diameter cubed. By taking the first derivative of te cumulativedistribution, combining with masses of individual colloids assuming spherical geometry andthen integrating the function between a lower and upper size inlit, tile total colloidal ass isobtained. Colloid masses were calculated using the number populations 11 and extrapolatedto include colloid sizes between 10 nm and I micrometer. A colloid mineral density of 25g/cm 3 was assumed. Details of this abstraction are described in 2].
Figure 4 illustrates the abstraction. The upper and lower bounding lines capture the highestand lowest concentrations of colloids. Between ionic strengths of ,01 and .05 moA-g, thenumber and mass oncentrations decrease as groundwater colloids are destabilized. Thedecrease is assumed to be linear in log-log space.
IE+13 3E-1
1E+12 3E-2 2CL
C function (ST,,,,,,.01E+11 3E-3 .2
C
0 1E+10 3E-4 0
E= 1 E9 3E-5Z
0L0 1 E8 3E-6 0
1 E7 3E-71 E-3 1E-2 IE-1 1170
Ionic Strength (M) Pik-6241'+M-0 -
NOTE: Schematicrelationship(tisedinabstraction)betweengroundwatei-colloidcot)ceritratioiiandioiiiestrength. Colloid masses were calculated using number populations extrapolated to include colloidsizes between IO nm ad I icrometer. A colloid ineral density of 25 g/cni' was assumed,
Figure 4 Schematic Relationship between Groundwater Colloid Concentration ad Ionic Strength
- 688 -

JAERI-Conf 2002-004
It is assurned that sorption for groundwater colloids is similar to clay minerals 2 and thesame Kd values used for waste-form colloids ae used for groundwater colloids. Theconcentration of a reversibly-sorbed radionuclide is determined using appropriate Kd values.
3.4 Mobile Colloidal Radionuclide Source TermThe mobile colloidal radionuclide source term is the sum of the radionuclide contributionfrom waste-forni colloids (reversibly and irreversibly attached), corrosion-product colloids,and groundwater ooids, The total colloid mass concentration is also provided forrecalculating reversibly attached radionuclide concentrations as dissolved concentrationschange during transport.
4. Model onfidence, Limitations, and ValidationThe model abstractions are based o laboratory esults from waste form corrosion testing andtesting of asorption and desorption properties of Pu and A on clay and iron-(hydr)oxidecolloids, To the extent that the laboratory tests and test conditions represent anticipatedrepository conditions, the abstraction is valid for calculating the colloid-associatedradionuclide concentrations and colloid mass concentrations. The approach for the olloidal-radionuclide source term is based on Yucca Mountain (YM)-specific field and laboratorystudies and results from YM-relevant studies. Te development of the conceptual model andimplementation requires consideration of colloid generation, colloid-radionuclide interaction,colloid stability behavior, and to some extent, colloid transport/ retardation behavior.Information used for groundwater colloids, waste-forrn colloids, and corrosion-productcolloids was obtained primarily from YM-specific studies. Consequently, the colloid-concentration model is expected to be representative of YM behavior.
Field evidence of small concentrations of radionuclides associated with colloids migratingconsiderable distances provides insight into possible colloid behavior at Ym. At the Benhamnuclear test site at the Nevada Test Site, rapid transport of colloid-associated Pu appears tohave occurred 7 At a point approximately 13 kin from the blast site, I x 10-14 mol/Lcolloid-associated plutonium was detected 30 years after the detonation. It is difficult todetermine what fraction of the transport was due to transport on colloids, injection throughfractures by the blast. or transport as dissolved Pu. However, in the cases of otherdetonations, fracture injections have not been observed to extend beyond a few hundredmeters, and dissolved Pu would be expected to sorb strongly to the fracture surfaces. It isplausible that the Pu was transported as Pu irreversibly attached to colloids. This exampleunderscores the potential significance of the irreversibility of radionuclide attachment tosmectite colloids observed in waste form corrosion experiments 4 Irreversibly attachedcolloids are included in the abstracted model as a contribution to the colloid-associatedradionuclide concentration.
Based on the considerations discussed above, this model is appropriate for its intended use.
&REFERENCES[1] DOE Office of Civilian Radioactive Waste Management (OCRWM), Waste Form
Degradation Process Model Report, TDR-WIS-MD-000001, July 2000.
[21 DOE OCRWM, Waste Form Colloid-Associated Concentratipn Limits: Abstraction andSummary, ANL-WIS-MD-000012,2000.
689 -

JAERI-Conf 2002-004
[3] W.L. Kingston and , Whitbeck, Characterization of Colloids Found in VariousGroundwater Environment i Central and Southern Nevada, DOF/NV/ 0384-36, 1991.
[4] DOE OCRWM, Colloid-Associated Radionuclide Concentration Limits: ANL, ANL-EBS-MD-000020,2000.
[5] J.F. McCarthy and C. Degueldre, "Sampling and Characterization of Colloids andParticles in Groundwater for Studying Their Role in Contaminant Transport," Chapter 6of ,Environmental Particles, Ed. by J. Buffle and .P. van Leeuwen, Vol.2, LewisPublishers, Boca Raton, Florida, 1993.
[6] U. McCarthy and J.M. Zachara. "Subsurface Transport of Contaminants,"Environmental Science Technology, 23, (5), 496-502,American Chemical Society,1989
[71 A.B. Kersting, et al "Migration of Plutonium in Ground Water at the Nevada Test Site.Nature, 397, 56-59, Macmillan Publishers, London, England, 1999.
690 -

JP0250368JAERI-Conf 2002-004
EFFECTS OF IRON ON LEACHING BEHAVIOR OF SLAG LAYER
OF MOLTEN SOLIDIFIED PRODUCTS
Toshikatsu Maeda*, Tsunetaka Banba and Hiromichi Ogawa
Department of Fuel Cycle Safety Research,
Tokai Research Establishment, Japan Atomic Energy Research Institute,
Tokai, Ibaraki JAPAN, 319-1195
*Fax: 81-29-282-5085, e-mail: tosbi�koala.tokai.jaeri.go.jp
Static corrosion tests were performed for slag specimen of olten solidified products of
simulated wastes doped with zero to five weight ercents of an in deionized water and in alkaline
solution at 25-C to undersiaod and quantify the effects of iron on the leachability of slag. It was
observed tat iron significantly decreased the release of silicon from the slag in alkaline solutions,
implying that iron-hearing precipitates inhibited the dissolution of the slag.
Key words: molten solidified products, slag, leach test, iron
1. INTRODUCTION
Melting and solidification Process can be applied to treatment of various kinds of
wastes, esulting solid waste forms of a wide range of chemical compositions, which is
called as molten solidified products. Waste constituents are separated into two different
phases during melting process. These two. phases are produced by the difference in
specific gravity, They are referred to as "metallic layer" and "Slag layer". It is
reported that long-lived adionuclides such as actinides contained i radioactive wastes
are incorporated into the slag layer [1]. It is therefore important to investigate the
leachability of te slag layer for evaluating the long-term barrier performance of molten
solidified products. The major components of the slag layer are silica (SiO2), calcium
oxide (CaO) and alumina (A1203) that oginate from non-metallic components such as
ash and concrete. A typical minor component in the slag ayer is iron. Most of iron in
metal wastes such as arbon steel and stainless steel is incorporated into the metallic
layer, but a raction of the iron is oxidized and incorporated into the slag layer during the
melting process. It is reported that a slag layer could contain iron up to about 30wt%
[2]. T Purpose of the present study is to understand ad quantify the effects of iron
on the leachability of the slag layer. The tests were conducted both in neutral and
alkaline conditions simulating repository environments.
2. EXPERIMENTAL
2.1 Preparation of te sample
691 -
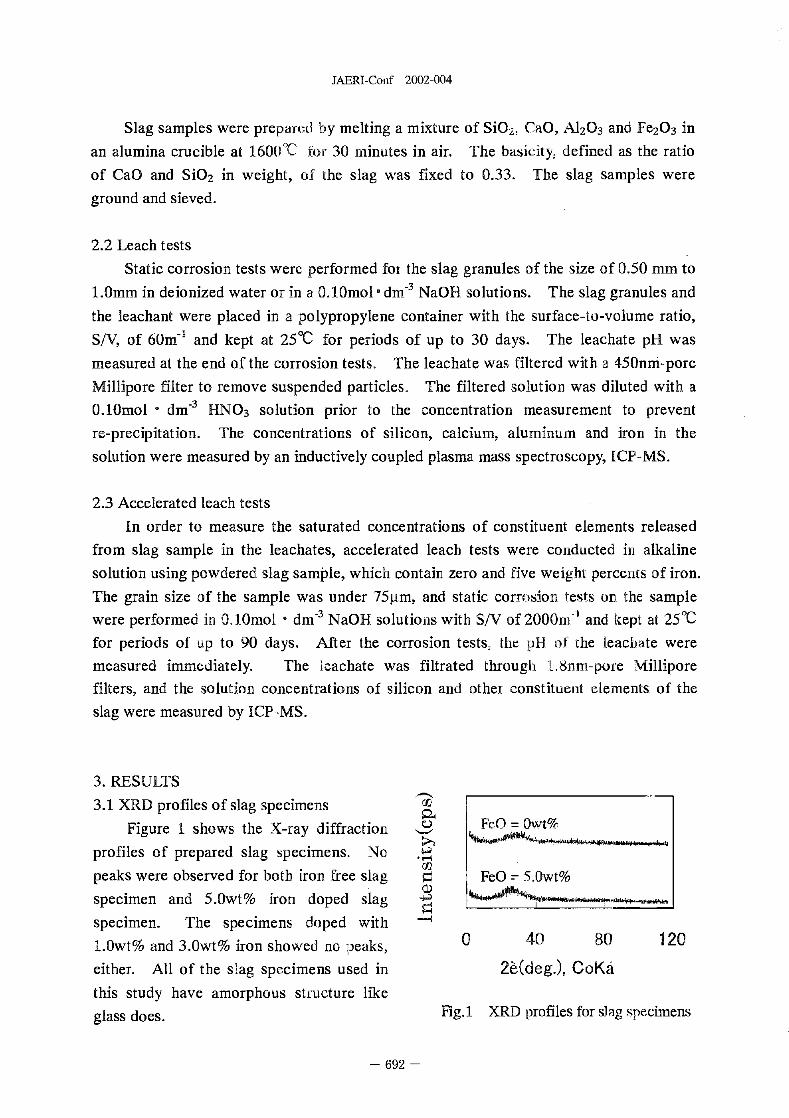
JAERI-Conf 2002-004
Slag samples were prepared by melting a mixture of SiO2, aO A203 and Fe2O in
an alumina crucible at 1600"C for 30 minutes in air. The basicity, defined as the ratio
of CaO and SiO2 in weight, of the slag was fixed to 033. The slag samples were
ground and sieved.
2.2 Leach tests
Static corrosion tests were performed for the slag granules of the size of 0.50 mm t O
I.OmmindeionizedwaterorinaO.10mol-dm-3NaORsolutions. Theslaggranulesand
the leachant were placed in a polypropylene container with the surface-to-volume ratio,
S/V, of 60m-1 and kept at 250C for periods of up to 30 days. The leachate pH was
measured at the end of the corrosion tests. The leachate was filtered with a 450nm-pore
Millipore filter to remove suspended particles. The filtered solution was diluted with a
0.10mol - dM-3 HNO solution prior to the concentration measurement to prevent
re-precipitation. The concentrations of silicon, calcium, aluminum and iron in the
solution were measured by an inductively coupled plasma mass spectroscopy, CP-MS.
2.3 Accelerated leach tests
In order to measure the saturated concentrations of constituent elements released
from slag sample in the leachates, accelerated leach tests were conducted in alkaline
solution using powdered slag sample, which contain zero and five weight percents of iron.
The grain size of the sample was under 75�tm, and static corrosion tests on the sample
were performed in 0 I Omol - dM-3 NaOH solutions with S/V of 20OOm-1 and kept at 250C
for periods of up to 90 days. After the corrosion tests, the pH of the eachate were
measured immediately. The leachate was filtrated through L.8nm-pore Millipore
filters, and the solution concentrations of silicon and other constituent elements of the
slag were measured by ICP-MS.
3.RESULTS
3.1 XRD profiles of slag specimensFeO Owt%Figure shows the X-ray diffraction
profiles of prepared slag specimens. No 4�
peaks were observed for both iron free slag FeO 5.Owt%
specimen and 5.Owt% iron doped slag
specimen. The specimens doped with
I.Owt% and 3.Owt% iron showed no peaks, 0 40 80 120either. All of the slag specimens used in 26(deg.), CoKa'
this study have amorphous structure like
glass does. Fig. XRD profiles for slag specimens
- 692 -

JAEFJ-Conf 2002-004
3.2 Results of leach tests
Figure 2 shows the pH values of the teachates as a function of corrosion time. It
can be seen from the figure that pH of the leaebate appears to be stable during leaching
periods i the both cases of neutral and alkaline conditions.
14 7i 0 FeO=Owt% in deionized water
48 12 FeO=1.Owt% in deionized waterMI 0 FeO=3.Owt% indeionized water
8CD FeO=5.Dwt% in deionized water
-C 6 434-� FeO=Owt% in 0.10mol - dm-3 NaOH solution4-0 4
la: 2 FeO=I.Owt% in 0.10mol dm'3 NaOH solution3
0 FeO=3.Owt% in 0.10mol dm- NaOH solution
FeO=S.Owt% in 0.10mol dM,3 NaOH solution0 10 20 30
Corrosion time (day)
Fig.2 Leachate pH as a function of corrosion time
The normalized elemental mass loss values, NL, of silicon for each sample in
deionized water and in alkaline solution are shown in Fig.3. For each slag sample, the
NL of silicon i alkaline solution was about two orders of magnitude higher than those in
deionized water. It an be seen that there is no differences between NL of silicon for
iron free sample and iron-doped sample in deionized water. On the other hand, in
alkaline solution, iron-doped sample has smaller NL of silicon compared with iron free
sample.
In deionized water In 0. 1 Omol dm-3 NaOH solution0.030 1.50
1-11 I-, 0C4 0
0.020 too - 0ho tw
0
4-40 0.010 0 0.50
Z Z0.000 0.00
0 1 0 20 30 0 10 20 30
Corrosion time (day) Corrosion time (day)
Fig.3 Normalized elemental mass loss of silicon as a function of corrosion time (In the
Figure. the symbols of circles, triangles, squares and diamonds represent zero,
one, three and five weight percents of iron doped slag specimens, respectively.)
- 693 -

JAERI-Conf 2002-004
3.3 Results of accelerated ]each tests
As shown in Fig.3 tere is a difference of the silicon NJ, between for iron free and
iron-doped slag samples in akaline solutions. Accelerated tests were conducted to
measure the saturated Si concentrations in leachates in alkaline solution for powdered
slag samples that contain zero and five weight percents of iron. Figure 4 shows the
results of the accelerated tests. There is no increase in Si concentrations for each slag
sample between the period of 50 days and 90 days. It suggests that Si concentrations
are saturated in 90 days for both slag samples.
Figure 4 also shows that the saturated concentration of silicon for iron-doped slag
samples is lower than that for iron free sample in alkaline solutions.
0.01PH=12.5+0.1
Temn.=25'C0 0 0
0+J C-�
E 0.001
00 E
0,0001
0 20 40 60 80 100
Corrosion time (day)
Fig.4 Silicon concentrations in the leachates as a function of corrosion time (ID the
figure, the symbols of circles and diamonds represent and five weight
percents of iron doped slag specimens, respectively.)
4. DISCUSSIONS
As shown in Fig.1, the X-ray diffraction profiles support that each slag specimen is
non-crystalline. In addition, te majo cemical components and its melting onditions
suggest that each sample prepared in this test can be Yogarded as a glass. According to
these results, it is considere tat we can discuss about the corrosion ehavior of the slag
on the basis of the dissolution mechanism for the glass waste orm 31.
Similarly to glass structure, silicon is thought to e a network former of the slag.
The degree of network dissolution is a reasonable measure for the ease of other
constituent elements and ence for the chemical durability of the slag sarnple. The
sample dissolution is therefore discussed ased on the leaching of sicon. Results of
the corrosion tests sown in Fig.3 suggest that iron doped in the slag sample significantly
reduced the release of silicon from the sample in alkaline solutions.
- 694 -

JAERI-Conf 2002-004
A possible eason can be supposed to �-xplain these effects. The iron dissolved
with silicon ormed a precipitated layer on the surface of the slag, and the layer acted as
a TOteCtiVe lay0f, which an reduce corrosion rates by ibiting dissolution of the
sample. Sinc a arge ount of iron dissolved to form te protective layer in alkaline
solutions, the inhibition of the sample dissolution by the layer must be significant
compared to that in eiouized water.
In addition, as sown in Fig.4, the sturated concentration of silicon for iron-doped
slag samples is still ower tha tat o iron free sample in alkaline solutions. It
suggests that the precipitated layer acts not only as a protective layer but also as a
solubility control solid, which reduced the amount of dissolved species. The dominant
precipitate for the iron-doped slag sample in alkaline condition is presumed to be
iron-bearing mineral.
5. CONCLUSIONS
Static corrosion tests were carried out using slag specimen doped with zero to five
weight percents of iron in deionized water and in alkaline solution at 250C. It was
observed that it-on significantly decreased the release of silicon and aluminum from the
slag sample in akaline solutions. It was supposed that iron-bearing precipitates
inhibited the dissolution of the slag in alkaline conditions.
REFERENCES
[1] T.Amakawa et al., Yokosuka Research Laboratory Rep. No.W98010, Central
Research Istitute of Electric Power Industry 1998)
[2] N.Nakasbio et al., JAERI-Research 2001-001, Japan Atomic Energy Research
Institute 2001).
[3] W.Lutze et al., Radioactive Waste Forms for the Future, North Holland 1988)
695 -

This is a blank page.

JP0250369JAERI-Conf 2002-004
REVIEW OF IMMOBILIZATION TECHNIQUES OF RADIOACTIVEIODINE FOR GEOLOGICAL DISPOSAL
HIR OYASU KATO, OSAMU KATO AND HIROMI TANABERadioactive Waste Management Funding and Research Center
No.15 Mori Bldg, 28-10, Toranomon, Minato-ku, Tokyo, t5-0001, Japan
Fax. 81-3-3504-1297, e-mail: h-kato�rwmc.orjp
Iodine-129 is one of the key uclides on te safety assessment fr the geological disposal of radioactive
waste containing transuranic elements, which will be generated from fuel cycle facilities such as reprocessing
and MOX fuel fbrication. To improve safety in disposal, it is implemented to develop the advanced iodine
waste form in which iodine-129 can be sustained with gradually releasing for more than hundreds of thousands
years. In this paper, iodine immobilization techniques under currently development in Japan are reviewed from
the points of views in the treatment techniques for immobilization, required pre-treatment techniques of the spent
filters and chemical and physical properties of immobilized waste form, The techniques can be classified into
three categories by the applicability of iodine release models from the waste. The possibilities of reduction of
maximum dose by geological disposal of iodine-129, adopting the advanced iodine waste forms wil be
discussed.
Key words: iodine, immobilization, geological disposal, spent filter, radioactive waste
INTRODUCTIONIodine-129 is one of te key nuclides on the safety assessment for the geological disposal
of radioactive waste ontaining transuranic elements, which will be generated from fuel cyclefacilities such as reprocessing and MOX fuel fabrication. Hereafter the waste containingtransuranic elements is called TRU waste in this paper. The Progress Report on DisposalConcept for TRU Waste in Japan [1] (hereafter, The TRU Progress Report) reported that themajor part of iodine-129 was contained in spent iodine filter generated from the operation ofdomestic reprocessing plants, and that the spent filter was solidified by cement, then disposedin a repository with engineered barriers composed of cementitious materials and bentonitematerials. The TRU Progress Report concluded that the current cement solidificationtechnique ay offer the safe disposal with regard to the spent filters containing largequantities of iodine-129. however the result of the safety assessment depends on theconditions of the geological environment.
On the safety assessment of TRU waste disposal, the maximum dose rate caused by theoverall waste is dominated by iodine-129. The rate by iodine-129 mainly depends on itschemical and radiological properties. Silver iodide (Agl) is the r1rain chemical form of iodine
in the waste and it ay be decomposed to soluble ions under reduced condition of deepgeological disposal, Generally, iodine ion has low sorption property on the engineered barriermaterials and te atural materials such as rocks and soils. Moreover iodine-129 is extremelylong-lived radionuclide (half-life: 1.57 X 10⁷ y). Therefore iodine-129 wilt be rapidly releasedfrom the repository, and migrate to biosphere through geological layer with relatively less
- 697 -

JAERI-Conf 2002-004
decay. Thus, a dose of iodine-129 ay be significantly affected y the, condition of the
geological environment, At tre viewpoint of the maximum close Yeductiort, it is necessary to
develop the waste form in wich iodine-129 is controlled to be eeased for more than
hundreds of thousands years, This advanced waste form would improve the flexibility in
providing acceptable performance i a wider range of geological environments in Japan.
In this study, the iodine immobilization techniques under urrently development in Japan
are reviewed from the points of views in treatment techniques for immobilization, required
pre-treatment techniques of the spent filters heating, crushing, conversion of chemical form
of iodine compounds, etc.), and cemical and physical properties of immobilized waste form.
Eight promising iodine immobilization techniques are iroduced. The techniques could be
classified into three categories by the applicability of iodine release odels from the waste.
The possibilities of reducing iodine-129 maximum dose o geological, disposal by adopting
the advanced iodine waste forms are discussed.
IMMOBILIZATION TECHNIQUES OF IODINE
According to The TRU Progress Report. spent iodine filter will be mainly generated from
the operation of domestic commercial reprocessing plants, The fresh iodine filter is silver
silica gel (AgS), which is composed of appox. 8]wt.% silica-gel and appox. 19wt.% silver
nitrate. Generated radioactive iodine Or 103-) reacts with Silver nitrate in the filter, and
forms AgI or AgIO3. Therefore spent filter is mixture of Agl, AgI03 and silica gel except for
minor impurities.
The iodine imobilization techniques under crrently development i Japan require some
pre-treatment processes of the spent iodine filters such as heating process fr removal of
impurities, crushing process for improvement of reaction efficiency and onversio of
chemical form of iodine compounds. Outline of each imobilization technique is showed as
follows, and pre-treatment processes required for respective imobilization technique and
chemical and pysical properties of each solidificates and proposed release model from
immobilized waste forms are shown in Table I ad Table U, respectively.
HIP treatment of the spqnft filter 2,3]
HIP (Hot Isostatic Pressing) process is a method under te operating condition of
high-temperature and high-pressure. uthermore, because of its isostatic pressing, not
one-dimensional pessing, products as less residual stress. Terefore it is possible to keep
their high mechanical properties of products for a long time.
Structure of silica gel of spent filter is amorphous ad porous. Under te simultaneous
application of high-pressure ad high-temperature, it is possible to transmute an aorphous
silica gel into crystalline quartz, which as high mechanical properties and is thermodynamic
stability. It is reported that the solubility of silica gel into solution tends to become s alley as
crystallized material than amorphous one. Radioactive iodine is confined as its chernical form
of AgI or AgIO3 among crystalline quartz grains, Thus the leach rate is reduced to low. It is
possible to produce a solidificate having a high pysical ability for iodine reteDtion, applying
HIP treatment.
- 698 -

JAERI-Conf 2002-004
Table I a n)-flobjb7ation technique, irieebarlism of the iodine confinement and required
pre-treatment process of the Spent iodine filter
ine 1111mobilization Mechanism of dine Reqijiferj pfe-treatnient process1-io-dTechniques colifineoren( of tbe spent iodine filter
141P treatineDt of be Spell Confuretuent by SiO� (I)GTinding (40 ft m)fillet (quartz) rylatfix (2)Pre-heafing(480'C)
g into capsule"w temperature Confinement y (I)Separation of AgI by the vacuum distillation
vitrification with ARI AglA920-P205 glass method(I)Recovery of iodine from the spent iodine
Low temperature Confinement by filtervitrification with BiPbO21 B203-SiO2-PbO glass (2)Production of BiPbO21 by ion exchange of
iodine with BiPbO2NO-3
Hot press of file pent filter Confinement by metallic(I)Pre-heating 4000C, 20 hours)with metallic copper powder copper matrix
Hot pess of apatite with Confinement by apatite (1)Agl separation fom the spent iodine filterspent fter matrix (2)Captuye of AgI by zeolite
(I)Dissolution of iodine from the spent iodineHigh performance C'effleut Sorptio o kbe ceinen o filter into te solution by reduction reaction
solidification witb 101- its composing Minerals (2)Conveysion of ' io 103- ty oxidationreaction with ozone gas bubbling
Synthesis of iodhie sodalite Low solubility of (I)AgI separation from the spent iodine filteriodine sodalite (2)Conveision, of Agi into Nal
Synthesis of lead Low solubility of (1)AgI separatio fom the spent iodine filtervanado-iodoapatite lead vanado-io
Table U Cemica a pysical propeTfies, of each solidificate and pToposi�d release model
of iodine font the waste form.
Mechanism of Iodine Chemical and physical properties Proposed elease model ofConfinement iodine from the waste form
-Density: >2�Confinement by o?, -Compression strength- >98Mpa Leaching model
(quatiz) matrix -Pefrueability of water: �<10-1( WS (by Diffusion)-effective iffusivity: 4X 10-16 m2/S
Confirlemelat by -Density: 5,5- .0 g/m�-Compressive strength. 4MPa-10OMPa Leaching model
Agl-Ag'2(-P2(5 OSS 7XIO-8 _ '-Leaching iate: 5xlO-'g/cm/dConfinement bv -Density, 6.4g/cm3 Leaching model
]3203-SiO,-PbOg��__Iodine loading: wt.%
Confinement by inetallic -Content of the spent filter. ca, 30 vol.% Leaching modelcopper Matrix -Corrosion rate: 1-4,u m/y (by corrosion)
Confinement by apatite -Density 3 g/cm 3matrix Mechanical strength- 300 MPa Leaching model
Sorption on the ement or -Density: I 74 g/cmits composing "lulorals Compression StIF : 22mpa Sorption model
-Distribution coefficient f iodate: ca.900i!!j/�
Low solubility of iodine -Solubility: 10-4- 10-' niol/L. Solubility limit modelsodalile
Low leachability or Leaching model orsolubility of lead apathe -Leaching rate (MCC-5): ca. 4x10" g/CTn2/d solubility limit model
699 -

JAERI-Conf 2002-004
Typical HIP treatment was carried out under the condition of a temperature at 750 C a
pressure at 1000k gf/CM2 (=98Mpa), after grinding, pre-heating tire filter, packing into capsule
and sealing up as pre-treatment pocesses.
As for the iodine release mechaDism from the HP solidificate, the path of iodine exudation
is a quartz grain boundary layer. Iodine retention ability of the solidificate is dominated by the
diffusion of a quartz grain boundary, Therefore diffusion model of a quartz grain boundary is
applied to iodine release model from the solidificate..
Low temperature vitrification with AgI 2,4]
This immobilization technique makes possible to confine radioactive iodine as
Ag1-Ag20-P205 glass waste forms. Proposed vitrification process consists of two steps:
- Separation of AgI from the spent iodine filter by the vacuum distillation ethod as
pre-treatment process.
- Vitrification with the separated AgI.
An AgI-Ag20-P205 glass system can homogeneously contain up to 6Oinol% Agl,
which leads to igh volume reduction efficiency approximately 125). It also can vitrify
the AgI without volatilization of iodine because of its low melting temperature (below
50OLC).
The physical properties of AgI-Ag20-P205 glass waste forms were examined
parametrically by changing the AgI content and Ag/P ratio of the silver phosphate.
Homogeneous glasses could be made without crystallization
Leach tests of this glass waste form were carried out according to the MCC-1 static leach
test procedure. The tests were done under the reducing ondition in an anaerobically
controlled glove box, which was purged by nitrogen gas with 3 hydrogen Ater immersion,
iodine concentration in the leachate was analyzed by ICP-MS. eaching behavior of the glass
was different between the fif st 10 days period and the after period, During the first 'IO days,the leaching rate was 7xlO-8g/CM2 /d, and dration after 10 days it decreased to 5x,0-9g/CM2 M.
These leach rates indicated a fairly long life o tis glass, The observation by te SEM
showed that precipitation layer was very tightly attached and its thickness was about 10 u m.
It was concluded that formation of the precipitation layer limited the dissolution of iodine in
the glass.
Low temperature vitrification with BiPb02! [5]
This immobilization technique consists of an iodine recover process and a vitrification
process as same as the vitrification technique with Agl mentioned above. A special iodide
compound, BiPbO2I, was used to forn a omogeneous dispersion of an iodine in
B203-Si2O-PbO glass system, In the vitrification process, a melting temperature is low 520
'C) to avoid a iodine volatilization during the vrification of an iodine compound.
- Recovery of iodine from the spent iodine filter as pre-treattrient
A reductant (N2H4, etc) was used to release an iodine nuclide from a spent iodine filter
into a solution. Then, the iodide ion was fixed into BiPbO21 by racting wine an inorganic
anion exchanger, BiPbO,)NO,. The ion exchange reaction can be described as follows:
- 700 -

JAERI-Conf 2002-004
BiPb02N0 F BiPbO21 + N03-
VitTification With ecovered BiPbO2l
The composition of the glass frit was B201:SiO2:PbO = 30:10:60 [mol%]. The glass
fTit was mixed with BiPbO21. The mixture was melted at 520 C for 30 min under aerobic
conditions, and then cooled to 300 'C.
Experiments are in progress, The specific data such as volatile rate and leaching rate will be
obtained i thenear future.
Hot-press of the spent filter with metallic coover owder 2]
The solidified waste form of the spent iodine filter in copper matrix has been developed by
hot press method with etallic copper powder. he form can be expected to perform
tong-term normal state and good corrosion resistance in reducing condition.
Required pre-treatment process is pre-heating the spent iodine filter at 4009C and 20 hours.
After the mixing of dried spent filter and metallic copper owder, hot-press were carried out
under a temperature at 7509C a pressure at 25Mpa and keeping time at 3 hours. Thus the
spent iodine filter was confined into metallic copper matrix.
A release of iodine from the solidificate occurs with corrosion of copper matrix. Therefore
the corrosion test of copper matrix was carried out. he corrosion rate of copper matrix
obtained from te experiment was 1-4 g m/y in anaerobic condition.
Hot-press of the spent filter with apatite 2]
The apatite solidification technique is a method for solidifying spent iodine filter directly or
zeolites that absorbed AgI separated from the filter, with physically and chemically stable
apatite matrix. The method is to solidify mixture of apatite particles and the spent iodine filter
or the zeolite tinder relatively high temperature and pressure such as hot-press. And before
the solidification, the filter or the zeolite are coated y apatite to reduce the leaching paths of
iodine, Thus the iodine is encapsulated with apatite matrix that are insoluble mineral.
In the case of no direct solidification of spent iodine filter, following re-treatment process
is required.
- Agl separation from the spent iodine filter
- Capture of AgI by zeolite that have higher ability of iodine absorption, to reduce total
volume of the waste.
Experiments are in progress, and the specific data such as leaching rate will be obtained in
the near future.
High performance cement solidification with 10,;- 2,6]
Hydrated cement inerals as monosulfate, ettringite and hydTotalcite have high sorption
property for anions. High sorption 'performance cement containing large amounts of
calcium-aluminate compounds has been developed by mixing alurnma cement with calcium
compounds sch as calcium sulfate and calcium hydroxide. And the distribution coefficient
Of I03 O MODOS1,11fate and ettringite was reported to be more than two orders of magnitude
higher than those of F Therefore high performance cement solidification with 103- was
- 701 -

JAERI-Conf 2002-004
proposed as the high iodineretontion waste form.The pre-treatment and immobilization process consists of three steps�- Dissolution of iodine ft0lu, the spent iodine filter into the solution y reduction, reaction
- Conversion of into 103- by oxidation reaction with ozone gas bubbling
- Mixing of the 103- With hgh sorption performance cement which is dfated materialof a mixture of CaSO4 2H20 ad alumina cement in a volume ratio of 15.5/100, andcontains large amounts of monosulfate and ettringite.
As a result of the sorption experiment for the high performance cement under a reducing
condition, it was reported that the distribution coefficient Of 103 -on the ement reached toabout 900 ml/g.
Synthesis of iodine sodalite 2,71Sodalite [Na8(AlSi0,*)6Cl?] is a mineral in nature which contains halogenous chlorine.
Iodine sodalite [Na8(AJSi04)6J2] is proposed as a stable waste form to immobilize adioactiveiodine, The sodalite alummosilicate lattice consists of tuncated otahedral which provide
large "cages" in which allow to place ions or atoms. The incorporation of iodine into the cagestructure has been studied. It -has been reported that the sodalite was synthesized asily fromclay minerals such as kaolin or some chemical reagents in the study of immobilization ofiodine from nuclear fuel reprocessing and solidification of halide salt waste frompyrochemical reprocessing. Because solubility of sodalite in aqueous solution iscomparatively low, iodine release is restricted by solubility limit of sodalite.
The iodine sodalite was synthesized of stoicbiornetric mixtures of SiO2, NaA102 and NaIby heating in argon gas flow at the temperatures of 800'C for 2hours.
Required Pre-treatment processes for this technique are as follows:- AgI separation from the spent iodine filter- Conversion of Agl ito Nal
Solubilities of the iodine sodalite in the several types of leachates were rn"sured by the batchmethods. The solubilities of the synthesized iodine sodalite were in the, range of 1-4 _ -5
mol/L.
Synthesis of lead vanado-iodoapatite 8,91As stated above, apatite materials have low solubility and leachability, A immobilization
technique for the synthesis of apatite containing iodine has een developed. A leadvanado-iodoapatite, Pblo(VO4)612 was sthesized. Because iodine compounds sed asstarting materials or product were volatile, the starting aterials were reacte i a sealed
quartz ampoule and a waste form was made from the product by hot-pressing. Thestoichiornetric aounts of PbO. Pb1 ad V205 ere 111iXed and pressed to a pellet at 35MPa
at room tempefature.'rhe pellet sample was pt in a valuated quartz ampoule Tile quartz
ampoule was sealed and beat-treated at 7009C for 5 bouts, After some properties we
measured with plverized product, the waste form was made by bot-ptessiog th e powde at
a pressure of MPa and temperature of 773K.
Required Pre-treatment processes fo tis technique are as follows:
- 702 -

JAERI-Conf 2002-004
Agl separation from te spent iodine filter
Conversion ofAgI into PbI2The X-ray iffraction pattern of the poduct showed apatite structure and chemical analysis
suggested some evaporation of iodine in a sealed quartz tube. Thermogravirrietry-differentialthermal analysis showed tat the apatite was stable up to 800K under argonatmosphere 7 days soxhiet leaching test(MCC-5) was performed with the hot-pressed sample.The leaching rate of iodine, ead ad vanadium were 3.98x10-', 1,55x10-' and 161xlO-' 9C111-2 d-J, respectively.
POSSIBILITY OF DOSE RE DUCTION ON GEOLOGICAL DISPOSALAccording to The TRU Progress Report, te dose rate with disposal of traditional cement
solidificate of the spent iodine into multi-bafriet system was ewaluated, and the maximumdose rate of odine-429 reached to ,u Sv/y under reference geological condition of crystallinerock which hydraulic conductivity was 0-9 nils. he dose ate was remarkably affected byincrease of hydraulic conductivity of the rock, It is reported that the contfolled-release-term ofiodine-129 by the advanced iodine waste for about 105 years wasrequeste i order to reducea maximum dose rate of one order less that the value obtained with traditional cementsolidified waste,
Iodine release odels ftorn the iodine wastes made by immobilization techniques in this
paper, are, roughly classified into 3 types at the viewpoint of dominant release mechanism;they are leaching model, sorption model and solubility limitation model as listed in Table 11.It is reported to be possible that that the controlled-release-term of iodine-129 from eachwaste form xceed more than 105 years, if applied those specific corresponding models to
iodine release twahiation, assuming tat the waste form would be physically stable withoutany change of cemical poperties with regard to iodine release for long-term.[1,2]
As for the geological disposal for the iodine-129 waste form, it will be necessary that theexaminations of suitable disposal systems for proposed iodine waste form, and the long-termperformance assessments of overall systems including the waste forms were necessary, inorder to examine the applicabilities of respective iodine waste forms to the geologicaldisposal.
CONCLUSIONEight immobilization techniques and their respective mechanisms of mmobilizations,
required pretreatment process, physical and chemical properties of iodine immobilized forms,proposed iodine elease model, were reviewed for the purpose of examination ofapplicabilities of respective iodine-129 immobilized form to geological disposal.
It becomes lear that some immobilization techniques require ot only grinding and heatingthe spent iodine filter, but also more complicated process such as sparation of AgI from thespent iodine filte ad conversion of AgI. Examinations of suitable disposal systems forproposed iodine waste, form and the long-term performance assessments of overall systemsincluding the waste form itself may be necessary. Furthermore, evaluation of economicefficiencies for te treatment process and the disposal is future problem as well as an
703 -

JAERI-Conf 2002-004
improvement of reliability on long-term performance assessment of the developed iodinewaste form on geological disposal.
ACKNOWLEDGEMENTSThe authors would like to express their thanks to Mr. T. Nishimura of Kobe Steel, Ltd., ML
T. Yoshida of Hitachi Ltd,, Mr. M. Kaneko of Toshiba Co., Mr. T. Nakazawa of MitsubishiMaterials Co., ML A. Sakashita of Mitsubishi Heavy Industries Ltd., Mr. T. AMAYA of JGCCo., Dr. M. Uno of Osaka Univ. and Mr. M Fukumoto of Japan Nuclear Cycle DevelopmentInstitute for their supports.
REFERENCES[1] TRU Coordination Office, Progress Report on Disposal Concept for TRU Waste in Japan,
JNC TY1400 2000-002, TRU TR-2000-02, Japan Nuclear Cycle Development Institute,The Federation of Electric Power Companies 2000).
[2]H. Fujihara et al., Radioactive Iodine Waste, Journal of Nuclear Fuel Cycle andEnvironment, Vol.6, No. 1, pp.51-81, 1999).
[3]H. Fujihara et al, Fixation of radioactive iodine by hot isostatic press, ICEM'99, Nagoya,Japan, Sep. 1999).
[4]H. Fujihara, T. Murase, T. Nishi, K. Noshita, T. Yoshida and M. Matsuda, Mat. Res. Soc.Syrup. Proc., Vol.556, pp.375-382, 1999).
[5]T. Amaya, S. Shibuya and H. Kodama, 2001 Fall Meeting of the Atomic Energy Society ofJapan, M59, 2001)
[6]M. Toyohara, M. KANEKO, H. UEDA and N. MITSUTSUKA, Journal of Nuclear Scienceand Technology, Vol.37, No.11, p.970, 2000)
[7]T. Nakazawa et al., Iodine immobilization by sodalite waste form, Scientific Basis forNuclear Waste Management, 2000 (in printing).
[8] M. Uno et al,, 2001 Spring Meeting of the Atomic Energy Society of Japan, M59, 2000)[91M. Shinohara, M. Uno, K.Kurosaki ad S. Yamanaka, Some properties of a lead
vanado-iodo apatite PblO(VO4)612, 160 IUPAC Conference Chemical Thermodyanamics,Canada.
704 -
JAERI-Conf 2002-004
TRU Chemistry
- 705 -

This is a blank page.

JP0250370JAERI-Conf 2002-004
ACTINIDE CHENtISTRV IN CONCENTRATED ALKALI:IMPLICATIONS FOR CLEANUP OF PROCESSING PLANTS
Kenneth LNash, Artem V� Guelis, ark Jensen, James C. Sllivan Adrew H BondArgonno National Laboratory
Alexander Yu. Oarnov, Linfeng PaoLawrence Beikeley National Laboratory
During 50 years of plutonium production for defense pposes in t U.S., a largeindustrial omplex with facilities sattered aound the country was developed. The first,and ultirnately the largest, of these facilities, at the Halt ford site in Washington state,produced plutonium for more than 40 years. During this period, three main actinidepartitioning processes were employed, thebisinuth phosphate precipitation pocess, andthe REDOX ad PITREX solvent extraction processes. Liquid pocess wastes were at firstdisposed, of directly to open trenebes and later to nderground waste storage tanks.Ultimately, 177 tanks ere constructed and used for "temporary" storage of wasteeffluents at this site, During the years of plutontran production and byproduct r ecovery,wastes were Jinxed between anks and sbject to vaporation to conserve I ited space.Similar underground storage anks containiag wastes of less diverse composition exist atother production acilities. All are presently scheduled for cleanup and closure as part ofthe decommissioning of a large portion of the US, defense complex.
Because te tanks are of arbon steel construction and to assist with control of the
solubility of rnetallic fission byproducts te ffluents were made strongly alkaline upon
their release to te as. Over the years of waste storage, these tank wastes have
spontaneously separated int sdge, solution/slurry, and salt cake phases. Remediation
of the illions of gallons of these waste aterials is one of the most imposing tasks to be
faced in the ongoing cleanup of the U.S. defense complex. Present site closure plans call
for the emoval of the wastes from the tanks. The wastes are to undergo minimal
processing primarily to remove non-radioactive constituents, and the remaining
radioactive portions vitrified prior to pennanent disposal in a geologic repository.
Reduction of the Al, Cr, P, and content of the wastes is to be accomplished using an
alkaline scrub of the sludge phase. It is expected that this alkaline sudge wash will only
remove the target species and leave the important actinides ad fission products in the
sludge phase as feedstock for vitrification, Given the extreme diversity of tank wastes and
the diverse redox chemistry of the light actinides, the assumption of consistent
insolubility of actinides in alkaline solutions appears to be debatable.
Working with simulants of sludges from the BiPO4, Redox, and PUREX processes and
with epresentative Solutions, we are investigating the nature of the interactions of
acti-nide cations components of ank sludge simulants and possible leachates A variety of
complementary analytical techniques have been employed in this investigation. We have
observed tat Pu dissolves somewhat more readily from Redox and BiPO4 sludgesimulants than it does from PUREX sludges, though Pu(TV) oxide/hydroxide most
probably controls solubility under most conditions. On the other hand, U and Np have
- 707 -

JAERI-Conf 2002-004
been observed to dissolve from sudges much more readily under many circumstances. Atbase concentrations above I N4, the solubility of oxidized actinides is moderate and isdominated by mononuclear ydroxides, even in the presence of moderate concentrationsof carbonate. Continuing research focuses on the influence of chelating agents known orsuspected to be in the tanks on actinide solubility and speciation, In this presentation, theresults of these observations will discussed to provide insights into behaviors that inightbe exhibited by. actinides during alkaline sludge washing procedures. The potentialimpact of alkaline actinide chemistry on hydrometallurgical processing of actinides willalso be explored.
This work was supported by the Assistant Secretary for Environmental Managementunder U.S. Department of Energy Contract Numbers W-31-109-ENG-38 at ArgonneNational Laboratory and DE-AC03-76SFOO98 at Lawrence Berkeley National Laboratory.
The submitted manuscript has been createdby the University of Chicago as Operator ofArgonne National Laboratory ("Argonne")under contract No, W-31-109-ENG-38 withthe U.S. Department of Energy. The U. ,Government retains for itself, and othersacting on its behalf, a paid-up, non-exclusive,irrevocable worldwide license in said article toreproduce, prepare derivative works,distribute copies to the public, and performpublicly and display publicly, by or on behalfof the Government.
708 -

JP0250371JAERI-Conf 2002-004
Electrochemistry Studies Of U02(acac)7L(aca = acetylacetonate,L = dimethyl sulfoxide, NN-dimethyiformamide, tetrahydrofuran)
Complexes in Non-aqueous Solvents
Seong-Yun Kim, Gunzo Uchiyama, Koicbiro Mizuoka', Yasuhisa Ikeda*Depaftinew of Fuel Cycle Safety Research, Japan Atomic Energy Research Institute,
2-4 Tokai-mura, tbaraki-ken, 319-1195, Japan
Tel.: 81-29-282-6675, Fax: +81-29-282-667�, E-rnail: skimCqprocsafe.tokai.jaeri.go.jp
Research Laboratory for Nuclear Reactors, Tokyo Institute of Technology
2-12-1 0-okayama, Meguro-ku, Tokyo 152-8550, Japan
Electrochemical studies On UV102(acac)zL(acac = acetylacetonate, L = dimethyl slfoxide
(dmso), NN-dimethylforrYjamide(dmf), fetrabydrofuran(thf)) complexes in non- aqueous
solvents ontaining elfabutylammonium erchlorate as supporting electrolyte have been
carried out by using cyclic voltarnmetry to compare the stability ofthe reduction products of
U(VI) complexes with bidentate ligands. It was found that the V'02(acaC)2dmso and
Uv,02(acac)?dmf complexes are quasi-reversibly reduced to [V02(acaC)2dmso]- and
[UvO2(acaC)2dmfl- species and that the Uv,02(acaC)2thf complex is irreversibly reduced to
[UvO2(acaC)2thfl- species at the Pt electrode.
Keywords: Uranyl(VI) complexes, Electrochemical reactions, Acetylacetonate, Non-
aqueous solvents
1. INTRODUCTION
Although many electrochemical studies on U(VI) complexes have been carried out,little iformation is available concerning the coordination chemistry of U(V insolutions. Electrochemical reactions of uranyl(VI) complexes have been extensivelystudied in aqueotts[l] and non-aqueous solutions[2] and their mechanisms have beenproposed. However, the properties of reduction products, i.e. U(V) complexes, havenot been examined in detail[l 3, Previously, we have investigated the electrochemicalproperties of uranyl(VI) complexes b using cyclic voltammetry(CV), normal pulsevoltammetry(NPV), and spectrophotometei equipped with an optical transparent thinlayer electrode(OTTLE) ell[4-8]. As a result, we have clarified that these complexesare reduced to U(V) complexes quasi-reversibly or reversibly to form relatively stableU(V) species (probably yl-type, U02') and that the U(V) complexes have small molarextinction coefficients in the visible region. Furthermore, recently we have carried outthe electrochemical study of U4+ Perchlorate in DMSO to examine whether theso-called bare U(V) ions (U5+) are generated by electrochemical oxidation of U4+
ions[9]. It was found that the U4+ ions in DMSO is not oxidized to U ions. Fromthese results, it is expected that the uranyl complexes with bidentate or multidentateligands, at their equatorial planes can form stable U(V) complexes by electrochemicalreduction and that the U(V) species in non-aqueous solvents are present more stably asthe Yl-tYPe (UO2+) than as the bare type (U5,).
In the present paper, we report the results of the electrochemical studies onU02(acaC)2L[acac = acetylacetonate, L = dimethyl sulfoxide(dmso), NN-dimethyIformamide(dmf), tetrahydrofuran(thf)] complexes in non-aqueous solvents by usingcyclic voltammetry.
2. EXPERIMENTAL
2.1 Materials. The U02(acaC)2L complexes were prepared by dissolvingU02(acaC)2H20 in warm DMSO, DMF and THF solvents. The U02(ac'aC)2H20complex was prepared by the procedure of Comyns et al.[10]. Solution containing
709 -
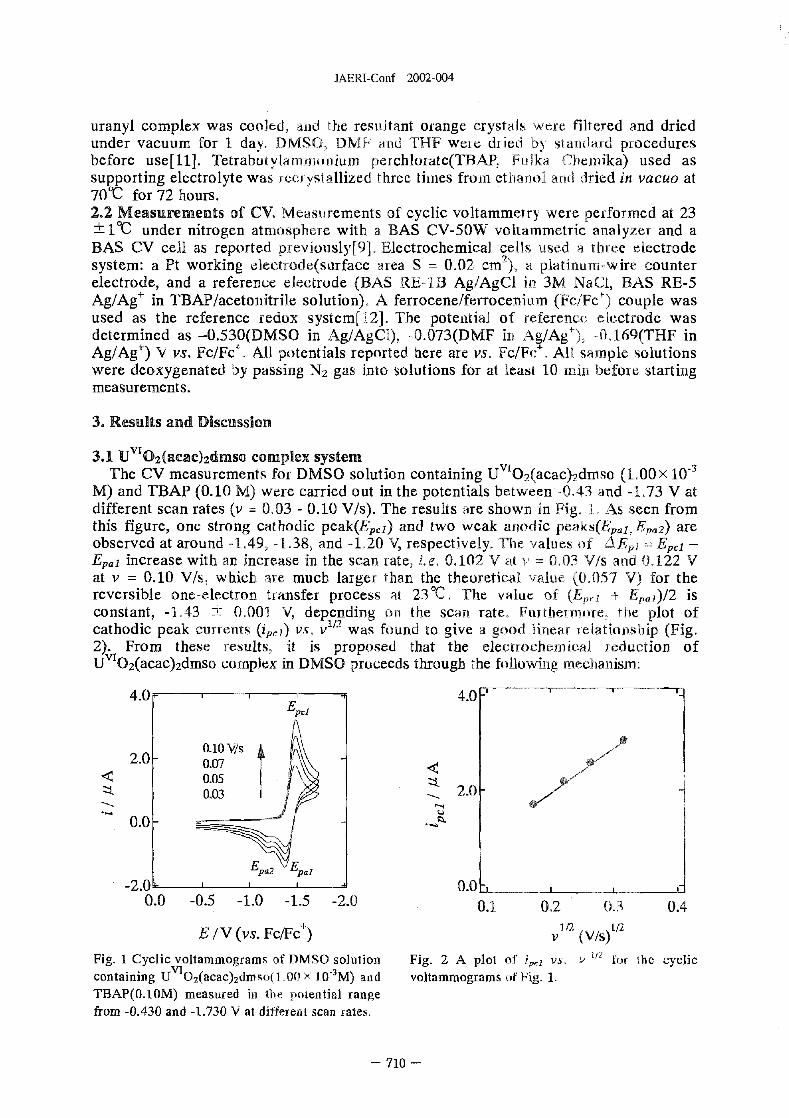
JAERI-Conf 2002-004
uranyl complex was cool ed, and e resultant oange crystals were filtered and driedunder vacuum for I day. DMSO, D ad THF were dried by standard proceduresbefore use[11]. Tetrabutylammonium perchlorate(TBAP, Fulka Chemika) used assupporting electrolyte was recrystallized three times from thanol and dried in vacuo at7OcC for 72 hours.2.2 Measurements of CV. Wasurements of cyclic voltammetry were erformed at 23±10C under nitrogen atrnospbefe with a BAS CV-50W VltaMMetTiC aalyzer and aBAS CV cell as reported previously[9]. Electrochemical cells used a tree electrodesystem: a Pt working clectrode(surface area = 002 cm), a platinurn-wire counterelectrode, and a reference electrode (BAS RE-13 Ag/AgCl in 3M NaC1, BAS RE-5Ag/Ag' in TBAP/acetojiitrile solution). A ferrocene/ferrocenium (Fe/Fe') couple wasused as the reference fedox system[t2j. The potential of reference electrode wasdetermined as -0.530(DMSO in Ag/AgCl), -0.073(DMF i Ag/Ag+-), -0.169(THF inAg/Ag') V vs. Fc/Fc'. Alt potentials reported here are vs. Fc/Fc'. Alt sample solutionswere deoxygenated by passing N2 gas into solutions for at least 10 min before startingmeasurements.
3. Results and Discussion
3.1 Uv,02,(acaC)2dmso complex system 0 (1. 00 X 10-3The CV measurements for DMSO solution containing Uv'02(acac)?-drns
M) and TBAP (0.10 M) were carried out in the potentials between .43 and 1.73 V atdifferent scan rates v = .03 - .10 Ws). The results are shown in Fi I As seen fromthis figure, one strong cathodic peak(Epj) and two weak anodic PCakS(Ep,,1, Ep,,2) areobserved at around 1.49, 1,38, and 1.20 V, respectively. Te values of _/AEp = Ep�j -Ep,,, increase with an increase in the san rate, L e. 0 102 V at v = 0, 03 V/s ad 0 122 Vat v = 0.10 V/s, which ae much larger than the teoretical value 0.057 V) for thereversible one-electron transfer process at 23cC. The value of (Ep,, + Epj)/2 isconstant, 143 ±- 0001 V, depending on te scan rate. Furthermore, the plot ofcathodic peak crurents (ipi) vs, v12 was found to give a good littear relationship (Fig.2). From these results, it is proposed that the lectrochemical reduction ofUVI02(acaC)2dmso omplex in DMSO proceeds through the following mechanism.
4.0 4.0 Ep,1
0.10 V/S2.0 - 0.07
0.050.03 2.0 -
0.0
EP.2-2.0-- 1 0.0 LL
0.0 -0.5 -1.0 -1.5 -2.0 0.1 0.2 0.3 0.4
E V (vs. Fc/Fc+) v1/2 (V/S)"
Fig. I Cyclic voltammograms of DMSO solution Fig. 2 A plot of i,,, vs. for the cycliccontaining U VI 02(aca02drPSO(LOO X 10-3 M) and voltammograms of Fig. ,TBALP(O.IOM) measured i t potential rangefrom 0.430 and 1.730 V at dfferent scan ates,
710 -

JAERI-Cont 2002-004
UVI02(8CaC)-1C1MS( + e [UV02(acac2dHIS01- Ep, i lEp. i (1)[Uv02(acac)2dMS0j + xDMSO - [U 02(acac)(uni-acac)(dmso)xj] (2)
fast[UvOg(acae)(tini-acac)(dmso)x,il- + DMSO - V02(acac)(dMSO)x,2 + acac- (3)
fastwhere uni-aca ad x symbolize te acac ligand Cordinated to U02 2+ as unidentate
and aDy number of coordinated dmso, respectively. Athough it is difficult to assignthe al Species generated by the electrochemical reduction of Uv'02(acaC)2dmso fromthe pesent study, it is most likely that the non-charged species UvO,?-(acac)(dmSO).,+2 is
formed through te intermediate v0,2(acac)(uni-acac) &so),,ij-. Therefore, thepeak p,,;? is supposed to Correspond to te oxidation of U 02(acae) (dMSO)x+2 (Eq. 4)followed by te oordination ad creation reactions of urn-acac (Eqs, (5) and 6)):UV02(aCaC)(dMS0),1- - [UVI02(acac)(drnso),,-,j ' + - Ep.2 (4)[Uv'0'?(acaC)(dMSO),,,21 + acac- UVI02(acae)(uni-acac)(di-nso),,+ + DMSO (5)
fastUVI02(acac)(uiii-acac)(drtiso),,+ - UVI02(acaC)2dmso + xDMSO (6)
fastIn te Fig. 1, the Ep,,, peaks coupled with Epj are small. This indicates that the
reaction (1) is amost Yeversible. Ingenerally, if the reaction, + ne = R, is reversible,the peak CUTrents(ip ae related t v as follows:i = 299n(ctrQ"2SCoDo' 17V 112 (at 23't ) (7)where C- 2/S) is the diffusion coefficient
,, (M) is the concentration of species 0, Do (cmof species 0 ad S cm 2) is the surface area of electrode. From the slope(9.46x 10⁻⁶ of
Fig. 2 te diffusion coefficient (Do) Of UV'02(acaC)2dmso at 230C was estimated as3.91 x 10-6 crn2l/s by using tn, = 064, n = , Co = 1.00 X 10⁻³ M ad = 002 CM2.
3.2 UVT02(acac)?dmf complex systemThe CV easurements were carried out for DMF solution containing
UV10?(aGaC)2d1-Df 1.52 x 10⁻³ M) and TBAP (0.10 M). The potentials was scannedbetween 0.073 and 1.773 V at different san rates (v = 003 - .11 V/s). The resultsare shown i Fig, 3 As seen frorn this figure, one strong cathodic peak(Epj) and twoweak anodic peaks(Ep,,j, Ep,,2) are observed at around 14, 140, and 083 V,respectively. The values of A p = Epj - Ep,,, decrease with a incf ease in the scanrate, i.e. 0148 V at v = �03 V/s and 0144 V at v = 0.11 V/s wich are much largerthan the teoretical value 0.057 V) for the reversible one-6ectron transfer process at230C. The value, of (Ep,j Ep,,j)/2 is nearly constant, 147 ± 0.001 V, withoutde cling on tire scan rate. Frthermore, the plot of cathodic peak currents (ipj) vs.v was found to give a good linear relationship �Fig 4 F these results, it isproposed that the electrochemical reduction Of U I02(acaC)2dmf complex in DMFproceeds trough te following mechanism:UVI02(aCaC)2dmf + e = [UV02(acaC)2dmf]- Ep�,Xp.j (8)[UV02(aCaC)?JMfl- + xDMF - [L�vO2(acac)(uni-acac)(dmf),,,] (9)
fast[UV02(acac)(uni-acac)(drnf)�,,,]- + DMF UV02(acac)(dmf)",2 + acac- (10)
fastwhere uni-acac and x symboli7C the acac ligand coordinated to U02 2+ as unidentateand any numbet of coordinated dmf, respectively. Although it is difficult to assign thefinal species generated y the electrochemical reduction of 'Uv'O,_(acaC 2dmf from thepresent study, it is most likely that the non-obarged species V02(acac)(dmf)x,2 isformed through tire ntermediate (V02(acac)(Ulli-acac) (dmf),+)j-- Therefore, the peakEp,,2 i Sposed to correspond to the oxidation Of V02(acac)(dMf),,2 (Eq. 11)
- 711 -

JAERI-Conf 2002-004
followed by the coordination and chelation reactions of uni-acac (Eqs. 12) and 13)):
6.0 - 6.0
EPCI
4.0 - 0.11v/ &
0.09 4.0 -0.07
2.0 - 0.050.03
2.0 -0.0
-pal
Epa2-2.0 - 0.0
0.0 -0.5 -1.0 -1.5 -2.0 0.1 0.2 0.3 0.4
E V (vs. Fc/Fc+) V 1/2 (V/S) 1 ,
Fig. 3 Cyclic voltarnmograms of DMF solution Fig. 4 A plot of ip, vs. for the cycliccontaining UOz(acac)zdrnf(l.52 X 10-3M) and voltammograms of Fig. 3.TBAP(O.10M) measured in the potential rangefrom 0.073 and -1,773V at different scan rates.
UV02(acac)(dMf)x+2 - [UV102(acac)(dMOJ,121' + e- Ep. 2 (11)
[UVI02(acac)(dn1f),+21' + acac - UVI02(acac)(uni-acac)(dmf),+ + DMF (12)fast
UVI02(acac)(uni-acac)(dmJ[),+j - UVI02(acaC)2dmf + xDMF (13)fast
In the Fig. 3 the Elal peaks coupled with Epl are very sall. This indicates that thereaction (8) is almost irreversible, Generally, if the reaction, + ne- = R isirreversible, the peak urrents(ip) are related to vll as following Eq.(7). Where is thenumber of electron transfer in the rate-determining step. The aft, value can beestimated by the following Eq.(14)[13].Ep1 - Ep = 0.0472/(an,,) (at 23-C) (14)where Ep and Epj2 are the potential at i = ip/2, respectively. In the present system, theEpi - Ep value is 0074 V and hence the n, value is evaluated as 0.64� By using OCK"0.64, n = Co = 152 x 10-1 M a = 2 cm the diffusion coefficient of[UV102(acac)drnf] was estimated as 3.14. x t6 c2/s (at 23cC) from the slope(I.29 x10-5) in plot of ip VS v117 shown in Fig. 4 thermore, the peak potential (Ep V isrelated with the standard rate constant (k,, m1s) as foflows[131:Ep =El/2-[(RT)/(an.F)]fO.780 + (1/2)lD[(anFvDo)/(RT)] -nkj (15)where E112 is the half-wave potential. Tus, the kc vlue was calculated from El. (15)by using E112 = 1.47 V an = 064 ad Do = 314 x 10-6 cm 2/S , alld is 6 x 10 - cm/sat = 11 V/s.
3.3 Uv'07(acac)2thf complex systemFig.5 shows the cyclic voltamrnogTaMS of TF solution containing v'07(aCaC)2thf
(1.00 X 10 3 M) and TBAP(O.10 M) measured at potentials between -OA69 and -L869V at different scan rates = 05 - 025 V/s). As can e seen from Fig. 5 a singlecathodic peak(Epj) is observed at 1.62 V with a coupled aodic peak(F,,,,j) at aound-0.875 V. These suggest that te coupled peaks, Fpl and Epj, correspond to he edoxreaction, UVI02(acaC)2thf + e- -- [V02(acaC)2thf . The values of -/AEp = p - Ep.,
- 712 -

JAERI-Conf 2002-004
are 0743 V at v =0.05V/s and 0846 V at v =0.25V/s, which are close to the theoreticalvalue 0.057 V) for the irreversible one-electron transfer process at 230C. In addition,the plot of cathodic peak urrents (ipj) vs. v /2 gives a good linear relationship asshown in Fig. 6.
6.0 6.0
4.0 - 0.25 V/s0.200.15 4.0 -
2,( - Z3_Z3 0.10
0.(5
0.0 2.0 -
-2.0
0.0r,0.5 0.0 -0.5 -. 0 -. 5 2.0 2.5 0.1 0.2 0.3 0.4 0.5 0.6
E / V (vs. Fc/Fc) V 1/2 MS) 1/2
Fig. Cyclic voitammograms of THF solution Fig. 6 A plot of ic vs. 1) 2 for the cycliccontaining U0,(acac),2tbf(1.00 X 10⁻³M) and voltammograms of Fig. .TBA2(0.IOM) measured in the potential rangefrom 0.169 and -1,869V at different scan rates.
From these results, it is concluded that the electrochemical reactions correspondingEpj and p,,, peaks are irreversible and a followed by the rapid chemical reactions.Hence, the following EC mechanism may be proposed as plausible one:UVI02(aCaC)2thf + e - [UV02(acaC)2thf] Ep.�j (16)JUV02(acaC)2thfj - UV02(acac)thf + acac- (17)
fastUV02(acac)thf - [UVI02(acac)thfl+ + e- Ep. (18)[UVI02(acac)thfl+ + acac- UVI02(acac)2thf (19)
fastAs the succeeding chemical reactions, the dissociation and association reactions of
acac seem to be reasonable, because such processes from the non-chafged complexesand result in te stabilization of products. From the slopc(7.89 x 10⁻⁶) in plot of ipj vs.
1/2 -v in Fig. 6 the diffusion coefficient Of UVI02(acaC)2thf at 230C was estimated as2.95 x 10-' cm ?/s by using Co = .00 X 10-3 M, and = 002 CM2 in Eq. 7).
4. CONCLUSIONS
The Uv'O?(acaC)2dmso and UVI02(acaC)2dmf complexes are reduced to[UV02(acaC)2dmso]- and V02(acaC)2drnf]- species quasi -reversibly and that theUV102(acaC)2thf Cmplex is irreversibly reduced to V02(acaC)2thf]- species at the Ptelectrode, Te reduction potentials (ipj, vs. Fc/Fc') for te U(V) were determined tobe 149 V for UVI02(acac)2dmso, 154 V for UV102(acaC)2dmf, and 162 V forUVI02(acaC)2thf. The plot of cathodic peak currents (ipj) vs. DA' (donor number) givesa good linear relationship. This means that the reduction Of UVI02(acaC)2L complexesbecomes difficult with an decrease in the basicity of the coordinated L(L =dimethylsulfoxide (dmso), NN-dimethyl- forinamide(dinf), tetrahydrofuran(thf)). TheU(V) species formed in the reduction Of UVI02(acaC)2L complexes existed stably in
- 713 -

JAERI-Conf 2002-004
non-aqueous solvents. As w xpected, the U(VI) complexes with bidentate ligands attheir equatorial planes were found to form stable U(V) complexes y flectrochemicalreduction, that is, those generated i the reduction Of U102(acac)2L were not reducedto U(IV).
5. REFERENCES
1. (a) B. McDuffie and C.N. Reilley, AnaL Chem., 38, 1881-1887 1966). (b S.Casadio and F. Orlandirti, J. Electroanal. Chem., 26, 91-96 1970), (C) L. Sipos,L.J. Jeftic, M. Branica and Z. Galus, J. Electroanal. Chem., 32, 35-47 971). ()D.W. Wester and J.C. Sullivan, Inorg. Chem. 9 238-2840 1980). (e) D. Hodkoand V. Pravdic, Electrochim. Acta, 30, 1341-1344 1985).
2. (a) H. Bildstein and V. Fleischer, V. Gutmann, Inorg. him. Ata 2 347-350(1968). (b) E.A. Kanevskii, B.V. Rengevich and G.R. Pavlovskaya, Radiokhimiya,17, 534-535 1975). () P. Zanello, A. Cinquantini and CI.A. Mazzocchin, Inorg.Chim. Acta, 21, 195-199 1977), (d) P. Zanello, A. Cinquantini PD. Bernardo andL. Magon, Iorg. Chim. Acta, 24, 131-137 1977). (e) P. Zanello, A. Cinquantini,G.A. Mazzocchin ad 0. Traverso, Inorg. Chirn. Acta, 27, 157-161 1978). ( P.Zanello, A. CinquaDtini and G.A. Mazzocchin, J. Flectroanal, Chem., 131,215-227 1982). (g) P. Seeber and P. Zanello, J. Chem, Soc. Dahon Trans., 601-603(1985). (h) S. Marouani and A.L.M. Gross, J Electrochim. Ata, 33, 147-155(1988). (i) L. Bahaduf and J.P. Pandey, J. Eectrochem. Soc., 37, 3755-3760(1990).
3. (a) G. Gritzner and J. Selbin, J. Inorg. Nucl. Chem., 30, 1799-1804 1968). (b) 1).Cohen, J. Inorg. AucL Chem., 32, 3525-3530 (1.970). () J.T. Be11� H.A Fiedmanand M.R. Billings, J. Inorg. Nucl. Chem,, 36, 2563-2567 1974). (d) C. Miyake andS. Yamana, H.O. Nishiguchi, Inorg, Chim. Acta, 95, 7-21 (t984). (e) C. Miyake, T.Kondo, S. Imoto and H.O. Nishiguchi, J. Less Comnton Met., 121, 313-317 1.986).(f) S.P. Best, R.J.H. Clark and R.P. Cooney, Inorg, Chirn. Acta, 145, 141-147(1988).
4. K. Mizuguchi, Y.Y. Park, H. Tomiyasu and Y. Ikeda, J Nucl, Sci. 7echnol., 30,542-548 1993).
5. S.H. Lee, K Mizuguchi, H. Tomiyasu ad Y. Ikeda, J. uci. Sci. Technol., 33,190-192 1996),
6. K. Mizuguchi, S.H L, Y. Ikeda and H. Tomiyasu, .. Alloys Comp.,271-273,163-467 (999).
7. S.Y. Kim, K. Hatakeyarna, H. Torniyasu ad Y Ikeda, J. Nucl. Sci. J�chttol., 35,437-442 1998),
8. S.Y. Kim, R. Touriyasit and Y. Ikeda, submitted to,1. Nucl St. Tecitnoi., 2001).9. S.Y. Kim, M. Harada, R. Tomiyasu, Y. Shiokawa and Y. Ikeda, .1. NUC1. Sci.
Technol., 37, 99- tO2 2000).10. A.E. Comyns, BM. Gatehouse and E. Wait, J. Cheat. Soc., 4655-4665 1958).11. D.D. Perrin a WL.F. Amarego, "Purification of Laboratoty Cemicals";
Pergarnon Press� xford, U.K., 1988).12. G. Gritzner a J Kuta, Pure Appi. Chem., 56, 461-466 94).13. (a) R.S. Nicholson, Anai. Chem,, 37, 1351-1355 (1965)� (b) RS. Nicholson and L
Shain, Atal. Cheat,, 36, 706-723 964). (e) H. Matsuda a Y, Ayabe Z.Elektrochetm, S9, 494-503 1955).
714 -