BY QPPLIED _ - International Atomic Energy Agency
259
BY QPPLIED _
-
Upload
khangminh22 -
Category
Documents
-
view
1 -
download
0
Transcript of BY QPPLIED _ - International Atomic Energy Agency

BY QPPLIED _

PAPERS PRESENTED AT THETENTH TOPICAL CONFERENCE ON HIGH-TEMPERATURE
PLASMA DIAGNOSTICS
Rochester, New YorkMay 8-12, 1994
TABLE OF CONTENTS
"Effects of limited spatial resolution on fluctuation measurements", (invited)R. V. Bravenec, A. J. WoottonFusionResearchCenter, The Universityof Texas,Austin,Texas 78712
"Correlation Radiometry of Electron Cyclotron Radiation in TEXT-U", (Invited)G. Cima, C. Watts*, R. Gandy*FusionResearchCenter,The Universityof Texas,Austin,Texas 78712*AuburnUniversity,Auburn,Alabama
"Vertical Viewing of Electron-Cyclotron Emissions for Diagnosing Fast-ElectronDynamics In TEXT.U.D.R. Roberts,R. F. Steimle,G. Giruzzi*,G. Cima, C. Watts**FusionResearchCenter, The Universityof Texas,Austin,Texas 78712*AssociationEURATOM-CEA sur la Fusion,Departementde Recherchessur la FusionControlee,Centre de'Etudesde Cadarache, 13108 St. Paul-lez-Durance(France)**PhysicsDepartment, AuburnUniversity,Auburn,Alabama
"Measurement of temperature fluctuations from electron-cyclotron emission",Christopher Watts, G. Cima*, F. G. Gandy, T. d. RempelPhysics Department, AuburnUniversity,AuburnAlabama*FusionResearchCenter,The Universityof Texas,Austin,Texas 78712
"A Varying Cross Section Magneti'c Coli Diagnostic Used in Digital Feedback Control ofPlasma Position in TEXT-UpgradeM.S. Foster,J.L. Craig, A.J. Wootton,P.E. Phillips,J. Uglum, E.R. Solano,D. L. Brower,Y. Jiang,S.C. McCool,J.Lierzer,George G. CastleFusionResearchCenter,The University of Texas, Austin,Texas 78712
"High-sensitivity, high resolution ,measurements of radiated power on TEXT-U",Yizhi Wena, R. V. Bravenec
auniversity of ScienceandTechnologyof China, Hefei, 230026, PeoplesRepublicof ChinaFusionResearchCenter,The Universityof Texas, Austin,Texas 78712
"Wave Launching as a Diagnostic Tool to Investigate Plasma Turbulence"H.Y.W. Tsui, R. D. Bengtson,G.X. Li, B. Richards,T. Uckana, J. UglumandA. J. WoottonFusionResearchCenter,The Universityof Texas, Austin,Texas 78712
aFusionEnergyDivision,Oak RidgeNationalLaboratory,Oak Ridge,Tennessee 37831
"Edge Parameters from an Energy Analyzer and Particle Transport on TEXT-U",D.B. Crockett,P.E. Phillips,W.A. Craven,WilliamL. Rowan,A.J. Wootton,A.S. Wan*, T. F. Yang**FusionResearchCenter,The Universityof Texas, Austin,Texas 78712*LawrenceLivermoreNationalLaboratory,LivermoreCalifornia*Plasma FusionCenter, MassachusettsInstituteof Technology,Cambridge,MA
"Initial Results From a Charge Exchange q-Diagnostic on TEXT-U"P.M. Valanju,L. Duraiappah,RogerD. Bengtson,Y. Karzhavin, A. NikitinFusionResearchCenter, The UniversityofTexas, Austin,Texas 78712
_ISTRIBUTION OF "THIS EX_C,UMENT 18 UNLIMITED

"A Method for Neutral Spectra Analysis Taking Ripple-Trapped Particle Losses intoAccount
A.Yu Dnestrovskija,b, RogerD. Bengtsonb, Yuri Karzhavinc, A.OurouacaKurchatovInstitute,Moscow,Russia
bFusionResearchCenter,The Universityof Texas,Austin,Texas 78712CRensselaerPolytechnicInstitute,Troy, N.Y.
"Application of a Three Sample Volume S(k,o)) Estimate to Optical Measurements ofTurbulence on TEXTP.D. Hurwitz,WilliamL. RowanFusionResearchCenter,The Universityof Texas, Austin,Texas 78712
"Initial Operation of the 2D FIRSIS on TEXT-Upgrade"D. L. Brower,Y. JiangElectricalEngineeringDepartment,and Instituteof Plasmaand FusionResearchUniversityof California,LosAngeles,California 90024
"Horizontal-View Interferometar on TEXT-UpgradeY. Jiang,D. L. BrowerElectricalEngineeringDepartment,Instituteof Plasmaand FusionResearchUniversityof California,LosAngeles,California 90024
"PLASMA POTENTIAL MEASUREMENTS ON TEXT-UPGRADE WITH A 2 MeV HEAVY ION BEAMPROBE.A. Ourora,J.W. Heard, T. P. Crowley,P.M. Schoch, K.A. Connor,R.R. White,J. Schwelberger,P.e. McLaren,d.Demers, W. RussellRensselaerPolytechnicInstitute,Troy, New York
"Fluctuation Measurements Using the 2 MEV Heavy Ion Beam Probe on TEXT-U.(AbstractOnly)J.W. Heard, A.Ouroua, T.P. Crowley, P.M. Schoch,R. L. Hickok,K. Connor,J.G. Schwelberger,R. R. White,P.E.McLarenRensselaerPolytechnicInstitute,Troy, NY
"The Time Domain Triple Probe Method"M. A. Meier, G. A. Hallock,H.Y.W. Tsui, R. D. BengtsonFusionResearchCenter,The Universityof Texas,Austin,Texas 78712
"A Phase Contrast Imaging System for TEXT-U"R. Chatterjee,G. A. Hallock,M. L. GartmanFusionResearchCenter, The Universityof Texas,Austin,Texas 78712
"Development of Rugged Corner Cube Detectors for the TEXT-U-FIR InterferometerG.A. Hallock,M. L. Gartman, H. LingFusion ResearchCenter,The Universityof Texas,Austin,Texas 78712

Effects of limited spatial resolution on fluctuation
measurements (invited)
R.V. Bravenec and A.J. Wootton
Fusion Research Center, The University of Texas, Austin,
Texas 78712
(Presented on 11 May, 1994)
The finite sample volumes of fluctuation diagnostics distort the
measurements not only by averaging the gross fluctuation pa-
rameters over the sample volumes, but more importantly
(except for collective scattering), by attenuating the shorter
wavelength components. In this work the response of various
sample volume sizes and orientations to a model fluctuation
power spectrum S(k,t.o) are examined. The model spectrum is
fashioned after observations by far-infrared scattering on
TEXT. The sample-volume extent in the direction of prop-
agation of the turbulence isshown to be the most critical - not
only does it reduce the measured fluctuation amplitude and
correlation length (as does an extent perpendicular to the
propagation direction), but also reduces the measured mean
frequency and increases the apparent average phase velocity of
the fluctuations. The differing sizes, shapes, and orientations
of the sample volumes among fluctuation diagnostics, as well
as deliberate variations within a single diagnostic, provide
information on the form of the underlying turbulence and can
be exploited to refine the model.

I
I. INTRODUCTION
Because microturbulence is the leading contender to ac-
count for the anomalous partcle and energy fluxes in toka-
maks, 1 accurate local measurements of fluctuations of plasma
density, temperature, potential, etc. are of prime importance.
All fluctuation diagnostics, including collective Thomson scat-
tering, average over a finite extent of the plasma. However,
the finite sample volumes of diagnostics such as the heavy-ion
beam probe (HIBP), beam-emission spectroscopy (BES), elec-
tron cyclotron emission (ECE) correlation radiometry, Lang-
muir probes, etc. also act to attenuate shorter wavelength com-
ponents of the turbulence. This acts to distort local measure-
ments not only of fluctuation amplitude, but also average phase
velocity and correlation lengths.
How this occurs can be understood from the following
intuitive example. Consider a 1-D plane wave of wavelength
and two sharp-boundary sample "lengths" shown as da and db
in Fig. 1. Here we have chosen extreme cases da << _, and db=
_. As the wave propagates by the sample locations, it will be
locally resolved in case a, while in case b, the wave will be
completely undetected since the equal positive and negative
components of the wave in the sample length always cancel.
Intermediate lengths will of course produce proportional
degrees of attenuation. The "positive" and "negative" compo-
nents of the wave here correspond to locally enhanced or de-
pressed ECE, ionization of the HIBP be_rn, emission from the
BES beam, etc.
The effects of sample volume size has been previously
examined by Ross et al.2 in the context of simultaneous two-
point measurements by the HIBP on TEXT. The treatment of
the subject in this work is meant to be more general and quali-
tative.
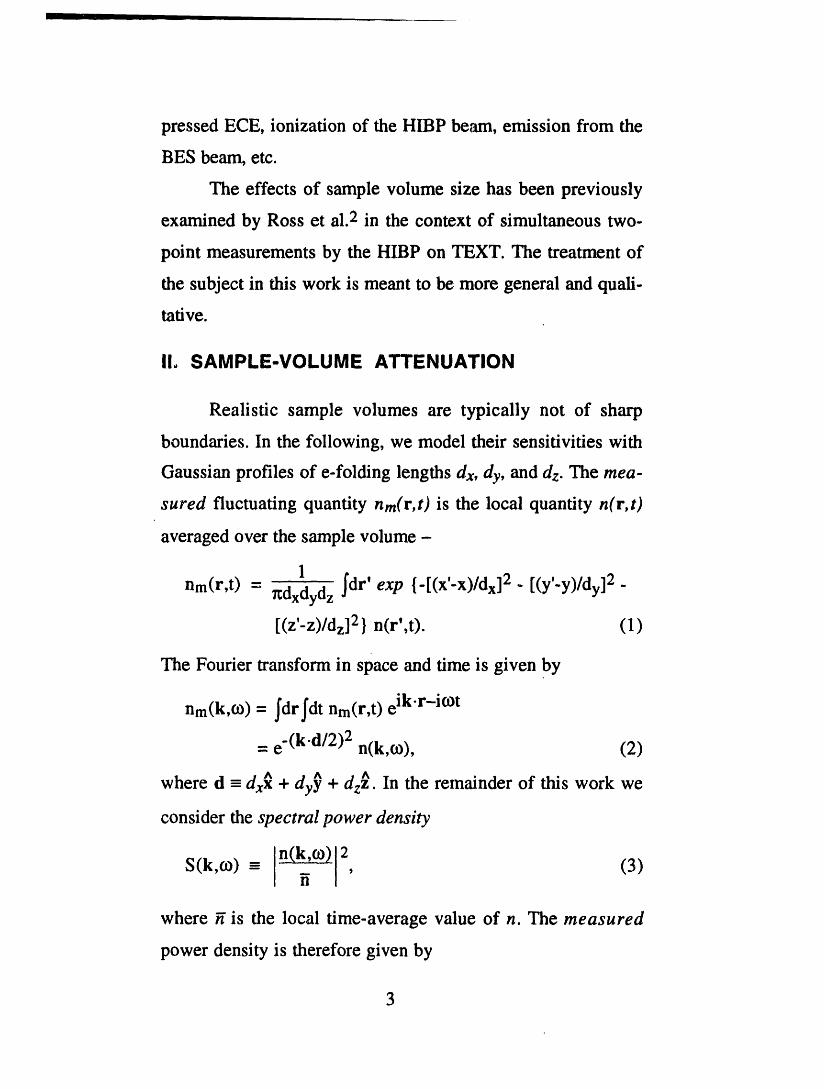
II, SAMPLE-VOLUME ATTENUATION
Realistic sample volumes are typically not of sharp
boundaries. In the following, we model their sensitivities with
Gaussian profiles of e-folding lengths dx, dy, and dz. The mea-
sured fluctuating quantity nm(r,t) is the local quantity n(r,t)
averaged over the sample volume -
1 _dr' exp {-[(x'-x)/dx] 2 [(y'-y)/dy] 2nm(r,t) = _:dxdydz " "
[(z'-z)/dz] 2} n(r',t). (1)
The Fourier transform in space and time is given by
nm(k,o_) = _dr_dt nrn(r,t) eik'r-icOt
= e"(k'd/2)2 n(k,co), (2)
where d -dx_ + dy_ + dz_. In the remainder of this work we
consider the spectral power density
n(k,c0) 2S(k,¢o) - , (3)
n
where _ is the local time-average value of n. The measured
power density is therefore given by
3
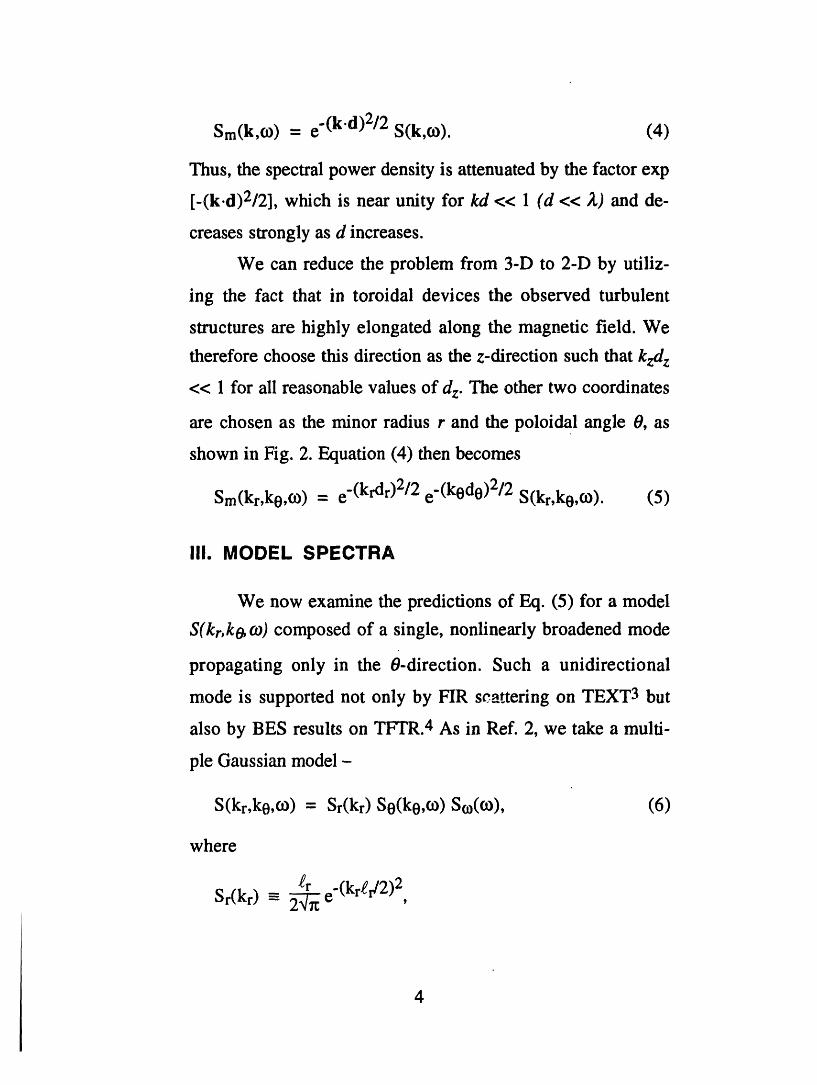
Sm(k,o_) = e"(k'd)2/2 S(k,o). (4)
Thus, the spectral power density is attenuated by the factor exp
[-(k.d)2/2], which is near unity for kd << 1 (d << Z) and de-
creases strongly as d increases.
We can reduce the problem from 3-D to 2-D by utiliz-
ing the fact that in toroidal devices the observed turbulent
structures are highly elongated along the magnetic field. We
therefore choose this direction as the z-direction such that kzd z
<< 1 for all reasonable values of dz. The other two coordinates
are chosen as the minor radius r and the poloidal angle 0, as
shown in Fig. 2. Equation (4) then becomes
Sm(kr,k0,o) = e"(krdr)2/2 e"(k0d0)2/2 S(kr,k0,o). (5)
III. MODEL SPECTRA
We now examine the predictions of Eq. (5) for a model
S(kr, kO,09) composed of a single, nonlinearly broadened mode
propagating only in the 0-direction. Such a unidirectional
mode is supported not only by FIR scattering on TEXT3 but
also by BES results on TFTR.4 As in Ref. 2, we take a multi-
ple Gaussian model-
S(kr,k0,_) = Sr(kr) S0(k0,o_) Sc0(Co), (6)
where
£r -(kr£r/2)2Sr(kr) =--_ e
4

_e {[ke-ke(c0)]_e/2}2Se(ko,o)- 2-_ e"
So(o) e I_12"[:_e"[(1°_['0o)'_/212
Here gr,Oarc the correlation lengths in the radial, poloidal dir-
ection (inversely proportional to the widths of the kr, O-spectra
about their respective means - 0 and i0(co), respectively)., T is
the correlation time (inversely proportional to the spread in
frequency about the mean - COo),and I_/n12 is the rms relative
fluctuation level. Suitable normalizations are used such that
IdkrSr(kr)= ]dkoSe(ke,o)= 1,-00 -00
O0
0 oso o,-I 1Note that, like the diagnostics themselves, we operate in the
half-space -_ < kr, O< _, 0 < w < _; including negative fre-
quencies would be redundant since reality conditions requireS(-k,-co) = S(k,co) (hence the Iol in the definition of So.)
Of particular interest in this work are the spectra inte-
grated over wavenumber-
S(kr, o) - Idk0 S(kr,k0,o) = Sr(kr)S_(_), (7a)
S(k0,m) - Idkr S(kr, k0,o) - Ss(k0,o)So(_), (7b)
S(m) - ldkr Idk0 S(kr,k0,m) = So(o), (7b)

As an example, we consider parameters loosely based on
observations of FIR scattering on TEXT - a feature propagat-
ing at approximately the electron diamagnetic drift velocity
Doppler-shifted by the E x B plasma rotation velocity of ~ 2
km/sec.5 We therefore choose k0(to) -- to/'fph with _ph -_ 2.7
km/sec. (ko(og) is actually given a slight dispersion in order to
better match the scattering data.) We also choose l0 =1 cm, a
value which is consistent with the measured S(kr_O,k O)= _dto
S(kr--O,ko, to),3 and somewhat arbitrarily we take lr = z:0. (In
actual fact, Zerand gOcould be functions of frequency.) Finally,
we set fo- tod2n: = 120 kHz and T= 4.25 Ixsec, also consistent
with the measured frequency spectrum. Contour plots6 of the
resulting S(kr,f) and S(ko, f) are shown in Fig. 3(a) and 3(b),
respectively.
This choice for S(kr, ko, og) yields a mean poloidal
wavenumber <ko>- _dko_d¢o ko S(ko, to)~ tOO_.ph ~ 3 cm-1.
With this value of k 0 and a sample volume with do = 1 cm,
Eq. (5) predicts an attenuation of exp[-(kodo)2/2] ~ 0.01!
Hence, reasonable sample volume dimensions affect this mode
strongly.
IV. MEASURED SPECTRA
Using Eq. (5) we can compute the finite-sample-volume
versions of Eqs. (7) -
6

OO
Sm(kr,O) --- e"(krdr)2/2 _dk0 e"(k0d0)2/2 S(kr,k0, to)-OO
= o_0 e'(Ct0k0d0)2/2 e"(krdr)2/2 S(kr,tO), (8a)
OO
Srn(k0,t.o) ---_e"(k0do)2/2 _dkr e"(krdr)2/2 S(kr,k0, to).OO
= O_re"(k0d0)2/2 S(k0,o), (8b)
OO OO
Sm(o_) - _dkre "(krdr)2/2 _dkoe'(kodo)2/2S(kr,ko '°_)-00 -00
= O_rtxOe"(t:tO_OdO)2/2S(to), (8c)
where
ct0 - [1 + 2(d0/£0)2] "1/2,
tZr -= [1 + 2(dr/£r)2]"1/2.
(Note that Eq. (8c) is the same as Eq. (A.7) of Ref. [2] with a
= dr, b = dO,a = 0, and subscripts x = r, y = 0.)
We now consider the effects of sample-volume extent in
the radial and poloidal directions separately. For dr finite, do
= 0, Eq. (8a) predicts a symmetrical attenuation of S(kr, tO)
about kr = 0. This decreases the apparent wavenumber spread
and therefore increases the measured correlation length zer,m
(in fact, Zar,m= Zar/O_r).Equations (8b) and (8c) indicate S(kaa_)
and S(co) are only attenuated by the factor ar (no changes to
the measured poloidal correlation length CO,m and mean wave-
number "ko,m(OO),or the measured peak frequency OOo,m and
7

correlation time Zm). These effects are exemplified in Figs.
(4a) and (4b), showing Sm(kr,f) and Sm(ko,f) respectively, for
our model spectrum with dr = 1 em.
However, the results are dramatically different with dr =
O, do finite. Although the radial correlation length from Eq.
(8a) is unaffected, there are now additional attenuating terms.
The most important is the exponential factor containing k O,
which introduces increasing attenuation with frequency (since
k0 *" to), as evident for our model radial spectrum with do = 1
cm shown in Fig. (5a). In Eq. (8c), this same factor acts to de-
crease the measured peak frequency (too,m--too/ot_ 2, where
o_co-- [1 + 2('¢0/'c2] "112 and "c0 = otodo/_ph ) and correlation
time. The effect on Eq. (Sb) is dramatic because of the peak in
the ko spectrum at finite ko. Not only is there a reduction of
the apparent poloidal correlation length, but also in the mean
poloidal wavenumber <kO>m - _dko_dto ko Sm(ko, to), and an
increase in the apparent average phase velocity (in fact, _ph,m
= _ph/Ot02). Sm(k6f) for our model spectrum with do = 1 cm
is shown in Fig. (5b) where _ph,m is increased by a factor of
a0 "2= 3.
The measur6 _ frequency spectra Sm(f) for our model
spectrum are summarized in Fig. 6, where we have also inclu-
ded the cases dr = do = 0 and dr = do = 1 cm. From Eq. (8c)
and our previous discussion we note that, for kr = O, only a
sample-volume extent in the poloidal direction will result in a
frequency down-shift, the magnitude of which depends on that
of the extent. A sample-volume extent in the radial direction
8

will result only in an overall attenuation of the frequency spec-
trum.
V. DISCUSSION
The results shown in Fig. 6 provide clues as to how the
underlying power density spectrum S(kr, ko, to) may be in-
ferred from actual measurements. A model S(kr, ko_) can be
constructed, as was done here; "measured" spectra Sm(kr, tO),
Srn(k_to), and Sm(_) can be calculated using the actual sam-
ple-volume dimensions; and the results compared with obser-
vation. The model spectrum can then be modified to seek
agreement. This procedure is aided greatly by employing the
results of a number of dissimilar diagnostics or by deliberately
varying the sample-volume dimensions and/or orientation of a
single diagnostic. The investigator should be wary, however,
of other instrumental effects, such as beam attenuation modu-
lation,7,8 which can confuse the interpretations.
ACKNOWLEDGEMENTS
The authors extend appreciation to D.W. Ross for his
previous work on sample-volume effects and subsequent dis-
cussions. This work is supported by U.S. Department of
Energy grants DE-FG05-88ER-53267.

H I
REFERENCES
1 P.C. Liewer, Nucl. Fusion 25, 543 (1985).
2 D.W. Ross, P.M. Schoch, J.W. Heard, T.P. Crowley, and R.L.
Hickok, Nucl. Fusion 31, 1355 (1991).
3 D.L. Brower, W.A. Peebles, N.C. Luhmann, Jr., Nu¢l. Fusion 27
(1987)2055.
4 R.L.Fonck,G. Cv_by,R.D.Durst,S.F.Paul,N. Bretz,S.Scott,E.
Synakowski,andG.Taylor,Phys.Rev.Left.70,3736(1993).
5 R.V.Bravenec,K.W. Gentle,B. Richards,D.W. Ross,D.C. Sing,
A.J.Wootton,D.L.Brower,N.C.Luhmann, Jr.,W.A. Peebles,C.X.
Yu, T.P.Crowley,J.W. Heard,R.L. Hickok,and P.M. Schoch,
Phys.FluidsB 4,2127(1992).
6 Theseandsubsequentplotsgeneratedusingthecommercialsoftware
packageMathematica®,WolframResearch,Inc.,Champaign,IL.
7 David W. Ross, M.L. Sloan,A.J.Wootton,P.M. Schoch,J.W.
Heard,T.P.Crowley,R.L.Hickok,andV. Simcic,Rev.Sci.Instrum.
63,2232 (1992).
8 R.D.Durst,R.J.Fonck,G. Cosby,H. Evensen,S.F.Paul,Rev.Sci.
Instrum.63,4907 (1992).
10

FIGURE CAPTIONS
FIG. 1. A sketch illustrating sample-volume attenuation of a plane wave of
wavelength _,.The shaded regions of length da and db represent l-D, sharp
boundary sample volumes.
FIG. 2. Poloidal coordinates r and 0. Here the unit vector _ is directed per-
pendicular to the flux surface and _ lies along the flux surface perpendicular
to the local magnetic field.
FIG. 3. The model power density spectrum S(kr, kO,f) integrated over (a)
k0, yielding S(kr,f), and (b) kr, yielding S(ko,fl. The dark curved line in (b)
represents ko(f).
FIG. 4. The measured power density spectrum Sm(kr,kO,fl with dr = 1 cm,
do = 0 integrated over (a) ko, yielding Sm(kr,f) and (b) kr, yielding
Sm(ko,f).
FIG. 5. The measured power density spectrum Sm(kr,ko,f) with dr = 0, do
= 1 cm integrated over (a) ko, yielding Sm(kr,f) and (b) kr, yielding
Sm(kaf). The dark curved line in (b) represents ko,m(f).
FIG. 6. The measured power density spectrum Sm(kr, kaf) integrated over
kr and ko, Sin(f), for various combinations of values of the sample-volume
dimensions dr and do.


500 .......... S(kr'f)
400
gO0N
200
) _It'100
o /-100
-6 -4 -2 0 2 4 6
kr(cm -1)
FIG. 3(a)
500 ,Sm(ke,f)
400I
,_- gO0 I
200
100 /__
-I00 ......................-2 0 2 4 6 g £0
ko(cm "1)
FIG. 3(b)

400
300
t 200
iO0
o-I00 ..............................-6 -4 -2 0 2 4 6
kr(cm -I)
FIG. 4(a)
500 "Sm(k o,f)
400
900
200
t00 0
-I00 ................................-2 0 2 4 6 8 I0
ko(cm"1)
FIG. 4(b)

5oo.................kr,_400
300
200
_oo k,i,i((((((©>),'))!:;.0 "
-6 -4 -2 0 2 4 6
kr(cm -1)
FIG. 5(a)
500 "Sm(ke,f)
40O
300N
_ ,
-100 ..........................-.2 0 2 4 6 8 I0
ko(cm "1)
FIG. 5(b)

1dr =0, d o =0
"_ 0 8.
dr = 1 cm, do = 00,6
dr = 0, do = 1 cmr_ 0,4
0,2 dr = 1 cm, do = 1 cm
100 200 :900 400 500
f (kHz)
FIG. 6

CORRELATIONRADIOMETRYOF ELECTRONCYCLOTRONRADIATION
IN TEXT-U
G. Cima,C. Watts*, R. Gandy*
FusionResearchCenter,Austin,Texas
*AuburnUniversity,Auburn,Alabama
Very low level plasma density and temperature fluctuations can be
responsible for anomalous transport in thermonuclear magnetic traps.
Measuring these fluctuations by detecting plasma electron cyclotron
emission (ECE) is both convenient and difficult. The most attractive
feature of ECEis the good localizationof the source, unique to this range
of frequencies among plasma radiation. To maintain spatial resolution,
only a small number of radiation modes should be detected and the
consequent poor statistics of the ECE measurement allows one to
measure only the average value for the temperature fluctuation
amplitude via correlation analysis of two ECE signals with suitable
correlation properties. Initial measurements of this kind have been
performed successfully but the results have only been partially
conclusive as to the relevance of electrostatic turbulence to heat
transport because of still too limited a spatial resolution and the
inability of correlating the measured signals with corresponding
potential fluctuation measurements. Suggestions of how to extend the
present resultsto correct for these drawbacksare discussed.
PACS:52.70.Gw, 52.25.Gj, 52.55.Fa

_RODUCTION
Looking back to a paper presented at this same conference two years ago,
where various untested ECE correlation radiometry schemes were reviewed,
shows that progress has been made: measurementshave been performed with
two of the schemes presented1,2 , both with positive results. It's unfortunate
that the relative merits of the two schemes can not be easily unraveled from
a comparison of the experimental results since, among other things, in one
case one dealswith a Stellaratorplasmaand in the other one with a Tokamak.
In both cases the main difficulty in reaching a definitive statement about the
relevance of electrostatic turbulence in heat transport of toroidal
confinement traps is, as known from the very beginning, the marginal spatial
resolution of ECE,especially in the poloidal direction. The indication that this
is a severe diagnostic limit comes from the measurementsthemselves [1] and
from independent density fluctuations measurements performed with the Far
Infrared Scattering (FIR) diagnostic. In this paper this limitation will be
addressedand suggestionswillbe investigatedfor attenuating this problem.
A further important obstacle to a quantitative assessment of the transport
implications of temperature fluctuations is the one of the simultaneous
measurement of temperature and electrostatic potential fluctuations. This
problemwill alsobe consideredin detailin the text.

3
TECHNIQUEOVERVIEW
In the past [3] the problem associated with EC:Ein measuring high frequency
temperature fluctuations has been the presence of a high level of radiation
thermal noise. An estimate for what we mean for "high frequency" can be
given by v;_ [4], where 8Tr_ is the root mean square value of the
temperature fluctuations, :T is the average electron temperature and &v is
the radiometer bandwidth. Av is superiorly limited (.1 08 Hz) by the
independent constraint of sufficient radial resolution of the measuretnent. In
practice the high frequency limit is of order 10 kHz for the parameters of
TEXT-U, that is well below the range where other diagnostics show
significant plasma turbulence. The intimate reason for this drop in
sensitivity of the EC:E temperature measurement at high frequency is
attributable to the fact that the "thermometric gas" of our thermometer, the
EC:Eradiation, consists in a system with a small number of degrees of
freedom. Although the number of photons detected by the radiometer per unit
time is large (~ 1015 s-l) they are mostly correlated to each other as always
is the case for classical thermal radiation (kT/hv. 107). With a radiation
band of order 108 Hz, or equivalently, with a radiation correlation time of 10-
8 s, to reach the required resolution of the measurement, O'Trm_s_;]0-2, aT
relatively long averaging time is required _= ---_.1_. ThisAt_
integration time turns out to be in excess of the turbulence correlation time
and, as a consequence, the turbulence signal itself is heavily attenuated in
the measurement.

4
Following the suggestion of an early paper [s], a couple of groups[6,7] have
recently developed Te fluctuation measuringschemes based on the correlation
of two ECE signals.This technique allows to extract the average amplitude of
a comn,_nsignalfrom two signalsheavilydisturbedby uncorrelatednoise.
In our instance this technique, which could be called ECE correlation
radiometry, translates in extracting from the plasma two radiation beams
whichsatisfy the two followingcorrelationconditions:
1) ucorrelatedwave thermalnoise
2) correlatedplasmatemperature fluctuations.
A radiometer channel output produces a signal proportional to the
instantaneous collected power, s(t) = (:T+b'T(t))(t+_(t)) = _(1+ b_(t)/T + _l(t)l T),
where T and b'T(t)are the average plasma temperature and its fluctuating
component, respectively, and _(t) is the radiation wave noise. Low pass
filtering reduces the thermal noise amplitude to a few percent and the final
quadratic fluctuation term, bT(t)_(t), is small. The observed (zero time-delay).--"2--
cross-correlation, R12=SLS2,between two radiometer channels identifies the
commonnormalizedelectrontemperaturefluctuations,
fThe method does not require that the radiometers be absolutely calibrated.
However, it does require an appropriately long integration time to reduce the
statistical error to well below the coherent temperature fluctuation
amplitude, particularly if one is seeking spectral information through
suitableanalysis.
If the two channels are detecting radiation coming from the same plasma
volume the terms representing ttte plasma temperature fluctuations, o_T(t),are
correlated, that is the first of the two correlationconditionsissatisfied.

/I
The condition for the wave thermal noise to be uncorrelated is more difficult
to clarify in an intuitive fashion. One of the possible demonstrations, a
compact thermodynamicargument applicableto all schemes put forward up to
now and both schemes experimentally employed, is reported in[5]. Reference
[7] illustrates an alternative proof applicable to one of the decorrelation
schemes. In both cases these demonstrations make use of the black body
property of total EC radiation absorption by the plasma. In alternative, for the
TEXT-U scheme presented at this conference [8], it's a convincing
experimental fact that thermal radiation noise strongly decorrelates even for
very small frequency separation. In Fig 1 we show the correlation coefficient
measured combining two frequency channels, about 30 MHz wide. The
frequency separation between the two channels, on the horizontal axis, has
beenchangedon a shot to shot basis.
As the figure shows the two signals decorrelate as soon as the filters cease
to overlap in frequency space. Translated to a space scale through the
relationship which relates cyclotron frequency to position along the gradient
of the cyclotron frequency, 30 MHz correspondsto 0.3 mm, a distance much
smaller than the plasma emission layer for cyclotron waves at the second
harmonic, X-mode. For TEXT plasma parameters consistent with the data of
fig 1, the lower limit estimate for this thickness is about 5 mm and any
disregarded line broadening process would make this figure an underestimate.
What this means is that the detected radiation is substantially uncorrelated
as long as it's emitted in a different frequency range even if it's produced by
the same particles at the same time. The leftover correlation has to be
interpreted either as due to finite filter selectivity or actual plasma
"temperature" fluctuation. Since we can independently measure the off band

6
rejection power of the filters we can also establish a lower limit for the
measurablelevelof plasmatemperaturefluctuation.
EXPERIMENTALRESULTS
As also described in [8] a certain number of experimental results have already
been produced by the described diagnostic. Fig 2 shows the frequency power
spectrum of the ECE radiative temperature fluctuations as a function of the
radial position. In particular the two figures show how reproducible these
very detailed measurements are for different experimental sessions and very
similarplasmaconditions.
These experimental results are very similar in amplitude and radial
distributionto the ones obtained with the Heavy Ion Beam diagnostic on TEXT-
U as shownin Fig3.
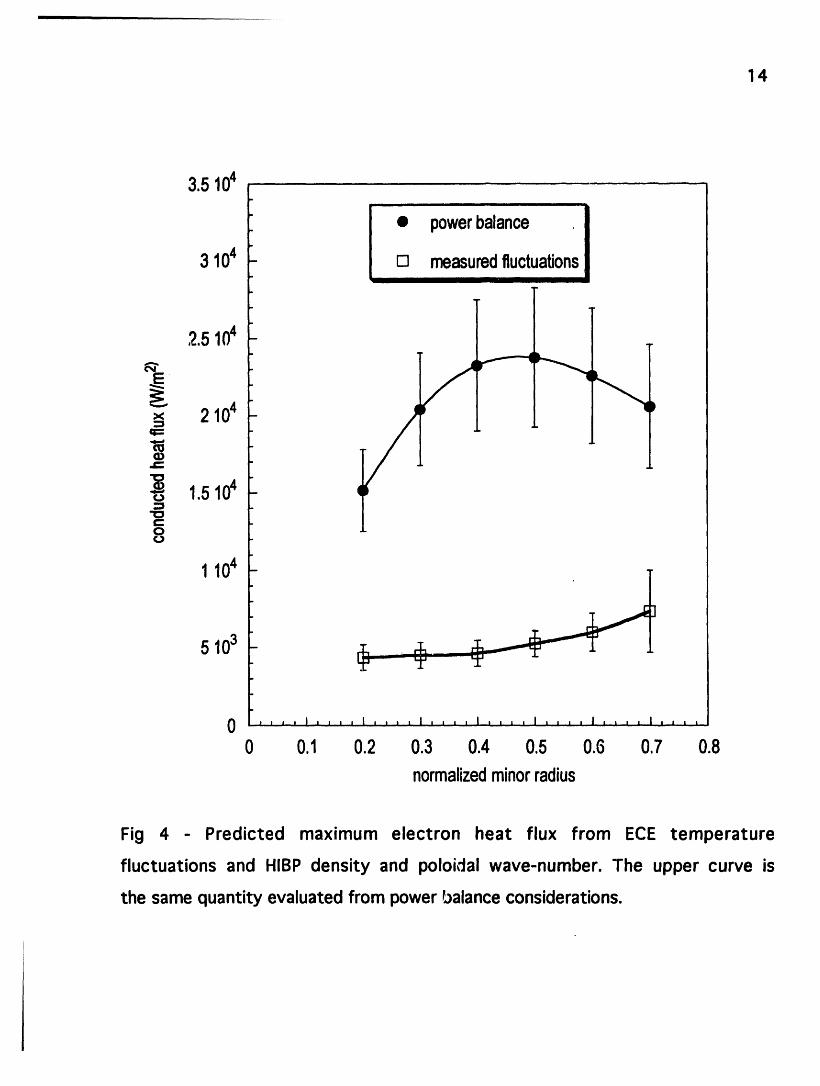
The heat flux resulting from the measured temperature fluctuations is
plotted in figure 4, where the heat flux estimated from power balance
considerations is shown for comparison. As in previous quasi-linear
calculations, the fluctuating electric field has been determined by assuming
the Boltzmann relationship, el_l/Te= IFIel/ne[10]. An average poloidal wave-
number as measured by the HIBP diagnostic, which varies with radius, has
beenassumed.
As the figure 4 shows our measurements, in conjunction with the HIBP
results, cannot account for anomalous transport. This is by itself an
interesting result but is restricted to a range of poloidal wave-numbers
(k_ <1). Similarly to ECE, the HIBP has a limited poloidal resolution and is
insensitive to ke_>l.5cm-1. In this circumstance any difference between the
actaal and measured ke spectra can induce a large variation in the predicted

7
transport, since it affects all the ingredients in the fluctuation induced heat
flux. Assuming that relevant turbulence extends to poloidal wave-numbers
consistent with FIR measurements, k-e-2cm-i, our measured and the
HIBP may eachneedto be considerablyenhanced.
OPENQUESTIONS
According to the authors there are three main open questions to be resolved
before a definite answer can be formulated concerning the role of the ECE
temperature fluctuations in determining anomalous transport. The three
subjects are: 1) the equivalence between radiative temperature and second
moment of the electron distribution function not only for their average values
but also for their fluctuations, 2) the significance of the _imited spatial
resolution of the ECE measurements, 3) the possibility of determining the
coherence and phase of the temperature and density fluctuations at the same
locationin the plasma.
As far as the first question is concerned, it's important to stress that
the equivalence between radiative temperature fluctuations, o_Tr, and
fluctuations of the second moment of the electron distribution function, o_e,
is not insured, just as with the radiative and electron temperatures
themselves [s]. These quantities coincide if the distribution is Maxwellian,
but the low collisionality of high temperature plasmas and the fast time
scale of the turbulence do not a priori guarantee that this is the case.
Consequently, the ratio 8Tr/_Te is distribution-function dependent and each
turbulence model would require separate analysis. This situation is
particularly relevant to cases of high optical thickness and when one requires
high spatial resolution (i.e. wide kll spectra), since the particles responsible

for the emission are the higher energy ones, and are thus not representative
of the whole distribution. Order of magnitude calculations indicate that the
problem should not affect the presented results, which originate from a
relativelylow temperature plasma.
Concerningthe second question, as mentioned earlier, the Far Infrared Laser,.o.
scattering diagnostic shows a density turbulence quite different from the one
measured by the HIBP. It is believed that the difference resides mainly in the
different k-spectrum resolution of the two diagnostics. With this limitation
in mind, from our data, we can only draw the partial conclusion that low k
turbulenceis not responsiblefor anomaloustransport.
The questionthen arisesif spatialresolutioncan be enhanced.
There is practically no room for improvement as far as the optics is
concerned. Although in theory diffraction would allow to reduce the spot size
by a factor of order two by increasing the aperture of the lens, this route
seemsto us practicallyvery arduous.
On the other side, as explaineding, the most critical resolution is the poloidal
one, as opposed to the radial, and since at present the ECEsample volume is
roughly two times narrower along the radial coordinate than along the
poloidal one, we propose to reorient the sample volume by shifting vertically
the obse_ation line(Fig. 5).
The radial correlation measurements presented in [8] corroborate the
theoreticalestimatesof the emissionlayer thickness.
In addition to the resolution advantage, to reorient the sample volume gives
us also the opportunity to obtain a direct measurement of the poloidal wave-
number, performing correlation measurements with variable channel
separation.

9
The third subject which needs clarification to complete the prediction of the
role of high frequency temperature fluctuations on transport is the one of the
determination of the correlation between the potential or density
fluctuations and the temperature ones. As explained in the introduction of [8]
the transport equations involve simultaneous measurements, at the same
location,of temperature and potentialor density.
One option would be the one of aligningthe two diagnosticsinvolved along the
same magnetic field line, exploiting the long longitudinal plasma turbulence
correlationlengths.
To test this idea we have attempted measurements with two ECEradiometers
toridally displaced along the same field lines (~ 2 m)to check on our ability
of selecting a narrow magnetic flux tube but we haven't succeeded to achieve
the same degree of correlation as with the two channels scheme. Broader and
larger fluctuations than the turbulence induced ones have been measured, as
in the case of saturated MHDinstabilities,but not highfrequencyones.
A better candidate for measuring simultaneously temperature and density
fluctuations is probably represented by a contemporary detection of second
and third harmonic cyclotron emission at the same plasma location through
the same optics. In this case one takes advantage of the optical grayness of
an ECE harmonic emission layer to get a partial contribution of the density
fluctuations. As explained in lo an independent measurement of density and
its average fluctuations is nevertheless needed to extract the phasing with
the temperature.
We plan to investigate experimentally in the very near future the poloidal
correlation scheme and we certainly plan to further understand the
distribution function dependence of our results (point 1). As far as the

10
multiple harmonic measurements are concerned, more work is needed to
convinceourselvesof the feasibilityof sucha project.

11
0-50 0 50 100 150 200 250
df(MHz)
Fig.1
Correlation coefficient as a function of channel frequency
separation for two _30 MHz wide IF filters. Along the EC
gradient 100 MHz correspondto 1.1mm in the physicalseparation
of two coldresonancepositions.

uata from 1/ 1 _/_4 1210 "8
- 10.5
- _" .... = 13.4 --
10.9
__ ' _]--',. f -'_,-_L ..... " , ir_,,. _ "X /x, I__ ,, _
1 0 "1°o so 1oo 1so 200
F (kHz)
Data from 1/6/94
10 "e.%_ , _ . _..,rr _ _ 10.5
-- - + ,"_ _ 13.4i. + --_ 16.3
_-_._=;ki- . '" 7__ta _ ' _ 19.1
-10 .9UJ
I,u _ _ _ _ _-..,'- - "i.',_-"_l_\ +_ - ' -----_ _/-- ",'i. ",,'
.. \\ .. __ ....,,_ ,,..._,,,,,,.,+-,,,,
\",\ +,, - A t ---,,,,%_i_i '+x_'i N--/" _V'\ kJ,4 it "_,10 "1°
O 50 1O0 1 50 200
F (kHz)
Fig.2 - The figure illustrates the frequency spectrum of the ECE radiat
fluctuations normalized to their average for the plateau of a typical TEX
ohmicplasmadischarge.

13
i I I * I I I I I I I i, I '
0 -0.4 -0.2 0 0.2 0.4 0.6 0.8normalizedminorradius
Fig 3. - The rms value of the ECEradiativetemperature fluctuations,in the 20
to 200 kHz spectral region, as a function of the plasma minor radius,
comparedto the HIBPdensityfluctuations.
14
0 .... I,,,, I , ,, ,I,,,, I ,,, ,I .... t .... I,,, ,
0 0.1 0.2 0.3 0.4 0,5 0.6 0.7 0.8
normalizedminorradius
Fig 4 - Predicted maximum electron heat flux from ECE temperature
fluctuations and HIBP density and poloidal wave-number. The upper curve is
the samequantityevaluatedfrom powerbalanceconsiderations.

15
0)=0)cl (0=0)c2
iF
I ii
I 2CHANNELSI RADIOMETER
LEN [-" ]
Fig. 5
Schematic of the ECE correlation optical vieweing line to allow for poloidal
correlation measurents.

16
1G. Cima, T. D. Rempel*, R. V. Bravenec,R. F. Gandy*, M. Kwon* C. Watts*,A. J. Wootton, Core Temperature FluctuationsAnd Related Heat Transport InThe Texas Experimental Torus -Upgrade, Submitted for publication, Physicsof Plasmas(1994)2S. Sattler, H. J. Hartfuss, and W7-AS Team, Phys. Rev. Lett., 72, 653(1994)3A. Cavallo,R.Cano,PlasmaPhys.,23, 61 (1981).4G. Cima, Correlation Properties of Black Body Radiation In The Context OfElectron Cyclotron Emission Of A Magnetized Plasma, submitted forpublicationto: II NuovoCimento(1994)5p.v. Brandford, T.C.Marshall, S.P.Schlesinger, IEEE Transactions onAntennasandPropagation,AP-15, 147 (1967)6S. Sattler, H.J. Hartfuss , Plasma Phys. Controlled Fusioa,5 1285(1993).7C.Watts,G.Cima,,this conference8M. Bornatici, R. Cano, O. De Barbieri, and F. Engelmann, Nucl. Fusion, 2 31153 (1983).9R.Bravenecet al, this conferencelOT. Rempel, R. Gandy, A. Wootton, Density Fluctuation Effects On ElectronCyclotron Emission Correlation Measurements In Optically Gray Plasmasaccepted for publication, Rev.Sci.Instrum(1994).

Vertical Vlewlng of Electron-Cyclotron Emlsslons
for Dlagnoslng Fast-Electron Dynamics In TEXT-U
D. R. Roberts, R.F. Steimle, G. Giruzzi*,
G. Cima, and C. Watts**
Fusion Research Center, The University of Texas at Austin,
Austin, TX 78712 (USA)
*Association EURATOM-CEA sur la Fusion, D6partement de
Recherches sur la Fusion Contr_lbe, Centre d'Etudes
de Cadarache, 13108 St. Paul-lez-Durance (France)
**Physics Department, Auburn University, Auburn, AL (USA)
Abstract
A system for vertically observing the second-harmonic electron-r
cyclotron emissions from the TEXT-U tokamak in conjunction with
fundamental electron-cyclotron heating is described. Using external
collection optics and heterodyne receivers, measurements of the
electron distribution can be performed over two-thirds of the
plasma radius and on transport time-scales. Observations are
typically of electrons with energy E<100keV and either steep or
shallow pitch angle, depending upon the toroidal viewing angle
relative to the plasma current. Two methods are also described for
measuring the radial losses of the fast electrons.
1
II I I

introductlon
The purpose of the TEXT-U vertical-viewing,
electron-cyclotron-emission (VECE) system is to track the
generation and transport of fast (suprathermal) electrons
during localized electron-cyclotron heating (ECH). Studies
confirming the emission and absorption of vertically
propagating, frequency-downshifted, electron-cyclotron
waves were originally performed on PLTI. VECE systems
were subsequently used on the Alcator C2, PLT3, and WT-
34 tokamaks to follow the development of anisotropic,
high-energy tails during lower-hybrid current drive.Similar systems employing electron-cyclotron wave
transmission have more recently been used for this
purpose on Versator 115and ToreSupra.6The energy and velocity resolution of VECE results
from the vertical viewing constraint of IBl=constant along
the viewing sight line. Observed frequency shifts about
the cold electron-cyclotron frequency are then due to the
Doppler (kll.vll) and relativistic mass (m_,= m/(1-v2/c2)1/2)
effects, as described by the resonance condition:
co= neB/m7 + kll. vii (1)
Here eB/m is the cold electron-cyclotron frequency and n
is an harmonic integer. The application of equation 1 to

VECE contrasts with the more usual case of horizontally-
viewed emissions, where the resonance condition typically
selects the sample location along the magnetic field
gradient, and the strength of emission correlates with the
temperature of the large thermal population at that
location. For VECE, the emissions from small populations
of high-energy electrons are typically not strongly
reabsorbed before exiting the plasma, and they thus
accumulate to yield chord-averaged observations. Also
because these emissions are optically grey, the emission
strength retains its more general dependence on the
density, energy, and velocity anisotropy of the radiating
particles. In particular, the emission intensity can often be
well approximated as a sum over the single-particle
emissions j(vII,V.L) given by the well-known Schott-Tribnukov formula.7
The scope if this paper is to review capabilities of the
TEXT-U VECE system for diagnosing the electron
distribution and fast-electron transport. The experimental
hardware and geometry are first described. Implications
for the range and resolution of measurements of the
distribution are then discussed. Finally, two methods are
briefly proposed in the last section for diagnosing radial
transport.
3

I
TEXT-U VECE and ECH Characteristics
The components and geometry for VECE observations
during ECH on TEXT-U (R=105cm, a=27cm) are shown in
Figure 1. Two VECE sight lines are located 240° toroidally
downstream (i.e. in the direction of the electron drift, Vde)
of the ECH launch port. Collection optics for each sight line
consists of a polarized horn/lens combination that defines
a collimated Gaussian beam throughout the observation
bandwidth 98-125GHz of second-harmonic emissions. At
the central frequency of 110GHz, the beam vacuum spot
size of 3.5cm remains nearly constant through the plasma
cross section because of the long Rayleigh length L-a.
Also owing to the placement of the collection optics
outside of the vacuum vessel, the sight lines can be
scanned from R=85-105cm. Ray tracing shows that
refraction (which can bend and further broaden the beam to
regions B_constant) is practically negligible for plasma
densities ne<2X1013cm-3.
The collection beam enters the vessel through a
shuttered, 2cm thick, high-density polyethylene window
(index of refraction = 1.5). It is necessary to calibrate for
the impedance mismatch that leads to power reflection
losses as large as 15% for certain frequencies within the
measured band. A 15cm (toroidal) x 30cm (radial) viewing
dump located on the opposing wall of the vacuum vessel is
4

also necessary to insure chord-localized measurements.
The dump consists of a grid of pyramids (0.25cm wide, 60°
apex angle) that are ground into a 1.25cm thick slab of
silicon carbide. The reflectivity is less than -20dB over
the measured band. Our initial investigations have
concluded that interpretation of the observed emission
spectra is extremely difficult without the dump. The clump
is toroidally offset 10° from the VECE window since a soft-
x-ray detector array occupies the opposing port.
Two, eight-channel heterodyne radiometers detect
the collected emissions with <ll_Sec resolution. One
covers 98-112Ghz and the other 111-125GHz (2GHz channel
spacing, 400MHz bandwidth/channel). In addition, three
200kW gyrotrons are available for ECH. One tube operates
at 56GHz and the other two at 60GHz. For experiments, we
apply fundamental (O-mode, outside launch) ECH and
observe second-harmonic ECE. Two ECH launchers provide
Gaussian beams that are focused and steerable. Both
beams have long Rayleigh lengths L-a and 6-+1cm spot
sizes at R=105cm. The beam from the third launcher is
unfocused (15cm midplane spot size) and unsteerable. All
gyrotrons car" be modulated at frequencies up to l kHz, as
is useful for investigations of the beam power deposition
and the subsequent heat-pulse propagation.

, i
Range and Resolution of Measurements
We first consider how the electron energies that
correspond to a selected emission frequency vary as a
VECE sight line is moved through the tokamak major radius.
Figure 2 shows a solution of equation 1 for
B(@R=105)=20kG a_d kll=0, so that variations are only due
to the relativistic mass effect. Labeled curves correspond
to the 16 receiver frequency channels. Since figure 2
corresponds to central ECH at 56GHz, a sight line at
R-105cm using the 98-112GHz receiver views emissions
from di_'ectly heated electrons with 70keV maximum
energy. A second sight line at R=95cm using the 111-
125GHz receiver also views electrons of the same energy.
While figure 2 summarizes the range of possible
measurements,-the energy resolution is much poorer than
that shown. Accounting for the 400MHz channel bandwidth
as well as the broadening due to VB over the 3.5cm beam
width yields ,_E~20keV. Often more significant is the
Doppler effect (kll:¢=0 in equation 1) that arises as a
consequence of the-finite VECE beam divergence and
toroidal viewing angle. The latter is of greatest
consequence in our case. In figure 3 we show another
solution of equation 1 in electron velocity space for the
case of emissions at 80 ° from the local magnetic field
direction ( kll/k=0.17 ) when B=20kG. Again, curves (now
semi-ellipses) are shown for 98-112GHz channels.

Constant energy curves are also shown and intersect each
ellipse. For kll = 0, the constant frequency curves shift into
coincidence with the constant energy curves and the
results of figure 2 at R=105cm are recovered. For the case
shown, we conclude 40<E(keV)<140 at 98GHz and
0<E(keV)<30 at 112GHz. Since the emission angle relative
to the helical magnetic field varies up to +/- 5°. (as in the
case for a sight line passing near the magnetic axis q~l),
the range of resonant energies/velocities is even further
extended beyond that shown in figure 3.
Very fortunately in practice, the population of
electrons that dominate VECE observations is not as
extensive as that of all the electrons satisfying equation 1
for our geometrY. This is due to two effects: 1) more
cumulative emissions from regions of higher electron-
density along an ellipse, and 2) more intense emission from
those electrons with large perpendicular velocity along an
ellipse. To make some intuitive progress in designing
experiments, one may consider a tokamak distribution (not
shown) that is superimposed on the space of figure 3. As is
well-known, the electric field generates a slideaway tail
that can characterize a substantial region of the
distribution for energies below the critical runaway
energy, but exceeding several times the thermal energy.
For ne=1.5x1013cm-3 in TEXT-U, Fokker-Planck
simulations show that this region extends to energies
beyond those encountered by the constant-frequency
7
ellipses in figure 3. Consequently, for the case where the
distribution contours become shifted into coincidence with
the semi-ellipses (i.e. Vde parallel to kll as shown in figure
1), effect (2) can dominate and VECE observations become
localized to the largest pitch-angle particles. When the
contours are shifted opposite to the observation semi-
ellipses (Vde anti-parallel to kll), effect (1) typically
dominates and observations can then become biased to
much shallower pitch-angle electrons. The dominant
emission regions corresponding to these two
configurations are shown as the shaded regions in figure 3.Next we demonstrate how the observations can be
radially localized along the viewing sight line when the
distribution gradients are taken into account. During
central ECH heating in TEXT-U, a central 'hot-spot' profile is
measured by Thomson and FIR scattering with
Te(p) (eV) = 800e-(p/0.47) 1"6s +600e-(p/0.15) 2 and
ne(p) (1013cm -3) = 1.5e-(p/0.86) 2"8s. Here, p = r/27 is the
normalized radius. Fokker-Planck simulations indicate that
the distribution is _,,ell-characterized by an isotropicMaxwellian with these parameters for v <5Vth
(Vth=Te(0)/m)l/2). The simulations also show that ECH
enhances the suprathermal slideaway tail, which we grossly
characterize consistent with the hot spot thermal profile
by ne'=0.002ne and Te'(p) (keV)=20e-(p/0.15) 2. For the
sake of illustrating the radial localization, we can neglect
the tail drift and consider only emissions with kll=0 so that
8

I
_o=¢o(E) as in Figure 1. Figure 4 shows the radial
distribution of second-harmonic, X-mode emissions
j'dvll dv_Lf(vll,v_L,p) jX(o),vlI,V_L) from 20 and 50keV electrons
(v/vth~4 and 6) along sight lines at R=95 and 105cm. The
beamwidth has been neglected in the calculation.
Reabsorption is small in each case, and the emission can be
strongly weighted towards the innermost radii that are
intercepted by each sight line.
Finally, we emphasize that since the distribution is in
fact the subject of VECE diagnosis, the distribution-
dependent localization described above can only be used
as an initial starting point in the design of experiments. In
the final analysis, the phase-space localization can only be
justified subject to the uniqueness and extent of
agreement between the observed spectral emissions andmore detailed simulations.8
Approaches to Measuring the Radial Diffusion
In this section, we suggest that VECE measurements,
when used in concert with ECH, could provide a
measurement of the fast-electron radial diffusion
coefficient, D(E). This is interesting since the energy
dependence (if any) of D will likely help to identify the
source of the anomalously large electron heat diffusivity,
X,e, from which the confinement objectives of existing
9

magnetic confinement devices continues to fundamentally
suffer.
Two methods for measuring D(E) are adapted from those
methods previously used to measure the thermal
transport. The most direct of these was already
introduced in the discussion of figure 2. Here two radially
separated sightlines would be employed during modulated
ECH of the plasma core for what is essentially a time-of-
flight (&t) measurement of D=AR2/6z_t, where AR is the
radial sightline separation and the numerical factor of 6
accounts for the cylindical geometry. The method is
analogous to that first used during modulated ECH to
measure X.e from delayed soft x-ray emissions.9
When extending the method to higher electron energies,
the processes of slowing down, pitch-angle scattering, and
other momentum-relaxation phenomena can compete on
similar time scales as the radial diffusion to change the
distribution, and, thus, the observed emission Figure 5
shows the minimum D(E) that one can expect to measure
with the method in the presence of collisional processes.
We define Dmin=_R2/6_e with collision time 1:e=l/ve, and
choose _R comparable to the ECH power deposition width.
Also shown is the anticipated D(E) that arises from a
combination of electrostatic and magnetic fluctuations
(15/E = lx10-2 and §/B = lx10-5)in the TEXT core.1 0
Note that D(E)=D(EII) for this case, so that a comparison is
only strictly valid for electrons in the parallel tail. One
10

concludes that the measurement is only possible at low
plasma density and high electron energies.
A second, less direct method is to compare the
observed spectra with simulated spectra that are
computed using detailed Fokker-Planck modelling of the
distribution changes during ECH.8 The effects of
competing transport and relaxation processes can then be
evaluated through the modelling in a manner more rigorous
than that just described. Also, the spectral character may
remain sensitive to the radial diffusion, even though the
effects of collisions and fluctuations as summarized in
figure 5 are similar. This approach represents a more
comprehensive development of the power-balance
methods already used to measure :Xe. The method most
severely suffers from the need to accurately measure
those parameters (e.g. density, loop voltage, Zeff)that
constrain the Fokker-Planck simulation.
Both of these methods are being investigated on TEXT-U,
and the results will be reported elsewhere.
Conclusions
Improved diagnosis of particle heating and transport in
the core of tokamak plasmas is continuing to develop with
the application of novel measurement tools and techniques.
The discussion of this paper suggests that such
investigation of the electron distribution should be
11
possible with good temporal and phase-space resolution
by using VECE in concert with ECH. Comparison of
observations with detailed simulations will facilitate the
interpretation of measurements.
Acknowledgements
The machining of some components was performed by
Jimmy Key and Dan Boyd. Silicon-carbide dump tiles were
manufactured by Resin Systems Inc. and are based upon the
designs of Hyeun Park. This research is supported under
USDOE grant DE-FG05-88ER-53267.
12

I I
References
1E. Mazzucato, P. Efthimion, and I. Fidone, Nuc. Fusion, 25, 11 (1985) 1681.
2K. Kato and I.H. Hutchinson, Phys. Fluids, 30, 12 (1987) 3809.
3T.C. Luce, P.C., Efthimion, and N.J. Fisch, Rev. Sci. Instrum., 59, 8(1988)
1593.
4S. Ide, M. lida, K. Ogura, H. Tanaka, A. Yamazaki, K. Iwamura, K.
Hanada, T. Itou, M. Iwamasa, A. Ando, M. Nakamura, T. Maekawa, Y.
Terumichi, and S. Tanaka, J. Phys. Soc. Japan, 57, 8 (1988) 2605.
5R.K. Kirkwood, I.H. Hutchinson, S.C. Luckhardt, and J.P. Squire, Nuclear
Fusion, 30, 3 (1990) 431.
6J.L. Segui and G. Giruzzi, Plasma Phys. Contr. Fusion, 36, 5 (1994) 897.
7see for example G. Bekefi, Radiation Processes in P/asmas (Wiley,
New York, 1966i p. 180.
81. Fidone and G. Giruzzi, Nuc. Fusion, 30, 5 (1990) 803.
9G.L. Jahns, S.K. Wong, R. Prater, S.H. Lin, and S. Ejima, Nuclear
Fusion, 26, 2 (1986) 226.
10J.R. Myra, P.J. Catto, A.J. Wo0tton, R.D. Bengtson, and P.W. Wang,
Phys. Fluids B, 4, 7 (1992) 2092.\
13

Figure Captions
Figure 1: Geometry for ECH and VECE observations in TEXT-U. An
overall toroidal view (A) and a radial view at the toroidal location
for VECE observations (B) are shown.
Figure 2: The electron energy range spanned by the receiver
frequency channels (solid lines) at two different sight line radii
(dashed lines) for kll=0. Conditions are for central ECH at 56GHz.
Figure 3: VECE resonance semi-ellipses (solid lines) for viewing
at 80° from B as shown in Figure 1 (B=20kG). Constant energy
semi-circles (dashed lines) are also shown every 20keV. Regions
yielding the strongest emissions when the suprathermal tail is
drifting parallel (a) and anti-parallel (b) to kll are shaded.
Figure 4: Radial emission profiles that are associated with
20keV (solid line) and 50keV (dashed line) electrons as computed
along sightlines at two major radii.
Figure 5: The minimum measurable D(E) due to collisional
relaxation for several densities (dotted lines). Upper and lower
lines are for ,_R=10cm and AR=5cm, respectively, in each case. The
D(E) anticipated from a combination of quasilinear electrostatic and
magnetic fluctuations is also shown for comparison (solid line).
14
°1_o,

11111
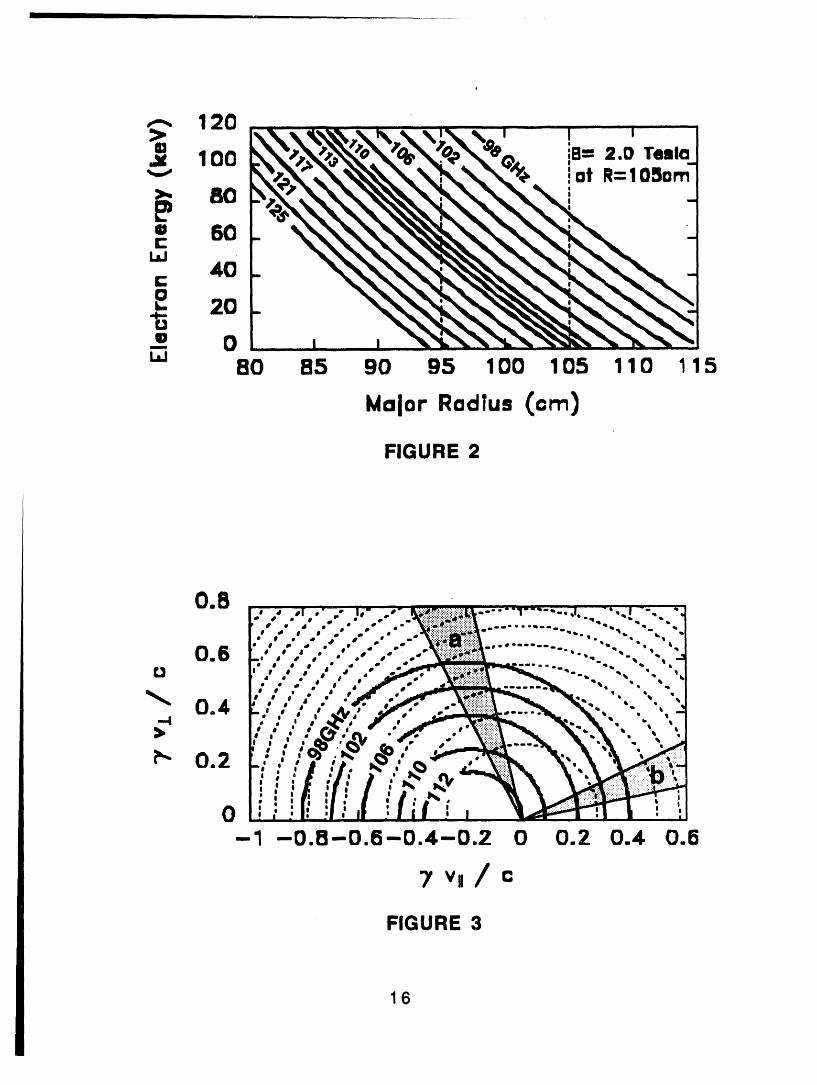
FIGURE 2
0.8"e _J ,! •" .- I,- . *" _i_i_ili_::_i_i[_f_l.--.... 1"-'---, .I.' - •;. I --. "J," ," _" _" •" ," •" X_i_::_iiii_i_ii_:#_i_L............. ,,. "" • "- ".1
I ; ." * ," ._ , ..if __ ..... _ _, ", -/
0.._ t;,, ,,..,"__i_ _ "_.. ,.. ,J
-- u.,=. , , • , v , r!! "I-, , , I _t. N ,, _¢>_ __i '% _'._ ___;_ii I I l | :: ::::::::::::
U l,; , : I; ;l, Ir : II i , I I._l"_-I ;! n , ;i
--1 --O.B--O.e--C).4--D.2 0 0.2 0.4 0.8
)' v,/=
FIGURE 3
16
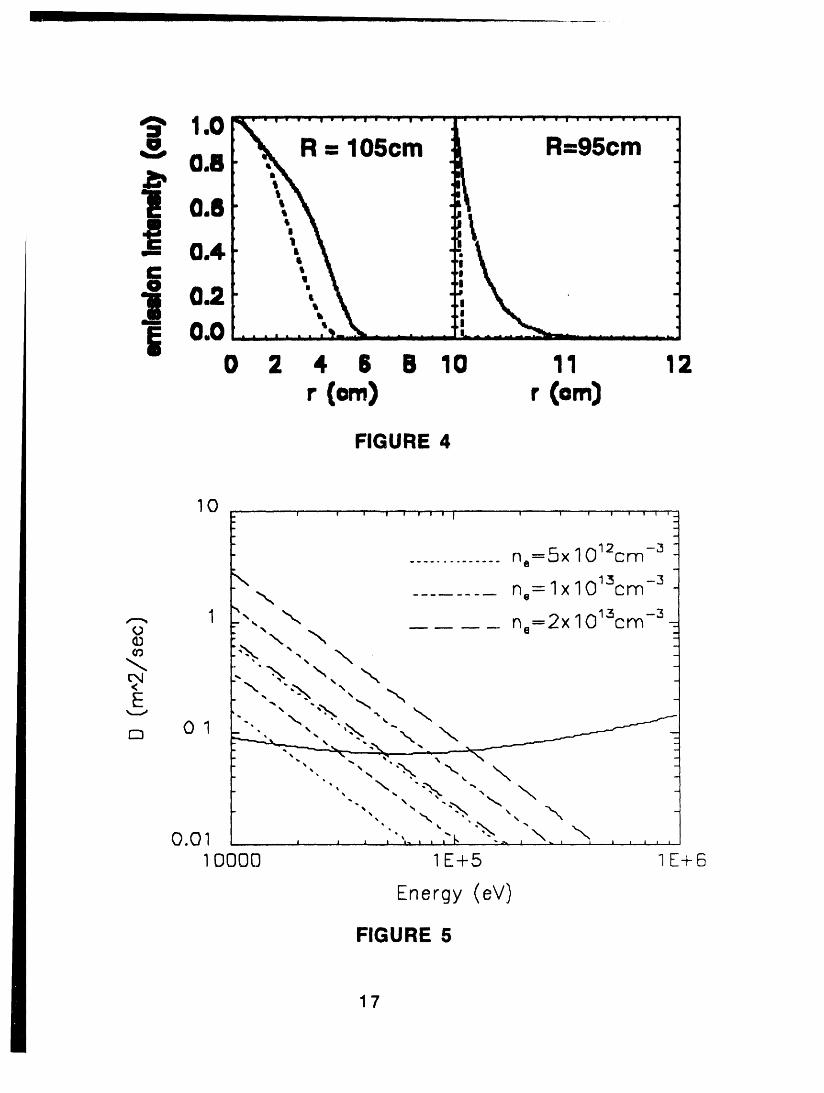
FIGURE 4
10_. _.... l ) I "'_ w ) I' _' w ') - "l ''I"' _' )' I' 'i'
p,.
_ -.............. n,=Sx 1012crn-_ -
k,,, _cr'n -..,., n.= lx 10_ -3,--., 1 .", "_, = O_3cm-3o .. n, 2xl -o \ "N
% -.. \
".. . .% -,.. \"... \. "% -, \
• "N ",
• . % . .,.OOl "',,. _ ,\• i i l I,, i _ i'" " -_ _ _ I i I I I
10000 1E+5 1 -+6
Energy (eV)
FIGURE 5
17
Measurementof temperaturefiuctuatk)nsfrom electron.cyclotronemission
ChristopherWatts,G.Cima',R.F.Gandy,T.D.Rempel
PhysicsDepartment,AuburnUnivm/ty,Auburn,Alabamai
*F-us/onResearchCenter,Austin,Texas.
RadialscansofECEhighfrequencyelectrontemperaturefluctu_ons_,rm=havebeen
performedinTEXT-Uohmicdischarges.Themeasurementswereaccomplishedbyusing
a techniquecorrelatingthesignalattwodisjointfrequencybandsemittedfromessentially
thesameplasmavolumes.Focusinganddefocusingtheopticsallowsustoestimatethe
poloidalk spectrumofthesefluctuations.Applyingthe analysissynchronouslywiththe
sawtoothoscillationsweshowthat,inthecentralregionoftheplasma,sawteetharethe
dominantcontributiontolowfrequencymodes.Additionally,byadjustingthefrequencyof
oneof the bands,we canseparatethe twovolumesandthusestimatethe radial
correlationofthesefluctu,_ons.
PACS:52.70.Gw,52.25.Gj,52.55.Fa

i
J
2
I. INTRODUCTION
Elecln)nheatconductivityinthecoreofTEXT-U[1],inferredfromthemeasuredpowerbalance,islarger
thancanbeexplainedbyestablishedtheories.Intryingtoexplainthisanomaloustransport,attentionhas
recentlyfocusedondeterminingcoreplasmaparticleandeleclronenergyfluxesgeneraldbyelectmstaltc
fluctuations.Thesearegivenrespectivelyby
F_ =(rle_e)=(rleP,O)/B (1)
Here,_e, i"e and l_erepresentthe fluctuationsin ele_roridensity,temperatureandpressure,and
ve= _/B ,=- Vel/B is theradialcomponentofthefluctuatingE x B velocity.
In thispaperwepresenta methodfor determiningcore ITe usingcorrelatede_n cyclolmnemission
(ECE)measurements.Restrictionsonthesignaltonoiseratio,however,meanthaithesemeasurements
yieldonlythermstemperaturefluctuationamplitude_,mw,andits associatedpowerspectrum.From
additionalmeasurementswecanInfertheextentofthepoloidalwavenumberspectnim,kit, andplacean
upperboundontheradialcorrelationlengthofthesefluctuation.
In thispaperwefocusontheexperimentaltechniqueandrecentmeasurementresults.A moredetailed
discussionofthemeasurementprincipleandthe relevanceofthesemeasurementstotransportcanbe
foundelsewhere[2,3].
II. EXPERIMENTALPRINCIPLE
ThermalnoiseoftheECEsignalcompletelyobscuresthecoherenthighfrequencytemperaturefluctuations
oftokamakplasmaturbulencebecauseoftheconsiderablespectralwidthandlimitedamplitudeofthese
fluctuations.BecauseofthisthermalnoisetheactualtimehistoryoftheTefluctuationsisnotaccessible.
However,wecanstillmeasuretheaverageamplitudei"e,rmsthroughcorrelalJonanalysis[4]usingtwo
suitablychosenECEsignalsinnearbutdisjointfrequencybandsemittedfromtwomostlyoverlapping
plasmaemissionvolumes.Themutualdependenceofbothsignalsonelectrontemperaturefluctuations

3
allowsustoobtainthetime-averagedfluctuationamplitude,sincetheuncorrelaledthermalnoiseineach
signalwillnotcontributetothiscorrelationinanaveragedsense[5].
Morespecifically,themeasuredsignalpoweroftheradiometerisgivenbyS(t) = (T + i"(t)X1+ N(t)),
whereT andT(t) aretheaverageplasmatemperatureanditsfluctuatingcomponent,respectively,and
_'(t) istheradiationwavenoise.Wecanexb'acttheaveragenormalizedtemperaturefluctuations,inthe
limitthattheplasmaapproximatesablackbody,bycomputingthecross-correlationbetweentwosuchECE
signals,aslongastheirthermalnoisecomponentsareuncorrelatedwitheachother.
[ Te,n_(to)]2 /_[sz(m)s_(m)])j=\ .. (3)
Here,sistheFouriertransformofSaqd9([]istherealpartIn'0urmethodtheseECEsignalsareselected
bynarrowbandwidthIFfiltersthatarespacedcloselyenoughtojuslJfytheassumplJonthatthedetected
radiationiscomingfromthesameplasmavolume,whiles611satisfyingtheconditionofindependencewith
regardstothermalnoise[5"].Themethodrequiresanappropriatelylongintegrationtimeto reducethe
statisticalerrorto wellbelowthecoherenttemperaturefluctuationamplitude,particularlyifoneisseeking
spectralinformationthroughsuitableanalysis.Anequivalentmethodhasbeenusedto measure
temperature,'.ctuationsinastellaratorplasma[6].
III. EXPERIMENTALAPPARATUS
Theradiometeropticsaredesignedto maximizepoloidalspatialresolution.Twoopticalsystemsare
employed,denotedbelowasTEXTandAU;aschematicoftheAUsystemisshowninfigure1.Themulti-
channelheterodyneradiometersaretunedto the2ndharmonicX-modeelectroncyclotronfrequency
viewingalonga tokamakmajorradiusintheequatorialplane.Inbothcasesthefocusingelementisa
metalliclensof11crn(TEXT)and18cm(AU)diameter.Duetothedispersionofthelenses,theoptimum
focusisafunctionofthefrequencyofthedetectedradiation.Threefrequencybandswereusedwiththe
lensespositionedatthreeradiallocationsforatotalofninedifferentfocalpositionsintheplasma.

4
Thelensesarefedbyscalarcorrugatedhornsto produceanoutputGaussianbeamofwaistdiameters
between1.3(TEXT)and2.5cm(AU)inthe95to 130GHzradiometerfrequencyrange.Thisbeamwaist
increasesbylessthan10%overarangeofabout12cmradially.Refractiveeffectsdonotaffectthesizeof
theviewingspotforthefrequencyanddensityrangesunderinvestigation,asindicatedinfigure2. With
thesesystemswearethusabletocovermostoftheplasmaminorradiuswithoptimumfocus.
ThehornsfeedTEo,1modewaveguidewhichisisolatedfromthevacuumbya micawindow.Thesignalis
downshiftedbya heterodyneradiometertoafrequencyrangebetween2and18GHzwithalocaloscillator
frequencyofeither95GHz(AU)or110GHz(TEXT).
Measurementof _,rmsisobtainedfromcross-correlationbetweenpairsof ECEsignalsselectedusing
narrowbandIFfiltersinamulti-channelsystem.Thesignalfromtheradiometerisseparatedinto4equal-
widthfrequencybandsbya multiplexercoveringthe2to 18GHzrange.Thesesignalsareamplifiedwith
broadband(2-18GHz)IFamplifierswitha nominalgainof32dB.Theamplifiershavea strongnonlinear
gaincurveforlargepowerinputswhichcanskewthecorrelationresults,hencetheneedforanattenuator
placedbeforethemultiplexer.Theamplifiedsignalis selectedbytheIFfiltersandthendetectedusing
square-lawdiodedetectors.Thesecrystaldetectorsconvertth_RFpowerintoproportionaldcvoltagesin
the10MHzto18GHzrange.
ThemajorityofourmeasurementshavebeenObtainedusing100MHzwide,5 and6 stageChebychev
bandpassfiltersawithtypicalselectivityof6dB/octaveperstage.Experimentswithtunablefiltersverifythe
transitionfromcompletecorrelation,inthecaseof overlappingfrequencyintervals,to nearlyabsent
correlation(<0.5%)forseparationsgreaterthan-1.5timesthefilterbandwidth.Forthemajorityofthedata
presentedherethestopbandbetweenthetwochannelsis 100MHz,whichforTEXT-Ufieldgradients
correspondsto a distanceof-1 mminthecoldelectroncyclotronresonancepositionalongthemajor
radius.Thisismuchlessthantheemissionlayerthickness,whichisoforder1cm[71.
Thelocationoftheresonancelayerintheplasmaisdeterminedbythemagneticfieldinconjunctionwith
thefrequencyofthedetectedradiation.Fortheseexperimentsthreesetsoffixedfilterswerechosenwith
resonantfrequenciesat(7.8;8.0),(10.6;10.8),and(13.2;13.4)GHz.ThusfortheAUsystemthecyclotron

5
resonanceisinMe103to108GHzrange,whilefortheTEXTsystemtheresonanceisinthe118to 123
GHzrange.AscanoftheminorradiusisaccomplishedbyvaryingthemagneUcfieldfrom16.0to22.4kG
inincrementsofabout0.5kG.
Fortheradialcorrelationstudiesweuseasingle100MHzwidefixedfilterinconjunctionwithatunableYIG
filter30 MHzwide.Thefilterseparationis variedovertherangeof +30 mmbyshiftingthe resonant
frequencyoftheYIGwithrespecttothefixedfilter.
Outputfromthecrystaldetectorsisroutedtoa setofvideoamplifierswhichprovideIowpassfilteringin
additionto a gainof 20dBto thesignal.MeasuredcoreturbulenceinTEXT-Usuggeststhatnoextra
informationisgainedbyincreasingthevideobandwidthabove250kHz;wethereforedigitizethesignalat
500kHz.
IV. EXPERIMENTALRESULTS
ThedatapresentedrefertoatypicalTEXT.Uohmicdischargeofdrcularcross-sectionwherethetoroidal
fieldis- 2T,theplasmacurrent- 200kAandthechordaveragedplasmadensity- 2x10¹⁹m"3.Figure3a
showsthecrossspectraldensityofrawECEsignalfluctuationsnormalizedtothesignalaverage,whichis
proportionaltotheauto-powerspectrumoftheplasmafluctuationsmeasuredbyECE.Inthelimitthatthe
plasmaapproximatesa blackbody,(r<0.7a) [8],thisrepresentsthenormalizedtemperaturefluctuation
amplitude_,rms/_. Theillustratedspectraresultfromtypicallya 1secondaverageoverdatarecords
selectedfromthecurrentplateauof similartokamakdischarges.Thenoiselevelis determinedfrom
sta_sticalconsiderations.Theseresultsarehighlyreproducible.
Severalaspectsofthespectraareconspicuous.Thereisanoveralldropinthesignalamplitudetowards
theinterioroftheplasma,duelargelytoanactualdropinfiuctuationpower,thoughitmayinpartbedueto
decreasedpoloidalresolution.Thereappeartobetwopersistentfeaturespresentinthespectra,onebelow
50 kHz,anda second,tensofkHzwidefeaturenear100kHz.Thissecondfeaturemovesto higher
frequencyastheresonanceismovedinwardinradius.
6
Thefiniteresolutionofthesystemopticsaffectsthemeasuredspectrabylimitingthesensitivitytoshorter
wavelengthmodes.Thiseffectwastestedbypurposelyshiftingthefocusoftheviewingopticstowardsthe
plasmacenter,resultingindecreasedpoloidalresolutionintheouterregion.Figure3bcomparesdata
takenat0.7awiththepoloidalspatialresolutiondecreasedbyabout20%.Thehigherfrequencypartofthe
spectrumis stronglyattenuated,a clearindicationthatthedetectedsignalcontainsabundantshort-
wavelengthcomponentsbeyondtheoptimumresolutionofoursystem:ke<_.1.5cm-1.
Inordertocompensatefortheeffectofsawtoothoscillations,thecross-correlationanalysiswasperformed
synchronouslywiththeseoscillations.Thedatawerebinnedintofoursub-intervalsrelativetothesawtooth
crash.Theeffect,whichismostdramatictowardstheplasmainterior,isshowninfigure4. It isapparent
thatimmediatelypriortothesawtoothcrashthereisasignificantincreaseinpoweratlowfrequency,whileh.
higherfrequenciesarelargelyunaffected.
Toestimatetheradialcorrelationlengthof Te,rmswemeasuredthecross-correlationbetweentwoECE
channelsfortenradialseparationsbetween:1:2..91cmata plasmaminorradiusof -0.6a. Thedatawerefit
toa Lorentzianfunctionateachof32frequencybins.Theresultingradialcorrelationlength(thehalf-width
at halfmaximum)isplottedversusfrequencyinfigure5.Atlowfrequencythecorrelationlengthisoforder
1cm,whileforfrequenciesnear100kHzthecorrelationlengthjumpsto -2 cm.Thislongercorrelation
lengthcorrespondstotheregionofthepersistentfeatureseeninthecross-spectraldensity(figure3).The
measured1 cmcorrelationlengthrepresentanlowerlimitonAkr, sinceitisof ordertheradialsample
volumewidth.
V. CONCLUSIONS
Wehavemeasuredthetemperaturefluctuationcharacteristic,_ofatokamakplasmausinga conventional
heterodyneradiometerwithgoodspatialresolutionbyexploitingtheknowncorrelationpropertiesofthe
fluctuationsof theopticallythicklinesofelectroncyclotronradiation.Theresultingspectraindicatetwo
features,onebelow50kHzandonecenterednear100kHz.Thereisanindicationthatthetemperature
fluctuationspectrumhassignificanthigherko components,becausethetotaltemperaturefluctuation

7
powerdependsonmodestchangesinthespatialresolutionof themeasurement.Sawtoothoscillations
contributesubstantiallyto the lowfrequencyportionof the spectrumtowardsthe plasmainterior.
Measurementsoftheradialcorrelationlengthof thesefluctuationsappeartosubstantiatethetwofeature
interpretation,witha shortcorrelationlengthfeatureatlowfrequencyandalongercorrelationlengthfeature
athigherfrequencies.
ACKNOWLEDGMENTS
WewouldliketothankDougRobertsforcalculatingtherefractiveeffectsonthebeamsize.Thisworkis
supportedbytheU.S.DOEundergrantsDE-FG05-88ER-53267andDE-FG05-90ER4085-93.
References
1p.H.Edmonds,E.R.SolanoandA.J.Wootton,Proceedingsofthe15thSymposiumonFusionTechnology,(ElsevierSciencePublishers,Amsterdam,Utrecht,1989),vol.1,342.
2 G.CimaandC.Watts,"Correlationradiometryof electroncyclotronradiationin TEXT-U',in this
publication(1994).
3 G. Cima,T.D.Rempel,R.V.Bravenec,R.F.Gandy,M.Kwon,C.WattsandA.J.Wootton,submittedto
PhysicsofPlasmas(1994).
4p.V.Brandford,T.C.MarshallandS.P.Schlesinger,IEEETransactionsonAntennasandPropagation,AP-15.147(1967).
5G.Cima,Rev.Sci.Instrum.,63,4630(1992).
6S.Sattler,H.J. HartfussandW.-A.Team,Phys.Rev.Lett.,72,653(1994).
7 C.E.ThomasandR.F.Gandy,Rev.Sci.Instrum.,61,3570(1990).
8T.D.Rempel,R.F.GandyandA.J.Wootton,Rev.Sci.Instrum.,65(1994).

I
FigureCaptions
FIG.1.SchematicoftheAUECEopticalsystemonTEXT-U(toscale).
FIG.2.RefractiveeffectsduetodensityontheECEbeamwaistsize.
FIG.3. a) Therealpartof thenormalizedcross-spectraldensityfunction(0=_,rms/_) foronepairof
closelyspacedECEsignals.Eachtracecorrespondstoadifferentradialpositionintheplasma,b)Cross-
spectraldensityfromtwoemissionvolumesatthesamelocation:onevolumewithoptimumpoloidal
resolutiona, andasecondvolumedefocusedwitha20%largerpoloidalextent
FIG.4.Comparisonofthecross-spectraldensityduringfourphasesofthesawtoothoscillation.
FIG.5. Theradialcorrelationlengthof electrontemperaturefluctuationsversusfrequency.Errorbars
indicatethegoodnessoffit.

-i._' /-- Metalic.LensR=IO
• • :-_:i;i;_;""" ......" :-: " " _J
_i_:
GHz I_1
FIG.1FIG.1

2
1.5
waistlocation .--.e--- n = lx1013cm_1 - invacuum e
---m--- n = 2x1013cm_e
0.5 _ n = 3x1013cm_e
0 1 0.5 normalizedradius 0 -0.5
FIG.2

=)10a
ResonanceIocalJon:0.7a
_ 10_
"_ noiselevelo. i i l= ill
10.7 ---e--- a = 1.3cm:optimumfocusa ,=1.6cm:defocused
I I IIIIII
b)10
0 50 100 150 200 250frequency(kHz)
FIG.3

resonancek)ca_: 0.29a ---e--- to--,./410_ _ isthe_ period -----m---to;crash
_ to+-,J4
," .....to+ 2_/4I
-i
-I
mm mm m m mmmmm m
noiselevel
0 50 100 150 200 250frequency(kHz)
FIG.4

A Varying Cross Section Magnetic Coil Diagnostic Used inDigital Feedback Control of Plasma Position in TEXT-Upgrade
M.S. Foster, J.L. Craig, A.J. Wootton, P.E. Phillips, J. Uglum, E.R. Solano, D.L.
Brower, Y. Jiang, S.C. McCool, J. Lierzer, and George G. Caste
The Fusion Re,_.ar_hCenter
The University of Texas at Austin
Austin, Texas 78712
ABSTRACT
A magnetic pickup coil diagnostic set is used to measure the position of the plasma
column in the Texas Experimental Tokamak Upgrade _-U) project. The output from
this coil set is used in a digital feedback system to control the plasma position. In order to
provide a fast time response for the feedback system, one complete coil set is located on the
interior of the non-circular, thick-walled, stainless steel vacuum vessel. Another set with a
slower time response is located on the exterior of the vacuum vessel. To simplify and
speed up data acquisition and processing, the coils are constructed so that the X and Y
coordinates of the plasma current centroid are each determined using the signals from only
two separate coils. For both coordinates one coil is used to measure a tangential (relative to
the coil surface) magnetic field component, while the second coil measures a normal field
component. Due to physical constraints, the coils are not continuous around the vacuum
vessel. The presence of gaps in the coils causes pickup of the external current flowing in
the divertor coil windings during TEXT-U diverted discharges. This pickup has been
successfully nulled out by adding a divertor current Rogowski coil to the X position coil
circuit. The data indicates that these coils, along with the digital feedback system, provide
effective and flexible position control for a wide range of TEXT-U plasma parameters.

I. Introduction/Theory
The radius of the currentcentroidof a plasma column in atoroidalgeometry can be determinedfrom the condition:[l ,2,3]
},1...i_pfj, f_dS , = (f_Br + R&,BN)dl= 0 (1)
where B N and Brare the magnetic field components normal andtangential, respectively to an arbitrary closed loop l whichsurrounds the plasma cross section. Using the forms for thefunctions fl and gl proposed in [2], we can derive equations forthe horizontal displacement, AX, and vertical displacement, AY,of the plasma current centroid from R =R o and Y=0 (R0 =105cm for TEXT-U):
and
_,.r ,-,,o/ ]AY - ,_YB,.rdl-{(R- Ro 1+ ..... BNdl . (3)#o_pLI t 2&
Using saddle type coils to measureBN and Rogowski typecoils to measure BT, the integrals above can be evaluated. Inorder to increase the time response of the system and simplifydata acquisition, the coils for the TEXT-U feedback diagnostichave the required functional dependence built in. For the Xposition coils this involves designing a saddle type coil with aneffective toroidalwidth o_Y(RIRo) and a Rogowski type coil witha cross-sectional area o_(R-Ro)(I+((R-Ro)I2Ro)). For the Yposition coils the saddle coil will have an effective toroidal widtho_(R-Ro)(I+((R-Ro)I2Ro)) while the Rogowski coil requires across-sectional area_ Y.

These coils used to measure the plasma current center arealso used to measure the parameter 13I+ (li/2), where [_I is thepoloidal beta value and (110/4_)1i is the inductance per unit
toroidal length between the plasma center and the plasma surface.Knowing this value, the geometric displacement Ag (thedisplacement of the center of the last closed flux surface) can bederived, and the plasma minor radius, ap, can be iterativelydetermined. The most general derivation of how to measure thequantity 13I+ (Li/2), with (l_0/4_)Li the inductance per unit
toroidal length between the plasma center and an external contourI outside the plasma surface, is found in [4,5]. It is shown in [6,7]that in terms of the time integrated coil output signals Sl T
("modified Rogowski"), SlN ("saddle") and SOT(plasma current
Rogowski) the general form of the required relationship must be
A = 13I+(1i/2) -1.0= c1+c2 (SlT/S0T)+C3(SIN/S0T)-c4 ln(a/eff/ap)(4)
where we have used the approximation Li/2 = [ln(a/eff/ap) +(1i/2)],i.e. the plasma and contour l are circular with a/eft as the radiusof the contour. However, since the TEXT-U vacuum vessel is
almost square, the moment coil contours are approximated by asquare with height and width 2_ = 0.64 m about a major radiusRI = 1.05 m. Therefore we use an effective radius for the coils ofa/eft = (o_+ o_/2)/2 = 0.39 m.
An analytic derivation shows that el = ((61rc/264) - 1.0)=-0.274, c2 = c3 = 5_R//(1 lo_2) = 14.6, and c4 = 1.0. To avoid the
inaccuracies associated with the expansion used in this theoreticalderivation, we numerically determine the parameters el, c2 andc3 for our specific coils using an analytic equilibrium. The
"Shafranov equilibrium"[8] describes the field components outside
a circular plasma with a specified geometric displacement Ag,minor radius ap and A. We numerically evaluate the expectedcoil signals (SIT, SIN, sOT) for the experimental coil geometry
outside this Shafranov equilibrium, for various values of Ag, ap,and A. We then fit the input value of A to the functional form

expected theoretically, and obtain the coefficients by a leastsquare fit. Note our results are now restricted to near circularplasmas. Finally the geometric displacement can evaluated:J6]
Ag = AX - [ap2/(2Rt)](l_i + (1i/2)-0.5) (5)
(AX is the current centroid displacement defined earlier).
Because ap is not known a priori, an iterative technique must beemployed:
1. Measure SIT, SIN, and sOT2. Determine the current centroid3. Determine the closest distance to limiter and use as
the approximate plasma minor radius, ap4. Estimate A using Eq. (4) and estimated ap5. Determine geometric center, Ag, using Eq. (5)6. Estimate ap from the geometric center and limiter
positions7. Repeat steps 4 - 6 until ap estimate converges
II. Internal Coil Set
Since the vacuum vessel of TEXT-U is 1.2 em to 2.5 cm
thick stainless steel, coils which will provide a rapid timeresponse to plasma column motion must be located on the insideof the vacuum vessel. This requires that they be constructedentirely from vacuum compatible components able to withstandthe potentially high temperatures attained by the inside of thevacuum chamber during normal and glow discharge operations.
The position diagnostic set consists of four coils, two foreach coordinate (one saddle and one Rogowski). The coilsthemselves have to be protected from direct contact with the
plasma, so they are all encased in stainless steel tubing. Asupplemental limiter system of graphite tiles has been installed toprotect the tubes. The location of the coil tubes relative to theinside of the vacuum vessel is shown in Fig. 1. The coils are

located directly underneath the toroidal field coils to minimizepickup from toroidal field ripple.
The tapered Rogowski coil segments are assembled fromspindle pieces fabricated from Torlon TM. The appropriatefunctional dependence of the effective coil area is obtained byvarying the diameter of the spindles and then winding the coil at aconstant pitch. The saddle coils are constructed by using smallalumina or stainless steel rods placed between TorlonTM plates ascoil forms. These rods are located so that the effective toroidal
width of the coil conforms to the required functional dependence.Using the expression for AX derived in the theory section,
and the formulas for the voltages induced on the variable crosssection coils as a function of B N and B T , we can derive the
following equation:
_t'[cm] = Ip[kA] V- ms J_ Vx.o_o_,_,dt- • L V- ms
(6)
Using a similar approach, the equation for AY is found to be
AY[cm]_- 1 (3541 " m"lrv,1,,[_,.]k" L'V_;'m_'J_' ,,R,,_,,,_dt+39.I..V-ms(7)
These are the algorithms used by the digital feedback system toprocess the voltages from the four coils to determine the plasmaposition.
III. External Coil Set
Position coils on the outside of the vacuum vessel are also
used as an independent and backup set, due to the need for avacuum vent in case of internal coil failure. As with the internal
set, these coils are located directly beneath the toroidal field coilsto minimize field ripple effects (Fig. 1). The Rogowski coils are

wound on rectangular Delrin TM forms, protected inside hollowG-10 forms. The saddle coils are wound directly in grooves cutinto G-10 plates. The external coil forms are held against thevacuum vessel by G-10 clamps which are connected to thetoroidal magnets.
By comparing data from the internal and external positioncoils we have found that there is a 5 millisecond delay in thepickup of the external position coils due to the screening effect ofthe vacuum vessel walls. This delay is not significant for positioncontrol of limiter discharges. However, it is of the order of thegrowth rates of unstable axisymmetrie rigid body displacementmodes in divertor discharges, hence the need for internalfeedback coils.
IV. Digital Feedback System
TEXT Upgrade is designed for operation with eitherlimiter or divertor defined discharges. In each ease, equilibriumrequires the use of poloidal magnetic fields generated by externalcoils. Unfortunately, the spatial curvature of the resultingmagnetic fields leads to the occurrence of unstable axisymmetricrigid body displacement modes. These modes are slowed by theresistive walls of the vacuum vessel, yielding growth rates in thefew millisecond range. On this time scale, use of active feedbackcontrol of the plasma position will effectively eliminate theinstabilities.
To realize maximum flexibility in sensing diagnostics,feedback algorithm, and operator interface, digital architecturewas selected for the controller hardware. A conventional PD
(position-derivative) feedback algorithm is used to generate D/Acontrol waveforms for input to the magnetic field coil powersupplies. Input consists of the four magnetic moment coil signalsdiscussed in the previous sections, and the Rogowski signal for theplasma current. These signals are numerically smoothed andintegrated. Position and velocity values for both radial andvertical motion are then computed and used in the PD feedback.

The code has also been structured to allow operatorspecification of feedback gains as a function of time, as well assetting both the radial and vertical target position as a function oftime. This latter option has been quite useful for diagnostic testingin general. The variable gain option allows programmed events,such as gas puffing or pellet injection, to be anticipated and theposition control response adjusted accordingly.
The system, either partially or in whole, has been operatingnow for well over two years and its performance has beeneffective.
V. Results of Comparative Analysis
In order to determine how accurate the magnetic positioncoils are in determining plasma position, we compared the datafrom the coils to diagnostics which did not rely on magneticfields. We used the UCLA FIR interferometer array diagnostic tocompare the centroid of the chord averaged electron densityprofile to the X position determined from the internal magneticcoils (Fig. 2). One of the TEXT-U soft x ray arrays was used tocompare the centroid of the vertical soft x-ray profile to theinternal magnetic coil Y position data (Fig. 3).
The results indicate that both and X and Y positionsdetermined by the internal magnetic position coils track to within!-0.5 cm of the FIR and SXR arrays during normal discharges.Also noteworthy is the position control demonstrated by thecombination of internal position coils and the feedback system.
VI. Problems
The divertor operation has an appreciable effect on theoutput of the position coils due to the fact that the coils are notpoloidally continuous. There are finite poloidal gaps betweensegments of the coils due to the physical constraints of the tubingconnections. If the Rogowski and saddle coils were continuousthey would theoretically each detect the divertor current and

produce signals equal in magnitude, but with polarities such thatthe sum of the integrated signals was zero. However, due to the
gaps and the geometry of the coils the pickup from the divertorcurrent does not necessarily sum to zero. The X positionRogowski coil divertor current pickup is smaller than it shouldbe, while the X position saddle coil divertor signal is larger(determined from modeling). Therefore, the divertor current ispicked up by the coils and the control system as a spuriousposition shift of the plasma column. The control system respondsto this unreal shift and moves the plasma "back" to its previousposition, thus shifting the plasma column by 1 to 2 cm (dependingon the divertor current). This problem has been compensated forby adding the signal from a Rogowski coil measuring the divertorcurrent directly to the X position Rogowski coil signal. Thecalibration constant of the divertor current Rogowski is such thatit cancels out most of the divertor pickup of the X position coilset. This pickup problem does not exist with the Y position coilset due to the different symmetry of the coils.
Since the position of the plasma is found from th,eintegrated signal of the position coils, any toroidal field pickupintroduces an offset in the measured position. This effect earl beeliminated for most operating conditions by starting integrationafter the toroidal magnetic field has stabilized. Unfortunately, forhigh toroidal fields of 26 kiloGauss or more, the toroidalmagnetic field typically does not reach its target level until afterthe start of the shot. Other than timing changes, a method to
correct for this offset is to measure the toroidal pickup directly(by pulsing only the toroidal field) and then numerically subtractthis pickup from the signals.
VII. Conclusions
The internal magnetic position sensing coils work well aspart of the TEXT-U feedback control system. They are vacuum
compatible and protected from the plasma. External magneticposition sensing coils have been installed as a backup.

The position of the plasma current eentroid as measured bythe internal coil set is probably accurate to :t:0.5 em duringnormal discharges. This accuracy may be improved as moreprofile diagnostics become available for comparison.
Due to gaps in the coils, the X position coil set picks up thedivertor current and shifts the plasma during the divertor pulse.High toroidal field strengths can also induce an apparent positionoffset. It appears possible to correct for both effects. Moresystematic work is required to characterize and optimize thesecorrections.
Acknowledgment
This work was sponsored by U. S. Department of Energyunder grant DE-FG05-88ER-53267.
IL.E. Zakharovand V.D. Shafranov,Soy. Phys. - Tech. Phys., vol. 18, p. 151, 1973.
2A.j. Woottonand L. Wang, IEEE Transaction on Plasma Science, vol. 18, p. 1008, 1990.
3H. Aikawa, A. Ogata, and Y. Suzuki,Japan. J. Appl. Phys., vol. 15, p. 2031, 1976.
4L. E. Zakharovand V. D. Shafranov,Equilibriumof currentcarryingplasmas in toroidalconfigurations,
in Reviews of Plasma Physics volume 11, edited by M. A. Leontovieh, Consultants Bureau, New York
(1986).
5V. D. Shafranov,Plasma Physics 13 (1971) 757.
6L. Wang and A. J. Wootton, FRC reportFRCR359.
7L. Wang and A. J. Wootton, FRC report FRCR 362.
8Mukhavatovand Shafranov,Nucl. Fusion 11, 605 (1971).

Inner- ,_ Outer-iiill ii
hi field side .v low fieldside
FIG. 1.Poloidalview of internaland externalpositioncoil placementon the vacuum
vessel. A circular plasmasurfacewith a radiusof 27 cm, centeredat R0=105cm, is shown
for reference.The plasma is limited by top, bottom, and outer movable rail limitcrsat onetoroidal location.

3
.--.-- internalmagnetics2 ------ FIR density centroid
0
X -2
-4
-5
0 100 200 300 400 500time [msee]
FIG. 2. Comparisonof the X position measuredby the internalcoilsto the centroidof the chordaveragedelectron density profile during
shot #194486.

' ' ' _ I ' " ' ' I ' "' ' ' I ' ' "'"' ' I "' " '" ' '"'_
------ internal magnetics
2 - ,, -.------ soft x ray profile centroid
-3 ..... I , ..... , , I , .i ..i , I , i , , I ....
0 100 200 300 400 500
time [msec]
FIG. 3. Comparison of the Y position measured by the internal coils
to the centroid of the chord averaged soft x-ray profile during shot
#194486.
High.sensitivity, high-resolution measurements of
radiated power on TEXT.U
Yizl_ Wena and R.V. Bravenec
Fusion Research Center, The University of Texas at Austin,
Austin, Texas 78712
Investigations of a possible radiationdrive of edge turbulence
in tokamaks require sensitive radiatedpower measurements
having high temporal and spatial resolution. We use a com-
mercially available 16,element X-UV-enhancedphotodiode ar-
my having essentially 100% quantumefficiency from ~25 eV
to > 6keV. The frequency response is presently limited by the
amplifiers to -50 kHz, althrough the ultimate response is
expected to be much higher (> 200kHz). Each element's view
is -0.4 cm wide along the majorradius at the plasma midplane
while the view of the entire arrayis ~6.3 cm wide and is scan-
nable over the entire plasma cross section. The details of the
system as well as observations of f'mespatial structures and
fluctuations undetectable by conventional bolometers are
presented.
a University of Science and Technology of China, Hefei, 230026,
People'sRepublicof China.
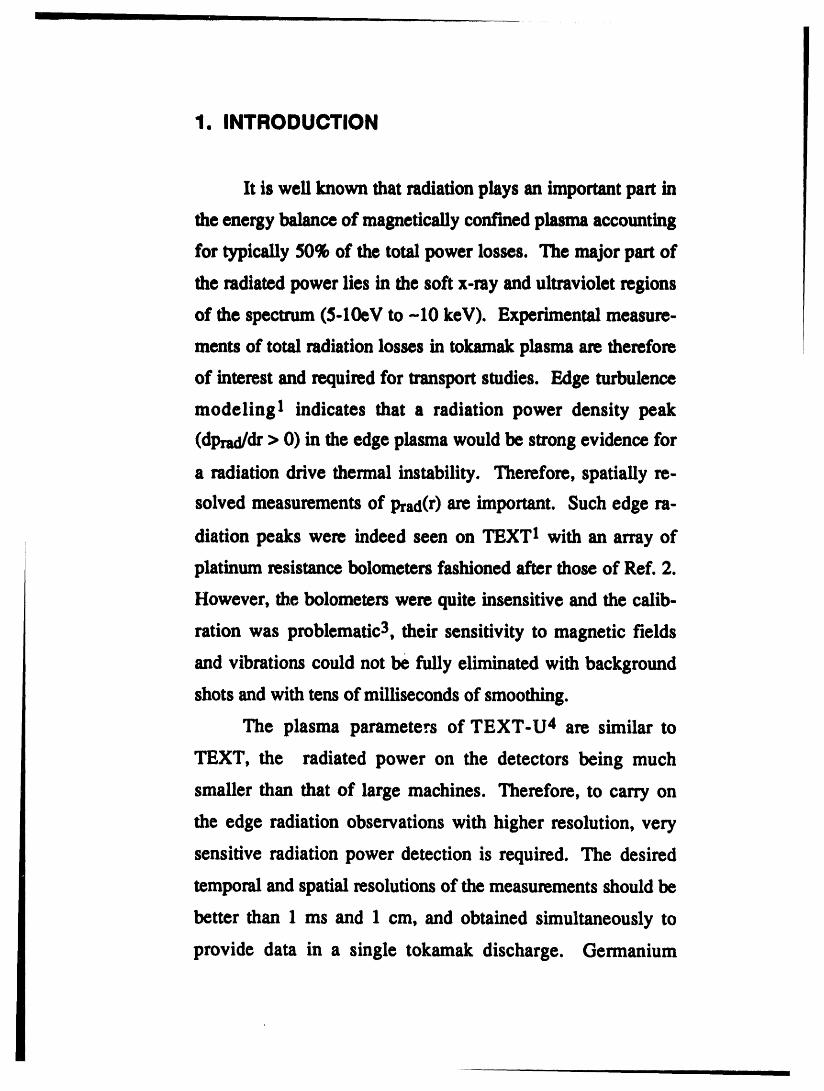
I
1. INTRODUCTION
It is well known that radiation plays an important part in
the energy balance of magnetically confined plasma accounting
for typically 50% of the total power losses. The major part of
the radiated power lies in the soft x-ray and ultraviolet regions
of the spectrum (5-10eV to -I0 keV). Experimental measure-
ments of total radiation losses in tokamak plasma are therefore
of interest and required for transport studies. Edge turbulence
modeling I indicates that a radiation power density peak
(dprad/dr> 0) in the edge plasma would be strong evidence for
a radiation drive thermal instability. Therefore, spatially re-
solved measurements of Prad(r)are important. Such edge ra-
diation peaks were indeed seen on TEXT! with an array of
platinum resistance bolometers fashioned after those of Ref. 2.
However, the bolometers were quite insensitive and the calib-
ration was problematic3, their sensitivity to magnetic fields
and vibrations could not be fully eliminated with background
shots and with tens of milliseconds of smoothing.
The plasma parameters of TEXT-U 4 are similar to
TEXT, the radiated power on the detectors being much
smaller than that of large machines. Therefore, to carry on
the edge radiation observations with higher resolution, very
sensitive radiation power detection is required. The desired
temporal and spatial resolutions of the measurements should be
better than 1 ms and 1 cm, and obtained simultaneously to
provide data in a single tokamak discharge. Germanium

resistance5 and pyroelectric6 bolometers may have fast
response but their sensitivity is still too low to meet the
requirements.
Recent advances in fabrication technology have resulted
in a new type of silicon X-UV-enhanced photodiode having
stable, fiat response to photon energies from--25 eV to 26 keV
with quantum efficiency of ~100%, and linearity over six dec-
ades.7-12 The high sensitivity (-0.275 A/W), fast response
(few microseconds), and insensivity to magnetic fields and
vibrations allow high temporal and spatial resolution with
excellent signal-to-noise ratio. Such detectors are now
commercially available in single element9 or 16-element
arrayl0 packages, and are high-vacuum compatible. Although
there is a degradation in the quantum efficiency (Q.E.) at high
energy l3 (similar to the transmission losses of the metal
bolometers2,14), and at low energyl I (Q.E. abruptly drops to
-36% below ~25 eV), most of the radiation from a tokamak
plasma is within the fiat response range.
II. EXPERIMENTAL SET-UP
The system on TEXT-U consists of a 16-channel X-UV
photodiode array,10 with each channel's view --0.4 cm wide
along the major radius at the plasma midplane. The view of
the entire array is ~6.3 cm and is scannable over the entire
plasma cross section (see Fig. I). A small aperture (4 mmx 2
mm) at the pivot produces the desirable spatial resolution, and

Ialso limits the total incident radiationpower on the detectors
to prevent degradationof the quantumefficiency over time.12
The frequencyresponse of the system to the incident radiation
is presently limited by the simple low-cost amplifier circuitry
(Fig. 2) to -50 ld-lz, which is still much higher than the res-
ponse of the platinum resistance bolometers (<100 Hz, with
complicatedsignal processing). In fact, the ultimatefrequency
response of the X-UV photodiodesystem is expected to exceed
200 kHz using fast amplifiersand appropriatebias if necessary
(presently zero bias).
In addition to the array,there is a single-element X-UV
photodiode9 viewing the central chord of the plasma column
through the same aperture as the platinum resistance bolo-
meters, Because the apertureis necessarily large (4.1 cm ×
1.1 cm) to compensatefor the insensitivities of the bolometers,
a mesh of ~1% transparency is placed in front of the
photodiode. A comparisonbetween brightness measurements
from the X-UV photodiode and the platinum resistance bolo-
meter (recently recalibratedlS) viewing essentially the same
central chord indicates J dl Prad(bolometer) - 0.82 [ dl Prad
(photodiode); the difference is within experimentalerror.
III. EXPERIMENTAL RESULTS
The high sensitivity, fast response, and high spatialreso-
lution of the X-UV photodiode arrayhave resulted in the ob-
servation of free spatial structuresand temporalfluctuations of
ill i II [
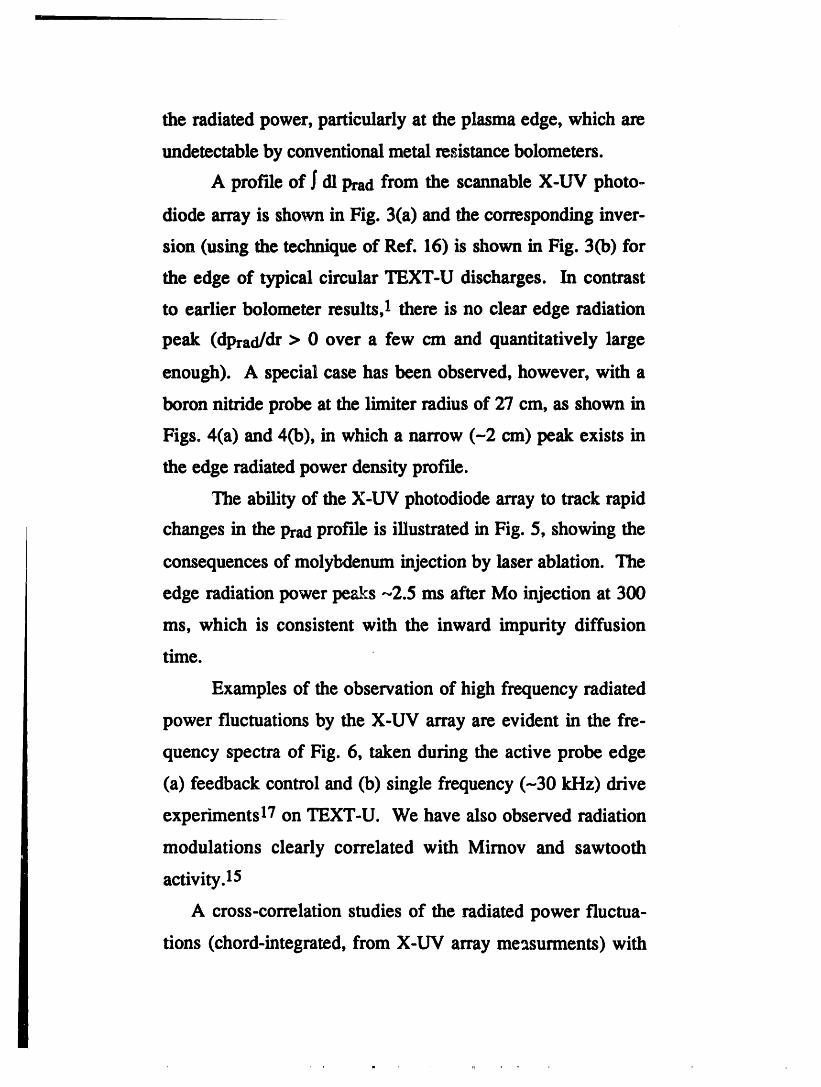
the radiated power, particularly at the plasma edge, which are
undetectable by conventional metal resistance bolometers.
A profile of _dl Pradfrom the scannable X-UV photo-
diode array is shown in Fig. 3(a) and the corresponding inver-
sion (using the technique of Ref. 16) is shown in Fig. 3(b) for
the edge of typical circular TEXT-U discharges. In contrast
to earlier bolometer results,! there is no clear edge radiation
peak (dprad/dr > 0 over a few cm and quantitatively large
enough). A special case has been observed, however, with a
boron nitride probe at the limiter radius of 27 cm, as shown in
Figs. 4(a) and 4(b), in which a narrow (-2 cm) peak exists in
the edge radiated power density profile.
The ability of the X-UV photodiode array to track rapid
changes in the Pradprofile is illustrated in Fig. 5, showing the
consequences of molybdenum injection by laser ablation. The
edge radiation power peaks ~2.5 ms after Mo injection at 300
ms, which is consistent with the inward impurity diffusion
time.
Examples of the observation of high frequency radiated
power fluctuations by the X-UV array are evident in the fre-
quency spectra of Fig. 6, taken during the active probe edge
(a) feedback control and (b) single frequency (-30 kHz) drive
experiments l7 on TEXT-U. We have also observed radiation
modulations clearly correlated with Mirnov and sawtooth
activity.15
A cross-correlation studies of the radiated power fluctua-
tions (chord-integrated, from X-UV array me_sunnents) with

the fast reciprocating Langmuir probe measurements is pre-
sented elsewhere in these proceedings.
IV. SUMMARY AND DISCUSSIONS
A high sensitivity, high temporal and spatial resolution
system using an X-UV photodiode array10 on the TEXT-U
tokamak is capable of measuring fine structures and observing
fluctuations in the radiated power density of the plasma. The
resolutions of the system can be even further improved if
necessary by use of a smaller aperture, more detector ele-
ments, faster amplifiers, and appropriate detector bias.
No evidence of a ubiquitous edge radiation peak
(dprad/dr > 0) has been found by the X-UV photodiode array
system. Peaks previously seen by the platinum resistance bolo-
meters were probably due to insufficient accuracy (poor spa-
tial resolution and questionable calibrations), and/or from the
contributions of neutrals.
Degraded response of the X-UV photodiodes to low
energy photons would affect the absolute radiated power mea-
surements if a substantial portion of the radiated photons is of
energy below -25 eV, which is the case in the extreme edge;
however, this would not have much affect on the fluctuation
observations, which are mostly relative measurements.
ACKNOWLEDGEMENTS
The authors would like to thank Dr. Alan J. Wootton
for his encouragement and support of this work, Dr. R. Korde
for supply and maintenance of our AXUV-16EL detectors,
and Mr. K.R. Carterfor his technical assistance.
This work is supported by the U.S. Department of Energy
under Grant DE-FGO5-88ER-53267.
1J.-N. Leboeuf, D.K. Lee, B.A. Carreras, N. Dominguez, J.H. Harris,
C.L. Hedrick, C. Hidalgo, J.A. Holmes, Jason Ruiter, P.H. Diamond,
A.S. Ware, Ch.P. Ritz, A.J. Wootton, W.L. Rowan, and R.V.
Bravenec, Phys. Fluids B 3, 2291 (1991).
2j. Schivell, G. Renda, J. Lowrance, and H. I-Isuan, Rev. Sci. Instrum.
53, 1527 (1982).
3yizhi Wen and R.V. Bravenec, Internal Report, FRC, 1993.
4p.H. Edmonds and the Fusion Research Center, Bull. Am. Phys. Soc.
38, 1948 (1993).
5H.J. Jackel, G. Kulmer, and J. Perchermeier, IPP 2/291 (1988).
6(3. Fiksel, J. Frank, and D. Holly, Rev. Sci. Instrum. 64, 2761 (1993).
7R.J. Maqueda, G.A. Wurden, and E.A. Crawford, Rev. Sci. Instrum.
63, 4717 (1992)
8Raj Korde and L.R. Canfield, Proc. SPIE 1140, 126 (1989).
9X-UV series data sheet, UDT Sensors, Inc., Hawthorne, CA.
10AXUV. 16EL data sheet, Int'l Radiation Detectors, Torrance, CA.
11yizhi Wen and R.V. Bravcnec, Bull. Am. Phys. Soc. 37, 1386 (1992).
12L.R. Canfield, Jonathan Kerncr, and Raj Korde, Appl. Optics 28, 3940
(1989).

13K.W. Wenzel, C.K. Li, R.D. Petrasso, D.H. Lo, M.W. Bautz, G.R.
Picker, Jr., Ed I-Isieh, Rev. Sci. Instrum. 64, 1723 (1993).
14K.F. Mast, H. Krause, K. Behringer, A. Bulliard, and G. Magyar, Rev.
Sci. Instrum. $6, 969 (1985).
15yizhi Wen and R.V. Bravenec, Bull. Am. Phys. Soc. 38, 1949 (1993).
16H.K. Park, Plasma Phys. and Contr.Fusion 31, 2035 (1989).
17Burton Richards, Bull. Am. Phys. Soc. 38, 1883 (1993).

FigureCaptions
Fig. 1. Poloidal view of the high-resolution scannable X-UV photodiode
array on TEXT-U.
Fig. 2. Circuit diagram of each X-UV photodiode channel.
Fig. 3. (a) Line-integrated and (b) inverted radiated power density versus
chord tangent radius for circular discharges limited at RTAN = 27 cm.
Fig. 4. Same as Fig. 3 with boron-nitride probe at RTAN = 27 cm.
Fig. 5. T'nneevolution of the edgeradiationprofileswith Mo injection.
Fig. 6. Frequency spectra of the X-UV photodiodes signals during active
probe experiments of (a) feedback control, (b) single frequency (-30 kHz)
drive.

Gat6 Valve
Slit(Pivot)
" " Bellowst
,°,°
.°
_,_o _.
,°,°
• 1GElement X-UVNrayf
Fig. 1

I-V
CONVERTOR ISOLATOR DIFFERENTIAL DIGITIZER
2_ AMPLIFIER
X-UVDIODE
,_= ==.m
Fig. 2

2.5 , I ' l ' I ' I ' ' I ' ! ' I ',=,,
_" " o 199874 "** 2 0 _ + 99875 -" _ & 199876 -,m
u . :_ _ _ "rZME(ms) 350--
3:1.5-- R/_ -
(,_ -(_ - .._1.0- _ -Z "I--' - _ ":i: - ]b "¢30 5-H • . I_OI .
(a) LIMITER ....,, , ,m _ Dt -
0.0 , , , , , I . ' , I .21 22 23 24 25 26 27 28 29
RTAN(CM)
100 - , , , , ' , ' ' ' ' ' ' ' ' '!
_, - o shot 199874
: 80 _& + shot 199875 0--"e&©&e&i&®&e&e&e & shot 19987660 T:ME(m,)3sE _ &e "
4o- % -. O_, "
Ill
u_ 20-u_ (b) LIMITER e_,e_e& .I-4 - $
l.¢J 0 i I ,. I i I , I _ I , I ,
21 22 23 24 25 26 27 28 29
RTAN(CM)
Fig. 3

ii i
i,
_' 1.4 _. o shot _99920 -= _+ + shot 99921• A shot 199922_1 2 q_.
_" 1.0 - _*¢;_'o_ob+ "I"IME(ms) 550-w0.8-(/3 - <_+ __0 6-Z • q_. -I"" " -.,
:z:0 4- ob+cZ_. .. Q_. __
0 2 (a) LIMITER ,I, ==+_+
0.0 , I i I , l , ' ' i , J , i ,21 22 23 24 25 26 27 28 29
R'rAN(C )
6O
" o shot 19992050 - o+
= & + shot 199921- o&+6_+& shot 199922= + o
(J 40- z_+q_+ ¢z_ TIME(ms) 350
30- o+>-- ,_._+20-I.-I>I--.Iv_ 10 - LIMITER %+_+
(b) $H_E'.' 0
21 22 23 24 25 26 27 28 29
RTAN(CM)
Fig.4


Wave Launching as a Diagnostic Tool to Investigate PlasmaTurbulence
H. Y. W. Tsui, R. D. Bengtson, G. X. Li, B. Richards, T. Uckan a, J. Uglum, and A. J.
Wootton
Fusion Research Center, The University of Texas at Austin, Austin, Texas 78712
aFusion Energy Division, Oak Ridge National Laboratory, Oak Ridge, Tennessee, 37831
ABSTRACT
An experimental scheme to extend the investigation of plasma turbulence has been
implemented. It involves driving waves into the plasma to modify the statistical properties
of the fluctuations; the dynamic balance of the turbulence is perturbed via the injection of
waves at selected spectral regions. A conditional sampling technique is used in conjunction
with correlation analyses to study the wave launching and the wave-wave coupling
pro _sses. Experimental results from TEXT-U tokamak show that the launched waves
interact with the intrinsic fluctuations both linearly and nonlinearly. The attainment of
driven nonlinearity is necessary for this diagnostic scheme to work. It is also the key to an
active modification andcontrol of edge turbulence in tokamaks.

! I
INTRODUCTION
In a magnetically confined plasma, the interactions and couplings between
spontaneously excited fluctuations can lead to particle and energy fluxes. In this way,
fluctuations can influence transport and confinement [1]. Indeed, much experimental
evidence exists to show that the fluctuation-induced fluxes dominate transport in the edge
plasma of tokamaks as well as other toroidal confinement devices. A major task in fusion
research is therefore to understand and to find ways to tailor these fluxes. Statistical
correlation (or signal processing) techniques [2] are used to measure the properties of the
fluctuation and the transport fluxes. The advances in this experimental area have provided
valuable information to quantify and to confirm the role of fluctuations in transport.
Despite the fact that much effort has been devoted to study the basic properties of these
fluctuations to gain insight into their nature, the causes and the underlying driving
mechanisms in sustaining the transport-related fluctuations are yet to be identified. One
approach to address this fundamental issue is to investigate the nonlinear turbulence
dynamics and to determine the energy cascade path, so as to locate and to identify the
driving and the damping modes. Such information can lead us to the driving and the
damping mechanisms and to allow a closer comparison with theoretical models. Higher-
order correlation techniques [3] are available and have been applied to the intrinsic
fluctuations in a number of studies to ascertain the presence of nonlinear interactions [4]
and phase-correlated coherent structures [5]. To facilitate further investigation, we embark
on a permrbative experiment whereby the dynamic balance of the turbulence is actively
modified via the injection of waves at selected spectral regions.
A driving signal can alter the statistical properties of the edge fluctuations via linear
and nonlinear processes. By tracking and studying these changes, it is possible to measure
the nonlinear coupling coefficient and to determine the energy cascade path more readily
than monitoring the intrinsic fluctuations alone. Furthermore, we can use the applied signal
as a reference in a conditional sampling scheme [6] to enhance the statistical analyses,

especially, the higher ordercorrelations. To quantify nonlinear interactions,we use a
combinationof digitalsignal processingtechniques includingthe bispectralanalysis [7].
This perturbativescheme allows us to probe into turbulencedynamics directly and to
follow the interactionsand energy transferin the spectralspace. These informationcan
lead us to the energy sources and the dissipationprocesses of the turbulenceand to the
development of schemes for active modification and control of the turbulence-induced
transport.
ARRANGEMENT
The experiment is conducted on the TEXT-U tokamak [8] which has a major
radius of 1.05 m and a minor radius, defined by a set of discrete limiters, of 0.27 m.
Typical dischargeparametersarea toroidal magneticfield of 2T, a plasma currentof 200
kA, and a line-averaged density of 3 xl019 m"3. The arrangementof the experiment is
illustrated in Figure 1. A time varying voltage signal is applied to a pair of Langmuir
probes(labeled the launchers)to drivewaves into theplasma. A pairof Langmuirprobes,
designated as the nearsensors, is located close to (< lcm) the launchersto measurethe
'near-field'response. A probearray,identified as the far sensors, located about half way
around the machine, providesinformationon the launchedwaves as they propagateaway
fromthe launchers. A more detaileddescriptionof thehardwareas well as the resultsof a
feedback experiment can be found in refs. 9 and 10. The Langmuir probe arrays are
mountedon pneumaticreciprocatingdrives, to minimize powerloading on t,_eprobe tips.
The reciprocatingcapabilityis also an asset inperformingradialscanmeasurements.
In the experiment, a single frequency voltage signal is applied to the launcher
probes. The results to be presented were obtained using a 30 kHz driving signal. The
driving frequency is comparable to the characteristic frequency of the background
turbulence in the scrape-off layer. The launchersalso have a d.c. bias to maximize the
drivingefficiency and to reduce the generationof harmoni_cs.Typical launcherconditions

_',, SilverSpring,Maryland20910

I I

are a d.c bias of about 60 volts, an applied signal of about 30 volts rms drawing a current
of about 3 Arms per probe. The two launchers are driven by separate amplifiers with
phase-shift adjustment. This, coupled to the finite separation (~ 1.8 cm) between the
launchers, can provide a degree of wavelength selection. During the current flat top, the
probes are moved into position and the driving signal is activated at the appropriatetime as
depicted in Figure 2. The separation of the far sensors from the flux bundle connected to
the launchers is adjusted by changing the plasma current (or the safety factor q to be exact).
The far sensors pick up a strong signal when they are connected to the launchers; the
distance along the field lines is approximately 12 meters.
ANALYSIS TECHNIQUES
The investigation of nonlinear phenomena requires the use of high order correlation
and spectral analyses. To detect three waves interaction, a standard bispectral analysis [7]
is available. The auto-bispectrum for a time series obtained at a fixed spatial point is
defined, in terms of the Fourier components, as
B(co ,co2)= (I)
with<...>denotingtheensembleaverageand_* thecomplexconjugateof_. Itdescribes
thecouplingamong a tripletof modes atfrequenciescol,co2,and co= col+ co2.
Furthermore,asquared-(auto-)bicoherencaisdefinedas
,_2(col,co2 ) I <_(CO I)_(CO2)q}* (COl+CO2)> 12= . (2)< I_(col)_(co2)I 2 > < I_(col+co2)I2 >
It may be used as a measure of the relative contribution from each of the interacting pairs
¢P(col)and _(co2) to _(col+co2). When modes of different frequencies vary independently
as in random noise the (auto-)bicoherence has a value of zero. When the amplitude of
_(coi+co2) is governed by nonlinear saturation, V2is finite and decreases as the number of
interacting mode increases. An extension of the bispectral analysis based on a 'total
squaw._-bicoherence',
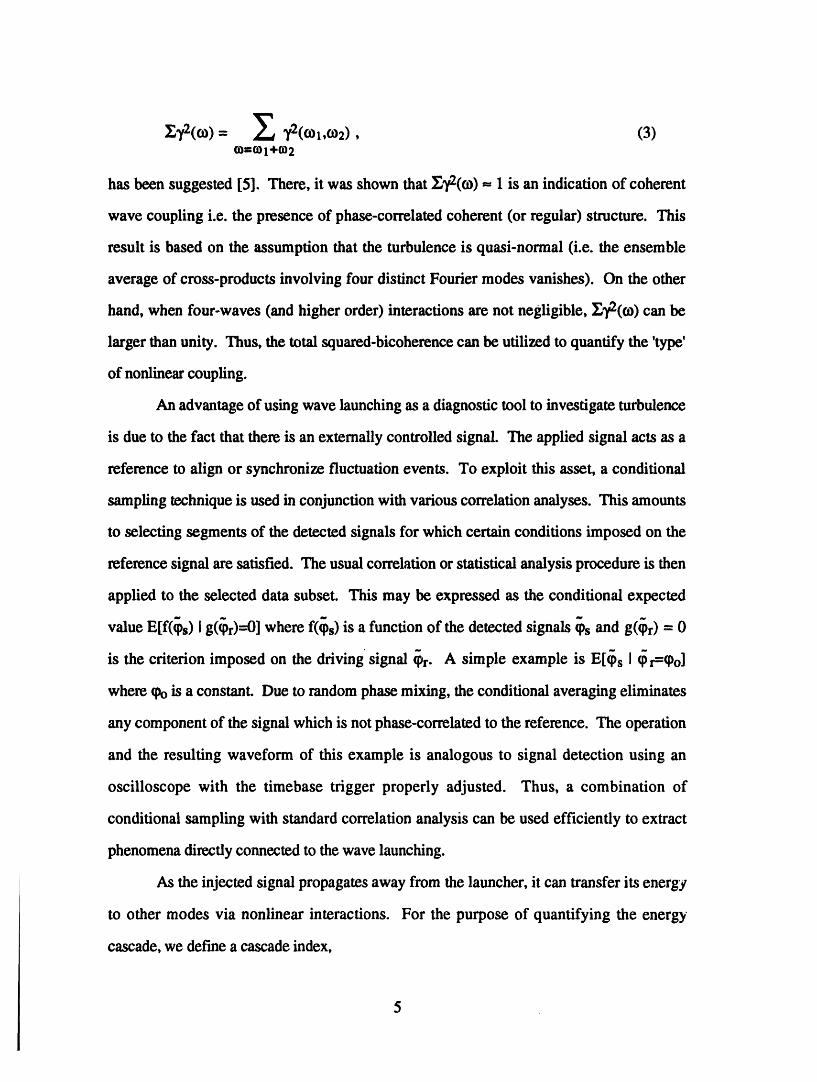
_- /2(ot,co2), (3)_-'-_1+¢02
has been suggested [5]. There, it was shown that _V2(o3) _ 1 is an indication of coherent
wave coupling i.e. the presence of phase-correlated coherent (or regular) structure. This
result is based on the assumption that the turbulence is quasi-normal (i.e. the ensemble
average of cross-products involving four distinct Fourier modes vanishes). On the other
hand, when four-waves (and higher order) interactions are not negligible, _y2(¢0) can be
larger than unity. Thus, the total squared-bicoherence can be utilized to quantify the 'type'
of nonlinear coupling.
An advantage of using wave launching as a diagnostic tool to investigate turbulence
is due to the fact that there is an externally controlled signal. The applied signal acts as a
reference to align or synchronize fluctuation events. To exploit this asset, a conditional
sampling technique is used in conjunction with various correlation analyses. This amounts
to selecting segments of the detected signals for which certain conditions imposed on the
reference signal are satisfied. The usual correlation or statistical analysis procedure is then
applied to the selected data subset. This may be expressed as the conditional expected
value E[f(_s) Ig(_r)--0] where f(_s) is a function of the detected signals _s and g(_r) = 0
is the criterion imposed on the driving signal _Pr. A simple example is E[_s I q_r=CPo]
where q_ois a constant. Due to random phase mixing, the conditional averaging eliminates
any component of the signal which is not phase-correlated to the reference. The operation
and the resulting waveform of this example is analogous to signal detection using an
oscilloscope with the timebase trigger properly adjusted. Thus, a combination of
conditional sampling with standard correlation analysis can be used efficiently to extract
phenomena directly connected to the wave launching.
As the injected signal propagates away from the launcher, it can transfer its energy
to other modes via nonlinear interactions. For the purpose of quantifying the energy
cascade, we define a cascade index,

_ total energy_of nonlinearly coupled modes.energy of injected mode (4)
The normalized cascade _ - _/_o, where _o is the cascade index at the launcher location,
has an initial value of unity and increases as the injected signal propagates away from the
launcher and transfers its energy to the background turbulence.
WAVE LAUNCHING AND NONLINEAR INTERACTIONS
In order to exploit wave launching as a diagnostic tool to investigate plasma
dynamics, we need to establish that i) waves can be driven into the plasma, ii) the launched
waves are of the appropriate 'type', and iii) the externally injected waves are sufficiently
strong to compete with the nonlinear saturation. When nonlinear interactions are detected,
it is necessary to identify the origin or source of the nonlinearity. Specifically, we need to
exclude nonlinearity arising from the driving electronics and from the current-voltage
characteristics of the launching probes.
An inspection of the sensor floating potential (¢Pn)in Figure 2 reveals that signal
can be driven into the plasma. To match the (statistical dispersion of the) background
turbulence, a phase-difference is introduced to the signals applied to the two launchers to
gain some wavenumber selection. Figure 3 shows the characteristic poloidal wavenumber
(the units of the wavenumber of the background turbulence) and the amplitude of the
sensor signal as a function of the phase-difference between the two driving signals. The
wavenumber (k) ratio is found to vary with the phase and has values less than unity in all
cases. The amplitude of the detected signal also varies with the phase. The k ratio is at its
minimum when the detected signal amplitude is at its maximum. Together these results
show that k selection is possible within a small range, some level of matching to the
background turbulence is feasible, and the lower k (longer wavelength) modes are more
readily excited.
6
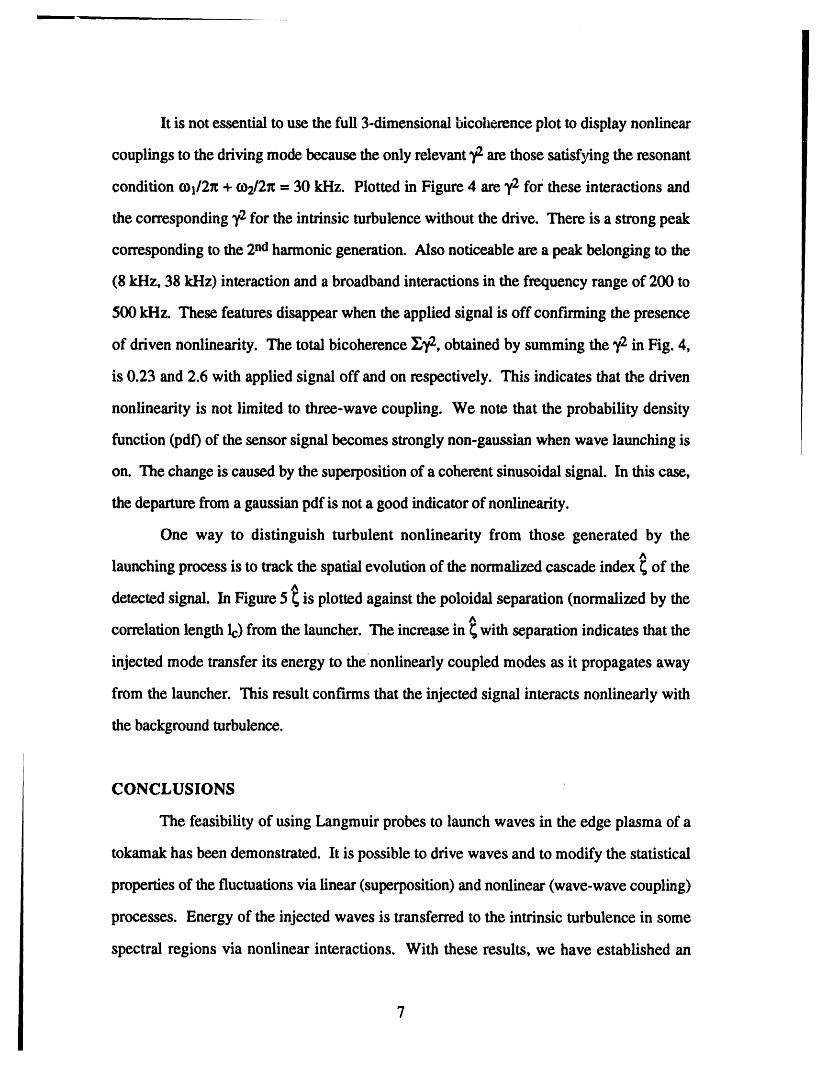
It is not essential to use the full 3-dimensional bicoherence plot to display nonlinear
couplings to the driving mode because the only relevant _ are those satisfying the resonant
condition ¢o1/2_ + to2/2_ = 30 kHz. Plotted in Figure 4 are y2 for these interactions and
the corresponding y2 for the intrinsic turbulence without the drive. There is a strong peak
corresponding to the 2na harmonic generation. Also noticeable are a peak belonging to the
(8 kI-Iz, 38 kHz) interaction and a broadband interactions in the frequency range of 200 to
500 ld-lz. These features disappear when the applied signal is off confirming the presence
of driven nonlinearity. The total bicoberence _, obtained by summing the _,2in Fig. 4,
is 0.23 and 2.6 with applied signal off and on respectively. This indicates that the driven
nonlinearity is not limited to three-wave coupling. We note that the probability density
function (pdf) of the sensor signal becomes strongly non-gaussian when wave launching is
on. The change is caused by the superposition of a coherent sinusoidal signal. In this case,
the departure from a gaussian pdf is not a good indicator of nonlinearity.
One way to distinguish turbulent nonlinearity from those generated by theA
launching process is to track the spatial evolution of the normalized cascade index _ of the
detected signal. In Figure 5 _ is plotted against the poloidal separation (normalized by theA
correlation length lc) from the launcher. The increase in _ with separation indicates that the
injected mode transfer its energy to the nonlinearly coupled modes as it propagates away
from the launcher. This result confirms that the injected signal interacts nonlinearly with
the background turbulence.
CONCLUSIONS
The feasibility of using Langmuir probes to launch waves in the edge plasma of a
tokamak has been demonstrated. It is possible to drive waves and to modify the statistical
properties of the fluctuations via linear (superposition) and nonlinear (wave-wave coupling)
processes. Energy of the injected waves is transferred to the intrinsic turbulence in some
spectral regions via nonlinear interactions. With these results, we have established an

'active' scheme to diagnose turbulence dynamics for the purpose of identifying the
mechanisms responsible for driving the transport-related turbulence.
ACKNOWLEDGMENT
It is a pleasure to acknowledge helpful discussions with Dr. B. A. Carreras. This
work was supported by the U.S. Department of Energy, Office of Fusion Energy,
Contract No. DE-FG05-89ER53267 and DE-AC05-84OR21400.
REFERENCES
[1] J.D. Callen, B. A. Carreras, and R. D. Stambaugh, Phys. Today 45, 34 (1992).
[2] M.B. Priestley, "Spectral Analysis and Time Series", Academic Press, London
(1981).
[3] E.J. Powers, Ch. P. Ritz, C. K. An, S. B. Kim, R. W. Miksad, and S. W. Nam, in
Proc. of the Workshop on Higher-Order Spectral Analysis, Vail, Colorado, June
28-30, 1989.
[4] Ch. P. Ritz, E. J. Powers, and R. D. Bengtson, Phys. Fluids B 1 (1989) 153.
[5] H.Y.W. Tsui, K. Rypdal, Ch. P. Ritz, and A. J. Wootton, Phys. Rev. Lett. 70
(1993) 2565.
[6] H. Johnsen, H. L. Pecseli, and J. Trulsen, Phys Rev Letts 55 (1985) 2297.
[7] Y.C. Kim, and E. J. Powers, IEEE Trans. Plasma Sci. PS.7 (1979) 120.
[8] P.H. Edmonds, E. R. Solano, and A. J. Wootton, in Proc. 15th Symposium on
Fusion Technology, Utrecht, The Netherlands, 19-23 Sept., 1988, Vol 1 (1988)
342.
[9] T. Uckan, et al., in Controlled Fusion and Plasma Physics (Proc.20th EPS
conference, Lisboa, Portugal, 1993) Vol II, p.635.
[ 10] B. Richards, et al., Phys. Plasmas, to be published.
FIGURE CAPTIONS
Figure 1 Arrangementof the wave launching experiment. A numberof sensor probes
measuringthe floatingpotentialcpflareusedto detecttheplasmaresponse.
Figure2 A timing diagramof the active probingexperiment. A 30 kHz signal and a d.c.
biasareappliedto the launcherprobesto drivewaves into theplasma.
Figure3 Variation of the wavelength and the amplitude of the detected signal as a
function of the phase differencebetween the drivingsignals appliedto the two
launchers.
Figure4 Bicoherence of interactionsinvolving the 30 kHz mode. A second harmonic
peak, a (8 kHz, 38 kHz) peak, and a broadbandinteractions appear when
external drive is on. The statisticalvarianceis 0.(}04.
Figure5 Spatialevolutionof the normalizedcascadeindex_ showing increase in _ with
the normalizedseparationd/lc. The cascade index is def'medas the energyratio
of the coupled modes to the injectedmode and _o is the index at the launcher
location.
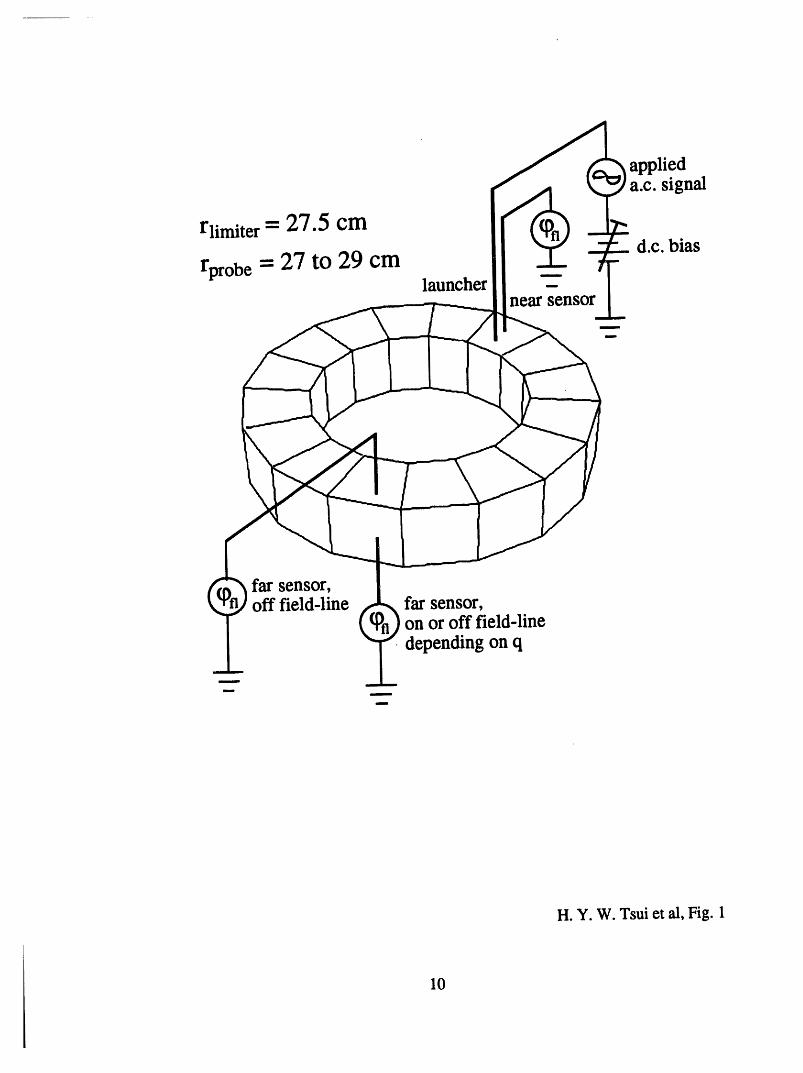
appliedd.C.signal
rlimite r = 27.5 cmd.c. bias
rprobe= 27 tO29 cmlauncher
far sensor,off field-line far sensor,
l on or off field-linedepending on q
H. Y. W.Tsui et al, Fig. 1
10

I ' I .... !

I I
i
kwith 30 kHz applied signal
k ratio - kintrinsic _ ..... - 10k ratio ""_ "'"oo mm • ,, ...--.-_
• °°e • Go _l _fl°l_ rms
0.5 - (volt)
0 0-4 -2 0 2
Phase between launching probes (rad.)
H. Y. W. Tsui et al, Fig. 3
12

0.303/2_; = C01/2_+_.0_2/2_
_,.a,co_.co9 =30_z_ / 2ndharmonic - 30 kHzsignalon
Near jg" generatton ........intrinsicfluctuations
Sensor
q_ /(8 kHz, 38 kHz)/
00 100 200 300 400 500
COl/2n(kHz)
H. Y. W. Tsui ct al, Fig. 4
13

10
H. Y. w. Tsui et al, Fig. 5
14

I i
Q .
EDGE PARAMETERS FROM AN ENERGY ANALYZER AND
PARTICLE TRANSPORT ON TEXT-U
D.B.Crockett,P.E.Phillips,W.A. Craven,WilliamL.Rowan, A. J.
Wootton
Fusion Research Center, The University of Texas at Austin
A.S. Wan
Lawrence Livermore National Laboratory, Livermore, CA
T. F. Yang
Plasma Fusion Center, M/T, Cambridge, MA
Abstract
The energy distributions of ions and electrons in the scrape-off
layer of TEXT are measured with a bi-directional Retarding
Field Analyzer (RFA). The probe provides simultaneous
measurements parallel and anti-parallel to the plasma
current. Large asymmetries in this direction in the flux and
temperature that were found with the RFA appear largely due
to differences in the connection lengths L c. The
measurements from the analyzer are compared with the
results of a simple edge model to infer the edge particle
diffusion coefficient. While the measurements are consistent
with the model for longer connection lengths (-10 meters in
TEXT-U), the agreement deteriorates for Lc less than two
meters.
Supported by USDOE under grant DE-FGO5-88ER-53267.

L INTRODUCTION
Processes in the edge plasma are important to the
behavior of the entire plasma, 1"3so it is critical to measure all
of the important plasma characteristics there. While electron
parameters in this region are routinely measured by
Langmuir probes, ion parameters are often assumed from the
electron data or neglected, as in a cold ion approximation. The
Retarding Field Analyzer RFA (or gridded energy analyzer)
enables direct measurement of ion characteristics. In this
paper, data from the RFA were used to estimate particle
diffusion coefficients in the edge of TEXT-U.
II. RETABDING FIELD ANALYZER
The Retarding Field Analyzer measures the energy
distribution of charged particles. In principle, it is simply
based on varying the potential through which charged
particles are crossing and then collecting the current of those
which are not repelled. The analyzer used was of a parallel
plate geometry where the repelling bias was applied to fine
meshes between the aperture and collector. The RFAs that
were used in TEXT-U for this experiment were the central part
of a two-sided probe, Janus, that was originally employed on
the Alcator C tokamak by Wan and Yang. 4 Janus also
contained a pair of Langmuir probes and calorimeters, but
only the RFA part of the probe was made functional. The two

analyzers were back to back, facing opposite directions, and
were aligned with the magnetic field. This allowed
simultaneous measurements of a species' energy distribution
that was both parallel and anti-parallel to the plasma current.
The side that faced the plasma current (the side Which collects
particles moving with the plasma current) is termed the ion
side. The other, "downstream", side is the electron side.
The key components of the analyzer are the aperture-
slit, the grids, and the collector (Figure 1). The slit is made in
a 0.64 mm thick tungsten plate that is tapered to a knife edge at
the perimeter of the slit, the dimensions of which are 4.2 mm x
0.05 mm. The collector is composed of a 1.0 mm thick plate of
stainless steel. The three grids are used to control the potential
within the probe. Originally, each grid-electrode was
composed of two fine tungsten meshes stretched across each
side of an elliptical ring of stainless steel.
The grids were modified after preliminary experiments
indicated a significant amount of secondary electrons were
emitting from them when the particle current was high.
Increasing their transparency decreases the number of wire-
particle collisions and thus reduces the number of secondary
electron emissions, so one mesh was removed from each
electrode. The third grid was fitted with a mesh of higher
transparency, increasing it from 72% to 81%.
The probe was operated to collect only one species for
each plasma discharge. One bias configuration was applied to
the grids for the ion current collection (ion mode); and another

for the electron current collection (electron mode). For either
mode, the second grid had the sweeping voltage, while the
other grids were held at a constant potential. For this
experiment, a triangular waveform with a cycle of 20 ms
provided the sweep. The first grid repelled the unwanted
species, and the third grid suppressed secondary electrons
emitted from the collector. The slit-aperture floated, and the
collector was at ground (referenced to the vessel wall). During
the ion mode (Figure lb), a bias of-130 V on Grid 1 repelled
incoming electrons, while Grid 2 was ramped from ground to
200 V. During the electron mode, a bias of 150 V on Grid 1
repelled incoming ions, while Grid 2 varied from -5 V to -150
V.
The recorded signals for the sweeping bias on Grid 2 and
the collector current during ion mode operation are shown in
Figure 2. Two current-voltage (I-V) curves were produced over
a 60 ms window of these data by summing the up-ramp signals
(where the voltage was ramping up) together and summing
the down-ramp signals together. The window was during a
portion of the discharge's steady state, from 200 to 260 ms.
Ideally, the I-V characteristic represents the integration
of the energy distribution.5 For a given voltage VG on the
curve, particles of charge q which have an energy equal to or
higher than q VG contribute to the current. Thus the RFA
provides unique information that can be used to study
questions such as the departure of edge particles' energy
distribution away from a Maxwellian distribution. However,

no consistent, large differences have yet been noted, and in this
paper the distribution is treated as Maxwellian.
Specifically, the ion parameters were unfolded from the
I-V curves based on a shifted Maxwellian distribution
predicted for ions reaching the wall or a solid surface. 6 This
warm ion, kinetic theory model predicts the velocity
distribution fw(vi) to be:
fw(vi)= 2_(Z,r) _ rni exp_(mivi2/2+qcPsh )Z no 2_kri kTi '
Pi>-DO, (1)
and it quickly drops to zero for vi < vo. Z is the charge state, z =
Te / Ti, no is the unperturbed ion density away from the wall,
mi the ion mass, ¢Pshthe sheath potential and vo = _ 2qcPsh/mi.
]_(Z,z) is similar to the error function and approximates unity
for all realistic values of Z and r. Also, the formula for the
collector current must incorporate an arbitrary space potential
Vp (in the model, Vp = 0) and the area of the slit As. Taking
these into account, rewriting Eq.(1) in terms of energy, and
integrating for energies above VG, we find:
1Ii (VG) = -enoA._ Ci exp[-Ze(VG - Vp)/kTi ], VG > Vp (2)2
where Ci = _/SkTi/_rni . The ion current saturates once VG
drops below the space potential:

Ii (VG <-Vp ) = 2enoAs Ci = Iisat (3)
A fit to the data for the ion parameters is shown in
Figure 3. A constant Co was added to the equation to account
for superthermal electrons, DC shifts from the electronics, or
other additive effects. Typically, Co was quite small. Ti wa'_
determined from the exponential constant and then used to
determine ni from Iisat. The transmission coefficients of the
analyzer's components which were estimated by a Monte Carlo
code 4 are not shown but were folded into the actual calculation.
For the electron mode, only the temperature was determined:
i
Ie (VG) = IDC +IeO exp(eVG /kTe) . (4)
HI. EXPERIMENT & RESULTS
RFA data were taken at TEXT-U for ohmic discharges in
hydrogen with a toroidal field BT of 2.2 Tesla, plasma current
Ip of 150 kAmp and central chord averaged density ne(O) of 2.5 x
1019/m 3. The boundaries of the plasma were determined by
three adjustable rail limiters at the top, outer radial, and
bottom, which were set to intersect a minor radius r of 27.0 cm.
The RFA was located on a top port, 90 ° toroidally from the rail
limiters (Figure 4). We did a radial scan with the probe in its
ion mode from r = 30.0 cm to 27.0 cm, every 0.5 cm. Electron
data were taken only at half as many positions, from 30.0 cm to
28.0 cm. The connection lengths Lc from the apertures to a
5

solid surface were determined for each radial position by a
magnetic field tracing program. As expected, the lengths
were much shorter on the ion-side than on the electron-side
except for those at r = 27.0 cm.
The collector current was much larger on the electron-
side, indicating a larger flux on that side. The analysis of the
data was in agreement with a lop-sided flux, as both
temperatures and densities measured higher on the electron
side throughout most of the edge profile (Figure 5). Also, Ti
was consistently larger than Te, as has been seen in the
scrape-off region of o_.her machines.7,8 The upstream-
downstream difference in the Ti was significantly smaller for
the innermost point, and, in fact, Ti on the ion-side was higher
than the electron-side T i at r = 27.0 cm. This change
corresponds with the large increase in the ion-side Lc. It
jumps by more than a factor five to a magnitude comparable to
the electron-side Lc at that point.
The iondensityprofilesaredisplayedinFigure5b with
an ne profilethatwas takenwith a reciprocatingLangmuir
probe.The two sides'nibecame closerattheinnermostpoint,
liketheTi valuesdid. However,the densitiesmay not be as
closethereas thedataindicate,sincetheelectron-sideprofile
issuspiciouslyfiatinsideofthe 28.5cm radius.Up to that
point,that side'sRFA data followedthe Langmuir probe
densityfairlywell,butne continuedtoincreasegoingin.
Thisflatteningofniislikelydue tothecollectedcurrent
reaching some maximum, so that the saturationcurrent
6
became constant as the probe was pushed in further. The data
show the density slightly dropping towards the inside, as it
should if Iisat stays the same, since Ti continues to rise and
lisat is proportional to ni_-_. It is probable that the current
reached the space-charge limit.9 A rule of thumb for this type
of probe is that the limit will be about one mAmp, lO and the
Iisat magnitude for those inner positions was over 0.5 mAmp.
Such a problem could be remedied by making the slit more
narrow.
IV. DIFFUSION COEFFICIENT
Simple edge models 11 predict a perpendicular particle
diffusion coefficient D± = Z2cs /Lc, where Xn is the density
scale length and Cs is the ion acoustic sound speed,
% = _/k(T i + Te) / mi . This relation is incorporated into other
edge models as well. 12 It also agrees qualitatively with the
previous data. Since the D± calculated from either the ion or
electron-side should be the same for a given radius, _/Lc for
either side should be roughly equal. So shorter Lc should have
smaller temperatures, as was true for the data. To make a
more quantitative test, we calculated D± by using results from
a modification of Stangeby's simple edge model.ll
Stangeby's model assumes charge neutrality in the edge
and an exponential fall-off of the density and temperatures
with a Te scale length Aeand a Ti scale length 2/:

n = noe-(r-a)/'_n , Te = Toe-('-a)/_te , Ti = Toe-(r-a)/Ai ,
where no and To are the density and temperature respectively
of the last closed flux surface (LCFS) at r = a. The sole source
is the cross-field transport, and the sink is the limiters which
are absorbing the particles with a flux F of:
1r =-no s.2
Then the panicle balance equation is:
_r (D± dn) = nCs/ 2Lc . (5)dr
To get a tractable solution for D±, the ion sound speed is
approximated by:
Cs = _]2kT i / mi .
Integrating from the LCFS to the wall produces:
_t2nCsOD±0 = 2L(1+ _tn / 2_ti) ' (6)
where D±o and CsOdesignate the values at the LCFS.
As long as n(r) is much larger than the n of the wall, Eq.
(6) may be used to estimate D± past the limiter. Therefore, the
data as far out as r -- 29 cm were valid for determining the
diffusion coefficient. Scaling lengths were taken from two
portions of the profile. One was from a radius of 27.5 cm to 29.5
cm for the calculations of D_ from 27.5 cm to 29.0 cm. The
8
other radial range was from 27.0 cm to 27.5 cm to determine
the diffusion coefficient at 27 cm.
Values for the scaling and connection lengths are
displayed in Table I. In the outer range, the _n derived from
the RFA's ni profil.es for the two sides agreed closely with each
other if the flattened portion of the electron-side profile was
disregarded, and they were within 10% of the _n from the
Langmuir probe's ne profile. For the inner _tn, only the ion-
side ni and the ne profiles ,vere used, and they also were
comparable.
The /)1 calculated from these lengths and from Ti and
Te are shown in Table II. Only the coefficients from the
innermost radius, where both sides' Lc were on the order of ten
n_eters, were nearly equivalent. The coefficients for the rest of
the scrape-off layer differed by almost an order of magnitude,
which clearly is not physically reasonable. This result
indicates that Eq. (6) may break down for shorter connection
lengths, apparently for Lc < 2 m.
V. CONCLUSIONS
i
There were large asymmetries in the upstream and
downstream measurements that we made with the RFA in the
scrape-off layer. For the most part, the flux and temperatures
were much higher on the electron-side than the ion-side,
which evidently were chiefly effects of the connection lengths
being much larger on that side.

Although the simple edge model'sderivationof D±
qualitativelysupportsthistrend,itdoesnotprovideconsistent
resultsforconnectionlengthslessthan two meters.Whether
_Tq.(6)isa fairestimateofthediffusioncoefficientforlargerLc
remainstobe determined,as an independentmeasure of Di
was notpresented.Also,furtherexperimentswhere edgedata
aretakenfora varietyofconnectionlengthsarenecessaryto
study its relation to D± and upstream-downstream
asymmetries.
10

TableI.Scaleand connectionlengthsusedin D± calculatioufor:
a)electron-side,b)ion-side.
....... i .......
r Side An Ai Lc
(cm) (m) (m) (m)
i ,, ii ii i
27.5 to a 0.013 0.053 13.4
29.0 b 0.013 0.031 1.6i i ,, | ill i --
27.0 a 0.010 0.034 13.2, ,, =[ i iill
b 0.010 0.015 9.6.......... ., ,,
Table II. Perpendicular particle diffusion coefficients for the two sides in
the scrape-off layer.
r D± e-side D± i-side
(cm) (m) (m)
i
29.0 0.42 2.4i i
28.5 0.41 2.5ii i, ,
28.0 0.44 2.8i ,,i , m ,, i,=, r •
27.5 0.45 3.1
27.0 0.30 0.37...... ,.,. __
II

aeferecnce8
1. R. J. Fonck, P. Beirsdorfer, M. Bell et al., in Heating in Toroidal Plasmas,
Proc. 4th Symp. Inter. School of Plasma Physics, Rome, 1984 (ENEA,
Frascati, 1984) 37
2. ASDEX Team, Nucl. Fusion 29 (1989) 1959
3. B. Lipschultz, J. of Nucl. Mater. 145-147 (1987) 15
4. A.S. Wan, T.F. Yang, B. Lipschultz & B. LaBombard, Rev. Sci. Instr. 57 8
(1986) 1542.
5. A.W. Molvik, Rev. Sci. Instr. 52 5 (1981) 704
6. G.A. Emmert, R.M. Wieland et al., Phys. FI. 23 4 (1980)
7. A.S. Wan, B. Lipschultz, F.S. McDern_ott et al., J. Nucl Mater. 162-164
(1989) 292
8. R.A. Pitts, G.M. McCracken, G.F. Matthews, in Controlled Fusion and
Plasma Physics (Proc. 16th Eur. Conf. Venice, 1989) 13B, European
Physcial Society (1989) 955
9. F.F. Chen, Plasma Diagnostic Techniques, Eds.: Huddlestone & Leonard,
Academic Press, New York (1965) 118
10. G.F. Matthews, private communication (1991)
11. P.C. Stangeby, G.M. McCracken, Nucl. Fusion 30 7 (1990) 1225
12. P.J. Catto, R.D. Hazeltine, U.T. Fusion Studies Report IFSR #626 (1993),
to be published in Phys. of Plasmas
12
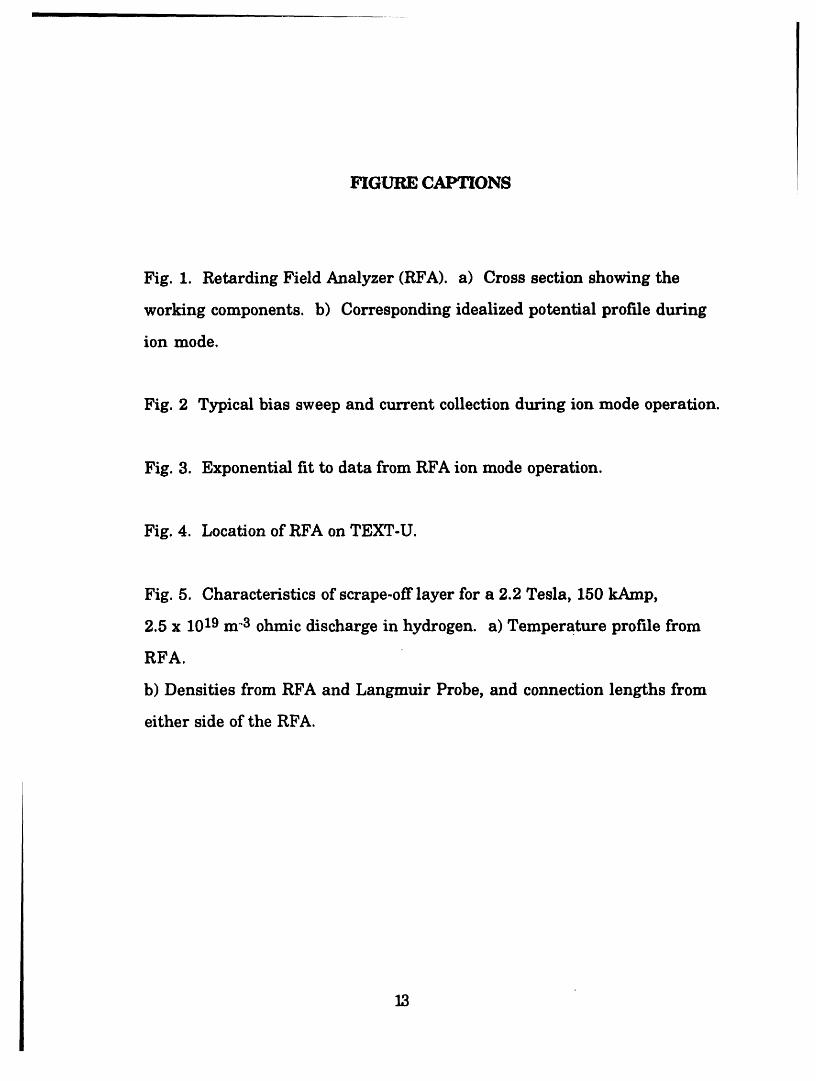
FIGURE CAPTIONS
Fig.I. RetardingFieldAnalyzer(RFA).a) Crosssectionshowingthe
workingcomponents,b) Correspondingidealizedpotentialprofileduring
ionmode.
Fig. 2 Typical bias sweep and current collection during ion mode operation.
Fig. 3. Exponential fit to data from RFA ion mode operation.
Fig. 4. Location of RFA on TEXT-U.
Fig. 5. Characteristics of scrape-off layer for a 2.2 Tesla, 150 kAmp,
2.5 x 10¹⁹ m "3 ohmic discharge in hydrogen, a) Temperature profile from
RFA.
b) Densities from RFA and Langmuir Probe, and connection lengths from
either side of the RFA.
13
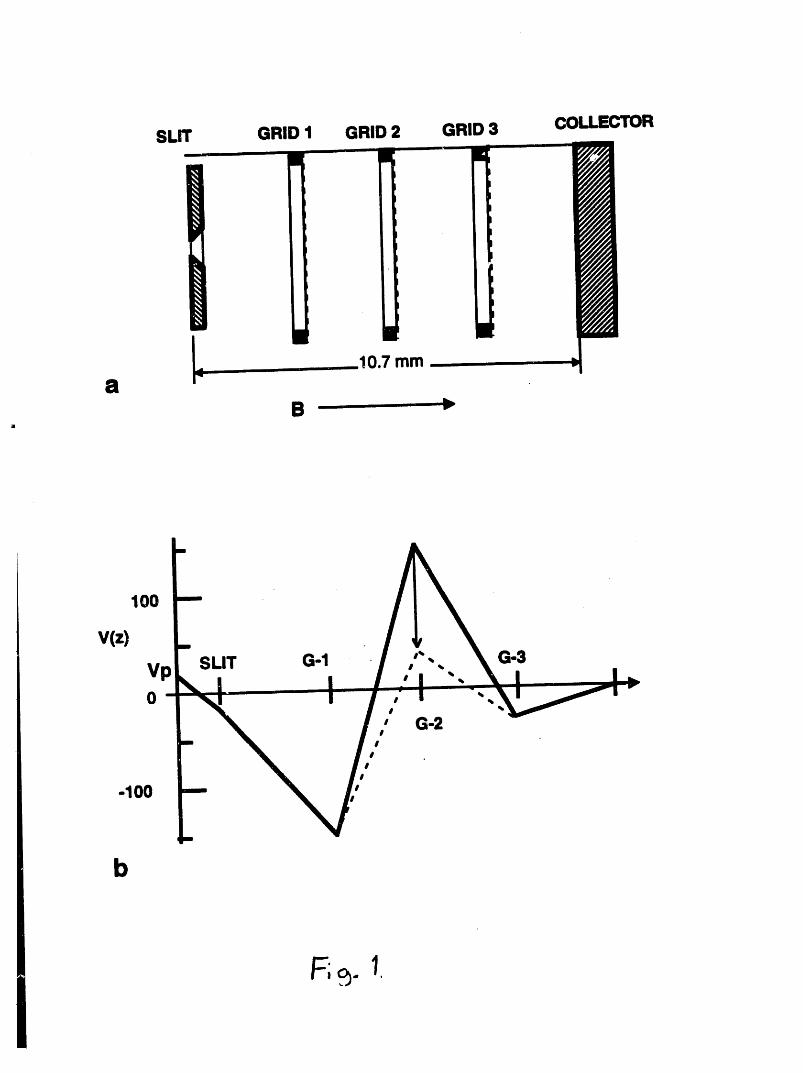
SLIT GRID 1 GRID 2 GRID 3 COLLECTOR
|
IA 10.7 mma r"
B "-
100
b

Current (a.u)

Current (mAmps) **-3

TOP VIEW of TEXT RFALocation
Rail Limiters

a
"t60 ..., , , , .... , .... , .... I ....
---=-- Ti e-side
50 --_- Ti i-side
" __q.__ _//_ --&-Te e-side40 L--_ Te n-side
30 -
[" 20
10
026 27 28 29 30 31
r (cm)
0 ni i-sideb --.- Lc eside . ni e-side
l..c i-s_de ...x. ne Langm. Pr.
30 1013
25 ×_-x.,_ X,.x . _ 1012
0 "'× i
"Xx.._x.x -..20- o ! gi pl,
B o o o _ lo II '_" a
10 _ _j 101 o5 " i
0 ____..___ _10 9Limiter _-
26 27 28 29 30 31r (cm)
F/_.g

INITIAL RESULTS FROM A CHARGE EXCHANGE q-DIAGNOSTIC ON TEXT-U*
P. M. Valanju, L. Duraiappah, Roger D. Bengtson, Y. Karzhavin, and A. Nikitin
Fusion Research Center
The University of Texas at Austin
Austin, TX 78712
Abstract
We present initial results from a new q-diagnostic for TEXT-Upgrade.
This method is based on using a toroidal arrayof detectors to determine
the plane in which beam-injected neutrals are emitted after two charge-
exchange collisions. The potential advantages are low cost, full plasma
accessibility, and good time resolution. Our initial series of experiments
on TEXT-U establish the feasibility of this technique.
Introduction
Valanju I has proposed a new way of measuring the direction of the internal magnetic
field of a tokamak using fast ions injected by a neutral beam in a plane perpendicular to the
toroidal field. A schematic is shown in Fig. 1. The fast beam neutrals injected along a central
chord by the vertical diagnostic neutral beam can penetrate the entire plasma. Some are ionized
by charge exchange or electron (or ion) impact ionization. They are confined, perhaps trapped
by toroidal ripple, to gyrate around the local magnetic field with a small vii and large v.L, and
drift vertically. These fast ions can leave the tokamak in a plane perpendicular to the local
magnetic field after another charge exchange reaction with a neutral in the plasma or the beam.
Another possible process is that of dissociation of the molecules injected by the beam 2. In
either case, the plane in which the neutrals leave can be located by a toroidaily spaced arrayof
neutralparticle energy analyzers set to receive only the fast neutrals. The toroidal location of the
peak in the signal, which can be monitored continuously, measures the direction of the
magnetic field at a single point in the plasma dcf'medby the intersection of the neutral beam and
the viewing lines of the detector array. The magnetic field distribution at all points along the
neutral beam can be measured either by scanning the detectors in a vertical plane, or using
many detector arrays simultaneously.

There are four potential advantages of this technique. The expected count rate in TEXT
is a few megahertz, with a high signal to noise ratio. This allows a time resolution better than0.5 ms with our modest diagnostic neutralbeam. Any plasma process that impartsa finite vii to
the trappedions also clears them out of the viewing region, leading to a signal that is naturally
dominated by ions injected with vii ---0. This automatic selection also tends to select only those
particles in the center of the beam which are perpendicularto the local magnetic field. The same
apparatus can in principle be used to measure ion temperature by scanning for lower energy
neutrals. Finally, since .the neutral beam can penetrate the plasma at all densities, and the
location of the maximum signal is independent of its absolute magnitude, our method should be
able to monitor q(r) in interesting plasma operating regimes which were previously
inaccessible. This includes high densities, sawtoothing plasmas, and current profile evolution
during disruptions and L-H mode transitions.
The apparatus we have built and installed on TEXT-U consists of 20 collimator tubes
aligned to view a small region on the beam chord, a set of 20 carbon foils (100 ,_ thick) to strip
the neutrals, a 900 cylindrical electrostatic energy analyzer (CEA)3, and 20 channel electron
multipliers (CEM's). This allows an angular resolution of 0.3 degrees, and covers a total of 3.2
degrees on either side of the radial direction. The viewing region is a cylinder of cross section 2
cm2 cutting across the beam of diameter 6 cm. All this is housed in an assembly which can be
moved vertically betweea shots to point at any radial location along the beam. The background
rate, part of which is due to UV photons, is subtracted from the rate observed during the beam.
We can operate the analyzer at a fixed energy, or sweep the voltage in time to produce an energy
and toroidal angle spectrum. Thus the q diagnostic can also measure ion temperature as well as
toroidal main ion rotation speed by observing the energy spectrum and the toroidal asymmetry
of plasma ions emerging as neutrals after single charge exchange with beam neutrals. However,
since carbon stripping foils are inefficient for ions below 3 kV, this cannot be done on TEXT-U
where the ion temperature is below 1 kV.
TEXT-U is an ohmicaUy heated tokamak with major radius 1.05 m, minor radius 0.27
m, and toroidal field up to 2.8 T. The diagnostic neutral beam (DNB) energy can be varied from
25-50 kV with beam currents from 2-6 amps. The beam consists of four energy peaks, at
E,E/2,E/3, and E/18, all of which can be seen i,nour first data (Fig. 2) taken with the hydrogen
beam injected into neutral hydrogen gas, witl,,only the toroidal field turned on. The peak widths
are consistent with the energy resolution of the spectrometer. A composite plot of simultaneous
count rates from the CEMs shows a peak at a toroidal angle (0) of-0.20 and full width of 20,

most of which comes from the angular divergence of the beam. This provides us with the
reference radial direction. Similar plots of count rate vs. theta at different radial locations are
obtained when a plasma is present.
The angular and the radial resolutions we obtain are limited by the large beam diameter.
The observed signal is a sum over the pencil shaped viewing region over which the toroidal
angle of the local B field (and hence the local e) varies by a significant amount, thus broadening
the peak in O.However, we can improve the fmal resolution by using an inversion procedure in
which a q profile is assumed from which signal profiles at all radial locations are calculated
using a beam simulation routine which uses the measured plasma current (Ip), density (ne),
toroidal field (Bt), beam voltage (VB), beam current (IB), and the known detector geometry.
The q profile parameters are then fixed by fitting the signal vs. 0 profiles at all radial locations
simultaneously. Figure 3 shows a plot of count rate as a function of toroidal angle for plasma
conditions BT = 2 T, fief 2x10¹⁹m "3, and Ip = 200kA, where the analyzer is viewing a
position near the plasma center.
We use a model q profile which accommodates the central (qo) and edge (qw) values,
and the profile curvature parameter (_,)
r t _ •"lllk
5Br= ---- is calculated from measured Bt and Ip. For proper choice of _,, this profile
where qw R/p
is a good approximation for the profile consistent with Spitzer-resistivity and a parabolic
temperature profile. The simulation routine uses many beamlets over the beam cross section.
Each beamlet penetration is calculated using the 3-d neutral transport code NUT 4. Cylindrical
Shafranov geometry is used to calculate the local B field direction from the given q profile. The
two parameters qo and Z are varied to obtain the best fit to the data. The fit is most sensitive to
qo. The results of one such fit are shown in Fig. 3, for which we obtain a central qo between
0.8 and 1.4 and Z =1. We also show the predicted location of signal peak at different radial
locations for an ideal thin beam for the same shot in Fig. 4.
There are some unexplained features of the date which should be noted. When
observing a plasma, we are able to see signals from the half and third beam energy components.
Both 1/2 and i/3 beam energies give equivalent q profiles. However, we do not observe a full
energy peak when the neutral beam is injected into a plasma, while _e do see a full energy
component when injecting into a neutral gas. Two possible explanations for this observation

are that orbit motions have moved the full energy particles out of our observing volume, or that
we are viewing the fast dissociation of a molecular beam as proposed by Herrmann2. The
decrease of our measured signal as we scan along the beam path is consistent with the calculated
attenuation of an atomic beam rather than a molecular beam. Research is continuing on this
point.
Figure Captions
Figure 1. Schematic of the charge exchange q diagnostic.
Figure 2. Count rate in central channel vs. energy selected by swept electrostatic analyzer
for the beam-into-neutral-gas case with a 32 kV beam energy. The width and location of each
of the four peaks is consistent with the energy resolution of the analyzer and energy straggling
in carbon foils.
Figure 3. Count rate vs. angle for the beam-into-plasma case with the analyzer viewing the
center of the plasma. The predicted best fit signal is shown by the solid line. Simultaneous fits
to I0 such prof'dcsat I0 different radial locations (at 2 cm intervals) arc used to obtain the be.st
fit parameters.
Figure 4. Predicted location of signal peak at different radial locations and average of q
over the cylindrical viewing region for the same shot as in Fig. 2. The small shift in the peaklocation near zero is from the Shafranov shift.
References
I. P. M. Valanju, University of Texas FRCR #331, January 1989 and P.M.Valanju, etal Rev. Sci. Instrum. 61 2935 (1990).
2. W. Herrmann, Plasma Physics and Controlled Fusion 32 605 (I 990).
3. P. Beirersdorder, A. L. Roquemore, and R. Kaita, Rev. Sci. Instmm. $8 2092
(1987).
4. P. M. Valanju, J. Comput. Phys. 88 114 (1990)
*Supported by USDOE under grant DE-FGOS-88ER-55267 and by the Texas Advanced
Research Program under grant No. 3658.139.

J_6ct(_
Radial
directionNeumd II
. Fig. I

6OO
Counts/ms E_ KV
4OO
2OO F_ ..F_$
00 10 20 30
Neutral Energy (keY)
Fig. 2

Counts/ms
21111
0-4 -3 -2 -1 0 1 2 3 4
Toroidal angle (degrees)
. Fig. 3

1 5 ........ _.........., "' " 'I _ _ • " • ' --6
1.4 4Location or expected toroidal peak
1.3 2
q(r) eo
1.2 0
q
I.I -2
1 -4.0 -I0 -5 0 5 I0
Y (cm) along the vertical beam chord
" Fig. 4

A Method for Neutral Spectra Analysis Taking Ripple-Trapped ParticleLosses into Account
A.Yu.Dnestrovskijl,2, Roger D. Bengtson 2, Yufi Karzhavin2, and A. Ouroua3
IKurchatov Institute, Moscow, Russia.
2FusionResearch Center, The University of Texas at Austin, Austin, TX.
3Rensselaer Polytechnic Institute, Troy, NY.
Abstract.
An analysis technique of charge exchange neutral spectra is proposed
and tested to obtain ion temperatures of a tokamak plasma. The
technique models the deviation of the ion distribution from
Maxwellian because of ripple trapped particles and introduces a hot
ion effective temperature as a fitting parameter. The analysis code has
been used to analyze active charge exchange data from TEXT
discharges in which a significant up-down asymmetry in the neutral
spectra was noted. An analysis considering ripple trapped particles
removed some of the asymmetry and indicated the need for another
mechanism for distorting charge exchange specwa.
Introduction
For the study of confinement properties and transport processes in high temperature
fusion plasmas, a detailed profile of ion temperature is needed. One technique for
obtaining ion temperatures is the charge exchange technique where plasma ions become
neutrals via a charge exchange reaction and escape from the plasma. The escaping neutrals
are detected and analyzed. If a beam of energetic neutralatoms is injected into the plasma,
it enha:,_es the charge exchange flux and allows a local measurement of the ion
temperature. The usual assumption is then made that the local ion energy distribution is
MaxweHian and the ion temperature is obtained from the slope of the energy spectra of the
emitted neutral particles. However, for many regions of tokamak operation, the energy
spectra of the escaping neutrals does not fit a single Maxwellian ion distribution and a
straight forward interpretation of the energy spectra may lead to asymmetric and unphysical
ion temperature profiles. In particular, hot ions trapped in t0roidal magnetic ripples can
cause significant distortions of ion distribution functions from a local Maxweilian
distribution. In this manuscript we develop a new analysis procedure for obtaining ion

temperatureprof'des from active charge exchange data and analyze TEXT data for a plasma
condition with a strong up-down asymmetry.
Description of method
A ripple in the toroidal magnetic field creates local magnetic wells which can change
hot ion transport from a diffusive process to a convective transport with particles drifting
across magnetic surfaces. This can cause a significant distortion of the ion distribution
function from a Maxwellian at locations away from the center since trapped hot ions move
quickly from the hot central p_urtof the plasma towards the edge. Following the work1-3
of Gurevich et a/and Berezovskij et al, we model the ion distribution function with
"Cle-E/Tt(r),E < Eo
f(r,E)-- C2e-E/Th,Eo <E<E. (1)
C3e-E/%,E_ < E
as is shown in fi ,,ure 1. The two characteristic energies in the model distribution function
are Edr, the drift energy in the magnetic ripple,2
)7 (2)
and Eo is the energy at which hot ions become importan I' _'_d is defined
•by Eo=Edr*Ti(r)/To. A is the depth of local magnetic wells along the magnetic field lines,
_, is the Coulomb logarithm, R is the major radius, and a is minor radius. Ti(r) is the ion
temperature at position r which corresponds to a Maxwellian distribution, Th is effective
ion temperature in the energy ranges indicated where the observed spectra may be distorted
by hot ions, and To is central ion temperature. In our experiments, Edr is high and not
in the energy range of our data.
The ion temperature profde is assumed to be constant on a flux surface and to have
the form Ti(x) =T o (!-xa)P where a, _, c and To are unknown parameters to be foundl+cx 2
from the fitting procedure. The set of parameters a, [}c, To, and Th are found from the
procedure of functional minimization between experimental spectral dataand the theoretical
spectra. The function to be minimized is
J= J((z,[_.c,To.Th) = IE_dE0(Et l_ixp(E)' AiFi(E)_ 2i=tE_. Fi(E) ) (3)
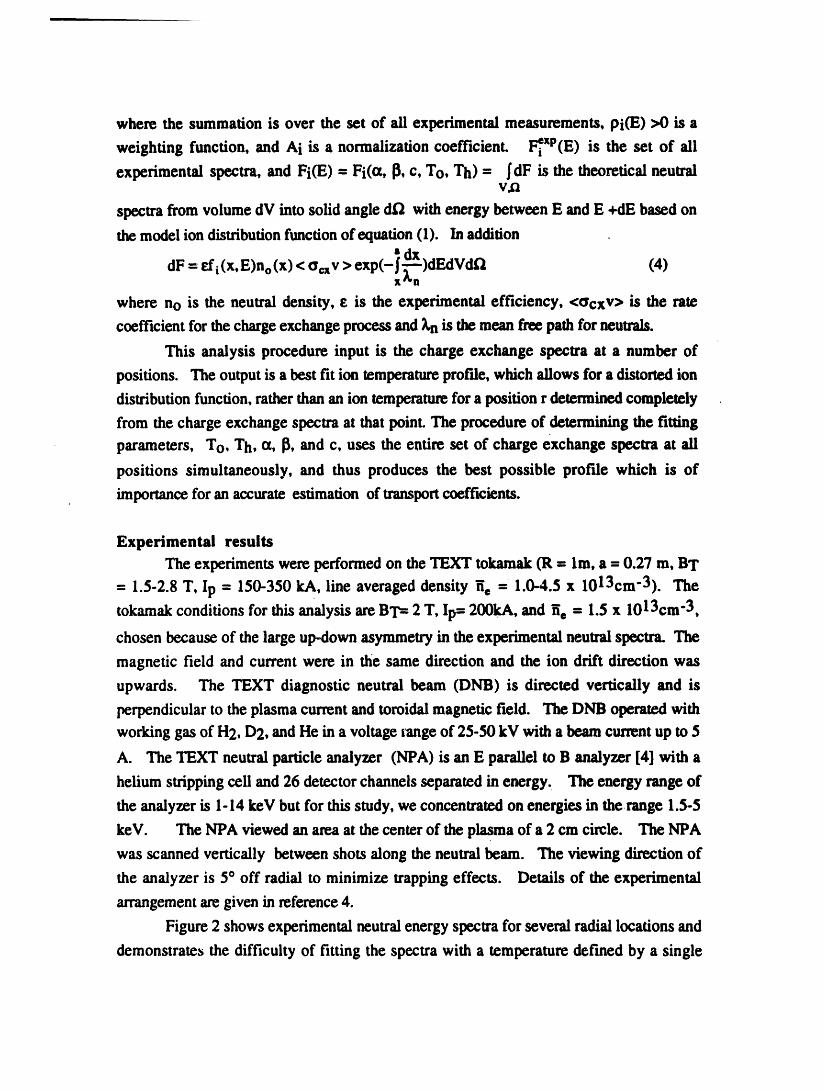
where the summation is over the set of all experimental measurements, pi(E) >0 is a
weighting function, and Ai is a normalization coefficient, l_iXP(E) is the set of all
experimental spectra, and Fi(E) = Fi(cz, 13,c, To, Th) = _dF is the theoretical neutralv_
spectra from volume dV into solid angle d_ with energy between E and E +dE based on
the model ion distribution function of equation (1). In addition
dF -- _i(x,E)no(X) < a_v > exp(- dEdVd_ (4)g-wII
where no is the neutral density, e is the experimental efficiency, <acxV> is the rate
coefficient for the charge exchange process and kn is the mean free path for neutrals.
This analysis procedure input is the charge exchange spectra at a number of
positions. The output is a best fit ion temperature prof'de,which allows for a distorted ion
distribution function, rather than an ion temperature for a position r determined completely
from the charge exchange spectra at that point. The procedure of determining the fitting
parameters, To, Th, ¢x, 13,and c, uses the entire set of charge exchange spectra at all
positions simultaneously, and thus produces the best possible profile which is of
importance for an accurate estimation of transportcoefficients.
Experimental results
The experiments were performed on the TEXT tokamak (R = lm, a = 0.27 m, BT
= 1.5-2.8 T, Ip = 150-350 kA, line averaged density fie 1.0-4.5 x I013cm-3). The
tokamak conditions for this analysis are BT= 2 T, Ip-- 200kA, and fie = 1.5 x 1013cm -3,
chosen because of the large up-down asymmetry in the experimental neutral spectra. The
magnetic field and current were in the same direction and the ion drift direction was
upwards. The TEXT diagnostic neutral beam (DNB) is directed vertically and is
perpendicular to the plasma current and toroidal magnetic field. The DNB operated with
working gas of H2, D2, and He in a voltage l_angeof 25-50 kV with a beam current up to 5
A. The TEXT neutral particle analyzer (NPA) is an E parallel to B analyzer [4] with a
helium stripping cell and 26 detector channels separated in energy. The energy range of
the analyzer is 1-14 keV but for this study, we concentrated on energies in therange 1.5-5
keV. The NPA viewed an area at the center of the plasma of a 2 cm circle. The NPA
was scanned vertically between shots along the neutral beam. The viewing direction of
the analyzer is 5 ° off radial to minimize trapping effects. Details of the experimental
arrangementare given in reference 4.
Figure 2 shows experimentalneutral energy spectra for several radial locations and
demonstrate_ the difficulty of fitting the spectra with a temperature defined by a single

Maxwenian distribution. There is also a sigr_cant up down asymmetry in the energy
spectra which results in very different ion temperatures in the top and bottom of plasma
when fit with a single Maxwellian distribution.
To test this analysis technique under conditions of a dramatic up-down asymmetry
(low density, low magnetic field) we have analyzed the charge exchange spectra for the top
and bottom independently. We assume, with support from experimental data, that the
population of trapped and non thermal particles in the lower half is small and trapped ions
VB-drift to the upper half where there is a significant distortion from a single Maxwellian
ion distribution. Figure 3 shows temperature profiles in the bottom and top plasmas along
with temperatures reduced from assuming a local Maxwellian distribution. There is little
difference between the ion temperature profde calculated from the minimization technique
and the assumption of a local thermal distribution in the bottom half of toms. Several
points are clear from these data reductions: first, the assumption of a l_cal Maxweilian
distribution in the upper half is not appropriate, second, the ion temperature profiles are
closer to symmetric when analyzed with the model ion distribution function of eq I and
third, there is still a significant distortion of distribution function which is not accounted for
by the tipple trappedmodel.
We can speculate about additional effects which could be relevant in producing the
up-down asymmetry observed at low density, high current conditions. In the original
development of tipple trapped ion theory by Gurevich I there was an assumption of no
radial electric field. However, there are radial electric fields in tokamak plasmas and the
radial fields could be important in the transport of trapped ions5. Another possibility is
halo neutrals in the analyzer collecting volume 6. The halo neutrals may contribute to the
active charge exchange signal by a second charge exchange event in the entire analyzer
collecting volume which may include regions with a large trapped ion population.
Furtherresearch is underway to quantify the effects of radial electric fields and halo effects
on trapped particle distributions, and thereby their importance in ion temperaturemeasurements.
Acknowledgments
This work was supported by DOE Grant # DE-FG05-88ER-53267 and National Academy
of Sciences NAO/CAST program. The authors wish to thank Dr. P. Yushmanov for
helpful comments.
References
1. Gurevich, A.V., Dimant, Ya.S., Nucl. Fusion21, 159 (1981)
2. Berezovskij, E. L., Izvozchikov, A. B., et al, Nucl.Fusion 23, 1575 (1983)
3. Berezovskij, E. L., Dnestrovskij,Yu. N., et al, Nucl. Fusion 27, 2019 (1987)4.Ouroua,A.Dissertation.UniversityofTexasatAustin(1989) and FRC
report #343. See also A. Ouroua,A. J. Wootton,et al NuclearFusion, 30,25S5(1990)
5. Gentle, K.W. and Hazeltine,R. D., Phys. Fluids B 3, 3198 (1991)6. B.C. Stratton,R. J. Fonck, et al, Nucl. Fusion 30, 675 (1990)

Figure CaptionsFigure 1 Ion distributionfunctionvs energy.Ti is theion temperatureon a magnetic
surface,This the effective temperaturein the intermediateenergyzone, and
TOis thecentralion temperature.
Figure2 Measuredenergyspectraat locations r= 9 cm O, 13 cm A, and 15 cm A,indicatinga non MaxweUiandistribution.
Figure3 Solidline-Ion temperatureprofdesreducedindependentlyfrom the lower
and tophalfof toms. A Iontemperatureredtred assuminga localMaxwellian distribution.

Edr E
ThInfi T
i
Figure 1

I
O r=9 cm--, & r:13 cmuJ 26 0 A r=15 cm"_ 0
A_.Ooo2' _ A Oo
_ _,_o22 A_OO O -_ A20 - , " ' " ' "
2 3 4 5
E keV
Figure 2
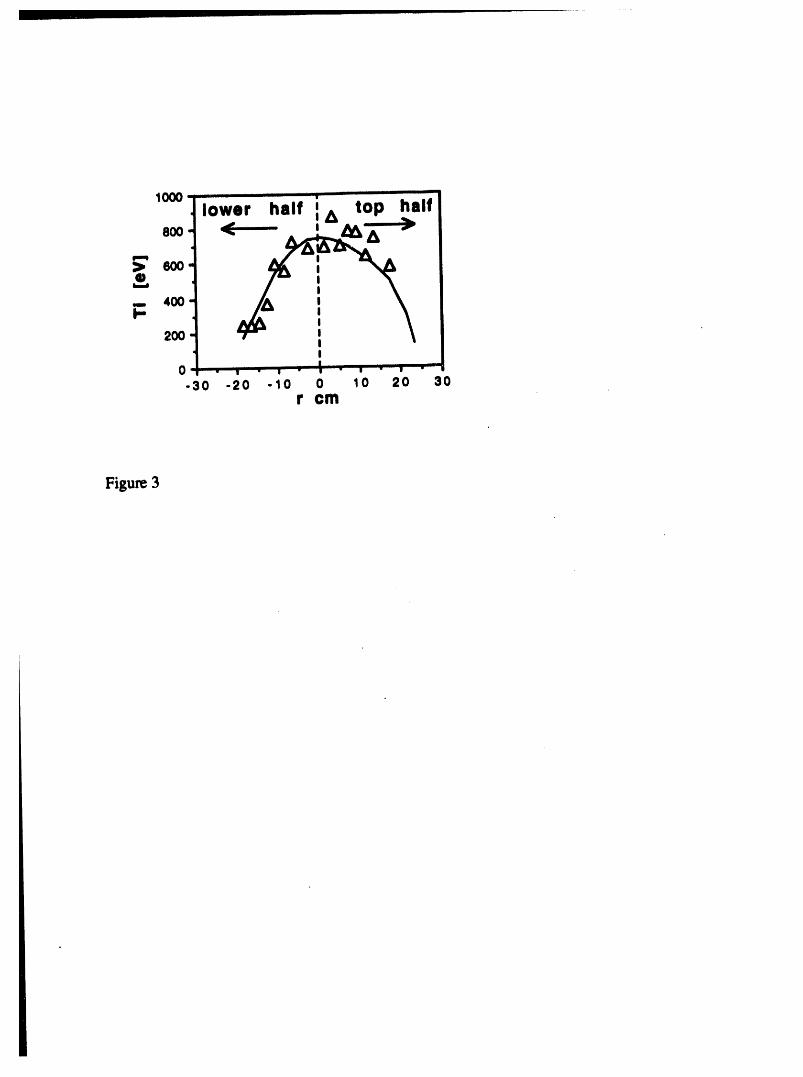
2_
ol . , • , .'l - , - , -_-30 -20 -i0 0 10 20 iO
r cm
Figure3

!
lApplication of a Three Sample Volume S(k,co) Estimate to
Optleal Measurements of Turbulence on TEXT
P. D. Hurwitz, William L. Rowan
Fgsion Research Center, The University of Texas at Austin, Agstin, Texas 78712
The flexibility and non-intrusivenatureof spectroscopicmeasurementscan complement
results from Langmuir probes by extending fluctuation measurements to otherwise
inaccessible regionsof the plasma. OnTEXT, studies of fuctuafions in Ha light using a
photodiodearray(PDA)detectorI haveyieldedestimatesfor fluctuationcharacteristicsthat
are in qualitativeagreementwith those from probes. The most obvious limitation of this
spectroscopicdiagnosticis its extendedradialviewing volume whichoverlapsthe naturally
occurringvelocity shearlayerjust inside the lastclosed flux surface (LCFS). We present
herea three samplevolumeestimate for the spectraldensityfunction$(k,(o)whichmodels
the PDA signal as consisting of two modes in k space correspondingto the contributions
frominsideandoutsideof the shearlayer. Thismethod aids in the radiallocalizationof the
PDA measurementandmaybe appliedto otherdiagnosticsas well.
I
I. INTRODUCTION
If high edge temperatures and densities prevent the use of
Langmuir probes in next-generation tokamaks such as TPX,
alternative fluctuation diagnostics will be necessary. On any
machine, in fact, probes are limited to a few fixed locations due
to size considerations and their need for direct contact with the
plasma. Spectroscopic measurement of line emission provides an
alternative to probes that does not suffer these specific limitations.
For example, studies of Ha light using a photodiode array (PDA)
detector 1 have yielded estimates for fluctuation parameters in the
edge of the Texas Experimental Tokamak (TEXT) that are in
qualitative agreement with those from probes. The spectroscopic
diagnostic has its own limitations, of course. The most obvious of
these is its extended radial viewing volume, which overlaps the
naturally occurring velocity shear layer at r = rs just inside the
LCFS. The average poloidal wavenumber k and phase velocity
measured by probes changes sign inside of this layer. We expect
and indeed find that the spectral density function S(k,o) measured
by the PDA reflects the presence of both positive and negative k
features in the chord integrated signals. Traditional estimates for
S(k,_) using data from two sample volumes cannot adequately
describe such a distribution. In this paper we present a method
for estimating S(k,o0) using three sample volumes which can in
fact detect the presence of two modes in k-space. This is
equivalent to separating the contributions from r < rs and r > rs,
2

providing improved spatial localization of the PDA data. The
method also allows for a white (k-independenz) electronic noise
component in the signal, which can be appreciable at high
frequencies. Other diagnostics, suc(J as BES 2 which have
observed dual modes in core turbulence may benefit from this
_hniquc as well.
The optics for the PDA consists of a simple lens and an
interference filter to image line emission from the plasma edge
onto a 32 element linear photodiode array with unity
magnification, as shown in Fig.l. Each diode's amplifier
provides a constant transimpedance gain in the range of 105-106
V/A up to 100 kHz. The poloidal separation between sample
volumes in the plasma is equal to the 1 mm separation between
diode centers on the array. The radial distribution of Ha
emission, peaked strongly near the LCFS, provides natural radial
discrimination in a tokamak. The PDA signal is a chord average
over both the near and far edges of the plasma, buz because the
transverse dimension of the viewing chords on the far side, about
20 cm, is much larger than the fluctuation scale lengths, spatial
averaging greatly attenuates the far side contribution.
The PDA provides an excellent test case for the S(k,e_)
estimation method discussed below for two reasons. First, as
already noted, we expect that two modes which have been well
diagnosed by reciprocating probes should be present in the PDA
signals. Secondly, we have obtained some data in which the
signals from 16 equally spaced diodes were recorded
simultaneously, allowing us to compute S(k,e)) using a full spatial
3

and temporalFourier transform. These results will be compared
with three sample volume estimate, which of course can be
obtained without the data acquisition costs of recording 16
channelson a routinebasis.
II. DESCRIPTION OF S(k,00) TECHNIQUE
The following discussion presumes the measuredturbulence
satisfies the random phase model, i.e. that it consists of a set of
uncorrelated modes. The spectral density function completely
describes the fluctuationsonly if this is true. Carlson3 has shown
that in this case the maximum amount of informationobtainable
from measurements made at two point is contained in the power
spectrum
and complex coherence,definedexperimentallyas
7(o)) = _p,i,,(_)p2 (0) ' (2)
where $1, $2 are the Fourier spectra of the fluctuating quantity
measuredat points x I and x2 and the bracketsdenote an ensemble
average. Because each frequency component can be considered
independently, we will omit the argument co in subsequent

equations. Information about the S(k) distribution is reflected in
the coherence because in the random phase model
3'(x) = SS(k)e_ dk (3)_S(k)dk '
Expanding both sides of this equation for kx << l, we see that
derivatives of the coherence are related to moments of the S(k)
distribution,
¥(0)=1, y'(0)= _ikS(k) dk_S(k)dk (4)
k)dk "'"
If measurements are made at two points separated by a distance d,
one usually defines a local kl and Olfrom the measured coherence
as
10_d2V(d)=eiklde -] I , (5)
so that in the small d limit, kl and Ol are indeed the mean and
standard deviation of the S(k) distribution. No additional
information is obtainable from a two point measurement,
however.

Using three sample volumes located at distances x = 0, x -
d, and x = 3d, the complex coherence can be obtained at three
spacings d, 2d, 3d. This provides 6 independent parameters (as
compared to 2 for the two point measurement) which can be used
to obtain information about S(k). In this paper we choose a
model S(k) with 7 free parameters that includes two features in k-
space to represent the contributions from both sides of the shear
layer. The model S(k) is of the form
S(k) = AexpI(k-kl)2 ] [ (k- k2)2 ]2_12 +Bexp 2_ 2 +C, (6)
where C represents the amount of electronic (k-independent)
noise in the signal. The corresponding form for the coherence is
10,2x2 1 ty_x 2),(x)= aeiklx e- _" 1 +beik2x e- _- 2 (7)9
+ (1 - a - b)Sx, 0
where a and b are the fractions of the total power in each of the
= two modes. Setting the coherence given by (6) at x = d, 2d, 3d to
the measured values results in 6 equations that can be used to
solve for the parameters a, b, k 1, etc.
This system of equations can be solved using a nonlinear
root finding algorithm such as Powelrs method which requires a
user supplied Jacobian and an initial guess at the solution. To
ensure the algorithm finds the best solution (in the least squares
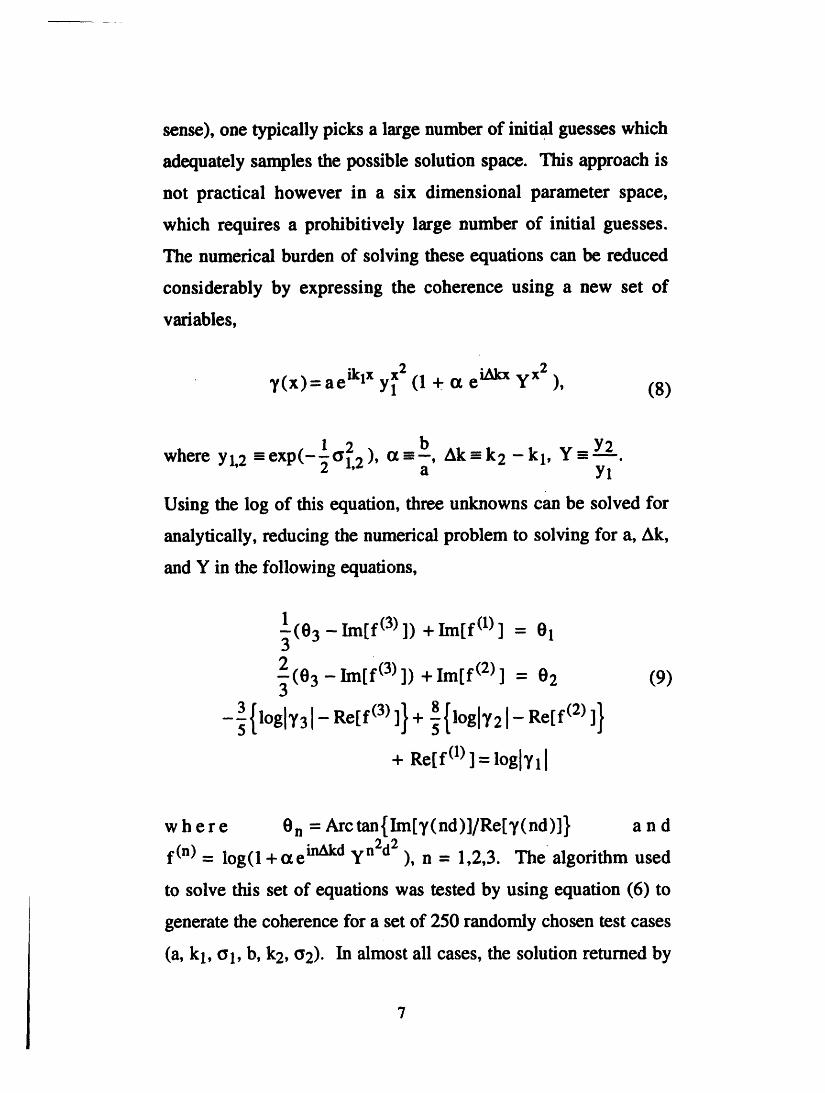
sense), one typically picks a large number of initial guesses which
adequately samples the possible solution space. This approach is
not practical however in a six dimensional parameter space,
which requires a prohibitively large number of initial guesses.
The numerical burden of solving these equations can be reduced
considerably by expressing the coherence using a new set of
variables,
x2 eiAkxY(x)=aeiklx Yl (1 + a yX2 )' (8)
la2 b Ak=k 2 kl ,Y Y2where y1,2 - exp(- _ 1,2 )' (Z-----, - - .a Yl
Using the log of this equation, three unknowns can be solved for
analytically, reducing the numerical problem to solving for a, Ak,
and Y in the following equations,
(0 - Ira[f(3) ]) + Im[f (1)] = O12
-_(03 - Im[f (3)]) + Im[f (2) ] = 02 (9)
__ 8 ]}3{logic,3[- RerfC3)3}+_-{Sogl_'2I- Re[fc2)5
+ Re[f0)]=1og1¥11
where On = Arc tan { Im[_,(nd)]/Re[ _,(nd)]} and
f(n) = log(1 +cte inakd Yn2d2 ), n = 1,2,3. Thealgorithm used
to solve this set of equations was tested by using equation (6) to
generate the coherence for a set of 250 randomly chosen test cases
(a, k l, C_l,b, k2, a2). In almost all cases, the solution returned by

II i ii
the algorithm matched the known solution exactly, as shown in
Fig. 2. For a few cases, an alternate root was found.
IIl. APPLICATION TO PDA DATA
By Fourier transforming the signals from 16 diodes in
space and time for a Bt = 22 kG, Ip = 220 kA, ne=4"1013/cm 3
discharge, we obtained the S(k,ca) distribution shown in Fig. 3(a).
The figure represents an ensemble average of 972 realizations of
the data from 4 identical discharges. Here, positive k corresponds
to the electron drift direction. At frequencies below 40 kHz, the
mean k is negative and varies linearly with ca,while above 70 kHz
the dominant k component is positive and presumably represents
the contribution originating from fluctuations inside the shear
layer. At intermediate frequencies, the two modes appear in
about equal proportion. Previous comparisons with Langmuir
probes have shown this partial separation of modes in frequency
space can be attributed to the radial variation of the IHe(ca)l
spectra which peak strongly at low frequencies in the SOL but
become broader inside the shear layer. In Fig. 3(b) the same data
has been used to calculate S(k,ca) using the three point method. It
reproduces the main features of the true distribution, even at high
frequencies where s/n falls to 0.1. The three point S(k, ca)
identifies the region where both positive and negative k features
are present, but occasionally chooses a one Gaussian solution that
covers both features.

I
We also show a comparison of two Bt = 22 kG, Ip = 230
kA, ne = 2.5"1013/cm 3 discharges with different major radii. As
the plasma is moved closer to the outboard neutral sources (the
rail limiter and the vessel wall), we expect the Ha distribution to
overlap more of the shear layer and increase the r < rs
contribution to the PDA signals. The data for a 16 point Fourier
transform was not obtained for these discharges. The three point
S(k,o_) distribution shown in Fig. 4(a) is for a plasma centered +1
cm outboard of the vessel center. At all frequencies, only one
feature in k space is seen. The peak k is negative, indicating tittle
contribution from r < rs. The distribution for a +3 cm discharge
is shown in Fig. 4(b). A small but persistent k > 0 feature
appears above 30 kHz, showing the measureable portion of the
signal which originates from inside the shear layer.
IV. CONCLUSIONS
We've developed a technique to estimate S(k,o_) using three
sample volume measurements. The method is especially suited
for turbulence data in which two modes may be present. When
applied to data from the PDA, the resulting S(k,to) estimate
agrees well with that obtained by a 16 point Fourier spatial
transform. This analysis provides a way to estimate the
contribution from each side of the velocity shear layer and
thereby helps to localize the PDA measurement. We are
currently exploring other ways to overcome the limitations
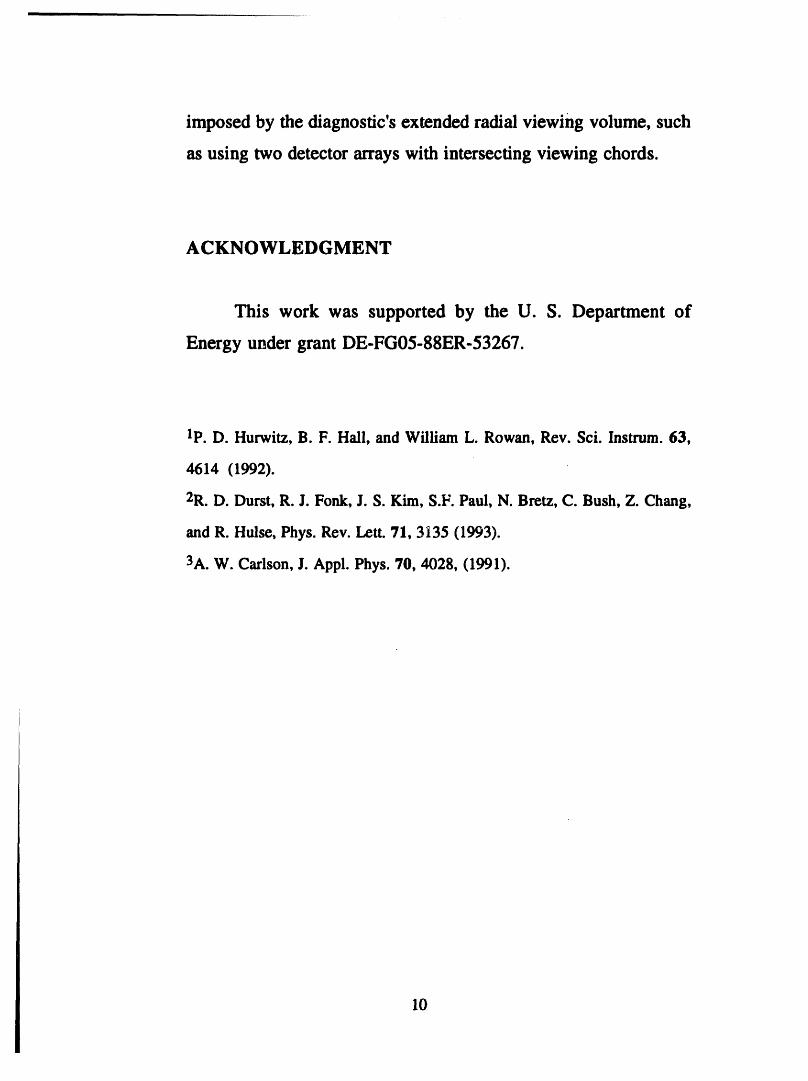
imposed by the diagnostic's extended radial viewing volume, such
as using two detector arrays with intersecting viewing chords.
ACKNOWLEDGMENT
This work was supported by the U. S. Department of
Energy under grant DE-FG05-88ER-53267.
1p. D. Hurwitz, B. F. Hall, and William L. Rowan, Rev. Sci. Instrum. 63,
4614 (1992).
2R. D. Durst, R. J. Fonk, J. S. Kim, S.F. Paul, N. Bretz, C. Bush, Z. Chang,
and R. Hulse, Phys. Rev. Lett. 71, 3135 (1993).
3A. W. Carlson, J. Appl. Phys. 70, 4028, (1991).
10

bandpass filter
f= 10 cm PDA
region of significantHa emission
" Grad B
FIG. 1 Viewing geometry of photodiode array(PDA) detector. The PDA is oriented
vertically so thatthe viewing chords of adjacent diodes are separated I ram poloidally at
the focal plane of the lens.
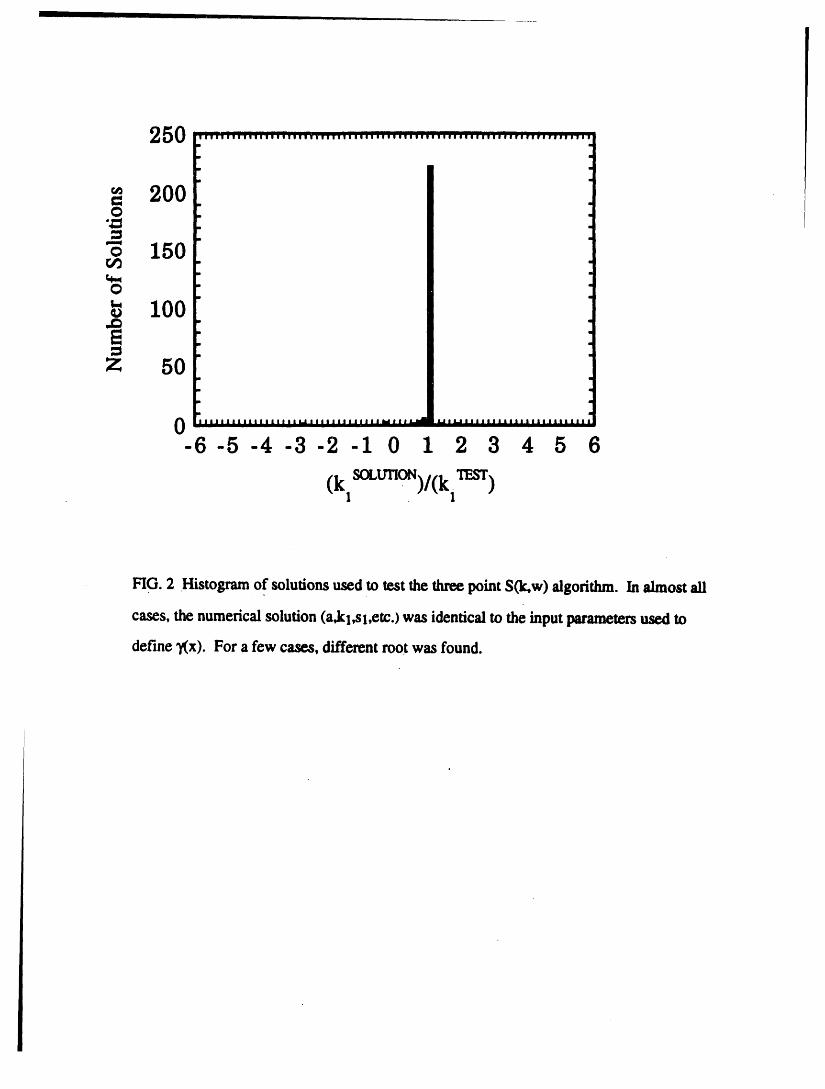
250
200o
o 150
0
o 100
z 50
0-6 -5 -4 -3 -2 -1 0 1 2 3 4 5 6
SOLUTION TEST
(k . )/(kl )
FIG. 2 Histogram of solutions used to test the three point S(k,w) algorithm. In almost all
cases, the numerical solution (a,kl,sl,etc.) was identical to the input parametersused to
define _(x). For a few cases, different root was found.
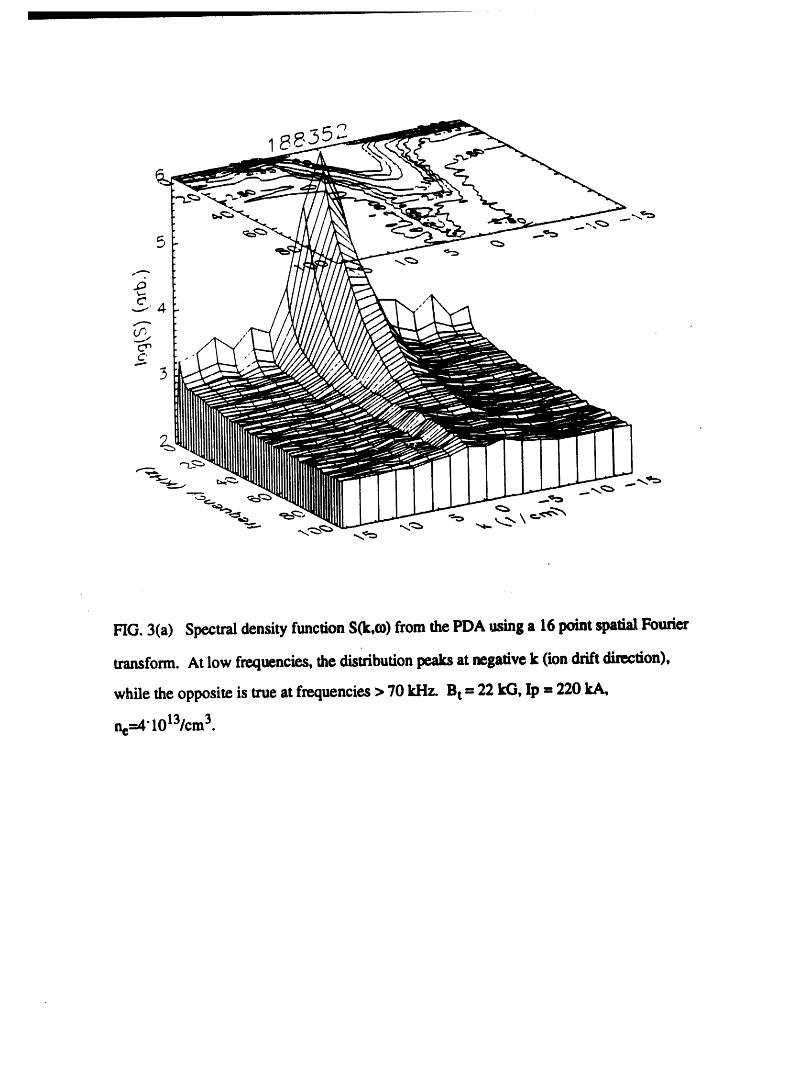
FIG. 3(a) SpectraldensityfunctionS(k,m)fromthe PDA using a 16pointspatialFourier
transform.At low frequencies,the distributionpeaks atnegativek (ion driftdirection),
while the opposite is trueat frequencies> 70 kHz. Bt-- 22 kG, Ip -- 220 kA,
he-_4"1013/cm3.
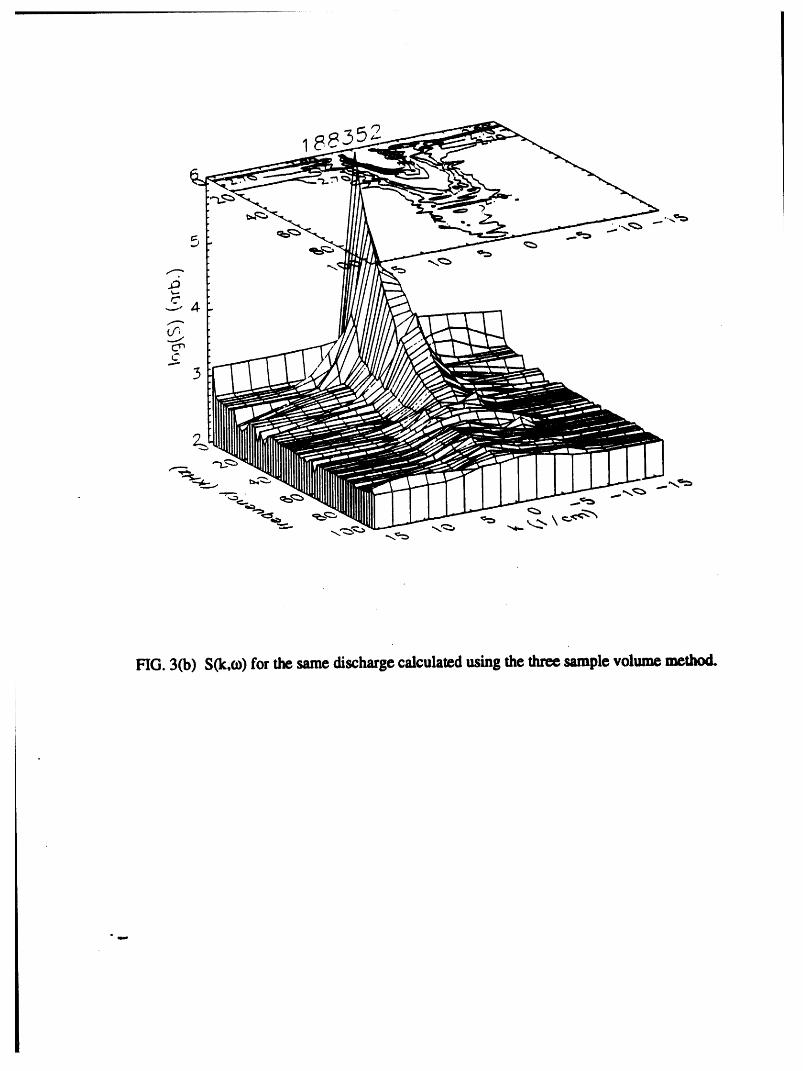
FIG.3Co) S(k,o_)forthe same dischargecalculatedusingthe threesamplevolume met_xl.

I I •
FIG.4(a) S(k,¢o)distributionfor a Bt= 22 kG, Ip= 230 kA, ne = 2.5.1013/cm3di_harge
displaced I cm outboardfrom thevessel center,
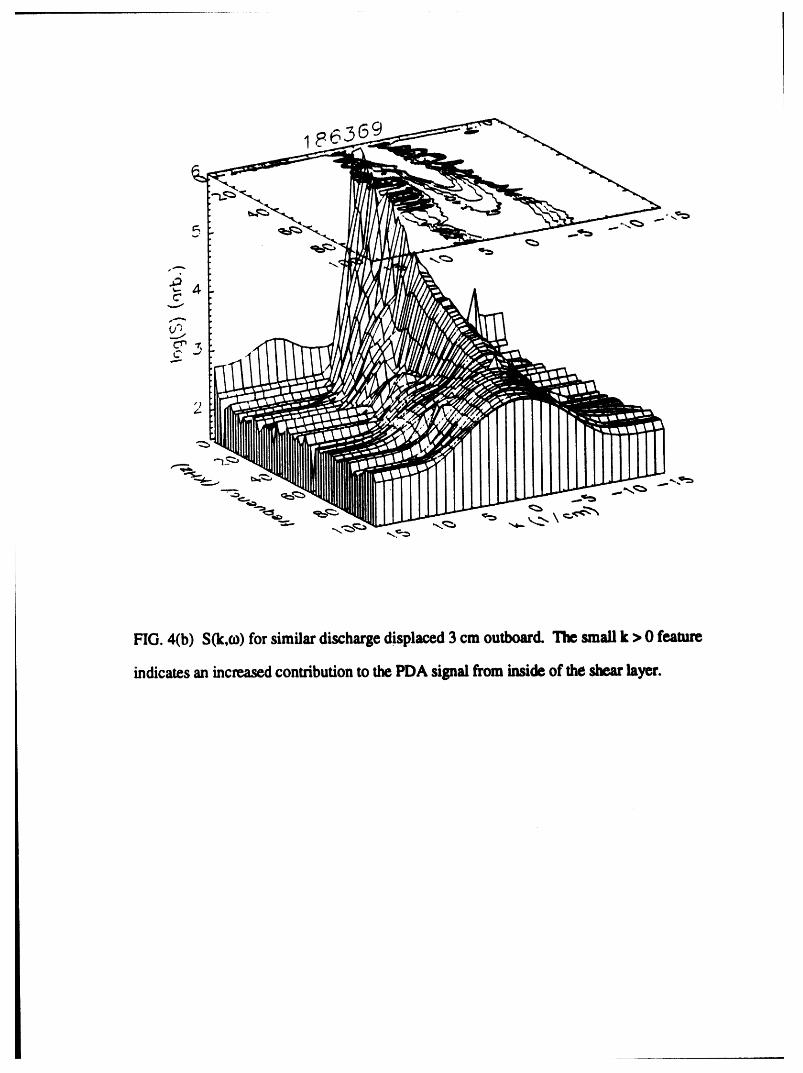
FIG. 4(b) S(k.o_)for similar discharge displaced3 cm outboard. The small k > 0 feature
indicatesan increasedcontributionto the PDAsignal frominsideof the shearlayer.

Initial Operation of the 2D FIRSIS on
TEXT-Upgrade
D.L. Brower and Y. Jiang
Electrical Engineering Department, and
Institute of Plasma and Fusion Research
University of California, Los Angeles, California 90024
May 6, 1994
Abstract
The UCLA far-infrared scattertng/interferometry system [FIRSISI on P
TEXT-Upgrade has recently been modified to include a 2D capability. Along
with the vertically viewing system, a horizontal-view has be_n added. For
interferometric measurements of the plasma density profile, the vertical view
consists of a 45 cm array while the horizontal view array spans 15 cm. Den-
sity profiles Text-Upgrade plasmas will be presented. Issues of plasma posi-
tion, profile symmetry and transport are addressed. For collective scattering
measurements of electron density fluct uations, cross-correlation of scat tered
signals from the two orthogonal views at the same wavevector will be exam-
ined. Finite cross-coherence may be used to spatially l_x'alize the flllCtUati()n
measurements.
i i I IIIll

J I. Introduction
The UCLA Far-lnfrared Scatterlng/Interferometry System FIRSIS on
TEXT-Upgrade has recently been modified to include a horizontal view ca-
pability to complement the existing vertical view. For collective scattering
measurements of electron density fluctuations, this will permit access to
the plasma edge on the high-field side along with the ability to measure the
poloidal and radial fluctuation spectra at the same spatial location. In addi-
tion, cross-correlation of the scattering signals from the two orthogonal views
at the same wave vector will be employed to improve spatial localization.
With a 2-D capability, tomographic reconstructions from the interferome.
ter data will also be possible. Issues related to plasma position and island
structure can be more directly addressed in the various asymmetric plasma
configurations of TEXT-Upgrade. Initial data from operation of the two-
view system is presented. Polarimetric measurement of the FIR laser beam
Faraday rotation to determine the plasma poloidal magnetic field profile is
also planned. *
II. 2-View Scattering
A schematic of the 2-view system arrangement for multichannel, heterc_-
dyne, collective FIR scattering is shown in Fig. l(a). The twin-frequency
. laser source is typically operated at 1220 #m (37 mW) with an difference fre-
quency of 1 MHz.[I] A heterodyne receiver system permits resolution of the
wave propagation direction for multiple modes. The vertical-view scattering
system, which he,_ previously been described in detail[2l, can be configllr_l
to simultaneously collects the frequency-shifted scattered radiati_m at six

discrete angles corresponding to 1 < k_ < 15 crn -_. The portion of the
far-infrared laser beam utilized as the probe beam is weakly ft_used along
a vertical chord to a waist of radius ao - 2 crn at the e -2 point of the in.
tensity distribution. The measured wavenumber resolution is independent
of wave vector with _k± = :i:l em -t (_- 2/ao). The length of the scatter-
ing volume along t_o varies as a function of wavenumber and ranges from
Lv = :1:8 cm (e -I point of scattered power) at k± = 12 _I_ -I to a chord
average as k± -, 0. The spatial resolution perpendicular to _, is the beam
diameter. Scattering occurs in a plane perpendicular to the toroidal mag-
netic field and when the source beam is incident upon the plasma along
a vertical chord at the tokamak major radius, scatt_.ring is primarily from
fluctuations with a polotdal wave vector k_. Radial wave vectors /_ are
measured by positioning the incident beam tangent to the pi_L_maedge.
For the horizontal-view, a similar multichannel system can be configtire_l.
To measure fluctuations with a poloidal wave vector k0, the source beam is
incident on the plasma along a midplane chord and reflecte<! on it_if from
a mirror attached to the inside wall of the vacuum vessel. The receiver
is aligned to collect scattered radiation from the wflecte<l beam. Like the
vertical view, scattering occurs in a plane perpendicular t_> the t_rc_id+ti
magnetic field. By moving the incident beam alcove _r below the mi(lplane.
one can also investigate fluctuations with radial wave vect_r kr.
A limitation of scattering systems is that ._patial re._<_hlti_n gt>es t_ a
chord average as the fluctuation wavelength incre&_es. Tw_ view s_-attering
will permit implementation of a cross-beam correlation techniclu+', firs! ttt i-
lized by Shtsher and Surko[3[, which can increase the spatial res<_iution of
the system from chord averaged to essentially the beam diameter. With t|_+,

orthogonal views at the same toroidal location, sample volumes measuring
the same wave vector from each view can be oriented to overlap as shown by
the shaded region in Fig. l(b). A finite cross-correlation between the two
signals can then be attributed to the region of space corresponding to the
sample volume overlap since the turbulence correlation length is typically
smaller than the laser beam diameter, a few centimeters. The overlap area
for a given wave vector can be moved throughout the plasma cross section.
However, as the volumes are moved, the poloidal and radial components of
the measured ki will change. Initial measurements have been made with the
zero degree channels from each view. This correspon(is to scattering within
the divergence of the laser beams giving -1 _<k± <_ I cnt -1. For this case,
the turbulent spectrum extended to 80 kHz while a finite crcxss-coherence
was measured up to 30 kHz.
III. 2D InterferometryF
High-resolution multichannel heterodyne interferometry using FIR laser
radiation is employed on TEXT-Upgrade to me_ure the spatial and tem-
poral evolution of the electron density profile. In addition, perturbations
to the electron density induced by naturally occuring sawt(u)th oscillations
or externally imposed gas-feed modulations can be used to ascertain the
local particle flux and transport coefficients in the pla.sma interior. Twt_-
dimensional interferometry will permit tomographic reconstructions which
will enhance resolution of small-scale perturbatit)ns such _Lsthose induced
by magnetic islands (Mirnov oscillations) or sawteeth. The secontl view will
also allow accurate determination of the equilibrium density prt_file in the

various asymmetric plasma configurations planned during d ivertor operati(_n
of TEXT-Upgrade.
A schematic illustration of the two-view FIR interferometer system has
been shown previously.J4] This system is realized by changing the receiver
and optics configuration shown in Fig. l(a) for 2-D scattering measurements.
For interferometry, the twin-frequency laser source operates at 432 #m (60
roW) or 1220 _rn (37 mW) with an intermediate frequency of 750 kHz. Both
the probe and the local oscillator beams are expanded in one dimension via
parabolic cylindrical mirrors in order to view the entire plasma cross section
accessbile from the viewing ports. High spatial sampling is achieved by the
arrangement of up to 29 [vertical-view] and 9 [horizontal-view] corner-cube
GaAs Schottky-diode mixers in a linear array with minimum spacing of
1.5 cm. Both views can be independently scanned across the plasma on a
shot-to-shot basis. The receiver is sensitive to density perturbations of 5 ×
•101°crn -3, thereby allowing observation of sawtooth phenomena and Mirnov• .
oscillations. Details of the vertical-view multichannel interferometer system F
have been previously described.J4, 5] Independent operation and description
of the horizontal-view system is described elsewhere. [6]
Line-averaged density profiles obtained from simultaneous operation of
both views are shown in Fig. 2. Each view had 3 cm spacing between
adjacent channels. The vertical-view profile wa_ determined by scanning
the 15 channel array across the plasma "over 2 shots while the horizontal
view used 6 discharges with a 5 channel array. Another example of the 2D
data is shown in Fig. 3(a), where line-average(| time traces from each view
are seen during a period of tearing mode activity [230-236 msec], locked
modes [236-242 msec{ and a disruption {242 mse(:] on TEXT-Upgrade. The

clean signals clearly show the high phase sensitivity of both interferometer
views. The spatial and temporal evolution of the vertical-view profile during
the tearing mode, locked mode and disruption phases of a TEXT-Upgrade
discharge are shown in Fig. 3(b). In the past with a single-view system,
tomographic reconstructions were produced by using the rotating magnetic
islands (i.e., rotating plasma) to generate multiple views by looking at differ-
ent times during a Mirnov cycle.J7] On TEXT-Upgrade, with a 2-D system,
reconstructions can now be generated without rigid-body plasma rotation
assumptions. Issues regarding plasma profile and transport symmetry can
also be addressed when considering the multiple asymmetric pl,_ma config-
urations planned for TEXT-Upgrade divertor operations.
Due to the asymmetric shape of the vacuum vessel and plasma, plasma
position measurement as determined from magnetic coils is greatly compli-
cated. During initial operations on TEXT-Upgrade, the density profile cen-
troid measured from the UCLA interferometer wa._used extensively to crossP
check and calibrate magnetic sensors designed to determine the plasma po-
sition, shape and X-point location. An example is provided in Fig. 4. where
the vertically-viewing interferometer density pr_file centroid [solid line] is
plotted against the plasma current density centroid determine<l from the
magnetic sensors [dashed line]. Excellent agr_ment is obtained throughout
the discharge. In the future for divertor operation, a more complete descrip-i
tion of the plasma configuration will also be made available from the EFIT
equilibrium code. Input to this code from the 2D interferometer mea_ure-
ments will greatly enhance the ability t_ accurately describe the poioidal
flux contours.

IV. Conclusion
The 2D FIRSIS on TEXT-Upgrade has several important applications
to tokamak confinement and turbulence studies. The 2D collective scatter-
ing system along with the entire array of fluctuation diagnostics available on
TEXT-Upgrade will provide the most detailed information yet available on
plasma turbulence. The 2D interferometer, in addition to providing details
of the electron density profile and its gradients, can also be employed to re-
solve small-amplitude perturbations. Investigations of these perturbations
are used to examine the profile dynamics and to provide estimates of the
electron particle transport in the plasma interior. A planned lapserupgrade
will allow operation of single-view scattering and interferometry simultane-.
ously to permit direct correlation between density profile and fluctuation
changes. Future work also calls for modifying the interferometer system
to include a polarimetry capability for measurement of the plasma poloidal
field profile.
V. Acknowledgements
Thisresearchissupportedby theU.S.DoE undergrantDE-FG03-86ER.-
53225,T_tskVIIA.

I
References
[1] Jiang, Y., C. Jing, W.A. Peebles, D.L. Brower, Rev. Sci. Instr. 63,4672-
4674(1992).
[2]D.L.Brower,H.K. Park,W.A. Peebles,N.C.Luhmann, Jr.,Topics in
Millimeter Wave Technology, ed.by K.J.Button (AcademicPress,
New York 1988),Volume If,Chapter3,pgs.83-172.
[31R.E. Slusher and C.M. Surko, Phys. Rev. Lett. 40.400(1978).
[4] Brower, D.L., Y. Jiang, W.A. Peebles, S. Burns, N.C. Luhmann. Jr..
Rev. Sci. Instr. 63,4990(1992).
[5} S.K. Kim et al., Rev. Sci. Instrum. 59,1550(t988).
[6] Y. Jiang and D.L. Brower, see this issue.
[7] J. Howard, et al., Rev. Sci. Instrum. 61,2829(1990).I,
8
i

Figure Captions
I
Figure 1 (a) 2D FIRSIS in the multichannel collectiv_scattering config-
uration. (b) Schematic of orthogonai-view cross-beam correlation setup.
Figure 2 Line-averaged density profiles from the (a) vertical and (b) hori-
zontal views. BT = 2 T and lp = 170 kA.
Figure 3 (a) 2D line-averaged data from the FIRSIS during tearing modes,
locked modes, and a disruption on TEXT-Upgrade; (b) Temporal and spa-
tial evolution of the vertical-view profile.
Figure 4 Comparison of the vertical-view density profile centroid [solid
line] with the current profile centroid [dashed line] computed from magnetic
sensor coils.
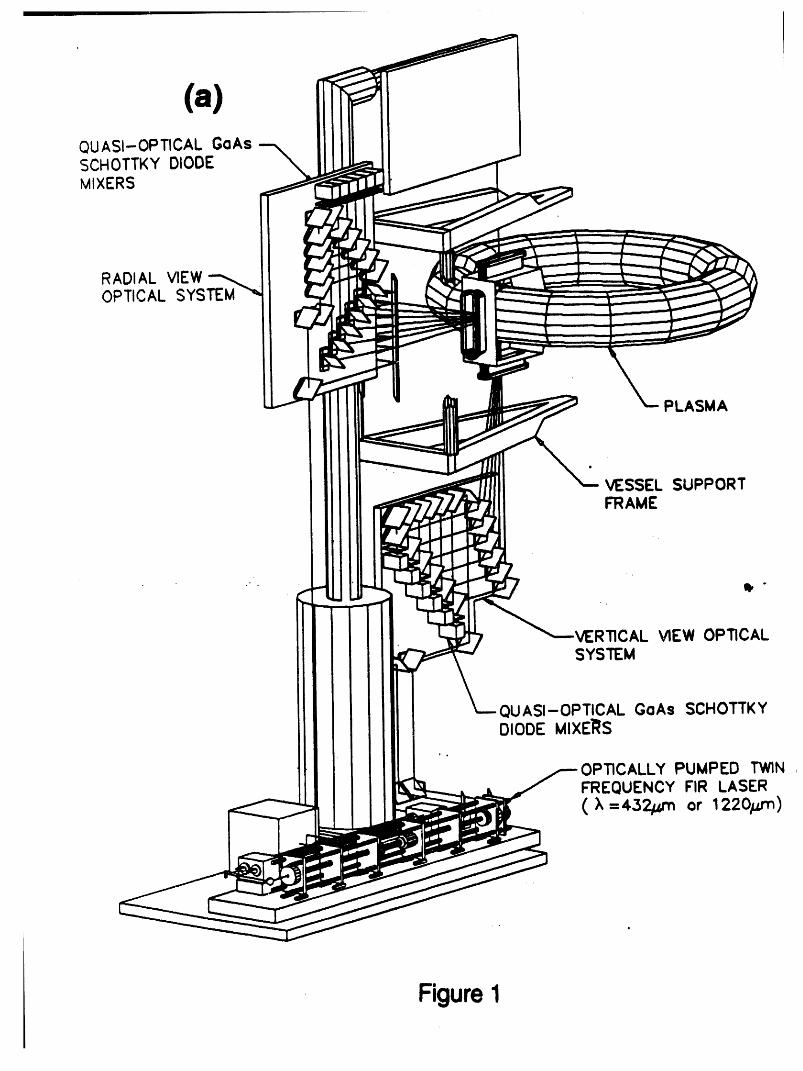
(a)_
QUASI-OPTICAL GaAsSCHOTTKYDIODEMIXERS
RADIAL VIEWOPTICAL SYSTEM '_
PLASMA
!!VESSEL SUPPORTFRAME
"" I i=_ Ib _
i--7 VERTICALVIEW OPTICAL
/ SYSTEM
QUASI-OPTICAL GoAs SCHOTTKYDIODE MIXE]_S
, .
OPTICALLY PUMPED TWINFREQUENCY FIR LASER
_ • ,
Figure1
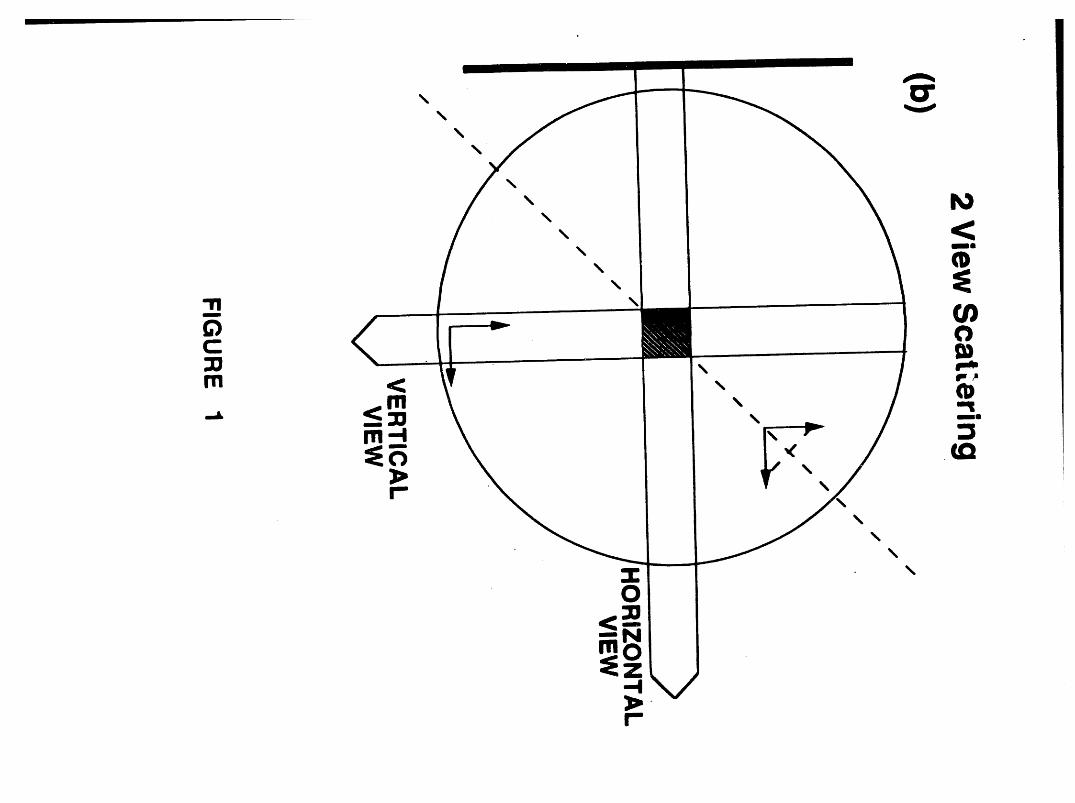
\
\
ml
"Ill \
0C
m _ \I'11'I \ "=I
_mm
r
\
0
Z--t
r
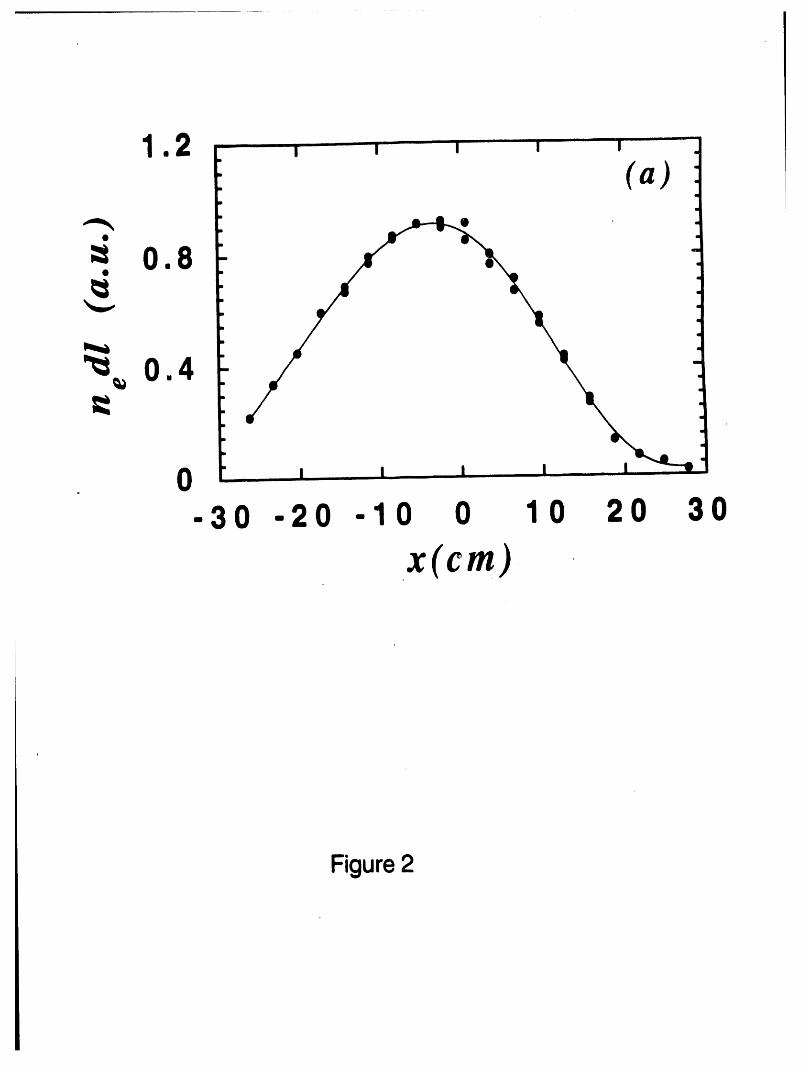

m2 I ........ I ...... I I .... I ......
='0.83
__ O.4
0 -
-30 -20 -I0 0 10 20 30
y(cm)
Figure2

...... I .....
!
x(cm) :6 . . 2
.12.2
-9.2
2.8
0 y(cm)0
-3 -3-6-9
.... -12"6 ........ I..... I,,---,-'--- I, , , I .... i
230 233 236 239 242 245
t(ms)
Figure3

o (b)
A
r_I
'E o.r_(
¢>qmm
,... OA mc_
O2g
r(cm) 0
-.27260 264 268
Time(msec)
Figure3

I I
density eenLroid [em]I I I
¢._ i_ ,-- 0 ,-- rO• 4 I @ I •
530 O 0 O 0 0
_ - _f°"n
C _ O_ ._ o- •I
&• .,._
2 -0 "
, I , I , ZI , l i I
I I I 0 _ 1_i_ _ • • •
• . . 0 .0 00 0 0
current density centroid [cm],
Horizontal-View Interferometer on
TEXT-Upgrade
Y. Jiang and D.L. Brower
Electrical Engineering Department. and
Institute of Plasma and Fusion Resear('h
University of California, Los Angeles. California 90024
May 6, 1994
Abstract
The first experimental results from the horizontal-view, multichannel.
heterodyne FIR interferometer system on TEXT-l'pgra(ie are rel_rte(l. The
system employs parabolic beam-expansion optic._ and a 15 cm array with
minimum channel spacing of 1.5 cm. Profiles of the plasma ele(:tr()n density
will be presented. In addition, small-amplitude density perturbations re-
sulting from sawteeth and tearing modes are examined. Due t_) the doul)ie
pass of the laser beam through the plasma and the large distance ()f the
detector array [2.5 m] from the pla.sma, refractive effects must be addressed
for densities greater than 2 x 1(}l:_c m -_. A ray tracing c_de is _teveh_p_l t_
correct the measured profiles.
I. Introduction
Knowledge of the density profile in any type of fusion plasma is crucial to
the understanding of confinement and stability. For a particular discharge,
one would like detailed information on the spatial and temporal evolution
of the electron density profile, he(r). In addition, resolution of small-scale
perturbations to the equilibrium profile can be used to provide an estimate
of the particle transport. A density diagnostic with high resolution, in am-
plitude, time and space, is required to flllly realize these applicat, i<ms.
On TEXT-Upgrade, a new horizontal-view multichannel hetert)dyne far-
infrared (FIR) laser interferometry system has re(:entl.v been installed and
operated. Application of this diagnostic tool t() tt)kamak plasma density
measurements will be described.
II. Experimental Apparatus
Details of the horizontal-view, multichannel, heterodyne, far-infrared
laser interferometer system [UCLA FIRSIS] are similar to those previ-
ously described for the vertically-viewing system.[l, 2] A twin-frequency
lair source is operated at 432 lmz (80 mW) or 1220/tin (37 roW) with a
difference frequency of 750 kHz. Both the pr(_l)¢,and i(_cal (_scillat(_r beams
are expanded in one dimension via parabolic cvlin(lrical mirr()rs in ()r(ler t(_
view an extended region of the plasma crtxss set'ti_m. A schemati(' (_t"the in-_
terferometer on TEXT-Upgrade, including b(_th the vertical an(l horiz(mtal
views, is shown in Fig. 1.
High spatial sampling is achieved by arranging c(_rner-cube (i_a As Sch( _ttky-i
(lit)(te mixers in a linear array [maximum ()f 9 channels maximtlm I with
.)
_
_

minimum spacing of 1.5 cm viewing a 15 cm region of tile plasma cross
section. A vertical scanning capability permits complete plasma coverage
by remotely translating the array across the plasma from shot-to-shot. The
present system utilizes beam expansion optics originally made for the Mi-
crotor tokamak. A future upgrade will include larger optics so that the
entire plasma cross section can be accessed during a single discharge. The
receiver system is sensitive to density perturbations of Aft, = 5 x 10l° cm -3.
allowing ob_rvation of sawtooth phenomena and Mirnov oscillations as well
as the equilibrium density profile. Data shown are for Ohmic discharges _n
TEXT-Upgrade where R=1.05 m and a=27 cm.
III. Experimental Results
The temporal evolution of the density line-integrals fi_r single-shot 5
channel array data with 3 cm spacing are shown in Fig. 2(a). for an Ohmic
hydrogen plasma with lp = 200 kA, BT = 2 T and _7_(0) __3.5 x 10t:_cm -:_.
The horizontal chords correspond to positions ranging from 4 to 12 cm be-
low tile midplane. This particular discharge disrupted at approximately 230
msec. In addition to the equilibrium density pr()file measurements, small-
amplitude perturbations can also be, resolved. By expanding the time axis
from 205 to 225 msec. as shown in Fig. 2(b). (letailed features ()n the
line-averaged density traces are observed. For this particular discharge, the
plasma evolved from sawtoothing [m=0] to a tearing mode [m=2] irnme(li-
ately prior to the disruption. The sawto_)th data indicate an inversion r;glhls
at about 10 cm below the midplane. Resoluti_u t_f the:s_, small-amplitu_le
perturbations allows one to estimate the electron l)arti(:le (liffttsi(m c(_elti(rient

in the confinement region.J3] Sawtooth density perturbations are typically
up to 5% on axis and 1.5% at the mixing radius. At about 218 msec. the
MHD activity in the plasma clearly changes from sawtoothing [500 Hz] to
Mirnov oscillations [2.5 kHz]. Tearing modes manifest themselves a._ local-
ized flattening in the density profile about the mode rational surfaces. This
type of profile perturbation, along with measurements of broadband elec-
tron density fluctuations, can be used to investigate the nature and drives
of microturbulence.[4] Evolution of the density profile thr(mgh the disrup-
tion can also be investigated with the excellent amplitude, time and spatial
resolution.
A line-averaged profile is obtained by scanning tilt UCLA FIRSIS across
the plasma from shot-to-shot for 5 discharges as shown in Fig. 3(a). The
plasma conditions were BT = 2 T, Ip = 120 kA, _,nd _(0) __ 1 × 10l_ cm.-3.
Here positive(negative) values correspond to horizontal chord positions sit-
uated above(below) the midplane. By fitting a spline to the measured data
points and performing an asymmetric _up-down) Abel inversion, the local
density profile he(r) is generated as shown in Fig. 3(b). Studies ()f ant_malt)us
transport and microturbulence on TEXT-(.Tpgrade require high-resolutit)n
information on the density profile and its local gradients.
Due to the distance of the receiver array from the plasma, apprt_ximately
2.5 m, and the double pass of the laser beam through the plasma, refractive
effects can be significant for the horiz(mtal'view interfert_meter. To evaluate
the refractive effect, a flfil-wave ray tracing ctxle was developed to track
the actual path of the beam through the plasma hack to the receiver array.
Corrections are then made fi)r the chord p_siti()n and length when (_()mputin_
the (lonsity.

In Fig. 4, the line-averaged and inverted profiles are shown both with
and without the refractive correction for the FIR system operating at 432
#m. The code intially takes the uncorrected data and performs an inversion
which is then used in the ray tracing code. Tile corrections for the chord
positions and lengths are made giving a corrected line-averaged profile. This
profile is then inverted providing a corrected local density profile. One only
needs to iterate on this process once or twice be.fore satisfactory convergence
is achieved. For the data shown in Fig. 4, only one iteration was required.
Even for this fairly low-density TEXT-Upgrade discharge, the correction
is seen to be significant. Refractive effects typically need to be evaluated
for pla,_ma densities above _,.(0) -_ 2 x 10¹³ c:m,-_ when operating at 432
#m. The problem is of course compotmded when operating at the longer
wavelength of 1220 #m which is only used at low density when better phase
resolution is desired. The vertical-view interferometer is much less effecte(l
by refraction as the system is single pass with the detector array being
located much closer to the plasma.
IV. Conclusion
The new UCLA horiz()ntal-view interfert)meter system ¢)nTEXT-Upgrade
is now installed and operating. Density profiles with high temp_ral, spa-
tial and phase resolution have been me,_ure(t. Small-amplitude natllrally-
occuring perturbations such as sawteeth and tearing m(_(tes |lave also ])een
readily observed. Refractive effects have been evaluated an(l apl)roi)riate
corrections to the measured pr(_files at'e made. This system will be used
to provide details of the eloctr(m (]en._ity [)r()lile and its gradients and can
also be employed to resolve small-amplitude perturbations. Investigations ,,f
these perturbations are used to examine the profile dynamics and to provide
estimates of the electron particle transport in the plasma interi()r. Expand-
ing the FIRSIS capabilities to perform 2-D measurements will permit issues
plasma profile and transport symmetry to be addressed.
V. Acknowledgements
This re,arch is supported by tile U.S. DoE un_ler grant DE-F(_03-8CiER-
53225, Task VIIA.
References
[1] W.A. Peebles, R.L. Savage, D.L. Brower, et al., International Journal
of Infrared and Millimeter Waves 8,1355(1987).
[2] D.L. Brower, H.K. Park, W.A. Peebles, N.C. Luhmann. Jr., Topics in
Millimeter Wave Technology, ed. by K.J. Button (Academic Press,
New York 1988), Volume II, Chapter 3. pgs. 83-I72.
[31 S.K. Kim, D.L. Brower, W.A. Peebles, N.C. Luhmann..Jr.. Phys. Rev.
Lett. 60,577(1988).
[4] C.X. Yu, D.L. Brower, et al., Phys. Fluids B 4.381(1!)92).

Figure Captions
Figure I Schematic of horizontal-view FIR interferometer on TEXT-Upgrade
Figure 2 (a) Temporal evolution of the interferometer line-integral density
during a TEXT-Upgrade discharge. Chord spacing is 3 cm and ranges from
4 to 12 cm below the midplane. (b) Expanded view of the chord-average_l
density showing the sawtooth and tearing mode activity prior t(_ a disrup-
tion.
Figure 3 (a) A chord-averaged density profile from the horiz(:mtal-view sys-
tem. (b) Inverted electron density profile.
Figure 4 (a) Line-averaged density profile for TEXT-Upgrade discharge
with BT = 2.5 T, Ip = 220 kA, and _e(0) -_ 3 x 10¹³ _-3. (b) Inverted
electron density profile shown before and after tile refraction correction was
implemented.
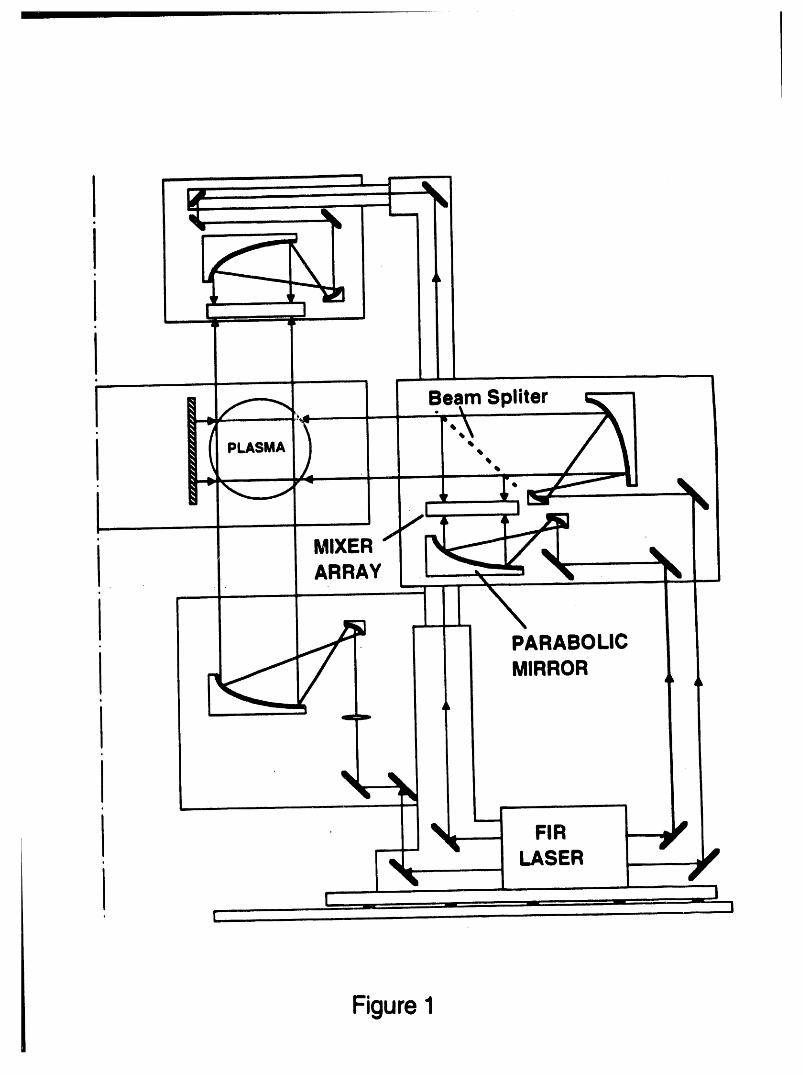
i I ,Beam Spliter-\
PLASMA • •q)
1
MIXERARRAY i
i I _I
, PARABOLIC
l MIRROR
l ,I LASER
E
Figure1

4 F' ' ' ' ' ..........' .....t(a)
_ 3_. 2
_ 1
00 47 94 141 188 235
t(ms)
Figure2

5
43
_, 2
0_'Q -1
(b)-2
205 209 2,13 217 221 225
t(ms)
Figure2

0 I 2_
-30 -20 -10 0 10 20 30
y(cm)
Figure3

n (1013 cm "3)e
o
I
• • • • ! • J • " i w' _ • I I "'_ • I ....
I
C
_ .

n *dl(a.u.)e
0
!
f"J') ...... '_'' ' I .... ' ...... I ....... " ' ' '

0-30 -20 -10 0 10 20 30
r(cm)
Figure 4


Abstract Submittedfor the Tenth Topical Conference on
High.Temperature Plasma DiagnosticsMay 8-12 1994, Rochester, New York
PLASMA POTENTIAL MEASUREMENTS ONTEXT-UPGRADE WITH A 2 MeV HEAVY ION BEAMPROBE*. A. Oumua, J.W. Heard,T.P. Crowley, P,M. Schoch,K.A. Connor, R.R. White, J. Schwelberger, P.E. McLaxen, D.Demers, and W. Russell. Rensselaer Polytechnic lnsrirute, Troy,New York. - The plasma potential is measured in TEXT-Upgradetokamak by injection and detection of high energy heavy ions(thallium,andcesiumwithasinglecharge)usinga2MeV acceleral_and a pan,el plate energyanalyzer.The changein beamenergy,as itcrosses the plasma, gives the local plasma potential at themeasurementvolume. Recentresultsof high energy _am operationsarepresentecL
*SupportedbyUSDOE ,
Prefer Poster Session Submincdby:
PreferOralSessimE] No Preference /---y
_'_ SpecialFa_lifi_ Requested Fusion ResearchCenter(e.g., movie projector) TheUniversity of Texas atAusdn
_-_ OtherSpecial Requests Austin,Texas, 78712

INTRODUCTION
The main mission of the new 2 MeV heavy ion beamprobe (HIBP) on TEXT-Upgrade is to measure and mon-itor changes in the elect,ric field structure during the L-to-H-mode transition. These measurements are expectedto be performed within the required temporal and spa-tial resolutions that are necessary for the study of theL-H transition. The study and comparison of turbulencecharacteristics in the L and H modes are also an impor-tant goal for the new HIBP system.
The TEXT-Upgrade 2 MeV heavy ion beam probe di-agnostic system is now operational at high beam energy.The installation and calibration of one of the two energyanalyzers have been completed. The new analyzer perfor-mance has been assessed by comparing the measured gaincurves with the analyzer theoretical functions. Results of
this comparison and initial electric potential profile mea-surements are presented.
Work supported by DOE.

THE 2 MeV HIBP DIAGNOSTIC SYSTEM
---SYSTEM PARAMETERS --
The TEXT-Upgrade 2 MeV Heavy IonBeam Probe diagnosticsystemcon-sistsof an electrostatic accelerator assembly with four I)elletron chargingchains, a beam deflection system with two beamlines, a be_ma steering sys-tem. and two parallel plate energy an,'d_ers.
• ACCELERATOR
Energy range 200 KeV -----, '2.0 .XIeVRipple < 100 Vm,Beam current and slmpe 100 ILA at 2.0 MeVfi_r Tl + tcm di_unet.er (FWH_[)
[nsldat.ing ga.,_ S F6: _ 65 PSI at '2 ._leV
• BEAM FOCUSING, DEFLECTION, STEERING,AND CONTROL
- [onextracti(msystem.
- Quadrupole lenses (x2) at exit of acceleration tube.
- Electrostatic steering plates in X and Y directions.
- 44° and 680 cylindrical deflect_ws with 1.5 m mean nulims and .3eragap between plates bia,,_edup it) :t: 50 k V.
- Beam profile monit_rs at deflector el_tnmce and exit.
- Energy control slits at deflector exit. (for feedb_wk control of begunenergy).
- Fhu:Iial and toroidal electro_t,ttic steering plates.
- A capacitive liner for volt,tge stabilization.
. DETECTION AND ANALYSIS
- P,tr, dlel pl_'tte elect r(_static t.ner_v ,tlhd.vzers.
- ,";l)lil-pl,tl¢' ¢ltrretlt tletect¢)rs .
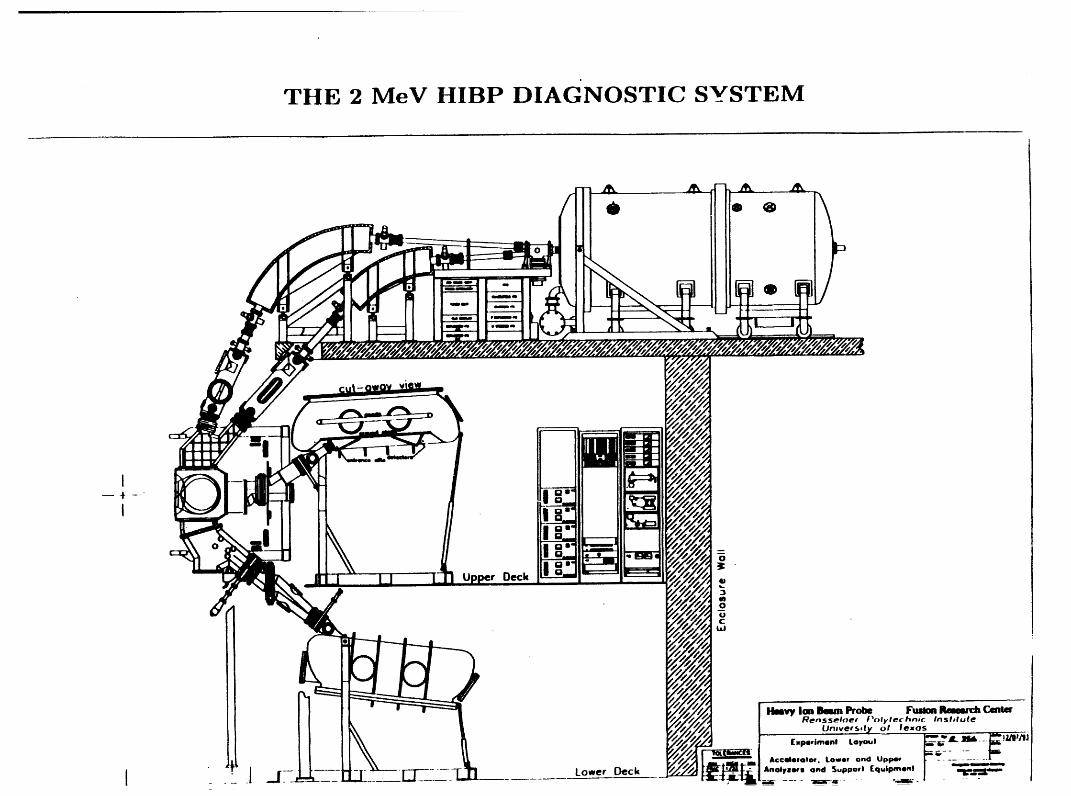
THE 2 MeV HIBP DIAGNOSTIC SYSTEM

2 4" " HIBP PRINCIPLE ()F MEASUREMENTS
•"J 9
Beam on detector plates
I . 8 UL ur_
i=I
v II.6Radlal and LL LRtoroldal
I . 4 ES Steerint _".,..4 /
X P I a tea / " 1()[II)C(IITI
"_ Jl . _" /forts Irroa Accelerator/ into Plasma :0
•,-,j l. / TI+. Cs+e_ /
HtGt't vOLTAGE till ATE
qll
/
la .6(o
v Ion• out of' /t0H_
O.
--._
o 4 . • i J
O. .2 .4 .6 .fl I. 1.2 1.4 1.6 l.fl 2. 2.22.42.62.fl 3. 3._3.4
R (Between TF Coils) (m)


PLASMA ELECTRIC POTENTIAL
_2+ (rSecondary particles with energy _beam_ , t). entering theanalyzer with an angle 0 :
2+ +Ebearn(r,t) = Ebeam(t) + e_(r, t) =eVac_el(t) + e(P(r, t)
For a parallel plate energy analyzer:
2+ [ai(_'t)F(8)+ G(8)]Ebeam(r, t) = 2eVanalyzer(t), i
[Ai(_'t)F(8)+ G(8)]- V_c_t(t)
F(O) - W(_,nOo+_o_O.t_nO)-- 8dsin20
XdtanO- YdG(O) = 4d_i,_o
O = analyzer entrance angle.
A i( r,t ) --._iurrper- itoweri iupper + ilower
Xg, YH, w, d, Oa=analyzer geometric: parameters.

PARAMETERS MEASURED WITH AHEAVY ION BEAM PROBE
• Plasma potential : (_(r, t), (_(r, t))
q(I)(r, t) -- AEbeam
• Density fluctuations: (fi(r,t))
_/_ a _/_
• Two-point measurement of wave propagation :(wave number _)
= (AO/d)
• Current density J(r) : (toroidal motion of beam)
itoroidal -- F(J(r))

SHOT 203933 T E X T' 23 MAR 94 t0: 30AM
.... i I ' i ' l ' I '
Radial sweep voltage (for fixed position)4 -
TYPICAL RAW DATA
2 -
D
h
T
A
o AV Tot oida| sweep ¥o| t ase
° \I _, #t
° 2 --
- Beam s ilna I on detector plate
, I , I ' 1 , I ,
tSO 200 2SO 300 3SO 400TIME (MSEC)

SHOT 204877 T E X T I ! APR 94 4 : 10PM
...... ' I ' I ' ! ' I '
4 - BEAM ENERGY RIPPLE WITH _STABILIZATION
2 -
D
A
T
A
0
V
O
I
t
2 -
0 too 200 300 400 500
TIME (MSEC)

SHOT 204867 T E X T 11 APR 94 3 : 16PM
i 1 ' I ' I ' I '
BEAM ENERGY RIPPLE WITHOUT4 ACTIVE STABILIZATION
2
D
A
T
A
0
V
O
I
t
2--
L I , ......t I ! , I ,
0 100 200 300 400 500
TaME (MSEC)

SHOT 2048 T 2 T E X T l l APR g4 3 : 44PM
...... ,.... T ' I ' I ' I '
4 - TYPICAL BEAM SIZE _
m u
A
T
A _ _ .... _
0 --
V Y-Di rect ion X-Di rect ionO
It
2 --
, I , 1 , I , I ,
2SO 290 300 310 320 330
TIME (MSEC)
IIII '__ _ J_


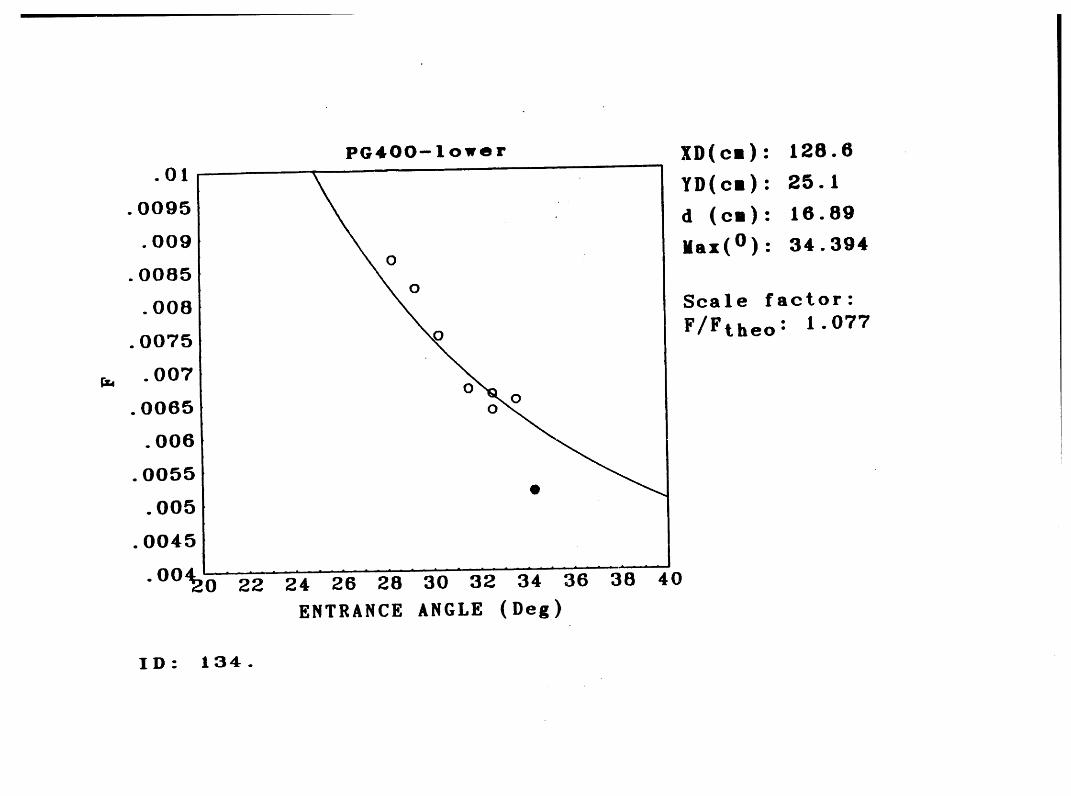
PG4OO-tower XD(cm): 128.6,
.Ol YD(cm) : 25.1
.0095 d (ca): 16.89
.009 Max(O): 34. 3940
.0085
.008 o Scale factor:F/Ftheo: 1.077
• 0075 D
.007
.0065 o o o
.006
•0055
.005
•0045
• 00420"22"24_'26"28"3"032"341" 3"63'840ENTRANCE ANGLE (Deg)
ID- 134.

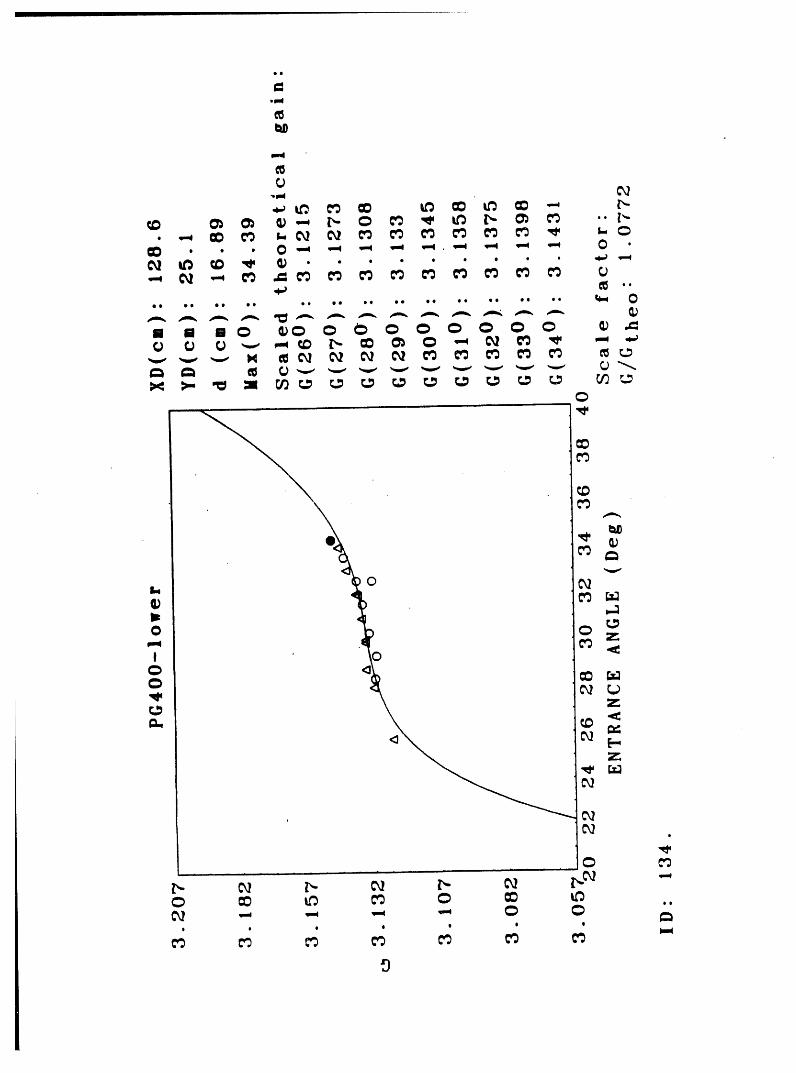

o
,o
.. _ Z
_ I _ _ "
•,,_ _ _ 0., _ _ _ _ ._
t
0
01 •t I _ I _ I t I n I i I _ I I I _ I t I t 1 t I I
I I I I I I I I I _ _ _ _I I I I I
(A)
SUMMARY
The 2 MeV heavy ion beam probe diagnostic system isnow operational at high beam energy. Secondary signalswith energies up to 1.5 MeV are routinely obtained. Thenew energy analyzer has been conditioned and operatedat voltages up to 300 kV with very good reliability. The
initial performance of the analyzer is very satisfactory.The experimentally determined gain curves are very closeto the analyzer theoretical gain functions. Plasma electricpotential profiles are now measured with the new HIBP.
lOth Topical Conference on High Temperature Plasma
Diagnostics
9.12 May 1994--- Rochester, NY
ABSTRACT SUBMITTAL FORM
FLUCTUATION MEASUREMENTS USING THE 2MEV HEAVY ION BEAM PROBE ON TEXT-U*. J.W.
Heard, A. Ouroua, T.P. Crowley, P.M. Schoch, R.L. Hickok, K.Conner, J.G. Schwelberger, R.R. White, P.E. McLaren, RensselaerPolytechnic Institute, Troy, NY. The heavy ion beam probe has beenshown to measure localized, simultaneous density and potentialfluctuations over a large poloidal cross-section of the plasma.Interpretation of the fluctuation signals using specu'al and correlationtime analyses yield fluctuation amplitudes, correlation lengths, wavenumber and velocity estimates that can help determine the turbulenceproperties of the fluctuations. Recent experimental results from theTEXT-U 2 MeV heavy ion beam probe are presented wi'h an emphasison the spectral characteristics.
*Supported by USDOE.
F_ This poster/oral should be placed in the /(s_gnature of APS member)following grouping: (specify order)With other RPI abstracts L W, Heard
Special Facilities Requested Fusion Research Center(e.g., movie projector) The University of Texas at Austin
[ J Austin, Texas 78712
_'] Other Special Requests
I I

The Time Domain Triple Probe Method
M. A. Meier, G. A. Hallock, H. Y. W. Tsui, R. D. Bengtson
Fusion Research Center, The University of Tezas at Austin,
Austin, Texas 7871_
Abstract
A new Langmuir probe technique based on the triple probe method
is being developed to provide simultaneous measurement of plasma tem-
perature, potential, and density with the temporal and spatial resolution
required to accurately characterize plasma turbulence. When the conven-
tional triple probe method is used in an inhomogeneous plasma, local dif-
ferences in the plasma measured at each probe introduce significant error in
the estimation of turbulence parameters. The Time Domain Triple Probe
method (TDTP) uses high speed switching of Langmuir probe potential,
rather than spatially separated probes, to gather the triple probe informa-
tion thus avoiding these errors. Analysis indicates that plasma response
times and recent electronics technology meet the requirements to imple-
ment the TDTP method. Data reduction techniques of TDTP data are to
include linear and higher order correlation analysis to estimate fluctuation
induced particle and thermal transport, as well as energy relationships be-
tween temperature, density, and potential fluctuations.
Presented at the 10th Topical Conference on High-Temperature Plasma
Diagnostics, Rochester, New York, May 8-12, 1994; to be published in Rev.Sci. Instrum.

Introduction
Langmuir probes have been used successfully for many years in the study of
magnetically confined plasmas. From the current - voltage (CV) character-
istic of a Langmuir probe, estimates of the density, electron temperature,
and electrical potential of a plasma can be made. A common implemen-
tation of Langmuir probes is the triple probe method [I]. Measurements
from three probes provide three points on the CV characteristic from which
plasma parameter estimates are made. Additionally, the dynamic behavior
of the three measurements have been used to estimate dynamic behavior
of pi_ma parameters and turbulence induced transport [2]. Due to lim-
itations of the technique, the derivations of these estimates requires the
assumption that electron temperature fluctuations are negligible.
However, some recent promising hypotheses on plasma turbulence
predict significant temperature turbulence in the region of confinement near
the boundary [3, 4, 5, 6, 7]. In addition, recent experimental findings indi-
cate the presence of measurable levels of electron temperature fluctuations
in the edge plasma [8, 9, 10]. If present, significant electron temperature
fluctuations would violate the assumption used in deriving estimates of the
dynamic behavior of plasma parameters and turbulence induced transport
from the triple probe method. The Time Domain Triple Probe (TDTP)
method is a modification which is designed to eliminate the need for the
negligible electron temperature fluctuation assumption.

The Triple Probe Method
Langmuir probe theory attempts to characterize the interaction between
a probe and plasma and derive the CV characteristic. Perhaps the best
approaches to the development of the theory for magnetized plasmas are
presented by Stangeby [11] and Hutchinson [12]. These authors provide
theories for the equilibrium solution of the portion of the CV characteristic
where the probe potential is less than the plasma potential. In this portion
of the CV characteristic, the electrons are electrostatically repulsed by the
probe, and their distribution is modelled as a Maxwell-Boltzmann veloc-
ity distribution modified by the Boltzmanu factor. The electron current
density from the plasma to the probe is then
_ _(ksT" _'/'
where _b_,obeis the potential difference between the probe and the plasma,
hoe is the electron number density in the unperturbed plasma far from the
probe, and Te is the electron temperature. The ion current density to the
probe is the ion saturation current density. It is derived from the equilibrium
solution to the equations of continuity and conservation of momentum of a
one dimensional flow of ions along magnetic field lines to the probe [11, 12];
J, - 0.35eC.no _ a, Z, (2)d d
where the summation is over all ion species present in the plasma; no -
_i n_ is the ion number density in the unperturbed plasma far from the
probe; Z_ is the charge number of ion species i; ai is the proportion of ion
species i to all ion species, a_ - no_/no; and c. is the sound speed. From the
condition of quasineutrality, hoe = _i noiZd = no _d aiZi, electron density
can be related to the ion current density given in Eqn. 2.
3

The triple probe method employs three separate Lan_uir probes
of identical geometric configuration and dimension placed a small distance
apart in the plasma and individually biased to three different potentials.
The probe potentials are less than the plasma potential so that negatively
biased sheaths exist around each probe. The spacing between probes must
be large enough to adequately shield them from one another. The current
density to each probe is the sum of the ion saturation current density given
by Eqn. 2, and the electron curr_.nt density given by Eqn. 1. A special
application of the triple probe method is shown in Fig. I. By combining
these conditions with the current density equations, the following triple
probe equations are derived [13].
kaTe = e (K._.,. - Vpo_t)/In2 (3)
n_ = (_ J,) / (O.35eCo) (4)
[ (21rm,_ !/' 1_i==,,. = Vp., kaTe In 0.35c, (5)
• kT, ) J
Turbulent Plasmas
An important though often unstated requirement of the conventional triple
probe technique is that all three Langmuir probes are immersed in plasma
sample volumes of identical character. Otherwise, a different CV charac-
teristic exists at each probe and a complete set of measured quantities for
a single CV characteristic is not obtained. This condition is satisfied only

for a homogeneous plasma. In turbulent plasmas, however, electron tem-
perature, density, and plasma potential are generally functions of time and
space. Hence, the local plasma surrounding each of three spatially sepa-
rated probes differs somewhat, as does the local CV characteristic. Time
averaged plasma conditions and CV characteristics at each probe can be
made to be nearly identical for properly positioned probes (e.g. all probes
on the same flux surface), thus allowing good estimates of time averaged
plasma parameters. For a pure proton-electron plasma with T_on, -- Te [13].
(mi)z/'7_j,w(O) where W = (kaY.) -'/zfloe = 0.49e
0.49e \ ksTe ) for Te -'* 0
_,,._. = _,,_,+35(k_./_) (6)where _xY is the cross-correlation of two series, {X(n)) and {Y(n)). In
practice, probes are placed as near to one another as possible, without
violating electrostatic shielding requirements (shadowing, etc.), so as to
minimize inhomogeneity of the plasma between probes. In a fluctuating
homogeneous plasma, the following relationships hold [13]
[ 5 ]'"kvT. - (l/N) [kBT,(n) - kBTe]'n--'--I
- "_ (7)- (_/z.2)[v;.,,,..+C,_,,.,-_v,,...,,,..,,.,,,.,(o)]'/'
g,.__. --- [_o_,+13(kBTdel'+7.1(kB/,)Z,Iv.f,o_,,.(O)]'" (8)
,,,.,,.(o)1'"_o--'__ \Ioo,/ 4 _,T.) - Io.,T. J (9)
where _/xY is the cross-covariance of two series, {X(n)} and {Y(n)}. For
homogeneous fluctuations, the fluctuation level measured at one probe is

also present at other probes, and there are no phase delays between probes.
Hence, all of the right hand side terms are available.
However, significant inhomogeneity of the plasma between closely
spaced probes has long been known to exist. :'or example, decorrelation and
phase delay between closely spaced floating potential probes are routinely
measured and used to estimate 'phase velocity' and spectral quantities.
These measurable inhomogeneities introduce significant error to the cross-
covariance terms in the above equations, which in turn, introduce significant
error to the fluctuation estimates of all plasma parameters. Additionally,
inhomogeneity of the plasma between probes violates the homogeneous re-
quirement used in the derivation of the triple probe equations, 3, 4, and 5.
Hence, estimates of turbulence parameters such as fluctuation levels and
phase relationships of electron temperature, density, and plasma potential,
as well as turbulence induced transport, are compromised or unobtainable.
The Time Domain Triple Probe
The inability of conventional Langmuir probe techniques to obtain reliable
fluctuation information when electron temperature fluctuations are present
essentially derives from the attempt to acquire a single CV characteristic
fron_ spatially separated probes in a turbulent plasma. To address this
difficulty, the TDTP method employs the time dimension_ rather than the
space dimension, to implement the triple probe method. Fig. 2 illustrates
the basic concept behind this approach. Plasma turbulence is bandlimited,
generally _: 200 kHz. Sufficiently fast switching of the potential on a single
probe can permit the acquisition of all triple probe measurements from a
single plasma sample volume without aliasing. Time interpolation of each
of the triple probe quantities can then be done without error (to the extent

that there is no aliasing) to obtain all three triple probe quantities for all
times sampled.
Two probes are required to implement the TDTP method. When
probe 1 is biased negative to collect the ion saturation current from the
plasma at its location, probe 2 returns this ion saturation current to the
plasma at its location and completes the triple probe circuit. Next, both
probes are open circuited and the floating potential is measured at each
probe location. Then, probe 2 is biased negative to collect the ion satura-
tion current from the plasma at its location, and probe 1 returns this ion
saturation current to the plasma at its location. Hence, the ion saturation
current, floating potential, and current return potential are measured at
the locations of both probe 1 and probe 2 at all times. However, while
the ion saturation current and floating potential measured at one probe
location is independent of the conditions at the other probe location, the
current return potential measured at one probe location is dependent on
the conditions at both probe locations. Thus, a new set of triple probe
equations must be derived.
Consider two probes located at positions zl and z2. The quantities
measured are the ion saturation current density at each probe, Ei Ji(zl,t)
and ]_, J_(z2, t), floating potentials at each probe, Vyio_t(zl , t) and V/loaf(z2 , t),
and the current return potential at each probe, Vretur.(zl, t) and Vretur. (z2, t).
The conditions for each state are:
• State 1: One probe is a strong negatively biased probe for which Je -
O. The current density measured by this probe is the ion saturation
current density, ]_ J_(z,n,t). The other probe is a current return probe
for which El J_(zm,t)+]_ Ji(zn, t)+Je(_return, zn, t) = O. The potential
of this probe relative to ground is measured, V_e,ur_(z., t).
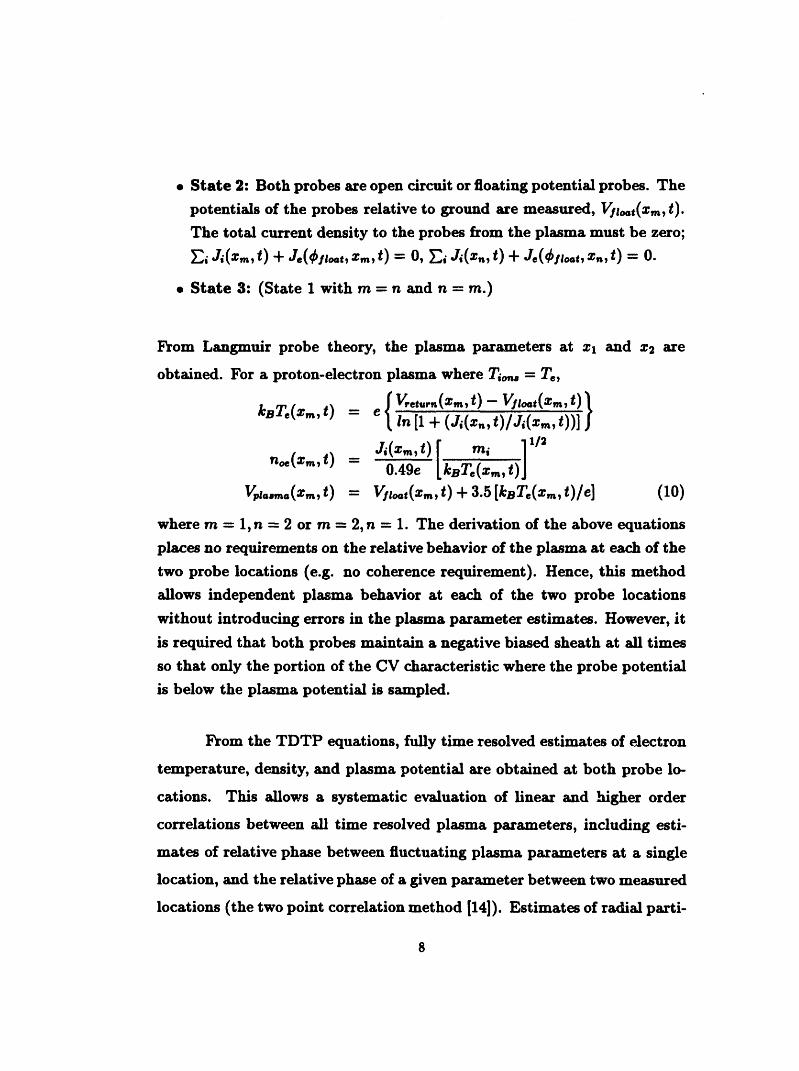
• State 2: Both probes are open circuit or floating potential probes. The
potentials of the probes relative to ground are measured, V/Ioat(zm, t).
The total current density to the probes from the plasma must be zero;
Ei Ji(z,_,t) + J.(_po_,, z=, t) = 0, Ei Ji(z,, t) + J,(_po_,, z,,t) = 0.
• State 3: (State 1 with m = n and n = m.)
From Lan_muir probe theory, the plasma parameters at zl and z2 are
obtained. For a proton-electron plasma where Tion. = Te,
{ V..,...(:., t)- Vl,o_,(z_, t) )
n_,(z..,t) = J,(z,.,t) [ m, 1,1,
Vpl.m.(z.,t) - Vpo.,(zm,t) + 3.5[keT.(z,_,t)ie] (10)
where m - 1, n - 2 or m = 2, n - 1. The derivation of the above equations
places no requirements on the relative behavior of the plasma at each of the
two probe locations (e.g. no coherence requirement). Hence, this method
allows independent plasma behavior at each of the two probe locations
without introducing errors in the plasma parameter estimates. However, it
is required that both probes maintain a negative biased sheath at all times
so that only the portion of the CV characteristic where the probe potential
is below the plasma potential is sampled.
From the TDTP equations, fully time resolved estimates of electron
temperature, density, and plasma potential are obtained at both probe lo-
cations. This allows a systematic evaluation of linear and higher order
correlations between all time resolved plasma parameters, including esti-
mates of relative phase between fluctuating plasma parameters at a single
location, and the relative phase of a given parameter between two measured
locations (the two point correlation method [14]). Estimates of radial parti-
8
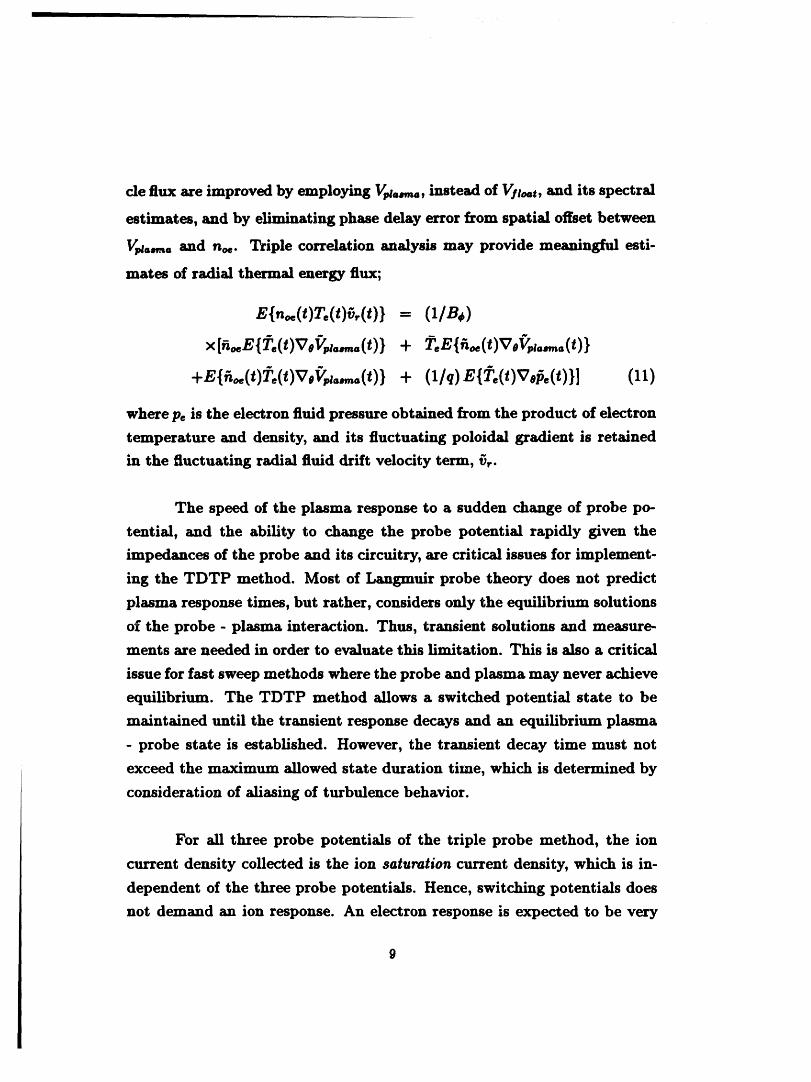
cle flux are improved by employing Vpla_a, instead of Vjloat, and its spectral
estimates, and by eliminating phase delay error from spatial offset between
V_a_,_, and n,e. Triple correlation analysis may provide meanlnghtl esti-
mates of radial thermal energy flux;
=
x[n,_E{_'.(t)Vef/_.,,n.(t)} + LE{h,,,_(t)VoV_.,_.(t)}
+E{a,_(t)T,(t)Vof/_...(t)} + (l/q) E{L(t)V,/_.(t)}] (11)
where pe is the electron fluid pressure obtained from the product of dectron
temperature and density, and its fluctuating poloidal gradient is retained
in the fluctuating radial fluid drift velocity term, fir.
The speed of the plasma response to a sudden change of probe po-
tential, and the ability to change the probe potential rapidly given the
impedances of the probe and its circuitry, are critical issues for implement-
ing the TDTP method. Most of Langmuir probe theory does not predict
plasma response times, but rather, considers only the equilibrium solutions
of the probe - plasma interaction. Thus, transient solutions and measure-
ments are needed in order to evaluate this limitation. This is also a critical
issue for fast sweep methods where the probe and plasma may never achieve
equilibrium. The TDTP method allows a switched potential state to be
maintained until the transient response decays and an equilibrium plasma
- probe state is established. However, the transient decay time must not
exceed the maximum allowed state duration time, which is determined by
consideration of aliasing of turbulence behavior.
For all three probe potentials of the triple probe method, the ion
current density collected is the ion saturation current density, which is in-
dependent of the three probe potentials. Hence, switching potentials does
not demand an ion response. An electron response is expected to be very
9

fast for small surface area probes. Electron plasma frequencies are tens of
gigahertz, compared to the several megahertz switching rates required to
avoid aliasing turbulence behavior. It is worth noting that under common
circumstances, the conventional triple probe method also requires plasma
response times of the order of several megahertz. A poloidal rotation veloc-
ity of several 10scm/Sec and a probe diameter of 0.5ram results in a plasma
- probe interaction time of only a fraction of a microsecond. This is the
same time scale applicable to the TDTP method.
Fig. 3 shows the time response of a benchtop prototype circuit con-
sisting of electronic components which fit inside the stem of a Langmuir
probe. Probe capacitances have been minimized by placing the switching
circuitry as near to the probe head as possible, and a resistive load was
placed between probes to permit a current of the order of the anticipated
ion saturation currents. Switching times from a floating state to a high
or low state are less than 100 nanoseconds. It is anticipated that in a
plasma, the floating state following the high state will switch much faster
than shown here, due to the speed of the electron response; while the float- i
ing state following the low state will remain slow, due to the ion response.
Hence, three of the four states are useful to the TDTP method. The high
state, low state, and the useful floating state, each are repeated every mi-
crosecond, thus meeting the Nyquist criterion for broadband turbulence up
to 500 kHz. The first TDTP measurements will use one half the shown
switching frequency to double the state duration and maximize allowance
for plasma response time.
10

Conclusion
Spatial separation of probes in a turbulent plasma introduces considerable
error in estimates of plasma parameters and dynamic behavior. To address
this problem, the TDTP method uses high speed switching to implement
the triple probe method, thus acquiring all triple probe quantities at a
given probe location. Two probes complete the high speed circuit through
the plasm,_. A set of TDTP equations have been derived which are valid
for differing plasma conditions at the two probes allowing for independent
plasma behavior at the probes, provided both probes remain in the ion
saturation region. A prototype circuit has been designed and constructed
which demonstrates the feasibility of locating a high speed switching cir-
cuit near the head of a Langmuir probe. If successfully implemented, the
TDTP method can provide improved measures of plasma turbulence and
transport.
11

References
[I]S.Chen and T. Sekiguchi,J.Appl.Phys.36, 2363(1965).
[2] E.J. Powers, Nucl. Fusion 14, 749 (1974).
[3] J.F. Drake, Phys. Fluids 30, 2429 (1987).
[4] D.R. Thayer and P.H. Diamond, Phys. Fluids 30, 3724 (1987)
[5] J.F. Drake, L. Sparks, and G. Van Hoven, Phys. Fluids 31,813 (1988).
[6] A.S. Ware, P.H. Diamond, B.A. Carreras, J.N. Leboeuf, and D.K. Lee,
Phys. Fluids B 4, 102 (1992).
[7] Y.Z. Zhang and S.M. Mahajan,, Phys. Fluids B 4, 207 (1992).
[8] C. Hidalgo, R. Bslbin, M.A. Pedrosa, I. Garcia-Cortes, and M.A.
Ochando, Phys. Rev. Lett. 69, 1205 (1992).
[9] H. Y. W. Tsui et al., Rev. Sci. Instrum 63, 4608 (1992).
[I0] H. Lin et al., Rev. Sci. Instrum f13, 4611 (1992).
[II] P.C. Stangeby, Phys. Fluids 30, 3262 (1987).
[12] I.H. Hutchinson, Phys. Fluids 30, 3777 (1987).
[13] M.A. Meier, Thesis, The University of Texas at Austin (1992).
[14] J.M. Beall, Y.C. Kim, and E.J. Powers, J. Appl. Phys. 53, 3933 (1982).
12


_. ,_ xa xa"" O" O"
"• _
_= _ -- J_ V_mn _-
•_ _ Vrelum Jsat
" @--. .--C)- - Vn_ Vs=a:
" _ _ V_.. -o
_" -- Jsat retumi,.Je
_" Vno= _ e_("_ V_,
Vretum Jsat
GO
-_o, 0---- _0- - Vnom Vm:_at
0 o

20O
150
_" 100
0.00 0.2s o.so o.75 1.00
Time (I0"6sec)
Figure 3: Several hundred periods of the switching waveform, at 1.008 microsec-
onds each, are sampled at 30 MHz and overlayed. The potential difference
between high and low states is 150 V.
15

A Phase Contrast Imaging System for TEXT-U
R. Chatterjee, G. A. Hailock and M. L. Gartman
The University of Texas at Austin. Austin, Teza,_ 7871
Abstract
A diagnostic to study plasma density fluctuations, Phase Contrast Imaging (PCI)
has been developed for the Texas Experimental Tokamak-Upgrade. The diagnos-
tic has a sensitivity of about 10-4 n°0 and is capable of detecting a wide range of
wavenumbers (0.5 cm -I - 12 cm -I) with a bandwidth of 500 Khz. The design of
the diagnostic, some results of acoustic calibration tests and preliminary results
of simulation of expected spectra are presented.

1 Introduction
The Texas Experimental Tokamak-Upgrade (TEXT-U) is a medium sized toka-
malt whose primary objective is to study plasma transport and turbulence. In
the interior of TEXT the UCLA far infrared scattering diagnostic, which can
spatially resolve wavenumbers _>2 crn-1, has observed a wavenumber spectrum
that peaks at h0 ~ 3 cm-1, although the scattered power at this wavenumber
is predominantly from the edge plasma (where the _0 is known to be 3 crn-z)
[1]. The RPI Heavy Ion Beam Probe, which is insensitive to wavenumbers > 5
cm-_, has identified a peak at/_ < 1 cm-Z[1]. The Phase Contrast Imaging (PCI)
diagnostic is strongly motivated by the need to resolve the differences between
the observations of these two diagnostics.
Imaging diagnostics have spatial resolution across the beam limited only
by the number of detectors and magnification, and are thus suitable for studying
a wide range of wavenumbers. With the use of focal plane filters as in Phase
Contrast Imaging (PCI), one obtains an image whose intensity is linearly related
to the density fluctuation amplitude and a contrast adjustment capability that
allows the use of sensitive heterodyne detectors.
2 Phase Modulation Theory
The phase contrast method [2] was invented by the Dutch scientist F. Zernike.
This technique was first used for the study of plasma density fluctuations by H.
Weisen [3] on the TCA tokamak at Laussane, and is currently being applied on
DIII-D[4] and Heliotron [5].
The density fluctuation of a plasma causes a refractive index perturbation,
thus diffracting a probing electromagnetic wave. Bragg diffraction occurs when
the Klein-Cook parameter Q [3], defined as,k2L
Q= N0---_ (_)
where ko is the wavenumber of the probing beam in vacuum, No is the unper-
turbed refractive index, h is the plasma wave number, and L is the length of
the interaction region in the direction of propagation of the probing beam, is
2
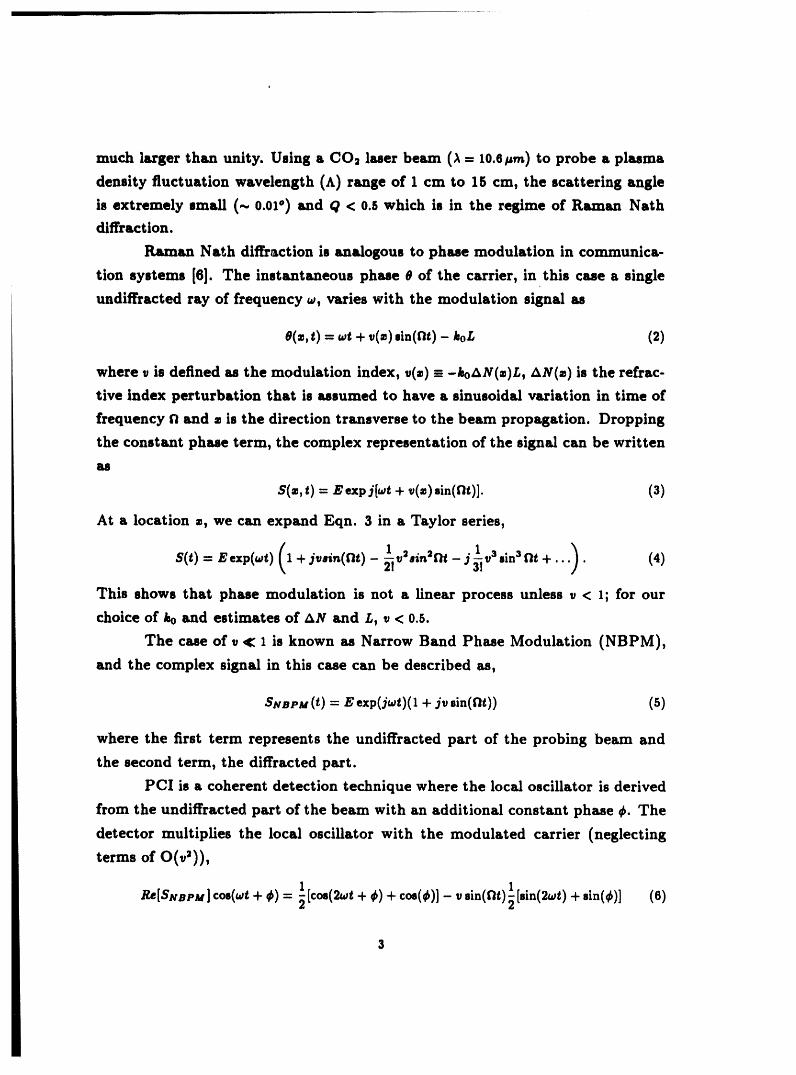
much larger than unity. Using a CO= laser beam (_ = 10.6 _m) to probe a plasma
density fluctuation wavelength (A) range of i cm to 15 cm, the scattering angle
is extremely small (~ 0.01°) and q < 0.5 which is in the regime of R_nan Nath
diffraction.
__n Nath diffraction is analogous to phase modulation in communica-
tion systems [6]. The instantaneous phase e of the carrier, in this case a single
undiffracted ray of frequency _, varies with the modulation signal as
O(z,t) = wt + v(z) sin(fit) - k0L (2)
where _ is defined as the modulation index, _(ffi)ffi-k0AN(z)L, AN(z) is the refrac-
tive index perturbation that is assumed to have a sinusoidal variation in time of
frequency fl and = is the direction transverse to the beam propagation. Dropping
the constant phase term, the complex representation of the signal can be written
as
S(=,t) = Eexpj[wt + u(=) sin(fit)]. (3)
At a location =, we can expand Eqn. 3 in a Taylor series,
( 2_ I )S(t) = Eexp(_t) 1 + ju.in(nt)- v=.i_=nt-jgi_3,in3nt + .... (4)
This shows that phase modulation is not a linear process unless _ < 1; for our
choice of k0 and estimates of AN and L, • < 0.5.
The case of u _: I is known as Narrow Band Phase Modulation (NBPM),
and the complex signal in this case can be described as,
SNaI, AI(t) = E exp(jwt)(1 + ju sin(t_t)) (5)
where the first term represents the undiffracted part of the probing beam and
the second term, the diffracted part.
PCI is a coherent detection technique where the local oscillator is derived
from the undiffracted part of the beam with an additional constant phase _. The
detector multiplies the local oscillator with the modulated carrier (neglecting
terms of O(_=)),
+ (8)l[sin(2wt)Re[$1_apl_]cos(wt+ _b)= [cos(2wt+ _) + cos(_b)]- usin(t3t)_
3

and acts as a low pass filter blocking the passage of the optical frequency _ and
its multiples. The detector signal is then,
,o(_) = _[cos(q_)- _sin(N_) sin(q6)]. (7)
It is clear from the above expression that in synchronous demodulation of NBPM
the choice for the phase delay q_that gives the best result is w/2. The detector
signal in this case is proportional to,
1[_ sin(N_)] (8)0o( )=
and is an exact repUca of the modulation signal (Eqn.2).
3 Implementation on TEXT-U and Test Stand Results
The PCI diagnostic on TEXT-U will share the optical tower and the port of the
TEXT FIR intefferometer [7]. A new vacuum flange with ZnSe and polyethylene
windows will allow a view of over 90% of the plasma. The anti-reflection coated
ZnSe windows are specified to introduce very low distortion to the total emergent
wavefront. All the optics are to be mounted on the tower to reduce the number
of optical elements needed and to keep alignment problems due to vibrations to
a minimum.
A careful optical design is being used to reduce the aberrations in the
system to a minimum; in particular, we will try to eliminate astigmatism and
coma. Fig. 1 is a schematic of the optical layout. The beam from a 25W Syn _d
CO2 laser is expanded by a ZnSe lens and collimated by a 17 cm wide parabolic
mirror (f-139 cm) to produce a Gaussian beam waist in the equatorial plane
of the plasma. A similar parabolic mirror images this waist on to the groove of
quarter wave phase plate [3]. The groove of the phase plate is an anti-reflection
coated ZnSe substrate; the rest of it is coated with a highly reflective layer of
aluminum and gold.
A second phase plate, possibly with a V-shaped groove [5] to adjust the
lower k cutoff, will be used to obtain increased contrast. This will require an
additional pair of lenses to form an image of the waist at the first plate. By

using the second phase plate the full laser power can be used without saturating
the detectors, thus improving sensitivity.
A 64 element liquid nitrogen cooled linear staggered photoconductive
HgCd_e detector array is currently being tested for the diagnostic. The de-
tectox elements are 100_m × 120_,m with a 100j,m pitch. The detectors have a
vide, noise level of about 4×10 -13 wotts/_/'H'z and a bandwidth of 1 MHz. Ini-
tially, 16 elements will be used with our low noise amplifiers with a gain of about
60 ©iB and an analog bandwidth of 500 Khz, set by the available digitizer rate.
A detector behind the phase plate will be used to trigger an interlock system to
protect the detector array in case of misalignment.
An optical setup similar to the one to be used on TEXT-U has been
assembled in a sldelab. The diagnostic has been tested with sound waves and a
single Cu doped Ge detector and is presently being calibrated with the HgCdTe
detector array. In the acoustic calibration [3] tests, the diagnostic has been
observed to be sensitive to a wavelength range of 0.5 cm to 12 cm. Fig. 2 shows
the output of five detectors along with the driving signal to a tweeter. The phase
velocity calculated by correlating the detector signals is in close agreement with
the speed of sound in air of 330 m/s.
The sensitivity of the system is calibrated by comparing the magnitude
of the detector signal with the output of a calibrated microphone (BrSel & Kjaer
type 4138). Present estimates show the system to be sensitive to a phase of
10 -e radian, the equivalent of _e = 4.8×101° cm -s at a wavelength of 3 cm. The
sensitivity is expected to improve after some noise problems associated with the
ltF oscillator in the laser are corrected. The diagnostic signal is also seen to
be linearly related to the amplitude of the density fluctuation. Future sidelab
experimentation will include testing a new design of the phase plate with a
variable :roove width and depth, verification of spatial frequency response and
the depth of focus of the system.

4 Expected results on TEXT-U
PCI makes line of sight measurement of density fluctuation (AN(z,t)) at horizon-
tally resolved locations (z) in the plasma. The time series signal from the linear
array of detectors can be Fourier transformed in two dimensions to directly give
an estimate of the spectrum $(k, f). This also directly provides the dispersion
relationship of the mode of turbulence. Provided the spectral component of a sig-
nal around any frequency band Af arising from a fluctuation mode in the plasma
is above the noise equivalent power of the detector, it will contribute to the de-
tector output. Thus, if several distinct modes are present the two dimensional
FFT should be able to unambiguously distinguish between them.
Simulation work to verify whether PCI will be able to detect several fluc-
tuation modes in the plasma is underway. Gaussian models of the spectra S(k,_)
that match the experimentally observed modes in TEXT [1] are used as input
to the simulations. The drift wave type mode observed by the FIR scattering
is assumed to have a _e = 3 cm-1, _ _ v_ and the long wavelength mode seen
by the HIBP is assumed to have a _e - 0.5 cm -1 and _ = v_; both features
are assumed to have a f0 =100 Khz. Initial results have been obtained with a
spatially homogenous model of plasma turbulence. The expected PCI signals
were obtained by performing a FFT of the input spectra and ._ing appropri-
ately spaced auto-correlation lags in space as the time series from the detector.
Further work on the simulation will include an inhomogenous plasma model and
the addition of noise to the signals.
Fig. 3 a, b and c are contour plots of one quadrant of the input S(k,w)
and d, e, and f respectively are the expected S(k,w) obtained from 16 PCI de-
tectors with a spacing of 6.2 ram, by simply Fourier transforming the time series
from the detector array in two dimensions. The expected spectra in the cases
when each mode is individually present, and the case when both the modes are
simultaneously present match closely with the input spectra. It was found that
the spatial resolution afforded by a large number of detectors was necessary to
detect the drift wave feature and a wide beam was necessary to resolve the long
wavelength mode, close to k = o.

5 Summary
A PCI diagnostic has been developed for TEXT-U. Preliminary calibration re-
sults indicate the to be sensitive to density fluctuations of the order of 10-4n00,
and a wavelength range of 0.5 cm to 12 cm. The frequency response is limited by
the detector response time to I MHz and the spatial resolution is limited by mag-
nification and the number of detectors. Simulation of expected spectra caused
by the presence of various modes of plasma turbulence observed previously by
other diagnostics is underway.
6 Acknowledgments
We gratefully acknowledge Dr. A. J. Wooton and Dr. P. H. Edmonds for very
helpful discussions. In addition, Dr. R. D. Bengtson provided us with much
of the optical hardware and the Cu doped Ge detectors and Dr. E. L. Hixson
provided us with the calibrated microphone. This work is supported by the U.
S. Department of Energy under gra_t DE-FG05-88ER-53267.

References
[1]R. V. Bravenec e_at.Physicso/Flui_ B, 7(4):2127,1992.
[2]F. Zernike.Ph_a/o:,7(7):686,1942.
[3] H. Weisen. Plato4 Phvaica a_ Con_olled _ion, 28(8):1147, 1986.
[4] S. Coda et al. Itev. Sci. In_trum., 63(10):4974-4976, 1992.
[5] K. Tanaka. Submitted to Journal of Physical Society of Japan, 1993.
[6] A. Korpel. Marcel-Dekker Inc., 1988.
[7] G. A. Hallock et aL Re=. $ci. laJt_m., 63(10):4987, 1992.

Figure 1:Schematic of optical layout l'or phase contrast on TEXT-U.
Figure 2:Signal from 5 detectors and speaker during acoustic testing
Figure 3:l_esults of shnulat|on of expected PCI spectra on TEXT-U
i
9

parabolicmirror
i
mm
plasma
torqueframe
phase plateparabolic mirror
='= m
FIG1

v°.u°...vo •
0 100 200 300
Channel "__=.
0 100 200 300
Channel 3
k,0 100 200 300
Channel 4
0 100 200 300
Channel 5
0 100 2O0 3O0
Channel 6: Speaker
0 100 200 500

0
F,
co I-\ \ \ \ \ "-._ _ oo
O O O O O O
o. o o. o o. o
......... ! ........ ,,,! .........
-0
• ,/ _ \,
"/ "
3" "Z ""-'rn El/
"= ) N
0 _ 0 0 0 0
/ f, ._, / X0 0 0 0 0
00 ,, ........ ,,,
\'\ "'\, ""....... _ -"1;
_ . ©
t,_ r,_ _ O t4D t4D _ OO O O O O O
X X _': X XO O O O O

Development of Rugged Corner Cube Detectors for the
TEXT-U FIR Interferometer
G. A. Hsllock, M. L. Gartman, and H. Ling
The Univeraity of Tezas at Austin, Austin, Tezas 78712
(Presented on 8/12 May 1994)
Abstract
The corner cube mixers originally developed for the TEXT-U far-infrared
interferometer were susceptible to damage by tokamak radiation, The source
of the damage has been traced to intense upo bursts emitted by the tokamak
during start-up, We have determined that this radiation was coupled into the
detector through a small gap in the original design. An electromagnetic model
has been used to calculate the electric field distribution within the gap, Results
are consistent with the expected power in a burst.

1 Introduction
A high resolution far-infrared interferometer has been developed to measure elec-
tron density profiles in the TEXT-UpgrLde tokamak [1]. The interferometer
views the plasma vertically, sad makes use of an extended port for full plasma
access. The port is located p_rtially under the toksmak iron core, which has ne-
cessitated locating the corner cube detectors quite close (_ 1 m) to the plasma.
Shortly after initial operation (Nov. 1991) it became apparent that the detectors
were being damaged in the tokamak environment.
The interferometer operates at a wavelength of 373.4 _m (803 GHz), using
two 100 mW output molecular gas lasers. The most sensitive mixers available at
this wavelength are whisker contacted Schottky diodes [2]. The whisker is used
as a long-wire antenna, and a corner reflector gives a beam pattern that is easily
coupled into an optical system.
The design of the TEXT-U interferometer allows for 1 cm ch_nnel spacing.
Because of the large number of possible channels (59) and high cost of commercial
corner cube mixers (_ 8000 $) we decided to construct our own detectors at the
University of Texas. The Schottky diodes are available from the University of
Virginia Semiconductor Device Laboratory [3], the group that supplies most ofthese diodes used worldwide.
Our original corner cube mount, shown in Fig. l(a), was based on a
design developed in the University of Texas Astronomy Department for telescope
applications. This mount has the corner reflector made in two pieces, which
attach to a base containing the connector, whisker, and diode. This design
is attractive as the whisker can be installed and the diode contacted with the
corner reflector removed from the base, giving excellent access. In addition, the
reflectors are easily aligned to give optimum sensitivity.
2 Detector Damage
Our original detectors exhibited very low survivability during TEXT operation.
Fig. 2 gives the current-voltage (I/V) characteristics of a good, weakly damaged,

and badly blown detector. The horlsontal scale on these traces Is -1 V to I V, with
0.2 V/div. The vertical scale is 0 to 12 _i, at 2 _A/div. A good diode is shown
In Fig. 2(a). The diode exhibits no reverse voltage breakdown, and a sharp knee
at _ 0.7 V. A weakly damaged diode is shown in Fig. 2(b). Reverse breakdown
current is observed, and the diode has s Usoft" knee at reduced forward voltage.
This diode would have greatly reduced sensitivity as an FIR mixer. A fully
damaged diode is shown in Fig. 2(c). The I/V characteristic is essentially linear,
with a resistance of n, 12.7 Ktq. It win no longer operate as an FIR mixer.
Each Schottky diode chip contains an array of several thousand Individual
diodes. A scanning electron microscope (SEM) photograph of a damaged diode
is shown in Fig. 3. A cavity is evident at the damage site, and debris extends
to neighboring diodes. The damage Is quite localized however, extending only a
few microns from the affected diode. The chip can always be recontacted at adifferent diode location.
The damage mechanism suggested by the SEM and soft diode charac-
teristics is contact heating. For the Schottky diode to work, a sharp metal-
semiconductor boundary must exist. Heating at this interface causes diffusion
and migration, eliminating the sharp boundary. A fairly large temperature rise
is required, _ 200-300 K. However, the thermal impedance and very small size of
these devices give a temperature rlsetime of _ 1 _mand a sharp damage thresh-
old. The bias current threshold for damage in the diodes we have tested is _ 10
mA. It is also known that RF power in the 10's of milUwatts can cause damage.
Detector damage was difficult to predict; the detectors survived some
tokamak runs, while other runs would damage all of the detectors in use. A
carefully documented set of test0 were made during 25 days of TEXT operation.
Before each run a set of good detectors (typically 6) were installed. After the run
the detectors were removed and checked. At least one detector was blown on 11
of the test days. Results indicated that the detector termination (shorting cap,
normal bias, etc.) had no effect on the probability of damage. The damage was
also uncorrelated with the type of diode (I11, IT9, or 2T6). No correlation was
found with machine conditions, such as toroldal field, plasma current, or density.
The only significant improvement in detector survivability was obtained
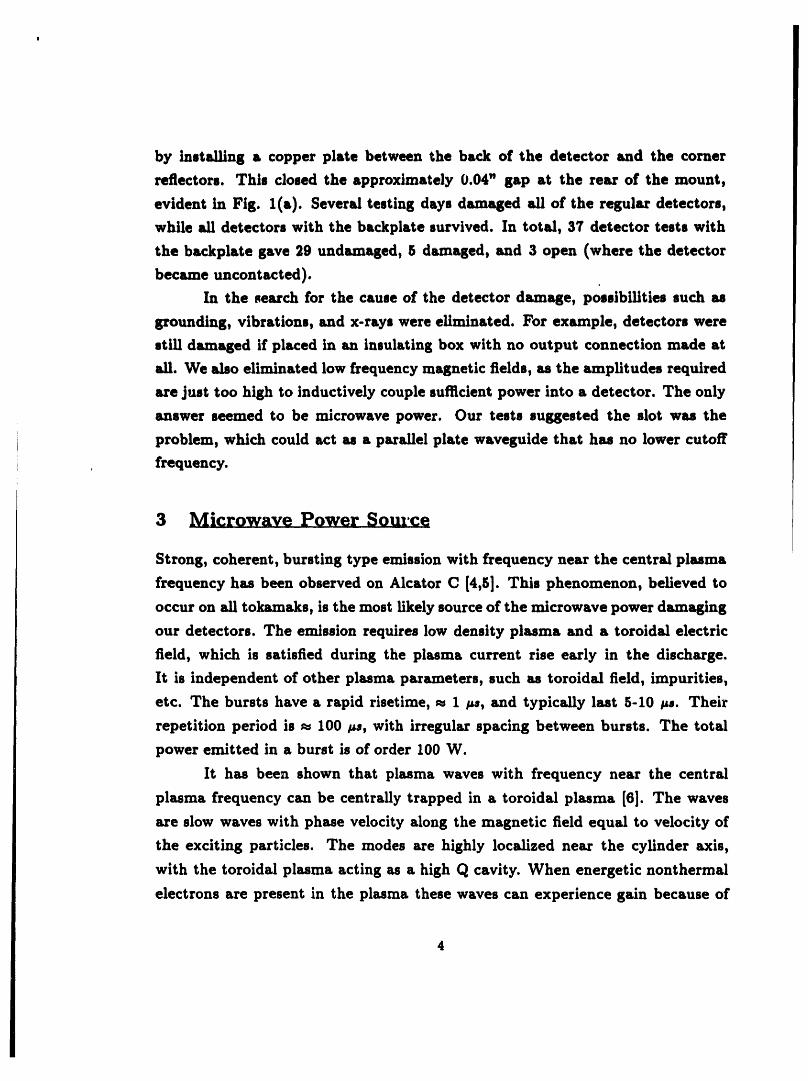
by Installing a copper plate between the back of the detector and the corner
reflectors. Thls closed the approximately 0.04" gap at the rear of the mount,
evident in Fig. l(a). Several testing days damaged all of the regular detectors,
while all detectors with the backplate survived. In total, 37 detector tests with
the backplate gave 29 undamaged, 5 damaged, and 3 open (where the detector
became uncontacted).
In the _earch for the cause of the detector damage, possibilities such as
grounding, vibrations, and x-rays were eliminated. For example, detectors were
still damaged if placed in an insulating box with no output connection made at
all. We also eliminated low frequency magnetic fields, as the amplitudes required
are just too high to inductively couple sufficient power into a detector. The only
answer seemed to be microwave power. Our tests suggested the slot was the
problem, which could act as a parallel plate waveguide that has no lower cutoff
frequency.
3 Microwave Power Source
Strong, coherent, bursting type emission with frequency near the central plasma
frequency has been observed on Alcator C [4,5]. This phenomenon, believed to
occur on all tokamaks, is the most likely source of the microwave power damaging
our detectors. The emission requires low density plasma and a toroidal electric
field, which is satisfied during the plasma current rise early in the discharge.
It is independent of other plasma parameters, such as toroidal field, impurities,
etc. The bursts have a rapid risetime, _ I/,8, and typically last 5-10/,s. Their
repetition period is _ I00 #a, with irregular spacing between bursts. The total
power emitted in a burst is of order 100 W.
It has been shown that plasma waves with frequency near the central
plasma frequency can be centrally trapped in a toroidal plasma [6]. The waves
are slow waves with phase velocity along the magnetic field equal to velocity of
the exciting particles. The modes are highly localized near the cylinder axis,
with the toroidal plasma acting as a high Q cavity. When energetic nonthermal
electrons are present in the plasma these waves can experience gain because of
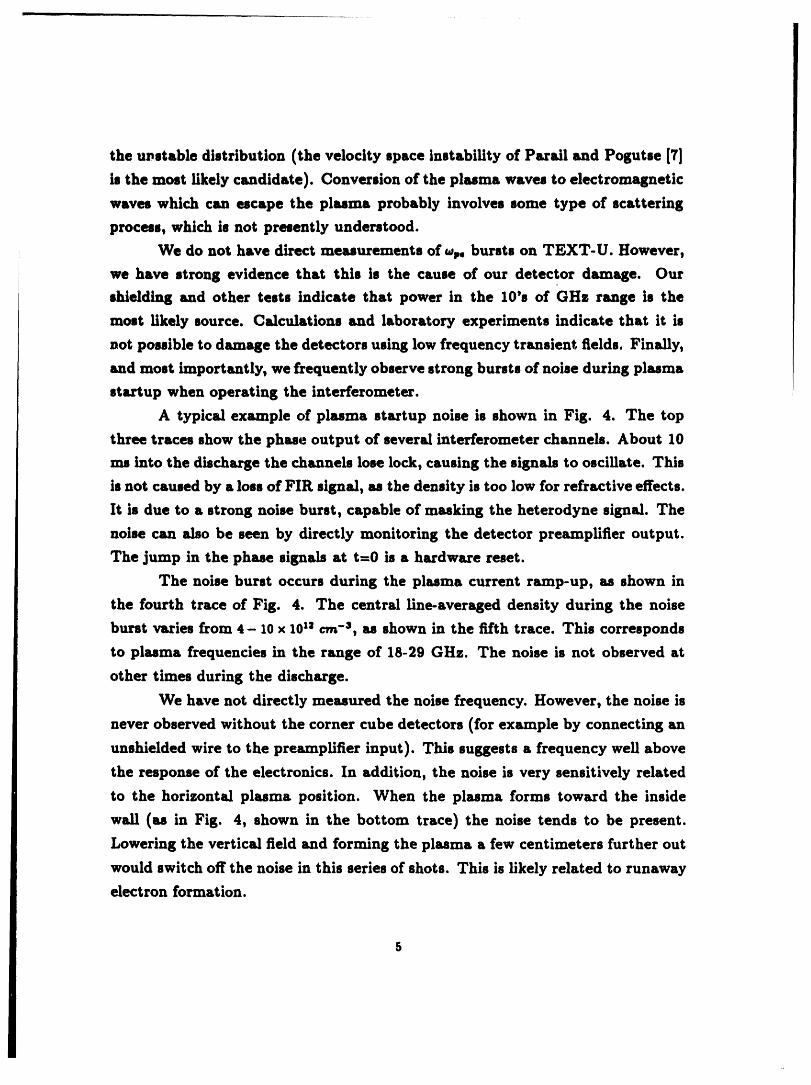
the upstable distribution (the velocity space instability of Parali and Pogutse [7]
is the most likely candidate). Conversion of the plasma waves to electromagnetic
waves which can escape the plasma probably involves some type of scattering
process, which is not presently understood.
We do not have direct measurements of _. bursts on TEXT-U. However,
we have strong evidence that this is the cause of our detector damage. Our
mhielding sad other tests indicate that power in the 10's of GHz range is the
most likely source. Calculations and laboratory experiments indicate that it is
not possible to damage the detectors using low frequency transient fields. Finally,
and most importantly, we frequently observe strong bursts of noise during plasma
startup when operating the interferometer.
A typical example of plasma startup noise is shown in Fig. 4. The top
three traces show the phase output of several interferometer channels. About 10
ms into the discharge the channels lose lock, causing the signals to oscillate. This
is not caused by a loss of FIR signs], as the density is too low for refractive effects.
It is due to a strong noise burst, capable of masking the heterodyne signal. The
noise can also be seen by directly monitoring the detector preamplifier output.
The jump in the phase signals at triO is a hardware reset.
The noise burst occurs during the plasma current ramp-up, as shown in
the fourth trace of Fig. 4. The central line-averaged density during the noise
burst varies from 4- 10 x 10I: on -a, as shown in the fifth trace. This corresponds
to plasma frequencies in the range of 18-29 G Hz. The noise is not observed at
other times during the discharge.
We have not directly measured the noise frequency. However, the noise is
never observed without the corner cube detectors (for example by connecting an
unshielded wire to the preamplifier input). This suggests a frequency well above
the response of the electronics. In addition, the noise is very sensitively related
to the horizontal plasma position. When the plasma forms toward the inside
wall (as in Fig. 4, shown in the bottom trace) the noise tends to be present.
Lowering the vertical field and forming the plasma a few centimeters further out
would switch off the noise in this series of shots. This is likely related to runaway
electron formation.

4 Electromagnetic Model
The field structure in the gap region hu been calculated, assuming an Hs po-
larized incident wave where s Is the direction para/lel to the Sap. The fields are
computed by rigorous numerical solution of the two dlmenslonLl electromagnetic
scattering problem [8,9]. The solution to the scsttering problem is formulsted by
expressing the fields outside the gap region in terms of the unknown tsagentl_l
aperture electric field. Similarly the fields inside the arbitrary gaP region can
be expressed as _ boundary integral of the electric sad magnetic fields on the
closed contour formed by the Sap aperture and the Sap walls. By m_tchlns the
aperture fields in the two regions, we arrive st a boundary intqrsd equation in
which the unknowns are the tangential electric sad magnetic fields on the asp
aperture and the tangential magnetic field s/ong the conducting gap walls.
The boundary integral equation is next dlscretised into s matrix equation
via the standard method of moments procedure, using pulse expansion and point-
matching. The unknown fields along the boundary axe then found by solving the
resulting moment matrix equation. Finally, since the fields in the interior alp
region can be expressed in terms of the electric and magnetic fields along the i
closed contour formed by the aperture and the wall surface, the fields everywhere
inside the gap can be readily found.
The gap width (0.04") ranges from 0.06A to 0.1A, where A is the free space
wavelength of 18-29 GHs radiation. The slot depth (0.22") varies from 0.3A to
0.SA. Results of the numerical code show that in the interior of the slot the
electric field across the gap (£,) is up to three times larger than the free space
(incident) value. The field amplitude varies strongly with depth. At a given
depth the field magnitude and phase is relatively constant at different positions
across the gap. The field structure within the slot is fairly insensitive to the
incident angle of the microwaves.
The electrical connection to the diode whisker runs across the asp, 0.15"
from the top of the slot. It is therefore parallel to E,, which can drive current
through the diode. With the diode impedance _ 100 f} and damage threshold
10 rnA, about 1 V across the slot is required. This requires a field strength

of _ 1000 V/m across the gap, or _ 300 V/m for the incident radiation. This
corresponds to an incident power of _ 120 W/m:. This level is quite consistent
with _p, bursts of the order of 100 W, since this power must escape through alimited number of windows on the vacuum vessel.
5 New Detectors
When it became apparent that the detector damage was due to the slot, we
redesigned the corner cube mount with a solid top structure. The new design,
shown in Fig. l(b), has completely solved the damage problem. A bank of these
corner cubes has now been in operation on TEXT-U for seven months with no
failures (the FIR data shown in Fig. 4 was obtained using the new detectors).
The startup noise has been hamdled by installing a passive two section
(4-pole) LC filter at the preamplifier input. This bandpau filter allows the 1
MHz FIR heterodyne signal (and the necessary sidebands) into the high gain
preamplifier, but effectively eliminates the wideband noise. The data shown in
Fig. 4 is without the filtering, and has a bamdwidth into the phase detector of
25 KHz to 5 MHz.
6 Conclusions
A difficult problem with the survivability of far-infrared detectors on TEXT up-
grade has been traced to intense microwave power bursts from the plasma. This
phenomena should be considered when designing sensitive microwave detectors
for tokamak applications_ especially if they are located close to the plasma.
7 Acknowledgements
We are grateful to G. Cima, P. H. Edmonds, D. T. Jalfe, D. P. Neikirk, and A.
J. Wootton for many helpful discussions on possible causes of the corner cube
damage. D. T. J affe also provided invaluable assistance in the art of fabricating
these devices, plus the design from which our original mounts were based. We

would also like to acknowledge A. S. Rahman for running the electromagnetic
field code. This work is supported by the U.S. Department of Energy under
grant DE-FG05-88ER-53267.

References
[1] G. A. Hallock, e_ al., Rev. Sci. Instrum. Vol. 63, No. 10, 4987 (1992).
[2] J. Zmu|dzinas, A. L. Betz, and R. T. Bore|ko, Infrared Phys. Vol. 29, No. 1,
119(1989).
[3] H. J. Neilson, Masters Thesis, Univ. of Virginia, M_y 1989.
[4] I. H. Hutchinson and S. E. Kissel, Phys. Fluids 23, 1698 (1980).
[5] R. F. Gaudy and D. H. Yates, Phys. Fluids 28, 1877 (1985).
[6] I. H. Hutchinson and R. F. Gaudy, Phys. Fluids 28, 1090 (1985).
[7] V. V. Parail and O. P. Pogutse, Soy. J. Plasma Phys. 2, 125 (1976).
[8] H. Ling, IEEE Trans. Ant. Prop., Vol. AP-38, 1413 (1990).
[9] T. M. Wang and H. Ling, IEEE Trans. Ant. Prop., Vol. AP-39, 1505 (1991).

Figure Captions
Fig. I. (a) Original and (b) new corner cube mixers.
Fig. 2. SEM photograph of a damaged Schottky diode.
Fig. 3. (a) Good, (b) weakly damaged, and (c) badly damaged diodes.
Fig. 4. TEXT-U shot with strong start-up noise.
10

(a) (b)

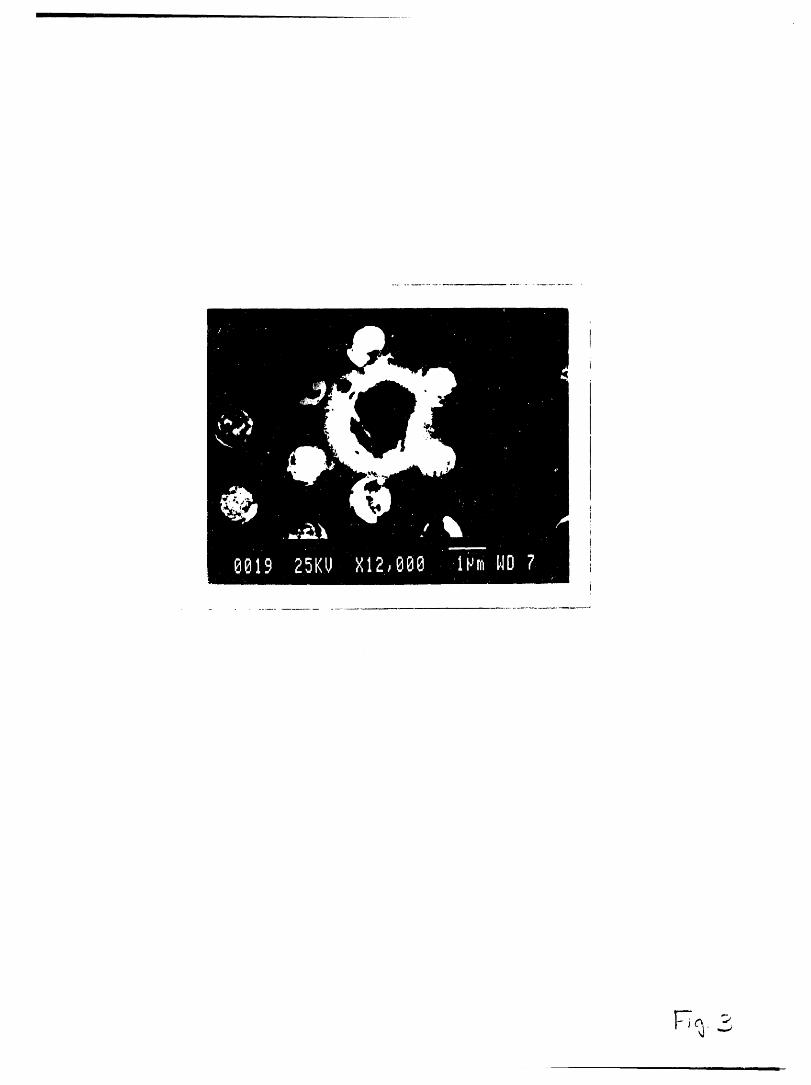

P
SHOT 194938 T E X T 14 OCT 93 12:33PM
CENTRAL RR CHORD
0 -
, ,__A_ _I_ +IscmFiRCHORD _0 I
ii_J _ +24 cm FIRCHORD
o- I
200 -
PLASMA CURRENT (KA)
0
20F_,+12 -
" _ PLASMA DENSITY (cm"31
0E+I2 ............. 'f_ " ................................. , , i ......... T _ " ------ "
0
/..,..._ / PLASMA HORIZ POSITION (cm) _
, I , I , I , I i I ,-5
._ -20 0 20 40 60 80 I00
TIME (MSEC)

m m