Euroregiunile de cooperare transfrontaliera din Bazinul inferior al Dunarii
Upload
independentCategory
view
0download
0
Developmental Science 11:3 (2008), pp 361–370 DOI: 10.1111/j.1467-7687.2008.00681.x
© 2008 The Authors. Journal compilation © 2008 Blackwell Publishing Ltd, 9600 Garsington Road, Oxford OX4 2DQ, UK and 350 Main Street, Malden, MA 02148, USA.
Blackwell Publishing LtdPAPER
Hemodynamic response to featural changes in the occipital and inferior temporal cortex in infants: a preliminary methodological exploration
Teresa Wilcox,1 Heather Bortfeld,1 Rebecca Woods,1 Eric Wruck1 and David A. Boas2
1. Department of Psychology, Texas A&M University, USA2. Anthinoula A. Martinos Center for Biomedical Imaging, Massachusetts General Hospital, Harvard Medical School, USA
Abstract
Over the past 30 years researchers have learned a great deal about the development of object processing in infancy. In contrast,little is understood about the neural mechanisms that underlie this capacity, in large part because there are few techniques avail-able to measure brain functioning in human infants. The present research examined the extent to which near-infrared spectroscopy(NIRS), an optical imaging technique, could be used to assess the relation between object processing and brain functioning.Infants aged 6.5 months were presented with an occlusion event involving objects that differed on many feature dimensions (multi-featural change), differed on shape only (shape change) or color only (color change), or did not differ (control). NIRS datawere collected in the occipital and inferior temporal cortex. In the occipital cortex, a significant increase in oxyhemoglobin(HbO2) was observed in response to all four events and these responses did not differ significantly from each other. In the inferiortemporal cortex, a significant increase in HbO2 was observed in the multi-featural and the shape change condition but not inthe control condition. An increase was also observed in the color change condition but this increase did not differ significantlyfrom baseline nor did it differ significantly from the response obtained in the control condition. These data were discussed interms of (a) what they suggest about the neural basis of feature processing in infants and (b) the viability of using NIRS tostudy brain–behavior relations in infants.
Introduction
Over the past 30 years, cognitive scientists have learneda great deal about the development of object processingin infants. For example, soon after birth infants attendto the boundaries of objects as determined by areas ofhigh contrast and motion-related information (Adams &Maurer, 1984; Arterberry & Yonas, 2000; Slater & Mori-son, 1985; Stephens & Banks, 1987) and then use thoseboundaries to segregate objects from other surfaces (Slater,Morison, Somers, Mattock, Brown & Taylor, 1990; Slater,Morison, Town & Rose, 1985; Spelke, 1985). By 4 months,infants reliably scan the entire object (Colombo, Mitchell,Coldren & Freeseman, 1991; Maurer & Salapatek, 1976)and attend to the featural properties of objects, such asshape, color, and pattern. However, discrepancies some-times exist between infants’ capacity to detect a featuralproperty and the extent to which infants use that featureto interpret events involving objects. For example, by 4.5months infants use form features, such as shape and size,to determine whether an object currently in view is thesame object, or a different object, than seen previously(Wilcox, 1999). However, it is not until much later that
infants use color information to individuate objects (Wilcox,1999; Wilcox & Chapa, 2004; Wilcox, Woods, Chapa &McCurry, 2007). Similar findings have been observed instudies of object segregation and identification (Need-ham, 1999; Tremoulet, Leslie & Hall, 2001) and modelshave been offered to explain differential patterns of behav-ioral responding (e.g. Káldy & Sigala, 2004; Mareschal& Johnson, 2003). These findings are intriguing becauseby 4.5 months infants have relatively good color visionand can detect color differences. However, they do not usethese differences to segregate and individuate objects.
In contrast, little is known about the underlying neuralmechanisms that are responsible for the developmentalchanges that have been observed in object processing tasks.One reason for this gap in knowledge is that there are alimited number of non-invasive neuroimaging techniquesavailable for use with human infants. Brain-imaging methodsthat can be used to identify the neural areas activated,such as functional magnetic resonance imaging (fMRI)and positron emission tomography (PET), are difficult toapply in awake infants. Other techniques, such as electro-encephalography (EEG), event-related brain potentials(ERP), and magnetoencephalography (MEG), provide
Address for correspondence: Teresa Wilcox, Department of Psychology, Texas A&M University, 4235 TAMU, College Station, TX 77843, USA;e-mail: [email protected]
362 Teresa Wilcox et al.
© 2008 The Authors. Journal compilation © 2008 Blackwell Publishing Ltd.
important information about the timing of neuralresponses but are limited in identifying the location fromwhich the responses were generated. There is, therefore,a critical need to identify new strategies to assess thefunctional development of object processing in thehuman brain.
Near-infrared spectroscopy
One method currently under development for use withinfants in the experimental setting is near-infrared spectro-scopy (NIRS) (Baird, Kagan, Gaudette, Walz, Hershlag& Boas, 2002; Bortfeld, Wruck & Boas, 2007; Peña,Maki, Kovacic, Dehaene-Lambertz, Koizumi, Bouquet& Mehler, 2003; Taga, Asakawa, Maki, Konishi &Koizumi, 2003; Wilcox, Bortfeld, Woods, Wruck & Boas,2005), an optical imaging technique that uses changes inblood volume and hemoglobin oxygenation as an indexof neural activation. The rationale for this approachrests on the concept that neural activation in response toa stimulus results in increased energy demands in the areaactivated. To accommodate the demand for energy,cerebral blood flow (CBF) increases to the activated brainareas bringing oxygen and glucose. Changes in blood flowlead to an increase in blood volume and can be assessedby measuring local concentrations of oxyhemoglobin(oxygenated blood) and deoxyhemoglobin (deoxygenatedblood). Typically, during cortical activation local con-centrations of oxyhemoglobin (HbO2) increase, whereasconcentrations of deoxyhemoglobin (HbR) decrease.However, the HbR response tends to be much smallerin magnitude and less reliable than the HbO2 response(Bartocci, Winberg, Ruggiero, Bergqvist, Serra &Lagercrantz, 2001; Chen, Sakatani, Lichty, Ning, Zhao &Zuo, 2002; Hoshi & Tamura, 1993; Jasdzewski, Strangman,Wagner, Kwong, Poldrack & Boas, 2003; Kato, Kamei,Takashima & Ozaki, 1993; Sakatani, Chen, Lichty, Zuo& Wang, 1999; Strangman, Culver, Thompson & Boas,2002; Strangman, Franceschini & Boas, 2003). Finally,from the summated changes in HbR and HbO2 totalhemoglobin (HbT) can be computed.
To measure changes in oxyhemoglobin and deoxy-hemoglobin, near-infrared light between approximately 650and 900 nm is projected through the skull and into thebrain. At these wavelengths, light is differentially absorbedby oxygenated and deoxygenated blood (Gratton, Sarno,Maclin, Corballis & Fabiani, 2000; Villringer & Chance,1997). Below 800 nm light is relatively more sensitive todeoxygenated blood and above 800 nm it is relatively moresensitive to oxygenated blood. Hence, measuring the lightintensity modulation during stimulus presentation, andcomparing it to the light intensity during a baseline eventin which no stimulus is presented, provides importantinformation about the hemodynamic response to brainactivation. Evidence that there is a linear relationshipbetween hemodynamics and neural activity (Gratton,Goodman-Wood & Fabiani, 2001), and that NIRSproduces results consistent with other imaging techniques
(i.e. fMRI and PET) used simultaneously (Kleinschmidt,Obrig, Requardt, Merboldt, Dirnagl, Villringer & Frahm,1996; Strangman et al., 2002; Villringer, Minoshima,Hock, Obrig, Ziegler, Dirnagl, Schweiger & Villringer,1997) provides converging evidence that NIRS can pro-vide a reliable measure of brain function.
Application of NIRS to object processing
Recently, Wilcox et al. (2005) used NIRS to explore theneural basis of infants’ sensitivity to featural informationin an occlusion event. Infants aged 6.5 months were shownan event in which a box and a ball emerged successivelyat opposite sides of an occluder. There is evidence fromlooking time and reaching tasks (McCurry, Wilcox &Woods, 2008; Wilcox & Baillargeon, 1998a, 1998b; Wilcox& Schweinle, 2002) that infants as young as 4.5 monthsattend to the featural differences between the box andthe ball and use those differences to interpret the eventas involving two separate and distinct objects. There isalso evidence from research with adult monkeys (DeYoe& Van Essen, 1988; Desimone & Ungerleider, 1989;Livingstone & Hubel, 1987, 1988; Mishkin, Ungerleider& Macko, 1983; Tanaka, 1997, 2000; Tsunoda, Yamane,Nishizaki & Tanifuji, 2001; Ungerleider & Mishkin, 1982;Van Essen, Anderson & Felleman, 1992; Wang, Tanifuji& Tanaka, 1998; Wang, Tanaka & Tanifuji, 1996) andadult humans (Boucart, Meyer, Pins, Humphreys, Scheiber,Gounod & Foucher, 2000; Clark, Parasuraman, Keil,Kulansky, Fannon, Maisog, Ungerleider & Haxby, 1997;Grill-Spector, Kushnir, Hendler, Edelman, Itzchak &Malach, 1998; Kraut, Hart, Soher & Gordon, 1997) thatthe occipital (O) and inferior temporal (IT) cortex arecritical components of the neural system that mediatesobject processing. Whereas occipital cortex is importantfor the processing of individual features, inferior temporalcortex is important for integrating features into wholeobject representations and for identifying objects on thebasis of the features included in those representations.
Wilcox et al. (2005) assessed the extent to which O andIT would be activated during a task that is known toengage these processes in infants. NIRS data revealeda significant increase in HbO2 in O and IT in responseto the box-ball event, suggesting that both neural areaswere activated during the object processing task. Theseresults, which were some of the first to be reported withinfants in an experimental setting, broke new ground inthe developmental neurosciences by demonstrating thatit is feasible to assess the neural basis of object process-ing in human infants using NIRS technology. At thesame time there are limitations to the conclusions thatcan be drawn from these data alone. For example, thebox and the ball varied on many feature dimensions,including shape, color, and pattern. The extent to whichany one of these differences alone would activate O andIT cortex is unknown. In light of recent evidence thatinfants are more sensitive to shape than color differencesin object processing tasks (Needham, 1999; Tremoulet
Hemodynamic response to features in O and IT 363
© 2008 The Authors. Journal compilation © 2008 Blackwell Publishing Ltd.
et al., 2001; Wilcox, 1999), we thought it possible thatdifferential patterns of neural activation would be observedin response to events involving shape and color differences.
Present research
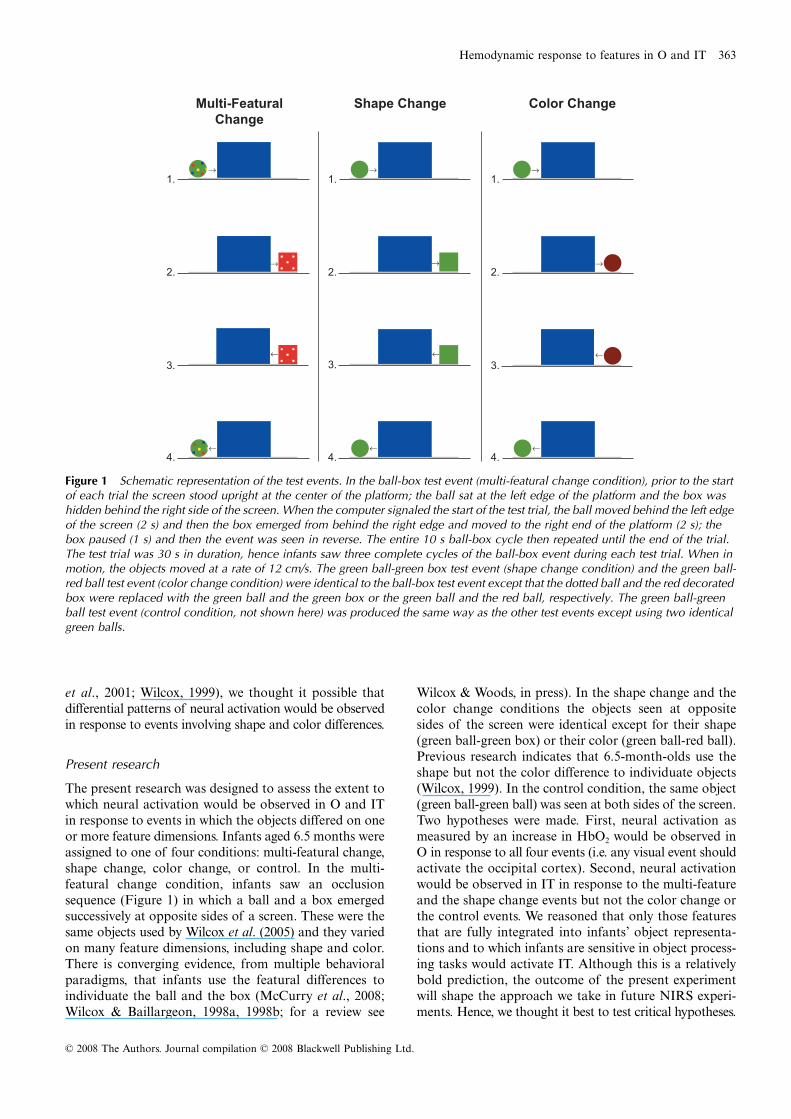
The present research was designed to assess the extent towhich neural activation would be observed in O and ITin response to events in which the objects differed on oneor more feature dimensions. Infants aged 6.5 months wereassigned to one of four conditions: multi-featural change,shape change, color change, or control. In the multi-featural change condition, infants saw an occlusionsequence (Figure 1) in which a ball and a box emergedsuccessively at opposite sides of a screen. These were thesame objects used by Wilcox et al. (2005) and they variedon many feature dimensions, including shape and color.There is converging evidence, from multiple behavioralparadigms, that infants use the featural differences toindividuate the ball and the box (McCurry et al., 2008;Wilcox & Baillargeon, 1998a, 1998b; for a review see
Wilcox & Woods, in press). In the shape change and thecolor change conditions the objects seen at oppositesides of the screen were identical except for their shape(green ball-green box) or their color (green ball-red ball).Previous research indicates that 6.5-month-olds use theshape but not the color difference to individuate objects(Wilcox, 1999). In the control condition, the same object(green ball-green ball) was seen at both sides of the screen.Two hypotheses were made. First, neural activation asmeasured by an increase in HbO2 would be observed inO in response to all four events (i.e. any visual event shouldactivate the occipital cortex). Second, neural activationwould be observed in IT in response to the multi-featureand the shape change events but not the color change orthe control events. We reasoned that only those featuresthat are fully integrated into infants’ object representa-tions and to which infants are sensitive in object process-ing tasks would activate IT. Although this is a relativelybold prediction, the outcome of the present experimentwill shape the approach we take in future NIRS experi-ments. Hence, we thought it best to test critical hypotheses.
Figure 1 Schematic representation of the test events. In the ball-box test event (multi-featural change condition), prior to the start of each trial the screen stood upright at the center of the platform; the ball sat at the left edge of the platform and the box was hidden behind the right side of the screen. When the computer signaled the start of the test trial, the ball moved behind the left edge of the screen (2 s) and then the box emerged from behind the right edge and moved to the right end of the platform (2 s); the box paused (1 s) and then the event was seen in reverse. The entire 10 s ball-box cycle then repeated until the end of the trial. The test trial was 30 s in duration, hence infants saw three complete cycles of the ball-box event during each test trial. When in motion, the objects moved at a rate of 12 cm/s. The green ball-green box test event (shape change condition) and the green ball-red ball test event (color change condition) were identical to the ball-box test event except that the dotted ball and the red decorated box were replaced with the green ball and the green box or the green ball and the red ball, respectively. The green ball-green ball test event (control condition, not shown here) was produced the same way as the other test events except using two identical green balls.
364 Teresa Wilcox et al.
© 2008 The Authors. Journal compilation © 2008 Blackwell Publishing Ltd.
Method
Participants
Thirty-five 6.5-month-olds, 21 m (M age = 6 months, 17days, range = 5 months, 12 days to 7 months, 22 days)participated. Twelve additional infants were tested but wereeliminated from analysis because they failed to contributeany NIRS data for one of the following reasons: largemotion artifacts in the signals (n = 6), obstruction by hair(n = 2), or procedural problems (n = 4). Another groupof infants (n = 6) were tested but eliminated becausedata were available for only one of the two brain regions(i.e. the signal-to-noise ratio was prohibitive in the otherarea). Infants were randomly assigned to one of the fourconditions: multi-featural change (n = 8), shape change(n = 8), color change (n = 10), or control (n = 9).
Apparatus and stimuli
The apparatus consisted of a wooden cubicle 213 cm high,105 cm wide and 43.5 cm deep. The infant sat on a parent’slap facing an opening 51 cm high and 93 cm wide in thefront wall of the apparatus; the infant’s head was approxi-mately 78 cm from the objects on the platform. The floorand the walls of the apparatus were cream or coveredwith lightly-patterned contact paper. A platform 1.5 cmhigh, 60 cm wide, and 19 cm deep lay 4.5 cm from theback wall and centered between the left and right walls.A slit in the back wall, concealed by a cream fringe, enabledthe experimenter to reach into the apparatus and movethe objects along the platform.
The ball used in the ball-box event was 10.25 cm indiameter and painted green with yellow, blue, and red dots.The box was 10.25 cm square, red, and decorated withsilver thumbtacks. The objects used in the green ball-greenbox event were identical to those of the ball-box eventexcept that both were green, without pattern or decora-tion. The balls used in the green ball-red ball event weregreen and red, respectively, without pattern or decora-tion and were equal in luminance (35 cd/m2). The twogreen balls used in the control condition were identicalto the green ball just described. The screen was 21.5 cmhigh and 30 cm wide and made of blue cardboard.
A muslin-covered shade was lowered in front of theopening in the front wall of the apparatus at the end ofeach trial and remained lowered until the beginning ofthe next trial. Two muslin-covered wooden frames, each213 cm high and 68 cm wide, stood at an angle on eitherside of the apparatus. These frames isolated the infantfrom the experimental room. To illuminate the stage, a20-watt fluorescent bulb was affixed inside each wall ofthe apparatus. No other lighting was used.
The amount of time infants spent looking at the testevent was recorded and looking time data were time-locked to the NIRS data. Looking behavior was moni-tored by two observers who watched the infant throughpeepholes in the muslin-covered frames on either side of
the apparatus. Interobserver agreement was measuredfor 24 of the infants and averaged 94%.
Infants were presented with four test trials appropriatefor their condition. Each trial was 30 s in duration. Becauseanalysis of the NIRS data requires baseline recordingsof the measured intensity of refracted light, prior to eachtrial infants were also presented with a 10 s silent pauseduring which time no event was presented. A final 10 ssilent pause followed the last trial. Hence, each infanthad 10 s of silent pause immediately prior to and follow-ing each test trial. Finally, because failure to visuallyattend to the event could result in a decrease in hemo-dynamic response in O and/or IT, the looking time datawere inspected for trials in which the infant accumulatedless than 20 s looking time. There were five trials (of 140possible) that failed to meet the behavioral criteria andwere eliminated from analysis.
Instrumentation
The imaging equipment contained three major com-ponents: (1) two fiber optic cables that delivered near-infrared light to the scalp of the participant (i.e. emitters);(2) four fiber optic cables that detected the diffusely reflectedlight at the scalp (i.e. detectors); and (3) an electroniccontrol box that served both as the source of the near-infrared light and the receiver of the reflected light.
The electronic control box produced light at 690 and830 nm wavelengths with two laser-emitting diodes (Boas,Franceschini, Dunn & Strangman, 2002; TechEn Inc.).Laser power emitted from the end of the diode was 4 mW.Light was square wave modulated at audio frequenciesof approximately 4 to 12 kHz. Each laser had a uniquefrequency so that synchronous detection could uniquelyidentify each laser source from the photodetector signal.Ambient illumination from the testing room did notinterfere with the laser signals because environmental lightsources modulate at a different frequency. The two fiberoptic cables that delivered the light from the control boxto the headgear (see below) were 1 mm in diameter and5 m in length. The four fiber optic cables that detectedthe diffusely reflected light at the scalp and transmittedit to the control box were also 1 mm in diameter and 5 min length. Each emitter delivered both wavelengths oflight (690 and 830 nm) and each detector responded toboth wavelengths. The signals received by the electroniccontrol box were processed and relayed to a DELL Inspiron7000™ laptop computer. A custom computer programrecorded and analyzed the signal. Additional details aboutthe NIRS equipment can be found in Franceschini,Joseph, Huppert, Diamond and Boas (2006) and Joseph,Huppert, Franceschini and Boas (2006), who used a similarinstrument except with a larger number of emitters anddetectors.
Prior to presentation of the test events, infants werefitted with custom-made headgear that secured the fiberoptics to the scalp. The ends of the fiber optic cableswere arranged in two triads. Each triad consisted of one
Hemodynamic response to features in O and IT 365
© 2008 The Authors. Journal compilation © 2008 Blackwell Publishing Ltd.
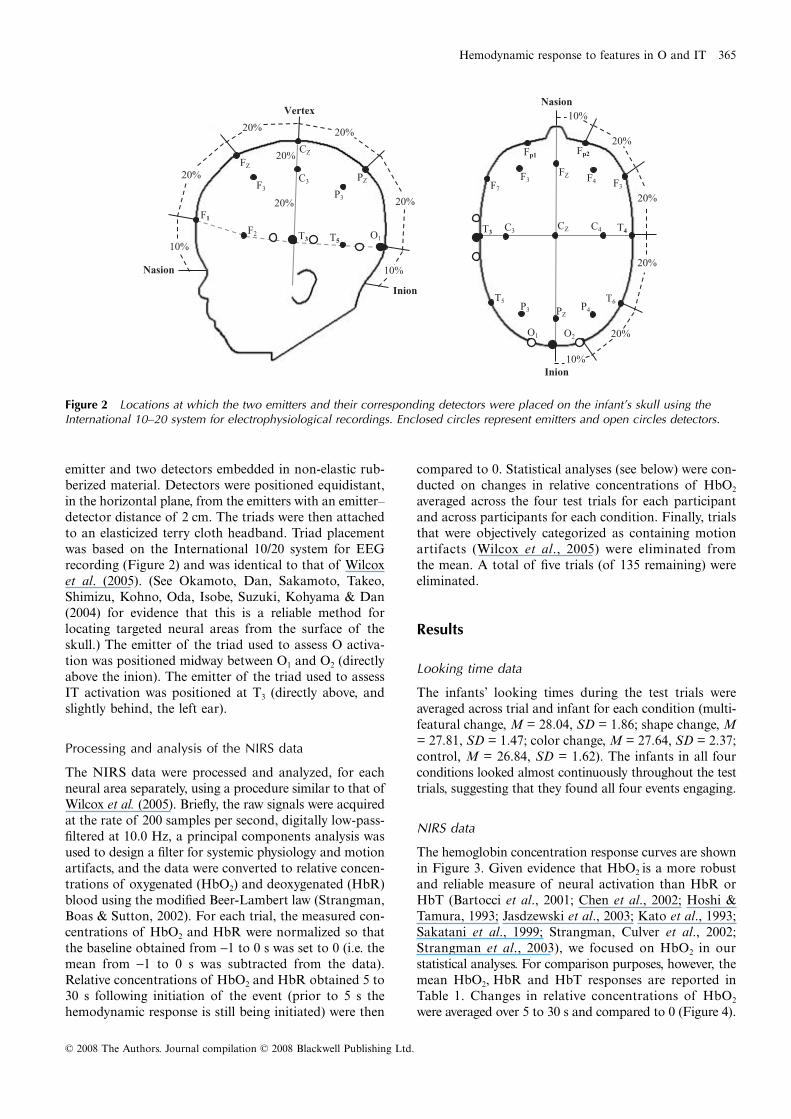
emitter and two detectors embedded in non-elastic rub-berized material. Detectors were positioned equidistant,in the horizontal plane, from the emitters with an emitter–detector distance of 2 cm. The triads were then attachedto an elasticized terry cloth headband. Triad placementwas based on the International 10/20 system for EEGrecording (Figure 2) and was identical to that of Wilcoxet al. (2005). (See Okamoto, Dan, Sakamoto, Takeo,Shimizu, Kohno, Oda, Isobe, Suzuki, Kohyama & Dan(2004) for evidence that this is a reliable method forlocating targeted neural areas from the surface of theskull.) The emitter of the triad used to assess O activa-tion was positioned midway between O1 and O2 (directlyabove the inion). The emitter of the triad used to assessIT activation was positioned at T3 (directly above, andslightly behind, the left ear).
Processing and analysis of the NIRS data
The NIRS data were processed and analyzed, for eachneural area separately, using a procedure similar to that ofWilcox et al. (2005). Briefly, the raw signals were acquiredat the rate of 200 samples per second, digitally low-pass-filtered at 10.0 Hz, a principal components analysis wasused to design a filter for systemic physiology and motionartifacts, and the data were converted to relative concen-trations of oxygenated (HbO2) and deoxygenated (HbR)blood using the modified Beer-Lambert law (Strangman,Boas & Sutton, 2002). For each trial, the measured con-centrations of HbO2 and HbR were normalized so thatthe baseline obtained from −1 to 0 s was set to 0 (i.e. themean from −1 to 0 s was subtracted from the data).Relative concentrations of HbO2 and HbR obtained 5 to30 s following initiation of the event (prior to 5 s thehemodynamic response is still being initiated) were then
compared to 0. Statistical analyses (see below) were con-ducted on changes in relative concentrations of HbO2
averaged across the four test trials for each participantand across participants for each condition. Finally, trialsthat were objectively categorized as containing motionartifacts (Wilcox et al., 2005) were eliminated fromthe mean. A total of five trials (of 135 remaining) wereeliminated.
Results
Looking time data
The infants’ looking times during the test trials wereaveraged across trial and infant for each condition (multi-featural change, M = 28.04, SD = 1.86; shape change, M= 27.81, SD = 1.47; color change, M = 27.64, SD = 2.37;control, M = 26.84, SD = 1.62). The infants in all fourconditions looked almost continuously throughout the testtrials, suggesting that they found all four events engaging.
NIRS data
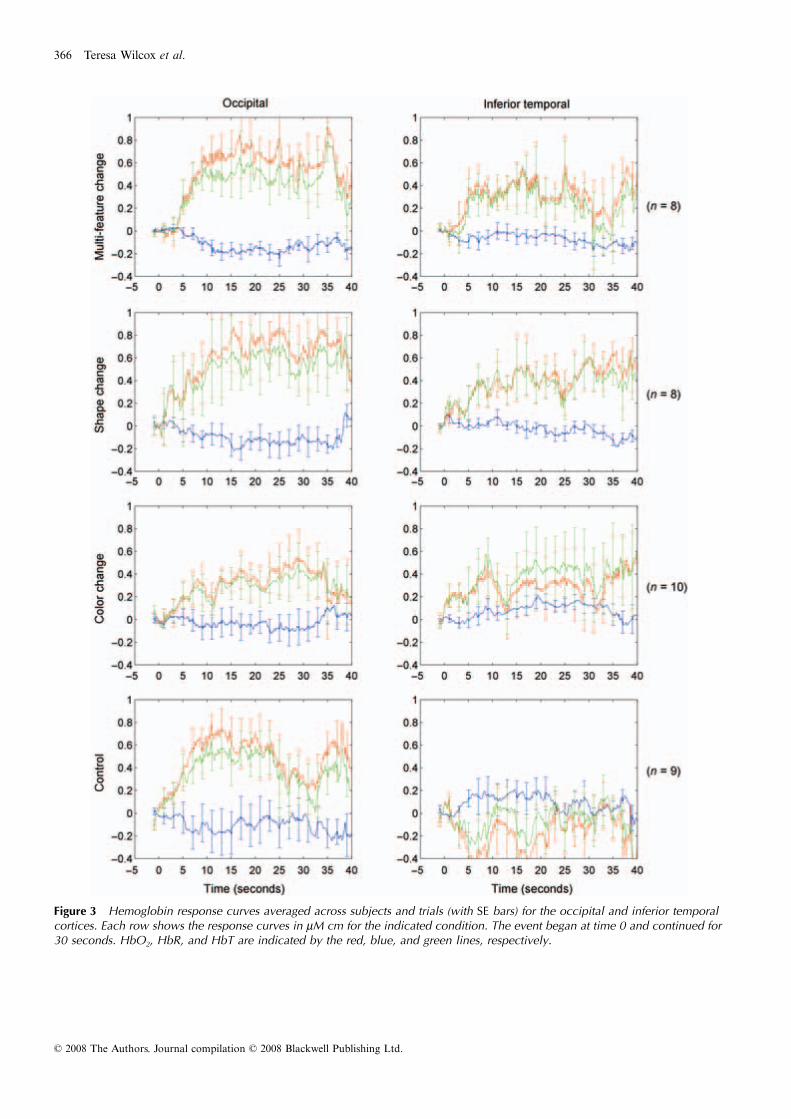
The hemoglobin concentration response curves are shownin Figure 3. Given evidence that HbO2 is a more robustand reliable measure of neural activation than HbR orHbT (Bartocci et al., 2001; Chen et al., 2002; Hoshi &Tamura, 1993; Jasdzewski et al., 2003; Kato et al., 1993;Sakatani et al., 1999; Strangman, Culver et al., 2002;Strangman et al., 2003), we focused on HbO2 in ourstatistical analyses. For comparison purposes, however, themean HbO2, HbR and HbT responses are reported inTable 1. Changes in relative concentrations of HbO2
were averaged over 5 to 30 s and compared to 0 (Figure 4).
Figure 2 Locations at which the two emitters and their corresponding detectors were placed on the infant’s skull using the International 10–20 system for electrophysiological recordings. Enclosed circles represent emitters and open circles detectors.
366 Teresa Wilcox et al.
© 2008 The Authors. Journal compilation © 2008 Blackwell Publishing Ltd.
Figure 3 Hemoglobin response curves averaged across subjects and trials (with SE bars) for the occipital and inferior temporal cortices. Each row shows the response curves in μM cm for the indicated condition. The event began at time 0 and continued for 30 seconds. HbO2, HbR, and HbT are indicated by the red, blue, and green lines, respectively.
Hemodynamic response to features in O and IT 367
© 2008 The Authors. Journal compilation © 2008 Blackwell Publishing Ltd.
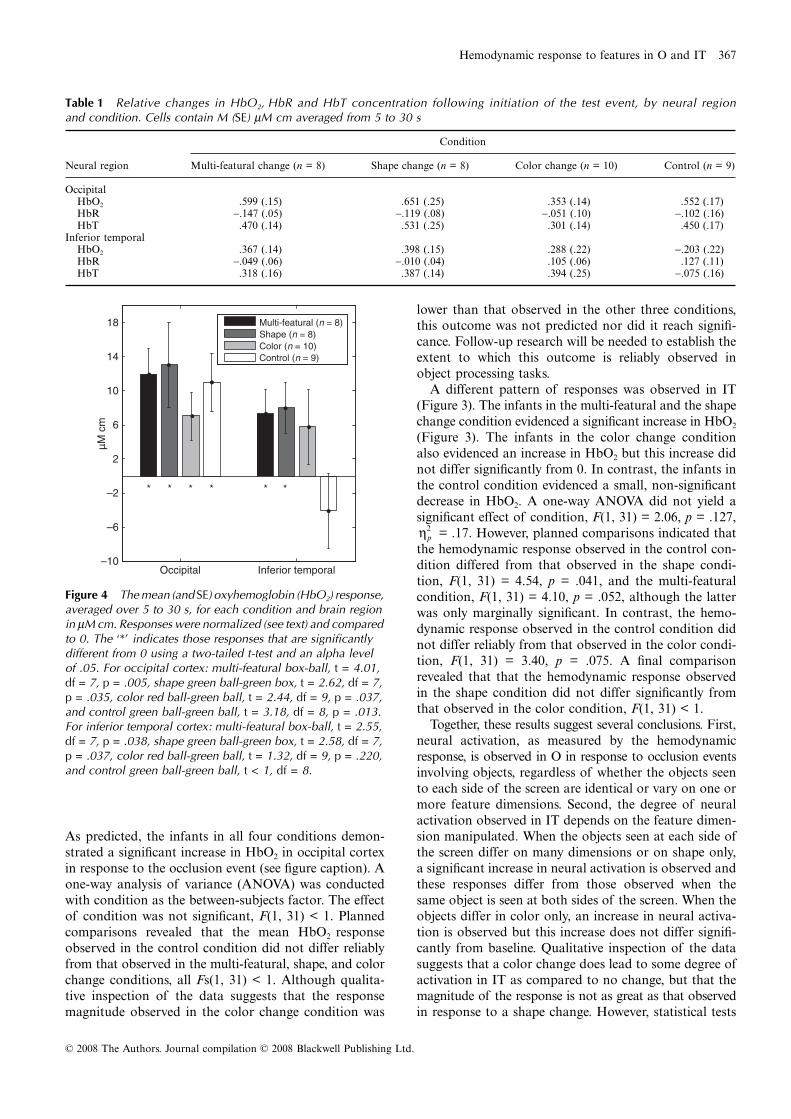
As predicted, the infants in all four conditions demon-strated a significant increase in HbO2 in occipital cortexin response to the occlusion event (see figure caption). Aone-way analysis of variance (ANOVA) was conductedwith condition as the between-subjects factor. The effectof condition was not significant, F(1, 31) < 1. Plannedcomparisons revealed that the mean HbO2 responseobserved in the control condition did not differ reliablyfrom that observed in the multi-featural, shape, and colorchange conditions, all Fs(1, 31) < 1. Although qualita-tive inspection of the data suggests that the responsemagnitude observed in the color change condition was
lower than that observed in the other three conditions,this outcome was not predicted nor did it reach signifi-cance. Follow-up research will be needed to establish theextent to which this outcome is reliably observed inobject processing tasks.
A different pattern of responses was observed in IT(Figure 3). The infants in the multi-featural and the shapechange condition evidenced a significant increase in HbO2
(Figure 3). The infants in the color change conditionalso evidenced an increase in HbO2 but this increase didnot differ significantly from 0. In contrast, the infants inthe control condition evidenced a small, non-significantdecrease in HbO2. A one-way ANOVA did not yield asignificant effect of condition, F(1, 31) = 2.06, p = .127,
= .17. However, planned comparisons indicated thatthe hemodynamic response observed in the control con-dition differed from that observed in the shape condi-tion, F(1, 31) = 4.54, p = .041, and the multi-featuralcondition, F(1, 31) = 4.10, p = .052, although the latterwas only marginally significant. In contrast, the hemo-dynamic response observed in the control condition didnot differ reliably from that observed in the color condi-tion, F(1, 31) = 3.40, p = .075. A final comparisonrevealed that that the hemodynamic response observedin the shape condition did not differ significantly fromthat observed in the color condition, F(1, 31) < 1.
Together, these results suggest several conclusions. First,neural activation, as measured by the hemodynamicresponse, is observed in O in response to occlusion eventsinvolving objects, regardless of whether the objects seento each side of the screen are identical or vary on one ormore feature dimensions. Second, the degree of neuralactivation observed in IT depends on the feature dimen-sion manipulated. When the objects seen at each side ofthe screen differ on many dimensions or on shape only,a significant increase in neural activation is observed andthese responses differ from those observed when thesame object is seen at both sides of the screen. When theobjects differ in color only, an increase in neural activa-tion is observed but this increase does not differ signifi-cantly from baseline. Qualitative inspection of the datasuggests that a color change does lead to some degree ofactivation in IT as compared to no change, but that themagnitude of the response is not as great as that observedin response to a shape change. However, statistical tests
Figure 4 The mean (and SE) oxyhemoglobin (HbO2) response, averaged over 5 to 30 s, for each condition and brain region in μM cm. Responses were normalized (see text) and compared to 0. The ‘*’ indicates those responses that are significantly different from 0 using a two-tailed t-test and an alpha level of .05. For occipital cortex: multi-featural box-ball, t = 4.01, df = 7, p = .005, shape green ball-green box, t = 2.62, df = 7, p = .035, color red ball-green ball, t = 2.44, df = 9, p = .037, and control green ball-green ball, t = 3.18, df = 8, p = .013. For inferior temporal cortex: multi-featural box-ball, t = 2.55, df = 7, p = .038, shape green ball-green box, t = 2.58, df = 7, p = .037, color red ball-green ball, t = 1.32, df = 9, p = .220, and control green ball-green ball, t < 1, df = 8.
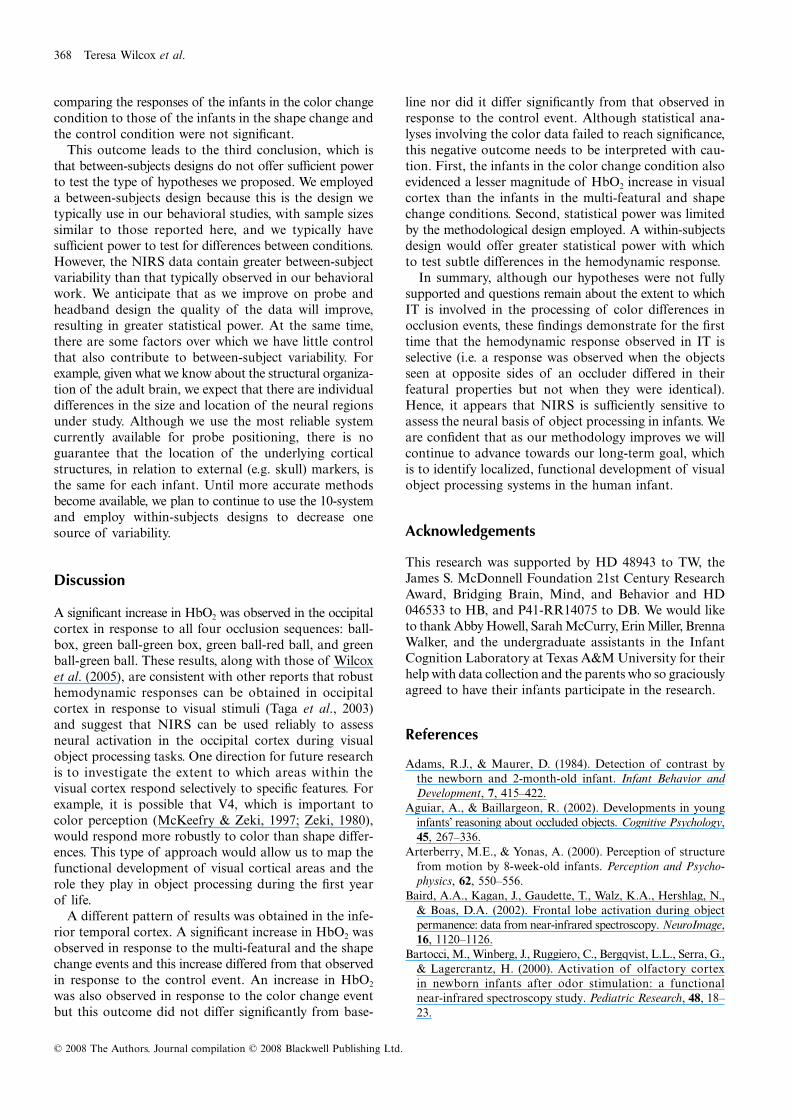
Table 1 Relative changes in HbO2, HbR and HbT concentration following initiation of the test event, by neural regionand condition. Cells contain M (SE) μM cm averaged from 5 to 30 s
Neural region
Condition
Multi-featural change (n = 8) Shape change (n = 8) Color change (n = 10) Control (n = 9)
OccipitalHbO2 .599 (.15) .651 (.25) .353 (.14) .552 (.17)HbR −.147 (.05) −.119 (.08) −.051 (.10) −.102 (.16)HbT .470 (.14) .531 (.25) .301 (.14) .450 (.17)
Inferior temporalHbO2 .367 (.14) .398 (.15) .288 (.22) −.203 (.22)HbR −.049 (.06) −.010 (.04) .105 (.06) .127 (.11)HbT .318 (.16) .387 (.14) .394 (.25) −.075 (.16)
ηp2
368 Teresa Wilcox et al.
© 2008 The Authors. Journal compilation © 2008 Blackwell Publishing Ltd.
comparing the responses of the infants in the color changecondition to those of the infants in the shape change andthe control condition were not significant.
This outcome leads to the third conclusion, which isthat between-subjects designs do not offer sufficient powerto test the type of hypotheses we proposed. We employeda between-subjects design because this is the design wetypically use in our behavioral studies, with sample sizessimilar to those reported here, and we typically havesufficient power to test for differences between conditions.However, the NIRS data contain greater between-subjectvariability than that typically observed in our behavioralwork. We anticipate that as we improve on probe andheadband design the quality of the data will improve,resulting in greater statistical power. At the same time,there are some factors over which we have little controlthat also contribute to between-subject variability. Forexample, given what we know about the structural organiza-tion of the adult brain, we expect that there are individualdifferences in the size and location of the neural regionsunder study. Although we use the most reliable systemcurrently available for probe positioning, there is noguarantee that the location of the underlying corticalstructures, in relation to external (e.g. skull) markers, isthe same for each infant. Until more accurate methodsbecome available, we plan to continue to use the 10-systemand employ within-subjects designs to decrease onesource of variability.
Discussion
A significant increase in HbO2 was observed in the occipitalcortex in response to all four occlusion sequences: ball-box, green ball-green box, green ball-red ball, and greenball-green ball. These results, along with those of Wilcoxet al. (2005), are consistent with other reports that robusthemodynamic responses can be obtained in occipitalcortex in response to visual stimuli (Taga et al., 2003)and suggest that NIRS can be used reliably to assessneural activation in the occipital cortex during visualobject processing tasks. One direction for future researchis to investigate the extent to which areas within thevisual cortex respond selectively to specific features. Forexample, it is possible that V4, which is important tocolor perception (McKeefry & Zeki, 1997; Zeki, 1980),would respond more robustly to color than shape differ-ences. This type of approach would allow us to map thefunctional development of visual cortical areas and therole they play in object processing during the first yearof life.
A different pattern of results was obtained in the infe-rior temporal cortex. A significant increase in HbO2 wasobserved in response to the multi-featural and the shapechange events and this increase differed from that observedin response to the control event. An increase in HbO2
was also observed in response to the color change eventbut this outcome did not differ significantly from base-
line nor did it differ significantly from that observed inresponse to the control event. Although statistical ana-lyses involving the color data failed to reach significance,this negative outcome needs to be interpreted with cau-tion. First, the infants in the color change condition alsoevidenced a lesser magnitude of HbO2 increase in visualcortex than the infants in the multi-featural and shapechange conditions. Second, statistical power was limitedby the methodological design employed. A within-subjectsdesign would offer greater statistical power with whichto test subtle differences in the hemodynamic response.
In summary, although our hypotheses were not fullysupported and questions remain about the extent to whichIT is involved in the processing of color differences inocclusion events, these findings demonstrate for the firsttime that the hemodynamic response observed in IT isselective (i.e. a response was observed when the objectsseen at opposite sides of an occluder differed in theirfeatural properties but not when they were identical).Hence, it appears that NIRS is sufficiently sensitive toassess the neural basis of object processing in infants. Weare confident that as our methodology improves we willcontinue to advance towards our long-term goal, whichis to identify localized, functional development of visualobject processing systems in the human infant.
Acknowledgements
This research was supported by HD 48943 to TW, theJames S. McDonnell Foundation 21st Century ResearchAward, Bridging Brain, Mind, and Behavior and HD046533 to HB, and P41-RR14075 to DB. We would liketo thank Abby Howell, Sarah McCurry, Erin Miller, BrennaWalker, and the undergraduate assistants in the InfantCognition Laboratory at Texas A&M University for theirhelp with data collection and the parents who so graciouslyagreed to have their infants participate in the research.
References
Adams, R.J., & Maurer, D. (1984). Detection of contrast bythe newborn and 2-month-old infant. Infant Behavior andDevelopment, 7, 415–422.
Aguiar, A., & Baillargeon, R. (2002). Developments in younginfants’ reasoning about occluded objects. Cognitive Psychology,45, 267–336.
Arterberry, M.E., & Yonas, A. (2000). Perception of structurefrom motion by 8-week-old infants. Perception and Psycho-physics, 62, 550–556.
Baird, A.A., Kagan, J., Gaudette, T., Walz, K.A., Hershlag, N.,& Boas, D.A. (2002). Frontal lobe activation during objectpermanence: data from near-infrared spectroscopy. NeuroImage,16, 1120–1126.
Bartocci, M., Winberg, J., Ruggiero, C., Bergqvist, L.L., Serra, G.,& Lagercrantz, H. (2000). Activation of olfactory cortexin newborn infants after odor stimulation: a functionalnear-infrared spectroscopy study. Pediatric Research, 48, 18–23.
Hemodynamic response to features in O and IT 369
© 2008 The Authors. Journal compilation © 2008 Blackwell Publishing Ltd.
Boas, D.A., Franceschini, M.A., Dunn, A.K., & Strangman, G.(2002). Noninvasive imaging of cerebral activation with diffuseoptical tomography. In R.D. Frostig (Ed.), In vivo opticalimaging of brain function (pp. 193–221). Boca Raton, FL:CRC Press.
Bortfeld, H., Wruck, E., & Boas, D.A. (2007). Assessinginfants’ cortical response to speech using near-infrared spectro-scopy. NeuroImage, 34, 407–415.
Boucart, M., Meyer, M.E., Pins, D., Humphreys, G.W.,Scheiber, C., Gounod, D., & Foucher, J. (2000). Automaticobject identification: an fMRI study. Brain Imaging, 11,2379–2383.
Chen, S., Sakatani, K., Lichty, W., Ning, P., Zhao, S., & Zuo, H.(2002). Auditory-evoked cerebral oxygenation changes inhypoxic-ischemic encephalopathy of newborn infants moni-tored by near infrared spectroscopy. Early Human Develop-ment, 67, 113–121.
Clark, V.P., Parasuraman, R., Keil, K., Kulansky, R., Fannon, S.,Maisog, J.M., Ungerleider, L.G., & Haxby, J.V. (1997).Selective attention to face identity and color studied withfMRI. Human Brain Mapping, 5, 293–297.
Colombo, J., Mitchell, D.W., Coldren, J.T., & Freeseman, L.J.(1991). Individuation differences in infant visual attention:are short lookers faster processors or featural processors?Child Development, 6, 1247–1257.
Desimone, R., & Ungerleider, L.G. (1989). Neural mechanismsof visual processing in monkeys. In F. Boller & J. Grafman(Eds.), Handbook of neuropsychology (Vol. 2, pp. 267–299).New York: Elsevier.
DeYoe, E.A., & Van Essen, D.C. (1988). Concurrent processingstreams in monkey visual cortex. Trends in Neuroscience, 11,219–226.
Franceschini, M.A., Joseph, D.K., Huppert, T.J., Diamond, S.G.,& Boas, D.A. (2006). Diffuse optical imaging of the wholehead. Journal of Biomedical Optics, 11 (5), 054007.
Gratton, G., Goodman-Wood, M.R., & Fabiani, M. (2001).Comparison of neuronal and hemodynamic measures of thebrain response to visual stimulation: an optical imagingstudy. Human Brain Mapping, 13, 13–25.
Gratton, G., Sarno, A., Maclin, E., Corballis, P.M., & Fabiani, M.(2000). Toward noninvasive 3-D imaging of the time courseof cortical activity: investigation of the depth of the event-related optical signal. NeuroImage, 11, 491–504.
Grill-Spector, K., Kushnir, T., Hendler, T., Edelman, S., Itzchak,Y., & Malach, R. (1998). A sequence of object-processingstages revealed by fMRI in the human occipital lobe. HumanBrain Mapping, 6, 316–328.
Hoshi, Y., & Tamura, M. (1993). Dynamic multichannel near-infrared optical imaging of human brain activity. Journal ofApplied Physiology, 75, 1842–1846.
Jasdzewski, G., Strangman, G., Wagner, J., Kwong, K.K.,Poldrack, R.A., & Boas, D.A. (2003). Differences in thehemodynamic response to event-related motor and visualparadigms as measured by near-infrared spectroscopy.NeuroImage, 20, 479–488.
Joseph, D.K., Huppert, T.J., Franceschini, M.A., & Boas, D.A.(2006). Diffuse optical tomography system to image brainactivation with improved spatial resolution and validationwith functional magnetic resonance imaging. Applied Optics,45, 8142–8151.
Káldy, S., & Sigala, N. (2004). The neural mechanisms ofobject working memory: what is where in the infant brain?Neuroscience and Behavioral Reviews, 28, 113–121.
Kato, T., Kamei, A., Takashima, S., & Ozaki, T. (1993). Humanvisual cortical function during photic stimulation monitor-ing by means of near-infrared spectroscopy. Journal ofCerebral Blood Flow and Metabolism, 13, 516–520.
Kleinschmidt, A., Obrig, H., Requardt, M., Merboldt, K.D.,Dirnagl, U., Villringer, A., & Frahm, J. (1996). Simultaneousrecording of cerebral blood oxygenation changes duringhuman brain activation by magnetic resonance imaging andnear-infrared spectroscopy. Journal of Cerebral Blood Flowand Metabolism, 16, 817–826.
Kraut, M., Hart, J., Soher, B.J., & Gordon, B. (1997). Objectshape processing in the visual system evaluated using func-tional MRI. Neurology, 48, 1416–1420.
Livingstone, M., & Hubel, D. (1987). Psychophysical evidencefor separate channels for the perception of form, color, move-ment, and depth. Journal of Neuroscience, 7, 3416–3468.
Livingstone, M., & Hubel, D. (1988). Segregation of form, color,movement, and depth: anatomy, physiology, and perception.Science, 240, 740–749.
McCurry, S., Wilcox, T., & Woods, R. (2008). Beyond the searchbarrier: new evidence for object individuation in young infants.Manuscript under review.
McKeefry, D.J., & Zeki, S. (1997). The position and topographyof the human colour centre as revealed by functional magneticresonance imaging. Brain, 120, 2229–2242.
Mareschal, D., & Johnson, M.H. (2003). The ‘what’ and ‘where’of object representations in infants. Cognition, 88, 259–276.
Maurer, D., & Salapatek, P. (1976). Developmental changes inthe scanning of faces by young infants. Child Development,47, 523–527.
Mishkin, M., Ungerleider, L.G., & Macko, K.A. (1983). Objectvision and spatial vision: two cortical pathways. Trends inNeuroscience, 6, 414–417.
Needham, A. (1999). The role of shape in 4-month-old infants’segregation of adjacent objects. Infant Behavior and Develop-ment, 22, 161–178.
Okamoto, M., Dan, H., Sakamoto, K., Takeo, K., Shimizu, K.,Kohno, S., Oda, I., Isobe, S., Suzuki, T., Kohyama, K., &Dan, I. (2004). Three-dimensional probabilistic anatomicalcranio-cerebral correlation via the international 10–20system oriented for transcranial functional brain mapping.NeuroImage, 21, 99–111.
Peña, M., Maki, A., Kovacic, D., Dehaene-Lambertz, G.,Koizumi, H., Bouquet, F., & Mehler, J. (2003). Sounds andsilence: an optical topography study of language recognitionat birth. Proceedings of the National Academy of Sciences,100, 11702–11705.
Sakatani, K., Chen, S., Lichty, W., Zuo, H., & Wang, Y. (1999).Cerebral blood oxygenation changes induced by auditorystimulation in newborn infants measured by near infraredspectroscopy. Early Human Development, 55, 229–236.
Slater, A., & Morison, V. (1985). Shape constancy and slantperception at birth. Perception, 14, 337–344.
Slater, A., Morison, V., Somers, M., Mattock, A., Brown, E.,& Taylor, D. (1990). Newborn and older infants’ perceptionof partly occluded objects. Infant Behavior and Development,13, 33–49.
Slater, A., Morison, V., Town, C., & Rose, D. (1985). Movementperception and identity constancy in the new-born baby.British Journal of Developmental Psychology, 3, 211–220.
Spelke, E.S. (1985). Perception of unity, persistence, andidentity: thoughts on infants’ conceptions of objects. In J.Mehler and R. Fox (Eds.), Neonate cognition: Beyond the
370 Teresa Wilcox et al.
© 2008 The Authors. Journal compilation © 2008 Blackwell Publishing Ltd.
blooming buzzing confusion (pp. 89–114). Hillsdale, NJ:Lawrence Erlbaum.
Stephens, B.R., & Banks, M.S. (1987). Contrast discriminationin human infants. Journal of Experimental Psychology: HumanPerception and Performance, 13, 558–565.
Strangman, G., Boas, D.A., & Sutton, J.P. (2002). Non-invasiveneuroimaging using near-infrared light. Biological Psychiatry,52, 679–693.
Strangman, G., Culver, J.P., Thompson, J.H., & Boas, D.A.(2002). A quantitative comparison of simultaneous BOLDfMRI and NIRS recordings during functional brain activation.NeuroImage, 17, 719–731.
Strangman, G., Franceschini, M.A., & Boas, D.A. (2003).Factors affecting the accuracy of near-infrared spectroscopyconcentration calculations for focal changes in oxygenationparameters. NeuroImage, 18, 865–879.
Taga, G., Asakawa, K., Maki, A., Konishi, Y., & Koizumi, H.(2003). Brain imaging in awake infants by near-infraredoptical topography. Proceedings of the National Academy ofSciences, 100, 10722–10727.
Tanaka, K. (1997). Mechanisms of visual object recognition:monkey and human studies. Current Opinion in Neurobiology,7, 523–529.
Tanaka, K. (2000). Mechanisms of visual object recognitionstudied in monkeys. Spatial Vision, 13, 147–163.
Tremoulet, P.D., Leslie, A.M., & Hall, G.D. (2001). Infantindividuation and identification of objects. Cognitive Develop-ment, 15, 499–522.
Tsunoda, K., Yamane, Y., Nishizaki, M., & Tanifuji, M. (2001).Complex objects are represented in macaque inferotemporalcortex by the combination of feature columns. Nature Neuro-science, 4, 832–838.
Ungerleider, L.G., & Mishkin, M. (1982). Two cortical visualsystems. In D.J. Ingle, M.A., Goodale, & R.J.W. Mansfield(Eds.), Analysis of visual behavior (pp. 549–586). Cambridge,MA: MIT Press.
Van Essen, D.C., Anderson, C.H., & Felleman, D.J. (1992).Information processing in the primate visual system: an inte-grated systems perspective. Science, 255, 419–423.
Villringer, A., & Chance, B. (1997). Non-invasive opticalspectroscopy and imaging of human brain function. Trendsin Neuroscience, 20, 435–442.
Villringer, A., Minoshima, S., Hock, C., Obrig, H., Ziegler, S.,Dirnagl, U., Schweiger, M., & Villringer, A. (1997). Assess-ment of local brain activation: a simultaneous PET andnear-infrared spectroscopy study. Advances in ExperimentalMedicine and Biology, 413, 149–153.
Wang, G., Tanaka, K., & Tanifuji, M. (1996). Optical imagingof functional organization in the monkey inferotemporalcortex. Science, 272, 1665–1668.
Wang, G., Tanifuji, M., & Tanaka, K. (1998). Functional architec-ture in monkey inferotemporal cortex revealed by in vivooptical imaging. Neuroscience Research, 31, 33–46.
Wilcox, T. (1999). Object individuation: infants’ use of shape,size, pattern, and color. Cognition, 72, 125–166.
Wilcox, T., & Baillargeon, R. (1998a). Object individuation ininfancy: the use of featural information in reasoning aboutocclusion events. Cognitive Psychology, 37, 97–155.
Wilcox, T., & Baillargeon, R (1998b). Object individuation inyoung infants: further evidence with an event monitoringtask. Developmental Science, 1, 127–142.
Wilcox, T., Bortfeld, H., Woods, R., Wruck, E., & Boas, D.A.(2005). Using near-infrared spectroscopy to assess neuralactivation during object processing in infants. Journal ofBiomedical Optics, 10, 0110101-9-0110101-10.
Wilcox, T., & Chapa, C. (2004). Priming infants to attend tocolor and pattern information in an individuation task.Cognition, 90, 265–302.
Wilcox, T., & Schweinle, A. (2002). Object individuation andevent mapping: developmental changes in infants’ use offeatural information. Developmental Science, 5, 87–105.
Wilcox, T., & Woods, R. (in press). Experience primes infantsto individuate objects: illuminating learning mechanisms. InA. Needham & A. Woodward (Eds.), Learning and the infantmind. New York: Oxford University Press.
Wilcox, T., Woods, R., Chapa, C., & McCurry, S. (2007). Multi-sensory exploration and object individuation in infants.Developmental Psychology, 43, 479–495.
Zeki, S.M. (1980). The representation of colours in the cerebralcortex. Nature, 284, 412–418.
Received: 28 March 2006Accepted: 27 April 2007
Copyright © 2022 FDOKUMEN