The influence of vibrissal somatosensory processing in rat superior colliculus on prey capture

doi:10.1152/jn.00813.2009 103:887-903, 2010. First published 16 December 2009;J NeurophysiolFrancisco A. Rodríguez, Heather L. Read and Monty A. EscabíInferior ColliculusSpectral and Temporal Modulation Tradeoff in the
You might find this additional info useful...
70 articles, 34 of which can be accessed free at:This article cites http://jn.physiology.org/content/103/2/887.full.html#ref-list-1
4 other HighWire hosted articlesThis article has been cited by
[PDF] [Full Text] [Abstract]
, June , 2010; 103 (6): 3248-3265.J NeurophysiolDavid M. Schneider and Sarah M. N. Woolleyin the Auditory MidbrainDiscrimination of Communication Vocalizations by Single Neurons and Groups of Neurons
[PDF] [Full Text] [Abstract], November 24, 2010; 30 (47): 15969-15980.J. Neurosci.
Francisco A. Rodríguez, Chen Chen, Heather L. Read and Monty A. EscabíStatisticsNeural Modulation Tuning Characteristics Scale to Efficiently Encode Natural Sound
[PDF] [Full Text] [Abstract], June , 2011; 105 (6): 2647-2667.J Neurophysiol
Edward L. Bartlett and Xiaoqin Wangawake marmosetCorrelation of neural response properties with auditory thalamus subdivisions in the
[PDF] [Full Text] [Abstract], November 23, 2011; 31 (47): 16977-16990.J. Neurosci.
Gunsoo Kim and Allison DoupeOrganized Representation of Spectrotemporal Features in Songbird Auditory Forebrain
including high resolution figures, can be found at:Updated information and services http://jn.physiology.org/content/103/2/887.full.html
can be found at:Journal of Neurophysiologyabout Additional material and information http://www.the-aps.org/publications/jn
This information is current as of April 1, 2012.
American Physiological Society. ISSN: 0022-3077, ESSN: 1522-1598. Visit our website at http://www.the-aps.org/.(monthly) by the American Physiological Society, 9650 Rockville Pike, Bethesda MD 20814-3991. Copyright © 2010 by the
publishes original articles on the function of the nervous system. It is published 12 times a yearJournal of Neurophysiology
on April 1, 2012
jn.physiology.orgD
ownloaded from

Spectral and Temporal Modulation Tradeoff in the Inferior Colliculus
Francisco A. Rodrıguez,1 Heather L. Read,1,2 and Monty A. Escabı1-3
1Biomedical Engineering, 2Psychology, 3Electrical and Computer Engineering, University of Connecticut, Storrs, Connecticut
Submitted 9 September 2009; accepted in final form 11 December 2009
Rodrıguez FA, Read HL, Escabı MA. Spectral and temporal modula-tion tradeoff in the inferior colliculus. J Neurophysiol 103: 887–903,2010. First published December 16, 2009; doi:10.1152/jn.00813.2009.The cochlea encodes sounds through frequency-selective channelsthat exhibit low-pass modulation sensitivity. Unlike the cochlea,neurons in the auditory midbrain are tuned for spectral and temporalmodulations found in natural sounds, yet the role of this transforma-tion is not known. We report a distinct tradeoff in modulationsensitivity and tuning that is topographically ordered within thecentral nucleus of the inferior colliculus (CNIC). Spectrotemporalreceptive fields (STRFs) were obtained with 16-channel electrodesinserted orthogonal to the isofrequency lamina. Surprisingly, temporaland spectral characteristics exhibited an opposing relationship alongthe tonotopic axis. For low best frequencies (BFs), units were selec-tive for fast temporal and broad spectral modulations. A systematicprogression was observed toward slower temporal and finer spectralmodulation sensitivity at high BF. This tradeoff was strongly reflectedin the arrangement of excitation and inhibition and, consequently, inthe modulation tuning characteristics. Comparisons with auditorynerve fibers show that these trends oppose the pattern imposed by theperipheral filters. These results suggest that spectrotemporal prefer-ences are reordered within the tonotopic axis of the CNIC. Thistopographic organization has profound implications for the coding ofspectrotemporal features in natural sounds and could underlie anumber of perceptual phenomena.
I N T R O D U C T I O N
The frequency decomposition performed by the cochlea isthe principle that gives rise to tonotopic representation in thecentral auditory system. Beyond the cochlea, sounds are furtherdecomposed into elementary spectral and temporal acousticfeatures. Spectral and temporal cues are critical for auditorypercepts of pitch and timbre (Goldstein 1973; Irino and Patter-son 1996; Plomp 1983; Schouten 1940; van-Veen and Hout-gast 1985). Furthermore, natural sounds and speech can all becharacterized by amplitude modulations of the signal overfrequency and time (Chi et al. 1999; Singh and Theunissen2003). Such spectrotemporal modulations are essential forspeech recognition and for discriminating and detecting bio-logically relevant sounds (Chi et al. 1999). How neural ensem-bles represent such information in the central auditory system,however, is unknown.
The central nucleus of the inferior colliculus (CNIC) is wellpoised for processing spectrotemporal features in naturalsounds. Its role as a key integrative center is well supported byits highly organized mosaic of laminar inputs (Malmierca et al.1993; Oliver 2000). The CNIC receives convergent inputsfrom the cochlear nucleus, superior olivary complex, and thenucleus of the lateral lemniscus (Adams 1979; Malmierca et al.
2005; Oliver 2000), all of which have unique aural, temporal,and spectral response properties (Batra and Fitzpatrick 1999;Batra et al. 1989; Joris 1996; Kuwada et al. 2006; Rhode 1995;Spirou and Young 1991). Although numerous studies havecharacterized response properties within the CNIC, the rela-tionship between the function and the underlying organizationof this structure is poorly understood. A current hypothesis isthat spectral and temporal receptive field preferences are sys-tematically organized within the CNIC frequency lamina(Ehret et al. 2003; Langner et al. 2002; Schreiner and Langner1988). Presently it is not clear whether receptive field prefer-ences are systematically organized across other dimensions ofthe CNIC, including the principal tonotopic axis.
There is no concise model for how spectral and temporalmodulations are processed and transformed within the CNIC.The auditory nerve (AN) is capable of following temporalmodulations that exceed 1 kHz and yet the cortex can onlyreliably follow at 25 Hz (Joris et al. 2004). Within the AN,fibers are low-pass tuned for temporal modulations, and fol-lowing rates tend to increase with characteristic frequency(Joris and Yin 1992). A simple hypothesis is that the CNICinherits the response properties of AN fibers. However, thisprediction is not supported by the finding that many CNICneurons show band-pass functions for temporal modulationsand temporal following rates are limited to �300 Hz (Krishnaand Semple 2000; Langner et al. 2002; Rees and Møller 1983;Rees and Palmer 1989). Langner and Schreiner (1988) foundthat best modulation frequencies increase with increasing bestfrequency (BF) analogous to the AN. However, others have notobserved this relationship.
Neurons in the CNIC are also selective for spectral modu-lations that are present in natural sounds and speech (Singh andTheunissen 2003). The spectrum of natural sounds can containpeaks and notches such that the amplitude of the sound ismodulated as a function of the sound frequency. Spectralmodulation sensitivity has been tested in the IC with spectralripple sounds (Escabı and Schreiner 2002) and a variety ofbroadband noises (Keller and Takahashi 2000; Lesica andGrothe 2008; Yu and Young 2000). CNIC units can exhibittuned responses to spectral modulations with selectivity forspectral modulation extending up to �3 cycle/octave (Qiu etal. 2003).
We tested whether spectrotemporal modulation preferencesare ordered along the tonotopic axis of the CNIC. Based on theresponse pattern of AN fibers (Joris and Yin 1992; Kim andYoung 1994) and CNIC neurons (Langner and Schreiner 1988)to AM signals, we hypothesized that temporal following rateswould increase with increasing BF. Contrary to this expecta-tion, we find that the Spectrotemporal receptive fields (STRFs)structure varied systematically from fast receptive fields forlow BFs to substantially slower receptive fields for high BFs.
Address for reprint requests and other correspondence: M. A. Escabı,University of Connecticut Electrical, and Computer Engineering, 371 FairfieldRd., Unit 2157, Storrs, CT 06269�1157 (E-mail: [email protected]).
J Neurophysiol 103: 887–903, 2010.First published December 16, 2009; doi:10.1152/jn.00813.2009.
887www.jn.org
on April 1, 2012
jn.physiology.orgD
ownloaded from

Surprisingly, spectral modulation tuning preferences and thearrangement and strength of inhibition also covaried with thesechanges, suggesting a central basis for this tradeoff. Finally, weshow that these trends differ substantially from AN fibers,indicating that spectral and temporal modulation preferencesare dramatically transformed within the CNIC.
M E T H O D S
Surgical procedure
Animals (n � 6) were housed and handled according to approvedprocedures by the University of Connecticut Animal Care and UseCommittee and in accordance with National Institutes of Health andAmerican Veterinary Medical Association guidelines. All efforts weremade and alternatives were considered to minimize the number ofanimals in the study. Experiments were performed in an acute record-ing setting (48–72 h). The cat was initially anesthetized with amixture of ketamine (10 mg/kg) and acepromazine (0.28 mg/kg im).A tracheotomy was performed to ensure adequate ventilation andreduce the nasal cavity acoustic noise. Afterward a craniotomy wasperformed under sodium pentobarbital (30 mg/kg) anesthesia. Theoverlying tissue in the occipital lobe and the bony tentorium wereremoved to expose the inferior colliculus (IC). Following surgery, theanimal was maintained in a nonreflexive state of anesthesia by acontinuous infusion of ketamine (2 mg �kg�1 �h�1) and diazepam (3mg �kg�1 �h�1) in a lactated Ringer solution (4 mg �kg�1 �h�1). Heartrate, temperature, breathing, and reflexes were monitored and used asphysiological criteria for adjusting the anesthetic infusion rate.
Acoustic stimuli and delivery
Sounds were presented dichotically to the animal in a sound-shielded chamber (IAC, Bronx, NY) via a closed binaural speakersystem attached to hollow ear-bars (Kopf Instruments, Tujunga, CA).The delivery system was calibrated for frequencies in the range of1–47 kHz (�3 dB SPL) with a finite impulse response (FIR) inversefilter that was implemented on a TDT RX6 digital processor (TDT,Alchua, FL). Sounds were delivered with either a TDT RX6 or a RMEDIGI 9652 sound card (Haimhausen, Germany) through electrostaticspeaker drivers (TDT EC1).
At each recording location we first presented a sequence of puretones to measure the frequency response areas (FRAs) of eachrecording site. FRAs were calculated during the experiment as a wayto verify the CNIC tonotopic gradient (Merzenich and Reid 1974;Semple and Aitkin 1979). The stimuli consisted of a random sequenceof pure tones (50-ms duration delivered every 300 ms with a 5-msrise-time) spanning the range from 1.4 to 44.2 kHz (in 1/8-octavesteps) and sound pressure levels from 5 to 85 dB SPL (in 10-dB steps).
Dynamic moving ripple (DMR) (Escabı and Schreiner 2002) wasused to measure spectrotemporal preferences of CNIC neurons. Per-ceptually the DMR can quickly change its acoustic composition so asto elicit a number of perceptual qualities. The sound can undergo fastchanges in spectral and temporal composition where the pitch andtimbre of the sound is perceived to change dynamically with time.Similarly, the sound will also produce the percept of rhythmic patternsor FM sweeps and can quickly change its temporal properties toproduce a more salient pitch quality. The DMR was generateddigitally using a sampling rate of 96 kHz and 24-bit resolution. Acontinuous 10-min DMR was presented twice (20 min total) at 80 dBSPL (65 dB spectrum level per 1/3 octave). The DMR is a continuoustime-varying broadband sound that covered a frequency range from 1to 48 kHz and probed spectrotemporal preferences. At a fixed instantin time, the spectrum of the DMR is represented by a sinusoidal AMacross the frequency axis were the density of peaks and troughs isdetermined by the spectral modulation frequency (SMF) parameter(cycle/octave). Temporally, the DMR sound contains amplitude mod-
ulations that are controlled by the temporal modulation frequency(TMF, Hz) parameter. The peak-to-peak amplitude of the DMR wasset to 30 dB because this produces robust responses for the vastmajority of IC neurons (Escabi et al. 2003). Both parameters (SMFand TMF) were varied randomly and continuously at a maximum rateof change of 0.25 Hz (SMF) and 1 Hz (TMF). SMF and TMF werevaried independently of one another so that they fully probe theparameter space (0–4 cycle/octave, SMF, and 0–500 Hz, TMF) in anunbiased manner. During the 20-min presentation of the DMR, eachear was stimulated with an independent DMR. This allowed us toconcurrently measure independent STRFs for the contralateral andipsilateral ears (Qiu et al. 2003). For the purpose of this study, only theSTRF for the contralateral ear are considered as it characterizes thedominant phase locked response of CNIC neurons (Qiu et al. 2003).
Electrophysiology
Customized acute 16-channel recording probes (NeuroNexus Tech-nologies, Ann Arbor, MI) with 150-�m electrode separation and177-�m2 gold-plated contact area were used for the neural recordings.These electrodes were specifically selected for high impedance (3–5M� at 1 kHz) across all of the 16 recording electrodes to enhanceisolation characteristics. The probes were first positioned on thesurface of the IC using a stereotaxic frame (Kopf Instruments). Theprobe shank was then inserted into the IC orthogonal to the isofre-quency-band laminae (inserted at �30° relative to the sagittal plane)(Schreiner and Langner 1997) with a LSS 6000 Inchiworm Microdive(Burleigh EXFO; Vanier, Quebec, Canada). Neuronal responses weredigitized and recorded into a hard drive for off-line analysis with aRX5 Pentusa Base station (TDT). At each penetration site, a sequenceof tones and a DMR (for STRF) were presented to the animal.Electrodes were repositioned by moving the probe �300 �m alongthe IC surface either along the dorsomedial to ventrolateral axis or therostrocaudal axis. Deviations from a prescribed stereotaxic grid wereoccasionally necessary to avoid the surface vasculature. The use of a16-channel probe at each penetration allowed us to systematicallyrecord neural activity across principal frequency axis while uniformlycovering the three-dimensional space of the CNIC in a grid likepattern.
STRF analysis
The neural responses to the DMR were used to compute a con-tralateral STRF at each recording location using a spike-triggeredaveraging procedure (Escabı and Schreiner 2002). Significance testingwas performed against a noise STRF that was derived for a randomfiring neuron of identical spike rate. A two-tailed significance test wasperformed by requiring that positive and negative STRF valuesexceed 3.09 SD of the noise STRF. This strict criterion guarantees thatwe detect STRF components at a significance level of P � 0.002 (P �0.001 for excitation and P � 0.001 for inhibition). As described indetail elsewhere, the color spectrum in all plots indicates spike raterelative to the mean such that blue and red denote decrease or increasebelow and above the mean, respectively (Escabı and Schreiner 2002).We refer to the blue domains in the STRF as inhibitory even thoughthe reduction in spike rate could arise theoretically from synapticinhibition or refractoriness at or below the level of the CNIC (seeDISCUSSION).
Neural data selection
Neuronal recordings consisted of small multiunit clusters and singleunits from 4,656 recording locations in six animals. During theexperiment recordings, we developed a conservative approach forselecting spike waveforms that would be representative of smallmultiunit clusters and would allow us to isolate single neurons forselect recording sites. To select a “small” number of units from each
888 F. RODRIGUEZ, H. L. READ, AND M. A. ESCABI
J Neurophysiol • VOL 103 • FEBRUARY 2010 • www.jn.org
on April 1, 2012
jn.physiology.orgD
ownloaded from

recording site, spike threshold discriminators were adjusted manuallyfor each of the 16 channels prior to recording so as to achieve spikerates of �5–20 spike/s. During this process, we had direct feedbackfrom the discriminator for the instantaneous and averaged spike ratefor each of the 16 sites (median spike rate: 7.5 spike/s). With thehigh-impedance probes used in this study, distinct action potentialwaveforms from multiunit clusters could readily be identified visuallyon roughly half of the recording sites. On average, we were able toisolate two single units across the 16 channels per recording session.
To assure that recording locations were confined to the CNICproper, we first examined the frequency organization for each record-ing site. Recording sites that did not follow a consistent tonotopicgradient as in Fig. 1, C and D, were assumed to lie outside the CNICand not included in the analysis (e.g., F). This initial pruning of thedata resulted in 3,262 recording locations (2,917 multiunits; 345single units). We next selected sites between 2 and 32 kHz (316 singleunits; 2,711 multiunits). The dataset was next truncated to assure thateach sited exhibited a clean and well-defined STRF. We did this bycomputing the phase-locking index (PLI) for each unit and requiringthat the PLI �0.08 (Escabı and Schreiner 2002). We have previouslydemonstrated that this criteria removes �99% of units with poorphase locking in the CNIC (Escabı and Schreiner 2002). This require-ment assures that the parameter estimates of each unit and the overallpopulation distribution was not corrupted by measurement noise. Thisfinal refinement of the data resulted in 2,249 multiunits and 285 singleunits.
Ripple transfer function analysis
The modulation preferences of each unit were characterized di-rectly from the ripple transfer function (RTF) (Escabı and Schreiner
2002). The RTF was obtained by performing a two-dimensionalFourier transform (ℑ2{ �}) on the significant STRF (significant prob-ability P � 0.002) and subsequently computing the magnitude (Escabıand Schreiner 2002)
RTFFm, � � �ℑ2�STRFt, x�� (1)
Here t is the time axis, x � log2(f/f0) is the frequency axis inoctaves, f0 � 1 kHz represents the minimum frequency of the DMRsound, Fm is the TMF, and � is the SMF. The spectral and temporalmodulation transfer functions (sMTF and tMTF) were then obtainedby collapsing the RTF along the spectral and temporal dimensions,respectively
sMTF� � RTFFm,�dFm (2A)
tMTFFm � RTFFm,�d� (2B)
and subsequently normalizing for a maximum gain of 1 (Miller etal. 2002). The peak responses from the sMTF and tMTF characterizedthe best spectral (bSMF) and the best TMF (bTMF), respectively. Thespectral and temporal modulation upper cutoff frequencies weredefined by the modulation frequency where the gain of the tMTF orsMTF were reduced by 3 dB or equivalently to 50% of the maximumpower (Fig. 2, B and D). Neuronal responses were classified as eitherband-pass or low-pass tuned response pattern for both the spectral andtemporal modulation dimensions (Qiu et al. 2003). To do this, thelower 3-dB cutoff was measured for the sMTF and tMTF indepen-dently. In both cases, the selectivity was classified as band-passwhenever the value of the lower 3-dB cutoff was greater than zero.Alternately, the sMTF or tMTF were classified as low-pass if themagnitude at zero TMF or SMF did not exceed the 3-dB criterion.
A
DC
LC CNIC
M
D
B
11
10
9
8
7
6
1
2 3
4
5
12
13
14
15
16
17
18
19
20
21 22
23
24
25
26
27
28 29
30
31
2 3
33
34
35
36
7 3
8 3
9 3
0 4
1 4
2 4
3 4
4 4
5 4
6 4
7 4
9 4
8 4
0 5
1 5
2 5
3 5
4 5
5 5 e.
f.
x
x
x
x
x
x
x x
x
x
x
x
x
x
x
x
x
x x
x
Anterior Posterior
Dorso-Medial
Ventro-Lateral Frequency(octave) Late
ncy
(ms)
2 3 4 5 0
10
C D E F
FIG. 1. Mapping spectrotemporal recep-tive field preferences within the central nucleusof the inferior colliculus (CNIC). A: illustrationshowing the placement of sixteen-channel re-cording probes into the CNIC. Probes wereinserted at 30° relative to the sagittal plane andapproximately orthogonal to the CNIC isofre-quency lamina (- - -). The dorsal cortex (DC,red) and lateral cortex (LC, blue) of the IC areshown for reference. B: surface view of the ICfrom 1 experiment with the probe penetrationsites superimposed. Penetration sites were se-lected to provide a uniform coverage of the ICin a grid-like pattern with �300 �m along theanterior-posterior and mediolateral aspect.Sites that did not exhibit a definitive best fre-quency gradient are marked (�). These record-ing locations were presumed to be outside thecentral nucleus of the IC and were discardedfrom the analysis. C–F: example STRFs frompenetrations within the IC of 4 separate exper-iments. Penetrations for E and F are from theexperiment in B (sites 8 and 48, respectively).Recording sites within the CNIC exhibit adistinct tonotopic gradient with increasing pen-etration depth (C–E). Site F lacks this tono-topic organization. This site was presumed tolie outside the CNIC and was discarded fromthe analysis.
889SPECTROTEMPORAL MODULATION TRADEOFF IN THE INFERIOR COLLICULUS
J Neurophysiol • VOL 103 • FEBRUARY 2010 • www.jn.org
on April 1, 2012
jn.physiology.orgD
ownloaded from

Finally, we also measured the spectral and temporal DC gains. Thesewere defined as the sMTF and tMTF gains (in dB) at � � 0cycle/octave and Fm � 0 Hz, respectively.
STRF temporal and spectral resolution
We measured the temporal and spectral resolution of each unit byconsidering the integration area of the STRF filters. According to theuncertainty principle, the spectral and temporal resolution of a filtercan be derived by considering the spectral and temporal powerdistributions of a filter (i.e., the power marginals) and measuring theaverage spread (i.e., the SD) across each of these dimensions (Cohen1995; Gabor 1946). To implement this for our CNIC units, we firstextracted the STRF envelope to define a time-frequency power dis-tribution for the STRF filter. This power distribution was defined bythe squared magnitude of the analytic STRF
Pt, x � �STRFt, x � j �H�STRFt, x��2 (3)
where H{ �} is the Hilbert transform and j � � �1. The spectraland temporal marginals were obtained by collapsing P(t,x) along
the temporal and spectral dimensions and normalizing for unitarea, respectively
Pxx � Pt, xdt/ Pt, xdtdx (4A)
ptt � Pt, xdx/ Pt, xdtdx (4B)
We have previously shown that the spectral and temporal marginalscan be used to define the extent of the integration area of a CNIC unitas well as several functionally relevant parameters (Qiu et al. 2003).Note that the marginals do not contain inhibitory or suppressive STRFdomains and have been normalized as a power distribution. The peaksof these distributions defined the STRF peak latency (PL) and BF. TheSTRF integration time (�t) and bandwidth (�f) were defined as twicethe SD of the spectral and temporal marginals
�t � 2 � � t � t�2pttdt (5A)
�f � 2 � � f � f�2pffdf (5B)
Modulation Transfer Function SpectroTemporal Receptive Field
2σ
Spe
ctra
l Mod
ulat
ion
(cyc
les/
octa
ve)
Temporal Modulation (Hz) −500 0 500
0
1
2
3
4
sMTF Upper Cutoff
tMTF Upper Cutoff -3dB
-3dB *
BAbTMF
bSMF
Fre
quen
cy (
octa
ve)
Latency (ms) 0 5 10 15 20 25
2
2. 5
3
3.5
4
4. 5
5
5. 5
BW
IntegratonTime
D C2σ
Fre
quen
cy (
octa
ve)
Latency (ms) 0 5 10 15 20 25
2
2. 5
3
3.5
4
4. 5
5
5. 5
BW
IntegrationTime
Spe
ctra
l Mod
ulat
ion
(cyc
les/
octa
ve)
Temporal Modulation (Hz) −500 0 500
0
1
2
3
4
-3dB
-3dB
sMTF Upper Cutoff
tMTF Upper Cutoff
*
bTMF
bSMF
FIG. 2. Quantitative analysis of spectrotemporal and modulation tuning preferences. A and C: spectrotemporal receptive fields (STRFs) and the correspondingripple transfer function (RTF, B and D) of 2 units. A unit with short STRF integration time that lacks sideband inhibition is shown in A. Temporally, this unitexhibits a fast OFF-ON-OFF pattern suggesting selectivity to fast temporal modulations. In contrast, the unit of C has longer integration time, narrower bandwidth,and significant spectral sideband and temporal inhibition. Only the significant portion of the STRF is shown (P � 0.002, see METHODS). The spectral and temporalmarginals are obtained for each STRF by projecting the STRF along the spectral and temporal dimensions (blue lines, see METHODS). The receptive fieldbandwidth and integration time are defined as twice the SD of the spectral and temporal marginals, respectively. B and D: ripple transfer functions for the unitsof A and C are obtained by Fourier transforming the STRF (Escabı and Schreiner 2002). The latency axis of the STRF is now represented by the temporalmodulation frequency (Hz), whereas the spectral axis is represented by the spectral modulation frequency (cycle/octave). The unit of B, same as A, ischaracterized by a band-pass tuned temporal response at �265 Hz (bTMF) and low-pass spectral response with peak at 0.1 cycle/octave (bSMF; noted by blackdot). The high bTMF and low bSMF for this unit are consistent with the broad but fast OFF-ON-OFF pattern observed in its STRF. The 3-dB spectral and temporalupper cutoffs (tMTF and sMTF upper cutoff, shown by asterisk) for this unit lie at 0.7 cycle/octave and 408 Hz (defined as the maximum frequencies for whichRTF power exceeds 0.5 of the peak response power), consistent with the observed broad spectral bandwidth and fast temporal response for this unit. D: the RTFfor the unit of C is characterized by a weakly tuned pattern about a bSMF of 1.6 cycle/octave, bTMF of 70.3 Hz, and 3-dB spectral and temporal upper cutoffsof 3.4 cycle/octave and 112.3 Hz. This is consistent with the slow temporal pattern, narrow bandwidth, and pronounced sideband inhibition as observed for thisunit’s STRF (C).
890 F. RODRIGUEZ, H. L. READ, AND M. A. ESCABI
J Neurophysiol • VOL 103 • FEBRUARY 2010 • www.jn.org
on April 1, 2012
jn.physiology.orgD
ownloaded from

where f� and t� represent the centroid values of the spectral andtemporal marginals, respectively, and f the frequency variable in hertz.Note that spectral marginal of Eq. 4A, px(x), was transformed into pf(f)using x � log2(f/f0) prior to computing the absolute bandwidth (inhertz). The uncertainty principle requires that the spectrotemporalresolution product obey: �t ��f �1/� (Cohen 1995; Gabor 1946).Finally we also measured spectral bandwidths in octaves using ananalogous equation
�x � 2 � � x � x� 2pxxdx (5C)
Population frequency analysis
To determine how and if spectral and temporal preferences varywith BF, we first subdivided the data according the BF of each unit.The data were subdivided either into 1- or 1⁄2-octave intervals for BFsbetween 2 and 32 kHz. For each of the selected BF intervals, wecomputed the population RTF by averaging the RTFs of individualunits that lie within each of the 1⁄2-octave intervals. Prior to averaging,the RTF of each unit was normalized for unit area so that spike ratesdo not bias the results. Statistical analysis was then performed as afunction of BF (using 1-octave intervals) for both STRF (integrationtime and bandwidth) and RTF parameters (bTMF, bSMF, 3-dBtemporal upper cutoff, and 3-dB spectral upper cutoff, etc.). All of theresponse parameters showed skewing and differed substantially froma normal distribution (�2 test, P � 0.05). We therefore employed themedian as a statistical metric with Bonferroni correction for thenumber of comparisons.
Analysis of excitation and inhibition
To characterize how functional inhibition contributes to modulationtuning and the observed trends, we quantitatively examined theexcitatory and inhibitory STRF components. The STRF of each unitwas first decomposed into its excitatory (STRFe) and inhibitory(STRFi) components (Fig. 8) by selecting the positive or negativeSTRF values, respectively. Following this decomposition, we re-estimated all of the previously described STRF parameters, althoughthese were now computed separately for the STRFe and STRFi. Theseparameters included the excitatory and inhibitory BF (BFe, BFi),bandwidths (BWe and BWi), and integration time (�te and �ti). Therelationship between all of the STRF parameters was then examinedas a function of strength of inhibition and BF.
To quantify the amount of inhibition present in the STRF of aparticular unit, we first computed the STRF power (Escabı andSchreiner 2002) associated with the STRFe and STRFi components.The excitatory power was derived from STRFe as
�e2 � STRFe, x2ddx (6A)
and the inhibitory power was derived from the STRFi as
�i2 � STRFi, x2ddx (6B)
The fractional inhibitory power in the STRF was then quantified asthe inhibitory-to-excitatory power ratio (IER)
IER � ��i
2
�e2 �e
2 �i2
�e2
�i2 �e
2 � �i2
(7)
This metric quantifies the relative strength between excitation andinhibition in the STRF. A value of 0 indicates that the STRF waseither purely excitatory or purely inhibitory. In contrast, a value of 1indicates that the strength of inhibition is equal to the strength ofexcitation. Although the IER metric cannot distinguish whether STRF
is dominated by excitatory (�e2 � �i
2) or inhibitory (�e2 � �i
2) power,for the vast majority of units the excitatory power dominated (�e
2 ��i
2, 2,522 of 2,534 units; �e2 � �i
2,12 units).
STRF Gabor-alpha model
To further characterize the relationship between functional inhibi-tion and modulation tuning, we developed a mathematical model ofthe STRF in which the strength and shape of excitation and inhibitioncould be systematically and independently adjusted along the tempo-ral and spectral dimensions of the STRF. This model is analogous tothe separable spectrotemporal Gabor model we have employed pre-viously to characterize CNIC STRFs (Qiu et al. 2003). The primarydifference is that the envelope of the temporal receptive consists of analpha function, whereas previously we employed a Gaussian temporalenvelope. The separable model STRF is expressed as
STRFmt, x � Wt �Gx (8A)
where
Gx � e��2x�xo/BW�2 cos�2� ��0 � x � x0 � P� (8B)
is the Gabor spectral receptive field profile. The spectral parameters ofthe model include the BF in octaves (x0), the receptive field bandwidth(BW, octave), the best SMF (�0, cycle/octave), and the spectral phase(P). The temporal component of the STRF is expressed as the productof an alpha function and a cosine waveform
Wt � Et � cos�2� �Fm0 � t � t0 � Q� (8C)
where the temporal envelope is given by the piecewise alpha function
Et � �0 0 � t � t0
K �t � t0
1 � e�1 � e�t�t0/1 t t0 & t � 1 � t,
K �t � t0 � 2 � 1
2 � e�1 � e�t�t0�2�1/2 t 1 � t0
(8D)
Here the temporal parameters of the model include the responselatency (t0), the receptive field rise (1) and decay times (2), the bestTMF (Fm0, Hz), and the temporal phase (Q). Two separate simula-tions were performed to examine the effects of temporal and spectralinhibition in the STRF.
First we varied the amount of temporal inhibition in the STRFindependently of the spectral receptive field characteristics (Fig. 7,A–C). The model simulation was performed by fixing all parameterswith the exception of the receptive field decay time (2), which wasvaried between 0.5 and 7 ms. For short decay times, the STRFcomposition for this model consists strictly of a brief excitatoryresponse. As the decay time increases, a STRFi component becomesapparent, and this component becomes more prominent with increas-ing decay time (Fig. 7A). The remaining spectral (x0 � 0 octave, �0 �0 cycle/octave, BW � 1 octave, Q � 0) and temporal (t0 � 5 ms,Fm0 � 100 Hz, 1 � 2 ms, q � �/6) parameters were fixed and chosento lie within the observed physiological range for a typical neuronwith 100-Hz bTMF (Qiu et al. 2003).
A second simulation was performed in which we characterized the roleof spectral inhibition (Fig. 7, D–F). For this simulation, the proportion ofspectral inhibition was varied independently of the STRF temporalcharacteristics by varying the receptive field bandwidth (BW � 0.3 – 1.5octave). For short bandwidths, the STRF model compositions consists ofa temporally brief and spectrally narrow excitatory response with notemporal or spectral inhibition. As the bandwidth is increased, sidebandinhibition is recruited and becomes more pronounced, although thetemporal characteristics remain unchanged (Fig. 7D). For this simu-
891SPECTROTEMPORAL MODULATION TRADEOFF IN THE INFERIOR COLLICULUS
J Neurophysiol • VOL 103 • FEBRUARY 2010 • www.jn.org
on April 1, 2012
jn.physiology.orgD
ownloaded from

lation, the remaining spectral (x0 � 0 octave, �0 � 1 cycle/octave,Q � 0) and temporal (t0 � 5 ms, fm0 � 0 Hz, 1 � 1 ms, 2 � 2 ms,q � �/6) parameters were fixed and chosen to lie within the observedphysiological range for a typical temporal low-pass neuron with 0-HzbTMF (Qiu et al. 2003).
Population STRFe and STRFi
To characterize the structure of the excitatory and inhibitory recep-tive field domains, we computed the population averaged STRFe andSTRFi for different BF intervals (BF range � 2–4, 4–8, 8–16, and16–32 kHz). To do this, it was necessary to account for differences inlatency and BF of each unit otherwise the population STRFe andSTRFi would exhibit a diffused pattern that does not properly reflectthe sound integration dynamics. Prior to averaging, we thereforealigned the STRFe and STRFi by subtracting the peak latency and BFfrom each unit (aligned to 0 octave and 0 ms). This procedureeffectively aligned the STRFs to the region of maximum amplitudeprior to averaging.
AN data analysis
Spectrotemporal resolution estimates were derived for data fromthe AN provided by Joris and Yin (1992) and Kim and Young (1994)to compare with our CNIC results. In the data from Joris and Yin, ANfilter impulse responses were not available that would allow us todirectly estimate �f and �t. Estimates were therefore derived from theFRAs and MTFs to sinusoidal amplitude modulated tones. We usedthe FRA bandwidths measured 10 dB above threshold to approximate�f. The temporal resolution, �t, was approximated as half the periodof the fastest temporal modulation that the unit could follow (3 dBupper cutoff frequency from the MTFs). The Kim and Young dataconsisted of STRFs measured using Gaussian noise. In this case,estimates of the temporal (�t) and spectral resolution (�f) wereobtained directly by applying Eqs. 4 and 5 as for the CNIC data.
R E S U L T S
STRFs were measured in the cat CNIC with a 16-channelprobe inserted orthogonal to the isofrequency lamina (Fig. 1A).The location of each penetration on the dorsal surface of the ICis shown for one experiment in Fig. 1B. In Fig. 1, C–E, are theSTRFs from representative penetrations. In all cases, a defininglow- to high-frequency gradient is observed, consistent withthe placement of the multichannel electrode within the CNIC atan orientation parallel to the tonotopic axis (Merzenich andReid 1974; Semple and Aitkin 1979) and orthogonal to theisofrequency lamina (Schreiner and Langner 1997). The re-sponses in Fig. 1F are from a penetration site along theposterior edge of the IC in which all of the STRFs exhibitedsimilar BFs. Such constant BF tuning is consistent with theplacement of the probes in the lateral cortex (LC) of the ICwhere the lamina have been shown to course orthogonal to theCNIC (Loftus et al. 2008). To limit our recordings to the CNICproper, all recording tracks that did not exhibit a consistent BFgradient as displayed for Fig. 1, C–E, were discarded from theanalysis (sites marked by x in Fig. 1B). Thus the selectedrecording locations all exhibit a monotonic low to high BFgradient with electrode position as expected for the CNIC.
Spectral and temporal modulation preferences vary withtonotopic position
Spectral and temporal response properties in the CNICappeared to vary systematically with tonotopic position (Fig. 1,
C–E). At first glance, it appeared that low-frequency sites wereoften characterized by short integration times and spectrallybroad STRFs, whereas those at higher frequencies often hadlonger integration times and were spectrally narrower (Fig. 1,C–E). We therefore sought to quantify the relationship betweenspectral and temporal preferences along the depth axis of theCNIC.
To characterize the relationship between spectral and tem-poral response preferences and BF, we extracted several pa-rameters directly from the STRF and the corresponding (RTF;Figs. 2 and 3) (Miller et al. 2002). The receptive field integra-tion resolution was characterized by measuring the STRFintegration time and bandwidth (in octaves) as illustrated fortwo units in Fig. 2, A and C. These were defined as the averagewidths of the spectral and temporal marginals (Fig. 2, A and C,blue contours; see METHODS). For each unit, we computed thetemporal and spectral MTF (tMTF and sMTF; Fig. 2, B and D,blue contours) and estimated the best spectral (bSMF) and besttemporal (bTMF) modulation frequencies, and spectral andtemporal 3-dB cutoff frequencies (see METHODS). The bTMFand bSMF define the stimulus modulations that produce max-imal phase-locked response, whereas the 3-dB cutoff frequen-cies provide an upper response limit where the phase-lockedresponse power has been reduced by 50% of the maximumresponse. Based on the derived functional parameters, the unitof Fig. 2A exhibits relatively broad spectral (bandwidth � 0.51octaves) and high temporal resolution (STRF integrationtime � 1.69 ms). Spectrally this unit has a broad “ON” receptivefield and brief “OFF-ON-OFF” temporal receptive field pattern.Accordingly, this unit exhibits low-pass selectivity for spectraland band-pass selectivity for temporal modulations, respec-tively (Fig. 2B, bSMF � 0.1 cycle/octave; bTMF � 256 Hz).In all instances, low-pass modulation tuning is observed forSTRFs that lacked spectral or temporal inhibition (Miller et al.2002; Qiu et al. 2003). The unit of Fig. 2C, by comparison,exhibits narrower spectral (bandwidth � 0.17 octave) andlower temporal resolution (4.97-ms integration time). This unitexhibits a noticeable amount of sideband inhibition around itsBF (14.88 kHz), and subsequently its sMTF is tuned withbSMF � 0.8 cycle/octave. Similarly, this unit exhibits a stronginhibitory/suppressive temporal pattern and is therefore tunedalong the temporal modulation dimension (bTMF � 70.3 Hz).A variety of complementary STRF arrangements and spectrallyand/or temporally tuned RTF patterns are observed across thepopulation of recording sites (Fig. 3).
The relationship between spectral and temporal modulationpreferences and resolution formed a continuum from high tolow resolution in each domain for the population of CNIC sitesexamined (Fig. 3A). At one extreme, units exhibit narrowspectral tuning, strong sideband inhibition, and band-passsMTF (Fig. 3, B–D). At the opposite extreme, units couldexhibit broad spectral tuning, lack of sideband inhibition andlow-pass sMTF (Fig. 3, H and I). Units with strong temporalinhibition exhibit band-pass tMTF (Fig. 3, D–I), whereas thosewith weak or absent temporal inhibition are characterized bylow-pass tMTF (Fig. 3, B and C). Such spectral and temporalpreferences systematically traded off and formed a continuum(Fig. 3A). Figure 3A illustrates the relationship between bSMFand bTMF (285 single units, U; 2,249 multiunits, F). At theextremes, units with fast temporal responses and thus highbTMF typically have broad spectral bandwidths and coarse
892 F. RODRIGUEZ, H. L. READ, AND M. A. ESCABI
J Neurophysiol • VOL 103 • FEBRUARY 2010 • www.jn.org
on April 1, 2012
jn.physiology.orgD
ownloaded from

spectral resolution as indicated by lower bSMF (Fig. 3, H andI). Similarly, units with slow temporal responses and thus lowbTMF can have narrow spectral bandwidths (high bSMF) and
consequently stronger sideband inhibition along the frequencydimension (e.g., Fig. 3, B–D). A large proportion of neurons isalso observed with low bTMF (�100 Hz) and bSMF (�1cycle/octave).
Spectral and temporal modulation preferences in the CNICcovaried with BF in a manner distinct from that observed in theperiphery where temporal modulation upper cutoffs increasewith BF and units exhibit low-pass modulation sensitivity(Joris and Yin 1992). A qualitative comparison of the exampleSTRFs reveals how modulation preferences vary with BF(Figs. 1 and 3). Sites with low BFs are often characterized bybroad STRFs with temporally succinct ON-OFF temporal re-sponse pattern (e.g., Fig. 3, H and I). Accordingly, these siteshave a high bTMF (309 and 281 Hz) and low bSMF (0.40 and0.23 cycle/octave). Recording sites with higher BFs (e.g., Fig.3, B and C) tend to have shorter STRF integration times,narrower spectral tuning, and stronger sideband inhibition. Thelatter examples have high bSMF (3.04 and 2.53 cycle/octave)and low bTMF (31.25 and 31.26 Hz). Sites with intermediatefrequencies (e.g., Fig. 3, E–G), by comparison, tend to fallbetween these two extremes.
Quantitative analysis of the spectrotemporal modulationpreferences confirms the described trends for the selectedexamples. We assessed the BF dependence by generatingpopulation RTFs grouped according to BF (in 1⁄2-octave fre-quency intervals, see METHODS). Figure 4 shows the populationaveraged RTF for each 1⁄2-octave frequency interval along withthe corresponding bTMF and bSMF values from individualunits (Fig. 4, superimposed dots). At low BF (2.0–2.8 kHz),the dominant response from the population RTF is confined toa lobe that extended to several hundred hertz TMF (populationpeak bTMF � 226.56 Hz) and SMF �1 cycle/octave (popu-lation peak bSMF � 0.11 cycle/octave). Individual bTMF andbSMF values for each unit (F, multiunit; U, single unit; Fig. 4)largely overlap the population RTF for this frequency range. Atthe opposite extreme, the population RTF of sites with highBFs (22.6–32 kHz, Fig. 4H) is dominated by energy at highbSMF (population peak bSMF � 0.86 cycle/octave) and lowbTMF values (population peak bTMF � 39.06 Hz), with alarger proportion of individual unit’s bTMF and bSMF valuesfalling within this dominant response as indicated by thecluster of dots. A smooth transition between the low and highBF sites is observed suggesting that tuning characteristicchange systematically with BF.
To quantify the observed relationships, we performed astatistical analysis of the spectral and temporal modulationpreferences as a function of BF (Fig. 5). The median bTMF and
0 100 200 300 400 500 0
1
2
3
Spe
ctra
l Mod
ulat
ion
(cyc
les/
octa
ve)
Temporal Modulation (Hz)
c
b
d
e f
g h i
STRF RTF C B
E D
G F
I H
Fre
quen
cy (
octa
ves)
Latency (ms)
Temporal Modulation (Hz)
A
0 1 0 2 0 0
1
2
3
4
5
− 500 0 500 0
1
2
3
4
0 1 0 2 0 0
1
2
3
4
5
− 500 0 500 0
1
2
3
4
0 1 0 2 0 0
1
2
3
4
5
− 500 0 500 0
1
2
3
4
0 1 0 2 0 0
1
2
3
4
5
− 500 0 500 0
1
2
3
4
0 1 0 2 0 0
1
2
3
4
5
− 500 0 500 0
1
2
3
4
0 1 0 2 0 0
1
2
3
4
5
− 500 0 500 0
1
2
3
4
0 1 0 2 0 0
1
2
3
4
5
− 500 0 500 0
1
2
3
4
0 1 0 2 0 0
1
2
3
4
5
− 500 0 500 0
1
2
3
4
Spe
ctra
l Mod
. (cy
cles
/oct
)
FIG. 3. Spectrotemporal tradeoff in modulation selection. Best temporaland spectral modulation frequencies covary. Sites with fast temporal prefer-ences (high bTMF) have coarse spectral resolution (low bSMF), whereas siteswith high spectral resolution (high bSMF) prefer slow temporal modulations(low bTMF). B—I: STRFs (A–H, left) and RTFs (B–I, right) from examplessites are selected to cover the CNIC response space (red dots in A). B—D:recording sites that exhibit narrow spectral tuning and strong sideband inhi-bition are characterized by high bSMF. These same units are tuned to slowtemporal modulations. E and F: recording sites with narrow bandwidths andlack of sideband inhibition are tuned for low bSMF. These 2 units have longintegration times and respond optimally to low bTMF. G: a fast neuron thatlacks sideband inhibition but has a fast ON-OFF STRF pattern. H and I: unitswith broadband spectral selectivity that lack sideband inhibition are tuned tolow spectral modulations. Both of these units exhibit fast temporal integrationwith interleaving patterns of excitation and inhibition and are tuned for fasttemporal modulations.
893SPECTROTEMPORAL MODULATION TRADEOFF IN THE INFERIOR COLLICULUS
J Neurophysiol • VOL 103 • FEBRUARY 2010 • www.jn.org
on April 1, 2012
jn.physiology.orgD
ownloaded from

tMTF upper cutoffs (Fig. 5, A and C) decreases significantlywith increasing BF for both single and multiunits (Wilcoxonrank sum, P � 0.05), suggesting that temporal modulationresolution decreases with BF. For frequencies between 2 and 4kHz, the median bTMF and upper cutoffs (single units:bTMF � 218 Hz, median upper cutoff � 275 Hz; multiunits:
median bTMF � 148 Hz, median upper cutoff � 250 Hz) aremore than doubled compared with 16–32 kHz (single units:bTMF � 62 Hz, upper cutoff � 123 Hz; multiunits: bTMF �63 Hz, upper cutoff � 126 Hz). An opposing trend is observedfor both single and multiunits along the spectral dimension(Fig. 5, B and D). The median bSMF and sMTF upper cutoff
−500 0 500 0
1
2
3
4
−500 0 500 0
1
2
3
4
−500 0 500 0
1
2
3
4
−500 0 500 0
1
2
3
4
− 500 0 500 0
1
2
3
4
− 500 0 500 0
1
2
3
4
− 500 0 500 0
1
2
3
4
− 500 0 500 0
1
2
3
4
Temporal Modulation (Hz)
Spe
ctra
l Mod
ulat
ion
(cyc
les/
octa
ve)
2-2.8kHz 2.8-4kHz 4-5.7kHz 5.7-8kHz
8-11.3kHz 11.3-16kHz 16-22.6kHz 22.6-32kHz
A B C D
E F G H
FIG. 4. Population spectrotemporal tuning varies systemati-cally with best frequencies. Ripple transfer functions wereobtained for each unit and averaged for different best frequency(BF) ranges. BFs were first partitioned into 1⁄2-octave bands andthe population RTF was obtained for each 1⁄2-octave range(frequency range is noted above each panel). Best temporal andspectral modulation frequencies are shown for each unit as dotson each panel (F, multiunits; U, single units). Low-frequencyunits were concentrated about low spectral resolution (lowbSMF) and fast temporal modulations (high bTMF). Accord-ingly, the population RTFs for low frequencies consisted of adominant response lobe that extended to high bTMF values andhad little energy for bSMF �0.5 cycle/octave (e.g., A and B). Incontrast high-frequency sites (e.g., F–H) prefer finer spectral(high bSMF) and slower temporal modulations (low bTMF).This was evident both in the density of units as well as theenergy distribution for the population RTF for each frequencyband. A smooth continuum was observed such that spectrotem-poral preferences varied systematically with increasing BF.
Bes
t Tem
pora
lM
odul
atio
n (H
z)
Ban
dwid
th (
octa
ve)
2−4 4−8 8−16 16−32Best Frequency (kHz)
2−4 4−8 8−16 16−32Best Frequency (kHz)
S
pect
ral M
odul
atio
nU
pper
Cut
off (
cycl
e/oc
t)
Tem
pora
l Mod
ulat
ion
U
pper
Cut
off (
Hz)
Inte
grat
ion
Tim
e (
ms)
Bes
t Spe
ctra
lM
odul
atio
n (c
ycle
s/oc
t)
0
1
2
3
4
Ban
dwid
th (
kHz)
0
2
4
6
0
100
200
300
400
100
200
300
0
0.5
1
0
0.5
1
1.5
0.5
1
0
BA
DC
F
G
E
N.S./N.S.* */
* */
N.S./N.S.* */
* */
N.S./N.S.* */
* */
* */* */
* */
* */* */
* */
* */* */
* */
*/N.S* */
* */
FIG. 5. Spectrotemporal resolution and modulation tuningcharacteristics vary systematically with recording location BF.Quantitative analysis of the STRF preferences reveals thattemporal and spectral modulation selectivity exhibit opposingtrends with increasing BF. , median values for single units; ■,multi units. A and C: median best temporal modulation andupper cutoffs decrease, while median best spectral modulationand upper cutoffs increase with increasing BF (B and D). Arelated trend is also observed for the STRF integration time andproportional bandwidth (in octaves). Median integration times(E) and proportional bandwidths (F) exhibit an opposing trendwith increasing BF. Temporal integration times are shorter andspectral bandwidths (in octaves) are broader for low-frequencysites (2–4 kHz). G: in contrast, absolute bandwidths (Hz)increase with increasing BF. *, designate significant compari-sons (Wilcoxon rank sum, P � 0.05).
894 F. RODRIGUEZ, H. L. READ, AND M. A. ESCABI
J Neurophysiol • VOL 103 • FEBRUARY 2010 • www.jn.org
on April 1, 2012
jn.physiology.orgD
ownloaded from

increases with BF, demonstrating that spectral resolution in-creases with BF (Wilcoxon rank sum, P � 0.05). MedianbSMFs (single units: 0.86 cycle/octave for 16–32 kHz; 0.05cycle/octave for 2–4 kHz; multiunits: 0.92 cycle/octave for16–32 kHz; 0.11 cycle/octave for 2–4 kHz) and spectralmodulation upper cutoffs (single units: 1.35 cycle/octave for16–32 kHz; 0.41 cycle/octave for 2–4 kHz; multiunits: 1.34cycle/octave for 16–32 kHz; 0.42 cycle/octave for 2–4 kHz)were considerably larger for high-frequency sites. In the STRFdomain, a similar but weaker pattern is observed. The medianSTRF integration times (Fig. 5E) is longer for sites with highBFs (single units: 2.9 ms for 2- to 4-kHz range; 4.0 ms for 16-to 32-kHz range; multiunits: 3.0 for 2- to 4-kHz range, 3.9 for16- to 32-kHz range; Wilcoxon rank sum, P � 0.05) while themedian proportional bandwidth (i.e., in octaves; Fig. 5F) de-creases considerably with increasing BF (single units: 0.72octaves for 2- to 4-kHz range; 0.24 octaves for 16- to 32-kHzrange; multiunits: 0.76 octaves for 2- to 4-kHz range; 0.28octaves for 16- to 32-kHz range; Wilcoxon rank sum, P �0.05). In contrast, the STRF absolute bandwidth (in Hz; Fig.5G) increases with increasing BF (single units: 1.5 kHz for 2-to 4-kHz range; 3.3 kHz for 16- to 32-kHz range; multiunits:1.7 kHz for 2- to 4-kHz range; 3.9 kHz for 16- to 32-kHzrange; Wilcoxon rank sum, P � 0.05).
Relationship to the uncertainty principle and cochlearfrequency resolution
The systematic relationship between BFs and CNIC recep-tive field properties may be related to the constraints imposed
by the uncertainty principle (Gabor 1946) and the frequencyresolution of AN fibers (Liberman and Kiang 1978). Accordingto the uncertainty principle, the minimum allowed temporaland spectral resolutions of a filter are inversely related suchthat: �t ��f 1/�. Here �t corresponds to the average temporalwidth of the filter, whereas �f corresponds to the average filterbandwidth (in hertz). As a consequence, the bandwidth of acochlear filter constrain its temporal resolution, such that thefastest temporal modulations encoded through the filter arepartly limited by the frequency interaction products within thefilter. Thus in theory, the fastest temporal modulation that canbe faithfully represented at the output of a cochlear filter isapproximately half the filter bandwidth.
The observed spectrotemporal tradeoff in the CNIC was notstrictly limited by the receptive field bandwidth. In the AN, astrong dependence among temporal modulation upper cutofffrequencies, BFs, and absolute bandwidths (in hertz) is ob-served (Joris and Yin 1992). Temporal modulation uppercutoffs increase with BF for frequencies up to �10 kHz;beyond 10 kHz temporal modulation upper cutoffs tend tosaturate at �1 kHz (Fig. 14 of Joris and Yin 1992). A trend thatmirrors the uncertainty principle tradeoff is observed for pe-ripheral AN fibers [Fig. 6, A and B; red data are from Joris andYin (1992); blue data are from Kim and Young (1994); dots,fiber recordings that fall within the CNIC BF range of 2–32kHz; plus sign, fiber recordings outside the 2- to 32-kHz range;dotted lines, predictions from the uncertainty principle]. Thereis a strong negative correlation between AN fiber spectral andtemporal resolution estimates obtained with SAM tones and
Integration Time
B
A
4-8kHz
8-16kHz
16-32kHz
2-4kHz
Integration Time
Num
ber
of U
nits
C
D
E
Uncertainty Principle
F
0 5 10 15 0
5
10
15
1 10 0.10
1
10
0
10
20
30
0
50
100
0
100
200
0.3 1 0 10 2000
100
200
FIG. 6. Cochlear filter bandwidths and the uncertainty principle do not account for the observed spectrotemporal resolution tradeoff. A: the time-frequency resolution(�t vs. �f) of AN fibers (red: data from Joris and Yin 1992; blue: data from Kim and Young 1994; dots: AN fibers with 2 � BF � 32 kHz; plus sign: AN Fibers withBF outside this range) roughly follow the inverse relationship for the uncertainty principle: �t ��f 1/� (dotted line). By comparison, the time-frequency resolution (�tvs. �f) of CNIC units deviates substantially from this theoretical bound (a; black dots � multiunits; gray dots � single units). Units with �t �15 ms are not shown (n �5). B: the same data as in A are shown using a double-logarithmic axis. Note that the time and frequency resolution of AN fibers is strongly negatively correlated andis within an order of magnitude of the uncertainty principle. C–F: the distribution of time-frequency resolution products, �t ��f, from all CNIC recording sites (graystacked histogram corresponds to single units; black stacked histogram corresponds to multiunits) and AN fibers (red histogram � Joris and Yin 1992; blue histogram �Kim and Young 1994) is shown as a function of best frequency (2–4, 4–8, 8–16, 16–32 kHz). For reference, the theoretical lower bound of 1/� imposed by theuncertainty principle is noted by dashed lines. For the vast majority of CNIC units, the time-frequency resolution product is greater than for AN fibers and more thanan order of magnitude from the theoretical limit. Furthermore, the time-frequency resolution increases systematically with increasing BF.
895SPECTROTEMPORAL MODULATION TRADEOFF IN THE INFERIOR COLLICULUS
J Neurophysiol • VOL 103 • FEBRUARY 2010 • www.jn.org
on April 1, 2012
jn.physiology.orgD
ownloaded from

tone pips [r � �0.89 � 0.02, t-test P � 0.05; log(�t) vs.log(�f)] (Joris and Yin 1992). A weaker trend is observed forAN fiber STRFs obtained with Gaussian white noise [r ��0.40 � 0.08, t-test P � 0.05; log(�t) vs. log(�f)] (Kim andYoung 1994) although this dataset did not include frequenciesbeyond 15 kHz. In contrast, CNIC neurons exhibit a weakertrend (r � �0.12 � 0.02, t-test P � 0.05; Fig. 6, A and B;black circles, multiunits; gray circles, single units) and aresubstantially further away from the theoretical limit (Fig. 6, Aand B, dotted curve). Viewed in a different way, the uncer-tainty principle predicts that temporal modulation upper cutoffsincrease with increasing bandwidth and consequently BF. Asexpected CNIC absolute bandwidths (in kHz) increase withincreasing BF (Fig. 5G; r � 0.75 � 0.01, mean � SE; t-testP � 0.05). Mc Laughlin et al. also found this relationship in theIC and AN fibers (Mc Laughlin et al. 2007). However, inopposition to the uncertainty principle is our finding thattemporal modulation upper cutoff frequencies decrease withincreasing BF (Fig. 5C). This trend opposes the relationshipobserved for AN fibers where temporal modulation uppercutoff frequencies tend to increase with BF (Joris and Yin1992).
To compare AN fibers and CNIC neurons with the predic-tions of the uncertainty principle, we measured the spectrotem-poral resolution product, �t ��f. For the uncertainty principle,this product is constant (1/�) regardless of the filter BF. In theAN, this product increases with BF for spectrotemporal reso-lution estimates derived from the responses to SAM tones andtone pips (Fig. 6, C–F, red histograms) (Joris and Yin 1992). Asimilar trend is also observed for AN fiber STRFs obtainedwith Gaussian white noise, although these tend to deviate morefrom the uncertainty principle for high BF sites (Fig. 6, C–F,blue histograms) (Kim and Young 1994). Unlike AN fibers,which are within an order of magnitude from the uncertaintyprinciple, this product is on average more than one order ofmagnitude away from the theoretical limit for CNIC neurons(single units: �t ��f � 9.3 � 0.4; multiunits: �t ��f � 10.2 �0.2) and is significantly larger than for AN fibers (P � 0.05,Wilcoxon rank sum; Fig. 6, C–F; red, AN fibers data fromJoris and Yin; blue, AN fiber data from Kim and Young; black,CNIC). This quantity increased with increasing BF in theCNIC for both single (median �t ��f for 2- to 4-kHz range �4.1 � 0.6; 4- to 8-kHz range � 7.4 � 0.4; 8- to 16-kHzrange � 9.9 � 0.6; 16- to 32-kHz range � 14.7 � 0.8;Wilcoxon rank sum, P � 0.001) and multiunits (median �t ��tfor 2- to 4-kHz range � 5.0 � 0.4; 4- to 8-kHz range � 6.7 �0.2; 8- to 16-kHz range � 9.9 � 0.2; 16- to 32-kHz range �16.0 � 0.4; Wilcoxon rank sum, P � 0.001), implying that thespectrotemporal resolution was poorer for high BF sites.
Role of functional inhibition in modulation tuning
It is possible that the observed filtering characteristics areinherited directly from the periphery. However, this is not thecase because best and upper temporal modulation frequenciesopposes the trends between BFs and temporal modulationupper cutoffs observed in the AN (Joris and Yin 1992).Furthermore, the presence of band-pass-tuned sMTFs andtMTFs in the CNIC differs substantially from the AN wherefibers exhibit low-pass temporal modulation tuning (Joris andYin 1992). Thus the modulation sensitivity of the peripheral
filters in the cochlea alone cannot account for the observedtrends. We therefore tested whether inhibition and/or suppres-sion potentially play a role in the observed spectrotemporalmodulation tradeoff. Throughout we will refer to the negativeSTRF domains as “inhibitory,” although these strictly reflectlack of a sound energy at a particular time and frequency priorto the initiation of an action potential, and could arise throughseveral mechanisms such as neural inhibition or suppression(see DISCUSSION).
As previously proposed (Miller et al. 2002; Qiu et al. 2003),neurons with strong temporal inhibition in the STRF exhibit aband-pass-tuned tMTF (e.g., Fig. 3, F–I) ,whereas units thatlack such temporal inhibition are characterized by low-passtMTF (e.g., Fig. 3, B and C). Similarly, units that exhibitspectral sideband inhibition will exhibit band-pass sMTF (Fig.3, B–D). Figure 7 illustrates this concept with a model STRF(see METHODS) in which the balance between excitation andinhibition is systematically varied along the temporal (A–C) orspectral (D–F) dimensions. When no inhibition is present (Fig.7, A and D, left), the tMTF and sMTF both exhibit a low-passpattern (i.e., untuned; Fig. 7, B and E, left). Increasing theamount of temporal inhibition in the STRF model leads to amore pronounced band-pass tMTF; however, the spectral tun-ing remains unchanged (Fig. 7, A and B, middle and right).Similarly, an increase in sideband inhibition strictly enhancesthe spectral selectivity such that the sMTF is band-pass tuned(Fig. 7, D and E, middle and right). Figure 7, C and F, plots theIER from the STRF versus the amount of spectral or temporaltuning as measured by the spectral and temporal DC gains (seeMETHODS). Increasing the IER by adding temporal inhibition tothe model STRF decreases the temporal DC gain (Fig. 7C),thus indicating stronger tMTF tuning. Similarly, an increasein the amount of spectral inhibition leads to more negativespectral DC gains and thus more pronounced spectral modu-lation tuning (Fig. 7F). The model results demonstrate theintricate interaction between STRFe and STRFi domains andtheir role in generating modulation tuning. A purely excitatorySTRF exhibits low-pass selectivity for both spectral and tem-poral modulations, whereas a STRF with excitation and inhi-bition exhibits band-pass modulation tuning.
Neural responses from the CNIC mirror the model predic-tions, suggesting that the pattern of inhibition shapes thespectrotemporal tuning. For each unit, we segmented the STRFinto its STRFe and STRFi components (Fig. 8, A–C) anddetermined how the balance between excitation and inhibitionin the STRF alters modulation tuning. Figure 8A shows a unitwith a purely excitatory STRF (IER � 0) that exhibits alow-pass function along both temporal and spectral modulationdimensions (temporal and spectral DC gains � 0 dB). The unitof Fig. 8B has inhibitory subregions flanking an excitatoryregion in the time domain (IER � 0.16). Consistent with themodel, this unit exhibits a band-pass tuned tMTF (temporal DCgain � �5.3 dB) although it is untuned for spectral modula-tions (spectral DC gain � 0 dB). Finally, the unit of Fig. 8Chas a complex primarily spectral inhibitory component (IER �0.21) and is therefore band-pass tuned primarily for spectralmodulations (spectral DC gain � �8.2 dB; temporal DCgain � �1.1 dB). Figure 8, D–F, shows histograms for therelationship between IER and the DC gains across all units.The selected example units of A–C are marked by �, �, and *on the histograms, respectively. Similar to the model findings,
896 F. RODRIGUEZ, H. L. READ, AND M. A. ESCABI
J Neurophysiol • VOL 103 • FEBRUARY 2010 • www.jn.org
on April 1, 2012
jn.physiology.orgD
ownloaded from

the DC gains decrease as the strength of inhibition (IER)increases. These parameters exhibit a significant negativecorrelation (IER vs. temporal DC gain: r � �0.52 � 0.02,P � 0.001; IER vs. spectral DC gain: r � �0.32 � 0.02, P �0.001; IER vs. maximum DC gain: r � �0.60 � 0.02, P �0.001), suggesting that stronger STRF inhibition leads to morepronounced tuning.
The excitatory and inhibitory components of the STRFexhibit marked changes in their spectral and temporal patternwith increasing BF. Figure 9 shows the population averaged(single and multiunits combined) excitatory (top) and inhibi-tory (bottom) STRF for different BF ranges (see METHODS; 2–4,4–8, 8–16, and 16–32 kHz). For the lowest BFs (2–4 kHz),the STRFe exhibits a spectrally broad (�1.3 octave bandwidth)and temporally succinct pattern (�3-ms integration time),whereas for the highest frequency range the STRFe exhibitsnarrower bandwidth (�0.25 octave) of similar integration time.The population STRFi (Fig. 9, bottom) also exhibits systematicchanges with BF, although the observed patterns and changeswere generally more complex. For the lowest BFs (2–4 kHz),the dominant component of the STRFi consists of a spectrallybroad and temporally succinct component that lagged theexcitatory component by �1 ms. A weaker although tempo-rally broad inhibitory component is also observed that lags theexcitatory component (starting at �5 and ending at �18 ms),whereas a weak and temporally succinct inhibitory componentprecedes the excitation (�2 ms lead). For high BFs sites(16–32 kHz), the STRFi consists of a prominent inhibitorycomponent that surrounds the excitation. Like the low BF sites,a small, but noticeable amount of inhibition precedes theexcitatory response. However, the high BF sites exhibit prom-
inent sideband inhibition, whereas the low BF sites did not. Aprominent and temporally broad secondary inhibitory compo-nent resembles the lagging component in the 2- to 4-kHz range;however, this component becomes more pronounced withincreasing BF. These changes in the STRFe and STRFi struc-ture are quantified in Fig. 10. As can be seen, the medianexcitatory and inhibitory integration times (Fig. 10, A and D)increase systematically with BF while the excitatory and in-hibitory bandwidths (B and E) tend to decrease (Wilcoxon ranksum, P � 0.05). There are significant differences betweensingle and multiunit inhibitory bandwidths for the low-fre-quency range (2–8 kHz; Fig. 10, E and F). While multiunitsexhibit a significant decreasing trend for inhibitory bandwidths(in octaves), their inhibitory bandwidths in hertz does not varysystematically with BF (Wilcoxon rank sum, N.S across all BFcomparisons). The alternative was true for single units, whichexhibit a systematic trend for inhibitory bandwidths in kilo-hertz but not in octaves (Wilcoxon rank sum, N.S. across allBF comparisons). It is possible that these differences are due tothe fact that there are few single-unit samples for the low andhigh BF range and the STRFi component is generally weakerand noisier than the excitatory component making it difficult toobtain reliable measurements. Overall, the changes with BF inthe excitatory and inhibitory patterns are consistent with thehypothesis that excitation and inhibition provide a basis forchanges in modulation tuning.
The results of Figs. 9 and 10 demonstrate that the shape ofthe STRFe and STRFi components changes systematicallywith BF, and these changes lead to changes in spectrotemporalmodulation tuning as observed in Figs. 4 and 5. It is alsopossible that higher BF sites exhibit stronger inhibition, which
0 0. 2 0. 4 0. 6 −25
−20
−15
−10
−5
0
5
4 6 8 10 12
−2
−1
0
1
2 4 6 8 1 0 12
−2
−1
0
1
2 4 6 8 1 0 12
−2
−1
0
1
2
−500 0 500 0
1
2
3
4
− 500 0 500 0
1
2
3
4
− 500 0 500 0
1
2
3
4
0 0. 2 0. 4 0. 6 −25
−20
−15
−10
−5
0
5
4 6 8 10 12 14
−2
−1
0
1
2 4 6 8 1 0 12 14
−2
−1
0
1
4 6 8 1 0 12 14
−2
−1
0
1
2
−500 0 500 0
1
2
3
4
− 500 0 500 0
1
2
3
4
− 500 0 500 0
1
2
3
4
Temporal Inhibition
Spectral Inhibition
IER Spe
ctra
l DC
Gai
n (d
B)
IER Tem
pora
l DC
Gai
n (d
B)
A
B
D
E
C
F
Temporal Modulation (Hz)
Spe
ctra
l Mod
ulat
ion
(cy
cles
/oct
) F
req.
(oc
tave
)
Latency (ms)
Temporal Modulation (Hz)
Spe
ctra
l Mod
ulat
ion
(cy
cles
/oct
) F
req.
(oc
tave
)
Latency (ms)
FIG. 7. The role of excitation and inhibi-tion in modulation tuning. A: increasing theamount of temporal inhibition in a modelSTRF (A, left to right) changes the temporaltuning in the RTF from low- to band-pass(B, left to right). The strength of inhibitionin the STRF was quantified by the inhibi-tory-to-excitatory power ratio (IER) whilethe strength of modulation tuning is char-acterized by the DC gain (see METHODS).C: temporal DC gains from B decreasewith increasing IER indicating that stron-ger temporal inhibition leads to strongertemporal tuning. D, left to right: increasingthe amount of sideband inhibition in amodel STRF leads to more pronouncedspectral tuning (E, left to right). F: spectralDC gains from the corresponding RTFs(E) decrease with increasing IER, indicat-ing that stronger sideband inhibition leadsto stronger spectral modulation tuning.
897SPECTROTEMPORAL MODULATION TRADEOFF IN THE INFERIOR COLLICULUS
J Neurophysiol • VOL 103 • FEBRUARY 2010 • www.jn.org
on April 1, 2012
jn.physiology.orgD
ownloaded from

would further refine spectrotemporal selectivity for high-fre-quency sites. Figure 11E plots the average IER versus BF anddemonstrates that the strength of inhibition did not increaseappreciably with increasing BF (Wilcoxon rank sum, N.S.).Despite this, there is a subtle but significant increase in theproportion of temporal band-pass single and multiunits (t-test,P � 0.05; Fig. 11A) and a significant reduction in the temporalDC gain (Wilcoxon rank sum, P � 0.05; C) for BFs between16 and 32 kHz compared with 2–4 kHz; however, these trendsare not systematic along the low to high BF continuum (Wil-coxon rank sum, N.S. across BF comparisons). The corre-sponding trends are considerably stronger for the spectraldimension where single and multiunits exhibit substantiallymore band-pass tuning (t-test, P � 0.05; Fig. 11B) and amarked reduction in the spectral DC gains for high BFs(Wilcoxon rank sum, P � 0.05; Fig. 11D). Only 4.5% (mul-tiunits � 4.5%; single units � 4.3%) of low-frequency units
with BFs between 2 and 4 kHz exhibit spectrally band-passRTFs while 58.7% (multiunits � 58.8%; single units � 57.5%)of the units between 16 and 32 kHz exhibit spectrally band-pass selectivity.
D I S C U S S I O N
This study provides a new surprising view of how spec-trotemporal features are transformed in the auditory mid-brain. Spectrotemporal filtering resolution exhibits a sys-tematic tradeoff along the tonotopic axis of the CNIC thatcannot be accounted by the spectrotemporal resolution ofthe peripheral auditory filters. At the extremes, low BF sitesare characterized by high temporal (short integration timesand high bTMF values) and poor spectral resolution (broadproportional bandwidths and low bSMF), whereas high BFsites exhibit poorer temporal (longer integration times and
STRF Excitatory STRF
Inhibitory STRF
RTFF
requ
ency
(oct
ave)
Fre
quen
cy(o
ctav
e)
Tem
pora
l DC
Gai
n
IER0 0.5 1
−20
−15
−10
−5
0
Spe
ctra
l DC
Gai
n
IER0 0.5 1
−20
−15
−10
−5
0
Max
DC
Gai
n
IER0 0.5 1
−20
−15
−10
−5
0
Fre
quen
cy(o
ctav
e)
Latency(ms)0 10 20
3
4
5
Spectral M
odulation (cycles/octave)
Temporal Modulation (Hz)−500 0 500
0
1
2
3
4
3
4
51
2
3
A
B
C
FED
FIG. 8. Strength of modulation tuning covaries with thestrength of STRF inhibition. A–C: quantitative analysis ofexcitatory and inhibitory STRF components. Each STRF wasbroken up into an inhibitory and excitatory component. The unitof A exhibits a strictly excitatory STRF. The correspondingRTF for this unit (far right) is low-pass for both spectral andtemporal modulations. B: this unit exhibits a strong temporalexcitatory and inhibitory pattern. Accordingly its RTF (farright) is strongly tuned for temporal modulations. The unit ofC exhibits strong sideband inhibition and a weak temporal inhib-itory component. This is reflected in its RTF as weak temporaltuning and strong spectral tuning (far right). D–F: histogramsshowing that the strength of STRF inhibition covaries with theamount of modulation tuning across all CNIC units. The IER isnegatively correlated with the temporal DC gains (D), spectral DCgains (E), and the maximum of the temporal or spectral DC gains(F). The units of A–C are represented by �, �, and *, respectively.
898 F. RODRIGUEZ, H. L. READ, AND M. A. ESCABI
J Neurophysiol • VOL 103 • FEBRUARY 2010 • www.jn.org
on April 1, 2012
jn.physiology.orgD
ownloaded from

low bTMF) and significantly better spectral resolution (nar-rower proportional bandwidths and higher bSMF). To-gether, the results suggest a dramatic transformation in theorganization of spectrotemporal preferences at the level ofthe CNIC.
Comparison to the cochlear filters
Spectrotemporal filtering characteristics of CNIC neuronsdiffer in a number of ways from AN fibers where modulationupper cutoffs tend to increase as a function of the fiber BF
(Joris and Yin 1992). First, CNIC temporal tuning propertiesshift systematically with BF although the resulting trendsoppose the observed pattern in the AN. Temporal upper cutofffrequencies and bTMFs decrease with increasing BF (Fig. 5, Aand C). Furthermore, unlike the peripheral auditory filters,which strictly exhibit low-pass temporal modulation sensitiv-ity, a substantial proportion of CNIC units also exhibit band-pass temporal modulation tuning.
Most CNIC studies have not identified a consistent relation-ship between BF and temporal modulation preferences in theCNIC (Krishna and Semple 2000; Rees and Møller 1983; Reesand Palmer 1989); however, Langner and colleagues haveargued that BFs and best temporal modulation frequenciesfollow a trend consistent with the AN (Langner and Schreiner1988; Langner et al. 1987, 2002). The main factor leading tothis disparity has to do with the fact that Langner et al. sampledneurons with very low BFs (down to �200 Hz), whereas mostother studies focused exclusively on BFs greater than �1 kHz.Note that to properly sample the SAM tones used in thesestudies, it is required that the carrier frequency be at least twicethe frequency of the sinusoidal modulation. Consequently,there is a strong dependence between the neuron’s BF and themaximum modulation frequency that can be tested. For low BFunits (e.g., 250 Hz), CNIC neurons can readily phase lock tothe fastest temporal modulations (e.g., 125 Hz) that are allowedby the sound carrier (250 Hz). Thus a direct relationshipbetween BF and modulation sensitivity as observed by Langnerand colleagues is expected a priori for the low-frequency range(i.e., �1 kHz). In our study, we were unable to sample thelow-frequency range (�2 kHz) because the dynamic ripplesound has temporal modulation �500 Hz, and this requirescarrier frequencies �1 kHz. Practically, to assure that theSTRF was fully within the stimulus frequency range, welimited our recordings to BFs �2 kHz.
Rel
ativ
e F
requ
ency
(oc
tave
)
Relative Latency(ms)0 10 20
−2
0
2
2-4kHz 4-8kHz 8-16kHz 16-32kHz
FIG. 9. Excitatory and inhibitory STRF preferences vary with BF. Thepopulation averaged excitatory (top) and inhibitory (bottom) STRF is shownfor four frequency ranges (2–4, 4–8, 8–16, 16–32 kHz). At low frequencies(2–4 kHz), the excitatory STRF exhibits substantially broader bandwidthscompared with high-frequency sites (16–32 kHz). In contrast, the structure ofthe inhibitory STRF is much more complex. For low frequencies (2–4 kHz),the STRFi is dominated by a brief (�2 ms) but strong temporal inhibitorycomponent that spans �1.8 octave. For this range of frequencies (2–4 kHz),sideband inhibition is not present. For high BFs (16–32 kHz), sidebandinhibition becomes stronger and the STRF temporal inhibition is substantiallynarrower and longer.
0
2
4
6
0
0.5
1
0
1
2
3
4
0
0.5
1
1.5
2
0
2
4
6
Ban
dwid
th (
kHz)
Inte
grat
ion
Tim
e (
ms)
Ban
dwid
th (
octa
ve)
2−4 4−8 8−16 16−32Best Frequency (kHz)
2−4 4−8 8−16 16−32Best Frequency (kHz)
2−4 4−8 8−16 16−32Best Frequency (kHz)
Ban
dwid
th (
kHz)
Inte
grat
ion
Tim
e (m
s)
Ban
dwid
th (
octa
ve)
2−4 4−8 8−16 16−32Best Frequency (kHz)
2−4 4−8 8−16 16−32Best Frequency (kHz)
2−4 4−8 8−16 16−32Best Frequency (kHz)
A CB
D FE
N.S./N.S.
* */* */
* */* */ * */
* */N.S./N.S.
* */
*/N.S*/N.S
*/N.S
* */
0
2
4
6
8
*N.S/* */
*/N.S
N.S./N.S.
*N.S/
Excitation.
Inhibition.
FIG. 10. Excitatory and inhibitory STRF preferences vary with recording location BF. Quantitative analysis of the excitatory and inhibitory STRFdemonstrates that temporal and spectral preferences shift in opposing directions with increasing BF. , median values to single units; ■, multiunits. The excitatory(A) and inhibitory (D) integration time both increase with BF while STRF excitatory bandwidths (in octaves) decrease (B). In contrast, absolute excitatorybandwidths increase with BF (C). The corresponding bandwidth trends for the inhibitory STRF component (E and F) were less systematic and differed somewhatbetween single and multiunits. *, significant comparisons (Wilcoxon rank sum, P � 0.05).
899SPECTROTEMPORAL MODULATION TRADEOFF IN THE INFERIOR COLLICULUS
J Neurophysiol • VOL 103 • FEBRUARY 2010 • www.jn.org
on April 1, 2012
jn.physiology.orgD
ownloaded from
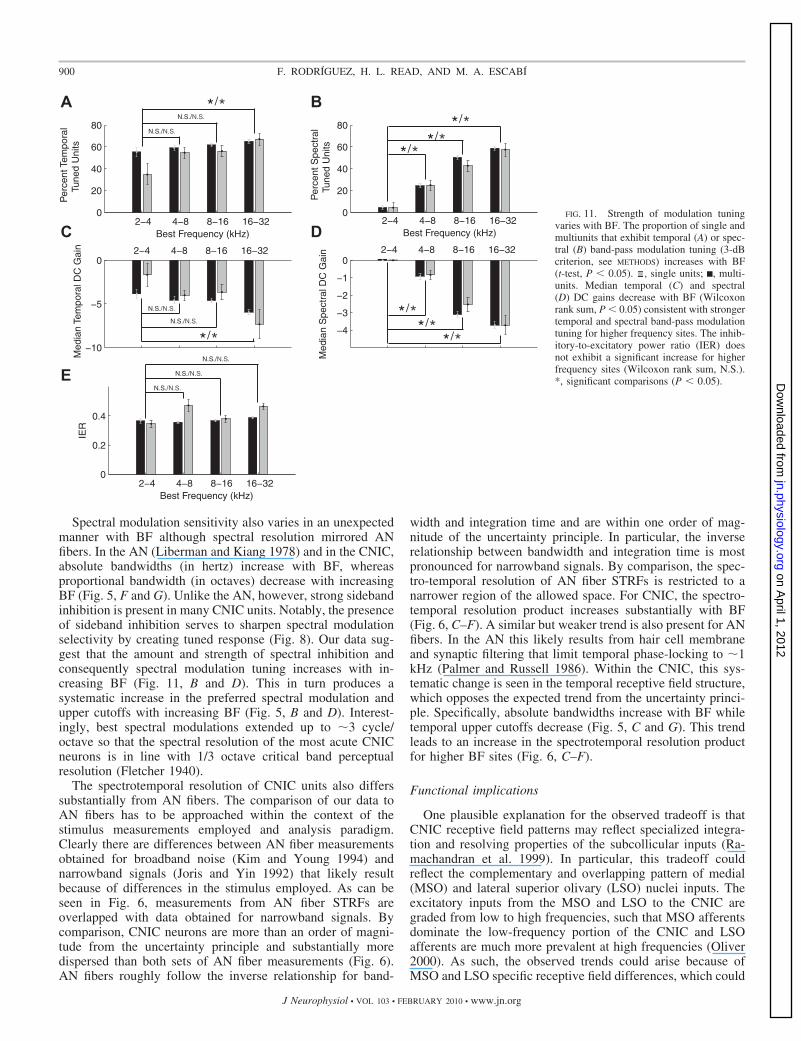
Spectral modulation sensitivity also varies in an unexpectedmanner with BF although spectral resolution mirrored ANfibers. In the AN (Liberman and Kiang 1978) and in the CNIC,absolute bandwidths (in hertz) increase with BF, whereasproportional bandwidth (in octaves) decrease with increasingBF (Fig. 5, F and G). Unlike the AN, however, strong sidebandinhibition is present in many CNIC units. Notably, the presenceof sideband inhibition serves to sharpen spectral modulationselectivity by creating tuned response (Fig. 8). Our data sug-gest that the amount and strength of spectral inhibition andconsequently spectral modulation tuning increases with in-creasing BF (Fig. 11, B and D). This in turn produces asystematic increase in the preferred spectral modulation andupper cutoffs with increasing BF (Fig. 5, B and D). Interest-ingly, best spectral modulations extended up to �3 cycle/octave so that the spectral resolution of the most acute CNICneurons is in line with 1/3 octave critical band perceptualresolution (Fletcher 1940).
The spectrotemporal resolution of CNIC units also differssubstantially from AN fibers. The comparison of our data toAN fibers has to be approached within the context of thestimulus measurements employed and analysis paradigm.Clearly there are differences between AN fiber measurementsobtained for broadband noise (Kim and Young 1994) andnarrowband signals (Joris and Yin 1992) that likely resultbecause of differences in the stimulus employed. As can beseen in Fig. 6, measurements from AN fiber STRFs areoverlapped with data obtained for narrowband signals. Bycomparison, CNIC neurons are more than an order of magni-tude from the uncertainty principle and substantially moredispersed than both sets of AN fiber measurements (Fig. 6).AN fibers roughly follow the inverse relationship for band-
width and integration time and are within one order of mag-nitude of the uncertainty principle. In particular, the inverserelationship between bandwidth and integration time is mostpronounced for narrowband signals. By comparison, the spec-tro-temporal resolution of AN fiber STRFs is restricted to anarrower region of the allowed space. For CNIC, the spectro-temporal resolution product increases substantially with BF(Fig. 6, C–F). A similar but weaker trend is also present for ANfibers. In the AN this likely results from hair cell membraneand synaptic filtering that limit temporal phase-locking to �1kHz (Palmer and Russell 1986). Within the CNIC, this sys-tematic change is seen in the temporal receptive field structure,which opposes the expected trend from the uncertainty princi-ple. Specifically, absolute bandwidths increase with BF whiletemporal upper cutoffs decrease (Fig. 5, C and G). This trendleads to an increase in the spectrotemporal resolution productfor higher BF sites (Fig. 6, C–F).
Functional implications
One plausible explanation for the observed tradeoff is thatCNIC receptive field patterns may reflect specialized integra-tion and resolving properties of the subcollicular inputs (Ra-machandran et al. 1999). In particular, this tradeoff couldreflect the complementary and overlapping pattern of medial(MSO) and lateral superior olivary (LSO) nuclei inputs. Theexcitatory inputs from the MSO and LSO to the CNIC aregraded from low to high frequencies, such that MSO afferentsdominate the low-frequency portion of the CNIC and LSOafferents are much more prevalent at high frequencies (Oliver2000). As such, the observed trends could arise because ofMSO and LSO specific receptive field differences, which could
Med
ian
Tem
pora
l DC
Gai
n
Per
cent
Spe
ctra
l
Tune
d U
nits
Per
cent
Tem
pora
l
Tun
ed U
nits
Med
ian
Spe
ctra
l DC
Gai
n
2−4 4−8 8−16 16−32Best Frequency (kHz)
2−4 4−8 8−16 16−32 2−4 4−8 8−16 16−32
2−4 4−8 8−16 16−32Best Frequency (kHz)
BA
C
E
0
0.2
0.4
IER
2−4 4−8 8−16 16−32Best Frequency (kHz)
0
20
40
60
80
0
20
40
60
80
−10
−5
0
−4
−3
−2
−1
0
D
N.S./N.S.
N.S./N.S.
N.S./N.S.
N.S./N.S.
N.S./N.S.
* */* */
* */* */
* */* */
* */N.S./N.S.
N.S./N.S.* */
FIG. 11. Strength of modulation tuningvaries with BF. The proportion of single andmultiunits that exhibit temporal (A) or spec-tral (B) band-pass modulation tuning (3-dBcriterion, see METHODS) increases with BF(t-test, P � 0.05). , single units; ■, multi-units. Median temporal (C) and spectral(D) DC gains decrease with BF (Wilcoxonrank sum, P � 0.05) consistent with strongertemporal and spectral band-pass modulationtuning for higher frequency sites. The inhib-itory-to-excitatory power ratio (IER) doesnot exhibit a significant increase for higherfrequency sites (Wilcoxon rank sum, N.S.).*, significant comparisons (P � 0.05).
900 F. RODRIGUEZ, H. L. READ, AND M. A. ESCABI
J Neurophysiol • VOL 103 • FEBRUARY 2010 • www.jn.org
on April 1, 2012
jn.physiology.orgD
ownloaded from

be important for sound localization phenomena. Although wehave not probed binaural preferences in this study, it is none-theless possible that the graded patterns of MSO and LSO inputcontribute to the observed trends.
The combined effects of excitation and inhibition likely playa role in the generation of the observed STRF patterns and thecorresponding frequency-dependent modulation trends (Figs.9–11). Inhibitory circuits are pervasive within the auditorybrain stem and midbrain and shape spectral and temporalsensitivity of units. Within the CNIC, local inhibition has aprofound effect on the spectrotemporal modulation preferencesof neurons (Andoni et al. 2007; Casseday et al. 2000; Kuwadaet al. 1997; LeBeau et al. 2001; Nataraj and Wenstrup 2006;Zhang and Kelly 2003). In principle, the negative componentof the STRF reflects lack of sound energy at a particular timeand frequency prior to the initiation of an action potential(Escabi et al. 2005), which could theoretically arise throughinhibition, neural adaptation or refractoriness. Several factors,however, point toward inhibition as the most likely mecha-nism. First, the time scales of the negative components ofCNIC STRFs are much too short to be accounted by neuraladaptation since adaptation in the midbrain takes place overhundredths of milliseconds (Kvale and Schreiner 2004; Nageland Doupe 2006) to tens of seconds (Malmierca et al. 2009).This is consistent with our data because average spike rates tothe continuous DMR adapt to �50% of the initial firing ratewith an average time constant of 18 s (data not shown). In asimilar manner, although refractoriness could in theory con-tribute for some very fast inhibitory regions (e.g., 1- to 2-msinhibitory integration time), it cannot account for the widerange of inhibitory integration times observed in our STRFs,which can extend up to tens of milliseconds. For many CNICSTRFs, the structure of the inhibitory pattern is actually incon-sistent with adaptation because the inhibitory patters actuallyprecede (e.g., Figs. 1, 3, H and I, and 8B) or occur concurrentlywith excitation as for sideband inhibitory regions (e.g., Figs. 1,2C, and 3, B–D). Sideband inhibitory regions could arisethrough basilar membrane suppression (Ruggero et al. 1992);however, sideband suppression is substantially weaker andspectrally narrower in AN fibers STRFs (Kim and Young1994) compared with the patterns we observe. A limitation ofour approach is the use of anesthesia for the neural recordings.Although anesthesia is known to alter spectral and temporalresponse preferences, its overall effects are substantially lesspronounced in the CNIC compared with auditory cortex (Ter-Mikaelian et al. 2007). Despite this, the anesthetic conditioncannot account for our frequency dependent trends becauseanesthesia would indiscriminately target all frequencies. Futurestudies will need to consider the origins and mechanisms thatlead to the observed sensitivity and trends.
Changes in the temporal arrangement of neural excitation,inhibition, and/or suppression are also consistent with thechanges in temporal modulation sensitivity observed with BF.Intriguingly, the proportion of STRF inhibitory power does notchange appreciably with BF (Fig. 11) although the spectrotem-poral arrangement of excitation and inhibition varies consid-erably (Fig. 9) with more prevalent sideband inhibition presentfor high BF sites. This results in a dramatic increase in thestrength and number of spectrally tuned sites at high frequen-cies. By comparison, the strength and amount of temporalmodulation tuning also increases slightly with BF, and this is
accompanied by a dramatic reduction of bTMF and temporalupper cutoffs as seen in Fig. 5. These changes in the modula-tion tuning are consistent with the observed changes in thespectrotemporal pattern of excitation and inhibition (Fig. 9).STRF integration time measurements are in line with measure-ments of CNIC cell membrane time constants (�5 ms) (Geisand Borst 2009). Specifically, the systematic trend towardslower STRFe’s and STRFi’s (Figs. 9 and 10) and slowermodulation sensitivity for high BFs (Fig. 5, A and C) isconsistent with the fact that cell membrane time constants tendto increase with BF in the CNIC (Geis and Borst 2009).Furthermore, these results resemble a comparable trend ob-served in the CNIC during electrical stimulation of the ANwhere higher limiting stimulation rates and shorter latencieswere observed for low BF CNIC neurons (Middlebrooks andSnyder 2008).
The described spectrotemporal modulation trends have notbeen observed in the CNIC with other types of sounds andmeasurement techniques. One notable difference between thisstudy and others is the large number of recording sites obtainedwith the 16-channel acute recording probes. Previous mappingstudies have exclusively used single electrodes and were un-able to achieve high-density sampling (e.g., �400 site/animalrecorded on average for this study) within a large volume of theCNIC. A second difference is that the STRF strictly measuresphase-locked neural activity and provides a description of thespectrotemporal sound pattern that is most likely to produce asingle phase-locked spike (Escabi et al. 2005). In contrast,previous studies that have looked for an organization foramplitude modulations have focused primarily on rate MTFmeasurements (Langner et al. 2002; Schreiner and Langner1988). Recently we have demonstrated that synchrony- andrate-tuning patterns are not complementary and can lead todistinctly different neural selectivity (Zheng and Escabi 2008).Thus it is likely that our findings would not be reproduciblewith rate based MTF approaches. Furthermore, the DMRsound employed in this study dynamically activates the entiresensory epithelium and simultaneously engages excitatory andinhibitory inputs across a broad frequency range. Given thatthe observed receptive field trends depend strongly on thearrangement of the receptive field inhibition (Figs. 9 and 10),it is likely that observed CNIC results would not be observedfor simpler narrowband sounds (e.g., SAM tones, tone pips)because these cannot efficiently probe sideband inhibitoryinputs.
Implication for the analysis of natural sounds
This study raises several new questions regarding the cost ofencoding spectral and temporal features in natural sounds.CNIC neurons operate suboptimally when one considers thetheoretical resolution limit set by the uncertainty principle.This is in contrast to the cochlear filters, which deviate slightlybut appear to operate much closer to the theoretical resolutionlimit (Fig. 6).
One explanation for this dichotomy is that the cochlea servesto efficiently encode and preserve information in the incomingsound waveform while CNIC neurons operate to extract spec-trotemporal features that are commonly found in naturalsounds. The spectrotemporal modulations in speech and othernatural sounds exhibit 1/f modulation spectrum (Attias and
901SPECTROTEMPORAL MODULATION TRADEOFF IN THE INFERIOR COLLICULUS
J Neurophysiol • VOL 103 • FEBRUARY 2010 • www.jn.org
on April 1, 2012
jn.physiology.orgD
ownloaded from

Schreiner 1998a; Singh and Theunissen 2003; Voss and Clarke1975) and log-normal amplitude statistics (Attias and Schreiner1998a; Escabi et al. 2003) and exhibit a spectrotemporalresolution tradeoff that mirrors our neuronal data (Singh andTheunissen 2003). In particular, Singh and Theunissen dem-onstrated that spectral and temporal modulation spectra ofanimal vocalization sounds and speech are not independent.Sounds with fast temporal modulations tend to have coarsespectral modulations while sounds with fine spectral modula-tions tend to have slower temporal modulations, analogous tothe observed neural sensitivity in Fig. 3A. Neurons in the CNIChave been shown to operate optimally with respect to severallow- and higher-order statistics of the modulation envelope ofnatural sounds (Attias and Schreiner 1998b; Escabi et al.2003). Thus it is possible that the observed frequency-depen-dent trends are important for encoding features that are repre-sented across the low- to high-frequency continuum of hearing.Specifically, most of the relevant information for animal com-munication sounds and speech is derived from the mid- andlow-frequency channels (French and Steinberg 1947; Pavlovic1987). Within this frequency range precise temporal informa-tion is essential for speech intelligibility although fine spectralinformation is not as important (Shannon et al. 1995). Hightemporal resolution is also essential for the analysis of inter-aural timing cues, which are important for sound localizationand are dominant for the low-frequency range of hearing(Macpherson and Middlebrooks 2002). Interestingly, the low-frequency units in our dataset exhibit the coarsest spectralresolution (broad bandwidth, low bSMF) and fastest temporalresolutions (short integration times, high bTMF).
In contrast, the observed spectral selectivity for high-fre-quency CNIC units may be necessary to properly resolvespectral details in head-related transfer function cues that areprominent in the high-frequency range of hearing and do notrequire fine temporal resolution (Kulkarni and Colburn 1998;Macpherson and Middlebrooks 2003; Tollin and Yin 2003). Incontrast to AN fibers, CNIC units exhibit sideband inhibitoryresponses that enhance spectral modulation selectivity (Figs. 8and 9). The fact that spectral modulation tuning is substantiallymore prominent for our high-frequency sites indicates thatselectivity for spectral cues is enhanced for high frequencies.This is consistent with the hypothesis that enhanced spectralmodulation selectivity at high frequencies could contribute tothe analysis of head related spectral cues.
Thus unlike the peripheral receptors, which efficiently pre-serve information in natural sounds (Lewicki 2002), our resultssuggest that spectrotemporal sound modulations are selectivelyfiltered and reordered within the CNIC. Future studies willneed to address whether frequency-dependent differences inthe statistical structure of natural sounds can be identified thatcorrespond to the observed filtering characteristics.
A C K N O W L E D G M E N T S
We thank D. L. Oliver, S. Kuwada, and C. E. Schreiner for reviewing themanuscript and providing thoughtful feedback and D. Kim for several insight-ful discussions. We also thank P. X. Joris, T.C.T. Yin, and E. D. Young forproviding auditory nerve fiber data.
G R A N T S
This work was supported by National Institute of Deafness and OtherCommunication Disorders Grant DC-006397.
R E F E R E N C E S
Adams JC. Ascending projections to the inferior colliculus. J Comp Neurol183: 519–538, 1979.
Andoni S, Li N, Pollak GD. Spectrotemporal receptive fields in the inferiorcolliculus revealing selectivity for spectral motion in conspecific vocaliza-tions. J Neurosci 27: 4882–4893, 2007.
Attias H, Schreiner C. Low-order temporal statistics of natural sounds. AdvNeural Inform Process Syst 9: 27–33, 1998a.
Attias H, Schreiner C. Coding of naturalistic stimuli by auditory midbrainneurons. Adv Neural Inform Process Syst 10: 103–109, 1998b.
Batra R, Fitzpatrick DC. Discharge patterns of neurons in the ventral nucleusof the lateral lemniscus of the unanesthetized rabbit. J Neurophysiol 82:1097–1113, 1999.
Batra R, Kuwada S, Stanford TR. Temporal coding of envelopes and theirinteraural delays in the inferior colliculus of the unanesthetized rabbit.J Neurophysiol 61: 257–268, 1989.
Casseday JH, Ehrlich D, Covey E. Neural measurement of sound duration:control by excitatory-inhibitory interactions in the inferior colliculus. J Neu-rophysiol 84: 1475–1487, 2000.
Chi T, Gao Y, Guyton MC, Ru P, Shamma S. Spectro-temporal modulationtransfer functions and speech intelligibility. J Acoust Soc Am 106: 2719–2732, 1999.
Cohen L. Time-Frequency Analysis. Englewood Cliffs, NJ: Prentice Hall,1995.
Ehret G, Egorova M, Hage SR, Muller BA. Spatial map of frequencytuning-curve shapes in the mouse inferior colliculus. Neuroreport 14:1365–1369, 2003.
Escabı MA, Miller LM, Read HL, Schreiner CE. Naturalistic auditorycontrast improves spectrotemporal coding in the cat inferior colliculus.J Neurosci 23: 11489–11504, 2003.
Escabı MA, Nassiri R, Miller LM, Schreiner CE, Read HL. The contribu-tion of spike threshold to acoustic feature selectivity, spike informationcontent, and information throughput. J Neurosci 25: 9524–9534, 2005.
Escabı MA, Schreiner CE. Nonlinear spectrotemporal sound analysis byneurons in the auditory midbrain. J Neurosci 22: 4114–4131, 2002.
Fletcher H. Auditory patterns. Rev Mod Phys 12: 47–65, 1940.French NR, Steinberg JC. Factors governing the intelligibility of speech
sounds. J Acoust Soc Am 19: 90–119, 1947.Gabor D. Theory of communication. J Inst Elec Engr 93: 429–457, 1946.Geis HR, Borst JG. Intracellular responses of neurons in the mouse inferior
colliculus to sinusoidal amplitude-modulated tones. J Neurophysiol 101:2002–2016, 2009.
Goldstein JL. An optimum processor theory for the central formation of thepitch of complex tones. J Acoust Soc Am 54: 1496–1516, 1973.
Irino T, Patterson RD. Temporal asymmetry in the auditory system. J AcoustSoc Am 99: 2316–2331, 1996.
Joris PX. Envelope coding in the lateral superior olive. II. Characteristicdelays and comparison with responses in the medial superior olive. J Neu-rophysiol 76: 2137–2156, 1996.
Joris PX, Yin TC. Responses to amplitude-modulated tones in the auditorynerve of the cat. J Acoust Soc Am 91: 215–232, 1992.
Joris PX, Schreiner CE, Rees A. Neural processing of amplitude-modulatedsounds. Physiol Rev 84: 541–577, 2004.
Keller CH, Takahashi TT. Representation of temporal features of complexsounds by the discharge patterns of neurons in the owl’s inferior colliculus.J Neurophysiol 84: 2638–2650, 2000.
Kim PJ, Young ED. Comparative analysis of spectro-temporal receptivefields, reverse correlation functions, and frequency tuning curves of audi-tory-nerve fibers. J Acoust Soc Am 95: 410–422, 1994.
Krishna BS, Semple MN. Auditory temporal processing: responses to sinu-soidally amplitude-modulated tones in the inferior colliculus. J Neuro-physiol 84: 255–273, 2000.
Kulkarni A, Colburn HS. Role of spectral detail in sound-source localization.Nature 396: 747–749, 1998.
Kuwada S, Fitzpatrick DC, Batra R, Ostapoff EM. Sensitivity to interauraltime differences in the dorsal nucleus of the lateral lemniscus of theunanesthetized rabbit: comparison with other structures. J Neurophysiol 95:1309–1322, 2006.
Kuwada S, Batra R, Yin TC, Oliver DL, Haberly LB, Stanford TR.Intracellular recordings in response to monaural and binaural stimulation ofneurons in the inferior colliculus of the cat. J Neurosci 17: 7565–7581, 1997.
Kvale MN, Schreiner CE. Short-term adaptation of auditory receptive fieldsto dynamic stimuli. J Neurophysiol 91: 604–612, 2004.
902 F. RODRIGUEZ, H. L. READ, AND M. A. ESCABI
J Neurophysiol • VOL 103 • FEBRUARY 2010 • www.jn.org
on April 1, 2012
jn.physiology.orgD
ownloaded from

Langner G, Albert M, Briede T. Temporal and spatial coding of periodicityinformation in the inferior colliculus of awake chinchilla (Chinchilla lani-ger). Hear Res 168: 110–130, 2002.
Langner G, Schreiner CE. Periodicity coding in the inferior colliculus of thecat. I. Neuronal mechanisms. J Neurophysiol 60: 1799–1822, 1988.
Langner G, Schreiner C, Merzenich MM. Covariation of latency andtemporal resolution in the inferior colliculus of the cat. Hear Res 31:197–201, 1987.
LeBeau FE, Malmierca MS, Rees A. Iontophoresis in vivo demonstrates akey role for GABA(A) and glycinergic inhibition in shaping frequencyresponse areas in the inferior colliculus of guinea pig. J Neurosci 21:7303–7312, 2001.
Lesica NA, Grothe B. Dynamic spectrotemporal feature selectivity in theauditory midbrain. J Neurosci 28: 5412–5421, 2008.
Lewicki MS. Efficient coding of natural sounds. Nat Neurosci 5: 356–363,2002.
Liberman MC, Kiang NY. Acoustic trauma in cats. Cochlear pathology andauditory-nerve activity. Acta Otolaryngol Suppl 358: 1–63, 1978.
Loftus WC, Malmierca MS, Bishop DC, Oliver DL The cytoarchitecture ofthe inferior colliculus revisited: a common organization of the lateral cortexin rat and cat. Neuroscience 154: 196–205, 2008.
Macpherson EA, Middlebrooks JC. Listener weighting of cues for lateralangle: the duplex theory of sound localization revisited. J Acoust Soc Am111: 2219–2236, 2002.
Macpherson EA, Middlebrooks JC. Vertical-plane sound localizationprobed with ripple-spectrum noise. J Acoust Soc Am 114: 430–445, 2003.
Malmierca MS, Blackstad TW, Osen KK, Karagulle T, Molowny RL. Thecentral nucleus of the inferior colliculus in rat: a Golgi and computerreconstruction study of neuronal and laminar structure. J Comp Neurol 333:1–27, 1993.
Malmierca MS, Cristaudo S, Perez-Gonzalez D, Covey E. Stimulus-specificadaptation in the inferior colliculus of the anesthetized rat. J Neurosci 29:5483–5493, 2009.
Malmierca MS, Saint Marie RL, Merchan MA, Oliver DL. Laminar inputsfrom dorsal cochlear nucleus and ventral cochlear nucleus to the centralnucleus of the inferior colliculus: two patterns of convergence. Neuroscience136: 883–894, 2005.
Mc Laughlin M, Van de Sande B, van der Heijden M, Joris PX. Compar-ison of bandwidths in the inferior colliculus and the auditory nerve. I.Measurement using a spectrally manipulated stimulus. J Neurophysiol 98:2566–2579, 2007.
Merzenich MM, Reid MD. Representation of the cochlea within the inferiorcolliculus of the cat. Brain Res 77: 397–415, 1974.
Middlebrooks JC, Snyder RL. Intraneural stimulation for auditory prosthesis:modiolar trunk and intracranial stimulation sites. Hear Res 242: 52–63, 2008.
Miller LM, Escabı MA, Read HL, Schreiner CE. Spectrotemporal receptivefields in the lemniscal auditory thalamus and cortex. J Neurophysiol 87:516–527, 2002.
Nagel KI, Doupe AJ. Temporal processing and adaptation in the songbirdauditory forebrain. Neuron 51: 845–859, 2006.
Nataraj K, Wenstrup JJ. Roles of inhibition in complex auditory responsesin the inferior colliculus: inhibited combination-sensitive neurons. J Neuro-physiol 95: 2179–2192, 2006.
Oliver DL. Ascending efferent projections of the superior olivary complex.Microsc Res Tech 51: 355–363, 2000.
Palmer AR, Russell IJ. Phase-locking in the cochlear nerve of the guinea pigand its relation to the receptor potential of inner hair-cells. Hear Res 24:1–15, 1986.
Pavlovic CV. Derivation of primary parameters and procedures for use inspeech intelligibility predictions. J Acoust Soc Am 82: 413–422, 1987.
Plomp R The role of modulations in hearing. In: Hearing: Physiological Basesand Psychophysics, edited by Klinke R, Hartmann R. New York: SpringerVerlag, 1983, p. 270–275.
Qiu A, Schreiner CE, Escabı MA Gabor analysis of auditory midbrainreceptive fields: spectro-temporal and binaural composition. J Neurophysiol90: 456–476, 2003.
Ramachandran R, Davis KA, May BJ. Single-unit responses in the inferiorcolliculus of decerebrate cats. I. Classification based on frequency responsemaps. J Neurophysiol 82: 152–163, 1999.
Rees A, Møller AR. Responses of neurons in the inferior colliculus of the ratto AM and FM tones. Hear Res 10: 301–330, 1983.
Rees A, Palmer AR. Neuronal responses to amplitude-modulated and pure-tone stimuli in the guinea pig inferior colliculus, and their modification bybroadband noise. J Acoust Soc Am 85: 1978–1994, 1989.
Rhode WS. Interspike intervals as a correlate of periodicity pitch in catcochlear nucleus. J Acoust Soc Am 97: 2414–2429, 1995.
Ruggero MA, Robles L, Rich NC. Two-tone suppression in the basilarmembrane of the cochlea: mechanical basis of auditory-nerve rate suppres-sion. J Neurophysiol 68: 1087–1099, 1992.
Schouten JF. The residue and the mechanisms of hearing. Proc K Ned AkadWet 43: 991–999, 1940.
Schreiner CE, Langner G. Periodicity coding in the inferior colliculus of thecat. II. Topographical organization. J Neurophysiol 60: 1823–1840, 1988.
Schreiner CE, Langner G. Laminar fine structure of frequency organizationin auditory midbrain. Nature 388: 383–386, 1997.
Semple MN, Aitkin LM. Representation of sound frequency and laterality byunits in central nucleus of cat inferior colliculus. J Neurophysiol 42:1626–1639, 1979.
Shannon RV, Zeng FG, Kamath V, Wygonski J, Ekelid M. Speechrecognition with primarily temporal cues. Science 270: 303–304, 1995.
Singh NC, Theunissen FE. Modulation spectra of natural sounds and etho-logical theories of auditory processing. J Acoust Soc Am 114: 3394–3411,2003.
Spirou GA, Young ED. Organization of dorsal cochlear nucleus type IV unitresponse maps and their relationship to activation by bandlimited noise.J Neurophysiol 66: 1750–1768, 1991.
Ter-Mikaelian M, Sanes DH, Semple MN. Transformation of temporalproperties between auditory midbrain and cortex in the awake Mongoliangerbil. J Neurosci 27: 6091–6102, 2007.
Tollin DJ, Yin TC. Spectral cues explain illusory elevation effects with stereosounds in cats. J Neurophysiol 90: 525–530, 2003.
van-Veen TM, Houtgast T. Spectral sharpness and vowel dissimilarity. JAcoust Soc Am 77: 628–634, 1985.
Voss RF, Clarke J. “1/f noise” in music and speech. Nature 258: 317–318,1975.
Yu JJ, Young ED. Linear and nonlinear pathways of spectral informationtransmission in the cochlear nucleus. Proc Natl Acad Sci USA 97: 11780–11786, 2000.
Zhang H, Kelly JB. Glutamatergic and GABAergic regulation of neuralresponses in inferior colliculus to amplitude-modulated sounds. J Neuro-physiol 90: 477–490, 2003.
Zheng Y, Escabi MA. Distinct roles for onset and sustained activity in theneuronal code for temporal periodicity and acoustic envelope shape. J Neu-rosci 28: 14230–14244, 2008.
903SPECTROTEMPORAL MODULATION TRADEOFF IN THE INFERIOR COLLICULUS
J Neurophysiol • VOL 103 • FEBRUARY 2010 • www.jn.org
on April 1, 2012
jn.physiology.orgD
ownloaded from
Copyright © 2022 FDOKUMEN