Functional Topography of Converging Visual and Auditory Inputs to Neurons in the Rat Superior...
15
92:2933-2946, 2004. First published Jun 30, 2004; doi:10.1152/jn.00450.2004 J Neurophysiol Andrew J. King Irini Skaliora, Timothy P. Doubell, Nicholas P. Holmes, Fernando R. Nodal and Colliculus Auditory Inputs to Neurons in the Rat Superior Functional Topography of Converging Visual and You might find this additional information useful... 69 articles, 35 of which you can access free at: This article cites http://jn.physiology.org/cgi/content/full/92/5/2933#BIBL including high-resolution figures, can be found at: Updated information and services http://jn.physiology.org/cgi/content/full/92/5/2933 can be found at: Journal of Neurophysiology about Additional material and information http://www.the-aps.org/publications/jn This information is current as of July 14, 2006 . http://www.the-aps.org/. American Physiological Society. ISSN: 0022-3077, ESSN: 1522-1598. Visit our website at (monthly) by the American Physiological Society, 9650 Rockville Pike, Bethesda MD 20814-3991. Copyright © 2005 by the publishes original articles on the function of the nervous system. It is published 12 times a year Journal of Neurophysiology on July 14, 2006 jn.physiology.org Downloaded from
-
Upload
bioacademy -
Category
Documents
-
view
0 -
download
0
Transcript of Functional Topography of Converging Visual and Auditory Inputs to Neurons in the Rat Superior...

92:2933-2946, 2004. First published Jun 30, 2004; doi:10.1152/jn.00450.2004 J NeurophysiolAndrew J. King Irini Skaliora, Timothy P. Doubell, Nicholas P. Holmes, Fernando R. Nodal andColliculus Auditory Inputs to Neurons in the Rat Superior Functional Topography of Converging Visual and
You might find this additional information useful...
69 articles, 35 of which you can access free at: This article cites http://jn.physiology.org/cgi/content/full/92/5/2933#BIBL
including high-resolution figures, can be found at: Updated information and services http://jn.physiology.org/cgi/content/full/92/5/2933
can be found at: Journal of Neurophysiologyabout Additional material and information http://www.the-aps.org/publications/jn
This information is current as of July 14, 2006 .
http://www.the-aps.org/.American Physiological Society. ISSN: 0022-3077, ESSN: 1522-1598. Visit our website at (monthly) by the American Physiological Society, 9650 Rockville Pike, Bethesda MD 20814-3991. Copyright © 2005 by the
publishes original articles on the function of the nervous system. It is published 12 times a yearJournal of Neurophysiology
on July 14, 2006 jn.physiology.org
Dow
nloaded from

Functional Topography of Converging Visual and Auditory Inputs to Neuronsin the Rat Superior Colliculus
Irini Skaliora, Timothy P. Doubell, Nicholas P. Holmes, Fernando R. Nodal, and Andrew J. KingUniversity Laboratory of Physiology, University of Oxford, Oxford OX1 3PT, United Kingdom
Submitted 30 April 2004; accepted in final form 21 June 2004
Skaliora, Irini, Timothy P. Doubell, Nicholas P. Holmes, Fer-nando R. Nodal, and Andrew J. King. Functional topography ofconverging visual and auditory inputs to neurons in the rat superiorcolliculus. J Neurophysiol 92: 2933–2946, 2004. First published June30, 2004; 10.1152/jn.00450.2004. We have used a slice preparation ofthe infant rat midbrain to examine converging inputs onto neurons inthe deeper multisensory layers of the superior colliculus (dSC).Electrical stimulation of the superficial visual layers (sSC) and of theauditory nucleus of the brachium of the inferior colliculus (nBIC)evoked robust monosynaptic responses in dSC cells. Furthermore, theinputs from the sSC were found to be topographically organized asearly as the second postnatal week and thus before opening of the eyesand ear canals. This precocious topography was found to be sculptedby GABAA-mediated inhibition of a more widespread set of connec-tions. Tracer injections in the nBIC, both in coronal slices as well asin hemisected brains, confirmed a robust projection originating in thenBIC with distinct terminals in the proximity of the cell bodies of dSCneurons. Combined stimulation of the sSC and nBIC sites revealedthat the presumptive visual and auditory inputs are summed linearly.Finally, whereas either input on its own could manifest a significantdegree of paired-pulse facilitation, temporally offset stimulation of thetwo sites revealed no synaptic interactions, indicating again that thetwo inputs function independently. Taken together, these data providethe first detailed intracellular analysis of convergent sensory inputsonto dSC neurons and form the basis for further exploration ofmultisensory integration and developmental plasticity.
I N T R O D U C T I O N
The superior colliculus (SC) plays a critical role in thecontrol of orienting movements of the head and eyes towardexternal stimuli, irrespective of their modality (Stein andMeredith 1993). To do this, spatial information from differentsensory modalities has to be combined and represented in theSC in the same coordinates. Many neurons in the deeper layersof the SC (dSC) are multisensory, in that they respond tocombinations of visual, auditory, and/or somatosensory stim-uli. Furthermore, the receptive fields of these cells are arrangedto form topographically aligned spatial maps (King and Palmer1983; Stein et al. 1975). For the visual modality, the mapreflects the spatial order already present in the retina, which isthen relayed to the superficial layers of the SC (sSC) and otherbrain structures. For the auditory modality, however, the re-ceptor surface in the cochlea is organized tonotopically. There-fore, a topographic representation of auditory space has to becomputed within the central auditory pathway and aligned inthe SC with the coordinates of visual space (King 1999). Theconstruction of overlapping sensory representations facilitates
the multisensory enhancement of dSC responses to stimuli thatare likely to be derived from the same event. This is thought tounderlie improvements in the localization of such stimuli(Burnett et al. 2004; Stein and Meredith 1990).
Previous studies have indicated that signals from the visualsystem are used to guide the formation of the topographicrepresentation of auditory space (King 1999). Degradation ofvisual inputs by binocular eyelid suture in young ferrets (Kingand Carlile 1993) and owls (Knudsen et al. 1991) causedabnormalities in the organization of the auditory space map inthe SC. In guinea pigs, dark rearing, which completely elimi-nates all visual information, was found to result in dSC cellswith broad auditory spatial receptive fields and an auditoryrepresentation that showed little or no topographic order (With-ington et al. 1994). Other studies have investigated moredirectly the effect of an experimentally induced misalignmentof the auditory and visual maps in the SC. Raising owls withprismatic spectacles (Knudsen and Brainard 1991) or removingone of the extraocular muscles in young ferrets (King et al.1988), which both cause a displacement of the visual fieldrelative to the head, led to a compensatory shift in the auditorymap so that the two maps remained in register.
The site of plasticity for this cross-modal calibration of theauditory map in mammals is not known, but there are severalindications that this is likely to be within the SC itself. First, theexternal cortex of the inferior colliculus (ICx) and the nucleusof the brachium of the inferior colliculus (nBIC), the mainsources of ascending auditory inputs (Edwards et al. 1979;King et al. 1998a), contain only coarse or partial spatial maps(Binns et al. 1992; Schnupp and King 1997), whereas the dSCis apparently the only midbrain area to contain a completetopographic representation of both sound azimuth and eleva-tion (King and Hutchings 1987; Middlebrooks and Knudsen1984; Palmer and King 1982). Second, partial aspiration of thesSC in neonatal ferrets impairs the emergence of auditorytopography in the region of the dSC underlying the aspiratedsSC (King et al. 1998b). This can be explained by loss of thetopographically organized input from the sSC to the dSC(Behan and Appell 1992; Doubell et al. 2003), although thepresence of a projection from the sSC to the nBIC (Doubell etal. 2000) leaves open the possibility that visual signals couldshape auditory responses at an earlier level of the pathway.These results do indicate, however, that the topographic visualsignals necessary for refinement of the auditory representationare projected through the sSC.
Address for reprint requests and other correspondence: I. Skaliora, Univer-sity Laboratory of Physiology, Parks Road, Oxford OX1 3PT, UK (E-mail:[email protected]).
The costs of publication of this article were defrayed in part by the paymentof page charges. The article must therefore be hereby marked “advertisement”in accordance with 18 U.S.C. Section 1734 solely to indicate this fact.
J Neurophysiol 92: 2933–2946, 2004.First published June 30, 2004; 10.1152/jn.00450.2004.
29330022-3077/04 $5.00 Copyright © 2004 The American Physiological Societywww.jn.org
on July 14, 2006 jn.physiology.org
Dow
nloaded from

So far, very little is known about the circuits that support theintegration of the two modalities in the SC. Investigating thesynaptic connectivity of these converging sensory inputs is acrucial step toward understanding both how sensory signals aretransformed to motor commands and how vision calibrates theauditory space map during development. To do this, it isimportant to be able to study not only the output of multisen-sory neurons as manifested in their spiking patterns, but alsothe integration of subthreshold inputs.
In this investigation we have, for the first time, examinedconverging synaptic inputs in a slice preparation of the mid-brain that contains the multisensory layers of the SC as well asthe source of both visual (the sSC) and auditory inputs (thenBIC). The purpose of this study was to assess the incidence ofconvergence onto dSC neurons from these two regions and toevaluate the synaptic integration properties of subthresholdexcitatory postsynaptic potentials (EPSPs) in these neurons.
M E T H O D S
In vitro electrophysiology
Coronal slices of the midbrain (500 �m) from 26 Sprague–Dawleyrats aged P11 to P17 were prepared as described previously (Doubellet al. 2000, 2003). All procedures involving animals were approvedand licensed by the United Kingdom Home Office following localethical committee review. Briefly, animals were decapitated and thebrains quickly removed and submerged in ice-cold artificial cerebro-spinal fluid (aCSF) containing (in mM): 124 NaCl, 26 NaHCO3, 2.5CaCl2, 2.3 KCl, 1.26 KHPO4, 1.0 MgSO4, and 10 D-glucose, bubbledwith 95% O2-5% CO2. Slices were cut with a Vibraslicer (CampdenInstruments, Sileby, UK) and placed in oxygenated aCSF at roomtemperature. After 30–60 min of incubation, the slices were trans-ferred to the stage of an upright microscope (Axioskop FS, Carl Zeiss,Welwyn Garden City, UK) equipped with video-enhanced DIC optics,and were continuously superfused with aCSF.
Individual cells in the dSC were visualized with Nomarski opticswith the use of a �63 water immersion objective. Suitable cells wereidentified morphologically in the stratum griseum intermediale (layerIV). Typically, recorded cells were large and their somata were round,oval, or pyramidal in shape, having 1 or 2 prominent dendrites. Wholecell patch-clamp recordings were made under visual control with thinglass wall electrodes containing (in mM): 120 potassium gluconate,10 KCl, 10 EGTA, 10 HEPES, 2 CaCl2, 2 MgCl2, 2 ATP-Na, as wellas 0.5% biocytin to stain the recorded neurons. The resistance of theelectrodes was 8–11 M� in the bath solution. Most recordings wereperformed at room temperature (23–24°C), although some experi-ments were done at more physiological temperatures (32–34°C) forcomparison. Because no differences were found between the 2 con-ditions, the data are pooled together. Where appropriate, 4 �Mbicuculline or 100 �M picrotoxin were applied to the bathing solutionto block inhibitory synaptic activity.
Data acquisition
Electrical stimuli (0.02 ms, 3–100 V; frequency of 0.2–1.0 Hz, or 20Hz) were applied to 1) the sSC, through a double-barreled (�-shaped)glass pipette filled with extracellular saline (tip diameter: 50–100 �m),and 2) the nBIC, through a Teflon-coated bipolar silver wire (diameter:200 �m) (Harvard Apparatus, Holliston, MA). The sSC stimulatingelectrode was positioned close to the border of the stratum griseumsuperficiale (layer II) and the stratum opticum (layer III) (Figs. 3, 6, 7),with the aim of stimulating the cell bodies of neurons in these layerswhile avoiding the spread of depolarization into the dSC (layer IV) itself.For some dSC recordings, a large number of sSC electrode positions were
tested, to determine the mediolateral extent of effective stimulation sites.In these cases, we also typically varied the dorsoventral location of thestimulating electrode, but nevertheless stayed close to the layer II–IIIborder. Stimulus strength was increased gradually until an evoked EPSPwas visible. Usually, each file included 50 repetitions of the stimulus.After conventional amplification (Axoclamp-2B, Axon Instruments, Fos-ter City, CA), the data were digitized at 20 kHz and fed into a computer(Power Mac, Apple; ITC-16 interface and Axograph software, AxonInstruments).
To examine whether subthreshold responses from the two modal-ities sum linearly at the soma, stimuli applied at the nBIC and sSCwere timed appropriately to ensure the EPSPs evoked in the recordedcell were temporally coincident. In practice, a 5-ms offset betweennBIC (first) and sSC (second) stimuli was sufficient for this purpose,given that nBIC latencies were usually between 9 and 12 ms, and sSClatencies between 4 and 7 ms (see RESULTS).
To assess whether subthreshold EPSPs from the two modalities weretemporally independent, nBIC and sSC stimuli were separated by 50 ms.The interval of 50 ms was selected to facilitate comparison with otherstudies (e.g., Clark and Collingridge 1996; Lohmann and Algur 1995;Margulis and Tank 1998) and also because at that interval it was possibleto consistently obtain distinct measurable EPSP peaks. Both nBIC fol-lowed by sSC, and sSC followed by nBIC stimulations were performed.For comparison, paired-pulse stimulation of the same projections wascarried out to assess homosynaptic facilitation or depression: both nBICand sSC were stimulated twice separately, at an interval of 50 ms. Duringthese protocols, responses to single stimuli were recorded again forcomparison.
Data analysis
Onset and peak latencies of the evoked postsynaptic potentials weremeasured manually for each of the 50 traces in each file and plottedas a function of time. We used the following measures to indicate thelatency variability: 1) the average latency for all of the traces in eachfile; and 2) the latency jitter, defined as the range (in ms) between theshortest and longest latency for a given input onto a given cell. Weused a combination of both measures to provide evidence for directconnectivity of both EPSPs and IPSPs, as explained in the RESULTS.For cells that displayed putative monosynaptic responses after stim-ulation of both nBIC and sSC, the amplitude of the initial peak andthe integral of the first 20 ms of the EPSP were measured usingAxograph software. All measurements were based on the averagedtraces of all trials uncontaminated by large voltage fluctuations orspikes. Measurements were taken from the baseline average restingpotential in the 1- to 5-ms interval after the stimulus artifact haddecayed (and before EPSP onset). For the temporal independenceprotocols, the first EPSP of the 2 pulses (either hetero- or homo-synaptic) was subtracted from the trace to allow calculation of thesecond EPSP amplitude.
EPSP values are expressed as amplitudes relative to the control,single-stimulation protocol. Data were calculated as percentage valuesindividually for each cell and then averaged over the group. In all cases,paired, 2-tailed t-tests were performed on the pairwise raw amplitude data(in mV), because it was the within-cell facilitation or depression of EPSPamplitudes contingent on simultaneous or prior stimulation that was thecrucial test of multisensory interaction. Percentage facilitation (or depres-sion) and temporal independence were calculated as follows
LINEAR SUMMATION
�EPSPnBIC�sSC�/�EPSPnBIC � EPSPsSC� � 100%
TEMPORAL INDEPENDENCE
sSC heterosynaptic stimulation: �EPSPnBICfsSC�/�EPSPsSC� � 100%
sSC homosynaptic stimulation: �EPSPsSCfsSC�/�EPSPsSC� � 100%
2934 SKALIORA ET AL.
J Neurophysiol • VOL 92 • NOVEMBER 2004 • www.jn.org
on July 14, 2006 jn.physiology.org
Dow
nloaded from
nBIC heterosynaptic stimulation: �EPSPsSCfnBIC�/�EPSPnBIC� � 100%
nBIC homosynaptic stimulation: �EPSPnBICfnBIC�/�EPSPnBIC� � 100%
where
EPSPnBIC�sSC � nBIC- and sSC-EPSPs occur simultaneously
EPSPsSC � sSC-EPSP occurs alone
EPSPnBICfsSC � sSC-EPSP preceded by nBIC-EPSP
EPSPnBIC � nBIC-EPSP occurs alone
EPSPsSCfnBIC � nBIC-EPSP preceded by sSC-EPSP
Histology
To visualize the recorded neurons by biocytin staining, the patchpipettes were carefully detached from the cells and the slices werefixed with 4% paraformaldehyde for several days at 4°C. The sliceswere subsequently serially sectioned at 50 �m on a sliding microtome(Leica Microsystems, Milton Keynes, UK), incubated with ABC(PK-6100, Vector Labs. Peterborough, UK), washed, and processedwith diaminobenzidine (DAB) to obtain a permanent labeling.
In vitro tract tracing experiments
Twenty-one Sprague–Dawley rats, aged P7–P16, were used forneuronal tracer injections in the nBIC. All animals were anesthetized(20% pentobarbitone, intraperitoneally) and perfused transcardiallywith 10 ml of ice-cold aCSF to wash out most of the blood that couldinterfere with the later histological procedures. After that, the cortexwas removed, and the midbrain blocked between the thalamus and theinferior colliculus before rapid chilling in ice-cold oxygenated aCSF.The midbrain was then either sliced at 500 or 1,000 �m using aVibraslicer (Leica Microsystems) (n � 7 animals) or left intact andjust divided along the midline (hemisected brains) (n � 14 animals).
Brain preparations were equilibrated at room temperature for atleast 10 min before the tracer injection. The tracers used werebiotinylated dextrans of 3,000 MW coupled with fluorescein (D-7156,Molecular Probes, Eugene, OR) or tetramethylrhodamine (D-7162,Molecular Probes).
The tracers were injected by iontophoresis using a positive currentof 0.5–2.5 mA for 5–10 min with a 50% duty cycle of 7 s. The tracerswere allowed to transport for 9–11 h by keeping the tissue inoxygenated aCSF at room temperature. The tissue was fixed byimmersion in 4% paraformaldehyde and 1% glutaraldehyde in 0.1 Mphosphate buffer (PB) overnight, then embedded in 2% agar andcryoprotected in 30% sucrose PB before serial sectioning at 40 �m ona freezing microtome. The sections were washed in 0.2% TritonX-100 PB, and the endogenous peroxidase was blocked before incu-bation with ABC for 90 min or overnight. After washing in PB, ABCwas reacted with DAB or DAB with nickel to produce a coloredprecipitate in labeled structures. At least one of the series of sectionswas counterstained with cresyl violet to enable histological bound-aries to be identified.
R E S U L T S
nBIC projection to the SC
Previous studies in several species (reviewed in King et al.1998a) have indicated that the dSC receives a substantialauditory projection from the inferior colliculus (IC), the largestcomponent of which comes from the nBIC. An IC-to-dSCprojection has also been described in the rat (Cadusseau andRoger 1985; Druga and Syka 1984), but the regions of the ICthat supply the SC afferents have not been identified. For this
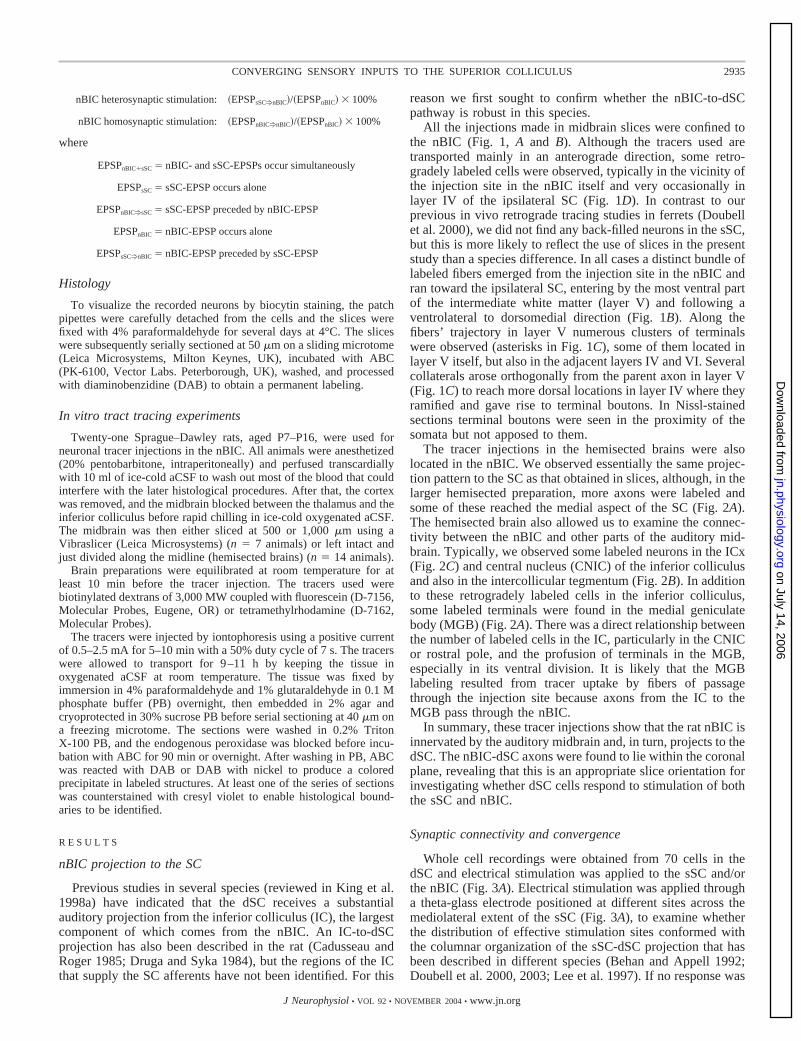
reason we first sought to confirm whether the nBIC-to-dSCpathway is robust in this species.
All the injections made in midbrain slices were confined tothe nBIC (Fig. 1, A and B). Although the tracers used aretransported mainly in an anterograde direction, some retro-gradely labeled cells were observed, typically in the vicinity ofthe injection site in the nBIC itself and very occasionally inlayer IV of the ipsilateral SC (Fig. 1D). In contrast to ourprevious in vivo retrograde tracing studies in ferrets (Doubellet al. 2000), we did not find any back-filled neurons in the sSC,but this is more likely to reflect the use of slices in the presentstudy than a species difference. In all cases a distinct bundle oflabeled fibers emerged from the injection site in the nBIC andran toward the ipsilateral SC, entering by the most ventral partof the intermediate white matter (layer V) and following aventrolateral to dorsomedial direction (Fig. 1B). Along thefibers’ trajectory in layer V numerous clusters of terminalswere observed (asterisks in Fig. 1C), some of them located inlayer V itself, but also in the adjacent layers IV and VI. Severalcollaterals arose orthogonally from the parent axon in layer V(Fig. 1C) to reach more dorsal locations in layer IV where theyramified and gave rise to terminal boutons. In Nissl-stainedsections terminal boutons were seen in the proximity of thesomata but not apposed to them.
The tracer injections in the hemisected brains were alsolocated in the nBIC. We observed essentially the same projec-tion pattern to the SC as that obtained in slices, although, in thelarger hemisected preparation, more axons were labeled andsome of these reached the medial aspect of the SC (Fig. 2A).The hemisected brain also allowed us to examine the connec-tivity between the nBIC and other parts of the auditory mid-brain. Typically, we observed some labeled neurons in the ICx(Fig. 2C) and central nucleus (CNIC) of the inferior colliculusand also in the intercollicular tegmentum (Fig. 2B). In additionto these retrogradely labeled cells in the inferior colliculus,some labeled terminals were found in the medial geniculatebody (MGB) (Fig. 2A). There was a direct relationship betweenthe number of labeled cells in the IC, particularly in the CNICor rostral pole, and the profusion of terminals in the MGB,especially in its ventral division. It is likely that the MGBlabeling resulted from tracer uptake by fibers of passagethrough the injection site because axons from the IC to theMGB pass through the nBIC.
In summary, these tracer injections show that the rat nBIC isinnervated by the auditory midbrain and, in turn, projects to thedSC. The nBIC-dSC axons were found to lie within the coronalplane, revealing that this is an appropriate slice orientation forinvestigating whether dSC cells respond to stimulation of boththe sSC and nBIC.
Synaptic connectivity and convergence
Whole cell recordings were obtained from 70 cells in thedSC and electrical stimulation was applied to the sSC and/orthe nBIC (Fig. 3A). Electrical stimulation was applied througha theta-glass electrode positioned at different sites across themediolateral extent of the sSC (Fig. 3A), to examine whetherthe distribution of effective stimulation sites conformed withthe columnar organization of the sSC-dSC projection that hasbeen described in different species (Behan and Appell 1992;Doubell et al. 2000, 2003; Lee et al. 1997). If no response was
2935CONVERGING SENSORY INPUTS TO THE SUPERIOR COLLICULUS
J Neurophysiol • VOL 92 • NOVEMBER 2004 • www.jn.org
on July 14, 2006 jn.physiology.org
Dow
nloaded from
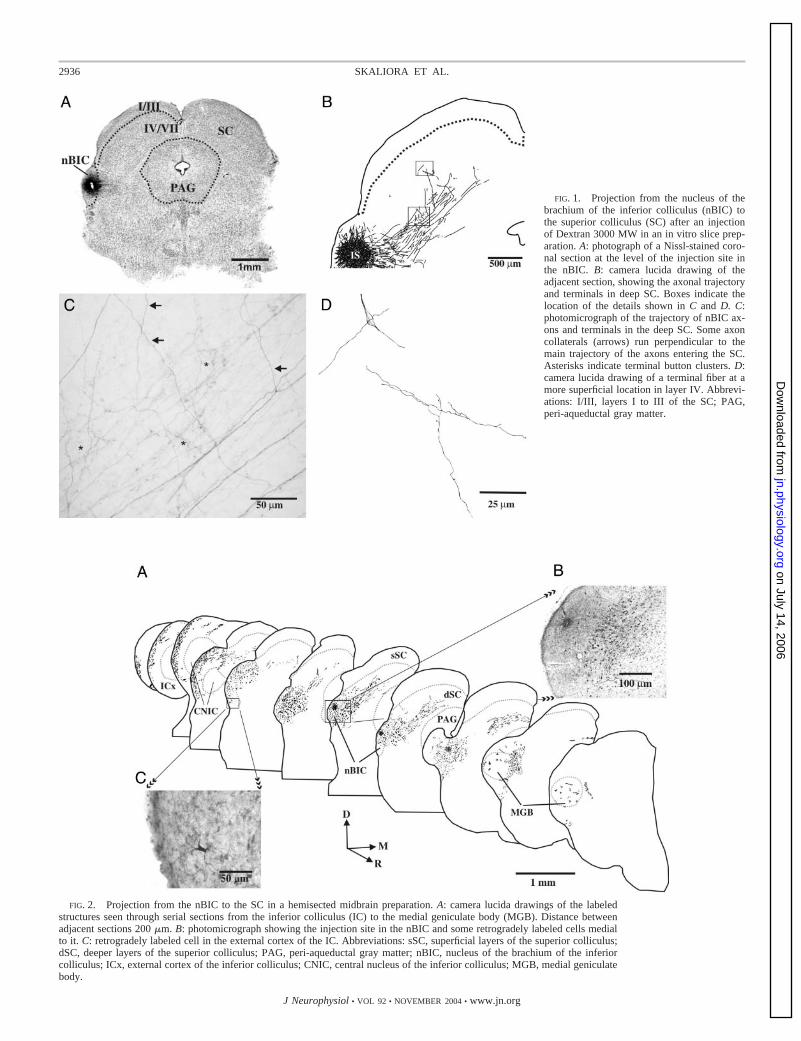
FIG. 1. Projection from the nucleus of thebrachium of the inferior colliculus (nBIC) tothe superior colliculus (SC) after an injectionof Dextran 3000 MW in an in vitro slice prep-aration. A: photograph of a Nissl-stained coro-nal section at the level of the injection site inthe nBIC. B: camera lucida drawing of theadjacent section, showing the axonal trajectoryand terminals in deep SC. Boxes indicate thelocation of the details shown in C and D. C:photomicrograph of the trajectory of nBIC ax-ons and terminals in the deep SC. Some axoncollaterals (arrows) run perpendicular to themain trajectory of the axons entering the SC.Asterisks indicate terminal button clusters. D:camera lucida drawing of a terminal fiber at amore superficial location in layer IV. Abbrevi-ations: I/III, layers I to III of the SC; PAG,peri-aqueductal gray matter.
FIG. 2. Projection from the nBIC to the SC in a hemisected midbrain preparation. A: camera lucida drawings of the labeledstructures seen through serial sections from the inferior colliculus (IC) to the medial geniculate body (MGB). Distance betweenadjacent sections 200 �m. B: photomicrograph showing the injection site in the nBIC and some retrogradely labeled cells medialto it. C: retrogradely labeled cell in the external cortex of the IC. Abbreviations: sSC, superficial layers of the superior colliculus;dSC, deeper layers of the superior colliculus; PAG, peri-aqueductal gray matter; nBIC, nucleus of the brachium of the inferiorcolliculus; ICx, external cortex of the inferior colliculus; CNIC, central nucleus of the inferior colliculus; MGB, medial geniculatebody.
2936 SKALIORA ET AL.
J Neurophysiol • VOL 92 • NOVEMBER 2004 • www.jn.org
on July 14, 2006 jn.physiology.org
Dow
nloaded from

evoked, the stimulating electrode was moved to one or moredifferent positions. In agreement with out recent finding inferrets (Doubell et al. 2003), we observed that small shifts ofthe stimulating electrode by less than 100 �m in the dorsoven-tral or mediolateral direction could reveal a response wherenone was there before. This indicates that our method andintensity of stimulation were capable of picking out specificinputs, and that the stimulating current did not spread by morethan about 50 �m around the theta electrode. Similarly, suchsmall shifts of the electrode resulted in qualitatively differentresponse patterns (Fig. 3B), indicating that distinct groups ofcells and axons were being activated at each site.
The data are expressed as the percentage of cells respondingrelative to the attempts at evoking responses. Of the 56 cells forwhich electrical stimulation was applied to the sSC, 46 (82%)manifested depolarizing postsynaptic potentials from at leastone sSC site. Similarly, of the 45 cells for which electrical
stimulation was applied to the nBIC, 24 (53%) manifesteddepolarizing postsynaptic potentials. Finally, of the 37 cells forwhich electrical stimulation was applied to both sites, 8showed no response (22%), whereas 21 cells (57%) gave aresponse to stimulation of both the sSC and nBIC. These dataare summarized in Fig. 4A.
Latency analysis
We then examined the latency values and variability of theseresponses, to estimate the proportion that were likely to beattributable to direct, monosynaptic connections. Responselatency for each stimulation site was determined as the averagelatency of 20–50 sweeps. In those cases where responses wererecorded using more than one stimulation site, the site with theshortest latency was included in the average population data.
Latencies of sSC-evoked responses ranged from 4.1 to 12.2ms (mean � SD: 6.9 � 2.1), whereas those from the nBICwere on average about twice as long (range: 6.0–20.3 ms,mean � SD: 12.8 � 3.3). However, we found that, in bothcases, the absolute latency values did not correlate in anysimple way with the latency variability of evoked responses.Figure 5 shows examples of responses evoked from electricalstimulation in the nBIC in 2 different cells. The first oneshowed an average response latency of 13 ms and a latency
FIG. 4. A: summary of the overall functional connectivity from sSC andnBIC to cells in the dSC. Numbers on the bars indicate the percentage of cellsresponding to neither, sSC, nBIC, or both inputs. B: breakdown of thefunctional connections into monosynaptic and polysynaptic responses. Num-bers in parentheses under each bar indicate the number of recorded cells testedin each condition.
FIG. 3. A: schematic diagram of experimental setup. Drawing of coronalslice through the midbrain at the level of the superior colliculus. Stimulationwas applied in the sSC and in the nBIC. Whole cell patch-clamp recordingswere made from cells in the deeper multisensory layers (dSC). Five coloredcircles represent 5 consecutive stimulation locations in layer III, which yieldedthe corresponding responses in B. Only one hemisphere is depicted; medial isto the right and dorsal to the top. B: depolarizing intracellular responses of onedSC neuron to electrical stimulation applied at the 5 locations illustrated in A.Numbers to the right of each trace indicate the relative distance of thestimulation sites in �m, 0 and 400 being the rightmost and leftmost location,respectively. It can be seen that 100-�m shifts of the stimulating electrodeyielded markedly different responses, indicating that a different group ofpresynaptic cells is stimulated each time. PAG, peri-aqueductal gray.
2937CONVERGING SENSORY INPUTS TO THE SUPERIOR COLLICULUS
J Neurophysiol • VOL 92 • NOVEMBER 2004 • www.jn.org
on July 14, 2006 jn.physiology.org
Dow
nloaded from

jitter of 1.6 ms (Fig. 5, A and C), whereas the second one hada shorter average latency of 9.4 ms, but a larger jitter of 2.5 ms(Fig. 5, B and D). Most neurons with short response latencies(�6 ms) also exhibited low variability (�2 ms), suggesting thepresence of a monosynaptic connection (Fig. 5, E and F).However, for longer latencies, the correlation was fairly flat,possibly reflecting variability in the degree of myelination ofimmature fibers. For this reason, a connection was judged to bemonosynaptic if either the average latency was 6 ms, or the
latency jitter was up to 2 ms. The same criteria were applied forall evoked EPSPs, whether they were triggered by stimulationof either the sSC or the nBIC. In the case of the longer latencynBIC-evoked responses, the criterion used was the latencyvariability, given that the absolute latency of these responseswas never below 6 ms. In ambiguous cases, the latencyvariability to a second pulse applied at 20 Hz was examined. Ifthe variability to the second pulse was similar to that of thefirst, the response was classified as monosynaptic. However, if
FIG. 5. Examples of evoked responses and latency analysis. A and B: responses of 2 different cells in the dSC to electricalstimulation in the nBIC. Each trace is a response to a 0.02-ms stimulus applied through a bipolar electrode at 0.2 Hz. Insets:illustrate the EPSP onset at higher magnification. C and D: plots illustrating the latency variability of the evoked responses. Eachsymbol indicates the latency of one EPSP and latencies are plotted in the order the data were acquired. First cell manifestedresponse latencies ranging from 12.2 to 13.6 ms, whereas the second one had response latencies that ranged from 7.9 to 10.4 ms.Thick dashed lines indicate the mean response latencies in each case (13 and 9.4 ms, respectively). It can be seen that the inputto the second cell (B and D) has a shorter latency than the input to the first cell (A and C), and yet manifests considerably morevariability, even without the one outlier at 12 ms. E and F: relationship between average latency and latency jitter for the totalsample of nBIC and sSC inputs, respectively. Lines represent linear regression fits and the correlation coefficients are indicated nextto each line.
2938 SKALIORA ET AL.
J Neurophysiol • VOL 92 • NOVEMBER 2004 • www.jn.org
on July 14, 2006 jn.physiology.org
Dow
nloaded from

there was a change (�10%) in either failure rate or in thelatency jitter, then the response was judged to be polysynaptic.
The results of this analysis are summarized in Fig. 4B andindicate that 74% of the 46 dSC cells that received synapticinputs from the sSC did so through apparently monosynapticconnections (60% of the total population, n � 56). The equiv-alent values for the auditory projection are: 58% of the 24 cellsconnected to the nBIC received monosynaptic inputs (31% ofthe total population, n � 45). Finally, 52% of cells withconvergent inputs (n � 21) were adjudged to be monosynap-tically connected to both sites. It should be noted that thesevalues represent the lowest estimate of direct connectivitybecause the likelihood of detecting monosynaptic inputs in-creased with the number of distinct locations where electricalstimulation was applied.
Functional topography
We examined the degree of functional topography in theprojection from the sSC to the dSC. For these experiments werecorded from dSC neurons and stimulated a wide range ofsites in the superficial layers, usually covering the entiremediolateral extent of the ipsilateral sSC. The stimulationintensity was kept constant and the electrode was lowered intothe tissue to a depth of about 20 �m to keep conditions assimilar as possible.
Figure 6 illustrates the responses obtained at different sSCstimulation sites for 4 different dSC neurons. The diagrams onthe left provide a qualitative illustration of the degree offunctional topography present in each case: blue dots representsites where stimulation was applied but no response wasevoked, whereas green and red dots are sites where identicalstimulation evoked a polysynaptic or monosynaptic EPSP,respectively. The locations of the recorded neurons are indi-cated by the black circles in the deep layers. Such maps wereobtained from a total of 8 cells in dSC and in 6 cases thetopography was similar to the type shown in the first 3examples (Fig. 6, A–F). In the remaining 2 neurons the con-nectivity was more widespread, as shown in the bottom panel(Fig. 6, G and H). The plots on the right of each map illustratethe magnitude of the response evoked from each stimulationsite for the corresponding cells. To generate these graphs theintegral of the evoked EPSP was calculated for each site, for a40-ms range after EPSP onset, and the values plotted as afunction of horizontal distance within the sSC. Although thelargest response was usually generated by putative monosyn-aptic connections, this was not always the case (e.g., Fig. 6B),possibly reflecting differential presynaptic recruitment.
To provide a more quantitative description of the degree offunctional topography we measured the extent of monosynap-tic and overall (mono- and polysynaptic) connectivity for eachof these 8 cells (see Table 1 for individual values). Responsesthat were adjudged to be monosynaptic were most likely to beelicited by stimulation of layer III and were obtained from anarrower range of stimulation sites than those evokingpolysynaptic EPSPs. The average horizontal spread of sSC todSC connections was 482 � 497 �m (monosynaptic) and1148 � 484 �m (overall).
Taken together, these results indicate that dSC cells receivespatially restricted, apparently monosynaptic inputs from thesSC, as early as the second postnatal week. This precocious
topography prompted us to examine whether GABAergic in-hibition is sculpting the topographic connectivity from a morewidespread excitatory projection. To address this issue wecarried out further functional mapping experiments in thepresence of the GABAA receptor blocker picrotoxin (100 �M).Examples of the maps yielded under these conditions areillustrated in Fig. 7. The main difference that is immediatelyobvious from the maps on the left is that there appear to bemultiple, discrete sites that are monosynaptically connected tothe dSC cells, whereas in control solution that was not the case(compare Figs. 6 and 7). Quantification of the extent ofconnectivity in all 5 cells for which complete maps weregenerated revealed that the average horizontal spread for ap-parently monosynaptic connectivity under GABAA blockadewas nearly 3 times that for the control solution (1395 � 693�m), whereas the horizontal spread for overall connectivitywas increased by about 50% (1778 � 327 �m).
Subthreshold linearity
To determine the extent to which EPSPs from the twomodalities sum linearly as measured at the soma, we recordedEPSPs from dSC cells while simultaneously stimulating thetwo inputs. Recordings were performed in the presence of 4�M bicuculline to block GABAA-mediated IPSPs. Cells wereselected that received monosynaptic inputs from both sites andelectrical stimulation was applied to the sSC and the nBIC witha temporal offset of 5 ms (to account for the shorter latency ofthe sSC-evoked response). Following earlier studies of inputsummation (Burke 1967; Langmoen and Andersen 1983), werefer to the EPSP resulting from simultaneous activation of thetwo inputs as the “observed sum” and use the term “arithmeticsum” for the computer-added, separately activated inputs (Fig.8A). In most cases combined stimulation resulted in EPSPs thatdeviated little from the arithmetic sum of the two separatelyevoked EPSPs, producing a population average of 96.7 � 3.4%of the arithmetic sum. This small difference was not statisti-cally significant (2-tailed, paired t-test, P � 0.10). Linearityvalues for all individual cells (n � 17) are shown in Fig. 8B.We also examined to what extent deviations from linearitywere dependent on the amplitude of the responses (eitherseparate or combined) and/or the natural variability in mem-brane potential. Neither was found to be a reliable predictor oflinearity, as indicated in Fig. 8, C and D.
Temporal independence
We finally examined whether an EPSP evoked by stimula-tion of one site could affect a closely following EPSP resultingfrom stimulation of the other site. To assess this we appliedpaired-pulse stimulation to the nBIC and sSC sites in cells thatreceived putative monosynaptic inputs from both. The stimuliwere temporally offset by 50 ms in either direction, as ex-plained in METHODS. Figure 9 illustrates one such examplewhere sSC-evoked EPSPs (first group of traces) are followedby nBIC-evoked EPSPs (Fig. 9A). After the sSC-evoked re-sponse was subtracted out, the average of the nBIC-evokedresponse (Fig. 9B, red trace) was superimposed on the averagenBIC-EPSP evoked on its own (green trace). The near-perfectmatching of the red and green traces indicates that a closelypreceding sSC-evoked EPSP had no discernable effect on the
2939CONVERGING SENSORY INPUTS TO THE SUPERIOR COLLICULUS
J Neurophysiol • VOL 92 • NOVEMBER 2004 • www.jn.org
on July 14, 2006 jn.physiology.org
Dow
nloaded from

amplitude of the nBIC-evoked EPSP recorded at the somata oflayer IV neurons. For comparison, and to confirm that thissame input is capable of short-term plasticity, we applied ahomosynaptic paired-pulse stimulation protocol to the nBICsite. In this case the nBIC-evoked EPSP manifested pro-nounced paired-pulse facilitation, as illustrated in both the rawtraces (Fig. 9C) and in the superimposed averaged traces (Fig.9D). In keeping with Clark and Collingridge (1996), we referto this interaction as “homosynaptic” and distinguish it fromthe “heterosynaptic” interaction between the two pathways.This particular example was typical of the entire population(n � 10) as indicated in the column chart (Fig. 9E), where thelack of heterosynaptic facilitation in nBIC-evoked EPSPs that
were preceded 50 ms earlier by sSC-evoked EPSPs (middlegray bar) is compared to the pronounced homosynaptic facil-itation of the nBIC inputs on the same cells (white bar). Thedifference in EPSP amplitude between a single pulse (1.24 �0.16 mV) and the second pulse in a homosynaptic paired-pulsestimulation protocol (2.23 � 0.32 mV) was significant (2-tailed, paired t-test, P � 0.0004).
The same qualitative result was found when the temporallyopposite effect was examined (i.e., when nBIC-evoked EPSPpreceded sSC-evoked EPSP by 50 ms). Again the EPSPevoked by the second pulse in the protocol (sSC) was notsignificantly different from the EPSP evoked by a single sSCstimulation pulse (P � 0.87), whereas the homosynaptic
FIG. 6. Functional topography of superficial-to-deep SC projection. Left panels (A, C, E, G) illustratethe extent of functional connectivity between the lay-ers. Theta-stimulating electrode was moved systemat-ically within the sSC to identify the location of effec-tive stimulation sites for the cells recorded in the dSC(black-filled circles). Blue dots indicate sites in thesSC where stimulation was applied but no responsewas evoked, whereas green- and red-filled dots indi-cate locations from where polysynaptic and monosyn-aptic responses were elicited, respectively. Size of thestimulating electrode and the stimulation intensitywere kept constant for all sites. Right panels (B, D, F,H) show the magnitude of the evoked response as afunction of horizontal distance along layer III. Evokedresponses were quantified by measuring the area underthe excitatory postsynaptic potential (EPSP) trace for a40-ms window from EPSP onset. Dots are similarlycolor-coded to reflect the stimulation sites as indicatedin the corresponding left-column panels for each cell.Yellow dot in the 3rd cell from the top illustrates anegative-going evoked response, indicating that a netinhibitory postsynaptic potential (IPSP) was evoked atthis site. Net IPSPs were uncommon under normalrecording conditions.
2940 SKALIORA ET AL.
J Neurophysiol • VOL 92 • NOVEMBER 2004 • www.jn.org
on July 14, 2006 jn.physiology.org
Dow
nloaded from

paired-pulse protocol resulted in a significant facilitation of thesecond EPSP (P � 0.036; Fig. 9F).
These results indicate that, although both sensory inputs arecapable of undergoing homosynaptic short-term synaptic plas-ticity, nBIC-evoked EPSPs do not interact with sSC-evokedEPSPs when these are induced in close temporal succession.
D I S C U S S I O N
This study is the first detailed investigation of convergingsynaptic potentials evoked in deep layer “multisensory” SCneurons by stimulation of the sSC (visual pathway) and thenBIC (auditory pathway). Because this circuit is a likely sitefor the visually guided development of the auditory space mapin the SC, elucidating the properties of synaptic convergenceand integration is an important step in understanding both themechanisms underlying synaptic plasticity as well as the pro-cessing of multisensory information.
Multisensory circuits in the slice: specificity ofafferent inputs
An important assumption in this study is that we are stim-ulating independently cells in visual and auditory structures/pathways, that is, that there is no cross talk between theafferent fibers that are activated by the stimulating electrodesplaced in the sSC and nBIC. This seems a reasonable assump-tion for several reasons. It is known that the sSC is an almostexclusively visual area that receives topographically orderedretinal inputs, as well as descending inputs from primary visualcortex (Huerta and Harting 1984). These afferent connectionsdevelop early and a mature map of visual space is present at the
time of eye opening (Chalupa et al. 1996; Kao et al. 1994; Kinget al. 1996). Furthermore, we and others have shown that thesSC–dSC pathway is preserved in a coronal slice preparation(Doubell et al. 2003; Isa et al. 1998; Ozen et al. 2000; Pettit etal. 1999).
Anatomical studies in several species have shown that thenBIC provides a large projection to the dSC (Edwards et al.1979; King et al. 1998a) and recordings in both ferrets(Schnupp and King 1997) and cats (Aitkin and Jones 1992)have confirmed that nBIC neurons are acoustically responsiveand have spatially tuned receptive fields. The tracing datapresented here show that nBIC neurons extend axons thatterminate in the dSC, suggesting that this pathway is also likelyto provide a major route in by which auditory informationreaches the SC in rats. The presence of retrogradely labeledcells in the ICx and CNIC in our hemisected midbrain prepa-ration raises the possibility that some of the labeled axons inthe SC were fibers of passage originating from these auditorystructures. However, the projection from other regions of theIC to the nBIC (Doubell et al. 2000; Wenstrup et al. 1994)could also account for those retrogradely labeled neurons.Moreover, projections from elsewhere in the IC to the dSC areless likely to be functional in the slices because most of theaxons would have been sectioned during the preparation of theslices. Even if a small component of the EPSPs recorded in theSC reflect the activation of axons from regions of the IC otherthan the nBIC, this does not alter our conclusions on theconvergence of visual and auditory inputs in the dSC.
Cross-modal connectivity in the superior colliculus
Recent in vitro studies in different species have documentedthe existence of functional connections between the superficialvisual and deeper multisensory layers of the SC (Doubell et al.2003; Isa et al. 1998; Lee et al. 1997; Ozen et al. 2000). Wefound that, of the sample of dSC neurons recorded, most(80%) receive inputs from the sSC and that, in more than halfof these, the connection is apparently monosynaptic. In addi-tion, we found that many of the dSC neurons tested receivedconverging inputs from the sSC and nBIC, and, on the basis ofthe small latency variability, half of those cells apparentlyreceived monosynaptic inputs from both regions. Althoughvisual–auditory neurons are widespread in the guinea pig dSC(King and Palmer 1985), electrophysiological recordings inrats (Westby et al. 1990) and other rodents (Chalupa andRhoades 1977; Drager and Hubel 1975) have reported a lowincidence of multisensory neurons. However, measurements ofthe expression profiles of the mRNA and protein products ofthe immediate-early gene zif268 suggest that most auditoryneurons in the dSC of the rat are also visually responsive. Thisclearly accords with the convergence patterns of synapticinputs revealed in the present study.
In vivo extracellular recordings in cats have reported thatmultisensory responses are absent in young animals andemerge gradually, beginning at about 2 wk after eye opening(Wallace and Stein 1997), whereas in monkeys, which are bornwith their eyes open, multisensory responses are apparent frombirth (Wallace and Stein 2001). It is highly likely that thestrong projection from the nBIC to the dSC that we observedat least in part underlies the auditory sensitivity of rat SCneurons (Gaese and Johnen 2000). The contribution of sSC
TABLE 1. Lateral extent of superficial layer stimulation sites thatevoked EPSPs in individual deep layer neurons
Cell AgePolysynapticRange, �m
MonosynapticRange, �m
OverallRange, �m
Control
SC40 P16 1,400 100 1,400SC41 P14 470 470SC42 P12 1,790 710 1,790SC43 P14 1,550 100 1,550SC44-1 P11 460 460SC44-1.2 P11 1,300 1,300SC44-2.2 P11 100 1,250 1,250SC45-1 P12 400 250 960
Mean 934 482 1,148SD 642 497 484Min 100 100 460Max 1,790 1,250 1,790
Plus picrotoxin
SC46-1.1 P12 910 1,910 1,910SC46-2.2 P12 2,140 1,790 2,140SC47-1 P13 1,300 390 1,300SC48-1 P14 1,610 1,610SC48-2.1 P14 1,930 1,490 1,930
Mean 1,578 1,395 1,778SD 491 693 327Min 910 390 1,300Max 2,140 1,910 2,140
2941CONVERGING SENSORY INPUTS TO THE SUPERIOR COLLICULUS
J Neurophysiol • VOL 92 • NOVEMBER 2004 • www.jn.org
on July 14, 2006 jn.physiology.org
Dow
nloaded from

inputs to the visual responses of rat dSC neurons is not known,although studies in other rodents have shown that those re-sponses are derived from the sSC (Mooney et al. 1992). Ourresults therefore suggest that, at around the time of eye openingand the onset of hearing (Friauf 1992), there exists a well-developed circuitry that could support multisensory interac-tions. Assuming multisensory maturation in rats is similar tothat described in a wide range of other species (King 1999),they also show that visual inputs from the sSC are in place toguide the maturation of the auditory spatial responses of dSCneurons.
Superficial deep-layer topography
Our slice recordings suggest that dSC neurons in young ratsreceive excitatory, monosynaptic inputs from a fairly restricted
region of the overlying sSC. Because we were recording fromunstained tissue, we were unable to identify unequivocally theprecise laminar location of the stimulating electrode. However,our data indicate that the likelihood of evoking monosynapticresponses increased when the electrode was close to the layerII–layer III border or within layer III. This is in agreement withthe anatomical studies of sSC-dSC connections in the treeshrew by Hall and Lee (1997). Moreover, a comparable degreeof columnar organization—although one that does not differ-entiate between mono- and polysynaptic connections—hasalso been reported in SC slices from young (P8–28) treeshrews (Lee et al. 1997).
We found that the topographic order in this pathway is partlyshaped by the selective inhibition of a broader set of availableconnections. Evidence for this comes from a limited sample of
FIG. 7. Effect of GABAA blockade on the range of effective stimulation sites in the sSC. Left panels (A, C, E) and right panels(B, D, F) were generated as described for Fig. 6, except that 100 �M picrotoxin was added to the extracellular solution. It can beseen that, in the presence of picrotoxin, dSC cells receive inputs from more widespread regions of the sSC. As before, blue, green,and red dots indicate locations in which stimulation elicited no response, polysynaptic EPSPs and monosynaptic EPSPs,respectively.
2942 SKALIORA ET AL.
J Neurophysiol • VOL 92 • NOVEMBER 2004 • www.jn.org
on July 14, 2006 jn.physiology.org
Dow
nloaded from

neurons, given that exploring the source of inhibition wasbeyond the scope of the present study. Anatomical data haverevealed the presence of numerous GABAergic neurons acrossall layers of the SC (Appell and Behan 1990; Behan et al. 2002;Mize 1992; Okada 1992; Ottersen and Storm-Mathisen 1984).Also, recordings in both slices and whole animals have re-vealed an extensive intralaminar network of inhibitory connec-tions by layer IV interneurons (Meredith and Ramoa 1998) orcollaterals of layer IV projection neurons (Zhu and Lo 2000).Any of these could have mediated the increase in polysynapticconnectivity we observed, but they cannot explain the unmask-ing of additional monosynaptic connections from sSC to dSC.Because we did not detect direct monosynaptic inhibitory inputfrom sSC to dSC, the picrotoxin-mediated unmasking of directsSC–dSC connections could indicate GABA-mediated (selec-tive) failure of spike propagation along the sSC axons (Lamotteet al. 1998; Lomeli et al. 1998; Verdier et al. 2003). Alterna-tively, or additionally, blocking inhibition globally could in-crease the number of neurons that are excited within thesuperficial layers.
Spatial and temporal summation of converging inputs
Recording the response of dSC cells to joint stimulation ofsSC and nBIC inputs revealed that the combined response(observed sum) was accurately predicted by the arithmetic sumof the two individual responses. This was true whether theevoked EPSPs were coincident or temporally offset by 50 ms,suggesting that each synaptic input functions independentlyand that events sum linearly. Linear summation of EPSPsinitiated by converging inputs has been reported in other brainareas (Burke 1967; Grabauskas and Bradley 1996; Langmoenand Andersen 1983), although deviations from linearity havebeen reported as well (Burke 1967; Kogo and Ariel 1999;Nettleton and Spain 2000).
In vivo studies in a range of mammalian species havereported that multisensory inputs can interact to enhance or
reduce the spike discharges of dSC neurons (King and Palmer1985; Meredith and Stein 1983, 1986; Populin and Yin 2002).Estimates of the prevalence and size of these interactions vary,reflecting differences in the species and experimental protocols(e.g., awake vs. anesthetized animals) used and in the defini-tions used by different authors to define multisensory facilita-tion. In keeping with other studies of synaptic potentials (e.g.,Cash and Yuste 1998; Nettleton and Spain 2000), we definedfacilitation as a response to simultaneous activation of thenBIC and dSC that exceeded the sum of the EPSPs to theseparately activated inputs.
Although we failed to find evidence for cross-modal inter-actions in the slice preparation, it is difficult to relate ourfindings on subthreshold summation of inputs to the responseenhancement apparent in the spike output of some dSC neuronsin whole animals. A supra-additive (or supralinear) summationof the spike output to combined visual and auditory stimulationmay simply reflect a spike threshold condition and need notnecessarily rely on a supralinear summation of the underlyingsynaptic inputs. Linear or even sublinear summation of sub-threshold EPSPs can still result in apparent supralinear inter-actions when assessed by the spike output of cells, if bothinputs on their own bring the neuron just below the actionpotential threshold (Langmoen and Andersen 1983). Alterna-tively, supralinearity could be a network property (Saito andIsa 2003).
The apparent absence of nonlinear visual–auditory interac-tions may also reflect the age of the animals, given that in vivostudies in other species have reported that supra-additive re-sponses to bimodal stimulation are first found several weeksafter the emergence of sensory responses in the SC (Wallaceand Stein 1997, 2001). In cats, the delayed maturation of thisintegrative property of dSC multisensory neurons appears to berelated to the development of corticocollicular inputs (Wallaceand Stein 2000). Such inputs are obviously missing in slicesprepared from infant animals, which may therefore underesti-
FIG. 8. Linear summation of subthreshold-evoked re-sponses. A: responses of a cell to separate stimulation of thenBIC (blue) and sSC (green) are superimposed on thearithmetic sum of the 2 (red) as well as the response tosimultaneous stimulation of each site (black). Near-perfectmatching of the red and black traces in this exampleindicates minimal deviation from linearity. B: histogramshowing the linearity values for each of the recorded cells(n � 17). Linearity did not correlate with either the size ofthe combined EPSP (C) or the membrane potential of therecorded cells (D).
2943CONVERGING SENSORY INPUTS TO THE SUPERIOR COLLICULUS
J Neurophysiol • VOL 92 • NOVEMBER 2004 • www.jn.org
on July 14, 2006 jn.physiology.org
Dow
nloaded from

mate the degree of nonlinearity. Nevertheless, it is likely thatfuture advances in our understanding of the capacity of neuronsto synthesize multisensory signals will benefit from both invivo and in vitro studies of synaptic integration.
Independence of visual and auditory inputs
Paired-pulse stimulation of either input alone revealed asignificant degree of homosynaptic paired-pulse facilitation forboth sSC and nBIC-mediated EPSPs. In contrast, stimulationof one set of fibers before stimulation of the other set of fibersdid not result in any heterosynaptic interactions. This indicatesthat the depolarization induced by synaptic activation of eitherthe visual or the auditory input does not affect the synapses atthe site of the other input. Thus at least at this developmentalstage, spread of depolarization from one input to the other, asshown in the hippocampus (Clark and Collingridge 1996), doesnot appear to underlie any interactions that may take placebetween the two modalities.
Taken together with the linear summation results discussedpreviously, our data suggest that, at least at around the time ofopening of eyes and ear canals, visual and auditory inputs
appear to function independently of each other. Any interac-tions between them are therefore likely to be mediated by theoverall level of activity of the postsynaptic cell.
A C K N O W L E D G M E N T S
We are grateful to A. Alli for assistance with the functional topographyexperiments.
G R A N T S
We thank the Wellcome Trust for financial support. A. J. King is aWellcome Senior Research Fellow.
R E F E R E N C E S
Aitkin L and Jones R. Azimuthal processing in the posterior auditorythalamus of cats. Neurosci Lett 142: 81–84, 1992.
Appell PP and Behan M. Sources of subcortical GABAergic projections tothe superior colliculus in the cat. J Comp Neurol 302: 143–158, 1990.
Behan M and Appell PP. Intrinsic circuitry in the cat superior colliculus:projections from the superficial layers. J Comp Neurol 315: 230–243, 1992.
Behan M, Steinhacker K, Jeffrey BS, and Meredith MA. Chemoarchitec-ture of GABAergic neurons in the ferret superior colliculus. J Comp Neurol452: 334–359, 2002.
Binns KE, Grant S, Withington DJ, and Keating MJ. A topographicrepresentation of auditory space in the external nucleus of the inferiorcolliculus of the guinea-pig. Brain Res 589: 231–242, 1992.
FIG. 9. Temporal independence of nBIC- and sSC-evoked EPSPs. A: heterosynaptic paired-pulse stimu-lation protocol, where electrical stimulation of the sSCis followed by electrical stimulation of the nBIC 50 mslater. First and second group of traces are sSC- andnBIC-evoked responses, respectively. B: averageEPSPs evoked by separate single stimulation in thenBIC (green trace) and by stimulation of the nBICafter stimulation of the sSC (red trace). C: homosyn-aptic paired-pulse stimulation protocol, where 2 iden-tical electrical pulses are applied to the nBIC at a50-ms interval. D: average EPSPs evoked by separatesingle stimulation in the nBIC (green trace) and bypaired-pulse stimulation in the nBIC (red trace illus-trates the second EPSP in the pair). E: percentagefacilitation of EPSPs evoked by single nBIC stimula-tion (single pulse), nBIC stimulation preceded by sSCstimulation (heterosynaptic), and nBIC stimulationpreceded by nBIC stimulation (homosynaptic).Whereas the homosynaptic stimulation paradigm re-vealed significant paired-pulse facilitation, an sSC-induced EPSP evoked at the same interval had noeffect on a subsequent nBIC-evoked EPSP. F: sameresult was obtained when the reverse order of stimu-lation was applied, where an sSC-induced EPSP waspreceded by either an nBIC-induced (heterosynaptic)or an sSC-induced response (homosynaptic),respectively.
2944 SKALIORA ET AL.
J Neurophysiol • VOL 92 • NOVEMBER 2004 • www.jn.org
on July 14, 2006 jn.physiology.org
Dow
nloaded from

Burke RE. Composite nature of the monosynaptic excitatory postsynapticpotential. J Neurophysiol 30: 1114–1137, 1967.
Burnett LR, Stein BE, Chaponis D, and Wallace MT. Superior colliculuslesions preferentially disrupt multisensory orientation. Neuroscience 124:535–547, 2004.
Cadusseau J and Roger M.Afferent projections to the superior colliculus inthe rat, with special attention to the deep layers. J Hirnforsch 26: 667–681,1985.
Cash S and Yuste R.Input summation by cultured pyramidal neurons is linearand position-independent. J Neurosci 18: 10–15, 1998.
Chalupa LM and Rhoades RW. Responses of visual, somatosensory, andauditory neurones in the golden hamster’s superior colliculus. J Physiol 270:595–626, 1977.
Chalupa LM, Snider CJ, and Kirby MA. Topographic organization in theretinocollicular pathway of the fetal cat demonstrated by retrograde labelingof ganglion cells. J Comp Neurol 368: 295–303, 1996.
Clark KA and Collingridge GL. Evidence that heterosynaptic depolarizationunderlies associativity of long-term potentiation in rat hippocampus.J Physiol 490: 455–462, 1996.
Doubell TP, Baron J, Skaliora I, and King AJ. Topographical projectionfrom the superior colliculus to the nucleus of the brachium of the inferiorcolliculus in the ferret: convergence of visual and auditory information. EurJ Neurosci 12: 4290–4308, 2000.
Doubell TP, Skaliora I, Baron J, and King AJ. Functional connectivitybetween the superficial and deeper layers of the superior colliculus: ananatomical substrate for sensorimotor integration. J Neurosci 23: 6596–6607, 2003.
Drager UC and Hubel DH. Responses to visual stimulation and relationshipbetween visual, auditory, and somatosensory inputs in mouse superiorcolliculus. J Neurophysiol 38: 690–713, 1975.
Druga R and Syka J. Projections from auditory structures to the superiorcolliculus in the rat. Neurosci Lett 45: 247–252, 1984.
Edwards SB, Ginsburgh CL, Henkel CK, and Stein BE. Sources ofsubcortical projections to the superior colliculus in the cat. J Comp Neurol184: 309–329, 1979.
Friauf E. Tonotopic order in the adult and developing auditory system of therat as shown by c-fos immunocytochemistry. Eur J Neurosci 4: 798–812,1992.
Gaese BH and Johnen A.Coding for auditory space in the superior colliculusof the rat. Eur J Neurosci 12: 1739–1752, 2000.
Grabauskas G and Bradley RM. Synaptic interactions due to convergentinput from gustatory afferent fibers in the rostral nucleus of the solitary tract.J Neurophysiol 76: 2919–2927, 1996.
Hall WC and Lee PH. Interlaminar connections of the superior colliculus inthe tree shrew. III: The optic layer. Vis Neurosci 14: 647–661, 1997.
Huerta MF and Harting JK. The mammalian superior colliculus: studies ofits morphology and connections. In: Comparative Neurology of the OpticTectum, edited by Vaneges H. New York: Plenum Press, 1984, p. 687–773.
Isa T, Endo T, and Saito Y.The visuo-motor pathway in the local circuit ofthe rat superior colliculus. J Neurosci 18: 8496–8504, 1998.
Kao CQ, McHaffie JG, Meredith MA, and Stein BE. Functional develop-ment of a central visual map in cat. J Neurophysiol 72: 266–272, 1994.
King AJ. Sensory experience and the formation of a computational map ofauditory space in the brain. Bioessays 21: 900–911, 1999.
King AJ and Carlile S. Changes induced in the representation of auditoryspace in the superior colliculus by rearing ferrets with binocular eyelidsuture. Exp Brain Res 94: 444–455, 1993.
King AJ and Hutchings ME. Spatial response properties of acousticallyresponsive neurons in the superior colliculus of the ferret: a map of auditoryspace. J Neurophysiol 57: 596–624, 1987.
King AJ, Hutchings ME, Moore DR, and Blakemore C. Developmentalplasticity in the visual and auditory representations in the mammaliansuperior colliculus. Nature 332: 73–76, 1988.
King AJ, Jiang ZD, and Moore DR. Auditory brainstem projections to theferret superior colliculus: anatomical contribution to the neural coding ofsound azimuth. J Comp Neurol 390: 342–365, 1998a.
King AJ and Palmer AR. Cells responsive to free-field auditory stimuli inguinea-pig superior colliculus: distribution and response properties.J Physiol 342: 361–381, 1983.
King AJ and Palmer AR. Integration of visual and auditory information inbimodal neurones in the guinea-pig superior colliculus. Exp Brain Res 60:492–500, 1985.
King AJ, Schnupp JW, Carlile S, Smith AL, and Thompson ID. Thedevelopment of topographically-aligned maps of visual and auditory spacein the superior colliculus. Prog Brain Res 112: 335–350, 1996.
King AJ, Schnupp JW, and Thompson ID. Signals from the superficiallayers of the superior colliculus enable the development of the auditoryspace map in the deeper layers. J Neurosci 18: 9394–9408, 1998b.
Knudsen EI and Brainard MS. Visual instruction of the neural map ofauditory space in the developing optic tectum. Science 253: 85–87, 1991.
Knudsen EI, Esterly SD, and du-Lac S.Stretched and upside-down maps ofauditory space in the optic tectum of blind-reared owls; acoustic basis andbehavioral correlates. J Neurosci 11: 1727–1747, 1991.
Kogo N and Ariel M. Response attenuation during coincident afferentexcitatory inputs. J Neurophysiol 81: 2945–2955, 1999.
Kudo M and Niimi K. Ascending projections of the inferior colliculus in thecat: an autoradiographic study. J Comp Neurol 191: 545–556, 1980.
Lamotte dIB, Destombes J, Thiesson D, Hellio R, Lasserre X, KouchtirDN, Jami L, and Zytnicki D. Indications for GABA-immunoreactiveaxo-axonic contacts on the intraspinal arborization of a Ib fiber in cat: aconfocal microscope study. J Neurosci 18: 10030–10036, 1998.
Langmoen IA and Andersen P.Summation of excitatory postsynaptic po-tentials in hippocampal pyramidal cells. J Neurophysiol 50: 1320–1329,1983.
Lee PH, Helms MC, Augustine GJ, and Hall WC.Role of intrinsic synapticcircuitry in collicular sensorimotor integration. Proc Natl Acad Sci USA 94:13299–13304, 1997.
Lohmann H and Algur Y. Spatio-temporal summation of synaptic activity invisual cortical pyramidal cells in vitro. Brain Res 671: 275–281, 1995.
Lomeli J, Quevedo J, Linares P, and Rudomin P.Local control of infor-mation flow in segmental and ascending collaterals of single afferents.Nature 395: 600–604, 1998.
Margulis M and Tang CM. Temporal integration can readily switch betweensublinear and supralinear summation. J Neurophysiol 79: 2809–2813, 1998.
Meredith MA and Ramoa AS. Intrinsic circuitry of the superior colliculus:pharmacophysiological identification of horizontally oriented inhibitory in-terneurons. J Neurophysiol 79: 1597–1602, 1998.
Meredith MA and Stein BE. Interactions among converging sensory inputs inthe superior colliculus. Science 221: 389–391, 1983.
Meredith MA and Stein BE. Visual, auditory, and somatosensory conver-gence on cells in superior colliculus results in multisensory integration.J Neurophysiol 56: 640–662, 1986.
Middlebrooks JC and Knudsen EI. A neural code for auditory space in thecat’s superior colliculus. J Neurosci 4: 2621–2634, 1984.
Mize RR. The organization of GABAergic neurons in the mammalian superiorcolliculus. Prog Brain Res 90: 219–248, 1992.
Mooney RD, Nikoletseas MM, King TD, Savage SV, Weaver MT, andRhoades RW.Structural and functional consequences of neonatal deaffer-entation in the superficial layers of the hamster’s superior colliculus. J CompNeurol 315: 398–412, 1992.
Nettleton JS and Spain WJ.Linear to supralinear summation of AMPA-mediated EPSPs in neocortical pyramidal neurons. J Neurophysiol 83:3310–3322, 2000.
Okada Y. The distribution and function of gamma-aminobutyric acid (GABA)in the superior colliculus. Prog Brain Res 90: 249–262, 1992.
Ottersen OP and Storm-Mathisen J. Glutamate- and GABA-containingneurons in the mouse and rat brain, as demonstrated with a new immuno-cytochemical technique. J Comp Neurol 229: 374–392, 1984.
Ozen G, Augustine GJ, and Hall WC. Contribution of superficial layerneurons to premotor bursts in the superior colliculus. J Neurophysiol 84:460–471, 2000.
Palmer AR and King AJ. The representation of auditory space in themammalian superior colliculus. Nature 299: 248–249, 1982.
Pettit DL, Helms MC, Lee P, Augustine GJ, and Hall WC.Local excitatorycircuits in the intermediate gray layer of the superior colliculus. J Neuro-physiol 81: 1424–1427, 1999.
Populin LC and Yin TC. Bimodal interactions in the superior colliculus of thebehaving cat. J Neurosci 22: 2826–2834, 2002.
Saito Y and Isa T. Local excitatory network and NMDA receptor activationgenerate a synchronous and bursting command from the superior colliculus.J Neurosci 23: 5854–5864, 2003.
Schnupp J and King A. Coding for auditory space in the nucleus of thebrachium of the inferior colliculus in the ferret. J Neurophysiol 78: 2717–2731, 1997.
Stein BE, Magalhaes-Castro B, and Kruger L.Superior colliculus: visuo-topic–somatotopic overlap. Science 189: 224–226, 1975.
2945CONVERGING SENSORY INPUTS TO THE SUPERIOR COLLICULUS
J Neurophysiol • VOL 92 • NOVEMBER 2004 • www.jn.org
on July 14, 2006 jn.physiology.org
Dow
nloaded from
Stein BE and Meredith MA. Multisensory integration. Neural and behavioralsolutions for dealing with stimuli from different sensory modalities. Ann NYAcad Sci 608: 51–65, 1990.
Stein BE and Meredith MA. The Merging of the Senses. Cambridge, MA:MIT Press, 1993.
Verdier D, Lund JP, and Kolta A. GABAergic control of action potentialpropagation along axonal branches of mammalian sensory neurons. J Neu-rosci 23: 2002–2007, 2003.
Wallace MT and Stein BE. Development of multisensory neurons andmultisensory integration in cat superior colliculus. J Neurosci 17: 2429–2444, 1997.
Wallace MT and Stein BE. Onset of cross-modal synthesis in the neonatalsuperior colliculus is gated by the development of cortical influences.J Neurophysiol 83: 3578–3582, 2000.
Wallace MT and Stein BE. Sensory and multisensory responses in thenewborn monkey superior colliculus. J Neurosci 21: 8886–8894, 2001.
Wenstrup JJ, Larue DT, and Winer JA. Projections of physiologicallydefined subdivisions of the inferior colliculus in the mustached bat: targetsin the medial geniculate body and extrathalamic nuclei. J Comp Neurol 346:207–236, 1994.
Westby GW, Keay KA, Redgrave P, Dean P, and Bannister M. Outputpathways from the rat superior colliculus mediating approach and avoid-ance have different sensory properties. Exp Brain Res 81: 626 – 638,1990.
Withington DJ, Binns KE, Ingham NJ, and Thornton SK. Plasticity in thesuperior collicular auditory space map of adult guinea-pigs. Exp Physiol 79:319–325, 1994.
Zangenehpour S and Chaudhuri A. Neural activity profiles of the neocortexand superior colliculus after bimodal sensory stimulation. Cereb Cortex 11:924–935, 2001.
Zhu JJ and Lo FS. Recurrent inhibitory circuitry in the deep layers of therabbit superior colliculus. J Physiol 3: 731–740, 2000.
2946 SKALIORA ET AL.
J Neurophysiol • VOL 92 • NOVEMBER 2004 • www.jn.org
on July 14, 2006 jn.physiology.org
Dow
nloaded from