Separate projections from the inferior colliculus to the cochlear nucleus and thalamus in guinea...
12
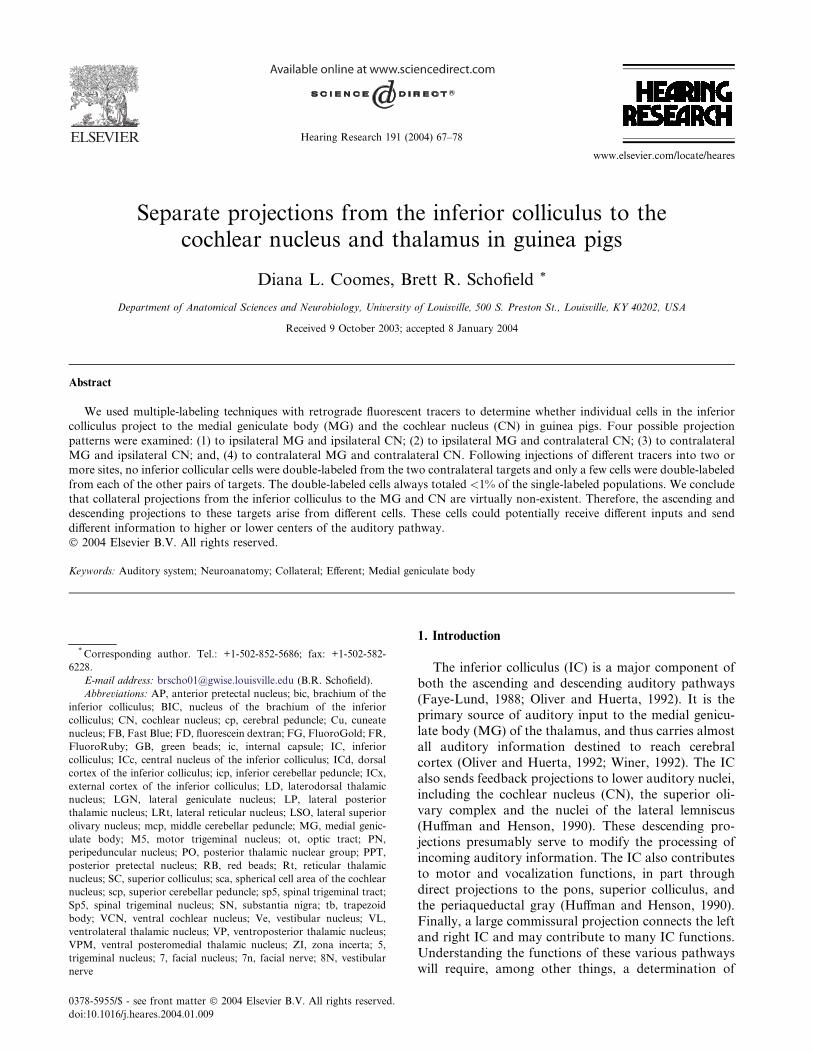
Separate projections from the inferior colliculus to the cochlear nucleus and thalamus in guinea pigs Diana L. Coomes, Brett R. Schofield * Department of Anatomical Sciences and Neurobiology, University of Louisville, 500 S. Preston St., Louisville, KY 40202, USA Received 9 October 2003; accepted 8 January 2004 Abstract We used multiple-labeling techniques with retrograde fluorescent tracers to determine whether individual cells in the inferior colliculus project to the medial geniculate body (MG) and the cochlear nucleus (CN) in guinea pigs. Four possible projection patterns were examined: (1) to ipsilateral MG and ipsilateral CN; (2) to ipsilateral MG and contralateral CN; (3) to contralateral MG and ipsilateral CN; and, (4) to contralateral MG and contralateral CN. Following injections of different tracers into two or more sites, no inferior collicular cells were double-labeled from the two contralateral targets and only a few cells were double-labeled from each of the other pairs of targets. The double-labeled cells always totaled <1% of the single-labeled populations. We conclude that collateral projections from the inferior colliculus to the MG and CN are virtually non-existent. Therefore, the ascending and descending projections to these targets arise from different cells. These cells could potentially receive different inputs and send different information to higher or lower centers of the auditory pathway. Ó 2004 Elsevier B.V. All rights reserved. Keywords: Auditory system; Neuroanatomy; Collateral; Efferent; Medial geniculate body 1. Introduction The inferior colliculus (IC) is a major component of both the ascending and descending auditory pathways (Faye-Lund, 1988; Oliver and Huerta, 1992). It is the primary source of auditory input to the medial genicu- late body (MG) of the thalamus, and thus carries almost all auditory information destined to reach cerebral cortex (Oliver and Huerta, 1992; Winer, 1992). The IC also sends feedback projections to lower auditory nuclei, including the cochlear nucleus (CN), the superior oli- vary complex and the nuclei of the lateral lemniscus (Huffman and Henson, 1990). These descending pro- jections presumably serve to modify the processing of incoming auditory information. The IC also contributes to motor and vocalization functions, in part through direct projections to the pons, superior colliculus, and the periaqueductal gray (Huffman and Henson, 1990). Finally, a large commissural projection connects the left and right IC and may contribute to many IC functions. Understanding the functions of these various pathways will require, among other things, a determination of * Corresponding author. Tel.: +1-502-852-5686; fax: +1-502-582- 6228. E-mail address: [email protected] (B.R. Schofield). Abbreviations: AP, anterior pretectal nucleus; bic, brachium of the inferior colliculus; BIC, nucleus of the brachium of the inferior colliculus; CN, cochlear nucleus; cp, cerebral peduncle; Cu, cuneate nucleus; FB, Fast Blue; FD, fluorescein dextran; FG, FluoroGold; FR, FluoroRuby; GB, green beads; ic, internal capsule; IC, inferior colliculus; ICc, central nucleus of the inferior colliculus; ICd, dorsal cortex of the inferior colliculus; icp, inferior cerebellar peduncle; ICx, external cortex of the inferior colliculus; LD, laterodorsal thalamic nucleus; LGN, lateral geniculate nucleus; LP, lateral posterior thalamic nucleus; LRt, lateral reticular nucleus; LSO, lateral superior olivary nucleus; mcp, middle cerebellar peduncle; MG, medial genic- ulate body; M5, motor trigeminal nucleus; ot, optic tract; PN, peripeduncular nucleus; PO, posterior thalamic nuclear group; PPT, posterior pretectal nucleus; RB, red beads; Rt, reticular thalamic nucleus; SC, superior colliculus; sca, spherical cell area of the cochlear nucleus; scp, superior cerebellar peduncle; sp5, spinal trigeminal tract; Sp5, spinal trigeminal nucleus; SN, substantia nigra; tb, trapezoid body; VCN, ventral cochlear nucleus; Ve, vestibular nucleus; VL, ventrolateral thalamic nucleus; VP, ventroposterior thalamic nucleus; VPM, ventral posteromedial thalamic nucleus; ZI, zona incerta; 5, trigeminal nucleus; 7, facial nucleus; 7n, facial nerve; 8N, vestibular nerve 0378-5955/$ - see front matter Ó 2004 Elsevier B.V. All rights reserved. doi:10.1016/j.heares.2004.01.009 Hearing Research 191 (2004) 67–78 www.elsevier.com/locate/heares
Transcript of Separate projections from the inferior colliculus to the cochlear nucleus and thalamus in guinea...
Separate projections from the inferior colliculus to thecochlear nucleus and thalamus in guinea pigs
Diana L. Coomes, Brett R. Schofield *
Department of Anatomical Sciences and Neurobiology, University of Louisville, 500 S. Preston St., Louisville, KY 40202, USA
Received 9 October 2003; accepted 8 January 2004
Abstract
We used multiple-labeling techniques with retrograde fluorescent tracers to determine whether individual cells in the inferior
colliculus project to the medial geniculate body (MG) and the cochlear nucleus (CN) in guinea pigs. Four possible projection
patterns were examined: (1) to ipsilateral MG and ipsilateral CN; (2) to ipsilateral MG and contralateral CN; (3) to contralateral
MG and ipsilateral CN; and, (4) to contralateral MG and contralateral CN. Following injections of different tracers into two or
more sites, no inferior collicular cells were double-labeled from the two contralateral targets and only a few cells were double-labeled
from each of the other pairs of targets. The double-labeled cells always totaled <1% of the single-labeled populations. We conclude
that collateral projections from the inferior colliculus to the MG and CN are virtually non-existent. Therefore, the ascending and
descending projections to these targets arise from different cells. These cells could potentially receive different inputs and send
different information to higher or lower centers of the auditory pathway.
� 2004 Elsevier B.V. All rights reserved.
Keywords: Auditory system; Neuroanatomy; Collateral; Efferent; Medial geniculate body
1. Introduction
The inferior colliculus (IC) is a major component of
both the ascending and descending auditory pathways
(Faye-Lund, 1988; Oliver and Huerta, 1992). It is theprimary source of auditory input to the medial genicu-
late body (MG) of the thalamus, and thus carries almost
all auditory information destined to reach cerebral
cortex (Oliver and Huerta, 1992; Winer, 1992). The IC
also sends feedback projections to lower auditory nuclei,
including the cochlear nucleus (CN), the superior oli-
vary complex and the nuclei of the lateral lemniscus
(Huffman and Henson, 1990). These descending pro-jections presumably serve to modify the processing of
incoming auditory information. The IC also contributes
to motor and vocalization functions, in part through
direct projections to the pons, superior colliculus, and
the periaqueductal gray (Huffman and Henson, 1990).
Finally, a large commissural projection connects the left
and right IC and may contribute to many IC functions.
Understanding the functions of these various pathwayswill require, among other things, a determination of
*Corresponding author. Tel.: +1-502-852-5686; fax: +1-502-582-
6228.
E-mail address: [email protected] (B.R. Schofield).
Abbreviations: AP, anterior pretectal nucleus; bic, brachium of the
inferior colliculus; BIC, nucleus of the brachium of the inferior
colliculus; CN, cochlear nucleus; cp, cerebral peduncle; Cu, cuneate
nucleus; FB, Fast Blue; FD, fluorescein dextran; FG, FluoroGold; FR,
FluoroRuby; GB, green beads; ic, internal capsule; IC, inferior
colliculus; ICc, central nucleus of the inferior colliculus; ICd, dorsal
cortex of the inferior colliculus; icp, inferior cerebellar peduncle; ICx,
external cortex of the inferior colliculus; LD, laterodorsal thalamic
nucleus; LGN, lateral geniculate nucleus; LP, lateral posterior
thalamic nucleus; LRt, lateral reticular nucleus; LSO, lateral superior
olivary nucleus; mcp, middle cerebellar peduncle; MG, medial genic-
ulate body; M5, motor trigeminal nucleus; ot, optic tract; PN,
peripeduncular nucleus; PO, posterior thalamic nuclear group; PPT,
posterior pretectal nucleus; RB, red beads; Rt, reticular thalamic
nucleus; SC, superior colliculus; sca, spherical cell area of the cochlear
nucleus; scp, superior cerebellar peduncle; sp5, spinal trigeminal tract;
Sp5, spinal trigeminal nucleus; SN, substantia nigra; tb, trapezoid
body; VCN, ventral cochlear nucleus; Ve, vestibular nucleus; VL,
ventrolateral thalamic nucleus; VP, ventroposterior thalamic nucleus;
VPM, ventral posteromedial thalamic nucleus; ZI, zona incerta; 5,
trigeminal nucleus; 7, facial nucleus; 7n, facial nerve; 8N, vestibular
nerve
0378-5955/$ - see front matter � 2004 Elsevier B.V. All rights reserved.
doi:10.1016/j.heares.2004.01.009
Hearing Research 191 (2004) 67–78
www.elsevier.com/locate/heares

whether different populations of cells project to each
target or, alternatively, individual cells send axon col-
laterals to multiple targets.
The issue of collateral projections is important with
respect to both inputs and outputs. Collateral projec-tions indicate a common origin from a single population
of cells and thus a common set of inputs. It would be
expected that the same information is then sent to each
target. In contrast, projections that originate from sep-
arate populations of cells could receive different sets of
inputs and send different information to the targets. The
presence of collateral projections suggests a common
function whereas separate projections could supportdifferent functions. Of course, any given set of projec-
tions could include some cells that have collateral pro-
jections and other cells that do not. The presence, and
prominence, of collateral projections must be deter-
mined for a full understanding of any particular circuit.
Only a few studies have examined the possibility of
collateral projections from IC cells. Gonz�alez-Hern�an-dez et al. (1991) used retrograde double-labeling meth-ods in rats and found that up to 30% of cells that project
to the ipsilateral MG also project to the contralateral
IC. The prominence of axonal branching has been fur-
ther demonstrated by intracellular labeling of IC cells
(Oliver et al., 1991; Smith, 1992; Reetz and Ehret, 1999).
In fact, experiments by Oliver et al. (1991) led them to
suggest that collateral projections might be the rule,
rather than the exception.Two recent studies suggest that IC cells have collat-
eral projections to higher and lower centers in the au-
ditory pathways. Reetz and Ehret (1999) stained the
axons of 19 IC cells in mice and found that many had
branches that entered multiple efferent pathways. Of
seven axons that entered the lateral lemniscus (i.e.,
presumptive descending projections), four had branches
that entered the brachium of the IC (i.e., presumptiveascending projections). Malmierca et al. (1996) de-
scribed a similar branching pattern in guinea pigs. A
different conclusion, i.e., that ascending and descending
collaterals are rare, was reached in cats (Hashikawa and
Kawamura, 1983). However, each of these studies is
limited by small sample size. In addition, the intracel-
lular studies (Malmierca et al., 1996; Reetz and Ehret,
1999) were limited by an inability to identify the ex-trinsic targets because the axons were not followed to
their termination.
The purpose of the present study is to address the
issue of ascending and descending collateral projections
from the IC in guinea pigs. Given the possibility of
species differences, as has been described for olivocol-
licular projections (Glendenning and Masterton, 1983;
Willard and Martin, 1984; Schofield and Cant, 1992),there is an advantage to focusing studies on a single
species with the goal of obtaining a complete picture of
the circuitry. We have chosen guinea pigs because they
are a prominent choice for auditory studies and have
been the focus of a large number of previous studies of
collateral projections in the auditory brainstem (e.g.,
Robertson et al., 1987; Aschoff and Ostwald, 1988;
Winter et al., 1989; Schofield, 1991, 1994, 2001, 2002;Schofield and Cant, 1992, 1996, 1999; Schofield and
Perkins, 1999). We used double-labeling techniques,
which allow examination of a large number of cells with
known targets.
2. Materials and methods
Experiments were performed on adult albino guinea
pigs obtained from Charles River Laboratories, Inc.
(Wilmington, MA). All procedures were approved by
the University of Louisville Animal Care and Use
Committee and administered following the National
Institutes of Health guidelines for the care and use of
laboratory animals.
2.1. Surgery and perfusion
Each guinea pig was anesthetized with halothane
(3.5% for induction, 2.5–2.75% for maintenance) in a
mixture of oxygen and nitrous oxide. Prior to surgery,
the animal was premedicated with atropine sulfate (0.08
mg/kg, i.m.). Antibiotic ointment (Neosporin Ophthal-
mic) was placed in each eye to prevent drying of thecornea during anesthesia. The scalp was shaved and
disinfected with Xenodine (polyhydroxydine solution;
Solvay Veterinary, Inc., Princeton, NJ). The animal was
then placed in a stereotaxic holder with the incisor bar
mounted 5.0 mm ventral to the horizontal plane through
interaural zero. Body temperature was maintained with
a feedback-controlled heating pad. An incision was
made in the scalp, and the margins of the incision wereinfiltrated with 0.25% bupivacaine (Sensorcaine; Astra
USA, Inc., Westborough, MA), a long-lasting local
anesthetic. A small hole was then drilled in the skull for
each injection, and tracers were injected into the MG
and CN using stereotaxic coordinates (CN: 2.0–4.0 mm
caudal; 3.6–4.0 mm lateral; 1.4–2.5 mm dorsal, all rel-
ative to interaural zero; MG: 4.3–6.5 rostral; 3.5–4.7
mm lateral; 3.9–4.8 mm dorsal). Each tracer (detailsbelow) was injected with a 10 ll Hamilton syringe that
was used only with that tracer. Injections were made at
1–4 sites within each target. A total volume of 0.3–0.8 llwas injected into each target. Following the injection,
the exposed brain was covered with Gelfoam and the
scalp was sutured. Ketoprofen (3 mg/kg, i.m.) was ad-
ministered immediately after surgery and again a day
later to provide 48 h of post-operative analgesia. Aftersurgery, the animal was placed in a clean cage and
monitored until it regained the ability to stand. The
animal was then returned in its cage to the animal fa-
68 D.L. Coomes, B.R. Schofield / Hearing Research 191 (2004) 67–78

cility. It was checked daily for any signs of abnormal
behavior.
Fast Blue (FB, 5% aqueous solution, Sigma, Inc., St.
Louis, MO), Fluorescein dextran (FD, 10% solution in
saline; molecular weight¼ 10,000: Molecular Probes,Inc., Eugene OR), FluoroRuby (FR, 10% solution in
saline; tetramethylrhodamine dextran, molecular
weight¼ 10,000: Molecular Probes, Inc., Eugene OR),
FluoroGold (FG, 4% aqueous solution; FluoroChrome
Inc., Englewood, CO), or red (RB) or green (GB) latex
microspheres (‘‘beads’’; undiluted; Luma-Fluor, Inc.,
Naples, FL) was injected into the left and right MG and
different tracers were injected into the left and right CNof five guinea pigs to label cells in the IC. Table 1 il-
lustrates what tracers were injected into each location
and the inferior colliculi that were examined for each
case.
After an appropriate interval for transport of the
injected tracers (4–7 days), the animal was sacrificed
with pentobarbital (i.p., 440 mg/kg) or CO2 gas (inha-
lation, 10 min). A thoracotomy was then performed andthe animal was perfused through the aorta with ap-
proximately 100 ml of Tyrode�s solution (pH 7.4), 350
ml of 4% paraformaldehyde in 0.1 M phosphate buffer,
pH 7.4 (PB), and then 350 ml of 4% paraformaldehyde/
10% sucrose in PB. The brain was removed and stored in
4% paraformaldehyde/30% sucrose in PB. The following
day the brain was frozen and cut on a sliding microtome
into 40 or 50 lm sections. The brain from caudal me-dulla to frontal cortex was cut in the transverse or
sagittal plane. Six series of sections were cut. At least 4
series were mounted on gelatin-coated slides and al-
lowed to dry. One series was counterstained with thionin
for identification of cytoarchitectonic borders, and all
sections were then coverslipped with DPX (Aldrich
Chemical Company, Inc., Milwaukee, WI).
2.2. Data analysis
Sections were examined with a fluorescence micro-
scope (Zeiss Axioplan 2). The location and extent of the
injection sites were drawn with a camera lucida, an x-y
plotter attached to the microscope, or a Neurolucida
system (MicroBrightField; Colchester, VT).
To identify cells that contained multiple fluorescent
tracers, every sixth section was viewed at high magnifi-
cation (40� objective). The tracers were visualized
through different filters, facilitating identification of
double-labeled cells. FluoroGold and Fast Blue, whichare both observed with an ultraviolet filter set, were not
used in combination to assess the collateral patterns
under study. The distributions of both single- and
double-labeled cells were plotted with the x-y plotter or
the Neurolucida system. Labeled cells were photo-
graphed with a digital camera (Magnafire, Optronics,
Inc., Goleta, CA). Adobe Photoshop was then used to
adjust brightness, contrast, and color balance. It wasalso used to arrange and label photographs and to
overlay images collected with different fluorescent filters.
Borders between IC subdivisions were drawn with
adjacent thionin sections on a Neurolucida system. The
three main IC regions (the central nucleus, dorsal cortex,
and external cortex) were distinguished according to
criteria described in guinea pigs and rats (Faye-Lund
and Osen, 1985; Malmierca et al., 1995).In every case, labeled cells were counted from every
sixth section throughout the IC. For quantitative anal-
ysis, within each case data for a given tracer were in-
cluded only if the series of sections contained at least 100
cells labeled with that tracer. To determine the per-
centage of double-labeled cells, the number of double-
labeled cells was divided by the sum of cells labeled by a
given tracer. The numbers presented have not been ad-justed for sample size. They have been included to il-
lustrate that numerous cells were labeled for each
projection and demonstrate that the overall percentage
of double-labeled cells is quite small.
3. Results
3.1. Characterization of injection sites
Fig. 1 shows a representative injection into the thal-
amus. The tracer included much of the MG and en-
croached on some of the surrounding nuclei. In a few
cases, the injection included parts of the superior colli-
culus, brachium of the IC, or posterior thalamic nucleus.
Table 1
Summary of injection sites
GP# IC plotted Tracer RCN Tracer LCN Tracer RMG Tracer LMG
246 R FG RB GB –
247 R FG FB GB –
266 R/L FR – FB –
354 R/L – FB FD FR
355 R/L FG FB GB RB
The tracers injected into the right and left cochlear nucleus (CN) and medial geniculate body (MG) are indicated for each case. The right (R) and/
or left (L) inferior colliculus (IC) was analyzed. FB, Fast Blue; FD, fluorescein dextran; FG, FluoroGold; FR, FluoroRuby; GB, green beads, RB,
red beads.
D.L. Coomes, B.R. Schofield / Hearing Research 191 (2004) 67–78 69

Because the IC sends axons to these areas (Andersenet al., 1980), IC cells that project to these regions could
have been labeled. However, the results from these cases
were similar to cases in which injections were confined to
the MG, (i.e., there were extremely few double-labeled
cells), so these cases were included in the analysis.
Following injections into the MG, labeled cells were
present bilaterally in the IC and were more numerous
on the ipsilateral side than the contralateral side. Oneach side, the cells were distributed among all three
subdivisions of the IC (the central nucleus, the dorsal
cortex, and the external cortex). Additional cells were
labeled in other auditory areas, such as temporal cor-
tex, as well as non-auditory structures, such as the su-
perior colliculus, substantia nigra, and zona incerta.
Cells in the latter structures are likely to have been
retrogradely labeled from spread of the tracer into
nuclei surrounding the MG. We will focus only on la-
beled cells within the IC.
Injections into the CN were centered on the dorsalCN and the granule cell areas, which are the primary
targets of projections from the IC (reviewed by Salda~na,1993). Our smallest injection into the CN was confined
to that structure, and included parts of both the dorsal
and ventral subdivisions (Fig. 2(a)). Our largest injection
spread throughout the CN and extended medially and
caudally to invade the inferior cerebellar peduncle and
spinal trigeminal tract and nucleus (Fig. 2(b)). Otherinjections spread into the middle cerebellar peduncle
and/or the vestibular nuclei (not shown). None of the
injections spread into the superior olivary complex or
the lateral lemniscus. IC cells have not been reported to
project to the cerebellum, trigeminal or vestibular nuclei;
thus, the results were unaffected by the spread of the
tracer.
The CN injections labeled cells in auditory structures(e.g., the contralateral cochlear nucleus, the superior
olivary nuclei, and the IC) as well as non-auditory
structures (e.g., the external cuneate and lateral reticular
nucleus). Cells in the latter structures were likely labeled
by tracer taken up by axons in the fiber tracts sur-
rounding the CN. Within the IC, the distribution of
labeled cells matched previous descriptions of this pro-
jection (Schofield, 2001), and will not be described fur-ther.
3.2. Analysis of labeled cells
Fig. 3 illustrates single- and double-labeled cells in the
IC. This figure makes several points. First, the results
are based on numerous tracers and the results were
similar regardless of the tracer used to label a particularpathway. Second, the presence of two different tracers in
a single cell was readily identified (Fig. 3(e), (e�)). Third,single-labeled cells frequently were found in close
proximity to cells that contained a different tracer. This
latter point is important when the projections are or-
ganized topographically, as is the case for the pathways
under study. Intermingling of the labeled cells indicates
that topographically similar parts of each pathway werelabeled.
We examined four possible patterns of collateral
projections from individual IC cells: (1) to the ipsilateral
MG and ipsilateral CN; (2) to the ipsilateral MG and
contralateral CN; (3) to the contralateral MG and ip-
silateral CN; and (4) to the contralateral MG and con-
tralateral CN. For purposes of illustration, we have
chosen one representative case, GP355, in which FastBlue and FluoroGold were injected in the left and right
CN, respectively, and red beads and green beads were
injected into the left and right MG, respectively. We
LGN
MG ic
Rt
PN
BICLP
RtLD
ic
LGN
PN
PN1
2
3
4
5
bic
MG
ic
VP
LP
MG
BIC
LGN LDRt
LP LD Rt
ic
BIC
SCot
MG VPM
SN
SC
PPT
AP
LP LD
ic
Rt
VLVPM
PO
cp SN ZI
VPL
GP354
Lateral
Medialrostral
dorsal
1mm
Fig. 1. Drawings of a representative injection site in the medial ge-
niculate body. The black area indicates a FluoroRuby injection in the
left medial geniculate body of GP354. The distance between sections
can be calculated by multiplying the difference between section num-
bers (at the lower left of each section) by 300 lm. Parasagittal sections.
Scale bar¼ 1 mm. See the list of abbreviations.
70 D.L. Coomes, B.R. Schofield / Hearing Research 191 (2004) 67–78

describe the results of this case first, and then present a
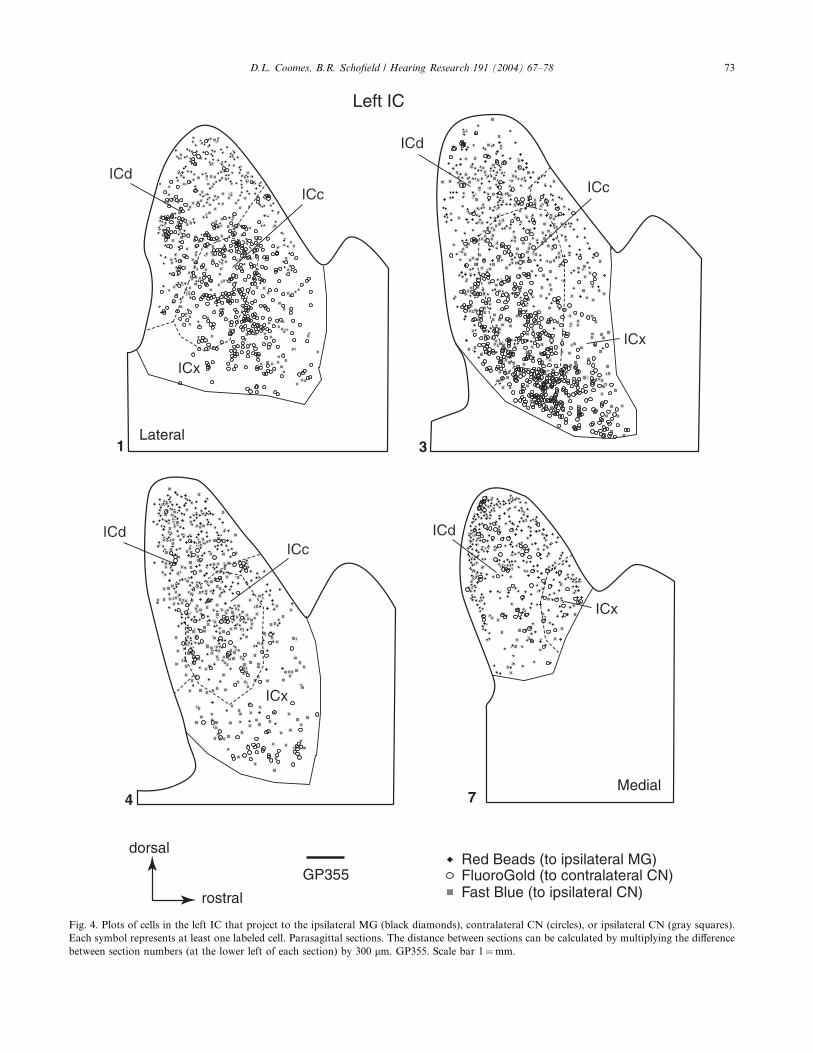
quantitative summary of the data collected across cases.Figs. 4 and 5 show the distributions of IC cells labeled
with FG, FB and RB in case GP355 (GB-labeled cells
are excluded from the figures for clarity). Fig. 4 shows
the labeled cells in the left IC, and thus illustrates cells
that project to the ipsilateral MG and to either CN.
None of the cells were double-labeled. A few double-
labeled cells were observed in other cases, but the results
suggest that extremely few IC cells project to the ipsi-lateral MG and to either CN.
Fig. 5 illustrates IC cells that project to the contra-
lateral MG as well as to either CN in case GP355 (GB-
labeled cells are excluded for clarity). As was true in the
opposite IC, this IC also contained many single-labeled
cells in each of the major subdivisions. Only one cell was
double-labeled. This cell contained FG and RB, indi-
cating collateral projections to the contralateral MGand ipsilateral CN (star in section 2, Fig. 5). Double-
labeled cells were extremely rare, suggesting that very
few IC cells project to the contralateral MG and to ei-
ther CN.
The case illustrated in Figs. 4 and 5 also contained
cells labeled with green beads injected into the right
MG. These cells were examined for the additional
presence of tracers injected into each CN. In the rightIC, ipsilateral to the GB injection, 3398 IC cells were
labeled with GB; three of these were double-labeled.
Two cells contained GB and FG, indicating projections
to the ipsilateral MG and ipsilateral CN. One cell con-
tained both GB and FB, indicating projections to the
ipsilateral MG and contralateral CN. In the right IC,1147 cells contained GB; none of these were double-
labeled.
Quantitative analysis confirmed that very few IC
cells send collateral projections to the MG and the
CN. We counted the labeled cells in every sixth sec-
tion through six inferior colliculi. A total of 16,525
cells were labeled from MG injections and 12,485 cells
were labeled from CN injections. Of these cells, onlynine were double-labeled. These double-labeled cells
were scattered among the three IC subdivisions. Fig. 6
portrays the percentages of double-labeled cells for the
three projection patterns for which double-labeled cells
were observed. No cells were double-labeled by in-
jections into the contralateral MG and contralateral
CN. For the other three patterns, the double-labeled
cells represented <1% of the single-labeled popula-tions.
4. Discussion
The purpose of the present study was to determine
whether IC projections to theMG and the CN arise from
the same cells or from different cells. Our results indicatethat these projections arise almost exclusively from dif-
ferent populations of cells. These findings complement
those of Hashikawa and Kawamura (1983), who reached
a similar conclusion for projections from the IC to the
sp5
CN
CN
Vesp5
scp
Sp5
icpVe
5
Cu
FB
GP355
FG
rostral
dorsal
1 mm
1
3
5
1
3
sp5
Sp5
7
LSO
7n M5
Ve
LRt
icp
5
mcp
mcp
mcp
mcp
tbVCN
sp5
8N
Left Right
tbicpsp5
CN
(a) (b)
Fig. 2. Drawings of injection sites in the cochlear nucleus. (a) Fast Blue injection site in the left CN. (b) FluoroGold injection site in the right CN.
Injection sites are indicated by the black areas. The distance between sections can be calculated by multiplying the difference between section numbers
(at the lower left of each section) by 300 lm. Parasagittal sections. Case GP355. Scale bar ¼ 1 mm. See the list of abbreviations.
D.L. Coomes, B.R. Schofield / Hearing Research 191 (2004) 67–78 71

ipsilateralMGand to eitherCN in cats.Wehave extendedtheir findings in several ways. First, we examined the
possibility of collateral projections from IC cells that
project to the contralateral MG. Second, we examined a
larger number of animals and used a wider variety of
tracers, including recently developed ones that, in our
experience, are more sensitive than those that were
available for the earlier study. These issues are particu-
larly important for studies in which the primary finding isone of negative evidence (i.e., the lack of double-labeled
cells), and are discussed in more detail below. Third, we
extended the previous analysis to a second species. Our
results thus broaden the generalization that ascending
and descending projections from the IC arise from dif-ferent cells.
4.1. Technical issues
It is unlikely that any given injection will label every
cell of a specific pathway. To maximize the likelihood of
finding collateral projections, we injected tracers at
multiple sites within each target. In many cases thetracer spread into surrounding structures. This was
particularly true for CN injections; however, the injected
nuclei and tracts around the CN are not known to re-
ceive projections from the IC. Furthermore, the superior
Fig. 3. Digital photomicrographs of labeled cells in the IC. (a)–(d) Fluorescent overlays of single-labeled cells. (a) Cells in the left external cortex of
the inferior colliculus (ICx) of GP354. FluoroRuby (FR)-labeled cells project to the left medial geniculate body (MG), the Fast Blue (FB)-labeled cell
projects to the left CN, and the fluorescein dextran (FD)-labeled cell projects to the right CN. (b) and (c) Cells in the right central nucleus of the
inferior colliculus and ICx, respectively, of GP355. Green bead (GB)-labeled cells project to the right MG, FluoroGold (FG)-labeled cells project to
the right CN, and the FB-labeled cell projects to the left CN. (d) Cells in the right ICx of GP266. FB-labeled cells project to the right MG and FR-
labeled cells project to the right CN. (e) and (e�) Cells in the right ICx of GP266. FB-labeled cells project to the right MG. The FR-labeled cell is
double-labeled with FB (arrowhead) and thus projects to the right CN and the right MG. Sections are parasagittal with dorsal up and rostral right.
Scale bar¼ 10 lm.
72 D.L. Coomes, B.R. Schofield / Hearing Research 191 (2004) 67–78
ICc
ICd
ICx
ICcICd
ICx
ICx
ICd
ICcICd
ICx
rostral
dorsal
GP355Red Beads (to ipsilateral MG)FluoroGold (to contralateral CN)Fast Blue (to ipsilateral CN)
Left IC
1 3
4 7
Lateral
Medial
Fig. 4. Plots of cells in the left IC that project to the ipsilateral MG (black diamonds), contralateral CN (circles), or ipsilateral CN (gray squares).
Each symbol represents at least one labeled cell. Parasagittal sections. The distance between sections can be calculated by multiplying the difference
between section numbers (at the lower left of each section) by 300 lm. GP355. Scale bar 1¼mm.
D.L. Coomes, B.R. Schofield / Hearing Research 191 (2004) 67–78 73

ICc
ICd
ICx
ICc
ICd
ICx
ICc
ICd
ICx
Right IC
ICc
ICd
ICx
Red Beads (to contralateral MG)FluoroGold (to ipsilateral CN)Fast Blue (to contralateral CN)FluoroGold/Red beads double label
1
54
2
rostral
dorsal
GP355
Lateral
Medial
Fig. 5. Plots of cells in the right IC that project to the contralateral MG (black diamonds), the ipsilateral CN (circles), or the contralateral CN (gray
squares). The star in section 2 indicates a double-labeled cell that projects to the ipsilateral CN and contralateral MG. Each symbol represents at least
one labeled cell. Parasagittal sections. The distance between sections can be calculated by multiplying the difference between section numbers (at the
lower left of each section) by 300 lm. GP355. Scale bar¼ 1 mm.
74 D.L. Coomes, B.R. Schofield / Hearing Research 191 (2004) 67–78

olivary complex and lateral lemniscus (which do receiveIC projections) were never included in the CN injection
sites. Consequently, the labeled IC cells almost certainly
project to the CN. Injections into the thalamus spread
into regions surrounding the MG, some of which may
receive IC projections (Andersen et al., 1980). In these
cases, we conclude that the labeled IC cells project to
higher centers (not necessarily the MG). The possibility
that we have labeled more cells than intended bolstersthe significance of negative findings and supports our
conclusion of limited collateral projections.
Of particular concern for identification of collateral
projections is the choice of tracers. Many fluorescent
tracers are available, however some (e.g., propidium
iodide and Evans Blue) are less sensitive than others
(e.g., Aschoff and Holl€ander, 1982). Even the most
sensitive tracers can show different sensitivity when ap-plied to a particular pathway (Richmond et al., 1994;
Choi et al., 2002). We minimized the limitations of in-
dividual tracers by using a wide variety of tracers and by
altering which tracer was used to examine a particular
pathway. It is unlikely that we missed a large portion of
any of the pathways under study. Injections into the CN
labeled cells throughout the IC in a pattern that was
similar across different tracers and that matched previ-ous descriptions of this pathway in guinea pigs (Syka
et al., 1988; Shore et al., 1991; Schofield, 2001). To the
best of our knowledge, the distribution of IC cells that
project to the MG has not been described in guinea pigs.
Our results, based on very large injections, preclude any
detailed description of this projection (e.g., differential
projections from specific IC subdivisions to specific MG
subdivisions), but suggest that the projection is similarto the projections described in numerous other species
(cat: Morest, 1965; Kudo and Niimi, 1978; tree shrew:
Casseday et al., 1976; Oliver and Hall, 1978; rabbit:
Tarlov and Moore, 1966; mustached bat: Wenstrup
et al., 1994). The large injections combined with the
presence of labeled cells throughout the IC suggest that
we did not miss a substantial portion of the ascendingprojection.
Another issue regarding choice of tracers concerns
the ability to recognize multiple tracers within a single
cell. A common combination is Fast Blue and nuclear
yellow. These tracers are visualized simultaneously with
a single filter set and are distinguished by color and by
subcellular distribution: nuclear yellow is generally
confined to the nucleus whereas Fast Blue is containedin the cytoplasm. However, Aschoff and Holl€ander(1982) concluded that these tracers often were more
diffusely localized and could be difficult to distinguish in
double-label experiments. To avoid this difficulty, we
used only combinations of tracers that are visualized
with different filter sets. We have used these same
combinations in the past and identified large numbers of
double-labeled cells in both the auditory and visualsystems (e.g., Hallman et al., 1988; Schofield and Cant,
1999). We conclude that the tracers and their applica-
tion were adequate to identify collateral projections.
Finally, it was important that the same result occur in
multiple animals in which a large number of cells were
labeled. This concern is relevant with respect to the
earlier study by Hashikawa and Kawamura (1983),
whose results were based on a single animal for each ofthe projection patterns examined. For the present study,
we examined over 29,000 cells in six colliculi, providing
strong support for our conclusions. As with any double-
labeling experiment, it is likely that we have underesti-
mated the number of cells with collateral projections.
However, given the arguments discussed above, we
conclude that the number of cells with collateral pro-
jections is quite small, and that the pathways understudy originate largely from different cells.
4.2. Previous studies of IC collateral projections
We return now to a point raised in Section 1 citing
evidence for IC cells with ascending and descending
(a) MG
CN
0.17%(range: 0-0.61%)
0.28%(range: 0-0.93%)
CN
MG
0.02%(range: 0-0.4%)
0.03%(range: 0-0.06%)
(c)MG
CN
0.05%(range: 0-0.18%)
0.15%(range: 0-0.44%)
(b)
Fig. 6. Schematic summarizing the percentages of IC cells that send collaterals to the MG and CN. (a) Percentages of double-labeled cells that project
to the ipsilateral CN and ipsilateral MG. Sample size¼ 5 colliculi. (b) Percentages of double-labeled cells that project to the contralateral CN and
ipsilateral MG. Sample size¼ 5 colliculi. (c) Percentages of double-labeled cells that project to the ipsilateral CN and contralateral MG. Sample
size¼ 3 colliculi. Percentages are shown as an average, with the range indicated beneath. Projections are shown from the left IC for simplicity. The
dotted line indicates midline.
D.L. Coomes, B.R. Schofield / Hearing Research 191 (2004) 67–78 75

collaterals in rats and guinea pigs (Malmierca et al.,
1996; Reetz and Ehret, 1999). In both studies, the axons
of IC cells were observed to branch within the IC and to
send one branch into the brachium of the IC and one
into the lateral lemniscus. This pattern suggests as-cending and descending collateral projections, but the
targets were not identified because the axons could not
be traced to their destination. These observations were
based on a small sample of cells, but the evidence from
the rats, in particular (Reetz and Ehret, 1999), suggested
that a significant proportion of cells have collateral
projections. If this is the case, the present results suggest
that the branches terminate in some pair of targets otherthan the MG and the CN. Perhaps the ascending branch
terminates in the nucleus of the brachium of the IC,
which was not routinely included in our injection site.
Another possibility is that the descending branch ter-
minates in the superior olivary complex, which receives
a substantial projection from the IC (Huffman and
Henson, 1990; Salda~na, 1993). Further experiments will
be necessary to address these possibilities.Another point raised earlier concerns the ubiquity
of collateral projections from IC cells. Apparently few
cells project to the MG and the CN (present results;
Hashikawa and Kawamura, 1983). Collaterals to the
pons and superior colliculus may also be rare, al-
though this conclusion is based on evidence from a
single animal (Hashikawa and Kawamura, 1983). In
contrast, collateral projections are numerous amongcells that project to the ipsilateral MG and the con-
tralateral IC (Gonz�alez-Hern�andez et al., 1991).
Clearly, collateral projections are more important for
some pathways than for others. Characterization of
these pathways, including their projection patterns as
well as their physiological and neurochemical proper-
ties, will be needed to gain further insight into their
functions.
4.3. Functional implications
As discussed in Section 1, separate cells of origin in-
dicate that two pathways could receive different inputs
and could send different information to their targets.
Many of the inputs to the IC terminate in banded pat-
terns (reviewed by Oliver, 2000). Inputs from differentsources have different degrees of overlap, establishing
‘‘synaptic domains’’ that are characterized by different
combinations of inputs. A cell whose dendrites are re-
stricted to one zone will get different inputs than a cell
whose dendrites are restricted to another zone. To date,
the available data focus on the patterns of termination
of various inputs to the IC with respect to the synaptic
domains. It remains to be determined whether, or how,these domains are related to IC cells that project to a
given extrinsic target. With regard to the current study,
it will be of interest to determine whether cells that
project to the MG occupy the same domains as cells that
project to the CN.
Separate origins of projections also raise the possi-
bility that the pathways send different information to
their targets. This would be an obvious result if the cellsreceive different inputs, but it could also occur if similar
inputs terminate on different cell types that process those
inputs in distinct ways. Multiple cell types have been
distinguished by either morphological or physiological
criteria. Two major classes of IC cells have been iden-
tified morphologically: stellate and disk-shaped (Geniec
and Morest, 1971; Rockel and Jones, 1973a,b; Fitzpa-
trick, 1975; Morest and Oliver, 1984). Both classes havesubtypes, and many of these subtypes appear to project
to the MG (Smith and Spirou, 2002; Oliver, 1984) or the
CN (Schofield, 2001). It remains to be determined
whether the proportions of specific cell types differ for
different pathways. IC cells have also been categorized
physiologically by their responses to acoustic stimuli
(reviewed by Ehret, 1997) or by their intrinsic membrane
properties (Peruzzi et al., 2000; Sivaramakrishnan andOliver, 2001; Bal et al., 2002). Unfortunately, little is
known about how these properties and the associated
physiological classes are related to the extrinsic projec-
tion patterns of IC cells.
Do ascending and descending projections have to
originate from different cells? Given that virtually all
ascending auditory information traverses the IC, the
ascending projections must participate in the majority ofauditory functions. Descending projections are generally
credited with a ‘‘feedback’’ function, whereby higher
levels can influence activity at earlier stages of process-
ing in the ascending auditory pathways. Perhaps the
descending signals are sufficiently different from those in
the ascending pathways that it is necessary to keep the
pathways separate (i.e., no collaterals). It is worth not-
ing that the superior olivary complex, like the IC, is amajor source of ascending and descending projections to
other components of the auditory pathways. A major
target of the ascending olivary projections is the IC, and
these olivocollicular projections arise from different cells
than project to the cochlea or CN (Aschoff and Ostwald,
1988; Schofield, 2002). In other words, ascending and
descending projections from the superior olivary com-
plex arise largely from different populations of cells.While not all ascending and descending pathways have
yet been studied, it appears that separate origins for
ascending and descending projections may be a general
characteristic of auditory pathways.
The present study indicates that ascending and de-
scending projections from the IC originate from differ-
ent cells. As described in Section 1, there are many
additional targets of IC projections, including the su-perior olivary complex, pons and superior colliculus, as
well as a large commissural projection between the two
IC. Clearly, there are many possible combinations of
76 D.L. Coomes, B.R. Schofield / Hearing Research 191 (2004) 67–78

targets that could potentially receive collateral projec-
tions from individual IC cells. In fact, collateral pro-
jections appear to be prominent in projections to the
MG and the contralateral IC (Gonz�alez-Hern�andezet al., 1991). Identifying the projection patterns and theprominence of collateralization will be an important
step toward characterizing the circuits and identifying
their functions.
Acknowledgements
Special thanks to Ark Slusarczyk for assistance with
histology and manuscript preparation. This study was
supported by NIH DC04391 and DC05277.
References
Andersen, R.A., Roth, G.L., Aitkin, L.M., Merzenich, M.M., 1980.
The efferent projections of the central nucleus and the pericentral
nucleus of the inferior colliculus in the cat. J. Comp. Neurol. 194,
649–662.
Aschoff, A., Holl€ander, H., 1982. Fluorescent compounds as retro-
grade tracers compared with horseradish peroxidase (HRP). I. A
parametric study in the central visual system of the albino rat.
J. Neurosci. Methods 6, 179–197.
Aschoff, A., Ostwald, J., 1988. Distribution of cochlear efferents and
olivo-cochlear neurons in the brainstem of rat and guinea pig. Exp.
Brain Res. 71, 241–251.
Bal, R., Green, G.G.R., Rees, A., Sanders, D.J., 2002. Firing patterns
of inferior colliculus neurons-histology and mechanism to change
firing patterns in rat brain slices. Neurosci. Lett. 317, 42–46.
Casseday, J.H., Diamond, I.T., Harting, J.K., 1976. Auditory path-
ways to the cortex in Tupaia glis. J. Comp. Neurol. 166, 303–340.
Choi, D., Li, D., Raisman, G., 2002. Fluorescent retrograde neuronal
tracers that label the rat facial nucleus: a comparison of Fast Blue,
Fluoro-Ruby, Fluoro-Emerald, Fluoro-Gold and DiI. J. Neurosci.
Methods 117, 167–172.
Ehret, G., 1997. The auditory midbrain, a ‘‘shunting yard’’ of
acoustical information processing. In: Ehret, G., Romand, R.
(Eds.), The Central Auditory System. Oxford University Press,
New York, pp. 259–316.
Faye-Lund, H., 1988. Inferior colliculus and related descending
pathways in rat. Upsala J. Med. Sci. 93, 1–17.
Faye-Lund, H., Osen, K.K., 1985. Anatomy of the inferior colliculus
in rat. Anat. Embryol. 171, 1–20.
Fitzpatrick, K.A., 1975. Cellular architecture and topographic orga-
nization of the inferior colliculus of the squirrel monkey. J. Comp.
Neurol. 164, 185–207.
Geniec, P., Morest, D.K., 1971. The neuronal architecture of the
human posterior colliculus. A study with the Golgi method. Acta.
Otolaryngol. Suppl. 295, 1–33.
Glendenning, K.K., Masterton, R.B., 1983. Acoustic chiasm: efferent
projections of the lateral superior olive. J. Neurosci. 3, 1521–1537.
Gonz�alez-Hern�andez, T.H., Galindo-Mireles, D., Casta~neyra-Per-
domo, A., Ferres-Torres, R., 1991. Divergent projections of
projecting neurons of the inferior colliculus to the medial geniculate
body and the contralateral inferior colliculus in the rat. Hear. Res.
52, 17–21.
Hallman, L.E., Schofield, B.R., Lin, C.S., 1988. Dendritic morphology
and axon collaterals of corticotectal, corticopontine, and callosal
neurons in layer V of primary visual cortex of the hooded rat.
J. Comp. Neurol. 272, 149–160.
Hashikawa, T., Kawamura, K., 1983. Retrograde labeling of ascend-
ing and descending neurons in the inferior colliculus. A fluorescent
double labeling study in the cat. Exp. Brain Res. 49, 457–461.
Huffman, R.F., Henson Jr., O.W., 1990. The descending auditory
pathway and acousticomotor systems: connections with the inferior
colliculus. Brain Res. Rev. 15, 295–323.
Kudo, M., Niimi, K., 1978. Ascending projections of the inferior
colliculus onto the medial geniculate body in the cat studied by
anterograde and retrograde tracing techniques. Brain Res. 155,
113–117.
Malmierca, M.S., Le Beau, F.E.N., Rees, A., 1996. The topographical
organization of descending projections from the central nucleus of
the inferior colliculus in guinea pig. Hear. Res. 93, 167–180.
Malmierca, M.S., Rees, A., Le Beau, F.E., Bjaalie, J.G., 1995.
Laminar organization of frequency-defined local axons within
and between the inferior colliculi of the guinea pig. J. Comp.
Neurol. 357, 124–144.
Morest, D.K., 1965. The lateral tegmental system of the midbrain and
the medial geniculate body: study with Golgi and Nauta methods
in cat. J. Anat. 99, 611–634.
Morest, D.K., Oliver, D.L., 1984. The neuronal architecture of the
inferior colliculus in the cat: defining the functional anatomy of the
auditory midbrain. J. Comp. Neurol. 222, 209–236.
Oliver, D.L., 1984. Neuron types in the central nucleus of the inferior
colliculus that project to the medial geniculate body. Neuroscience
11, 409–424.
Oliver, D.L., 2000. Ascending efferent projections of the superior
olivary complex. Microsc. Res. Tech. 51, 355–363.
Oliver, D.L., Hall, W.C., 1978. The medial geniculate body of the tree
shrew, Tupaia glis. I. Cytoarchitecture and midbrain connections.
J. Comp. Neurol. 182, 423–458.
Oliver, D.L., Huerta, M.F., 1992. Inferior and superior colliculi. In:
Webster, D.B., Popper, A.N., Fay, R.R. (Eds.), The Mammalian
Auditory Pathway: Neuroanatomy. Springer, New York, pp. 168–
221.
Oliver, D.L., Kuwada, S., Yin, T.C.T., Haberly, L.B., Henkel, C.K.,
1991. Dendritic and axonal morphology of HRP-injected neurons
in the inferior colliculus of the cat. J. Comp. Neurol. 303, 75–100.
Peruzzi, D., Sivaramakrishnan, S., Oliver, D.L., 2000. Identification of
cell types in brain slices of the inferior colliculus. Neuroscience 101,
403–416.
Reetz, G., Ehret, G., 1999. Inputs from three brainstem sources to
identified neurons of the mouse inferior colliculus slice. Brain Res.
816, 527–543.
Richmond, F.J.R., Gladdy, R., Creasy, J.L., Kitamura, S., Smits, E.,
Thomson, D.B., 1994. Efficacy of seven retrograde tracers, com-
pared in multiple-labelling studies of feline motoneurones.
J. Neurosci. Methods 53, 35–46.
Robertson, D., Cole, K.S., Corbett, K., 1987. Quantitative estimate of
bilaterally projecting medial olivocochlear neurones in the guinea
pig brainstem. Hear. Res. 27, 177–181.
Rockel, A.J., Jones, E.G., 1973a. The neuronal organization of the
inferior colliculus of the adult cat. I. The central nucleus. J. Comp.
Neurol. 147, 11–60.
Rockel, A.J., Jones, E.G., 1973b. The neuronal organization of the
inferior colliculus of the adult cat II. The pericentral nucleus.
J. Comp. Neurol. 149, 301–334.
Salda~na, E., 1993. Descending projections from the inferior colliculus
to the cochlear nuclei in mammals. In: Merchan, M.A. (Ed.), The
Mammalian Cochlear Nuclei: Organization and Function. Plenum
Press, New York, pp. 153–165.
Schofield, B.R., 1991. Superior paraolivary nucleus in the pigmented
guinea pig: separate classes of neurons project to the inferior
colliculus and the cochlear nucleus. J. Comp. Neurol. 312,
68–76.
D.L. Coomes, B.R. Schofield / Hearing Research 191 (2004) 67–78 77

Schofield, B.R., 1994. Projections to the cochlear nuclei from principal
cells in the medial nucleus of the trapezoid body in guinea pigs. J.
Comp. Neurol. 344, 83–100.
Schofield, B.R., 2001. Origins of projections from the inferior
colliculus to the cochlear nucleus in guinea pigs. J. Comp. Neurol.
429, 206–220.
Schofield, B.R., 2002. Ascending and descending projections from the
superior olivary complex in guinea pigs: different cells project to the
cochlear nucleus and the inferior colliculus. J. Comp. Neurol. 453,
217–225.
Schofield, B.R., Cant, N.B., 1992. Organization of the superior olivary
complex in theguineapig: II.Patternsofprojection fromtheperiolivary
nuclei to the inferior colliculus. J. Comp. Neurol. 317, 438–455.
Schofield, B.R., Cant, N.B., 1996. Projections from the
ventral cochlear nucleus to the inferior colliculus and the
contralateral cochlear nucleus in guinea pigs. Hear. Res. 102, 1–14.
Schofield, B.R., Cant, N.B., 1999. Descending auditory pathways:
projections from the inferior colliculus contact superior olivary
cells that project bilaterally to the cochlear nuclei. J. Comp.
Neurol. 409, 210–223.
Schofield, B.R., Perkins, S.A., 1999. Projections from the inferior
colliculus to the cochlear nucleus and the contralateral inferior
colliculus in guinea pigs.Assoc.Res.Otolaryngol.Abst. 19, 221–222.
Shore, S.E., Helfert, R.H., Bledsoe, S.C., Altschuler, R.A., Godfrey,
D.A., 1991. Descending projections to the dorsal and ventral divisions
of the cochlear nucleus in guinea pig. Hear. Res. 52, 255–268.
Sivaramakrishnan, S., Oliver, D.L., 2001. Distinct K currents result in
physiologically distinct cell types in the inferior colliculus of the rat.
J. Neurosci. 21, 2861–2877.
Smith, P.H., 1992. Anatomy and physiology of multipolar cells in the
rat inferior collicular cortex using the in vitro brain slice technique.
J. Neurosci. 12, 3700–3715.
Smith, P.H., Spirou, G.A., 2002. From the cochlea to the cortex and
back. In: Oertel, D., Fay, R.R., Popper, A.N. (Eds.), Integrative
Functions in the Mammalian Auditory Pathway. Springer, New
York, pp. 6–71.
Syka, J., Popel�ar, J., Druga, R., Vlkov�a, A., 1988. Descending central
auditory pathway – structure and function. In: Syka, J., Masterton,
R.B. (Eds.), Auditory Pathway – Structure and Function. Plenum
Press, New York, pp. 279–292.
Tarlov, C.E., Moore, R.Y., 1966. The tecto-thalamic connection in the
brain of the rabbit. J. Comp. Neurol. 126, 403–422.
Wenstrup, J.J., Larue, D.T., Winer, J.A., 1994. Projections of
physiologically defined subdivisions of the inferior colliculus in
the mustached bat: targets in the medial geniculate body and
extrathalamic nuclei. J. Comp. Neurol. 346, 207–236.
Willard, F.H., Martin, G.F., 1984. Collateral innervation of the
inferior colliculus in the North American opossum: a study using
fluorescent markers in a double-label paradigm. Brain Res. 303,
171–182.
Winer, J.A., 1992. The functional architecture of the medial genicu-
late body and the primary auditory cortex. In: Webster,
D.B., Popper, A.N., Fay, R.R. (Eds.), The Mammalian Audi-
tory Pathway: Neuroanatomy. Springer, New York, pp.
222–409.
Winter, I.M., Robertson, D., Cole, K.S., 1989. Descending projections
from auditory brainstem nuclei to the cochlea and cochlear nucleus
of the guinea pig. J. Comp. Neurol. 280, 143–157.
78 D.L. Coomes, B.R. Schofield / Hearing Research 191 (2004) 67–78