A NONREDUNDANT LIST DEVELOPED BY COMBINATION OF FOUR SEPARATE SOURCES*□ S
16
The Human Plasma Proteome A NONREDUNDANT LIST DEVELOPED BY COMBINATION OF FOUR SEPARATE SOURCES* □ S N. Leigh Anderson‡§, Malu Polanski‡, Rembert Pieper¶, Tina Gatlin¶, Radhakrishna S. Tirumalai**, Thomas P. Conrads**, Timothy D. Veenstra**, Joshua N. Adkins‡‡, Joel G. Pounds‡‡, Richard Fagan§§, and Anna Lobley§§ We have merged four different views of the human plasma proteome, based on different methodologies, into a single nonredundant list of 1175 distinct gene products. The methodologies used were 1) literature search for proteins reported to occur in plasma or serum; 2) multidimensional chromatography of proteins followed by two-dimensional electrophoresis and mass spectroscopy (MS) identifica- tion of resolved proteins; 3) tryptic digestion and multidi- mensional chromatography of peptides followed by MS identification; and 4) tryptic digestion and multidimen- sional chromatography of peptides from low-molecular- mass plasma components followed by MS identification. Of 1,175 nonredundant gene products, 195 were included in more than one of the four input datasets. Only 46 appeared in all four. Predictions of signal sequence and transmem- brane domain occurrence, as well as Genome Ontology annotation assignments, allowed characterization of the nonredundant list and comparison of the data sources. The “nonproteomic” literature (468 input proteins) is strongly biased toward signal sequence-containing extracellular proteins, while the three proteomics methods showed a much higher representation of cellular proteins, including nuclear, cytoplasmic, and kinesin complex proteins. Cyto- kines and protein hormones were almost completely absent from the proteomics data (presumably due to low abun- dance), while categories like DNA-binding proteins were almost entirely absent from the literature data (perhaps unexpected and therefore not sought). Most major catego- ries of proteins in the human proteome are represented in plasma, with the distribution at successively deeper layers shifting from mostly extracellular to a distribution more like the whole (primarily cellular) proteome. The resulting non- redundant list confirms the presence of a number of inter- esting candidate marker proteins in plasma and serum. Molecular & Cellular Proteomics 3:311–326, 2004. The human plasma proteome is likely to contain most, if not all, human proteins, as well as proteins derived from some viruses, bacteria, and fungi. Many of the human proteins, introduced by low-level tissue leakage, ought to be present at very low concentrations (pg/ml), while others, such as al- bumin, are present in very large amounts (mg/ml). Numer- ous post-translationally modified forms of each protein are likely to be present, along with literally millions of distinct clonal immunoglobulin (Ig) 1 sequences. This complexity and enormous dynamic range make plasma the most difficult specimen to be dealt with by proteomics (1). At the same time, plasma is the most generally informative proteome from a medical viewpoint. Almost all cells in the body communicate with plasma directly or through extracel- lular or cerebrospinal fluids, and many release at least part of their contents into plasma upon damage or death. Some medical conditions, such as myocardial infarction, are offi- cially defined based on the increase of a specific protein in the plasma (e.g. cardiac troponin-T), and it is difficult to argue convincingly that there is any disease state that does not produce some specific pattern of protein change in the body’s working fluid. This immense diagnostic potential has spurred a rapid acceleration in the search for protein disease markers by a wide variety of proteomics strategies. Current methods of proteomics are only beginning to cat- alog the contents of plasma. Two-dimensional electrophore- sis was able to resolve 40 distinct plasma proteins in 1976 (2), but, because of the dynamic range problem, this number had only grown to 60 in 1992 (3) and is substantially unchanged today, a quarter century later. It is now clear that more than two dimensions of conventional resolution are required to progress beyond this point. Recently, several truly multidi- mensional survey efforts have been mounted, with the result that the number of distinct proteins detected has increased dramatically. Additional dimensions of separation can be in- troduced at any of three levels: a) separation of intact pro- teins, either by specific binding (e.g. subtraction of defined high-abundance proteins) or continuous resolution (e.g. elec- trophoresis or chromatography); b) separation of peptides From ‡The Plasma Proteome Institute, Washington DC 20009- 3450; ¶Large Scale Biology Corporation, Proteomics Division, Ger- mantown, MD 20876; **Laboratory of Proteomics and Analytical Technologies, SAIC-Frederick Inc., National Cancer Institute, Fred- erick, MD 21702-1201; ‡‡Biological Sciences Department, Pacific Northwest National Laboratory, Richland, WA 99352; and §§Inphar- matica Ltd., London, W1T 2NU, United Kingdom Received, November 29, 2003, and in revised form, January 9, 2004 Published, MCP Papers in Press, January 12, 2004, DOI 10.1074/mcp.M300127-MCP200 1 The abbreviations used are: Ig, immunoglobulin; MS, mass spec- trometry; GO, Genome Ontology; 2DE, two-dimensional electro- phoresis; NR, nonredundant; TM, transmembrane; LC, liquid chroma- tography; MS/MS, tandem MS; IT, ion trap. Research © 2004 by The American Society for Biochemistry and Molecular Biology, Inc. Molecular & Cellular Proteomics 3.4 311 This paper is available on line at http://www.mcponline.org
-
Upload
idontknowyet -
Category
Documents
-
view
1 -
download
0
Transcript of A NONREDUNDANT LIST DEVELOPED BY COMBINATION OF FOUR SEPARATE SOURCES*□ S
The Human Plasma ProteomeA NONREDUNDANT LIST DEVELOPED BY COMBINATION OF FOUR SEPARATE SOURCES*□S
N. Leigh Anderson‡§, Malu Polanski‡, Rembert Pieper¶�, Tina Gatlin¶�,Radhakrishna S. Tirumalai**, Thomas P. Conrads**, Timothy D. Veenstra**,Joshua N. Adkins‡‡, Joel G. Pounds‡‡, Richard Fagan§§, and Anna Lobley§§
We have merged four different views of the human plasmaproteome, based on different methodologies, into a singlenonredundant list of 1175 distinct gene products. Themethodologies used were 1) literature search for proteinsreported to occur in plasma or serum; 2) multidimensionalchromatography of proteins followed by two-dimensionalelectrophoresis and mass spectroscopy (MS) identifica-tion of resolved proteins; 3) tryptic digestion and multidi-mensional chromatography of peptides followed by MSidentification; and 4) tryptic digestion and multidimen-sional chromatography of peptides from low-molecular-mass plasma components followed by MS identification. Of1,175 nonredundant gene products, 195 were included inmore than one of the four input datasets. Only 46 appearedin all four. Predictions of signal sequence and transmem-brane domain occurrence, as well as Genome Ontologyannotation assignments, allowed characterization of thenonredundant list and comparison of the data sources. The“nonproteomic” literature (468 input proteins) is stronglybiased toward signal sequence-containing extracellularproteins, while the three proteomics methods showed amuch higher representation of cellular proteins, includingnuclear, cytoplasmic, and kinesin complex proteins. Cyto-kines and protein hormones were almost completely absentfrom the proteomics data (presumably due to low abun-dance), while categories like DNA-binding proteins werealmost entirely absent from the literature data (perhapsunexpected and therefore not sought). Most major catego-ries of proteins in the human proteome are represented inplasma, with the distribution at successively deeper layersshifting from mostly extracellular to a distribution more likethe whole (primarily cellular) proteome. The resulting non-redundant list confirms the presence of a number of inter-esting candidate marker proteins in plasma and serum.Molecular & Cellular Proteomics 3:311–326, 2004.
The human plasma proteome is likely to contain most, if notall, human proteins, as well as proteins derived from someviruses, bacteria, and fungi. Many of the human proteins,introduced by low-level tissue leakage, ought to be present atvery low concentrations (��pg/ml), while others, such as al-bumin, are present in very large amounts (��mg/ml). Numer-ous post-translationally modified forms of each protein arelikely to be present, along with literally millions of distinctclonal immunoglobulin (Ig)1 sequences. This complexity andenormous dynamic range make plasma the most difficultspecimen to be dealt with by proteomics (1).
At the same time, plasma is the most generally informativeproteome from a medical viewpoint. Almost all cells in thebody communicate with plasma directly or through extracel-lular or cerebrospinal fluids, and many release at least part oftheir contents into plasma upon damage or death. Somemedical conditions, such as myocardial infarction, are offi-cially defined based on the increase of a specific protein in theplasma (e.g. cardiac troponin-T), and it is difficult to argueconvincingly that there is any disease state that does notproduce some specific pattern of protein change in the body’sworking fluid. This immense diagnostic potential has spurreda rapid acceleration in the search for protein disease markersby a wide variety of proteomics strategies.
Current methods of proteomics are only beginning to cat-alog the contents of plasma. Two-dimensional electrophore-sis was able to resolve 40 distinct plasma proteins in 1976 (2),but, because of the dynamic range problem, this number hadonly grown to 60 in 1992 (3) and is substantially unchangedtoday, a quarter century later. It is now clear that more thantwo dimensions of conventional resolution are required toprogress beyond this point. Recently, several truly multidi-mensional survey efforts have been mounted, with the resultthat the number of distinct proteins detected has increaseddramatically. Additional dimensions of separation can be in-troduced at any of three levels: a) separation of intact pro-teins, either by specific binding (e.g. subtraction of definedhigh-abundance proteins) or continuous resolution (e.g. elec-trophoresis or chromatography); b) separation of peptides
From ‡The Plasma Proteome Institute, Washington DC 20009-3450; ¶Large Scale Biology Corporation, Proteomics Division, Ger-mantown, MD 20876; **Laboratory of Proteomics and AnalyticalTechnologies, SAIC-Frederick Inc., National Cancer Institute, Fred-erick, MD 21702-1201; ‡‡Biological Sciences Department, PacificNorthwest National Laboratory, Richland, WA 99352; and §§Inphar-matica Ltd., London, W1T 2NU, United Kingdom
Received, November 29, 2003, and in revised form, January 9,2004
Published, MCP Papers in Press, January 12, 2004, DOI10.1074/mcp.M300127-MCP200
1 The abbreviations used are: Ig, immunoglobulin; MS, mass spec-trometry; GO, Genome Ontology; 2DE, two-dimensional electro-phoresis; NR, nonredundant; TM, transmembrane; LC, liquid chroma-tography; MS/MS, tandem MS; IT, ion trap.
Research
© 2004 by The American Society for Biochemistry and Molecular Biology, Inc. Molecular & Cellular Proteomics 3.4 311This paper is available on line at http://www.mcponline.org
derived from plasma proteins, either by specific binding (e.g.capture by anti-peptide antibodies) or continuous resolution(e.g. chromatography); and c) separation of peptides, andparticularly their fragments, by mass spectrometry (MS).Many possible combinations of these dimensions can beimplemented, the only limitations being the effort, cost, andtime of analyzing many fractions or runs instead of one.
In this article, we have compared and combined data fromthree different multi-dimensional strategies with data from afourth, classical source (the protein biochemistry and clinicalchemistry literature) to provide a meta-level overview of boththe contents and the rate of discovery of new components inplasma. The three experimental datasets are derived from 1)whole protein separation by a three-dimensional process (im-munosubtraction/ion exchange/size exclusion) followed bytwo-dimensional electrophoresis (2DE) followed by MS iden-tification of resolved spots (4); 2) Ig subtraction followed bytrypsin digestion followed by two-dimensional liquid chroma-tography (LC) (ion exchange/reversed phase) followed by tan-dem MS (MS/MS) (5); and 3) molecular mass fractionation,followed by trypsin digestion followed by two-dimensional LC(cation exchange/reversed phase) followed by MS/MS (6).These three experimental approaches have two features incommon (the removal of most Igs, by specific subtraction orsize, and the use of MS for molecular identification) but oth-erwise they span the gamut of proteomics discovery ap-proaches: separation at the protein level, separation at thetryptic peptide level, and a hybrid.
Combining experimental data with literature search resultson proteins detected in plasma (representing a large body ofaccumulated “nonproteomics” data) should provide a broadperspective on plasma contents. Because the same proteinsdetected by various methods can be referred to by differentnames or accession numbers, we have used a sequence-based approach to eliminate redundancy and cluster all oc-currences of the same protein. The resulting list makes itpossible to examine the overlap between the various ap-proaches and to see whether they are biased toward partic-ular classes of proteins. In addition, a pooled nonredundantlist should provide a relatively unbiased survey of the kinds ofproteins present in plasma, which could have important diag-nostic implications. Finally, a large list of proteins actuallyobserved in plasma paves the way for top-down, targetedproteomics approaches to the discovery of disease markers:the development of accurate high-throughput specific assaysfor selected candidates from this list, as a supplement to the useof single methods for marker discovery in small sample sets. Inthe longer term, proteins with strong, mechanistic disease rela-tionships may be viable therapeutic candidates as well.
DATA SOURCES AND METHODS
Lit: Literature Search
Manual Medline searches were performed searching for titles orabstracts containing human plasma or serum proteins, excluding
articles on membranes, stimulation, drug, and dose. A total of 468entries were collected, of which 458 had a human sequence acces-sion number in one or more of the major databases.
2DEMS: Separation of Serum Proteins(LC3/2-DE) � MS/MS Identification
Intact proteins were fractionated by chromatography and 2DE andidentified by MS, generating the dataset described by Pieper et al. (7).Briefly, human blood sera were obtained in equal volumes from twohealthy male donors (ages 40 and 80). Albumin, haptoglobin, trans-ferrin, transthyretin, �-1-anti trypsin, �-1-acid glycoprotein, he-mopexin, and �-2-macroglobulin were removed by immunoaffinitychromatography. The immunoaffinity-subtracted serum concentratewas fractionated further by sequential anion exchange and size ex-clusion chromatography. The resulting 66 samples were individuallysubjected to 2DE. All visible Coomassie Blue R250 spots were cutout, destained, reduced, alkylated, and digested with trypsin. Allextracted peptides were analyzed by matrix-assisted laser desorp-tion/ionization time-of-flight (MALDI-TOF) on a Bruker Biflex orAutoflex mass spectrometer (Bruker, Billerica, MA) and searchedagainst Swiss-Prot. Those samples that did not give positive identi-fication by MALDI-TOF where subjected to LC-MS/MS analysis by iontrap (IT) MS (Thermo Finnegan LCQ, Woburn, MA) and searchedagainst the National Center for Biotechnology Information (NCBI)database using SEQUEST.
LCMS1: Separation of Peptide Digests of SerumMinus Ig (LC2) � MS/MS Identification
A published dataset prepared by Adkins et al., (5) was used. Briefly,human blood serum was obtained from a healthy anonymous femaledonor. Igs were depleted by affinity adsorption chromatography usingprotein A/G. The resulting Ig-depleted plasma was digested withtrypsin and separated by strong cation exchange on a polysulfoethylA column followed by reverse-phase separation on a capillary C18column. The capillary column was interfaced to an IT-MS (ThermoFinnigan LCQ Deca XP) using electrospray ionization. The IT-MS wasconfigured to perform MS/MS scans on the three most intense pre-cursor masses from a single MS scan. All samples were measuredover a mass/charge (m/z) range of 400–2,000, with fractions contain-ing high complexity being measured with segmented m/z ranges.Tandem mass spectra were analyzed by SEQUEST as describedusing the NCBI May 2002 database.
LCMS2: Separation of Peptide Digests of Low-Molecular-MassSerum Proteins (LC2) � MS/MS Identification
The fourth dataset is that described by Tirumalai et al. (6), focusedon the lower-molecular-mass plasma proteome. Briefly standard hu-man serum was purchased from the National Institute of Standardsand Technology. High-molecular-mass proteins were removed in thepresence of acetonitrile using Centriplus centrifugal filters with amolecular mass cutoff of 30 kDa. The low-molecular-mass filtrate wasreduced, alkylated, and digested with trypsin. The digested samplewas fractionated by strong cation exchange chromatography on apolysulfoethyl A column. Reversed-phase LC was subsequently per-formed on 300A Jupiter C-18 column coupled on line to an IT-MS(Thermo Finnegan LCQ Deca XP). Each full MS scan was followed bythree MS/MS scans where the three most abundant peptide molec-ular ions were selected. MS/MS spectra were searched against the ahuman protein database using SEQUEST.
Bioinformatics
Sequence Clustering—The Blastp protein comparison algorithm (8,9) was used to query the sequence of each protein identified against
Nonredundant Human Plasma Proteome
312 Molecular & Cellular Proteomics 3.4
a database containing the aggregate sequences of all proteins iden-tified by any method. Sequences sharing greater than 95% identityover an aligned region were grouped into “unique sequence clusters.”Sequences were unmasked, and the minimum alignment length con-sidered was 15 aa. This similarity-based approach was sufficient togroup identical sequences, sequence fragments, and splice variants.Annotation in the nonredundant table was reported for the “bestannotated” protein in the cluster set.
Signal Peptide Prediction—Signal peptides were predicted usingthe commercially available SignalP version 2.0 neural net and hiddenMarkov model (HMM) algorithms (10) and sigmask (11) signal mask-ing program developed as part of Inpharmatica’s Biopendium (12)protein annotation database. Each sequence received a score of �1for a statistically significant positive signal peptide prediction fromany of the three algorithms. The scores 0, 1, 2, and 3 for a particularsequence were then converted to qualitative terms “no,” “possiblesignal,” “signal,” or “signal confident,” respectively.
Transmembrane Prediction—Transmembrane (TM) regions werepredicted using the commercial version of TMHMM version 2.0 algo-rithm (13). The total number of TM helices predicted per sequencewas reported for each protein sequence. When a predicted TM regionoverlapped a predicted signal sequence (as it did in 40 cases inH_Plasma_NR_v2), this was interpreted as a signal sequence only.
Structural and Sequence-based Domain Annotation—Sequenceswere scanned against a library of BioPendium and iPSI-BLAST (9,11)-like protein profiles constructed from SCOP (14), PFAM (15),PRINTS (16), and PROSITE (17) domain families. Hits to these profileswere reported at a statistical e-value cut-off of 1e-5. This cut-off waschosen to maximize profile coverage and minimize the occurrence offalse positives. Sequences were not masked for low complexity orcoiled coils prior to profile scanning.
Gene Ontology (GO) Term Annotation—NCBI GI number acces-sions for the sequences were matched to their SPTR (18) equivalentsbased on sequences sharing �95% sequence identity over 90% ofthe query sequence length. GO (19) component, process, and func-tion terms were then extracted from text-based annotation files avail-able for download from the GO database ftp site: ftp.geneontology.org/pub/go/gene-associations/gene_association.goa_human. Forgraphical reporting, a series of GO terms in each category wereextracted by text searching of relevant keywords (indicated by thecategory names on plots) through all the assigned GO definitions. AGO component summary for the whole human proteome was pre-pared by applying the same approach to the complete GO humandatabase referred to above.
Database Assembly—The nonredundant (NR) plasma databasewas assembled as a series of tables in a PostgreSQL relationaldatabase and queried to derive summary statistics for tables andfigures shown here.
RESULTS
Number of Distinct Proteins Detected in Plasma, and theNature of Nonredundancy
Four sets of accession numbers for proteins occurring inplasma (468 from Lit, 319 from 2DEMS, 607 [reported as 490nonredundant accessions] from LCMS1, and 341 fromLCMS2) were combined to yield 1,735 total initial accessions(Table I). A total of 55 of the input accessions referred tononhuman sequences, and these were not considered furtherin the present analysis. A very conservative method of select-ing distinct proteins was used in order to avoid countingsequence variants, splice variants, or cleavage products ofone gene product as different: any sequences that shared a
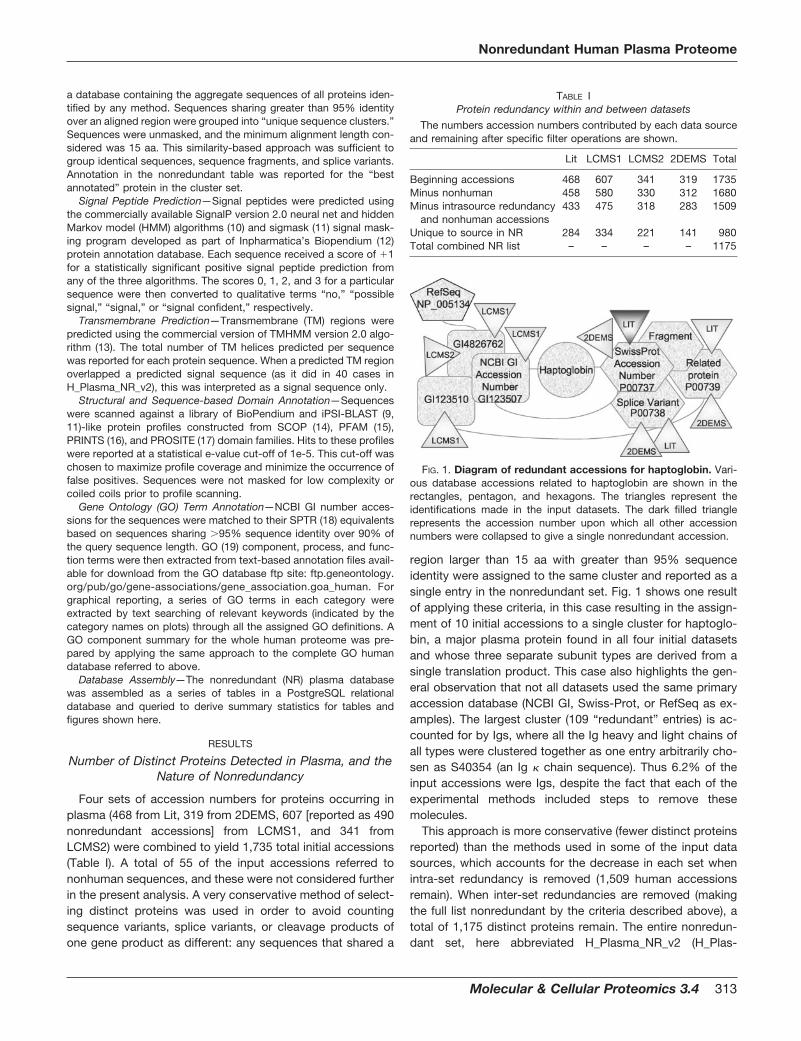
region larger than 15 aa with greater than 95% sequenceidentity were assigned to the same cluster and reported as asingle entry in the nonredundant set. Fig. 1 shows one resultof applying these criteria, in this case resulting in the assign-ment of 10 initial accessions to a single cluster for haptoglo-bin, a major plasma protein found in all four initial datasetsand whose three separate subunit types are derived from asingle translation product. This case also highlights the gen-eral observation that not all datasets used the same primaryaccession database (NCBI GI, Swiss-Prot, or RefSeq as ex-amples). The largest cluster (109 “redundant” entries) is ac-counted for by Igs, where all the Ig heavy and light chains ofall types were clustered together as one entry arbitrarily cho-sen as S40354 (an Ig � chain sequence). Thus 6.2% of theinput accessions were Igs, despite the fact that each of theexperimental methods included steps to remove thesemolecules.
This approach is more conservative (fewer distinct proteinsreported) than the methods used in some of the input datasources, which accounts for the decrease in each set whenintra-set redundancy is removed (1,509 human accessionsremain). When inter-set redundancies are removed (makingthe full list nonredundant by the criteria described above), atotal of 1,175 distinct proteins remain. The entire nonredun-dant set, here abbreviated H_Plasma_NR_v2 (H_Plas-
FIG. 1. Diagram of redundant accessions for haptoglobin. Vari-ous database accessions related to haptoglobin are shown in therectangles, pentagon, and hexagons. The triangles represent theidentifications made in the input datasets. The dark filled trianglerepresents the accession number upon which all other accessionnumbers were collapsed to give a single nonredundant accession.
TABLE IProtein redundancy within and between datasets
The numbers accession numbers contributed by each data sourceand remaining after specific filter operations are shown.
Lit LCMS1 LCMS2 2DEMS Total
Beginning accessions 468 607 341 319 1735Minus nonhuman 458 580 330 312 1680Minus intrasource redundancy
and nonhuman accessions433 475 318 283 1509
Unique to source in NR 284 334 221 141 980Total combined NR list – – – – 1175
Nonredundant Human Plasma Proteome
Molecular & Cellular Proteomics 3.4 313
ma_NR_v1 being Table I of Ref. 1), is provided as a supple-mental data table. Of these, a total of 980 occur in only onesource. Because so many entries occur only once, and giventhe non-zero frequency of false MS identifications, independ-ent confirmation will be required to validate most of this list astrue plasma components.
Protein Coverage by Data Source
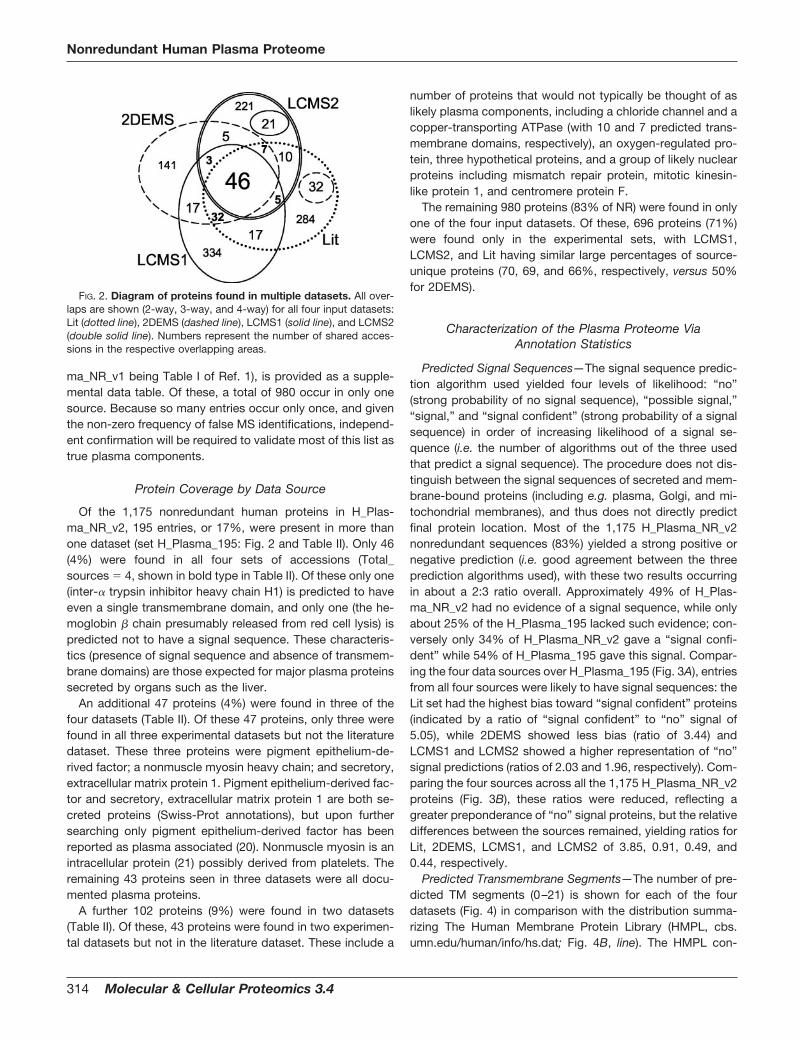
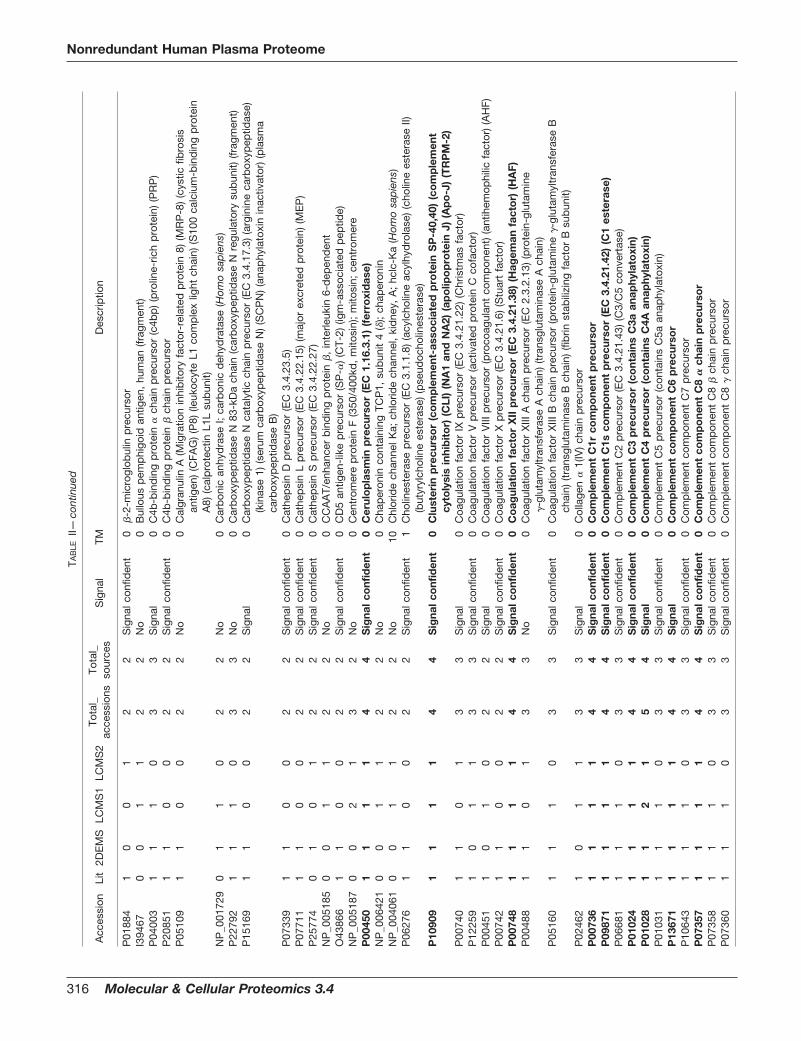
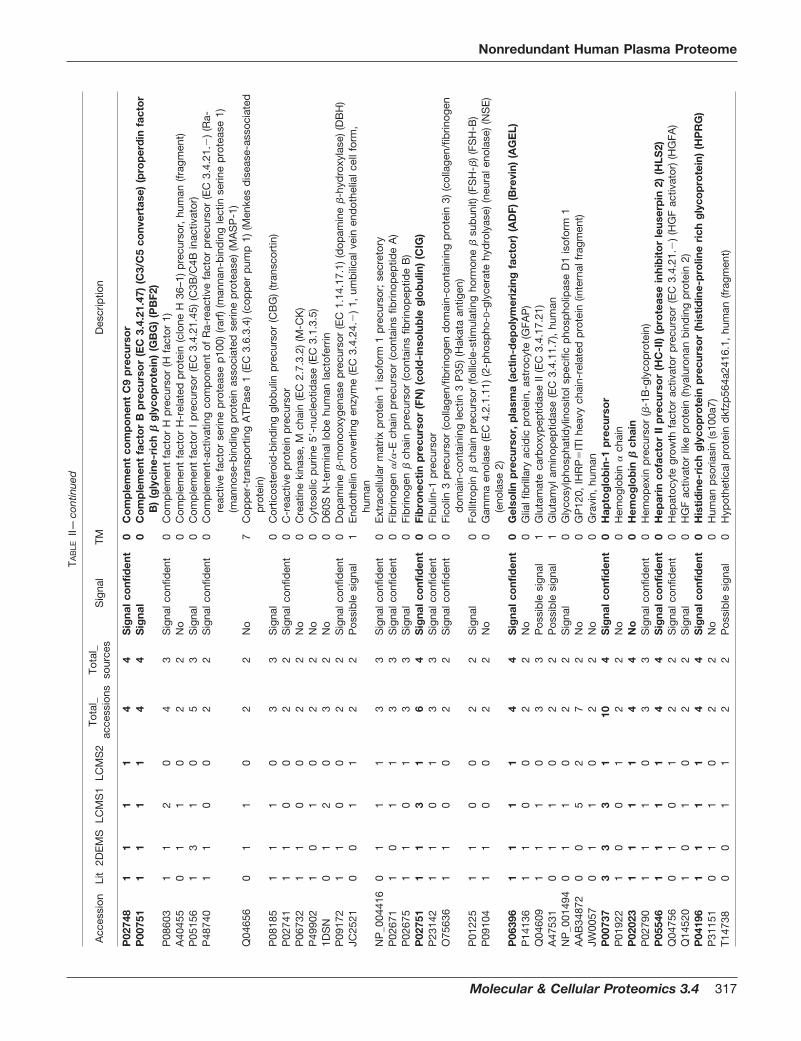
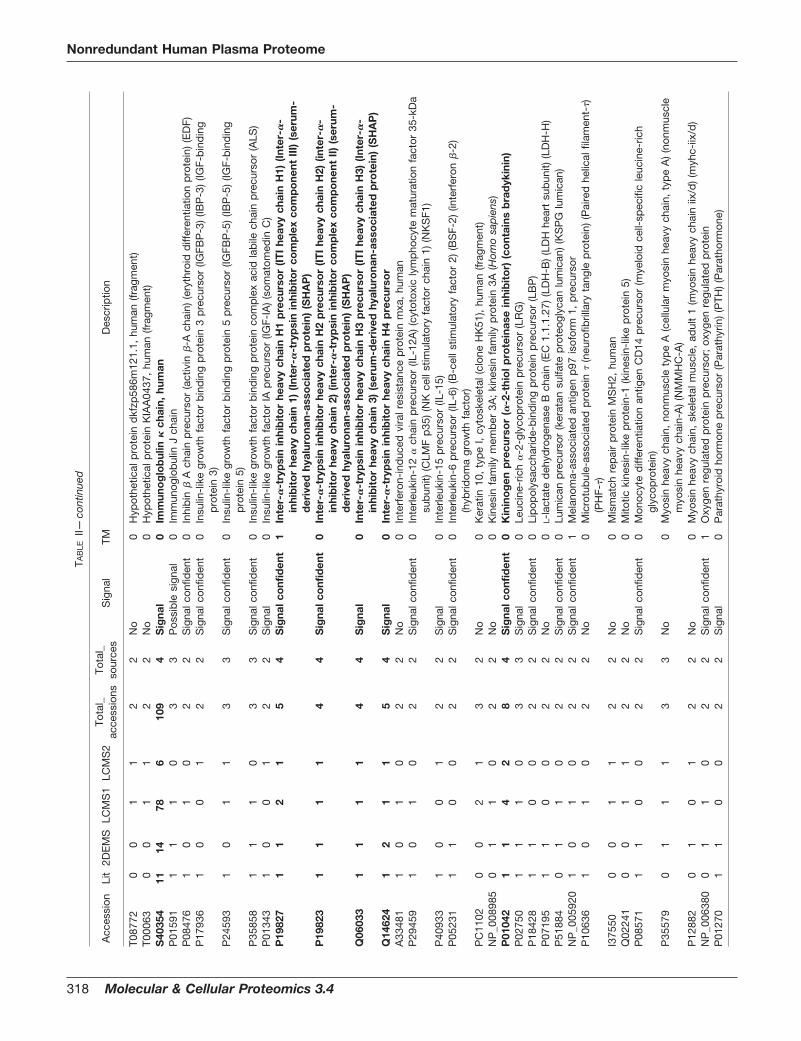
Of the 1,175 nonredundant human proteins in H_Plas-ma_NR_v2, 195 entries, or 17%, were present in more thanone dataset (set H_Plasma_195: Fig. 2 and Table II). Only 46(4%) were found in all four sets of accessions (Total_sources � 4, shown in bold type in Table II). Of these only one(inter-� trypsin inhibitor heavy chain H1) is predicted to haveeven a single transmembrane domain, and only one (the he-moglobin � chain presumably released from red cell lysis) ispredicted not to have a signal sequence. These characteris-tics (presence of signal sequence and absence of transmem-brane domains) are those expected for major plasma proteinssecreted by organs such as the liver.
An additional 47 proteins (4%) were found in three of thefour datasets (Table II). Of these 47 proteins, only three werefound in all three experimental datasets but not the literaturedataset. These three proteins were pigment epithelium-de-rived factor; a nonmuscle myosin heavy chain; and secretory,extracellular matrix protein 1. Pigment epithelium-derived fac-tor and secretory, extracellular matrix protein 1 are both se-creted proteins (Swiss-Prot annotations), but upon furthersearching only pigment epithelium-derived factor has beenreported as plasma associated (20). Nonmuscle myosin is anintracellular protein (21) possibly derived from platelets. Theremaining 43 proteins seen in three datasets were all docu-mented plasma proteins.
A further 102 proteins (9%) were found in two datasets(Table II). Of these, 43 proteins were found in two experimen-tal datasets but not in the literature dataset. These include a
number of proteins that would not typically be thought of aslikely plasma components, including a chloride channel and acopper-transporting ATPase (with 10 and 7 predicted trans-membrane domains, respectively), an oxygen-regulated pro-tein, three hypothetical proteins, and a group of likely nuclearproteins including mismatch repair protein, mitotic kinesin-like protein 1, and centromere protein F.
The remaining 980 proteins (83% of NR) were found in onlyone of the four input datasets. Of these, 696 proteins (71%)were found only in the experimental sets, with LCMS1,LCMS2, and Lit having similar large percentages of source-unique proteins (70, 69, and 66%, respectively, versus 50%for 2DEMS).
Characterization of the Plasma Proteome ViaAnnotation Statistics
Predicted Signal Sequences—The signal sequence predic-tion algorithm used yielded four levels of likelihood: “no”(strong probability of no signal sequence), “possible signal,”“signal,” and “signal confident” (strong probability of a signalsequence) in order of increasing likelihood of a signal se-quence (i.e. the number of algorithms out of the three usedthat predict a signal sequence). The procedure does not dis-tinguish between the signal sequences of secreted and mem-brane-bound proteins (including e.g. plasma, Golgi, and mi-tochondrial membranes), and thus does not directly predictfinal protein location. Most of the 1,175 H_Plasma_NR_v2nonredundant sequences (83%) yielded a strong positive ornegative prediction (i.e. good agreement between the threeprediction algorithms used), with these two results occurringin about a 2:3 ratio overall. Approximately 49% of H_Plas-ma_NR_v2 had no evidence of a signal sequence, while onlyabout 25% of the H_Plasma_195 lacked such evidence; con-versely only 34% of H_Plasma_NR_v2 gave a “signal confi-dent” while 54% of H_Plasma_195 gave this signal. Compar-ing the four data sources over H_Plasma_195 (Fig. 3A), entriesfrom all four sources were likely to have signal sequences: theLit set had the highest bias toward “signal confident” proteins(indicated by a ratio of “signal confident” to “no” signal of5.05), while 2DEMS showed less bias (ratio of 3.44) andLCMS1 and LCMS2 showed a higher representation of “no”signal predictions (ratios of 2.03 and 1.96, respectively). Com-paring the four sources across all the 1,175 H_Plasma_NR_v2proteins (Fig. 3B), these ratios were reduced, reflecting agreater preponderance of “no” signal proteins, but the relativedifferences between the sources remained, yielding ratios forLit, 2DEMS, LCMS1, and LCMS2 of 3.85, 0.91, 0.49, and0.44, respectively.
Predicted Transmembrane Segments—The number of pre-dicted TM segments (0–21) is shown for each of the fourdatasets (Fig. 4) in comparison with the distribution summa-rizing The Human Membrane Protein Library (HMPL, cbs.umn.edu/human/info/hs.dat; Fig. 4B, line). The HMPL con-
FIG. 2. Diagram of proteins found in multiple datasets. All over-laps are shown (2-way, 3-way, and 4-way) for all four input datasets:Lit (dotted line), 2DEMS (dashed line), LCMS1 (solid line), and LCMS2(double solid line). Numbers represent the number of shared acces-sions in the respective overlapping areas.
Nonredundant Human Plasma Proteome
314 Molecular & Cellular Proteomics 3.4

TAB
LEII
Pla
sma
pro
tein
sd
etec
ted
inat
leas
ttw
od
atas
ets
The
tab
lep
rese
nts
ano
nred
und
ant
list
of19
5p
rote
ins
foun
din
atle
ast
two
ofth
efo
urin
put
dat
aso
urce
s,al
pha
bet
ized
by
pro
tein
des
crip
tion
(con
tain
ing
nam
ean
dsy
nony
ms)
.E
ntrie
sfo
und
inal
lfou
rd
ata
sour
ces
are
show
nin
bol
d.
Lit,
2DE
MS
,LC
MS
1,an
dLC
MS
2co
lum
nsgi
veth
enu
mb
erof
acce
ssio
nsin
each
orig
inal
dat
ase
tth
atw
ere
assi
gned
toea
chN
Ren
try.
Thes
ear
esu
mm
edac
ross
the
dat
aso
urce
sto
yiel
dTo
tal_
acce
ssio
ns.T
otal
_sou
rces
sum
mar
izes
the
num
ber
ofso
urce
s(h
ere
rang
ing
from
2to
4)in
whi
chth
een
try
was
foun
d.S
igna
lpro
vid
eson
eof
four
pos
sib
leva
lues
resu
lting
from
the
sign
alse
que
nce
pre
dic
tion
pro
ced
ure.
TMgi
ves
the
pre
dic
ted
num
ber
oftr
ansm
emb
rane
segm
ents
inth
ep
rote
in.
Acc
essi
onLi
t2D
EM
SLC
MS
1LC
MS
2To
tal_
acce
ssio
nsTo
tal_
sour
ces
Sig
nal
TMD
escr
iptio
n
P10
809
10
11
33
No
060
-kD
ahe
atsh
ock
pro
tein
,m
itoch
ond
rialp
recu
rsor
(Hsp
60)
(60-
kDa
chap
eron
in)
(CP
N60
)(H
eat
shoc
kp
rote
in60
)(H
SP
-60)
(mito
chon
dria
lmat
rixp
rote
inP
1)(P
60ly
mp
hocy
tep
rote
in)
(huc
ha60
)A
AB
2704
50
01
12
2P
ossi
ble
sign
al0
70-k
Da
per
oxis
omal
mem
bra
nce
pro
tein
hom
olog
(inte
rnal
frag
men
t)P
0257
02
40
28
3N
o0
Act
in,
cyto
pla
smic
1(�
-act
in)
Q15
848
11
00
22
Sig
nalc
onfid
ent
0A
dip
onec
tinp
recu
rsor
(30-
kDa
adip
ocyt
eco
mp
lem
ent-
rela
ted
pro
tein
)(A
CR
P30
)(a
dip
ose
mos
tab
und
ant
gene
tran
scrip
t1)
(ap
m-1
)(g
elat
in-b
ind
ing
pro
tein
)N
P_0
0112
40
11
02
2S
igna
lcon
fiden
t0
Afa
min
pre
curs
or;
�-a
lbum
in(H
omo
sap
iens
)P
0276
31
11
03
3S
igna
lcon
fiden
t0
�-1
-aci
dgl
ycop
rote
in1
pre
curs
or(A
GP
1)(o
roso
muc
oid
1)(O
MD
1)P
0101
11
12
04
3S
igna
lcon
fiden
t0
�-1
-ant
ichy
mot
ryp
sin
pre
curs
or(A
CT)
P01
009
11
11
44
Sig
nalc
onf
iden
t0
�-1
-ant
itry
psi
np
recu
rso
r(�
-1p
rote
ase
inhi
bit
or)
(�-1
-ant
ipro
tein
ase)
(PR
O06
84/
PR
O22
09)
P04
217
11
10
33
No
0�
-1B
-gly
cop
rote
inp
recu
rsor
(�-1
-Bgl
ycop
rote
in)
P08
697
11
11
44
Sig
nal
0�
-2-a
ntip
lasm
inp
recu
rso
r(�
-2-p
lasm
inin
hib
ito
r)(�
-2-P
I)(�
-2-A
P)
P02
765
11
11
44
Sig
nalc
onf
iden
t0
�-2
-HS
-gly
cop
rote
inp
recu
rso
r(F
etui
n-A
)(�
-2-Z
-glo
bul
in)
(Ba-
�-2
-gly
cop
rote
in)
(PR
O27
43)
P01
023
11
21
54
Sig
nalc
onf
iden
t0
�-2
-mac
rog
lob
ulin
pre
curs
or
(�-2
-M)
P02
760
11
10
33
Sig
nalc
onfid
ent
0A
MB
Pp
rote
inp
recu
rsor
[con
tain
s�
-1-m
icro
glob
ulin
(pro
tein
HC
)(c
omp
lex-
form
ing
glyc
opro
tein
hete
roge
neou
sin
char
ge)
(�-1
mic
rogl
ycop
rote
in);
inte
r-�
-try
psi
nin
hib
itor
light
chai
n(IT
I-LC
)(b
ikun
in)
(HI-
30)]
P01
019
11
11
44
Sig
nal
0A
ngio
tens
ino
gen
pre
curs
or
[co
ntai
nsan
gio
tens
inI
(Ang
I);an
gio
tens
inII
(Ang
II);
ang
iote
nsin
III(A
ngIII
)(D
es-A
sp[1
]-an
gio
tens
inII)
]P
0100
81
11
14
4S
igna
l0
Ant
ithr
om
bin
-III
pre
curs
or
(AT
III)
(PR
O03
09)
P02
647
11
22
64
Sig
nalc
onf
iden
t0
Ap
olip
op
rote
inA
-Ip
recu
rso
r(A
po
-AI)
P02
652
11
11
44
Sig
nalc
onf
iden
t0
Ap
olip
op
rote
inA
-II
pre
curs
or
(Ap
o-A
II)(a
po
a-II)
P06
727
11
12
54
Sig
nalc
onf
iden
t0
Ap
olip
op
rote
inA
-IV
pre
curs
or
(Ap
o-A
IV)
P04
114
11
20
43
Sig
nalc
onfid
ent
0A
pol
ipop
rote
inB
-100
pre
curs
or(A
po
B-1
00)
[con
tain
s:ap
olip
opro
tein
B-4
8(A
po
B-4
8)]
P02
655
11
11
44
Sig
nalc
onf
iden
t0
Ap
olip
op
rote
inC
-II
pre
curs
or
(Ap
o-C
II)P
0265
61
11
14
4S
igna
lco
nfid
ent
0A
po
lipo
pro
tein
C-I
IIp
recu
rso
r(A
po
-CIII
)P
0509
01
11
14
4S
igna
lco
nfid
ent
0A
po
lipo
pro
tein
Dp
recu
rso
r(A
po
-D)
(ap
od
)P
0264
91
32
17
4S
igna
lco
nfid
ent
0A
po
lipo
pro
tein
Ep
recu
rso
r(A
po
-E)
Q13
790
11
11
44
Sig
nalc
onf
iden
t0
Ap
olip
op
rote
inF
pre
curs
or
(Ap
o-F
)O
1479
11
11
14
4S
igna
l0
Ap
olip
op
rote
inL1
pre
curs
or
(ap
olip
op
rote
inL-
I)(a
po
lipo
pro
tein
L)(a
po
l-I)
(Ap
o-L
)(a
po
l)P
0851
91
01
02
2S
igna
l0
Ap
olip
opro
tein
(a)
pre
curs
or(E
C3.
4.21
.�)
(Ap
o(a)
)(L
p(a
))P
0657
60
11
02
2P
ossi
ble
sign
al0
ATP
synt
hase
�ch
ain,
mito
chon
dria
lpre
curs
or(E
C3.
6.3.
14)
P01
160
10
10
22
Sig
nalc
onfid
ent
0A
tria
lnat
riure
ticfa
ctor
pre
curs
or(A
NF)
(atr
ialn
atriu
retic
pep
tide)
(AN
P)
(pre
pro
natr
iod
ilatin
)[c
onta
ins:
card
iod
ilatin
-rel
ated
pep
tide
(CD
P)]
P02
749
11
11
44
Sig
nalc
onf
iden
t0
�-2
-gly
cop
rote
inI
pre
curs
or
(ap
olip
op
rote
inH
)(A
po
-H)
(B2G
PI)
(�(2
)GP
I)(a
ctiv
ated
pro
tein
C-b
ind
ing
pro
tein
)(A
PC
inhi
bit
or)
Nonredundant Human Plasma Proteome
Molecular & Cellular Proteomics 3.4 315
TAB
LEII—
cont
inue
d
Acc
essi
onLi
t2D
EM
SLC
MS
1LC
MS
2To
tal_
acce
ssio
nsTo
tal_
sour
ces
Sig
nal
TMD
escr
iptio
n
P01
884
10
01
22
Sig
nalc
onfid
ent
0�
-2-m
icro
glob
ulin
pre
curs
orI3
9467
00
11
22
No
0B
ullo
usp
emp
higo
idan
tigen
,hu
man
(frag
men
t)P
0400
31
11
03
3S
igna
l0
C4b
-bin
din
gp
rote
in�
chai
np
recu
rsor
(c4b
p)
(pro
line-
rich
pro
tein
)(P
RP
)P
2085
11
10
02
2S
igna
lcon
fiden
t0
C4b
-bin
din
gp
rote
in�
chai
np
recu
rsor
P05
109
11
00
22
No
0C
algr
anul
inA
(Mig
ratio
nin
hib
itory
fact
or-r
elat
edp
rote
in8)
(MR
P-8
)(c
ystic
fibro
sis
antig
en)
(CFA
G)
(P8)
(leuk
ocyt
eL1
com
ple
xlig
htch
ain)
(S10
0ca
lciu
m-b
ind
ing
pro
tein
A8)
(cal
pro
tect
inL1
Lsu
bun
it)N
P_0
0172
90
11
02
2N
o0
Car
bon
ican
hyd
rase
I;ca
rbon
icd
ehyd
rata
se(H
omo
sap
iens
)P
2279
21
11
03
3N
o0
Car
box
ypep
tidas
eN
83-k
Da
chai
n(c
arb
oxyp
eptid
ase
Nre
gula
tory
sub
unit)
(frag
men
t)P
1516
91
10
02
2S
igna
l0
Car
box
ypep
tidas
eN
cata
lytic
chai
np
recu
rsor
(EC
3.4.
17.3
)(a
rgin
ine
carb
oxyp
eptid
ase)
(kin
ase
1)(s
erum
carb
oxyp
eptid
ase
N)
(SC
PN
)(a
nap
hyla
toxi
nin
activ
ator
)(p
lasm
aca
rbox
ypep
tidas
eB
)P
0733
91
10
02
2S
igna
lcon
fiden
t0
Cat
hep
sin
Dp
recu
rsor
(EC
3.4.
23.5
)P
0771
11
10
02
2S
igna
lcon
fiden
t0
Cat
hep
sin
Lp
recu
rsor
(EC
3.4.
22.1
5)(m
ajor
excr
eted
pro
tein
)(M
EP
)P
2577
40
10
12
2S
igna
lcon
fiden
t0
Cat
hep
sin
Sp
recu
rsor
(EC
3.4.
22.2
7)N
P_0
0518
50
01
12
2N
o0
CC
AA
T/en
hanc
erb
ind
ing
pro
tein
�,
inte
rleuk
in6-
dep
end
ent
O43
866
11
00
22
Sig
nalc
onfid
ent
0C
D5
antig
en-l
ike
pre
curs
or(S
P-�
)(C
T-2)
(igm
-ass
ocia
ted
pep
tide)
NP
_005
187
00
21
32
No
0C
entr
omer
ep
rote
inF
(350
/400
kd,
mito
sin)
;m
itosi
n;ce
ntro
mer
eP
0045
01
11
14
4S
igna
lco
nfid
ent
0C
erul
op
lasm
inp
recu
rso
r(E
C1.
16.3
.1)
(fer
roxi
das
e)N
P_0
0642
10
01
12
2N
o0
Cha
per
onin
cont
aini
ngTC
P1,
sub
unit
4(�
);ch
aper
onin
NP
_004
061
00
11
22
No
10C
hlor
ide
chan
nelK
a;ch
lorid
ech
anne
l,ki
dne
y,A
;hc
lc-K
a(H
omo
sap
iens
)P
0627
61
10
02
2S
igna
lcon
fiden
t1
Cho
lines
tera
sep
recu
rsor
(EC
3.1.
1.8)
(acy
lcho
line
acyl
hyd
rola
se)
(cho
line
este
rase
II)(b
utyr
ylch
olin
ees
tera
se)
(pse
udoc
holin
este
rase
)P
1090
91
11
14
4S
igna
lco
nfid
ent
0C
lust
erin
pre
curs
or
(co
mp
lem
ent-
asso
ciat
edp
rote
inS
P-4
0,40
)(c
om
ple
men
tcy
toly
sis
inhi
bit
or)
(CLI
)(N
A1
and
NA
2)(a
po
lipo
pro
tein
J)(A
po
-J)
(TR
PM
-2)
P00
740
11
01
33
Sig
nal
0C
oagu
latio
nfa
ctor
IXp
recu
rsor
(EC
3.4.
21.2
2)(C
hris
tmas
fact
or)
P12
259
10
11
33
Sig
nalc
onfid
ent
0C
oagu
latio
nfa
ctor
Vp
recu
rsor
(act
ivat
edp
rote
inC
cofa
ctor
)P
0045
11
01
02
2S
igna
l0
Coa
gula
tion
fact
orV
IIIp
recu
rsor
(pro
coag
ulan
tco
mp
onen
t)(a
ntih
emop
hilic
fact
or)
(AH
F)P
0074
21
10
02
2S
igna
lcon
fiden
t0
Coa
gula
tion
fact
orX
pre
curs
or(E
C3.
4.21
.6)
(Stu
art
fact
or)
P00
748
11
11
44
Sig
nalc
onf
iden
t0
Co
agul
atio
nfa
cto
rX
IIp
recu
rso
r(E
C3.
4.21
.38)
(Hag
eman
fact
or)
(HA
F)P
0048
81
10
13
3N
o0
Coa
gula
tion
fact
orX
IIIA
chai
np
recu
rsor
(EC
2.3.
2.13
)(p
rote
in-g
luta
min
e�-g
luta
myl
tran
sfer
ase
Ach
ain)
(tran
sglu
tam
inas
eA
chai
n)P
0516
01
11
03
3S
igna
lcon
fiden
t0
Coa
gula
tion
fact
orX
IIIB
chai
np
recu
rsor
(pro
tein
-glu
tam
ine
�-g
luta
myl
tran
sfer
ase
Bch
ain)
(tran
sglu
tam
inas
eB
chai
n)(fi
brin
stab
ilizi
ngfa
ctor
Bsu
bun
it)P
0246
21
01
13
3S
igna
l0
Col
lage
n�
1(IV
)ch
ain
pre
curs
orP
0073
61
11
14
4S
igna
lco
nfid
ent
0C
om
ple
men
tC
1rco
mp
one
ntp
recu
rso
rP
0987
11
11
14
4S
igna
lco
nfid
ent
0C
om
ple
men
tC
1sco
mp
one
ntp
recu
rso
r(E
C3.
4.21
.42)
(C1
este
rase
)P
0668
11
11
03
3S
igna
lcon
fiden
t0
Com
ple
men
tC
2p
recu
rsor
(EC
3.4.
21.4
3)(C
3/C
5co
nver
tase
)P
0102
41
11
14
4S
igna
lco
nfid
ent
0C
om
ple
men
tC
3p
recu
rso
r(c
ont
ains
C3a
anap
hyla
toxi
n)P
0102
81
12
15
4S
igna
l0
Co
mp
lem
ent
C4
pre
curs
or
(co
ntai
nsC
4Aan
aphy
lato
xin)
P01
031
11
10
33
Sig
nalc
onfid
ent
0C
omp
lem
ent
C5
pre
curs
or(c
onta
ins
C5a
anap
hyla
toxi
n)P
1367
11
11
14
4S
igna
l0
Co
mp
lem
ent
com
po
nent
C6
pre
curs
or
P10
643
11
10
33
Sig
nalc
onfid
ent
0C
omp
lem
ent
com
pon
ent
C7
pre
curs
orP
0735
71
11
14
4S
igna
lco
nfid
ent
0C
om
ple
men
tco
mp
one
ntC
8�
chai
np
recu
rso
rP
0735
81
11
03
3S
igna
lcon
fiden
t0
Com
ple
men
tco
mp
onen
tC
8�
chai
np
recu
rsor
P07
360
11
10
33
Sig
nalc
onfid
ent
0C
omp
lem
ent
com
pon
ent
C8
�ch
ain
pre
curs
or
Nonredundant Human Plasma Proteome
316 Molecular & Cellular Proteomics 3.4
TAB
LEII—
cont
inue
d
Acc
essi
onLi
t2D
EM
SLC
MS
1LC
MS
2To
tal_
acce
ssio
nsTo
tal_
sour
ces
Sig
nal
TMD
escr
iptio
n
P02
748
11
11
44
Sig
nalc
onf
iden
t0
Co
mp
lem
ent
com
po
nent
C9
pre
curs
or
P00
751
11
11
44
Sig
nal
0C
om
ple
men
tfa
cto
rB
pre
curs
or
(EC
3.4.
21.4
7)(C
3/C
5co
nver
tase
)(p
rop
erd
infa
cto
rB
)(g
lyci
ne-r
ich
�g
lyco
pro
tein
)(G
BG
)(P
BF2
)P
0860
31
12
04
3S
igna
lcon
fiden
t0
Com
ple
men
tfa
ctor
Hp
recu
rsor
(Hfa
ctor
1)A
4045
50
11
02
2N
o0
Com
ple
men
tfa
ctor
H-r
elat
edp
rote
in(c
lone
H36
–1)
pre
curs
or,
hum
an(fr
agm
ent)
P05
156
13
10
53
Sig
nal
0C
omp
lem
ent
fact
orI
pre
curs
or(E
C3.
4.21
.45)
(C3B
/C4B
inac
tivat
or)
P48
740
11
00
22
Sig
nalc
onfid
ent
0C
omp
lem
ent-
activ
atin
gco
mp
onen
tof
Ra-
reac
tive
fact
orp
recu
rsor
(EC
3.4.
21.�
)(R
a-re
activ
efa
ctor
serin
ep
rote
ase
p10
0)(r
arf)
(man
nan-
bin
din
gle
ctin
serin
ep
rote
ase
1)(m
anno
se-b
ind
ing
pro
tein
asso
ciat
edse
rine
pro
teas
e)(M
AS
P-1
)Q
0465
60
11
02
2N
o7
Cop
per
-tra
nsp
ortin
gA
TPas
e1
(EC
3.6.
3.4)
(cop
per
pum
p1)
(Men
kes
dis
ease
-ass
ocia
ted
pro
tein
)P
0818
51
11
03
3S
igna
l0
Cor
ticos
tero
id-b
ind
ing
glob
ulin
pre
curs
or(C
BG
)(tr
ansc
ortin
)P
0274
11
10
02
2S
igna
lcon
fiden
t0
C-r
eact
ive
pro
tein
pre
curs
orP
0673
21
10
02
2N
o0
Cre
atin
eki
nase
,M
chai
n(E
C2.
7.3.
2)(M
-CK
)P
4990
21
01
02
2N
o0
Cyt
osol
icp
urin
e5�
-nuc
leot
idas
e(E
C3.
1.3.
5)1D
SN
01
20
32
No
0D
60S
N-t
erm
inal
lob
ehu
man
lact
ofer
rinP
0917
21
10
02
2S
igna
lcon
fiden
t0
Dop
amin
e�
-mon
ooxy
gena
sep
recu
rsor
(EC
1.14
.17.
1)(d
opam
ine
�-h
ydro
xyla
se)
(DB
H)
JC25
210
01
12
2P
ossi
ble
sign
al1
End
othe
linco
nver
ting
enzy
me
(EC
3.4.
24.�
)1,
umb
ilica
lvei
nen
dot
helia
lcel
lfor
m,
hum
anN
P_0
0441
60
11
13
3S
igna
lcon
fiden
t0
Ext
race
llula
rm
atrix
pro
tein
1is
ofor
m1
pre
curs
or;
secr
etor
yP
0267
11
01
13
3S
igna
lcon
fiden
t0
Fib
rinog
en�
/�-E
chai
np
recu
rsor
(con
tain
sfib
rinop
eptid
eA
)P
0267
51
10
13
3S
igna
l0
Fib
rinog
en�
chai
np
recu
rsor
(con
tain
sfib
rinop
eptid
eB
)P
0275
11
13
16
4S
igna
lco
nfid
ent
0Fi
bro
nect
inp
recu
rso
r(F
N)
(co
ld-i
nso
lub
leg
lob
ulin
)(C
IG)
P23
142
11
01
33
Sig
nalc
onfid
ent
0Fi
bul
in-1
pre
curs
orO
7563
61
10
02
2S
igna
lcon
fiden
t0
Fico
lin3
pre
curs
or(c
olla
gen/
fibrin
ogen
dom
ain-
cont
aini
ngp
rote
in3)
(col
lage
n/fib
rinog
end
omai
n-co
ntai
ning
lect
in3
P35
)(H
akat
aan
tigen
)P
0122
51
10
02
2S
igna
l0
Folli
trop
in�
chai
np
recu
rsor
(folli
cle-
stim
ulat
ing
horm
one
�su
bun
it)(F
SH
-�)
(FS
H-B
)P
0910
41
10
02
2N
o0
Gam
ma
enol
ase
(EC
4.2.
1.11
)(2
-pho
spho
-D-g
lyce
rate
hyd
roly
ase)
(neu
rale
nola
se)
(NS
E)
(eno
lase
2)P
0639
61
11
14
4S
igna
lco
nfid
ent
0G
elso
linp
recu
rso
r,p
lasm
a(a
ctin
-dep
oly
mer
izin
gfa
cto
r)(A
DF)
(Bre
vin)
(AG
EL)
P14
136
11
00
22
No
0G
lialf
ibril
lary
acid
icp
rote
in,
astr
ocyt
e(G
FAP
)Q
0460
91
11
03
3P
ossi
ble
sign
al1
Glu
tam
ate
carb
oxyp
eptid
ase
II(E
C3.
4.17
.21)
A47
531
01
10
22
Pos
sib
lesi
gnal
1G
luta
myl
amin
opep
tidas
e(E
C3.
4.11
.7),
hum
anN
P_0
0149
40
11
02
2S
igna
l0
Gly
cosy
lpho
spha
tidyl
inos
itols
pec
ific
pho
spho
lipas
eD
1is
ofor
m1
AA
B34
872
00
52
72
No
0G
P12
0,IH
RP
�IT
Ihe
avy
chai
n-re
late
dp
rote
in(in
tern
alfr
agm
ent)
JW00
570
11
02
2N
o0
Gra
vin,
hum
anP
0073
73
33
110
4S
igna
lco
nfid
ent
0H
apto
glo
bin
-1p
recu
rso
rP
0192
21
00
12
2N
o0
Hem
oglo
bin
�ch
ain
P02
023
11
11
44
No
0H
emo
glo
bin
�ch
ain
P02
790
11
10
33
Sig
nalc
onfid
ent
0H
emop
exin
pre
curs
or(�
-1B
-gly
cop
rote
in)
P05
546
11
11
44
Sig
nalc
onf
iden
t0
Hep
arin
cofa
cto
rII
pre
curs
or
(HC
-II)
(pro
teas
ein
hib
ito
rle
user
pin
2)(H
LS2)
Q04
756
01
01
22
Sig
nalc
onfid
ent
0H
epat
ocyt
egr
owth
fact
orac
tivat
orp
recu
rsor
(EC
3.4.
21.�
)(H
GF
activ
ator
)(H
GFA
)Q
1452
01
01
02
2S
igna
l0
HG
Fac
tivat
orlik
ep
rote
in(h
yalu
rona
nb
ind
ing
pro
tein
2)P
0419
61
11
14
4S
igna
lco
nfid
ent
0H
isti
din
e-ri
chg
lyco
pro
tein
pre
curs
or
(his
tid
ine-
pro
line
rich
gly
cop
rote
in)
(HP
RG
)P
3115
10
11
02
2N
o0
Hum
anp
soria
sin
(s10
0a7)
T147
380
01
12
2P
ossi
ble
sign
al0
Hyp
othe
tical
pro
tein
dkf
zp56
4a24
16.1
,hu
man
(frag
men
t)
Nonredundant Human Plasma Proteome
Molecular & Cellular Proteomics 3.4 317
TAB
LEII—
cont
inue
d
Acc
essi
onLi
t2D
EM
SLC
MS
1LC
MS
2To
tal_
acce
ssio
nsTo
tal_
sour
ces
Sig
nal
TMD
escr
iptio
n
T087
720
01
12
2N
o0
Hyp
othe
tical
pro
tein
dkf
zp58
6m12
1.1,
hum
an(fr
agm
ent)
T000
630
01
12
2N
o0
Hyp
othe
tical
pro
tein
KIA
A04
37,
hum
an(fr
agm
ent)
S40
354
1114
786
109
4S
igna
l0
Imm
uno
glo
bul
in�
chai
n,hu
man
P01
591
11
10
33
Pos
sib
lesi
gnal
0Im
mun
oglo
bul
inJ
chai
nP
0847
61
01
02
2S
igna
lcon
fiden
t0
Inhi
bin
�A
chai
np
recu
rsor
(act
ivin
�-A
chai
n)(e
ryth
roid
diff
eren
tiatio
np
rote
in)
(ED
F)P
1793
61
00
12
2S
igna
lcon
fiden
t0
Insu
lin-l
ike
grow
thfa
ctor
bin
din
gp
rote
in3
pre
curs
or(IG
FBP
-3)
(IBP
-3)
(IGF-
bin
din
gp
rote
in3)
P24
593
10
11
33
Sig
nalc
onfid
ent
0In
sulin
-lik
egr
owth
fact
orb
ind
ing
pro
tein
5p
recu
rsor
(IGFB
P-5
)(IB
P-5
)(IG
F-b
ind
ing
pro
tein
5)P
3585
81
11
03
3S
igna
lcon
fiden
t0
Insu
lin-l
ike
grow
thfa
ctor
bin
din
gp
rote
inco
mp
lex
acid
lab
ilech
ain
pre
curs
or(A
LS)
P01
343
10
01
22
Sig
nal
0In
sulin
-lik
egr
owth
fact
orIA
pre
curs
or(IG
F-IA
)(s
omat
omed
inC
)P
1982
71
12
15
4S
igna
lco
nfid
ent
1In
ter-
�-t
ryp
sin
inhi
bit
or
heav
ych
ain
H1
pre
curs
or
(ITI
heav
ych
ain
H1)
(Inte
r-�
-in
hib
ito
rhe
avy
chai
n1)
(Inte
r-�
-try
psi
nin
hib
ito
rco
mp
lex
com
po
nent
III)
(ser
um-
der
ived
hyal
uro
nan-
asso
ciat
edp
rote
in)
(SH
AP
)P
1982
31
11
14
4S
igna
lco
nfid
ent
0In
ter-
�-t
ryp
sin
inhi
bit
or
heav
ych
ain
H2
pre
curs
or
(ITI
heav
ych
ain
H2)
(inte
r-�
-in
hib
ito
rhe
avy
chai
n2)
(inte
r-�
-try
psi
nin
hib
ito
rco
mp
lex
com
po
nent
II)(s
erum
-d
eriv
edhy
alur
ona
n-as
soci
ated
pro
tein
)(S
HA
P)
Q06
033
11
11
44
Sig
nal
0In
ter-
�-t
ryp
sin
inhi
bit
or
heav
ych
ain
H3
pre
curs
or
(ITI
heav
ych
ain
H3)
(Inte
r-�
-in
hib
ito
rhe
avy
chai
n3)
(ser
um-d
eriv
edhy
alur
ona
n-as
soci
ated
pro
tein
)(S
HA
P)
Q14
624
12
11
54
Sig
nal
0In
ter-
�-t
ryp
sin
inhi
bit
or
heav
ych
ain
H4
pre
curs
or
A33
481
10
10
22
No
0In
terf
eron
-ind
uced
vira
lres
ista
nce
pro
tein
mxa
,hu
man
P29
459
10
10
22
Sig
nalc
onfid
ent
0In
terle
ukin
-12
�ch
ain
pre
curs
or(IL
-12A
)(c
ytot
oxic
lym
pho
cyte
mat
urat
ion
fact
or35
-kD
asu
bun
it)(C
LMF
p35
)(N
Kce
llst
imul
ator
yfa
ctor
chai
n1)
(NK
SF1
)P
4093
31
00
12
2S
igna
l0
Inte
rleuk
in-1
5p
recu
rsor
(IL-1
5)P
0523
11
10
02
2S
igna
lcon
fiden
t0
Inte
rleuk
in-6
pre
curs
or(IL
-6)
(B-c
ells
timul
ator
yfa
ctor
2)(B
SF-
2)(in
terf
eron
�-2
)(h
ybrid
oma
grow
thfa
ctor
)P
C11
020
02
13
2N
o0
Ker
atin
10,
typ
eI,
cyto
skel
etal
(clo
neH
K51
),hu
man
(frag
men
t)N
P_0
0898
50
11
02
2N
o0
Kin
esin
fam
ilym
emb
er3A
;ki
nesi
nfa
mily
pro
tein
3A(H
omo
sap
iens
)P
0104
21
14
28
4S
igna
lco
nfid
ent
0K
inin
og
enp
recu
rso
r(�
-2-t
hio
lpro
tein
ase
inhi
bit
or)
(co
ntai
nsb
rad
ykin
in)
P02
750
11
10
33
Sig
nal
0Le
ucin
e-ric
h�
-2-g
lyco
pro
tein
pre
curs
or(L
RG
)P
1842
81
10
02
2S
igna
lcon
fiden
t0
Lip
opol
ysac
char
ide-
bin
din
gp
rote
inp
recu
rsor
(LB
P)
P07
195
11
00
22
No
0L-
lact
ate
deh
ydro
gena
seB
chai
n(E
C1.
1.1.
27)
(LD
H-B
)(L
DH
hear
tsu
bun
it)(L
DH
-H)
P51
884
01
10
22
Sig
nalc
onfid
ent
0Lu
mic
anp
recu
rsor
(ker
atan
sulfa
tep
rote
ogly
can
lum
ican
)(K
SP
Glu
mic
an)
NP
_005
920
10
10
22
Sig
nalc
onfid
ent
1M
elan
oma-
asso
ciat
edan
tigen
p97
isof
orm
1,p
recu
rsor
P10
636
10
10
22
No
0M
icro
tub
ule-
asso
ciat
edp
rote
in�
(neu
rofib
rilla
ryta
ngle
pro
tein
)(P
aire
dhe
lical
filam
ent-
�)(P
HF-
�)I3
7550
00
11
22
No
0M
ism
atch
rep
air
pro
tein
MS
H2,
hum
anQ
0224
10
01
12
2N
o0
Mito
ticki
nesi
n-lik
ep
rote
in-1
(kin
esin
-lik
ep
rote
in5)
P08
571
11
00
22
Sig
nalc
onfid
ent
0M
onoc
yte
diff
eren
tiatio
nan
tigen
CD
14p
recu
rsor
(mye
loid
cell-
spec
ific
leuc
ine-
rich
glyc
opro
tein
)P
3557
90
11
13
3N
o0
Myo
sin
heav
ych
ain,
nonm
uscl
ety
pe
A(c
ellu
lar
myo
sin
heav
ych
ain,
typ
eA
)(n
onm
uscl
em
yosi
nhe
avy
chai
n-A
)(N
MM
HC
-A)
P12
882
01
01
22
No
0M
yosi
nhe
avy
chai
n,sk
elet
alm
uscl
e,ad
ult
1(m
yosi
nhe
avy
chai
niix
/d)
(myh
c-iix
/d)
NP
_006
380
01
10
22
Sig
nalc
onfid
ent
1O
xyge
nre
gula
ted
pro
tein
pre
curs
or;
oxyg
enre
gula
ted
pro
tein
P01
270
11
00
22
Sig
nal
0P
arat
hyro
idho
rmon
ep
recu
rsor
(Par
athy
rin)
(PTH
)(P
arat
horm
one)
Nonredundant Human Plasma Proteome
318 Molecular & Cellular Proteomics 3.4

TAB
LEII—
cont
inue
d
Acc
essi
onLi
t2D
EM
SLC
MS
1LC
MS
2To
tal_
acce
ssio
nsTo
tal_
sour
ces
Sig
nal
TMD
escr
iptio
n
NP
_006
784
00
11
22
Pos
sib
lesi
gnal
0P
erox
ired
oxin
3;an
tioxi
dan
tp
rote
in1;
thio
red
oxin
-dep
end
ent
Q15
648
10
01
22
No
0P
erox
isom
ep
rolif
erat
or-a
ctiv
ated
rece
pto
rb
ind
ing
pro
tein
(PB
P)
(PP
AR
bin
din
gp
rote
in)
(thyr
oid
horm
one
rece
pto
r-as
soci
ated
pro
tein
com
ple
xco
mp
onen
tTR
AP
220)
(thyr
oid
rece
pto
rin
tera
ctin
gp
rote
in2)
(TR
IP2)
(p53
regu
lato
ryp
rote
inR
B18
A)
P04
180
11
00
22
Sig
nalc
onfid
ent
2P
hosp
hatid
ylch
olin
e-st
erol
acyl
tran
sfer
ase
pre
curs
or(E
C2.
3.1.
43)
(leci
thin
-cho
lest
erol
acyl
tran
sfer
ase)
(pho
spho
lipid
-cho
lest
erol
acyl
tran
sfer
ase)
NP
_001
074
01
10
22
No
0P
hosp
hod
iest
eras
e5A
isof
orm
1;cg
mp
-bin
din
gcg
mp
-sp
ecifi
cP
1525
91
11
03
3N
o0
Pho
spho
glyc
erat
em
utas
e2
(EC
5.4.
2.1)
(EC
5.4.
2.4)
(EC
3.1.
3.13
)(p
hosp
hogl
ycer
ate
mut
ase
isoz
yme
M)
(PG
AM
-M)
(BP
G-d
epen
den
tP
GA
M2)
(mus
cle-
spec
ific
pho
spho
glyc
erat
em
utas
e)N
P_0
0620
90
01
12
2N
o0
Pho
spho
inos
itid
e-3-
kina
se,
cata
lytic
,�
pol
ypep
tide
P36
955
01
11
33
Sig
nalc
onfid
ent
0P
igm
ent
epith
eliu
m-d
eriv
edfa
ctor
pre
curs
or(P
ED
F)(E
PC
-1)
P03
952
11
10
33
Sig
nal
0P
lasm
aka
llikr
ein
pre
curs
or(E
C3.
4.21
.34)
(pla
sma
pre
kalli
krei
n)(k
inin
ogen
in)
(Fle
tche
rfa
ctor
)P
0515
51
11
03
3S
igna
lcon
fiden
t0
Pla
sma
pro
teas
eC
1in
hib
itor
pre
curs
or(C
1In
h)(C
1Inh
)P
0275
31
11
03
3S
igna
lcon
fiden
t0
Pla
sma
retin
ol-b
ind
ing
pro
tein
pre
curs
or(P
RB
P)
(RB
P)
(PR
O22
22)
P05
154
11
10
33
Sig
nalc
onfid
ent
0P
lasm
ase
rine
pro
teas
ein
hib
itor
pre
curs
or(P
CI)
(pro
tein
Cin
hib
itor)
(pla
smin
ogen
activ
ator
inhi
bito
r-3)
(PA
I3)
(acr
osom
alse
rine
pro
teas
ein
hib
itor)
P05
121
11
00
22
Sig
nalc
onfid
ent
0P
lasm
inog
enac
tivat
orin
hib
itor-
1p
recu
rsor
(PA
I-1)
(end
othe
lialp
lasm
inog
enac
tivat
orin
hib
itor)
(PA
I)P
0074
71
12
15
4S
igna
l0
Pla
smin
og
enp
recu
rso
r(E
C3.
4.21
.7)
(co
ntai
nsan
gio
stat
in)
P02
775
10
01
22
Sig
nal
0P
late
let
bas
icp
rote
inp
recu
rsor
(PB
P)
(sm
alli
nduc
ible
cyto
kine
B7)
(CX
CL7
)P
0277
61
00
12
2S
igna
lcon
fiden
t0
Pla
tele
tfa
ctor
4p
recu
rsor
(PF-
4)(C
XC
L4)
(onc
osta
tinA
)(Ir
opla
ct)
P43
034
11
00
22
No
0P
late
let-
activ
atin
gfa
ctor
acet
ylhy
dro
lase
IB�
sub
unit
(EC
3.1.
1.47
)(P
AF
acet
ylhy
dro
lase
45kD
asu
bun
it)(P
AF-
AH
45-k
Da
sub
unit)
(PA
F-A
H�
)(P
AFA
H�
)(L
isse
ncep
haly
-1p
rote
in)
(LIS
-1)
NP
_006
197
00
11
22
Sig
nalc
onfid
ent
1P
late
let-
der
ived
grow
thfa
ctor
rece
pto
r�
pre
curs
or(H
omo
sap
iens
)N
P_0
0043
60
01
12
2N
o0
Ple
ctin
1,in
term
edia
tefil
amen
tb
ind
ing
pro
tein
500
kDa;
ple
ctin
1P
2074
21
11
03
3S
igna
lcon
fiden
t0
Pre
gnan
cyzo
nep
rote
inp
recu
rsor
P07
288
20
10
32
Sig
nalc
onfid
ent
0P
rost
ate-
spec
ific
antig
enp
recu
rsor
(EC
3.4.
21.7
7)(P
SA
)(�
-sem
inop
rote
in)
(kal
likre
in3)
(sem
enog
elas
e)(s
emin
in)
(P-3
0an
tigen
)P
0723
71
10
02
2S
igna
lcon
fiden
t0
Pro
tein
dis
ulfid
eis
omer
ase
pre
curs
or(P
DI)
(EC
5.3.
4.1)
(pro
lyl4
-hyd
roxy
lase
�su
bun
it)(c
ellu
lar
thyr
oid
horm
one
bin
din
gp
rote
in)
(P55
)N
P_0
0272
50
11
02
2N
o0
Pro
tein
kina
se,
cam
p-d
epen
den
t,re
gula
tory
,ty
pe
I,�
AA
B22
439
00
11
22
No
0P
rote
inty
rosi
nep
hosp
hata
se;
ptp
ase
(Hom
osa
pie
ns)
P00
734
11
21
54
Sig
nal
0P
roth
rom
bin
pre
curs
or
(EC
3.4.
21.5
)(c
oag
ulat
ion
fact
or
II)P
2261
42
00
13
2S
igna
lcon
fiden
t0
Put
ativ
ese
rum
amyl
oid
A-3
pro
tein
P04
626
10
10
22
Sig
nalc
onfid
ent
2R
ecep
tor
pro
tein
-tyr
osin
eki
nase
erb
b-2
pre
curs
or(E
C2.
7.1.
112)
(p18
5erb
b2)
(NE
Up
roto
-onc
ogen
e)(C
-erb
b-2
)(ty
rosi
neki
nase
-typ
ece
llsu
rfac
ere
cep
tor
HE
R2)
(MLN
19)
NP
_005
397
00
11
22
No
0R
ho-a
ssoc
iate
d,
coile
d-c
oilc
onta
inin
gp
rote
inki
nase
1;p
160r
ock
P49
908
10
10
22
Sig
nalc
onfid
ent
0S
elen
opro
tein
Pp
recu
rsor
(sep
)N
P_0
0620
60
11
02
2S
igna
lcon
fiden
t0
Ser
ine
(or
cyst
eine
)p
rote
inas
ein
hib
itor,
clad
eA
(�-1
)P
0278
71
11
14
4S
igna
lco
nfid
ent
0S
ero
tran
sfer
rin
pre
curs
or
(tra
nsfe
rrin
)(s
ider
op
hilin
)(�
-1-m
etal
bin
din
gg
lob
ulin
)(P
RO
1400
)P
0276
81
11
03
3S
igna
lcon
fiden
t0
Ser
umal
bum
inp
recu
rsor
Nonredundant Human Plasma Proteome
Molecular & Cellular Proteomics 3.4 319
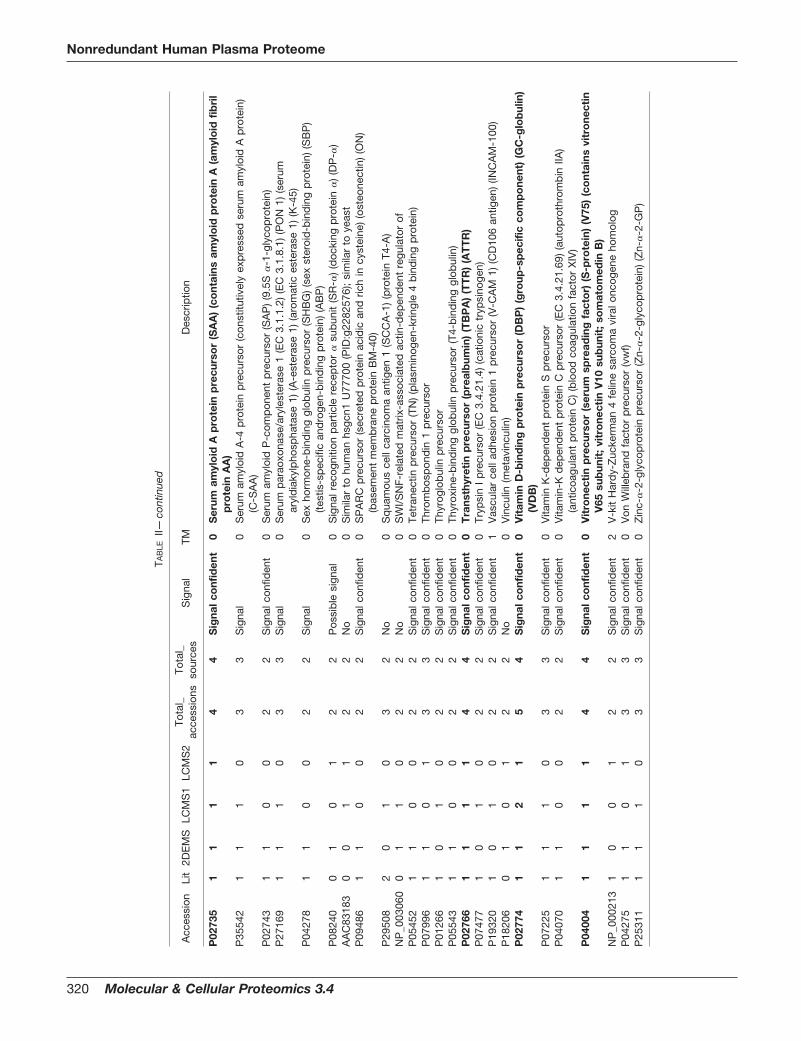
TAB
LEII—
cont
inue
d
Acc
essi
onLi
t2D
EM
SLC
MS
1LC
MS
2To
tal_
acce
ssio
nsTo
tal_
sour
ces
Sig
nal
TMD
escr
iptio
n
P02
735
11
11
44
Sig
nalc
onf
iden
t0
Ser
umam
ylo
idA
pro
tein
pre
curs
or
(SA
A)
(co
ntai
nsam
ylo
idp
rote
inA
(am
ylo
idfib
ril
pro
tein
AA
)P
3554
21
11
03
3S
igna
l0
Ser
umam
yloi
dA
-4p
rote
inp
recu
rsor
(con
stitu
tivel
yex
pre
ssed
seru
mam
yloi
dA
pro
tein
)(C
-SA
A)
P02
743
11
00
22
Sig
nalc
onfid
ent
0S
erum
amyl
oid
P-c
omp
onen
tp
recu
rsor
(SA
P)
(9.5
S�
-1-g
lyco
pro
tein
)P
2716
91
11
03
3S
igna
l0
Ser
ump
arao
xona
se/a
ryle
ster
ase
1(E
C3.
1.1.
2)(E
C3.
1.8.
1)(P
ON
1)(s
erum
aryl
dia
kylp
hosp
hata
se1)
(A-e
ster
ase
1)(a
rom
atic
este
rase
1)(K
-45)
P04
278
11
00
22
Sig
nal
0S
exho
rmon
e-b
ind
ing
glob
ulin
pre
curs
or(S
HB
G)
(sex
ster
oid
-bin
din
gp
rote
in)
(SB
P)
(test
is-s
pec
ific
and
roge
n-b
ind
ing
pro
tein
)(A
BP
)P
0824
00
10
12
2P
ossi
ble
sign
al0
Sig
nalr
ecog
nitio
np
artic
lere
cep
tor
�su
bun
it(S
R-�
)(d
ocki
ngp
rote
in�
)(D
P-�
)A
AC
8318
30
01
12
2N
o0
Sim
ilar
tohu
man
hsgc
n1U
7770
0(P
ID:g
2282
576)
;si
mila
rto
yeas
tP
0948
61
10
02
2S
igna
lcon
fiden
t0
SP
AR
Cp
recu
rsor
(sec
rete
dp
rote
inac
idic
and
rich
incy
stei
ne)
(ost
eone
ctin
)(O
N)
(bas
emen
tm
emb
rane
pro
tein
BM
-40)
P29
508
20
10
32
No
0S
qua
mou
sce
llca
rcin
oma
antig
en1
(SC
CA
-1)
(pro
tein
T4-A
)N
P_0
0306
00
11
02
2N
o0
SW
I/S
NF-
rela
ted
mat
rix-a
ssoc
iate
dac
tin-d
epen
den
tre
gula
tor
ofP
0545
21
10
02
2S
igna
lcon
fiden
t0
Tetr
anec
tinp
recu
rsor
(TN
)(p
lasm
inog
en-k
ringl
e4
bin
din
gp
rote
in)
P07
996
11
01
33
Sig
nalc
onfid
ent
0Th
rom
bos
pon
din
1p
recu
rsor
P01
266
10
10
22
Sig
nalc
onfid
ent
0Th
yrog
lob
ulin
pre
curs
orP
0554
31
10
02
2S
igna
lcon
fiden
t0
Thyr
oxin
e-b
ind
ing
glob
ulin
pre
curs
or(T
4-b
ind
ing
glob
ulin
)P
0276
61
11
14
4S
igna
lco
nfid
ent
0T
rans
thyr
etin
pre
curs
or
(pre
alb
umin
)(T
BP
A)
(TT
R)
(AT
TR
)P
0747
71
01
02
2S
igna
lcon
fiden
t0
Tryp
sin
Ip
recu
rsor
(EC
3.4.
21.4
)(c
atio
nic
tryp
sino
gen)
P19
320
10
10
22
Sig
nalc
onfid
ent
1V
ascu
lar
cell
adhe
sion
pro
tein
1p
recu
rsor
(V-C
AM
1)(C
D10
6an
tigen
)(IN
CA
M-1
00)
P18
206
01
01
22
No
0V
incu
lin(m
etav
incu
lin)
P02
774
11
21
54
Sig
nalc
onf
iden
t0
Vit
amin
D-b
ind
ing
pro
tein
pre
curs
or
(DB
P)
(gro
up-s
pec
ific
com
po
nent
)(G
C-g
lob
ulin
)(V
DB
)P
0722
51
11
03
3S
igna
lcon
fiden
t0
Vita
min
K-d
epen
den
tp
rote
inS
pre
curs
orP
0407
01
10
02
2S
igna
lcon
fiden
t0
Vita
min
-Kd
epen
den
tp
rote
inC
pre
curs
or(E
C3.
4.21
.69)
(aut
opro
thro
mb
inIIA
)(a
ntic
oagu
lant
pro
tein
C)
(blo
odco
agul
atio
nfa
ctor
XIV
)P
0400
41
11
14
4S
igna
lco
nfid
ent
0V
itro
nect
inp
recu
rso
r(s
erum
spre
adin
gfa
cto
r)(S
-pro
tein
)(V
75)
(co
ntai
nsvi
tro
nect
inV
65su
bun
it;
vitr
one
ctin
V10
sub
unit
;so
mat
om
edin
B)
NP
_000
213
10
01
22
Sig
nalc
onfid
ent
2V
-kit
Har
dy-
Zuc
kerm
an4
felin
esa
rcom
avi
ralo
ncog
ene
hom
olog
P04
275
11
01
33
Sig
nalc
onfid
ent
0V
onW
illeb
rand
fact
orp
recu
rsor
(vw
f)P
2531
11
11
03
3S
igna
lcon
fiden
t0
Zin
c-�
-2-g
lyco
pro
tein
pre
curs
or(Z
n-�
-2-g
lyco
pro
tein
)(Z
n-�
-2-G
P)
Nonredundant Human Plasma Proteome
320 Molecular & Cellular Proteomics 3.4
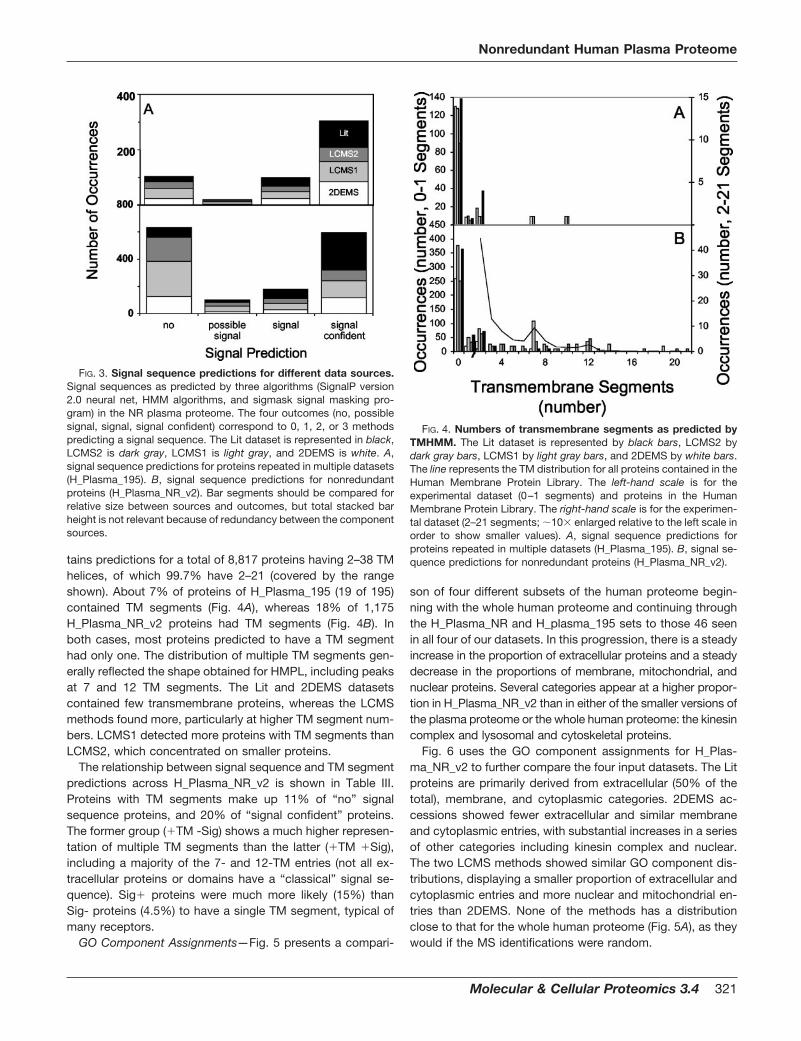
tains predictions for a total of 8,817 proteins having 2–38 TMhelices, of which 99.7% have 2–21 (covered by the rangeshown). About 7% of proteins of H_Plasma_195 (19 of 195)contained TM segments (Fig. 4A), whereas 18% of 1,175H_Plasma_NR_v2 proteins had TM segments (Fig. 4B). Inboth cases, most proteins predicted to have a TM segmenthad only one. The distribution of multiple TM segments gen-erally reflected the shape obtained for HMPL, including peaksat 7 and 12 TM segments. The Lit and 2DEMS datasetscontained few transmembrane proteins, whereas the LCMSmethods found more, particularly at higher TM segment num-bers. LCMS1 detected more proteins with TM segments thanLCMS2, which concentrated on smaller proteins.
The relationship between signal sequence and TM segmentpredictions across H_Plasma_NR_v2 is shown in Table III.Proteins with TM segments make up 11% of “no” signalsequence proteins, and 20% of “signal confident” proteins.The former group (�TM -Sig) shows a much higher represen-tation of multiple TM segments than the latter (�TM �Sig),including a majority of the 7- and 12-TM entries (not all ex-tracellular proteins or domains have a “classical” signal se-quence). Sig� proteins were much more likely (15%) thanSig- proteins (4.5%) to have a single TM segment, typical ofmany receptors.
GO Component Assignments—Fig. 5 presents a compari-
son of four different subsets of the human proteome begin-ning with the whole human proteome and continuing throughthe H_Plasma_NR and H_plasma_195 sets to those 46 seenin all four of our datasets. In this progression, there is a steadyincrease in the proportion of extracellular proteins and a steadydecrease in the proportions of membrane, mitochondrial, andnuclear proteins. Several categories appear at a higher propor-tion in H_Plasma_NR_v2 than in either of the smaller versions ofthe plasma proteome or the whole human proteome: the kinesincomplex and lysosomal and cytoskeletal proteins.
Fig. 6 uses the GO component assignments for H_Plas-ma_NR_v2 to further compare the four input datasets. The Litproteins are primarily derived from extracellular (50% of thetotal), membrane, and cytoplasmic categories. 2DEMS ac-cessions showed fewer extracellular and similar membraneand cytoplasmic entries, with substantial increases in a seriesof other categories including kinesin complex and nuclear.The two LCMS methods showed similar GO component dis-tributions, displaying a smaller proportion of extracellular andcytoplasmic entries and more nuclear and mitochondrial en-tries than 2DEMS. None of the methods has a distributionclose to that for the whole human proteome (Fig. 5A), as theywould if the MS identifications were random.
FIG. 3. Signal sequence predictions for different data sources.Signal sequences as predicted by three algorithms (SignalP version2.0 neural net, HMM algorithms, and sigmask signal masking pro-gram) in the NR plasma proteome. The four outcomes (no, possiblesignal, signal, signal confident) correspond to 0, 1, 2, or 3 methodspredicting a signal sequence. The Lit dataset is represented in black,LCMS2 is dark gray, LCMS1 is light gray, and 2DEMS is white. A,signal sequence predictions for proteins repeated in multiple datasets(H_Plasma_195). B, signal sequence predictions for nonredundantproteins (H_Plasma_NR_v2). Bar segments should be compared forrelative size between sources and outcomes, but total stacked barheight is not relevant because of redundancy between the componentsources.
FIG. 4. Numbers of transmembrane segments as predicted byTMHMM. The Lit dataset is represented by black bars, LCMS2 bydark gray bars, LCMS1 by light gray bars, and 2DEMS by white bars.The line represents the TM distribution for all proteins contained in theHuman Membrane Protein Library. The left-hand scale is for theexperimental dataset (0–1 segments) and proteins in the HumanMembrane Protein Library. The right-hand scale is for the experimen-tal dataset (2–21 segments; �10� enlarged relative to the left scale inorder to show smaller values). A, signal sequence predictions forproteins repeated in multiple datasets (H_Plasma_195). B, signal se-quence predictions for nonredundant proteins (H_Plasma_NR_v2).
Nonredundant Human Plasma Proteome
Molecular & Cellular Proteomics 3.4 321
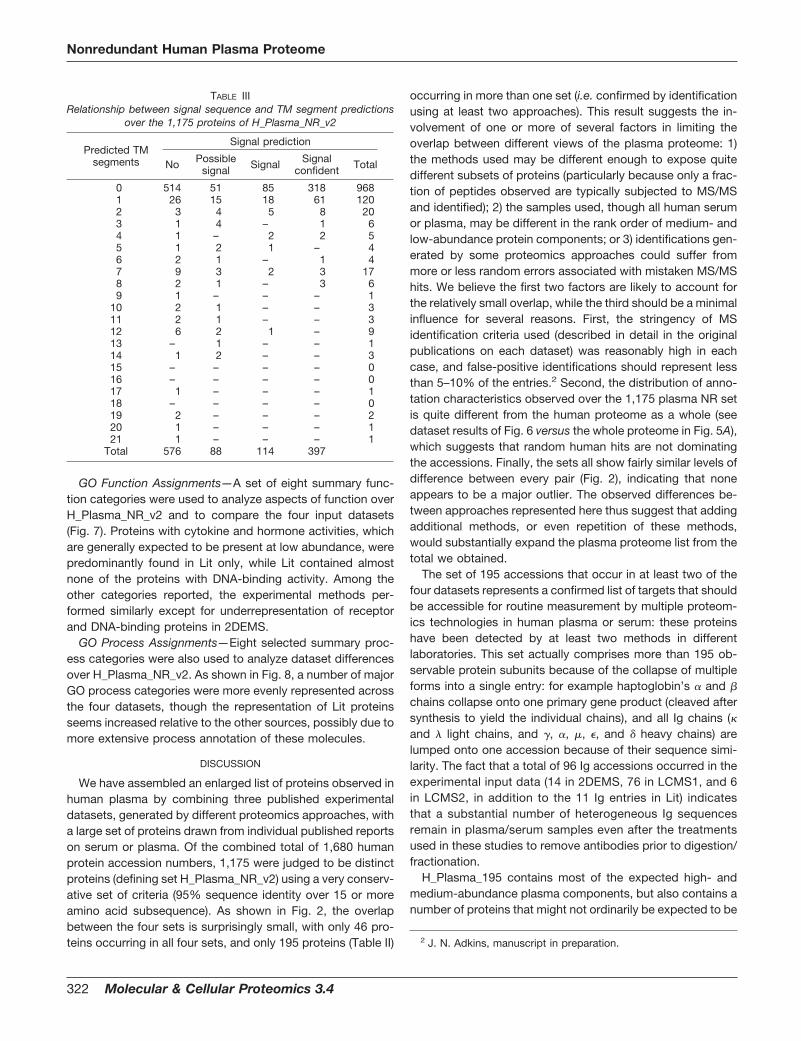
GO Function Assignments—A set of eight summary func-tion categories were used to analyze aspects of function overH_Plasma_NR_v2 and to compare the four input datasets(Fig. 7). Proteins with cytokine and hormone activities, whichare generally expected to be present at low abundance, werepredominantly found in Lit only, while Lit contained almostnone of the proteins with DNA-binding activity. Among theother categories reported, the experimental methods per-formed similarly except for underrepresentation of receptorand DNA-binding proteins in 2DEMS.
GO Process Assignments—Eight selected summary proc-ess categories were also used to analyze dataset differencesover H_Plasma_NR_v2. As shown in Fig. 8, a number of majorGO process categories were more evenly represented acrossthe four datasets, though the representation of Lit proteinsseems increased relative to the other sources, possibly due tomore extensive process annotation of these molecules.
DISCUSSION
We have assembled an enlarged list of proteins observed inhuman plasma by combining three published experimentaldatasets, generated by different proteomics approaches, witha large set of proteins drawn from individual published reportson serum or plasma. Of the combined total of 1,680 humanprotein accession numbers, 1,175 were judged to be distinctproteins (defining set H_Plasma_NR_v2) using a very conserv-ative set of criteria (95% sequence identity over 15 or moreamino acid subsequence). As shown in Fig. 2, the overlapbetween the four sets is surprisingly small, with only 46 pro-teins occurring in all four sets, and only 195 proteins (Table II)
occurring in more than one set (i.e. confirmed by identificationusing at least two approaches). This result suggests the in-volvement of one or more of several factors in limiting theoverlap between different views of the plasma proteome: 1)the methods used may be different enough to expose quitedifferent subsets of proteins (particularly because only a frac-tion of peptides observed are typically subjected to MS/MSand identified); 2) the samples used, though all human serumor plasma, may be different in the rank order of medium- andlow-abundance protein components; or 3) identifications gen-erated by some proteomics approaches could suffer frommore or less random errors associated with mistaken MS/MShits. We believe the first two factors are likely to account forthe relatively small overlap, while the third should be a minimalinfluence for several reasons. First, the stringency of MSidentification criteria used (described in detail in the originalpublications on each dataset) was reasonably high in eachcase, and false-positive identifications should represent lessthan 5–10% of the entries.2 Second, the distribution of anno-tation characteristics observed over the 1,175 plasma NR setis quite different from the human proteome as a whole (seedataset results of Fig. 6 versus the whole proteome in Fig. 5A),which suggests that random human hits are not dominatingthe accessions. Finally, the sets all show fairly similar levels ofdifference between every pair (Fig. 2), indicating that noneappears to be a major outlier. The observed differences be-tween approaches represented here thus suggest that addingadditional methods, or even repetition of these methods,would substantially expand the plasma proteome list from thetotal we obtained.
The set of 195 accessions that occur in at least two of thefour datasets represents a confirmed list of targets that shouldbe accessible for routine measurement by multiple proteom-ics technologies in human plasma or serum: these proteinshave been detected by at least two methods in differentlaboratories. This set actually comprises more than 195 ob-servable protein subunits because of the collapse of multipleforms into a single entry: for example haptoglobin’s � and �
chains collapse onto one primary gene product (cleaved aftersynthesis to yield the individual chains), and all Ig chains (�and � light chains, and �, �, �, , and � heavy chains) arelumped onto one accession because of their sequence simi-larity. The fact that a total of 96 Ig accessions occurred in theexperimental input data (14 in 2DEMS, 76 in LCMS1, and 6in LCMS2, in addition to the 11 Ig entries in Lit) indicatesthat a substantial number of heterogeneous Ig sequencesremain in plasma/serum samples even after the treatmentsused in these studies to remove antibodies prior to digestion/fractionation.
H_Plasma_195 contains most of the expected high- andmedium-abundance plasma components, but also contains anumber of proteins that might not ordinarily be expected to be
2 J. N. Adkins, manuscript in preparation.
TABLE IIIRelationship between signal sequence and TM segment predictions
over the 1,175 proteins of H_Plasma_NR_v2
Predicted TMsegments
Signal prediction
No Possiblesignal Signal Signal
confident Total
0 514 51 85 318 9681 26 15 18 61 1202 3 4 5 8 203 1 4 – 1 64 1 – 2 2 55 1 2 1 – 46 2 1 – 1 47 9 3 2 3 178 2 1 – 3 69 1 – – – 1
10 2 1 – – 311 2 1 – – 312 6 2 1 – 913 – 1 – – 114 1 2 – – 315 – – – – 016 – – – – 017 1 – – – 118 – – – – 019 2 – – – 220 1 – – – 121 1 – – – 1
Total 576 88 114 397
Nonredundant Human Plasma Proteome
322 Molecular & Cellular Proteomics 3.4
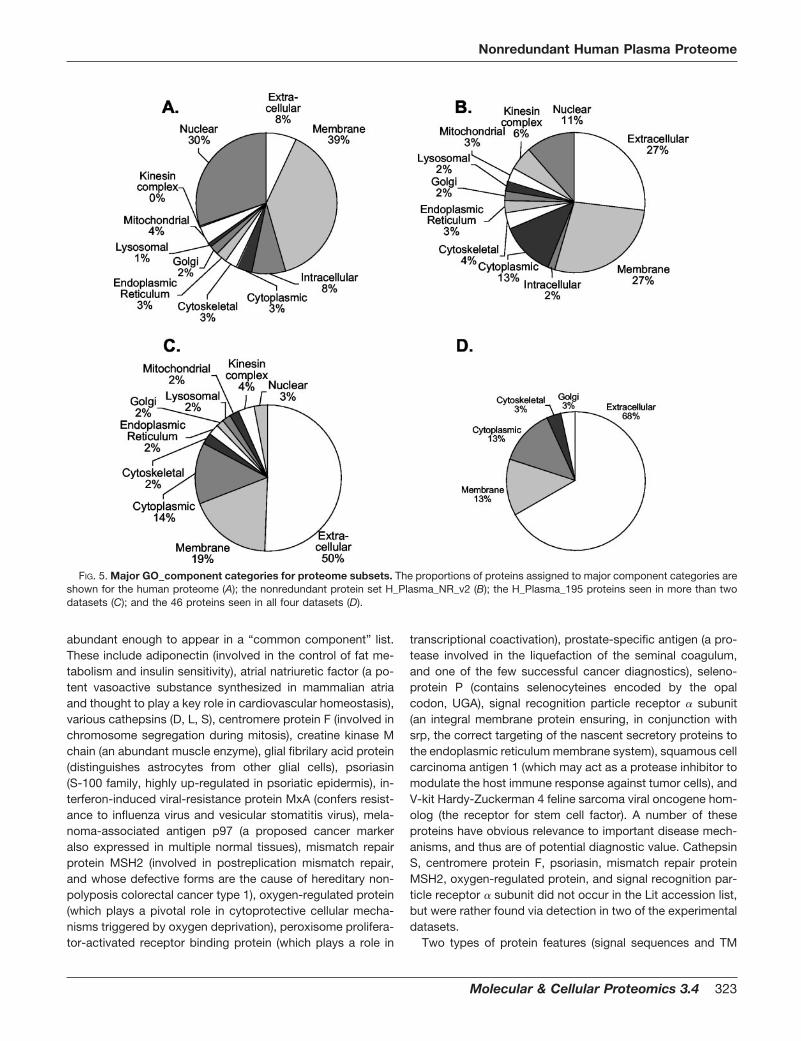
abundant enough to appear in a “common component” list.These include adiponectin (involved in the control of fat me-tabolism and insulin sensitivity), atrial natriuretic factor (a po-tent vasoactive substance synthesized in mammalian atriaand thought to play a key role in cardiovascular homeostasis),various cathepsins (D, L, S), centromere protein F (involved inchromosome segregation during mitosis), creatine kinase Mchain (an abundant muscle enzyme), glial fibrilary acid protein(distinguishes astrocytes from other glial cells), psoriasin(S-100 family, highly up-regulated in psoriatic epidermis), in-terferon-induced viral-resistance protein MxA (confers resist-ance to influenza virus and vesicular stomatitis virus), mela-noma-associated antigen p97 (a proposed cancer markeralso expressed in multiple normal tissues), mismatch repairprotein MSH2 (involved in postreplication mismatch repair,and whose defective forms are the cause of hereditary non-polyposis colorectal cancer type 1), oxygen-regulated protein(which plays a pivotal role in cytoprotective cellular mecha-nisms triggered by oxygen deprivation), peroxisome prolifera-tor-activated receptor binding protein (which plays a role in
transcriptional coactivation), prostate-specific antigen (a pro-tease involved in the liquefaction of the seminal coagulum,and one of the few successful cancer diagnostics), seleno-protein P (contains selenocyteines encoded by the opalcodon, UGA), signal recognition particle receptor � subunit(an integral membrane protein ensuring, in conjunction withsrp, the correct targeting of the nascent secretory proteins tothe endoplasmic reticulum membrane system), squamous cellcarcinoma antigen 1 (which may act as a protease inhibitor tomodulate the host immune response against tumor cells), andV-kit Hardy-Zuckerman 4 feline sarcoma viral oncogene hom-olog (the receptor for stem cell factor). A number of theseproteins have obvious relevance to important disease mech-anisms, and thus are of potential diagnostic value. CathepsinS, centromere protein F, psoriasin, mismatch repair proteinMSH2, oxygen-regulated protein, and signal recognition par-ticle receptor � subunit did not occur in the Lit accession list,but were rather found via detection in two of the experimentaldatasets.
Two types of protein features (signal sequences and TM
FIG. 5. Major GO__component categories for proteome subsets. The proportions of proteins assigned to major component categories areshown for the human proteome (A); the nonredundant protein set H_Plasma_NR_v2 (B); the H_Plasma_195 proteins seen in more than twodatasets (C); and the 46 proteins seen in all four datasets (D).
Nonredundant Human Plasma Proteome
Molecular & Cellular Proteomics 3.4 323
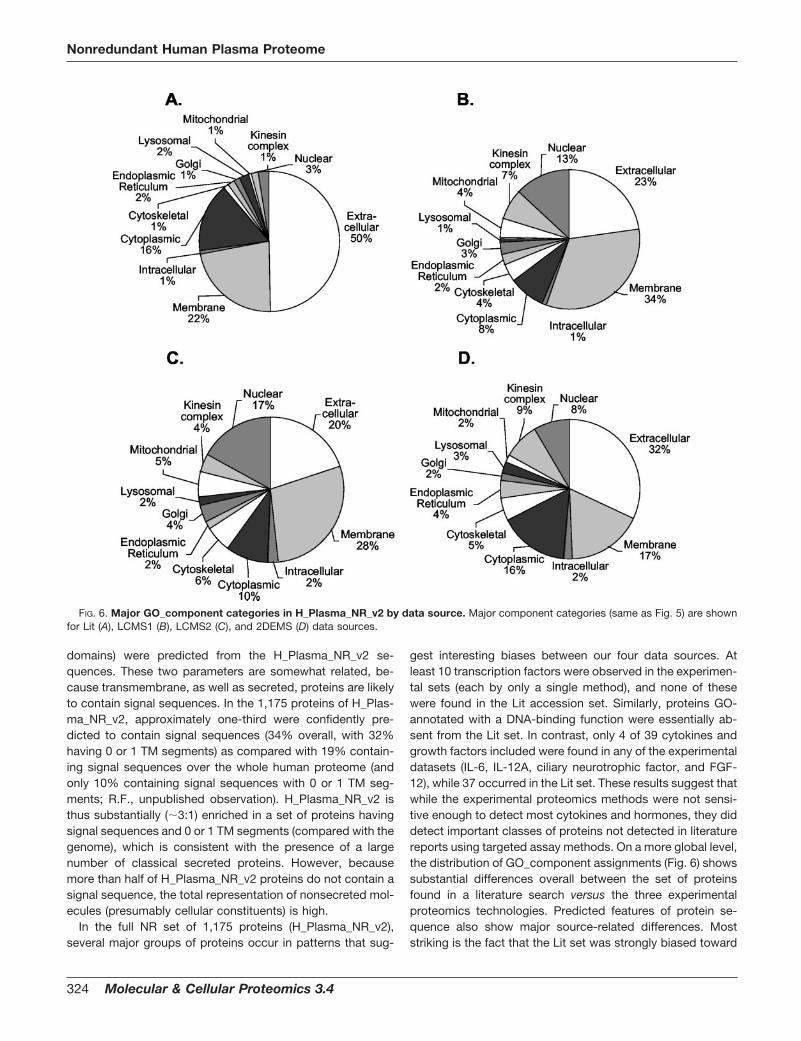
domains) were predicted from the H_Plasma_NR_v2 se-quences. These two parameters are somewhat related, be-cause transmembrane, as well as secreted, proteins are likelyto contain signal sequences. In the 1,175 proteins of H_Plas-ma_NR_v2, approximately one-third were confidently pre-dicted to contain signal sequences (34% overall, with 32%having 0 or 1 TM segments) as compared with 19% contain-ing signal sequences over the whole human proteome (andonly 10% containing signal sequences with 0 or 1 TM seg-ments; R.F., unpublished observation). H_Plasma_NR_v2 isthus substantially (�3:1) enriched in a set of proteins havingsignal sequences and 0 or 1 TM segments (compared with thegenome), which is consistent with the presence of a largenumber of classical secreted proteins. However, becausemore than half of H_Plasma_NR_v2 proteins do not contain asignal sequence, the total representation of nonsecreted mol-ecules (presumably cellular constituents) is high.
In the full NR set of 1,175 proteins (H_Plasma_NR_v2),several major groups of proteins occur in patterns that sug-
gest interesting biases between our four data sources. Atleast 10 transcription factors were observed in the experimen-tal sets (each by only a single method), and none of thesewere found in the Lit accession set. Similarly, proteins GO-annotated with a DNA-binding function were essentially ab-sent from the Lit set. In contrast, only 4 of 39 cytokines andgrowth factors included were found in any of the experimentaldatasets (IL-6, IL-12A, ciliary neurotrophic factor, and FGF-12), while 37 occurred in the Lit set. These results suggest thatwhile the experimental proteomics methods were not sensi-tive enough to detect most cytokines and hormones, they diddetect important classes of proteins not detected in literaturereports using targeted assay methods. On a more global level,the distribution of GO_component assignments (Fig. 6) showssubstantial differences overall between the set of proteinsfound in a literature search versus the three experimentalproteomics technologies. Predicted features of protein se-quence also show major source-related differences. Moststriking is the fact that the Lit set was strongly biased toward
FIG. 6. Major GO_component categories in H_Plasma_NR_v2 by data source. Major component categories (same as Fig. 5) are shownfor Lit (A), LCMS1 (B), LCMS2 (C), and 2DEMS (D) data sources.
Nonredundant Human Plasma Proteome
324 Molecular & Cellular Proteomics 3.4
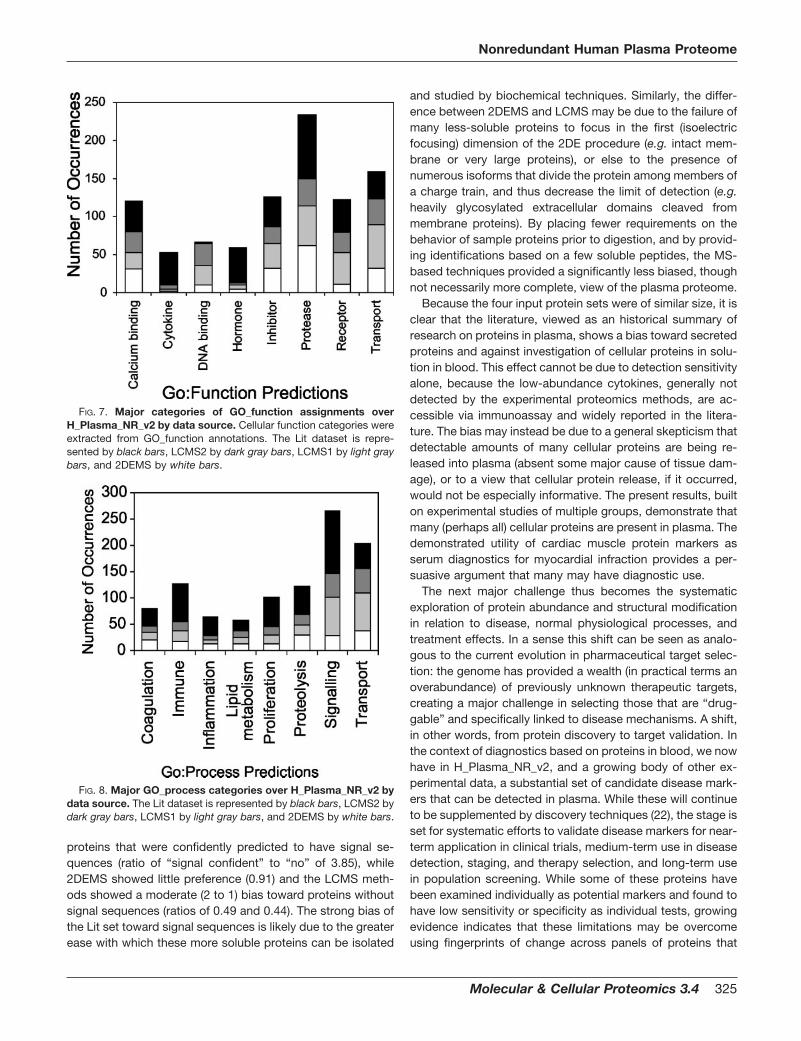
proteins that were confidently predicted to have signal se-quences (ratio of “signal confident” to “no” of 3.85), while2DEMS showed little preference (0.91) and the LCMS meth-ods showed a moderate (2 to 1) bias toward proteins withoutsignal sequences (ratios of 0.49 and 0.44). The strong bias ofthe Lit set toward signal sequences is likely due to the greaterease with which these more soluble proteins can be isolated
and studied by biochemical techniques. Similarly, the differ-ence between 2DEMS and LCMS may be due to the failure ofmany less-soluble proteins to focus in the first (isoelectricfocusing) dimension of the 2DE procedure (e.g. intact mem-brane or very large proteins), or else to the presence ofnumerous isoforms that divide the protein among members ofa charge train, and thus decrease the limit of detection (e.g.heavily glycosylated extracellular domains cleaved frommembrane proteins). By placing fewer requirements on thebehavior of sample proteins prior to digestion, and by provid-ing identifications based on a few soluble peptides, the MS-based techniques provided a significantly less biased, thoughnot necessarily more complete, view of the plasma proteome.
Because the four input protein sets were of similar size, it isclear that the literature, viewed as an historical summary ofresearch on proteins in plasma, shows a bias toward secretedproteins and against investigation of cellular proteins in solu-tion in blood. This effect cannot be due to detection sensitivityalone, because the low-abundance cytokines, generally notdetected by the experimental proteomics methods, are ac-cessible via immunoassay and widely reported in the litera-ture. The bias may instead be due to a general skepticism thatdetectable amounts of many cellular proteins are being re-leased into plasma (absent some major cause of tissue dam-age), or to a view that cellular protein release, if it occurred,would not be especially informative. The present results, builton experimental studies of multiple groups, demonstrate thatmany (perhaps all) cellular proteins are present in plasma. Thedemonstrated utility of cardiac muscle protein markers asserum diagnostics for myocardial infraction provides a per-suasive argument that many may have diagnostic use.
The next major challenge thus becomes the systematicexploration of protein abundance and structural modificationin relation to disease, normal physiological processes, andtreatment effects. In a sense this shift can be seen as analo-gous to the current evolution in pharmaceutical target selec-tion: the genome has provided a wealth (in practical terms anoverabundance) of previously unknown therapeutic targets,creating a major challenge in selecting those that are “drug-gable” and specifically linked to disease mechanisms. A shift,in other words, from protein discovery to target validation. Inthe context of diagnostics based on proteins in blood, we nowhave in H_Plasma_NR_v2, and a growing body of other ex-perimental data, a substantial set of candidate disease mark-ers that can be detected in plasma. While these will continueto be supplemented by discovery techniques (22), the stage isset for systematic efforts to validate disease markers for near-term application in clinical trials, medium-term use in diseasedetection, staging, and therapy selection, and long-term usein population screening. While some of these proteins havebeen examined individually as potential markers and found tohave low sensitivity or specificity as individual tests, growingevidence indicates that these limitations may be overcomeusing fingerprints of change across panels of proteins that
FIG. 7. Major categories of GO_function assignments overH_Plasma_NR_v2 by data source. Cellular function categories wereextracted from GO_function annotations. The Lit dataset is repre-sented by black bars, LCMS2 by dark gray bars, LCMS1 by light graybars, and 2DEMS by white bars.
FIG. 8. Major GO_process categories over H_Plasma_NR_v2 bydata source. The Lit dataset is represented by black bars, LCMS2 bydark gray bars, LCMS1 by light gray bars, and 2DEMS by white bars.
Nonredundant Human Plasma Proteome
Molecular & Cellular Proteomics 3.4 325
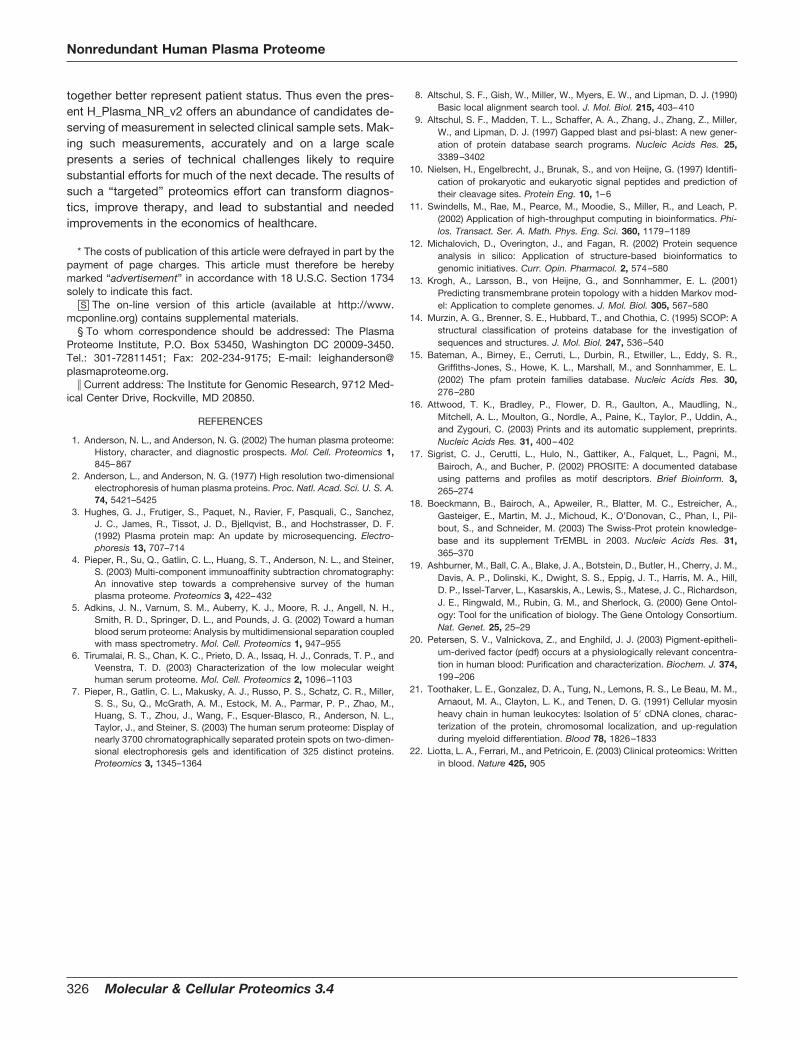
together better represent patient status. Thus even the pres-ent H_Plasma_NR_v2 offers an abundance of candidates de-serving of measurement in selected clinical sample sets. Mak-ing such measurements, accurately and on a large scalepresents a series of technical challenges likely to requiresubstantial efforts for much of the next decade. The results ofsuch a “targeted” proteomics effort can transform diagnos-tics, improve therapy, and lead to substantial and neededimprovements in the economics of healthcare.
* The costs of publication of this article were defrayed in part by thepayment of page charges. This article must therefore be herebymarked “advertisement” in accordance with 18 U.S.C. Section 1734solely to indicate this fact.
□S The on-line version of this article (available at http://www.mcponline.org) contains supplemental materials.
§ To whom correspondence should be addressed: The PlasmaProteome Institute, P.O. Box 53450, Washington DC 20009-3450.Tel.: 301-72811451; Fax: 202-234-9175; E-mail: [email protected].
� Current address: The Institute for Genomic Research, 9712 Med-ical Center Drive, Rockville, MD 20850.
REFERENCES
1. Anderson, N. L., and Anderson, N. G. (2002) The human plasma proteome:History, character, and diagnostic prospects. Mol. Cell. Proteomics 1,845–867
2. Anderson, L., and Anderson, N. G. (1977) High resolution two-dimensionalelectrophoresis of human plasma proteins. Proc. Natl. Acad. Sci. U. S. A.74, 5421–5425
3. Hughes, G. J., Frutiger, S., Paquet, N., Ravier, F, Pasquali, C., Sanchez,J. C., James, R., Tissot, J. D., Bjellqvist, B., and Hochstrasser, D. F.(1992) Plasma protein map: An update by microsequencing. Electro-phoresis 13, 707–714
4. Pieper, R., Su, Q., Gatlin, C. L., Huang, S. T., Anderson, N. L., and Steiner,S. (2003) Multi-component immunoaffinity subtraction chromatography:An innovative step towards a comprehensive survey of the humanplasma proteome. Proteomics 3, 422–432
5. Adkins, J. N., Varnum, S. M., Auberry, K. J., Moore, R. J., Angell, N. H.,Smith, R. D., Springer, D. L., and Pounds, J. G. (2002) Toward a humanblood serum proteome: Analysis by multidimensional separation coupledwith mass spectrometry. Mol. Cell. Proteomics 1, 947–955
6. Tirumalai, R. S., Chan, K. C., Prieto, D. A., Issaq, H. J., Conrads, T. P., andVeenstra, T. D. (2003) Characterization of the low molecular weighthuman serum proteome. Mol. Cell. Proteomics 2, 1096–1103
7. Pieper, R., Gatlin, C. L., Makusky, A. J., Russo, P. S., Schatz, C. R., Miller,S. S., Su, Q., McGrath, A. M., Estock, M. A., Parmar, P. P., Zhao, M.,Huang, S. T., Zhou, J., Wang, F., Esquer-Blasco, R., Anderson, N. L.,Taylor, J., and Steiner, S. (2003) The human serum proteome: Display ofnearly 3700 chromatographically separated protein spots on two-dimen-sional electrophoresis gels and identification of 325 distinct proteins.Proteomics 3, 1345–1364
8. Altschul, S. F., Gish, W., Miller, W., Myers, E. W., and Lipman, D. J. (1990)Basic local alignment search tool. J. Mol. Biol. 215, 403–410
9. Altschul, S. F., Madden, T. L., Schaffer, A. A., Zhang, J., Zhang, Z., Miller,W., and Lipman, D. J. (1997) Gapped blast and psi-blast: A new gener-ation of protein database search programs. Nucleic Acids Res. 25,3389–3402
10. Nielsen, H., Engelbrecht, J., Brunak, S., and von Heijne, G. (1997) Identifi-cation of prokaryotic and eukaryotic signal peptides and prediction oftheir cleavage sites. Protein Eng. 10, 1–6
11. Swindells, M., Rae, M., Pearce, M., Moodie, S., Miller, R., and Leach, P.(2002) Application of high-throughput computing in bioinformatics. Phi-los. Transact. Ser. A. Math. Phys. Eng. Sci. 360, 1179–1189
12. Michalovich, D., Overington, J., and Fagan, R. (2002) Protein sequenceanalysis in silico: Application of structure-based bioinformatics togenomic initiatives. Curr. Opin. Pharmacol. 2, 574–580
13. Krogh, A., Larsson, B., von Heijne, G., and Sonnhammer, E. L. (2001)Predicting transmembrane protein topology with a hidden Markov mod-el: Application to complete genomes. J. Mol. Biol. 305, 567–580
14. Murzin, A. G., Brenner, S. E., Hubbard, T., and Chothia, C. (1995) SCOP: Astructural classification of proteins database for the investigation ofsequences and structures. J. Mol. Biol. 247, 536–540
15. Bateman, A., Birney, E., Cerruti, L., Durbin, R., Etwiller, L., Eddy, S. R.,Griffiths-Jones, S., Howe, K. L., Marshall, M., and Sonnhammer, E. L.(2002) The pfam protein families database. Nucleic Acids Res. 30,276–280
16. Attwood, T. K., Bradley, P., Flower, D. R., Gaulton, A., Maudling, N.,Mitchell, A. L., Moulton, G., Nordle, A., Paine, K., Taylor, P., Uddin, A.,and Zygouri, C. (2003) Prints and its automatic supplement, preprints.Nucleic Acids Res. 31, 400–402
17. Sigrist, C. J., Cerutti, L., Hulo, N., Gattiker, A., Falquet, L., Pagni, M.,Bairoch, A., and Bucher, P. (2002) PROSITE: A documented databaseusing patterns and profiles as motif descriptors. Brief Bioinform. 3,265–274
18. Boeckmann, B., Bairoch, A., Apweiler, R., Blatter, M. C., Estreicher, A.,Gasteiger, E., Martin, M. J., Michoud, K., O’Donovan, C., Phan, I., Pil-bout, S., and Schneider, M. (2003) The Swiss-Prot protein knowledge-base and its supplement TrEMBL in 2003. Nucleic Acids Res. 31,365–370
19. Ashburner, M., Ball, C. A., Blake, J. A., Botstein, D., Butler, H., Cherry, J. M.,Davis, A. P., Dolinski, K., Dwight, S. S., Eppig, J. T., Harris, M. A., Hill,D. P., Issel-Tarver, L., Kasarskis, A., Lewis, S., Matese, J. C., Richardson,J. E., Ringwald, M., Rubin, G. M., and Sherlock, G. (2000) Gene Ontol-ogy: Tool for the unification of biology. The Gene Ontology Consortium.Nat. Genet. 25, 25–29
20. Petersen, S. V., Valnickova, Z., and Enghild, J. J. (2003) Pigment-epitheli-um-derived factor (pedf) occurs at a physiologically relevant concentra-tion in human blood: Purification and characterization. Biochem. J. 374,199–206
21. Toothaker, L. E., Gonzalez, D. A., Tung, N., Lemons, R. S., Le Beau, M. M.,Arnaout, M. A., Clayton, L. K., and Tenen, D. G. (1991) Cellular myosinheavy chain in human leukocytes: Isolation of 5� cDNA clones, charac-terization of the protein, chromosomal localization, and up-regulationduring myeloid differentiation. Blood 78, 1826–1833
22. Liotta, L. A., Ferrari, M., and Petricoin, E. (2003) Clinical proteomics: Writtenin blood. Nature 425, 905
Nonredundant Human Plasma Proteome
326 Molecular & Cellular Proteomics 3.4