Organization of radial and non-radial glia in the developing rat thalamus
Upload
tuebingen-mpg-deCategory
view
1download
0
ORIGINAL ARTICLE
Direct diffusion-based parcellation of the human thalamus
Vinod Kumar • Sarah Mang • Wolfgang Grodd
Received: 29 October 2013 /Accepted: 7 February 2014 / Published online: 22 March 2014
� Springer-Verlag Berlin Heidelberg 2014
Abstract To assess stable anatomical features of the
human thalamus, an unbiased diffusion tensor parcellation
approach was used to segment thalamic substructures with
similar spatial orientation. We determined localization, size
and individual variations of 21 thalamic clusters in a group
of 63 healthy human subjects (32 males/31 females). The
laterality differences accounted for ±6 % and gender dif-
ferences for ±4 % of the thalamic volume. Consecutively,
five stable clusters in the anterior, medial, lateral and
posterior thalamus were selected, which were common to
90 % of all subjects and contained at least 10 voxels. These
clusters could be assigned to the anteroventral nucleus
(AN) group, the mediodorsal (MD) nucleus, the medial
pulvinar (PuM), and the lateral nuclei group. The subcor-
tical and cortical connectivity of these clusters revealed
that: (1) the oblique cranio-caudal-oriented fibers of the
AN cluster mainly connect to limbic structures, (2) the
numerous dorso-frontal-oriented fibers of MD mainly
project to the prefrontal cortex and the medial temporal
lobe, (3) the fibers of the PuM running in parallel with the
x-axis project to medio-occipital and medio-temporal areas
and connect visual areas with the hippocampus and
amygdala and via intrathalamic pathways with medio-
frontal areas, and (4) the oblique caudo-cranial fibers of the
two lateral clusters located anteriorly in the motor and
posteriorly in the sensory thalamus are routing sensory–
motor information from the brain stem via the internal
capsule to pre- and peri-central regions of the cortex.
Keywords Thalamus � Anatomy � Diffusion tensor
imaging � Laterality � Gender � Connectivity
Abbreviations
AC Anterior commissure
Acc Nucleus accumbens
AD Anterodorsal nucleus
AM Anteromedial nucleus
Amy Amygdala
AN Anterior cluster
AV Anteroventral group
BS Brainstem
Cau Caudate nucleus
CoG Center of gravity
DDO Dominant diffusion orientations
Den Dentate nucleus
DTI Diffusion tensor imaging
EPI Echo planar imaging
Hip Hippocampus
LA Lateral-anterior cluster
LD Lateral dorsal group
LP Lateral-posterior cluster
MD Mediodorsal nucleus
MED Medial cluster
MRI Magnetic resonance imaging
Electronic supplementary material The online version of thisarticle (doi:10.1007/s00429-014-0748-2) contains supplementarymaterial, which is available to authorized users.
V. Kumar � W. Grodd (&)
Department of Psychiatry, Psychotherapy and Psychosomatics,
JARA-Translational Brain Medicine, University Hospital,
Rheinisch-Westfalische Technische Hochschule (RWTH)
Aachen University, Pauwelstr. 30, Aachen 52074, Germany
e-mail: [email protected]
V. Kumar
Graduate School of Neural and Behavioral Sciences,
International Max Planck Research School, Tubingen, Germany
S. Mang
Software Development for Integrated Diagnostics and Therapy,
German Cancer Research Center, Heidelberg, Germany
123
Brain Struct Funct (2015) 220:1619–1635
DOI 10.1007/s00429-014-0748-2

Pal Pallidum
PC Posterior commissure
PO Posterior cluster
PuM Medial pulvinar
Put Putamen
Red Red nucleus
SD Standard deviation
T Tesla
TE Echo time
TR Repetition time
VA Ventral anterior
VLa Ventral lateral anterior
VLp Ventral lateral posterior
VM Ventral medial
VP Ventral posterior complex
VPI Ventral posterior inferior nucleus
VPL Ventral posterolateral
VPM Ventral posteromedial
Introduction
The thalamus is one of the most complex structures of the
CNS. Its internal organization and connections are until
today only distinguishable by histology. Although a num-
ber of studies using various magnetic resonance imaging
(MRI) methods like combined T1- and T2-maps at
1.5 Tesla (T) (Deoni et al. 2007), magnetization transfer at
3 T (Gringel et al. 2009), high-resolution T1-maps at 4.7 T
(Lemaire et al. 2010), and susceptibility-weighted imaging
at 7 T (Abosch et al. 2010) were performed, these
approaches did not offer sufficient tissue contrast and thus
cannot be used for an internal differentiation. However, as
each thalamic nucleus possesses a specific pattern of cor-
tical and subcortical connections, a parcellation in vivo can
be achieved using diffusion tensor imaging (DTI). Diffu-
sion tensor imaging detects the directional organization of
brain tissue with the aid of restricted diffusion properties of
water molecules and allows examining connectivity pattern
of thalamic compartments using additional probabilistic
tractography methods (Behrens et al. 2003a). This
approach has successfully been used to identify specific
connections between the thalamus and cortical areas (Jo-
hansen-Berg et al. 2005) and to parcellate the thalamus into
distinct ‘connectivity-defined regions’. However, the cor-
tical areas have to be segmented in correspondence to their
known connectivity with major nuclear groups known from
studies in non-human primates in advance to tractography.
An alternative in vivo approach is to distinguish voxels
within the thalamus solely by their DTI-determined fiber
orientations. Using an automatic DTI clustering algorithm
(Wiegell et al. 2003) determined the center-of-mass
coordinates for the segmented nuclei, registered them to
Talairach space (Talairach et al. 1957), and found a fair
agreement to centers obtained from the stereotactic atlas of
the human thalamus provided by Niemann et al. (2000).
The DTI method in this study uses a similar approach
and is based on prior work of our group (Unrath et al.
2008), where we determined the principal diffusion direc-
tion and classified them according to their three major
orientations to identify thalamic sub-regions. This diffusion
direction-based segmentation allows a simple and fast
parcellation. In general, classification techniques based on
the principal diffusion direction are much less sensitive to
user-defined parameters and do not rely on a manual pre-
segmentation of brain areas in contrast to connectivity-
based DTI methods. Our segmentation approach has
meanwhile been improved by defining a set of 21 reference
directions, geometrically distributed over the unit sphere
(Mang et al. 2012). In evaluating this approach in a group
of subjects, we were able to classify the local, dominant
diffusion orientations for each voxel of the thalamus. The
stability of this segmentation in respect to the number of
gradient-encoding directions was shown using 12, 30 and
126 directions at 1.5 and 3 T. We found that the CoG of the
clusters was stable in location (Kumar et al. 2010) but
showed a considerable individual variability in size
(Kumar et al. 2011). In the present study, we now report on
differences in laterality and gender, on the anatomical
assignment of five major clusters and on their specific
subcortical and cortical connectivity profiles.
Materials and methods
Subjects
Sixty-three healthy right-handed volunteers (32 male and
31 female) age 20–40 years (male: mean 26.3, SD 5.15;
female: mean 25.5, SD 4.28) recruited for a functional MRI
study were additionally examined with a DTI sequence. All
subjects gave written informed consent to the data acqui-
sition and its evaluation for research purposes. The Ethics
committee of the University of Tubingen approved the
study.
MR data acquisition
Data acquisition was performed on a 1.5 T MR-Scanner
(Sonata, Siemens, Erlangen, Germany) with a standard
8-channel head coil and an DTI echo planar imaging (EPI)
sequence (12 directions and one volume without diffusion
weighting; repetition time (TR) = 6,700 ms; echo time
(TE) = 82 ms, 52 axial slices (b value = 800 s/mm2). In
plane, resolution was 2 9 2 mm2, slice thickness 2.5 mm.
1620 Brain Struct Funct (2015) 220:1619–1635
123

Additional anatomical MRI scans in all subjects were per-
formed using a T1-weighted MDEFT sequence (TR =
7.92 ms; TE = 2.48 ms; inversion time (TI) = 910 ms; flip
angle (FA) = 16�; voxel size: 1 9 1 9 1 mm3, field of view
(FoV) = 176 9 256 9 256 mm3.
Data preprocessing
The data have been processed cognisant to recent literature
to minimize DTI analysis pitfalls reported in the literature
(Jones and Cercignani 2010) and in recent mailing lists
(Smith et al. 2004). For the analysis, an improved version
of segmentation algorithm was applied (Mang et al. 2012)
by adding cluster reordering, redefined cluster colors and
cluster stability detection at different probabilities using the
following software packages: FSL 4.1 & 5.0 (www.fmrib.
ox.ac.uk/fsl) (Smith et al. 2004), Camino-R1010 (Cook
et al. 2006), SPM 5 (http://www.fil.ion.ucl.ac.uk/spm)
(Friston et al. 1994), SPSS Statistics 19.0, BrainVoyager
2.4 (Goebel et al. 2006), and the freeview GUI utility from
FreeSurfer v5.1.0/5.2.0 (http://surfer.nmr.mgh.harvard.edu/
) (Dale et al. 1999) installed on windows & Fedora
workstations.
For automated comparison of the individual data, all
data sets were aligned and normalized to the MNI152
brain template (2 mm3) using the FSL (Smith et al.
2004). First, the T1-weighted anatomy images were
aligned with the MNI template using the ‘‘flirt’’ routine
in FSL. Then, an affine transformation (flirt from FSL)
was used to match the individual diffusion-weighted
images to the anatomy. This step also compensated for
motion during the DWI acquisition. The corresponding
gradient directions were accordingly adapted (Alexander
et al. 2001; Rohde et al. 2004; Leemans and Jones 2009).
The tensor was then estimated from the aligned data
using the ‘‘analyzedti’’ function from Camino. Then, a
nonlinear warp was applied to normalize the anatomy
image to the MNI template (fnirt function from the FSL
library). This transformation was also applied to all
individual tensor elements. Finally, the orientation of the
tensors was corrected using the ‘‘reorient’’ routine from
the Camino library (Alexander et al. 2001; Cook et al.
2006) before the dominant diffusion orientations (DDO)
were extracted from these tensors.
Thalamic mask definition
The digital model of the 3D anatomy of the thalamus
according to the atlas of Morel was obtained by a written
consent with Prof. G. Szekely from the Computer Vision
Laboratory of the ETH Zurich. The atlas mask was further
realigned with thalamus connectivity-based probability
atlas available in FSL library (Smith et al. 2004). The FSL
thalamus probability template was thresholded to contain
only voxels inside the thalamus with a probability above
50 % (see Fig. 2d). The boundaries of the thalamic mask
were also visually inspected on high-resolution T1-
weighted scans by clinically experienced neuroradiologist
(WG).
Individual segmentation
The automatic segmentation method as described in detail
(Mang et al. 2012) is based on the classification of local
DDO. For each voxel, the DDO is computed by diago-
nalization of the second-order diffusion tensor, which is
assumed to be equal to the eigenvector and corresponds to
the largest eigenvalue. The direction of the diffusion pro-
cess determined from DTI data is presumably symmetric,
i.e., equal in either direction on an orientation axis. To
identify thalamic areas with similar DDOs, a set of pre-
defined reference orientations was used (see Fig. 1) to
classify every voxel in a data set based on similarity
between reference orientations. We used the set of refer-
ence directions from earlier work (Unrath et al. 2008) on
the thalamus parcellation. Each reference direction defines
a diffusion orientation class or cluster. To construct the set
of reference directions first the three main axes (cluster #1,
#4, and #7) were used, which define the octants of a unit
sphere serving as basis for further subdivision. Each octant
has a similar subdivision into nine regions. Beside the three
main axes, each octant has three reference directions con-
sisting of a mixture of two of the main axes (xy—#8, #9;
xz—#2, #3; yz—#5, #6) and three reference directions
mixing all three axes (class #10–21), this results in 21
clusters, which were used for the color-sphere representa-
tion (see Fig. 1b).
Group segmentation and statistics analysis
To restrict the volume and CoG evaluation to clusters that
are located inside the thalamus, the thalamus was masked
as a whole. The mask containing 1,887 voxels on each side
was applied after classification therefore could not affect
the segmentation process and similar individual segmented
clusters could not exceed the mask. As each voxel and each
cluster within this mask were labeled after having a unique
match with the predefined reference table of angular
directions, we assume that no additional errors exist. We
used a 2 9 2 ANOVA with the factors laterality (left/right)
and gender (female/male) to determine the difference in
hemispheres and gender for different clusters.
To compare high-resolution T1-weighted images with
the electronic version of the histology atlas (Krauth et al.
2010), group probability maps were calculated (including
only clusters showing in[50 and[90 % of all subjects in
Brain Struct Funct (2015) 220:1619–1635 1621
123
the male and female group) to depict the overlap of cor-
responding individual clusters of all subjects. If the prob-
ability in a voxel was 100 %, it was similarly classified in
all subjects. Second, the volume and CoG of all 21 clusters
were separately determined in each male and female sub-
ject for the left and right hemisphere.
Histological comparison
From the 3D volumes of the atlas of Morel (2007), the
volume and CoG of each thalamic nucleus and of all 29
Morel nuclei were determined. Segmented DTI cluster,
which was common in at least 90 % of all subjects, was
taken into account for histological concordance analysis.
The CoG and the percentage overlap between the DTI
cluster, thalamic nuclei or nuclei groups were calculated,
and the shortest distance in CoG and maximal overlap
was chosen for a pictorial comparison with atlas from
Mai and Paxinos (Morel 2007; Mai et al. 2008). Anterior
commissure (AC) and posterior commissure (PC) line and
AC–PC mid were determined from the Mai and Paxinos
atlas (Mai et al. 2008). Distances between MNI 1 mm
brain and the atlas were accordingly aligned and the
closest corresponding cluster location was compared (see
Fig. 4).
Probabilistic tractography
Probabilistic tractography analysis was performed using
FSL (Smith et al. 2004). Seed region selection was done
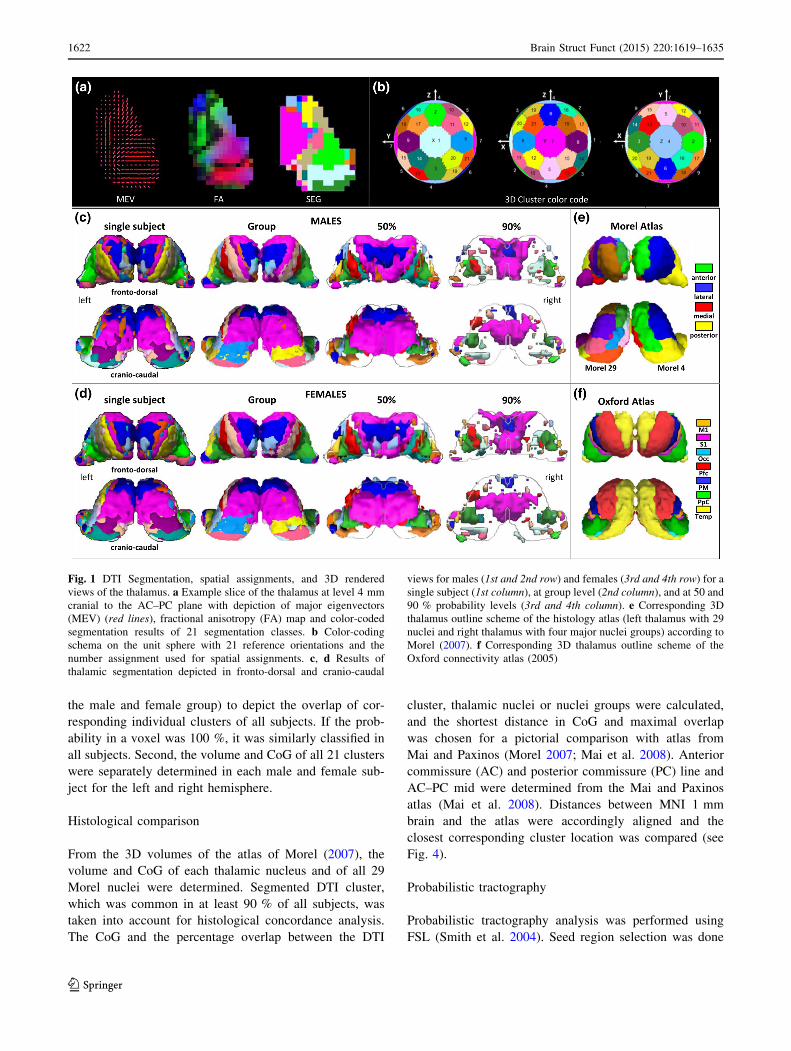
Fig. 1 DTI Segmentation, spatial assignments, and 3D rendered
views of the thalamus. a Example slice of the thalamus at level 4 mm
cranial to the AC–PC plane with depiction of major eigenvectors
(MEV) (red lines), fractional anisotropy (FA) map and color-coded
segmentation results of 21 segmentation classes. b Color-coding
schema on the unit sphere with 21 reference orientations and the
number assignment used for spatial assignments. c, d Results of
thalamic segmentation depicted in fronto-dorsal and cranio-caudal
views for males (1st and 2nd row) and females (3rd and 4th row) for a
single subject (1st column), at group level (2nd column), and at 50 and
90 % probability levels (3rd and 4th column). e Corresponding 3D
thalamus outline scheme of the histology atlas (left thalamus with 29
nuclei and right thalamus with four major nuclei groups) according to
Morel (2007). f Corresponding 3D thalamus outline scheme of the
Oxford connectivity atlas (2005)
1622 Brain Struct Funct (2015) 220:1619–1635
123

with group clusters common to at least 90 % of all subjects
containing at least 10 connected voxels. For the thalamo-
cortical tracking, the cortical masks of both hemispheres
were taken from the FreeSurfer (Dale et al. 1999) for
automatic segmentation of T1-weighted 3D MP-Rage
anatomy. Standard DTI preprocessing steps were followed
i.e., eddy current correction, head motion correction, reg-
istration, b-matrix rotation, FA map calculation on each
individual dataset. Connectivity analysis was performed on
individual data sets after visual inspection of individual FA
maps and the assigned RGB orientation. To generate
connectivity distributions for each selected regions the
common default parameters of bedpost and probtrackx
(number of samples = 5,000, curvature threshold 0.2,
Maximum number of steps = 2,000, step length = 0.5)
were applied.
Statistical analysis
For each cluster, the corresponding tractograms were
divided by the number corresponding to the total number of
generated tracts (waytotal) and then multiplied by 100 to
normalize them for comparison (as suggested in FSL
mailing list). From each seed target, the number of con-
nections was separately determined. Subsequently an
ANOVA was performed to evaluate hemispheric and
gender differences for each of the tractograms, which were
then used to assess the described intrathalamic, subcortical
and cortical connectivity pattern.
Connectivity, track rendering and surface visualization
The connectivity profiles of five clusters were determined
using the corresponding areas with 90 % probability level
as seed regions for probabilistic tracking (a) to nine
selected subcortical and (b) to the whole cortex using FSL
(Smith et al. 2004). The subcortical areas were chosen from
the FSL-Harvard Oxford subcortical atlas. In the ipsilateral
cortex areas, we first determined the total number of tracts
and then the number of cortical target voxels at 50 and
90 % probability level to the complete ipsilateral hemi-
sphere. Each tractogram was imported as volume of
interest and color coded according to the assigned cluster
color using BrainVoyager (Goebel et al. 2006), and then
volume and surface-based group probabilistic maps were
calculated. The volume and surface probability maps were
threshold at 50 and 90 % (we considered only tracks that
were common to[50 and[90 % of all subjects). For five
thalamic clusters, the rendered volume maps for subcortical
and cortical connectivity were finally displayed on a
slightly inflated brain.
Results
Size and localization
An overview over localization and size of all thalamic
clusters is given in rendered 3D views for males and
females in Fig. 1 together with thalamic masks derived
from the histological atlas of Morel (2007) and the Oxford
connectivity atlas (Johansen-Berg et al. 2005). The first
column shows the segmentation of a representative single
subject of each group, and columns 2–4, the corresponding
group evaluations. First, the segmentation of all subjects is
shown without any threshold; we then introduced a group
probability threshold of 50 and 90 %.
In general, the figure shows that (1) the method allows a
complete parcellation of the whole thalamus in single
subjects as well as in groups, (2) the clusters vary con-
siderably in size, (3) a number of smaller sub-clusters with
similar spatial orientation occur at different locations,
indicating that the segmentation does not account for spa-
tial congruency, (4) the cluster volumes diminish with
increasing probability thresholding but remain stable in
location, (5) differences exist in respect to laterality and
gender, and (6) no simple correspondence emerges in
comparison to anatomical-defined nuclei and connectivity-
defined thalamic regions.
The number of voxel and their hemispheric distribu-
tion are displayed in Fig. 2 and their values are sum-
marized in Tables 1 and 2. Each thalamus contained
1,887 voxel corresponding to 7,548 mm3. The cluster
sizes ranged from a maximum of 560 voxel (#7 male
right) to a minimum of 3 voxels (#10 female left) but
only 7 clusters (#1, 3, 6, 7, 13, 14 and 15) contained on
average more than 100 voxels in both groups. Smaller
sub-clusters of major clusters (#4, 6, 7, 18, 19, and 21)
occurring at different locations were not considered in
the succeeding evaluation unless they exceeded the
minimal cluster size of 10 voxels.
Laterality and gender
The summarized laterality difference for all clusters
amounted for ±119 voxels in the male group and
±109 voxels in the female group and thus accounted for
±6.3 % (males) and for ±5.8 % (females) of the thalamic
volume (1,887 voxel). In all cases, cluster #10 was the
smallest (3–4 voxels) and cluster #7 the largest
(457–560 voxels). In respect to hemispheric differences, 10
clusters were 16–25 % larger on the right and 11 clusters
were 33–56 % larger on the left. The hemispheric differ-
ence reached significance (p\ 0.001) in both groups for
clusters #1, 3, 4, 7, 9, 13, 14, 18, 18, 20, and 21.
Brain Struct Funct (2015) 220:1619–1635 1623
123
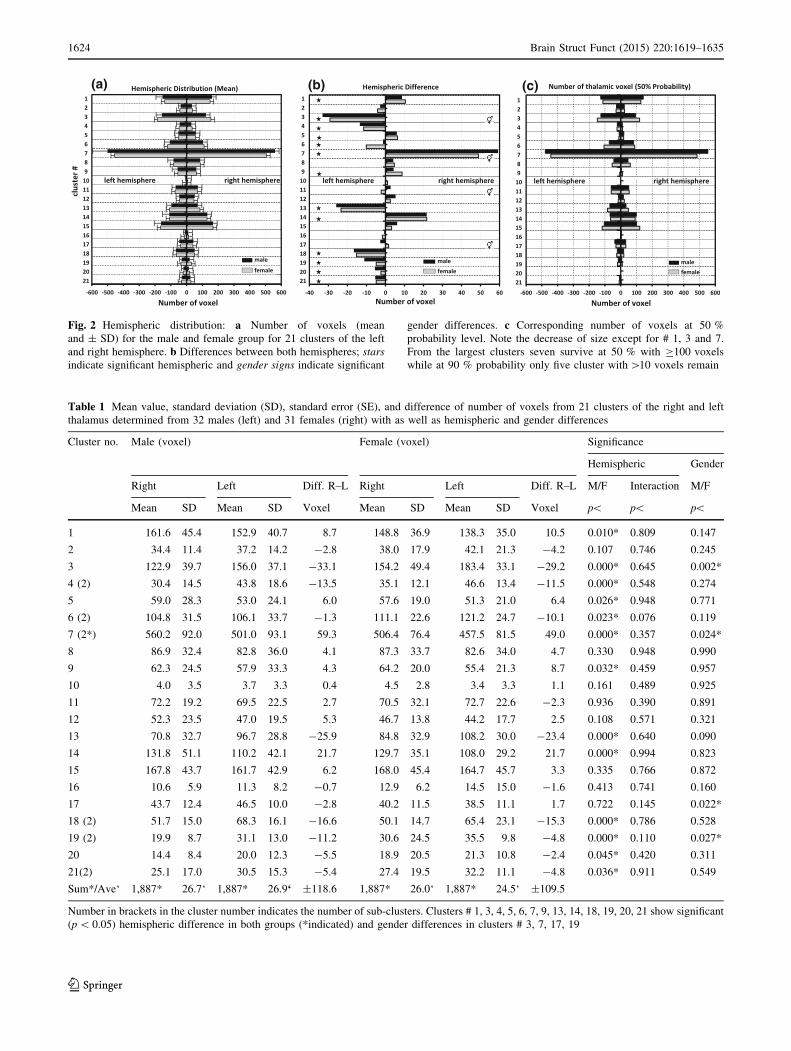
(a) (b) (c)
Fig. 2 Hemispheric distribution: a Number of voxels (mean
and ± SD) for the male and female group for 21 clusters of the left
and right hemisphere. b Differences between both hemispheres; stars
indicate significant hemispheric and gender signs indicate significant
gender differences. c Corresponding number of voxels at 50 %
probability level. Note the decrease of size except for # 1, 3 and 7.
From the largest clusters seven survive at 50 % with C100 voxels
while at 90 % probability only five cluster with[10 voxels remain
Table 1 Mean value, standard deviation (SD), standard error (SE), and difference of number of voxels from 21 clusters of the right and left
thalamus determined from 32 males (left) and 31 females (right) with as well as hemispheric and gender differences
Cluster no. Male (voxel) Female (voxel) Significance
Hemispheric Gender
Right Left Diff. R–L Right Left Diff. R–L M/F Interaction M/F
Mean SD Mean SD Voxel Mean SD Mean SD Voxel p\ p\ p\
1 161.6 45.4 152.9 40.7 8.7 148.8 36.9 138.3 35.0 10.5 0.010* 0.809 0.147
2 34.4 11.4 37.2 14.2 -2.8 38.0 17.9 42.1 21.3 -4.2 0.107 0.746 0.245
3 122.9 39.7 156.0 37.1 -33.1 154.2 49.4 183.4 33.1 -29.2 0.000* 0.645 0.002*
4 (2) 30.4 14.5 43.8 18.6 -13.5 35.1 12.1 46.6 13.4 -11.5 0.000* 0.548 0.274
5 59.0 28.3 53.0 24.1 6.0 57.6 19.0 51.3 21.0 6.4 0.026* 0.948 0.771
6 (2) 104.8 31.5 106.1 33.7 -1.3 111.1 22.6 121.2 24.7 -10.1 0.023* 0.076 0.119
7 (2*) 560.2 92.0 501.0 93.1 59.3 506.4 76.4 457.5 81.5 49.0 0.000* 0.357 0.024*
8 86.9 32.4 82.8 36.0 4.1 87.3 33.7 82.6 34.0 4.7 0.330 0.948 0.990
9 62.3 24.5 57.9 33.3 4.3 64.2 20.0 55.4 21.3 8.7 0.032* 0.459 0.957
10 4.0 3.5 3.7 3.3 0.4 4.5 2.8 3.4 3.3 1.1 0.161 0.489 0.925
11 72.2 19.2 69.5 22.5 2.7 70.5 32.1 72.7 22.6 -2.3 0.936 0.390 0.891
12 52.3 23.5 47.0 19.5 5.3 46.7 13.8 44.2 17.7 2.5 0.108 0.571 0.321
13 70.8 32.7 96.7 28.8 -25.9 84.8 32.9 108.2 30.0 -23.4 0.000* 0.640 0.090
14 131.8 51.1 110.2 42.1 21.7 129.7 35.1 108.0 29.2 21.7 0.000* 0.994 0.823
15 167.8 43.7 161.7 42.9 6.2 168.0 45.4 164.7 45.7 3.3 0.335 0.766 0.872
16 10.6 5.9 11.3 8.2 -0.7 12.9 6.2 14.5 15.0 -1.6 0.413 0.741 0.160
17 43.7 12.4 46.5 10.0 -2.8 40.2 11.5 38.5 11.1 1.7 0.722 0.145 0.022*
18 (2) 51.7 15.0 68.3 16.1 -16.6 50.1 14.7 65.4 23.1 -15.3 0.000* 0.786 0.528
19 (2) 19.9 8.7 31.1 13.0 -11.2 30.6 24.5 35.5 9.8 -4.8 0.000* 0.110 0.027*
20 14.4 8.4 20.0 12.3 -5.5 18.9 20.5 21.3 10.8 -2.4 0.045* 0.420 0.311
21(2) 25.1 17.0 30.5 15.3 -5.4 27.4 19.5 32.2 11.1 -4.8 0.036* 0.911 0.549
Sum*/Ave‘ 1,887* 26.7‘ 1,887* 26.9‘ ±118.6 1,887* 26.0‘ 1,887* 24.5‘ ±109.5
Number in brackets in the cluster number indicates the number of sub-clusters. Clusters # 1, 3, 4, 5, 6, 7, 9, 13, 14, 18, 19, 20, 21 show significant
(p\ 0.05) hemispheric difference in both groups (*indicated) and gender differences in clusters # 3, 7, 17, 19
1624 Brain Struct Funct (2015) 220:1619–1635
123

The summarized gender difference for all clusters
amounted for ±82 voxels in the right and ±79 voxel in the
left hemisphere and thus accounted for ±4.4 % (right) and
±4.2 % (left) of the thalamic volume. In the right hemi-
sphere, 10 clusters in males and 13 clusters in females were
larger. The greatest difference was found in male cluster #12
(11 %) and in female cluster #19 (54 %). In the left hemi-
sphere, 9 clusters in males and 11 clusters in females were
larger. The greatest difference was found in male cluster #17
(17 %) and female cluster #16 (29 %). The difference
reached significance (p\ 0.05) for clusters #3, 7, 17, and 19.
Stability
As the majority of clusters contained \100 voxels, we
consecutively selected only five clusters (#1, 3, 6, 7, and
13), which were common to more than 90 % of all subjects
and contained at least 10 voxels to confine spatial assign-
ment and avoid false tracking.
For those five clusters, location and size at 50 and 90 %
probability levels were determined (Fig. 3). Laterality at
different levels remained stable in three clusters (#3 and #13
to the left, #7 to the right) in both groups. However, cluster #1
exhibited a change in laterality at the 90 % level and for
cluster #6 laterality changed with different probability (s.
Fig. 3c; Table 2). Apparently, the use of a higher probability
results in a stronger spatial confinement and causes changes in
laterality; variations that probably reflect underlying hetero-
geneities in cellularity andfiber arrangement. In a second step,
these five clusters were later taken to assess their anatomical
location and to determine their connectivity. For the sake of
simplicity, we decided to rename the clusters in accordance to
their thalamic location: #6 in anterior (AN), #7 in medial
(MED, #13 in lateral-anterior (LA), #3 in lateral-posterior
(LP), and, #1 in posterior (PO) cluster. These assignmentswill
be used in the following sections (s. Fig. 3b).
Anatomical correspondence and connectivity
To assess the anatomical relation of five clusters common to
90 %, a pictorial comparison of the male group (left hemi-
sphere) with the atlas of (Mai et al. 2008) and Morel (2007)
was performed (s. Figs. 4, 5, 6, 7). Hereby overlap and dis-
tance between each cluster and its closest thalamic nucleus
were determined using the electronic version electronic atlas
of Morel (Krauth et al. 2010). Considering the various ana-
tomical assignments of thalamic nuclei,we hereby refer to the
nomenclature of Morel. The size and CoG of five male
Table 2 Cluster size at 50 and
90 % probability levels for the
male and female group and the
corresponding group differences
Note the decrease in size and
the vanishing of smaller clusters
with increasing probability.
Only the clusters # 1.3 6. 7. 13
with[10 voxels survived in at
least C90 % volunteers
Cluster no. Male Female
50 % 90 % 50 % 90 %
Right Left Diff.
R–L
Right Left Diff.
R–L
Right Left Diff.
R–L
Right Left Diff.
R–L
1 143 126 17 25 38 -13 128 113 15 23 32 -9
2 23 26 -3 9 8 1 25 29 -4 7 9 -2
3 94 125 -31 25 48 -23 120 148 -28 43 73 -30
4 10 21 -11 2 5 -3 12 23 -11 2 6 -4
5 20 9 11 0 0 19 11 8 0 0
6 82 72 10 23 11 12 89 106 -17 20 18 2
7 553 478 75 242 191 51 484 443 41 234 175 59
8 46 43 3 0 0 61 54 7 1 0 1
9 4 1 3 0 0 12 6 6 0 0
10 0 0 0 0 0 0 0 0
11 51 60 -9 2 5 -3 54 60 -6 2 8 -6
12 17 14 3 0 2 -2 23 15 8 1 1
13 34 68 -34 1 18 -17 49 84 -35 5 26 -21
14 99 67 32 8 6 2 92 64 28 5 8 -3
15 101 104 -3 3 10 -7 121 117 4 5 7 -2
16 4 1 3 0 0 4 0 4 0 0
17 32 37 -5 1 5 -4 33 30 3 2 0 2
18 19 21 -2 3 5 -2 20 25 -5 5 4 1
19 7 15 -8 1 2 -1 10 20 -10 2 5 -3
20 0 0 0 0 0 0 0 0
21 1 7 -6 0 2 -2 3 9 -6 1 4 -3
Brain Struct Funct (2015) 220:1619–1635 1625
123

clusterswith thalamic structures obtained from theMorel and
Oxford atlas are given in Tables S1 and S2 in the supplement.
The connectivity profiles of five clusters were deter-
mined using the 90 % probability areas as seed regions for
probabilistic tracking (a) to nine selected subcortical areas,
and (b) to the ipsilateral cortex using FSL (Smith et al.
2004). The subcortical areas were ipsilateral the nucleus
accumbens (Acc), amygdala (Amy), brainstem (BS), cau-
date nucleus (Cau), hippocampus (Hip), pallidum (Pal),
putamen (Put), red nucleus (Red), and contralateral the
dentate nucleus (Den). All structures were chosen from the
FSL-Harvard Oxford subcortical atlas. In general, we
found that the subcortical compared to cortical projections
exhibit a limited number of connections (mean 370–461) as
they project to small spatially confined masks. We defined
subcortical connections as weak, moderate, strong for
\500,[500,[1,000 tracks. In contrast, the cortical tracks
encircling the whole hemisphere were quite numerous
(a) (b)
(c)
(d)
Fig. 3 Location, size and probability of 5 selected clusters and number
of cortical tracks. a Cluster outline in axial views of five clusters with
different probability levels for males (top) and females (bottom). Note
the decrease in size but the stability in localization. b Color-coded
outline of five selected clusters renamed according to their thalamic
location: #1 in posterior (PO), #3 in lateral-posterior (LP), #6 in anterior
(AN), #7 in medial (MED), and #13 in lateral-anterior (LA). c Corre-sponding hemispheric and gender distribution (top row) and differences
(bottom row) for the five clusters given in number of voxels for the left
(negative values) and right hemisphere (positive values). Depicted are
the values for the mean and at 50 and 90 % probability levels for males
(black bars) and females (gray bars). indicate significant hemispheric
differences and indicate significant gender differences. The color-
coding at 90 % indicates clusters selected for the connectivity analysis.
Negative abscissae values indicate the left hemisphere. Note the
variability of the hemispheric differences, in which cluster 3, 7, and 13
show stable preferences to the left (#3 and #13) or right (#7), while
cluster 1 and 6 possess variable preferences. d Bar graph of the mean
number of cortical tracks (top) and corresponding hemispheric
differences (bottom) in thousands of tracks to the ipsilateral cortex for
the male and female group
1626 Brain Struct Funct (2015) 220:1619–1635
123

(mean 47–65,000). To diminish tracking variability and to
assess major connectivity features the tracking was
threshold to a probability level of 50 and 90 % in each
group. This resulted in a reduction of distant connections at
group level and allowed a better visualization. The ana-
tomical assignments and their corresponding connectivity
profiles are subsequently described and displayed in
Figs. 4, 5, 6, 7. The corresponding data are given in Tables
S3 and S4 in the supplement.
Anterior cluster (AN)
Anatomy
The anterior cluster AN (#6) is located 6 mm posterior to
the AC in the anterior nuclei group (Fig. 4a). Morel (2007)
divides the anterior group into the anteroventral (AV),
anteromedial (AM), anterodorsal (AD), and lateral dorsal
(LD) group. The anterior cluster with its oblique cranio-
Fig. 4 Anterior cluster (AN): anatomical correspondence, subcortical
and cortical connectivity: a Comparison of anterior cluster AN (#6)
with the atlas of Mai et al. (2008) and of Morel (Krauth et al. 2010).
Top row rendered axial and coronal views of the thalamus and cluster
#6 (left) and AV as the closest Morel nucleus (right) as well as
corresponding axial outlines with depiction of the CoG (red point
Morel, green point cluster) and their closest distance in mm. Bottom
row pictorial comparison of the cluster AN probability map (left) with
coronal views of the histology (2nd row), the scheme of May et al.
(3rd row), and the scheme of Morel (last row). b Subcortical
connectivity for AN. Left Bar graph of mean number and SD of
subcortical tracks to nine subcortical structures for the male and
female group. Right rendered subcortical tracks at 90 % probability
level overlaid on left- and right-lateral and cranio-caudal views of
semitransparent target structures. c Rendered cortical tracks for AN at
50 % probability level in medio-lateral and bottom views for males
(left) and females (right). d Corresponding cortical areas at 90 % at
probability level in medial and lateral views as well as bottom views
for the male (left) and the female group (right). e Rendered
subcortical target structures with color-coded anatomical assign-
ments. Please note, that the axial view for the subcortical in (b) andcortical projections in (c, d) changes from neurological (top view) in
(b) to radiological convention (bottom view) in (c)
Brain Struct Funct (2015) 220:1619–1635 1627
123

caudal-oriented fibers mostly overlaps (91 %) with AV.
The anterior nuclear group is concerned as the limbic
thalamus as the AV and LD nuclei are reciprocally con-
nected with the limbic cortex of the cingulate gyrus, the
retrosplenial area and the pre- and parasubiculum (Nie-
uwenhuys et al. 2008). AV and AM also receive axons
from the basal nucleus of the amygdala in macaques
(Percheron et al. 1996).
Connectivity
The anterior cluster possesses subcortical strong
([1,000) left dominant connections to Amy, Cau, Den,
Hip, and Red, which are with the exception to Den
lower in females, while all other projections were
moderate ([500) or weak (\500) (Fig. 4b). However,
those strong connections to Den ([1,100) in both
groups are only present in a subgroup of the subjects
(8-14/14-18: R-L for males/females, s. Table S3) and
vanish at higher probability. Therefore, it can be
assumed that in the connectivity profile to Den sub-
groups exist. In contrast, connections to Acc, Amy,
Cau and Hip persist in both groups. The 90 % rendered
tracts show major connections anteriorly to Acc and
Cau and posteriorly along the fornix to Hip and Amy.
The number of cortical tracks (s. Table S4) reveal a
slight left-side dominance, which is more pronounced
in females (10/50 %: m/f). The major tracts run (1)
posteriorly via the body of the fornix to the Hip and
Amy and (2) anteriorly via mammillothalamic tract and
Fig. 5 Medial Cluster (MED): anatomical correspondence, subcorti-
cal and cortical connectivity profiles: a Comparison of medial cluster
MED (#7) with the atlas of Mai et al. (2008) and of Morel (Krauth
et al. 2010). Top row rendered axial and coronal views of the
thalamus and cluster #7 (left) and MD as the closest Morel nucleus
(right) as well as corresponding axial outlines with depiction of the
CoG (red point Morel, green point cluster) and their closest distance
in mm. Bottom row pictorial comparison of the clusters probability
map (left) with coronal views of the histology (2nd row), the scheme
of May et al. (3rd row), and of Morel (last row). b Subcortical
connectivity of MED. Left: bar graph of mean number and SD of
subcortical tracks to nine subcortical structures for male and female
group. Right: rendered subcortical tracks at 90 % probability level
overlaid on left- and right-lateral and cranio-caudal views of
semitransparent target structures. c Rendered cortical tracks for
MED at 50 % probability level in medio-lateral and bottom views for
males (left) and females (right). d Corresponding cortical areas at
90 % at probability level in medial and lateral views as well as
bottom or top views for the male (left) and the female group (right).
Please note, that the axial view for the subcortical in (b) and cortical
projections in (c, d) changes from neurological (top view) in (b) toradiological convention (bottom view) in (c)
1628 Brain Struct Funct (2015) 220:1619–1635
123

post-commissural fibers to the hypothalamus and cor-
pora mamillaria, and (3) from the septal nuclei to
orbito-frontal areas and via the AC back to the
amygdala (Fig. 4c). In addition, (4) in females a
prominent left-sided track arises from junction of the
AC with the amygdala and projects via the posterior
limb of the internal capsule to left occipito-parietal
areas [red arrow in Fig. 4c), and finally (5)] weak
connections project to the primary visual cortices.
Corresponding to the dominant subcortical profile the
cortical areas are confined to orbito- and medio-frontal
areas and the primary visual cortex. However, here in
contrast to the overall left-sided dominance the orbito-
frontal areas are pronounced in females to the right and
bilaterally expressed in males (red arrows in Fig. 4d).
Medial cluster (MED)
Anatomy
The medial cluster MED (#7) being significantly larger on the
right in both groups contains fibers strictly oriented along y-axis
and is located at AC–PC midline in the medial nuclei group
(Fig. 5a). The medial group can be divided in the mediodorsal
nucleus (MD), the intralaminar and the midline group. The
cluster lies almost completely (91 %) in MD, which is located
at the medial wall of the thalamus and particularly large in
humans (Spinks et al. 2002). Human MD reaches its peak
dimensions and cytoarchitectonic complexity in parallel with
the expansion of the prefrontal cortex (Jones 2007). Medio-
dorsal nucleus is an associative nucleus and can be subdivided
Fig. 6 Posterior Cluster (PO): anatomical correspondence, subcorti-
cal and cortical connectivity profiles: a Comparison of posterior
cluster (#1) with the atlas of Mai et al. (2008) and the atlas of Morel
(Krauth et al., 2010). Top row rendered axial and coronal view of the
thalamus and cluster #1 (left) and PuM as the closest Morel nucleus
(right) as well as corresponding axial outlines with depiction of the
CoG (red point Morel, green point cluster) and their closest distance
in mm. Bottom row pictorial comparison of the clusters PO
probability map (left) with coronal views of the histology (2nd
row), the scheme of May et al. (3rd row), and of Morel (last row).
b Subcortical connectivity for PO. Left: bar graph of mean number
and SD of subcortical tracks to nine subcortical structures for male
and female group. Right: rendered subcortical tracks at 90 %
probability level overlaid on left- and right-lateral and cranio-caudal
views of semitransparent target structures. c Rendered cortical tracks
for PO at 50 % probability level in medio-lateral and bottom views
for males (left) and females (right). d Corresponding cortical areas at
90 % at probability level in medial and lateral views as well as
bottom or top views for the male (left) and the female group (right).
Please note, that the axial views for the subcortical in (b) and cortical
projections in (c, d) change from neurological (top view) in (b) toradiological convention (bottom view) in (c)
Brain Struct Funct (2015) 220:1619–1635 1629
123

Fig. 7 Lateral-Anterior (LA) and Lateral-Posterior Cluster (LP):
anatomical correspondence, subcortical and cortical connectivity
profiles: a Comparison of lateral-anterior cluster LA (#13) cluster
with the atlas of Mai et al. (2008) and the atlas of Morel (Krauth et al.
2010). Top row rendered axial and coronal view of the thalamus and
of cluster #13 (left) and VM as the closest Morel nucleus (right) as
well as corresponding axial outlines with depiction of the CoG (red
point Morel, green point cluster) and their closest distance in mm.
Bottom row pictorial comparison of the clusters probability map (left)
with coronal views of the histology (2nd row), the scheme of May
et al. (3rd row), and of Morel (last row). b Subcortical connectivity
for LA. Left: bar graph of mean number and SD of subcortical tracks
to nine subcortical structures for male and female group. Right:
rendered subcortical tracks at 90 % probability level overlaid on left-
and right-lateral and cranio-caudal views of semitransparent target
structures. c Comparison of lateral-posterior LP (#3) cluster with the
atlas of Mai et al. (2008) and the atlas of Morel (Krauth et al., 2010).
Top row rendered axial and coronal view of the cluster#3 (left) and
VPI as the closest Morel nucleus (right) as well as corresponding
axial outlines with depiction of the CoG and their closest distance in
mm. Bottom row pictorial comparison of the clusters probability map
(left) with coronal views of the histology (2nd row), the scheme of
May et al. (3rd row), and of Morel (last row). d Subcortical
connectivity for LP. Left: bar graph of mean number of subcortical
tracks to nine subcortical structures for male and female group. Right:
rendered subcortical tracks at 90 % probability level overlaid on left-
and right-lateral and cranio-caudal views of semitransparent target
structures. e Rendered cortical tracks at 50 % probability level for LA
(red) and LP (green) in medio-lateral and bottom views for males
(left) and females (right). f Corresponding cortical areas at 90 % at
probability level in medial and lateral views as well as bottom or top
views for the male (left) and the female group (right). Please note, that
the axial view for the subcortical in (b) and (d) and cortical
projections in (e, f) changes from neurological (top view) in (b and
d) to radiological convention (bottom view) in (e and f)
1630 Brain Struct Funct (2015) 220:1619–1635
123

intomedialmagnocellular and lateral parvocellular parts (Akert
1964; Ray and Price 1992). The magnocellular part is recip-
rocally connected with olfactory-related areas in medial pre-
frontal and orbito-frontal regions of the neocortex (Spinks et al.
2002). The frontal efferents of the MD are so extensive that
Fuster defines the prefrontal cortex as cortical tissue havingMD
connectivity (Fuster 1997). Mediodorsal nucleus also receives
fibers from the medial temporal lobe especially the amygdala
via the inferior thalamic peduncle (Aggleton and Mishkin
1984), aswell as from entorhinal and perirhinal cortices and the
temporal pole (Nieuwenhuys et al. 2008). In addition, direct
fibers from the retina to theMDhave been described recently in
a new world primate, suggesting a possible regulation of the
MD by visual activity (De Sousa et al. 2013).
Connectivity
The medial cluster (Fig. 5b) shows subcortical except of
moderate bilateral connections to Den only weak connec-
tions in both groups. The 90 % tracking profile nicely
reveals the associative nature of the nucleus, which encir-
cles almost the whole thalamus as it mediates connections
of other nuclei as well as to subcortical and cortical target
areas. In contrast, the cortical projections possess the most
numerous tracks (s. Fig. 5c; Table S4) revealing a slight
right-sided dominance (4.9/6.8 %; m/f). The tracks show
extensive bilateral connections (1) via the anterior limb of
the internal capsule to medio-frontal areas and via (2) the
uncinate fasciculus and inferior thalamic peduncle to
anterior and medio-temporal areas. The orbito-frontal areas
are more prominent in females on the right (red arrows in
Fig. 5c). Furthermore, stable projections run posteriorly via
the fornix and pulvinar to Hip and Amy and anteriorly along
the AC to medial and anterior temporal areas. In addition, in
both groups, occipital projections exist, which are, however,
confined to the calcarine fissure. The cortical projections are
complementarily reflected in the cortical targets (Fig. 5d),
which show selected areas along the calcarine fissure and
extended medio- and orbito-frontal areas including the
anterior cingulate as well as anterior-medial and inferior
areas of the temporal lobe, which are known to receive
neocortical projections from Amy (Ray and Price 1992).
Posterior cluster (PO)
Anatomy
The posterior cluster PO (#1) is located 2 mm dorsal to the
PC without clear laterality. It contains horizontally oriented
fibers running in parallel with the x-axis (Fig. 6a). The
cluster lies almost completely (95 %) within the medial
pulvinar (PuM) of the posterior nuclei group. The pulvinar
is an associative nucleus as most of its input and output
relations are associated with parieto-occipito-temporal
cortical areas. It can be divided in four areas (anterior,
inferior, lateral and medial) and is involved in visual and
auditory processing, in attention and language functions
(Shipp 2003; Saalmann et al. 2012; Troiani and Schultz
2013; Hebb and Ojemann 2013), and plays an important
role in gating neuronal activity of the visual cortex (Fischer
and Whitney 2012).
Connectivity
The cluster shows subcortical moderate bilateral connec-
tions to Acc and strong connections to Den and Red
(Fig. 6b). The latter are pronounced to left Red (1551) in
males but strongest to right Red (2446) in females. In
contrast, the cortical tracks display no significant laterality
and gender difference (Fig. 6c). In both groups the tracks
mainly project bilateral (1) via the inferior longitudinal
fasciculus to medio-occipital and medio-temporal areas
and connect visual (and auditory) areas with Hip and Amy
and (2) via the uncinate fasciculus the anterior temporal
lobe with orbito-frontal areas (Catani and Thiebaut de
Schotten 2008). In addition, a third pathway exists, which
links the pulvinar via intrathalamic fibers and anterior limb
of the internal capsule with medio-frontal areas. Finally, an
interhemispheric connection via the splenium of the corpus
callosum is found, which is more pronounced in females.
Accordingly, the cortical areas are bilateral confined to the
calcarine fissure and collateral sulcus, the insula, the gyrus
rectus, and the subgenual part of the anterior cingulate;
hereby the orbito-frontal and anterior temporal areas are
slightly more pronounced in males (red arrows in Fig. 6d).
Lateral-anterior cluster (LA)
Anatomy
The lateral-anterior cluster LA (#13) is located 3 mm
anterior to the AC–PC midline in lateral nuclei group (Fig.
7a) and possesses clear left-side dominance in both groups
(Fig. 3a). Its fibers mainly project oblique in caudo-cranial
direction similar to those of the adjacent internal capsule.
The lateral group is according to Morel (2007) divided in
the ventral posterior complex (VP), the ventral lateral
posterior (VLp) and ventral lateral anterior (VLa), the
ventral anterior (VA) and ventral medial (VM) group. The
cluster lies adjacent to VLa and partly overlaps (17 %)
with VM. VLa is concerned as part of the motor thalamus
as it receives afferents from the pars reticulata of the
substantia nigra and, to a lesser extent, from the internal
segment of the pallidum and is reciprocally connected with
Brain Struct Funct (2015) 220:1619–1635 1631
123

the frontal eye field (Brodmann area 8) and the prefrontal
cortex including the cingulate cortex (Nieuwenhuys et al.
2008). In addition, pallidofugal fibers project to the VLa
and particularly to the anterior part giving off collateral
branches to the centromedian nucleus.
Connectivity
The subcortical tracks show moderate connections to right
Cau and strong connections to left Den and Red in males
(Fig. 7b). In addition, females exhibit moderate, bilateral
connections to Acc, Amy and Hip as well as strong,
bilateral connections to Den and Red. The cortical tracts
show significant left laterality and slight gender difference;
especially the hemispheric differences are in males
([350 %) in contrast to females (59 %) pronounced (s.
Table S4). The tracts invariably project to left premotor
and primary motor areas, whereby in females a branching
into motor and premotor areas occurs (red arrow in
Fig. 7e). The tracking seems to reflect the left dominant
motor function of the lateral-anterior cluster, which as part
of the motor thalamus receives inputs from the cerebellum
and gives output to primary motor and premotor cortex
(Mai and Forutan 2012). A pattern that most probably is
due to the right-handedness of all subjects.
Lateral-posterior cluster (LP)
Anatomy
The lateral-posterior cluster LP (#3) lies 2 mm anterior to
PC in ventral posterior complex VP of the lateral nuclei
group (Fig. 7c) and exhibits only weak laterality and
gender differences (Fig. 3c). VP is part of the somatosen-
sory thalamus and comprises two major divisions, the
ventral posterolateral (VPL) and ventral posteromedial
(VPM) nuclei, as well as the smaller ventral posterior
inferior nucleus (VPI) located inferiorly between both.
Within VP, the cluster with its oblique fronto-cranial-ori-
ented fibers mostly overlaps (37 %) with VPI. Both VPL
and VPM represent the principal somatosensory relay
nuclei. VPL gets projections from the contralateral medial
cuneate and gracile nuclei via the medial lemniscus and
receives spinothalamic afferents from the contralateral side
of the spinal cord (Percheron et al. 1996; Nieuwenhuys
et al. 2008).
Connectivity
This cluster shows strong subcortical connections bilateral
to Amy, Cau, Den, Hip, and Red in males (Fig. 7d). The
female profile is similar with the exception that
connections to Amy, Cau, Den and Hip are less but to Acc
and Red are more pronounced. Overall, the dominant
connections to Amy, Red and Den probably indicate the
receipt of spinothalamic afferents. In the cortical connec-
tivity, only a small laterality difference of \10 % to the
right is found for males (s. Table S4); however, this dif-
ference did not reach significance (p[ 0.05). The cortical
tracking pattern reveals compact bilateral projections,
which run (1) upwards through the posterior limb of the
internal capsule and branches within the corona radiata to
pre- and post-central areas and (2) project downwards via
the medial lemniscus to the midbrain and medulla (Fig.
7e). The cortical projections areas are in accordance with
the somatosensory nature of the VP complex strictly con-
fined to apical and medial areas around the central sulcus
and adjacent parietal areas exhibiting no significant
asymmetry (Fig. 7f).
Discussion
The thalamus remains largely an enigma in terms of its
connectivity patterns, the functioning of its circuitry, and
its functional relationship to the cerebral cortex (Sherman
and Guillery 2009). Although thalamic abnormalities play
a prominent role in the pathophysiology of psychiatric and
neurodegenerative disorders, thalamic substructures are
still delineated by their cytoarchitectonic appearance using
postmortem atlases to identify and localize structures for
neurosurgical or radio-surgical intervention (Lemaire et al.
2007). Consequently, an increasing need exists to parcel-
late the human thalamus into meaningful subdivisions
in vivo to better serve scientific and clinical demands.
The segmentation method proposed by Behrens et al.
(2003b) uses cortical connectivity profiles to distinguish
between different thalamic regions. Therefore, this par-
cellation depends on the number of pre-segmented cortical
targets, which then corresponds to the number of regions
within the thalamus. As many cortical target regions are
connected to more than one thalamic nucleus and many
nuclei connected to more than one cortical target they bi-
narized the individual results and included only those
thalamic voxels with a connection probability [25 % to
achieve a delineation of different zones. The resulting
connectivity map (Behrens et al. 2003b; Johansen-Berg
et al. 2005) reveals that this parcellation divides the thal-
amus (s. Figs. 2, 3 of the Behrens paper) in seven oblique
latero-caudally oriented stripe-like zones, which in size and
their anterior–posterior sequence resemble that of their
cortical target regions. This pre-segmentation consequently
restricts the resolution and the subsequent tracking cannot
distinguish between cortico-thalamic and thalamo-cortical
connectivity pattern. As a consequence, details of the
1632 Brain Struct Funct (2015) 220:1619–1635
123

thalamic parcellation can be blurred or obscured. This is
obvious for the prefrontal region, which is connected to
MD, parts of the anterior complex as well as parts of the
medial and inferior pulvinar. Thus, their statement ‘‘that
the relative volumes of these connectivity-defined sub-
regions correlate well with volumetric predictions based on
a histological atlas’’, slightly overstates their findings.
The DTI method presented here relies on prior work,
which enabled us to identify meaningful thalamic sub-
regions. However, as the method is based on a simple
diffusion evaluation it possesses important restrictions.
Most prominently, it does not account for spatial congru-
ency and does not consider partial volume effects and
various intra-voxel diffusion profiles. Similarly, the num-
ber of 21 orientations was arbitrarily chosen and could be
expanded or rotated. In addition, diffusion tensor-based
segmentation and tracking methods have their own limi-
tations because of the high intrinsic uncertainties (Behrens
et al. 2003b). Therefore, tensor-based and other higher-
order diffusion imaging methods like Q-ball imaging and
diffusion spectrum imaging need to be evaluated for seg-
mentation of subcortical structures. However, a recent
study (Schultz 2011) comparing tensor and Q-ball based
thalamic segmentation did not find significant differences.
Consequently, for a detailed anatomical and connectivity
analysis, we had to confine ourselves to a restricted number
of clusters.
Considering that individual variability of thalamic
nuclei is seen as a major problem that has always influ-
enced the anatomical description in humans (Mai and
Forutan 2012) the differences in laterality and gender as
determined here are with ±6 % resp. ±4 % rather mod-
erate. This may be related to the simplicity of our
approach as well as to the age restriction in our sample.
These differences are most probably caused by or related
to differences in cellularity and axonal branching. And the
determined variations are in line with recent findings on
gender differences in the human thalamus, where higher
values of fractional anisotropy and lower radial diffusivity
in males were found (Menzler et al. 2011) suggesting
gender differences in the underlying microstructure.
Similarly, a postmortem study reported on a structural
asymmetry of MD, where glial cell density in men was
greater on the right, while in women it was greater on the
left (Amunts 2008). However, our result cannot simply be
compared with histological findings, where thalamic
subdivisions are delimited on the basis of multiple criteria
provided by the staining of sections (Morel 2007; Krauth
et al. 2010), as those neurochemical procedures most
likely have no significant influence on the DTI
acquisition.
In respect to the anatomical assignments, it must be
stated that despite severe methodological restriction
mentioned above, the diffusion-based clusters are stable and
most likely caused by the local, dominant fiber arrange-
ment. Using an electronic version of the Morel atlas, the
clusters could tentatively be assigned to histological defined
structures. In addition, the tracking provides impressive
views on the connectivity profile of the thalamus and sup-
ports and expands the classic view that the thalamus serves
as a gateway, which links all information from the sensory
systems and the cerebellum to the cortex (Jones 2007).
In respect to the specific anatomical findings of the
cluster, we found an overall agreement as provided by
various atlases and textbooks. The AN cluster located
within the anterior nuclei group encircles all major struc-
tures known as the circuit of Papez (Papez 1937; Granziera
et al. 2011). Its close connection with the Hip and Amy is
in line with the limbic profile of the anterior nuclei group
and the left laterality is supported by a majority of imaging
studies (Baas et al. 2004). Even the pronounced connec-
tivity profile in females might be linked to behavior, as
females are better than males at understanding the emo-
tions of themselves and others (Baron-Cohen and Wheel-
wright 2004), although, imaging studies on lateralization of
emotional processing yielded ambiguous results. Wagner
et al. (2003) did not find support for the hypothesis of
overall lateralization of emotional function, while in a
recent study on valence effects reported on a pronounced
hemispheric lateralization to the right (Vrticka et al. 2013).
The cluster MD shows the expected extensive bilateral
cortical connectivity to the frontal lobe and selective con-
nection to the primary visual cortex. However, the right
lateralization of MD and its prominence in females has not
been reported. Spinks et al. (2002) using manually defined
start regions and an artificial neural network to automati-
cally define both the whole thalamus and the MD in 15
males and 15 females found slightly larger values for the
left MD (0.72 versus 0.70 cm3) but no gender difference.
The posterior cluster PO exhibits no significant laterality
and gender differences. However, its intense projections
were not confined to the visual cortices but include con-
nections to auditory and medio-frontal areas as well as to
the Hip and Amy. This complex connectivity may indicate
a close linkage of visual processing with memory recall,
attention and awareness. Thus, its inherent processing
functions may go beyond an ‘‘automatic fashion’’ accord-
ing to a stimulus’s biological significance (Padmala et al.
2010; Sladky et al. 2012). Finally, the similarity of the AN,
MED, and PO connections to Hip, Amy, and orbito-frontal
and visual areas is in our view remarkable. Those joint
connections arising from different loci may indicate that
the thalamus not merely serves as a gateway but acts as
central core unit in guiding attention and linking various
sensory, emotional and cognitive processing with memory
encoding and recall.
Brain Struct Funct (2015) 220:1619–1635 1633
123

Acknowledgments The digital model of the 3D anatomy of the
thalamus according to the atlas of Morel (Krauth et al. 2010) was
obtained by a written consent with Prof. G. Szekely from the Com-
puter Vision Laboratory of the ETH Zurich. We thank Susanne
Reiterer for providing the data, Klaus Scheffler for giving access to
analysis facilities, Bernd Kardatzki for technical support, Ute Habel,
and Eugene Datta for reviewing the manuscript. The German research
council (DFG) Grant GR 833/9-1 in part supported this work.
References
Abosch A, Yacoub E, Ugurbil K, Harel N (2010) An assessment of
current brain targets for deep brain stimulation surgery with
susceptibility-weighted imaging at 7 Tesla. Neurosurgery
67:1745–1756
Aggleton JP, Mishkin M (1984) Projections of the amygdala to the
thalamus in the cynomolgus monkey. J Comp Neurol 222:56–68
Akert K (1964) Comparative anatomy of frontal cortex and thalamo-
frontal connections. In: Warren JM, Akert K (eds) The frontal
granular cortex and behavior. McGraw-Hill, NewYork, pp 372–396
Alexander DC, Pierpaoli C, Basser PJ, Gee JC (2001) Spatial
transformations of diffusion tensor magnetic resonance images.
IEEE Trans Med Imaging 20:1131–1139
Amunts VV (2008) Individual variability in the structural asymmetry
of the dorsomedial nucleus of the thalamus in men and women.
Neurosci Behav Physiol 38:715–720
Baas D, Aleman A, Kahn RS (2004) Lateralization of amygdala
activation: a systematic review of functional neuroimaging
studies. Brain Res Rev 45:96–103
Baron-Cohen S, Wheelwright S (2004) The empathy quotient: an
investigation of adults with Asperger syndrome or high
functioning autism, and normal sex differences. J Autism Dev
Disord 34:163–175
Behrens TEJ, Johansen-Berg H, Woolrich MW et al (2003a) Non-
invasive mapping of connections between human thalamus and
cortex using diffusion imaging. Nat Neurosci 6:750–757
Behrens TEJ, Woolrich MW, Jenkinson M et al (2003b) Character-
ization and propagation of uncertainty in diffusion-weighted MR
imaging. Magn Reson Med 50:1077–1088
Catani M, Thiebaut de Schotten M (2008) A diffusion tensor imaging
tractography atlas for virtual in vivo dissections. Cortex
44:1105–1132
Cook P, Bai Y, Gilani N et al. (2006) Camino: open-source diffusion-
MRI reconstruction and processing. In: 14th scientific meeting of
the international society for magnetic resonance in medicine,
vol. 2759
Dale AM, Fischl B, Sereno MI (1999) Cortical surface-based analysis.
I. Segmentation and surface reconstruction.Neuroimage9:179–194
De Sousa TB, de Santana MAD, Ade MS et al (2013) Mediodorsal
thalamic nucleus receives a direct retinal input in marmoset
monkey (Callithrix jacchus): a subunit B cholera toxin study.
Ann Anat 195:32–38
Deoni SCL, Rutt BK, Parrent AG, Peters TM (2007) Segmentation of
thalamic nuclei using a modified k-means clustering algorithm
and high-resolution quantitative magnetic resonance imaging at
1.5 T. NeuroImage 34:117–126
Fischer J, Whitney D (2012) Attention gates visual coding in the
human pulvinar. Nat Commun 3:1051
Friston KJ, Jezzard P, Turner R (1994) Analysis of functional MRI
time-series. Hum Brain Mapp 1:153–171
Fuster JM (1997) The prefrontal cortex: anatomy, physiology, and
neuropsychology of the frontal lobe. Lippincott-Raven,
Philadelphia
Goebel R, Esposito F, Formisano E (2006) Analysis of functional
image analysis contest (FIAC) data with brainvoyager QX: from
single-subject to cortically aligned group general linear model
analysis and self-organizing group independent component
analysis. Hum Brain Mapp 27:392–401
Granziera C, Hadjikhani N, Arzy S et al (2011) In-vivo magnetic
resonance imaging of the structural core of the Papez circuit in
humans. Neuroreport 22:227–231
Gringel T, Schulz-Schaeffer W, Elolf E et al (2009) Optimized high-
resolution mapping of magnetization transfer (MT) at 3 Tesla for
direct visualization of substructures of the human thalamus in
clinically feasible measurement time. J Magn Reson Imaging
29:1285–1292
Hebb AO, Ojemann GA (2013) The thalamus and language revisited.
Brain Lang 126:99–108
Johansen-Berg H, Behrens TEJ, Sillery E et al (2005) Functional-
anatomical validation and individual variation of diffusion
tractography-based segmentation of the human thalamus. Cereb
Cortex 15:31–39
Jones EG (2007) The Thalamus 2 Volume Set. Cambridge University
Press
Jones DK, Cercignani M (2010) Twenty-five pitfalls in the analysis of
diffusion MRI data. NMR Biomed 23:803–820
Krauth A, Blanc R, Poveda A et al (2010) A mean three-dimensional
atlas of the human thalamus: generation from multiple histolog-
ical data. Neuroimage 49:2053–2062
Kumar K, Mang S, Grodd W (2010) Consistency of automatic
thalamus segmentation using DTI. Poster presented at the 16th
annual meeting of the organization for human brain mapping,
Barcelona (see supplement material)
Kumar K, Mang S, Reiterer S., Grodd W. (2011) DTI of the human
thalamus: hemispheric and gender variability. Oral presentation
in 17th annual meeting of the organization for human brain
mapping, Quebec (see supplement material)
Leemans A, Jones DK (2009) The B-matrix must be rotated when
correcting for subject motion in DTI data. Magn Reson Med
61:1336–1349
Lemaire J–J, Coste J, Ouchchane L et al (2007) Brain mapping in
stereotactic surgery: a brief overview from the probabilistic
targeting to the patient-based anatomic mapping. Neuroimage
37(Suppl 1):S109–S115
Lemaire J–J, Sakka L, Ouchchane L et al (2010) Anatomy of the
human thalamus based on spontaneous contrast and microscopic
voxels in high-field magnetic resonance imaging. Neurosurgery
66:161–172
Mai JK, Forutan F (2012) Thalamus. In: Mai Juergen K, Paxinos
George (eds) Human nervous system, 3rd edn. Academic Press,
San Diego, pp 618–677
Mai JK, Paxinos G, Voss T (2008) Atlas of the human brain.
Academic Press, San Diego
Mang SC, Busza A, Reiterer S et al (2012) Thalamus segmentation
based on the local diffusion direction: a group study. Magn
Reson Med 67:118–126
Menzler K, Belke M, Wehrmann E et al (2011) Men and women are
different: diffusion tensor imaging reveals sexual dimorphism in
the microstructure of the thalamus, corpus callosum and
cingulum. Neuroimage 54:2557–2562
Morel A (2007) Stereotactic atlas of the human thalamus and basal
ganglia. Informa Healthcare, New York, London
Niemann K, Mennicken VR, Jeanmonod D, Morel A (2000) The
morel stereotactic atlas of the human thalamus: atlas-to-mr
registration of internally consistent canonical model. NeuroIm-
age 12:601–616
Nieuwenhuys R, Voogd J, Huijzen CV et al (2008) The human central
nervous system, 4th edn. Springer-Verlag, Berlin Heidelberg,
New York
1634 Brain Struct Funct (2015) 220:1619–1635
123

Padmala S, Lim S-L, Pessoa L (2010) Pulvinar and affective
significance: responses track moment-to-moment stimulus visi-
bility. Front Hum Neurosci 4:64
Papez JW (1937) A proposed mechanism of emotion. Arch Neural
Psychiat 38:725–743
Percheron G, Francois C, Talbi B et al (1996) The primate motor
thalamus. Brain Res Brain Res Rev 22:93–181
Ray JP, Price JL (1992) The organization of the thalamocortical
connections of the mediodorsal thalamic nucleus in the rat,
related to the ventral forebrain–prefrontal cortex topography.
J Comp Neurol 323:167–197
Rohde GK, Barnett AS, Basser PJ et al (2004) Comprehensive
approach for correction of motion and distortion in diffusion-
weighted MRI. Magn Reson Med 51:103–114
Saalmann YB, Pinsk MA, Wang L et al (2012) The pulvinar regulates
information transmission between cortical areas based on
attention demands. Science 337:753–756
Schultz T (2011) Segmenting thalamic nuclei: what can we gain from
HARDI? In: Fichtinger G, Martel A, Peters T (eds) Medical
image computing and computer-assisted intervention–MICCAI
2011. Springer, Berlin, Heidelberg, pp 141–148
Sherman SM, Guillery RW (2009) Exploring the thalamus and its role
in cortical function. Mit Press, Cambridge
Shipp S (2003) The functional logic of cortico-pulvinar connections.
Philos Trans R Soc Lond B Biol Sci 358:1605–1624
Sladky R, Hoflich A, Atanelov J et al (2012) Increased neural
habituation in the amygdala and orbitofrontal cortex in social
anxiety disorder revealed by fMRI. PLoS One 7:e50050
Smith SM, Jenkinson M, Woolrich MW et al (2004) Advances in
functional and structural MR image analysis and implementation
as FSL. Neuroimage 23(Suppl 1):S208–S219
Spinks R, Magnotta VA, Andreasen NC et al (2002) Manual and
automated measurement of the whole thalamus and mediodorsal
nucleus using magnetic resonance imaging. Neuroimage
17:631–642
Talairach J, David M, Tournoux P, Corredor H, Kvasina T (1957)
Atlas d’Anatomie Ste0re0otaxique. Repe0rage Radiologique Indi-
rect des Noyaux Gris Centraux, des Re0gions Me0sence0phalo-sous-Optique et Hypothalamique de l’Homme. Masson & Cie,
Paris
Troiani V, Schultz RT (2013) Amygdala, pulvinar, and inferior
parietal cortex contribute to early processing of faces without
awareness. Front Hum Neurosci 7:241
Unrath A, Klose U, Grodd W et al (2008) Directional colour encoding
of the human thalamus by diffusion tensor imaging. Neurosci
Lett 434:322–327
Vrticka P, Sander D, Vuilleumier P (2013) Lateralized interactive
social content and valence processing within the human amyg-
dala. Front Hum Neurosci 6:358
Wager TD, Phan KL, Liberzon I, Taylor SF (2003) Valence, gender,
and lateralization of functional brain anatomy in emotion: a
meta-analysis of findings from neuroimaging. NeuroImage
19:513–531
Wiegell MR, Tuch DS, Larsson HB, Wedeen VJ (2003) Automatic
segmentation of thalamic nuclei from diffusion tensor magnetic
resonance imaging. NeuroImage 19:391–401
Brain Struct Funct (2015) 220:1619–1635 1635
123
Copyright © 2022 FDOKUMEN