Anatomical and functional parcellation of the human lateral premotor cortex
13
Anatomical and functional parcellation of the human lateral premotor cortex Ricarda I. Schubotz a,b, ⁎, Alfred Anwander a , Thomas R. Knösche a , D. Yves von Cramon a,b , Marc Tittgemeyer b a Max Planck Institute for Human Cognitive and Brain Sciences, Leipzig, Germany b Max Planck Institute for Neurological Research, Cologne, Germany abstract article info Article history: Received 5 August 2009 Revised 10 November 2009 Accepted 15 December 2009 Available online 24 December 2009 Keywords: Cortex parcellation Connectivity Diffusion-weighted imaging (DWI) Functional magnetic resonance imaging (fMRI) Precentral gyrus Premotor cortex The lateral premotor cortex (PM) of the macaque monkey is an anatomically multifaceted area, which serves multiple sensorimotor and cognitive functions. While evidence for the functional organization of human premotor cortex accumulates, much less is known about the underlying anatomical properties of this brain region. We used diffusion tractography and functional magnetic resonance imaging (fMRI) to investigate whether the precentral gyrus in humans can be segregated on the basis of anatomical connectivity and of functional activation in a set of cognitive and motor tasks. Tractographic data suggested a distinction between ventral and dorsal premotor cortex, and furthermore inferior and superior subparcellation of both. Functional MRI data corroborated these four areas, showing that anatomical parcellation predicts the distribution of functional activation and vice versa (preliminary evidence). These results may encourage the application of combining diffusion tractography and fMRI in vivo in order to shed light on the correspondence of brain function and anatomy. © 2009 Elsevier Inc. All rights reserved. Introduction Evidence has accumulated that the human lateral premotor cortex (PM), subserves not only sensorimotor transformation and motor control, but also attentional and cognitive functions (for an overview, see Schubotz and von Cramon, 2003). A systematic task-dependent localization of the activations found within this area implies a functionally multifaceted brain region. However, the functional analysis of the human PM, and the human cortex in general, is still limited by the fact that insights in the correspondence between function and microstructure, which is taken to correspond to functional units, have been inaccessible so far. That is because, until the emergence of diffusion-weighted imaging (DWI), individual microstructural maps could be derived only postmortem. Macro- structure, i.e., sulci and gyri, are accessible in vivo, but do not provide reliable information about functional borders, because changes in cortical microstructure (and hence function) do not necessarily respect cortical macrostructure. Moreover, both micro- and macro- structure are subject to considerable inter- and intraindividual variability (Ono et al., 1990; Rademacher et al., 1993; Roland and Zilles 1996). Hence, a crucial yet unresolved question concerns how many functionally and structurally distinct fields there are in the human lateral premotor cortex. Cortex parcellation based on diffusion-weighted imaging and tractography capitalizes on the view that differences in anatomical connectivity of brain areas signal for a functional segregation (Behrens & Johansen-Berg, 2005; Johansen-Berg & Behrens, 2006; Johansen-Berg et al., 2004; Anwander et al., 2007). Here, we use diffusion tractography and functional magnetic resonance imaging (fMRI) to investigate in vivo whether distinct patterns of connectivity can be found to segregate subregions of the human lateral premotor cortex, and if so, whether these fields are reflected by functional specificity. Anatomical and functional research in PM of the macaque monkey (area 6, Brodmann 1909) implies PM of the convexity to be subdivided into two major fields, a ventral PM and a dorsal PM (Barbas and Pandya 1987, Dum and Strick, 1991, Ghosh and Gattera, 1995, Rizzolatti et al., 1998, Tanne-Gariepy et al., 2002). Correspond- ingly, a ventral and a dorsal PM are suggested in humans as well, the border between which is however still a matter of debate (Rizzolatti et al., 2002, Preuss et al., 1996). In fact, Tomassini and colleagues (2007) reported the distinction of a ventral and a dorsal PM based on diffusion tractography, but mostly, evidence for an anatomical parcellation of the human PCG stems from functional studies (for reviews, see Schubotz & von Cramon 2003, Schubotz 2004). However, since a further structural and functional subdivision running orthogonally in rostrocaudal direction has been suggested and often reconfirmed in macaques, resulting in a rostroventral (F5), a caudoventral (F4), a rostrodorsal (F7) and a caudodorsal (F2) field (cf. Geyer et al., 2000), we tested whether our data would support four distinct fields on the lateral convexity as well. Human imaging studies suggest the distinction of at least three functionally distinct fields in lateral PM (Picard & Strick, 2001; Schubotz & von Cramon, 2003). While these confirm a role of dorsal PM in spatial tasks and for NeuroImage 50 (2010) 396–408 ⁎ Corresponding author. Max Planck Institute for Neurological Research, Motor Cognition Group, Gleueler Strasse 50, 50931 Köln, Germany. Fax: +49 (0)221 4726 298. E-mail address: [email protected] (R.I. Schubotz). 1053-8119/$ – see front matter © 2009 Elsevier Inc. All rights reserved. doi:10.1016/j.neuroimage.2009.12.069 Contents lists available at ScienceDirect NeuroImage journal homepage: www.elsevier.com/locate/ynimg
-
Upload
independent -
Category
Documents
-
view
4 -
download
0
Transcript of Anatomical and functional parcellation of the human lateral premotor cortex
NeuroImage 50 (2010) 396–408
Contents lists available at ScienceDirect
NeuroImage
j ourna l homepage: www.e lsev ie r.com/ locate /yn img
Anatomical and functional parcellation of the human lateral premotor cortex
Ricarda I. Schubotz a,b,⁎, Alfred Anwander a, Thomas R. Knösche a, D. Yves von Cramon a,b, Marc Tittgemeyer b
a Max Planck Institute for Human Cognitive and Brain Sciences, Leipzig, Germanyb Max Planck Institute for Neurological Research, Cologne, Germany
⁎ Corresponding author. Max Planck Institute forCognition Group, Gleueler Strasse 50, 50931 Köln, Germa
E-mail address: [email protected] (R.I. Schubotz)
1053-8119/$ – see front matter © 2009 Elsevier Inc. Adoi:10.1016/j.neuroimage.2009.12.069
a b s t r a c t
a r t i c l e i n f oArticle history:Received 5 August 2009Revised 10 November 2009Accepted 15 December 2009Available online 24 December 2009
Keywords:Cortex parcellationConnectivityDiffusion-weighted imaging (DWI)Functional magnetic resonance imaging(fMRI)Precentral gyrusPremotor cortex
The lateral premotor cortex (PM) of the macaque monkey is an anatomically multifaceted area, which servesmultiple sensorimotor and cognitive functions. While evidence for the functional organization of humanpremotor cortex accumulates, much less is known about the underlying anatomical properties of this brainregion. We used diffusion tractography and functional magnetic resonance imaging (fMRI) to investigatewhether the precentral gyrus in humans can be segregated on the basis of anatomical connectivity and offunctional activation in a set of cognitive and motor tasks. Tractographic data suggested a distinctionbetween ventral and dorsal premotor cortex, and furthermore inferior and superior subparcellation of both.Functional MRI data corroborated these four areas, showing that anatomical parcellation predicts thedistribution of functional activation and vice versa (preliminary evidence). These results may encourage theapplication of combining diffusion tractography and fMRI in vivo in order to shed light on thecorrespondence of brain function and anatomy.
Neurological Research, Motorny. Fax:+49 (0)221 4726 298..
ll rights reserved.
© 2009 Elsevier Inc. All rights reserved.
Introduction
Evidence has accumulated that the human lateral premotor cortex(PM), subserves not only sensorimotor transformation and motorcontrol, but also attentional and cognitive functions (for an overview,see Schubotz and von Cramon, 2003). A systematic task-dependentlocalization of the activations found within this area implies afunctionally multifaceted brain region. However, the functionalanalysis of the human PM, and the human cortex in general, is stilllimited by the fact that insights in the correspondence betweenfunction and microstructure, which is taken to correspond tofunctional units, have been inaccessible so far. That is because, untilthe emergence of diffusion-weighted imaging (DWI), individualmicrostructural maps could be derived only postmortem. Macro-structure, i.e., sulci and gyri, are accessible in vivo, but do not providereliable information about functional borders, because changes incortical microstructure (and hence function) do not necessarilyrespect cortical macrostructure. Moreover, both micro- and macro-structure are subject to considerable inter- and intraindividualvariability (Ono et al., 1990; Rademacher et al., 1993; Roland andZilles 1996). Hence, a crucial yet unresolved question concerns howmany functionally and structurally distinct fields there are in thehuman lateral premotor cortex.
Cortex parcellation based on diffusion-weighted imaging andtractography capitalizes on the view that differences in anatomical
connectivity of brain areas signal for a functional segregation(Behrens & Johansen-Berg, 2005; Johansen-Berg & Behrens, 2006;Johansen-Berg et al., 2004; Anwander et al., 2007). Here, we usediffusion tractography and functional magnetic resonance imaging(fMRI) to investigate in vivo whether distinct patterns of connectivitycan be found to segregate subregions of the human lateral premotorcortex, and if so, whether these fields are reflected by functionalspecificity.
Anatomical and functional research in PM of the macaque monkey(area 6, Brodmann 1909) implies PM of the convexity to besubdivided into two major fields, a ventral PM and a dorsal PM(Barbas and Pandya 1987, Dum and Strick, 1991, Ghosh and Gattera,1995, Rizzolatti et al., 1998, Tanne-Gariepy et al., 2002). Correspond-ingly, a ventral and a dorsal PM are suggested in humans as well, theborder between which is however still a matter of debate (Rizzolattiet al., 2002, Preuss et al., 1996). In fact, Tomassini and colleagues(2007) reported the distinction of a ventral and a dorsal PM based ondiffusion tractography, but mostly, evidence for an anatomicalparcellation of the human PCG stems from functional studies (forreviews, see Schubotz & von Cramon 2003, Schubotz 2004). However,since a further structural and functional subdivision runningorthogonally in rostrocaudal direction has been suggested and oftenreconfirmed in macaques, resulting in a rostroventral (F5), acaudoventral (F4), a rostrodorsal (F7) and a caudodorsal (F2) field(cf. Geyer et al., 2000), we tested whether our data would supportfour distinct fields on the lateral convexity as well. Human imagingstudies suggest the distinction of at least three functionally distinctfields in lateral PM (Picard & Strick, 2001; Schubotz & von Cramon,2003). While these confirm a role of dorsal PM in spatial tasks and for

397R.I. Schubotz et al. / NeuroImage 50 (2010) 396–408
ventral PM in object-related tasks, as in macaques, the inferiormostportion of ventral PM seems to be particularly relevant for processingrhythm and pitch (Schubotz & von Cramon, 2001, 2002; Schubotz etal., 2003, Wolfensteller et al., 2007). Hence, previous functionalstudies point to a complex parcellation of the human PCG, but itremains an open question as to whether or not structural andcorresponding functional compartments can be identified. Thepresent study aimed to further this issue by using diffusion tensorimaging (DTI) and fMRI. Notably, these methods were conductedindependently, i.e., DTI data were not used to direct fMRI analysis orvice versa, but in an overlapping sample of subjects in order todetermine whether or not there is congruence in the outcomes onstructure and function.We first examinedwhether PM subregions canbe identified using diffusion tractography; then we proceeded toassess functional (motor and cognitive) specialization of differentsectors of PM (cf. Johansen-Berg et al., 2004 for a comparableapproach to the supplementary motor area). To this end, weconducted three experiments (see Methods for details) in the samesubjects from which we also collected diffusion weighted imagingdata. Experiments employed paradigms that are well established inhuman and macaque research on premotor function.
In Experiment 1, we aimed to localize two subregions of theprimary motor cortex within each hemisphere together with theirrespective premotor contributions. Subjects were instructed to movetheir tongue or their fingers according to visual stimuli presented onthe screen. Regarding premotor activations, we expected widespreadand overlapping activations for tongue and hand movement;however, based on previous findings (summarized in Schubotz &von Cramon, 2003), we expected a direct task contrast to revealtongue movements to dominate hand movements in the ventral PCG,whereas the opposite should hold true for the dorsal PCG.
In Experiment 2, subjects were asked to attend to the order ofserially presented stimuli, either with respect to rhythmical, object-based, or spatial properties. This so-called serial prediction task (SPT,Schubotz, 1999) has been found to reliably engage distinct subregionsof the lateral premotor cortex in the absence of motor requirements(Schubotz & von Cramon, 2001; Schubotz et al., 2003; Schubotz,2004). Following previous findings, we hypothesized rhythmicpredictions to engage the inferior ventral PCG, object-based predic-tion the superior ventral PCG, and spatial predictions the dorsal PCG.Note that (1) these differences, as for Experiment 1, were expected tobe revealed by direct task contrasts, i.e., to reflect a weighting ordominance of task-activation relationships rather than absolutedifferences; and that (2) labels “inferior ventral,” “superior ventral”and “dorsal” are assigned as coarse classifications within eachprecentral area as revealed by imaging findings cited above(Schubotz, 2004).
In Experiment 3, subjects watched short video clips showing eithera pointing or a grasping action towards artifacts. Since movement/action observation has been found to draw on different premotorportions depending on which body part is engaged (Sakreida et al.,2005, Buccino et al., 2001), and according to findings in the macaquereporting differential premotor activity in reaching and grasping(Caminiti et al., 1999, Rizzolatti, 1987), observation of pointing wasexpected to draw more on dorsal PCG than observation of grasping/manipulation, whereas the opposite pattern was expected for theventral PCG.
Materials and methods
Diffusion-weighted imaging
SubjectsTen right-handed subjects (21–33 years, mean 26.1 years, 5
females) took part in the diffusion data acquisition. Participants gavewritten consent before being included in testing. All participants were
right-handed, had normal or corrected-to-normal vision, and werenative German speakers. No participant had a history of neurologic,psychiatric, or other major medical disorder. No participant wastaking medication at the time of measurement. The experimentalstandards were approved by the local ethics committee of theUniversity of Leipzig (Leipzig, Germany). Data were handledanonymously.
Data acquisition and preprocessingDiffusion-weighted data and high-resolution 3-dimensional (3D)
T1- and T2-weighted images were acquired on a Siemens 3T Trioscanner with an 8-channel array head coil and maximum gradientstrength of 40 mT/m. The diffusion-weighted data were acquiredusing spin-echo echo planar imaging (EPI) (TR=12 s, TE=100ms, 72axial slices, resolution 1.72×1.72×1. 7 mm, no cardiac gating). AGRAPPA technique (red.-factor 2.0) was chosen as parallel imagingscheme. Diffusion weighting was isotropically distributed along 60directions (b-value=1000 s/mm2). Additionally, seven data sets withno diffusion weighting were acquired initially and interleaved aftereach block of 10 diffusion weighted images as anatomical referencefor motion correction. The high angular resolution of the diffusionweighting directions improves the robustness of the tensor estima-tion by increasing the signal-to-noise ratio (SNR) and reducingdirectional bias. To further increase SNR, scanning was repeated threetimes for averaging, requiring a total scan time for the DWI protocol ofapproximately 45 min. DWI data were acquired after the T2-weightedimages in the same scanner reference system.
As first step in preprocessing the data, the 3D T1-weighted(MPRAGE; TR=1300 ms, TI=650 ms, TE=3.97 ms, resolution1.0×1.0×1. 0 mm, flip angle 10°, 2 acquisitions) images werereoriented to the sagittal plane through the anterior and posteriorcommissures. Upon reorientation, the 3D T2-weighted images (RARE;TR=2 s, TE=355 ms, resolution 1.0×1.0×1. 0 mm, flip angle 180°)were coregistered to the reoriented 3D T1-weighted images usingrigid-body transformations (Jenkinson et al., 2002), implemented inFSL (2006). The images without diffusion weightings were used toestimate motion correction parameters with the same registrationmethod. The motion correction for the DWI data was combined withthe global registration to the T1 anatomy. The gradient direction foreach volume was corrected using the rotation parameters. Theregistered images were interpolated to an isotropic voxel resolutionof 1 mm and the three corresponding acquisitions were averaged.Finally, for each voxel, a diffusion tensor was fitted to the DWI data.For presentation purposes, cortical surfaces were rendered on basis ofthe T1-weighted images by using Freesurfer (Dale et al., 1999).
Definition of the region of interestSince the lateral premotor cortex cannot be determined on the
basis of macroanatomical landmarks, and individual cytoarchitectonicdata are not available, we preselected the precentral gyrus (PCG) ineach individual, i.e., the anatomical region that is considered tocomprise (part of) BA 4 and BA 6 (Brodmann, 1909). The precentralgyrus amounts to the posterior convolution of the frontal lobe, and isbounded in back by the central sulcus and in front by the precentralsulcus. Accordingly, central and precentral sulcus were determined on1 mm thick axial slices in each individual (MRICron, Rorden et al.,2007). Two-dimensional slices containing these selection markersthen entered in an interpolation to generate 3D ROI volumes in the leftand in the right hemisphere of all 10 subjects. This selection wasfurther validated by a comparison with the probabilistic microstruc-tural map of BA 6, based on a postmortem analysis of the agranularfrontal cortex in ten brains (Geyer, 2004; Eickhoff, 2006). Whileselecting the PCG may have come at the cost of underestimating theextension of the dorsal PM close to the midline, this choice ensuredthat we excluded anteriorly adjacent prefrontal tissue from oursample which was not of interest for the present investigation.

398 R.I. Schubotz et al. / NeuroImage 50 (2010) 396–408
The region of interest (ROI) was defined by an experiencedneurologist (DYC) on the individual T1-weighted MR images. Itencompassed the precentral gyrus bilaterally, bounded by the central,precentral, lateral, and interhemispheric sulci. TheROIswere segmentedinto white and gray matter compartments thresholding the fractionalanisotropy (FA) of the diffusion tensor (white matter: FAN0.1). Eachwhitematter voxel in the ROI that neighboured a graymatter voxel waslabeled as seed point for subsequent diffusion tractography.
Diffusion tractographic methodWe applied a 3-dimensional extension (Anwander et al., 2007) of
the random walk method proposed by Koch et al. (2002). Thealgorithmwas applied to each of the seed voxels. The target space wasthewholewhitematter volumewith a resolution of 1.0×1.0×1.0mm3.The algorithm can be described by a model of randomly movingparticles. Imagine a particle in a seed voxel A, moving in a randommanner fromvoxel to voxel. The transitionprobability toaneighbouringvoxel depends on the local probability density function (lPDF) based onthe local diffusivity profile that is modeled from the DTI measurement.This lPDF isdiscretised into26directions corresponding toneighbouringvoxels and yields higher transitional probabilities along directions withhigh diffusivity, i.e., the presumed fibre directions. Hence, the particlewill move with a higher probability along a fibre direction thanperpendicular to it. If we perform this “experiment” many times andcount how often particles fromvoxel A reach a target voxel B, we obtaina relative measure of the probability of tracing a pathway between thetwo voxels. The random walk is stopped when the particle leaves thewhite matter volume. The 3-dimensional distribution of the connectiv-ity values of a particular seed voxel with all voxels in the brain is called atractogram. The average tractogram, i.e., the arithmetic mean ofconnectivity probabilities for each seed point in each volume of interest(VOI), for an entire region we call the connectivity signature of thisregion.
For each elementary transition of the particle, the probability for amovement from the seed voxel m to the target voxel n (the lPDF) iscomputed as
P mYnð Þ = dmYn;m � dmYn;n
� �a
P(m→n): probability for a transition from voxelm to voxel n, dm→n,m:diffusion coefficient in voxelm for the direction of the connecting linebetween voxel m and n.
The exponent a=7 is used to focus the probability distribution tomain fibre direction and reduce the influence of the transversediffusion. The value was empirically chosen in such a way that thetrajectories of most particles follow the main fibre directions asdefined by the lPDF. The transition directions in the local model arelimited to the 26 discrete neighbours of the voxel, which is sufficientto produce a smooth distribution of the fibres directions afterinterpolation of the tensor data to 1 mm voxel size. A total of100,000 particles were tested for each seed voxel. To compensate forthe distance dependent bias, each connectivity value is normalized tothe shortest pathway1 between the seed and the respective targetvoxel (Anwander et al., 2007). After reducing the dynamic range ofthe connectivity values by logarithmic transformation, the entiretractogram was scaled to its maximum value. To remove randomartefacts, only connectivity values bigger than 0.4 were used forfurther processing (Anwander et al., 2007).
Cortex parcellationThe idea underlying cortex parcellation is that cortical areas with
similar long-range connectivity are combined to one region, which is
1 The “shortest pathway” between seed and target voxel refers to the smallestnumber of jumps that any one out of the 100,000 test particles has needed to reach theparticular target.
segregated from neighbouring regions with different connectivity.The connectivity pattern of a cortical voxel is approximated by thetractogram associated to its neighbouring white matter voxel, i.e., theseed points for our diffusion tractography algorithm reside at the graymatter/white matter interface to ensure that the computed tracto-graphic signatures are dominated by long-range connections, withinthe given resolution. This kind of segregation technique has beentermed connectivity-based parcellation accordingly (Johansen-Berget al., 2004). The general principle of the tractographic andparcellation technique that we applied here is outlined by Anwanderet al. (2007).
Functional MRI experiments
SubjectsTwo women and two men (29–33 years, mean age 29.8 years) of
the 10 subjects of the DWI experiment participated in three functionalexperiments. Trials of Experiments 1 and 2 were measured within thesame experimental session (order counterbalanced between indivi-duals), and those of Experiment 3 in an extra session. In order toenhance signal-to-noise ratio within single subject data while at thesame time respecting a maximal scanning time of about 45min/d andsession, participants performed in the first type of session (containingtrials of Experiments 1 and 2) three times on three different days.Together with Experiment 3, subjects participated in four sessions onfour different days in total.
Logistic limitations ruled out testing all 10 subjects (6 out of 10students with the DTI data set were no longer available). Note thatthese limitations do not impose a problem on the interpretation of ourdata because DTI and fMRI were conducted independently from eachother.
fMRI Experiment 1Within each trial, subjects were presentedwith sequences of seven
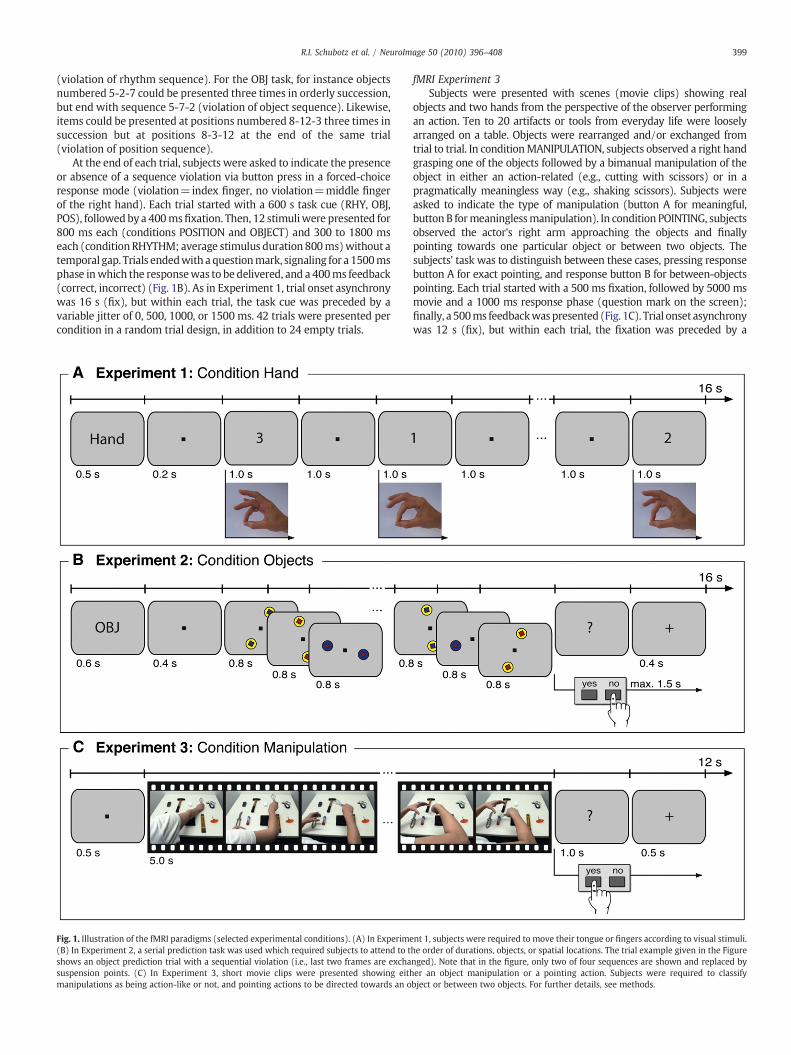
stimuli. Trials of the condition TONGUE showed two-syllable pseudowords like LOYO or YALA, whereas trials of the condition HANDshowed random numbers from 1 to 4. Participants were instructed tosilently say the pseudo word by using only the tongue, or to perform afinger-opponent movement according to the number on the screen(1=touching thumb with the index finger, 2=touching thumb withthe middle finger, and so on). Each trial started with a 500ms task cue(TONGUE or HAND) followed by a 200 ms fixation cross and sevenstimuli presented consecutively for 1000 ms each with a 1000 ms gap(Fig. 1A). Trial onset asynchrony was 16 s (fix), but within each trial,the task cue was preceded by a variable jitter of 0, 500, 1000, or1500 ms. 18 trials per condition were presented in a random trialdesign, resulting in 126 movements per motor effector. Additionally,six empty trials were randomly interspersed.
fMRI Experiment 2Three experimental conditions of a serial prediction task (Schubotz,
1999) were employed in a random trial design. In each condition,subjects were presented with sequences of twelve abstract geometricstimuli. On each screen, two identical figures appeared on oppositelocations of a virtual circle (detailed description of stimuli in Schubotzet al., 2001). Depending on the task cue, participants were required toattend to the order of durations (condition RHYTHM), objects(condition OBJECT), or locations (condition POSITION). The stimulusorder wasmade up by four presentations of a three-element sequence(4×3=12 stimuli). In half of the trials, the presentation order ofpicture 11 and 12 was switched with respect to the task relevantstimulus property, resulting in a sequence violation. For example, inthe RHY task, a three-element rhythmwas presented by picture 1-2-3lasting 600-300-1500 ms. This rhythm was correctly repeated twofurther times before picture 11 and 12 switched with respect to theirpresentation duration, resulting in a new rhythm of 600-1500-300ms
399R.I. Schubotz et al. / NeuroImage 50 (2010) 396–408
(violation of rhythm sequence). For the OBJ task, for instance objectsnumbered 5-2-7 could be presented three times in orderly succession,but end with sequence 5-7-2 (violation of object sequence). Likewise,items could be presented at positions numbered 8-12-3 three times insuccession but at positions 8-3-12 at the end of the same trial(violation of position sequence).
At the end of each trial, subjects were asked to indicate the presenceor absence of a sequence violation via button press in a forced-choiceresponse mode (violation=index finger, no violation=middle fingerof the right hand). Each trial started with a 600 s task cue (RHY, OBJ,POS), followed by a 400msfixation. Then, 12 stimuliwere presented for800 ms each (conditions POSITION and OBJECT) and 300 to 1800 mseach (conditionRHYTHM; average stimulus duration 800ms)without atemporal gap. Trials endedwith a questionmark, signaling for a 1500msphase inwhich the responsewas to be delivered, and a 400ms feedback(correct, incorrect) (Fig. 1B). As in Experiment 1, trial onset asynchronywas 16 s (fix), but within each trial, the task cue was preceded by avariable jitter of 0, 500, 1000, or 1500 ms. 42 trials were presented percondition in a random trial design, in addition to 24 empty trials.
Fig. 1. Illustration of the fMRI paradigms (selected experimental conditions). (A) In Experime(B) In Experiment 2, a serial prediction task was used which required subjects to attend to tshows an object prediction trial with a sequential violation (i.e., last two frames are exchasuspension points. (C) In Experiment 3, short movie clips were presented showing eithmanipulations as being action-like or not, and pointing actions to be directed towards an o
fMRI Experiment 3Subjects were presented with scenes (movie clips) showing real
objects and two hands from the perspective of the observer performingan action. Ten to 20 artifacts or tools from everyday life were looselyarranged on a table. Objects were rearranged and/or exchanged fromtrial to trial. In conditionMANIPULATION, subjects observed a right handgrasping one of the objects followed by a bimanual manipulation of theobject in either an action-related (e.g., cutting with scissors) or in apragmatically meaningless way (e.g., shaking scissors). Subjects wereasked to indicate the type of manipulation (button A for meaningful,button B formeaninglessmanipulation). In condition POINTING, subjectsobserved the actor's right arm approaching the objects and finallypointing towards one particular object or between two objects. Thesubjects' task was to distinguish between these cases, pressing responsebutton A for exact pointing, and response button B for between-objectspointing. Each trial started with a 500 ms fixation, followed by 5000 msmovie and a 1000 ms response phase (question mark on the screen);finally, a 500ms feedbackwaspresented (Fig. 1C). Trial onset asynchronywas 12 s (fix), but within each trial, the fixation was preceded by a
nt 1, subjects were required to move their tongue or fingers according to visual stimuli.he order of durations, objects, or spatial locations. The trial example given in the Figurenged). Note that in the figure, only two of four sequences are shown and replaced byer an object manipulation or a pointing action. Subjects were required to classifybject or between two objects. For further details, see methods.

400 R.I. Schubotz et al. / NeuroImage 50 (2010) 396–408
variable jitter of 0, 500, 1000, or 1500ms. Sixty trials were presented percondition in a random trial design, in addition to 30 empty trials.
Data acquisitionParticipants were supine on the gantry, with two fingers of their
right hand positioned over the corresponding response buttons inExperiments 2 and 3. The participants' handswere carefully stabilized,and form-fitting cushions were used to prevent arm, hand, and headmotion. To attenuate scanner noise, participants were provided withearplugs. Imaging was performed on a 3T scanner (Siemens TRIO,Erlangen) equipped with the standard birdcage head coil. Forregistration purposes, a set of two-dimensional anatomical imageswere acquired for each participant immediately before the functionalimaging. T1-weighted modified driven equilibrium fourier transform(MDEFT) images (256×256 pixel matrix) were obtained with a non-slice-selective inversion pulse followed by a single excitation of eachslice. Anatomical images were positioned parallel to the bicommis-sural plane (anterior commissure–posterior commissure). Functionaldata were acquired from 18 axial slices (thickness 4 mm; gap 25%) byusing a single-shot gradient echo echo-planar imaging (EPI) sequence(echo time 30 ms; pixel matrix 64×64; flip angle 90°; field of view192 mm). During each trial, eight (Experiments 1 and 2) and sixvolumes (Experiment 3) were obtained at a rate of 2 s per volume,resulting in a total of 480 (Experiment 1), 1200 (Experiment 2), and900 (Experiment 3) functional images for each participant. Due to therepetition protocol of experimental sessions 1 and 2, the total numberof volumes was 1440 for Experiment 1 and 3600 for Experiment 2.
Functional imaging data analysisThe fMRI data processing was performed by using the software
package LIPSIA (Lohmann et al., 2001). Functional data were motion-corrected offline with the Siemens motion correction protocol(Siemens). To correct for the temporal offset between the slicesacquired in one scan, a cubic-spline interpolation was applied. Atemporal high-pass filter with cutoff frequencies of 1/120 Hz (Exper-iment 1 and 2) and 1/90 Hz (Experiment 3) were used for baselinecorrection of the signal; since individual data were analyzed, no spatialGaussian filtering was applied. To align the functional slices with a 3Dstereotactic coordinate reference system, a rigid linear registrationwithsix degrees of freedom (three rotational and three translational) wasperformed. The rotational and translational parameters were acquiredon the basis of theMDEFT andEPI-T1 slices to achieve anoptimalmatchbetween these slices and the individual 3D reference data set. This 3Dreference data set was acquired for each subject during a previousscanning session. TheMDEFTvolumedata setwith160 slices and1-mmslice thickness was standardized to the Talairach stereotactic space(Talairach & Tournoux, 1988). The rotational and translationalparameters were then used to transform the functional slices byusing trilinear interpolation so that the resulting functional slices werealigned with the stereotactic coordinate system.
The statistical evaluation was based on a least-squares estimationby using the general linear model for serially autocorrelated observa-tions (Friston, 1994; Friston et al., 1995a,b;Worsley and Friston, 1995).The design matrix was generated with a boxcar function (Experiment1 and 2) and a gamma function (Experiment 3), convolved with ahemodynamic response function including a delay of 6 s. The analyzedepoch comprised the time in which subjects were presented withstimuli (including corresponding movements in Experiment 1), i.e.,phases of 14 s (Experiment 1), 9.6 s (Experiment 2), and 5 s(Experiment 3). The model equation, including the observation data,the design matrix, and the error term, was convolved with a Gaussiankernel of dispersion of 4 s full width at half maximum.
For the analysis of individual data sets, required for determiningstructure-function-correspondence, z-maps of the differences betweenthe specified conditions were calculated for each subject. The followingcontrasts were calculated: (1.a) tongueNfingers and (1.b) fin-
gersN tongue (Experiment 1); (2.a) RHYNOBJ & POS, (2.b) OBJNRHY &POS, (2.c) POSNRHY&OBJ (Experiment2); (3.a) graspingNpointing and(3.b) pointingNgrasping (Experiment 3). For the analysis of groupeffectswhichwasmerely performed for descriptive purposes (cf. Fig. 6),contrast images of the differences between the specified conditionswere calculated for each subject (same contrasts as in the single subjectdata analysis). Group analyses (random-effects model) based on thecontrast images were subsequently performed. The individual contrastimages were then entered into a second-level random effects analysis(one-sample t test). Subsequently, t values were transformed into Zscores. To protect against false-positive activations, only regionswith a ZscoreN3.09 (Pb0.001 uncorrected) and with a volumeN135 mm3 (5contiguous voxels) were considered (Forman et al., 1995).
Assessment of structure-function correspondenceTo assess the degree of correspondence between the individual
functional activation patterns (revealed by fMRI) and the anatomicalareas (revealed from cortex parcellation), we computed the relativeoverlap (OL%):
Rij =NfMRI+DTIijffiffiffiffiffiffiffiffiffiffiffi
NfMRIi
q�
ffiffiffiffiffiffiffiffiffiNDTIj
q ð1Þ
NDTI + fMRIij denotes the number of superficial gray matter voxels that
belong to both the functional activation pattern i and the anatomicalarea j,NfMRI
i is the number of voxels in the functional activation pattern iand NDTI
j is the number of voxels in the anatomical area j. In eachhemisphere, we computed all relative overlaps according to equation(1) between the 14 functional activation patterns (7 contrasts in 2hemispheres: tongueNfingers, fingersN tongue, rhythmNobject andposition, objectNrhythm and position, positionNrhythm and object,graspingNpointing, pointingNgrasping) and the 4 anatomical areas.
In order to statistically test whether there is a significant correlationbetween the activation patterns and anatomical areas across indivi-duals, we applied a bootstrap approach by first computing two differentdistributions for the relative overlaps. In the random match conditionrelative overlaps between activation patterns of any subject and corticalareas of any other subject (whichmay also be the same) were includedinto the distribution. In the correct match condition the distributiononly comprises relative overlap values within subject.
If indeed the particular cortex parcellation in a particular subjectpredicts functional activation patterns in the same subject better thanthe functional activation in any other subject, the two distributionsshould be different. More specifically, one would predict for thecorrect match condition a higher incidence of low relative overlaps (ifthe particular anatomical area does not support the particularfunction) and high relative overlaps (if the anatomical area is partof the neuronal substrate of the respective function), while interme-diate values are less frequent.
Quantification of interindividual parcellation reproducibilityIn order to quantify the parcellation reproducibility over subjects,
the following strategy was employed. For each hemisphere, therelative overlaps between all pairs of subject–area combinations werecalculated. Then, these values were averaged over subjects. Theresulting values quantify the mean relative overlap between any pairof areas in different subjects.
Results
Cortex parcellation
The PCG could be consistently divided into two areas in bothhemispheres for all 10 subjects: a dorsal area (PCGd) and a ventral area(PCGv) (Fig. 2). On the convexity of the PCG, the average Talairach z

Fig. 2. Connectivity-based parcellation of the PCG. Results of parcellating the left and the right hemisphere for all 10 subjects indicate that the PCG is divided into a dorsal (area PCGd)and a ventral (area PCGv) area in both hemispheres. Further subdivisions yielded consistent parcellations of four clusters, resulting in a superior (blue) and an inferior (green) area ofPCGd as well as in a superior (yellow) and an inferior (red) area of PCGv. Arrows indicate the central sulcus in each hemisphere.
401R.I. Schubotz et al. / NeuroImage 50 (2010) 396–408

402 R.I. Schubotz et al. / NeuroImage 50 (2010) 396–408
coordinate of the border between ventral and dorsal areaswas 49 (95%confidence interval: 47 to 51) in the left and 52 (95% confidenceinterval: 48 to 56) in the right hemisphere. Visual inspection of theconnectivity signatures (i.e., the average diffusion tractogram, cf.Anwander et al., 2007) of the dorsal area indicated strong connectionprobabilities into the descending corticofugal (pyramidal) tracts, toadjacent postcentral areas, to the superior parietal lobule, and to theposteriormost portion (foot region) of themiddle frontal gyrus. For theventral part, connection probabilities were found to the middle andthe inferior frontal gyri, to superior and inferior parietal areas, and totemporal regions.
Fig. 3. Tractographic target sites for each of the four parcellated PCG fields in each of the tepoint for each individual parcellated field. The endings of tractograms at a cortical locatiopattern of such targets indicates the characteristic anatomical connectivity of the particula
However, an equivalently consistent parcellation across subjectsshowed up at four clusters (Fig. 2). Both the dorsal area and theventral area were subdivided again into a superior–caudal and aninferior–rostral area (hereafter superior PCGd, inferior PCGd, superiorPCGv, inferior PCGv), respectively.
The connectivity signatures of the different regions showed strongpyramidal connection probabilities for superior PCGd, and a morediverse pattern dominated by connections with the caudal dorsolat-eral prefrontal cortex for inferior PCGd. Across subjects, there wereconsistent connections (cf. Fig. 3) into the directly adjacent postcentralregion (BA 5) for superior PCGd (left: 9 of 10 subjects; right: 8) but
n subjects. Tractography was started at the white matter–gray matter interface in anyn (tractographic target sites) are depicted color-coded (cf. Fig. 2) for each field. Ther field.

403R.I. Schubotz et al. / NeuroImage 50 (2010) 396–408
insignificant prefrontal targets; for inferior PCGd, consistent connec-tionswere found in directly adjacent postcentral area reaching into thesuperior parietal lobule (BA 5 and BA 7; left: 7 of 10 subjects; right: 10)and in the posterior portion of themiddle frontal gyrus (BA 8; left: 7 of10 subjects; right: 7).
The two ventral regions showed connections to the parietal andthe temporal lobe. For superior PCGv, the interindividually mostconsistent connections across subjects were found around theanterior intraparietal sulcus (BA 7/39; left: 7 of 10 subjects; right:6). In addition, subjects showed prefrontal connection probabilitiesinto lateral BA 9 and/or BA 44 (left: 5 of 10 subjects; right: 4) as wellas into different temporal regions (left: 8 of 10 subjects; right: 6). Incontrast, inferior PCGv showed parietal connections mostly aroundsupramarginal gyrus and angular gyrus (BA 39/40; left: 5 of 10subjects; right: 6), but no connection probabilities with the superiorparietal lobule (BA 7). Also for this area, very consistent connectionswere found into BA 44 (left: 9 of 10 subjects; right: 10) and intotemporal regions (left: 10 of 10 subjects; right: 7); some subjects alsoshowed prefrontal connections with the posterior portions of theupper bank of the inferior frontal sulcus (left: 6 of 10 subjects; right:5). Thus, while both ventral areas showed parietal and temporalconnection probabilities, their connection patterns were consistentlydifferent across subjects.
As to the quantification of the parcellation reproducibility oversubjects, the mean relative overlaps between any pair of areas indifferent subjects are displayed in matrix form in the right panel ofFig. 4. If the resulting matrices (one per hemisphere) are stronglydiagonal, this means that corresponding fields agree much betterbetween different subjects than noncorresponding ones, i.e., theparcellations are similar between subjects. As a result, the valueswere much bigger in the main diagonals, i.e., between the sameareas across different subjects. Some overlap can also be observedbetween adjacent areas (so-called secondary diagonals), especially
Fig. 4. Relative overlap (scale ranging from 0 to 10 subjects) of each individual area in the leplotted onto the inflated cortex as well as onto the pial surface (smaller insets). Matrices o
between the two ventral areas in the right hemisphere where theparcellation is in two subjects rostro–caudal rather than ventral–dorsal. The population maps in the left part of Fig. 4 illustrate thevariability of the areas.
Functional MRI data
The motor localizer tasks (Experiment 1) yielded clearly distin-guishable activations located in the caudal precentral and in thepostcentral gyrus for both finger and tongue movements (Fig. 5A).Finger movements activated the well-known region of the invertedomega-shape on the PCG (Yousry et al., 1997) whereas tonguemovements elicited activations in a more ventral region close to theone reported by Fox and colleagues (2001). Fox and colleagues reportthe left mouth area at Talairach coordinates x/y/z of−46/−8/40 andthe right at 52/−8/38; in comparison, the average location ofactivation was −50/−9/36 and 55/−6/42 in our subjects (forcomparison, average location of the right finger movements was−29/−17/60).
As expected on the basis of previous results, Experiment 2replicated that rhythmic, object-based and spatial sequence tasksactivate different portions of the lateral premotor cortex to differentextents (Fig. 5B). Note that these differences, based on direct contrastsbetween experimental conditions, reflect relative variations of theBOLD response rather than absolute differences. In contrast to theobject and the spatial task, rhythmic sequences corresponded toactivation in the right inferiormost ventral premotor cortex; objectsequences caused highest activation in the left superior ventralpremotor cortex; spatial sequences led to most pronounced signalchanges in the dorsal premotor cortex in both hemispheres.Maximally activated areas were, on average, (43/10/9) for rhythmsequences, (−41/−3/27) for object sequences, and (−29/−5/66)and (28/−8/58) for spatial sequences.
ft (upper panel) and right (lower panel) hemisphere, respectively. Population maps aren the right side depict a quantification the mean relative overlap between areas.

Fig. 5. Representative fMRI data of one individual subject. Z maps show maximalactivated voxels (Z scoreN3.09, Pb0.001 uncorrected, volumeN135 mm3) for directtask contrasts from Experiment 1 (tongue vs. hand, hand vs. tongue), Experiment 2(rhythm vs. objects and positions, objects vs. rhythm and positions, positions vs.rhythm and objects), and Experiment 3 (observation of grasping/manipulation vs.observation of pointing, observation of pointing vs. observation of grasping/manipulation).
404 R.I. Schubotz et al. / NeuroImage 50 (2010) 396–408
In Experiment 3,watchingmovies of object grasping/manipulationas compared to observing pointingmovements directed at or betweenobjects was particularly correlated with activations in the ventral PCG.The opposite contrast revealed specific activation in dorsal PCG,slightly stronger on the left side (Fig. 5C).
Systematic comparison between fMRI findings and cortex parcellation
None of the fMRI contrasts we reported revealed activationrestricted to only one single PCG field. However, activation was
Fig. 6. Comparison between functional activations (fMRI data) and cortex parcellation of thtogether with the outlines of the diffusion-based PCG fields (white lines) overlaid to the correfor each contrast (see legends) and then collapsed into one view per hemisphere and exconnectivity-based parcellation and functional activations per experimental contrast and aindicate the relative overlap between significantly activated voxels and the inferior ventralfield as determined by cortex parcellation.
distributed differently depending on the task contrast (Fig. 6). Sincethere are no standards of how to compare diffusion-based corticalparcellation with fMRI data, we computed for each subject andhemisphere the relative overlap between each pair of cortex parcella-tion area and the cortex area activated in a certain experimentalcontrast. The relative overlap was then subjected to a bootstrapapproach (see Methods).
As to the relative overlaps between activation patterns and corticalareas, we found a clear difference between the random matchdistribution and the correct match distribution, as depicted by thenormalized histograms in Fig. 7. In detail (as presented in Fig. 6),tongue movements (Experiment 1) exposed significant activationsnearly exclusively in the ventral fields (∼91% of relative overlap,hereafter ∼91%OL) as compared to hand movements (PCGvNPCGdTONGUE: t(7)=14.631, pb0.001, according to a Students' t test),whereas for hand movements, the major portion of activation(∼66%OL) was recorded in the dorsal PCG fields (marginal effect:PCGdNPCGv HAND: t(7)=2.09, pb0.075). For Experiment 2, activa-tion was almost restricted to the ventral fields for rhythmic ascompared to object and spatial sequences (PCGv NPCGd RHYTHM:t(7)=13.652, pb0.001). There was a clear asymmetry indicatingrhythm activity to be more pronounced in the inferior (∼61%OL) ascompared to the superior (∼29%OL) PCGv (inferior PCGvNsuperiorPCGd RHYTHM: t(7)=2.574, p=0.037). Similarly, object sequencesshowed particularly ventral PCG activation (PCGvNPCGd OBJECT:t(7)=2.551, p=0.0381) but with a (non significant) tendencytowards the opposite distribution (∼31%OL inferior vs. ∼43%OL
superior); however, more than a further 22%OL of the voxels activatedin this contrast fell into inferior PCGd. In contrast, spatial sequenceselicited activations particularly in the dorsal fields (∼40%OL inferior,∼18%OL superior) and showed less activity in the ventral areas(∼28%OL superior, ∼14%OL inferior), but the statistical effects wereonly marginal (PCGdNPCGv POSITION: t(7)=1.954, p=0.0916). InExperiment 3, finally, observation of grasping/manipulation of objectsshowed again a clear preference for ventral areas (∼82%OL,PCGvNPCGd MANIPULATION: t(7)=4.848, p=0.002), with a parti-cular dominance of the inferior PCGv (∼65%OL; inferior PCGvNsuperiorPCGd MANIPULATION: t(7)=3.835, p=0.006). For pointing obser-vation, the opposite pattern was found with more than 65%OL in thedorsal fields and the rest of it in the superior PCGv; no normalizedoverlap was registered in the inferior PCGv for this condition.
Discussion
The present study used both diffusion tractography and fMRI toinvestigate the structural and functional properties of the humanprecentral gyrus (PCG) in the same subjects. As major results onstructure, our data suggest a ventral and a dorsal PCG field that couldbe further segregated into superior and inferior parts, respectively,resulting in four PCG fields altogether. With respect to functionalproperties, we report preliminary evidence for cortex parcellation tobe paralleled by functional profiles in three fMRI studies.
Four distinguishable subareas in PCG
On the basis of functional imaging studies, Rizzolatti andcolleagues (2002) have proposed that human dorsal premotor cortexis located superiorly and ventral premotor cortex inferiorly to aboutz=51 (pial surface) of Talairach space. This view is well corroborated
e PCG. The left panel shows individual fMRI data of both hemispheres of four subjects,sponding inflated individual anatomies. Significantly activated voxels were color-codedperiment. The right panel shows the corresponding relative overlaps (OL%) betweenveraged across both hemispheres of all subjects (group data). Colors (cf. Figs. 3 and 4)(yellow), superior ventral (red), inferior dorsal (green), and superior dorsal (blue) PCG

405R.I. Schubotz et al. / NeuroImage 50 (2010) 396–408

Fig. 7. Normalized histograms of relative overlaps (OL%) between each pair of cortexparcellation areas and functional activation patterns from the fMRI experiments, for thecorrect match and random match conditions (after square root transformation). If aparticular cortex parcellation in a particular subject predicts functional activationpatterns in the same subject better than the functional activation in any other subject,the two distributions should be different, and one would predict for the correct matchcondition a higher incidence of low relative overlaps and high relative overlaps, whileintermediate values are less frequent. Clearly, for the correct match condition, thepattern is more binary, with both very low and very high values being more frequent.For details of calculation of OL%, please refer to “Assessment of structure–functioncorrespondence” in the Materials and methods section.
406 R.I. Schubotz et al. / NeuroImage 50 (2010) 396–408
by our findings, as we could separate twomore ventral fields from twomore dorsal fields at a Talairach level of about z =49 (left) and 52(right) at the pial surface.
On the basis of cytoarchitecture, motor representations, sulcalontogeny, and the putative macroanatomical location of the humanfrontal eye field, homologies between macaque and human ventraland dorsal premotor cortex have been proposed (Rizzolatti et al.,1998). Accordingly, macaque areas F2 and F7 correspond to thesuperior part area 6aα and the area 6aβ of Vogt and Vogt (1919),respectively, whereas the inferior part of Vogts' area 6aα and BA 44(Brodmann 1909) correspond to areas F4 and F5, respectively. Thatmeans, however, that among lateral premotor fields only F2 and F4fall into PCG, whereas both F5 and F7 lie in anteriorly adjacent regions,namely in the opercular part of the inferior frontal gyrus and in thecaudal portion of the superior frontal gyrus, respectively. While ourfindings support a ventral–dorsal border exactly where proposed byRizzolatti and coworkers (2002), they reflect more than two, namelyfour, fields within the PCG with typical premotor connectivity. Forinstance, our inferior dorsal PCG-field exposed prefrontal connectionprobabilities, which points to a homolog of F7 rather than F2 (whichreceives prefrontal input from 8B and 46d). Moreover, two fieldsmade up the ventral PCG, which is in line with two ventral premotorfields in the macaque (F4 and F5). An alternative explanation wouldbe that two subareas make up F4, which however has not yet beenreported. Together, our findings point to four distinguishablepremotor subareas in the PCG.
Despite of some advances to validate diffusion tractography resultsby autoradiographic tracer techniques in the macaque (Schmahmannet al., 2007), cortex parcellation as inferred by DWI in the human brainand projection areas as revealed by histologic tracer studies in themacaque brain cannot be directly compared. Thus, speculations aboutputative homologies as suggested by connectivity differences be-tween premotor subregions have to be handled with great caution.For the dorsal fields we identified profiles of connections to primarymotor, prefrontal, and parietal areas (Geyer et al., 2000; Rizzolatti &Luppino, 2001; Marconi et al., 2001; cf. Husain & Nachev, 2007) are inline with the suggestion that the superior PCGd could roughlycorrespond to F2 in the macaque, and inferior PCGd to F7. For theventral fields, subtle but consistent differences between connectivitysignatures of our superior and inferior PCGv may justify thespeculation that these regions could correspond to F4 (Colby et al.,1993; Duhamel et al., 1997a,b; cf. Bremmer et al., 2001) and F5
(Godschalk et al., 1984; Matelli et al., 1986; cf. Caspers et al., 2006) ofthe macaque, respectively. Against the background of the macaqueliterature, temporal connectivity of our ventral PCG fields have to beconsidered to reflect indirect rather than direct connections (Luppinoet al., 1999; Maioli et al., 1998) via parietal (Rozzi et al., 2006; forliterature review, see Keysers & Perrett, 2004) or primary motorcortex (Simonyan & Jürgens, 2002, 2005).
Functional data in relation to cortex parcellation
Extrinsic (parietal and prefrontal) connections differ amongpremotor subregions in the macaque brain and support theirfunctional differentiation. Following this rationale, we hypothesizedcortex parcellations of the PCG to reflect the distribution of BOLDactivation assessed in different experimental tasks (Experiments 1, 2,and 3). Note however that differences of extrinsic connections inmacaque premotor cortex are clearly limited and reflect differentlyweighted connectivity rather than absolutely different ones. Also,recent findings from DWI data in humans suggest that the projectionsfrom dominant fibre pathways can be quite variable; a prominentexample with respect to our results is provided by language-relatedpathways indicating a noticeably variability in the ventral premotorand adjacent prefrontal region (Rilling et al., 2008., Friederici, 2009).
As to the variable but still very consistent findings on structuralsubregions in PCG, we think that the ventral premotor cortex is indeeda phylogenetically quite variable structure, which surfaces here in twointerindividually different variants: a (less frequent) rostro–caudalorganisation (cf. Fig. 2, right hemispheres of subjects no. 481, 650, and860) and a (more frequent) ventro–dorsal one. In contrast, method-ological shortcomings or problems, e.g., due to misalignment, head-motion, imaging artefacts, or scanner setting, would rather result ininconsistent findings across all subjects, and presumably withadditional inconsistencies between hemispheres as well. Moreover,the data quality was carefully examined and turned out to becomparable between all subjects.
As expected against this background, individual data sets showedextensive and spreading premotor activation clusters. In order toassess which of the PCG fields contribute more to one experimentalcondition as compared to another, we focused on direct task contrasts.Hence, we analyzed a weighting profile for the PCG fields in differentfunctional tasks. Moreover, we used a bootstrap approach in order toshow that there is a specific assignment of fMRI activations andcortical parcellation.
Experiment 1 served as a localizer study for major primary motorand premotor areas on the lateral convexity, i.e., tongue and fingers.The somatotopical maps of the lateral premotor cortex lie in roughcorrespondence to those in the primary motor cortex but expose aconsiderable and ventrally even increasing overlap. There is aforelimb and hindlimb representation in PMd, and an orofacial andforelimb representation within PMv. More specifically, both areas F4and F5 are organized somatotopically, with arm movements repre-sented dorsally and orofacial movements ventrally. They differ in thatdistal arm movements (i.e., those of the hand and fingers) are mainlyrepresented in F5, and proximal arm movements in F4 (for adiscussion, see Geyer et al., 2000). In F2, leg movements arerepresented dorsally and (proximal and distal) arm movementsventrally; ventral F7 has a representation of arm movements as well.
We found tongue movements to elicit activations in the inferiorventral and in the superior ventral PCG (∼91%), possiblycorresponding to F5 and F4, respectively, i.e., those premotor areas,which have an orofacial representation in the macaque. Compared totongue movements, hand (finger) movements elicited mainly activa-tions in the dorsal PCG (∼66%). In monkey dorsal premotor cortex,both subareas F2 and F7 are engaged in arm movements, but only F2in distal ones, i.e., those which were relevant in our present study.However, F7 is suggested in conditional movement selection and

407R.I. Schubotz et al. / NeuroImage 50 (2010) 396–408
visual localization of stimuli in space as a prerequisite for reachingmovements (Rizzolatti et al., 1998). It hence could be plausible thatfinger-thumb opposition under abstract (numerical) visual cueingtriggered also activation in the F7 homologue. Together, we take theactivation pattern induced by tongue and finger movements to bereconcilable with the rough premotor somatotopy reported in themacaque monkey.
Experiment 2 followed the rationale of a series of fMRI studies thatinvestigated the role of the premotor areas in the processing of serialorder (Schubotz & von Cramon, 2003; Schubotz, 2004). Findingsreplicated the typical and robust activation BOLD response pattern,with rhythmic, object-based and spatial sequence tasks activatinglateral premotor fields in a ventral-to-dorsal succession. The HAPEMframework (Schubotz, 2007) explains these findings by a repertoire ofstyles of transformations, primarily coded in PM, that can be exploitedfor both action and perception. Accordingly, the prediction of an eventthat is structured with regard to a property P engages the subarea ofthe lateral premotor cortex that is best adapted to specify its motoroutput in terms of P. For instance, a spatially defined event (e.g., arotation) will be simulated using the premotor–parietal loop forreaching because an arm action plan amounts to the expectation of asequence of mostly spatially defined perceptions. The same mappinglogic holds for other pairings as well, connecting object-definedevents to the grasping circuit and pitch or rhythm-defined events tothe vocal and articulatory circuit. This account suggests that merely asubset of sensorimotor neurons in the areas controlling such actions isexploited in a rudimentary simulation mode. This simulation sufficesto predict some of the relevant dynamics of the observed event, but itcannot serve as an exhaustive event description (for detailedexplanation of the framework see Schubotz, 2007).
Comparing fMRI data with cortex parcellation, the present studyrevealed that the four PCG fields showed not absolute but ratherrelative differences with respect to the activation corresponding tosequence tasks. Thus, the majority of significantly activated voxelsduring the rhythmic sequence task fell within the inferior PCGv(∼61%), whereas those of the object-based sequence task were ratherdistributed among both inferior (∼31%) and superior PCGv (∼43%)and those of the spatial sequence task among both PCGd fields (∼40%and ∼18% for inferior and superior, respectively).
Experiment 3, finally, required subjects to deal with observedactions, either with a focus on grasping/manipulation, or with a focuson pointing. Since the attentive analysis of observed actions has beenreported to rely on those premotor areas which are also engaged inthe production of the very same actions (for a review, see Rizzolatti &Craighero, 2004), we expected premotor areas for distal arm move-ments and those for proximal arm movements to be detected in therespective direct condition contrasts. Specifically, the former shouldroughly correspond to the human homologue of F5, the latter to thehuman homologues of F2, F4, and F7 (for a literature overview, seeGeyer et al., 2000). In line with these considerations, we found theobservation of grasping/manipulation to especially activate voxels ofthe inferior PCGv (∼65%); remaining voxels fell either in superiorPCGv (∼17%) or in the PCGd. Pointing observation, as expected,particularly activated the superior PCGv (∼35%) and the inferior PCGd(∼48%), which could reflect, according to our present interpretation,the human homologues of F4 and F7, respectively, and some voxels(∼17%) in the superior PCGd. Hence, the pattern of activation wascomparable between pointing observation and the spatial sequencetask from Experiment 2, as expected (cf. Schubotz, 2007).
Overall, functional data from three fMRI experiments were largelyconsistent with the interpretation of the cortex parcellation of foursubregions in the PCG. This finding parallels a methodologicallysimilar approach to separate two subregions of the supplementarymotor area (SMA proper vs. pre-SMA, Johansen-Berg et al., 2004).However, our results also showed that functional activations were notsharply restricted to the connectivity-based fields. This differencemay
be due to the fact that the contributions of the subregions of the PCGare differently weighted for different functional requirements ratherthan exclusively engaged in only the one or the other function or task.To give an example for the cognitive domain, even when only arhythmic sequence is to be processed, the task-relevant information issupplied via a stimulus that necessarily has object and spatialproperties as well. These properties may be considered even whentask-irrelevant, particularly because in ecological environments,dynamic changes of a stimulus property typically coevolves withchanges of (some of) its other properties as well. For instance, whenwe have to predict the trajectory of a ball, parameters of its speed,location, and surfacewill alter concurrently. Turning to an example forthe motor domain, movements of the fingers frequently require orentail concurrent movement of the wrist, and sometimes even thoseof the elbow and the shoulder. Across all motor fields, limbs arerepresented in a distributed fashion, and for several premotor fieldsand the primary motor cortex, between-limb somatotopy (face, armand leg) is evident. Additionally somatotopic gradients can beidentified on top of an underlying distributed representation at leastwithin the upper extremities. However, general within-limb somato-topy is clearly limited. Motor functional segregations and integrationsgenerally parallel the biomechanical independence of and dependen-cies between different body parts (Schieber 2001). In sum, this well-known mixture of functional segregation and functional overlap inpremotor regions builds a plausible background to our interpretationthat PCG subregions contribute in a characteristically combined andweighted fashion to different functional requirements rather thanbeing exclusively involved in only the one or the other task.
Resume
Connectivity-based cortex parcellation revealed that the humanprecentral gyrus (PCG) consists of four distinct subregions. Thisparcellation seems consistent with the assumption of four premotorfields on the lateral convexity, as assessed in the macaque monkey.Moreover, three functional MRI experiments supported the interpre-tation that different connectivity profiles corresponded to differentfunctional profiles in the identified areas. Though cortex parcellationbased on diffusion based tracing techniques is not free of possibleartifacts and pitfalls (for discussion, cf. Anwander et al., 2007), we takeour findings to encourage the application of this promising approachin other cortical regions as well.
Acknowledgments
The authors wish to thank Timm Wetzel and Enrico Kaden foracquisition and preprocessing of the diffusion-weighted MR datasets,Marcel Mücke for experimental and analytical assistance, AndreaGast-Sandmann, Kerstin Flake and Corina Melzer for illustrations, andUtaWolfensteller for proof reading and helpful suggestions on formerversions of the manuscript.
References
Anwander, A., Tittgemeyer, M., von Cramon, D.Y., Friederici, A.D., Knosche, TR., 2007.Connectivity-based parcellation of Broca's area. Cereb. Cortex 17, 816–825.
Barbas, H., Pandya, D.N., 1987. Architecture and frontal cortical connections of thepremotor cortex (area-6) in the rhesus-monkey. J. Comp. Neurol. 256, 211–228.
Behrens, T.E., Johansen-Berg, H., 2005. Relating connectional architecture to greymatter function using diffusion imaging. Philos. Trans. R. Soc. Lond. B. Biol. Sci. 360(1457), 903–911.
Bremmer, F., Schlack, A., Shah, N.J., Zafiris, O., Kubischik, M., Hoffmann, K., Zilles, K., Fink,G.R., 2001. Polymodal motion processing in posterior parietal and premotor cortex:a human fMRI study strongly implies equivalencies between humans andmonkeys.Neuron 29, 287–296.
Brodmann, K., 1909. Vergleichende Lokalisationslehre der Groβhirnrinde in ihrenPrinzipien dargestellt auf Grund des Zellaufbaues. Leipzig, Barth.
Buccino, G., Binkofski, F., Fink, G.R., Fadiga, L., Fogassi, L., Gallese, V., Seitz, R.J., Zilles, K.,Rizzolatti, G., Freund, H.J., 2001. Action observation activates premotor and parietalareas in a somatotopic manner: an fMRI study. Eur. J. Neurosci. 13, 400–404.

408 R.I. Schubotz et al. / NeuroImage 50 (2010) 396–408
Caminiti, R., Genovesio, A., Marconi, B., Mayer, A.B., Onorati, P., Ferraina, S., Mitsuda, T.,Giannetti, S., Squatrito, S., Maioli, M.G., Molinari, M., 1999. Early coding of reaching:frontal and parietal association connections of parieto-occipital cortex. Eur. J.Neurosci. 11, 3339–3345.
Caspers, S., Geyer, S., Schleicher, A., Mohlberg, H., Amunts, K., Zilles, K., 2006. Thehuman inferior parietal cortex: cytoarchitectonic parcellation and interindividualvariability. Neuroimage 33, 430–448.
Colby, C., Duhamel, J., Goldberg, M., 1993. Ventral intraparietal area of the macaque:anatomic location and visual response properties. J. Neurophysiol. 69, 902–914.
Dale, A.M., Fischl, B., Sereno, M.I., 1999. Cortical surface-based analysis. I. Segmentationand surface reconstruction. Neuroimage 9, 179–194.
Duhamel, J.R., Bremmer, F., BenHamed, S., Graf, W., 1997a. Spatial invariance of visualreceptive fields in parietal cortex neurons. Nature 389, 845–848.
Duhamel, J.R., Colby, C., Goldberg, M., 1997b. Ventral intraparietal area of the macaque:congruent visual and somatic properties. J. Neurophysiol. 79, 126–136.
Dum, R.P., Strick, P.L., 1991. The origin of corticospinal projections from the premotorareas in the frontal lobe. J. Neurosci. 11, 667–689.
Eickhoff, S.B., Heim, S., Zilles, K., Amunts, K., 2006. Testing anatomically specifiedhypotheses in functional imaging using cytoarchitectonic maps. NeuroImage 32,570–582.
Forman, S.D., Cohen, J.D., Fitzgerald, M., Eddy, W.F., Mintun, M.A., Noll, D.C., 1995.Improved assessment of significant activation in functional magnetic resonanceimaging (fMRI): use of a cluster-size threshold. Magn. Reson. Med. 33, 636–647.
Fox, P.T., Huang, A., Parsons, L.M., Xiong, J.H., Zamarippa, F., Rainey, L., Lancaster, J.L.,2001. Location-probability profiles for the mouth region of human primary motor-sensory cortex: model and validation. Neuroimage 13, 196–209.
Friederici, A.D., 2009. Pathways to language: fiber tracts in the human brain. TrendsCogn. Sci. 13, 175–181.
Friston, K.J., 1994. Statistical parametric mapping. In: Thatcher, R.W., Hallet, M., Zeffiro,T., John, E.R., Huerta, M. (Eds.), Functional neuroimaging: technical foundations.Academic Press, San Diego, pp. 79–93.
Friston, K.J., Holmes, A.P., Poline, J.B., Grasby, P.J., Williams, S.C.R., Frackowiak, R.S.J.,Turner, R., 1995a. Analysis of fMRI time-series revisited. Neuroimage 2, 45–53.
Friston, K.J., Holmes, A.P., Worsley, K.J., Poline, J.P., Frith, C.D., Frackowiak, R.S.J., 1995b.Statistical parametric maps in functional imaging: a general linear approach. Hum.Brain Mapp. 2, 189–210.
FSL, "FMRIB Software Library," University of Oxford, 2006. [Online]. Available: http://www.fmrib.ox.ac.uk/fsl.
Geyer, S., 2004. The microstructural border between the motor and the cognitivedomain in the human cerebral cortex. Adv. Anat. Embryol Cell. Biol. 174, 1–89.
Geyer, S., Matelli, M., Luppino, G., Zilles, K., 2000. Functional neuroanatomy of theprimate isocortical motor system. Anat. Embryol (Berl) 202, 443–474.
Ghosh, S., Gattera, R., 1995. A comparison of the ipsilateral cortical projections to thedorsal and ventral subdivisions of the macaque premotor cortex. Somatosens. Mot.Res. 12, 359–378.
Godschalk, M., Lemon, R., Kuypers, H., Ronday, H., 1984. Cortical afferents and efferentsof monkey postarcuate area: an anatomical and electrophysiological study. Exp.Brain Res. 56, 410–424.
Husain, M., Nachev, P., 2007. Space and the parietal cortex. Trends Cogn. Sci. 11, 30–36.Jenkinson, M., Bannister, P., Brady, M., Smith, S., 2002. “Improved optimization for the
robust and accurate linear registration and motion correction of brain images.NeuroImage 17 (2), 825–841.
Johansen-Berg, H., Behrens, T.E., Robson, M.D., Drobnjak, I., Rushworth, M.F., Brady, J.M.,Smith, S.M., Higham, D.J., Matthews, P.M., 2004. Changes in connectivity profilesdefine functionally distinct regions in human medial frontal cortex. Proc. Natl.Acad. Sci. U. S. A. 101, 13335–13340.
Johansen-Berg, H., Behrens, T.E., 2006. Just pretty pictures? What diffusion tracto-graphy can add in clinical neuroscience. Curr. Opin. Neurol. 19, 379–385.
Keysers, C., Perrett, D.I., 2004. Demystifying social cognition: a Hebbian perspective.Trends Cogn. Sci. 8, 501–507.
Koch, M.A., Norris, D.G., Hund-Georgiadis, M., 2002. An investigation of functional andanatomical connectivity using magnetic resonance imaging. Neuroimage 16 (1),241–250.
Lohmann, G., Müller, K., Bosch, V., Mentzel, H., Hessler, S., Chen, L., Zysset, S., VonCramon, D.Y., 2001. Lipsia - a new software system for the evaluation of functionalmagnetic resonance images of the human brain. Comput. Med. Imaging Graph. 25,449–457.
Luppino, G., Murata, A., Govoni, P., Matelli, M., 1999. Largely segregated parietofrontalconnections linking rostral intraparietal cortex (areas AIP and VIP) and the ventralpremotor cortex (areas F5 and F4). Exp. Brain Res. 128, 181–187.
Maioli, M.G., Squatrito, S., Samolsky-Dekel, B.G., Sanseverino, E.R., 1998. Corticocorticalconnections between frontal periarcuate regions and visual areas of the superiortemporal sulcus and the adjoining inferior parietal lobule in the macaque monkey.Brain Res. 789, 118–125.
Marconi, B., Genovesio, A., Battaglia-Mayer, A., Ferraina, S., Squatrito, S., Molinari, M.,Lacquaniti, F., Caminiti, R., 2001. Eye-hand coordination during reaching. I. Anatomicalrelationships between parietal and frontal cortex. Cereb. Cortex 11, 513–527.
Matelli,M., Camarda, R., Glickstein,M., Rizzolatti, G., 1986. Afferent andefferent projectionsof the inferior area 6 in the macaque monkey. J. Comp. Neurol. 251, 281–298.
Ono, M., Kubik, S., Abernathey, C.D., 1990. Atlas of the cerebral sulci. Stuttgart, Thieme.Picard, N., Strick, P.L., 2001. Imaging the premotor areas. Curr. Opin. Neurobiol. 11 (6),
663–672.Preuss, T.M., Stepniewska, I., Kaas, J.H., 1996. Movement representation in the dorsal
and ventral premotor areas of owl monkeys: a microstimulation study. J. Comp.Neurol. 371, 649–676.
Rademacher, J., Caviness, V.S., Steinmetz, H., Galaburda, A.M., 1993. Topographicalvariation of the human primary cortices: implications for neuroimaging, brainmapping, and neurobiology. Cereb. Cortex 3, 313–329.
Rilling, J.K., Glasser, M.F., Preuss, T.M., Ma, X., Zhao, T., Hu, X., Behrens, T.E., 2008. Theevolution of the arcuate fasciculus revealed with comparative DTI. Nat. Neurosci. 11(4), 426–428.
Rizzolatti, G., 1987. Functional organization of inferior area 6. Ciba Found. Symp. 132,171–186.
Rizzolatti, G., Craighero, L., 2004. The mirror-neuron system. Annu. Rev. Neurosci. 27,169–192.
Rizzolatti, G., Fogassi, L., Gallese, V., 2002. Motor and cognitive functions of the ventralpremotor cortex. Curr. Opin. Neurobiol. 12, 149–154.
Rizzolatti, G., Luppino, G., 2001. The cortical motor system. Neuron 31, 889–901.Rizzolatti, G., Luppino, G., Matelli, M., 1998. The organization of the cortical motor
system: new concepts. Electroencephalogr. Clin. Neurophysiol. 106, 283–296.Roland, P.E., Zilles, K., 1996. Functions and structures of the motor cortices in humans.
Curr. Opin. Neurobiol. 6, 773–781.Rorden, C., Karnath, H.O., Bonilha, L., 2007. Improving lesion-symptommapping. J. Cogn.
Neurosci. 19 (7), 1081–1088.Rozzi, S., Calzavara, R., Belmalih, A., Borra, E., Gregoriou, G.G., Matelli, M., Luppino, G.,
2006. Cortical connections of the inferior parietal cortical convexity of the Macaquemonkey. Cereb. Cortex 16, 1389–1417.
Sakreida, K., Schubotz, R.I., Wolfensteller, U., von Cramon, D.Y., 2005. Motion classdependency in observers' motor areas revealed by functional magnetic resonanceimaging. J. Neurosci. 25, 1335–1342.
Schieber, M., 2001. Constraints on somatotopic organization in the primary motorcortex. J. Neurophysiol. 86 (5), 2125–2143.
Schmahmann, J.D., Pandya, D.N., Wang, R., Dai, G., D'Arceuil, H.E., de Crespigny, A.J.,Wedeen, V.J., 2007. Association fibre pathways of the brain: parallel observationsfrom diffusion spectrum imaging and autoradiography. Brain 130, 630–653.
Schubotz, R.I., 1999. Instruction differentiates the processing of temporal and spatialsequential patterns: Evidence from slow wave activity in humans. Neurosci. Lett.265, 1–4.
Schubotz, R.I., von Cramon, D.Y., 2001. Functional organization of the lateral premotorcortex: fMRI reveals different regions activated by anticipation of object properties,location and speed. Cogn. Brain Res. 11, 97–112.
Schubotz, R.I., von Cramon, D.Y., 2002. Predicting perceptual events activatescorresponding motor schemes in lateral premotor cortex: an fMRI study.Neuroimage 15 (4), 787–796.
Schubotz, R.I., von Cramon, D.Y., 2003. Functional-anatomical concepts of humanpremotor cortex: evidence from fMRI and PET studies. Neuroimage 20, 120–131.
Schubotz, R.I., von Cramon, D.Y., Lohmann, G., 2003. Auditory what, where, and when: asensory somatotopy in lateral premotor cortex. NeuroImage 20, 173–185.
Schubotz, R.I., 2004. Human premotor cortex: beyondmotor performance. MPI Series inHuman Cognitive and Brain Sciences, Vol. 50. Max Planck Institute for HumanCognitive and Brain Sciences, Leipzig.
Schubotz, R.I., 2007. Prediction of external events with our motor system: towards anew framework. Trends Cogn. Neurosci. 11, 211–218.
Simonyan, K., Jürgens, U., 2002. Cortico-cortical projections of the motorcortical larynxarea in the rhesus monkey. Brain Res. 949, 23–31.
Simonyan, K., Jürgens, U., 2005. Afferent cortical connections of the motor corticallarynx area in the rhesus monkey. Neuroscience 130, 133–149.
Talairach, J., Tournoux, P., 1988. Co-planar stereotaxis atlas of the human brain. Thieme,New York.
Tanne-Gariepy, J., Rouiller, E., Boussaoud, D., 2002. Parietal inputs to dorsal versusventral premotor areas in the macaque monkey: evidence for largely segregatedvisuomotor pathways. Exp. Brain Res. 145, 91–103.
Tomassini, V., Jbabdi, S., Klein, J.C., Behrens, T.E., Pozzilli, C., Matthews, P.M.,Rushworth, MF., Johansen-Berg, H., 2007. Diffusion-weighted imaging tractogra-phy-based parcellation of the human lateral premotor cortex identifies dorsal andventral subregions with anatomical and functional specializations. J. Neurosci. 27(38), 10259–10269.
Vogt C, Vogt O. 1919. Zur Kenntnis der pathologischen Veränderungen des Striatumund des Pallidum und zur Pathophysiologie der dabei auftretenden Krankheit-serscheinungen. Heidelberg. Sitzungsberichte der Heidelberger Akademie derWissenschaften. Mathematisch-naturwissenschaftliche Klasse.
Wolfensteller, U., Schubotz, R.I., von Cramon, D.Y., 2007. Understanding non-biologicaldynamics with your own premotor system. Neuroimage 36 (Suppl. 2), T33–43.
Worsley, K.J., Friston, K.J., 1995. Analysis of fMRI time-series revisited—again. Neuro-image 2, 173–181.
Yousry, T.A., Schmid, U.D., Alkadhi, H., Schmidt, D., Peraud, A., Buettner, A., Winkler, P.,1997. Localization of the motor hand area to a knob on the precentral gyrus. A newlandmark. Brain 120, 141–157.