Spectral and temporal modulation tradeoff in the inferior colliculus
doi: 10.1152/jn.91300.2008102:167-180, 2009. First published 29 April 2009;J Neurophysiol
Donald Gans, Kianoush Sheykholeslami, Diana Coomes Peterson and Jeffrey WenstrupColliculus: Effects of Stimulus Duration and Rise TimeTemporal Features of Spectral Integration in the Inferior
You might find this additional info useful...
67 articles, 43 of which you can access for free at: This article citeshttp://jn.physiology.org/content/102/1/167.full#ref-list-1
4 other HighWire-hosted articles: This article has been cited by http://jn.physiology.org/content/102/1/167#cited-by
including high resolution figures, can be found at: Updated information and serviceshttp://jn.physiology.org/content/102/1/167.full
can be found at: Journal of Neurophysiology about Additional material and informationhttp://www.the-aps.org/publications/jn
This information is current as of March 21, 2013.
http://www.the-aps.org/. Copyright © 2009 the American Physiological Society. ISSN: 0022-3077, ESSN: 1522-1598. Visit our website attimes a year (monthly) by the American Physiological Society, 9650 Rockville Pike, Bethesda MD 20814-3991.
publishes original articles on the function of the nervous system. It is published 12Journal of Neurophysiology
at Iowa S
tate Univ on M
arch 21, 2013http://jn.physiology.org/
Dow
nloaded from
Temporal Features of Spectral Integration in the Inferior Colliculus:Effects of Stimulus Duration and Rise Time
Donald Gans, Kianoush Sheykholeslami, Diana Coomes Peterson, and Jeffrey WenstrupDepartment of Anatomy and Neurobiology, Northeastern Ohio Universities College of Medicine, Rootstown, Ohio
Submitted 9 December 2008; accepted in final form 24 April 2009
Gans D, Sheykholeslami K, Peterson DC, Wenstrup J. Temporalfeatures of spectral integration in the inferior colliculus: effects ofstimulus duration and rise time. J Neurophysiol 102: 167–180, 2009.First published April 29, 2009; doi:10.1152/jn.91300.2008. This re-port examines temporal features of facilitation and suppression thatunderlie spectrally integrative responses to complex vocal signals.Auditory responses were recorded from 160 neurons in the inferiorcolliculus (IC) of awake mustached bats. Sixty-two neurons showedcombination-sensitive facilitation: responses to best frequency (BF)signals were facilitated by well-timed signals at least an octave lowerin frequency, in the range 16–31 kHz. Temporal features and strengthof facilitation were generally unaffected by changes in duration offacilitating signals from 4 to 31 ms. Changes in stimulus rise timefrom 0.5 to 5.0 ms had little effect on facilitatory strength. Theseresults suggest that low frequency facilitating inputs to high BFneurons have phasic-on temporal patterns and are responsive tostimulus rise times over the tested range. We also recorded from 98neurons showing low-frequency (11–32 kHz) suppression of higherBF responses. Effects of changing duration were related to thefrequency of suppressive signals. Signals �23 kHz usually evokedsuppression sustained throughout signal duration. This and otherfeatures of such suppression are consistent with a cochlear origin thatresults in masking of responses to higher, near-BF signal frequencies.Signals in the 23- to 30-kHz range—frequencies in the first sonarharmonic—generally evoked phasic suppression of BF responses.This may result from neural inhibitory interactions within and belowIC. In many neurons, we observed two or more forms of the spectralinteractions described here. Thus IC neurons display temporally andspectrally complex responses to sound that result from multiplespectral interactions at different levels of the ascending auditorypathway.
I N T R O D U C T I O N
For many auditory neurons, responses to complex soundsdepend on neural mechanisms activated by frequencies welloutside a neuron’s excitatory receptive field or inhibitorysidebands. Integration of spectrally distinct acoustic signalcomponents occurs in neurons from the auditory nerve toauditory cortex and has been shown by disparate methodsincluding neuroethological approaches (Fuzessery and Feng1983; Margoliash and Fortune 1992; Suga et al. 1978), re-sponse area assessments (Shofner and Young 1985; Young andBrownell 1976), two-tone paradigms (Mittmann and Wenstrup1995; Sachs and Kiang 1968; Sutter et al. 1999), spectro-temporal receptive fields (deCharms et al. 1998; Theunissenet al. 2000), and intracellular recording (Machens et al. 2004;Voytenko and Galazyuk 2007; Xie et al. 2007). Many of these
approaches have shown that the temporal features of the distantspectral elements, and the temporal features of the response tothose elements, can significantly affect the response to com-plex signals (Olsen and Suga 1991; O’Neill and Suga 1979;Sen et al. 2001; Voytenko and Galazyuk 2007). In this study,we compare the temporal features of stimuli and their evokedresponses as a tool to examine the inputs and mechanismsunderlying spectral integration.
This study examines forms of spectrally integrative re-sponses prevalent in the inferior colliculus (IC) of the mus-tached bat. Combination-sensitive facilitation, underlying se-lective responses to the bat’s social and sonar vocal signals(Esser et al. 1997; Ohlemiller et al. 1996; O’Neill and Suga1979; Suga et al. 1978, 1979), is an enhanced response thatoccurs when two spectrally distinct signals are combined in anappropriate temporal relationship. Such facilitation does notoccur in auditory brain stem structures (Marsh et al. 2006;Portfors and Wenstrup 2001), but instead seems to originate inIC (Mittmann and Wenstrup 1995; Nataraj and Wenstrup 2005;Wenstrup and Leroy 2001; Wenstrup et al. 1999). Recent workhas shown that response facilitation in IC neurons is indepen-dent of glutamatergic inputs but requires both low- and high-frequency–tuned glycinergic inputs (Sanchez et al. 2008). Alikely source of these glycinergic inputs is the ventral nucleusof the lateral lemniscus (VNLL) (Wenstrup et al. 1999; Wineret al. 1995). Across species, many VNLL neurons have onset-type temporal response patterns (Batra and Fitzpatrick 1999;Covey and Casseday 1991; Metzner and Radtke-Schuller 1987;Portfors and Wenstrup 2001; Zhang and Kelly 2006). Thecorrespondence between glycinergic VNLL neurons and onsetresponse properties is particularly strong in bats (Covey andCasseday 1991; Portfors and Wenstrup 2001; Vater et al. 1997;Winer et al. 1995). If VNLL onset neurons contribute tocombination-sensitive facilitation in the mustached bat, wepredicted that facilitatory interactions should remain unalteredby changes in the duration of low-frequency facilitatory sig-nals.
Many IC neurons show suppressive effects of stimuli atfrequencies well below their best/characteristic frequency(Mittmann and Wenstrup 1995; Nataraj and Wenstrup 2005,2006; O’Neill 1985; Portfors and Felix 2005; Portfors andWenstrup 1999). Previous studies in the mustached bat suggesttwo different forms of suppressive spectral interactions. In oneform, low-frequency suppression has broad tuning generally inthe 10- to 22-kHz frequency range, has thresholds generallyexceeding 60 dB SPL, and is sometimes accompanied by anexcitatory response to the low-frequency signal (Marsh et al.2006; Nataraj and Wenstrup 2006). These features are consis-tent with two-tone suppressive interactions and accompanying
Address for reprint requests and other correspondence: J. Wenstrup, Dept. ofAnatomy and Neurobiology, Northeastern Ohio Univ. College of Medicine,4209 State Route 44, PO Box 95, Rootstown, OH 44272 (E-mail: [email protected]).
J Neurophysiol 102: 167–180, 2009.First published April 29, 2009; doi:10.1152/jn.91300.2008.
1670022-3077/09 $8.00 Copyright © 2009 The American Physiological Societywww.jn.org
at Iowa S
tate Univ on M
arch 21, 2013http://jn.physiology.org/
Dow
nloaded from
low-frequency excitatory responses observed in high best(characteristic) frequency (BF) auditory nerve fibers (Arthuret al. 1971; Delgutte 1990b; Kiang and Moxon 1974; Sachsand Kiang 1968), features that originate in the cochlea (Rug-gero et al. 1992; Temchin et al. 1997). Because two-tonesuppression in the auditory nerve lasts for the duration of asuppressive signal (Arthur et al. 1971), suppression in IC thatconsistently shows a similar time course may suggest a co-chlear origin.
A second form of low-frequency suppression in IC neurons(Mittmann and Wenstrup 1995; O’Neill 1985; Portfors andWenstrup 1999) seems to depend on inhibitory neural interac-tions that may arise either within or below the IC (Nataraj andWenstrup 2006; Peterson et al. 2008; Portfors and Wenstrup2001). These suppressive neural interactions may depend oninputs from onset neurons in VNLL (Wenstrup et al. 1999),and therefore may display duration-insensitive timing. Wehypothesize that sensitivity of IC neurons to the duration oflow-frequency suppressive sounds will show differences in theunderlying suppressive mechanisms.
To address these issues, we recorded extracellular responsesfrom single IC neurons showing spectral facilitatory and/orsuppressive interactions. We varied the duration of the inter-acting low-frequency signal, but also its rise-fall time becausethis may show additional temporal sensitivity. The resultsindicate that facilitatory interactions were relatively unaffectedby changes in duration, suggesting that facilitatory inputs to ICneurons have onset temporal patterns. An increase in rise timealtered the temporal features of interactions but did not other-wise affect it. For suppressive interactions, the results suggesttwo types of low-frequency interaction that, in general, differboth in frequency tuning and duration sensitivity.
M E T H O D S
We examined auditory responses in the IC of 11 wild-caught awakemustached bats (Pteronotus parnellii), captured in Trinidad and To-bago. All procedures were approved by the Northeastern Ohio Uni-versities College of Medicine Animal Care and Use Committee andadministered following the National Institutes of Health guidelines forthe care and use of laboratory animals.
Surgery
Before surgery, each bat was medicated with the sedative butor-phanol (5 mg/kg, Fort Dodge Animal Health, Fort Dodge, IA) andatropine (0.06 mg/kg, Phoenix Scientific, St Joseph, MO) to preventbronchial secretions. The bats were then anesthetized with isoflurane(1.5–2.0%, Abbott Laboratories, North Chicago, IL) and placed in astereotaxic holder. Depilatory lotion was used to remove hair over theskull, and the skin on the head was disinfected with betadine.
During surgery, a midline incision was made in the skin, and theunderlying muscles were reflected laterally to expose the dorsalsurface of the skull. A metal pin was cemented onto the rostral portionof the skull to secure the head during physiological experiments.Using surface and stereotaxic coordinates, a small hole (�0.5 mmdiam) was opened to expose the IC. A second, smaller hole was madenear the lateral surface overlying the cerebral cortex, and a tungstenwire was cemented to serve as ground for electrophysiological record-ings. After surgery, Lidocaine (a local anesthetic) was applied to thesurgical areas and the bat was returned to the holding cage. The batwas allowed to recover for 2–3 days before physiological experimentswere initiated.
Acoustic stimulation
Single and multiple tone bursts of variable duration (4–31 ms) andrise/fall times (0.5 or 5.0 ms) were synthesized on a computer,downloaded to a digital signal processor (Microstar DAP 5216A), andconverted to analog signals at a sampling rate of 400 kHz. The analogsignal(s) were filtered with an anti-aliasing filter (model FT6-2,Tucker-Davis Technologies), attenuated (model PA5, Tucker-DavisTechnologies), and amplified (model HCA-800II, Parasound). Thesignal(s) were connected to a loudspeaker (Infinity EMIT-B tweeter,Harmon International Industries, Woodbury, NY) that was placed 10cm from the contralateral ear and 25° into the sound field contralateralto the recorded IC. Sound repetition rate was constant at 4/s, with a100- or 150-ms peristimulus record duration for neural responses. Theperformance of the speakers was tested with a calibrated microphone(model 4135, Bruel and Kjaer). There was a smooth decrease of �3dB per 10 kHz from 10 to 120 kHz. Distortion components were notdetectable �55 dB below the signal level.
Physiological recording
For physiological experiments, bats were placed in a stereotaxicapparatus within a heated single-walled acoustic chamber. To mini-mize distress, bats were lightly sedated with butorphanol (2.5 mg/kg,IP). Recording sessions never exceeded 6 h in a single day.
Data were obtained only from well-isolated single neurons locatedwithin the IC. Glass micropipettes with tips ranging from �1 to 6 �mwere filled with physiological saline or 1 M NaCl and advanceddorso-ventrally into the IC with a hydraulic micropositioner (model650, David Kopf Instruments). Extracellular action potentials wereamplified, band-pass filtered (600–6,000 Hz), and connected to aspike signal enhancer (model 40-46-1, Fredrick Haer and Co.) beforebeing digitized at a sampling rate of 40 kHz (DAP 5216A, Microstar).
Consistent with the neuroethological literature, BF refers to thefrequency at which the lowest sound level elicited stimulus-lockedaction potentials. Both BF and minimum threshold (MT) were ob-tained with single tone burst stimuli. BF was measured with aresolution 1/10th of a kilohertz but expressed here in kilohertz. MTwas measured to the nearest decibel. Because many IC neuronsrespond best to combinations of distinct spectral elements in sounds(combination sensitivity), two-tone stimulus paradigms were used toevaluate the underlying spectral interactions of these units. Thehigh-frequency tone was set at the unit’s BF, 10–15 dB above itsthreshold. The second tone (a lower-frequency tone) was varied overa range of frequencies, sound levels, and delays relative to the BFsignal. Because the potential parameter space is very large, wesearched manually for frequencies, levels, and delays that were knownto activate low-frequency effects on the responses to higher-frequencysignals at the BF of IC neurons (Leroy and Wenstrup 2000; Mittmannand Wenstrup 1995; Nataraj and Wenstrup 2005, 2006; Portfors andWenstrup 1999, 2002). Once low-frequency facilitatory or suppres-sive effects on BF responses were observed, the best interactingfrequency was identified to a resolution of 0.5–2.0 kHz. This resolu-tion was sufficient to identify frequency-specific effects of theselow-frequency interactions (Fig. 1A). Interactions �23 kHz wereparticularly broadly tuned. Over the course of these and contempora-neous studies (Marsh et al. 2006; Nataraj and Wenstrup 2006), wemore closely attended to responses in the 10–22 kHz, range. As aresult, it is likely that the occurrence of suppressive responses withinthis band is more common than described here. Once an interactionwas detected, the sound level of the low-frequency signal was raised5–10 dB for quantitative tests described below.
In units that showed low-frequency influences, quantitative mea-sures of delay-sensitive facilitation and/or suppression were obtainedand compared with the single-tone responses. For these tests, thetemporal features of the BF tone remained constant, whereas theduration and rise/fall time of the low-frequency tone was varied across
168 GANS, SHEYKHOLESLAMI, PETERSON, AND WENSTRUP
J Neurophysiol • VOL 102 • JULY 2009 • www.jn.org
at Iowa S
tate Univ on M
arch 21, 2013http://jn.physiology.org/
Dow
nloaded from
tests. Delay tests were thus obtained with the low-frequency durationset at 4, 13, and 31 ms with a 0.5-ms rise/fall time, as well as 13- and31-ms duration with a 5.0-ms rise/fall time. The high-frequencyduration was maintained at 4 ms and only increased if the unitresponded poorly to the short-duration signal. We also obtainedrate-level and duration tests for some neurons.
Analysis
We measured neural responses to the BF tone as a function of thetiming of a second, lower-frequency tone. Spike discharge was ana-
lyzed within a temporal window based on each neuron’s response toits BF tone. The window was set to encompass all sound-evokedspiking activity in response to the BF tone presented alone. Forcalculation of responses to the second tone presented alone, the samewindow width was used. For tests involving combinations of the twotones, the same window width was used, placed to include theneuron’s response to the BF signal.
For facilitation, neurons were considered to be combination-sensi-tive if their response to the combined sounds, separated by the delayproviding the largest interaction effect, was �20% higher than thesum of the responses to the two signals presented separately. Thestrength of combination-sensitive interactions was quantified by aninteraction index, where index � (RC � RLF � RBF)/(RC � RLF �RBF). RLF is the response to the low-frequency signal, RBF is theresponse to the higher BF signal, and RC is the response to thecombination of signals. The largest positive interaction index of �1.0corresponds to maximum facilitation. Facilitatory responses weredefined as those having an index value of �0.09 or greater, corre-sponding to an increase of 20% above the summed response of thetwo signals.
Neurons were considered to show low-frequency suppression if theresponse to the combined signal, separated by the delay providing thegreatest response reduction, was �20% lower than the response tothe BF signal presented separately. The formula used for the interac-tion index is (RC � RBF)/(RC � RBF). This differs from the index forfacilitation by eliminating the measurement of the low-frequencyresponse presented alone. This index allowed for a more strict mea-sure of suppression of BF by the low-frequency signal, withoutcontamination by excitatory low-frequency responses. Maximum sup-pression corresponds to an interaction index value of �1.0, whereasthe 20% threshold criterion corresponds to an interaction index valueof –0.11. As used here, the term “suppression” refers to any reductionin the BF response by sounds at least an octave lower in frequency,independent of the underlying mechanism.
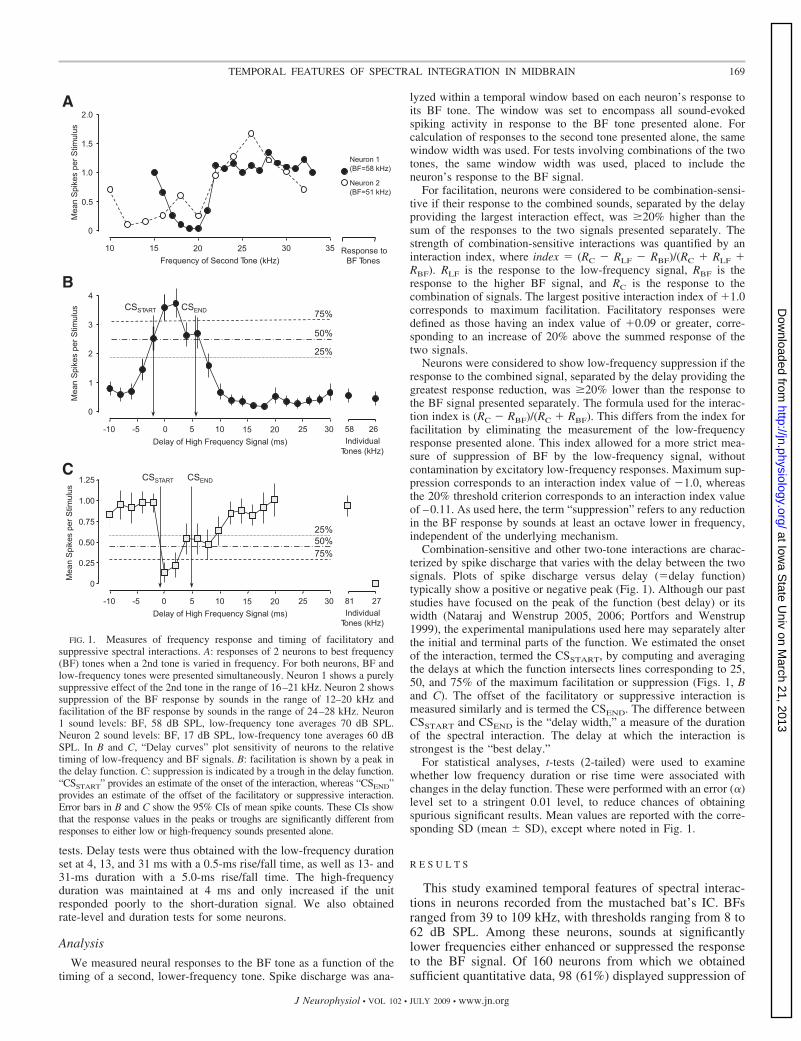
Combination-sensitive and other two-tone interactions are charac-terized by spike discharge that varies with the delay between the twosignals. Plots of spike discharge versus delay (�delay function)typically show a positive or negative peak (Fig. 1). Although our paststudies have focused on the peak of the function (best delay) or itswidth (Nataraj and Wenstrup 2005, 2006; Portfors and Wenstrup1999), the experimental manipulations used here may separately alterthe initial and terminal parts of the function. We estimated the onsetof the interaction, termed the CSSTART, by computing and averagingthe delays at which the function intersects lines corresponding to 25,50, and 75% of the maximum facilitation or suppression (Figs. 1, Band C). The offset of the facilitatory or suppressive interaction ismeasured similarly and is termed the CSEND. The difference betweenCSSTART and CSEND is the “delay width,” a measure of the durationof the spectral interaction. The delay at which the interaction isstrongest is the “best delay.”
For statistical analyses, t-tests (2-tailed) were used to examinewhether low frequency duration or rise time were associated withchanges in the delay function. These were performed with an error (�)level set to a stringent 0.01 level, to reduce chances of obtainingspurious significant results. Mean values are reported with the corre-sponding SD (mean � SD), except where noted in Fig. 1.
R E S U L T S
This study examined temporal features of spectral interac-tions in neurons recorded from the mustached bat’s IC. BFsranged from 39 to 109 kHz, with thresholds ranging from 8 to62 dB SPL. Among these neurons, sounds at significantlylower frequencies either enhanced or suppressed the responseto the BF signal. Of 160 neurons from which we obtainedsufficient quantitative data, 98 (61%) displayed suppression of
81 27 Delay of High Frequency Signal (ms)
-10 -5 0 5 10 15 20 25 30
25% 50% 75%
CSSTART CSEND
Delay of High Frequency Signal (ms) 58 26 -10 -5 0 5 10 15 20 25 30
CSSTART CSEND
25%
50%
75%
Frequency of Second Tone (kHz) 10 15 20 25 30 35
A
B
C
FIG. 1. Measures of frequency response and timing of facilitatory andsuppressive spectral interactions. A: responses of 2 neurons to best frequency(BF) tones when a 2nd tone is varied in frequency. For both neurons, BF andlow-frequency tones were presented simultaneously. Neuron 1 shows a purelysuppressive effect of the 2nd tone in the range of 16–21 kHz. Neuron 2 showssuppression of the BF response by sounds in the range of 12–20 kHz andfacilitation of the BF response by sounds in the range of 24–28 kHz. Neuron1 sound levels: BF, 58 dB SPL, low-frequency tone averages 70 dB SPL.Neuron 2 sound levels: BF, 17 dB SPL, low-frequency tone averages 60 dBSPL. In B and C, “Delay curves” plot sensitivity of neurons to the relativetiming of low-frequency and BF signals. B: facilitation is shown by a peak inthe delay function. C: suppression is indicated by a trough in the delay function.“CSSTART” provides an estimate of the onset of the interaction, whereas “CSEND”provides an estimate of the offset of the facilitatory or suppressive interaction.Error bars in B and C show the 95% CIs of mean spike counts. These CIs showthat the response values in the peaks or troughs are significantly different fromresponses to either low or high-frequency sounds presented alone.
169TEMPORAL FEATURES OF SPECTRAL INTEGRATION IN MIDBRAIN
J Neurophysiol • VOL 102 • JULY 2009 • www.jn.org
at Iowa S
tate Univ on M
arch 21, 2013http://jn.physiology.org/
Dow
nloaded from
BF responses by low-frequency sounds, whereas the remainder(n � 62, 39%) displayed low frequency–evoked facilitationthat was often accompanied by suppression. We also reportobservations from 17 neurons showing two or more forms oflow-frequency interaction.
Low-frequency facilitating interactions were tuned in therange of 16–31 kHz. With the BF sound presented 10–15 dBabove threshold, the sound level required for low-frequencyfacilitation (42–80 dB SPL) was on average 26.1 � 13.4 dBhigher than for the BF excitatory response (P � 0.001, pairedt-test).
Low-frequency suppressive interactions had BFs of suppres-sion in the range 11–32 kHz, with thresholds in the range of22–75 dB SPL (for BF sounds 10–15 dB above thresholds). Asdescribed previously (Nataraj and Wenstrup 2006), there was amarked difference in mean threshold for suppression as afunction of the best suppressive frequency. Thus suppressiontuned �23 kHz had on average 13.8 dB higher thresholds thansuppression tuned �23 kHz (P � 0.001, unpaired t-test). As aresult, there was greater disparity in sound levels used to evokeBF excitation and low-frequency suppression when the sup-pression was tuned �23 kHz. Thus sound levels required forsuppression tuned �23 kHz were on average 47.6 � 13.1 dBhigher than for the BF excitatory response (P � 0.001, pairedt-test). In contrast, sound levels required for suppression tunedin the 23- to 30-kHz range were on average 26.5 � 16.7 dBhigher than for the BF excitatory response (P � 0.001, pairedt-test).
Predictions of effects of temporal manipulations
The main objective of these experiments was to characterizethe temporal properties of low frequency–evoked facilitationand suppression. We therefore examined how variations intemporal features of low-frequency sounds (duration and rise-fall times) altered the delay function of two-tone interactions—the response as a function of the relative timing of low-frequency and higher-frequency (BF) signals.
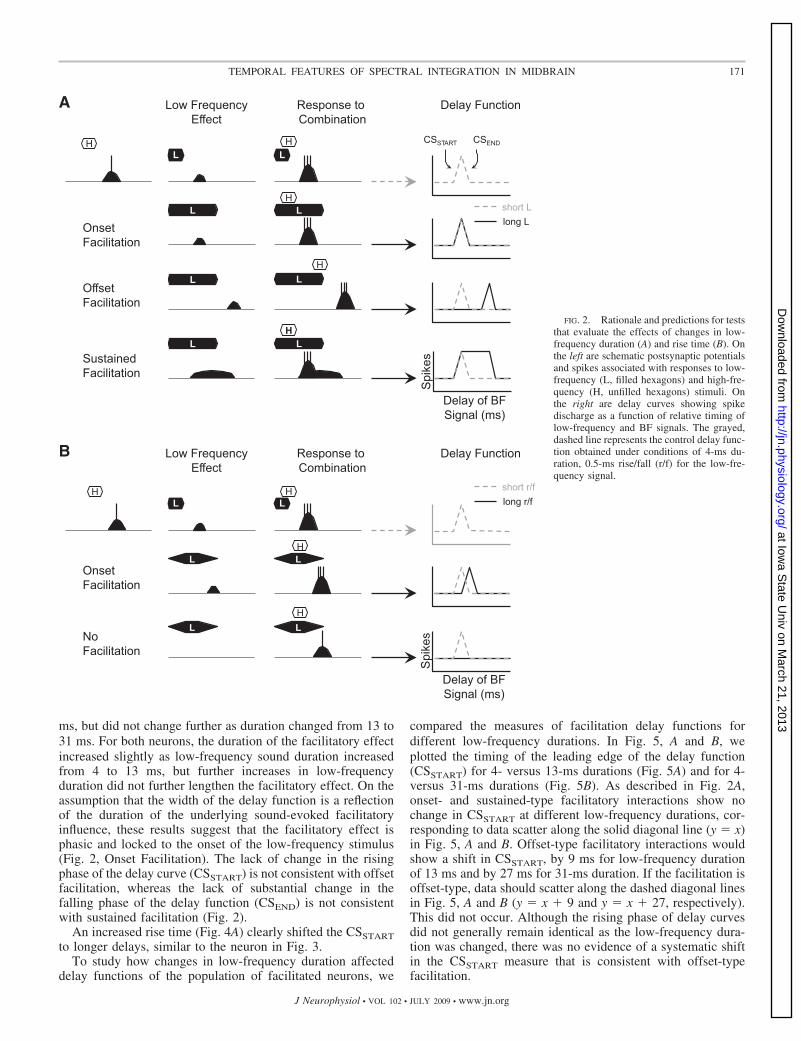
We first consider potential changes in the delay function thatmay result if changes in low-frequency duration alter thetiming of evoked facilitation or suppression (Fig. 2A). Withshort-duration signals, the combination response shows a sharppeak (or trough, for suppressive interactions) in the delayfunction because the low and high frequency–evoked facilita-tory influences are temporally restricted (Fig. 2A, top row).When the duration of the low-frequency facilitating signal isincreased, one possible effect is that the low-frequency re-sponse is unaffected. This would occur if the low-frequencyresponse is insensitive to low-frequency duration but is lockedto the onset of the low-frequency sound. Under these condi-tions, there would be no change in the features of the delayfunction (Fig. 2A, Onset Facilitation). A second result wouldoccur if the low-frequency facilitating response was locked tothe offset of the low-frequency signal. The timing but not theduration of the low-frequency facilitatory input would change.The result is that the delay function would retain the sameshape but the CSSTART, peak and CSEND measures would shiftto later delays (Fig. 2A, Offset Facilitation). A third possibilityis that the facilitating influence extends throughout the durationof the low-frequency signal. As a result, the range of delaysover which facilitation would occur is broader, and the CSEND
measure would shift to longer delays (Fig. 2A, SustainedFacilitation). Although effects of low-frequency duration areshown for facilitatory interactions, suppressive interactionscould show similar effects.
The rise time of low-frequency signals may also influencethe delay function of combination-sensitive interactions.Figure 2B (top row) shows a facilitatory interaction evokedby signals with fast rise times (0.5 ms). When the rise timeof the low-frequency signal is increased, the latency of thelow-frequency facilitating input would be increased becausethe sound level reaches threshold later (Fig. 2B, OnsetFacilitation). As a result, CSSTART, peak, and CSEND mea-sures would shift to later delays. Corresponding changeswould be expected if low-frequency facilitation were of anoffset or sustained type. Another possible result is thatneurons that provide low-frequency facilitating (or inhibi-tory) inputs to combination-sensitive IC neurons may beunresponsive to longer rise times (Fig. 2B, No Facilitation).The same may also occur for low-frequency sound durations(data not shown).
Temporal features of facilitating interactions
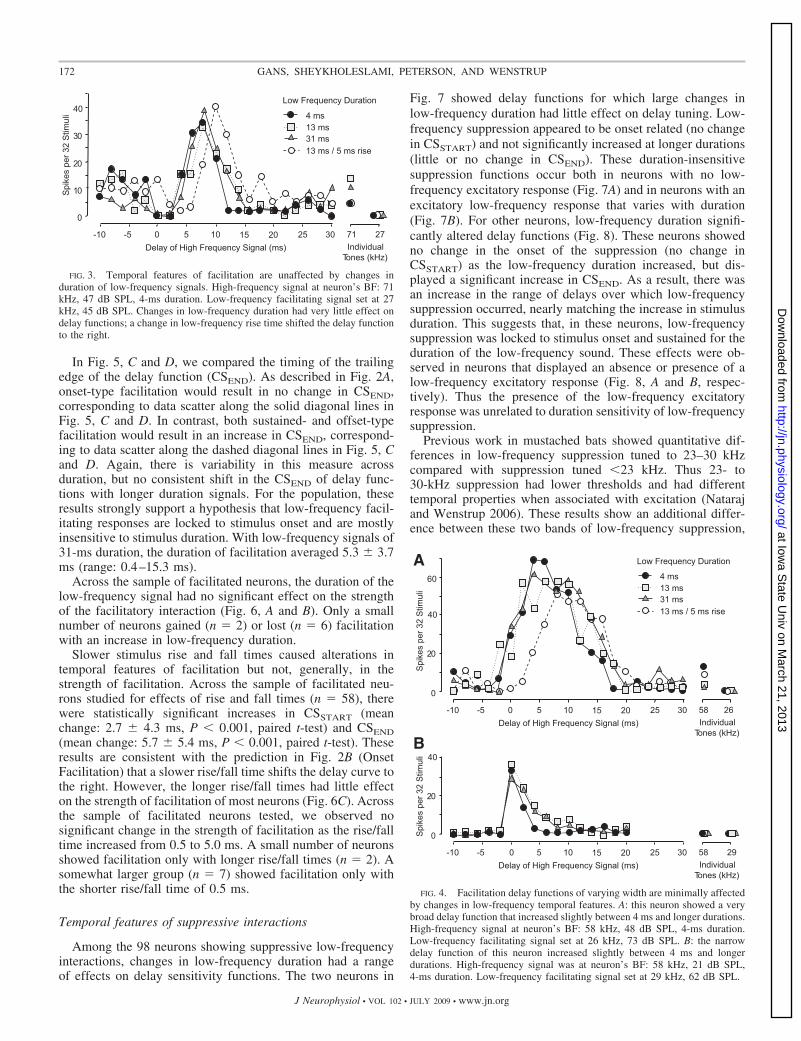
Among 62 facilitated neurons, we found little evidence thatchanges in the duration of low-frequency facilitating signalscaused systematic changes in the facilitation delay function.However, low-frequency rise time generally altered features ofthe delay curve. For the neuron in Fig. 3, delay functionschanged little as the duration of the low-frequency facilitatingsignal was increased from 4 to 13 to 31 ms. For all threefunctions, the delay-tuned peak remained at 8 ms, and theinitial rise (CSSTART) and fall (CSEND) of the delay functionvaried by �1.0 ms. These results strongly suggest that thefacilitating effect of the low-frequency signal is phasic andlocked to the onset of the low-frequency signal. The delayfunction was more strongly affected by a change in the risetime of the low-frequency signal, from 0.5 to 5 ms. The longerrise time shifted the rising and falling edges of the delayfunction by 3.5 and 3.9 ms, respectively, and increased the bestdelay by 2 ms. Thus in this neuron, features of the facilitationdelay function were shaped by stimulus rise time but thefacilitation occurred over a range of rise times.
Delay functions in two other neurons (Fig. 4) show addi-tional features of changing low-frequency duration: 1) low-frequency sound duration altered delay functions somewhat,but these effects were limited, and 2) the limited effect ofduration occurred in neurons for which the width of the delayfunction was quite different. For the neuron in Fig. 4A, therising phase (CSSTART) of the delay function was unaffected bylow-frequency duration. The falling phase (CSEND) increasedby 3.9 ms as duration was changed from 4 to 13 ms butincreased only slightly (1.3 ms) as duration changed from 13 to31 ms. The width of the delay function ranged from 8.9 to 15.0to 15.3 ms for low-frequency durations from 4 to 13 to 31 ms,respectively. These functions were among the widest observedin the study. In contrast, the neuron in Fig. 4B had a particu-larly narrow facilitatory delay function (3.3–5.7 ms) thatshowed only very minor changes with increasing sound dura-tion. Thus the rising phase of the delay function (CSSTART) wasunaffected by low-frequency duration. The falling phase(CSEND) increased by 2.4 ms as duration changed from 4 to 13
170 GANS, SHEYKHOLESLAMI, PETERSON, AND WENSTRUP
J Neurophysiol • VOL 102 • JULY 2009 • www.jn.org
at Iowa S
tate Univ on M
arch 21, 2013http://jn.physiology.org/
Dow
nloaded from
ms, but did not change further as duration changed from 13 to31 ms. For both neurons, the duration of the facilitatory effectincreased slightly as low-frequency sound duration increasedfrom 4 to 13 ms, but further increases in low-frequencyduration did not further lengthen the facilitatory effect. On theassumption that the width of the delay function is a reflectionof the duration of the underlying sound-evoked facilitatoryinfluence, these results suggest that the facilitatory effect isphasic and locked to the onset of the low-frequency stimulus(Fig. 2, Onset Facilitation). The lack of change in the risingphase of the delay curve (CSSTART) is not consistent with offsetfacilitation, whereas the lack of substantial change in thefalling phase of the delay function (CSEND) is not consistentwith sustained facilitation (Fig. 2).
An increased rise time (Fig. 4A) clearly shifted the CSSTARTto longer delays, similar to the neuron in Fig. 3.
To study how changes in low-frequency duration affecteddelay functions of the population of facilitated neurons, we
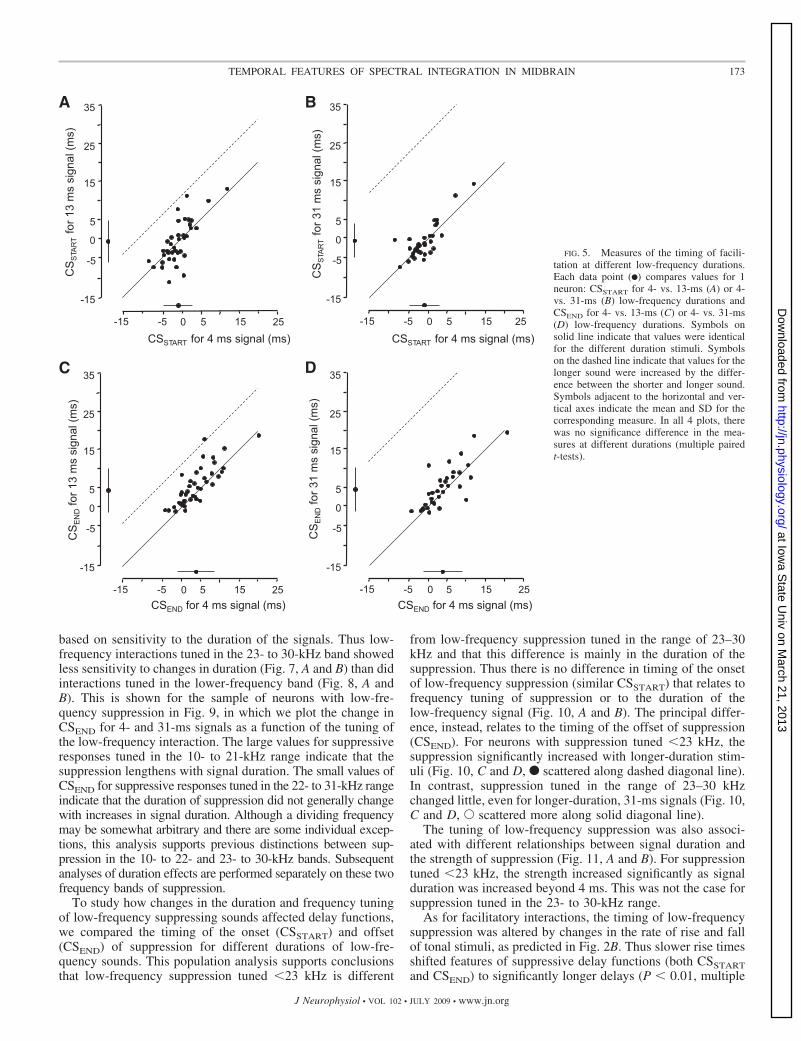
compared the measures of facilitation delay functions fordifferent low-frequency durations. In Fig. 5, A and B, weplotted the timing of the leading edge of the delay function(CSSTART) for 4- versus 13-ms durations (Fig. 5A) and for 4-versus 31-ms durations (Fig. 5B). As described in Fig. 2A,onset- and sustained-type facilitatory interactions show nochange in CSSTART at different low-frequency durations, cor-responding to data scatter along the solid diagonal line (y � x)in Fig. 5, A and B. Offset-type facilitatory interactions wouldshow a shift in CSSTART, by 9 ms for low-frequency durationof 13 ms and by 27 ms for 31-ms duration. If the facilitation isoffset-type, data should scatter along the dashed diagonal linesin Fig. 5, A and B (y � x � 9 and y � x � 27, respectively).This did not occur. Although the rising phase of delay curvesdid not generally remain identical as the low-frequency dura-tion was changed, there was no evidence of a systematic shiftin the CSSTART measure that is consistent with offset-typefacilitation.
L H
L
L H
L H
L L H
L H
L
Delay of BF Signal (ms)
Spi
kes
Onset Facilitation
Offset Facilitation
Sustained Facilitation
Low Frequency Effect
Response to Combination
Delay Function A
H
L H
L H
Delay of BF Signal (ms)
Spi
kes
Onset Facilitation
No Facilitation
Low Frequency Effect
Response to Combination
Delay Function
L L
L H L
B
CSSTART CSEND
long L short L
long r/f short r/f
FIG. 2. Rationale and predictions for teststhat evaluate the effects of changes in low-frequency duration (A) and rise time (B). Onthe left are schematic postsynaptic potentialsand spikes associated with responses to low-frequency (L, filled hexagons) and high-fre-quency (H, unfilled hexagons) stimuli. Onthe right are delay curves showing spikedischarge as a function of relative timing oflow-frequency and BF signals. The grayed,dashed line represents the control delay func-tion obtained under conditions of 4-ms du-ration, 0.5-ms rise/fall (r/f) for the low-fre-quency signal.
171TEMPORAL FEATURES OF SPECTRAL INTEGRATION IN MIDBRAIN
J Neurophysiol • VOL 102 • JULY 2009 • www.jn.org
at Iowa S
tate Univ on M
arch 21, 2013http://jn.physiology.org/
Dow
nloaded from
In Fig. 5, C and D, we compared the timing of the trailingedge of the delay function (CSEND). As described in Fig. 2A,onset-type facilitation would result in no change in CSEND,corresponding to data scatter along the solid diagonal lines inFig. 5, C and D. In contrast, both sustained- and offset-typefacilitation would result in an increase in CSEND, correspond-ing to data scatter along the dashed diagonal lines in Fig. 5, Cand D. Again, there is variability in this measure acrossduration, but no consistent shift in the CSEND of delay func-tions with longer duration signals. For the population, theseresults strongly support a hypothesis that low-frequency facil-itating responses are locked to stimulus onset and are mostlyinsensitive to stimulus duration. With low-frequency signals of31-ms duration, the duration of facilitation averaged 5.3 � 3.7ms (range: 0.4–15.3 ms).
Across the sample of facilitated neurons, the duration of thelow-frequency signal had no significant effect on the strengthof the facilitatory interaction (Fig. 6, A and B). Only a smallnumber of neurons gained (n � 2) or lost (n � 6) facilitationwith an increase in low-frequency duration.
Slower stimulus rise and fall times caused alterations intemporal features of facilitation but not, generally, in thestrength of facilitation. Across the sample of facilitated neu-rons studied for effects of rise and fall times (n � 58), therewere statistically significant increases in CSSTART (meanchange: 2.7 � 4.3 ms, P � 0.001, paired t-test) and CSEND(mean change: 5.7 � 5.4 ms, P � 0.001, paired t-test). Theseresults are consistent with the prediction in Fig. 2B (OnsetFacilitation) that a slower rise/fall time shifts the delay curve tothe right. However, the longer rise/fall times had little effecton the strength of facilitation of most neurons (Fig. 6C). Acrossthe sample of facilitated neurons tested, we observed nosignificant change in the strength of facilitation as the rise/falltime increased from 0.5 to 5.0 ms. A small number of neuronsshowed facilitation only with longer rise/fall times (n � 2). Asomewhat larger group (n � 7) showed facilitation only withthe shorter rise/fall time of 0.5 ms.
Temporal features of suppressive interactions
Among the 98 neurons showing suppressive low-frequencyinteractions, changes in low-frequency duration had a rangeof effects on delay sensitivity functions. The two neurons in
Fig. 7 showed delay functions for which large changes inlow-frequency duration had little effect on delay tuning. Low-frequency suppression appeared to be onset related (no changein CSSTART) and not significantly increased at longer durations(little or no change in CSEND). These duration-insensitivesuppression functions occur both in neurons with no low-frequency excitatory response (Fig. 7A) and in neurons with anexcitatory low-frequency response that varies with duration(Fig. 7B). For other neurons, low-frequency duration signifi-cantly altered delay functions (Fig. 8). These neurons showedno change in the onset of the suppression (no change inCSSTART) as the low-frequency duration increased, but dis-played a significant increase in CSEND. As a result, there wasan increase in the range of delays over which low-frequencysuppression occurred, nearly matching the increase in stimulusduration. This suggests that, in these neurons, low-frequencysuppression was locked to stimulus onset and sustained for theduration of the low-frequency sound. These effects were ob-served in neurons that displayed an absence or presence of alow-frequency excitatory response (Fig. 8, A and B, respec-tively). Thus the presence of the low-frequency excitatoryresponse was unrelated to duration sensitivity of low-frequencysuppression.
Previous work in mustached bats showed quantitative dif-ferences in low-frequency suppression tuned to 23–30 kHzcompared with suppression tuned �23 kHz. Thus 23- to30-kHz suppression had lower thresholds and had differenttemporal properties when associated with excitation (Natarajand Wenstrup 2006). These results show an additional differ-ence between these two bands of low-frequency suppression,
4 ms 13 ms31 ms13 ms / 5 ms rise
Low Frequency Duration
0
10
20
30
40
Spi
kes
per 3
2 S
timul
i
71 27Individual
Tones (kHz) Delay of High Frequency Signal (ms)
-10 -5 0 5 10 15 20 25 30
FIG. 3. Temporal features of facilitation are unaffected by changes induration of low-frequency signals. High-frequency signal at neuron’s BF: 71kHz, 47 dB SPL, 4-ms duration. Low-frequency facilitating signal set at 27kHz, 45 dB SPL. Changes in low-frequency duration had very little effect ondelay functions; a change in low-frequency rise time shifted the delay functionto the right.
Spi
kes
per 3
2 S
timul
i
0
20
40
60
IndividualTones (kHz)
Delay of High Frequency Signal (ms) 58 26-10 -5 0 5 10 15 20 25 30
Spi
kes
per 3
2 S
timul
i
0
20
40
58 29Individual
Tones (kHz) Delay of High Frequency Signal (ms)
-10 -5 0 5 10 15 20 25 30
4 ms 13 ms31 ms13 ms / 5 ms rise
Low Frequency Duration A
B
FIG. 4. Facilitation delay functions of varying width are minimally affectedby changes in low-frequency temporal features. A: this neuron showed a verybroad delay function that increased slightly between 4 ms and longer durations.High-frequency signal at neuron’s BF: 58 kHz, 48 dB SPL, 4-ms duration.Low-frequency facilitating signal set at 26 kHz, 73 dB SPL. B: the narrowdelay function of this neuron increased slightly between 4 ms and longerdurations. High-frequency signal was at neuron’s BF: 58 kHz, 21 dB SPL,4-ms duration. Low-frequency facilitating signal set at 29 kHz, 62 dB SPL.
172 GANS, SHEYKHOLESLAMI, PETERSON, AND WENSTRUP
J Neurophysiol • VOL 102 • JULY 2009 • www.jn.org
at Iowa S
tate Univ on M
arch 21, 2013http://jn.physiology.org/
Dow
nloaded from
based on sensitivity to the duration of the signals. Thus low-frequency interactions tuned in the 23- to 30-kHz band showedless sensitivity to changes in duration (Fig. 7, A and B) than didinteractions tuned in the lower-frequency band (Fig. 8, A andB). This is shown for the sample of neurons with low-fre-quency suppression in Fig. 9, in which we plot the change inCSEND for 4- and 31-ms signals as a function of the tuning ofthe low-frequency interaction. The large values for suppressiveresponses tuned in the 10- to 21-kHz range indicate that thesuppression lengthens with signal duration. The small values ofCSEND for suppressive responses tuned in the 22- to 31-kHz rangeindicate that the duration of suppression did not generally changewith increases in signal duration. Although a dividing frequencymay be somewhat arbitrary and there are some individual excep-tions, this analysis supports previous distinctions between sup-pression in the 10- to 22- and 23- to 30-kHz bands. Subsequentanalyses of duration effects are performed separately on these twofrequency bands of suppression.
To study how changes in the duration and frequency tuningof low-frequency suppressing sounds affected delay functions,we compared the timing of the onset (CSSTART) and offset(CSEND) of suppression for different durations of low-fre-quency sounds. This population analysis supports conclusionsthat low-frequency suppression tuned �23 kHz is different
from low-frequency suppression tuned in the range of 23–30kHz and that this difference is mainly in the duration of thesuppression. Thus there is no difference in timing of the onsetof low-frequency suppression (similar CSSTART) that relates tofrequency tuning of suppression or to the duration of thelow-frequency signal (Fig. 10, A and B). The principal differ-ence, instead, relates to the timing of the offset of suppression(CSEND). For neurons with suppression tuned �23 kHz, thesuppression significantly increased with longer-duration stim-uli (Fig. 10, C and D, F scattered along dashed diagonal line).In contrast, suppression tuned in the range of 23–30 kHzchanged little, even for longer-duration, 31-ms signals (Fig. 10,C and D, E scattered more along solid diagonal line).
The tuning of low-frequency suppression was also associ-ated with different relationships between signal duration andthe strength of suppression (Fig. 11, A and B). For suppressiontuned �23 kHz, the strength increased significantly as signalduration was increased beyond 4 ms. This was not the case forsuppression tuned in the 23- to 30-kHz range.
As for facilitatory interactions, the timing of low-frequencysuppression was altered by changes in the rate of rise and fallof tonal stimuli, as predicted in Fig. 2B. Thus slower rise timesshifted features of suppressive delay functions (both CSSTARTand CSEND) to significantly longer delays (P � 0.01, multiple
-15
35
-5
25
15
5
0
-15 -5 25 15 5 0
-15
35
-5
25
15
5
0
-15 -5 25 15 5 0
-15
35
-5
25
15
5
0
-15 -5 25 15 5 0
-15
35
-5
25
15
5
0
-15 -5 25 15 5 0
CS
STA
RT fo
r 13
ms
sign
al (m
s)
CSSTART for 4 ms signal (ms)
A
CSSTART for 4 ms signal (ms)
CS
STA
RT fo
r 31
ms
sign
al (m
s)
B
CSEND for 4 ms signal (ms)
CS
EN
D fo
r 13
ms
sign
al (m
s)
C
CSEND for 4 ms signal (ms)
CS
EN
D fo
r 31
ms
sign
al (m
s)
D
FIG. 5. Measures of the timing of facili-tation at different low-frequency durations.Each data point (F) compares values for 1neuron: CSSTART for 4- vs. 13-ms (A) or 4-vs. 31-ms (B) low-frequency durations andCSEND for 4- vs. 13-ms (C) or 4- vs. 31-ms(D) low-frequency durations. Symbols onsolid line indicate that values were identicalfor the different duration stimuli. Symbolson the dashed line indicate that values for thelonger sound were increased by the differ-ence between the shorter and longer sound.Symbols adjacent to the horizontal and ver-tical axes indicate the mean and SD for thecorresponding measure. In all 4 plots, therewas no significance difference in the mea-sures at different durations (multiple pairedt-tests).
173TEMPORAL FEATURES OF SPECTRAL INTEGRATION IN MIDBRAIN
J Neurophysiol • VOL 102 • JULY 2009 • www.jn.org
at Iowa S
tate Univ on M
arch 21, 2013http://jn.physiology.org/
Dow
nloaded from
paired t-tests, data not shown). This effect was independent ofthe frequency tuning of suppression. The strength of suppres-sion was not significantly altered by the rate of rise of low-frequency stimuli (Fig. 11C), and this was also independent ofthe frequency tuning of suppression.
Multiple spectral interactions in IC neurons
As this study progressed, it became clear that many neuronsshowed more than one of the types of spectral interactions
described above. When a subset of neurons (n � 17) wassystematically studied for multituned effects, 41% (n � 7)were found to exhibit sustained suppression tuned to frequen-cies �23 kHz and phasic suppression (n � 5) or facilitation(n � 3) �23 kHz. The neuron in Fig. 12 showed all three formsof low-frequency interaction described in this study: facilita-tion and suppression tuned near 27 kHz (Fig. 12A) and sup-pression tuned near 20 kHz (Fig. 12B). We describe thisneuron’s response below to clarify the complex features of itslow-frequency interactions.
The response to brief (13 ms) BF tones (58 kHz) wasfacilitated by 27-kHz tone bursts at some delays and wassuppressed by 27-kHz tones at other delays (Fig. 12A). BFtones presented individually evoked a phasic discharge, whereas
0 S
pike
s pe
r 32
Stim
uli
0
2 0
40
Individual Tones (kHz)
Delay of High Frequency Signal (ms) 96 25 -10 -5 5 10 15 20 25 30
4 ms 13 ms 31 ms
Low Frequency Duration
A
B
Time (ms)
Spi
kes
0
16
32 26 kHz / 31 ms
0 75 0 75 0 75 0 75 0 75 0 75
26 kHz / 13 ms
t = 10 ms t = 0 ms 76 kHz 26 kHz / 4 ms t = -2 ms t = 28 ms
35 57 0 47 41 32
35 35 0 60 29 14
33 10 0 53 32 33
Spi
kes
per 3
2 S
timul
i
0
2 0
40 60
Individual Tones (kHz)
Delay of High Frequency Signal (ms) 76 26 -10 -5 0 5 10 15 20 25 30
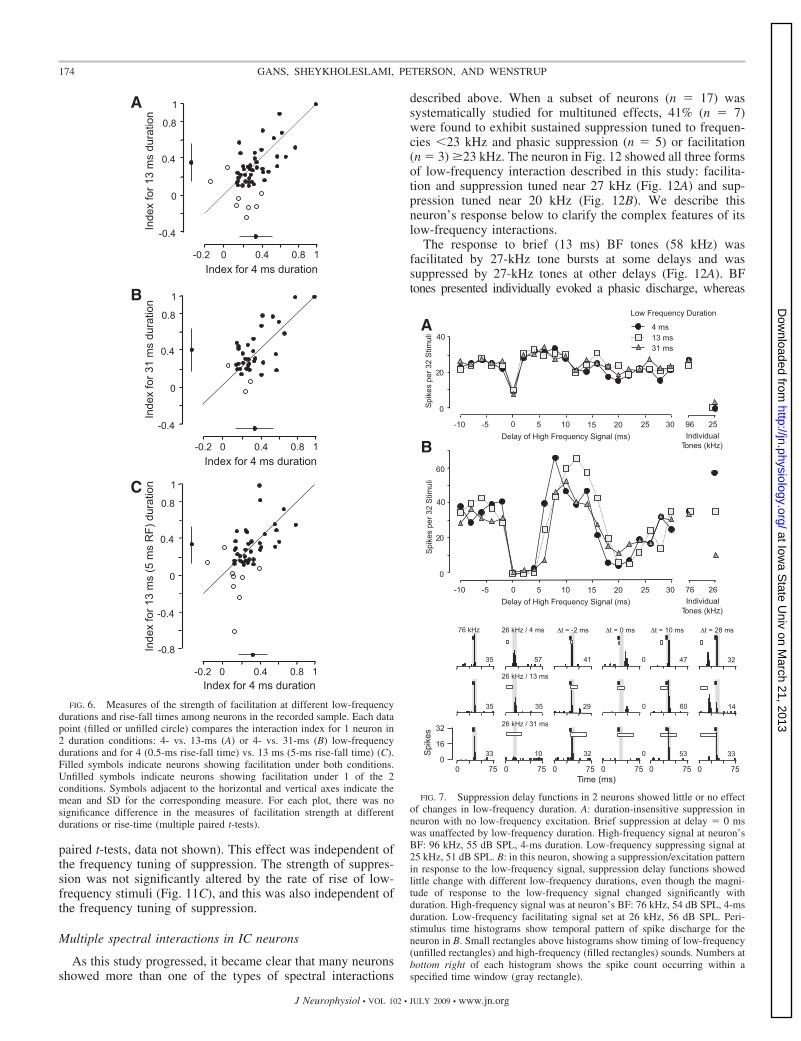
FIG. 7. Suppression delay functions in 2 neurons showed little or no effectof changes in low-frequency duration. A: duration-insensitive suppression inneuron with no low-frequency excitation. Brief suppression at delay � 0 mswas unaffected by low-frequency duration. High-frequency signal at neuron’sBF: 96 kHz, 55 dB SPL, 4-ms duration. Low-frequency suppressing signal at25 kHz, 51 dB SPL. B: in this neuron, showing a suppression/excitation patternin response to the low-frequency signal, suppression delay functions showedlittle change with different low-frequency durations, even though the magni-tude of response to the low-frequency signal changed significantly withduration. High-frequency signal was at neuron’s BF: 76 kHz, 54 dB SPL, 4-msduration. Low-frequency facilitating signal set at 26 kHz, 56 dB SPL. Peri-stimulus time histograms show temporal pattern of spike discharge for theneuron in B. Small rectangles above histograms show timing of low-frequency(unfilled rectangles) and high-frequency (filled rectangles) sounds. Numbers atbottom right of each histogram shows the spike count occurring within aspecified time window (gray rectangle).
0
-0.4
0.8
1
0.4
-0.2 0 1 0.4 0.8
Inde
x fo
r 13
ms
dura
tion
Index for 4 ms duration
-0.2 0 1 0.4 0.8
0
-0.4
0.8
1
0.4
-0.8 Inde
x fo
r 13
ms
(5 m
s R
F) d
urat
ion
Index for 4 ms duration
A
0
-0.4
0.8
1
0.4
-0.2 0 1 0.4 0.8
Inde
x fo
r 31
ms
dura
tion
Index for 4 ms duration
B
C
FIG. 6. Measures of the strength of facilitation at different low-frequencydurations and rise-fall times among neurons in the recorded sample. Each datapoint (filled or unfilled circle) compares the interaction index for 1 neuron in2 duration conditions: 4- vs. 13-ms (A) or 4- vs. 31-ms (B) low-frequencydurations and for 4 (0.5-ms rise-fall time) vs. 13 ms (5-ms rise-fall time) (C).Filled symbols indicate neurons showing facilitation under both conditions.Unfilled symbols indicate neurons showing facilitation under 1 of the 2conditions. Symbols adjacent to the horizontal and vertical axes indicate themean and SD for the corresponding measure. For each plot, there was nosignificance difference in the measures of facilitation strength at differentdurations or rise-time (multiple paired t-tests).
174 GANS, SHEYKHOLESLAMI, PETERSON, AND WENSTRUP
J Neurophysiol • VOL 102 • JULY 2009 • www.jn.org
at Iowa S
tate Univ on M
arch 21, 2013http://jn.physiology.org/
Dow
nloaded from
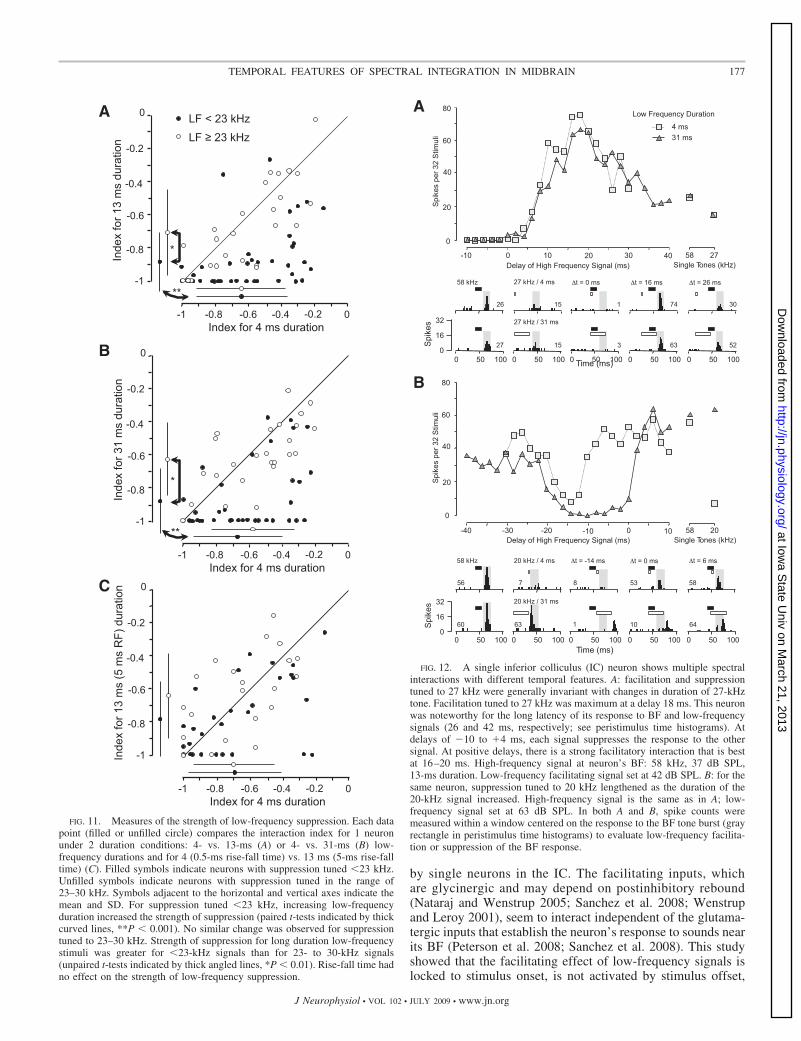
brief (4 ms) tones at 27 kHz evoked slightly less spike discharge.Particularly noteworthy was the long latency of the BF exci-tatory response (26 ms) and the very long latency of the27-kHz response (42 ms). Because the latencies of the excita-tory responses to the individual tones are closely correlatedwith the latency of facilitatory influences (Portfors and Wen-strup 1999; Sanchez et al. 2008), the latency difference predictsa best delay of 16 ms for the strong facilitatory response. Thisis close to the observed best delay of 18 ms. This facilitatoryinteraction was virtually identical with low-frequency dura-tions of 4 and 31 ms, both in terms of the delay function andthe temporal response pattern (Fig. 12A, peristimulus timehistograms). There was strong suppression of the BF responseby the 27-kHz signal over a range of delays from �10 (BFsignal leading) to �4 ms. This suppression is likely related tothe very long latency of the BF excitatory response, and wehypothesize that it depends on a short latency but long-lasting
suppression evoked by the 27-kHz signal. The 27-kHz sup-pression seems to be independent of signal duration, becausethe delay function and temporal response patterns are nearlyidentical under the 4- and 31-ms conditions.
After completing two-tone tests with BF and 27-kHz signals,we examined effects of 20-kHz tones on BF (Fig. 12B). At thistime, the response to the BF signal doubled compared withresponses shown in Fig. 12A, but we confirmed that otherresponse properties including facilitation and response latencywere the same. The response to the 20-kHz signal was durationsensitive: weak at 4-ms duration and strong at 31-ms duration.When the BF and 20-kHz signals were presented together, the20-kHz signal suppressed BF responses over a range of nega-tive delays (BF signal leading), the result of the very longlatency of the BF response. In contrast to suppression by27-kHz responses, the 20-kHz suppression was duration sen-sitive, increasing in strength and duration as the signal durationincreased.
Because we only examined the co-occurrence of such re-sponses later in this study, the exact proportions of neuronswith suppression �23 kHz and either facilitation or suppres-sion in the 23- to 30-kHz range is unclear. It is our sense,however, that suppressive effects of signals �23 kHz are quitecommon, occurring in most if not all high-frequency tunedneurons of the IC.
D I S C U S S I O N
This study examined temporal features of spectral interac-tions that contribute to neuronal responsiveness to complexsounds in the IC. We sought to characterize the inputs andmechanisms underlying these interactions in IC. Major obser-vations are that facilitatory interactions are locked to the onsetof a low-frequency facilitating signal and are largely insensi-tive to its duration. These interactions may depend on auditorybrain stem inputs that show onset-type temporal responsepatterns. Suppressive interactions are diverse in their responseto changes in duration, suggesting that multiple mechanisms orinputs underlie such interactions. The temporal sensitivity ofboth facilitatory and suppressive interactions suggests a variety
Frequency of Suppression (kHz) 35 10 15 20 25 30
Cha
nge
in C
SE
ND (m
s)
10
40
30
20
0
Individual Neurons
Average value (2 kHz wide)
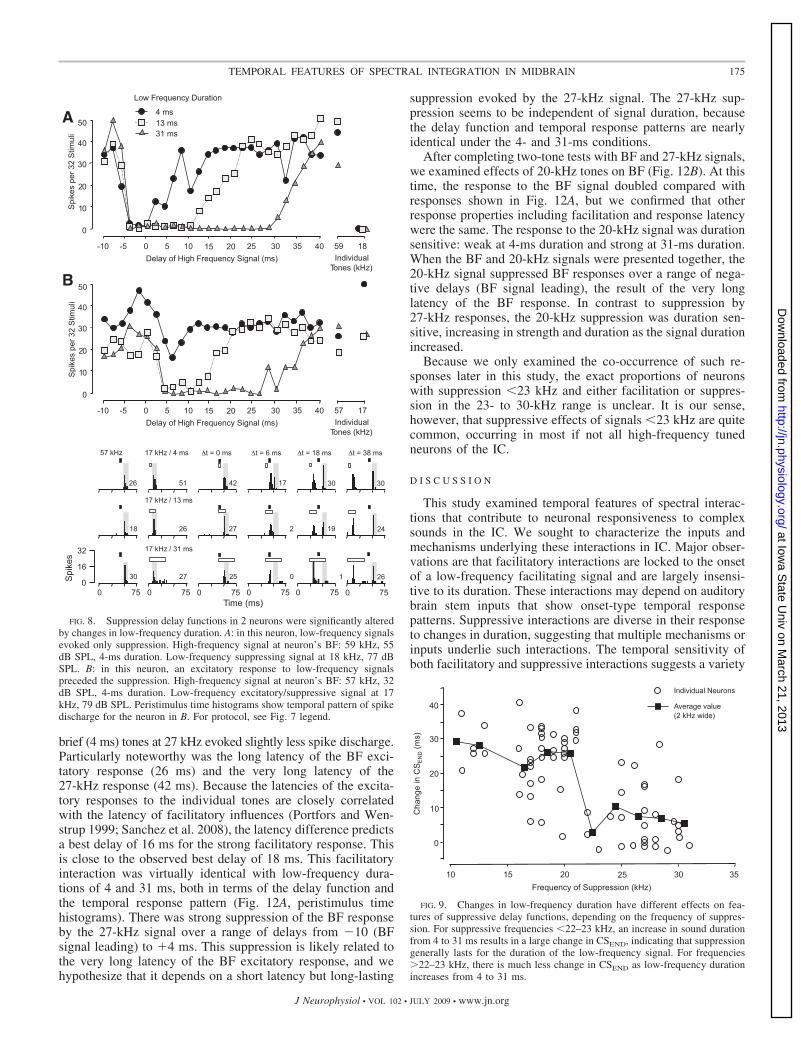
FIG. 9. Changes in low-frequency duration have different effects on fea-tures of suppressive delay functions, depending on the frequency of suppres-sion. For suppressive frequencies �22–23 kHz, an increase in sound durationfrom 4 to 31 ms results in a large change in CSEND, indicating that suppressiongenerally lasts for the duration of the low-frequency signal. For frequencies�22–23 kHz, there is much less change in CSEND as low-frequency durationincreases from 4 to 31 ms.
35 40 Individual
Tones (kHz) Delay of High Frequency Signal (ms)
57 17 -10 -5 0 5 10 15 20 25 30
35 40 Individual
Tones (kHz) Delay of High Frequency Signal (ms)
59 18 -10 -5 0 5 10 15 20 25 30
4 ms 13 ms 31 ms
Low Frequency Duration
Time (ms)
17 kHz / 31 ms
0 75 0 75 0 75 0 75 0 75 0 75
17 kHz / 13 ms
t = 18 ms t = 6 ms 57 kHz 17 kHz / 4 ms t = 0 ms t = 38 ms
26 51 17 30 42 30
18 26 2 19 27 24
30 27 0 1 25 26
A
B
FIG. 8. Suppression delay functions in 2 neurons were significantly alteredby changes in low-frequency duration. A: in this neuron, low-frequency signalsevoked only suppression. High-frequency signal at neuron’s BF: 59 kHz, 55dB SPL, 4-ms duration. Low-frequency suppressing signal at 18 kHz, 77 dBSPL. B: in this neuron, an excitatory response to low-frequency signalspreceded the suppression. High-frequency signal at neuron’s BF: 57 kHz, 32dB SPL, 4-ms duration. Low-frequency excitatory/suppressive signal at 17kHz, 79 dB SPL. Peristimulus time histograms show temporal pattern of spikedischarge for the neuron in B. For protocol, see Fig. 7 legend.
175TEMPORAL FEATURES OF SPECTRAL INTEGRATION IN MIDBRAIN
J Neurophysiol • VOL 102 • JULY 2009 • www.jn.org
at Iowa S
tate Univ on M
arch 21, 2013http://jn.physiology.org/
Dow
nloaded from
of effects that can contribute to the response to complexsounds. For many neurons, we observed more than one type ofinteraction, resulting in even more elaborate responses tocomplex sounds.
Changes in the rate of rise and fall of lower-frequency tonebursts altered the time course of facilitatory and suppressiveinteractions by shifting delay functions to larger values. Thisresult is expected, arising from a delay in the time required forthe low-frequency sound to reach threshold. This shows thatour measurements were sufficiently sensitive to detect smallchanges in the temporal features of two-tone interactions.Other features of interactions such as strength were generallyunaffected by changes in rise and fall times, suggesting that themechanisms that create low-frequency facilitation or suppres-sion operate well in the range used in this study.
Temporal properties of facilitation in combination-sensitive neurons
Facilitation, referring to a nonlinear enhancement of a neu-ron’s response to an input in the presence of a second input,occurs in many neural systems. In sensory systems, it createsselectivity to complex stimuli including the direction of motion
of a visual object (Clifford and Ibbotson 2003), the electricfield of weakly electric fish (Carlson and Kawasaki 2004), thedirection of motion across whiskers (Kida et al. 2005), andcombinations of odorants (Yoshida and Mori 2007) or acousticelements in vocal signals (Suga et al. 1978). The time scales offacilitation and the underlying neuronal mechanisms vary sub-stantially. Neurons in the medial superior olivary nucleus areselective for interaural timing differences (ITDs) in the sub-millisecond range, and this selectivity seems to be based in parton facilitation (Goldberg and Brown 1969; Pecka et al. 2008;Yin and Chan 1990). This time scale of facilitation depends onseveral factors, including precisely timed inputs from eachcochlear nucleus (Joris et al. 1994), as well as fast excitatorypostsynaptic potentials and ionic currents that limit temporalintegration (Kuba et al. 2002; Scott et al. 2005; Svirskis et al.2004). At a longer time scale, neurons in the superior colliculusare facilitated by multimodal sensory inputs that are distributedover tens and hundreds of milliseconds; these facilitatoryinputs depend in part on the slower action of NMDA receptors(Binns 1999). The nervous system thus uses an array ofmechanisms to create facilitation on the “desired” time scale.
In the mustached bat, facilitatory spectral interactions arisethrough the integration of low and high frequency–tuned inputs
-15
35
-5
25
15
5
0
-15 -5 25 15 5 0
LF < 23 kHz LF 23 kHz
-15
35
-5
25
15
5
0
-15 -5 25 15 5 0
-15
35
-5
25
15
5
0
-15 -5 25 15 5 0
-15
35
-5
25
15
5
0
-15 -5 25 15 5 0
CS
STA
RT fo
r 13
ms
sign
al (m
s)
CSSTART for 4 ms signal (ms)
A
CSSTART for 4 ms signal (ms)
CS
STA
RT fo
r 31
ms
sign
al (m
s)
B
CSEND for 4 ms signal (ms)
CS
EN
D fo
r 13
ms
sign
al (m
s)
C
CSEND for 4 ms signal (ms)
CS
EN
D fo
r 31
ms
sign
al (m
s)
D
** **
**
**
**
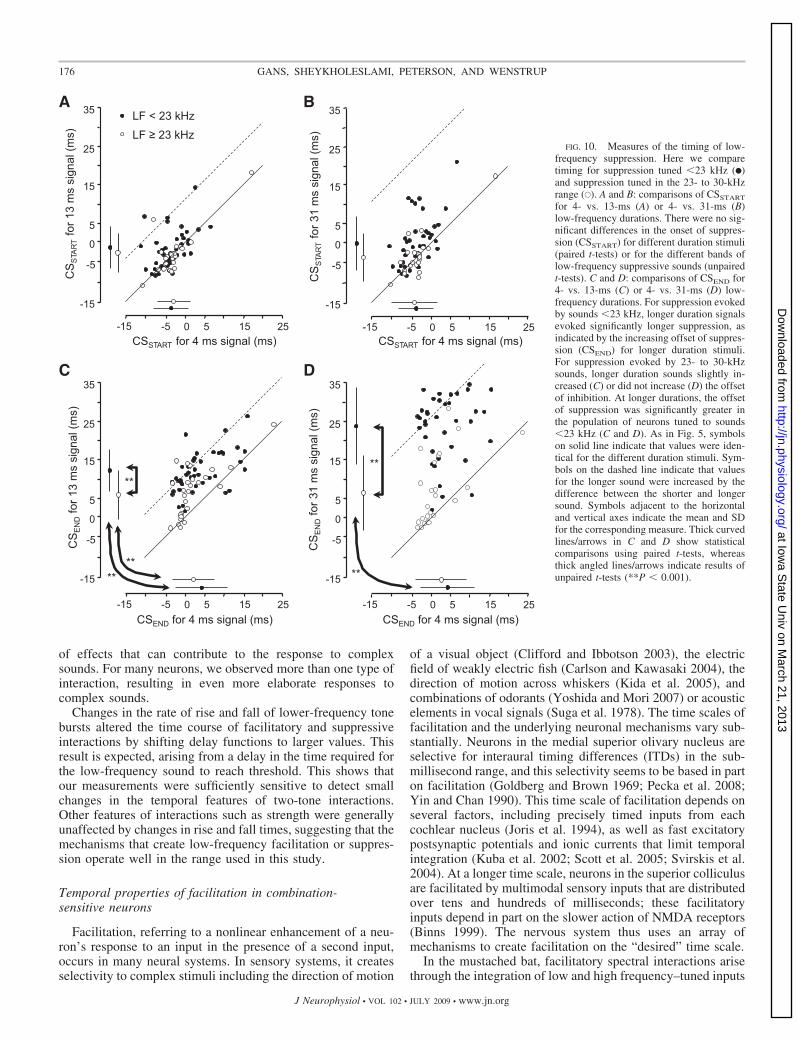
FIG. 10. Measures of the timing of low-frequency suppression. Here we comparetiming for suppression tuned �23 kHz (F)and suppression tuned in the 23- to 30-kHzrange (E). A and B: comparisons of CSSTART
for 4- vs. 13-ms (A) or 4- vs. 31-ms (B)low-frequency durations. There were no sig-nificant differences in the onset of suppres-sion (CSSTART) for different duration stimuli(paired t-tests) or for the different bands oflow-frequency suppressive sounds (unpairedt-tests). C and D: comparisons of CSEND for4- vs. 13-ms (C) or 4- vs. 31-ms (D) low-frequency durations. For suppression evokedby sounds �23 kHz, longer duration signalsevoked significantly longer suppression, asindicated by the increasing offset of suppres-sion (CSEND) for longer duration stimuli.For suppression evoked by 23- to 30-kHzsounds, longer duration sounds slightly in-creased (C) or did not increase (D) the offsetof inhibition. At longer durations, the offsetof suppression was significantly greater inthe population of neurons tuned to sounds�23 kHz (C and D). As in Fig. 5, symbolson solid line indicate that values were iden-tical for the different duration stimuli. Sym-bols on the dashed line indicate that valuesfor the longer sound were increased by thedifference between the shorter and longersound. Symbols adjacent to the horizontaland vertical axes indicate the mean and SDfor the corresponding measure. Thick curvedlines/arrows in C and D show statisticalcomparisons using paired t-tests, whereasthick angled lines/arrows indicate results ofunpaired t-tests (**P � 0.001).
176 GANS, SHEYKHOLESLAMI, PETERSON, AND WENSTRUP
J Neurophysiol • VOL 102 • JULY 2009 • www.jn.org
at Iowa S
tate Univ on M
arch 21, 2013http://jn.physiology.org/
Dow
nloaded from
by single neurons in the IC. The facilitating inputs, whichare glycinergic and may depend on postinhibitory rebound(Nataraj and Wenstrup 2005; Sanchez et al. 2008; Wenstrupand Leroy 2001), seem to interact independent of the glutama-tergic inputs that establish the neuron’s response to sounds nearits BF (Peterson et al. 2008; Sanchez et al. 2008). This studyshowed that the facilitating effect of low-frequency signals islocked to stimulus onset, is not activated by stimulus offset,
Inde
x fo
r 13
ms
dura
tion
Index for 4 ms duration
-1
-0.6
-0.2
0
-0.4
-0.8
-1 -0.8 -0.2 -0.6 -0.4 0
LF < 23 kHz LF 23 kHz
A In
dex
for 3
1 m
s du
ratio
n
Index for 4 ms duration
-1
-0.6
-0.2
0
-0.4
-0.8
-1 -0.8 -0.2 -0.6 -0.4 0
B
Inde
x fo
r 13
ms
(5 m
s R
F) d
urat
ion
-1
-0.6
-0.2
0
-0.4
-0.8
-1 -0.8 -0.2 -0.6 -0.4 0 Index for 4 ms duration
C
**
**
*
*
FIG. 11. Measures of the strength of low-frequency suppression. Each datapoint (filled or unfilled circle) compares the interaction index for 1 neuronunder 2 duration conditions: 4- vs. 13-ms (A) or 4- vs. 31-ms (B) low-frequency durations and for 4 (0.5-ms rise-fall time) vs. 13 ms (5-ms rise-falltime) (C). Filled symbols indicate neurons with suppression tuned �23 kHz.Unfilled symbols indicate neurons with suppression tuned in the range of23–30 kHz. Symbols adjacent to the horizontal and vertical axes indicate themean and SD. For suppression tuned �23 kHz, increasing low-frequencyduration increased the strength of suppression (paired t-tests indicated by thickcurved lines, **P � 0.001). No similar change was observed for suppressiontuned to 23–30 kHz. Strength of suppression for long duration low-frequencystimuli was greater for �23-kHz signals than for 23- to 30-kHz signals(unpaired t-tests indicated by thick angled lines, *P � 0.01). Rise-fall time hadno effect on the strength of low-frequency suppression.
80
Spi
kes
per 3
2 S
timul
i
0
20
40 60
58 27 Single Tones (kHz) Delay of High Frequency Signal (ms)
-10 0 10 20 30 40
Low Frequency Duration
4 ms 31 ms
80
Spi
kes
per 3
2 S
timul
i
0
20
40 60
58 20 Single Tones (kHz) Delay of High Frequency Signal (ms)
-40 -30 -20 -10 0 10
Time (ms)
Spi
kes
0
16
32
50 0 100 50 0 100 50 0 100 50 0 100 50 0 100
26 15 1
58 kHz 27 kHz / 4 ms t = 0 ms
74 30
52 63 3 15 27
t = 16 ms t = 26 ms
27 kHz / 31 ms
Spi
kes
0
16
32
50 0 100 Time (ms)
50 0 100 50 0 100 50 0 100 50 0 100
56 7
58 kHz 20 kHz / 4 ms t = 0 ms t = 6 ms
53 58
64 10 1
20 kHz / 31 ms
60 63
8
t = -14 ms
A
B
FIG. 12. A single inferior colliculus (IC) neuron shows multiple spectralinteractions with different temporal features. A: facilitation and suppressiontuned to 27 kHz were generally invariant with changes in duration of 27-kHztone. Facilitation tuned to 27 kHz was maximum at a delay 18 ms. This neuronwas noteworthy for the long latency of its response to BF and low-frequencysignals (26 and 42 ms, respectively; see peristimulus time histograms). Atdelays of �10 to �4 ms, each signal suppresses the response to the othersignal. At positive delays, there is a strong facilitatory interaction that is bestat 16–20 ms. High-frequency signal at neuron’s BF: 58 kHz, 37 dB SPL,13-ms duration. Low-frequency facilitating signal set at 42 dB SPL. B: for thesame neuron, suppression tuned to 20 kHz lengthened as the duration of the20-kHz signal increased. High-frequency signal is the same as in A; low-frequency signal set at 63 dB SPL. In both A and B, spike counts weremeasured within a window centered on the response to the BF tone burst (grayrectangle in peristimulus time histograms) to evaluate low-frequency facilita-tion or suppression of the BF response.
177TEMPORAL FEATURES OF SPECTRAL INTEGRATION IN MIDBRAIN
J Neurophysiol • VOL 102 • JULY 2009 • www.jn.org
at Iowa S
tate Univ on M
arch 21, 2013http://jn.physiology.org/
Dow
nloaded from
and is generally insensitive to increases in signal durationbeyond 4–13 ms. The results further suggest that the low-frequency facilitating effect is temporally restricted, lasting �5ms on average. Our interpretation is that the glycinergic inputs,or at least the low-frequency glycinergic input, have a pha-sic-on response to sound. We further speculate that the pha-sic-on spikes of the glycinergic input neurons then activate ahyperpolarization with a duration dictated by postsynaptic pas-sive and active mechanisms and not by stimulus duration. Thisis followed by a rebound depolarization with timing also de-pendent on passive and active postsynaptic membrane proper-ties, but independent of stimulus duration.
The mostly likely sources of facilitating glycinergic inputsare neurons in the ventral (VNLL) and intermediate nuclei(INLL) of the lateral lemniscus. Glycinergic neurons occur ineach of these nuclei (Aoki et al. 1988; Saint Marie et al. 1997;Vater et al. 1997; Winer et al. 1995), and nearly all smallspherical cells in the “columnar” subdivisions of echolocatinganimals are glycinergic (Vater et al. 1997; Winer et al. 1995).Moreover, VNLL and INLL have the largest numbers of brainstem neurons that project to facilitative combination-sensitiveregions of the IC, and some of the projecting VNLL and INLLneurons occur in putative low-frequency regions (Wenstrupet al. 1999; Yavuzoglu and Wenstrup 2008). Neurons withonset-type temporal response patterns, which seem to charac-terize the facilitating inputs, are common in INLL and VNLL,especially in the columnar subdivision of VNLL (Covey andCasseday 1991; Haplea et al. 1994; Metzner and Radtke-Schuller 1987; Portfors and Wenstrup 2001). Although otherbrain stem nuclei may contribute onset-type facilitating gly-cinergic input to IC (e.g., medial superior olive; Grothe 1994),there is no indication that their low-frequency regions projectto the high-frequency IC regions containing combination-sensitive neurons (Wenstrup et al. 1999; Yavuzoglu and Wen-strup 2008). We therefore propose that inputs from onset-typeneurons in VNLL or INLL are crucial for establishing thefacilitated combination-sensitive response in IC neurons.
These facilitating glycinergic inputs create sensitivity tocombinations of neural elements that are separated by de-lays in the range of 0 –30 ms. The degree of selectivity, onaverage �5 ms, is established by the phasic nature of thelow-frequency, and probably high-frequency, facilitatingglycinergic input, as well as the temporal restriction on thedepolarizing influence of the phasic glycinergic inputs. Thetemporal properties of interactions described here arethought to create selectivity to pulse-echo delay and otheranalyses in the mustached bat (Olsen and Suga 1991;O’Neill and Suga 1982; Portfors and Wenstrup 1999). How-ever, both the mechanisms and their uses in acoustic anal-yses are more general. For example, the spectrotemporalintegrative properties describe here may result, in othersystems, from GABAergic inputs that are phasic and appro-priately tuned in frequency. The time scales of these inter-actions are also appropriate for mechanisms that createselectivity to short time scale elements in vocal communi-cation signals (Leroy and Wenstrup 2000; Ohlemiller et al.1996; Rauschecker et al. 1995) and for analysis of phonemicelements in human speech (Suga 1996; Sussman et al.1998).
Temporal properties of suppression
In the mustached bat, IC neurons show two forms of low-frequency suppression of responses to BF tones, apart fromlower sideband inhibition. One form is characterized by re-sponsiveness to frequencies in the bat’s audible range �23kHz, i.e., below the frequencies used in the first harmonic ofthe biosonar signal. There are several features that are morecommon for suppression tuned in this range: 1) it is sustainedfor the duration of the suppressing signal, 2) it has a relativelyhigh threshold (typically �60 dB SPL), 3) its strength is onaverage greater than the other form of low-frequency suppres-sion, becoming stronger with longer signal duration, and 4) itis often associated with excitatory responses to the low-fre-quency signals that precede the suppressive response (Natarajand Wenstrup 2006; this study). This form of suppression hasbeen observed in cochlear nuclei (Marsh et al. 2006), as well asin the IC of this species. In IC, blockade of GABAergic and/orglycinergic inhibition fails to eliminate suppression tuned �23kHz (Nataraj and Wenstrup 2006). Thus it seems clear that itsorigin is below the IC.
Although we cannot rule out mechanisms operating withinthe lower auditory brain stem, this suppression seems mostlikely to be the result of cochlear mechanisms (Marsh et al.2006; Nataraj and Wenstrup 2006). In addition to our previouscharacterizations of sound levels evoking this suppression, ofits broad low-frequency tuning, and of its association withlow-frequency excitation, this study further shows that thesuppression generally lasts for the duration of the low-fre-quency signal. Each of these properties corresponds well toproperties of two-tone suppression observed in auditory nervefibers (Arthur et al. 1971; Delgutte 1990b; Kiang and Moxon1974; Sachs and Kiang 1968), If this suppression is of cochlearorigin, it is reasonable to expect that it would be present in theresponses of all IC neurons, as it is in auditory nerve fibers(Sachs and Kiang 1968). We believe that may be the case.However, the current and previous studies have not systemat-ically documented this because of primary focus on combina-tion-sensitive inhibition in the 23- to 30-kHz range. Recordingsof auditory nerve fibers in the mustached would help to identifythe origin of these features of low-frequency responses amongneurons tuned to high BFs.
Cochlear suppression and mechanisms that generate tails ofexcitatory tuning curves to higher frequencies may be epiphe-nomenal of cochlear processing, but they can have profoundeffects on the processing of complex sounds. Indeed, Kiangand Moxon (1974) suggested that responses to complex signalsin cats are influenced by cochlear mechanics acting within thetails of high-frequency tuning curves. Delgutte (1990a) showedthat masking effects of these low-frequency signals are oftenassociated with suppressive rather than excitatory effects. Sim-ilar observations have been reported for IC neurons in themustached bat (Holmstrom et al. 2007; Sheykholeslami et al.2004). The manner in which IC neurons respond to sounds inthe tail/suppressive region is complex: tail excitation may bephasic or sustained, and it occludes the response to BF signalsat certain delays (Nataraj and Wenstrup 2006). The suppres-sion, in contrast, is nearly always sustained, lasting for theduration of the low-frequency signal. Depending on which ofthese effects predominate, significant energy in the tail regionmay shut down a neuron’s responses to BF signals or replace
178 GANS, SHEYKHOLESLAMI, PETERSON, AND WENSTRUP
J Neurophysiol • VOL 102 • JULY 2009 • www.jn.org
at Iowa S
tate Univ on M
arch 21, 2013http://jn.physiology.org/
Dow
nloaded from
them with excitatory responses to sounds in the tail region. Inthis way, high BF neurons that are tuned to the mustached bat’ssonar signal may respond in a different behavioral context,analyzing low-frequency signals with no energy near the neu-rons’ BFs.
The second type of suppressive low-frequency interaction isa form of combination sensitivity that seems to depend onneural inhibition. The suppression is tuned to frequencies in therange of 23–30 kHz, a limited band corresponding to thefrequencies of the first harmonic of the bat’s biosonar signalbut also included in many social vocalizations (Kanwal et al.1994). This study showed that suppression tuned in this rangeis typically phasic and locked to the onset of the suppressivesignal and that its strength is not consistently altered bychanges in duration or rise time of the suppressive signal.
Inhibitory combination-sensitive interactions seem to occurboth within and below the IC. Thus this form of suppression israre in cochlear nuclei (Marsh et al. 2006) but present in laterallemniscal nuclei (Portfors and Wenstrup 2001). In IC, blockadeof GABAergic and/or glycinergic inhibition generally fails toeliminate suppression tuned in the range of 23–30 kHz (Natarajand Wenstrup 2005, 2006). In intracellular recordings from ICneurons that show suppression by 23- to 30-kHz sounds, themajority (57%) do not show low frequency–evoked inhibitorypostsynaptic potentials (IPSPs) (Peterson et al. 2008). Theseresults support a conclusion that combination-sensitive inhibi-tion originates in auditory brain stem nuclei below the IC.However, GABA or glycine receptor blockade significantlyreduces combination-sensitive inhibition in some IC neurons(Nataraj and Wenstrup 2005, 2006), and the intracellular studyobserved low frequency–evoked IPSPs in 43% of combina-tion-sensitive neurons (Peterson et al. 2008). These resultssuggest that low frequency–tuned brain stem neurons project tosome high BF neurons in IC. Overall, these results are consis-tent with conclusions that 1) this neural inhibition depends oninteractions within one or more lower auditory centers, 2) theresults of those interactions are inherited by IC neurons viaexcitatory inputs, and 3) the 23- to 30-kHz inhibition isenhanced in some IC neurons by direct low-frequency inhibi-tory input. Combination-sensitive inhibition thus seems to be acomplex response property that arises through multiple, spec-tral integrative interactions in the ascending auditory pathway.
The phasic nature of this inhibition in the majority ofinhibitory combination-sensitive neurons corresponds well to apresumed function in acoustic behavior: it generates a briefsuppression of excitatory responses to an emitted sound withsignificant energy in both the 23- to 30-kHz band and ahigher-frequency band near the neuron’s BF. This occurs inbiosonar, where emitted sonar signals have substantial energyboth at the fundamental (23–30 kHz) and higher harmonics. Inechoes, the amplitude of all harmonics is reduced, but theamplitude of the fundamental may be too weak to activate thissuppression. Thus low frequency–evoked inhibition is thoughtto suppress responses to emitted sonar signals but permitssubsequent responses to returning echoes. In many cases, thislow-frequency inhibition is coupled with facilitation that per-mits a strong response only to echoes returning at particulartimes, creating neurons tuned to particularly ranges of pulse-echo delay (Nataraj and Wenstrup 2005; Olsen and Suga 1991;Portfors and Wenstrup 1999).
Although this form of low-frequency suppression is partic-ularly well documented in mustached bats in association withanalysis of sonar echoes, it clearly has a broader role inanalyzing complex sounds in this bat and in other species. Thusinhibition in spectrally distinct bands (vs. lateral inhibition)occurs in mustached bat IC neurons tuned to combinationsoutside the sonar band (Leroy and Wenstrup 2000), in mouseIC (Portfors and Felix 2005), and in cat and primate auditorycortex (Kadia and Wang 2003; Rauschecker et al. 1995; Sutteret al. 1999). These interactions contribute to analyses of abroad range of complex sounds.
A C K N O W L E D G M E N T S
We thank W. E. O’Neill for discussions that initiated this study, theAuditory Neuroscience Group at NEOUCOM for discussion and comments onthe manuscript, and C. Grose for preparation of the figures. We are grateful tothe Wildlife Section of the Ministry of Agriculture, Land and Marine Re-sources of Trinidad and Tobago for permission to exports bats.
Present address of K. Sheykholeslami: Department of Otolaryngology-Headand Neck Surgery, University Hospitals of Cleveland, Case Medical Center,Case Western Reserve University, 11100 Euclid Ave., Cleveland, OH 44106.
G R A N T S
This work was supported by National Institute on Deafness and OtherCommunication Disorders Grants R01 DC-00937 to J. J. Wenstrup and F32DC-007786 to D. C. Peterson.
R E F E R E N C E S
Aoki E, Semba R, Keino H, Kato K, Kashiwamata S. Glycine-like immu-noreactivity in the rat auditory pathway. Brain Res 442: 63–71, 1988.
Arthur RM, Pfeiffer RR, Suga N. Properties of “two-tone inhibition” inprimary auditory neurones. J Physiol 212: 593–609, 1971.
Batra R, Fitzpatrick DC. Discharge patterns of neurons in the ventral nucleusof the lateral lemniscus of the unanesthetized rabbit. J Neurophysiol 82:1097–1113, 1999.
Binns KE. The synaptic pharmacology underlying sensory processing in thesuperior colliculus. Prog Neurobiol 59: 129–159, 1999.
Carlson BA, Kawasaki M. Nonlinear response properties of combination-sensitive electrosensory neurons in the midbrain of Gymnarchus niloticus.J Neurosci 24: 8039–8048, 2004.
Clifford CWG, Ibbotson MR. Fundamental mechanisms of visual motiondetection: models, cells and functions. Prog Neurobiol 68: 409–437, 2003.
Covey E, Casseday JH. The monaural nuclei of the lateral lemniscus in anecholocating bat: parallel pathways for analyzing temporal features ofsound. J Neurosci 11: 3456–3470, 1991.
deCharms RC, Blake DT, Merzenich MM. Optimizing sound features forcortical neurons. Science 280: 1439–1443, 1998.
Delgutte B. Physiological mechanisms of psychophysical masking: observa-tions from auditory-nerve fibers. J Acoust Soc Am 87: 791–809, 1990a.
Delgutte B. Two-tone rate suppression in auditory-nerve fibers: dependence onsuppressor frequency and level. Hear Res 49: 225–246, 1990b.
Esser KH, Condon CJ, Suga N, Kanwal JS. Syntax processing by auditorycortical neurons in the FM-FM area of the mustached bat Pteronotusparnellii. Proc Natl Acad Sci USA 94: 14019–14024, 1997.
Fuzessery ZM, Feng AS. Mating call selectivity in the thalamus and midbrainof the leopard frog (Rana p. pipiens): single and multiunit analyses. J CompPhysiol [A] 150: 333–344, 1983.
Goldberg JM, Brown PB. Response of binaural neurons of dog superiorolivary complex to dichotic tonal stimuli: some physiological mechanismsof sound localization. J Neurophysiol 32: 613–636, 1969.
Grothe B. Interaction of excitation and inhibition in processing of pure toneand amplitude-modulated stimuli in the medial superior olive of the mus-tached bat. J Neurophysiol 71: 706–721, 1994.
Haplea S, Covey E, Casseday JH. Frequency tuning and response latenciesat three levels in the brainstem of the echolocating bat, Eptesicus fuscus.J Comp Physiol [A] 174: 671–683, 1994.
Holmstrom L, Roberts PD, Portfors CV. Responses to social vocalizations in theinferior colliculus of the mustached bat are influenced by secondary tuning curves.J Neurophysiol 98: 3461–3472, 2007.
179TEMPORAL FEATURES OF SPECTRAL INTEGRATION IN MIDBRAIN
J Neurophysiol • VOL 102 • JULY 2009 • www.jn.org
at Iowa S
tate Univ on M
arch 21, 2013http://jn.physiology.org/
Dow
nloaded from
Joris PX, Carney LH, Smith PH, Yin TC. Enhancement of neural synchro-nization in the anteroventral cochlear nucleus. I. Responses to tones at thecharacteristic frequency. J Neurophysiol 71: 1022–1036, 1994.
Kadia SC, Wang X. Spectral integration in A1 of awake primates: neuronswith single- and multipeaked tuning characteristics. J Neurophysiol 89:1603–1622, 2003.
Kanwal JS, Matsumura S, Ohlemiller K, Suga N. Analysis of acousticelements and syntax in communication sounds emitted by mustached bats.J Acoust Soc Am 96: 1229–1254, 1994.
Kiang NY, Moxon EC. Tails of tuning curves of auditory-nerve fibers. JAcoust Soc Am 55: 620–630, 1974.
Kida H, Shimegi S, Sato H. Similarity of direction tuning among responsesto stimulation of different whiskers in neurons of rat barrel cortex. J Neu-rophysiol 94: 2004–2018, 2005.
Kuba H, Koyano K, Ohmori H. Development of membrane conductanceimproves coincidence detection in the nucleus laminaris of the chicken.J Physiol 540: 529–542, 2002.
Leroy SA, Wenstrup JJ. Spectral integration in the inferior colliculus of themustached bat. J Neurosci 20: 8533–8541, 2000.
Machens CK, Wehr MS, Zador AM. Linearity of cortical receptive fieldsmeasured with natural sounds. J Neurosci 24: 1089–1100, 2004.
Margoliash D, Fortune ES. Temporal and harmonic combination-sensitiveneurons in the zebra finch’s HVc. J Neurosci 12: 4309–4326, 1992.
Marsh RA, Nataraj K, Gans D, Portfors CV, Wenstrup JJ. Auditoryresponses in the cochlear nucleus of awake mustached bats: precursors tospectral integration in the auditory midbrain. J Neurophysiol 95: 88–105,2006.
Metzner W, Radtke-Schuller S. The nuclei of the lateral lemniscus in therufous horseshoe bat, Rhinolophus rouxi. A neurophysiological approach.J Comp Physiol [A] 160: 395–411, 1987.
Mittmann DH, Wenstrup JJ. Combination-sensitive neurons in the inferiorcolliculus. Hear Res 90: 185–191, 1995.
Nataraj K, Wenstrup JJ. Roles of inhibition in creating complex auditoryresponses in the inferior colliculus: facilitated combination-sensitive neu-rons. J Neurophysiol 93: 3294–3312, 2005.
Nataraj K, Wenstrup JJ. Roles of inhibition in complex auditory responsesin the inferior colliculus: inhibited combination-sensitive neurons. J Neuro-physiol 95: 2179–2192, 2006.
Ohlemiller KK, Kanwal JS, Suga N. Facilitative responses to species-specific calls in cortical FM-FM neurons of the mustached bat. Neuroreport7: 1749–1755, 1996.
Olsen JF, Suga N. Combination-sensitive neurons in the medial geniculatebody of the mustached bat: encoding of target range information. J Neuro-physiol 65: 1275–1296, 1991.
O’Neill WE. Responses to pure tones and linear FM components of theCF-FM biosonar signal by single units in the inferior colliculus of themustached bat. J Comp Physiol [A] 157: 797–815, 1985.
O’Neill WE, Suga N. Target range-sensitive neurons in the auditory cortex ofthe mustache bat. Science 203: 69–73, 1979.
O’Neill WE, Suga N. Encoding of target range and its representation in theauditory cortex of the mustached bat. J Neurosci 2: 17–31, 1982.
Pecka M, Brand A, Behrend O, Grothe B. Interaural time differenceprocessing in the mammalian medial superior olive: the role of glycinergicinhibition. J Neurosci 28: 6914–6925, 2008.
Peterson DC, Voytenko S, Gans D, Galazyuk A, Wenstrup J. Intracellularrecordings from combination-sensitive neurons in the inferior colliculus.J Neurophysiol 100: 629–645, 2008.
Portfors CV, Felix RA II. Spectral integration in the inferior colliculus of theCBA/CaJ mouse. J Neurosci 136: 1159–1170, 2005.
Portfors CV, Wenstrup JJ. Delay-tuned neurons in the inferior colliculus ofthe mustached bat: implications for analyses of target distance. J Neuro-physiol 82: 1326–1338, 1999.
Portfors CV, Wenstrup JJ. Responses to combinations of tones in the nucleiof the lateral lemniscus. J Assoc Res Otolaryngol 2: 104–117, 2001.
Portfors CV, Wenstrup JJ. Excitatory and facilitatory frequency responseareas in the inferior colliculus of the mustached bat. Hear Res 168: 131–138,2002.
Rauschecker JP, Tian B, Hauser M. Processing of complex sounds in themacaque nonprimary auditory cortex. Science 268: 111–114, 1995.
Ruggero MA, Robles L, Rich NC. Two-tone suppression in the basilarmembrane of the cochlea: mechanical basis of auditory-nerve suppression.J Neurophysiol 68: 1087–1099, 1992.
Sachs MB, Kiang NY. Two-tone inhibition in auditory-nerve fibers. J AcoustSoc Am 43: 1120–1128, 1968.
Saint Marie RL, Shneiderman A, Stanforth DA. Patterns of gamma-aminobutyric acid and glycine immunoreactivities reflect structural andfunctional differences of the cat lateral lemniscal nuclei. J Comp Neurol389: 264–276, 1997.
Sanchez JT, Gans D, Wenstrup JJ. Glycinergic “inhibition” mediates selec-tive excitatory response to combinations of sounds. J Neurosci 28: 80–90,2008.
Scott LL, Mathews PJ, Golding NL. Posthearing developmental refinementof temporal processing in principal neurons of the medial superior olive.J Neurosci 25: 7887–7895, 2005.
Sen K, Theunissen FE, Doupe AJ. Feature analysis of natural sounds in thesongbird auditory forebrain J Neurophysiol 86: 1445–1458, 2001.
Sheykholeslami K, Gans D, Portfors C, Wenstrup J. Representation ofspecies-specific vocalizations in the inferior colliculus of the mustached bat.Soc Neurosci Abstr 30: 305.12, 2004.
Shofner WP, Young ED. Excitatory/inhibitory response types in the cochlearnucleus: relationships to discharge patterns and responses to electricalstimulation of the auditory nerve. J Neurophysiol 54: 917–939, 1985.
Suga N. Basic acoustic patterns and neural mechanisms shared by humans andanimals for auditory perception: a neuroethologists’s view. In: AuditoryBasis of Speech Perception, edited by Ainsworth WA and Greenberg S.Staffordshire, UK: Keele University, 1996, p. 31–38.
Suga N, O’Neill WE, Manabe T. Cortical neurons sensitive to combinationsof information-bearing elements of biosonar signals in the mustache bat.Science 200: 778–781, 1978.
Suga N, O’Neill WE, Manabe T. Harmonic-sensitive neurons in the auditorycortex of the mustache bat. Science 203: 270–274, 1979.
Sussman HM, Fruchter D, Hilbert J, Sirosh J. Linear correlates in thespeech signal: the orderly output constraint. Behav Brain Sci 21: 241–259,1998.
Sutter ML, Schreiner CE, McLean M, O’Connor KN, Loftus WC. Orga-nization of inhibitory frequency receptive fields in cat primary auditorycortex. J Neurophysiol 82: 2358–2371, 1999.
Svirskis G, Kotak V, Sanes DH, Rinzel J. Sodium along with low-thresholdpotassium currents enhance coincidence detection of subthreshold noisysignals in MSO neurons. J Neurophysiol 91: 2465–2473, 2004.
Temchin AN, Rich NC, Ruggero MA. Low-frequency suppression of audi-tory nerve responses to characteristic frequency tones. Hear Res 113:29–56, 1997.
Theunissen FE, Sen K, Doupe AJ. Spectral-temporal receptive fields ofnonlinear auditory neurons obtained using natural sounds. J Neurosci 20:2315–2331, 2000.
Vater M, Covey E, Casseday JH. The columnar region of the ventral nucleusof the lateral lemniscus in the big brown bat (Eptesicus fuscus): synapticarrangements and structural correlates of feedforward inhibitory function.Cell Tissue Res 289: 223–233, 1997.
Voytenko SV, Galazyuk AV. Intracellular recording reveals temporal inte-gration in inferior colliculus neurons of awake bats. J Neurophysiol 97:1368–1378, 2007.
Wenstrup J, Leroy SA. Spectral integration in the inferior colliculus: role ofglycinergic inhibition in response facilitation. J Neurosci 21: RC124, 2001.
Wenstrup JJ, Mittmann DH, Grose CD. Inputs to combination-sensitiveneurons of the inferior colliculus. J Comp Neurol 409: 509–528, 1999.
Winer JA, Larue DT, Pollak GD. GABA and glycine in the central auditorysystem of the mustache bat: structural substrates for inhibitory neuronalorganization. J Comp Neurol 355: 317–353, 1995.
Xie R, Gittelman JX, Pollak GD. Rethinking tuning: in vivo whole-cellrecordings of the inferior colliculus in awake bats. J Neurosci 27: 9469–9481, 2007.
Yavuzoglu A, Wenstrup J. Glycinergic inputs to facilitated combination-sensitive neurons in inferior colliculus of mustached bat. Assoc Res Otolar-yngol Abstr 31: 107, 2008.
Yin TC, Chan JC. Interaural time sensitivity in medial superior olive of cat.J Neurophysiol 64: 465–488, 1990.
Yoshida I, Mori K. Odorant category profile selectivity of olfactory cortexneurons. J Neurosci 27: 9105–9114, 2007.
Young ED, Brownell WE. Responses to tones and noise of single cells indorsal cochlear nucleus of unanesthetized cats. J Neurophysiol 39: 282–300,1976.
Zhang H, Kelly JB. Responses of neurons in the rat’s ventral nucleus of thelateral lemniscus to monaural and binaural tone bursts. J Neurophysiol 95:2501–2512, 2006.
180 GANS, SHEYKHOLESLAMI, PETERSON, AND WENSTRUP
J Neurophysiol • VOL 102 • JULY 2009 • www.jn.org
at Iowa S
tate Univ on M
arch 21, 2013http://jn.physiology.org/
Dow
nloaded from
Copyright © 2022 FDOKUMEN