Frequency discrimination and stimulus deviance in the inferior colliculus and cochlear nucleus
19
ORIGINAL RESEARCH ARTICLE published: 14 January 2013 doi: 10.3389/fncir.2012.00119 Frequency discrimination and stimulus deviance in the inferior colliculus and cochlear nucleus Yaneri A. Ayala 1 , David Pérez-González 1 , Daniel Duque 1 , Israel Nelken 2 and Manuel S. Malmierca 1,3 * 1 Auditory Neurophysiology Laboratory, Institute of Neuroscience of Castilla y León, University of Salamanca, Salamanca, Spain 2 Department of Neurobiology, Institute of Life Sciences, The Interdisciplinary Center for Neural Computation and the Edmond and Lily Safra Center for Brain Sciences, The Hebrew University of Jerusalem, Jerusalem, Israel 3 Department of Cell Biology and Pathology, Faculty of Medicine, University of Salamanca, Salamanca, Spain Edited by: Eric D. Young, Johns Hopkins University, USA Reviewed by: Sarah L. Pallas, Georgia State University, USA Edward L. Bartlett, Purdue University, USA *Correspondence: Manuel S. Malmierca, Laboratory for the Neurobiology of Hearing, Auditory Neurophysiology Unit (Lab 1), Institute of Neuroscience of Castilla y León, University of Salamanca, C/ Pintor Fernando Gallego 1, 37007 Salamanca, Spain. e-mail: [email protected] Auditory neurons that exhibit stimulus-specific adaptation (SSA) decrease their response to common tones while retaining responsiveness to rare ones. We recorded single-unit responses from the inferior colliculus (IC) where SSA is known to occur and we explored for the first time SSA in the cochlear nucleus (CN) of rats. We assessed an important functional outcome of SSA, the extent to which frequency discriminability depends on sensory context. For this purpose, pure tones were presented in an oddball sequence as standard (high probability of occurrence) or deviant (low probability of occurrence) stimuli. To study frequency discriminability under different probability contexts, we varied the probability of occurrence and the frequency separation between tones. The neuronal sensitivity was estimated in terms of spike-count probability using signal detection theory. We reproduced the finding that many neurons in the IC exhibited SSA, but we did not observe significant SSA in our CN sample. We concluded that strong SSA is not a ubiquitous phenomenon in the CN. As predicted, frequency discriminability was enhanced in IC when stimuli were presented in an oddball context, and this enhancement was correlated with the degree of SSA shown by the neurons. In contrast, frequency discrimination by CN neurons was independent of stimulus context. Our results demonstrated that SSA is not widespread along the entire auditory pathway, and suggest that SSA increases frequency discriminability of single neurons beyond that expected from their tuning curves. Keywords: SSA, deviant sensitivity, change detection, mismatch negativity, non-lemniscal pathway, ROC analysis INTRODUCTION Auditory neurons displaying stimulus-specific adaptation (SSA) decrease their response to high probability stimuli (stan- dards) while maintaining responsiveness to rare ones (deviants, Ulanovsky et al., 2003). SSA is correlated with behavioral habit- uation (Netser et al., 2011; Gutfreund, 2012) and it has been proposed to underlie sensory memory for stimulation history (Ulanovsky et al., 2004). Neurons showing SSA have been found in the mammalian auditory pathway from the inferior collicu- lus (IC) up to the cortex (Ulanovsky et al., 2003; Pérez-González et al., 2005; Anderson et al., 2009; Malmierca et al., 2009; von der Behrens et al., 2009; Yu et al., 2009; Antunes et al., 2010; Lumani and Zhang, 2010; Reches et al., 2010; Taaseh et al., 2011; Zhao et al., 2011; Ayala and Malmierca, 2012; Duque et al., 2012; Anderson and Malmierca, 2013) as well as in bird midbrain and forebrain (Reches and Gutfreund, 2008, 2009). Originally, SSA was suggested to emerge in the auditory cortex and to be trans- mitted downstream to subcortical nuclei through the corticofugal pathway (Nelken and Ulanovsky, 2007), as subcortical SSA is mostly confined to the non-lemniscal regions (Malmierca et al., 2009; Antunes et al., 2010; Duque et al., 2012), the main tar- get of the corticofugal projections (Malmierca and Ryugo, 2011). However, it has been recently shown that cortical deactivation does not affect SSA neither in the non-lemniscal auditory tha- lamus (Antunes and Malmierca, 2011) nor in the IC (Anderson and Malmierca, 2013), while SSA in lemniscal regions is minimal (Malmierca et al., 2009; Antunes et al., 2010; Bäuerle et al., 2011). Thus, SSA may be computed independently in the non-lemniscal pathway and in primary auditory cortex. Thus far, the existence of SSA has not been explored in auditory nuclei below the IC, where the lemniscal and non-lemniscal divisions first emerge. Frequency discrimination has been widely explored in psy- choacoustics (Nelson and Kiester, 1978; Sinnott et al., 1985; Syka et al., 1996; Talwar and Gerstein, 1998, 1999; Shofner, 2000; Witte and Kipke, 2005; Walker et al., 2009), but few studies tested the detection of frequency deviants by single neurons (Ulanovsky et al., 2003; Malmierca et al., 2009; von der Behrens et al., 2009). SSA has already been shown to result in a change in frequency discrimination performance by single neurons (Ulanovsky et al., 2003; Malmierca et al., 2009) but this relationship has not been thoroughly explored. The main goal of our study is to compare the relationships between frequency discrimination and SSA in two neuronal pop- ulations; one at the IC that it is already known to exhibit SSA Frontiers in Neural Circuits www.frontiersin.org January 2013 | Volume 6 | Article 119 | 1 NEURAL CIRCUITS
-
Upload
independent -
Category
Documents
-
view
0 -
download
0
Transcript of Frequency discrimination and stimulus deviance in the inferior colliculus and cochlear nucleus
ORIGINAL RESEARCH ARTICLEpublished: 14 January 2013
doi: 10.3389/fncir.2012.00119
Frequency discrimination and stimulus deviance in theinferior colliculus and cochlear nucleusYaneri A. Ayala1, David Pérez-González1, Daniel Duque1, Israel Nelken 2 and Manuel S. Malmierca1,3*
1 Auditory Neurophysiology Laboratory, Institute of Neuroscience of Castilla y León, University of Salamanca, Salamanca, Spain2 Department of Neurobiology, Institute of Life Sciences, The Interdisciplinary Center for Neural Computation and the Edmond and Lily Safra Center for Brain
Sciences, The Hebrew University of Jerusalem, Jerusalem, Israel3 Department of Cell Biology and Pathology, Faculty of Medicine, University of Salamanca, Salamanca, Spain
Edited by:
Eric D. Young, Johns HopkinsUniversity, USA
Reviewed by:
Sarah L. Pallas, Georgia StateUniversity, USAEdward L. Bartlett, PurdueUniversity, USA
*Correspondence:
Manuel S. Malmierca, Laboratory forthe Neurobiology of Hearing,Auditory Neurophysiology Unit(Lab 1), Institute of Neuroscience ofCastilla y León, University ofSalamanca, C/ Pintor FernandoGallego 1, 37007 Salamanca, Spain.e-mail: [email protected]
Auditory neurons that exhibit stimulus-specific adaptation (SSA) decrease their responseto common tones while retaining responsiveness to rare ones. We recorded single-unitresponses from the inferior colliculus (IC) where SSA is known to occur and we exploredfor the first time SSA in the cochlear nucleus (CN) of rats. We assessed an importantfunctional outcome of SSA, the extent to which frequency discriminability depends onsensory context. For this purpose, pure tones were presented in an oddball sequenceas standard (high probability of occurrence) or deviant (low probability of occurrence)stimuli. To study frequency discriminability under different probability contexts, we variedthe probability of occurrence and the frequency separation between tones. The neuronalsensitivity was estimated in terms of spike-count probability using signal detectiontheory. We reproduced the finding that many neurons in the IC exhibited SSA, butwe did not observe significant SSA in our CN sample. We concluded that strong SSAis not a ubiquitous phenomenon in the CN. As predicted, frequency discriminabilitywas enhanced in IC when stimuli were presented in an oddball context, and thisenhancement was correlated with the degree of SSA shown by the neurons. In contrast,frequency discrimination by CN neurons was independent of stimulus context. Our resultsdemonstrated that SSA is not widespread along the entire auditory pathway, and suggestthat SSA increases frequency discriminability of single neurons beyond that expected fromtheir tuning curves.
Keywords: SSA, deviant sensitivity, change detection, mismatch negativity, non-lemniscal pathway, ROC analysis
INTRODUCTIONAuditory neurons displaying stimulus-specific adaptation (SSA)decrease their response to high probability stimuli (stan-dards) while maintaining responsiveness to rare ones (deviants,Ulanovsky et al., 2003). SSA is correlated with behavioral habit-uation (Netser et al., 2011; Gutfreund, 2012) and it has beenproposed to underlie sensory memory for stimulation history(Ulanovsky et al., 2004). Neurons showing SSA have been foundin the mammalian auditory pathway from the inferior collicu-lus (IC) up to the cortex (Ulanovsky et al., 2003; Pérez-Gonzálezet al., 2005; Anderson et al., 2009; Malmierca et al., 2009; vonder Behrens et al., 2009; Yu et al., 2009; Antunes et al., 2010;Lumani and Zhang, 2010; Reches et al., 2010; Taaseh et al., 2011;Zhao et al., 2011; Ayala and Malmierca, 2012; Duque et al., 2012;Anderson and Malmierca, 2013) as well as in bird midbrain andforebrain (Reches and Gutfreund, 2008, 2009). Originally, SSAwas suggested to emerge in the auditory cortex and to be trans-mitted downstream to subcortical nuclei through the corticofugalpathway (Nelken and Ulanovsky, 2007), as subcortical SSA ismostly confined to the non-lemniscal regions (Malmierca et al.,2009; Antunes et al., 2010; Duque et al., 2012), the main tar-get of the corticofugal projections (Malmierca and Ryugo, 2011).
However, it has been recently shown that cortical deactivationdoes not affect SSA neither in the non-lemniscal auditory tha-lamus (Antunes and Malmierca, 2011) nor in the IC (Andersonand Malmierca, 2013), while SSA in lemniscal regions is minimal(Malmierca et al., 2009; Antunes et al., 2010; Bäuerle et al., 2011).Thus, SSA may be computed independently in the non-lemniscalpathway and in primary auditory cortex. Thus far, the existence ofSSA has not been explored in auditory nuclei below the IC, wherethe lemniscal and non-lemniscal divisions first emerge.
Frequency discrimination has been widely explored in psy-choacoustics (Nelson and Kiester, 1978; Sinnott et al., 1985; Sykaet al., 1996; Talwar and Gerstein, 1998, 1999; Shofner, 2000; Witteand Kipke, 2005; Walker et al., 2009), but few studies tested thedetection of frequency deviants by single neurons (Ulanovskyet al., 2003; Malmierca et al., 2009; von der Behrens et al., 2009).SSA has already been shown to result in a change in frequencydiscrimination performance by single neurons (Ulanovsky et al.,2003; Malmierca et al., 2009) but this relationship has not beenthoroughly explored.
The main goal of our study is to compare the relationshipsbetween frequency discrimination and SSA in two neuronal pop-ulations; one at the IC that it is already known to exhibit SSA
Frontiers in Neural Circuits www.frontiersin.org January 2013 | Volume 6 | Article 119 | 1
NEURAL CIRCUITS
Ayala et al. Frequency discrimination and stimulus deviance
and the other at a lower auditory structure, the cochlear nucleus(CN) where SSA has not been explored thus far. For this purposewe assessed whether the probabilistic context affects frequencydiscrimination as judged by signal detection theory (Green andSwets, 1966) based on distributions of spike counts, and to whatextent changes in frequency discriminability reflect the degree ofSSA in these two stations. We show that SSA and the enhancementin neurometric frequency discrimination in the IC are stronglycorrelated and that both depend on the frequency separationand deviant probability in similar ways. Our results also demon-strated that SSA and context-dependent neuronal sensitivity arenot present in CN supporting the hypothesis that SSA first emergein non-lemniscal IC.
MATERIALS AND METHODSSURGICAL PROCEDURESExperiments were performed on 71 adult female rats (Rattusnorvergicus, Rj: Long–Evans) with body weights between 160and 270 g. All experimental procedures were carried out at theUniversity of Salamanca with the approval of, and using meth-ods conforming to the standards of, the University of SalamancaAnimal Care Committee. Anesthesia was induced (1.5 g/kg, i.p.,20% solution) and maintained (0.5 g/kg, i.p. given as needed)with urethane. Urethane was chosen as an anesthetic because ofits effects on multiple aspects of neural activity, including inhi-bition and spontaneous firing, are known to be less than thoseof barbiturates and other anesthetic drugs (Hara and Harris,2002). The respiration was maintained artificially (SAR-830/PVentilator) monitoring the end-tidal CO2 level (CapStar-100).For this purpose, the trachea was cannulated and atropine sulfate(0.05 mg/kg, s.c.) was administered to reduce bronchial secre-tions. Body temperature was maintained at 38 ± 1◦C by meansof a heating blanket. Details of surgical procedures have beendescribed previously (Hernández et al., 2005; Pérez-Gonzálezet al., 2005; Malmierca et al., 2009; Antunes et al., 2010). The ani-mal was placed inside a sound-attenuated room in a stereotaxicframe in which the ear bars were replaced by a hollow speculumthat accommodated a sound delivery system.
ACOUSTIC STIMULI AND ELECTROPHYSIOLOGICAL RECORDINGExtracellular single unit responses were recorded from neuronsin the IC and CN in two separate sets of experiments. For theIC recordings, a craniotomy was performed to expose the cere-bral cortex overlying the IC and a tungsten electrode (1 – 2 M�)(Merrill and Ainsworth, 1972) was lowered through the cortexby means of a piezoelectric microdrive (Burleigh 6000 ULN).Neuron identification in the IC was based on stereotaxic coordi-nates, physiological criteria of tonotopicity, and response prop-erties (Rees et al., 1997; LeBeau et al., 2001; Malmierca et al.,2003; Hernández et al., 2005; Pérez-González et al., 2005, 2006).An electrode dorsoventral penetration (with an angle of 20◦ fromthe frontal plane) through the central nucleus of the IC is iden-tified by the stepwise progression from low to high frequencies(Malmierca et al., 2008) and by the constant presence of ton-ically firing units (Rees et al., 1997). Typical responses of theneurons in the cortices of the IC (i.e., dorsal, lateral, and rostral)are characterized by longer response latencies, predominantly
on-phasic firing patterns and weaker tonic firing than thosefrom the central nucleus. Cortical IC neurons commonly dis-play broadly tuned, W-shaped, or other complex tuning curves(Lumani and Zhang, 2010; Geis et al., 2011; Duque et al., 2012)and a clear topographic organization of the frequencies alongthe dorsal cortex is not present (Malmierca et al., 2008; Lumaniand Zhang, 2010). For the recording of CN neurons, part of thecerebellum was carefully aspirated to visually localize the dorsalcochlear nucleus (DCN). Glass micropipettes filled with 2 M NaCl(15 – 25 M�) or tungsten electrodes (1 – 2 M�) were advancedinto the DCN. For some IC experiments and most of the CNrecordings, an electrolytic lesion (10 – 15 μA for 10 – 15 s) wasapplied for subsequent histological verification of the recordingsite. Brains were fixed using a mixture of 1% paraformaldehydeand 1% glutaraldehyde diluted in 0.4 M phosphate buffer saline(0.5% NaNO3 in PBS). After fixation, tissue was cryoprotectedin 30% sucrose and sectioned in the coronal or sagital planeat a thickness of 40 μm on a freezing microtome. Slices wereNissl stained with 0.1% cresyl violet to facilitate identificationof cytoarchitectural boundaries. The CN units were assigned toone of the two main divisions (dorsal or ventral) of the nucleususing as reference the standard sections from a rat brain atlas(Paxinos and Watson, 2007).
Acoustic stimuli were delivered through a sealed acousticsystem (Rees, 1990; Rees et al., 1997) using two electrostaticloudspeakers (TDT-EC1) driven by two TDT-ED1 modules.Search stimuli were pure tones or noise bursts monaurallydelivered under computer control using TDT System 2 hard-ware (Tucker-Davis Technologies) and custom software (Faureet al., 2003; Pérez-González et al., 2005, 2006; Malmierca et al.,2008). The output of the system at each ear was calibratedin situ using a ¼ inch condenser microphone (Brüel and Kjær4136, Nærum, Denmark) and a DI-2200 spectrum analyzer(Diagnostic Instruments Ltd., Livingston, Scotland, UK). Themaximum output of the TDT system was flat from 0.3 to 5 kHz(∼100 ± 7 dB SPL) and from 5 to 40 kHz (90 ± 5 dB SPL).The highest frequency produced by this system was limited to40 kHz. The second and third harmonic components in the sig-nal were 40 dB or more below the level of the fundamental atthe highest output level (Hernández et al., 2005; Malmierca et al.,2009).
Action potentials were recorded with a BIOAMP amplifier(TDT), the 10× output of which was further amplified andbandpass-filtered (TDT PC1; fc: 0.5 – 3 kHz) before passingthrough a spike discriminator (TDT SD1). Spike times werelogged at one microsecond resolution on a computer by feedingthe output of the spike discriminator into an event timer (TDTET1) synchronized to a timing generator (TDT TG6). Stimulusgeneration and on-line data visualization were controlled withcustom software. Spike times were displayed as dot rasters sortedby the acoustic parameter varied during testing.
Once a neuron was isolated, the monoaural frequencyresponse area (FRA), i.e., the combination of frequencies andintensities capable of evoking a response, was obtained by anautomated procedure with 5 stimulus repetitions at each fre-quency (from 0.5 to 40 kHz, in 20 – 30 logarithmic steps) andintensity step (steps of 10 dB) presented randomly at a repetition
Frontiers in Neural Circuits www.frontiersin.org January 2013 | Volume 6 | Article 119 | 2
Ayala et al. Frequency discrimination and stimulus deviance
rate of 4 Hz. The stimuli used to generate the tuning curves werepure tones with duration of 75 ms. The neuronal response tothe combination of frequencies and intensities was plotted usingMATLAB software (Mathworks, Inc.) and the best frequency (BF)and threshold for each neuron were identified.
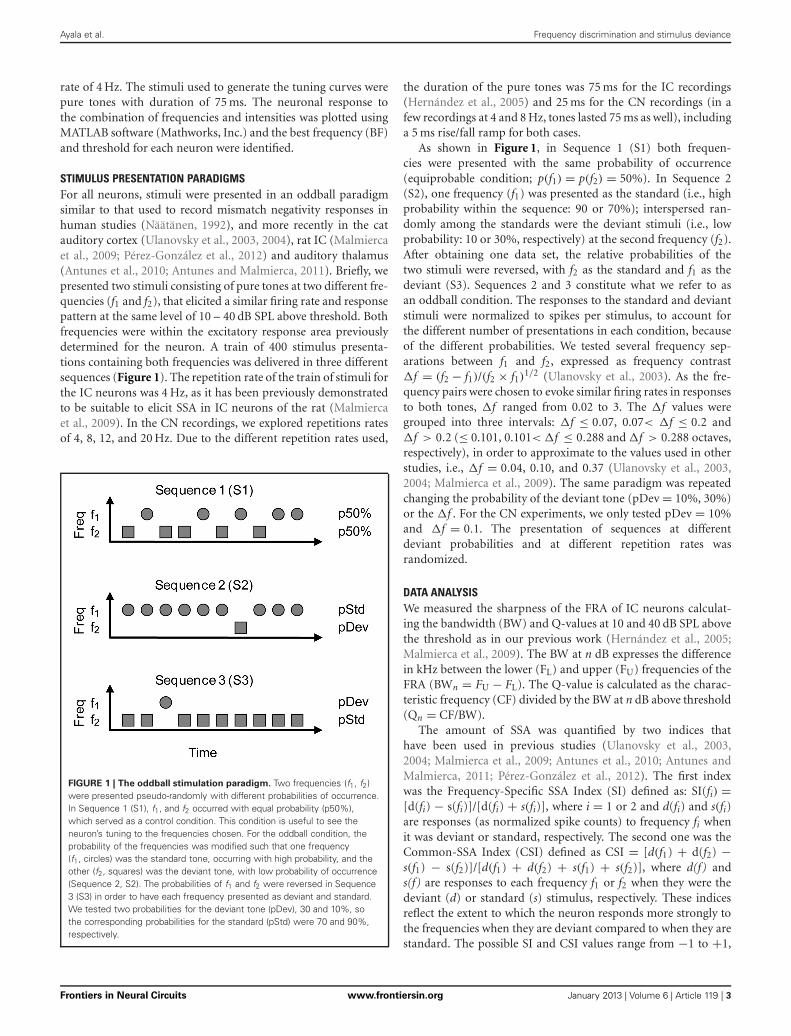
STIMULUS PRESENTATION PARADIGMSFor all neurons, stimuli were presented in an oddball paradigmsimilar to that used to record mismatch negativity responses inhuman studies (Näätänen, 1992), and more recently in the catauditory cortex (Ulanovsky et al., 2003, 2004), rat IC (Malmiercaet al., 2009; Pérez-González et al., 2012) and auditory thalamus(Antunes et al., 2010; Antunes and Malmierca, 2011). Briefly, wepresented two stimuli consisting of pure tones at two different fre-quencies (f1 and f2), that elicited a similar firing rate and responsepattern at the same level of 10 – 40 dB SPL above threshold. Bothfrequencies were within the excitatory response area previouslydetermined for the neuron. A train of 400 stimulus presenta-tions containing both frequencies was delivered in three differentsequences (Figure 1). The repetition rate of the train of stimuli forthe IC neurons was 4 Hz, as it has been previously demonstratedto be suitable to elicit SSA in IC neurons of the rat (Malmiercaet al., 2009). In the CN recordings, we explored repetitions ratesof 4, 8, 12, and 20 Hz. Due to the different repetition rates used,
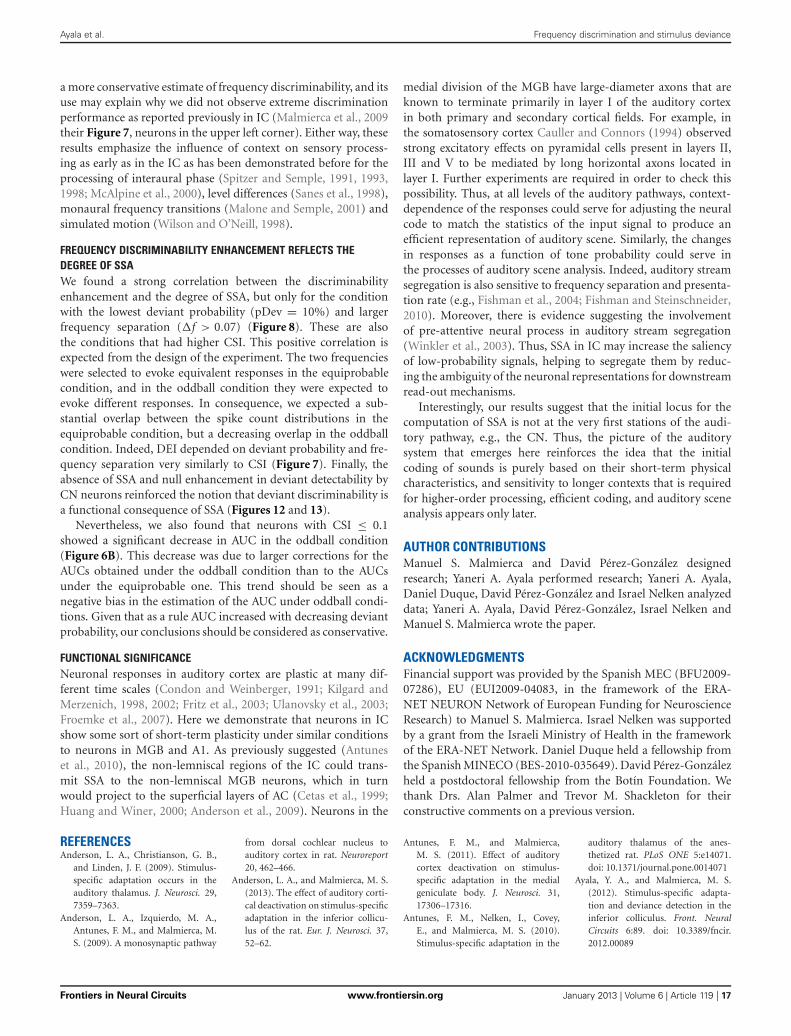
FIGURE 1 | The oddball stimulation paradigm. Two frequencies (f1, f2)were presented pseudo-randomly with different probabilities of occurrence.In Sequence 1 (S1), f1, and f2 occurred with equal probability (p50%),which served as a control condition. This condition is useful to see theneuron’s tuning to the frequencies chosen. For the oddball condition, theprobability of the frequencies was modified such that one frequency(f1, circles) was the standard tone, occurring with high probability, and theother (f2, squares) was the deviant tone, with low probability of occurrence(Sequence 2, S2). The probabilities of f1 and f2 were reversed in Sequence3 (S3) in order to have each frequency presented as deviant and standard.We tested two probabilities for the deviant tone (pDev), 30 and 10%, sothe corresponding probabilities for the standard (pStd) were 70 and 90%,respectively.
the duration of the pure tones was 75 ms for the IC recordings(Hernández et al., 2005) and 25 ms for the CN recordings (in afew recordings at 4 and 8 Hz, tones lasted 75 ms as well), includinga 5 ms rise/fall ramp for both cases.
As shown in Figure 1, in Sequence 1 (S1) both frequen-cies were presented with the same probability of occurrence(equiprobable condition; p(f1) = p(f2) = 50%). In Sequence 2(S2), one frequency (f1) was presented as the standard (i.e., highprobability within the sequence: 90 or 70%); interspersed ran-domly among the standards were the deviant stimuli (i.e., lowprobability: 10 or 30%, respectively) at the second frequency (f2).After obtaining one data set, the relative probabilities of thetwo stimuli were reversed, with f2 as the standard and f1 as thedeviant (S3). Sequences 2 and 3 constitute what we refer to asan oddball condition. The responses to the standard and deviantstimuli were normalized to spikes per stimulus, to account forthe different number of presentations in each condition, becauseof the different probabilities. We tested several frequency sep-arations between f1 and f2, expressed as frequency contrast�f = (f2 − f1)/(f2 × f1)1/2 (Ulanovsky et al., 2003). As the fre-quency pairs were chosen to evoke similar firing rates in responsesto both tones, �f ranged from 0.02 to 3. The �f values weregrouped into three intervals: �f ≤ 0.07, 0.07< �f ≤ 0.2 and�f > 0.2 (≤ 0.101, 0.101< �f ≤ 0.288 and �f > 0.288 octaves,respectively), in order to approximate to the values used in otherstudies, i.e., �f = 0.04, 0.10, and 0.37 (Ulanovsky et al., 2003,2004; Malmierca et al., 2009). The same paradigm was repeatedchanging the probability of the deviant tone (pDev = 10%, 30%)or the �f . For the CN experiments, we only tested pDev = 10%and �f = 0.1. The presentation of sequences at differentdeviant probabilities and at different repetition rates wasrandomized.
DATA ANALYSISWe measured the sharpness of the FRA of IC neurons calculat-ing the bandwidth (BW) and Q-values at 10 and 40 dB SPL abovethe threshold as in our previous work (Hernández et al., 2005;Malmierca et al., 2009). The BW at n dB expresses the differencein kHz between the lower (FL) and upper (FU) frequencies of theFRA (BWn = FU − FL). The Q-value is calculated as the charac-teristic frequency (CF) divided by the BW at n dB above threshold(Qn = CF/BW).
The amount of SSA was quantified by two indices thathave been used in previous studies (Ulanovsky et al., 2003,2004; Malmierca et al., 2009; Antunes et al., 2010; Antunes andMalmierca, 2011; Pérez-González et al., 2012). The first indexwas the Frequency-Specific SSA Index (SI) defined as: SI(fi) =[d(fi) − s(fi)]/[d(fi) + s(fi)], where i = 1 or 2 and d(fi) and s(fi)are responses (as normalized spike counts) to frequency fi whenit was deviant or standard, respectively. The second one was theCommon-SSA Index (CSI) defined as CSI = [d(f1) + d(f2) −s(f1) − s(f2)]/[d(f1) + d(f2) + s(f1) + s(f2)], where d(f) ands(f) are responses to each frequency f1 or f2 when they were thedeviant (d) or standard (s) stimulus, respectively. These indicesreflect the extent to which the neuron responds more strongly tothe frequencies when they are deviant compared to when they arestandard. The possible SI and CSI values range from −1 to +1,
Frontiers in Neural Circuits www.frontiersin.org January 2013 | Volume 6 | Article 119 | 3

Ayala et al. Frequency discrimination and stimulus deviance
being positive if the response to the deviant stimulus is greaterand negative if the response to the standard stimulus is greater.
To estimate the neuronal sensitivity we performed a receiveroperating characteristic (ROC) analysis (Tanner and Swets, 1954;Cohn et al., 1975; Fawcett, 2006; for a review of the use of ROCin psychometric and neurometric data analysis, see Stüttgen et al.,2011). This analysis has been previously used to measure the abil-ity of CN units to signal changes in intensity (Shofner and Dye,1989) and the sensitivity of IC units to interaural-time differencesand binaural correlation (Skottun et al., 2001; Shackleton et al.,2003, 2005; Gordon et al., 2008). It is assumed that when differentstimuli elicit different firing rates the response of a neuron pro-vides the basis for discriminating between them. However, thereis also a substantial variability in the responses to each stimulus,so the distributions of firing rates to similar stimuli overlap, andthus discrimination based upon firing rate will only be correct ona proportion of trials. The ROC analysis allows us to calculate theperformance of the best possible discriminator between the twofrequencies which is based on spike counts only. This discrimi-nator is a function of the two probability distributions of spikecounts in response to the two stimuli.
The ROC plots the probability of correct detection of f2 againstthe probability of “false alarm” detection of f2 when f1 occurred.Since detection is assumed to be based on spike counts only, tri-als have to be classified to one or the other frequency based solelyon the evoked spike count. Thus, any discriminator between thetwo frequencies consists, in practice, of a list of spike counts thatare assigned to frequency f1, with all other spike counts assignedto frequency f2 (we do not need to consider so-called “random-ized rules” here, because we are only interested in the integral ofthe ROC, see below). In many studies, ROCs are calculated by athreshold on spike counts: all spike counts below the thresholdare assigned to one frequency, and those above the threshold tothe other. However, the lemma of Neyman and Pearson (Maris,2012) requires spike counts to be assigned to frequencies basedon their likelihoods, the ratio p(n|f2)/p(n|f1). For an optimal deci-sion rule, a threshold is selected, and all spike counts whoselikelihood is larger than that threshold are assigned to f2 (withthe others assigned to f1). The probabilities of correct decisionand false alarm for this decision rule can then be calculated ina straightforward manner. The ROC is obtained by calculatingthese probabilities while varying the threshold.
Then, we calculated the area under the ROC curve (AUC)as an estimate of the neural discriminability of frequency. TheAUC corresponds to the probability of correct stimulus detectionexpected from an ideal observer in a two-alternative forced-choicepsychophysical task (Green and Swets, 1966; Fawcett, 2006).Thus, sensitivity measured as AUC varies between 0.5 and 1,where 0.5 occurs when the spike count distributions for frequen-cies f1 and f2 are identical, and 1 indicates complete separationof the distributions. To compensate for sampling bias, we cor-rected each AUC value by performing 10,000 permutations of theoriginal spike count distributions, assigned randomly to either f1or f2, calculated the corresponding AUCs, and subtracted theirmean value from the original AUC. Due to this correction someof the AUC values we report are smaller than 0.5. We also usedthe permutations test to estimate the probability of the AUC being
significantly larger than 0.5. This way, we obtained one AUC valuefor the equiprobable condition (S1) and two AUC values for theoddball conditions (S2, S3). We used the mean AUC of S2 andS3 for the analyses instead of the maximum value as in previousworks (Ulanovsky et al., 2003; Malmierca et al., 2009), in order toavoid an upward bias.
The CSI values were tested against zero by bootstrapping (1000samples) in order to estimate a 95% confidence interval. Typically,CSI values smaller than 0.1 were not statistically different fromzero (85% of all cases with CSI < 0.1 and 15% of the cases withCSI > 0.1). Thus, CSI values within the range of −0.1 to 0.1were considered be due to random fluctuations in spike counts.This procedure provided a CSI cutoff comparable to other val-ues previously set with different criteria (e.g., CSI = 0.18 forauditory thalamus of the rat; Antunes et al., 2010). It may besomewhat smaller than the cutoff in thalamus because of thelower variability in the responses of IC neurons (e.g., Chechiket al., 2006).
RESULTSTo investigate how frequency sensitivity is affected by the stim-ulation context we recorded the response of 224 well isolatedsingle units in the IC and 51 units in the CN using an oddballparadigm. The frequency contrast (�f ≤ 0.07, 0.07< �f ≤ 0.2,�f > 0.2) and probability of the deviant tone (pDev = 30% or10%) were varied in IC recordings, and the repetition rate (4, 8,12, and 20 Hz) in the CN. Additionally, an equiprobable context(p(f1) = p(f2) = 50%) was tested as control condition in both setsof experiments.
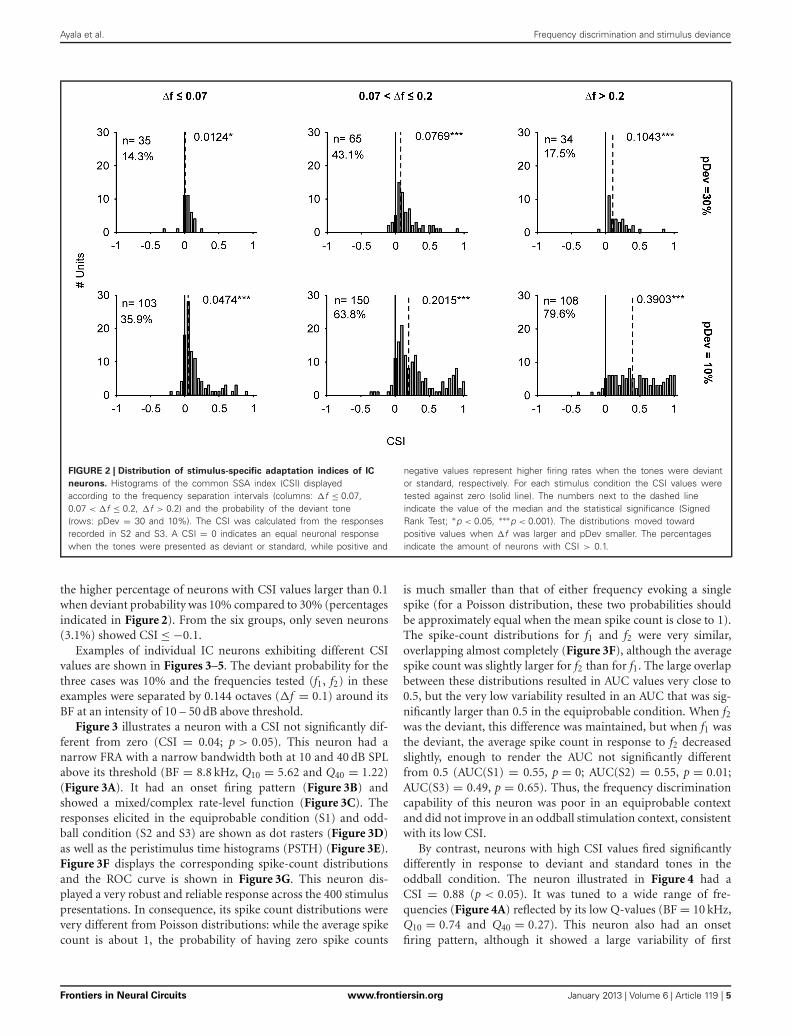
NEURONS IN THE IC SHOW DIFFERENT DEGREES OF SSA ANDSTIMULUS DISCRIMINABILITYAs might be expected from our previous studies (Pérez-Gonzálezet al., 2005; Malmierca et al., 2009), neurons in the IC exhib-ited different degrees of SSA. Figure 2 shows the distribution ofthe CSI under different stimulus conditions in the current sam-ple. The distributions of CSI are skewed toward positive values,and their medians are significantly different from zero (SignedRank Test; p < 0.05) regardless of the condition tested (Figure 2).Positive CSI values reflect a stronger response to the deviant tonethan to the standard one. The effects of frequency separationand deviant probability were tested using a Two-Way ANOVA on�f × probability. There was a main effect of �f (F(2, 489) = 18,p = 0) and of probability condition [F(1, 489) = 39, p = 0].The interaction just failed to reach significance [F(2, 489) = 2.5,p = 0.08]. Post-hoc comparisons showed that the most positiveCSI values were observed for deviant probability of 10% at thetwo highest frequency contrast intervals; 0.07< �f ≤ 0.2 and�f > 0.2. For the 10% probability condition, the CSIs increasedsignificantly with increased frequency separation: CSI10%/�f >0.2
> CSI10%/0.07<�f ≤0.2 > CSI10%/�f ≤0.07. On the other hand,the post-hoc comparisons did not show a significant differencebetween the average CSIs in the 30% condition and different fre-quency separations. There was also a significant difference dueto changes in deviant probability for the two highest frequencyseparation intervals: CSI10%/0.07<�f ≤0.2 > CSI30%/0.07<�f ≤0.2;CSI10%/�f >0.2 > CSI30%/�f >0.2. This trend was emphasized by
Frontiers in Neural Circuits www.frontiersin.org January 2013 | Volume 6 | Article 119 | 4
Ayala et al. Frequency discrimination and stimulus deviance
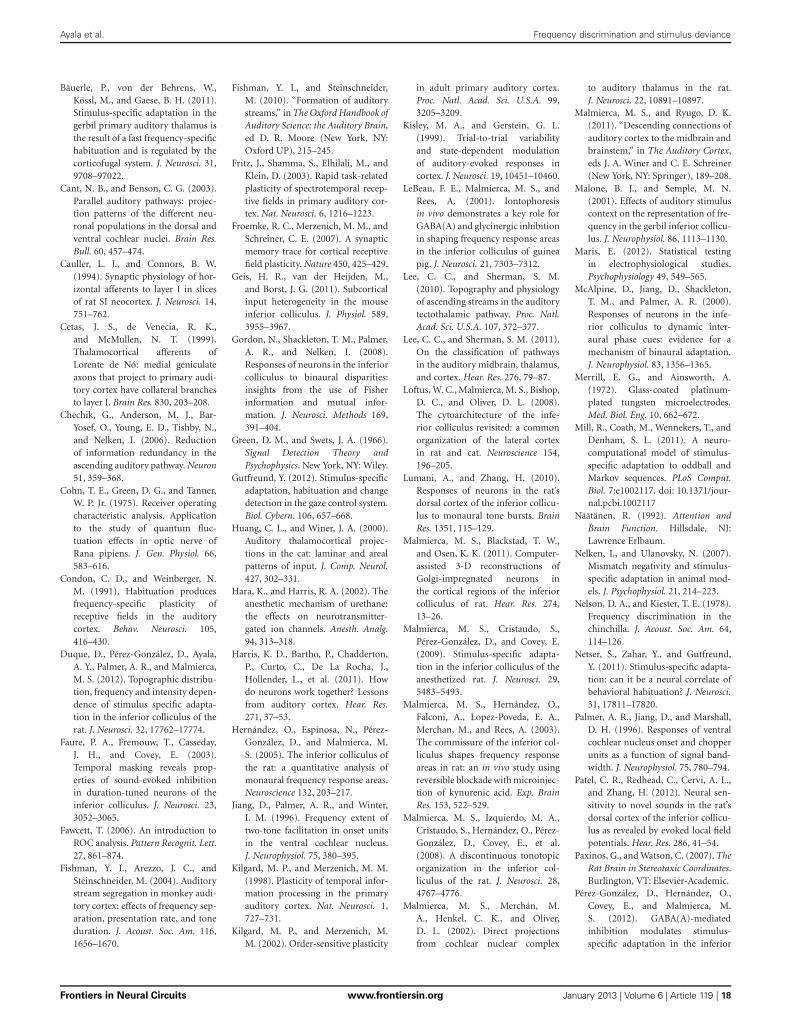
FIGURE 2 | Distribution of stimulus-specific adaptation indices of IC
neurons. Histograms of the common SSA index (CSI) displayedaccording to the frequency separation intervals (columns: �f ≤ 0.07,0.07 < �f ≤ 0.2, �f > 0.2) and the probability of the deviant tone(rows: pDev = 30 and 10%). The CSI was calculated from the responsesrecorded in S2 and S3. A CSI = 0 indicates an equal neuronal responsewhen the tones were presented as deviant or standard, while positive and
negative values represent higher firing rates when the tones were deviantor standard, respectively. For each stimulus condition the CSI values weretested against zero (solid line). The numbers next to the dashed lineindicate the value of the median and the statistical significance (SignedRank Test; ∗p < 0.05, ∗∗∗p < 0.001). The distributions moved towardpositive values when �f was larger and pDev smaller. The percentagesindicate the amount of neurons with CSI > 0.1.
the higher percentage of neurons with CSI values larger than 0.1when deviant probability was 10% compared to 30% (percentagesindicated in Figure 2). From the six groups, only seven neurons(3.1%) showed CSI ≤ −0.1.
Examples of individual IC neurons exhibiting different CSIvalues are shown in Figures 3–5. The deviant probability for thethree cases was 10% and the frequencies tested (f1, f2) in theseexamples were separated by 0.144 octaves (�f = 0.1) around itsBF at an intensity of 10 – 50 dB above threshold.
Figure 3 illustrates a neuron with a CSI not significantly dif-ferent from zero (CSI = 0.04; p > 0.05). This neuron had anarrow FRA with a narrow bandwidth both at 10 and 40 dB SPLabove its threshold (BF = 8.8 kHz, Q10 = 5.62 and Q40 = 1.22)(Figure 3A). It had an onset firing pattern (Figure 3B) andshowed a mixed/complex rate-level function (Figure 3C). Theresponses elicited in the equiprobable condition (S1) and odd-ball condition (S2 and S3) are shown as dot rasters (Figure 3D)as well as the peristimulus time histograms (PSTH) (Figure 3E).Figure 3F displays the corresponding spike-count distributionsand the ROC curve is shown in Figure 3G. This neuron dis-played a very robust and reliable response across the 400 stimuluspresentations. In consequence, its spike count distributions werevery different from Poisson distributions: while the average spikecount is about 1, the probability of having zero spike counts
is much smaller than that of either frequency evoking a singlespike (for a Poisson distribution, these two probabilities shouldbe approximately equal when the mean spike count is close to 1).The spike-count distributions for f1 and f2 were very similar,overlapping almost completely (Figure 3F), although the averagespike count was slightly larger for f2 than for f1. The large overlapbetween these distributions resulted in AUC values very close to0.5, but the very low variability resulted in an AUC that was sig-nificantly larger than 0.5 in the equiprobable condition. When f2was the deviant, this difference was maintained, but when f1 wasthe deviant, the average spike count in response to f2 decreasedslightly, enough to render the AUC not significantly differentfrom 0.5 (AUC(S1) = 0.55, p = 0; AUC(S2) = 0.55, p = 0.01;AUC(S3) = 0.49, p = 0.65). Thus, the frequency discriminationcapability of this neuron was poor in an equiprobable contextand did not improve in an oddball stimulation context, consistentwith its low CSI.
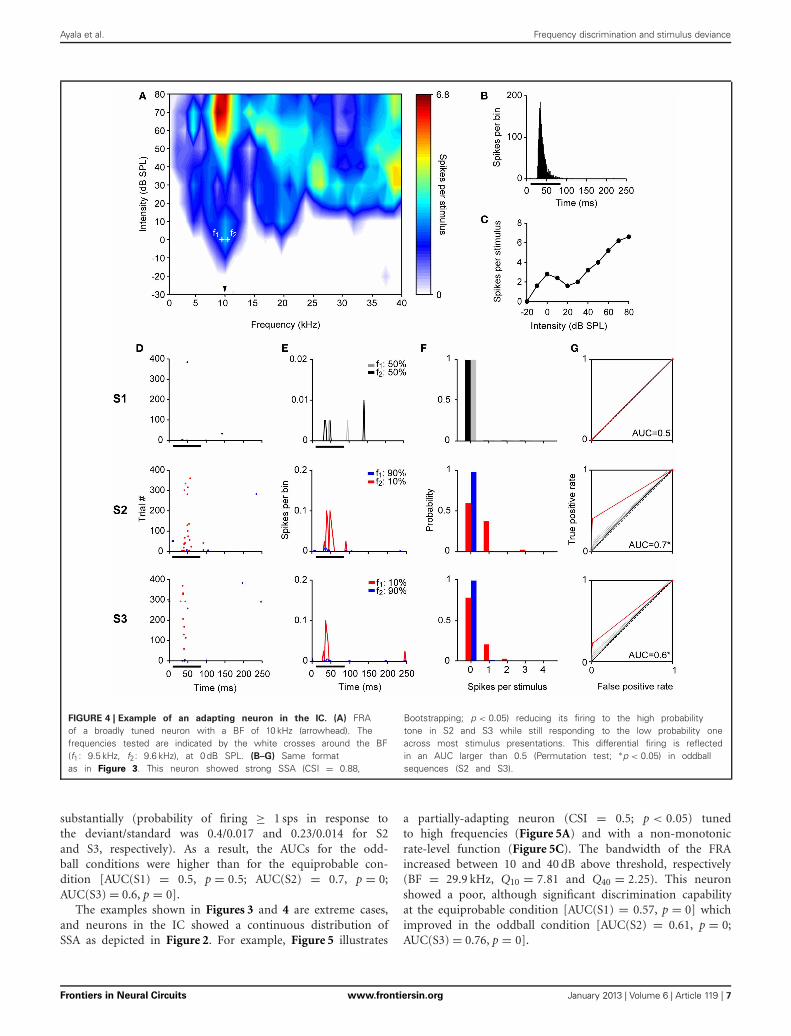
By contrast, neurons with high CSI values fired significantlydifferently in response to deviant and standard tones in theoddball condition. The neuron illustrated in Figure 4 had aCSI = 0.88 (p < 0.05). It was tuned to a wide range of fre-quencies (Figure 4A) reflected by its low Q-values (BF = 10 kHz,Q10 = 0.74 and Q40 = 0.27). This neuron also had an onsetfiring pattern, although it showed a large variability of first
Frontiers in Neural Circuits www.frontiersin.org January 2013 | Volume 6 | Article 119 | 5

Ayala et al. Frequency discrimination and stimulus deviance
FIGURE 3 | Example of a non-adapting neuron in the IC. (A) Narrow FRAin color code for response magnitude. The tested frequencies (f1: 8.7 kHz,f2: 9.6 kHz, white crosses) were chosen around the BF (8.8 kHz) (arrowhead),at 45 dB SPL. (B) PSTH of the accumulated response to all the frequencies(0.5 – 40 kHz) and intensities (0 – 80 dB SPL) presented (1 ms bins).(C) Rate-level function at BF. (D–G) The responses of the neuron for each pairof stimuli for each of the three sequences (S1, S2, S3) are shown as dotraster plots (D), PSTH (3 ms bins) (E), spike probability distributions (F), andROC curves (G). In the dot raster each dot represents the occurrence of aspike. The black bar under the PSTH and dot raster plots indicates theduration of the stimulus (75 ms). The probability of each frequency for eachsequence is indicated on the upper left of the (E) panels. In the ROCcurves (G) the dashed line corresponds to random guessing or no stimulus
discrimination (AUC = 0.5), indicating complete overlap of the spikeprobability distributions. The red line represents the ROC curve calculatedusing the recorded data, the curves plotted in gray were obtained with thepermutation method of the original spike count distributions, and the blackline is represents the mean ROC curve of permutations. A total of 10,000permutations were calculated, but for visual clarity only 100 curves aredisplayed. For each ROC curve, the area under the ROC curve (AUC) isshown corresponding to the original AUC value minus the mean AUC frompermutations, as well as, the significance value for AUC > 0.5 (Permutationtest; ∗p < 0.05). The repetition rate was 4 Hz and the frequency separationwas 0.141 octaves. This neuron did not show SSA (CSI = 0.04,Bootstrapping; p > 0.05), displaying a very similar response to f1 and f2across the three sequences regardless the probability of each tone.
spike latency (FSL) (Figure 4B) and had a non-monotonic rate-level function (Figure 4C). During the equiprobable presenta-tion of the tones (S1), this neuron adapted its response toboth frequencies, and had a very low probability to respond
at all (P≥1sps = 0.005). In the oddball condition, responsesto the standard tone remained extremely sparse, but devianttrials did evoke a few spikes with higher probability. Thus,the overlap between the spike-count distributions was reduced
Frontiers in Neural Circuits www.frontiersin.org January 2013 | Volume 6 | Article 119 | 6
Ayala et al. Frequency discrimination and stimulus deviance
FIGURE 4 | Example of an adapting neuron in the IC. (A) FRAof a broadly tuned neuron with a BF of 10 kHz (arrowhead). Thefrequencies tested are indicated by the white crosses around the BF(f1: 9.5 kHz, f2: 9.6 kHz), at 0 dB SPL. (B–G) Same formatas in Figure 3. This neuron showed strong SSA (CSI = 0.88,
Bootstrapping; p < 0.05) reducing its firing to the high probabilitytone in S2 and S3 while still responding to the low probability oneacross most stimulus presentations. This differential firing is reflectedin an AUC larger than 0.5 (Permutation test; ∗p < 0.05) in oddballsequences (S2 and S3).
substantially (probability of firing ≥ 1 sps in response tothe deviant/standard was 0.4/0.017 and 0.23/0.014 for S2and S3, respectively). As a result, the AUCs for the odd-ball conditions were higher than for the equiprobable con-dition [AUC(S1) = 0.5, p = 0.5; AUC(S2) = 0.7, p = 0;AUC(S3) = 0.6, p = 0].
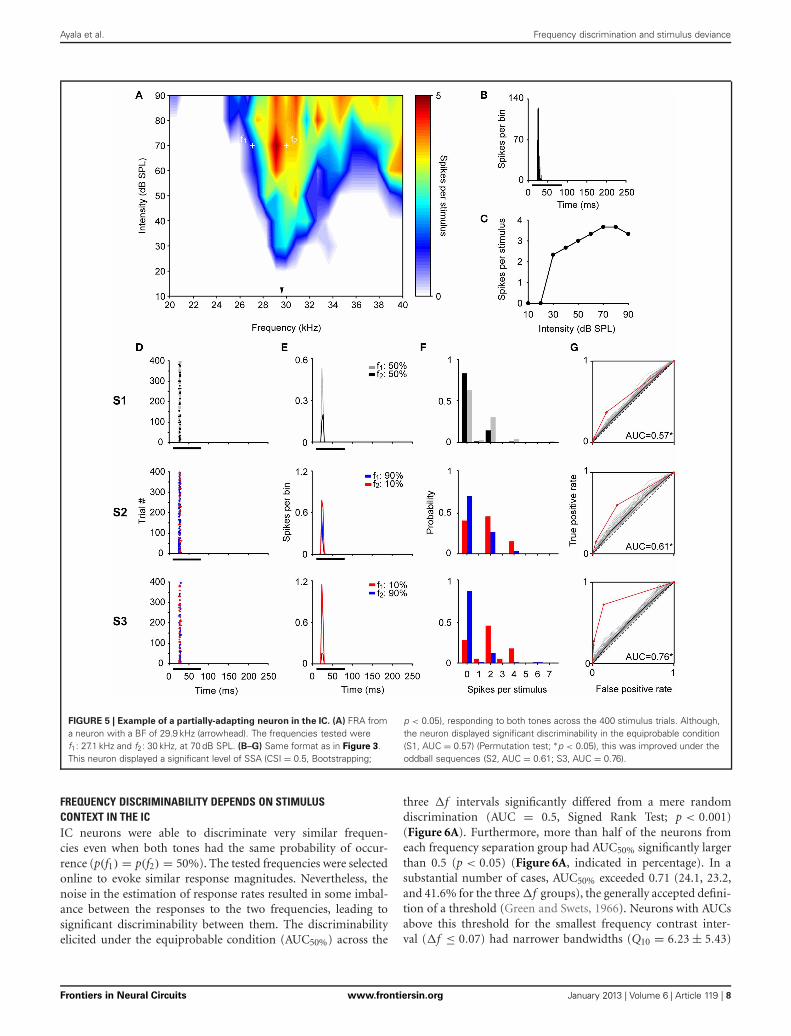
The examples shown in Figures 3 and 4 are extreme cases,and neurons in the IC showed a continuous distribution ofSSA as depicted in Figure 2. For example, Figure 5 illustrates
a partially-adapting neuron (CSI = 0.5; p < 0.05) tunedto high frequencies (Figure 5A) and with a non-monotonicrate-level function (Figure 5C). The bandwidth of the FRAincreased between 10 and 40 dB above threshold, respectively(BF = 29.9 kHz, Q10 = 7.81 and Q40 = 2.25). This neuronshowed a poor, although significant discrimination capabilityat the equiprobable condition [AUC(S1) = 0.57, p = 0] whichimproved in the oddball condition [AUC(S2) = 0.61, p = 0;AUC(S3) = 0.76, p = 0].
Frontiers in Neural Circuits www.frontiersin.org January 2013 | Volume 6 | Article 119 | 7
Ayala et al. Frequency discrimination and stimulus deviance
FIGURE 5 | Example of a partially-adapting neuron in the IC. (A) FRA froma neuron with a BF of 29.9 kHz (arrowhead). The frequencies tested weref1: 27.1 kHz and f2: 30 kHz, at 70 dB SPL. (B–G) Same format as in Figure 3.This neuron displayed a significant level of SSA (CSI = 0.5, Bootstrapping;
p < 0.05), responding to both tones across the 400 stimulus trials. Although,the neuron displayed significant discriminability in the equiprobable condition(S1, AUC = 0.57) (Permutation test; ∗p < 0.05), this was improved under theoddball sequences (S2, AUC = 0.61; S3, AUC = 0.76).
FREQUENCY DISCRIMINABILITY DEPENDS ON STIMULUSCONTEXT IN THE ICIC neurons were able to discriminate very similar frequen-cies even when both tones had the same probability of occur-rence (p(f1) = p(f2) = 50%). The tested frequencies were selectedonline to evoke similar response magnitudes. Nevertheless, thenoise in the estimation of response rates resulted in some imbal-ance between the responses to the two frequencies, leading tosignificant discriminability between them. The discriminabilityelicited under the equiprobable condition (AUC50%) across the
three �f intervals significantly differed from a mere randomdiscrimination (AUC = 0.5, Signed Rank Test; p < 0.001)(Figure 6A). Furthermore, more than half of the neurons fromeach frequency separation group had AUC50% significantly largerthan 0.5 (p < 0.05) (Figure 6A, indicated in percentage). In asubstantial number of cases, AUC50% exceeded 0.71 (24.1, 23.2,and 41.6% for the three �f groups), the generally accepted defini-tion of a threshold (Green and Swets, 1966). Neurons with AUCsabove this threshold for the smallest frequency contrast inter-val (�f ≤ 0.07) had narrower bandwidths (Q10 = 6.23 ± 5.43)
Frontiers in Neural Circuits www.frontiersin.org January 2013 | Volume 6 | Article 119 | 8
Ayala et al. Frequency discrimination and stimulus deviance
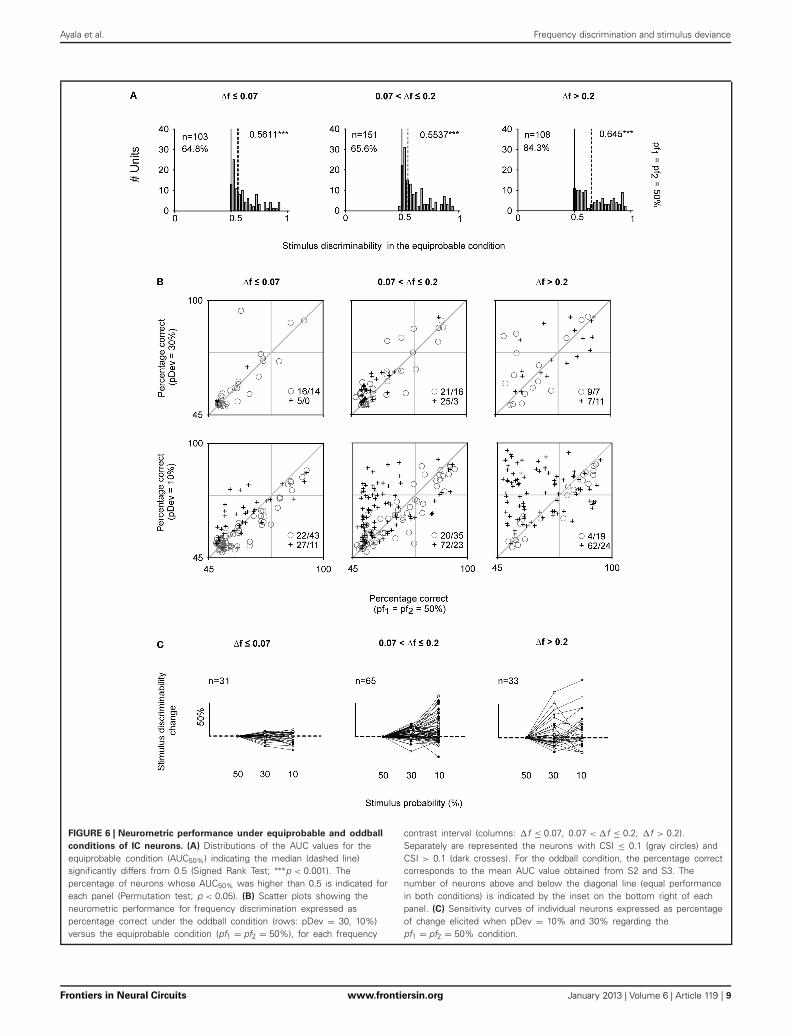
FIGURE 6 | Neurometric performance under equiprobable and oddball
conditions of IC neurons. (A) Distributions of the AUC values for theequiprobable condition (AUC50%) indicating the median (dashed line)significantly differs from 0.5 (Signed Rank Test; ∗∗∗p < 0.001). Thepercentage of neurons whose AUC50% was higher than 0.5 is indicated foreach panel (Permutation test; p < 0.05). (B) Scatter plots showing theneurometric performance for frequency discrimination expressed aspercentage correct under the oddball condition (rows: pDev = 30, 10%)versus the equiprobable condition (pf1 = pf2 = 50%), for each frequency
contrast interval (columns: �f ≤ 0.07, 0.07 < �f ≤ 0.2, �f > 0.2).Separately are represented the neurons with CSI ≤ 0.1 (gray circles) andCSI > 0.1 (dark crosses). For the oddball condition, the percentage correctcorresponds to the mean AUC value obtained from S2 and S3. Thenumber of neurons above and below the diagonal line (equal performancein both conditions) is indicated by the inset on the bottom right of eachpanel. (C) Sensitivity curves of individual neurons expressed as percentageof change elicited when pDev = 10% and 30% regarding thepf1 = pf2 = 50% condition.
Frontiers in Neural Circuits www.frontiersin.org January 2013 | Volume 6 | Article 119 | 9
Ayala et al. Frequency discrimination and stimulus deviance
that the rest of neurons (Q10 = 3.53 ± 5.47) (Signed Rank Test;p < 0.05).
To address the central question of this paper, Figure 6B com-pares the percent correct (as estimated by AUC) in the oddballand equiprobable condition for each neuron. For the oddballcondition, we used the mean discriminability (AUCoddball) fromthe values elicited in the two oddball sequences since there wasnot significant difference in the AUC values elicited in S2 andS3 (Rank Sum Test; p > 0.05). Neurons whose discriminabilitywas unaffected in the oddball condition fell along the diagonalline. Neurons under the diagonal line showed a better discrim-inability in the equiprobable condition. By contrast, neuronsthat improved their discriminability in the oddball paradigmwere located above the diagonal. Neurons with CSI > 0.1 aremarked by crosses, the others are marked by circles. WhenpDev = 10%, there was a larger proportion of neurons withCSI > 0.1 than neurons with CSI ≤ 0.1 that showed improveddiscriminability in the oddball condition (χ2 = 58.6, df = 1, p <
0.001), but these proportions did not depend on frequency sep-aration (χ2 = 5.4, df = 2, p = 0.07). For this probability condi-tion, the AUCs of neurons with CSI ≤ 0.1 were slightly, althoughsignificantly, smaller in the oddball than in the equiprobablecondition (46/96, neurons above and below the bisecting line,respectively, for all frequency separation classes together). Thiseffect was due presumably to the poorer sampling of the spikecount histograms for the deviant stimuli in the oddball condi-tion. On the other hand, AUCoddball increased substantially forneurons with CSI > 0.1 (161/59 neurons above and below thebissecting line, respectively). The increase resulted in many neu-rons whose frequency discrimination was below threshold inthe equiprobable condition (AUC50% < 0.71) and that exceedthreshold in the oddball conditions (AUCoddball > 0.71). Withinthis subset of neurons, there are cases in which the neuromet-ric performance reached values close to 100% correct in theoddball condition. Such cases were much more common atthe largest frequency contrasts (0.07< �f ≤ 0.2 and �f > 0.2).For pDev = 30%, the discriminability did not change consis-tently relative to the equiprobable condition, and proportionsof neurons with slight increase or decrease in discriminabilitywere as common in the different frequency difference classes(χ2 = 5.4, df = 2, p = 0.07) and among CSI classes (χ2 = 3.9,df = 1, p = 0.05).
In order to verify whether the same trend was observed at thelevel of single neurons, we obtained the individual “sensitivitycurves” for the neurons that were tested under all probabili-ties conditions (50, 30, and 10%) and for the same frequencypairs (Figure 6C). The discriminability increment was expressedas the percentage of change in AUCoddball relative to the discrim-inability displayed under the equiprobable condition (AUC50%).These sensitivity curves revealed a considerable diversity in theneuronal performance. Both neuron identity and stimulus prob-ability had a significant effect on the discrimination capabilityfor the intermediate �f interval [Two-Way ANOVA on stim-ulus probability × neuron, significant main effect of stimu-lus probability: F(2, 128) = 7.7, p < 0.001], but for the smallestand largest �f the main effect of stimulus probability was notsignificant.
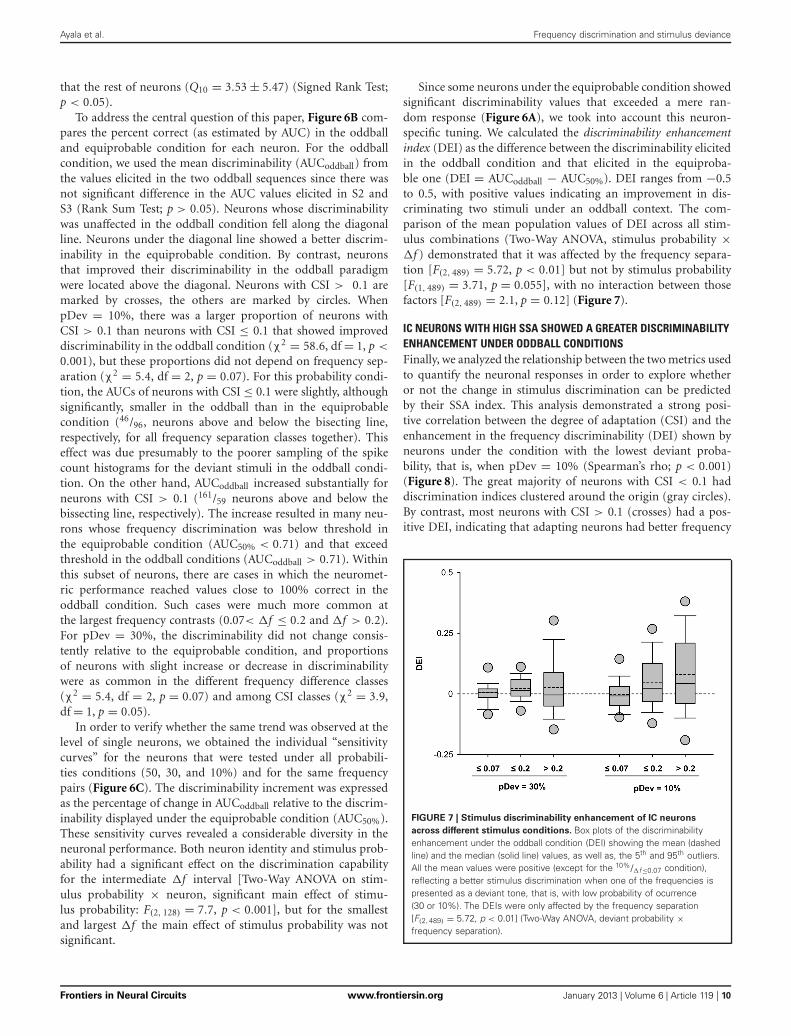
Since some neurons under the equiprobable condition showedsignificant discriminability values that exceeded a mere ran-dom response (Figure 6A), we took into account this neuron-specific tuning. We calculated the discriminability enhancementindex (DEI) as the difference between the discriminability elicitedin the oddball condition and that elicited in the equiproba-ble one (DEI = AUCoddball − AUC50%). DEI ranges from −0.5to 0.5, with positive values indicating an improvement in dis-criminating two stimuli under an oddball context. The com-parison of the mean population values of DEI across all stim-ulus combinations (Two-Way ANOVA, stimulus probability ×�f ) demonstrated that it was affected by the frequency separa-tion [F(2, 489) = 5.72, p < 0.01] but not by stimulus probability[F(1, 489) = 3.71, p = 0.055], with no interaction between thosefactors [F(2, 489) = 2.1, p = 0.12] (Figure 7).
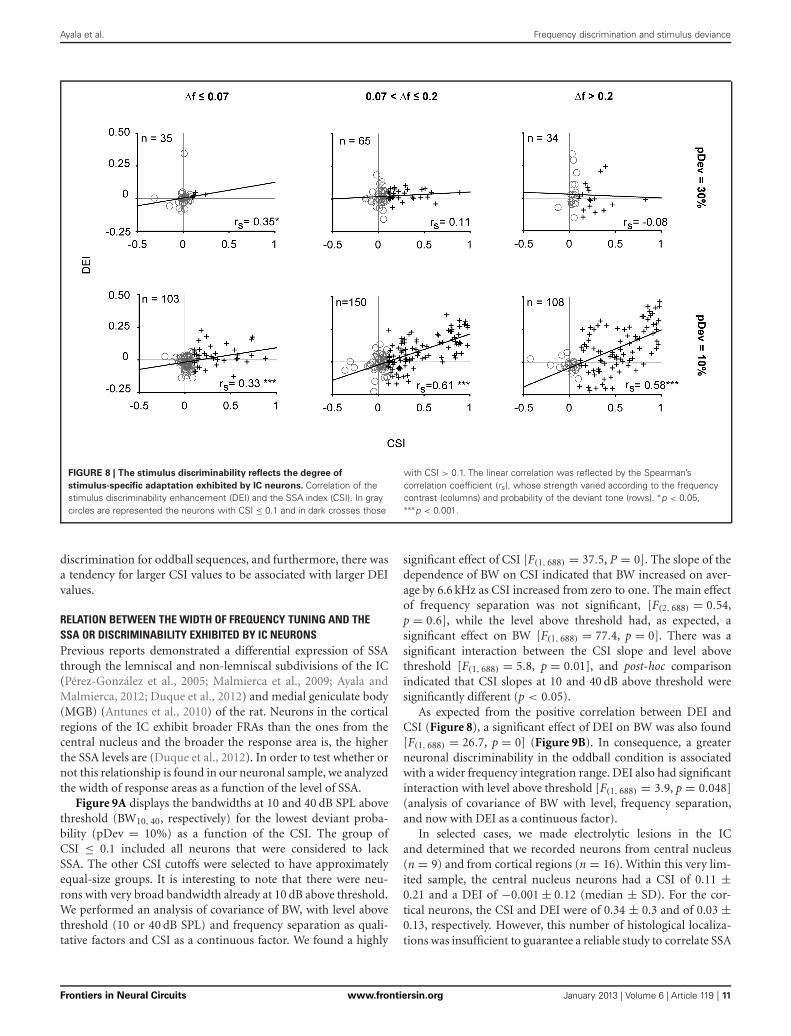
IC NEURONS WITH HIGH SSA SHOWED A GREATER DISCRIMINABILITYENHANCEMENT UNDER ODDBALL CONDITIONSFinally, we analyzed the relationship between the two metrics usedto quantify the neuronal responses in order to explore whetheror not the change in stimulus discrimination can be predictedby their SSA index. This analysis demonstrated a strong posi-tive correlation between the degree of adaptation (CSI) and theenhancement in the frequency discriminability (DEI) shown byneurons under the condition with the lowest deviant proba-bility, that is, when pDev = 10% (Spearman’s rho; p < 0.001)(Figure 8). The great majority of neurons with CSI < 0.1 haddiscrimination indices clustered around the origin (gray circles).By contrast, most neurons with CSI > 0.1 (crosses) had a pos-itive DEI, indicating that adapting neurons had better frequency
FIGURE 7 | Stimulus discriminability enhancement of IC neurons
across different stimulus conditions. Box plots of the discriminabilityenhancement under the oddball condition (DEI) showing the mean (dashedline) and the median (solid line) values, as well as, the 5th and 95th outliers.All the mean values were positive (except for the 10%/�f≤0.07 condition),reflecting a better stimulus discrimination when one of the frequencies ispresented as a deviant tone, that is, with low probability of ocurrence(30 or 10%). The DEIs were only affected by the frequency separation[F(2,489) = 5.72, p < 0.01] (Two-Way ANOVA, deviant probability ×frequency separation).
Frontiers in Neural Circuits www.frontiersin.org January 2013 | Volume 6 | Article 119 | 10
Ayala et al. Frequency discrimination and stimulus deviance
FIGURE 8 | The stimulus discriminability reflects the degree of
stimulus-specific adaptation exhibited by IC neurons. Correlation of thestimulus discriminability enhancement (DEI) and the SSA index (CSI). In graycircles are represented the neurons with CSI ≤ 0.1 and in dark crosses those
with CSI > 0.1. The linear correlation was reflected by the Spearman’scorrelation coefficient (rs), whose strength varied according to the frequencycontrast (columns) and probability of the deviant tone (rows). ∗p < 0.05,∗∗∗p < 0.001.
discrimination for oddball sequences, and furthermore, there wasa tendency for larger CSI values to be associated with larger DEIvalues.
RELATION BETWEEN THE WIDTH OF FREQUENCY TUNING AND THESSA OR DISCRIMINABILITY EXHIBITED BY IC NEURONSPrevious reports demonstrated a differential expression of SSAthrough the lemniscal and non-lemniscal subdivisions of the IC(Pérez-González et al., 2005; Malmierca et al., 2009; Ayala andMalmierca, 2012; Duque et al., 2012) and medial geniculate body(MGB) (Antunes et al., 2010) of the rat. Neurons in the corticalregions of the IC exhibit broader FRAs than the ones from thecentral nucleus and the broader the response area is, the higherthe SSA levels are (Duque et al., 2012). In order to test whether ornot this relationship is found in our neuronal sample, we analyzedthe width of response areas as a function of the level of SSA.
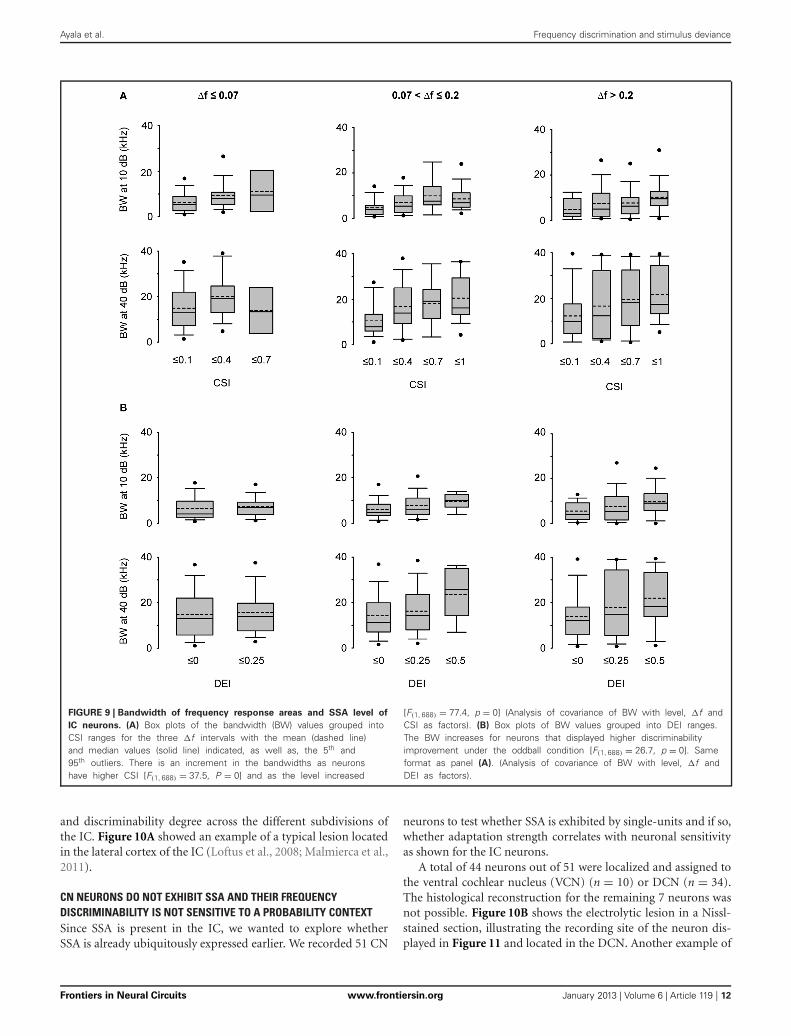
Figure 9A displays the bandwidths at 10 and 40 dB SPL abovethreshold (BW10, 40, respectively) for the lowest deviant proba-bility (pDev = 10%) as a function of the CSI. The group ofCSI ≤ 0.1 included all neurons that were considered to lackSSA. The other CSI cutoffs were selected to have approximatelyequal-size groups. It is interesting to note that there were neu-rons with very broad bandwidth already at 10 dB above threshold.We performed an analysis of covariance of BW, with level abovethreshold (10 or 40 dB SPL) and frequency separation as quali-tative factors and CSI as a continuous factor. We found a highly
significant effect of CSI [F(1, 688) = 37.5, P = 0]. The slope of thedependence of BW on CSI indicated that BW increased on aver-age by 6.6 kHz as CSI increased from zero to one. The main effectof frequency separation was not significant, [F(2, 688) = 0.54,p = 0.6], while the level above threshold had, as expected, asignificant effect on BW [F(1, 688) = 77.4, p = 0]. There was asignificant interaction between the CSI slope and level abovethreshold [F(1, 688) = 5.8, p = 0.01], and post-hoc comparisonindicated that CSI slopes at 10 and 40 dB above threshold weresignificantly different (p < 0.05).
As expected from the positive correlation between DEI andCSI (Figure 8), a significant effect of DEI on BW was also found[F(1, 688) = 26.7, p = 0] (Figure 9B). In consequence, a greaterneuronal discriminability in the oddball condition is associatedwith a wider frequency integration range. DEI also had significantinteraction with level above threshold [F(1, 688) = 3.9, p = 0.048](analysis of covariance of BW with level, frequency separation,and now with DEI as a continuous factor).
In selected cases, we made electrolytic lesions in the ICand determined that we recorded neurons from central nucleus(n = 9) and from cortical regions (n = 16). Within this very lim-ited sample, the central nucleus neurons had a CSI of 0.11 ±0.21 and a DEI of −0.001 ± 0.12 (median ± SD). For the cor-tical neurons, the CSI and DEI were of 0.34 ± 0.3 and of 0.03 ±0.13, respectively. However, this number of histological localiza-tions was insufficient to guarantee a reliable study to correlate SSA
Frontiers in Neural Circuits www.frontiersin.org January 2013 | Volume 6 | Article 119 | 11
Ayala et al. Frequency discrimination and stimulus deviance
FIGURE 9 | Bandwidth of frequency response areas and SSA level of
IC neurons. (A) Box plots of the bandwidth (BW) values grouped intoCSI ranges for the three �f intervals with the mean (dashed line)and median values (solid line) indicated, as well as, the 5th and95th outliers. There is an increment in the bandwidths as neuronshave higher CSI [F(1, 688) = 37.5, P = 0] and as the level increased
[F(1, 688) = 77.4, p = 0] (Analysis of covariance of BW with level, �f andCSI as factors). (B) Box plots of BW values grouped into DEI ranges.The BW increases for neurons that displayed higher discriminabilityimprovement under the oddball condition [F(1, 688) = 26.7, p = 0]. Sameformat as panel (A). (Analysis of covariance of BW with level, �f andDEI as factors).
and discriminability degree across the different subdivisions ofthe IC. Figure 10A showed an example of a typical lesion locatedin the lateral cortex of the IC (Loftus et al., 2008; Malmierca et al.,2011).
CN NEURONS DO NOT EXHIBIT SSA AND THEIR FREQUENCYDISCRIMINABILITY IS NOT SENSITIVE TO A PROBABILITY CONTEXTSince SSA is present in the IC, we wanted to explore whetherSSA is already ubiquitously expressed earlier. We recorded 51 CN
neurons to test whether SSA is exhibited by single-units and if so,whether adaptation strength correlates with neuronal sensitivityas shown for the IC neurons.
A total of 44 neurons out of 51 were localized and assigned tothe ventral cochlear nucleus (VCN) (n = 10) or DCN (n = 34).The histological reconstruction for the remaining 7 neurons wasnot possible. Figure 10B shows the electrolytic lesion in a Nissl-stained section, illustrating the recording site of the neuron dis-played in Figure 11 and located in the DCN. Another example of
Frontiers in Neural Circuits www.frontiersin.org January 2013 | Volume 6 | Article 119 | 12
Ayala et al. Frequency discrimination and stimulus deviance
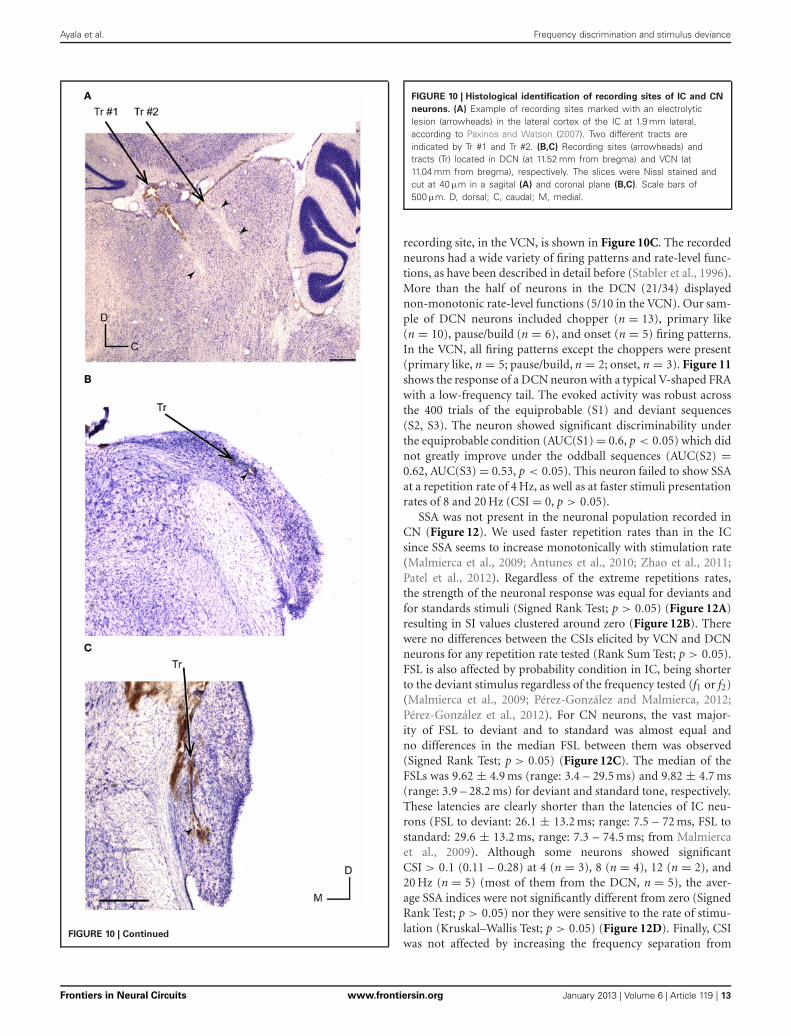
FIGURE 10 | Continued
FIGURE 10 | Histological identification of recording sites of IC and CN
neurons. (A) Example of recording sites marked with an electrolyticlesion (arrowheads) in the lateral cortex of the IC at 1.9 mm lateral,according to Paxinos and Watson (2007). Two different tracts areindicated by Tr #1 and Tr #2. (B,C) Recording sites (arrowheads) andtracts (Tr) located in DCN (at 11.52 mm from bregma) and VCN (at11.04 mm from bregma), respectively. The slices were Nissl stained andcut at 40 μm in a sagital (A) and coronal plane (B,C). Scale bars of500 μm. D, dorsal; C, caudal; M, medial.
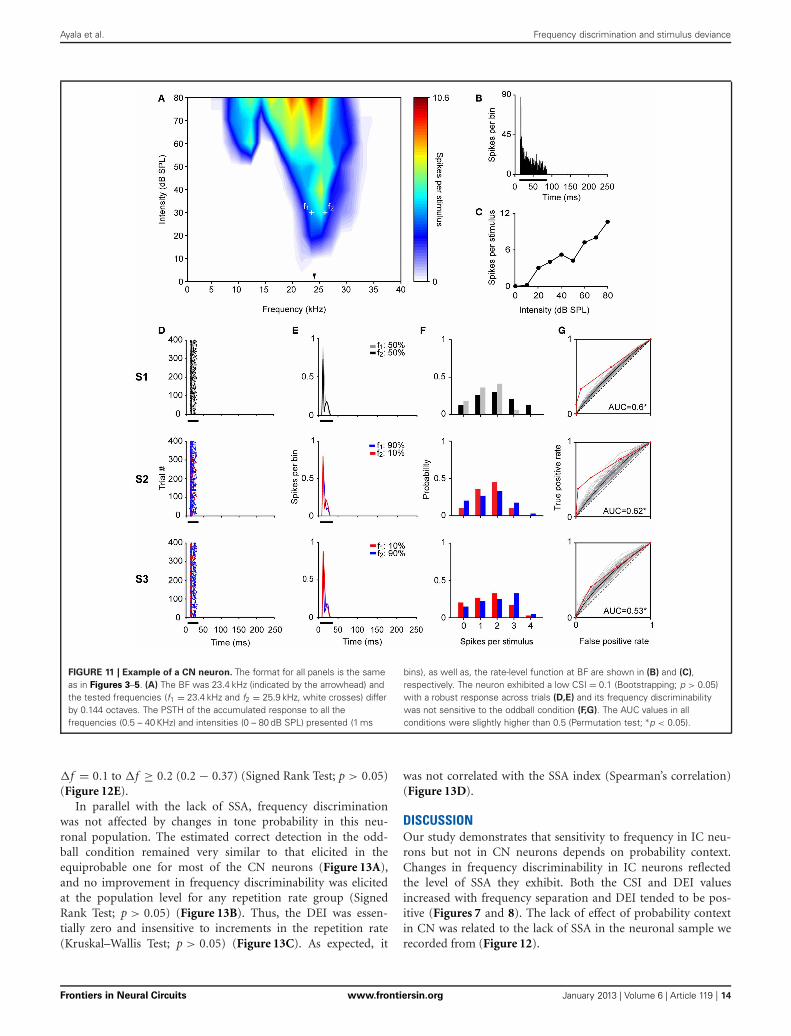
recording site, in the VCN, is shown in Figure 10C. The recordedneurons had a wide variety of firing patterns and rate-level func-tions, as have been described in detail before (Stabler et al., 1996).More than the half of neurons in the DCN (21/34) displayednon-monotonic rate-level functions (5/10 in the VCN). Our sam-ple of DCN neurons included chopper (n = 13), primary like(n = 10), pause/build (n = 6), and onset (n = 5) firing patterns.In the VCN, all firing patterns except the choppers were present(primary like, n = 5; pause/build, n = 2; onset, n = 3). Figure 11shows the response of a DCN neuron with a typical V-shaped FRAwith a low-frequency tail. The evoked activity was robust acrossthe 400 trials of the equiprobable (S1) and deviant sequences(S2, S3). The neuron showed significant discriminability underthe equiprobable condition (AUC(S1) = 0.6, p < 0.05) which didnot greatly improve under the oddball sequences (AUC(S2) =0.62, AUC(S3) = 0.53, p < 0.05). This neuron failed to show SSAat a repetition rate of 4 Hz, as well as at faster stimuli presentationrates of 8 and 20 Hz (CSI = 0, p > 0.05).
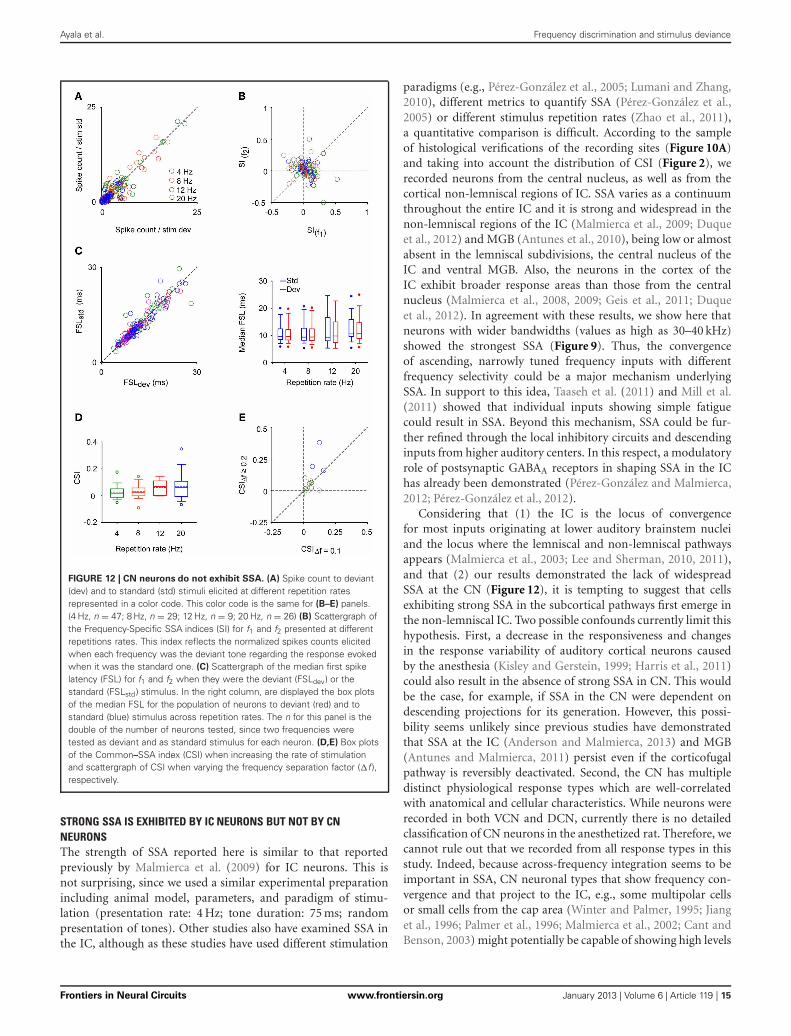
SSA was not present in the neuronal population recorded inCN (Figure 12). We used faster repetition rates than in the ICsince SSA seems to increase monotonically with stimulation rate(Malmierca et al., 2009; Antunes et al., 2010; Zhao et al., 2011;Patel et al., 2012). Regardless of the extreme repetitions rates,the strength of the neuronal response was equal for deviants andfor standards stimuli (Signed Rank Test; p > 0.05) (Figure 12A)resulting in SI values clustered around zero (Figure 12B). Therewere no differences between the CSIs elicited by VCN and DCNneurons for any repetition rate tested (Rank Sum Test; p > 0.05).FSL is also affected by probability condition in IC, being shorterto the deviant stimulus regardless of the frequency tested (f1 or f2)(Malmierca et al., 2009; Pérez-González and Malmierca, 2012;Pérez-González et al., 2012). For CN neurons, the vast major-ity of FSL to deviant and to standard was almost equal andno differences in the median FSL between them was observed(Signed Rank Test; p > 0.05) (Figure 12C). The median of theFSLs was 9.62 ± 4.9 ms (range: 3.4 – 29.5 ms) and 9.82 ± 4.7 ms(range: 3.9 – 28.2 ms) for deviant and standard tone, respectively.These latencies are clearly shorter than the latencies of IC neu-rons (FSL to deviant: 26.1 ± 13.2 ms; range: 7.5 – 72 ms, FSL tostandard: 29.6 ± 13.2 ms, range: 7.3 – 74.5 ms; from Malmiercaet al., 2009). Although some neurons showed significantCSI > 0.1 (0.11 – 0.28) at 4 (n = 3), 8 (n = 4), 12 (n = 2), and20 Hz (n = 5) (most of them from the DCN, n = 5), the aver-age SSA indices were not significantly different from zero (SignedRank Test; p > 0.05) nor they were sensitive to the rate of stimu-lation (Kruskal–Wallis Test; p > 0.05) (Figure 12D). Finally, CSIwas not affected by increasing the frequency separation from
Frontiers in Neural Circuits www.frontiersin.org January 2013 | Volume 6 | Article 119 | 13
Ayala et al. Frequency discrimination and stimulus deviance
FIGURE 11 | Example of a CN neuron. The format for all panels is the sameas in Figures 3–5. (A) The BF was 23.4 kHz (indicated by the arrowhead) andthe tested frequencies (f1 = 23.4 kHz and f2 = 25.9 kHz, white crosses) differby 0.144 octaves. The PSTH of the accumulated response to all thefrequencies (0.5 – 40 KHz) and intensities (0 – 80 dB SPL) presented (1 ms
bins), as well as, the rate-level function at BF are shown in (B) and (C),respectively. The neuron exhibited a low CSI = 0.1 (Bootstrapping; p > 0.05)with a robust response across trials (D,E) and its frequency discriminabilitywas not sensitive to the oddball condition (F,G). The AUC values in allconditions were slightly higher than 0.5 (Permutation test; ∗p < 0.05).
�f = 0.1 to �f ≥ 0.2 (0.2 − 0.37) (Signed Rank Test; p > 0.05)(Figure 12E).
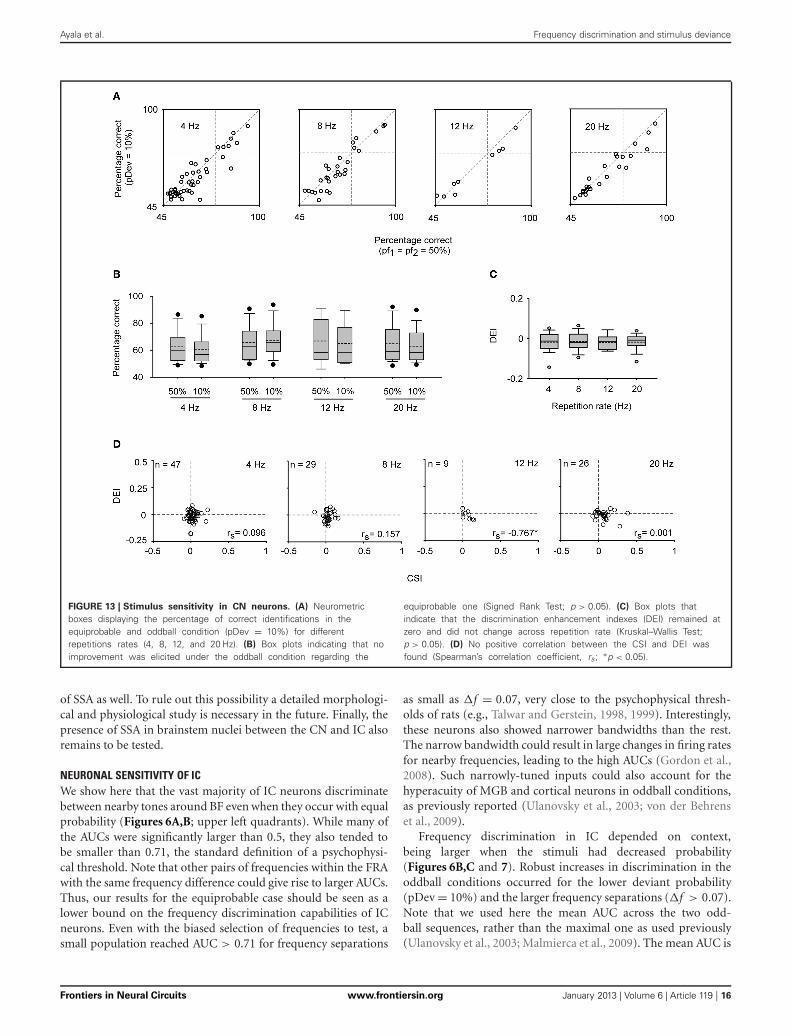
In parallel with the lack of SSA, frequency discriminationwas not affected by changes in tone probability in this neu-ronal population. The estimated correct detection in the odd-ball condition remained very similar to that elicited in theequiprobable one for most of the CN neurons (Figure 13A),and no improvement in frequency discriminability was elicitedat the population level for any repetition rate group (SignedRank Test; p > 0.05) (Figure 13B). Thus, the DEI was essen-tially zero and insensitive to increments in the repetition rate(Kruskal–Wallis Test; p > 0.05) (Figure 13C). As expected, it
was not correlated with the SSA index (Spearman’s correlation)(Figure 13D).
DISCUSSIONOur study demonstrates that sensitivity to frequency in IC neu-rons but not in CN neurons depends on probability context.Changes in frequency discriminability in IC neurons reflectedthe level of SSA they exhibit. Both the CSI and DEI valuesincreased with frequency separation and DEI tended to be pos-itive (Figures 7 and 8). The lack of effect of probability contextin CN was related to the lack of SSA in the neuronal sample werecorded from (Figure 12).
Frontiers in Neural Circuits www.frontiersin.org January 2013 | Volume 6 | Article 119 | 14
Ayala et al. Frequency discrimination and stimulus deviance
FIGURE 12 | CN neurons do not exhibit SSA. (A) Spike count to deviant(dev) and to standard (std) stimuli elicited at different repetition ratesrepresented in a color code. This color code is the same for (B–E) panels.(4 Hz, n = 47; 8 Hz, n = 29; 12 Hz, n = 9; 20 Hz, n = 26) (B) Scattergraph ofthe Frequency-Specific SSA indices (SI) for f1 and f2 presented at differentrepetitions rates. This index reflects the normalized spikes counts elicitedwhen each frequency was the deviant tone regarding the response evokedwhen it was the standard one. (C) Scattergraph of the median first spikelatency (FSL) for f1 and f2 when they were the deviant (FSLdev) or thestandard (FSLstd) stimulus. In the right column, are displayed the box plotsof the median FSL for the population of neurons to deviant (red) and tostandard (blue) stimulus across repetition rates. The n for this panel is thedouble of the number of neurons tested, since two frequencies weretested as deviant and as standard stimulus for each neuron. (D,E) Box plotsof the Common–SSA index (CSI) when increasing the rate of stimulationand scattergraph of CSI when varying the frequency separation factor (�f ),respectively.
STRONG SSA IS EXHIBITED BY IC NEURONS BUT NOT BY CNNEURONSThe strength of SSA reported here is similar to that reportedpreviously by Malmierca et al. (2009) for IC neurons. This isnot surprising, since we used a similar experimental preparationincluding animal model, parameters, and paradigm of stimu-lation (presentation rate: 4 Hz; tone duration: 75 ms; randompresentation of tones). Other studies also have examined SSA inthe IC, although as these studies have used different stimulation
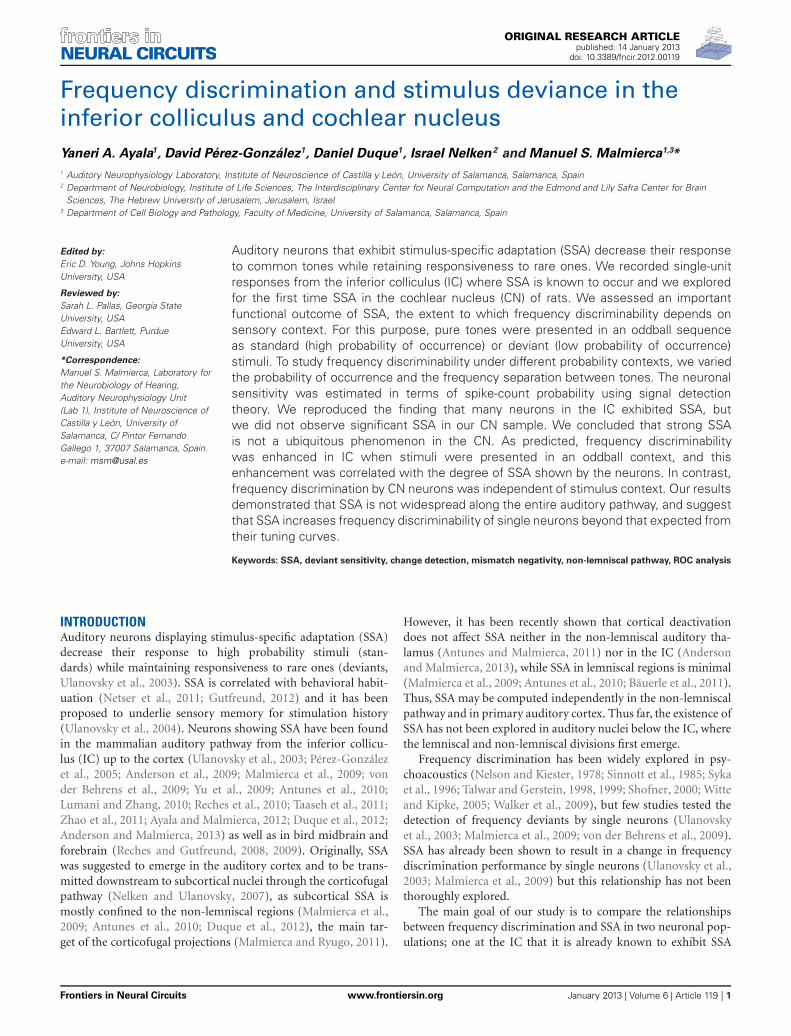
paradigms (e.g., Pérez-González et al., 2005; Lumani and Zhang,2010), different metrics to quantify SSA (Pérez-González et al.,2005) or different stimulus repetition rates (Zhao et al., 2011),a quantitative comparison is difficult. According to the sampleof histological verifications of the recording sites (Figure 10A)and taking into account the distribution of CSI (Figure 2), werecorded neurons from the central nucleus, as well as from thecortical non-lemniscal regions of IC. SSA varies as a continuumthroughout the entire IC and it is strong and widespread in thenon-lemniscal regions of the IC (Malmierca et al., 2009; Duqueet al., 2012) and MGB (Antunes et al., 2010), being low or almostabsent in the lemniscal subdivisions, the central nucleus of theIC and ventral MGB. Also, the neurons in the cortex of theIC exhibit broader response areas than those from the centralnucleus (Malmierca et al., 2008, 2009; Geis et al., 2011; Duqueet al., 2012). In agreement with these results, we show here thatneurons with wider bandwidths (values as high as 30–40 kHz)showed the strongest SSA (Figure 9). Thus, the convergenceof ascending, narrowly tuned frequency inputs with differentfrequency selectivity could be a major mechanism underlyingSSA. In support to this idea, Taaseh et al. (2011) and Mill et al.(2011) showed that individual inputs showing simple fatiguecould result in SSA. Beyond this mechanism, SSA could be fur-ther refined through the local inhibitory circuits and descendinginputs from higher auditory centers. In this respect, a modulatoryrole of postsynaptic GABAA receptors in shaping SSA in the IChas already been demonstrated (Pérez-González and Malmierca,2012; Pérez-González et al., 2012).
Considering that (1) the IC is the locus of convergencefor most inputs originating at lower auditory brainstem nucleiand the locus where the lemniscal and non-lemniscal pathwaysappears (Malmierca et al., 2003; Lee and Sherman, 2010, 2011),and that (2) our results demonstrated the lack of widespreadSSA at the CN (Figure 12), it is tempting to suggest that cellsexhibiting strong SSA in the subcortical pathways first emerge inthe non-lemniscal IC. Two possible confounds currently limit thishypothesis. First, a decrease in the responsiveness and changesin the response variability of auditory cortical neurons causedby the anesthesia (Kisley and Gerstein, 1999; Harris et al., 2011)could also result in the absence of strong SSA in CN. This wouldbe the case, for example, if SSA in the CN were dependent ondescending projections for its generation. However, this possi-bility seems unlikely since previous studies have demonstratedthat SSA at the IC (Anderson and Malmierca, 2013) and MGB(Antunes and Malmierca, 2011) persist even if the corticofugalpathway is reversibly deactivated. Second, the CN has multipledistinct physiological response types which are well-correlatedwith anatomical and cellular characteristics. While neurons wererecorded in both VCN and DCN, currently there is no detailedclassification of CN neurons in the anesthetized rat. Therefore, wecannot rule out that we recorded from all response types in thisstudy. Indeed, because across-frequency integration seems to beimportant in SSA, CN neuronal types that show frequency con-vergence and that project to the IC, e.g., some multipolar cellsor small cells from the cap area (Winter and Palmer, 1995; Jianget al., 1996; Palmer et al., 1996; Malmierca et al., 2002; Cant andBenson, 2003) might potentially be capable of showing high levels
Frontiers in Neural Circuits www.frontiersin.org January 2013 | Volume 6 | Article 119 | 15
Ayala et al. Frequency discrimination and stimulus deviance
FIGURE 13 | Stimulus sensitivity in CN neurons. (A) Neurometricboxes displaying the percentage of correct identifications in theequiprobable and oddball condition (pDev = 10%) for differentrepetitions rates (4, 8, 12, and 20 Hz). (B) Box plots indicating that noimprovement was elicited under the oddball condition regarding the
equiprobable one (Signed Rank Test; p > 0.05). (C) Box plots thatindicate that the discrimination enhancement indexes (DEI) remained atzero and did not change across repetition rate (Kruskal–Wallis Test;p > 0.05). (D) No positive correlation between the CSI and DEI wasfound (Spearman’s correlation coefficient, rs; ∗p < 0.05).
of SSA as well. To rule out this possibility a detailed morphologi-cal and physiological study is necessary in the future. Finally, thepresence of SSA in brainstem nuclei between the CN and IC alsoremains to be tested.
NEURONAL SENSITIVITY OF ICWe show here that the vast majority of IC neurons discriminatebetween nearby tones around BF even when they occur with equalprobability (Figures 6A,B; upper left quadrants). While many ofthe AUCs were significantly larger than 0.5, they also tended tobe smaller than 0.71, the standard definition of a psychophysi-cal threshold. Note that other pairs of frequencies within the FRAwith the same frequency difference could give rise to larger AUCs.Thus, our results for the equiprobable case should be seen as alower bound on the frequency discrimination capabilities of ICneurons. Even with the biased selection of frequencies to test, asmall population reached AUC > 0.71 for frequency separations
as small as �f = 0.07, very close to the psychophysical thresh-olds of rats (e.g., Talwar and Gerstein, 1998, 1999). Interestingly,these neurons also showed narrower bandwidths than the rest.The narrow bandwidth could result in large changes in firing ratesfor nearby frequencies, leading to the high AUCs (Gordon et al.,2008). Such narrowly-tuned inputs could also account for thehyperacuity of MGB and cortical neurons in oddball conditions,as previously reported (Ulanovsky et al., 2003; von der Behrenset al., 2009).
Frequency discrimination in IC depended on context,being larger when the stimuli had decreased probability(Figures 6B,C and 7). Robust increases in discrimination in theoddball conditions occurred for the lower deviant probability(pDev = 10%) and the larger frequency separations (�f > 0.07).Note that we used here the mean AUC across the two odd-ball sequences, rather than the maximal one as used previously(Ulanovsky et al., 2003; Malmierca et al., 2009). The mean AUC is
Frontiers in Neural Circuits www.frontiersin.org January 2013 | Volume 6 | Article 119 | 16
Ayala et al. Frequency discrimination and stimulus deviance
a more conservative estimate of frequency discriminability, and itsuse may explain why we did not observe extreme discriminationperformance as reported previously in IC (Malmierca et al., 2009their Figure 7, neurons in the upper left corner). Either way, theseresults emphasize the influence of context on sensory process-ing as early as in the IC as has been demonstrated before for theprocessing of interaural phase (Spitzer and Semple, 1991, 1993,1998; McAlpine et al., 2000), level differences (Sanes et al., 1998),monaural frequency transitions (Malone and Semple, 2001) andsimulated motion (Wilson and O’Neill, 1998).
FREQUENCY DISCRIMINABILITY ENHANCEMENT REFLECTS THEDEGREE OF SSAWe found a strong correlation between the discriminabilityenhancement and the degree of SSA, but only for the conditionwith the lowest deviant probability (pDev = 10%) and largerfrequency separation (�f > 0.07) (Figure 8). These are alsothe conditions that had higher CSI. This positive correlation isexpected from the design of the experiment. The two frequencieswere selected to evoke equivalent responses in the equiprobablecondition, and in the oddball condition they were expected toevoke different responses. In consequence, we expected a sub-stantial overlap between the spike count distributions in theequiprobable condition, but a decreasing overlap in the oddballcondition. Indeed, DEI depended on deviant probability and fre-quency separation very similarly to CSI (Figure 7). Finally, theabsence of SSA and null enhancement in deviant detectability byCN neurons reinforced the notion that deviant discriminability isa functional consequence of SSA (Figures 12 and 13).
Nevertheless, we also found that neurons with CSI ≤ 0.1showed a significant decrease in AUC in the oddball condition(Figure 6B). This decrease was due to larger corrections for theAUCs obtained under the oddball condition than to the AUCsunder the equiprobable one. This trend should be seen as anegative bias in the estimation of the AUC under oddball condi-tions. Given that as a rule AUC increased with decreasing deviantprobability, our conclusions should be considered as conservative.
FUNCTIONAL SIGNIFICANCENeuronal responses in auditory cortex are plastic at many dif-ferent time scales (Condon and Weinberger, 1991; Kilgard andMerzenich, 1998, 2002; Fritz et al., 2003; Ulanovsky et al., 2003;Froemke et al., 2007). Here we demonstrate that neurons in ICshow some sort of short-term plasticity under similar conditionsto neurons in MGB and A1. As previously suggested (Antuneset al., 2010), the non-lemniscal regions of the IC could trans-mit SSA to the non-lemniscal MGB neurons, which in turnwould project to the superficial layers of AC (Cetas et al., 1999;Huang and Winer, 2000; Anderson et al., 2009). Neurons in the
medial division of the MGB have large-diameter axons that areknown to terminate primarily in layer I of the auditory cortexin both primary and secondary cortical fields. For example, inthe somatosensory cortex Cauller and Connors (1994) observedstrong excitatory effects on pyramidal cells present in layers II,III and V to be mediated by long horizontal axons located inlayer I. Further experiments are required in order to check thispossibility. Thus, at all levels of the auditory pathways, context-dependence of the responses could serve for adjusting the neuralcode to match the statistics of the input signal to produce anefficient representation of auditory scene. Similarly, the changesin responses as a function of tone probability could serve inthe processes of auditory scene analysis. Indeed, auditory streamsegregation is also sensitive to frequency separation and presenta-tion rate (e.g., Fishman et al., 2004; Fishman and Steinschneider,2010). Moreover, there is evidence suggesting the involvementof pre-attentive neural process in auditory stream segregation(Winkler et al., 2003). Thus, SSA in IC may increase the saliencyof low-probability signals, helping to segregate them by reduc-ing the ambiguity of the neuronal representations for downstreamread-out mechanisms.
Interestingly, our results suggest that the initial locus for thecomputation of SSA is not at the very first stations of the audi-tory pathway, e.g., the CN. Thus, the picture of the auditorysystem that emerges here reinforces the idea that the initialcoding of sounds is purely based on their short-term physicalcharacteristics, and sensitivity to longer contexts that is requiredfor higher-order processing, efficient coding, and auditory sceneanalysis appears only later.
AUTHOR CONTRIBUTIONSManuel S. Malmierca and David Pérez-González designedresearch; Yaneri A. Ayala performed research; Yaneri A. Ayala,Daniel Duque, David Pérez-González and Israel Nelken analyzeddata; Yaneri A. Ayala, David Pérez-González, Israel Nelken andManuel S. Malmierca wrote the paper.
ACKNOWLEDGMENTSFinancial support was provided by the Spanish MEC (BFU2009-07286), EU (EUI2009-04083, in the framework of the ERA-NET NEURON Network of European Funding for NeuroscienceResearch) to Manuel S. Malmierca. Israel Nelken was supportedby a grant from the Israeli Ministry of Health in the frameworkof the ERA-NET Network. Daniel Duque held a fellowship fromthe Spanish MINECO (BES-2010-035649). David Pérez-Gonzálezheld a postdoctoral fellowship from the Botín Foundation. Wethank Drs. Alan Palmer and Trevor M. Shackleton for theirconstructive comments on a previous version.
REFERENCESAnderson, L. A., Christianson, G. B.,
and Linden, J. F. (2009). Stimulus-specific adaptation occurs in theauditory thalamus. J. Neurosci. 29,7359–7363.
Anderson, L. A., Izquierdo, M. A.,Antunes, F. M., and Malmierca, M.S. (2009). A monosynaptic pathway
from dorsal cochlear nucleus toauditory cortex in rat. Neuroreport20, 462–466.
Anderson, L. A., and Malmierca, M. S.(2013). The effect of auditory corti-cal deactivation on stimulus-specificadaptation in the inferior collicu-lus of the rat. Eur. J. Neurosci. 37,52–62.
Antunes, F. M., and Malmierca,M. S. (2011). Effect of auditorycortex deactivation on stimulus-specific adaptation in the medialgeniculate body. J. Neurosci. 31,17306–17316.
Antunes, F. M., Nelken, I., Covey,E., and Malmierca, M. S. (2010).Stimulus-specific adaptation in the
auditory thalamus of the anes-thetized rat. PLoS ONE 5:e14071.doi: 10.1371/journal.pone.0014071
Ayala, Y. A., and Malmierca, M. S.(2012). Stimulus-specific adapta-tion and deviance detection in theinferior colliculus. Front. NeuralCircuits 6:89. doi: 10.3389/fncir.2012.00089
Frontiers in Neural Circuits www.frontiersin.org January 2013 | Volume 6 | Article 119 | 17
Ayala et al. Frequency discrimination and stimulus deviance
Bäuerle, P., von der Behrens, W.,Kössl, M., and Gaese, B. H. (2011).Stimulus-specific adaptation in thegerbil primary auditory thalamus isthe result of a fast frequency-specifichabituation and is regulated by thecorticofugal system. J. Neurosci. 31,9708–97022.
Cant, N. B., and Benson, C. G. (2003).Parallel auditory pathways: projec-tion patterns of the different neu-ronal populations in the dorsal andventral cochlear nuclei. Brain Res.Bull. 60, 457–474.
Cauller, L. J., and Connors, B. W.(1994). Synaptic physiology of hor-izontal afferents to layer I in slicesof rat SI neocortex. J. Neurosci. 14,751–762.
Cetas, J. S., de Venecia, R. K.,and McMullen, N. T. (1999).Thalamocortical afferents ofLorente de Nó: medial geniculateaxons that project to primary audi-tory cortex have collateral branchesto layer I. Brain Res. 830, 203–208.
Chechik, G., Anderson, M. J., Bar-Yosef, O., Young, E. D., Tishby, N.,and Nelken, I. (2006). Reductionof information redundancy in theascending auditory pathway. Neuron51, 359–368.
Cohn, T. E., Green, D. G., and Tanner,W. P. Jr. (1975). Receiver operatingcharacteristic analysis. Applicationto the study of quantum fluc-tuation effects in optic nerve ofRana pipiens. J. Gen. Physiol. 66,583–616.
Condon, C. D., and Weinberger, N.M. (1991). Habituation producesfrequency-specific plasticity ofreceptive fields in the auditorycortex. Behav. Neurosci. 105,416–430.
Duque, D., Pérez-González, D., Ayala,A. Y., Palmer, A. R., and Malmierca,M. S. (2012). Topographic distribu-tion, frequency and intensity depen-dence of stimulus specific adapta-tion in the inferior colliculus of therat. J. Neurosci. 32, 17762–17774.
Faure, P. A., Fremouw, T., Casseday,J. H., and Covey, E. (2003).Temporal masking reveals prop-erties of sound-evoked inhibitionin duration-tuned neurons of theinferior colliculus. J. Neurosci. 23,3052–3065.
Fawcett, T. (2006). An introduction toROC analysis. Pattern Recognit. Lett.27, 861–874.
Fishman, Y. I., Arezzo, J. C., andSteinschneider, M. (2004). Auditorystream segregation in monkey audi-tory cortex: effects of frequency sep-aration, presentation rate, and toneduration. J. Acoust. Soc. Am. 116,1656–1670.
Fishman, Y. I., and Steinschneider,M. (2010). “Formation of auditorystreams,” in The Oxford Handbook ofAuditory Science: the Auditory Brain,ed D. R. Moore (New York, NY:Oxford UP), 215–245.
Fritz, J., Shamma, S., Elhilali, M., andKlein, D. (2003). Rapid task-relatedplasticity of spectrotemporal recep-tive fields in primary auditory cor-tex. Nat. Neurosci. 6, 1216–1223.
Froemke, R. C., Merzenich, M. M., andSchreiner, C. E. (2007). A synapticmemory trace for cortical receptivefield plasticity. Nature 450, 425–429.
Geis, H. R., van der Heijden, M.,and Borst, J. G. (2011). Subcorticalinput heterogeneity in the mouseinferior colliculus. J. Physiol. 589,3955–3967.
Gordon, N., Shackleton, T. M., Palmer,A. R., and Nelken, I. (2008).Responses of neurons in the inferiorcolliculus to binaural disparities:insights from the use of Fisherinformation and mutual infor-mation. J. Neurosci. Methods 169,391–404.
Green, D. M., and Swets, J. A. (1966).Signal Detection Theory andPsychophysics. New York, NY: Wiley.
Gutfreund, Y. (2012). Stimulus-specificadaptation, habituation and changedetection in the gaze control system.Biol. Cybern. 106, 657–668.
Huang, C. L., and Winer, J. A. (2000).Auditory thalamocortical projec-tions in the cat: laminar and arealpatterns of input. J. Comp. Neurol.427, 302–331.
Hara, K., and Harris, R. A. (2002). Theanesthetic mechanism of urethane:the effects on neurotransmitter-gated ion channels. Anesth. Analg.94, 313–318.
Harris, K. D., Bartho, P., Chadderton,P., Curto, C., De La Rocha, J.,Hollender, L., et al. (2011). Howdo neurons work together? Lessonsfrom auditory cortex. Hear. Res.271, 37–53.
Hernández, O., Espinosa, N., Pérez-González, D., and Malmierca, M.S. (2005). The inferior colliculus ofthe rat: a quantitative analysis ofmonaural frequency response areas.Neuroscience 132, 203–217.
Jiang, D., Palmer, A. R., and Winter,I. M. (1996). Frequency extent oftwo-tone facilitation in onset unitsin the ventral cochlear nucleus.J. Neurophysiol. 75, 380–395.
Kilgard, M. P., and Merzenich, M. M.(1998). Plasticity of temporal infor-mation processing in the primaryauditory cortex. Nat. Neurosci. 1,727–731.
Kilgard, M. P., and Merzenich, M.M. (2002). Order-sensitive plasticity
in adult primary auditory cortex.Proc. Natl. Acad. Sci. U.S.A. 99,3205–3209.
Kisley, M. A., and Gerstein, G. L.(1999). Trial-to-trial variabilityand state-dependent modulationof auditory-evoked responses incortex. J. Neurosci. 19, 10451–10460.
LeBeau, F. E., Malmierca, M. S., andRees, A. (2001). Iontophoresisin vivo demonstrates a key role forGABA(A) and glycinergic inhibitionin shaping frequency response areasin the inferior colliculus of guineapig. J. Neurosci. 21, 7303–7312.
Lee, C. C., and Sherman, S. M.(2010). Topography and physiologyof ascending streams in the auditorytectothalamic pathway. Proc. Natl.Acad. Sci. U.S.A. 107, 372–377.
Lee, C. C., and Sherman, S. M. (2011).On the classification of pathwaysin the auditory midbrain, thalamus,and cortex. Hear. Res. 276, 79–87.
Loftus, W. C., Malmierca, M. S., Bishop,D. C., and Oliver, D. L. (2008).The cytoarchitecture of the infe-rior colliculus revisited: a commonorganization of the lateral cortexin rat and cat. Neuroscience 154,196–205.
Lumani, A., and Zhang, H. (2010).Responses of neurons in the rat’sdorsal cortex of the inferior collicu-lus to monaural tone bursts. BrainRes. 1351, 115–129.
Malmierca, M. S., Blackstad, T. W.,and Osen, K. K. (2011). Computer-assisted 3-D reconstructions ofGolgi-impregnated neurons inthe cortical regions of the inferiorcolliculus of rat. Hear. Res. 274,13–26.
Malmierca, M. S., Cristaudo, S.,Pérez-González, D., and Covey, E.(2009). Stimulus-specific adapta-tion in the inferior colliculus of theanesthetized rat. J. Neurosci. 29,5483–5493.
Malmierca, M. S., Hernández, O.,Falconi, A., Lopez-Poveda, E. A.,Merchan, M., and Rees, A. (2003).The commissure of the inferior col-liculus shapes frequency responseareas in rat: an in vivo study usingreversible blockade with microinjec-tion of kynurenic acid. Exp. BrainRes. 153, 522–529.
Malmierca, M. S., Izquierdo, M. A.,Cristaudo, S., Hernández, O., Pérez-González, D., Covey, E., et al.(2008). A discontinuous tonotopicorganization in the inferior col-liculus of the rat. J. Neurosci. 28,4767–4776.
Malmierca, M. S., Merchán, M.A., Henkel, C. K., and Oliver,D. L. (2002). Direct projectionsfrom cochlear nuclear complex
to auditory thalamus in the rat.J. Neurosci. 22, 10891–10897.
Malmierca, M. S., and Ryugo, D. K.(2011). “Descending connections ofauditory cortex to the midbrain andbrainstem,” in The Auditory Cortex,eds J. A. Winer and C. E. Schreiner(New York, NY: Springer), 189–208.
Malone, B. J., and Semple, M. N.(2001). Effects of auditory stimuluscontext on the representation of fre-quency in the gerbil inferior collicu-lus. J. Neurophysiol. 86, 1113–1130.
Maris, E. (2012). Statistical testingin electrophysiological studies.Psychophysiology 49, 549–565.
McAlpine, D., Jiang, D., Shackleton,T. M., and Palmer, A. R. (2000).Responses of neurons in the infe-rior colliculus to dynamic inter-aural phase cues: evidence for amechanism of binaural adaptation.J. Neurophysiol. 83, 1356–1365.
Merrill, E. G., and Ainsworth, A.(1972). Glass-coated platinum-plated tungsten microelectrodes.Med. Biol. Eng. 10, 662–672.
Mill, R., Coath, M., Wennekers, T., andDenham, S. L. (2011). A neuro-computational model of stimulus-specific adaptation to oddball andMarkov sequences. PLoS Comput.Biol. 7:e1002117. doi: 10.1371/jour-nal.pcbi.1002117
Näätänen, R. (1992). Attention andBrain Function. Hillsdale, NJ:Lawrence Erlbaum.
Nelken, I., and Ulanovsky, N. (2007).Mismatch negativity and stimulus-specific adaptation in animal mod-els. J. Psychophysiol. 21, 214–223.
Nelson, D. A., and Kiester, T. E. (1978).Frequency discrimination in thechinchilla. J. Acoust. Soc. Am. 64,114–126.
Netser, S., Zahar, Y., and Gutfreund,Y. (2011). Stimulus-specific adapta-tion: can it be a neural correlate ofbehavioral habituation? J. Neurosci.31, 17811–17820.
Palmer, A. R., Jiang, D., and Marshall,D. H. (1996). Responses of ventralcochlear nucleus onset and chopperunits as a function of signal band-width. J. Neurophysiol. 75, 780–794.
Patel, C. R., Redhead, C., Cervi, A. L.,and Zhang, H. (2012). Neural sen-sitivity to novel sounds in the rat’sdorsal cortex of the inferior collicu-lus as revealed by evoked local fieldpotentials. Hear. Res. 286, 41–54.
Paxinos, G., and Watson, C. (2007). TheRat Brain in Stereotaxic Coordinates.Burlington, VT: Elsevier-Academic.
Pérez-González, D., Hernández, O.,Covey, E., and Malmierca, M.S. (2012). GABA(A)-mediatedinhibition modulates stimulus-specific adaptation in the inferior
Frontiers in Neural Circuits www.frontiersin.org January 2013 | Volume 6 | Article 119 | 18
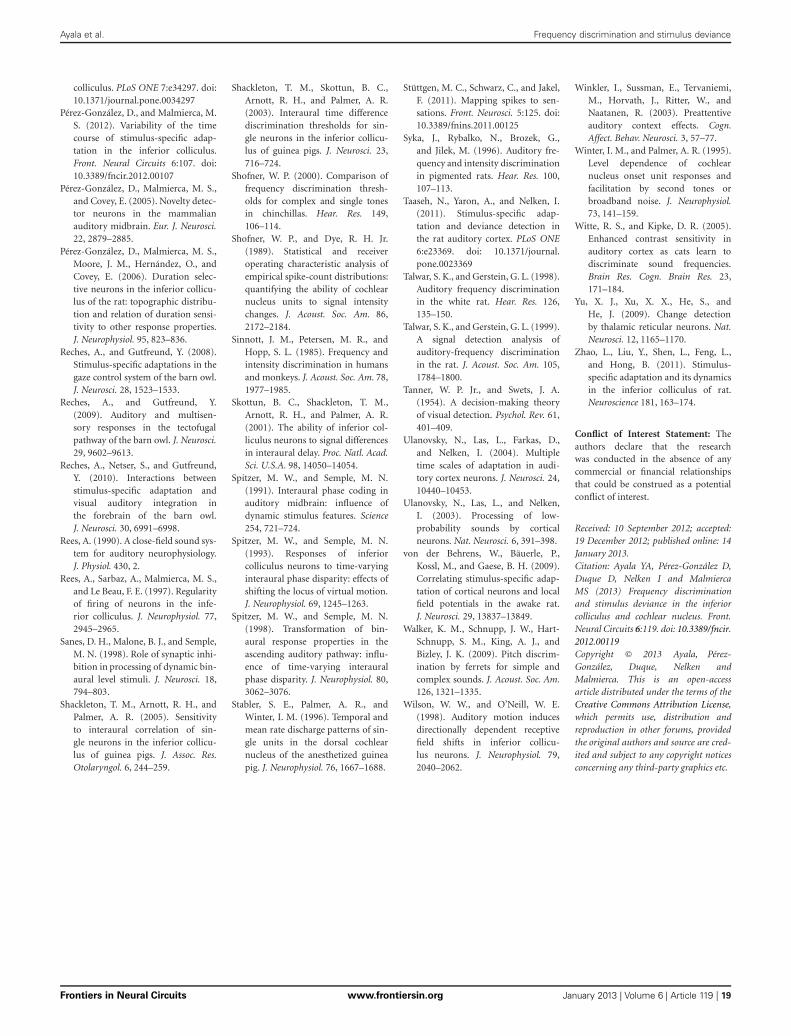
Ayala et al. Frequency discrimination and stimulus deviance
colliculus. PLoS ONE 7:e34297. doi:10.1371/journal.pone.0034297
Pérez-González, D., and Malmierca, M.S. (2012). Variability of the timecourse of stimulus-specific adap-tation in the inferior colliculus.Front. Neural Circuits 6:107. doi:10.3389/fncir.2012.00107
Pérez-González, D., Malmierca, M. S.,and Covey, E. (2005). Novelty detec-tor neurons in the mammalianauditory midbrain. Eur. J. Neurosci.22, 2879–2885.
Pérez-González, D., Malmierca, M. S.,Moore, J. M., Hernández, O., andCovey, E. (2006). Duration selec-tive neurons in the inferior collicu-lus of the rat: topographic distribu-tion and relation of duration sensi-tivity to other response properties.J. Neurophysiol. 95, 823–836.
Reches, A., and Gutfreund, Y. (2008).Stimulus-specific adaptations in thegaze control system of the barn owl.J. Neurosci. 28, 1523–1533.
Reches, A., and Gutfreund, Y.(2009). Auditory and multisen-sory responses in the tectofugalpathway of the barn owl. J. Neurosci.29, 9602–9613.
Reches, A., Netser, S., and Gutfreund,Y. (2010). Interactions betweenstimulus-specific adaptation andvisual auditory integration inthe forebrain of the barn owl.J. Neurosci. 30, 6991–6998.
Rees, A. (1990). A close-field sound sys-tem for auditory neurophysiology.J. Physiol. 430, 2.
Rees, A., Sarbaz, A., Malmierca, M. S.,and Le Beau, F. E. (1997). Regularityof firing of neurons in the infe-rior colliculus. J. Neurophysiol. 77,2945–2965.
Sanes, D. H., Malone, B. J., and Semple,M. N. (1998). Role of synaptic inhi-bition in processing of dynamic bin-aural level stimuli. J. Neurosci. 18,794–803.
Shackleton, T. M., Arnott, R. H., andPalmer, A. R. (2005). Sensitivityto interaural correlation of sin-gle neurons in the inferior collicu-lus of guinea pigs. J. Assoc. Res.Otolaryngol. 6, 244–259.
Shackleton, T. M., Skottun, B. C.,Arnott, R. H., and Palmer, A. R.(2003). Interaural time differencediscrimination thresholds for sin-gle neurons in the inferior collicu-lus of guinea pigs. J. Neurosci. 23,716–724.
Shofner, W. P. (2000). Comparison offrequency discrimination thresh-olds for complex and single tonesin chinchillas. Hear. Res. 149,106–114.
Shofner, W. P., and Dye, R. H. Jr.(1989). Statistical and receiveroperating characteristic analysis ofempirical spike-count distributions:quantifying the ability of cochlearnucleus units to signal intensitychanges. J. Acoust. Soc. Am. 86,2172–2184.
Sinnott, J. M., Petersen, M. R., andHopp, S. L. (1985). Frequency andintensity discrimination in humansand monkeys. J. Acoust. Soc. Am. 78,1977–1985.
Skottun, B. C., Shackleton, T. M.,Arnott, R. H., and Palmer, A. R.(2001). The ability of inferior col-liculus neurons to signal differencesin interaural delay. Proc. Natl. Acad.Sci. U.S.A. 98, 14050–14054.
Spitzer, M. W., and Semple, M. N.(1991). Interaural phase coding inauditory midbrain: influence ofdynamic stimulus features. Science254, 721–724.
Spitzer, M. W., and Semple, M. N.(1993). Responses of inferiorcolliculus neurons to time-varyinginteraural phase disparity: effects ofshifting the locus of virtual motion.J. Neurophysiol. 69, 1245–1263.
Spitzer, M. W., and Semple, M. N.(1998). Transformation of bin-aural response properties in theascending auditory pathway: influ-ence of time-varying interauralphase disparity. J. Neurophysiol. 80,3062–3076.
Stabler, S. E., Palmer, A. R., andWinter, I. M. (1996). Temporal andmean rate discharge patterns of sin-gle units in the dorsal cochlearnucleus of the anesthetized guineapig. J. Neurophysiol. 76, 1667–1688.
Stüttgen, M. C., Schwarz, C., and Jakel,F. (2011). Mapping spikes to sen-sations. Front. Neurosci. 5:125. doi:10.3389/fnins.2011.00125
Syka, J., Rybalko, N., Brozek, G.,and Jilek, M. (1996). Auditory fre-quency and intensity discriminationin pigmented rats. Hear. Res. 100,107–113.
Taaseh, N., Yaron, A., and Nelken, I.(2011). Stimulus-specific adap-tation and deviance detection inthe rat auditory cortex. PLoS ONE6:e23369. doi: 10.1371/journal.pone.0023369
Talwar, S. K., and Gerstein, G. L. (1998).Auditory frequency discriminationin the white rat. Hear. Res. 126,135–150.
Talwar, S. K., and Gerstein, G. L. (1999).A signal detection analysis ofauditory-frequency discriminationin the rat. J. Acoust. Soc. Am. 105,1784–1800.
Tanner, W. P. Jr., and Swets, J. A.(1954). A decision-making theoryof visual detection. Psychol. Rev. 61,401–409.
Ulanovsky, N., Las, L., Farkas, D.,and Nelken, I. (2004). Multipletime scales of adaptation in audi-tory cortex neurons. J. Neurosci. 24,10440–10453.
Ulanovsky, N., Las, L., and Nelken,I. (2003). Processing of low-probability sounds by corticalneurons. Nat. Neurosci. 6, 391–398.
von der Behrens, W., Bäuerle, P.,Kossl, M., and Gaese, B. H. (2009).Correlating stimulus-specific adap-tation of cortical neurons and localfield potentials in the awake rat.J. Neurosci. 29, 13837–13849.
Walker, K. M., Schnupp, J. W., Hart-Schnupp, S. M., King, A. J., andBizley, J. K. (2009). Pitch discrim-ination by ferrets for simple andcomplex sounds. J. Acoust. Soc. Am.126, 1321–1335.
Wilson, W. W., and O’Neill, W. E.(1998). Auditory motion inducesdirectionally dependent receptivefield shifts in inferior collicu-lus neurons. J. Neurophysiol. 79,2040–2062.
Winkler, I., Sussman, E., Tervaniemi,M., Horvath, J., Ritter, W., andNaatanen, R. (2003). Preattentiveauditory context effects. Cogn.Affect. Behav. Neurosci. 3, 57–77.
Winter, I. M., and Palmer, A. R. (1995).Level dependence of cochlearnucleus onset unit responses andfacilitation by second tones orbroadband noise. J. Neurophysiol.73, 141–159.
Witte, R. S., and Kipke, D. R. (2005).Enhanced contrast sensitivity inauditory cortex as cats learn todiscriminate sound frequencies.Brain Res. Cogn. Brain Res. 23,171–184.
Yu, X. J., Xu, X. X., He, S., andHe, J. (2009). Change detectionby thalamic reticular neurons. Nat.Neurosci. 12, 1165–1170.
Zhao, L., Liu, Y., Shen, L., Feng, L.,and Hong, B. (2011). Stimulus-specific adaptation and its dynamicsin the inferior colliculus of rat.Neuroscience 181, 163–174.
Conflict of Interest Statement: Theauthors declare that the researchwas conducted in the absence of anycommercial or financial relationshipsthat could be construed as a potentialconflict of interest.
Received: 10 September 2012; accepted:19 December 2012; published online: 14January 2013.Citation: Ayala YA, Pérez-González D,Duque D, Nelken I and MalmiercaMS (2013) Frequency discriminationand stimulus deviance in the inferiorcolliculus and cochlear nucleus. Front.Neural Circuits 6:119. doi: 10.3389/fncir.2012.00119Copyright © 2013 Ayala, Pérez-González, Duque, Nelken andMalmierca. This is an open-accessarticle distributed under the terms of theCreative Commons Attribution License,which permits use, distribution andreproduction in other forums, providedthe original authors and source are cred-ited and subject to any copyright noticesconcerning any third-party graphics etc.
Frontiers in Neural Circuits www.frontiersin.org January 2013 | Volume 6 | Article 119 | 19