RESPIRATORY AND HEMODYNAMIC EFFECTS OF ...
150
RESPIRATORY AND HEMODYNAMIC EFFECTS OF DIMINISHED EXPIRATORY FLOW DURING ARTIFICIAL VENTILATION THESIS SUBMITTED FOR THE DEGREE OF DOCTOR OF MEDICINE AT THE ERASMUS UNIVERSITY ROTTERDAM ON THE AUTHORITY OF THE RECTOR MAGNIFICUS PROF. DR. M.W. VAN HOF AND BY THE DECISION OF THE COLLEGE OF DEANS. THE PUBLIC DEFENCE WILL TAKE PLACE ON FRIDAY JUNE 6, 1986 AT 14.00 HRS BY WILLEM VAN ROOYEN BORN IN BANDUNG krips repro meppel
-
Upload
khangminh22 -
Category
Documents
-
view
8 -
download
0
Transcript of RESPIRATORY AND HEMODYNAMIC EFFECTS OF ...

RESPIRATORY AND HEMODYNAMIC EFFECTS OF DIMINISHED EXPIRATORY FLOW
DURING ARTIFICIAL VENTILATION
THESIS
SUBMITTED FOR THE DEGREE OF DOCTOR OF MEDICINE
AT THE ERASMUS UNIVERSITY ROTTERDAM ON THE AUTHORITY OF THE RECTOR MAGNIFICUS
PROF. DR. M.W. VAN HOF AND BY THE DECISION OF THE COLLEGE OF DEANS.
THE PUBLIC DEFENCE WILL TAKE PLACE ON FRIDAY JUNE 6, 1986
AT 14.00 HRS
BY
WILLEM VAN ROOYEN
BORN IN BANDUNG
krips repro meppel
PROMOTIECOMMISSIE
PROMOTOR: PROF. DR. A. VERSPRILLE OVERIGE LEDEN: PROF. DR. C. HILVERING
PROF. DR. L.G. THIJS PROF. DR. D.l. WESTBROEK
CO-Pi10MOTOR: DR. H.A. BRUINING
De uiteindelijke vormgeving van dit proefschrift werd mede mogelijk gemaakt door financiele steun van het Affiliatiefonds Medische Specialisten van het Sophia Ziekenhuis te Zwolle.
Druk: Krips Repro Meppel


Contents
Chapter I
Chapter II
Chapter III
Chapter IV
Chapter V
Chapter VI
Introduction
Methods
Cardiac output measurement by the thermodilution technique
Results of the effects of varying degrees of a diminished
expiratory flow and comparable positive end-expiratory
pressure during mechanical ventilation on hemodynamic and
pulmonary parameters.
Discussion of the results of the hemodynamic and respira
tory effects of a diminished expiratory flow and comparable
positive end-expiratory pressure during mechanical
ventilation.
Single breath analysis of carbon dioxide exchange dependent
on the duration of expiration during mechanical ventilation
Chapter VII Summary
Chapter VIII Samenvatting
Appendix
References
Acknowledgements
Curriculum Vitae


List of abreviations frequently used:
IPPV intermittent positive pressure ventilation
DEF diminished expiratory flov
PEEP positive end-expiratory pressure
tracheal pressure
partial pressure of arterial oxygen
partial pressure of arterial carbon dioxide
partial pressure of mixed venous carbon dioxide
partial pressure of carbon dioxide in the expiratory air
partial pressure of carbon dioxide in the end-expiratory air
systemic arterial pressure
pulmonary arterial pressure
right atrial pressure
Substituting P for P gives the mean
ventilatory flov
carbon dioxide output
physiological dead space fraction
cardiac output estimated by the thermodilution method
cardiac output estimated by the Fick method for oxygen


CHAPTER 1
Introduction and review of the literature
It is a matter o£ common clinical observation. that many patients with
chronic obstructive pulmonary disease (COPD), especially patients with a
severe emphysema, per£orm their expiratory effort through pursed lips,
particularly during episodes of dyspnea.
One of the main objectives in the treatment a£ COPD is to avoid
hypoventilation by an increase of tidal volume and to diminish uneven
ventilation. The resultant improvement of gas exchange can partly be
achieved by breathing exercises using a prolonged expiration, with or
without the active use of diaphragmatic muscles (Barach, 1938; Miller,
, 958). The mechanism of this improvement obtained by pursed lips
breathing has been debated in the literature. Indeed, it does seem
con£licting to £urther increase airway resistance during expiration by
pursed lips breathing or an additional external expiratory resistance.
since an elevated expiratory airflow resistance is a main problem in
patients with COPD. Thus an additional airway resistance will even
further increase expiratory e££ort (Mead et al .• 1955). However, in
patients with pulmonary emphysema, the expiratory obstruction is mainly
caused by a collapse a£ the airways due to a loss of pulmonary elasticity
which is shown to exist in patients with emphysema (Christie, 1934) and
which normally support the airways (Hughes et al., 1974). During
expiration a rise of intrapleural pressure due to active muscular ef£ort
compresses the bronchi in those segments, where intraluminal pressure is
lower (Dayman, 1951) resulting in air trapping. Pursed lips breathing may
prevent this phenomenon of collapse by causing an extra obstruction
downstream £rom the bronchial level resulting in an increase o£ the
intraluminal airway pressure, and thus reducing
transbronchial pressure dif£erence (Miller, 1958).
the e£fective
An increased
intraluminal airway pressure of 4-8 em H2o has been shown to result in
less constriction of the bronchi during expiration in asthmatic patients,
studied by bronchograms (Barach, 1938). A higher mean airway pressure,
either caused by prolonged insufflation during mechanical ventilation or
retarded expiration, has been thought to be the main determinant for a
11

A
B
-· c -·-· .-· r ---:_:;:>·...---.-·- J _ . ....,
-·-· ! -·-.-EEP2 EPP1
---+<------R e
Fig. I-1: Pressure fall during expiration over intra- and extrathoracic air...,ays
A. A schematic conceptual model of extra (1) and intrathoracic (2) airways as a tube of constant resistance between alveoli (3) and mouth of nostrils. This implies a nonlinear projection of anatomical length of the airways on this tube. Parts with a relatively large resistance as the upper airways will take a longer part of the tube than peripheral bronch~_oli vhere the resistance is relatively low. PA is alveolar pressure recoil pressure; Pth airways.
during expiration; VE is (intrathoracic pressure)
expiratory flow; PL = PA-PL; Pth surrounds
is the
B. Pressure fall from alveoli to nostrils over a normal airway resistance (Rn). At the site where pressure in the airways is decreased to PA-P1 , transmural pressure is zero because airway pressure is equal to Pth" This is the equal pressure point (EEP). Downstream (in left direction) surrounding pressure is higher than intraluminal pressure causing some compression of the airways. C. Conceptual diagram for a patient with emphysema. Airway resistance is increased, therefore the abscis is lengthened to the right (Re) with respect toRn. Extrathoracic resistance is constant. A higher PA is needed for expiration. Due to loss of elasticity P1 is decreased. Therefore, Pth is higher during expiration than in normal humans. The point of zero transmural pressure is shifted to the periphery with respect to normals (EPP
1 ). An
additional external resistance (Par) decreases the pressure gradient giving a shift of EPP 1 to proximal airways (EPP2 ) and a smaller positive pressure on the airways down-stream of EPP 2 .
12

more uni~orm distribution o~ inspired gas and pulmonary blood, producing
better gas exchange (Bergman, 1963).
Expiratory ~low depends on the pressure drop along the intrathoracic
airways. By pursed lips breathing a portion o~ this pressure drop will be
moved to the upmost airway so that the drop occurring along the airways
will be decreased by an equivalent amount, resulting in an increased
amount o~ expiratory volume and hence ventilation (Fry and Hyatt, 1960).
This mechanism is explained in Fig. I-1 .
An additional effect of pursed lips breathing is the induced reduction of
the initial respiratory flow rate reducing the Bernouilli effect created
by airflow and there~ore reducing the tendency ~or poorly supported
airways to collapse (Schmidt et al., 1964), resulting in a longer
maintained patency of very compliant_airways.
Another effect seen with pursed lips breathing is a reduced respiratory
rate after the onset. The reduction o~ the respiratory rate has been
favoured by some as the main beneficial effect (Thoman et al., 1966:
Abboud et al., 1968; Mueller et al., 1970). This would be in accordance
with Motley (1963), who found that slow deep breathing in patients with
emphysema resulted in an increase
improvement in the blood-gas exchange
However, Paul et al. (1966) did
in tidal volume, and a significant
for oxygen and carbon dioxide.
not find an improved effective
distribution o~ ventilation during respiratory rate slowing, although
effective ventilation increased and allowed the patients to breathe with a
smaller total ventilation. Yet. the patients ~elt less comfortable during
the slowed respiratory rate.
According to Thoman et al. (1966), pursed lips breathing results in a
slow expiration and may thus cause a more uniform emptying of dif~erent
parts of the lung. This results in an increased ventilatory rate of the
slow space, representing the more poorly ventilated areas of the lung, as
lung regions with a low ventilation
empty at low flov rates, whereas
per~usion ratio preferentially empty
1963). So, by pursed lips
to perfusion ratio preferentially
regions with a high ventilation to
at high rates of flow (Young et al.,
breathing ventilation to per~usion
relationships seem to improve in different parts of the lung.
Ventilatory and pulmonary changes ascribed to pursed lips breathing or an
additional external expiratory resistance will include:
-a higher vital capacity (Schmidt et al., 1964);
- a higher end-expiratory lung volume (Moomjian et al., 1980) which is
even more marked in normal subjects (Ingram and Schilder, 1967);
-an increase of the tidal volume (Zechman et al., 1957; Thoman et al.,
1966; Mueller et al., 1970);
-a decrease of respiratory rate (Zechman et al., 1957; Thoman et al.,
13

1966; Abboud et al., 1968; Mueller et al., 1970);
-increase in the ventilation rate of the slow space (Thoman et al.,
1966);
- an increase in the partial pressure of oxygen in the systemic arterial
blood (Thoman et al., 1966; Mueller et al .• 1970);
- a decrease in the partial pressure of carbon dioxide in the systemic
arterial blood (Thoman et al., 1966; Mueller et al .• 1970);
-a decrease of the physiological dead space (Abboud et al., 1968), and
- a shift of the equal pressure point to the higher airways, and therefore
a decrease in collapsibility (Fig. I-1 ).
The data presented in the literature are incomplete, and some authors are
not in accordance with others. Probably, the beneficial effect of pursed
lips breathing in patients with COPD is the combination of a decreased
airway collapse resulting in less airtrapping and in better emptying of
the more compliant alveoli and so a better ventilation to perfusion
relationship in them, an enlarged tidal volume and a slowed respiratory
rate.
Hemodynamic phenomena were not studied during pursed lips breathing,
except for the demonstration of a decrease of cardiac output during
expiratory obstruction (Huggett, 1924).
Acute decompensation of chronic respiratory failure in a patient with COPD
poses a great problem, with large difficulties to treat. It is emphasized
however to delay mechanical ventilation as long as possible (Pontoppidan
et al., 1972), because intubation and mechanical ventilation produce a
high incidence of complications, e.g. pulmonary barotrauma resulting in
subcutaneous and/or mediastinal emphysema or even pneumothorax (Kumar et
al., 1973) and a decrease in cardiac output. -Auto-PEEP- (positive
alveolar pressure throughout the ventilatory cycle during mechanical
ventilation producing an increase in intrathoracic pressure, even without
intentional application of PEEP) has been reported as a mechanism for
these complications in mechanically ventilated patients with airflow
obstruction (Pepe and Marini, 1982). Often high tidal volumes are needed
for effective artificial ventilation of COPD patients, which may lead to a
fall of cardiac output to very low levels (Redley-Whyte et al., 1966).
Many studies have been done to investigate the influence of the
inspiratory waveform on the efficiency of gas exchange, but experimental
and clinical investigations and extensive computer simulation of
biophysical modeling have failed to show convincingly that the
configuration of the inspiratory pressure flow pattern is of major
clinical importance (Pontoppidan et al., 1977; Damman and McAslan, 1977)
especially in healthy subjects (Bergman, 1967). However, an inspiratory
14

hold or end-inspiratory pause was seen to be beneficial to improve gas
distribution and efficiency of washout (Damman et al., 1978; Perez-Chada
et al., 1983) resulting in a rise of the partial pressure o£ systemic
arterial oxygen and a decrease in the partial pressure of systemic
arterial carbon dioxide (Knelson et al., 1970). The effects of an
expiratory flow retard during artificial ventilation, simulating pursed
lips breathing were thought to be disadvantageous (Fairley, 1976) but have
not as yet been investigated. It has been mentioned once that an
expiratory flow retard should be distinguished from a positive expiratory
pressure plateau (Mcintyre et al .• 1969), which is the same as PEEP.
Expiratory flow impedance was used to generate PEEP but coughing and
straining with the creation of dangerously high. airway pressures were a
hazard with consequently a high incidence of barotrauma resulting in
bilateral tension pneumothorax, subcutaneous and mediastinal emphysema
(Kumar et
(Pontoppidan
1 972).
al., 1 970). There was no evidence of its effectiveness
et al., 1972) and it was therefore abandoned (Falke et al.,
Objectives of the study
The supposition, that a diminished expiratory flow (DEF) during artificial
ventilation will improve blood-gas exchange. especially in obstructive
pulmonary disease and that DEF improves blood-gas exchange better than a
comparable positive end-expiratory pressure (PEEP. producing the same rise
in mean tracheal pressure) was explored in experiments using Yorkshire
piglets, without altering respiratory rate, tidal volume, inspiratory
time~ inspiratory hold or expiratory time.
During mechanical ventilation the effects of DEF and a comparable PEEP on
hemodynamics, gas exchange and pulmonary mechanics were studied.
These effects were compared to each other and to intermittent positive
pressure ventilation (IPPV) in health and disease induced by histamine.
acetylcholine or oleic acid in order to evaluate hypothetic mechanisms of
the effects of DEF.
Additionally the validity of cardiac output estimation by the
thermodilution method and the cyclic modulation of these estimates during
the three modes of mechanical ventilation were analysed in order to find
the most appropriate way of calculating mean cardiac output from the
smallest number of estimates.
15

Outlines of this thesis
In chapter II the experimental model and the methods are described.
In chapter III cardiac output estimations by the thermodilution method are
evaluated.
The results of hemodynamic and respiratory effects (pulmonary mechanics
and gas exchange) of DEF and PEEP are presented in chapter IV and
discussed in chapter v.
In chapter VI the effects of the expiratory flow on the exchange of carbon
dioxide during mechanical ventilation are studied using single breath
analyses.
16


CHAPTER II
METHODS
II-1 MATERIAL
Yorkshire piglets with a mean age of 40 days (range 29-49) and with a mean
weight of 9.4 kg (range 8.2-11 .3) were used for the experiments. All
piglets came from the same breeding farm (Rijpwetering. Holland) and were
used for the experiments upon arrival at the laboratory.
II-2 EXPERIMENTAL CONDITIONS
Anesthesia was induced by intraperitoneal administration of 30 mg-kg- 1
pentobarbital sodium. After completion of the surgical procedures
anesthesia was
7.5 mg·kg- 1 -h-1 .
maintained by
The piglets
a continuous intravenous
were paralysed with
infusion of
d-tubocurarine
hydrochloride. Initially 1 mg was administered intravenously as a loading
dose over a period of three minutes. followed by a continuous infusion of
0.2 mg.kg- 1 -h-1 throughout the experiments.
Body temperature was maintained between 37°C and 39°C by placing the
animals on a thermo-controlled operating table.
Heparin-sodium was administered every hour in a dosage of 200 IU-kg- 1 to
prevent clotting.
II-3 SURGICAL PROCEDURES
Induction of anesthesia was followed by the application of subcutaneous
ECG electrodes. Expiratory co2-concentration was monitored throughout the
surgical procedures. A tracheostomy was performed between the fourth and
fifth cartilage ring. a metal Y-shaped tracheal canula was inserted and
the trachea was ligated around the canula. Connection of one of the Y
19

branches to a Fleisch pneumotachograph head (type 0, Godart) followed.
The other branch was sealed off and used for occasional bronchial
suctioning.
Two polyethylene catheters, manufactured on the laboratory, were inserted
into the right common carotid artery. One, a double-walled injection
catheter, was placed with its tip about 2.5 em beyond the aortic valve
within the left ventricle under the guidance of pressure-curve monitoring.
The outer diameter was 1.9 mm and the inner diameter 0.86 mm. The length
of the intracorporeal part of the catheter varied from 10-14 em, dependent
on the size of the individual animal. The other catheter, with a
thermistor at its tip, was positioned in the-aortic arch near the origin
of the brachiocephalic artery. The outer diameter was 1.57 mm. The lumen
was used for measurement and continuous monitoring of the systemic
arterial pressure and for sampling systemic arterial blood.
A four-lumen catheter, modified from a Swan-Ganz catheter (Edwards
Laboratories, type 93A-131, 7 French) was placed with its tip at the level
of the right atrium through the right internal jugular vein. One lumen
was used for monitoring the central venous pressure, the other lumina for
intravenous infusions of pentobarbital sodium
hydrochloride and injections of heparin (II-2).
nnd d-tubocurarine
A Swan-Ganz catheter (Edwards Laboratories, type 93-110, 5 French) was
inserted via the external jugular vein into the pulmonary artery under the
guidance of pressure-curve monitoring. It was used for monitoring the
pulmonary arterial pressure, and for sampling mixed venous blood.
II-4 VENTILATION
During the surgical procedures the pigs breathed spontaneously with
intermittent sighs. After the surgical procedures total paralysis was
induced (see II-2) and intermittent positive pressure ventilation (IPPV)
with room air was started using a Servo-ventilator (type 900A, Siemens
Elema-SchOnander, Sweden) at a rate of 10 per minute. The inflation time
was 25%, the inspiratory pause was 10% and the expiratory time 65% of the
ventilatory cycle.
arterial PC02
The tidal volume was adjusted to
between 41 mmHg and 45 mmHg
circumstances. On average the ventilatory volume was
obtain a systemic
under steady state
15 ml·kg- 1 (range
13.5-18.5), measured by an oil-filled volumeter (type 51. Meterfabriek,
Dordrecht).
20

II-5
--------------------~
'""'''' '" ••'•••·••~" "''""~•I oc.~<»Oom r-----~ _ S<Pno~ ~
C.1lh<'lN I~ ct~hl "'''"~oo~-~ T;;~~~u~r f--------+-1
-___,f,;,..,~.,oo<oo ~~
H~wl<.>tt-P.>ekacd
Cod~rd
St St•t~am
OEC 01\)otill £quopm<ml Corp.
HP n~
-~l.,~ufaeturcd at the l~borato.-y for p;othop~y~lology
r .. 0 .
" •c.
0
" 0
'• " u
Fig. 11-1. SCH[MATIC R[PR[$[NTATION OF TH[ DATA FLOW ANO CONTINUOUS -\10NITO!l1NC
DATA AQUISITION AND ANALYSIS
' ' '
II-5-1 ~easured signals
By continuous monitoring on a Hewlett-Packard 7758A chart recorder (fig.
II-1) the following data were simultaneously obtained throughout the
experiments:
- electrocardiogram (ECG) with subcutanous needles midsternally and in the
right leg;
-aortic pressure (Pa0 ), pulmonary arterial pressure (Ppa)' and central
venous pressure in the right atrium (Pra) by means of fluid pressure
transducers (Statham medical instruments. type P23De);
blood temperature in the aortic arch or thermodilution signa~s as
21

described later;
- tracheal pressure (PT) with a gaspressure transducer (Hewlett-Packard,
type 270);
- ventilatory flow (V) by means of a pneumotachograph (Godart, type
17212). and
- C02-concentration
(capnogram) with a
in the expiratory air as
capnograph (Godart mark II).
a function 0~ time
Sampled air was returned into the expiratory tube of the ventilatory
system.
The site of the measurements of the last three data is shown in Fig.
II-2.
The signals were also recorded on a Racal thermionic store 14
electromagnetic tape recorder during a series of measurements. Moreover
they were analysed on-line with a digital computer PDP 11/03, except for
the capnogram and ventilatory flow (Fig. II-1 ). The sample frequency was
200 Hz for ECG and bloodpressures and 50 Hz for the ventilatory flow,
tracheal pressure and thermodilution curves.
22
Fig. 11-2. SCHEMATIC DIAGRAM OF VENTILATORY CONNECTIONS
1. outlet of tr-acheal canula for measuring trache<JI pi"('SSure 2. outlets of Fleisch-he<Jd for connection to pneumotachograph 3. outlet for C02 analysis of the ventilatory air
la. to capnograph 3b. to mass-spectrometer
4. Capnograph Godard Mark II S. inlet for return of sampled <~ir by c<~pnograph 6. Servo-ventilator 7. inlet ventilator for connection to compressed air 8. mixing box for expired air 9. outlet mixing box for measurement of mixed expired 02 and C02 fractions
10. water seal, used for Positive End Expiratory Pressure 11. sealed off access for bronchial suctloning 12. one way valve
Arrows indicate direction of airflow.

Tidal Volume
Hb
R = Radiomet
PE = Perkin -
+--- ~ R
OSM 2
~ ~
er. Copenh;:.gen
Elmer
Mixed vcnou"' blood
"'ample
Systemic arterial
blood sample
Expired air
f-> II R
A8L 1
_,
I mass
Hmixing box~ spectro-
~ meter
P-E [+ MGA 1100
Fig. 11-3. SCHEMATIC REPRESENTATION OF THE ADDITIONAL MEASUREMENTS AND CALCULATIONS
II-5-2 Off line measurements
The ~allowing additional measurements and calculations were performed
(Fig. II-3),
systemic arterial and mixed venous bloodgas analysis, i.e.
pressure of oxygen (Po2 ) and carbon dioxide (Pco2
) in
acid-base values (ABL 1, Radiometer, Copenhagen) at 37°C;
the partial pressure of co2 in the end expiratory air (PEco2 ,e)
PEco2 ,e was calculated according to:
where:
~raction of co2 in the end-expiratory air
atmospheric pressure in mm Hg
water vapour pressure at the central temperature
of the animal and at full saturation
partial
nun Hg and
in nunHg
23

II-5-3 Derived variables
Cardiac output was estimated using two methods:
1 . the thermodilution method
24
The thermodilution measurements of cardiac output (COTh) were
automatically performed by injections of 0.5 ml saline (0.9% NaCl) at
room temperature into the left ventricle through the double walled
catheter (Fig. II-4). as described by Jansen et al. (1981). To
obtain complete mixing of indicator with blood three small sideholes
were made in the last centimeter of the catheter on the circumference.
about 120° apart. The tip of this catheter was sealed off.
Volume reproducibility of the syringe was checked by weighing the
volume after multiple ejections. which were performed by a pneumatic
cylinder driven by compressed air. Injections of indicator into the
ventricle were initiated by an electric signal derived from a delay
E~r--f:,A;{fPo""o// ~ ~ Loft Vontciclo Vinj = 0.5 ml _j w Pncum<Jtic Cylinder
lnjectate
Delay
Adjustable
Fig. 11-4. SCHEMATIC DIAGRAM OF THE THERMODILUTION TECHNIQUE USED
Vinj ::o syringe giving an injection volume of 0.5 ml
Comp =digital computer PDP 11/03
Tape = Racal thermionic tape recorder
Record= Hewlett P;:~ckard 7758 A ch<~rt recorder

unit. A~ter each measurement the syringe vas automatically refilled.
At least ~ive ventilatory cycles {i.e. 30 seconds) were taken between
two injections, as the 99% thermal response time of the double walled
injection catheter was about 26 seconds.
The moment of injection of the indicator depended on two factors:
a. a manual starting signal in the middle of the ventilatory cycle cycle
in which COTh was to be determined,
b. the moment vithin the ventilatory cycle. This actual moment of
automatic injection vas derived from the ventilator signal of the cycle
and preset before the manual starting signal was given {Delay, Fig.
II-4).
The thermistor in the aortic arch for the detection of the
temperature-time curve had
mm, resistance at 37°C 5000 Q
the following characteristics: diameter 0.5
It had a 90% thermal response time of
approximately 0.2 seconds. To avoid influences caused by changes in the
velocity of blood, the voltage across the thermistor was kept low. The
thermistor, measuring blood temperature {Tb) had been calibrated against a
mercury thermometer, by vhich the temperature o~ the injectate {Ti) vas
measured. Tb and Ti were determined be~ore and after each series of
measurements.
The delay unit controlled the start o~ the digital integration o~ the
temperature-time curve, detected vith the thermistor catheter and derived
from the temperature bridge. The voltage temperature characteristic of
the
the
temperature bridge gave
measurements {37-39°C).
a satisfactory linearity within the range of
COTh vas calculated according to the
following equation:
m. piSiQi{T b1 - Ti) - Cki(T b1 T.) ' '
A (T b2 - T b 1) ( t: - ttl I 2
TbT Jtl+/::.t
t, T b(t)dt/t:.t
and:
T b2 Jto+/::.t
t: T b(t)dt//::.t
mi is the effective amount of indicator in calories;
Pi and Pb are specific gravity of injectate (1 .005) and blood {1 .045)
respectively in g-ml- 1 ;
25

si and ~ are specific hea~ of injectate (0.097) and blood (0.870)
respectively in cal·g-1- 0c- 1 ;
Tb is the temperature of blood at the detection site in OC;
Ti is the temperature of injectate in oC;
A is leakage of cold through the ~all of the injection catheter
in °C-sec;
Qi is the injectate volume in ml;
Gk is the caloric value of injection catheter plus remaining injectate
in cal-cm- 1 - 0 c- 1 ;
1 is the length of the intracorporeal part of the injection catheter in
em;
t 1-t2 is the integration interval;
~tis the heart interval.
The cyclic temperature fluctuations concomitant ~ith the ventilatory cycle
~ere corrected for by integration of the area of these fluctuations over
an equal period of time within the phase of the cycle after the
dilutioncurve.
Transfer of cold through the ~all of the injection catheter, negligable
during the short injection period and slow in the measuring period, was
corrected for by subtracting the area produced by this phenomenon in the
temperature-time curve from the total area.
The sequence of the measurements was either every half second from o.o to
5.5 seconds or reversedly from 5-5 to 0.0 seconds, reckoned from the
beginning of insufflation (in total 12 measurements in one ventilatory
cycle), because of the cyclic modulation of the GOTh value with the
respiratory cycle (J~~sen et al., 1981 ).
Furthermore this series was carried out to investigate the effects of a
slackened fall in airway pressure on the GOTh estimates during a
diminished expiratory flow, as described in II-6. Finally this series was
done to find an appropriate way of calculating mean cardiac output ~ith
the smallest number of estimates. For this purpose the average of t~o
estimations, a half cycle apart from each other, ~as calculated, as ~ell
as the average of three and four estimations, one third and one quarter
cycle apart respectively.
cardiac output.
These averages ~ere compared ~ith the mean
Mean individual GOTh ~as determined as the mean of the 12 measurements
equally spread over the ventilatory cycle.
2: The direct Fick method for oxygen (Sto~. 1954).
26
A measurement of cardiac output by the direct Fick method for oxygen
(COFick) ~as performed immediately before and after each series of 12
thermodilution measurements. Systemic arterial and mixed venous blood

was sampled ~or bloodgas analyses (Fig. II-3). The duration of the
sampling lasted at least a ~ew ventilatory cycles.
Cardiac output was calculated according to:
VI
VE FI02
FE02
FEC02
cao2 • cyo2
PsH20(Tr)
sao2. Sy02
where: -1 V
1 =VT·k·RR/60 m!•sec
273 k X
PB- Hr • P5H 20 (Tr)
760
and
-1 ml•sec
inspiratory ~low (ml·sec- 1 ) of dry air;
expiratory flow (ml-sec- 1 ) of dry air;
oxygen-fraction in the inspiratory air;
oxygen-~raction in the mixed expiratory air;
carbon dioxide fraction in the mixed expiratory air;
oxygen content of systemic arterial, a. and mixed
venous, V, blood;
tidal volume, delivered by the respirator (ml);
respiratory rate per minute;
room temperature in °C;
atmospheric pressure in mmHg;
relative humidity of room air as a fraction of full
saturation;
water vapour pressure, at Tr and full saturation;
oxygen saturation of systemic arterial, a, and mixed
venous, V, blood;
partial pressure of oxygen in systemic arterial, a,
and mixed venous, V, blood in mmHg.
A value of 1.39 ml o2 -g- 1 Hb (STPB) was used as the oxygen binding
capacity (International Committee for Standardization in Hematology,
1965).
27

Expiratory air, sampled from the gas mixing box (Fig. II-2) over a
period of 3 minutes, was analyzed concerning oxygen (02 ) and carbon
dioxide using a mass-spectrometer (Perkin-Elmer MGA 1100). The oxygen
uptake, vo2
(ml·s- 1 , STPD), was corrected for differences between
inspired and expired volumes, assuming that no volume change of
nitrogen took place (Otis, 1964).
Physiological dead space fraction (VD/VT) was derived (Fig.
according to:
where
partial pressure of carbon dioxide (Co2 ) in the systemic
arterial blood in mmHg;
FEco2 co2 fraction in the dry mixed expiratory air;
PB atmospheric pressure in mmHg;
PsH20 =saturated water vapor pressure at body temperature in mmHg.
In summary, a~ of measurements and calculations consisted of:
- coTh and coFick
- Heart rate
- Pao' Ppa' pra
- PT,p
- Pa02 , Paco2 , PyC02 , PECo2 ,e
- VD/VT
II-6 EXPERIMENTAL PROTOCOL
II-4)
During each experiment the effects of three different modes of artificial
ventilation were examined and compared. Measurements and calculations
were carried out when stationary circumstances were achieved. An interval
of 15 minutes after changing the ventilatory mode appeared to be
sufficient.
The first mode was intermittent positive pressure ventilation (IPPV1
) as a
28
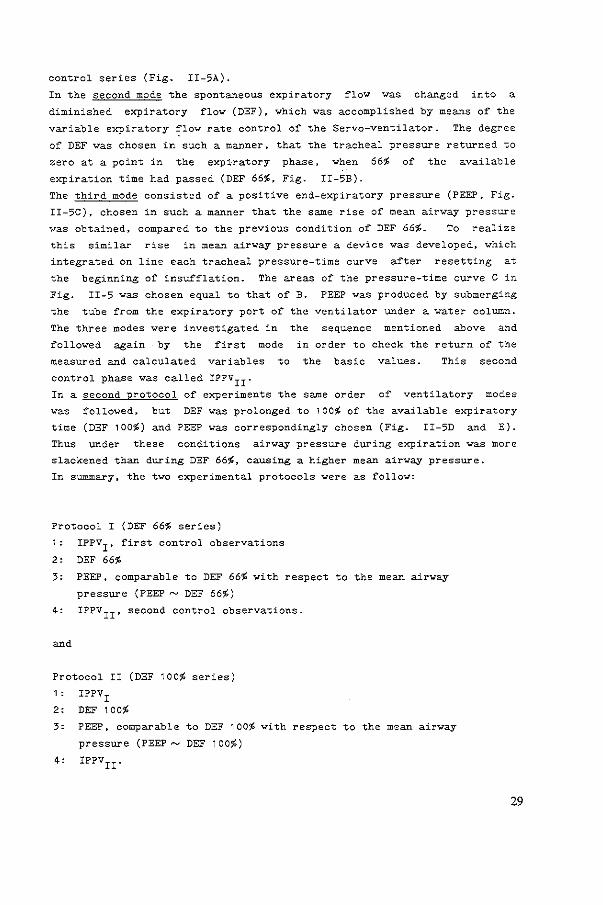
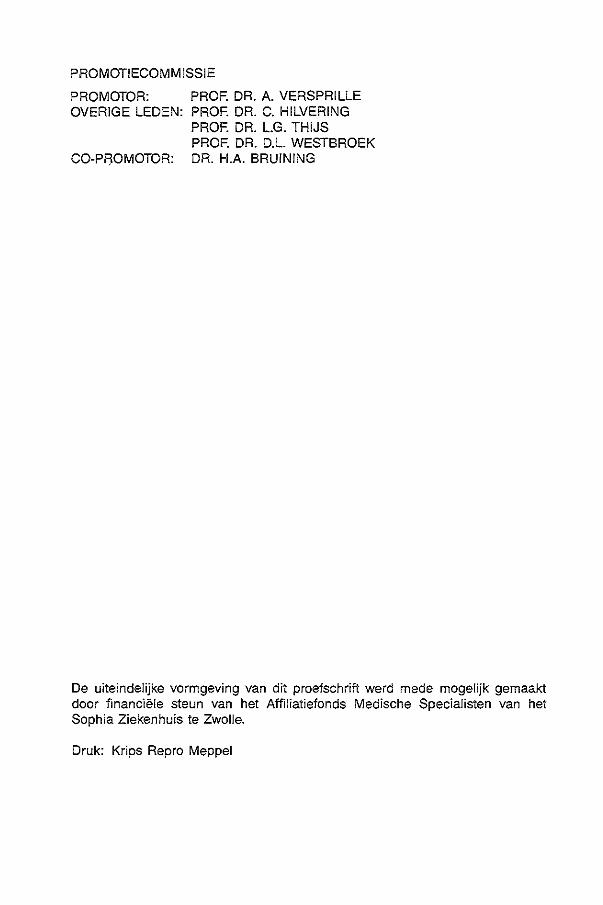
control series (Fig. II-5A).
In the second mode the spontaneous expiratory flow was changed into a
diminished expiratory flow (DEF), which was accomplished by means of the
variable expiratory ~low rate control of the Servo-ventilator. The degree
of DEF was chosen in such a manner, that the tracheal pressure returned to
zero at a point in the expiratory phase, when 66% of the available
expiration time had passed (DEF 66%, Fig. II-5B).
The third mode consisted of a positive end-expiratory pressure (PEEP. Fig.
II-5C), chosen in such a manner that the same rise of mean airway pressure
was obtained, compared to the previous condition of DEF 66%. To realize
this similar rise in mean airway pressure a device was developed, which
integrated on line each tracheal pressure-time curve after resetting at
the beginning of insufflation. The areas of the pressure-time curve C in
Fig. II-5 was chosen equal to that of B. PEEP was produced by submerging
the tube from the expiratory port of the ventilator under a water column.
The three modes were investigated in the sequence mentioned above and
followed again by the first mode in order to check the return of the
measured and calculated variables to the basic values.
control phase was called IPPVII"
This second
In a second protocol of experiments the same order of ventilatory modes
was followed, but DEF was prolonged to 100% of the available expiratory
time (DEF 100%) and PEEP was correspondingly chosen (Fig. II-5D and E).
Thus under these conditions airway pressure during expiration was more
slackened than during DEF 66%, causing a higher mean airway pressure.
In summary, the two experimental protocols were as follow:
Protocol I (DEF 66% series)
1: IPPV1
, first control observations
2' DEF 66%
3: PEEP, comparable to DEF 66% with respect to the mean airway
pressure (PEEP~ DEF 66%)
4: IPPVII' second control observations.
Protocol II (DEF 100% series)
1 : IPPVI
2: DEF 100%
3: PEEP, comparable to DEF 100% with respect to the mean airway
pressure (PEEP~ DEF 100%)
4: IPPVII.
29

IPPY A
.. t(>]
8 c p[[p
6 t(•J & tl>l
<I <I
[ '~ 7 6 t(•J 6 t(>)
'• (cmH20)
'• (cmH20) P[[P
E
" OEF lOot D "
" "
6 tt•J
30

Fig. II-5:
course of tracheal pressure (P ) and airflow (V) during a ventilatory cycle. A: Intermittent positive p;essure ventilation (IPPV) .. B: IP~V with a diminished expiratory flow retarded to 66~ of the total explratory tlm~ (DEF 66%). c: IPPV with ·a positive end-expiratory pressure (PEEP) producl~g the same increase in mean tracheal pressure as DEF 66%. D: IPPV w1th a diminished expiratory flow retarded to 100% of the total expiratory time (DEF). E: IPPV with a positive end-expiratory pressure (PEEP) producing the same increase in mean tracheal pressure as DEF 100%.
II-7 PHYSIOLOGICAL AND EXPERIMENTAL PATHOLOGICAL CONDITIONS
Experimental series were carried out under four different pulmonary
conditions:
a. Normal lungs
In 12 piglets both protocols were performed; in 6 animals protocol I
and in the other 6 protocol II was performed firstly. In these series
IPPVII of the first protocol served as IPPVI of the second. In 6 other
animals only protocol I and in 9 animals only protocol II was done.
This means, that in total protocol I was performed as a first series in
12 piglets and as a second series in 6, whereas protocol II was done as
a first series in 15 and as a second series in 6 animals.
b. Histamine induced bronchoconstriction
To simulate bronchocontriction, histamine in a dose of 1.1 mg·kg- 1·h-1
was continuously infused into the pulmonary artery. On average a
stable situation was reached 75 minutes (range 40-126) after the
beginning of infusion. Then the protocols could commence.
In six piglets both protocols I and II were succesfully carried out,
four times protocol I and two times protocol II first. In one animal
only protocol I could be included and in another only protocol II.
c. Acetylcholine induced bronchoconstriction
To simulate bronchoconstriction, acetylcholine in a dose of 0.56
mg·kg- 1 -h- 1 was continuously infused into the pulmonary artery. The
protocols started on average 59 minutes (range 46-79) after the onset
of infusion.
In six piglets both protocols I and II were performed, four times
protocol I first, and two times protocol II first. In one piglet only
protocol II could be included.
31

d. Oleic acid and alloxan induced pulmonary edema
32
These lungs served as a model for the respiratory distress syndrome by
the administration of Alloxan in a dose of 75·mg-kg- 1 and 1 ml of a
mixture consisting of 50% ethanol and 50% oleic acid, both into the
pulmonary artery, as a slow bolus injection over a period of about 30
seconds. To expected deterioration the
hemodynamic
compensate for the
condition, 10 mg-kg- 1 Dextran (10$, mean molecular
40.000) was infused simultaneously. The hypoxia was
increasing the inspiratory oxygen fraction (FI02 } to
compensated
0.40.
weight
for by
In four animals only protocol II was performed, on average 61 minutes
(range 55-69) after the injections when the situation had stabilized.
II-8 POSTMORTEM EXAMINATION
After each experiment the piglet was sacrificed and at autopsy the
position of all catheters was verified. The lungs were examined, and
sections were taken for histopathological investigation when histamine,
acetylcholine or oleic acid had been administered.
II-9 STATISTICAL ANALYSIS
The data were analysed by the method of paired comparison using the
student's t-test. Significance was determined at the 95 percent
confidence level. In both protocols DEF was compared with IPPV1 ,
IPPVII and PEEP of the corresponding DEF (PEEP~ DEF). PEEP was also
compared with both IPPV's and IPPVII was compared with IPPV1 .
Both protocols were devided into two parts:
1: protocol performed as a first series in the individual animal
2: protocol performed as a second series in the individual animal.
These two parts were separately compiled for statistical analysis.
Also the two parts were totalled and statistically analysed.


Fig. III-1:
Correlation (GOTh) and ventilatory
B / ~-
.·
D / ml-kQ•SOC_,
co'"'"
between cardiac output estimated by the thermodilution the direct Fick method for oxygen (COFick) during the
modes.
Thin line is the identity line Thick line is the regression line n is the number of animals
34
technique different

CHAPTER III
CARDIAC OUTPUT MEASUREMENT BY THE THERMODILUTION METHOD
RESULTS
Three aspects o~ cardiac output measurement will be presented:
1 . the correlation between cardiac output measurements by the
thermodilution method and those by the direct Fick method ~or oxygen
2. the cyclic variation in cardiac output estimates with the
thermodilution method during the ~ive di~~erent patterns o~ arti~icial
ventilation
3. reduction o~ the deviation o~ these individual estimates ~rom the mean.
Thermodilution versus Fick method
The mean value o~ all 12 cardiac output estimates equally spread over the
ventilatory cycle using the thermodilution method (COTh) was plotted
against the mean o~ both cardiac output values, measured by the direct
Fick method ~or oxygen (COFick) be~ore and after each series of
thermodilution measurements (Fig. III-1 ). The equations o~ the
regression lines and the correlation coefficients ~or the di~~erent modes
o~ ventilation are depicted in Table A-1 • showing a good agreement between
the two methods within the range o~ cardiac output measurements.
Cyclic variation of cardiac output
The mean o~ 12 GOTh estimates with the moment o~ injection equally spread
over the ventilatory cycle was taken as the 100% value ~or each series.
Individual measurements o~ each series were expressed as a percentage of
the corresponding mean. All results at similar phases in the ventilatory
35

Cardiac Output
'
Cardiac Output
36
,,. B
,.
,.
..
Output
' 120 A
::~
,.
..
D DEF 100'l.
n=ll
t(s)
::~ t(s)
iPPV
""
Cardiac Output
'
Cardiac Output
'
..
,.
,,.
,.
..
c
E
PEEP- DEF 66'l. n=l6
PEEP.-..DEF 100~ n=21
t[$)
u~J
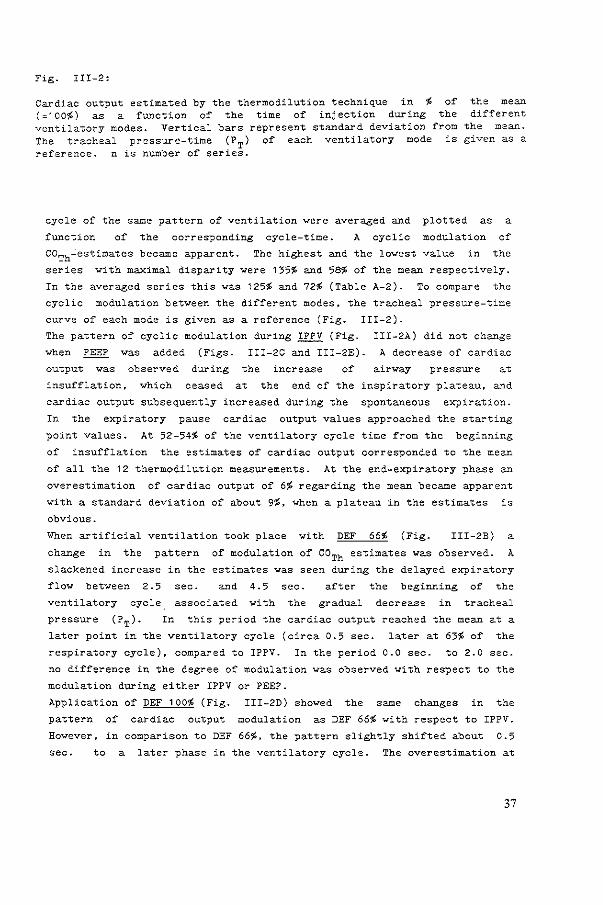
Fig. III-2:
Cardiac output estimated by the thermodilution technique in ~ of the mean (~100~) as a function of the time of injection during the different ventilatory modes. Vertical bars represent standard deviation from the mean. The tracheal pressure-time (PT) of each ventilatory mode is given as a reference. n is number of series.
cycle of the same pattern of ventilation were averaged and plotted as a
function of the corresponding cycle-time. A cyclic modulation of
COTh~estimates became apparent. The highest and the lowest value in the
series with maximal disparity were 135% and 58% of the mean respectively.
In the averaged series this was 125~ and 72% (Table A-2). To compare the
cyclic modulation between the different modes. the tracheal pressure-time
curve of each mode is given as a reference (Fig. III-2).
The pattern of cyclic modulation during IPPV (Fig. III-2A) did not change
when PEEP was added (Figs. III-2C and III-2E). A decrease of cardiac
output was observed during the increase airway pressure at
insufflation. which ceased at the end of the inspiratory plateau, and
cardiac output subsequently increased during the spontaneous expiration.
In the expiratory pause cardiac output values approached the starting
point values. At 52-54~ of the ventilatory cycle time from the beginning
of insufflation the estimates of cardiac output corresponded to the mean
of all the 12 thermodilution measurements. At the end-expiratory phase an
overestimation of cardiac output of 6% regarding the mean became apparent
with a standard deviation of about 9%, when a plateau in the estimates is
obvious.
When artificial ventilation took place with DEF 66% (Fig. III-2B) a
change in the pattern of modulation of COTh estimates was observed. A
slackened increase in the estimates was seen during the delayed expiratory
flow between 2.5 sec. and 4.5 sec. after the beginning of the
ventilatory cycle associated with the gradual decrease in tracheal
pressure (PT). In this period the cardiac output reached the mean at a
later point in the ventilatory cycle (circa 0.5 sec. later at 63% of the
respiratory cycle). compared to IPPV. In the period 0.0 sec. to 2.0 sec.
no difference in the degree of modulation was observed with respect to the
modulation during either IPPV or PEEP.
Application of DEF 100% (Fig. III-2D) showed the same changes in the
pattern of cardiac output modulation as DEF 66% with respect to IPPV.
However. in comparison to DEF 66%. the pattern slightly shifted about 0.5
sec. to a later phase in the ventilatory cycle. The overestimation at
37

the end o£ expiration ~ith respect to the mean ~as the same £or DEF 66%
and DEF 100% as during IPPV and PEEP, but during DEF (either 66% or 100%)
no expiratory plateau is present.
Fig. III-3:
~
125-
115
1 OS-
85
75-
Cardiac Output (Th)
T point 2 point average
IPPV
3 point average
4 point average
Averaging stratagem £or estimation o£ cardiac output by the thermodilution (Th) technique, reducing the deviation £rom the mean (=100%) to bet~een 0.1% and 0.7% in the £ourpoint average. IPPV is sho~ here, but the con£iguration is valid for all ventilatory modes studied (Table A-2). Vertical bars represent standard deviations from the mean.
38

Reduction of the deviation Trom the mean cardiac output, as seen with
individual measurements with the thermodilution method
As described in the preceding paragraph an appreciable deviation from the
mean cardiac output can exist in the individual estimates by the
thermodilution method due to the cyclic modulation of cardiac output by
artificial ventilation. To reduce this deviation, the average was
calculated of two, three and four estimates in each series evenly spread
over the ventilatory cycle. So, in these series the respective
measurements were 50%, 33.3% and 25% apart from each other in the
ventilatory cycle. Thus, three new series were produced with 6, 4 and 3
averaged estimates. This averaging technique reduced the deviation from
the mean from the range between 72% and 125% in the mean of the individual
measurements to a range between 84% and 114% in the mean of two point
averages, between 89% and 110% in the mean of three point averages and an
even smaller range in the mean of four point averages (Fig. III-3 and
Table A-2).
DISCUSSION
The thermodilution method
Cardiac output was measured by the thermodilution technique (GOTh) as well
as by the direct Fick method for oxygen (COFick). In the experiments
automatic injections with a very short injection time (0.3 seconds), using
a pneumatic cylinder driven by compressed air (Jansen et al., 1981 ), were
carried out for measuring GOTh" This provides a highly reproducible
amount of indicator injected (Saadjian et al., 1976) and a steadiness of
injectate flow rate (Nelson and Houtchens, 1982) compared to manual
injections.
Three important conditions have to be fulfilled for reliable accuracy of
GOTh-measurements:
1. Complete mixing of diluent
2. No loss of indicator
3. Constant blood flow during the measurements.
Complete mixing of the indicator fluid with the blood was assumed to be
39

achieved by the mechanical actions of the heart resulting in turbulence,
and a high injection speed through multiple side holes at the tip of the
injection catheter (Saadjian et al., 1976; Jansen et al., 1981 ).
Loss of indicator theoretically can occur during injection through the
wall of the catheter and between injection and detection sites to the
surrounding tissues. The heat loss through the wall of the catheter
during the period of injection could be neglected due to a high degree of
insulation of the catheter (double-walled with air in between the walls)
producing a very low thermal conductivity and due to the short time and
high speed of injection. Evenso, heat loss to the endothelial structures
of the left ventricle and aorta after injection of thermal indicator is
negligible in piglets (von Reth et al., 1978) and could not be
demonstrated when cardiac output measurements by thermal and dye-dilution
were compared (Wessel et al., 1971 ).
The third condition, a constant blood flow during the measurements is not
fulfilled during positive pressure ventilation. The concomitant
modulation of flow causes a distortion of the shape of the dilution curve.
This was not corrected for, but it may well be possible to realize this in
future time (Jansen et al., 1983).
Indicator volume (0.5 ml NaCl 0.9%) sufficed, as together with corrections
(as mentioned) a good correlation between the mean of 12 GOTh-measurements
equally spread over the ventilatory cycle and COFick was demonstrated
(Fig. III-1, Tables A-1, A-3 and A-4).
To simplify the practice of correction of the effective amount of
indicator the temperature of the indicator was chosen to be room
temperature, as otherwise the temperature of the amount of indicator in
the extracorporeal part of the injection catheter would continuously
change (Wessel et al., 1 971 ; Vliers et al., 1973). The amount of
indicator in the intracorporeal part of the injection catheter had to be
deducted from the total amount of indicator as this rises to body
temperature between two consecutive injections. After the injections
residual indicator is -injected- unintentionally, producing an enlargement
of the thermodilution curve which has to be corrected for (Jansen et al.,
1981 ). Artificial ventilation produces cyclic fluctuations in aortic
blood temperature with small pulsations due to heart actions superimposed
on it (Pavek et al., 1970; Vliers et al., 1973; Saadjian et al., 1976).
The actual dilution curves were corrected for these base line
fluctuations.
40

nodulation of cardiac output in th& v&ntilatory cycle
COTh estimates spread throughout the ventilatory cycle show a cyclic
modulation when the estimates are plotted against the moment of
indicator-injection in the ventilatory cycle. as was described by Jansen
et al. ( 1981 ) • Although the maximal
estimates in the individual series was 130%
disparity between single COTh
- 58% of the mean COTh and in
the averaged series 115%- 81% of the mean COTh' the mean of the twelve
estimates correlated well with the mean cardiac output as expressed
CDFick (Fig. III-1 ). During IPPV the mean COTh is reached in the
curve, producing by plotting COTh against the moment of indicator
injection in the ventilatory cycle at 10% and 54% of the ventilatory
cycle, during DEF 66% at 14% and 63%, during DEF 100% at 19% and 67%,
during PEEP- DEF 66% at 12% and 54% and during PEEP DEF 100% at 11% and
53%. This indicates that for IPPV and PEEP ideal injection times are
10-12% or 53-54% of the ventilatory cycle, and that during DEF 66% and
100% these ideal moments of injection shift to a later phase in the
ventilatory cycle. Such a shift was also seen by Jansen and Versprille
(1986) in experiments with a diversity of other patterns of ventilation.
It must be stressed that these results are valid for artificial
ventilation
inspiratory
instituted.
with
hold
an inspiration-expiration ratio of
of 10%, and may well be different when
25-65% and an
other ratio's are
The variation of cardiac output is due to the mechanical influence of a
varying intrathoracic pressure on venous return (Guyton, 1957; Versprille
et al., 1982; Versprille and Jansen, 1985). Insufflation causes a higher
intrathoracic pressure with a concomitant fall in venous return to the
heart, resulting in a decrease of cardiac output. Therefore lower
inflation pressures will produce less variation in cardiac output (Snyder
and Powner, 1982). During expiration this is abolished, resulting again
in an increase of cardiac output. The shift of the curves (COTh plotted
against the cycle time, Fig. III-2) to the right during DEF 100%, and to
a lesser extent during DEF 66% might be explained by the retarded fall in
intrathoracic pressure during expiration with i-.espect to IPPV and PEEP,
and therefore by a retarded recovery of cardiac output.
Because a difference exists in the ideal injection times for different
modes of ventilation, it can be concluded that for estimation of mean
cardiac output at least several estimations equally spread in the
ventilatory cycle are necessary (Jansen and Versprille, 1986). The end of
the expiratory pause could be an easy mark for trend studies to inject
indicator fluid with the best stationarity of flow, but an overestimation
41

vill exist regarding mean cardiac output. Moreover, this overestimation
vill change, vhen the ventilatory pattern is changed. This implies, that
the overestimation is not systematic and therefore not feasible for follov
up.
Mean cardiac output estimates by the thermodilution method
The averaging technique sho~ed that mean cardiac output can be reliably
calculated by averaging the results of three or four estimates at evenly
spaced intervals in the ventilatory cycle and that the averaging technique
is dependent of the mode of mechanical ventilation. This confirms the
results of Jansen and Versprille (1986).
Conclusion
Cardiac output measurement during mechanical ventilation by the
thermodilution technique is reliable and accurate, provided kno~ledge of
the cyclic variations of cardiac output during the respiratory cycle in
different modes of artificial ventilation leads to averaging of three to
four determinations equally spaced in the ventilatory cycle.
42


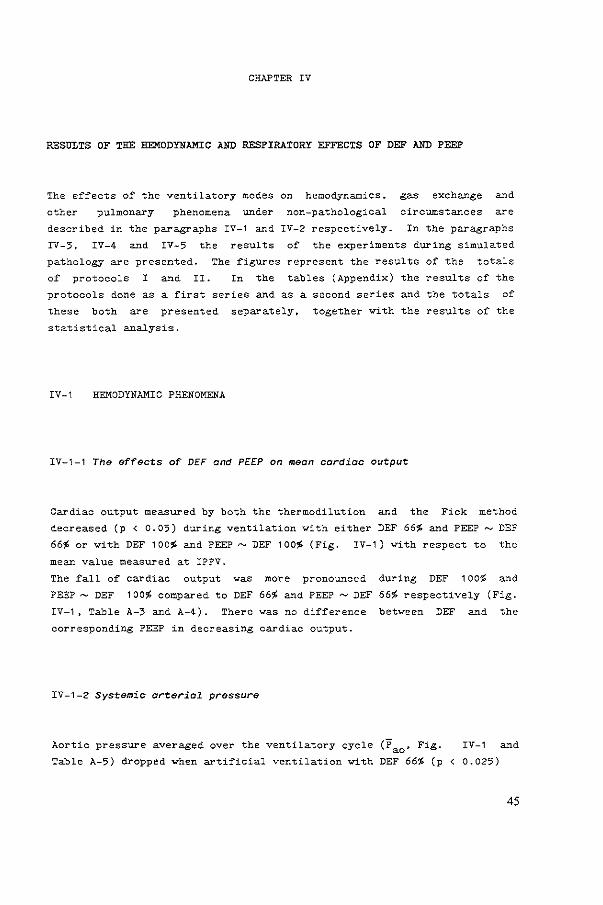
CHAPTER IV
RESULTS OF THE HEMODYNAMIC AND RESPIRATORY EFFECTS OF DEF AND PEEP
The effects of the ventilatory modes on hemodynamics. gas exchange and
other pulmonary phenomena under non-pathological circumstances are
described in the paragraphs IV-1 and IV-2 respectively. In the paragraphs
IV-3, IV-4 and IV-5 the results of the experiments during simulated
pathology are presented. The figures represent the results of the totals
of protocols I and II. In the tables (Appendix) the results of the
protocols done as a first series and as a second series and the totals of
these both are presented separately, together with the results of the
statistical analysis.
IV-1 HEMODYNAMIC PHENOMENA
IV-1-1 The effects of DEF and PEEP on mean cardiac output
Cardiac output measured by both the thermodilution and the Fick method
decreased (p < 0.05) during ventilation with either DEF 66% and PEEP- DEF
66~ or with DEF 100% and PEEP~ DEF 100% (Fig. IV-1) with respect to the
mean value measured at IPPV.
The fall of cardiac output was more pronounced during DEF 100% and
PEEP~ DEF 100% compared to DEF 66% and PEEP~ DEF 66% respectively (Fig.
IV-1, Table A-3 and A-4). There was no difference between DEF and the
corresponding PEEP in decreasing cardiac output.
IV-1-2 Systemic arterial pressure
Aortic pressure averaged over the ventilatory cycle (Pao' Fig.
Table A-5) dropped when artificial ventilation with DEF 66% (p
IV-1 and
0.025)
45

46
coTh
11 0~ ~ 100'b
90'b
80~
Protocol n ~ 18
::::~ "<:o---T----T-~ 90~ ~...L 80~
Pao (mm Hg)
120 l 110
100
90
80
P pa (mm Hg)
::~ I~I j P ra (mm Hg)
+3.5
+2.5
+ 1. 5
+0.5 0
-o. 5
-1. 5
-2.5
DEF 66'b
I
PEEP "'DEF 66~
I
e
COTh
110~~ 100~
90'!,
80'b
Protocol II n 21
::::~ ~----------90'!,
80'!,
P ao (mm Hg)
: ::i 1::] ,,]
Ppa (mmHg)
::~ I---+-+--1 j P ra (mm Hg)
+3.5
+2,5
+1. 5
.. o. 5 0
-0.5
-1. 5
-2.5
DEF 1 00~
PEEP ""DEF 100~

Fig. IV-1:
Hemodynamic parameters during the different modes of ventilation in protocols I and II (chapter II-6). Cardiac output, estimated by the thermodilution technique (GOTh) and the direct Fick method for oxygen (COFick)' for DEF, ~EEP DEF and IPPVII is given as % of t~e mean during IPPVI. p = mean systemic arterial pressure; P = mean pressure in the pulmonary a~~ery; Pra = right atrial pressure mea~~ed at the end of inflation (i) and at the end of expiration (e); Vertical bars represent standard deviations from the mean; n is number of series in healthy piglets.
was applied whether as a first or as a second series, compared to IPPVI,
IPPV II and ventilation with the corresponding PEEP value. PEEP had no
effect on mean systemic arterial pressure.
Institution of DEF 100% also decreased aortic pressure (p < 0.001)
compared to IPPVI and IPPVII" This was slightly more than DEF 66% in the
respective series. Compared to the value at the corresponding PEEP
systemic arterial pressure was lower during DEF 100% (p < 0.005) when the
protocol was done as a first series.
PEEP~ DEF 100% decreased aortic pressure slightly but not significantly
compared to IPPV.
IV-1-3 Pulmonary arterial pressure
Pulmonary arterial pressure averaged over the ventilatory cycle (Ppa) did
not change with DEF 66%, compared to IPPVI. When the corresponding PEEP
~as applicated Ppa rose and remained at the same level (p < 0.001) when
PEEP ~as discontinued (Fig. IV-1 and Table A-6) in protocol I as done as
a first series. There was no statistical significance in protocol I done
as a second series. In protocol II Ppa was lower (p < 0. 01 ) during DEF
100% compared to IPPVI, IPPVII and the corresponding PEEP, which had no
effect on ppa' with respect to IPPVI and IPPVII.
IV-1-4 Right atrial pressure
Right atrial
end of the
pressure averaged over the cardiac cycle and measured at the
inspiratory pause (Pra,i) and at the end of the expiratory
47

Fig. IV-2:
., 00
" "
" .,
~~k " VD/VT
O.ll
0.25
O.ll
O.lt
0., o.n
·-·~ O.ll OU PUP
.. \ '-O(F
"' IPPV11
.. ., • " " " n
" •
~l~ PEC02.~ l"""HQ)
~~~ •
VDIVT
O.ll
o.u
"·'' ·-·~ O.l1
O.tS
o.u
Peak tracheal pressure (PT ), positive end-expiratory pressure (PEEP), partial pressure of systemic ~terial oxygen (Pa02 ) and carbon d1oxide (Paco2 ) and of mixed venous carbon dioxide (PyC02 ) and of carbon dioxide in the end-expiratory a1r (PEco2 e). and physiological dead space (Vn/VT) during the d1fferent modes of ventilai1on in protocols I and II (chapter II-6). Vertical bars represents standard deviations from the mean. n is number of series in healthy piglets.
48

pause (Pra,e) changed slightly (Fig. IV-1. Tables A-7 and A-8). At the
end of the inspiratory pause during both levels of PEEP a rise (p < 0.01)
was noted compared to IPPV and DEF in both protocols and both series.
During DEF 66% and DEF 100% Pra,i increased (p < protocols I and II were carried out as a first series.
0.05) only when the
The right
0.025)
IPPVI
atrial
during
except
pressure at the end of the expiratory phase was higher (p <
circumstances of DEF and PEEP in both protocols compared to
for DEF 66%
PEEP, P ra,e
compared to IPPVI in the second series. During both levels of
was higher (p < 0.001) than during ventilation with the two
levels of DEF.
IV-1-5 Heart rate
The heart rate did not change much during the different types of
artificial ventilation in the different experimental series (Table A-9).
IV-2 PULMONARY PHENOMENA AND BLOODGASSES
IV-2-1 Airway pressure
PEEP, producing a similar rise in mean tracheal pressure as DEF 66% or DEF
100% in the protocols I and II, amounted to a mean of 2.4 ~ 0.3 em H2 0
higher at p < 0.001 during
and 3.9 + 0.4 em H2o respectively (fig. IV-2).
The peak tracheal pressure (PT,p) was
ventilation with DEF (either 66% or 100%) than during IPPV (Fig. IV-5 and
Table A-10) but not different between DEF 66% and IPPVII in protocol I
done as a second series. During DEF 66% or 100% PT,p was lower at
p < 0.001 compared to the PT.p values during ventilation with the
corresponding PEEP values. These PT,p values during PEEP were higher at
p < 0.001 than those during IPPV. In protocol I, PT,p during IPPVII was
lower at p < 0.05 than the value of IPPVI when the protocol was carried
out as a first series, but higher at p < 0.01 after a second series. In
protocol II, PT,p during IPPVII was lower at p < 0.01 compared to the
value of IPPVI, whether the protocol was performed as a first or as a
49

second series.
IV-2-2 Partial pressure oT arterial oxygen (Pao 2 )
Arti£icial ventilation with DEF (both 66% and 100%) raised Pao2 (Fig.
IV-2) compared to IPPV and ventilation with PEEP ~ DEF 66% as well as
PEEP~ DEF 100% respectively (p < 0.05). The increase o£ Pao2 vas more
pronounced during DEF 100% than during DEF 66%. During PEEP~ DEF 66%,
the Pao2 did not increase compared to IPPV1 , but vas higher at p < 0.005
than the value measured during IPPV11 . This latter value vas at p < 0.005
lover than the initial Pa0 2 (IPPV1 ). With a higher PEEP ( ~ DEF 100%) the
Pao2 vas raised regarding IPPV1
and IPPv11
(p < 0.025), except regarding
IPPV11
in the second series.
IV-2-3 Partial pressure oT arterial carbon dioxide (P0CD2 )
Arti£icial ventilation with DEF (66% as well as 100%) brought down Paco2 (p < 0.025), regarding other types o£ ventilation (Fig. IV-2 and Table
A-12). The e££ect o£ DEF 100% in this respect vas slightly better than
the e££ect o£ DEF 66%. PEEP~ DEF 66% had no e££ect on Paco2 .
PEEP~ DEF 100% produced a lover Paco2 compared to IPPV1 (p < 0.01 ), but
not with respect to IPPV11 .
IV-2-4 Partial pressure oT mixed venous carbon dioxide (PvCD2 )
DEF in both protocols had the same e££ect on PyC02 as regarding Paco2 •
i.e. PyC02 dropped (p < 0.025) compared to the other modes o£ arti£icial
ventilation (Fig. IV-2 and Table A-13).
PEEP~ DEF 66% had no e££ect on PyCD2 , and PEEP~ DEF 100% levered PyC02
only compared to IPPV 1 when the protocol vas carried out as a £irst
series.
50

IV-2-5 Partial pressure of carbon dioxide in the end expiratory air
(P£co2 ,e)
PEco2 ,e was higher at p < 0.025 (Fig. IV-2 and Table A-14) during
arti£icial ventilation with both DEF 66% as well as with DEF 100%,
compared to IPPV and PEEP ( ~ DEF 66% or 100% in the respective series).
PEEP had no in£luence on PEco2 .e.
The value o£ PEco2 ,e approximated the under DEF
circumstances. i.e. PEco2 ,e was higher at p < 0.001 than Paco2 (Fig.
IV-2). During IPPV and PEEP the PEco2 ,e values were below the Paco2 values (p < 0.001).
IV-2-6 Physiological dead space fraction (v0;vT)
v0 ;vT appeared to be lower (p < 0.01) during DEF 66% as well as DEF 100%
compared to the other modes o£ ventilation (Fig. IV-2 and Table A-15).
VD/VT did not change during PEEP~ DEF 66% compared to IPPVI and IPPVII"
During IPPVII' v0 ;vT was lower than IPPVI (p < 0.05) i£ protocol I was
done as a £irst series. PEEP~ DEF 100% did not change v0 jvT compared to
IPPV1 , but during IPPVII VD/VT was lower than during PEEP~ DEF 100% and
IPPVI (p < 0.01) i£ the protocol was carried out as a £irst series. The
e££ect o£ DEF 100% compared to DEF 66% in lowering v0 jVT was better in all
series.
IV-3 HISTAMINE INDUCED PULMONARY PATHOLOGY SIMULATING OBSTRUCTIVE
LUNG DISEASE
The e££ect o£ histamine, continuously in£used into the pulmonary artery
(see paragraph II-7) on hemodynamic, ventilatory and respiratory variables
compared to those under normal circumstances during IPPV are listed in
Table IV-1. Cardiac output and mean pulmonary arterial pressure
increased, while mean systemic arterial pressure decreased. Peak tracheal
pressure increased.
were higher after histamine administration. On auscultation a de£inite
wheezing with basal crepitation could be heard over the lungs.
51

Normal Histamine 0 Statistical 0
lungs induced change analysis pulmonary pathology
coTh (mt•kg-l·s-1) 2.63 ' 0.56 3.24 ' 0.66 +24 p < 0.001
p (mm Hg) ao
100.9 ' 8. 7 79.7 ' 7. 9 -21 p < 0. 001
P pa (mm Hg) 16.8 ' 1.8 22.6 ' 2.3 +36 p < 0. 001
p (mm Hg) ra,e
- 2.0 ' 0.4 - 2.2 ' 0.5 - NS
p (mm Hg) + 1. 2 ' 0.4 + 1.2 ' 0.4 - NS ra,i
Heartrate (l•min-1) 1 so ' 21 182 ' 16 +23 p < 0. 005
PT,o (em H,OJ 17.6 ' 1.4 23.3 ' 1.7 +33 p < 0.001
Pao 2 (mm Hg) 75.8 ' 6.4 58.4 ± 5.2 -23 p < 0.001
Paco 2 (mm Hg) 42.8 ± 1.4 47.1 ' 1.9 +1 0 p < 0. 005
PyC0 2 (mm Hg} 49. 1 ± 0.9 54.2 ± 3. 1 +1 0 p < o. 005
PEC02,e (mm Hg) 42.2 ' 1.7 48.6 ± 2. 5 +14 p < 0.001
VD/VT 0.25 ' 0.03 0.25 ' 0.03 - NS
Table IV-1:
Mean absolute values and standard deviations ~rom the mean o~ hemodynamic and pulmonary parameters be~ore and after in~usion o~ histamine (1 .1 mg-kg- 1-h- 1 ) into the pulmonary artery.
IV-3-1 Hemodynamic phenomena
The e~~ects o~ the di~~erent modes o~ arti~icial ventilation on the
hemodynamic variables vere not
described ~or the experiments under
paragraph IV-1 and Tables A-16 to
substantially different from those, as
non-pathological circumstances (see
A-21 ). Therefore only the respiratory
phenomena of the experiments with histamine induced pulmonary pathology
52

will be described in the same order as those under baseline conditions
(III-2).
IV-3-2 Pulmonary phenomena and bloodgasses
IV-3-2-1 Airway pressure
PEEP. producing a similar rise in mean tracheal pressure as DEF 66% and
DEF 100% amounted to a mean o~ 2.9 ! 0.2 em H2 0 and 4.4 ! 0.2 em H2 o
respectively (Fig. IV-3 and table A-22). These values are on average 0.5
em higher than in the series under non-pathological circumstances (see
paragraph IV-2-1 ).
The peak tracheal pressure did not change with DEF 66% or DEF 100%
compared to IPPVI. After the DEF 100% series the peak tracheal pressure
at IPPVII was lower (p < 0.001) compared to IPPVI and DEF (Table A-22).
IV-3-2-2 Partial pressure of arterial oxygen (Pao2 )
DEF, either 66% or 100%. raised Pao2 (Fig. IV-3 and Table A-23) compared
to IPPV (p < 0.001 ). The rise in Pao2 during DEF was higher on average
than in both protocols under non-pathological circumstances (11% more in
the DEF 100% series).
DEF 66% and PEEP~ DEF 66% were not different in raising Pao2 . DEF 100%
produced a higher PaOz than PEEP~ DEF 100% (p < 0.01 ). PEEP (both ~ DEF
66% and ~ 100%) also gave a higher Pao2 compared to IPPV (p < 0.025 and
p < 0.001 respectively). Pao2 during IPPV1 and IPPVII was not different.
IV-3-2-3 Partial pressure of arterial carbon dioxide (Paco2 )
Both DEF 66% and DEF 100% reduced Paco2 (p < 0.01) regarding other
patterns of ventilation (Fig. IV-3 and Table A-24). Only in the DEF 100%
53

......,_,,,( ............ ) n ~ 7
PT.<> h:,M 101 PT.J> (<a'>M 101
~~r-01 ~r-Y\
"
VO/VT VO/VT
'·" .. ,. '·" "·"
O.lS
O,ll 0.2)
"·''
o....v1 '!!~ ,."'i,~ IPPYU IPPY 0 ~~ ,."'i.~ 1PPY11
"' 100:
Fig. IV-3:
Peak tracheal pressure (PT,p). .positive end-expiratory pressure (PEEP), partial pressures of systemic arterial oxygen (Pa02 ) and carbon dioxide (Paco2 ) and of mixed venous carbon d~oxide (PyC02 ) and of carbon dioxide in the end-expiratory air (PEco2 e)• and physiological dead space (VD/VT) dur1ng the different modes of ventilation in protocols I and II (chapter II-6). Vertical bars represent standard deviations from the mean. n is number of series in histamine induced pulmonary disease.
54

series Paco2 on average was more markedly reduced than in the comparable
series under non-pathological circumstances. There was no difference
between Paco2 during IPPV1
and IPPV11 . PEEP in the DEF 66% series did not
affect Paco2 regarding IPPV1
• but during IPPV11 • Paco2 increased with
respect to PEEP~ DEF 66% (p < 0.005). In the DEF 100% series Paco2 was
lower during PEEP compared to IPPV1
(p < 0.005}. but was not significantly
different from the value during IPPV11 .
IV-3-2-4 Partial pressure of mixed venous carbon dioxide (Pyco2 )
DEF 66% as well as DEF 100% produced a lower PyC02 (Fig. IV-3 and Table
A-25) compared to both IPPV and PEEP (p < 0.01 ). This was hardly
different from the results seen during non-pathological circumstances.
IV-3-2-5 Partial pressure of carbon dioxide in the end expiratory air
(PEC02,e)
PEco2 .e was higher (Fig. IV-3 and Table A-26) with DEF 66$ as well as DEF
100% compared to the other modes of ventilation (p < 0.025). The values
of PEco2 .e were about the same as in the comparable series under non
pathological circumstances.
IV-3-2-6 Physiological dead space fraction (VD/VT)
VD/VT was lower with both DEF 66% and DEF 100%. compared to IPPV and PEEP
in the respective series (p < 0.01 and p < 0.001 ). The decrease in VD/VT
was markedly more in the DEF 66% and in the DEF 100% series compared to
the values seen under non-pathological circumstances (71% versus ao% and
58% versus 72% respectively). PEEP had no effect on VD/VT compared to
IPPV (fig. IV-3 and Table A-27).
55

IV-3-3 Histological examinations
In the lung biopsies, taken after postmortem examination, a vasodilatation
was seen with a capillary overhydration. Locally a protein-like substance
was present in the alveolar spaces. Septal edema was encountered and in
four piglets perivascular edema was present.
Normal Acetylcholine conditions induced
pulmonary pathology
COTh (ml·kg-1·s-1) 2.38 ± 0.36 2.84 ± 0.53
p (mm Hg) ao 94.7 ± 13.7 72.5 ± 7.6
P pa (mm Hg) 17.7 ± 4.4 24.5 ± 2.5
p (mm Hg) - 1.28 ± ra,e 0.47 - 0.47 ± 0.67
p ra,i (mm Hg) 1. 86 ± 0.69 2.79 ± 0.62
Heart rate ( ·min- 1) 147 ± 16 182 ± 17
PT ,p {em H20) 19.4 ± 2.8 24.8 ± 1.4
Pa02 (mm Hg) 75.9 ± 6.2 66.5 ± 6.2
Paco2 {mm Hg) 43.7 ± 1.3 45.8 ± 1.6
P-CO v 2 (mm Hg) 49.9 ± 1.3 50.8 ± 2
PEco2.e (mm Hg) 41.3 ± 1.8 44.3 ± 1.5
VD/VT 0.30 ± 0.05 0.30::!:: 0.03
Table IV-2:
Mean absolute values and standard deviations from the pulmonary parameters before and after infusion mg-kg- 1-h-1 ) into the pulmonary artery.
56
~ Statistical change .analysis
•20 p < 0. OS
-23 p < 0. 001
•44 p < 0. 005
p < 0.05
p < 0.05
+26 p < 0.025
+29 p < 0.005
-12 p < 0.005
• 5 p < 0. 005
NS
• 7 p < 0.005
NS
mean of hemodynamic and of acetylcholine (0.56

Fig. IV-4:
P"'t<>COI I (A<:etylci>Oih>o) "=6
Pco<ocol II (A<:etylcl»ll"") "= 7
'::l'-rY\"'" '•:;l'-rY\"'" n n n n
n ll
,, ,,
" "
~~v ~~~ ~>;co2 (m<n H9 J r;;co 2 (mm ~91
~;j~ ~;j~
'If~ Tf~
0.20
::y 0.30
"' .,. '" '" 0.20
()(F ""'EP 100~ -. OEF
100~
Peak tracheal pressure (PT ), positive end-expiratory pressure (PEEP), partial pressures o~ system~c arterial oxygen (Pao2 ) and carbon dioxide (Paco2 ) and o~ mixed venous carbon dioxide (PyC02 ) and o~ carbon dioxide in the end-expiratory air (PEco2 e)' and physiological dead space (VD/VT) during the di~~erent modes o~ ventilaiion in protocols I and II (chapter II-6). Vertical bars represent standard deviations from the mean. n is number of series in acetylcholine induced pulmonary disease.
57

IV-4 ACETYLCHOLINE INDUCED PULMONARY PATHOLOGY SIMULATING
OBSTRUCTIVE LUNG DISEASE
Acetylcholine, continuously infused into the pulmonary artery (II-7) had
the effects on hemodynamic and respiratory parameters compared to those
under normal pulmonary circumstances as listed in Table IV-2. The
hemodynamic effects were about the same as in the histamine series (Tables
A-16 to A-21). Pa02 decreased and Paco2 increased less than in the
histamine series.
The effects of DEF and PEEP on pulmonary phenomena and gas exchange
compared mutually and to IPPV during acetylcholine induced pulmonary
pathology (Fig. IV-4) were less marked than the results seen vith
histamine (Tables A-22 to A-27), and vere about the same as the results
seen during non-pathological circumstances. PEEP amounted to 3 ~ 0.4 em
H2o and 4.3 +
and Table A-22),
0.5 em H2o in protocol I and II respectively (Fig. IV-4
which is comparable to the PEEP values in the histamine
series.
In the lung biopsies after postmortem examination a marked vasodilatatic~
was seen with focal hemorrhages in the alveolar septa. Sometimes the
septa were very pronounced with a polymorphonuclear infiltrate. Edema was
present, but not in all specimens. together with a intra-alveolar
protein-like substance.
IV-5 PULMONARY PATHOLOGY INDUCED BY ALLOXAN AND OLEIC ACID
The conditions of the animals after injection of alloxan and oleic acid
into the pulmonary artery and
listed in Table IV-3.
after compensatory Dextran infusion (II-7)
are
compensatory infusions of
Cardiac
Dextran.
output
Peak
physiological dead space increased
Pa02 levels were good with an FI02
markedly
of 0.40.
(48%
decreased
tracheal
nnd 36%
in spite of
pressure and
respectively).
With
respect to the condition of the animals only a DEF 100% series was carried
out.
PEEP amounted to 5.4 ~ 0.7 em H20 (Fig. IV-5). Cardiac output was not
altered by DEF or PEEP (Table A-28)
DEF 100% and PEEP~ DEF 100% increased Pao2 (p < 0.025) compared with
IPPV, but PEEP~ DEF 100% elevated Pa02 to a much higher level (Fig. IV-5
and Table A-30).
58
Normal conditions
COTh (ml·kg-1-s-1) 2.59 ± 0. 2
P ao (mm Hg) 98.8 ± 9. 9
P oa (mm Hg) 22,4 ± 3.8
p (mm Hg) -ra,e
0.94 ± 0.6
p ra, i
{mm Hg) 2. 3 ± 0. 7
Heartrate ( •min-1) 188 ± 29
PT ,P (em Hpl 18.7 ± 3.1
P3
02
(mm Hg) 68.8 ± 1 0.1
PaC0 2 {mm Hg) 42.6 ± 1. 3
P-CO v 2
(mm Hg) 48.5 ± 2.5
PEC02,e (mm Hg) 42. 1 ± 1.7
VD!VT 0.28 = 0.04
After infusion of Dextran (10 ml.kg-1
)
** F10
2 = 0.40
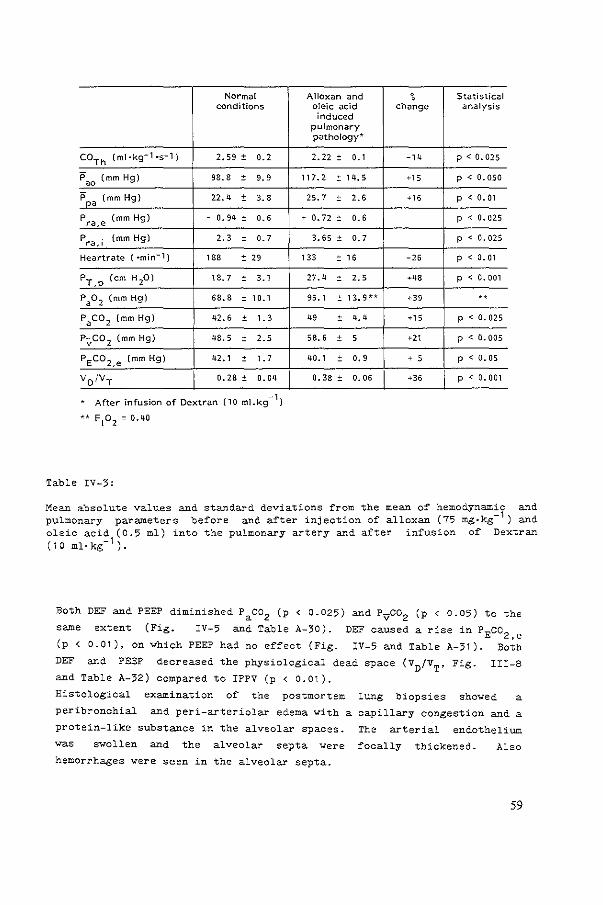
Table IV-3:
Alloxan and ~ Statistical oleic acid change analysis induced
pulmonary pathology*
2.22 ± 0. 1 -14 p<0.025
117.2 ± 14.5 '" p < 0. 050
25. 7 ± 2.6 '" p < 0. 01
' 0. 72 ± 0.6 p < 0. 025
3.65 ± o. 7 p < 0.025
133 ± 16 -26 p < 0. 01
27.4 ± 2. 5 •48 p < 0. 001
95.1 ± 13,9H '" .,
49 ± 4. 4 •15 p < 0.025
58.6 ± 5 ,, p < o. 005
40.1 ± o. 9 ' 5 p < 0.05
0.38 = 0.06 p < 0.001
Mean absolute values and standard deviations from the mean of hemodynamic and pulmonary parameters before and after injection of alloxan (75 mg•kg- 1 ) and oleic acid (0.5 ml) into the pulmonary artery and after infusion of Dextran (10 ml·kg- 1 ).
Both DEF and PEEP diminished Paco2 (p < 0.025) and Pyco2 (p < 0.05) to the
same
(p <
DEF
extent (Fig. IV-5 and Table A-30).
0.01), on
and PEEP
Yhich PEEP had no effect (Fig. DEF caused a rise in PEco2 ,e
IV-5 and Table A-31). Both
and Table A-32)
decreased the physiological dead space (VD/VT'
compared to IPPV (p < 0.01 ).
Fig. III-8
Histological examination of the postmortem lung biopsies showed a
peribronchial and peri-arteriolar edema with a
protein-like substance in the alveolar spaces.
was swollen and the alveolar septa were
hemorrhages were seen in the alveolar septa.
capillary congestion and a
The arterial endothelium
focally thickened. Also
59

Fig. IV-5:
1~ :rA
.. ~ " " " "
0.21
"" '·" ..
OEF PIOEP 11'PVu 100\ '1- OEF .• ,
Peak tracheal pressure (PT,p)' positive end-expiratory pressure (PEEP), partial pressures of systemic arterial oxygen (Pao2 ) and carbon dioxide (Paco2 ) and of mixed venous carbon dioxide (PyC02 ) and of carbon dioxide in the end-expiratory air {PEco2 e), and physiological dead space (VD/VT) during the different modes of ventilaiion in protocol II (chapter II-6). Vertical bars represent standard deviations from the mean. n is number of series in oleic acid induced pulmonary disease.
60


CHAPTER V
DISCUSSION
THE EXPERIMENTAL CONDITIONS
St:abilit:y
Piglets, 4-7 weeks old, constitute an adequate animal model, resembling
adult swine regarding cardiovascular control (Buckley et al., 1979.a) and
the geometric relations of the_ heart
of pentobarbital sodium (II-2)
(Versprille et al., 1976). The dose
sufficient surgical anesthesia
injected
(Buckley et
intraperitoneally
al., 1979,b and
provided
present
experience). During the surgical procedures the pigs breathed
spontaneously in a regular pattern with intermittent sighs. This was
terminated by the infusion of d-tubocurarine during the experimental
procedures when mechanical ventilation was started. Schreuder et al.
(1982) have demonstrated that continuous infusion of pentobarbital sodium
sufficient for anesthesia as used for the experiments in this study
(II-2), produced stable plasma-concentrations over hours. Together with
continuous infusion of d-tubocurarine hemodynamic
parameters were constant and comparable in the
and respiratory
different animals
throughout the experimental procedures. Pentobarbital has been said to
depress the cardiovascular functions (Strobel and Wollman, 1969; Effendi,
1972; Effendi et al., 1974). Sawyer et al. (1971) found a decrease of
41% in cardiac output compared to pre-anesthesia control values with
slightly higher plasma-concentrations of pentobarbital sodium as Schreuder
et al. (1982) described. However Buckley et al. (1979,b) did not find
significantly different values for systemic arterial pressure under
pentobarbital anesthesia, compared to those obtained in piglets and swine
under local (Evans et al., 1963; HOrnicke, 1966), halothane (Buckley et
al., 1976) or ketamine (Rowe and Arango, 1977) anesthesia. This leads to
the conclusion that pentobarbital anesthesia produces reliable
experimental circumstances for studying the effects of several modes of
mechanical ventilation on hemodynamic variables during baseline conditions
63

and experimental pathology. The hemodynamic values before and after the
DEF 66~ and the DEF 100~ series were not significantly different (III-1)
indicating a stable animal model throughout the observation period. The
baseline values were in accordance with those described by HOrnicke
(1966), Rowe and Arango (1977), Buckley et al. (1979,b) and Schreuder et
al. (1982).
PEEP was produced by submerging the tube from the expiratory port of the
ventilator under a water column because it was noted, that the PEEP-valve
of the Servo ventilator had a marked expiratory resistance producing an
increase in expiration time, as described later by Link (1983).
Histamine
Obstructive lung disease was simulated by infusion of histamine or
acetylcholine into the pulmonary artery. Histamine has definite effects
on the respiratory and cardiovascular systems. The drug is known to
constrict bronchial and alveolar duct smooth muscle, the magnitude of
which is qualitatively related to the amount of smooth muscle in alveolar
ducts (Colebatch and Engel, 1974). The resultant effect is an increase in
predominantly peripheral resistance of the lung (Drazen et al .• 1976) and
a decrease of the dynamic compliance. A higher airway pressure at
volume-constant inflation is seen with histamine, due to constriction of
alveolar
regulating
Mitchell,
duct
the
muscle in series with the pulmonary fibre network and thus
distensibility of respiratory units (Colebatch and
1971 ) • In accordance. a
observed in this study after histamine
however been extremely difficult to
rise in peak tracheal pressure
infusion (Table A-16). It
was
has
reproduce the typical increase in
functional residual capacity seen in humans after bronchial provocation
(Hutchison et al .• 1982). There
aerosol challenge among individual
is a wide
animals
range of
(Snapper
responsiveness to
et al., 1978).
However, a correlation was found to exist between responsiveness to
aerosol histamine and parenterally administered histamine, suggesting that
airway responsiveness is an inherent physiologic property (Hutchison et
al., 1982). Histamine infused into the left atrium or into the pulmonary
artery produced similar afore mentioned changes in pulmonary mechanics
(Hutchison et al .• 1982), but according to Colebatch et al. (1966) a
12-30 times greater minimal dose is needed for left sided injections to
decrease lung compliance and increase lung resistance compared to right
sided injections. Infusion into the pulmonary artery was highly
64

reproducible.
Pappenheimer,
Histamine has no effect on
1955; Cole batch et al., 1966;
dead space (Folkow and
Drazen et al., 1979) which
was confirmed in this study (Table A-16). According to Douglas (1980) the
effects of histamine on cardiovascular systems are the following: the
most characteristic action on the vascular tree is a vasodilatation, which
can produce an impressive fall in systemic blood pressure. The second
classic effect of histamine on the fine vessels is an increased capillary
permeability resulting in edema, as was seen histopathologically in the
post mortem lung biopsies (see chapter IV-5) and was made likely in this
study, because the hemoglobin concentration increased by 0.7 mmol·L- 1
(range 0.2- 1 .5) during histamine in~usion (unpublished data). Heart
rate and cardiac output tend to be augmented by histamine, evenso the
pulmonary artery blood pressure. This was also con~irmed in the
experiments (Table A-16). The dose used (1 .1 mg-kg- 1 -h-1 ) was empirically
found to obtain a good reproducible response and is somewhat higher than
used in the literature. This may account ~or the pulmonary edema seen at
post mortem investigation.
Because both PT,p and Paco2 increased during histamine in~usion and
wheezing was heard over the lungs, it may be concluded, that bronchospasm
was present.
Acetylcholine
Acetylcholine has a di~~useness o~ action (Taylor, 1980). The effects on
the respiratory system include increased tracheobronchial secretion and
bronchoconstriction, which may precipitate an asthmatic attack.
Acetylcholine produces a smaller decrease in lung compliance, but a
greater increase in pulmonary resistance compared to histamine. It
reduces dead space and 'decreases arterial tension (Colebatch et al.,
1966). Reduction of dead space was not encountered in this study, but the
decrease in arterial oxygen tension was highly signi~icant, evenso the
rise in peak tracheal pressure.
The reported cardiovascular effects after the dose used (0.56 mg-kg- 1 ·h-1 )
were a generalized vasodilatation (Taylor, 1980), producing an evanescent
~all in systemic arterial pressure, accompanied usually by reflex
tachycardia. These indeed were ~eatures in this study together with an
augmented cardiac output and a remarkable increase in pulmonary arterial
pressure (Table A-29). The systemic arterial pressure though did not
return to pre-infusion values after the initial ~all (Table A-29) due to
65
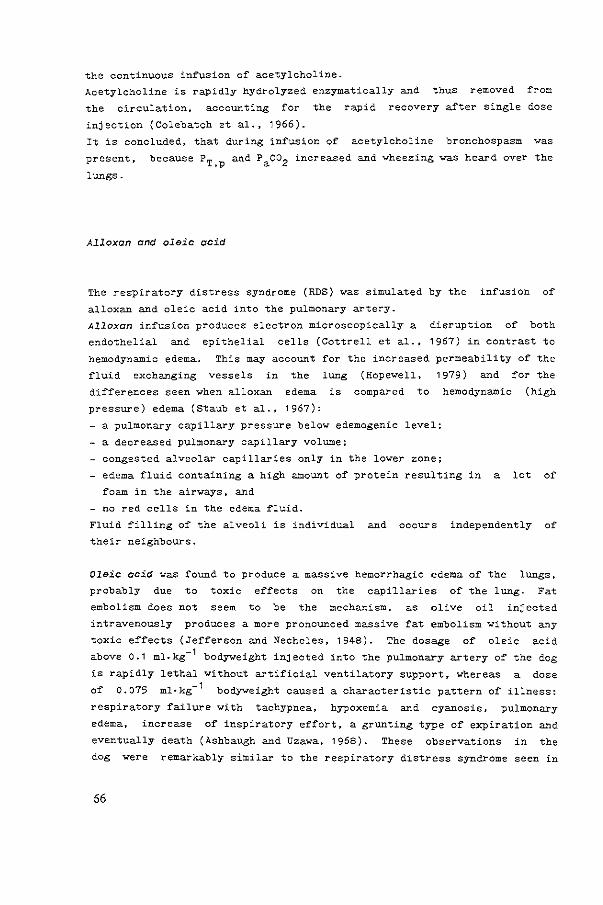
the continuous in~usion o~ acetylcholine.
Acetylcholine is rapidly hydrolyzed enzymatically and thus removed ~rom
the circulation, accounting ~or the rapid recovery a~ter single dose
injection (Colebatch et al., 1966).
It is concluded, that during in~usion o~ acetylcholine bronchospasm Yas
present, because PT,p and Paco2 increased and Yheezing Yas heard over the
lungs.
Alloxan and oleic acid
The respiratory distress syndrome (RDS) Yas simulated by the in~usion o~
alloxan and oleic acid into the pulmonary artery.
Alloxan in~usion produces electron microscopically a
endothelial and epithelial cells (Cottrell et al.,
disruption o~ both
1967) in contrast to
hemodynamic edema. This may account ~or the increased permeability o~ the
~luid exchanging vessels in the lung (HopeYell, 1979) and ~or the
differences seen Yhen alloxan edema is compared to hemodynamic (high
pressure) edema (Staub et al., 1967):
- a pulmonary capillary pressure belaY edemogenic level;
- a decreased pulmonary capillary volume;
- congested alveolar capillaries only in the laYer zone;
- edema ~luid containing a high amount of protein resulting in a lot of
~cam in the airways, and
- no red cells in the edema ~luid.
Fluid ~illing of the alveoli is individual and occurs independently of
their neighbours.
Oleic acid was found to produce a massive hemorrhagic edema of the lungs,
probably due to toxic effects on the capi~laries o~ the lung. Fat
embolism does not seem to be the mechanism, as olive oil injected
intravenously produces a more pronounced massive fat embolism without any
toxic ef~ects (Jef~erson and Necheles, 1948). The dosage of oleic acid
above 0.1 ml.kg- 1 bo~eight injected into the pulmonary artery of the dog
is rapidly lethal without arti~icial ventilatory support, whereas a dose
of 0.075 ml·kg- 1 bodYWeight caused a characteristic pattern of illness:
respiratory failure with tachypnea, hypoxemia and cyanosis, pulmonary
edema, increase of inspiratory effort, a grunting type of expiration and
eventually death (Ashbaugh and Uzawa, 1968). These observations in the
dog were remarkably similar to the respiratory distress syndrome seen in
66

humans (Ashbaugh et al., 1967).
After intravenous injection of oleic acid (0.045 and 0.09 ml·kg- 1
differing only in the extent of the diseased zones) pulmonary edema,
capillary congestion, perivascular infiltrates and hemorrhage are seen
microscopically (Derks and Jacobovits-Derks, 1977). Grossman et al.
(1980) found that the loss of lung volume after oleic acid injury (0.043
ml-kg- 1 ) secondary to alveolar flooding ~as the most important reason for
the decrease of lung compliance. Increase in extravascular lung ~ater
content and sequential flooding of the alveoli ~ith edema fluid is related
to an increase in the alveolo-arterial oxygen gradient, and a decrease in
compliance and functional residual capacity (Hofman et al., 1985). This
increase in extravascular lung ~ater may be much more an index for the
degree of lung injury than the ~ecrease o~ Pao2 (Schuster and Trulock,
1984). In the oleic acid model for pulmonary edema intravascular
coagulation occurs as a secondary phenomenon (King et al., 1971 ).
The effects produced by alloxan and oleic acid as described in chapter
IV-5 in the doses described in chapter II-7 ~ere in accordance ~ith the
results of other ~orkers (Ashbaugh and Uza~a. 1968; Schuster and Trulock,
1984; Hofman et al .. 1985; Johnston et al., 1985). As the hemodynamic
and gasexchange conditions ~ere stable throughout the experiments, and the
effects of oleic acid and alloxan infusion ~ere ~ell reproducible, it can
therefore be concluded that a useful respiratory distress model ~as
achieved for studying the effects of DEF and PEEP on hemodynamic and
pulmonary phenomena.
HEMODYNAMIC PHENOMENA
Mean cardiac output decreased to the same extent compared to IPPV ~hen DEF
or PEEP~ DEF ~ere instituted. This can be explained primarily by the
same rise in mean tracheal pressure. If the tracheal pressure is
substituted as an indicator of intrathoracic pressure (especially in the
experiments on animals ~ith non-diseased pulmonary conditons and ~ithin
the same animals), this rise ~ill impede venous return to the heart,
causing less right ventricular filling (Humphreys et al., 1938; Cournand
et al., 1948; Versprille and Jansen, 1985). Indeed, ~ith a higher mean
tracheal pressure during DEF 100% and PEEP- DEF 100% the decrease in
car'diac output ~as more pronounced than during a lo~er mean tracheal
pressure as during DEF 66% and PEEP~ DEF 66% (Fig. IV-1, Table A-3, A-4,
67

A-17).
Although right atrial pressure averaged over the cardiac cycle (Pra)'
measured at the moments of end expiration and peak insufflation, was
significantly higher during PEEP compared to the values of the same
moments in the other modes of ventilation, no differences in the mean
value of Pra averaged over the ventilatory cycle were observed because in
the phase of prolonged expiration by DEF (between the end-inspiration and
end-expiration measuring moments) a higher and gradually diminishing Pra
existed as seen on the recording (Fig. V-1 ). This behaviour of Pra might
explain the same fall in cardiac output during DEF or PEEP circumstances.
Mean pulmonary arterial pressure <Ppa)
compared to the other ventilatory patterns,
an increase.
only dropped during DEF 100~
whereas PEEP - DEF 66~ caused
However, transmural Pra and Ppa may well drop (Versprille, 1983) both due
to a decrease in venous return i.e. preload of the ventricle and thus
producing a fall in cardiac output.
Mean aortic pressure dropped during DEF (either 66% of 100%) compared to
the other modes of ventilation probably due to a lower value of systemic
arterial carbondioxide (chapter IV-2-3).
t~6 mmHg
"
'
Fig. V-1:
Tracing of (A). DEF p ra and PT
68
A B C . :JJJ=UR ---~-. t-H-1 .• -. II ::-:±l±J_--~_=- -_=- ~+- :::_:;::::::!:::!
-~·~' ____:____.:___~ , I - ~--- ------,
I -~---- . -- - .. - ·-
right atrial pressure (Pr ) and tracheal pressure (PT) during IPPV 66% (B), PEEP~ DEF 66% fc), DEF 100% (D) and PEEP~ DEF 100% (E). show a slackening fall during expiration with DEF 66% and DEF 1 00%.

PULMONARY PHENOMENA
Airway pressure
During arti~icial ventilation with DEF a rise in peak tracheal pressure
(PT,p) compared to the first control series (IPPV1 ) was only seen in the
piglets with normal lungs (Fig. IV-5. Table A-10) and not under
pathological circumstances. This phenomenon, without a change of tidal
volume, could be explained by an increase in functional residual capacity
(FRC) as seen during expiration with a resistance (Buhain et al., 1972;
Moomjiam et al., 1980) and during pursed lips breathing producing a more
pronounced rise in end-expiratory lung volume in healthy controls (Ingram
and Schilder, 1967). Also, a small rise was seen in FRC during mechanical
ventilation with a maximum inspiratory hold and shortest expiration to
produce zero end-expiratory flow (Perez-Chada et al., 1983). This was
also the impression, when Helium wash-in and wash-out procedures were
performed on three occasions (unpublished data).
At higher PT,p' as seen after induced pulmonary pathology (Tables A-16,
A-29 and A-30) DEF did not result in a significantly higher PT,p compared
to IPPV1 , probably due to less or absent increase of FRC (Ingram and
Schilder, 1967). Whether opening of units with airtrapping due to airway
collapse is a mechanism remains speculative.
The PT,p during the second control series (IPPV11 ) was lower than during
IPPV1 , presumably due to -adaptation- (Bernstein, 1957) after the period
of higher inflation pressures during the previous positive end-expiratory
pressure (PEEP) period in the experimental series (see chapter II-6), and
due to influence of stress relaxation (Sharp et al., 1967). Elastic
hysteresis related to surface phenomena may also contribute (Mead et al.,
1957).
Further, PEEP
during
will dissolve atelectasis in the dependent regions of
artificial ventilation and anesthesia (Strandberg, 1985) lung
PEEP
0~
causes a release of surfactant, resulting in a lower surface tension
the alveoli and lower peak tracheal pressures after PEEP is
discontinued. There is gradual recovery from the adapted state
(Bernstein, 1957) and probably, after PEEP, atelactasis in the dependent
regions may reoccur, which may account for the one exception in this
study, i.e. PT,p during IPPv11 was higher than the value during IPPV1 , if
the DEF 66% series was performed after a DEF 100% series (Table A-10).
The highest PT,p evidently was found during PEEP- DEF 100$ and this part
69

of the series was done just before the DEF 66% series started meaning the
IPPVII of the DEF 100% series was the IPPVI of the DEF 100% series. The
gradual recovery from the adapted state took place during the whole of the
DEF 66% series so PT,p rose to a higher level during IPPVII compared to
IPPV I
co2 elimination and o2 uptake
In this study the respiratory rate, tidal volume, inspiratory flow rate
and time and inspiratory hold were maintained constant to rule out any
possible change in blood gas exchange by altering these settings.
Mechanical ventilation with a diminished expiratory flow (DEF) always
ended in a zero end-expiratory pressure (ZEEP) and flow and resulted in an
increase in mean airway pressure by the slower pressure fall from peak
airway pressure to ZEEP. During intermittent positive pressure
ventilation (IPPV) with a positive end-expiratory pressure (PEEP) mean
airway pressure was adjusted to the same level in order to approximate
similar effects on cardiac output.
In summary DEF. in piglets with normal lungs, was found to have the
following effects on co2 elimination and o2
uptake when compared to IPPV
(fig. III-5).'
- an increase in Pa02 (6% + 4 at DEF 66%; 10% '!: 4 at DEF 1 00%);
- a decrease in P aco2 ( 6% + 3 at DEF 66%; 8% :': 3 at DEF 100%);
- a decrease in PyC02 (3% :': 3 at DEF 66%; 6% '!: 3 at DEF 1 oo,:) • and
- a decr'ease in VD/VT (20% :!:: 13 at DEF 66%; 28% + 15 at DEF 1 00%).
The effects of PEEP on Pao2 were less marked, whereas the effect of PEEP
on Paco 2 and V0 /VT were slight, if present at all. This leads to the
conclusion that both co2 elimination and 0 2 uptake are better during DEF
than during comparable PEEP especially as cardiac output is the same.
However, as oxygen saturation is only slightly higher during DEF compared
to IPPV (about 1-2% for DEF 66% and DEF 100% respectively), oxygen
transport will decrease as cardiac output falls. Oxygen transport is
slightly better during DEF than during PEEP, as cardiac output is the same
and oxygen saturation is higher (about 1% for both DEF 66% and DEF 100%).
In the clinical situation, oxygen transport may be elevated by raising the
preload of the right ventricle through infusion of fluids (Ashbaugh and
Petty, 1 973; Qvist et al., 1975).
The better co2 elimination and o2
uptake can be explained by a better
effective alveolar ventilation (VA,eff)' which can be deducted from the
70

equation:
carbon dioxide production, and
mean alveolar carbon dioxide fraction.
As
in vco
2 the
remained the same during the three ventilatory modes (C02 fraction
mixed expiratory air did not change at steady state conditions
during the three ventilatory modes in one protocol, unpublished data) and
as Paco2 represents Fxco2 , meaning Fxco2 decreased during DEF, vA,eff must
have increased leading to a decrease of v0 ;vT, because tidal volume did
not change. There are several possible explanations for the increased
efficiency of alveolar ventilation during DEF Compared to PEEP and IPPV
and probably all contribute.
First, the longer presence of a larger amount of inspired gas in the lung
will result in a greater amount of co2 expired (Nye, 1970), as a larger
volume provides a greater area for blood gas diffusion with a lower
resistance for diffusion due to a thinner membrane (Stam et al., 1983).
Second, a longer increased lung volume will increase the surface area of
the diffusion interface between gas in the alveoli and gas in the airways
and thus provides a longer period for diffusion to occur (Gumming et al.,
1967; Bowes et al .• 1985).
Third, during retarded expiration redistribution o£ gas from
overventilated, low resistance alveoli to underventilated high resistance
alveoli can occur (Otis et al., 1956), which may be improved by the
sustained increase in the pressure of the main airways as with DEF (Sykes
and Lumley, 1969).
Also, DEF will result in more complete emptying of the alveoli, especially
the alveoli with high airflow resistance, resulting in movement of more
air into these alveoli during inspiration, producing a more even
distribution o£ ventilation therefore an improved
ventilation/perfusion matching (Connors et al., 1981 ). Thus, a larger
fraction of the inspired volume will effectively mix with the alveolar air
(Luijendijk et al., 1980).
The prolonged actual expiration during DEF may
of the intra-acinar gas concentration by
allow better homogenisation
diffusion (Feenstra et al.,
1985), resulting in a redistribution of o2
from alveoli with high
ventilation/perfusion ratio's to alveoli with low ventilation/perfusion
ratio's and vice versa for co2 , reducing the part of the physiological
dead space determined by inhomogeneity.
71
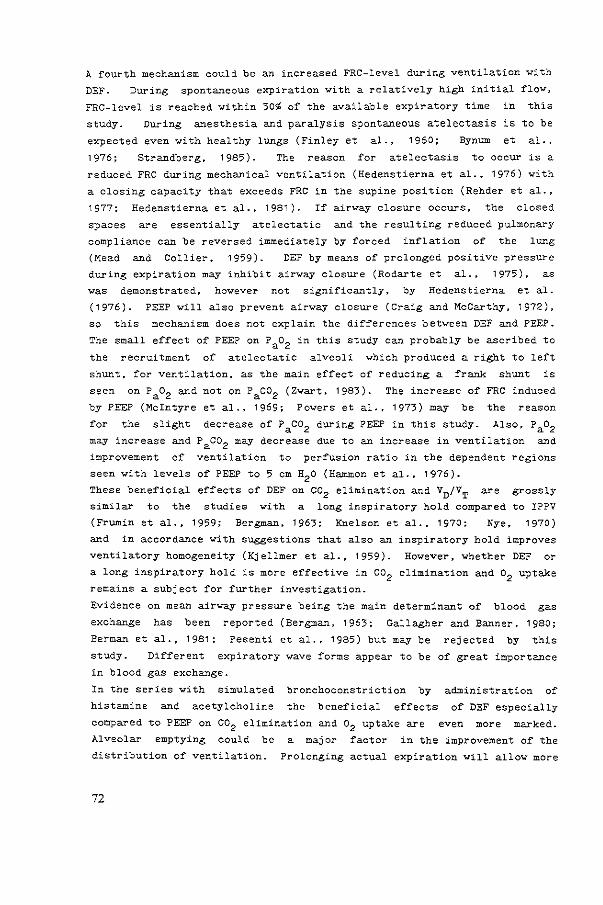
A fourth mechanism could be an increased FRC-level during ventilation with
DEF. During spontaneous expiration with a relatively high initial flow,
FRC-level is reached within 30% of the available expiratory time in this
study. During anesthesia and paralysis spontaneous atelectasis is to be
expected even with healthy lungs (Finley et al., 1960; Bynum et al.,
1976; Strandberg, 1985). The reason for atelectasis to occur is a
reduced FRC during mechanical ventilation (Hedenstierna et al., 1976) with
a closing capacity that exceeds FRC in the supine position (Rehder et al.,
1977; Hedenstierna et al., 1981 ). If airway closure occurs, the closed
spaces are essentially atelectatic and the resulting reduced pulmonary
compliance can be reversed immediately by forced inflation of the lung
(Mead and Collier, 1959). DEF by means of prolonged positive pressure
during expiration may inhibit airway closure (Rodarte et al., 1975), as
was demonstrated, however not significantly, by Hedenstierna et al.
{1976). PEEP will also prevent airway closure (Craig and McCarthy, 1972),
so this mechanism does not explain the differences between DEF and PEEP.
The small effect of PEEP on Pa02 in this study can probably be ascribed to
the recruitment of atelectatic alveoli which produced a right to left
shunt, for ventilation, as the main effect of reducing a frank shunt is
seen on Pa02 and not on Paco2 (Zwart, 1983). The increase of FRC induced
by PEEP (Mcintyre et al., 1969; Powers et al., 1973) may be the reason
for the slight decrease of Paco2 during PEEP in this study. Also, Pa02 may increase and Paco2 may decrease due to an increase in ventilation and
improvement of ventilation to perfusion ratio in the dependent regions
seen with levels of PEEP to 5 em H2o (Hammon et al., 1976).
These beneficial effects of DEF on co2 elimination and VDJVT are grossly
similar to the studies with a long inspiratory hold compared to IPPV
(Frumin et al., 1959; Bergman, 1963; Knelson et al., 1970; Nye, 1970)
and in accordance with suggestions that also an inspiratory hold improves
ventilatory homogeneity (Kjellmer et al., 1959). However, whether DEF or
a long inspiratory hold is more effective in C02 elimination and 02
uptake
remains a subject for further investigation.
Evidence on mean airway pressure being the main determinant of blood gas
exchange has been reported (Bergman, 1963; Gallagher and Banner. 1980;
Berman et al., 1981; Pesenti et al., 1985) but may be rejected by this
study. Different expiratory wave forms appear to be of great importance
in blood gas exchange.
In the series with simulated bronchoconstriction by administration of
histamine and acetylcholine the beneficial effects of DEF especially
compared to PEEP on co2 elimination and o2 uptake are even more marked.
Alveolar emptying could be a major factor in the improvement of the
distribution of ventilation. Prolonging actual expiration will allow more
72

complete emptying of respiratory units with large time constants for
volume changes, resulting in more air movement from and into these alveoli
producing a more even distribution of ventilation and an improved matching
of ventilation to perfusion by this type of ventilation.
PEEP mainly improved o2 uptake. which may be due to the dissolvement of
atelectasis caused by formation of pulmonary edema during histamine and
acetylcholine infusion. PEEP again had hardly beneficial effects on
VD/VT, if any. and therefore on Paco2 .
In oleic acid lung injury, both DEF and PEEP reduced Paco2 and VD/VT to
non significantly different levels, but PEEP produced a greater increase
in Pao2 . The cause for this is probably the great increase in FRC by the
recruitment and splinting of previously collapsed alveoli produced by this
pattern of ventilation especially in this form of pulmonary disease.
These results are in accordance with the experimental work of Perez-Chada
et al. (1983) comparing an inspiratory hold to PEEP with respect to the
same rise in mean airway pressure in oleic acid induced pulmonary injury
in goats. This also suggests that the more beneficial effects of either
DEF or an inspiratory hold remain to be investigated.
Partial pressure or co2 in the expiratory air (PEco2 )
During DEF the partial pressure of co2 in the end expiratory air (PEco2 ,e)
was always higher than this value during the other modes of ventilation
studied in health and simulated disease (Fig. IV-2, IV-3, IV-4 and IV-5).
Also, during DEF PECo2 ,e was higher than the partial pressure of systemic
arterial C02 (Paco2 ) but lower than the values of the partial pressure of
co2
in the mixed venous blood (PyC02 , Table A-12, A-13, A-14, A-24, A-25,
A-26, A-30 and A-31 ). A negative arterial to alveolar co2 gradient ((a-A)
PC02 ) has been described during rebreathing studies in dogs (Jennings and
Chen, 1975) and in man with pulmonary disease (Field et al., 1971 ), and
even a negative mixed venous to alveolar carbon dioxide pressure gradient
was found (Gurtner et al., 1969; Guyatt et al., 1973). Possible
explanations for this phenomenon include a charged membrane hypothesis
{Gurtner et al., 1969) and a delayed equilibration hypothesis (Hill et
al., 1973) but these were disputed (Forster, 1977) and rejected in a
critical review, which concluded that PC02 equality is attained between
gas and blood when co2 is at equilibrium (Scheid and Piiper, 1980).
Nevertheless, in exercise a negative arterial to end-tidal C02 gradient
((a-ET) PC02 ) was calculated (Zwart et al., 1983) and seen to be inversely
73
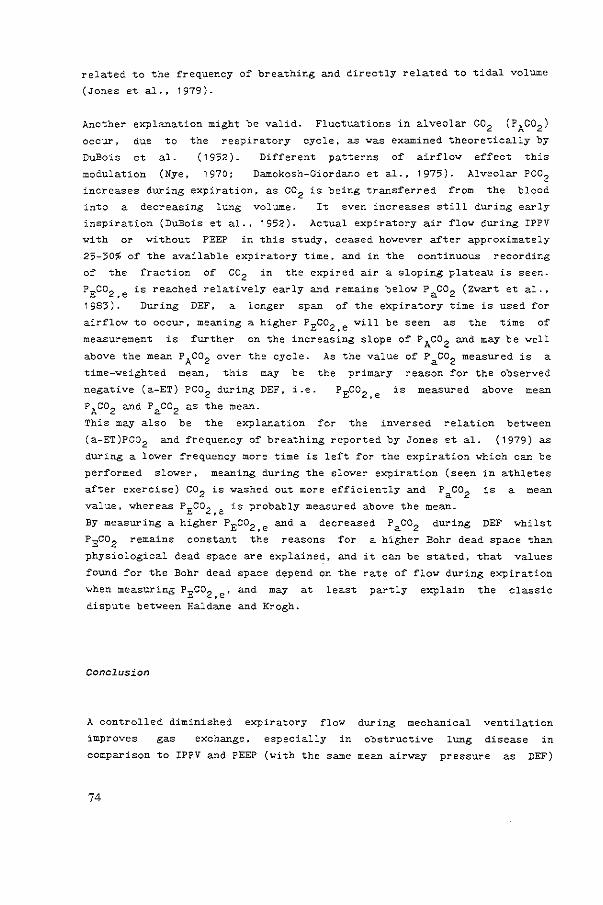
related to the frequency of breathing and directly related to tidal volume
(Jones et al., 1979).
Another explanation might be valid. Fluctuations in alveolar C02 {PAC02 )
occur, due to the respiratory cycle, as was examined theoretically by
DuBois et al. (1952). Different patterns of airflow effect this
modulation (Nye, 1970; Damokosh-Giordano et al., 1975). Alveolar PC02 increases during expiration, as co2 is being transferred from the blood
into a decreasing lung volume. It even increases still during early
inspiration (DuBois et al., 1952)- Actual expiratory air flow during IPPV
with or without PEEP in this study, ceased however after approximately
25-30% of the available expiratory time, and in the continuous recording
of the fraction of Co2 in the expired air a sloping plateau is seen.
PECo2 .e is reached relatively early and remains below Paco2 (Zwart et al.,
1983). During DEF, a longer span of the expiratory time is used for
airflow to occur, meaning a higher PEco2 ,e will be seen as the time of
measurement is further on the increasing slope of PAco2 and may be well
above the mean PAC02 over the cycle.
time-weighted mean, this may be
negative (a-ET) PC02 during DEF, i.e.
PAco2 and Paco2 as the mean.
As the value of PaCo2 measured is a
the primary reason for the observed
PEco 2 ,e is measured above mean
This may also be the explanation for the inversed relation between
(a-ET)Pco2 and frequency of breathing reported by Jones et al. (1979) as
during a lower frequency more time is left for the expiration which can be
performed slower, meaning during the slower expiration (seen in athletes
after exercise) C02 is washed out more efficiently and Paco2 is a mean
value, whereas PEco2 ,e is probably measured above the mean.
By measuring a higher PEco2 ,e and a decreased- Paco2 during DEF whilst
PEco2 remains constant the reasons for a higher Bohr dead space than
physiological dead space are explained, and it can be stated, that values
found for the Bohr dead space depend
when measuring PEco2 ,e, and may at
dispute between Haldane and Krogh.
conclusion
on the rate of flow during expiration
least partly explain the classic
A controlled diminished expiratory flow during mechanical ventilation
improves gas exchange, especially in obstructive lung disease in
comparison to IPPV and PEEP (with the same mean airway pressure as DEF)
74

and without changing the inspiratory-expiratory time ratio due to a
combination o~:
- a larger gas volume in the lung ~or period o~ the total expiratory time
and a better e~~ective mixing o~ the inspired air with the alveolar air,
leading to a better equilibration in the intra-acinar inhomogeneity due
to the longer actual expiration:
- a better distribution o~ ventilation between alveolar units with short
and long time constants due to a higher airway pressure during
expiration;
- a more complete emptying o~ the alveoli especially those with a high
resistance. and
- a prevention o~ alveolar collapse during expiration due to the sustained
but slackening positive expiratory pressure.
However, in view o~ the possible side-effects (barotrauma during coughing
or ~ighting the respirator, as has been described by Kumar et al., 1970)
patients treated with a controlled diminished expiratory flow should be
monitored care~ully and at least be sedated, and rather paralysed, as when
incomplete emptying of the lung during expiration happens, the patient can
be virtually -blown up-.
Further, the partial pressure o~ end-expiratory co2 depends on the mode of
expiration, and may lead to higher values than the arterial values, which
correspond with the average values of alveolar PC02 .
75

Fig. VI-1:
Slow tracing of tracheal pressure (PT)' airflow (V) and the fraction of carbon dioxide in the ventilatory air (Fco2 ) at IPPV and after the change to IPPV with a maximally retarded expiration (DEF 100%) (arrow). Note the higher FC02 at the end of the expirium, which gradually becomes a little less during stabilization.
76

CHAPTER VI
C02 EXCHANGE DEPENDENT ON THE DURATION OF SPONTANEOUS EXPIRATION DURING
ARTIFICIAL VENTILATION
Introduction
During spontaneous breathing alveolar co2-concentration fluctuates with
each respiratory cycle according to a typical pattern (DuBois et al.,
1952; Rahn, 1954 and Otis, 1964). Different patterns of airflow effect
this pattern of fluctuation (Nye, 1970) and may also show differences in
the transferred amount of co2 during the respiratory cycle (Nye, 1970:
Damokosh-Giordano et al., 1975).
Mechanical ventilation with a diminished expiratory flow (DEF, resulting
in a lengthening of the duration of exhalation) and without changing tidal
volume. inspiratory flow wave form or inspiratory hold, resulted compared
to intermittent positive pressure ventilation in a new steady state,
characterized by an increased partial pressure of systemic arterial oxygen
(Pa02 ) and a decreased partial pressure of systemic arterial carbon
dioxide (Paco2 • Fig. IV-2), suggesting very strongly an improvement of
gas exchange using a retard during expiration.
During the experiments immediately after the change from IPPV to DEF a
rise of end tidal Pco2 in the expiratory air (PEco2 ,e) was seen, which
slightly diminished but remained at a higher level than during IPPV (Fig.
VI-1 ). After a gradual stabilization from the sudden changes by DEF the
PC02 in the mixed expiratory air (PEC02 ) was similar to the value during
IPPV (unpublished data). This implies that in both steady states co2 output was also similar but at a lower Paco2 when DEF was used. Thus,
during the initial stabilization period after changing the ventilatory
mode from IPPV to DEF more co2 was transferred from the blood to the
pulmonary air, indicating a more effective ventilation (Chapter IV). This
leaded to the hypothesis, that the output of co2 will be positively
dependent on the duration of expiration at constant PaCo2 and tidal
volume. In order to test this hypothesis, the relationship between the
exchange of co2 and the duration of expiration was studied in single
breath analyses, where retarded expirations of various degrees were
inserted at intervals of about two minutes in steady state ventilation.
77

Methods
Five Yorkshire piglets with a mean weight of 7.4 kg C± 9 kg, SD) were used
under pentobarbital sodium anesthesia (7.5 mg-kg- 1-h- 1 , i.v. infusion).
Surgical procedures, experimental conditions and data-acquisition were the
same as described in Chapter
ventilatory air. This signal was
II except
directly
for the C0 2 measurement in the
obtained from the tracheal
canula using a Hewlett Packard capnometer, model 47210A. A delay time of
160 msec with respect to the airflow signal was compensated for in order
to plot the partial pressure of expiratory carbon dioxide (PEco2 ) versus
expiratory volume (VE).
CPPV was used at a slight PEEP of 2.5 em H2 o in steady state conditions.
Ventilation was performed with a computer controlled piston ventilator.
The ratio of insufflation, inspiratory pause and expiration was 35:5:60.
At intervals of two minutes a ventilatory cycle with a diminished
expiratory flow (DEF-procedure) was inserted. During these DEF-procedures
expiration was lengthened between 30% and 100% of the available expiratory
time (tE,max' which is the 100% value). Intervals of 2 minutes appeared
to be sufficient for maintainance of steady state conditions.
During ventilatory rates of about 10 and 6 per minute a double series of
observations was performed with 8 different tE values between 30% and 100%
of tE,max' done only
with one exception ( exp. 501), in wh~.ch the observations were
once. The order of observations was randomly chosen, with one
exception (exp.502),
lengthened from 30%
where the expiratory time was
to 100% of tE.max and back again.
systematically
The observations
with the same expiratory time were averaged. The expiratory rates were
not exactly 6 and 10 per minute in all experiments, due to technical
problems in the timing of the control unit of the ventilator. This was of
minor importance for the data analyses.
During each DEF-procedure alveolar air went into the piston pump which
controlled expiratory flow and tE. This implied a rebreathing of
expiratory air during the next ventilation. During each DEF-procedure
expiratory volume {VE) was made equal to insufflation volume, and
expiratory flow eVE) was constant. Therefore. VE decreased proportionally
with an increase of tE in percentage
Arterial bloodgas analyses were done of tE,max· before and after each series of
observations. The partial pressure of arterial carbon dioxide {Paco2 ) of
both measurements was averaged, when used for comparison with the partial
pressure of end-expiratory carbon dioxide (PEco2 ,e) and for calculation of
physiological dead space (VD,phys).
arterial, pulmonary artery and
78
Recordings were made of ECG, and
central venous pressures to check
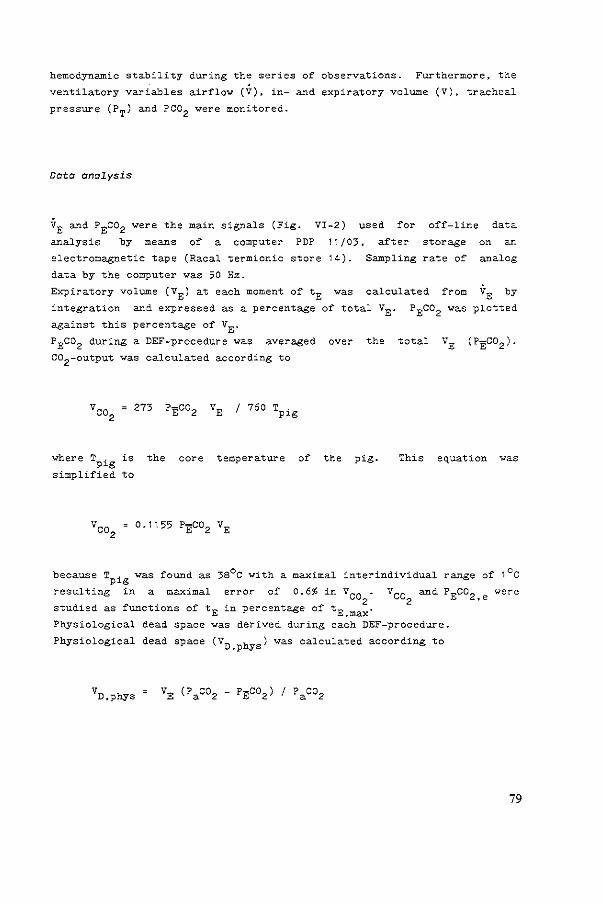
hemodynamic stability during the series of observations. Furthermore, the
ventilatory variables airflow (V), in- and expiratory volume (v), tracheal
pressure (PT) and PC02 were monitored.
Data analysis
VE and PEC02 were the main signals (Fig. VI-2) used for off-line data
analysis by means of a computer PDP 11/03, after storage on ~~
electromagnetic tape (Racal termionic store 14). Sampling rate of analog
data by the computer was 50 Hz.
Expiratory volume (VE) at each moment of tE was calculated from VE by
integration and expressed as a percentage of total VE. PEco2 was plotted
against this percentage of VE.
PEco2 during a DEF-procedure was averaged over the total VE (PEC02 ).
co2-output was calculated according to
vco 273 PEC02 VE I 760 Tpig 2
where Tpig is the core temperature 0~ the pig. This equation vas
simplified to
because Tpig was found as 38°C with a maximal interindividual
resulting in a maximal error of 0.6% in VCO . VCO and
studied as functions of tE in percentage of tE 2
. 2
range of 1°C
PEco2 ,e were
,max Physiological dead space was derived during each DEF-procedure.
Physiological dead space (vD,phys) was calculated according to
79

80

Fig. VI-2:
A recording of three DEF-procedures. obtained from experiment 502, series 1. Pao =aortic pressure measured against ambient air; Ppa =pulmonary artery pressure; Pcv =central venous pressure; PT =tracheal pressure; V =air flow in arbitrary units, positive deflection indicates insufflation, negative deflection expiration; V =ventilatory volume,-·obtained by integration of V. Full negative deflection during these DEF-procedures represents a volume of 155 ml; PC02 =partial pressure in ventilatory air of carbon dioxide.
Results
In Fig. VI-2 a recording is shown of three DEF-procedures. The
DEF-procedure had no effect on the hemodynamic steady state condition. In
the lower traces Pr~ V and V indicate the constant flow during the
DEF-procedures. Only at the beginning and the end of the expiration the
flow was temporarily smaller than the applied value of constant flow.
During the DEF-procedure PEco2 changed in three phases: first a phase I
of zero pressure during expiration of dead space air, followed by a fast
rise as phase II and third a
reaching a maximum (PEco2 ,e) at
plateau of gradual increase
the end of expiration.
as phase III
Because the
expiratory air of each DEF-procedure was returned into the ventilator the
succeeding normal ventilation was characterized by a rebreathing of this
expiratory air, causing temporarily an increased value of end tidal PC02.
After about 5 ventilations baseline values of end tidal PC02 were
regained. Therefore, 20 normal ventilations in between the DEF-procedures
were assumed to be sufficient.
PEC02 was plotted against VE for all DEF-procedures in order to compare
the changes in the relationship between PECo 2 and expired volume for
different expiratory flow values as a parameter of this relationship.
Examples are given in Fig. VI-3. Again a three phasic character of the
relationship can be observed, with a maximal-value of PEC02 at total
expired volume (PECo2 .e)' which coincided with the end of expiration as
reported for the co2 curves in
moderate shift of the steep
Fig. VI-2.
rise (phase II)
In
to
general a slight to
the left was seen, when
expiratory time was increased, i.e. when expiratory flow was decreased.
In the three plottings of Fig. VI-3 the gradual increase of PEco2 is
higher when expiratory flow is smaller and thus tE longer. This was seen
in all experiments.
In order to investigate the parameter function of expiratory time, i.e.
81

mmHg PE,C02
40-
•••• #
•• • •• • • • +++ 96% • 20- • • • • • • •
tE 68% • •• 31 %
• • - • •
. 5o . 'o 'lo
0 J
• 100
Fig. VI-3:
Explratory Pco2 as a function of expired volume (100% 200ml) at three different DEF values (tE). Data were obtained from experiment 505, second series. Phase I. II and III are mentioned in the text.
expiratory flow in a reciprocal value, PEco2 ,e was plotted against tE
expressed as a percentage of total available expiration time (Fig.
VI-4A). The plottings yield a linear relationship, which was also found
in all other experiments (Table VI-1A). Correlation coefficients were
high, except for the first series of exp. 503 due to a larger variation
of the data.
The area below the co2 curve of Fig. VI-3 reflects co2 output (VCO )
during a DEF-procedure. At lower expiratory flow this area was increasea.
In Fig. VI-4B an example is given of the change in Vca as a function of
tE. yielding a linear relationship as the best mathemitical description.
All regression equations are given in Table VI-1B. Again the results of
exp. 503, but now the second series, pr?duced a relatively lower
correlation coefficient than the others.
Both regression equations are characterized by a positive slope in all
series of observations, implying an increase in PEco2 .e and vc02
when
expiratory time is lengthened (or expiratory flow is decreased). PECo2 .e
at the end of total available time, i.e. tE,max• was calculated from the
regression equations and indicated as PECo2 ,max· Its value was expressed
as a percentage of arterial PC02 . All values were slightly smaller than
100%, and within all but one experiment not different when using lar~ely
82

A
B
c
Fig. VI-4:
mmHg
40
38
36
ml
5.5
5.0
ml
55
50
45
0 • • • •
•
•
50 % 100
•
0/ 0 100 r-----------------------~----, ok
50
v • D, phys. 36.7
0
• 33.3 •
• • 30
50 % 100
End tidal PCO (A). co2-output during a DEF-procedure (B) and physiological dead space fc) plotted against expiratory time (tE) in percentage o~ total available expiratory time. These relationships represent the results o~ exp. 501 , series 1 , which was the ~irst series o~ all observations in order to avoid a selection o~ the best results. Regression equations and correlation coe~ficients are given in Tables VI-1A and VI-1B.
dif~erent values o~ tE.max· The exception is experiment 503, where r
values are relatively low.
83

Exp. series
501 1 2
502 1 2
503 1 2
504 1 2
505 1 2
PE,C02,e
PE,C02,max: P a,C02 tc VE a
b
r
TABLE IV-1A
Vent.Cycle PE,C02,e"' a + btE PE,C02 ,max
tc VE a b r P a,G~2 sec ml mmllg :nmHg.%-1
6.16 150 36.4 .050 .89 90 8.15 199 33-7 .064 .91 90
5.0 115 35-9 .032 .96 97 8.32 155 33-9 .072 .98 99
6.0 130 31.3 .047 .84 92 10.0 195 31 .5 .049 .90 85
6.17 115 32.8 .056 .98 99 1 o.o 200 33.1 .075 -99 98
6.0 130 30.0 .075 .97 96 , 0.0 200 31.2 .095 .99 95
end exp:~.ratory co2-pressure, when exp:~.ratory flow becomes zero; time of expiratory flow as a percentage of total available expiratory time;
PE,C02 ,e at tE = 100%; arterial co2-pressure; cycle time of ventilation; expiratory volume; virtual value of PE,C02 ,e' when tidal volume should be expired in zero time; increase in PE,C02 ,e' when diminished expiratory flow lasts a larger part of available expiratory time; correlation coefficient of regression equations.
In Fig. VI-4C physiological dead space is presented as a function of tE
in percentage of
Physiological dead
phenomenon was
tE,max' derived from the same series of observations.
space decreased linearly, as tE increased. This
observed in all series (Table VI-1B). Correlation
coefficients of these linear relationships are high, except for the second
series of experiment 503. In all animals physiological dead space
84
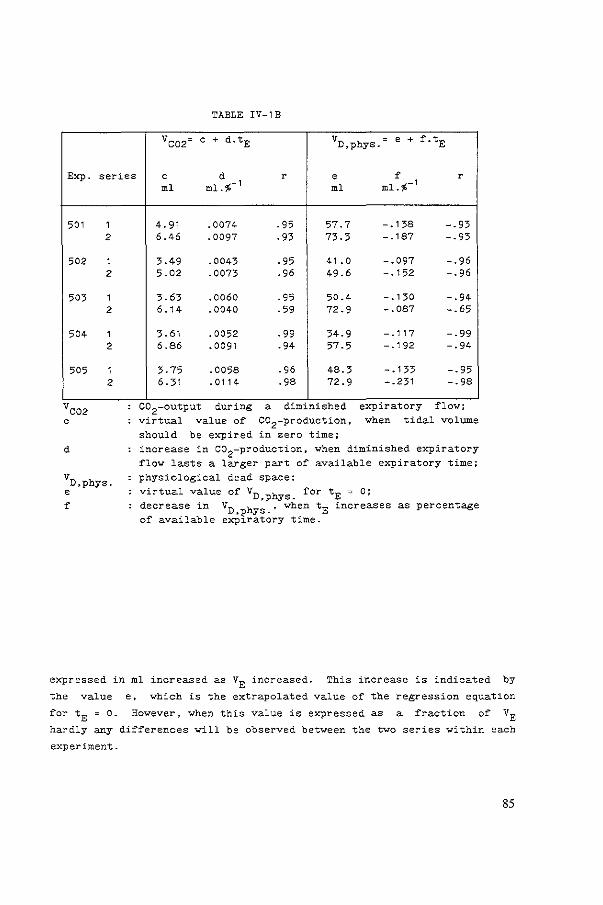
Exp. series
501 1 2
502 1 2
503 1 2
504 1 2
505 1 2
d
TABLE IV-1B
Vco2= c + d.tE vD,phys. " e + f.tE
c d r e ~ r ml ml.%- 1 ml ml.%-1
4.91 .0074 .95 57.7 -.138 -.93 6.46 .0097 .93 73.3 -.187 -.93
3-49 .0043 .95 41.0 -.097 -.96 5.02 .0073 .96 49.6 -.152 -.96
3.63 .0060 .95 50.4 -.130 -.94 6.14 .0040 .59 72.9 -.087 -.65
3.61 .0052 .99 34.9 -.117 -.99 6.86 .0091 .94 57.5 -.192 -.94
3. 75 .0058 .96 48.3 -.133 -.95 6. 31 .0114 .98 72.9 -.231 -.98
C02 output dur~ng a d~m~n~shed exp~ratory flow, virtual value of C02-production, when tidal volume
should be expired in zero time; increase in co2-production. when diminished expiratory flow lasts a larger part of available expiratory time; physiological dead space;
virtual value of VD,phys. for tE = 0; decrease in vD,phys.' when tE increases as percentage of available expiratory time.
expressed in ml increased as VE increased. This increase is indicated by
the value e, which is the extrapolated value of the regression equation
for tE = 0. However, when this value is expressed as a fraction of VE
hardly any differences will be observed between the two series within each
experiment.
85
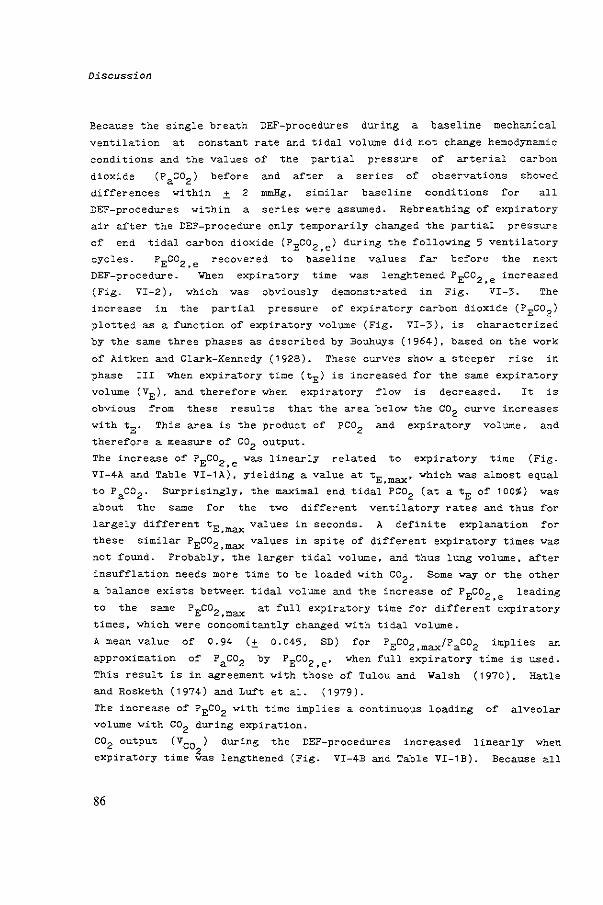
Discussion
Because the single breath DEF-procedures during a baseline mechanical
ventilation at constant rate and tidal volume did not change hemodynamic
conditions and the values o~ the partial pressure o~ arterial carbon
dioxide (Paco2 ) be~ore and after a series of observations sho~ed
differences ~ithin ± 2 mmHg, similar baseline conditions for all
DEF-procedures ~ithin a series were assumed. Rebreathing of expiratory
air after the DEF-procedure only temporarily changed the partial pressure
of end tidal carbon dioxide (PEco2 ,e) during the following 5 ventilatory
cycles. PECo2 ,e recovered to baseline values far before the next
DEF-procedure. When expiratory time was lenghtened PEco2 ,e increased
(Fig. VI-2), which was obviously demonstrated in Fig. VI-3. The
increase in the partial pressure of expiratory carbon dioxide (PEco 2 )
plotted as a function of expiratory volume (Fig. VI-3), is characterized
bY the same three phases as described by Bouhuys (1964), based on the ~ork
of Aitken and Clark-Kennedy (1928). These curves show a steeper rise in
phase III when expiratory time (tE) is increased for the same expiratory
volume (VE), and therefore when expiratory flow is decreased. It is
obvious from these results that the area below the co2 curve increases
with tE. This area is the product of PC02 and expiratory volume, and
therefore a measure of co2 output.
The increase of PECo2 ,e was linearly related to expiratory time (Fig.
VI-4A and Table VI-1A), yielding a value at tE,max' which was almost equal
to Paco 2 . Surprisingly, the maximal end tidal PC02 (at atE of 100%) was
about the same ~or the two different ventilatory rates and thus for
largely different tE,max values in seconds. A definite explanation ~or
these similar PEco2 ,max values in spite of dif~erent expiratory times was
not found. Probably, the larger tidal volume, and thus lung volume, after
insufflation needs more time to be loaded with co2 . Some way or the other
a balance exists between tidal volume and the increase of PEco2 ,e leading
to the same PEco2 ,max at full expiratory time for different expiratory
times, which were concomitantly changed with tidal volume.
A mean value of 0.94 C± 0.045, SD) for PEco2 ,max/PaC02 implies an
approximation of Paco2 by PEco2 .e' when full expiratory time is used.
This result is in agreement with those of Tulou and Walsh (1970), Hatle
and Rosketh (1974) and Luft et al. (1979).
The increase of PEC02 with time implies a continuous loading of alveolar
volume ~ith co2 during expiration.
co2 output (VCO ) during the DEF-procedures
expiratory time ~as lengthened (Fig. VI-4B and
86
increased linearly when
Table VI-1B). Because all

DEF-procedures were done during steady state conditions the results verify
the hypothesis that the output of co2 is positively dependent on the
duration of expiration at constant Paco2 .
When alveolar volume is loaded more with co2 at longer expiration time,
mean expiratory PC02 will increase correspondingly. At constant Paco2 this will decrease the quotient (Paco2-P~o2 ) I Paco2 • and therefore
physiological dead space. This result is shown in Table VI-1B. These
results are different from those of Worth et al. (1977). who found no
difference of alveolar ventilation with different speeds of expiration.
When physiological dead space decreases. ventilation at constant tidal
volume becomes more effective. Thus. the results of the single breath DEF
procedures confirm a former conclusion in chapter v. based on steady state
ventilation with DEF. implying that DEF improves gas exchange by a more
effective ventilation.
87


CHAPTER VII
SUMMARY
Chapter I
Pursed lips breathing seems beneficial for patients with chronic
obstructive pulmonary disease and is tought to them during breathing
exercises, if they do not already perform their expiratory effort through
pursed lips. The beneficial effects described in the literature are
reviewed.
breathing
Hypotheses about the mechanism of improvement
include a decreased airway collapse in the
by pursed
lung (Fig.
lips
I-1)
resulting in less air trapping and in better emptying of the more
compliant lung regions, an improvement of ventilation to perfusion
relationships, an enlarged tidal volume and a decreased respiratory rate.
The objectives of this study were to investigate in pigs whether a
diminished expiratory flo·" (DEF) during mechanical ventilation, resembling
pursed lips breathing, does improve gas exchange, especially in pulmonary
disease and whether this effect is different from intermittent positive
pressure ventilation (IPPV) with a positive end-expiratory pressure
(PEEP). Further, hemodynamic effects of DEF were explored and the effects
of DEF on the measurement of cardiac output by the thermodilution
technique were investigated.
Chapter II
Material, experimental conditions, surgical procedures and data
acquisition and analysis are described. The thermodilution technique and
the direct Fick method for oxygen for the determination of cardiac output
are detailed and additional measurements are specified. The respiratory
and hemodynamic effects of three different modes of artificial ventilation
were examined and compared to each other in healthy pigs: intermittent
positive pressure ventilation (IPPV), mechanical ventilation with a
89

diminished expiratory flow (DEF) and ventilation with a positive
end-expiratory pressure (PEEP). IPPV served as a control series. Two
degrees of DEF were studied, and DEF was chosen in such a manner, that the
tracheal pressure returned to zero at a point in the expiratory phase when
66% (DEF 66%) or 100% (DEF 100%) of the available expiratory time had
passed (Fig. II-5). Due to the slackening fall of tracheal pressure a
higher mean tracheal pressure (PT) was present during DEF, and comparable
PEEP values were chosen to produce the same rise in PT as DEF 66%
(PEEP~ DEF 66%) and as DEF 100% (PEEP~ DEF 100%) in the respective
protocols. Thus, the two experimental protocols were:
I, DEF 66% series
1' IPPVI; 2' DEF 66%; 3' PEEP,..., DEF 66%; ., IPPV II
II, DEF 100% series
1' IPPV I; 2' DEF 1 00%; 3' PEEP ""' DEF 100%; ., IPPV II.
Finally methods for experimental pathology (bronchospasm and pulmonary
edema) are delineated. DEF and PEEP studies were repeated under these
pathological circumstances.
Chapter III
Under circumstances of mechanical ventilation the thermodilution technique
for estimation of mean cardiac output proved to be reliable if the mean of
12 estimates, equally spread over the ventilatory cycle was taken.
Compared with the direct Fick method for oxygen, a good correlation
between the two methods was seen (Fig. III-1 )·:
However, mechanical ventilation modulates cardiac output within the
ventilatory cycle, and the maximal disparity of values in an individual
respiratory cycle was from 58% to 135% of the mean, being from 72% to 125%
in the average of all series. When plotting the values against the phase
in the ventilatory cycle a systemic pattern of modulation appeared,
related to airway pressure (Fig. III-2). During IPPV and PEEP an
expiratory
the curve
plateau was present, which was absent with DEF. Furthermore,
of cardiac output plotted against ventilatory time seemed to
shift to the right.
An averaging stratagem showed, that the averages of 3 to 4 estimations,
equally spread over the ventilatory cycle, were approximately 1$ (~ 4%,
SD) different from the mean, as calculated by the mean of 12 estimations
equally spread over the ventilatory cycle (Fig. III-3).
90

Chapter IV
The ~allowing hemodynamic ef£ects o£ DEF and comparable PEEP, when
compared to IPPV, were obtained (Fig. IV-1 ):
-a decrease of cardiac output to the same extent during DEF and PEEP;
-a decrease o£ mean systemic arterial pressure during DEF, PEEP having
no e££ect;
-a decrease o£ mean pressure in the pulmonary artery during DEF, PEEP
having no in£luence, and
- an increase of right atrial pressure during DEF less marked than
during PEEP.
The respiratory e£fects of DEF and PEEP, when compared to IPPV, were as
follow (Fig. IV-2):
- a higher peak tracheal pressure during DEF and even higher during PEEP;
- a higher partial pressure of systemic arterial oxygen, during DEF more
marked than during comparable PEEP;
- a decrease of the partial pressures of systemic arterial and mixed
venous carbon dioxide during DEF, whereas comparable PEEP hardly
revealed any influence;
- an increase of the partial pressure of carbon dioxide in the end
expiratory air during DEF, whereas PEEP had no ef£ect, and
- a decrease of the physiological dead space during DEF, not seen during
PEEP.
These respiratory effects were more marked during experimental pulmonary
pathology induced by infusions of histamine (Fig. IV-3) and acetylcholine
(Fig. IV-4) producing bronchospasm, but PEEP did have, although less
prominent, some beneficial effects, probably due to pulmonary edema as
seen with these infusions.
The beneficial ef£ects of DEF and PEEP during pulmonary edema (Fig. IV-5)
induced by alloxan and oleic acid were the same as far as carbon dioxide
and physiological dead space were concerned, but PEEP was superior to DEF
with regard to oxygenation. probably due to the great increase in
functional residual capacity related to this pattern of ventilation.
In conclusion, an improvement of gas exchange by DEF was seen compared to
IPPV and IPPV with a PEEP, when a DEF was applied.
91
Chapter V
The experimental model (chapter II) and actions of histamine,
acetylcholine, alloxan and oleic acid (chapter IV) are discussed, showing
good correlation with the literature.
The results shown in chapter IV are discussed and interpreted with the
literature.
Decrease of cardiac output was thought to be caused by an increase of mean
airway pressure producing an increase of mean intrathoracic pressure, and
therefore a decrease of venous return to the heart.
The beneficial effects of DEF on gasexchange were thought to be related to
several mechanisms:
- a longer presence in the lung of volume of inspired gas and the higer
airway pressure produce a greater amount of carbon dioxide expired;
- a better equilibration of the intra-acinar inhomogeneity, and
- a more complete emptying of alveoli resulting in a more even
distribution of ventilation and improved ventilation/perfusion
relationships.
During DEF partial pressure of carbon dioxide in the end-expiratory air
was found to be higher than the arterial value. This was thought to be
due to the fact that the arterial Pco 2 was a weighted mean, whilst the
value in the end-expiratory air nearly represents the highest alveolar
value, i.e. well above the mean.
Chapter VI
During series of single breath procedures of DEF between 30% and 100% at
constant Paco2 and Pvco2 carbon dioxide output and phYsiological dead
space were found to be linearly related to the expiratory time in % of the
maximal available time. co2 output during a DEF procedure increased (Fig.
VI-4B) and phYsiological dead space decreased (Fig. VI-4C), when
expiratory time was increased. These results verified the hypotheses on
the beneficial effects of DEF as stated in chapter V.
92


CHAPTER VIII
SAMENVATTING
Hoofdstuk I
Langzaam uitademen door samengeperste lippen lijkt nuttig te zijn veer
patienten met een chronisch aspecifieke respiratoire aandoening. Deze
techniek wordt deze groep patienten aangeleerd tijdens
ademhalingsoefeningen, als zij dit niet uit zich zelf al doen. In een
literatuur overzicht worden de gunstige invloeden van deze wijze van
uitademen besproken. De volgende mechanismen worden verondersteld bij te
dragen aan de subjectieve en de objectieve verbetering tijdens het
langzaam uitademen door samengeperste lippen:
- verminderde collaps van de luchtwegen. wat resulteert in het minder
vasthouden van lucht voor de gecollabeerde luchtwegen en zodoende een
verbeterde ontlediging van de longregionen met een hoge compliantie;
- een verbeterde ventilatie-perfusie verhouding;
- een verhoogd ademvolume per teug, en
- een langzame adem~requentie.
Het doel van deze studie was, met biggen als proefdieren, te onderzoeken,
of een vertraagd expirium tijdens beademing (DEF), gelijkend op het
uitademen door samengeperste lippen, de gasuitwisseling in de longen
verbetert, vooral in de aanwezigheid van longafwijkingen. Tevens werd
nagegaan of de effecten van deze vorm van beademing op de gasuitwisseling
verschilden van die, veroorzaakt door beademing met een positieve
eind-expiratoire druk (PEEP). Ook werd de invloed van DEF of de
verschillende bloeddrukken en op het hart-minuutvolume, bepaald met de
thermodilutie methode, onderzocht en vergeleken met PEEP.
Hoofdstuk II
Het materiaal, de operatieve handelingen en de proefopstelling worden
beschreven. De wijze van het verkrijgen van de data en de analyse ervan
95

worden uiteengezet. Uitgebreid wordt ingegaan op de bepaling van het
hart-minuutvolume door middel van de thermodilutie en de Fick methode, en
de overige metingen en berekeningen worden besproken.
De respiratoire
van beademing
en hemodynamische effecten van drie
werden onderzocht bij gezonde
verschillende vormen
biggen en onderling
vergeleken: intermitterende positieve druk beademing (IPPV), beademing
met een vertraagd expirium (DEF) en beademing met een positieve
eind-expiratoire druk (PEEP). IPPV diende als uitgangspunt. Twee stappen
van DEF werden opgelegd, namelijk zo, dat de druk in de trachea kwam op
nul, wanneer 66% (DEF 66%) respectievelijk 100% (DEF 100%) v~~ de totaal
beschikbare tijd veer uitademing voorbij waren (Fig. II-5). Door het
langzame drukverval in de trachea tijdens DEF wordt de gemiddelde
intra-tracheale druk (PT) tijdens een beademingscyclus hager en een
vergelijkbare PEEP werd dusdanig gekozen, dat een zelfde verhoging van PT
ontstond tijdens PEEP als tijdens DEF 66% (PEEP~ DEF 66%) en DEF 100%
(PEEP~ DEF 100%) binnen de experimenten. Aldus ontstonden twee series:
I )1: IPPV1 ; 2: DEF 66%; 3: PEEP"' DEF 66%; 4: IPPVII' en
II)1: IPPV1 ; 2: DEF 100%; 3: PEEP~ DEF 100%; 4: IPPVII.
Tenslotte worden methoden vermeld om een bronchospasme (met histamine en
acetylcholine) en longoedeem (met alloxan en oliezuur) te veroorzaken.
DEF en PEEP werden ook onder deze pathologische omstan~igheden bestudeerd.
Hoofdstuk III
Tijdens beademing bleek de bepaling van het hart-minuutvolume met de
thermodilutie methode betrouwbaar te zijn op grand van de vergelijking met
de Fick methode, als het gemiddelde berekend werd van 12 bepalingen,
gelijkelijk verdeeld over de beademingscyclus. Een goede correlatie
tussen deze twee methodes werd gevonden (Fig. III-1 ).
Binnen een beademingscyclus varieert het hart-minuutvolume echter, en de
gevonden waarden met de thermodilutie methode in een beademingscyclus
lagen tussen 58% en 135% ten opzichte van het gemiddelde. Als de waarden
van het hart-minuutvolume uitgezet worden tegen de fase in de beademingscyclus werd een curve verkregen, duidelijk gerelateerd aan de druk in de trachea (Fig. III-2). Tij dens IPPV
eind-expiratoir plateau, in tegenstelling tot DEF.
curve tijdens DEF naar rechts te verschuiven.
en PEEP is er een
Verder lijkt deze
Door 3 of 4 bepalingen van het hart-minuutvolume, gelijkelijk verdeeld
over de beademingscyclus, te middelen, bleek de gevonden waarde ± 1% (±
96

4%, SD) van het gemiddelde van de bovengenoemde 12 bepalingen, af te
liggen (Fig. III-3).
HooTdstuk IV
De volgende effecten van DEF en van de daarmee vergelijkbare PEEP op de
circulatie werden gevonden (Fig. IV-1):
- een daling van het hart-minuutvolume, gelijk voor DEF en PEEP (Fig.
IV-4);
- een daling van de gemiddelde druk in de aorta en in de arteria
pulmonalis tijdens DEF en niet tijdens PEEP, en
- een verhoging van de centraal veneuze druk tijdens DEF en PEEP.
De respiratoire effecten van DEF en PEEP waren, vergeleken met IPPV, als
volgt (Fig. IV-2):
- een hogere piek trachea druk met DEF en neg hager met PEEP;
- een hogere arteriele zuurstof spanning, die met DEF hager is dan met de
vergelijkbare PEEP;
- een lagere arteriele en gemengd veneuze koolzuur spanning met DEF,
terwijl PEEP nauwelijks een beYnvloeding liet zien;
- een hogere koolzuurspanning in de eind-expiratoire lucht met DEF,
terwijl PEEP geen effect hierop sorteerde, en
- een vermindering van de physiologische dade ruimte met DEF en niet met
PEEP.
De effecten van DEF op de gaswisseling en physiologisch dode ruimte waren
versterkt aanwezig bij experimentele longafwijkingen, met name
bronchospasme, teweeg gebracht door infusies met histamine (Fig. IV-3) en
acetylcholine (Fig. IV-4). PEEP had eveneens, maar in mindere mate, een
gunstige invloed op de gaswisseling, waarschijnlijk door het longoedeem,
dat door de infusies werd veroorzaakt.
Tijdens longoedeem veroorzaakt door injecties van oliezuur en alloxan, was
PEEP superieur ten aanzien van de oxygenatie waarschijnlijk door de
verhoging van de functionele residuaal capaciteit. Maar oak DEF liet een
verbetering zien. PEEP en DEF hadden eenzelfde gunstige invloed op de
uitwas van koolzuur en de verkleining van de physiologische dode ruimte
tijdens deze vorm van longoedeem (Fig. IV-5).
Concluderend werd een verbetering van de gasuitwisseling gezien tijdens
beademing met DEF onder normale en pathologische (bronchospasme)
omstandigheden, vergeleken met IPPV en de PEEP, die dezelfde gemiddelde
pulmonale drukverhoging veroorzaakte.
97

Hoof"dstuk V
Het proefdiermodel. zeals omschreven in hoofdstuk II en de effecten van
histamine, acetylcholine en alloxan gecombineerd met oliezuur (Hoofdstuk
IV) werden besproken. Deze gegevens lieten een goede overeenkomst zien
met die in de literatuur.
Vervolgens werden de effecten van DEF en PEEP besproken (Hoofdstuk IV) en
vergeleken met de literatuur.
De daling van het hart-minuutvolume werd geweten aan een verhoging van de
gemiddelde druk in de luchtwegen, die een verhoging van de gemiddelde
intrathoracale druk en zodoende een vermindering van de terugstroom van
bleed naar het hart veroorzaakte.
Geconcludeerd werd, dat verschillende mechanismen bijdroegen aan de
gunstige invloed van DEF op de gasuitwisseling:
- een langer verblijf van een hoeveelheid ingeademende lucht en de hogere
druk in de luchtwegen dragen zorg voor.· een grotere hoeveel- heid
koolzuur dat wordt uitgeademd;
- een verbeterde equilibratie van de intra-acinaire inhomogeniteit, en
- een vollediger ledigen van de alveoli, resulterend in een gelijk-
matiger distributie van de ventilatie en in een verbeterde ventilatie/
perfusie verhouding.
Tijdens DEF werd een hogere koolzuur spanning in de eind-expiratoire lucht
dan in het arteriele bleed gevonden. Dit kan verklaard worden, doordat de
waarde van het arteriele bleed een gemiddelde waarde is, terwijl de
eind-expiratoire waarde bijna de hoogste waarde van de alveolaire PC02 representeert.
Hoofdstuk VI
In series DEF procedures, tussen 30~ en 100% van de totaal beschikbare
expiratie tijd gedurende een enkele beademingscyclus. bleken
koolzuuruitwas en physiologisch dode ruimte recht evenredig te zijn met de
duur van de uitademing, die werd uitgedrukt in procenten van de totaal
beschikbare expiratietijd. Wanneer de uitademingstijd
ontstond er een verbeterde koolzuuruitwas (Fig.
vermindering van de physiologisch dode ruimte (Fig.
verlengd werd,
VI-4B) en een
VI-4C). Deze
resultaten steunden de hypothese over de begunstigende invloeden van DEF,
zeals die zijn beschreven in Hoofdstuk V.
98


APPENDIX

Equation of Correlation-Type of ventilation regression line coeffficient
IPPV y = 0.40 + 0.85x 0.93
DEF 66% y = 0.20 + 0.89x 0.87
PEEP -v DEF 66% y = - o. 1 7 + 0.96x 0.87
DEF 100% y = -0.35 + 1. 16x 0.93
PEEP -v DEF 100% y = -0. 28 + 1. 11x 0.89
Table A-1 Correlation bet~een cardiac output estimated by the thermodilution technique and the direct Fick method for oxygen respectively during the different ventilatory modes.
102

sec. IPPV DEF 66%. PEEP"" DEF 66~ DEF 1 00'& PEEP "" DEF 1 00~
0. 0 107.2 ± 6.3 11 o. 1 ± 6.4 106.0 ± 5.8 109. 8 ± 7. 8 106.8 ± 0. 5 102.0 ± 8.0 1 04.9 ' 5. 4 101.5 + 6.6 1 08.6 ± 9. 5 101. 0 ' 1. 0 95.6 ± 9. 6 99.0 ± 7. 8 96.7 ± 7.3 102.9 ± 9.2 96. 2 ' 1.5 91.1 ± 9.1 93.2 ± 7.0 89.5 ± 7.0 96.2 ± 7.2 92.0 ' 2.0 89.3 ± 7.4 91.3 ± 8. 5 91.3 ± 4.9 91.7 ± 6.0 89. 4 ' one 2.5 93.3 ' 8.2 92.5 ± 5. 9 94.6 ± 6.8 89.2 ± 5. 6 93.2 ' point 3.0 97.1 ± 8.5 95.8 ± 8. 2 95.8 ± 7.0 91.9 :'.: 6.4 99.5 ' average 3.5 1 02.6 ' 8. 9 98.6 ± 5. 2 103.0 ± 4.0 95.9 ' 8. 3 104.5 ± 4.0 1 04.8 ' 8.5 102.7 ± 7. 2 102.2 ± 7. 9 1 00.0 ± 8. 3 101. 0 ± 4.5 1 04. 9 ± 10.0 102.2 :'.: 10.0 106.9 ± 8.2 1 04. 3 ± 6.1 104.3 ' 5.0 104.8 ± 8.0 106.2 ± 7.6 106.7 ± 7.4 1 01. 9 ± 7.6 105.3 ' 5.5 107.1 ± 7. 9 103.6 ± 7.3 106.0 ± 5.1 107.7 :'.: 7. 9 106.8 ±
0.0-3.0 102.2 ± 5. 3 1 03.0 ' 5.2 100.9 ± 4.5 100.8 ± 5.0 103.2
two 0.5-3.5 102.3 ± 6. 0 1 01. 7 ' 3.8 102.3 ± 3.8 102.3 ± 6.3 102.8
point 1. 0-4.0 100.2 ± 6. 4 1 oo. 8 :'.: 5.3 99.4 ± 5.4 101.5 ' 6.2 98.6 1. 5-4. 5 98.1 ± 6. 8 97.7 ' 6.1 98.2 ± 5.4 1 00.2 ' 4.7 98.2 average 2.0-5.0 97.1 ± 5. 5 98.7 ± 5.7 99.0 ± 4.4 96.8 ± 4. 9 97.4 2.5-5.5 100.2 ± 5.7 98.0 ± 4.7 100.3 ± 4.3 98.4 :'.: 4.8 100.0
three 0.0-2.0-4.0 100.4 ± 4. 3 101.4 :'.: 4. 3 99.8 ± 3.6 100.5 ± 4. 3 99. 1
point 0.5-2.5-4.5 100.1 ± 5.1 99.9 :'.: 4. 3 100.9 ± 4.2 100.7 :'.: 4.2 99.5 1. 0-3.0-5.0 99.2 ± 5.0 1 oo. 3 ± 4.5 99.7 ± 4.2 98.9 ± 4. 5 100.3 average 1.5-3.5-5.5 100.3 ± 5. 0 98.5 ± 3.8 99.5 ± 3.2 99.9 ± 4. 5 101. 1
four 0. 0-1.5-3.0-4.5 1 00.1 ' 4.3 100.3 ± 4.0 99.5 :'.: 3. 5 100.5 ± 3. 5 1 oo. 7 point 0.5-2.0-3.5-5.0 99.8 ± 4.1 100.2 ± 3.4 1 00.6 ' 2.9 99.5 ± 3.5 1 oo. 1 average 1.0-2.5-4. 0-5.5 100.2 ± 4.3 99.4 ~ 3.5 99.9 :'.: 3.4 99.9 ± 3.9 99.3
Table A-2 Averaging stratagem for the estimation of cardiac output by the thermodilution method. Values are given as % of the mean cardiac output (=100%, mean of 12 estimations equally spread over the ventilatory cycle) for all ventilatory modes.
5. 8 9. 5 8.0 8. 3 7. 3 7. 3 8.1 9. 7 9. 4 7. 9 7.4
11.8
5.0 6.8 6.2 5.7 5.2 6. 9
4.4 4. 8 4. 5 5. 8
3. 8 4.3 4.6
103

COTh
First series Second series Totals
Protocol I n ml •kg-1 •sec-1 ~ n ml•kg-1-sec-1 ~ n ml•kg-1 ·sec-1 ~
IPPV1 2,, ' 0. 3 100 2. 8 ' 0. 3 100 2. 5 :: 0.' 100
DEF 66~ 2.1 ' 0. 3 90 ' 6 2. 7 ' 0.' " ' 7 2. 3 ' 0.' 91 ' 12 6 18 PEEP ' DEF 66':. 2. 2 ' 0. 3 91 ' 8 2. 7 ' u " ' 7 2.3 ' 0.' " ' IPPV 11 2. 3 ' 0. 3 99 ' 9 2. 7 ' o .• 96 :: 7 2. 5 ' 0.' 98 ' Protocol II
IPPV1
2.9 ' 0.' 100 2.' ' 0. 2 100 2. 7 ' 0.' 100
DEF 1 00':. "' ' 0. 5 84 :: 7 6
2. 2 ' 0. 2 95 ' 9 21
2.' ' 0.' 87 ' 15 PEEP "' DEF 1 00~ 2. 4 :: 0. 5 83 ' 7 2. 1 ' 0. 2 91 ' 8 2. 3 ' 0. 5 85 ' I PPV II 2. 8 .:': 0. 5 96 ' 7 2.' ' o. 3 18' ' 10 2.7 ' 0.5 99 '
St.:.tl,;.tical an.,ly,;.is
First series Second ,;.edes Totals
DEF vs I?PVI p < 0.0005 DE> vs IPPV1 p < 0.05 ,., vs IPPV
1 p < 0.001
DE> vs PEEP N5 DE> vs PEEP " DE> vs PEEP N5
DE> vs IPPv11
p < 0.005 DE> vs IPPVII " DE> vs IPPV11
p < 0.005 Protocol I
PEEP vs IPPVI p < 0.005 PEEP vs IPPV1
p < 0.005 PEEP vs IPPVI p < 0.001
PEEP vs IPPV11
p < 0.005 PEEP vs IPPV11 " PEEP vs IPPv
11 p < 0.001
lPPV 11 vs lPPV1
N$ IPPV!l vs IPPV1 p < 0.05 IPPVll vs lPPVI " DE> vs IPPV
1 p < 0.0005 DE> vs IPPV
1 " DE> vs IPPV1 p < o.ooos
DE> v:; PEEP NS DE> vs ?EEP p < 0.025 DE> vs PEE? NS
DE> vs- IPPV11
p < 0.0005 Dee vs IPPV11
p < 0.025 DE> vs IPPV11
p < 0.0005 Protocol II
PEE? vs IPPV1
p < 0.0005 PEEP vs IPPV1 p < 0.025 PEEP vs IP?VI p < 0.001
PEEP vs IPPV11
p < 0.0005 PEEP v·s !?PV11
p < 0.005 ?EEP vs IP?VII p < 0.001
IPPVII vs IPPVI NS IPPVII vs IPPV 1 NS I?PV 11 vs IPPV
1 "
Table A-3 Mean absolute and relative (%of the mean during IPPV1 ) of cardiac output estimated by the thermodilution method and standard deviations from the mean in protocols I
values (GOTh) and II
104
whether performed as a first series or as a second series in the individual animal (chapter II-6) and both series totalled. Results of the statistical analysis are given comparing the absolute values during the different modes with each other. n is number of series in healthy animals.
7
7
7
9
8
6

COFick
First series Second series Totals
Protocol I n ml·kg-1-sec-1 ' n ml•kg-1-sec-1 ' n ml•kg-1-sec-1 ' IPPV1 2.5 ± o. 5 100 2. 9 ' 0. 4 100 7.6 ' 0.5 100
DEF 66~ 12
2. 3 ± 0. 4 93 ± 6 2. 5 ' o. 3 89 ' 9 2.4 ' o.• 9Z ' 5 ,. PEEP ' DEF 66'!.. 2.4 ' 0 •• 94 ± 8 2. 5 ± 0. 3 88 ' 7 2.4 :! o.• 9Z ' IPPV
11 2.6 ' 0 •• 103 ± 8 2.8 ± 0 •• 98 ' ' 2.6 ± o.• 101 ' Protocol II
IPPV1 2.8 ' 0. 4 100 2. 5 ' 0. 3 100 2.8 ' 0.4 100
DEF 100'!.. 2.4 ' 0. 4 85 ± 7 2. 3 ' o. 3 87 ± 5 2 •• ' 0.3 85 ± 15 6 Z1
PEEP"" DEF 1 00~ 2.4 ' 0. 4 85 ' 6 2. 2 ' 0. 2 85 ' 7 2. 3 ' o.• 85
IPPV11 2.8 ' 0. 4 98 ' 6 2. 7 ' 0. 3 101 ' 5 2. 7 ' 0. 4 99
Fl~st sedcs Seeond -;e~ies TotJis
'" "' IPPV1
p < 0.001 '" vs IPPV1 p < 0.025 '" vs IPPV
1 p < 0.001
DEC vs PEEP N5 "' vs PEEP NS "' vs PEEP NS
"' vs IPPV 11 p < 0.005 '" vs IPPV11
p < 0.005 "' vs IPPVII p < 0.001 P~otocol 1
PEEP VS IPPV1 p < 0.01 PEEP vs IPPV
1 p < 0.01 PEEP vs IPPV1
p < 0.001
PEEP vs IPPV11
p < 0.001 PEEP vs IPPVII p < 0.005 PEEP vs IPPV 11 p < 0.001
IPPVII vs IPPV 1 NS IPPV 11 v-; IPPV1 NS IPPV
11 vs IPPV
1 N>
'" vs IPPV1
p < 0.0005 "' vs IPPV1
p < o.ooos '" vs IPPV1 p < o.ooos
"' vs PEEP NS "' vs PEEP NS "' vs PEEP NS
"' vs IPPVII p < 0.0005 '" vs IPPV11
p < 0.0005 "' vs IPPVII p < 0.0005 Protocol 11
PEEP vs IPPV1 p < 0.0005 PEEP vs IPPV
1 p < 0.0005 PEEP vs IPPV1 p < 0.0005
PEEP vs IPPV11
p < 0.0005 PEEP vs IPPV11
p < 0.0005 PEEP vs IPPV 11 p < 0.0005
IPPVIl vs IPPV 1 NS IPPVII vs IPPV 1 NS IPPVII vs IPPV 1 NS
Table A-4 Mean absolute and relative (% of the mean during IPPVI) values of cardiac output estimated by the direct Fick method for oxygen and standard deviations from the mean in protocols I and II whether performed as a first series or as a second series in the individual animal (chapter II-6) and both series totalled. Results of the statistical analysis are given comparing the absolute values during the different modes with each other. n is number of series in healthy animals.
105
±
'
7
7
8
' 6
5

p oo
First series Second series Totals
Protocol I n mm Hg ' n mm Hg ' n mm Hg ' IPPV
1 100 ' " 100 109 ' 12 100 103 :': 12 100
DEF 66'1. 96 ' n 95 ' 6 103 ' 16 94 ' 5 98 ! 12 95 . 12 6 18
PEEP"-' DEF 66~ 100 ' 13 100 ' 5 105 ' 16 96 ± 5 1 03 ' 13 99 ±
I PPV II 101 ' 13 101 ' 5 1 07 ± 15 98 ' 5 1 03 ' 13 100 ±
Protocol II
IPPV1
107 ' • 1 00 107 ± 14 1 00 107 ± 9 100
DEF 1 00';, 15
99 ' 10 93 ± 6 5
97 ' 12 91 ' 5 21
99 ± 10 92 ~
PEEP "v DEF 100~ 105 ' 9 97 ' 7 1 03 :!: 14 96 ± 9 1 04 ' n 97 ' I PPV II 107 ' 9 100 ' 5 1 OS :!: 13 99 ± 6 107 ' 10 100 '
St t' t' I Jn<>l il 1:\o IC<l YSIS
First series Second series Totab
"' vs IPPV1
p < 0.025 DEF vs IPPV1 p < 0-025 DEF vs IPPV
1 p < o.oos
OEF vs PEEP p < 0.025 DEF "" PEEP p < 0.025 "' vs PEEP p < o.oos DEF vs IPPV
11 p < 0.025 "' vs IPPV
11 p < 0.025 "' vs IPPV!J p < 0.005
Protocol I PEEP vs IPPV
1 " PEEP vs IPPV1 <S PEEP VS IPPV1 " PEEP vs IPPV
11 " PEEP vs IPPV11 " PEEP vs IPPV 11 "
IPPV 11 vs IPPVI NS IPPV11
vs IPPV1 " IPPVII vs 1PPV1 NS
"' V5 IPPVI p < 0,0005 "' vs IPPV1
p < o.oos "' vs JPPV1 p < 0.0005
"' vs PEEP p < 0.005 "' vs PEEP NS "' vs PEEP p < 0.001
"' "" IPPV 11 p < 0.001 DEF vs IPPV11
p < 0.0005 "' vs IPPV11
p < 0.0005 Protocol " PEEP vs IPPV
1 " PEEP vs IPPV1 " PEEP vs IPPV
1 NS
PEEP vs IPPV11
p < 0.025 PEEP vs-IPPV11
NS PEEP vs IPPV 11 NS
IPPV11
vs IPPV1 " IPPV
11 vs IPPV
1 NS IPPV11
vs IPPV1
NS
Table A-5 Mean absolute and relative (% of the mean during IPPVI) values of the mean systemic arterial pressure measured in the aortic arch (fa0 ) and standard deviations from the mean in protocols I and II whether performed as a first series or as a second series in the individual animal (chapter II-6) and both series totalled.
106
Results of the statistical absolute values during the
analysis are given comparing different modes with each other.
n is number of series in healthy animals.
the
5
5
5
5
7
5

p po
First series Second series Totals
Protocol I n mm Hg 00 n mm Hg ' n mm Hg ' 1PPV
1 " ' 4 100 18 ' 4 1 00 17 ' 4 1 00
DEF 65'i> 12
17 ' 3 1 04 ' 10 6
17 ' 3 95 ' 10 18
17 ' 3 101 . PEEP "' DEF 66~ 18 ' 3 "' ' 11 19 ' 4 108 ' 13 19 ' 3 112 ' IPPV
11 18 ' 4 113 ' 15 20 . 4 111 ' 19 19 ' 4 112 ' Protocol II
IPPV1
18 ' 3 100 19 ' 4 100 18 ' 3 100
DEF 1 00~ 15 " ' 3 93 ' 6 17
6 ' 3 88 = 5 21 " ' 3 91 '
PEEP"" DEF 1 00~ 18 ' 3 105 ' 10 20 ' 4 103 ' 11 19 . 3 104 ' IPPV 11 19 ' 3 108 ' 20 20 ' 4 103 ' 11 19 ' 3 107 .
Fir:;t scrle:; Second so:.rles. TotJIS
De> vs. IPPV1 N5 DC> vs IPPV 1 NS "' vs IPPV 1 N>
DC> vs PEEP p < 0.025 DEe vs PEEP p < 0.05 "' vs PEEP p < 0.001
"' vs IPPV 11 p < 0.05 "' vs IPPV11 p < 0.05 DC> vs IPPV 11 p < 0.005 Prot<><::ol I
PEEP v:; IPPV1 p < 0.0005 PEEP VS IPPV1 N5 PEEP vs lPPV 1 p < 0.001
PEEP vs. IPPV11 NS PEEP V5 IPPV 11 "' PEEP v,; lPPv
11 NS
IPPV11
vs IPPV1 p < 0.01 IPPVII vs IPPVI NS IPPV 11 vs 1PPV 1 p < 0.005
"' vs IPPV1
p < 0.001 "' vs IPPV1
p < 0.005 DC> vs IPPV1
p < o.ooos
"' vs PEEP p < o.ooos DEe vs PEEP p < 0.025 "' vs PEEP p < 0.0005
"' vs IPPV11
p < 0.005 "' vs IPPVII p < 0.01 DC> vs IPPV11
p < 0.0005 Protocol II
PEEP vs IPPV1
N5 PEEP vs IPPVI N> PEEP vs IPPV1 NS
PEEP vs IPPV11 "' PEEP V!:. IPPVII N5 PEEP vs lPPV
11 <S
IPPV11
vs IPPV1 "' IPPVII vs lPPV 1 NS 1PPV
11 vs lPPV
1 NS
Table A-6 Mean absolute and relative (% o~ the mean during IPPVI) values o~ the mean pressure in the pulmonary artery (Ppa) and standard deviations ~rom the mean in protocols I and II whether performed as a ~irst series or as a second series in the individual animal (chapter II-6) and both series totalled. Results of the statistical analysis are given comparing the absolute values during the different modes vith each other. n is number of series in healthy animals.
107
11
12
"
6
10
10

p . ra,,
First series Second series Totals
Protocol I n mm Hg n mm Hg n mm Hg
IPPV1 L5 ' 0. 6 1.2 ' 0. 4 1 .4 ± 0. 5
OEF 66~ 1. 6 ' o. 5 1.2 ± 0. 4 1.5 ' 0. 5 12 6 18
PEEP ' DEF 66'1. 2. 1 ' 0. 5 1.8 ' 0. 5 2. 0 ' 0. 6
I PPV II 1.4 ' o. 6 1.2 ' o. 5 1.4 ' 0. 5
Protocol II
!PPV1 1.7 ' 0. 5 1.4 ' 0. 6 1.6 ' 0. 5
DEF 1 00~ 1.' ' 0. 4 1.5 ' 0. 6 1.8 ' 0. 5 IS 6 21
PEEP ' DEF 1 00'1. 2. 7 ' 0. 6 2. 5 . 0. 7 2. 6 ' 0. 6
JPPv11
1.6 ' o. 6 1.4 ' 0. 7 1.5 ' 0. 6
First serie:> Second series Tot~ls
D<' vs !PPV1 p < 0.025 '" vs IPPV 1 NS '" vs IPPV
1 NS
"' vs PEEP p < o.ooos '" vs PEEP p < 0.005 "' vs PEEP p < 0.001
D<' VS IPPV II p < 0.05 '" vs IPPV 11 NS '" vs IPPV11 NS
Protocol I PEEP VS IPJ>VI p < o.ooos PEEP VS I?PVI p < o.oos PEEP VS IPPVI p < ().()()1
"'" vs IPP¥11
p < 0.0005 PEEP vs IPPV 11 p < 0.01 PEEP vs lPPV11
p < 0.001
IPPV11
vs IPPV1
NS IPPV 11 vs IPPVJ NS JPPV11
vs IPPV1
NS
"' vs IPPV1 p < o.oos "' vs IPPV1 NS 0<' vs IPPV1 p < 0.01
'" vs PEEP p < 0.0005 '" vs PEEP p < 0.0005 D<C v,; PEEP p < o.ooos D<' vs IPPVII p < 0.005 '" vs IPPVII NS D<C vs IPPV 11 p < 0.005
Protocol n PEEP vs IPPV
1 p < o.ooos PEEP VS I?P\11 p < o.ooos PEEP vs IPPV1
p < o.ooos PEEP vs IPPVII p < 0.0005 PEEP vs IPPVII p .< 0,0005 PEEP vs IPPV11 p < O.OOOS
IPPV 11 vs !PPV1 NS IPPVII vs IPPV 1 NS !PPV11 vs IPPV 1 NS
Table A-7 Mean absolute values of the right atrial pressure measured at the end of inflation (Pra,i) and standard deviations from the mean in protocols I and II whether performed as a first series or as a second series in the individual animal (chapter II-6) and both series totalled.
108
Results of the statistical analysis are given comparing the absolute values during the different modes with each other. n is number of series in healthy animals.

p ra,e
First series Second series Totals
Protocol n mm Hg n mm Hg n mm Hg
IPPV1
~].6 0. 6 ~ 2. 0 . 0. 6 -1.7 ' 0. 6
DEF 66~ 12
-1.4 o. 6 -1. 9 . 0. 6 -1.6 ' 0. 7 18
PEEP ' DEF 66'i. -0.8 0. 5 -1. 3 0. 6 -1.0 0. 6
IPPV11 -1.7 0. 7 -2. 1 ' o. 6 -1.9 ' 0. 6
Protocol II
IPPV 1 -1.6 ' 0. 5 -1. 9 ' 0. 8 -1.7 . 0. 6
DEF 1 OO't -1.2 ' 0. q 15 6
-1. 6 0. 7 21
-1. 3 ' 0. 5
PEEP"' DEF 1 00~ -0.2 ' 0. 5 -o.s o. 7 - o. 3 ' 0. 6
IPPV11
-1.7 ' 0. 6 -1. 9 0. 7 -1.7 0. 6
First series Second sedes Tot.:.ls
oc> vs IPPV1 p < 0.025 oc> vs IPPV
1 NS 0,> vs IPPVI NS
OC> vs PEEP p < 0,0005 OC> vs PEEP p ~ 0.0005 OC> vs PEEP p < 0.001
OC> vs ~P?Vll p < 0.0005 OC> vs IPPV!l p < 0.025 OC> vs IPPVII NS Protocol I
PEEP vs IPPV1
p < o.ooos PEEP vs IPPV1 p < 0.0005 PEEP vs IPPV
1 p < 0.001
PEEP vs IPPV11 p < 0.0005 PEEP vs IPPV11
p < 0.0005 PEEP vs lPPVlt p < 0.001
IPPV 11 vs IPPV1 p < 0.005 t?PV 11 "" lPPV1 p < 0.025 IPPVII vs IPPV 1 p < 0,001
OC> VS lPPVl p < o.ooos OC> vs IPPV1
p < o.ot OC> vs 1PPV1 p < o.ooos Oe> vs PEEP p < o.ooos OC> vs PEEP p < 0.0005 O» vs PEEP p < 0.0005
DC> ~' IPPV11
p < O.OOOS OC> vs !PPV!I p < 0.05 OCF vs IPPV 11 p < 0.0005 Protocol 11
PEEP ~, IPPV1 p < 0.0005 PEEP vs IPPV 1 p < o.ooos PEEP vs 1PPV
1 p < 0.0005
PEEP ~, IPPV11
p < 0.0005 PEEP vs IPPV11
p < 0.0005 PEEP vs IPPV 11 p < 0.0005
IPPV 11 vs IPPV 1 NS IPPV11
vs IPPV1 NS IPPV
11 vs IPPV
1 NS
Table A-8 Mean absolute values o£ the right atrial pressure measured at the end of expiration (Pra e) and standard deviations from the mean in protocols I and fr whether performed as a first series or as a second series in the individual animal (chapter II-6) and both series totalled. Results o£ the statistical analysis are absolute values during the different modes n is number of series in healthy animals.
given comparing with each other.
the
109

Heartrate
First series Second series Totals
Protocol l n ·min~l ~ n •min-1 ' n ·min-1 ' JPPV1 156 ' 29 100 148 ± 20 1 00 154 ' 25 1 00
DEF 66~ 12
155 ' 32 99 ' 5 6
150 ' 21 1 02 ' 15 18
153 ' 28 1 00 ' PEEP "" DEF 66~ 162 ± 29 1 04 ' 8 154 ± 25 1 05 . 20 159 ' 27 1 04 . I PPV ll 166 ' 29 1 09 ' 13 156 ± 28 1 06 ' 21 162 ± 28 1 07 ' Protocol ll
IPPV1 156 ± 21 100 168 ± 36 100 160 . 25 100
DEF 1 00~ 148 ' 25 95 .:': 9 167 ' 37 99 .:': 4 154 ' 29 96 ' 15 6 21 PEEP "-' DEF 100~ 151 ± 23 96 = 8 165 ± 35 96 ± ' 155 ± 27 96 ± IPPV
11 157 ± 19 101 ± ' 174 .:': 35 104 ± 6 162 ± 25 102 ±
y
First series Second series Totals
"" vs IPPV1 "' "" vs !PPV 1 "' DEF vs IPPV
1 "' "" vs PEEP p < 0.01 "" vs PEEP "' DEF vs PEEP p < 0.01
"" vs IPPVII p < 0.01 "" vs IPPV 11 "' DEF vs IPPV11
p < 0.005 Protocol 1
PEEP vs !PPV I N$ PEEP vs 1PPV1 NS PEEP vs 1PPV1 "' PEEP vs 1PPV11 NS PEEP VS !PPV!l NS PEEP vs 1PPV 11 NS
1PPV11
vs IPPV1 p < 0.05 IPPVII vs IPPV 1 NS IPPVII vs 1PPV1 NS
"" vs lPPV1 p < 0.025 "" vs 1PPV
1 NS DEF V5 IPPV1 NS
DEF vs PEEP NS "" vs PEEP NS DEF vs PEEP NS
"" vs IPPV11
p < 0.05 "" Protocol II vs IPPV 11 p < O.OS DEF vs IPPVII p < 0.01
PEEP vs IPPV1 NS PEEP vs IPPV 1 NS PEEP vs IPPV
1 NS
PEEP vs IPPV11
p < 0.05 PEEP vs IPPV11 NS PEEP vs IPPV
11 p < 0.005
IPPV11
vs IPPV1
NS lPPVII vs IPPV 1 NS !PPVII vs IPPV1
NS
Table A-9 Mean absolute and relative (%of the mean during IPPVI) values of heart rate and standard deviations from the mean in protocols I and II whether performed as a first series or as a second series in the individual animal (chapter II-6) and both series totalled.
110
Results of the statistical analysis are given comparing the absolute values during the different modes with each other. n is number of series in healthy animals.
10
13
15
8
7
'

PT,p
First series Second series Totals
Protocol I n em H20 ~ n cmH
20 ' n cmH 20 ~
IPPV1
19.2 ± 2. 1 100 17.2 ' 2. 2 100 18. 5 ± 2. 2 100
DEF 66~ 12
20.2 ± 1.9 106 ± 3
' 18.8 ' 2. 3 110 ' 4
18 19.8 ± 2. 0 107 ±
PEEP ' DEF 66'i 22.5 ' 1.7 118 ± ' 22.0 ' 2. 4 128 ' 5 22.3 ± 1.9 121 ±
IPPV11 18.6 ' 1. 7 97 ± 6 19.0 ' z. 9 110 ' ' 18.6 ± 2. 1 102 ±
Protocol li
1PPV1
19.4 ' 2.' 100 18.3 ± 1.5 100 19. 1 ± 2. 3 100
DEF 1 OO'i 15
20.9 ' 2. 5 108 ' 3 20.1 6
. 1. 5 110 ' 2 21
20. 6 ' 2. 2 108 ' PEEP ' DEF 1 OO'i 23. 9 ' z. 5 124 ± ' 23.6 ± 1.3 129 ' ' 23.8 ± 2. 2 125 ' IPPV
11 17.9 ' 2. 4 93 ' ' 17. 2 ' 1.4 94 . 1 17. 7 . 2. 1 93 '
Stati~tic;;.l <:~n<!ly~l~
Flr~t series Second ~edc~ Totals
Oe> vs IPPV! p" o.ooos 00> vs IPPV 1 p " 0.001 00> v~ IPPV1 p " 0.001
00> v~ PEEP p < 0.0005 0" v~ PEEP p < o.ooos DO> v~ PEEP p < o.oot 0" v~ IPPV
11 p < 0.0005 0"
Protocol I v~ IPPV
11 " DO> vs IPPVII p < 0.00$
PEEP "' IPPV1 p < 0.0005 PEEP vs IPPV
1 p < 0.0005 PEEP vs IPPV
1 p < 0.001
PEEP "' IPPV11
p < 0.0005 PEEP vs IPPVII p < 0.0005 PEEP vs IPPV 11 p < 0.001
IPPVII vs IPPV1 p " 0.05 IPPV11 vs IPPV
1 p < 0.01 IPPV
11 V5 IPPV 1 "
DCF "' IPPV1 p < o.ooos 0" vs IPPV
1 p < 0.0005 OCF vs IPPVI p < 0.0005
OCF v~ PEEP p < o.ooos OCF vs PEEP p < o.ooos OCF vs PEEP p < o.ooos DCF vs IPPV
11 p < O.OOOS OEF vs IPPV
11 p < 0.0005 DEF VS IPPV 11 p ~ 0,0005
Protocol II ?EEP vs IPPV
1 p < o.ooos PEEP vs IPPV1
p < o.ooos PEEP vs JPPV1
p < 0.0005
PEEP "' IPPV11
p < 0.0005 PEEP vs IPPV11
p < 0.0005 PEEP vs IPPV11 p < 0.0005
IPPVII vs IPPV1 p < 0.0005 IPPVII vs 1PPV1
p < o.ooos IPPV11
vs IPPV1 p < 0.0005
Table A-10 Mean absolute and relative (%or the mean during IPPVI) values or the peak tracheal pressure (PT,p) and standard deviations from the mean in protocols I and II whether performed as a first series or as a second series in the individual animal (chapter II-6) and both series totalled. Results of the statistical analysis are given comparing the absolute values during the different modes with each other. n is number of series in healthy animals.
111
4
7
8
3
' 5

Pa02
First series Second series Totals
Protocol I n mm Hg ' n mm Hg ' n mm Hg ' IPPV
1 73.3 ± 9. 2 100 73.9 ' 4.1 100 73. 5 ' 7.5 100
DEF 66'i. 76.9 ± 8. 0 105 ± 4 78.1 ' 2.3 106 ' 5 77.3 ± 6. 4 106 ' 4 12 6 18
PEEP"' DEF 66't 74,8 ± 8.3 102 ' 4 74.1 ± 5. 6 100 ' 6 74.5 ± 7.1 102 ' 4
I PPV II 70.7 ± 8.5 97 ±4 69.9 ' 5.4 95 -±_ 6 70. 4 ± 7. 2 96 ± 4
P1·otocol II
IPPV 1 75.7 ' 5. 3 100 69.4 ± 10.2 100 73.9 ' 7.2 100
DEF 1 OO't 82.3 ' 4. 7 1 09 :!: 3 77.1 ' 7.2 112± 6 80.8 . 5. 7 110 ' 4
PEEP"-' DEF 1 OO't 15
79.0 ' 6
5.1 105 ' 5 72.9 ' 8.8 105 21
' 4 77.3 ' 6.6 105 ' 4
IPPV11
75. 0 ' 5.1 99 ' 5 71.5 ' 10.5 103 ' 5 74.0 ' 6.8 1 00 ' 5
Statl:>tic;.~l an;.~lysl:>
First series S~nd :>erie,; Totals
DEF vs IPPY1
p < o.ooos "' vs. IPPV1
p < 0.025 DEF vs IPPV1
p < o.oos DEF v5 PEEP p < 0.00$ DEF vs PEEP p < o.os OEF vs PEEP p < 0.0005
OEF v5 IPPV11
p < 0.0005 DEF Protocol I
v,; IPPV11
p < 0.005 OEF vs IPPV11
p < 0.0005
PEEP vs IPPVI p < o.os PEEP vs IPPY1
NS PEEP vs IPPV1
NS
PEEP vs IPPV11
p < 0.0005 PEEP vs IPPV11
p < O.OOS PEEP vs lPPVIl p < 0.0005
IPPV 11 vs IPPV1
p < 0.005 IPPVII v,; IPPV1 p < o.os IPPV 11 vs IPPV
1 p < 0.0005
"' vs IPPV1
p < 0.0005 OEF v,; JPPV1
p < 0.001 OEF vs IPPV1
p < o.ooos DEF v5 PEEP p < 0.0005 OEF vs PEEP p < 0.01 OCF vs PEEP p < 0.0005
DEF vs IPPV11
p < 0.0005 OEF Protocol II
v:; IPPV11
p < 0.025 OEF vs 1PPV11
p < 0.0005
PEEP vs IPPV1
p < 0.005 PEEP vs IPPV1
p < 0.025 PEEP vs 1PP'J1
p < 0.0005
PCEP vs IPPV11
p < 0.0005 PEEP vs IPPV 11 NS PEEP vs IPPV
11 p < 0.0005
IPPV11
vs IPPV1 NS IPPV
11 vs IPPV
1 NS 1PPV 11 vs IPPV 1
NS
Table A-11 Mean absolute and relative (%of the mean during IPPVI) values of the partial pressure of systemic arterial oxygen (Pao2 ) and sta~dard deviations from the mean in protocols I and II whether performed as a first series or as a second series in the individual animal (chapter II-6) and both series totalled. Results of the statistical analysis are given comparing the absolute values during the different modes with each other. n is number of series in healthy animals.
112

Paco 2
First series Second series Totals
Protocol I n mm Hg ' n mm Hg ' n mm Hg ' IPPV
1 42.6 ' 1.5 100 41.8 = 1.4 100 42. 3 ' 1. 5 100
DEF 66'1, 40.3 ' 1.8 94 ± 3 39.0 ± 2. 5 93 ' 4 39. 9 ± 2. 0 94 ' 12 6 18 PEEP ' DEF 66'& 42.6 ± 1.8 100 . 4 41.6 ' 2.' 100 ' 6 42.3 ± 2.1 100 ±
IPPV11
42.9 ± 1.7 101 ' 2 41.9 ' 2. 5 100 ± 4 42. 6 ' 2. 0 101 ' Protocol II
IPPV1 43.9 ± 0. 7 100 42.3 ' 0. 8 100 43.4 . 1. 0 100
DEF 1 00'1 15
40.6 ' 1.5 93 ± 3 6
37.7 ± 1. 4 89 ' 3 21
39.8 ' 1. 9 92 ' PEEP"' DEF 100'1 42.4 ' 1.5 97 ' 3 41.1 ± 0. 6 97 ' 2 42. 0 ' '-' 97 ' IPPV 11
42.4 ± 1.3 97 ' 3 41.5 ± 1.2 98 ' 3 42.2 ± 0. 9 97 ±
St-.tistiC<JI <~n<lly~is
Fir,;t ,;erie,; Second series Tot-.1,
OEF vs IPPV I p ~ 0.0005 OEF vs 1PPV1
p ~ 0.005 OEF "" IPPV 1 p < 0.0005
OEF vs PEEP p ~ 0.0005 OEF vs PEEP p < 0.025 OEF v,; PEEP p < 0.0005
DEC vs IPPV11
p < 0.0005 OEF vs IPPV11
p < 0.005 DEF vs IPPVII p < 0.0005 Protocol ' PEEP "' IPPV
1 NS PEEP v,; IPPV
1 N> PEEP vs IPPV
1 " PEEP "' IPPV 11 NS PEEP VS IPPV 11 NS PEEP vs IPPV11 NS
IPPVII VS IPPV1 NS IPPV
11 vs IPPV
1 NS IPPVII v,; IPPV1 NS
DEF "' IPPV1
p < 0.0005 DEF vs IPPV1
p ~ 0.0005 DEF vs IPPV 1 p < 0.0005
DEF "' PEEP p < 0.0005 DEF vs PEEP p < 0.005 OEF vs PEEP p < 0.0005
DEF "' lPPVll p < 0.0005 DEF vs IPPV!l p < 0.00! DEF v,; IPPV11
p < 0.0005 Protocol II
PEEP "' IPPV1
p < 0.0005 PEEP vs IPPV1
p ~ 0.01 PEEP vs IPPV1 p < 0.0005
PEEP "' IPPV11 " PEEP vs IPPV!I NS PEEP vs !PPV
11 NS
IPPVII v,;. IPPV1
p < o.oos IPPV 11 vs IPPV1 NS 1PPV11
V5 IPPV1 p < 0.0005
Table A-12 Mean absolute and relative (%of the mean during IPPV1 ) values of the partial pressure of systemic arterial carbon dioxide (Paco2 ) and standard deviations from the mean in protocols I and II whether performed as a first series or as a second series in the individual animal (chapter II-6) and both series totalled. Results of the statistical analysis are absolute values during the different modes n is number or series in healthy animals.
given comparing with each other.
the
113
3
4
3
3
3
3

P-CO v 2
First series Second series Totals
Protocol I n mm Hg 00 n mm Hg ' n mm Hg ' IPPV
1 48.6 ' 1.5 100 47. 8 ' 1.8 100 48.3 ' 1.6 1 00
OEF 66~ 47.3 ' 1.9 " ' 3 45. 1 ' 2. 5 94 ' 3 46.6 ' 2. 2 97 ' 12 6 18 PEEP ' DEF 66'1. 48.7 ' 2. 0 100 ' 3 47.4 ' 2. 8 99 ' 6 48.3 ' 2. 3 1 00 ' IPPV
11 49.1 ' 1.4 101 ' 2 47.4 ' 2. 8 99 ' 5 48.5 ' 2. 0 1 00 '
Protocol II
!PPV1
50.0 ' 1.3 100 48,8 :: o. 4 100 49.7 ' 1.2 100
OEF 1 00~ 15
47.1 ' 1.7 94 :: 4 6
45.7 :: 1.6 94 ' 3 21
46.7 . 1.7 94 ::
PEEP ' OEF 1 oo<-o 48.8 ' 1.4 " ' 3 48,8 ' 0. 5 100 ' 2 48.8 ' 1.2 98 ' I PPV !I 48.6 ' 1.6 97 ' 3 47.9 ' 1.5 98 ' 3 48.4 ± 1.5 98 .
Stiltlstlcal anillysls
First series Second S<>ries Totills
DEC vs IPPV1
p < 0.005 0" vs IPPV1
p < 0.005 0" v~ IPPV1 p < 0.0005
0" V"O> PEEP p < 0-005 0" vs PEEP p < O.OZ5 DEF vs PEEP p < 0.0005
OEF vs IPP\1-II p < 0.0005 0" vs IPPVII p < 0.01 OEF vs IPPV11
p < 0.0005 Protocol 1
PEEP vs IPPV1
N5 PEEP vs IPPV1 " PEEP v,; IPPVT " PEEP vs IPPV
11 N5 PEEP vs IPPV
11 " PEEP v,; IPPV11 N5
IPPV11
vs IPPV1
N5 JPPV11
v,; IPPV1
NS IPPV11
vs IPPV1
NS
OEF vs IPPVI p < 0.0005 OEF vs IPPV1
p < 0.005 D" "' IPPV1 p < o.ooos
OEF vs PEEP p < o.ooos OEF vs PEEP p < 0.005 0" vs PEEP p < 0.0005
0" v,; IPPV11
p < 0.0005 OEF vs IPPV11
p < O.OOS 0" vs IPPVII p < O.OQ05 Protocol II
PEEP vs IPPV1
p < 0.01 PEEP vs IPPV1
NS PEEP vs IPPVI NS
PEEP vs IPPVII NS PEEP vs IPPVII. NS PEEP vs IPPV11 NS
IPPVIJ vs IPPV 1 p < 0.025 IPPVII vs IPPVI NS IPPV
11 vs IPPV
1 p < o.ooos
Table A-13 Mean absolute and relative (% o~ the mean during IPPV1
) values o~ the partial pressure o~ mixed venous carbon dioxide (PyCD2 ) and standard deviations ~rom the mean in protocols I and II whether per~ormed as a ~irst series or as a second series in the individual animal (chapter II-6) and both series totalled. Results o~ the statistical analysis are given comparing the absolute values during the di~£erent modes with each other. n is number o£ series in healthy animals.
114
3
4
4
3
3
4

PEC02,e
First series Second series Totals
Protocol I n mm Hg ' n mm Hg ' n mm Hg ' IPPV
1 40. 3 ± 2 .• 100 41.6 ± 1.5 100 40.7 ± 2. 1 1 00
DEF 66";, 43. 3 ± 2. 3 107 ± 2 43.9 ± 2. 1 106 ± 3 43.5 ± 2. 1 107 ± 12 6 18
PEEP ' DEF 66't 41. 0 ± 2.3 102 ± ' 41. 9 ± 2. 5 101 ± 5 41. 3 ± 2. 2 102 ±
1PPV11 41.0 ± 2.1 102 ± ' 42.2 ± 2. 9 101 ± 7 41. 4 ± 2. 3 102 ±
Protocol II
IPPV1 41. 9 ± 1. 7 100 41. 2 ± 1.6 100 41.7 ± 1. 6 100
DEF 1 OO't 44. 5 ± 1.9 106 ::!: 2 44. 6 15 6
± 1.2 1 09 :!: 3 21
44.5 ± 1.6 107 ± PEEP ' DEF 1 OO't 41. 6 ± 1.6 99 ± 2 42.0 ± 1. 7 102 ± 3 41. 7 ± 1.6 100 ± 1 PPV ll 41. 6 ± 1.5 99 ± 3 41.6 ± 1.0 101 ± ' 41. 6 ± 1.3 100 -
Statistical analysis
First series Second series Tow Is
DEF vs lPPV1 p "'o.ooos DEF vs IPPV 1 p < 0.005 De> vs IPPV
1 p < o.ooos
DE> vs PEEP p < 0.0005 DE> vs PEEP p < 0-0005 DE> vs PEEP p < o.ooos DE> vs IPPV
11 p < 0.0005 DE>
Protocol I vs IPPV 11 p < 0.025 DE> vs IPPV
11 p < 0.0005
PEEP vs IPPV1 "' PEEP vs IPPV
1 NS PEEP vs IPPV
1 NS
PEEP "' lPPV11 NS PEEP vs lPPV 11 NS PEEP vs IPPV
11 NS
IPPVII vs IPPV 1 NS IPPV!I vs IPPV1 NS !PPV
11 vs lPPV
1 NS
DE> "' IPPV1
p < o.ooos DE> vs IPPV1
p < 0.0005 DE> v,. IPPV1
p < 0.000~
DE> "' PEEP p < o.ooos DE> vs PEEP p < 0-001 DE> vs PEEP p < 0.0005
DE> "' lPPV II p < Q.OOOS Protocol II
DE> vs IPPv11
p < 0.0005 DE> vs IPPVIl p < 0.0005
PEEP "' lPPV1
NS PEEP vl> IPPV1
NS PEEP vl> lPPV1
NS
PEEP "' IPPV11
NS PEEP vs IPPV 11 NS PEEP Vl> IPPV 11 NS
IP~Vll vs lPPV 1 NS IPPV11
vs lPPV1
NS IPPV11
vs IPPV1 NS
Table A-14 Mean absolute and relative (%of the mean during IPPVI) values of the partial pressure of carbon dioxide in the end expiratory air (PEC02 e) and standard deviations from the mean in protocols I bnd II whether performed as a first series or as a second series in the individual animal (chapter II-6) and both series totalled. Results of the statistical analysis are given comparing the absolute values during the different modes with each other. n is number of series in healthy animals.
115
2
' '
2
3
3

VD/VT
First series Second series Tot<:lls
Protocol I n ' n ' n ' IPPV1 0. 28 :!: 0. 04 100 0. 23 :!: 0. 03 100 0. 27 ' 0. 04 1 00
DEF 66':, 0. 23 ' 0. OS 82 . 11 0. 18 ' 0. 04 75 . 17 0. 21 ' 0. OS 80 ' 12 6 18 PEEP ' DEF 66~ 0. 27 ' 0. OS 97 ' 1 0 0. 24 ' 0. 04 101 ' 16 0. 26 ' 0. OS 98 ' IPPV 11 0. 27 ' 0. OS 95 ' ' 0. 23 ' 0. 03 98 ' 19 0. 2S ' 0. 04 96 ' Protocol II
IPPV 1 0.28 ' 0. 04 100 0.24 ' 0. 04 100 0. 27 ' 0. 04 1 00
DEF 1 00':, 15
0. 22 ' 0. OS 78 ' 10 6
o. 14 ' 0. OS 58 ' " 21 0. 20 ' 0. OS 72 .
PEEP ' DEF 1 00':, 0. 27 ' 0. 04 97 ' ' 0. 23 ' 0. 03 " ' 6 o. 26 ' 0. 04 97 ' I PPV !I 0. 2S ' 0. 04 91 ' 7 0. 22 ' 0. 04 93 ' 10 0. 2S . 0. 04 91 '
St;;>tistic<>l <>n<>lysis
First series Second series Totuls
OE> vs IPPV1
p < o.ooos OE> vs !PPVI p < o.o1 OEF vs IPPV 1 p < 0.001
OE> vs PEEP p < o.ooos OE> vs PEEP p < o.oos OE> "" PEEP p < 0.001
OE> vs IPPV11
p < 0.001 OEF vs IPPV 11 p < Q.OOS OE> vs IPPV 11 p < 0.001 Protocol I
PEEP vs IPPV1
<S PEEP vs IPPV1 <5 PEEP vs IPPV1 <5
PEEP vs IPPV11
NS PEEP vs IPPV11
NS PEEP "' IPPV11 NS
IPPV 11 vs IPPV1
NS IPPV11
vs !PPV1
NS IPPV11
vs IPPV 1 NS
' OEF "' IPPV1
p < 0.0005 OEF vs !PPV1
p < 0-001 OEF "' IPPV 1 p < o.ooos
OEF vs PEEP p < 0.0005 OEF vs PEEP p < 0.001 OEF vs PEEP p<O.OOOS
OEF vs !PPV11
p < 0.0005 OEF Protocol II
vs IPPV11
p < 0.0005 OEF vs IPPV 11 p < 0.0005
PEEP vs IPPV1
<5 PEEP vs IPPV1
NS PEEP vs tPPV1 <5
PEEP vs IPPV!I p < 0.01 PEEP vs IPPV11 NS PEEP vs IPPV 11 p < 0.005
IPPVll vs lPPV 1 p < 0.0005 lPPV
11 vs IPPV
1 NS IPPV11
vs IPPV1 p < o.ooos
Table A-15 Mean absolute and relative (%of the mean during IPPVI) values of the physiological dead space fraction (VD/VT) and standard deviations from the mean in protocols I and II whether performed as a first series or as a second series in the individual animal (chapter II-6) and both series totalled. Results of the statistical analysis are given comparing the absolute values during the different modes with each other. n is number of series in healthy animals.
116
13
12
12
15
7
'

Histamine Acetylcholine
COTh COTh
Protocol I n ml.kg.sec1 ~ n ml.kg.sec-1 ~
JPPV1 3.4 ' 0.7 100 2. 8 = 0. 6 100
DEF 66~ 3.1 ' 0. 8 92 = 8 2. 6 ' 0.6 94 ' 3 7 6
PEEP "" DEF 66~ 3. 2 ' 0. 8 96 = 5 2. 6 ' o. 6 94 ' 3
IPPV 11 3. 3 ' 0. 3 97 ' 5 2.8 ' 0. 6 100 ' 3
Protocol II
JPPV 1 3.1 ' 0. 7 100 2.8 = 0.5 100
DEF 100~ 7
2.8 . 0. 6 89 ' 4 2. 5 . 0.4 89 ' 5 7
PEEP .,_, DEF 1 00~ 2.7 ' 0. 6 88 ' 4 2. 5 ' 0. 4 88 = 6
IPPVII 3.0 ' 0. 6 97 ' 4 2. 7 ' 0.4 97 ' 8
Statistical analysis
Histamine Acetylcholine
DEF vs tPPV1
NS DEF vs IPPV1
p < o.oos DEF vs PEEP NS DEF vs PEEP NS
DEF " IPPV11 NS DEF vs IPPV
11 p < o.ozs
Protocol 1 PEEP "' IPPV
1 NS PEEP V$ IPPV 1 p<0.025
PEEP " IPPV11
NS PEEP vs \PPVII p<0.025
IPPV11 vs lPPV 1 NS IPPVJI " IPPV
1 NS
DEF vs IPPV1
p<0.001 DEF "' IPPV 1 p < 0. 005
DEF vs PEEP NS DEF vs PEEP NS
DEF vs IPPV11
p ( 0. 01 DEF vs !PPV11
p < 0. 01 Protocol 11
PEEP vs IPPV1
p < 0.001 PEEP vs IPPV1
p < 0.005
PEEP " IPPV11
p<0.001 PEEP vs IPPV11 p<O.OOS
IPPv11 " IPPV
1 NS lPPV
11 vs IPPV
1 NS
Table A-16 Mean absolute and relative {%of the mean during IPPVI) values of cardiac output estimated by the thermodilution technique (CO!h) and standard deviations from the mean in protocols I and II (chapter II-6) during pulmonary disease induced by histamine and acetylcholine respectively. Results of the statistical analysis are absolute values during the different each other. n is number of series.
given comparing ventilatory modes
the with
117
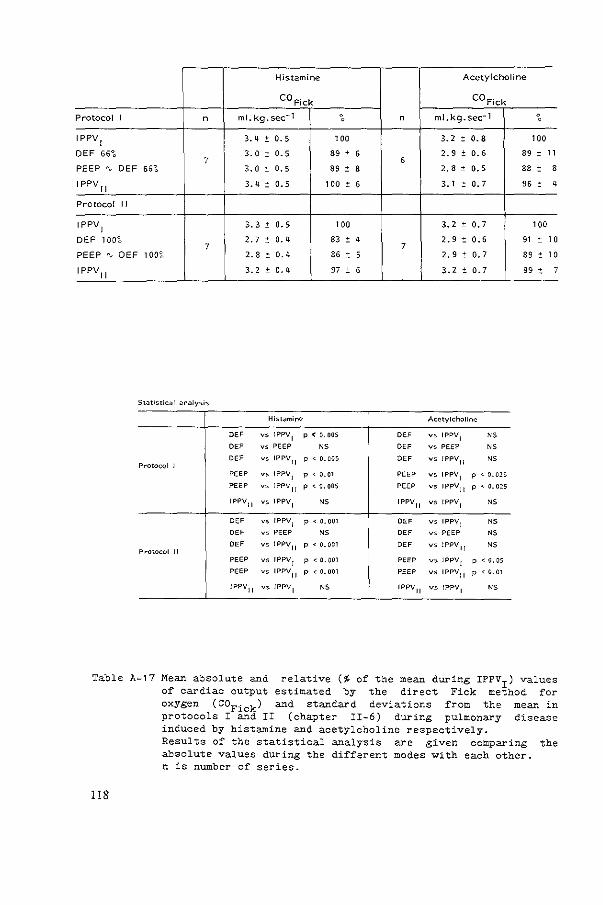
Histamine Acetylcholine
COFick COFick
Protocol I n ml.kg.sec-1 ~ n ml.kg.sec-1 ~
IPPV1 3. 4 ' 0. 5 100 3. 2 ' 0.8 100
DEF 66°o 3.0 7 ' 0. 5 89 ' 6
6 2. 9 ' 0. 6 89 ' 11
PEEP "" DEF 66~ 3. 0 . 0. 5 89 ' 8 2.8 . 0. 5 88 ' 8
IPPV11 3.4 ' 0. 5 100 ' 6 3.1 ' 0. 7 96 ' 4
Protocol II
IPPV1 3. 3 ' 0. 5 100 3. 2 . 0.7 100
DEF 1 00~ 2. 7 ' 0. 4 83 ' 4 2. 9 ' 0.6 91 . 10 7 7
PEEP "" DEF 1 00~ 2. 8 ' 0.4 86 ' 5 2.9 ' 0. 7 89 ' 10
IPPV11
3.2 ' o. 4 97 ' 6 3.2 " 0.7 99 ' 7
Hist<~min(' Acetylcholine
DE' vs IPPV1
p<O.OOS DEF vs IPPV1
NS
DE' vs PEEP NS DEF vs PEEP NS
DE' vs IPPV11 p < o.oos DE' vs JPPVII NS
Protocol 1 PEEP vs IPPV
1 p < 0.01 PEEP vs IPPV1
p < 0.025
PEEP V> IPPv11
p<o.oos PEEP V> IPPV11 p < 0. 025
IPPV11 vs IPPVI NS IPPV
11 v' IPPV1 NS
DE' vs IPPV1 p < 0.001 DEF V> IPPV
1 NS DEF vs PEEP NS DEF vs PEEP NS
DE' vs IPPVII p <0.001 DEF vs !PPV 11 NS Protocol II
PEEP vs IPPV1 p < 0.001 PEEP vs IPPV
1 p < 0. OS
PEEP vs IPPV11
p < 0. 001 PEEP vs IPPVII p < G.Ol
!PPV11 vs IPPV
1 NS IPPv11
vs IPPV 1 NS
Table A-17 Mean absolute and relative (%of the mean during IPPVI) values of cardiac output estimated by the direct Fick method for oxygen (COFick) and standard deviations from the mean in protocols I and II (chapter II-6) during pulmonary disease induced by histamine and acetylcholine respectively.
118
Results of the statistical analysis are given comparing the absolute values during the different modes with each other. n is number of series.

Histamine Acetylcholine
p p ao '0
Protocol I n mm Hg ~ n mm Hg ~
1PPV1 79 . 8 100 72 . 8 1 00
DEF 66~ 75 ± 8 95 ' 4 73 ± 10 101 ' 8 7 6
PEEP "' DEF 66~ 77 ' 7 98 . 5 71 ± 9 99 ± 2
IPPV11 82 ' 7 1 OS ' 7 73 ± 10 101 ± 5
Protocol II
1PPV1 83 ± 7 1 00 73 ± 10 1 00
DEF 1 00~ 78 ± 7 94 ' 3 70 ' 11 95 ' 7 7 7
PEEP "-' DEF 1 00~ 81 ± 7 99 ± 3 71 . 12 97 . 6
1PPV 11 85 ± 9 103 ± 3 75 ' 13 102 ± 8
St;,tistical analysis
Histamine Acetylcholine
OH vs t?PV1
p < 0.01 OH vs IPPV1 "
OH vs PEEP NS OH vs PEEP NS
OH Protocol I
vs IPPV11
p < 0.01 OH vs IPPVll NS
PEEP vs IPPV1
NS PEEP vs IPPV1
NS
PEEP vs IPPV11
N$ PEEP vs IPPV 11 NS
IPPV11
vs !PPV1
NS IPPV11
vs l?PV1
NS
OH vs IPPV1
p < 0.005 OH vs JPPV1 NS
OH vs PEEP p < 0.01 OH vs PEEP NS
OH vs 1PPV11
p<O.OOS Protocol II
OH vs IPPVII NS
PEEP vs 1PPV1 NS PEEP vs lPPV 1 NS
?EEP vs 1PPV 11 NS PEEP vs 1PPV11
NS
1PPV11
vs 1PPV1 NS IPPV 11 vs IPPV 1 NS
Table A-18 Mean absolute and relative (%of the mean during IPPVI) values of the mean systemic arterial pressure measured in the aortic arch (P ) and standard deviations from the mean in protocols I and II rghapter II-6) during pulmonary disease induced by histamine and acetylcholine respectively. Results of the statistical analysis are given comparing the absolute values during the different ventilatory modes with each other. n is number of series.
119

Histamine Acetylcholine
p p P' po
Protocol I n mm Hg ~ n mm Hg : IPPVJ 23 " 4 1 00 24 ' 2 1 00
OEF 661. 21 ' 3 93 ' 6 24 ' 3 1 00 . 5 7 6
PEEP "" OEF 661. 23 ' 4 99 . 7 24 ' 3 1 00 ' 9
l PPV 1l 25 ' 4 l 09 ' 15 25 ' 3 104 ' 12
Protocol " IPPV
1 25 . 3 1 00 25 ' 3 1 00
DEF 1 001. 22 ' 2 88 ' 6 23 ' 3 92 ' 4 7 7
PEEP "" DEF 1 001. 24 ' 3 97 ' 9 25 ' 3 98 ' 5
IPPV11 26 ' 4 104 ' 14 25 ' 4 97 ' 7
Statistical analysis
Histamine Ac.,tylcholin"
D'" vs IPPV1 " D'" vr. IPPV
1 NS
D'" vs PEEP NS D'" " PEEP NS
D'" "' IPPV11 p < 0. 01 DEF " IPPV
11 " P~otocol 1 PEEP " IPPV
1 NS PEEP "' IPPV
1 NS
PEEP "' IPPV11
NS PEEP " IPPV11 NS
IPPVIl "' IPPV1
NS IPPV11 " IPPV
1 NS
DEF " IPPV1
p<O.OOl DEF "' IPPV1 p<0.005
DEF vs PEEP p<O.OOl DEF yO PEEP p < 0.001
D'" vs IPPVII p<O.OOl DEF "' tPPV11
NS Protocol II
PEEP "' IPPV1
NS PEEP "' IPPV1
NS
PEEP " IPPV11
NS PEEP "' IPPv11
NS
IPPV11
yO IPPV1
NS IPPV11
yO IPPV1 NS
Table A-19 Mean absolute and relative (%of the mean dur~ng IPPV1 ) values of the mean pressure in the pulmonary artery (P ) and standard deviations from the mean in protocols I and I~a(chapter II-6) during pulmonary disease induced by histamine and acetylcholine
120
respectively. Results of the statistical analysis are absolute values during the different each other. n is number of series.
given comparing the ventilatory modes ~ith

Histamine Acetylcholine
p ra, i
p ra, i
Protocol I n mm Hg n mm Hg
IPPV 1 1. 2 ' 0.4 2. 8 ' 0. 7
DEF 66~ 7
1. 5 ' 0. 7 6
2.8 ' 0. 6
PEEP "" DEF 66~ 2. 0 . 0. 4 3. 6 ' 0. 7
!PPV 11 1. 4 ' 0.5 2.8 ' 0. 7
Protocol II
!PPV1 1.4 ' 0. 5 2.8 ' 0. 6
DEF 1 oc~ 1.6 ' 0. 4 2. 9 ' 0. 7
' ' 7 PEEP "" DEF 100'1, 2. 4 ' 0.4 4. 2 ' 1.0
lPPV11 1.4 ' 0.4 2.8 ' 0. 8
. Hist<J.mine Acetylcholine
OEF V$ IP?V1 NS DEF vs IPPV
1 " DEF vs PEEP p < 0. Ot DEF vs PEEP p~o.oo1
D>F vs IPPV11 NS DEF vs IP?Vll NS
Protocol l PEEP vs IPPV
1 p~0.001 PEEP vs lPPV
1 p<0.001
PEEP v:; !PPV11
p<0.001 PEEP vs IPPV 11 p < 0.001
!PPV11 vs !PPV
1 NS IPPV 11 v:; IPPV
1 NS
DEF V:> IPPV1
NS DEF v:; IPPV1 NS
DEF vs PEEP p < 0.001 DEF v:> PEEP p<O.OOl
OEF vs IPPV11 NS OEF VS IPPV 11 NS
Protocol II mP v:; IPPV
1 p<O.OOt PEEP v:; IPPV1 p < 0.001
PEEP vs IPPV11
p<0.001 PEEP vs !PPV 11 p < 0.001
IPPV11
v:> IPPV1 NS IPPV
11 v:; lPPV
1 NS
Table A-20 Mean absolute values of the right atrial pressure measured at the end of inflation (Pra,i) and standard deviations from the mean in protocols I and II (chapter II-6) during pulmonary disease induced by histamine and acetylcholine respectively. Results of the statistical analysis are given comparing the absolute values during the different ventilatory modes Yith each other. n is number of series.
121

Histamine Acetylcholine
p ra,e
p ra,e
Protocol I n mm Hg n mm Hg
IPPV1
-2.2 ' 0.5 -0. 5 ' 0 7
DEF 66't 7
-l. 9 ± o. 7 6
-0.4 ± 0. 7
PEEP ' DEF 66't -1. 1 ± 0. 5 .. o.s ± 1.0
lPPV 11 -2. 1 ± 0. 4 -0.4 ± 0. 9
Protocol II
IPPV1
-2.1 ± 0. 5 -0.6 ± 0. 7
DEF lOO't 7
-1.6 . 0. 3 7
-0. 3 ± 0. 7
PEEP ' DEF 1 OO't - o. 4 ' 0.1 ... , . 0 ± 0. 9
IPPV 11 -2. 0 ± 0. 2 -o. 7 ± 0. 6
St<Jtistk:at ;Jn<Jiysis
Histamine AcetYicholino;>
DEF vs IPPY1
NS DEF vs IPPV1
NS
DEF vs PEEP p < 0.01 DEF vs PEEP p < o.oos DEF vs IPPVII NS DEF "' 1PPV
11 NS
Protocol I PEEP vs IPPV I p<0.001 PEEP " 1PPV
1 p < 0. 001
PEEP vs IPPVII p<0.001 PEEP "' tPPV11
p < 0.001
IPPv11
v::. IPPV1
NS tPPv11 "' !PPV
1 NS
DEF vs IPPV1
p < 0.001 DEF " tPPV1 p<O.OOS
DEF vs PEEP p < 0.001 DEF "' PEEP p < 0.001
DEF vs IPPYII p < 0.001 DEF " tPPV11 p<O '"' Protocol " PEEP vs IPPY
1 p < 0.001 PEEP " IPPV
1 p<O ""' PEEP vs IP?YII p < 0.001 PEEP "' !PPV11
p < 0 ""' IPPV[I vs lPPVI NS IPPv
11 vs 1PPV
1 NS
Table A-21 Mean absolute values of the right atrial pressure measured at at the end of expiration (Pra e) and standard deviations from the mean in protocols I and fr (chapter II-6) during pulmonary disease induced by histamine and acetylcholine respectively. Results of the statistical analysis are given comparing the absolute values during the different ventilatory modes with each other. n is number of series.
122

Histamine Acetylcholine
Protocol I n PT ,p (cmHpl EEP (cmH20) n PT ,p (cmH 20) EEP (cmH
20)
IPPV1 23.1 ' 2.2 0 24.7 . 1.5 0
DEF 66~ 23.7 . 2.6 0 25.3 = 1.6 0 7 6
PEEP "- DEF 66~ 26.0 . 1.8 2. 9 ' 0. 2 27.3 = 1. 9 3. 0 = 0. 4
IPPV 11 23. 1 ' 2. 1 0 22.5 ' 1.4 0
Protocol II
IPPV1 23.1 = 1.8 0 23.0 ' 1.7 0
DEF 100~ 7
23.9 = 1.4 0 24.4 7 ' 1.6 0
PEEP "' DEF 1on 27.5 = 1.6 4.4 = 0. 2 27.7 = 1. 8 4.3 = 0.6
IPPV II 21. 9 ' 1.7 0 21. 6 = 2. 0 0
St<:~tistic<:~l an<:~lysis
Hist<:~mlne Acetylcholine
DE> vs !PPV1 NS DE' vs IPPV
1 NS
DE' vs PEEP p < 0.0005 DE' vs PEEP p < 0.0005
DE' V> NS DE> p < o.ooos P.-otocol I
IPPV11
vs IPPV11
PEEP V> IPPV1
p < o.ooos PEEP vs IPPV1
p < o.ooos PEEP v< IP?V
11 p < o.ooos PEEP vs !PPV
11 p < o.ooos
IPPV11
vs IPPV1
NS IPPV11 v< IPPV 1 p < 0.001
DE' vs IPPV1 NS DE' V> IPPV
1 p < o.oos
DE' vs PEEP p < 0.0005 DE' v< PEEP p < 0.0005
DE> v< p < 0.001 D" p ~ o.ooos Protocol II
IPPV11 vs IPPV
11
-·
Table A-22
PEEP V> IPPV1
p < o.ooos PEEP vs IPPV1
p ~ 0.0005
PEEP V> IPPV11
p < o.ooos PEEP vs IPPV11
p < 0.0005
IPPV11 V> IPPV
1 p < 0.0005 IPPV
11 vs IPPV
1 p < 0.0005
Mean absolute values of the mean peak tracheal pressure (PT ) and end expiratory pressure (EEP) and standard deviations rfEm the mean in protocols I and II (chapter II-6) during pulmonary disease induced by histamine and acetylcholine respectively. Results of the statistical analysis are given comparing the absolute values during the different ventilatory modes with each other. n is number of series.
123

Histamine Acetylcholine
p a o, Pa 0 2
Protocol I n mm Hg ' n mm Hg 0 0 0
IPPV1 50.2 ' 4.8 100 57.3 ' 5. 3 1 00
DEF 55~ 55.3 ' 5.1 110 ' 4 72. 7 ' 5.3 108 . 4 7 5
PEEP "" OEF 55~ 54.1 ' 3.8 107 ' 5 71.1 ' 5. 5 105 ' 3
JPPV 11 58.8 ' 3.9 98 ' 5 57.3 ' 5. 5 100 ' 4
Protocol II
IPPV1 57.1 ' 4.1 100 65.1 ' 5. 5 100
DEF 1 00~ 58.6 7 ' 4.8 120 ' 4 72.7 ' 5. 8 110 ' 3
7 PEEP "" DEF TOO~ 55. 1 ' 4.4 115 ' 4 70.2 ' 5. 7 106 ' 2
IPPV 11 58.8 ' 3.5 103 ' 3 65.0 . 7. 6 98 ' 5
St.;~tistic.;~l .;~n;Jiysis
Hist<Jmine Acetylcholine
'" vs IPPV1
p < 0.0005 '" vs IPPV1
p < 0.001
'" vs PEEP NS DEF vs PEEP NS
DEF v,; IPPVIJ p < 0.0005 DEF vs IPPV11
p < 0.001 Protocol I
PEEP v,; IPPV1
p < 0.025 PEEP vs lPPV1 p < 0. 01
PEEP vs IPPVII p < 0.0005 PEEP vo IPPV11 p < o.oos
IPPV11 vs IPPVI NS IPPV
11 " IPPV1
NS
DEF vs IPPV1 p < 0.0005 DEF vo IPPV
1 p < 0.0005
DEF vs PEEP p < 0.01 DEF v-s PEEP NS
'" vs IPPV11
p < o.ooos DEF vs IPPV11 p < o.oos
Protocol II PEEP vo IPPV
1 p < 0~0005 PEEP vs IPPV
1 p < 0-0005
PEEP vo IPPV11
p < 0.0005 PEEP vs IPPVII p < o.oos
IPPV11 vo IPPV
1 NS IPPV
11 vs IPPV
1 NS
Table A-23 Mean absolute and relative (%of the mean during IPPV1 ) values of the partial pressure of systemic arterial oxygen (Pao2 ) and standard deviations from the mean in protocols I and II (chapter II-6) during pulmonary disease induced by histamine and acetylcholine respectively.
124
Results of the statistical analysis are given comparing the absolute values during the different ventilatory modes with each other. n is number of series.

Histamine Acetylcholine
P, co, P, co, Protocol I n mm Hg ~ n mm Hg 0
0
IPPV1 45.6 ± 2. 6 100 46. 1 ' 1.6 100
DEF 66~ 42.8 ' 3. 0 94 . 5 43.4 ± 1.8 94 ' 3 7 6
PEEP "" DEF 66~ 45.5 ' 3.3 100 ± 4 44.9 ± 2. 0 97 . 3
!PPV11
47.4 ± 3. 5 104 ± 6 45.5 ' 1.0 99 ± 2
Protocol II
IPPV1
48.0 ± 3.2 100 45.3 ± 1. 0 100
OEF 100':. 41.8 ± 2. 0 87 ' 4 42.3 ± 1.6 93 ' 3 7 7
PEEP "" OEF 100~ 45.2 ± 2. 7 94 ± 2 44.6 ' 1. 6 98 . 3 -
IPPV 11 46.2 ± 3. 8 96 ± 4 45.1 ' 1. 9 1 00 ' 3
St-JtistiC;'ll .,n<~lysis
Histamine Acetylcholine
OEF v~ IPPV 1 p ~ 0.01 OEF vs IPPV
1 p ~ o.oos
OEF v~ PECP p ~ o.oos OEF vs PEEP p ~ o.oos OEF vs IPPVII p ~ o.oos
Protocol I OEF vs IPPv
11 p < 0.01
PEEP vs IPPV1 NS PEEP " IPPV
1 NS
PEEP vs IPPV11
p < o.oos PEEP v> IPPV11
NS
1PPV11 V> IPPV
1 NS IPPVII v> IPPV1
NS
OEF V> IPPV1
p < o.ooos OEF vs IPPV1
p < 0.0005
OEF V> PEEP p < 0.001 OEF vs PEEP p < o.oos OEF v~ IPPVll p < o.ooos OEF vs IPPV
11 p < 0.01
Protocol 11 PEEP vs IPPV
1 p < o.oocs PEEP vs IPPV
1 NS
PEEP vs IPPV11
NS PEEP v~ IPPV11
NS
IPPV11
v~ IPPV 1 NS IPPv11
vs IPPV1
NS
Table A-24 Mean absolute and relative (% o£ the mean during IPPVI) values o£ the partial pressure o£ systemic arterial carbon dioxide (Paco2 ) and standard deviations £rom the mean in protocols I and II (chapter II-6) during pulmonary disease induced by histamine and acetylcholine respectively. Results o£ the statistical analysis are given comparing the absolute values during the different ventilatory modes with each other. n is number of series.
125

Histamine Acetylcholine
P- CO v 2 Py C0 2
Protocol I n mm Hg ~ n mm Hg 0 0
IPPV 1 52.6 ' 3.2 100 51.3 i 1.6 1 00
DEF 66't 50.7 ' 3. 0 96 ± 2 49.4 ± 1.4 96 ' 2 7 6
PEEP "-' DEF 66't 52.9 ± 4. 0 101 ± 4 51.2 ± 1.2 1 00 ' 3
IPPV 11 54.2 ± 3. 3 103 ' 5 51.7 ± 0.7 101 ' 3
Protocol II
IPPV 1 55.2 ' 2.9 100 51. 2 :: 1.7 100
DEF 1 00°o 51.2 . 2.8 93 i 2 48.9 ± 1. 7 96 ' 1 7 7
PEEP "-' DEF 1 OO't 53.0 ' 3. 0 96 ' 1 so. 2 ± 1.6 98 ' 1
IPPV 11 54.1 ± 4. 0 98 ' 3 50.5 ' 1. 9 99 ± 2
St;Jtistic;;~l ;Jn<Jiysis
Hist;;~minc Acetylcholine
DEF vs IPPV1
p ~ 0.005 DEC vs IPPV1 p ~ 0.005
DEC v' PEEP p ~ 0. 01 DEC vs PEEP p < 0-001
DEC vs IPPV 11 p < 0.005 DEC vs IPPV 11 p < o.oos Protocol I
PEEP vs IPPV1
NS PEEP vs IPPV 1 NS
PEEP v' IPPV 11 NS PEEP vs IPPV 11 NS
IPPV11 vs IPPV1 NS IPPv
11 vs IPPV 1 NS
DEC vs IPPV1
p < o.ooos DEC vs IPPV 1 p < o.ooos DEC vs PEEP p<0.0005 DEC vs PEEP p < 0.005
DEC vs IPPVII p < 0.01 DEF vs IPPV 11 p ~ o.oos Protocol II
PEEP vs_ JPPV 1 p ~ o.ooos PEEP vs IPPV 1 p < o.oos PEEP vs (ppy II NS PEEP vs IPPV 11 NS
JPPV 11 vs IPPV 1 NS IPPV11 vs IPPV 1 NS
Table A-25 Mean absolute and relative (%of the mean during IPPVI) values of the partial pressure of mixed venous carbon dioxide (PyC02 ) and standard deviations from the mean in protocols I and II (chapter II-6) during pulmonary disease induced by histamine and acetylcholine respectively.
126
Results of the statistical analysis are given comparing the absolute values during the different ventilatory modes with each other. n is number of series-
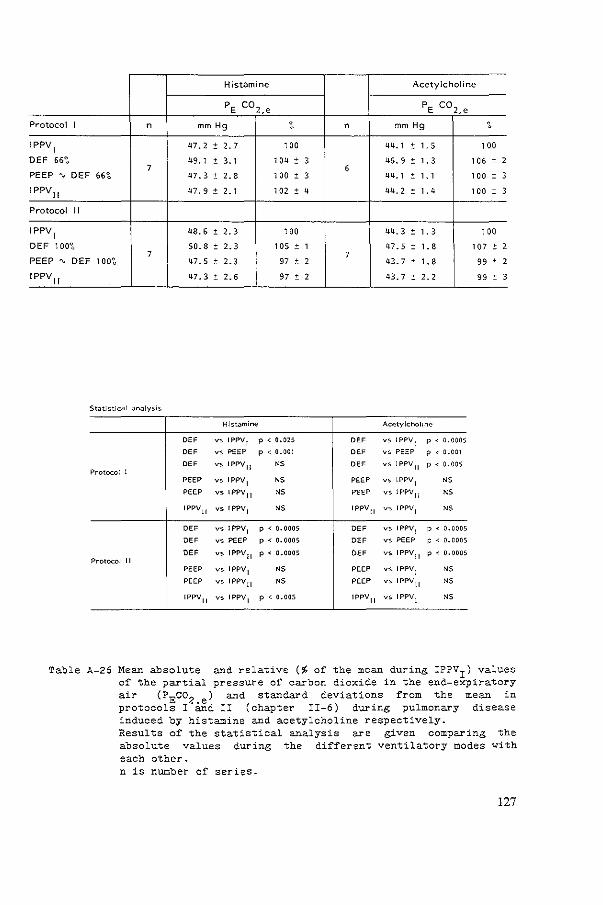
Histamine Acetylcholine
PE co2.e PE co2.e
Protocol I n mm Hg ~ n mm Hg ' IPPV
1 47.2 0 2. 7 1 00 44.1 0 1.5 100
DEF 66';, 49. 1 0 3.1 1 04 0 3 46.9 0 1.3 106 ± 2 7 6
PEEP "' DEF 66~ 47.3 0 2. 8 1 00 ± 3 44.1 ' 1.1 100 ± 3
I PPV11 47.9 0 2. 1 102 ± 4 44.2 ' 1.4 100 ± 3
Protocol II
1PPV1 48.6 ± 2. 3 1 00 44.3 ' 1.3 100
DEF 100';, 50.8 ± 2. 3 105 ± 1 47.5 ' 1. 8 107 ± 2 7 7
PEEP "' DEF 100';, 47.5 ± 2. 3 97 ± 2 43. 7 . 1.8 99 ± 2
IPPV 11
47.3 ± 2.6 97 ± 2 43. 7 ' 2. 2 99 ' 3
Hist<>mine Acetylcholine
DEF V> IPPV 1 p < 0.025 DEF vs IPPV1 p ~ 0.0005
DEF v> PEEP p ~ 0.001 DEF vs PEEP p ~ 0.001
DEF V> IPPV 11 " DEF vs IPPV 11 p < o.oos Protocol I
PEEP vs IPPV 1 " PEEP vs !PPV 1 NS
PEEP vs IPPV 11 NS PEEP vs IPPV 11 NS
IPPV 11 vs IPPVI NS IPPV 11 V> IPPV 1 NS
DEF vs IPPV 1 p < ().0005 DEF V> IPPV 1 p < o.ooos DEF vs PEEP p < ().0005 DEF vs PEEP f:= < 0.0005
DEF V> IPPV 11 p ~ 0.0005 DEF V> IPPV 11 p < o.ooos Protocol II
PEEP v> IPPV 1 NS PEEP v> IPPV 1 NS
PEEP V> IPPV!I NS PEEP V> IPPV 11 NS
IPPV 11 V> IPPV 1 p < 0.005 IPPV 11 vs IPPV1 NS
Table A-26 Mean absolute and relative (% of the mean during IPPVI) values of the partial pressure of carbon dioxide in the end-expiratory air (PEco2 .e) and standard deviatio~s from the mean in protocols I and II (chapter II-6) dur1ng pulmonary disease induced by histamine and acetylcholine respectively. Results of the statistical analysis are given comparing the absolute values during the different ventilatory modes with each other. n is number of series.
127

Histamine Acetylcholine
VD/VT VD/VT
Protocol I n absolute relative {~) n absolute relative (~)
IPPV 1 0.24 " 0.03 100 0.30 " 0.03 100
DEF 66';, 0.17 " 0.06 71 " 20 0.25 " 0.04 83 = 7 7 6
PEEP "' DEF 66';, 0.23 = 0.04 95 " 12 0.30 " 0.04 99 ' 10
!PPV II 0.25 ' 0.04 102 ' 12 0.29 ' 0.03 97 ' 9
Protocol " IPPV
1 0.25 " 0.04 100 0.29 " 0.02 100
OEF 100';, 0.15 7 ' 0.04 58 " 10 0.24 " 0.04 83 ' 9
7 PEEP "' DEF 1 00~ 0.24 ' 0.04 94 ' 9 0.30 . 0.03 106 ' 8
JPPv11 0.24 . 0.04 97 ' 9 0.29 ' 0. 01 1 01 ' 1 0
Statistical analysis
Histamine Acetylcholine
DEF vs IPPV 1 p < o.oos DEF vs !PPV 1 p < 0.001 DEF vs PEEP P < o.o1 DEF vs PEEP p < 0.0005 DEF vs IPPV 11 p < o.o1 DEF vs IPPV 11 p < o.oos
Protocol I PEEP vs IPPVI NS PEEP vs IPPV 1 NS
PEEP vs IPPV 11 NS PEEP " IPPV 11 NS
IPPV11 vs IPPVI NS IPPV 11 vs IPPVI NS
DEF vs IPPVI p < o.ooos OEF vs JPPV 1 p < 0.001 DEF vs PEEP p < o.ooos OEF vs PEEP p < o.ooos OEF vs IPPV 11 p < 0-001 OEF vs IPPV 11 NS
Protocol II PEEP vs IPPV 1 NS PEEP vs IPPVJ NS
'='EEP v' IPPV 11 NS PEEP V> 1PPV 11 NS
JPPV 11 vs 1PPV1 NS JPPV 11 V> 1PPV1 NS
Table A-27 Mean absolute and relative (% o£ the mean during IPPV1 ) values o£ the physiological dead space £raction (VD/VT) and standard deviations £rom the mean in protocols I and II (chapter II-6) during pulmonary disease induced by histamine and acetylcholine
128
respectively. Results o£ the statistical analysis are absolute values during the di££erent each other. n is number o£ series.
given comparing the ventilatory modes with
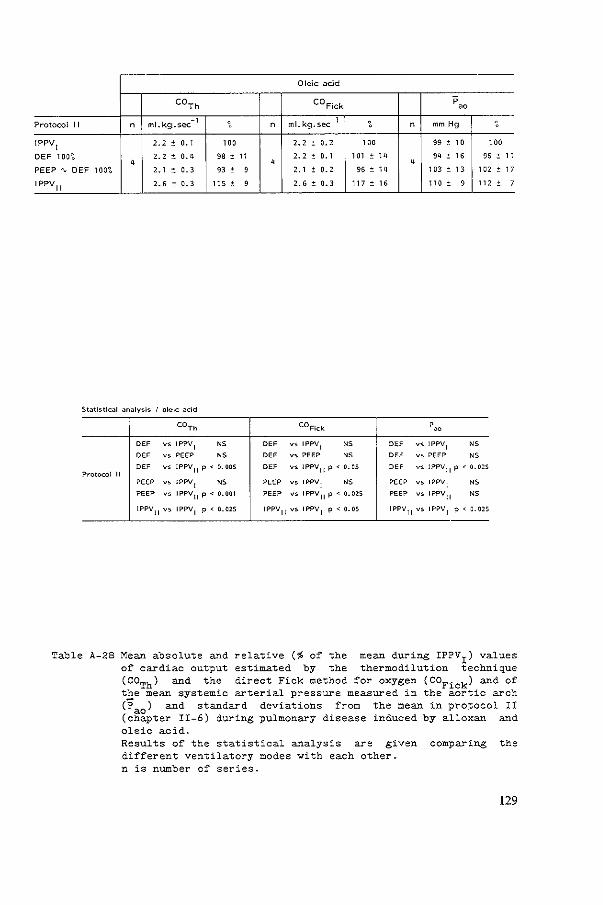
Oleic ;;~cid
COTh COFick p
00
Protocol II _,
' n ml.kg.sec n ml.kg.sec 1
' n mm Hg ' IPPV1 2. 2 ' 0.' "0 2. 2 ' o. 2 '" 99 ' " "0
DEF 1on 2. 2 ' 0.' 98 ' " 2.2 ' 0.' '" ' " " ' " 96 ' " ' ' ' PEEP"" DEF 100~ 2.' ' 0. 3 93 ' 9 2.' ' 0. 2 96 . " '" ' " 1 a:<: ' " IPPV 11 2. 6 ' 0. 3 ns ' 9 2. 6 ' 0. 3 m . " no ' 9 "' ' 7
Statistical analysis I ol.,lc acid
COTh COFlck 'oo
DEF " IPPV1 " DEF vs IPPV 1 " DEF vs IPPV 1 NS
DEF vs PEEP NS DEF vs PEEP NS DEF vs PEEP NS
DEF ~' IPPV11
p < 0.005 "' vs IPPVII p < 0.05 DEF vs IPPV11
p < 0.025 Protocol II
PEEP " !PPV1 NS PEEP vs !PPV I NS PEEP vs !PPV
1 " PEEP " IPPV11
p < 0.001 PEEP vs !PPV11
p < 0.025 PEEP vs !PPVII " 1PPV
11 vs IPPV 1
p < 0.025 IPPV11
vs IPPV1
p < 0.05 IPPV11
vs IPPV1
p < 0.025
Table A-28 Mean absolute and relative (~ of the mean during IPPVI) values of cardiac output estimated by the thermodilution technique (GOTh) and the direct Fick method for oxygen (COFick) and of the mean systemic arterial pressure measured in the aortic arch (Pa0 ) and standard deviations from the mean in protocol II (chapter II-6) during pulmonary disease induced by alloxan and oleic acid. Results of the statistical analysis are given comparing the different ventilatory modes with each other. n is number of series.
129

Oleic ~cid
p p p r~,i po r~,e
Protocol II n mrn Hg ", n mm Hg n mrn Hg
IPPV1
26 ' 3 100 0. 8 ~ 0. 9 3. 7 :!: 0. 7
DEF 1 00';, 24 4 ' 2 94 :!: 3 0. 3 ~ 1.1
4 4 3. 2 ± 1.0
PEEP"" DEF 1 OO"t 21 ± 4 83 ± 7 1.3 ± o. 9 3. 9 ± 1.0
!PPV11
25 ' 5 97 ± 12 -0. 1 ± o. 6 2. 3 ± 0. 4
Statistical analy•is I oleic <Jcid -• p
r;,,e p r;,,l
"' V$ IPPVI p < 0.025 "' vs JPPVI " DEC vs IPPV1 " "' vs PEEP p < 0.05 "' vs PEEP p < 0.005 "' vs PEEP p < 0. oos
Protocol II "' vs IPPV11 " "' vs IPPVII " "' v~ IPPVII "
PEEP vs JPPV1
p<O.OOS PEEP vs IPPV1 " PEEP vs IPPV1 " PEEP VS JPPVII p < 0.025 PEEP vs IPPV
11 p < 0.02$ PEEP vs IPPV
11 p < 0.05
IPPVII vs IPPV 1 " JPPV11
vs JPPV1
p < 0.05 IPPV11
vs IPPV1 p < 0. 025
Table A-29 Mean absolute and relative (% of the mean durin§ IPPV1 ) values of the mean pressure in the_pulmonary artery (Ppa) and mean absolute values of the rlght atrial pressure measured at the end of inflation (Pra,i) and at the end of expiration (Pra,e) and standard deviatlons from the mean in protocols I and II (chapter II-6) during pulmonary disease induced by alloxan and oleic acid.
130
Results of the statistical analysis are given comparing the absolute values during the different ventilatory modes vith each other. n is number of series.

oleic acid
Pa02 Paco 2 P-CO
v 2
Protocol II n mm Hg ' n mm Hg ' n mm Hg ' IPPV
1 95.1 ' 13.9 100 49. 0 ~ 4. 4 1 00 58.6 ' 5. 0 100
DEF 1 00';. 11 S. S . 11. 2 126 ' 19 43. 2 ~ 4. 2 88 ' 5 4
52. 1 ' 4.1 89 ' 4 4 PEEP"' DEF 1 00';. 159.6 ~ 9. 0 171 ' 30 44. 3 ' 4. 3 " ' 5 53. 0 ' 5. 2 91 ' IPPV 11 92. 1 ' 7. 2 93 :: 10 47. 2 ' 2. 8 97 ' 5 55. 2 . 3. 3 95 '
St t' t ~ IS lc.;l JI1J ysos "'C ilCI ' P~02 P.,C02 P;:,C0 2
"' " IPPV1
p < 0.02$ 0" vs IPPV1 p < 0.01 DE> vs IPPV 1 p < o.os
0" ., '"" p < o.oos DE> vs PEEP " DE> vs PEEP " 0" V> IPPV 11 p < 0.025 DE> vs IPPV 11 p < 0-02$ 0" vs IPPVII p < 0.025 P~otocol 11
PEEP ., IPPV1 p < 0.005 PEEP vs IPPV 1 p < 0.025 PEEP "'" IPPV1 p < o.os
PEEP " IPPV 11 p < 0.005 PEEP vs IPPVII NS PEEP vs IPPVII NS
IPPV11
vs IPPV1
NS IPPVII vs IPPV 1 NS tPPVIl v>- IPPVI NS
Table A-30 Mean absolute and relative (% of the mean during IPPVI) values of the partial pressures of systemic arterial oxygen (Pao
2).
systemic arterial carbon dioxide (Paco2 ) and mixed venous carbon dioxide (PyC02 ) and standard deviations from the mean in protocol II (chapter II-6) during pulmonary disease induced by alloxan and oleic acid. Results of the statistical analysis are absolute values during the different each other. n is number of series.
given comparing the ventilatory modes ~ith
131
8
8
5
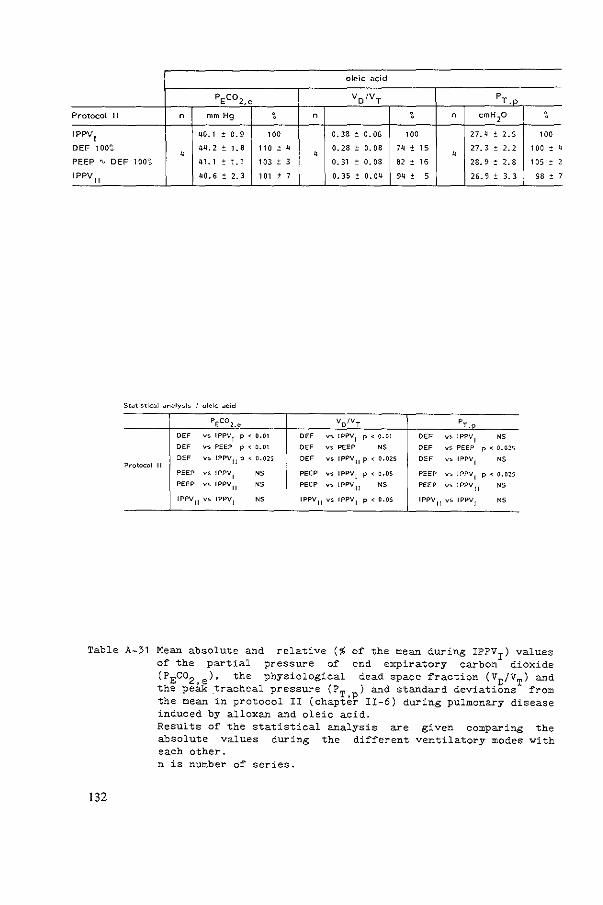
oleic acid
PEco2,e VDIVT PT,p
Protocol II n mm Hg ' n ' n em H20 '
IPPV1
40.1 = 0. 9 100 0. 38 = o. 05 '" 27. 4 ± 2, 5 '" DEF 1 00~ 44. 2 ± L8 no ' " 0.28 ± 0. 08 '" ± " 27. 3 ± 2, 2 '" ' " " " PEEP ' DEF 100~ 41. 1 ± '-' 103 ± 3 0. 31 ± 0.08 82 ' '6 28.9 ' 2. 8 '05 ' I PPV
11 40.5 ' 2, 3 '" ± 7 0. 35 ' 0. 04 94 :: 5 26.9 :: 3, 3 98 '
St-Jtlsti<::-JI ~n~ly,.ls I oleic -J<:id
PEco2.e VD/VT PT.._,_r:>_
"" vs IPPV1 p < 0-01 "" v,;. !PP\1
1 p < o.ot DEF v,_ IPPVI " DEF v,;. PEEP p < 0.01 "" vs PEEP " "" vs PEEP p < 0.025
"" vs IPPV11
p < 0.025 "" vs IPPV 11 p < 0.025 DEF vs IPPVII " Protocol II PEEP vs IPP\1
1 <5 PEEP V$ IPPV1 p < o.os PEEP vs 1PPV
1 p < 0.025 PEEP vs IPPV
11 <5 PEEP vs 1PPV11 <5 PEEP vs IPPV
11 " IPPV
11 vs IPP\1
1 " IPPV 11 vs IPPV1 p < o.os IPPV
11 vs IPPV
1 "
Table A-31 Mean absolute and relative (% of the mean during IPPV1
) values of the partial pressure of end expiratory carbon dioxide (PEco2 .e)' the phys1ological dead space fraction (VD/VT) and the peak tracheal pressure (PT ) and standard deviations from the mean in protocol II (chapte~ II-6) during pulmonary disease induced by alloxan and oleic acid.
132
Results of the statistical analysis are given comparing the absolute values during the different ventilatory modes with each other. n is number of series.
" 2
7


REFERENCES


REFERENCES
ABBOUD, R.T., BEIDAS-JUBRAN, N., FEISAL, K.A. and F.J.D. FULEIHAN. The effect of added expiratory obstruction on gas exchange in chronic airways obstruction. Brit:. J. Dis. Chest: 1 968; 62: 36-40.
AITKEN, R.S. composition exercise. J.
and A.E. CLARK-KENNEDY. On the fluctuation in the of the alveolar air during the respiratory cycle in muscular
Physicl., London 1928; 65: 389-411.
ASHBAUGH, D.G., BIGELOV, D.B., PETTY, T.L. and B.E. LEVINE. respiratory distress in adults. Lancet 1967: ii: 319-323.
Acute
ASHBAUGH, Physiology, Surg. 1973;
D.G. and T.L. PETTY. Positive indications, and contraindications. 65: 165-170.
end-expiratory pressure. J. Thorac. Cardiovasc.
ASHBAUGH, D.G. and T. UZAVA. Respiratory and hemodynamic changes after injection of free fatty acids. J. Surg. Res. 1968; 8: 417-423.
BARACH, A.L .. Physiological methods in the diagnosis and treatment of asthma and emphysema. Ann. Int:. l'lfed.: 1938-1939; 12: 454-481.
BERGMAN, N.A.. Effect of alveolar-arterial gradients 1049-1052.
different in dogs.
pressure breathing patterns on J. Appl. Physiol. 1963; 18:
BERGMAN, N.A .. Effects of varying respiratory waveforms on gas exchange. Anesthesiology 1967; 28: 390-395.
BERMAN, L.S., DOWNS, J.B., van EEDEN, A. and D. DELHAGEN. expiration !fled. 1981;
ratio. Is mean airway pressure the difference? g, 775-777.
Inspiration: Grit. Care
BERNSTEIN, L .. The elastic pressure-volume curves of the lungs and thorax of the living rabbit. J. Physiol. 1957; 138: 473-487.
BOUHUYS, A. Respiratory Dead Space. 3: Respiration, volume 1. ~.o.
Physic!. Soc., Washington D.C., 1964:
In: Handbook of Physiology, Section Fenn and H.P. Rahn, eds .. Am.
chapt. 28, p 699-714.
BOWES, C.L., RICHARDSON, J.D., CUMMING, G. and K. HORSFIELD. Effect of breathing ducts. J.
pattern on gas mixing Appl. Physiol. 1985; 58:
in a model with asymmetrical alveolar 18-26.
BUCKLEY, N .M., cardiovascular Neonate 1976;
GOOTMAN, P.M., GOOTMAN, N., et al.. Age dependent afferent stimulation in neonatal pigs. Biol. effects of
30: 268-279.
BUCKLEY, N.M., GOOTMAN, P.M., BRAZEAU, function in anesthetized miniature swine. 200-208.
P., et al.. Cardiovascular Lab. Anim. Sci. 1979-a; 29:
137

BUCKLEY, N.M., GOOTMAN, P.M., YELLIN, E.L. and P. BRAZEAU. Age-related cardiovascular e~~ects o~ catecholamines in anesthetized piglets. Cir. Res. 1979-b; 45: 282-292.
BUHAIN, W.J., BRODY, J.S. and A.B. FISHER. E~~ect o~ artificial airway obstruction on elastic properties of the lung. J. Appl. Physiol. 1972; 33' 589-59<.
BYNUM, L.J., WILSON, J.E. III and A.K. PIERCE. Comparison o~
spontaneous and positive-pressure breathing in supine normal subjects. J. Appl. Physiol. 1976; 41: 341-347.
CHRISTIE, R.V .. The elastic properties their clinical significance. J. Clin.
of the emphysematous lung Invest. 1934; 13: 295-321.
and
COLEBATCH, H.J.H. before and after 798-805.
and L.A. ENGEL. Constriction of the lung by histamine adrenalectomy in cats. J. Appl. Physiol. 1974; 37:
COLEBATCH, H.J.H. and C.A. MITCHELL. Constriction of isolated living liquid-filled dog and cat lungs with histamine. J. Appl. Physiol. 1971; 30: 691-702.
COLEBATCH, H.J.H., OLSEN, C.R. serotonin. and acetylcholine Physiol. 1966; 21 : 217-226.
and J.A. NADEL. Effect of histamine, on the peripheral airways. J. Appl.
CONNORS, A.F., McCAFFREE, D.R. and B.A. GRAY. flow rate on gas Respir. Dis. 1981 ;
exchange during 124: 537-543.
mechanical Effect of inspiratory ventilation. Am. Rev.
COTTRELL, T.S., LEVINE, O.R., SENIOR, R.M., et al .. Electron microscopic alterations at the alveolar level in pulmonary edema. Circ. Res. 1967; 21: 783-797.
COURNAND, A., MOTLEY, H.L., WERKO, L. and D.W. RICHARDS jt .. Physiological studies of the breathing on cardiac output in 162-174.
effects of intermittent positive pressure man. Am. J. Physiol. 1 948; 152:
CRAIG, D.B. and D.S. McCARTHY. Airway clo_sure and lung volumes during breathing with maintained airway positive pressures. Anesthesiology 1972; 36: 540-543.
CUMMING, G., HORSFIELD, K., JONES. J.G. and D.C.F. MUIR. The influence of gaseous diffusion on the alveolar plateau at different lung volumes. Respir. Physiol. 1967; 2: 386-398.
DAMMANN, J.F. and T.C. McASLAN. Optimal flow pattern ventilation of the lungs. Evaluation with a model lung. 1977; 5: 128-136.
138
~or
Crit. mechanical Care /Yied.

DAMMAN, J.F., McASLAN, T.C. and C.J. MAFFEO. mechanical ventilation o~ the square wave ~low pattern with and patients. Crit. Care ~ed. 1978;
lungs. 2. vithout an 6' 293-310.
Optimal ~lov pattern ~or
The e~~ect o£ a sine versus end-inspiratory pause in
DAMOKOSH-GIORDANO, A .• LONGOBARDO. G.S., BAAN, J. and N .s. CHERNIAK. The effect 0~
theoretical study. variations in airflov Respir. Physiol. 1975;
pattern on gas-exchange. 25: 217-234.
DAYMAN, H .. Mechanics o~ air~lov in health and in emphysema. Invest. 1951; 30: 1175-1190.
J. Clin.
DERKS, C.M. oleic acid. 143-158.
and D. JACOBOVITZ-DERKS. Embolic A systematic morphologic study.
pneumopathy induced by Am. J. Pathol. 1977 87:
DOUGLAS, W.W .. Histamine and 5-hydroxytryptamine (serotonin) and their antagonists. In: Goodman and Gilman's The pharmacological basis of therapeutics. Sixth edition 1980. Macmillan publishing Co., Inc. New York; Collier Macmillan Canada, Ltd., Toronto; Bailliere Tindall, London.
DRAZEN, J.M., LORING, S.H. and R.H. INGRAM Jr .. Localization o~ constriction using gases o~ varying density and viscosity. J. Physiol. 1976; 41: 396-399.
airway Appl.
DRAZEN, J.M., LORING, S.H., JACKSON, A.C., SNAPPER, J.R. and R.H. INGRAM Jr.. E~~ects o£ volume history on airway changes induced by histamine or vagal stimulation. J. Appl. Physiol.: Respirat. Environ. Exercise Physiol. 1979; 47: 657-665.
DuBOIS, A.B., BRITT, A.G. and W.O. FENN. repiratory cycle. J. Appl. Physiol. 1952; 4:
Alveolar 535-548.
C02 during the
EFFENDI, H .. Het negatie~ inotrope e~~ect van barbituraten op het hart van pasgeboren en volwassen cavia"s. Thesis: 1972. Rijksuniversiteit Lei den.
EFFENDI, H., VERSPRILLE, A. and e£~ect o~ barbiturates on the Arch. Intern. Pharmacodyn. 1974;
M.E. heart 209:
WISE. The negative inotropic of newborn and adult guinea-pigs. 127-143.
EVANS, J.R., ROWE, R.D., DOWNIE, H.G. and H.C. ROSWELL. ~rom ductus arteriosus in normal newborn svine. Circ. 85-93.
Murmurs arising Res. 1963; 12:
FAIRLEY, H.B .. Positive end-expiratory pressure: effect on arterial oxygenation during respiratory ~ailure in chronic ostructive airway disease: Comment. Survey of Anesthesiology 1976; 20: 99.
FALKE, K.J., PONTOPPIDAN, H., KUMAR, A., et end-expiratory pressure in acute lung disease. 51: 2315-2323.
al.. Ventilation with J. Clin. Invest. 1972;
139

FEENSTRA, B.W.A., LUIJENDIJK, S.C.M., JANSEN. J.R.C., VAN ROOYEN, W. and H.A. BRUINING. In~luence o~ expiratory ~low pattern on co2 exchange. Bull. Eur. Physiopathol. Respir. 1985; 21: 9A.
FIELD, G.B., JONES, G. and E.R. McFADDEN Jr.. Alveolar-arterial PC02 di~~erences during rebreathing in chronic airways obstruction. J. Appl. Physiol. 1971; 31: 490-496.
FINLEY, T.N., LENFANT, c .• HAAB, P., PilFER, J. and H. RAHN. Venous Appl. admixture in
Physiol. 1960; the 15:
pulmonary circulation o~ anesthetized dogs. 418-424.
J.
FINUCANE, K.E. and H.J.H. COLEBATCH. airway obstruction.
Elastic behaviour o~ the lung in patients 330-338.
with J. Appl. Physiol. 1 969; 26:
FOLKOW, B. space and drue;:s. J.
and J.R. PAPPENHEIMER. Components o~ the respiratory dead their variation with pressure breathing and with bronchoactive Appl. Physiol. 1955; 8: 102-110.
FORSTER, R.E .. Can alveolar No. J. Appl. Physiol.:
Pc02 exceed pulmonary end-capillary co2 Respirat. Environ. Exercise Physiol. 1977;
?
42: 323-328.
FRUMIN, M.J., BERGMAN, N.A., HOLADAY, D.A., RACKOW, H. and E. SALANITRE. Alveolar-arterial o2 di~~erences during artificial respiration in man. J. Appl. Physiol. 1959; 14: 694-700.
FRY, D.L. and R.E. HYATT. Pulmonary mechanics. A uni~ied the relationship between pressure, volume and gasflow in normal and diseased human subjects. Am. J. ned. 1960; 29:
GALLAGHER, T.J. and M.J. o~ oxygenation (abstract).
BANNER. Me~~ airway pressure as a Crit. Care f'ed. 1980; 8: 244-
analysis of the lungs of 672-689.
determinant
GROSSMAN, R.F., JONES, J.G. and J.F. MURRAY. Ef~ects
acid-induced pulmonary edema on lung mechanics. J. Appl. Respirat. Environ. Exercise Physiol. 1980; 48: 1 045-1 051 .
of oleic Physiol.:
GURTNER, G.H., SONG, S.H. and L.E. FARHI. Alveolar to mixed venous Pc02 difference under conditions of no gas exchange. Respir. Physiol. 1969; 7: 173-187.
GUYATT, A.R., YU, C.J., LUTHERER, B. and A.B. OTIS. Studies of alveolar-mixed venous co2 and o2 gradients in the rebreathing dog lung. Respir. Physiol. 1 973; 1 7: 1 78-1 94.
GUYTON, A.C., LINDSEY, A.W., ABERNATHY, B. and T. RICHARDSON. Venous return at various right atrial pressures and the normal venous return curve. Am. J. Physiol. 1957; 189: 609-615.
HAMMON, J.W., WOLFE, W.G., MORAN, J.F., JONES, R.H. and D.C. SABISTON. The effect of positive end-expiratory pressure on regional ventilation and perfusion in the normal and injured primate lung. J. Thorac. Cardiovasc. Surg. 1976; 72: 680-689.
140
HATLE, L. and R. ROSKETH. tension gradient in acute diseases. Chest 1974; 66:
The arterial to end-expiratory carbon dioxide pulmonary embolism and other cardiopulmonary
352-357.
HEDENSTIERNA, G., BINDSLEV, L., SANTESSON, J. and O.P. NORLANDER. each lung o~ anesthetized human subjects. J. Appl. Environ. Exercise Physiol. 1981; 50: 55-64.
Air~ay closure in Physiol.: Respirat.
HEDENSTIERNA, G., McCARTHY, G. and M. BERGSTROM. Air~ay closure during mechanical ventilation. Anesthesiology 1976; 44: 114-123.
HEDLEY-WHYTE, J., PONTOPPIDAN, H. and M.J. MORRIS. The patients ~ith respiratory failure and cardiopulmonary disease levels of constant volume ventilation. J. Clin. Invest. 1543-1554.
response of to dif~erent 1966; 45:
HILL, E.P., POWER, G.G. and L.D. LONGO. Mathematical simulation of pulmonary o2 and co2 exchange. Am. J. Physiol. 1973; 224: 904-917.
HOFMAN, W.F., EHRHART, I. C. and W.M. GRANGER. cardiopulmonary changes after oleic-acid injury in dogs. Crit. 1985; 13: 22-27.
Sequential Care !ffed.
HOPEWELL, P.C .. Failure o~ positive end-expiratory pressure to lung ~ater content in alloxan-induced pulmonary edema. Am. Rev. Dis. 1979; 120: 813-819.
decrease Respir.
H5RNICKE, H.. Der Blutdruck des EinflUssen. Arch. Exp. Vet !ffed. 1966;
Sch~eines unter 20: 1035-1047.
verschiedenen
HUGGETT, A.St.G .. Studies on the respiration and circulation of the cat. IV. The heart output during respiratory obstruction. J. Physiol. 1924; 59; 373-380.
HUGHES, J.M.B., JONES, H.A., WILSON, A.G., GRANT, B.J.B. and N.B. PRIDE. Stability o~ intrapulmonary bronchial dimensions during expiratory ~lo~ in excised lungs. J. Appl. Physiol. 1974; 37: 684-694.
HUMPHREYS, G.H., MOORE, R.L., MAIER, H.C. and V. APGAR. Studies of the cardiac output of anesthetized dogs during continuous and intermittent inflation of the lungs. J. Thoracic Surg. 1938; 7: 438-451.
HUTCHISON, A.A., BRIGHAM, K.L. and J.R. SNAPPER. Ef~ect o~ histamine on lung mechanics administration.
in Am.
sheep. Comparison of aerosol and parenteral Rev. Respir. Dis. 1982; 126: 1025-1 029.
INGRAM Jr., R.H. and D.P. SCHILDER. Effect of pursed lips expiration on the pulmonary pressure-flo~ relationship in obstructive lung disease. Am. Rev. Respir. Dis. 1967; 96: 381-388.
141
JANSEN. J.R.C., BOGAARD, J.M. and A. VERSPRILLE. Discrepancies bet~een
models as a basis for cardiac output estimation and medical practice. In: Modelling and data analysis in biotechnology and medical engineering. G.C. Vansteenkiste and P.C. Young (eds.) North-Holland Publishing Company. 1 983.
JANSEN, J.R.C., SCHREUDER, J.J., BOOGAARD, J .. van ROOYEN, W. and AVERSPRILLE. Thermodilution technique for measurement of cardiac output during artificial ventilation. J. Appl. Physiol.: Respirat. Environ. Exercise Physiol. 1981; 50: 584-591.
JANSEN, J.R.C. and A. VERSPRILLE. Improvement of cardiac output estimation by the thermodilution method during mechanical ventilation. Intensive Core Med., 1986 in press.
JEFFERSON, N.C. and H. NECHELES. Oleic acid toxicity and fat embolism. Proc. Soc. Exp. Biol. /fled. 1948; 68: 248-250-
JENNINGS, D.B. and C.C. CHEN. Negative arterial-mixed gradient during acute and chronic hypercapnia. J. Appl. 38: 382-388.
expired P COZ Physiol. 1 975;
JOHNSTON, W.E., PROUGH, D.S., ROYSTER, R.L .• et al.. Pulmonary artery ~edge pressure may fail to reflect left ventricular end-diastolic pressure in dogs ~ith oleic acid-induced pulmonary edema. Crit. care Med. 1985; 13: 487-491.
JONES, N.L., ROBERTSON, D.G. and J.W. KANE. end-tidal and arterial PC02 in exercise. J. Appl. Environ. Exercise Physiol. 1979; 47: 954-960.
Difference Physiol.:
between Respirot.
KING, E.G., NAKANE, P.K. and D.G. ASHBAUGH. The canine oleic acid model of fibrin localisation in fat embolism. Surgery 1971; 69: 782-787.
KJELLMER, I., SANDQVIST, L. and E. BERGLUND. -Alveolar plateau- of the single breath nitrogen elimination curve in normal subjects. J. Appl. Physiol. 1959; 14: 105-108.
KNELSON, J.H., HOWATT, W.F. and G.R. pattern on alveolar gas exchange. 328-331 .
DeMUTH. J. Appl.
Effect of respiratory Physiol. 1 970; 29:
KUMAR, A .• FALKE, K.J., GEFFIN. B., et al .. Continuous positive-pressure ventilation in acute respiratory failure. Effects on hemodynamics and lung function. N. Engl. J. /'led. 1970; 283: 1430-14-36.
KUMAR, A., PONTOPPIDAN, H., FALKE, K.J., WILSON, R.S. and M.B. LAVER. Pulmonary 1973; 1:
barotrauma 181-186.
during mechanical ventilation. Crit. Care ftled.
LINK, J .. Increase of expiratory resistance Servoventilator. Intensive care /fled. 1983;
142
by the PEEP-valve 9: 137-138.
of the

LUFT, U.C., LOEPPKY. J.A. and E.M. MOSTYN. Mean alveolar alveolar-arterial gradients in pulmonary patients. J. Appl. Respirot. Environ. Exercise Physiol. 1979; 46: 534-540.
gases and Physiol.:
LUIJENDIJK, S.C.M., ZWART, A., de VRIES, W.R. and W.M. SALET. The sloping alveolar plateau at synchronous ventilation. 1980; 384: 267-277.
Pf'lOgers Arch.
MciNTYRE, R.W., LAWS, A.K. and P.R. RAMACHANDRAN. Positive expiratory pressure plateau: Can. Anaesth. Soc.
improved J. 1969;
gas-exchange during mechanical ventilation. 16: 477-486.
MEAD, J. and C. COLLIER. respiratory mechanics in 14: 669-678.
Relation of volume anesthetized dogs. J.
history of lungs to Appl. Physiol. 1959;
MEAD, J., LINDGREN, I. the lungs in emphysema.
and E.A. J. Clin.
GAENSLER. The mechanical properties Invest. 1955; 34: 1005-1016.
of
MEAD, J., WHITTENBERGER, J.L. and E.P. RADFORD Jr .. a factor 1957; 10:
in pulmonary 191-196.
volume-pressure hysteresis. Surface tension as J. Appl. Physiol.
MILLER, W.F .. Physical therapeutic measures in the treatment of bronchopulmonary disorders. Methods for breathing training. Med. 1958; 24: 929-940.
chronic Am. J.
MOOMJIAN, A.S., SCHWARTZ, J.G., WAGAMAN, M.J., SHUTACK, J.G. and Th.H. SCHAFFER. The effect of external expiratory resistance on lung volume and pulmonary function in the neonate. J. Pediatrics 1980; 96: 908-911.
MOTLEY, H.L .. The effects exchange in emphysema. Am.
of slow deep breathing on Rev. Resp. Dis. 1 963; 88:
the blood 484-492.
gas
MUELLER, R.E., PETTY, T.L. and G.F. FILLEY. Ventilation and blood gas changes induced by pursed lips breathing. J. Appl. 1970; 28: 784-789.
arterial Physiol.
NELSON, L.D. and B.A. HOUTCHENS. Automatic thermodilution cardiac output determinations. 190-192.
vs manual injections Crit. Care trfed. 1982;
for 10:
NYE Jr., R.E .. Influence of the cyclical pattern of ventilatory flow on pulmonary gas exchange. Respir. Physiol. 1970; 10: 321-337.
OTIS, A.B .. Quantitative relationships in steady-state gas exchange. In: Handbook of' Physiology. Section 3: Respiration, volume 1. W.O. Fenn and H.A. Rahn, eds .. Am. Physiol. Soc., Washington D.C., 1964; chapt. 27, p. 681-698.
OTIS, A.B., McKERROW, C.B., BARTLETT, R.A. distribution of pulmonary ventilation. 427-443.
et al .. Mechanical factors in J. Appl. Physiol. 1956; 8:
143
PAUL, G., ELDRIDGE, F., MITCHELL, J. and T. FIENE. Some slowing respiration rate in chronic emphysema and bronchitis. Physiol. 1966; 21: 877-882.
effects of J. Appl.
PAVEK. E., PAVEK, K. and D. BOSKA. Mixing and observation errors in indicator-dilution studies. J. Appl. Physiol. 1970; 28: 733-740.
PEPE, P.E. and J.J. MARINI. Occult positive end-expiratory pressure in mechanically ventilated patients with airflow obstruction. The auto-PEEP effect. Am. Rev. Respir. Dis. 1982; 126: 166-170.
PEREZ-CHADA, R.D., GARDAZ, Cardiorespiratory effects of pressure ventilation in goats.
J.-P., MADGWICK, R.G. and M.K. SYKES. an inspiratory hold and continuous positive Intensive Core Med. 1983; 9: 263-269.
PESENTI, A .• MARGOLIN, R., PRATO, P., et al.. Mean airway pressure vs positive end-expiratory pressure during mechanical ventilation. Crit. Care Med. 1985; 13: 34-37.
PONTOPPIDAN, H., GEFFIN, failure in the adult. N. 799-806.
B. and Engl. J.
E. LOWENSTEIN. !fed. 1972; 287:
Acute respiratory 690-698, 743-752,
PONTOPPIDAN, H., WILSON, Respiratory intensive care.
R.S., RIE, M.A. Anesthesiology 1977;
and 47:
R.c. 96-116.
SCHNEIDER.
POWERS, S.R., MANNAL, R .• NECLERIO, M., et al .. Physiologic of positive end-expiratory pressure (PEEP) ventilation. Ann. 178: 265-272.
consequences Surg. 1973;
QVIST, J., PONTOPPIDAN, H., WILSON, R.S., LOWENSTEIN, E. and M.B. LAVER. Hemodynamic responses to mechanical ventilation with PEEP: The effect of hypervolemia. Anesthesiology 1975; 42: 45-55.
RAHN, H. The dampling of alveolar gas. Physiology. Randolph Field, Texas:
In: Air
Handbook of' Univ. School
Respiratory of Aviation
Medicine, 1954: 29-37.
REHDER, K., MARSH, H.M., RODARTE, J.R. and R.E. HYATT. Airway closure. Anesthesiology 1977; 47: 40-52.
RETH, E. von, VERSPRILLE, A. and J.A. POULIS. Evaluatie van de thermodilutie methode voor de bepaling van het hartminuut volume. Verslag van het afstudeer onderzoek, Technische Hogeschool, Eindhoven 1978.
RODARTE, J.R., HYATT, R.E. and D.A. CORTESE. Influence of flow on closing capacity at low expiratory flow rates. Physiol. 1975; 39: 60-65.
expiratory J. Appl.
ROWE, M.I. and-A. ARANGO. A critical appraisal of two common -neonatalexperimental subjects. J. Ped. Sur. 1977; 12: 409-412.
SAADJIAN, A., QUERCY, by thermodilution. 3: 161-167.
144
J.E. and J. TORRESANI. Cardiac output measurement Methodologic problems. Med. Progr. Technol. 1976;

SAWYER, D.C., LUMB, W.V. and halothane, methoxy~lurane,
Physiol. 1 971 ; :;o: 36-4:5.
H.L. STONE. pentobarbital
Cardiovascular and thia.mylal.
e~~ects of J. Appl.
SCHARP, J.T., JOHNSON, F.N., GOLDBERG, N.A. and P. van LITH. and stress adaptation in the human respiratory system. Physiol. 1967; 23: 487-497.
Hysteresis J. Appl.
SCHEID, P. and J. PIIPER. Blood/gas equilibrium of carbon dioxide in lungs. A critical review. Respir. Physiol. 1980; 39: 1-31.
SCHMIDT, R.W., WASSERMAN, K. and G.A. LILLINGTON. The flow and oral pressure asthma and emphysema. Am.
on the mechanics of breathing Rev. Respir. Dis. 1964; 90:
effect of air in patients with 564-571 .
SCHREUDER, J.J., JANSEN, J.R.C. BOGAARD, J.M. and A. VERSPRILLE. Hemodynamic effects of positive end-expiratory pressure applied as a ramp. J. Appl. Physiol. 1982; 53: 1239-1247.
SCHUSTER, D.P. and E.P. TRULOCK. lung dogs.
water and hemodynamics after Crit. Care ftled. 1984; 12:
Correlation of changes in oxygenation oleic acid-induced acute long injury in 1044-1048.
SNAPPER, J.R., DRAZEN, J.M., LORING S.H., SCHNEIDER, W. and R.H. INGRAM Jr.. Distribution of pulmonary responsiveness to aerosol histamine in dogs. J. Appl. Physiol.: Respirat. Environ. Exercise Physiol. 1978; 44: 738-742.
SNYDER, J.V. and D.J. POWNER. Effects of mechanical ventilation on the measurement of cardiac output by thermodilution. Crit. Care ftled. 1982; 10: 677-682.
STAM, H., VERSPRILLE, monoxide diffusing europ. Physiopath.
A. and J.M. BOGAARD. The components of the capacity in man dependent on alveolar volume.
resp. 1983; 19: 17-22.
STAUB, N.C .• NAGANO, H., and M.L. especially the sequence of fluid Physiol. 1967; 22: 227-240.
PEARCE. Pulmonary edema accumulation in lungs.
in J.
carbon Bull.
dogs, Appl.
STOW, R.W .. Systematic errors in flow determinations by the Fick method. fl'finn ftled. 1954; 37: 30.
STRANDBERG, A .. Lung collapse during general anaesthesia. Thesis, 1985; Huddinge Hospital, Huddinge Sweden, Depts. of Surgery, Clinical Physiology, Anaesthesiology and Radiology.
STROBEL, G.E. and H. WOLLMAN. Pharmacology 28: 1386-1403.
of anesthetic agents. Federation Proc. 1969;
SYKES, M.K. and expiratory ratios surgery. Br. J.
J. LUMLEY. The on gas exchange
Anoesth.1969; 41:
effect of varying during anaesthesia 374-380.
inspiratory: for open heart
145

TAYLOR, P. Cholinergic agonists. In: Goodman and pharmacological basis of therapeutics Sixth edition, publishing Co., Inc. New York. Collier Macmillan Canada, Balliere Tindal, London.
Gilman's The 1980. Macmillan
Ltd. Toronto
THOMAN, R.L., STOKER, G.L. and J.C. ROSS. The e~~icacy o~ pursed-lips breathing in Rev. Respir.
patients Dis. 1966:
chronic obstructive pulmonary disease. 100-106.
Am.
TULOU, P.P. and P.M. WALSH. Measurement of alveolar carbon dioxide tension at maximal expiration as an estimate o~ arterial carbon dioxide tension in patients with airway obstruction. Am. Rev. Respir. Dis. 1970; 102: 921-926.
VERSPRILLE, A .. Physiology o~ pulmonary per~ormance. Intensive Car& Med. 1983; 9:
circulation 149.
and right heart
VERSPRILLE, A., JANSEN, J.R.C., HARINCK, E., van NIE, C.J. and K.J. de NEEF. Functional interaction o~ both ventricles at birth and the changes during the neonatal period in relation to the changes of geometry. In: Fetal and newborn cardiovascular physiology. Developmental aspects. Longo, L.D. and Reneau D.D. (eds.) Garland STPM Press. New York and London, 1976, val. 1.
VERSPRILLE, A. characteristic press).
and J.R.C. JANSEN. Mean systemic ~illing pressure as a pressure ~or venous return. PflDgers Arch. 1985 (in
VERSPRILLE, A., JANSEN, J.R.C. and J.J. SCHREUDER. Dynamic aspects of the interaction between airway pressure and the circulation. In: Applied physiology in clinical respiratory care. 0. Prakash (ed.) Martinus Nijhof~ The Hague/Boston/London, 1982; 447-463.
VLIERS, A.C.A.P., VISSER, K.R. and W.G. ZIJLSTRA. Analysis o~ indicator distribution in the determination of cardiac output by thermal dilution. Cardiovasc. Res. 1973: 7: 125-132.
WESSEL, H.K., PAUL, M.H., JAMES, G.W. and A.R. GRAHN. thermal dilution curves ~or cardiac determinations. J. 1971 ; 30: 643-652.
Limitations o~
Appl. Physiol.
WORTH, H., ADARO, F. and J. PIIPER. Penetration o~ inhaled He and SF6 into alveolar space at low tidal volumes. J. Appl. Physiol.:Respirat. Environ. Exercis& Physiol. 1977; 43: 403-408.
YOUNG, A.C., MARTIN, C.J. and W.R. PACE Jr .. E~~ect o~ expiratory ~low
patterns on lung emptying. J. Appl. Physiol. 1963; 18: 47-50.
ZECHMAN, F., HALL, F.G. and W.E. HULL. Effects o~ graded resistance to tracheal air ~low in man. J. ApplPhysiol. 1957; 10: 356-362.
ZWART, A .. Modelling o~ gas transfer in the lung. A study of prediction and ~alsi~ication. Thesis, 1983; Katholieke Universiteit, Nijmegen.
146

ZWART, A., arterial conditions. 1983; 54;
LUIJENDIJK, S.C.M. pressure relations
J. Appl. Physiol.: 1745-1753.
and W.R. de VRIES. Expiratory and under different ventilation-perfusion Respir. Environ. Exercise Physiol.
147


ACKNOWLEDGEMENTS
This thesis could never have reached its final presentation without the
help of many others, and here I want to express my gratitude to them.
Dr. H.A. Bruining, Kieje, you provided the idea for this investigation,
partly because of your curiosity for every knob on any machine, especially
those which can be locked. You have longly awaited the results and I
thank you for your patience and continuous interest.
Prof. Dr. A. Versprille, Ad, I want to thank you for the hospitality to
perform the experimental procedures at your department and for being
-promotor-. As an editor you were very consciencious and in the end I
very much appreciate your vision and supervision.
The late Professor Dr. H. Muller and later Professor Dr. H. van Houten
agreed to my not being part of any clinical duties during the experimental
part of this thesis.
J.R.C. Jansen. Jos, I am greatly indebted to your knowledge and help
during the experimental procedures and for the ever voluntary manner you
made computer programs for this investigation. You also designed the
computer-controlled ventilator used for the experiments described in
chapter 6. Without you, this thesis would not have been written for at
least a decade to come.
The laboratory for experimental surgery (head Professor Dr. D.L.
Westbroek) provided biotechnical help during the experiments and for
making slides for histological investigations. Erik Ridderhof, you have
done almost all of the experiments with me, and you have really helped me
with your ever-lasting joyfulness, especially during the late hours of the
ongoing experiments. Enno Colly occasionally substituted him. Rob Meijer
made the slides for histopathological examinations.
Rob Zandbergen constructed the on-line integrator apparatus and was always
there when problems arose with the Servo-ventilator.
Arnold Drop produced the injector and thermistor catheters and on occasion
stood in for helping me during the experiments. Also, you made the
figures and tables of chapter 6, and helped me bind the work, submitted in
a representative way to promotor and committee.
The willingness of my collegues at that time in the Academical Hospital
Rotterdam-Dijkzigt to take over my clinical work in the period of the
experiments and during parts of the preparation of the thesis will ever be
underappreciated.
I owe a lot of thanks to my collegues in the Sophia Hospital in Zwolle
(Dr. J. Boeve, K.J. Bongers, M.C. Kerdel, R.J.G. Ponsen and W.G.
Sillevis Smitt) for the time off they allowed me for the final progress of
this work, without Yhich the completion would have taken years.
149

F.J.W. ten Kate helped looking at the histological slides and to describe
the findings.
The -Audio Visueel Centrum- made the figures and the tables, f'or which
especially Gees, Bea, Cor and Ineke are to be mentioned.
Aart Zwart and Bouke Feenstra helped me through discussion about this
difficult subject.
Leny Molenaar-Hebly was always interested and
acted as a -medium- to her boss.
reprocuce literature was invaluable.
Your
pushing me
willingness
to write and
to help and to
Leny Hopman-Andressen, you typed and retyped the manuscript again and
again and again, working many long hours, always cheerf'ull and eventually
believing in the completion. Your dedication and spontaneousness was a
main feature in the effectuation of' this -book-. and I hope that you f'eel
that it is as much yours as it is mine.
Harma Meijer acted as a post-woman taking my work time and again f'rom and
to Rotterdam.
Magali, in your own way you always knew that someday the thesis would
appear and always silently encouraged me, but more important, cared f'or
me. Willem-Arnoud and Milou appreciated something was growing ~~d had to
be done, but it was difficult to understand that only after the public
defence this work would be ended.
Finally I would like to thank the -paranymphs- Marinus Eef'tinck
Schattenkerk and Robert Schreve f'or their interest in the progress and
enthusiasm and help preparing the day.
!50
CURRICULUM VITAE
The author o~ this thesis was born in August 1948 in Bandung (Indonesia).
He passed his ~inal school exams, beta-section, at the -·s-Gravenhaags
Christelijk Gymnasium Sorghvliet- in 1966 and started medical studies the
same year at the State University of Leiden. From December 1970 - January
1972 he was a student-assistant at the postoperative recovery of the
department of thoracic surgery (head then: Prof.Dr. A.G. Brom) of the
Academical Hospital Leiden. In 1973 he was assistant at the department of
pulmonary diseases (head then: the late Prof.Dr. J. Swierenga) of the
Academical Hospital Leiden during four months.
In October 1974 he graduated from medical school and became assistant at
the department of Internal Medicine II (head then: Prof.Dr. M. Frenkel)
of the Academical Hospital Rotterdam-pijkzigt. His surgical training
started in July 1975 in the same hospital under the guidance of the late
Prof.Dr. H. Muller and Prof.Dr. H. van Houten. The author was
registered as a specialist in surgery in July 1981 and stayed at the
department as a -chef de clinique- for nearly three years. At present,
since April 1984, he is a surgeon in the Sophia Hospital in Zwolle.
151