Flexible Global Software Development (GSD): Antecedents of Success in Requirements Analysis

GSD-1G and MPI-DING Reference Glasses for In Situand Bulk Isotopic Determination
Klaus Peter Jochum (1)*, Steven A. Wilson (2), Wafa Abouchami (1), Marghaleray Amini (3, 4),Jérome Chmeleff (5, 6), Anton Eisenhauer (3), Ernst Hegner (7), Linda M. Iaccheri (7),Bruno Kieffer (12), Joachim Krause (1), William F. McDonough (8), Regina Mertz-Kraus (1),Ingrid Raczek (1), Roberta L. Rudnick (8), Denis Scholz (9, 1), Grit Steinhoefel (5),Brigitte Stoll (1), Andreas Stracke (10, 14), Sonia Tonarini (11), Dominique Weis (12),Ulrike Weis (1) and Jon D. Woodhead (13)
(1) Max-Planck-Institut für Chemie, Postfach 3060, 55020 Mainz, Germany(2) US Geological Survey, Box 25046, MS 973, Denver Federal Center, Denver, CO 80225, USA(3) Leibniz-Institut für Meereswissenschaften, IFM-GEOMAR, Wischhofstraße 1-3, 24148 Kiel, Germany(4) Saskatchewan Isotope Laboratory, Department of Geological Sciences, University of Saskatchewan, 114 Science Place, Saskatoon,
SK S7N 5E2, Canada(5) Institut für Mineralogie, Leibniz Universität Hannover, Callinstrasse 3, 30167 Hannover, Germany(6) LMTG, Université de Toulouse III, 14 Avenue E. Belin, 31400 Toulouse, France(7) Department für Geo- und Umweltwissenschaften, Ludwig-Maximilians-Universität München, Theresienstrasse 41, 80333 Munich,
Germany(8) Department of Geology; University of Maryland, College Park, MD 20742-4211, USA(9) Johannes Gutenberg-Universität Mainz, Institut für Geowissenschaften, Johann-Joachim-Becher-Weg 21, 55128 Mainz, Germany
(10) Institut Isotopengeologie und Mineralische Rohstoffe, Eidgenössische Technische Hochschule Zürich, Clausiusstrasse 25, 8092 Zürich,Switzerland
(11) Istituto di Geoscienze e Georisorse-CNR, Pisa 56124, Italy(12) Pacific Centre for Isotopic and Geochemical Research, Department of Earth and Ocean Sciences, University of British Columbia,
6339 Stores Road, Vancouver, BC V6T 1Z4, Canada(13) University of Melbourne, Melbourne, Victoria, 3010, Australia(14) Institut für Mineralogie, Westfälische Wilhelms-Universität, Corrensstr. 24, 48149 Münster, Germany* Corresponding author. e-mail: [email protected]
This paper contains the results of an extensiveisotopic study of United States Geological SurveyGSD-1G and MPI-DING reference glasses. Thirteendifferent laboratories were involved using high-precision bulk (TIMS, MC-ICP-MS) andmicroanalytical (LA-MC-ICP-MS, LA-ICP-MS)techniques. Detailed studies were performed todemonstrate the large-scale and small-scalehomogeneity of the reference glasses. Togetherwith previously published isotopic data from tenother laboratories, preliminary reference andinformation values as well as their uncertainties atthe 95% confidence level were determined for H,O, Li, B, Si, Ca, Sr, Nd, Hf, Pb, Th and U isotopesusing the recommendations of the InternationalAssociation of Geoanalysts for certification ofreference materials. Our results indicate thatGSD-1G and the MPI-DING glasses are suitablereference materials for microanalytical and bulkanalytical purposes.
Ce document contient les résultats d’une importanteétude isotopique des verres de référence USGS GSD-1G et MPI-DING. Treize laboratoires différents ontparticipé au travers de techniques analytiques dehaute précision travaillant soit sur échantillon total(TIMS, MC-ICP-MS) soit par microanalyse «in situ»(LA-MC-ICP-MS, LA-ICP-MS). Des études détailléesont été réalisées pour démontrer l’homogénéité aussibien à grande qu’à petite échelle des verres deréférence. Grace aux résultats de cette étudeauxquels ont été ajoutés les données isotopiquesdéjà publiées de dix autres laboratoires, des valeursde référence et des informations préliminaires ainsique les incertitudes associées à un niveau deconfiance de 95% ont été déterminées pour lesisotopes de H, O, Li, B, Si, Ca, Sr, Nd, Hf, Pb, Th et U etceci en utilisant les recommandations de l’Associationinternationale des géoanalystes (IAG) pour lacertification de matériaux de référence. Nos résultatsindiquent que les verres GSD-1G et MPI-DING sontdes matériaux de référence appropriés pour lamicroanalyse et pour l’analyse sur échantillon total.
doi: 10.1111/j.1751-908X.2010.00114.xª 2010 The Authors. Geostandards and Geoanalytical Research ª 2010 International Association of Geoanalysts 1

Keywords: microbeam techniques, International Associa-tion of Geoanalysts, in situ techniques, thermal ionisationmass spectrometry, ICP-MS, LA-ICP-MS.
Received 07 Jun 10 – Accepted 09 Jul 10
Mots-clés : techniques de microanalyse, AssociationInternationale des Géoanalystes, techniques «in situ»,spectrométrie de masse à ionisation thermique, ICP-MS,LA-ICP-MS.
Reference glasses have become important calibrationand quality control materials for in situ microanalytical tech-niques, such as LA-ICP-MS, SIMS, l-SXRF, and PIXE asdemonstrated by the evaluation of the most frequentlyrequested reference materials of the GeoReM data-base (http://georem.mpch-mainz.gwdg.de; Jochum et al.2005a, Jochum and Nohl 2008). More than 50% of thetop thirty reference materials of geological and environ-mental interest are reference glasses, such as those fromthe National Institute for Standards and Technology (NIST)(e.g., SRM 612, 610; USGS 1996), the United States Geo-logical Survey (USGS) (e.g., BCR-2G, BHVO-2G) and theMPI-DING (e.g., KL2-G, ATHO-G; Jochum et al. 2000,2006b). Currently, NIST SRM 612 and 610 are the mostwidely used reference glasses, mainly because their traceelement abundances are similar and high enough (ca. 50and 500 lg g-1, respectively) for primary calibration. TheUSGS, MPI-DING and, recently, the new Chinese Geologi-cal Standard (CGS) geological glasses from the NationalResearch Center for Geoanalysis, Beijing (Hu et al. 2010),are especially useful as secondary reference materials forgeochemical work. To enable matrix-matched calibration,they were also used for a primary calibration (e.g., Helle-brand et al. 2001, Jochum et al. 2007, Gaboardi andHumayun 2009) of their analytical data.
As outlined by Kane (1998) and Jochum et al. (2000),one of the most important drawbacks of the NIST glassesfor the analysis of geological samples is that the glasseshave major element compositions very different from geo-logical materials. Therefore, the USGS has prepared a setof four synthetic reference glasses (GSA-1G, GSC-1G,GSD-1G, GSE-1G) with a natural (basaltic) major elementcomposition and trace elements in equal abundances, butfour different concentration levels (< 0.1, 4, 40, 400 lg g-1;Guillong et al. 2005, Jochum et al. 2005b). GSD-1G is animportant sample of this set, because its trace element con-centration level of 40 lg g-1 makes it suitable for manygeochemical applications, and hence GSD-1G has greatpotential to become one of the most widely used geologi-cal reference glasses in the future.
In situ isotopic determination has recently become animportant tool in geochemistry. Lead isotopes have been
determined in glasses and minerals by SIMS (Saal et al.1998) and LA-ICP-MS (Paul et al. 2005, Jochum et al.2006a), Sr isotopes in melt inclusions of oceanic basaltsby LA-MC-ICP-MS (Jackson and Hart 2006) and LA-ICP-MS (Jochum et al. 2009) as well as Th, U isotopes incarbonates and silicate glasses by LA-(MC)-ICP-MS (Ber-nal et al. 2005, Hoffmann et al. 2009, Mertz-Kraus et al.2010). Besides radiogenic isotopes (Nd, Hf, Pb), the insitu determination of the isotopic composition of O, Li, B,Si and other elements is a new and promising applica-tion of LA-(MC)-ICP-MS (Tiepolo et al. 2006, Chmeleffet al. 2008) and SIMS (Kasemann et al. 2005, Ickertet al. 2008). Therefore, there is a great demand for refer-ence glasses with well-known isotopic composition. Cur-rently, only few isotope data exist for the NIST SRM glassseries (see GeoReM database). The most extensive studyhas been performed for the MPI-DING glasses, whereisotope data for H, Li, B, O, Ca, Sr, Nd, Hf, Pb, Th andU are available (Jochum et al. 2006b, Matthews et al.2008).
The aim of this paper is to present a comprehensive setof isotope data for GSD-1G and the MPI-DING referenceglasses obtained by high-precision (such as TIMS andMC-ICP-MS) and microanalytical techniques (such asLA-MC-ICP-MS and LA-ICP-MS) from different laboratories,to demonstrate isotopic homogeneity of the glasses and topresent preliminary reference values and their uncertainties.All laboratories participating in this work were consideredas ‘qualified’, because they have the technical competenceto perform measurements that match certification goals forreference materials (Kane et al. 2003).
Samples
GSD-1G is one of four glasses that were prepared bythe USGS using a set of synthetic glass powders originallyprepared at the Corning Glass Works (Meyers et al.1976). It was prepared by taking an aliquot (1.5 kg) of theoriginal GSD material and adding selected amounts ofmajor element oxides so that the final glass would be morebasaltic in composition. In addition to the major oxides,seven rare earth elements (REEs) and eight transition metalswere added as powders to expand the range of trace
2 ª 2010 The Authors. Geostandards and Geoanalytical Research ª 2010 International Association of Geoanalysts

elements present in the final product. This new mixture wasblended ⁄ ground in a 4 l ball jar with corundum grindingmedia for a total of 3 hr. The mixture was transferred to a1 l platinum bowl, transferred to a Lindberg heavy-dutymuffle furnace and melted at 1325 �C for 2 hr, thenremoved and vigorously stirred with a platinum rod for� 30 s. Subsequently, the bowl was returned to the ovenfor an additional fusion of 2 hr, and the resulting meltpoured into a specially designed platinum boat, whichafter a brief period of cooling, was immersed in a waterbath. After overnight cooling the glass was removed fromthe platinum boat. The resulting synthetic glass has a basal-tic major element composition doped with more than fiftytrace elements with concentrations of about 40 lg g-1 (seeGeoReM preferred values).
The USGS (S.A. Wilson) provided � 6 g of the GSD-1G material for this study of isotope ratio measurements.The glass was divided into splits of about 10–400 mg(split # 1–45). Later on, some larger splits were subdividedinto 20–80 mg samples (termed a, b, c, …). Splits # 0, A –D, SW and M3 were provided by S.A. Wilson shortly afterpreparation of the glass. Some preliminary isotopic data ofGSD-1G have been published recently (Jochum et al.2008).
The MPI-DING glasses, which comprise the basaltsKL2-G, ML3B-G, the andesite StHs6 ⁄ 80-G, the komatiitesGOR128-G, GOR132-G, the rhyolite ATHO-G and thequartz-diorite T1-G were prepared by direct fusion (Jochumet al. 2000). Together with GSD-1G, splits of 30–50 mgwere distributed to the different laboratories for isotopicdetermination. Preliminary isotopic data for the elements H,O, B, Li, Ca, Sr, Nd, Hf, Pb in the eight MPI-DING glasseswere previously published by Jochum et al. (2006b).Recently, B isotopes have been measured in StHs6 ⁄ 80-G,GOR128-G and GOR 132-G (Tiepolo et al. 2006), Pbisotopes in ATHO-G and KL2-G (Paul et al. 2005), T1-G,ATHO-G, KL2-G and ML3B-G (Souders and Sylvester2008), Th and U isotopes in ATHO-G, T1-G and KL2-G(Matthews et al. 2008, Mertz-Kraus et al. 2010), Ca iso-topes in all MPI-DING glasses (Amini et al. 2009), and Srisotopes in KL2-G, ML3B-G and GOR128-G (Jochumet al. 2009).
NIST SRM 610 and SRM 612 are synthetic referenceglasses that have been used in many laboratories as cali-bration materials for trace element determination, but iso-tope data only exist for some elements, such as Li, B, O, Sr,Nd, Pb and U (see GeoReM database). NIST solutionsand glasses, as well as other reference materials, wereused as quality control materials and delta-zero materials.
Analytical techniques
In this study, the results of five different analytical tech-niques (TIMS, MC-ICP-MS, LA-MC-ICP-MS, LA-ICP-MS,SIMS) are presented and discussed. Twenty-three labora-tories were involved in the characterisation process(Table 1), where thirteen of them participated in thisstudy and ten laboratories already published their resultsindependently.
In the following, analytical procedures and most impor-tant features of the instruments used in this paper aredescribed briefly. All participating laboratories compliedwith a special analysis protocol:
(1) Sample preparation – the sample chips were ultra-sonically treated in ultra-pure water for 15 min (no treat-ment by acids). For microanalytical work it was preferred tomount the glass samples and to polish them.
(2) Bulk analysis using wet chemistry – all chips weretreated separately. Chips (no powders) were dissolvedusing standard procedures for dissolving samples and ele-ment separation.
(3) Microanalytical work – isotopes were measured ata minimum of five locations on each chip, with an averagedistance of several hundreds of micrometres between eachlocation. Spot sizes were adjusted in order to obtain rea-sonable count rates for the mass spectrometer. Triplicateanalyses were performed in most cases.
(4) Data – isotopic data for GSD-1G, the MPI-DINGglasses and the delta-zero materials are reported, alongwith in-run precision and with long-term reproducibility ofthe mass spectrometric measurements.
Lithium isotopes
Lithium isotopes and concentrations were determinedat the University of Maryland (UMd). The glass chips wereplaced in Milli-Q water for 20 min in an ultrasonic bath.After drying, samples were weighed, then placed in� 3 ml concentrated Seastar HF, 1 ml concentrated dou-bly distilled HNO3 in screw-top Savillex beakers andplaced on a � 90 �C hotplate overnight. After evaporationto dryness, the samples were treated with doubly distilledHCl until clear, evaporated to dryness again and thentaken up in 4 mol l-1 HCl for column chemistry. Details ofthe column procedure are provided in Rudnick et al.(2004) and Teng et al. (2006). Column yields were moni-tored by collection of after-cuts and were determined to be
ª 2010 The Authors. Geostandards and Geoanalytical Research ª 2010 International Association of Geoanalysts 3

better than 95% (Marks et al. 2007). Lithium concentrationsand isotopic compositions were measured by the sample-calibrator bracketing method using a Nu Plasma MC-ICP-MS following the procedures outlined in Teng et al.(2004). Long-term precision of £ 1‰ (2s) on d7Li wasestablished based on hundreds of analyses of the pure Lireference solutions UMD-1 and IRMM-016 over a periodof 9 years. Published data for the IRMM-016 and UMD-1Li solutions and international rock reference materials AGV-1, BCR-1, BIR-1, BHVO-1, BHVO-2, G-2, JB-2, QLO-1,STM-1 and UBN-1, analysed in this laboratory by thesemethods, are provided on the GeoReM website. Precisionfor Li abundances is ± 10% (Teng et al. 2006).
Boron isotopes
Isotopic compositions of boron were determined bypositive TIMS at the Istituto di Geoscienze e Georisorse(IGG), Pisa, Italy. The instrument used was a VG Isomass54E mass spectrometer. Boron extraction and purificationprocedures are described in detail by Tonarini et al.(2003). The accuracy of the procedure was evaluated byrepeated analysis of NIST SRM 951, which had beenprocessed through the full chemistry procedure. Isotopic
fractionation associated with the mass spectrometer analy-ses was corrected using a fractionation factor calculated as(Rcert + 0.00079) ⁄ Rmeas, where Rcert and Rmeas are the certi-fied and the measured 11B ⁄ 10B ratios, respectively. Themeasured 11B ⁄ 10Bmeas ratio of SRM 951 was 4.0525 ±0.0013 (2s). Replicate analyses of NIST SRM 951 that didnot go through the chemical procedure yielded an aver-age 11B ⁄ 10Bmeas = 4.0522 ± 0.0008 (2s). Boron isotopiccompositions of the samples are reported in the conven-tional delta notation (d11B) as the per mil deviation fromthe accepted composition of NIST SRM 951(11B ⁄ 10Bcert = 4.04362; Catanzaro et al. 1970).
Silicon isotopes
Silicon isotope ratios were determined using anin-house built UV-femtosecond laser ablation system basedon a 100 fs Ti-Sapphire regenerative amplifier system(Spectra Physics Hurricane I, CA, USA) connected to aThermo Neptune MC-ICP-MS at the Leibniz University ofHannover, Germany, following the analytical protocol ofChmeleff et al. (2008). A detailed description of the instru-mental set-up is given by Horn and von Blanckenburg(2007). The MC-ICP-MS provided a high mass resolution
Table 1.Institutions involved in the characterisation process of GSD-1G and the MPI-DING glasses
Institution Laboratory(mass spectr.)
Isotopesystem
Analysts ⁄ Reference
Max-Planck-Institut für Chemie (MPI), Mainz, Germany TIMS (Triton) Pb, Sr, Nd W. Abouchami, I. RaczekMax-Planck-Institut für Chemie (MPI), Mainz, Germany TIMS (MAT 261) Sr, Nd Raczek et al. (2003)Max-Planck-Institut für Chemie (MPI), Mainz, Germany LA-ICP-MS (Element2) Pb, Th, U, Sr B. Stoll, U. Weis, R. Mertz-Kraus, K.P.
Jochum; Jochum et al.(2005c,d, 2006b, 2009)
Max-Planck-Institut für Chemie (MPI), Mainz, Germany MC-ICP-MS (Nu Plasma) U, Li, Hf D. Scholz, J. Krause, Jochum et al.(2006b)
Max-Planck-Institut für Chemie (MPI), Mainz, Germany ICP-MS (Element2) Pb Jochum et al. (2005c)University of Maryland (UMd), College Park, USA MC-ICP-MS (Nu Plasma) Li W.F. McDonough, R.L. RudnickIstituto die Geoscienze e Georisorse (IGG), Pisa, Italy TIMS (VG54) B S. TonariniLeibniz Universität Hannover, Germany LA-MC-ICP-MS (Neptune) Si J. Chmeleff, G. SteinhoefelLeibniz-Inst. für Meereswissenschaften, IFM-GEOMAR,Kiel, Germany
TIMS (Triton) Ca M. Amini, A. Eisenhauer; Amini et al.(2009)
Ludwigs-Maximilians-Universität (LMU), München, Germany TIMS (MAT 261) Sr, Nd E. Hegner, L.M. IaccheriLudwigs-Maximilians-Universität (LMU), München, Germany TIMS (Triton) Sr, Nd E. Hegner, L.M. IaccheriUniversity of British Columbia (UBC), Vancouver, Canada TIMS (Triton) Sr, Nd D. Weis, B. KiefferUniversity of British Columbia (UBC), Vancouver, Canada MC-ICP-MS (Nu Plasma) Hf, Pb D. Weis, J. BarlingEidgenössische Technische Hochschule (ETH),Zürich, Switzerland
MC-ICP-MS (Nu Plasma) Hf A. Stracke
University of Melbourne (UMel), Australia MC-ICP-MS (Nu Plasma) Pb J. WoodheadUniversity of Melbourne (UMel), Australia LA-MC-ICP-MS (Nu Plasma) Pb J. Woodhead; Paul et al. (2005)University of Bristol (UB), Great Britain MC-ICP-MS (Neptune) Li Kasemann et al. (2005)University of Bristol (UB), Great Britain TIMS (Triton) Li Kasemann et al. (2005)University of Edinburgh (UEd), Great Britain SIMS (Cameca 4f) Li Jochum et al. (2006b)Memorial University of Newfoundland (MUN), Canada LA-MC-ICP-MS (Neptune) Pb Souders and Sylvester (2008)Los Alamos National Laboratory (LANL), USA TIMS (VG 54) Th, U Matthews et al. (2008)GeoForschungszentrum (GFZ), Potsdam, Germany TIMS (MAT 262) B Rosner and Meixner (2004)University of Saskatchewan (SIL), Saskatoon, Canada TIMS (Triton) Ca Amini et al. (2009)
4 ª 2010 The Authors. Geostandards and Geoanalytical Research ª 2010 International Association of Geoanalysts

of � 8000 (5%), which permitted resolution of all molecu-lar interferences on 28Si, 29Si and 30Si. Measurements wereperformed using square rasters of 150 lm side length anda spot diameter of 35 lm. The data acquisition involvedthe measurement of one block with sixty cycles with a cycleintegration time of 2 s. The instrumental mass discriminationand its temporal drift were corrected by using the calibra-tor-sample bracketing technique. The quartz referencematerial NIST SRM 8546 (= NBS 28) was used as thedelta-zero material. All d29Si and d30Si values are reportedrelative to this reference material. The overall long-termrepeatability for d29Si and d30Si was 0.11‰ and 0.20‰,respectively (2s, 195 measurements on the reference mate-rial IRMM-017). The accuracy and precision of this methodwere validated by Chmeleff et al. (2008) by analysingsample materials that were previously characterised bylaser fluorination-MS, MC-ICP-MS in solution mode orSIMS. Measurements were performed during two differentsessions in 2008 (J. Chmeleff) and 2010 (G. Steinhöfel).
Calcium isotopes
Calcium isotopes were measured in the Leibniz-Institutfür Meereswissenschaften IFM-GEOMAR in Kiel, Germany,following the procedures described in detail by Amini et al.(2009). Samples were weighed in Savillex PFA vials spikedwith a mixed 43Ca–48Ca double spike and subject to acommon HF-HNO3 acid attack. Two millilitre HF and 1 mlconcentrated HNO3 were added to the samples andheated to 120 �C in closed beakers for 48 hr. The dis-solved samples were then evaporated to dryness and trea-ted three times by concentrated HNO3 and once by6 mol l-1 HCl to eliminate possible fluorides. After evapora-tion the solutions were taken up in 2.2 mol l-1 HCl.
A commonly used chromatographic clean-up for seawa-ter and basalts, which is based on cation exchange andHCl elution, was applied. The reference materials IAPSO,BHVO-2 and a blank were processed with every batch ofsamples. The samples were processed through 0.6 ml col-umns (Bio-Rad, Philadelphia, PA, USA) that were filled withMCI gel (75–100 mesh). Around 4 lg Ca was eluted with5 ml of 1.5 mol l-1 HCl. The quality of the separation waschecked by individual elution schemes and only a Ca yieldof up to 80% was collected in order to obtain a fairly pureCa eluate. Potentially occurring fractionation of the Ca iso-topes on the column was corrected by adding a 43Ca–48Cadouble spike to the sample prior to the column chemistry.
The mass spectrometric measurements were carried outon a Thermo Triton instrument using a routine methodadapted from Heuser et al. (2002). A total amount of
about 300 ng Ca was loaded with a Ta activator onto sin-gle Re filaments. Calcium isotopes were measured when asignal of 4 V on mass 40Ca was achieved over an integra-tion time of 4 s for seven blocks of twenty-two scans. Massfractionation was corrected by an exponential law. The iso-tope ratios are reported in the delta notation relative toNIST SRM 915a (40Ca ⁄ 44Ca = 47.213). The seawatersalinity reference material IAPSO was used as an internalcontrol. During the course of this study the average long-term value for IAPSO, comprising 135 single measure-ments, was 1.82 ± 0.15‰ (2s) (40Ca ⁄ 44Ca = 47.217) rel-ative to NIST SRM 915a, in agreement with the proposedvalues of Hippler et al. (2003). The results are averages ofreplicate analyses from at least two chromatographic col-umn separations. Overall, analytical uncertainties were lessthan 0.2‰ (2s).
Strontium and neodymium isotopes
Strontium and Nd isotopic compositions were deter-mined in three laboratories, Ludwig-Maximilians-Universityof Munich (LMU), University of British Columbia (UBC), Paci-fic Centre for Isotopic and Geochemical Research (PCIGR),Vancouver, and Max Planck Institute for Chemistry (MPI),Mainz, using high-precision TIMS.
Ludwig-Maximilians University: Glass chips of GSD-1G and the MPI-DING glasses, weighing ca.120–160 mg, were thoroughly washed in acetone andultra-pure water before dissolution in a mixture of 2 mlconcentrated HF and � 100 ll HClO4 in PFA beakersover 5 days at ca. 80 �C. Strontium and the LREE wereseparated on a quartz column with a 5 ml resin bed ofAG 50W-X12 of 200–400 mesh. Neodymium was sepa-rated from the LREE fraction on a quartz column filled withTeflon powder (1.7 ml) coated with di-ethylhexylphosphoricacid (HDEHP). The separated Sr and Nd cuts of each glasssplit were divided into three portions that were analysedindividually. Strontium was loaded with TaF5 on a W-fila-ment and Nd with diluted phosphoric acid on a Re-fila-ment. Strontium and Nd isotopes were measured as metalin single filament and double filament configurations,respectively. Total procedural blanks of < 500 pg for Sr and< 200 pg for Nd were not significant for the processedamounts of Sr and Nd.
GSD-1G splits # 4, 34, and 36 were analysed on anupgraded MAT 261 mass spectrometer. Isotope abun-dance ratios were determined with a dynamic double-col-lector routine for Sr and a dynamic triple-collector routinefor Nd in order to reduce cup factors (e.g., Thirlwall 1991).Signal integration times for the two line Sr and Nd
ª 2010 The Authors. Geostandards and Geoanalytical Research ª 2010 International Association of Geoanalysts 5

methods were 8 s per line and included monitoring ofinterfering Rb and Sm. 87Sr ⁄ 86Sr and 143Nd ⁄ 144Nd ratioswere normalised to 86Sr ⁄ 88Sr = 0.1194 and 146Nd ⁄144Nd = 0.7219, respectively, applying an exponentialfractionation law. During this study the MAT 261 yielded a87Sr ⁄ 86Sr ratio of 0.710234 ± 0.000006 (2s of popula-tion, N = 8) for the NIST SRM 987 Sr reference materialand for the La Jolla Nd reference material a 143Nd ⁄ 144Ndratio of 0.511847 ± 0.000008 (2s of population,N = 10). Measurements of NIST SRM 987, La Jolla Ndand the MPI-DING reference glass ATHO-G were inter-spersed with those of GSD-1G. The long-term reproducibil-ity for 87Sr ⁄ 86Sr and 143Nd ⁄ 144Nd measured on the MAT261 was estimated at � 1.1 · 10-5 (2s).
Strontium and Nd isotope abundance ratios of GSD-1G splits #11, 23, 40 and StHs6 ⁄ 80-G were analysed ona recently installed Thermo Scientific Triton mass spectrome-ter using a triple-collector routine for Sr (three lines, integra-tion time 8 s per line) and the dynamic three-line methodfor 143Nd ⁄ 144Nd (16.8 s integration time per line)described in Upadhyay et al. (2008). Using these methodsthe NIST SRM 987 Sr reference material yielded87Sr ⁄ 86Sr = 0.7102473 ± 0.0000023 (2s, N = 10), theLa Jolla Nd reference material 143Nd ⁄ 144Nd =0.5118460 ± 0.0000012 (2s of population, N = 30),and GSJ JNdi-1 (Tanaka et al. 2000) 143Nd ⁄ 144Nd =0.5121024 ± 0.0000010 (2s, N = 8).
In addition to the reference glasses, Sr isotopes werealso determined in the carbonate reference materialMACS-3 from the USGS with the Triton instrument. About10 mg of sample were dissolved in 1 ml of 2.5 mol l-1
HCl and Sr was separated on a quartz column with a5 ml resin bed of AG 50W-X12 of 200–400 mesh.The total procedural blank of < 500 pg was not signifi-cant for the ca. 65 lg of processed Sr. Strontium wasloaded on five W-filaments coated with TaF5 and mea-sured with a dynamic triple-collector routine to minimisecup effects.
University of British Columbia PCIGR: The chemistryand the mass spectrometry procedures for the accuratehigh-precision determination of Sr and Nd isotopes in theglass reference materials have been described in detail inWeis et al. (2006), but an abbreviated version is givenbelow. The samples were placed in Savillex beakers with10 ml of 48% v ⁄ v HF and 1.0 ml of 14 mol l-1 HNO3,and then dissolved on a hotplate for 48 hr at 130 �C. Afterdigestion, samples were evaporated to dryness overnighton a hotplate, reconstituted in 6.0 ml of 6 mol l-1 sub-boiled HCl and re-dissolved for 24 hr at 130 �C. Lead, Hf,
Sr and Nd were purified from the same sample solution.The first stage was the separation of Pb from other ele-ments using an anion exchange column. A standard cationexchange column of Bio-Rad AG50W-X8 resin (100–200mesh) was used to separate Sr from Hf and the REE. Neo-dymium was separated from the other REE on a columnusing HDEHP-coated Teflon powder as the ion exchangemedium.
Isotopic composition measurements for Sr and Nd wereperformed on a Thermo Finnigan Triton instrument. Stron-tium and Nd isotopic compositions were measured in staticmode with relay matrix rotation on single Ta and doubleRe-Ta filaments, respectively. The data were corrected formass fractionation by normalising to 86Sr ⁄ 88Sr = 0.1194and 146Nd ⁄ 144Nd = 0.7219, using an exponential law.Strontium and Nd isotopic ratios for replicate analyses ofthe Sr and Nd reference materials NIST SRM 987(87Sr ⁄ 86Sr = 0.710255 ± 0.000005, 2s, N = 4) and LaJolla (143Nd ⁄ 144Nd = 0.511854 ± 0.000009, 2s,N = 3), respectively, were also determined (Table 2h).
Max Planck Institute: The chemical procedures usedhave been described in detail by Raczek et al. (2003). Thereference glasses were dissolved in Savillex beakers on ahotplate using 24 mol l-1 HF and 7 mol l-1 HClO4. The ini-tial chemical separation of Sr and Nd followed standardion exchange procedures, employing 5 ml of AG50W-X12 (200–400 mesh) ion exchange resin. The REE fractionwas further separated on a 2 ml column of Teflon powdercoated with di-2-ethylhexyl phosphoric acid. Neodymiumwas eluted with 0.18 mol l-1 HCl. The isotopic ratios weredetermined on a Thermo Triton mass spectrometerequipped with a multi-collector. Strontium (100 ng) wasloaded with TaF5 on single W filaments, whereas 100 ngNd was loaded on double Re filaments and determinedas metal. Generally, 200 ratios were determined for eachanalysis. During the analytical period, several measure-ments of the NIST SRM 987 Sr (87Sr ⁄ 86Sr = 0.710236 ±0.000009, 2s, N = 6) and La Jolla Nd (143Nd ⁄144Nd = 0.511841 ± 0.000002, 2s, N = 5) referencematerials were performed (Table 2e).
Hafnium isotopes
The Hf isotope compositions of the reference glasseswere determined in two MC-ICP-MS laboratories, UBCPCIGR in Vancouver, Canada and the EidgenössischeTechnische Hochschule (ETH), Zürich, Switzerland.
University of British Columbia PCIGR: A detaileddescription of the chemical separation of Hf has been
6 ª 2010 The Authors. Geostandards and Geoanalytical Research ª 2010 International Association of Geoanalysts
given by Connelly et al. (2006). The glasses were dissolvedin Savillex beakers. Estimates of Hf recovered after the dis-solution stage were close to 100%. The following method-ology was chosen for the primary column: Teflon columnswere loaded with Bio-Rad AG50W-X8 100–200 meshcation exchange resin and equilibrated with 1.5 mol l-1
HCl. The second column chemistry corresponded to the‘Stage 2 chemistry for HF-HNO3 digestion’ using the TOD-GA resin described in Connelly et al. (2006).
Hafnium isotopic compositions were determined by sta-tic multi-collection using a MC-ICP-MS (Nu Instruments Ltd.).The collector array on the Nu Plasma was fixed and azoom lens was employed to position the masses in the col-
lectors. For Hf determinations, as described in Weis et al.(2007), eight Faraday collectors (H4 to L3) were used. Thisconfiguration enabled simultaneous collection of Hf(masses 180, 179, 178, 177, 176 and 174) together withthe monitoring of Lu at mass 175 and Yb at mass 172.The latter two measurements allowed interference correc-tions to be applied to masses 174 and 176. Hafnium iso-tope measurements were normalised internally to a179Hf ⁄ 177Hf ratio of 0.7325 using an exponential correc-tion. Samples were run using a modified sample-calibratorbracketing approach with JMC-475 Hf standard solutionanalysed after every second sample to monitor systematicin-run drift in the reference value. (JMC-475 Hf standard
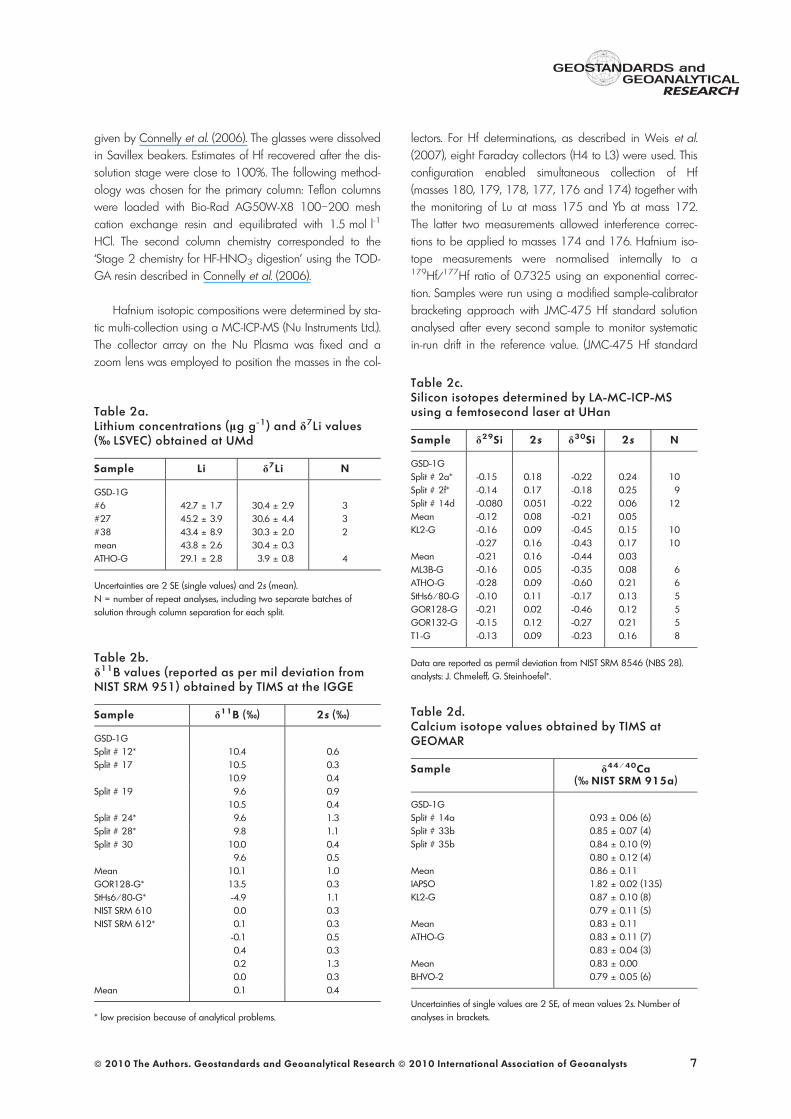
Table 2a.Lithium concentrations (lg g-1) and d7Li values(‰ LSVEC) obtained at UMd
Sample Li d7Li N
GSD-1G#6 42.7 ± 1.7 30.4 ± 2.9 3#27 45.2 ± 3.9 30.6 ± 4.4 3#38 43.4 ± 8.9 30.3 ± 2.0 2mean 43.8 ± 2.6 30.4 ± 0.3ATHO-G 29.1 ± 2.8 3.9 ± 0.8 4
Uncertainties are 2 SE (single values) and 2s (mean).N = number of repeat analyses, including two separate batches ofsolution through column separation for each split.
Table 2b.d11B values (reported as per mil deviation fromNIST SRM 951) obtained by TIMS at the IGGE
Sample d11B (‰) 2s (‰)
GSD-1GSplit # 12* 10.4 0.6Split # 17 10.5 0.3
10.9 0.4Split # 19 9.6 0.9
10.5 0.4Split # 24* 9.6 1.3Split # 28* 9.8 1.1Split # 30 10.0 0.4
9.6 0.5Mean 10.1 1.0GOR128-G* 13.5 0.3StHs6 ⁄ 80-G* -4.9 1.1NIST SRM 610 0.0 0.3NIST SRM 612* 0.1 0.3
-0.1 0.50.4 0.30.2 1.30.0 0.3
Mean 0.1 0.4
* low precision because of analytical problems.
Table 2c.Silicon isotopes determined by LA-MC-ICP-MSusing a femtosecond laser at UHan
Sample d29Si 2s d30Si 2s N
GSD-1GSplit # 2a* -0.15 0.18 -0.22 0.24 10Split # 2f* -0.14 0.17 -0.18 0.25 9Split # 14d -0.080 0.051 -0.22 0.06 12Mean -0.12 0.08 -0.21 0.05KL2-G -0.16 0.09 -0.45 0.15 10
-0.27 0.16 -0.43 0.17 10Mean -0.21 0.16 -0.44 0.03ML3B-G -0.16 0.05 -0.35 0.08 6ATHO-G -0.28 0.09 -0.60 0.21 6StHs6 ⁄ 80-G -0.10 0.11 -0.17 0.13 5GOR128-G -0.21 0.02 -0.46 0.12 5GOR132-G -0.15 0.12 -0.27 0.21 5T1-G -0.13 0.09 -0.23 0.16 8
Data are reported as permil deviation from NIST SRM 8546 (NBS 28).analysts: J. Chmeleff, G. Steinhoefel*.
Table 2d.Calcium isotope values obtained by TIMS atGEOMAR
Sample d44 ⁄ 40Ca(‰ NIST SRM 915a)
GSD-1GSplit # 14a 0.93 ± 0.06 (6)Split # 33b 0.85 ± 0.07 (4)Split # 35b 0.84 ± 0.10 (9)
0.80 ± 0.12 (4)Mean 0.86 ± 0.11IAPSO 1.82 ± 0.02 (135)KL2-G 0.87 ± 0.10 (8)
0.79 ± 0.11 (5)Mean 0.83 ± 0.11ATHO-G 0.83 ± 0.11 (7)
0.83 ± 0.04 (3)Mean 0.83 ± 0.00BHVO-2 0.79 ± 0.05 (6)
Uncertainties of single values are 2 SE, of mean values 2s. Number ofanalyses in brackets.
ª 2010 The Authors. Geostandards and Geoanalytical Research ª 2010 International Association of Geoanalysts 7

solution available on request from J. Patchett at the Univer-sity of Arizona. Note that this is the only Hf isotopic compo-sition reference solution. JMC-475, as currently available atJohnson-Matthey, is an ICP-MS standard solution withguaranteed concentration but with a variable isotopic com-position) The results were normalised to a 176Hf ⁄ 177Hfvalue for JMC-475 of 0.282160, based on the mean ofeach individual day of analysis. During the period of datacollection (October 2007), the two daily averages for theJMC-475 were: 176Hf ⁄ 177Hf = 0282153 ± 0.000005 (n =13) and 0.282149 ± 0.000008 (n = 9).
ETH Zürich: Hafnium was separated following theprocedure described in detail by Münker et al. (2001). TheHf isotope ratios were analysed on a Nu Instruments
MC-ICP-MS in static data collection mode. The samplesolution was introduced using a Cetac ARIDUS II desolva-tion system. The measured Hf isotope ratios were correctedusing an exponential mass fractionation law assuming179Hf ⁄ 177Hf = 0.7325. The JMC-475 Hf reference solutionwas run repeatedly at the beginning and end of eachanalytical session, as well as after every third sample dur-ing the analysis period. Repeated measurements of JMC-475 during the analysis period yielded a mean of176Hf ⁄ 177Hf of 0.282223 ± 0.000018 (2s of twenty-twomeasurements). The results are reported relative to theJMC-475 Hf reference value for 176Hf ⁄ 177Hf of 0.282160(Blichert-Toft et al. 1997). Accuracy and precision of the fullanalytical procedure were monitored by repeated mea-surement of USGS rock reference materials BCR-2 and
Table 2e.Strontium and neodymium isotopic ratios determined in the MPI, Mainz TIMS laboratory
Sample 87Sr ⁄ 86Sr 143Nd ⁄ 144Nd
GSD-1GSplit # 22 0.709394 ± 0.000006 0.511516 ± 0.000005
0.511513 ± 0.0000050.709397 ± 0.000006 0.511514 ± 0.000005
Mean 0.709396 0.511514Split # 26 0.709409 ± 0.000006
0.709397 ± 0.000006 0.511514 ± 0.0000040.709402 ± 0.000006 0.511512 ± 0.000005
Mean 0.709403 0.511513Split # 31 0.709404 ± 0.000007 0.511517 ± 0.000005
0.709397 ± 0.000006 0.511518 ± 0.0000070.709408 ± 0.000006 0.511511 ± 0.000004
Mean 0.709403 0.511515Mean (split # 22,26,31) 0.709401 ± 0.000011 (2s, N = 8) 0.511514 ± 0.000005 (2s, N = 8)KL2-G 0.703541 ± 0.000005 0.512944 ± 0.000005
0.703550 ± 0.000007 0.512951 ± 0.0000050.703549 ± 0.000006 0.512950 ± 0.0000060.703548 ± 0.000006 0.512950 ± 0.0000050.703550 ± 0.000006 0.512951 ± 0.000004
Mean 0.703548 ± 0.000008 (2s, N = 5) 0.512949 ± 0.000006 (2s, N = 5)ATHO-G 0.703263 ± 0.000006 0.512996 ± 0.000005
0.703262 ± 0.000008 0.513001 ± 0.0000050.703256 ± 0.000006 0.513000 ± 0.000005
0.513002 ± 0.0000050.513005 ± 0.000005
Mean 0.703260 ± 0.000008 (2s, N = 3) 0.513001 ± 0.000007 (2s, N = 5)NIST SRM 987 (100 ng) 0.710243 ± 0.000009
0.710234 ± 0.0000070.710231 ± 0.0000070.710240 ± 0.0000070.710234 ± 0.0000070.710235 ± 0.000006
Mean 0.710236 ± 0.000009 (2s, N = 6)La Jolla std. (100 ng) 0.511840 ± 0.000005
0.511840 ± 0.0000050.511842 ± 0.0000040.511842 ± 0.0000060.511841 ± 0.000005
Mean 0.511841 ± 0.000002 (2s, N = 5)
Uncertainties of single ratios are 2 SE. Reproducibility of data is 2s.
8 ª 2010 The Authors. Geostandards and Geoanalytical Research ª 2010 International Association of Geoanalysts

BHVO-2. 176Hf ⁄ 177Hf ratios of 0.282861 ± 0.000025 (2sof seven measurements over an 8-month period) for BCR-2and 0.283107 ± 0.000016 (2s of five measurements over
an 8-month period) for BHVO-2 are in excellent agree-ment with reported literature values (e.g., Chu et al. 2002,Bizzarro et al. 2003, Weis et al. 2007). Mass 172Yb was
Table 2f.Strontium and Nd isotopic ratios determined in the LMU TIMS laboratory using a MAT261 mass spectrom-eter
Sample 87Sr ⁄ 86Sr (number of ratios) 143Nd ⁄ 144Nd (number of ratios)
GSD-1GSplit # 4 0.709400 ± 0.000006 (100) 0.511531 ± 0.000009 (100)
0.709405 ± 0.000007 (103) 0.511532 ± 0.000009 (128)0.709404 ± 0.000006 (113) 0.511533 ± 0.000009 (110)0.709410 ± 0.000006 (100)
Mean 0.709405 0.511532Split # 34 0.709408 ± 0.000006 (100) 0.511532 ± 0.000008 (98)
0.709406 ± 0.000006 (99) 0.511533 ± 0.000008 (115)0.709408 ± 0.000006 (101) 0.511521 ± 0.000008 (143)0.709398 ± 0.000007 (101) 0.511527 ± 0.000009 (127)
Mean 0.709405 0.511528Split # 36 0.709407 ± 0.000007 (115) 0.511528 ± 0.000009 (105)
0.709408 ± 0.000006 (116) 0.511532 ± 0.000009 (113)0.709410 ± 0.000006 (100) 0.511531 ± 0.000008 (114)
Mean 0.709408 0.511530Mean (split # 4,34,36) 0.709406 ± 0.000008 (2s, N = 11) 0.511530 ± 0.000007 (2s, N = 10)ATHO-G 0.703269 ± 0.000006 (99) 0.513020 ± 0.000009 (130)
0.703271 ± 0.000006 (98) 0.513020 ± 0.000008 (116)0.703276 ± 0.000007 (99) 0.513022 ± 0.000008 (116)0.703266 ± 0.000006 (102) 0.513011 ± 0.000008 (130)
0.513015 ± 0.000007 (173)Mean 0.703270 ± 0.000008 (2s, N = 4) 0.513018 ± 0.000009 (2s, N = 5)NIST SRM 987 0.710231 ± 0.000006 (101)
0.710233 ± 0.000007 (102)0.710234 ± 0.000006 (101)0.710236 ± 0.000007 (101)0.710238 ± 0.000007 (86)0.710231 ± 0.000006 (111)0.710230 ± 0.000007 (100)0.710236 ± 0.000007 (90)
Mean 0.710234 ± 0.000006 (2s, N = 8)Ames Nd Std. (in-house std.) 0.512145 ± 0.000008 (105)
0.512144 ± 0.000009 (105)0.512140 ± 0.000010 (105)0.512144 ± 0.000008 (120)0.512140 ± 0.000008 (120)0.512143 ± 0.000007 (150)0.512143 ± 0.000009 (100)0.512138 ± 0.000009 (131)0.512150 ± 0.000008 (115)0.512139 ± 0.000009 (97)
Mean 0.512143 ± 0.000007 (2s, N = 10)La Jolla Nd 0.511850 ± 0.000010 (75)
0.511849 ± 0.000009 (131)0.511852 ± 0.000008 (114)0.511841 ± 0.000009 (130)0.511844 ± 0.000009 (100)0.511846 ± 0.000008 (131)0.511851 ± 0.000009 (114)0.511845 ± 0.00000 (130)0.511846 ± 0.000009 (90)0.511848 ± 0.000010 (70)
Mean 0.511847 ± 0.000007 (2s, N = 10)
Uncertainties of single ratios are 2 SE. Reproducibility of data is 2s.
ª 2010 The Authors. Geostandards and Geoanalytical Research ª 2010 International Association of Geoanalysts 9

monitored for isobaric interferences on 176Yb on mass176Hf. The contribution of 176Yb to the 176Hf signal neverexceeded 0.005% during analysis and was thereforewithin the reported analytical error. The total proceduralblank for Hf did not significantly influence the measuredisotopic composition.
Lead isotopes
The Pb isotopic composition of the reference glasseswas determined in five laboratories using different analyti-cal techniques. High-precision measurements were per-formed by TIMS at MPI, Mainz as well as by MC-ICP-MSat UBC PCIGR Vancouver and University of Melbourne(UMel). In situ microanalytical Pb isotope determinationswere done by LA-MC-ICP-MS at UMel and LA-ICP-MS atMPI, Mainz.
Max Planck Institute TIMS laboratory : The chemicalprocedure for Pb isotope TIMS measurements in referenceglasses has been described in detail by Abouchami et al.
(2000). The samples were ultrasonically treated andwashed with ultra-pure water. The glass chips were thendissolved in a HF–HNO3 mixture and Pb separation wascarried out on Bio-Rad AG1-X8 anion-exchange resin in aHBr–HNO3 mixed medium (Lugmair and Galer 1992).Total procedural blanks were below 20 pg. Measurementswere done on a Thermo Triton mass spectrometer in staticmulti-collection mode. The Pb triple spike technique (Galer1999) was used to correct for instrumental mass fraction-ation. This technique improved the accuracy on Pb isotoperatios to levels of 100 ppm. Lead isotope ratios of the NISTSRM 981 reference material measured during the sameperiod (Table 2k) were comparable with those reportedpreviously using this technique (e.g., Abouchami et al.2000, Huang et al. 2009).
University of British Columbia PCIGR: The analyticalprocedures followed are described in detail by Weis et al.(2005, 2006). Samples were dissolved in screw-top Savil-lex beakers, with 10.0 ml of 48% v ⁄ v HF and 1.0 ml of� 14 mol l-1 HNO3, on a hotplate for 48 hr at 130 �C,
Table 2g.Strontium and Nd isotopic ratios determined in the LMU TIMS laboratory using a Triton mass spectrometer
Sample 87Sr ⁄ 86Sr (number of ratios) 143Nd ⁄ 144Nd (number of ratios)
GSD-1GSplit # 11 0.709416 ± 0.000003 (187) 0.511521 ± 0.000003 (216)
0.709418 ± 0.000003 (290) 0.511523 ± 0.000002 (232)0.709417 ± 0.000003 (255) 0.511520 ± 0.000002 (268)0.709415 ± 0.000003 (254)
Mean 0.709416 0.511521Split # 23 0.709419 ± 0.000003 (347) 0.511522 ± 0.000002 (172)
0.709413 ± 0.000003 (351) 0.511523 ± 0.000002 (258)0.709417 ± 0.000002 (327) 0.511520 ± 0.000002 (194)0.709417 ± 0.000003 (209)
Mean 0.709416 0.511521Split # 40 0.709419 ± 0.000002 (346) 0.511521 ± 0.000002 (156)
0.709414 ± 0.000002 (244) 0.511519 ± 0.000001 (258)0.709417 ± 0.000002 (344) 0.511519 ± 0.000002 (194)0.709411 ± 0.000003 (344)
Mean 0.709415 0.5115200Mean (splits #11, 23, 40) 0.709416 ± 0.000005 (2s, N = 12) 0.511521 ± 0.000003 (2s, N = 9)StHs6 ⁄ 80-G 0.703533 ± 0.000003 (173) 0.512920 ± 0.000003 (102)
0.703535 ± 0.000002 (252) 0.512917 ± 0.000003 (60)0.703537 ± 0.000003 (336)0.703536 ± 0.000002 (343)
Mean 0.703535 ± 0.000003 (2s, N = 4) 0.5129187 ± 0.0000040 (2s, N = 2)NIST SRM 987 0.710247 ± 0.000002 (2s, N = 10)La Jolla Nd 0.511846 ± 0.000001 (2s, N = 30)JNdi 0.512102 ± 0.000001 (2s, N = 8)MACS-3 0.7075552 ± 0.0000028 (214)
0.7075508 ± 0.0000028 (235)0.7075520 ± 0.0000026 (183)0.7075533 ± 0.0000030 (243)0.7075548 ± 0.0000028 (187)
Mean 0.7075532 ± 0.0000037 (2s, N = 5)
Uncertainties of single ratios are 2 SE. Reproducibility of data is 2s.
1 0 ª 2010 The Authors. Geostandards and Geoanalytical Research ª 2010 International Association of Geoanalysts

with periodic ultrasonic treatment to ensure completedigestion. Lead was separated from the other elementsusing anion-exchange column (Bio-Rad AG1-X8100–200 mesh resin) in HBr–HCl media. Lead isotopiccompositions were determined by static multi-collection ona MC-ICP-MS (Nu Instruments Ltd., Wrexham, UK). The con-figuration for Pb isotopic determinations enabled simulta-neous collection of Pb (m ⁄ e = 208, 207, 206 and 204)together with Tl (m ⁄ e = 205 and 203) and Hg(m ⁄ e = 202). Thallium was used to monitor and correct forinstrumental mass discrimination and Hg to correct for theisobaric overlap of 204Hg on 204Pb. The 204Hg correction
Tab
le2
h.St
ront
ium
and
Nd
iso
top
icra
tios
det
erm
ined
inth
eU
BC
TIM
Sla
bo
rato
ry
Sam
ple
87Sr
⁄86Sr
(nu
mb
er
of
rati
os)
88Sr
⁄86Sr
14
3N
d⁄1
44N
d(n
um
ber
of
rati
os)
14
5N
d⁄1
44N
d1
46N
d⁄1
44N
d
GSD
-1G
Split
#2c
0.70
9436
±0.
0000
08(1
44)
0.11
940.
5115
19±
0.00
0005
(112
)0.
3484
500.
7205
Split
#14
e0.
7094
15±
0.00
0006
(145
)0.
1195
0.51
1534
±0.
0000
05(1
15)
0.34
8438
0.72
27Sp
lit#
370.
7094
28±
0.00
0008
(149
)0.
1196
0.51
1520
±0.
0000
04(1
16)
0.34
8458
0.72
00M
ean
0.70
9426
±0.
0000
21(2
s,N
=3)
0.51
1524
±0.
0000
16(2
s,N
=3)
KL2-
G0.
7035
83±
0.00
0007
(144
)0.
1189
0.51
2952
±0.
0000
05(1
15)
0.34
8415
0.72
15AT
HO
-G0.
7032
69±
0.00
0008
(144
)0.
1193
0.51
3027
±0.
0000
07(1
14)
0.34
8407
0.71
96N
IST
SRM
987
(300
ng)
0.71
0256
±0.
0000
14(5
0)0.
1184
0.71
0251
±0.
0000
12(6
6)0.
1186
0.71
0257
±0.
0000
09(1
15)
0.11
910.
7102
55±
0.00
0009
(130
)0.
1190
Mea
n0.
7102
55±
0.00
0005
(2s,
N=
4)La
Jolla
(150
ng)
0.51
1854
±0.
0000
05(1
18)
0.51
1849
±0.
0000
07(1
15)
0.51
1858
±0.
0000
06(1
13)
Mea
n0.
5118
54±
0.00
0009
(2s,
N=
3)
Unc
erta
intie
sar
e2
SE.R
epro
duci
bilit
yof
data
is2s
.
Table 2i.Hafnium isotope data determined at the ETHZürich using MC-ICP-MS
Sample 176Hf ⁄ 177Hf
GSD-1GSplit # 2 0.282128 ± 0.000010
0.282119 ± 0.0000120.282140 ± 0.0000130.282101 ± 0.0000100.282132 ± 0.000008
Mean 0.282124Split # 14 0.282108 ± 0.000009
0.282121 ± 0.0000070.282124 ± 0.0000090.282109 ± 0.0000070.282127 ± 0.000009
Mean 0.282118Split # 22 0.282116 ± 0.000010
0.282125 ± 0.0000070.282129 ± 0.0000070.282129 ± 0.0000070.282127 ± 0.000008
Mean 0.282125Mean(splits #2, 14, 22)
0.282122 ± 0.000021 (2s, N = 15)
ATHO-G 0.283173 ± 0.0000050.283182 ± 0.0000070.283164 ± 0.000006
Mean 0.283173 ± 0.000018 (2s, N = 3)KL2-G 0.283105 ± 0.000007
0.283108 ± 0.000009Mean 0.283107 ± 0.000004 (2s, N = 2)BCR-2 0.282864 ± 0.000007
0.282866 ± 0.0000060.282842 ± 0.0000150.282847 ± 0.0000090.282868 ± 0.0000050.282860 ± 0.0000060.282877 ± 0.000007
Mean 0.282861 ± 0.000025 (2s, N = 7)BHVO-2 0.283116 ± 0.000007
0.283100 ± 0.0000060.283097 ± 0.0000070.283110 ± 0.0000040.283112 ± 0.000004
Mean 0.283107 ± 0.000016 (2s, N = 5)
Data were normalised to JMC-475 = 0.282160. Uncertainties are 2 SE(single values) and 2s (mean).
ª 2010 The Authors. Geostandards and Geoanalytical Research ª 2010 International Association of Geoanalysts 1 1

was made using natural abundances (202Hg = 0.29863and 204Hg = 0.06865) adjusted for instrumental massfractionation as monitored by the 205Tl ⁄ 203Tl ratio. Ionbeam intensities for 202Hg were always below 0.17 mV forall runs, corresponding to a correction of less than 0.1 mVon mass 204.
To improve the reproducibility of the analytical condi-tions for the Pb isotopic compositions, and thus the preci-sion and the accuracy (i.e., better precision on205Tl ⁄ 203Tl and less interference on 204Pb), all samplesolutions were analysed with the same [Pb] ⁄ [Tl] ratio (4)as the NIST SRM 981 reference material. To accomplish
this, a small aliquot of each sample was analysed usingthe Thermo Element2 HR-ICP-MS to determine the exactamount of Pb available for isotopic determination. Sam-ples were analysed in dry plasma mode (using a NuInstruments DSN-100 desolvator), with the referencematerial NIST SRM 981 (40 ng ml-1) ran every twosamples. This ensured a 208Pb ion beam of > 2 V. Theanalyses of NIST SRM 981 on the day of this studygave: 208Pb ⁄ 204Pb = 36.7178 ± 0.0038, 207Pb ⁄ 204Pb =15.4976 ± 0.0015 and 206Pb ⁄ 204Pb = 16.9413 ±0.0015 (n = 11). The results were first corrected forinstrumental mass bias by Tl addition (using 2.3885 for205Tl ⁄ 203Tl), and then adjusted to the triple spike values(208Pb ⁄ 204Pb, 207Pb ⁄ 204Pb and 206Pb ⁄ 204Pb of36.7039 ± 34, 15.5011 ± 14, 16.9435 ± 15, respec-tively, Table 2l) by sample-calibrator bracketing.
University of Melbourne MC-ICP-MS laboratory: Theanalytical procedures used are described in detail byWoodhead (2002). Aliquots of small (� 1–2 mm) glasschips, ranging in size from 50 to 100 mg, were cleanedby heating for 10 min in hot 6 mol l-1 HCl, followed byrepeated washing in ultra-pure water. Dissolution wasachieved by heating overnight with a HF ⁄ HNO3 mixture insealed Teflon vials. Lead was separated using standardion exchange procedures [Bio-Rad AG1-X8 (200–400mesh resin)] in HBr–HCl media. Total procedural blankswere less than 20 pg.
Table 2j.Hafnium isotope data determined at UBC usingMC-ICP-MS
Sample 176Hf ⁄ 177Hf
GSD-1GSplit # 2c 0.282123 ± 0.000005Split # 14e 0.282119 ± 0.000005
0.282115 ± 0.000007Split # 37 0.282121 ± 0.000006Mean 0.282120 ± 0.000007 (2s, N = 4)ATHO-G 0.283169 ± 0.000006JMC-475 0.282153 ± 0.000005 (N = 13)
0.282149 ± 0.000008 (N = 9)
Data were normalised to JMC-475 = 0.282160. Uncertainties are 2 SE(single values) and 2s (mean).
Table 2k.Lead isotopic ratios determined in the MPI TIMS laboratory
Sample 206Pb ⁄ 204Pb 207Pb ⁄ 204Pb 208Pb ⁄ 204Pb 208Pb ⁄ 206Pb 207Pb ⁄ 206Pb
GSD-1GSplit # 15 19.5775 ± 0.0027 15.7435 ± 0.0032 38.9050 ± 0.0106 1.98724 ± 0.00027 0.804164 ± 0.000055
19.5780 ± 0.0019 15.7437 ± 0.0023 38.9064 ± 0.0075 1.98724 ± 0.00019 0.804152 ± 0.000038Weighted mean 19.5778 ± 0.0016 15.7436 ± 0.0019 38.9059 ± 0.0061 1.98724 ± 0.00016 0.804156 ± 0.000031Split # 26a 19.5794 ± 0.0035 15.7447 ± 0.0042 38.9100 ± 0.0137 1.98730 ± 0.00035 0.804150 ± 0.000071
19.5792 ± 0.0057 15.7445 ± 0.0069 38.9093 ± 0.0227 1.98729 ± 0.00058 0.804146 ± 0.000117Weighted mean 19.5793 ± 0.0030 15.7446 ± 0.0036 38.9095 ± 0.0061 1.98730 ± 0.00030 0.804149 ± 0.000061Split # 45 19.5780 ± 0.0025 15.7458 ± 0.0029 38.9151 ± 0.0095 1.98763 ± 0.00024 0.804239 ± 0.000049
19.5783 ± 0.0030 15.7461 ± 0.0036 38.9161 ± 0.0117 1.98765 ± 0.00030 0.804245 ± 0.000060Weighted mean 19.5781 ± 0.0019 15.7459 ± 0.0023 38.9158 ± 0.0061 1.98764 ± 0.00019 0.804241 + 0.000038Mean(split # 15,26a, 45)
19.5784 ± 0.0016 15.7447 ± 0.0023 38.9104 ± 0.0100 1.98739 ± 0.00043 0.804182 ± 0.000103
ATHO-G 18.3759 ± 0.0029 15.4802 ± 0.0037 38.1046 ± 0.0121 2.07361 ± 0.00033 0.842413 ± 0.000067KL2-G 19.0440 ± 0.0019 15.6313 ± 0.0022 38.4731 ± 0.0072 2.02020 ± 0.00018 0.820793 ± 0.000037
19.0443 ± 0.0029 15.6314 ± 0.0036 38.4732 ± 0.0119 2.02020 ± 0.00031 0.820798 ± 0.000063Weighted mean 19.0441 ± 0.0016 15.6313 ± 0.0019 38.4732 ± 0.0061 2.02020 ± 0.00016 0.820794 ± 0.000032NIST SRM 981 16.9444 ± 0.0016 15.5019 ± 0.0020 36.7331 ± 0.0060 2.16786 ± 0.00017 0.914870 ± 0.000037
16.9431 ± 0.0017 15.5005 ± 0.0020 36.7301 ± 0.0062 2.16785 ± 0.00017 0.914855 ± 0.00003716.9427 ± 0.0014 15.5005 ± 0.0019 36.7292 ± 0.0059 2.16785 ± 0.00017 0.914881 ± 0.00003616.9436 ± 0.0014 15.5013 ± 0.0019 36.7312 ± 0.0058 2.16786 ± 0.00017 0.914873 ± 0.000036
Mean 16.9435 ± 0.0015 15.5011 ± 0.0014 36.7309 ± 0.0034 2.16786 ± 0.00012 0.914870 ± 0.000022
Uncertainties of single ratios and weighted mean are 2 SE. Reproducibility of data is 2s.
1 2 ª 2010 The Authors. Geostandards and Geoanalytical Research ª 2010 International Association of Geoanalysts

After chemical separation, samples were taken up inca. 1 ml of a 10 ng g-1 Tl solution in 2% v ⁄ v HNO3, andthen further diluted with the same solution as necessary toobtain appropriate ion currents in the range 10–15 V totalPb. This solution was freshly prepared prior to each analyti-cal session from an ICP-MS 100 lg ml-1 Tl standard solu-tion (QCD Analysts), and always checked for negligible Pbblank by performing an ion counter scan before use. Sam-ples were introduced into a Nu Plasma MC-ICP-MS via aCetac Aridus desolvating unit, using a Glass ExpansionOpalMist nebuliser operating at an uptake rate of� 30 ll min-1. All analyses were conducted in static modeusing Faraday cups. Analyses typically consisted of threeblocks of data, each comprising thirty scans of 10 s dura-tion. Baselines were measured ‘on peak’ to remove any Hgcontributions to the signal at mass m ⁄ e = 204, with a fur-ther ‘online’ correction for any residual (i.e., sample-derived)Hg interference. A modified Tl normalisation technique(Woodhead 2002) was used to correct for mass bias. Inthis method, a natural Tl-isotopic composition wasassumed, and a series of reference samples were then runin order to define the mathematical relationship between Tl
and Pb mass bias. This relationship could then be appliedto unknowns providing a robust correction for any massbias related to either instrument drift or matrix effects. Onthe basis of a 2-year compilation of analyses of both sam-ples and reference samples, accuracy using this techniqueis estimated to be between 100 and 200 ppm for allratios involving 204Pb (Woodhead 2002). All ratios mea-sured in the Melbourne laboratory are reported relative to206Pb ⁄ 204Pb, 207Pb ⁄ 204Pb, 208Pb ⁄ 204Pb of 16.9435,15.5011, 36.7039 (triple spike data), respectively, for NISTSRM 981 (Table 2m).
University of Melbourne LA-MC-ICP-MS laboratory :Small chips of several different GSD-1G splits weremounted in resin blocks and polished to a diamond finish.Blocks were cleaned in an ultrasonic bath with a 2% v ⁄ vnitric acid solution for 5 min, washed in ultra-purewater and finally wiped with ultra-pure methanol prior toanalysis.
In situ Pb isotope determinations were performed usinga Helex laser ablation system, constructed around a
Table 2l.Lead isotopic ratios determined in the UBC MC-ICP-MS laboratory
Sample 206Pb ⁄ 204Pb 207Pb ⁄ 204Pb 208Pb ⁄ 204Pb 208Pb ⁄ 206Pb 207Pb ⁄ 206Pb
GSD-1GSplit # 12 19.5772 ± 0.0008 15.7433 ± 0.0007 38.9038 ± 0.0024 1.98706 ± 0.00003 0.804067 ± 0.000009Split # 14e 19.5762 ± 0.0008 15.7432 ± 0.0007 38.9036 ± 0.0017 1.98714 ± 0.00003 0.804095 ± 0.000011Split # 37 19.5775 ± 0.0006 15.7440 ± 0.0005 38.9047 ± 0.0014 1.98708 ± 0.00002 0.804083 ± 0.000006Mean split # 12,14e,37) 19.5770 ± 0.0014 15.7435 ± 0.0009 38.9040 ± 0.0012 1.98710 ± 0.00008 0.804082 ± 0.000028ATHO-G 18.3846 ± 0.0016 15.4783 ± 0.0008 38.1043 ± 0.0021 2.07258 ± 0.00004 0.841907 ± 0.000012KL2-G 19.0420 ± 0.0017 15.6303 ± 0.0013 38.4941 ± 0.0043 2.02167 ± 0.00004 0.820847 ± 0.000013
19.0421 ± 0.0020 15.6303 ± 0.0018 38.4969 ± 0.0049 2.02158 ± 0.00003 0.820799 ± 0.000010Mean 19.0421 ± 0.0002 15.6303 ± 0.0002 38.4955 ± 0.0042 2.0216 ± 0.0003 0.82083 ± 0.00002
Uncertainties of single ratios are 2 SE. Reproducibility of data is 2s. Pb values were normalised to triple spike NIST SRM 981 values (Table 2k).
Table 2m.Lead isotopic ratios determined by MC-ICP-MS at UMel
Sample 206Pb ⁄ 204Pb 207Pb ⁄ 204Pb 208Pb ⁄ 204Pb 208Pb ⁄ 206Pb 207Pb ⁄ 206Pb
GSD-1GSplit #0 19.5792 ± 0.0007 15.7458 ± 0.0005 38.9098 ± 0.0017 1.98732 ± 0.00005 0.804207 ± 0.000009
19.5806 ± 0.0006 15.7468 ± 0.0006 38.9127 ± 0.0018 1.98732 ± 0.00004 0.804197 ± 0.00000919.5810 ± 0.0005 15.7452 ± 0.0004 38.9070 ± 0.0012 1.98700 ± 0.00004 0.804103 ± 0.00000519.5814 ± 0.0006 15.7445 ± 0.0004 38.9109 ± 0.0013 1.98714 ± 0.00003 0.804053 ± 0.000006
Mean (normalised totriple spike data)
19.5806 ± 0.0019 15.7456 ± 0.0019 38.9101 ± 0.0048 1.98719 ± 0.00031 0.80414 ± 0.00015
NIST SRM 610 17.0499 ± 0.0006 15.5115 ± 0.0005 36.9778 ± 0.0014 2.16880 ± 0.00005 0.909754 ± 0.00000917.0496 ± 0.0005 15.5114 ± 0.0005 36.9787 ± 0.0013 2.16889 ± 0.00004 0.909771 ± 0.00000717.0489 ± 0.0006 15.5100 ± 0.0005 36.9736 ± 0.0012 2.16870 ± 0.00003 0.909739 ± 0.000006
Mean 17.0495 ± 0.0010 15.5109 ± 0.0017 36.9767 ± 0.0054 2.16879 ± 0.00019 0.90976 ± 0.00003
Individual errors are within run precision (2 SE). Reproducibility is 2s. Pb values were normalised to the triple spike NIST SRM 981 values of Table 2k.
ª 2010 The Authors. Geostandards and Geoanalytical Research ª 2010 International Association of Geoanalysts 1 3

Lambda Physik Compex 110 ArF excimer laser operatingat 193 nm and coupled to the Nu Plasma MC-ICP-MS(Woodhead et al. 2004). While much of the previous in situdeterminations using this system have focused on relativelylow Pb concentration materials using multiple ion countingtechniques (e.g., Paul et al. 2005), it was considered thatthe relatively high Pb content of the GSD-1G glass(� 50 lg g-1) would permit analysis using a static all-Fara-day cup detection routine. An analytical procedure verysimilar to that employed above for solution analyses wastherefore employed with baselines measured ‘on peak’between samples. The laser system was operated with aspot size of 93 lm and a repetition rate of 8 Hz. Power
density was estimated to be < 5 J cm-2. An automated runsequence was digitised with multiple analyses of each ali-quot interspersed with calibration (NIST SRM 612) and sec-ondary (BCR-2G, ATHO-G) reference materials. All datawere collected in a single long file. Laser firing and stagecontrol was achieved using the Resonetics ‘Geostar’ systemwhile deconvolution employed the Iolite software of Hell-strom et al. (2008) for processing of time-resolved data.Areas of baseline were selected in between samples(where the laser was not firing) and a smoothing splineapplied to estimate true baselines during the times whensamples were being analysed. Correction for instrumentalmass bias was achieved by reference to multiple runs of
Table 2n.Lead isotopic ratios determined in the UMel LA-MC-ICP-MS laboratory
Sample 208Pb ⁄ 204Pb 207Pb ⁄ 204Pb 206Pb ⁄ 204Pb 208Pb ⁄ 206Pb 207Pb ⁄ 206Pb
GSD-1GSplit # 37e 38.826 15.727 19.547 1.9872 0.8044
39.105 15.822 19.670 1.9871 0.804339.021 15.802 19.629 1.9863 0.8038
Mean 38.984 15.784 19.615 1.9869 0.8042Split # 37d 38.839 15.733 19.557 1.9837 0.8033
38.924 15.772 19.594 1.9873 0.804739.019 15.782 19.645 1.9869 0.8045
Mean 38.927 15.762 19.599 1.9860 0.8042Split # 37c 39.103 15.823 19.683 1.9869 0.8045
39.066 15.791 19.671 1.9871 0.804238.965 15.760 19.616 1.9866 0.8041
Mean 39.044 15.791 19.657 1.9869 0.8043Split # 33a 38.764 15.699 19.492 1.9867 0.8045
39.072 15.822 19.678 1.9856 0.803839.055 15.794 19.610 1.9864 0.8044
Mean 38.963 15.772 19.593 1.9862 0.8042Split # 14b 38.774 15.711 19.532 1.9854 0.8040
39.065 15.821 19.667 1.9864 0.804338.979 15.764 19.618 1.9870 0.8042
Mean 38.940 15.765 19.605 1.9863 0.8042Split # 2b 39.177 15.862 19.734 1.9855 0.8035
39.038 15.810 19.646 1.9866 0.804638.904 15.776 19.586 1.9860 0.8037
Mean 39.040 15.816 19.655 1.9860 0.8039Mean (split#37c,d,e,33a,14b,2b)
38.98 ± 0.24(2s, N = 18)
15.78 ± 0.09(2s, N = 18)
19.62 ± 0.12(2s, N = 18)
1.9864 ± 0.0017(2s, N = 18)
0.8042 ± 0.0008(2s, N = 18)
BCR-2G 2.0661 0.83342.0654 0.83162.0672 0.83222.0678 0.83242.0667 0.83232.0649 0.82912.0696 0.8332
Mean 2.0668 ± 0.0031(2s, N = 7)
0.8320 ± 0.0028(2s, N = 7)
ATHO-G 2.0780 0.84472.0707 0.84062.0801 0.8402
Mean 2.0763 ± 0.0098(2s, N = 3)
0.8418 ± 0.0050(2s, N = 3)
Uncertainties are 2s.
1 4 ª 2010 The Authors. Geostandards and Geoanalytical Research ª 2010 International Association of Geoanalysts

NIST SRM 612 interspersed throughout the sequence withmass bias corrections once more interpolated throughoutthe run using smoothing splines. We believe that thismethod of collecting all data in a single file so that base-lines and reference values can be interpolated in a robustfashion throughout the entire run sequence provides signifi-cant advantages over more conventional single spot analy-sis methods (see Hellstrom et al. 2008 for a detaileddescription of this process). NIST SRM 612 values weretaken from Woodhead and Hergt (2001).
Signal sizes for the GSD-1G glass were typically� 250 mV total Pb allowing determination of 204Pb basedratios in addition to 208Pb ⁄ 206Pb and 207Pb ⁄ 206Pb. How-ever, for the secondary reference materials, BCR-2G andATHO-G, Pb signals were too low to permit accurate mea-surement of 204Pb using Faraday cups. We therefore con-cur with Kent (2008) that measurement of 204Pb inFaraday cups should be limited to analyses with total ioncurrents above � 100 mV (corresponding to � 1 mV204Pb). Any potential matrix effects related to using theNIST glass for calibration were not detectable at the levelsof precision of these analyses.
Max Planck Institute LA-ICP-MS laboratory: In situ208Pb ⁄ 206Pb and 207Pb ⁄ 206Pb measurements were per-formed using a single collector sector-field ICP mass spec-trometer Thermo Element2, which was combined with aNew Wave UP 193SS 193 nm wavelength Nd:YAG laserablation system. A detailed description of this technique hasbeen given by Jochum et al. (2006a). Splits of GSD-1G,ATHO-G, KL2-G and NIST SRM 612 reference glasseswere analysed using a spot size of 75 lm at an energydensity of about 6 J cm-2. The ablation time was about150 s. The washout time between spots was 45 s. Blankcount rates were measured for 20 s prior to ablation. Exper-iments were performed using the fast electrical scan mode
Table 2o.Lead isotopic ratios determined in the MPI LA-ICP-MS laboratory
Sample 208Pb ⁄ 206Pb 207Pb ⁄ 206Pb
GSD-1GSplit# 2d 1.9887 0.8049
1.9884 0.80501.9892 0.80531.9883 0.80531.9846 0.80451.9861 0.80421.9858 0.80361.9877 0.80311.9845 0.80351.9860 0.8033
Mean 1.9869 ± 0.0034(N = 10)
0.8043 ± 0.0017(N = 10)
Split # 35a 1.9887 0.80451.9878 0.80481.9868 0.80501.9878 0.80431.9870 0.80441.9865 0.80361.9875 0.80461.9866 0.80491.9857 0.80401.9871 0.8038
Mean 1.9872 ± 0.0016(N = 10)
0.8044 ± 0.0009(N = 10)
Split # 37a 1.9882 0.80481.9871 0.80461.9860 0.80481.9879 0.80451.9880 0.80481.9876 0.80401.9866 0.80411.9876 0.80431.9864 0.80341.9891 0.8042
Mean 1.9875 ± 0.0018(N = 10)
0.8043 ± 0.0009(N = 10)
Mean (split#2d,35a,37a)
1.9872 ± 0.0024(N = 30)
0.8043 ± 0.0012(N = 30)
KL2-G 2.0290 0.82122.0232 0.81832.0278 0.82152.0230 0.82322.0226 0.81962.0218 0.81952.0256 0.82162.0233 0.8219
Mean 2.0245 ± 0.0052(N = 8)
0.8209 ± 0.0032(N = 8)
ATHO-G 2.0814 0.84282.0752 0.84222.0726 0.83992.0725 0.83872.0716 0.84082.0707 0.84062.0746 0.84142.0719 0.8411
Mean 2.0738 ± 0.0068(N = 8)
0.8409 ± 0.0026(N = 8)
Table 2o (continued).
Sample 208Pb ⁄ 206Pb 207Pb ⁄ 206Pb
NIST SRM 612 2.1691 0.90772.1661 0.90782.1654 0.90712.1657 0.90652.1662 0.90802.1679 0.90712.1676 0.90812.1682 0.9077
Mean 2.1670 ± 0.0026(N = 8)
0.9075 ± 0.0011(N = 8)
Uncertainties are 2s (N = number of analyses).
ª 2010 The Authors. Geostandards and Geoanalytical Research ª 2010 International Association of Geoanalysts 1 5

with 0.075 s per pass for the mass scan of 206Pb, 207Pband 208Pb. Each run consisted of about 270 blank and2000 ablation measurements. An individual Pb isotopedetermination corresponded to three spot measurementsperformed in the same area of the split (distances less than200 lm). To test for small-scale homogeneity of the individ-ual splits, four to five Pb isotope determinations at distancesof 500 lm were performed. The mass discrimination wasdetermined before, during and after each measurementseries from the deviation of 208Pb ⁄ 206Pb LA-ICP-MS valuein a reference glass (e.g., NIST SRM 612) from high-preci-sion TIMS and MC-ICP-MS data (see GeoReM database).A linear function was sufficient to correct the instrumentalmass discrimination (Jochum et al. 2006a). The reproduci-bility was 0.1–0.3% RSD.
Uranium and Th isotopes
Max Planck Institute LA-ICP-MS laboratory: Mertz-Kraus et al. (2010) developed an in situ LA-ICP-MS tech-nique for the sensitive determination of 230Th ⁄ 232Th,234U ⁄ 238U, 235U ⁄ 238U, 230Th ⁄ 238U ratios in silicateglasses and other solid materials using a New Wave UP213 Nd:YAG laser ablation system connected to a single-collector sector-field ICP-MS Thermo Element2. Precisionand accuracy of this method were tested using silicate ref-erence glasses. The reproducibility (2 RSD) of low230Th ⁄ 238U ratio samples having U > 0.4 lg g-1 wasabout 3.5%. The Th and U isotope LA-ICP-MS data ofUSGS and MPI-DING glasses agreed within uncertaintylimits with published values (Matthews et al. 2008). Thematerial was ablated using line scans about 1800 lmlong with a laser spot size of 110 lm. Ablation time wasabout 35 min. One analysis consisted of three such scans,consuming about 60 lg of material. Energy density was25 J cm-2. Corrections were applied for (a) background,(b) tail contributions of the high abundance masses on thelow abundance masses, (c) outliers, (d) instrumental massdiscrimination, and (e) differences in the sensitivity of Thand U. Calibration of 230Th ⁄ 238U ratios was performedusing the USGS BCR-2G glass having a Th ⁄ U =3.507 ± 0.018 (1 SE). Mass discrimination of natural geo-logical glasses was calculated from the measured238U ⁄ 235U ratio of the analysed sample and assuming anatural 238U ⁄ 235U ratio of 137.88.
Because the synthetic GSD-1G sample has depleted Uisotopes the mass fractionation factor determined duringthe same session from BCR-2G was applied to determinethe 238U ⁄ 235U ratio. On two splits of GSD-1G (SW andM3) three line scans were performed, each 900 lm long,consisting of about 15000 cycles of background and abla-
tion measurements. Sample times were 0.01 s for 235U and0.002 s for 238U, i.e., a duration of 0.062 s for each cycle.Measurement time was about 17 min for each line scan.
Table 2p.Atomic 238U ⁄ 235U ratios determined in the MPILA-ICP-MS laboratory
Sample 238U ⁄ 235U
GSD-1GSplit SW 279.8 (N = 9)
280.4 (N = 9)280.3 (N = 9)
Mean 280.2 ± 1.4 (N = 27)Split M3 278.7 (N = 9)
279.8 (N = 9)280.4 (N = 9)
Mean 279.6 ± 1.9 (N = 27)Mean (split SW, M3) 279.9 ± 1.7 (N = 54)MACS-3 367.4 (N = 3)
364.1 (N = 3)363.2 (N = 3)360.8 (N = 3)365.0 (N = 3)366.0 (N = 3)368.7 (N = 3)366.8 (N = 3)
Mean 365 ± 5 (N = 24)
Uncertainties are 2s (N = number of ratios).
Table 2q.Uranium isotope data determined at MPI usingMC-ICP-MS
Sample 238U ⁄ 235U 234U ⁄ 238U
GSD-1GSplit # 2 271.62 ± 0.16 0.000017949 ± 0.000000051
271.23 ± 0.36 0.000017995 ± 0.000000073Mean 271.43 ± 0.55 0.000017972 ± 0.000000065Split # 16 271.36 ± 0.31 0.000017983 ± 0.000000050
271.30 ± 0.25 0.000018013 ± 0.000000045Mean 271.33 ± 0.08 0.000017998 ± 0.000000042Split # 35a 271.45 ± 0.18 0.000017970 ± 0.000000042Mean(split #2,16,35a)
271.40 ± 0.13 0.000017980 ± 0.000000031
KL2-G 141.12 ± 0.09 0.00005325 ± 0.00000013140.91 ± 0.08 0.00005346 ± 0.00000012140.86 ± 0.21 0.00005295 ± 0.00000017
Mean 140.96 ± 0.28 0.00005322 ± 0.00000051BCR-2G 137.68 ± 0.07 0.00005504 ± 0.00000012
138.02 ± 0.18 0.00005513 ± 0.00000019137.86 ± 0.05 0.00005511 ± 0.00000010
Mean 137.85 ± 0.34 0.00005509 ± 0.00000010ATHO-G 138.10 ± 0.07 0.00005496 ± 0.00000014
137.97 ± 0.07 0.00005493 ± 0.00000010Mean 138.03 ± 0.18 0.00005495 ± 0.00000004MACS-3 373.27 ± 0.40 0.000013807 ± 0.000000050
373.57 ± 0.68 0.000013193 ± 0.000000053Mean 373.42 ± 0.42 0.00001350 ± 0.00000087
Uncertainties are 2 SE (single values) and 2s (mean).
1 6 ª 2010 The Authors. Geostandards and Geoanalytical Research ª 2010 International Association of Geoanalysts

Max Planck Institute MC-ICP-MS laboratory: Uraniumdeterminations were performed using a Nu-instruments Nu
Plasma MC-ICP-MS, equipped with a variable mass dis-persion ‘zoom lens’ directing the ion beams into a fixed
Table 3a.Isotopic data for GSD-1G. Preferred values [reference (Ref) and information (Inf) values] were calculatedfrom the analytical data
GSD-1G Isotope ratio (±± 2s) Analyticaltechnique
Laboratory Reference Preferred value(±± 95% CL)
d7Li (‰ LSVEC) 30.4 ± 0.3 MC-ICP-MS UMd This work 30.9 ± 1.0 (Ref)31.14 ± 0.08 MC-ICP-MS UB Kasemann et al.
(2005)31.7 ± 0.7 TIMS UB Kasemann et al.
(2005)30.3 ± 0.8 MC-ICP-MS MPI Jochum et al.
(2006b)31.3 ± 1.2* SIMS UEd Jochum et al.
(2006b)d11B (‰ NIST 951) 10.1 ± 1.0 TIMS IGG This work 10.1 (Inf)d29Si(‰ NIST SRM8546)
-0.12 ± 0.08 LA-MC-ICP-MS UHan This work -0.12 (Inf)
d30Si(‰ NIST SRM8546)
-0.21 ± 0.05 LA-MC-ICP-MS UHan This work -0.21 (Inf)
d44 ⁄ 40Ca (‰ NISTSRM 915a)
0.86 ± 0.11 TIMS GEOMAR This work 0.86 (Inf)
87Sr ⁄ 86Sr 0.709419 ± 0.000008 TIMS LMU This work 0.709416 ± 0.00005 (Ref)0.709416 ± 0.000005 TIMS LMU This work0.709418 ± 0.000021 TIMS UBC This work0.709412 ± 0.000011 TIMS MPI This work
143Nd ⁄ 144Nd 0.511529 ± 0.000007 TIMS LMU This work 0.511521 ± 0.000009 (Ref)0.511521 ± 0.000003 TIMS LMU This work0.511516 ± 0.000016 TIMS UBC This work0.511519 ± 0.000005 TIMS MPI This work
176Hf ⁄ 177Hf 0.282120 ± 0.000007 MC-ICP-MS UBC This work 0.282121 ± 0.000013 (Inf)0.282122 ± 0.000021 MC-ICP-MS ETH This work
206Pb ⁄ 204Pb 19.5784 ± 0.0016 TIMS MPI This work 19.579 ± 0.004 (Ref)19.5770 ± 0.0014 MC-ICP-MS UBC This work19.5806 ± 0.0019 MC-ICP-MS UMel This work
19.62 ± 0.12* LA-MC-ICP-MS UMel This work207Pb ⁄ 204Pb 15.7447 ± 0.0023 TIMS MPI This work 15.745 ± 0.002 (Ref)
15.7435 ± 0.0009 MC-ICP-MS UBC This work15.7456 ± 0.0019 MC-ICP-MS UMel This work
15.78 ± 0.09* LA-MC-ICP-MS UMel This work208Pb ⁄ 204Pb 38.9104 ± 0.0100 TIMS MPI This work 38.908 ± 0.009 (Ref)
38.9040 ± 0.0012 MC-ICP-MS UBC This work38.9101 ± 0.0048 MC-ICP-MS UMel This work
38.98 ± 0.24* LA-MC-ICP-MS UMel This work208Pb ⁄ 206Pb 1.98739 ± 0.00043 TIMS MPI This work 1.9871 ± 0.0005 (Ref)
1.98710 ± 0.00008 MC-ICP-MS UBC This work1.98719 ± 0.00031 MC-ICP-MS UMel This work
1.9872 ± 0.0024 LA-ICP-MS MPI This work1.9864 ± 0.0017 LA-MC-ICP-MS UMel This work
207Pb ⁄ 206Pb 0.80418 ± 0.00010 TIMS MPI This work 0.80418 ± 0.00010 (Ref)0.80408 ± 0.00003 MC-ICP-MS UBC This work0.80414 ± 0.00015 MC-ICP-MS UMel This work
0.8043 ± 0.0012 LA-ICP-MS MPI This work0.8042 ± 0.0008 LA-MC-ICP-MS UMel This work
238U ⁄ 235U 271.40 ± 0.13 MC-ICP-MS MPI This work 271.4 (Inf)279.9 ± 1.7* LA-ICP-MS MPI This work
234U ⁄ 238U 0.000017980 MC-ICP-MS MPI This work 0.00001798 (Inf)
TIMS and MC-ICP-MS values of Sr, Nd, Hf and Pb were normalised to NIST SRM 987 (87Sr ⁄ 86Sr = 0.710247), La Jolla (143Nd ⁄ 144Nd = 0.511846), JMC-475 (176Hf ⁄ 177Hf = 0.282160) and NIST SRM 981 (206Pb ⁄ 204Pb = 16.9435, 207Pb ⁄ 204Pb = 15.5011, 208Pb ⁄ 204Pb = 36.7309,208Pb ⁄ 206Pb = 2.16786, 207Pb ⁄ 206Pb = 0.914870), respectively.* not used.
ª 2010 The Authors. Geostandards and Geoanalytical Research ª 2010 International Association of Geoanalysts 1 7

Table 3b.Isotopic data for ATHO-G. Preferred values [reference (Ref) and information (Inf) values] were calculatedfrom the analytical data
ATHO-G Isotope ratio (±± 2s ) Analyticaltechnique
Laboratory Reference Preferred value(±± 95% CL)
d17O(‰ VSMOW)
1.59 ± 0.04 MS UTüb Jochum et al. (2006b) 1.59 (Inf)
d18O(‰ VSMOW)
3.20 ± 0.07 MS UTüb Jochum et al. (2006b) 3.20 (Inf)
d7Li (‰ LSVEC) 3.9 ± 0.8* MC-ICP-MS UMd This work17.1 ± 0.8* MC-ICP-MS MPI Jochum et al. (2006b)
d29Si(‰ NISTSRM 8546)
-0.28 ± 0.09 LA-MC-ICP-MS UHan This work -0.28 (Inf)
d30Si(‰ NISTSRM 8546)
-0.60 ± 0.21 LA-MC-ICP-MS UHan This work -0.60 (Inf)
d44 ⁄ 40Ca(‰ NIST SRM915a)
0.83 ± 0.00 TIMS GEOMAR This work 0.85 ± 0.06 (Inf)0.87 ± 0.08 TIMS GEOMAR Amini et al. (2009)0.84 ± 0.15 TIMS GEOMAR Jochum et al. (2006b)
87Sr ⁄ 86Sr 0.703271 ± 0.000008 TIMS MPI This work 0.703271 ± 0.000015 (Ref)0.703283 ± 0.000008 TIMS LMU This work0.703261 ± 0.000008 TIMS UBC This work0.703268 ± 0.000035 TIMS MPI Raczek et al. (2003)
143Nd ⁄ 144Nd 0.513006 ± 0.000007 TIMS MPI This work 0.513015 ± 0.000009 (Ref)0.513017 ± 0.000009 TIMS LMU This work0.513019 ± 0.000007 TIMS UBC This work0.513016 ± 0.000030 TIMS MPI Raczek et al. (2003)
176Hf ⁄ 177Hf 0.283169 ± 0.000006 MC-ICP-MS UBC This work 0.283171 ± 0.000025 (Inf)0.283173 ± 0.000018 MC-ICP-MS ETH This work
206Pb ⁄ 204Pb 18.3759 ± 0.0029 TIMS MPI This work 18.383 ± 0.009 (Ref)18.3846 ± 0.0016 MC-ICP-MS UBC This work
18.39 ± 0.06* LA-MC-ICP-MS MUN Souders and Sylvester(2008)
18.3892 ± 0.0011 TIMS MPI Jochum et al. (2005c)18.3832 ± 0.0005 MC-ICP-MS UMel Jochum et al. (2005c)
18.7 ± 0.8* LA-ICP-MS MPI Jochum et al. (2005d)18.38 ± 0.11* LA-MC-ICP-MS UMel Paul et al. (2005)
207Pb ⁄ 204Pb 15.4802 ± 0.0037 TIMS MPI This work 15.481 ± 0.004 (Ref)15.4783 ± 0.0008 MC-ICP-MS UBC This work
15.46 ± 0.05* LA-MC-ICP-MS MUN Souders and Sylvester(2008)
15.4836 ± 0.0011 TIMS MPI Jochum et al. (2005c)15.4837 ± 0.0005 MC-ICP-MS UMel Jochum et al. (2005c)
15.8 ± 0.6* LA-ICP-MS MPI Jochum et al. (2005d)15.48 ± 0.09* LA-MC-ICP-MS UMel Paul et al. (2005)
208Pb ⁄ 204Pb 38.1046 ± 0.0121 TIMS MPI This work 38.110 ± 0.011 (Ref)38.1043 ± 0.0021 MC-ICP-MS UBC This work
38.10 ± 0.12* LA-MC-ICP-MS MUN Souders and Sylvester(2008)
38.1154 ± 0.0032 TIMS MPI Jochum et al. (2005c)38.1170 ± 0.0012 MC-ICP-MS UMel Jochum et al. (2005c)
38.8 ± 1.2* LA-ICP-MS MPI Jochum et al. (2005d)38.10 ± 0.18* LA-MC-ICP-MS UMel Paul et al. (2005)
208Pb ⁄ 206Pb 2.07361 ± 0.00033 TIMS MPI This work 2.07394 ± 0.00085 (Ref)2.07258 ± 0.00004 MC-ICP-MS UBC This work
2.0763 ± 0.0098 LA-MC-ICP-MS UMel This work2.0738 ± 0.0068 LA-ICP-MS MPI This work2.0759 ± 0.0007 LA-MC-ICP-MS MUN Souders and Sylvester
(2008)2.07269 ± 0.00007 TIMS MPI Jochum et al. (2005c)2.07348 ± 0.00002 MC-ICP-MS UMel Jochum et al. (2005c)
2.074 ± 0.011 ICP-MS MPI Jochum et al. (2005c)2.073 ± 0.001 LA-ICP-MS MPI Jochum et al. (2005d)2.075 ± 0.008 LA-ICP-MS MPI Jochum et al. (2005d)2.073 ± 0.006 LA-MC-ICP-MS UMel Paul et al. (2005)
1 8 ª 2010 The Authors. Geostandards and Geoanalytical Research ª 2010 International Association of Geoanalysts

array of fifteen collectors. The instrument was equipped withthree SEM ion counting detectors and twelve Faraday cups.
Samples were weighed and then dissolved in an HCl-HF mixture. Since the focus of this study was the determina-tion of the U isotopic composition of the samples, no spikewas added. HF (100 ll) and HCl (300 ll) were added tothe samples and heated to 100 �C for � 24 hr. The dis-solved samples were then evaporated to dryness and trea-ted by concentrated HCl in order to vaporise potentiallyformed fluorides. After evaporation, the residue was dis-solved in 1 ml of 6 mol l-1 HCl, and U was separated fol-lowing traditional chemical separation and purificationprocedures (e.g., Ivanovich and Harmon 1992). Subse-quently, the samples were analysed in a 0.8 mol l-1 HNO3
solution.
The analytical protocol for the MC-ICP-MS analysisutilised a common calibrator-bracketing procedure in
order to derive correction factors for mass fractionationand Faraday cup to SEM gain. The widely applied NBL-112a reference material was used for bracketing (e.g.,Hoffmann et al. 2007). Samples were introduced using aCetac Aridus nebuliser with a PFA spray chamber. Forboth calibrator and sample analysis, three mass jumpswere performed in each cycle with a 2.5 s magnet delaytime. In the first cycle, masses 238 and 235 were mea-sured on Faraday cups. Mass 234 was measured on anion counter in the same cycle. The 238U peak was cen-tred on Faraday Cup H1 at the beginning of each acqui-sition. In the two subsequent cycles masses 237.5 and238.5 were switched to H1 in order to determine thehalf-mass baselines.
Data reduction was performed off-line. First the half-mass backgrounds were subtracted following the proce-dure described by Hellstrom (2003). For the ion beamsmeasured on Faraday cups the half mass baselines
Table 3b (continued).
ATHO-G Isotope ratio (±± 2s ) Analyticaltechnique
Laboratory Reference Preferred value(±± 95% CL)
207Pb ⁄ 206Pb 0.842413 ± 0.000067 TIMS MPI This work 0.84207 ± 0.00056 (Ref)0.841907 ± 0.000012 MC-ICP-MS UBC This work
0.8418 ± 0.0050 LA-MC-ICP-MS UMel This work0.8409 ± 0.0026 LA-ICP-MS MPI This work
0.84130 ± 0.00003 LA-MC-ICP-MS MUN Souders and Sylvester(2008)
0.841985 ± 0.000017 TIMS MPI Jochum et al. (2005c)0.84226 ± 0.00001 MC-ICP-MS UMel Jochum et al. (2005c)
0.8423 ± 0.0018 ICP-MS MPI Jochum et al. (2005c)0.8417 ± 0.0034 LA-ICP-MS MPI Jochum et al. (2005d)0.8442 ± 0.0051 LA-ICP-MS MPI Jochum et al. (2005d)
0.842 ± 0.004 LA-MC-ICP-MS UMel Paul et al. (2005)230Th ⁄ 232Th 0.000005484 ± 0.000000609 TIMS LANL Matthews et al. (2008) 0.000005484 (Inf)
0.00000554 ± 0.00000007* LA-ICP-MS MPI Mertz-Kraus et al.(2010)
(230Th) ⁄ (232Th) 1.018 ± 0.011 TIMS LANL Matthews et al. (2008) 1.018 (Inf)1.028 ± 0.013* LA-ICP-MS MPI Mertz-Kraus et al.
(2010)230Th ⁄ 238U 0.0000183 ± 0.00000047 LA-ICP-MS MPI Mertz-Kraus et al.
(2010)0.0000183 (Inf)
(230Th) ⁄ (238U) 1.102 ± 0.013 TIMS LANL Matthews et al. (2008) 1.102 (Inf)1.080 ± 0.027* LA-ICP-MS MPI Mertz-Kraus et al.
(2010)234U ⁄ 238U 0.00005483 ± 0.00000015 TIMS LANL Matthews et al. (2008) 0.00005489 ± 0.00000076
(Ref)0.0000546 ± 0.0000008* LA-ICP-MS MPI Mertz-Kraus et al.
(2010)0.00005495 ± 0.00000004 MC-ICP-MS MPI This work
(234U) ⁄ (238U) 0.999 ± 0.0015 TIMS LANL Matthews et al. (2008) 0.999 (Inf)0.995 ± 0.015* LA-ICP-MS MPI Mertz-Kraus et al.
(2010)238U ⁄ 235U 138.03 ± 0.18 MC-ICP-MS MPI This work 138.03 (Inf)
TIMS and MC-ICP-MS values of Sr, Nd, Hf and Pb were normalised to NIST SRM 987 (87Sr ⁄ 86Sr = 0.710247), La Jolla (143Nd ⁄ 144Nd = 0.511846),JMC-475 (176Hf ⁄ 177Hf = 0.282160) and NIST SRM 981 (206Pb ⁄ 204Pb = 16.9435, 207Pb ⁄ 204Pb = 15.5011, 208Pb ⁄ 204Pb = 36.7309,208Pb ⁄ 206Pb = 2.16786, 207Pb ⁄ 206Pb = 0.914870), respectively.* not used.
ª 2010 The Authors. Geostandards and Geoanalytical Research ª 2010 International Association of Geoanalysts 1 9

recorded for the corresponding collector were averaged.For the 234U beam measured on an ion counter the 238Utail was subtracted by log-weighted interpolation of thebaselines measured at half mass on either side of thepeak. For the reference sample measurements, instrumentalmass fractionation was calculated using the exponential
law from the 238U ⁄ 235U ratio measured on NBL-112a(Hoffmann et al. 2007). Similarly, ion counter gain wasdetermined by comparing the measured 234U ⁄ 238U ratiowith the known ratio of NBL-112a. Sample data were thencorrected using linear interpolation between the bracketingcalibrators.
Table 3c.Isotopic data for BM90 ⁄ 21-G. Information (Inf) values were calculated from the analytical data
BM90 ⁄ 21-G Isotope ratio (±± 2s ) Analyticaltechnique
Laboratory Reference Preferred value(±± 95% CL)
d17O (‰ VSMOW) 4.27 ± 0.04 MS UTüb Jochum et al. (2006b) 4.27 (Inf)d18O (‰ VSMOW) 8.40 ± 0.07 MS UTüb Jochum et al. (2006b) 8.40 (Inf)d44 ⁄ 40Ca (‰ NISTSRM 915a)
1.01 ± 0.07 TIMS GEOMAR Amini et al. (2009) 1.01 (Inf)1.29 ± 0.15* TIMS GEOMAR Jochum et al. (2006b)
87Sr ⁄ 86Sr 0.706320 ± 0.000023 TIMS MPI Raczek et al. (2003) 0.706320 (Inf)143Nd ⁄ 144Nd 0.512605 ± 0.000030 TIMS MPI Raczek et al. (2003) 0.512605 (Inf)
TIMS and MC-ICP-MS values of Sr and Nd were normalised to NIST SRM 987 (87Sr ⁄ 86Sr = 0.710247) and La Jolla (143Nd ⁄ 144Nd = 0.511846),respectively.* not used.
Table 3d.Isotopic data for GOR128-G. Preferred values [reference (Ref) and information (Inf) values] werecalculated from the analytical data
GOR128-G Isotope ratio(±± 2s )
Analyticaltechnique
Laboratory Reference Preferred value(±± 95% CL)
d17O (‰ VSMOW) 4.83 ± 0.04 MS UTüb Jochum et al. (2006b) 4.83 (Inf)d18O (‰ VSMOW) 9.43 ± 0.07 MS UTüb Jochum et al. (2006b) 9.43 (Inf)d7Li (‰ LSVEC) 14.4 ± 0.8 MC-ICP-MS MPI Jochum et al. (2006b) 14.4 (Inf)
12.6 ± 2.0* SIMS UEd Jochum et al. (2006b)d11B (‰ NIST SRM 951) 13.5 ± 0.3 TIMS IGG This work 13.7 ± 0.6 (Ref)
13.55 ± 0.22 TIMS GFZ Rosner and Meixner(2004)
14.0 ± 1.4 LA-MC-ICP-MS Th Tiepolo et al. (2006)d29Si (‰ NIST SRM8546)
-0.21 ± 0.02 LA-MC-ICP-MS UHan This work -0.210 (Inf)
d30Si (‰ NIST SRM8546)
-0.46 ± 0.12 LA-MC-ICP-MS UHan This work -0.460 (Inf)
d44 ⁄ 40Ca (‰ NIST SRM915a)
0.70 ± 0.05 TIMS GEOMAR Amini et al. (2009) 0.77 (Inf)0.83 ± 0.04 TIMS SIL Amini et al. (2009)0.66 ± 0.15* TIMS GEOMAR Jochum et al. (2006b)
87Sr ⁄ 86Sr 0.706932 ± 0.000030 TIMS MPI Raczek et al. (2003) 0.706932 (Inf)0.7076 ± 0.0040* LA-ICP-MS MPI Jochum et al. (2009)
143Nd ⁄ 144Nd 0.513241 ± 0.000019 TIMS MPI Raczek et al. (2003) 0.513241 (Inf)206Pb ⁄ 204Pb 18.5175 ± 0.0018 MC-ICP-MS UMel Jochum et al. (2005c) 18.518 (Inf)207Pb ⁄ 204Pb 15.6286 ± 0.0015 MC-ICP-MS UMel Jochum et al. (2005c) 15.629 (Inf)208Pb ⁄ 204Pb 38.2860 ± 0.0040 MC-ICP-MS UMel Jochum et al. (2005c) 38.286 (Inf)208Pb ⁄ 206Pb 2.06762 ± 0.00004 MC-ICP-MS UMel Jochum et al. (2005c) 2.069 ± 0.014 (Ref)
2.081 ± 0.001 ICP-MS MPI Jochum et al. (2005c)2.068 ± 0.012 LA-ICP-MS MPI Jochum et al. (2005c)2.060 LA-ICP-MS MPI Jochum et al. (2005c)
207Pb ⁄ 206Pb 0.84398 ± 0.00002 MC-ICP-MS UMel Jochum et al. (2005c) 0.8450 ± 0.0034 (Ref)0.8479 ± 0.0029 ICP-MS MPI Jochum et al. (2005c)0.8432 ± 0.0050 LA-ICP-MS MPI Jochum et al. (2005c)0.8452 LA-ICP-MS MPI Jochum et al. (2005c)
TIMS and MC-ICP-MS values of Sr, Nd and Pb were normalised to NIST SRM 987 (87Sr ⁄ 86Sr = 0.710247), La Jolla (143Nd ⁄ 144Nd = 0.511846) and NISTSRM 981 (206Pb ⁄ 204Pb = 16.9435, 207Pb ⁄ 204Pb = 15.5011, 208Pb ⁄ 204Pb = 36.7309, 208Pb ⁄ 206Pb = 2.16786, 207Pb ⁄ 206Pb = 0.914870), respectively.* not used.
2 0 ª 2010 The Authors. Geostandards and Geoanalytical Research ª 2010 International Association of Geoanalysts

Results and discussion
Tables 2a–q list the new results for GSD-1G and theMPI-DING glasses. Tables 3a–i show the mean values ofTables 2a–q together with previously published data forthese reference glasses and the calculated reference andinformation values with their uncertainties. The TIMS andMC-ICP-MS Sr, Nd, Hf and Pb data of Tables 3a–iwere normalised to NIST SRM 987 (87Sr ⁄ 86Sr = 0.710247,Table 2g), La Jolla (143Nd ⁄ 144Nd = 0.511846, Table 2g),JMC-475 (176Hf ⁄ 177Hf = 0.282160, Blichert-Toft et al.1997) and NIST SRM 981 (206Pb ⁄ 204Pb = 16.9435,207Pb ⁄ 204Pb = 15.5011, 208Pb ⁄ 204Pb = 36.7309, 208Pb ⁄206Pb = 2.16786, 207Pb ⁄ 206Pb = 0.914870, Table 2k),respectively.
Homogeneity
Homogeneity is a fundamental requirement for any ref-erence material. It is not an inherent property of the mate-
rial, but is specific to both element and analytical testportion mass (Kane 2002). We have therefore investigatedpossible small- (within a single split) and large-scale (differ-ent splits) isotopic heterogeneities of GSD-1G and theMPI-DING glasses. Because of their low analytical uncer-tainty (ca. 0.001–0.1%), large-scale heterogeneities weretested by high-precision TIMS and MC-ICP-MS (analyticaltest portion masses of about 20–100 mg). To test possibleisotopic micro-heterogeneities we used LA-(MC)-ICP-MSand SIMS (analytical test portion masses in the ng–lgrange), where the analytical uncertainty was about 0.1–0.5%. In the following, the isotopic data will be discussedin detail.
Lithium isotopes
Table 2a lists the new MC-ICP-MS Li data obtained atUMd. The d7Li values of three different splits of GSD-1Gagree well with other high-precision data of other splits(Kasemann et al. 2005, Jochum et al. 2006b) (Figure 1).
Table 3e.Isotopic data for GOR132-G. Preferred values [reference (Ref) and information (Inf) values] were calcu-lated from the analytical data
GOR132-G Isotope ratio (±± 2s ) Analyticaltechnique
Laboratory Reference Preferred value(±± 95% CL)
d17O (‰ VSMOW) 4.34 ± 0.04 MS UTüb Jochum et al. (2006b) 4.34 (Inf)d18O (‰ VSMOW) 8.52 ± 0.08 MS UTüb Jochum et al. (2006b) 8.52 (Inf)d7Li (‰ LSVEC) 8.9 ± 0.8 MC-ICP-MS MPI Jochum et al. (2006b) 8.9 (inf)
8.6 ± 1.2* SIMS UEd Jochum et al. (2006b)d11B (‰ NIST SRM 951) 7.11 ± 0.96 TIMS GFZ Rosner and Meixner
(2004)7.1 (Inf)
6.8 ± 6.0 LA-MC-ICP-MS Th Tiepolo et al. (2006)d29Si (‰ NIST SRM 8546) -0.15 ± 0.12 LA-MC-ICP-MS UHan This work -0.15 (Inf)d30Si (‰ NIST SRM 8546) -0.27 ± 0.21 LA-MC-ICP-MS UHan This work -0.27 (Inf)d44 ⁄ 40Ca (‰ NISTSRM 915a)
0.57 ± 0.05 TIMS GEOMAR Amini et al. (2009) 0.61 (Inf)0.64 ± 0.06 TIMS SIL Amini et al. (2009)0.49 ± 0.15* TIMS GEOMAR Jochum et al. (2006b)
87Sr ⁄ 86Sr 0.707200 ± 0.000025 TIMS MPI Raczek et al. (2003) 0.707200 (Inf)143Nd ⁄ 144Nd 0.513289 ± 0.000030 TIMS MPI Raczek et al. (2003) 0.513289 (Inf)206Pb ⁄ 204Pb 19.2524 ± 0.0005 MC-ICP-MS UMel Jochum et al. (2005c) 19.25 (Inf)
19.3 ± 0.4* LA-ICP-MS MPI Jochum et al. (2005c)207Pb ⁄ 204Pb 15.7226 ± 0.0004 MC-ICP-MS UMel Jochum et al. (2005c) 15.72 (Inf)
15.5 ± 0.2* LA-ICP-MS MPI Jochum et al. (2005c)208Pb ⁄ 204Pb 38.7182 ± 0.0011 MC-ICP-MS UMel Jochum et al. (2005c) 38.72 (Inf)
38.2 ± 0.2* LA-ICP-MS MPI Jochum et al. (2005c)208Pb ⁄ 206Pb 2.01112 ± 0.00002 MC-ICP-MS UMel Jochum et al. (2005c) 2.008 ± 0.005 (Ref)
2.007 ± 0.010 ICP-MS MPI Jochum et al. (2005c)2.011 ± 0.008 LA-ICP-MS MPI Jochum et al. (2005c)2.004 ± 0.016 LA-ICP-MS MPI Jochum et al. (2005c)
207Pb ⁄ 206Pb 0.81665 ± 0.00001 MC-ICP-MS UMel Jochum et al. (2005c) 0.8160 ± 0.0026 (Ref)0.8156 ± 0.0047 ICP-MS MPI Jochum et al. (2005c)0.8179 ± 0.0033 LA-ICP-MS MPI Jochum et al. (2005c)
0.814 ± 0.020 LA-ICP-MS MPI Jochum et al. (2005c)
TIMS and MC-ICP-MS values of Sr, Nd and Pb were normalised to NIST SRM 987 (87Sr ⁄ 86Sr = 0.710247), La Jolla (143Nd ⁄ 144Nd = 0.511846) and NISTSRM 981 (206Pb ⁄ 204Pb = 16.9435, 207Pb ⁄ 204Pb = 15.5011, 208Pb ⁄ 204Pb = 36.7309, 208Pb ⁄ 206Pb = 2.16786, 207Pb ⁄ 206Pb = 0.914870), respectively.* not used.
ª 2010 The Authors. Geostandards and Geoanalytical Research ª 2010 International Association of Geoanalysts 2 1

Table 3f.Isotopic data for KL2-G. Preferred values [reference (Ref) and information (Inf) values] were calculatedfrom the analytical data
KL2-G Isotope ratio (±± 2s ) Analyticaltechnique
Laboratory Reference Preferred value(±± 95% CL)
d17O (‰ VSMOW) 4.31 ± 0.04 MS UTüb Jochum et al. (2006b) 4.31 (Inf)d18O (‰ VSMOW) 8.63 ± 0.09 MS UTüb Jochum et al. (2006b) 8.63 (Inf)d7Li (‰ LSVEC) 4.1 ± 3.0 SIMS UEd Jochum et al. (2006b) 4.1 (Inf)d29Si (‰ NISTSRM 8546)
-0.21 ± 0.16 LA-MC-ICP-MS UHan This work -0.21 (Inf)
d30Si (‰NISTSRM 8546)
-0.44 ± 0.03 LA-MC-ICP-MS UHan This work -0.44 (Inf)
d44 ⁄ 40Ca(‰ NISTSRM 915a)
0.83 ± 0.11 TIMS GEOMAR This work 0.77 (Inf)0.70 ± 0.07 TIMS GEOMAR Amini et al. (2009)0.67 ± 0.15* TIMS GEOMAR Jochum et al. (2006b)
87Sr ⁄ 86Sr 0.703559 ± 0.000008 TIMS MPI This work 0.703565 ± 0.000022 (Ref)0.703575 ± 0.000007 TIMS UBC This work0.703561 ± 0.000035 TIMS MPI Raczek et al. (2003)
0.7036 ± 0.0008* LA-ICP-MS MPI Jochum et al. (2009)143Nd ⁄ 144Nd 0.512954 ± 0.000006 TIMS MPI This work 0.512952 ± 0.000017 (Ref)
0.512944 ± 0.000005 TIMS UBC This work0.512957 ± 0.000010 TIMS MPI Raczek et al. (2003)
176Hf ⁄ 177Hf 0.283109 ± 0.000009 MC-ICP-MS MPI Jochum et al. (2006b) 0.283108 ± 0.000002 (Inf)0.283107 ± 0.000004 MC-ICP-MS ETH This work
206Pb ⁄ 204Pb 19.0441 ± 0.0016 TIMS MPI This work 19.038 ± 0.009 (Ref)19.0421 ± 0.0002 MC-ICP-MS UBC This work
19.033 ± 0.020 TIMS MPI Jochum et al. (2005c)19.0339 ± 0.0006 MC-ICP-MS UMel Jochum et al. (2005c)
19.2 ± 0.8* LA-ICP-MS MPI Jochum et al. 2005d19.03 ± 0.07* LA-MC-ICP-MS MUN Souders and Sylvester
(2008)19.04 ± 0.27* LA-MC-ICP-MS UMel Paul et al. (2005)
207Pb ⁄ 204Pb 15.6313 ± 0.0019 TIMS MPI This work 15.634 ± 0.006 (Ref)15.6303 ± 0.0002 MC-ICP-MS UBC This work
15.636 ± 0.008 TIMS MPI Jochum et al. (2005c)15.6386 ± 0.0006 MC-ICP-MS UMel Jochum et al. (2005c)
15.8 ± 0.8* LA-ICP-MS MPI Jochum et al. (2005d)15.612 ± 0.044* LA-MC-ICP-MS MUN Souders and Sylvester
(2008)15.62 ± 0.28* LA-MC-ICP-MS UMel Paul et al. (2005)
208Pb ⁄ 204Pb 38.4732 ± 0.0061 TIMS MPI This work 38.509 ± 0.047 (Ref)38.4955 ± 0.0042 MC-ICP-MS UBC This work
38.528 ± 0.032 TIMS MPI Jochum et al. (2005c)38.5373 ± 0.0014 MC-ICP-MS UMel Jochum et al. (2005c)
38.6 ± 2.5* LA-ICP-MS MPI Jochum et al. (2005d)38.55 ± 0.14* LA-MC-ICP-MS MUN Souders and Sylvester
(2008)38.52 ± 0.57* LA-MC-ICP-MS UMel Paul et al. (2005)
208Pb ⁄ 206Pb 2.02020 ± 0.00016 TIMS MPI This work 2.0232 ± 0.0016 (Ref)2.0216 ± 0.0003 MC-ICP-MS UBC This work2.0245 ± 0.0052 LA-ICP-MS MPI This work2.0243 ± 0.0007 TIMS MPI Jochum et al. (2005c)
2.02470 ± 0.00002 MC-ICP-MS UMel Jochum et al. (2005c)2.021 ± 0.008 ICP-MS MPI Jochum et al. (2005c)2.024 ± 0.003 LA-ICP-MS MPI Jochum et al. (2005c)2.021 ± 0.020 LA-ICP-MS MPI Jochum et al. (2005d)
2.0276 ± 0.0004 LA-MC-ICP-MS MUN Souders and Sylvester(2008)
2.023 ± 0.014 LA-MC-ICP-MS UMel Paul et al. (2005)
2 2 ª 2010 The Authors. Geostandards and Geoanalytical Research ª 2010 International Association of Geoanalysts

The figure also shows 25 lm spot analyses of a GSD-1Gsplit done by SIMS (Jochum et al. 2006b). Distancesbetween the points were about 100 lm. All data pointsagreed within uncertainty limits with the high-precision val-ues. This means that GSD-1G is homogeneous withrespect to Li isotopes at the small scale and at the largescale.
Similar experiments have been previously done withthe MPI-DING glasses GOR128-G, GOR132-G, KL2-G,ML3B-G, T1-G and ATHO-G using SIMS and MC-ICP-MS(Jochum et al. 2006b). Slight micro-heterogeneities of Liisotopes (about 20%) were observed for GOR128-G andML3B-G. The SIMS data were within the range of MC-ICP-MS data. The reason for the large discrepancy of the Li iso-tope MC-ICP-MS data for ATHO-G obtained at UMd(Table 2a) and MPI, Mainz (Table 3b, Jochum et al.2006b) is unclear, presumably an analytical problem,which should be proved.
Boron isotopes
Boron isotopes in six different splits of GSD-1G weredetermined by TIMS at IGG (Table 2b). Figure 2 shows theresults. For splits # 17, 19 and 30 replicate analyses wereperformed. Because of analytical problems the analyses ofsplits #12, 24 and 28 were a factor of about two less pre-cise. However, all analyses agreed within 2s. This meansthat no detectable large-scale heterogeneities of the boronisotopes in GSD-1G were found. We obtained a meand11B value of 10.1 ± 1.0‰ (2s) (relative to NIST SRM951) for GSD-1G.
Micro and bulk analytical investigations have alsobeen performed for some MPI-DING glasses (Jochum et al.2006b) and demonstrate small-scale as well as large-scale homogeneity. As an example, Figure 2 shows thed11B values for GOR 128-G and StHs6 ⁄ 80-G. TheLA-MC-ICP-MS analyses of Tiepolo et al. (2006) indicateuniform distribution of B isotopes. They agree with the twohigh-precision TIMS measurements done on different splits(Table 2b, Rosner and Meixner 2004).
Silicon isotopes
Silicon isotope measurements on three splits of GSD-1G and seven MPI-DING glasses were performed at Leib-niz University (Hannover) using LA-MC-ICP-MS and arelisted in Table 2c. All d29Si and d30Si values were negativerelative to NIST SRM 8546 (NBS 28). The analysed splits2a, 2f and 14d of GSD-1G revealed identical Si isotopecompositions within uncertainty demonstrating small-scaleand large-scale homogeneity of GSD-1G (Figure 3). Also,two independent analyses of KL2-G agreed within uncer-tainty limits.
Calcium isotopes
Table 2d lists the high-precision TIMS measurements ofCa isotopes done at IFM-GEOMAR (Kiel). The results forthree different splits of GSD-1G agreed within uncertaintylimits of 2 SE demonstrating large-scale homogeneity inGSD-1G with respect to Ca isotopes (Figure 4). Table 2dalso lists new results for other reference materials includingthe MPI-DING glasses KL2-G and ATHO-G. As Figure 4
Table 3f (continued).
KL2-G Isotope ratio (±± 2s ) Analyticaltechnique
Laboratory Reference Preferred value(±± 95% CL)
207Pb ⁄ 206Pb 0.820794 ± 0.000032 TIMS MPI This work 0.82099 ± 0.00066 (Ref)0.82083 ± 0.00002 MC-ICP-MS UBC This work
0.8209 ± 0.0032 LA-ICP-MS MPI This work0.82146 ± 0.00054 TIMS MPI Jochum et al. (2005c)0.82162 ± 0.00001 MC-ICP-MS UMel Jochum et al. (2005c)
0.8203 ± 0.0007 ICP-MS MPI Jochum et al. (2005c)0.8225 ± 0.0002 LA-ICP-MS MPI Jochum et al. (2005c)0.8214 ± 0.0082 LA-ICP-MS MPI Jochum et al. (2005d)0.8209 ± 0.0011 LA-MC-ICP-MS MUN Souders and Sylvester
(2008)0.819 ± 0.009 LA-MC-ICP-MS UMel Paul et al. (2005)
234U ⁄ 238U 0.00005322 ± 0.00000051 MC-ICP-MS MPI This work 0.0000532 (Inf)238U ⁄ 235U 140.96 ± 0.28 MC-ICP-MS MPI This work 141.0 (Inf)
TIMS and MC-ICP-MS values of Sr, Nd, Hf and Pb were normalised to NIST SRM 987 (87Sr ⁄ 86Sr = 0.710247), La Jolla (143Nd ⁄ 144Nd = 0.511846),JMC-475 (176Hf ⁄ 177Hf = 0.282160) and NIST SRM 981 (206Pb ⁄ 204Pb = 16.9435, 207Pb ⁄ 204Pb = 15.5011, 208Pb ⁄ 204Pb = 36.7309,208Pb ⁄ 206Pb = 2.16786, 207Pb ⁄ 206Pb = 0.914870), respectively.* not used.
ª 2010 The Authors. Geostandards and Geoanalytical Research ª 2010 International Association of Geoanalysts 2 3

shows there was a good agreement with analyses per-formed on other splits of the MPI-DING glasses (Jochumet al. 2006b, Amini et al. 2009) also indicating Ca isoto-pic homogeneity at the millimetre scale for KL2-G andATHO-G.
Strontium and Nd isotopes
Strontium and Nd isotope ratios were determined infour different TIMS laboratories. Tables 2e–h list the data
for GSD-1G and some MPI-DING glasses together withthe results for NIST SRM 987 and La Jolla.
Each laboratory analysed three different splits of GSD-1G. This meant that data for twelve different splits wereavailable. The results of the different splits in each labora-tory agreed within uncertainty, demonstrating isotopichomogeneity of Sr and Nd in GSD-1G. The absolutevalues of 87Sr ⁄ 86Sr obtained in the various laboratoriesdiffered slightly (Tables 2e–h); however, they agreed if
Table 3g.Isotopic data for ML3B-G. Preferred values [reference (Ref) and information (Inf) values] were calculatedfrom the analytical data
ML3B-G Isotope ratio (±± 2s ) Analyticaltechnique
Laboratory Reference Preferred value(±± 95% CL)
d17O (‰ VSMOW) 4.28 ± 0.08 MS UTüb Jochum et al. (2006b) 4.28 (Inf)d18O (‰ VSMOW) 8.35 ± 0.22 MS UTüb Jochum et al. (2006b) 8.35 (Inf)d7Li (‰ LSVEC) 4.35 ± 0.18 MC-ICP-MS MPI Jochum et al. (2006b) 4.35 (Inf)
4.7 ± 3.0* SIMS UEd Jochum et al. (2006b)d29Si (‰ NIST SRM 8546) -0.16 ± 0.05 LA-MC-ICP-MS UHan This work -0.16 (Inf)d30Si (‰ NIST SRM 8546) -0.35 ± 0.08 LA-MC-ICP-MS UHan This work -0.35 (Inf)d44 ⁄ 40Ca (‰ NISTSRM 915a)
0.72 ± 0.05 TIMS GEOMAR Amini et al. (2009) 0.70 ± 0.05 (Inf)0.67 ± 0.15 TIMS GEOMAR Jochum et al. (2006b)
87Sr ⁄ 86Sr 0.703849 ± 0.000015 TIMS MPI Raczek et al. (2003) 0.703849 (Inf)0.7038 ± 0.0008* LA-ICP-MS MPI Jochum et al. (2009)
143Nd ⁄ 144Nd 0.512882 ± 0.000010 TIMS MPI Raczek et al. (2003) 0.512882 (Inf)176Hf ⁄ 177Hf 0.283067 ± 0.000017 MC-ICP-MS MPI Jochum et al. (2006b) 0.283067 (Inf)206Pb ⁄ 204Pb 18.732 ± 0.031 TIMS MPI Jochum et al. (2005c) 18.72 ± 0.04 (Ref)
18.7030 ± 0.0005 MC-ICP-MS UMel Jochum et al. (2005c)18.9 ± 1.0* LA-ICP-MS MPI Jochum et al. (2005c)
18.71 ± 0.28 LA-MC-ICP-MS MUN Souders and Sylvester(2008)
207Pb ⁄ 204Pb 15.609 ± 0.030 TIMS MPI Jochum et al. (2005c) 15.58 ± 0.10 (Ref)15.5945 ± 0.0005 MC-ICP-MS UMel Jochum et al. (2005c)
15.7 ± 0.7* LA-ICP-MS MPI Jochum et al. (2005c)15.53 ± 0.23 LA-MC-ICP-MS MUN Souders and Sylvester
(2008)208Pb ⁄ 204Pb 38.477 ± 0.094 TIMS MPI Jochum et al. (2005c) 38.42 ± 0.15 (Ref)
38.4270 ± 0.0012 MC-ICP-MS UMel Jochum et al. (2005c)38.6 ± 2.0* LA-ICP-MS MPI Jochum et al. (2005c)
38.36 ± 0.66 LA-MC-ICP-MS MUN Souders and Sylvester(2008)
208Pb ⁄ 206Pb 2.0541 ± 0.0047 TIMS MPI Jochum et al. (2005c) 2.0540 ± 0.0020 (Ref)2.05462 ± 0.00002 MC-ICP-MS UMel Jochum et al. (2005c)
2.056 ± 0.005 ICP-MS MPI Jochum et al. (2005c)2.055 ± 0.004 LA-ICP-MS MPI Jochum et al. (2005c)2.054 ± 0.016 LA-ICP-MS MPI Jochum et al. (2005c)
2.0503 ± 0.0056 LA-MC-ICP-MS MUN Souders and Sylvester(2008)
207Pb ⁄ 206Pb 0.8333 ± 0.0015 TIMS MPI Jochum et al. (2005c) 0.8329 ± 0.0020 (Ref)0.83379 ± 0.00001 MC-ICP-MS UMel Jochum et al. (2005c)
0.8342 ± 0.0028 ICP-MS MPI Jochum et al. (2005c)0.8317 ± 0.0083 LA-ICP-MS MPI Jochum et al. (2005c)0.8348 ± 0.0100 LA-ICP-MS MPI Jochum et al. (2005c)
0.82974 ± 0.00021 LA-MC-ICP-MS MUN Souders and Sylvester(2008)
TIMS and MC-ICP-MS values of Sr, Nd, Hf and Pb were normalised to NIST SRM 987 (87Sr ⁄ 86Sr = 0.710247), La Jolla (143Nd ⁄ 144Nd = 0.511846), JMC-475 (176Hf ⁄ 177Hf = 0.282160) and NIST SRM 981 (206Pb ⁄ 204Pb = 16.9435, 207Pb ⁄ 204Pb = 15.5011, 208Pb ⁄ 204Pb = 36.7309,208Pb ⁄ 206Pb = 2.16786, 207Pb ⁄ 206Pb = 0.914870), respectively.* not used.
2 4 ª 2010 The Authors. Geostandards and Geoanalytical Research ª 2010 International Association of Geoanalysts

normalised to a common NIST SRM 987 value (Figure 5).This was also the case for 143Nd ⁄ 144Nd when correctedwith the same value of the La Jolla Nd reference material(Figure 6). The Triton NIST SRM 987 and La Jolla data ofLMU (Table 2g) were used for normalisation. In Figures 5and 6, the Sr and the Nd isotope data from the four labo-ratories are compared after normalisation to a commonNIST SRM 987 and La Jolla value, respectively.
Tables 2e–h also report isotopic data for ATHO-G andKL2-G. In Tables 3b, f the Sr and Nd data are comparedwith the previously published data for these referenceglasses (Raczek et al. 2003), which were also normalised
to the Triton data of NIST SRM 987 and La Jolla, respec-tively (Table 2g).
Hafnium isotopes
Tables 2i, j list the 176Hf ⁄ 177Hf ratios obtained by MC-ICP-MS at UBC and the ETH, respectively. Three differentsplits of GSD-1G were analysed in each laboratory andthe data were normalised to the accepted value for JMC-475. The agreement of the data is excellent demonstratinglarge-scale homogeneity of Hf isotopes in GSD-1G (Fig-ure 7). Mean 176Hf ⁄ 177Hf values of the UBC and ETH lab-oratories (0.282122; 0.282120) were nearly identical.
Table 3h.Isotopic data for StHs6 ⁄ 80-G. Preferred values [reference (Ref) and information (Inf) values] werecalculated from the analytical data
StHs6 ⁄ 80-G Isotope ratio (±± 2s) Analyticaltechnique
Laboratory Reference Preferred value(±± 95% CL)
dD (‰ VSMOW) -95 ± 2 MS UTüb Jochum et al. (2006b) -95 (Inf)d17O (‰ VSMOW) 3.21 ± 0.10 MS UTüb Jochum et al. (2006b) 3.21(Inf)d18O (‰ VSMOW) 6.12 ± 0.07 MS UTüb Jochum et al. (2006b) 6.12 (Inf)d7Li (‰ LSVEC) 3.6 ± 0.8 MC-ICP-MS MPI Jochum et al. (2006b) 3.6 (Inf)d11B (‰ NIST SRM951)
-4.9 ± 1.1 TIMS IGG Pisa This work -4.7 ± 0.4 (Ref)-4.48 ± 0.28 TIMS GFZ Rosner and Meixner
(2004)-4.3 ± 4.8* LA-MC-ICP-MS Th Tiepolo et al. (2006)
d29Si (‰ NIST SRM8546)
-0.10 ± 0.11 LA-MC-ICP-MS UHan This work -0.10 (Inf)
d30Si (‰ NIST SRM8546)
--0.17 ± 0.13 LA-MC-ICP-MS UHan This work -0.17 (Inf)
d44 ⁄ 40Ca (‰ NISTSRM 915a)
0.75 ± 0.05 TIMS GEOMAR Amini et al. (2009) 0.75 (Inf)0.74 ± 0.15 TIMS GEOMAR Jochum et al. (2006b)
87Sr ⁄ 86Sr 0.703541 ± 0.000009 TIMS MPI Raczek et al. (2003) 0.703538 ± 0.000038 (Inf)0.703535 ± 0.000003 TIMS LMU This work
143Nd ⁄ 144Nd 0.512901 ± 0.000012 TIMS MPI Raczek et al. (2003) 0.51291 ± 0.00011 (inf)0.512919 ± 0.000004 TIMS This work
206Pb ⁄ 204Pb 18.9022 ± 0.0011 TIMS MPI Jochum et al. (2005c) 18.902 ± 0.004 (Ref)18.9016 ± 0.0006 MC-ICP-MS UMel Jochum et al. (2005c)
19.0 ± 0.6* LA-ICP-MS MPI Jochum et al. (2005c)207Pb ⁄ 204Pb 15.6161 ± 0.0012 TIMS MPI Jochum et al. (2005c) 15.618 ± 0.022 (Ref)
15.6196 ± 0.0005 MC-ICP-MS UMel Jochum et al. (2005c)15.7 ± 0.6* LA-ICP-MS MPI Jochum et al. (2005c)
208Pb ⁄ 204Pb 38.5148 ± 0.0034 TIMS MPI Jochum et al. (2005c) 38.52 ± 0.08 (Ref)38.5267 ± 0.0012 MC-ICP-MS UMel Jochum et al. (2005c)
38.7 ± 1.0* LA-ICP-MS MPI Jochum et al. (2005c)208Pb ⁄ 206Pb 2.03756 ± 0.00008 TIMS MPI Jochum et al. (2005c) 2.0380 ± 0.0031 (Ref)
2.03831 ± 0.00002 MC-ICP-MS UMel Jochum et al. (2005c)2.042 ± 0.003 ICP-MS MPI Jochum et al. (2005c)2.036 ± 0.012 LA-ICP-MS MPI Jochum et al. (2005c)2.036 ± 0.024 LA-ICP-MS MPI Jochum et al. (2005c)
207Pb ⁄ 206Pb 0.826139 ± 0.000018 TIMS MPI Jochum et al. (2005c) 0.82644 ± 0.00096 (Ref)0.82635 ± 0.00001 MC-ICP-MS UMel Jochum et al. (2005c)
0.8256 ± 0.0012 ICP-MS MPI Jochum et al. (2005c)0.8264 ± 0.0033 LA-ICP-MS MPI Jochum et al. (2005c)0.8277 ± 0.0099 LA-ICP-MS MPI Jochum et al. (2005c)
TIMS and MC-ICP-MS values of Sr, Nd and Pb were normalised to NIST SRM 987 (87Sr ⁄ 86Sr = 0.710247), La Jolla (143Nd ⁄ 144Nd = 0.511846) and NISTSRM 981 (206Pb ⁄ 204Pb = 16.9435, 207Pb ⁄ 204Pb = 15.5011, 208Pb ⁄ 204Pb = 36.7309, 208Pb ⁄ 206Pb = 2.16786, 207Pb ⁄ 206Pb = 0.914870), respectively.* not used.
ª 2010 The Authors. Geostandards and Geoanalytical Research ª 2010 International Association of Geoanalysts 2 5

Table 3i.Isotopic data for T1-G. Preferred values [reference (Ref) and information (Inf) values] were calculated fromthe analytical data
T1-G Isotope ratio (±± 2s ) Analyticaltechnique
Laboratory Reference Preferred value(±± 95% CL)
dD (‰ VSMOW) -117 ± 2 MS UTüb Jochum et al. (2006b) -117 (Inf)d17O (‰ VSMOW) 3.89 ± 0.04 MS UTüb Jochum et al. (2006b) 3.89 (Inf)d18O (‰ VSMOW) 7.53 ± 0.07 MS UTüb Jochum et al. (2006b) 7.53 (Inf)d7Li (‰ LSVEC) 2.05 ± 0.14 MC-ICP-MS MPI Jochum et al. (2006b) 2.1 (Inf)
-0.1 ± 1.4* SIMS UEd Jochum et al. (2006b)d29Si (‰ NIST SRM8546)
-0.13 ± 0.09 LA-MC-ICP-MS UHan This work -0.13 (Inf)
d30Si (‰ NIST SRM8546)
-0.23 ± 0.16 LA-MC-ICP-MS UHan This work -0.23 (Inf)
d44 ⁄ 40Ca (‰ NISTSRM 915a)
0.80 ± 0.06 TIMS GEOMAR Amini et al. (2009) 0.80 (Inf)0.73 ± 0.15* TIMS GEOMAR Jochum et al. (2006b)
87Sr ⁄ 86Sr 0.710137 ± 0.000004 TIMS MPI Raczek et al. (2003) 0.710137 (Inf)143Nd ⁄ 144Nd 0.512333 ± 0.000017 TIMS MPI Raczek et al. (2003) 0.512333 (Inf)206Pb ⁄ 204Pb 18.7278 ± 0.0011 TIMS MPI Jochum et al. (2005c) 18.731 ± 0.006 (Ref)
18.7325 ± 0.0007 MC-ICP-MS UMel Jochum et al. (2005c)19.0 ± 0.3* LA-ICP-MS MPI Jochum et al. (2005c)
18.732 ± 0.011 LA-MC-ICP-MS MUN Souders and Sylvester(2008)
207Pb ⁄ 204Pb 15.6808 ± 0.0011 TIMS MPI Jochum et al. (2005c) 15.678 ± 0.023 (Ref)15.6859 ± 0.0006 MC-ICP-MS UMel Jochum et al. (2005c)
15.9 ± 0.5* LA-ICP-MS MPI Jochum et al. (2005c)15.668 ± 0.013 LA-MC-ICP-MS MUN Souders and Sylvester
(2008)208Pb ⁄ 204Pb 38.9743 ± 0.0032 TIMS MPI Jochum et al. (2005c) 38.977 ± 0.012 (Ref)
38.9831 ± 0.0015 MC-ICP-MS UMel Jochum et al. (2005c)39.3 ± 0.6* LA-ICP-MS MPI Jochum et al. (2005c)
38.975 ± 0.027 LA-MC-ICP-MS MUN Souders and Sylvester(2008)
208Pb ⁄ 206Pb 2.08106 ± 0.00007 TIMS MPI Jochum et al. (2005c) 2.0811 ± 0.0002 (Ref)2.08108 ± 0.00002 MC-ICP-MS UMel Jochum et al. (2005c)
2.081 ± 0.001 ICP-MS MPI Jochum et al. (2005c)2.081 ± 0.008 LA-ICP-MS MPI Jochum et al. (2005c)2.081 ± 0.012 LA-ICP-MS MPI Jochum et al. (2005c)
2.08151 ± 0.008 LA-MC-ICP-MS MUN Souders and Sylvester(2008)
207Pb ⁄ 206Pb 0.837288 ± 0.000015 TIMS MPI Jochum et al. (2005c) 0.83740 ± 0.00072 (Ref)0.83736 ± 0.00001 MC-ICP-MS UMel Jochum et al. (2005c)
0.8367 ± 0.0015 ICP-MS MPI Jochum et al. (2005c)0.8382 ± 0.0034 LA-ICP-MS MPI Jochum et al. (2005c)0.8382 ± 0.0084 LA-ICP-MS MPI Jochum et al. (2005c)
0.83665 ± 0.00011 LA-MC-ICP-MS MUN Souders and Sylvester(2008)
230Th ⁄ 232Th 0.000000990 ± 0.000000009 TIMS LANL Matthews et al. (2008) 0.000000990 (Inf)0.00000098 ± 0.000000003* LA-ICP-MS MPI Mertz-Kraus et al. (2010)
(230Th) ⁄ (232Th) 0.184 ± 0.002 TIMS LANL Matthews et al. (2008) 0.184 (Inf)0.181 ± 0.001* LA-ICP-MS MPI Mertz-Kraus et al. (2010)
230Th ⁄ 238U 0.00001866 ± 0.00000056 LA-ICP-MS MPI Mertz-Kraus et al. (2010) 0.00001866 (Inf)(230Th) ⁄ (238U) 1.102 ± 0.013 TIMS LANL Matthews et al. (2008) 1.102 (Inf)
1.101 ± 0.033* LA-ICP-MS MPI Mertz-Kraus et al. (2010)234U ⁄ 238U 0.00005497 ± 0.00000010 TIMS LANL Matthews et al. (2008) 0.00005497 (Inf)
0.0000548 ± 0.0000007* LA-ICP-MS MPI Mertz-Kraus et al. (2010)(234U) ⁄ (238U) 1.001 ± 0.002 TIMS LANL Matthews et al. (2008) 1.001 (Inf)
0.998 ± 0.013 LA-ICP-MS MPI Mertz-Kraus et al. (2010)
TIMS and MC-ICP-MS values of Sr, Nd and Pb were normalised to NIST SRM 987 (87Sr ⁄ 86Sr = 0.710247), La Jolla (143Nd ⁄ 144Nd = 0.511846) and NISTSRM 981 (206Pb ⁄ 204Pb = 16.9435, 207Pb ⁄ 204Pb = 15.5011, 208Pb ⁄ 204Pb = 36.7309, 208Pb ⁄ 206Pb = 2.16786, 207Pb ⁄ 206Pb = 0.914870), respectively.* not used.
2 6 ª 2010 The Authors. Geostandards and Geoanalytical Research ª 2010 International Association of Geoanalysts

A good agreement was also found for the ATHO-Ganalyses performed in the two laboratories (Figure 7). Theresult of the KL2-G analysis done at the ETH was identicalwith the published MC-ICP-MS value derived at the MPI(Jochum et al. 2006b).
-0.60
-0.40
-0.20
0.00
0.20
Split #2a #2f #14d
δ30Si
(‰)
single valuesSplit# 2a
meanGSD-1G
Figure 3. d30Si LA-MC-ICP-MS values for three GSD-
1G splits using a femtosecond laser. Bars indicate ± 2
SE (single values) and ± 2s (mean values).
δ44/4
0 Ca
(‰) GSD-1G KL2-G ATHO-G
this workAmini et al. (2009)Jochum et al. (2006b)
#14a #33b #35b
1.4
1.2
1
0.8
0.6
0.4
Figure 4. d44 ⁄ 40Ca TIMS values obtained from differ-
ent splits of GSD-1G, KL-2G and ATHO-G. Bars indi-
cate 2 SE uncertainties.
GSD-1G12
11
10
9
8
7#12 #17 #19 #24 #28 #30
δ11 B
(‰)
δ11 B
(‰)
StHs6/80-G
GOR 128-G
60 µm 80 µm
LA-MC-ICP-MS TIMS25
20
15
10
5
0
-5
-10
-15
Tiepolo et al. (2006)Rosner and Meixner (2004)this work
Figure 2. d11B TIMS values obtained from different
splits of GSD-1G, GOR128-G and StHs6 ⁄ 80-G. Also
included are published TIMS and LA-MC-ICP-MS anal-
yses (using spot sizes of 60 and 80 lm, respectively).
Bars indicate ± 2s (TIMS) and ± 2 SE (LA-MC-ICP-MS
single values).
29Split #A #B
#C#D
#6#38
#27
30
31
32
33
34
this workJochum et al. (2006b)Kasemann et al. (2005)
7 Li (
‰)
SIMS MC-ICP-MS TIMS
GSD-1G
Figure 1. d7Li values obtained for different splits of
GSD-1G. The new MC-ICP-MS data agree well with
published high-precision MC-ICP-MS and TIMS values.
The agreement with the in situ SIMS measurements
indicates small-scale and large-scale homogeneity of
GSD-1G. Bars of single values indicate typical ± 2 SE
uncertainties.
0.70940
0.70942
0.70944
0.70946
Split #22#26
#31 #4#34
#36 #11#23
#40 #2c#14e
#37
GSD-1G
87Sr
/86 S
r
MPILMU (MAT 261)LMU (Triton)UBC
Figure 5. High-precision 87Sr ⁄ 86Sr TIMS values of
twelve different splits of GSD-1G obtained from four
different laboratories. Uncertainties are ± 2 SE. The Sr
isotope data from the four laboratories were norma-
lised to a common value (0.710247) for NIST SRM
987.
ª 2010 The Authors. Geostandards and Geoanalytical Research ª 2010 International Association of Geoanalysts 2 7

Lead isotopes
The Pb isotope data of GSD-1G and some other ref-erence materials using TIMS and MC-ICP-MS are listed in
Table 2k (MPI), Table 2l (UBC) and Table 2m (UMel). Inorder to compare the Pb isotopic data of the three labora-tories, all values were normalised to the triple spike dataof NIST SRM 981 determined at the MPI (Table 2k).Figure 8 shows the 206Pb ⁄ 204Pb, 207Pb ⁄ 204Pb and208Pb ⁄ 204Pb ratios performed on seven different splits ofGSD-1G. There is an excellent agreement of the TIMSand MC-ICP-MS data obtained in the three laboratories.Within uncertainty limits the 206Pb ⁄ 204Pb and 207Pb ⁄204Pb ratios are indistinguishable from each other. In sum-mary, the Pb isotope data of three different institutionsshowed no hint of large-scale Pb isotopic heterogeneity inGSD-1G.
Possible small-scale Pb isotopic heterogeneities ofGSD-1G were tested at different locations on different
GSD-1G
#2 #14 #22 #2c #14e #37
ETH (this work)UBC (this work)MPI (Jochum et al. 2006b)
ATHO-GKL2-G
176 H
f/17
7 Hf
0.28216
0.28214
0.28212
0.28210
0.28208
0.28206
0.28318
0.28316
0.28314
0.28312
0.28310
Figure 7. MC-ICP-MS 176Hf ⁄ 177Hf ratios from different
splits of GSD-1G, ATHO-G and KL2-G obtained in
three different laboratories. Uncertainties are ± 2 SE.
Values were normalised to a 176Hf ⁄ 177Hf ratio for
JMC-475 of 0.282160.
0.51151
0.51152
0.51153
0.51154
Split #22#26
#31 #4#34
#36 #11#23
#40 #2c#14e
#37
GSD-1G
MPILMU (MAT 261)LMU (Triton)UBC
143 N
d/14
4 Nd
Figure 6. High-precision 143Nd ⁄ 144Nd TIMS values
from twelve different splits of GSD-1G obtained in
four different laboratories. Uncertainties are ± 2 SE.
The Nd isotope data from the four laboratories were
normalised to a common value (0.511846) for
La Jolla.
15.740
15.744
15.748
19.57
19.58
19.59
38.89
38.90
38.91
38.92
38.93
#15#26a
#45#12
#14e#37
#0
TIMS MPI
MC-ICP-MS UBC
MC-ICP-MS UMel
GSD-1G
206 P
b/20
4 Pb
207 P
b/20
4 Pb
208 P
b/20
4 Pb
Figure 8. High-precision TIMS and MC-ICP-MS Pb iso-
topic ratios from seven different splits of GSD-1G. The
data of three different laboratories agree very well
when normalising to the same triple spike values of
NIST SRM 981 (Table 2k). Uncertainties are ± 2 SE.
2 8 ª 2010 The Authors. Geostandards and Geoanalytical Research ª 2010 International Association of Geoanalysts

splits by LA-MC-ICP-MS at UMel and LA-ICP-MS at theMPI using spot sizes of 93 and 75 lm, respectively(Tables 2n, o). Figure 9 shows the results for 208Pb ⁄ 206Pband 207Pb ⁄ 206Pb in GSD-1G. Because of the multipleFaraday collector system used for ion detection, the preci-sion of the LA-MC-ICP-MS measurements (2 RSD =0.09% for 208Pb ⁄ 206Pb, 207Pb ⁄ 206Pb in GSD-1G) wasbetter than that of the LA-ICP-MS data using only a sin-gle ion counter (about 0.13%). Such values are typicallyobtained for homogeneous glasses. This means that therewas no indication for a heterogeneous distribution of Pbisotopes in GSD-1G in the 75–93 lm range. Figure 8also shows that the LA-(MC)-ICP-MS data agreed verywell with the high-precision (2 RSD < 0.02%) TIMS andMC-ICP-MS data. GSD-1G is therefore a very suitablereference material for both, high-precision and in situ Pbisotopic work.
The homogeneity of the MPI-DING glasses was investi-gated in detail by Jochum et al. (2006b). Small Pb isotopicheterogeneities were found in GOR 128-G and ML3B-G.However, they are generally lower than the reproducibilityobtained from in situ microanalytical techniques, such asSIMS and LA-ICP-MS. The new results for KL2-G andATHO-G (Tables 2k, l) generally agreed with the formerlypublished Pb isotope ratios when normalising to the sameNIST SRM 981 value.
Uranium and Th isotopes
Matthews et al. (2008) reported high-precision TIMSdata for U and Th isotopic ratios in MPI-DING ATHO-G,T1-G (Tables 3b, i) and some USGS reference glasses.These data are extremely useful to assess the performanceof LA-ICP-MS, which require matrix-matched solid referencematerials for correction of U-series elemental and isotopicratios. Recently, Mertz-Kraus et al. (2010) published in situLA-ICP-MS Th and U isotopic data and used the data ofMatthews et al. (2008) to test their data quality.Tables 3b, i show the results for T1-G and ATHO-G. Thereproducibility (2 RSD) of the data was between 0.6% and3.5%. In all cases, Th and U isotopic data agreed withinuncertainty limits with the TIMS values of Matthews et al.(2008). We conclude from the LA-ICP-MS and the TIMSdata that Th and U isotopes are homogeneously distrib-uted in the T1-G and ATHO-G much better than 3.5%.
As mentioned earlier, U isotopes in GSD-1G aredepleted (238U ⁄ 235U = 271.4; Table 3a). Our LA-ICP-MSmeasurements on different glass splits (SW, M3) of GSD-1G yielded isotopic homogeneity with respect to238U ⁄ 235U (Figure 10). Because of the large correctioncaused by the high Th concentration (41 lg g-1),230Th ⁄ 232Th and 230Th ⁄ 238U ratios in GSD-1G could notbe determined precisely by LA-ICP-MS. High-precision
1.982
1.986
1.990
LA-MC-ICP-MS LA-ICP-MS
0.802
0.803
0.804
0.805
TIM
SM
C-I
CP
-MS
MC
-IC
P-M
S
#37e
#37d
#37c
#33a
#14b
#2b
#2d
#35a
#37a
#15,
26a,
45
# 12,
14e,
37
mea
n
mea
n
# 0
GSD-1G
208 P
b/20
6 Pb
207 P
b/20
6 Pb
Figure 9. Microanalytical LA-(MC)-ICP-MS 208Pb ⁄ 206Pb and 207Pb ⁄ 206Pb data obtained from nine different splits
of GSD-1G. Uncertainties of the mean values are ± 2s. Both data sets agreed within uncertainty limits with the
high-precision TIMS and MC-ICP-MS values.
ª 2010 The Authors. Geostandards and Geoanalytical Research ª 2010 International Association of Geoanalysts 2 9

MC-ICP-MS measurements performed on three differentsplits of GSD-1G (Table 2q) yielded 238U ⁄ 235U and234U ⁄ 238U ratios, which agreed within uncertainty limitsand confirmed large-scale homogeneity of U isotopes inGSD-1G. The 238U ⁄ 235U and the 234U ⁄ 238U ratios ofKL2-G were 3% higher than the ratios measured in theoriginal KL2 rock powder (238U ⁄ 235U = 137.31 ±0.07, 234U ⁄ 238U = 0.0000549 ± 0.0000001) presum-ably caused by the U contamination introduced duringglass preparation (Jochum et al. 2000).
Derivation of reference andinformation values and theiruncertainties
Tables 3a–i list a summary of currently available isoto-pic data for GSD-1G and the MPI-DING glasses. In orderto determine preliminary reference and information valuesfrom the data we adopt the recommendations of the Inter-national Association of Geoanalysts (IAG), which undertookefforts to function as a certifying body and developed aprotocol for the certification of geological and environmen-tal reference materials (Kane 2002, Kane et al. 2003).
All laboratories participating in this work have the tech-nical competence to perform measurements that match cer-tification goals for reference values, particularly recognisingthe need to minimise inter-laboratory bias and to achievestandards of traceability and uncertainty (Kane et al.2003). In this programme, thirteen laboratories participatedin the isotopic characterisation of GSD-1G and the MPI-DING glasses (Table 1) and a further 10 laboratories havepreviously published their analytical results for the samples.
All laboratories were considered as ‘qualified’. As outlinedin Kane et al. (2003) the competence is assessed by partic-ipating in the IAG GeoPT proficiency testing programmeand ⁄ or on the quality of published research data whereissues of error investigation and uncertainty estimation havebeen evaluated satisfactorily. The collaborating laboratorieshave demonstrated their technical competence in geo-chemical research by using thoroughly investigated andwell established methods, as well as the publication ofreports and research papers describing ‘state of the prac-tice’ analytical techniques.
The laboratories submitted their mean results with therespective standard deviations (Tables 2a–p). Nearly all ofthem also provided the results of all measurements made.Descriptions of the methods including some references aregiven above.
Traceability (King 1997, Potts 1997) is a key conceptfor characterising reference samples. It links the validity ofall analytical measurements to national and internationalreference materials through an unbroken chain of compari-sons, for each of which an analytical uncertainty is knownat a specified level of confidence (Kane 2002). Traceabilitywas established in the results by the use of international ref-erence materials such as NIST SRM 981, 987, 610, 612.
From these data, we have calculated preliminary refer-ence and information values, which serve the scientificcommunity. In contrast to the recommendations of the IAGfor the certification of major and trace element abun-dances (Uriano and Gravatt 1977), where reference val-ues were derived using three or more independent
285
290
280
275
270
238 U
/235 U
5 10 15 20 25 5 10 15 20 25
3M G1-DSGWS G1-DSG
Experiment
Figure 10. 238U ⁄ 235U ratios obtained from two different splits of GSD-1G using LA-ICP-MS. This diagram shows
that the U isotopes in GSD-1G were homogeneously distributed, but much higher than the natural ratio of
137.88. Bars indicate ± 2 SE, shaded band ± 2s.
3 0 ª 2010 The Authors. Geostandards and Geoanalytical Research ª 2010 International Association of Geoanalysts

techniques, this is not possible in the case of isotopic ratioswhere only two different high-precision techniques for iso-topic analyses exist, namely TIMS and MC-ICP-MS. There-fore, we report reference values when analytical data arein statistical agreement and are derived from at least threedifferent laboratories using at least one high-precisiontechnique. They are determined by averaging the mostprecise results, in particular those of TIMS and MC-ICP-MS.Those isotopic ratios that were determined by fewer thanthree laboratories and ⁄ or only by microanalytical tech-niques are assigned information values rather than refer-ence values.
The reference values and some information values areaccompanied with uncertainties at the 95% confidencelevel. These values were calculated using the IAG protocol(Kane et al. 2003), where the uncertainty, u, is basedmainly on three components of variance. The first compo-nent is the standard deviation of the mean of the N con-tributing laboratories’ mean data, the second and thirdcomponents account for heterogeneities in the glasses andbetween-laboratory biases, respectively. The last two com-ponents do not affect the data seriously, because theGSD-1G and the MPI-DING glasses have been demon-strated to be homogeneous at the small and the largescale for nearly all isotope systems. Hence, the biases areexpected to be very small, and as they are likely to be dis-tributed normally, they will be included in the standarddeviation of the mean. The expanded uncertaintyU = k · u defines an interval having a confidence level(CL) of 95%, where k is the coverage factor. The coveragefactor varied between 12.71 and 2.23 as the number oflaboratory mean data varied between N = 2 andN = 11 (Tables 3a–i).
Conclusions
The investigations of this paper demonstrate that GSD-1G and the MPI-DING glasses are homogeneous at thesmall scale (test portion masses: ng–lg range) and at thelarge- scale (mg range). In an earlier study (Jochum et al.2006b) small isotopic heterogeneities were found, such asfor Li in GOR128-G and Pb in ML3B-G (Jochum et al.2006b). These heterogeneities may be a feature to betaken seriously. However, in the case of Pb they are gener-ally lower than the reproducibility obtained from in situ mi-croanalytical techniques. GSD-1G and the MPI-DINGglasses are therefore suitable samples for most micro- andbulk analytical isotopic investigations. Their reference valueshave a high level of confidence. This is especially true forSr, Nd, Hf and Pb isotopes, where the results of 2–11 labo-ratories are available.
References
Abouchami W., Galer S.J.G. and Hofmann A.W.(2000)High precision lead isotope systematics of lavas from theHawaiian Scientific Drilling Project. Chemical Geology,169, 187–209.
Amini M., Eisenhauer A., Böhm F., Holmden C., KreissigK., Hauff F. and Jochum K.P. (2009)Calcium isotopes (d44 ⁄ 40Ca) in MPI-DING referenceglasses, USGS rock powders and various rocks: Evidencefor Ca isotope fractionation in terrestrial silicates. Geo-standards and Geoanalytical Research, 33, 231–247.
Bernal J.-P., Eggins S.M. and McCulloch M.T. (2005)Accurate in situ 238U-234U-232Th-230Th analysis of silicateglasses and iron oxides by laser-ablation MC-ICP-MS.Journal of Analytical Atomic Spectrometry, 20,1240–1249.
Bizzarro M., Baker J.A. and Ulfbeck D. (2003)A new digestion and chemical separation technique forrapid and highly reproducible determination of Lu ⁄ Hfand Hf isotope ratios in geological materials by MC-ICP-MS. Geostandards Newsletter: The Journal ofGeostandards and Geoanalysis, 27, 133–145.
Blichert-Toft J., Chauvel C. and Albarède F. (1997)Separation of Hf and Lu for high-precision isotope analy-sis of rock samples by magnetic sector-multiple collectorICP-MS. Contributions to Mineralogy and Petrology,127, 248–260.
Catanzaro E.J., Champion C.E., Garner E.L.,Sappenfield K.M. and Shields K.M. (1970)Boric acid: Isotopic and assay standard reference materi-als. United States National Bureau of Standards(Gaithersburg, MD, USA), Special Publication 260-17,70pp.
Chmeleff J., Horn I., Steinhoefel G. and von Blancken-burg F. (2008)In situ determination of precise stable Si isotope ratios byUV-femtosecond laser ablation high-resolution multi-col-lector ICP-MS. Chemical Geology, 249, 155–166.
Chu N.C., Taylor R.N., Chavagnac V., Nesbitt R.W.,Boella R.M., Milton J.A., German C.R., Bayon G. andBurton K. (2002)Hf isotope analysis using multi-collector inductively cou-pled plasma mass spectrometry: An evaluation of isobaricinterference corrections. Journal of Analytical AtomicSpectrometry, 17, 1567–1574.
Connelly J.N., Ulfbeck D.G., Thrane K., Bizzarro M. andHoush T. (2006)A method for purifying Lu and Hf for analyses by MC-ICP-MS using TODGA resin. Chemical Geology, 233,126–136.
ª 2010 The Authors. Geostandards and Geoanalytical Research ª 2010 International Association of Geoanalysts 3 1

re ferences
Gaboardi M. and Humayun M. (2009)Elemental fractionation during LA-ICP-MS analysis of sili-cate glasses: Implications for matrix-independent stan-dardization. Journal of Analytical Atomic Spectrometry,24, 1188–1197.
Galer S.J.G. (1999)Optimal double and triple spiking for high precisionlead isotopic measurement. Chemical Geology, 157,255–274.
Guillong M., Hametner K., Reusser E., Wilson S.A. andGünther D. (2005)Preliminary characterisation of new glass reference mate-rials (GSA-1G, GSC-1G, GSD-1G and GSE-1G) bylaser ablation-inductively coupled plasma-mass spec-trometry using 193 nm, 213 nm and 266 nm wave-lengths. Geostandards and Geoanalytical Research,29, 315–331.
Hellebrand E., Snow J.E., Dick H.J.B. and HofmannA.W. (2001)Coupled major and trace elements as indicators of theextent of melting in mid-ocean-ridge peridotites. Nature,410, 677–681.
Hellstrom J. (2003)Rapid and accurate U ⁄ Th dating using parallel ion-counting multicollector ICP-MS. Journal of AnalyticalAtomic Spectrometry, 18, 1346–1351.
Hellstrom J., Paton C., Woodhead J. and Hergt J.(2008)Iolite: Software for spatially resolved LA-(quad and MC)ICP-MS analysis. Mineralogical Association of CanadaShort Course Series, 40, 343–348.
Heuser A., Eisenhauer A., Gussone N., Bock B., HansenB.T. and Nägler T.F. (2002)Measurement of calcium isotopes (d44Ca) using amulticollector TIMS technique. International Journal ofMass Spectrometry, 220, 385–397.
Hippler D., Schmitt A.D., Gussone N., Heuser A., StilleP., Eisenhauer A. and Nägler T.F. (2003)Calcium isotopic composition of various reference materi-als and seawater. Geostandards Newsletter: The Journalof Geostandards and Geoanalysis, 27, 13–19.
Hoffmann D.L., Prytulak J., Richards D.A., Elliott T.,Coath C.D., Smart P.L. and Scholz D. (2007)Procedures for accurate U and Th isotope measurementsby high precision MC-ICP-MS. International Journal ofMass Spectrometry, 264, 97–190.
Hoffmann D.L., Spötl C. and Mangini A. (2009)Micromill and in situ laser ablation sampling techniquesfor high spatial resolution MC-ICP-MS U-Th dating of car-bonates. Chemical Geology, 259, 253–261.
Horn I. and von Blanckenburg F. (2007)Investigation on elemental and isotopic fractionation dur-ing 196 nm femtosecond laser ablation multiple collectorinductively coupled plasma mass spectrometry. Spectro-chimica Acta Part B, 62, 410–422.
Hu M.-Y., Fan X.-T., Stoll B., Kuzmin D., Liu Ying, LiuYongsheng, Sun W., Wang G., Zhan X.-C. and JochumK.P. (2010)Preliminary characterisation of new reference materialsfor microanalysis: The Chinese GeologicalStandard Glasses CGSG-1, CGSG-2, CGSG-4 andCGSG-5. Geostandards and Geoanalytical Research,in press.
Huang S., Abouchami W., Blichert-Toft J., Clague D.A.,Cousens B.L., Frey F.A. and Humayun M. (2009)Ancient carbonate sedimentary signature in theHawaiian plume: Evidence from Mahukona volcano,Hawaii. Geochemistry Geophysics Geosystems, 10,Q08002.
Ickert R.B., Hiess J., Williams I.S., Holden P., Ireland T.R.,Lanc P., Schram N., Foster J.J. and Clement S.W. (2008)Determining high precision, in situ, oxygen isotope ratioswith a Shrimp II: Analyses of MPI-DING silicate-glassreference materials and zircon from contrasting granites.Chemical Geology, 257, 114–128.
Ivanovich M. and Harmon R.S. (1992)Uranium-series disequilibrium: Applications to Earth, mar-ine and environmental sciences. Oxford University Press(Oxford), 910pp.
Jackson M.G. and Hart S.R. (2006)Strontium isotopes in melt inclusions from Samoanbasalts: Implications for heterogeneity in the Samoanplume. Earth and Planetary Science Letters, 245,260–277.
Jochum K.P. and Nohl U. (2008)Reference materials in geochemistry and environmentalresearch and the GeoReM database. ChemicalGeology, 253, 50–53.
Jochum K.P., Dingwell D.B., Rocholl A., Stoll B., Hof-mann A.W., Becker S., Besmehn A., Bessette D., DietzeH.-J., Dulski P., Erzinger J., Hellebrand E., Hoppe P.,Horn I., Janssens K., Jenner G.A., Klein M., McDonoughW.F., Maetz M., Mezger K., Münker C., Nikogosian I.K.,Pickhardt C., Raczek I., Rhede D., Seufert H.M., SimakinS.G., Sobolev A.V., Spettel B., Straub S., Vincze L., Walli-anos A., Weckwerth G., Weyer S., Wolf D. and ZimmerM. (2000)The preparation and preliminary characterisation ofeight geological MPI-DING reference glasses forin-situ microanalysis. Geostandards Newsletter: TheJournal of Geostandards and Geoanalysis, 24,87–133.
Jochum K.P., Nohl U., Herwig K., Lammel E., Stoll B.and Hofmann A.W. (2005a)GeoReM: A new geochemical database for referencematerials and isotopic standards. Geostandards andGeoanalytical Research, 29, 333–338.
Jochum K.P., Willbold M., Raczek I., Stoll B. and HerwigK. (2005b)Chemical characterisation of the USGS reference glassesGSA-1G, GSC-1G, GSD-1G, GSE-1G, BCR-2G, BHVO-2G and BIR-1G using EPMA, ID-TIMS, ID-ICP-MS andLA-ICP-MS. Geostandards and Geoanalytical Research,29, 285–302.
3 2 ª 2010 The Authors. Geostandards and Geoanalytical Research ª 2010 International Association of Geoanalysts

re ferences
Jochum K.P., Pfänder J., Woodhead J.D., Willbold M.,Stoll B., Herwig K., Amini M., Abouchami W. andHofmann A.W. (2005c)MPI-DING glasses: New geological reference materialsfor in situ Pb isotope analysis. Geochemistry GeophysicsGeosystems, 6, Q10008.
Jochum K.P., Stoll B., Herwig K., Amini M., AbouchamiW. and Hofmann A.W. (2005d)Lead isotope ratio measurements in geological glassesby laser ablation-sector field-ICP mass spectrometry(LA-SF-ICP-MS). International Journal of MassSpectrometry, 242, 281–289.
Jochum K.P., Stoll B., Herwig K. and Willbold M.(2006a)Improvement of in situ Pb isotope analysis by LA-ICP-MSusing a 193 nm Nd:YAG laser. Journal of AnalyticalAtomic Spectrometry, 21, 666–675.
Jochum K.P., Stoll B., Herwig K., Willbold M., HofmannA.W., Amini M., Aarburg S., Abouchami W., Helle-brand E., Mocek B., Raczek I., Stracke A., Alard O.,Bouman C., Becker St., Dücking M., Brätz H., Klemd R.,de Bruin D., Canil D., Cornell D., de Hoog J.C.M.,Dalpé C., Danyushevsky L. V., Eisenhauer A., Gao Y.,Snow J.E., Groschopf N., Günther D., Latkoczy C.,Guillong M., Hauri E., Höfer H.E., Lahaye Y., Horz K.,Jacob D.E., Kasemann S., Kent A.J.R., Zack T., LudwigT., Mason P.R.D., Meixner A., Rosner M., Misawa K.,Nash B.P., Pfänder J.A., Premo W.R., Sun Weidong D.,Tiepolo M., Vannucci R., Vennemann T., Wayne D. andWoodhead J.D. (2006b)MPI-DING reference glasses for in situ microanalysis:New reference values for element concentrations and iso-tope ratios. Geochemistry Geophysics Geosystems, 7,Q02008.
Jochum K.P., Stoll B., Herwig K. and Willbold M.(2007)Validation of LA-ICP-MS trace element analysis of geolog-ical glasses using a new solid-state 193 nm Nd:YAGlaser and matrix-matched calibration. Journal of Analyti-cal Atomic Spectrometry, 22, 112–121.
Jochum K.P., Wilson S.A., Abouchami W., Amini M.,Chmeleff J., McDonough W.F., Raczek I., Rudnick R.L.,Stoll B. and Tonarini S. (2008)USGS GSD-1G: A geological reference glass for in situelemental and isotopic analysis. EOS Transactions AGU,89. Fall Meeting Supplement, Abstract V13A-2095.
Jochum K.P., Stoll B., Weis U., Kuzmin D.V. and SobolevA.V. (2009)In situ Sr isotopic analysis of low Sr silicates usingLA-ICP-MS. Journal of Analytical Atomic Spectrometry,24, 1237–1243.
Kane J.S. (1998)An assessment of suitability of NIST glass SRM literaturedata for the derivation of reference values. GeostandardsNewsletter: The Journal of Geostandards and Geoanal-ysis, 22, 15–31.
Kane J.S. (2002)Fitness-for-purpose of reference material reference valuesin relation to traceability of measurement, as illustrated by
USGS BCR-1, NIST SRM 610 and IAEA NBS 28. Geo-standards Newsletter: The Journal of Geostandards andGeoanalysis, 26, 7–29.
Kane J.S., Potts P.J., Wiedenbeck M., Carignan J. andWilson S. (2003)International Association of Geoanalysts’ protocol for thecertification of geological and environmental referencematerials. Geostandards Newsletter: The Journal ofGeostandards and Geoanalysis, 27, 227–244.
Kasemann S.A., Jeffcoate A.B. and Elliott T. (2005)Lithium isotope composition of basalt glass referencematerial. Analytical Chemistry, 77, 5251–5257.
Kent A.J.R. (2008)In situ analysis of Pb isotope ratios using laser ablationMC-ICP-MS: Controls on precision and accuracy andcomparison between Faraday cup and ion counting sys-tems. Journal of Analytical Atomic Spectrometry, 23,968–975.
King B. (1997)Traceability of chemical analysis. The Analyst, 122,197–204.
Lugmair G.W. and Galer S.J.G. (1992)Age and isotopic relationships among the angrites LewisCliff 86010 and Angra dos Reis. Geochimica et Cosmo-chimica Acta, 56, 1673–1694.
Marks M., Rudnick R.L., McCammon C., Vennemann T.and Markl G. (2007)Arrested kinetic Li isotopic fractionation at the margin ofthe Ilímaussaq complex, South Greenland: Evidence foropen-system processes during final cooling of peralkalineigneous rock. Chemical Geology, 246, 207–230.
Matthews K.A., Goldstein S.J., Norman D.E., Nunn A.J.and Murrell M.T. (2008)Evaluation of solid geologic reference materials foruranium-series measurements via LA-ICP-MS. EOSTransactions AGU, 89. Fall Meeting Supplement,Abstract V13A-2090.
Mertz-Kraus R., Jochum K.P., Sharp W.D., Stoll B., WeisU. and Andreae M.O. (2010)In situ 230Th-232Th-234U-238U analysis of silicate glassesand carbonates using laser ablation single-collectorsector-field ICP-MS. Journal of Analytical AtomicSpectrometry, 25, 1895–1904.
Meyers A.T., Havens R.G., Connor J.J., Conklin N.M.and Rose H.J. (1976)Glass reference standards for the trace-element analysis ofgeologic materials – compilation of interlaboratory data.U.S. Geological Survey Professional Paper, 1013 , 29pp.
Münker C., Weyer S., Scherer E. and Mezger K. (2001)Separation of high field strength elements (Nb, Ta, Zr, Hf)and Lu from rock samples for MC-ICP-MS measurements.Geochemistry Geophysics Geosystems, 2, 1064.
ª 2010 The Authors. Geostandards and Geoanalytical Research ª 2010 International Association of Geoanalysts 3 3

re ferences
Paul B., Woodhead J.D. and Hergt J. (2005)Improved in situ isotope analysis of low-Pb materialsusing LA-MC-ICP-MS with parallel ion counter and Fara-day detection. Journal of Analytical Atomic Spectrometry,20, 1350–1357.
Potts P.J. (1997)A glossary of terms and definitions used in analyticalchemistry. Geostandards Newsletter: The Journal ofGeostandards and Geoanalysis, 21, 157–161.
Raczek I., Jochum K.P. and Hofmann A.W. (2003)Neodymium and strontium isotope data for USGS refer-ence materials BCR-1, BCR-2, BHVO-1, BHVO-2, AGV-1,AGV-2, GSP-1, GSP-2 and eight MPI-DING referenceglasses. Geostandards Newsletter: The Journal of Geo-standards and Geoanalysis, 27, 173–179.
Rosner M. and Meixner A. (2004)Boron isotopic composition and concentration of ten geo-logical reference materials. Geostandards and Geoana-lytical Research, 28, 431–441.
Rudnick R.L., Tomascak P.B., Njo H.B. and Gardner R.L.(2004)Extreme lithium isotopic fractionation during continentalweathering revealed in saprolites from South Carolina.Chemical Geology, 212, 45–58.
Saal A., Hart S.R., Shimizu N. and Layne G.D. (1998)Pb isotopic variability in melt inclusions from oceanic bas-alts, Polynesia. Science, 282, 1481–1484.
Souders A.K. and Sylvester P.J. (2008)Improved in situ measurements of lead isotopes in silicateglasses by LA-MC-ICP-MS using multiple ion counters.Journal of Analytical Atomic Spectrometry, 23, 535–543.
Tanaka T., Togahsi S., Kamioka H., Amakawa H.,Kagami H., Hamamoto T., Yuhara M., Orihashi Y.,Yoneda S., Shimizu H., Kunimaru T., Takahashi K.,Yanagi T., Nakano T., Fujimaki H., Shinjo R., AsaharaY., Tanimizu M. and Dragusanu C. (2000)JNdi-1: A neodymium isotopic reference in consistencywith La Jolla neodymium. Chemical Geology, 168,279–281.
Teng F.-Z., McDonough W.F., Rudnick R.L., Dalpé C.,Tomascak P.B., Chappell B.W. and Gao S. (2004)Lithium isotopic composition and concentration of theupper continental crust. Geochimica et CosmochimicaActa, 68, 4167–4178.
Teng F.-Z., McDonough W.F., Rudnick R.L. and WalkerR.J. (2006)Diffusion-driven extreme lithium isotopic fractionation inthe country rocks of the Tin Mountain Pegmatite. Earthand Planetary Science Letters, 243, 701–710.
Thirlwall M.F. (1991)Long-term reproducibility of multicollector Sr and Ndisotope ratio analysis. Chemical Geology (IsotopeGeoscience Section), 94, 85–104.
Tiepolo M.C., Bouman C., Vannucci R. and SchwietersJ.B. (2006)Laser ablation multicollector ICP-MS of d11B in geologicalsamples. Applied Geochemistry, 21, 788–801.
Tonarini S., Pennisi M., Adomi-Braccesi A., Dini A.,Ferrara G., Gonflantini R., Wiedenbeck M. and Grö-ning M. (2003)Intercomparison of boron isotope and concentrationmeasurements. Part I: Selection, preparation and homo-geneity tests of the intercomparison material. Geostan-dards Newsletter: The Journal of Geostandards andGeoanalysis, 27, 21–39.
Upadhyay D., Scherer E.E. and Mezger K. (2008)Fractionation and mixing of Nd isotopes during thermalionization mass spectrometry: Implications for high preci-sion 142Nd ⁄ 144Nd analyses. Journal of AnalyticalAtomic Spectrometry, 23, 561–568.
Uriano G.A. and Gravatt C.C. (1977)The role of reference materials and reference methods inchemical analysis. CRC Critical Reviews in AnalyticalChemistry, 6, 361–411.
USGS (1996)Microbeam standard Columbia River basalt (Glass) BCR-2G. United States Geological Survey, Special Bulletin(Reference Materials Project), Preliminary report, 10pp.
Weis D., Kieffer B., Maerschalk C., Pretorius W. andBarling J. (2005)High-precision Pb-Sr-Nd-Hf isotopic characterization ofUSGS BHVO-1 and BHVO-2 reference materials.Geochemistry Geophysics Geosystems, 6, Q02002.
Weis D., Kieffer B., Maerschalk C., Barling J., de JongJ., Williams G.A., Hanano D., Pretorius W., Mattielli N.,Scoates J.S., Goolaerts A., Friedman R.M. andMahoney J.B. (2006)High-precision isotopic characterization of USGS refer-ence materials by TIMS and MC-ICP-MS. GeochemistryGeophysics Geosystems, 7, Q08006.
Weis D., Kieffer B., Hanano D., Silva I.N., Barling J.,Pretorius W., Maerschalk C. and Mattielli N. (2007)Hf isotope compositions of U.S. Geological Survey refer-ence materials. Geochemistry Geophysics Geosystems,8, Q06006.
Woodhead J.D. (2002)A simple method for obtaining highly accurate Pb-isotopedata by MC-ICP-MS. Journal of Analytical AtomicSpectrometry, 17, 1381–1385.
Woodhead J.D. and Hergt J.M. (2001)Strontium, neodymium and lead isotope analyses of NISTglass certified reference materials: SRM 610, 612, 614.Geostandards Newsletter: The Journal of Geostandardsand Geoanalysis, 25, 261–266.
Woodhead J., Hergt J., Shelley M., Eggins S.and Kemp R. (2004)Zircon Hf-isotope analysis with an excimer laser, depthprofiling, ablation of complex geometries, and concomi-tant age estimation. Chemical Geology, 209, 121–135.
3 4 ª 2010 The Authors. Geostandards and Geoanalytical Research ª 2010 International Association of Geoanalysts
Copyright © 2022 FDOKUMEN