MPI-DING glasses: New geological reference materials for in situ Pb isotope analysis
15
MPI-DING glasses: New geological reference materials for in situ Pb isotope analysis Klaus Peter Jochum Max-Planck-Institut fu ¨ r Chemie, Postfach 3060, D-55020 Mainz, Germany ([email protected]) Jo ¨rg Pfa ¨nder Max-Planck-Institut fu ¨r Chemie, Postfach 3060, D-55020 Mainz, Germany Now at Technische Universita ¨t Bergakademie Freiberg, Bernhard-von-Cotta-Str. 2, D-09599 Freiberg, Germany Jon D. Woodhead School of Earth Sciences, University of Melbourne, Melbourne, Victoria 3010, Australia Matthias Willbold, Brigitte Stoll, and Kirstin Herwig Max-Planck-Institut fu ¨r Chemie, Postfach 3060, D-55020 Mainz, Germany Marghaleray Amini Max-Planck-Institut fu ¨r Chemie, Postfach 3060, D-55020 Mainz, Germany Now at Leibniz-Institut fu ¨ r Meereswissenschaften, IFM-GEOMAR, Wischhofstr. 1 – 3, D-24148 Kiel, Germany Wafa Abouchami and Albrecht W. Hofmann Max-Planck-Institut fu ¨r Chemie, Postfach 3060, D-55020 Mainz, Germany [1] Advances in microanalytical techniques continue to revolutionize trace element and isotope geochemistry. Yet the lack of widely available geological reference materials has made interlaboratory comparisons and assessment of analytical accuracy difficult or impossible in many cases. The preparation and extensive analysis of the MPI-DING glasses has been designed to fill this gap. Here we report high- precision Pb isotope analyses by TIMS and MC-ICPMS techniques on seven geological MPI-DING glasses. The Pb concentrations in the reference glasses vary between 0.4 and 20 mg/g, allowing use in a wide range of analytical situations. In addition, solution ICPMS and LA-ICPMS analyses were used to investigate the analytical performance of a rapidly scanning single-collector sector-field mass spectrometer for the measurement of Pb isotope ratios. Our TIMS and MC-ICPMS measurements demonstrate that variations of 208 Pb/ 206 Pb and 207 Pb/ 206 Pb in most MPI-DING glasses are less than 0.03%. Preliminary reference values for 208 Pb/ 204 Pb, 207 Pb/ 204 Pb, 206 Pb/ 204 Pb, 208 Pb/ 206 Pb, and 207 Pb/ 206 Pb were obtained by averaging all high-precision data and normalizing them to the mean triple spike data for NIST SRM 981, obtained in the Mainz laboratory. 208 Pb/ 206 Pb and 207 Pb/ 206 Pb ratios, which are commonly utilized for in situ Pb isotope studies, vary from 2.0110 (GOR132-G) to 2.0810 (T1-G) and 0.81656 (GOR132-G) to 0.84389 (GOR128-G), respectively. Any heterogeneity present in the glasses is generally lower than the reproducibility obtained from in situ microanalytical techniques, such as LA-ICPMS and SIMS (about 0.1–0.3% for 208 Pb/ 206 Pb and 207 Pb/ 206 Pb measurements). This is demonstrated by the results for our LA-ICPMS Pb isotope analyses using a single-collector sector-field ICP mass spectrometer, which agree to within 0.2% of the reference values. A similar accuracy was obtained from solution ICPMS using the same single-collector mass spectrometer. Components: 7792 words, 4 figures, 7 tables. Keywords: MPI-DING reference glasses; Pb isotopes; TIMS; MC-ICPMS; ICPMS; LA-ICPMS. G 3 G 3 Geochemistry Geophysics Geosystems Published by AGU and the Geochemical Society AN ELECTRONIC JOURNAL OF THE EARTH SCIENCES Geochemistry Geophysics Geosystems Technical Brief Volume 6, Number 10 22 October 2005 Q10008, doi:10.1029/2005GC000995 ISSN: 1525-2027 Copyright 2005 by the American Geophysical Union 1 of 15
-
Upload
independent -
Category
Documents
-
view
5 -
download
0
Transcript of MPI-DING glasses: New geological reference materials for in situ Pb isotope analysis

MPI-DING glasses: New geological reference materials forin situ Pb isotope analysis
Klaus Peter JochumMax-Planck-Institut fur Chemie, Postfach 3060, D-55020 Mainz, Germany ([email protected])
Jorg PfanderMax-Planck-Institut fur Chemie, Postfach 3060, D-55020 Mainz, Germany
Now at Technische Universitat Bergakademie Freiberg, Bernhard-von-Cotta-Str. 2, D-09599 Freiberg, Germany
Jon D. WoodheadSchool of Earth Sciences, University of Melbourne, Melbourne, Victoria 3010, Australia
Matthias Willbold, Brigitte Stoll, and Kirstin HerwigMax-Planck-Institut fur Chemie, Postfach 3060, D-55020 Mainz, Germany
Marghaleray AminiMax-Planck-Institut fur Chemie, Postfach 3060, D-55020 Mainz, Germany
Now at Leibniz-Institut fur Meereswissenschaften, IFM-GEOMAR, Wischhofstr. 1–3, D-24148 Kiel, Germany
Wafa Abouchami and Albrecht W. HofmannMax-Planck-Institut fur Chemie, Postfach 3060, D-55020 Mainz, Germany
[1] Advances in microanalytical techniques continue to revolutionize trace element and isotopegeochemistry. Yet the lack of widely available geological reference materials has made interlaboratorycomparisons and assessment of analytical accuracy difficult or impossible in many cases. The preparationand extensive analysis of the MPI-DING glasses has been designed to fill this gap. Here we report high-precision Pb isotope analyses by TIMS and MC-ICPMS techniques on seven geological MPI-DINGglasses. The Pb concentrations in the reference glasses vary between 0.4 and 20 mg/g, allowing use in awide range of analytical situations. In addition, solution ICPMS and LA-ICPMS analyses were used toinvestigate the analytical performance of a rapidly scanning single-collector sector-field mass spectrometerfor the measurement of Pb isotope ratios. Our TIMS and MC-ICPMS measurements demonstrate thatvariations of 208Pb/206Pb and 207Pb/206Pb in most MPI-DING glasses are less than 0.03%. Preliminaryreference values for 208Pb/204Pb, 207Pb/204Pb, 206Pb/204Pb, 208Pb/206Pb, and 207Pb/206Pb were obtained byaveraging all high-precision data and normalizing them to the mean triple spike data for NIST SRM 981,obtained in the Mainz laboratory. 208Pb/206Pb and 207Pb/206Pb ratios, which are commonly utilized forin situ Pb isotope studies, vary from 2.0110 (GOR132-G) to 2.0810 (T1-G) and 0.81656 (GOR132-G) to0.84389 (GOR128-G), respectively. Any heterogeneity present in the glasses is generally lower than thereproducibility obtained from in situ microanalytical techniques, such as LA-ICPMS and SIMS (about0.1–0.3% for 208Pb/206Pb and 207Pb/206Pb measurements). This is demonstrated by the results for ourLA-ICPMS Pb isotope analyses using a single-collector sector-field ICP mass spectrometer, which agreeto within 0.2% of the reference values. A similar accuracy was obtained from solution ICPMS using thesame single-collector mass spectrometer.
Components: 7792 words, 4 figures, 7 tables.
Keywords: MPI-DING reference glasses; Pb isotopes; TIMS; MC-ICPMS; ICPMS; LA-ICPMS.
G3G3GeochemistryGeophysics
Geosystems
Published by AGU and the Geochemical Society
AN ELECTRONIC JOURNAL OF THE EARTH SCIENCES
GeochemistryGeophysics
Geosystems
Technical Brief
Volume 6, Number 10
22 October 2005
Q10008, doi:10.1029/2005GC000995
ISSN: 1525-2027
Copyright 2005 by the American Geophysical Union 1 of 15

Index Terms: 1040 Geochemistry: Radiogenic isotope geochemistry; 1094 Geochemistry: Instruments and techniques.
Received 8 April 2005; Revised 10 August 2005; Accepted 6 September 2005; Published 22 October 2005.
Jochum, K. P., J. Pfander, J. D. Woodhead, M. Willbold, B. Stoll, K. Herwig, M. Amini, W. Abouchami, and A. W. Hofmann
(2005), MPI-DING glasses: New geological reference materials for in situ Pb isotope analysis, Geochem. Geophys. Geosyst.,
6, Q10008, doi:10.1029/2005GC000995.
1. Introduction
[2] Homogeneous reference glasses are importanttools for many tasks in analytical geochemistry,particularly for calibration and quality control ofanalytical data. This is especially true for in situmicroanalytical techniques, such as secondary ionmass spectrometry (SIMS), laser ablation induc-tively coupled plasma-mass spectrometry (LA-ICPMS) and synchrotron radiation-induced X-rayfluorescence (SR-XRF). Most geochemists use thesynthetic NIST (National Institute of Standards andTechnology) SRM 610 and 612 reference glasses[Pearce et al., 1997] for these purposes. However,the major and trace element compositions of theNIST glasses are very different from those of anygeological sample. In order to redress this defi-ciency, the United States Geological Survey(USGS) and the Max-Planck-Institut fur Chemie– Dingwell (MPI-DING) have prepared largeamounts of glasses with natural compositions toprovide reference materials for in situ geochemicalanalysis. These glasses are now well characterizedwith respect to both major and trace elementconcentrations [Jochum et al., 2000; USGS, Geo-chemical reference materials and certificates, http://minerals.cr.usgs.gov/geo_chem_stand/, 2004]. Be-cause there is also a need for isotopic data onreference glasses, the determination of stable (H,Li, B, O) and radiogenic (Sr, Nd, Hf, Pb) isotopesin the MPI-DING glasses is now in progress [e.g.,Raczek et al., 2003; Rosner and Meixner, 2004;Jochum et al., 2005]. In situ Pb isotope ratiomeasurements are of particular importance forgeochronology of zircon [Tiepolo, 2003] and geo-chemistry of inclusions [Saal et al., 1998; Jochumet al., 2004]. Reference glasses with well-analyzedPb isotopic compositions are also of use in thedetermination and hence correction of mass frac-tionation effects. However, until now only few Pbisotope data have been available for internationalreference glasses [e.g.,Woodhead and Hergt, 2001,Baker et al., 2004].
[3] The aim of the this paper is to present the firsthigh-precision Pb isotope ratios for seven MPI-
DING reference glasses obtained using thermalionization mass spectrometry (TIMS) and multi-collector ICP mass spectrometry (MC-ICPMS) inthe Mainz and Melbourne laboratories, and toestablish the degree of homogeneity of these mate-rials. The ratios 208Pb/206Pb and 207Pb/206Pb are ofparticular importance because they are commonlyemployed in microanalysis [Saal et al., 1998;Tiepolo, 2003; Jochum et al., 2004, 2005]. Finally,the geological MPI-DING glasses have a largerange of Pb contents (0.4–20 mg/g) and thus allowus to assess the performance of a highly sensitivelaser ablation single-collector sector-field ICP massspectrometer (LA-ICPMS) for in situ Pb isotopeanalysis. Solution ICPMS analyses performed withthe same single-collector instrument help to deter-mine the repeatability of the LA-ICPMS data.
2. Samples
[4] Different splits of the MPI-DING glassesATHO-G, KL2-G, ML3B-G, T1-G, StHs6/80-G,GOR128-G and GOR132-G were used for thisstudy. These reference materials cover the entirespectrum from ultramafic to highly siliceous com-positions. Table 1 lists the rock type of the samplesand their Pb concentrations. As shown by Jochumet al. [2000], the abundances of most elements inthe MPI-DING glasses are identical to those in theoriginal rock powders. An exception is lead: it ishigher in the glasses than in the starting materials,as a result of contamination during glass prepara-tion. In addition, the NIST reference materialsSRM 610, 612, 981 and the USGS referencesamples (rock powders) BHVO-1 and AGV-1 werealso analyzed by a subset of the techniques.
3. Analytical Techniques
3.1. TIMS (MPI Mainz)
[5] TIMS analyses were performed at the Max-Planck-Institut Mainz. Different glass splits ofKL2-G, ML3B-G, ATHO-G, StHs6/80-G and T1-Gwere analyzed (Table 2) weighing 20 to 140 mg.
GeochemistryGeophysicsGeosystems G3G3
jochum et al.: mpi-ding glasses 10.1029/2005GC000995
2 of 15
The samples were ultrasonicated in cold ultrapurewater for 15 min, then washed in hot ultrapurewater for another 30 min. Sample ML3B-G split 2bwas additionally leached in hot 6 mol/l HCl for1 hour. After rinsing, the chips were dissolved inclosed Teflon vessels using hot HF-HNO3 (about5:1) for >48 hours. Lead separation was carried outon Bio-Rad AG1-X8 anion-exchange resin usinga HBr-HNO3 eluent [Abouchami et al., 2000].Measurements were done on a Finnigan MAT 261mass spectrometer in static multicollection modeusing the Pb triple spike technique to correct forinstrumental mass fractionation [Galer, 1999].This technique requires the running of both spikedand unspiked sample aliquots to correct for instru-mental mass fractionation effects, but improves theaccuracy of the isotopic ratios significantly to levelsaround 100 ppm. Total procedural blanks werebelow 50 pg.
3.2. MC-ICPMS (University of Melbourne)
[6] Pb isotope compositions of the seven MPI-DING glasses were determined by MC-ICPMSat the University of Melbourne (Table 3). Theanalytical procedures are described in detail byWoodhead [2002]. Aliquots of small (�1 mm)glass chips ranging in size from 10 to 150 mg,depending upon Pb concentration, were cleanedby heating for 15 min in hot 6 mol/l HCl,followed by repeated washing in ultrapure water.Dissolution was achieved by heating overnightwith a HF/HNO3 mixture in sealed Teflon vials.Lead was separated using standard ion exchangeprocedures (BioRad AG1-X8 (200–400 mesh
resin) in HBr-HCl media. Total proceduralblanks were less than 20 pg. After chemicalseparation, samples were taken up in ca. 1 mlof 10 ng/g Tl solution in 2% HNO3, and thenfurther diluted with the same solution as neces-sary to obtain appropriate ion currents (seebelow). This solution is freshly prepared priorto each analytical session from an ICPMS 100 ppmTl standard solution (QCD Analysts), and alwayschecked for negligible Pb blank by performingan ion counter scan across the Pb spectrum,before use. Samples were introduced to a NuPlasma MC-ICP mass spectrometer via a CetacAridus desolvating unit, using a Glass ExpansionOpalMist nebulizer operating at an uptake rateof �30 mL min�1. All analyses were conductedin static mode using Faraday cups. Analysestypically consisted of 4 blocks of data, eachblock comprising a 30 s baseline measurementand 20 scans of 10 s duration. Total Pb beamsranged from 5–10 V, typically consuming 30–60 ng of Pb. Isotope ratios were corrected ‘‘online’’ for Hg interference on 204Pb. This Hginterference is derived from the argon carriergas but for all analyses considered here thecorrection is trivial, amounting to only 200 ppmon mass 204 in the worst case. A modifiedTl-normalization technique [Woodhead, 2002]was used to correct for mass bias. In thismethod, a natural Tl-isotopic composition isassumed, and a series of standards are thenrun in order to define the mathematical relation-ship between Tl and Pb mass bias. This rela-tionship can then be applied to unknownsproviding a robust correction for any mass bias
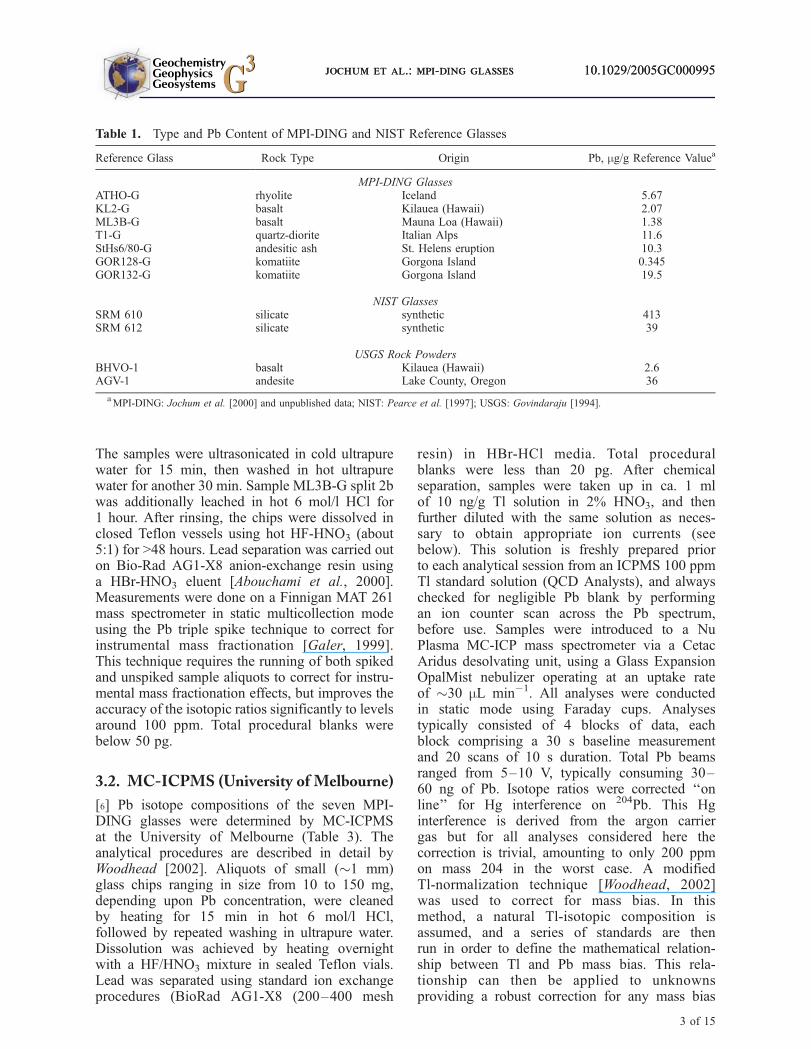
Table 1. Type and Pb Content of MPI-DING and NIST Reference Glasses
Reference Glass Rock Type Origin Pb, mg/g Reference Valuea
MPI-DING GlassesATHO-G rhyolite Iceland 5.67KL2-G basalt Kilauea (Hawaii) 2.07ML3B-G basalt Mauna Loa (Hawaii) 1.38T1-G quartz-diorite Italian Alps 11.6StHs6/80-G andesitic ash St. Helens eruption 10.3GOR128-G komatiite Gorgona Island 0.345GOR132-G komatiite Gorgona Island 19.5
NIST GlassesSRM 610 silicate synthetic 413SRM 612 silicate synthetic 39
USGS Rock PowdersBHVO-1 basalt Kilauea (Hawaii) 2.6AGV-1 andesite Lake County, Oregon 36
aMPI-DING: Jochum et al. [2000] and unpublished data; NIST: Pearce et al. [1997]; USGS: Govindaraju [1994].
GeochemistryGeophysicsGeosystems G3G3
jochum et al.: mpi-ding glasses 10.1029/2005GC000995jochum et al.: mpi-ding glasses 10.1029/2005GC000995
3 of 15
related to either instrument drift or matrixeffects. On the basis of a two-year compilationof analyses of both samples and standards,accuracy using this technique is estimated tobe between 100 and 200 ppm for all ratiosinvolving 204Pb [Woodhead, 2002]. All ratiosmeasured in the Melbourne laboratory arereported relative to the following values forNIST SRM 981: 206Pb/204Pb = 16.9356,207Pb/204Pb = 15.4891, 208Pb/204Pb = 36.7006[Todt et al., 1996].
3.3. Solution ICPMS (MPI Mainz)
[7] Between 50 and 150 mg of glass chips (rockpowder in the case of AGV-1 and BHVO-1) wereultrasonicated in purified water (18MW cm�1 re-sistivity, Milli-Q system, Millipore, USA) for 15min and were then dissolved in an HF-HNO3
mixture. After drying, the samples were treatedtwice with conc. HCl to eliminate fluorides beforethey were taken up in 0.4 mol/l HNO3. A thalliumsolution (prepared from NIST SRM 997) wasadded for mass fractionation correction. Theamount of total dissolved solid was adjusted toobtain ca. 0.5 to 1 ng ml�1 Pb in the final solution.Isotope ratios were acquired with a single-collectorsector-field ThermoFinnigan ICP mass spectrome-ter ELEMENT2 (Max-Planck-Institut) equippedwith a PFA microconcentric nebulizer (uptake rate100 mL min�1) and a PFA spray chamber. Ionintensities were measured by fast electric scanningover the masses 203Tl, 205Tl, 206Pb, 207Pb, and208Pb in low mass resolution with flat top peaks.The total time per mass scan was 0.125 s tooptimize the precision of isotope ratios. About2100 scans were taken for each measurement.Experimental parameters were: RF power =1300 W, cool gas flow rate = 15 l min�1,auxiliary gas flow rate = 1.0 l min�1, samplegas flow rate = 1 l min�1, sample time = 0.002s,samples per peak = 120, mass window = 10%of total peak width, ion counting mode. About300 scans of the 0.4 mol/l HNO3 solution used todilute the samples were measured prior to eachsample, using identical instrument settings to mon-itor the blank. The data reduction was performed onblank-corrected ion intensities. Isotope ratios of205Tl/203Tl, 207Pb/206Pb and 208Pb/206Pb were cal-culated for each scan. A mass fractionation factorused to correct the Pb isotope ratios was defined[Woodhead, 2002] as F = [(205Tl/203Tl)meas/(205Tl/203Tl)true]/ln[Mass 205Tl/Mass 203Tl] andwas calculated for each scan. The subscripts‘‘meas’’ and ‘‘true’’ refer to the measured and trueT
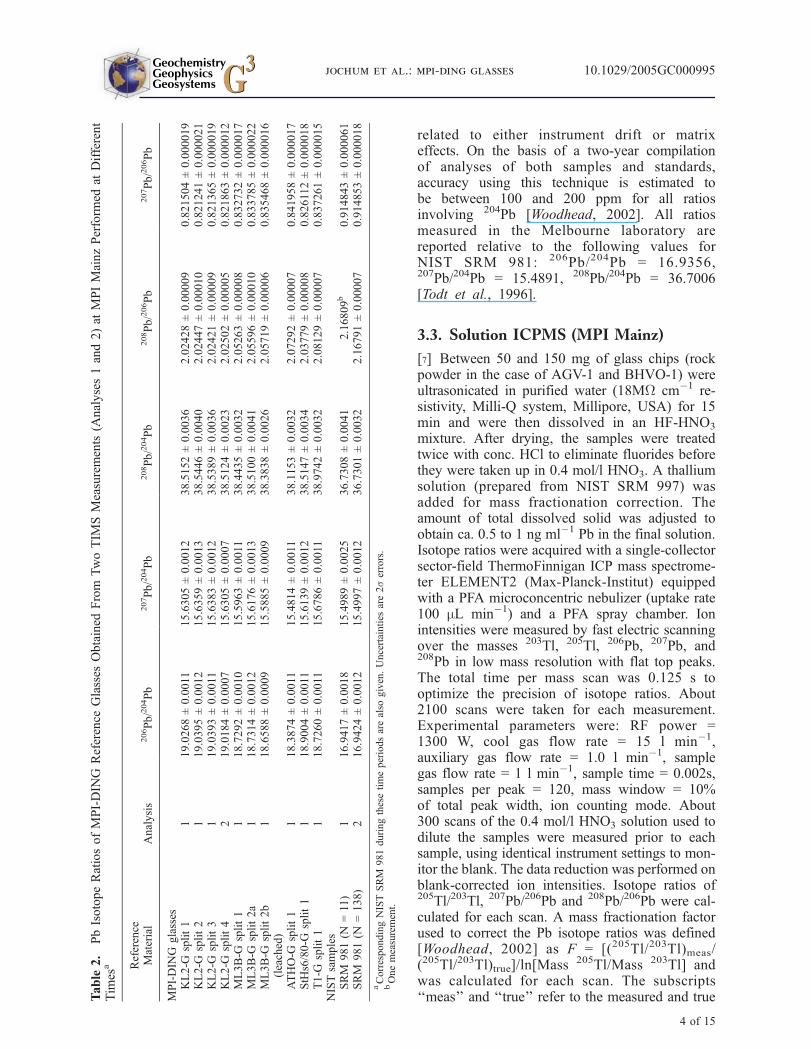
able
2.
PbIsotopeRatiosofMPI-DIN
GReference
Glasses
Obtained
From
TwoTIM
SMeasurements
(Analyses1and2)at
MPIMainzPerform
edat
Different
Tim
esa Reference
Material
Analysis
206Pb/204Pb
207Pb/204Pb
208Pb/204Pb
208Pb/206Pb
207Pb/206Pb
MPI-DIN
Gglasses
KL2-G
split1
119.0268±0.0011
15.6305±0.0012
38.5152±0.0036
2.02428±0.00009
0.821504±0.000019
KL2-G
split2
119.0395±0.0012
15.6359±0.0013
38.5446±0.0040
2.02447±0.00010
0.821241±0.000021
KL2-G
split3
119.0393±0.0011
15.6383±0.0012
38.5389±0.0036
2.02421±0.00009
0.821365±0.000019
KL2-G
split4
219.0184±0.0007
15.6305±0.0007
38.5124±0.0023
2.02502±0.00005
0.821863±0.000012
ML3B-G
split1
118.7292±0.0010
15.5963±0.0011
38.4435±0.0032
2.05263±0.00008
0.832732±0.000017
ML3B-G
split2a
118.7314±0.0012
15.6176±0.0013
38.5100±0.0041
2.05596±0.00010
0.833785±0.000022
ML3B-G
split2b
(leached)
118.6588±0.0009
15.5885±0.0009
38.3838±0.0026
2.05719±0.00006
0.835468±0.000016
ATHO-G
split1
118.3874±0.0011
15.4814±0.0011
38.1153±0.0032
2.07292±0.00007
0.841958±0.000017
StHs6/80-G
split1
118.9004±0.0011
15.6139±0.0012
38.5147±0.0034
2.03779±0.00008
0.826112±0.000018
T1-G
split1
118.7260±0.0011
15.6786±0.0011
38.9742±0.0032
2.08129±0.00007
0.837261±0.000015
NISTsamples
SRM
981(N
=11)
116.9417±0.0018
15.4989±0.0025
36.7308±0.0041
2.16809b
0.914843±0.000061
SRM
981(N
=138)
216.9424±0.0012
15.4997±0.0012
36.7301±0.0032
2.16791±0.00007
0.914853±0.000018
aCorrespondingNISTSRM
981duringthesetimeperiodsarealso
given.Uncertainties
are2serrors.
bOnemeasurement.
GeochemistryGeophysicsGeosystems G3G3
jochum et al.: mpi-ding glasses 10.1029/2005GC000995
4 of 15

Tl isotope ratios, and ‘‘Mass’’ refers to the atomicmass of the respective isotopes [Loss, 2003]. Theassumed ‘‘true’’ 205Tl/203Tl ratio used is 2.3871[Rosman and Taylor, 1998].
3.4. LA-ICPMS (MPI Mainz)
[8] The seven MPI-DING glasses were also ana-lyzed by LA-ICPMS using a New Wave UP-213laser system combined with a single-collector sec-tor-field ThermoFinnigan ICP mass spectrometerELEMENT2 equipped with the fast-scanningoption. The detailed analytical procedures havebeen described by Jochum et al. [2005]. Spotanalyses were performed with spot diameters of60–160 mm at an energy density of about 7 J/cm2.Ablation time was about 40 s, and the washout timebetween spots was 45 s. Blank count rates weremeasured for 20 s prior to ablation. The low massresolution mode with flat top peaks was used forthis work. Experimental parameters were: RFpower = 1270 W, ablation rate = 10 Hz, cool gasflow rate = 15 l min�1, auxiliary gas = 1.0 l min�1,carrier gas (Ar) = 0.85 l min�1 and carrier gas(He) = 0.65 l min�1, sample time = 0.002s,samples per peak = 100, mass window = 10%,counting mode.
[9] Experiments were performed using the electri-cal (Escan) and the combined magnetic scan(Bscan) – Escan modes. To measure Pb isotoperatios as precisely as possible, the Escan was used[Jochum et al., 2005]. This scan was very fast with0.075 s per pass for the mass scan of 206Pb,207Pb, 208Pb. Each run consisted of about 250blank and 500 ablation measurements. To measureall Pb isotopes together with other elements (e.g.,
Ca, rare earth elements, Hg, Th, U), the combinedBscan-Escan mode including magnetic jumps andelectrical scans was used. Because times per pass(typically 0.3–1 s) were much longer than those ofthe Escan, the number of ablation measurementswas only about 100. 202Hg was monitored tocorrect the isobaric interference of 204Hg (derivedfrom the He gas) on 204Pb.
[10] Each individual Pb isotope analysis corre-sponds to three spot measurements. Data werereduced by calculating the blank corrected Pbisotope ratios for each pass and by determiningthe mean values. Mass fractionation was deter-mined from the deviation of the 205Tl/203Tl ratioin the NIST SRM 612 measured prior to theunknown samples from the literature value of2.3871 [Rosman and Taylor, 1998]. This remainedconstant over a period of several hours; how-ever, mass fractionation varied from experimentto experiment (between �0.5 and +0.5%/amu[Jochum et al., 2005]).
4. Results and Discussion
4.1. High-Precision TIMS andMC-ICPMS Data
[11] Table 2 shows the TIMS results (MPI Mainz)for the MPI-DING glasses. The isotope ratios forthe various reference glasses differ significantly;e.g., 208Pb/206Pb and 207Pb/206Pb ratios range from2.024 (KL2-G) to 2.081 (T1-G) and 0.821 (KL2-G)to 0.842 (ATHO-G), respectively. In-run errors(2 RSE) are of the order of 0.004–0.010% for206Pb/204Pb, 207Pb/204Pb, 208Pb/204Pb ratios, and0.002–0.005% for 207Pb/206Pb, 208Pb/206Pb ratios.
Table 3. Pb Isotope Ratios of MPI-DING and NIST Reference Materials Obtained From MC-ICPMS Measurementsat University of Melbournea
Reference Material 206Pb/204Pb 207Pb/204Pb 208Pb/204Pb 208Pb/206Pb 207Pb/206Pb
MPI-DING glassesKL2-G split 5 19.0261 ± 0.0006 15.6280 ± 0.0006 38.5070 ± 0.0014 2.02391 ± 0.00002 0.82141 ± 0.00001ML3B-G split 3 18.6952 ± 0.0005 15.5839 ± 0.0005 38.3967 ± 0.0012 2.05383 ± 0.00002 0.83358 ± 0.00001ATHO-G split 2 18.3754 ± 0.0005 15.4731 ± 0.0005 38.0867 ± 0.0012 2.07269 ± 0.00002 0.84205 ± 0.00001StHs6/80-G split 2 18.8938 ± 0.0006 15.6090 ± 0.0005 38.4964 ± 0.0012 2.03752 ± 0.00002 0.82614 ± 0.00001T1-G split 2 18.7247 ± 0.0007 15.6753 ± 0.0006 38.9528 ± 0.0015 2.08029 ± 0.00002 0.83715 ± 0.00001GOR128-G split 1 18.5097 ± 0.0018 15.6180 ± 0.0015 38.2557 ± 0.0040 2.06683 ± 0.00004 0.84377 ± 0.00002GOR132-G split 1 19.2446 ± 0.0005 15.7120 ± 0.0004 38.6879 ± 0.0011 2.01033 ± 0.00002 0.81644 ± 0.00001
NIST samplesSRM 981 - 1st run 16.9348 ± 0.0006 15.4892 ± 0.0007 36.6965 ± 0.0013 2.16692 ± 0.00003 0.91461 ± 0.00001SRM 981 - 2nd run 16.9365 ± 0.0005 15.4917 ± 0.0005 36.7047 ± 0.0012 2.16722 ± 0.00003 0.91470 ± 0.00001SRM 610 glass 17.0482 ± 0.0006 15.5100 ± 0.0007 36.9794 ± 0.0015 2.16914 ± 0.00002 0.90978 ± 0.00001SRM 612 glass - 1st run 17.0943 ± 0.0006 15.5090 ± 0.0006 36.9990 ± 0.0014 2.16439 ± 0.00002 0.90726 ± 0.00001SRM 612 glass - 2nd run 17.0940 ± 0.0006 15.5085 ± 0.0006 36.9998 ± 0.0013 2.16447 ± 0.00002 0.90725 ± 0.00001
aUncertainties are 2s errors.
GeochemistryGeophysicsGeosystems G3G3
jochum et al.: mpi-ding glasses 10.1029/2005GC000995
5 of 15

For KL2-G and ML3B-G, several splits of eachsample were analyzed separately. Although splits 2and 3 of KL2-G agree within error limits for the206Pb/204Pb, 207Pb/204Pb and 208Pb/204Pb ratios,this is not the case for splits 1 and 4, which differfrom splits 2 and 3, and from each other, welloutside analytical uncertainties, with a maximumdifference of about 0.1%, 0.05%, and 0.08% and0.05% in 206Pb/204Pb, 207Pb/204Pb, 208Pb/204Pb,and 208Pb/206Pb ratios, respectively.
[12] Table 3 shows the MC-ICPMS data for theMPI-DING glasses as well as data for NIST SRM610 and 612 glasses and SRM 981 that wererun concurrently. Within-run precision (2 RSE) istypically of the order of 0.003% for 206Pb/204Pb,207Pb/204Pb, and 208Pb/204Pb ratios, with the excep-
tion of sample GOR128-G which was approxi-mately three times higher. Values for in-runprecision are generally lower than obtained byTIMS due to the more stable mass bias of plasmacompared to thermal ionization sources. The206Pb/204Pb, 207Pb/204Pb and 208Pb/204Pb ratiosmeasured by MC-ICPMS are systematically lowerthan the TIMS values by between 0.004 and 0.3%(sample ML3B-G split 2b is not considered here).This is also observed for NIST SRM 981 inwhich the values are lower by 0.04–0.08%. Forthe 208Pb/206Pb and 207Pb/206Pb ratios, the offsetis smaller between 0.003 and 0.1%. Disregardingsample ML3B-G, in which the deviations arelargest and which is more heterogeneous thanKL2-G, the offset in 208Pb/206Pb and 207Pb/206Pbratios is in the range between 0.003 and 0.05%
Table 4. TIMS and MC-ICPMS Data and Preliminary Reference Values of the MPI-DING Glassesa
MPI-DING Glass Method 206Pb/204Pb 207Pb/204Pb 208Pb/204Pb 208Pb/206Pb 207Pb/206Pb
KL2-GSplit 1 TIMS 19.026 15.629 38.509 2.0240 0.82146Split 2 TIMS 19.038 15.634 38.538 2.0242 0.82120Split 3 TIMS 19.038 15.636 38.532 2.0239 0.82132Split 4 TIMS 19.016 15.628 38.507 2.0249 0.82181Split 5 MC-ICPMS 19.032 15.635 38.533 2.0246 0.82153Reference value 19.030 15.632 38.524 2.0243 0.821461 SD 0.009 0.004 0.015 0.0004 0.00023
ML3B-GSplit 1 TIMS 18.728 15.594 38.437 2.0523 0.83269Split 2a TIMS 18.730 15.616 38.503 2.0557 0.83374Split 3 MC-ICPMS 18.701 15.591 38.423 2.0545 0.83370Reference value 18.720 15.600 38.454 2.0542 0.833381 SD 0.016 0.014 0.043 0.0017 0.00060
ATHO-GSplit 1 TIMS 18.386 15.480 38.109 2.0726 0.84191Split 2 MC-ICPMS 18.381 15.480 38.112 2.0734 0.84217Reference value 18.383 15.480 38.111 2.0730 0.84204
StHs6/80-GSplit 1 TIMS 18.899 15.612 38.508 2.0375 0.82607Split 2 MC-ICPMS 18.900 15.616 38.522 2.0382 0.82626Reference value 18.900 15.614 38.515 2.0379 0.82616
T1-GSplit 1 TIMS 18.725 15.677 38.968 2.0810 0.83722Split 2 MC-ICPMS 18.731 15.682 38.979 2.0810 0.83727Reference value 18.728 15.679 38.973 2.0810 0.83724
GOR128-GSplit 1 MC-ICPMS 18.516 15.625 38.282 2.0675 0.84389Reference value 18.516 15.625 38.282 2.0675 0.84389
GOR132-GSplit 1 MC-ICPMS 19.251 15.719 38.714 2.0110 0.81656Reference value 19.251 15.719 38.714 2.0110 0.81656
aTIMS (Table 2) and MC-ICPMS (Table 3) data are normalized to the mean of 169 Mainz triple spike data of NIST SRM 981: 206Pb/204Pb =
16.9407, 207Pb/204Pb = 15.4971, 208Pb/204Pb = 36.7245, 208Pb/206Pb = 2.16782, 207Pb/206Pb = 0.91479 (see compilation of Baker et al. [2004]).
GeochemistryGeophysicsGeosystems G3G3
jochum et al.: mpi-ding glasses 10.1029/2005GC000995
6 of 15
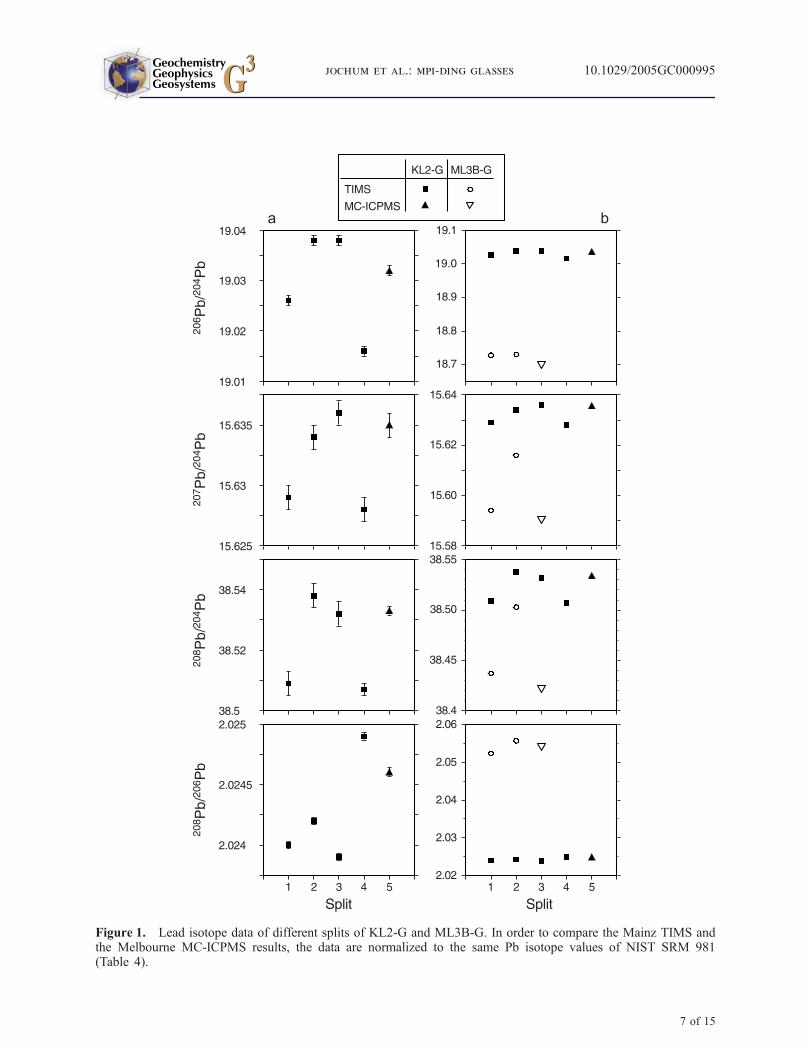
Figure 1. Lead isotope data of different splits of KL2-G and ML3B-G. In order to compare the Mainz TIMS andthe Melbourne MC-ICPMS results, the data are normalized to the same Pb isotope values of NIST SRM 981(Table 4).
GeochemistryGeophysicsGeosystems G3G3
jochum et al.: mpi-ding glasses 10.1029/2005GC000995
7 of 15

and thus in the range attributed to heterogeneitiesproduced during glass preparation. Lead isotopeanalyses for the NIST glasses and NIST SRM 981produced in the Melbourne laboratory usingdouble spike TIMS methods have been publishedby Woodhead and Hergt [2000, 2001]. TheMC-ICPMS analyses of these materials recordedduring the present study are entirely in agreementwith these previous TIMS data. We thereforeconclude that the difference between the resultsfrom the two laboratories is due to the differencebetween the assumed ‘‘true’’ isotope ratios ofNIST SRM 981. Therefore, in order to comparethe Melbourne and the Mainz data, we havenormalized the TIMS (Table 2) and MC-ICPMS(Table 3) data to the same Pb isotope values ofNIST SRM 981 (average values of 169 triplespike analyses of the Mainz laboratory; see com-pilation of Baker et al. [2004]). The results areshown in Table 4 and Figure 1.
[13] Figure 1a shows that the results obtained bythe two laboratories for KL2-G have significantdiscrepancies between individual splits, whichexceed any possible interlaboratory differences.
Figure 1b shows the results for both KL2-G andML3B-G using a more compressed scale. Thediscrepancies between individual splits are evengreater for ML3B-G than for KL2-G. In particu-lar, the leached sample ML3B-G split 2b comingfrom the same piece as ML3B-G split 2a haslower 206Pb/204Pb, 207Pb/204Pb and 208Pb/204Pbratios and significantly higher 208Pb/206Pb and207Pb/206Pb ratios than the unleached sample(Table 2). It is unclear whether these discrepan-cies are caused by sample heterogeneity or theleaching procedure. Overall, these discrepanciesare well outside the analytical reproducibilitesachieved routinely by both laboratories involved.This suggests that the heterogeneities are real andhave been introduced by contamination duringproduction of the glasses. This hypothesis isborne out by the fact that the measured leadconcentrations of these glasses are approximatelytwice the values of the powders from which theseglasses were made, namely 2.07 mg/g in KL2-G(Table 1) versus 1.02 mg/g in KL-2 [Newsom etal., 1986], and 1.38 mg/g in ML3B-G versus0.856 mg/g in ML-3B. As a result the Pb isotopiccompositions in the glass reference materialsdiffer from the original samples and representmixtures between the starting material and thecontaminant. This heterogeneity is only resolvedby high-precision isotope measurements, but notby concentration measurements using microana-lytical techniques where the analytical uncertaintyis usually 3–5% (see Figure 2).
[14] At first sight, the level of contamination andheterogeneity discussed above would seem tomake the MP-DING glasses unsuitable as referencematerials for microbeam Pb analysis. However, itmust be remembered that at the current level ofprecision achievable by microbeam methods, theseproblems are of relatively little consequence. Thisis illustrated by the bottom panel of Figure 1b,which shows 208Pb/206Pb ratios of the varioussplits measured in two laboratories (relationshipsof 207Pb/206Pb ratios, not shown, are very similar).The limits of sensitivity and precision of ion probeand laser ICP-MS analyses of lead isotope ratios inbasalts are such that 204Pb cannot be measuredadequately, and therefore Pb isotope analyses aregenerally restricted to 208Pb/206Pb and 207Pb/206Pbratios. These ratios are measured at precisions ofabout 0.1%, and this is similar to the scatter givenby the high-precision TIMS and ICP-MS mea-surements, in spite of the contamination-induceddiscrepancies. Consequently, despite the severelead contamination apparently introduced during
Figure 2. Lead data of ML3B-G and GOR132-G. Theglasses were analyzed by LA-ICPMS (spot diameter =120 mm) at different locations spaced about 1 mm fromeach other. Concentrations are normalized to the meanvalue. Error bars correspond to ±1 SE (N = 3–5).Reproducibility (1 RSD) is better than 5%.
GeochemistryGeophysicsGeosystems G3G3
jochum et al.: mpi-ding glasses 10.1029/2005GC000995
8 of 15

glass preparation (and possibly during the leach-ing procedure), these glasses can still serve asadequate reference materials at present. It is clear,however, that this will not be the case if and whenthe analytical precision of such microbeam anal-yses is improved to a level similar to that cur-rently achieved by double and triple-spike TIMSand ICP-MS analyses.
4.2. Reference Values
[15] Table 4 shows preliminary reference valuesfor the Pb isotope ratios of seven MPI-DINGglasses which were obtained by averaging the
normalized TIMS andMC-ICPMS data. The qualityof the data varies between samples. Whereas two tofive different splits of KL2-G, ML3B-G, ATHO-G,T1-G, StHs6/80-G were analyzed by two differenthigh-precision techniques in two laboratories, thiswas not the case for the two komatiite glassesGOR128-G and GOR132-G where only onehigh-precision analysis exists. However, indepen-dent solution ICPMS and LA-ICPMS analyses(Tables 5 and 6) help to further constrain thereference values.
[16] As shown in Table 4 and discussed above,RSD values and percentage differences of
Table 5. Pb Isotope Ratio Measurements by Solution ICPMS Using an ELEMENT2 MassSpectrometera
Analysis
Mean RSD, %1 2 3 4
208Pb/206PbStHs80/6-G split 3 2.040 2.042 2.042 2.042 0.06RSE, % 0.07 0.17 0.25ATHO-G split 3 2.075 2.079 2.068 2.074 0.26RSE, % 0.10 0.06 0.39KL2-G split 6 2.025 2.021 2.017 2.021 0.20RSE, % 0.13 0.09 0.19ML3B-G split 4 2.056 2.058 2.054 2.056 0.12RSE, % 0.05 0.09 0.44GOR132-G split 2 2.006 2.013 2.002 2.007 0.25RSE, % 0.04 0.07 0.15GOR128-G split 2 2.081 2.081 2.082 2.081 0.02RSE, % 0.11 0.30 0.26T1-G split 3 2.080 2.083 2.080 2.081 0.09RSE, % 0.08 0.05 0.22AGV-1 2.031 2.033 2.034 2.036 2.034 0.09RSE, % 0.04 0.11 0.09 0.28BHVO-1 2.060 2.059 2.057 2.053 2.057 0.15RSE, % 0.18 0.11 0.11 0.05
207Pb/206PbStHs80/6-G split 3 0.8261 0.8250 0.8258 0.8256 0.07RSE, % 0.04 0.16 0.29ATHO-G split 3 0.8415 0.8434 0.8422 0.8423 0.11RSE, % 0.10 0.05 0.28KL2-G split 6 0.8206 0.8204 0.8200 0.8203 0.04RSE, % 0.15 0.04 0.11ML3B-G split 4 0.8358 0.8339 0.8330 0.8342 0.17RSE, % 0.11 0.07 0.28GOR132-G split 2 0.8129 0.8174 0.8164 0.8156 0.29RSE, % 0.07 0.21 0.16GOR128-G split 2 0.8463 0.8479 0.8493 0.8479 0.17RSE, % 0.09 0.16 0.25T1-G split 3 0.8358 0.8370 0.8373 0.8367 0.09RSE, % 0.06 0.09 0.16AGV-1 0.8220 0.8233 0.8238 0.8262 0.8238 0.21RSE, % 0.07 0.08 0.06 0.20BHVO-1 0.8332 0.8346 0.8334 0.8329 0.8335 0.09RSE, % 0.19 0.11 0.05 0.08
aAbout 2100 scans have been performed for each analysis.
GeochemistryGeophysicsGeosystems G3G3
jochum et al.: mpi-ding glasses 10.1029/2005GC000995
9 of 15
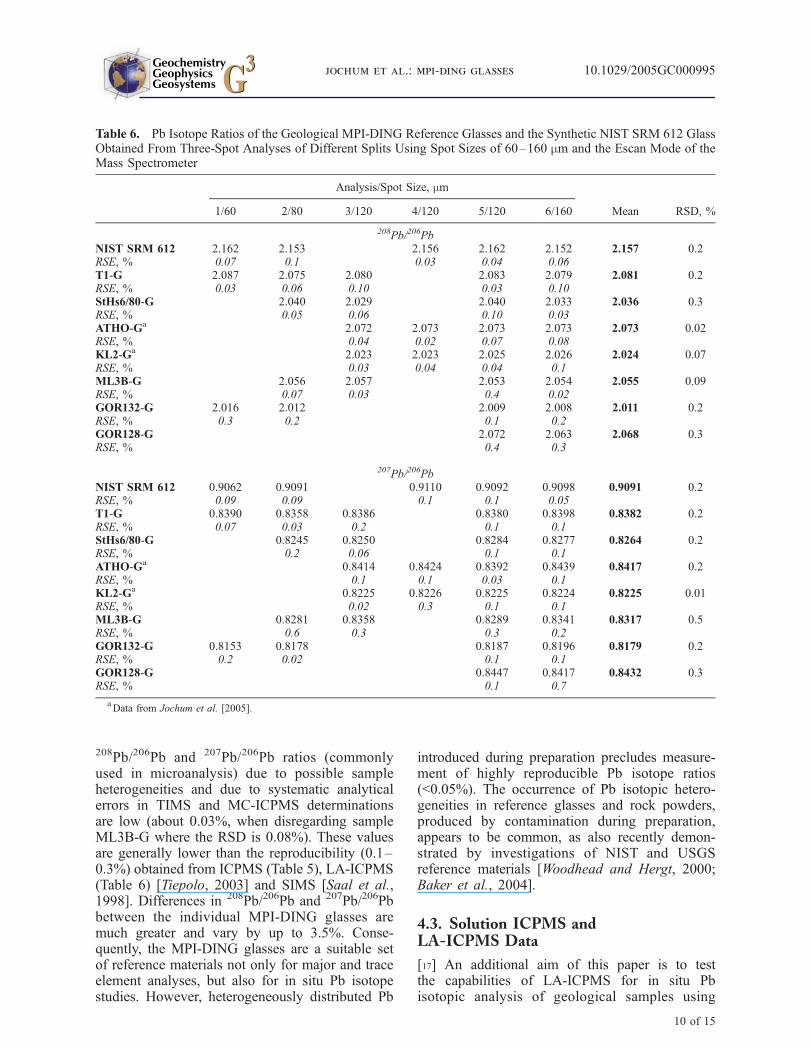
208Pb/206Pb and 207Pb/206Pb ratios (commonlyused in microanalysis) due to possible sampleheterogeneities and due to systematic analyticalerrors in TIMS and MC-ICPMS determinationsare low (about 0.03%, when disregarding sampleML3B-G where the RSD is 0.08%). These valuesare generally lower than the reproducibility (0.1–0.3%) obtained from ICPMS (Table 5), LA-ICPMS(Table 6) [Tiepolo, 2003] and SIMS [Saal et al.,1998]. Differences in 208Pb/206Pb and 207Pb/206Pbbetween the individual MPI-DING glasses aremuch greater and vary by up to 3.5%. Conse-quently, the MPI-DING glasses are a suitable setof reference materials not only for major and traceelement analyses, but also for in situ Pb isotopestudies. However, heterogeneously distributed Pb
introduced during preparation precludes measure-ment of highly reproducible Pb isotope ratios(<0.05%). The occurrence of Pb isotopic hetero-geneities in reference glasses and rock powders,produced by contamination during preparation,appears to be common, as also recently demon-strated by investigations of NIST and USGSreference materials [Woodhead and Hergt, 2000;Baker et al., 2004].
4.3. Solution ICPMS andLA-ICPMS Data
[17] An additional aim of this paper is to testthe capabilities of LA-ICPMS for in situ Pbisotopic analysis of geological samples using
Table 6. Pb Isotope Ratios of the Geological MPI-DING Reference Glasses and the Synthetic NIST SRM 612 GlassObtained From Three-Spot Analyses of Different Splits Using Spot Sizes of 60–160 mm and the Escan Mode of theMass Spectrometer
Analysis/Spot Size, mm
Mean RSD, %1/60 2/80 3/120 4/120 5/120 6/160
208Pb/206PbNIST SRM 612 2.162 2.153 2.156 2.162 2.152 2.157 0.2RSE, % 0.07 0.1 0.03 0.04 0.06T1-G 2.087 2.075 2.080 2.083 2.079 2.081 0.2RSE, % 0.03 0.06 0.10 0.03 0.10StHs6/80-G 2.040 2.029 2.040 2.033 2.036 0.3RSE, % 0.05 0.06 0.10 0.03ATHO-Ga 2.072 2.073 2.073 2.073 2.073 0.02RSE, % 0.04 0.02 0.07 0.08KL2-Ga 2.023 2.023 2.025 2.026 2.024 0.07RSE, % 0.03 0.04 0.04 0.1ML3B-G 2.056 2.057 2.053 2.054 2.055 0.09RSE, % 0.07 0.03 0.4 0.02GOR132-G 2.016 2.012 2.009 2.008 2.011 0.2RSE, % 0.3 0.2 0.1 0.2GOR128-G 2.072 2.063 2.068 0.3RSE, % 0.4 0.3
207Pb/206PbNIST SRM 612 0.9062 0.9091 0.9110 0.9092 0.9098 0.9091 0.2RSE, % 0.09 0.09 0.1 0.1 0.05T1-G 0.8390 0.8358 0.8386 0.8380 0.8398 0.8382 0.2RSE, % 0.07 0.03 0.2 0.1 0.1StHs6/80-G 0.8245 0.8250 0.8284 0.8277 0.8264 0.2RSE, % 0.2 0.06 0.1 0.1ATHO-Ga 0.8414 0.8424 0.8392 0.8439 0.8417 0.2RSE, % 0.1 0.1 0.03 0.1KL2-Ga 0.8225 0.8226 0.8225 0.8224 0.8225 0.01RSE, % 0.02 0.3 0.1 0.1ML3B-G 0.8281 0.8358 0.8289 0.8341 0.8317 0.5RSE, % 0.6 0.3 0.3 0.2GOR132-G 0.8153 0.8178 0.8187 0.8196 0.8179 0.2RSE, % 0.2 0.02 0.1 0.1GOR128-G 0.8447 0.8417 0.8432 0.3RSE, % 0.1 0.7
aData from Jochum et al. [2005].
GeochemistryGeophysicsGeosystems G3G3
jochum et al.: mpi-ding glasses 10.1029/2005GC000995
10 of 15

single-collector sector-field ICP mass spectrome-ters. Such instruments consist of a double focusingmass spectrometer with magnetic and electricalsector fields. They have the advantages of highdetection power, extremely low sample consump-tion, the option of having high mass resolution,and flat top peaks in low mass resolution.
[18] To test the analytical performance of the sectorfield ICPMS model ELEMENT2 we used homo-geneous sample solutions. For these purposes wemeasured 208Pb/206Pb and 207Pb/206Pb ratios inchemically dissolved samples of the MPI-DINGreference glasses and the USGS reference materialsAGV-1 and BHVO-1. Table 5 shows the results of3–4 analyses. The reproducibility (1 RSD) of208Pb/206Pb and 207Pb/206Pb ranges from <0.1 to0.3% and agrees well with the within-run preci-sions (1 RSE, n = 2100; in this paper in-runprecision of ICPMS and LA-ICPMS data is quotedas 1 RSE as mainly used in microanalysis) ofthe respective isotope ratios. Most data for theMPI-DING glasses agree within the uncertaintylimits of the ICPMS analyses (<0.3%) with thereference values (Table 4) obtained from high-precision TIMS and MC-ICPMS data (Figure 3).An exception is GOR128-G, which shows devia-tions of 208Pb/206Pb and 207Pb/206Pb of 0.7% and0.5% from the reference values, respectively. The
low Pb concentration in GOR128-G (0.345 mg/g;Table 1) cannot be the reason for this mismatch,since the amount of total dissolved solid has beenadjusted to yield about 0.5 to 1 ng ml�1 Pb in thesolution. Possible explanations for the discrepancyinclude inadequate mass fractionation correction
Figure 3. Comparison of Pb isotope data using LA-ICPMS and solution ICPMS with reference values obtainedfrom high-precision TIMS and MC-ICPMS measurements. Error bars indicate ±1 SD external precision of theLA-ICPMS and solution ICPMS data. The shaded band represents the precision (1 RSD) of the reference values.
Figure 4. In-run precision (1 relative standard error,RSE) of 208Pb/206Pb and 207Pb/206Pb versus spot sizeused in LA-ICPMS. Curves show the approximatedependence of RSE on the spot size for different Pbconcentrations. They are derived from three-spotanalyses of MPI-DING glasses and GSE-1G of thisstudy, Jochum et al. [2005], and K. P. Jochum(unpublished). The error bars represent the uncertaintiesfor a Pb-poor and a Pb-rich sample.
GeochemistryGeophysicsGeosystems G3G3
jochum et al.: mpi-ding glasses 10.1029/2005GC000995
11 of 15

Table 7. Pb Isotope Ratios of the MPI-DING and NIST SRM 612 Reference Glasses Obtained From Three-SpotAnalyses Using Spot Sizes of 120 mm and the Combined Bscan-Escan Mode of the Mass Spectrometer
Analysis
Mean RSD, %1 2 3 4 5 6 7 8 9
208Pb/206PbNIST SRM 612 2.152 2.179 2.171 2.168 2.157 2.148 2.141 2.141 2.154 2.157 0.6RSE, % 1 1 0.6 0.3 0.2 0.6 0.2 0.4 0.2T1-G 2.075 2.082 2.088 2.080 2.081 0.3RSE, % 0.3 0.1 0.03 0.1StHs6/80-G 2.030 2.038 2.051 2.025 2.036 0.6RSE, % 0.3 0.2 0.3 0.5ATHO-Ga 2.073 2.081 2.080 2.073 2.071 2.079 2.078 2.069 2.074 2.075 0.2RSE, % 0.02 0.1 0.2 0.7 0.3 0.2 0.7 0.1 0.3KL2-Ga 2.028 2.013 2.027 2.037 2.016 2.014 2.012 2.012 2.027 2.021 0.5RSE, % 0.1 0.1 0.05 0.3 0.2 0.7 0.2 0.3 0.3ML3B-G 2.057 2.064 2.052 2.054 2.054 2.041 2.054 0.4RSE, % 0.1 0.02 0.4 0.3 0.1 0.5GOR132-G 2.009 1.999 2.004 0.4RSE, % 0.1 0.4GOR128-G 2.060 2.060RSE, % 0.1
207Pb/206PbNIST SRM 612 0.9032 0.9110 0.9151 0.9107 0.9113 0.9056 0.9090 0.9045 0.9088 0.9088 0.4RSE, % 0.8 0.3 0.4 0.5 0.2 0.9 0.1 0.2 0.4T1-G 0.8443 0.8370 0.8350 0.8363 0.8382 0.5RSE, % 0.5 0.2 0.9 0.3StHs6/80-G 0.8331 0.8247 0.8307 0.8224 0.8277 0.6RSE, % 0.8 0.3 0.3 0.2ATHO-Ga 0.8450 0.8405 0.8438 0.8402 0.8477 0.8454 0.8460 0.8419 0.8469 0.8442 0.3RSE, % 0.5 0.6 0.01 0.4 0.4 0.4 0.1 0.1 0.5KL2-Ga 0.8255 0.8250 0.8192 0.8243 0.8197 0.8237 0.8205 0.8218 0.8128 0.8214 0.5RSE, % 0.05 0.5 0.2 0.3 0.9 0.3 0.5 0.3 0.8ML3B-G 0.8306 0.8321 0.8365 0.8375 0.8428 0.8295 0.8348 0.6RSE, % 0.2 0.4 0.5 0.5 0.2 0.5GOR132-G 0.8207 0.8070 0.8139 1.2RSE, % 0.5 0.2GOR128-G 0.8452 0.8452RSE, % 0.8
208Pb/204PbNIST SRM 612 37.11 37.47 37.29 36.82 36.81 37.03 36.07 36.28 36.89 36.86 1.2RSE, % 0.6 1.3 1 0.6 0.3 0.9 0.8 0.4 0.3T1-G 39.68 39.22 39.18 38.98 39.27 0.8RSE, % 0.7 0.1 1 0.6StHs6/80-G 39.15 37.97 38.77 38.75 38.66 1.3RSE, % 0.4 1 1 1ATHO-Ga 38.84 38.75 38.86 39.16 38.07 39.88 38.48 37.98 39.24 38.81 1.5RSE, % 0.5 0.6 0.5 2 0.5 2 3 0.5 1KL2-Ga 38.86 38.85 38.95 40.21 37.94 36.31 37.41 39.01 39.99 38.61 3.2RSE, % 0.8 0.6 1 1 0.3 4 0.3 0.9 1ML3B-G 38.74 38.70 39.49 37.77 37.22 39.80 38.62 2.6RSE, % 0.9 0.7 2 2 0.9 1GOR132-G 38.24 38.24RSE, % 0.3
207Pb/204PbNIST SRM 612 15.62 15.61 15.70 15.47 15.58 15.68 15.55 15.34 15.59 15.57 0.7RSE, % 3 0.2 1 0.6 0.3 1 0.7 0.3 0.3T1-G 16.25 15.79 15.79 15.70 15.88 1.6RSE, % 0.4 0.1 0.7 0.4StHs6/80-G 16.15 15.39 15.64 15.74 15.73 2.0RSE, % 0.5 2 0.9 0.9
GeochemistryGeophysicsGeosystems G3G3
jochum et al.: mpi-ding glasses 10.1029/2005GC000995
12 of 15
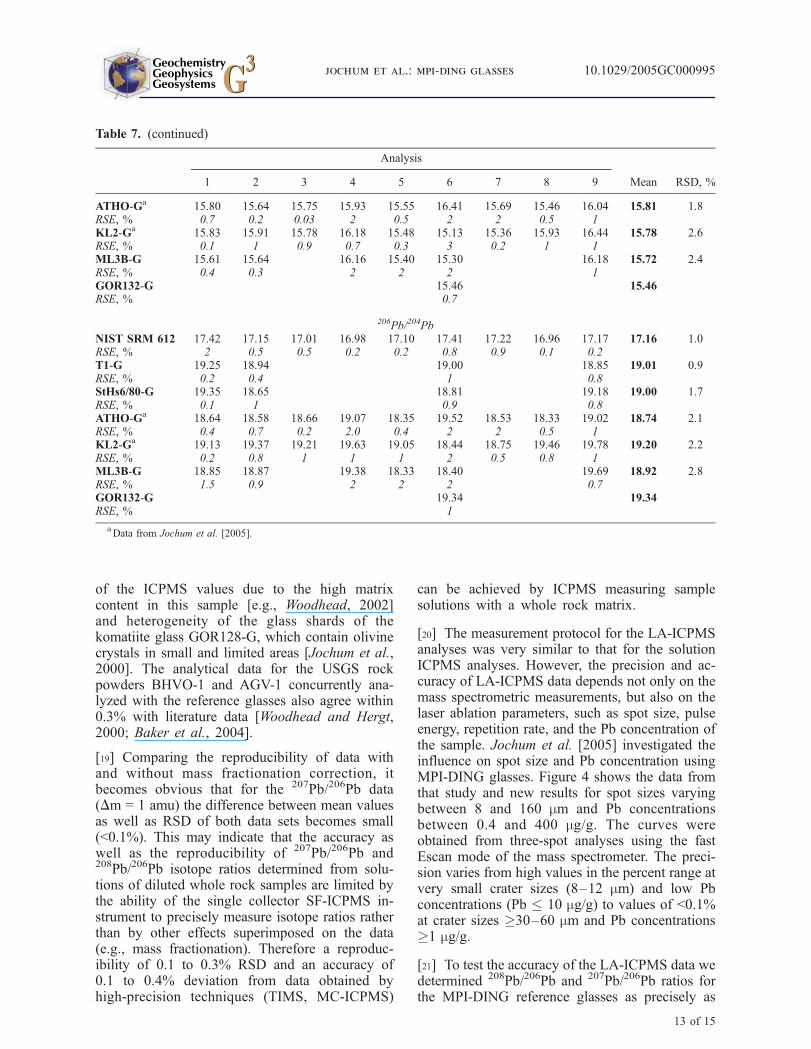
of the ICPMS values due to the high matrixcontent in this sample [e.g., Woodhead, 2002]and heterogeneity of the glass shards of thekomatiite glass GOR128-G, which contain olivinecrystals in small and limited areas [Jochum et al.,2000]. The analytical data for the USGS rockpowders BHVO-1 and AGV-1 concurrently ana-lyzed with the reference glasses also agree within0.3% with literature data [Woodhead and Hergt,2000; Baker et al., 2004].
[19] Comparing the reproducibility of data withand without mass fractionation correction, itbecomes obvious that for the 207Pb/206Pb data(Dm = 1 amu) the difference between mean valuesas well as RSD of both data sets becomes small(<0.1%). This may indicate that the accuracy aswell as the reproducibility of 207Pb/206Pb and208Pb/206Pb isotope ratios determined from solu-tions of diluted whole rock samples are limited bythe ability of the single collector SF-ICPMS in-strument to precisely measure isotope ratios ratherthan by other effects superimposed on the data(e.g., mass fractionation). Therefore a reproduc-ibility of 0.1 to 0.3% RSD and an accuracy of0.1 to 0.4% deviation from data obtained byhigh-precision techniques (TIMS, MC-ICPMS)
can be achieved by ICPMS measuring samplesolutions with a whole rock matrix.
[20] The measurement protocol for the LA-ICPMSanalyses was very similar to that for the solutionICPMS analyses. However, the precision and ac-curacy of LA-ICPMS data depends not only on themass spectrometric measurements, but also on thelaser ablation parameters, such as spot size, pulseenergy, repetition rate, and the Pb concentration ofthe sample. Jochum et al. [2005] investigated theinfluence on spot size and Pb concentration usingMPI-DING glasses. Figure 4 shows the data fromthat study and new results for spot sizes varyingbetween 8 and 160 mm and Pb concentrationsbetween 0.4 and 400 mg/g. The curves wereobtained from three-spot analyses using the fastEscan mode of the mass spectrometer. The preci-sion varies from high values in the percent range atvery small crater sizes (8–12 mm) and low Pbconcentrations (Pb � 10 mg/g) to values of <0.1%at crater sizes �30–60 mm and Pb concentrations�1 mg/g.
[21] To test the accuracy of the LA-ICPMS data wedetermined 208Pb/206Pb and 207Pb/206Pb ratios forthe MPI-DING reference glasses as precisely as
Table 7. (continued)
Analysis
Mean RSD, %1 2 3 4 5 6 7 8 9
ATHO-Ga 15.80 15.64 15.75 15.93 15.55 16.41 15.69 15.46 16.04 15.81 1.8RSE, % 0.7 0.2 0.03 2 0.5 2 2 0.5 1KL2-Ga 15.83 15.91 15.78 16.18 15.48 15.13 15.36 15.93 16.44 15.78 2.6RSE, % 0.1 1 0.9 0.7 0.3 3 0.2 1 1ML3B-G 15.61 15.64 16.16 15.40 15.30 16.18 15.72 2.4RSE, % 0.4 0.3 2 2 2 1GOR132-G 15.46 15.46RSE, % 0.7
206Pb/204PbNIST SRM 612 17.42 17.15 17.01 16.98 17.10 17.41 17.22 16.96 17.17 17.16 1.0RSE, % 2 0.5 0.5 0.2 0.2 0.8 0.9 0.1 0.2T1-G 19.25 18.94 19.00 18.85 19.01 0.9RSE, % 0.2 0.4 1 0.8StHs6/80-G 19.35 18.65 18.81 19.18 19.00 1.7RSE, % 0.1 1 0.9 0.8ATHO-Ga 18.64 18.58 18.66 19.07 18.35 19.52 18.53 18.33 19.02 18.74 2.1RSE, % 0.4 0.7 0.2 2.0 0.4 2 2 0.5 1KL2-Ga 19.13 19.37 19.21 19.63 19.05 18.44 18.75 19.46 19.78 19.20 2.2RSE, % 0.2 0.8 1 1 1 2 0.5 0.8 1ML3B-G 18.85 18.87 19.38 18.33 18.40 19.69 18.92 2.8RSE, % 1.5 0.9 2 2 2 0.7GOR132-G 19.34 19.34RSE, % 1
aData from Jochum et al. [2005].
GeochemistryGeophysicsGeosystems G3G3
jochum et al.: mpi-ding glasses 10.1029/2005GC000995
13 of 15

possible. We therefore only used data from analyseswith large spot sizes� 60 mm (for Pb� 10 mg/g),�80 mm (for Pb � 2 mg/g), and � 120 mm (for Pb �0.3 mg/g). Table 6 lists the results. In-run precision(1 RSE) of single three-spot analyses is about0.05%, with the exception of the two komatiiteglasses GOR128-G, GOR132-G and the basaltglass ML3B-G where 1 RSE is about 0.1–0.5%.As already mentioned, possible reasons for thelarger in-run precisions of the komatiite samplesare higher sample heterogeneities [Jochum et al.,2000] and low Pb abundance (0.345 mg/g) inGOR128-G. ML3B-G seems to be more heteroge-neous with respect to Pb isotopes than the othersamples as also demonstrated by TIMS analyses ofdifferent splits (Table 2). The in-run precision of theLA-ICPMS data of the remaining samples (about0.05–0.2%) is about the same as, or better than thatof the solution ICPMS data (about 0.05–0.3%)indicating that the laser ablation system does notcontribute to the overall analytical uncertainty.
[22] Table 7 shows the Pb isotope results ofLA-ICPMS including 204Pb and using the lessprecise combined Bscan - Escan mode. The208Pb/206Pb and the 207Pb/206Pb data are a factorof 2–5 less precise than those of the Escan mode(Table 6) due to the much higher time per pass, andconsequently a reduced number of Pb measure-ments. The precision of 208Pb/204Pb, 207Pb/204Pband 206Pb/204Pb is even lower because of the lowabundance of 204Pb and errors from the correctionof the 204Hg interference on this isotope.
[23] The mean Escan measurements of 208Pb/206Pband 207Pb/206Pb ratios of 2–5 independentLA-ICPMS analyses of the MPI-DING glasses(Table 6) are identical within 0.2% with the refer-ence values (Figure 2). These deviations are similarto external precision (1 RSD = 0.1–0.3%) of theLA-ICPMS data indicating that sample heteroge-neity (with the possible exception of the GORsamples and ML3B-G) and calibration errors aresmall. The less precise data of Table 7 also agreewith the reference values within error limits. How-ever, differences are higher for 208Pb/206Pb,207Pb/206Pb (0.1 –0.3%), and especially for208Pb/204Pb, 207Pb/204Pb, 206Pb/204Pb (0.2–2%).
5. Conclusions
[24] A comparative study employing TIMS,MC-ICPMS, ICPMS and LA-ICPMS techniquesdemonstrates the utility of MPI-DING glasses asreference materials for in situ Pb isotopic analysis.
Preliminary reference values for 208Pb/206Pb and207Pb/206Pb are reported, derived from high-precision TIMS and MC-ICPMS data. Analyticaluncertainties (1 RSD) for the reference valuesare <0.03% with the exception of ML3B-Gwhere the uncertainty is 0.08%. Potential hetero-geneities in the Pb isotopic compositions for mostreference glasses are small and generally lowerthan the precision obtained from microanalyticaltechniques.
[25] We have tested the capabilities of LA-ICPMSfor in situ Pb isotopic analysis using the MPI-DINGreference glasses. We obtained data for 208Pb/206Pband 207Pb/206Pb ratios that have an in-run precision(1 RSE) of better than 0.1% for most referenceglasses, and an external precision (1 RSD) of about0.1–0.3%. Our LA-ICPMS data are identical withthe reference values within 0–0.2%.
Acknowledgment
[26] We thank the reviewers J. Bryce and A. Saal and the
Associate Editor M. R. Reid for their valuable comments.
References
Abouchami, W., S. J. G. Galer, and A. W. Hofmann (2000),High precision lead isotope systematics of lavas from theHawaiian Scientific Drilling Project, Chem. Geol., 169,187–209.
Baker, J., D. Peate, T. Waight, and C. Meyzen (2004), Pb iso-topic analysis of standards and samples using a 207Pb-204Pbdouble spike and thallium to correct for mass bias with adouble-focusing MC-ICP-MS, Chem. Geol., 211, 275–303.
Galer, S. J. G. (1999), Optimal double and triple spiking forhigh precision lead isotopic measurement, Chem. Geol., 157,255–274.
Govindaraju, K. (1994), 1994 compilation of working valuesand sample description for 383 geostandards, Geostand.Newsl., 18, 1–158.
Jochum, K. P., et al. (2000), The preparation and preliminarycharacterisation of eight geological MPI-DING referenceglasses for in-situ microanalysis, Geostand. Newsl., 24,87–133.
Jochum, K. P., B. Stoll, K. Herwig, and A. W. Hofmann(2004), Pb isotopes and trace elements in melt inclusionsfrom Hawaiian basalts using LA-ICPMS and SR-XRF, Geo-chim. Cosmochim. Acta, 68, suppl. 1, A564.
Jochum, K. P., B. Stoll, K. Herwig, B. Amini, W. Abouchami,and A. W. Hofmann (2005), Lead isotope ratio measure-ments in geological glasses by laser ablation-sector field-ICP mass spectrometry (LA-SF-ICPMS), Int. J. MassSpectrom., 242, 281–289.
Loss, R. D. (2003), Atomic weights of the elements 2001(IUPAC Technical Report), Pure Appl. Chem., 75, 1107–1122.
Newsom, H. E., W. M. White, K. P. Jochum, and A. W.Hofmann (1986), Siderophile and chalcophile element abun-dances in oceanic basalts, Pb isotope evolution and growth ofthe Earth’s core, Earth Planet. Sci. Lett., 80, 299–313.
GeochemistryGeophysicsGeosystems G3G3
jochum et al.: mpi-ding glasses 10.1029/2005GC000995
14 of 15
Pearce, N. J. G., W. T. Perkins, J. A. Westgate, M. P. Gorton,S. E. Jackson, C. R. Neal, and S. P. Chenery (1997), Acompilation of new and published major and trace elementdata for NIST SRM 610 and NIST SRM 612 glass refer-ence materials, Geostand. Newsl., 21, 115–144.
Raczek, I., K. P. Jochum, and A. W. Hofmann (2003), Neody-mium and strontium isotope data for USGS referencematerials BCR-1, BCR-2, BHVO-1, BHVO-2, AGV-1,AGV-2, GSP-1, GSP-2 and eight MPI-DING referenceglasses, Geostand. Newsl., 27, 173–179.
Rosman, K. J. R., and P. D. P. Taylor (1998), Isotopic composi-tions of the elements 1997, Pure Appl. Chem., 70, 217–236.
Rosner, M., and A. Meixner (2004), Boron isotopic composi-tion and concentration of ten geological reference materials,Geostand. Geoanal. Res., 28, 431–441.
Saal, A. E., S. R. Hart, N. Shimizu, and G. D. Layne (1998),Pb isotopic variability in melt inclusions from oceanic islandbasalts, Polynesia, Science, 282, 1481–1484.
Tiepolo, M. (2003), In situ Pb geochronology of zircon withlaser ablation-inductively coupled plasma–sector field massspectrometry, Chem. Geol., 199, 159–177.
Todt, W., R. A. Cliff, A. Hanser, and A. W. Hofmann (1996),Evaluation of a 202Pb-205Pb double spike for high precisionlead isotope analysis, in Earth Processes: Reading theIsotopic Code, Geophys. Monogr. Ser., vol. 95, edited byA. Basu and S. R. Hart, pp. 429–437, AGU, Washington,D. C.
Woodhead, J. D. (2002), A simple method for obtaining highlyaccurate Pb-isotope data by MC-ICPMS, J. Anal. At. Spec-trom., 17, 1381–1385.
Woodhead, J., and J. M. Hergt (2000), Pb-isotope analysis ofUSGS reference materials, Geostand. Newsl., 24, 33–38.
Woodhead, J. D., and J. M. Hergt (2001), Strontium, neody-mium and lead isotope analyses of NIST glass certifiedreference materials: SRM 610, 612, 614, Geostand. Newsl.,25, 261–266.
GeochemistryGeophysicsGeosystems G3G3
jochum et al.: mpi-ding glasses 10.1029/2005GC000995
15 of 15