Growth and differentiation of mouse osteoblasts on chitosan–collagen sponges
10
Research Paper Tissue Enhancement Growth and differentiation of mouse osteoblasts on chitosan–collagen sponges P. Arpornmaeklong, N. Suwatwirote, P. Pripatnanont, K. Oungbho: Growth and differentiation of mouse osteoblasts on chitosan–collagen sponges. Int. J. Oral Maxillofac. Surg. 2007; 36: 328–337. # 2006 International Association of Oral and Maxillofacial surgeons. Published by Elsevier Ltd. All rights reserved. P. Arpornmaeklong, N. Suwatwirote 1 , P. Pripatnanont 1 , K. Oungbho 2 1 Department of Oral and Maxillofacial Surgery, Faculty of Dentistry, Prince of Songkla University, Hat Yai, 90112 Songkhla, Thailand; 2 Department of Pharmaceutical Technology, Faculty of Pharmaceutical Sciences, Prince of Songkla University, Hat Yai, 90112 Songkhla, Thailand Abstract. The aim of this study was to investigate the effects of collagen on the microstructure and biocompatibility of chitosan–collagen composite sponges fabricated by a freezing and drying technique. The study was categorized into four groups: Group I: collagen; Group II: chitosan; Group III: 1:1 (by wt) chitosan– collagen and Group IV: 1:2 (by wt) chitosan–collagen sponges. A mouse osteoblast cell line, MC3T3-E1, was cultivated on the sponges in a mineralized culture medium for 21 days. Microstructure of scaffolds and growth of cells on the sponges were examined using scanning electron and confocal laser scanning electron microscopes. Pore size was analysed from scanning electron microscope images using Image-Pro 1 Plus image analysis software. Cell viability (MTT assay), alkaline phosphatase activity and levels of osteocalcin and calcium were monitored every 3 days and on days 15 and 21, respectively. It was found that the sponges were porous with average pore sizes of 80–100 mm. A combination of chitosan and collagen matrixes created a well defined porous microstructure and biocompatible scaffolds. Chitosan–collagen composite sponges promoted growth and differentiation of osteoblasts into the mature stage. To optimize application of the composite sponges in bone regeneration, the fabrication process must be improved to increase the pore size of the scaffolds. Key words: chitosan–collagen scaffold; bio- compatibility; osteoblastic differentiation. Accepted for publication 28 September 2006 Available online 12 January 2007 Scaffolds play an essential role in support- ing bone regeneration in bone tissue engi- neering. The three-dimensional structure of scaffolds provides physical support and acts as a substrate regulating cell growth, adhesion and differentiation 21 . Interaction between cells and extracellular matrix (ECM) regulates growth and differentia- tion of osteoblasts 38 . Natural macromole- cule polymeric scaffolds have advantages over synthetic polymers in that they facil- itate cell attachment and maintain differ- entiation of cells 29 . Chitosan and collagen are among the most used natural biode- gradable polymers as tissue scaffolds. Chitosan, an aminopolysaccharide (poly-1,4-D-glucosamine), is the alkaline decetylated product of chitin. The similar- ity in structure of chitosan to glycosami- noglycan in ECM contributes to its superior tissue biocompatibility. Chitosan can be fabricated into various forms and has been widely applied in biomedicine 1,6,20,32 . Disadvantages of chitosan are its poor physical property of being brittle at the dried stage 35 and restriction of cell spread- ing and cytoskeletal actin distribution 8 . Collagen is a major component of ECM and an important substrate enhancing pro- liferation, migration and differentiation of osteoblast-like cells 2,3,5,25 . Resorbable collagen sponges have been successfully used as carriers of BMP-2, but they have Int. J. Oral Maxillofac. Surg. 2007; 36: 328–337 doi:10.1016/j.ijom.2006.09.023, available online at http://www.sciencedirect.com 0901-5027/040328 + 010 $30.00/0 # 2006 International Association of Oral and Maxillofacial surgeons. Published by Elsevier Ltd. All rights reserved.
Transcript of Growth and differentiation of mouse osteoblasts on chitosan–collagen sponges

Int. J. Oral Maxillofac. Surg. 2007; 36: 328–337doi:10.1016/j.ijom.2006.09.023, available online at http://www.sciencedirect.com
Research PaperTissue Enhancement
Growth and differentiation ofmouse osteoblasts onchitosan–collagen sponges
P. Arpornmaeklong, N. Suwatwirote, P. Pripatnanont, K. Oungbho: Growth anddifferentiation of mouse osteoblasts on chitosan–collagen sponges. Int. J. OralMaxillofac. Surg. 2007; 36: 328–337. # 2006 International Association of Oral andMaxillofacial surgeons. Published by Elsevier Ltd. All rights reserved.0901-5027/040328 + 010 $30.00/0 # 2006 Intern
ational Association of Oral and Maxillofacial surgeonP. Arpornmaeklong,N. Suwatwirote1,P. Pripatnanont1, K. Oungbho2
1Department of Oral and MaxillofacialSurgery, Faculty of Dentistry, Prince ofSongkla University, Hat Yai, 90112 Songkhla,Thailand; 2Department of PharmaceuticalTechnology, Faculty of PharmaceuticalSciences, Prince of Songkla University, HatYai, 90112 Songkhla, Thailand
Abstract. The aim of this study was to investigate the effects of collagen on themicrostructure and biocompatibility of chitosan–collagen composite spongesfabricated by a freezing and drying technique. The study was categorized into fourgroups: Group I: collagen; Group II: chitosan; Group III: 1:1 (by wt) chitosan–collagen and Group IV: 1:2 (by wt) chitosan–collagen sponges. A mouse osteoblastcell line, MC3T3-E1, was cultivated on the sponges in a mineralized culturemedium for 21 days. Microstructure of scaffolds and growth of cells on the spongeswere examined using scanning electron and confocal laser scanning electronmicroscopes. Pore size was analysed from scanning electron microscope imagesusing Image-Pro1 Plus image analysis software. Cell viability (MTT assay),alkaline phosphatase activity and levels of osteocalcin and calcium were monitoredevery 3 days and on days 15 and 21, respectively. It was found that the sponges wereporous with average pore sizes of 80–100 mm. A combination of chitosan andcollagen matrixes created a well defined porous microstructure and biocompatiblescaffolds. Chitosan–collagen composite sponges promoted growth anddifferentiation of osteoblasts into the mature stage. To optimize application of thecomposite sponges in bone regeneration, the fabrication process must be improvedto increase the pore size of the scaffolds.
Key words: chitosan–collagen scaffold; bio-compatibility; osteoblastic differentiation.
Accepted for publication 28 September 2006Available online 12 January 2007
Scaffolds play an essential role in support-ing bone regeneration in bone tissue engi-neering. The three-dimensional structureof scaffolds provides physical support andacts as a substrate regulating cell growth,adhesion and differentiation21. Interactionbetween cells and extracellular matrix(ECM) regulates growth and differentia-tion of osteoblasts38. Natural macromole-cule polymeric scaffolds have advantagesover synthetic polymers in that they facil-
itate cell attachment and maintain differ-entiation of cells29. Chitosan and collagenare among the most used natural biode-gradable polymers as tissue scaffolds.
Chitosan, an aminopolysaccharide(poly-1,4-D-glucosamine), is the alkalinedecetylated product of chitin. The similar-ity in structure of chitosan to glycosami-noglycan in ECM contributes to its superiortissue biocompatibility. Chitosan can befabricated into various forms and has been
widely applied in biomedicine1,6,20,32.Disadvantages of chitosan are its poorphysical property of being brittle at thedried stage35 and restriction of cell spread-ing and cytoskeletal actin distribution8.
Collagen is a major component of ECMand an important substrate enhancing pro-liferation, migration and differentiation ofosteoblast-like cells2,3,5,25. Resorbablecollagen sponges have been successfullyused as carriers of BMP-2, but they have
s. Published by Elsevier Ltd. All rights reserved.
Chitosan–collagen sponges and osteoblastic differentiation 329
the disadvantages of a fast degradationrate and low mechanical strength11,12,17.
The specific properties of chitosan andcollagen can be combined to create newmaterials with unique structural andmechanical properties appropriate forbone regeneration. Physical and biologicalproperties of chitosan can be modified bycross-linking chitosan with other materialssuch as gelatin, tricalcium phosphate andcollagen to form chitosan–compositesponges24,26,36. The optimal ratio of col-lagen in a chitosan–collagen composite asa sustained release drug carrier is 1:235.The scaffolds may function as bioactivesubstance influencing the behaviour of theincorporated or in growing cells.
In this study, chitosan was combinedwith collagen in different ratios and putthrough a freezing and drying procedure tocreate porous bioresorbable scaffolds forbone tissue engineering. The study aimedto investigate the effects of collagen on themicrostructure and growth and differentia-tion of osteoblasts on chitosan–collagensponges in long-term three-dimensionalcell culture.
Materials and methods
Study groups
There were four study groups: Group I:collagen; Group II: chitosan; Group III:1:1 chitosan:collagen and Group IV: 1:2chitosan:collagen scaffolds (Table 1). Inall groups five samples were analysed foreach investigated parameter at the giventime points.
Preparation of sponges
Porous matrices of chitosan, collagen andchitosan–collagen composites were fabri-cated using simple freezing and dryingtechniques35. To prepare 1% chitosan sus-pension, chitosan powder (medium mole-cular weight, Fluka, Switzerland) wasdissolved in 1% acetic acid (Merck, Ger-many) at room temperature. Chitosan andcollagen sponges were prepared by pouring1% chitosan suspension into 1% atelopep-
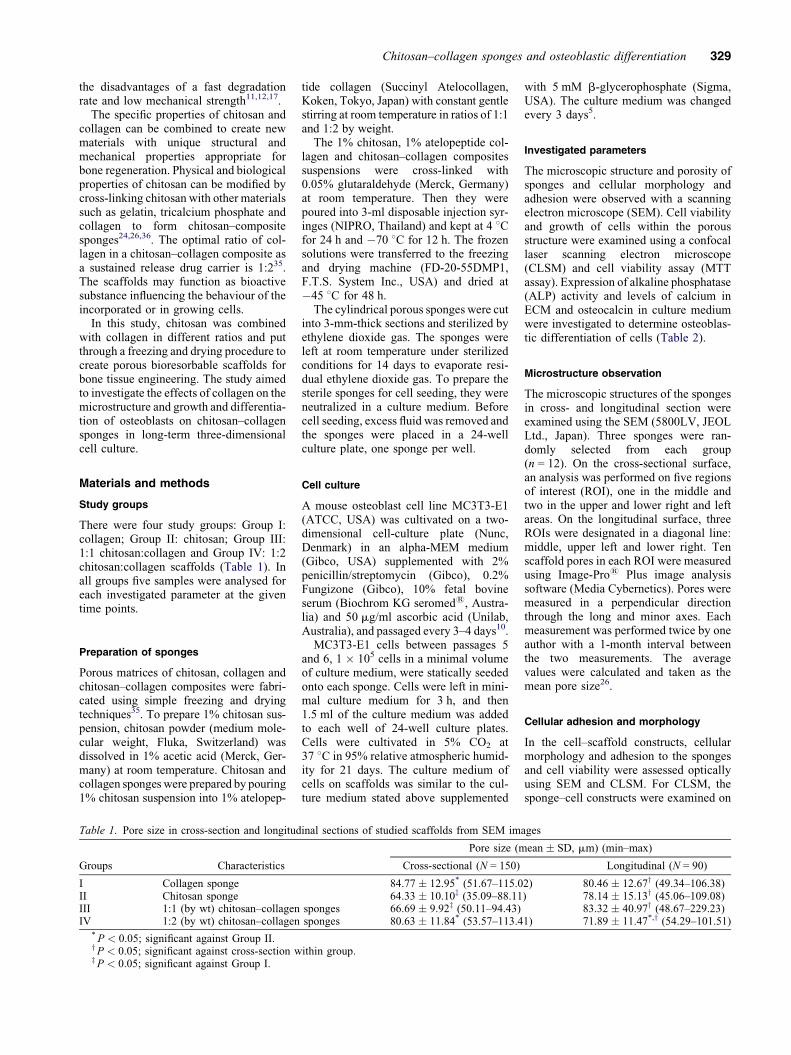
Table 1. Pore size in cross-section and longitud
Groups Characteristics
I Collagen spongeII Chitosan spongeIII 1:1 (by wt) chitosan–collagenIV 1:2 (by wt) chitosan–collagen
* P < 0.05; significant against Group II.yP < 0.05; significant against cross-section wzP < 0.05; significant against Group I.
tide collagen (Succinyl Atelocollagen,Koken, Tokyo, Japan) with constant gentlestirring at room temperature in ratios of 1:1and 1:2 by weight.
The 1% chitosan, 1% atelopeptide col-lagen and chitosan–collagen compositessuspensions were cross-linked with0.05% glutaraldehyde (Merck, Germany)at room temperature. Then they werepoured into 3-ml disposable injection syr-inges (NIPRO, Thailand) and kept at 4 8Cfor 24 h and �70 8C for 12 h. The frozensolutions were transferred to the freezingand drying machine (FD-20-55DMP1,F.T.S. System Inc., USA) and dried at�45 8C for 48 h.
The cylindrical porous sponges were cutinto 3-mm-thick sections and sterilized byethylene dioxide gas. The sponges wereleft at room temperature under sterilizedconditions for 14 days to evaporate resi-dual ethylene dioxide gas. To prepare thesterile sponges for cell seeding, they wereneutralized in a culture medium. Beforecell seeding, excess fluid was removed andthe sponges were placed in a 24-wellculture plate, one sponge per well.
Cell culture
A mouse osteoblast cell line MC3T3-E1(ATCC, USA) was cultivated on a two-dimensional cell-culture plate (Nunc,Denmark) in an alpha-MEM medium(Gibco, USA) supplemented with 2%penicillin/streptomycin (Gibco), 0.2%Fungizone (Gibco), 10% fetal bovineserum (Biochrom KG seromed1, Austra-lia) and 50 mg/ml ascorbic acid (Unilab,Australia), and passaged every 3–4 days10.
MC3T3-E1 cells between passages 5and 6, 1 � 105 cells in a minimal volumeof culture medium, were statically seededonto each sponge. Cells were left in mini-mal culture medium for 3 h, and then1.5 ml of the culture medium was addedto each well of 24-well culture plates.Cells were cultivated in 5% CO2 at37 8C in 95% relative atmospheric humid-ity for 21 days. The culture medium ofcells on scaffolds was similar to the cul-ture medium stated above supplemented
inal sections of studied scaffolds from SEM im
Pore size (m
Cross-sectional (N = 150)
84.77 � 12.95* (51.67–115.064.33 � 10.10z (35.09–88.11
sponges 66.69 � 9.92z (50.11–94.43)sponges 80.63 � 11.84* (53.57–113.4
ithin group.
with 5 mM b-glycerophosphate (Sigma,USA). The culture medium was changedevery 3 days5.
Investigated parameters
The microscopic structure and porosity ofsponges and cellular morphology andadhesion were observed with a scanningelectron microscope (SEM). Cell viabilityand growth of cells within the porousstructure were examined using a confocallaser scanning electron microscope(CLSM) and cell viability assay (MTTassay). Expression of alkaline phosphatase(ALP) activity and levels of calcium inECM and osteocalcin in culture mediumwere investigated to determine osteoblas-tic differentiation of cells (Table 2).
Microstructure observation
The microscopic structures of the spongesin cross- and longitudinal section wereexamined using the SEM (5800LV, JEOLLtd., Japan). Three sponges were ran-domly selected from each group(n = 12). On the cross-sectional surface,an analysis was performed on five regionsof interest (ROI), one in the middle andtwo in the upper and lower right and leftareas. On the longitudinal surface, threeROIs were designated in a diagonal line:middle, upper left and lower right. Tenscaffold pores in each ROI were measuredusing Image-Pro1 Plus image analysissoftware (Media Cybernetics). Pores weremeasured in a perpendicular directionthrough the long and minor axes. Eachmeasurement was performed twice by oneauthor with a 1-month interval betweenthe two measurements. The averagevalues were calculated and taken as themean pore size26.
Cellular adhesion and morphology
In the cell–scaffold constructs, cellularmorphology and adhesion to the spongesand cell viability were assessed opticallyusing SEM and CLSM. For CLSM, thesponge–cell constructs were examined on
ages
ean � SD, mm) (min–max)
Longitudinal (N = 90)
2) 80.46 � 12.67y (49.34–106.38)) 78.14 � 15.13y (45.06–109.08)
83.32 � 40.97y (48.67–229.23)1) 71.89 � 11.47*,y (54.29–101.51)

330 Arpornmaeklong et al.
Table 2. Investigated parameters and investigation times
Investigation Parameter Investigation time No. of samples(at each time point)
Microstructure (SEM) Microstructure of scaffolds Before cell seeding 3Morphology of cells on surface of the scaffolds On culture-days 9, 15 and 21 3
CLSM Viability/growth of cells within porous structureof the scaffolds
On culture-day 6 3
Cell proliferation Cell viability assay (MTT) 24 h and every 3rd culture-day thereafter 5Early osteoblastic
differentiation stageALP activity 24 h and every 3rd culture-day thereafter 5
Late osteoblasticdifferentiation stage
Calcium content (in-vitro mineralization) On culture-days 15 and 21 5Osteocalcin in culture medium On culture-days 3, 15 and 21 5
culture-day 6 and for SEM on culture-days9, 15 and 21. The examinations were per-formed on three sponges selected from eachgroup (n = 12). For CLSM, the constructswere incubated in fluorescence diacetate(FDA, 2 mg/ml; Sigma, USA) for 30 minat 37 8C, to stain viable cells green. Afterthat the constructs were rinsed twice inphosphate-buffered saline (PBS) andobserved under the microscope. Depth pro-jection micrographs were constructed from120 to 150 horizontal image sections (5 mmeach) through the constructs33. For SEM,the constructs were fixed in glutaraldehydeand formaldehyde (Merck, Germany).They were then dehydrated in ethanol ser-ies of 30–100%, dried, mounted, gold sput-ter-coated and imaged26.
Cell viability assay
The MTT (Cell Titer 96 Aqueous OneSolution, Bioactive, USA) test measuresthe mitochondrial (metabolic) activity inthe cell culture, which reflects the numberof viable cells30. In brief, the cultures werewashed in PBS, and 500 ml of culture med-ium containing 50 ml MTT reagent wereadded. Following incubation for 1 h in theincubator (in 5% CO2 at 37 8C) the absorp-tion of the medium was measured in anELISA Reader (BiotrakTM II, Amersham/Bioscience, Australia) at 440 nm with areference wave length >600 nm.
Cell lysis and cellular protein analysis
Every third day, the sponges were moved toa new well and washed two times in Dul-becco’s PBS (Gibco). Cells were lysated byfreezing and thawing for three cycles andincubated on ice in 2% Triton X-100(Sigma) in Dulbecco’s PBS for 1.30 h.Then protein solutions were centrifugedat 2000 � g for 15 min at 4 8C (Laborfuge400R, Heraeus, Germany). The superna-tants were kept at �20 8C for the analysisof ALP activity and protein content37.
The quantification of protein in celllysate solution was performed according
to the manufacturer’s instructions (Bioradprotein assay kit) basing on the Lawryassay. The solutions were read at650 nm absorbance in duplicate using amicroplate reader (BiotrakTM II Amer-sham/Bioscience). A total cellular proteinanalysis was performed on the same sam-ples as the ALP activity and osteocalcinmeasurements9.
Alkaline phosphatase assay
The procedure for measurement of ALPactivity was modified from a previousreport45. In brief, the cellular protein solu-tions were mixed with 400 ml of substratesolution (2 mg/ml p-nitrophenylphosphatedisodium salt (Merck, Germany) in a lysisbuffer, pH 10.3) and were incubated for1 h at 37 8C. Then NaOH 50 mM (Merck)was added to each sample to stop thereaction. The solutions were read at440 nm absorbance in triplicate using amicroplate reader (BiotrakTM II). The ana-lysis was performed every 3 days after cellseeding. Levels of activity were neutra-lized with amount of protein in cell lysatesolution (mg p-nitrophenol/mg protein).
Osteocalcin assay
Quantification of osteocalcin in serum-free cell-culture medium was performedaccording to manufacturer’s instructionsusing the Osteocalcin EIA kit (BiomedicalTechnologies Inc., USA). The solutionswere read at 650 nm absorbance in dupli-cate using a microplate reader (BiotrakTM
II). Total cellular protein analysis wasperformed on the same samples as theALP activity and calcium content mea-surements9. The assay was performed onculture-days 3, 15 and 21. Levels of osteo-calcin were reported as nanograms permilligram protein.
Calcium assay
Analysis of the amount of calcium deposi-tion in the ECM within the sponges was
modified from a previous report16. Inbrief, the scaffolds were washed two timesin DPBS, excess fluid was removed andthe scaffolds were minced into smallpieces with a surgical blade. Then theywere incubated in 0.5N HCl at room tem-perature with constant shaking (150 rpm)(IKA, Germany) for 12 h. The solutionswere centrifuged at 13,000 � g for 5 minand the supernatants collected and kept at�20 8C for analysis.
Calcium content of the cell lysate wasquantified spectrophotometrically withcresolphthalein complexone (Sigma).The absorbance of the samples was readat 575 nm using a microplate reader (Bio-trakTM II). The calcium concentration wascalculated from a standard curve gener-ated from a serial dilution of a calciumstandard solution (Sigma). The analysiswas performed on culture-days 15 and 21.
Data analysis
The data were analysed using the statis-tical package SPSS for Windows version11. The data distribution was checked bythe Shapiro–Wilk test for normal distribu-tion. One-way analysis of variance wasapplied to detect differences amonggroups where the data were normally dis-tributed. Multiple comparisons with theTukey HSD test were done where var-iances were homogeneous (Levene’s sta-tistic), otherwise Dunnett T3 was applied.Paired t-test was used to compare thedifference between culture days withineach group. The level of statistical sig-nificance was set at P < 0.05.
Results
Microstructure of the scaffolds
Sponges of all groups were porous. Poresize ranged from 50 to 113 mm in cross-sections and 55 to 110 mm in longitudinalsections (Table 1). Irregular size and shapeof sheet-like structure was observed in thecollagen and chitosan sponges in Groups I

Chitosan–collagen sponges and osteoblastic differentiation 331
and II, whereas the chitosan–collagencomposite sponges in Groups III and IVwere rather homogenous (Fig. 1).
On cross-sectional surface, the largestpore size was found in Group I: collagensponges (84.77 � 12.95 mm), followed by
Fig. 1. SEM images show microstructures of spoChitosan. (III and VII) 1:1 Chitosan–collagen. (
Group IV: 1:2 chitosan–collagen sponges(80.63� 11.84 mm) (P < 0.05), Group III:1:1 chitosan–collagen sponges (66.69�9.92 mm) (P < 0.001) and Group II: chit-osan sponges (64.33 � 10.07 mm) (P <0.001). Pore size of Group IV was also
nges on cross-sections (I–IV) and longitudinal secIV and VIII) 1:2 chitosan–collagen sponges.
significantly larger than of Groups II andIII (ANOVA, F = 120.806, df = 3,596,P = 0.00). Pore sizes of Groups II andIII were not significantly different(Dunnett T3, MD = �2.358, P = 0.227)(Fig. 1(I–IV)).
tions (V–VIII). (I and V) Collagen. (II and VI)

332 Arpornmaeklong et al.
Fig. 2. SEM images show morphology, attachment and growth of osteoblasts on the sponges on culture-day 9. (I) Collagen. (II) Chitosan. (III) 1:1chitosan–collagen. (IV) 1:2 chitosan–collagen sponges.
Fig. 3. SEM images show growth of cells in multilayers on outer surface and within porous structure of the sponges on culture-day 21. The smallnodules of mineralized ECM are indicated by the arrow. (I) Collagen. (II) Chitosan. (III) 1:1 chitosan–collagen. (IV) 1:2 chitosan–collagensponges.

Chitosan–collagen sponges and osteoblastic differentiation 333
On longitudinal surface, the smallestpore size was found in Group IV: 1:2chitosan–collagen sponges (71.89 �11.47 mm), and was significantly smallerthan in Groups I (80.46 � 12.67 mm) (Dun-nett T3, MD = �8.572, P = 0.000) and II(78.14 � 15.13 mm) (Dunnett T3,MD = �6.246, P = 0.013). Pore sizes ofGroups IV and III were not significantlydifferent (Dunnett T3, MD = �11.433,P = 0.071) (Fig. 1(V–VIII)).
It was found that average pore dia-meters on longitudinal and cross-sectionalsurfaces were significantly different ineach group. Pore sizes on the longitudinalsurface of collagen (80.46 � 12.67 mm)and 1:2 chitosan–collagen sponges(71.89 � 11.47 mm) were significantlysmaller than pore sizes on the cross-sectional surface (84.77 � 12.95 mm,80.63 � 11.84 mm, respectively), but poresizes of 1:1 chitosan–collagen (83.32 �40.97 mm) and chitosan sponges(78.14 � 15.13 mm) on the longitudinal
Fig. 4. CLSM images show viability and growthChitosan. (III) 1:1 chitosan–collagen. (IV) 1:2 c
surface were significantly larger than poresizes on the cross-sectional surface(66.69 � 9.92, 64.33 � 10.10 mm, respec-tively, P < 0.001) (Table 1).
Growth and morphology of cells on
structure of scaffolds
SEM images demonstrated that the porousthree-dimensional structures of thesponges promoted intercellular contactand accumulation of ECM (Figs 2 and3). Cells attached and sprouted their cyto-plasmic processes on the surface and grewwell into the porous structures of collagenand chitosan–collagen composite sponges.On chitosan sponges cells grew more onthe outer surface because of the flabbystructure of the sponges (Fig. 2). At a laterstage, cells grew in multilayers andsecreted ECM. The ECM was mineralizedand mineralization nodules could beobserved in all groups on culture-day 21(Fig. 3).
of osteoblasts (green colour, FDA-labelled) cultuhitosan–collagen sponges.
CLSM demonstrated cell viability andabundant cell growth within the three-dimensional structure of all sponges ineach group except Group II: chitosansponges (Fig. 4). It was noted that themorphology and attachment of cells onchitosan sponges (Group II) were differentfrom other groups. The cells on chitosansponges were relatively round with limitedspreading of cytoplasmic processes, andcell density was markedly lower than inother groups (Fig. 4II).
Cell viability assay
Growth of cells steadily increased from24 h after cell seeding to culture-day 15,and on culture-days 18 and 21 reached aplateau phase, but there was no significantdifference among groups (P > 0.05).Growth of cells on collagen and chito-san–collagen sponges (Groups I, III andIV) had a similar pattern and levelsthroughout the cell-culture period.
red for 6 days on the sponges. (I) Collagen. (II)

334 Arpornmaeklong et al.
Fig. 5. Cell viability (MTT assay) of osteoblasts cultured for 21 days on the sponges. *P < 0.05;significant against Group II: chitosan sponges. zP < 0.05; significant against Group IV: 1:2chitosan–collagen sponges.
Chitosan sponges tended to promotegrowth of cells to a greater level than othergroups. Growth of cells on chitosansponges (Group II) was lower than othergroups during culture-days 3 and 6, andthen sharply increased on culture-days6–12 and became stable on days 18 and21. On culture-day 12, growth of cells on1:2 chitosan–collagen sponges (Group IV)and chitosan (Group II) was sharplyincreased and significantly higher thanin Groups I and III (ANOVA,F = 10.355, df = 3,16, P = 0.000). On cul-ture-day 15, growth of cells on chitosansponges was still significantly higher thanon collagen sponges (Group I) (TukeyHSD, MD = 0.440, P = 0.029) (Fig. 5).
Fig. 6. ALP activity of osteoblasts cultured for 21 days on the sponges. zP < 0.05; significantagainst Group I: collagen sponges. *P < 0.05; significant against Group II: chitosan sponges.yP < 0.05; significant against Group IV: 1:2 chitosan–collagen sponges (mean � SE, n = 5).
Differentiation of osteoblasts on the
sponges
ALP activity
Growth of cells in all groups showed asimilar pattern of levels of ALP activity.The activity gradually increased. Group I:collagen sponges reached the highest levelon culture-day 18, Group II: chitosansponges on culture-day 12 and GroupsIII and IV on culture-day 21. Significantdifferences in activity among the studygroup were found on culture-days 18and 21. ALP activity of cells on chitosansponges (Group II) was significantlydecreased on culture-day 18 and thenstable. It was significantly lower thancells on all other sponges on culture-day18 (ANOVA, F = 22.705, df = 3,16,P = 0.000) and than 1:1 (Group III) and1:2 (Group IV) chitosan–collagen spongeson culture-day 21 (ANOVA, F = 30.316,df = 3,16, P = 0.000). Levels of ALPactivity of the composite sponges in
Groups III and IV were similar throughoutthe cell-culture period, except on culture-day 21, and were not significantly differ-ent from collagen sponges (Group I),except on culture-days 18 and 21. Onculture-day 18, the level of ALP activityof Group I: collagen sponges was signifi-cantly higher than of 1:2 (Group IV), 1:1chitosan–collagen sponges (Group III) andchitosan sponges (ANOVA, F = 22.705,df = 3,16, P = 0.000). On culture-day 21,the activity of Group III was markedlyincreased and had the highest level com-pared to other groups (ANOVA,F = 30.316, df = 3,16, P = 0.000) (Fig. 6).
Levels of osteocalcin in culture medium
On culture-day 3, expression of osteocal-cin at low levels was found in all groups(P > 0.05) with an average value of
7.31 � 4.8 ng/mg. Levels of osteocalcinof cells on collagen and chitosan–collagensponges, Groups I, III and IV, on culture-day 3 were significantly lower than onculture-days 15 and 21. The low levelsof osteocalcin of Group II on culture-days3, 15 and 21 with a range of 3.70–11.87 ng/mg protein were not significantlydifferent (P > 0.05). On culture-day 15,levels of osteocalcin in Group II weresignificantly lower than in Groups IIIand IV (Tukey HSD, MD = �46.556,P = 0.000; MD = �20.781, P = 0.002)and on culture-day 21 were significantlylower than Group I (Tukey HSD,MD = �74.709, P = 0.005). Levels ofosteocalcin of Groups I, III and IV onculture-days 15 and 21 were not signifi-cantly different (Fig. 7).
Level of calcium content
Calcium content of ECM was determinedin all groups on culture-days 15 and 21.The levels of calcium of cells on chitosanand 1:1 and 1:2 chitosan–collagensponges, Groups II–IV, between culture-days 15 and 21 were not significantlydifferent (P > 0.05), but the levels of cal-cium of cells on collagen sponges, GroupI, on culture-day 21 were significantly lessthan on culture-day 15 (paired t-test,t = �4.127, P = 0.014). On culture-days15 and 21, the lowest level of calciumwas found in Group II: chitosan sponges,and it was significantly lower than in othergroups (Groups I, III and IV) on culture-day 15 (ANOVA, F = 4.843, df = 3,16,P = 0.014), but was significantly lowerthan only 1:1 chitosan–collagen sponges(Group III) on culture-day 21 (TukeyHSD, MD = �0.78, P = 0.010) (Fig. 8).

Chitosan–collagen sponges and osteoblastic differentiation 335
Fig. 7. Osteocalcin content of culture medium of osteoblasts on the sponges on culture-days 3,15 and 21. zP < 0.05; significant against culture-day 15 within the same group. yP < 0.05;significant against culture-day 21 within the same group. *P < 0.05; significant against Group II:chitosan sponges. �P < 0.05; significant against Group III: 1:1 chitosan–collagen sponges(mean � SE, n = 5).
Fig. 8. Calcium content of ECM of osteoblasts on the sponges on culture-days 15 and 21.*P < 0.05; significant against Group II: chitosan sponges. zP < 0.05; significant against culture-day 15 within the same group (mean � SE, n = 5).
Discussion
Scaffolds not only function as a deliveryvehicle for growth factors and living cells,but support and regulate bone regenerationby functioning as ECM and maintainingthe space and shape of the defect for theregenerated bone21. Collagen and chitosanhave intrinsic properties that supportgrowth and differentiation of osteo-blasts18,22,25. Collagen was combined withchitosan and cross-linked to improve thebiological stability and strength of chito-san–collagen composite sponges to reachthe demand of an application in bonetissue engineering. The incorporation ofchitosan into a collagen scaffold increases
the mechanical strength of the scaffoldand reduces the biodegradation rateagainst collagenase23,42.
Scaffolds must be porous to allowingrowth of cells and migration of vascu-lar tissue21. SEM images revealed thatcollagen, chitosan and chitosan–collagensponges are porous and have an irregularpore size and fold-like structure (Fig. 1).This might be because pore diameters arevaried with a radial position in cylindricalscaffolds and the formation of ice crystalsin chitosan–collagen sponges affects theformation of pore microstructure. In thisstudy, cylindrical syringes, 5 mm in dia-meter, were used. The temperature of thefreeze-dryer and the freezing temperature
of the suspension were controlled at aconstant rate and duration to minimizeeffects of surface area and temperatureon the microstructure of all sponges.Freezing conditions determined micro-structure and whole structural rigidity ofthe scaffolds28. The scaffolds producedusing the constant cooling rate techniqueby controlling the suspension freezing ratewere observed to have a more homoge-neous pore structure34.
Incorporation of collagen into a chito-san matrix tended to increase the pore sizeand density of the chitosan–collagen com-posite matrix and improve structuralhomogeneity. Pore-size analysis showeda large pore size on cross section and smallpore size on longitudinal section of the 1:2chitosan–collagen sponges (Fig. 1,Table 1). According to SEM images, porestructures were better defined in groups ofcomposite chitosan–collagen spongesthan chitosan and collagen sponges. Irre-gular pore size and shape were foundmostly in chitosan, followed by collagen,1:2 chitosan–collagen and 1:1 chitosan–collagen sponges (Fig. 1). This might bebecause chitosan in chitosan–collagencomposites improves the structural stabi-lity of the matrices. The large number ofamino groups on the molecular chain ofchitosan functions as a cross-linkingbridge to increase overall matrix integrityby reinforcing the structure and cross-linking efficiency of glutaraldehyde inthe scaffolds26,27,41. Collagen improvesthe porous structure and strength of chit-osan–collagen composite sponges com-pared to chitosan sponges35. It washypothesized that the biostability,mechanical strength and osteoconductiveproperties of chitosan–collagen spongeswere greater than of collagen or chitosansponges.
Pore structure significantly affects cellbinding and migration in vitro and influ-ences the rate and depth of cellularingrowth in vitro and in vivo44. CLSMimages demonstrated cell viability andgrowth of cells within the porous struc-tures of the sponges (Fig. 4). SEM imagesconfirmed the CLSM observations that theporous three-dimensional structure of thesponges promoted intercellular contactand accumulation of ECM (Figs. 2 and3). Osteoblasts with a mean size of 10–30 mm were able to establish intercellularcontact, grow in a multilayer and secreteECM on scaffolds with a mean pore size of64–85 mm (ranging from 50 to 113 mm) incross section and 72–83 mm (ranging from48 to 229 mm) in longitudinal section(Table 1, Figs. 2 and 3). This disagreeswith the results of KOSE et al.19 that aver-

336 Arpornmaeklong et al.
age pore size should be at least three times(>100 mm) the size of cells so that a singlecell could establish contact with others. Inthis study, the chitosan–collagen spongeswith pore size less than 100 mm (50–100 mm) allowed a favourable arrange-ment of cells. This finding agreed with aprevious report that pore size can be smal-ler in under non-load-bearing conditionswith a minimum pore size of 50–100 mm15.
A porous scaffold microstructure withminimal pore size ranging from 100 to150 mm is usually required to allow tissueingrowth46. A minimum pore size of100 mm is required for ingrowth of osteo-blasts in the load-bearing area of dogfemur14. A larger pore size promotes cellproliferation by facilitating revasculariza-tion and transport of oxygen and nutri-ents40. Pores of size 300–400 mm areoptimal for in-vivo bone regeneration asthey allow migration of blood vessels andpromote faster migration of cells into theporous structures21,43. The fabrication pro-cess of chitosan–collagen compositesponges should be further developed toincrease pore size and enhance their appli-cation in bone regeneration. This may bedone by increasing the titrating ratio ofcollagen in chitosan–collagen sponges.
The collagen, chitosan and chitosan–collagen sponges in this study were bio-compatible. All sponges supported growthof cells on three-dimensional structures ina similar manner. Chitosan sponges had atendency to promote growth of cells to agreater extent than the other groups(Fig. 5). It is postulated that strong attrac-tion between positive charges on the chit-osan surface and negative charges on thecell surface enhanced the metabolic activ-ity of cells on chitosan sponges26. In vivo,chitosan enhances angiogenesis andwound healing8, and supports growthand differentiation of osteoblasts18,22,31.
Collagen and chitosan–collagen com-posite sponges promoted growth and dif-ferentiation of osteoblasts into the maturestage (Figs. 6–8). Expression of pheno-types of osteoblasts is sequential. Osteo-calcin is secreted when expression of ALPreaches the highest level to maximizemineralization of ECM45. The ALP activ-ity of each group reached the highest levelon different culture-days: chitosan on cul-ture-day 12, collagen on culture-day 18and chitosan–collagen sponges on culture-day 21 (Fig. 6). This suggested that therate and extent of differentiation of cells ineach group were different, as could beseen from the different levels of oseteo-calcin and calcium in each group (Figs. 7and 8).
Collagen matrix promoted osteoblasticdifferentiation and enhanced the osteo-conductivity of chitosan–collagensponges. High levels of markers of osteo-blastic differentiation at a mature stage,osteocalcin and calcium, were clearlydemonstrated in collagen and chitosan–collagen sponges but not chitosansponges (Figs. 7 and 8). There are severalpossible reasons for this: first, osteoblastshave a specific affinity for collagenfibres; secondly, the stimulating effectof collagen matrix was further enhancedby the three-dimensional structure ofthe scaffolds4,5; and thirdly chitosanimproves the internal porous structureof a chitosan–collagen composite41. Alimitation of chitosan sponges in support-ing the spreading of cytoplasmic mem-brane on their surface might hinderosteoblastic differentiation on thesesponges (Fig. 4b)7.
High levels of ALP activity, osteocalcinand calcium suggest that a collagen blendimproves the osteoconductive property ofchitosan sponges. Chitosan–collagencomposites form an ionic complexbetween positively charged chitosan andthe negatively charge collagen, creatingnew materials with different struc-tures39,42. It is generally agreed that ahighly porous microstructure with inter-connected pores and a large surface area isconducive for tissue ingrowth13.
It can be concluded that the chitosan–collagen composite scaffolds had a super-ior microstructure and supported prolif-eration and differentiation of osteoblastswhereas chitosan supported only prolif-eration of the cells. Thus a combinationof collagen and chitosan matrixes shouldcreate an appropriate environment forgrowth and differentiation of osteoblasts.However, pore size and interconnectedpore structure of the composite spongesneed to be improved through the fabrica-tion process.
Acknowledgements. This study was sup-ported by the Prince of Songkla UniversityResearch Fund and the Commission onHigher Education, Thailand.
References
1. Aiedeh K, Gianasi E, Orienti I, Zecchi
V. Chitosan microcapsules as controlledrelease systems for insulin. J Microen-capsul 1997: 14: 567–576.
2. Andrianarivo AG, Robinson JA,Mann KG, Tracy RP. Growth on typeI collagen promotes expression of theosteoblastic phenotype in human osteo-
sarcoma MG-63 cells. J Cell Physiol1992: 153: 256–265.
3. Aronow MA, Gerstenfeld LC, Owen
TA, Tassinari MS, Stein GS, Lian JB.Factors that promote progressive devel-opment of the osteoblast phenotype incultured fetal rat calvaria cells. J CellPhysiol 1990: 143: 213–221.
4. Bouvier M, Couble ML, Hartmann
DJ, Gauthier JP, Magloire H. Ultra-structural and immunocytochemicalstudy of bone-derived cells cultured inthree-dimensional matrices: influence ofchondroitin-4 sulfate on mineralization.Differentiation 1990: 45: 128–137.
5. Casser-Bette M, Murray AB, Closs
EI, Erfle V, Schmidt J. Bone formationby osteoblast-like cells in a three-dimen-sional cell culture. Calcif Tissue Int 1990:46: 46–56.
6. Chandy T, Sharma CP. Chitosan matrixfor oral sustained delivery of ampicillin.Biomaterials 1993: 14: 939–944.
7. Chevallay B, Herbage D. Collagen-based biomaterials as 3D scaffold for cellcultures: applications for tissue engineer-ing and gene therapy. Med Biol EngComput 2000: 38: 211–218.
8. Chupa JM, Foster AM, Sumner SR,Madihally SV, Matthew HW. Vascu-lar cell responses to polysaccharide mate-rials: in vitro and in vivo evaluations.Biomaterials 2000: 21: 2315–2322.
9. Dieudonne SC, van den DJ, de Ruij-
ter JE, Paldan H, Peltola T, ‘t Hof
MA, Happonen RP, Jansen JA. Osteo-blast differentiation of bone marrow stro-mal cells cultured on silica gel and sol-gel-derived titania. Biomaterials 2002:23: 3041–3051.
10. Franceschi RT, Iyer BS. Relationshipbetween collagen synthesis and expres-sion of the osteoblast phenotype inMC3T3-E1 cells. J Bone Miner Res1992: 7: 235–246.
11. Higuchi T, Kinoshita A, Takahashi K,Oda S, Ishikawa I. Bone regeneration byrecombinant human bone morphogeneticprotein-2 in rat mandibular defects. Anexperimental model of defect filling. JPeriodontol 1999: 70: 1026–1031.
12. Hollinger JO, Schmitt JM, Buck DC,Shannon R, Joh SP, Zegzula HD,Wozney J. Recombinant human bonemorphogenetic protein-2 and collagenfor bone regeneration. J Biomed MaterRes 1998: 43: 356–364.
13. Hu Y, Zhang C, Zhang S, Xiong Z, Xu
J. Development of a porous poly(L-lacticacid)/hydroxyapatite/collagen scaffold asa BMP delivery system and its use inhealing canine segmental bone defect. JBiomed Mater Res 2003: 67A: 591–598.
14. Hulbert SF, Young FA, Mathews RS,Klawitter JJ, Talbert CD, Stelling
FH. Potential of ceramic materials aspermanently implantable skeletal pros-theses. J Biomed Mater Res 1970: 4:433–456.

Chitosan–collagen sponges and osteoblastic differentiation 337
15. Itala AI, Ylanen HO, Ekholm C,Karlsson KH, Aro HT. Pore diameterof more than 100 microm is not requisitefor bone ingrowth in rabbits. J BiomedMater Res 2001: 58: 679–683.
16. Kim SS, Sun PM, Jeon O, Yong CC,Kim BS. Poly(lactide-co-glycolide)/hydroxyapatite composite scaffolds forbone tissue engineering. Biomaterials2006: 27: 1399–1409.
17. Kinoshita A, Oda S, Takahashi K,Yokota S, Ishikawa I. Periodontalregeneration by application of recombi-nant human bone morphogenetic protein-2 to horizontal circumferential defectscreated by experimental periodontitis inbeagle dogs. J Periodontol 1997: 68: 103–109.
18. Klokkevold PR, Vandemark L, Ken-
ney EB, Bernard GW. Osteogenesisenhanced by chitosan (poly-N-acetyl glu-cosaminoglycan) in vitro. J Periodontol1996: 67: 1170–1175.
19. Kose GT, Kenar H, Hasirci N, Hasirci
V. Macroporous poly(3-hydroxybutyrate-co-3-hydroxyvalerate) matrices for bonetissue engineering. Biomaterials 2003:24: 1949–1958.
20. Kratz G, Arnander C, Swedenborg J,Back M, Falk C, Gouda I, Larm O.Heparin-chitosan complexes stimulatewound healing in human skin. Scand JPlast Reconstr Surg Hand Surg 1997: 31:119–123.
21. Kuboki Y, Jin Q, Takita H. Geometry ofcarriers controlling phenotypic expres-sion in BMP-induced osteogenesis andchondrogenesis. J Bone Joint Surg Am2001: 83-A: S105–S115.
22. Lahiji A, Sohrabi A, Hungerford DS,Frondoza CG. Chitosan supports theexpression of extracellular matrix pro-teins in human osteoblasts and chondro-cytes. J Biomed Mater Res 2000: 51:586–595.
23. Lee SB, Kim YH, Chong MS, Lee YM.Preparation and characteristics of hybridscaffolds composed of beta-chitin andcollagen. Biomaterials 2004: 25: 2309–2317.
24. Leffler CC, Muller BW. Influence ofthe acid type on the physical and drugliberation properties of chitosan-gelatinsponges. Int J Pharm 2000: 194: 229–237.
25. Lynch MP, Stein JL, Stein GS, Lian
JB. The influence of type I collagen on thedevelopment and maintenance of theosteoblast phenotype in primary and pas-saged rat calvarial osteoblasts: modifica-tion of expression of genes supportingcell growth, adhesion, and extracellularmatrix mineralization. Exp Cell Res1995: 216: 35–45.
26. Ma J, Wang H, He B, Chen J. Apreliminary in vitro study on the fabri-cation and tissue engineering applica-tions of a novel chitosan bilayer materialas a scaffold of human neofetal dermalfibroblasts. Biomaterials 2001: 22: 331–336.
27. Ma L, Gao C, Mao Z, Zhou J, Shen J,Hu X, Han C. Collagen/chitosan porousscaffolds with improved biostability forskin tissue engineering. Biomaterials2003: 24: 4833–4841.
28. Madihally SV, Matthew HW. Porouschitosan scaffolds for tissue engineering.Biomaterials 1999: 20: 1133–1142.
29. Mao JS, Zhao LG, Yin YJ, Yao KD.Structure and properties of bilayer chit-osan-gelatin scaffolds. Biomaterials2003: 24: 1067–1074.
30. Merklein F, Hendrich C, Noth U,Kochinki G, Rader CP, Schutze N,Thull R, Eulert J. Standardized testsof bone implant surfaces with an osteo-blast cell culture system. I. Orthopedicstandard materials. Biomed Tech (Berl)1998: 43: 354–359.
31. Mizuno M, Shindo M, Kobayashi D,Tsuruga E, Amemiya A, Kuboki Y.Osteogenesis by bone marrow stromalcells maintained on type I collagen matrixgels in vivo. Bone 1997: 20: 101–107.
32. Muzzarelli RA, Zucchini C, Ilari P,Pugnaloni A, Mattioli BM, Biagini
G, Castaldini C. Osteoconductive prop-erties of methylpyrrolidinone chitosan inan animal model. Biomaterials 1993: 14:925–929.
33. Ng KW, Hutmacher DW, Schantz JT,Ng CS, Too HP, Lim TC, Phan TT,Teoh SH. Evaluation of ultra-thin poly(-epsilon-caprolactone) films for tissue-engineered skin. Tissue Eng 2001: 7:441–455.
34. O’Brien FJ, Harley BA, Yannas IV,Gibson L. Influence of freezing rate onpore structure in freeze-dried collagen-GAG scaffolds. Biomaterials 2004: 25:1077–1086.
35. OUNGBHO K. Biodegradable sponges fromhydrocolloids as sustained release drugcarrier systems (Dissertation). Faculty ofMathematics-Natural Sciences, Chris-tian-Albrechts-University, Kiel, Ger-many, 1997.
36. Park YJ, Lee YM, Lee JY, Seol YJ,Chung CP, Lee SJ. Controlled release ofplatelet-derived growth factor-BB fromchondroitin sulfate-chitosan sponge forguided bone regeneration. J Control Rel2000: 67: 385–394.
37. Rozycki MD, Edelstein SJ. Proteinextraction and solubilization. In: Bollag
DM, Rozycki MD, Edelstein SJ, eds:
Protein Methods. John Wiley & Sons,Ltd. 1996.
38. Sampath TK, Reddi AH. Dissociativeextraction and reconstitution of extracel-lular matrix components involved in localbone differentiation. Proc Natl Acad SciU S A 1981: 78: 7599–7603.
39. Sionkowska A, Wisniewski M, Sko-
pinska J, Kennedy CJ, Wess TJ. Mole-cular interactions in collagen and chitosanblends. Biomaterials 2004: 25: 795–801.
40. Takahashi Y, Tabata Y. Effect ofthe fiber diameter and porosity of non-woven PET fabrics on the osteogenicdifferentiation of mesenchymal stemcells. J Biomater Sci Polym Ed 2004:15: 41–57.
41. Tan W, Krishnaraj R, Desai TA. Eva-luation of nanostructured composite col-lagen–chitosan matrices for tissueengineering. Tissue Eng 2001: 7: 203–210.
42. Taravel MN, Domard A. Relationbetween the physicochemical character-istics of collagen and its interactions withchitosan: I. Biomaterials 1993: 14: 930–938.
43. Tsuruga E, Takita H, Itoh H, Waki-
saka Y, Kuboki Y. Pore size of poroushydroxyapatite as the cell-substratumcontrols BMP-induced osteogenesis. JBiochem (Tokyo) 1997: 121: 317–324.
44. van Tienen TG, Heijkants RG, Buma
P, de Groot JH, Pennings AJ, Veth RP.Tissue ingrowth and degradation of twobiodegradable porous polymers with dif-ferent porosities and pore sizes. Bioma-terials 2002: 23: 1731–1738.
45. Wada Y, Kataoka H, Yokose S, Ishi-
zuya T, Miyazono K, Gao YH, Shiba-
saki Y, Yamaguchi A. Changes inosteoblast phenotype during differentia-tion of enzymatically isolated rat calvariacells. Bone 1998: 22: 479–485.
46. Zeltinger J, Sherwood JK, Graham
DA, Mueller R, Griffith LG. Effect ofpore size and void fraction on cellularadhesion, proliferation, and matrixdeposition. Tissue Eng 2001: 7: 557–572.
Address:Premjit ArpornmaeklongDepartment of Oral and Maxillofacial
SurgeryFaculty of DentistryPrince of Songkla UniversityHat Yai90112 SongkhlaThailandTel: +66 74 429 876Fax: +66 74 212 922E-mail: [email protected]